QUEENSLAND TREASURY
2022–23
Report on State Finances
of the Queensland Government – 30 June 2023
Incorporating the Outcomes Report and
the AASB 1049 Financial Statements

EXHIBIT (c)(xiv)
Government of Queensland’s Consolidated Financial Statements for the Year Ended June 30, 2023
FORWARD-LOOKING STATEMENTS
This exhibit contains forward-looking statements. Statements that are not historical facts, including statements about the State of Queensland’s (the “State” or “Queensland”) beliefs and expectations, are forward-looking statements. These statements are based on current plans, budgets, estimates and projections and therefore you should not place undue reliance on them. The words “believe”, “may”, “will”, “should”, “estimate”, “continue”, “anticipate”, “intend”, “expect”, “forecast” and similar words are intended to identify forward-looking statements. Forward-looking statements speak only as of the date they are made, and neither the Queensland Treasury Corporation nor the State undertake any obligation to update publicly any of them in light of new information or future events.
Forward-looking statements are based on current plans, estimates and projections and, therefore, undue reliance should not be placed on them. Although the Queensland Treasury Corporation and the State believe that the beliefs and expectations reflected in such forward-looking statements are reasonable, no assurance can be given that such beliefs and expectations will prove to have been correct. Forward-looking statements involve inherent risks and uncertainties. We caution you that actual results may differ materially from those contained in any forward-looking statements.
A number of important factors could cause actual results to differ materially from those expressed in any forward-looking statement. Factors that could cause the actual outcomes to differ materially from those expressed or implied in forward-looking statements include:
| • | the international and Australian economies, and in particular the rates of growth (or contraction) of the State’s major trading partners; |
| • | the effects, both internationally and in Australia, of any subsequent economic downturn, as well as the effect of ongoing economic, banking and sovereign debt risk; |
| • | the effect of natural disasters, epidemics and geopolitical events, such as the novel coronavirus (COVID-19) pandemic, the Russia-Ukraine conflict and the Israel-Hamas conflict; |
| • | increases or decreases in international and Australian domestic interest rates; |
| • | changes in and increased volatility in currency exchange rates; |
| • | changes in the State’s domestic consumption; |
| • | changes in the State’s labor force participation and productivity; |
| • | downgrades in the credit ratings of the State and Australia; |
| • | changes in the rate of inflation in the State; |
| • | changes in environmental and other regulation; and |
| • | changes in the distribution of revenue from the Commonwealth of Australia Government to the State. |
(c)(xiv)-1
QUEENSLAND TREASURY
2022–23
Report on State Finances
of the Queensland Government – 30 June 2023
Incorporating the Outcomes Report and
the AASB 1049 Financial Statements
Contents
| Page | ||||
| Message from the Treasurer |
2 | |||
| Outcomes Report - Uniform Presentation Framework |
||||
| Overview and Analysis |
3 - 1 | |||
| Operating Statement by Sector |
3 - 8 | |||
| Balance Sheet by Sector |
3 - 9 | |||
| Cash Flow Statement by Sector |
3 - 10 | |||
| General Government Sector Taxes |
3 - 11 | |||
| General Government Sector Dividend and Income Tax Equivalent Income |
3 - 11 | |||
| General Government Sector Grants Revenue |
3 - 12 | |||
| General Government Sector Grants Expenses |
3 - 12 | |||
| General Government Sector Expenses by Function |
3 - 13 | |||
| General Government Sector Purchases of Non-financial Assets by Function |
3 - 14 | |||
| Certification of Outcomes Report |
3 - 15 | |||
| AASB 1049 Financial Statements |
||||
| Overview and Analysis |
4 - 1 | |||
| Audited Financial Statements |
||||
| Operating Statement |
5 - 1 | |||
| Balance Sheet |
5 - 2 | |||
| Statement of Changes in Equity (Net Worth) |
5 - 3 | |||
| Cash Flow Statement |
5 - 5 | |||
| Notes to the Financial Statements |
5 - 7 | |||
| Certification of Queensland State Government Financial Statements |
5 - 92 | |||
| Independent Auditor’s Report to the Treasurer of Queensland |
5 - 93 | |||
| Report on State Finances 2022–23 – Queensland Government | 1 |
Message from the Treasurer
I present Queensland’s 2022-23 Report on State Finances which includes the Outcomes Report and AASB 1049 Financial Statements.
The Queensland economy has continued to grow in 2022-23 despite rising interest rates, inflationary pressures, and temporary domestic and international supply chain constraints.
The strength of the Queensland economy, including the state’s labour market performance, combined with exceptionally high prices received by the state’s coal producers have resulted in Queensland delivering an operating surplus of $13.93 billion in 2022-23. This record surplus is $1.625 billion higher than the $12.305 billion surplus estimated in the 2023-24 Budget mainly due to the Australian Government bringing forward funding from later years.
The record surplus provides Queensland with the capacity to deliver substantial cost-of-living measures support for Queensland families and businesses, while also supporting the state’s record capital program over the next four years.
The Outcomes Report
The Outcomes Report contains financial statements that are presented in accordance with the Uniform Presentation Framework (UPF) which provides comparable reporting of Commonwealth, State and Territory Governments’ financial information.
Queensland’s annual Budget was prepared in accordance with the UPF. The Outcomes Report compares the 2022-23 actual results with the revised forecasts contained in the 2023-24 Budget papers.
The UPF presentation is structured on a sectoral basis with a focus on the General Government and Public Non-financial Corporations Sectors.
AASB 1049 Financial Statements
The AASB 1049 Financial Statements outline the operations of the Queensland Government in accordance with Australian Accounting Standard AASB 1049 Whole of Government and General Government Sector Financial Reporting and other applicable standards and are audited.
These statements focus on the General Government Sector (GGS) and Total State Sector (TSS) and include detailed notes.
The statements include comparatives for the 2021-22 year, as well as analysis of variances between the published 2022-23 Budget and the 2022-23 outcome.
AASB 1049 aims to harmonise the Government Finance Statistics (GFS) and Accounting Standard frameworks. The GFS reporting framework, developed by the Australian Bureau of Statistics (ABS), is based on international statistical standards and allows comprehensive assessments to be made of the economic impact of government.
I note the assurances of Treasury officials that both the Outcomes Report and the audited financial statements are presented on a true and fair basis and that the independent auditor’s report is unqualified.
In endorsing this report, I place on record my appreciation of the professionalism and co-operation extended to Queensland Treasury by agency personnel and of the Treasury staff involved in its preparation.
The Honourable Cameron Dick MP
Treasurer
Minister for Trade and Investment
Related Publications
This report complements other key publications relating to the financial performance of the Queensland Public Sector including:
| – | the annual Budget papers; |
| – | the Treasurer’s Consolidated Fund Financial Report; |
| – | the annual reports of the various departments, statutory bodies, Government-owned corporations and other entities that comprise the Queensland Government; and |
| – | the Queensland Sustainability Report. |
| 2 | Report on State Finances 2022–23 – Queensland Government |
Outcomes Report
QUEENSLAND TREASURY
2022–2023
Outcomes Report
Uniform Presentation Framework of the
Queensland Government – 30 June 2023
Outcomes Report - Overview and Analysis
Overview
Queensland’s strong economic performance and continued exceptionally high commodity prices have resulted in a substantial improvement in the State’s fiscal position in 2022-23 compared to the original 2022-23 Budget forecasts.
The General Government Sector (GGS) realised a Uniform Presentation Framework (UPF) net operating surplus of $13.93 billion for 2022-23. This is the largest surplus in Queensland’s history and follows the previous record surplus of $4.284 billion (restated) in 2021-22.
The 2022-23 operating surplus was an improvement of $1.625 billion compared to the estimated operating surplus of $12.305 billion reported in the 2023-24 Budget, and a substantial turnaround relative to the original 2022-23 Budget operating deficit estimate of $1.029 billion. Refer Chart 3.1.
The record surplus in 2022-23 reflects higher royalty revenue, driven by higher coal prices and new progressive coal royalty tiers, and strong labour market performance. The stronger revenue performance in 2022-23 has resulted in lower borrowings, enabling restoration of fiscal buffers to respond to future external shocks and build capacity for the State’s transformative capital program.
The $1.625 billion increase in net operating balance since the 2023-24 Budget is primarily due to the Australian Government providing advance payments under the Disaster Recovery Financial Arrangements (DRFA) and Social Housing Accelerator program in 2022-23.
Chart 3.1: 2022-23 General Government Sector UPF net operating balance compared to budget forecasts
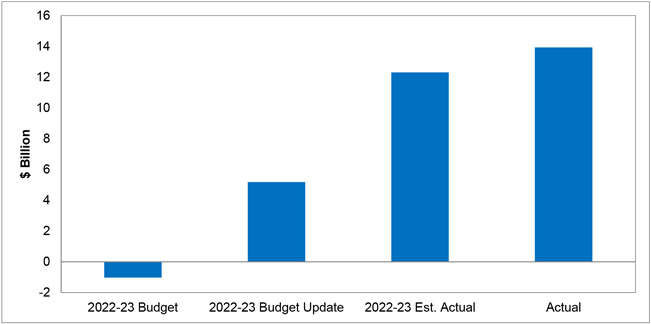
Source: 2022-23 and 2023-24 Queensland State Budgets, 2022-23 Budget Update and 2022-23 Queensland Report on State Finances
In 2022-23, GGS revenue totalled $89.81 billion, up $2.187 billion on the 2023-24 Budget estimated actual revenue of $87.623 billion. The increase in revenue primarily reflects the Australian Government’s decision in late June 2023 to make advance payments of Financial Assistance Grants (FAGs), DRFA payments and Social Housing Accelerator program grants.
Higher GGS expenses partly offset the improved revenue in 2022-23. GGS expenses totalled $75.88 billion in 2022-23, $563 million higher than the 2023-24 Budget estimated actual. The higher expenses largely reflect the on-passing to local councils of the advance payment of FAGs from the Australian Government.
| Report on State Finances 2022–23 – Queensland Government | 3-1 |
Outcomes Report - Overview and Analysis
Overview continued
GGS net debt in 2022-23 is $2.615 billion, a $3.237 billion improvement since the 2023-24 Budget. Refer Chart 3.2.
Chart 3.2: 2022-23 General Government Sector net debt compared to budget forecasts
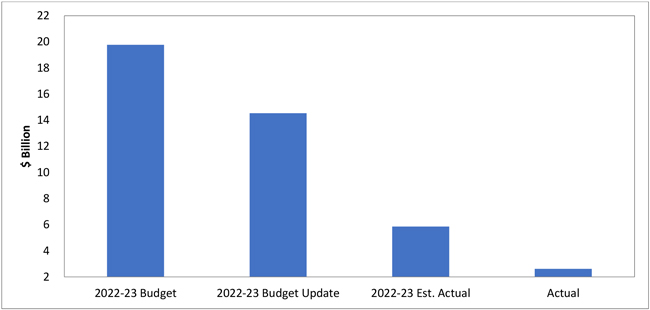
Source: 2022-23 and 2023-24 Queensland State Budgets, 2022-23 Budget Update and 2022-23 Queensland Report on State Finances
Higher than estimated net operating cash flows, partly as a result of advance grant payments from the Australian Government, contribute toward the lower net debt outcome in 2022-23. Better than expected market valuation of investments, loans and placements also contributed to lower net debt. These movements were partly offset by higher purchases of non-financial assets.
Net debt has improved significantly since the original 2022-23 Budget forecast of $19.772 billion as the government has used stronger royalty revenue to reduce borrowing requirements and set aside investments for future regional infrastructure. GGS net debt has declined for a third consecutive year, demonstrating the broad strength of the Queensland economy following the Government’s health response and recovery measures to the COVID-19 pandemic in 2019-20.
As at 30 June 2023, GGS borrowing totalled $53.726 billion, $967 million lower than the 2023-24 Budget estimated actual. Lower borrowing were largely due to the improved net cash inflows from operating activities, partly offset by modestly higher than expected purchases of non-financial assets.
Non-financial Public Sector (NFPS) borrowing as at 30 June 2023 was $102.821 billion, marginally higher than estimated actual in the 2023-24 Budget. Higher NFPS borrowing reflects a market value adjustment to derivatives held by energy Government-owned corporations (GOCs) to hedge movements in electricity prices, offset in part by lower GGS borrowing.
NFPS net debt is $42.848 billion as at 30 June 2023, a $2.801 billion improvement on the 2023-24 estimated actual projection. This improvement is predominantly due to the better than expected GGS net debt outcome.
Fiscal principles
In the 2021-22 Queensland Budget, the Government set out its medium-term strategy for fiscal recovery, including a new Charter of Fiscal Responsibility. The aim of the Charter is to guide Budget strategy in the medium term in response to the fiscal challenges brought on by the COVID-19 pandemic. The Charter includes Fiscal Principles to support the delivery of net operating surpluses and the stabilisation of net debt.
Principle 1 – Stabilise the General Government Sector net debt to revenue ratio at sustainable levels in the medium term, and target reductions in the net debt to revenue ratio in the long term.
Net debt is a key fiscal measure of the overall strength of the State’s fiscal position and the net debt to revenue ratio indicates the Government’s ability to service this debt.
| 3-2 | Report on State Finances 2022–23 – Queensland Government |
Outcomes Report - Overview and Analysis
Fiscal principles continued
Like other Australian jurisdictions, Queensland’s strong public health response to the COVID-19 virus and its decision to prioritise economic recovery resulted in an increase in gross borrowings and net debt, particularly in 2019-20. The Government is focused on stabilising net debt in the medium term by restoring operating surpluses, as per Fiscal Principle 2.
Queensland’s net debt to revenue ratio was 3 per cent in 2022-23, a reduction from the 15 per cent ratio reported in the 2021-22 Outcome. The continued revenue strength in 2022-23 has resulted in a consecutive year reduction in the GGS net debt to revenue ratio and reflects the Government’s prudent management of short term revenue uplifts to restore fiscal buffers and provide capacity to invest in transformative infrastructure.
Principle 2 – Ensure that average annual growth in General Government Sector expenditure in the medium term is below the average annual growth in General Government Sector revenue to deliver fiscally sustainable net operating surpluses.
Fiscal Principle 2 is designed to provide a broad measure of expenditure growth management. Delivering operating surpluses will assist debt stabilisation.
Queensland’s net operating balance has improved substantially since the 2022-23 Budget, from an operating deficit of $1.029 billion to an operating surplus of $13.93 billion. This historical surplus follows the previous record surplus of $4.284 billion (restated) in 2021-22.
In 2022-23, revenues grew by 21.1 per cent and expenses by 8.6 per cent compared to 2021-22. Adjusting revenue for the extraordinary uplift from royalty revenue driven by high commodity prices over the last 2 years, revenue growth was 9.7 per cent, over 1 per cent higher than expenses growth in 2022-23.
Principle 3 – Target continual improvements in net operating surpluses to ensure that, in the medium term, net cash flows from investments in non-financial assets (capital) will be funded primarily from net cash inflows from operating activities. The capital program will focus on supporting a productive economy, jobs and ensuring a pipeline of infrastructure that responds to population growth.
In 2022-23, GGS net cash flows from operating activities of $19.885 billion were more than double the GGS net cash flows from investments in non-financial assets of $9.718 billion, enabling lower borrowings in the short term to provide capacity for the state’s future capital program.
The capital program includes purchases of non-financial assets, capital grants and new finance leases and similar arrangements. The capital program delivered by the State Non-financial Sector in 2022-23 was $17.561 billion, $559 million, or 3.5 per cent higher than the estimated actual forecast in the 2023-24 Budget.
The Government announced in the 2023-24 Budget, the biggest infrastructure build ever undertaken by the State with a capital program of $88.729 billion planned over the next 4 years to 2026-27. The expanded infrastructure program will focus on delivering increased health system capacity, decarbonisation of the state’s energy system, improving water security and preparing for the Brisbane 2032 Olympic and Paralympic Games.
Principle 4 – Maintain competitive taxation by ensuring that, on a per capita basis, Queensland has lower taxation than the average of other states.
The fiscal principles will ensure that Queenslanders continue to pay less tax than Australians in other states and territories, providing a meaningful indication of the comparative impact of Queensland’s tax regime and policies.
At the time of the 2023-24 Budget, Queensland’s taxation per capita was $720 less than the average of other jurisdictions in 2021-22 (latest available data).
Principle 5 – Target full funding of long term liabilities such as superannuation and WorkCover in accordance with actuarial advice
Consistent with the long-standing practice of successive governments, the Queensland Government is committed to ensuring that the State sets aside assets, on an actuarially determined basis, to meet long term liabilities such as superannuation and WorkCover. The latest full actuarial review of the QSuper scheme was as at 30 June 2021 and was published in a report dated 3 December 2021. The report found the scheme to be fully funded. The next triennial review will report on the funding status of the scheme as at 30 June 2024.
As at 30 June 2023, WorkCover Queensland was fully funded.
| Report on State Finances 2022–23 – Queensland Government | 3-3 |
Outcomes Report - Overview and Analysis
Key UPF Financial Aggregates
Outlined in the table below are the key aggregates, by sector for 2022-23. The actual outcome for 2022-23 is compared to the estimated actual per the 2023-24 Budget.
| General Government Sector |
Public Non-financial Corporations Sector |
Non-financial
Public Sector | ||||||||||||||||||||
| Est. Actual | Outcome | Est. Actual | Outcome | Est. Actual | Outcome | |||||||||||||||||
| $ million | $ million | $ million | $ million | $ million | $ million | |||||||||||||||||
| Revenue |
87,623 | 89,810 | 15,835 | 16,270 | 98,403 | 100,821 | ||||||||||||||||
| Expenses |
75,317 | 75,880 | 14,887 | 15,222 | 85,660 | 86,341 | ||||||||||||||||
| Net operating balance |
12,305 | 13,930 | 948 | 1,048 | 12,743 | 14,480 | ||||||||||||||||
| Capital purchases |
9,194 | 9,899 | 4,489 | 4,497 | 13,601 | 14,300 | ||||||||||||||||
| Fiscal balance |
6,786 | 8,092 | (824 | ) | (904 | ) | 5,533 | 6,786 | ||||||||||||||
| Borrowing with QTC |
47,014 | 46,166 | 43,074 | 43,276 | 90,088 | 89,442 | ||||||||||||||||
| Leases and similar arrangements |
7,586 | 7,519 | 354 | 367 | 7,941 | 7,887 | ||||||||||||||||
| Securities and derivatives |
93 | 41 | 4,447 | 5,458 | 4,533 | 5,491 | ||||||||||||||||
| Borrowings |
54,693 | 53,726 | 47,875 | 49,101 | 102,561 | 102,821 | ||||||||||||||||
| Net Debt |
5,852 | 2,615 | 39,804 | 40,240 | 45,649 | 42,848 | ||||||||||||||||
| Notes: |
||||||||||||||||||||||
|
1. Numbers may not add due to rounding. 2. Non-financial Public Sector consolidates the General Government and Public Non-financial Corporations Sectors and excludes inter-sector transactions and balances. | ||||||||||||||||||||||
General Government Sector
Revenue
| 2022-23 | 2022-23 | |||||||||
| General Government Revenue | Est. Actual | Outcome | ||||||||
| $ million | $ million | |||||||||
| Taxation revenue |
20,563 | 20,601 | ||||||||
| Grants revenue |
36,571 | 38,335 | ||||||||
| Sales of goods and services |
6,344 | 6,483 | ||||||||
| Interest income |
3,166 | 3,226 | ||||||||
| Dividend and income tax equivalent income |
1,043 | 1,007 | ||||||||
| Other revenue |
19,937 | 20,160 | ||||||||
| Total Revenue |
87,623 | 89,810 | ||||||||
| Note: |
||||||||||
|
1. Numbers may not add due to rounding. | ||||||||||
General Government revenue totalled $89.81 billion in 2022-23, up $2.187 billion or 2.5 per cent compared to the 2023-24 Budget estimated actual projection of $87.623 billion.
The increase in revenue since the 2023-24 Budget was in large part due to the Australian Government making grant payments in advance in 2022-23. Grants revenue was $1.764 billion higher than the 2023-24 Budget estimated actual forecast. Grants revenue received in advance included $758 million DRFA grants, representing around 40 per cent of DRFA payments budgeted to be received in 2023-24, $620 million in Financial Assistance Grants (FAGs) brought forward in full from the 2023-24 financial year and $398 million in up-front funding for the Social Housing Accelerator program. National Health Reform grant funding was also higher than forecast, however, this was largely offset by lower GST revenue and the timing of infrastructure grants.
Better than expected sales revenue, interest income and other revenue, including modestly higher royalty revenue, also contributed towards higher than forecast revenue compared to the estimated actual forecast.
| 3-4 | Report on State Finances 2022–23 – Queensland Government |
Outcomes Report - Overview and Analysis
Key UPF Financial Aggregates continued
General Government Sector continued
Expenses
| 2022-23 | 2022-23 | |||||||||||
| General Government Expenses | Est. Actual | Outcome | ||||||||||
| $ million | $ million | |||||||||||
| Employee expenses |
30,279 | 30,557 | ||||||||||
| Superannuation expenses |
||||||||||||
| Superannuation interest cost |
775 | 776 | ||||||||||
| Other superannuation expenses |
3,733 | 3,756 | ||||||||||
| Other operating expenses |
20,287 | 20,014 | ||||||||||
| Depreciation and amortisation |
4,910 | 5,018 | ||||||||||
| Other interest expenses |
1,715 | 1,688 | ||||||||||
| Grants expenses |
13,618 | 14,072 | ||||||||||
| Total Expenses |
75,317 | 75,880 | ||||||||||
| Note: |
||||||||||||
|
1. Numbers may not add due to rounding. |
| |||||||||||
Total GGS expenses for 2022-23 were $563 million or 0.7 per cent higher than expected in the 2023-24 Budget.
The higher expenses largely reflect the on-passing to local councils of the advance payment of FAGs from the Australian Government.
GGS expenditure is focused on the delivery of core services to the community. As shown in Chart 3.3 below, education and health account for over half of the total expenses, consistent with their share in other jurisdictions.
Chart 3.3: 2022-23 General Government Sector expenses by function 1
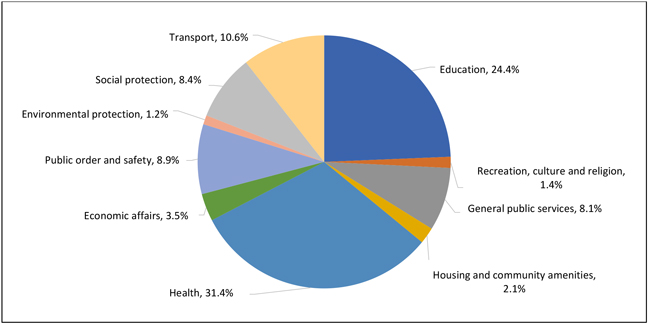
| 1 | Refer to page 3-13 for further detail of expenses in each function. |
| Report on State Finances 2022–23 – Queensland Government | 3-5 |
Outcomes Report - Overview and Analysis
Key UPF Financial Aggregates continued
General Government Sector continued
Net Operating Balance
The net operating balance is the net of revenue and expenses from transactions and was an operating surplus of $13.93 billion for 2022-23. The 2022-23 outcome was a $1.625 billion increase on the $12.305 billion operating surplus forecast at the time of the 2023-24 Budget. Revenue was $2.187 billion higher and expenses were $563 million higher, for the reasons discussed above.
Capital Purchases
GGS purchases of non-financial assets are the actual cash outlays per the Cash Flow Statement and totalled $9.899 billion, which was $705 million higher than the 2022-23 estimated actual. Reclassification of $245 million capital expenditure from acquisitions of non-financial assets under new finance leases to purchases of non-financial assets partly were partly a factor for the increase compared to the estimated actual projection. The net increase in capital expenditure of $459 million was due to higher than expected activity in the final quarter.
Fiscal Balance
The fiscal balance measure broadly shows how much of the acquisition of non-financial assets is financed by the net operating balance (excluding depreciation) and how much by borrowing.
The fiscal surplus of $8.092 billion for 2022-23 was $1.306 billion higher than the estimated actual projection of an $6.786 billion surplus. The larger than forecast fiscal surplus is mainly due to the improved net operating surplus, offset in part by higher than expected net acquisition of non-financial assets.
Borrowing
Borrowing was $53.726 billion, compared to the 2023-24 Budget projection of $54.693 billion, a decrease of $967 million. The lower balance partly reflects the increase in cash flows from operating activities offset in part by higher capital purchases. Not all of the improved net operating cash flows, net of higher capital purchases, flows through as a corresponding decrease in borrowings, as some of the additional net cash inflows were retained as cash balance at year end.
Net Worth
The GGS net worth was $303.973 billion as at 30 June 2023, $34.763 billion higher than the estimated actual included in the 2023-24 Budget. The increase is predominantly due to upward valuations of roads infrastructure, land under roads, school buildings and public housing.
Net Debt
Net debt is defined as the sum of particular financial liabilities: deposits held, advances received and borrowings less particular assets: cash and deposits, advances paid and investments, loans and placements. Financial liabilities exceeded financial assets in the GGS by $2.615 billion at 30 June 2023, a $3.237 billion reduction in net debt from the 2023-24 Budget estimate of $5.852 billion.
Net debt has decreased since the 2023-24 Budget due to lower borrowings and higher cash balances from the improved net cash flows from operating activities partly offset by modestly higher capital purchases. Better than expected market valuations of investments, loans and placements also contributed to the improved net debt metric.
Operating Result
The operating result measures the outcome for the State under the Accounting Standards framework, rather than the GFS framework. The GGS operating result of $14.128 billion differs from the net operating balance as it includes valuation adjustments, such as gains and losses on financial and non-financial assets. The operating result has improved $2.408 billion since the 2023-24 Budget reflecting the increased net operating surplus, better than expected market value adjustments to investments, loans and placements, and downward actuarial adjustments of the government’s self insurance liabilities, offset in part by the increase in the actuarial valuations of the Long Service Leave Central Scheme.
Comprehensive Result - Total Change in Net Worth
The comprehensive result includes the revaluation of assets taken to reserves and actuarial adjustments to defined benefit superannuation liabilities.
The comprehensive result for 2022-23 was $54.349 billion, an increase of $34.762 billion from the 2022-23 estimated actual forecast. The increase in the actual comprehensive result is mainly due to significant upward valuations of non-financial assets.
| 3-6 | Report on State Finances 2022–23 – Queensland Government |
Outcomes Report - Overview and Analysis
Key UPF Financial Aggregates continued
Public Non-financial Corporations (PNFC) Sector
The Public Non-financial Corporations Sector comprises bodies such as Government-owned corporations (GOCs) that mainly engage in the production of goods and services (of a non-financial nature) for sale in the market place at prices that aim to recover most of the costs involved.
| – | The PNFC Sector recorded a net operating surplus of $1.048 billion, $100 million higher than the 2023-24 Budget forecast. |
| – | The fiscal balance was a deficit of $904 million, compared to an estimated 2022-23 deficit of $824 million. The modest increase in fiscal deficit is due to higher net acquisitions of non-financial assets of $180 million exceeding the relative improvement in net operating balance. |
| – | PNFC borrowing with Queensland Treasury Corporation (QTC) was $202 million higher than budgeted due to the slight deterioration in net cash flows from operating activities. Securities and derivative liabilities were $5.458 billion at year end, $1.011 billion higher compared to the 2022-23 estimated actual projection. Higher securities and derivatives were primarily driven by market value movements in the value of electricity hedging contracts held by the generator GOCs. |
| – | Net debt for the PNFC sector was $40.24 billion, $436 million higher than the 2023-24 Budget estimated actual forecast. Net debt has increased since the 2023-24 Budget partly due to higher borrowing with QTC resulting from lower than projected net cash flows from operating activities. The impact of higher derivative liabilities were to a large extent negated by the associated increase in electricity derivative assets, minimising the impact to the PNFC net debt metric. |
State Financial Sector (SFS)
The State Financial Sector is the GFS terminology used for the consolidation of all State Government departments and other General Government entities, Public Non-financial Corporations, Public Financial Corporations and their controlled entities. The equivalent term for SFS used in the AASB 1049 section of this report is Total State Sector. All material inter-entity and intra-entity transactions and balances have been eliminated to the extent practicable.
| – | The net operating balance for 2022-23 was a surplus of $11.098 billion. |
| – | Purchases of non-financial assets for the SFS were $14.309 billion. |
| – | The SFS net worth was $311.514 billion, an increase of $55.842 billion compared to that published in the 2021-22 Outcomes Report. This was mainly due to non-financial asset revaluations and operating result achieved in 2022–23. |
| Report on State Finances 2022–23 – Queensland Government | 3-7 |
2022 - 23 Operating Statement by Sector ($ million)
| General
Government
|
Public
Non-financial
|
Non-financial Public Sector (b)
|
Public
|
State
|
||||||||||||||||||||||||||||||
| Est. Actual | Outcome | Est. Actual | Outcome | Est. Actual | Outcome | Outcome (c) | Outcome (c) | |||||||||||||||||||||||||||
| Revenue from Transactions |
||||||||||||||||||||||||||||||||||
| Taxation revenue |
20,563 | 20,601 | - | - | 20,190 | 20,189 | - | 20,051 | ||||||||||||||||||||||||||
| Grants revenue |
36,571 | 38,335 | 867 | 912 | 36,592 | 38,352 | - | 38,233 | ||||||||||||||||||||||||||
| Sales of goods and services |
6,344 | 6,483 | 14,314 | 14,735 | 17,719 | 18,161 | 3,140 | 20,838 | ||||||||||||||||||||||||||
| Interest income |
3,166 | 3,226 | 92 | 117 | 3,238 | 3,312 | 4,355 | 2,184 | ||||||||||||||||||||||||||
| Dividend and income tax equivalent income |
1,043 | 1,007 | - | - | 167 | 164 | - | - | ||||||||||||||||||||||||||
| Other revenue |
19,937 | 20,160 | 562 | 506 | 20,497 | 20,644 | 144 | 20,778 | ||||||||||||||||||||||||||
| Total Revenue from Transactions |
87,623 | 89,810 | 15,835 | 16,270 | 98,403 | 100,821 | 7,639 | 102,084 | ||||||||||||||||||||||||||
| Expenses from Transactions |
||||||||||||||||||||||||||||||||||
| Employee expenses |
30,279 | 30,557 | 2,491 | 2,532 | 32,623 | 32,925 | 453 | 32,988 | ||||||||||||||||||||||||||
| Superannuation expenses |
||||||||||||||||||||||||||||||||||
| Superannuation interest cost |
775 | 776 | - | (17 | ) | 775 | 759 | - | 759 | |||||||||||||||||||||||||
| Other superannuation expenses |
3,733 | 3,756 | 290 | 308 | 4,024 | 4,063 | 29 | 4,092 | ||||||||||||||||||||||||||
| Other operating expenses |
20,287 | 20,014 | 7,087 | 7,608 | 24,427 | 24,544 | 2,934 | 27,468 | ||||||||||||||||||||||||||
| Depreciation and amortisation |
4,910 | 5,018 | 2,945 | 2,720 | 7,855 | 7,737 | 23 | 7,760 | ||||||||||||||||||||||||||
| Other interest expenses |
1,715 | 1,688 | 1,679 | 1,675 | 3,159 | 3,107 | 7,300 | 4,712 | ||||||||||||||||||||||||||
| Grants expenses |
13,618 | 14,072 | 25 | 29 | 12,798 | 13,206 | 119 | 13,206 | ||||||||||||||||||||||||||
| Other property expenses |
- | - | 369 | 369 | - | - | 56 | - | ||||||||||||||||||||||||||
| Total Expenses from Transactions
|
|
75,317
|
|
|
75,880
|
|
|
14,887
|
|
|
15,222
|
|
|
85,660
|
|
|
86,341
|
|
|
10,913
|
|
|
90,986
|
| ||||||||||
| Net Operating Balance |
12,305 | 13,930 | 948 | 1,048 | 12,743 | 14,480 | (3,274 | ) | 11,098 | |||||||||||||||||||||||||
| Other economic flows - included in operating result |
(585 | ) | 198 | (594 | ) | (574 | ) | (1,339 | ) | (466 | ) | 4,024 | 5,052 | |||||||||||||||||||||
| Operating Result |
11,720 | 14,128 | 355 | 474 | 11,404 | 14,014 | 750 | 16,150 | ||||||||||||||||||||||||||
| Other economic flows - other movements in equity |
7,866 | 40,221 | 3,711 | 3,316 | 8,181 | 40,333 | (108 | ) | 39,692 | |||||||||||||||||||||||||
| Comprehensive Result - Total Change in Net Worth (d) |
19,587 | 54,349 | 4,065 | 3,790 | 19,585 | 54,347 | 643 | 55,842 | ||||||||||||||||||||||||||
| KEY FISCAL AGGREGATES |
||||||||||||||||||||||||||||||||||
| Net Operating Balance |
12,305 | 13,930 | 948 | 1,048 | 12,743 | 14,480 | (3,274 | ) | 11,098 | |||||||||||||||||||||||||
| Net Acquisition/(Disposal) of Non-financial Assets |
||||||||||||||||||||||||||||||||||
| Purchases of non-financial assets |
9,194 | 9,899 | 4,489 | 4,497 | 13,601 | 14,300 | 9 | 14,309 | ||||||||||||||||||||||||||
| Less |
Sales of non-financial assets | 104 | 181 | 38 | 63 | 142 | 243 | - | 243 | |||||||||||||||||||||||||
| Less |
Depreciation | 4,910 | 5,018 | 2,945 | 2,720 | 7,855 | 7,737 | 23 | 7,760 | |||||||||||||||||||||||||
| Plus |
Change in inventories | 65 | 79 | 169 | 129 | 234 | 208 | - | 208 | |||||||||||||||||||||||||
| Plus |
Other movements in non-financial assets | 1,275 | 1,058 | 97 | 108 | 1,371 | 1,167 | 2 | 1,169 | |||||||||||||||||||||||||
| Equals |
Total Net Acquisition of Non-financial Assets | 5,520 | 5,838 | 1,772 | 1,952 | 7,210 | 7,694 | (12 | ) | 7,682 | ||||||||||||||||||||||||
| Fiscal Balance |
6,786 | 8,092 | (824 | ) | (904 | ) | 5,533 | 6,786 | (3,262 | ) | 3,416 | |||||||||||||||||||||||
| Notes: | ||||||||||||||||||||||||||||||||||
|
(a) Numbers may not add due to rounding and have been restated where necessary to ensure comparability.
(b) The Non-financial Public Sector (NFP) consolidates the GGS and PNFC Sectors, eliminating inter-sector balances and transactions such as dividend and income tax equivalent income. The State Financial Sector consolidates the NFP and the PFC Sectors.
(c) In accordance with UPF, estimates for Public Financial Corporations (PFC) and State Financial Sectors are not required in Budget documentation.
(d) For GFS, the change in Net Worth is the change from the previous published outcome. This differs from the AASB 1049 statements where prior year adjustments are permitted under IFRS. |
| |||||||||||||||||||||||||||||||||
| 3-8 | Report on State Finances 2022–23 – Queensland Government |
2022 - 23 Balance Sheet by Sector ($ million)
| General
Government
|
Public
Non-financial
|
Non-financial Public Sector (b)
|
Public
|
State
|
||||||||||||||||||||||||||||
| Est. Actual | Outcome | Est. Actual | Outcome | Est. Actual | Outcome | Outcome (c) | Outcome (c) | |||||||||||||||||||||||||
| Assets |
||||||||||||||||||||||||||||||||
| Financial assets |
||||||||||||||||||||||||||||||||
| Cash and deposits |
1,072 | 2,357 | 851 | 1,031 | 1,923 | 3,388 | 7,801 | 9,007 | ||||||||||||||||||||||||
| Advances paid |
1,222 | 1,239 | 1,597 | 1,675 | 1,223 | 1,215 | - | 1,215 | ||||||||||||||||||||||||
| Investments, loans and placements |
48,330 | 49,426 | 5,638 | 6,194 | 53,967 | 55,619 | 175,822 | 103,039 | ||||||||||||||||||||||||
| Receivables |
4,075 | 4,320 | 2,238 | 2,742 | 5,413 | 6,256 | 485 | 6,603 | ||||||||||||||||||||||||
| Equity |
||||||||||||||||||||||||||||||||
| Investments in other public sector entities |
24,717 | 24,414 | - | - | 3,033 | 3,006 | - | - | ||||||||||||||||||||||||
| Investments - other |
165 | 175 | 56 | - | 221 | 174 | - | 174 | ||||||||||||||||||||||||
| Total financial assets |
79,580 | 81,930 | 10,380 | 11,642 | 65,780 | 69,657 | 184,108 | 120,039 | ||||||||||||||||||||||||
|
Non-Financial Assets |
||||||||||||||||||||||||||||||||
| Land and other fixed assets |
290,149 | 322,812 | 68,471 | 68,176 | 358,619 | 390,987 | 132 | 391,119 | ||||||||||||||||||||||||
| Other non-financial assets |
6,915 | 9,743 | 1,608 | 4,707 | 1,125 | 1,229 | 267 | 1,216 | ||||||||||||||||||||||||
| Total Non-financial Assets |
297,064 | 332,554 | 70,079 | 72,883 | 359,743 | 392,216 | 399 | 392,335 | ||||||||||||||||||||||||
| Total assets |
376,644 | 414,484 | 80,459 | 84,526 | 425,523 | 461,873 | 184,507 | 512,373 | ||||||||||||||||||||||||
| Liabilities |
||||||||||||||||||||||||||||||||
| Payables |
5,295 | 5,921 | 2,035 | 2,105 | 6,484 | 7,275 | 171 | 7,340 | ||||||||||||||||||||||||
| Superannuation liability |
21,205 | 20,913 | (400 | ) | (354 | ) | 20,805 | 20,559 | - | 20,559 | ||||||||||||||||||||||
| Other employee benefits |
9,559 | 10,419 | 956 | 1,040 | 10,516 | 11,460 | 181 | 11,641 | ||||||||||||||||||||||||
| Deposits held |
- | - | 11 | 14 | 11 | 14 | 10,298 | 5,104 | ||||||||||||||||||||||||
| Advances received |
1,782 | 1,909 | 4 | 25 | 190 | 235 | - | 235 | ||||||||||||||||||||||||
| Borrowing (d) |
54,693 | 53,726 | 47,875 | 49,101 | 102,561 | 102,821 | 162,312 | 132,216 | ||||||||||||||||||||||||
| Other liabilities |
14,898 | 17,622 | 8,294 | 11,185 | 15,746 | 15,537 | 8,541 | 23,765 | ||||||||||||||||||||||||
| Total liabilities |
107,434 | 110,511 | 58,774 | 63,117 | 156,313 | 157,900 | 181,502 | 200,859 | ||||||||||||||||||||||||
| Net Worth |
269,210 | 303,973 | 21,685 | 21,409 | 269,210 | 303,973 | 3,006 | 311,514 | ||||||||||||||||||||||||
| KEY FISCAL AGGREGATES |
||||||||||||||||||||||||||||||||
| Net Financial Worth |
(27,853 | ) | (28,581 | ) | (48,395 | ) | (51,474 | ) | (90,533 | ) | (88,243 | ) | 2,606 | (80,820 | ) | |||||||||||||||||
| Net Financial Liabilities |
52,570 | 52,995 | NA | NA | 93,566 | 91,249 | NA | 80,820 | ||||||||||||||||||||||||
| Net Debt |
5,852 | 2,615 | 39,804 | 40,240 | 45,649 | 42,848 | (11,014 | ) | 24,293 | |||||||||||||||||||||||
| Notes: |
||||||||||||||||||||||||||||||||
| (a) Numbers may not add due to rounding and have been restated where necessary to ensure comparability.
(b) The Non-financial Public Sector (NFP) consolidates the GGS and PNFC Sectors, eliminating inter-sector balances and transactions such as dividend and income tax equivalent income. The State Financial Sector consolidates the NFP and the PFC Sectors.
(c) In accordance with UPF, estimates for Public Financial Corporations (PFC) and State Financial Sectors are not required in Budget documentation.
(d) Borrowing line is comprised of |
| |||||||||||||||||||||||||||||||
| Borrowing with QTC |
47,014 | 46,166 | 43,074 | 43,276 | 90,088 | 89,442 | - | - | ||||||||||||||||||||||||
| Leases and other similar arrangements |
7,586 | 7,519 | 354 | 367 | 7,941 | 7,887 | 485 | 8,372 | ||||||||||||||||||||||||
| Securities and derivatives |
93 | 41 | 4,447 | 5,458 | 4,533 | 5,491 | 161,827 | 123,844 | ||||||||||||||||||||||||
| 54,693 | 53,726 | 47,875 | 49,101 | 102,561 | 102,821 | 162,312 | 132,216 | |||||||||||||||||||||||||
| Report on State Finances 2022–23 – Queensland Government | 3-9 |
2022 - 23 Cash Flow Statement by Sector ($ million)
| General
Government
|
Public
Non-financial
|
Non-financial Public Sector (b)
|
Public
|
State
|
||||||||||||||||||||||||||||
| Est. Actual | Outcome | Est. Actual | Outcome | Est. Actual | Outcome | Outcome (c) | Outcome (c) | |||||||||||||||||||||||||
| Cash Receipts from Operating Activities |
||||||||||||||||||||||||||||||||
| Taxes received |
20,561 | 20,410 | - | - | 20,189 | 20,002 | - | 19,864 | ||||||||||||||||||||||||
| Grants and subsidies received |
36,948 | 38,684 | 844 | 841 | 36,956 | 38,701 | - | 38,583 | ||||||||||||||||||||||||
| Sales of goods and services |
5,712 | 6,886 | 17,086 | 17,092 | 19,495 | 20,825 | 3,404 | 23,777 | ||||||||||||||||||||||||
| Interest receipts |
3,169 | 3,201 | 92 | 106 | 3,242 | 3,279 | 4,353 | 2,150 | ||||||||||||||||||||||||
| Dividends and income tax equivalents |
837 | 922 | - | - | 91 | 101 | - | - | ||||||||||||||||||||||||
| Other receipts |
20,498 | 22,502 | 425 | 402 | 20,838 | 22,843 | 176 | 23,010 | ||||||||||||||||||||||||
| 87,725 | 92,604 | 18,447 | 18,442 | 100,811 | 105,752 | 7,934 | 107,384 | |||||||||||||||||||||||||
| Cash Payments for Operating Activities |
||||||||||||||||||||||||||||||||
| Payments for employees |
(34,791 | ) | (34,232 | ) | (2,758 | ) | (2,750 | ) | (37,403 | ) | (36,818 | ) | (475 | ) | (36,903 | ) | ||||||||||||||||
| Payments for goods and services |
(20,955 | ) | (23,090 | ) | (9,449 | ) | (9,727 | ) | (27,094 | ) | (29,729 | ) | (2,103 | ) | (31,835 | ) | ||||||||||||||||
| Grants and subsidies |
(13,532 | ) | (13,777 | ) | (25 | ) | (29 | ) | (12,720 | ) | (12,984 | ) | (119 | ) | (12,984 | ) | ||||||||||||||||
| Interest paid |
(1,639 | ) | (1,616 | ) | (1,674 | ) | (1,671 | ) | (3,078 | ) | (3,036 | ) | (7,298 | ) | (4,641 | ) | ||||||||||||||||
| Other payments |
(1 | ) | (4 | ) | (1,117 | ) | (1,149 | ) | (612 | ) | (554 | ) | (344 | ) | (837 | ) | ||||||||||||||||
| (70,918 | ) | (72,719 | ) | (15,023 | ) | (15,325 | ) | (80,907 | ) | (83,120 | ) | (10,340 | ) | (87,200 | ) | |||||||||||||||||
| Net Cash Flows from Operating Activities |
16,807 | 19,885 | 3,424 | 3,117 | 19,904 | 22,631 | (2,406 | ) | 20,184 | |||||||||||||||||||||||
| Cash Flows from Investing Activities |
||||||||||||||||||||||||||||||||
|
Non-financial Assets |
||||||||||||||||||||||||||||||||
| Purchases of non-financial assets |
(9,194 | ) | (9,899 | ) | (4,489 | ) | (4,497 | ) | (13,601 | ) | (14,300 | ) | (9 | ) | (14,309 | ) | ||||||||||||||||
| Sales of non-financial assets |
104 | 181 | 38 | 63 | 142 | 243 | - | 243 | ||||||||||||||||||||||||
| (9,090 | ) | (9,718 | ) | (4,451 | ) | (4,434 | ) | (13,459 | ) | (14,056 | ) | (9 | ) | (14,065 | ) | |||||||||||||||||
| Financial Assets (Policy Purposes) |
(774 | ) | (766 | ) | (703 | ) | (711 | ) | 35 | 56 | - | 56 | ||||||||||||||||||||
| Financial Assets (Liquidity Purposes) |
(7,122 | ) | (8,035 | ) | 370 | 463 | (6,752 | ) | (7,573 | ) | 875 | (550 | ) | |||||||||||||||||||
| Net Cash Flows from Investing Activities |
(16,986 | ) | (18,519 | ) | (4,784 | ) | (4,682 | ) | (20,177 | ) | (21,573 | ) | 866 | (14,559 | ) | |||||||||||||||||
| Net Cash Flows from Financing Activities |
||||||||||||||||||||||||||||||||
| Advances received (net) |
482 | 598 | (1 | ) | (1 | ) | (62 | ) | (28 | ) | - | (28 | ) | |||||||||||||||||||
| Borrowing (net) |
(942 | ) | (1,318 | ) | 1,592 | 2,202 | 650 | 885 | (1,337 | ) | (452 | ) | ||||||||||||||||||||
| Dividends paid |
- | - | (246 | ) | (246 | ) | - | - | (40 | ) | - | |||||||||||||||||||||
| Deposits received (net) |
- | - | - | 3 | - | 3 | 1,878 | (1,536 | ) | |||||||||||||||||||||||
| Other financing (net) |
- | - | (296 | ) | (523 | ) | (1,264 | ) | (1,401 | ) | 3,439 | (1,084 | ) | |||||||||||||||||||
| Net Cash Flows from Financing Activities |
(460 | ) | (719 | ) | 1,049 | 1,435 | (676 | ) | (542 | ) | 3,940 | (3,099 | ) | |||||||||||||||||||
| Net Increase/(Decrease) in Cash Held |
(638 | ) | 647 | (311 | ) | (130 | ) | (949 | ) | 516 | 2,400 | 2,526 | ||||||||||||||||||||
| KEY FISCAL AGGREGATES |
||||||||||||||||||||||||||||||||
| Net cash from operating activities |
16,807 | 19,885 | 3,424 | 3,117 | 19,904 | 22,631 | (2,406 | ) | 20,184 | |||||||||||||||||||||||
| Net cash from investments in non-financial assets |
(9,090 | ) | (9,718 | ) | (4,451 | ) | (4,434 | ) | (13,459 | ) | (14,056 | ) | (9 | ) | (14,065 | ) | ||||||||||||||||
| Dividends paid |
- | - | (246 | ) | (246 | ) | - | - | (40 | ) | - | |||||||||||||||||||||
|
Cash Surplus/(Deficit) |
7,717 | 10,167 | (1,273 | ) | (1,563 | ) | 6,444 | 8,575 | (2,455 | ) | 6,119 | |||||||||||||||||||||
| Derivation of ABS GFS Cash Surplus/Deficit |
||||||||||||||||||||||||||||||||
| Cash surplus/(deficit) |
7,717 | 10,167 | (1,273 | ) | (1,563 | ) | 6,444 | 8,575 | (2,455 | ) | 6,119 | |||||||||||||||||||||
| Acquisitions under finance leases and similar arrangements |
(1,082 | ) | (849 | ) | (34 | ) | (49 | ) | (1,116 | ) | (899 | ) | (2 | ) | (900 | ) | ||||||||||||||||
| ABS GFS Cash Surplus/(Deficit) Including Finance Leases and Similar Arrangements |
6,635 | 9,318 | (1,307 | ) | (1,613 | ) | 5,328 | 7,676 | (2,457 | ) | 5,219 | |||||||||||||||||||||
| Notes: |
| |||||||||||||||||||||||||||||||
|
(a) Numbers may not add due to rounding and have been restated where necessary to ensure comparability.
(b) The Non-financial Public Sector (NFP) consolidates the GGS and PNFC Sectors, eliminating inter-sector balances and transactions such as dividend and income tax equivalent income. The State Financial Sector consolidates the NFP and the PFC Sectors.
(c) In accordance with UPF, estimates for Public Financial Corporations (PFC) and State Financial Sectors are not required in Budget documentation. |
| |||||||||||||||||||||||||||||||
| 3-10 | Report on State Finances 2022–23 – Queensland Government |
Outcomes Report - Other General Government UPF Data
Data in the following tables is presented in accordance with the Uniform Presentation Framework.
General Government Sector
| Taxes |
2022-23
|
|||
| Taxes on employers’ payroll and labour force |
5,850 | |||
| Taxes on property |
||||
| Land taxes |
1,732 | |||
| Other |
625 | |||
| Taxes on the provision of goods and services |
||||
| Stamp duties on financial and capital transactions |
5,309 | |||
| Financial institutions’ transactions taxes |
350 | |||
| Taxes on gambling |
1,911 | |||
| Taxes on insurance |
1,409 | |||
| Taxes on use of goods and performance of activities |
||||
| Motor vehicle taxes |
3,017 | |||
| Other |
396 | |||
| Total Taxation Revenue
|
|
20,601
|
| |
| Note: |
||||
|
1. Numbers may not add due to rounding. |
||||
| Dividend and Income Tax Equivalent Income | 2022-23 Outcome $ million |
|||
| Dividend and Income Tax Equivalent income from PNFC sector |
843 | |||
| Dividend and Income Tax Equivalent income from PFC sector |
164 | |||
| Total Dividend and Income Tax Equivalent income
|
|
1,007
|
| |
| Note: |
||||
|
1. Numbers may not add due to rounding.
|
||||
| Report on State Finances 2022–23 – Queensland Government | 3-11 |
Outcomes Report - Other General Government UPF Data
General Government Sector continued
| Grants Revenue | 2022-23 Outcome $ million |
|||
| Current grants revenue |
||||
| Current grants from the Commonwealth |
||||
| General purpose grants |
18,310 | |||
| Specific purpose grants |
10,699 | |||
| Specific purpose grants for on-passing |
4,740 | |||
| Total current grants from the Commonwealth |
33,749 | |||
| Other contributions and grants |
453 | |||
| Total current grants revenue |
34,202 | |||
| Capital grants revenue |
||||
| Capital grants from the Commonwealth |
||||
| Specific purpose grants |
4,088 | |||
| Other contributions and grants |
44 | |||
| Total capital grants revenue |
4,133 | |||
|
Total grants revenue |
38,335 | |||
| Note: |
||||
|
1. Numbers may not add due to rounding. |
||||
| Grants Expense | 2022-23 Outcome $ million |
|||
| Current grants expenses |
||||
| Private and not-for-profit sector |
3,219 | |||
| Private and not-for-profit sector on-passing |
4,015 | |||
| Local Government |
267 | |||
| Local Government on-passing |
776 | |||
| Grants to other sectors of Government |
2,921 | |||
| Other |
446 | |||
| Total current grants expense |
11,643 | |||
| Capital grants expenses |
||||
| Private and not-for-profit sector |
619 | |||
| Local Government |
1,615 | |||
| Grants to other sectors of Government |
70 | |||
| Other |
125 | |||
| Total capital grants expenses |
2,430 | |||
| Total grants expenses
|
|
14,072
|
| |
| Note: |
||||
|
1. Numbers may not add due to rounding.
|
||||
| 3-12 | Report on State Finances 2022–23 – Queensland Government |
Outcomes Report - Other General Government UPF Data
General Government Sector continued
|
Expenses by Function |
2022-23 | 2022-23 | ||||||||
| Outcome | Outcome | |||||||||
| $ million | $ million | |||||||||
| General Public Services |
6,135 | Health | 23,864 | |||||||
| Executive and legislative organs, financial and |
Outpatient services |
3,571 | ||||||||
| fiscal affairs, external affairs |
991 | Hospital services |
13,057 | |||||||
| General services |
338 | Mental health institutions |
707 | |||||||
| Public debt transactions |
1,650 | Community health services |
4,972 | |||||||
| Transfers of a general character between level |
Public health services |
536 | ||||||||
| of government |
1,017 | R&D - Health |
224 | |||||||
| General public services n.e.c. |
2,139 | Health n.e.c. |
797 | |||||||
| Public Order and Safety |
6,703 | Recreation, Culture and Religion | 1,081 | |||||||
| Police services |
3,145 | Recreation and sporting services |
469 | |||||||
| Civil and fire protection services |
784 | Cultural services |
426 | |||||||
| Law courts |
1,105 | Recreation, culture and religion n.e.c. |
186 | |||||||
| Prisons |
1,615 | |||||||||
| Public order and safety n.e.c. |
53 | Education | 18,497 | |||||||
| Pre-primary and primary education |
8,803 | |||||||||
| Economic Affairs |
2,672 | Secondary education |
6,309 | |||||||
| General economic, commercial and labour |
Tertiary education |
1,528 | ||||||||
| affairs |
352 | Subsidiary services to education |
205 | |||||||
| Agriculture, forestry, fishing and hunting |
461 | Education n.e.c. |
1,652 | |||||||
| Fuel and energy |
964 | |||||||||
| Mining, manufacturing and construction |
487 | Social Protection | 6,390 | |||||||
| R&D - Economic affairs |
182 | Sickness and disability |
2,292 | |||||||
| Other industries |
205 | Old age |
20 | |||||||
| Economic affairs |
20 | Family and children |
2,227 | |||||||
|
|
Housing |
390 | ||||||||
| Environmental Protection |
894 | Social exclusion n.e.c. |
259 | |||||||
| Protection of biodiversity and landscape |
508 | Social protection n.e.c. |
1,202 | |||||||
| Environmental protection n.e.c. |
386 | |||||||||
| Transport | 8,047 | |||||||||
| Housing and Community Amenities |
1,597 | Road transport |
3,547 | |||||||
| Housing development |
903 | Bus transport |
127 | |||||||
| Community development |
137 | Water transport |
184 | |||||||
| Water supply |
253 | Railway transport |
2,389 | |||||||
| Housing and community amenities n.e.c. |
303 | Multi-mode urban transport |
933 | |||||||
| Transport n.e.c. |
867 | |||||||||
| Total | 75,880 | |||||||||
| Note: |
||||||||||
| 1. Numbers may not add due to rounding. |
||||||||||
|
|
||||||||||
| Report on State Finances 2022–23 – Queensland Government | 3-13 |
Outcomes Report - Other General Government UPF Data
General Government Sector continued
|
Purchases of Non-financial Assets by Function |
|
2022-23 Outcome $ million |
| |
| General public services |
255 | |||
| Public order and safety |
568 | |||
| Economic affairs |
24 | |||
| Environmental protection |
80 | |||
| Housing and community amenities |
458 | |||
| Health |
1,561 | |||
| Recreation, culture and religion |
83 | |||
| Education |
1,350 | |||
| Social protection |
83 | |||
| Transport |
5,437 | |||
| Total |
9,899 | |||
|
|
||||
| Note: |
||||
| 1. Numbers may not add due to rounding. |
||||
|
|
||||
| 3-14 | Report on State Finances 2022–23 – Queensland Government |
Certification of Outcomes Report
Management Certification
The foregoing Outcomes Report contains financial statements for the Queensland State Government, prepared and presented in accordance with the Uniform Presentation Framework (UPF) agreed to at the 1991 Premiers’ Conference and revised in 2008 to align with AASB 1049 Whole of Government and General Government Sector Financial Reporting.
This report separately discloses outcomes for the General Government, Public Non-financial Corporations, Public Financial Corporations and State Financial Sectors within Queensland. Entities excluded from this report include local governments and universities. Queensland public sector entities consolidated for this report are listed in the AASB 1049 Financial Statements, taking into account intra and inter-agency eliminations.
Only those agencies considered material by virtue of their financial transactions and balances are consolidated in this report.
We certify that, in our opinion, the Outcomes Report has been properly drawn up, in accordance with UPF requirements, to present a true and fair view of:
(i) the Operating Statement and Cash Flows of the Queensland State Government for the financial year; and
(ii) the Balance Sheet of the Government at 30 June 2023.
At the date of certification of this report, we are not aware of any material circumstances that would render any particulars included in the Outcomes Report misleading or inaccurate.
| Dennis Molloy |
Michael Carey | |
| Deputy Under Treasurer |
Under Treasurer | |
| Queensland Treasury |
Queensland Treasury | |
16 October 2023
| Report on State Finances 2022–23 – Queensland Government | 3-15 |
AASB 1049 Overview
QUEENSLAND TREASURY
2022–23
AASB 1049
Financial Statements
Overview and Analysis – 30 June 2023
AASB 1049 - Overview and Analysis
The following analysis compares current year General Government Sector (GGS) and Total State Sector (TSS) performance with last year’s balances, restated for changes in accounting policies, presentational and timing differences and errors.
AASB 1049 Whole of Government and General Government Sector Financial Reporting aims to harmonise the disclosure presentation to be consistent with the Uniform Presentation Framework disclosed in the Outcomes Report.
Summary of Key Financial Aggregates of the Consolidated Financial Statements
The table below provides aggregate information under AASB1049:
| General Government | Total State | |||||||||||||||
| Sector | Sector | |||||||||||||||
| 2023 | 2022 | 2023 | 2022 | |||||||||||||
| $ million | $ million | $ million | $ million | |||||||||||||
| Taxation revenue |
20,601 | 20,011 | 20,051 | 19,508 | ||||||||||||
| Grants revenue |
38,335 | 34,135 | 38,233 | 34,034 | ||||||||||||
| Sales of goods and services |
6,483 | 5,896 | 20,838 | 20,282 | ||||||||||||
| Interest income |
3,226 | 2,643 | 2,184 | 1,188 | ||||||||||||
| Dividend and income tax equivalent income |
1,007 | 790 | - | - | ||||||||||||
| Other revenue |
20,160 | 10,710 | 20,778 | 11,164 | ||||||||||||
| Continuing Revenue from Transactions |
89,810 | 74,185 | 102,084 | 86,176 | ||||||||||||
| Employee expenses |
30,557 | 28,068 | 32,988 | 30,251 | ||||||||||||
| Superannuation expenses |
4,532 | 3,763 | 4,851 | 4,045 | ||||||||||||
| Other operating expenses |
20,014 | 18,229 | 27,468 | 26,075 | ||||||||||||
| Depreciation and amortisation |
5,018 | 4,506 | 7,760 | 7,250 | ||||||||||||
| Other interest expenses |
1,688 | 1,508 | 4,712 | 4,064 | ||||||||||||
| Grants expenses |
14,072 | 13,827 | 13,206 | 13,167 | ||||||||||||
| Continuing Expenses from Transactions
|
|
75,880
|
|
|
69,902
|
|
|
90,986
|
|
|
84,853
|
| ||||
| Net Operating Balance |
13,930 | 4,284 | 11,098 | 1,323 | ||||||||||||
| Other Economic Flows - Included in Operating Result |
198 | (913 | ) | 5,052 | 16,227 | |||||||||||
| Operating Result |
14,128 | 3,371 | 16,150 | 17,550 | ||||||||||||
| Other Economic Flows - Other Movements in Equity |
40,255 | 36,755 | 39,727 | 36,538 | ||||||||||||
| Comprehensive Result 1 |
54,383 | 40,126 | 55,877 | 54,088 | ||||||||||||
| Purchases of non-financial assets |
9,899 | 7,878 | 14,309 | 11,136 | ||||||||||||
| Fiscal Balance |
8,092 | (72 | ) | 3,416 | (3,596 | ) | ||||||||||
| Borrowing with QTC |
46,166 | 49,000 | - | - | ||||||||||||
| Leases and other similar arrangements |
7,519 | 7,671 | 8,372 | 8,532 | ||||||||||||
| Securities and derivatives |
41 | 93 | 123,844 | 136,591 | ||||||||||||
| Assets |
414,484 | 363,430 | 512,373 | 469,802 | ||||||||||||
| Liabilities |
110,511 | 113,840 | 200,859 | 214,165 | ||||||||||||
| Net Worth |
303,973 | 249,590 | 311,514 | 255,637 | ||||||||||||
| Net Debt |
2,615 | 10,997 | 24,293 | 36,753 | ||||||||||||
|
Note: | ||||||||||
| 1. | Comprehensive result is different to the Outcomes Report as it reflects the movement from the 2022 recast position, rather than the 2022 published position. | |||||||||
| 2. |
Numbers may not add due to rounding. | |||||||||
| Report on State Finances 2022–23 – Queensland Government | 4-1 |
AASB 1049 - Overview and Analysis
Net Operating Balance
After a strong economic rebound in 2021-22, Queensland’s economy has continued to strengthen in 2022-23 despite inflationary pressures both globally and domestically. The GGS net operating balance was an historically high surplus of $13.93 billion compared to a restated surplus of $4.284 billion in 2021-22. The 2022-23 record surplus was driven by the exceptionally high coal prices that have continued to be received by Queensland’s coal producers, as well as the state’s strong labour market performance.
GGS revenue rose by around 21 per cent ($15.625 billion) while expenses grew by 8.6 per cent ($5.978 billion).
The Total State Sector (TSS) net operating balance showed an operating surplus of $11.098 billion compared to a restated surplus of $1.323 billion in 2021-22.
The variances are explained below.
Revenue
Revenue from transactions increased by 21 per cent from $74.185 billion in 2021-22 to be $89.81 billion in the GGS and totalled $102.084 billion in the TSS, a rise of $15.908 billion over 2021-22.
Revenues by type for the GGS and TSS are shown in the following chart:
Chart 4.1: General Government and Total State Sector Revenue by type compared to 2021-22
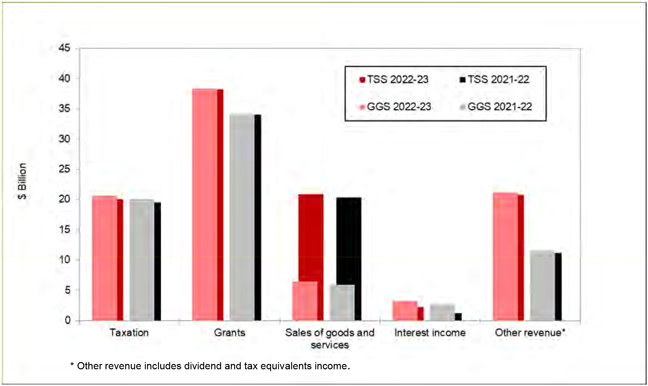
Taxation revenues for the GGS were $20.601 billion in 2022-23, $590 million or 2.9 per cent higher than 2021-22 and increased $543 million to total $20.051 billion for the TSS.
The increase in GGS taxation revenue reflects the strength of the domestic economic activity and the state’s strong jobs growth and labour market performance. Aside from transfer duties, all taxation revenues experienced strong growth in 2022-23.
Payroll tax increased $668 million, or 13.4 per cent in 2022-23 driven by strong employment and wages growth. In addition, from 1 January 2023, Queensland introduced a mental health levy for large businesses with national payrolls of more than $10 million to provide a sustainable on-going funding source for mental health services and investment. Mental health levies collected in the first half of 2023 from businesses (outside of Queensland government) totalled $182 million.
Gaming machine taxes and levies and motor vehicle registration were respectively $266 million and $123 million higher than 2021-22. Land taxes increased $99 million in 2022-23 as a result of material increases in land values in recent years.
| 4-2 | Report on State Finances 2022–23 – Queensland Government |
AASB 1049 - Overview and Analysis
Revenue continued
Duties declined $826 million compared to 2021-22 in large part due to lower transfer duty as a result of significant moderation in both residential and non-residential activity following the exceptional rebound in property markets over the preceding two years.
Commonwealth and other grants comprised 43 per cent of GGS revenue and 38 per cent of TSS revenue. Grant revenue increased $4.2 billion from 2021-22 for both the GGS and the TSS. The increase was due to
| – | higher GST revenue of $2.227 billion primarily driven by a larger national GST pool; |
| – | advance payment of $758 million of disaster recovery funding, representing around 40% of DRFA payments expected to be received in 2023-24; |
| – | an uplift in funding for Quality Schools, including for non-government schools; |
| – | $398 million in up-front funding for the Social Housing Accelerator program. |
GGS sales of goods and services were $587 million higher than 2021-22 largely due to revenue from public transport sales, hospital fees and transport and traffic fees. TSS sales of goods and services increased $556 million compared to 2021-22.
Interest income of $3.226 billion for the GGS was $583 million higher than the 2021-22 due in part to interest earnings on investment of royalty windfalls in 2022 ($2.5 billion) and 2023 ($3 billion), and investment of an additional $1 billion to support the Housing Investment Fund. TSS interest income increased $996 million compared to 2021-22 driven by earnings on financial assets held by Queensland Treasury Corporation.
Dividend and income tax equivalent revenue for the GGS increased by $217 million in comparison to 2021-22, reflecting a return to the normal GOC dividend policy in 2022-23 following the government’s decision to allow GOCs to retain 2021-22 dividends for reinvestment in critical infrastructure. Higher dividend income is partly offset by lower tax equivalent revenue from electricity network GOCs.
GGS other revenue was $20.16 billion in 2022-23, $9.45 billion higher than 2021-22 predominantly due to an increase in royalties and land rents. The increase in royalties was primarily driven by the combination of extraordinary strength in global coal and oil prices received by Queensland’s key commodity producers and the introduction of new progressive coal royalty tiers. This increase flows through to the TSS.
Expenses
Total expenses for 2022-23 were $75.88 billion for the GGS and $90.986 billion for the TSS, $5.978 billion and $6.133 billion more than the previous year, respectively.
Expenses by type are shown in the following chart:
Chart 4.2: General Government and Total State Sector Expenses by Type compared to 2021-22

| Report on State Finances 2022–23 – Queensland Government | 4-3 |
AASB 1049 - Overview and Analysis
Expenses continued
GGS employee and superannuation expenses together were $3.258 billion or 10.2 per cent higher in 2022-23, broadly consistent with the estimate in the 2023-24 Budget. TSS employee and superannuation expenses were $3.543 billion higher in 2022-23.
GGS employee expenses were $2.489 billion (or 8.9 per cent) higher in 2022-23 in part due to numerous public sector agreements being certified within the financial year, combined with a 2.7 per cent increase in full time equivalent employees. Newly certified public sector agreements included wage increases of 4 percent in year one and two and 3 per cent in year 3, an uplift from expiring agreements annual wage increase of 2.5 per cent. In addition, certified agreements included a Cost of Living Adjustment (COLA) payment for employees where inflation exceeds headline wage increases established in agreements, capped at 3 per cent. COLA payments were triggered for newly certified agreements at the maximum cap of 3 percent, applied to base wages.
An increase in GGS superannuation expenses of $769 million in 2022-23 arose from higher defined benefit costs due to changes in actuarial assumptions and new Queensland public sector superannuation arrangements coming into effect from 1 July 2023. The Queensland Government has simplified its employer contribution arrangements to 18 per cent of salary for police officers, 14.25 per cent for fire service officers and 12.75 per cent of salary for other employees. Superannuation contributions are payable on base salary, ordinary time allowances and paid leave.
Other operating expenses were $1.785 billion higher in 2022-23 for the GGS mainly due to the $175 Cost of Living Rebate on Queensland household’s power bills, increased demand for health, education and child and family services, and an increase in operating costs associated with the delivery of the State’s road and rail infrastructure program. TSS other operating expenses were $1.393 billion higher in comparison to 2021-22 due to the higher costs in the GGS, offset in part by lower claims expenses for the Queensland National Injury Insurance Scheme.
Depreciation and amortisation increased by $512 million for the GGS mainly due to increases in the stock and value of infrastructure.
GGS interest costs were $1.688 billion, an increase of $180 million on the previous year due to a rise in interest rates with GGS borrowing actually lower. The interest expense for TSS was $648 million higher which reflects the increase in interest on client deposits, the nominal increase in external borrowing and higher interest rates.
Grant expenses were $14.072 billion in the GGS, $245 million higher than 2021-22. Contributing to the increase in grants expenses were higher Australian Government grants on-passed to non-government schools, payments as part of the Energy Price Relief Plan agreed by National Cabinet in December 2022 and higher community service obligations to Energy Queensland Limited. Higher grants expenses in 2022-23 were partly offset by the impact of waste levy payments made to councils in 2021-22 and the winding down of the Australian Government’s HomeBuilder Grants program.
Operating Result
The operating result is the surplus or deficit for the year under the Australian Accounting Standards framework. Valuation and other adjustments such as deferred tax, capital returns and market value interest are shown as other economic flows and are included in the operating result.
The GGS operating result for the 2022-23 year was a surplus of $14.128 billion, compared to a surplus of $3.371 billion in 2021-22. The significant upturn in the operating result is mainly due to the improved net operating balance, discussed above, improved market value adjustments to the fixed rate notes with QTC and actuarial adjustments to self-insurance liabilities.
The TSS operating result was a surplus of $16.15 billion in 2022-23. This result is due in large part to the comparable improvement in the 2022-23 net operating balance and the net effect of realised and unrealised market value adjustments to investments and borrowings.
Fiscal Balance
The GGS fiscal surplus was $8.092 billion for 2022-23 compared to a deficit of $72 million for 2021-22. The TSS fiscal surplus was $3.416 billion for 2022-23 compared to a deficit of $3.596 billion for 2021-22. The changes are driven by the improved net operating balances offset to an extent by higher total net acquisitions of non-financial assets.
Assets
Assets controlled by the GGS at 30 June 2023 totalled $414.484 billion, an increase of $51.054 billion on 2021-22, while assets controlled by the TSS at 30 June 2023 totalled $512.373 billion. This is an increase of $42.571 billion from the 2021-2022 balance of $469.802 billion.
| 4-4 | Report on State Finances 2022–23 – Queensland Government |
AASB 1049 - Overview and Analysis
Assets continued
Financial assets in the GGS increased $10.554 billion in the year to total $81.93 billion as at 30 June 2023. This was mainly due to an increase in securities held following additional long-term asset investments made from the improved net operating cash flows and an increase in the investment in public enterprises. Higher investments reflect the $3 billion investment of royalty windfalls to fund regional priority infrastructure projects and an additional $1 billion investment to support the Housing Investment Fund, combined with the reinvestment of interest earnings for the Debt Retirement Fund. The increase in investments in public sector entities is largely due to improved net worth of government-owned electricity businesses and the National Injury Insurance Scheme, Queensland.
Financial assets of the TSS declined by $1.738 billion, reflecting market value adjustments to derivatives held by government-owned electricity generation businesses, offset to a large extent by higher cash balances and securities held mainly by QTC.
Non-financial assets increased by $40.499 billion in the GGS due to revaluations of land under roads, road infrastructure and schools, as well as capital purchases exceeding depreciation. The increase at the TSS level was $44.31 billion.
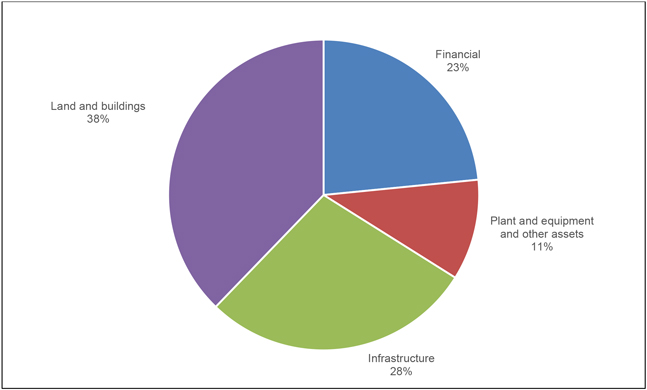
Of the TSS assets, GGS assets comprised 81 per cent. Total assets are made up of:
| General Government |
Total State | |||||||
| $M | $M | |||||||
| Financial |
81,930 | 120,039 | ||||||
| Infrastructure |
90,560 | 144,911 | ||||||
| Land and buildings |
188,326 | 193,617 | ||||||
| Plant and equipment and other |
44,642 | 53,807 | ||||||
| Deferred tax asset |
9,026 | — | ||||||
|
|
|
|
|
|||||
| 414,484 | 512,373 | |||||||
|
|
|
|
|
|||||
The main types of assets owned by the State are detailed in the following chart:
Chart 4.3: Total State Assets by Type
| Report on State Finances 2022–23 – Queensland Government | 4-5 |
AASB 1049 - Overview and Analysis
Liabilities
Liabilities at 30 June 2023 totalled $110.511 billion for the GGS and $200.859 billion for the TSS, a decrease of $3.329 billion over 2021-22 for the GGS and a decrease of $13.306 billion for the State.
The overall decline in liabilities for the GGS is due to some extent to the record operating surplus in 2022-23 partly flowing through to reduced borrowing with QTC ($2.834 billion). Lower deferred tax liabilities ($1.285 billion), mainly from Stanwell Corporation, also contribute to the decline in liabilities within the year.
For the TSS, derivatives held by GOC electricity generation businesses declined $11.945 billion, largely reflecting downward valuations of hedging contracts. Lower deposits primarily held by QTC ($1.535 billion) also factored into the decline in TSS liabilities.
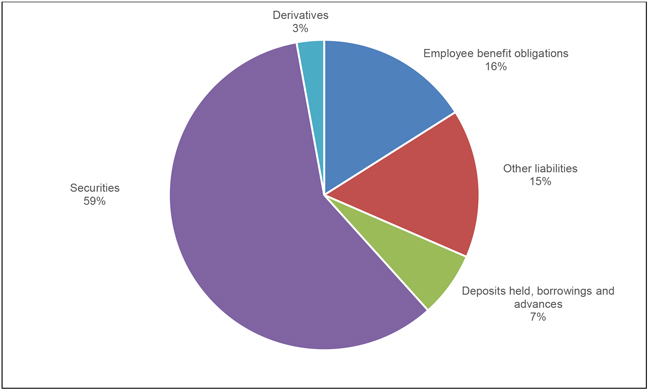
Of the TSS liabilities, GGS liabilities comprised 55 per cent. Total liabilities are made up of:
| General Government |
Total State | |||||||
| $M | $M | |||||||
| Securities |
— | 118,114 | ||||||
| Derivatives |
41 | 5,729 | ||||||
| Deposits held, borrowings and advances |
55,594 | 13,711 | ||||||
| Employee benefit obligations |
31,332 | 32,200 | ||||||
| Other liabilities |
23,544 | 31,105 | ||||||
|
|
|
|
|
|||||
| 110,511 | 200,859 | |||||||
|
|
|
|
|
|||||
The components of State liabilities are shown in the following chart:
Chart 4.4: Total State Liabilities by Type
| 4-6 | Report on State Finances 2022–23 – Queensland Government |
AASB 1049 - Overview and Analysis
Net Debt
The GGS net debt was $2.615 billion at 30 June 2023, compared to $10.997 billion in 2021-22, an improvement of $8.382 billion. The improvement in net debt is largely driven by the record net operating surplus in 2022-23 flowing through to higher cash balances, investments and reduced borrowings with QTC.
TSS net debt at 30 June 2023 was $24.293 billion, an improvement of $12.46 billion on 2022, largely due to an increase in securities held by QTC for whole-of-government long term liabilities and capital market operations, and a net decrease in derivative liabilities held by energy GOCs to hedge market movements in electricity prices.
Cash Flow Statement
The GGS recorded positive net cash flows from operating activities of $19.885 billion which were used to fund net investments in non-financial assets of $9.718 billion, resulting in a cash surplus of $10.167 billion (cash surplus of $2.816 billion in 2021-22).
The TSS recorded net cash flows from operating activities for the 2022-23 financial year of $20.184 billion. After net investments in non-financial assets of $14.065 billion, the resulting cash surplus is $6.119 billion, compared to a $182 million cash deficit for 2021-22.
| Report on State Finances 2022–23 – Queensland Government | 4-7 |
Audited Information
QUEENSLAND TREASURY
2022–23
Audited Information
Queensland General Government and
Whole of Government Consolidated
Financial Statements
30 June 2023
Operating Statement for Queensland
for the Year Ended 30 June 2023
| General Government | Total State | |||||||||||||||||||
| 2023 | 2022 | 2023 | 2022 | |||||||||||||||||
| Notes | $M | $M | $M | $M | ||||||||||||||||
| Continuing Operations |
||||||||||||||||||||
| Revenue from Transactions |
||||||||||||||||||||
| Taxation revenue |
3 | 20,601 | 20,011 | 20,051 | 19,508 | |||||||||||||||
| Grants revenue |
4 | 38,335 | 34,135 | 38,233 | 34,034 | |||||||||||||||
| Sales of goods and services |
5 | 6,483 | 5,896 | 20,838 | 20,282 | |||||||||||||||
| Interest income |
6 | 3,226 | 2,643 | 2,184 | 1,188 | |||||||||||||||
| Dividend and income tax equivalent income |
7 | 1,007 | 790 | - | - | |||||||||||||||
| Other revenue |
8 | 20,160 | 10,710 | 20,778 | 11,164 | |||||||||||||||
| Total Revenue from Transactions |
89,810 | 74,185 | 102,084 | 86,176 | ||||||||||||||||
| Expenses from Transactions |
||||||||||||||||||||
| Employee expenses |
9 | 30,557 | 28,068 | 32,988 | 30,251 | |||||||||||||||
| Superannuation expenses |
10 | 4,532 | 3,763 | 4,851 | 4,045 | |||||||||||||||
| Other operating expenses |
11 | 20,014 | 18,229 | 27,468 | 26,075 | |||||||||||||||
| Depreciation and amortisation |
12 | 5,018 | 4,506 | 7,760 | 7,250 | |||||||||||||||
| Other interest expenses |
13 | 1,688 | 1,508 | 4,712 | 4,064 | |||||||||||||||
| Grants expenses |
14 | 14,072 | 13,827 | 13,206 | 13,167 | |||||||||||||||
| Total Expenses from Transactions |
75,880 | 69,902 | 90,986 | 84,853 | ||||||||||||||||
| Net Operating Balance from Continuing Operations |
13,930 | 4,284 | 11,098 | 1,323 | ||||||||||||||||
| Other Economic Flows - Included in Operating Result |
||||||||||||||||||||
| Gains/(losses) on sale of assets/settlement of liabilities |
15 | 11 | (6 | ) | 213 | 1,822 | ||||||||||||||
| Revaluation increments/(decrements) and impairment (losses)/reversals |
16 | 64 | (1,087 | ) | 3,660 | 26 | ||||||||||||||
| Asset write-downs |
17 | (271 | ) | (516 | ) | (300 | ) | (535 | ) | |||||||||||
| Actuarial adjustments to liabilities |
18 | 236 | 906 | 386 | 1,523 | |||||||||||||||
| Deferred income tax equivalents |
1(i) | (103 | ) | (446 | ) | - | - | |||||||||||||
| Dividends and tax equivalents treated as capital returns |
19 | 90 | 80 | - | - | |||||||||||||||
| Other |
20 | 171 | 155 | 1,094 | 13,391 | |||||||||||||||
| Total Other Economic Flows - Included in Operating Result |
198 | (913 | ) | 5,052 | 16,227 | |||||||||||||||
| Operating Result from Continuing Operations |
14,128 | 3,371 | 16,150 | 17,550 | ||||||||||||||||
| Other Economic Flows - Other Movements in Equity |
||||||||||||||||||||
| Adjustments to opening balances * |
- | (14 | ) | - | (14 | ) | ||||||||||||||
| Revaluations |
40,255 | 36,770 | 39,727 | 36,552 | ||||||||||||||||
| Total Other Economic Flows - Other Movements in Equity |
21 | 40,255 | 36,755 | 39,727 | 36,538 | |||||||||||||||
| Comprehensive Result/Total Change in Net Worth |
54,383 | 40,126 | 55,877 | 54,088 | ||||||||||||||||
| KEY FISCAL AGGREGATES |
||||||||||||||||||||
| Net Operating Balance |
13,930 | 4,284 | 11,098 | 1,323 | ||||||||||||||||
| Net Acquisition/(Disposal) of Non-Financial Assets |
||||||||||||||||||||
| Purchases of non-financial assets |
9,899 | 7,878 | 14,309 | 11,136 | ||||||||||||||||
| Less Sales of non-financial assets |
181 | 254 | 243 | 319 | ||||||||||||||||
| Less Depreciation |
5,018 | 4,506 | 7,760 | 7,250 | ||||||||||||||||
| Plus Change in inventories |
79 | (77 | ) | 208 | (29 | ) | ||||||||||||||
| Plus Other movement in non-financial assets |
1,058 | 1,315 | 1,169 | 1,382 | ||||||||||||||||
| Equals Net Acquisition/(Disposal) of Non-Financial Assets |
|
5,838 | 4,356 | 7,682 | 4,919 | |||||||||||||||
| Fiscal Balance |
8,092 | (72 | ) | 3,416 | (3,596 | ) | ||||||||||||||
This Operating Statement should be read in conjunction with the accompanying notes. Note 2 provides disaggregated information in relation to the above components.
| Audited Consolidated Financial Statements 2022–23 – Queensland Government | 5-1 |
Balance Sheet for Queensland
as at 30 June 2023
| General Government | Total State | |||||||||||||||||
| 2023 | 2022 | 2023 | 2022 | |||||||||||||||
| Notes | $M | $M | $M | $M | ||||||||||||||
| Assets |
||||||||||||||||||
| Financial Assets |
||||||||||||||||||
| Cash and deposits |
22 | 2,357 | 1,710 | 9,007 | 6,481 | |||||||||||||
| Receivables and loans |
||||||||||||||||||
| Receivables |
23(a) | 4,320 | 4,160 | 6,603 | 6,335 | |||||||||||||
| Advances paid |
23(b) | 1,239 | 1,233 | 1,215 | 1,216 | |||||||||||||
| Loans paid |
23(c) | 306 | 330 | 11,224 | 12,344 | |||||||||||||
| Securities other than shares |
24(a) | 49,120 | 43,805 | 91,815 | 95,230 | |||||||||||||
| Shares and other equity investments |
||||||||||||||||||
| Investments in public sector entities |
24(b) | 24,414 | 19,973 | - | - | |||||||||||||
| Investments in other entities |
16 | 6 | 16 | 6 | ||||||||||||||
| Investments accounted for using the equity method |
25(a) | 159 | 159 | 158 | 166 | |||||||||||||
| Total Financial Assets |
81,930 | 71,376 | 120,039 | 121,777 | ||||||||||||||
| Non-Financial Assets |
||||||||||||||||||
| Inventories |
27 | 731 | 650 | 1,644 | 1,410 | |||||||||||||
| Assets held for sale |
28 | 72 | 84 | 75 | 84 | |||||||||||||
| Investment properties |
29 | 451 | 498 | 812 | 838 | |||||||||||||
| Property, plant and equipment |
31 | 309,203 | 269,433 | 375,479 | 332,370 | |||||||||||||
| Intangibles |
32 | 728 | 739 | 1,750 | 1,738 | |||||||||||||
| Service concession assets - GORTO |
33 | 11,660 | 10,608 | 11,660 | 10,608 | |||||||||||||
| Deferred tax asset |
1(i) | 9,026 | 9,270 | - | - | |||||||||||||
| Other non-financial assets |
34 | 682 | 772 | 915 | 977 | |||||||||||||
| Total Non-Financial Assets |
332,554 | 292,055 | 392,335 | 348,025 | ||||||||||||||
| Total Assets |
414,484 | 363,430 | 512,373 | 469,802 | ||||||||||||||
| Liabilities |
||||||||||||||||||
| Payables |
35 | 5,921 | 5,222 | 7,340 | 6,982 | |||||||||||||
| Employee benefit obligations |
||||||||||||||||||
| Superannuation liability |
36(a) | 20,913 | 22,168 | 20,559 | 21,768 | |||||||||||||
| Other employee benefits |
36(b) | 10,419 | 9,029 | 11,641 | 10,137 | |||||||||||||
| Deposits held |
37(a) | - | - | 5,104 | 6,639 | |||||||||||||
| Advances received |
37(b) | 1,909 | 1,310 | 235 | 262 | |||||||||||||
| Borrowing with QTC |
37(c) | 46,166 | 49,000 | - | - | |||||||||||||
| Leases and other loans |
37(d) | 7,519 | 7,671 | 8,372 | 8,532 | |||||||||||||
| Securities and derivatives |
37(e) | 41 | 93 | 123,844 | 136,591 | |||||||||||||
| Deferred tax liability |
1(i) | 4,410 | 5,695 | - | - | |||||||||||||
| Provisions |
38 | 4,991 | 5,120 | 14,593 | 13,888 | |||||||||||||
| Service concession liabilities - GORTO |
33 | 7,207 | 7,442 | 7,207 | 7,442 | |||||||||||||
| Other liabilities |
39 | 1,015 | 1,089 | 1,966 | 1,925 | |||||||||||||
| Total Liabilities |
110,511 | 113,840 | 200,859 | 214,165 | ||||||||||||||
| Net Assets |
303,973 | 249,590 | 311,514 | 255,637 | ||||||||||||||
| Net Worth |
||||||||||||||||||
| Accumulated surplus |
110,042 | 95,171 | 118,597 | 101,505 | ||||||||||||||
| Reserves |
193,931 | 154,419 | 192,917 | 154,132 | ||||||||||||||
| Total Net Worth |
303,973 | 249,590 | 311,514 | 255,637 | ||||||||||||||
| KEY FISCAL AGGREGATES |
||||||||||||||||||
| Net Financial Worth |
(28,581 | ) | (42,465 | ) | (80,820 | ) | (92,388 | ) | ||||||||||
| Net Financial Liabilities |
52,995 | 62,438 | 80,820 | 92,388 | ||||||||||||||
| Net Debt |
2,615 | 10,997 | 24,293 | 36,753 | ||||||||||||||
This Balance Sheet should be read in conjunction with the accompanying notes. Note 2 provides disaggregated information in relation to the components of the net assets.
| 5-2 | Audited Consolidated Financial Statements 2022–23 – Queensland Government |
Statement of Changes in Equity (Net Worth) for Queensland General Government Sector
for the Year ended 30 June 2023
| Opening Balance |
Comprehensive Result for Period |
Closing Balance | ||||||||||||||||||||||
| Adjustments to Opening |
Movements 3 | Transfers/Entity Cessation 3 |
Actuarial Gain/ (Loss) on Superannuation 1 |
|||||||||||||||||||||
| $M |
$M |
$M |
$M |
$M |
$M |
|||||||||||||||||||
|
|
|
|
|
|
|
|
|
|
|
|
|
|||||||||||||
| 2023 |
||||||||||||||||||||||||
| Accumulated surplus |
95,171 | - | 14,127 | - | 744 | 110,042 | ||||||||||||||||||
| Revaluation reserve - financial assets |
11,053 | - | 4,178 | - | - | 15,232 | ||||||||||||||||||
| Revaluation reserve - non-financial assets |
143,259 | - | 35,334 | (3 | ) | - | 178,589 | |||||||||||||||||
| Other reserves |
107 | - | - | 3 | - | 111 | ||||||||||||||||||
|
|
|
|
|
|
|
|
|
|
|
|
|
|||||||||||||
| Total equity at the end of the financial year |
249,590 | - | 53,639 | - | 744 | 303,973 | ||||||||||||||||||
|
|
|
|
|
|
|
|
|
|
|
|
|
|||||||||||||
| 2022 |
||||||||||||||||||||||||
| Accumulated surplus |
87,251 | (14 | ) | 3,371 | (25 | ) | 4,589 | 95,171 | ||||||||||||||||
| Revaluation reserve - financial assets |
13,339 | - | (2,312 | ) | 27 | - | 11,053 | |||||||||||||||||
| Revaluation reserve - non-financial assets |
108,759 | - | 34,493 | 7 | - | 143,259 | ||||||||||||||||||
| Other reserves |
116 | - | - | (9 | ) | - | 107 | |||||||||||||||||
|
|
|
|
|
|
|
|
|
|
|
|
|
|||||||||||||
| Total equity at the end of the financial year |
209,464 | (14 | ) | 35,551 | - | 4,589 | 249,590 | |||||||||||||||||
|
|
|
|
|
|
|
|
|
|
|
|
|
|||||||||||||
| Notes:
1. Refer to Note 21 – Other economic flows – other movement in equity.
2. Adjustments to opening balance largely relate to accounting for water infrastructure.
3. There have been immaterial adjustments to 2022 movements and transfers. |
|
|||||||||||||||||||||||
| Audited Consolidated Financial Statements 2022–23 – Queensland Government | 5-3 |
Statement of Changes in Equity (Net Worth) for Queensland Total State Sector
for the Year ended 30 June 2023
| Opening Balance |
Comprehensive Result for Period | Closing Balance | ||||||||||||||||||||||
| Adjustments to Opening Balances 2 |
Movements 3 | Transfers/Entity Cessation 3 |
Actuarial Gain/ (Loss) on Superannuation 1 |
|||||||||||||||||||||
| $M | $M | $M | $M | $M | $M | |||||||||||||||||||
|
|
|
|
|
|
|
|
|
|
|
|
|
|||||||||||||
| 2023 |
||||||||||||||||||||||||
| Accumulated surplus |
101,505 | - | 16,150 | 229 | 712 | 118,597 | ||||||||||||||||||
| Revaluation reserve - financial asset |
(2,226 | ) | - | 2,226 | - | - | - | |||||||||||||||||
| Revaluation reserve - non-financial assets |
155,298 | - | 36,789 | (164 | ) | - | 191,924 | |||||||||||||||||
| Other reserves |
1,059 | - | - | (65 | ) | - | 994 | |||||||||||||||||
|
|
|
|
|
|
|
|
|
|
|
|
|
|||||||||||||
| Total equity at the end of the financial year |
255,637 | - | 55,165 | - | 712 | 311,514 | ||||||||||||||||||
|
|
|
|
|
|
|
|
|
|
|
|
|
|||||||||||||
| 2022 |
||||||||||||||||||||||||
| Accumulated surplus |
78,724 | (14 | ) | 17,550 | 553 | 4,693 | 101,505 | |||||||||||||||||
| Revaluation reserve - financial assets |
604 | - | (2,857 | ) | 27 | - | (2,226 | ) | ||||||||||||||||
| Revaluation reserve - non-financial assets |
120,744 | - | 34,716 | (162 | ) | - | 155,298 | |||||||||||||||||
| Other reserves |
1,477 | - | - | (418 | ) | - | 1,059 | |||||||||||||||||
|
|
|
|
|
|
|
|
|
|
|
|
|
|||||||||||||
| Total equity at the end of the financial year |
201,549 | (14 | ) | 49,409 | - | 4,693 | 255,637 | |||||||||||||||||
|
|
|
|
|
|
|
|
|
|
|
|
|
|||||||||||||
Notes:
| 1. | Refer to Note 21 – Other economic flows – other movement in equity. |
| 2. | Adjustments to opening balance largely relate to accounting for water infrastructure. |
| 3. | There have been immaterial adjustments to 2022 movements and transfers. |
| 5-4 | Audited Consolidated Financial Statements 2022–23 – Queensland Government |
Cash Flow Statement for Queensland
for the Year Ended 30 June 2023
| General Government | Total State | |||||||||||||||||||
| 2023 | 2022 | 2023 | 2022 | |||||||||||||||||
| Notes | $M | $M | $M | $M | ||||||||||||||||
| Cash Flows from Operating Activities |
||||||||||||||||||||
| Cash received |
||||||||||||||||||||
| Taxes received |
20,410 | 20,764 | 19,864 | 20,272 | ||||||||||||||||
| Grants and subsidies received |
38,684 | 34,378 | 38,583 | 34,276 | ||||||||||||||||
| Sales of goods and services |
6,886 | 6,297 | 23,777 | 22,567 | ||||||||||||||||
| Interest receipts |
3,201 | 2,638 | 2,150 | 1,183 | ||||||||||||||||
| Dividends and income tax equivalents |
922 | 1,202 | - | - | ||||||||||||||||
| Other receipts |
22,502 | 12,478 | 23,010 | 12,950 | ||||||||||||||||
| 92,604 | 77,757 | 107,384 | 91,247 | |||||||||||||||||
| Cash paid |
||||||||||||||||||||
| Payments for employees |
(34,232 | ) | (31,739 | ) | (36,903 | ) | (34,168 | ) | ||||||||||||
| Payments for goods and services |
(23,090 | ) | (20,510 | ) | (31,835 | ) | (28,650 | ) | ||||||||||||
| Grants and subsidies paid |
(13,777 | ) | (13,628 | ) | (12,984 | ) | (12,979 | ) | ||||||||||||
| Interest paid |
(1,616 | ) | (1,441 | ) | (4,641 | ) | (3,996 | ) | ||||||||||||
| Other payments |
(4 | ) | - | (837 | ) | (820 | ) | |||||||||||||
| (72,719 | ) | (67,318 | ) | (87,200 | ) | (80,613 | ) | |||||||||||||
| Net Cash Flows from Operating Activities |
40(a) | 19,885 | 10,440 | 20,184 | 10,634 | |||||||||||||||
| Cash Flows from Investing Activities in |
||||||||||||||||||||
| Non-Financial Assets |
||||||||||||||||||||
| Purchases of non-financial assets |
(9,899 | ) | (7,878 | ) | (14,309 | ) | (11,136 | ) | ||||||||||||
| Sales of non-financial assets |
181 | 254 | 243 | 319 | ||||||||||||||||
| (9,718 | ) | (7,624 | ) | (14,065 | ) | (10,817 | ) | |||||||||||||
| Financial Assets (Policy Purposes) |
||||||||||||||||||||
| Equity acquisitions / disposals |
(818 | ) | 12 | - | 3 | |||||||||||||||
| Advances and concessional loans paid |
(133 | ) | (157 | ) | (131 | ) | (161 | ) | ||||||||||||
| Advances and concessional loans received |
186 | 272 | 186 | 270 | ||||||||||||||||
| (766 | ) | 127 | 56 | 112 | ||||||||||||||||
| Financial Assets (Liquidity Purposes) |
||||||||||||||||||||
| Purchases of investments |
(13,936 | ) | (6,470 | ) | (62,617 | ) | (45,758 | ) | ||||||||||||
| Sales of investments |
5,900 | 2,580 | 62,067 | 32,718 | ||||||||||||||||
| (8,035 | ) | (3,889 | ) | (550 | ) | (13,041 | ) | |||||||||||||
| Net Cash Flows from Investing Activities |
(18,519 | ) | (11,386 | ) | (14,559 | ) | (23,746 | ) | ||||||||||||
| Cash Flows from Financing Activities |
||||||||||||||||||||
| Cash received |
||||||||||||||||||||
| Advances received |
3,264 | 2,339 | 3 | 1 | ||||||||||||||||
| Proceeds of borrowing |
43 | 3,088 | 5,987 | 2,888 | ||||||||||||||||
| Deposits received |
- | - | 5,563 | 6,472 | ||||||||||||||||
| Other financing (including interest bearing liabilities) |
- | - | 26,755 | 30,244 | ||||||||||||||||
| 3,306 | 5,427 | 38,309 | 39,606 | |||||||||||||||||
| Cash paid |
||||||||||||||||||||
| Advances paid |
(2,665 | ) | (2,465 | ) | (31 | ) | (40 | ) | ||||||||||||
| Borrowing repaid |
(1,360 | ) | (1,435 | ) | (6,439 | ) | (6,381 | ) | ||||||||||||
| Deposits withdrawn |
- | - | (7,099 | ) | (6,217 | ) | ||||||||||||||
| Other financing (including interest bearing liabilities) |
- | - | (27,839 | ) | (19,798 | ) | ||||||||||||||
| (4,025 | ) | (3,900 | ) | (41,408 | ) | (32,436 | ) | |||||||||||||
| Net Cash Flows from Financing Activities |
(719 | ) | 1,527 | (3,099 | ) | 7,170 | ||||||||||||||
| Net Increase/(Decrease) in Cash and Deposits Held |
647 | 581 | 2,526 | (5,942 | ) | |||||||||||||||
| Cash and deposits at the beginning of the financial year |
1,710 | 1,129 | 6,481 | 12,423 | ||||||||||||||||
| Cash and Cash Equivalents Held at the End of the Financial Year
|
|
22
|
|
|
2,357
|
|
|
1,710
|
|
|
9,007
|
|
|
6,481
|
| |||||
| Audited Consolidated Financial Statements 2022–23 – Queensland Government | 5-5 |
Cash Flow Statement for Queensland
for the Year Ended 30 June 2023 continued
| General Government | Total State | |||||||||||||||||||
| 2023 | 2022 | 2023 | 2022 | |||||||||||||||||
| Notes | $M | $M | $M | $M | ||||||||||||||||
| KEY FISCAL AGGREGATES |
||||||||||||||||||||
| Net Cash from Operating Activities |
19,885 | 10,440 | 20,184 | 10,634 | ||||||||||||||||
| Net Cash Flow from Investments in Non-Financial Assets |
(9,718 | ) | (7,624 | ) | (14,065 | ) | (10,817 | ) | ||||||||||||
| CASH SURPLUS/(DEFICIT)
|
|
10,167
|
|
|
2,816
|
|
|
6,119
|
|
|
(182
|
)
| ||||||||
| Derivation of ABS GFS Cash Surplus/Deficit |
||||||||||||||||||||
| Cash surplus/(deficit) |
10,167 | 2,816 | 6,119 | (182 | ) | |||||||||||||||
| Acquisitions under finance leases and similar arrangements |
(849 | ) | (1,051 | ) | (900 | ) | (1,070 | ) | ||||||||||||
| ABS GFS Cash Surplus/(Deficit) Including Finance Leases and Similar Arrangements | 9,318 | 1,765 | 5,219 | (1,252 | ) | |||||||||||||||
This Cash Flow Statement should be read in conjunction with the accompanying notes. Note 2 provides disaggregated information in relation to the components of the net cash flows.
| 5-6 | Audited Consolidated Financial Statements 2022–23 – Queensland Government |
Notes to the Financial Statements
Index of Notes
| 1. |
Basis of financial statements preparation |
5 - 8 | ||
| 2. |
Disaggregated information |
5 - 14 | ||
| 3. |
Taxation revenue |
5 - 19 | ||
| 4. |
Grants revenue |
5 - 19 | ||
| 5. |
Sales of goods and services |
5 - 20 | ||
| 6. |
Interest income |
5 - 20 | ||
| 7. |
Dividend and income tax equivalent income |
5 - 21 | ||
| 8. |
Other revenue |
5 - 21 | ||
| 9. |
Employee expenses |
5 - 21 | ||
| 10. |
Superannuation expenses |
5 - 22 | ||
| 11. |
Other operating expenses |
5 - 22 | ||
| 12. |
Depreciation and amortisation |
5 - 22 | ||
| 13. |
Other interest expenses |
5 - 23 | ||
| 14. |
Grants expenses |
5 - 23 | ||
| 15. |
Gains/(losses) on sale of assets/settlement of liabilities |
5 - 24 | ||
| 16. |
Revaluation increments/(decrements) and impairment (losses)/reversals |
5 - 24 | ||
| 17. |
Asset write-downs |
5 - 25 | ||
| 18. |
Actuarial adjustments to liabilities |
5 - 25 | ||
| 19. |
Dividends and tax equivalents treated as capital returns |
5 - 25 | ||
| 20. |
Other economic flows - included in operating result – other |
5 - 26 | ||
| 21. |
Other economic flows - other movements in equity |
5 - 26 | ||
| 22. |
Cash and deposits |
5 - 26 | ||
| 23. |
Receivables and loans |
5 - 27 | ||
| 24. |
Securities and shares |
5 - 30 | ||
| 25. |
Other investments |
5 - 31 | ||
| 26. |
Public private partnerships |
5 - 32 | ||
| 27. |
Inventories |
5 - 38 | ||
| 28. |
Assets held for sale |
5 - 38 | ||
| 29. |
Investment properties |
5 - 38 | ||
| 30. |
Restricted assets |
5 - 38 | ||
| 31. |
Property, plant and equipment |
5 - 39 | ||
| 32. |
Intangibles |
5 - 52 | ||
| 33. |
Service Concession Arrangements - Grant of Right to Operate (SCA - GORTO) |
5 - 52 | ||
| 34. |
Other non-financial assets |
5 - 53 | ||
| 35. |
Payables |
5 - 53 | ||
| 36. |
Employee benefit obligations |
5 - 54 | ||
| 37. |
Deposits, borrowings and advances, securities and derivatives |
5 - 55 | ||
| 38. |
Provisions |
5 - 59 | ||
| 39. |
Other liabilities |
5 - 61 | ||
| 40. |
Notes to the Cash Flow Statement |
5 - 62 | ||
| 41. |
Capital expenditure commitments |
5 - 63 | ||
| 42. |
Cash and other assets held in trust |
5 - 63 | ||
| 43. |
Contingent assets and liabilities |
5 - 64 | ||
| 44. |
Post balance date events |
5 - 66 | ||
| 45. |
Sustainability Related Risks |
5 - 67 | ||
| 46. |
Financial risk management disclosure |
5 - 68 | ||
| 47. |
Net fair value of financial instruments |
5 - 73 | ||
| 48. |
Retirement benefit obligations |
5 - 77 | ||
| 49. |
Related parties and Ministerial remuneration |
5 - 80 | ||
| 50. |
Controlled entities |
5 - 81 | ||
| 51. |
Expenses from transactions by function |
5 - 86 | ||
| 52. |
Sector assets by function |
5 - 86 | ||
| 53. |
General Government Sector Budget to actual comparison |
5 - 87 |
| Audited Consolidated Financial Statements 2022–23 – Queensland Government | 5-7 |
Notes to the Financial Statements
| 1. | Basis of financial statements preparation |
| (a) | General information |
This financial report is prepared for the Queensland General Government Sector (GGS) and the consolidated Total State Sector (TSS).
The GGS is a component of the TSS. The GGS is determined in accordance with the principles and rules contained in the Australian Bureau of Statistics’ (ABS) Australian System of Government Finance Statistics: Concepts, Sources and Methods 2015 (ABS GFS Manual). According to the ABS GFS Manual, the GGS consists of all government units and non-profit institutions controlled and mainly financed by government. Government units are legal entities established by political processes that have legislative, judicial or executive authority over other units and which provide goods and services to the community or to individuals on a non-market basis and make transfer payments to redistribute income and wealth. Non-profit institutions are created for the purpose of producing or distributing goods and services but are not a source of income, profit or other financial gain for the Government. Refer Note 1(c) for further information on sectors.
Unless otherwise stated, references in this report to “the State” include both the GGS and TSS.
| (b) | The Government reporting entity |
The Queensland Government economic entity (TSS) includes all State Government departments, other General Government entities, Public Non-financial Corporations (PNFC), Public Financial Corporations (PFC) and their controlled entities. Refer Note 50 for a full list of controlled entities included in each sector.
Under AASB 1049 Whole of Government and General Government Sector Financial Reporting, the preparation of the GGS financial report does not require full application of AASB 10 Consolidated Financial Statements and AASB 9 Financial Instruments. The GGS includes the value of all material assets, liabilities, equity, revenue and expenses of entities controlled by the GGS of Queensland. Assets, liabilities, revenue, expenses and cash flows of Government controlled entities that are in the PNFC and the PFC are not separately recognised in the GGS.
Instead, the GGS recognises an asset, being the controlling equity investment in those entities and recognises an increment or decrement relating to changes in the carrying amount of that asset, measured in accordance with AASB 1049. The asset is reported as ‘Investments in public sector entities’ on the Balance Sheet.
Generally, only those agencies considered material by virtue of the size of their financial transactions and/or resources managed are consolidated for the purposes of this report (refer Note 50 for further details).
In the process of reporting the Queensland Government as a single economic entity, all material inter-entity and intra-entity transactions and balances have been eliminated to the extent practicable.
The ABS GFS Manual provides the basis upon which GFS information contained in the financial report is prepared. In particular, Note 1(l) discloses how key fiscal aggregates of net worth, net operating balance, fiscal balance and cash surplus/(deficit), determined using the principles and rules in the ABS GFS Manual, differ from the aggregates included in this financial report.
| (c) | Sectors |
Assets, liabilities, revenue and expenses that are attributed reliably to each sector of the Queensland Government economic entity (TSS) are disclosed in Note 2. For disclosure purposes, transactions and balances between entities within each sector have been eliminated in the sector. The financial impact of inter-sector transactions and balances is also disclosed under the heading of Consolidation Adjustments.
A brief description of each broad sector of the Government’s activities, determined in accordance with the ABS GFS Manual follows:
General Government Sector (GGS)
The primary function of GGS agencies is to provide public services that:
– are non-trading in nature and that are for the collective benefit of the community;
– are largely financed by way of taxes, fees and other compulsory charges; and
– involve the transfer or redistribution of income.
Public Non-financial Corporations Sector (PNFC Sector)
The primary function of enterprises in the PNFC Sector is to provide goods and services that:
– are trading, non-regulatory or non-financial in nature; and
– are financed by way of sales of goods and services to consumers.
| 5-8 | Audited Consolidated Financial Statements 2022–23 – Queensland Government |
Notes to the Financial Statements
| 1. | Basis of financial statements preparation continued |
| (c) | Sectors continued |
Public Financial Corporations Sector (PFC Sector)
The PFC Sector comprises publicly-owned institutions which provide financial services, usually on a commercial basis.
Functions they perform may include:
– central bank functions;
– accepting on-call, term or savings deposits;
– investment fund management;
– having the authority to incur liabilities and acquire financial assets in the market on their own account; or
– providing insurance services.
| (d) | Compliance with prescribed requirements |
This financial report has been prepared in accordance with the Financial Accountability Act 2009. In addition, the financial statements comply with AASB 1049 which requires compliance with all Australian Accounting Standards and Concepts, Interpretations and other authoritative pronouncements, except those identified below.
With respect to compliance with Australian Accounting Standards and Interpretations, the GGS and the TSS have applied those requirements applicable to not-for-profit entities, as the GGS and the TSS are classified as such. It is, however, recognised that the TSS is an aggregation of both for-profit and not-for-profit entities.
Unless otherwise stated, the accounting policies adopted for the reporting period are consistent with those of the previous reporting period. In accordance with AASB 101 Presentation of Financial Statements and AASB 108 Accounting Policies, Changes in Accounting Estimates and Errors, changes to accounting policies are applied retrospectively unless specific transitional provisions apply.
The financial report of the TSS is a general purpose financial report. The financial report of the GGS is included as two separate columns adjacent to the TSS financial information. GGS information is shaded.
The statements have been prepared on an accrual basis that recognises the financial effects of transactions and events when they occur.
AASB 1049 harmonises GFS with Generally Accepted Accounting Principles (GAAP) to the extent that GFS does not conflict with GAAP. This requires the selection of options within the Australian Accounting Standards that harmonise with the ABS GFS Manual.
The purpose of this financial report is to provide users with information about the stewardship by the Government in relation to the GGS and TSS and accountability for the resources entrusted to it, information about the financial performance, position and cash flows of the GGS and TSS and information that facilitates assessments of the macro-economic impact of the Government.
| (e) | New and changed accounting standards and accounting policies |
Accounting Standards applied for the first time in 2022-23
No new accounting standards effective for the first time in 2022-23 had a material impact on the State.
Future impact of accounting standards not yet effective
AASB 17 Insurance Contracts
This standard applies to insurance contracts and is proposed to be effective for the public sector in 2026-27. Public sector specific modifications and guidance include:
| – | pre-requisites, indicators and other considerations that need to be judged to identify arrangements that fall within the scope of AASB 17 in a public sector context; |
| – | guidance on coverage periods in a public sector context, which has consequences for determining the cash flows used to measure insurance liabilities and the pattern of revenue recognition; and |
| – | an accounting policy choice to measure liabilities for remaining coverage applying the premium allocation approach. |
The State has not yet commenced in-depth analysis of the potential accounting impact of AASB 17 for its insurance contracts.
The State’s insurance liabilities are currently accounted for under AASB 1023 General Insurance Contracts or AASB 137 Provisions, Contingent Liabilities and Contingent Assets, and are reported in Note 38.
| Audited Consolidated Financial Statements 2022–23 – Queensland Government | 5-9 |
Notes to the Financial Statements
| 1. | Basis of financial statements preparation continued |
| (f) | Reporting period |
The reporting period of the GGS and TSS is the financial year ended 30 June 2023.
| (g) | Presentation |
Currency and rounding
All amounts in these statements are in Australian dollars and have been rounded to the nearest $1 million or where the amount is less than $500,000, to zero, unless otherwise indicated. Accordingly, numbers may not add due to rounding.
Comparative information and errors
Where applicable, comparatives have been restated, to be consistent with changes in presentation for the current reporting period. The impact of any material prior year adjustments on net worth is noted in the Statement of Changes in Equity.
AASB 108 Accounting Policies, Changes in Accounting Estimates and Errors requires that material prior period errors be corrected retrospectively by either restating comparative amounts if the errors occurred in the prior year or restating the opening balances of assets, liabilities and equity of the prior year where the error occurred before the prior year.
Foreign currency
Foreign currency transactions are translated into Australian dollars at the rate of exchange prevailing at the date of the transaction. Amounts payable and receivable in foreign currencies are translated to Australian dollars at rates of exchange prevalent at balance date.
Translation differences relating to amounts payable and receivable in foreign currencies are brought to account as exchange gains or losses in other economic flows in the operating result, except when deferred in equity as qualifying cash flow hedges and net investment hedges.
Translation differences on non-monetary assets and liabilities such as equities held at fair value through profit or loss are recognised in other economic flows in the operating result as part of the fair value gain or loss. Translation differences on non-monetary assets such as equities at fair value through other comprehensive income are included in the fair value reserve in equity.
Translation differences relating to borrowings are accounted for as exchange gains or losses in other economic flows in the operating result.
| (h) | Basis of measurement |
These financial statements use historical cost accounting principles as the measurement basis unless otherwise stated in the report. Other significant valuation methodologies used include:
| – | Financial assets: |
| • | receivables and loans (except onlendings by Queensland Treasury Corporation (QTC)) are measured at amortised cost; |
| • | term deposits are measured at amortised cost; |
| • | corporate bonds and investments in other public sector entities within GGS are measured at fair value through other comprehensive income (FVTOCI); and |
| • | other financial assets, including onlendings by QTC, securities and derivatives, are recorded at fair value through profit or loss. |
| – | Financial liabilities: |
| • | payables are measured at amortised cost; |
| • | lease liabilities, Service Concession Arrangements (SCA) - non-GORTO (Grant of Right to Operate) liabilities, advances, interest bearing deposits and GGS loans from QTC are measured at amortised cost; and |
| • | other financial liabilities, including securities and derivatives, are recorded at fair value through profit or loss. |
| – | Non-financial assets: |
| • | inventories (other than those held for distribution) are valued at the lower of cost and net realisable value under AASB 102 Inventories; and |
| • | land, buildings, infrastructure, major plant and equipment and heritage and cultural assets are valued at fair value. Other classes of assets are valued at cost, which approximates fair value; and |
| • | service concession assets are recorded at fair value. |
| 5-10 | Audited Consolidated Financial Statements 2022–23 – Queensland Government |
Notes to the Financial Statements
| 1. | Basis of financial statements preparation continued |
| (h) | Basis of measurement continued |
| – | Non-financial liabilities: |
| • | provisions in relation to superannuation, long service leave, workers’ compensation, insurance and redress are based on actuarial valuations, measured at the present value of the estimate of the expenditure required to settle the present obligation at the reporting date; and |
| • | service concession liabilities in relation to GORTO arrangements and unearned revenue are measured at their amortised amounts after deducting revenue earned to date. |
| (i) | Commonwealth taxation and income tax equivalents |
The Government is exempt from Commonwealth taxation except for Fringe Benefits Tax and Goods and Services Tax (GST). Revenue, expenses and assets are recognised net of GST, except where the amount of GST incurred is not recoverable from the Australian Taxation Office (ATO), in which case, the GST is recognised as part of the acquisition cost of the asset or as part of the item of expense.
Receivables and payables include GST. The amounts of GST receivable from, or payable to, the ATO are included as a current asset or liability in the Balance Sheet. Cash flows are included in the Cash Flow Statement on a gross basis. The GST components of cash flows arising from investing and financing activities which are recoverable from, or payable to, the ATO are classified as operating cash flows.
The GGS is the collector of income tax equivalents from the PNFC and PFC Sectors. Current income tax is included in the net operating balance while deferred tax is treated as an other economic flow. The deferred tax assets and liabilities with other public sector entities are reflected on the face of the GGS Balance Sheet and are eliminated in the TSS.
| (j) | Classification |
AASB 1049 requires the Operating Statement to include all items of revenue and expenses recognised in a period. All amounts relating to an item included in the determination of comprehensive result (total change in net worth) are classified as transactions or other economic flows in a manner that is consistent with the ABS GFS Manual. Key technical terms from the ABS GFS Manual that are used in this financial report are outlined in Notes 1(c) and 1(k).
Transactions are interactions between two units by mutual agreement or an action within a unit that is analytically useful to treat as a transaction. Other economic flows are changes in the volume or value of an asset or liability that do not result from transactions (e.g. revaluations and other changes in the volume of assets).
Where application of accounting standards results in a variance to GFS, Note 1(l) describes the differences.
| (k) | Key GFS technical terms |
ABS GFS Manual
The ABS GFS Manual refers to the ABS publication Australian System of Government Finance Statistics: Concepts, Sources and Methods 2015 as updated from time to time.
Cash surplus/(deficit)
The cash surplus/(deficit) is calculated as net cash flows from operating activities plus net cash flows from acquisition and disposal of non-financial assets less distributions paid. GFS cash surplus/(deficit) also deducts the value of assets acquired under finance leases and similar arrangements.
Comprehensive result - total change in net worth before transactions with owners as owners
This is the net result of all items of revenue and expenses recognised for the period. It is the aggregate of the operating result and other movements in equity, other than transactions with owners as owners.
Financial assets and non-financial assets
A financial asset is any asset that is:
– cash;
– an equity instrument of another entity;
– a contractual right:
| (a) | to receive cash or another financial asset from another entity; or |
| (b) | to exchange financial assets or financial liabilities with another entity under conditions that are potentially favourable to the entity. |
All assets that are not “financial assets” are non-financial assets.
| Audited Consolidated Financial Statements 2022–23 – Queensland Government | 5-11 |
Notes to the Financial Statements
| 1. | Basis of financial statements preparation continued |
| (k) | Key GFS technical terms continued |
Key fiscal aggregates
Key fiscal aggregates are referred to as analytical balances in the ABS GFS Manual. These are data identified in the ABS GFS Manual as useful for macro-economic analysis purposes, including assessing the impact of a Government on the economy. They are opening net worth, net operating balance (which equals change in net worth due to transactions), fiscal balance, change in net worth due to revaluations and changes in the volume of assets, total change in net worth, closing net worth and cash surplus/(deficit).
Net debt
Net debt in these statements is disclosed as per the UPF and equals (deposit liabilities held plus advances and borrowing liabilities) less (cash and deposits plus investments and loans plus asset advances outstanding). GFS now has a wider definition of net debt which includes all liabilities in the calculation.
Fiscal balance
Also known as Net lending/(borrowing), this measures the financing requirements of a government and is calculated as the net operating balance, less the net acquisition of non-financial assets. A positive result reflects a fiscal surplus (net lending position) and a negative result reflects a fiscal deficit (net borrowing position), based on the definition in the ABS GFS Manual.
Net operating balance
This is calculated as income from transactions less expenses from transactions, based on the definition in the ABS GFS Manual.
Net worth
For the GGS and TSS, net worth is the result of assets less liabilities, since shares and contributed capital is zero. It is an economic measure of wealth and reflects the contribution of governments to the wealth of Australia.
Non-profit institution
A non-profit institution is a legal or social entity that is created for the purpose of producing or distributing goods and services but is not permitted to be a source of income, profit or other financial gain for the units that establish, control or finance it.
Operating result
Operating result is a measure of financial performance of the operations of the State for the period. It is the net result of items of revenue and gains, and expenses and losses recognised for the period, excluding those that are classified as other movements in equity.
Other economic flows
Changes in the volume or value of an asset or liability that do not result from transactions (e.g. revaluations and other changes in the volume of assets) are other economic flows.
Transactions
Refer Note 1(j).
| 5-12 | Audited Consolidated Financial Statements 2022–23 – Queensland Government |
Notes to the Financial Statements
| 1. | Basis of financial statements preparation continued |
| (l) | Reconciliation to GFS |
As required by AASB1049, this note identifies the convergence differences between the key aggregates per AASB1049 and the calculations in terms of the GFS Manual.
| AASB 1049 Treatment | ABS GFS Treatment | |
| Reconciliation to GFS Net Operating Balance | ||
|
Onerous contract expenses are recognised as other economic flows included in the operating result. |
Onerous contract expenses are recognised as expenses from transactions when payments are made from the provision. | |
|
Dividends to owners are treated as a distribution to owners and therefore a direct debit to equity. |
Dividends to owners are treated as an expense.
The differences do not flow through to the TSS as they arise from inter-sector transactions. | |
|
Lease expenses related to leased assets recognised on the Balance Sheet are recognised as amortisation expenses and lease finance charges |
Operating leases are recognised as other operating expenses when paid. | |
|
An elimination difference arises in respect of social benefits.
Under AASB 10, intragroup transactions are eliminated in full. |
Certain transactions within and between the GGS and the PNFC Sector are not eliminated on consolidation of the GGS or TSS.
These benefits are grossed up for GFS reporting in sales of goods and services and other operating expenses and there is no net effect on the net operating balance. | |
| Reconciliation to GFS Fiscal Balance | ||
|
Purchases and sales of land inventories and assets held for rental and subsequently held for sale are reflected in changes in net inventories |
Purchases and sales of land inventories and assets held for rental and subsequently held for sale are treated as purchases and sales of non-financial assets. | |
| Reconciliation to GFS Net Worth and Change in net worth | ||
|
Equity investments in PNFCs and PFCs are measured as the Government’s proportional share of the carrying amount of net assets of the PNFC and PFC Sector entities on a GAAP basis. |
Equity investments in PNFCs and PFCs are impacted by the above convergence differences.
This difference does not flow through to the TSS as it arises from inter-sector balances. | |
|
Operating leases are recognised on the balance sheet under AASB 16 Leases unless the lease is shorter than 12 months or where the underlying assets are worth less than $10 000 when new. |
Operating leases are not recognised on the balance sheet. | |
|
Restoration assets and restoration provisions are recognised in the Balance Sheet. |
Restoration assets and restoration provisions are not recognised. | |
|
Deferred tax assets are classified as non-financial assets and deferred tax liabilities are classified as non-financial liabilities in the Balance Sheet. |
Deferred tax assets and deferred tax liabilities are not recognised.
The difference does not flow through to the TSS as it arises from inter-sector transactions. | |
|
Service concession arrangements – GORTO assets and GORTO liabilities have been recognised in the Balance Sheet. |
Service concession arrangements – GORTO assets and GORTO liabilities are not recognised. | |
|
A provision for onerous contracts is recognised on the Balance Sheet. |
A provision for onerous contracts is not recognised. | |
|
Net Worth is calculated as assets less liabilities. |
Net worth is measured as assets less liabilities less shares/contributed equity. | |
| Reconciliation to GFS Cash Surplus/(Deficit) | ||
|
Cash Flow Statement does not recognise notional cash flows. |
A notional cash outflow relating to new finance leases and similar arrangements is recognised in calculating cash surplus/(deficit). | |
| Audited Consolidated Financial Statements 2022–23 – Queensland Government | 5-13 |
Notes to the Financial Statements
| 2. | Disaggregated information |
| General Government * |
Public Non-financial Corporations * |
Public Financial Corporations * |
Consolidation Adjustments |
Total State
|
||||||||||||||||||||||||||||||||||||
| 2023 | 2022 | 2023 | 2022 | 2023 | 2022 | 2023 | 2022 | 2023 | 2022 | |||||||||||||||||||||||||||||||
| $M | $M | $M | $M | $M | $M | $M | $M | $M | $M | |||||||||||||||||||||||||||||||
| Continuing Operations |
||||||||||||||||||||||||||||||||||||||||
| Revenue from Transactions |
||||||||||||||||||||||||||||||||||||||||
| Taxation revenue |
20,601 | 20,011 | - | - | - | - | (550 | ) | (503 | ) | 20,051 | 19,508 | ||||||||||||||||||||||||||||
| Grants revenue |
38,335 | 34,135 | 912 | 697 | - | - | (1,014 | ) | (799 | ) | 38,233 | 34,034 | ||||||||||||||||||||||||||||
| Sales of goods and services |
6,483 | 5,896 | 14,735 | 14,894 | 3,140 | 2,726 | (3,520 | ) | (3,234 | ) | 20,838 | 20,282 | ||||||||||||||||||||||||||||
| Interest income |
3,226 | 2,643 | 117 | 66 | 4,355 | 3,467 | (5,513 | ) | (4,989 | ) | 2,184 | 1,188 | ||||||||||||||||||||||||||||
| Dividend and income tax equivalent income |
1,007 | 790 | - | - | - | - | (1,007 | ) | (790 | ) | - | - | ||||||||||||||||||||||||||||
| Other revenue |
20,160 | 10,710 | 506 | 293 | 144 | 179 | (32 | ) | (19 | ) | 20,778 | 11,164 | ||||||||||||||||||||||||||||
| Total Revenue from Transactions |
89,810 | 74,185 | 16,270 | 15,951 | 7,639 | 6,372 | (11,635 | ) | (10,332 | ) | 102,084 | 86,176 | ||||||||||||||||||||||||||||
| Expenses from Transactions |
||||||||||||||||||||||||||||||||||||||||
| Employee expenses |
30,557 | 28,068 | 2,532 | 2,254 | 453 | 398 | (554 | ) | (468 | ) | 32,988 | 30,251 | ||||||||||||||||||||||||||||
| Superannuation expenses |
4,532 | 3,763 | 290 | 256 | 29 | 26 | - | - | 4,851 | 4,045 | ||||||||||||||||||||||||||||||
| Other operating expenses |
20,014 | 18,229 | 7,608 | 7,484 | 2,934 | 3,229 | (3,088 | ) | (2,867 | ) | 27,468 | 26,075 | ||||||||||||||||||||||||||||
| Depreciation and amortisation |
5,018 | 4,506 | 2,720 | 2,719 | 23 | 25 | - | - | 7,760 | 7,250 | ||||||||||||||||||||||||||||||
| Other interest expenses |
1,688 | 1,508 | 1,675 | 1,610 | 7,300 | 6,336 | (5,949 | ) | (5,391 | ) | 4,712 | 4,064 | ||||||||||||||||||||||||||||
| Grants expenses |
14,072 | 13,827 | 29 | 25 | 119 | 114 | (1,014 | ) | (799 | ) | 13,206 | 13,167 | ||||||||||||||||||||||||||||
| Other property expenses |
- | - | 369 | 550 | 56 | 49 | (424 | ) | (599 | ) | - | - | ||||||||||||||||||||||||||||
| Total Expenses from Transactions |
75,880 | 69,902 | 15,222 | 14,897 | 10,913 | 10,178 | (11,029 | ) | (10,124 | ) | 90,986 | 84,853 | ||||||||||||||||||||||||||||
| Net Operating Balance from Continuing Operations |
13,930 | 4,284 | 1,048 | 1,054 | (3,274 | ) | (3,806 | ) | (606 | ) | (209 | ) | 11,098 | 1,323 | ||||||||||||||||||||||||||
| Other Economic Flows - Included in Operating Result |
198 | (913 | ) | (574 | ) | (126 | ) | 4,024 | 3,384 | 1,405 | 13,882 | 5,052 | 16,227 | |||||||||||||||||||||||||||
| Operating Result from Continuing Operations |
14,128 | 3,371 | 474 | 927 | 750 | (421 | ) | 799 | 13,673 | 16,150 | 17,550 | |||||||||||||||||||||||||||||
| Other Economic Flows - Other Movements in Equity |
40,255 | 36,755 | 3,324 | (1,951 | ) | (108 | ) | 11 | (3,745 | ) | 1,723 | 39,727 | 36,538 | |||||||||||||||||||||||||||
| Comprehensive Result/Total Change in Net Worth |
54,383 | 40,126 | 3,799 | (1,024 | ) | 642 | (411 | ) | (2,946 | ) | 15,397 | 55,877 | 54,088 | |||||||||||||||||||||||||||
| KEY FISCAL AGGREGATES |
||||||||||||||||||||||||||||||||||||||||
| Net Operating Balance |
13,930 | 4,284 | 1,048 | 1,054 | (3,274 | ) | (3,806 | ) | (606 | ) | (209 | ) | 11,098 | 1,323 | ||||||||||||||||||||||||||
| Net Acquisition/(Disposal) of Non-Financial Assets |
||||||||||||||||||||||||||||||||||||||||
| Purchases of non-financial assets |
9,899 | 7,878 | 4,497 | 3,134 | 9 | 6 | (96 | ) | 118 | 14,309 | 11,136 | |||||||||||||||||||||||||||||
| Less Sales of non-financial assets |
181 | 254 | 63 | 63 | - | 3 | - | - | 243 | 319 | ||||||||||||||||||||||||||||||
| Less Depreciation |
5,018 | 4,506 | 2,720 | 2,719 | 23 | 25 | - | - | 7,760 | 7,250 | ||||||||||||||||||||||||||||||
| Plus Change in inventories |
79 | (77 | ) | 129 | 48 | - | - | - | - | 208 | (29 | ) | ||||||||||||||||||||||||||||
| Plus Other movement in non-financial assets |
1,058 | 1,315 | 108 | 60 | 2 | 6 | - | - | 1,169 | 1,382 | ||||||||||||||||||||||||||||||
| Equals Total Net Acquisition/(Disposal) of Non-Financial Assets |
5,838 | 4,356 | 1,952 | 461 | (12 | ) | (16 | ) | (96 | ) | 118 | 7,682 | 4,919 | |||||||||||||||||||||||||||
| Fiscal Balance |
8,092 | (72 | ) | (904 | ) | 593 | (3,262 | ) | (3,790 | ) | (510 | ) | (326 | ) | 3,416 | (3,596 | ) | |||||||||||||||||||||||
* See Note 1(c) for explanation of sectors
| 5-14 | Audited Consolidated Financial Statements 2022–23 – Queensland Government |
Notes to the Financial Statements
| 2. | Disaggregated information continued |
Balance Sheet
| General Government * |
Public Non-financial Corporations * |
Public Financial Corporations * |
Consolidation Adjustments |
Total State
|
||||||||||||||||||||||||||||||||||||
| 2023 | 2022 | 2023 | 2022 | 2023 | 2022 | 2023 | 2022 | 2023 | 2022 | |||||||||||||||||||||||||||||||
| $M | $M | $M | $M | $M | $M | $M | $M | $M | $M | |||||||||||||||||||||||||||||||
| Assets |
||||||||||||||||||||||||||||||||||||||||
| Financial Assets |
||||||||||||||||||||||||||||||||||||||||
| Cash and deposits |
2,357 | 1,710 | 1,031 | 1,162 | 7,801 | 5,401 | (2,182 | ) | (1,792 | ) | 9,007 | 6,481 | ||||||||||||||||||||||||||||
| Receivables and loans |
||||||||||||||||||||||||||||||||||||||||
| Receivables |
4,320 | 4,160 | 2,743 | 2,637 | 485 | 439 | (945 | ) | (901 | ) | 6,603 | 6,335 | ||||||||||||||||||||||||||||
| Advances paid |
1,239 | 1,233 | 1,675 | 1,053 | - | - | (1,699 | ) | (1,070 | ) | 1,215 | 1,216 | ||||||||||||||||||||||||||||
| Loans paid |
306 | 330 | 1,356 | 2,178 | 91,463 | 94,639 | (81,901 | ) | (84,804 | ) | 11,224 | 12,344 | ||||||||||||||||||||||||||||
| Securities other than shares |
49,120 | 43,805 | 4,837 | 13,736 | 84,360 | 78,061 | (46,501 | ) | (40,373 | ) | 91,815 | 95,230 | ||||||||||||||||||||||||||||
| Shares and other equity investments |
||||||||||||||||||||||||||||||||||||||||
| Investments in public sector entities |
24,414 | 19,973 | - | - | - | - | (24,414 | ) | (19,973 | ) | - | - | ||||||||||||||||||||||||||||
| Investments in other entities |
16 | 6 | - | - | - | - | - | - | 16 | 6 | ||||||||||||||||||||||||||||||
| Investments accounted for using the equity method |
159 | 159 | - | 6 | - | - | (1 | ) | - | 158 | 166 | |||||||||||||||||||||||||||||
| Total Financial Assets |
81,930 | 71,376 | 11,642 | 20,771 | 184,108 | 178,542 | (157,642 | ) | (148,912 | ) | 120,039 | 121,777 | ||||||||||||||||||||||||||||
| Non-Financial Assets |
||||||||||||||||||||||||||||||||||||||||
| Inventories |
731 | 650 | 912 | 760 | - | - | - | - | 1,644 | 1,410 | ||||||||||||||||||||||||||||||
| Assets held for sale |
72 | 84 | 3 | - | - | - | - | - | 75 | 84 | ||||||||||||||||||||||||||||||
| Investment properties |
451 | 498 | 361 | 339 | - | - | - | - | 812 | 838 | ||||||||||||||||||||||||||||||
| Property, plant and equipment |
309,203 | 269,433 | 66,162 | 62,812 | 114 | 124 | - | - | 375,479 | 332,370 | ||||||||||||||||||||||||||||||
| Intangibles |
728 | 739 | 1,004 | 978 | 18 | 21 | - | - | 1,750 | 1,738 | ||||||||||||||||||||||||||||||
| Service concession assets - GORTO |
11,660 | 10,608 | - | - | - | - | - | - | 11,660 | 10,608 | ||||||||||||||||||||||||||||||
| Deferred tax asset |
9,026 | 9,270 | 4,154 | 5,431 | 256 | 266 | (13,436 | ) | (14,967 | ) | - | - | ||||||||||||||||||||||||||||
| Other non-financial assets |
682 | 772 | 287 | 247 | 11 | 11 | (66 | ) | (53 | ) | 915 | 977 | ||||||||||||||||||||||||||||
| Total Non-Financial Assets |
332,554 | 292,055 | 72,883 | 70,568 | 399 | 422 | (13,501 | ) | (15,019 | ) | 392,335 | 348,025 | ||||||||||||||||||||||||||||
| Total Assets |
414,484 | 363,430 | 84,525 | 91,339 | 184,507 | 178,964 | (171,143 | ) | (163,931 | ) | 512,373 | 469,802 | ||||||||||||||||||||||||||||
* See Note 1(c) for explanation of sectors
| Audited Consolidated Financial Statements 2022–23 – Queensland Government | 5-15 |
Notes to the Financial Statements
| 2. | Disaggregated information continued |
Balance Sheet continued
| General Government * |
Public Non-financial Corporations * |
Public Financial Corporations * |
Consolidation Adjustments |
Total State
|
||||||||||||||||||||||||||||||||||||
| 2023 | 2022 | 2023 | 2022 | 2023 | 2022 | 2023 | 2022 | 2023 | 2022 | |||||||||||||||||||||||||||||||
| $M | $M | $M | $M | $M | $M | $M | $M | $M | $M | |||||||||||||||||||||||||||||||
| Liabilities |
||||||||||||||||||||||||||||||||||||||||
| Payables |
5,921 | 5,222 | 2,105 | 2,476 | 171 | 100 | (857 | ) | (815 | ) | 7,340 | 6,982 | ||||||||||||||||||||||||||||
| Employee benefit obligations |
||||||||||||||||||||||||||||||||||||||||
| Superannuation liability |
20,913 | 22,168 | (354 | ) | (400 | ) | - | - | - | - | 20,559 | 21,768 | ||||||||||||||||||||||||||||
| Other employee benefits |
10,419 | 9,029 | 1,041 | 933 | 181 | 174 | - | - | 11,641 | 10,137 | ||||||||||||||||||||||||||||||
| Deposits held |
- | - | 14 | 11 | 10,298 | 8,420 | (5,208 | ) | (1,792 | ) | 5,104 | 6,639 | ||||||||||||||||||||||||||||
| Advances received |
1,909 | 1,310 | 25 | 22 | - | - | (1,699 | ) | (1,070 | ) | 235 | 262 | ||||||||||||||||||||||||||||
| Borrowing with QTC |
46,166 | 49,000 | 43,276 | 41,851 | - | - | (89,442 | ) | (90,851 | ) | - | - | ||||||||||||||||||||||||||||
| Leases and other loans |
7,519 | 7,671 | 367 | 357 | 485 | 504 | - | - | 8,372 | 8,532 | ||||||||||||||||||||||||||||||
| Securities and derivatives |
41 | 93 | 5,458 | 17,288 | 161,827 | 159,589 | (43,482 | ) | (40,379 | ) | 123,844 | 136,591 | ||||||||||||||||||||||||||||
| Deferred tax liability |
4,410 | 5,695 | 9,001 | 9,248 | 25 | 22 | (13,436 | ) | (14,965 | ) | - | - | ||||||||||||||||||||||||||||
| Provisions |
4,991 | 5,120 | 1,213 | 1,098 | 8,470 | 7,749 | (81 | ) | (79 | ) | 14,593 | 13,888 | ||||||||||||||||||||||||||||
| Service concession liabilities - GORTO |
7,207 | 7,442 | - | - | - | - | - | - | 7,207 | 7,442 | ||||||||||||||||||||||||||||||
| Other liabilities |
1,015 | 1,089 | 972 | 846 | 45 | 44 | (66 | ) | (54 | ) | 1,966 | 1,925 | ||||||||||||||||||||||||||||
| Total Liabilities |
110,511 | 113,840 | 63,117 | 73,729 | 181,502 | 176,601 | (154,271 | ) | (150,005 | ) | 200,859 | 214,165 | ||||||||||||||||||||||||||||
| Net Assets |
303,973 | 249,590 | 21,408 | 17,610 | 3,006 | 2,363 | (16,872 | ) | (13,926 | ) | 311,514 | 255,637 | ||||||||||||||||||||||||||||
| Net Worth |
||||||||||||||||||||||||||||||||||||||||
| Contributed equity |
- | - | 9,767 | 8,890 | 690 | 690 | (10,457 | ) | (9,580 | ) | - | - | ||||||||||||||||||||||||||||
| Accumulated surplus |
110,042 | 95,171 | (277 | ) | (293 | ) | 1,393 | 683 | 7,440 | 5,945 | 118,597 | 101,505 | ||||||||||||||||||||||||||||
| Reserves |
193,931 | 154,419 | 11,919 | 9,014 | 923 | 991 | (13,855 | ) | (10,292 | ) | 192,917 | 154,132 | ||||||||||||||||||||||||||||
| Total Net Worth |
303,973 | 249,590 | 21,409 | 17,610 | 3,006 | 2,363 | (16,873 | ) | (13,927 | ) | 311,514 | 255,637 | ||||||||||||||||||||||||||||
| KEY FISCAL AGGREGATES |
||||||||||||||||||||||||||||||||||||||||
| Net Financial Worth |
(28,581 | ) | (42,465 | ) | (51,475 | ) | (52,958 | ) | 2,606 | 1,941 | (3,371 | ) | 1,093 | (80,820 | ) | (92,388 | ) | |||||||||||||||||||||||
| Net Financial Liabilities |
52,995 | 62,438 | NA | NA | NA | NA | NA | NA | 80,820 | 92,388 | ||||||||||||||||||||||||||||||
| Net Debt |
2,615 | 10,997 | 40,240 | 41,400 | (11,014 | ) | (9,590 | ) | (7,548 | ) | (6,054 | ) | 24,293 | 36,753 | ||||||||||||||||||||||||||
* See Note 1(c) for explanation of sectors
| 5-16 | Audited Consolidated Financial Statements 2022–23 – Queensland Government |
Notes to the Financial Statements
| 2. | Disaggregated information continued |
Cashflow Statement
| General Government * |
Public Non-financial Corporations * |
Public Financial Corporations * |
Consolidation Adjustments |
Total State
|
||||||||||||||||||||||||||||||||||||
| 2023 | 2022 | 2023 | 2022 | 2023 | 2022 | 2023 | 2022 | 2023 | 2022 | |||||||||||||||||||||||||||||||
| $M | $M | $M | $M | $M | $M | $M | $M | $M | $M | |||||||||||||||||||||||||||||||
| Cash Flows from Operating Activities |
||||||||||||||||||||||||||||||||||||||||
| Cash received |
||||||||||||||||||||||||||||||||||||||||
| Taxes received |
20,410 | 20,764 | - | - | - | - | (546 | ) | (492 | ) | 19,864 | 20,272 | ||||||||||||||||||||||||||||
| Grants and subsidies received |
38,684 | 34,378 | 841 | 687 | - | - | (942 | ) | (788 | ) | 38,583 | 34,276 | ||||||||||||||||||||||||||||
| Sales of goods and services |
6,886 | 6,297 | 17,092 | 16,473 | 3,404 | 2,890 | (3,605 | ) | (3,093 | ) | 23,777 | 22,567 | ||||||||||||||||||||||||||||
| Interest receipts |
3,201 | 2,638 | 106 | 66 | 4,353 | 3,467 | (5,510 | ) | (4,988 | ) | 2,150 | 1,183 | ||||||||||||||||||||||||||||
| Dividends and income tax equivalents |
922 | 1,202 | - | - | - | - | (922 | ) | (1,202 | ) | - | - | ||||||||||||||||||||||||||||
| Other receipts |
22,502 | 12,478 | 402 | 224 | 176 | 176 | (70 | ) | 72 | 23,010 | 12,950 | |||||||||||||||||||||||||||||
| 92,604 | 77,757 | 18,442 | 17,449 | 7,934 | 6,533 | (11,595 | ) | (10,492 | ) | 107,384 | 91,247 | |||||||||||||||||||||||||||||
| Cash paid |
||||||||||||||||||||||||||||||||||||||||
| Payments for employees |
(34,232 | ) | (31,739 | ) | (2,750 | ) | (2,496 | ) | (475 | ) | (402 | ) | 554 | 468 | (36,903 | ) | (34,168 | ) | ||||||||||||||||||||||
| Payments for goods and services |
(23,090 | ) | (20,510 | ) | (9,727 | ) | (8,938 | ) | (2,103 | ) | (1,953 | ) | 3,085 | 2,752 | (31,835 | ) | (28,650 | ) | ||||||||||||||||||||||
| Grants and subsidies paid |
(13,777 | ) | (13,628 | ) | (29 | ) | (25 | ) | (119 | ) | (114 | ) | 940 | 788 | (12,984 | ) | (12,979 | ) | ||||||||||||||||||||||
| Interest paid |
(1,616 | ) | (1,441 | ) | (1,671 | ) | (1,606 | ) | (7,298 | ) | (6,330 | ) | 5,944 | 5,382 | (4,641 | ) | (3,996 | ) | ||||||||||||||||||||||
| Other payments |
(4 | ) | - | (1,149 | ) | (976 | ) | (344 | ) | (285 | ) | 660 | 442 | (837 | ) | (820 | ) | |||||||||||||||||||||||
| (72,719 | ) | (67,318 | ) | (15,325 | ) | (14,042 | ) | (10,340 | ) | (9,085 | ) | 11,184 | 9,831 | (87,200 | ) | (80,613 | ) | |||||||||||||||||||||||
| Net Cash Flows from Operating Activities |
19,885 | 10,440 | 3,117 | 3,407 | (2,406 | ) | (2,551 | ) | (412 | ) | (661 | ) | 20,184 | 10,634 | ||||||||||||||||||||||||||
| Cash Flows from Investing Activities in |
||||||||||||||||||||||||||||||||||||||||
| Non-Financial Assets |
||||||||||||||||||||||||||||||||||||||||
| Purchases of non-financial assets |
(9,899 | ) | (7,878 | ) | (4,497 | ) | (3,134 | ) | (9 | ) | (6 | ) | 96 | (118 | ) | (14,309 | ) | (11,136 | ) | |||||||||||||||||||||
| Sales of non-financial assets |
181 | 254 | 63 | 63 | - | 3 | - | - | 243 | 319 | ||||||||||||||||||||||||||||||
| (9,718 | ) | (7,624 | ) | (4,434 | ) | (3,071 | ) | (9 | ) | (3 | ) | 96 | (118 | ) | (14,065 | ) | (10,817 | ) | ||||||||||||||||||||||
| Financial Assets (Policy Purposes) |
(766 | ) | 127 | (711 | ) | 4 | - | - | 1,532 | (19 | ) | 56 | 112 | |||||||||||||||||||||||||||
| Financial Assets (Liquidity Purposes) |
(8,035 | ) | (3,889 | ) | 463 | 899 | 875 | (13,563 | ) | 6,148 | 3,512 | (550 | ) | (13,041 | ) | |||||||||||||||||||||||||
| Net Cash Flows from Investing Activities |
(18,519 | ) | (11,386 | ) | (4,682 | ) | (2,168 | ) | 866 | (13,567 | ) | 7,777 | 3,375 | (14,559 | ) | (23,746 | ) | |||||||||||||||||||||||
| Cash Flows from Financing Activities |
||||||||||||||||||||||||||||||||||||||||
| Advances received (net) |
598 | (126 | ) | (1 | ) | (1 | ) | - | - | (626 | ) | 88 | (28 | ) | (39 | ) | ||||||||||||||||||||||||
| Proceeds of borrowing (net) |
(1,318 | ) | 1,653 | 2,202 | 248 | (1,337 | ) | (5,394 | ) | 1 | - | (452 | ) | (3,493 | ) | |||||||||||||||||||||||||
| Dividends paid (net) |
- | - | (246 | ) | (735 | ) | (40 | ) | (45 | ) | 286 | 781 | - | - | ||||||||||||||||||||||||||
| Deposits received (net) |
- | - | 3 | (1 | ) | 1,878 | 316 | (3,417 | ) | (60 | ) | (1,536 | ) | 255 | ||||||||||||||||||||||||||
| Other financing (net) |
- | - | (523 | ) | (705 | ) | 3,439 | 14,734 | (4,000 | ) | (3,583 | ) | (1,084 | ) | 10,446 | |||||||||||||||||||||||||
| Net Cash Flows from Financing Activities |
(719 | ) | 1,527 | 1,435 | (1,194 | ) | 3,940 | 9,611 | (7,755 | ) | (2,774 | ) | (3,099 | ) | 7,170 | |||||||||||||||||||||||||
* See Note 1(c) for explanation of sectors
| Audited Consolidated Financial Statements 2022–23 – Queensland Government | 5-17 |
Notes to the Financial Statements
| 2. | Disaggregated information continued |
Cashflow Statement continued
| General Government * |
Public Non-financial Corporations * |
Public Financial Corporations * |
Consolidation Adjustments |
Total State
|
||||||||||||||||||||||||||||||||||||
| 2023 | 2022 | 2023 | 2022 | 2023 | 2022 | 2023 | 2022 | 2023 | 2022 | |||||||||||||||||||||||||||||||
| $M | $M | $M | $M | $M | $M | $M | $M | $M | $M | |||||||||||||||||||||||||||||||
| Net Increase/(Decrease) in Cash and Deposits Held |
647 | 581 | (130 | ) | 44 | 2,400 | (6,507 | ) | (390 | ) | (60 | ) | 2,526 | (5,942 | ) | |||||||||||||||||||||||||
| Cash and deposits at the beginning of the financial year |
1,710 | 1,129 | 1,162 | 1,117 | 5,401 | 11,908 | (1,792 | ) | (1,732 | ) | 6,481 | 12,423 | ||||||||||||||||||||||||||||
| Cash and Cash Equivalents Held at the End of the Financial Year |
2,357 | 1,710 | 1,031 | 1,162 | 7,801 | 5,401 | (2,182 | ) | (1,792 | ) | 9,007 | 6,481 | ||||||||||||||||||||||||||||
| KEY FISCAL AGGREGATES |
||||||||||||||||||||||||||||||||||||||||
| Net Cash from Operating Activities |
19,885 | 10,440 | 3,117 | 3,407 | (2,406 | ) | (2,551 | ) | (412 | ) | (661 | ) | 20,184 | 10,634 | ||||||||||||||||||||||||||
| Net Cash Flow from Investments in Non-Financial Assets |
(9,718 | ) | (7,624 | ) | (4,434 | ) | (3,071 | ) | (9 | ) | (3 | ) | 96 | (118 | ) | (14,065 | ) | (10,817 | ) | |||||||||||||||||||||
| Dividends Paid |
- | - | (246 | ) | (735 | ) | (40 | ) | (45 | ) | 286 | 781 | - | - | ||||||||||||||||||||||||||
| CASH SURPLUS/(DEFICIT) |
10,167 | 2,816 | (1,563 | ) | (400 | ) | (2,455 | ) | (2,600 | ) | (30 | ) | 2 | 6,119 | (182 | ) | ||||||||||||||||||||||||
* See Note 1(c) for explanation of sectors
| 5-18 | Audited Consolidated Financial Statements 2022–23 – Queensland Government |
Notes to the Financial Statements
| 3. | Taxation revenue |
| General Government | Total State | |||||||||||||||||||||
| 2023 | 2022 | 2023 | 2022 | |||||||||||||||||||
| $M | $M | $M | $M | |||||||||||||||||||
| Stamp duties |
||||||||||||||||||||||
| Transfer |
5,240 | 6,336 | 5,240 | 6,336 | ||||||||||||||||||
| Motor vehicles |
791 | 703 | 791 | 703 | ||||||||||||||||||
| Insurance |
1,371 | 1,219 | 1,371 | 1,219 | ||||||||||||||||||
| Other duties |
70 | 40 | 70 | 40 | ||||||||||||||||||
| 7,472 | 8,298 | 7,472 | 8,298 | |||||||||||||||||||
| Payroll tax |
5,669 | 5,001 | 5,500 | 4,858 | ||||||||||||||||||
| Mental health levy |
182 | - | 173 | - | ||||||||||||||||||
| Vehicle registration fees |
2,226 | 2,103 | 2,226 | 2,102 | ||||||||||||||||||
| Gaming taxes and levies |
1,911 | 1,645 | 1,911 | 1,645 | ||||||||||||||||||
| Land tax |
1,732 | 1,633 | 1,710 | 1,607 | ||||||||||||||||||
| Fire levy |
625 | 604 | 625 | 604 | ||||||||||||||||||
| Guarantee fees |
350 | 333 | - | - | ||||||||||||||||||
| Other taxes |
434 | 393 | 434 | 393 | ||||||||||||||||||
| 20,601 | 20,011 | 20,051 | 19,508 | |||||||||||||||||||
Taxation revenue is recognised when one or more of the following events are satisfied:
| – | the underlying transaction or event which gives rise to the right to collect the revenue occurs and can be measured reliably; |
| – | the assessment is raised by the self-assessor (a person who lodges transactions online); and/or |
| – | the assessment is issued as a result of Commissioner-assessed transactions or following compliance activities such as reviews and audits. |
| 4. | Grants revenue |
| General Government | Total State | |||||||||||||||||||||
| 2023 | 2022 | 2023 | 2022 | |||||||||||||||||||
| $M | $M | $M | $M | |||||||||||||||||||
| Commonwealth |
||||||||||||||||||||||
| General purpose payments |
||||||||||||||||||||||
| GST revenue grants |
18,306 | 16,079 | 18,306 | 16,079 | ||||||||||||||||||
| Other general purpose payments |
4 | 4 | 6 | 4 | ||||||||||||||||||
| Specific purpose payments |
10,109 | 10,225 | 10,111 | 10,228 | ||||||||||||||||||
| National partnership payments |
4,678 | 3,123 | 4,678 | 3,123 | ||||||||||||||||||
| Grants for on-passing to non-Queensland Government entities |
4,740 | 4,325 | 4,740 | 4,325 | ||||||||||||||||||
| 37,837 | 33,756 | 37,842 | 33,759 | |||||||||||||||||||
| Other |
||||||||||||||||||||||
| Industry/community contributions |
241 | 148 | 251 | 153 | ||||||||||||||||||
| Other grants |
256 | 231 | 141 | 123 | ||||||||||||||||||
| 497 | 379 | 392 | 275 | |||||||||||||||||||
| 38,335 | 34,135 | 38,233 | 34,034 | |||||||||||||||||||
Commonwealth and other grants are recognised as revenue when the State obtains control over the grant, usually upon receipt. Where the grant is enforceable and contains sufficiently specific performance obligations for the State to transfer goods or services, revenue is recognised as and when the obligations are satisfied.
Specific purpose payments include $5.5 billion (2022: $5.2 billion) of activity based funding for health services received from the Australian Government’s National Health Funding Pool. This funding is assessed as sufficiently specific and enforceable and is classified as revenue from contracts with customers. Substantially all the performance obligations under this funding contract are satisfied in the same financial year that the funding is received, through health services delivered by Queensland Health. No material contract liability relating to this funding was recognised at year end (2022: $11 million). The State does not have other material grants that are classified as revenue from contracts with customers.
| Audited Consolidated Financial Statements 2022–23 – Queensland Government | 5-19 |
Notes to the Financial Statements
| 5. | Sales of goods and services |
| General Government | Total State | |||||||||||||||||||||
| 2023 | 2022 | 2023 | 2022 | |||||||||||||||||||
| $M | $M | $M | $M | |||||||||||||||||||
| User charges |
||||||||||||||||||||||
| Sale of goods and services |
4,467 | 4,064 | 18,176 | 17,863 | ||||||||||||||||||
| Rental income |
598 | 553 | 673 | 628 | ||||||||||||||||||
| 5,065 | 4,617 | 18,849 | 18,491 | |||||||||||||||||||
| Fees |
||||||||||||||||||||||
| Transport and other licences and permits |
986 | 893 | 986 | 893 | ||||||||||||||||||
| Other regulatory fees |
432 | 387 | 1,003 | 898 | ||||||||||||||||||
| 1,418 | 1,280 | 1,989 | 1,791 | |||||||||||||||||||
| 6,483 | 5,896 | 20,838 | 20,282 | |||||||||||||||||||
Revenue from sales of goods and services and licences is recognised when the State satisfies performance obligations for the transfer of goods or services to the customer. When revenue has been received in advance for services or works still to be completed at balance date, this revenue is considered to be unearned and is reported in other liabilities (refer Note 39).
Sales of goods and services includes revenue from contracts with customers totalling $5.7 billion (2022: $5.2 billion) for the GGS and $17.7 billion (2022: $17.5 billion) for the TSS. Below are details about the nature and timing of the satisfaction of performance obligations and related revenue recognition policies for the State’s major types of revenue from contracts with customers.
Electricity supply and distribution
| – | Electricity wholesale revenue is recognised at a point in time when the electricity is dispatched to the National Electricity Market. Retail sales revenue is recognised either at a point in time when the electricity is dispatched to the customer or over time where there are a series of performance obligations in the contract. Progress is measured based on units of electricity delivered. |
| – | Network tariffs revenue is recognised over time as customers are provided with access to the network and simultaneously receive and consume energy delivered to their premises. |
Other sales of goods and services
| – | Fare revenue and transport and traffic fees are recognised as the services are provided to the customer and the performance obligations are met. |
| – | Revenue from bulk water sales to distributor retailers is recognised monthly based on the actual megalitres supplied to the grid customer during the calendar month. |
| – | Port cargo handling charges and harbour dues are recognised at a point in time based on tonnage processed or over time based on the contractual terms, and payment is generally due upon completion of cargo handling services. To the extent that customers carry forward unused take-or-pay, revenue is deferred until such time that the tonnes have been utilised by the customers. |
| – | Revenue from the Pharmaceutical Benefit Scheme subsidy is recognised at a point in time when the drugs are dispensed to patients. |
Rental income from operating leases is recognised on a straight-line basis over the lease term.
Revenue from regulatory fees is recognised when the taxable event giving rise to the receivable occurs.
| 6. | Interest income |
| General Government | Total State | |||||||||||||||||||||||
| 2023 | 2022 | 2023 | 2022 | |||||||||||||||||||||
| $M | $M | $M | $M | |||||||||||||||||||||
| Interest on fixed rate notes |
2,739 | 2,446 | - | - | ||||||||||||||||||||
| Distributions from managed funds |
49 | 116 | 413 | 499 | ||||||||||||||||||||
| Other interest |
438 | 80 | 1,771 | 688 | ||||||||||||||||||||
| 3,226 | 2,643 | 2,184 | 1,188 | |||||||||||||||||||||
| 5-20 | Audited Consolidated Financial Statements 2022–23 – Queensland Government |
Notes to the Financial Statements
| 7. | Dividend and income tax equivalent income |
| General Government | Total State | |||||||||||||||||||||||||||
| 2023 | 2022 | 2023 | 2022 | |||||||||||||||||||||||||
| $M | $M | $M | $M | |||||||||||||||||||||||||
| Dividends |
606 | 209 | - | - | ||||||||||||||||||||||||
| Income tax equivalents |
401 | 581 | - | - | ||||||||||||||||||||||||
| 1,007 | 790 | - | - | |||||||||||||||||||||||||
For the GGS, dividends from PNFC and PFC Sector entities are recorded as revenue from transactions where the dividends are declared out of current profits. Refer Note 19 for dividends and tax equivalents paid out of prior accumulated profits and reserves or from the sale of businesses.
Dividends from the PNFC and PFC Sectors are eliminated in the TSS.
| 8. | Other revenue |
| General Government | Total State | |||||||||||||||||||||
| 2023 | 2022 | 2023 | 2022 | |||||||||||||||||||
| $M | $M | $M | $M | |||||||||||||||||||
| Royalties |
18,214 | 8,917 | 18,195 | 8,902 | ||||||||||||||||||
| Land rents |
181 | 171 | 182 | 172 | ||||||||||||||||||
| Donations, gifts and services received at below fair value |
160 | 166 | 161 | 167 | ||||||||||||||||||
| Contributed assets |
311 | 395 | 370 | 442 | ||||||||||||||||||
| Fines |
815 | 558 | 815 | 558 | ||||||||||||||||||
| Other |
479 | 504 | 1,055 | 923 | ||||||||||||||||||
| 20,160 | 10,710 | 20,778 | 11,164 | |||||||||||||||||||
Royalties are recognised when one or more of the following events are satisfied:
| – | the underlying transaction or event which gives rise to the right to collect the revenue occurs and can be measured reliably; |
| – | the assessment is raised by the self-assessor (a person who lodges transactions online); and/or |
| – | the assessment is issued as a result of Commissioner-assessed transactions or following compliance activities such as reviews and audits. |
Assets received at below fair value, including those received free of charge and that can be measured reliably, are recognised as revenue at their fair value when control over the assets is obtained, normally either on receipt of the assets or on notification that the assets have been secured.
| 9. | Employee expenses |
| General Government | Total State | |||||||||||||||||||||
| 2023 | 2022 | 2023 | 2022 | |||||||||||||||||||
| $M | $M | $M | $M | |||||||||||||||||||
| Salaries and wages |
26,461 | 24,331 | 28,832 | 26,470 | ||||||||||||||||||
| Annual leave |
2,642 | 2,393 | 2,852 | 2,575 | ||||||||||||||||||
| Long service leave |
787 | 736 | 877 | 791 | ||||||||||||||||||
| Workers’ compensation |
368 | 317 | 14 | 17 | ||||||||||||||||||
| Other employee related expenses |
299 | 291 | 414 | 399 | ||||||||||||||||||
| 30,557 | 28,068 | 32,988 | 30,251 | |||||||||||||||||||
| The number of full time equivalent employees in the GGS at 30 June 2023 relating to the GGS entities listed in Note 50 totalled 252,431 (2022: 245,872). Per Budget Paper 2, Table 5.2, the estimated number of full time equivalents for 2023 was 251,354. Using the same scope as Budget Paper 2, the actual number of full time equivalents is 245,992 (2022: 239,889). |
The number of Total State full time equivalent employees at 30 June 2023 relating to the consolidated entities listed in Note 50 totalled 275,710 (2022: 267,721).
| Audited Consolidated Financial Statements 2022–23 – Queensland Government | 5-21 |
Notes to the Financial Statements
| 10. | Superannuation expenses |
| General Government | Total State | |||||||||||||||||||||
| 2023 | 2022 | 2023 | 2022 | |||||||||||||||||||
| $M | $M | $M | $M | |||||||||||||||||||
| Defined Benefit (refer Note 48 for additional disclosures) |
||||||||||||||||||||||
| Current service cost |
721 | 930 | 740 | 959 | ||||||||||||||||||
| Interest cost |
776 | 377 | 759 | 372 | ||||||||||||||||||
| 1,497 | 1,307 | 1,499 | 1,331 | |||||||||||||||||||
| Accumulation contributions |
3,035 | 2,456 | 3,352 | 2,714 | ||||||||||||||||||
| 4,532 | 3,763 | 4,851 | 4,045 | |||||||||||||||||||
| 11. | Other operating expenses |
| General Government | Total State | |||||||||||||||||||||
| 2023 | 2022 | 2023 | 2022 | |||||||||||||||||||
| $M | $M | $M | $M | |||||||||||||||||||
| Supplies and services |
16,226 | 14,863 | 23,216 | 21,779 | ||||||||||||||||||
| Transport service contract |
2,088 | 2,001 | - | - | ||||||||||||||||||
| WorkCover Queensland and other claims |
492 | 403 | 3,255 | 3,506 | ||||||||||||||||||
| Other expenses |
1,208 | 962 | 997 | 790 | ||||||||||||||||||
| 20,014 | 18,229 | 27,468 | 26,075 | |||||||||||||||||||
| Audit fees charged by the Queensland Audit Office to entities included in these financial statements amounted to: | 16 | 15 | 23 | 21 | ||||||||||||||||||
| 12. | Depreciation and amortisation |
| General Government | Total State | |||||||||||||||||||||
| 2023 | 2022 | 2023 | 2022 | |||||||||||||||||||
| $M | $M | $M | $M | |||||||||||||||||||
| Depreciation and amortisation expenses for the financial year were charged in respect of: | ||||||||||||||||||||||
| Buildings |
2,301 | 2,002 | 2,446 | 2,139 | ||||||||||||||||||
| Infrastructure |
1,196 | 1,076 | 3,284 | 3,128 | ||||||||||||||||||
| Major plant and equipment |
60 | 51 | 123 | 129 | ||||||||||||||||||
| Other plant and equipment |
618 | 601 | 902 | 892 | ||||||||||||||||||
| Heritage and cultural assets |
58 | 37 | 58 | 37 | ||||||||||||||||||
| ROU assets |
630 | 580 | 692 | 646 | ||||||||||||||||||
| SCA - non-GORTO |
45 | 41 | 45 | 41 | ||||||||||||||||||
| Software development |
109 | 117 | 241 | 265 | ||||||||||||||||||
| Capitalised depreciation expense |
- | - | (31 | ) | (28 | ) | ||||||||||||||||
| 5,018 | 4,506 | 7,760 | 7,250 | |||||||||||||||||||
A number of assets held by the State have been determined to have indefinite useful lives and are therefore not depreciated. Such assets include land, certain road formation earthworks, the Reference Collection of the State Library of Queensland, the Art Collection and Library Heritage Collection held by the Queensland Art Gallery, the State Collection and Library Heritage Collection of the Queensland Museum, and certain other heritage and cultural assets that are subject to preservation requirements to maintain these assets in perpetuity.
Other non-financial assets are depreciated or amortised on a straight-line basis, from their date of acquisition (or in respect of internally constructed assets, from the time the asset is completed and held ready for use), over their estimated useful lives to the agency.
Where assets have separately identifiable components that are subject to regular replacement, these components are assigned useful lives distinct from the asset to which they relate and are depreciated accordingly. Any expenditure that increases the originally assessed capacity or service potential of an asset is capitalised and the new depreciable value is depreciated over the remaining useful life of the asset.
| 5-22 | Audited Consolidated Financial Statements 2022–23 – Queensland Government |
Notes to the Financial Statements
| 12. | Depreciation and amortisation continued |
Right-of-use (ROU) assets are depreciated over the lease term, except where the State expects to obtain ownership of the asset at the end of the lease, in which case depreciation is over the useful life of the underlying asset.
Leasehold improvements are depreciated over the estimated useful lives of the improvements or the remaining lease term, whichever is shorter. The remaining lease term includes any option period/s where exercise of the option is reasonably certain.
Capital work in progress is not depreciated until it reaches service delivery capacity.
Major spares purchased specifically for particular assets are capitalised and depreciated on the same basis as the asset to which they relate.
Estimated useful lives, residual values and depreciation methods are reviewed at the end of each annual reporting period. Reference should be made to individual agency reports for details of depreciation and amortisation methodologies.
The State has a broad range of property, plant and equipment and estimated useful lives vary widely depending on the agency. The following provides an indication of the range of estimated useful lives of the different non-financial asset classes held by the State:
| Asset class | Useful life range | |||
| Property, plant and equipment |
||||
| Buildings |
up to 80 years | |||
| Infrastructure |
up to 80 years | |||
| Plant and equipment |
up to 50 years | |||
| Heritage and cultural assets that do not have an indefinite life |
up to 100 years | |||
| Intangibles |
||||
|
Computer software |
up to 30 years | |||
| 13. | Other interest expenses |
| General Government | Total State | |||||||||||||||||||||||||||
| 2023 | 2022 | 2023 | 2022 | |||||||||||||||||||||||||
| $M | $M | $M | $M | |||||||||||||||||||||||||
| Interest |
1,538 | 1,351 | 4,586 | 3,925 | ||||||||||||||||||||||||
| Leases and service concession finance charges |
109 | 122 | 116 | 128 | ||||||||||||||||||||||||
| Other |
40 | 35 | 10 | 11 | ||||||||||||||||||||||||
| 1,688 | 1,508 | 4,712 | 4,064 | |||||||||||||||||||||||||
Interest and other finance charges are recognised as expenses in the period in which they are incurred.
| 14. | Grants expenses |
| General Government | Total State | |||||||||||||||||||||||||||
| 2023 | 2022 | 2023 | 2022 | |||||||||||||||||||||||||
| $M | $M | $M | $M | |||||||||||||||||||||||||
| Grants - recurrent |
10,751 | 10,895 | 10,596 | 10,836 | ||||||||||||||||||||||||
| Grants - capital |
2,356 | 1,998 | 2,289 | 1,946 | ||||||||||||||||||||||||
| Grants to first home owners |
73 | 143 | 73 | 143 | ||||||||||||||||||||||||
| Personal benefit payments |
247 | 242 | 247 | 242 | ||||||||||||||||||||||||
| Community service obligations |
644 | 550 | - | - | ||||||||||||||||||||||||
| 14,072 | 13,827 | 13,206 | 13,167 | |||||||||||||||||||||||||
| Audited Consolidated Financial Statements 2022–23 – Queensland Government | 5-23 |
Notes to the Financial Statements
| 15. | Gains/(losses) on sale of assets/settlement of liabilities |
| General Government | Total State | |||||||||||||||||||||||
| 2023 | 2022 | 2023 | 2022 | |||||||||||||||||||||
| $M | $M | $M | $M | |||||||||||||||||||||
| Financial assets/settlement of liabilities |
||||||||||||||||||||||||
| Derivatives |
- | - | (512 | ) | 949 | |||||||||||||||||||
| Other investments/settlement of liabilities |
1 | (11 | ) | 700 | 892 | |||||||||||||||||||
| 1 | (11 | ) | 188 | 1,840 | ||||||||||||||||||||
| Non-financial assets |
10 | 5 | 25 | (19 | ) | |||||||||||||||||||
| 11 | (6 | ) | 213 | 1,822 | ||||||||||||||||||||
| 16. | Revaluation increments/(decrements) and impairment (losses)/reversals |
| General Government | Total State | |||||||||||||||||||||||
| 2023 | 2022 | 2023 | 2022 | |||||||||||||||||||||
| $M | $M | $M | $M | |||||||||||||||||||||
| Revaluation increments/(decrements) |
||||||||||||||||||||||||
| Financial assets |
||||||||||||||||||||||||
| Derivatives |
27 | 127 | 390 | (499 | ) | |||||||||||||||||||
| Fixed rate notes* |
(19 | ) | (1,073 | ) | - | - | ||||||||||||||||||
| Other investments (mainly managed funds) |
112 | (185 | ) | 3,772 | 452 | |||||||||||||||||||
| 119 | (1,132 | ) | 4,161 | (47 | ) | |||||||||||||||||||
| Non-financial assets |
(4 | ) | 131 | 14 | 117 | |||||||||||||||||||
| Impairment (losses)/reversals |
||||||||||||||||||||||||
| Receivables and advances |
(51 | ) | (84 | ) | (68 | ) | (92 | ) | ||||||||||||||||
| Non-financial assets |
- | (2 | ) | (447 | ) | 48 | ||||||||||||||||||
| (51 | ) | (86 | ) | (515 | ) | (44 | ) | |||||||||||||||||
| 64 | (1,087 | ) | 3,660 | 26 | ||||||||||||||||||||
* Adjustment to reflect market value of underlying investments managed by QIC limited.
Impairment of non-financial assets
Annual impairment assessments are undertaken to identify indications that an asset is impaired. If impairment indicators exist, an impairment loss is recognised when an asset’s carrying amount exceeds its recoverable amount. Assets that have previously been impaired are assessed annually to determine if there has been a reversal in impairment.
Specialised assets held for their service capacity and not for generation of cash flows that are measured at fair value are not subject to impairment processes, because their annual revaluations adequately account for any impairment and loss of service capacity.
Estimates and judgements are continually evaluated and are based on historical experience and other factors, including expectations of future events that may have a financial impact on the State and that are believed to be reasonable under the circumstances. The resulting accounting estimates will, by definition, seldom equal the related actual results. The estimates and assumptions that have a significant risk of causing a material adjustment to the carrying amount of assets and liabilities within the next financial year are discussed below.
Impairment - electricity generators
The value-in-use of electricity generators is determined on the estimated future cash flows based on the continuing use of the asset, discounted to a present value.
The cash flow projections are prepared using forecast economic, market and industry trends, market-based assumptions (such as demand, pricing and operational costs), and capital expenditure programs that willing market participants might reasonably adopt. The present value of projected cash flows is determined using a discount rate which is based on the weighted-average cost of capital (WACC). Determination of the WACC is based on separate analysis of debt and equity costs, utilising information (some of which is publicly available), including the risk-free interest rate, an industry risk premium, and the underlying cost of debt.
| 5-24 | Audited Consolidated Financial Statements 2022–23 – Queensland Government |
Notes to the Financial Statements
| 16. | Revaluation increments/(decrements) and impairment (losses)/reversals continued |
Impairment of non-financial assets continued
Impairment - electricity generators continued
Stanwell recognised an impairment loss of $160 million representing the write-down to the recoverable amount for the Tarong Precinct cash generating unit (2022: nil).
CS Energy recognised an impairment loss of $85 million (2022: $133 million impairment reversal) for the Callide B Power Station and Kogan Renewable Hydrogen Demonstration plant work in progress.
Impairment - water assets
Queensland Bulk Water Supply Authority (Seqwater) charges South East Queensland distributor-retailers, local governments and other customers for the supply of bulk water, with bulk water prices passed through to customers. From 2007-08, a price path was implemented to phase in price rises associated with the construction of the South East Queensland water grid. Under the price path, prices progressively transitioned to full cost recovery, with price path debt to be repaid by 2027-28.
Seqwater has performed an impairment assessment on its bulk water asset base reflecting the three most likely bulk water pricing scenarios up to and post 2028, consistent with the previous year’s methodology, and this is incorporated in the annual valuation process (refer Note 31).
Sunwater recognised an impairment loss of $132 million (2021-22: $64 million), largely in relation to 2022-23 capital expenditure on its Dam Improvement Program and various water supply schemes.
Impairment of financial assets
Refer Note 23(e).
| 17. | Asset write-downs |
| General Government | Total State | |||||||||||||||||||||
| 2023 | 2022 | 2023 | 2022 | |||||||||||||||||||
| $M | $M | $M | $M | |||||||||||||||||||
| Bad debts written off not previously impaired |
(187) | (202) | (205) | (213) | ||||||||||||||||||
| Non-financial assets written off |
(85) | (314) | (95) | (322) | ||||||||||||||||||
| (271) | (516) | (300) | (535) | |||||||||||||||||||
| 18. | Actuarial adjustments to liabilities |
| General Government | Total State | |||||||||||||||||||||
| 2023 | 2022 | 2023 | 2022 | |||||||||||||||||||
| $M | $M | $M | $M | |||||||||||||||||||
| Long service leave - gains/(losses) |
(91 | ) | 552 | (91 | ) | 552 | ||||||||||||||||
| Insurances and other - gains/(losses) |
328 | 355 | 477 | 971 | ||||||||||||||||||
| 236 | 906 | 386 | 1,523 | |||||||||||||||||||
| 19. | Dividends and tax equivalents treated as capital returns |
For GGS, dividends and tax equivalents from PNFC and PFC Sector entities paid out of prior accumulated profits and reserves or from the sale of businesses represent a return of Government’s initial equity investment under ABS GFS principles and are disclosed as other economic flows.
There were no tax equivalents treated as capital returns in 2022-23 or 2021-22.
| Audited Consolidated Financial Statements 2022–23 – Queensland Government | 5-25 |
Notes to the Financial Statements
| 20. | Other economic flows - included in operating result - other |
| General Government | Total State | |||||||||||||||||||||
| 2023 | 2022 | 2023 | 2022 | |||||||||||||||||||
| $M | $M | $M | $M | |||||||||||||||||||
| Net market value interest revenue/(expense) |
- | - | 952 | 13,333 | ||||||||||||||||||
| Time value adjustments |
64 | 33 | (9 | ) | 48 | |||||||||||||||||
| Share of net profit/(loss) of associates and joint ventures accounted for using the equity method | (7 | ) | (3 | ) | (14 | ) | (3 | ) | ||||||||||||||
| Onerous contracts expense |
- | - | 57 | (107 | ) | |||||||||||||||||
| SCA - assets - GORTO depreciation |
(146 | ) | (137 | ) | (146 | ) | (137 | ) | ||||||||||||||
| SCA - liabilities - GORTO amortisation |
235 | 235 | 235 | 235 | ||||||||||||||||||
| Other economic flows not elsewhere classified |
24 | 27 | 19 | 23 | ||||||||||||||||||
| 171 | 155 | 1,094 | 13,391 | |||||||||||||||||||
| 21. | Other economic flows - other movements in equity |
| General Government | Total State | |||||||||||||||||||||
| 2023 | 2022 | 2023 | 2022 | |||||||||||||||||||
| $M | $M | $M | $M | |||||||||||||||||||
| Revaluations |
||||||||||||||||||||||
| Revaluations of financial assets - increments/(decrements) |
||||||||||||||||||||||
| Investments in Public Sector entities |
3,570 | (1,495) | - | - | ||||||||||||||||||
| Other financial assets |
608 | (817) | 2,226 | (2,857) | ||||||||||||||||||
| 4,178 | (2,312) | 2,226 | (2,857) | |||||||||||||||||||
| Revaluations of non-financial assets - increments/(decrements) |
||||||||||||||||||||||
| Property, plant and equipment |
34,135 | 33,744 | 35,591 | 33,967 | ||||||||||||||||||
| SCA - GORTO |
1,199 | 750 | 1,199 | 750 | ||||||||||||||||||
| 35,333 | 34,493 | 36,789 | 34,716 | |||||||||||||||||||
| Actuarial gain/(loss) on defined benefit superannuation plans |
744 | 4,589 | 712 | 4,693 | ||||||||||||||||||
| 40,255 | 36,770 | 39,727 | 36,552 | |||||||||||||||||||
Of the above revaluation movements, balances relating to financial assets at fair value through other comprehensive income and cash flow hedges may subsequently be recycled to the Operating Result.
| 22. | Cash and deposits |
| General Government | Total State | |||||||||||||||||||||
| 2023 | 2022 | 2023 | 2022 | |||||||||||||||||||
| $M | $M | $M | $M | |||||||||||||||||||
| Cash and Deposits on call |
849 | 738 | 9,007 | 6,481 | ||||||||||||||||||
| QTC cash funds |
1,507 | 972 | - | - | ||||||||||||||||||
| 2,357 | 1,710 | 9,007 | 6,481 | |||||||||||||||||||
| Reconciliation to Cash Flow Statement |
||||||||||||||||||||||
| Balances per Cash Flow Statement |
2,357 | 1,710 | 9,007 | 6,481 | ||||||||||||||||||
All material cash balances held by agencies are managed and invested by QTC daily to maximise returns in accordance with agreed risk profiles on a whole of Government basis.
Cash and deposits include cash on hand, cash at bank, deposits at call (which are readily convertible to cash on hand and are subject to an insignificant risk of changes in value) and money market deposits, net of outstanding bank overdrafts. Where a net overdraft arises on cash at bank, the overdraft is included in loans - other on the Balance Sheet.
| 5-26 | Audited Consolidated Financial Statements 2022–23 – Queensland Government |
Notes to the Financial Statements
| 23. | Receivables and loans |
| (a) Receivables |
| General Government | Total State | |||||||||||||||||||||
| 2023 | 2022 | 2023 | 2022 | |||||||||||||||||||
| $M | $M | $M | $M | |||||||||||||||||||
| Current |
||||||||||||||||||||||
| Trade debtors |
1,025 | 1,163 | 2,614 | 2,994 | ||||||||||||||||||
| GST input tax credits receivable |
404 | 322 | 456 | 378 | ||||||||||||||||||
| Income tax equivalent, dividends and guarantee fees receivable |
583 | 500 | - | - | ||||||||||||||||||
| Royalties and land rents revenue receivable |
76 | 57 | 76 | 57 | ||||||||||||||||||
| Taxes receivable |
768 | 580 | 762 | 575 | ||||||||||||||||||
| Other receivables |
2,020 | 2,118 | 2,739 | 2,463 | ||||||||||||||||||
| 4,876 | 4,739 | 6,647 | 6,468 | |||||||||||||||||||
| Less: Loss allowance |
686 | 694 | 740 | 755 | ||||||||||||||||||
| 4,190 | 4,045 | 5,906 | 5,712 | |||||||||||||||||||
| Non-current |
||||||||||||||||||||||
| Trade debtors |
33 | 22 | 415 | 366 | ||||||||||||||||||
| Other |
110 | 104 | 298 | 274 | ||||||||||||||||||
| 142 | 127 | 713 | 639 | |||||||||||||||||||
| Less: Loss allowance |
12 | 12 | 16 | 16 | ||||||||||||||||||
| 131 | 115 | 697 | 623 | |||||||||||||||||||
| 4,320 | 4,160 | 6,603 | 6,335 | |||||||||||||||||||
| (b) Advances paid |
| General Government | Total State | |||||||||||||||||||||
| 2023 | 2022 | 2023 | 2022 | |||||||||||||||||||
| $M | $M | $M | $M | |||||||||||||||||||
| Current |
||||||||||||||||||||||
| Advances |
213 | 110 | 192 | 97 | ||||||||||||||||||
| Less: Loss allowance |
19 | 17 | 19 | 17 | ||||||||||||||||||
| 194 | 93 | 174 | 80 | |||||||||||||||||||
| Non-current |
||||||||||||||||||||||
| Advances |
1,139 | 1,236 | 1,138 | 1,234 | ||||||||||||||||||
| Less: Loss allowance |
95 | 96 | 96 | 98 | ||||||||||||||||||
| 1,044 | 1,139 | 1,041 | 1,136 | |||||||||||||||||||
| 1,239 | 1,233 | 1,215 | 1,216 | |||||||||||||||||||
| (c) Loans paid |
| General Government | Total State | |||||||||||||||||||||
| 2023 | 2022 | 2023 | 2022 | |||||||||||||||||||
| $M | $M | $M | $M | |||||||||||||||||||
| Current |
||||||||||||||||||||||
| Finance leases |
15 | 11 | 17 | 13 | ||||||||||||||||||
| Other loans |
21 | 16 | 1,259 | 2,070 | ||||||||||||||||||
| 36 | 27 | 1,276 | 2,083 | |||||||||||||||||||
| Non-current |
||||||||||||||||||||||
| Onlendings |
- | - | 9,560 | 9,833 | ||||||||||||||||||
| Finance leases |
149 | 172 | 251 | 273 | ||||||||||||||||||
| Other loans |
121 | 131 | 138 | 154 | ||||||||||||||||||
| 270 | 303 | 9,948 | 10,261 | |||||||||||||||||||
| 306 | 330 | 11,224 | 12,344 | |||||||||||||||||||
| Audited Consolidated Financial Statements 2022–23 – Queensland Government | 5-27 |
Notes to the Financial Statements
| 23. | Receivables and loans continued |
| (c) Loans paid continued |
Loans include finance leases and loans supporting policy objectives of the Government rather than for liquidity management purposes. Settlement on finance leases is within the terms of the lease, ranging from 2 to 99 years. Title is passed to the purchaser on full repayment.
Receivables and loans are initially measured at fair value plus any directly attributable transaction costs. Subsequently, receivables and loans (except onlendings by QTC) are recorded at amortised cost using the effective interest method less any loss allowances. Onlendings are recognised at fair value through profit or loss.
Any interest income is recognised in the operating result in the period in which it accrues. For further details on the State revenue recognition policies, refer the relevant revenue notes (Notes 3 to 8).
(d) Contractual maturities of lease receivables
Minimum operating lease receivable not recognised in the financial statements:
| General Government | Total State | |||||||||||||||||||||
| 2023 | 2022 | 2023 | 2022 | |||||||||||||||||||
| $M | $M | $M | $M | |||||||||||||||||||
| Not later than 1 year |
49 | 54 | 115 | 116 | ||||||||||||||||||
| Later than 1 year but not later than 5 years |
128 | 152 | 333 | 343 | ||||||||||||||||||
| Later than 5 years |
220 | 242 | 933 | 898 | ||||||||||||||||||
| 397 | 448 | 1,381 | 1,357 | |||||||||||||||||||
(e) Impairment of receivables and advances
The loss allowances for receivables reflect lifetime expected credit losses, while the loss allowances for advances paid reflect either 12-month expected credit losses or lifetime expected credit losses depending on whether there has been a significant increase in credit risk.
Expected credit loss calculations incorporate both historical credit loss data and reasonable and supportable forward-looking information. Forward-looking information includes forecast economic changes expected to impact the State’s debtors, along with relevant industry and statistical data where applicable.
Loss allowances for receivables are assessed by agencies either individually by debtor or on a collective basis using provision matrices. Where a provision matrix is used, loss rates are determined separately for groupings of customers with similar loss patterns.
Areas of significant credit risk concentrations for the GGS and TSS are unpaid penalties and fines within the State Penalties Enforcement Registry (SPER), taxation debtors of the Queensland Revenue Office (QRO), COVID-19 Jobs Support Loans issued by the Queensland Rural and Industry Development Authority (QRIDA), and Queensland Building and Construction Commission (QBCC) claims receivables which are primarily Insurance Fund Group debtors.
SPER penalties and fines receivables and QRO tax receivables all exhibit high credit loss rates due to their nature. Further, tax receivables include amounts owed by companies that have already gone into liquidation. QBCC insurance claims are recoverable from at-fault builders who, in the majority of cases, have ceased trading due to bankruptcy or insolvency.
The COVID-19 Jobs Support Loans scheme was launched in March 2020, with principal repayments having commenced in April 2023. The degree of estimation uncertainty for COVID-19 Jobs Support Loans has been reduced in 2023 due to the increased repayment performance data obtained. The forward looking multiplier has been increased in the measurement of the expected credit loss for these loans to acknowledge the macroeconomic uncertainty of the effects of inflation. $58 million (2022: $54 million) of these loans are considered credit-impaired, and $3 million (2022: $3 million) collateral exists in respect of these credit-impaired loans.
| 5-28 | Audited Consolidated Financial Statements 2022–23 – Queensland Government |
Notes to the Financial Statements
| 23. | Receivables and loans continued |
(e) Impairment of receivables and loans continued
| Total State Sector | Expected | |||||||||||||||
| Gross | Average | credit | Carrying | |||||||||||||
| receivables | loss rate | losses | amount | |||||||||||||
| 2023 | $M | $M | $M | |||||||||||||
| Receivables |
||||||||||||||||
| SPER penalties and fines receivable |
1,146 | 27.0% | 310 | 836 | ||||||||||||
| Queensland Revenue Office taxes receivable |
414 | 24.5% | 102 | 313 | ||||||||||||
| QBCC claims receivable |
96 | 77.2% | 74 | 22 | ||||||||||||
| Other receivables |
5,704 | 4.8% | 271 | 5,432 | ||||||||||||
|
|
|
|
|
|
|
|
|
| ||||||||
| 7,360 | 757 | 6,603 | ||||||||||||||
|
|
|
|
|
|
|
|
|
| ||||||||
| Advances paid |
||||||||||||||||
| QRIDA COVID-19 Jobs Support Loans receivable |
693 | 12.8% | 89 | 604 | ||||||||||||
| Other advances |
637 | 4.1% | 26 | 611 | ||||||||||||
|
|
|
|
|
|
|
|
|
| ||||||||
| 1,330 | 115 | 1,215 | ||||||||||||||
|
|
|
|
|
|
|
|
|
| ||||||||
| 2022 | ||||||||||||||||
| Receivables |
||||||||||||||||
| SPER penalties and fines receivable |
1,117 | 29.4% | 329 | 789 | ||||||||||||
| Queensland Health quarantine fees receivable |
109 | 63.4% | 69 | 40 | ||||||||||||
| Queensland Revenue Office taxes receivable |
311 | 21.2% | 66 | 245 | ||||||||||||
| QBCC claims receivable |
81 | 75.7% | 61 | 20 | ||||||||||||
| Other receivables |
5,489 | 4.5% | 247 | 5,242 | ||||||||||||
|
|
|
|
|
|
|
|
|
| ||||||||
| 7,107 | 772 | 6,335 | ||||||||||||||
|
|
|
|
|
|
|
|
|
| ||||||||
| Advances paid |
||||||||||||||||
| QRIDA COVID-19 Jobs Support Loans receivable |
746 | 12.3% | 91 | 655 | ||||||||||||
| Other advances |
584 | 4.0% | 23 | 561 | ||||||||||||
|
|
|
|
|
|
|
|
|
| ||||||||
| 1,330 | 115 | 1,216 | ||||||||||||||
|
|
|
|
|
|
|
|
|
| ||||||||
The State typically considers a financial asset to be in default when it is over 90 days past due. However, debts referred to SPER are usually over 90 days past due, and SPER will continue enforcement activity on those debts as long as it is cost effective to do so. A financial asset can also be in default before becoming 90 days past due if information indicates that the State is unlikely to receive the outstanding amounts in full.
Where the State has no reasonable expectation of recovering an amount owed by a debtor, the debt is written off by directly reducing the receivable against the loss allowance. SPER debts are written off in accordance with internal policy guidelines when it becomes unlikely that the debts could be recovered cost-effectively. If the amount of debt written off exceeds the loss allowance, the excess is recognised as an impairment loss.
Movement in Loss allowance
| General Government | Total State | |||||||||||||||||||||
| 2023 | 2022 | 2023 | 2022 | |||||||||||||||||||
| $M | $M | $M | $M | |||||||||||||||||||
| Loss allowance as at 1 July |
819 | 754 | 887 | 824 | ||||||||||||||||||
| Amounts written off during the year |
(177 | ) | (146 | ) | (192 | ) | (156 | ) | ||||||||||||||
| Increase/decrease in allowance recognised in operating result |
169 | 211 | 177 | 219 | ||||||||||||||||||
| Loss allowance as at 30 June |
812 | 819 | 872 | 887 | ||||||||||||||||||
| Audited Consolidated Financial Statements 2022–23 – Queensland Government | 5-29 |
Notes to the Financial Statements
| 24. | Securities and shares |
(a) Securities other than shares
| General Government | Total State | |||||||||||||||||||||
| 2023 | 2022 | 2023 | 2022 | |||||||||||||||||||
| $M | $M | $M | $M | |||||||||||||||||||
| Current |
||||||||||||||||||||||
| Term deposits and other investments held at amortised cost |
59 | 78 | 59 | 78 | ||||||||||||||||||
| QTC deposits |
3,027 | - | - | - | ||||||||||||||||||
| Securities/bonds |
254 | 239 | 11,597 | 11,885 | ||||||||||||||||||
| Fixed rate notes |
3,173 | 2,496 | - | - | ||||||||||||||||||
| Investments managed by QIC Limited* |
1,027 | 2,005 | 8,856 | 8,261 | ||||||||||||||||||
| Derivatives |
||||||||||||||||||||||
| Cash flow hedges |
- | - | 431 | 1,380 | ||||||||||||||||||
| Other derivatives |
- | - | 2,755 | 8,708 | ||||||||||||||||||
| Other |
50 | 37 | 10,910 | 8,378 | ||||||||||||||||||
| 7,589 | 4,854 | 34,607 | 38,691 | |||||||||||||||||||
| Non-current |
||||||||||||||||||||||
| Term deposits and other investments held at amortised cost |
101 | 53 | 110 | 64 | ||||||||||||||||||
| Securities/bonds |
- | - | 8,402 | 8,279 | ||||||||||||||||||
| Fixed rate notes |
40,302 | 37,876 | - | - | ||||||||||||||||||
| Investments managed by QIC Limited* |
694 | 644 | 46,290 | 43,676 | ||||||||||||||||||
| Derivatives |
||||||||||||||||||||||
| Cash flow hedges |
- | - | 142 | 398 | ||||||||||||||||||
| Other derivatives |
- | - | 1,488 | 3,445 | ||||||||||||||||||
| Other |
434 | 377 | 776 | 676 | ||||||||||||||||||
| 41,531 | 38,950 | 57,208 | 56,539 | |||||||||||||||||||
| 49,120 | 43,805 | 91,815 | 95,230 | |||||||||||||||||||
* Investments managed by QIC Limited were allocated over the following categories:
| Debt Retirement Fund | Total State | |||||||||||||||||||||
| 2023 | 2022 | 2023 | 2022 | |||||||||||||||||||
| $M | $M | $M | $M | |||||||||||||||||||
| Cash |
1,450 | 1,096 | 12,561 | 8,988 | ||||||||||||||||||
| Fixed interest |
235 | 511 | 1,550 | 4,164 | ||||||||||||||||||
| Global equities |
3,128 | 2,970 | 11,936 | 10,539 | ||||||||||||||||||
| Property and infrastructure |
2,448 | 2,205 | 14,642 | 14,087 | ||||||||||||||||||
| Other |
1,075 | 936 | 14,456 | 14,159 | ||||||||||||||||||
| 8,336 | 7,718 | 55,145 | 51,938 | |||||||||||||||||||
Debt Retirement Fund
The Debt Retirement Fund (DRF) is a sub fund of the Queensland Future Fund (QFF). The DRF was established for the purpose of providing funding for reducing the State’s debt. Funds invested in the DRF are held for future growth and are offset against state debt to support Queensland’s credit rating. In accordance with the Queensland Future Fund Act 2020, payments from the DRF may only be made to reduce the State’s debt or pay fees or expenses relating to the administration of the fund.
Further information on the DRF can be found in Note 38 of Queensland Treasury’s audited financial statements.
(b) Investments in public sector entities
The GGS has equity investments in PNFCs and PFCs that are measured at fair value as the Government’s proportional share of the carrying amount of net assets of the PNFC and PFC Sector entities on a GAAP basis. Investments in public sector entities on this basis differ from valuations under GFS. Refer Note 1(l) for a discussion of differences between GAAP and GFS.
Note 1(c) outlines the functions of the PNFC and PFC Sectors. Refer Note 50 for a comprehensive list of entities consolidated within each sector. Investments in the PNFC and PFC Sectors are eliminated on consolidation of the TSS.
| 5-30 | Audited Consolidated Financial Statements 2022–23 – Queensland Government |
Notes to the Financial Statements
| 24. | Securities and shares continued |
Accounting Policy
Financial assets disclosed in this note are classified as either financial assets held at amortised cost, financial assets at fair value through other comprehensive income or financial assets at fair value through profit or loss. The carrying amount of financial assets in each of the categories is disclosed in Note 47.
Financial assets at amortised cost
Term deposits are measured at amortised cost, as these are held for collecting contractual cash flows.
Financial assets at fair value through other comprehensive income (FVOCI)
Financial assets at FVOCI are valued at fair value at balance date. Unrealised gains and losses are brought to account in equity and included as ‘Other economic flows - other movements in equity’ on the Operating Statement.
For the GGS, securities/bonds are measured at FVOCI as they are held for the purpose of both selling and collecting contractual cash flows. These include corporate bonds, corporate notes and government bonds.
For GGS, controlling investments in other public sector entities (PNFCs and PFCs) are also measured at FVOCI. The State has not disposed of any FVOCI equity investments during this reporting period.
Financial assets at fair value through profit or loss (FVTPL)
Financial assets at FVTPL are valued at fair value at balance date. Unrealised gains and losses are brought to account as ‘Other economic flows - included in operating result’ on the Operating Statement.
For GGS, fixed rate notes held with QTC are measured at FVTPL because the cash flows do not solely represent payments of principal and interest. Fixed rate notes are eliminated on consolidation of the TSS.
Other financial assets at fair value through profit or loss held by the State include deposits with QTC, discount securities, Commonwealth and State securities, floating rate notes, medium term notes, fixed interest deposits, investments managed by QIC Limited, other investments in managed funds, shares, derivatives, and interests under Rental Purchase Plan agreements. The accounting policy for derivatives is further discussed in Note 37.
| 25. | Other investments |
Other investments refer to claims on other entities (or arrangements) entitling the State to:
| – | a share of the income of the entity and a right to a share of the residual assets of the entity should it be wound up (associates and joint ventures) or |
| – | a share of revenue, expenses, assets and liabilities of the arrangement (joint operations). |
These investments are held at fair value.
(a) Investments accounted for using the equity method
Associates are those entities over which the State has significant influence but not control. Joint ventures are joint arrangements whereby the State has joint control and rights to the net assets of the arrangements. Associates and joint ventures are accounted for using the equity method of accounting in accordance with AASB 128 Investments in Associates and Joint Ventures. The State’s share of its associates’ or joint ventures’ post-acquisition profits or losses (less dividends) is recognised in the Operating Statement as an other economic flow and its share of post-acquisition movements in reserves is recognised in the reserves. The cumulative post-acquisition movements are recognised against the carrying amount of the investment. Dividends from associates and joint ventures are recognised as revenue from transactions in the Operating Statement.
The State has a number of investments in unlisted associated and joint venture entities that are accounted for using the equity method, with the most material of these being:
(i) a 50% share in the Dumaresq-Barwon Border Rivers Commission, a joint authority constituted by an agreement between the Queensland and New South Wales Governments, and
(ii) a 25% interest in the Translational Research Institute (TRI) Trust, a discretionary unit trust founded by four members, of which Queensland Health is one. The Trust’s objectives are to operate and manage the TRI Facility to promote medical study, research and education.
| Audited Consolidated Financial Statements 2022–23 – Queensland Government | 5-31 |
Notes to the Financial Statements
| 25. | Other investments continued |
(b) Investments in joint operations
Joint operations are joint arrangements whereby the State has control and rights to the assets and obligations for the liabilities relating to the arrangements. Such arrangements are accounted for in accordance with AASB 11 Joint Arrangements. The State recognises its share of jointly held or incurred assets, liabilities, revenue and expenses in the joint operations.
| General Government Sector
Joint arrangements are as follows:
Queensland Health
Queensland Health is a partner to the Australian e-Health Research Centre (AEHRC) joint operation under the current agreement which runs to 30 June 2027.
Sunshine Coast Hospital and Health Service
The Sunshine Coast Hospital and Health Service has a 28.9% (2022: 28.9%) interest in the Sunshine Coast Health Institute (SCHI). TAFE Queensland, Griffith University and the University of the Sunshine Coast each have a 23.7% interest in the SCHI. SCHI’s primary aims are to advance the education of trainee medical officers, nurses, midwives and other health care professional, while providing outstanding patient care and extending research knowledge.
Metro North Hospital and Health Service
Metro North HHS has joint control over two arrangements, namely Herston Imaging Research Facility (HIRF) and the Oral Health Centre (OHC).
|
Total State Sector
Joint arrangements for the TSS include the GGS joint arrangements above, as well as the following:
| – | CS Energy Limited has a 50% interest in Callide Power Management Pty Ltd and Callide Power Trading Pty Ltd. |
| – | CS Energy Limited also has a 50% interest in Callide C Power Station through the unincorporated Callide Power Project Joint Venture and is entitled to 50% of the earnings generated by Alinta Energy Retail Sales Pty Ltd in the residential retail energy market in South East Queensland. |
| – | CleanCo Queensland Limited has a 50% interest in Kogan North Joint Venture operation with the principal activities being exploration and production of gas. |
| – | Stanwell Corporation Limited acquired a 50% interest in the Wambo Wind Farm on 15 December 2022, with Cubico Sustainable Investments holding the remaining interest. The joint operation is a staged, large scale renewable energy development located near Jandowae in the Western Downs region of Queensland. |
| 26. | Public private partnerships |
The State has entered into a number of Public Private Partnerships (PPPs) over time. The accounting treatment of these PPPs varies according to the terms of the arrangements. They may be:
| – | directly owned by the State, but partly privately financed; |
| – | Right of use (ROU) assets held through leases and similar arrangements; or |
| – | Service Concession Arrangement (SCA) assets and liabilities, either GORTO (Grant of Right to Operate) or non-GORTO. |
The purpose of this note is to describe the various arrangements the State has entered into and how and when they are accounted for as well as aggregating the undiscounted net future cash flows the State is committed to under these arrangements.
The following PPPs apply to both the GGS and TSS statements.
Education
(a) South East Queensland schools - Aspire
In April 2009, the State Government entered into a contractual arrangement with Aspire Schools (Qld) Pty Limited (Aspire) to design, construct, maintain and partially finance seven State schools for a period of 30 years on the State’s land.
| 5-32 | Audited Consolidated Financial Statements 2022–23 – Queensland Government |
Notes to the Financial Statements
| 26. | Public private partnerships continued |
Education continued
(a) South East Queensland schools - Aspire continued
Construction work was finalised in January 2014. This is a social infrastructure arrangement whereby the State pays for the third party use of the asset through regular service payments to Aspire over the life of the contract.
The State pays Aspire abatable, undissected service payments for the operation, maintenance and provision of the schools. At the expiry of the agreement in 2039, the buildings will revert to the State for nil consideration. The land on which the schools are constructed is owned and recognised as an asset of the State.
The fair value of the buildings is recognised as an asset in Note 31 with the corresponding recognition for future payments as a loan liability in Note 37(d).
(b) Queensland schools - Plenary
In December 2013, the State Government entered into a contractual arrangement with Plenary Schools Pty Ltd (Plenary) for the construction and management of 10 schools in South East Queensland on State land. This is a social infrastructure arrangement whereby the State pays for the third party use of the asset through regular service payments to Plenary over the life of the contract. The project period is for 30 years and is expected to end in December 2043.
Construction work was finalised in January 2019. The State paid a series of capital contributions during the construction phase of the project totalling $190 million. These contribution payments result in lower service payments over the period of the concession.
The fair values of the buildings is recognised as an asset in Note 31 with the corresponding recognition for future payments as a loan liability in Note 37(d).
Youth Justice, Employment, Small Business and Training
(a) Southbank Education and Training Precinct
In April 2005, the State Government entered into a contractual arrangement with Axiom Education Queensland Pty Ltd (Axiom) to design, construct, maintain and finance the Southbank Education and Training Precinct for a period of 34 years on State land. This is a social infrastructure arrangement whereby the State pays for the third party use of the asset through regular service payments to Axiom over the life of the contract. The arrangement involved the refurbishment or demolition of existing buildings and the development of new buildings.
Construction work was completed on 31 October 2008. The State pays abatable, undissected service payments to Axiom for the operation, maintenance and provision of the precinct. At the expiry of the agreement in 2039, the buildings will revert to the State for nil consideration.
The fair value of the buildings is recognised as an asset in Note 31 with the corresponding recognition for future payments as a loan liability in Note 37(d).
Queensland Health and Hospital and Health Services (HHSs)
(a) Sunshine Coast University Hospital (SCUH)
In 2012, the State entered into a PPP with Exemplar Health (EH) to finance, design, build and operate the SCUH. The 25-year operating phase of the PPP commenced on 16 November 2016. The fair value of the liability payable to EH for the construction of SCUH was $538 million. Other than certain assets contained within the Sunshine Coast Health Institute, Sunshine Coast HHS (SCHHS) has full control of all SCUH buildings, land, specialist medical assets and all other equipment. EH ensures all infrastructure is fit for use throughout the operating term, but SCHHS operates the facility and manages all healthcare provided. At the end of the 25-year term, the assets will remain in the control of SCHHS. These assets are included in the building asset class in Note 31.
As part of the SCUH PPP, EH constructed two carparks on the SCUH site. These carparks are legally owned by the SCHHS and recorded in the building asset class in Note 31. The State has granted EH a licence to undertake carparking operations for the duration of the 25-year operating term which entitles EH to generate revenue from the operations themselves. The State has unearned revenue from the carpark licence included in Note 39.
| Audited Consolidated Financial Statements 2022–23 – Queensland Government | 5-33 |
Notes to the Financial Statements
| 26. | Public private partnerships continued |
Queensland Health and Hospital and Health Services (HHSs) continued
(b) Surgical, Treatment and Rehabilitation Service (STARS)
In 2017, the State entered into a PPP with Australian Unity. Australian Unity’s scope of work includes the construction of a new Surgical, Treatment and Rehabilitation Service (STARS) at Herston. The land on which STARS was developed is owned by the State and leased to Australian Unity for 99 years. The State was contractually obligated to occupy the STARS building upon completion and entered into a lease on 4 November 2020 for an initial 20-year period, with an option to extend this lease by two periods of 10 years. The assets are included as right of use (ROU) assets in Note 31 and the lease liability is included in Note 37(d).
(c) Other public infrastructure facilities
The State Government has entered into a number of other contractual arrangements with private sector entities for the construction and operation of public infrastructure facilities on State land for a period of time. After an agreed period of time, ownership of these facilities will pass to the State.
| Entity |
Facility |
Counterparty |
Term of Agreement | Commencement Date | ||||||
| Gold Coast HHS | Western car park | SurePark Pty Ltd | 31 years | July 2010 | ||||||
| Metro North HHS | Butterfield Street car park | International Parking Group Pty Ltd | 30 years | January 1998 | ||||||
| Metro North HHS | The Prince Charles Hospital car park | International Parking Group Pty Ltd | 22 years | November 2000 | ||||||
| Metro South HHS | The Princess Alexandra Hospital multi storey car park | International Parking Group Pty Ltd | 25 years | February 2008 | ||||||
| Sunshine Coast HHS | Noosa Hospital | Noosa Privatised Hospital Pty Limited | 10 years | July 2020 | ||||||
| Townsville HHS | Medilink | Trilogy Funds Management Ltd | 30 years | January 2012 | ||||||
| Townsville HHS | Goodstart Early Learning | Trilogy Funds Management Ltd | 32 years | February 2012 |
The Gold Coast University Hospital western car park is a SCA under AASB1059 and is included in Note 33 as a GORTO asset.
The Metro North car parks are not considered SCAs under AASB 1059 and are included in land and buildings in Note 31, with unearned revenue included in Note 39.
The Princess Alexandra Hospital car park is a SCA under AASB 1059 and is included in Note 33 as a GORTO asset.
The SCHHS funds Noosa Hospital for the provision of Combined Services which includes Public Patient Services and Ambulatory Services. This is not considered a SCA under AASB 1059.
The Medilink and GoodStart Early Learning centres are not controlled by the Townsville HHS and are not included on the Balance Sheet.
(d) Co-location agreements
The State has also entered into a number of contractual arrangements (termed co-location agreements) with private sector entities for the construction and operation of private health facilities for a period of time on State land. After an agreed period, ownership of these facilities will pass to the State. The State does not control the facilities associated with these arrangements and accordingly, does not recognise these facilities and any rights or obligations that may attach to these arrangements, other than those recognised under generally accepted accounting principles.
| 5-34 | Audited Consolidated Financial Statements 2022–23 – Queensland Government |
Notes to the Financial Statements
| 26. | Public private partnerships continued |
Queensland Health and Hospital and Health Services (HHSs) continued
(d) Co-location agreements continued
| Entity |
Facility |
Counterparty |
Term of Agreement | Commencement Date | ||||||
| Gold Coast HHS | Gold Coast Private Hospital | Healthscope Ltd | 50 years | March 2016 | ||||||
| Metro North HHS | Caboolture Private Hospital | Affinity Health Ltd | 25 years | May 1998 | ||||||
| Metro North HHS | St Vincent’s Private Hospital Northside (formerly known as Holy Spirit Northside Private Hospital) | St Vincent’s Private Hospital Northside Ltd | 66 years | September 1999 | ||||||
| Metro South HHS | Mater Private Hospital Redland | Sisters of Mercy in Queensland | 25 years + 30 years |
August 1999 | ||||||
| Metro South HHS | Translational Research Institute Building | Translational Research Institute Pty Ltd | 30 years + 20 years |
May 2013 | ||||||
| Metro South HHS | University of Queensland Training Facility – Redland Hospital | University of Queensland | 20 years | August 2015 | ||||||
| Metro South HHS | University of Queensland Training Facility – Queen Elizabeth II Jubilee Hospital | University of Queensland | 20 years | September 2015 |
Transport and Main Roads
(a) Gold Coast Light Rail - G:link (GCLR)
In May 2011, the State entered into a contractual arrangement with GoldLinQ Consortium (GoldLinQ) to finance, design, build, operate and maintain the Gold Coast light rail system linking key activity centres from Griffith University (Gold Coast Campus) and the Gold Coast University Hospital to Broadbeach via Southport. The operation of the system commenced in July 2014.
GoldLinQ partially financed construction of the system, with the State providing a capital contribution. During operations, GoldLinQ paid monthly performance-based payments for operations, maintenance and repayment of the debt finance used to construct the system. The State receives fare-box and advertising revenue generated by the system.
In April 2016, the State entered into a contractual arrangement with GoldLinQ for stage two of the Gold Coast Light Rail system. Stage two connects the existing light rail system at Gold Coast University Hospital Light Rail station to heavy rail at the Helensvale station. Stage two of the system commenced operations on 18 December 2017.
In March 2022 the State entered into a contractual arrangement with GoldlinQ for Stage three of the Gold Coast Light Rail system. Early works have been completed and construction on Stage three of the system has commenced. Stage three will extend the light rail from Broadbeach to Burleigh Heads. The 6.7km extension south of the existing tram network will link Helensvale to Burleigh Heads and provide eight additional stations and 5 new light rail vehicles.
Planning has begun for the Gold Coast Light Rail Stage four, a 13km extension south of the light rail Stage three, linking Burleigh Heads to Coolangatta via the Gold Coast Airport.
At the end of the 15-year operations period, ownership of the system will transfer to the State.
The GCLR assets are disclosed as non-GORTO service concessions in Note 31 and liabilities in Note 37(d).
(b) Toowoomba Second Range Crossing (TSRC)
In August 2015, the State Government entered into a contractual arrangement with Nexus Infrastructure Consortium to finance, design, build, operate and maintain a range crossing connecting the Warrego Highway at Helidon Spa in the east with the Gore Highway at Athol in the west, via Charlton.
The bypass opened to traffic in September 2019 and toll collection commenced in December 2019, with Transurban Queensland contracted to provide the tolling collection service on behalf of the State.
| Audited Consolidated Financial Statements 2022–23 – Queensland Government | 5-35 |
Notes to the Financial Statements
| 26. | Public private partnerships continued |
Transport and Main Roads continued
(b) Toowoomba Second Range Crossing (TSRC) continued
The State will make ongoing quarterly service payments over the 25-year operation and maintenance period, which includes repayment of the debt finance used to construct the bypass. Maintenance payments will be expensed during the relevant year. At the expiry of the concession period, the State will retain ownership of the range crossing.
The TSRC assets are disclosed as non-GORTO service concessions in Note 31 and liabilities in Note 37(d).
(c) New Generation Rollingstock
In January 2014, the State entered into a 32-year contractual arrangement with NGR Project Company Pty Ltd (Bombardier NGR Consortium) for the design, construction and maintenance of 75 new six car train sets and a new purpose-built maintenance centre. The arrangement involves the State paying the consortium a series of availability payments.
In June 2016, the maintenance centre was accepted by the State. By December 2019, all train sets had been accepted and recognised on the Balance Sheet.
In March 2019, an amendment deed was signed to modify the trains in accordance with the Disability Standards for Accessible Public Transport 2002. Modifications to all 75 trains will be completed by 2024. Rectification works have been completed for 26 trains in 2022-23, with a total of 44 units upgraded to date under this agreement.
At the expiry of the arrangement, the State will retain ownership of the trains and the maintenance centre.
The rollingstock assets are disclosed in Note 31 as major plant and equipment and liabilities as other loans in Note 37(d).
(d) Airportlink M7
In June 2008, the State entered into a 45-year SCA with BrisConnections to design, construct and maintain the Airport Link toll road (Airportlink). In April 2016, Transurban Queensland assumed responsibility for Airportlink and now operates Airportlink under the SCA.
In return for collecting the tolls, Transurban Queensland must maintain, operate and manage the toll road for the concession period and also assume the demand and patronage risk. At the end of the service concession period, Airportlink assets will be transferred to the State for nil consideration.
Airportlink is disclosed as a GORTO in Note 33.
(e) Gateway and Logan Motorways and Port Drive
A Road Franchise Agreement (RFA) was established between the State and Queensland Motorways Limited (QML) in April 2011 for the operation, maintenance and management of the Gateway and Logan Motorways for a period of 40 years. In 2014, Transurban Queensland acquired QML and now operates the Gateway Motorway and Logan Motorway toll roads under the RFA with the State.
In return for collecting the tolls, Transurban Queensland must maintain, operate and manage the toll roads for the period of the franchise and also assumes the demand and patronage risk for the franchise period. At the end of the RFA concession period, the toll roads infrastructure assets will be transferred to the State.
An RFA was also established with Port of Brisbane to maintain and manage the Port Drive motorway. The operator obtains indirect benefits from ongoing maintenance through this increased capacity and access to the port precinct.
All the Gateway and Logan Motorways and Port Drive assets and liabilities are disclosed as GORTOs in Note 33.
(f) Brisbane Airport Rail Link
In 1998, the State Government entered into a 35-year concession agreement with Airtrain Citylink Limited (Airtrain) to design, construct, maintain and operate the Brisbane Airport Rail Link (BARL), a public passenger rail system connecting the Queensland Rail City network to the Brisbane Domestic and International Airports. The BARL is currently in the maintenance and operating phase of the agreement after commencement of operations on 7 May 2001.
| 5-36 | Audited Consolidated Financial Statements 2022–23 – Queensland Government |
Notes to the Financial Statements
| 26. | Public private partnerships continued |
Transport and Main Roads continued
(f) Brisbane Airport Rail Link continued
In return for collecting passenger fares, Airtrain must maintain, operate and manage the BARL for the period of the concession and also assume the demand and patronage risk for the concession period. At the end of this period, the agreement provides for Airtrain to transfer the BARL assets to the State for nil consideration.
The State Government leases airport land from the Brisbane Airport Corporation and sub-leases the land to Airtrain. The State recognises the assets and liabilities associated with the arrangement as GORTOs in Note 33.
Energy and Public Works
(a) Development at 1 William Street Brisbane
1 William Street is a commercial office tower development. Cbus Property was the successful tenderer with a bid of $653 million and on 21 December 2012, the State entered into a project deed, development lease, 99-year ground lease and a sub-lease from the developer for 15 years. The building was occupied in October 2016.
The asset is disclosed as a ROU asset in Note 31 and the lease liability is included in Note 37(d).
(b) Queen’s Wharf Precinct
On 16 November 2015, the State entered into contractual arrangements with the Destination Brisbane Consortium (the Consortium) to redevelop the Queen’s Wharf Precinct in the centre of Brisbane into an Integrated Resort Development (IRD) Project. A leasehold development lease and a freehold development lease for the project commenced on 22 February 2018, transferring responsibility of the whole of the site from the State to the Consortium. As at 30 June 2023, the land and buildings in the precinct have been valued on the basis that the contractual arrangements are considered to be non-cancellable and the highest and best use of the land and buildings in the precinct is that of an IRD.
Cross River Rail Delivery Authority
On 4 April 2019, the State announced the companies selected to build one of the key Cross River Rail Project works packages. The Tunnel, Stations and Development (TSD) PPP will be delivered by the Pulse consortium.
The TSD PPP will deliver the underground section of the project, including the tunnel from Dutton Park to Normanby and the construction of four new underground stations at Boggo Road, Woolloongabba, Albert Street and Roma Street.
The TSD package reached financial close on 1 July 2019 and is accounted for as a construction contract with a service outsourcing arrangement. The State is contracted to make payments between 2019-20 and 2049-50 covering the capital cost and financing of the TSD component, as well as maintenance.
The asset is included in Note 31 as capital work in progress and the liability as other loans in Note 37(d).
The estimated net undiscounted cash flows resulting from PPPs are reflected below:
| General Government | Total State | |||||||||||||||||||||
| 2023 | 2022 | 2023 | 2022 | |||||||||||||||||||
| $M | $M | $M | $M | |||||||||||||||||||
| Inflows |
||||||||||||||||||||||
| Not later than 1 year |
67 | 71 | 67 | 71 | ||||||||||||||||||
| Later than 1 year but not later than 5 years |
289 | 321 | 289 | 321 | ||||||||||||||||||
| Later than 5 years but not later than 10 years |
274 | 383 | 274 | 383 | ||||||||||||||||||
| Later than 10 years |
531 | 615 | 531 | 615 | ||||||||||||||||||
| 1,161 | 1,390 | 1,161 | 1,390 | |||||||||||||||||||
| Outflows |
||||||||||||||||||||||
| Not later than 1 year |
(998 | ) | (1,461 | ) | (998 | ) | (1,461 | ) | ||||||||||||||
| Later than 1 year but not later than 5 years |
(4,608 | ) | (3,631 | ) | (4,608 | ) | (3,631 | ) | ||||||||||||||
| Later than 5 years but not later than 10 years |
(3,283 | ) | (3,487 | ) | (3,283 | ) | (3,487 | ) | ||||||||||||||
| Later than 10 years |
(6,503 | ) | (7,038 | ) | (6,503 | ) | (7,038 | ) | ||||||||||||||
| (15,392 | ) | (15,617 | ) | (15,392 | ) | (15,617 | ) | |||||||||||||||
| Net Cash Outflows |
(14,231 | ) | (14,227 | ) | (14,231 | ) | (14,227 | ) | ||||||||||||||
| Audited Consolidated Financial Statements 2022–23 – Queensland Government | 5-37 |
Notes to the Financial Statements
| 27. | Inventories |
| General Government | Total State | |||||||||||||||||||||
| 2023 | 2022 | 2023 | 2022 | |||||||||||||||||||
| $M | $M | $M | $M | |||||||||||||||||||
| Raw materials, work in progress and finished goods |
213 | 235 | 900 | 806 | ||||||||||||||||||
| Land held for resale |
359 | 265 | 359 | 265 | ||||||||||||||||||
| Inventories held for distribution |
147 | 143 | 147 | 143 | ||||||||||||||||||
| Environmental certificates held for sale/surrender |
- | - | 106 | 82 | ||||||||||||||||||
| Other |
12 | 8 | 132 | 114 | ||||||||||||||||||
| 731 | 650 | 1,644 | 1,410 | |||||||||||||||||||
Inventories (other than those held for distribution) are carried at the lower of cost and net realisable value under AASB 102 Inventories. Cost is determined on the weighted average cost basis and includes expenditure incurred in acquiring the inventories and bringing them to their present location and condition. Where inventories are acquired for nil or nominal consideration, the cost is the current replacement cost as at the date of acquisition.
Land held for resale is stated at the lower of cost and net realisable value. Such cost is assigned by specific identification and includes the cost of acquisition and development.
Inventories held for distribution are those inventories which the State distributes for nil or nominal consideration. These are measured at cost, adjusted for any loss of service potential.
Environmental certificates are recognised in the financial statements at fair market value.
| 28. | Assets held for sale |
Non-current assets classified as held for sale, mainly land and buildings, are determined to be available for immediate sale in their present condition and, where their sale is highly probable, within the next twelve months.
Assets held for sale are measured at the lower of carrying amount and fair value less costs to sell and are not depreciated or amortised.
| 29. | Investment properties |
Properties held to earn rental income or for capital gains purposes are classified as investment properties and held at fair value. Changes in fair value are recognised in the Operating Statement as other economic flows and no depreciation expense or asset impairment is recognised. Movements in investment properties in the current year largely relate to reclassifications to land inventory.
| 30. | Restricted assets |
A number of assets included in the consolidated financial statements are classified as restricted assets because their use is wholly or partially restricted by externally imposed requirements. These assets include:
| General Government | Total State | |||||||||||||||||||||
| 2023 | 2022 | 2023 | 2022 | |||||||||||||||||||
| $M | $M | $M | $M | |||||||||||||||||||
| Rental bond receipts restricted by legislation |
1,144 | 903 | 1,144 | 903 | ||||||||||||||||||
| Funding held for specific assistance programs approved under regulation |
224 | 209 | 224 | 209 | ||||||||||||||||||
| Cash and property, plant and equipment to be used for other specific purposes | 269 | 259 | 273 | 266 | ||||||||||||||||||
| 1,637 | 1,372 | 1,641 | 1,379 | |||||||||||||||||||
| 5-38 | Audited Consolidated Financial Statements 2022–23 – Queensland Government |
Notes to the Financial Statements
| 31. | Property, plant and equipment |
| General Government Sector |
| |||||||||||||||||||||||||||||||
| Gross | Accumulated depreciation/impairment |
Written down value | ||||||||||||||||||||||||||||||
| 2023 | 2022 | 2023 | 2022 | 2023 | 2022 | |||||||||||||||||||||||||||
| $M | $M | $M | $M | $M | $M | |||||||||||||||||||||||||||
| Land |
135,958 | 122,975 | (8 | ) | (8 | ) | 135,950 | 122,967 | ||||||||||||||||||||||||
| Buildings |
87,039 | 74,413 | (34,663 | ) | (28,883 | ) | 52,376 | 45,530 | ||||||||||||||||||||||||
| Infrastructure |
119,642 | 101,310 | (29,081 | ) | (24,511 | ) | 90,560 | 76,800 | ||||||||||||||||||||||||
| Major plant and equipment |
1,565 | 1,384 | (227 | ) | (162 | ) | 1,338 | 1,223 | ||||||||||||||||||||||||
| Other plant and equipment |
7,886 | 7,438 | (4,856 | ) | (4,633 | ) | 3,031 | 2,805 | ||||||||||||||||||||||||
| Heritage and cultural assets |
3,227 | 2,579 | (963 | ) | (639 | ) | 2,265 | 1,939 | ||||||||||||||||||||||||
| ROU assets |
5,403 | 5,101 | (2,212 | ) | (1,679 | ) | 3,191 | 3,421 | ||||||||||||||||||||||||
| SCA - non-GORTO |
2,761 | 2,584 | (235 | ) | (190 | ) | 2,526 | 2,394 | ||||||||||||||||||||||||
| Capital work in progress |
17,967 | 12,353 | - | - | 17,967 | 12,353 | ||||||||||||||||||||||||||
|
|
|
|
|
|
|
|
|
|
|
|
|
|
|
|
|
|
| |||||||||||||||
| 381,448 | 330,137 | (72,246 | ) | (60,705 | ) | 309,203 | 269,433 | |||||||||||||||||||||||||
|
|
|
|
|
|
|
|
|
|
|
|
|
|
|
|
|
|
| |||||||||||||||
| Reconciliations of the carrying amount for each class of property, plant and equipment are set out below: |
| |||||||||||||||||||||||||||||||
| Land | Buildings | Infrastructure | Major plant and equipment | |||||||||||||||||||||||||||||
| 2023 | 2022 | 2023 | 2022 | 2023 | 2022 | 2023 | 2022 | |||||||||||||||||||||||||
| $M | $M | $M | $M | $M | $M | $M | $M | |||||||||||||||||||||||||
| Carrying amount at beginning of year |
122,967 | 102,303 | 45,530 | 41,230 | 76,800 | 64,527 | 1,223 | 1,187 | ||||||||||||||||||||||||
| Acquisitions |
471 | 477 | 677 | 851 | - | - | - | - | ||||||||||||||||||||||||
| Disposals |
(118 | ) | (36 | ) | (54 | ) | (31 | ) | (5 | ) | (4 | ) | - | (4 | ) | |||||||||||||||||
| Revaluation increments/(decrements) |
12,391 | 20,026 | 7,387 | 3,978 | 13,399 | 9,250 | 59 | 28 | ||||||||||||||||||||||||
| Depreciation and amortisation |
- | - | (2,301 | ) | (2,002 | ) | (1,196 | ) | (1,076 | ) | (60 | ) | (51 | ) | ||||||||||||||||||
| Net asset transfers |
238 | 198 | 1,138 | 1,504 | 1,563 | 4,101 | 117 | 64 | ||||||||||||||||||||||||
|
|
|
|
|
|
|
|
|
|
|
|
|
|
|
|
|
|
|
|
|
|
|
|
| |||||||||
| Carrying amount at end of year |
135,950 | 122,967 | 52,376 | 45,530 | 90,560 | 76,800 | 1,338 | 1,223 | ||||||||||||||||||||||||
|
|
|
|
|
|
|
|
|
|
|
|
|
|
|
|
|
|
|
|
|
|
|
|
| |||||||||
| Audited Consolidated Financial Statements 2022–23 – Queensland Government | 5-39 |
Notes to the Financial Statements
| 31. | Property, plant and equipment continued |
| General Government Sector continued |
| |||||||||||||||||||||||||||||||
| Reconciliations of the carrying amount for each class of property, plant and equipment are set out below continued: |
| |||||||||||||||||||||||||||||||
| Other Plant and equipment |
Heritage and cultural assets |
ROU assets | SCA-non-GORTO | |||||||||||||||||||||||||||||
| 2023 | 2022 | 2023 | 2022 | 2023 | 2022 | 2023 | 2022 | |||||||||||||||||||||||||
| $M | $M | $M | $M | $M | $M | $M | $M | |||||||||||||||||||||||||
| Carrying amount at beginning of year |
2,805 | 2,911 | 1,939 | 1,595 | 3,421 | 3,517 | 2,394 | 2,293 | ||||||||||||||||||||||||
| Acquisitions |
578 | 355 | 5 | 9 | 758 | 975 | 91 | 76 | ||||||||||||||||||||||||
| Disposals |
(24 | ) | (26 | ) | - | - | (4 | ) | (4 | ) | - | - | ||||||||||||||||||||
| Revaluation increments/(decrements) |
(4 | ) | (3 | ) | 225 | 353 | 141 | 74 | 132 | 242 | ||||||||||||||||||||||
| Depreciation and amortisation |
(618 | ) | (601 | ) | (58 | ) | (37 | ) | (630 | ) | (580 | ) | (45 | ) | (41 | ) | ||||||||||||||||
| Net asset transfers |
293 | 169 | 153 | 21 | (495 | ) | (561 | ) | (47 | ) | (176 | ) | ||||||||||||||||||||
|
|
|
|
|
|
|
|
|
|
|
|
|
|
|
|
|
|
|
|
|
|
|
|
| |||||||||
| Carrying amount at end of year |
3,031 | 2,805 | 2,265 | 1,939 | 3,191 | 3,421 | 2,526 | 2,394 | ||||||||||||||||||||||||
|
|
|
|
|
|
|
|
|
|
|
|
|
|
|
|
|
|
|
|
|
|
|
|
| |||||||||
| Capital work in progress |
Total | |||||||||||||||||||||||||||||||
| 2023 | 2022 | 2023 | 2022 | |||||||||||||||||||||||||||||
| $M | $M | $M | $M | |||||||||||||||||||||||||||||
| Carrying amount at beginning of year |
12,353 | 11,388 | 269,433 | 230,952 | ||||||||||||||||||||||||||||
| Acquisitions |
8,188 | 5,918 | 10,768 | 8,661 | ||||||||||||||||||||||||||||
| Disposals |
(3 | ) | (1 | ) | (208 | ) | (106 | ) | ||||||||||||||||||||||||
| Revaluation increments/(decrements) |
- | - | 33,730 | 33,948 | ||||||||||||||||||||||||||||
| Depreciation and amortisation |
- | - | (4,909 | ) | (4,388 | ) | ||||||||||||||||||||||||||
| Net asset transfers |
(2,570 | ) | (4,952 | ) | 389 | 366 | ||||||||||||||||||||||||||
|
|
|
|
|
|
|
|
|
|
|
|
|
|||||||||||||||||||||
| Carrying amount at end of year |
17,967 | 12,353 | 309,203 | 269,433 | ||||||||||||||||||||||||||||
|
|
|
|
|
|
|
|
|
|
|
|
|
|||||||||||||||||||||
| 5-40 | Audited Consolidated Financial Statements 2022–23 – Queensland Government |
Notes to the Financial Statements
| 31. | Property, plant and equipment continued |
| Total State Sector | ||||||||||||||||||||||||||||||||
| Gross | Accumulated | Written down value | ||||||||||||||||||||||||||||||
| depreciation/impairment | ||||||||||||||||||||||||||||||||
| 2023 | 2022 | 2023 | 2022 | 2023 | 2022 | |||||||||||||||||||||||||||
| $M | $M | $M | $M | $M | $M | |||||||||||||||||||||||||||
| Land |
138,856 | 125,654 | (73 | ) | (66 | ) | 138,783 | 125,588 | ||||||||||||||||||||||||
| Buildings |
92,136 | 78,941 | (37,302 | ) | (31,111 | ) | 54,834 | 47,830 | ||||||||||||||||||||||||
| Infrastructure |
212,324 | 189,352 | (67,413 | ) | (59,955 | ) | 144,911 | 129,397 | ||||||||||||||||||||||||
| Major plant and equipment |
3,408 | 3,151 | (1,019 | ) | (925 | ) | 2,390 | 2,226 | ||||||||||||||||||||||||
| Other plant and equipment |
13,209 | 12,630 | (8,265 | ) | (7,924 | ) | 4,944 | 4,706 | ||||||||||||||||||||||||
| Heritage and cultural assets |
3,228 | 2,580 | (963 | ) | (639 | ) | 2,266 | 1,940 | ||||||||||||||||||||||||
| ROU assets |
6,039 | 5,690 | (2,516 | ) | (1,927 | ) | 3,522 | 3,763 | ||||||||||||||||||||||||
| SCA - non-GORTO |
2,761 | 2,584 | (235 | ) | (190 | ) | 2,526 | 2,394 | ||||||||||||||||||||||||
| Capital work in progress |
21,304 | 14,526 | - | - | 21,304 | 14,526 | ||||||||||||||||||||||||||
|
|
|
|
|
|
|
|
|
|
|
|
|
|
|
|
|
|
| |||||||||||||||
| 493,265 | 435,107 | (117,786) | (102,737) | 375,479 | 332,370 | |||||||||||||||||||||||||||
|
|
|
|
|
|
|
|
|
|
|
|
|
|
|
|
|
|
| |||||||||||||||
| Reconciliations of the carrying amount for each class of property, plant and equipment are set out below: |
| |||||||||||||||||||||||||||||||
| Land | Buildings | Infrastructure | Major plant and equipment | |||||||||||||||||||||||||||||
| 2023 | 2022 | 2023 | 2022 | 2023 | 2022 | 2023 | 2022 | |||||||||||||||||||||||||
| $M | $M | $M | $M | $M | $M | $M | $M | |||||||||||||||||||||||||
| Carrying amount at beginning of year |
125,588 | 104,712 | 47,830 | 43,297 | 129,397 | 117,353 | 2,226 | 2,154 | ||||||||||||||||||||||||
| Acquisitions |
479 | 477 | 677 | 851 | 139 | 12 | - | 2 | ||||||||||||||||||||||||
| Disposals |
(144 | ) | (39 | ) | (57 | ) | (40 | ) | (16 | ) | (42 | ) | - | (5 | ) | |||||||||||||||||
| Revaluation increments/(decrements) |
12,610 | 20,226 | 7,601 | 4,259 | 14,934 | 8,792 | 110 | 114 | ||||||||||||||||||||||||
| Impairment (losses)/reversals |
(7 | ) | 1 | (4 | ) | 6 | (151 | ) | 72 | - | - | |||||||||||||||||||||
| Depreciation and amortisation |
- | - | (2,446 | ) | (2,139 | ) | (3,284 | ) | (3,128 | ) | (123 | ) | (129 | ) | ||||||||||||||||||
| Net asset transfers |
258 | 211 | 1,234 | 1,596 | 3,892 | 6,338 | 177 | 89 | ||||||||||||||||||||||||
|
|
|
|
|
|
|
|
|
|
|
|
|
|
|
|
|
|
|
|
|
|
|
|
| |||||||||
| Carrying amount at end of year |
138,783 | 125,588 | 54,834 | 47,830 | 144,911 | 129,397 | 2,390 | 2,226 | ||||||||||||||||||||||||
|
|
|
|
|
|
|
|
|
|
|
|
|
|
|
|
|
|
|
|
|
|
|
|
| |||||||||
| Audited Consolidated Financial Statements 2022–23 – Queensland Government | 5-41 |
Notes to the Financial Statements
| 31. | Property, plant and equipment continued |
Total State Sector continued
Reconciliations of the carrying amount for each class of property, plant and equipment are set out below continued:
| Other Plant and equipment |
Heritage and cultural assets | ROU assets | SCA - non-GORTO | |||||||||||||||||||||||||||||
| 2023 | 2022 | 2023 | 2022 | 2023 | 2022 | 2023 | 2022 | |||||||||||||||||||||||||
| $M | $M | $M | $M | $M | $M | $M | $M | |||||||||||||||||||||||||
| Carrying amount at beginning of year |
4,706 | 4,833 | 1,940 | 1,596 | 3,763 | 3,975 | 2,394 | 2,293 | ||||||||||||||||||||||||
| Acquisitions |
617 | 387 | 6 | 9 | 809 | 995 | 91 | 76 | ||||||||||||||||||||||||
| Disposals |
(40 | ) | (43 | ) | - | - | (4 | ) | (7 | ) | - | - | ||||||||||||||||||||
| Revaluation increments/(decrements) |
(26 | ) | (30 | ) | 225 | 353 | 142 | 9 | 132 | 242 | ||||||||||||||||||||||
| Impairment (losses)/reversals |
(75 | ) | 2 | - | - | - | - | - | - | |||||||||||||||||||||||
| Depreciation and amortisation |
(902 | ) | (892 | ) | (58 | ) | (37 | ) | (692 | ) | (646 | ) | (45 | ) | (41 | ) | ||||||||||||||||
| Net asset transfers |
663 | 451 | 153 | 21 | (496 | ) | (563 | ) | (47 | ) | (176 | ) | ||||||||||||||||||||
|
|
|
|
|
|
|
|
|
|
|
|
|
|
|
|
|
|
|
|
|
|
|
|
| |||||||||
| Carrying amount at end of year |
4,944 | 4,706 | 2,266 | 1,940 | 3,522 | 3,763 | 2,526 | 2,394 | ||||||||||||||||||||||||
|
|
|
|
|
|
|
|
|
|
|
|
|
|
|
|
|
|
|
|
|
|
|
|
| |||||||||
| Capital work in progress |
Total | |||||||||||||||||||||||||||||||
| 2023 | 2022 | 2023 | 2022 | |||||||||||||||||||||||||||||
| $M | $M | $M | $M | |||||||||||||||||||||||||||||
| Carrying amount at beginning of year |
14,526 | 13,188 | 332,370 | 293,401 | ||||||||||||||||||||||||||||
| Acquisitions |
12,276 | 8,921 | 15,094 | 11,729 | ||||||||||||||||||||||||||||
| Disposals |
(19 | ) | (21 | ) | (280 | ) | (197 | ) | ||||||||||||||||||||||||
| Revaluation increments/(decrements) |
- | - | 35,729 | 33,964 | ||||||||||||||||||||||||||||
| Impairment (losses)/reversals |
(164 | ) | (32 | ) | (402 | ) | 49 | |||||||||||||||||||||||||
| Depreciation and amortisation |
- | - | (7,551 | ) | (7,012 | ) | ||||||||||||||||||||||||||
| Net asset transfers |
(5,315 | ) | (7,529 | ) | 518 | 436 | ||||||||||||||||||||||||||
|
|
|
|
|
|
|
|
|
|
|
|
| |||||||||||||||||||||
| Carrying amount at end of year |
21,304 | 14,526 | 375,479 | 332,370 | ||||||||||||||||||||||||||||
|
|
|
|
|
|
|
|
|
|
|
|
|
|||||||||||||||||||||
| 5-42 | Audited Consolidated Financial Statements 2022–23 – Queensland Government |
Notes to the Financial Statements
| 31. | Property, plant and equipment continued |
Recognition and measurement
Acquisition
Items of property, plant and equipment with a cost or other value greater than the asset recognition thresholds below are initially capitalised and recorded at cost. Queensland Treasury’s Non-Current Asset Policies for the Queensland Public Sector mandates asset recognition thresholds for departments and not-for-profit statutory bodies as follows:
| Asset class | Asset recognition threshold | |||
| Land |
$1 (all land) | |||
| Buildings and infrastructure |
$10,000 | |||
| Plant & equipment |
$5,000 | |||
| Major plant & equipment |
An amount greater than or equal to $5,000, the exact amount of which is at the agency’s discretion. |
|||
| Heritage & cultural assets |
$5,000 | |||
| Work in progress |
n/a | |||
|
Library reference collections |
$1,000,000 | |||
Asset recognition thresholds for other entities within the TSS do not exceed the thresholds above.
Items with a cost or other value below the relevant recognition threshold are expensed in the year of acquisition. Cost is determined as the value given as consideration, plus costs incidental to the acquisition including all other costs incurred in getting the assets ready for use. Assets acquired at no cost or for nominal consideration are recognised at the asset’s fair value where that fair value can be measured reliably and exceeds the recognition threshold.
Training, promotional, administration and general overhead costs are expensed as incurred.
Recording and valuation
Land, buildings, infrastructure, major plant and equipment, heritage and cultural assets, and SCA assets are valued at fair value in accordance with AASB 13 Fair Value Measurement, AASB 116 Property, Plant and Equipment, AASB 1049 Whole of Government and General Government Sector Financial Reporting and AASB 1059 Service Concession Arrangements: Grantors. Other classes of assets are valued at cost which approximates fair value.
On initial recognition, all costs incurred in purchasing or constructing the asset and getting it ready for use are capitalised to the value of the asset. Costs also include the initial estimate of the costs of dismantling and restoring the site on which it is located, where that obligation is recognised and measured in accordance with AASB 137 Provisions, Contingent Liabilities and Contingent Assets.
Subsequent costs are added to the carrying amount of the asset when it improves the condition of the asset beyond its originally assessed standard of performance or capacity. Otherwise, subsequent costs are expensed.
Non-current physical assets measured at fair value are comprehensively revalued once every five years or as appropriate, with interim valuations using relevant indices being otherwise performed on an annual basis. Separately identified components of assets are measured on the same basis as the assets to which they relate.
Any revaluation increment arising on the revaluation of an asset is credited to the asset revaluation reserve for that class of assets, except to the extent it reverses a revaluation decrement for the class of assets previously recognised as an other economic flow included in the operating result. A decrease in the carrying amount on revaluation is charged as an other economic flow included in the operating result, to the extent it exceeds the balance of the relevant asset revaluation reserve for the same class of assets.
Items or components that form an integral part of an asset are recognised as a single asset (functional asset). The recognition threshold is applied to the aggregate cost of each functional asset. Energy entities’ easements are disclosed as part of property, plant and equipment because they are considered to be an integral part of the property, plant and equipment of those entities.
| Audited Consolidated Financial Statements 2022–23 – Queensland Government | 5-43 |
Notes to the Financial Statements
| 31. | Property, plant and equipment continued |
Recognition and measurement continued
Recording and valuation continued
Land under roads
The value included in the balance of land under roads is approximately $85 billion (2022: $77 billion).
All land under roads acquired is recorded at fair value in accordance with AASB 13 and AASB 116 using an englobo basis based on the statutory land valuations (as agreed by all state Valuers-General in 2009).
The englobo method reflects the characteristics that would be taken into account by a potential buyer of land under roads that is made available for sale (after having the legislative restriction removed). Englobo valuation is inclusive of all potential land uses and assumes that if removal of the legislative restriction occurred, land under roads would revert to its original state before subdivision. The methodology is appropriate for all land under roads, regardless of its location or whatever type of road infrastructure (if any) is currently on it.
Fair value is determined by the State Valuation Services using a valuation methodology which is undertaken by multiplying the total area of land under roads within each local government area by the average statutory value of all freehold and leasehold land within the corresponding local government area. The statutory valuations for non-rural land are determined on the basis of site value, with the unimproved value used for rural land.
Railway corridor land
Under the Transport Infrastructure Act 1994, railway corridor land is rendered State land under the control of the Department of Resources which, for reporting purposes, records the land at nil value. This land is on-leased to Queensland Rail via the Department of Transport and Main Roads at no cost.
Right-of-use (ROU) assets
Right-of-use assets, including those from concessionary leases, are measured at cost on initial recognition, and are subsequently measured using the cost model. ROU assets are depreciated over the lease term, except where the State expects to obtain ownership of the asset at the end of the lease, in which case depreciation is over the useful life of the underlying asset.
The State has elected not to recognise ROU assets arising from short-term leases and leases of low value assets. The lease payments are instead expensed on a straight-line basis over the lease term. An asset is considered low value if it is expected to cost less than $10,000 when new.
Where a contract contains both lease and non-lease components such as asset maintenance services, the State allocates the contractual payments to each component on the basis of their stand-alone prices, except for leases of plant and equipment, where the State accounts for them as a single lease component. This is also the case for accommodation leases where the base rent is ‘all inclusive’ as the non-lease component cannot be reliably measured.
The State’s ROU assets are predominantly for leases of buildings including the following:
Commercial office accommodation - $1.55 billion (2022: $1.72 billion)
The State leases a portfolio of commercial accommodation, primarily through the Queensland Government Accommodation Office, represented by ROU assets (buildings).
These leases are negotiated on an individual basis and contain a wide range of different terms and conditions in order to achieve the best whole of Government outcome. The State is exposed to potential future increases in variable lease payments based on CPI or market rates, which make up approximately 8% of the portfolio and these are not included in the lease liability until they take effect. When adjustments to lease payments based on CPI or market rates do take effect, the lease liability is reassessed and adjusted against the ROU asset.
Extension options are included in the majority of office accommodation leases, however these are not included in the lease term assessed at commencement date due to the State not being reasonably certain that they will be exercised. In determining whether these options should be included in the lease term assessed at commencement date, the State considers its current office accommodation strategic plan and its history of exercising extension options. The lease term is reassessed if the State becomes reasonably certain that an extension option will be exercised.
The lease agreements do not impose any covenants other than the security interests in the leased assets that may be held by the lessor.
| 5-44 | Audited Consolidated Financial Statements 2022–23 – Queensland Government |
Notes to the Financial Statements
| 31. | Property, plant and equipment continued |
Recognition and measurement continued
Recording and valuation continued
Right-of-use (ROU) assets continued
Buildings on Deed of Grant in Trust land - $825 million (2022: $819 million)
The State has concessionary leases consisting of buildings on Deed of Grant in Trust land. These buildings are leased from a number of Aboriginal and Torres Strait Islander councils on below-market rental terms.
The leases facilitate the construction and/or refurbishment of properties on communal land in accordance with the National Partnership on Remote Housing, entered into between the Australian Government and the Queensland Government. The State is responsible for construction, upgrades, maintenance and insurance of the properties and the use of the properties is restricted to social housing purposes.
The State also has a lease with Australian Unity for the Surgical, Treatment and Rehabilitation Services (STARS) facility. See Note 26 for further details.
Interest expense on lease liabilities is disclosed in Note 13. Cash outflows for leases are disclosed in Note 40(b). The State’s expenses relating to short-term leases, leases of low value assets and variable lease payments are not material.
Service concession assets – non-GORTO
Non-GORTO refers to those SCAs where the State pays the operator to construct, maintain and operate an asset that delivers public services. This is distinct from Grant of Right to Operate (GORTO) arrangements where the State grants the operator a right to charge for third party usage of the asset or a right to access a revenue-generating asset located on State land. Service concession assets and liabilities arising from GORTO arrangements are separately disclosed in Note 33 because they do not fit within the Government Finance Statistics framework.
The State’s non-GORTO arrangements at balance date are the Toowoomba Bypass and Gold Coast Light Rail - G:link. More details about these arrangements can be found in Note 26.
Service concession assets are measured at current replacement cost on initial recognition or reclassification and are subsequently measured at fair value determined using current replacement cost. The assets are depreciated on a straight-line basis over their components’ useful lives which range from 29 to 82 years. The assets are categorised at level 3 in the fair value hierarchy. The valuation methodology and significant unobservable inputs are the same as for level 3 buildings and roads and track infrastructure, as disclosed in this note.
Impairment
An impairment loss is recognised as an other economic flow included in the operating result, unless the asset is carried at a revalued amount. When assets are measured at a revalued amount, the impairment loss is offset against the asset revaluation surplus of the relevant class.
Refer Note 16 for the State’s policies and disclosures on impairment and for any impairment losses recognised in the Operating Statement.
Fair value measurement
Fair value is the price that would be received to sell an asset or paid to transfer a liability in an orderly transaction between market participants at the measurement date under current market conditions (i.e. an exit price) regardless of whether that price is directly derived from observable inputs or estimated using another valuation technique.
Observable inputs are publicly available data that are relevant to the characteristics of the assets/liabilities being valued, for example, published sales data for land and general office buildings.
Unobservable inputs are data, assumptions and judgements that are not available publicly but are relevant to the characteristics of the assets/liabilities being valued. Significant unobservable inputs used by the State include, but are not limited to, subjective adjustments made to observable data to take account of the characteristics of the State’s assets/liabilities, internal records of recent construction costs (and/or estimates of such costs) for assets’ characteristics/functionality, and assessments of physical condition and remaining useful life. Unobservable inputs are used to the extent that sufficient relevant and reliable observable inputs are not available for similar assets/liabilities.
| Audited Consolidated Financial Statements 2022–23 – Queensland Government | 5-45 |
Notes to the Financial Statements
| 31. | Property, plant and equipment continued |
Recognition and measurement continued
Fair value measurement continued
A fair value measurement of a non-financial asset takes into account a market participant’s ability to generate economic benefits by using the asset in its highest and best use.
All assets and liabilities of the State for which fair value is measured or disclosed in the financial statements are categorised within the following fair value hierarchy, based on the data and assumptions used in the most recent specific appraisals:
| – | Level 1: represents fair value measurements that reflect unadjusted quoted market prices in active markets for identical assets and liabilities; |
| – | Level 2: represents fair value measurements that are substantially derived from inputs (other than quoted prices included within level 1) that are observable, either directly or indirectly; and |
| – | Level 3: represents fair value measurements that are substantially derived from unobservable inputs. |
None of the State’s valuations of non-financial assets are eligible for categorisation into level 1 of the fair value hierarchy.
More specific fair value information about the State’s property, plant and equipment is outlined below.
| 5-46 | Audited Consolidated Financial Statements 2022–23 – Queensland Government |
Notes to the Financial Statements
| 31. | Property, plant and equipment continued |
Level 3 fair value reconciliation
| General Government Sector | ||||||||||||||||||||||||||||||||
| Land | Buildings | Infrastructure | Major plant and | |||||||||||||||||||||||||||||
| equipment | ||||||||||||||||||||||||||||||||
| 2023 | 2022 | 2023 | 2022 | 2023 | 2022 | 2023 | 2022 | |||||||||||||||||||||||||
| $M | $M | $M | $M | $M | $M | $M | $M | |||||||||||||||||||||||||
| Carrying amount at beginning of year |
16,981 | 14,602 | 41,102 | 37,012 | 76,798 | 64,526 | 1,170 | 1,130 | ||||||||||||||||||||||||
| Acquisitions |
90 | 21 | 595 | 705 | - | - | - | - | ||||||||||||||||||||||||
| Disposals |
(47 | ) | (21 | ) | (12 | ) | (27 | ) | (5 | ) | (3 | ) | - | - | ||||||||||||||||||
| Revaluation increments/(decrements) |
1,426 | 2,156 | 6,982 | 3,693 | 13,395 | 9,250 | 45 | 19 | ||||||||||||||||||||||||
| Depreciation and amortisation |
- | - | (2,111 | ) | (1,873 | ) | (1,196 | ) | (1,075 | ) | (47 | ) | (43 | ) | ||||||||||||||||||
| Net asset transfers |
249 | 222 | 993 | 1,592 | 1,563 | 4,100 | 115 | 64 | ||||||||||||||||||||||||
|
|
|
|
|
|
|
|
|
|
|
|
|
|
|
|
|
|
|
|
|
|
|
|
| |||||||||
| Carrying amount at end of year |
18,699 | 16,981 | 47,549 | 41,102 | 90,555 | 76,798 | 1,282 | 1,170 | ||||||||||||||||||||||||
|
|
|
|
|
|
|
|
|
|
|
|
|
|
|
|
|
|
|
|
|
|
|
|
| |||||||||
| Heritage and cultural | SCA - non-GORTO | Total | ||||||||||||||||||||||||||||||
| assets | ||||||||||||||||||||||||||||||||
| 2023 | 2022 | 2023 | 2022 | 2023 | 2022 | |||||||||||||||||||||||||||
| $M | $M | $M | $M | $M | $M | |||||||||||||||||||||||||||
| Carrying amount at beginning of year |
1,898 | 1,568 | 2,166 | 2,293 | 140,114 | 121,130 | ||||||||||||||||||||||||||
| Acquisitions |
2 | 15 | - | 242 | 687 | 982 | ||||||||||||||||||||||||||
| Disposals |
- | (3 | ) | - | - | (64 | ) | (54 | ) | |||||||||||||||||||||||
| Revaluation increments/(decrements) |
81 | 325 | 132 | (329 | ) | 22,062 | 15,115 | |||||||||||||||||||||||||
| Depreciation and amortisation |
(8 | ) | (36 | ) | (45 | ) | (41 | ) | (3,407 | ) | (3,068 | ) | ||||||||||||||||||||
| Net asset transfers |
51 | 29 | - | - | 2,971 | 6,008 | ||||||||||||||||||||||||||
|
|
|
|
|
|
|
|
|
|
|
|
|
|
|
|
|
|
|
|||||||||||||||
| Carrying amount at end of year |
2,024 | 1,898 | 2,253 | 2,166 | 162,363 | 140,114 | ||||||||||||||||||||||||||
|
|
|
|
|
|
|
|
|
|
|
|
|
|
|
|
|
|
|
|||||||||||||||
| Audited Consolidated Financial Statements 2022–23 – Queensland Government | 5-47 |
Notes to the Financial Statements
| 31. | Property, plant and equipment continued |
Level 3 fair value reconciliation continued
| Total State Sector | ||||||||||||||||||||||||||||||||
| Land | Buildings | Infrastructure | Major plant and | |||||||||||||||||||||||||||||
| equipment | ||||||||||||||||||||||||||||||||
| 2023 | 2022 | 2023 | 2022 | 2023 | 2022 | 2023 | 2022 | |||||||||||||||||||||||||
| $M | $M | $M | $M | $M | $M | $M | $M | |||||||||||||||||||||||||
| Carrying amount at beginning of year |
18,319 | 15,890 | 43,458 | 39,136 | 129,279 | 117,204 | 2,172 | 2,097 | ||||||||||||||||||||||||
| Acquisitions |
90 | 21 | 595 | 705 | 139 | 11 | - | 2 | ||||||||||||||||||||||||
| Disposals |
(71 | ) | (21 | ) | (12 | ) | (29 | ) | (16 | ) | (37 | ) | - | - | ||||||||||||||||||
| Revaluation increments/(decrements) |
1,493 | 2,191 | 7,196 | 3,973 | 14,911 | 8,792 | 96 | 105 | ||||||||||||||||||||||||
| Impairment (losses)/reversals |
(8 | ) | 2 | (4 | ) | 5 | (152 | ) | 75 | - | - | |||||||||||||||||||||
| Depreciation and amortisation |
- | - | (2,254 | ) | (2,008 | ) | (3,272 | ) | (3,112 | ) | (110 | ) | (120 | ) | ||||||||||||||||||
| Net asset transfers |
268 | 237 | 1,081 | 1,676 | 3,762 | 6,347 | 175 | 88 | ||||||||||||||||||||||||
|
|
|
|
|
|
|
|
|
|
|
|
|
|
|
|
|
|
|
|
|
|
|
|
| |||||||||
| Carrying amount at end of year |
20,092 | 18,319 | 50,061 | 43,458 | 144,650 | 129,279 | 2,334 | 2,172 | ||||||||||||||||||||||||
|
|
|
|
|
|
|
|
|
|
|
|
|
|
|
|
|
|
|
|
|
|
|
|
| |||||||||
| Heritage and cultural | SCA - non-GORTO | Total | ||||||||||||||||||||||||||||||
| assets | ||||||||||||||||||||||||||||||||
| 2023 | 2022 | 2023 | 2022 | 2023 | 2022 | |||||||||||||||||||||||||||
| $M | $M | $M | $M | $M | $M | |||||||||||||||||||||||||||
| Carrying amount at beginning of year |
1,898 | 1,568 | 2,166 | 2,293 | 197,293 | 178,188 | ||||||||||||||||||||||||||
| Acquisitions |
2 | 15 | - | 242 | 826 | 996 | ||||||||||||||||||||||||||
| Disposals |
- | (3 | ) | - | - | (99 | ) | (89 | ) | |||||||||||||||||||||||
| Revaluation increments/(decrements) |
81 | 325 | 132 | (329 | ) | 23,909 | 15,057 | |||||||||||||||||||||||||
| Impairment (losses)/reversals |
- | - | - | - | (164 | ) | 81 | |||||||||||||||||||||||||
| Depreciation and amortisation |
(8 | ) | (36 | ) | (45 | ) | (41 | ) | (5,689 | ) | (5,317 | ) | ||||||||||||||||||||
| Net asset transfers |
51 | 29 | - | - | 5,337 | 8,377 | ||||||||||||||||||||||||||
|
|
|
|
|
|
|
|
|
|
|
|
|
|
|
|
|
|
|
|||||||||||||||
| Carrying amount at end of year |
2,024 | 1,898 | 2,253 | 2,166 | 221,414 | 197,293 | ||||||||||||||||||||||||||
|
|
|
|
|
|
|
|
|
|
|
|
|
|
|
|
|
|
|
|||||||||||||||
| 5-48 | Audited Consolidated Financial Statements 2022–23 – Queensland Government |
Notes to the Financial Statements
| 31. | Property, plant and equipment continued |
Level 3 significant valuation inputs and relationship to fair value
| General Government Sector
| ||||||
| Description |
Fair value $M |
Significant unobservable inputs | ||||
| Land | 18,699 | Level 3 land assets are mainly held by the Department of Resources and Department of Environment and Science. These assets are classified as reserves, unallocated state land, national parks and leasehold land.
| ||||
| The valuation of reserves and unallocated state land is based, where possible, on recent sales in the general location of the land, adjusted for specific attributes of, and restrictions on, the land being valued. As such, the most significant unobservable input into the valuation of reserves and unallocated state land is the valuers’ professional judgement applied in determining the fair value.
| ||||||
| National park land is valued with reference to sales of land with a similar topography and location. This market data is adjusted by the valuer to reflect the nature of restrictions upon national park land. Accordingly, the most significant input to the valuation of national park land is the valuers’ judgement in relation to the adjustments potential market participants would make to the price paid for this land in light of the restrictions.
| ||||||
| Leasehold land is valued using the present value of the future income from leases over the land. In calculating the value of leasehold land, the discount rate applied to the leases is a significant unobservable input.
| ||||||
| Buildings | 47,549 | Buildings classified as Level 3 are those which, due to their specialised nature and/or construction, do not have an active market.
| ||||
| Within level 3 buildings, major sub-groups exist which are valued using similar methods. The most significant of these groups are valued at current replacement cost listed below:
| ||||||
|
– Schools and early childhood buildings – The valuation utilises published current construction costs for the standard components of the buildings. Adjustment and allowances are made for specialised fit out requirements and more contemporary construction/design approaches. Significant judgement is also required in determining the remaining service life of these buildings.
| ||||||
|
– Correctional centres, court houses and juvenile justice facilities – Significant inputs into this approach are construction costs, locality allowances for regional and remote facilities, remaining useful life and current condition assessments.
| ||||||
|
– Health services buildings (including hospitals) – In determining the replacement cost of each building, the estimated replacement cost of the asset, or the likely cost of construction including fees and on costs at the valuation date, is assessed based on historical records and adjusted for contemporary design/construction practices. The resulting values are adjusted using published locality indices to allow for regional and remote location. The valuers apply professional judgement in assessing the assets’ current condition and remaining service lives.
| ||||||
| Market based inputs
| ||||||
|
Social housing is valued using market based inputs. However, because multi-unit properties do not have separate titles, significant adjustments are made by valuers. Significant unobservable inputs to the valuers’ adjustments are the discount rates applied to represent the cost of obtaining strata title.
| ||||||
| Audited Consolidated Financial Statements 2022–23 – Queensland Government | 5-49 |
Notes to the Financial Statements
| 31. | Property, plant and equipment continued |
Level 3 significant valuation inputs and relationship to fair value continued
| General Government Sector continued
| ||||||
| Description | Fair value 2023 $M
|
Significant unobservable inputs | ||||
| Infrastructure | 90,555 | Level 3 infrastructure within the GGS is primarily roads held by the Department of Transport and Main Roads, and roads and tracks within National Park and State Forest land. Due to their specialised nature and the lack of an active market for infrastructure, these assets are valued using a current replacement cost methodology.
Assets in the SCA non-GORTO class are mainly the Gold Coast Light Rail and Toowoomba Second Range Crossing and are measured at fair value using the same valuation methodology as infrastructure assets.
| ||||
| SCA - non-GORTO |
2,253 | Road infrastructure, and roads, tracks and rail are valued based on a combination of raw materials and other costs of construction compiled by an external expert and internal assumptions based on engineering professional judgement. As part of this process, road stereotypes (ranging from unformed roads through to major motorways) are assigned to each road segment and are further defined by variables such as terrain, environment, surface types and costing regions. These inputs are also adjusted for contemporary technology and construction techniques. Accordingly, the most significant unobservable input to the valuation of roads is the calculated replacement cost which is heavily reliant upon engineers’ and valuers’ professional judgement.
| ||||
| Major plant and equipment | 1,282 | Major plant and equipment in the GGS primarily consist of New Generation Rollingstock assets held by the Department of Transport and Main Roads.
| ||||
| Rollingstock is valued using a current replacement cost approach. The significant unobservable inputs to the valuation of rollingstock are estimated costs to replace existing assets and the assumptions made about current asset condition and remaining useful life.
| ||||||
| Heritage and cultural assets | 2,024 | Heritage and cultural assets are mainly comprised of unique or iconic items which are considered to be of historical or cultural significance. These assets are primarily held by the Queensland Art Gallery and the Queensland Museum. While some of these items are able to be traded, such transactions are highly individualised and accordingly it is not considered that there is an active market for these types of assets.
| ||||
|
Collections held by the Queensland Art Gallery and Queensland Museum are largely valued on an individual basis with reference to recent transactions in similar works or the cost of replicating or recollecting items. Due to the unique nature of these items, despite some reliance on recent transactions in similar items, the most significant input to the valuation of collections held by the Queensland Art Gallery and Queensland Museum is the professional judgement of the valuer.
| ||||||
| 5-50 | Audited Consolidated Financial Statements 2022–23 – Queensland Government |
Notes to the Financial Statements
| 31. | Property, plant and equipment continued |
Level 3 significant valuation inputs and relationship to fair value continued
Total State Sector
| Description |
Fair value 2023
$M |
Significant unobservable inputs | ||||
| Infrastructure | 144,650 | In addition to the infrastructure assets identified above in the GGS, level 3 infrastructure for the TSS includes rail, ports, electricity and water infrastructure assets.
| ||||
| Income based approach
| ||||||
| Water infrastructure assets (mainly Seqwater) – Unobservable inputs in this type of valuation include assumptions about future market conditions and selection of an appropriate discount rate. The discount rate is a significant unobservable input to the valuation of water infrastructure.
| ||||||
| Port infrastructure – Inherent in this valuation process are assumptions in relation to future operating cash flows, projected capital replacement and selection of an appropriate discount rate (equal to the Weighted Average Cost of Capital) for the organisation holding the assets. The discount rate has a significant impact upon the final valuation and, being based upon professional judgement, is an unobservable input.
| ||||||
| Electricity distribution and transmission infrastructure – Being regulated assets, significant professional judgement is required in forecasting future cash flows. The significant unobservable inputs affecting the valuation of electricity infrastructure include assumptions about future revenue cash flows, future capital expenditure requirements and selection of an appropriate discount rate.
| ||||||
| National Electricity Market connected power stations – using a pre-tax nominal cash flow and discount rate model and various demand, supply and Renewable Energy Target scenarios. The significant unobservable inputs affecting the valuation include assumptions about electricity spot prices, contract load and premium and discount rate.
| ||||||
| Current replacement cost
| ||||||
| The majority of rail infrastructure is valued using a current replacement cost methodology except for regional freight assets which are valued on a discounted cash flow basis. The significant unobservable inputs to the current replacement cost valuation are costs to replace existing assets and the assessments of current asset condition and remaining useful life.
| ||||||
| Major plant and equipment | 2,334 | Major plant and equipment in the TSS, in addition to that in the GGS, is primarily Queensland Rail rollingstock.
| ||||
| Audited Consolidated Financial Statements 2022–23 – Queensland Government | 5-51 |
Notes to the Financial Statements
| 32. | Intangibles |
| General Government Sector |
| |||||||||||||||||||||||
| Gross | Accumulated Amortisation | Written down value | ||||||||||||||||||||||
| 2023 | 2022 | 2023 | 2022 | 2023 | 2022 | |||||||||||||||||||
| $M | $M | $M | $M | $M | $M | |||||||||||||||||||
| Software development |
2,108 | 2,063 | (1,464 | ) | (1,416 | ) | 643 | 647 | ||||||||||||||||
| Purchased software |
343 | 345 | (298 | ) | (287 | ) | 46 | 58 | ||||||||||||||||
| Other |
68 | 61 | (29 | ) | (27 | ) | 39 | 34 | ||||||||||||||||
|
|
|
|
|
|
|
|
|
|
|
|
|
|||||||||||||
| 2,519 | 2,469 | (1,791 | ) | (1,730 | ) | 728 | 739 | |||||||||||||||||
|
|
|
|
|
|
|
|
|
|
|
|
|
|||||||||||||
| Total State Sector |
| |||||||||||||||||||||||
| Gross | Accumulated Amortisation | Written down value | ||||||||||||||||||||||
| 2023 | 2022 | 2023 | 2022 | 2023 | 2022 | |||||||||||||||||||
| $M | $M | $M | $M | $M | $M | |||||||||||||||||||
| Software development |
3,831 | 3,729 | (2,415 | ) | (2,369 | ) | 1,416 | 1,360 | ||||||||||||||||
| Purchased software |
691 | 691 | (557 | ) | (513 | ) | 134 | 178 | ||||||||||||||||
| Licences and rights |
116 | 116 | (103 | ) | (103 | ) | 13 | 13 | ||||||||||||||||
| Other |
372 | 369 | (185 | ) | (182 | ) | 187 | 187 | ||||||||||||||||
|
|
|
|
|
|
|
|
|
|
|
|
|
|||||||||||||
| 5,010 | 4,905 | (3,260 | ) | (3,167 | ) | 1,750 | 1,738 | |||||||||||||||||
|
|
|
|
|
|
|
|
|
|
|
|
|
|||||||||||||
Most intangibles arise from software development.
Intangible assets are recognised in accordance with AASB 138 Intangible Assets. Software is classified as an intangible asset, rather than property, plant and equipment unless it is an integral part of the related hardware.
Internally generated goodwill, brands and items of similar substance, as well as expenditure on initial research, are specifically excluded from being recognised on the Balance Sheet.
In accordance with the Non-Current Assets Policies for the Queensland Public Sector, the recognition threshold for departments and statutory bodies is $100,000. Items with a lesser value are expensed. The threshold for other entities does not exceed this amount.
Internally generated intangible assets are only revalued where an active market exists for the asset in question, otherwise they are measured at cost.
For information on impairment policies, refer Note 16.
| 33. | Service Concession Arrangements – Grant of Right to Operate (SCA - GORTO) |
| General Government | Total State | |||||||||||||||||||||||
| 2023 | 2022 | 2023 | 2022 | |||||||||||||||||||||
| $M | $M | $M | $M | |||||||||||||||||||||
| Gross |
13,593 | 12,391 | 13,593 | 12,391 | ||||||||||||||||||||
| Less: Accumulated depreciation |
1,932 | 1,783 | 1,932 | 1,783 | ||||||||||||||||||||
| 11,660 | 10,608 | 11,660 | 10,608 | |||||||||||||||||||||
| GORTO movement reconciliation: Service concession assets |
||||||||||||||||||||||||
| Carrying amount at beginning of year |
10,608 | 9,996 | 10,608 | 9,996 | ||||||||||||||||||||
| Net revaluation increments |
1,199 | 750 | 1,199 | 750 | ||||||||||||||||||||
| Depreciation expense |
(146 | ) | (137 | ) | (146 | ) | (137 | ) | ||||||||||||||||
| Carrying amount at end of year |
11,660 | 10,608 | 11,660 | 10,608 | ||||||||||||||||||||
| Service concession liabilities |
||||||||||||||||||||||||
| Carrying amount at beginning of year |
7,442 | 7,677 | 7,442 | 7,677 | ||||||||||||||||||||
| Amortisation |
(235 | ) | (235 | ) | (235 | ) | (235 | ) | ||||||||||||||||
| Carrying amount at end of year |
7,207 | 7,442 | 7,207 | 7,442 | ||||||||||||||||||||
| 5-52 | Audited Consolidated Financial Statements 2022–23 – Queensland Government |
Notes to the Financial Statements
| 33. | Service Concession Arrangements – Grant of Right to Operate (SCA - GORTO) continued |
Arrangements where the State grants the operator a right to charge for third party usage of an asset that provides public services, such as a toll road, or a right to access a revenue-generating asset located on State land, in return for the construction and operation of that asset and return of the asset to the State at the end of the PPP are, for convenience, referred to as GORTO arrangements in this document.
Service concession assets are measured at current replacement cost and are depreciated over their useful lives. GORTO liabilities (which are unearned revenue) are amortised straight-line over the terms of the service concession arrangements. The net Operating Statement impact is reflected in Note 20.
Refer Note 26 for further details of individual GORTO arrangements.
| 34. | Other non-financial assets |
| General Government | Total State | |||||||||||||||||||||
| 2023 | 2022 | 2023 | 2022 | |||||||||||||||||||
| $M | $M | $M | $M | |||||||||||||||||||
| Current |
||||||||||||||||||||||
| Prepayments |
462 | 492 | 629 | 646 | ||||||||||||||||||
| Other |
93 | 78 | 121 | 89 | ||||||||||||||||||
| 555 | 570 | 751 | 735 | |||||||||||||||||||
| Non-current |
||||||||||||||||||||||
| Prepayments |
96 | 194 | 117 | 219 | ||||||||||||||||||
| Other |
32 | 7 | 48 | 24 | ||||||||||||||||||
| 128 | 202 | 164 | 243 | |||||||||||||||||||
| 682 | 772 | 915 | 977 | |||||||||||||||||||
Other non-financial assets primarily represent prepayments by the State. These prepayments include salaries and wages, grant payments, prepayments under finance lease agreements and payments of a general nature made in advance.
| 35. | Payables |
| General Government | Total State | |||||||||||||||||||||
| 2023 | 2022 | 2023 | 2022 | |||||||||||||||||||
| $M | $M | $M | $M | |||||||||||||||||||
| Current |
||||||||||||||||||||||
| Trade creditors |
2,681 | 2,567 | 3,980 | 4,139 | ||||||||||||||||||
| Grants and other contributions |
668 | 320 | 536 | 260 | ||||||||||||||||||
| GST payable |
60 | 52 | 157 | 152 | ||||||||||||||||||
| Other payables |
2,457 | 2,157 | 2,543 | 2,248 | ||||||||||||||||||
| 5,866 | 5,096 | 7,218 | 6,799 | |||||||||||||||||||
| Non-current |
||||||||||||||||||||||
| Trade creditors |
51 | 121 | 117 | 176 | ||||||||||||||||||
| Other payables |
4 | 5 | 5 | 7 | ||||||||||||||||||
| 55 | 126 | 122 | 183 | |||||||||||||||||||
| 5,921 | 5,222 | 7,340 | 6,982 | |||||||||||||||||||
Payables mainly represent amounts owing for goods and services provided to the State prior to the end of the financial year. The amounts are unsecured, are usually paid within 30 days of recognition and are non-interest bearing.
Payables are recognised at amortised cost using the effective interest rate method.
| Audited Consolidated Financial Statements 2022–23 – Queensland Government | 5-53 |
Notes to the Financial Statements
| 36. | Employee benefit obligations |
(a) Superannuation liability
| General Government | Total State | |||||||||||||||||||||
| 2023 | 2022 | 2023 | 2022 | |||||||||||||||||||
| $M | $M | $M | $M | |||||||||||||||||||
| Current |
||||||||||||||||||||||
| Superannuation |
1,975 | 1,938 | 1,975 | 1,938 | ||||||||||||||||||
| Judges’ pensions |
30 | 29 | 30 | 29 | ||||||||||||||||||
| 2,005 | 1,967 | 2,005 | 1,967 | |||||||||||||||||||
| Non-current |
||||||||||||||||||||||
| Superannuation |
18,073 | 19,376 | 17,719 | 18,976 | ||||||||||||||||||
| Judges’ pensions |
834 | 825 | 834 | 825 | ||||||||||||||||||
| 18,908 | 20,201 | 18,553 | 19,801 | |||||||||||||||||||
| Total superannuation liability (refer Note 48) |
20,913 | 22,168 | 20,559 | 21,768 | ||||||||||||||||||
The State recognises a superannuation liability in respect of the various employees’ accrued superannuation benefits which represents the difference between the net market value of plan assets and the estimated accrued superannuation benefits at year end.
The present value of the accrued benefits is calculated using the projected unit credit method and represents the actuarial value of all benefits that are expected to become payable in the future in respect of contributions made or periods of service completed prior to the valuation date, allowing for future salary increases.
The costs of providing future benefits to employees are recognised over the period during which employees provide services. All superannuation plan costs, excluding actuarial gains and losses, are recognised in the Operating Statement. Actuarial gains and losses are recognised directly in equity on an annual basis and represent experience adjustments (the effects of differences between the previous actuarial assumptions and what has actually occurred e.g. investment returns on plan assets) and the effects of changes in actuarial assumptions underlying the valuation.
For the Government Division of Australian Retirement Trust (QSuper), expected future payments are discounted using market yields at the reporting date on Government bonds with terms to maturity that match the estimated future cash outflows. The gross discount rate for 10 year Commonwealth bonds at 30 June 2023 was 4.0% (2022: 3.7%).
Employees in the electricity industry contribute to an industry multiple employer superannuation fund, Energy Super, a sub-fund within Brighter Super (previously known as the Local Government Investment Australia Super Fund (ES LGIA)). The Energy Super fund uses discount rates that are more closely aligned to corporate bond rates (refer Note 48).
Future taxes are part of the provision of the existing benefit obligations and are taken into account in measuring the net liability or asset.
(b) Other employee benefits
| General Government | Total State | |||||||||||||||||||||
| 2023 | 2022 | 2023 | 2022 | |||||||||||||||||||
| $M | $M | $M | $M | |||||||||||||||||||
| Current |
||||||||||||||||||||||
| Salary and wages payable |
1,599 | 776 | 1,745 | 914 | ||||||||||||||||||
| Annual leave |
2,922 | 2,753 | 3,218 | 3,032 | ||||||||||||||||||
| Long service leave |
708 | 652 | 1,273 | 1,155 | ||||||||||||||||||
| Other employee entitlements |
167 | 41 | 284 | 149 | ||||||||||||||||||
| 5,396 | 4,221 | 6,521 | 5,251 | |||||||||||||||||||
| Non-current |
||||||||||||||||||||||
| Long service leave |
5,007 | 4,794 | 5,098 | 4,855 | ||||||||||||||||||
| Other employee entitlements |
16 | 14 | 22 | 30 | ||||||||||||||||||
| 5,023 | 4,808 | 5,120 | 4,886 | |||||||||||||||||||
| 10,419 | 9,029 | 11,641 | 10,137 | |||||||||||||||||||
| 5-54 | Audited Consolidated Financial Statements 2022–23 – Queensland Government |
Notes to the Financial Statements
| 36. | Employee benefit obligations continued |
(b) Other employee benefits continued
Wages, salaries and sick leave
Liabilities for wages and salaries are accrued at year end. For most agencies, sick leave is non-vesting and is expensed as incurred. Liabilities have been calculated based on wage and salary rates at the date they are expected to be paid and include related on-costs.
Annual leave
The Annual Leave Central Scheme (ALCS) was established on 30 June 2008 to centrally fund annual leave obligations of departments, commercialised business units and shared service providers. Members pay a levy equal to their accrued leave cost into the scheme and are reimbursed by the scheme for annual leave payments made to their employees. Entities that do not participate in the ALCS continue to determine and recognise their own leave liabilities.
The State’s annual leave liability has been calculated based on wage and salary rates at the date they are expected to be paid and includes related on-costs. In accordance with AASB 119 Employee Benefits, where annual leave is not expected to be paid within 12 months, the liability is measured at the present value of the future cash flows.
Long service leave
The Long Service Leave Central Scheme was introduced in 1999-2000 to centrally manage long service leave liabilities within the General Government Sector. Participating agencies (predominantly Government departments) pay a levy into the scheme. From 1 January 2022, the long service leave levy rate payable by participating agencies is 2.6% of salary and wages costs. Amounts paid to employees for long service leave are then claimed from the scheme as a reimbursement. The liability is assessed annually by the State Actuary.
The valuation method used incorporates consideration of expected future wage and salary levels, experience of employee departures and periods of service. On-costs have been included in the liabilities and expenses for the Long Service Leave Central Scheme. These amounts have not been separately identified as they are not material in the context of the State’s overall employee entitlement liabilities.
The State’s long service leave provisions are calculated in accordance with AASB 119 using yield rates of Government bonds at reporting date and actuarial assumptions which are mutually compatible. The gross discount rate for 10 year Commonwealth bonds at 30 June 2023 was 4.0% (2022: 3.7%).
Entities that do not participate in the Long Service Leave Central Scheme determine their liability for long service leave based on the present value of estimated future cash outflows to be made.
Termination benefits
Termination benefits are payable when employment is terminated before the normal retirement date or when an employee accepts a voluntary redundancy in exchange for these benefits. The State recognises termination benefits when it is demonstrably committed to either terminating the employment of employees according to a detailed formal plan without possibility of withdrawal or providing termination benefits as a result of an offer made to encourage voluntary redundancy. Benefits falling due more than 12 months after balance date are discounted to present value.
| 37. | Deposits, borrowings and advances, securities and derivatives |
(a) Deposits held
| General Government | Total State | |||||||||||||||||||||
| 2023 | 2022 | 2023 | 2022 | |||||||||||||||||||
| $M | $M | $M | $M | |||||||||||||||||||
| Current |
||||||||||||||||||||||
| Deposits at fair value through profit or loss |
- | - | 5,090 | 6,628 | ||||||||||||||||||
| Interest bearing security deposits |
- | - | 14 | 11 | ||||||||||||||||||
| - | - | 5,104 | 6,639 | |||||||||||||||||||
| Audited Consolidated Financial Statements 2022–23 – Queensland Government | 5-55 |
Notes to the Financial Statements
| 37. | Deposits, borrowings and advances, securities and derivatives continued |
(b) Advances received
| General Government | Total State | |||||||||||||||||||||
| 2023 | 2022 | 2023 | 2022 | |||||||||||||||||||
| $M | $M | $M | $M | |||||||||||||||||||
| Current |
||||||||||||||||||||||
| Commonwealth |
21 | 30 | 21 | 30 | ||||||||||||||||||
| Public Non-financial Corporations |
1,674 | 1,048 | - | - | ||||||||||||||||||
| 1,695 | 1,077 | 21 | 30 | |||||||||||||||||||
| Non-current |
||||||||||||||||||||||
| Commonwealth |
214 | 233 | 214 | 233 | ||||||||||||||||||
| 1,909 | 1,310 | 235 | 262 | |||||||||||||||||||
| (c) Borrowing with QTC | ||||||||||||||||||||||
| General Government | Total State | |||||||||||||||||||||
| 2023 | 2022 | 2023 | 2022 | |||||||||||||||||||
| $M | $M | $M | $M | |||||||||||||||||||
| Current |
23 | 23 | - | - | ||||||||||||||||||
| Non-current |
46,143 | 48,976 | - | - | ||||||||||||||||||
| 46,166 | 49,000 | - | - | |||||||||||||||||||
|
At 30 June 2023, $5.215 billion (2022: $2.415 billion) was held in a redraw facility, offsetting borrowing with QTC in the Balance Sheet.
(d) Leases and other loans
|
| |||||||||||||||||||||
| General Government | Total State | |||||||||||||||||||||
| 2023 | 2022 | 2023 | 2022 | |||||||||||||||||||
| $M | $M | $M | $M | |||||||||||||||||||
| Current |
||||||||||||||||||||||
| Lease liability |
499 | 507 | 573 | 554 | ||||||||||||||||||
| SCA - non-GORTO liabilities |
40 | 37 | 40 | 37 | ||||||||||||||||||
| Loans - other |
445 | 974 | 527 | 1,059 | ||||||||||||||||||
| 985 | 1,518 | 1,141 | 1,650 | |||||||||||||||||||
| Non-current |
||||||||||||||||||||||
| Lease liability |
2,420 | 2,568 | 2,752 | 2,926 | ||||||||||||||||||
| SCA - non-GORTO liabilities |
590 | 701 | 590 | 701 | ||||||||||||||||||
| Loans - other |
3,525 | 2,884 | 3,889 | 3,254 | ||||||||||||||||||
| 6,534 | 6,153 | 7,231 | 6,881 | |||||||||||||||||||
| 7,519 | 7,671 | 8,372 | 8,532 | |||||||||||||||||||
|
Lease liabilities are effectively secured, as the rights to the leased assets revert to the lessor in the event of a default. Interest on leases is recognised as an expense as it accrues.
(e) Securities and derivatives
|
| |||||||||||||||||||||
| General Government | Total State | |||||||||||||||||||||
| 2023 | 2022 | 2023 | 2022 | |||||||||||||||||||
| $M | $M | $M | $M | |||||||||||||||||||
| Current |
||||||||||||||||||||||
| Government securities issued |
- | - | 13,513 | 16,448 | ||||||||||||||||||
| Derivatives |
||||||||||||||||||||||
| Cash flow hedges |
- | - | 1,238 | 3,718 | ||||||||||||||||||
| Other derivatives |
- | - | 2,709 | 8,706 | ||||||||||||||||||
| - | - | 17,460 | 28,872 | |||||||||||||||||||
| 5-56 | Audited Consolidated Financial Statements 2022–23 – Queensland Government |
Notes to the Financial Statements
| 37. | Deposits, borrowings and advances, securities and derivatives continued |
(e) Securities and derivatives continued
| General Government | Total State | |||||||||||||||||||||
| 2023 | 2022 | 2023 | 2022 | |||||||||||||||||||
| $M | $M | $M | $M | |||||||||||||||||||
| Non-current |
||||||||||||||||||||||
| Government securities issued |
- | - | 104,601 | 102,468 | ||||||||||||||||||
| Derivatives |
||||||||||||||||||||||
| Cash flow hedges |
- | - | 332 | 1,409 | ||||||||||||||||||
| Other derivatives |
41 | 93 | 1,450 | 3,841 | ||||||||||||||||||
| 41 | 93 | 106,383 | 107,719 | |||||||||||||||||||
| 41 | 93 | 123,844 | 136,591 | |||||||||||||||||||
Financial liabilities disclosed above are classified as either financial liabilities held at amortised cost or as financial liabilities at fair value through profit or loss. The carrying amount of financial liabilities in each of the categories is disclosed in Note 47.
Financial liabilities held at amortised cost
Financial liabilities held at amortised cost are initially measured at fair value plus any directly attributable transaction costs and subsequently measured at amortised cost using the effective interest method.
Financial liabilities measured at amortised cost include interest bearing security deposits, borrowing with QTC, advances from the Australian Government and PNFCs, lease liabilities, service concession liabilities and other loans (except those held by QTC). The borrowing with QTC and advances from PNFCs are eliminated on consolidation of the TSS.
Financial liabilities at fair value through profit or loss
Financial liabilities are categorised as fair value through profit or loss if they are classified as held for trading or designated so upon initial recognition. Financial liabilities at fair value through profit or loss are valued at fair value at balance date. Unrealised gains and losses are brought to account as other economic flows included in the operating result.
Financial liabilities at fair value through profit or loss include deposits and other loans held by QTC, Government securities issued by QTC, and derivatives. In relation to deposits, income derived from their investment accrues to depositors daily. The amount shown in the Balance Sheet represents the market value of deposits held at balance date. Collateral held and securities which are sold under agreements to repurchase are disclosed as deposits.
Government securities issued include short-term treasury notes, Australian bonds and floating rate notes principally raised by QTC.
Derivative financial instruments
The State, through its controlled entities, enters into derivative financial instruments in the normal course of business in order to hedge exposure to movements in interest rates, electricity prices and foreign currency exchange rates.
Derivatives are initially recognised at fair value on the date a derivative contract is entered into and are subsequently remeasured to their fair value at each reporting period.
Some derivatives are used in cash flow hedges for highly probable forecast transactions, as detailed in subsection (i) below. Gains or losses on the effective portion of cash flow hedges are recognised in the cash flow hedge reserve in equity, while the ineffective portion is recognised immediately as other economic flows included in the operating result. Amounts taken to equity are transferred to the operating result when the hedged transaction affects the operating result, such as when a forecast sale or purchase occurs, or when the hedge becomes ineffective. Where the forecast transaction that is hedged results in recognising a non-financial asset or liability, the gains or losses previously deferred in equity are transferred to the carrying amount of the asset or liability.
All derivatives are carried as assets when fair value is positive and liabilities when fair value is negative. Derivative assets are disclosed in Note 24(a) and derivative liabilities are disclosed in part (e) of this note. Derivative instruments used by the State include options, futures contracts, electricity derivative contracts, forward starting loans, forward rate agreements, foreign exchange contracts, cross currency swaps and interest rate swaps.
| Audited Consolidated Financial Statements 2022–23 – Queensland Government | 5-57 |
Notes to the Financial Statements
| 37. | Deposits, borrowings and advances, securities and derivatives continued |
Derivative financial instruments continued
(i) Cash flow hedges
Risk management strategy
The State applies hedge accounting on eligible electricity derivatives (mostly price swaps, futures, and options) that are used to protect against movements in the price of electricity. The economic relationship is determined by matching the critical terms, such as forecasted volume and time period, between the hedging instrument and the hedged item. The hedge ratio for these hedging relationships is intended to be 100 per cent. However, the inherent variability in the volume of electricity demand and sales means that actual sales and purchases volumes can vary from the forecasts. These variances are the main source of hedge ineffectiveness.
The State also enters into forward exchange contracts and interest rate swaps to protect against foreign exchange and interest rate movements. The total amount of these derivatives is not material.
Amount, timing and uncertainty of future cash flows
The electricity derivatives are recognised at trade date and settled net, with the majority of cash flows expected within four years. The nominal amount of electricity hedges outstanding and their price average are as follows:
Total State Sector
| Nominal quantity |
Price average |
|||||||
| GWh | $ / MWh | |||||||
| 2023 |
||||||||
| Electricity derivatives designated as cash flow hedges of electricity sales |
31,450 | 73 | ||||||
| Electricity derivatives designated as cash flow hedges of electricity purchases |
9,649 | 101 | ||||||
| 2022 |
||||||||
| Electricity derivatives designated as cash flow hedges of electricity sales |
44,635 | 69 | ||||||
| Electricity derivatives designated as cash flow hedges of electricity purchases |
13,077 | 85 | ||||||
|
Effects of cash flow hedge accounting on financial position and performance |
||||||||
| Total State | ||||||||
| 2023 | 2022 | |||||||
| $M | $M | |||||||
| Carrying amount of cash flow hedging instruments - assets |
573 | 1,778 | ||||||
| - liabilities |
1,571 | 5,127 | ||||||
| Change in fair value of hedging instruments - gain/(loss) - for calculating hedge ineffectiveness |
1,463 | (3,823 | ) | |||||
| Change in value of hedged items - gain/(loss) - for calculating hedge ineffectiveness |
(1,383 | ) | 3,222 | |||||
| Hedge ineffectiveness recognised in profit or loss (See Note 16) |
114 | 71 | ||||||
| Cash flow hedge reserve reconciliation: |
||||||||
| Opening balance |
(3,153 | ) | (314 | ) | ||||
| Effective portion of hedging gains or losses recognised in equity |
939 | (3,609 | ) | |||||
| Amounts reclassified to profit or loss - hedged item has affected profit or loss 1 |
1,279 | 776 | ||||||
| Amounts reclassified to profit or loss - hedged future cash flows no longer expected to occur |
(1 | ) | (6 | ) | ||||
| Amounts included in the carrying amount of a non-financial asset or liability |
1 | 1 | ||||||
|
|
|
|
|
|||||
| Closing balance |
(934 | ) | (3,153 | ) | ||||
|
|
|
|
|
|||||
1 Reclassification adjustments are included in sales of goods and services (for sales) in Note 5 or other operating expenses (for purchases) in Note 11.
The closing balance of the cash flow hedge reserve relates to continuing hedges, with the exception of $29 million of losses (2022: $42 million) that relates to hedge relationships for which hedge accounting is no longer applied.
No amounts were recognised in or transferred from hedging reserves by GGS entities in 2023 or 2022.
| 5-58 | Audited Consolidated Financial Statements 2022–23 – Queensland Government |
Notes to the Financial Statements
| 37. | Deposits, borrowings and advances, securities and derivatives continued |
Derivative financial instruments continued
(ii) Derivatives which do not qualify for hedge accounting
Certain derivatives do not qualify for hedge accounting as they are held for trading or not designated as hedges. These instruments typically include some electricity derivatives such as swaps, caps and options and load following hedges, and environmental derivatives contracts, such as forward contracts and options. Interest rate swaps, forward rate agreements, options and credit default swaps are also used to hedge exposure to interest rate movements, foreign currency and credit risks but are not hedge accounted.
| 38. | Provisions |
| General Government | Total State | |||||||||||||||||||||
| 2023 | 2022 | 2023 | 2022 | |||||||||||||||||||
| $M | $M | $M | $M | |||||||||||||||||||
| Current |
||||||||||||||||||||||
| Outstanding claims |
||||||||||||||||||||||
| Workers’ compensation |
- | - | 1,806 | 1,590 | ||||||||||||||||||
| Other |
324 | 262 | 345 | 276 | ||||||||||||||||||
| Onerous contracts |
- | - | 39 | 39 | ||||||||||||||||||
| National Injury Insurance Scheme Queensland |
- | - | 138 | 143 | ||||||||||||||||||
| Queensland Government Insurance Fund |
337 | 361 | 337 | 361 | ||||||||||||||||||
| Other |
377 | 267 | 547 | 369 | ||||||||||||||||||
| 1,038 | 890 | 3,212 | 2,777 | |||||||||||||||||||
| Non-current |
||||||||||||||||||||||
| Outstanding claims |
||||||||||||||||||||||
| Workers’ compensation |
- | - | 2,948 | 2,643 | ||||||||||||||||||
| Other |
699 | 691 | 713 | 708 | ||||||||||||||||||
| Onerous contracts |
- | - | 148 | 189 | ||||||||||||||||||
| National Injury Insurance Scheme Queensland |
- | - | 3,545 | 3,340 | ||||||||||||||||||
| Queensland Government Insurance Fund |
2,975 | 3,262 | 2,975 | 3,262 | ||||||||||||||||||
| Other |
278 | 278 | 1,051 | 969 | ||||||||||||||||||
| 3,953 | 4,231 | 11,381 | 11,111 | |||||||||||||||||||
| 4,991 | 5,120 | 14,593 | 13,888 | |||||||||||||||||||
Provisions are recognised when there is a present legal or constructive obligation as a result of past events, it is probable that an outflow of resources will be required to settle the obligation and the amount has been reliably estimated. Where there are a number of similar obligations, the likelihood that an outflow will be required is determined by considering the class of obligations as a whole. Provisions are measured at the present value of the estimate of the expenditure required to settle the present obligation at the reporting date. The discount rate used to determine the present value reflects current market assessment of the time value of money and risks specific to the liability.
Outstanding claims
The liability for outstanding claims is measured as the present value of expected future payments, the majority of which are actuarially assessed. The liability includes outstanding claim recoveries and reinsurance receivables.
In accordance with AASB 1023 General Insurance Contracts, the claims liability includes a risk margin in addition to expected future payments. These liabilities are discounted for the time value of money using risk-free discount rates that are based on current, observable, objective rates.
(i) Workers’ Compensation
WorkCover Queensland is the main provider of workers’ compensation insurance in Queensland. The discount rate applied to Workers’ Compensation gross outstanding claims as at 30 June 2023 was 4.5% (2022: 3.9%) and the inflation rate was 3.5% (2022: 3.5%). The risk margin applied was 9% (2022: 9%).
| Audited Consolidated Financial Statements 2022–23 – Queensland Government | 5-59 |
Notes to the Financial Statements
| 38. | Provisions continued |
Outstanding claims continued
(ii) National Redress Scheme for Survivors of Institutional Child Sexual Abuse
The National Redress Scheme for Survivors of Institutional Child Sexual Abuse commenced on 1 July 2018 and will run for ten years. Queensland Government will pay 50% of redress cost for Queensland institutions under the expanded Funder of Last Resort (FoLR) arrangements that commenced 3 December 2021.
The Scheme provides eligible applicants support through a monetary payment capped at $150,000.
The provision for the National Redress Scheme includes an estimate of Queensland’s future payments to the Commonwealth including amounts for monetary payments, counselling, psychological care, legal and administrative costs and offsets for payments previously made to survivors, largely under the previous National Redress Scheme.
(iii) National Injury Insurance Scheme Queensland (NIISQ)
NIISQ was established on 1 July 2016 to provide ongoing lifetime treatment, care and support services for people who sustain eligible, serious personal injuries in a motor vehicle accident on or after 1 July 2016, regardless of fault.
The NIISQ is funded via a levy which Queensland motorists pay in conjunction with their Compulsory Third Party (CTP) premium and registration. The levy is set annually and is based on actuarial advice to fully fund present and likely future liabilities of the scheme. Scheme liabilities are long term in nature and estimates of costs are sensitive to underlying financial assumptions for inflation and the discount rate. Actuarial assumptions underpinning the levy adopt long-term assumptions for inflation and the discount rate to support year to year levy stability (3.3% p.a. and 4.3% p.a. respectively for 2022-23).
NIISQ provisions are assessed annually by independent actuaries and are measured in accordance with AASB 137 as the present value of the expected future payments for claims of the NIISQ incurred up to 30 June 2023, including claims incurred but not reported. The estimate of the NIISQ provision is based on market consistent assumptions of 3.5% inflation and a discount rate of 4.4% as at 30 June 2023 (3.4% and 4% respectively for 2022).
(iv) Queensland Government Insurance Fund (QGIF)
QGIF was established as a centrally managed self-insurance fund for the State’s insurable liabilities covering property, medical and other liabilities and is an administrative arrangement within the Consolidated Fund. QGIF aims to improve the management of insurable risks through identifying, providing for and funding the Government’s insurance liabilities. Participating Government agencies pay premiums into the fund to meet the cost of claims and future insurable liabilities. QGIF outstanding claim liabilities are reported at the whole of Government level, with claims paid out of Queensland Treasury’s Administered accounts.
The State’s QGIF provisions are actuarially assessed annually and are calculated in accordance with AASB 137. The liabilities relate to all claims incurred prior to 30 June 2023 and include an estimate of the cost of claims that are incurred but not reported. Expected future payments are discounted using yields on Australian government bonds. This risk-free discount rate applied as at 30 June 2023 was 4.3% (2022: 3.8%).
Other provisions
(i) Power Purchase/Pooling Agreement provisions
A provision for onerous contracts has been recognised in relation to long-term power purchase/pooling agreements (PPAs) when the unavoidable costs of meeting the ongoing obligations under these agreements exceed the expected benefits to be received. The provision for onerous contracts reflects the net present value of the least net cost of exiting these onerous PPAs, which is the lower of the cost of fulfilling the agreements or the compensation payable, as defined in these agreements, for early termination.
An onerous contract provision exists in relation to the Gladstone Inter-connection and Power Pooling Agreement and was remeasured downwards by $57 million (2022: upwards by $84 million) during the year due to a change in future cash flow assumptions.
| 5-60 | Audited Consolidated Financial Statements 2022–23 – Queensland Government |
Notes to the Financial Statements
| 38. | Provisions continued |
Other provisions continued
(i) Power Purchase/Pooling Agreement provisions continued
The extent of the future losses from the power purchase/pooling agreements will depend on future wholesale pool prices as well as the need for the State to meet its network support obligations. The future level of Queensland wholesale pool prices remains significantly uncertain. The critical determinants of future pool prices will be the bidding behaviour of participants in the National Electricity Market, load growth, network reliability and the introduction of new generation capacity. The discount rate used reflects current market assessments of the time value of money and the risks specific to these obligations.
(ii) Restoration provisions
Provisions are recognised for dismantling, removal and restoration costs where a constructive obligation exists. The present value of the obligation is recorded in the initial cost of the asset.
Movements in provisions
| General Government Sector | Outstanding Claims |
QGIF | Other Provisions |
Total | ||||||||||||||||
| 2023 | 2023 | 2023 | 2023 | |||||||||||||||||
| $M | $M | $M | $M | |||||||||||||||||
| Carrying amount at beginning of year |
|
953 | 3,622 | 545 | 5,120 | |||||||||||||||
| Additional provisions recognised |
|
304 | 256 | 187 | 747 | |||||||||||||||
| Reductions in provisions and payments |
|
(294 | ) | (235 | ) | (108 | ) | (637 | ) | |||||||||||
| Transfers and reclassifications |
|
- | - | - | - | |||||||||||||||
| Change from remeasurement and discounting adjustments |
|
61 | (331 | ) | 31 | (239 | ) | |||||||||||||
|
|
|
|
|
|
|
|
|
|
|
|
| |||||||||
| Carrying amount at end of year |
|
1,023 | 3,312 | 655 | 4,991 | |||||||||||||||
|
|
|
|
|
|
|
|
|
|
|
|
| |||||||||
| Total State Sector |
|
Outstanding Claims |
|
NIISQ | QGIF | |
Other Provisions |
|
Total | |||||||||||
| 2023 | 2023 | 2023 | 2023 | 2023 | ||||||||||||||||
| $M | $M | $M | $M | $M | ||||||||||||||||
| Carrying amount at beginning of year |
5,216 | 3,483 | 3,622 | 1,566 | 13,888 | |||||||||||||||
| Additional provisions recognised |
2,857 | 516 | 256 | 289 | 3,918 | |||||||||||||||
| Reductions in provisions and payments |
(2,321 | ) | (167 | ) | (235 | ) | (205 | ) | (2,928 | ) | ||||||||||
| Transfers and reclassifications |
- | - | - | 56 | 56 | |||||||||||||||
| Change from remeasurement and discounting adjustments |
61 | (149 | ) | (331 | ) | 79 | (341 | ) | ||||||||||||
|
|
|
|
|
|
|
|
|
|
|
|
|
|
|
| ||||||
| Carrying amount at end of year |
5,813 | 3,683 | 3,312 | 1,785 | 14,593 | |||||||||||||||
|
|
|
|
|
|
|
|
|
|
|
|
|
|
|
| ||||||
| 39. | Other liabilities |
| General Government | Total State | |||||||||||||||
| 2023 | 2022 | 2023 | 2022 | |||||||||||||
| $M | $M | $M | $M | |||||||||||||
| Current |
||||||||||||||||
| Unearned revenue |
624 | 719 | 951 | 931 | ||||||||||||
| Environmental surrender obligations (RECs, GECs, NGACs) |
- | - | 179 | 174 | ||||||||||||
| Other |
176 | 158 | 149 | 131 | ||||||||||||
|
|
|
|
|
|
|
|
|
|
|
|
| |||||
| 800 | 877 | 1,279 | 1,236 | |||||||||||||
|
|
|
|
|
|
|
|
|
|
|
|
| |||||
| Non-current |
||||||||||||||||
| Unearned revenue |
215 | 204 | 662 | 671 | ||||||||||||
| Other |
- | 8 | 25 | 17 | ||||||||||||
|
|
|
|
|
|
|
|
|
|
|
|
| |||||
| 215 | 212 | 687 | 688 | |||||||||||||
|
|
|
|
|
|
|
|
|
|
|
|
| |||||
|
|
|
|
|
|
|
|
|
|
|
|
| |||||
| 1,015 | 1,089 | 1,966 | 1,925 | |||||||||||||
|
|
|
|
|
|
|
|
|
|
|
|
| |||||
| Audited Consolidated Financial Statements 2022–23 – Queensland Government | 5-61 |
Notes to the Financial Statements
| 40. | Notes to the Cash Flow Statement |
| (a) | Reconciliation of operating result to net cash flows from operating activities |
| General Government | Total State | |||||||||||||||
| 2023 | 2022 | 2023 | 2022 | |||||||||||||
| $M | $M | $M | $M | |||||||||||||
| Operating result |
14,128 | 3,371 | 16,150 | 17,550 | ||||||||||||
| Non-cash movements: |
||||||||||||||||
| Depreciation and amortisation |
5,166 | 4,644 | 7,914 | 7,391 | ||||||||||||
| Net (gain)/loss on disposal of Non-current assets |
(11 | ) | 6 | (193 | ) | (1,819 | ) | |||||||||
| Impairment and write-off of bad debts |
51 | 86 | 515 | 44 | ||||||||||||
| Equity accounting (profit)/loss |
7 | 3 | 14 | 3 | ||||||||||||
| Unrealised net (gain)/loss on borrowings/investments |
(1 | ) | 30 | (879 | ) | (13,318 | ) | |||||||||
| Revaluation (increments)/decrements |
(115 | ) | 1,000 | (4,175 | ) | (70 | ) | |||||||||
| Net asset write downs, transfers and donations |
(270 | ) | (391 | ) | (318 | ) | (432 | ) | ||||||||
| Other |
(35 | ) | (347 | ) | (72 | ) | (723 | ) | ||||||||
| (Increase)/decrease in receivables |
(146 | ) | 1,335 | 33 | 589 | |||||||||||
| (Increase)/decrease in inventories |
(129 | ) | 32 | (429 | ) | (116 | ) | |||||||||
| (Increase)/decrease in prepayment and other assets |
(13 | ) | 155 | (303 | ) | (262 | ) | |||||||||
| Increase/(decrease) in payables |
1,840 | 1,009 | 1,456 | 1,370 | ||||||||||||
| Increase/(decrease) in provisions |
(552 | ) | (611 | ) | 248 | 121 | ||||||||||
| Increase/(decrease) in other liabilities |
(34 | ) | 118 | 221 | 306 | |||||||||||
|
|
|
|
|
|
|
|
|
|
|
|
| |||||
| Total non-cash movements |
5,757 | 7,069 | 4,034 | (6,915 | ) | |||||||||||
|
|
|
|
|
|
|
|
|
|
|
|
| |||||
| Cash flows from operating activities |
19,885 | 10,440 | 20,184 | 10,634 | ||||||||||||
| (b) | Changes in liabilities arising from financing activities |
| General Government Sector |
||||||||||||||||||||||||||||
| |-------Cash Flows-----| | |------Non-Cash Changes-----| | |||||||||||||||||||||||||||
| Opening | Cash | Cash | New | Market | Other | Closing | ||||||||||||||||||||||
| Balance | Received | Payments | Leases | & Time | Balance | |||||||||||||||||||||||
| & similar | Value | |||||||||||||||||||||||||||
| $M | $M | $M | $M | $M | $M | |||||||||||||||||||||||
| 2023 |
||||||||||||||||||||||||||||
| Advances received |
1,310 | 3,264 | (2,665 | ) | - | 1 | - | 1,909 | ||||||||||||||||||||
| Borrowing with QTC |
49,000 | 13 | (46 | ) | - | - | (2,800 | ) | 46,166 | |||||||||||||||||||
| Other loans |
3,858 | - | (579 | ) | 625 | - | 66 | 3,970 | ||||||||||||||||||||
| Leases |
3,076 | - | (527 | ) | 133 | 141 | 96 | 2,919 | ||||||||||||||||||||
| SCA non-GORTOs |
737 | - | (202 | ) | 91 | - | 3 | 630 | ||||||||||||||||||||
| Securities and derivatives |
93 | - | - | - | (27 | ) | (26 | ) | 41 | |||||||||||||||||||
|
|
|
|
|
|
|
|
|
|
|
|
|
|
|
|
|
|
|
|
|
| ||||||||
| 58,074 | 3,276 | (4,018 | ) | 849 | 116 | (2,661 | ) | 55,636 | ||||||||||||||||||||
|
|
|
|
|
|
|
|
|
|
|
|
|
|
|
|
|
|
|
|
|
| ||||||||
| 2022 |
||||||||||||||||||||||||||||
| Advances received |
1,435 | 2,339 | (2,465 | ) | - | 1 | - | 1,310 | ||||||||||||||||||||
| Borrowing with QTC |
46,153 | 3,038 | (36 | ) | - | - | (155 | ) | 49,000 | |||||||||||||||||||
| Other loans |
3,818 | - | (842 | ) | 815 | - | 67 | 3,858 | ||||||||||||||||||||
| Leases |
3,191 | - | (504 | ) | 160 | 74 | 155 | 3,076 | ||||||||||||||||||||
| SCA non-GORTOs |
694 | - | (36 | ) | 76 | 3 | 1 | 737 | ||||||||||||||||||||
| Securities and derivatives |
220 | - | - | - | (127 | ) | - | 93 | ||||||||||||||||||||
|
|
|
|
|
|
|
|
|
|
|
|
|
|
|
|
|
|
|
|
|
| ||||||||
| 55,511 | 5,377 | (3,883 | ) | 1,051 | (49 | ) | 68 | 58,074 | ||||||||||||||||||||
|
|
|
|
|
|
|
|
|
|
|
|
|
|
|
|
|
|
|
|
|
| ||||||||
| 5-62 | Audited Consolidated Financial Statements 2022–23 – Queensland Government |
Notes to the Financial Statements
| 40. | Notes to the Cash Flow Statement continued |
| (b) | Changes in liabilities arising from financing activities continued |
| Total State Sector |
||||||||||||||||||||||||||||
| |-------Cash Flows-----| | |------Non-Cash Changes-----| | |||||||||||||||||||||||||||
| Opening | Cash | Cash | New | Market | Other | Closing | ||||||||||||||||||||||
| Balance | Received | Payments | Leases | & Time | Balance | |||||||||||||||||||||||
| & similar | Value | |||||||||||||||||||||||||||
| $M | $M | $M | $M | $M | $M | $M | ||||||||||||||||||||||
| 2023 |
||||||||||||||||||||||||||||
| Advances received |
262 | 3 | (31 | ) | - | 1 | - | 235 | ||||||||||||||||||||
| Other loans |
4,313 | 30 | (623 | ) | 625 | 4 | 66 | 4,416 | ||||||||||||||||||||
| Leases |
3,481 | - | (588 | ) | 184 | 142 | 107 | 3,326 | ||||||||||||||||||||
| SCA non-GORTOs |
737 | - | (202 | ) | 91 | - | 3 | 630 | ||||||||||||||||||||
| Deposits held |
6,639 | 5,563 | (7,099 | ) | - | - | - | 5,104 | ||||||||||||||||||||
| Securities and derivatives |
136,591 | 26,756 | (27,839 | ) | - | (11,637 | ) | (26 | ) | 123,844 | ||||||||||||||||||
|
|
|
|
|
|
|
|
|
|
|
|
|
|
|
|
|
|
|
|
|
| ||||||||
| 152,024 | 32,352 | (36,381 | ) | 900 | (11,490 | ) | 150 | 137,554 | ||||||||||||||||||||
|
|
|
|
|
|
|
|
|
|
|
|
|
|
|
|
|
|
|
|
|
| ||||||||
| 2022 |
||||||||||||||||||||||||||||
| Advances received |
300 | 1 | (40 | ) | - | 1 | - | 262 | ||||||||||||||||||||
| Other loans |
4,212 | 113 | (862 | ) | 815 | (31 | ) | 67 | 4,313 | |||||||||||||||||||
| Leases |
3,697 | - | (566 | ) | 180 | 10 | 160 | 3,481 | ||||||||||||||||||||
| SCA non-GORTOs |
694 | - | (36 | ) | 76 | 3 | 1 | 737 | ||||||||||||||||||||
| Deposits held |
6,384 | 6,472 | (6,217 | ) | - | - | - | 6,639 | ||||||||||||||||||||
| Securities and derivatives |
124,191 | 30,244 | (19,798 | ) | - | 1,953 | - | 136,590 | ||||||||||||||||||||
|
|
|
|
|
|
|
|
|
|
|
|
|
|
|
|
|
|
|
|
|
| ||||||||
| 139,479 | 36,831 | (27,520 | ) | 1,070 | 1,936 | 227 | 152,024 | |||||||||||||||||||||
|
|
|
|
|
|
|
|
|
|
|
|
|
|
|
|
|
|
|
|
|
| ||||||||
| 41. | Capital expenditure commitments |
As at 30 June 2023, State Government entities had entered into the following capital commitments. Commitments are exclusive of anticipated recoverable GST. Commitments in this note have not been recognised as liabilities in the Balance Sheet.
| General Government | Total State | |||||||||||||||
| 2023 | 2022 | 2023 | 2022 | |||||||||||||
| $M | $M | $M | $M | |||||||||||||
|
|
|
|
|
|
|
|
|
|
|
|
| |||||
| Capital expenditure commitments |
11,129 | 8,555 | 15,081 | 11,474 | ||||||||||||
|
|
|
|
|
|
|
|
|
|
|
|
| |||||
| 42. | Cash and other assets held in trust |
Various monies and other assets were held in trust by State Government agencies at year end and have not been included as assets / liabilities in the Balance Sheet:
| General Government | Total State | |||||||||||||||
| 2023 | 2022 | 2023 | 2022 | |||||||||||||
| $M | $M | $M | $M | |||||||||||||
| QIC Limited |
- | - | 46,340 | 46,616 | ||||||||||||
| The Public Trustee of Queensland |
2,264 | 1,937 | 2,264 | 1,937 | ||||||||||||
| Other |
402 | 424 | 402 | 425 | ||||||||||||
|
|
|
|
|
|
|
|
|
|
|
|
| |||||
| 2,666 | 2,361 | 49,006 | 48,978 | |||||||||||||
|
|
|
|
|
|
|
|
|
|
|
|
| |||||
Security, tender and other deposits administered by the State in a fiduciary or trust capacity are not recognised in the financial statements but are disclosed for information purposes. Whilst these transactions and balances are in the care of the State, they are subject to the normal internal control and external audit requirements.
| Audited Consolidated Financial Statements 2022–23 – Queensland Government | 5-63 |
Notes to the Financial Statements
| 43. | Contingent assets and liabilities |
Contingent assets and liabilities represent items that are not recognised in the Balance Sheet because at balance date:
| – | there is a possible asset or obligation arising from past events whose existence will be confirmed by the occurrence or non-occurrence of one or more uncertain future events not wholly within the control of the Government; or |
| – | there is a present obligation arising from past events, but it is not recognised because it is either not probable that an outflow of resources embodying economic benefits will be required to settle the obligation or the amount of the obligation cannot be measured reliably. |
Below are details of the more significant contingent assets and liabilities from a GGS and TSS perspective.
Pursuant to section 15 of the Queensland Treasury Corporation Act 1988, any losses of QTC are the responsibility of the Consolidated Fund. On this basis, the contingent assets and liabilities of QTC, which forms part of the PFC Sector, are also incorporated in GGS statements.
| (a) | Contingent liabilities – quantifiable |
| General Government | Total State | |||||||||||||||
| 2023 | 2022 | 2023 | 2022 | |||||||||||||
| $M | $M | $M | $M | |||||||||||||
| Nature of contingency | ||||||||||||||||
| Guarantees and indemnities | 54,443 | 53,646 | 12,747 | 12,842 | ||||||||||||
| Other | 117 | 174 | 120 | 178 | ||||||||||||
|
|
|
|
|
|
|
|
|
|
|
|
| |||||
| 54,560 | 53,821 | 12,867 | 13,020 | |||||||||||||
|
|
|
|
|
|
|
|
|
|
|
|
| |||||
Guarantees and indemnities
| General Government Sector
For the GGS, these mainly comprise guarantees of borrowings by local governments and PNFCs from QTC of $8.79 billion and $41.514 billion (2022: $8.955 billion and $40.777 billion) respectively. QTC also provided guarantees of $2.09 billion (2022: $1.84 billion) relating to Australian Financial Services Licences for CS Energy Limited, Energy Queensland Limited, Stanwell Corporation Limited and CleanCo Queensland Limited, and guarantees of $150 million (2022: $300 million) relating to the trading activities in the National Electricity Market of subsidiaries of Energy Queensland Limited. |
|
Total State Sector
From a TSS perspective, borrowings by PNFCs from QTC as disclosed above are eliminated on consolidation.
(b) Contingent liabilities - not quantifiable
|
| General Government Sector
Legal proceedings and disputes
A number of legal actions have been brought against the State Government and its agencies. Notification has also been received of a number of other cases that are not yet subject to court action but which may result in subsequent litigation. Due to the wide variety and nature of the claims and the uncertainty of any potential liability, no value has been attributed to these actions / claims.
Native title
A number of native title claims that affect the Queensland Government have been filed with the National Native Title Tribunal under the Native Title Act 1993 (Commonwealth).
The Native Title Act 1993 provides for payment of compensation to native titleholders for a variety of acts that may affect native title. The Government has a potentially significant liability in respect of compensation arising from acts that have extinguished or impaired native title since 1975. The High Court decision in relation to Griffiths v Northern Territory of Australia (known as the Timber Creek case), handed down on 13 March 2019, provides some guidance for calculating native title compensation.
At 30 June 2023, there were 53 (2022: 47) unresolved native title claims before the federal court over State lands (including offshore islands). The claims cover an area of approximately 16.6% (2022: 18.1%) of the state. At reporting date, it is not possible to make an estimate of any probable outcome of these claims, or of any financial effects. |
| 5-64 | Audited Consolidated Financial Statements 2022–23 – Queensland Government |
Notes to the Financial Statements
| 43. | Contingent assets and liabilities continued |
| (b) | Contingent liabilities – not quantifiable |
| General Government Sector continued
Guarantees
The State has provided a number of guarantees in the normal course of business. The amount of any future claims against these guarantees cannot be reliably estimated.
Financial assurance liability gap for mining projects
Financial assurances are required for mining projects to cover the rehabilitation liability should a mining leaseholder fail to undertake rehabilitation. The liability to undertake rehabilitation work remains the responsibility of the mining leaseholder. The State’s responsibility regarding rehabilitation is limited to managing any potential public safety and health risks only. At reporting date, it is not possible to determine the extent or timing of any potential financial effect of this responsibility.
Long-term sales permits
The Department of Agriculture and Fisheries has issued long-term permits to various sawmilling businesses regarding the supply of log timber from State-owned native forests. These sales permits provide for the payment of compensation by the State to the holder to the extent that the specified quantity of log timber is not harvested from the particular State-owned forests. At reporting date, the State does not foresee the need to pay compensation in relation to any of these long-term sales permits.
Collingwood Park guarantee
Due to a mine subsidence event that occurred at Collingwood Park in 2008, the State, under the Mineral Resources Act 1989, provides a guarantee to owners of affected land to stabilise land, repair subsidence related damage (if cost effective to do so), or purchase land beyond economic repair.
Impact of disasters
As a result of disasters impacting Queensland, further claims are anticipated on the State via the Queensland Reconstruction Authority. As per the 2023-24 Budget, the expected future expenditure in relation to past disasters is $4.12 billion (2022: $4.129 billion), the majority of which is expected to be recovered from the Australian Government.
Contaminated land
The State Government controls certain areas of land that are affected by pollutants. The agencies involved will be obliged to restore these assets to a safe and useable condition if their use changes, for example, when the land is sold. Given its nature, it is not possible to provide an estimate of the potential liability of this exposure. |
|
Total State Sector
The following PNFC and PFC non-quantifiable contingent liabilities are in addition to the GGS items above.
WorkCover Queensland
The Workers’ Compensation and Rehabilitation Act 2003 provides that the State Government guarantees every WorkCover policy or other insurance contract with WorkCover Queensland, a statutory body. Given the nature of this contingency, it is not possible to estimate the liability, if any, due under this heading.
QIC Limited
QIC Limited, in its capacity as trustee, is potentially liable for the unsettled liabilities of a number of trusts that it administers. However, under the respective trust deeds, the Corporation is entitled to be indemnified out of the assets of the trusts for any losses or outgoings that may be sustained in its role as trustee, provided the trustee has acted within the terms of the trust deeds.
The directors of QIC have assessed the recoverable amounts of the assets of the trusts and concluded that currently they have excess assets over liabilities. |
| Audited Consolidated Financial Statements 2022–23 – Queensland Government | 5-65 |
Notes to the Financial Statements
| 43. | Contingent assets and liabilities continued |
| (b) | Contingent liabilities – not quantifiable continued |
| Total State Sector continued
State asset sales
As part of the State’s asset sales process in 2011 and 2012 (the initial public offering of shares in QR National Limited (now Aurizon Limited), the Forestry Plantations business, the Port of Brisbane business, the Abbot Point Coal Terminal (X50) business and Queensland Motorways Limited), the State put in place contractual arrangements which result in contingent liabilities as follows: – Superannuation indemnity for QR National and Forestry Plantations Queensland for the cost of employer contributions above a particular threshold for their employees who remained as members of QSuper’s defined benefit category; – State indemnities for directors and officers of relevant Government-owned corporations and State public servants were put into place in relation to liabilities which might arise out of the restructuring and sale of the various sale entities; – Indemnities as to tax and other liabilities accrued during the State’s ownership; – Compensation potentially payable in the event that the leases issued over land and infrastructure by State agencies are terminated; – Compensation potentially payable for improvements in the event of the termination of relevant leases; and – Various warranties in relation to the businesses sold.
At present, the State is unaware of any breaches of agreements and there are no claims being made. As such, it is not possible to estimate any potential financial effect should such a claim arise in the future. |
| (c) | Contingent assets - quantifiable |
| General Government | Total State | |||||||
| 2023 | 2022 | 2023 | 2022 | |||||
| $M | $M | $M | $M | |||||
| Nature of contingency |
||||||||
| Guarantees and indemnities |
7,525 | 6,468 | 8,314 | 7,232 | ||||
| Other |
11 | 11 | 11 | 11 | ||||
|
|
|
|
| |||||
| 7,535 | 6,478 | 8,324 | 7,243 | |||||
|
|
|
|
| |||||
Guarantees and indemnities
| General Government Sector
The Financial Provisioning Scheme (FPS) manages the State’s financial risk from the potential failure of a resource activity holder of an environmental authority or small-scale mining tenure to meet their rehabilitation and environmental obligations under various legislation. Over time, the scheme will also provide funds to support rehabilitation of abandoned mines and expand research into mine rehabilitation.
Queensland Treasury holds non-cash surety totalling $7.009 billion (2022: $6.066 billion), made up of bank guarantees $5.334 billion (2022: $4.482 billion) and insurance bonds $1.676 billion (2022: $1.584 billion). |
|
Total State Sector
In addition to the above GGS quantifiable guarantees and indemnities, the following relate specifically to the PNFC and PFC sectors:
WorkCover Queensland held bank guarantees on behalf of self-insurers totalling $471 million (2022: $494 million).
(d) Contingent assets - not quantifiable
Total State Sector
PNFC and PFC non-quantifiable contingent assets include insurance claims yet to be finalised, including the Callide Unit C4 claim, bank guarantees in the event of non-payment of services, and performance fees yet to be received. |
| 44. | Post balance date events |
There were no material events after the reporting date of 30 June 2023 that have a bearing on the State’s operations, the results of those operations or these financial statements.
| 5-66 | Audited Consolidated Financial Statements 2022–23 – Queensland Government |
Notes to the Financial Statements
| 45. | Sustainability Related Risks |
The Queensland Government is exposed to sustainability related risks and develops and implements strategies, policies and procedures to manage these risks. The Queensland Government has identified the below material sustainability risk factors.
| Environment, Social and Governance (ESG) Factors | Policy initiatives taken to - | |||
| Climate Change | Transition to a low carbon future, by lowering greenhouse gas emission. Address the physical impacts arising from climate change by embedding adaption and resilience. |
|||
| Natural Capital | Manage the balance of resources used between industry and the community whilst safeguarding the natural environment. This includes surface and underground water management, biosecurity, aquaculture, forestry management and environmental protection. |
|||
| Social | Support an educated, healthy, and skilled community, through education, health services, social welfare, public order, diversity and opportunity, cyber security and safety. |
|||
| Governance (Economic and Fiscal) |
Provide robust frameworks that support Ministers and accountable officers to provide oversight and discharge their obligations. Strong economic and fiscal management is fundamental to achieving government’s objectives and good governance. |
|||
The Queensland Government is committed to ensuring that its risk management practices reflect a high standard of governance. The Government’s Queensland Sustainability Report (the Report) provides detailed information on how the Queensland Government manages these risks and ESG information to meet developing expectations and information needs of investors, financial markets, rating agencies and the community. The Report includes the Government’s sustainability disclosures on matters of governance, strategy, risk management, and metrics/targets to support positive ESG outcomes for a resilient and sustainable future.
Climate change is a material risk for the State. The Government both impacts, and is impacted by, climate change in many ways. The impacts of climate change have the potential to affect the State’s ability to provide essential services to the community, the operations of State entities and the value of State assets.
The government takes a risk management approach to climate change to ensure significant climate change risks are addressed in the government’s culture, policies, systems and processes by building on existing organisational strategic planning, performance management and risk and governance frameworks. Queensland Climate Ready (QCR) program is a multi-year program which supports agencies to identify and implement climate risk management within their risk management practices.
| (i) | The Queensland Climate Action Plan 2030 (QCAP) |
The QCAP has set achievable targets for reducing the state’s emissions while creating jobs and the Queensland Climate Adaptation Strategy 2017-2030 (Q-CAS) is a central component of Queensland’s climate change response, preparing the state for current and future climate changes by understanding the impacts, managing the risks and harnessing the opportunities. The QCAP supports the management of key risks and opportunities by Cabinet through the responsible Minister and administering departments.
| Queensland Government has set renewable energy and emissions reduction targets to meet objectives of achieving net zero emissions and decarbonising the energy sector. | – 30% emissions reduction below 2005 levels by 2030 – 50% renewable energy target by 2030 – 70% renewable energy target by 2032 – 80% renewable energy target by 2035 – Zero net emissions by 2050 |
The Queensland Government monitors progress on its targets using the State and Territory Greenhouse Gas Inventories prepared by the Australian Government. All national and state/territory inventory data is publicly available from Australia’s National Greenhouse Accounts (National Greenhouse Gas Inventory – UNFCCC classifications). The Department of Environment and Science reports progress on its climate targets on the Queensland Climate Action Plan 2020-2030 website.
| (ii) | The Queensland Energy and Jobs Plan (QEJP) |
The QEJP outlines the state’s pathway to a clean, reliable and affordable energy system to provide power for generations. It includes a pathway to build the new Queensland SuperGrid to connect solar, wind, battery and hydrogen projects across the state and unlock new capacity and storage. By decarbonising Queensland’s electricity network, input costs to industry will be lowered and energy sources will meet the requirements of increasingly ESG-conscious investors and consumers.
| Audited Consolidated Financial Statements 2022–23 – Queensland Government | 5-67 |
Notes to the Financial Statements
| 45. | Sustainability Related Risks continued |
| (iii) | Queensland new-industry development strategy |
The Queensland new-industry development strategy sets out the government’s approach to proactively developing the industries that will be in demand in a decarbonising world. The strategy targets six key areas:
| – | renewable energy manufacturing and infrastructure; |
| – | critical minerals processing, manufacturing and product development; |
| – | battery industry development; |
| – | green hydrogen; |
| – | the circular economy, including resource recovery; and |
| – | bioeconomy including biofuels and sustainable aviation fuel. |
| 46. | Financial risk management disclosure |
The State’s activities expose it to a variety of financial risks such as credit risk, liquidity risk and market risk (including interest rate risk, price risk and foreign exchange risk). The State’s overall risk management objectives, policies and strategies focus on minimising financial risk exposures and seek to mitigate potential adverse effects. The diverse nature of the financing and investing activities undertaken by agencies across the Queensland Government supports a decentralised approach to risk management. Individual agencies are responsible for managing risks to which they are exposed.
Risk management strategies in relation to the State’s financial assets and liabilities are summarised below. Additional risk management information can be found in individual agencies’ general purpose financial reports.
| (a) | Credit risk |
Credit risk exposure represents the potential loss that would be recognised if counterparties failed to meet contractual obligations in relation to receivables, loans and other financial assets.
Receivables, advances and loans
Queensland Treasury’s credit management strategy in respect of tax, royalties, and fines and penalties receivables focuses on the prompt collection of revenues and follow up of outstanding amounts within specified timeframes. Risk assessments are performed upon non-payment of debt, risk ratings are assigned and compliance plans are developed with reference to the debt management strategies.
The State operates in the National Electricity Market, operated by the Australian Energy Market Operator, which has strict prudential guidelines that minimise the potential for credit related losses. This is supported by individual GOCs’ Board approved policies. Where appropriate, collateral in the form of security deposits, letters of credit or bank guarantees are obtained from customers to mitigate possible losses. Concentration of credit risk for retail electricity customers is minimised due to the wide customer base and limiting credit to any individual customer.
Advances made under the COVID-19 Jobs Support Loans scheme are managed by credit assessment procedures, annual loan reviews, reporting of arrears, monitoring undertaken by an external credit reference bureau, and requiring security on loans over $100,000. $58 million of COVID-19 Jobs Support Loans are credit-impaired as at 30 June 2023 (2022: $54 million).
Onlendings made to local governments, universities, grammar schools and private companies as part of the Industry Support Package are actively monitored through credit reviews and covenant monitoring to ensure all counterparties maintain adequate debt serviceability and long-term financial stability.
Details of credit risk exposure and expected credit losses for receivables and advances are disclosed in Note 23.
Cash, securities and derivatives
In respect of cash, deposits, securities and bonds, the State is exposed to significant concentrations of credit risk in the finance sector, in particular, the domestic banking sector. While the State has been focused on diversifying its investment portfolio, investments in bank credit predominate because of the State’s requirement to invest with counterparties rated BBB+ or better and to invest in highly liquid securities. Key characteristics of these entities are monitored including their regulatory requirements, additional capital buffers, type of issuance and the impact of exigent developments. A ratings-based approach is used to determine maximum credit exposure, as well as the counterparty’s credit metrics, country of domicile, size of its funding programs, asset composition and quality of the underlying security.
| 5-68 | Audited Consolidated Financial Statements 2022–23 – Queensland Government |
Notes to the Financial Statements
| 46. | Financial risk management disclosure continued |
| (a) | Credit risk continued |
Cash, securities and derivatives continued
The State’s largest holder of investments and non-electricity derivatives is QTC. QTC’s credit risk exposures and its counterparty exposures by rating are as follows:
| 2023 | Cash & | Financial | Derivatives | Total | % of | |||||||||||||||
| equivalent | assets | Total | ||||||||||||||||||
| $M | $M | $M | $M | |||||||||||||||||
| AAA |
- | 2,079 | - | 2,079 | 6% | |||||||||||||||
| AA+ |
- | 609 | - | 609 | 2% | |||||||||||||||
| AA |
- | 364 | - | 364 | 1% | |||||||||||||||
| AA- |
7,354 | 22,524 | 39 | 29,917 | 79% | |||||||||||||||
| A+ |
- | 3,312 | 16 | 3,328 | 9% | |||||||||||||||
| A |
- | 919 | - | 919 | 2% | |||||||||||||||
| Other |
- | 522 | - | 522 | 1% | |||||||||||||||
|
|
|
|
|
|
|
|
|
|
|
|||||||||||
| 7,354 | 30,331 | 55 | 37,740 | 100% | ||||||||||||||||
|
|
|
|
|
|
|
|
|
|
|
|||||||||||
| 2022 | Cash & | Financial | Derivatives | Total | % of | |||||||||||||||
| equivalent | assets | Total | ||||||||||||||||||
| $M | $M | $M | $M | |||||||||||||||||
| AAA |
- | 2,770 | - | 2,770 | 8% | |||||||||||||||
| AA+ |
- | 1,116 | - | 1,116 | 3% | |||||||||||||||
| AA |
- | 371 | - | 371 | 1% | |||||||||||||||
| AA- |
5,247 | 18,890 | 35 | 24,172 | 72% | |||||||||||||||
| A+ |
- | 3,043 | 14 | 3,057 | 9% | |||||||||||||||
| A |
- | 1,784 | - | 1,784 | 5% | |||||||||||||||
| Other |
- | 515 | - | 515 | 2% | |||||||||||||||
|
|
|
|
|
|
|
|
|
|
|
|||||||||||
| 5,247 | 28,488 | 49 | 33,785 | 100% | ||||||||||||||||
|
|
|
|
|
|
|
|
|
|
|
|||||||||||
Credit risk exposures that relate to electricity derivatives are managed under International Swaps and Derivatives Association (ISDA) agreements. The ISDA also has a strict credit policy, based on counterparties’ credit ratings and requiring appropriate security.
Collateral and other credit enhancements
The maximum exposure to credit risk for the GGS and TSS on recognised financial assets, including derivatives, without taking account of any collateral or other credit enhancements is the carrying amount of these assets on the Balance Sheet.
The State holds as security, collateral in the form of charges over real property, business stock and assets, cash deposits, and bank, insurance company and other guarantees. Refer Note 43 for details of guarantees and indemnities.
Master netting arrangements
The GGS does not have financial instruments that are subject to enforceable master netting arrangements or similar agreements.
The TSS enters into derivative transactions under ISDA Master Agreements and similar agreements. Under the terms of these agreements, the right to set off is enforceable only on the occurrence of default or other credit events. The Total State’s ISDA agreements do not currently meet the criteria for offsetting at balance date, and accordingly the relevant assets and liabilities are shown grossed up.
Collateral is also transferred with derivative counterparties to reduce the Total State’s credit exposure.
| Audited Consolidated Financial Statements 2022–23 – Queensland Government | 5-69 |
Notes to the Financial Statements
| 46. | Financial risk management disclosure continued |
| (a) | Credit risk continued |
Cash, securities and derivatives continued
Master netting arrangements continued
The following table presents financial instruments, including collateral, that are subject to enforceable master netting or similar agreements but not yet offset in the balance sheet. The column ‘net amount’ shows the net impact on Total State if all set off rights (including collateral) were exercised.
| Gross amount |
Master netting & collateral |
Net amount | ||||||||||
| $M | $M | $M | ||||||||||
| 2023 |
||||||||||||
| Financial assets |
5,925 | (3,979 | ) | 1,946 | ||||||||
| Financial liabilities |
5,722 | (3,981 | ) | 1,741 | ||||||||
|
|
|
|
|
|
|
|
|
| ||||
| Net exposure |
203 | 2 | 205 | |||||||||
|
|
|
|
|
|
|
|
|
| ||||
| 2022 |
||||||||||||
| Financial assets |
15,753 | (9,981 | ) | 5,772 | ||||||||
| Financial liabilities |
17,790 | (9,981 | ) | 7,809 | ||||||||
|
|
|
|
|
|
|
|
|
| ||||
| Net exposure |
(2,037 | ) | - | (2,037 | ) | |||||||
|
|
|
|
|
|
|
|
|
| ||||
| (b) | Liquidity risk |
Liquidity risk arises from the possibility that individual agencies may be unable to settle a transaction on the due date. A range of funding strategies is used to ensure funds are available, such as maintaining a sufficient level of cash holdings to fund unexpected cash flows. QTC maintains appropriate liquidity to meet minimum requirements for the following liquidity metrics, which are reviewed annually:
| – | Standard & Poor’s Liquidity Ratio – maintaining a minimum ratio of liquid assets to debt serving requirements at all times over a rolling 12 month horizon; |
| – | Liquidity coverage ratio – maintaining a minimum liquidity balance sufficient to cover a stressed liquidity requirement over a set of horizon; and |
| – | Cash flow waterfall – maintaining positive cash equivalents net of all inflows and outflows over a set horizon. |
Liquidity risk of electricity market trading is controlled by the Australian Energy Market Operator, whereby all market participants are required to deliver irrevocable bank guarantees as security for timely settlement.
The contractual cash flow maturities of financial liabilities are included in the tables below. They are calculated based on undiscounted cash flows relating to the repayment of principal and interest amounts outstanding at balance date:
| General Government Sector
2023 |
||||||||||||||||||||
| 1 Year or | 1 to 5 | Over 5 | Total | Carrying | ||||||||||||||||
| Less | Years | Years | Value | |||||||||||||||||
| $M | $M | $M | $M | $M | ||||||||||||||||
| Payables |
10,555 | 71 | - | 10,626 | 10,626 | |||||||||||||||
| Commonwealth advances |
31 | 117 | 167 | 315 | 235 | |||||||||||||||
| Lease liabilities |
553 | 1,542 | 1,188 | 3,284 | 2,919 | |||||||||||||||
| SCA - non-GORTO liabilities |
86 | 327 | 539 | 952 | 630 | |||||||||||||||
| Other liabilities at amortised cost |
2,277 | 2,390 | 3,941 | 8,607 | 5,644 | |||||||||||||||
| Borrowing with QTC |
1,334 | 5,313 | 46,094 | 52,741 | 46,166 | |||||||||||||||
| Derivatives |
- | - | 59 | 59 | 41 | |||||||||||||||
|
|
|
|
|
|
|
|
|
|
|
| ||||||||||
| 14,836 | 9,760 | 51,988 | 76,584 | 66,261 | ||||||||||||||||
|
|
|
|
|
|
|
|
|
|
|
| ||||||||||
| 5-70 | Audited Consolidated Financial Statements 2022–23 – Queensland Government |
Notes to the Financial Statements
| 46. | Financial risk management disclosure continued |
| (b) | Liquidity risk continued |
| General Government Sector
2022 |
||||||||||||||||||||
| 1 Year or | 1 to 5 | Over 5 | Total | Carrying | ||||||||||||||||
| Less | Years | Years | Value | |||||||||||||||||
| $M | $M | $M | $M | $M | ||||||||||||||||
| Payables |
8,666 | 140 | - | 8,806 | 8,806 | |||||||||||||||
| Commonwealth advances |
40 | 117 | 190 | 348 | 262 | |||||||||||||||
| Lease liabilities |
548 | 1,552 | 1,336 | 3,436 | 3,076 | |||||||||||||||
| SCA - non-GORTO liabilities |
155 | 325 | 621 | 1,102 | 737 | |||||||||||||||
| Other liabilities at amortised cost |
2,147 | 1,958 | 3,927 | 8,032 | 4,905 | |||||||||||||||
| Borrowing with QTC |
1,241 | 4,975 | 48,943 | 55,158 | 49,000 | |||||||||||||||
| Derivatives |
- | 40 | 78 | 118 | 93 | |||||||||||||||
|
|
|
|
|
|
|
|
|
|
|
| ||||||||||
| 12,798 | 9,107 | 55,096 | 77,000 | 66,880 | ||||||||||||||||
|
|
|
|
|
|
|
|
|
|
|
| ||||||||||
| Total State Sector
2023 |
1 year or | 1 to 5 | Over 5 | Total | Carrying | |||||||||||||||
| less | years | years | value | |||||||||||||||||
| $M | $M | $M | $M | $M | ||||||||||||||||
| Payables |
12,463 | 146 | - | 12,609 | 12,609 | |||||||||||||||
| Commonwealth advances |
31 | 117 | 167 | 315 | 235 | |||||||||||||||
| Lease liabilities |
632 | 1,785 | 1,237 | 3,654 | 3,326 | |||||||||||||||
| SCA - non-GORTO liabilities |
86 | 327 | 539 | 952 | 630 | |||||||||||||||
| Other liabilities at amortised cost |
628 | 2,390 | 3,941 | 6,959 | 3,996 | |||||||||||||||
| Government securities and other loans at fair value |
22,639 | 59,509 | 75,685 | 157,833 | 123,637 | |||||||||||||||
| Derivatives |
5,172 | 621 | 246 | 6,038 | 5,730 | |||||||||||||||
|
|
|
|
|
|
|
|
|
|
|
| ||||||||||
| 41,651 | 64,895 | 81,814 | 188,359 | 150,163 | ||||||||||||||||
|
|
|
|
|
|
|
|
|
|
|
| ||||||||||
| 2022 | 1 year or | 1 to 5 | Over 5 | Total | Carrying | |||||||||||||||
| less | years | years | value | |||||||||||||||||
| $M | $M | $M | $M | $M | ||||||||||||||||
| Payables |
10,894 | 213 | - | 11,107 | 11,107 | |||||||||||||||
| Commonwealth advances |
40 | 117 | 190 | 348 | 262 | |||||||||||||||
| Lease liabilities |
601 | 1,778 | 1,439 | 3,818 | 3,481 | |||||||||||||||
| SCA - non-GORTO liabilities |
155 | 325 | 621 | 1,102 | 737 | |||||||||||||||
| Other liabilities at amortised cost |
1,100 | 1,982 | 3,927 | 7,009 | 3,882 | |||||||||||||||
| Government securities and other loans at fair value |
26,806 | 53,519 | 72,611 | 152,936 | 125,987 | |||||||||||||||
| Derivatives |
15,117 | 5,199 | 590 | 20,906 | 17,675 | |||||||||||||||
|
|
|
|
|
|
|
|
|
|
|
| ||||||||||
| 54,713 | 63,134 | 79,378 | 197,225 | 163,131 | ||||||||||||||||
|
|
|
|
|
|
|
|
|
|
|
| ||||||||||
| (c) | Market risk |
| (i) | Interest rate and unit price risk |
Interest income
The GGS and TSS are exposed to interest rate risk through investments managed by QIC Limited and cash deposits with the Commonwealth Bank of Australia. The GGS is also exposed to interest rate risk through its deposits and fixed rate notes with QTC. The State Investment Advisory Board (SIAB) determines the investment objectives, risk profiles and strategy for the Long Term Assets and Queensland Future Fund (Debt Retirement Fund) within the framework provided by the Government. The long term expected equilibrium rate of return on the portfolios remains unchanged at 6.5%. The Long Term Assets are held to fund superannuation and other long term obligations of the State, while the Debt Retirement Fund was established to provide funding to reduce the State’s debt.
The GGS does not undertake hedging in relation to interest rate risk on cash deposits or borrowings. This is managed as per the liquidity risk management strategy.
| Audited Consolidated Financial Statements 2022–23 – Queensland Government | 5-71 |
Notes to the Financial Statements
| 46. | Financial risk management disclosure continued |
(c) Market risk continued
| (i) | Interest rate and unit price risk continued |
Interest expense
The GGS and TSS are exposed to interest rate risk through borrowings. For the GGS, this includes borrowing with QTC and the Commonwealth Government. A number of other State-owned entities enter into interest rate swaps, forward rate agreements and futures contracts to assist in the management of interest rate risk. In some instances, interest rate swaps are utilised to swap medium to long term fixed rate borrowings into floating rate. At times, floating to fixed swaps may be undertaken to generate a fixed rate term funding profile.
| General Government Sector
The GGS is exposed to movements in interest rates and managed fund unit prices through its cash deposits, investments and borrowings.
The effect of a 1% movement in interest rates on the GGS cash balances would be a $24 million (2022: $17 million) change in the GGS operating result and equity.
The GGS has fixed rate notes with QTC and other investments with QIC Limited that are exposed to interest rate changes and changes in the unit price of the funds managed. The rate on the fixed rate notes is reviewed annually and remains unchanged at 6.5%. Assuming all other variables remained constant, if the return on the notes moved by +/-1%, the GGS net operating balance would be approximately $435 million higher or lower (2022: $414 million). A +/-1% change in the market value of the underlying QIC investments on QTC’s Balance Sheet would be reflected in an increment / decrement in the GGS other economic flows included in the operating result. If the return on other GGS investments, including with QIC, moved by +/-1%, the GGS operating result and equity would be approximately $55 million higher or lower (2022: $33 million).
GGS borrowing with QTC is in the form of fixed rate loans, generic debt pool borrowings (which are akin to fixed rate loans) or floating rate loans. Although the majority of the GGS borrowings are either fixed rate loans or generic debt pool loans, the Consolidated Fund bears the risk of movements between the fixed rate and market rate. Consequently, if interest rates on borrowing with QTC were to change by 1%, the effect on the GGS operating result and equity would be approximately $462 million (2022: $490 million). |
Total State Sector
As the State’s corporate treasury, QTC undertakes portfolio management activities on behalf of the State and raises funding in advance of requirements to ensure Queensland public sector entities have ready access to funding when required and also to reduce the risk associated with refinancing maturing loans. In addition, QTC holds and invests surplus funds on behalf of its clients and for liquidity management purposes.
These activities expose the State to interest rate risk, which is managed with consideration given to duration risk, yield curve risk, basis risk and a value at risk (VaR) framework, complemented by other measures such as defined stress tests.
To manage the risk of non-parallel yield curve movements, QTC manages portfolio cash flows in a series of time periods so that the net interest rate risk in each time period can be measured. QTC enters into interest rate swaps, forward rate agreements and futures contracts to assist in the management of interest rate risk.
| Total State | ||||||||
| 2023 | 2022 | |||||||
| $M | $M | |||||||
| Interest rate risk VaR at 30 June |
40 | 47 | ||||||
| Average for the year |
47 | 27 | ||||||
| Financial year - minimum |
39 | 8 | ||||||
| Financial year - maximum |
62 | 54 | ||||||
The effect of a 1% movement in interest rates on the TSS cash balances would result in a $90 million (2022: $65 million) change to the State’s operating result and equity.
The State has other investments exposed to interest rate changes and changes in the unit price of the funds managed by QIC Limited. Assuming all other variables remained constant, if the return on these investments moved by 1%, the effect on the State’s operating result and equity would be approximately +$534 million/-$532 million (2022: +$504 million/-$501 million). For the range of changes to the operating result and equity that are considered reasonably possible at year end, refer individual agency statements, particularly QTC.
| 5-72 | Audited Consolidated Financial Statements 2022–23 – Queensland Government |
Notes to the Financial Statements
| 46. | Financial risk management disclosure continued |
| (c) | Market risk continued |
| (ii) | Commodity price risk |
The State is exposed to commodity price risk resulting from changes in electricity, coal, gas, diesel, environmental certificates and other commodity prices.
The ownership of electricity generating GOCs exposes the State to electricity price risk. Electricity derivatives (price swaps, futures, caps and option contracts) are used to protect against movements in the price of electricity in the National Electricity Market. Longer term fixed price supply agreements are utilised to manage risk in relation to coal and gas.
Each entity is responsible for its own risk management and may make varying assumptions in assessing its sensitivity to such movements. The agencies with a material impact for TSS are CS Energy, Energy Queensland Limited, Stanwell Corporation Limited and CleanCo Queensland Limited.
On the assumption that all other variables remain constant, the impact of a +20%/-20% movement in electricity forward prices will impact the State’s operating result by +$798million/-$797million (2022:+$457million/-$474million) and equity by -$581million/+$554million (2022:-$883million/+$884million).
| (d) | Foreign exchange risk |
The State is exposed to movements in foreign currencies as a result of future commercial transactions and recognised assets and liabilities denominated in currencies other than the Australian dollar. The State enters into forward exchange contracts, currency options and swaps to effectively manage the exposure resulting from purchases of plant, equipment and materials in foreign currencies. Foreign exchange risk is managed by individual agencies which hedge significant proportions of anticipated transactions in line with their respective risk management strategies.
The State also borrows offshore to provide access to additional sources of funding and diversify risk and undertakes investments in foreign currency assets. Foreign exchange contracts and cross currency swaps are used to effectively manage the exposure to fluctuations in exchange rates.
The State’s exposure to foreign exchange risk is not considered material due to the effectiveness of risk management strategies.
| 47. | Net fair value of financial instruments |
The carrying amounts of the GGS and TSS financial assets and financial liabilities by category are:
| General Government | Total State | |||||||||||||||
| 2023 | 2022 | 2023 | 2022 | |||||||||||||
| $M | $M | $M | $M | |||||||||||||
| Financial assets |
||||||||||||||||
| Amortised cost | 8,382 | 7,564 | 18,658 | 16,685 | ||||||||||||
| FVTPL - designated upon initial recognition | 5,231 | 3,062 | 100,952 | 104,682 | ||||||||||||
| FVTPL - mandatorily measured at FVTPL | 43,475 | 40,372 | - | - | ||||||||||||
| FVTOCI - debt instruments | 254 | 239 | 254 | 239 | ||||||||||||
| FVTOCI - equity instruments | 24,429 | 19,979 | 16 | 6 | ||||||||||||
|
|
|
|
|
|
|
|
|
|
|
|
| |||||
| 81,771 | 71,216 | 119,880 | 121,611 | |||||||||||||
|
|
|
|
|
|
|
|
|
|
|
|
| |||||
| Financial liabilities |
||||||||||||||||
| Amortised cost | 66,221 | 66,786 | 20,809 | 19,481 | ||||||||||||
| FVTPL - designated upon initial recognition | - | - | 125,194 | 131,103 | ||||||||||||
| FVTPL - held for trading | 41 | 93 | 4,160 | 12,547 | ||||||||||||
|
|
|
|
|
|
|
|
|
|
|
|
| |||||
| 66,261 | 66,880 | 150,163 | 163,131 | |||||||||||||
|
|
|
|
|
|
|
|
|
|
|
|
| |||||
| Audited Consolidated Financial Statements 2022–23 – Queensland Government | 5-73 |
Notes to the Financial Statements
| 47. | Net fair value of financial instruments continued |
The carrying amounts of GGS and TSS financial assets and liabilities, including cash, deposits, receivables and payables, equate approximately to their net fair value, except as outlined below:
| General Government Sector |
||||||||||||||||
| Carrying amount |
Fair value |
Carrying amount |
Fair value | |||||||||||||
| 2023 | 2023 | 2022 | 2022 | |||||||||||||
| $M | $M | $M | $M | |||||||||||||
| Financial assets |
||||||||||||||||
| QRIDA loans |
1,105 | 1,027 | 1,108 | 1,146 | ||||||||||||
| Financial liabilities |
||||||||||||||||
| Commonwealth Borrowings |
235 | 308 | 262 | 346 | ||||||||||||
| Education non-concessional loans |
562 | 371 | 575 | 376 | ||||||||||||
| QTC borrowings |
46,166 | 40,342 | 49,000 | 43,983 | ||||||||||||
| Total State Sector |
||||||||||||||||
| Carrying amount |
Fair value |
Carrying amount |
Fair value | |||||||||||||
| 2023 | 2023 | 2022 | 2022 | |||||||||||||
| $M | $M | $M | $M | |||||||||||||
| Financial assets |
||||||||||||||||
| QRIDA loans |
1,105 | 1,027 | 1,108 | 1,146 | ||||||||||||
| Financial liabilities |
||||||||||||||||
| Commonwealth Borrowings |
235 | 308 | 262 | 346 | ||||||||||||
| Education non-concessional loans |
562 | 371 | 575 | 376 | ||||||||||||
Financial instruments measured at fair value have been classified in accordance with the hierarchy described in AASB 13, except for the GGS equity investments in PNFCs and PFCs that are measured at fair value as the Government’s proportional share of the carrying amount of net assets of the PNFC and PFC Sector entities on a GAAP basis.
The three levels of fair value hierarchy reflect the significance of the inputs used to determine the valuation of these instruments.
| – | Level 1: represents fair value measurements that reflect unadjusted quoted market prices in active markets for identical assets and liabilities; |
| – | Level 2: represents fair value measurements that are substantially derived from inputs (other than quoted prices included within Level 1) that are observable, either directly or indirectly; and |
| – | Level 3: represents fair value measurements that are substantially derived from inputs that are not based on observable market data. |
Level 1
The fair value of financial assets and liabilities with standard terms and conditions and traded in an active market is based on unadjusted quoted market prices. Financial instruments in this category include certain equity and debt investments where quoted prices are available from an active market, such as publicly traded derivatives, short-term and tradeable bank deposits, actively traded Commonwealth and semi-Government bonds and futures contracts and investments in certain unit trusts. Financial liabilities consist of QTC benchmark bonds and actively traded electricity derivatives.
Level 2
The fair value of financial assets and liabilities is determined by using quoted market prices in active markets for similar instruments or quoted prices for identical or similar instruments in markets that are considered less than active or other valuation techniques where all significant inputs are directly (prices) or indirectly (derived from prices) observable from market data, other than quoted prices included in Level 1. Financial instruments in this category include fixed interest deposits, fixed term notes, floating rate notes, commercial paper, non-actively traded corporate and semi-Government bonds, certain money market securities, onlendings, treasury notes, medium-term notes, client deposits, unit trusts and other derivatives such as over-the-counter derivatives, including forward exchange contracts, commodity swaps, interest rate and cross currency swaps and some electricity derivatives.
| 5-74 | Audited Consolidated Financial Statements 2022–23 – Queensland Government |
Notes to the Financial Statements
| 47. | Net fair value of financial instruments continued |
Level 3
Where financial instruments are measured using valuation techniques based on unobservable inputs or observable inputs to which significant adjustments have been applied, such instruments are included in Level 3 of the fair value hierarchy. These may include some unit trusts, power purchase agreements and other electricity derivative contracts.
Valuation policies and procedures of the GGS and TSS are developed and reviewed by management of respective agencies. Major valuation techniques adopted by the GGS and TSS include market comparison techniques, option valuation models, forecasting, estimated discounted cash flow techniques, and extrapolation, scalar and translation techniques. There have been no material changes in the above valuation techniques used during the year.
Significant valuation inputs used to value financial instruments categorised within Level 2 and Level 3 of the fair value hierarchy are:
| – | Interest rates; | – | Credit risk; | |||
| – | Trading margins; | – | Forward curve prices; | |||
| – | Exchange rates; | – | Electricity settled prices; | |||
| – | Market indices; | – | Forecast generation; | |||
| – | Credit spreads; | – | Extrapolation rates; | |||
| – | Expected cash flows; | – | Scalar and translation factors; | |||
| – | Discount rates; | – | Market volatility; | |||
| – | Exchange traded market prices; | – | Renewable energy and greenhouse gas targets; | |||
| – | Broker quotes or market prices for similar instruments; | – | Emerging technologies. |
The following table presents the GGS and TSS financial assets and liabilities recognised and measured at fair value.
| General Government Sector |
||||||||||||||||||||||
| Level 1 | Level 2 | Level 3 | Total | |||||||||||||||||||
| $M | $M | $M | $M | |||||||||||||||||||
| 2023 |
||||||||||||||||||||||
| Assets |
||||||||||||||||||||||
| Financial assets at fair value through profit or loss |
||||||||||||||||||||||
| Other investments |
218 | 4,920 | 43,567 | 48,705 | ||||||||||||||||||
| Financial assets at fair value through equity |
||||||||||||||||||||||
| Securities and bonds |
254 | - | - | 254 | ||||||||||||||||||
| 472 | 4,920 | 43,567 | 48,959 | |||||||||||||||||||
| Liabilities |
||||||||||||||||||||||
| Financial liabilities at fair value through profit or loss |
||||||||||||||||||||||
| Derivatives |
- | - | 41 | 41 | ||||||||||||||||||
| - | - | 41 | 41 | |||||||||||||||||||
| 2022 |
||||||||||||||||||||||
| Assets |
||||||||||||||||||||||
| Financial assets at fair value through profit or loss |
||||||||||||||||||||||
| Other investments |
210 | 2,656 | 40,569 | 43,435 | ||||||||||||||||||
| Financial assets at fair value through equity |
||||||||||||||||||||||
| Securities and bonds |
239 | - | - | 239 | ||||||||||||||||||
| 449 | 2,656 | 40,569 | 43,674 | |||||||||||||||||||
| Liabilities |
||||||||||||||||||||||
| Financial liabilities at fair value through profit or loss |
||||||||||||||||||||||
| Derivatives |
- | - | 93 | 93 | ||||||||||||||||||
| - | - | 93 | 93 | |||||||||||||||||||
| Audited Consolidated Financial Statements 2022–23 – Queensland Government | 5-75 |
Notes to the Financial Statements
| 47. | Net fair value of financial instruments continued |
| Total State Sector |
||||||||||||||||||||||
| Level 1 | Level 2 | Level 3 | Total | |||||||||||||||||||
| $M | $M | $M | $M | |||||||||||||||||||
| 2023 |
||||||||||||||||||||||
| Assets |
||||||||||||||||||||||
| Financial assets at fair value through profit or loss |
||||||||||||||||||||||
| Derivatives |
3,228 | 696 | 893 | 4,817 | ||||||||||||||||||
| Securities and bonds |
15,299 | 4,445 | - | 19,744 | ||||||||||||||||||
| Loans |
- | 9,560 | - | 9,560 | ||||||||||||||||||
| Other investments |
747 | 39,530 | 26,553 | 66,831 | ||||||||||||||||||
| Financial assets at fair value through equity |
||||||||||||||||||||||
| Securities and bonds |
254 | - | - | 254 | ||||||||||||||||||
| 19,529 | 54,231 | 27,446 | 101,206 | |||||||||||||||||||
| Liabilities |
||||||||||||||||||||||
| Financial liabilities at fair value through profit or loss |
||||||||||||||||||||||
| Derivatives |
4,417 | 1,034 | 287 | 5,738 | ||||||||||||||||||
| Deposits |
- | 5,089 | - | 5,089 | ||||||||||||||||||
| Government securities issued |
86,766 | 31,347 | - | 118,113 | ||||||||||||||||||
| Borrowings |
- | 421 | - | 421 | ||||||||||||||||||
| 91,183 | 37,891 | 287 | 129,361 | |||||||||||||||||||
| 2022 |
||||||||||||||||||||||
| Assets |
||||||||||||||||||||||
| Financial assets at fair value through profit or loss |
||||||||||||||||||||||
| Derivatives |
12,089 | 1,127 | 701 | 13,917 | ||||||||||||||||||
| Securities and bonds |
14,435 | 5,490 | - | 19,925 | ||||||||||||||||||
| Loans |
- | 9,833 | - | 9,833 | ||||||||||||||||||
| Other investments |
752 | 34,234 | 26,006 | 60,991 | ||||||||||||||||||
| Financial assets at fair value through equity |
||||||||||||||||||||||
| Securities and bonds |
239 | - | - | 239 | ||||||||||||||||||
| 27,514 | 50,684 | 26,707 | 104,905 | |||||||||||||||||||
| Liabilities |
||||||||||||||||||||||
| Financial liabilities at fair value through profit or loss |
||||||||||||||||||||||
| Derivatives |
13,960 | 3,069 | 653 | 17,682 | ||||||||||||||||||
| Deposits |
- | 6,628 | - | 6,628 | ||||||||||||||||||
| Government securities issued |
90,549 | 28,367 | - | 118,916 | ||||||||||||||||||
| Borrowings |
- | 432 | - | 432 | ||||||||||||||||||
| 104,509 | 38,495 | 653 | 143,657 | |||||||||||||||||||
Classification of instruments into fair value hierarchy levels is reviewed annually and the GGS and TSS recognise any transfers between levels of the fair value hierarchy during the reporting period in which the transfer has occurred.
The following table presents the net changes in Level 3 instruments:
| General Government | Total State | |||||||||||||||
| 2023 | 2022 | 2023 | 2022 | |||||||||||||
| $M | $M | $M | $M | |||||||||||||
| Opening balance asset / (liability) |
40,475 | 37,720 | 26,054 | 18,555 | ||||||||||||
| Purchases |
3,048 | 3,705 | 948 | 495 | ||||||||||||
| Sales |
(2,121 | ) | (2,028 | ) | (8 | ) | (28 | ) | ||||||||
| Settlements |
- | - | 836 | 1,803 | ||||||||||||
| Movements in other comprehensive income |
- | - | 72 | (126 | ) | |||||||||||
| Movements recognised in profit or loss |
2,124 | 1,012 | (746 | ) | 2,286 | |||||||||||
| Transfers into Level 3 |
- | 67 | - | 3,071 | ||||||||||||
| Transfers out of Level 3 into Level 2 |
- | - | 3 | (2 | ) | |||||||||||
|
|
|
|
|
|
|
|
|
|
|
|
| |||||
| Closing balance asset / (liability) |
43,527 | 40,475 | 27,159 | 26,054 | ||||||||||||
|
|
|
|
|
|
|
|
|
|
|
|
| |||||
The sensitivity of the State’s financial instruments is disclosed in Note 46.
| 5-76 | Audited Consolidated Financial Statements 2022–23 – Queensland Government |
Notes to the Financial Statements
| 48. | Retirement benefit obligations |
Retirement benefit liabilities include the following final salary defined benefit schemes:
| – | Defined benefit entitlements under the Government Division of the Australian Retirement Trust (QSuper); |
| – | Pensions provided under the Judges and Governors schemes; |
| – | Energy Super, a sub-fund within Brighter Super (previously known as Local Government Investment Australia Super Fund). |
QSuper, Judges’ Scheme and Governors’ Scheme
The QSuper defined benefit schemes, which are closed to new members, provide accrued benefits based on a member’s salary, contribution rate and length of membership. State Government budget-dependent agencies, together with certain statutory bodies and GOCs (excluding principally the Queensland electricity supply industry), make employer contributions as required. Employer contributions are held by the State, with the State meeting its share of liabilities when defined benefits become payable.
On 28 February 2022, QSuper and Sunsuper merged to form the Australian Retirement Trust. On this date, the Superannuation (State Public Sector) Deed 1990 was repealed and its provisions incorporated under the Government Division Rules of the Australian Retirement Trust Deed. No changes were made to the rules of QSuper’s defined benefit schemes.
Australian Retirement Trust, including its Government Division (QSuper), is a regulated scheme under the prudential supervision of the Australian Prudential Regulation Authority (APRA) and its trustee, Australian Retirement Trust Pty Ltd, is subject to the Superannuation Industry (Supervision) Act 1993 and Regulations. The provisions of the Superannuation (State Public Sector) Act 1990 and the Government Division Rules of the Australian Retirement Trust Deed govern the operation of QSuper.
The QSuper scheme is subject to an actuarial investigation at least every three years although this has been performed annually by the State Actuary since 2016. The latest actuarial investigation of QSuper was as at 30 June 2021 and was presented in a report dated 3 December 2021. Actuarial reviews have returned to the triennial cycle utilised prior to 2016, so the next actuarial investigation will be as at 30 June 2024.
The Judges’ Scheme provides defined benefit pension entitlements to serving judges, Crime and Corruption Commission Queensland Commissioners and Parole Board Presidents and Deputy Presidents and is governed by the provisions of the Judges (Pensions and Long Leave) Act 1957, the Crime and Corruption Act 2001 and the Corrective Services Act 2006. Governors pensions are provided in accordance with the Governors (Salary and Pensions) Act 2003. The Judges’ and Governors’ Schemes are wholly unfunded schemes. Due to materiality, the Governors’ pension liability is included with the Judges’ Scheme liabilities.
These schemes expose the State to the following:
| – | Inflation risk - the defined benefit obligations are linked to employees’ salaries and therefore the net liability position can be adversely affected by an increase in the defined benefit obligation resulting from unexpected wage inflation. Similarly, the proportion of the defined benefit obligation linked to the consumer price index (pensions) is also subject to the risk of unexpected price inflation; |
| – | Interest rate risk - a decrease in the discount rate will increase the defined benefit obligations; |
| – | Investment risk - resulting from the mismatch between the current investment strategy and the liabilities; and |
| – | Demographic risk - resulting from unexpected employee movements. |
QSuper also incorporates defined contribution categories, for which the State has no further legal or constructive obligation other than to pay contributions. These liabilities and assets have been accounted for in accordance with the standards relevant to defined contribution schemes. In particular, no assets or liabilities relating to the funded defined contribution scheme have been included in the Balance Sheet. The expense relating to these schemes is the amount of employer contributions.
Energy Super – a sub-fund of Brighter Super
On 1 July 2021, Energy Super Fund and Brighter Super merged, creating one fund which is managed by the Brighter Super Trustee.
Queensland electricity entities contribute to Energy Super, an industry multiple employer superannuation fund. Members are entitled to benefits from the fund on retirement, resignation, retrenchment, disability or death.
Energy Super is regulated by APRA under the Superannuation Industry (Supervision) Act 1993.
| Audited Consolidated Financial Statements 2022–23 – Queensland Government | 5-77 |
Notes to the Financial Statements
| 48. | Retirement benefit obligations continued |
Energy Super – a sub-fund of Brighter Super continued
The defined benefit account of this fund is a funded plan which provides defined lump sum benefits based on years of service and average final salary. Employer contributions to the defined benefit section of the plan are based on recommendations by the plan’s actuary. The actuary has adopted the aggregate funding method to ensure that the benefit entitlements of members and other beneficiaries are fully funded by the time they become payable. This funding method seeks to have benefits funded by a total contribution which is expected to be a constant percentage of members’ salaries and wages over their working lifetimes. Actuarial assessments are made at no more than three yearly intervals, with the most recent actuarial assessment undertaken as at 1 July 2021 by Willis Towers Watson.
Energy Super does not impose a legal liability on employer agencies to cover any deficits that may exist in the Fund. If the Fund was to be wound up, there would be no legal obligation on employer agencies to make good any shortfall. The Trust Deed of the Fund states that if the Fund is terminated, after payment of all costs and member benefits in respect for the period up to the date of termination, any remaining assets are to be distributed by the Trustees of the Fund, acting on the advice of the actuary, to participating employers.
Employer agencies may benefit from any surplus in the Fund in the form of a contribution reduction or contribution holiday. Any reduction in contributions would normally be implemented only after advice from the Fund’s actuary.
The defined benefit account of this Fund is closed to new members.
| General Government | Total State | |||||||||||||||
| 2023 | 2022 | 2023 | 2022 | |||||||||||||
| $M | $M | $M | $M | |||||||||||||
| Present value of the defined benefit obligation |
||||||||||||||||
| QSuper DB |
26,810 | 27,523 | 26,810 | 27,523 | ||||||||||||
| Judges |
865 | 854 | 865 | 854 | ||||||||||||
| ES - Brighter Super |
- | - | 802 | 738 | ||||||||||||
|
|
|
|
|
|
|
|
|
|
|
|
| |||||
| Total present value of the defined benefit obligation |
27,675 | 28,377 | 28,477 | 29,115 | ||||||||||||
|
|
|
|
|
|
|
|
|
|
|
|
| |||||
| Fair value of plan assets |
||||||||||||||||
| QSuper DB |
6,762 | 6,209 | 6,762 | 6,209 | ||||||||||||
| ES - Brighter Super |
- | - | 1,157 | 1,138 | ||||||||||||
|
|
|
|
|
|
|
|
|
|
|
|
| |||||
| Total fair value of the plan assets |
6,762 | 6,209 | 7,918 | 7,347 | ||||||||||||
|
|
|
|
|
|
|
|
|
|
|
|
| |||||
| Defined benefit obligation Liability/(Asset) recognised in Balance Sheet |
||||||||||||||||
| QSuper DB |
20,048 | 21,314 | 20,048 | 21,314 | ||||||||||||
| Judges |
865 | 854 | 865 | 854 | ||||||||||||
| ES - Brighter Super |
- | - | (354 | ) | (400 | ) | ||||||||||
|
|
|
|
|
|
|
|
|
|
|
|
| |||||
| Liability/(Asset) recognised in Balance Sheet |
20,913 | 22,168 | 20,559 | 21,768 | ||||||||||||
|
|
|
|
|
|
|
|
|
|
|
|
| |||||
| Reconciliation of the present value of the defined benefit obligation |
||||||||||||||||
| Opening balance |
28,377 | 33,868 | 29,115 | 34,802 | ||||||||||||
| Current service cost |
721 | 930 | 741 | 959 | ||||||||||||
| Contributions by plan participants |
162 | 165 | 173 | 175 | ||||||||||||
| Interest cost |
996 | 466 | 1,031 | 485 | ||||||||||||
| Benefits paid (including contributions tax) |
(2,363 | ) | (2,400 | ) | (2,428 | ) | (2,482 | ) | ||||||||
| Actuarial (gain)/loss |
(218 | ) | (4,652 | ) | (155 | ) | (4,824 | ) | ||||||||
|
|
|
|
|
|
|
|
|
|
|
|
| |||||
| Closing balance |
27,675 | 28,377 | 28,477 | 29,115 | ||||||||||||
|
|
|
|
|
|
|
|
|
|
|
|
| |||||
| Reconciliation of the fair value of plan assets |
||||||||||||||||
| Opening balance |
6,209 | 6,536 | 7,347 | 7,743 | ||||||||||||
| Return on plan assets at discount rate |
220 | 89 | 273 | 113 | ||||||||||||
| Return on plan assets above/(below) discount rate (actuarial gain) |
539 | (108 | ) | 556 | (131 | ) | ||||||||||
| Employer contributions - State share of beneficiary payments |
1,965 | 1,900 | 1,965 | 1,900 | ||||||||||||
| Employer contributions |
- | - | 2 | 2 | ||||||||||||
| Contributions by plan participants |
162 | 165 | 173 | 175 | ||||||||||||
| Benefits paid (including contributions tax) |
(2,334 | ) | (2,374 | ) | (2,399 | ) | (2,456 | ) | ||||||||
|
|
|
|
|
|
|
|
|
|
|
|
| |||||
| Closing balance |
6,762 | 6,209 | 7,918 | 7,347 | ||||||||||||
|
|
|
|
|
|
|
|
|
|
|
|
| |||||
| 5-78 | Audited Consolidated Financial Statements 2022–23 – Queensland Government |
Notes to the Financial Statements
| 48. | Retirement benefit obligations continued |
| General Government | Total State | |||||||||||||||
| 2023 | 2022 | 2023 | 2022 | |||||||||||||
| $M | $M | $M | $M | |||||||||||||
| Amounts recognised in Operating Statement |
||||||||||||||||
| Current service cost (including employer contributions) |
721 | 930 | 740 | 959 | ||||||||||||
| Superannuation interest cost |
776 | 377 | 759 | 372 | ||||||||||||
|
|
|
|
|
|
|
|
|
|
|
|
| |||||
| Total amounts recognised in Operating Statement |
1,497 | 1,307 | 1,499 | 1,331 | ||||||||||||
|
|
|
|
|
|
|
|
|
|
|
|
| |||||
| Remeasurements of net defined benefit obligation |
||||||||||||||||
| Actuarial gain/(loss) due to changes in demographic assumptions |
- | (103 | ) | - | (103 | ) | ||||||||||
| Actuarial gain/(loss) due to changes in financial assumptions |
650 | 5,094 | 588 | 5,124 | ||||||||||||
| Actuarial gain/(loss) due to changes in experience adjustments |
(432 | ) | (339 | ) | (433 | ) | (197 | ) | ||||||||
| Return on plan assets above/below discount rate |
539 | (108 | ) | 556 | (131 | ) | ||||||||||
|
|
|
|
|
|
|
|
|
|
|
|
| |||||
| Amounts recognised in Statement of Changes in Net Assets (Equity) |
757 | 4,545 | 712 | 4,693 | ||||||||||||
|
|
|
|
|
|
|
|
|
|
|
|
| |||||
Plan Asset Allocations
The Government Division of the Australian Retirement Trust (QSuper) holds investments with the following asset allocations:
| Quoted | Unquoted | Quoted | Unquoted | |||||||||||||
| 2023 | 2023 | 2022 | 2022 | |||||||||||||
| $M | $M | $M | $M | |||||||||||||
| Global equities |
5,565 | - | 4,794 | - | ||||||||||||
| Global private equity |
- | 50 | - | 62 | ||||||||||||
| Cash and fixed interest |
- | 1,147 | - | 1,352 | ||||||||||||
|
|
|
|
|
|
|
|
|
|
|
|
| |||||
| 5,565 | 1,197 | 4,794 | 1,414 | |||||||||||||
|
|
|
|
|
|
|
|
|
|
|
|
| |||||
QSuper plan assets are those held within the Government Division of the Australian Retirement Trust Fund only. QSuper holds investments in unit trusts that hold financial instruments issued by the State. These instruments are difficult to value accurately and are immaterial in proportion to the value of the unit trusts. In addition, these trusts own properties which are used by Government agencies. Again, the exact values attributable to these tenancies are difficult to determine accurately, nor do they represent a material proportion of the fair value of plan assets.
No plan assets are held in respect of the Judges’ Scheme or Governors’ Pensions.
Plan Asset Allocations
The major categories of Energy Super plan assets are as follows:
| 2023 | 2022 | |||||||
| $M | $M | |||||||
| Global equities |
335 | 307 | ||||||
| Cash and fixed interest |
451 | 432 | ||||||
| Real estate |
174 | 182 | ||||||
| Other |
197 | 216 | ||||||
|
|
|
|
|
|||||
| 1,157 | 1,138 | |||||||
|
|
|
|
|
|||||
| QSuper DB | QSuper DB | ES Brighter | ES Brighter | |||||||||||||
| 2023 | 2022 | 2023 | 2022 | |||||||||||||
| $M | $M | $M | $M | |||||||||||||
| Actual return on plan assets |
759 | (18 | ) | 70 | 1 | |||||||||||
The estimate of employer contributions to be paid in 2022-23 is $2.112 billion for QSuper DB and $2 million for Energy Super.
| Audited Consolidated Financial Statements 2022–23 – Queensland Government | 5-79 |
Notes to the Financial Statements
| 48. | Retirement benefit obligations continued |
Plan Asset Allocations continued
At 30 June 2023, the weighted average duration of the QSuper defined benefit obligation is 7 years (2022: 7 years).
| QSuper DB | QSuper DB | Judges | Judges | ES Brighter | ES Brighter | |||||||||||||||||||
| Principal actuarial assumptions at: |
2023 | 2022 | 2023 | 2022 | 2023 | 2022 | ||||||||||||||||||
| Discount rate (gross) |
4.00% | 3.70% | 4.00% | 3.70% | 5.3 - 5.5% | 4.9 - 5.1% | ||||||||||||||||||
| Future inflationary salary increases |
3.40% | 3.40% | 3.40% | 3.40% | 3 - 3.5% | 3 - 3.5% | ||||||||||||||||||
| Expected CPI increases |
2.40% | 2.40% | N/A | N/A | N/A | N/A | ||||||||||||||||||
| Sensitivity Analysis for each significant actuarial assumption |
|
|||||||||||||||||||||||
| QSuper DB | Judges | |||||||||||||||||||||||
| 2023 | 2023 | |||||||||||||||||||||||
| $M | $M | |||||||||||||||||||||||
| Change in defined benefit obligation brought about by a 1% increase in: |
|
|||||||||||||||||||||||
| Discount rate |
|
(1,779 | ) | (110) | ||||||||||||||||||||
| Future inflationary salary increases |
|
1,836 | 136 | |||||||||||||||||||||
| Expected CPI increases |
|
149 | N/A | |||||||||||||||||||||
The sensitivity analysis shown above represents the effects of notional changes in each of the key parameters underlying the obligations, while holding all other assumptions constant. The sensitivity analysis may not be representative of the actual change in the defined benefit obligation as it is unlikely that the change in assumptions would occur in isolation of one another as some of the assumptions are correlated. They are not intended to represent any particular probability of occurrence.
In presenting the above sensitivity analysis, the present value of the defined benefit obligation has been calculated using the projected unit credit method at the end of the reporting period, which is the same as that applied in calculating the defined benefit obligation liability recognised in the Balance Sheet.
QSuper funding arrangements and funding policy that affect future contributions
QSuper defined benefit category members are required to contribute a percentage of salary. Standard member contributions range between 2 - 6% of salary.
Unlike typical regulated defined benefit schemes, only the employee contributions are held within the QSuper Fund. Employer contributions received from employing authorities are held separate from the QSuper Fund in the Long Term Asset portfolio held by QTC. The State makes a last minute contribution to the QSuper Fund when a member exits the defined benefit scheme. Employer contributions to the QSuper Fund are based on 92% share of benefit payments and capitalised new pensions.
| 49. | Related parties and Ministerial remuneration |
Key Management Personnel
All Ministers in the Queensland Cabinet are considered to be Key Management Personnel (KMP) of the State (including the GGS).
The aggregate remuneration of all Ministers (according to the period of time each Member of Parliament served as Minister) is as follows:
| 2023 | 2022 | |||||||
| $M | $M | |||||||
| Short-term employee benefits |
6.9 | 6.6 | ||||||
| Post-service benefits |
0.8 | 0.8 | ||||||
|
|
|
|
|
|
| |||
| Total |
7.7 | 7.4 | ||||||
|
|
|
|
|
|
| |||
Short-term benefits include base and additional salary entitlements, motor vehicle allowances, personal use of motor vehicles, chauffeur services and other entitlements. Post-service benefits comprise Government superannuation contributions for Ministers.
There are no material transactions between the State and Key Management Personnel and their related entities.
| 5-80 | Audited Consolidated Financial Statements 2022–23 – Queensland Government |
Notes to the Financial Statements
| 49. | Related parties and Ministerial remuneration continued |
Transactions between the GGS and entities within the PNFC and PFC Sectors
Note 1(b) describes the reporting relationship between the GGS and entities within the PNFC and PFC Sectors. These entities are partially consolidated and are disclosed as investments in public sector entities on the face of the Balance Sheet. Names of these individual entities can be found in Note 50.
The following are the major transactions (>$100 million) and balances (>$200 million) between the GGS and other public sector entities:
Revenue and assets
The GGS records dividend and income tax equivalent income from entities within the PNFC and PFC Sectors as per Note 7, with the related receivables per Note 23(a). Deferred tax equivalent income from the PNFC and PFC Sectors is shown on the Operating Statement and deferred tax equivalent assets and liabilities are shown on the Balance Sheet.
The GGS has balances with QTC cash funds which are disclosed in Note 22 and deposits with QTC which are disclosed in Note 24.
The GGS holds fixed rate notes from QTC which earn interest that is included in Note 6 and incurs a market value adjustment included in Note 16. The carrying value of the notes in the Balance Sheet is disclosed in Note 24(a). The rate on the fixed rate notes is also discussed in Note 46(c)(i).
The GGS receives competitive neutrality fees from entities within the PNFC and PFC Sector which are included in guarantee fees per Note 3. GGS payroll tax revenue per Note 3 includes $169 million (2022: $143 million) from entities within PNFC and PFC sectors. GGS sales of goods and services (including revenue from contracts with customers) with the PNFC sector are included in Note 5.
Expenses and liabilities
The GGS has borrowing with QTC. Note 13 discloses the interest expense which is predominantly with QTC and the borrowing balances are shown in Note 37(c). Further information on the terms of the QTC loans can be found in Note 46(c)(i).
Under the State’s cash management regime, GOCs advance surplus cash to the GGS. The GGS pays interest on these advances at the QTC Cash Fund rate. The balance outstanding on these GOC advances is per Note 37(b).
The GGS has a transport service contract expense with Queensland Rail, disclosed in Note 11, and pays community service obligations to electricity and water PNFC entities as per Note 14. Electricity expenses, also disclosed in Note 11, are paid by the GGS to electricity entities in the PNFC Sector.
Workers’ compensation premiums are paid to WorkCover by the GGS as per Note 9.
Equity injections and withdrawals
During the year, the GGS invested $500 million in CleanCo Queensland Limited, $208 million in Stanwell Corporation Limited and $102 million in CS Energy Limited under the Government’s Renewable Energy and Hydrogen Jobs Plan.
| 50. | Controlled entities |
Public sector entities are generally considered material for the purposes of this report if they meet either of the following criteria:
| – | net operating result in excess of $5 million; or |
| – | net assets in excess of $100 million. |
However, in addition to material entities, the State consolidates some entities which are not material in terms of the operating position or net asset position criteria if they are either a department or if they are funded for the delivery of services.
When financial results are available in respect of non-material entities, they are reviewed with the aim of including any newly material entities in the following year’s consolidated financial statements.
Newly created entities that are expected to meet the materiality criteria on the basis of their initial budget estimates are included in the consolidated financial statements from the time of their establishment.
The GGS has 100% ownership and voting power in other Queensland public sector entities, classified as either PNFCs or PFCs.
| Audited Consolidated Financial Statements 2022–23 – Queensland Government | 5-81 |
Notes to the Financial Statements
| 50. | Controlled entities continued |
The following controlled entities of the Government have been included in the consolidated financial statements for the year ended 30 June 2023. The list has been classified by activity sectors as outlined in Note 1(c). Entities denoted with an asterisk are consolidated with the accounts of the preceding entity.
General Government
| Departments | |
Agriculture and Fisheries
Child Safety, Seniors and Disability Services (renamed 18 May 2023)
Education
| * | Office of Industrial Relations |
Energy and Public Works
| * | QBuild - commercialised business unit |
| * | QFleet - commercialised business unit |
Environment and Science
Health
| * | Queensland Ambulance Service |
Housing (renamed 18 May 2023)
Justice and Attorney-General
Premier and Cabinet
| * | Screen Queensland Pty Ltd |
Queensland Corrective Services
Queensland Fire and Emergency Services
Queensland Police Service
Queensland Treasury
Regional Development, Manufacturing and Water
Resources
State Development, Infrastructure, Local Government and Planning
| * | Economic Development Queensland - commercialised business unit |
Tourism, Innovation and Sport
Treaty, Aboriginal and Torres Strait Islander Partnerships, Communities and the Arts (renamed 18 May 2023)
| * | Arts Queensland |
Transport and Main Roads
| * | Digital Economy |
| * | CITEC - commercialised business unit |
| * | Corporate Administration Agency - shared service provider |
| * | Queensland Shared Services - shared service provider |
| * | RoadTek - commercialised business unit |
Youth Justice, Employment, Small Business and Training (renamed 18 May 2023)
Other General Government entities
Board of the Queensland Museum
| * | Queensland Museum Foundation Trust |
Crime and Corruption Commission
Cross River Rail Delivery Authority
Electoral Commission of Queensland
Gold Coast Waterways Authority
Health and Wellbeing Queensland
| 5-82 | Audited Consolidated Financial Statements 2022–23 – Queensland Government |
Notes to the Financial Statements
| 50. | Controlled entities continued |
Other General Government entities continued
Hospital and Health Services
Cairns and Hinterland
Central Queensland
Central West
Children’s Health Queensland
Darling Downs
Gold Coast
Mackay
Metro North
Metro South
North West
South West
Sunshine Coast
Torres and Cape
Townsville
West Moreton
Wide Bay
Legal Aid Queensland
Legislative Assembly
Library Board of Queensland
| * | Queensland Library Foundation |
Motor Accident Insurance Commission
Nominal Defendant
Office of the Governor
Office of the Health Ombudsman
Office of the Information Commissioner
Office of the Inspector-General of Emergency Management
Office of the Ombudsman
Prostitution Licensing Authority
Public Sector Commission (renamed on 1 March 2023)
Queensland Art Gallery Board of Trustees
| * | Queensland Art Gallery I Gallery of Modern Art (QAGOMA) Foundation |
Queensland Audit Office
Queensland Building and Construction Commission
Queensland Curriculum and Assessment Authority
Queensland Family and Child Commission
Queensland Human Rights Commission
Queensland Mental Health Commission
Queensland Performing Arts Trust
Queensland Racing Integrity Commission
Queensland Reconstruction Authority
Queensland Rural and Industry Development Authority
Residential Tenancies Authority
South Bank Corporation
TAFE Queensland
| * | Aviation Australia Pty Ltd |
The Council of the Queensland Institute of Medical Research
The Public Trustee of Queensland
Tourism and Events Queensland
| * | Gold Coast Events Management Ltd |
Trade and Investment Queensland
| Audited Consolidated Financial Statements 2022–23 – Queensland Government | 5-83 |
Notes to the Financial Statements
| 50. | Controlled entities continued |
Public Non-financial Corporations
Brisbane Organising Committee for the 2032 Olympic and Paralympic Games
CleanCo Queensland Limited
CS Energy Limited
| * | Aberdare Collieries Pty Ltd |
| * | Callide Energy Pty Ltd |
| * | CS Energy Financial Services Pty Ltd |
| * | CS Energy Group Holdings Pty Ltd |
| * | CS Energy Kogan Creek Pty Ltd |
| * | CS Kogan (Australia) Pty Ltd |
| * | CSE BESS Pty Ltd |
| * | CSE H2 Operations Pty Ltd |
| * | CSE H2 Pty Ltd |
| * | Kogan Creek Power Pty Ltd |
| * | Kogan Creek Power Station Pty Ltd |
| * | T75 Segregated Cell |
Energy Queensland Limited
| * | Energex Limited |
| * | Ergon Energy Corporation Limited |
| * | Ergon Energy Queensland Pty Ltd |
| * | Ergon Energy Telecommunications Pty Ltd |
| * | Metering Dynamics Pty Ltd |
| * | SPARQ Solutions Pty Ltd |
| * | Varnsdorf Pty Ltd |
| * | VH Operations Pty Ltd |
| * | Yurika Pty Ltd |
Far North Queensland Ports Corporation Limited
Gladstone Area Water Board
Gladstone Ports Corporation Limited
| * | Gladstone Marine Pilot Services Pty Ltd |
Mount Isa Water Board
North Queensland Bulk Ports Corporation Limited
| * | Artex Insurance (Guernsey) PCC Limited – Cell NQBP |
| * | Ports Corporation of Queensland Limited (dormant) |
| * | Mackay Ports Limited (dormant) |
Port of Townsville Limited
Powerlink Queensland
| * | Copperstring 2.0 Electricity Transmission Corporation Pty Ltd |
| * | Harold Street Holdings Pty Ltd |
| * | Powerlink Transmission Services Pty Ltd |
| * | Queensland Capacity Network Pty Ltd |
Queensland Bulk Water Supply Authority (trading as Seqwater)
Queensland Hydro Pty Ltd (controlled entity of Queensland Treasury) (established 3 August 2022)
Queensland Rail
| * | Queensland Rail Limited |
| * | On Track Insurance Pty Ltd |
Queensland Treasury Holdings Pty Ltd (controlled entity of Queensland Treasury)
| * | Brisbane Port Holdings Pty Ltd |
| * | DBCT Holdings Pty Ltd |
| * | Queensland Airport Holdings (Cairns) Pty Ltd (dormant) |
| * | Queensland Airport Holdings (Mackay) Pty Ltd (dormant) |
| * | Queensland Lottery Corporation Pty Ltd |
Stadiums Queensland
| 5-84 | Audited Consolidated Financial Statements 2022–23 – Queensland Government |
Notes to the Financial Statements
| 50. | Controlled entities continued |
Public Non-financial Corporations continued
Stanwell Corporation Limited
| * | Glen Wilga Coal Pty Ltd (dormant) |
| * | Goondi Energy Pty Ltd (dormant) |
| * | Mica Creek Pty Ltd |
| * | SCL North West Pty Ltd |
| * | Stanwell Asset Maintenance Company Pty Ltd |
| * | Stanwell Renewable Energy Pty Ltd |
| * | Tarong Energy Corporation Pty Ltd (dormant) |
| * | Tarong Fuel Pty Ltd |
| * | Tarong North Pty Ltd |
| * | TEC Coal Pty Ltd |
| * | TN Power Pty Ltd |
| * | Wambo 2 Hold Co Pty Ltd |
| * | Wambo 2 Project Co Pty Ltd |
SunWater Limited
| * | Burnett Water Pty Ltd |
| * | Eungella Water Pipeline Pty Ltd |
| * | North West Queensland Water Pipeline Pty Ltd |
Public Financial Corporations
QIC Limited (non-trading entities are not included in this list)
| * | QIC Corporate Holdings Pty Ltd |
| * | QIC Asian Investment Services Pte. Ltd. |
| * | QIC Corporate Holdings Trust |
| * | QIC European Investment Services Limited |
| * | QIC Infrastructure Management Pty Ltd |
| * | QIC Infrastructure Management No.2 Pty Ltd |
| * | QIC Investments No. 1 Pty Ltd |
| * | QIC Investments No. 2 Pty Ltd |
| * | QIC Investments No. 3 Pty Ltd |
| * | QIC Investment Holdings Pty Ltd |
| * | QIC QGIF II GP No.1 S.à r.l. |
| * | QIDF GP USD S.à r.l. |
| * | QIDP GP1 S.à r.l. |
| * | QIC Investment Holdings Trust |
| * | QIC Private Capital Pty Ltd |
| * | QICP Pty Ltd |
| * | QIC Retail Pty Ltd |
QIC US Management, Inc.
| * | QIC Corporate Management, Inc. |
| * | QIC Global Infrastructure (US), Inc. |
| * | QIC Properties US, Inc. |
| * | QIC US Investment Services Inc. |
| * | QIC Non-Member Manager LLC |
| * | QIC QGIF GP Co No. 1 Inc |
| * | QIC US Private Equity, LLC |
| * | QIC US Private Equity No. 2 LLC |
| * | QIC US Shopping Centre Fund No.1 GP LLC |
| * | South Bay Managing Member LLC |
Queensland Treasury Corporation
The National Injury Insurance Agency, Queensland
WorkCover Queensland
| Audited Consolidated Financial Statements 2022–23 – Queensland Government | 5-85 |
Notes to the Financial Statements
| 51. | Expenses from transactions by function |
| General Government | Total State | |||||||||||||||
| 2023 | 2022 | 2023 | 2022 | |||||||||||||
| $M | $M | $M | $M | |||||||||||||
| General public services |
6,135 | 5,182 | 12,079 | 10,357 | ||||||||||||
| Public order and safety |
6,703 | 6,323 | 6,554 | 6,200 | ||||||||||||
| Economic affairs |
2,672 | 2,609 | 10,989 | 10,994 | ||||||||||||
| Environmental protection |
894 | 1,586 | 892 | 1,584 | ||||||||||||
| Housing and community amenities |
1,597 | 1,038 | 2,561 | 1,869 | ||||||||||||
| Health |
23,864 | 22,045 | 23,648 | 21,846 | ||||||||||||
| Recreation, culture and religion |
1,081 | 936 | 1,160 | 1,017 | ||||||||||||
| Education |
18,497 | 16,871 | 18,355 | 16,740 | ||||||||||||
| Social protection |
6,390 | 5,743 | 6,682 | 6,669 | ||||||||||||
| Transport |
8,047 | 7,570 | 8,066 | 7,577 | ||||||||||||
|
|
|
|
|
|
|
|
|
|
|
|
| |||||
| 75,880 | 69,902 | 90,986 | 84,853 | |||||||||||||
|
|
|
|
|
|
|
|
|
|
|
|
| |||||
| 52. | Sector assets by function |
| General Government | Total State | |||||||||||||||
| 2023 | 2022 | 2023 | 2022 | |||||||||||||
| $M | $M | $M | $M | |||||||||||||
| General public services1 |
63,690 | 55,099 | 94,806 | 88,592 | ||||||||||||
| Public order and safety |
9,817 | 9,214 | 9,535 | 9,018 | ||||||||||||
| Economic affairs |
14,248 | 13,530 | 53,883 | 60,380 | ||||||||||||
| Environmental protection |
105,601 | 95,973 | 105,537 | 95,911 | ||||||||||||
| Housing and community amenities |
24,144 | 21,601 | 37,347 | 34,719 | ||||||||||||
| Health |
20,160 | 17,691 | 20,011 | 17,538 | ||||||||||||
| Recreation, culture and religion |
5,604 | 5,213 | 6,592 | 6,125 | ||||||||||||
| Education |
35,888 | 29,683 | 35,852 | 29,652 | ||||||||||||
| Social protection |
2,686 | 2,764 | 5,784 | 5,184 | ||||||||||||
| Transport |
132,647 | 112,661 | 143,027 | 122,683 | ||||||||||||
|
|
|
|
|
|
|
|
|
|
|
|
| |||||
| 414,484 | 363,430 | 512,373 | 469,802 | |||||||||||||
|
|
|
|
|
|
|
|
|
|
|
|
| |||||
1 For GGS, includes fixed rate notes and investments in other public sector entities. For TSS, includes investments managed by QIC, securities and bonds.
| 5-86 | Audited Consolidated Financial Statements 2022–23 – Queensland Government |
Notes to the Financial Statements
| 53. | General Government Sector Budget to actual comparison |
Operating Statement
| Variance Notes |
Published $M |
Actual 2023 $M |
Change $M |
Change % |
||||||||||||||
| Revenue from Transactions |
||||||||||||||||||
| Taxation revenue |
1 | 18,842 | 20,601 | 1,759 | 9% | |||||||||||||
| Grants revenue |
2 | 35,242 | 38,335 | 3,092 | 9% | |||||||||||||
| Sales of goods and services |
6,181 | 6,483 | 302 | 5% | ||||||||||||||
| Interest income |
3 | 2,847 | 3,226 | 379 | 13% | |||||||||||||
| Dividend and income tax equivalent income |
4 | 1,499 | 1,007 | (493 | ) | (33%) | ||||||||||||
| Other revenue |
5 | 9,275 | 20,160 | 10,885 | 117% | |||||||||||||
| Total Revenue from Transactions |
73,886 | 89,810 | 15,923 | 22% | ||||||||||||||
| Expenses from Transactions |
||||||||||||||||||
| Employee expenses |
30,076 | 30,557 | 481 | 2% | ||||||||||||||
| Superannuation expenses |
||||||||||||||||||
| Superannuation interest cost |
6 | 655 | 776 | 121 | 18% | |||||||||||||
| Other superannuation expenses |
6 | 3,493 | 3,756 | 262 | 8% | |||||||||||||
| Other operating expenses |
19,805 | 20,014 | 209 | 1% | ||||||||||||||
| Depreciation and amortisation |
7 | 4,652 | 5,018 | 366 | 8% | |||||||||||||
| Other interest expenses |
8 | 1,826 | 1,688 | (139 | ) | (8%) | ||||||||||||
| Grants expenses |
14,407 | 14,072 | (335 | ) | (2%) | |||||||||||||
| Total Expenses from Transactions |
74,915 | 75,880 | 964 | 1% | ||||||||||||||
| Net Operating Balance |
(1,029 | ) | 13,930 | 14,959 | ||||||||||||||
| Other economic flows—included in operating result |
1 | 198 | 196 | |||||||||||||||
| Operating Result |
(1,028 | ) | 14,128 | 15,155 | ||||||||||||||
| Other economic flows—other movements in equity * |
9 | 3,348 | 40,255 | 36,907 | ||||||||||||||
| Comprehensive Result—Total Change in Net Worth |
2,321 | 54,383 | 52,063 | |||||||||||||||
| KEY FISCAL AGGREGATES |
||||||||||||||||||
| Net Operating Balance |
(1,029 | ) | 13,930 | 14,959 | ||||||||||||||
| Net Acquisition/(Disposal) of Non-Financial Assets |
||||||||||||||||||
| Purchases of non-financial assets |
8,478 | 9,899 | 1,420 | |||||||||||||||
| Less Sales of non-financial assets |
177 | 181 | 3 | |||||||||||||||
| Less Depreciation |
4,652 | 5,018 | 366 | |||||||||||||||
| Plus Change in inventories |
42 | 79 | 37 | |||||||||||||||
| Plus Other movement in non-financial assets |
914 | 1,058 | 144 | |||||||||||||||
| Equals Total Net Acquisition/(Disposal) of Non-Financial Assets |
4,606 | 5,838 | 1,232 | |||||||||||||||
| Fiscal Balance |
(5,635 | ) | 8,092 | 13,727 | ||||||||||||||
| * For GFS, the change in Net Worth is the change from the previous published outcome. This differs from the AASB 1049 statements where prior year adjustments are permitted under IFRS. |
| |||||||||||||||||
| Audited Consolidated Financial Statements 2022–23 – Queensland Government | 5-87 |
Notes to the Financial Statements
| 53. | General Government Sector Budget to actual comparison continued |
Balance Sheet
| Variance | Published Budget 2023 |
Actual 2023 |
Change | Change | ||||||||||||||
| Notes | $M | $M | $M | % | ||||||||||||||
| Assets |
||||||||||||||||||
| Financial Assets |
||||||||||||||||||
| Cash and deposits |
10 | 757 | 2,357 | 1,600 | 211% | |||||||||||||
| Advances paid |
1,408 | 1,239 | (169 | ) | (12%) | |||||||||||||
| Investments, loans and placements |
11 | 46,267 | 49,426 | 3,159 | 7% | |||||||||||||
| Receivables |
4,947 | 4,320 | (627 | ) | (13%) | |||||||||||||
| Equity |
||||||||||||||||||
| Investments in other public sector entities |
12 | 22,455 | 24,414 | 1,958 | 9% | |||||||||||||
| Investments in other entities |
165 | 175 | 9 | 5% | ||||||||||||||
| Total Financial Assets |
76,000 | 81,930 | 5,930 | 8% | ||||||||||||||
| Non-Financial Assets |
||||||||||||||||||
| Land and other fixed assets |
13 | 254,571 | 322,812 | 68,240 | 27% | |||||||||||||
| Other non-financial assets |
14 | 6,745 | 9,743 | 2,998 | 44% | |||||||||||||
| Total Non-Financial Assets |
261,316 | 332,554 | 71,238 | 27% | ||||||||||||||
| Total Assets |
337,316 | 414,484 | 77,168 | 23% | ||||||||||||||
| Liabilities |
||||||||||||||||||
| Payables |
15 | 4,965 | 5,921 | 956 | 19% | |||||||||||||
| Superannuation liability |
16 | 24,069 | 20,913 | (3,156 | ) | (13%) | ||||||||||||
| Other employee benefits |
17 | 9,615 | 10,419 | 805 | 8% | |||||||||||||
| Advances received |
1,745 | 1,909 | 165 | 9% | ||||||||||||||
| Borrowing |
18 | 66,459 | 53,726 | (12,732 | ) | (19%) | ||||||||||||
| Other liabilities |
14 | 14,210 | 17,622 | 3,413 | 24% | |||||||||||||
| Total Liabilities |
121,062 | 110,511 | (10,550 | ) | (9%) | |||||||||||||
| Net Worth |
216,254 | 303,973 | 87,719 | 41% | ||||||||||||||
| Net Financial Worth |
(45,062 | ) | (28,581 | ) | 16,481 | |||||||||||||
| Net Financial Liabilities |
67,517 | 52,995 | (14,522 | ) | ||||||||||||||
| Net Debt |
19,772 | 2,615 | (17,157 | ) | ||||||||||||||
| 5-88 | Audited Consolidated Financial Statements 2022–23 – Queensland Government |
Notes to the Financial Statements
| 53. | General Government Sector Budget to actual comparison continued |
Cash Flow Statement
| Variance | Published Budget 2023 |
Actual 2023 |
Change | Change | ||||||||||||||
| Notes | $M | $M | $M | % | ||||||||||||||
| Cash Receipts from Operating Activities |
||||||||||||||||||
| Taxes received |
19 | 18,840 | 20,410 | 1,570 | 8% | |||||||||||||
| Grants and subsidies received |
20 | 34,382 | 38,684 | 4,302 | 13% | |||||||||||||
| Sales of goods and services |
6,457 | 6,886 | 429 | 7% | ||||||||||||||
| Interest receipts |
2,844 | 3,201 | 357 | 13% | ||||||||||||||
| Dividends and income tax equivalents |
788 | 922 | 134 | 17% | ||||||||||||||
| Other receipts |
21 | 10,866 | 22,502 | 11,636 | 107% | |||||||||||||
| Total Operating Receipts |
74,178 | 92,604 | 18,426 | 25% | ||||||||||||||
| Cash Payments for Operating Activities |
||||||||||||||||||
| Payments for employees |
(34,334 | ) | (34,232 | ) | 102 | (0%) | ||||||||||||
| Payments for goods and services |
(22,258 | ) | (23,090 | ) | (832 | ) | 4% | |||||||||||
| Grants and subsidies |
(14,293 | ) | (13,777 | ) | 517 | (4%) | ||||||||||||
| Interest paid |
(1,755 | ) | (1,616 | ) | 139 | (8%) | ||||||||||||
| Other payments |
— | (4 | ) | (4 | ) | NA | ||||||||||||
| Total Operating Payments |
(72,641 | ) | (72,719 | ) | (78 | ) | 0% | |||||||||||
| Net Cash Flows from Operating Activities |
1,538 | 19,885 | 18,348 | 1193% | ||||||||||||||
| Cash Flows from Investments in |
||||||||||||||||||
| Non-Financial Assets |
||||||||||||||||||
| Purchases of non-financial assets |
22 | (8,478 | ) | (9,899 | ) | (1,420 | ) | 17% | ||||||||||
| Sales of non-financial assets |
177 | 181 | 3 | 2% | ||||||||||||||
| (8,301 | ) | (9,718 | ) | (1,417 | ) | 17% | ||||||||||||
| Financial Assets for Policy Purposes |
23 | (478 | ) | (766 | ) | (288 | ) | 60% | ||||||||||
| Financial Assets for Liquidity Purposes |
24 | 1,321 | (8,035 | ) | (9,356 | ) | (708%) | |||||||||||
| Net Cash Flows from Investing Activities |
(7,458 | ) | (18,519 | ) | (11,061 | ) | 148% | |||||||||||
| Receipts from Financing Activities |
||||||||||||||||||
| Advances received (net) |
900 | 598 | (302 | ) | (34%) | |||||||||||||
| Borrowing (net) |
25 | 4,797 | (1,318 | ) | (6,114 | ) | (127%) | |||||||||||
| Net Cash Flows from Financing Activities |
5,697 | (719 | ) | (6,416 | ) | (113%) | ||||||||||||
| Net Increase/(Decrease) in Cash Held |
(223 | ) | 647 | 871 | (391%) | |||||||||||||
| KEY FISCAL AGGREGATES |
||||||||||||||||||
| Net Cash from Operating Activities |
1,538 | 19,885 | 18,348 | |||||||||||||||
| Net Cash Flow from Investments in Non-Financial Assets |
(8,301 | ) | (9,718 | ) | (1,417 | ) | ||||||||||||
| CASH SURPLUS/(DEFICIT) |
(6,763 | ) | 10,167 | 16,931 | ||||||||||||||
| Derivation of ABS GFS Cash Surplus/Deficit |
||||||||||||||||||
| Cash surplus/(deficit) |
(6,763 | ) | 10,167 | 16,930 | ||||||||||||||
| Acquisitions under finance leases and similar arrangements |
(810 | ) | (849 | ) | (40 | ) | ||||||||||||
| ABS GFS Cash Surplus/(Deficit) Including Finance Leases and |
||||||||||||||||||
| Similar Arrangements |
(7,573 | ) | 9,318 | 16,890 | ||||||||||||||
| Audited Consolidated Financial Statements 2022–23 – Queensland Government | 5-89 |
Notes to the Financial Statements
| 53. | General Government Sector Budget to actual comparison continued |
Explanations of major variances between AASB 1049 actual amounts and corresponding original Budget amounts for GGS
Operating Statement
| 1. | Taxation revenue was $1.759 billion or 9% higher than the 2022-23 Budget due to the stronger than expected domestic economy and state labour market. Major drivers for the improvement in taxation revenue included: |
| – | $761 million in higher stamp duties, mainly from better-than-expected housing market activity and higher car sales; |
| – | $609 million in higher payroll tax revenue reflecting stronger growth in employment and wages; |
| – | Higher gambling taxes and motor vehicle registration of $217 million and $74 million respectively. |
| 2. | Grant revenue was $3.092 billion higher compared to the 2022-23 Budget forecast reflecting growth in the national GST pool ($495 million). In addition, the Australian Government made advance payments in late June 2023 of Financial Assistance Grants on-passed to local councils ($620 million), Disaster Recovery Financial arrangements payments ($758 million) and up-front Social Housing Accelerator program payments ($398 million). Higher National Health Reform and Quality Schools specific payments from the Australian Government also contributed to the comparatively higher grants revenue. |
| 3. | Interest income increased $379 million compared to the 2022-23 Budget reflecting earnings on the investment of an additional $3 billion in royalty windfalls, and an additional $1 billion invested in the long term assets to support the Housing Investment Fund, higher interest on solicitor trust accounts, and interest on higher cash balances. |
| 4. | Dividend and income tax equivalent income was $493 million lower than forecast mainly due to lower earnings by Energy Queensland and Stanwell Corporation. |
| 5. | Other revenue was $10.885 billion higher than 2022-23 Budget estimate largely driven by royalty income from extraordinarily high coal and oil prices earned by Queensland commodity producers. |
| 6. | Superannuation expenses in total were $383 million higher than forecast in part due to a change in financial assumptions used in the actuarial valuation of the defined benefit superannuation liabilities and the introduction of new Queensland public sector employer contribution arrangements. |
| 7. | Depreciation and amortisation expenses were $366 million higher in comparison to the 2022-23 Budget estimate because of unbudgeted upward valuations of road infrastructure, schools and hospitals and increased capital expenditure. |
| 8. | Other interest expenses were 8% lower than the 2022-23 Budget estimate primarily due to lower borrowing with QTC following improved net operating balances realised in 2022 and 2023. |
| 9. | Other movements in equity were $36.907 billion higher than estimated in the 2022-23 Budget due to upward valuations of road infrastructure, land under roads and school buildings and upward valuation of the investment in the PNFC and PFC Sector entities. Property, plant and equipment adjustments were largely driven by significant increases in the cost of inputs into roads infrastructure, such as raw materials, plant and labour as well as an increase in the market value of land in Queensland. |
Balance Sheet
| 10. | Refer Cash Flow Statement for movements in the cash balance. |
| 11. | Investments, loans and placements were $3.159 billion higher than the 2022-23 Budget estimate mainly reflecting the government’s decision to set aside $3 billion of the extraordinary royalties uplift for future investment in Queensland regional infrastructure and an additional $1 billion invested into the long term assets to support the Housing Investment Fund. |
| 12. | Investments in public sector entities were $1.958 billion higher than the 2022-23 Budget estimate reflecting the increase in net worth of the PNFC and PFC Sectors mainly from upwards valuation of property, plant and equipment by electricity network GOCs. |
| 5-90 | Audited Consolidated Financial Statements 2022–23 – Queensland Government |
Notes to the Financial Statements
| 53. | General Government Sector Budget to actual comparison continued |
Explanations of major variances between AASB 1049 actual amounts and corresponding original Budget amounts for GGS continued
Balance Sheet continued
| 13. | The increase of $68.24 billion in land and other fixed assets over the 2022-23 Budget mainly reflect the revaluation adjustments that occurred in the 2021-22 year end process (post 2022-23 Budget) as well as within the 2022-23 year, and result from the increased cost and shortage of inputs such as building materials and labour, as well as a significant increase in land values. Road infrastructure, school buildings and land under roads were particularly impacted. (Refer variance note 9.) To a lesser extent, higher than originally projected purchases of non-financial assets also contributed to the comparative increase. |
| 14. | Deferred tax assets and liabilities were higher than the 2022-23 Budget largely due to deferred tax assets and liability movements being netted off for budget reporting by Stanwell Corporation Limited, contributing to the comparative increase in other non-financial assets and other liabilities. |
| 15. | Payables were $956 million higher than the Budget projection due in part to an increase in cash surety held within the Financial Provisioning Scheme and GST overpaid by the Australian Government. |
| 16. | The $3.156 billion lower defined benefit superannuation liability mainly reflects the actuarial valuation adjustments which occurred in the 2021-22 year end process, post the 2022-23 Budget, when discount rates increased sharply. |
| 17. | Other employee benefit obligations were $805 million higher than the 2022-23 Budget projection partly due to Cost-of-Living Adjustment payments payable to employees on certification of enterprise bargaining agreements for nurses and teachers and wages payable on agreements certified late in the year. |
| 18. | Compared to the 2022-23 Budget, borrowings were $12.732 billion lower than projected primarily reflecting the lower borrowings from the 2021-22 outcome, which rolled forward into the opening balance for 2022-23 and lower than expected borrowing requirements within the year as a result of Queensland’s record net operating surplus driven by higher royalty income and improved taxation revenue, partly offset by higher capital purchases. |
Cash Flow Statement
| 19. | Tax receipts were $1.57 billion above the 2022-23 Budget estimate which is lower than the increase in the Operating Statement (refer variance Note 1) due to additional receivables at year end. |
| 20. | Grants and subsidies received are $4.302 billion higher than budgeted. This variance is higher than the Operating Statement (refer variance Note 2), due to the timing of receipts from the Commonwealth for GST payments. |
| 21. | In addition to the increase in the Operating Statement (refer variance Note 5) other receipts were higher than budget due to higher than expected net GST receipts from the ATO. |
| 22. | Purchases of non-financial assets are $1.42 billion higher than the 2022-23 Budget estimate as agencies have been able to deliver ahead of overall expectations for the sector. |
| 23. | Net cash outflows from policy purposes are $288 million higher than budget, mainly due to the timing of equity investments in GOCs partly offset by lower than expected new concessional loans. |
| 24. | Net cash outflows from liquidity purposes are $9.356 billion higher than budget, mainly due to the investment of funds to support priority regional infrastructure projects and additional investment in the QTC redraw facility. |
| 25. | Net proceeds from borrowing are $6.114 billion lower than budget mainly due to the improved operating cash position reducing the State’s expected funding requirements. |
| Audited Consolidated Financial Statements 2022–23 – Queensland Government | 5-91 |
Certification of Queensland State Government Financial Statements
General Government Sector and Total State Sector Consolidated Financial Statements
2022 – 23
Management Certificate
The foregoing GGS and TSS consolidated financial statements have been prepared pursuant to section 25(1)(a) and (b) of the Financial Accountability Act 2009 and other prescribed requirements.
In our opinion and in terms of section 25(3) of the Financial Accountability Act 2009, we certify that the GGS and TSS consolidated financial statements have been properly drawn up, under the prescribed requirements, to present a true and fair view of:
| (i) | the financial operations and cash flows of the Government of Queensland for the financial year; and |
| (ii) | the financial position of the Government of Queensland at 30 June 2023. |
At date of certification of the statements, we are not aware of any material circumstances that would render any particulars included in the GGS and TSS consolidated financial statements misleading or inaccurate.
| David Newby, CA |
Michael Carey |
The Honourable Cameron Dick MP | ||
| Director, Financial Reporting |
Under Treasurer |
Treasurer | ||
| Queensland Treasury |
Queensland Treasury |
Minister for Trade and Investment |
16 October 2023
| 5-92 | Audited Consolidated Financial Statements 2022–23 – Queensland Government |

INDEPENDENT AUDITOR’S REPORT
To the Treasurer of Queensland
Report on the audit of the financial report
Opinion
I have audited the accompanying financial report of the Queensland Government (the group) including the General Government Sector and Total State Sector as set out on pages 5-1 to 5-92.
In my opinion, the financial report:
| a) | gives a true and fair view of the Queensland Government’s financial position as at 30 June 2023, and its financial performance and cash flows for the year then ended |
| b) | complies with the Financial Accountability Act 2009 and Australian Accounting Standard AASB 1049 Whole of Government and General Government Sector Financial Reporting (AASB 1049). |
The financial report comprises the balance sheets as at 30 June 2023, the operating statements, statements of changes in equity (net worth), cash flow statements for the year then ended, notes to the financial statements including material accounting policy information, and the certificate given by the Treasurer, Under Treasurer and Director, Financial Reporting.
Basis for opinion
I conducted my audit in accordance with the Auditor-General Auditing Standards, which incorporate the Australian Auditing Standards. My responsibilities under those standards are further described in the Auditor’s Responsibilities for the Audit of the Financial Report section of my report.
I am independent of the Queensland Government in accordance with the ethical requirements of the Accounting Professional and Ethical Standards Board’s APES 110 Code of Ethics for Professional Accountants (the Code) that are relevant to my audit of the financial report in Australia. I have also fulfilled my other ethical responsibilities in accordance with the Code and the Auditor-General Auditing Standards.
I believe that the audit evidence I have obtained is sufficient and appropriate to provide a basis for my opinion.
Key audit matters
Key audit matters are those matters that, in my professional judgement, were of most significance in my audit of the financial report of the current period. I addressed these matters in the context of my audit of the financial report as a whole, and in forming my opinion thereon, and I do not provide a separate opinion on these matters.
| Audited Consolidated Financial Statements 2022–23 – Queensland Government | 5-93 |
Valuation of property, plant and equipment (Total State Sector $375.48 billion; General Government Sector $309.20 billion at 30 June 2023)
Refer to Note 31 in the financial report.
| Key audit matter | How my audit addressed this key audit matter | |
|
Property, plant and equipment is the most material balance on the Balance Sheet and is reported at fair value in compliance with AASB 13 Fair Value Measurement.
The valuation of some assets requires significant management judgement due to the uncertainties inherent in the valuation of these significant physical assets.
Complex valuation methodologies are applied to certain government assets including infrastructure assets, and some asset classes are difficult to value due to their nature. The inputs to valuation models are subjective and are reliant upon significant estimates and judgements.
Not all entities that are consolidated into the Whole of Government financial statements are required to report their material assets at fair value in their own general purpose financial statements. This increases the risk that material assets may not be reported at fair value in the consolidated financial statements. |
For material assets that were reported at fair value in entity financial statements, my procedures included, but were not limited to:
• confirming, on a sample basis, the fair value of material assets included in the consolidated statements to the public sector entity’s audited financial statements
• confirming the appropriateness of the approach used to measure the fair value for each type of asset class, and identifying the significant judgements made by management in determining fair value
• confirming the appropriateness of disclosures made under AASB 13 Fair Value Measurement by agreeing them to the entity’s audited financial statements.
For material assets that were not reported at fair value in entity financial statements, my procedures included, but were not limited to:
• assessing the methodology used to derive the fair values of those assets
• agreeing with component auditors the approach for auditing those values within materiality levels directed
• confirming with the component auditors the results of testing performed over the fair values and the significant judgements used by management
• assessing the impact of fair value adjustments on other balances in the financial statements, including depreciation and movements in the asset revaluation surplus
• assessing the reasonableness of values of remaining assets not reported at fair value to ensure that the values are not likely to be materially different to their fair value
• assessing the appropriateness of disclosures under AASB 13 Fair Value Measurement.
| |
|
| ||
| 5-94 | Audited Consolidated Financial Statements 2022–23 – Queensland Government |
Valuation of defined benefit superannuation liability (Total State Sector $20.56 billion; General Government Sector $20.91 billion at 30 June 2023)
Refer to Notes 36 and 48 in the financial report.
| Key audit matter | How my audit addressed this key audit matter | |
|
The Queensland Government defined benefit superannuation liability is a material amount on the Balance Sheet.
The underlying model used to value the liability is complex and involves a significant degree of management judgement and estimation in the selection of long-term assumptions, including salary growth, discount rates and expected CPI increases, to which the valuation of the scheme is highly sensitive.
The Government Division of the Australian Retirement Trust (QSuper) defined benefit scheme is assessed annually by the State Actuary. |
My procedures included, but were not limited to:
• obtaining management’s actuarial report and:
– assessing the appropriateness of any changes to the methodology used by the State Actuary
– assessing the reasonableness of any material changes to the underlying assumptions and judgements used in estimating the liability
– confirming the accuracy of the value reported in the consolidated financial statements
• assessing the appropriateness and adequacy of related disclosures in the financial statements against the requirements of applicable Australian accounting standards.
| |
|
Consolidation of financial information
|
||
| Key audit matter | How my audit addressed this key audit matter | |
|
The consolidated financial statements require the consolidation of financial information from over 90 public sector entities.
Entities may apply different financial reporting frameworks or apply accounting standards and accounting policies differently in the preparation of their individual financial statements.
AASB 1049 requires restatement or reclassification of certain information prepared under generally accepted accounting principles (GAAP) to comply with the Government Financial Statistics (GFS) requirements developed by the Australian Bureau of Statistics. |
My procedures included, but were not limited to:
• verifying the completeness of material public sector entities included in the consolidated financial statements
• obtaining assurance over the completeness and accuracy of the financial information of individual entities consolidated in the financial statements by agreeing the financial information back to the audited financial statements for material public sector entities
• verifying compliance with the ABS GFS manual with respect to accounting treatment and disclosures in the financial statements and the classification of entities into the relevant sectors of government
• assessing the quality of the process used to identify and eliminate transactions and balances occurring between public sector entities and sectors of government
• reviewing material manual adjustments and reclassification of amounts for reasonableness
• for those public sector entities not consolidated into the financial statements, we confirmed that they did not exceed the thresholds for reporting and therefore were not material. | |
| Audited Consolidated Financial Statements 2022–23 – Queensland Government | 5-95 |
Other information
Other information comprises financial and non-financial information (other than the audited financial report) included in the Queensland Government’s Report on State Finances for the year ended 30 June 2023.
The Treasurer, through Queensland Treasury, is responsible for the other information.
My opinion on the financial report does not cover the other information and accordingly I do not express any form of assurance conclusion thereon.
In connection with my audit of the financial report, my responsibility is to read the other information and, in doing so, consider whether the other information is materially inconsistent with the financial report or my knowledge obtained in the audit or otherwise appears to be materially misstated.
If, based on the work I have performed, I conclude that there is a material misstatement of this other information, I am required to report that fact.
I have nothing to report in this regard.
Responsibilities of the Treasurer and Queensland Treasury for the financial report
The Treasurer, through Queensland Treasury, is responsible for the preparation of the financial report that gives a true and fair view in accordance with the Financial Accountability Act 2009, Australian Accounting Standard 1049, and for such internal control as the Treasurer, through Queensland Treasury, determines is necessary to enable the preparation of the financial report that is free from material misstatement, whether due to fraud or error. AASB 1049 requires compliance with other applicable Australian Accounting Standards.
The Treasurer, through Queensland Treasury, is also responsible for disclosing, as applicable, matters relating to going concern and using the going concern basis of accounting in the preparation of the financial statements unless this is assessed as not being appropriate.
Auditor’s responsibilities for the audit of the financial report
My objectives are to obtain reasonable assurance about whether the financial report as a whole is free from material misstatement, whether due to fraud or error, and to issue an auditor’s report that includes my opinion. Reasonable assurance is a high level of assurance, but is not a guarantee that an audit conducted in accordance with the Australian Auditing Standards will always detect a material misstatement when it exists. Misstatements can arise from fraud or error and are considered material if, individually or in aggregate, they could reasonably be expected to influence the economic decisions of users taken on the basis of this financial report.
As part of an audit in accordance with the Australian Auditing Standards, I exercise professional judgement and maintain professional scepticism throughout the audit. I also:
| • | Identify and assess the risks of material misstatement of the financial report, whether due to fraud or error, design and perform audit procedures responsive to those risks, and obtain audit evidence that is sufficient and appropriate to provide a basis for my opinion. The risk of not detecting a material misstatement resulting from fraud is higher than for one resulting from error, as fraud may involve collusion, forgery, intentional omissions, misrepresentations, or the override of internal control. |
| • | Obtain an understanding of internal controls relevant to the audit in order to design audit procedures that are appropriate in the circumstances. This is not done for the purpose of expressing an opinion on the effectiveness of the Queensland Government’s internal controls. |
| 5-96 | Audited Consolidated Financial Statements 2022–23 – Queensland Government |
| • | Evaluate the appropriateness of material accounting policy information used and the reasonableness of accounting estimates and related disclosures made by the group. |
| • | Conclude on the appropriateness of the Queensland Government’s use of the going concern basis of accounting. |
| • | Evaluate the overall presentation, structure, and content of the financial report, including the disclosures, and whether the financial report represents the underlying transactions and events in a manner that achieves fair presentation. |
| • | Obtain sufficient appropriate audit evidence regarding the financial information of the entities or business activities within the group to express an opinion on the financial report. I am responsible for the direction, supervision and performance of the audit of the group. I remain solely responsible for my audit opinion. |
I communicate with the Treasurer, through Queensland Treasury, regarding, among other matters, the planned scope and timing of the audit and significant audit findings, including any significant deficiencies in internal control that I identify during my audit.
From the matters communicated with the Treasurer, through Queensland Treasury, I determine those matters that were of most significance in the audit of the financial report of the current period and are therefore the key audit matters. I describe these matters in my auditor’s report unless law or regulation precludes public disclosure about the matter or when, in extremely rare circumstances, I determine that a matter should not be communicated in my report because the adverse consequences of doing so would reasonably be expected to outweigh the public interest benefits of such communication.
| 17 October 2023 | ||
| Brendan Worrall |
Queensland Audit Office | |
| Auditor-General |
Brisbane | |
| Audited Consolidated Financial Statements 2022–23 – Queensland Government | 5-97 |