20577.5811889.4712779.3513601.6615430.916725.4219106.0912355.4913707.7811507.3718299.6715440.6411926.719677.3412852.2611945.4711427.0811126.6812627.1310000100009999.8710450.919949.77100001000015856.9114424.2913869.8912876.6912920.712536.9521229.6717900.2224862.3120775.1117396.715095.739195.731337.8732272.4726809.4223382.9519688.0214356.1313134.4112528.4412073.7312908.68100001000010025.7110637.0812150.2920096.3617765.5115301.0823268.6222254.5825862.6617741.7515571.3119076.5816212.6613270.0411386.8933409.1328549.0517200.4618352.2822226.1725768.9531829.8100001000014688.3815092.0113453.7413267.1812879.1310228.2110054.1519984.8624000.823855.2553572.4743315.6141043.95100001000016622.6617446.8716010.2815952.5621153.4921388.361295814222.2911680.9714202.7818520.7221417.9510146.7510411.2712772.0213310.6712947.6213557.3423815.6724471.29100009394.9711271.3412334.1513534.2515108.1219239.217310.2116962.1420558.5413262.0414530.7618892.3618171.3117436.720510.0920356.2520545.710000942211410.3812451.7320417.215855.1912571.1110768.5313876.8310831.3111524.3210762.5612255.749759.41000021167.2223307.8832154.2915819.5117352.9124795.7210440.0812899.9513840.4239046.411000013316.691000010416.6124607.2213573.9921491.9216022.317505.0521485.4514245.7214245.6415608.3217137.2417167.324679.8224733.1220498.4120542.3422215.4422266.69100001000010419.0410420.7112908.7930653.7830726.7637046.2137149.8512917.3413749.0713764.7315587.56994010592.512397.3438515.8429527.120537.317274.2922919.1616011.8616035.2722963.917315.620596.9729611.5238650.3417323.5723909.4829038.669939.2910597.0712409.439975.7610275.6911747.812888.5718419.5715728.2813581.5713599.7517812.4619798.24100309877.519712.1110028.679881.7710989.8210158.414603.410971.6810127.9914553.5713528.9613543.2317737.531004010039.29887.59891.911233.4711248.9313930.5513964.4518855.1118907.1220869.2420946.4811687.7311712.8416988.4217029.9414075.4214106.4411193.3612454.7611637.4915621.6713846.7416922.46100009736.0912049.6912009.3520871.0314756.8814756.8822068.0325050.7622387.4122387.4114930.4715744.7715088.6115088.6114582.5517455.5712714.9212714.9213503.9413792.7913616.9713616.9710561.0510425.5510594.210594.212640.4912893.1322527.9822527.9829246.9334281.0534277.4920947.921519.221519.222090.9622934.5821144.65100001154613245.31000010000100001000038358.2933481.3729882.9729899.9931665.524411.4224956.3124838.4118449.0117658.1817924.2217924.2222994.5723377.818449.0113009.0213009.0210000100001000010536.910562.741000018212.4912550.0612658.1312658.1320547.7520772.3520772.3513264.9513350.0513350.0514009.4714130.6114130.6111150.911855.910562.7412954.3518012.518199.3318188.5923188.5323388.9423366.1912813.9712887.8912887.8915043.2115055.8415055.8410750.8710711.9310711.9315484.4315494.6115494.6111582.6111616.0111616.0112398.33124221242210006.729991.169991.1612391.6212358.4212358.421000010657.913691.810000100001000013756.7112344.1116712.1612132.5310820.9210829.11100001000012233.6512951.5713558.113560.8610290.1412974.6812861.611907.0812297.5916544.1912720.6112132.5312053.7912788.3212344.1112142.0117349.0116712.1616325.0612805.0613756.7113569.411979.0821456.9220842.0816721.7616702.2315571.05100001061013572.721391.0912974.6812297.5913558.110820.921000019409.611000014791.514835.2212248.0112248.0110926.7412164.311000013931.314993.4414993.4413816.951000011984.410000100001000014144.614144.612087.5926568.0426774.5820970.8225157.6814636.3612990.7315776.9615776.9613520.6915426.3718992.5918992.5917118.7418262.4133671336713082.5415800.5814134.0314134.0311807.4213723.1321526.0221505.9516394.4120408.7416382.0416382.0413321.27100001000012343.5811980.9911941.8111753.2410431.6510140.5913868.3214463.6614965.7417818.5715498.6318680.3114520.2915818.8920745.9822102.123836.9716648.2319341.82100001000010399.0310448.9617990.2718649.0723624.1924659.6428301.8829670.9814017.0514350.8420170.3920745.1916762.9517320.8512824.9312948.6312966.2913170.8614208.2214503.57100001000024564.6625743.2915659.1616179.9616547.9417156.8121033.6721945.9113699.1413968.5813799.9214116.2418536.0819058.1310388.2310442.3112311.8812430.1212469.812653.8112070.7221633.7718093.1111370.418895.2820619.8510249.1714608.814758.4310285.6515320.3416681.4512155.4517169.0914126.311502.1513345.6913381.4212213.8313706.6511868.8110314.9712046.9213072.1410437.0510443.8811816.5610531.2211934.2110000100001000010392.2417950.97100001000010368.0213533.6515315.7616086.0417018.213080.5512967.6913223.9314850.2315360.1812588.9512715.7812857.4611448.5411253.6211453.8612413.9310440.0211308.691000011202.8510344.3610267.561000011144.3211238.8613091.3112530.9312305.8711278.8714854.0413187.6413054.5112801.8612523.7214931.4215374.6413316.2417366.7917027.9215679.6417863.2910259.21100001000012360.2611332.9511187.7711288.5211251.7510344.6212631.6415152.2815063.7813251.4913151.9412605.5717446.6116040.0315663.1213517.7813203.912955.5818091.0418588.88100001000012949.7313335.0113555.6813943.7516183.4816629.4712630.0412918.1113429.913577.3715481.2115627.4910205.0410312.1711458.3711503.6811421.4311593.419460.3812946.3413720.0616498.4713628.6114372.9217328.9220146.411000010306.3111776.0711890.431000010200.8111747.9811685.2113316.0913910.1816702.6914140.5414895.5317957.87100001000010171.9410298.2611949.1614137.0917315.5817574.6814109.8614735.7615029.9411978.7611859.5112105.4313157.1513596.3713921.115668.7218575.2919374.6921252.9922145.6412113.9310290.78100001000010163.1516268.4914049.8813818.0613315.7612283.5412007.3412148.4615510.5815202.511446618280.7717949.6314319.5619504.7320485.6322622.6223735.9814161.9814018.0313448.212448.4415924.5915612.3914774.2918909.6121441.0120302.7816786.825112.7623783.5410282.7212269.07100001000010138.3318490.9314484.7312125.9412309.0519410.5415008.2115921.0716245.4117181.7520926.1112205.0512548.8213537.0414141.051456518940.07100001000010139.7610279.4612382.1212414.9714226.8722203.0424743.6926243.4512251.0312477.5812438.2210275.2110138.99100001000019222.9614610.114257.4614212.0113583.2112608.1721345.9517399.816450.3416092.2715144.6119701.5126952.7225393.4322652.7510127.53100001000027428.2613627.2512664.3312306.4912536.0212492.7110270.1415223.319920.7319403.7414658.1114289.614277.5325706.1622966.5221521.7117567.716534.8916229.199970.929996.449991.8998012931.7611953.741197210003.6212135.6512153.1213629.5910925.9214663.7713251.0712087.849798.223236.3918996.8713972.3111601.9416128.4213877.3415554.739735.719299.2114840.6319134.4111546.4828867.3221083.7816857.069770.3620919.2216149.9226474.221146634901.7225278.6622109.1910800.7612606.249637.528861.9111330993015668.4114792.6610719.769889.6111907.169969.0315139.319487.428582.318551.8710142.4610083.7217884.913052.069928.249157.4411272.539875.9610071.77false0000904333N-1A0.0080.0080.0080.0090.0090.0110.0140.0150.0180.0220.0350.0300.0650.0710.0840.1330.1750.0530.0090.0100.0460.0290.2060.0650.0390.0860.0740.0220.0460.0420.0820.0670.0280.1580.1650.1800.1060.0980.0680.0650.0430.0410.0380.0290.0280.0250.0050.0020.3900.0720.0560.0430.0390.0380.0100.1200.1190.1060.0320.0290.0290.0290.0270.0260.0480.0410.0390.0320.1120.0060.0260.0520.0560.0710.0760.2080.1510.1280.1140.0520.0600.0610.0820.0830.1060.0200.0260.0320.0450.5300.0260.0500.0650.0670.1310.1310.0110.0110.0110.0100.0100.0100.0090.0090.0080.0120.0220.0130.0000.1870.1790.1740.1680.0890.0490.0460.0440.0290.0460.0580.0630.1100.0310.0310.0330.0350.0380.0410.3930.0230.0470.0560.0920.1630.1980.0410.0510.0580.7880.0140.0140.0290.0330.0240.0200.0210.0220.0230.0160.0160.0170.0180.0190.0480.0440.0330.0230.0220.0200.1970.1560.1330.1040.0890.0800.0100.0120.0510.0390.0530.0670.0680.1040.1110.1240.1950.2170.0840.0690.0660.0410.0300.0280.0240.0220.0220.0150.3610.1290.1050.1010.0900.0810.0470.0280.0230.0180.0170.0000.0050.0060.0060.0100.0040.0040.0050.0050.0050.0100.1790.1680.0130.0180.0280.0330.0400.1660.1620.0890.0550.0490.0580.0600.0190.0200.0210.0250.0260.0360.0740.0130.0010.0200.0440.0940.0940.0950.1050.1310.3420.0220.0230.0290.1370.0500.0450.0390.0320.0310.0250.0210.1140.1110.1120.0690.0580.0570.5330.1290.0030.0030.0020.0230.0040.0040.0030.0110.0300.0290.0220.0200.0170.0160.0160.0140.0120.0020.0010.0760.0730.0580.0460.0410.0390.1190.1130.0810.2190.1320.0060.0060.0050.0070.0060.0060.0060.0060.0060.0090.0420.0040.0020.1840.1490.1250.1130.0980.0700.0630.0550.0480.0470.0210.0140.0130.0120.0120.0120.0100.0110.0110.0110.0360.0320.0360.0560.0500.0360.2410.1940.1090.1010.0880.0750.1480.2280.0320.0180.0000.0500.0670.0930.0930.1090.1090.0180.0170.0170.0150.0140.0130.0470.0290.0230.0210.1200.1040.0960.1580.1840.0020.0930.0840.0730.0350.0350.0160.0060.0040.0030.0060.0040.0040.0040.0040.0040.0030.1370.1210.0930.0720.0510.0500.0400.0380.0330.0040.2030.1580.0140.0310.0080.0090.0090.0090.0090.0110.0120.0230.0020.0100.0430.0530.0650.0750.0860.0980.1100.1230.1580.1770.0820.0820.1390.1400.2420.0310.0320.0450.0460.0800.0810.0030.0020.0020.0020.0020.0020.0020.0020.0020.0040.0050.0330.0360.0510.0520.0670.0270.0310.0330.0370.0370.0510.0760.0810.1130.1150.1260.2450.0770.0810.0870.2200.3190.0520.0280.0340.0430.0130.0130.0160.0170.0270.0270.0840.1030.1200.1360.1690.2500.0030.0060.0180.0280.0350.0480.0500.1010.1070.1140.1940.3410.0250.0270.0410.0240.0060.2670.1540.3620.0990.0870.0300.0870.0990.3620.4220.2390.0500.0500.0340.1610.1350.1240.0710.0540.0500.5000.2830.0890.0780.0500.1210.1600.2080.0330.0330.0400.0430.0520.1050.1200.0700.0520.0400.0330.4360.2080.1610.0300.3050.0900.0840.0420.0400.0390.0330.1550.0910.0300.0250.3320.3220.1560.0610.0400.0340.0610.0600.0340.0510.1090.0630.4810.0200.0260.0280.0170.0200.0340.0400.0630.1050.2210.5000.2790.1540.0250.0250.0310.0360.0410.0700.0840.1160.0120.0170.0200.0200.0260.0700.0760.0840.2220.4530.0640.0480.0410.0370.0290.0240.2540.1340.1310.0760.0890.0760.0650.0240.0210.0210.4210.2500.0200.0130.1260.0720.0620.0530.0420.0390.0290.0250.2410.1380.0180.0140.0980.0720.0620.0260.0220.0210.4040.2630.0440.0430.0300.0290.2280.1440.1130.0690.0600.0580.0230.0220.0150.0150.3860.2740.1070.0700.0600.0280.1740.1550.0850.0350.0670.0620.0570.0450.0400.0380.3490.2840.1570.0460.0390.0350.0340.0220.0150.0100.0090.0410.0410.0390.0380.1870.1060.1010.0750.0710.0470.0420.0410.0310.0190.0160.0060.3990.2090.1870.0450.0050.0400.0810.0720.0520.0470.0440.0420.1940.1160.0840.0040.1520.2120.0170.0210.0270.0310.0450.0540.4370.0560.0920.0920.1260.1960.0430.0440.0450.0480.0530.4650.0020.0130.0180.0210.0380.0490.0620.1010.2310.0440.0490.0500.0510.0530.0560.0940.1000.1370.2040.0180.0500.0510.0630.0650.2520.4770.0010.0090.0140.2010.1000.1010.1380.0450.0500.0550.0550.0580.0600.0060.0090.0180.0450.0500.0550.0740.2520.4910.1980.0460.0510.0550.0580.0590.0610.1000.1030.1380.0050.2550.4920.0070.0200.0330.0520.0590.0770.0460.0530.0590.0610.0630.0630.1010.1070.1410.1980.0040.0050.0150.0200.0540.0630.0800.2620.497Fund expenses may have been partially absorbed by the investment adviser and its affiliates. Without these reductions, the fund’s returns would have been lower. These returns do not reflect the deduction of taxes that a shareholder would pay on fund distributions or the redemption of fund shares.Excludes derivatives.Less than 0.05%.Includes the fund’s position(s) in money market mutual funds registered under the Investment Company Act of 1940, as amended.The fund’s performance relative to the index may be affected by fair-value pricing and timing differences in foreign exchange calculations.Performance does not reflect the deduction of taxes that a shareholder would pay on fund distributions or the redemption of fund shares.Effective June 21, 2024, the fund changed its comparative index from the Russell RAFI™ US Small Company Index to the RAFI Fundamental High Liquidity US Small Index in connection with a change to the fund’s investment objective and investment strategy to invest its assets in accordance with the index. The inception date of the RAFI Fundamental High Liquidity US Small Index is January 31, 2024. The fund began tracking the index after the close of business on June 21, 2024.Expenses were reduced by a contractual fee waiver in effect for so long as the investment adviser serves as adviser to the fund. This agreement to limit the total annual fund operating expenses is limited to the fund’s direct operating expenses and, therefore, does not apply to acquired fund fees and expenses (AFFE), which are indirect expenses incurred by the fund through its investments in the underlying funds.The net version of the index reflects reinvested dividends net of withholding taxes but reflects no deductions for expenses or other taxes.The S&P 500® Index serves as the fund’s regulatory index and provides a broad measure of market performance. The fund generally invests in securities that are included in the Russell Midcap® Index. The fund does not seek to track the regulatory index.Effective June 21, 2024, the fund changed its comparative index from the Russell RAFI™ US Large Company Index to the RAFI Fundamental High Liquidity US Large Index in connection with a change to the fund’s investment objective and investment strategy to invest its assets in accordance with the index. The inception date of the RAFI Fundamental High Liquidity US Large Index is January 31, 2024. The fund began tracking the index after the close of business on June 21, 2024.Effective June 21, 2024, the fund changed its comparative index from the Russell RAFI™ Developed ex US Small Company Index (Net) to the RAFI Fundamental High Liquidity Developed ex US Small Index (Net) in connection with a change to the fund’s investment objective and investment strategy to invest its assets in accordance with the index. The inception date of the RAFI Fundamental High Liquidity Developed ex US Small Index (Net) is January 31, 2024. The fund began tracking the index after the close of business on June 21, 2024.Effective June 21, 2024, the fund changed its comparative index from the Russell RAFI™ Developed ex US Large Company Index (Net) to the RAFI Fundamental High Liquidity Developed ex US Large Index (Net) in connection with a change to the fund’s investment objective and investment strategy to invest its assets in accordance with the index. The inception date of the RAFI Fundamental High Liquidity Developed ex US Large Index (Net) is January 31, 2024. The fund began tracking the index after the close of business on June 21, 2024.The S&P 500® Index serves as the fund’s regulatory index and provides a broad measure of market performance. The fund generally invests in securities that are included in the RAFI Fundamental High Liquidity US Small Index. The fund does not seek to track the regulatory index.Effective June 21, 2024, the fund changed its comparative index from the Russell RAFI™ Emerging Markets Large Company Index (Net) to the RAFI Fundamental High Liquidity Emerging Markets Index (Net) in connection with a change to the fund’s investment objective and investment strategy to invest its assets in accordance with the index. The inception date of the RAFI Fundamental High Liquidity Emerging Markets Index (Net) is January 31, 2024. The fund began tracking the index after the close of business on June 21, 2024.The holdings listed exclude any temporary liquidity investments.The S&P 500® Index serves as the fund’s regulatory index and provides a broad measure of market performance. The fund generally invests in securities that are included in the Russell 1000® Value Index. The fund does not seek to track the regulatory index.The Russell 1000® Index serves as the fund’s regulatory index and provides a broad measure of market performance. The fund generally invests in securities that are included in the RAFI Fundamental High Liquidity US Large Index. The fund does not seek to track the regulatory index.The MSCI EAFE® Index (Net) serves as the fund’s regulatory index and provides a broad measure of market performance. The fund generally invests in securities that are included in the RAFI Fundamental High Liquidity Developed ex US Large Index (Net). The fund does not seek to track the regulatory index.The S&P 500® Index serves as the fund’s regulatory index and provides a broad measure of market performance. The Russell 2000® Index is the fund’s additional index and is more representative of the fund’s investment universe than the regulatory index.The fund commenced operations on October 16, 1996 which became the Schwab International Opportunities Fund Investor Shares. The Investor Shares were consolidated into Select Shares on February 26, 2019. The performance presented is that of the former Select Shares which commenced operations on April 2, 2004.The S&P 500® Index serves as the fund’s regulatory index and provides a broad measure of market performance. The Dow Jones Global Health Care Index is the fund’s additional index and is more representative of the fund’s investment universe than the regulatory index.The S&P 500® Index serves as the fund’s regulatory index and provides a broad measure of market performance. The fund generally invests in securities that are included in the Russell 1000® Growth Index. The fund does not seek to track the regulatory index.Expenses were reduced by a contractual fee waiver in effect for so long as the investment adviser serves as adviser to the fund.The S&P 500® Index serves as the fund’s regulatory index and provides a broad measure of market performance. The fund generally invests in securities that are included in the Russell 2000® Index. The fund does not seek to track the regulatory index.The S&P 500® Index serves as the fund’s regulatory index and provides a broad measure of market performance. The Russell 1000® Value Index is the fund’s additional index and is more representative of the fund’s investment universe than the regulatory index.The S&P 500® Index serves as the fund’s regulatory index and provides a broad measure of market performance. The Russell 1000® Growth Index is the fund’s additional index and is more representative of the fund’s investment universe than the regulatory index.The MSCI Emerging Markets Index (Net) serves as the fund’s regulatory index and provides a broad measure of market performance. The fund generally invests in securities that are included in the RAFI Fundamental High Liquidity Emerging Markets Index (Net). The fund does not seek to track the regulatory index.The MSCI EAFE® Index (Net) serves as the fund’s regulatory index and provides a broad measure of market performance. The fund generally invests in securities that are included in the RAFI Fundamental High Liquidity Developed ex US Small Index (Net). The fund does not seek to track the regulatory index. 0000904333 2024-11-01 2025-10-31 0000904333 cik0000904333:C000195502Member 2017-12-20 2025-10-31 0000904333 cik0000904333:Russell1000GrowthIndexMember 2017-12-20 2025-10-31 0000904333 us-gaap:StandardPoors500IndexMember 2017-12-20 2025-10-31 0000904333 cik0000904333:Russell1000ValueIndexMember 2017-12-20 2025-10-31 0000904333 cik0000904333:C000195503Member 2017-12-20 2025-10-31 0000904333 cik0000904333:C000195504Member 2017-12-20 2025-10-31 0000904333 cik0000904333:RussellMidcapIndexMember 2017-12-20 2025-10-31 0000904333 cik0000904333:C000195502Member 2017-12-20 2024-10-31 0000904333 cik0000904333:Russell1000GrowthIndexMember 2017-12-20 2024-10-31 0000904333 us-gaap:StandardPoors500IndexMember 2017-12-20 2024-10-31 0000904333 cik0000904333:Russell1000ValueIndexMember 2017-12-20 2024-10-31 0000904333 cik0000904333:C000195503Member 2017-12-20 2024-10-31 0000904333 cik0000904333:C000195504Member 2017-12-20 2024-10-31 0000904333 cik0000904333:RussellMidcapIndexMember 2017-12-20 2024-10-31 0000904333 cik0000904333:C000195502Member 2017-12-20 2023-10-31 0000904333 cik0000904333:Russell1000GrowthIndexMember 2017-12-20 2023-10-31 0000904333 us-gaap:StandardPoors500IndexMember 2017-12-20 2023-10-31 0000904333 cik0000904333:Russell1000ValueIndexMember 2017-12-20 2023-10-31 0000904333 cik0000904333:C000195503Member 2017-12-20 2023-10-31 0000904333 cik0000904333:C000195504Member 2017-12-20 2023-10-31 0000904333 cik0000904333:RussellMidcapIndexMember 2017-12-20 2023-10-31 0000904333 cik0000904333:C000195502Member 2017-12-20 2022-10-31 0000904333 cik0000904333:Russell1000GrowthIndexMember 2017-12-20 2022-10-31 0000904333 us-gaap:StandardPoors500IndexMember 2017-12-20 2022-10-31 0000904333 cik0000904333:Russell1000ValueIndexMember 2017-12-20 2022-10-31 0000904333 cik0000904333:C000195503Member 2017-12-20 2022-10-31 0000904333 cik0000904333:C000195504Member 2017-12-20 2022-10-31 0000904333 cik0000904333:RussellMidcapIndexMember 2017-12-20 2022-10-31 0000904333 cik0000904333:C000195502Member 2017-12-20 2021-10-31 0000904333 cik0000904333:Russell1000GrowthIndexMember 2017-12-20 2021-10-31 0000904333 us-gaap:StandardPoors500IndexMember 2017-12-20 2021-10-31 0000904333 cik0000904333:Russell1000ValueIndexMember 2017-12-20 2021-10-31 0000904333 cik0000904333:C000195503Member 2017-12-20 2021-10-31 0000904333 cik0000904333:C000195504Member 2017-12-20 2021-10-31 0000904333 cik0000904333:RussellMidcapIndexMember 2017-12-20 2021-10-31 0000904333 cik0000904333:C000195502Member 2017-12-20 2020-10-31 0000904333 cik0000904333:Russell1000GrowthIndexMember 2017-12-20 2020-10-31 0000904333 us-gaap:StandardPoors500IndexMember 2017-12-20 2020-10-31 0000904333 cik0000904333:Russell1000ValueIndexMember 2017-12-20 2020-10-31 0000904333 cik0000904333:C000195503Member 2017-12-20 2020-10-31 0000904333 cik0000904333:C000195504Member 2017-12-20 2020-10-31 0000904333 cik0000904333:RussellMidcapIndexMember 2017-12-20 2020-10-31 0000904333 cik0000904333:C000195502Member 2017-12-20 2019-10-31 0000904333 cik0000904333:Russell1000GrowthIndexMember 2017-12-20 2019-10-31 0000904333 us-gaap:StandardPoors500IndexMember 2017-12-20 2019-10-31 0000904333 cik0000904333:Russell1000ValueIndexMember 2017-12-20 2019-10-31 0000904333 cik0000904333:C000195503Member 2017-12-20 2019-10-31 0000904333 cik0000904333:C000195504Member 2017-12-20 2019-10-31 0000904333 cik0000904333:RussellMidcapIndexMember 2017-12-20 2019-10-31 0000904333 cik0000904333:C000195502Member 2017-12-20 2018-10-31 0000904333 cik0000904333:Russell1000GrowthIndexMember 2017-12-20 2018-10-31 0000904333 us-gaap:StandardPoors500IndexMember 2017-12-20 2018-10-31 0000904333 cik0000904333:C000195503Member 2017-12-20 2018-10-31 0000904333 cik0000904333:Russell1000ValueIndexMember 2017-12-20 2018-10-31 0000904333 cik0000904333:C000195504Member 2017-12-20 2018-10-31 0000904333 cik0000904333:RussellMidcapIndexMember 2017-12-20 2018-10-31 0000904333 cik0000904333:Target2060CompositeIndexMember 2016-08-25 2016-08-25 0000904333 cik0000904333:BloombergUSAggregateBondIndexMember 2016-08-25 2016-08-25 0000904333 cik0000904333:DowJonesUSTotalStockMarketIndexMember 2016-08-25 2016-08-25 0000904333 cik0000904333:C000172771Member 2016-08-25 2016-08-25 0000904333 cik0000904333:DowJonesUSTotalStockMarketIndexMember 2016-08-25 2024-10-31 0000904333 cik0000904333:C000172771Member 2016-08-25 2024-10-31 0000904333 cik0000904333:Target2060CompositeIndexMember 2016-08-25 2024-10-31 0000904333 cik0000904333:BloombergUSAggregateBondIndexMember 2016-08-25 2024-10-31 0000904333 cik0000904333:Target2060CompositeIndexMember 2016-08-25 2023-10-31 0000904333 cik0000904333:BloombergUSAggregateBondIndexMember 2016-08-25 2023-10-31 0000904333 cik0000904333:DowJonesUSTotalStockMarketIndexMember 2016-08-25 2023-10-31 0000904333 cik0000904333:C000172771Member 2016-08-25 2023-10-31 0000904333 cik0000904333:Target2060CompositeIndexMember 2016-08-25 2022-10-31 0000904333 cik0000904333:BloombergUSAggregateBondIndexMember 2016-08-25 2022-10-31 0000904333 cik0000904333:DowJonesUSTotalStockMarketIndexMember 2016-08-25 2022-10-31 0000904333 cik0000904333:C000172771Member 2016-08-25 2022-10-31 0000904333 cik0000904333:DowJonesUSTotalStockMarketIndexMember 2016-08-25 2021-10-31 0000904333 cik0000904333:C000172771Member 2016-08-25 2021-10-31 0000904333 cik0000904333:Target2060CompositeIndexMember 2016-08-25 2021-10-31 0000904333 cik0000904333:BloombergUSAggregateBondIndexMember 2016-08-25 2021-10-31 0000904333 cik0000904333:Target2060CompositeIndexMember 2016-08-25 2020-10-31 0000904333 cik0000904333:BloombergUSAggregateBondIndexMember 2016-08-25 2020-10-31 0000904333 cik0000904333:DowJonesUSTotalStockMarketIndexMember 2016-08-25 2020-10-31 0000904333 cik0000904333:C000172771Member 2016-08-25 2020-10-31 0000904333 cik0000904333:Target2060CompositeIndexMember 2016-08-25 2019-10-31 0000904333 cik0000904333:BloombergUSAggregateBondIndexMember 2016-08-25 2019-10-31 0000904333 cik0000904333:DowJonesUSTotalStockMarketIndexMember 2016-08-25 2019-10-31 0000904333 cik0000904333:C000172771Member 2016-08-25 2019-10-31 0000904333 cik0000904333:DowJonesUSTotalStockMarketIndexMember 2016-08-25 2018-10-31 0000904333 cik0000904333:C000172771Member 2016-08-25 2018-10-31 0000904333 cik0000904333:Target2060CompositeIndexMember 2016-08-25 2018-10-31 0000904333 cik0000904333:BloombergUSAggregateBondIndexMember 2016-08-25 2018-10-31 0000904333 cik0000904333:Target2060CompositeIndexMember 2016-08-25 2017-10-31 0000904333 cik0000904333:BloombergUSAggregateBondIndexMember 2016-08-25 2017-10-31 0000904333 cik0000904333:DowJonesUSTotalStockMarketIndexMember 2016-08-25 2017-10-31 0000904333 cik0000904333:C000172771Member 2016-08-25 2017-10-31 0000904333 cik0000904333:C000195502Member 2017-12-20 2017-12-20 0000904333 cik0000904333:Russell1000GrowthIndexMember 2017-12-20 2017-12-20 0000904333 us-gaap:StandardPoors500IndexMember 2017-12-20 2017-12-20 0000904333 cik0000904333:C000195503Member 2017-12-20 2017-12-20 0000904333 cik0000904333:Russell1000ValueIndexMember 2017-12-20 2017-12-20 0000904333 cik0000904333:C000195504Member 2017-12-20 2017-12-20 0000904333 cik0000904333:RussellMidcapIndexMember 2017-12-20 2017-12-20 0000904333 cik0000904333:Target2060CompositeIndexMember 2016-08-25 2025-10-31 0000904333 cik0000904333:BloombergUSAggregateBondIndexMember 2016-08-25 2025-10-31 0000904333 cik0000904333:DowJonesUSTotalStockMarketIndexMember 2016-08-25 2025-10-31 0000904333 cik0000904333:C000172771Member 2016-08-25 2025-10-31 0000904333 cik0000904333:C000225748Member 2021-02-25 2021-02-25 0000904333 cik0000904333:DowJonesUSTotalStockMarketIndexMember 2021-02-25 2021-02-25 0000904333 cik0000904333:BloombergUSAggregateBondIndexMember 2021-02-25 2021-02-25 0000904333 cik0000904333:Target2065CompositeIndexMember 2021-02-25 2021-02-25 0000904333 cik0000904333:C000225748Member 2021-02-25 2024-10-31 0000904333 cik0000904333:DowJonesUSTotalStockMarketIndexMember 2021-02-25 2024-10-31 0000904333 cik0000904333:BloombergUSAggregateBondIndexMember 2021-02-25 2024-10-31 0000904333 cik0000904333:Target2065CompositeIndexMember 2021-02-25 2024-10-31 0000904333 cik0000904333:C000225748Member 2021-02-25 2023-10-31 0000904333 cik0000904333:DowJonesUSTotalStockMarketIndexMember 2021-02-25 2023-10-31 0000904333 cik0000904333:BloombergUSAggregateBondIndexMember 2021-02-25 2023-10-31 0000904333 cik0000904333:Target2065CompositeIndexMember 2021-02-25 2023-10-31 0000904333 cik0000904333:C000225748Member 2021-02-25 2022-10-31 0000904333 cik0000904333:DowJonesUSTotalStockMarketIndexMember 2021-02-25 2022-10-31 0000904333 cik0000904333:BloombergUSAggregateBondIndexMember 2021-02-25 2022-10-31 0000904333 cik0000904333:Target2065CompositeIndexMember 2021-02-25 2022-10-31 0000904333 cik0000904333:C000225748Member 2021-02-25 2021-10-31 0000904333 cik0000904333:DowJonesUSTotalStockMarketIndexMember 2021-02-25 2021-10-31 0000904333 cik0000904333:BloombergUSAggregateBondIndexMember 2021-02-25 2021-10-31 0000904333 cik0000904333:Target2065CompositeIndexMember 2021-02-25 2021-10-31 0000904333 cik0000904333:C000017890Member 2015-11-01 2024-10-31 0000904333 cik0000904333:MSCIEAFEIndexNetMember 2015-11-01 2024-10-31 0000904333 us-gaap:StandardPoors500IndexMember 2015-11-01 2024-10-31 0000904333 cik0000904333:C000015013Member 2015-11-01 2024-10-31 0000904333 cik0000904333:C000015015Member 2015-11-01 2024-10-31 0000904333 cik0000904333:Russell1000ValueIndexMember 2015-11-01 2024-10-31 0000904333 cik0000904333:C000015012Member 2015-11-01 2024-10-31 0000904333 cik0000904333:Russell1000GrowthIndexMember 2015-11-01 2024-10-31 0000904333 cik0000904333:C000015017Member 2015-11-01 2024-10-31 0000904333 cik0000904333:Russell2000IndexMember 2015-11-01 2024-10-31 0000904333 cik0000904333:C000015021Member 2015-11-01 2024-10-31 0000904333 cik0000904333:DowJonesGlobalHealthCareIndexMember 2015-11-01 2024-10-31 0000904333 cik0000904333:C000063316Member 2015-11-01 2024-10-31 0000904333 cik0000904333:C000016166Member 2015-11-01 2024-10-31 0000904333 cik0000904333:C000016169Member 2015-11-01 2024-10-31 0000904333 cik0000904333:C000016171Member 2015-11-01 2024-10-31 0000904333 cik0000904333:DowJonesUSTotalStockMarketIndexMember 2015-11-01 2024-10-31 0000904333 cik0000904333:C000016173Member 2015-11-01 2024-10-31 0000904333 cik0000904333:C000046821Member 2015-11-01 2024-10-31 0000904333 cik0000904333:FundamentalUSLargeSplicedIndexMember 2015-11-01 2024-10-31 0000904333 cik0000904333:RussellRAFIUSLargeCompanyIndexMember 2015-11-01 2024-10-31 0000904333 cik0000904333:Russell1000IndexMember 2015-11-01 2024-10-31 0000904333 cik0000904333:C000046824Member 2015-11-01 2024-10-31 0000904333 cik0000904333:RussellRAFIUSSmallCompanyIndexMember 2015-11-01 2024-10-31 0000904333 cik0000904333:C000046827Member 2015-11-01 2024-10-31 0000904333 cik0000904333:RussellRAFIDevelopedexUSLargeCompanyIndexNetMember 2015-11-01 2024-10-31 0000904333 cik0000904333:FundamentalDevelopedexUSLargeSplicedIndexMember 2015-11-01 2024-10-31 0000904333 cik0000904333:C000055855Member 2015-11-01 2024-10-31 0000904333 cik0000904333:FundamentalDevelopedExUSSmallSplicedIndexMember 2015-11-01 2024-10-31 0000904333 cik0000904333:RussellRAFIDevelopedexUSSmallCompanyIndexNetMember 2015-11-01 2024-10-31 0000904333 cik0000904333:SAndPDevelopedExUSSmallCapIndexNetMember 2015-11-01 2024-10-31 0000904333 cik0000904333:FundamentalEmergingMarketsSplicedIndexMember 2015-11-01 2024-10-31 0000904333 cik0000904333:RussellRAFITMEmergingMarketsLargeCompanyIndexNetMember 2015-11-01 2024-10-31 0000904333 cik0000904333:MSCIEmergingMarketsIndexNetMember 2015-11-01 2024-10-31 0000904333 cik0000904333:C000055852Member 2015-11-01 2024-10-31 0000904333 cik0000904333:BalancedBlendedIndexMember 2015-11-01 2024-10-31 0000904333 cik0000904333:C000017885Member 2015-11-01 2024-10-31 0000904333 cik0000904333:C000016175Member 2015-11-01 2024-10-31 0000904333 cik0000904333:AllEquityCompositeIndexMember 2015-11-01 2024-10-31 0000904333 cik0000904333:C000016177Member 2015-11-01 2024-10-31 0000904333 cik0000904333:GrowthCompositeIndexMember 2015-11-01 2024-10-31 0000904333 cik0000904333:C000016178Member 2015-11-01 2024-10-31 0000904333 cik0000904333:BloombergUSAggregateBondIndexMember 2015-11-01 2024-10-31 0000904333 cik0000904333:BalancedCompositeIndexMember 2015-11-01 2024-10-31 0000904333 cik0000904333:C000016180Member 2015-11-01 2024-10-31 0000904333 cik0000904333:ConservativeCompositeIndexMember 2015-11-01 2024-10-31 0000904333 cik0000904333:C000015023Member 2015-11-01 2024-10-31 0000904333 cik0000904333:Target2010CompositeIndexMember 2015-11-01 2024-10-31 0000904333 cik0000904333:Target2015CompositeIndexMember 2015-11-01 2024-10-31 0000904333 cik0000904333:C000059131Member 2015-11-01 2024-10-31 0000904333 cik0000904333:C000015024Member 2015-11-01 2024-10-31 0000904333 cik0000904333:Target2020CompositeIndexMember 2015-11-01 2024-10-31 0000904333 cik0000904333:C000059132Member 2015-11-01 2024-10-31 0000904333 cik0000904333:Target2025CompositeIndexMember 2015-11-01 2024-10-31 0000904333 cik0000904333:C000015025Member 2015-11-01 2024-10-31 0000904333 cik0000904333:Target2030CompositeIndexMember 2015-11-01 2024-10-31 0000904333 cik0000904333:C000059133Member 2015-11-01 2024-10-31 0000904333 cik0000904333:Target2035CompositeIndexMember 2015-11-01 2024-10-31 0000904333 cik0000904333:Target2040CompositeIndexMember 2015-11-01 2024-10-31 0000904333 cik0000904333:C000015026Member 2015-11-01 2024-10-31 0000904333 cik0000904333:C000122183Member 2015-11-01 2024-10-31 0000904333 cik0000904333:Target2045CompositeIndexMember 2015-11-01 2024-10-31 0000904333 cik0000904333:C000122184Member 2015-11-01 2024-10-31 0000904333 cik0000904333:Target2050CompositeIndexMember 2015-11-01 2024-10-31 0000904333 cik0000904333:Target2055CompositeIndexMember 2015-11-01 2024-10-31 0000904333 cik0000904333:C000122185Member 2015-11-01 2024-10-31 0000904333 cik0000904333:MSCIEAFEIndexNetMember 2015-11-01 2022-10-31 0000904333 cik0000904333:C000017890Member 2015-11-01 2022-10-31 0000904333 us-gaap:StandardPoors500IndexMember 2015-11-01 2022-10-31 0000904333 cik0000904333:C000015013Member 2015-11-01 2022-10-31 0000904333 cik0000904333:Russell1000ValueIndexMember 2015-11-01 2022-10-31 0000904333 cik0000904333:C000015015Member 2015-11-01 2022-10-31 0000904333 cik0000904333:C000015012Member 2015-11-01 2022-10-31 0000904333 cik0000904333:Russell1000GrowthIndexMember 2015-11-01 2022-10-31 0000904333 cik0000904333:C000015017Member 2015-11-01 2022-10-31 0000904333 cik0000904333:Russell2000IndexMember 2015-11-01 2022-10-31 0000904333 cik0000904333:DowJonesGlobalHealthCareIndexMember 2015-11-01 2022-10-31 0000904333 cik0000904333:C000015021Member 2015-11-01 2022-10-31 0000904333 cik0000904333:C000063316Member 2015-11-01 2022-10-31 0000904333 cik0000904333:C000016166Member 2015-11-01 2022-10-31 0000904333 cik0000904333:C000016169Member 2015-11-01 2022-10-31 0000904333 cik0000904333:C000016171Member 2015-11-01 2022-10-31 0000904333 cik0000904333:DowJonesUSTotalStockMarketIndexMember 2015-11-01 2022-10-31 0000904333 cik0000904333:C000016173Member 2015-11-01 2022-10-31 0000904333 cik0000904333:Russell1000IndexMember 2015-11-01 2022-10-31 0000904333 cik0000904333:FundamentalUSLargeSplicedIndexMember 2015-11-01 2022-10-31 0000904333 cik0000904333:RussellRAFIUSLargeCompanyIndexMember 2015-11-01 2022-10-31 0000904333 cik0000904333:C000046821Member 2015-11-01 2022-10-31 0000904333 cik0000904333:FundamentalUSSmallSplicedIndexMember 2015-11-01 2022-10-31 0000904333 cik0000904333:RussellRAFIUSSmallCompanyIndexMember 2015-11-01 2022-10-31 0000904333 cik0000904333:C000046824Member 2015-11-01 2022-10-31 0000904333 cik0000904333:C000046827Member 2015-11-01 2022-10-31 0000904333 cik0000904333:RussellRAFIDevelopedexUSLargeCompanyIndexNetMember 2015-11-01 2022-10-31 0000904333 cik0000904333:FundamentalDevelopedexUSLargeSplicedIndexMember 2015-11-01 2022-10-31 0000904333 cik0000904333:FundamentalDevelopedExUSSmallSplicedIndexMember 2015-11-01 2022-10-31 0000904333 cik0000904333:RussellRAFIDevelopedexUSSmallCompanyIndexNetMember 2015-11-01 2022-10-31 0000904333 cik0000904333:C000055855Member 2015-11-01 2022-10-31 0000904333 cik0000904333:SAndPDevelopedExUSSmallCapIndexNetMember 2015-11-01 2022-10-31 0000904333 cik0000904333:FundamentalEmergingMarketsSplicedIndexMember 2015-11-01 2022-10-31 0000904333 cik0000904333:RussellRAFITMEmergingMarketsLargeCompanyIndexNetMember 2015-11-01 2022-10-31 0000904333 cik0000904333:MSCIEmergingMarketsIndexNetMember 2015-11-01 2022-10-31 0000904333 cik0000904333:C000055852Member 2015-11-01 2022-10-31 0000904333 cik0000904333:C000017885Member 2015-11-01 2022-10-31 0000904333 cik0000904333:BalancedBlendedIndexMember 2015-11-01 2022-10-31 0000904333 cik0000904333:C000016175Member 2015-11-01 2022-10-31 0000904333 cik0000904333:AllEquityCompositeIndexMember 2015-11-01 2022-10-31 0000904333 cik0000904333:C000016177Member 2015-11-01 2022-10-31 0000904333 cik0000904333:GrowthCompositeIndexMember 2015-11-01 2022-10-31 0000904333 cik0000904333:BloombergUSAggregateBondIndexMember 2015-11-01 2022-10-31 0000904333 cik0000904333:BalancedCompositeIndexMember 2015-11-01 2022-10-31 0000904333 cik0000904333:C000016178Member 2015-11-01 2022-10-31 0000904333 cik0000904333:ConservativeCompositeIndexMember 2015-11-01 2022-10-31 0000904333 cik0000904333:C000016180Member 2015-11-01 2022-10-31 0000904333 cik0000904333:Target2010CompositeIndexMember 2015-11-01 2022-10-31 0000904333 cik0000904333:C000015023Member 2015-11-01 2022-10-31 0000904333 cik0000904333:C000059131Member 2015-11-01 2022-10-31 0000904333 cik0000904333:Target2015CompositeIndexMember 2015-11-01 2022-10-31 0000904333 cik0000904333:C000015024Member 2015-11-01 2022-10-31 0000904333 cik0000904333:Target2020CompositeIndexMember 2015-11-01 2022-10-31 0000904333 cik0000904333:C000059132Member 2015-11-01 2022-10-31 0000904333 cik0000904333:Target2025CompositeIndexMember 2015-11-01 2022-10-31 0000904333 cik0000904333:C000015025Member 2015-11-01 2022-10-31 0000904333 cik0000904333:Target2030CompositeIndexMember 2015-11-01 2022-10-31 0000904333 cik0000904333:Target2035CompositeIndexMember 2015-11-01 2022-10-31 0000904333 cik0000904333:C000059133Member 2015-11-01 2022-10-31 0000904333 cik0000904333:Target2040CompositeIndexMember 2015-11-01 2022-10-31 0000904333 cik0000904333:C000015026Member 2015-11-01 2022-10-31 0000904333 cik0000904333:C000122183Member 2015-11-01 2022-10-31 0000904333 cik0000904333:Target2045CompositeIndexMember 2015-11-01 2022-10-31 0000904333 cik0000904333:Target2050CompositeIndexMember 2015-11-01 2022-10-31 0000904333 cik0000904333:C000122184Member 2015-11-01 2022-10-31 0000904333 cik0000904333:C000122185Member 2015-11-01 2022-10-31 0000904333 cik0000904333:Target2055CompositeIndexMember 2015-11-01 2022-10-31 0000904333 cik0000904333:MSCIEAFEIndexNetMember 2015-11-01 2019-10-31 0000904333 cik0000904333:C000017890Member 2015-11-01 2019-10-31 0000904333 us-gaap:StandardPoors500IndexMember 2015-11-01 2019-10-31 0000904333 cik0000904333:C000015013Member 2015-11-01 2019-10-31 0000904333 cik0000904333:Russell1000ValueIndexMember 2015-11-01 2019-10-31 0000904333 cik0000904333:C000015015Member 2015-11-01 2019-10-31 0000904333 cik0000904333:Russell1000GrowthIndexMember 2015-11-01 2019-10-31 0000904333 cik0000904333:C000015012Member 2015-11-01 2019-10-31 0000904333 cik0000904333:C000015017Member 2015-11-01 2019-10-31 0000904333 cik0000904333:Russell2000IndexMember 2015-11-01 2019-10-31 0000904333 cik0000904333:DowJonesGlobalHealthCareIndexMember 2015-11-01 2019-10-31 0000904333 cik0000904333:C000015021Member 2015-11-01 2019-10-31 0000904333 cik0000904333:C000063316Member 2015-11-01 2019-10-31 0000904333 cik0000904333:C000016166Member 2015-11-01 2019-10-31 0000904333 cik0000904333:C000016169Member 2015-11-01 2019-10-31 0000904333 cik0000904333:DowJonesUSTotalStockMarketIndexMember 2015-11-01 2019-10-31 0000904333 cik0000904333:C000016171Member 2015-11-01 2019-10-31 0000904333 cik0000904333:C000016173Member 2015-11-01 2019-10-31 0000904333 cik0000904333:C000046821Member 2015-11-01 2019-10-31 0000904333 cik0000904333:Russell1000IndexMember 2015-11-01 2019-10-31 0000904333 cik0000904333:FundamentalUSLargeSplicedIndexMember 2015-11-01 2019-10-31 0000904333 cik0000904333:RussellRAFIUSLargeCompanyIndexMember 2015-11-01 2019-10-31 0000904333 cik0000904333:C000046824Member 2015-11-01 2019-10-31 0000904333 cik0000904333:RussellRAFIUSSmallCompanyIndexMember 2015-11-01 2019-10-31 0000904333 cik0000904333:FundamentalUSSmallSplicedIndexMember 2015-11-01 2019-10-31 0000904333 cik0000904333:C000046827Member 2015-11-01 2019-10-31 0000904333 cik0000904333:RussellRAFIDevelopedexUSLargeCompanyIndexNetMember 2015-11-01 2019-10-31 0000904333 cik0000904333:FundamentalDevelopedexUSLargeSplicedIndexMember 2015-11-01 2019-10-31 0000904333 cik0000904333:RussellRAFIDevelopedexUSSmallCompanyIndexNetMember 2015-11-01 2019-10-31 0000904333 cik0000904333:C000055855Member 2015-11-01 2019-10-31 0000904333 cik0000904333:SAndPDevelopedExUSSmallCapIndexNetMember 2015-11-01 2019-10-31 0000904333 cik0000904333:FundamentalDevelopedExUSSmallSplicedIndexMember 2015-11-01 2019-10-31 0000904333 cik0000904333:FundamentalEmergingMarketsSplicedIndexMember 2015-11-01 2019-10-31 0000904333 cik0000904333:RussellRAFITMEmergingMarketsLargeCompanyIndexNetMember 2015-11-01 2019-10-31 0000904333 cik0000904333:MSCIEmergingMarketsIndexNetMember 2015-11-01 2019-10-31 0000904333 cik0000904333:C000055852Member 2015-11-01 2019-10-31 0000904333 cik0000904333:C000017885Member 2015-11-01 2019-10-31 0000904333 cik0000904333:BalancedBlendedIndexMember 2015-11-01 2019-10-31 0000904333 cik0000904333:C000016175Member 2015-11-01 2019-10-31 0000904333 cik0000904333:AllEquityCompositeIndexMember 2015-11-01 2019-10-31 0000904333 cik0000904333:C000016177Member 2015-11-01 2019-10-31 0000904333 cik0000904333:GrowthCompositeIndexMember 2015-11-01 2019-10-31 0000904333 cik0000904333:BloombergUSAggregateBondIndexMember 2015-11-01 2019-10-31 0000904333 cik0000904333:BalancedCompositeIndexMember 2015-11-01 2019-10-31 0000904333 cik0000904333:C000016178Member 2015-11-01 2019-10-31 0000904333 cik0000904333:ConservativeCompositeIndexMember 2015-11-01 2019-10-31 0000904333 cik0000904333:C000016180Member 2015-11-01 2019-10-31 0000904333 cik0000904333:Target2010CompositeIndexMember 2015-11-01 2019-10-31 0000904333 cik0000904333:C000015023Member 2015-11-01 2019-10-31 0000904333 cik0000904333:C000059131Member 2015-11-01 2019-10-31 0000904333 cik0000904333:Target2015CompositeIndexMember 2015-11-01 2019-10-31 0000904333 cik0000904333:C000015024Member 2015-11-01 2019-10-31 0000904333 cik0000904333:Target2020CompositeIndexMember 2015-11-01 2019-10-31 0000904333 cik0000904333:C000059132Member 2015-11-01 2019-10-31 0000904333 cik0000904333:Target2025CompositeIndexMember 2015-11-01 2019-10-31 0000904333 cik0000904333:C000015025Member 2015-11-01 2019-10-31 0000904333 cik0000904333:Target2030CompositeIndexMember 2015-11-01 2019-10-31 0000904333 cik0000904333:Target2035CompositeIndexMember 2015-11-01 2019-10-31 0000904333 cik0000904333:C000059133Member 2015-11-01 2019-10-31 0000904333 cik0000904333:Target2040CompositeIndexMember 2015-11-01 2019-10-31 0000904333 cik0000904333:C000015026Member 2015-11-01 2019-10-31 0000904333 cik0000904333:C000122183Member 2015-11-01 2019-10-31 0000904333 cik0000904333:Target2045CompositeIndexMember 2015-11-01 2019-10-31 0000904333 cik0000904333:Target2050CompositeIndexMember 2015-11-01 2019-10-31 0000904333 cik0000904333:C000122184Member 2015-11-01 2019-10-31 0000904333 cik0000904333:C000122185Member 2015-11-01 2019-10-31 0000904333 cik0000904333:Target2055CompositeIndexMember 2015-11-01 2019-10-31 0000904333 cik0000904333:C000017890Member 2015-11-01 2017-10-31 0000904333 cik0000904333:MSCIEAFEIndexNetMember 2015-11-01 2017-10-31 0000904333 us-gaap:StandardPoors500IndexMember 2015-11-01 2017-10-31 0000904333 cik0000904333:C000015013Member 2015-11-01 2017-10-31 0000904333 cik0000904333:Russell1000ValueIndexMember 2015-11-01 2017-10-31 0000904333 cik0000904333:C000015015Member 2015-11-01 2017-10-31 0000904333 cik0000904333:Russell1000GrowthIndexMember 2015-11-01 2017-10-31 0000904333 cik0000904333:C000015012Member 2015-11-01 2017-10-31 0000904333 cik0000904333:C000015017Member 2015-11-01 2017-10-31 0000904333 cik0000904333:Russell2000IndexMember 2015-11-01 2017-10-31 0000904333 cik0000904333:DowJonesGlobalHealthCareIndexMember 2015-11-01 2017-10-31 0000904333 cik0000904333:C000015021Member 2015-11-01 2017-10-31 0000904333 cik0000904333:C000063316Member 2015-11-01 2017-10-31 0000904333 cik0000904333:C000016166Member 2015-11-01 2017-10-31 0000904333 cik0000904333:C000016169Member 2015-11-01 2017-10-31 0000904333 cik0000904333:C000016171Member 2015-11-01 2017-10-31 0000904333 cik0000904333:DowJonesUSTotalStockMarketIndexMember 2015-11-01 2017-10-31 0000904333 cik0000904333:C000016173Member 2015-11-01 2017-10-31 0000904333 cik0000904333:FundamentalUSLargeSplicedIndexMember 2015-11-01 2017-10-31 0000904333 cik0000904333:RussellRAFIUSLargeCompanyIndexMember 2015-11-01 2017-10-31 0000904333 cik0000904333:C000046821Member 2015-11-01 2017-10-31 0000904333 cik0000904333:Russell1000IndexMember 2015-11-01 2017-10-31 0000904333 cik0000904333:RussellRAFIUSSmallCompanyIndexMember 2015-11-01 2017-10-31 0000904333 cik0000904333:FundamentalUSSmallSplicedIndexMember 2015-11-01 2017-10-31 0000904333 cik0000904333:C000046824Member 2015-11-01 2017-10-31 0000904333 cik0000904333:C000046827Member 2015-11-01 2017-10-31 0000904333 cik0000904333:RussellRAFIDevelopedexUSLargeCompanyIndexNetMember 2015-11-01 2017-10-31 0000904333 cik0000904333:FundamentalDevelopedexUSLargeSplicedIndexMember 2015-11-01 2017-10-31 0000904333 cik0000904333:SAndPDevelopedExUSSmallCapIndexNetMember 2015-11-01 2017-10-31 0000904333 cik0000904333:RussellRAFIDevelopedexUSSmallCompanyIndexNetMember 2015-11-01 2017-10-31 0000904333 cik0000904333:C000055855Member 2015-11-01 2017-10-31 0000904333 cik0000904333:FundamentalDevelopedExUSSmallSplicedIndexMember 2015-11-01 2017-10-31 0000904333 cik0000904333:C000055852Member 2015-11-01 2017-10-31 0000904333 cik0000904333:RussellRAFITMEmergingMarketsLargeCompanyIndexNetMember 2015-11-01 2017-10-31 0000904333 cik0000904333:FundamentalEmergingMarketsSplicedIndexMember 2015-11-01 2017-10-31 0000904333 cik0000904333:MSCIEmergingMarketsIndexNetMember 2015-11-01 2017-10-31 0000904333 cik0000904333:BalancedBlendedIndexMember 2015-11-01 2017-10-31 0000904333 cik0000904333:C000017885Member 2015-11-01 2017-10-31 0000904333 cik0000904333:C000016175Member 2015-11-01 2017-10-31 0000904333 cik0000904333:AllEquityCompositeIndexMember 2015-11-01 2017-10-31 0000904333 cik0000904333:C000016177Member 2015-11-01 2017-10-31 0000904333 cik0000904333:GrowthCompositeIndexMember 2015-11-01 2017-10-31 0000904333 cik0000904333:C000016178Member 2015-11-01 2017-10-31 0000904333 cik0000904333:BloombergUSAggregateBondIndexMember 2015-11-01 2017-10-31 0000904333 cik0000904333:BalancedCompositeIndexMember 2015-11-01 2017-10-31 0000904333 cik0000904333:ConservativeCompositeIndexMember 2015-11-01 2017-10-31 0000904333 cik0000904333:C000016180Member 2015-11-01 2017-10-31 0000904333 cik0000904333:C000015023Member 2015-11-01 2017-10-31 0000904333 cik0000904333:Target2010CompositeIndexMember 2015-11-01 2017-10-31 0000904333 cik0000904333:Target2015CompositeIndexMember 2015-11-01 2017-10-31 0000904333 cik0000904333:C000059131Member 2015-11-01 2017-10-31 0000904333 cik0000904333:C000015024Member 2015-11-01 2017-10-31 0000904333 cik0000904333:Target2020CompositeIndexMember 2015-11-01 2017-10-31 0000904333 cik0000904333:Target2025CompositeIndexMember 2015-11-01 2017-10-31 0000904333 cik0000904333:C000059132Member 2015-11-01 2017-10-31 0000904333 cik0000904333:C000015025Member 2015-11-01 2017-10-31 0000904333 cik0000904333:Target2030CompositeIndexMember 2015-11-01 2017-10-31 0000904333 cik0000904333:C000059133Member 2015-11-01 2017-10-31 0000904333 cik0000904333:Target2035CompositeIndexMember 2015-11-01 2017-10-31 0000904333 cik0000904333:C000015026Member 2015-11-01 2017-10-31 0000904333 cik0000904333:Target2040CompositeIndexMember 2015-11-01 2017-10-31 0000904333 cik0000904333:C000122183Member 2015-11-01 2017-10-31 0000904333 cik0000904333:Target2045CompositeIndexMember 2015-11-01 2017-10-31 0000904333 cik0000904333:Target2050CompositeIndexMember 2015-11-01 2017-10-31 0000904333 cik0000904333:C000122184Member 2015-11-01 2017-10-31 0000904333 cik0000904333:Target2055CompositeIndexMember 2015-11-01 2017-10-31 0000904333 cik0000904333:C000122185Member 2015-11-01 2017-10-31 0000904333 cik0000904333:MSCIEAFEIndexNetMember 2015-11-01 2016-10-31 0000904333 cik0000904333:C000017890Member 2015-11-01 2016-10-31 0000904333 us-gaap:StandardPoors500IndexMember 2015-11-01 2016-10-31 0000904333 cik0000904333:C000015013Member 2015-11-01 2016-10-31 0000904333 cik0000904333:Russell1000ValueIndexMember 2015-11-01 2016-10-31 0000904333 cik0000904333:C000015021Member 2015-11-01 2016-10-31 0000904333 cik0000904333:C000016173Member 2015-11-01 2016-10-31 0000904333 cik0000904333:C000046824Member 2015-11-01 2016-10-31 0000904333 cik0000904333:RussellRAFIUSSmallCompanyIndexMember 2015-11-01 2016-10-31 0000904333 cik0000904333:FundamentalUSSmallSplicedIndexMember 2015-11-01 2016-10-31 0000904333 cik0000904333:RussellRAFIDevelopedexUSSmallCompanyIndexNetMember 2015-11-01 2016-10-31 0000904333 cik0000904333:C000055855Member 2015-11-01 2016-10-31 0000904333 cik0000904333:SAndPDevelopedExUSSmallCapIndexNetMember 2015-11-01 2016-10-31 0000904333 cik0000904333:FundamentalDevelopedExUSSmallSplicedIndexMember 2015-11-01 2016-10-31 0000904333 cik0000904333:BalancedBlendedIndexMember 2015-11-01 2016-10-31 0000904333 cik0000904333:C000017885Member 2015-11-01 2016-10-31 0000904333 cik0000904333:C000016175Member 2015-11-01 2016-10-31 0000904333 cik0000904333:AllEquityCompositeIndexMember 2015-11-01 2016-10-31 0000904333 cik0000904333:C000016177Member 2015-11-01 2016-10-31 0000904333 cik0000904333:GrowthCompositeIndexMember 2015-11-01 2016-10-31 0000904333 cik0000904333:BloombergUSAggregateBondIndexMember 2015-11-01 2016-10-31 0000904333 cik0000904333:BalancedCompositeIndexMember 2015-11-01 2016-10-31 0000904333 cik0000904333:C000016178Member 2015-11-01 2016-10-31 0000904333 cik0000904333:C000016180Member 2015-11-01 2016-10-31 0000904333 cik0000904333:ConservativeCompositeIndexMember 2015-11-01 2016-10-31 0000904333 cik0000904333:Target2010CompositeIndexMember 2015-11-01 2016-10-31 0000904333 cik0000904333:DowJonesUSTotalStockMarketIndexMember 2015-11-01 2016-10-31 0000904333 cik0000904333:C000015023Member 2015-11-01 2016-10-31 0000904333 cik0000904333:C000059131Member 2015-11-01 2016-10-31 0000904333 cik0000904333:Target2015CompositeIndexMember 2015-11-01 2016-10-31 0000904333 cik0000904333:C000015024Member 2015-11-01 2016-10-31 0000904333 cik0000904333:Target2020CompositeIndexMember 2015-11-01 2016-10-31 0000904333 cik0000904333:Target2025CompositeIndexMember 2015-11-01 2016-10-31 0000904333 cik0000904333:C000059132Member 2015-11-01 2016-10-31 0000904333 cik0000904333:C000015025Member 2015-11-01 2016-10-31 0000904333 cik0000904333:Target2030CompositeIndexMember 2015-11-01 2016-10-31 0000904333 cik0000904333:Target2035CompositeIndexMember 2015-11-01 2016-10-31 0000904333 cik0000904333:C000059133Member 2015-11-01 2016-10-31 0000904333 cik0000904333:C000122183Member 2015-11-01 2016-10-31 0000904333 cik0000904333:Target2045CompositeIndexMember 2015-11-01 2016-10-31 0000904333 cik0000904333:Target2050CompositeIndexMember 2015-11-01 2016-10-31 0000904333 cik0000904333:C000122184Member 2015-11-01 2016-10-31 0000904333 cik0000904333:C000017890Member 2015-10-31 2015-10-31 0000904333 cik0000904333:MSCIEAFEIndexNetMember 2015-10-31 2015-10-31 0000904333 us-gaap:StandardPoors500IndexMember 2015-10-31 2015-10-31 0000904333 cik0000904333:C000015013Member 2015-10-31 2015-10-31 0000904333 cik0000904333:C000015015Member 2015-10-31 2015-10-31 0000904333 cik0000904333:Russell1000ValueIndexMember 2015-10-31 2015-10-31 0000904333 cik0000904333:Russell1000GrowthIndexMember 2015-10-31 2015-10-31 0000904333 cik0000904333:C000015012Member 2015-10-31 2015-10-31 0000904333 cik0000904333:C000015017Member 2015-10-31 2015-10-31 0000904333 cik0000904333:Russell2000IndexMember 2015-10-31 2015-10-31 0000904333 cik0000904333:DowJonesGlobalHealthCareIndexMember 2015-10-31 2015-10-31 0000904333 cik0000904333:C000015021Member 2015-10-31 2015-10-31 0000904333 cik0000904333:C000063316Member 2015-10-31 2015-10-31 0000904333 cik0000904333:C000016166Member 2015-10-31 2015-10-31 0000904333 cik0000904333:C000016169Member 2015-10-31 2015-10-31 0000904333 cik0000904333:C000016171Member 2015-10-31 2015-10-31 0000904333 cik0000904333:DowJonesUSTotalStockMarketIndexMember 2015-10-31 2015-10-31 0000904333 cik0000904333:C000016173Member 2015-10-31 2015-10-31 0000904333 cik0000904333:C000046821Member 2015-10-31 2015-10-31 0000904333 cik0000904333:Russell1000IndexMember 2015-10-31 2015-10-31 0000904333 cik0000904333:FundamentalUSLargeSplicedIndexMember 2015-10-31 2015-10-31 0000904333 cik0000904333:RussellRAFIUSLargeCompanyIndexMember 2015-10-31 2015-10-31 0000904333 cik0000904333:C000046824Member 2015-10-31 2015-10-31 0000904333 cik0000904333:RussellRAFIUSSmallCompanyIndexMember 2015-10-31 2015-10-31 0000904333 cik0000904333:FundamentalUSSmallSplicedIndexMember 2015-10-31 2015-10-31 0000904333 cik0000904333:C000046827Member 2015-10-31 2015-10-31 0000904333 cik0000904333:RussellRAFIDevelopedexUSLargeCompanyIndexNetMember 2015-10-31 2015-10-31 0000904333 cik0000904333:FundamentalDevelopedexUSLargeSplicedIndexMember 2015-10-31 2015-10-31 0000904333 cik0000904333:SAndPDevelopedExUSSmallCapIndexNetMember 2015-10-31 2015-10-31 0000904333 cik0000904333:RussellRAFIDevelopedexUSSmallCompanyIndexNetMember 2015-10-31 2015-10-31 0000904333 cik0000904333:FundamentalDevelopedExUSSmallSplicedIndexMember 2015-10-31 2015-10-31 0000904333 cik0000904333:C000055855Member 2015-10-31 2015-10-31 0000904333 cik0000904333:MSCIEmergingMarketsIndexNetMember 2015-10-31 2015-10-31 0000904333 cik0000904333:FundamentalEmergingMarketsSplicedIndexMember 2015-10-31 2015-10-31 0000904333 cik0000904333:RussellRAFITMEmergingMarketsLargeCompanyIndexNetMember 2015-10-31 2015-10-31 0000904333 cik0000904333:C000055852Member 2015-10-31 2015-10-31 0000904333 cik0000904333:BalancedBlendedIndexMember 2015-10-31 2015-10-31 0000904333 cik0000904333:C000017885Member 2015-10-31 2015-10-31 0000904333 cik0000904333:C000016175Member 2015-10-31 2015-10-31 0000904333 cik0000904333:AllEquityCompositeIndexMember 2015-10-31 2015-10-31 0000904333 cik0000904333:C000016177Member 2015-10-31 2015-10-31 0000904333 cik0000904333:GrowthCompositeIndexMember 2015-10-31 2015-10-31 0000904333 cik0000904333:C000016178Member 2015-10-31 2015-10-31 0000904333 cik0000904333:BloombergUSAggregateBondIndexMember 2015-10-31 2015-10-31 0000904333 cik0000904333:BalancedCompositeIndexMember 2015-10-31 2015-10-31 0000904333 cik0000904333:C000016180Member 2015-10-31 2015-10-31 0000904333 cik0000904333:ConservativeCompositeIndexMember 2015-10-31 2015-10-31 0000904333 cik0000904333:C000015023Member 2015-10-31 2015-10-31 0000904333 cik0000904333:Target2010CompositeIndexMember 2015-10-31 2015-10-31 0000904333 cik0000904333:Target2015CompositeIndexMember 2015-10-31 2015-10-31 0000904333 cik0000904333:C000059131Member 2015-10-31 2015-10-31 0000904333 cik0000904333:C000015024Member 2015-10-31 2015-10-31 0000904333 cik0000904333:Target2020CompositeIndexMember 2015-10-31 2015-10-31 0000904333 cik0000904333:Target2025CompositeIndexMember 2015-10-31 2015-10-31 0000904333 cik0000904333:C000059132Member 2015-10-31 2015-10-31 0000904333 cik0000904333:C000015025Member 2015-10-31 2015-10-31 0000904333 cik0000904333:Target2030CompositeIndexMember 2015-10-31 2015-10-31 0000904333 cik0000904333:C000059133Member 2015-10-31 2015-10-31 0000904333 cik0000904333:Target2035CompositeIndexMember 2015-10-31 2015-10-31 0000904333 cik0000904333:C000015026Member 2015-10-31 2015-10-31 0000904333 cik0000904333:Target2040CompositeIndexMember 2015-10-31 2015-10-31 0000904333 cik0000904333:C000122183Member 2015-10-31 2015-10-31 0000904333 cik0000904333:Target2045CompositeIndexMember 2015-10-31 2015-10-31 0000904333 cik0000904333:Target2050CompositeIndexMember 2015-10-31 2015-10-31 0000904333 cik0000904333:C000122184Member 2015-10-31 2015-10-31 0000904333 cik0000904333:Target2055CompositeIndexMember 2015-10-31 2015-10-31 0000904333 cik0000904333:C000122185Member 2015-10-31 2015-10-31 0000904333 cik0000904333:Target2065CompositeIndexMember 2021-02-25 2025-10-31 0000904333 cik0000904333:C000225748Member 2021-02-25 2025-10-31 0000904333 cik0000904333:DowJonesUSTotalStockMarketIndexMember 2021-02-25 2025-10-31 0000904333 cik0000904333:BloombergUSAggregateBondIndexMember 2021-02-25 2025-10-31 0000904333 cik0000904333:MSCIEAFEIndexNetMember 2015-11-01 2025-10-31 0000904333 cik0000904333:C000017890Member 2015-11-01 2025-10-31 0000904333 us-gaap:StandardPoors500IndexMember 2015-11-01 2025-10-31 0000904333 cik0000904333:C000015013Member 2015-11-01 2025-10-31 0000904333 cik0000904333:C000015015Member 2015-11-01 2025-10-31 0000904333 cik0000904333:Russell1000ValueIndexMember 2015-11-01 2025-10-31 0000904333 cik0000904333:Russell1000GrowthIndexMember 2015-11-01 2025-10-31 0000904333 cik0000904333:C000015012Member 2015-11-01 2025-10-31 0000904333 cik0000904333:C000015017Member 2015-11-01 2025-10-31 0000904333 cik0000904333:Russell2000IndexMember 2015-11-01 2025-10-31 0000904333 cik0000904333:C000015021Member 2015-11-01 2025-10-31 0000904333 cik0000904333:DowJonesGlobalHealthCareIndexMember 2015-11-01 2025-10-31 0000904333 cik0000904333:C000063316Member 2015-11-01 2025-10-31 0000904333 cik0000904333:C000016166Member 2015-11-01 2025-10-31 0000904333 cik0000904333:C000016169Member 2015-11-01 2025-10-31 0000904333 cik0000904333:C000016171Member 2015-11-01 2025-10-31 0000904333 cik0000904333:DowJonesUSTotalStockMarketIndexMember 2015-11-01 2025-10-31 0000904333 cik0000904333:C000016173Member 2015-11-01 2025-10-31 0000904333 cik0000904333:FundamentalUSLargeSplicedIndexMember 2015-11-01 2025-10-31 0000904333 cik0000904333:RussellRAFIUSLargeCompanyIndexMember 2015-11-01 2025-10-31 0000904333 cik0000904333:Russell1000IndexMember 2015-11-01 2025-10-31 0000904333 cik0000904333:C000046821Member 2015-11-01 2025-10-31 0000904333 cik0000904333:C000046824Member 2015-11-01 2025-10-31 0000904333 cik0000904333:RussellRAFIUSSmallCompanyIndexMember 2015-11-01 2025-10-31 0000904333 cik0000904333:FundamentalUSSmallSplicedIndexMember 2015-11-01 2025-10-31 0000904333 cik0000904333:C000046827Member 2015-11-01 2025-10-31 0000904333 cik0000904333:RussellRAFIDevelopedexUSLargeCompanyIndexNetMember 2015-11-01 2025-10-31 0000904333 cik0000904333:FundamentalDevelopedexUSLargeSplicedIndexMember 2015-11-01 2025-10-31 0000904333 cik0000904333:RussellRAFIDevelopedexUSSmallCompanyIndexNetMember 2015-11-01 2025-10-31 0000904333 cik0000904333:C000055855Member 2015-11-01 2025-10-31 0000904333 cik0000904333:FundamentalDevelopedExUSSmallSplicedIndexMember 2015-11-01 2025-10-31 0000904333 cik0000904333:SAndPDevelopedExUSSmallCapIndexNetMember 2015-11-01 2025-10-31 0000904333 cik0000904333:FundamentalEmergingMarketsSplicedIndexMember 2015-11-01 2025-10-31 0000904333 cik0000904333:RussellRAFITMEmergingMarketsLargeCompanyIndexNetMember 2015-11-01 2025-10-31 0000904333 cik0000904333:MSCIEmergingMarketsIndexNetMember 2015-11-01 2025-10-31 0000904333 cik0000904333:C000055852Member 2015-11-01 2025-10-31 0000904333 cik0000904333:C000017885Member 2015-11-01 2025-10-31 0000904333 cik0000904333:BalancedBlendedIndexMember 2015-11-01 2025-10-31 0000904333 cik0000904333:BloombergUSAggregateBondIndexMember 2015-11-01 2025-10-31 0000904333 cik0000904333:C000016175Member 2015-11-01 2025-10-31 0000904333 cik0000904333:AllEquityCompositeIndexMember 2015-11-01 2025-10-31 0000904333 cik0000904333:C000016177Member 2015-11-01 2025-10-31 0000904333 cik0000904333:GrowthCompositeIndexMember 2015-11-01 2025-10-31 0000904333 cik0000904333:BalancedCompositeIndexMember 2015-11-01 2025-10-31 0000904333 cik0000904333:C000016178Member 2015-11-01 2025-10-31 0000904333 cik0000904333:ConservativeCompositeIndexMember 2015-11-01 2025-10-31 0000904333 cik0000904333:C000016180Member 2015-11-01 2025-10-31 0000904333 cik0000904333:Target2010CompositeIndexMember 2015-11-01 2025-10-31 0000904333 cik0000904333:C000015023Member 2015-11-01 2025-10-31 0000904333 cik0000904333:Target2015CompositeIndexMember 2015-11-01 2025-10-31 0000904333 cik0000904333:C000059131Member 2015-11-01 2025-10-31 0000904333 cik0000904333:C000015024Member 2015-11-01 2025-10-31 0000904333 cik0000904333:Target2020CompositeIndexMember 2015-11-01 2025-10-31 0000904333 cik0000904333:C000059132Member 2015-11-01 2025-10-31 0000904333 cik0000904333:Target2025CompositeIndexMember 2015-11-01 2025-10-31 0000904333 cik0000904333:C000015025Member 2015-11-01 2025-10-31 0000904333 cik0000904333:Target2030CompositeIndexMember 2015-11-01 2025-10-31 0000904333 cik0000904333:C000059133Member 2015-11-01 2025-10-31 0000904333 cik0000904333:Target2035CompositeIndexMember 2015-11-01 2025-10-31 0000904333 cik0000904333:Target2040CompositeIndexMember 2015-11-01 2025-10-31 0000904333 cik0000904333:C000015026Member 2015-11-01 2025-10-31 0000904333 cik0000904333:C000122183Member 2015-11-01 2025-10-31 0000904333 cik0000904333:Target2045CompositeIndexMember 2015-11-01 2025-10-31 0000904333 cik0000904333:Target2050CompositeIndexMember 2015-11-01 2025-10-31 0000904333 cik0000904333:C000122184Member 2015-11-01 2025-10-31 0000904333 cik0000904333:Target2055CompositeIndexMember 2015-11-01 2025-10-31 0000904333 cik0000904333:C000122185Member 2015-11-01 2025-10-31 0000904333 cik0000904333:C000017890Member 2015-11-01 2023-10-31 0000904333 cik0000904333:MSCIEAFEIndexNetMember 2015-11-01 2023-10-31 0000904333 us-gaap:StandardPoors500IndexMember 2015-11-01 2023-10-31 0000904333 cik0000904333:C000015013Member 2015-11-01 2023-10-31 0000904333 cik0000904333:Russell1000ValueIndexMember 2015-11-01 2023-10-31 0000904333 cik0000904333:C000015015Member 2015-11-01 2023-10-31 0000904333 cik0000904333:Russell1000GrowthIndexMember 2015-11-01 2023-10-31 0000904333 cik0000904333:C000015012Member 2015-11-01 2023-10-31 0000904333 cik0000904333:C000015017Member 2015-11-01 2023-10-31 0000904333 cik0000904333:Russell2000IndexMember 2015-11-01 2023-10-31 0000904333 cik0000904333:DowJonesGlobalHealthCareIndexMember 2015-11-01 2023-10-31 0000904333 cik0000904333:C000015021Member 2015-11-01 2023-10-31 0000904333 cik0000904333:C000063316Member 2015-11-01 2023-10-31 0000904333 cik0000904333:C000016166Member 2015-11-01 2023-10-31 0000904333 cik0000904333:C000016169Member 2015-11-01 2023-10-31 0000904333 cik0000904333:C000016171Member 2015-11-01 2023-10-31 0000904333 cik0000904333:DowJonesUSTotalStockMarketIndexMember 2015-11-01 2023-10-31 0000904333 cik0000904333:C000016173Member 2015-11-01 2023-10-31 0000904333 cik0000904333:FundamentalUSLargeSplicedIndexMember 2015-11-01 2023-10-31 0000904333 cik0000904333:RussellRAFIUSLargeCompanyIndexMember 2015-11-01 2023-10-31 0000904333 cik0000904333:C000046821Member 2015-11-01 2023-10-31 0000904333 cik0000904333:Russell1000IndexMember 2015-11-01 2023-10-31 0000904333 cik0000904333:C000046824Member 2015-11-01 2023-10-31 0000904333 cik0000904333:RussellRAFIUSSmallCompanyIndexMember 2015-11-01 2023-10-31 0000904333 cik0000904333:FundamentalUSSmallSplicedIndexMember 2015-11-01 2023-10-31 0000904333 cik0000904333:C000046827Member 2015-11-01 2023-10-31 0000904333 cik0000904333:RussellRAFIDevelopedexUSLargeCompanyIndexNetMember 2015-11-01 2023-10-31 0000904333 cik0000904333:FundamentalDevelopedexUSLargeSplicedIndexMember 2015-11-01 2023-10-31 0000904333 cik0000904333:FundamentalDevelopedExUSSmallSplicedIndexMember 2015-11-01 2023-10-31 0000904333 cik0000904333:SAndPDevelopedExUSSmallCapIndexNetMember 2015-11-01 2023-10-31 0000904333 cik0000904333:RussellRAFIDevelopedexUSSmallCompanyIndexNetMember 2015-11-01 2023-10-31 0000904333 cik0000904333:C000055855Member 2015-11-01 2023-10-31 0000904333 cik0000904333:MSCIEmergingMarketsIndexNetMember 2015-11-01 2023-10-31 0000904333 cik0000904333:C000055852Member 2015-11-01 2023-10-31 0000904333 cik0000904333:FundamentalEmergingMarketsSplicedIndexMember 2015-11-01 2023-10-31 0000904333 cik0000904333:RussellRAFITMEmergingMarketsLargeCompanyIndexNetMember 2015-11-01 2023-10-31 0000904333 cik0000904333:C000017885Member 2015-11-01 2023-10-31 0000904333 cik0000904333:BalancedBlendedIndexMember 2015-11-01 2023-10-31 0000904333 cik0000904333:C000016175Member 2015-11-01 2023-10-31 0000904333 cik0000904333:AllEquityCompositeIndexMember 2015-11-01 2023-10-31 0000904333 cik0000904333:C000016177Member 2015-11-01 2023-10-31 0000904333 cik0000904333:GrowthCompositeIndexMember 2015-11-01 2023-10-31 0000904333 cik0000904333:C000016178Member 2015-11-01 2023-10-31 0000904333 cik0000904333:BloombergUSAggregateBondIndexMember 2015-11-01 2023-10-31 0000904333 cik0000904333:BalancedCompositeIndexMember 2015-11-01 2023-10-31 0000904333 cik0000904333:ConservativeCompositeIndexMember 2015-11-01 2023-10-31 0000904333 cik0000904333:C000016180Member 2015-11-01 2023-10-31 0000904333 cik0000904333:C000015023Member 2015-11-01 2023-10-31 0000904333 cik0000904333:Target2010CompositeIndexMember 2015-11-01 2023-10-31 0000904333 cik0000904333:Target2015CompositeIndexMember 2015-11-01 2023-10-31 0000904333 cik0000904333:C000059131Member 2015-11-01 2023-10-31 0000904333 cik0000904333:C000015024Member 2015-11-01 2023-10-31 0000904333 cik0000904333:Target2020CompositeIndexMember 2015-11-01 2023-10-31 0000904333 cik0000904333:C000059132Member 2015-11-01 2023-10-31 0000904333 cik0000904333:Target2025CompositeIndexMember 2015-11-01 2023-10-31 0000904333 cik0000904333:C000015025Member 2015-11-01 2023-10-31 0000904333 cik0000904333:Target2030CompositeIndexMember 2015-11-01 2023-10-31 0000904333 cik0000904333:Target2035CompositeIndexMember 2015-11-01 2023-10-31 0000904333 cik0000904333:C000059133Member 2015-11-01 2023-10-31 0000904333 cik0000904333:C000015026Member 2015-11-01 2023-10-31 0000904333 cik0000904333:Target2040CompositeIndexMember 2015-11-01 2023-10-31 0000904333 cik0000904333:C000122183Member 2015-11-01 2023-10-31 0000904333 cik0000904333:Target2045CompositeIndexMember 2015-11-01 2023-10-31 0000904333 cik0000904333:Target2050CompositeIndexMember 2015-11-01 2023-10-31 0000904333 cik0000904333:C000122184Member 2015-11-01 2023-10-31 0000904333 cik0000904333:Target2055CompositeIndexMember 2015-11-01 2023-10-31 0000904333 cik0000904333:C000122185Member 2015-11-01 2023-10-31 0000904333 cik0000904333:C000017890Member 2015-11-01 2021-10-31 0000904333 cik0000904333:MSCIEAFEIndexNetMember 2015-11-01 2021-10-31 0000904333 us-gaap:StandardPoors500IndexMember 2015-11-01 2021-10-31 0000904333 cik0000904333:C000015013Member 2015-11-01 2021-10-31 0000904333 cik0000904333:Russell1000ValueIndexMember 2015-11-01 2021-10-31 0000904333 cik0000904333:C000015015Member 2015-11-01 2021-10-31 0000904333 cik0000904333:C000015012Member 2015-11-01 2021-10-31 0000904333 cik0000904333:Russell1000GrowthIndexMember 2015-11-01 2021-10-31 0000904333 cik0000904333:C000015017Member 2015-11-01 2021-10-31 0000904333 cik0000904333:Russell2000IndexMember 2015-11-01 2021-10-31 0000904333 cik0000904333:DowJonesGlobalHealthCareIndexMember 2015-11-01 2021-10-31 0000904333 cik0000904333:C000015021Member 2015-11-01 2021-10-31 0000904333 cik0000904333:C000063316Member 2015-11-01 2021-10-31 0000904333 cik0000904333:C000016166Member 2015-11-01 2021-10-31 0000904333 cik0000904333:C000016169Member 2015-11-01 2021-10-31 0000904333 cik0000904333:C000016171Member 2015-11-01 2021-10-31 0000904333 cik0000904333:DowJonesUSTotalStockMarketIndexMember 2015-11-01 2021-10-31 0000904333 cik0000904333:C000016173Member 2015-11-01 2021-10-31 0000904333 cik0000904333:C000046821Member 2015-11-01 2021-10-31 0000904333 cik0000904333:Russell1000IndexMember 2015-11-01 2021-10-31 0000904333 cik0000904333:FundamentalUSLargeSplicedIndexMember 2015-11-01 2021-10-31 0000904333 cik0000904333:RussellRAFIUSLargeCompanyIndexMember 2015-11-01 2021-10-31 0000904333 cik0000904333:C000046824Member 2015-11-01 2021-10-31 0000904333 cik0000904333:RussellRAFIUSSmallCompanyIndexMember 2015-11-01 2021-10-31 0000904333 cik0000904333:FundamentalUSSmallSplicedIndexMember 2015-11-01 2021-10-31 0000904333 cik0000904333:C000046827Member 2015-11-01 2021-10-31 0000904333 cik0000904333:RussellRAFIDevelopedexUSLargeCompanyIndexNetMember 2015-11-01 2021-10-31 0000904333 cik0000904333:FundamentalDevelopedexUSLargeSplicedIndexMember 2015-11-01 2021-10-31 0000904333 cik0000904333:FundamentalDevelopedExUSSmallSplicedIndexMember 2015-11-01 2021-10-31 0000904333 cik0000904333:C000055855Member 2015-11-01 2021-10-31 0000904333 cik0000904333:SAndPDevelopedExUSSmallCapIndexNetMember 2015-11-01 2021-10-31 0000904333 cik0000904333:RussellRAFIDevelopedexUSSmallCompanyIndexNetMember 2015-11-01 2021-10-31 0000904333 cik0000904333:FundamentalEmergingMarketsSplicedIndexMember 2015-11-01 2021-10-31 0000904333 cik0000904333:RussellRAFITMEmergingMarketsLargeCompanyIndexNetMember 2015-11-01 2021-10-31 0000904333 cik0000904333:MSCIEmergingMarketsIndexNetMember 2015-11-01 2021-10-31 0000904333 cik0000904333:C000055852Member 2015-11-01 2021-10-31 0000904333 cik0000904333:C000017885Member 2015-11-01 2021-10-31 0000904333 cik0000904333:BalancedBlendedIndexMember 2015-11-01 2021-10-31 0000904333 cik0000904333:C000016175Member 2015-11-01 2021-10-31 0000904333 cik0000904333:AllEquityCompositeIndexMember 2015-11-01 2021-10-31 0000904333 cik0000904333:C000016177Member 2015-11-01 2021-10-31 0000904333 cik0000904333:GrowthCompositeIndexMember 2015-11-01 2021-10-31 0000904333 cik0000904333:C000016178Member 2015-11-01 2021-10-31 0000904333 cik0000904333:BloombergUSAggregateBondIndexMember 2015-11-01 2021-10-31 0000904333 cik0000904333:BalancedCompositeIndexMember 2015-11-01 2021-10-31 0000904333 cik0000904333:C000016180Member 2015-11-01 2021-10-31 0000904333 cik0000904333:ConservativeCompositeIndexMember 2015-11-01 2021-10-31 0000904333 cik0000904333:C000015023Member 2015-11-01 2021-10-31 0000904333 cik0000904333:Target2010CompositeIndexMember 2015-11-01 2021-10-31 0000904333 cik0000904333:Target2015CompositeIndexMember 2015-11-01 2021-10-31 0000904333 cik0000904333:C000059131Member 2015-11-01 2021-10-31 0000904333 cik0000904333:C000015024Member 2015-11-01 2021-10-31 0000904333 cik0000904333:Target2020CompositeIndexMember 2015-11-01 2021-10-31 0000904333 cik0000904333:C000059132Member 2015-11-01 2021-10-31 0000904333 cik0000904333:Target2025CompositeIndexMember 2015-11-01 2021-10-31 0000904333 cik0000904333:C000015025Member 2015-11-01 2021-10-31 0000904333 cik0000904333:Target2030CompositeIndexMember 2015-11-01 2021-10-31 0000904333 cik0000904333:Target2035CompositeIndexMember 2015-11-01 2021-10-31 0000904333 cik0000904333:C000059133Member 2015-11-01 2021-10-31 0000904333 cik0000904333:Target2040CompositeIndexMember 2015-11-01 2021-10-31 0000904333 cik0000904333:C000015026Member 2015-11-01 2021-10-31 0000904333 cik0000904333:Target2045CompositeIndexMember 2015-11-01 2021-10-31 0000904333 cik0000904333:C000122183Member 2015-11-01 2021-10-31 0000904333 cik0000904333:C000122184Member 2015-11-01 2021-10-31 0000904333 cik0000904333:Target2050CompositeIndexMember 2015-11-01 2021-10-31 0000904333 cik0000904333:Target2055CompositeIndexMember 2015-11-01 2021-10-31 0000904333 cik0000904333:C000122185Member 2015-11-01 2021-10-31 0000904333 cik0000904333:C000017890Member 2020-11-01 2025-10-31 0000904333 cik0000904333:MSCIEAFEIndexNetMember 2020-11-01 2025-10-31 0000904333 us-gaap:StandardPoors500IndexMember 2020-11-01 2025-10-31 0000904333 cik0000904333:C000015013Member 2020-11-01 2025-10-31 0000904333 cik0000904333:Russell1000ValueIndexMember 2020-11-01 2025-10-31 0000904333 cik0000904333:C000015015Member 2020-11-01 2025-10-31 0000904333 cik0000904333:Russell1000GrowthIndexMember 2020-11-01 2025-10-31 0000904333 cik0000904333:C000015012Member 2020-11-01 2025-10-31 0000904333 cik0000904333:C000015017Member 2020-11-01 2025-10-31 0000904333 cik0000904333:Russell2000IndexMember 2020-11-01 2025-10-31 0000904333 cik0000904333:DowJonesGlobalHealthCareIndexMember 2020-11-01 2025-10-31 0000904333 cik0000904333:C000015021Member 2020-11-01 2025-10-31 0000904333 cik0000904333:C000063316Member 2020-11-01 2025-10-31 0000904333 cik0000904333:C000016166Member 2020-11-01 2025-10-31 0000904333 cik0000904333:C000016169Member 2020-11-01 2025-10-31 0000904333 cik0000904333:DowJonesUSTotalStockMarketIndexMember 2020-11-01 2025-10-31 0000904333 cik0000904333:C000016171Member 2020-11-01 2025-10-31 0000904333 cik0000904333:C000195502Member 2020-11-01 2025-10-31 0000904333 cik0000904333:C000195503Member 2020-11-01 2025-10-31 0000904333 cik0000904333:RussellMidcapIndexMember 2020-11-01 2025-10-31 0000904333 cik0000904333:C000195504Member 2020-11-01 2025-10-31 0000904333 cik0000904333:C000016173Member 2020-11-01 2025-10-31 0000904333 cik0000904333:RussellRAFIUSLargeCompanyIndexMember 2020-11-01 2025-10-31 0000904333 cik0000904333:Russell1000IndexMember 2020-11-01 2025-10-31 0000904333 cik0000904333:C000046821Member 2020-11-01 2025-10-31 0000904333 cik0000904333:FundamentalUSLargeSplicedIndexMember 2020-11-01 2025-10-31 0000904333 cik0000904333:RussellRAFIUSSmallCompanyIndexMember 2020-11-01 2025-10-31 0000904333 cik0000904333:FundamentalUSSmallSplicedIndexMember 2020-11-01 2025-10-31 0000904333 cik0000904333:C000046824Member 2020-11-01 2025-10-31 0000904333 cik0000904333:RussellRAFIDevelopedexUSLargeCompanyIndexNetMember 2020-11-01 2025-10-31 0000904333 cik0000904333:FundamentalDevelopedexUSLargeSplicedIndexMember 2020-11-01 2025-10-31 0000904333 cik0000904333:C000046827Member 2020-11-01 2025-10-31 0000904333 cik0000904333:SAndPDevelopedExUSSmallCapIndexNetMember 2020-11-01 2025-10-31 0000904333 cik0000904333:C000055855Member 2020-11-01 2025-10-31 0000904333 cik0000904333:FundamentalDevelopedExUSSmallSplicedIndexMember 2020-11-01 2025-10-31 0000904333 cik0000904333:RussellRAFIDevelopedexUSSmallCompanyIndexNetMember 2020-11-01 2025-10-31 0000904333 cik0000904333:RussellRAFITMEmergingMarketsLargeCompanyIndexNetMember 2020-11-01 2025-10-31 0000904333 cik0000904333:MSCIEmergingMarketsIndexNetMember 2020-11-01 2025-10-31 0000904333 cik0000904333:FundamentalEmergingMarketsSplicedIndexMember 2020-11-01 2025-10-31 0000904333 cik0000904333:C000055852Member 2020-11-01 2025-10-31 0000904333 cik0000904333:C000017885Member 2020-11-01 2025-10-31 0000904333 cik0000904333:BloombergUSAggregateBondIndexMember 2020-11-01 2025-10-31 0000904333 cik0000904333:BalancedBlendedIndexMember 2020-11-01 2025-10-31 0000904333 cik0000904333:AllEquityCompositeIndexMember 2020-11-01 2025-10-31 0000904333 cik0000904333:C000016175Member 2020-11-01 2025-10-31 0000904333 cik0000904333:C000016177Member 2020-11-01 2025-10-31 0000904333 cik0000904333:GrowthCompositeIndexMember 2020-11-01 2025-10-31 0000904333 cik0000904333:BalancedCompositeIndexMember 2020-11-01 2025-10-31 0000904333 cik0000904333:C000016178Member 2020-11-01 2025-10-31 0000904333 cik0000904333:ConservativeCompositeIndexMember 2020-11-01 2025-10-31 0000904333 cik0000904333:C000016180Member 2020-11-01 2025-10-31 0000904333 cik0000904333:C000015023Member 2020-11-01 2025-10-31 0000904333 cik0000904333:Target2010CompositeIndexMember 2020-11-01 2025-10-31 0000904333 cik0000904333:C000059131Member 2020-11-01 2025-10-31 0000904333 cik0000904333:Target2015CompositeIndexMember 2020-11-01 2025-10-31 0000904333 cik0000904333:Target2020CompositeIndexMember 2020-11-01 2025-10-31 0000904333 cik0000904333:C000015024Member 2020-11-01 2025-10-31 0000904333 cik0000904333:Target2025CompositeIndexMember 2020-11-01 2025-10-31 0000904333 cik0000904333:C000059132Member 2020-11-01 2025-10-31 0000904333 cik0000904333:C000015025Member 2020-11-01 2025-10-31 0000904333 cik0000904333:Target2030CompositeIndexMember 2020-11-01 2025-10-31 0000904333 cik0000904333:Target2035CompositeIndexMember 2020-11-01 2025-10-31 0000904333 cik0000904333:C000059133Member 2020-11-01 2025-10-31 0000904333 cik0000904333:Target2040CompositeIndexMember 2020-11-01 2025-10-31 0000904333 cik0000904333:C000015026Member 2020-11-01 2025-10-31 0000904333 cik0000904333:C000122183Member 2020-11-01 2025-10-31 0000904333 cik0000904333:Target2045CompositeIndexMember 2020-11-01 2025-10-31 0000904333 cik0000904333:Target2050CompositeIndexMember 2020-11-01 2025-10-31 0000904333 cik0000904333:C000122184Member 2020-11-01 2025-10-31 0000904333 cik0000904333:Target2055CompositeIndexMember 2020-11-01 2025-10-31 0000904333 cik0000904333:C000122185Member 2020-11-01 2025-10-31 0000904333 cik0000904333:Target2060CompositeIndexMember 2020-11-01 2025-10-31 0000904333 cik0000904333:C000172771Member 2020-11-01 2025-10-31 0000904333 cik0000904333:C000017890Member 2015-11-01 2020-10-31 0000904333 cik0000904333:MSCIEAFEIndexNetMember 2015-11-01 2020-10-31 0000904333 us-gaap:StandardPoors500IndexMember 2015-11-01 2020-10-31 0000904333 cik0000904333:C000015013Member 2015-11-01 2020-10-31 0000904333 cik0000904333:Russell1000ValueIndexMember 2015-11-01 2020-10-31 0000904333 cik0000904333:C000015015Member 2015-11-01 2020-10-31 0000904333 cik0000904333:C000015012Member 2015-11-01 2020-10-31 0000904333 cik0000904333:Russell1000GrowthIndexMember 2015-11-01 2020-10-31 0000904333 cik0000904333:C000015017Member 2015-11-01 2020-10-31 0000904333 cik0000904333:Russell2000IndexMember 2015-11-01 2020-10-31 0000904333 cik0000904333:DowJonesGlobalHealthCareIndexMember 2015-11-01 2020-10-31 0000904333 cik0000904333:C000015021Member 2015-11-01 2020-10-31 0000904333 cik0000904333:C000063316Member 2015-11-01 2020-10-31 0000904333 cik0000904333:C000016166Member 2015-11-01 2020-10-31 0000904333 cik0000904333:C000016169Member 2015-11-01 2020-10-31 0000904333 cik0000904333:C000016171Member 2015-11-01 2020-10-31 0000904333 cik0000904333:DowJonesUSTotalStockMarketIndexMember 2015-11-01 2020-10-31 0000904333 cik0000904333:C000016173Member 2015-11-01 2020-10-31 0000904333 cik0000904333:FundamentalUSLargeSplicedIndexMember 2015-11-01 2020-10-31 0000904333 cik0000904333:RussellRAFIUSLargeCompanyIndexMember 2015-11-01 2020-10-31 0000904333 cik0000904333:C000046821Member 2015-11-01 2020-10-31 0000904333 cik0000904333:Russell1000IndexMember 2015-11-01 2020-10-31 0000904333 cik0000904333:C000046824Member 2015-11-01 2020-10-31 0000904333 cik0000904333:RussellRAFIUSSmallCompanyIndexMember 2015-11-01 2020-10-31 0000904333 cik0000904333:FundamentalUSSmallSplicedIndexMember 2015-11-01 2020-10-31 0000904333 cik0000904333:C000046827Member 2015-11-01 2020-10-31 0000904333 cik0000904333:RussellRAFIDevelopedexUSLargeCompanyIndexNetMember 2015-11-01 2020-10-31 0000904333 cik0000904333:FundamentalDevelopedexUSLargeSplicedIndexMember 2015-11-01 2020-10-31 0000904333 cik0000904333:FundamentalDevelopedExUSSmallSplicedIndexMember 2015-11-01 2020-10-31 0000904333 cik0000904333:SAndPDevelopedExUSSmallCapIndexNetMember 2015-11-01 2020-10-31 0000904333 cik0000904333:RussellRAFIDevelopedexUSSmallCompanyIndexNetMember 2015-11-01 2020-10-31 0000904333 cik0000904333:C000055855Member 2015-11-01 2020-10-31 0000904333 cik0000904333:MSCIEmergingMarketsIndexNetMember 2015-11-01 2020-10-31 0000904333 cik0000904333:C000055852Member 2015-11-01 2020-10-31 0000904333 cik0000904333:FundamentalEmergingMarketsSplicedIndexMember 2015-11-01 2020-10-31 0000904333 cik0000904333:RussellRAFITMEmergingMarketsLargeCompanyIndexNetMember 2015-11-01 2020-10-31 0000904333 cik0000904333:C000017885Member 2015-11-01 2020-10-31 0000904333 cik0000904333:BalancedBlendedIndexMember 2015-11-01 2020-10-31 0000904333 cik0000904333:C000016175Member 2015-11-01 2020-10-31 0000904333 cik0000904333:AllEquityCompositeIndexMember 2015-11-01 2020-10-31 0000904333 cik0000904333:C000016177Member 2015-11-01 2020-10-31 0000904333 cik0000904333:GrowthCompositeIndexMember 2015-11-01 2020-10-31 0000904333 cik0000904333:C000016178Member 2015-11-01 2020-10-31 0000904333 cik0000904333:BloombergUSAggregateBondIndexMember 2015-11-01 2020-10-31 0000904333 cik0000904333:BalancedCompositeIndexMember 2015-11-01 2020-10-31 0000904333 cik0000904333:ConservativeCompositeIndexMember 2015-11-01 2020-10-31 0000904333 cik0000904333:C000016180Member 2015-11-01 2020-10-31 0000904333 cik0000904333:C000015023Member 2015-11-01 2020-10-31 0000904333 cik0000904333:Target2010CompositeIndexMember 2015-11-01 2020-10-31 0000904333 cik0000904333:Target2015CompositeIndexMember 2015-11-01 2020-10-31 0000904333 cik0000904333:C000059131Member 2015-11-01 2020-10-31 0000904333 cik0000904333:C000015024Member 2015-11-01 2020-10-31 0000904333 cik0000904333:Target2020CompositeIndexMember 2015-11-01 2020-10-31 0000904333 cik0000904333:C000059132Member 2015-11-01 2020-10-31 0000904333 cik0000904333:Target2025CompositeIndexMember 2015-11-01 2020-10-31 0000904333 cik0000904333:Target2030CompositeIndexMember 2015-11-01 2020-10-31 0000904333 cik0000904333:C000015025Member 2015-11-01 2020-10-31 0000904333 cik0000904333:C000059133Member 2015-11-01 2020-10-31 0000904333 cik0000904333:Target2035CompositeIndexMember 2015-11-01 2020-10-31 0000904333 cik0000904333:C000015026Member 2015-11-01 2020-10-31 0000904333 cik0000904333:Target2040CompositeIndexMember 2015-11-01 2020-10-31 0000904333 cik0000904333:Target2045CompositeIndexMember 2015-11-01 2020-10-31 0000904333 cik0000904333:C000122183Member 2015-11-01 2020-10-31 0000904333 cik0000904333:Target2050CompositeIndexMember 2015-11-01 2020-10-31 0000904333 cik0000904333:C000122184Member 2015-11-01 2020-10-31 0000904333 cik0000904333:Target2055CompositeIndexMember 2015-11-01 2020-10-31 0000904333 cik0000904333:C000122185Member 2015-11-01 2020-10-31 0000904333 cik0000904333:C000017890Member 2015-11-01 2018-10-31 0000904333 cik0000904333:MSCIEAFEIndexNetMember 2015-11-01 2018-10-31 0000904333 us-gaap:StandardPoors500IndexMember 2015-11-01 2018-10-31 0000904333 cik0000904333:C000015013Member 2015-11-01 2018-10-31 0000904333 cik0000904333:C000015015Member 2015-11-01 2018-10-31 0000904333 cik0000904333:Russell1000ValueIndexMember 2015-11-01 2018-10-31 0000904333 cik0000904333:Russell1000GrowthIndexMember 2015-11-01 2018-10-31 0000904333 cik0000904333:C000015012Member 2015-11-01 2018-10-31 0000904333 cik0000904333:C000015017Member 2015-11-01 2018-10-31 0000904333 cik0000904333:Russell2000IndexMember 2015-11-01 2018-10-31 0000904333 cik0000904333:DowJonesGlobalHealthCareIndexMember 2015-11-01 2018-10-31 0000904333 cik0000904333:C000015021Member 2015-11-01 2018-10-31 0000904333 cik0000904333:C000063316Member 2015-11-01 2018-10-31 0000904333 cik0000904333:C000016166Member 2015-11-01 2018-10-31 0000904333 cik0000904333:C000016169Member 2015-11-01 2018-10-31 0000904333 cik0000904333:C000016171Member 2015-11-01 2018-10-31 0000904333 cik0000904333:DowJonesUSTotalStockMarketIndexMember 2015-11-01 2018-10-31 0000904333 cik0000904333:C000016173Member 2015-11-01 2018-10-31 0000904333 cik0000904333:C000046821Member 2015-11-01 2018-10-31 0000904333 cik0000904333:Russell1000IndexMember 2015-11-01 2018-10-31 0000904333 cik0000904333:FundamentalUSLargeSplicedIndexMember 2015-11-01 2018-10-31 0000904333 cik0000904333:RussellRAFIUSLargeCompanyIndexMember 2015-11-01 2018-10-31 0000904333 cik0000904333:C000046824Member 2015-11-01 2018-10-31 0000904333 cik0000904333:RussellRAFIUSSmallCompanyIndexMember 2015-11-01 2018-10-31 0000904333 cik0000904333:FundamentalUSSmallSplicedIndexMember 2015-11-01 2018-10-31 0000904333 cik0000904333:C000046827Member 2015-11-01 2018-10-31 0000904333 cik0000904333:RussellRAFIDevelopedexUSLargeCompanyIndexNetMember 2015-11-01 2018-10-31 0000904333 cik0000904333:FundamentalDevelopedexUSLargeSplicedIndexMember 2015-11-01 2018-10-31 0000904333 cik0000904333:C000055855Member 2015-11-01 2018-10-31 0000904333 cik0000904333:SAndPDevelopedExUSSmallCapIndexNetMember 2015-11-01 2018-10-31 0000904333 cik0000904333:RussellRAFIDevelopedexUSSmallCompanyIndexNetMember 2015-11-01 2018-10-31 0000904333 cik0000904333:FundamentalDevelopedExUSSmallSplicedIndexMember 2015-11-01 2018-10-31 0000904333 cik0000904333:C000055852Member 2015-11-01 2018-10-31 0000904333 cik0000904333:FundamentalEmergingMarketsSplicedIndexMember 2015-11-01 2018-10-31 0000904333 cik0000904333:RussellRAFITMEmergingMarketsLargeCompanyIndexNetMember 2015-11-01 2018-10-31 0000904333 cik0000904333:MSCIEmergingMarketsIndexNetMember 2015-11-01 2018-10-31 0000904333 cik0000904333:BalancedBlendedIndexMember 2015-11-01 2018-10-31 0000904333 cik0000904333:C000017885Member 2015-11-01 2018-10-31 0000904333 cik0000904333:C000016175Member 2015-11-01 2018-10-31 0000904333 cik0000904333:AllEquityCompositeIndexMember 2015-11-01 2018-10-31 0000904333 cik0000904333:C000016177Member 2015-11-01 2018-10-31 0000904333 cik0000904333:GrowthCompositeIndexMember 2015-11-01 2018-10-31 0000904333 cik0000904333:C000016178Member 2015-11-01 2018-10-31 0000904333 cik0000904333:BloombergUSAggregateBondIndexMember 2015-11-01 2018-10-31 0000904333 cik0000904333:BalancedCompositeIndexMember 2015-11-01 2018-10-31 0000904333 cik0000904333:C000016180Member 2015-11-01 2018-10-31 0000904333 cik0000904333:ConservativeCompositeIndexMember 2015-11-01 2018-10-31 0000904333 cik0000904333:C000015023Member 2015-11-01 2018-10-31 0000904333 cik0000904333:Target2010CompositeIndexMember 2015-11-01 2018-10-31 0000904333 cik0000904333:Target2015CompositeIndexMember 2015-11-01 2018-10-31 0000904333 cik0000904333:C000059131Member 2015-11-01 2018-10-31 0000904333 cik0000904333:C000015024Member 2015-11-01 2018-10-31 0000904333 cik0000904333:Target2020CompositeIndexMember 2015-11-01 2018-10-31 0000904333 cik0000904333:Target2025CompositeIndexMember 2015-11-01 2018-10-31 0000904333 cik0000904333:C000059132Member 2015-11-01 2018-10-31 0000904333 cik0000904333:C000015025Member 2015-11-01 2018-10-31 0000904333 cik0000904333:Target2030CompositeIndexMember 2015-11-01 2018-10-31 0000904333 cik0000904333:Target2035CompositeIndexMember 2015-11-01 2018-10-31 0000904333 cik0000904333:C000059133Member 2015-11-01 2018-10-31 0000904333 cik0000904333:Target2040CompositeIndexMember 2015-11-01 2018-10-31 0000904333 cik0000904333:C000015026Member 2015-11-01 2018-10-31 0000904333 cik0000904333:C000122183Member 2015-11-01 2018-10-31 0000904333 cik0000904333:Target2045CompositeIndexMember 2015-11-01 2018-10-31 0000904333 cik0000904333:C000122184Member 2015-11-01 2018-10-31 0000904333 cik0000904333:Target2050CompositeIndexMember 2015-11-01 2018-10-31 0000904333 cik0000904333:Target2055CompositeIndexMember 2015-11-01 2018-10-31 0000904333 cik0000904333:C000122185Member 2015-11-01 2018-10-31 0000904333 cik0000904333:C000015015Member 2015-11-01 2016-10-31 0000904333 cik0000904333:Russell1000GrowthIndexMember 2015-11-01 2016-10-31 0000904333 cik0000904333:C000015012Member 2015-11-01 2016-10-31 0000904333 cik0000904333:C000015017Member 2015-11-01 2016-10-31 0000904333 cik0000904333:Russell2000IndexMember 2015-11-01 2016-10-31 0000904333 cik0000904333:DowJonesGlobalHealthCareIndexMember 2015-11-01 2016-10-31 0000904333 cik0000904333:C000063316Member 2015-11-01 2016-10-31 0000904333 cik0000904333:C000016166Member 2015-11-01 2016-10-31 0000904333 cik0000904333:C000016169Member 2015-11-01 2016-10-31 0000904333 cik0000904333:C000016171Member 2015-11-01 2016-10-31 0000904333 cik0000904333:C000046821Member 2015-11-01 2016-10-31 0000904333 cik0000904333:Russell1000IndexMember 2015-11-01 2016-10-31 0000904333 cik0000904333:FundamentalUSLargeSplicedIndexMember 2015-11-01 2016-10-31 0000904333 cik0000904333:RussellRAFIUSLargeCompanyIndexMember 2015-11-01 2016-10-31 0000904333 cik0000904333:C000046827Member 2015-11-01 2016-10-31 0000904333 cik0000904333:RussellRAFIDevelopedexUSLargeCompanyIndexNetMember 2015-11-01 2016-10-31 0000904333 cik0000904333:FundamentalDevelopedexUSLargeSplicedIndexMember 2015-11-01 2016-10-31 0000904333 cik0000904333:RussellRAFITMEmergingMarketsLargeCompanyIndexNetMember 2015-11-01 2016-10-31 0000904333 cik0000904333:FundamentalEmergingMarketsSplicedIndexMember 2015-11-01 2016-10-31 0000904333 cik0000904333:MSCIEmergingMarketsIndexNetMember 2015-11-01 2016-10-31 0000904333 cik0000904333:C000055852Member 2015-11-01 2016-10-31 0000904333 cik0000904333:Target2040CompositeIndexMember 2015-11-01 2016-10-31 0000904333 cik0000904333:C000015026Member 2015-11-01 2016-10-31 0000904333 cik0000904333:C000122185Member 2015-11-01 2016-10-31 0000904333 cik0000904333:Target2055CompositeIndexMember 2015-11-01 2016-10-31 0000904333 cik0000904333:C000017890Member 2025-10-31 0000904333 cik0000904333:C000017890Member cik0000904333:NovartisAGMember 2025-10-31 0000904333 cik0000904333:C000017890Member cik0000904333:AdyenNvMember 2025-10-31 0000904333 cik0000904333:C000017890Member cik0000904333:ProsusNvMember 2025-10-31 0000904333 cik0000904333:C000017890Member cik0000904333:SpotifyTechnologySaMember 2025-10-31 0000904333 cik0000904333:C000017890Member cik0000904333:ShellPLCMember 2025-10-31 0000904333 cik0000904333:C000017890Member cik0000904333:MercadoLibreIncMember 2025-10-31 0000904333 cik0000904333:C000017890Member cik0000904333:SamsungElectronicsCoLtdMember 2025-10-31 0000904333 cik0000904333:C000017890Member cik0000904333:TaiwanSemiconductorManufacturingCoLtdMember 2025-10-31 0000904333 cik0000904333:C000017890Member cik0000904333:ASMLHoldingNVMember 2025-10-31 0000904333 cik0000904333:C000017890Member cik0000904333:SchwabEmergingMarketsEquityEtfMember 2025-10-31 0000904333 cik0000904333:C000017890Member oef:CommunicationsSectorMember 2025-10-31 0000904333 cik0000904333:C000017890Member country:TW 2025-10-31 0000904333 cik0000904333:C000017890Member oef:MaterialsSectorMember 2025-10-31 0000904333 cik0000904333:C000017890Member oef:ConsumerStaplesSectorMember 2025-10-31 0000904333 cik0000904333:C000017890Member us-gaap:HealthcareSectorMember 2025-10-31 0000904333 cik0000904333:C000017890Member cik0000904333:FinancialsMember 2025-10-31 0000904333 cik0000904333:C000017890Member country:JP 2025-10-31 0000904333 cik0000904333:C000017890Member country:DE 2025-10-31 0000904333 cik0000904333:C000017890Member us-gaap:RealEstateSectorMember 2025-10-31 0000904333 cik0000904333:C000017890Member oef:UtilitiesSectorMember 2025-10-31 0000904333 cik0000904333:C000017890Member country:AU 2025-10-31 0000904333 cik0000904333:C000017890Member cik0000904333:ShortTermInvestmentMember 2025-10-31 0000904333 cik0000904333:C000017890Member cik0000904333:OtherCountriesMember 2025-10-31 0000904333 cik0000904333:C000017890Member country:CA 2025-10-31 0000904333 cik0000904333:C000017890Member us-gaap:EnergySectorMember 2025-10-31 0000904333 cik0000904333:C000017890Member country:GB 2025-10-31 0000904333 cik0000904333:C000017890Member country:US 2025-10-31 0000904333 cik0000904333:C000017890Member cik0000904333:InvestmentCompaniesMember 2025-10-31 0000904333 cik0000904333:C000017890Member country:KR 2025-10-31 0000904333 cik0000904333:C000017890Member country:CH 2025-10-31 0000904333 cik0000904333:C000017890Member country:NL 2025-10-31 0000904333 cik0000904333:C000017890Member country:FR 2025-10-31 0000904333 cik0000904333:C000017890Member country:CN 2025-10-31 0000904333 cik0000904333:C000017890Member oef:ConsumerDiscretionarySectorMember 2025-10-31 0000904333 cik0000904333:C000017890Member oef:InformationTechnologySectorMember 2025-10-31 0000904333 cik0000904333:C000017890Member oef:IndustrialSectorMember 2025-10-31 0000904333 cik0000904333:C000015013Member 2025-10-31 0000904333 cik0000904333:C000015013Member cik0000904333:NVIDIACorpMember 2025-10-31 0000904333 cik0000904333:C000015013Member cik0000904333:MicrosoftCorpMember 2025-10-31 0000904333 cik0000904333:C000015013Member cik0000904333:AppleIncMember 2025-10-31 0000904333 cik0000904333:C000015013Member cik0000904333:AlphabetIncClassAMember 2025-10-31 0000904333 cik0000904333:C000015013Member cik0000904333:BroadcomIncMember 2025-10-31 0000904333 cik0000904333:C000015013Member cik0000904333:MetaPlatformsIncClassAMember 2025-10-31 0000904333 cik0000904333:C000015013Member cik0000904333:AmazoncomIncMember 2025-10-31 0000904333 cik0000904333:C000015013Member cik0000904333:FidelityNationalInformationServicesIncMember 2025-10-31 0000904333 cik0000904333:C000015013Member cik0000904333:ExxonMobilCorpMember 2025-10-31 0000904333 cik0000904333:C000015013Member cik0000904333:VisaIncClassAMember 2025-10-31 0000904333 cik0000904333:C000015013Member us-gaap:RealEstateSectorMember 2025-10-31 0000904333 cik0000904333:C000015013Member cik0000904333:ShortTermInvestmentMember 2025-10-31 0000904333 cik0000904333:C000015013Member oef:InformationTechnologySectorMember 2025-10-31 0000904333 cik0000904333:C000015013Member oef:IndustrialSectorMember 2025-10-31 0000904333 cik0000904333:C000015013Member oef:ConsumerDiscretionarySectorMember 2025-10-31 0000904333 cik0000904333:C000015013Member oef:ConsumerStaplesSectorMember 2025-10-31 0000904333 cik0000904333:C000015013Member us-gaap:EnergySectorMember 2025-10-31 0000904333 cik0000904333:C000015013Member oef:UtilitiesSectorMember 2025-10-31 0000904333 cik0000904333:C000015013Member oef:MaterialsSectorMember 2025-10-31 0000904333 cik0000904333:C000015013Member us-gaap:HealthcareSectorMember 2025-10-31 0000904333 cik0000904333:C000015013Member cik0000904333:FinancialsMember 2025-10-31 0000904333 cik0000904333:C000015013Member oef:CommunicationsSectorMember 2025-10-31 0000904333 cik0000904333:C000015015Member 2025-10-31 0000904333 cik0000904333:C000015015Member cik0000904333:MicrosoftCorpMember 2025-10-31 0000904333 cik0000904333:C000015015Member cik0000904333:ExxonMobilCorpMember 2025-10-31 0000904333 cik0000904333:C000015015Member cik0000904333:InternationalBusinessMachinesCorpMember 2025-10-31 0000904333 cik0000904333:C000015015Member cik0000904333:CocaColaCoMember 2025-10-31 0000904333 cik0000904333:C000015015Member cik0000904333:DukeEnergyCorpMember 2025-10-31 0000904333 cik0000904333:C000015015Member cik0000904333:BlackrockIncMember 2025-10-31 0000904333 cik0000904333:C000015015Member cik0000904333:JPMorganChaseAndCoMember 2025-10-31 0000904333 cik0000904333:C000015015Member cik0000904333:BroadcomIncMember 2025-10-31 0000904333 cik0000904333:C000015015Member cik0000904333:MorganStanleyMember 2025-10-31 0000904333 cik0000904333:C000015015Member cik0000904333:WalmartIncMember 2025-10-31 0000904333 cik0000904333:C000015015Member oef:IndustrialSectorMember 2025-10-31 0000904333 cik0000904333:C000015015Member oef:MaterialsSectorMember 2025-10-31 0000904333 cik0000904333:C000015015Member us-gaap:RealEstateSectorMember 2025-10-31 0000904333 cik0000904333:C000015015Member oef:UtilitiesSectorMember 2025-10-31 0000904333 cik0000904333:C000015015Member oef:CommunicationsSectorMember 2025-10-31 0000904333 cik0000904333:C000015015Member oef:ConsumerDiscretionarySectorMember 2025-10-31 0000904333 cik0000904333:C000015015Member us-gaap:EnergySectorMember 2025-10-31 0000904333 cik0000904333:C000015015Member cik0000904333:FinancialsMember 2025-10-31 0000904333 cik0000904333:C000015015Member oef:InformationTechnologySectorMember 2025-10-31 0000904333 cik0000904333:C000015015Member oef:ConsumerStaplesSectorMember 2025-10-31 0000904333 cik0000904333:C000015015Member us-gaap:HealthcareSectorMember 2025-10-31 0000904333 cik0000904333:C000015012Member 2025-10-31 0000904333 cik0000904333:C000015012Member cik0000904333:AmazoncomIncMember 2025-10-31 0000904333 cik0000904333:C000015012Member cik0000904333:BroadcomIncMember 2025-10-31 0000904333 cik0000904333:C000015012Member cik0000904333:AlphabetIncClassAMember 2025-10-31 0000904333 cik0000904333:C000015012Member cik0000904333:AppleIncMember 2025-10-31 0000904333 cik0000904333:C000015012Member cik0000904333:MicrosoftCorpMember 2025-10-31 0000904333 cik0000904333:C000015012Member cik0000904333:NVIDIACorpMember 2025-10-31 0000904333 cik0000904333:C000015012Member cik0000904333:NetflixIncMember 2025-10-31 0000904333 cik0000904333:C000015012Member cik0000904333:EliLillyAndCoMember 2025-10-31 0000904333 cik0000904333:C000015012Member cik0000904333:TeslaIncMember 2025-10-31 0000904333 cik0000904333:C000015012Member cik0000904333:MetaPlatformsIncClassAMember 2025-10-31 0000904333 cik0000904333:C000015012Member oef:InformationTechnologySectorMember 2025-10-31 0000904333 cik0000904333:C000015012Member oef:ConsumerStaplesSectorMember 2025-10-31 0000904333 cik0000904333:C000015012Member cik0000904333:FinancialsMember 2025-10-31 0000904333 cik0000904333:C000015012Member oef:IndustrialSectorMember 2025-10-31 0000904333 cik0000904333:C000015012Member us-gaap:HealthcareSectorMember 2025-10-31 0000904333 cik0000904333:C000015012Member oef:CommunicationsSectorMember 2025-10-31 0000904333 cik0000904333:C000015012Member oef:ConsumerDiscretionarySectorMember 2025-10-31 0000904333 cik0000904333:C000015017Member 2025-10-31 0000904333 cik0000904333:C000015017Member cik0000904333:EnovaInternationalIncMember 2025-10-31 0000904333 cik0000904333:C000015017Member cik0000904333:BankUnitedIncMember 2025-10-31 0000904333 cik0000904333:C000015017Member cik0000904333:BloomEnergyCorpClassAMember 2025-10-31 0000904333 cik0000904333:C000015017Member cik0000904333:JacksonFinancialIncClassAMember 2025-10-31 0000904333 cik0000904333:C000015017Member cik0000904333:DiamondRockHospitalityCoMember 2025-10-31 0000904333 cik0000904333:C000015017Member cik0000904333:AlexanderBaldwinIncMember 2025-10-31 0000904333 cik0000904333:C000015017Member cik0000904333:HancockWhitneyCorpMember 2025-10-31 0000904333 cik0000904333:C000015017Member cik0000904333:IBEXHoldingsLtdMember 2025-10-31 0000904333 cik0000904333:C000015017Member cik0000904333:PortlandGeneralElectricCoMember 2025-10-31 0000904333 cik0000904333:C000015017Member cik0000904333:CredoTechnologyGroupHoldingLtdMember 2025-10-31 0000904333 cik0000904333:C000015017Member oef:UtilitiesSectorMember 2025-10-31 0000904333 cik0000904333:C000015017Member oef:ConsumerStaplesSectorMember 2025-10-31 0000904333 cik0000904333:C000015017Member cik0000904333:ShortTermInvestmentMember 2025-10-31 0000904333 cik0000904333:C000015017Member us-gaap:HealthcareSectorMember 2025-10-31 0000904333 cik0000904333:C000015017Member oef:IndustrialSectorMember 2025-10-31 0000904333 cik0000904333:C000015017Member cik0000904333:FinancialsMember 2025-10-31 0000904333 cik0000904333:C000015017Member oef:InformationTechnologySectorMember 2025-10-31 0000904333 cik0000904333:C000015017Member oef:ConsumerDiscretionarySectorMember 2025-10-31 0000904333 cik0000904333:C000015017Member oef:MaterialsSectorMember 2025-10-31 0000904333 cik0000904333:C000015017Member us-gaap:EnergySectorMember 2025-10-31 0000904333 cik0000904333:C000015017Member us-gaap:RealEstateSectorMember 2025-10-31 0000904333 cik0000904333:C000015017Member oef:CommunicationsSectorMember 2025-10-31 0000904333 cik0000904333:C000015021Member 2025-10-31 0000904333 cik0000904333:C000015021Member cik0000904333:UnitedHealthGroupIncMember 2025-10-31 0000904333 cik0000904333:C000015021Member cik0000904333:JohnsonAndJohnsonMember 2025-10-31 0000904333 cik0000904333:C000015021Member cik0000904333:AbbVieIncMember 2025-10-31 0000904333 cik0000904333:C000015021Member cik0000904333:EliLillyAndCoMember 2025-10-31 0000904333 cik0000904333:C000015021Member cik0000904333:NovartisAGMember 2025-10-31 0000904333 cik0000904333:C000015021Member cik0000904333:MerckAndCoIncMember 2025-10-31 0000904333 cik0000904333:C000015021Member cik0000904333:AmgenIncMember 2025-10-31 0000904333 cik0000904333:C000015021Member cik0000904333:StrykerCorpMember 2025-10-31 0000904333 cik0000904333:C000015021Member cik0000904333:BostonScientificCorpMember 2025-10-31 0000904333 cik0000904333:C000015021Member cik0000904333:ThermoFisherScientificIncMember 2025-10-31 0000904333 cik0000904333:C000015021Member cik0000904333:PharmaceuticalsMember 2025-10-31 0000904333 cik0000904333:C000015021Member cik0000904333:HealthCareServicesMember 2025-10-31 0000904333 cik0000904333:C000015021Member cik0000904333:HealthCareDistributorsMember 2025-10-31 0000904333 cik0000904333:C000015021Member cik0000904333:ManagedHealthCareMember 2025-10-31 0000904333 cik0000904333:C000015021Member cik0000904333:LifeSciencesToolsAndServicesMember 2025-10-31 0000904333 cik0000904333:C000015021Member cik0000904333:HealthCareEquipmentMember 2025-10-31 0000904333 cik0000904333:C000015021Member cik0000904333:BiotechnologyMember 2025-10-31 0000904333 cik0000904333:C000015021Member country:GB 2025-10-31 0000904333 cik0000904333:C000015021Member country:CH 2025-10-31 0000904333 cik0000904333:C000015021Member cik0000904333:OtherCountriesMember 2025-10-31 0000904333 cik0000904333:C000015021Member country:US 2025-10-31 0000904333 cik0000904333:C000015021Member cik0000904333:HealthCareSuppliesMember 2025-10-31 0000904333 cik0000904333:C000015021Member cik0000904333:HealthCareFacilitiesMember 2025-10-31 0000904333 cik0000904333:C000015021Member country:IE 2025-10-31 0000904333 cik0000904333:C000015021Member country:JP 2025-10-31 0000904333 cik0000904333:C000063316Member 2025-10-31 0000904333 cik0000904333:C000063316Member cik0000904333:SonyGroupCorpMember 2025-10-31 0000904333 cik0000904333:C000063316Member cik0000904333:RocheHoldingAGMember 2025-10-31 0000904333 cik0000904333:C000063316Member cik0000904333:HSBCHoldingsPLCMember 2025-10-31 0000904333 cik0000904333:C000063316Member cik0000904333:ASMLHoldingNVMember 2025-10-31 0000904333 cik0000904333:C000063316Member cik0000904333:NovartisAGMember 2025-10-31 0000904333 cik0000904333:C000063316Member cik0000904333:ABBLtdMember 2025-10-31 0000904333 cik0000904333:C000063316Member cik0000904333:BNPParibasSAMember 2025-10-31 0000904333 cik0000904333:C000063316Member cik0000904333:AstraZenecaPLCMember 2025-10-31 0000904333 cik0000904333:C000063316Member cik0000904333:RollsRoyceHoldingsPLCMember 2025-10-31 0000904333 cik0000904333:C000063316Member cik0000904333:ShellPLCMember 2025-10-31 0000904333 cik0000904333:C000063316Member country:ES 2025-10-31 0000904333 cik0000904333:C000063316Member country:AU 2025-10-31 0000904333 cik0000904333:C000063316Member country:CN 2025-10-31 0000904333 cik0000904333:C000063316Member country:SE 2025-10-31 0000904333 cik0000904333:C000063316Member country:KR 2025-10-31 0000904333 cik0000904333:C000063316Member country:IT 2025-10-31 0000904333 cik0000904333:C000063316Member country:JP 2025-10-31 0000904333 cik0000904333:C000063316Member country:GB 2025-10-31 0000904333 cik0000904333:C000063316Member cik0000904333:OtherCountriesMember 2025-10-31 0000904333 cik0000904333:C000063316Member country:CH 2025-10-31 0000904333 cik0000904333:C000063316Member country:FR 2025-10-31 0000904333 cik0000904333:C000063316Member country:DE 2025-10-31 0000904333 cik0000904333:C000063316Member us-gaap:RealEstateSectorMember 2025-10-31 0000904333 cik0000904333:C000063316Member oef:UtilitiesSectorMember 2025-10-31 0000904333 cik0000904333:C000063316Member country:NL 2025-10-31 0000904333 cik0000904333:C000063316Member us-gaap:EnergySectorMember 2025-10-31 0000904333 cik0000904333:C000063316Member oef:CommunicationsSectorMember 2025-10-31 0000904333 cik0000904333:C000063316Member oef:MaterialsSectorMember 2025-10-31 0000904333 cik0000904333:C000063316Member oef:ConsumerStaplesSectorMember 2025-10-31 0000904333 cik0000904333:C000063316Member oef:InformationTechnologySectorMember 2025-10-31 0000904333 cik0000904333:C000063316Member oef:ConsumerDiscretionarySectorMember 2025-10-31 0000904333 cik0000904333:C000063316Member us-gaap:HealthcareSectorMember 2025-10-31 0000904333 cik0000904333:C000063316Member oef:IndustrialSectorMember 2025-10-31 0000904333 cik0000904333:C000063316Member cik0000904333:FinancialsMember 2025-10-31 0000904333 cik0000904333:C000016166Member 2025-10-31 0000904333 cik0000904333:C000016166Member cik0000904333:NVIDIACorpMember 2025-10-31 0000904333 cik0000904333:C000016166Member cik0000904333:AppleIncMember 2025-10-31 0000904333 cik0000904333:C000016166Member cik0000904333:MicrosoftCorpMember 2025-10-31 0000904333 cik0000904333:C000016166Member cik0000904333:AmazoncomIncMember 2025-10-31 0000904333 cik0000904333:C000016166Member cik0000904333:BroadcomIncMember 2025-10-31 0000904333 cik0000904333:C000016166Member cik0000904333:AlphabetIncClassAMember 2025-10-31 0000904333 cik0000904333:C000016166Member cik0000904333:MetaPlatformsIncClassAMember 2025-10-31 0000904333 cik0000904333:C000016166Member cik0000904333:AlphabetIncClassCMember 2025-10-31 0000904333 cik0000904333:C000016166Member cik0000904333:TeslaIncMember 2025-10-31 0000904333 cik0000904333:C000016166Member cik0000904333:BerkshireHathawayIncClassBMember 2025-10-31 0000904333 cik0000904333:C000016166Member oef:InformationTechnologySectorMember 2025-10-31 0000904333 cik0000904333:C000016166Member cik0000904333:FinancialsMember 2025-10-31 0000904333 cik0000904333:C000016166Member oef:ConsumerDiscretionarySectorMember 2025-10-31 0000904333 cik0000904333:C000016166Member oef:CommunicationsSectorMember 2025-10-31 0000904333 cik0000904333:C000016166Member us-gaap:HealthcareSectorMember 2025-10-31 0000904333 cik0000904333:C000016166Member oef:IndustrialSectorMember 2025-10-31 0000904333 cik0000904333:C000016166Member oef:ConsumerStaplesSectorMember 2025-10-31 0000904333 cik0000904333:C000016166Member us-gaap:EnergySectorMember 2025-10-31 0000904333 cik0000904333:C000016166Member oef:UtilitiesSectorMember 2025-10-31 0000904333 cik0000904333:C000016166Member us-gaap:RealEstateSectorMember 2025-10-31 0000904333 cik0000904333:C000016166Member oef:MaterialsSectorMember 2025-10-31 0000904333 cik0000904333:C000016166Member cik0000904333:ShortTermInvestmentMember 2025-10-31 0000904333 cik0000904333:C000016169Member 2025-10-31 0000904333 cik0000904333:C000016169Member cik0000904333:KratosDefenseSecuritySolutionsIncMember 2025-10-31 0000904333 cik0000904333:C000016169Member cik0000904333:FabrinetMember 2025-10-31 0000904333 cik0000904333:C000016169Member cik0000904333:IonQIncMember 2025-10-31 0000904333 cik0000904333:C000016169Member cik0000904333:CredoTechnologyGroupHoldingLtdMember 2025-10-31 0000904333 cik0000904333:C000016169Member cik0000904333:DWaveQuantumIncMember 2025-10-31 0000904333 cik0000904333:C000016169Member cik0000904333:AeroVironmentIncMember 2025-10-31 0000904333 cik0000904333:C000016169Member cik0000904333:RigettiComputingIncMember 2025-10-31 0000904333 cik0000904333:C000016169Member cik0000904333:OkloIncMember 2025-10-31 0000904333 cik0000904333:C000016169Member cik0000904333:BloomEnergyCorpClassAMember 2025-10-31 0000904333 cik0000904333:C000016169Member oef:IndustrialSectorMember 2025-10-31 0000904333 cik0000904333:C000016169Member us-gaap:HealthcareSectorMember 2025-10-31 0000904333 cik0000904333:C000016169Member cik0000904333:ShortTermInvestmentMember 2025-10-31 0000904333 cik0000904333:C000016169Member oef:ConsumerStaplesSectorMember 2025-10-31 0000904333 cik0000904333:C000016169Member oef:CommunicationsSectorMember 2025-10-31 0000904333 cik0000904333:C000016169Member oef:UtilitiesSectorMember 2025-10-31 0000904333 cik0000904333:C000016169Member oef:MaterialsSectorMember 2025-10-31 0000904333 cik0000904333:C000016169Member cik0000904333:FinancialsMember 2025-10-31 0000904333 cik0000904333:C000016169Member oef:InformationTechnologySectorMember 2025-10-31 0000904333 cik0000904333:C000016169Member oef:ConsumerDiscretionarySectorMember 2025-10-31 0000904333 cik0000904333:C000016169Member us-gaap:RealEstateSectorMember 2025-10-31 0000904333 cik0000904333:C000016169Member us-gaap:EnergySectorMember 2025-10-31 0000904333 cik0000904333:C000016171Member 2025-10-31 0000904333 cik0000904333:C000016171Member cik0000904333:MicrosoftCorpMember 2025-10-31 0000904333 cik0000904333:C000016171Member cik0000904333:AppleIncMember 2025-10-31 0000904333 cik0000904333:C000016171Member cik0000904333:TeslaIncMember 2025-10-31 0000904333 cik0000904333:C000016171Member cik0000904333:AlphabetIncClassCMember 2025-10-31 0000904333 cik0000904333:C000016171Member cik0000904333:MetaPlatformsIncClassAMember 2025-10-31 0000904333 cik0000904333:C000016171Member cik0000904333:AlphabetIncClassAMember 2025-10-31 0000904333 cik0000904333:C000016171Member cik0000904333:BroadcomIncMember 2025-10-31 0000904333 cik0000904333:C000016171Member cik0000904333:AmazoncomIncMember 2025-10-31 0000904333 cik0000904333:C000016171Member cik0000904333:NVIDIACorpMember 2025-10-31 0000904333 cik0000904333:C000016171Member cik0000904333:BerkshireHathawayIncClassBMember 2025-10-31 0000904333 cik0000904333:C000016171Member cik0000904333:ShortTermInvestmentMember 2025-10-31 0000904333 cik0000904333:C000016171Member oef:MaterialsSectorMember 2025-10-31 0000904333 cik0000904333:C000016171Member oef:ConsumerStaplesSectorMember 2025-10-31 0000904333 cik0000904333:C000016171Member oef:CommunicationsSectorMember 2025-10-31 0000904333 cik0000904333:C000016171Member us-gaap:HealthcareSectorMember 2025-10-31 0000904333 cik0000904333:C000016171Member oef:IndustrialSectorMember 2025-10-31 0000904333 cik0000904333:C000016171Member oef:ConsumerDiscretionarySectorMember 2025-10-31 0000904333 cik0000904333:C000016171Member cik0000904333:FinancialsMember 2025-10-31 0000904333 cik0000904333:C000016171Member oef:InformationTechnologySectorMember 2025-10-31 0000904333 cik0000904333:C000016171Member us-gaap:RealEstateSectorMember 2025-10-31 0000904333 cik0000904333:C000016171Member oef:UtilitiesSectorMember 2025-10-31 0000904333 cik0000904333:C000016171Member us-gaap:EnergySectorMember 2025-10-31 0000904333 cik0000904333:C000195502Member 2025-10-31 0000904333 cik0000904333:C000195502Member cik0000904333:NVIDIACorpMember 2025-10-31 0000904333 cik0000904333:C000195502Member cik0000904333:BroadcomIncMember 2025-10-31 0000904333 cik0000904333:C000195502Member cik0000904333:AmazoncomIncMember 2025-10-31 0000904333 cik0000904333:C000195502Member cik0000904333:TeslaIncMember 2025-10-31 0000904333 cik0000904333:C000195502Member cik0000904333:MetaPlatformsIncClassAMember 2025-10-31 0000904333 cik0000904333:C000195502Member cik0000904333:AlphabetIncClassAMember 2025-10-31 0000904333 cik0000904333:C000195502Member cik0000904333:AlphabetIncClassCMember 2025-10-31 0000904333 cik0000904333:C000195502Member cik0000904333:EliLillyAndCoMember 2025-10-31 0000904333 cik0000904333:C000195502Member cik0000904333:AppleIncMember 2025-10-31 0000904333 cik0000904333:C000195502Member cik0000904333:MicrosoftCorpMember 2025-10-31 0000904333 cik0000904333:C000195502Member oef:CommunicationsSectorMember 2025-10-31 0000904333 cik0000904333:C000195502Member us-gaap:HealthcareSectorMember 2025-10-31 0000904333 cik0000904333:C000195502Member cik0000904333:FinancialsMember 2025-10-31 0000904333 cik0000904333:C000195502Member oef:IndustrialSectorMember 2025-10-31 0000904333 cik0000904333:C000195502Member oef:InformationTechnologySectorMember 2025-10-31 0000904333 cik0000904333:C000195502Member oef:ConsumerDiscretionarySectorMember 2025-10-31 0000904333 cik0000904333:C000195502Member oef:UtilitiesSectorMember 2025-10-31 0000904333 cik0000904333:C000195502Member us-gaap:EnergySectorMember 2025-10-31 0000904333 cik0000904333:C000195502Member cik0000904333:InvestmentCompaniesMember 2025-10-31 0000904333 cik0000904333:C000195502Member oef:ConsumerStaplesSectorMember 2025-10-31 0000904333 cik0000904333:C000195502Member us-gaap:RealEstateSectorMember 2025-10-31 0000904333 cik0000904333:C000195502Member cik0000904333:ShortTermInvestmentMember 2025-10-31 0000904333 cik0000904333:C000195502Member oef:MaterialsSectorMember 2025-10-31 0000904333 cik0000904333:C000195503Member 2025-10-31 0000904333 cik0000904333:C000195503Member cik0000904333:BankofAmericaCorpMember 2025-10-31 0000904333 cik0000904333:C000195503Member cik0000904333:BerkshireHathawayIncClassBMember 2025-10-31 0000904333 cik0000904333:C000195503Member cik0000904333:JPMorganChaseAndCoMember 2025-10-31 0000904333 cik0000904333:C000195503Member cik0000904333:AmazoncomIncMember 2025-10-31 0000904333 cik0000904333:C000195503Member cik0000904333:AlphabetIncClassAMember 2025-10-31 0000904333 cik0000904333:C000195503Member cik0000904333:ExxonMobilCorpMember 2025-10-31 0000904333 cik0000904333:C000195503Member cik0000904333:AlphabetIncClassCMember 2025-10-31 0000904333 cik0000904333:C000195503Member cik0000904333:JohnsonAndJohnsonMember 2025-10-31 0000904333 cik0000904333:C000195503Member cik0000904333:WalmartIncMember 2025-10-31 0000904333 cik0000904333:C000195503Member cik0000904333:ProcterAndGambleCoMember 2025-10-31 0000904333 cik0000904333:C000195503Member cik0000904333:ShortTermInvestmentMember 2025-10-31 0000904333 cik0000904333:C000195503Member cik0000904333:InvestmentCompaniesMember 2025-10-31 0000904333 cik0000904333:C000195503Member oef:ConsumerDiscretionarySectorMember 2025-10-31 0000904333 cik0000904333:C000195503Member oef:ConsumerStaplesSectorMember 2025-10-31 0000904333 cik0000904333:C000195503Member us-gaap:EnergySectorMember 2025-10-31 0000904333 cik0000904333:C000195503Member oef:UtilitiesSectorMember 2025-10-31 0000904333 cik0000904333:C000195503Member us-gaap:RealEstateSectorMember 2025-10-31 0000904333 cik0000904333:C000195503Member oef:MaterialsSectorMember 2025-10-31 0000904333 cik0000904333:C000195503Member us-gaap:HealthcareSectorMember 2025-10-31 0000904333 cik0000904333:C000195503Member oef:InformationTechnologySectorMember 2025-10-31 0000904333 cik0000904333:C000195503Member oef:CommunicationsSectorMember 2025-10-31 0000904333 cik0000904333:C000195503Member cik0000904333:FinancialsMember 2025-10-31 0000904333 cik0000904333:C000195503Member oef:IndustrialSectorMember 2025-10-31 0000904333 cik0000904333:C000195504Member 2025-10-31 0000904333 cik0000904333:C000195504Member cik0000904333:BankofNewYorkMellonCorpMember 2025-10-31 0000904333 cik0000904333:C000195504Member cik0000904333:VertivHoldingsCoClassAMember 2025-10-31 0000904333 cik0000904333:C000195504Member cik0000904333:QuantaServicesIncMember 2025-10-31 0000904333 cik0000904333:C000195504Member cik0000904333:HowmetAerospaceIncMember 2025-10-31 0000904333 cik0000904333:C000195504Member cik0000904333:RoyalCaribbeanCruisesLtdMember 2025-10-31 0000904333 cik0000904333:C000195504Member cik0000904333:CorningIncMember 2025-10-31 0000904333 cik0000904333:C000195504Member cik0000904333:CloudflareIncClassAMember 2025-10-31 0000904333 cik0000904333:C000195504Member cik0000904333:CoinbaseGlobalIncClassAMember 2025-10-31 0000904333 cik0000904333:C000195504Member cik0000904333:ROBLOXCorpClassAMember 2025-10-31 0000904333 cik0000904333:C000195504Member cik0000904333:RobinhoodMarketsIncClassAMember 2025-10-31 0000904333 cik0000904333:C000195504Member oef:CommunicationsSectorMember 2025-10-31 0000904333 cik0000904333:C000195504Member cik0000904333:ShortTermInvestmentMember 2025-10-31 0000904333 cik0000904333:C000195504Member cik0000904333:InvestmentCompaniesMember 2025-10-31 0000904333 cik0000904333:C000195504Member oef:IndustrialSectorMember 2025-10-31 0000904333 cik0000904333:C000195504Member cik0000904333:FinancialsMember 2025-10-31 0000904333 cik0000904333:C000195504Member oef:InformationTechnologySectorMember 2025-10-31 0000904333 cik0000904333:C000195504Member oef:ConsumerDiscretionarySectorMember 2025-10-31 0000904333 cik0000904333:C000195504Member us-gaap:HealthcareSectorMember 2025-10-31 0000904333 cik0000904333:C000195504Member us-gaap:RealEstateSectorMember 2025-10-31 0000904333 cik0000904333:C000195504Member oef:UtilitiesSectorMember 2025-10-31 0000904333 cik0000904333:C000195504Member us-gaap:EnergySectorMember 2025-10-31 0000904333 cik0000904333:C000195504Member oef:MaterialsSectorMember 2025-10-31 0000904333 cik0000904333:C000195504Member oef:ConsumerStaplesSectorMember 2025-10-31 0000904333 cik0000904333:C000016173Member 2025-10-31 0000904333 cik0000904333:C000016173Member cik0000904333:ASMLHoldingNVMember 2025-10-31 0000904333 cik0000904333:C000016173Member cik0000904333:SAPSEMember 2025-10-31 0000904333 cik0000904333:C000016173Member cik0000904333:AstraZenecaPLCMember 2025-10-31 0000904333 cik0000904333:C000016173Member cik0000904333:NestleSAMember 2025-10-31 0000904333 cik0000904333:C000016173Member cik0000904333:HSBCHoldingsPLCMember 2025-10-31 0000904333 cik0000904333:C000016173Member cik0000904333:NovartisAGMember 2025-10-31 0000904333 cik0000904333:C000016173Member cik0000904333:ToyotaMotorCorpMember 2025-10-31 0000904333 cik0000904333:C000016173Member cik0000904333:RocheHoldingAGMember 2025-10-31 0000904333 cik0000904333:C000016173Member cik0000904333:ShellPLCMember 2025-10-31 0000904333 cik0000904333:C000016173Member cik0000904333:SiemensAGMember 2025-10-31 0000904333 cik0000904333:C000016173Member country:ES 2025-10-31 0000904333 cik0000904333:C000016173Member country:IT 2025-10-31 0000904333 cik0000904333:C000016173Member country:SE 2025-10-31 0000904333 cik0000904333:C000016173Member oef:MaterialsSectorMember 2025-10-31 0000904333 cik0000904333:C000016173Member oef:CommunicationsSectorMember 2025-10-31 0000904333 cik0000904333:C000016173Member oef:UtilitiesSectorMember 2025-10-31 0000904333 cik0000904333:C000016173Member cik0000904333:FinancialsMember 2025-10-31 0000904333 cik0000904333:C000016173Member oef:IndustrialSectorMember 2025-10-31 0000904333 cik0000904333:C000016173Member us-gaap:HealthcareSectorMember 2025-10-31 0000904333 cik0000904333:C000016173Member oef:ConsumerDiscretionarySectorMember 2025-10-31 0000904333 cik0000904333:C000016173Member oef:InformationTechnologySectorMember 2025-10-31 0000904333 cik0000904333:C000016173Member oef:ConsumerStaplesSectorMember 2025-10-31 0000904333 cik0000904333:C000016173Member country:GB 2025-10-31 0000904333 cik0000904333:C000016173Member country:JP 2025-10-31 0000904333 cik0000904333:C000016173Member us-gaap:EnergySectorMember 2025-10-31 0000904333 cik0000904333:C000016173Member us-gaap:RealEstateSectorMember 2025-10-31 0000904333 cik0000904333:C000016173Member cik0000904333:ShortTermInvestmentMember 2025-10-31 0000904333 cik0000904333:C000016173Member country:NL 2025-10-31 0000904333 cik0000904333:C000016173Member country:AU 2025-10-31 0000904333 cik0000904333:C000016173Member country:CH 2025-10-31 0000904333 cik0000904333:C000016173Member country:DE 2025-10-31 0000904333 cik0000904333:C000016173Member country:FR 2025-10-31 0000904333 cik0000904333:C000016173Member cik0000904333:OtherCountriesMember 2025-10-31 0000904333 cik0000904333:C000046821Member 2025-10-31 0000904333 cik0000904333:C000046821Member cik0000904333:AlphabetIncClassCMember 2025-10-31 0000904333 cik0000904333:C000046821Member cik0000904333:JPMorganChaseAndCoMember 2025-10-31 0000904333 cik0000904333:C000046821Member cik0000904333:AmazoncomIncMember 2025-10-31 0000904333 cik0000904333:C000046821Member cik0000904333:ChevronCorpMember 2025-10-31 0000904333 cik0000904333:C000046821Member cik0000904333:IntelCorpMember 2025-10-31 0000904333 cik0000904333:C000046821Member cik0000904333:MetaPlatformsIncClassAMember 2025-10-31 0000904333 cik0000904333:C000046821Member cik0000904333:AppleIncMember 2025-10-31 0000904333 cik0000904333:C000046821Member cik0000904333:MicrosoftCorpMember 2025-10-31 0000904333 cik0000904333:C000046821Member cik0000904333:AlphabetIncClassAMember 2025-10-31 0000904333 cik0000904333:C000046821Member cik0000904333:ExxonMobilCorpMember 2025-10-31 0000904333 cik0000904333:C000046821Member us-gaap:HealthcareSectorMember 2025-10-31 0000904333 cik0000904333:C000046821Member oef:CommunicationsSectorMember 2025-10-31 0000904333 cik0000904333:C000046821Member oef:IndustrialSectorMember 2025-10-31 0000904333 cik0000904333:C000046821Member cik0000904333:FinancialsMember 2025-10-31 0000904333 cik0000904333:C000046821Member oef:InformationTechnologySectorMember 2025-10-31 0000904333 cik0000904333:C000046821Member cik0000904333:ShortTermInvestmentMember 2025-10-31 0000904333 cik0000904333:C000046821Member oef:ConsumerDiscretionarySectorMember 2025-10-31 0000904333 cik0000904333:C000046821Member us-gaap:EnergySectorMember 2025-10-31 0000904333 cik0000904333:C000046821Member oef:ConsumerStaplesSectorMember 2025-10-31 0000904333 cik0000904333:C000046821Member oef:MaterialsSectorMember 2025-10-31 0000904333 cik0000904333:C000046821Member oef:UtilitiesSectorMember 2025-10-31 0000904333 cik0000904333:C000046821Member us-gaap:RealEstateSectorMember 2025-10-31 0000904333 cik0000904333:C000046824Member 2025-10-31 0000904333 cik0000904333:C000046824Member cik0000904333:ViasatIncMember 2025-10-31 0000904333 cik0000904333:C000046824Member cik0000904333:LumentumHoldingsIncMember 2025-10-31 0000904333 cik0000904333:C000046824Member cik0000904333:DelekUSHoldingsIncMember 2025-10-31 0000904333 cik0000904333:C000046824Member cik0000904333:OpendoorTechnologiesIncMember 2025-10-31 0000904333 cik0000904333:C000046824Member cik0000904333:RocketCosIncClassAMember 2025-10-31 0000904333 cik0000904333:C000046824Member cik0000904333:EchoStarCorpClassAMember 2025-10-31 0000904333 cik0000904333:C000046824Member cik0000904333:CommScopeHoldingCoIncMember 2025-10-31 0000904333 cik0000904333:C000046824Member cik0000904333:ComfortSystemsUSAIncMember 2025-10-31 0000904333 cik0000904333:C000046824Member cik0000904333:AnywhereRealEstateIncMember 2025-10-31 0000904333 cik0000904333:C000046824Member cik0000904333:TTMTechnologiesIncMember 2025-10-31 0000904333 cik0000904333:C000046824Member oef:ConsumerDiscretionarySectorMember 2025-10-31 0000904333 cik0000904333:C000046824Member oef:InformationTechnologySectorMember 2025-10-31 0000904333 cik0000904333:C000046824Member us-gaap:RealEstateSectorMember 2025-10-31 0000904333 cik0000904333:C000046824Member us-gaap:HealthcareSectorMember 2025-10-31 0000904333 cik0000904333:C000046824Member oef:MaterialsSectorMember 2025-10-31 0000904333 cik0000904333:C000046824Member us-gaap:EnergySectorMember 2025-10-31 0000904333 cik0000904333:C000046824Member oef:CommunicationsSectorMember 2025-10-31 0000904333 cik0000904333:C000046824Member oef:ConsumerStaplesSectorMember 2025-10-31 0000904333 cik0000904333:C000046824Member oef:UtilitiesSectorMember 2025-10-31 0000904333 cik0000904333:C000046824Member cik0000904333:ShortTermInvestmentMember 2025-10-31 0000904333 cik0000904333:C000046824Member oef:IndustrialSectorMember 2025-10-31 0000904333 cik0000904333:C000046824Member cik0000904333:FinancialsMember 2025-10-31 0000904333 cik0000904333:C000046827Member 2025-10-31 0000904333 cik0000904333:C000046827Member cik0000904333:TotalEnergiesSEMember 2025-10-31 0000904333 cik0000904333:C000046827Member cik0000904333:SamsungElectronicsCoLtdMember 2025-10-31 0000904333 cik0000904333:C000046827Member cik0000904333:RocheHoldingAGMember 2025-10-31 0000904333 cik0000904333:C000046827Member cik0000904333:BHPGroupLtdMember 2025-10-31 0000904333 cik0000904333:C000046827Member cik0000904333:BancoSantanderSAMember 2025-10-31 0000904333 cik0000904333:C000046827Member cik0000904333:HSBCHoldingsPLCMember 2025-10-31 0000904333 cik0000904333:C000046827Member cik0000904333:GlencorePLCMember 2025-10-31 0000904333 cik0000904333:C000046827Member cik0000904333:BPPLCMember 2025-10-31 0000904333 cik0000904333:C000046827Member cik0000904333:ToyotaMotorCorpMember 2025-10-31 0000904333 cik0000904333:C000046827Member cik0000904333:ShellPLCMember 2025-10-31 0000904333 cik0000904333:C000046827Member cik0000904333:ShortTermInvestmentMember 2025-10-31 0000904333 cik0000904333:C000046827Member us-gaap:RealEstateSectorMember 2025-10-31 0000904333 cik0000904333:C000046827Member oef:UtilitiesSectorMember 2025-10-31 0000904333 cik0000904333:C000046827Member oef:CommunicationsSectorMember 2025-10-31 0000904333 cik0000904333:C000046827Member us-gaap:HealthcareSectorMember 2025-10-31 0000904333 cik0000904333:C000046827Member oef:ConsumerStaplesSectorMember 2025-10-31 0000904333 cik0000904333:C000046827Member oef:InformationTechnologySectorMember 2025-10-31 0000904333 cik0000904333:C000046827Member us-gaap:EnergySectorMember 2025-10-31 0000904333 cik0000904333:C000046827Member oef:MaterialsSectorMember 2025-10-31 0000904333 cik0000904333:C000046827Member oef:ConsumerDiscretionarySectorMember 2025-10-31 0000904333 cik0000904333:C000046827Member oef:IndustrialSectorMember 2025-10-31 0000904333 cik0000904333:C000046827Member cik0000904333:FinancialsMember 2025-10-31 0000904333 cik0000904333:C000046827Member country:KR 2025-10-31 0000904333 cik0000904333:C000046827Member country:DE 2025-10-31 0000904333 cik0000904333:C000046827Member cik0000904333:OtherCountriesMember 2025-10-31 0000904333 cik0000904333:C000046827Member country:GB 2025-10-31 0000904333 cik0000904333:C000046827Member country:JP 2025-10-31 0000904333 cik0000904333:C000046827Member country:NL 2025-10-31 0000904333 cik0000904333:C000046827Member country:ES 2025-10-31 0000904333 cik0000904333:C000046827Member country:AU 2025-10-31 0000904333 cik0000904333:C000046827Member country:CH 2025-10-31 0000904333 cik0000904333:C000046827Member country:FR 2025-10-31 0000904333 cik0000904333:C000046827Member country:CA 2025-10-31 0000904333 cik0000904333:C000055855Member 2025-10-31 0000904333 cik0000904333:C000055855Member cik0000904333:IbidenCoLtdMember 2025-10-31 0000904333 cik0000904333:C000055855Member cik0000904333:SinoBiopharmaceuticalLtdMember 2025-10-31 0000904333 cik0000904333:C000055855Member cik0000904333:SpectrisPLCMember 2025-10-31 0000904333 cik0000904333:C000055855Member cik0000904333:AirtelAfricaPLCMember 2025-10-31 0000904333 cik0000904333:C000055855Member cik0000904333:SSRMiningIncMember 2025-10-31 0000904333 cik0000904333:C000055855Member cik0000904333:DoosanCoLtdMember 2025-10-31 0000904333 cik0000904333:C000055855Member cik0000904333:HDKoreaShipbuildingOffshoreEngineeringCoLtdMember 2025-10-31 0000904333 cik0000904333:C000055855Member cik0000904333:KindenCorpMember 2025-10-31 0000904333 cik0000904333:C000055855Member cik0000904333:EagersAutomotiveLtdMember 2025-10-31 0000904333 cik0000904333:C000055855Member cik0000904333:CelesticaIncMember 2025-10-31 0000904333 cik0000904333:C000055855Member cik0000904333:ShortTermInvestmentMember 2025-10-31 0000904333 cik0000904333:C000055855Member oef:UtilitiesSectorMember 2025-10-31 0000904333 cik0000904333:C000055855Member us-gaap:EnergySectorMember 2025-10-31 0000904333 cik0000904333:C000055855Member us-gaap:HealthcareSectorMember 2025-10-31 0000904333 cik0000904333:C000055855Member oef:CommunicationsSectorMember 2025-10-31 0000904333 cik0000904333:C000055855Member us-gaap:RealEstateSectorMember 2025-10-31 0000904333 cik0000904333:C000055855Member country:HK 2025-10-31 0000904333 cik0000904333:C000055855Member country:CH 2025-10-31 0000904333 cik0000904333:C000055855Member country:SE 2025-10-31 0000904333 cik0000904333:C000055855Member country:DE 2025-10-31 0000904333 cik0000904333:C000055855Member country:FR 2025-10-31 0000904333 cik0000904333:C000055855Member country:AU 2025-10-31 0000904333 cik0000904333:C000055855Member oef:ConsumerStaplesSectorMember 2025-10-31 0000904333 cik0000904333:C000055855Member oef:InformationTechnologySectorMember 2025-10-31 0000904333 cik0000904333:C000055855Member oef:MaterialsSectorMember 2025-10-31 0000904333 cik0000904333:C000055855Member cik0000904333:FinancialsMember 2025-10-31 0000904333 cik0000904333:C000055855Member oef:ConsumerDiscretionarySectorMember 2025-10-31 0000904333 cik0000904333:C000055855Member oef:IndustrialSectorMember 2025-10-31 0000904333 cik0000904333:C000055855Member country:GB 2025-10-31 0000904333 cik0000904333:C000055855Member country:KR 2025-10-31 0000904333 cik0000904333:C000055855Member country:CA 2025-10-31 0000904333 cik0000904333:C000055855Member cik0000904333:OtherCountriesMember 2025-10-31 0000904333 cik0000904333:C000055855Member country:JP 2025-10-31 0000904333 cik0000904333:C000055852Member 2025-10-31 0000904333 cik0000904333:C000055852Member cik0000904333:TaiwanSemiconductorManufacturingCoLtdMember 2025-10-31 0000904333 cik0000904333:C000055852Member cik0000904333:ChinaConstructionBankCorpHSharesMember 2025-10-31 0000904333 cik0000904333:C000055852Member cik0000904333:HonHaiPrecisionIndustryCoLtdMember 2025-10-31 0000904333 cik0000904333:C000055852Member cik0000904333:AlibabaGroupHoldingLtdMember 2025-10-31 0000904333 cik0000904333:C000055852Member cik0000904333:JDcomIncMember 2025-10-31 0000904333 cik0000904333:C000055852Member cik0000904333:IndustrialCommercialBankofChinaLtdHSharesMember 2025-10-31 0000904333 cik0000904333:C000055852Member cik0000904333:PetroleoBrasileiroSAPetrobrasCommonStockMember 2025-10-31 0000904333 cik0000904333:C000055852Member cik0000904333:PetroleoBrasileiroSAPetrobrasPreferredStockMember 2025-10-31 0000904333 cik0000904333:C000055852Member cik0000904333:TencentHoldingsLtdMember 2025-10-31 0000904333 cik0000904333:C000055852Member cik0000904333:ValeSAMember 2025-10-31 0000904333 cik0000904333:C000055852Member oef:CommunicationsSectorMember 2025-10-31 0000904333 cik0000904333:C000055852Member oef:ConsumerDiscretionarySectorMember 2025-10-31 0000904333 cik0000904333:C000055852Member us-gaap:EnergySectorMember 2025-10-31 0000904333 cik0000904333:C000055852Member oef:MaterialsSectorMember 2025-10-31 0000904333 cik0000904333:C000055852Member oef:InformationTechnologySectorMember 2025-10-31 0000904333 cik0000904333:C000055852Member cik0000904333:FinancialsMember 2025-10-31 0000904333 cik0000904333:C000055852Member cik0000904333:ShortTermInvestmentMember 2025-10-31 0000904333 cik0000904333:C000055852Member us-gaap:HealthcareSectorMember 2025-10-31 0000904333 cik0000904333:C000055852Member us-gaap:RealEstateSectorMember 2025-10-31 0000904333 cik0000904333:C000055852Member oef:UtilitiesSectorMember 2025-10-31 0000904333 cik0000904333:C000055852Member oef:ConsumerStaplesSectorMember 2025-10-31 0000904333 cik0000904333:C000055852Member oef:IndustrialSectorMember 2025-10-31 0000904333 cik0000904333:C000055852Member country:ZA 2025-10-31 0000904333 cik0000904333:C000055852Member country:IN 2025-10-31 0000904333 cik0000904333:C000055852Member cik0000904333:OtherCountriesMember 2025-10-31 0000904333 cik0000904333:C000055852Member country:BR 2025-10-31 0000904333 cik0000904333:C000055852Member country:TW 2025-10-31 0000904333 cik0000904333:C000055852Member country:CN 2025-10-31 0000904333 cik0000904333:C000055852Member country:HK 2025-10-31 0000904333 cik0000904333:C000055852Member country:TH 2025-10-31 0000904333 cik0000904333:C000055852Member country:MX 2025-10-31 0000904333 cik0000904333:C000017885Member 2025-10-31 0000904333 cik0000904333:C000017885Member cik0000904333:SchwabGovernmentMoneyFundUltraSharesMember 2025-10-31 0000904333 cik0000904333:C000017885Member cik0000904333:StateStreetInstitutionalUSGovernmentMoneyMarketFundClassPremierMember 2025-10-31 0000904333 cik0000904333:C000017885Member cik0000904333:SchwabCoreEquityFundMember 2025-10-31 0000904333 cik0000904333:C000017885Member cik0000904333:SchwabSelectLargeCapGrowthFundMember 2025-10-31 0000904333 cik0000904333:C000017885Member cik0000904333:SchwabUSAggregateBondIndexFundMember 2025-10-31 0000904333 cik0000904333:C000017885Member cik0000904333:SchwabInternationalOpportunitiesFundMember 2025-10-31 0000904333 cik0000904333:C000017885Member cik0000904333:SchwabSmallCapEquityFundMember 2025-10-31 0000904333 cik0000904333:C000017885Member cik0000904333:MoneyMarketFundMember 2025-10-31 0000904333 cik0000904333:C000017885Member cik0000904333:USStocksSmallCapMember 2025-10-31 0000904333 cik0000904333:C000017885Member cik0000904333:InternationalStocksDevelopedMarketsMember 2025-10-31 0000904333 cik0000904333:C000017885Member cik0000904333:FixedIncomeIntermediateTermBondMember 2025-10-31 0000904333 cik0000904333:C000017885Member cik0000904333:USStocksLargeCapMember 2025-10-31 0000904333 cik0000904333:C000016175Member 2025-10-31 0000904333 cik0000904333:C000016175Member cik0000904333:SchwabSAndP500IndexFundMember 2025-10-31 0000904333 cik0000904333:C000016175Member cik0000904333:SchwabFundamentalInternationalSmallEquityIndexFundMember 2025-10-31 0000904333 cik0000904333:C000016175Member cik0000904333:SchwabUSREITETFMember 2025-10-31 0000904333 cik0000904333:C000016175Member cik0000904333:SchwabFundamentalUSSmallCompanyIndexFundMember 2025-10-31 0000904333 cik0000904333:C000016175Member cik0000904333:SchwabInternationalIndexFundMember 2025-10-31 0000904333 cik0000904333:C000016175Member cik0000904333:SchwabFundamentalUSLargeCompanyIndexFundMember 2025-10-31 0000904333 cik0000904333:C000016175Member cik0000904333:SchwabUSLargeCapGrowthIndexFundMember 2025-10-31 0000904333 cik0000904333:C000016175Member cik0000904333:SchwabFundamentalInternationalEquityIndexFundMember 2025-10-31 0000904333 cik0000904333:C000016175Member cik0000904333:SchwabSmallCapIndexFundMember 2025-10-31 0000904333 cik0000904333:C000016175Member cik0000904333:SchwabFundamentalEmergingMarketsEquityIndexFundMember 2025-10-31 0000904333 cik0000904333:C000016175Member cik0000904333:USStocksLargeCapMember 2025-10-31 0000904333 cik0000904333:C000016175Member cik0000904333:InternationalStocksDevelopedMarketsMember 2025-10-31 0000904333 cik0000904333:C000016175Member cik0000904333:USStocksSmallCapMember 2025-10-31 0000904333 cik0000904333:C000016175Member cik0000904333:InternationalStocksEmergingMarketsMember 2025-10-31 0000904333 cik0000904333:C000016175Member cik0000904333:RealEstateUSREITsMember 2025-10-31 0000904333 cik0000904333:C000016177Member 2025-10-31 0000904333 cik0000904333:C000016177Member cik0000904333:SchwabInternationalIndexFundMember 2025-10-31 0000904333 cik0000904333:C000016177Member cik0000904333:SchwabUSAggregateBondIndexFundMember 2025-10-31 0000904333 cik0000904333:C000016177Member cik0000904333:SchwabSAndP500IndexFundMember 2025-10-31 0000904333 cik0000904333:C000016177Member cik0000904333:SchwabFundamentalInternationalSmallEquityIndexFundMember 2025-10-31 0000904333 cik0000904333:C000016177Member cik0000904333:SchwabFundamentalEmergingMarketsEquityIndexFundMember 2025-10-31 0000904333 cik0000904333:C000016177Member cik0000904333:SchwabUSREITETFMember 2025-10-31 0000904333 cik0000904333:C000016177Member cik0000904333:SchwabSmallCapIndexFundMember 2025-10-31 0000904333 cik0000904333:C000016177Member cik0000904333:SchwabFundamentalInternationalEquityIndexFundMember 2025-10-31 0000904333 cik0000904333:C000016177Member cik0000904333:SchwabUSLargeCapGrowthIndexFundMember 2025-10-31 0000904333 cik0000904333:C000016177Member cik0000904333:SchwabFundamentalUSLargeCompanyIndexFundMember 2025-10-31 0000904333 cik0000904333:C000016177Member cik0000904333:USStocksSmallCapMember 2025-10-31 0000904333 cik0000904333:C000016177Member cik0000904333:InternationalStocksEmergingMarketsMember 2025-10-31 0000904333 cik0000904333:C000016177Member cik0000904333:RealEstateUSREITsMember 2025-10-31 0000904333 cik0000904333:C000016177Member cik0000904333:MoneyMarketFundMember 2025-10-31 0000904333 cik0000904333:C000016177Member cik0000904333:USStocksLargeCapMember 2025-10-31 0000904333 cik0000904333:C000016177Member cik0000904333:InternationalStocksDevelopedMarketsMember 2025-10-31 0000904333 cik0000904333:C000016177Member cik0000904333:FixedIncomeIntermediateTermBondMember 2025-10-31 0000904333 cik0000904333:C000016178Member 2025-10-31 0000904333 cik0000904333:C000016178Member cik0000904333:SchwabUSREITETFMember 2025-10-31 0000904333 cik0000904333:C000016178Member cik0000904333:SchwabUSAggregateBondIndexFundMember 2025-10-31 0000904333 cik0000904333:C000016178Member cik0000904333:SchwabFundamentalUSLargeCompanyIndexFundMember 2025-10-31 0000904333 cik0000904333:C000016178Member cik0000904333:SchwabUSLargeCapGrowthIndexFundMember 2025-10-31 0000904333 cik0000904333:C000016178Member cik0000904333:SchwabSmallCapIndexFundMember 2025-10-31 0000904333 cik0000904333:C000016178Member cik0000904333:SchwabShortTermBondIndexFundMember 2025-10-31 0000904333 cik0000904333:C000016178Member cik0000904333:SchwabFundamentalInternationalEquityIndexFundMember 2025-10-31 0000904333 cik0000904333:C000016178Member cik0000904333:SchwabGovernmentMoneyFundUltraSharesMember 2025-10-31 0000904333 cik0000904333:C000016178Member cik0000904333:SchwabSAndP500IndexFundMember 2025-10-31 0000904333 cik0000904333:C000016178Member cik0000904333:SchwabInternationalIndexFundMember 2025-10-31 0000904333 cik0000904333:C000016178Member cik0000904333:RealEstateUSREITsMember 2025-10-31 0000904333 cik0000904333:C000016178Member cik0000904333:InternationalStocksEmergingMarketsMember 2025-10-31 0000904333 cik0000904333:C000016178Member cik0000904333:USStocksLargeCapMember 2025-10-31 0000904333 cik0000904333:C000016178Member cik0000904333:FixedIncomeIntermediateTermBondMember 2025-10-31 0000904333 cik0000904333:C000016178Member cik0000904333:InternationalStocksDevelopedMarketsMember 2025-10-31 0000904333 cik0000904333:C000016178Member cik0000904333:USStocksSmallCapMember 2025-10-31 0000904333 cik0000904333:C000016178Member cik0000904333:FixedIncomeShortTermBondMember 2025-10-31 0000904333 cik0000904333:C000016178Member cik0000904333:MoneyMarketFundMember 2025-10-31 0000904333 cik0000904333:C000016180Member 2025-10-31 0000904333 cik0000904333:C000016180Member cik0000904333:SchwabInternationalIndexFundMember 2025-10-31 0000904333 cik0000904333:C000016180Member cik0000904333:SchwabFundamentalUSLargeCompanyIndexFundMember 2025-10-31 0000904333 cik0000904333:C000016180Member cik0000904333:SchwabGovernmentMoneyFundUltraSharesMember 2025-10-31 0000904333 cik0000904333:C000016180Member cik0000904333:SchwabUSLargeCapGrowthIndexFundMember 2025-10-31 0000904333 cik0000904333:C000016180Member cik0000904333:SchwabSAndP500IndexFundMember 2025-10-31 0000904333 cik0000904333:C000016180Member cik0000904333:SchwabShortTermBondIndexFundMember 2025-10-31 0000904333 cik0000904333:C000016180Member cik0000904333:SchwabUSAggregateBondIndexFundMember 2025-10-31 0000904333 cik0000904333:C000016180Member cik0000904333:SchwabUSREITETFMember 2025-10-31 0000904333 cik0000904333:C000016180Member cik0000904333:SchwabFundamentalInternationalEquityIndexFundMember 2025-10-31 0000904333 cik0000904333:C000016180Member cik0000904333:SchwabSmallCapIndexFundMember 2025-10-31 0000904333 cik0000904333:C000016180Member cik0000904333:InternationalStocksEmergingMarketsMember 2025-10-31 0000904333 cik0000904333:C000016180Member cik0000904333:RealEstateUSREITsMember 2025-10-31 0000904333 cik0000904333:C000016180Member cik0000904333:MoneyMarketFundMember 2025-10-31 0000904333 cik0000904333:C000016180Member cik0000904333:USStocksSmallCapMember 2025-10-31 0000904333 cik0000904333:C000016180Member cik0000904333:FixedIncomeShortTermBondMember 2025-10-31 0000904333 cik0000904333:C000016180Member cik0000904333:InternationalStocksDevelopedMarketsMember 2025-10-31 0000904333 cik0000904333:C000016180Member cik0000904333:USStocksLargeCapMember 2025-10-31 0000904333 cik0000904333:C000016180Member cik0000904333:FixedIncomeIntermediateTermBondMember 2025-10-31 0000904333 cik0000904333:C000015023Member 2025-10-31 0000904333 cik0000904333:C000015023Member cik0000904333:SchwabUSAggregateBondIndexFundMember 2025-10-31 0000904333 cik0000904333:C000015023Member cik0000904333:BairdAggregateBondFundClassInstitutionalMember 2025-10-31 0000904333 cik0000904333:C000015023Member cik0000904333:DodgeAndCoxStockFundClassIMember 2025-10-31 0000904333 cik0000904333:C000015023Member cik0000904333:SchwabGovernmentMoneyFundUltraSharesMember 2025-10-31 0000904333 cik0000904333:C000015023Member cik0000904333:SchwabInternationalCoreEquityFundMember 2025-10-31 0000904333 cik0000904333:C000015023Member cik0000904333:SchwabSelectLargeCapGrowthFundMember 2025-10-31 0000904333 cik0000904333:C000015023Member cik0000904333:SchwabInternationalOpportunitiesFundMember 2025-10-31 0000904333 cik0000904333:C000015023Member cik0000904333:SchwabTreasuryInflationProtectedSecuritiesIndexFundMember 2025-10-31 0000904333 cik0000904333:C000015023Member cik0000904333:SchwabShortTermBondIndexFundMember 2025-10-31 0000904333 cik0000904333:C000015023Member cik0000904333:SchwabSAndP500IndexFundMember 2025-10-31 0000904333 cik0000904333:C000015023Member cik0000904333:USStocksMidCapMember 2025-10-31 0000904333 cik0000904333:C000015023Member cik0000904333:USStocksSmallCapMember 2025-10-31 0000904333 cik0000904333:C000015023Member cik0000904333:FixedIncomeInternationalBondMember 2025-10-31 0000904333 cik0000904333:C000015023Member cik0000904333:RealEstateGlobalRealEstateMember 2025-10-31 0000904333 cik0000904333:C000015023Member cik0000904333:MoneyMarketFundMember 2025-10-31 0000904333 cik0000904333:C000015023Member cik0000904333:FixedIncomeInflationProtectedBondMember 2025-10-31 0000904333 cik0000904333:C000015023Member cik0000904333:InternationalStocksDevelopedMarketsMember 2025-10-31 0000904333 cik0000904333:C000015023Member cik0000904333:FixedIncomeShortTermBondMember 2025-10-31 0000904333 cik0000904333:C000015023Member cik0000904333:USStocksLargeCapMember 2025-10-31 0000904333 cik0000904333:C000015023Member cik0000904333:FixedIncomeIntermediateTermBondMember 2025-10-31 0000904333 cik0000904333:C000059131Member 2025-10-31 0000904333 cik0000904333:C000059131Member cik0000904333:SchwabTreasuryInflationProtectedSecuritiesIndexFundMember 2025-10-31 0000904333 cik0000904333:C000059131Member cik0000904333:SchwabInternationalOpportunitiesFundMember 2025-10-31 0000904333 cik0000904333:C000059131Member cik0000904333:SchwabSelectLargeCapGrowthFundMember 2025-10-31 0000904333 cik0000904333:C000059131Member cik0000904333:SchwabInternationalCoreEquityFundMember 2025-10-31 0000904333 cik0000904333:C000059131Member cik0000904333:DodgeAndCoxStockFundClassIMember 2025-10-31 0000904333 cik0000904333:C000059131Member cik0000904333:SchwabGlobalRealEstateFundMember 2025-10-31 0000904333 cik0000904333:C000059131Member cik0000904333:SchwabUSAggregateBondIndexFundMember 2025-10-31 0000904333 cik0000904333:C000059131Member cik0000904333:BairdAggregateBondFundClassInstitutionalMember 2025-10-31 0000904333 cik0000904333:C000059131Member cik0000904333:SchwabSAndP500IndexFundMember 2025-10-31 0000904333 cik0000904333:C000059131Member cik0000904333:SchwabShortTermBondIndexFundMember 2025-10-31 0000904333 cik0000904333:C000059131Member cik0000904333:InternationalStocksDevelopedMarketsMember 2025-10-31 0000904333 cik0000904333:C000059131Member cik0000904333:FixedIncomeShortTermBondMember 2025-10-31 0000904333 cik0000904333:C000059131Member cik0000904333:FixedIncomeInflationProtectedBondMember 2025-10-31 0000904333 cik0000904333:C000059131Member cik0000904333:RealEstateGlobalRealEstateMember 2025-10-31 0000904333 cik0000904333:C000059131Member cik0000904333:MoneyMarketFundMember 2025-10-31 0000904333 cik0000904333:C000059131Member cik0000904333:FixedIncomeInternationalBondMember 2025-10-31 0000904333 cik0000904333:C000059131Member cik0000904333:FixedIncomeIntermediateTermBondMember 2025-10-31 0000904333 cik0000904333:C000059131Member cik0000904333:USStocksLargeCapMember 2025-10-31 0000904333 cik0000904333:C000059131Member cik0000904333:USStocksSmallCapMember 2025-10-31 0000904333 cik0000904333:C000059131Member cik0000904333:USStocksMidCapMember 2025-10-31 0000904333 cik0000904333:C000015024Member 2025-10-31 0000904333 cik0000904333:C000015024Member cik0000904333:BairdAggregateBondFundClassInstitutionalMember 2025-10-31 0000904333 cik0000904333:C000015024Member cik0000904333:SchwabShortTermBondIndexFundMember 2025-10-31 0000904333 cik0000904333:C000015024Member cik0000904333:SchwabTreasuryInflationProtectedSecuritiesIndexFundMember 2025-10-31 0000904333 cik0000904333:C000015024Member cik0000904333:SchwabInternationalOpportunitiesFundMember 2025-10-31 0000904333 cik0000904333:C000015024Member cik0000904333:SchwabSelectLargeCapGrowthFundMember 2025-10-31 0000904333 cik0000904333:C000015024Member cik0000904333:SchwabInternationalCoreEquityFundMember 2025-10-31 0000904333 cik0000904333:C000015024Member cik0000904333:DodgeAndCoxStockFundClassIMember 2025-10-31 0000904333 cik0000904333:C000015024Member cik0000904333:SchwabGlobalRealEstateFundMember 2025-10-31 0000904333 cik0000904333:C000015024Member cik0000904333:SchwabUSAggregateBondIndexFundMember 2025-10-31 0000904333 cik0000904333:C000015024Member cik0000904333:SchwabSAndP500IndexFundMember 2025-10-31 0000904333 cik0000904333:C000015024Member cik0000904333:MoneyMarketFundMember 2025-10-31 0000904333 cik0000904333:C000015024Member cik0000904333:USStocksMidCapMember 2025-10-31 0000904333 cik0000904333:C000015024Member cik0000904333:InternationalStocksDevelopedMarketsMember 2025-10-31 0000904333 cik0000904333:C000015024Member cik0000904333:FixedIncomeShortTermBondMember 2025-10-31 0000904333 cik0000904333:C000015024Member cik0000904333:FixedIncomeInflationProtectedBondMember 2025-10-31 0000904333 cik0000904333:C000015024Member cik0000904333:RealEstateGlobalRealEstateMember 2025-10-31 0000904333 cik0000904333:C000015024Member cik0000904333:FixedIncomeInternationalBondMember 2025-10-31 0000904333 cik0000904333:C000015024Member cik0000904333:USStocksSmallCapMember 2025-10-31 0000904333 cik0000904333:C000015024Member cik0000904333:FixedIncomeIntermediateTermBondMember 2025-10-31 0000904333 cik0000904333:C000015024Member cik0000904333:USStocksLargeCapMember 2025-10-31 0000904333 cik0000904333:C000059132Member 2025-10-31 0000904333 cik0000904333:C000059132Member cik0000904333:SchwabSelectLargeCapGrowthFundMember 2025-10-31 0000904333 cik0000904333:C000059132Member cik0000904333:SchwabInternationalCoreEquityFundMember 2025-10-31 0000904333 cik0000904333:C000059132Member cik0000904333:DodgeAndCoxStockFundClassIMember 2025-10-31 0000904333 cik0000904333:C000059132Member cik0000904333:AllspringCorePlusBondFundClassR6Member 2025-10-31 0000904333 cik0000904333:C000059132Member cik0000904333:SchwabUSAggregateBondIndexFundMember 2025-10-31 0000904333 cik0000904333:C000059132Member cik0000904333:SchwabSAndP500IndexFundMember 2025-10-31 0000904333 cik0000904333:C000059132Member cik0000904333:BairdAggregateBondFundClassInstitutionalMember 2025-10-31 0000904333 cik0000904333:C000059132Member cik0000904333:SchwabShortTermBondIndexFundMember 2025-10-31 0000904333 cik0000904333:C000059132Member cik0000904333:SchwabTreasuryInflationProtectedSecuritiesIndexFundMember 2025-10-31 0000904333 cik0000904333:C000059132Member cik0000904333:SchwabInternationalOpportunitiesFundMember 2025-10-31 0000904333 cik0000904333:C000059132Member cik0000904333:USStocksSmallCapMember 2025-10-31 0000904333 cik0000904333:C000059132Member cik0000904333:FixedIncomeInternationalBondMember 2025-10-31 0000904333 cik0000904333:C000059132Member cik0000904333:MoneyMarketFundMember 2025-10-31 0000904333 cik0000904333:C000059132Member cik0000904333:USStocksMidCapMember 2025-10-31 0000904333 cik0000904333:C000059132Member cik0000904333:FixedIncomeIntermediateTermBondMember 2025-10-31 0000904333 cik0000904333:C000059132Member cik0000904333:USStocksLargeCapMember 2025-10-31 0000904333 cik0000904333:C000059132Member cik0000904333:InternationalStocksDevelopedMarketsMember 2025-10-31 0000904333 cik0000904333:C000059132Member cik0000904333:FixedIncomeShortTermBondMember 2025-10-31 0000904333 cik0000904333:C000059132Member cik0000904333:FixedIncomeInflationProtectedBondMember 2025-10-31 0000904333 cik0000904333:C000059132Member cik0000904333:RealEstateGlobalRealEstateMember 2025-10-31 0000904333 cik0000904333:C000015025Member 2025-10-31 0000904333 cik0000904333:C000015025Member cik0000904333:SchwabSAndP500IndexFundMember 2025-10-31 0000904333 cik0000904333:C000015025Member cik0000904333:SchwabUSAggregateBondIndexFundMember 2025-10-31 0000904333 cik0000904333:C000015025Member cik0000904333:SchwabInternationalOpportunitiesFundMember 2025-10-31 0000904333 cik0000904333:C000015025Member cik0000904333:AllspringCorePlusBondFundClassR6Member 2025-10-31 0000904333 cik0000904333:C000015025Member cik0000904333:BairdAggregateBondFundClassInstitutionalMember 2025-10-31 0000904333 cik0000904333:C000015025Member cik0000904333:SchwabInternationalCoreEquityFundMember 2025-10-31 0000904333 cik0000904333:C000015025Member cik0000904333:SchwabSelectLargeCapGrowthFundMember 2025-10-31 0000904333 cik0000904333:C000015025Member cik0000904333:SchwabShortTermBondIndexFundMember 2025-10-31 0000904333 cik0000904333:C000015025Member cik0000904333:DodgeAndCoxStockFundClassIMember 2025-10-31 0000904333 cik0000904333:C000015025Member cik0000904333:PIMCOInternationalBondFundUSDollarHedgedClassInstitutionalMember 2025-10-31 0000904333 cik0000904333:C000015025Member cik0000904333:USStocksLargeCapMember 2025-10-31 0000904333 cik0000904333:C000015025Member cik0000904333:FixedIncomeIntermediateTermBondMember 2025-10-31 0000904333 cik0000904333:C000015025Member cik0000904333:InternationalStocksDevelopedMarketsMember 2025-10-31 0000904333 cik0000904333:C000015025Member cik0000904333:FixedIncomeShortTermBondMember 2025-10-31 0000904333 cik0000904333:C000015025Member cik0000904333:FixedIncomeInternationalBondMember 2025-10-31 0000904333 cik0000904333:C000015025Member cik0000904333:RealEstateGlobalRealEstateMember 2025-10-31 0000904333 cik0000904333:C000015025Member cik0000904333:USStocksSmallCapMember 2025-10-31 0000904333 cik0000904333:C000015025Member cik0000904333:FixedIncomeInflationProtectedBondMember 2025-10-31 0000904333 cik0000904333:C000015025Member cik0000904333:USStocksMidCapMember 2025-10-31 0000904333 cik0000904333:C000015025Member cik0000904333:MoneyMarketFundMember 2025-10-31 0000904333 cik0000904333:C000015025Member cik0000904333:InternationalStocksEmergingMarketsMember 2025-10-31 0000904333 cik0000904333:C000059133Member 2025-10-31 0000904333 cik0000904333:C000059133Member cik0000904333:SchwabGlobalRealEstateFundMember 2025-10-31 0000904333 cik0000904333:C000059133Member cik0000904333:PIMCOInternationalBondFundUSDollarHedgedClassInstitutionalMember 2025-10-31 0000904333 cik0000904333:C000059133Member cik0000904333:BairdAggregateBondFundClassInstitutionalMember 2025-10-31 0000904333 cik0000904333:C000059133Member cik0000904333:SchwabFundamentalUSLargeCompanyIndexFundMember 2025-10-31 0000904333 cik0000904333:C000059133Member cik0000904333:SchwabSAndP500IndexFundMember 2025-10-31 0000904333 cik0000904333:C000059133Member cik0000904333:SchwabUSAggregateBondIndexFundMember 2025-10-31 0000904333 cik0000904333:C000059133Member cik0000904333:SchwabInternationalOpportunitiesFundMember 2025-10-31 0000904333 cik0000904333:C000059133Member cik0000904333:SchwabInternationalCoreEquityFundMember 2025-10-31 0000904333 cik0000904333:C000059133Member cik0000904333:SchwabSelectLargeCapGrowthFundMember 2025-10-31 0000904333 cik0000904333:C000059133Member cik0000904333:DodgeAndCoxStockFundClassIMember 2025-10-31 0000904333 cik0000904333:C000059133Member cik0000904333:RealEstateGlobalRealEstateMember 2025-10-31 0000904333 cik0000904333:C000059133Member cik0000904333:FixedIncomeInternationalBondMember 2025-10-31 0000904333 cik0000904333:C000059133Member cik0000904333:FixedIncomeShortTermBondMember 2025-10-31 0000904333 cik0000904333:C000059133Member cik0000904333:InternationalStocksEmergingMarketsMember 2025-10-31 0000904333 cik0000904333:C000059133Member cik0000904333:USStocksMidCapMember 2025-10-31 0000904333 cik0000904333:C000059133Member cik0000904333:MoneyMarketFundMember 2025-10-31 0000904333 cik0000904333:C000059133Member cik0000904333:USStocksLargeCapMember 2025-10-31 0000904333 cik0000904333:C000059133Member cik0000904333:FixedIncomeIntermediateTermBondMember 2025-10-31 0000904333 cik0000904333:C000059133Member cik0000904333:InternationalStocksDevelopedMarketsMember 2025-10-31 0000904333 cik0000904333:C000059133Member cik0000904333:USStocksSmallCapMember 2025-10-31 0000904333 cik0000904333:C000059133Member cik0000904333:FixedIncomeInflationProtectedBondMember 2025-10-31 0000904333 cik0000904333:C000015026Member 2025-10-31 0000904333 cik0000904333:C000015026Member cik0000904333:SchwabCoreEquityFundMember 2025-10-31 0000904333 cik0000904333:C000015026Member cik0000904333:SchwabSelectLargeCapGrowthFundMember 2025-10-31 0000904333 cik0000904333:C000015026Member cik0000904333:SchwabUSAggregateBondIndexFundMember 2025-10-31 0000904333 cik0000904333:C000015026Member cik0000904333:DodgeAndCoxStockFundClassIMember 2025-10-31 0000904333 cik0000904333:C000015026Member cik0000904333:SchwabFundamentalUSLargeCompanyIndexFundMember 2025-10-31 0000904333 cik0000904333:C000015026Member cik0000904333:SchwabGlobalRealEstateFundMember 2025-10-31 0000904333 cik0000904333:C000015026Member cik0000904333:SchwabSmallCapEquityFundMember 2025-10-31 0000904333 cik0000904333:C000015026Member cik0000904333:SchwabSAndP500IndexFundMember 2025-10-31 0000904333 cik0000904333:C000015026Member cik0000904333:SchwabInternationalOpportunitiesFundMember 2025-10-31 0000904333 cik0000904333:C000015026Member cik0000904333:SchwabInternationalCoreEquityFundMember 2025-10-31 0000904333 cik0000904333:C000015026Member cik0000904333:MoneyMarketFundMember 2025-10-31 0000904333 cik0000904333:C000015026Member cik0000904333:FixedIncomeIntermediateTermBondMember 2025-10-31 0000904333 cik0000904333:C000015026Member cik0000904333:InternationalStocksDevelopedMarketsMember 2025-10-31 0000904333 cik0000904333:C000015026Member cik0000904333:USStocksMidCapMember 2025-10-31 0000904333 cik0000904333:C000015026Member cik0000904333:FixedIncomeShortTermBondMember 2025-10-31 0000904333 cik0000904333:C000015026Member cik0000904333:InternationalStocksEmergingMarketsMember 2025-10-31 0000904333 cik0000904333:C000015026Member cik0000904333:FixedIncomeInternationalBondMember 2025-10-31 0000904333 cik0000904333:C000015026Member cik0000904333:RealEstateGlobalRealEstateMember 2025-10-31 0000904333 cik0000904333:C000015026Member cik0000904333:USStocksSmallCapMember 2025-10-31 0000904333 cik0000904333:C000015026Member cik0000904333:USStocksLargeCapMember 2025-10-31 0000904333 cik0000904333:C000122183Member 2025-10-31 0000904333 cik0000904333:C000122183Member cik0000904333:DodgeAndCoxStockFundClassIMember 2025-10-31 0000904333 cik0000904333:C000122183Member cik0000904333:SchwabSelectLargeCapGrowthFundMember 2025-10-31 0000904333 cik0000904333:C000122183Member cik0000904333:SchwabInternationalCoreEquityFundMember 2025-10-31 0000904333 cik0000904333:C000122183Member cik0000904333:SchwabInternationalOpportunitiesFundMember 2025-10-31 0000904333 cik0000904333:C000122183Member cik0000904333:SchwabSAndP500IndexFundMember 2025-10-31 0000904333 cik0000904333:C000122183Member cik0000904333:SchwabCoreEquityFundMember 2025-10-31 0000904333 cik0000904333:C000122183Member cik0000904333:SchwabUSAggregateBondIndexFundMember 2025-10-31 0000904333 cik0000904333:C000122183Member cik0000904333:SchwabSmallCapEquityFundMember 2025-10-31 0000904333 cik0000904333:C000122183Member cik0000904333:SchwabGlobalRealEstateFundMember 2025-10-31 0000904333 cik0000904333:C000122183Member cik0000904333:SchwabFundamentalUSLargeCompanyIndexFundMember 2025-10-31 0000904333 cik0000904333:C000122183Member cik0000904333:USStocksLargeCapMember 2025-10-31 0000904333 cik0000904333:C000122183Member cik0000904333:MoneyMarketFundMember 2025-10-31 0000904333 cik0000904333:C000122183Member cik0000904333:FixedIncomeShortTermBondMember 2025-10-31 0000904333 cik0000904333:C000122183Member cik0000904333:USStocksMidCapMember 2025-10-31 0000904333 cik0000904333:C000122183Member cik0000904333:FixedIncomeInternationalBondMember 2025-10-31 0000904333 cik0000904333:C000122183Member cik0000904333:InternationalStocksEmergingMarketsMember 2025-10-31 0000904333 cik0000904333:C000122183Member cik0000904333:RealEstateGlobalRealEstateMember 2025-10-31 0000904333 cik0000904333:C000122183Member cik0000904333:USStocksSmallCapMember 2025-10-31 0000904333 cik0000904333:C000122183Member cik0000904333:FixedIncomeIntermediateTermBondMember 2025-10-31 0000904333 cik0000904333:C000122183Member cik0000904333:InternationalStocksDevelopedMarketsMember 2025-10-31 0000904333 cik0000904333:C000122184Member 2025-10-31 0000904333 cik0000904333:C000122184Member cik0000904333:SchwabCoreEquityFundMember 2025-10-31 0000904333 cik0000904333:C000122184Member cik0000904333:SchwabSmallCapEquityFundMember 2025-10-31 0000904333 cik0000904333:C000122184Member cik0000904333:SchwabGlobalRealEstateFundMember 2025-10-31 0000904333 cik0000904333:C000122184Member cik0000904333:GoldmanSachsEmergingMarketsEquityInsightsFundInstitutionalClassMember 2025-10-31 0000904333 cik0000904333:C000122184Member cik0000904333:SchwabFundamentalUSLargeCompanyIndexFundMember 2025-10-31 0000904333 cik0000904333:C000122184Member cik0000904333:DodgeAndCoxStockFundClassIMember 2025-10-31 0000904333 cik0000904333:C000122184Member cik0000904333:SchwabSelectLargeCapGrowthFundMember 2025-10-31 0000904333 cik0000904333:C000122184Member cik0000904333:SchwabInternationalCoreEquityFundMember 2025-10-31 0000904333 cik0000904333:C000122184Member cik0000904333:SchwabInternationalOpportunitiesFundMember 2025-10-31 0000904333 cik0000904333:C000122184Member cik0000904333:SchwabSAndP500IndexFundMember 2025-10-31 0000904333 cik0000904333:C000122184Member cik0000904333:USStocksMidCapMember 2025-10-31 0000904333 cik0000904333:C000122184Member cik0000904333:RealEstateGlobalRealEstateMember 2025-10-31 0000904333 cik0000904333:C000122184Member cik0000904333:InternationalStocksEmergingMarketsMember 2025-10-31 0000904333 cik0000904333:C000122184Member cik0000904333:FixedIncomeIntermediateTermBondMember 2025-10-31 0000904333 cik0000904333:C000122184Member cik0000904333:USStocksSmallCapMember 2025-10-31 0000904333 cik0000904333:C000122184Member cik0000904333:InternationalStocksDevelopedMarketsMember 2025-10-31 0000904333 cik0000904333:C000122184Member cik0000904333:USStocksLargeCapMember 2025-10-31 0000904333 cik0000904333:C000122184Member cik0000904333:MoneyMarketFundMember 2025-10-31 0000904333 cik0000904333:C000122184Member cik0000904333:FixedIncomeShortTermBondMember 2025-10-31 0000904333 cik0000904333:C000122184Member cik0000904333:FixedIncomeInternationalBondMember 2025-10-31 0000904333 cik0000904333:C000122185Member 2025-10-31 0000904333 cik0000904333:C000122185Member cik0000904333:SchwabSAndP500IndexFundMember 2025-10-31 0000904333 cik0000904333:C000122185Member cik0000904333:SchwabSelectLargeCapGrowthFundMember 2025-10-31 0000904333 cik0000904333:C000122185Member cik0000904333:SchwabInternationalCoreEquityFundMember 2025-10-31 0000904333 cik0000904333:C000122185Member cik0000904333:SchwabInternationalOpportunitiesFundMember 2025-10-31 0000904333 cik0000904333:C000122185Member cik0000904333:SchwabCoreEquityFundMember 2025-10-31 0000904333 cik0000904333:C000122185Member cik0000904333:SchwabGlobalRealEstateFundMember 2025-10-31 0000904333 cik0000904333:C000122185Member cik0000904333:GoldmanSachsEmergingMarketsEquityInsightsFundInstitutionalClassMember 2025-10-31 0000904333 cik0000904333:C000122185Member cik0000904333:SchwabSmallCapEquityFundMember 2025-10-31 0000904333 cik0000904333:C000122185Member cik0000904333:SchwabFundamentalUSLargeCompanyIndexFundMember 2025-10-31 0000904333 cik0000904333:C000122185Member cik0000904333:DodgeAndCoxStockFundClassIMember 2025-10-31 0000904333 cik0000904333:C000122185Member cik0000904333:FixedIncomeShortTermBondMember 2025-10-31 0000904333 cik0000904333:C000122185Member cik0000904333:FixedIncomeInternationalBondMember 2025-10-31 0000904333 cik0000904333:C000122185Member cik0000904333:USStocksMidCapMember 2025-10-31 0000904333 cik0000904333:C000122185Member cik0000904333:FixedIncomeIntermediateTermBondMember 2025-10-31 0000904333 cik0000904333:C000122185Member cik0000904333:RealEstateGlobalRealEstateMember 2025-10-31 0000904333 cik0000904333:C000122185Member cik0000904333:InternationalStocksEmergingMarketsMember 2025-10-31 0000904333 cik0000904333:C000122185Member cik0000904333:USStocksSmallCapMember 2025-10-31 0000904333 cik0000904333:C000122185Member cik0000904333:InternationalStocksDevelopedMarketsMember 2025-10-31 0000904333 cik0000904333:C000122185Member cik0000904333:USStocksLargeCapMember 2025-10-31 0000904333 cik0000904333:C000172771Member 2025-10-31 0000904333 cik0000904333:C000172771Member cik0000904333:SchwabSAndP500IndexFundMember 2025-10-31 0000904333 cik0000904333:C000172771Member cik0000904333:SchwabCoreEquityFundMember 2025-10-31 0000904333 cik0000904333:C000172771Member cik0000904333:SchwabGlobalRealEstateFundMember 2025-10-31 0000904333 cik0000904333:C000172771Member cik0000904333:SchwabSmallCapEquityFundMember 2025-10-31 0000904333 cik0000904333:C000172771Member cik0000904333:SchwabFundamentalUSLargeCompanyIndexFundMember 2025-10-31 0000904333 cik0000904333:C000172771Member cik0000904333:GoldmanSachsEmergingMarketsEquityInsightsFundInstitutionalClassMember 2025-10-31 0000904333 cik0000904333:C000172771Member cik0000904333:DodgeAndCoxStockFundClassIMember 2025-10-31 0000904333 cik0000904333:C000172771Member cik0000904333:SchwabSelectLargeCapGrowthFundMember 2025-10-31 0000904333 cik0000904333:C000172771Member cik0000904333:SchwabInternationalCoreEquityFundMember 2025-10-31 0000904333 cik0000904333:C000172771Member cik0000904333:SchwabInternationalOpportunitiesFundMember 2025-10-31 0000904333 cik0000904333:C000172771Member cik0000904333:FixedIncomeShortTermBondMember 2025-10-31 0000904333 cik0000904333:C000172771Member cik0000904333:InternationalStocksDevelopedMarketsMember 2025-10-31 0000904333 cik0000904333:C000172771Member cik0000904333:USStocksLargeCapMember 2025-10-31 0000904333 cik0000904333:C000172771Member cik0000904333:FixedIncomeInternationalBondMember 2025-10-31 0000904333 cik0000904333:C000172771Member cik0000904333:USStocksMidCapMember 2025-10-31 0000904333 cik0000904333:C000172771Member cik0000904333:FixedIncomeIntermediateTermBondMember 2025-10-31 0000904333 cik0000904333:C000172771Member cik0000904333:RealEstateGlobalRealEstateMember 2025-10-31 0000904333 cik0000904333:C000172771Member cik0000904333:InternationalStocksEmergingMarketsMember 2025-10-31 0000904333 cik0000904333:C000172771Member cik0000904333:USStocksSmallCapMember 2025-10-31 0000904333 cik0000904333:C000225748Member 2025-10-31 0000904333 cik0000904333:C000225748Member cik0000904333:SchwabCoreEquityFundMember 2025-10-31 0000904333 cik0000904333:C000225748Member cik0000904333:SchwabGlobalRealEstateFundMember 2025-10-31 0000904333 cik0000904333:C000225748Member cik0000904333:SchwabSmallCapEquityFundMember 2025-10-31 0000904333 cik0000904333:C000225748Member cik0000904333:SchwabFundamentalUSLargeCompanyIndexFundMember 2025-10-31 0000904333 cik0000904333:C000225748Member cik0000904333:GoldmanSachsEmergingMarketsEquityInsightsFundInstitutionalClassMember 2025-10-31 0000904333 cik0000904333:C000225748Member cik0000904333:DodgeAndCoxStockFundClassIMember 2025-10-31 0000904333 cik0000904333:C000225748Member cik0000904333:SchwabSelectLargeCapGrowthFundMember 2025-10-31 0000904333 cik0000904333:C000225748Member cik0000904333:SchwabInternationalCoreEquityFundMember 2025-10-31 0000904333 cik0000904333:C000225748Member cik0000904333:SchwabInternationalOpportunitiesFundMember 2025-10-31 0000904333 cik0000904333:C000225748Member cik0000904333:SchwabSAndP500IndexFundMember 2025-10-31 0000904333 cik0000904333:C000225748Member cik0000904333:FixedIncomeInternationalBondMember 2025-10-31 0000904333 cik0000904333:C000225748Member cik0000904333:FixedIncomeShortTermBondMember 2025-10-31 0000904333 cik0000904333:C000225748Member cik0000904333:FixedIncomeIntermediateTermBondMember 2025-10-31 0000904333 cik0000904333:C000225748Member cik0000904333:USStocksMidCapMember 2025-10-31 0000904333 cik0000904333:C000225748Member cik0000904333:RealEstateGlobalRealEstateMember 2025-10-31 0000904333 cik0000904333:C000225748Member cik0000904333:InternationalStocksEmergingMarketsMember 2025-10-31 0000904333 cik0000904333:C000225748Member cik0000904333:USStocksSmallCapMember 2025-10-31 0000904333 cik0000904333:C000225748Member cik0000904333:InternationalStocksDevelopedMarketsMember 2025-10-31 0000904333 cik0000904333:C000225748Member cik0000904333:USStocksLargeCapMember 2025-10-31 0000904333 cik0000904333:C000017890Member 2024-11-01 2025-10-31 0000904333 cik0000904333:MSCIEAFEIndexNetMember 2024-11-01 2025-10-31 0000904333 cik0000904333:C000015013Member 2024-11-01 2025-10-31 0000904333 us-gaap:StandardPoors500IndexMember 2024-11-01 2025-10-31 0000904333 cik0000904333:C000015015Member 2024-11-01 2025-10-31 0000904333 cik0000904333:Russell1000ValueIndexMember 2024-11-01 2025-10-31 0000904333 cik0000904333:C000015012Member 2024-11-01 2025-10-31 0000904333 cik0000904333:Russell1000GrowthIndexMember 2024-11-01 2025-10-31 0000904333 cik0000904333:C000015017Member 2024-11-01 2025-10-31 0000904333 cik0000904333:Russell2000IndexMember 2024-11-01 2025-10-31 0000904333 cik0000904333:C000015021Member 2024-11-01 2025-10-31 0000904333 cik0000904333:DowJonesGlobalHealthCareIndexMember 2024-11-01 2025-10-31 0000904333 cik0000904333:C000063316Member 2024-11-01 2025-10-31 0000904333 cik0000904333:C000016166Member 2024-11-01 2025-10-31 0000904333 cik0000904333:C000016169Member 2024-11-01 2025-10-31 0000904333 cik0000904333:C000016171Member 2024-11-01 2025-10-31 0000904333 cik0000904333:DowJonesUSTotalStockMarketIndexMember 2024-11-01 2025-10-31 0000904333 cik0000904333:C000195502Member 2024-11-01 2025-10-31 0000904333 cik0000904333:C000195503Member 2024-11-01 2025-10-31 0000904333 cik0000904333:C000195504Member 2024-11-01 2025-10-31 0000904333 cik0000904333:RussellMidcapIndexMember 2024-11-01 2025-10-31 0000904333 cik0000904333:C000016173Member 2024-11-01 2025-10-31 0000904333 cik0000904333:C000046821Member 2024-11-01 2025-10-31 0000904333 cik0000904333:RAFIFundamentalHighLiquidityUSLargeIndexMember 2024-11-01 2025-10-31 0000904333 cik0000904333:RussellRAFIUSLargeCompanyIndexMember 2024-11-01 2025-10-31 0000904333 cik0000904333:FundamentalUSLargeSplicedIndexMember 2024-11-01 2025-10-31 0000904333 cik0000904333:Russell1000IndexMember 2024-11-01 2025-10-31 0000904333 cik0000904333:C000046824Member 2024-11-01 2025-10-31 0000904333 cik0000904333:FundamentalUSSmallSplicedIndexMember 2024-11-01 2025-10-31 0000904333 cik0000904333:RussellRAFIUSSmallCompanyIndexMember 2024-11-01 2025-10-31 0000904333 cik0000904333:RAFIFundamentalHighLiquidityUSSmallIndexMember 2024-11-01 2025-10-31 0000904333 cik0000904333:C000046827Member 2024-11-01 2025-10-31 0000904333 cik0000904333:FundamentalDevelopedexUSLargeSplicedIndexMember 2024-11-01 2025-10-31 0000904333 cik0000904333:RAFIFundamentalHighLiquidityDevelopedexUSLargeIndexNetMember 2024-11-01 2025-10-31 0000904333 cik0000904333:RussellRAFIDevelopedexUSLargeCompanyIndexNetMember 2024-11-01 2025-10-31 0000904333 cik0000904333:C000055855Member 2024-11-01 2025-10-31 0000904333 cik0000904333:SAndPDevelopedExUSSmallCapIndexNetMember 2024-11-01 2025-10-31 0000904333 cik0000904333:RussellRAFIDevelopedexUSSmallCompanyIndexNetMember 2024-11-01 2025-10-31 0000904333 cik0000904333:RAFIFundamentalHighLiquidityDevelopedExUSSmallIndexNetMember 2024-11-01 2025-10-31 0000904333 cik0000904333:FundamentalDevelopedExUSSmallSplicedIndexMember 2024-11-01 2025-10-31 0000904333 cik0000904333:C000055852Member 2024-11-01 2025-10-31 0000904333 cik0000904333:FundamentalEmergingMarketsSplicedIndexMember 2024-11-01 2025-10-31 0000904333 cik0000904333:RussellRAFITMEmergingMarketsLargeCompanyIndexNetMember 2024-11-01 2025-10-31 0000904333 cik0000904333:RAFIFundamentalHighLiquidityEmergingMarketsIndexNetMember 2024-11-01 2025-10-31 0000904333 cik0000904333:MSCIEmergingMarketsIndexNetMember 2024-11-01 2025-10-31 0000904333 cik0000904333:C000017885Member 2024-11-01 2025-10-31 0000904333 cik0000904333:BloombergUSAggregateBondIndexMember 2024-11-01 2025-10-31 0000904333 cik0000904333:BalancedBlendedIndexMember 2024-11-01 2025-10-31 0000904333 cik0000904333:C000016175Member 2024-11-01 2025-10-31 0000904333 cik0000904333:AllEquityCompositeIndexMember 2024-11-01 2025-10-31 0000904333 cik0000904333:C000016177Member 2024-11-01 2025-10-31 0000904333 cik0000904333:GrowthCompositeIndexMember 2024-11-01 2025-10-31 0000904333 cik0000904333:C000016178Member 2024-11-01 2025-10-31 0000904333 cik0000904333:BalancedCompositeIndexMember 2024-11-01 2025-10-31 0000904333 cik0000904333:C000016180Member 2024-11-01 2025-10-31 0000904333 cik0000904333:ConservativeCompositeIndexMember 2024-11-01 2025-10-31 0000904333 cik0000904333:C000015023Member 2024-11-01 2025-10-31 0000904333 cik0000904333:Target2010CompositeIndexMember 2024-11-01 2025-10-31 0000904333 cik0000904333:C000059131Member 2024-11-01 2025-10-31 0000904333 cik0000904333:Target2015CompositeIndexMember 2024-11-01 2025-10-31 0000904333 cik0000904333:C000015024Member 2024-11-01 2025-10-31 0000904333 cik0000904333:Target2020CompositeIndexMember 2024-11-01 2025-10-31 0000904333 cik0000904333:C000059132Member 2024-11-01 2025-10-31 0000904333 cik0000904333:Target2025CompositeIndexMember 2024-11-01 2025-10-31 0000904333 cik0000904333:C000015025Member 2024-11-01 2025-10-31 0000904333 cik0000904333:Target2030CompositeIndexMember 2024-11-01 2025-10-31 0000904333 cik0000904333:C000059133Member 2024-11-01 2025-10-31 0000904333 cik0000904333:Target2035CompositeIndexMember 2024-11-01 2025-10-31 0000904333 cik0000904333:C000015026Member 2024-11-01 2025-10-31 0000904333 cik0000904333:Target2040CompositeIndexMember 2024-11-01 2025-10-31 0000904333 cik0000904333:C000122183Member 2024-11-01 2025-10-31 0000904333 cik0000904333:Target2045CompositeIndexMember 2024-11-01 2025-10-31 0000904333 cik0000904333:C000122184Member 2024-11-01 2025-10-31 0000904333 cik0000904333:Target2050CompositeIndexMember 2024-11-01 2025-10-31 0000904333 cik0000904333:C000122185Member 2024-11-01 2025-10-31 0000904333 cik0000904333:Target2055CompositeIndexMember 2024-11-01 2025-10-31 0000904333 cik0000904333:C000172771Member 2024-11-01 2025-10-31 0000904333 cik0000904333:Target2060CompositeIndexMember 2024-11-01 2025-10-31 0000904333 cik0000904333:C000225748Member 2024-11-01 2025-10-31 0000904333 cik0000904333:Target2065CompositeIndexMember 2024-11-01 2025-10-31 0000904333 cik0000904333:RAFIFundamentalHighLiquidityUSLargeIndexMember 2024-01-31 2024-01-31 0000904333 cik0000904333:RAFIFundamentalHighLiquidityUSSmallIndexMember 2024-01-31 2024-01-31 0000904333 cik0000904333:RAFIFundamentalHighLiquidityDevelopedexUSLargeIndexNetMember 2024-01-31 2024-01-31 0000904333 cik0000904333:RAFIFundamentalHighLiquidityDevelopedExUSSmallIndexNetMember 2024-01-31 2024-01-31 0000904333 cik0000904333:RAFIFundamentalHighLiquidityEmergingMarketsIndexNetMember 2024-01-31 2024-01-31 0000904333 cik0000904333:RAFIFundamentalHighLiquidityUSLargeIndexMember 2024-01-31 2024-10-31 0000904333 cik0000904333:RAFIFundamentalHighLiquidityUSSmallIndexMember 2024-01-31 2024-10-31 0000904333 cik0000904333:RAFIFundamentalHighLiquidityDevelopedexUSLargeIndexNetMember 2024-01-31 2024-10-31 0000904333 cik0000904333:RAFIFundamentalHighLiquidityDevelopedExUSSmallIndexNetMember 2024-01-31 2024-10-31 0000904333 cik0000904333:RAFIFundamentalHighLiquidityEmergingMarketsIndexNetMember 2024-01-31 2024-10-31 0000904333 cik0000904333:RAFIFundamentalHighLiquidityUSLargeIndexMember 2024-01-31 2025-10-31 0000904333 cik0000904333:RAFIFundamentalHighLiquidityUSSmallIndexMember 2024-01-31 2025-10-31 0000904333 cik0000904333:RAFIFundamentalHighLiquidityDevelopedexUSLargeIndexNetMember 2024-01-31 2025-10-31 0000904333 cik0000904333:RAFIFundamentalHighLiquidityDevelopedExUSSmallIndexNetMember 2024-01-31 2025-10-31 0000904333 cik0000904333:RAFIFundamentalHighLiquidityEmergingMarketsIndexNetMember 2024-01-31 2025-10-31 iso4217:USD xbrli:pure cik0000904333:Holding
UNITED STATES
SECURITIES AND EXCHANGE COMMISSION
CERTIFIED SHAREHOLDER REPORT OF
REGISTERED MANAGEMENT INVESTMENT COMPANIES
Investment Company Act file number: 811-07704
(Exact name of registrant as specified in charter)
9800 Schwab Way, Lone Tree, Colorado 80124
(Address of principal executive offices) (Zip code)
Omar Aguilar
Schwab Capital Trust
9800 Schwab Way, Lone Tree, Colorado 80124
(Name and address of agent for service)
Registrant’s telephone number, including area code: (800) 648-5300
Date of fiscal year end: October 31
Date of reporting period: October 31, 2025
Item 1: Report(s) to Shareholders.
October 31, 2025
Schwab International Opportunities Fund
This annual shareholder report contains important information about the fund for the period of November 1, 2024, to October 31,
2025.
You can find additional information about the fund at
www.schwabassetmanagement.com/prospectus
. You can also request
this information by calling
or by sending an email request to
orders@mysummaryprospectus.com
.
If you purchase
or hold fund shares through a financial intermediary, the fund’s prospectus, Statement of Additional Information (SAI), reports to
shareholders
and
other information about the fund are available from
your
financial
intermediary.
FUND COSTS FOR THE LAST year ENDED October 31, 2025
(BASED ON A HYPOTHETICAL $10,000 INVESTMENT)
|
|
|
Schwab International Opportunities Fund |
|
|
MANAGEMENT’S DISCUSSION OF FUND
PERFORMANCE
For the 12-month period ended October 31, 2025, the fund returned 23.82%. The MSCI EAFE
®
Index (Net)
1
the 12-month reporting period, all four of the fund’s active subadvisers posted positive returns.
Columbia Management Investment Advisers, LLC (Columbia)
outperformed its comparative index. As of October 31, 2025,
Columbia managed 27.6% of the fund’s net assets.
■
Contributed to total return:
●
Japanese securities, including Mitsubishi UFJ Financial
Group, Inc.
●
Securities from the Netherlands
■
Detracted from total return:
●
Danish securities, including Class B holdings of Novo
Nordisk AS
●
Securities from Kazakhstan
■
From an individual security perspective:
●
Class A holdings of Societe Generale SA were the largest
contributor to total return (Columbia’s position was sold
prior to the end of the reporting period)
●
Class B holdings of Novo Nordisk AS were the largest
detractor from total return
American Century Investment Management, Inc. (American
Century) outperformed its comparative index. As of October 31,
2025, American Century managed 19.5% of the fund’s net
assets.
■
Contributed to total return:
●
Japanese securities, including Ryohin Keikaku Co. Ltd.
■
Detracted from total return:
●
Indian securities, including KEI Industries Ltd. (American
Century’s position was sold prior to the end of the reporting
period)
■
From an individual security perspective:
●
Lundin Gold, Inc. was the largest contributor to total return
●
NEXTDC Ltd. was the largest detractor from total return
Baillie Gifford Overseas Limited (Baillie Gifford) outperformed its
comparative index. As of October 31, 2025, Baillie Gifford
managed
10.6% of the fund’s net assets.
■
Contributed to total return:
●
Swedish securities, including Spotify Technology SA
●
Securities from the United States
■
Detracted from total return:
●
German securities, including Delivery Hero SE
■
From an individual security perspective:
●
Spotify Technology SA was the largest contributor to total
return
●
Class B holdings of Meituan were the largest detractor from
total return
Schwab International Opportunities Fund | Annual Report
MANAGEMENT’S DISCUSSION OF FUND PERFORMANCE
Harris Associates L.P. (Harris) underperformed its comparative
index. As of October 31, 2025, Harris managed 8.7% of the
fund’s net assets.
■
Detracted from total return:
●
Indonesian securities, including Bank Mandiri Persero Tbk.
PT
■
Contributed to total return:
●
German securities, including Continental AG
■
From an individual security perspective:
●
WPP PLC was the largest detractor from total return
(Harris’ position was sold prior to the end of the reporting
period)
●
Continental AG was the largest contributor to total return
Schwab Asset Management seeks to track the performance of
the FTSE Developed ex US Quality Factor Index. The fund’s
allocation to Schwab Asset Management performed in line with
this objective, generally tracking its comparative index. As of
October 31, 2025, Schwab Asset Management managed 33.6%
of the fund’s net
assets
.
■
Contributed to total return:
●
Securities from the United Kingdom, including Rolls-Royce
Holdings PLC
●
Securities from the Republic of Korea
■
Detracted from total return:
●
Danish securities, including Class B holdings of Novo
Nordisk AS
Portfolio holdings may have changed since the report
date
.
The net version of the index reflects reinvested dividends net of withholding taxes but reflects no deductions for expenses or other taxes.
Schwab International Opportunities Fund | Annual Report
The performance data quoted represents past performance. Past performance does not guarantee future results. Investment returns
and principal value of an investment will fluctuate so that an investor’s shares may be worth more or less than their original cost. Current performance may be lower or higher than performance data quoted.
To obtain performance information current to the most
recent month end, please visit
www.schwabassetmanagement.com/prospectus
Performance of Hypothetical $10,000 Investment (October 31, 2015 - October 31, 2025)
Average Annual Total Returns
|
|
|
|
Fund: Schwab International Opportunities Fund (04/02/2004) 1,2,3 |
|
|
|
|
|
|
|
All total returns on this page assume dividends and distributions were reinvested. Index figures do not include trading and management costs, which would lower
performance. Indices are unmanaged and cannot be invested in directly. Performance results less than one year are not annualized.
For index definitions, please see www.schwabassetmanagement.com/glossary.
Fund expenses may have been partially absorbed by the investment adviser and its affiliates. Without these reductions, the fund’s returns would have been lower.
These
returns do not reflect the deduction of taxes that a shareholder would pay on fund distributions or the redemption of fund shares.
The fund commenced operations on October 16, 1996 which became the Schwab International Opportunities Fund Investor Shares. The Investor Shares were consolidated
into Select Shares on February 26, 2019. The performance presented is that of the former Select Shares which commenced operations on April 2, 2004.
The fund’s performance relative to the index may be affected by fair-value pricing and timing differences in foreign exchange calculations.
The net version of the index reflects reinvested dividends net of withholding taxes but reflects no deductions for expenses or other taxes.
Schwab International Opportunities Fund |
Annual
Report
|
|
|
|
|
|
Advisory Fees Paid by the Fund |
|
Weighted Average Market Cap (millions) |
|
Price/Earnings Ratio (P/E) |
|
|
|
Foreign Tax Paid and Passed Through |
|
Gross Income From Foreign Sources |
|
Qualified Dividend Income |
|
Sector Weightings % of
Investments
Top Equity Holdings % of Net
Top Country Weightings % of Investments
Portfolio holdings may have changed since the report
date
.
The Sector/Industry classifications in this report use the Global Industry Classification Standard (GICS) which was developed by and is the exclusive property of MSCI Inc.
(MSCI) and Standard & Poor’s (S&P). GICS is a service mark of MSCI and S&P and has been licensed for use by Charles Schwab &
Co
., Inc.
Includes the fund’s position(s) in money market mutual funds registered under the Investment Company Act of 1940, as
.
Schwab International Opportunities Fund | Annual Report
AVAILABILITY OF ADDITIONAL INFORMATION
You can find the fund’s prospectus, Statement of Additional Information (SAI), reports to shareholders, financial information,
holdings, certain tax information, proxy voting information, and other information about the fund online at
www.schwabassetmanagement.com/prospectus
.
Proxy Voting Policies, Procedures and Results
A description of the proxy voting policies and procedures used to determine how to vote proxies on behalf of the funds is available
without charge, upon request, by visiting the Schwab Funds’ website at
www.schwabassetmanagement.com/prospectus
, the
SEC’s website at
, or by contacting Schwab Funds at 1-877-824-5615.
Information regarding how a fund voted proxies relating to portfolio securities during the most recent twelve-month period ended
June 30 is available, without charge, by visiting the fund’s website at
www.schwabassetmanagement.com/prospectus
or the
SEC’s website at
, by calling
, or by sending an email request to
orders@mysummaryprospectus.com
.
Schwab International Opportunities Fund | Annual Report
October 31, 2025
Schwab Core Equity Fund
This annual shareholder report contains important information about the fund for the period of November 1, 2024, to October 31,
2025.
You can find additional information about the fund at
www.schwabassetmanagement.com/prospectus
. You can also request
this information by calling
1-866-414-6349
or by sending an email request to
orders@mysummaryprospectus.com
.
If you purchase
or hold fund shares through a financial intermediary, the fund’s prospectus, Statement of Additional Information (SAI), reports to
shareholders and other information about the fund are available from your financial intermediary.
FUND COSTS FOR THE LAST year ENDED October 31, 2025
(BASED ON A HYPOTHETICAL $10,000 INVESTMENT)
MANAGEMENT’S DISCUSSION OF FUND PERFORMANCE
For the 12-month reporting period ended October 31, 2025, the fund returned 16.89%. The S&P 500
®
Index returned 21.45%.
Top detractors from total return:
■
Health care sector securities, including UnitedHealth Group, Inc.
■
Financials sector securities
Top contributors to total return:
■
Information technology sector securities, including NVIDIA Corp.
■
Communication services sector securities
From an individual security perspective:
■
Fidelity National Information Services, Inc. was the largest detractor from total return
■
NVIDIA Corp. was the largest contributor to total return
Portfolio holdings may have changed since the report date.
Schwab Core Equity Fund | Annual Report
The performance data quoted represents past performance. Past performance does not guarantee future results. Investment returns
and principal value of an investment will fluctuate so that an investor’s shares may be worth more or less than their original cost. Current performance may be lower or higher than performance data quoted.
To obtain performance information current to the most
recent month end, please visit
www.schwabassetmanagement.com/prospectus
Performance of Hypothetical $10,000 Investment (October 31, 2015 - October 31, 2025)
Average Annual Total Returns
|
|
|
|
Fund: Schwab Core Equity Fund (07/01/1996) 1 |
|
|
|
|
|
|
|
All total returns on this page assume dividends and distributions were reinvested. Index figures do not include trading and management costs, which would lower
performance. Indices are unmanaged and cannot be invested in directly. Performance results less than one year are not annualized.
For index definitions, please see www.schwabassetmanagement.com/glossary.
Fund expenses may have been partially absorbed by the investment adviser and its affiliates. Without these reductions, the fund’s returns would have been lower.
These
returns do not reflect the deduction of taxes that a shareholder would pay on fund distributions or the redemption of fund shares.
Schwab Core Equity Fund | Annual Report
|
|
|
|
|
|
Advisory Fees Paid by the Fund |
|
Weighted Average Market Cap (millions) |
|
Price/Earnings Ratio (P/E) |
|
|
|
Dividends Received Deduction |
|
Qualified Dividend Income |
|
Long Term Capital Gain Distribution |
|
Sector Weightings % of Investments
Top Equity Holdings % of Net Assets
Portfolio holdings may have changed since the report date.
The Sector/Industry classifications in this report use the Global Industry Classification Standard (GICS) which was developed by and is the exclusive property of MSCI Inc.
(MSCI) and Standard & Poor’s (S&P). GICS is a service mark of MSCI and S&P and has been licensed for use by Charles Schwab & Co., Inc.
Includes the fund’s position(s) in money market mutual funds
registered
under the Investment Company Act of 1940, as amended.
Schwab Core Equity Fund | Annual Report
AVAILABILITY OF ADDITIONAL INFORMATION
You can find the fund’s prospectus, Statement of Additional Information (SAI), reports to shareholders, financial information,
holdings, certain tax information, proxy voting information, and other information about the fund online at
www.schwabassetmanagement.com/prospectus
.
Proxy Voting Policies, Procedures and Results
A description of the proxy voting policies and procedu
res use
d to determine how to vote proxies on behalf of the funds is available
without charge, upon request, by visiting the Schwab Funds’ website at
www.schwabassetmanagement.com/prospectus
, the
SEC’s website at
, or by contacting Schwab Funds at 1-877-824-5615.
Information regarding how a fund voted proxies relating to portfolio securities during the most recent twelve-month period ended
June 30 is available, without charge, by visiting the fund’s website at
www.schwabassetmanagement.com/prospectus
or the
SEC’s website at
, by calling
, or by sending an email request to
orders@mysummaryprospectus.com
.
Schwab Core Equity Fund | Annual Report
October 31, 2025
Schwab Dividend Equity Fund
This annual shareholder report contains important information about the fund for the period of November 1, 2024, to October 31,
2025.
You can find additional information about the fund at
www.schwabassetmanagement.com/prospectus
.
You can also request
this information by calling
or by sending an email request to
orders@mysummaryprospectus.com
.
If you purchase
or hold fund shares through a financial intermediary, the fund’s prospectus, Statement of Additional Information (SAI), reports to
shareholders and other information about the fund are available from your financial intermediary.
FUND COSTS FOR THE LAST year ENDED October 31, 2025
(BASED ON A HYPOTHETICAL $10,000 INVESTMENT)
|
|
|
Schwab Dividend Equity Fund |
|
|
MANAGEMENT’S DISCUSSION OF FUND PERFORMANCE
For the 12-month reporting period ended October 31, 2025, the fund returned 10.73%. The S&P 500
®
Index, which serves as the
fund’s regulatory index and provides a broad measure of market performance, returned 21.45%. The Russell 1000
®
Value Index,
which returned 11.15%, is the fund’s additional index, and is more representative of the fund’s investment universe than the
regulatory index.
■
Lower yielding dividend stocks drove returns of the fund and the Russell 1000
®
Value Index with performance driven by
advancements in artificial intelligence (AI) within the information technology and communications services sectors
■
As of October 31, 2025, the fund’s dividend yield was 2.36%, higher than the 1.92% dividend yield of the index. As of October 31,
2025, the fund’s 30-Day SEC yield was 1.62%.
■
Top detractors from total return:
●
Health care sector securities, including UnitedHealth Group, Inc. (which was sold prior to the end of the reporting period)
●
Real estate sector securities
■
Top contributors to total return:
●
Information technology sector securities, including Broadcom, Inc.
●
Financials sector securities
■
From an individual security perspective:
●
UnitedHealth Group, Inc. was the largest detractor from total return
●
Broadcom, Inc. was the largest contributor to total return
Portfolio holdings may have changed since the report date.
Schwab Dividend Equity Fund | Annual Report
The performance data quoted represents past performance. Past performance does not guarantee future results. Investment returns
and principal value of an investment will fluctuate so that an investor’s shares may be worth more or less than their original cost. Current performance may be lower or higher than performance data quoted.
To obtain performance information current to the most
recent month end, please visit
www.schwabassetmanagement.com/prospectus
Performance of Hypothetical $10,000 Investment (October 31, 2015 - October 31, 2025)
Average Annual Total Returns
|
|
|
|
Fund: Schwab Dividend Equity Fund (09/02/2003) 1,2 |
|
|
|
|
|
|
|
Russell 1000 ® Value Index |
|
|
|
All total returns on this page assume dividends and distributions were reinvested. Index figures do not include trading and management costs, which would lower
performance. Indices are unmanaged and cannot be invested in directly. Performance results less than one year are not annualized.
For index definitions, please see www.schwabassetmanagement.com/glossary.
Fund expenses may have been partially absorbed by the investment adviser and its affiliates. Without these reductions, the fund’s returns would have been lower.
These
returns do not reflect the deduction of taxes that a shareholder would pay on fund distributions or the redemption of fund shares.
The fund’s performance relative to the index may be affected by fair-value pricing and timing differences in foreign exchange calculations.
The S&P 500
®
Index serves as the fund’s regulatory index and provides a broad measure of market performance. The Russell 1000
®
Value Index is the fund’s additional
index and is more representative of the fund’s investment universe than the regulatory index.
Schwab Dividend Equity Fund | Annual Report
|
|
|
|
|
|
Advisory Fees Paid by the Fund |
|
Weighted Average Market Cap (millions) |
|
Price/Earnings Ratio (P/E) |
|
|
|
|
|
Dividends Received Deduction |
|
Qualified Dividend Income |
|
Long Term Capital Gain Distribution |
|
Sector Weightings % of Investments
Top Equity Holdings % of Net Assets
Portfolio holdings may have changed since the report date.
The Sector/Industry classifications in this report use the Global Industry Classification Standard (GICS) which was developed by and is the exclusive property of MSCI Inc.
(MSCI) and Standard & Poor’s (S&P). GICS is a s
ervice
mark of MSCI and S
&P and has
been licensed for use by Charles Schwab & Co., Inc.
Schwab Dividend Equity Fund | Annual Report
AVAILABILITY OF ADDITIONAL INFORMATION
You can find the fund’s prospectus, Statement of Additional Information (SAI), reports to shareholders, financial information,
holdings, certain tax information, proxy voting information, and other information about the fund online at
www.schwabassetmanagement.com/prospectus
.
Proxy Voting Policies, Procedures and Results
A description of the proxy voting policies and procedures used to determine how to vote proxies on behalf of the funds is available
without charge, upon request, by visiting the Schwab Funds’ website at
www.schwabassetmanagement.com/prospectus
, the
SEC’s website at
, or by contacting Schwab Funds at 1-877-824-5615.
Information regarding how a fund voted proxies relating to portfolio securities during the most recent twelve-month period ended
June 30 is available, without charge, by visiting the fund’s website at
www.schwabassetmanagement.com/prospectus
or the
SEC’s website at
, by calling
, or by sending an email request to
orders@mysummaryprospectus.com
.
Schwab Dividend Equity Fund | Annual Report
October 31, 2025
Schwab Large-Cap Growth Fund
This annual shareholder report contains important information about the fund for the period of November 1, 2024, to October 31,
2025.
You can find additional information about the fund at
www.schwabassetmanagement.com/prospectus
. You can also request
this information by calling
or by sending an email request to
orders@mysummaryprospectus.com
.
If you purchase
or hold fund shares through a financial intermediary, the fund’s prospectus, Statement of Additional Information (SAI), reports to
shareholders and other information about the fund are available from your financial intermediary.
FUND COSTS FOR THE LAST year ENDED October 31, 2025
(BASED ON A HYPOTHETICAL $10,000 INVESTMENT)
|
|
|
Schwab Large-Cap Growth Fund* |
|
|
Expenses were reduced by a contractual fee waiver in effect for so
long as th
e investment adviser serves as adviser to the fund.
MANAGEMENT’S DISCUSSION OF FUND PERFORMANCE
For the 12-month reporting period ended October 31, 2025, the fund returned 29.65%. The S&P 500
®
Index, which serves as the
fund’s regulatory index and provides a broad measure of market performance, returned 21.45%. The Russell 1000
®
Growth Index,
which returned 30.52%, is the fund’s additional index, and is more repr
esentative
of the fund’s investment universe than the
regulatory index.
■
Large-cap growth stocks outperformed the broader market primarily driven by advancements in artificial intelligence (AI) within the
information technology sector and strong sales and earnings growth of mega-capitalization companies
■
Top detractors from total return:
●
Health care sector securities, including Thermo Fisher Scientific, Inc. (which was sold prior to the end of the reporting period)
●
Energy sector securities
■
Top contributors to total return:
●
Information technology sector securities, including NVIDIA Corp.
●
Communication services sector securities
■
From an individual security perspective:
●
Class A holdings of Accenture PLC were the largest detractor from total return
●
NVIDIA Corp. was the largest contributor to total return
Portfolio holdings may have changed since the report date.
Schwab Large-Cap Growth Fund | Annual Report
The performance data quoted represents past performance. Past performance does not guarantee future results. Investment returns
and principal value of an investment will fluctuate so that an investor’s shares may be worth more or less than their original cost. Current performance may be lower or higher than performance data quoted.
To obtain performance information current to the most
recent month end, please visit
www.schwabassetmanagement.com/prospectus
Performance of Hypothetical $10,000 Investment (October 31, 2015 - October 31, 2025)
Average Annual Total Returns
|
|
|
|
Fund: Schwab Large-Cap Growth Fund (10/03/2005) 1 |
|
|
|
|
|
|
|
Russell 1000 ® Growth Index |
|
|
|
All total returns on this page assume dividends and distributions were reinvested. Index figures do not include trading and management costs, which would lower
performance. Indices are unmanaged and cannot be invested in directly. Performance results less than one year are not annualized.
For index definitions, please see www.schwabassetmanagement.com/glossary.
Fund expenses may have been partially absorbed by the investment adviser and its affiliates. Without these reductions, the fund’s returns would have been lower.
These
returns do not reflect the deduction of taxes that a shareholder would pay on fund distributions or the redemption of fund shares.
The S&P 500
®
Index serves as the fund’s regulatory index and provides a broad measure of market performance. The Russell 1000
®
Growth Index is the fund’s additional
index and is more representative of the fund’s investment universe than the regulatory index.
Schwab Large-Cap Growth Fund | Annual Report
|
|
|
|
|
|
Advisory Fees Paid by the Fund |
|
Weighted Average Market Cap (millions) |
|
Price/Earnings Ratio (P/E) |
|
|
|
Long Term Capital Gain Distribution |
|
Sector Weightings % of Investments
Top Equity Holdings % of Net Assets
Portfolio holdings may have changed since the report date.
The Sector/Industry classifications in this report use the Global Industry Classification Standard (GICS) which was developed by and is the exclusive property of MSCI Inc.
(MSCI) and Standard & Poor’s (S&P). GICS is a service mark of MSCI and S&P and has been licensed for use b
y Charle
s Schwab & Co., Inc.
Schwab Large-Cap Growth Fund | Annual Report
AVAILABILITY OF ADDITIONAL INFORMATION
You can find the fund’s prospectus, Statement of Additional Information (SAI), reports to shareholders, financial information,
holdings, certain tax information, proxy voting information, and other inform
ation a
bout the fund online at
www.schwabassetmanagement.com/prospectus
.
Proxy Voting Policies, Procedures and Results
A description of the proxy voting policies and procedures used to determine how to vote proxies on behalf of the funds is available
without charge, upon request, by visiting the Schwab Funds’ website at
www.schwabassetmanagement.com/prospectus
, the
SEC’s website at
, or by contacting Schwab Funds at 1-877-824-5615.
Information regarding how a fund voted proxies relating to portfolio securities during the most recent twelve-month period ended
June 30 is available, without charge, by visiting the fund’s website at
www.schwabassetmanagement.com/prospectus
or the
SEC’s website at
, by calling
, or by sending an email request to
orders@mysummaryprospectus.com
.
Schwab Large-Cap Growth Fund | Annual Report
October 31, 2025
Schwab Small-Cap Equity Fund
This annual shareholder report contains important information about the fund for the period of November 1, 2024, to October 31,
2025.
You can find additional information about the fund at
www.schwabassetmanagement.com/prospectus
. You can also request
this information by calling
or by sending an email request to
orders@mysummaryprospectus.com
.
If you purchase
or hold fund shares through a financial intermediary, the fund’s prospectus, Statement of Additional Information (SAI), reports to
shareholders and other information about the fund are available from your financial intermediary.
FUND COSTS FOR THE LAST year ENDED October 31, 2025
(BASED ON A HYPOTHETICAL $10,000 INVESTMENT)
|
|
|
Schwab Small-Cap Equity Fund |
|
|
MANAGEMENT’S DISCUSSION OF FUND PERFORMANCE
For the 12-month reporting period ended October 31, 2025, the fund returned 12.59%. The S&P 500
®
Index, which serves as the
fund’s regulatory index and provides a broad measure of market performance, returned 21.45%. The Russell 2000
®
Index, which
returned 14.41%, is the fund’s additional index, and is more representative of the fund’s investment universe than the regulatory
index.
■
Small-cap stocks underperformed the broader market primarily driven by advancements in artificial intelligence (AI) within the
information technology sector and strong sales and earnings growth of mega-capitalization companies
■
Top detractors from total return:
●
Real estate sector securities, including Innovative Industrial Properties, Inc. (which was sold prior to the end of the reporting
period)
●
Communication services sector securities
■
Top contributors to total return:
●
Industrials sector securities, including Class A holdings of Bloom Energy Corp.
●
Health care sector securities
■
From an individual security perspective:
●
Vaxcyte, Inc. was the largest detractor from total return (which was sold prior to the end of the reporting period)
●
Class A holdings of Bloom Energy Corp. were the largest contributor to total return
Portfolio holdings may have changed since the report date.
Schwab Small-Cap Equity Fund | Annual Report
The performance data quoted represents past performance. Past performance does not guarantee future results. Investment returns
and
principal value of an investment will fluctuate
so
that an investor’s shares may be worth more or less than their original cost. Current performance may be lower or higher than performance data quoted.
To obtain performance information current to the most
recent month end, please visit
www.schwabassetmanagement.com/prospectus
Performance of Hypothetical $10,000 Investment (October 31, 2015 - October 31, 2025)
Average Annual Total Returns
|
|
|
|
Fund: Schwab Small-Cap Equity Fund (07/01/2003) 1 |
|
|
|
|
|
|
|
|
|
|
|
All total returns on this page assume dividends and distributions were reinvested. Index figures do not include trading and management costs, which would lower
performance. Indices are unmanaged and cannot be invested in directly. Performance results less than one year are not annualized.
For index definitions, please see www.schwabassetmanagement.com/glossary.
Fund expenses may have been partially absorbed by the investment adviser and its affiliates. Without these reductions, the fund’s returns would have been lower.
These
returns do not reflect the deduction of taxes that a shareholder would pay on fund distributions or the redemption of fund shares.
The S&P 500
®
Index serves as the fund’s regulatory index and provides a broad measure of market performance. The Russell 2000
®
Index is the fund’s additional index and
is more representative of the fund’s investment universe than the regulatory index.
Schwab Small-Cap Equity Fund | Annual Report
|
|
|
|
|
|
Advisory Fees Paid by the Fund |
|
Weighted Average Market Cap (millions) |
|
Price/Earnings Ratio (P/E) |
|
|
|
Dividends Received Deduction |
|
Qualified Dividend Income |
|
Long Term Capital Gain Distribution |
|
Qualified Business Income (199A) |
|
Sector Weightings % of Investments
Top Equity Holdings % of Net Assets
Portfolio holdings may have changed since the report date.
The Sector/Industry classifications in this report use the Global Industry Classification Standard (GICS) which was developed by and is the exclusive property of MSCI Inc.
(MSCI) and Standard & Poor’s (S&P). GICS is a service mark of MSCI and S&P and has been licensed for use by Charles Schwab & Co., Inc.
Includes the fund’s position(s) in money market mutual funds registered under the Investment Company Act of 1940, as
amended.
Schwab Small-Cap Equity Fund | Annual Report
AVAILABILITY OF ADDITIONAL INFORMATION
You can find the fund’s prospectus, Statement of Additional Information (SAI), reports to shareholders, financial information,
holdings, certain tax information, proxy voting information, and other information about the fund online at
www.schwabassetmanagement.com/prospectus
.
Proxy Voting Policies,
Procedures
and Results
A description of the proxy voting policies and procedures used to determine how to vote proxies on behalf of the funds is available
without charge, upon request, by visiting the Schwab Funds’ website at
www.schwabassetmanagement.com/prospectus
, the
SEC’s website at
, or by contacting Schwab Funds at 1-877-824-5615.
Information regarding how a fund voted proxies relating to portfolio securities during the most recent twelve-month period ended
June 30 is available, without charge, by visiting the fund’s website at
www.schwabassetmanagement.com/prospectus
or the
SEC’s website at
, by calling
, or by sending an email request to
orders@mysummaryprospectus.com
.
Schwab Small-Cap Equity Fund | Annual Report
October 31, 2025
Schwab Health Care Fund
This annual shareholder report contains important information about the fund for the period of November 1, 2024, to October 31,
2025.
You can find additional information about the fund at
www.schwabassetmanagement.com/prospectus
. You can also request
this information by calling
or by sending an email request to
orders@mysummaryprospectus.com
.
If you purchase
or hold fund shares through a financial intermediary, the fund’s prospectus, Statement of Additional Information (SAI), reports to
shareholders and other information about the fund are available from your financial intermediary.
FUND COSTS FOR THE LAST year ENDED October 31, 2025
(BASED ON A HYPOTHETICAL $10,000 INVESTMENT)
MANAGEMENT’S DISCUSSION OF FUND PERFORMANCE
For the 12-month reporting period ended October 31, 2025, the fund returned 0.20%. The S&P 500
®
Index, which serves as the
fund’s regulatory index and provides a broad measure of market performance, returned 21.45%. The Dow Jones Global Health Care
Index, which returned 0.93%, is the fund’s
additional
index, and is more representative of the fund’s investment universe than the
regulatory index.
■
Health care stocks underperformed the broader market as the health care sector is typically more defensive and has lower volatility
than the broader market and tends to underperform in periods of strong growth
■
Top detractors from total return:
●
Managed health care sub-industry securities, including UnitedHealth Group, Inc.
●
Health care services sub-industry securities
■
Top contributors to total return:
●
Health care distributors sub-industry securities, including McKesson Corp.
●
Biotechnology sub-industry securities
■
From an individual security perspective:
●
UnitedHealth Group, Inc. was the largest detractor from total return
●
Johnson & Johnson was the largest contributor to total return
Portfolio holdings may have changed since the report date.
Schwab Health Care Fund | Annual Report
The performance data quoted represents past performance. Past
performance does not guarantee future results. Investment returns
and principal value of an investment will fluctuate so that an investor’s shares may be worth more or less than their original cost. Current performance may be lower or higher than performance data quoted.
To obtain performance information current to the most
recent month end, please visit
www.schwabassetmanagement.com/prospectus
Performance of Hypothetical $10,000 Investment (October 31, 2015 - October 31, 2025)
Average Annual Total Returns
|
|
|
|
Fund: Schwab Health Care Fund (07/03/2000) 1,2 |
|
|
|
|
|
|
|
Dow Jones Global Health Care Index |
|
|
|
All total returns on this page assume dividends and distributions were reinvested. Index figures do not include trading and management costs, which would lower
performance. Indices are unmanaged and cannot be invested in directly. Performance results less than one year are not annualized.
For index definitions, please see www.schwabassetmanagement.com/glossary.
Fund expenses may have been partially absorbed by the investment adviser and its affiliates. Without these reductions, the fund’s returns would have been lower.
These
returns do not reflect the deduction of taxes that a shareholder would pay on fund distributions or the redemption of fund shares.
The fund’s performance relative to the index may be affected by fair-value pricing and timing differences in foreign exchange calculations.
The S&P 500
®
Index serves as the fund’s regulatory index and provides a broad measure of market performance. The Dow Jones Global Health Care Index is the fund’s
additional index and is more representative of the fund’s investment universe than the regulatory index.
Schwab Health Care Fund | Annual Report
|
|
|
|
|
|
Advisory Fees Paid by the Fund |
|
Weighted Average Market Cap (millions) |
|
Price/Earnings Ratio (P/E) |
|
|
|
Dividends Received Deduction |
|
Qualified Dividend Income |
|
Long Term Capital Gain Distribution |
|
Industry Weightings % of Investments
Top Equity Holdings % of Net Assets
Top Country Weightings % of Investments
Portfolio holdings may have changed since the
report
date.
The Sector/Industry classifications in this report use the Global Industry Classification Standard (GICS) which was developed by and is the exclusive property of MSCI Inc.
(MSCI) and Standard & Poor’s (S&P). GICS is a service mark of MSCI and S&P and has been licensed for use by Charles Schwab & Co., Inc.
Schwab Health Care Fund | Annual Report
AVAILABILITY OF ADDITIONAL INFORMATION
You can find the fund’s prospectus, Statement of Additional Information (SAI), reports to shareholders, financial information,
holdings, certain tax information, proxy voting information, and other information about the fund online at
www.schwabassetmanagement.com/prospectus
.
Proxy Voting Policies, Procedures and Results
A description of the proxy voting policies and procedures used to determine how to vote proxies on behalf of the funds is available
without charge, upon request, by visiting the Schwab Funds’ website at
www.schwabassetmanagement.com/prospectus
, the
SEC’s website at
, or by contacting Schwab Funds at 1-877-824-5615.
Information regarding how a fund voted proxies relating to portfolio securities during the most recent twelve-month period ended
June 30 is available, without charge, by visiting the fund’s website at
www.schwabassetmanagement.com/prospectus
or the
SEC’s website at
, by calling
, or by sending an email request to
orders@mysummaryprospectus.com
.
Schwab Health Care Fund | Annual Report
October 31, 2025
Schwab International Core Equity Fund
This annual shareholder report contains important information about the fund for the period of November 1, 2024, to October 31,
2025.
You can find additional information about the fund at
www.schwabassetmanagement.com/prospectus
.
You can also request
this information by calling
or by sending an email request to
orders@mysummaryprospectus.com
.
If you purchase
or hold fund shares through a financial intermediary, the fund’s prospectus, Statement of Additional Information (SAI), reports to
shareholders and other information about the fund are available from your financial intermediary.
FUND COSTS FOR THE LAST year ENDED October 31, 2025
(BASED ON A HYPOTHETICAL $10,000 INVESTMENT)
|
|
|
Schwab International Core Equity Fund* |
|
|
Expenses were reduced by a contractual fee waiver in effect for so long as the investment adviser serves as adviser to the fund.
MANAGEMENT’S DISCUSSION OF FUND PERFORMANCE
For the 12-month reporting period ended October 31, 2025, the fund returned 28.77%. The MSCI EAFE
®
Index (Net)
1
which
returned 23.03%.
Top contributors to total return:
■
Securities from the United Kingdom, including HSBC Holdings PLC
Top detractors from total return:
■
Danish securities, including Class B holdings of Novo Nordisk AS
From an individual security perspective:
■
Heidelberg Materials AG was the largest contributor to total return
■
Class B holdings of Novo Nordisk AS were the largest detractor from total return
Portfolio holdings may have changed since the report date.
The net version of the index reflects reinvested dividends net of withholding taxes but reflects no deductions for expenses or other taxes.
Schwab International Core Equity Fund | Annual
Report
The performance data quoted represents past performance. Past performance does not guarantee future results. Investment returns
and principal value of an investment will fluctuate so that an investor’s shares may be worth more or less than their original cost. Current performance may be lower or higher than performance data quoted.
To obtain performance information current to the most
recent month end, please visit
www.schwabassetmanagement.com/prospectus
Performance of Hypothetical $10,000 Investment (October 31, 2015 - October 31, 2025)
Average Annual Total Returns
|
|
|
|
Fund: Schwab International Core Equity Fund (05/30/2008) 1,2 |
|
|
|
|
|
|
|
All total returns on this page assume dividends and distributions were reinvested. Index figures do not include trading and management costs, which would lower
performance. Indices are unmanaged and cannot be invested in directly. Performance results less than one year are not annualized.
For index definitions, please see www.schwabassetmanagement.com/glossary.
Fund expenses may have been partially absorbed by the investment adviser and its affiliates. Without these reductions, the fund’s returns would have been lower.
These
returns do not reflect the deduction of taxes that a shareholder would pay on fund distributions or the redemption of fund shares.
The fund’s performance relative to the index may be affected by fair-value pricing and timing differences in foreign exchange calculations.
The net version of the index reflects reinvested dividends net of withholding taxes but reflects no deductions for expenses or other taxes.
Schwab International Core Equity Fund | Annual Report
|
|
|
|
|
|
Advisory Fees Paid by the Fund |
|
Weighted Average Market Cap (millions) |
|
Price/Earnings Ratio (P/E) |
|
|
|
Foreign Tax Paid and Passed Through |
|
Gross Income From Foreign Sources |
|
Qualified Dividend Income |
|
Sector Weightings % of Investments
Top Equity Holdings % of Net Assets
Top Country Weightings % of Investments
Portfolio holdings may have changed since the report date.
The Sector/Industry classifications in this report use the Global Industry Classification Standard (GICS) which was developed by and is the exclusive property of MSCI Inc.
(MSCI) and Standard & Poor’s (S&P). GICS is a service mark of MSCI and S&P and has been licensed for use by Charles Schwab & Co., Inc.
Schwab International Core Equity Fund |
Annual Report
AVAILABILITY OF ADDITIONAL INFORMATION
You can find the fund’s prospectus, Statement of Additional Information (SAI), reports to shareholders, financial information,
holdings, certain tax information, proxy voting information, and other information about the fund online at
www.schwabassetmanagement.com/prospectus
.
Proxy Voting Policies, Procedures and Results
A description of the proxy voting policies and procedures used to determine how to vote proxies on behalf of the funds is available
without charge, upon request, by visiting the Schwab Funds’ website at
www.schwabassetmanagement.com/prospectus
, the
SEC’s website at
, or by contacting Schwab Funds at 1-877-824-5615.
Information regarding how a fund voted proxies relating to portfolio securities during the most recent twelve-month period ended
June 30 is available, without charge, by visiting the fund’s website at
www.schwabassetmanagement.com/prospectus
or the
SEC’s website at
, by calling
, or by sending an email request to
orders@mysummaryprospectus.com
.
Schwab International Core Equity Fund | Annual Report
October 31, 2025
Schwab S&P 500 Index Fund
This annual shareholder report contains important information about the fund for the period of November 1, 2024, to October 31, 2025. You can find additional information about the fund at
www.schwabassetmanagement.com/prospectus
. You can also request
this information by calling
or by sending an email request to
orders@mysummaryprospectus.com
.
If you purchase
or hold fund shares through a financial intermediary, the fund’s prospectus, Statement of Additional Information (SAI), reports to
shareholders and other information about the fund are available from your financial intermediary.
This report describes changes to the fund that occurred during the reporting period.
FUND COSTS FOR THE LAST year ENDED October 31, 2025
(BASED ON A HYPOTHETICAL $10,000 INVESTMENT)
|
|
|
Schwab S&P 500 Index Fund |
|
|
MANAGEMENT’S DISCUSSION OF FUND PERFORMANCE
For the 12-month reporting period ended October 31, 2025, the fund returned 21.43%. The S&P 500
®
Index returned 21.45%
during the same period. Differences between the return of the fund and the return of the S&P 500
®
Index may be attributable to,
among other things, the operational and transactional costs incurred by the fund and not the index.
Top detractors from total return:
■
Health care sector securities, including UnitedHealth Group, Inc.
■
Materials sector securities
Top contributors to total return:
■
Information technology sector securities,
including
NVIDIA Corp.
■
Communication services sector securities
Portfolio holdings may have changed since the report date.
Schwab S&P 500 Index Fund | Annual Report
The performance data quoted represents past performance. Past performance does not guarantee future results. Investment returns
and principal value of an investment will fluctuate so that an investor’s shares may be worth more or less than their original cost. Current performance may be lower or higher than performance data quoted.
To obtain performance information current to the most
recent month end, please visit
www.schwabassetmanagement.com/prospectus
Performance of Hypothetical $10,000 Investment (October 31, 2015 - October 31, 2025)
Average Annual Total Returns
|
|
|
|
Fund: Schwab S&P 500 Index Fund (05/19/1997) 1 |
|
|
|
|
|
|
|
All total returns on this page assume dividends and distributions were reinvested. Index figures do not include trading and management costs, which would lower
performance. Indices are unmanaged and cannot be invested in directly. Performance results less than one year are not annualized.
For index definitions, please see www.schwabassetmanagement.com/glossary.
Index ownership – “Standard & Poor’s
®
,” “S&P
®
,” and “S&P 500
®
” are registered trademarks of Standard & Poor’s Financial Services LLC (S&P), and “Dow Jones
®
” is a
registered trademark of Dow Jones Trademark Holdings LLC (Dow Jones) and have been licensed for use by S&P Dow Jones Indices LLC and its affiliates and sublicensed for
certain purposes by Charles Schwab Investment Management, Inc. The “S&P 500
®
Index” is a product of S&P Dow Jones Indices LLC or its affiliates, and has been licensed for
use by Charles Schwab Investment Management, Inc. The Schwab S&P 500 Index Fund is not sponsored, endorsed, sold or promoted by S&P Dow Jones Indices LLC, Dow
Jones, S&P, or their respective affiliates, and neither S&P Dow Jones Indices LLC, Dow Jones, S&P, nor their respective affiliates make any representation regarding the
advisability of investing in the fund.
Performance does not reflect the deduction of taxes that a shareholder would pay on fund distributions or the redemption of fund shares.
Schwab S&P 500 Index Fund | Annual Report
|
|
|
|
|
|
Advisory Fees Paid by the Fund |
|
Weighted Average Market Cap (millions) |
|
Price/Earnings Ratio (P/E) |
|
|
|
Dividends Received Deduction |
|
Qualified Dividend Income |
|
Qualified Business Income (199A) |
|
Sector Weightings % of Investments
Top Equity Holdings % of Net Assets
Portfolio holdings may have changed since the report date.
The Sector/Industry classifications in this report use the Global Industry Classification Standard (GICS) which was developed by and is the exclusive property of MSCI Inc.
(MSCI) and Standard & Poor’s (S&P). GICS is a service mark of MSCI and S&P and has been licensed for use by Charles Schwab & Co., Inc.
Includes the fund’s position(s) in money market mutual funds registered under the Investment Company Act of 1940,
as amended
.
Schwab S&P 500 Index Fund | Annual Report
This is a summary of certain changes to the fund since November 1, 2024. For more complete information, you may review the
fund’s prospectus at
www.schwabassetmanagement.com/prospectus
or upon request by calling
or by sending
an email request to
orders@mysummaryprospectus.com
.
■
On June 5, 2025, the Board of Trustees authorized a 6-for-1 share split for the fund, which applied to shareholders of record as of
the close of U.S. markets on August 14, 2025. Certain of the fund’s financial statements were retroactively adjusted for the period
ended October 31, 2025, and all prior periods, to reflect the share split.
AVAILABILITY OF ADDITIONAL INFORMATION
You can find the fund’s prospectus, Statement of Additional Information (SAI), reports to shareholders, financial information,
holdings, certain tax information, proxy voting information, and other information about the fund online at
www.schwabassetmanagement.com/prospectus
.
Proxy Voting Policies, Procedures and Results
A description of the proxy voting policies and procedures used to determine how to vote proxies on behalf of the funds is available
without charge, upon request, by visiting the Schwab Funds’ website at
www.schwabassetmanagement.com/prospectus
, the
SEC’s website at
, or by contacting Schwab Funds at 1-877-824-5615.
Information regarding how a fund voted proxies relating to portfolio securities during the most recent twelve-month period ended
June 30 is available, without charge, by visiting the fund’s website at
www.schwabassetmanagement.com/prospectus
or the SEC’s
website at
, by calling
, or by sending an email request to
orders@mysummaryprospectus.com
.
Schwab S&P 500 Index Fund | Annual Report
October 31, 2025
Schwab Small-Cap Index Fund
This annual shareholder report contains important information about the fund for the period of November 1, 2024, to October 31,
2025.
You can find additional information about the fund at
www.schwabassetmanagement.com/prospectus
. You can also request
this information by calling
or by sending an email request to
orders@mysummaryprospectus.com
.
If you purchase
or hold fund shares through a financial intermediary, the fund’s prospectus, Statement of Additional Information (SAI), reports to
shareholders
and
other information about the fund are available from
your
financial intermediary.
FUND COSTS FOR THE LAST year ENDED October 31, 2025
(BASED ON A HYPOTHETICAL $10,000 INVESTMENT)
|
|
|
Schwab Small-Cap Index Fund |
|
|
MANAGEMENT’S DISCUSSION OF FUND PERFORMANCE
For the 12-month reporting period ended October 31, 2025, the fund returned 14.50%. The S&P 500
®
Index, which serves as the
fund’s regulatory index and provides a broad measure of market performance, returned 21.45%. The fund generally invests in
securities that are included in the Russell 2000
®
Index, which returned 14.41% during the same period. The fund does not seek to
track the regulatory index.
Top contributors to total return:
■
Industrials sector securities, including Class A holdings of Bloom Energy Corp.
■
Information technology sector securities
Top detractors from total return:
■
Real estate sector securities, including Innovative Industrial Properties, Inc.
■
While there were no additional sectors that detracted from the total return of the fund, consumer staples sector securities were
the smallest contributors to total return
Portfolio holdings may have changed since the report date.
Schwab Small-Cap Index Fund | Annual Report
The performance data quoted represents past performance. Past performance does not guarantee future results. Investment returns
and principal value of an investment will fluctuate so that an investor’s shares may be worth more or less than their original cost. Current performance may be lower or higher than performance data quoted.
To obtain performance information current to the most
recent month end, please visit
www.schwabassetmanagement.com/prospectus
Performance of Hypothetical $10,000 Investment (October 31, 2015 - October 31, 2025)
Average Annual Total Returns
|
|
|
|
Fund: Schwab Small-Cap Index Fund (05/19/1997) 1 |
|
|
|
|
|
|
|
|
|
|
|
All total returns on this page assume dividends and distributions were reinvested. Index figures do not include trading and management costs, which would lower
performance. Indices are unmanaged and cannot be invested in directly. Performance results less than one year are not annualized.
For index definitions, please see www.schwabassetmanagement.com/glossary.
Index ownership – “Russell 2000
®
” is a registered mark of the Frank Russell Company (Russell) and has been licensed for use by the Schwab Small-Cap Index Fund. The
Schwab Small-Cap Index Fund is not sponsored, endorsed, sold or promoted by Russell and Russell makes no representation regarding the advisability of investing in the
fund.
Performance does not reflect the deduction of taxes that a shareholder would pay on fund distributions or the redemption of fund shares.
The S&P 500
®
Index serves as the fund’s regulatory index and provides a broad measure of market performance. The fund generally invests in securities that are included in
the Russell 2000
®
Index. The fund does not seek to track the regulatory index.
Schwab Small-Cap Index Fund | Annual Report
|
|
|
|
(excludes in-kind transactions) |
|
Advisory Fees Paid by the Fund |
|
Weighted Average Market Cap (millions) |
|
Price/Earnings Ratio (P/E) |
|
|
|
Dividends Received Deduction |
|
Qualified Dividend Income |
|
Qualified Business Income (199A) |
|
Sector Weightings % of Investments
Top Equity Holdings % of Net Assets
Portfolio holdings may have changed since the report date.
The Sector/Industry classifications in this report use the Global Industry Classification Standard (GICS) which was developed by and is the exclusive property of MSCI Inc.
(MSCI) and Standard & Poor’s (S&P). GICS is a service mark of MSCI and S&P and has been licensed for use by Charles Schwab & Co., Inc.
Includes the fund’s position(s) in money market mutual funds registered under the Investment Company Act of 1940, as amended.
Schwab Small-Cap Index Fund | Annual Report
AVAILABILITY OF ADDITIONAL INFORMATION
You can find the fu
nd’s prospectus, Statement of Additional Information (SAI), reports to shareholders, financial information,
holdings, certain tax information, proxy voting information, and other information about the fund online at
www.schwabassetmanagement.com/prospectus
.
Proxy Voting Policies, Procedures and Results
A description of the proxy voting policies and procedures used to determine how to vote proxies on behalf of the funds is available
without charge, upon request, by visiting the Schwab Funds’ website at
www.schwabassetmanagement.com/prospectus
, the
SEC’s website at
, or by contacting Schwab Funds at 1-877-824-5615.
Information regarding how a fund voted proxies relating to portfolio securities during the most recent twelve-month period ended
June 30 is available, without charge, by visiting the fund’s website at
www.schwabassetmanagement.com/prospectus
or the
SEC’s website at
, by calling
, or by sending an email request to
orders@mysummaryprospectus.com
.
Schwab Small-Cap Index Fund | Annual Report
October 31, 2025
Schwab Total Stock Market Index Fund
This annual shareholder report contains important information about the fund for the period of November 1, 2024, to October 31,
2025.
You can find additional information about the fund at
www.schwabassetmanagement.com/prospectus
. You can also request
this information by calling
or by sending an email request to
orders@mysummaryprospectus.com
.
If you purchase
or hold fund shares through a financial intermediary, the fund’s prospectus, Statement of Additional Information (SAI), reports to
shareholders and other information about the fund are available from your financial intermediary.
This report describes changes to the fund that occurred during the reporting period.
FUND COSTS FOR THE LAST year ENDED October 31, 2025
(BASED ON A HYPOTHETICAL $10,000 INVESTMENT)
|
|
|
Schwab Total Stock Market Index Fund |
|
|
MANAGEMENT’S DISCUSSION OF FUND PERFORMANCE
For the 12-month reporting period ended October 31, 2025, the fund returned 20.85%. The Dow Jones U.S. Total Stock Market
Index
SM
returned 20.90% during the same period. Differences between the return of the fund and the return of the Dow Jones
U.S. Total Stock Market Index
SM
may be attributable to, among other things, the operational and trans
actional c
osts incurred by the
fund and not the index.
Top detractors from total return:
■
Health care sector securities, including UnitedHealth Group, Inc.
■
Real estate sector securities
Top contributors to total return:
■
Information technology sector securit
ies, in
cluding NVIDIA Corp.
■
Communication
services
sector securities
Portfolio holdings may have changed since the report date.
Schwab Total Stock Market Index Fund | Annual Report
The performance data quoted represents past performance. Past performance does not guarantee future results. Investment returns
and principal value of an investment will fluctuate so that an investor’s shares may be worth more or less than their original cost. Current performance may be lower or higher than performance data quoted.
To obtain performance information current to the most
recent month end, please visit
www.schwabassetmanagement.com/prospectus
Performance of Hypothetical $10,000 Investment (October 31, 2015 - October 31, 2025)
Average Annual Total Returns
|
|
|
|
Fund: Schwab Total Stock Market Index Fund (06/01/1999) 1 |
|
|
|
Dow Jones U.S. Total Stock Market Index SM |
|
|
|
All total returns on this page assume dividends and distributions were reinvested. Index figures do not include trading and management costs, which would lower
performance. Indices are unmanaged and cannot be invested in directly. Performance results less than one year are not annualized.
For index definitions, please see www.schwabassetmanagement.com/glossary.
Index ownership – “Standard & Poor’s
®
” and “S&P
®
” are registered trademarks of Standard & Poor’s Financial Services LLC (S&P), and “Dow Jones
®
” is a registered trademark
of Dow Jones Trademark Holdings LLC (Dow Jones) and have been licensed for use by S&P Dow Jones Indices LLC and its affiliates and sublicensed for certain purposes by
Charles Schwab Investment Management, Inc. The “Dow Jones U.S. Total Stock Market Index
SM
” is a product of S&P Dow Jones Indices LLC or its affiliates, and has been
licensed for use by Charles Schwab Investment Management, Inc. The Schwab Total Stock Market Index Fund is not sponsored, endorsed, sold or promoted by S&P Dow
Jones Indices LLC, Dow Jones, S&P, or their respective affiliates, and neither S&P Dow Jones Indices LLC, Dow Jones, S&P, nor their respective affiliates make any
representation regarding the advisability of investing in the fund.
Performance does not reflect the deduction of taxes that a shareholder would pay on fund distributions or the redemption of fund shares.
Schwab Total Stock Market Index Fund | Annual Report
|
|
|
|
|
|
Advisory Fees Paid by the Fund |
|
Weighted Average Market Cap (millions) |
|
Price/Earnings Ratio (P/E) |
|
|
|
Dividends Received Deduction |
|
Qualified Dividend Income |
|
Qualified Business Income (199A) |
|
Sector Weightings % of Investments
Top Equity Holdings % of Net Assets
Portfolio holdings may have changed since the report date.
The Sector/Industry classifications in this report use the Global Industry Classification Standard (GICS) which was developed by and is the exclusive property of MSCI Inc.
(MSCI) and Standard & Poor’s (S&P). GICS is a service mark of MSCI and S&P and has been licensed for use by Charles Schwab & Co., Inc.
Includes the fund’s position(s) in money market mutual funds registered under the Investment Company Act of 1940, as amended.
Schwab Total Stock Market Index Fund | Annual Report
This is a summary of certain changes to the fund since November 1, 2024. For more complete information, you may review the
fund’s Annual Holdings and Financial Statements at
www.schwabassetmanagement.com/prospectus
or upon request by calling
or by sending an email request to
orders@mysummaryprospectus.com
.
■
On June 5, 2025, the Board of Trustees authorized a 7-for-1 share split for the fund, which applied to shareholders of record as of
the close of U.S. markets on August 14, 2025. Certain of the fund’s financial statements were retroactively adjusted for the period
ended October 31, 2025, and all prior periods, to reflect the share split.
AVAILABILITY OF ADDITIONAL INFORMATION
You can find the fund’s prospectus, Statement of Additional Information (SAI), reports to shareholders, financial information,
holdings, certain tax information, proxy voting information, and other information about the fund online at
www.schwabassetmanagement.com/prospectus
.
Proxy Voting Policies, Procedures and Results
A description of the proxy voting policies and procedures used to determine how to vote proxies on behalf of the funds is available
without charge, upon request, by visiting the Schwab Funds’ website at
www.schwabassetmanagement.com/prospectus
, the
SEC’s website at
, or by contacting Schwab Funds at 1-877-824-5615.
Information regarding how a fund voted proxies relating to portfolio securities during the most recent twelve-month period ended
June 30 is available, without charge, by visiting the fund’s website at
www.schwabassetmanagement.com/prospectus
or the SEC’s
website at
, by calling
, or by sending an email request to
orders@mysummaryprospectus.com
.
Schwab Total Stock Market Index Fund | Annual Report
October 31, 2025
Schwab U.S. Large-Cap Growth Index Fund
This annual shareholder report contains important information about the fund for the period of November 1, 2024, to October 31,
2025.
You can find additional information about the fund at
www.schwabassetmanagement.com/prospectus
.
You can also request
this information by calling
or by sending an email request to
orders@mysummaryprospectus.com
.
If you purchase
or hold fund shares through a financial intermediary, the fund’s prospectus, Statement of Additional Information (SAI), reports to
shareholders and other information about the fund are available from your financial intermediary.
This report describes changes to the fund that occurred during the reporting period.
FUND COSTS FOR THE LAST year ENDED October 31, 2025
(BASED ON A HYPOTHETICAL $10,000 INVESTMENT)
|
|
|
Schwab U.S. Large-Cap Growth Index Fund |
|
|
MANAGEMENT’S DISCUSSION OF FUND PERFORMANCE
For the 12-month reporting period ended October 31, 2025, the fu
n
d returned 30.44%. The S&P 500
®
Index, which serves as the
fund’s regulatory index and provides a broad measure of market performance, returned 21.45%. The fund generally invests in
securities that are included in the Russell 1000
®
Growth Index, which returned 30.52% during the same period. The fund does not
seek to track the regulatory index. Differences between the return of the fund and the return of the Russell 1000
®
Growth Index may
be attributable to, among other things, the operational and transactional costs incurred by the fund and not the index.
Top detractors from to
tal
return:
■
Real estate sector securities, including American Tower Corp.
■
Consumer staples sector securities
Top contributors to total return:
■
Information technology sector securities, including NVIDIA Corp.
■
Communication services sector securities
Portfolio holdings may have changed since the re
po
rt d
ate.
Schwab U.S. Large-Cap Growth Index Fund | Annual Report
The performance data quoted represents past performance. Past performance does not guarantee future results. Investment returns
and principal value of an investment will fluctuate so that an investor’s shares may be worth more or less than their original cost. Current performance may be lower or higher than performance data quoted.
To obtain performance information current to the most
recent month end, please visit
www.schwabassetmanagement.com/prospectus
Performance of Hypothetical $10,000 Investment (December 20, 2017 - O
ctobe
r 31, 2025)
|
|
|
|
Fund: Schwab U.S. Large-Cap Growth Index Fund (12/20/2017) 1 |
|
|
|
|
|
|
|
|
|
|
|
All total returns on this page assume dividends and distributions were reinvested. Index figures do not include trading and management costs, which would lower
performance. Indices are unmanaged and cannot be invested in directly. Performance results less than one year are not annualized.
For index definitions, please see www.schwabassetmanagement.com/glossary.
Index ownership – The Russell 1000
®
Growth Index is a registered mark of the Frank Russell Company (Russell) and has been licensed for use by the Schwab U.S. Large-Cap
Growth Index Fund. The Schwab U.S. Large-Cap Growth Index Fund is not sponsored, endorsed, sold or promoted by Russell and Russell makes no representation regarding
the advisability of investing in the fund.
Performance does not reflect the deduction of taxes that a shareholder would pay on fund distributions or the redemption of fund shares.
The S&P 500
®
Index serves as the fund’s regulatory index and provides a broad measure of market performance. The fund generally invests in securities that are included in
the Russell 1000
®
Growth Index. The fund does not seek to track the regulatory index.
Schwab U.S. Large-Cap Growth Index Fund | Annual Report
|
|
|
|
(excludes in-kind transactions) |
|
Advisory Fees Paid by the Fund |
|
Weighted Average Market Cap (millions) |
|
Price/Earnings Ratio (P/E) |
|
|
|
Dividends Received Deduction |
|
Qualified Dividend Income |
|
Qualified Business Income (199A) |
|
Sector Weightings % of In
vest
ments
Top Equity
Holdi
ngs % of N
et Assets
Portfolio holdings may have changed since the rep
ort dat
e.
The Sector/Industry classifications in this report use the Global Industry Classification Standard (GICS) which was developed by and is the exclusive property of MSCI Inc.
(MSCI) and Standard & Poor’s (S&P). GICS is a service mark of MSCI and S&P and has been licensed for use by Charles Schwab & Co., Inc.
Includes the fund’s position(s) in money market mutual funds registered under the Investment Company Act of 1940, as amended.
Schwab U.S. Large-Cap Growth Index Fund | Annual Report
This is a summary of certain changes to the fund since November 1, 2024. For more complete information, you may review the
fund’s Annual Holdings and Financial Statements at
www.schwabassetmanagement.com/prospectus
or upon request by calling
or by sending an email request to
orders@mysummaryprospectus.com
.
■
On June 5, 2025, the Board of Trustees authorized a 8-for-1 share split for the fund, which applied to shareholders of record as of
the close of U.S. markets on August 14, 2025. Certain of the fund’s fi
nan
cial statements were retroactively adjusted for the period
ended October 31, 2025, and all prior periods, to reflect the share split.
AVAILABILITY OF ADDITIONAL INFORMATION
You can find the fund’s prospectus, Statement of Additional Information (SAI), reports to shareholders, financial information,
holdings, certain tax information, proxy voting information, and other information about the fund online at
www.schwabassetmanagement.com/prospectus
.
Proxy Voting Policies, Procedures and Results
A description of the proxy voting policies and procedures used to determine how to vote proxies on behalf of the funds is available
without charge, upon request, by visiting the Schwab Funds’ website at
www.schwabassetmanagement.com/prospectus
, the
SEC’s website at
, or by contacting Schwab Funds at 1-877-824-5615.
Information regarding how a fund voted proxies relating to portfolio securities during the most recent twelve-month period ended
June 30 is available, without charge, by visiting the fund’s website at
www.schwabassetmanagement.com/prospectus
or the SEC’s
website at
, by calling
, or by sending an email request to
orders@mysummaryprospectus.com
.
Schwab U.S. Large-Cap Growth Index Fund | Annual Report
October 31, 2025
Schwab U.S. Large-Cap Value Index Fund
This annual shareholder report contains important information about the fund for the period of November 1, 2024, to October 31,
2025.
You can find additional information about the fund at
www.schwabassetmanagement.com/prospectus
. You can also request
this information by calling
or by sending an email request to
orders@mysummaryprospectus.com
.
If you purchase
or hold fund shares through a financial intermediary, the fund’s prospectus, Statement of Additional Information (SAI), reports to
shareholders and other information about the fund are available from your financial intermediary.
This report describes changes to the fund that occurred during the reporting period.
FUND COSTS FOR THE LAST year ENDED October 31, 2025
(BASED ON A HYPOTHETICAL $10,000 IN
VESTMEN
T)
|
|
|
Schwab U.S. Large-Cap Value Index Fund |
|
|
MANAGEMENT’S DISCUSSION OF FUND PERFORMANCE
For the 12-month reporting period ended October 31, 2025, the fund returned 11.13%. The S&P 500
®
Index, which serves as the
fund’s regulatory index and provides a broad measure of market performance, returned 21.45%. The fund generally invests in
securities that are included in the Russell 1000
®
Value Index, which returned 11.15% during the same period. The fund does not
seek to track the regulatory index. Differences between the return of the fund and the return of the Russell 1000
®
Value Index may
be attributable to, among other things, the operational and transactional costs incurred by the fund and not the index.
Top detractors from total return:
■
Health care sector securities, including UnitedHealth Group, Inc.
■
Materials sector securities
Top contributors to total return:
■
Financials sector securities, including JPMorgan Chase & Co.
■
Industrials sector securities
Portfolio holdings may have changed since the report date.
Schwab U.S. Large-Cap Value Index
Fund
| Annual Report
The performance data quoted represents past performance. Past performance does not guarantee future results. Investment returns
and principal value of an investment will fluctuate so that an investor’s shares may be worth more or less than their original cost. Current performance may be lower or higher than performance data quoted.
To obtain performance information current to the most
recent month end, please visit
www.schwabassetmanagement.com/prospectus
Performance of Hypothetical $10,000 Investment (December 20, 2017 - Octob
er 31
, 2025)
|
|
|
|
Fund: Schwab U.S. Large-Cap Value Index Fund (12/20/2017) 1 |
|
|
|
|
|
|
|
Russell 1000 ® Value Index |
|
|
|
All total returns on this page assume dividends and distributions were reinvested. Index figures do not include trading and management costs, which would lower
performance. Indices are unmanaged and cannot be invested in directly. Performance results less than one year are not annualized.
For index definitions, please see www.schwabassetmanagement.com/glossary.
Index ownership – The Russell 1000
®
Value Index is a registered mark of the Frank Russell Company (Russell) and has been licensed for use by the Schwab U.S. Large-Cap
Value Index Fund. The Schwab U.S. Large-Cap Value Index Fund is not sponsored, endorsed, sold or promoted by Russell and Russell makes no representation regarding the
advisability of investing in the fund.
Performance does not reflect the deduction of taxes that a shareholder would pay on fund distributions or the redemption of fund shares.
The S&P 500
®
Index serves as the fund’s regulatory index and provides a broad measure of market performance. The fund generally invests in securities that are included in
the Russell 1000
®
Value Index. The fund does not seek to track the regulatory index.
Schwab U.S. Large-Cap Va
lue Index Fu
nd | Annual Report
|
|
|
|
(excludes in-kind transactions) |
|
Advisory Fees Paid by the Fund |
|
Weighted Average Market Cap (millions) |
|
Price/Earnings Ratio (P/E) |
|
|
|
Dividends Received Deduction |
|
Qualified Dividend Income |
|
Long Term Capital Gain Distribution |
|
Qualified Business Income (199A) |
|
Sector Weightings % of Investments
Top Equity Holdings % of Net Assets
Portfolio holdings may have changed since the rep
ort date
.
The Sector/Industry classifications in this report use the Global Industry Classification Standard (GICS) which was developed by and is the exclusive property of MSCI Inc.
(MSCI) and Standard & Poor’s (S&P). GICS is a service mark of MSCI and S&P and has been licensed for use by Charles Schwab & Co., Inc.
Includes the fund’s position(s) in money market mutual funds registered under the Investment Company Act
of 1940
, as amended.
Schwab U.S. Large-Cap Value Index Fund | Annual Report
This is a summary of certain changes to the fund since November 1, 2024. For more complete information, you may review the
fund’s Annual Holdings and Financial Statements at
www.schwabassetmanagement.com/prospectus
or upon request by calling
or by sending an email request to
orders@mysummaryprospectus.com
.
■
On June 5, 2025, the Board of Trustees authorized a 4-for-1 share split for the fund, which applied
to sh
areholders of record as of
the close of U.S. markets on August 14, 2025. Certain of the fund’s financial statements were retroactively adjusted for the period
ended October 31, 2025, and all prior periods, to reflect the share split.
AVAILABILITY OF ADDITIONAL INFORMATION
You can find the fund’s prospectus, Statement of Additional Information (SAI), reports to shareholders, financial information,
holdings, certain tax information, proxy voting information, and other information about the fund online at
www.schwabassetmanagement.com/prospectus
.
Proxy Voting Policies, Procedures and Results
A description of the proxy voting policies and procedures used to determine how to vote proxies on behalf of the funds is available
without charge, upon request, by visiting the Schwab Funds’ website at
www.schwabassetmanagement.com/prospectus
, the
SEC’s website at
, or by contacting Schwab Funds at 1-877-824-5615.
Information regarding how a fund voted proxies relating to portfolio securities during the most recent twelve-month period ended
June 30 is available, without charge, by visiting the fund’s website at
www.schwabassetmanagement.com/prospectus
or the SEC’s
website at
, by calling
, or by sending an email request to
orders@mysummaryprospectus.com
.
Schwab U.S. Large-Cap Value Index Fund | Annual Report
October 31, 2025
Schwab U.S. Mid-Cap Index Fund
This annual shareholder report contains important information about the fund for the period of November 1, 2024, to October 31,
2025.
You can find additional information about the fund at
www.schwabassetmanagement.com/prospectus
. You can also request
this information by calling
or by sending an email request to
orders@mysummaryprospectus.com
.
If you purchase
or hold fund shares through a financial intermediary, the fund’s prospectus, Statement of Additional Information (SAI), reports to
shareholders and other information about the fund are available from your financial intermediary.
This report describes changes to the fund that occurred during the reporting period.
FUND COSTS FOR THE LAST year ENDED October 31, 2025
(BASED ON A HYPOTHETICAL $10,000 INVESTMENT)
|
|
|
Schwab U.S. Mid-Cap Index Fund |
|
|
MANAGEMENT’S DISCUSSION OF FUND PERFORMANCE
For the 12-month reporting period ended October 31, 2025, the fund returned 10.68%. The S&P 500
®
Index, which serves as the
fund’s regulatory index and provides a broad measure of market performance, returned 21.45%. The fund generally invests in
securities that are included in the Russell Midcap
®
Index, which returned 10.79% during the same period. The fund does not seek
to track the regulatory index. Differences between the return of the fund and the return of the Russell Midcap
®
Index may be
attributable to, among other things, the operational and transactional costs incurred by the fund and not the index.
Top detractors from total return:
■
Materials sector securities, including Dow, Inc.
■
Real estate sector securities
Top contributors to total return:
■
Information technology sector securities, including Class A holdings of Palantir Technologies, Inc. (which was sold prior to the
end of the reporting period)
■
Financials sector securities
Portfolio holdings may have changed since the report date.
Schwab U.S. Mid-Cap Index Fund | Annual Report
The performance data quoted represents past performance. Past performance does not guarantee future results. Investment returns
and principal value of an investment will fluctuate so that an investor’s shares may be worth more or less than their original cost. Current performance may be lower or higher than performance data quoted.
To obtain performance information current to the most
recent month end, please visit
www.schwabassetmanagement.com/prospectus
Performance of Hypothetical $10,000 Investment (December 20, 2017 - October 31, 2025)
|
|
|
|
Fund: Schwab U.S. Mid-Cap Index Fund (12/20/2017) 1 |
|
|
|
|
|
|
|
|
|
|
|
All total returns on this page assume dividends and distributions were reinvested. Index figures do not include trading and management costs, which would lower
performance. Indices are unmanaged and cannot be invested in directly. Performance results less than one year are not annualized.
For index definitions, please see www.schwabassetmanagement.com/glossary.
Index ownership – The Russell Midcap
®
Index is a registered mark of the Frank Russell Company (Russell) and has been licensed for use by the Schwab U.S. Mid-Cap Index
Fund. The Schwab U.S. Mid-Cap Index Fund is not sponsored, endorsed, sold or promoted by Russell and Russell makes no representation regarding the advisability of
investing in the fund.
Performance does not reflect the deduction of taxes that a shareholder would pay on fund distributions or the redemption of fund shares.
The S&P 500
®
Index serves as the fund’s regulatory index and provides a broad measure of market performance. The fund generally invests in securities that are included in
the Russell Midcap
®
Index. The fund does not seek to track the regulatory index.
Schwab U.S. Mid-Cap Index Fund | Annual Report
|
|
|
|
(excludes in-kind transactions) |
|
Advisory Fees Paid by the Fund |
|
Weighted Average Market Cap (millions) |
|
Price/Earnings Ratio (P/E) |
|
|
|
Dividends Received Deduction |
|
Qualified Dividend Income |
|
Long Term Capital Gain Distribution |
|
Qualified Business Income (199A) |
|
Sector Weightings % of Investments
Top Equity Holdings % of Net Assets
Portfolio holdings may have changed since the report date.
The Sector/Industry classifications in this report use the Global Industry Classification Standard (GICS) which was developed by and is the exclusive property of MSCI Inc.
(MSCI) and Standard & Poor’s (S&P). GICS is a service mark of MSCI and S&P and has been licensed for use by Charles Schwab & Co., Inc.
Includes the fund’s position(s) in money market mutual funds registered under the Investment Company Act of 1940, as amended.
Schwab U.S. Mid-Cap Index Fund | Annual Report
This is a summary of certain changes to the fund since November 1, 2024. For more complete information, you may review the
fund’s Annual Holdings and Financial Statements at
www.schwabassetmanagement.com/prospectus
or upon request by calling
or by sending an email request to
orders@mysummaryprospectus.com
.
■
On June 5, 2025, the Board of Trustees authorized a 5-for-1 share split for the fund, which applied to shareholders of record as of
the close of U.S. markets on August 14, 2025. Certain of the fund’s financial statements were retroactively adjusted for the period
ended October 31, 2025, and all prior periods, to reflect the share split.
AVAILABILITY OF ADDITIONAL INFORMATION
You can find the fund’s prospectus, Statement of Additional Information (SAI), reports to shareholders, financial information,
holdings, certain tax information, proxy voting information, and other information about the fund online at
www.schwabassetmanagement.com/prospectus
.
Proxy Voting Policies, Procedures and Results
A description of the proxy voting policies and procedures used to determine how to vote proxies on behalf of the funds is available
without charge, upon request, by visiting the Schwab Funds’ website at
www.schwabassetmanagement.com/prospectus
, the
SEC’s website at
, or by contacting Schwab Funds at 1-877-824-5615.
Information regarding how a fund voted proxies relating to portfolio securities during the most recent twelve-month period ended
June 30 is available, without charge, by visiting the fund’s website at
www.schwabassetmanagement.com/prospectus
or the SEC’s
website at
, by calling
, or by sending an email request to
orders@mysummaryprospectus.com
.
Schwab U.S. Mid-Cap Index Fund | Annual Report
October 31, 2025
Schwab International Index Fund
This annual shareholder report contains important information about the fund for the period of November 1, 2024, to October 31,
2025.
You can find additional information about the fund at
www.schwabassetmanagement.com/prospectus
.
You can also request
this information by calling
or by sending an email request to
orders@mysummaryprospectus.com
.
If you purchase
or hold fund shares through a financial intermediary, the fund’s prospectus, Statement of Additional Information (SAI), reports to
shareholders and other information about the fund are available from your financial intermediary.
FUND COSTS FOR THE LAST year ENDED October 31, 2025
(BASED ON A HYPOTHETICAL $10,000 INVESTMENT)
|
|
|
Schwab International Index Fund |
|
|
MANAGEMENT’S DISCUSSION OF FUND PERFORMANCE
For the 12-month reporting period ended October 31, 2025, the fund returned 23.33%. The MSCI EAFE
®
1
returned
23.03% during the same period.
Top contributors to total return:
■
Japanese securities, including SoftBank Group Corp.
■
Securities from the United Kingdom
Top detractors from total return:
■
Danish securities, including Class B holdings of Novo Nordisk AS
■
Securities from New Zealand
Portfolio holdings may have changed since the report date.
The net version of the index reflects reinvested dividends net of withholding taxes but reflects no deductions for expenses or other taxes.
Schwab International Index Fund | Annual Report
The performance data quoted represents past performance. Past performance does not guarantee future results. Inves
tm
ent returns
and principal value of an investment will fluctuate so that an investor’s shares may be worth more or less than their original cost. Current performance may be lower or higher than performance data quoted.
To obtain performance information current to the most
recent month end, please visit
www.schwabassetmanagement.com/prospectus
Performance of Hypothetical $10,000 Investment (October 31, 2015 - October 31, 2025)
Average Annual Total Returns
|
|
|
|
Fund: Schwab International Index Fund (05/19/1997) 1,2 |
|
|
|
|
|
|
|
All total returns on this page assume dividends and distributions were reinvested. Index figures do not include trading and management costs, which would lower
performance. Indices are unmanaged and cannot be invested in directly. Performance results less than one year are not annualized.
For index definitions, please see www.schwabassetmanagement.com/glossary.
Index ownership – “MSCI EAFE
®
” is a registered mark of MSCI and has been licensed for use by the Schwab International Index Fund. The Schwab International Index Fund is
not sponsored, endorsed, sold or promoted by MSCI and MSCI bears no liability with respect to the fund. The Statement of Additional Information contains a more detailed
description of the limited relationship MSCI has with the fund.
Performance does not reflect the deduction of taxes that a shareholder would pay on fund distributions or the redemption of fund shares.
The fund’s performance relative to the index may be affected by fair-value pricing and timing differences in foreign exchange calculations.
The net version of the index reflects reinvested dividends net of withholding taxes but reflects no deductions for expenses or other taxes.
Schwab International Index Fund | Annual Report
|
|
|
|
|
|
Advisory Fees Paid by the Fund |
|
Weighted Average Market Cap (millions) |
|
Price/Earnings Ratio (P/E) |
|
|
|
Foreign Tax Paid and Passed Through |
|
Gross Income From Foreign Sources |
|
Qualified Dividend Income |
|
Sector Weightings % of Investments
Top Equity Holdings % of Net Assets
Top Country Weightings % of Investments
Portfolio holdings may have changed since the report date.
The Sector/Industry classifications in this report use the Global Industry Cla
ssifica
tion Standard (GICS) which was developed by and is the exclusive property of MSCI Inc.
(MSCI) and Standard & Poor’s (S&P). GICS is a service mark of MSCI and S&P and has been licensed for use by Charles Schwab & Co., Inc.
Includes the fund’s position(s) in money market mutual funds registered under the Investment Company Act of 1940, as amended.
Schwab International Index Fund | Annual Report
AVAILABILITY OF ADDITIONAL INFORMATION
You can find the fund’s prospectus, Statement of Additional Information (SAI), reports to shareholders, financial information,
holdings, certain tax information, proxy voting information, and other information about the fund online at
www.schwabassetmanagement.com/prospectus
.
Proxy Voting Policies, Procedures and Results
A description of the proxy voting policies and procedures used to determine how to vote proxies on behalf of the funds is available
without charge, upon request, by visiting the Schwab Funds’ website at
www.schwabassetmanagement.com/prospectus
, the
SEC’s website at
, or by contacting Schwab Funds at 1-877-824-5615.
Information regarding how a fund voted proxies relating to portfolio securities during the most recent twelve-month period ended
June 30 is available, without charge, by visiting the fund’s website at
www.schwabassetmanagement.com/prospectus
or the
SEC’s website at
, by calling
, or by sending an email request to
orders@mysummaryprospectus.com
.
Schwab International Index Fund | Annual Report
October 31, 2025
Schwab Fundamental U.S. Large Company Index Fund
(formerly Schwab Fundamental US Large Company Index Fund)
This annual shareholder report contains important information about the fund for the period of November 1, 2024, to October 31,
2025.
You can find additional information about the fund at
www.schwabassetmanagement.com/prospectus
. You
can
also request
this information by calling
or by sending an email request to
orders@mysummaryprospectus.com
.
If you purchase
or hold fund shares through a financial intermediary, the fund’s prospectus, Statement of Additional Information (SAI), reports to
shareholders and other information about the fund are available from
your
financial intermediary.
FUND COSTS FOR THE LAST year ENDED October 31, 2025
(BASED ON A HYPOTHETICAL $10,000 INVESTMENT)
|
|
|
Schwab Fundamental U.S. Large Company Index Fund |
|
|
MANAGEMENT’S DISCUSSION OF FUND PERFORMANCE
For the 12-month reporting period ended October 31, 2025, the fund returned 14.48%. The Russell 1000
®
Index, which serves as
the fund’s regulatory index and provides a broad measure of market performance, returned 21.14%. The fund generally invests in
securities that are included in the RAFI Fundamental High Liquidity US Large Index which returned 14.72% during the same period.
The fund does not seek to track the regulatory index. Differences between the return of the fund and the return of the RAFI
Fundamental High Liquidity US Large Index may be attributable to, among other things, the operational and transactional costs
incurred by the fund and not the index.
Top detractors from total return:
■
Health care sector securities, including UnitedHealth Group, Inc.
■
Materials sector securities
Top contributors to total return:
■
Information technology sector securities, including Microsoft Corp.
■
Financials sector securities
Portfolio holdings may have changed since the report date.
Schwab Fundamental U.S. Large Company Index Fund | Annual Report
The performance data quoted represents past performance. Past performance does not guarantee future results. Investment returns
and principal value of an investment will fluctuate so that an investor’s shares may be worth more or less than their original cost. Current performance may be lower or higher than performance data quoted.
To obtain performance information current to the most
recent month end, please visit
www.schwabassetmanagement.com/prospectus
Performance of Hypothetical $10,000 Investment (October 31, 2015 - October 31, 2025)
Average Annual Total Returns
|
|
|
|
Fund: Schwab Fundamental U.S. Large Company Index Fund (04/02/2007) 1 |
|
|
|
|
|
|
|
RAFI Fundamental High Liquidity US Large Index 3 |
|
|
|
Russell RAFI TM US Large Company Index |
|
|
|
Fundamental US Large Spliced Index |
|
|
|
All total returns on this page assume dividends and distributions were reinvested. Index figures do not include trading and management costs, which would lower
performance. Indices are unmanaged and cannot be invested in directly. Performance results less than one year are not annualized.
For index definitions, please see www.schwabassetmanagement.com/glossary.
Index ownership – The RAFI Fundamental High Liquidity US Large Index (the Index) is a service mark of RAFI Indices, LLC or its affiliates (collectively, RAFI) and has been
licensed for use by Charles Schwab Investment Management, Inc. The intellectual and other property rights to the Index are owned by or licensed to RAFI. The Schwab
Fundamental U.S. Large Company Index Fund is not sponsored, endorsed, sold or promoted by RAFI, its agents or service providers (collectively, the RAFI Parties). The RAFI
Parties: (i) make no representation or warranty as to the results to be obtained from the use of the Index or otherwise; and (ii) shall not be liable (whether in negligence or
otherwise) to any person for any error in the Index. For full disclaimer, please see the fund’s statement of additional information.
Performance does not reflect the deduction of taxes that a shareholder would pay on fund distributions or the redemption of fund shares.
The Russell 1000
®
Index serves as the fund’s regulatory index and provides a broad measure of market performance. The fund generally invests in securities that are
included in the RAFI Fundamental High Liquidity US Large Index. The fund does not seek to track the regulatory index.
Effective June 21, 2024, the fund changed its comparative index from the Russell RAFI™ US Large Company Index to the RAFI Fundamental High Liquidity US Large Index in
connection with a change to the fund’s investment objective and investment strategy to invest its assets in accordance with the index. The inception date of the RAFI
Fundamental High Liquidity US Large Index is January 31, 2024. The fund began tracking the index after the close of business on June 21, 2024.
Schwab Fundamental U.S. Large Company Index Fund | Annual Report
|
|
|
|
(excludes in-kind transactions) |
|
Advisory Fees Paid by the Fund |
|
Weighted Average Market Cap (millions) |
|
Price/Earnings Ratio (P/E) |
|
|
|
Dividends Received Deduction |
|
Qualified Dividend Income |
|
Top Equity Holdings % of Net Assets
Portfolio holdings may have
changed
since the report da
te.
The Sector/Industry classifications in this report use the Global Industry Classification Standard (GICS) which was developed by and is the exclusive property of MSCI Inc.
(MSCI) and Standard & Poor’s (S&P). GICS is a service mark of MSCI and S&P and has been licensed for use by Charles Schwab & Co., Inc.
Includes the fund’s position(s) in money market mutual funds registered under the Investment Company Act of 1940, as amended.
Schwab Fundamental U.S. Large Company Index Fund | Annual Report
AVAILABILITY OF ADDITIONAL INFORMATION
You can find the fund’s prospectus, Statement of Additional Information (SAI), reports to shareholders, financial information,
holdings, certain tax information, proxy voting information, and other information about the fund online at
www.schwabassetmanagement.com/prospectus
.
Proxy Voting Policies, Procedures and Results
A description of the proxy voting policies and procedures used to determine how to vote proxies on behalf of the funds is available
without charge, upon request, by visiting the Schwab Funds’ website at
www.schwabassetmanagement.com/prospectus
, the
SEC’s website at
, or by contacting Schwab Funds at 1-877-824-5615.
Information regarding how a fund voted proxies relating to portfolio securities during the most recent twelve-month period ended
June 30 is available, without charge, by visiting the fund’s website at
www.schwabassetmanagement.com/prospectus
or the
SEC’s website at
, by calling
, or by sending an email request to
orders@mysummaryprospectus.com
.
Schwab Fundamental U.S. Large Company Index Fund | Annual Report
October 31, 2025
Schwab Fundamental U.S. Small Company Index Fund
(formerly Schwab Fundamental US Small Company Index Fund)
This annual shareholder report contains important information about the fund for the period of November 1, 2024, to October 31,
2025.
You can find additional information about the fund at
www.schwabassetmanagement.com/prospectus
.
You can also request
this information by calling
or by sending an email request to
orders@mysummaryprospectus.com
.
If you purchase
or hold fund shares through a financial intermediary, the fund’s prospectus, Statement of Additional Information (SAI), reports to
shareholders and other information about the fund are available from your financial intermediary.
FUND COSTS FOR THE LAST year ENDED October 31, 2025
(BASED ON A
HYPOTHETICAL
$10,000 INVESTMENT)
|
|
|
Schwab Fundamental U.S. Small Company Index Fund |
|
|
MANAGEMENT’S DISCUSSION OF FUND PERFORMANCE
For the 12-month reporting period ended October 31, 2025, the fund returned 6.16%. The S&P 500
®
Index, which serves as the
fund’s regulatory index and provides a broad measure of market performance, returned 21.45%. The fund generally invests in
securities that are included in the RAFI Fundamental High Liquidity US Small Index which returned 6.32% during the same period.
The fund does not seek to track the regulatory index. Differences between the return of the fund and the return of the RAFI
Fundamental High Liquidity US Small Index may be attributable to, among other things, the operational and transactional costs
incurred by the fund and not the index.
Top detractors from total return:
■
Consumer staples sector securities, including Spectrum Brands Holdings, Inc.
■
Health care sector securities
Top contributors to total return:
■
Information technology sector securities, including ViaSat, Inc.
■
Industrials sector securities
Portfolio holdings may have changed since the report date.
Schwab
Fundamental U.S. Small Company Index Fund | Annual Report
The performance data quoted represents past performance. Past performance does not guarantee future results. Investment returns
and principal value of an investment will fluctuate so that an investor’s shares may be worth more or less than their original cost. Current performance may be lower or higher than performance data quoted.
To obtain performance information current to the most
recent month end, please visit
www.schwabassetmanagement.com/prospectus
Performance of Hypothetical $10,000 Investment (October 31, 2015 - October 31, 2025)
Average Annual Total Returns
|
|
|
|
Fund: Schwab Fundamental U.S. Small Company Index Fund (04/02/2007) 1 |
|
|
|
|
|
|
|
RAFI Fundamental High Liquidity US Small Index 3 |
|
|
|
Russell RAFI TM US Small Company Index |
|
|
|
Fundamental US Small Spliced Index |
|
|
|
|
|
|
|
All total returns on this page assume dividends and distributions were reinvested. Index figures do not include trading and management costs, which would lower
performance. Indices are unmanaged and cannot be invested in directly. Performance results less than one year are not annualized.
For index definitions, please see www.schwabassetmanagement.com/glossary.
Index ownership – The RAFI Fundamental High Liquidity US Small Index (the Index) is a service mark of RAFI Indices, LLC or its affiliates (collectively, RAFI) and has been
licensed for use by Charles Schwab Investment Management, Inc. The intellectual and other property rights to the Index are owned by or licensed to RAFI. The Schwab
Fundamental U.S. Small Company Index Fund is not sponsored, endorsed, sold or promoted by RAFI, its agents or service providers (collectively, the RAFI Parties). The RAFI
Parties: (i) make no representation or warranty as to the results to be obtained from the use of the Index or otherwise; and (ii) shall not be liable (whether in negligence or
otherwise) to any person for any error in the Index. For full disclaimer, please see the fund’s statement of additional information.
Performance does not reflect the deduction of taxes that a shareholder would pay on fund distributions or the redemption of fund shares.
The S&P 500
®
Index serves as the fund’s regulatory index and provides a broad measure of market performance. The fund generally invests in securities that are included in
the RAFI Fundamental High Liquidity US Small Index. The fund does not seek to track the regulatory index.
Effective June 21, 2024, the fund changed its comparative index from the Russell RAFI™ US Small Company Index to the RAFI Fundamental High Liquidity US Small Index in
connection with a change to the fund’s investment objective and investment strategy to invest its assets in accordance with the index. The inception date of the RAFI
Fundamental High Liquidity US Small Index is January 31, 2024. The fund began tracking the index after the close of business on June 21, 2024.
Schwab Fundamental U.S. Small Company Index Fund | Annual Report
|
|
|
|
(excludes in-kind transactions) |
|
Advisory Fees Paid by the Fund |
|
Weighted Average Market Cap (millions) |
|
Price/Earnings Ratio (P/E) |
|
|
|
Dividends Received Deduction |
|
Qualified Dividend Income |
|
Qualified Business Income (199A) |
|
Sector Weightings % of Investments
Top Equity Holdings % of Net Assets
Portfolio holdings may have changed since the report date.
The Sector/Industry classifications in this
report
use the Global Industry Classification Standard (GICS) which was developed by and is the exclusive property of MSCI Inc.
(MSCI) and Standard & Poor’s (S&P). GICS is a service mark of MSCI and S&P and has been licensed for use by Charles Schwab & Co., Inc.
Includes the fund’s position(s) in money market mutual funds registered under the Investment Company Act of 1940, as amended.
Schwab Fundamental U.S. Small Company Index Fund | Annual Report
AVAILABILITY OF ADDITIONAL INFORMATION
You can find the fund’s prospectus, Statement of Additional Information (SAI), reports to shareholders, financial information,
holdings, certain tax information, proxy voting information, and other information about the fund online at
www.schwabassetmanagement.com/prospectus
.
Proxy Voting Policies, Procedures and Results
A description of the proxy voting policies and procedures used to determine how to vote proxies on behalf of the funds is available
without charge, upon request, by visiting the Schwab Funds’ website at
www.schwabassetmanagement.com/prospectus
, the
SEC’s website at
, or by contacting Schwab Funds at 1-877-824-5615.
Information regarding how a fund voted proxies relating to portfolio securities during the most recent twelve-month period ended
June 30 is available, without charge, by visiting the fund’s website at
www.schwabassetmanagement.com/prospectus
or the
SEC’s website at
, by calling
, or by sending an email request to
orders@mysummaryprospectus.com
.
Schwab Fundamental U.S. Small Company Index Fund | Annual Report
October 31, 2025
Schwab Fundamental International Equity Index Fund
(formerly Schwab Fundamental International Large Company Index Fund)
This annual shareholder report contains important information about the fund for the period of November 1, 2024,
to October 31,
2025.
You can find additional information about the fund at
www.schwabassetmanagement.com/prospectus
. You can also request
this information by calling
or by sending an email request to
orders@mysummaryprospectus.com
.
If you purchase
or hold fund shares through a financial intermediary, the fund’s prospectus, Statement of Additional Information (SAI), reports to
shareholders and other information about the fund are available from your financial intermediary.
FUND COSTS FOR THE LAST year ENDED October 31, 2025
(BASED ON A HYPOTHETICAL $10,000 INVESTMENT)
|
|
|
Schwab Fundamental International Equity Index Fund |
|
|
MANAGEMENT’S DISCUSSION OF FUND PERFORMANCE
For the 12-month reporting period ended October 31, 2025, the fund returned 28.74%. The MSCI EAFE
®
Index (Net)
1
, which serves
as the fund’s regulatory index and provides a broad measure of market performance, returned 23.03%. The fund generally invests in
securities that are included in the RAFI Fundamental High Liquidity Developed ex US Large Index (Net)
1
which returned 28.47%
during the same period. The fund does not seek to track the regulatory index.
Top contributors to total return:
■
Japanese securities, including SoftBank Group Corp.
■
Securities from the United Kingdom
Top detractors from total return:
■
Danish securities, including Class B holdings of Novo Nordisk AS
■
Securities from New Zealand
Portfolio holdings may have changed since the report date.
The net version of the index reflects reinvested dividends net of withholding taxes but reflects no deductions for expenses or other taxes.
Schwab Fundamental International Equity Index Fund | Annual Report
The performance data quoted represents past performance. Past performance does not guarantee future results. Investment returns
and principal value of an investment will fluctuate so that an investor’s shares may be worth more or less than their original cost. Current performance may be lower or higher than performance data quoted.
To obtain performance information current to the most
recent month end, please visit
www.schwabassetmanagement.com/prospectus
Performance of Hypothetical $10,000 Investment (October 31, 2015 - October 31, 2025)
Average Annual Total Returns
|
|
|
|
Fund: Schwab Fundamental International Equity Index Fund (04/02/2007) 1,2 |
|
|
|
MSCI EAFE ® Index (Net) 3,4 |
|
|
|
RAFI Fundamental High Liquidity Developed ex US Large Index (Net) 3,5 |
|
|
|
Russell RAFI TM Developed ex US Large Company Index (Net) 3 |
|
|
|
Fundamental Developed ex US Large Spliced Index |
|
|
|
All total returns on this page assume dividends and distributions were reinvested. Index figures do not include trading and management costs, which would lower
performance. Indices are unmanaged and cannot be invested in directly. Performance results less than one year are not annualized.
For index definitions, please see www.schwabassetmanagement.com/glossary.
Index ownership – The RAFI Fundamental High Liquidity Developed ex US Large Index (the Index) is a service mark of RAFI Indices, LLC or its affiliates (collectively, RAFI) and
has been licensed for use by Charles Schwab Investment Management, Inc. The intellectual and other property rights to the Index are owned by or licensed to RAFI. The
Schwab Fundamental International Equity Index Fund is not sponsored, endorsed, sold or promoted by RAFI, its agents or service providers (collectively, the RAFI Parties). The
RAFI Parties: (i) make no representation or warranty as to the results to be obtained from the use of the Index or otherwise; and (ii) shall not be liable (whether in negligence
or otherwise) to any person for any error in the Index. For full disclaimer, please see the fund’s statement of additional information.
Performance does not reflect the deduction of taxes that a shareholder would pay on fund distributions or the redemption of fund shares.
The fund’s performance relative to the index may be affected by fair-value pricing and timing differences in foreign exchange calculations.
The net version of the index reflects reinvested dividends net of withholding taxes but reflects no deductions for expenses or other taxes.
The MSCI EAFE
®
Index (Net) serves as the fund’s regulatory index and provides a broad measure of market performance. The fund generally invests in securities that are
included in the RAFI Fundamental High Liquidity Developed ex US Large Index (Net). The fund does not seek to track the regulatory index.
Effective June 21, 2024, the fund changed its comparative index from the Russell RAFI™ Developed ex US Large Company Index (Net) to the RAFI Fundamental High
Liquidity Developed ex US Large Index (Net) in connection with a change to the fund’s investment objective and investment strategy to invest its assets in accordance with
the index. The inception date of the RAFI Fundamental High Liquidity Developed ex US Large Index (Net) is January 31, 2024. The fund began tracking the index after the
close of business on June 21, 2024.
Schwab Fundamental International Equity Index Fund | Annual Report
|
|
|
|
|
|
Advisory Fees Paid by the Fund |
|
Weighted Average Market Cap (millions) |
|
Price/Earnings Ratio (P/E) |
|
|
|
Foreign Tax Paid and Passed Through |
|
Gross Income From Foreign Sources |
|
Qualified Dividend Income |
|
Sector Weightings % of Investments
Top Equity Holdings % of Net Assets
Top Country Weightings % of Investments
Portfolio holdings may have changed since the report date.
The Sector/Industry classifications in this report use the Global Industry Classification Standard (GICS) which was developed by and is the exclusive
propert
y of MSCI Inc.
(MSCI) and Standard & Poor’s (S&P). GICS is a service mark of MSCI and S&P and has been licensed for use by Charles Schwab & Co., Inc.
Includes the fund’s position(s) in money market mutual funds registered under the Investment Company Act of 1940, as amended.
Schwab Fundamental International Equity Index Fund | Annual Report
AVAILABILITY OF ADDITIONAL INFORMATION
You can find the fund’s prospectus, Statement of Additional Information (SAI), reports to shareholders, financial information,
holdings, certain tax information, proxy voting information, and other information about the fund online at
www.schwabassetmanagement.com/prospectus
.
Proxy Voting Policies, Procedures and Results
A description of the proxy voting policies and procedures used to determine how to vote proxies on behalf of the funds is available
without charge, upon request, by visiting the Schwab Funds’ website at
www.schwabassetmanagement.com/prospectus
, the
SEC’s website at
, or by contacting Schwab Funds at 1-877-824-5615.
Information regarding how a fund voted proxies relating to portfolio securities during the most recent twelve-month period ended
June 30 is available, without charge, by visiting the fund’s website at
www.schwabassetmanagement.com/prospectus
or the
SEC’s website at
, by calling
, or by sending an email request to
orders@mysummaryprospectus.com
.
Schwab Fundamental International Equity Index Fund | Annual Report
October 31, 2025
Schwab Fundamental International Small Equity Index Fund
(formerly Schwab Fundamental International Small Company Index Fund)
This annual shareholder report contains important information about the fund for the period of November 1, 2024, to October 31,
2025.
You can find additional information about the fund at
www.schwabassetmanagement.com/prospectus
. You can also request
this information by calling
or by sending an email request to
orders@mysummaryprospectus.com
.
If you purchase
or hold fund shares through a financial intermediary, the fund’s prospectus, Statement of Additional Information (SAI), reports to
shareholders and other information about the fund are available from your financial intermediary.
FUND COSTS FOR THE LAST year ENDED October 31, 2025
(BASED ON A HYPOTHETICAL $10,000 INVESTMENT)
|
|
|
Schwab Fundamental International Small Equity Index Fund |
|
|
MANAGEMENT’S DISCUSSION OF FUND PERFORMANCE
For the 12-month reporting period ended October 31, 2025, the fund returned 27.67%. The MSCI EAFE
®
Index (Net)
1
, which serves
as the fund’s regulatory index and provides a broad measure of market performance, returned 23.03%. The fund generally invests in
securities that are included in the RAFI Fundamental High Liquidity Developed ex US Small Index (Net)
1
which returned 27.92%
during the same period. The fund does not seek to track the regulatory index. Differences between the return of the fund and the
return of the RAFI Fundamental High Liquidity Developed ex US Small Index (Net)
1
may be attributable to, among other things, the
operational and transactional costs incurred by the fund and not the index.
Over the reporting period, no sectors detracted from the return of the fund. However, the smallest contributors to total return were:
■
Peruvian securities, including Hochschild Mining PLC (which was sold prior to the end of the reporting period)
Top contributors to total return:
■
Japanese securities, including Ibiden Co. Ltd.
Portfolio holdings may have changed since the report date.
The net version of the index reflects reinvested dividends net of withholding taxes but reflects no deductions for expenses or other taxes.
Schwab Fundamental International Small Equity Index Fund | Annual Report
The performance data quoted represents past performance. Past performance does not guarantee future results. Investment returns
and principal value of an investment will fluctuate so that an investor’s shares may be worth more or less than their original cost. Current performance may be lower or higher than performance data quoted.
To obtain performance information current to the most
recent month end, please visit
www.schwabassetmanagement.com/prospectus
Performance of Hypothetical $10,000 Investment (October 31, 2015 - October 31, 2025)
Average Annual Total Returns
|
|
|
|
Fund: Schwab Fundamental International Small Equity Index Fund (01/31/2008) 1,2 |
|
|
|
MSCI EAFE ® Index (Net) 3,4 |
|
|
|
RAFI Fundamental High Liquidity Developed ex US Small Index (Net) 3,5 |
|
|
|
Russell RAFI TM Developed ex US Small Company Index (Net) 3 |
|
|
|
Fundamental Developed ex US Small Spliced Index |
|
|
|
S&P Developed ex-U.S. Small Cap Index (Net) 3 |
|
|
|
All total returns on this page assume dividends and distributions were reinvested. Index figures do not include trading and management costs, which would lower
performanc
e.
Indices are unmanaged and cannot be invested in directly. Performance results less than one year are not annualized.
For index definitions, please see www.schwabassetmanagement.com/glossary.
Index ownership – The RAFI Fundamental High Liquidity Developed ex US Small Index (the Index) is a service mark of RAFI Indices, LLC or its affiliates (collectively, RAFI) and
has been licensed for use by Charles Schwab Investment Management, Inc. The intellectual and other property rights to the Index are owned by or licensed to RAFI. The
Schwab Fundamental International Small Equity Index Fund is not sponsored, endorsed, sold or promoted by RAFI, its agents or service providers (collectively, the RAFI
Parties). The RAFI Parties: (i) make no representation or warranty as to the results to be obtained from the use of the Index or otherwise; and (ii) shall not be liable (whether in
negligence or otherwise) to any person for any error in the Index. For full disclaimer, please see the fund’s statement of additional information.
Performance does not reflect the deduction of taxes that a shareholder would pay on fund distributions or the redemption of fund shares.
The fund’s performance relative to the index may be affected by fair-value pricing and timing differences in foreign exchange calculations.
The net version of the index reflects reinvested dividends net of withholding taxes but reflects no deductions for expenses or other taxes.
The MSCI EAFE
®
Index (Net) serves as the fund’s regulatory index and provides a broad measure of market performance. The fund generally invests in securities that are
included in the RAFI Fundamental High Liquidity Developed ex US Small Index (Net). The fund does not seek to track the regulatory index.
Effective June 21, 2024, the fund changed its comparative index from the Russell RAFI™ Developed ex US Small Company Index (Net) to the RAFI Fundamental High
Liquidity Developed ex US Small Index (Net) in connection with a change to the fund’s investment objective and investment strategy to invest its assets in accordance with
the index. The inception date of the RAFI Fundamental High Liquidity Developed ex US Small Index (Net) is January 31, 2024. The fund began tracking the index after the
close of business on June 21, 2024.
Schwab Fundamental International Small Equity Index Fund | Annual Report
|
|
|
|
|
|
Advisory Fees Paid by the Fund |
|
Weighted Average Market Cap (millions) |
|
Price/Earnings Ratio (P/E) |
|
|
|
Foreign Tax Paid and Passed Through |
|
Gross Income From Foreign Sources |
|
Qualified Dividend Income |
|
Long Term Capital Gain Distribution |
|
Sector Weightings % of Investments
Top Equity Holdings % of Net Assets
Top Country Weightings % of Investments
Portfolio holdings may have changed since the report date.
The Sector/Industry classifications in this report use the Global Industry Classification Standard (GICS) which was developed by and is the exclusive property of MSCI Inc.
(MS
CI)
and Standard & Poor’s (S&P). GICS is a service mark of MSCI and S&P and has been licensed for use by Charles Schwab & Co., Inc.
Includes the fund’s position(s) in money market mutual funds registered under the Investment Company Act of 1940, as amended.
Schwab Fundamental International Small Equity Index Fund | Annual Report
AVAILABILITY OF ADDITIONAL INFORMATION
You can find the fund’s prospectus, Statement of Additional Information (SAI), reports to shareholders, financial information,
holdings, certain tax information, proxy voting information, and other information about the fund online at
www.schwabassetmanagement.com/prospectus
.
Proxy Voting Policies, Procedures and Results
A description of the proxy voting policies and procedures used to determine how to vote proxies on behalf of the funds is available
without charge, upon request, by visiting the Schwab Funds’ website at
www.schwabassetmanagement.com/prospectus
, the
, or by contacting Schwab Funds at 1-877-824-5615.
Information regarding how a fund voted proxies relating to portfolio securities during the most recent twelve-month period ended
June 30 is available, without charge, by visiting the fund’s website at
www.schwabassetmanagement.com/prospectus
or the
SEC’s website at
, by calling
, or by sending an email request to
orders@mysummaryprospectus.com
.
Schwab Fundamental International Small Equity Index Fund | Annual Report
October 31, 2025
Schwab Fundamental Emerging Markets Equity Index Fund
(formerly Schwab Fundamental Emerging Markets Large Company Index Fund)
This annual shareholder report contains important information about the fund for the period of November 1, 2024, to October 31,
2025.
You can find additional information about the fund at
www.schwabassetmanagement.com/prospectus
. You can also request
this information by calling
or by sending an email request to
orders@mysummaryprospectus.com
.
If you purchase
or hold fund shares through a financial intermediary, the fund’s prospectus, Statement of Additional Information (SAI), reports to
shareholders and other information about the fund are available from your financial intermediary.
FUND COSTS FOR THE LAST year ENDED October 31, 2025
(BASED ON A HYPOTHETICAL $10,000 INVESTMENT)
|
|
|
Schwab Fundamental Emerging Markets Equity Index Fund |
|
|
MANAGEMENT’S DISCUSSION OF FUND PERFORMANCE
For the 12-month reporting period ended October 31, 2025, the fund returned 23.27%. The MSCI Emerging Markets Index (Net)
1
,
which serves as the fund’s regulatory index and provides a broad measure of market performance, returned 27.91%. The fund
generally invests in securities that are included in the RAFI Fundamental High Liquidity Emerging Markets Index (Net)
1
which
returned 23.42% during the same period. The fund does not seek to track the regulatory index. Differences between the return of
the fund and the return of the RAFI Fundamental High Liquidity Emerging Markets Index (Net)
1
may be attributable to, among other
things, the operational and transactional costs incurred by the fund and not the index.
Top detractors from total return:
■
Indian securities, including Infosys Ltd.
Top contributors to total return:
■
Chinese securities, including Alibaba Group Holding Ltd.
Portfolio holdings may have changed since the report date.
The net version of the index reflects reinvested dividends net of withholding taxes but reflects no deductions for expenses or other taxes.
Schwab Fundamental Emerging Markets Equity Index Fund | Annual Report
The performance data quoted represents past performance. Past performance does not guarantee future results. Investment returns
and principal value of an investment will fluctuate so that an investor’s shares may be worth more or less than their original cost. Current performance may be lower or higher than performance data quoted.
To obtain performance information current to the most
recent month end, please visit
www.schwabassetmanagement.com/prospectus
Performance of Hypothetical $10,000 Investment (October 31, 2015 - October 31, 2025)
Average Annual Total Returns
|
|
|
|
Fund: Schwab Fundamental Emerging Markets Equity Index Fund (01/31/2008) 1,2 |
|
|
|
MSCI Emerging Markets Index (Net) 3,4 |
|
|
|
RAFI Fundamental High Liquidity Emerging Markets Index (Net) 3,5 |
|
|
|
Russell RAFI TM Emerging Markets Large Company Index (Net) 3 |
|
|
|
Fundamental Emerging Markets Spliced Index |
|
|
|
All total returns on this page assume dividends and distributions were reinvested. Index figures do not include trading and management costs, which would lower
performan
ce.
Indices are unmanaged and cannot be invested in directly. Performance results less than one year are not annualized.
For index definitions, please see www.schwabassetmanagement.com/glossary.
Index ownership – The RAFI Fundamental High Liquidity Emerging Markets Index (the Index) is a service mark of RAFI Indices, LLC or its affiliates (collectively, RAFI) and has
been licensed for use by Charles Schwab Investment Management, Inc. The intellectual and other property rights to the Index are owned by or licensed to RAFI. The Schwab
Fundamental Emerging Markets Equity Index Fund is not sponsored, endorsed, sold or promoted by RAFI, its agents or service providers (collectively, the RAFI Parties). The
RAFI Parties: (i) make no representation or warranty as to the results to be obtained from the use of the Index or otherwise; and (ii) shall not be liable (whether in negligence
or otherwise) to any person for any error in the Index. For full disclaimer, please see the fund’s statement of additional information.
Performance does not reflect the deduction of taxes that a shareholder would pay on fund distributions or the redemption of fund shares.
The fund’s performance relative to the index may be affected by fair-value pricing and timing differences in foreign exchange calculations.
The net version of the index reflects reinvested dividends net of withholding taxes but reflects no deductions for expenses or other taxes.
The MSCI Emerging Markets Index (Net) serves as the fund’s regulatory index and provides a broad measure of market performance. The fund generally invests in securities
that are included in the RAFI Fundamental High Liquidity Emerging Markets Index (Net). The fund does not seek to track the regulatory index.
Effective June 21, 2024, the fund changed its comparative index from the Russell RAFI™ Emerging Markets Large Company Index (Net) to the RAFI Fundamental High
Liquidity Emerging Markets Index (Net) in connection with a change to the fund’s investment objective and investment strategy to invest its assets in accordance with the
index. The inception date of the RAFI Fundamental High Liquidity Emerging Markets Index (Net) is January 31, 2024. The fund began tracking the index after the close of
business on June 21, 2024.
Schwab Fundamental Emerging Markets Equity Index Fund | Annual Report
|
|
|
|
|
|
Advisory Fees Paid by the Fund |
|
Weighted Average Market Cap (millions) |
|
Price/Earnings Ratio (P/E) |
|
|
|
Foreign Tax Paid and Passed Through |
|
Gross Income From Foreign Sources |
|
Qualified Dividend Income |
|
Sector Weightings % of Investments
Top Equity Holdings % of Net Assets
Top Country Weightings % of Investments
Portfolio holdings may have changed since the report date.
The Sector/Industry classifications in this report use the Global Industry Classification Standard (GICS) which was developed by and is the exclusive property of MSCI Inc.
(MSCI) and Standard & Poor’s (S&P). GICS is a service mark of MSCI and S&P and has been licensed for use by Charles Schwab & Co., Inc.
Includes the fund’s position(s) in money market mutual funds registered under the Investment Company Act of 1940, as amended.
Schwab Fundamental Emerging Markets Equity Index Fund | Annual Report
AVAILABILITY OF ADDITIONAL INFORMATION
You can find the fund’s prospectus, Statement of Additional Information (SAI), reports to shareholders, financial information,
holdings, certain
tax
information, proxy voting information, and other information about the fund online at
www.schwabassetmanagement.com/prospectus
.
Proxy Voting Policies, Procedures and Results
A description of the proxy voting policies and procedures used to determine how to vote proxies on behalf of the funds is available
without charge, upon request, by visiting the Schwab Funds’ website at
www.schwabassetmanagement.com/prospectus
, the
SEC’s website at
, or by contacting Schwab Funds at 1-877-824-5615.
Information regarding how a fund voted proxies relating to portfolio securities during the most recent twelve-month period ended
June 30 is available, without charge, by visiting the fund’s website at
www.schwabassetmanagement.com/prospectus
or the
SEC’s website at
, by calling
, or by sending an email request to
orders@mysummaryprospectus.com
.
Schwab Fundamental Emerging Markets Equity Index Fund | Annual Report
October 31, 2025
Schwab Balanced Fund
This annual shareholder report contains important information about the fund for the period of November 1, 2024, to October 31,
2025.
You can find additional information about the fund at
www.schwabassetmanagement.com/prospectus
. You can also request
this information by calling
or by sending an email request to
orders@mysummaryprospectus.com
.
If you purchase
or hold fund shares through a financial intermediary, the fund’s prospectus, Statement of Additional Information (SAI), reports to
shareholders and other information about the fund are available from your financial intermediary.
FUND COSTS FOR THE LAST year ENDED October 31, 2025
(BASED ON A HYPOTHETICAL $10,000 INVESTMENT)
Expenses were reduced by a contractual fee waiver in effect for so long as the investment adviser serves as adviser to the fund. This agreement to limit the total annual
fund operating expenses is limited to the fund’s direct operating expenses and, therefore, does not apply to acquired fund fees and expenses (AFFE), which are indirect
expenses incurred by the fund through its investments in the underlying funds.
MANAGEMENT’S DISCUSSION OF FUND PERFORMANCE
For the 12-month reporting period ended October 31, 2025, the fund returned 14.27%. The S&P 500
®
Index, which provides a
broad measure of equity market performance, and the Bloomberg US Aggregate Bond Index, which provides a broad measure of
bond market performance, returned 21.45% and 6.16%, respectively. The fund’s internally calculated comparative index, the
Balanced Blended Index (the composite index), returned 14.90%.
■
Asset allocations were broadly in line with those of the composite index
■
Top contributors to total return:
●
Schwab Core Equity Fund
●
Schwab Select Large Cap Growth Fund
■
Over the reporting period, there were no detractors from the return of the fund. However, the smallest contributors to total return
were:
●
Schwab Small-Cap Equity Fund
●
Schwab International Opportunities Fund
Portfolio holdings may have changed since the report date.
Schwab Balanced Fund | Annual Report
The performance data quoted represents past performance. Past performance does not guarantee future results. Investment returns
and principal value of an investment will fluctuate so that an investor’s shares may be worth more or less than their original cost. Current performance may be lower or higher than performance data quoted.
To obtain performance information current to the most
recent month end, please visit
www.schwabassetmanagement.com/prospectus
Performance of Hypothetical $10,000 Investment (October 31, 2015 - October 31, 2025)
Average Annual Total Returns
|
|
|
|
Fund: Schwab Balanced Fund (11/18/1996) 1 |
|
|
|
|
|
|
|
Bloomberg US Aggregate Bond Index |
|
|
|
|
|
|
|
All total returns on this page assume dividends and distributions were reinvested. Index figures do not include trading and management costs, which would lower
performance. Indices are unmanaged and cannot be invested in directly. Performance results less than one year are not annualized.
For index definitions, please see www.schwabassetmanagement.com/glossary.
Fund expenses may have been partially absorbed by the investment adviser and its affiliates. Without these reductions, the fund’s returns would have been lower.
These
returns do not reflect the deduction of taxes that a shareholder would pay on fund distributions or the redemption of fund shares.
Schwab Balanced Fund | Annual Report
|
|
|
|
|
|
Advisory Fees Paid by the Fund |
|
Foreign Tax Paid and Passed Through |
|
Gross Income From Foreign Sources |
|
Dividends Received Deduction |
|
Qualified Dividend Income |
|
Long Term Capital Gain Distribution |
|
Qualified Business Income (199A) |
|
Business Interest Deduction (163j) |
|
Asset Class Weightings % of Investments
Top Holdings % of Net Assets
Portfolio holdings may have changed since the report da
te.
The holdings listed exclude any
temporary
liquidity investments.
Schwab Balanced Fund | Annual Report
AVAILABILITY OF ADDITIONAL INFORMATION
You can find the fund’s prospectus, Statement of Additional Information (SAI), reports to shareholders, financial information,
holdings, certain tax information, proxy voting information, and other information about the fund online at
www.schwabassetmanagement.com/prospectus
.
Proxy Voting Policies, Procedures and Results
A description of the proxy voting policies and procedures used to determine how to vote proxies on behalf of the funds is available
without charge, upon request, by visiting the Schwab Funds’ website at
www.schwabassetmanagement.com/prospectus
, the
SEC’s website at
, or by contacting Schwab Funds at 1-877-824-5615.
Information regarding how a fund voted proxies relating to portfolio securities during the most recent twelve-mon
th pe
riod ended
June 30 is available, without charge, by visiting the fund’s website at
www.schwabassetmanagement.com/prospectus
or the
SEC’s website at
, by calling
, or by sending an email request to
orders@mysummaryprospectus.com
.
Schwab Balanced Fund | Annual Report
October 31, 2025
Schwab MarketTrack All Equity Portfolio™
This annual shareholder report contains important information about the fund for the period of November 1, 2024, to October 31,
2025.
You can find additional information about the fund at
www.schwabassetmanagement.com/prospectus
. You can also request
this information by calling
or by sending an email request to
orders@mysummaryprospectus.com
.
If you purchase
or hold fund shares through a financial intermediary, the fund’s prospectus, Statement of Additional Information (SAI), reports to
shareholders and other information about the fund are available from your financial intermediary.
FUND COSTS FOR THE LAST year ENDED October 31, 2025
(BASED ON A HYPOTHETICAL $10,000 INVESTMENT)
|
|
|
Schwab MarketTrack All Equity Porfolio |
|
|
MANAGEMENT’S DISCUSSION OF FUND PERFORMANCE
For the 12-month reporting period ended October 31, 2025, the fund returned 19.80%. The S&P 500
®
Index, which provides a
broad measure of equity market performance, returned 21.45%. The fund’s custom blended comparative index, the All Equity
Composite Index (the composite index), returned 20.32%.
■
Asset allocations were broadly in line with those of the composite index
■
Top contributors to total return:
●
Schwab S&P 500 Index Fund
●
Schwab International Index Fund
■
Top detractors from total return:
●
While there were no additional underlying funds that detracted from the total return of the fund, Schwab Emerging Markets
Equity ETF was the smallest contributor to total return
Portfolio holdings may have changed since the report date.
Schwab MarketTrack All Equity Portfolio™ | Annual Report
The performance data quoted represents past performance. Past performance does not guarantee future results. Investment returns
and principal value of an investment will fluctuate so that an investor’s shares may be worth more or less than their original cost. Current performance may be lower or higher than performance data quoted.
To obtain performance information current to the most
recent month end, please visit
www.schwabassetmanagement.com/prospectus
Performance of Hypothetical $10,000 Investment (October 31, 2015 - October 31, 2025)
Average Annual Total Returns
|
|
|
|
Fund: Schwab MarketTrack All Equity Portfolio (05/19/1998) 1 |
|
|
|
|
|
|
|
All Equity Composite Index |
|
|
|
All total returns on this page assume dividends and distributions were reinvested. Index figures do not include trading and management costs, which would lower
performance. Indices are unmanaged and cannot be invested in directly. Performance results less than one year are not annualized.
For index definitions, please see www.schwabassetmanagement.com/glossary.
Fund expenses may have been partially absorbed by the investment adviser and its affiliates. Without these reductions, the fund’s returns would have been lower.
These
returns do not reflect the deduction of taxes that a shareholder would pay on fund distributions or the redemption of fund shares.
Schwab MarketTrack All Equity Portfolio™ | Annual Repo
rt
|
|
|
|
|
|
Advisory Fees Paid by the Fund |
|
Foreign Tax Paid and Passed Through |
|
Gross Income From Foreign Sources |
|
Dividends Received Deduction |
|
Qualified Dividend Income |
|
Long Term Capital Gain Distribution |
|
Qualified Business Income (199A) |
|
Asset Class Weightings % of Investments
Top Holdings % of Net Assets
Portfolio holdings may have changed since the report date.
Schwab MarketTrack All Equity Portfolio™ | Annual Report
AVAILABILITY OF ADDITIONAL INFORMATION
You can find the fund’s prospectus, Statement of Additional Information (SAI), reports to shareholders, financial information,
holdings, certain tax information, proxy voting information, and other information
abo
ut the fund online at
www.schwabassetmanagement.com/prospectus
.
Proxy Voting Policies, Procedures and Results
A description of the proxy voting policies and procedures used to determine how to vote proxies on behalf of the funds is available
without charge, upon request, by visiting the Schwab Funds’ website at
www.schwabassetmanagement.com/prospectus
, the
SEC’s website at
, or by contacting Schwab Funds at 1-877-824-5615.
Information regarding how a fund voted proxies relating to portfolio securities during the most recent twelve-month period ended
June 30 is available, without charge, by visiting the fund’s website at
www.schwabassetmanagement.com/prospectus
or the
SEC’s website at
, by calling
, or by sending an email request to
orders@mysummaryprospectus.com
.
Schwab MarketTrack All Equity Portfolio™ | Annual Report
October 31, 2025
Schwab MarketTrack Growth Portfolio™
This annual shareholder report contains important information about the fund for the period of November 1, 2024, to October 31,
2025.
You can find additional information about the fund at
www.schwabassetmanagement.com/prospectus
. You can also request
this information by calling
or by sending an email request to
orders@mysummaryprospectus.com
.
If you purchase
or hold fund shares through a financial intermediary, the fund’s prospectus, Statement of Additional Information (SAI), reports to
shareholders and other information about the fund are available from your financial intermediary.
FUND COSTS FOR THE LAST year ENDED October 31, 2025
(BASED ON A HYPOTHETICAL $10,000 INVESTMENT)
|
|
|
Schwab MarketTrack Growth Porfolio |
|
|
MANAGEMENT’S DISCUSSION OF FUND PERFORMANCE
For the 12-month reporting period ended October 31, 2025, the fund returned 16.79%. The S&P 500
®
Index, which provides a
broad measure of equity market performance, and the Bloomberg US Aggregate Bond Index, which provides a broad measure of
bond market performance, returned 21.45% and 6.16%, respectively. The fund’s custom blended comparative index, the Growth
Composite Index (the composite index), returned 17.30%.
■
Asset allocations were broadly in line with those of the composite index
■
Top contributors to total return:
●
Schwab S&P 500 Index Fund
●
Schwab International Index Fund
■
Top detractors from total return:
●
While there were no additional underlying funds that detracted from the total return of the fund, Schwab Emerging Markets
Equity ETF was the smallest contributor to total return
Portfolio holdings may have changed since the report date.
Schwab MarketTrack Growth Portfolio™ | Annual Report
The performance data quoted represents past performance. Past performance does not guarantee future results. Investment returns
and principal value of an investment will fluctuate so that an investor’s shares may be worth more or less than their original cost. Current performance may be lower or higher than performance data quoted.
To obtain performance information current to the most
recent month end, please visit
www.schwabassetmanagement.com/prospectus
Performance of Hypothetical $10,000 Investment (October 31, 2015 - October 31, 2025)
Average Annual Total Returns
|
|
|
|
Fund: Schwab MarketTrack Growth Portfolio (11/20/1995) 1 |
|
|
|
|
|
|
|
Bloomberg US Aggregate Bond Index |
|
|
|
|
|
|
|
All total returns on this page assume dividends and distributions were reinvested. Index figures do not include trading and management costs, which would lower
performance. Indices are unmanaged and cannot be invested in directly. Performance results less than one year are not annualized.
For index definitions, please see www.schwabassetmanagement.com/glossary.
Fund expenses may have been partially absorbed by the investment adviser and its affiliates. Without these reductions, the fund’s returns would have been lower.
These
returns do not reflect the deduction of taxes that a shareholder would pay on fund distributions or the redemption of fund shares.
Schwab MarketTrack Growth Portfolio™ | Annual Report
|
|
|
|
|
|
Advisory Fees Paid by the Fund |
|
Foreign Tax Paid and Passed Through |
|
Gross Income From Foreign Sources |
|
Dividends Received Deduction |
|
Qualified Dividend Income |
|
Long Term Capital Gain Distribution |
|
Qualified Business Income (199A) |
|
Business Interest Deduction (163j) |
|
Asset Class Weightings % of Investments
Top Holdings % of Net Assets
Portfolio holdings may have changed since the report date.
Schwab MarketTrack Growth Portfolio™ | Annual Report
AVAILABILITY OF ADDITIONAL INFORMATION
You can find the fund’s prospectus, Statement of Additional Information (SAI),
reports
to shareholders, financial information,
holdings, certain tax information, proxy voting information, and other information about the fund online at
www.schwabassetmanagement.com/prospectus
.
Proxy Voting Policies, Procedures and Results
A description of the proxy voting policies and procedures used to determine how to vote proxies on behalf of the funds is available
without charge, upon request, by visiting the Schwab Funds’ website at
www.schwabassetmanagement.com/prospectus
, the
SEC’s website at
, or by contacting Schwab Funds at 1-877-824-5615.
Information regarding how a fund voted proxies relating to portfolio securities during the most recent twelve-month period ended
June 30 is available, without charge, by visiting the fund’s website at
www.schwabassetmanagement.com/prospectus
or the
SEC’s website at
, by calling
, or by sending an email request to
orders@mysummaryprospectus.com
.
Schwab MarketTrack Growth Portfolio™ | Annual Report
October 31, 2025
Schwab MarketTrack Balanced Portfolio™
This annual shareholder report contains important information about the fund for the period of November 1, 2024, to October 31,
2025.
You can find additional information about the fund at
www.schwabassetmanagement.com/prospectus
.
You can also request
this information by calling
or by sending an email request to
orders@mysummaryprospectus.com
.
If you purchase
or hold fund shares through a financial intermediary, the fund’s prospectus, Statement of Additional Information (SAI), reports to
shareholders and other information about the fund are available from your financial intermediary.
FUND COSTS FOR THE LAST year ENDED October 31, 2025
(BASED ON A HYPOTHETICAL $10,000 INVESTMENT)
|
|
|
Schwab MarketTrack Balanced Portfolio |
|
|
MANAGEMENT’S DISCUSSION OF FUND PERFORMANCE
For the 12-month reporting period ended October 31, 2025, the fund returned 13.97%. The S&P 500
®
Index, which provides a
broad measure of equity market performance, and the Bloomberg US Aggregate Bond Index, which provides a broad measure of
bond market performance, returned 21.45% and 6.16%, respectively. The fund’s custom blended comparative index, the Balanced
Composite Index (the composite index), returned 14.49%.
■
Asset allocations were broadly in line with those of the composite index
■
Top contributors to total return:
●
Schwab S&P 500 Index Fund
●
Schwab U.S. Aggregate Bond Index Fund
■
Top detractors from total return:
●
Schwab High Yield Bond ETF
Portfolio holdings may have changed since the report date.
Schwab MarketTrack Balanced Portfolio™ | Annual Report
The performance data quoted represents past performance. Past performance does not guarantee future results. Investment returns
and principal value of an investment will fluctuate so that an investor’s shares may be worth more or less than their original cost. Current performance may be lower or higher than performance data quoted.
To obtain performance information current to the most
recent month end, please visit
www.schwabassetmanagement.com/prospectus
Performance of Hypothetical $10,000 Investment (October 31, 2015 - October 31, 2025)
Average Annual Total Returns
|
|
|
|
Fund: Schwab MarketTrack Balanced Portfolio (11/20/1995) 1 |
|
|
|
|
|
|
|
Bloomberg US Aggregate Bond Index |
|
|
|
|
|
|
|
All total returns on this page assume dividends and distributions were reinvested. Index figures do not include trading and management costs, which would lower
performance. Indices are unmanaged and cannot be invested in directly. Performance results less than one year are not annualized.
For index definitions, please see www.schwabassetmanagement.com/glossary.
Fund expenses may have been partially absorbed by the investment adviser and its affiliates. Without these reductions, the fund’s returns would have been lower.
These
returns do not reflect the deduction of taxes that a shareholder would pay on fund distributions or the redemption of fund shares.
Schwab MarketTrack Balanced Portfolio™ | Annual Report
|
|
|
|
|
|
Advisory Fees Paid by the Fund |
|
Foreign Tax Paid and Passed Through |
|
Gross Income From Foreign Sources |
|
Dividends Received Deduction |
|
Qualified Dividend Income |
|
Long Term Capital Gain Distribution |
|
Qualified Business Income (199A) |
|
Business Interest Deduction (163j) |
|
Asset Class Weightings % of Investments
Top Holdings % of Net Assets
Portfolio holdings may have changed since the report date.
Schwab MarketTrack Balanced Portfolio™ | Annual Report
AVAILABILITY OF ADDITIONAL INFORMATION
You can find the fund’s prospectus, Statement of Additional Information (SAI), reports to shareholders, financial information,
holdings, certain tax information, proxy voting information, and other information about the fund online at
www.schwabassetmanagement.com/prospectus
.
Proxy Voting Policies, Procedures and Results
A description of the proxy voting policies and procedures used to determine how to vote proxies on behalf of the funds is available
without charge, upon request, by visiting the Schwab Funds’ website at
www.schwabassetmanagement.com/prospectus
, the
SEC’s website at
, or by contacting Schwab Funds at 1-877-824-5615.
Information regarding how a fund voted proxies relating to portfolio securities during the most recent twelve-month period ended
June 30 is available, without charge, by visiting the fund’s website at
www.schwabassetmanagement.com/prospectus
or the
SEC’s website at
, by calling
, or by sending an email request to
orders@mysummaryprospectus.com
.
Schwab MarketTrack Balanced Portfolio™ | Annual Report
October 31, 2025
Schwab MarketTrack Conservative Portfolio™
This annual shareholder report contains important information about the fund for the period of November 1, 2024, to October 31,
2025.
You can find additional information about the fund at
www.schwabassetmanagement.com/prospectus
. You can also request
this information by calling
or by sending an email request to
orders@mysummaryprospectus.com
.
If you purchase
or hold fund shares through a financial intermediary, the fund’s prospectus, Statement of Additional Information (SAI), reports to
shareholders and other information about the fund are available from your financial intermediary.
FUND COSTS FOR THE LAST year ENDED October 31, 2025
(BASED ON A HYPOTHETICAL $10,000 INVESTMENT)
|
|
|
Schwab MarketTrack Conservative Portfolio |
|
|
MANAGEMENT’S DISCUSSION OF FUND PERFORMANCE
For the 12-month reporting period ended October 31, 2025, the fund returned 11.12%. The S&P 500
®
Index, which provides a
broad measure of equity market performance, and the Bloomberg US Aggregate Bond Index, which provides a broad measure of
bond market performance, returned 21.45% and 6.16%, respectively. The fund’s custom blended comparative index, the
Conservative Composite Index (the composite index), returned 11.59%.
■
Asset allocations were broadly in line with those of the composite index
■
Top contributors to total return:
●
Schwab U.S. Aggregate Bond Index Fund
●
Schwab S&P 500 Index Fund
■
Top detractors from total return:
●
Schwab High Yield Bond ETF
Portfolio holdings may have changed since the report date.
Sc
hwab MarketTrack Conservative Portfolio™ | Annual Report
The performance data quoted represents past performance. Past performance does not guarantee future results. Investment returns
and principal value of an investment will fluctuate so that an investor’s shares may be worth more or less than their original cost. Current performance may be lower or higher than performance data quoted.
To obtain performance information current to the most
recent month end, please visit
www.schwabassetmanagement.com/prospectus
Performance of Hypothetical $10,000 Investment (October 31, 2015 - October 31, 2025)
Average Annual Total Returns
|
|
|
|
Fund: Schwab MarketTrack Conservative Portfolio (11/20/1995) 1 |
|
|
|
|
|
|
|
Bloomberg US Aggregate Bond Index |
|
|
|
Conservative Composite Index |
|
|
|
All total returns on this page assume dividends and distributions were reinvested. Index figures do not include trading and management costs, which would lower
performance. Indices are unmanaged and cannot be invested in directly. Performance results less than one year are not annualized.
For index definitions, please see www.schwabassetmanagement.com/glossary.
Fund expenses may have been partially absorbed by the investment adviser and its affiliates. Without these reductions, the fund’s returns would have been lower.
These
returns do not reflect the deduction of taxes that a shareholder would pay on fund distributions or the redemption of fund shares.
Schwab MarketTrack Conservative Portfolio™ | Annual Report
|
|
|
|
|
|
Advisory Fees Paid by the Fund |
|
Foreign Tax Paid and Passed Through |
|
Gross Income From Foreign Sources |
|
Dividends Received Deduction |
|
Qualified Dividend Income |
|
Long Term Capital Gain Distribution |
|
Qualified Business Income (199A) |
|
Business Interest Deduction (163j) |
|
Asset Class Weightings % of Investments
Top Holdings % of Net Assets
Portfolio holdings may have changed since the report date.
Schwab MarketTrack Conservative Portfolio™ | Annual Report
AVAILABILITY OF ADDITIONAL INFORMATION
You can find the fund’s prospectus, Statement of Additional Information (SAI), reports to shareholders, financial information,
holdings, certain tax information, proxy voting information, and other information about the fund online at
www.schwabassetmanagement.com/prospectus
.
Proxy Voting Policies, Procedures and Results
A description of the proxy voting policies and procedures used to determine how to vote proxies on behalf of the funds is available
without charge, upon request, by visiting the Schwab Funds’ website at
www.schwabassetmanagement.com/prospectus
, the
SEC’s website at
, or by contacting Schwab Funds at 1-877-824-5615.
Information regarding how a fund voted proxies relating to portfolio securities during the most recent twelve-month period ended
June 30 is available, without charge, by visiting the fund’s website at
www.schwabassetmanagement.com/prospectus
or the
SEC’s website at
, by calling
, or by sending an email request to
orders@mysummaryprospectus.com
.
Schwab MarketTrack Conservative Portfolio™ | Annual Report
October 31, 2025
Schwab Target 2010 Fund
This annual shareholder report contains important information about the fund for the period of November 1, 2024, to October 31,
2025.
You can find additional information about the fund at
www.schwabassetmanagement.com/prospectus
. You can also request
this information by calling
or by sending an email request to
orders@mysummaryprospectus.com
.
If you purchase
or hold fund shares through a financial intermediary, the fund’s prospectus, Statement of Additional Information (SAI), reports to
shareholders and other information about the fund are available from your financial intermediary.
FUND COSTS FOR THE LAST year ENDED October 31, 2025
(BASED ON A HYPOTHETICAL $10,000 INVESTMENT)
Expenses were reduced by a contractual fee waiver in effect for so long as the investment adviser serves as adviser to the fund. This agreement to limit the total annual
fund operating expenses is limited to the fund’s direct operating expenses and, therefore, does not apply to acquired fund fees and expenses (AFFE), which are indirect
expenses incurred by the fund through its investments in the underlying funds.
MANAGEMENT’S DISCUSSION OF FUND PERFORMANCE
For the 12-month reporting period ended October 31, 2025, the 2010 Fund returned 10.75%. The Dow Jones U.S. Total Stock
Market Index
SM
, which provides a broad measure of equity market performance, and the Bloomberg US Aggregate Bond Index,
which provides a broad measure of bond market performance, returned 20.90% and 6.16%, respectively. The 2010 Fund’s internally
calculated comparative index, the Target 2010 Composite Index (the composite index), returned 10.76%.
■
Asset allocations were broadly in line with those of the composite index
■
Top contributors to total return:
●
Schwab S&P 500 Index Fund
●
Schwab U.S. Aggregate Bond Index Fund
■
Over the reporting period, there were no detractors from the return of the fund. However, the smallest contributors to total return
were:
●
ClearBridge Small Cap Growth Fund (Class IS) (which was sold prior to the end of the reporting period)
●
Loomis Sayles Investment Grade Bond Fund (Class Y)
Portfolio holdings may have changed since the report date.
Schwab Target 2010 Fund | Annual Report
The performance data quoted represents past performance. Past performance does not guarantee future results. Investment returns
and principal value of an investment will fluctuate so that an investor’s shares may be worth more or less than their original cost. Current performance may be lower or higher than performance data quoted.
To obtain performance information current to the most
recent month end, please visit
www.schwabassetmanagement.com/prospectus
Performance of Hypothetical $10,000 Investment (October 31, 2015 - October 31, 2025)
Average Annual Total Returns
|
|
|
|
Fund: Schwab Target 2010 Fund (07/01/2005) 1 |
|
|
|
Dow Jones U.S. Total Stock Market Index SM |
|
|
|
Bloomberg US Aggregate Bond Index |
|
|
|
Target 2010 Composite Index |
|
|
|
All total returns on this page assume dividends and distributions were reinvested. Index figures do not include trading and management costs, which would lower
performance. Indices are unmanaged and cannot be invested in directly. Performance results less than one year are not annualized.
For index definitions, please see www.schwabassetmanagement.com/glossary.
Fund expenses may have been partially absorbed by the investment adviser and its affiliates. Without these reductions, the fund’s returns would have been lower.
These
returns do not reflect the deduction of taxes that a shareholder would pay on fund distributions or the redemption of fund shares.
Schwab Target 2010 Fund | Annual Report
|
|
|
|
|
|
Advisory Fees Paid by the Fund |
|
Foreign Tax Paid and Passed Through |
|
Gross Income From Foreign Sources |
|
Dividends Received Deduction |
|
Qualified Dividend Income |
|
Long Term Capital Gain Distribution |
|
Qualified Business Income (199A) |
|
Business Interest Deduction (163j) |
|
Asset Class Weightings % of Investments
Top Holdings % of Net Assets
Portfolio holdings may have changed since the report date.
Schwab Target 2010 Fund | Annual Report
AVAILABILITY OF ADDITIONAL INFORMATION
You can find the fund’s prospectus, Statement of Additional Information (SAI), reports to shareholders, financial information,
holdings, certain tax information, proxy voting information, and other information about the fund online at
www.schwabassetmanagement.com/prospectus
.
Proxy Voting Policies, Procedures and Results
A description of the proxy voting policies and pr
ocedu
res used to determine how to vote proxies on behalf of the
fund
s is available
without charge, upon request, by visiting the Schwab Funds’ website at
www.schwabassetmanagement.com/prospectus
, the
SEC’s website at
, or by contacting Schwab Funds at 1-877-824-5615.
Information regarding how a fund voted proxies relating to portfolio securities during the most recent twelve-month period ended
June 30 is available, without charge, by visiting the fund’s website at
www.schwabassetmanagement.com/prospectus
or the
SEC’s website at
, by calling
, or by sending an email request to
orders@mysummaryprospectus.com
.
Schwab Target 2010 Fund | Annual Report
October 31, 2025
Schwab Target 2015 Fund
This annual shareholder report contains important information about the fund for the period of November 1, 2024, to October 31,
2025.
You can find additional information about the fund at
www.schwabassetmanagement.com/prospectus
. You can also request
this information by calling
or by sending an email request to
orders@mysummaryprospectus.com
.
If you purchase
or hold fund shares through a financial intermediary, the fund’s prospectus, Statement of Additional Information (SAI), reports to
shareholders and other information about the fund are available from your financial intermediary.
FUND COSTS FOR THE LAST year ENDED October 31, 2025
(BASED ON A HYPOTHETICAL $10,000 INVESTMENT)
Expenses were reduced by a contractual fee waiver in effect for so long as the investment adviser serves as adviser to the fund. This agreement to limit the total annual
fund operating expenses is limited to the fund’s direct operating expenses and, therefore, does not apply to acquired fund fees and expenses (AFFE), which are indirect
expenses incurred by the fund through its investments in the underlying funds.
MANAGEMENT’S DISCUSSION OF FUND PERFORMANCE
For the 12-month reporting period ended October 31, 2025, the 2015 Fund returned 11.39%. The Dow Jones U.S. Total Stock
Market Index
SM
, which provides a broad measure of equity market performance, and the Bloomberg US Aggregate Bond Index,
which provides a broad measure of bond market performance, returned 20.90% and 6.16%, respectively. The 2015 Fund’s internally
calculated comparative index, the Target 2015 Composite Index (the composite index), returned 11.37%.
■
Asset allocations were broadly in line with those of the composite index
■
Top contributors to total return:
●
Schwab S&P 500 Index Fund
●
Schwab U.S. Aggregate Bond Index Fund
■
Over the reporting period, there were no detractors from the return of the fund. However, the smallest contributors to total return
were:
●
ClearBridge Small Cap Growth Fund (Class IS) (which was sold prior to the end of the reporting period)
●
Driehaus Small Cap Growth Fund (Institutional Shares)
Portfolio holdings may have changed since the report date.
Schwab Target 2015 Fund | Annual Report
The performance data quoted represents past performance. Past performance does not guarantee future results. Investment returns
and principal value of an investment will fluctuate so that an investor’s shares may be worth more or less than their original cost. Current performance may be lower or higher than performance data quoted.
To obtain performance information current to the most
recent month end, please visit
www.schwabassetmanagement.com/prospectus
Performance of Hypothetical $10,000 Investment (October 31, 2015 - October 31, 2025)
Average Annual Total Returns
|
|
|
|
Fund: Schwab Target 2015 Fund (03/12/2008) 1 |
|
|
|
Dow Jones U.S. Total Stock Market Index SM |
|
|
|
Bloomberg US Aggregate Bond Index |
|
|
|
Target 2015 Composite Index |
|
|
|
All total returns on this page assume dividends and distributions were reinvested. Index figures do not include trading and management costs, which would lower
performance. Indices are unmanaged and cannot be invested in directly. Performance results less than one year are not annualized.
For index definitions, please see www.schwabassetmanagement.com/glossary.
Fund expenses may have been partially absorbed by the investment adviser and its affiliates. Without these reductions, the fund’s returns would have been lower.
These
returns do not reflect the deduction of taxes that a shareholder would pay on fund distributions or the redemption of fund shares.
Schwab Target 2015 Fund | Annual Report
|
|
|
|
|
|
Advisory Fees Paid by the Fund |
|
Foreign Tax Paid and Passed Through |
|
Gross Income From Foreign Sources |
|
Dividends Received Deduction |
|
Qualified Dividend Income |
|
Long Term Capital Gain Distribution |
|
Qualified Business Income (199A) |
|
Business Interest Deduction (163j) |
|
Asset Class Weightings % of Investments
Top Holdings % of Net Assets
Portfolio holdings may have changed since the report date.
Schwab Target 2015 Fund | Annual Report
AVAILABILITY OF ADDITIONAL INFORMATION
You can find the fund’s prospectus, Statement of Additional Information (SAI), reports to shareholders, financial information,
holdings, certain tax information, proxy voting information, and other information about the fund online at
www.schwabassetmanagement.com/prospectus
.
Proxy Voting Policies, Procedures and Results
A description of the proxy voting policies and proced
ures
used to determine how to vote proxies on behalf of the funds is available
without charge, upon request, by visiting the Schwab Funds’ website at
www.schwabassetmanagement.com/prospectus
, the
SEC’s website at
, or by contacting Schwab Funds at 1-877-824-5615.
Information regarding how a fund voted proxies relating to portfolio securities during the most recent twelve-month period ended
June 30 is available, without charge, by visiting the fund’s website at
www.schwabassetmanagement.com/prospectus
or the
SEC’s website at
, by calling
, or by sending an email request to
orders@mysummaryprospectus.com
.
Schwab Target 2015 Fund | Annual Report
October 31, 2025
Schwab Target 2020 Fund
This annual shareholder report contains important information about the fund for the period of November 1, 2024, to October 31,
2025.
You can find additional information about the fund at
www.schwabassetmanagement.com/prospectus
. You can also request
this information by calling
or by sending an email request to
orders@mysummaryprospectus.com
.
If you purchase
or hold fund shares through a financial intermediary, the fund’s prospectus, Statement of Additional Information (SAI), reports to
shareholders and other information about the fund are available from your financial intermediary.
FUND COSTS FOR THE LAST year ENDED October 31, 2025
(BASED ON A HYPOTHETICAL $10,000 INVESTMENT)
Expenses were reduced by a contractual fee waiver in effect for so long as the investment adviser serves as adviser to the fund. This agreement to limit the total annual
fund operating expenses is limited to the fund’s direct operating expenses and, therefore, does not apply to acquired fund fees and expenses (AFFE), which are indirect
expenses incurred by the fund through its investments in the underlying funds.
MANAGEMENT’S DISCUSSION OF FUND PERFORMANCE
For the 12-month reporting period ended October 31, 2025, the 2020 Fund returned 11.79%. The Dow Jones U.S. Total Stock
Market Index
SM
, which provides a broad measure of equity market performance, and the Bloomberg US Aggregate Bond Index,
which provides a broad measure of bond market performance, returned 20.90% and 6.16%, respectively. The 2020 Fund’s internally
calculated comparative index, the Target 2020 Composite Index (the composite index), returned 11.78%.
■
Asset allocations were broadly in line with those of the composite index
■
Top contributors to total return:
●
Schwab S&P 500 Index Fund
●
Schwab U.S. Aggregate Bond Index Fund
■
Over the reporting period, there were no detractors from the return of the fund. However, the smallest contributors to total return
were:
●
Driehaus Small Cap Growth Fund (Institutional Shares)
●
ClearBridge Small Cap Growth Fund (Class IS) (which was sold prior to the end of the reporting period)
Portfolio holdings may have changed since the report date.
Schwab Target 2020 Fund | Annual Report
The performance data quoted represents past performance. Past performance does not guarantee future results. Investment returns
and principal value of an investment will fluctuate so that an investor’s shares may be worth more or less than their original cost. Current performance may be lower or higher than performance data quoted.
To obtain performance information current to the most
recent month end, please visit
www.schwabassetmanagement.com/prospectus
Performance of Hypothetical $10,000 Investment (October 31, 2015 - October 31, 2025)
Average Annual Total Returns
|
|
|
|
Fund: Schwab Target 2020 Fund (07/01/2005) 1 |
|
|
|
Dow Jones U.S. Total Stock Market Index SM |
|
|
|
Bloomberg US Aggregate Bond Index |
|
|
|
Target 2020 Composite Index |
|
|
|
All total returns on this page assume dividends and distributions were reinvested. Index figures do not include trading and management costs, which would lower
performance. Indices are unmanaged and cannot be invested in directly. Performance results less than one year are not annualized.
For index definitions, please see www.schwabassetmanagement.com/glossary.
Fund expenses may have been partially absorbed by the investment adviser and its affiliates. Without these reductions, the fund’s returns would have been lower.
These
returns do not reflect the deduction of taxes that a shareholder would pay on fund distributions or the redemption of fund shares.
Schwab Target 2020 Fund | Annual Report
|
|
|
|
|
|
Advisory Fees Paid by the Fund |
|
Foreign Tax Paid and Passed Through |
|
Gross Income From Foreign Sources |
|
Dividends Received Deduction |
|
Qualified Dividend Income |
|
Long Term Capital Gain Distribution |
|
Qualified Business Income (199A) |
|
Business Interest Deduction (163j) |
|
Asset Class Weightings % of Investments
Top Holdings % of Net Assets
Portfolio holdings may have changed since the report date.
Schwab Target 2020 Fund | Annual Report
AVAILABILITY OF ADDITIONAL INFORMATION
You can find the fund’s prospectus, Statement of Additional Information (SAI), reports to shareholders, fin
ancial
information,
holdings, certain tax information, proxy voting information, and other information about the fund online at
www.schwabassetmanagement.com/prospectus
.
Proxy Voting Policies, Procedures and Results
A description of the proxy voting policies and procedures used to determine how to vote proxies on behalf of the funds is available
without charge, upon request, by visiting the Schwab Funds’ website at
www.schwabassetmanagement.com/prospectus
, the
SEC’s website at
, or by contacting Schwab Funds at 1-877-824-5615.
Information regarding how a fund voted proxies relating to portfolio securities during the most recent twelve-month period ended
June 30 is available, without charge, by visiting the fund’s website at
www.schwabassetmanagement.com/prospectus
or the
SEC’s website at
, by calling
, or by sending an email request to
orders@mysummaryprospectus.com
.
Schwab Target 2020 Fund | Annual Report
October 31, 2025
Schwab Target 2025 Fund
This annual shareholder report contains important information about the fund for the period of November 1, 2024, to October 31,
2025.
You can find additional information about the fund at
www.schwabassetmanagement.com/prospectus
. You can also request
this information by calling
or by sending an email request to
orders@mysummaryprospectus.com
.
If you purchase
or hold fund shares through a financial intermediary, the fund’s prospectus, Statement of Additional Information (SAI), reports to
shareholders and other information about the fund are available from your financial intermediary.
FUND COSTS FOR THE LAST year ENDED October 31, 2025
(BASED ON A HYPOTHETICAL $10,000 INVESTMENT)
Expenses were reduced by a contractual fee waiver in effect for so long as the investment adviser serves as adviser to the fund. This agreement to limit the total annual
fund operating expenses is limited to the fund’s direct operating expenses and, therefore, does not apply to acquired fund fees and expenses (AFFE), which are indirect
expenses incurred by the fund through its investments in the underlying funds.
MANAGEMENT’S DISCUSSION OF FUND PERFORMANCE
For the 12-month reporting period ended October 31, 2025, the 2025 Fund returned 12.30%. The Dow Jones U.S. Total Stock
Market Index
SM
, which provides a broad measure of equity market performance, and the Bloomberg US Aggregate Bond Index,
which provides a broad measure of bond market performance, returned 20.90% and 6.16%, respectively. The 2025 Fund’s internally
calculated comparative index, the Target 2025 Composite Index (the composite index), returned 12.19%.
■
Asset allocations were broadly in line with those of the composite index
■
Top contributors to total return:
●
Schwab S&P 500 Index Fund
●
Schwab U.S. Aggregate Bond Index Fund
■
Top detractors from total return:
●
Goldman Sachs Emerging Markets Equity Insights Fund (Institutional Class) (which was sold prior to the end of the reporting
period)
●
While there were no additional underlying funds that detracted from the total return of the fund, ClearBridge Small Cap Growth
Fund (Class IS) was the smallest contributor to total return (which was sold prior to the end of the reporting period)
Portfolio holdings may have changed since the report date.
Schwab Target 2025 Fund | Annual Report
The performance data quoted represents past performance. Past performance does not guarantee future results. Investment returns
and principal value of an investment will fluctuate so that an investor’s shares may be worth more or less than their original cost. Current performance may be lower or higher than performance data quoted.
To obtain performance information current to the most
recent month end, please visit
www.schwabassetmanagement.com/prospectus
Performance of Hypothetical $10,000 Investment (October 31, 2015 - October 31, 2025)
Average Annual Total Returns
|
|
|
|
Fund: Schwab Target 2025 Fund (03/12/2008) 1 |
|
|
|
Dow Jones U.S. Total Stock Market Index SM |
|
|
|
Bloomberg US Aggregate Bond Index |
|
|
|
Target 2025 Composite Index |
|
|
|
All total returns on this page assume dividends and distributions were reinvested. Index figures do not include trading and management costs, which would lower
performance. Indices are unmanaged and cannot be invested in directly. Performance results less than one year are not annualized.
For index definitions, please see www.schwabassetmanagement.com/glossary.
Fund expenses may have been partially absorbed by the investment adviser and its affiliates. Without these reductions, the fund’s returns would have been lower.
These
returns do not reflect the deduction of taxes that a shareholder would pay on fund distributions or the redemption of fund shares.
Schwab Target 2025 Fund | Annual Report
|
|
|
|
|
|
Advisory Fees Paid by the Fund |
|
Foreign Tax Paid and Passed Through |
|
Gross Income From Foreign Sources |
|
Dividends Received Deduction |
|
Qualified Dividend Income |
|
Long Term Capital Gain Distribution |
|
Qualified Business Income (199A) |
|
Business Interest Deduction (163j) |
|
Asset Class Weightings % of Investments
Top Holdings % of Net Assets
Portfolio holdings may have changed
since
the report date.
Schwab Target 2025 Fund | Annual Report
AVAILABILITY OF ADDITIONAL INFORMATION
You can find the fund’s prospectus, Statement of Additional Information (SAI), reports to shareholders, financial information,
holdings, certain tax information, proxy voting information, and other information about the fund online at
www.schwabassetmanagement.com/prospectus
.
Proxy Voting Policies, Procedures and Results
A description of the proxy voting policies and procedures used to determine how to vote proxies on behalf of the funds is available
without charge, upon request, by visiting the Schwab Funds’ website at
www.schwabassetmanagement.com/prospectus
, the
SEC’s website at
, or by contacting Schwab Funds at 1-877-824-5615.
Information regarding how a fund voted proxies relating to portfolio securities during the most recent twelve-month period ended
June 30 is available, without charge, by visiting the fund’s website at
www.schwabassetmanagement.com/prospectus
or the
SEC’s website at
, by calling
, or by sending an email request to
orders@mysummaryprospectus.com
.
Schwab Target 2025 Fund | Annual Report
October 31, 2025
Schwab Target 2030 Fund
This annual shareholder report contains important information about the fund for the period of November 1, 2024, to October 31,
2025.
You can find additional information about the fund at
www.schwabassetmanagement.com/prospectus
. You can also request
this information by calling
or by sending an email request to
orders@mysummaryprospectus.com
.
If you purchase
or hold fund shares through a financial intermediary, the fund’s prospectus, Statement of Additional Information (SAI), reports to
shareholders and other information about the fund are available from your financial intermediary.
FUND COSTS FOR THE LAST year ENDED October 31, 2025
(BASED ON A HYPOTHETICAL $10,000 INVESTMENT)
Expenses were reduced by a contractual fee waiver in effect for so long as the investment adviser serves as adviser to the fund. This agreement to limit the total annual
fund operating expenses is limited to the fund’s direct operating expenses and, therefore, does not apply to acquired fund fees and expenses (AFFE), which are indirect
expenses incurred by the fund through its investments in the underlying funds.
MANAGEMENT’S DISCUSSION OF FUND PERFORMANCE
For the 12-month reporting period ended October 31, 2025, the 2030 Fund returned 14.42%. The Dow Jones U.S. Total Stock
Market Index
SM
, which provides a broad measure of equity market performance, and the Bloomberg US Aggregate Bond Index,
which provides a broad measure of bond market performance, returned 20.90% and 6.16%, respectively. The 2030 Fund’s internally
calculated comparative index, the Target 2030 Composite Index (the composite index), returned 14.30%.
■
Asset allocations were broadly in line with those of the composite index
■
Top contributors to total return:
●
Schwab S&P 500 Index Fund
●
Schwab International Opportunities Fund
■
Over the reporting period, there were no detractors from the return of the fund. However, the smallest contributors to total return
were:
●
ClearBridge Small Cap Growth Fund (Class IS) (which was sold prior to the end of the reporting period)
●
Driehaus Small Cap Growth Fund (Institutional Shares)
Portfolio holdings may have changed since the report date.
Schwab Target 2030 Fund | Annual Report
The performance data quoted represents past performance. Past performance does not guarantee future results. Investment returns
and principal value of an investment will fluctuate so that an investor’s shares may be worth more or less than their original cost. Current performance may be lower or higher than performance data quoted.
To obtain performance information current to the most
recent month end, please visit
www.schwabassetmanagement.com/prospectus
Performance of Hypothetical $10,000 Investment (October 31, 2015 - October 31, 2025)
Average Annual Total Returns
|
|
|
|
Fund: Schwab Target 2030 Fund (07/01/2005) 1 |
|
|
|
Dow Jones U.S. Total Stock Market Index SM |
|
|
|
Bloomberg US Aggregate Bond Index |
|
|
|
Target 2030 Composite Index |
|
|
|
All total returns on this page assume dividends and distributions were reinvested. Index figures do not include trading and management costs, which would lower
performance. Indices are unmanaged and cannot be invested in directly. Performance results less than one year are not annualized.
For index definitions, please see www.schwabassetmanagement.com/glossary.
Fund expenses may have been partially absorbed by the investment adviser and its affiliates. Without these reductions, the fund’s returns would have been lower.
These
returns do not reflect the deduction of taxes that a shareholder would pay on fund distributions or the redemption of fund shares.
Schwab Target 2030 Fund | Annual Report
|
|
|
|
|
|
Advisory Fees Paid by the Fund |
|
Foreign Tax Paid and Passed Through |
|
Gross Income From Foreign Sources |
|
Dividends Received Deduction |
|
Qualified Dividend Income |
|
Long Term Capital Gain Distribution |
|
Qualified Business Income (199A) |
|
Business Interest Deduction (163j) |
|
Asset Class Weightings % of Investments
Top Holdings % of Net Assets
Portfolio holdings may have changed since the report date.
Schwab Target 2030 Fund | Annual Report
AVAILABILITY OF ADDITIONAL INFORMATION
You can find the fund’s prospectus, Statement of Additional Information (SAI), reports to shareholders, financial information,
holdings, certain tax information, proxy voting information, and other information about the fund online at
www.schwabassetmanagement.com/prospectus
.
Proxy Voting Policies, Procedures and Results
A description of the proxy voting policies and procedures used to determine how to vote proxies on behalf of the funds is a
vaila
ble
without charge, upon request, by visiting the Schwab Funds’ website at
www.schwabassetmanagement.com/prospectus
, the
SEC’s website at
, or by contacting Schwab Funds at 1-877-824-5615.
Information regarding how a fund voted proxies relating to portfolio securities during the most recent twelve-month period ended
June 30 is available, without charge, by visiting the fund’s website at
www.schwabassetmanagement.com/prospectus
or the
SEC’s website at
, by calling
, or by sending an email request to
orders@mysummaryprospectus.com
.
Schwab Target 2030 Fund | Annual Report
October 31, 2025
Schwab Target 2035 Fund
This annual shareholder report contains important information about the fund for the period of November 1, 2024, to October 31,
2025.
You can find additional information about the fund at
www.schwabassetmanagement.com/prospectus
. You can also request
this information by calling
or by sending an email request to
orders@mysummaryprospectus.com
.
If you purchase
or hold fund shares through a financial intermediary, the fund’s prospectus, Statement of Additional Information (SAI), reports to
shareholders and other information about the fund are available from your financial intermediary.
FUND COSTS FOR THE LAST year ENDED October 31, 2025
(BASED ON A HYPOTHETICAL $10,000 INVESTMENT)
Expenses were reduced by a contractual fee waiver in effect for so long as the investment adviser serves as adviser to the fund. This agreement to limit the total annual
fund operating expenses is limited to the fund’s direct operating expenses and, therefore, does not apply to acquired fund fees and expenses (AFFE), which are indirect
expenses incurred by the fund through its investments in the underlying funds.
MANAGEMENT’S DISCUSSION OF FUND PERFORMANCE
For the 12-month reporting period ended October 31, 2025, the 2035 Fund returned 15.99%. The Dow Jones U.S. Total Stock
Market Index
SM
, which provides a broad measure of equity market performance, and the Bloomberg US Aggregate Bond Index,
which provides a broad measure of bond market performance, returned 20.90% and 6.16%, respectively. The 2035 Fund’s internally
calculated comparative index, the Target 2035 Composite Index (the composite index), returned 15.87%.
■
Asset allocations were broadly in line with those of the composite index
■
Top contributors to total return:
●
Schwab S&P 500 Index Fund
●
Schwab International Opportunities Fund
■
Over the reporting period, there were no detractors from the return of the fund. However, the smallest contributors to total return
were:
●
Schwab Treasury Inflation Protected Securities Index Fund
●
ClearBridge Small Cap Growth Fund (Class IS) (which was sold prior to the end of the reporting period)
Portfolio holdings may have changed since the report date.
Schwab Target 2035 Fund | Annual Report
The performance data quoted represents past performance. Past performance does not guarantee future results. Investment returns
and principal value of an investment will fluctuate so that an investor’s shares may be worth more or less than their original cost. Current performance may be lower or higher than performance data quoted.
To obtain performance information current to the most
recent month end, please visit
www.schwabassetmanagement.com/prospectus
Performance of Hypothetical $10,000 Investment (October 31, 2015 - October 31, 2025)
Average Annual Total Returns
|
|
|
|
Fund: Schwab Target 2035 Fund (03/12/2008) 1 |
|
|
|
Dow Jones U.S. Total Stock Market Index SM |
|
|
|
Bloomberg US Aggregate Bond Index |
|
|
|
Target 2035 Composite Index |
|
|
|
All total returns on this page assume dividends and distributions were reinvested. Index figures do not include trading and management costs, which would lower
performance. Indices are unmanaged and cannot be invested in directly. Performance results less than one year are not annualized.
For index definitions, please see www.schwabassetmanagement.com/glossary.
Fund expenses may have been partially absorbed by the investment adviser and its affiliates. Without these reductions, the fund’s returns would have been lower.
These
returns do not reflect the deduction of taxes that a shareholder would pay on fund distributions or the redemption of fund shares.
Schwab Target 2035 Fund | Annual Report
|
|
|
|
|
|
Advisory Fees Paid by the Fund |
|
Foreign Tax Paid and Passed Through |
|
Gross Income From Foreign Sources |
|
Dividends Received Deduction |
|
Qualified Dividend Income |
|
Long Term Capital Gain Distribution |
|
Qualified Business Income (199A) |
|
Business Interest Deduction (163j) |
|
Asset Class Weightings % of Investments
Top Holdings % of Net Assets
Portfolio holdings may have changed since the report date.
Schwab Target 2035 Fund | Annual Report
AVAILABILITY OF ADDITIONAL INFORMATION
You can find the fund’s prospectus, Statement of Additional Information (SAI), reports to shareholders, financial information,
holdings, certain tax information, proxy voting information, and other information about the fund online at
www.schwabassetmanagement.com/prospectus
.
Proxy Voting Policies, Procedures and Results
A description of the proxy voting policies and procedures used to determine how to vote proxies on behalf of the funds is available
without charge, upon request, by visiting the Schwab Funds’ website at
www.schwabassetmanagement.com/prospectus
, the
, or by contacting Schwab Funds at 1-877-824-5615.
Information regarding how a fund voted proxies relating to portfolio securities during the most recent twelve-month period ended
June 30 is available, without charge, by visiting the fund’s website at
www.schwabassetmanagement.com/prospectus
or the
SEC’s website at
, by calling
, or by sending an email request to
orders@mysummaryprospectus.com
.
Schwab Target 2035 Fund | Annual Report
October 31, 2025
Schwab Target 2040 Fund
This annual shareholder report contains important information about the fund for the period of November 1, 2024, to October 31,
2025.
You can find additional information about the fund at
www.schwabassetmanagement.com/prospectus
. You can also request
this information by calling
or by sending an email request to
orders@mysummaryprospectus.com
.
If you purchase
or hold fund shares through a financial intermediary, the fund’s prospectus, Statement of Additional Information (SAI), reports to
shareholders and other information about the fund are available from your financial intermediary.
FUND COSTS FOR THE LAST year ENDED October 31, 2025
(BASED ON A HYPOTHETICAL $10,000 INVESTMENT)
Expenses were reduced by a contractual fee waiver in effect for so long as the investment adviser serves as adviser to the fund. This agreement to limit the total annual
fund operating expenses is limited to the fund’s direct operating expenses and, therefore, does not apply to acquired fund fees and expenses (AFFE), which are indirect
expenses incurred by the fund through its investments in the underlying funds.
MANAGEMENT’S DISCUSSION OF FUND PERFORMANCE
For the 12-month reporting period ended October 31, 2025, the 2040 Fund returned 17.14%. The Dow Jones U.S. Total Stock
Market Index
SM
, which provides a broad measure of equity market performance, and the Bloomberg US Aggregate Bond Index,
which provides a broad measure of bond market performance, returned 20.90% and 6.16%, respectively. The 2040 Fund’s internally
calculated comparative index, the Target 2040 Composite Index (the composite index), returned 17.12%.
■
Asset allocations were broadly in line with those of the composite index
■
Top contributors to total return:
●
Schwab S&P 500 Index Fund
●
Schwab International Opportunities Fund
■
Over the reporting period, there were no detractors from the return of the fund. However, the smallest contributors to total return
were:
●
Allspring Core Plus Bond Fund (Class R6)
●
Schwab Short-Term Bond Index Fund
Portfolio holdings may have changed since the report date.
Schwab Target 2040 Fund | Annual Report
The performance data quoted represents past performance. Past performance does not guarantee future results. Investment returns
and principal value of an investment will fluctuate so that an investor’s shares may be worth more or less than their original cost. Current performance may be lower or higher than performance data quoted.
To obtain performance information current to the most
recent month end, please visit
www.schwabassetmanagement.com/prospectus
Performance of Hypothetical $10,000 Investment (October 31, 2015 - October 31, 2025)
Average Annual Total Returns
|
|
|
|
Fund: Schwab Target 2040 Fund ( 07/01/2005) 1 |
|
|
|
Dow Jones U.S. Total Stock Market Index SM |
|
|
|
Bloomberg US Aggregate Bond Index |
|
|
|
Target 2040 Composite Index |
|
|
|
All total returns on this page assume dividends and distributions were reinvested. Index figures do not include trading and management costs, which would lower
performance. Indices are unmanaged and cannot be invested in directly. Performance results less than one year are not annualized.
For index definitions, please see www.schwabassetmanagement.com/glossary.
Fund expenses may have been partially absorbed by the investment adviser and its affiliates. Without these reductions, the fund’s returns would have been lower.
These
returns do not reflect the deduction of taxes that a shareholder would pay on fund distributions or the redemption of fund shares.
Schwab Target 2040 Fund | Annual Report
|
|
|
|
|
|
Advisory Fees Paid by the Fund |
|
Foreign Tax Paid and Passed Through |
|
Gross Income From Foreign Sources |
|
Dividends Received Deduction |
|
Qualified Dividend Income |
|
Long Term Capital Gain Distribution |
|
Qualified Business Income (199A) |
|
Business Interest Deduction (163j) |
|
Asset Class Weightings % of Investments
Top Holdings % of Net Assets
Portfolio holdings may have changed since the report date.
Schwab Target 2040 Fund | Annual Report
AVAILABILITY OF ADDITIONAL INFORMATION
You can find the fund’s prospectus, Statement of Additional Information (SAI), reports to shareholders, financial information,
holdings, certain tax information, proxy voting information, and other information about the fund online at
www.schwabassetmanagement.com/prospectus
.
Proxy Voting Policies, Procedures and Results
A description of the proxy voting policies and procedures used to determine how to vote proxies on behalf of the funds is available
without charge, upon request, by visiting the Schwab Funds’ website at
www.schwabassetmanagement.com/prospectus
, the
SEC’s website at
, or by contacting Schwab Funds at 1-877-824-5615.
Information regarding how a fund voted proxies relating to portfolio securities during the most recent twelve-month period ended
June 30 is available, without charge, by visiting the fund’s website at
www.schwabassetmanagement.com/prospectus
or the
, by calling
, or by sending an email request to
orders@mysummaryprospectus.com
.
Schwab Target 2040 Fund | Annual Report
October 31, 2025
Schwab Target 2045 Fund
This annual shareholder report contains important information about the fund for the period of November 1, 2024, to October 31,
2025.
You can find additional information about the fund at
www.schwabassetmanagement.com/prospectus
. You can also request
this information by calling
or by sending an email request to
orders@mysummaryprospectus.com
.
If you purchase
or hold fund shares through a financial intermediary, the fund’s prospectus, Statement of Additional Information (SAI), reports to
shareholders and other information about the fund are available from your financial intermediary.
FUND COSTS FOR THE LAST year ENDED October 31, 2025
(BASED ON A HYPOTHETICAL $10,000 INVESTMENT)
Expenses were
reduced by
a contractual fee waiver in effect for so long as the investment adviser serves as adviser to the fund. This agreement to limit the total annual
fund operating expenses is limited to the fund’s direct operating expenses and, therefore, does not apply to acquired fund fees and expenses (AFFE), which are indirect
expenses incurred by the fund through its investments in the underlying funds.
MANAGEMENT’S DISCUSSION OF FUND PERFORMANCE
For the 12-month reporting period ended October 31, 2025, the 2045 Fund returned 18.24%. The Dow Jones U.S. Total Stock
Market Index
SM
, which provides a broad measure of equity market performance, and the Bloomberg US Aggregate Bond Index,
which provides a broad measure of bond market performance, returned 20.90% and 6.16%, respectively. The 2045 Fund’s internally
calculated comparative index, the Target 2045 Composite Index (the composite index), returned 18.20%.
■
Asset allocations were broadly in line with those of the composite index
■
Top contributors to total return:
●
Schwab S&P 500 Index Fund
●
Schwab International Opportunities Fund
■
Over the reporting period, there were no detractors from the return of the fund. However, the smallest contributors to total return
were:
●
Allspring Core Plus Bond Fund (Class R6)
●
Schwab Short-Term Bond Index Fund
Portfolio
holdings
may have changed since the report date.
Schwab Target 2045 Fund | Annual Report
The performance data quoted represents past performance. Past performance does not guarantee future results. Investment returns
and principal value of an investment will fluctuate so that an investor’s shares may be worth more or less than their original cost. Current performance may be lower or higher than performance data quoted.
To obtain performance information current to the most
recent month end, please visit
www.schwabassetmanagement.com/prospectus
Performance of Hypothetical $10,000 Investment (October 31, 2015 - October 31, 2025)
Average Annual Total Returns
|
|
|
|
Fund: Schwab Target 2045 Fund (01/23/2013) 1 |
|
|
|
Dow Jones U.S. Total Stock Market Index SM |
|
|
|
Bloomberg US Aggregate Bond Index |
|
|
|
Target 2045 Composite Index |
|
|
|
All total returns on this page assume dividends and distributions were reinvested. Index figures do not include trading and management costs, which would lower
performance. Indices are unmanaged and cannot be invested in directly. Performance results less than one year are not annualized.
For index definitions, please see www.schwabassetmanagement.com/glossary.
Fund expenses may have been partially absorbed by the investment adviser and its affiliates. Without these reductions, the fund’s returns would have been lower.
These
returns do not reflect the deduction of taxes that a shareholder would pay on fund distributions or the redemption of fund shares.
Schwab Target 2045 Fund | Annual Report
|
|
|
|
|
|
Advisory Fees Paid by the Fund |
|
Foreign Tax Paid and Passed Through |
|
Gross Income From Foreign Sources |
|
Dividends Received Deduction |
|
Qualified Dividend Income |
|
Long Term Capital Gain Distribution |
|
Qualified Business Income (199A) |
|
Business Interest Deduction (163j) |
|
Asset Class Weightings % of Investments
Top Holdings % of Net Assets
Portfolio holdings may
have
changed since the report date.
Schwab Target 2045 Fund | Annual Report
AVAILABILITY OF ADDITIONAL INFORMATION
You can find the fund’s prospectus, Statement of Additional Information (SAI), reports to shareholders, financial information,
holdings, certain tax information, proxy voting information, and other information about the fund online at
www.schwabassetmanagement.com/prospectus
.
Proxy Voting Policies, Procedures and Results
A description of the proxy voting policies and procedures used to determine how to vote proxies on behalf of the funds is available
without charge, upon request, by visiting the Schwab Funds’ website at
www.schwabassetmanagement.com/prospectus
, the
SEC’s website at
, or by contacting Schwab Funds at 1-877-824-5615.
Information regarding how a fund voted proxies relating to portfolio securities during the most recent twelve-month period ended
June 30 is available, without charge, by visiting the fund’s website at
www.schwabassetmanagement.com/prospectus
or the
SEC’s website at
, by calling
, or by sending an email request to
orders@mysummaryprospectus.com
.
Schwab Target 2045 Fund | Annual Report
October 31, 2025
Schwab Target 2050 Fund
This annual shareholder report contains important information about the fund for the period of November 1, 2024, to October 31,
2025.
You can find additional information about the fund at
www.schwabassetmanagement.com/prospectus
. You can also request
this information by calling
or by sending an email request to
orders@mysummaryprospectus.com
.
If you purchase
or hold fund shares through a financial intermediary, the fund’s
prospectus
, Statement of Additional Information (SAI), reports to
shareholders and other information about the fund are available from your financial intermediary.
FUND COSTS FOR THE LAST year ENDED October 31, 2025
(BASED ON A HYPOTHETICAL $10,000 INVESTMENT)
Expenses were reduced by a contractual fee waiver in effect for so long as the investment adviser serves as adviser to the fund. This agreement to limit the total annual
fund operating expenses is limited to the fund’s direct operating expenses and, therefore, does not apply to acquired fund fees and expenses (AFFE), which are indirect
expenses incurred by the fund through its investments in the underlying funds.
MANAGEMENT’S DISCUSSION OF FUND PERFORMANCE
For the 12-month reporting period ended
October 31, 2025
, the 2050 Fund returned 18.96%. The Dow Jones U.S. Total Stock
Market Index
SM
, which provides a broad measure of equity market performance, and the Bloomberg US Aggregate Bond Index,
which provides a broad measure of bond market performance, returned 20.90% and 6.16%, respectively. The 2050 Fund’s internally
calculated comparative index, the Target 2050 Composite Index (the composite index), returned 18.98%.
■
Asset allocations were broadly in line with those of the composite index
■
Top contributors to total return:
●
Schwab S&P 500 Index Fund
●
Schwab International Opportunities Fund
■
Over the reporting period,
there were
no detractors from the
return of
the fund. However, the smallest contributors to total return
were:
●
Allspring
Core Plus
Bond Fund (Class R6)
●
Schwab Short-Term Bond Index Fund
Portfolio holdings may have changed since the report date.
Schwab Target 2050 Fund | Annual Report
The performance data quoted represents past performance. Past performance does not guarantee future results. Investment returns
and principal value of an investment will fluctuate so that an
investor’s
shares may be worth more or less than their original cost. Current performance may be lower or higher than performance data quoted.
To obtain performance information current to the most
recent month end, please visit
www.schwabassetmanagement.com/prospectus
Performance of Hypothetical $10,000 Investment (October 31, 2015 - October 31, 2025)
Average Annual Total Returns
|
|
|
|
Fund: Schwab Target 2050 Fund (01/23/2013) 1 |
|
|
|
Dow Jones U.S. Total Stock Market Index SM |
|
|
|
Bloomberg US Aggregate Bond Index |
|
|
|
Target 2050 Composite Index |
|
|
|
All total returns on this page assume dividends and distributions were reinvested. Index figures do not include trading and management costs, which would lower
performance. Indices are unmanaged and cannot be invested in directly. Performance results less than one year are not annualized.
For index definitions, please see www.schwabassetmanagement.com/glossary.
Fund expenses may have been partially absorbed by the investment adviser and its affiliates. Without these reductions, the fund’s returns would have been lower.
These
returns do not reflect the deduction of taxes that a shareholder would pay on fund distributions or the redemption of fund shares.
Schwab Target 2050 Fund | Annual Report
|
|
|
|
|
|
Advisory Fees Paid by the Fund |
|
Foreign Tax Paid and Passed Through |
|
Gross Income From Foreign Sources |
|
Dividends Received Deduction |
|
Qualified Dividend Income |
|
Long Term Capital Gain Distribution |
|
Qualified Business Income (199A) |
|
Business Interest Deduction (163j) |
|
Asset Class Weightings % of Investments
Top Holdings % of Net Assets
Portfolio holdings may have changed since the report date.
Schwab Target 2050 Fund | Annual Report
AVAILABILITY OF ADDITIONAL INFORMATION
You can find the fund’s prospectus, Statement of Additional Information (SAI), reports to shareholders, financial information,
holdings, certain tax information, proxy voting information, and other information about the fund online at
www.schwabassetmanagement.com/prospectus
.
Proxy Voting Policies, Procedures and Results
A description of the proxy voting policies and procedures used to determine how to vote proxies on behalf of the funds is available
without charge, upon request, by visiting the Schwab Funds’ website at
www.schwabassetmanagement.com/prospectus
, the
SEC’s website at
, or by contacting Schwab Funds at 1-877-824-5615.
Information regarding how a fund voted proxies relating to portfolio securities during the most recent twelve-month period ended
June 30 is available, without charge, by visiting the fund’s website at
www.schwabassetmanagement.com/prospectus
or the
SEC’s website at
, by calling
, or by sending an email request to
orders@mysummaryprospectus.com
.
Schwab Target 2050 Fund | Annual Report
October 31, 2025
Schwab Target 2055 Fund
This annual shareholder report contains important information about the fund for the period of November 1, 2024, to October 31,
2025.
You can find additional information about the fund at
www.schwabassetmanagement.com/prospectus
. You can also request
this information by calling
or by sending an email request to
orders@mysummaryprospectus.com
.
If you purchase
or hold fund shares through a financial intermediary, the fund’s prospectus, Statement of Additional Information (SAI), reports to
shareholders and other information about the fund are available from your financial intermediary.
FUND COSTS FOR THE LAST year ENDED October 31, 2025
(BASED ON A HYPOTHETICAL $10,000 INVESTMENT)
Expenses were reduced by a contractual fee waiver in effect for so long as the investment adviser serves as adviser to the fund. This agreement to limit the total annual
fund operating expenses is limited to the fund’s direct operating expenses and, therefore, does not apply to acquired fund fees and expenses (AFFE), which are indirect
expenses incurred by the fund through its investments in the underlying funds.
MANAGEMENT’S DISCUSSION OF FUND PERFORMANCE
For the 12-month reporting period ended October 31, 2025, the 2055 Fund returned 19.44%. The Dow Jones U.S. Total Stock
Market Index
SM
, which provides a broad measure of equity market performance, and the Bloomberg US Aggregate Bond Index,
which provides a broad measure of bond market performance, returned 20.90% and 6.16%, respectively. The 2055 Fund’s internally
calculated comparative index, the Target 2055 Composite Index (the composite index), returned 19.43%.
■
Asset allocations were broadly in line with those of the composite index
■
Top contributors to total return:
●
Schwab S&P 500 Index Fund
●
Schwab International Opportunities Fund
■
Over the reporting period, there were no detractors from the return of the fund. However, the smallest contributors to total return
were:
●
Baird Aggregate Bond Fund (Institutional Class)
●
Schwab Short-Term Bond Index Fund
Portfolio holdings may have changed since the report date.
Schwab Target 2055 Fund | Annual Report
The performance data quoted represents past performance. Past performance does not guarantee future results. Investment returns
and principal value of an investment will fluctuate so that an investor’s shares may be worth more or less than their original cost. Current performance may be lower or higher than performance data quoted.
To obtain performance information current to the most
recent month end, please visit
www.schwabassetmanagement.com/prospectus
Performance of Hypothetical $10,000 Investment (October 31, 2015 - October 31, 2025)
Average Annual Total Returns
|
|
|
|
Fund: Schwab Target 2055 Fund (01/23/2013) 1 |
|
|
|
Dow Jones U.S. Total Stock Market Index SM |
|
|
|
Bloomberg US Aggregate Bond Index |
|
|
|
Target 2055 Composite Index |
|
|
|
All total returns on this page assume dividends and distributions were reinvested. Index figures do not include trading and management costs, which would lower
performance. Indices are unmanaged and cannot be invested in directly. Performance results less than one year are not annualized.
For index definitions, please see www.schwabassetmanagement.com/glossary.
Fund expenses may have been partially absorbed by the investment adviser and its affiliates. Without these reductions, the fund’s returns would have been lower.
These
returns do not reflect the deduction of taxes that a shareholder would pay on fund distributions or the redemption of fund shares.
Schwab Target 2055 Fund | Annual Report
|
|
|
|
|
|
Advisory Fees Paid by the Fund |
|
Foreign Tax Paid and Passed Through |
|
Gross Income From Foreign Sources |
|
Dividends Received Deduction |
|
Qualified Dividend Income |
|
Long Term Capital Gain Distribution |
|
Qualified Business Income (199A) |
|
Business Interest Deduction (163j) |
|
Asset Class Weightings % of Investments
Top Holdings % of Net Assets
Portfolio holdings may have changed since the report date.
Schwab Target 2055 Fund | Annual Report
AVAILABILITY OF ADDITIONAL INFORMATION
You can find the fund’s prospectus, Statement of Additional
Information
(SAI), reports to shareholders, financial information,
holdings, certain tax information, proxy voting information, and other information about the fund online at
www.schwabassetmanagement.com/prospectus
.
Proxy Voting Policies, Procedures and
Results
A description of the proxy voting policies and procedures used to determine how to vote proxies on behalf of the funds is available
without charge, upon request, by visiting the Schwab Funds’ website at
www.schwabassetmanagement.com/prospectus
, the
SEC’s website at
, or by contacting Schwab Funds at 1-877-824-5615.
Information regarding how a fund voted proxies relating to portfolio securities during the most recent twelve-month period ended
June 30 is available, without charge, by visiting the fund’s website at
www.schwabassetmanagement.com/prospectus
or the
SEC’s website at
, by calling
, or by sending an email request to
orders@mysummaryprospectus.com
.
Schwab Target 2055 Fund | Annual Report
October 31, 2025
Schwab Target 2060 Fund
This annual shareholder report contains important information about the fund for the period of November 1, 2024, to October 31,
2025.
You can find additional information about the fund at
www.schwabassetmanagement.com/prospectus
. You can also request
this information by calling
or by sending an email request to
orders@mysummaryprospectus.com
.
If you purchase
or hold fund shares through a financial intermediary, the fund’s prospectus, Statement of Additional Information (SAI), reports to
shareholders and other information about the fund are available from your financial intermediary.
FUND COSTS FOR THE LAST year ENDED October 31, 2025
(BASED ON A HYPOTHETICAL $10,000 INVESTMENT)
Expenses were reduced by a contractual fee waiver in effect for so long as the investment adviser serves as adviser to the fund. This agreement to limit the total annual
fund operating expenses is limited to the fund’s direct operating expenses and, therefore, does not apply to acquired fund fees and expenses (AFFE), which are indirect
expenses incurred by the fund through its investments in the underlying funds.
MANAGEMENT’S DISCUSSION OF FUND PERFORMANCE
For the 12-month reporting period ended October 31, 2025, the 2060 Fund returned 19.90%. The Dow Jones U.S. Total Stock
Market Index
SM
, which provides a broad measure of equity market performance, and the Bloomberg US Aggregate Bond Index,
which provides a broad measure of bond market performance, returned 20.90% and 6.16%, respectively. The 2060 Fund’s internally
calculated comparative index, the Target 2060 Composite Index (the composite index), returned 19.74%.
■
Asset allocations were broadly in line with those of the composite index
■
Top contributors to total return:
●
Schwab S&P 500 Index Fund
●
Schwab International Opportunities Fund
■
Over the reporting period, there were no detractors from the return of the fund. However, the smallest contributors to total return
were:
●
Allspring Core Plus Bond Fund (Class R6)
●
Schwab Short-Term Bond Index Fund
Portfolio holdings may have changed since the report date.
Schwab Target 2060 Fund | Annual Report
The performance data quoted represents past performance. Past performance does not guarantee future results. Investment returns
and principal value of an investment will fluctuate so that an investor’s shares may be worth more or less than their original cost. Current performance may be lower or higher than performance data quoted.
To obtain performance information current to the most
recent month end, please visit
www.schwabassetmanagement.com/prospectus
Performance of Hypothetical $10,000 Investment (August 25, 2016 - October 31, 2025)
Average Annual Total Returns
|
|
|
|
Fund: Schwab Target 2060 Fund (08/25/2016) 1 |
|
|
|
Dow Jones U.S. Total Stock Market Index SM |
|
|
|
Bloomberg US Aggregate Bond Index |
|
|
|
Target 2060 Composite Index |
|
|
|
All total returns on this page assume dividends and distributions were reinvested. Index figures do not include trading and management costs, which would lower
performance. Indices are unmanaged and cannot be invested in directly. Performance results less than one year are not annualized.
For index definitions, please see www.schwabassetmanagement.com/glossary.
Fund expenses may have been partially absorbed by the investment adviser and its affiliates. Without these reductions, the fund’s returns would have been lower.
These
returns do not reflect the deduction of taxes that a shareholder would pay on fund distributions or the redemption of fund shares.
Schwab Target 2060 Fund | Annual Report
|
|
|
|
|
|
Advisory Fees Paid by the Fund |
|
Foreign Tax Paid and Passed Through |
|
Gross Income From Foreign Sources |
|
Dividends Received Deduction |
|
Qualified Dividend Income |
|
Long Term Capital Gain Distribution |
|
Qualified Business Income (199A) |
|
Business Interest Deduction (163j) |
|
Asset Class Weightings % of Investments
Top Holdings % of Net Assets
Portfolio holdings may have changed since the report
date
.
Schwab Target 2060 Fund | Annual Report
AVAILABILITY OF ADDITIONAL INFORMATION
You can find the fund’s prospectus,
Statement
of Additional Information (SAI), reports to shareholders, financial information,
holdings, certain tax information, proxy voting information, and other information about the fund online at
www.schwabassetmanagement.com/prospectus
.
Proxy Voting
Policies
, Procedures and Results
A description of the proxy voting policies and procedures used to determine how to vote proxies on behalf of the funds is available
without charge, upon request, by visiting the Schwab Funds’ website at
www.schwabassetmanagement.com/prospectus
, the
SEC’s website at
, or by contacting Schwab Funds at 1-877-824-5615.
Information regarding
how
a fund voted proxies relating to portfolio securities during the most recent twelve-month period ended
June 30 is available, without charge, by visiting the fund’s website at
www.schwabassetmanagement.com/prospectus
or the
SEC’s website at
, by calling
, or by sending an email request to
orders@mysummaryprospectus.com
.
Schwab Target 2060 Fund | Annual Report
October 31, 2025
Schwab Target 2065 Fund
This annual shareholder report contains important information about the fund for the period of November 1, 2024, to October 31,
2025.
You can find additional information about the fund at
www.schwabassetmanagement.com/prospectus
. You can also request
this information by calling
or by sending an email request to
orders@mysummaryprospectus.com
.
If you purchase
or hold
fund
shares through a financial intermediary, the fund’s prospectus, Statement of Additional Information (SAI), reports to
shareholders and
other
information about the fund are available from your financial intermediary.
FUND COSTS FOR THE LAST year ENDED October 31, 2025
(BASED ON A HYPOTHETICAL $10,000 INVESTMENT)
Expenses were reduced by a contractual fee waiver in effect for so long as the investment adviser serves as adviser to the fund. This agreement to limit the total annual
fund operating expenses is limited to the fund’s direct operating expenses and, therefore, does not apply to acquired fund fees and expenses (AFFE), which are indirect
expenses incurred by the fund through its investments in the underlying funds.
MANAGEMENT’S DISCUSSION OF FUND PERFORMANCE
For the 12-month reporting period ended October 31, 2025, the 2065 Fund returned 20.09%. The Dow Jones U.S. Total Stock
Market Index
SM
, which provides a broad measure of equity market performance, and the Bloomberg US Aggregate Bond Index,
which provides a broad measure of bond market performance, returned 20.90% and 6.16%, respectively. The 2065 Fund’s internally
calculate
d com
parative index, the Target 2065 Composite Index (the composite index), returned 20.05%.
■
Asset allocations were broadly in line with those of the composite index
■
Top contributors to total return:
●
Schwab S&P 500 Index Fund
●
Schwab International Opportunities Fund
■
Over the reporting period, there were no detractors from the return of the fund. However, the smallest contributors to total return
were:
●
Schwab U.S. Aggregate Bond Index Fund
●
Schwab Short-Term Bond Index Fund
Portfolio holdings may have changed since the report date.
Schwab Target 2065 Fund | Annual Report
The performance data quoted represents past performance.
Past performance does not guarantee future results. Investment returns
and principal value of an investment will fluctuate so that an investor’s shares may be worth more or less than their original cost. Current performance may be lower or higher than performance data quoted.
To obtain performance information current to the most
recent month end, please visit
www.schwabassetmanagement.com/prospectus
Performance of Hypothetical $10,000 Investment (February 25, 2021 - October 31, 2025)
Average Annual Total Returns
|
|
|
Fund: Schwab Target 2065 Fund (02/25/2021) 1 |
|
|
Dow Jones U.S. Total Stock Market Index SM |
|
|
Bloomberg US Aggregate Bond Index |
|
|
Target 2065 Composite Index |
|
|
All total returns on this page assume dividends and distributions were reinvested. Index figures do not include trading and management costs, which would lower
performance. Indices are unmanaged and cannot be invested in directly. Performance results less than one year are not annualized.
For index definitions, please see www.schwabassetmanagement.com/glossary.
Fund expenses may have been partially absorbed by the investment adviser and its affiliates. Without these reductions, the fund’s returns would have been lower.
These
returns do not reflect the deduction of taxes that a shareholder would pay on fund distributions or the redemption of fund shares.
Schwab Target 2065 Fund | Annual Report
|
|
|
|
|
|
Advisory Fees Paid by the Fund |
|
Foreign Tax Paid and Passed Through |
|
Gross Income From Foreign Sources |
|
Dividends Received Deduction |
|
Qualified Dividend Income |
|
Long Term Capital Gain Distribution |
|
Qualified Business Income (199A) |
|
Business Interest Deduction (163j) |
|
Asset Class Weightings % of Investments
Top Holdings % of Net Assets
Portfolio holdings may have changed since the report date.
Schwab Target 2065 Fund | Annual Report
AVAILABILITY OF ADDITIONAL INFORMATION
You can find the fund’s prospectus, Statement of Additional Information (SAI), reports to shareholders, financial information,
holdings, certain tax information, proxy voting information, and other information about the fund online at
www.schwabassetmanagement.com/prospectus
.
Proxy Voting Policies, Procedures and Results
A description of the proxy voting policies and procedures used to determine how to vote proxies on behalf of the funds is available
without charge, upon request, by visiting the Schwab Funds’ website at
www.schwabassetmanagement.com/prospectus
, the
SEC’s website at
, or by contacting Schwab Funds at 1-877-824-5615.
Information regarding how a fund voted proxies relating to portfolio securities during the most recent twelve-month period ended
June 30 is available, without charge, by visiting the fund’s website at
www.schwabassetmanagement.com/prospectus
or the
SEC’s website at
, by calling
, or by sending an email request to
orders@mysummaryprospectus.com
.
Schwab Target 2065 Fund | Annual Report
Item 2: Code of Ethics.
| (a) |
Registrant has adopted a code of ethics that applies to its principal executive officer, principal financial officer, and any other persons who perform a similar function, regardless of whether these individuals are employed by Registrant or a third party. |
| (c) |
During the period covered by the report, no amendments were made to the provisions of this code of ethics. |
| (d) |
During the period covered by the report, Registrant did not grant any waivers, including implicit waivers, from the provisions of this code of ethics. |
| (f)(1) |
Registrant has filed this code of ethics as an exhibit pursuant to Item 19(a)(1) of Form N-CSR. |
Item 3: Audit Committee Financial Expert.
Registrant’s Board of Trustees has determined that Kimberly S. Patmore, Michael J. Beer and J. Derek Penn, each currently serving on its audit, compliance and valuation committee, are each an “audit committee financial expert,” as such term is defined in Item 3 of Form N-CSR. Each member of Registrant’s audit, compliance and valuation committee is “independent” under the standards set forth in Item 3 of Form N-CSR.
The designation of each of Ms. Patmore, Mr. Beer and Mr. Penn as an “audit committee financial expert” pursuant to Item 3 of Form N-CSR does not (i) impose upon such individual any duties, obligations, or liability that are greater than the duties, obligations and liability imposed upon such individual as a member of Registrant’s audit, compliance and valuation committee or Board of Trustees in the absence of such designation; and (ii) affect the duties, obligations or liability of any other member of Registrant’s audit, compliance and valuation committee or Board of Trustees.
Item 4: Principal Accountant Fees and Services.
Registrant is composed of fifty-two operational series. Thirty-six series have a fiscal year-end of October 31, whose annual financial statements are reported in Item 1, three series have a fiscal year-end of December 31, twelve series have a fiscal year-end of March 31, and one series has a fiscal year-end of the last day of February. Principal accountant fees disclosed in Items 4(a)-(d) and 4(g) include fees billed for services rendered to the fifty-two operational series during 2025/2026 and 2024/2025, based on their respective 2025/2026 and 2024/2025 fiscal years, as applicable.
The following table presents fees billed by the principal accountant in each of the last two fiscal years for the services rendered to the Funds:
|
|
|
|
|
|
|
|
|
|
|
|
|
|
|
|
|
|
|
|
|
|
|
|
|
|
|
|
|
| (a) Audit Fees1 |
|
|
(b) Audit-Related Fees2 |
|
|
(c) Tax Fees3 |
|
|
(d) All Other Fees |
|
Fiscal Year
2025/2026 |
|
Fiscal Year
2024/2025 |
|
|
Fiscal Year
2025/2026 |
|
|
Fiscal Year
2024/2025 |
|
|
Fiscal Year
2025/2026 |
|
|
Fiscal Year
2024/2025 |
|
|
Fiscal Year
2025/2026 |
|
|
Fiscal Year
2024/2025 |
|
| $1,292,600 |
|
$ |
1,292,600 |
|
|
$ |
95,400 |
|
|
$ |
95,400 |
|
|
$ |
170,820 |
|
|
$ |
170,820 |
|
|
$ |
0 |
|
|
$ |
0 |
|
| 1 |
The nature of the services includes audit of the registrant’s annual financial statements and normally provided services in connection with regulatory filings for those fiscal years. |
| 2 |
The nature of the services includes assurance and related services reasonably related to the performance of the audit for compliance with Rule 17f-2 under the Investment Company Act of 1940. |
| 3 |
The tax fees consist of professional services relating to tax compliance, tax advice, and the preparation of the Registrant’s tax returns. |
|
|
|
|
|
| (e) |
|
(1) |
|
Registrant’s audit, compliance and valuation committee does not have pre-approval policies and procedures as described in paragraph (c)(7) of Rule 2-01 of Regulation S-X. |
|
|
|
|
|
(2) |
|
There were no services described in each of paragraphs (b) through (d) above that were approved by Registrant’s audit, compliance and valuation committee pursuant to paragraph (c)(7)(i)(C) of Rule 2-01 of Regulation S-X. |
| (g) |
Below are the aggregate non-audit fees billed in each of the last two fiscal years by Registrant’s principal accountant for services rendered to Registrant, to Registrant’s investment adviser, and to any entity controlling, controlled by, or under common control with Registrant’s investment adviser that provides ongoing services to Registrant. |
|
|
|
|
|
|
|
|
|
|
|
2024/2025: $2,012,853 |
|
2023/2024: $2,549,698 |
| (h) |
During the past fiscal year, all non-audit services provided by Registrant’s principal accountant to either Registrant’s investment adviser or to any entity controlling, controlled by, or under common control with Registrant’s investment adviser that provides ongoing services to Registrant were pre-approved. Included in the audit, compliance and valuation committee’s pre-approval was the review and consideration as to whether the provision of these non-audit services is compatible with maintaining the principal accountant’s independence. |
Item 5: Audit Committee of Listed Registrants.
Not applicable.
Item 6: Schedule of Investments.
The schedules of investments are included under Item 7 of this Form.
Item 7: Financial Statements and Financial Highlights for Open-End Management Investment Companies.
Annual Holdings and Financial Statements | October 31, 2025
Schwab International Opportunities Fund
Fund investment adviser: Charles Schwab Investment Management, Inc., dba Schwab Asset Management®
Distributor: Charles Schwab & Co., Inc. (Schwab)
The Sector/Industry classifications in this report use the Global Industry Classification Standard (GICS) which was developed by and is the exclusive property of MSCI Inc. (MSCI) and Standard & Poor’s (S&P). GICS is a service mark of MSCI and S&P and has been licensed for use by Schwab.
Schwab International Opportunities Fund | Annual Holdings and Financial Statements
1
Schwab International Opportunities Fund
Financial Statements
| |
|
|
|
|
|
|
| |
Net asset value at beginning of period |
|
|
|
|
|
|
Income (loss) from investment operations: |
|
|
|
|
|
|
Net investment income (loss)1 |
|
|
|
|
|
|
Net realized and unrealized gains (losses) |
|
|
|
|
|
|
Total from investment operations |
|
|
|
|
|
|
| |
|
|
|
|
|
|
Distributions from net investment income |
|
|
|
|
|
|
Distributions from net realized gains |
|
|
|
|
|
|
| |
|
|
|
|
|
|
Net asset value at end of period |
|
|
|
|
|
|
| |
|
|
|
|
|
|
| |
Ratios to average net assets: |
|
|
|
|
|
|
| |
|
|
|
|
|
|
| |
|
|
|
|
|
|
Net investment income (loss) |
|
|
|
|
|
|
| |
|
|
|
|
|
|
Net assets, end of period (x 1,000,000) |
|
|
|
|
|
|
| |
Calculated based on the average shares outstanding during the period. |
| |
Ratio excludes less than 0.01% of acquired fund fees and expenses, which are indirect expenses incurred by the fund through its investments in underlying funds and are subject to a contractual expense limitation (see financial note 3, Expense Limitation, for additional information). |
| |
Effective February 25, 2022, the net operating expense limitation was lowered from 1.25% to 0.86%. The ratio presented for the period ended October 31, 2022, is a blended ratio. |
| |
Ratio includes less than 0.005% of non-routine proxy expenses. |
2
Schwab International Opportunities Fund | Annual Holdings and Financial Statements
Schwab International Opportunities Fund
Portfolio Holdings as of October 31, 2025
| |
|
|
COMMON STOCKS 94.1% OF NET ASSETS |
| |
| |
| |
|
|
| |
|
|
| |
|
|
| |
|
|
| |
|
|
| |
|
|
| |
|
|
| |
|
|
| |
|
|
| |
|
|
| |
|
|
| |
|
|
Cleanaway Waste Management Ltd. |
|
|
| |
|
|
| |
|
|
| |
|
|
| |
|
|
| |
|
|
| |
|
|
| |
|
|
| |
|
|
| |
|
|
| |
|
|
| |
|
|
Harvey Norman Holdings Ltd. |
|
|
| |
|
|
| |
|
|
| |
|
|
Insurance Australia Group Ltd. |
|
|
| |
|
|
| |
|
|
| |
|
|
Magellan Financial Group Ltd. |
|
|
| |
|
|
| |
|
|
| |
|
|
| |
|
|
Northern Star Resources Ltd. |
|
|
| |
|
|
| |
|
|
| |
|
|
| |
|
|
| |
|
|
| |
|
|
| |
|
|
| |
|
|
| |
|
|
| |
|
|
| |
|
|
| |
|
|
| |
|
|
| |
|
|
| |
|
|
| |
|
|
| |
|
|
| |
|
|
| |
|
|
| |
|
|
Telix Pharmaceuticals Ltd. * |
|
|
| |
|
|
Temple & Webster Group Ltd. * |
|
|
| |
|
|
| |
|
|
| |
|
|
Treasury Wine Estates Ltd. |
|
|
| |
|
|
Washington H Soul Pattinson & Co. Ltd. |
|
|
| |
|
|
| |
|
|
| |
|
|
Woodside Energy Group Ltd. |
|
|
| |
|
|
| |
|
|
| |
|
|
| |
|
|
| |
|
|
| |
| |
| |
|
|
| |
|
|
| |
|
|
| |
|
|
| |
|
|
| |
|
|
| |
|
|
| |
| |
| |
|
|
| |
|
|
| |
|
|
| |
|
|
| |
|
|
| |
|
|
| |
|
|
| |
| |
| |
|
|
| |
|
|
Inter & Co., Inc., Class A |
|
|
Itau Unibanco Holding SA, ADR |
|
|
NU Holdings Ltd., Class A * |
|
|
| |
|
|
| |
| |
| |
|
|
| |
| |
| |
|
|
Alamos Gold, Inc., Class A |
|
|
Alimentation Couche-Tard, Inc. |
|
|
| |
|
|
| |
|
|
| |
|
|
Badger Infrastructure Solutions Ltd. |
|
|
| |
|
|
Bombardier, Inc., Class B * |
|
|
| |
|
|
Brookfield Asset Management Ltd., Class A |
|
|
| |
|
|
| |
|
|
Canadian National Railway Co. |
|
|
Canadian Natural Resources Ltd. |
|
|
Canadian Tire Corp. Ltd., Class A (a) |
|
|
| |
|
|
| |
|
|
Schwab International Opportunities Fund | Annual Holdings and Financial Statements
3
Schwab International Opportunities Fund
Portfolio Holdings as of October 31, 2025 (continued)
| |
|
|
| |
|
|
| |
|
|
Chartwell Retirement Residences |
|
|
Descartes Systems Group, Inc. * |
|
|
| |
|
|
| |
|
|
Finning International, Inc. |
|
|
| |
|
|
| |
|
|
| |
|
|
| |
|
|
| |
|
|
| |
|
|
| |
|
|
| |
|
|
| |
|
|
| |
|
|
Magna International, Inc. |
|
|
| |
|
|
| |
|
|
Pan American Silver Corp. (b) |
|
|
Pan American Silver Corp. (b) |
|
|
| |
|
|
| |
|
|
Shopify, Inc., Class A *(b) |
|
|
Shopify, Inc., Class A *(b) |
|
|
| |
|
|
| |
|
|
| |
|
|
| |
|
|
| |
|
|
| |
|
|
| |
|
|
Wheaton Precious Metals Corp. |
|
|
| |
|
|
| |
|
|
| |
| |
AAC Technologies Holdings, Inc. |
|
|
Alibaba Group Holding Ltd. |
|
|
Atour Lifestyle Holdings Ltd., ADR |
|
|
Bosideng International Holdings Ltd. |
|
|
Budweiser Brewing Co. APAC Ltd. |
|
|
| |
|
|
Chow Tai Fook Jewellery Group Ltd. |
|
|
| |
|
|
| |
|
|
Nexteer Automotive Group Ltd. |
|
|
PDD Holdings, Inc., ADR * |
|
|
Ping An Insurance Group Co. of China Ltd., H Shares |
|
|
Shenzhou International Group Holdings Ltd. |
|
|
SITC International Holdings Co. Ltd. |
|
|
| |
|
|
Xinyi Glass Holdings Ltd. |
|
|
| |
|
|
| |
| |
AP Moller - Maersk AS, Class A |
|
|
AP Moller - Maersk AS, Class B |
|
|
| |
|
|
| |
|
|
| |
|
|
| |
|
|
| |
|
|
| |
|
|
| |
|
|
| |
|
|
| |
|
|
| |
|
|
| |
|
|
| |
|
|
| |
|
|
| |
| |
| |
|
|
| |
|
|
| |
|
|
| |
|
|
| |
|
|
| |
|
|
| |
|
|
| |
|
|
| |
|
|
| |
|
|
| |
|
|
| |
|
|
| |
|
|
| |
| |
| |
|
|
| |
|
|
| |
|
|
| |
|
|
| |
|
|
| |
|
|
| |
|
|
| |
|
|
| |
|
|
| |
|
|
| |
|
|
Cie Generale des Etablissements Michelin SCA |
|
|
| |
|
|
| |
|
|
| |
|
|
| |
|
|
| |
|
|
| |
|
|
| |
|
|
| |
|
|
| |
|
|
| |
|
|
LVMH Moet Hennessy Louis Vuitton SE |
|
|
| |
|
|
| |
|
|
| |
|
|
| |
|
|
| |
|
|
| |
|
|
| |
|
|
| |
|
|
| |
|
|
| |
|
|
| |
|
|
| |
|
|
| |
|
|
| |
|
|
| |
|
|
| |
4
Schwab International Opportunities Fund | Annual Holdings and Financial Statements
Schwab International Opportunities Fund
Portfolio Holdings as of October 31, 2025 (continued)
| |
|
|
| |
| |
|
|
| |
|
|
| |
|
|
| |
|
|
| |
|
|
Bayerische Motoren Werke AG |
|
|
| |
|
|
| |
|
|
| |
|
|
Carl Zeiss Meditec AG, Bearer Shares |
|
|
| |
|
|
CTS Eventim AG & Co. KGaA |
|
|
| |
|
|
| |
|
|
| |
|
|
| |
|
|
| |
|
|
DWS Group GmbH & Co. KGaA |
|
|
| |
|
|
| |
|
|
| |
|
|
Fresenius Medical Care AG |
|
|
| |
|
|
Friedrich Vorwerk Group SE |
|
|
| |
|
|
| |
|
|
| |
|
|
| |
|
|
| |
|
|
| |
|
|
| |
|
|
| |
|
|
| |
|
|
| |
|
|
| |
|
|
| |
|
|
| |
|
|
| |
|
|
| |
|
|
| |
|
|
| |
|
|
| |
|
|
| |
|
|
| |
|
|
| |
|
|
| |
|
|
| |
|
|
| |
|
|
| |
| |
| |
|
|
National Bank of Greece SA |
|
|
| |
|
|
| |
| |
| |
|
|
| |
| |
BOC Hong Kong Holdings Ltd. |
|
|
Cathay Pacific Airways Ltd. |
|
|
CK Infrastructure Holdings Ltd. |
|
|
| |
|
|
Galaxy Entertainment Group Ltd. |
|
|
| |
|
|
Hong Kong & China Gas Co. Ltd. |
|
|
Hong Kong Exchanges & Clearing Ltd. |
|
|
Johnson Electric Holdings Ltd. |
|
|
| |
|
|
| |
|
|
| |
|
|
Orient Overseas International Ltd. |
|
|
Power Assets Holdings Ltd. |
|
|
Swire Pacific Ltd., A Shares |
|
|
Techtronic Industries Co. Ltd. |
|
|
| |
|
|
| |
|
|
| |
|
|
Yue Yuen Industrial Holdings Ltd. |
|
|
| |
|
|
| |
| |
Amber Enterprises India Ltd. * |
|
|
| |
|
|
| |
|
|
| |
|
|
| |
|
|
| |
|
|
Max Healthcare Institute Ltd. |
|
|
| |
|
|
Rainbow Children's Medicare Ltd. |
|
|
| |
|
|
| |
| |
Bank Mandiri Persero Tbk. PT |
|
|
| |
|
|
Jardine Matheson Holdings Ltd. |
|
|
| |
|
|
| |
| |
| |
|
|
Flutter Entertainment PLC * |
|
|
James Hardie Industries PLC, CDI * |
|
|
Jazz Pharmaceuticals PLC * |
|
|
| |
|
|
| |
|
|
Ryanair Holdings PLC, ADR |
|
|
| |
|
|
| |
| |
| |
|
|
| |
| |
| |
|
|
| |
|
|
Bezeq The Israeli Telecommunication Corp. Ltd. |
|
|
Big Shopping Centers Ltd. |
|
|
| |
|
|
| |
|
|
Check Point Software Technologies Ltd. * |
|
|
| |
|
|
| |
|
|
Energix-Renewable Energies Ltd. |
|
|
Enlight Renewable Energy Ltd. * |
|
|
Fattal Holdings 1998 Ltd. * |
|
|
| |
|
|
| |
|
|
Schwab International Opportunities Fund | Annual Holdings and Financial Statements
5
Schwab International Opportunities Fund
Portfolio Holdings as of October 31, 2025 (continued)
| |
|
|
| |
|
|
| |
|
|
Menora Mivtachim Holdings Ltd. |
|
|
Migdal Insurance & Financial Holdings Ltd. |
|
|
Mivne Real Estate KD Ltd. |
|
|
Next Vision Stabilized Systems Ltd. |
|
|
| |
|
|
| |
|
|
| |
|
|
| |
|
|
| |
|
|
| |
|
|
| |
|
|
Teva Pharmaceutical Industries Ltd. * |
|
|
Tower Semiconductor Ltd. *(b) |
|
|
Tower Semiconductor Ltd. *(b) |
|
|
| |
|
|
| |
| |
| |
|
|
| |
|
|
| |
|
|
| |
|
|
Infrastrutture Wireless Italiane SpA |
|
|
| |
|
|
| |
|
|
| |
|
|
| |
|
|
| |
|
|
| |
|
|
| |
|
|
Recordati Industria Chimica e Farmaceutica SpA |
|
|
| |
|
|
| |
|
|
| |
|
|
Terna - Rete Elettrica Nazionale |
|
|
| |
|
|
| |
| |
| |
|
|
| |
|
|
| |
|
|
| |
|
|
| |
|
|
| |
|
|
| |
|
|
| |
|
|
| |
|
|
| |
|
|
| |
|
|
| |
|
|
Asahi Group Holdings Ltd. |
|
|
| |
|
|
| |
|
|
| |
|
|
Bandai Namco Holdings, Inc. |
|
|
| |
|
|
| |
|
|
| |
|
|
Blue Zones Holdings Co. Ltd. |
|
|
| |
|
|
| |
|
|
| |
|
|
Canon Marketing Japan, Inc. |
|
|
| |
|
|
| |
|
|
| |
|
|
| |
|
|
Chugai Pharmaceutical Co. Ltd. |
|
|
Chugoku Electric Power Co., Inc. |
|
|
| |
|
|
Cosmo Energy Holdings Co. Ltd. |
|
|
Cosmos Pharmaceutical Corp. |
|
|
Dai Nippon Printing Co. Ltd. |
|
|
| |
|
|
| |
|
|
| |
|
|
| |
|
|
Daito Trust Construction Co. Ltd. |
|
|
| |
|
|
| |
|
|
| |
|
|
| |
|
|
| |
|
|
| |
|
|
Electric Power Development Co. Ltd. |
|
|
| |
|
|
| |
|
|
| |
|
|
| |
|
|
| |
|
|
Frontier Real Estate Investment Corp. |
|
|
| |
|
|
| |
|
|
| |
|
|
| |
|
|
Furukawa Electric Co. Ltd. |
|
|
| |
|
|
GMO Payment Gateway, Inc. |
|
|
| |
|
|
| |
|
|
Hakuhodo DY Holdings, Inc. |
|
|
Harmonic Drive Systems, Inc. |
|
|
| |
|
|
Hisamitsu Pharmaceutical Co., Inc. |
|
|
Hitachi Construction Machinery Co. Ltd. |
|
|
| |
|
|
| |
|
|
| |
|
|
| |
|
|
| |
|
|
| |
|
|
| |
|
|
| |
|
|
Internet Initiative Japan, Inc. |
|
|
Invincible Investment Corp. |
|
|
Isetan Mitsukoshi Holdings Ltd. |
|
|
| |
|
|
| |
|
|
| |
|
|
| |
|
|
Japan Airport Terminal Co. Ltd. |
|
|
Japan Elevator Service Holdings Co. Ltd. |
|
|
Japan Hotel REIT Investment Corp. |
|
|
Japan Logistics Fund, Inc. |
|
|
| |
|
|
| |
|
|
| |
|
|
| |
|
|
| |
|
|
| |
|
|
| |
|
|
| |
|
|
6
Schwab International Opportunities Fund | Annual Holdings and Financial Statements
Schwab International Opportunities Fund
Portfolio Holdings as of October 31, 2025 (continued)
| |
|
|
| |
|
|
| |
|
|
| |
|
|
| |
|
|
Kawasaki Kisen Kaisha Ltd. |
|
|
| |
|
|
KDX Realty Investment Corp. |
|
|
| |
|
|
| |
|
|
| |
|
|
| |
|
|
| |
|
|
| |
|
|
Kobayashi Pharmaceutical Co. Ltd. |
|
|
| |
|
|
Koei Tecmo Holdings Co. Ltd. |
|
|
Koito Manufacturing Co. Ltd. |
|
|
| |
|
|
| |
|
|
| |
|
|
| |
|
|
| |
|
|
Kotobuki Spirits Co. Ltd. |
|
|
| |
|
|
| |
|
|
| |
|
|
Kurita Water Industries Ltd. |
|
|
Kyushu Electric Power Co., Inc. |
|
|
| |
|
|
| |
|
|
| |
|
|
| |
|
|
| |
|
|
| |
|
|
| |
|
|
| |
|
|
| |
|
|
| |
|
|
| |
|
|
McDonald's Holdings Co. Japan Ltd. |
|
|
| |
|
|
| |
|
|
| |
|
|
| |
|
|
Mitsubishi Chemical Group Corp. |
|
|
| |
|
|
Mitsubishi Electric Corp. |
|
|
Mitsubishi Estate Co. Ltd. |
|
|
Mitsubishi Gas Chemical Co., Inc. |
|
|
Mitsubishi Heavy Industries Ltd. |
|
|
Mitsubishi Logistics Corp. |
|
|
Mitsubishi Materials Corp. |
|
|
| |
|
|
Mitsubishi UFJ Financial Group, Inc. |
|
|
| |
|
|
| |
|
|
Mitsui Fudosan Accommodations Fund, Inc. |
|
|
| |
|
|
| |
|
|
| |
|
|
| |
|
|
| |
|
|
| |
|
|
Murata Manufacturing Co. Ltd. |
|
|
| |
|
|
| |
|
|
Nankai Electric Railway Co. Ltd. |
|
|
| |
|
|
| |
|
|
| |
|
|
| |
|
|
| |
|
|
| |
|
|
| |
|
|
| |
|
|
| |
|
|
Nihon M&A Center Holdings, Inc. |
|
|
| |
|
|
| |
|
|
Nippon Electric Glass Co. Ltd. |
|
|
| |
|
|
Nippon Sanso Holdings Corp. |
|
|
| |
|
|
| |
|
|
Nippon Television Holdings, Inc. |
|
|
| |
|
|
| |
|
|
Nisshin Seifun Group, Inc. |
|
|
Nissin Foods Holdings Co. Ltd. |
|
|
| |
|
|
| |
|
|
| |
|
|
| |
|
|
| |
|
|
| |
|
|
| |
|
|
| |
|
|
OBIC Business Consultants Co. Ltd. |
|
|
| |
|
|
| |
|
|
| |
|
|
| |
|
|
Open House Group Co. Ltd. |
|
|
| |
|
|
| |
|
|
| |
|
|
| |
|
|
| |
|
|
| |
|
|
| |
|
|
| |
|
|
| |
|
|
Pola Orbis Holdings, Inc. |
|
|
| |
|
|
Recruit Holdings Co. Ltd. |
|
|
| |
|
|
| |
|
|
| |
|
|
| |
|
|
| |
|
|
| |
|
|
| |
|
|
| |
|
|
| |
|
|
| |
|
|
Santen Pharmaceutical Co. Ltd. |
|
|
| |
|
|
Sawai Group Holdings Co. Ltd. |
|
|
| |
|
|
| |
|
|
| |
|
|
| |
|
|
Sekisui Chemical Co. Ltd. |
|
|
| |
|
|
| |
|
|
Shikoku Electric Power Co., Inc. |
|
|
Schwab International Opportunities Fund | Annual Holdings and Financial Statements
7
Schwab International Opportunities Fund
Portfolio Holdings as of October 31, 2025 (continued)
| |
|
|
| |
|
|
| |
|
|
| |
|
|
Shin-Etsu Chemical Co. Ltd. |
|
|
| |
|
|
Ship Healthcare Holdings, Inc. |
|
|
SHO-BOND Holdings Co. Ltd. |
|
|
| |
|
|
Sinfonia Technology Co. Ltd. |
|
|
SKY Perfect JSAT Holdings, Inc. |
|
|
| |
|
|
| |
|
|
| |
|
|
Sony Financial Group, Inc. * |
|
|
| |
|
|
Square Enix Holdings Co. Ltd. |
|
|
Stanley Electric Co. Ltd. |
|
|
| |
|
|
Sumitomo Bakelite Co. Ltd. |
|
|
Sumitomo Chemical Co. Ltd. |
|
|
| |
|
|
Sumitomo Electric Industries Ltd. |
|
|
Sumitomo Forestry Co. Ltd. |
|
|
Sumitomo Metal Mining Co. Ltd. |
|
|
| |
|
|
Suntory Beverage & Food Ltd. |
|
|
| |
|
|
| |
|
|
| |
|
|
| |
|
|
| |
|
|
| |
|
|
| |
|
|
Takasago Thermal Engineering Co. Ltd. |
|
|
| |
|
|
| |
|
|
| |
|
|
| |
|
|
| |
|
|
| |
|
|
| |
|
|
| |
|
|
| |
|
|
| |
|
|
| |
|
|
| |
|
|
Tokyo Ohka Kogyo Co. Ltd. |
|
|
| |
|
|
| |
|
|
| |
|
|
| |
|
|
| |
|
|
| |
|
|
| |
|
|
Toyo Seikan Group Holdings Ltd. |
|
|
| |
|
|
| |
|
|
| |
|
|
| |
|
|
| |
|
|
| |
|
|
| |
|
|
| |
|
|
| |
|
|
| |
|
|
| |
|
|
| |
|
|
| |
|
|
| |
|
|
| |
|
|
| |
|
|
| |
|
|
| |
|
|
| |
|
|
| |
|
|
| |
|
|
| |
|
|
| |
|
|
| |
|
|
| |
|
|
| |
|
|
| |
|
|
| |
| |
| |
|
|
| |
|
|
| |
|
|
| |
|
|
| |
|
|
| |
|
|
| |
| |
| |
|
|
| |
| |
| |
|
|
| |
|
|
| |
|
|
| |
|
|
| |
|
|
| |
|
|
| |
|
|
| |
|
|
| |
| |
| |
|
|
| |
|
|
| |
|
|
| |
|
|
| |
| |
| |
|
|
| |
| |
Fomento Economico Mexicano SAB de CV, ADR |
|
|
| |
|
|
| |
|
|
| |
| |
| |
|
|
| |
|
|
| |
|
|
| |
|
|
| |
|
|
| |
|
|
| |
|
|
ASML Holding NV, Registry Shares |
|
|
| |
|
|
| |
|
|
8
Schwab International Opportunities Fund | Annual Holdings and Financial Statements
Schwab International Opportunities Fund
Portfolio Holdings as of October 31, 2025 (continued)
| |
|
|
| |
|
|
| |
|
|
| |
|
|
| |
|
|
| |
|
|
| |
|
|
| |
|
|
| |
|
|
Koninklijke Ahold Delhaize NV |
|
|
| |
|
|
| |
|
|
| |
|
|
| |
|
|
| |
|
|
| |
|
|
| |
|
|
| |
|
|
| |
| |
| |
|
|
| |
|
|
Fisher & Paykel Healthcare Corp. Ltd. |
|
|
| |
|
|
| |
|
|
| |
|
|
| |
|
|
| |
|
|
| |
| |
| |
|
|
| |
|
|
| |
|
|
| |
|
|
| |
|
|
| |
|
|
| |
|
|
| |
|
|
| |
|
|
| |
|
|
| |
|
|
Vend Marketplaces ASA, B Shares |
|
|
| |
|
|
| |
| |
Intercorp Financial Services, Inc. |
|
|
| |
| |
| |
|
|
| |
|
|
| |
|
|
Powszechna Kasa Oszczednosci Bank Polski SA |
|
|
| |
|
|
| |
| |
| |
|
|
| |
|
|
| |
|
|
| |
|
|
| |
| |
|
|
| |
| |
|
|
| |
|
|
| |
|
|
| |
|
|
| |
|
|
| |
|
|
| |
|
|
| |
|
|
| |
|
|
| |
|
|
| |
|
|
| |
|
|
| |
|
|
| |
|
|
| |
|
|
Hankook Tire & Technology Co. Ltd. |
|
|
| |
|
|
Hanmi Semiconductor Co. Ltd. |
|
|
| |
|
|
| |
|
|
| |
|
|
| |
|
|
HD Hyundai Electric Co. Ltd. |
|
|
HD Hyundai Heavy Industries Co. Ltd. |
|
|
HD Hyundai Marine Solution Co. Ltd. |
|
|
| |
|
|
HD Korea Shipbuilding & Offshore Engineering Co. Ltd. |
|
|
| |
|
|
| |
|
|
| |
|
|
| |
|
|
Hyundai Engineering & Construction Co. Ltd. |
|
|
| |
|
|
Hyundai Marine & Fire Insurance Co. Ltd. * |
|
|
| |
|
|
| |
|
|
| |
|
|
| |
|
|
| |
|
|
| |
|
|
| |
|
|
KEPCO Plant Service & Engineering Co. Ltd. |
|
|
| |
|
|
KIWOOM Securities Co. Ltd. |
|
|
| |
|
|
| |
|
|
| |
|
|
Kumho Petrochemical Co. Ltd. |
|
|
| |
|
|
| |
|
|
| |
|
|
| |
|
|
| |
|
|
| |
|
|
| |
|
|
| |
|
|
| |
|
|
NH Investment & Securities Co. Ltd. |
|
|
| |
|
|
| |
|
|
| |
|
|
| |
|
|
Schwab International Opportunities Fund | Annual Holdings and Financial Statements
9
Schwab International Opportunities Fund
Portfolio Holdings as of October 31, 2025 (continued)
| |
|
|
Samsung Biologics Co. Ltd. *(c) |
|
|
| |
|
|
| |
|
|
| |
|
|
Samsung Electro-Mechanics Co. Ltd. |
|
|
Samsung Electronics Co. Ltd. |
|
|
Samsung Heavy Industries Co. Ltd. * |
|
|
| |
|
|
| |
|
|
SK Biopharmaceuticals Co. Ltd. * |
|
|
| |
|
|
| |
|
|
| |
|
|
| |
|
|
| |
|
|
| |
| |
| |
|
|
| |
|
|
| |
|
|
CapitaLand Integrated Commercial Trust |
|
|
| |
|
|
Frasers Logistics & Commercial Trust |
|
|
| |
|
|
Hutchison Port Holdings Trust, U Shares |
|
|
Jardine Cycle & Carriage Ltd. |
|
|
| |
|
|
| |
|
|
Mapletree Industrial Trust |
|
|
Mapletree Pan Asia Commercial Trust |
|
|
| |
|
|
| |
|
|
| |
|
|
| |
|
|
| |
|
|
| |
|
|
| |
|
|
Singapore Technologies Engineering Ltd. |
|
|
Singapore Telecommunications Ltd. |
|
|
| |
|
|
| |
|
|
| |
| |
Impala Platinum Holdings Ltd. |
|
|
| |
| |
| |
|
|
ACS Actividades de Construccion y Servicios SA |
|
|
| |
|
|
| |
|
|
| |
|
|
| |
|
|
| |
|
|
Industria de Diseno Textil SA |
|
|
International Consolidated Airlines Group SA |
|
|
| |
|
|
| |
|
|
| |
|
|
| |
|
|
| |
|
|
| |
| |
|
|
| |
| |
|
|
| |
|
|
| |
|
|
Asmodee Group AB, Class B * |
|
|
| |
|
|
| |
|
|
| |
|
|
| |
|
|
| |
|
|
| |
|
|
| |
|
|
| |
|
|
H & M Hennes & Mauritz AB, B Shares |
|
|
| |
|
|
| |
|
|
Industrivarden AB, A Shares |
|
|
Industrivarden AB, C Shares |
|
|
Investment AB Latour, B Shares |
|
|
| |
|
|
| |
|
|
| |
|
|
| |
|
|
| |
|
|
RaySearch Laboratories AB |
|
|
| |
|
|
| |
|
|
| |
|
|
| |
|
|
| |
|
|
| |
|
|
| |
|
|
Swedish Orphan Biovitrum AB * |
|
|
| |
|
|
Telefonaktiebolaget LM Ericsson, B Shares |
|
|
| |
|
|
| |
|
|
| |
|
|
Volvo Car AB, B Shares *(a) |
|
|
| |
|
|
| |
| |
| |
|
|
| |
|
|
| |
|
|
| |
|
|
Chocoladefabriken Lindt & Spruengli AG |
|
|
Chocoladefabriken Lindt & Spruengli AG, Participation Certificates |
|
|
Cie Financiere Richemont SA, Class A |
|
|
| |
|
|
| |
|
|
| |
|
|
| |
|
|
| |
|
|
| |
|
|
| |
|
|
| |
|
|
| |
|
|
| |
|
|
Kuehne & Nagel International AG |
|
|
| |
|
|
| |
|
|
Logitech International SA |
|
|
| |
|
|
10
Schwab International Opportunities Fund | Annual Holdings and Financial Statements
Schwab International Opportunities Fund
Portfolio Holdings as of October 31, 2025 (continued)
| |
|
|
| |
|
|
Partners Group Holding AG |
|
|
| |
|
|
Roche Holding AG, Bearer Shares |
|
|
| |
|
|
Schindler Holding AG, Participation Certificates |
|
|
| |
|
|
| |
|
|
| |
|
|
SMG Swiss Marketplace Group AG * |
|
|
| |
|
|
| |
|
|
| |
|
|
Swatch Group AG, Bearer Shares |
|
|
Swissquote Group Holding SA |
|
|
| |
|
|
| |
|
|
| |
|
|
| |
| |
| |
|
|
AURAS Technology Co. Ltd. |
|
|
| |
|
|
| |
|
|
King Yuan Electronics Co. Ltd. |
|
|
| |
|
|
Taiwan Semiconductor Manufacturing Co. Ltd. |
|
|
| |
|
|
| |
| |
| |
|
|
| |
United Arab Emirates 0.4% |
| |
|
|
| |
| |
| |
|
|
| |
|
|
| |
|
|
| |
|
|
| |
|
|
Associated British Foods PLC |
|
|
| |
|
|
| |
|
|
| |
|
|
| |
|
|
| |
|
|
| |
|
|
Berkeley Group Holdings PLC |
|
|
British American Tobacco PLC |
|
|
| |
|
|
| |
|
|
CK Hutchison Holdings Ltd. |
|
|
Coca-Cola Europacific Partners PLC |
|
|
| |
|
|
| |
|
|
| |
|
|
| |
|
|
| |
|
|
| |
|
|
| |
|
|
| |
|
|
| |
|
|
| |
|
|
| |
|
|
Hikma Pharmaceuticals PLC |
|
|
| |
|
|
| |
|
|
| |
|
|
| |
|
|
| |
|
|
InterContinental Hotels Group PLC |
|
|
| |
|
|
| |
|
|
| |
|
|
| |
|
|
Marks & Spencer Group PLC |
|
|
Metlen Energy & Metals PLC * |
|
|
| |
|
|
| |
|
|
| |
|
|
| |
|
|
| |
|
|
| |
|
|
Reckitt Benckiser Group PLC |
|
|
| |
|
|
| |
|
|
| |
|
|
| |
|
|
| |
|
|
| |
|
|
| |
|
|
| |
|
|
| |
|
|
| |
|
|
| |
|
|
| |
|
|
| |
|
|
| |
|
|
| |
|
|
| |
|
|
| |
|
|
| |
|
|
United Utilities Group PLC |
|
|
| |
|
|
| |
|
|
| |
|
|
| |
|
|
| |
| |
ACADIA Pharmaceuticals, Inc. * |
|
|
GQG Partners, Inc., Class A |
|
|
| |
|
|
| |
|
|
| |
|
|
| |
|
|
| |
|
|
| |
|
|
Total Common Stocks
(Cost $859,562,841) |
|
| |
PREFERRED STOCKS 0.3% OF NET ASSETS |
| |
| |
| |
|
|
| |
|
|
| |
|
|
| |
Schwab International Opportunities Fund | Annual Holdings and Financial Statements
11
Schwab International Opportunities Fund
Portfolio Holdings as of October 31, 2025 (continued)
| |
|
|
| |
Telecom Italia SpA - RSP * |
|
|
| |
| |
Samsung Electronics Co. Ltd. |
|
|
Samsung Fire & Marine Insurance Co. Ltd. |
|
|
| |
|
|
Total Preferred Stocks
(Cost $2,729,379) |
|
| |
RIGHTS 0.0% OF NET ASSETS |
| |
| |
| |
expires 11/13/25, strike NOK 0.50 *(c) |
|
|
| |
|
| |
WARRANTS 0.0% OF NET ASSETS |
| |
| |
Constellation Software, Inc. |
| |
|
|
| |
|
| |
INVESTMENT COMPANIES 2.2% OF NET ASSETS |
| |
| |
Schwab Emerging Markets Equity ETF (d) |
|
|
Total Investment Companies
(Cost $22,777,321) |
|
| |
|
|
SHORT-TERM INVESTMENTS 2.8% OF NET ASSETS |
| |
| |
State Street Institutional U.S. Government Money Market Fund, Premier Class 4.01% (e) |
|
|
State Street Institutional U.S. Government Money Market Fund, Premier Class 4.01% (e)(f) |
|
|
| |
|
|
Total Short-Term Investments
(Cost $33,303,817) |
|
Total Investments in Securities
(Cost $918,373,358) |
|
| |
|
|
CURRENT VALUE/
UNREALIZED
APPRECIATION
($) |
| |
| |
|
|
|
MSCI EAFE Index, expires 12/19/25 |
|
|
|
12
Schwab International Opportunities Fund | Annual Holdings and Financial Statements
Schwab International Opportunities Fund
Portfolio Holdings as of October 31, 2025 (continued)
| |
|
|
AMOUNT OF CURRENCY TO BE RECEIVED |
|
AMOUNT OF CURRENCY TO BE DELIVERED |
UNREALIZED
APPRECIATION
(DEPRECIATION)
($) |
FORWARD FOREIGN CURRENCY EXCHANGE CONTRACTS |
| |
|
|
|
|
|
|
| |
|
|
|
|
|
|
| |
|
|
|
|
|
|
| |
|
|
|
|
|
|
| |
|
|
|
|
|
|
| |
|
|
|
|
|
|
| |
|
|
|
|
|
|
| |
|
|
|
|
|
|
| |
|
|
|
|
|
|
| |
|
|
|
|
|
|
| |
|
|
|
|
|
|
| |
|
|
|
|
|
|
| |
|
|
|
|
|
|
| |
State Street Bank & Trust Co. |
|
|
|
|
|
| |
|
|
|
|
|
|
| |
|
|
|
|
|
|
| |
|
|
|
|
|
|
| |
|
|
|
|
|
|
| |
|
|
|
|
|
|
| |
|
|
|
|
|
|
| |
|
|
|
|
|
|
| |
|
|
|
|
|
|
| |
|
|
|
|
|
|
| |
|
|
|
|
|
|
| |
|
|
|
|
|
|
| |
|
|
|
|
|
|
Net Unrealized Appreciation on Forward Foreign Currency Exchange Contracts |
|
| |
Non-income producing security. |
| |
All or a portion of this security is on loan. Securities on loan were valued at $122,240. |
| |
Security is traded on separate exchanges for the same issuer. |
| |
Fair valued using significant unobservable inputs (see financial note 2(a), Securities for which no quoted value is available, for additional information). |
| |
Issuer is affiliated with the fund’s investment adviser. |
| |
The rate shown is the annualized 7-day yield. |
| |
Security purchased with cash collateral received for securities on loan. |
| |
American Depositary Receipt |
| |
CHESS Depositary Interest |
| |
|
| |
|
| |
Real Estate Investment Trust |
| |
Risparmio (Savings Shares) |
| |
|
| |
|
| |
|
| |
|
| |
|
| |
|
| |
|
| |
|
| |
|
| |
|
| |
|
Schwab International Opportunities Fund | Annual Holdings and Financial Statements
13
Schwab International Opportunities Fund
Portfolio Holdings as of October 31, 2025 (continued)
| |
|
| |
Includes holdings within sectors that are less than 1.0% of net assets. |
Below is a summary of the fund’s transactions with affiliated issuers during the period ended October 31, 2025:
| |
|
|
|
NET REALIZED GAINS (LOSSES) |
NET CHANGE IN UNREALIZED APPRECIATION (DEPRECIATION) |
|
BALANCE OF SHARES HELD AT 10/31/25 |
|
INVESTMENT COMPANIES 2.2% OF NET ASSETS |
| |
| |
Schwab Emerging Markets Equity ETF |
|
|
|
|
|
|
|
|
| |
|
|
|
|
|
|
|
|
| |
Distributions received include distributions from net investment income and capital gains, if any, from the underlying fund. |
The following is a summary of the inputs used to value the fund’s investments as of October 31, 2025 (see financial note 2(a) for additional information):
| |
QUOTED PRICES IN
ACTIVE MARKETS FOR
IDENTICAL ASSETS
(LEVEL 1) |
OTHER SIGNIFICANT
OBSERVABLE INPUTS
(LEVEL 2) |
SIGNIFICANT
UNOBSERVABLE INPUTS
(LEVEL 3) |
|
| |
|
|
|
|
| |
|
|
|
|
| |
|
|
|
|
| |
|
|
|
|
| |
|
|
|
|
| |
|
|
|
|
| |
|
|
|
|
| |
|
|
|
|
| |
|
|
|
|
| |
|
|
|
|
| |
|
|
|
|
| |
|
|
|
|
| |
|
|
|
|
| |
|
|
|
|
| |
|
|
|
|
| |
|
|
|
|
| |
|
|
|
|
14
Schwab International Opportunities Fund | Annual Holdings and Financial Statements
Schwab International Opportunities Fund
Portfolio Holdings as of October 31, 2025 (continued)
| |
QUOTED PRICES IN ACTIVE MARKETS FOR IDENTICAL ASSETS (LEVEL 1) |
OTHER SIGNIFICANT OBSERVABLE INPUTS (LEVEL 2) |
SIGNIFICANT UNOBSERVABLE INPUTS (LEVEL 3) |
|
| |
|
|
|
|
| |
|
|
|
|
| |
|
|
|
|
| |
|
|
|
|
| |
|
|
|
|
| |
|
|
|
|
| |
|
|
|
|
| |
|
|
|
|
| |
|
|
|
|
| |
|
|
|
|
| |
|
|
|
|
| |
|
|
|
|
| |
|
|
|
|
| |
|
|
|
|
| |
|
|
|
|
| |
|
|
|
|
| |
|
|
|
|
| |
|
|
|
|
| |
|
|
|
|
| |
|
|
|
|
| |
|
|
|
|
Forward Foreign Currency Exchange Contracts2 |
|
|
|
|
| |
|
|
|
|
Forward Foreign Currency Exchange Contracts2 |
|
|
|
|
| |
|
|
|
|
| |
As categorized in the Portfolio Holdings. |
| |
Futures contracts and forward foreign currency exchange contracts are reported at cumulative unrealized appreciation or depreciation. |
Schwab International Opportunities Fund | Annual Holdings and Financial Statements
15
Schwab International Opportunities Fund
Statement of Assets and Liabilities
| |
Investments in securities, at value - affiliated issuers (cost $22,777,321) |
|
|
Investments in securities, at value - unaffiliated issuers (cost $895,596,037) including securities on loan of $122,240 |
|
|
| |
|
|
Foreign currency, at value (cost $651,439) |
|
|
Deposit with broker for futures contracts |
|
|
| |
|
|
| |
|
|
| |
|
|
| |
|
|
| |
|
|
Income from securities on loan |
|
|
Unrealized appreciation on forward foreign currency exchange contracts |
|
|
| |
|
|
| |
|
|
| |
| |
Collateral held for securities on loan |
|
|
| |
|
|
| |
|
|
| |
|
|
Investment adviser and administrator fees |
|
|
Foreign capital gains tax |
|
|
| |
|
|
Variation margin on futures contracts |
|
|
| |
|
|
Independent trustees’ fees |
|
|
Unrealized depreciation on forward foreign currency exchange contracts |
|
|
| |
|
|
| |
|
|
| |
|
|
| |
| |
Capital received from investors |
|
|
Total distributable earnings |
|
|
| |
|
|
16
Schwab International Opportunities Fund | Annual Holdings and Financial Statements
Schwab International Opportunities Fund
Statement of Operations
For the period November 1, 2024 through October 31, 2025 |
| |
Dividends received from securities - unaffiliated issuers (net of foreign withholding tax of $2,098,028) |
|
|
Dividends received from securities - affiliated issuers |
|
|
| |
|
|
| |
|
|
| |
|
|
| |
| |
Investment adviser and administrator fees |
|
|
| |
|
|
| |
|
|
Portfolio accounting fees |
|
|
| |
|
|
| |
|
|
| |
|
|
Independent trustees’ fees |
|
|
| |
|
|
| |
|
|
| |
|
|
| |
|
|
| |
|
|
| |
|
|
| |
REALIZED AND UNREALIZED GAINS (LOSSES) |
Net realized losses on sales of securities - affiliated issuers |
|
|
Net realized gains on sales of securities - unaffiliated issuers (net of foreign capital gains tax paid of $500,281) |
|
|
Net realized gains on futures contracts |
|
|
Net realized gains on forward foreign currency exchange contracts |
|
|
Net realized losses on foreign currency transactions |
|
|
| |
|
|
Net change in unrealized appreciation (depreciation) on securities - affiliated issuers |
|
|
Net change in unrealized appreciation (depreciation) on securities - unaffiliated issuers (net of change in foreign capital gains tax of $906,947) |
|
|
Net change in unrealized appreciation (depreciation) on futures contracts |
|
|
Net change in unrealized appreciation (depreciation) on forward foreign currency exchange contracts |
|
|
Net change in unrealized appreciation (depreciation) on foreign currency translations |
|
|
Net change in unrealized appreciation (depreciation) |
|
|
Net realized and unrealized gains |
|
|
Increase in net assets resulting from operations |
|
|
| |
Includes professional fees of $2,613 associated with the filing of foreign withholding tax claims in the European Union. Fees are deemed to be non-contingent and non-routine expenses of the fund (see financial notes 2(d) and 3 for additional information). |
Schwab International Opportunities Fund | Annual Holdings and Financial Statements
17
Schwab International Opportunities Fund
Statement of Changes in Net Assets
For the current and prior report periods
| |
| |
|
|
| |
|
|
|
| |
|
|
|
Net change in unrealized appreciation (depreciation) |
|
|
|
Increase in net assets resulting from operations |
|
|
|
| |
DISTRIBUTIONS TO SHAREHOLDERS |
| |
|
|
|
TRANSACTIONS IN FUND SHARES |
| |
|
|
| |
|
|
|
|
|
| |
|
|
|
|
|
| |
|
|
|
|
|
| |
|
|
|
|
|
Net transactions in fund shares |
|
|
|
|
|
| |
SHARES OUTSTANDING AND NET ASSETS |
| |
|
|
| |
|
|
|
|
|
| |
|
|
|
|
|
Total increase (decrease) |
|
|
|
|
|
| |
|
|
|
|
|
18
Schwab International Opportunities Fund | Annual Holdings and Financial Statements
Schwab International Opportunities Fund
1. Business Structure of the Fund:
The fund in this report is a series of Schwab Capital Trust (the trust), a no-load, open-end management investment company. The trust is organized as a Massachusetts business trust and is registered under the Investment Company Act of 1940, as amended (the 1940 Act). The list below shows all the operational funds in the trust as of the end of the period, including the fund discussed in this report, which is highlighted:
| |
Schwab International Opportunities Fund |
|
Schwab S&P 500 Index Fund |
|
Schwab Small-Cap Index Fund |
|
Schwab Total Stock Market Index Fund |
|
Schwab U.S. Large-Cap Growth Index Fund |
|
Schwab U.S. Large-Cap Value Index Fund |
Schwab Fundamental U.S. Large Company Index Fund |
Schwab U.S. Mid-Cap Index Fund |
Schwab Fundamental U.S. Small Company Index Fund |
Schwab International Index Fund |
Schwab Fundamental International Equity Index Fund |
Schwab MarketTrack All Equity Portfolio™ |
Schwab Fundamental International Small Equity Index Fund |
Schwab MarketTrack Growth Portfolio™ |
Schwab Fundamental Emerging Markets Equity Index Fund |
Schwab MarketTrack Balanced Portfolio™ |
Schwab Fundamental Global Real Estate Index Fund |
Schwab MarketTrack Conservative Portfolio™ |
Schwab Target 2010 Index Fund |
| |
Schwab Target 2015 Index Fund |
| |
Schwab Target 2020 Index Fund |
Schwab Dividend Equity Fund |
Schwab Target 2025 Index Fund |
Schwab Large-Cap Growth Fund |
Schwab Target 2030 Index Fund |
Schwab Small-Cap Equity Fund |
Schwab Target 2035 Index Fund |
| |
Schwab Target 2040 Index Fund |
Schwab International Core Equity Fund |
Schwab Target 2045 Index Fund |
| |
Schwab Target 2050 Index Fund |
| |
Schwab Target 2055 Index Fund |
| |
Schwab Target 2060 Index Fund |
| |
Schwab Target 2065 Index Fund |
| |
Schwab Monthly Income Fund – Target Payout |
| |
Schwab Monthly Income Fund – Flexible Payout |
| |
Schwab Monthly Income Fund – Income Payout |
The fund offers one share class. Shares are bought and sold at closing net asset value per share, which is the price for all outstanding shares of the fund. Each share has a par value of 1/1,000 of a cent, and the fund’s Board of Trustees may authorize the issuance of as many shares as necessary.
The fund maintains its own account for purposes of holding assets and accounting, and is considered a separate entity for tax purposes. Within its account, the fund may also keep certain assets in segregated accounts, as required by securities law. The "Schwab Funds Complex" includes The Charles Schwab Family of Funds, Schwab Capital Trust, Schwab Investments, Schwab Annuity Portfolios, Schwab Strategic Trust and Laudus Trust.
The Schwab International Opportunities Fund seeks long-term capital appreciation.
2. Significant Accounting Policies: The following is a summary of the significant accounting policies the fund uses in its preparation of financial statements. The fund follows the investment company accounting and reporting guidance of the Financial Accounting Standards Board (FASB) Accounting Standard Codification (ASC) Topic 946 Financial Services — Investment Companies. The accounting policies are in conformity with accounting principles generally accepted in the United States of America (GAAP).
In this reporting period, the fund adopted FASB Accounting Standards Update 2023-07, ASC Topic 280 Segment Reporting (Topic 280) Improvements to Reportable Segment Disclosures. Adoption of the new standard impacted financial statement disclosures only and did not affect the fund’s financial position or the results of operations. An operating segment is defined in Topic 280 as a component of a public entity that engages in business activities from which it may recognize revenues and incur expenses, has operating results that are regularly reviewed by the public entity’s chief operating decision maker (CODM) to make decisions about resources to be allocated to the segment and assess its performance, and has discrete financial information available. The
Schwab International Opportunities Fund | Annual Holdings and Financial Statements
19
Schwab International Opportunities Fund
Financial Notes (continued)
2. Significant Accounting Policies (continued):
management committee of the fund’s investment adviser acts as the fund’s CODM. The CODM has determined that the fund operates as a single operating segment given the fund has a single defined investment strategy disclosed in its respective prospectus. The discrete financial information in the form of the fund’s portfolio composition, total returns, expense ratios and changes in net assets (i.e., changes in net assets resulting from operations, shares sold and shares redeemed), which is used by the CODM to assess performance against the prospectus and to make resource allocation decisions with respect to the fund, is presented within the fund’s financial statements.
The fund may invest in mutual funds and exchange-traded funds, which are referred to as "underlying funds." For more information about the underlying funds’ operations and policies, please refer to those funds’ semiannual and annual reports and holdings and financial statements, which are filed in Form N-CSR with the U.S. Securities and Exchange Commission (SEC) and available on the SEC’s website at www.sec.gov.
Pursuant to Rule 2a-5 under the 1940 Act, the Board of Trustees has designated authority to a Valuation Designee, the fund’s investment adviser, to make fair valuation determinations under adopted procedures, subject to Board of Trustees oversight. The investment adviser has formed a Pricing Committee to administer the pricing and valuation of portfolio securities and other assets and liabilities as well as to ensure that prices used for internal purposes or provided by third parties reasonably reflect fair value. The Valuation Designee may utilize independent pricing services, quotations from securities and financial instrument dealers and other market sources to determine fair value.
Securities held in the fund’s portfolio are valued every business day. The following valuation policies and procedures are used by the Valuation Designee to value various types of securities:
● Securities traded on an exchange or over-the-counter: Traded securities are valued at the closing value for the day, or, on days when no closing value has been reported, at the mean of the most recent bid and ask quotes. Securities that are primarily traded on foreign exchanges are valued at the official closing price or the last sales price on the exchange where the securities are principally traded with these values then translated into U.S. dollars at the current exchange rate, unless these securities are fair valued as discussed below.
● Foreign equity security fair valuation: The Valuation Designee has adopted procedures to fair value foreign equity securities that are traded in markets that close prior to the valuation of the fund’s holdings. By fair valuing securities whose prices may have been affected by events occurring after the close of trading, the Valuation Designee seeks to establish prices that investors might expect to realize upon the current sales of these securities. This methodology is designed to deter “arbitrage” market timers, who seek to exploit delays between the change in the value of the fund’s portfolio holdings and the net asset value of the fund’s shares and seeks to help ensure that the prices at which the fund’s shares are purchased and redeemed are fair and do not result in dilution of shareholder interest or other harm to shareholders. When fair value pricing is used at the open or close of a reporting period, it may cause a temporary divergence between the return of the fund and that of its comparative index or benchmark.
● Futures contracts: Futures contracts are valued at their settlement prices as of the close of their exchanges.
● Forward foreign currency exchange contracts: Forward foreign currency exchange contracts are valued based on that day’s forward exchange rates or by using an interpolated forward exchange rate for contracts with interim settlement dates.
● Mutual funds: Mutual funds are valued at their respective net asset values.
● Securities for which no quoted value is available: The Valuation Designee has adopted procedures to fair value the fund’s securities when market prices are not “readily available” or are unreliable. For example, a security may be fair valued when it’s de-listed or its trading is halted or suspended; when a security’s primary pricing source is unable or unwilling to provide a price; or when a security’s primary trading market is closed during regular market hours. Fair value determinations are made in good faith in accordance with adopted valuation procedures. The Valuation Designee considers a number of factors, including unobservable market inputs, when arriving at fair value. The Valuation Designee may employ methods such as the review of related or comparable assets or liabilities, related market activities, recent transactions, market multiples, book values, transactional back-testing, disposition analysis and other relevant information. Due to the subjective and variable nature of fair value pricing, there can be no assurance that the fund could obtain the fair value assigned to the security upon the sale of such security.
20
Schwab International Opportunities Fund | Annual Holdings and Financial Statements
Schwab International Opportunities Fund
Financial Notes (continued)
2. Significant Accounting Policies (continued):
In accordance with the authoritative guidance on fair value measurements and disclosures under GAAP, the fund discloses the fair value of its investments in a hierarchy that prioritizes the significant inputs to valuation methods used to measure the fair value. The hierarchy gives the highest priority to valuations based upon unadjusted quoted prices in active markets for identical assets or liabilities (Level 1 measurements) and the lowest priority to valuations based upon unobservable inputs that are significant to the valuation (Level 3 measurements). If inputs used to measure the financial instruments fall within different levels of the hierarchy, the categorization is based on the lowest level input that is significant to the valuation. If it is determined that either the volume and/or level of activity for an asset or liability has significantly decreased (from normal conditions for that asset or liability) or price quotations or observable inputs are not associated with orderly transactions, increased analysis and the Valuation Designee’s judgment will be required to estimate fair value.
The three levels of the fair value hierarchy are as follows:
● Level 1 — quoted prices in active markets for identical investments — Investments whose values are based on quoted market prices in active markets. These generally include active listed equities, mutual funds, exchange-traded funds and futures contracts. Mutual funds and exchange-traded funds are classified as Level 1 prices, without consideration to the classification level of the underlying securities held which could be Level 1, Level 2, or Level 3 in the fair value hierarchy.
● Level 2 — other significant observable inputs (including quoted prices for similar securities, interest rates, prepayment speeds, credit risk, etc.) — Investments that trade in markets that are not considered to be active, but whose values are based on quoted market prices, dealer quotations or valuations provided by alternative pricing sources supported by observable inputs are classified as Level 2 prices. These generally include forward foreign currency exchange contracts, U.S. government and sovereign obligations, most government agency securities, investment-grade corporate bonds, certain mortgage products, less liquid listed equities, and state, municipal and provincial obligations. In addition, international securities whose markets close hours before the valuation of the fund’s holdings may require fair valuations due to significant movement in the U.S. markets occurring after the daily close of foreign markets. The Valuation Designee has approved a vendor that calculates fair valuations of international equity securities based on a number of factors that appear to correlate to the movements in the U.S. markets.
● Level 3 — significant unobservable inputs (including the Valuation Designee’s assumptions in determining the fair value of investments) — Investments whose values are classified as Level 3 prices have significant unobservable inputs, as they may trade infrequently or not at all. When observable prices are not readily available for these securities, one or more valuation methods are used for which sufficient and reliable data is available. The inputs used in estimating the value of Level 3 prices may include the original transaction price, quoted prices for similar securities or assets in active markets, completed or pending third-party transactions in the underlying investment or comparable issuers, and changes in financial ratios or cash flows. Level 3 prices may also be adjusted to reflect illiquidity and/or non-transferability, with the amount of such discount estimated in the absence of market information. Assumptions used due to the lack of observable inputs may significantly impact the resulting fair value and therefore the fund’s results of operations.
The inputs or methodology used for valuing securities are not necessarily an indication of the risk associated with investing in those securities.
The levels associated with valuing the fund’s investments as of October 31, 2025, are disclosed in the fund’s Portfolio Holdings.
(b) Accounting Policies for certain Portfolio Investments (if held):
Futures Contracts: Futures contracts are instruments that represent an agreement between two parties that obligates one party to buy, and the other party to sell, specific instruments at an agreed upon price on a stipulated future date. The fund must give the broker a deposit of cash and/or securities (initial margin) whenever it enters into a futures contract. The amount of the deposit may vary from one contract to another. Subsequent payments (variation margin) are made or received by the fund depending on the daily fluctuations in the value of the futures contract and are accounted for as unrealized appreciation or depreciation until the contract is closed, at which time the gains or losses are realized. Futures contracts are traded publicly on exchanges, and their value may change daily.
Forward Foreign Currency Exchange Contracts: Forward foreign currency exchange contracts are contracts to buy and sell a currency at a set price on a future date. The value of the forward foreign currency exchange contracts is accounted for as unrealized appreciation or depreciation until the contracts settle, at which time the gains or losses are realized.
Securities Lending: Under the trust’s Securities Lending Program, the fund (lender) may make short-term loans of its securities to another party (borrower) to generate additional revenue for the fund. The borrower pledges collateral in the form of cash, securities issued or fully guaranteed by the U.S. government or foreign governments, or letters of credit issued by a bank. Collateral at the
Schwab International Opportunities Fund | Annual Holdings and Financial Statements
21
Schwab International Opportunities Fund
Financial Notes (continued)
2. Significant Accounting Policies (continued):
individual loan level is required to be maintained on a daily marked-to-market basis in an amount at least equal to the current value of the securities loaned. The lending agent provides the fund with indemnification against borrower default (the borrower fails to return the security on loan) reducing the risk of loss as a result of default. The cash collateral of securities loaned is currently invested in money market portfolios operating pursuant to Rule 2a-7 under the 1940 Act. The fund bears the risk of loss with respect to the investment of cash collateral. The terms of the securities lending agreement allow the fund or the lending agent to terminate any loan at any given time and the securities must be returned within the earlier of the standard trade settlement period or the specified time period under the relevant securities lending agreement. Securities lending income, as disclosed in the fund’s Statement of Operations, if applicable, represents the income earned from the investment of the cash collateral plus any fees paid by borrowers, less the fees paid to the lending agent and broker rebates which are subject to adjustments pursuant to the securities lending agreement. On loans not collateralized by cash, a fee is received from the borrower, and is allocated between the fund and the lending agent. The aggregate market value of securities loaned will not at any time exceed one-third of the total assets of the fund, including collateral received from the loan. Securities lending fees paid to the unaffiliated lending agent start at 9% of gross lending revenue, with subsequent breakpoints to a low of 5%. In this context, the gross lending revenue equals the income received from the investment of cash collateral and fees paid by borrowers less any rebates paid to the borrowers. Any expenses charged by the cash collateral fund are in addition to these fees. All remaining revenue is retained by the fund, as applicable. No portion of lending revenue is paid to or retained by the investment adviser or any of its affiliates.
As of October 31, 2025, the fund had securities on loan, all of which were classified as common stocks. The value of securities on loan and the related collateral as of October 31, 2025, are disclosed in the fund’s Portfolio Holdings and Statement of Assets and Liabilities.
Passive Foreign Investment Companies: The fund may own shares in certain foreign corporations that meet the Internal Revenue Code, as amended, definition of a Passive Foreign Investment Company (PFIC). The fund may elect for tax purposes to mark-to-market annually the shares of each PFIC lot held and would be required to distribute as ordinary income to shareholders any such marked-to-market gains (as well as any gains realized on sale).
Central Securities Depositories Regulation: The Central Securities Depositories Regulation (CSDR) introduced measures for the authorization and supervision of European Union Central Security Depositories and created a common set of prudential, organizational, and conduct of business standards at a European level. CSDR is designed to support securities settlement and operational aspects of securities settlement, including the provision of shorter settlement periods; mandatory buy-ins; and cash penalties, to prevent and address settlement fails. CSDR measures are aimed to prevent settlement fails by ensuring that all transaction details are provided to facilitate settlement, as well as further incentivizing timely settlement by imposing cash penalty fines and buy-ins. The fund may be subject to pay cash penalties and may also receive cash penalties with certain counterparties in instances where there are settlement fails. These cash penalties are included in net realized gains (losses) on sales of securities - unaffiliated issuers in the fund’s Statement of Operations, if any.
(c) Security Transactions:
Security transactions are recorded as of the date the order to buy or sell the security is executed. Realized gains and losses from security transactions are based on the identified costs of the securities involved.
Assets and liabilities denominated in foreign currencies are reported in U.S. dollars. For assets and liabilities held on a given date, the dollar value is based on market exchange rates in effect on that date. Transactions involving foreign currencies, including purchases, sales, income receipts and expense payments, are calculated using exchange rates in effect on the transaction date. Realized foreign exchange gains or losses arise from sales of foreign currencies, currency gains or losses realized between the trade and settlement dates on securities transactions and the differences between the recorded amounts of dividends, interest, and foreign withholding taxes and the U.S. dollar equivalent of the amounts actually received or paid. Net unrealized foreign exchange appreciation or depreciation arises from changes in foreign exchange rates on foreign denominated assets and liabilities other than investments in securities held at the end of the reporting period. These realized and unrealized foreign exchange gains or losses are reported in foreign currency transactions or translations, if any, in the fund’s Statement of Operations. The fund does not isolate the portion of the fluctuations on investments resulting from changes in foreign currency exchange rates from the fluctuations in market prices of investments held. Such fluctuations are included with the net realized and unrealized gain or loss from investments, if any.
Gains realized by the fund on the sale of securities in certain foreign countries may be subject to non-U.S. taxes. In those instances, the fund records a liability based on unrealized appreciation to provide for potential non-U.S. taxes payable upon the sale of these securities.
When the fund closes out a futures contract position, it calculates the difference between the value of the position at the beginning and at the end of the contract, and records a realized gain or loss accordingly.
22
Schwab International Opportunities Fund | Annual Holdings and Financial Statements
Schwab International Opportunities Fund
Financial Notes (continued)
2. Significant Accounting Policies (continued):
When the fund closes out a forward foreign currency contract position, it calculates the difference between the value of the position at the beginning and at the end of the settlement of the contract, and records a realized gain or loss accordingly.
Interest income is recorded as it accrues. Dividends and distributions from portfolio securities and underlying funds are recorded on the date they are effective (the ex-dividend date), although the fund records certain foreign security dividends on the date the ex-dividend date is confirmed. Non-cash dividends in the form of additional securities are recorded on the ex-dividend date at fair value, if any. Any distributions from underlying funds are recorded in accordance with the character of the distributions as designated by the underlying funds.
Income received from foreign sources may result in withholding tax. Withholding taxes are accrued at the same time as the related income if the tax rate is fixed and known, unless a tax withheld is reclaimable from the local tax authorities and there are no significant uncertainties on collectibility in which case it is recorded as receivable. If the tax rate is not known or estimable, such expense or reclaim receivable is recorded when the net proceeds are received.
The fund filed claims to recover taxes previously withheld in certain European Union countries on the basis that those countries had purportedly violated certain provisions in the Treaty on the Functioning of the European Union. These filings are subject to various administrative and judicial proceedings within these countries, and all professional fees associated with these filings have been paid by the investment adviser. The professional fees related to European Union foreign withholding tax claims are non-contingent and non-routine expenses which are subject to repayment to the investment adviser (see financial note 3 for additional information).
For U.S. income tax purposes, European Union reclaims received reduce the amounts of foreign taxes that the fund passes through to its shareholders. If European Union reclaims received exceed foreign withholding taxes paid, the fund will evaluate the requirements for entering into a closing agreement with the Internal Revenue Service (IRS) to address any prior years’ U.S. income tax liabilities attributable to fund shareholders resulting from the recovery of foreign taxes. The closing agreement would result in the fund paying a compliance fee to the IRS, on behalf of its shareholders, representing the estimated tax savings generated from foreign tax credits claimed by fund shareholders on their tax returns in prior years. During the period ended October 31, 2025, the fund did not incur any compliance fees.
Expenses that are specific to the fund are charged directly to the fund. Expenses that are common to more than one fund in the Schwab Funds Complex generally are allocated among those funds in proportion to their average daily net assets.
(f) Distributions to Shareholders:
The fund makes distributions from net investment income and net realized capital gains, if any, once a year. To receive a distribution, you must be a registered shareholder on the record date. Distributions are paid to shareholders on the payable date.
(g) Accounting Estimates:
The accounting policies described in this report conform to GAAP. Notwithstanding this, shareholders should understand that in order to follow these principles, fund management has to make estimates and assumptions that affect the information reported in the financial statements. It’s possible that once the results are known, they may turn out to be different from these estimates and these differences may be material.
(h) Federal Income Taxes:
The fund intends to meet federal income and excise tax requirements for regulated investment companies under subchapter M of the Internal Revenue Code, as amended. Accordingly, the fund distributes substantially all of its net investment income and net realized capital gains, if any, to its shareholders each year. As long as the fund meets the tax requirements, it is not required to pay federal income tax.
The fund may be subject to foreign taxes (a portion of which may be reclaimable) on income, corporate events, foreign currency exchanges and capital gains on investments. All foreign taxes are recorded in accordance with the applicable foreign tax regulations and rates that exist in foreign markets in which the fund invests. These foreign taxes, if any, are paid by the fund and are disclosed in the fund’s Statement of Operations. Foreign taxes accrued as of October 31, 2025, if any, are reflected in the fund’s Statement of Assets and Liabilities.
Schwab International Opportunities Fund | Annual Holdings and Financial Statements
23
Schwab International Opportunities Fund
Financial Notes (continued)
2. Significant Accounting Policies (continued):
(j) Indemnification:
Under the fund’s organizational documents, the officers and trustees are indemnified against certain liabilities arising out of the performance of their duties to the fund. In addition, in the normal course of business the fund enters into contracts with its vendors and others that provide general indemnifications. The fund’s maximum exposure under these arrangements is unknown as this would involve future claims that may be made against the fund. However, based on experience, the fund expects the risk of loss attributable to these arrangements to be remote.
(k) Recent Accounting Pronouncements:
In December 2023, the FASB issued ASU 2023-09 Income Taxes (Topic 740): Improvements to Income Tax Disclosures. The amendments were issued to enhance the transparency and decision usefulness of income tax disclosures primarily related to rate reconciliation and income taxes paid information. The guidance is effective for annual periods beginning after December 15, 2024, and with early adoption permitted. At this time, management is evaluating the impact of this amendment but believes it will not have a material impact on the financial statements and income tax disclosures.
3. Affiliates and Affiliated Transactions: Charles Schwab Investment Management, Inc., dba Schwab Asset Management, a wholly owned subsidiary of The Charles Schwab Corporation, serves as the fund’s investment adviser and administrator pursuant to the Amended and Restated Investment Advisory and Administration Agreement between the investment adviser and the trust. American Century Investment Management, Inc., Baillie Gifford Overseas Limited, Columbia Management Investment Advisers, LLC and Harris Associates L.P., the fund’s subadvisers, provide day-to-day portfolio management services to the fund, subject to the supervision of the investment adviser.
For its advisory and administrative services to the fund, the investment adviser is entitled to receive an annual fee, payable monthly, equal to 0.63% of the fund’s average daily net assets.
The investment adviser (not the fund) pays a portion of the advisory fees it receives to the subadvisers in return for their portfolio management services.
The Board of Trustees has adopted a Shareholder Servicing Plan (the Plan) on behalf of the fund. The Plan enables the fund to bear expenses relating to the provision by financial intermediaries, including Charles Schwab & Co., Inc. (Schwab), a broker-dealer affiliate of the investment adviser, (together, service providers), of certain account maintenance, customer liaison and shareholder services to the current shareholders of the fund.
Pursuant to the Plan, the fund’s shares are subject to an annual shareholder servicing fee up to 0.20%. The shareholder servicing fee paid to a particular service provider is made pursuant to its written agreement with Schwab, as distributor of the fund (or, in the case of payments made to Schwab acting as a service provider, pursuant to Schwab’s written agreement with the fund). Payments under the Plan are made as described above without regard to whether the fee is more or less than the service provider’s actual cost of providing the services, and if more, such excess may be retained as profit by the service provider.
The investment adviser and its affiliates have agreed, for so long as the investment adviser serves as the investment adviser to the fund, in which the agreement may only be amended or terminated with the approval of the Board of Trustees, to limit the total annual fund operating expenses charged (including acquired fund fees and expenses, which are indirect expenses incurred by the fund through its investments in underlying funds), excluding interest, taxes and certain non-routine expenses to 0.86%.
24
Schwab International Opportunities Fund | Annual Holdings and Financial Statements
Schwab International Opportunities Fund
Financial Notes (continued)
3. Affiliates and Affiliated Transactions (continued):
Investments from Affiliates
Funds in the Schwab Funds Complex may own shares of other funds in the Schwab Funds Complex. The table below reflects the percentage of shares of the fund in this report that is owned by other funds in the Schwab Funds Complex as of October 31, 2025, as applicable:
Investments in Affiliates
The fund may engage in certain transactions involving affiliated parties. Pursuant to an exemptive order issued by the SEC, the fund may invest in affiliated funds. As of October 31, 2025, the fund’s ownership percentage of affiliated fund’s shares is as follows:
Schwab Emerging Markets Equity ETF |
|
Other Affiliated Transactions
The professional fees related to European Union foreign withholding tax claims discussed in financial note 2(d) are non-contingent and non-routine expenses. The investment adviser agreed to pay these professional fees, on behalf of the fund, subject to reimbursement by the fund to the investment adviser to the extent the fund is able to successfully recover tax claims in the future.
During the period ended October 31, 2025, the professional fees incurred by the fund and paid by the investment adviser were $2,613, as shown as Professional fees in the fund’s Statement of Operations.
During the period ended October 31, 2025, the fund recovered previously withheld foreign taxes from Finland and France. The payments received by the fund amounted to $432,769 which includes $6,259 of interest income and is recorded as Dividends received from securities — unaffiliated issuers in the fund’s Statement of Operations. The investment adviser paid upfront professional fees associated with recovering these foreign taxes in the amount of $16,257, which was reimbursed to the investment adviser by the fund and is also recorded as Dividends received from securities — unaffiliated issuers in the fund’s Statement of Operations.
As of October 31, 2025, the fund had no balance of professional fees related to foreign withholding tax claims subject to future reimbursement by the fund to the investment adviser.
No other amounts for additional foreign withholding tax claims are reflected in the financial statements due to the uncertainty surrounding the ultimate resolution of proceedings, the likelihood of receipt of these claims, and the potential timing of payment.
The fund’s investment adviser or subadvisers may engage in direct transactions with other funds they manage in accordance with procedures adopted by the Board of Trustees pursuant to Rule 17a-7 under the 1940 Act. When one fund is seeking to sell a security that another fund is seeking to buy, an interfund transaction can allow both funds to benefit by reducing transaction costs while allowing each fund to execute the transaction at the current market price. This practice is limited to funds that share the same investment adviser or subadvisers. The net realized gains or losses on sales of interfund transactions, are recorded in Net realized
Schwab International Opportunities Fund | Annual Holdings and Financial Statements
25
Schwab International Opportunities Fund
Financial Notes (continued)
3. Affiliates and Affiliated Transactions (continued):
gains (losses) on sales of securities — unaffiliated issuers in the Statement of Operations. For the period ended October 31, 2025, the fund’s purchases and sales of securities with other funds managed by the investment adviser or subadvisers was $53,050,731 and $27,314,224, respectively, and includes net realized losses of $1,959,519.
Interfund Borrowing and Lending
Pursuant to an exemptive order issued by the SEC, the fund may enter into interfund borrowing and lending transactions with other funds in the Schwab Funds Complex. All loans are for temporary or emergency purposes and the interest rate to be charged will be the average of the overnight repurchase agreement rate and the short-term bank loan rate. All loans are subject to numerous conditions designed to ensure fair and equitable treatment of all participating funds. The interfund lending facility is subject to the oversight and periodic review by the Board of Trustees. The fund had no interfund borrowing or lending activity during the period.
The Board of Trustees may include people who are officers and/or directors of the investment adviser or its affiliates. Federal securities law limits the percentage of such “interested persons” who may serve on a trust’s board, and the trust was in compliance with these limitations throughout the report period. The fund did not pay any of these interested persons for their services as trustees, but did pay non-interested persons (independent trustees), as noted in the fund’s Statement of Operations.
During the period, the fund was a participant with other funds in the Schwab Funds Complex in a joint, syndicated, committed $1.2 billion line of credit (the Syndicated Credit Facility), which matured on September 25, 2025. On September 25, 2025, the Syndicated Credit Facility was amended to run for a new 28 day period with the line of credit amount remaining unchanged, maturing on October 23, 2025. On October 23, 2025, the Syndicated Credit Facility was amended to run for a new 364 day period with the line of credit amount remaining unchanged, maturing on October 22, 2026. Under the terms of the Syndicated Credit Facility, in addition to the interest charged on any borrowings by the fund, the fund paid a commitment fee of 0.15% per annum on the fund’s proportionate share of the unused portion of the Syndicated Credit Facility.
During the period, the fund was a participant with other funds in the Schwab Funds Complex in a joint, unsecured, uncommitted $400 million line of credit (the Uncommitted Credit Facility) with State Street Bank and Trust Company, which matured on September 25, 2025. On September 25, 2025, the Uncommitted Credit Facility was amended to run for a new 28 day period with the line of credit amount remaining unchanged, maturing on October 23, 2025. On October 23, 2025, the Uncommitted Credit Facility was amended to run for a new 364 day period with the line of credit amount remaining unchanged, maturing on October 22, 2026. Under the terms of the Uncommitted Credit Facility, the fund pays interest on the amount the fund borrows. There were no borrowings by the fund from either line of credit during the period.
The fund also has access to custodian overdraft facilities. The fund may have utilized the overdraft facility and incurred an interest expense, which is disclosed in the fund’s Statement of Operations, if any. The interest expense is determined based on a negotiated rate above the current Federal Funds Rate.
The fund entered into futures contracts during the report period to equitize available cash. The fund also invested in forward foreign currency exchange contracts to minimize the uncertainty of changes in future foreign currency exchange rates and to hedge exposure to certain currencies.
26
Schwab International Opportunities Fund | Annual Holdings and Financial Statements
Schwab International Opportunities Fund
Financial Notes (continued)
6. Derivatives (continued):
As of October 31, 2025, the Statement of Assets and Liabilities included the following financial derivative instrument fair values held at period end:
| |
|
FOREIGN
CURRENCY
EXCHANGE
CONTRACTS |
|
| |
|
|
|
| |
|
|
|
Forward Foreign Currency Exchange Contracts2 |
|
|
|
| |
|
|
|
Forward Foreign Currency Exchange Contracts2 |
|
|
|
| |
|
| |
Includes cumulative unrealized appreciation of futures contracts as reported in the fund’s Portfolio Holdings. Only current day’s variation margin on futures contracts is reported in the Statement of Assets and Liabilities. |
| |
Statement of Assets and Liabilities location: Unrealized appreciation on forward foreign currency exchange contracts and Unrealized depreciation on forward foreign currency exchange contracts. |
The effects of the derivative contracts in the Statement of Operations for the period ended October 31, 2025, were:
| |
|
FOREIGN
CURRENCY
EXCHANGE
CONTRACTS |
|
Net Realized Gains (Losses) |
|
|
|
| |
|
|
|
Forward Foreign Currency Exchange Contracts1 |
|
|
|
Net Change in Unrealized Appreciation (Depreciation) |
|
|
|
| |
|
|
|
Forward Foreign Currency Exchange Contracts2 |
|
|
|
| |
|
| |
Statement of Operations location: Net realized gains (losses) on futures contracts and net realized gains (losses) on forward foreign currency exchange contracts. |
| |
Statement of Operations location: Net change in unrealized appreciation (depreciation) on futures contracts and net change in unrealized appreciation (depreciation) on forward foreign currency exchange contracts. |
During the period ended October 31, 2025, the month-end average notional amounts of futures contracts held by the fund and the month-end average number of contracts held were as follows:
During the period ended October 31, 2025, the month-end average notional amounts of forward foreign currency exchange contracts held by the fund and the month-end average unrealized appreciation (depreciation) were as follows:
| |
UNREALIZED APPRECIATION (DEPRECIATION) |
| |
|
| |
|
The fund’s forward foreign currency exchange contracts are entered into pursuant to International Swaps and Derivatives Association, Inc. (ISDA) agreements which govern certain terms of derivative transactions. ISDA agreements typically contain, among other things, master netting provisions in the event of a default or other termination event. Master netting provisions allow the fund and the counterparty, in the event of a default or other termination event, to offset payable and receivable amounts for each party related to derivative contracts to one net amount payable by either the fund or the counterparty. The fund’s forward foreign currency exchange contracts, which are reported gross in the Statement of Assets and Liabilities, are presented in the table
Schwab International Opportunities Fund | Annual Holdings and Financial Statements
27
Schwab International Opportunities Fund
Financial Notes (continued)
6. Derivatives (continued):
below. The following table presents the fund’s forward foreign currency exchange contracts, net of amounts available for offset under a master netting agreement and net of any related collateral received by the fund for assets and pledged by the fund for liabilities as of October 31, 2025.
| |
GROSS AMOUNTS OF ASSETS PRESENTED IN THE STATEMENT OF ASSETS AND LIABILITIES |
FINANCIAL INSTRUMENTS AVAILABLE FOR OFFSET |
|
|
| |
|
|
|
|
| |
|
|
|
|
| |
|
|
|
|
| |
|
|
|
|
| |
|
|
|
|
| |
|
|
|
|
| |
|
|
|
|
| |
GROSS AMOUNTS OF LIABILITIES PRESENTED IN THE STATEMENT OF ASSETS AND LIABILITIES |
FINANCIAL INSTRUMENTS AVAILABLE FOR OFFSET |
|
|
| |
|
|
|
|
| |
|
|
|
|
| |
|
|
|
|
| |
|
|
|
|
State Street Bank & Trust Co. |
|
|
|
|
| |
|
|
|
|
| |
|
|
|
|
| |
|
|
|
|
| |
Represents the net amount due from/due to the counterparty in the event of default. |
7. Purchases and Sales of Investment Securities: For the period ended October 31, 2025, purchases and sales of securities (excluding short-term obligations) were as follows:
As of October 31, 2025, the tax basis cost of the fund’s investments and gross unrealized appreciation and depreciation were as follows:
| |
|
GROSS UNREALIZED
APPRECIATION |
GROSS UNREALIZED
DEPRECIATION |
NET UNREALIZED
APPRECIATION
(DEPRECIATION) |
| |
|
|
|
|
| |
|
|
|
|
| |
|
|
|
|
The primary differences between book basis and tax basis unrealized appreciation or unrealized depreciation of investments are the tax deferral of losses on wash sales, the realization for tax purposes of unrealized appreciation or depreciation on futures contracts, the realization for tax purposes of unrealized appreciation on investments in PFICs and partnership investments. The tax cost of the fund’s investments, disclosed above, have been adjusted from its book amounts to reflect these unrealized appreciation or depreciation differences, as applicable.
28
Schwab International Opportunities Fund | Annual Holdings and Financial Statements
Schwab International Opportunities Fund
Financial Notes (continued)
8. Federal Income Taxes (continued):
As of October 31, 2025, the components of distributable earnings on a tax basis were as follows:
UNDISTRIBUTED
ORDINARY
INCOME |
UNDISTRIBUTED
LONG-TERM
CAPITAL GAINS |
NET UNREALIZED
APPRECIATION
(DEPRECIATION)
ON INVESTMENTS |
NET OTHER UNREALIZED
APPRECIATION
(DEPRECIATION) |
|
| |
|
|
|
|
As of October 31, 2025, the fund had no capital loss carryforwards available to offset future realized capital gains for federal income tax purposes.
For the fiscal year ended October 31, 2025, the fund had capital loss carryforwards utilized of $35,748,733.
The tax basis components of distributions paid during the current and prior fiscal years were as follows:
| |
CURRENT FISCAL YEAR END DISTRIBUTIONS |
PRIOR FISCAL YEAR END DISTRIBUTIONS |
| |
|
|
| |
|
|
Distributions paid to shareholders are based on net investment income and net realized gains determined on a tax basis, which may differ from net investment income and net realized gains for financial reporting purposes. These differences reflect the differing character of certain income items and net realized gains and losses for financial statement and tax purposes, and may result in reclassification among certain capital accounts in the financial statements. The fund may also designate a portion of the amount paid to redeeming shareholders as a distribution for tax purposes.
Permanent book and tax basis differences may result in reclassifications between components of net assets as required. The adjustments will have no impact on net assets or the results of operations.
As of October 31, 2025, management has reviewed the tax positions for open periods (for federal purposes, three years from the date of filing and for state purposes, four years from the date of filing) as applicable to the fund, and has determined that no provision for income tax is required in the fund’s financial statements. The fund recognizes interest and penalties, if any, related to unrecognized tax benefits as income tax expense in the fund’s Statement of Operations. During the fiscal year ended October 31, 2025, the fund did not incur any interest or penalties.
Management has determined there are no subsequent events or transactions through the date the financial statements were issued that would have materially impacted the financial statements as presented.
Schwab International Opportunities Fund | Annual Holdings and Financial Statements
29
Schwab International Opportunities Fund
Report of Independent Registered Public Accounting Firm
To the Board of Trustees of Schwab Capital Trust and Shareholders of Schwab International Opportunities Fund:
Opinion on the Financial Statements and Financial Highlights
We have audited the accompanying statement of assets and liabilities, including the portfolio holdings, of Schwab International Opportunities Fund (the “Fund”), one of the funds constituting Schwab Capital Trust, as of October 31, 2025, the related statement of operations for the year then ended, the statements of changes in net assets for each of the two years in the period then ended, the financial highlights for each of the five years in the period then ended, and the related notes (collectively referred to as the “financial statements and financial highlights”). In our opinion, the financial statements and financial highlights present fairly, in all material respects, the financial position of the Fund as of October 31, 2025, and the results of its operations for the year then ended, the changes in its net assets for each of the two years in the period then ended, and the financial highlights for each of the five years in the period then ended in conformity with accounting principles generally accepted in the United States of America.
These financial statements and financial highlights are the responsibility of the Fund’s management. Our responsibility is to express an opinion on the Fund’s financial statements and financial highlights based on our audits. We are a public accounting firm registered with the Public Company Accounting Oversight Board (United States) (PCAOB) and are required to be independent with respect to the Fund in accordance with the U.S. federal securities laws and the applicable rules and regulations of the Securities and Exchange Commission and the PCAOB.
We conducted our audits in accordance with the standards of the PCAOB. Those standards require that we plan and perform the audit to obtain reasonable assurance about whether the financial statements and financial highlights are free of material misstatement, whether due to error or fraud. The Fund is not required to have, nor were we engaged to perform, an audit of its internal control over financial reporting. As part of our audits we are required to obtain an understanding of internal control over financial reporting but not for the purpose of expressing an opinion on the effectiveness of the Fund’s internal control over financial reporting. Accordingly, we express no such opinion.
Our audits included performing procedures to assess the risks of material misstatement of the financial statements and financial highlights, whether due to error or fraud, and performing procedures that respond to those risks. Such procedures included examining, on a test basis, evidence regarding the amounts and disclosures in the financial statements and financial highlights. Our audits also included evaluating the accounting principles used and significant estimates made by management, as well as evaluating the overall presentation of the financial statements and financial highlights. Our procedures included confirmation of securities owned as of October 31, 2025, by correspondence with the custodian and brokers; when replies were not received from brokers, we performed other auditing procedures. We believe that our audits provide a reasonable basis for our opinion.
Deloitte & Touche LLP
Denver, Colorado
December 16, 2025
We have served as the auditor of one or more investment companies in the Schwab Funds Complex since 2020.
30
Schwab International Opportunities Fund | Annual Holdings and Financial Statements
Changes in and Disagreements with Accountants for Open-End Management Investment Companies
Schwab International Opportunities Fund | Annual Holdings and Financial Statements
31
Proxy Disclosures for Open-End Management Investment Companies
32
Schwab International Opportunities Fund | Annual Holdings and Financial Statements
Remuneration Paid to Directors, Officers, and Others of Open-End Management Investment Companies
The remuneration paid to directors, officers and others are included under Item 7 (Financial Statements and Financial Highlights for Open-End Management Investment Companies).
Schwab International Opportunities Fund | Annual Holdings and Financial Statements
33
Schwab International Opportunities Fund
Investment Advisory and Sub-Advisory Agreement Approval
The Investment Company Act of 1940, as amended (the 1940 Act), requires that the initial approval and/or continuation of a fund’s investment advisory agreement must be specifically approved (1) by the vote of the trustees or by a vote of the shareholders of the fund, and (2) by the vote of a majority of the trustees who are not parties to the investment advisory agreement or “interested persons” of any party thereto (the Independent Trustees), cast in person at a meeting called for the purpose of voting on such approval. In connection with such approvals, the fund’s trustees must request and evaluate, and the investment adviser is required to furnish, such information as may be reasonably necessary to evaluate the terms of the investment advisory agreement.
The Board of Trustees (the Board or the Trustees, as appropriate) calls and holds one or more meetings each year that are dedicated, in whole or in part, to considering whether to renew the investment advisory and administration agreement between Schwab Capital Trust (the Trust) and Charles Schwab Investment Management, Inc. (dba Schwab Asset Management) (the investment adviser) with respect to the existing funds in the Trust, including Schwab International Opportunities Fund (the Fund), and the individual sub-advisory agreements between the investment adviser and American Century Investment Management, Inc., Baillie Gifford Overseas Limited (Baillie Gifford), Columbia Management Investment Advisers, LLC (Columbia) and Harris Associates L.P. (Harris) relating to the Fund (each, a Sub-Adviser and collectively, the Sub-Advisers). Such investment advisory and administration agreement and sub-advisory agreements are collectively referred to herein as the Agreements. The Trustees also review certain other agreements pursuant to which the investment adviser provides investment advisory services to certain other registered investment companies. In preparation for the meeting(s), the Board requests and reviews a wide variety of materials provided by the investment adviser and the Sub-Advisers, including information about their affiliates, personnel, business goals and priorities, profitability, oversight of third-party service providers, corporate structure and operations. As part of the renewal process, the Independent Trustees’ legal counsel, on behalf of the Independent Trustees, sends an information request letter to the investment adviser and the investment adviser sends an information request letter to each of the Sub-Advisers seeking certain relevant information. The responses by the investment adviser and the Sub-Advisers are provided to the Trustees in the Board materials for their review prior to their meeting, and the Trustees are provided with the opportunity to request any additional materials. The Board also receives data provided by an independent provider of investment company data. This information is in addition to the detailed information about the Fund that the Board reviews during the course of each year, including information that relates to the Fund’s operations and
performance, legal and compliance matters, risk management, portfolio turnover, and sales and marketing activity. In considering the renewal, the Independent Trustees receive advice from Independent Trustees’ legal counsel, including a memorandum regarding the responsibilities of trustees for the approval of investment advisory agreements. In addition, the Independent Trustees participate in question and answer sessions with representatives of the investment adviser and meet in executive session outside the presence of Fund management. The Board also discusses with the investment adviser the Fund’s operations and the investment adviser’s ability, consistent with the “manager of managers” structure of the Fund, to (i) identify and recommend to the Trustees sub-advisers for the Fund, (ii) monitor and oversee the performance and investment capabilities of each Sub-Adviser, and (iii) recommend the termination and/or replacement of a Sub-Adviser when appropriate.
The Board, including a majority of the Independent Trustees, considered information relating specifically to the continuance of the Agreements with respect to the Fund at meetings held on May 7, 2025 and June 5, 2025, and approved the renewal of the Agreements with respect to the Fund for an additional one-year term at the meeting on June 5, 2025 called for the purpose of voting on such approval.
The Board’s approval of the continuance of the Agreements with respect to the Fund was based on consideration and evaluation of a variety of specific factors discussed at these meetings and at prior meetings, including:
1.
the nature, extent and quality of the services provided to the Fund under the Agreements, including the resources of the investment adviser and its affiliates, and the Sub-Advisers, dedicated to the Fund;
2.
the Fund’s investment performance and how it compared to that of certain other comparable mutual funds and benchmark data;
3.
the Fund’s expenses and how those expenses compared to those of certain other similar mutual funds;
4.
the profitability of the investment adviser and its affiliates, including Charles Schwab & Co., Inc. (Schwab), with respect to the Fund, including both direct and indirect benefits accruing to the investment adviser and its affiliates, as well as the profitability of the Sub-Advisers; and
5.
the extent to which economies of scale would be realized as the Fund grows and whether fee levels in the Agreements reflect those economies of scale for the benefit of Fund investors.
Nature, Extent and Quality of Services. The Board considered the nature, extent and quality of the services provided to the Fund and the resources of the investment adviser and its
34
Schwab International Opportunities Fund | Annual Holdings and Financial Statements
Schwab International Opportunities Fund
affiliates and the Sub-Advisers dedicated to the Fund. In this regard, the Trustees evaluated, among other things, the investment adviser’s and the Sub-Advisers’ experience, track record, compliance program, resources dedicated to hiring and retaining skilled personnel and specialized talent, and information security resources. The Trustees also considered information provided by the investment adviser and the Sub-Advisers relating to the services and support provided with respect to the Fund’s portfolio management team, portfolio strategy, and internal investment guidelines, as well as trading infrastructure, liquidity management, product design and analysis, shareholder communications, securities valuation, and vendor and risk oversight. The Trustees also considered the investment adviser’s continued investment in its infrastructure, including the investment adviser’s technology and use of data, business continuity, cybersecurity, due diligence, risk management processes, and information security programs. The Trustees considered Schwab’s overall financial condition and its reputation as a full service brokerage firm as well as the wide range of products, services and account features that benefit Funds shareholders who are brokerage clients of Schwab. The Board also considered the nature, extent and quality of the sub-advisory services provided by the Sub-Advisers to the Fund and the resources each dedicates to the Fund. Following such evaluation, the Board concluded, within the context of its full deliberations, that the nature, extent and quality of services provided by the investment adviser and the Sub-Advisers to the Fund and the resources of the investment adviser, its affiliates, and the Sub-Advisers dedicated to the Fund supported renewal of the Agreements with respect to the Fund.
Fund Performance. The Board considered the Fund’s performance in determining whether to renew the Agreements with respect to the Fund. Specifically, the Trustees considered the Fund’s performance relative to a peer category of other mutual funds and an applicable benchmark index, in light of total return and the market environment, as well as in consideration of the Fund’s investment style and strategy. As part of this review, the Trustees considered the composition of the peer category, selection criteria and the reputation of the independent provider of investment company data who prepared the peer category analysis. In addition, the Trustees considered whether irrespective of relative performance, each Sub-Adviser’s absolute performance was consistent with expectations for such Sub-Adviser’s unique investment methodology. The Trustees further considered the level of Fund performance in the context of their review of Fund expenses and adviser and Sub-Adviser profitability discussed below and also noted that the Board and a designated committee of the Board review performance throughout the year. Following such evaluation, the Board concluded, within the context of its full deliberations, that the performance of the Fund supported renewal of the Agreements with respect to the Fund.
Fund Expenses. With respect to the Fund’s expenses, the Trustees considered the rate of compensation called for by the
Agreement and the Fund’s net operating expense ratio, in each case, in comparison to those of other similar mutual funds, such peer groups and comparisons having been selected and calculated by an independent provider of investment company data. The investment adviser reported to the Board, and the Board took into account, the risk assumed by the investment adviser in the development of the Fund and provision of services as well as the competitive marketplace for financial products. The Trustees considered the effects of the investment adviser’s and Schwab’s practice of waiving certain fees to prevent total annual operating expenses of the Fund from exceeding a specified cap. The Trustees also considered the investment adviser’s contractual commitment to limit the total annual operating expenses of the Fund for so long as the investment adviser serves as the adviser to the Fund. The Trustees also considered fees charged by the investment adviser and the Sub-Advisers to other mutual funds and to other types of accounts, but, with respect to such other types of accounts, accorded less weight to such comparisons due to the different legal, regulatory, compliance and operating features of mutual funds as compared to these other types of accounts, and any differences in the nature and scope of the services the investment adviser provides to these other accounts, as well as differences in the market for these types of accounts. Following such evaluation, the Board concluded, within the context of its full deliberations, that the expenses of the Fund are reasonable and supported renewal of the Agreement with respect to the Fund.
Profitability. The Trustees considered the compensation flowing to the investment adviser and its affiliates, directly or indirectly and reviewed profitability on a pre-tax basis, without regard to distribution expenses. The Trustees reviewed the profitability of the investment adviser relating to the Schwab fund complex as a whole, noting the benefits to Fund shareholders of being part of the Schwab fund complex, including the allocations of certain costs across the Fund and other funds in the complex. The Trustees also considered any other benefits derived by the investment adviser from its relationship with the Fund, such as whether, by virtue of its management of the Fund, the investment adviser obtains investment information or other research resources that aid it in providing advisory services to other clients. The Trustees considered whether the compensation and profitability with respect to the Fund under the Agreements and other service agreements were reasonable in light of the quality of all services rendered to the Fund by the investment adviser and its affiliates. The Trustees noted that the investment adviser continues to invest substantial sums in its business in order to provide enhanced research capabilities, services and systems to benefit the Fund.
In addition, the Trustees also considered the compensation received by each Sub-Adviser, directly or indirectly. The Trustees also considered any other benefits derived by each Sub-Adviser from its relationship with the Fund, such as whether, by virtue of its management of the Fund, such
Schwab International Opportunities Fund | Annual Holdings and Financial Statements
35
Schwab International Opportunities Fund
Sub-Adviser obtains investment information or other research resources that aid it in providing advisory services to other clients. With respect to each Sub-Adviser, the Trustees considered whether the compensation and profitability under the applicable Agreement were reasonable and justified in light of the quality of all services rendered to the Fund by such Sub-Adviser, and its affiliates. The Board also considered the profitability of each Sub-Adviser with respect to the sub-advisory services it provides to the Fund, although, when doing so, the Board took into account the fact that the Sub-Advisers are compensated by the investment adviser, and not by the Fund directly, and such compensation with respect to any Sub-Adviser reflects an arms-length negotiation between the Sub-Adviser and the investment adviser. Based on this evaluation, the Board concluded, within the context of its full deliberations, that the profitability of the investment adviser and the Sub-Advisers is reasonable and supported renewal of the Agreements.
Economies of Scale. Although the Trustees recognized the difficulty of determining economies of scale with precision, and although the Fund does not have breakpoints in its advisory fees, the Trustees considered the potential existence of any economies of scale and whether those are passed along to the Fund’s shareholders through (i) the enhancement of services provided to the Fund in return for fees paid, including through the investment adviser’s continued investment in its infrastructure, and use of data and technology, increasing expertise and capabilities in key areas (including portfolio and trade operations), and improving business continuity,
cybersecurity, due diligence and information security programs, which are designed to provide enhanced services to the Fund and its shareholders; (ii) graduated investment advisory fee schedules or unitary fee structures, fee waivers, or expense caps by the investment adviser and its affiliates for those funds in the Schwab fund complex with such features; and (iii) pricing the Fund to scale and keeping overall expenses down as the Fund grows. The Trustees considered that the investment adviser and its affiliates employ contractual expense caps to protect shareholders from higher fees, including, for example, when fund assets are relatively small. Based on this evaluation, the Board concluded, within the context of its full deliberations, that the Fund obtains reasonable benefits from economies of scale.
* * * * * * * * * * * * * * * * * * * * * * * * * * * * * * * * * * * * * * * *
In the course of their deliberations, the Trustees may have accorded different weights to various factors and did not identify any particular information or factor that was all important or controlling. Based on the Trustees’ deliberation and their evaluation of the information described above, the Board, including all of the Independent Trustees, approved the continuation of the Agreements with respect to the Fund and concluded that the compensation under the Agreements with respect to the Fund is fair and reasonable in light of the services provided and the related expenses borne by the investment adviser and its affiliates and such other matters as the Trustees considered to be relevant in the exercise of their reasonable judgment.
36
Schwab International Opportunities Fund | Annual Holdings and Financial Statements
Annual Holdings and Financial Statements | October 31, 2025
Schwab Active Equity Funds
Schwab Dividend Equity Fund
Schwab Large-Cap Growth Fund
Schwab Small-Cap Equity Fund
Schwab International Core Equity Fund
Fund investment adviser: Charles Schwab Investment Management, Inc., dba Schwab Asset Management®
Distributor: Charles Schwab & Co., Inc. (Schwab)
The Sector/Industry classifications in this report use the Global Industry Classification Standard (GICS) which was developed by and is the exclusive property of MSCI Inc. (MSCI) and Standard & Poor’s (S&P). GICS is a service mark of MSCI and S&P and has been licensed for use by Schwab. The Industry classifications used in the Portfolio Holdings are sub-categories of Sector classifications.
Schwab Active Equity Funds | Annual Holdings and Financial Statements
1
Financial Statements
| |
|
|
|
|
|
|
| |
Net asset value at beginning of period |
|
|
|
|
|
|
Income (loss) from investment operations: |
|
|
|
|
|
|
Net investment income (loss)1 |
|
|
|
|
|
|
Net realized and unrealized gains (losses) |
|
|
|
|
|
|
Total from investment operations |
|
|
|
|
|
|
| |
|
|
|
|
|
|
Distributions from net investment income |
|
|
|
|
|
|
Distributions from net realized gains |
|
|
|
|
|
|
| |
|
|
|
|
|
|
Net asset value at end of period |
|
|
|
|
|
|
| |
|
|
|
|
|
|
| |
Ratios to average net assets: |
|
|
|
|
|
|
| |
|
|
|
|
|
|
| |
|
|
|
|
|
|
Net investment income (loss) |
|
|
|
|
|
|
| |
|
|
|
|
|
|
Net assets, end of period (x 1,000,000) |
|
|
|
|
|
|
| |
Calculated based on the average shares outstanding during the period. |
| |
Ratio includes less than 0.005% of non-routine proxy expenses. |
2
Schwab Active Equity Funds | Annual Holdings and Financial Statements
Portfolio Holdings as of October 31, 2025
| |
|
|
COMMON STOCKS 100.1% OF NET ASSETS |
| |
| |
| |
|
|
| |
|
|
| |
|
|
| |
|
|
| |
|
|
| |
|
|
Rockwell Automation, Inc. |
|
|
| |
|
|
| |
Commercial & Professional Services 2.0% |
Republic Services, Inc., Class A |
|
|
| |
|
|
| |
|
|
| |
Consumer Discretionary Distribution & Retail 5.6% |
| |
|
|
| |
|
|
| |
|
|
| |
Consumer Staples Distribution & Retail 1.4% |
| |
|
|
| |
| |
| |
|
|
| |
|
|
| |
|
|
| |
Equity Real Estate Investment Trusts (REITs) 0.5% |
| |
|
|
| |
| |
| |
|
|
| |
|
|
Fidelity National Information Services, Inc. |
|
|
| |
|
|
| |
|
|
| |
|
|
| |
|
|
| |
|
|
| |
Food, Beverage & Tobacco 0.9% |
Constellation Brands, Inc., Class A |
|
|
| |
Health Care Equipment & Services 5.8% |
| |
|
|
Boston Scientific Corp. * |
|
|
Intuitive Surgical, Inc. * |
|
|
| |
|
|
| |
|
|
| |
| |
|
|
Household & Personal Products 1.9% |
L'Oreal SA, Sponsored ADR (a) |
|
|
| |
|
|
| |
|
|
| |
| |
Marsh & McLennan Cos., Inc. |
|
|
Old Republic International Corp. |
|
|
| |
|
|
| |
|
|
| |
| |
| |
|
|
| |
Media & Entertainment 10.6% |
| |
|
|
Meta Platforms, Inc., Class A |
|
|
| |
|
|
| |
Pharmaceuticals, Biotechnology & Life Sciences 6.3% |
| |
|
|
| |
|
|
Thermo Fisher Scientific, Inc. |
|
|
| |
|
|
| |
|
|
| |
Semiconductors & Semiconductor Equipment 16.7% |
ASML Holding NV, Registry Shares |
|
|
| |
|
|
| |
|
|
| |
|
|
| |
|
|
| |
Software & Services 15.1% |
| |
|
|
International Business Machines Corp. |
|
|
| |
|
|
Palo Alto Networks, Inc. * |
|
|
| |
|
|
| |
|
|
| |
Technology Hardware & Equipment 7.4% |
| |
|
|
| |
|
|
| |
|
|
| |
| |
| |
|
|
| |
|
|
| |
|
|
| |
|
|
Total Common Stocks
(Cost $771,228,096) |
|
Schwab Active Equity Funds | Annual Holdings and Financial Statements
3
Portfolio Holdings as of October 31, 2025 (continued)
| |
|
|
SHORT-TERM INVESTMENTS 0.3% OF NET ASSETS |
| |
| |
State Street Institutional U.S. Government Money Market Fund, Premier Class 4.01% (b) |
|
|
State Street Institutional U.S. Government Money Market Fund, Premier Class 4.01% (b)(c) |
|
|
| |
|
|
Total Short-Term Investments
(Cost $5,187,486) |
|
Total Investments in Securities
(Cost $776,415,582) |
|
| |
Non-income producing security. |
| |
All or a portion of this security is on loan. Securities on loan were valued at $2,070,304. |
| |
The rate shown is the annualized 7-day yield. |
| |
Security purchased with cash collateral received for securities on loan. |
| |
American Depositary Receipt |
The following is a summary of the inputs used to value the fund’s investments as of October 31, 2025 (see financial note 2(a) for additional information):
| |
QUOTED PRICES IN
ACTIVE MARKETS FOR
IDENTICAL ASSETS
(LEVEL 1) |
OTHER SIGNIFICANT
OBSERVABLE INPUTS
(LEVEL 2) |
SIGNIFICANT
UNOBSERVABLE INPUTS
(LEVEL 3) |
|
| |
|
|
|
|
| |
|
|
|
|
| |
|
|
|
|
| |
|
|
|
|
| |
As categorized in the Portfolio Holdings. |
4
Schwab Active Equity Funds | Annual Holdings and Financial Statements
Statement of Assets and Liabilities
| |
Investments in securities, at value - unaffiliated issuers (cost $776,415,582) including securities on loan of $2,070,304 |
|
|
| |
|
|
| |
|
|
| |
|
|
| |
|
|
Income from securities on loan |
|
|
| |
|
|
| |
|
|
| |
| |
Collateral held for securities on loan |
|
|
| |
|
|
| |
|
|
Investment adviser and administrator fees |
|
|
| |
|
|
Independent trustees’ fees |
|
|
| |
|
|
| |
|
|
| |
|
|
| |
| |
Capital received from investors |
|
|
Total distributable earnings |
|
|
| |
|
|
Schwab Active Equity Funds | Annual Holdings and Financial Statements
5
Statement of Operations
For the period November 1, 2024 through October 31, 2025 |
| |
Dividends received from securities - unaffiliated issuers (net of foreign withholding tax of $48,987) |
|
|
| |
|
|
| |
|
|
| |
| |
Investment adviser and administrator fees |
|
|
| |
|
|
Portfolio accounting fees |
|
|
| |
|
|
| |
|
|
| |
|
|
| |
|
|
Independent trustees’ fees |
|
|
| |
|
|
| |
|
|
| |
|
|
| |
|
|
| |
REALIZED AND UNREALIZED GAINS (LOSSES) |
Net realized gains on sales of securities - unaffiliated issuers |
|
|
Net change in unrealized appreciation (depreciation) on securities - unaffiliated issuers |
|
|
Net realized and unrealized gains |
|
|
Increase in net assets resulting from operations |
|
|
6
Schwab Active Equity Funds | Annual Holdings and Financial Statements
Statement of Changes in Net Assets
For the current and prior report periods
| |
| |
|
|
| |
|
|
|
| |
|
|
|
Net change in unrealized appreciation (depreciation) |
|
|
|
Increase in net assets resulting from operations |
|
|
|
| |
DISTRIBUTIONS TO SHAREHOLDERS |
| |
|
|
|
TRANSACTIONS IN FUND SHARES |
| |
|
|
| |
|
|
|
|
|
| |
|
|
|
|
|
| |
|
|
|
|
|
| |
|
|
|
|
|
Net transactions in fund shares |
|
|
|
|
|
| |
SHARES OUTSTANDING AND NET ASSETS |
| |
|
|
| |
|
|
|
|
|
| |
|
|
|
|
|
Total increase (decrease) |
|
|
|
|
|
| |
|
|
|
|
|
Schwab Active Equity Funds | Annual Holdings and Financial Statements
7
Schwab Dividend Equity Fund
Financial Statements
| |
|
|
|
|
|
|
| |
Net asset value at beginning of period |
|
|
|
|
|
|
Income (loss) from investment operations: |
|
|
|
|
|
|
Net investment income (loss)1 |
|
|
|
|
|
|
Net realized and unrealized gains (losses) |
|
|
|
|
|
|
Total from investment operations |
|
|
|
|
|
|
| |
|
|
|
|
|
|
Distributions from net investment income |
|
|
|
|
|
|
Distributions from net realized gains |
|
|
|
|
|
|
| |
|
|
|
|
|
|
Net asset value at end of period |
|
|
|
|
|
|
| |
|
|
|
|
|
|
| |
Ratios to average net assets: |
|
|
|
|
|
|
| |
|
|
|
|
|
|
| |
|
|
|
|
|
|
Net investment income (loss) |
|
|
|
|
|
|
| |
|
|
|
|
|
|
Net assets, end of period (x 1,000,000) |
|
|
|
|
|
|
| |
Calculated based on the average shares outstanding during the period. |
| |
Ratio includes less than 0.005% of non-routine proxy expenses. |
8
Schwab Active Equity Funds | Annual Holdings and Financial Statements
Schwab Dividend Equity Fund
Portfolio Holdings as of October 31, 2025
| |
|
|
COMMON STOCKS 99.1% OF NET ASSETS |
| |
| |
| |
|
|
| |
|
|
| |
|
|
| |
|
|
| |
| |
| |
|
|
| |
|
|
| |
|
|
| |
|
|
Illinois Tool Works, Inc. |
|
|
| |
|
|
| |
|
|
Rockwell Automation, Inc. |
|
|
| |
|
|
| |
|
|
| |
|
|
| |
Consumer Discretionary Distribution & Retail 5.0% |
| |
|
|
| |
|
|
| |
|
|
| |
|
|
| |
| |
| |
|
|
| |
Consumer Staples Distribution & Retail 3.2% |
| |
|
|
| |
| |
| |
|
|
| |
|
|
| |
|
|
| |
|
|
| |
|
|
| |
Equity Real Estate Investment Trusts (REITs) 2.6% |
AvalonBay Communities, Inc. |
|
|
Lamar Advertising Co., Class A |
|
|
| |
|
|
| |
|
|
| |
| |
| |
|
|
Fidelity National Information Services, Inc. |
|
|
| |
|
|
| |
|
|
| |
|
|
| |
Food, Beverage & Tobacco 6.6% |
| |
|
|
| |
|
|
Constellation Brands, Inc., Class A |
|
|
| |
|
|
Philip Morris International, Inc. |
|
|
| |
|
|
| |
Health Care Equipment & Services 5.6% |
| |
|
|
| |
|
|
| |
|
|
| |
|
|
| |
|
|
| |
|
|
| |
Household & Personal Products 2.8% |
| |
|
|
| |
|
|
| |
|
|
| |
| |
| |
|
|
Cincinnati Financial Corp. |
|
|
| |
|
|
| |
|
|
| |
| |
| |
|
|
| |
Media & Entertainment 3.7% |
| |
|
|
| |
|
|
| |
|
|
| |
|
|
| |
Pharmaceuticals, Biotechnology & Life Sciences 5.8% |
| |
|
|
| |
|
|
| |
|
|
| |
|
|
| |
|
|
| |
Semiconductors & Semiconductor Equipment 4.9% |
| |
|
|
| |
|
|
| |
|
|
| |
| |
| |
|
|
International Business Machines Corp. |
|
|
| |
|
|
| |
|
|
| |
Technology Hardware & Equipment 3.1% |
| |
|
|
| |
|
|
| |
|
|
| |
Telecommunication Services 1.9% |
Verizon Communications, Inc. |
|
|
| |
Schwab Active Equity Funds | Annual Holdings and Financial Statements
9
Schwab Dividend Equity Fund
Portfolio Holdings as of October 31, 2025 (continued)
| |
|
|
| |
| |
|
|
| |
| |
| |
|
|
| |
|
|
| |
|
|
| |
|
|
Total Common Stocks
(Cost $372,070,242) |
|
Total Investments in Securities
(Cost $372,070,242) |
|
The following is a summary of the inputs used to value the fund’s investments as of October 31, 2025 (see financial note 2(a) for additional information):
| |
QUOTED PRICES IN
ACTIVE MARKETS FOR
IDENTICAL ASSETS
(LEVEL 1) |
OTHER SIGNIFICANT
OBSERVABLE INPUTS
(LEVEL 2) |
SIGNIFICANT
UNOBSERVABLE INPUTS
(LEVEL 3) |
|
| |
|
|
|
|
| |
|
|
|
|
| |
|
|
|
|
| |
As categorized in the Portfolio Holdings. |
10
Schwab Active Equity Funds | Annual Holdings and Financial Statements
Schwab Dividend Equity Fund
Statement of Assets and Liabilities
| |
Investments in securities, at value - unaffiliated issuers (cost $372,070,242) |
|
|
| |
|
|
Foreign currency, at value (cost $37,911) |
|
|
| |
|
|
| |
|
|
| |
|
|
| |
|
|
| |
|
|
| |
|
|
| |
| |
| |
|
|
| |
|
|
Investment adviser and administrator fees |
|
|
| |
|
|
Independent trustees’ fees |
|
|
| |
|
|
| |
|
|
| |
|
|
| |
| |
Capital received from investors |
|
|
Total distributable earnings |
|
|
| |
|
|
Schwab Active Equity Funds | Annual Holdings and Financial Statements
11
Schwab Dividend Equity Fund
Statement of Operations
For the period November 1, 2024 through October 31, 2025 |
| |
Dividends received from securities - unaffiliated issuers (net of foreign withholding tax of $2,934) |
|
|
| |
|
|
| |
|
|
| |
| |
Investment adviser and administrator fees |
|
|
| |
|
|
Portfolio accounting fees |
|
|
| |
|
|
| |
|
|
| |
|
|
Independent trustees’ fees |
|
|
| |
|
|
| |
|
|
| |
|
|
| |
|
|
| |
|
|
| |
REALIZED AND UNREALIZED GAINS (LOSSES) |
Net realized gains on sales of securities - unaffiliated issuers |
|
|
Net realized gains on foreign currency transactions |
|
|
| |
|
|
Net change in unrealized appreciation (depreciation) on securities - unaffiliated issuers |
|
|
Net change in unrealized appreciation (depreciation) on foreign currency translations |
|
|
Net change in unrealized appreciation (depreciation) |
|
|
Net realized and unrealized gains |
|
|
Increase in net assets resulting from operations |
|
|
12
Schwab Active Equity Funds | Annual Holdings and Financial Statements
Schwab Dividend Equity Fund
Statement of Changes in Net Assets
For the current and prior report periods
| |
| |
|
|
| |
|
|
|
| |
|
|
|
Net change in unrealized appreciation (depreciation) |
|
|
|
Increase in net assets resulting from operations |
|
|
|
| |
DISTRIBUTIONS TO SHAREHOLDERS |
| |
|
|
|
TRANSACTIONS IN FUND SHARES |
| |
|
|
| |
|
|
|
|
|
| |
|
|
|
|
|
| |
|
|
|
|
|
| |
|
|
|
|
|
Net transactions in fund shares |
|
|
|
|
|
| |
SHARES OUTSTANDING AND NET ASSETS |
| |
|
|
| |
|
|
|
|
|
| |
|
|
|
|
|
Total increase (decrease) |
|
|
|
|
|
| |
|
|
|
|
|
Schwab Active Equity Funds | Annual Holdings and Financial Statements
13
Schwab Large-Cap Growth Fund
Financial Statements
| |
|
|
|
|
|
|
| |
Net asset value at beginning of period |
|
|
|
|
|
|
Income (loss) from investment operations: |
|
|
|
|
|
|
Net investment income (loss)1 |
|
|
|
|
|
|
Net realized and unrealized gains (losses) |
|
|
|
|
|
|
Total from investment operations |
|
|
|
|
|
|
| |
|
|
|
|
|
|
Distributions from net investment income |
|
|
|
|
|
|
Distributions from net realized gains |
|
|
|
|
|
|
| |
|
|
|
|
|
|
Net asset value at end of period |
|
|
|
|
|
|
| |
|
|
|
|
|
|
| |
Ratios to average net assets: |
|
|
|
|
|
|
| |
|
|
|
|
|
|
| |
|
|
|
|
|
|
Net investment income (loss) |
|
|
|
|
|
|
| |
|
|
|
|
|
|
Net assets, end of period (x 1,000,000) |
|
|
|
|
|
|
| |
Calculated based on the average shares outstanding during the period. |
| |
Per-share amount was less than $0.005. |
| |
Ratio includes less than 0.005% of non-routine proxy expenses. |
14
Schwab Active Equity Funds | Annual Holdings and Financial Statements
Schwab Large-Cap Growth Fund
Portfolio Holdings as of October 31, 2025
| |
|
|
COMMON STOCKS 99.4% OF NET ASSETS |
| |
Automobiles & Components 3.2% |
| |
|
|
| |
| |
| |
|
|
| |
|
|
| |
|
|
| |
|
|
| |
|
|
Vertiv Holdings Co., Class A |
|
|
| |
|
|
| |
Commercial & Professional Services 0.3% |
Republic Services, Inc., Class A |
|
|
| |
Consumer Discretionary Distribution & Retail 8.2% |
| |
|
|
| |
|
|
O'Reilly Automotive, Inc. * |
|
|
| |
|
|
| |
|
|
| |
| |
| |
|
|
DoorDash, Inc., Class A * |
|
|
Royal Caribbean Cruises Ltd. |
|
|
| |
|
|
| |
Consumer Staples Distribution & Retail 1.8% |
| |
|
|
| |
|
|
| |
|
|
| |
| |
| |
|
|
| |
|
|
| |
|
|
Interactive Brokers Group, Inc., Class A |
|
|
Mastercard, Inc., Class A |
|
|
| |
|
|
| |
|
|
| |
Food, Beverage & Tobacco 0.8% |
Philip Morris International, Inc. |
|
|
| |
Health Care Equipment & Services 1.8% |
Boston Scientific Corp. * |
|
|
Intuitive Surgical, Inc. * |
|
|
| |
|
|
| |
| |
|
|
Media & Entertainment 13.0% |
| |
|
|
Meta Platforms, Inc., Class A |
|
|
| |
|
|
| |
|
|
| |
|
|
| |
Pharmaceuticals, Biotechnology & Life Sciences 4.9% |
| |
|
|
Alnylam Pharmaceuticals, Inc. * |
|
|
| |
|
|
Vertex Pharmaceuticals, Inc. * |
|
|
| |
|
|
| |
Semiconductors & Semiconductor Equipment 20.0% |
Advanced Micro Devices, Inc. * |
|
|
| |
|
|
| |
|
|
| |
|
|
| |
|
|
| |
|
|
| |
|
|
| |
Software & Services 21.3% |
AppLovin Corp., Class A * |
|
|
Cadence Design Systems, Inc. * |
|
|
Crowdstrike Holdings, Inc., Class A * |
|
|
| |
|
|
International Business Machines Corp. |
|
|
| |
|
|
| |
|
|
| |
|
|
Palantir Technologies, Inc., Class A * |
|
|
Palo Alto Networks, Inc. * |
|
|
| |
|
|
| |
|
|
Snowflake, Inc., Class A * |
|
|
| |
|
|
| |
|
|
| |
Technology Hardware & Equipment 11.3% |
| |
|
|
| |
|
|
| |
|
|
| |
|
|
| |
| |
Uber Technologies, Inc. * |
|
|
Total Common Stocks
(Cost $238,053,998) |
|
Total Investments in Securities
(Cost $238,053,998) |
|
| |
Non-income producing security. |
Schwab Active Equity Funds | Annual Holdings and Financial Statements
15
Schwab Large-Cap Growth Fund
Portfolio Holdings as of October 31, 2025 (continued)
The following is a summary of the inputs used to value the fund’s investments as of October 31, 2025 (see financial note 2(a) for additional information):
| |
QUOTED PRICES IN
ACTIVE MARKETS FOR
IDENTICAL ASSETS
(LEVEL 1) |
OTHER SIGNIFICANT
OBSERVABLE INPUTS
(LEVEL 2) |
SIGNIFICANT
UNOBSERVABLE INPUTS
(LEVEL 3) |
|
| |
|
|
|
|
| |
|
|
|
|
| |
|
|
|
|
| |
As categorized in the Portfolio Holdings. |
16
Schwab Active Equity Funds | Annual Holdings and Financial Statements
Schwab Large-Cap Growth Fund
Statement of Assets and Liabilities
| |
Investments in securities, at value - unaffiliated issuers (cost $238,053,998) |
|
|
| |
|
|
| |
|
|
| |
|
|
| |
|
|
| |
|
|
| |
|
|
| |
|
|
| |
| |
| |
|
|
| |
|
|
Investment adviser and administrator fees |
|
|
| |
|
|
Independent trustees’ fees |
|
|
| |
|
|
| |
|
|
| |
|
|
| |
| |
Capital received from investors |
|
|
Total distributable earnings |
|
|
| |
|
|
Schwab Active Equity Funds | Annual Holdings and Financial Statements
17
Schwab Large-Cap Growth Fund
Statement of Operations
For the period November 1, 2024 through October 31, 2025 |
| |
Dividends received from securities - unaffiliated issuers (net of foreign withholding tax of $842) |
|
|
| |
|
|
| |
|
|
| |
| |
Investment adviser and administrator fees |
|
|
| |
|
|
Portfolio accounting fees |
|
|
| |
|
|
| |
|
|
| |
|
|
Independent trustees’ fees |
|
|
| |
|
|
| |
|
|
| |
|
|
| |
|
|
| |
|
|
| |
|
|
| |
|
|
| |
REALIZED AND UNREALIZED GAINS (LOSSES) |
Net realized gains on sales of securities - unaffiliated issuers |
|
|
Net realized losses on futures contracts |
|
|
| |
|
|
Net change in unrealized appreciation (depreciation) on securities - unaffiliated issuers |
|
|
Net change in unrealized appreciation (depreciation) on futures contracts |
|
|
Net change in unrealized appreciation (depreciation) |
|
|
Net realized and unrealized gains |
|
|
Increase in net assets resulting from operations |
|
|
18
Schwab Active Equity Funds | Annual Holdings and Financial Statements
Schwab Large-Cap Growth Fund
Statement of Changes in Net Assets
For the current and prior report periods
| |
| |
|
|
| |
|
|
|
| |
|
|
|
Net change in unrealized appreciation (depreciation) |
|
|
|
Increase in net assets resulting from operations |
|
|
|
| |
DISTRIBUTIONS TO SHAREHOLDERS |
| |
|
|
|
TRANSACTIONS IN FUND SHARES |
| |
|
|
| |
|
|
|
|
|
| |
|
|
|
|
|
| |
|
|
|
|
|
| |
|
|
|
|
|
Net transactions in fund shares |
|
|
|
|
|
| |
SHARES OUTSTANDING AND NET ASSETS |
| |
|
|
| |
|
|
|
|
|
| |
|
|
|
|
|
| |
|
|
|
|
|
| |
|
|
|
|
|
Schwab Active Equity Funds | Annual Holdings and Financial Statements
19
Schwab Small-Cap Equity Fund
Financial Statements
| |
|
|
|
|
|
|
| |
Net asset value at beginning of period |
|
|
|
|
|
|
Income (loss) from investment operations: |
|
|
|
|
|
|
Net investment income (loss)1 |
|
|
|
|
|
|
Net realized and unrealized gains (losses) |
|
|
|
|
|
|
Total from investment operations |
|
|
|
|
|
|
| |
|
|
|
|
|
|
Distributions from net investment income |
|
|
|
|
|
|
Distributions from net realized gains |
|
|
|
|
|
|
| |
|
|
|
|
|
|
Net asset value at end of period |
|
|
|
|
|
|
| |
|
|
|
|
|
|
| |
Ratios to average net assets: |
|
|
|
|
|
|
| |
|
|
|
|
|
|
| |
|
|
|
|
|
|
Net investment income (loss) |
|
|
|
|
|
|
| |
|
|
|
|
|
|
Net assets, end of period (x 1,000,000) |
|
|
|
|
|
|
| |
Calculated based on the average shares outstanding during the period. |
| |
Ratio includes less than 0.005% of non-routine proxy expenses. |
20
Schwab Active Equity Funds | Annual Holdings and Financial Statements
Schwab Small-Cap Equity Fund
Portfolio Holdings as of October 31, 2025
| |
|
|
COMMON STOCKS 95.7% OF NET ASSETS |
| |
Automobiles & Components 1.1% |
| |
|
|
Cooper-Standard Holdings, Inc. * |
|
|
| |
|
|
| |
|
|
Modine Manufacturing Co. * |
|
|
Strattec Security Corp. * |
|
|
| |
|
|
| |
| |
| |
|
|
| |
|
|
| |
|
|
| |
|
|
Customers Bancorp, Inc. * |
|
|
Enterprise Financial Services Corp. |
|
|
| |
|
|
| |
|
|
| |
|
|
| |
|
|
International Bancshares Corp. |
|
|
| |
|
|
OceanFirst Financial Corp. |
|
|
Texas Capital Bancshares, Inc. * |
|
|
| |
|
|
| |
|
|
| |
|
|
| |
|
|
| |
| |
| |
|
|
| |
|
|
American Superconductor Corp. * |
|
|
Applied Industrial Technologies, Inc. |
|
|
| |
|
|
Array Technologies, Inc. * |
|
|
| |
|
|
| |
|
|
Atmus Filtration Technologies, Inc. |
|
|
Bloom Energy Corp., Class A * |
|
|
Comfort Systems USA, Inc. |
|
|
| |
|
|
| |
|
|
| |
|
|
| |
|
|
| |
|
|
Franklin Electric Co., Inc. |
|
|
| |
|
|
| |
|
|
| |
|
|
| |
|
|
| |
|
|
| |
|
|
| |
|
|
| |
|
|
| |
|
|
Mueller Water Products, Inc., Class A |
|
|
NEXTracker, Inc., Class A * |
|
|
| |
|
|
Power Solutions International, Inc. * |
|
|
Preformed Line Products Co. |
|
|
| |
|
|
| |
|
|
Resideo Technologies, Inc. * |
|
|
| |
|
|
| |
|
|
Sterling Infrastructure, Inc. * |
|
|
Thermon Group Holdings, Inc. * |
|
|
| |
|
|
Watts Water Technologies, Inc., Class A |
|
|
| |
|
|
| |
Commercial & Professional Services 2.5% |
| |
|
|
| |
|
|
ExlService Holdings, Inc. * |
|
|
Huron Consulting Group, Inc. * |
|
|
| |
|
|
| |
|
|
| |
|
|
Verra Mobility Corp., Class A * |
|
|
| |
|
|
| |
|
|
| |
Consumer Discretionary Distribution & Retail 2.4% |
Build-A-Bear Workshop, Inc. |
|
|
| |
|
|
| |
|
|
National Vision Holdings, Inc. * |
|
|
| |
|
|
Sally Beauty Holdings, Inc. * |
|
|
Sonic Automotive, Inc., Class A |
|
|
| |
|
|
| |
|
|
Victoria's Secret & Co. * |
|
|
| |
|
|
| |
Consumer Durables & Apparel 1.8% |
| |
|
|
Green Brick Partners, Inc. * |
|
|
| |
|
|
| |
|
|
| |
|
|
Peloton Interactive, Inc., Class A * |
|
|
Taylor Morrison Home Corp., Class A * |
|
|
| |
|
|
| |
|
|
| |
| |
Adtalem Global Education, Inc. * |
|
|
American Public Education, Inc. * |
|
|
| |
|
|
Brinker International, Inc. * |
|
|
Cheesecake Factory, Inc. (a) |
|
|
| |
|
|
| |
|
|
Life Time Group Holdings, Inc. * |
|
|
Monarch Casino & Resort, Inc. |
|
|
| |
|
|
Red Rock Resorts, Inc., Class A |
|
|
Rush Street Interactive, Inc. * |
|
|
| |
|
|
| |
|
|
Universal Technical Institute, Inc. * |
|
|
| |
|
|
| |
Schwab Active Equity Funds | Annual Holdings and Financial Statements
21
Schwab Small-Cap Equity Fund
Portfolio Holdings as of October 31, 2025 (continued)
| |
|
|
Consumer Staples Distribution & Retail 0.5% |
Sprouts Farmers Market, Inc. * |
|
|
United Natural Foods, Inc. * |
|
|
| |
|
|
| |
| |
California Resources Corp. |
|
|
Centrus Energy Corp., Class A * |
|
|
| |
|
|
| |
|
|
Helix Energy Solutions Group, Inc. * |
|
|
National Energy Services Reunited Corp. * |
|
|
| |
|
|
Oceaneering International, Inc. * |
|
|
Oil States International, Inc. * |
|
|
Par Pacific Holdings, Inc. * |
|
|
PBF Energy, Inc., Class A |
|
|
| |
|
|
ProFrac Holding Corp., Class A * |
|
|
| |
|
|
Riley Exploration Permian, Inc. |
|
|
| |
|
|
| |
|
|
| |
|
|
| |
|
|
| |
Equity Real Estate Investment Trusts (REITs) 3.8% |
Alexander & Baldwin, Inc. |
|
|
DiamondRock Hospitality Co. |
|
|
| |
|
|
| |
|
|
Piedmont Realty Trust, Inc., Class A |
|
|
Ryman Hospitality Properties, Inc. |
|
|
Sabra Health Care REIT, Inc. |
|
|
| |
|
|
Xenia Hotels & Resorts, Inc. |
|
|
| |
|
|
| |
| |
Acadian Asset Management, Inc. |
|
|
Atlanticus Holdings Corp. * |
|
|
| |
|
|
Bread Financial Holdings, Inc. |
|
|
Enova International, Inc. * |
|
|
| |
|
|
| |
|
|
Green Dot Corp., Class A * |
|
|
Jackson Financial, Inc., Class A |
|
|
| |
|
|
| |
|
|
| |
|
|
NMI Holdings, Inc., Class A * |
|
|
Pagseguro Digital Ltd., Class A |
|
|
| |
|
|
Regional Management Corp. |
|
|
Virtus Investment Partners, Inc. |
|
|
| |
|
|
| |
|
|
| |
| |
|
|
Food, Beverage & Tobacco 0.7% |
| |
|
|
Seneca Foods Corp., Class A * |
|
|
| |
|
|
| |
Health Care Equipment & Services 3.3% |
| |
|
|
| |
|
|
Aveanna Healthcare Holdings, Inc. * |
|
|
| |
|
|
Bioventus, Inc., Class A * |
|
|
BrightSpring Health Services, Inc. * |
|
|
| |
|
|
| |
|
|
| |
|
|
Hims & Hers Health, Inc. * |
|
|
iRhythm Technologies, Inc. * |
|
|
| |
|
|
| |
|
|
OmniAb, Inc., Class A *(b) |
|
|
OmniAb, Inc., Class B *(b) |
|
|
| |
|
|
Option Care Health, Inc. * |
|
|
| |
|
|
| |
|
|
| |
|
|
| |
|
|
| |
|
|
| |
|
|
| |
|
|
| |
Household & Personal Products 0.0% |
Nu Skin Enterprises, Inc., Class A |
|
|
| |
| |
CNO Financial Group, Inc. |
|
|
Donegal Group, Inc., Class A |
|
|
Fidelis Insurance Holdings Ltd. |
|
|
Genworth Financial, Inc., Class A * |
|
|
Heritage Insurance Holdings, Inc. * |
|
|
| |
|
|
Selective Insurance Group, Inc. |
|
|
Skyward Specialty Insurance Group, Inc. * |
|
|
Slide Insurance Holdings, Inc. * |
|
|
| |
|
|
| |
| |
Alpha Metallurgical Resources, Inc. * |
|
|
Caledonia Mining Corp. PLC |
|
|
| |
|
|
| |
|
|
| |
|
|
| |
|
|
Constellium SE, Class A * |
|
|
| |
|
|
| |
|
|
| |
|
|
| |
|
|
| |
|
|
| |
|
|
Minerals Technologies, Inc. |
|
|
| |
|
|
22
Schwab Active Equity Funds | Annual Holdings and Financial Statements
Schwab Small-Cap Equity Fund
Portfolio Holdings as of October 31, 2025 (continued)
| |
|
|
| |
|
|
| |
|
|
| |
Media & Entertainment 1.4% |
AMC Networks, Inc., Class A * |
|
|
| |
|
|
| |
|
|
| |
|
|
| |
|
|
Nexxen International Ltd. * |
|
|
| |
|
|
| |
|
|
| |
|
|
| |
|
|
| |
|
|
| |
Pharmaceuticals, Biotechnology & Life Sciences 14.5% |
10X Genomics, Inc., Class A * |
|
|
Adaptive Biotechnologies Corp. * |
|
|
| |
|
|
Amicus Therapeutics, Inc. * |
|
|
Amneal Pharmaceuticals, Inc. * |
|
|
| |
|
|
Arbutus Biopharma Corp. * |
|
|
Arcus Biosciences, Inc. * |
|
|
Arcutis Biotherapeutics, Inc. * |
|
|
| |
|
|
Arrowhead Pharmaceuticals, Inc. * |
|
|
Aurinia Pharmaceuticals, Inc. * |
|
|
Axsome Therapeutics, Inc. * |
|
|
Beam Therapeutics, Inc. * |
|
|
BioCryst Pharmaceuticals, Inc. * |
|
|
| |
|
|
| |
|
|
Catalyst Pharmaceuticals, Inc. * |
|
|
Cidara Therapeutics, Inc. * |
|
|
Cogent Biosciences, Inc. * |
|
|
Collegium Pharmaceutical, Inc. * |
|
|
Dianthus Therapeutics, Inc. * |
|
|
| |
|
|
Harmony Biosciences Holdings, Inc. * |
|
|
| |
|
|
Kiniksa Pharmaceuticals International PLC * |
|
|
| |
|
|
| |
|
|
Madrigal Pharmaceuticals, Inc. * |
|
|
| |
|
|
| |
|
|
Mirum Pharmaceuticals, Inc. * |
|
|
| |
|
|
Niagen Bioscience, Inc. * |
|
|
Nurix Therapeutics, Inc. * |
|
|
Organogenesis Holdings, Inc., Class A * |
|
|
| |
|
|
ORIC Pharmaceuticals, Inc. * |
|
|
Pacira BioSciences, Inc. * |
|
|
Phathom Pharmaceuticals, Inc. * |
|
|
Phibro Animal Health Corp., Class A |
|
|
Praxis Precision Medicines, Inc. * |
|
|
Prestige Consumer Healthcare, Inc. * |
|
|
| |
|
|
Rhythm Pharmaceuticals, Inc. * |
|
|
Supernus Pharmaceuticals, Inc. * |
|
|
Tarsus Pharmaceuticals, Inc. * |
|
|
Taysha Gene Therapies, Inc. * |
|
|
| |
|
|
| |
|
|
Travere Therapeutics, Inc. * |
|
|
| |
|
|
| |
|
|
Vir Biotechnology, Inc. * |
|
|
Xeris Biopharma Holdings, Inc. * |
|
|
| |
|
|
| |
|
|
| |
Real Estate Management & Development 0.4% |
Cushman & Wakefield PLC * |
|
|
Newmark Group, Inc., Class A |
|
|
| |
|
|
| |
Semiconductors & Semiconductor Equipment 4.2% |
ACM Research, Inc., Class A * |
|
|
| |
|
|
Axcelis Technologies, Inc. * |
|
|
Credo Technology Group Holding Ltd. * |
|
|
| |
|
|
Penguin Solutions, Inc. * |
|
|
| |
|
|
Rigetti Computing, Inc. * |
|
|
| |
|
|
Silicon Laboratories, Inc. * |
|
|
| |
|
|
| |
|
|
| |
|
|
| |
| |
| |
|
|
| |
|
|
Alarm.com Holdings, Inc. * |
|
|
Appfolio, Inc., Class A * |
|
|
| |
|
|
Backblaze, Inc., Class A * |
|
|
| |
|
|
| |
|
|
Commvault Systems, Inc. * |
|
|
| |
|
|
| |
|
|
| |
|
|
| |
|
|
| |
|
|
Freshworks, Inc., Class A * |
|
|
| |
|
|
| |
|
|
| |
|
|
| |
|
|
| |
|
|
| |
|
|
| |
|
|
RingCentral, Inc., Class A * |
|
|
Sprout Social, Inc., Class A * |
|
|
| |
|
|
| |
|
|
Zeta Global Holdings Corp., Class A * |
|
|
| |
|
|
| |
Technology Hardware & Equipment 6.2% |
| |
|
|
Advanced Energy Industries, Inc. |
|
|
Arlo Technologies, Inc. * |
|
|
| |
|
|
CommScope Holding Co., Inc. * |
|
|
Schwab Active Equity Funds | Annual Holdings and Financial Statements
23
Schwab Small-Cap Equity Fund
Portfolio Holdings as of October 31, 2025 (continued)
| |
|
|
| |
|
|
| |
|
|
| |
|
|
| |
|
|
| |
|
|
| |
|
|
| |
|
|
| |
|
|
| |
|
|
| |
|
|
| |
|
|
| |
Telecommunication Services 1.4% |
Bandwidth, Inc., Class A * |
|
|
| |
|
|
Liberty Latin America Ltd., Class A * |
|
|
Lumen Technologies, Inc. * |
|
|
| |
|
|
| |
| |
Costamare Bulkers Holdings Ltd. * |
|
|
| |
|
|
Hertz Global Holdings, Inc. *(a) |
|
|
| |
|
|
| |
|
|
Sun Country Airlines Holdings, Inc. * |
|
|
| |
|
|
| |
| |
| |
|
|
Hawaiian Electric Industries, Inc. * |
|
|
| |
|
|
| |
|
|
Portland General Electric Co. |
|
|
Southwest Gas Holdings, Inc. |
|
|
| |
|
|
Total Common Stocks
(Cost $518,515,059) |
|
| |
|
|
SHORT-TERM INVESTMENTS 0.3% OF NET ASSETS |
| |
| |
State Street Institutional U.S. Government Money Market Fund, Premier Class 4.01% (c)(d) |
|
|
Total Short-Term Investments
(Cost $2,207,396) |
|
Total Investments in Securities
(Cost $520,722,455) |
|
| |
|
|
CURRENT VALUE/
UNREALIZED
APPRECIATION
($) |
| |
| |
|
|
|
Russell 2000 Index, e-mini, expires 12/19/25 |
|
|
|
| |
Non-income producing security. |
| |
All or a portion of this security is on loan. Securities on loan were valued at $2,153,880. |
| |
Fair valued using significant unobservable inputs (see financial note 2(a), Securities for which no quoted value is available, for additional information). |
| |
The rate shown is the annualized 7-day yield. |
| |
Security purchased with cash collateral received for securities on loan. |
| |
Real Estate Investment Trust |
Below is a summary of the fund’s transactions with affiliated issuers and companies which are or were affiliates during the period ended October 31, 2025. An affiliated company is a company in which the investment adviser has or had an ownership of at least 5% of the voting securities of a security issue during the report period. A dash in the Value at October 31, 2024, and/or Value and Balance of Shares Held at October 31, 2025, columns means either the issuer was not held or not held as an affiliate on the stated date.
| |
|
|
|
NET REALIZED GAINS (LOSSES) |
NET CHANGE IN UNREALIZED APPRECIATION (DEPRECIATION) |
|
BALANCE OF SHARES HELD AT 10/31/25 |
|
COMMON STOCKS 0.0% OF NET ASSETS |
| |
Media & Entertainment 0.0% |
| |
|
|
|
|
|
|
|
|
24
Schwab Active Equity Funds | Annual Holdings and Financial Statements
Schwab Small-Cap Equity Fund
Portfolio Holdings as of October 31, 2025 (continued)
The following is a summary of the inputs used to value the fund’s investments as of October 31, 2025 (see financial note 2(a) for additional information):
| |
QUOTED PRICES IN
ACTIVE MARKETS FOR
IDENTICAL ASSETS
(LEVEL 1) |
OTHER SIGNIFICANT
OBSERVABLE INPUTS
(LEVEL 2) |
SIGNIFICANT
UNOBSERVABLE INPUTS
(LEVEL 3) |
|
| |
|
|
|
|
| |
|
|
|
|
Health Care Equipment & Services |
|
|
|
|
| |
|
|
|
|
| |
|
|
|
|
| |
|
|
|
|
| |
Level 3 amount shown includes securities determined to have no value at October 31, 2025. |
| |
As categorized in the Portfolio Holdings. |
| |
Futures contracts are reported at cumulative unrealized appreciation or depreciation. |
Schwab Active Equity Funds | Annual Holdings and Financial Statements
25
Schwab Small-Cap Equity Fund
Statement of Assets and Liabilities
| |
Investments in securities, at value - unaffiliated issuers (cost $520,722,455) including securities on loan of $2,153,880 |
|
|
| |
|
|
Deposit with broker for futures contracts |
|
|
| |
|
|
Variation margin on future contracts |
|
|
| |
|
|
| |
|
|
Income from securities on loan |
|
|
| |
|
|
| |
|
|
| |
| |
Collateral held for securities on loan |
|
|
| |
|
|
Investment adviser and administrator fees |
|
|
| |
|
|
| |
|
|
| |
|
|
Independent trustees’ fees |
|
|
| |
|
|
| |
|
|
| |
|
|
| |
| |
Capital received from investors |
|
|
Total distributable earnings |
|
|
| |
|
|
26
Schwab Active Equity Funds | Annual Holdings and Financial Statements
Schwab Small-Cap Equity Fund
Statement of Operations
For the period November 1, 2024 through October 31, 2025 |
| |
Dividends received from securities - unaffiliated issuers (net of foreign withholding tax of $3,505) |
|
|
| |
|
|
| |
|
|
| |
|
|
| |
| |
Investment adviser and administrator fees |
|
|
| |
|
|
Portfolio accounting fees |
|
|
| |
|
|
| |
|
|
| |
|
|
| |
|
|
Independent trustees’ fees |
|
|
| |
|
|
| |
|
|
| |
|
|
| |
|
|
| |
REALIZED AND UNREALIZED GAINS (LOSSES) |
Net realized losses on sales of securities - affiliated issuers |
|
|
Net realized gains on sales of securities - unaffiliated issuers |
|
|
Net realized gains on futures contracts |
|
|
| |
|
|
Net change in unrealized appreciation (depreciation) on securities - affiliated issuers |
|
|
Net change in unrealized appreciation (depreciation) on securities - unaffiliated issuers |
|
|
Net change in unrealized appreciation (depreciation) on futures contracts |
|
|
Net change in unrealized appreciation (depreciation) |
|
|
Net realized and unrealized gains |
|
|
Increase in net assets resulting from operations |
|
|
Schwab Active Equity Funds | Annual Holdings and Financial Statements
27
Schwab Small-Cap Equity Fund
Statement of Changes in Net Assets
For the current and prior report periods
| |
| |
|
|
| |
|
|
|
| |
|
|
|
Net change in unrealized appreciation (depreciation) |
|
|
|
Increase in net assets resulting from operations |
|
|
|
| |
DISTRIBUTIONS TO SHAREHOLDERS |
| |
|
|
|
TRANSACTIONS IN FUND SHARES |
| |
|
|
| |
|
|
|
|
|
| |
|
|
|
|
|
| |
|
|
|
|
|
| |
|
|
|
|
|
Net transactions in fund shares |
|
|
|
|
|
| |
SHARES OUTSTANDING AND NET ASSETS |
| |
|
|
| |
|
|
|
|
|
| |
|
|
|
|
|
Total increase (decrease) |
|
|
|
|
|
| |
|
|
|
|
|
28
Schwab Active Equity Funds | Annual Holdings and Financial Statements
Financial Statements
| |
|
|
|
|
|
|
| |
Net asset value at beginning of period |
|
|
|
|
|
|
Income (loss) from investment operations: |
|
|
|
|
|
|
Net investment income (loss)1 |
|
|
|
|
|
|
Net realized and unrealized gains (losses) |
|
|
|
|
|
|
Total from investment operations |
|
|
|
|
|
|
| |
|
|
|
|
|
|
Distributions from net investment income |
|
|
|
|
|
|
Distributions from net realized gains |
|
|
|
|
|
|
| |
|
|
|
|
|
|
Net asset value at end of period |
|
|
|
|
|
|
| |
|
|
|
|
|
|
| |
Ratios to average net assets: |
|
|
|
|
|
|
| |
|
|
|
|
|
|
| |
|
|
|
|
|
|
Net investment income (loss) |
|
|
|
|
|
|
| |
|
|
|
|
|
|
Net assets, end of period (x 1,000,000) |
|
|
|
|
|
|
| |
Calculated based on the average shares outstanding during the period. |
| |
Ratio includes less than 0.005% of non-routine proxy expenses. |
Schwab Active Equity Funds | Annual Holdings and Financial Statements
29
Portfolio Holdings as of October 31, 2025
| |
|
|
COMMON STOCKS 99.8% OF NET ASSETS |
| |
| |
| |
|
|
| |
| |
| |
|
|
| |
| |
Consun Pharmaceutical Group Ltd. |
|
|
Hansoh Pharmaceutical Group Co. Ltd. |
|
|
Livzon Pharmaceutical Group, Inc., H Shares |
|
|
| |
|
|
| |
| |
| |
|
|
| |
|
|
| |
|
|
| |
| |
| |
|
|
| |
|
|
| |
|
|
| |
| |
| |
|
|
| |
| |
United Laboratories International Holdings Ltd. |
|
|
| |
| |
| |
|
|
| |
| |
Recordati Industria Chimica e Farmaceutica SpA |
|
|
| |
| |
| |
|
|
| |
|
|
| |
|
|
| |
|
|
| |
|
|
Kissei Pharmaceutical Co. Ltd. |
|
|
| |
|
|
| |
|
|
Takeda Pharmaceutical Co. Ltd. |
|
|
| |
|
|
| |
| |
Fisher & Paykel Healthcare Corp. Ltd. |
|
|
| |
| |
| |
|
|
| |
| |
|
|
| |
| |
|
|
| |
| |
| |
|
|
| |
|
|
| |
|
|
| |
|
|
| |
| |
| |
|
|
| |
|
|
| |
|
|
| |
| |
| |
|
|
| |
|
|
| |
|
|
Alnylam Pharmaceuticals, Inc. * |
|
|
| |
|
|
ANI Pharmaceuticals, Inc. * |
|
|
Axsome Therapeutics, Inc. * |
|
|
| |
|
|
| |
|
|
| |
|
|
Boston Scientific Corp. * |
|
|
BrightSpring Health Services, Inc. * |
|
|
| |
|
|
| |
|
|
Catalyst Pharmaceuticals, Inc. * |
|
|
| |
|
|
| |
|
|
| |
|
|
| |
|
|
| |
|
|
| |
|
|
| |
|
|
| |
|
|
| |
|
|
GE HealthCare Technologies, Inc. |
|
|
| |
|
|
Halozyme Therapeutics, Inc. * |
|
|
| |
|
|
| |
|
|
| |
|
|
| |
|
|
Intuitive Surgical, Inc. * |
|
|
| |
|
|
| |
|
|
| |
|
|
| |
|
|
| |
|
|
Mettler-Toledo International, Inc. * |
|
|
Mirum Pharmaceuticals, Inc. * |
|
|
| |
|
|
| |
|
|
Prestige Consumer Healthcare, Inc. * |
|
|
Regeneron Pharmaceuticals, Inc. |
|
|
| |
|
|
| |
|
|
| |
|
|
Thermo Fisher Scientific, Inc. |
|
|
United Therapeutics Corp. * |
|
|
| |
|
|
30
Schwab Active Equity Funds | Annual Holdings and Financial Statements
Portfolio Holdings as of October 31, 2025 (continued)
| |
|
|
| |
|
|
Vertex Pharmaceuticals, Inc. * |
|
|
| |
|
|
| |
|
|
| |
|
|
Total Common Stocks
(Cost $405,965,740) |
|
Total Investments in Securities
(Cost $405,965,740) |
|
| |
Non-income producing security. |
| |
|
| |
| |
|
| |
|
| |
|
Life Sciences Tools & Services |
|
| |
|
| |
|
| |
|
| |
|
| |
|
| |
|
The following is a summary of the inputs used to value the fund’s investments as of October 31, 2025 (see financial note 2(a) for additional information):
| |
QUOTED PRICES IN
ACTIVE MARKETS FOR
IDENTICAL ASSETS
(LEVEL 1) |
OTHER SIGNIFICANT
OBSERVABLE INPUTS
(LEVEL 2) |
SIGNIFICANT
UNOBSERVABLE INPUTS
(LEVEL 3) |
|
| |
|
|
|
|
| |
|
|
|
|
| |
|
|
|
|
| |
|
|
|
|
| |
|
|
|
|
| |
|
|
|
|
| |
|
|
|
|
| |
|
|
|
|
| |
|
|
|
|
| |
|
|
|
|
| |
|
|
|
|
| |
|
|
|
|
| |
|
|
|
|
| |
|
|
|
|
| |
|
|
|
|
| |
|
|
|
|
| |
As categorized in the Portfolio Holdings. |
Schwab Active Equity Funds | Annual Holdings and Financial Statements
31
Statement of Assets and Liabilities
| |
Investments in securities, at value - unaffiliated issuers (cost $405,965,740) |
|
|
| |
|
|
Foreign currency, at value (cost $23,085) |
|
|
| |
|
|
| |
|
|
| |
|
|
| |
|
|
| |
|
|
| |
|
|
| |
| |
| |
|
|
| |
|
|
Investment adviser and administrator fees |
|
|
| |
|
|
Independent trustees’ fees |
|
|
| |
|
|
| |
|
|
| |
|
|
| |
| |
Capital received from investors |
|
|
Total distributable earnings |
|
|
| |
|
|
32
Schwab Active Equity Funds | Annual Holdings and Financial Statements
Statement of Operations
For the period November 1, 2024 through October 31, 2025 |
| |
Dividends received from securities - unaffiliated issuers (net of foreign withholding tax of $336,486) |
|
|
| |
|
|
| |
|
|
| |
|
|
| |
| |
Investment adviser and administrator fees |
|
|
| |
|
|
Portfolio accounting fees |
|
|
| |
|
|
| |
|
|
| |
|
|
| |
|
|
Independent trustees’ fees |
|
|
| |
|
|
| |
|
|
| |
|
|
| |
|
|
| |
REALIZED AND UNREALIZED GAINS (LOSSES) |
Net realized gains on sales of securities - unaffiliated issuers |
|
|
Net realized losses on foreign currency transactions |
|
|
| |
|
|
Net change in unrealized appreciation (depreciation) on securities - unaffiliated issuers |
|
|
Net change in unrealized appreciation (depreciation) on foreign currency translations |
|
|
Net change in unrealized appreciation (depreciation) |
|
|
Net realized and unrealized losses |
|
|
Decrease in net assets resulting from operations |
|
|
Schwab Active Equity Funds | Annual Holdings and Financial Statements
33
Statement of Changes in Net Assets
For the current and prior report periods
| |
| |
|
|
| |
|
|
|
| |
|
|
|
Net change in unrealized appreciation (depreciation) |
|
|
|
Increase (decrease) in net assets resulting from operations |
|
|
|
| |
DISTRIBUTIONS TO SHAREHOLDERS |
| |
|
|
|
TRANSACTIONS IN FUND SHARES |
| |
|
|
| |
|
|
|
|
|
| |
|
|
|
|
|
| |
|
|
|
|
|
| |
|
|
|
|
|
Net transactions in fund shares |
|
|
|
|
|
| |
SHARES OUTSTANDING AND NET ASSETS |
| |
|
|
| |
|
|
|
|
|
| |
|
|
|
|
|
Total increase (decrease) |
|
|
|
|
|
| |
|
|
|
|
|
34
Schwab Active Equity Funds | Annual Holdings and Financial Statements
Schwab International Core Equity Fund
Financial Statements
| |
|
|
|
|
|
|
| |
Net asset value at beginning of period |
|
|
|
|
|
|
Income (loss) from investment operations: |
|
|
|
|
|
|
Net investment income (loss)1 |
|
|
|
|
|
|
Net realized and unrealized gains (losses) |
|
|
|
|
|
|
Total from investment operations |
|
|
|
|
|
|
| |
|
|
|
|
|
|
Distributions from net investment income |
|
|
|
|
|
|
Net asset value at end of period |
|
|
|
|
|
|
| |
|
|
|
|
|
|
| |
Ratios to average net assets: |
|
|
|
|
|
|
| |
|
|
|
|
|
|
| |
|
|
|
|
|
|
Net investment income (loss) |
|
|
|
|
|
|
| |
|
|
|
|
|
|
Net assets, end of period (x 1,000,000) |
|
|
|
|
|
|
| |
Calculated based on the average shares outstanding during the period. |
| |
Ratio includes less than 0.005% of non-routine proxy expenses. |
Schwab Active Equity Funds | Annual Holdings and Financial Statements
35
Schwab International Core Equity Fund
Portfolio Holdings as of October 31, 2025
| |
|
|
COMMON STOCKS 99.3% OF NET ASSETS |
| |
| |
| |
|
|
| |
|
|
| |
|
|
| |
|
|
| |
|
|
Northern Star Resources Ltd. |
|
|
| |
|
|
| |
|
|
| |
|
|
| |
|
|
| |
| |
| |
|
|
| |
| |
BB Seguridade Participacoes SA |
|
|
| |
| |
Constellation Software, Inc. |
|
|
| |
|
|
| |
|
|
| |
|
|
| |
|
|
| |
| |
Aluminum Corp. of China Ltd., H Shares |
|
|
China Hongqiao Group Ltd. |
|
|
China Life Insurance Co. Ltd., H Shares |
|
|
| |
|
|
New China Life Insurance Co. Ltd., H Shares |
|
|
PetroChina Co. Ltd., H Shares |
|
|
Sino Biopharmaceutical Ltd. |
|
|
| |
|
|
| |
|
|
| |
| |
| |
|
|
| |
|
|
| |
|
|
| |
|
|
| |
|
|
| |
| |
| |
|
|
| |
|
|
| |
|
|
| |
|
|
| |
| |
| |
|
|
| |
|
|
| |
|
|
| |
|
|
Cie Generale des Etablissements Michelin SCA |
|
|
| |
|
|
| |
|
|
| |
|
|
| |
|
|
| |
|
|
LVMH Moet Hennessy Louis Vuitton SE |
|
|
| |
|
|
| |
|
|
| |
|
|
| |
|
|
| |
| |
| |
|
|
| |
|
|
| |
|
|
Fresenius Medical Care AG |
|
|
| |
|
|
| |
|
|
| |
|
|
| |
|
|
Muenchener Rueckversicherungs-Gesellschaft AG in Muenchen |
|
|
| |
|
|
| |
|
|
| |
|
|
| |
| |
Hellenic Telecommunications Organization SA |
|
|
| |
|
|
Piraeus Financial Holdings SA * |
|
|
| |
|
|
| |
| |
| |
|
|
Hong Kong Exchanges & Clearing Ltd. |
|
|
| |
|
|
| |
|
|
| |
| |
Jardine Matheson Holdings Ltd. |
|
|
| |
| |
| |
|
|
| |
| |
| |
|
|
| |
|
|
| |
|
|
| |
|
|
| |
| |
| |
|
|
Central Japan Railway Co. |
|
|
Daiwa House Industry Co. Ltd. |
|
|
Daiwa Securities Group, Inc. |
|
|
| |
|
|
| |
|
|
| |
|
|
| |
|
|
| |
|
|
36
Schwab Active Equity Funds | Annual Holdings and Financial Statements
Schwab International Core Equity Fund
Portfolio Holdings as of October 31, 2025 (continued)
| |
|
|
| |
|
|
| |
|
|
Japan Post Holdings Co. Ltd. |
|
|
Japan Post Insurance Co. Ltd. |
|
|
| |
|
|
| |
|
|
| |
|
|
| |
|
|
Mitsubishi Heavy Industries Ltd. |
|
|
Mitsubishi UFJ Financial Group, Inc. |
|
|
| |
|
|
Open House Group Co. Ltd. |
|
|
| |
|
|
| |
|
|
| |
|
|
Recruit Holdings Co. Ltd. |
|
|
| |
|
|
| |
|
|
| |
|
|
| |
|
|
| |
|
|
| |
|
|
Sumitomo Mitsui Financial Group, Inc. |
|
|
Tokio Marine Holdings, Inc. |
|
|
| |
|
|
| |
|
|
| |
|
|
| |
| |
| |
|
|
| |
| |
| |
|
|
| |
|
|
Koninklijke Ahold Delhaize NV |
|
|
| |
|
|
| |
|
|
| |
| |
| |
|
|
| |
|
|
| |
|
|
| |
| |
Samsung Electronics Co. Ltd. |
|
|
| |
|
|
| |
|
|
| |
| |
| |
|
|
Yangzijiang Shipbuilding Holdings Ltd. |
|
|
| |
|
|
| |
| |
Harmony Gold Mining Co. Ltd. |
|
|
| |
| |
| |
|
|
Banco Bilbao Vizcaya Argentaria SA |
|
|
| |
|
|
| |
|
|
International Consolidated Airlines Group SA |
|
|
| |
|
|
| |
| |
| |
|
|
Telefonaktiebolaget LM Ericsson, B Shares |
|
|
| |
|
|
| |
|
|
| |
| |
| |
|
|
| |
|
|
| |
|
|
| |
|
|
Logitech International SA |
|
|
| |
|
|
| |
|
|
| |
|
|
Schindler Holding AG, Participation Certificates |
|
|
| |
|
|
| |
| |
| |
|
|
Taiwan Semiconductor Manufacturing Co. Ltd. |
|
|
| |
|
|
| |
| |
| |
|
|
| |
|
|
| |
|
|
British American Tobacco PLC |
|
|
| |
|
|
| |
|
|
| |
|
|
| |
|
|
| |
|
|
| |
|
|
| |
|
|
| |
|
|
| |
|
|
| |
|
|
| |
|
|
| |
|
|
| |
|
|
Total Common Stocks
(Cost $629,645,267) |
|
Total Investments in Securities
(Cost $629,645,267) |
|
| |
Non-income producing security. |
| |
Global Depositary Receipt |
Schwab Active Equity Funds | Annual Holdings and Financial Statements
37
Schwab International Core Equity Fund
Portfolio Holdings as of October 31, 2025 (continued)
The following is a summary of the inputs used to value the fund’s investments as of October 31, 2025 (see financial note 2(a) for additional information):
| |
QUOTED PRICES IN
ACTIVE MARKETS FOR
IDENTICAL ASSETS
(LEVEL 1) |
OTHER SIGNIFICANT
OBSERVABLE INPUTS
(LEVEL 2) |
SIGNIFICANT
UNOBSERVABLE INPUTS
(LEVEL 3) |
|
| |
|
|
|
|
| |
|
|
|
|
| |
|
|
|
|
| |
|
|
|
|
| |
|
|
|
|
| |
|
|
|
|
| |
|
|
|
|
| |
|
|
|
|
| |
|
|
|
|
| |
As categorized in the Portfolio Holdings. |
38
Schwab Active Equity Funds | Annual Holdings and Financial Statements
Schwab International Core Equity Fund
Statement of Assets and Liabilities
| |
Investments in securities, at value - unaffiliated issuers (cost $629,645,267) |
|
|
Foreign currency, at value (cost $8,249,225) |
|
|
| |
|
|
| |
|
|
| |
|
|
| |
|
|
| |
|
|
| |
|
|
| |
|
|
| |
| |
| |
|
|
| |
|
|
| |
|
|
Investment adviser and administrator fees |
|
|
| |
|
|
| |
|
|
Independent trustees’ fees |
|
|
| |
|
|
| |
|
|
| |
|
|
| |
| |
Capital received from investors |
|
|
Total distributable earnings |
|
|
| |
|
|
Schwab Active Equity Funds | Annual Holdings and Financial Statements
39
Schwab International Core Equity Fund
Statement of Operations
For the period November 1, 2024 through October 31, 2025 |
| |
Dividends received from securities - unaffiliated issuers (net of foreign withholding tax of $1,856,727) |
|
|
| |
|
|
| |
|
|
| |
| |
Investment adviser and administrator fees |
|
|
| |
|
|
Portfolio accounting fees |
|
|
| |
|
|
| |
|
|
| |
|
|
| |
|
|
| |
|
|
Independent trustees’ fees |
|
|
| |
|
|
| |
|
|
| |
|
|
| |
|
|
| |
|
|
| |
REALIZED AND UNREALIZED GAINS (LOSSES) |
Net realized gains on sales of securities - unaffiliated issuers |
|
|
Net realized gains on foreign currency transactions |
|
|
| |
|
|
Net change in unrealized appreciation (depreciation) on securities - unaffiliated issuers |
|
|
Net change in unrealized appreciation (depreciation) on foreign currency translations |
|
|
Net change in unrealized appreciation (depreciation) |
|
|
Net realized and unrealized gains |
|
|
Increase in net assets resulting from operations |
|
|
| |
Includes professional fees of $3,465 associated with the filing of foreign withholding tax claims in the European Union. Fees are deemed to be non-contingent and non-routine expenses of the fund (see financial notes 2(d) and 3 for additional information). |
40
Schwab Active Equity Funds | Annual Holdings and Financial Statements
Schwab International Core Equity Fund
Statement of Changes in Net Assets
For the current and prior report periods
| |
| |
|
|
| |
|
|
|
| |
|
|
|
Net change in unrealized appreciation (depreciation) |
|
|
|
Increase in net assets resulting from operations |
|
|
|
| |
DISTRIBUTIONS TO SHAREHOLDERS |
| |
|
|
|
TRANSACTIONS IN FUND SHARES |
| |
|
|
| |
|
|
|
|
|
| |
|
|
|
|
|
| |
|
|
|
|
|
| |
|
|
|
|
|
Net transactions in fund shares |
|
|
|
|
|
| |
SHARES OUTSTANDING AND NET ASSETS |
| |
|
|
| |
|
|
|
|
|
| |
|
|
|
|
|
Total increase (decrease) |
|
|
|
|
|
| |
|
|
|
|
|
Schwab Active Equity Funds | Annual Holdings and Financial Statements
41
Schwab Active Equity Funds
1. Business Structure of the Funds:
Each of the funds in this report is a series of Schwab Capital Trust (the trust), a no-load, open-end management investment company. The trust is organized as a Massachusetts business trust and is registered under the Investment Company Act of 1940, as amended (the 1940 Act). The list below shows all the operational funds in the trust as of the end of the period, including the funds discussed in this report, which are highlighted:
| |
| |
|
Schwab Dividend Equity Fund |
|
Schwab Large-Cap Growth Fund |
|
Schwab Small-Cap Equity Fund |
|
| |
|
Schwab International Core Equity Fund |
Schwab Fundamental U.S. Large Company Index Fund |
Schwab S&P 500 Index Fund |
Schwab Fundamental U.S. Small Company Index Fund |
Schwab Small-Cap Index Fund |
Schwab Fundamental International Equity Index Fund |
Schwab Total Stock Market Index Fund |
Schwab Fundamental International Small Equity Index Fund |
Schwab U.S. Large-Cap Growth Index Fund |
Schwab Fundamental Emerging Markets Equity Index Fund |
Schwab U.S. Large-Cap Value Index Fund |
Schwab Fundamental Global Real Estate Index Fund |
Schwab U.S. Mid-Cap Index Fund |
Schwab Target 2010 Index Fund |
Schwab International Index Fund |
Schwab Target 2015 Index Fund |
Schwab MarketTrack All Equity Portfolio™ |
Schwab Target 2020 Index Fund |
Schwab MarketTrack Growth Portfolio™ |
Schwab Target 2025 Index Fund |
Schwab MarketTrack Balanced Portfolio™ |
Schwab Target 2030 Index Fund |
Schwab MarketTrack Conservative Portfolio™ |
Schwab Target 2035 Index Fund |
Schwab International Opportunities Fund |
Schwab Target 2040 Index Fund |
| |
Schwab Target 2045 Index Fund |
| |
Schwab Target 2050 Index Fund |
| |
Schwab Target 2055 Index Fund |
| |
Schwab Target 2060 Index Fund |
| |
Schwab Target 2065 Index Fund |
| |
Schwab Monthly Income Fund - Target Payout |
| |
Schwab Monthly Income Fund - Flexible Payout |
| |
Schwab Monthly Income Fund - Income Payout |
Each fund offers one share class. Shares are bought and sold at closing net asset value per share, which is the price for all outstanding shares of a fund. Each share has a par value of 1/1,000 of a cent, and the funds’ Board of Trustees may authorize the issuance of as many shares as necessary.
Each fund maintains its own account for purposes of holding assets and accounting, and is considered a separate entity for tax purposes. Within its account, each fund may also keep certain assets in segregated accounts, as required by securities law. The "Schwab Funds Complex" includes The Charles Schwab Family of Funds, Schwab Capital Trust, Schwab Investments, Schwab Annuity Portfolios, Schwab Strategic Trust and Laudus Trust.
The Schwab Core Equity Fund seeks long-term capital growth.
The Schwab Dividend Equity Fund seeks current income and capital appreciation.
The Schwab Large-Cap Growth Fund seeks long-term capital growth.
The Schwab Small-Cap Equity Fund seeks long-term capital growth.
The Schwab Health Care Fund seeks long-term capital growth.
The Schwab International Core Equity Fund seeks long-term capital growth.
42
Schwab Active Equity Funds | Annual Holdings and Financial Statements
Schwab Active Equity Funds
Financial Notes (continued)
2. Significant Accounting Policies:
The following is a summary of the significant accounting policies the funds use in their preparation of financial statements. The funds follow the investment company accounting and reporting guidance of the Financial Accounting Standards Board (FASB) Accounting Standard Codification (ASC) Topic 946 Financial Services — Investment Companies. The accounting policies are in conformity with accounting principles generally accepted in the United States of America (GAAP).
In this reporting period, the funds adopted FASB Accounting Standards Update 2023-07, ASC Topic 280 Segment Reporting (Topic 280) Improvements to Reportable Segment Disclosures. Adoption of the new standard impacted financial statement disclosures only and did not affect the funds’ financial position or the results of operations. An operating segment is defined in Topic 280 as a component of a public entity that engages in business activities from which it may recognize revenues and incur expenses, has operating results that are regularly reviewed by the public entity’s chief operating decision maker (CODM) to make decisions about resources to be allocated to the segment and assess its performance, and has discrete financial information available. The management committee of each fund’s investment adviser acts as the funds’ CODM. The CODM has determined that each fund operates as a single operating segment given each fund has a single defined investment strategy disclosed in its respective prospectus. The discrete financial information in the form of each fund’s portfolio composition, total returns, expense ratios and changes in net assets (i.e., changes in net assets resulting from operations, shares sold and shares redeemed), which is used by the CODM to assess performance against the prospectus and to make resource allocation decisions with respect to the funds, is presented within each of the fund’s financial statements.
The funds may invest in mutual funds and exchange-traded funds, which are referred to as "underlying funds." For more information about the underlying funds’ operations and policies, please refer to those funds’ semiannual and annual reports and holdings and financial statements, which are filed in Form N-CSR with the U.S. Securities and Exchange Commission (SEC) and available on the SEC’s website at www.sec.gov.
Pursuant to Rule 2a-5 under the 1940 Act, the Board of Trustees has designated authority to a Valuation Designee, the funds’ investment adviser, to make fair valuation determinations under adopted procedures, subject to Board of Trustees oversight. The investment adviser has formed a Pricing Committee to administer the pricing and valuation of portfolio securities and other assets and liabilities as well as to ensure that prices used for internal purposes or provided by third parties reasonably reflect fair value. The Valuation Designee may utilize independent pricing services, quotations from securities and financial instrument dealers and other market sources to determine fair value.
Securities held in each fund’s portfolio are valued every business day. The following valuation policies and procedures are used by the Valuation Designee to value various types of securities:
● Securities traded on an exchange or over-the-counter: Traded securities are valued at the closing value for the day, or, on days when no closing value has been reported, at the mean of the most recent bid and ask quotes. Securities that are primarily traded on foreign exchanges are valued at the official closing price or the last sales price on the exchange where the securities are principally traded with these values then translated into U.S. dollars at the current exchange rate, unless these securities are fair valued as discussed below.
● Foreign equity security fair valuation: The Valuation Designee has adopted procedures to fair value foreign equity securities that are traded in markets that close prior to the valuation of a fund’s holdings. By fair valuing securities whose prices may have been affected by events occurring after the close of trading, the Valuation Designee seeks to establish prices that investors might expect to realize upon the current sales of these securities. This methodology is designed to deter “arbitrage” market timers, who seek to exploit delays between the change in the value of a fund’s portfolio holdings and the net asset value of a fund’s shares and seeks to help ensure that the prices at which a fund’s shares are purchased and redeemed are fair and do not result in dilution of shareholder interest or other harm to shareholders. When fair value pricing is used at the open or close of a reporting period, it may cause a temporary divergence between the return of a fund and that of its comparative index or benchmark.
● Futures contracts: Futures contracts are valued at their settlement prices as of the close of their exchanges.
● Mutual funds: Mutual funds are valued at their respective net asset values.
● Securities for which no quoted value is available: The Valuation Designee has adopted procedures to fair value a fund’s securities when market prices are not “readily available” or are unreliable. For example, a security may be fair valued when it’s de-listed or its trading is halted or suspended; when a security’s primary pricing source is unable or unwilling to provide a price; or when a security’s primary trading market is closed during regular market hours. Fair value determinations are made in good faith in accordance with adopted valuation procedures. The Valuation Designee considers a number of factors, including
Schwab Active Equity Funds | Annual Holdings and Financial Statements
43
Schwab Active Equity Funds
Financial Notes (continued)
2. Significant Accounting Policies (continued):
unobservable market inputs, when arriving at fair value. The Valuation Designee may employ methods such as the review of related or comparable assets or liabilities, related market activities, recent transactions, market multiples, book values, transactional back-testing, disposition analysis and other relevant information. Due to the subjective and variable nature of fair value pricing, there can be no assurance that a fund could obtain the fair value assigned to the security upon the sale of such security.
In accordance with the authoritative guidance on fair value measurements and disclosures under GAAP, the funds disclose the fair value of their investments in a hierarchy that prioritizes the significant inputs to valuation methods used to measure the fair value. The hierarchy gives the highest priority to valuations based upon unadjusted quoted prices in active markets for identical assets or liabilities (Level 1 measurements) and the lowest priority to valuations based upon unobservable inputs that are significant to the valuation (Level 3 measurements). If inputs used to measure the financial instruments fall within different levels of the hierarchy, the categorization is based on the lowest level input that is significant to the valuation. If it is determined that either the volume and/or level of activity for an asset or liability has significantly decreased (from normal conditions for that asset or liability) or price quotations or observable inputs are not associated with orderly transactions, increased analysis and the Valuation Designee’s judgment will be required to estimate fair value.
The three levels of the fair value hierarchy are as follows:
● Level 1 — quoted prices in active markets for identical investments — Investments whose values are based on quoted market prices in active markets. These generally include active listed equities, mutual funds, exchange-traded funds and futures contracts. Mutual funds and exchange-traded funds are classified as Level 1 prices, without consideration to the classification level of the underlying securities held which could be Level 1, Level 2, or Level 3 in the fair value hierarchy.
● Level 2 — other significant observable inputs (including quoted prices for similar securities, interest rates, prepayment speeds, credit risk, etc.) — Investments that trade in markets that are not considered to be active, but whose values are based on quoted market prices, dealer quotations or valuations provided by alternative pricing sources supported by observable inputs are classified as Level 2 prices. These generally include forward foreign currency exchange contracts, U.S. government and sovereign obligations, most government agency securities, investment-grade corporate bonds, certain mortgage products, less liquid listed equities, and state, municipal and provincial obligations. In addition, international securities whose markets close hours before the valuation of a fund’s holdings may require fair valuations due to significant movement in the U.S. markets occurring after the daily close of foreign markets. The Valuation Designee has approved a vendor that calculates fair valuations of international equity securities based on a number of factors that appear to correlate to the movements in the U.S. markets.
● Level 3 — significant unobservable inputs (including the Valuation Designee’s assumptions in determining the fair value of investments) — Investments whose values are classified as Level 3 prices have significant unobservable inputs, as they may trade infrequently or not at all. When observable prices are not readily available for these securities, one or more valuation methods are used for which sufficient and reliable data is available. The inputs used in estimating the value of Level 3 prices may include the original transaction price, quoted prices for similar securities or assets in active markets, completed or pending third-party transactions in the underlying investment or comparable issuers, and changes in financial ratios or cash flows. Level 3 prices may also be adjusted to reflect illiquidity and/or non-transferability, with the amount of such discount estimated in the absence of market information. Assumptions used due to the lack of observable inputs may significantly impact the resulting fair value and therefore a fund’s results of operations.
The inputs or methodology used for valuing securities are not necessarily an indication of the risk associated with investing in those securities.
The levels associated with valuing the funds’ investments as of October 31, 2025, are disclosed in each fund’s Portfolio Holdings.
(b) Accounting Policies for certain Portfolio Investments (if held):
Futures Contracts: Futures contracts are instruments that represent an agreement between two parties that obligates one party to buy, and the other party to sell, specific instruments at an agreed upon price on a stipulated future date. A fund must give the broker a deposit of cash and/or securities (initial margin) whenever it enters into a futures contract. The amount of the deposit may vary from one contract to another. Subsequent payments (variation margin) are made or received by a fund depending on the daily fluctuations in the value of the futures contract and are accounted for as unrealized appreciation or depreciation until the contract is closed, at which time the gains or losses are realized. Futures contracts are traded publicly on exchanges, and their value may change daily.
44
Schwab Active Equity Funds | Annual Holdings and Financial Statements
Schwab Active Equity Funds
Financial Notes (continued)
2. Significant Accounting Policies (continued):
Cash Investments: The funds, except for Schwab Core Equity Fund and Schwab International Core Equity Fund, may invest a portion of their assets in cash. Cash includes cash bank balances in an interest-bearing demand deposit account with maturity on demand by the funds.
Securities Lending: Under the trust’s Securities Lending Program, a fund (lender) may make short-term loans of its securities to another party (borrower) to generate additional revenue for the fund. The borrower pledges collateral in the form of cash, securities issued or fully guaranteed by the U.S. government or foreign governments, or letters of credit issued by a bank. Collateral at the individual loan level is required to be maintained on a daily marked-to-market basis in an amount at least equal to the current value of the securities loaned. The lending agent provides a fund with indemnification against borrower default (the borrower fails to return the security on loan) reducing the risk of loss as a result of default. The cash collateral of securities loaned is currently invested in money market portfolios operating pursuant to Rule 2a-7 under the 1940 Act. Each fund bears the risk of loss with respect to the investment of cash collateral. The terms of the securities lending agreement allow the funds or the lending agent to terminate any loan at any given time and the securities must be returned within the earlier of the standard trade settlement period or the specified time period under the relevant securities lending agreement. Securities lending income, as disclosed in each fund’s Statement of Operations, if applicable, represents the income earned from the investment of the cash collateral plus any fees paid by borrowers, less the fees paid to the lending agent and broker rebates which are subject to adjustments pursuant to the securities lending agreement. On loans not collateralized by cash, a fee is received from the borrower, and is allocated between a fund and the lending agent. The aggregate market value of securities loaned will not at any time exceed one-third of the total assets of a fund, including collateral received from the loan. Securities lending fees paid to the unaffiliated lending agent start at 9% of gross lending revenue, with subsequent breakpoints to a low of 5%. In this context, the gross lending revenue equals the income received from the investment of cash collateral and fees paid by borrowers less any rebates paid to the borrowers. Any expenses charged by the cash collateral fund are in addition to these fees. All remaining revenue is retained by the fund, as applicable. No portion of lending revenue is paid to or retained by the investment adviser or any of its affiliates.
As of October 31, 2025, Schwab Core Equity Fund and Schwab Small-Cap Equity Fund had securities on loan, all of which were classified as common stocks. The value of securities on loan and the related collateral as of October 31, 2025, are disclosed in each fund’s Portfolio Holdings and Statement of Assets and Liabilities.
Passive Foreign Investment Companies: Certain funds may own shares in certain foreign corporations that meet the Internal Revenue Code, as amended, definition of a Passive Foreign Investment Company (PFIC). The funds may elect for tax purposes to mark-to-market annually the shares of each PFIC lot held and would be required to distribute as ordinary income to shareholders any such marked-to-market gains (as well as any gains realized on sale).
Central Securities Depositories Regulation: The Central Securities Depositories Regulation (CSDR) introduced measures for the authorization and supervision of European Union Central Security Depositories and created a common set of prudential, organizational, and conduct of business standards at a European level. CSDR is designed to support securities settlement and operational aspects of securities settlement, including the provision of shorter settlement periods; mandatory buy-ins; and cash penalties, to prevent and address settlement fails. CSDR measures are aimed to prevent settlement fails by ensuring that all transaction details are provided to facilitate settlement, as well as further incentivizing timely settlement by imposing cash penalty fines and buy-ins. Certain funds may be subject to pay cash penalties and may also receive cash penalties with certain counterparties in instances where there are settlement fails. These cash penalties are included in net realized gains (losses) on sales of securities — unaffiliated issuers in each fund’s Statement of Operations, if any.
(c) Security Transactions:
Security transactions are recorded as of the date the order to buy or sell the security is executed. Realized gains and losses from security transactions are based on the identified costs of the securities involved.
Assets and liabilities denominated in foreign currencies are reported in U.S. dollars. For assets and liabilities held on a given date, the dollar value is based on market exchange rates in effect on that date. Transactions involving foreign currencies, including purchases, sales, income receipts and expense payments, are calculated using exchange rates in effect on the transaction date. Realized foreign exchange gains or losses arise from sales of foreign currencies, currency gains or losses realized between the trade and settlement dates on securities transactions and the differences between the recorded amounts of dividends, interest, and foreign withholding taxes and the U.S. dollar equivalent of the amounts actually received or paid. Net unrealized foreign exchange appreciation or depreciation arises from changes in foreign exchange rates on foreign denominated assets and liabilities other than investments in securities held at the end of the reporting period. These realized and unrealized foreign exchange gains or losses are
Schwab Active Equity Funds | Annual Holdings and Financial Statements
45
Schwab Active Equity Funds
Financial Notes (continued)
2. Significant Accounting Policies (continued):
reported in foreign currency transactions or translations, if any, in each fund’s Statement of Operations. The funds do not isolate the portion of the fluctuations on investments resulting from changes in foreign currency exchange rates from the fluctuations in market prices of investments held. Such fluctuations are included with the net realized and unrealized gain or loss from investments, if any.
Gains realized by the funds on the sale of securities in certain foreign countries may be subject to non-U.S. taxes. In those instances, the funds record a liability based on unrealized appreciation to provide for potential non-U.S. taxes payable upon the sale of these securities.
When a fund closes out a futures contract position, it calculates the difference between the value of the position at the beginning and at the end of the contract, and records a realized gain or loss accordingly.
Interest income is recorded as it accrues. Dividends and distributions from portfolio securities and underlying funds are recorded on the date they are effective (the ex-dividend date), although the funds record certain foreign security dividends on the date the ex-dividend date is confirmed. Non-cash dividends in the form of additional securities are recorded on the ex-dividend date at fair value, if any. Any distributions from underlying funds are recorded in accordance with the character of the distributions as designated by the underlying funds.
Income received from foreign sources may result in withholding tax. Withholding taxes are accrued at the same time as the related income if the tax rate is fixed and known, unless a tax withheld is reclaimable from the local tax authorities and there are no significant uncertainties on collectibility in which case it is recorded as receivable. If the tax rate is not known or estimable, such expense or reclaim receivable is recorded when the net proceeds are received.
The Schwab International Core Equity Fund filed claims to recover taxes previously withheld in certain European Union countries on the basis that those countries had purportedly violated certain provisions in the Treaty on the Functioning of the European Union. These filings are subject to various administrative and judicial proceedings within these countries, and all professional fees associated with these filings have been paid by the investment adviser. The professional fees related to European Union foreign withholding tax claims are non-contingent and non-routine expenses which are subject to repayment to the investment adviser (see financial note 3 for additional information).
For U.S. income tax purposes, European Union reclaims received reduce the amounts of foreign taxes that the fund passes through to its shareholders. If European Union reclaims received exceed foreign withholding taxes paid, the Schwab International Core Equity Fund will evaluate the requirements for entering into a closing agreement with the Internal Revenue Service (IRS) to address any prior years’ U.S. income tax liabilities attributable to fund shareholders resulting from the recovery of foreign taxes. The closing agreement would result in the fund paying a compliance fee to the IRS, on behalf of its shareholders, representing the estimated tax savings generated from foreign tax credits claimed by fund shareholders on their tax returns in prior years. During the period ended October 31, 2025, the Schwab International Core Equity Fund did not incur any compliance fees.
Expenses that are specific to a fund are charged directly to the fund. Expenses that are common to more than one fund in the Schwab Funds Complex generally are allocated among those funds in proportion to their average daily net assets.
(f) Distributions to Shareholders:
The funds make distributions from net investment income and net realized capital gains, if any, once a year, except for the Schwab Dividend Equity Fund which typically makes distributions from net investment income at the end of each calendar quarter. To receive a distribution, you must be a registered shareholder on the record date. Distributions are paid to shareholders on the payable date.
(g) Accounting Estimates:
The accounting policies described in this report conform to GAAP. Notwithstanding this, shareholders should understand that in order to follow these principles, fund management has to make estimates and assumptions that affect the information reported in the financial statements. It’s possible that once the results are known, they may turn out to be different from these estimates and these differences may be material.
46
Schwab Active Equity Funds | Annual Holdings and Financial Statements
Schwab Active Equity Funds
Financial Notes (continued)
2. Significant Accounting Policies (continued):
(h) Federal Income Taxes:
The funds intend to meet federal income and excise tax requirements for regulated investment companies under subchapter M of the Internal Revenue Code, as amended. Accordingly, the funds distribute substantially all of their net investment income and net realized capital gains, if any, to their shareholders each year. As long as a fund meets the tax requirements, it is not required to pay federal income tax.
Certain funds may be subject to foreign taxes (a portion of which may be reclaimable) on income, corporate events, foreign currency exchanges and capital gains on investments. All foreign taxes are recorded in accordance with the applicable foreign tax regulations and rates that exist in foreign markets in which a fund invests. These foreign taxes, if any, are paid by the funds and are disclosed in each fund’s Statement of Operations. Foreign taxes accrued as of October 31, 2025, if any, are reflected in each fund’s Statement of Assets and Liabilities.
Under the funds’ organizational documents, the officers and trustees are indemnified against certain liabilities arising out of the performance of their duties to the funds. In addition, in the normal course of business the funds enter into contracts with their vendors and others that provide general indemnifications. The funds’ maximum exposure under these arrangements is unknown as this would involve future claims that may be made against the funds. However, based on experience, the funds expect the risk of loss attributable to these arrangements to be remote.
(k) Recent Accounting Pronouncements:
In December 2023, the FASB issued ASU 2023-09 Income Taxes (Topic 740): Improvements to Income Tax Disclosures. The amendments were issued to enhance the transparency and decision usefulness of income tax disclosures primarily related to rate reconciliation and income taxes paid information. The guidance is effective for annual periods beginning after December 15, 2024, and with early adoption permitted. At this time, management is evaluating the impact of this amendment but believes it will not have a material impact on the financial statements and income tax disclosures.
3. Affiliates and Affiliated Transactions: Charles Schwab Investment Management, Inc., dba Schwab Asset Management, a wholly owned subsidiary of The Charles Schwab Corporation, serves as each fund’s investment adviser and administrator pursuant to the Amended and Restated Investment Advisory and Administration Agreement between the investment adviser and the trust.
For its advisory and administrative services to the funds, the investment adviser is entitled to receive an annual fee, payable monthly, based on a percentage of each fund’s average daily net assets as follows:
% OF AVERAGE DAILY NET ASSETS |
|
SCHWAB DIVIDEND EQUITY FUND |
SCHWAB LARGE-CAP GROWTH FUND |
SCHWAB SMALL-CAP EQUITY FUND |
SCHWAB INTERNATIONAL CORE EQUITY FUND |
| |
|
|
|
|
|
For its advisory and administrative services to the fund, the investment adviser is entitled to receive an annual fee, payable monthly, based on a percentage of the fund’s average daily net assets as follows:
% OF AVERAGE DAILY NET ASSETS |
|
| |
|
$500 million to $1 billion |
|
| |
|
For the period ended October 31, 2025, the aggregate net advisory fee paid to the investment adviser by the Schwab Health Care Fund was 0.54% (annualized), as a percentage of the fund’s average daily net assets.
Schwab Active Equity Funds | Annual Holdings and Financial Statements
47
Schwab Active Equity Funds
Financial Notes (continued)
3. Affiliates and Affiliated Transactions (continued):
Shareholder Servicing
The Board of Trustees has adopted a Shareholder Servicing Plan (the Plan) on behalf of the funds. The Plan enables each fund to bear expenses relating to the provision by financial intermediaries, including Charles Schwab & Co., Inc. (Schwab), a broker-dealer affiliate of the investment adviser, (together, service providers), of certain account maintenance, customer liaison and shareholder services to the current shareholders of the funds.
Pursuant to the Plan, each fund’s shares are subject to an annual shareholder servicing fee up to 0.25%. The shareholder servicing fee paid to a particular service provider is made pursuant to its written agreement with Schwab, as distributor of the funds (or, in the case of payments made to Schwab acting as a service provider, pursuant to Schwab’s written agreement with the funds). Payments under the Plan are made as described above without regard to whether the fee is more or less than the service provider’s actual cost of providing the services, and if more, such excess may be retained as profit by the service provider.
The investment adviser and its affiliates have agreed with the trust, for so long as the investment adviser serves as the investment adviser to the funds, in which the agreement may only be amended or terminated with the approval of the Board of Trustees, to limit the total annual fund operating expenses charged, excluding interest, taxes and certain non-routine expenses.
The agreement to limit the funds’ total expenses charged is limited to each fund’s direct operating expenses and, therefore, does not apply to acquired fund fees and expenses, which are indirect expenses incurred by a fund through its investments in underlying funds. The expense limitation is as follows:
| |
SCHWAB DIVIDEND EQUITY FUND |
SCHWAB LARGE-CAP GROWTH FUND |
SCHWAB SMALL-CAP EQUITY FUND |
|
SCHWAB INTERNATIONAL CORE EQUITY FUND |
| |
|
|
|
|
|
Investments from Affiliates
Funds in the Schwab Funds Complex may own shares of other funds in the Schwab Funds Complex. The table below reflects the percentage of shares of each fund in this report that is owned by other funds in the Schwab Funds Complex as of October 31, 2025, as applicable:
| |
|
| |
|
SCHWAB SMALL-CAP EQUITY FUND |
SCHWAB INTERNATIONAL CORE EQUITY FUND |
| |
|
|
|
| |
|
|
|
| |
|
|
|
| |
|
|
|
| |
|
|
|
| |
|
|
|
| |
|
|
|
| |
|
|
|
| |
|
|
|
| |
|
|
|
| |
|
|
|
| |
|
|
|
| |
|
|
|
48
Schwab Active Equity Funds | Annual Holdings and Financial Statements
Schwab Active Equity Funds
Financial Notes (continued)
3. Affiliates and Affiliated Transactions (continued):
Other Affiliated Transactions
The professional fees related to European Union foreign withholding tax claims discussed in financial note 2(d) are non-contingent and non-routine expenses. The investment adviser agreed to pay these professional fees, on behalf of the Schwab International Core Equity Fund, subject to reimbursement by the fund to the investment adviser to the extent the fund is able to successfully recover tax claims in the future.
During the period ended October 31, 2025, the professional fees incurred by the Schwab International Core Equity Fund and paid by the investment adviser were $3,465, as shown as Professional fees in the fund’s Statement of Operations.
During the period ended October 31, 2025, the Schwab International Core Equity Fund recovered previously withheld foreign taxes from Finland. The payment received by the fund amounted to $350,673 which includes $15,682 of interest income and is recorded as Dividends received from securities — unaffiliated issuers in the fund’s Statement of Operations. The investment adviser paid upfront professional fees associated with recovering these foreign taxes in the amount of $23,975, which was reimbursed to the investment adviser by the fund and is also recorded as Dividends received from securities — unaffiliated issuers in the fund’s Statement of Operations.
As of October 31, 2025, the Schwab International Core Equity Fund had no balance of professional fees related to foreign withholding tax claims subject to future reimbursement by the fund to the investment adviser.
No other amounts for additional foreign withholding tax claims are reflected in the financial statements due to the uncertainty surrounding the ultimate resolution of proceedings, the likelihood of receipt of these claims, and the potential timing of payment.
The funds may engage in direct transactions with other funds in the Schwab Funds Complex in accordance with procedures adopted by the Board of Trustees pursuant to Rule 17a-7 under the 1940 Act. When one fund is seeking to sell a security that another fund is seeking to buy, an interfund transaction can allow both funds to benefit by reducing transaction costs while allowing each fund to execute the transaction at the current market price. This practice is limited to funds that share the same investment adviser. The net realized gains or losses on sales of interfund transactions, if any, are recorded in Net realized gains (losses) on sales of securities — unaffiliated issuers in the Statement of Operations. For the period ended October 31, 2025, each fund’s purchases and sales of securities with other funds in the Schwab Funds Complex as well as any net realized gains (losses) were as follows:
| |
|
|
NET REALIZED GAINS (LOSSES) |
| |
|
|
|
Schwab Dividend Equity Fund |
|
|
|
Schwab Large-Cap Growth Fund |
|
|
|
Schwab Small-Cap Equity Fund |
|
|
|
| |
|
|
|
Schwab International Core Equity Fund |
|
|
|
Interfund Borrowing and Lending
Pursuant to an exemptive order issued by the SEC, the funds may enter into interfund borrowing and lending transactions with other funds in the Schwab Funds Complex. All loans are for temporary or emergency purposes and the interest rate to be charged will be the average of the overnight repurchase agreement rate and the short-term bank loan rate. All loans are subject to numerous conditions designed to ensure fair and equitable treatment of all participating funds. The interfund lending facility is subject to the oversight and periodic review by the Board of Trustees. The funds had no interfund borrowing or lending activity during the period.
The Board of Trustees may include people who are officers and/or directors of the investment adviser or its affiliates. Federal securities law limits the percentage of such “interested persons” who may serve on a trust’s board, and the trust was in compliance with these limitations throughout the report period. The funds did not pay any of these interested persons for their services as trustees, but did pay non-interested persons (independent trustees), as noted in each fund’s Statement of Operations.
Schwab Active Equity Funds | Annual Holdings and Financial Statements
49
Schwab Active Equity Funds
Financial Notes (continued)
5. Borrowing from Banks:
During the period, the funds were participants with other funds in the Schwab Funds Complex in a joint, syndicated, committed $1.2 billion line of credit (the Syndicated Credit Facility), which matured on September 25, 2025. On September 25, 2025, the Syndicated Credit Facility was amended to run for a new 28 day period with the line of credit amount remaining unchanged, maturing on October 23, 2025. On October 23, 2025, the Syndicated Credit Facility was amended to run for a new 364 day period with the line of credit amount remaining unchanged, maturing on October 22, 2026. Under the terms of the Syndicated Credit Facility, in addition to the interest charged on any borrowings by a fund, each fund paid a commitment fee of 0.15% per annum on the funds’ proportionate share of the unused portion of the Syndicated Credit Facility.
During the period, the funds were participants with other funds in the Schwab Funds Complex in a joint, unsecured, uncommitted $400 million line of credit (the Uncommitted Credit Facility) with State Street Bank and Trust Company, which matured on September 25, 2025. On September 25, 2025, the Uncommitted Credit Facility was amended to run for a new 28 day period with the line of credit amount remaining unchanged, maturing on October 23, 2025. On October 23, 2025, the Uncommitted Credit Facility was amended to run for a new 364 day period with the line of credit amount remaining unchanged, maturing on October 22, 2026. Under the terms of the Uncommitted Credit Facility, each fund pays interest on the amount a fund borrows. There were no borrowings by any of the funds from either line of credit during the period.
The funds also have access to custodian overdraft facilities. A fund may have utilized the overdraft facility and incurred an interest expense, which is disclosed in each fund’s Statement of Operations, if any. The interest expense is determined based on a negotiated rate above the current Federal Funds Rate.
Certain funds entered into futures contracts during the report period to equitize available cash.
As of October 31, 2025, the Statement of Assets and Liabilities included the following financial derivative instrument fair values held at period end:
| |
|
|
| |
|
|
Schwab Small-Cap Equity Fund |
|
|
| |
|
|
| |
|
| |
Includes cumulative unrealized appreciation of futures contracts as reported in each fund’s Portfolio Holdings. Only current day’s variation margin on futures contracts is reported in the Statement of Assets and Liabilities. |
The effects of the derivative contracts in the Statement of Operations for the period ended October 31, 2025, were:
| |
|
|
Net Realized Gains (Losses) |
|
|
Schwab Large-Cap Growth Fund |
|
|
| |
|
|
Schwab Small-Cap Equity Fund |
|
|
| |
|
|
| |
|
| |
Statement of Operations location: Net realized gains (losses) on futures contracts. |
Net Change in Unrealized Appreciation (Depreciation) |
|
|
Schwab Large-Cap Growth Fund |
|
|
| |
|
|
Schwab Small-Cap Equity Fund |
|
|
| |
|
|
| |
|
| |
Statement of Operations location: Net change in unrealized appreciation (depreciation) on futures contracts. |
50
Schwab Active Equity Funds | Annual Holdings and Financial Statements
Schwab Active Equity Funds
Financial Notes (continued)
6. Derivatives (continued):
During the period ended October 31, 2025, the month-end average notional amounts of futures contracts held by the funds and the month-end average number of contracts held were as follows:
| |
|
|
| |
|
|
Schwab Dividend Equity Fund |
|
|
Schwab Large-Cap Growth Fund |
|
|
Schwab Small-Cap Equity Fund |
|
|
| |
|
|
Schwab International Core Equity Fund |
|
|
7. Purchases and Sales of Investment Securities: For the period ended October 31, 2025, purchases and sales of securities (excluding short-term obligations) were as follows:
| |
|
|
| |
|
|
Schwab Dividend Equity Fund |
|
|
Schwab Large-Cap Growth Fund |
|
|
Schwab Small-Cap Equity Fund |
|
|
| |
|
|
Schwab International Core Equity Fund |
|
|
As of October 31, 2025, the tax basis cost of the funds’ investments and gross unrealized appreciation and depreciation were as follows:
| |
|
GROSS UNREALIZED
APPRECIATION |
GROSS UNREALIZED
DEPRECIATION |
NET UNREALIZED
APPRECIATION
(DEPRECIATION) |
| |
|
|
|
|
Schwab Dividend Equity Fund |
|
|
|
|
Schwab Large-Cap Growth Fund |
|
|
|
|
Schwab Small-Cap Equity Fund |
|
|
|
|
| |
|
|
|
|
Schwab International Core Equity Fund |
|
|
|
|
The primary differences between book basis and tax basis unrealized appreciation or unrealized depreciation of investments are the tax deferral of losses on wash sales, the realization for tax purposes of unrealized appreciation or depreciation on futures contracts, the realization for tax purposes of unrealized appreciation on investments in PFICs and partnership investments. The tax cost of the funds’ investments, disclosed above, have been adjusted from their book amounts to reflect these unrealized appreciation or depreciation differences, as applicable.
Schwab Active Equity Funds | Annual Holdings and Financial Statements
51
Schwab Active Equity Funds
Financial Notes (continued)
8. Federal Income Taxes (continued):
As of October 31, 2025, the components of distributable earnings on a tax basis were as follows:
| |
UNDISTRIBUTED
ORDINARY
INCOME |
UNDISTRIBUTED
LONG-TERM
CAPITAL GAINS |
NET UNREALIZED
APPRECIATION
(DEPRECIATION)
ON INVESTMENTS |
NET OTHER UNREALIZED
APPRECIATION
(DEPRECIATION) |
CAPITAL LOSS
CARRYFORWARDS
AND OTHER LOSSES |
|
| |
|
|
|
|
|
|
Schwab Dividend Equity Fund |
|
|
|
|
|
|
Schwab Large-Cap Growth Fund |
|
|
|
|
|
|
Schwab Small-Cap Equity Fund |
|
|
|
|
|
|
| |
|
|
|
|
|
|
Schwab International Core Equity Fund |
|
|
|
|
|
|
As of October 31, 2025, the funds had no capital loss carryforwards available to offset future realized capital gains for federal income tax purposes.
For tax purposes, late-year ordinary losses may be deferred and treated as occurring on the first day of the following fiscal year. For the fiscal year ended October 31, 2025, the Schwab Large-Cap Growth Fund had late-year ordinary losses deferred of $1,733,198.
For the fiscal year ended October 31, 2025, the funds had capital loss carryforwards utilized as follows:
| |
|
| |
|
Schwab Dividend Equity Fund |
|
Schwab Large-Cap Growth Fund |
|
Schwab Small-Cap Equity Fund |
|
| |
|
Schwab International Core Equity Fund |
|
The tax basis components of distributions paid during the current and prior fiscal years were as follows:
| |
CURRENT FISCAL YEAR END DISTRIBUTIONS |
PRIOR FISCAL YEAR END DISTRIBUTIONS |
| |
|
|
|
|
| |
|
|
|
|
Schwab Dividend Equity Fund |
|
|
|
|
Schwab Large-Cap Growth Fund |
|
|
|
|
Schwab Small-Cap Equity Fund |
|
|
|
|
| |
|
|
|
|
Schwab International Core Equity Fund |
|
|
|
|
Distributions paid to shareholders are based on net investment income and net realized gains determined on a tax basis, which may differ from net investment income and net realized gains for financial reporting purposes. These differences reflect the differing character of certain income items and net realized gains and losses for financial statement and tax purposes, and may result in reclassification among certain capital accounts in the financial statements. The funds may also designate a portion of the amount paid to redeeming shareholders as a distribution for tax purposes.
Permanent book and tax basis differences may result in reclassifications between components of net assets as required. The adjustments will have no impact on net assets or the results of operations.
As of October 31, 2025, management has reviewed the tax positions for open periods (for federal purposes, three years from the date of filing and for state purposes, four years from the date of filing) as applicable to the funds, and has determined that no provision for income tax is required in the funds’ financial statements. The funds recognize interest and penalties, if any, related to unrecognized tax benefits as income tax expense in each fund’s Statement of Operations. During the fiscal year ended October 31, 2025, the funds did not incur any interest or penalties.
52
Schwab Active Equity Funds | Annual Holdings and Financial Statements
Schwab Active Equity Funds
Financial Notes (continued)
9. Subsequent Events:
Management has determined there are no subsequent events or transactions through the date the financial statements were issued that would have materially impacted the financial statements as presented.
Schwab Active Equity Funds | Annual Holdings and Financial Statements
53
Schwab Active Equity Funds
Report of Independent Registered Public Accounting Firm
To the Board of Trustees of Schwab Capital Trust and Shareholders of Schwab Core Equity Fund, Schwab Dividend Equity Fund, Schwab Large-Cap Growth Fund, Schwab Small-Cap Equity Fund, Schwab Health Care Fund, and Schwab International Core Equity Fund:
Opinion on the Financial Statements and Financial Highlights
We have audited the accompanying statements of assets and liabilities, including the portfolio holdings, of Schwab Core Equity Fund, Schwab Dividend Equity Fund, Schwab Large-Cap Growth Fund, Schwab Small-Cap Equity Fund, Schwab Health Care Fund, and Schwab International Core Equity Fund (the “Funds”), six of the Funds constituting Schwab Capital Trust, as of October 31, 2025, the related statements of operations for the year then ended, the statements of changes in net assets for each of the two years in the period then ended, the financial highlights for each of the five years in the period then ended, and the related notes (collectively referred to as the “financial statements and financial highlights”). In our opinion, the financial statements and financial highlights present fairly, in all material respects, the financial position of each of the Funds as of October 31, 2025, and the results of their operations for the year then ended, the changes in their net assets for each of the two years in the period then ended, and the financial highlights for each of the five years in the period then ended in conformity with accounting principles generally accepted in the United States of America.
These financial statements and financial highlights are the responsibility of the Funds’ management. Our responsibility is to express an opinion on the Funds’ financial statements and financial highlights based on our audits. We are a public accounting firm registered with the Public Company Accounting Oversight Board (United States) (PCAOB) and are required to be independent with respect to the Funds in accordance with the U.S. federal securities laws and the applicable rules and regulations of the Securities and Exchange Commission and the PCAOB.
We conducted our audits in accordance with the standards of the PCAOB. Those standards require that we plan and perform the audit to obtain reasonable assurance about whether the financial statements and financial highlights are free of material misstatement, whether due to error or fraud. The Funds are not required to have, nor were we engaged to perform, an audit of their internal control over financial reporting. As part of our audits we are required to obtain an understanding of internal control over financial reporting but not for the purpose of expressing an opinion on the effectiveness of the Funds’ internal control over financial reporting. Accordingly, we express no such opinion.
Our audits included performing procedures to assess the risks of material misstatement of the financial statements and financial highlights, whether due to error or fraud, and performing procedures that respond to those risks. Such procedures included examining, on a test basis, evidence regarding the amounts and disclosures in the financial statements and financial highlights. Our audits also included evaluating the accounting principles used and significant estimates made by management, as well as evaluating the overall presentation of the financial statements and financial highlights. Our procedures included confirmation of securities owned as of October 31, 2025, by correspondence with the custodian and brokers; when replies were not received from brokers, we performed other auditing procedures. We believe that our audits provide a reasonable basis for our opinion.
Deloitte & Touche LLP
Denver, Colorado
December 16, 2025
We have served as the auditor of one or more investment companies in the Schwab Funds Complex since 2020.
54
Schwab Active Equity Funds | Annual Holdings and Financial Statements
Changes in and Disagreements with Accountants for Open-End Management Investment Companies
Schwab Active Equity Funds | Annual Holdings and Financial Statements
55
Proxy Disclosures for Open-End Management Investment Companies
56
Schwab Active Equity Funds | Annual Holdings and Financial Statements
Remuneration Paid to Directors, Officers, and Others of Open-End Management Investment Companies
The remuneration paid to directors, officers and others are included under Item 7 (Financial Statements and Financial Highlights for Open-End Management Investment Companies).
Schwab Active Equity Funds | Annual Holdings and Financial Statements
57
Schwab Active Equity Funds
Investment Advisory Agreement Approval
The Investment Company Act of 1940, as amended (the 1940 Act), requires that the continuation of a fund’s investment advisory agreement must be specifically approved (1) by the vote of the trustees or by a vote of the shareholders of the fund, and (2) by the vote of a majority of the trustees who are not parties to the investment advisory agreement or “interested persons” of any party thereto (the Independent Trustees), cast in person at a meeting called for the purpose of voting on such approval. In connection with such approvals, the fund’s trustees must request and evaluate, and the investment adviser is required to furnish, such information as may be reasonably necessary to evaluate the terms of the investment advisory agreement.
The Board of Trustees (the Board or the Trustees, as appropriate) calls and holds one or more meetings each year that are dedicated, in whole or in part, to considering whether to renew the investment advisory and administration agreement (the Agreement) between Schwab Capital Trust (the Trust) and Charles Schwab Investment Management, Inc. (dba Schwab Asset Management) (the investment adviser) with respect to the existing funds in the Trust, including Schwab Core Equity Fund, Schwab Dividend Equity Fund, Schwab Large-Cap Growth Fund, Schwab Small-Cap Equity Fund, Schwab Health Care Fund and Schwab International Core Equity Fund (each, a Fund and collectively, the Funds), and to review certain other agreements pursuant to which the investment adviser provides investment advisory services to certain other registered investment companies. In preparation for the meeting(s), the Board requests and reviews a wide variety of materials provided by the investment adviser, including information about the investment adviser’s affiliates, personnel, business goals and priorities, profitability, oversight of third-party service providers, corporate structure and operations. As part of the renewal process, the Independent Trustees’ legal counsel, on behalf of the Independent Trustees, sends an information request letter to the investment adviser seeking certain relevant information. The responses by the investment adviser are provided to the Trustees in the Board materials for their review prior to their meeting, and the Trustees are provided with the opportunity to request any additional materials. The Board also receives data provided by an independent provider of investment company data. This information is in addition to the detailed information about the Funds that the Board reviews during the course of each year, including information that relates to the Funds’ operations and performance, legal and compliance matters, risk management, portfolio turnover, and sales and marketing activity. In considering the renewal, the Independent Trustees receive advice from Independent Trustees’ legal counsel, including a memorandum regarding the responsibilities of trustees for the approval of investment advisory agreements. In addition, the Independent Trustees participate in question and answer
sessions with representatives of the investment adviser and meet in executive session outside the presence of Fund management.
The Board, including a majority of the Independent Trustees, considered information specifically relating to the continuance of the Agreement with respect to the Funds at meetings held on May 7, 2025 and June 5, 2025, and approved the renewal of the Agreement with respect to the Funds for an additional one-year term at the meeting on June 5, 2025 called for the purpose of voting on such approval.
The Board’s approval of the continuance of the Agreement with respect to the Funds was based on consideration and evaluation of a variety of specific factors discussed at these meetings and at prior meetings, including:
1.
the nature, extent and quality of the services provided to each Fund under the Agreement, including the resources of the investment adviser and its affiliates dedicated to the Funds;
2.
each Fund’s investment performance and how it compared to that of certain other comparable mutual funds and benchmark data;
3.
each Fund’s expenses and how those expenses compared to those of certain other similar mutual funds;
4.
the profitability of the investment adviser and its affiliates, including Charles Schwab & Co., Inc. (Schwab), with respect to each Fund, including both direct and indirect benefits accruing to the investment adviser and its affiliates; and
5.
the extent to which economies of scale would be realized as each Fund grows and whether fee levels in the Agreement reflect those economies of scale for the benefit of Fund investors.
Nature, Extent and Quality of Services. The Board considered the nature, extent and quality of the services provided by the investment adviser to the Funds and the resources of the investment adviser and its affiliates dedicated to the Funds. In this regard, the Trustees evaluated, among other things, the investment adviser’s experience, track record, compliance program, resources dedicated to hiring and retaining skilled personnel and specialized talent, and information security resources. The Trustees also considered information provided by the investment adviser relating to services and support provided with respect to each Fund’s portfolio management team, portfolio strategy, and internal investment guidelines, as well as trading infrastructure, liquidity management, product design and analysis, shareholder communications, securities valuation, and vendor and risk oversight. The Trustees also considered the investment adviser’s continued investment in its infrastructure, including the investment adviser’s
58
Schwab Active Equity Funds | Annual Holdings and Financial Statements
Schwab Active Equity Funds
technology and use of data, business continuity, cybersecurity, due diligence, risk management processes, and information security programs. The Trustees considered Schwab’s overall financial condition and its reputation as a full service brokerage firm, as well as the wide range of products, services and account features that benefit Fund shareholders who are brokerage clients of Schwab. Following such evaluation, the Board concluded, within the context of its full deliberations, that the nature, extent and quality of services provided by the investment adviser to the Funds and the resources of the investment adviser and its affiliates dedicated to the Funds supported renewal of the Agreement with respect to the Funds.
Fund Performance. The Board considered each Fund’s performance in determining whether to renew the Agreement with respect to such Fund. Specifically, the Trustees considered each Fund’s performance relative to a peer category of other mutual funds and applicable indices/benchmarks, in light of total return and the market environment, as well as in consideration of each Fund’s investment style and strategy. As part of this review, the Trustees considered the composition of the peer category, selection criteria and the reputation of the independent provider of investment company data who prepared the peer category analysis. In evaluating the performance of each Fund, the Trustees considered the risk profile for such Fund and the appropriateness of the benchmark used to compare the performance of each Fund. The Trustees further considered the level of Fund performance in the context of their review of Fund expenses and the investment adviser’s profitability discussed below and also noted that the Board and a designated committee of the Board review performance throughout the year. Following such evaluation, the Board concluded, within the context of its full deliberations, that the performance of each Fund supported renewal of the Agreement with respect to such Fund.
Fund Expenses. With respect to each Fund’s expenses, the Trustees considered the rate of compensation called for by the Agreement and each Fund’s net operating expense ratio, in each case, in comparison to those of other similar mutual funds, such peer groups and comparisons having been selected and calculated by an independent provider of investment company data. The investment adviser reported to the Board, and the Board took into account, the risk assumed by the investment adviser in the development of the Funds and provision of services as well as the competitive marketplace for financial products. The Trustees also considered the investment adviser’s contractual commitment to limit the total annual operating expenses of each Fund for so long as the investment adviser serves as the adviser to the Fund. The Trustees also considered fees charged by the investment adviser to other mutual funds and to other types of accounts, but, with respect to such other types of accounts, accorded less weight to such comparisons due to the different legal, regulatory, compliance and operating features of mutual funds
as compared to these other types of accounts, and any differences in the nature and scope of the services the investment adviser provides to these other accounts, and any differences in the market for these types of accounts. Following such evaluation, the Board concluded, within the context of its full deliberations, that the expenses of each Fund are reasonable and supported renewal of the Agreement with respect to such Fund.
Profitability. The Trustees considered the compensation flowing to the investment adviser and its affiliates, directly or indirectly and reviewed profitability on a pre-tax basis, without regard to distribution expenses. The Trustees reviewed the profitability of the investment adviser relating to the Schwab fund complex as a whole, noting the benefits to Fund shareholders of being part of the Schwab fund complex, including the allocations of certain costs across the Funds and other funds in the complex. The Trustees also considered any other benefits derived by the investment adviser from its relationship with the Funds, such as whether, by virtue of its management of the Funds, the investment adviser obtains investment information or other research resources that aid it in providing advisory services to other clients. The Trustees considered whether the compensation and profitability with respect to the Funds under the Agreement and other service agreements were reasonable in light of the quality of all services rendered to the Funds by the investment adviser and its affiliates. The Trustees noted that the investment adviser continues to invest substantial sums in its business in order to provide enhanced research capabilities, services, and systems to benefit the Funds. Based on this evaluation, the Board concluded, within the context of its full deliberations, that the profitability of the investment adviser with respect to each Fund is reasonable and supported renewal of the Agreement with respect to such Fund.
Economies of Scale. Although the Trustees recognized the difficulty of determining economies of scale with precision, and although the Funds do not have breakpoints in their advisory fees, the Trustees considered the potential existence of any economies of scale and whether those are passed along to a Fund’s shareholders through (i) the enhancement of services provided to the Funds in return for fees paid, including through the investment adviser’s continued investment in its infrastructure, and use of data and technology, increasing expertise and capabilities in key areas (including portfolio and trade operations), and improving business continuity, cybersecurity, due diligence and information security programs, which are designed to provide enhanced services to the Funds and their shareholders; and (ii) pricing a fund to scale and keeping overall expenses down as the fund grows. The Trustees considered that the investment adviser and its affiliates may employ contractual expense caps to protect shareholders from higher fees, including for example, when fund assets are relatively small. Based on this evaluation, the
Schwab Active Equity Funds | Annual Holdings and Financial Statements
59
Schwab Active Equity Funds
Board concluded, within the context of its full deliberations, that each Fund obtains reasonable benefits from economies of scale.
* * * * * * * * * * * * * * * * * * * * * * * * * * * * * * * * * * * * * * * *
In the course of their deliberations, the Trustees may have accorded different weights to various factors and did not identify any particular information or factor that was all important or controlling. Based on the Trustees’ deliberation
and their evaluation of the information described above, the Board, including all of the Independent Trustees, approved the continuation of the Agreement with respect to the Funds and concluded that the compensation under the Agreement with respect to the Funds is fair and reasonable in light of the services provided and the related expenses borne by the investment adviser and its affiliates and such other matters as the Trustees considered to be relevant in the exercise of their reasonable judgment.
60
Schwab Active Equity Funds | Annual Holdings and Financial Statements
Annual Holdings and Financial Statements | October 31, 2025
Schwab Equity Index Funds®
Schwab S&P 500 Index Fund
Schwab Small-Cap Index Fund
Schwab Total Stock Market Index Fund
Schwab U.S. Large-Cap Growth
Index Fund
Schwab U.S. Large-Cap Value
Index Fund
Schwab U.S. Mid-Cap Index Fund
Schwab International Index Fund
Fund investment adviser: Charles Schwab Investment Management, Inc., dba Schwab Asset Management®
Distributor: Charles Schwab & Co., Inc. (Schwab)
The Sector/Industry classifications in this report use the Global Industry Classification Standard (GICS) which was developed by and is the exclusive property of MSCI Inc. (MSCI) and Standard & Poor’s (S&P). GICS is a service mark of MSCI and S&P and has been licensed for use by Schwab. The Industry classifications used in the Portfolio Holdings are sub-categories of Sector classifications.
Schwab Equity Index Funds | Annual Holdings and Financial Statements
1
Schwab S&P 500 Index Fund
Financial Statements
| |
|
|
|
|
|
|
| |
Net asset value at beginning of period |
|
|
|
|
|
|
Income (loss) from investment operations: |
|
|
|
|
|
|
Net investment income (loss)2 |
|
|
|
|
|
|
Net realized and unrealized gains (losses) |
|
|
|
|
|
|
Total from investment operations |
|
|
|
|
|
|
| |
|
|
|
|
|
|
Distributions from net investment income |
|
|
|
|
|
|
Distributions from net realized gains |
|
|
|
|
|
|
| |
|
|
|
|
|
|
Net asset value at end of period |
|
|
|
|
|
|
| |
|
|
|
|
|
|
| |
Ratios to average net assets: |
|
|
|
|
|
|
| |
|
|
|
|
|
|
Net investment income (loss) |
|
|
|
|
|
|
| |
|
|
|
|
|
|
Net assets, end of period (x 1,000,000) |
|
|
|
|
|
|
| |
Per-Share Data has been retroactively adjusted to reflect a 6-for-1 share split effective after the close of U.S. markets on August 15, 2025 (see financial note 9 for additional information). |
| |
Calculated based on the average shares outstanding during the period. |
| |
Ratio includes less than 0.005% of non-routine proxy expenses. |
| |
Portfolio turnover rate excludes in-kind transactions. |
2
Schwab Equity Index Funds | Annual Holdings and Financial Statements
Schwab S&P 500 Index Fund
Portfolio Holdings as of October 31, 2025
| |
|
|
COMMON STOCKS 99.7% OF NET ASSETS |
| |
Automobiles & Components 2.4% |
| |
|
|
| |
|
|
| |
|
|
| |
|
|
| |
|
|
| |
| |
| |
|
|
| |
|
|
Citizens Financial Group, Inc. |
|
|
| |
|
|
Huntington Bancshares, Inc. |
|
|
| |
|
|
| |
|
|
| |
|
|
PNC Financial Services Group, Inc. |
|
|
| |
|
|
| |
|
|
| |
|
|
| |
|
|
| |
|
|
| |
| |
| |
|
|
| |
|
|
| |
|
|
| |
|
|
| |
|
|
| |
|
|
Builders FirstSource, Inc. * |
|
|
| |
|
|
| |
|
|
| |
|
|
| |
|
|
| |
|
|
| |
|
|
| |
|
|
| |
|
|
| |
|
|
| |
|
|
| |
|
|
| |
|
|
| |
|
|
| |
|
|
Honeywell International, Inc. |
|
|
| |
|
|
| |
|
|
Huntington Ingalls Industries, Inc. |
|
|
| |
|
|
Illinois Tool Works, Inc. |
|
|
| |
|
|
Johnson Controls International PLC |
|
|
L3Harris Technologies, Inc. |
|
|
Lennox International, Inc. |
|
|
| |
|
|
| |
|
|
| |
|
|
| |
|
|
| |
|
|
| |
|
|
| |
|
|
| |
|
|
| |
|
|
| |
|
|
Rockwell Automation, Inc. |
|
|
| |
|
|
| |
|
|
Stanley Black & Decker, Inc. |
|
|
| |
|
|
| |
|
|
| |
|
|
| |
|
|
Westinghouse Air Brake Technologies Corp. |
|
|
| |
|
|
| |
|
|
| |
|
|
| |
Commercial & Professional Services 0.9% |
Automatic Data Processing, Inc. |
|
|
Broadridge Financial Solutions, Inc. |
|
|
| |
|
|
| |
|
|
| |
|
|
| |
|
|
| |
|
|
| |
|
|
| |
|
|
| |
|
|
Republic Services, Inc., Class A |
|
|
| |
|
|
| |
|
|
Verisk Analytics, Inc., Class A |
|
|
| |
|
|
| |
|
|
| |
Consumer Discretionary Distribution & Retail 5.8% |
| |
|
|
| |
|
|
| |
|
|
| |
|
|
| |
|
|
| |
|
|
| |
|
|
| |
|
|
O'Reilly Automotive, Inc. * |
|
|
| |
|
|
| |
|
|
| |
|
|
| |
|
|
| |
|
|
| |
|
|
| |
|
|
| |
Consumer Durables & Apparel 0.5% |
| |
|
|
| |
|
|
| |
|
|
| |
|
|
| |
|
|
Lululemon Athletica, Inc. * |
|
|
Mohawk Industries, Inc. * |
|
|
| |
|
|
| |
|
|
| |
|
|
Ralph Lauren Corp., Class A |
|
|
Schwab Equity Index Funds | Annual Holdings and Financial Statements
3
Schwab S&P 500 Index Fund
Portfolio Holdings as of October 31, 2025 (continued)
| |
|
|
| |
|
|
| |
|
|
| |
| |
| |
|
|
| |
|
|
| |
|
|
Chipotle Mexican Grill, Inc., Class A * |
|
|
| |
|
|
| |
|
|
DoorDash, Inc., Class A * |
|
|
| |
|
|
Hilton Worldwide Holdings, Inc. |
|
|
| |
|
|
Marriott International, Inc., Class A |
|
|
| |
|
|
MGM Resorts International * |
|
|
Norwegian Cruise Line Holdings Ltd. * |
|
|
Royal Caribbean Cruises Ltd. |
|
|
| |
|
|
| |
|
|
| |
|
|
| |
|
|
| |
Consumer Staples Distribution & Retail 1.7% |
| |
|
|
| |
|
|
| |
|
|
| |
|
|
| |
|
|
| |
|
|
| |
|
|
| |
|
|
| |
| |
| |
|
|
Baker Hughes Co., Class A |
|
|
| |
|
|
| |
|
|
| |
|
|
| |
|
|
| |
|
|
| |
|
|
| |
|
|
| |
|
|
| |
|
|
| |
|
|
| |
|
|
| |
|
|
Occidental Petroleum Corp. |
|
|
| |
|
|
| |
|
|
| |
|
|
| |
|
|
| |
|
|
| |
|
|
| |
|
|
| |
|
|
| |
Equity Real Estate Investment Trusts (REITs) 1.7% |
Alexandria Real Estate Equities, Inc. |
|
|
| |
|
|
AvalonBay Communities, Inc. |
|
|
| |
|
|
| |
|
|
| |
|
|
| |
|
|
Digital Realty Trust, Inc. |
|
|
| |
|
|
| |
|
|
Essex Property Trust, Inc. |
|
|
Extra Space Storage, Inc. |
|
|
Federal Realty Investment Trust |
|
|
Healthpeak Properties, Inc. |
|
|
Host Hotels & Resorts, Inc. |
|
|
| |
|
|
| |
|
|
| |
|
|
Mid-America Apartment Communities, Inc. |
|
|
| |
|
|
| |
|
|
| |
|
|
| |
|
|
SBA Communications Corp., Class A |
|
|
Simon Property Group, Inc. |
|
|
| |
|
|
| |
|
|
VICI Properties, Inc., Class A |
|
|
| |
|
|
| |
|
|
| |
|
|
| |
| |
| |
|
|
Ameriprise Financial, Inc. |
|
|
Apollo Global Management, Inc. |
|
|
Bank of New York Mellon Corp. |
|
|
Berkshire Hathaway, Inc., Class B * |
|
|
| |
|
|
| |
|
|
| |
|
|
Capital One Financial Corp. |
|
|
Cboe Global Markets, Inc. |
|
|
| |
|
|
| |
|
|
Coinbase Global, Inc., Class A * |
|
|
| |
|
|
FactSet Research Systems, Inc. |
|
|
Fidelity National Information Services, Inc. |
|
|
| |
|
|
| |
|
|
| |
|
|
Goldman Sachs Group, Inc. |
|
|
Interactive Brokers Group, Inc., Class A |
|
|
Intercontinental Exchange, Inc. |
|
|
| |
|
|
Jack Henry & Associates, Inc. |
|
|
| |
|
|
Mastercard, Inc., Class A |
|
|
| |
|
|
| |
|
|
| |
|
|
| |
|
|
| |
|
|
| |
|
|
Raymond James Financial, Inc. |
|
|
Robinhood Markets, Inc., Class A * |
|
|
| |
|
|
| |
|
|
| |
|
|
4
Schwab Equity Index Funds | Annual Holdings and Financial Statements
Schwab S&P 500 Index Fund
Portfolio Holdings as of October 31, 2025 (continued)
| |
|
|
T. Rowe Price Group, Inc. |
|
|
| |
|
|
| |
|
|
| |
Food, Beverage & Tobacco 2.0% |
| |
|
|
Archer-Daniels-Midland Co. |
|
|
Brown-Forman Corp., Class B |
|
|
| |
|
|
| |
|
|
| |
|
|
| |
|
|
Constellation Brands, Inc., Class A |
|
|
| |
|
|
| |
|
|
| |
|
|
| |
|
|
| |
|
|
| |
|
|
| |
|
|
Lamb Weston Holdings, Inc. |
|
|
McCormick & Co., Inc. - Non Voting Shares |
|
|
Molson Coors Beverage Co., Class B |
|
|
Mondelez International, Inc., Class A |
|
|
| |
|
|
| |
|
|
Philip Morris International, Inc. |
|
|
Tyson Foods, Inc., Class A |
|
|
| |
|
|
| |
Health Care Equipment & Services 3.6% |
| |
|
|
| |
|
|
Baxter International, Inc. |
|
|
| |
|
|
Boston Scientific Corp. * |
|
|
| |
|
|
| |
|
|
| |
|
|
| |
|
|
| |
|
|
| |
|
|
| |
|
|
| |
|
|
Edwards Lifesciences Corp. * |
|
|
| |
|
|
GE HealthCare Technologies, Inc. |
|
|
| |
|
|
| |
|
|
| |
|
|
| |
|
|
IDEXX Laboratories, Inc. * |
|
|
| |
|
|
Intuitive Surgical, Inc. * |
|
|
| |
|
|
| |
|
|
| |
|
|
Molina Healthcare, Inc. * |
|
|
| |
|
|
| |
|
|
| |
|
|
| |
|
|
| |
|
|
| |
|
|
Universal Health Services, Inc., Class B |
|
|
| |
|
|
Zimmer Biomet Holdings, Inc. |
|
|
| |
|
|
| |
Household & Personal Products 0.9% |
Church & Dwight Co., Inc. |
|
|
| |
|
|
| |
|
|
Estee Lauder Cos., Inc., Class A |
|
|
| |
|
|
| |
|
|
| |
|
|
| |
|
|
| |
| |
| |
|
|
| |
|
|
American International Group, Inc. |
|
|
| |
|
|
| |
|
|
| |
|
|
| |
|
|
| |
|
|
| |
|
|
Cincinnati Financial Corp. |
|
|
Erie Indemnity Co., Class A |
|
|
| |
|
|
| |
|
|
Hartford Insurance Group, Inc. |
|
|
| |
|
|
Marsh & McLennan Cos., Inc. |
|
|
| |
|
|
Principal Financial Group, Inc. |
|
|
| |
|
|
Prudential Financial, Inc. |
|
|
| |
|
|
| |
|
|
| |
|
|
| |
|
|
| |
| |
Air Products & Chemicals, Inc. |
|
|
| |
|
|
| |
|
|
| |
|
|
| |
|
|
CF Industries Holdings, Inc. |
|
|
| |
|
|
| |
|
|
| |
|
|
| |
|
|
| |
|
|
| |
|
|
International Flavors & Fragrances, Inc. |
|
|
| |
|
|
| |
|
|
LyondellBasell Industries NV, Class A |
|
|
Martin Marietta Materials, Inc. |
|
|
| |
|
|
| |
|
|
| |
|
|
Packaging Corp. of America |
|
|
| |
|
|
| |
|
|
| |
|
|
Solstice Advanced Materials, Inc. * |
|
|
Schwab Equity Index Funds | Annual Holdings and Financial Statements
5
Schwab S&P 500 Index Fund
Portfolio Holdings as of October 31, 2025 (continued)
| |
|
|
| |
|
|
| |
|
|
| |
|
|
| |
Media & Entertainment 9.3% |
| |
|
|
| |
|
|
Charter Communications, Inc., Class A * |
|
|
| |
|
|
| |
|
|
| |
|
|
Interpublic Group of Cos., Inc. |
|
|
Live Nation Entertainment, Inc. * |
|
|
| |
|
|
Meta Platforms, Inc., Class A |
|
|
| |
|
|
| |
|
|
| |
|
|
Paramount Skydance Corp., Class B (b) |
|
|
Take-Two Interactive Software, Inc. * |
|
|
| |
|
|
Trade Desk, Inc., Class A * |
|
|
| |
|
|
Warner Bros Discovery, Inc. * |
|
|
| |
|
|
| |
Pharmaceuticals, Biotechnology & Life Sciences 5.3% |
| |
|
|
Agilent Technologies, Inc. |
|
|
| |
|
|
| |
|
|
| |
|
|
| |
|
|
Charles River Laboratories International, Inc. * |
|
|
| |
|
|
| |
|
|
| |
|
|
| |
|
|
| |
|
|
| |
|
|
| |
|
|
Mettler-Toledo International, Inc. * |
|
|
| |
|
|
| |
|
|
Regeneron Pharmaceuticals, Inc. |
|
|
| |
|
|
Thermo Fisher Scientific, Inc. |
|
|
Vertex Pharmaceuticals, Inc. * |
|
|
| |
|
|
| |
|
|
West Pharmaceutical Services, Inc. |
|
|
| |
|
|
| |
|
|
| |
Real Estate Management & Development 0.1% |
CBRE Group, Inc., Class A * |
|
|
| |
|
|
| |
|
|
| |
Semiconductors & Semiconductor Equipment 14.9% |
Advanced Micro Devices, Inc. * |
|
|
| |
|
|
| |
|
|
| |
|
|
| |
|
|
| |
|
|
| |
|
|
| |
|
|
| |
|
|
Microchip Technology, Inc. |
|
|
| |
|
|
Monolithic Power Systems, Inc. |
|
|
| |
|
|
| |
|
|
| |
|
|
| |
|
|
| |
|
|
| |
|
|
| |
|
|
| |
|
|
| |
Software & Services 12.1% |
| |
|
|
| |
|
|
Akamai Technologies, Inc. * |
|
|
AppLovin Corp., Class A * |
|
|
| |
|
|
Cadence Design Systems, Inc. * |
|
|
Cognizant Technology Solutions Corp., Class A |
|
|
Crowdstrike Holdings, Inc., Class A * |
|
|
| |
|
|
| |
|
|
| |
|
|
| |
|
|
| |
|
|
| |
|
|
| |
|
|
International Business Machines Corp. |
|
|
| |
|
|
| |
|
|
| |
|
|
Palantir Technologies, Inc., Class A * |
|
|
Palo Alto Networks, Inc. * |
|
|
| |
|
|
| |
|
|
| |
|
|
| |
|
|
| |
|
|
Tyler Technologies, Inc. * |
|
|
| |
|
|
| |
|
|
| |
|
|
| |
Technology Hardware & Equipment 9.0% |
| |
|
|
| |
|
|
| |
|
|
| |
|
|
| |
|
|
| |
|
|
Dell Technologies, Inc., Class C |
|
|
| |
|
|
Hewlett Packard Enterprise Co. |
|
|
| |
|
|
| |
|
|
Keysight Technologies, Inc. * |
|
|
| |
|
|
| |
|
|
Seagate Technology Holdings PLC |
|
|
6
Schwab Equity Index Funds | Annual Holdings and Financial Statements
Schwab S&P 500 Index Fund
Portfolio Holdings as of October 31, 2025 (continued)
| |
|
|
Super Micro Computer, Inc. * |
|
|
| |
|
|
Teledyne Technologies, Inc. * |
|
|
| |
|
|
| |
|
|
Zebra Technologies Corp., Class A * |
|
|
| |
|
|
| |
Telecommunication Services 0.8% |
| |
|
|
| |
|
|
Verizon Communications, Inc. |
|
|
| |
|
|
| |
| |
CH Robinson Worldwide, Inc. |
|
|
| |
|
|
| |
|
|
Expeditors International of Washington, Inc. |
|
|
| |
|
|
JB Hunt Transport Services, Inc. |
|
|
| |
|
|
Old Dominion Freight Line, Inc. |
|
|
| |
|
|
Uber Technologies, Inc. * |
|
|
| |
|
|
United Airlines Holdings, Inc. * |
|
|
United Parcel Service, Inc., Class B |
|
|
| |
|
|
| |
| |
| |
|
|
| |
|
|
| |
|
|
American Electric Power Co., Inc. |
|
|
American Water Works Co., Inc. |
|
|
| |
|
|
| |
|
|
| |
|
|
Consolidated Edison, Inc. |
|
|
Constellation Energy Corp. |
|
|
| |
|
|
| |
|
|
| |
|
|
| |
|
|
| |
|
|
| |
|
|
| |
|
|
| |
|
|
| |
|
|
| |
|
|
| |
|
|
| |
|
|
| |
|
|
| |
|
|
Pinnacle West Capital Corp. |
|
|
| |
|
|
Public Service Enterprise Group, Inc. |
|
|
| |
|
|
| |
|
|
| |
|
|
| |
|
|
| |
|
|
| |
|
|
Total Common Stocks
(Cost $46,212,523,678) |
|
| |
|
|
SHORT-TERM INVESTMENTS 0.0% OF NET ASSETS |
| |
| |
State Street Institutional U.S. Government Money Market Fund, Premier Class 4.01% (c)(d) |
|
|
Total Short-Term Investments
(Cost $9,128,124) |
|
Total Investments in Securities
(Cost $46,221,651,802) |
|
| |
|
|
CURRENT VALUE/
UNREALIZED
APPRECIATION
($) |
| |
| |
|
|
|
S&P 500 Index, e-mini, expires 12/19/25 |
|
|
|
| |
Non-income producing security. |
| |
Issuer is affiliated with the fund’s investment adviser. |
| |
All or a portion of this security is on loan. Securities on loan were valued at $8,444,278. |
| |
The rate shown is the annualized 7-day yield. |
| |
Security purchased with cash collateral received for securities on loan. |
| |
Real Estate Investment Trust |
Below is a summary of the fund’s transactions with affiliated issuers during the period ended October 31, 2025:
| |
|
|
|
NET REALIZED GAINS (LOSSES) |
NET CHANGE IN UNREALIZED APPRECIATION (DEPRECIATION) |
|
BALANCE OF SHARES HELD AT 10/31/25 |
|
COMMON STOCKS 0.3% OF NET ASSETS |
| |
| |
| |
|
|
|
|
|
|
|
|
Schwab Equity Index Funds | Annual Holdings and Financial Statements
7
Schwab S&P 500 Index Fund
Portfolio Holdings as of October 31, 2025 (continued)
The following is a summary of the inputs used to value the fund’s investments as of October 31, 2025 (see financial note 2(a) for additional information):
| |
QUOTED PRICES IN
ACTIVE MARKETS FOR
IDENTICAL ASSETS
(LEVEL 1) |
OTHER SIGNIFICANT
OBSERVABLE INPUTS
(LEVEL 2) |
SIGNIFICANT
UNOBSERVABLE INPUTS
(LEVEL 3) |
|
| |
|
|
|
|
| |
|
|
|
|
| |
|
|
|
|
| |
|
|
|
|
| |
|
|
|
|
| |
As categorized in the Portfolio Holdings. |
| |
Futures contracts are reported at cumulative unrealized appreciation or depreciation. |
8
Schwab Equity Index Funds | Annual Holdings and Financial Statements
Schwab S&P 500 Index Fund
Statement of Assets and Liabilities
| |
Investments in securities, at value - affiliated issuers (cost $162,513,919) |
|
|
Investments in securities, at value - unaffiliated issuers (cost $46,059,137,883) including securities on loan of $8,444,278 |
|
|
| |
|
|
Deposit with broker for futures contracts |
|
|
| |
|
|
| |
|
|
| |
|
|
Variation margin on future contracts |
|
|
Income from securities on loan |
|
|
| |
|
|
| |
| |
Collateral held for securities on loan |
|
|
| |
|
|
| |
|
|
| |
|
|
| |
|
|
| |
|
|
| |
| |
Capital received from investors |
|
|
Total distributable earnings |
|
|
| |
|
|
Schwab Equity Index Funds | Annual Holdings and Financial Statements
9
Schwab S&P 500 Index Fund
Statement of Operations
For the period November 1, 2024 through October 31, 2025 |
| |
Dividends received from securities - unaffiliated issuers (net of foreign withholding tax of $345,515) |
|
|
| |
|
|
Dividends received from securities - affiliated issuers |
|
|
| |
|
|
| |
|
|
| |
| |
| |
|
|
| |
|
|
| |
|
|
| |
REALIZED AND UNREALIZED GAINS (LOSSES) |
Net realized gains on sales of securities - affiliated issuers |
|
|
Net realized losses on sales of securities - unaffiliated issuers |
|
|
Net realized gains on futures contracts |
|
|
| |
|
|
Net change in unrealized appreciation (depreciation) on securities - affiliated issuers |
|
|
Net change in unrealized appreciation (depreciation) on securities - unaffiliated issuers |
|
|
Net change in unrealized appreciation (depreciation) on futures contracts |
|
|
Net change in unrealized appreciation (depreciation) |
|
|
Net realized and unrealized gains |
|
|
Increase in net assets resulting from operations |
|
|
10
Schwab Equity Index Funds | Annual Holdings and Financial Statements
Schwab S&P 500 Index Fund
Statement of Changes in Net Assets
For the current and prior report periods
| |
| |
|
|
| |
|
|
|
| |
|
|
|
Net change in unrealized appreciation (depreciation) |
|
|
|
Increase in net assets resulting from operations |
|
|
|
| |
DISTRIBUTIONS TO SHAREHOLDERS |
| |
|
|
|
TRANSACTIONS IN FUND SHARES1 |
| |
|
|
| |
|
|
|
|
|
| |
|
|
|
|
|
| |
|
|
|
|
|
| |
|
|
|
|
|
Net transactions in fund shares |
|
|
|
|
|
| |
SHARES OUTSTANDING AND NET ASSETS1 |
| |
|
|
| |
|
|
|
|
|
| |
|
|
|
|
|
| |
|
|
|
|
|
| |
|
|
|
|
|
| |
For the period ended October 31, 2025, and the prior report period, transactions in fund shares have been retroactively adjusted to reflect a 6-for-1 share split effective after the close of U.S. markets on August 15, 2025. The retroactive adjustment of the share split does not change the transaction in fund shares values (see financial note 9 for additional information). |
Schwab Equity Index Funds | Annual Holdings and Financial Statements
11
Financial Statements
| |
|
|
|
|
|
|
| |
Net asset value at beginning of period |
|
|
|
|
|
|
Income (loss) from investment operations: |
|
|
|
|
|
|
Net investment income (loss)2 |
|
|
|
|
|
|
Net realized and unrealized gains (losses) |
|
|
|
|
|
|
Total from investment operations |
|
|
|
|
|
|
| |
|
|
|
|
|
|
Distributions from net investment income |
|
|
|
|
|
|
Distributions from net realized gains |
|
|
|
|
|
|
| |
|
|
|
|
|
|
Net asset value at end of period |
|
|
|
|
|
|
| |
|
|
|
|
|
|
| |
Ratios to average net assets: |
|
|
|
|
|
|
| |
|
|
|
|
|
|
Net investment income (loss) |
|
|
|
|
|
|
| |
|
|
|
|
|
|
Net assets, end of period (x 1,000,000) |
|
|
|
|
|
|
| |
Per-Share Data has been retroactively adjusted to reflect a 10-for-1 share split effective after the close of U.S. markets on August 15, 2025 (see financial note 9 for additional information). |
| |
Calculated based on the average shares outstanding during the period. |
| |
Ratio includes less than 0.005% of non-routine proxy expenses. |
| |
Portfolio turnover rate excludes in-kind transactions. |
12
Schwab Equity Index Funds | Annual Holdings and Financial Statements
Portfolio Holdings as of October 31, 2025
| |
|
|
COMMON STOCKS 99.9% OF NET ASSETS |
| |
Automobiles & Components 2.3% |
| |
|
|
| |
|
|
| |
|
|
| |
|
|
| |
|
|
| |
|
|
| |
|
|
| |
|
|
Modine Manufacturing Co. * |
|
|
Rivian Automotive, Inc., Class A * |
|
|
| |
|
|
| |
|
|
| |
|
|
| |
| |
| |
|
|
| |
|
|
| |
|
|
| |
|
|
| |
|
|
Citizens Financial Group, Inc. |
|
|
Columbia Banking System, Inc. |
|
|
| |
|
|
Commerce Bancshares, Inc. |
|
|
Cullen/Frost Bankers, Inc. |
|
|
| |
|
|
| |
|
|
First Citizens BancShares, Inc., Class A |
|
|
First Financial Bankshares, Inc. |
|
|
| |
|
|
| |
|
|
| |
|
|
| |
|
|
| |
|
|
| |
|
|
Huntington Bancshares, Inc. |
|
|
| |
|
|
| |
|
|
| |
|
|
| |
|
|
Pinnacle Financial Partners, Inc. |
|
|
PNC Financial Services Group, Inc. |
|
|
| |
|
|
Prosperity Bancshares, Inc. |
|
|
| |
|
|
| |
|
|
| |
|
|
| |
|
|
| |
|
|
| |
|
|
| |
|
|
| |
|
|
| |
|
|
| |
|
|
| |
|
|
| |
|
|
| |
|
|
| |
|
|
| |
| |
|
|
| |
| |
|
|
| |
|
|
| |
|
|
| |
|
|
Advanced Drainage Systems, Inc. |
|
|
| |
|
|
| |
|
|
| |
|
|
| |
|
|
| |
|
|
Allison Transmission Holdings, Inc. |
|
|
| |
|
|
| |
|
|
Applied Industrial Technologies, Inc. |
|
|
Archer Aviation, Inc., Class A * |
|
|
Armstrong World Industries, Inc. |
|
|
| |
|
|
| |
|
|
Bloom Energy Corp., Class A * |
|
|
| |
|
|
Builders FirstSource, Inc. * |
|
|
| |
|
|
| |
|
|
Carpenter Technology Corp. |
|
|
| |
|
|
| |
|
|
| |
|
|
| |
|
|
Comfort Systems USA, Inc. |
|
|
Construction Partners, Inc., Class A * |
|
|
Core & Main, Inc., Class A * |
|
|
| |
|
|
| |
|
|
| |
|
|
| |
|
|
| |
|
|
| |
|
|
| |
|
|
| |
|
|
| |
|
|
| |
|
|
| |
|
|
| |
|
|
| |
|
|
| |
|
|
Ferguson Enterprises, Inc. |
|
|
| |
|
|
| |
|
|
| |
|
|
Fortune Brands Innovations, Inc. |
|
|
| |
|
|
Gates Industrial Corp. PLC * |
|
|
| |
|
|
| |
|
|
| |
|
|
| |
|
|
| |
|
|
| |
|
|
| |
|
|
| |
|
|
Honeywell International, Inc. |
|
|
| |
|
|
| |
|
|
Huntington Ingalls Industries, Inc. |
|
|
| |
|
|
| |
|
|
Schwab Equity Index Funds | Annual Holdings and Financial Statements
13
Portfolio Holdings as of October 31, 2025 (continued)
| |
|
|
Illinois Tool Works, Inc. |
|
|
| |
|
|
| |
|
|
| |
|
|
Johnson Controls International PLC |
|
|
| |
|
|
Kratos Defense & Security Solutions, Inc. * |
|
|
L3Harris Technologies, Inc. |
|
|
Lennox International, Inc. |
|
|
| |
|
|
Lincoln Electric Holdings, Inc. |
|
|
| |
|
|
| |
|
|
| |
|
|
| |
|
|
| |
|
|
| |
|
|
| |
|
|
NEXTracker, Inc., Class A * |
|
|
| |
|
|
| |
|
|
| |
|
|
| |
|
|
| |
|
|
| |
|
|
| |
|
|
| |
|
|
| |
|
|
| |
|
|
| |
|
|
| |
|
|
| |
|
|
| |
|
|
Resideo Technologies, Inc. * |
|
|
| |
|
|
Rockwell Automation, Inc. |
|
|
| |
|
|
Simpson Manufacturing Co., Inc. |
|
|
SiteOne Landscape Supply, Inc. * |
|
|
| |
|
|
| |
|
|
| |
|
|
Stanley Black & Decker, Inc. |
|
|
Sterling Infrastructure, Inc. * |
|
|
| |
|
|
| |
|
|
| |
|
|
| |
|
|
| |
|
|
| |
|
|
| |
|
|
| |
|
|
| |
|
|
| |
|
|
Vertiv Holdings Co., Class A |
|
|
| |
|
|
Watts Water Technologies, Inc., Class A |
|
|
WESCO International, Inc. |
|
|
Westinghouse Air Brake Technologies Corp. |
|
|
| |
|
|
| |
|
|
| |
|
|
| |
|
|
Zurn Elkay Water Solutions Corp. |
|
|
| |
|
|
| |
Commercial & Professional Services 1.1% |
| |
|
|
Automatic Data Processing, Inc. |
|
|
Booz Allen Hamilton Holding Corp., Class A |
|
|
Broadridge Financial Solutions, Inc. |
|
|
CACI International, Inc., Class A * |
|
|
Casella Waste Systems, Inc., Class A * |
|
|
| |
|
|
| |
|
|
| |
|
|
| |
|
|
| |
|
|
ExlService Holdings, Inc. * |
|
|
| |
|
|
| |
|
|
| |
|
|
| |
|
|
| |
|
|
| |
|
|
| |
|
|
| |
|
|
| |
|
|
Paylocity Holding Corp. * |
|
|
| |
|
|
Republic Services, Inc., Class A |
|
|
| |
|
|
SS&C Technologies Holdings, Inc. |
|
|
| |
|
|
| |
|
|
| |
|
|
Verisk Analytics, Inc., Class A |
|
|
| |
|
|
| |
|
|
| |
Consumer Discretionary Distribution & Retail 5.7% |
| |
|
|
| |
|
|
| |
|
|
| |
|
|
| |
|
|
Boot Barn Holdings, Inc. * |
|
|
Burlington Stores, Inc. * |
|
|
| |
|
|
| |
|
|
| |
|
|
| |
|
|
Dick's Sporting Goods, Inc. |
|
|
| |
|
|
| |
|
|
| |
|
|
| |
|
|
Floor & Decor Holdings, Inc., Class A * |
|
|
GameStop Corp., Class A * |
|
|
| |
|
|
| |
|
|
| |
|
|
| |
|
|
Lithia Motors, Inc., Class A |
|
|
| |
|
|
| |
|
|
| |
|
|
Ollie's Bargain Outlet Holdings, Inc. * |
|
|
14
Schwab Equity Index Funds | Annual Holdings and Financial Statements
Portfolio Holdings as of October 31, 2025 (continued)
| |
|
|
O'Reilly Automotive, Inc. * |
|
|
Penske Automotive Group, Inc. |
|
|
| |
|
|
| |
|
|
| |
|
|
| |
|
|
| |
|
|
| |
|
|
| |
|
|
| |
|
|
| |
|
|
| |
Consumer Durables & Apparel 0.6% |
| |
|
|
| |
|
|
| |
|
|
| |
|
|
Installed Building Products, Inc. |
|
|
| |
|
|
Lululemon Athletica, Inc. * |
|
|
| |
|
|
| |
|
|
Mohawk Industries, Inc. * |
|
|
| |
|
|
| |
|
|
| |
|
|
Ralph Lauren Corp., Class A |
|
|
| |
|
|
Somnigroup International, Inc. |
|
|
| |
|
|
Taylor Morrison Home Corp., Class A * |
|
|
| |
|
|
| |
|
|
| |
|
|
| |
|
|
| |
|
|
| |
| |
| |
|
|
| |
|
|
| |
|
|
| |
|
|
| |
|
|
Bright Horizons Family Solutions, Inc. * |
|
|
Brinker International, Inc. * |
|
|
Caesars Entertainment, Inc. * |
|
|
| |
|
|
| |
|
|
Chipotle Mexican Grill, Inc., Class A * |
|
|
Choice Hotels International, Inc. |
|
|
| |
|
|
| |
|
|
| |
|
|
DoorDash, Inc., Class A * |
|
|
DraftKings, Inc., Class A * |
|
|
| |
|
|
Dutch Bros, Inc., Class A * |
|
|
| |
|
|
Flutter Entertainment PLC * |
|
|
Grand Canyon Education, Inc. * |
|
|
| |
|
|
Hilton Worldwide Holdings, Inc. |
|
|
Hyatt Hotels Corp., Class A |
|
|
| |
|
|
Life Time Group Holdings, Inc. * |
|
|
| |
|
|
| |
|
|
Marriott International, Inc., Class A |
|
|
| |
|
|
MGM Resorts International * |
|
|
Norwegian Cruise Line Holdings Ltd. * |
|
|
Planet Fitness, Inc., Class A * |
|
|
Royal Caribbean Cruises Ltd. |
|
|
Service Corp. International |
|
|
| |
|
|
| |
|
|
Texas Roadhouse, Inc., Class A |
|
|
| |
|
|
| |
|
|
| |
|
|
Wyndham Hotels & Resorts, Inc. |
|
|
| |
|
|
| |
|
|
| |
|
|
| |
Consumer Staples Distribution & Retail 1.7% |
Albertsons Cos., Inc., Class A |
|
|
BJ's Wholesale Club Holdings, Inc. * |
|
|
Casey's General Stores, Inc. |
|
|
| |
|
|
| |
|
|
| |
|
|
| |
|
|
| |
|
|
Performance Food Group Co. * |
|
|
Sprouts Farmers Market, Inc. * |
|
|
| |
|
|
| |
|
|
U.S. Foods Holding Corp. * |
|
|
| |
|
|
| |
|
|
| |
| |
| |
|
|
| |
|
|
| |
|
|
Baker Hughes Co., Class A |
|
|
| |
|
|
| |
|
|
| |
|
|
| |
|
|
| |
|
|
| |
|
|
| |
|
|
| |
|
|
| |
|
|
| |
|
|
| |
|
|
| |
|
|
| |
|
|
| |
|
|
| |
|
|
| |
|
|
| |
|
|
Occidental Petroleum Corp. |
|
|
| |
|
|
| |
|
|
Permian Resources Corp., Class A |
|
|
| |
|
|
| |
|
|
| |
|
|
| |
|
|
Schwab Equity Index Funds | Annual Holdings and Financial Statements
15
Portfolio Holdings as of October 31, 2025 (continued)
| |
|
|
| |
|
|
| |
|
|
| |
|
|
Venture Global, Inc., Class A |
|
|
Viper Energy, Inc., Class A |
|
|
| |
|
|
| |
|
|
| |
Equity Real Estate Investment Trusts (REITs) 1.9% |
| |
|
|
Alexandria Real Estate Equities, Inc. |
|
|
American Healthcare REIT, Inc. |
|
|
American Homes 4 Rent, Class A |
|
|
| |
|
|
AvalonBay Communities, Inc. |
|
|
Brixmor Property Group, Inc. |
|
|
| |
|
|
| |
|
|
| |
|
|
| |
|
|
| |
|
|
Digital Realty Trust, Inc. |
|
|
EastGroup Properties, Inc. |
|
|
| |
|
|
Equity LifeStyle Properties, Inc. |
|
|
| |
|
|
Essential Properties Realty Trust, Inc. |
|
|
Essex Property Trust, Inc. |
|
|
Extra Space Storage, Inc. |
|
|
Federal Realty Investment Trust |
|
|
First Industrial Realty Trust, Inc. |
|
|
Gaming & Leisure Properties, Inc. |
|
|
Healthcare Realty Trust, Inc., Class A |
|
|
Healthpeak Properties, Inc. |
|
|
Host Hotels & Resorts, Inc. |
|
|
| |
|
|
| |
|
|
| |
|
|
Lamar Advertising Co., Class A |
|
|
| |
|
|
Mid-America Apartment Communities, Inc. |
|
|
Millrose Properties, Inc., Class A |
|
|
| |
|
|
Omega Healthcare Investors, Inc. |
|
|
| |
|
|
| |
|
|
| |
|
|
| |
|
|
Rexford Industrial Realty, Inc. |
|
|
Ryman Hospitality Properties, Inc. |
|
|
SBA Communications Corp., Class A |
|
|
Simon Property Group, Inc. |
|
|
| |
|
|
| |
|
|
| |
|
|
| |
|
|
| |
|
|
VICI Properties, Inc., Class A |
|
|
| |
|
|
| |
|
|
| |
|
|
| |
|
|
| |
|
|
| |
| |
|
|
| |
Affiliated Managers Group, Inc. |
|
|
| |
|
|
| |
|
|
| |
|
|
| |
|
|
Ameriprise Financial, Inc. |
|
|
Annaly Capital Management, Inc. |
|
|
Apollo Global Management, Inc. |
|
|
ARES Management Corp., Class A |
|
|
Bank of New York Mellon Corp. |
|
|
Berkshire Hathaway, Inc., Class B * |
|
|
| |
|
|
| |
|
|
| |
|
|
Blue Owl Capital, Inc., Class A |
|
|
Capital One Financial Corp. |
|
|
| |
|
|
Cboe Global Markets, Inc. |
|
|
| |
|
|
| |
|
|
Coinbase Global, Inc., Class A * |
|
|
Corebridge Financial, Inc. |
|
|
| |
|
|
Credit Acceptance Corp. * |
|
|
| |
|
|
| |
|
|
| |
|
|
| |
|
|
FactSet Research Systems, Inc. |
|
|
Fidelity National Information Services, Inc. |
|
|
| |
|
|
| |
|
|
| |
|
|
| |
|
|
Goldman Sachs Group, Inc. |
|
|
Hamilton Lane, Inc., Class A |
|
|
Houlihan Lokey, Inc., Class A |
|
|
Interactive Brokers Group, Inc., Class A |
|
|
Intercontinental Exchange, Inc. |
|
|
| |
|
|
Jack Henry & Associates, Inc. |
|
|
Jackson Financial, Inc., Class A |
|
|
Janus Henderson Group PLC |
|
|
Jefferies Financial Group, Inc. |
|
|
| |
|
|
| |
|
|
LPL Financial Holdings, Inc. |
|
|
MarketAxess Holdings, Inc. |
|
|
Mastercard, Inc., Class A |
|
|
| |
|
|
| |
|
|
| |
|
|
| |
|
|
| |
|
|
| |
|
|
| |
|
|
| |
|
|
| |
|
|
| |
|
|
PennyMac Financial Services, Inc. |
|
|
| |
|
|
Raymond James Financial, Inc. |
|
|
| |
|
|
Robinhood Markets, Inc., Class A * |
|
|
16
Schwab Equity Index Funds | Annual Holdings and Financial Statements
Portfolio Holdings as of October 31, 2025 (continued)
| |
|
|
Rocket Cos., Inc., Class A |
|
|
| |
|
|
| |
|
|
Shift4 Payments, Inc., Class A * |
|
|
| |
|
|
SoFi Technologies, Inc. * |
|
|
Starwood Property Trust, Inc. |
|
|
| |
|
|
| |
|
|
| |
|
|
| |
|
|
T. Rowe Price Group, Inc. |
|
|
| |
|
|
| |
|
|
Tradeweb Markets, Inc., Class A |
|
|
| |
|
|
| |
|
|
| |
|
|
| |
|
|
| |
|
|
| |
Food, Beverage & Tobacco 1.9% |
| |
|
|
Archer-Daniels-Midland Co. |
|
|
Brown-Forman Corp., Class B |
|
|
| |
|
|
| |
|
|
| |
|
|
| |
|
|
| |
|
|
Coca-Cola Consolidated, Inc. |
|
|
| |
|
|
Constellation Brands, Inc., Class A |
|
|
| |
|
|
| |
|
|
| |
|
|
| |
|
|
| |
|
|
| |
|
|
| |
|
|
| |
|
|
Lamb Weston Holdings, Inc. |
|
|
McCormick & Co., Inc. - Non Voting Shares |
|
|
Molson Coors Beverage Co., Class B |
|
|
Mondelez International, Inc., Class A |
|
|
| |
|
|
| |
|
|
Philip Morris International, Inc. |
|
|
| |
|
|
| |
|
|
| |
|
|
| |
|
|
Tyson Foods, Inc., Class A |
|
|
| |
|
|
| |
Health Care Equipment & Services 3.6% |
| |
|
|
| |
|
|
Baxter International, Inc. |
|
|
| |
|
|
Boston Scientific Corp. * |
|
|
| |
|
|
| |
|
|
| |
|
|
| |
|
|
| |
|
|
| |
|
|
| |
|
|
| |
|
|
| |
|
|
| |
|
|
Doximity, Inc., Class A * |
|
|
Edwards Lifesciences Corp. * |
|
|
| |
|
|
| |
|
|
| |
|
|
GE HealthCare Technologies, Inc. |
|
|
| |
|
|
Globus Medical, Inc., Class A * |
|
|
| |
|
|
| |
|
|
| |
|
|
| |
|
|
Hims & Hers Health, Inc. * |
|
|
| |
|
|
| |
|
|
IDEXX Laboratories, Inc. * |
|
|
| |
|
|
Intuitive Surgical, Inc. * |
|
|
iRhythm Technologies, Inc. * |
|
|
| |
|
|
| |
|
|
| |
|
|
| |
|
|
Merit Medical Systems, Inc. * |
|
|
Molina Healthcare, Inc. * |
|
|
| |
|
|
| |
|
|
| |
|
|
| |
|
|
| |
|
|
| |
|
|
| |
|
|
| |
|
|
| |
|
|
| |
|
|
Universal Health Services, Inc., Class B |
|
|
Veeva Systems, Inc., Class A * |
|
|
| |
|
|
Zimmer Biomet Holdings, Inc. |
|
|
| |
|
|
| |
Household & Personal Products 0.9% |
Church & Dwight Co., Inc. |
|
|
| |
|
|
| |
|
|
| |
|
|
Estee Lauder Cos., Inc., Class A |
|
|
| |
|
|
| |
|
|
| |
|
|
| |
|
|
| |
| |
| |
|
|
| |
|
|
American Financial Group, Inc. |
|
|
American International Group, Inc. |
|
|
| |
|
|
| |
|
|
| |
|
|
Schwab Equity Index Funds | Annual Holdings and Financial Statements
17
Portfolio Holdings as of October 31, 2025 (continued)
| |
|
|
| |
|
|
Axis Capital Holdings Ltd. |
|
|
| |
|
|
| |
|
|
Cincinnati Financial Corp. |
|
|
| |
|
|
Erie Indemnity Co., Class A |
|
|
| |
|
|
Fidelity National Financial, Inc. |
|
|
First American Financial Corp. |
|
|
| |
|
|
Hanover Insurance Group, Inc. |
|
|
Hartford Insurance Group, Inc. |
|
|
Kinsale Capital Group, Inc. |
|
|
| |
|
|
| |
|
|
| |
|
|
Marsh & McLennan Cos., Inc. |
|
|
| |
|
|
Old Republic International Corp. |
|
|
| |
|
|
Principal Financial Group, Inc. |
|
|
| |
|
|
Prudential Financial, Inc. |
|
|
Reinsurance Group of America, Inc. |
|
|
RenaissanceRe Holdings Ltd. |
|
|
| |
|
|
Ryan Specialty Holdings, Inc., Class A |
|
|
| |
|
|
| |
|
|
| |
|
|
| |
|
|
| |
|
|
| |
| |
Air Products & Chemicals, Inc. |
|
|
| |
|
|
| |
|
|
| |
|
|
| |
|
|
| |
|
|
| |
|
|
| |
|
|
Axalta Coating Systems Ltd. * |
|
|
| |
|
|
| |
|
|
| |
|
|
CF Industries Holdings, Inc. |
|
|
| |
|
|
| |
|
|
| |
|
|
| |
|
|
| |
|
|
| |
|
|
| |
|
|
| |
|
|
| |
|
|
| |
|
|
| |
|
|
| |
|
|
| |
|
|
Graphic Packaging Holding Co. |
|
|
| |
|
|
International Flavors & Fragrances, Inc. |
|
|
| |
|
|
| |
|
|
| |
|
|
| |
|
|
LyondellBasell Industries NV, Class A |
|
|
Martin Marietta Materials, Inc. |
|
|
| |
|
|
| |
|
|
| |
|
|
| |
|
|
| |
|
|
Packaging Corp. of America |
|
|
| |
|
|
| |
|
|
| |
|
|
| |
|
|
| |
|
|
| |
|
|
Solstice Advanced Materials, Inc. * |
|
|
| |
|
|
| |
|
|
| |
|
|
| |
|
|
| |
Media & Entertainment 8.8% |
| |
|
|
| |
|
|
Charter Communications, Inc., Class A * |
|
|
| |
|
|
EchoStar Corp., Class A * |
|
|
| |
|
|
| |
|
|
Interpublic Group of Cos., Inc. |
|
|
Liberty Broadband Corp., Class C * |
|
|
Liberty Media Corp.-Liberty Formula One, Class C * |
|
|
Liberty Media Corp.-Liberty Live, Class C * |
|
|
Live Nation Entertainment, Inc. * |
|
|
| |
|
|
Meta Platforms, Inc., Class A |
|
|
| |
|
|
New York Times Co., Class A |
|
|
| |
|
|
Nexstar Media Group, Inc., Class A |
|
|
| |
|
|
Paramount Skydance Corp., Class B |
|
|
Pinterest, Inc., Class A * |
|
|
| |
|
|
| |
|
|
| |
|
|
| |
|
|
| |
|
|
Take-Two Interactive Software, Inc. * |
|
|
| |
|
|
Trade Desk, Inc., Class A * |
|
|
| |
|
|
Warner Bros Discovery, Inc. * |
|
|
| |
|
|
| |
Pharmaceuticals, Biotechnology & Life Sciences 5.5% |
| |
|
|
Agilent Technologies, Inc. |
|
|
Alnylam Pharmaceuticals, Inc. * |
|
|
| |
|
|
| |
|
|
Avidity Biosciences, Inc. * |
|
|
Axsome Therapeutics, Inc. * |
|
|
18
Schwab Equity Index Funds | Annual Holdings and Financial Statements
Portfolio Holdings as of October 31, 2025 (continued)
| |
|
|
| |
|
|
BioMarin Pharmaceutical, Inc. * |
|
|
Bio-Rad Laboratories, Inc., Class A * |
|
|
| |
|
|
| |
|
|
| |
|
|
Charles River Laboratories International, Inc. * |
|
|
Corcept Therapeutics, Inc. * |
|
|
| |
|
|
| |
|
|
Elanco Animal Health, Inc. * |
|
|
| |
|
|
| |
|
|
| |
|
|
| |
|
|
Halozyme Therapeutics, Inc. * |
|
|
| |
|
|
| |
|
|
| |
|
|
Ionis Pharmaceuticals, Inc. * |
|
|
| |
|
|
Jazz Pharmaceuticals PLC * |
|
|
| |
|
|
Madrigal Pharmaceuticals, Inc. * |
|
|
| |
|
|
| |
|
|
Mettler-Toledo International, Inc. * |
|
|
| |
|
|
| |
|
|
Neurocrine Biosciences, Inc. * |
|
|
Nuvalent, Inc., Class A * |
|
|
| |
|
|
Regeneron Pharmaceuticals, Inc. |
|
|
| |
|
|
Revolution Medicines, Inc. * |
|
|
| |
|
|
Rhythm Pharmaceuticals, Inc. * |
|
|
| |
|
|
Royalty Pharma PLC, Class A |
|
|
Summit Therapeutics, Inc. *(a) |
|
|
| |
|
|
Thermo Fisher Scientific, Inc. |
|
|
United Therapeutics Corp. * |
|
|
Vertex Pharmaceuticals, Inc. * |
|
|
| |
|
|
| |
|
|
West Pharmaceutical Services, Inc. |
|
|
| |
|
|
| |
|
|
| |
Real Estate Management & Development 0.2% |
CBRE Group, Inc., Class A * |
|
|
| |
|
|
Jones Lang LaSalle, Inc. * |
|
|
Zillow Group, Inc., Class C * |
|
|
| |
|
|
| |
Semiconductors & Semiconductor Equipment 14.1% |
Advanced Micro Devices, Inc. * |
|
|
Allegro MicroSystems, Inc. * |
|
|
| |
|
|
| |
|
|
| |
|
|
| |
|
|
| |
|
|
| |
|
|
| |
|
|
Credo Technology Group Holding Ltd. * |
|
|
| |
|
|
| |
|
|
| |
|
|
| |
|
|
| |
|
|
| |
|
|
| |
|
|
| |
|
|
Lattice Semiconductor Corp. * |
|
|
MACOM Technology Solutions Holdings, Inc. * |
|
|
| |
|
|
Microchip Technology, Inc. |
|
|
| |
|
|
| |
|
|
Monolithic Power Systems, Inc. |
|
|
| |
|
|
| |
|
|
| |
|
|
| |
|
|
| |
|
|
| |
|
|
| |
|
|
| |
|
|
| |
|
|
| |
|
|
| |
|
|
| |
|
|
| |
|
|
| |
Software & Services 12.2% |
| |
|
|
| |
|
|
| |
|
|
Akamai Technologies, Inc. * |
|
|
| |
|
|
Appfolio, Inc., Class A * |
|
|
AppLovin Corp., Class A * |
|
|
Atlassian Corp., Class A * |
|
|
Aurora Innovation, Inc. * |
|
|
| |
|
|
Bentley Systems, Inc., Class B |
|
|
| |
|
|
Cadence Design Systems, Inc. * |
|
|
CCC Intelligent Solutions Holdings, Inc. * |
|
|
Circle Internet Group, Inc. *(a) |
|
|
Clearwater Analytics Holdings, Inc., Class A * |
|
|
Cloudflare, Inc., Class A * |
|
|
Cognizant Technology Solutions Corp., Class A |
|
|
Commvault Systems, Inc. * |
|
|
Confluent, Inc., Class A * |
|
|
CoreWeave, Inc., Class A * |
|
|
Crowdstrike Holdings, Inc., Class A * |
|
|
| |
|
|
Docusign, Inc., Class A * |
|
|
| |
|
|
| |
|
|
| |
|
|
| |
|
|
| |
|
|
Schwab Equity Index Funds | Annual Holdings and Financial Statements
19
Portfolio Holdings as of October 31, 2025 (continued)
| |
|
|
| |
|
|
Figma, Inc., Class A *(a) |
|
|
| |
|
|
| |
|
|
| |
|
|
| |
|
|
| |
|
|
Guidewire Software, Inc. * |
|
|
| |
|
|
Informatica, Inc., Class A * |
|
|
| |
|
|
International Business Machines Corp. |
|
|
| |
|
|
| |
|
|
| |
|
|
Manhattan Associates, Inc. * |
|
|
| |
|
|
| |
|
|
| |
|
|
| |
|
|
| |
|
|
| |
|
|
Palantir Technologies, Inc., Class A * |
|
|
Palo Alto Networks, Inc. * |
|
|
| |
|
|
Procore Technologies, Inc. * |
|
|
| |
|
|
| |
|
|
| |
|
|
| |
|
|
| |
|
|
| |
|
|
SentinelOne, Inc., Class A * |
|
|
| |
|
|
ServiceTitan, Inc., Class A * |
|
|
Snowflake, Inc., Class A * |
|
|
SoundHound AI, Inc., Class A * |
|
|
Strategy, Inc., Class A * |
|
|
| |
|
|
| |
|
|
Tyler Technologies, Inc. * |
|
|
| |
|
|
| |
|
|
Varonis Systems, Inc., Class B * |
|
|
| |
|
|
| |
|
|
Zoom Communications, Inc. * |
|
|
| |
|
|
| |
|
|
| |
Technology Hardware & Equipment 8.6% |
Advanced Energy Industries, Inc. |
|
|
| |
|
|
| |
|
|
| |
|
|
Arrow Electronics, Inc. * |
|
|
| |
|
|
| |
|
|
| |
|
|
| |
|
|
| |
|
|
| |
|
|
| |
|
|
| |
|
|
Dell Technologies, Inc., Class C |
|
|
| |
|
|
| |
|
|
| |
|
|
| |
|
|
Hewlett Packard Enterprise Co. |
|
|
| |
|
|
| |
|
|
| |
|
|
| |
|
|
Keysight Technologies, Inc. * |
|
|
| |
|
|
Lumentum Holdings, Inc. * |
|
|
Mirion Technologies, Inc., Class A * |
|
|
| |
|
|
| |
|
|
Pure Storage, Inc., Class A * |
|
|
| |
|
|
| |
|
|
Seagate Technology Holdings PLC |
|
|
Super Micro Computer, Inc. * |
|
|
| |
|
|
| |
|
|
Teledyne Technologies, Inc. * |
|
|
| |
|
|
| |
|
|
| |
|
|
| |
|
|
Zebra Technologies Corp., Class A * |
|
|
| |
|
|
| |
Telecommunication Services 0.7% |
| |
|
|
| |
|
|
Frontier Communications Parent, Inc. * |
|
|
| |
|
|
| |
|
|
Verizon Communications, Inc. |
|
|
| |
|
|
| |
| |
| |
|
|
American Airlines Group, Inc. * |
|
|
Avis Budget Group, Inc. * |
|
|
CH Robinson Worldwide, Inc. |
|
|
| |
|
|
| |
|
|
Expeditors International of Washington, Inc. |
|
|
| |
|
|
| |
|
|
JB Hunt Transport Services, Inc. |
|
|
| |
|
|
Knight-Swift Transportation Holdings, Inc. |
|
|
| |
|
|
| |
|
|
Old Dominion Freight Line, Inc. |
|
|
| |
|
|
| |
|
|
| |
|
|
Uber Technologies, Inc. * |
|
|
U-Haul Holding Co., Non Voting Shares |
|
|
| |
|
|
United Airlines Holdings, Inc. * |
|
|
United Parcel Service, Inc., Class B |
|
|
20
Schwab Equity Index Funds | Annual Holdings and Financial Statements
Portfolio Holdings as of October 31, 2025 (continued)
| |
|
|
| |
|
|
| |
|
|
| |
| |
| |
|
|
| |
|
|
| |
|
|
American Electric Power Co., Inc. |
|
|
American Water Works Co., Inc. |
|
|
| |
|
|
| |
|
|
| |
|
|
Consolidated Edison, Inc. |
|
|
Constellation Energy Corp. |
|
|
| |
|
|
| |
|
|
| |
|
|
| |
|
|
| |
|
|
Essential Utilities, Inc. |
|
|
| |
|
|
| |
|
|
| |
|
|
| |
|
|
| |
|
|
| |
|
|
| |
|
|
| |
|
|
| |
|
|
| |
|
|
| |
|
|
| |
|
|
| |
|
|
Pinnacle West Capital Corp. |
|
|
| |
|
|
Public Service Enterprise Group, Inc. |
|
|
| |
|
|
| |
|
|
Southwest Gas Holdings, Inc. |
|
|
| |
|
|
| |
|
|
| |
|
|
| |
|
|
| |
|
|
| |
|
|
| |
|
|
Total Common Stocks
(Cost $3,514,421,880) |
|
| |
|
|
SHORT-TERM INVESTMENTS 0.1% OF NET ASSETS |
| |
| |
State Street Institutional U.S. Government Money Market Fund, Premier Class 4.01% (d) |
|
|
State Street Institutional U.S. Government Money Market Fund, Premier Class 4.01% (d)(e) |
|
|
| |
|
|
Total Short-Term Investments
(Cost $22,995,983) |
|
Total Investments in Securities
(Cost $3,537,417,863) |
|
| |
|
|
CURRENT VALUE/
UNREALIZED
APPRECIATION
(DEPRECIATION)
($) |
| |
| |
|
|
|
S&P 400 Mid-Cap Index, e-mini, expires 12/19/25 |
|
|
|
S&P 500 Index, e-mini, expires 12/19/25 |
|
|
|
| |
|
|
|
| |
Non-income producing security. |
| |
All or a portion of this security is on loan. Securities on loan were valued at $3,963,256. |
| |
Issuer is affiliated with the fund’s investment adviser. |
| |
Fair valued using significant unobservable inputs (see financial note 2(a), Securities for which no quoted value is available, for additional information). |
| |
The rate shown is the annualized 7-day yield. |
| |
Security purchased with cash collateral received for securities on loan. |
| |
Real Estate Investment Trust |
Below is a summary of the fund’s transactions with affiliated issuers during the period ended October 31, 2025:
| |
|
|
|
NET REALIZED GAINS (LOSSES) |
NET CHANGE IN UNREALIZED APPRECIATION (DEPRECIATION) |
|
BALANCE OF SHARES HELD AT 10/31/25 |
|
COMMON STOCKS 0.3% OF NET ASSETS |
| |
| |
| |
|
|
|
|
|
|
|
|
Schwab Equity Index Funds | Annual Holdings and Financial Statements
21
Portfolio Holdings as of October 31, 2025 (continued)
The following is a summary of the inputs used to value the fund’s investments as of October 31, 2025 (see financial note 2(a) for additional information):
| |
QUOTED PRICES IN
ACTIVE MARKETS FOR
IDENTICAL ASSETS
(LEVEL 1) |
OTHER SIGNIFICANT
OBSERVABLE INPUTS
(LEVEL 2) |
SIGNIFICANT
UNOBSERVABLE INPUTS
(LEVEL 3) |
|
| |
|
|
|
|
| |
|
|
|
|
Telecommunication Services |
|
|
|
|
| |
|
|
|
|
| |
|
|
|
|
| |
|
|
|
|
| |
|
|
|
|
| |
|
|
|
|
| |
Level 3 amount shown includes securities determined to have no value at October 31, 2025. |
| |
As categorized in the Portfolio Holdings. |
| |
Futures contracts are reported at cumulative unrealized appreciation or depreciation. |
22
Schwab Equity Index Funds | Annual Holdings and Financial Statements
Statement of Assets and Liabilities
| |
Investments in securities, at value - affiliated issuers (cost $9,371,386) |
|
|
Investments in securities, at value - unaffiliated issuers (cost $3,528,046,477) including securities on loan of $3,963,256 |
|
|
Deposit with broker for futures contracts |
|
|
| |
|
|
| |
|
|
| |
|
|
Variation margin on future contracts |
|
|
Income from securities on loan |
|
|
| |
|
|
| |
| |
Collateral held for securities on loan |
|
|
| |
|
|
| |
|
|
| |
|
|
| |
|
|
| |
|
|
| |
|
|
| |
| |
Capital received from investors |
|
|
Total distributable earnings |
|
|
| |
|
|
Schwab Equity Index Funds | Annual Holdings and Financial Statements
23
Statement of Operations
For the period November 1, 2024 through October 31, 2025 |
| |
Dividends received from securities - unaffiliated issuers (net of foreign withholding tax of $67,502) |
|
|
Dividends received from securities - affiliated issuers |
|
|
| |
|
|
| |
|
|
| |
|
|
| |
| |
| |
|
|
| |
|
|
| |
|
|
| |
REALIZED AND UNREALIZED GAINS (LOSSES) |
Net realized gains on sales of securities - affiliated issuers |
|
|
Net realized gains on sales of securities - unaffiliated issuers |
|
|
Net realized gains on sales of in-kind redemptions - unaffiliated issuers |
|
|
Net realized gains on futures contracts |
|
|
| |
|
|
Net change in unrealized appreciation (depreciation) on securities - affiliated issuers |
|
|
Net change in unrealized appreciation (depreciation) on securities - unaffiliated issuers |
|
|
Net change in unrealized appreciation (depreciation) on futures contracts |
|
|
Net change in unrealized appreciation (depreciation) |
|
|
Net realized and unrealized gains |
|
|
Increase in net assets resulting from operations |
|
|
24
Schwab Equity Index Funds | Annual Holdings and Financial Statements
Statement of Changes in Net Assets
For the current and prior report periods
| |
| |
|
|
| |
|
|
|
| |
|
|
|
Net change in unrealized appreciation (depreciation) |
|
|
|
Increase in net assets resulting from operations |
|
|
|
| |
DISTRIBUTIONS TO SHAREHOLDERS |
| |
|
|
|
TRANSACTIONS IN FUND SHARES1 |
| |
|
|
| |
|
|
|
|
|
| |
|
|
|
|
|
| |
|
|
|
|
|
| |
|
|
|
|
|
Net transactions in fund shares |
|
|
|
|
|
| |
SHARES OUTSTANDING AND NET ASSETS1 |
| |
|
|
| |
|
|
|
|
|
| |
|
|
|
|
|
Total increase (decrease) |
|
|
|
|
|
| |
|
|
|
|
|
| |
For the period ended October 31, 2025, and the prior report period, transactions in fund shares have been retroactively adjusted to reflect a 10-for-1 share split effective after the close of U.S. markets on August 15, 2025. The retroactive adjustment of the share split does not change the transaction in fund shares values (see financial note 9 for additional information). |
Schwab Equity Index Funds | Annual Holdings and Financial Statements
25
Schwab Small-Cap Index Fund
Financial Statements
| |
|
|
|
|
|
|
| |
Net asset value at beginning of period |
|
|
|
|
|
|
Income (loss) from investment operations: |
|
|
|
|
|
|
Net investment income (loss)1 |
|
|
|
|
|
|
Net realized and unrealized gains (losses) |
|
|
|
|
|
|
Total from investment operations |
|
|
|
|
|
|
| |
|
|
|
|
|
|
Distributions from net investment income |
|
|
|
|
|
|
Distributions from net realized gains |
|
|
|
|
|
|
| |
|
|
|
|
|
|
Net asset value at end of period |
|
|
|
|
|
|
| |
|
|
|
|
|
|
| |
Ratios to average net assets: |
|
|
|
|
|
|
| |
|
|
|
|
|
|
Net investment income (loss) |
|
|
|
|
|
|
| |
|
|
|
|
|
|
Net assets, end of period (x 1,000,000) |
|
|
|
|
|
|
| |
Calculated based on the average shares outstanding during the period. |
| |
Ratio includes less than 0.005% of non-routine proxy expenses. |
| |
Portfolio turnover rate excludes in-kind transactions. |
26
Schwab Equity Index Funds | Annual Holdings and Financial Statements
Schwab Small-Cap Index Fund
Portfolio Holdings as of October 31, 2025
| |
|
|
COMMON STOCKS 99.6% OF NET ASSETS |
| |
Automobiles & Components 1.4% |
| |
|
|
American Axle & Manufacturing Holdings, Inc. * |
|
|
Cooper-Standard Holdings, Inc. * |
|
|
| |
|
|
| |
|
|
Faraday Future Intelligent Electric, Inc. *(a) |
|
|
Fox Factory Holding Corp. * |
|
|
| |
|
|
| |
|
|
Goodyear Tire & Rubber Co. * |
|
|
| |
|
|
| |
|
|
Livewire Group, Inc., Class A * |
|
|
Luminar Technologies, Inc. *(a) |
|
|
Modine Manufacturing Co. * |
|
|
Motorcar Parts of America, Inc. * |
|
|
| |
|
|
| |
|
|
| |
|
|
Standard Motor Products, Inc. |
|
|
Strattec Security Corp. * |
|
|
| |
|
|
Winnebago Industries, Inc. |
|
|
| |
|
|
| |
|
|
| |
| |
| |
|
|
| |
|
|
Amalgamated Financial Corp. |
|
|
| |
|
|
| |
|
|
| |
|
|
| |
|
|
| |
|
|
Atlantic Union Bankshares Corp. |
|
|
| |
|
|
| |
|
|
| |
|
|
| |
|
|
| |
|
|
| |
|
|
| |
|
|
Bank of NT Butterfield & Son Ltd. |
|
|
| |
|
|
| |
|
|
| |
|
|
Bankwell Financial Group, Inc. |
|
|
| |
|
|
| |
|
|
| |
|
|
| |
|
|
| |
|
|
| |
|
|
Blue Ridge Bankshares, Inc. * |
|
|
Bridgewater Bancshares, Inc. * |
|
|
Burke & Herbert Financial Services Corp. |
|
|
Business First Bancshares, Inc. |
|
|
| |
|
|
| |
|
|
| |
|
|
| |
|
|
| |
|
|
| |
|
|
| |
|
|
| |
|
|
Capital City Bank Group, Inc. |
|
|
Capitol Federal Financial, Inc. |
|
|
Carter Bankshares, Inc. * |
|
|
| |
|
|
CB Financial Services, Inc. |
|
|
Central Pacific Financial Corp. |
|
|
| |
|
|
Chain Bridge Bancorp, Inc., Class A * |
|
|
| |
|
|
ChoiceOne Financial Services, Inc. |
|
|
Citizens & Northern Corp. |
|
|
Citizens Community Bancorp, Inc. |
|
|
Citizens Financial Services, Inc. |
|
|
| |
|
|
| |
|
|
| |
|
|
Coastal Financial Corp. * |
|
|
CoastalSouth Bancshares, Inc. * |
|
|
| |
|
|
Columbia Financial, Inc. * |
|
|
Community Financial System, Inc. |
|
|
Community Trust Bancorp, Inc. |
|
|
Community West Bancshares |
|
|
| |
|
|
Customers Bancorp, Inc. * |
|
|
| |
|
|
Dime Community Bancshares, Inc. |
|
|
Eagle Bancorp Montana, Inc. |
|
|
| |
|
|
Eagle Financial Services, Inc. |
|
|
| |
|
|
| |
|
|
Enterprise Financial Services Corp. |
|
|
Equity Bancshares, Inc., Class A |
|
|
Esquire Financial Holdings, Inc. |
|
|
Farmers & Merchants Bancorp, Inc. |
|
|
Farmers National Banc Corp. |
|
|
| |
|
|
| |
|
|
Fidelity D&D Bancorp, Inc. |
|
|
Financial Institutions, Inc. |
|
|
| |
|
|
| |
|
|
| |
|
|
| |
|
|
First Bancorp/Southern Pines NC |
|
|
| |
|
|
| |
|
|
First Business Financial Services, Inc. |
|
|
| |
|
|
First Commonwealth Financial Corp. |
|
|
First Community Bankshares, Inc. |
|
|
| |
|
|
| |
|
|
First Financial Bankshares, Inc. |
|
|
| |
|
|
| |
|
|
| |
|
|
First Interstate BancSystem, Inc., Class A |
|
|
| |
|
|
Schwab Equity Index Funds | Annual Holdings and Financial Statements
27
Schwab Small-Cap Index Fund
Portfolio Holdings as of October 31, 2025 (continued)
| |
|
|
First Mid Bancshares, Inc. |
|
|
| |
|
|
First Savings Financial Group, Inc. |
|
|
| |
|
|
First Western Financial, Inc. * |
|
|
Firstsun Capital Bancorp * |
|
|
| |
|
|
| |
|
|
| |
|
|
Franklin Financial Services Corp. |
|
|
| |
|
|
| |
|
|
| |
|
|
GBank Financial Holdings, Inc. * |
|
|
German American Bancorp, Inc. |
|
|
| |
|
|
Great Southern Bancorp, Inc. |
|
|
Greene County Bancorp, Inc. |
|
|
| |
|
|
| |
|
|
| |
|
|
| |
|
|
Hawthorn Bancshares, Inc. |
|
|
| |
|
|
| |
|
|
| |
|
|
| |
|
|
Hingham Institution For Savings |
|
|
| |
|
|
| |
|
|
HomeTrust Bancshares, Inc. |
|
|
| |
|
|
| |
|
|
| |
|
|
Independent Bank Corp. MI |
|
|
International Bancshares Corp. |
|
|
| |
|
|
John Marshall Bancorp, Inc. |
|
|
| |
|
|
| |
|
|
| |
|
|
| |
|
|
| |
|
|
Live Oak Bancshares, Inc. |
|
|
MainStreet Bancshares, Inc. |
|
|
Mechanics Bancorp, Class A * |
|
|
| |
|
|
| |
|
|
Metrocity Bankshares, Inc. |
|
|
Metropolitan Bank Holding Corp. |
|
|
| |
|
|
| |
|
|
Midland States Bancorp, Inc. |
|
|
MidWestOne Financial Group, Inc. |
|
|
| |
|
|
National Bank Holdings Corp., Class A |
|
|
National Bankshares, Inc. |
|
|
| |
|
|
| |
|
|
| |
|
|
| |
|
|
Northeast Community Bancorp, Inc. |
|
|
| |
|
|
Northpointe Bancshares, Inc. |
|
|
| |
|
|
Northwest Bancshares, Inc. |
|
|
| |
|
|
| |
|
|
| |
|
|
OceanFirst Financial Corp. |
|
|
| |
|
|
| |
|
|
| |
|
|
| |
|
|
| |
|
|
Orange County Bancorp, Inc. |
|
|
| |
|
|
Orrstown Financial Services, Inc. |
|
|
| |
|
|
| |
|
|
| |
|
|
Patriot National Bancorp, Inc. * |
|
|
| |
|
|
Peapack-Gladstone Financial Corp. |
|
|
Peoples Bancorp of North Carolina, Inc. |
|
|
| |
|
|
Peoples Financial Services Corp. |
|
|
| |
|
|
| |
|
|
Ponce Financial Group, Inc. * |
|
|
| |
|
|
| |
|
|
| |
|
|
Provident Bancorp, Inc. * |
|
|
Provident Financial Services, Inc. |
|
|
| |
|
|
| |
|
|
Red River Bancshares, Inc. |
|
|
| |
|
|
Republic Bancorp, Inc., Class A |
|
|
Rhinebeck Bancorp, Inc. * |
|
|
Richmond Mutual BanCorp, Inc. (a) |
|
|
| |
|
|
| |
|
|
| |
|
|
Seacoast Banking Corp. of Florida |
|
|
ServisFirst Bancshares, Inc. |
|
|
| |
|
|
| |
|
|
Simmons First National Corp., Class A |
|
|
| |
|
|
Sound Financial Bancorp, Inc. |
|
|
South Plains Financial, Inc. |
|
|
Southern First Bancshares, Inc. * |
|
|
Southern Missouri Bancorp, Inc. |
|
|
Southside Bancshares, Inc. |
|
|
| |
|
|
| |
|
|
Sterling Bancorp, Inc. *(b) |
|
|
Stock Yards Bancorp, Inc. |
|
|
Texas Capital Bancshares, Inc. * |
|
|
Third Coast Bancshares, Inc. * |
|
|
| |
|
|
| |
|
|
| |
|
|
| |
|
|
Triumph Financial, Inc. * |
|
|
| |
|
|
| |
|
|
| |
|
|
| |
|
|
| |
|
|
United Community Banks, Inc. |
|
|
United Security Bancshares |
|
|
| |
|
|
| |
|
|
USCB Financial Holdings, Inc. |
|
|
28
Schwab Equity Index Funds | Annual Holdings and Financial Statements
Schwab Small-Cap Index Fund
Portfolio Holdings as of October 31, 2025 (continued)
| |
|
|
| |
|
|
Virginia National Bankshares Corp. |
|
|
| |
|
|
Washington Trust Bancorp, Inc. |
|
|
| |
|
|
| |
|
|
| |
|
|
Western New England Bancorp, Inc. |
|
|
| |
|
|
| |
|
|
| |
| |
| |
|
|
| |
|
|
| |
|
|
| |
|
|
| |
|
|
AirJoule Technologies Corp. *(a) |
|
|
AIRO Group Holdings, Inc. * |
|
|
| |
|
|
Albany International Corp., Class A |
|
|
| |
|
|
Alta Equipment Group, Inc. |
|
|
Ameresco, Inc., Class A * |
|
|
American Superconductor Corp. * |
|
|
American Woodmark Corp. * |
|
|
Amprius Technologies, Inc. * |
|
|
| |
|
|
Archer Aviation, Inc., Class A * |
|
|
| |
|
|
| |
|
|
Array Technologies, Inc. * |
|
|
| |
|
|
| |
|
|
| |
|
|
Atmus Filtration Technologies, Inc. |
|
|
| |
|
|
Bloom Energy Corp., Class A * |
|
|
| |
|
|
BlueLinx Holdings, Inc. * |
|
|
| |
|
|
Bowman Consulting Group Ltd., Class A * |
|
|
Brookfield Business Corp., Class A |
|
|
Byrna Technologies, Inc. * |
|
|
| |
|
|
| |
|
|
| |
|
|
| |
|
|
Concrete Pumping Holdings, Inc. |
|
|
Construction Partners, Inc., Class A * |
|
|
| |
|
|
Custom Truck One Source, Inc. * |
|
|
Distribution Solutions Group, Inc. * |
|
|
| |
|
|
| |
|
|
| |
|
|
| |
|
|
| |
|
|
| |
|
|
| |
|
|
Enerpac Tool Group Corp., Class A |
|
|
| |
|
|
| |
|
|
| |
|
|
Eos Energy Enterprises, Inc. *(a) |
|
|
| |
|
|
| |
|
|
| |
|
|
| |
|
|
| |
|
|
| |
|
|
| |
|
|
Franklin Electric Co., Inc. |
|
|
| |
|
|
Gencor Industries, Inc. * |
|
|
Gibraltar Industries, Inc. * |
|
|
| |
|
|
| |
|
|
| |
|
|
Granite Construction, Inc. |
|
|
Great Lakes Dredge & Dock Corp. * |
|
|
| |
|
|
| |
|
|
Helios Technologies, Inc. |
|
|
| |
|
|
| |
|
|
Hillman Solutions Corp. * |
|
|
Hudson Technologies, Inc. * |
|
|
| |
|
|
| |
|
|
| |
|
|
| |
|
|
Intuitive Machines, Inc., Class A * |
|
|
Janus International Group, Inc. * |
|
|
| |
|
|
| |
|
|
| |
|
|
| |
|
|
| |
|
|
Kratos Defense & Security Solutions, Inc. * |
|
|
KULR Technology Group, Inc. *(a) |
|
|
L.B. Foster Co., Class A * |
|
|
| |
|
|
| |
|
|
| |
|
|
| |
|
|
| |
|
|
| |
|
|
| |
|
|
Mayville Engineering Co., Inc. * |
|
|
| |
|
|
| |
|
|
Microvast Holdings, Inc. * |
|
|
| |
|
|
| |
|
|
| |
|
|
Mueller Water Products, Inc., Class A |
|
|
| |
|
|
NANO Nuclear Energy, Inc. *(a) |
|
|
National Presto Industries, Inc. |
|
|
| |
|
|
NEXTracker, Inc., Class A * |
|
|
NPK International, Inc. * |
|
|
| |
|
|
NWPX Infrastructure, Inc. * |
|
|
| |
|
|
Orion Group Holdings, Inc. * |
|
|
| |
|
|
| |
|
|
| |
|
|
| |
|
|
| |
|
|
Power Solutions International, Inc. * |
|
|
Preformed Line Products Co. |
|
|
Schwab Equity Index Funds | Annual Holdings and Financial Statements
29
Schwab Small-Cap Index Fund
Portfolio Holdings as of October 31, 2025 (continued)
| |
|
|
| |
|
|
| |
|
|
Quanex Building Products Corp. |
|
|
| |
|
|
Resideo Technologies, Inc. * |
|
|
| |
|
|
Richtech Robotics, Inc., Class B *(a) |
|
|
Rush Enterprises, Inc., Class A |
|
|
Satellogic, Inc., Class A * |
|
|
Shoals Technologies Group, Inc., Class A * |
|
|
| |
|
|
Southland Holdings, Inc. * |
|
|
| |
|
|
Standex International Corp. |
|
|
Sterling Infrastructure, Inc. * |
|
|
| |
|
|
| |
|
|
| |
|
|
| |
|
|
| |
|
|
| |
|
|
Thermon Group Holdings, Inc. * |
|
|
Titan International, Inc. * |
|
|
| |
|
|
| |
|
|
| |
|
|
| |
|
|
| |
|
|
| |
|
|
| |
|
|
Voyager Technologies, Inc., Class A * |
|
|
| |
|
|
| |
|
|
Watts Water Technologies, Inc., Class A |
|
|
Willis Lease Finance Corp. |
|
|
Worthington Enterprises, Inc. |
|
|
| |
|
|
Zurn Elkay Water Solutions Corp. |
|
|
| |
|
|
| |
Commercial & Professional Services 3.2% |
| |
|
|
| |
|
|
| |
|
|
ACV Auctions, Inc., Class A * |
|
|
| |
|
|
| |
|
|
Barrett Business Services, Inc. |
|
|
BlackSky Technology, Inc. * |
|
|
BrightView Holdings, Inc. * |
|
|
| |
|
|
Casella Waste Systems, Inc., Class A * |
|
|
| |
|
|
CECO Environmental Corp. * |
|
|
| |
|
|
CompX International, Inc. |
|
|
| |
|
|
| |
|
|
| |
|
|
CSG Systems International, Inc. |
|
|
| |
|
|
| |
|
|
| |
|
|
| |
|
|
| |
|
|
Forrester Research, Inc. * |
|
|
| |
|
|
| |
|
|
| |
|
|
Healthcare Services Group, Inc. * |
|
|
Heidrick & Struggles International, Inc. |
|
|
| |
|
|
| |
|
|
Huron Consulting Group, Inc. * |
|
|
| |
|
|
| |
|
|
| |
|
|
| |
|
|
| |
|
|
Kelly Services, Inc., Class A |
|
|
| |
|
|
| |
|
|
| |
|
|
Liquidity Services, Inc. * |
|
|
| |
|
|
| |
|
|
| |
|
|
Mobile Infrastructure Corp. * |
|
|
Montrose Environmental Group, Inc. * |
|
|
| |
|
|
| |
|
|
Perma-Fix Environmental Services, Inc. * |
|
|
| |
|
|
| |
|
|
| |
|
|
| |
|
|
Resolute Holdings Management, Inc. * |
|
|
Resources Connection, Inc. |
|
|
| |
|
|
Spire Global, Inc., Class A *(a) |
|
|
| |
|
|
| |
|
|
| |
|
|
| |
|
|
| |
|
|
| |
|
|
| |
|
|
Verra Mobility Corp., Class A * |
|
|
| |
|
|
| |
|
|
| |
|
|
| |
|
|
| |
Consumer Discretionary Distribution & Retail 2.2% |
1-800-Flowers.com, Inc., Class A *(a) |
|
|
Abercrombie & Fitch Co., Class A * |
|
|
Academy Sports & Outdoors, Inc. |
|
|
| |
|
|
A-Mark Precious Metals, Inc. |
|
|
American Eagle Outfitters, Inc. |
|
|
America's Car-Mart, Inc. * |
|
|
| |
|
|
| |
|
|
Asbury Automotive Group, Inc. * |
|
|
| |
|
|
Barnes & Noble Education, Inc. * |
|
|
Bed Bath & Beyond, Inc. * |
|
|
Boot Barn Holdings, Inc. * |
|
|
| |
|
|
Build-A-Bear Workshop, Inc. |
|
|
| |
|
|
Camping World Holdings, Inc., Class A |
|
|
| |
|
|
Designer Brands, Inc., Class A |
|
|
30
Schwab Equity Index Funds | Annual Holdings and Financial Statements
Schwab Small-Cap Index Fund
Portfolio Holdings as of October 31, 2025 (continued)
| |
|
|
| |
|
|
| |
|
|
| |
|
|
GigaCloud Technology, Inc., Class A * |
|
|
| |
|
|
| |
|
|
Haverty Furniture Cos., Inc. |
|
|
| |
|
|
| |
|
|
| |
|
|
| |
|
|
| |
|
|
National Vision Holdings, Inc. * |
|
|
| |
|
|
OneWater Marine, Inc., Class A * |
|
|
Petco Health & Wellness Co., Inc., Class A * |
|
|
| |
|
|
| |
|
|
Sally Beauty Holdings, Inc. * |
|
|
Savers Value Village, Inc. * |
|
|
| |
|
|
| |
|
|
| |
|
|
Sonic Automotive, Inc., Class A |
|
|
Stitch Fix, Inc., Class A * |
|
|
| |
|
|
Tile Shop Holdings, Inc. * |
|
|
Torrid Holdings, Inc. *(a) |
|
|
| |
|
|
| |
|
|
Victoria's Secret & Co. * |
|
|
Warby Parker, Inc., Class A * |
|
|
| |
|
|
| |
|
|
| |
|
|
| |
|
|
| |
Consumer Durables & Apparel 2.7% |
| |
|
|
American Outdoor Brands, Inc. * |
|
|
Bassett Furniture Industries, Inc. |
|
|
| |
|
|
| |
|
|
| |
|
|
| |
|
|
Century Communities, Inc. |
|
|
| |
|
|
| |
|
|
| |
|
|
Dream Finders Homes, Inc., Class A * |
|
|
| |
|
|
| |
|
|
Ethan Allen Interiors, Inc. |
|
|
| |
|
|
Flexsteel Industries, Inc. |
|
|
| |
|
|
G-III Apparel Group Ltd. * |
|
|
Green Brick Partners, Inc. * |
|
|
Hamilton Beach Brands Holding Co., Class A |
|
|
| |
|
|
| |
|
|
Hovnanian Enterprises, Inc., Class A * |
|
|
Installed Building Products, Inc. |
|
|
| |
|
|
Johnson Outdoors, Inc., Class A |
|
|
| |
|
|
| |
|
|
| |
|
|
Lakeland Industries, Inc. |
|
|
| |
|
|
| |
|
|
| |
|
|
| |
|
|
| |
|
|
| |
|
|
| |
|
|
Malibu Boats, Inc., Class A * |
|
|
| |
|
|
MasterCraft Boat Holdings, Inc. * |
|
|
| |
|
|
| |
|
|
| |
|
|
| |
|
|
Peloton Interactive, Inc., Class A * |
|
|
| |
|
|
| |
|
|
Smith & Wesson Brands, Inc. |
|
|
| |
|
|
| |
|
|
| |
|
|
Superior Group of Cos., Inc. |
|
|
Taylor Morrison Home Corp., Class A * |
|
|
Topgolf Callaway Brands Corp. * |
|
|
| |
|
|
| |
|
|
Wolverine World Wide, Inc. |
|
|
| |
|
|
| |
| |
Accel Entertainment, Inc., Class A * |
|
|
Adtalem Global Education, Inc. * |
|
|
American Public Education, Inc. * |
|
|
| |
|
|
Biglari Holdings, Inc., Class B * |
|
|
| |
|
|
| |
|
|
| |
|
|
Brinker International, Inc. * |
|
|
Carriage Services, Inc., Class A |
|
|
| |
|
|
| |
|
|
Cracker Barrel Old Country Store, Inc. |
|
|
Dave & Buster's Entertainment, Inc. * |
|
|
| |
|
|
| |
|
|
Driven Brands Holdings, Inc. * |
|
|
El Pollo Loco Holdings, Inc. * |
|
|
European Wax Center, Inc., Class A * |
|
|
First Watch Restaurant Group, Inc. * |
|
|
| |
|
|
| |
|
|
Global Business Travel Group I * |
|
|
Golden Entertainment, Inc. |
|
|
Graham Holdings Co., Class B |
|
|
Hilton Grand Vacations, Inc. * |
|
|
Inspired Entertainment, Inc. * |
|
|
| |
|
|
KinderCare Learning Cos., Inc. * |
|
|
| |
|
|
Kura Sushi USA, Inc., Class A * |
|
|
Laureate Education, Inc. * |
|
|
Life Time Group Holdings, Inc. * |
|
|
Lincoln Educational Services Corp. * |
|
|
Schwab Equity Index Funds | Annual Holdings and Financial Statements
31
Schwab Small-Cap Index Fund
Portfolio Holdings as of October 31, 2025 (continued)
| |
|
|
Lindblad Expeditions Holdings, Inc. * |
|
|
Marriott Vacations Worldwide Corp. |
|
|
Matthews International Corp., Class A |
|
|
| |
|
|
| |
|
|
Monarch Casino & Resort, Inc. |
|
|
| |
|
|
| |
|
|
OneSpaWorld Holdings Ltd. |
|
|
Papa John's International, Inc. |
|
|
| |
|
|
Portillo's, Inc., Class A * |
|
|
Pursuit Attractions & Hospitality, Inc. * |
|
|
RCI Hospitality Holdings, Inc. |
|
|
Red Rock Resorts, Inc., Class A |
|
|
Rush Street Interactive, Inc. * |
|
|
| |
|
|
Serve Robotics, Inc. *(a) |
|
|
Shake Shack, Inc., Class A * |
|
|
Six Flags Entertainment Corp. * |
|
|
Strategic Education, Inc. |
|
|
| |
|
|
| |
|
|
Sweetgreen, Inc., Class A * |
|
|
Target Hospitality Corp. * |
|
|
| |
|
|
United Parks & Resorts, Inc. * |
|
|
Universal Technical Institute, Inc. * |
|
|
Xponential Fitness, Inc., Class A * |
|
|
| |
|
|
| |
|
|
| |
Consumer Staples Distribution & Retail 0.5% |
| |
|
|
| |
|
|
Grocery Outlet Holding Corp. * |
|
|
Guardian Pharmacy Services, Inc., Class A * |
|
|
| |
|
|
Ingles Markets, Inc., Class A |
|
|
Natural Grocers by Vitamin Cottage, Inc. |
|
|
| |
|
|
United Natural Foods, Inc. * |
|
|
Village Super Market, Inc., Class A |
|
|
| |
|
|
| |
|
|
| |
| |
| |
|
|
| |
|
|
Atlas Energy Solutions, Inc., Class A |
|
|
| |
|
|
| |
|
|
| |
|
|
| |
|
|
| |
|
|
California Resources Corp. |
|
|
| |
|
|
Centrus Energy Corp., Class A * |
|
|
Clean Energy Fuels Corp. * |
|
|
| |
|
|
Comstock Resources, Inc. * |
|
|
| |
|
|
Core Natural Resources, Inc. |
|
|
Crescent Energy Co., Class A |
|
|
| |
|
|
| |
|
|
Delek U.S. Holdings, Inc. |
|
|
| |
|
|
Diversified Energy Co. PLC |
|
|
| |
|
|
| |
|
|
| |
|
|
| |
|
|
| |
|
|
Energy Services of America Corp. |
|
|
| |
|
|
Evolution Petroleum Corp. |
|
|
Excelerate Energy, Inc., Class A |
|
|
Expro Group Holdings NV * |
|
|
| |
|
|
Flowco Holdings, Inc., Class A |
|
|
Forum Energy Technologies, Inc. * |
|
|
| |
|
|
| |
|
|
| |
|
|
Granite Ridge Resources, Inc. |
|
|
| |
|
|
| |
|
|
Helix Energy Solutions Group, Inc. * |
|
|
| |
|
|
HighPeak Energy, Inc. (a) |
|
|
Infinity Natural Resources, Inc., Class A * |
|
|
Innovex International, Inc. * |
|
|
International Seaways, Inc. |
|
|
Kinetik Holdings, Inc., Class A (a) |
|
|
Kodiak Gas Services, Inc. |
|
|
Kolibri Global Energy, Inc. * |
|
|
| |
|
|
Liberty Energy, Inc., Class A |
|
|
| |
|
|
Magnolia Oil & Gas Corp., Class A |
|
|
Mammoth Energy Services, Inc. * |
|
|
| |
|
|
| |
|
|
NACCO Industries, Inc., Class A |
|
|
National Energy Services Reunited Corp. * |
|
|
Natural Gas Services Group, Inc. |
|
|
| |
|
|
New Fortress Energy, Inc. *(a) |
|
|
| |
|
|
| |
|
|
| |
|
|
Nordic American Tankers Ltd. |
|
|
| |
|
|
Oceaneering International, Inc. * |
|
|
Oil States International, Inc. * |
|
|
OPAL Fuels, Inc., Class A * |
|
|
Par Pacific Holdings, Inc. * |
|
|
Patterson-UTI Energy, Inc. |
|
|
PBF Energy, Inc., Class A |
|
|
| |
|
|
Prairie Operating Co. *(a) |
|
|
PrimeEnergy Resources Corp. * |
|
|
ProFrac Holding Corp., Class A * |
|
|
| |
|
|
Ranger Energy Services, Inc., Class A |
|
|
REX American Resources Corp. * |
|
|
Riley Exploration Permian, Inc. |
|
|
| |
|
|
| |
|
|
| |
|
|
| |
|
|
SEACOR Marine Holdings, Inc. * |
|
|
32
Schwab Equity Index Funds | Annual Holdings and Financial Statements
Schwab Small-Cap Index Fund
Portfolio Holdings as of October 31, 2025 (continued)
| |
|
|
| |
|
|
Select Water Solutions, Inc. |
|
|
| |
|
|
| |
|
|
Solaris Energy Infrastructure, Inc. |
|
|
| |
|
|
| |
|
|
| |
|
|
Teekay Tankers Ltd., Class A |
|
|
TETRA Technologies, Inc. * |
|
|
| |
|
|
| |
|
|
| |
|
|
| |
|
|
| |
|
|
Verde Clean Fuels, Inc. * |
|
|
| |
|
|
| |
|
|
| |
|
|
| |
|
|
XCF Global, Inc., Class A * |
|
|
| |
|
|
| |
Equity Real Estate Investment Trusts (REITs) 4.9% |
| |
|
|
Alexander & Baldwin, Inc. |
|
|
| |
|
|
Alpine Income Property Trust, Inc. |
|
|
American Assets Trust, Inc. |
|
|
American Healthcare REIT, Inc. |
|
|
Apartment Investment & Management Co., Class A |
|
|
Apple Hospitality REIT, Inc. |
|
|
Armada Hoffler Properties, Inc. |
|
|
Braemar Hotels & Resorts, Inc. |
|
|
| |
|
|
Broadstone Net Lease, Inc. |
|
|
| |
|
|
| |
|
|
CBL & Associates Properties, Inc. |
|
|
| |
|
|
| |
|
|
| |
|
|
| |
|
|
Community Healthcare Trust, Inc. |
|
|
| |
|
|
| |
|
|
Curbline Properties Corp. |
|
|
DiamondRock Hospitality Co. |
|
|
Diversified Healthcare Trust |
|
|
| |
|
|
Easterly Government Properties, Inc. |
|
|
| |
|
|
Empire State Realty Trust, Inc., Class A |
|
|
Essential Properties Realty Trust, Inc. |
|
|
| |
|
|
Four Corners Property Trust, Inc. |
|
|
Franklin Street Properties Corp. |
|
|
| |
|
|
| |
|
|
Gladstone Commercial Corp. |
|
|
| |
|
|
Global Medical REIT, Inc. |
|
|
| |
|
|
Hudson Pacific Properties, Inc. * |
|
|
Independence Realty Trust, Inc. |
|
|
Industrial Logistics Properties Trust |
|
|
| |
|
|
Innovative Industrial Properties, Inc. |
|
|
InvenTrust Properties Corp. |
|
|
| |
|
|
| |
|
|
| |
|
|
| |
|
|
| |
|
|
| |
|
|
National Health Investors, Inc. |
|
|
NET Lease Office Properties |
|
|
| |
|
|
NexPoint Diversified Real Estate Trust |
|
|
NexPoint Residential Trust, Inc. |
|
|
One Liberty Properties, Inc. |
|
|
| |
|
|
| |
|
|
| |
|
|
| |
|
|
Phillips Edison & Co., Inc. |
|
|
Piedmont Realty Trust, Inc., Class A |
|
|
Plymouth Industrial REIT, Inc. |
|
|
Postal Realty Trust, Inc., Class A |
|
|
| |
|
|
| |
|
|
Ryman Hospitality Properties, Inc. |
|
|
Sabra Health Care REIT, Inc. |
|
|
| |
|
|
| |
|
|
Service Properties Trust (c) |
|
|
| |
|
|
| |
|
|
| |
|
|
Smartstop Self Storage REIT, Inc. |
|
|
Strawberry Fields REIT, Inc. |
|
|
Summit Hotel Properties, Inc. |
|
|
Sunstone Hotel Investors, Inc. |
|
|
| |
|
|
| |
|
|
| |
|
|
Universal Health Realty Income Trust |
|
|
| |
|
|
| |
|
|
| |
|
|
Xenia Hotels & Resorts, Inc. |
|
|
| |
|
|
| |
| |
| |
|
|
Acadian Asset Management, Inc. |
|
|
ACRES Commercial Realty Corp. * |
|
|
| |
|
|
Advanced Flower Capital, Inc. |
|
|
AG Mortgage Investment Trust, Inc. |
|
|
| |
|
|
| |
|
|
Angel Oak Mortgage REIT, Inc. |
|
|
Apollo Commercial Real Estate Finance, Inc. |
|
|
Arbor Realty Trust, Inc. (a) |
|
|
Ares Commercial Real Estate Corp. |
|
|
ARMOUR Residential REIT, Inc. |
|
|
Artisan Partners Asset Management, Inc., Class A |
|
|
Atlanticus Holdings Corp. * |
|
|
| |
|
|
Banco Latinoamericano de Comercio Exterior SA, Class E |
|
|
Schwab Equity Index Funds | Annual Holdings and Financial Statements
33
Schwab Small-Cap Index Fund
Portfolio Holdings as of October 31, 2025 (continued)
| |
|
|
Better Home & Finance Holding Co. *(a) |
|
|
| |
|
|
Blackstone Mortgage Trust, Inc., Class A |
|
|
Bread Financial Holdings, Inc. |
|
|
BrightSpire Capital, Inc., Class A |
|
|
| |
|
|
| |
|
|
| |
|
|
Cass Information Systems, Inc. |
|
|
Chicago Atlantic Real Estate Finance, Inc. |
|
|
| |
|
|
Claros Mortgage Trust, Inc. * |
|
|
| |
|
|
Compass Diversified Holdings |
|
|
Consumer Portfolio Services, Inc. * |
|
|
| |
|
|
Diamond Hill Investment Group, Inc. |
|
|
DigitalBridge Group, Inc. |
|
|
Donnelley Financial Solutions, Inc. * |
|
|
| |
|
|
Ellington Financial, Inc. |
|
|
| |
|
|
Encore Capital Group, Inc. * |
|
|
Enova International, Inc. * |
|
|
| |
|
|
| |
|
|
Federal Agricultural Mortgage Corp., Class C |
|
|
Finance of America Cos., Inc., Class A * |
|
|
| |
|
|
| |
|
|
Forge Global Holdings, Inc. * |
|
|
Franklin BSP Realty Trust, Inc. |
|
|
GCM Grosvenor, Inc., Class A |
|
|
Green Dot Corp., Class A * |
|
|
HA Sustainable Infrastructure Capital, Inc. |
|
|
International Money Express, Inc. * |
|
|
Invesco Mortgage Capital, Inc. |
|
|
Jackson Financial, Inc., Class A |
|
|
| |
|
|
KKR Real Estate Finance Trust, Inc. |
|
|
Ladder Capital Corp., Class A |
|
|
| |
|
|
| |
|
|
loanDepot, Inc., Class A * |
|
|
Lument Finance Trust, Inc. |
|
|
| |
|
|
| |
|
|
| |
|
|
Medallion Financial Corp. |
|
|
| |
|
|
| |
|
|
| |
|
|
| |
|
|
| |
|
|
| |
|
|
NerdWallet, Inc., Class A * |
|
|
| |
|
|
Nexpoint Real Estate Finance, Inc. |
|
|
NMI Holdings, Inc., Class A * |
|
|
| |
|
|
Open Lending Corp., Class A * |
|
|
Oportun Financial Corp. * |
|
|
| |
|
|
Orchid Island Capital, Inc. |
|
|
| |
|
|
| |
|
|
Pagseguro Digital Ltd., Class A |
|
|
Patria Investments Ltd., Class A |
|
|
| |
|
|
| |
|
|
| |
|
|
PennyMac Financial Services, Inc. |
|
|
PennyMac Mortgage Investment Trust |
|
|
Perella Weinberg Partners, Class A |
|
|
| |
|
|
PJT Partners, Inc., Class A |
|
|
| |
|
|
Priority Technology Holdings, Inc. * |
|
|
| |
|
|
| |
|
|
| |
|
|
| |
|
|
Regional Management Corp. |
|
|
| |
|
|
Repay Holdings Corp., Class A * |
|
|
Rithm Property Trust, Inc. |
|
|
Security National Financial Corp., Class A * |
|
|
Seven Hills Realty Trust *(a) |
|
|
| |
|
|
Siebert Financial Corp. * |
|
|
Silvercrest Asset Management Group, Inc., Class A |
|
|
StepStone Group, Inc., Class A |
|
|
| |
|
|
| |
|
|
Sunrise Realty Trust, Inc. |
|
|
| |
|
|
TPG RE Finance Trust, Inc. |
|
|
| |
|
|
Two Harbors Investment Corp. |
|
|
| |
|
|
| |
|
|
Velocity Financial, Inc. * |
|
|
Victory Capital Holdings, Inc., Class A |
|
|
Virtus Investment Partners, Inc. |
|
|
| |
|
|
| |
|
|
Waterstone Financial, Inc. |
|
|
Westwood Holdings Group, Inc. |
|
|
| |
|
|
| |
|
|
| |
|
|
| |
Food, Beverage & Tobacco 0.9% |
| |
|
|
| |
|
|
| |
|
|
| |
|
|
| |
|
|
| |
|
|
| |
|
|
| |
|
|
Fresh Del Monte Produce, Inc. |
|
|
Hain Celestial Group, Inc. * |
|
|
Ispire Technology, Inc. * |
|
|
| |
|
|
John B Sanfilippo & Son, Inc. |
|
|
| |
|
|
| |
|
|
| |
|
|
| |
|
|
| |
|
|
34
Schwab Equity Index Funds | Annual Holdings and Financial Statements
Schwab Small-Cap Index Fund
Portfolio Holdings as of October 31, 2025 (continued)
| |
|
|
| |
|
|
National Beverage Corp. * |
|
|
Seneca Foods Corp., Class A * |
|
|
| |
|
|
| |
|
|
Tootsie Roll Industries, Inc. |
|
|
| |
|
|
Turning Point Brands, Inc. |
|
|
| |
|
|
| |
|
|
| |
|
|
| |
|
|
| |
|
|
| |
|
|
| |
|
|
| |
Health Care Equipment & Services 6.1% |
| |
|
|
AdaptHealth Corp., Class A * |
|
|
| |
|
|
| |
|
|
AirSculpt Technologies, Inc. *(a) |
|
|
Alignment Healthcare, Inc. * |
|
|
Alphatec Holdings, Inc. * |
|
|
AMN Healthcare Services, Inc. * |
|
|
| |
|
|
Anteris Technologies Global Corp. * |
|
|
| |
|
|
| |
|
|
| |
|
|
| |
|
|
| |
|
|
Aveanna Healthcare Holdings, Inc. * |
|
|
| |
|
|
| |
|
|
Bioventus, Inc., Class A * |
|
|
BrightSpring Health Services, Inc. * |
|
|
Brookdale Senior Living, Inc. * |
|
|
Butterfly Network, Inc. * |
|
|
| |
|
|
| |
|
|
Castle Biosciences, Inc. * |
|
|
| |
|
|
| |
|
|
| |
|
|
| |
|
|
Clover Health Investments Corp., Class A * |
|
|
Community Health Systems, Inc. * |
|
|
Concentra Group Holdings Parent, Inc. |
|
|
| |
|
|
| |
|
|
Cross Country Healthcare, Inc. * |
|
|
| |
|
|
Definitive Healthcare Corp. * |
|
|
| |
|
|
| |
|
|
| |
|
|
| |
|
|
| |
|
|
| |
|
|
| |
|
|
Evolent Health, Inc., Class A * |
|
|
| |
|
|
| |
|
|
| |
|
|
| |
|
|
| |
|
|
| |
|
|
| |
|
|
| |
|
|
| |
|
|
Hims & Hers Health, Inc. * |
|
|
| |
|
|
| |
|
|
| |
|
|
| |
|
|
Integra LifeSciences Holdings Corp. * |
|
|
| |
|
|
iRhythm Technologies, Inc. * |
|
|
| |
|
|
Kestra Medical Technologies Ltd. * |
|
|
KORU Medical Systems, Inc. * |
|
|
Lantheus Holdings, Inc. * |
|
|
| |
|
|
| |
|
|
| |
|
|
LifeStance Health Group, Inc. * |
|
|
| |
|
|
Lucid Diagnostics, Inc. * |
|
|
Merit Medical Systems, Inc. * |
|
|
| |
|
|
| |
|
|
National HealthCare Corp. |
|
|
| |
|
|
| |
|
|
| |
|
|
| |
|
|
| |
|
|
| |
|
|
| |
|
|
| |
|
|
OmniAb, Inc., Class A *(b) |
|
|
OmniAb, Inc., Class B *(b) |
|
|
| |
|
|
Oncology Institute, Inc. * |
|
|
| |
|
|
| |
|
|
Option Care Health, Inc. * |
|
|
OraSure Technologies, Inc. * |
|
|
| |
|
|
| |
|
|
| |
|
|
| |
|
|
| |
|
|
Pediatrix Medical Group, Inc. * |
|
|
| |
|
|
| |
|
|
| |
|
|
Privia Health Group, Inc. * |
|
|
PROCEPT BioRobotics Corp. * |
|
|
| |
|
|
| |
|
|
| |
|
|
Pulse Biosciences, Inc. * |
|
|
| |
|
|
| |
|
|
| |
|
|
| |
|
|
| |
|
|
SBC Medical Group Holdings, Inc. * |
|
|
| |
|
|
Select Medical Holdings Corp. |
|
|
Semler Scientific, Inc. * |
|
|
Shoulder Innovations, Inc. *(a) |
|
|
| |
|
|
Schwab Equity Index Funds | Annual Holdings and Financial Statements
35
Schwab Small-Cap Index Fund
Portfolio Holdings as of October 31, 2025 (continued)
| |
|
|
| |
|
|
| |
|
|
Sonida Senior Living, Inc. * |
|
|
| |
|
|
| |
|
|
| |
|
|
| |
|
|
Tactile Systems Technology, Inc. * |
|
|
| |
|
|
Tandem Diabetes Care, Inc. * |
|
|
| |
|
|
TransMedics Group, Inc. * |
|
|
Treace Medical Concepts, Inc. * |
|
|
| |
|
|
U.S. Physical Therapy, Inc. |
|
|
| |
|
|
Utah Medical Products, Inc. |
|
|
| |
|
|
Viemed Healthcare, Inc. * |
|
|
| |
|
|
| |
|
|
| |
Household & Personal Products 0.5% |
| |
|
|
Central Garden & Pet Co. * |
|
|
Central Garden & Pet Co., Class A * |
|
|
Edgewell Personal Care Co. |
|
|
| |
|
|
| |
|
|
| |
|
|
| |
|
|
| |
|
|
| |
|
|
| |
|
|
Nature's Sunshine Products, Inc. * |
|
|
Nu Skin Enterprises, Inc., Class A |
|
|
| |
|
|
| |
|
|
Spectrum Brands Holdings, Inc. |
|
|
USANA Health Sciences, Inc. * |
|
|
Waldencast PLC, Class A * |
|
|
| |
|
|
| |
|
|
| |
| |
Abacus Global Management, Inc. * |
|
|
Ambac Financial Group, Inc. * |
|
|
American Coastal Insurance Corp., Class C |
|
|
American Integrity Insurance Group, Inc. * |
|
|
| |
|
|
Aspen Insurance Holdings Ltd., Class A *(a) |
|
|
Ategrity Specialty Holdings LLC * |
|
|
Baldwin Insurance Group, Inc., Class A * |
|
|
Bowhead Specialty Holdings, Inc. * |
|
|
| |
|
|
CNO Financial Group, Inc. |
|
|
| |
|
|
Donegal Group, Inc., Class A |
|
|
| |
|
|
| |
|
|
F&G Annuities & Life, Inc. |
|
|
Fidelis Insurance Holdings Ltd. |
|
|
Genworth Financial, Inc., Class A * |
|
|
| |
|
|
GoHealth, Inc., Class A * |
|
|
Goosehead Insurance, Inc., Class A |
|
|
Greenlight Capital Re Ltd., Class A * |
|
|
Hamilton Insurance Group Ltd., Class B * |
|
|
| |
|
|
Heritage Insurance Holdings, Inc. * |
|
|
| |
|
|
Horace Mann Educators Corp. |
|
|
| |
|
|
James River Group Holdings Ltd. |
|
|
| |
|
|
| |
|
|
Kingsway Financial Services, Inc. * |
|
|
| |
|
|
| |
|
|
| |
|
|
| |
|
|
Oscar Health, Inc., Class A * |
|
|
| |
|
|
| |
|
|
| |
|
|
Safety Insurance Group, Inc. |
|
|
Selective Insurance Group, Inc. |
|
|
| |
|
|
| |
|
|
Skyward Specialty Insurance Group, Inc. * |
|
|
Slide Insurance Holdings, Inc. * |
|
|
Stewart Information Services Corp. |
|
|
| |
|
|
| |
|
|
| |
|
|
Universal Insurance Holdings, Inc. |
|
|
| |
|
|
| |
| |
| |
|
|
Alpha Metallurgical Resources, Inc. * |
|
|
American Battery Technology Co. * |
|
|
American Vanguard Corp. * |
|
|
Ardagh Metal Packaging SA |
|
|
| |
|
|
| |
|
|
| |
|
|
| |
|
|
| |
|
|
| |
|
|
| |
|
|
Caledonia Mining Corp. PLC |
|
|
| |
|
|
| |
|
|
| |
|
|
| |
|
|
| |
|
|
Compass Minerals International, Inc. * |
|
|
Constellium SE, Class A * |
|
|
| |
|
|
Core Molding Technologies, Inc. * |
|
|
Critical Metals Corp. *(a) |
|
|
| |
|
|
| |
|
|
| |
|
|
Flotek Industries, Inc. * |
|
|
Friedman Industries, Inc. |
|
|
| |
|
|
| |
|
|
| |
|
|
36
Schwab Equity Index Funds | Annual Holdings and Financial Statements
Schwab Small-Cap Index Fund
Portfolio Holdings as of October 31, 2025 (continued)
| |
|
|
| |
|
|
Idaho Strategic Resources, Inc. * |
|
|
| |
|
|
| |
|
|
| |
|
|
| |
|
|
| |
|
|
| |
|
|
| |
|
|
| |
|
|
| |
|
|
| |
|
|
| |
|
|
| |
|
|
| |
|
|
| |
|
|
Minerals Technologies, Inc. |
|
|
| |
|
|
NioCorp Developments Ltd. * |
|
|
Novagold Resources, Inc. * |
|
|
| |
|
|
| |
|
|
| |
|
|
Perimeter Solutions, Inc. * |
|
|
Perpetua Resources Corp. * |
|
|
PureCycle Technologies, Inc. * |
|
|
| |
|
|
Ramaco Resources, Inc., Class A * |
|
|
Ranpak Holdings Corp., Class A * |
|
|
Rayonier Advanced Materials, Inc. * |
|
|
| |
|
|
Sensient Technologies Corp. |
|
|
| |
|
|
| |
|
|
| |
|
|
| |
|
|
| |
|
|
| |
|
|
| |
|
|
| |
|
|
| |
|
|
| |
|
|
| |
|
|
| |
|
|
| |
|
|
| |
|
|
U.S. Lime & Minerals, Inc. |
|
|
| |
|
|
| |
|
|
| |
|
|
| |
|
|
| |
|
|
| |
Media & Entertainment 2.0% |
Advantage Solutions, Inc. * |
|
|
Altice USA, Inc., Class A * |
|
|
AMC Entertainment Holdings, Inc., Class A * |
|
|
AMC Networks, Inc., Class A * |
|
|
| |
|
|
Arena Group Holdings, Inc. * |
|
|
Atlanta Braves Holdings, Inc., Class C * |
|
|
Boston Omaha Corp., Class A * |
|
|
| |
|
|
| |
|
|
| |
|
|
| |
|
|
| |
|
|
| |
|
|
| |
|
|
EchoStar Corp., Class A * |
|
|
| |
|
|
Entravision Communications Corp., Class A |
|
|
Eventbrite, Inc., Class A * |
|
|
EverQuote, Inc., Class A * |
|
|
EW Scripps Co., Class A *(c) |
|
|
| |
|
|
| |
|
|
Gambling.com Group Ltd. * |
|
|
| |
|
|
Getty Images Holdings, Inc. *(a) |
|
|
Golden Matrix Group, Inc. * |
|
|
| |
|
|
| |
|
|
Ibotta, Inc., Class A *(a) |
|
|
iHeartMedia, Inc., Class A * |
|
|
| |
|
|
Integral Ad Science Holding Corp. * |
|
|
John Wiley & Sons, Inc., Class A |
|
|
Lionsgate Studios Corp. * |
|
|
Madison Square Garden Entertainment Corp., Class A * |
|
|
| |
|
|
| |
|
|
MediaAlpha, Inc., Class A * |
|
|
| |
|
|
| |
|
|
Nextdoor Holdings, Inc. * |
|
|
Nexxen International Ltd. * |
|
|
| |
|
|
| |
|
|
PubMatic, Inc., Class A * |
|
|
| |
|
|
| |
|
|
| |
|
|
| |
|
|
| |
|
|
| |
|
|
Sphere Entertainment Co. * |
|
|
Stagwell, Inc., Class A * |
|
|
Starz Entertainment Corp. * |
|
|
| |
|
|
| |
|
|
| |
|
|
| |
|
|
| |
|
|
| |
|
|
| |
|
|
| |
|
|
Vivid Seats, Inc., Class A * |
|
|
Webtoon Entertainment, Inc. *(a) |
|
|
| |
|
|
| |
|
|
| |
|
|
ZipRecruiter, Inc., Class A * |
|
|
| |
|
|
| |
Pharmaceuticals, Biotechnology & Life Sciences 10.8% |
10X Genomics, Inc., Class A * |
|
|
4D Molecular Therapeutics, Inc. * |
|
|
Aardvark Therapeutics, Inc. * |
|
|
Abeona Therapeutics, Inc. * |
|
|
| |
|
|
ACADIA Pharmaceuticals, Inc. * |
|
|
Schwab Equity Index Funds | Annual Holdings and Financial Statements
37
Schwab Small-Cap Index Fund
Portfolio Holdings as of October 31, 2025 (continued)
| |
|
|
Aclaris Therapeutics, Inc. * |
|
|
Actuate Therapeutics, Inc. *(a) |
|
|
Adaptive Biotechnologies Corp. * |
|
|
| |
|
|
| |
|
|
Agios Pharmaceuticals, Inc. * |
|
|
Akebia Therapeutics, Inc. * |
|
|
Akero Therapeutics, Inc. * |
|
|
Aldeyra Therapeutics, Inc. * |
|
|
| |
|
|
| |
|
|
Allogene Therapeutics, Inc. * |
|
|
| |
|
|
| |
|
|
| |
|
|
Amicus Therapeutics, Inc. * |
|
|
Amneal Pharmaceuticals, Inc. * |
|
|
Amphastar Pharmaceuticals, Inc. * |
|
|
Amylyx Pharmaceuticals, Inc. * |
|
|
| |
|
|
Anavex Life Sciences Corp. *(a) |
|
|
ANI Pharmaceuticals, Inc. * |
|
|
Anika Therapeutics, Inc. * |
|
|
| |
|
|
Apogee Therapeutics, Inc. * |
|
|
Aquestive Therapeutics, Inc. * |
|
|
Arbutus Biopharma Corp. * |
|
|
| |
|
|
Arcturus Therapeutics Holdings, Inc. * |
|
|
Arcus Biosciences, Inc. * |
|
|
Arcutis Biotherapeutics, Inc. * |
|
|
| |
|
|
ArriVent Biopharma, Inc. *(a) |
|
|
Arrowhead Pharmaceuticals, Inc. * |
|
|
ARS Pharmaceuticals, Inc. *(a) |
|
|
| |
|
|
Astria Therapeutics, Inc. * |
|
|
Atea Pharmaceuticals, Inc. * |
|
|
Atlantic International Corp. * |
|
|
| |
|
|
| |
|
|
Aurinia Pharmaceuticals, Inc. * |
|
|
Avadel Pharmaceuticals PLC * |
|
|
Avidity Biosciences, Inc. * |
|
|
| |
|
|
Axsome Therapeutics, Inc. * |
|
|
| |
|
|
Beam Therapeutics, Inc. * |
|
|
Benitec Biopharma, Inc. * |
|
|
Bicara Therapeutics, Inc. * |
|
|
| |
|
|
BioCryst Pharmaceuticals, Inc. * |
|
|
| |
|
|
BioLife Solutions, Inc. * |
|
|
| |
|
|
| |
|
|
Bright Minds Biosciences, Inc. * |
|
|
Candel Therapeutics, Inc. *(a) |
|
|
Capricor Therapeutics, Inc. *(a) |
|
|
Cardiff Oncology, Inc. *(a) |
|
|
| |
|
|
Cartesian Therapeutics, Inc. * |
|
|
Catalyst Pharmaceuticals, Inc. * |
|
|
| |
|
|
Celldex Therapeutics, Inc. * |
|
|
| |
|
|
Cidara Therapeutics, Inc. * |
|
|
| |
|
|
| |
|
|
Cogent Biosciences, Inc. * |
|
|
Coherus Oncology, Inc. *(a) |
|
|
Collegium Pharmaceutical, Inc. * |
|
|
Compass Therapeutics, Inc. * |
|
|
| |
|
|
Corvus Pharmaceuticals, Inc. * |
|
|
Crinetics Pharmaceuticals, Inc. * |
|
|
| |
|
|
| |
|
|
Cullinan Therapeutics, Inc. * |
|
|
Cytek Biosciences, Inc. * |
|
|
| |
|
|
Day One Biopharmaceuticals, Inc. * |
|
|
Denali Therapeutics, Inc. * |
|
|
Design Therapeutics, Inc. * |
|
|
DiaMedica Therapeutics, Inc. * |
|
|
Dianthus Therapeutics, Inc. * |
|
|
| |
|
|
Dynavax Technologies Corp. * |
|
|
Dyne Therapeutics, Inc. * |
|
|
Edgewise Therapeutics, Inc. * |
|
|
| |
|
|
Eledon Pharmaceuticals, Inc. * |
|
|
Emergent BioSolutions, Inc. * |
|
|
Enanta Pharmaceuticals, Inc. * |
|
|
Enliven Therapeutics, Inc. * |
|
|
Entrada Therapeutics, Inc. * |
|
|
| |
|
|
Esperion Therapeutics, Inc. * |
|
|
Eton Pharmaceuticals, Inc. * |
|
|
| |
|
|
EyePoint Pharmaceuticals, Inc. * |
|
|
Fate Therapeutics, Inc. * |
|
|
Fennec Pharmaceuticals, Inc. * |
|
|
Foghorn Therapeutics, Inc. * |
|
|
| |
|
|
Fulcrum Therapeutics, Inc. * |
|
|
| |
|
|
Ginkgo Bioworks Holdings, Inc. * |
|
|
| |
|
|
| |
|
|
Greenwich Lifesciences, Inc. *(a) |
|
|
Gyre Therapeutics, Inc. * |
|
|
Harmony Biosciences Holdings, Inc. * |
|
|
| |
|
|
Heron Therapeutics, Inc. *(a) |
|
|
| |
|
|
Ideaya Biosciences, Inc. * |
|
|
| |
|
|
| |
|
|
| |
|
|
| |
|
|
Inhibikase Therapeutics, Inc. * |
|
|
Inhibrx Biosciences, Inc. * |
|
|
| |
|
|
| |
|
|
Intellia Therapeutics, Inc. * |
|
|
Iovance Biotherapeutics, Inc. * |
|
|
Ironwood Pharmaceuticals, Inc., Class A * |
|
|
| |
|
|
Janux Therapeutics, Inc. * |
|
|
| |
|
|
KalVista Pharmaceuticals, Inc. * |
|
|
Keros Therapeutics, Inc. * |
|
|
| |
|
|
| |
|
|
| |
|
|
38
Schwab Equity Index Funds | Annual Holdings and Financial Statements
Schwab Small-Cap Index Fund
Portfolio Holdings as of October 31, 2025 (continued)
| |
|
|
| |
|
|
Kymera Therapeutics, Inc. * |
|
|
Larimar Therapeutics, Inc. * |
|
|
LENZ Therapeutics, Inc. * |
|
|
Lexeo Therapeutics, Inc. * |
|
|
Lifecore Biomedical, Inc. * |
|
|
Ligand Pharmaceuticals, Inc. * |
|
|
| |
|
|
Madrigal Pharmaceuticals, Inc. * |
|
|
| |
|
|
Maravai LifeSciences Holdings, Inc., Class A * |
|
|
| |
|
|
Maze Therapeutics, Inc. * |
|
|
| |
|
|
| |
|
|
| |
|
|
| |
|
|
| |
|
|
| |
|
|
Mind Medicine MindMed, Inc. * |
|
|
Mineralys Therapeutics, Inc. * |
|
|
Mirum Pharmaceuticals, Inc. * |
|
|
Monopar Therapeutics, Inc. * |
|
|
Monte Rosa Therapeutics, Inc. * |
|
|
| |
|
|
| |
|
|
Niagen Bioscience, Inc. * |
|
|
| |
|
|
| |
|
|
Nurix Therapeutics, Inc. * |
|
|
Nuvalent, Inc., Class A * |
|
|
| |
|
|
Nuvectis Pharma, Inc. *(a) |
|
|
Ocular Therapeutix, Inc. * |
|
|
Olema Pharmaceuticals, Inc. * |
|
|
| |
|
|
| |
|
|
Organogenesis Holdings, Inc., Class A * |
|
|
ORIC Pharmaceuticals, Inc. * |
|
|
Oruka Therapeutics, Inc. * |
|
|
Pacific Biosciences of California, Inc. *(a) |
|
|
Pacira BioSciences, Inc. * |
|
|
Palvella Therapeutics, Inc. * |
|
|
| |
|
|
Perspective Therapeutics, Inc. * |
|
|
Phathom Pharmaceuticals, Inc. * |
|
|
Phibro Animal Health Corp., Class A |
|
|
Praxis Precision Medicines, Inc. * |
|
|
| |
|
|
Prestige Consumer Healthcare, Inc. * |
|
|
| |
|
|
Protagonist Therapeutics, Inc. * |
|
|
Protalix BioTherapeutics, Inc. * |
|
|
Protara Therapeutics, Inc. * |
|
|
| |
|
|
| |
|
|
Puma Biotechnology, Inc. * |
|
|
| |
|
|
| |
|
|
Rapport Therapeutics, Inc. * |
|
|
Recursion Pharmaceuticals, Inc., Class A *(a) |
|
|
| |
|
|
Relay Therapeutics, Inc. * |
|
|
| |
|
|
| |
|
|
Rhythm Pharmaceuticals, Inc. * |
|
|
| |
|
|
Rigel Pharmaceuticals, Inc. * |
|
|
Rocket Pharmaceuticals, Inc. * |
|
|
Sana Biotechnology, Inc. *(a) |
|
|
| |
|
|
Scholar Rock Holding Corp. * |
|
|
SELLAS Life Sciences Group, Inc. *(a) |
|
|
| |
|
|
| |
|
|
Sionna Therapeutics, Inc. * |
|
|
Soleno Therapeutics, Inc. * |
|
|
Solid Biosciences, Inc. * |
|
|
Spyre Therapeutics, Inc. * |
|
|
Standard BioTools, Inc. * |
|
|
Stoke Therapeutics, Inc. * |
|
|
Supernus Pharmaceuticals, Inc. * |
|
|
Syndax Pharmaceuticals, Inc. * |
|
|
Tango Therapeutics, Inc. * |
|
|
Tarsus Pharmaceuticals, Inc. * |
|
|
Taysha Gene Therapies, Inc. * |
|
|
Tectonic Therapeutic, Inc. * |
|
|
Terns Pharmaceuticals, Inc. * |
|
|
Tevogen Bio Holdings, Inc. * |
|
|
| |
|
|
Theravance Biopharma, Inc. * |
|
|
Third Harmonic Bio, Inc. *(b) |
|
|
Tonix Pharmaceuticals Holding Corp. * |
|
|
Travere Therapeutics, Inc. * |
|
|
Trevi Therapeutics, Inc. * |
|
|
TriSalus Life Sciences, Inc. * |
|
|
TuHURA Biosciences, Inc. * |
|
|
Tvardi Therapeutics, Inc. *(a) |
|
|
| |
|
|
| |
|
|
| |
|
|
| |
|
|
Vanda Pharmaceuticals, Inc. * |
|
|
| |
|
|
Vera Therapeutics, Inc., Class A * |
|
|
| |
|
|
| |
|
|
| |
|
|
Vir Biotechnology, Inc. * |
|
|
Viridian Therapeutics, Inc. * |
|
|
Voyager Therapeutics, Inc. * |
|
|
WaVe Life Sciences Ltd. * |
|
|
| |
|
|
Xenon Pharmaceuticals, Inc. * |
|
|
Xeris Biopharma Holdings, Inc. * |
|
|
| |
|
|
Zenas Biopharma, Inc. *(a) |
|
|
Zevra Therapeutics, Inc. * |
|
|
| |
|
|
| |
|
|
| |
Real Estate Management & Development 0.6% |
American Realty Investors, Inc. * |
|
|
Anywhere Real Estate, Inc. * |
|
|
| |
|
|
Cushman & Wakefield PLC * |
|
|
| |
|
|
| |
|
|
| |
|
|
| |
|
|
Kennedy-Wilson Holdings, Inc. |
|
|
Logistic Properties of The Americas, Class A * |
|
|
| |
|
|
Schwab Equity Index Funds | Annual Holdings and Financial Statements
39
Schwab Small-Cap Index Fund
Portfolio Holdings as of October 31, 2025 (continued)
| |
|
|
Maui Land & Pineapple Co., Inc. * |
|
|
Newmark Group, Inc., Class A |
|
|
RE/MAX Holdings, Inc., Class A * |
|
|
| |
|
|
| |
|
|
Seaport Entertainment Group, Inc. * |
|
|
| |
|
|
Stratus Properties, Inc. * |
|
|
| |
|
|
Transcontinental Realty Investors, Inc. * |
|
|
| |
|
|
| |
Semiconductors & Semiconductor Equipment 3.9% |
ACM Research, Inc., Class A * |
|
|
| |
|
|
| |
|
|
Alpha & Omega Semiconductor Ltd. * |
|
|
| |
|
|
| |
|
|
| |
|
|
Axcelis Technologies, Inc. * |
|
|
Blaize Holdings, Inc. *(a) |
|
|
| |
|
|
| |
|
|
Credo Technology Group Holding Ltd. * |
|
|
| |
|
|
| |
|
|
| |
|
|
| |
|
|
indie Semiconductor, Inc., Class A *(a) |
|
|
| |
|
|
Kulicke & Soffa Industries, Inc. |
|
|
| |
|
|
Navitas Semiconductor Corp., Class A *(a) |
|
|
| |
|
|
| |
|
|
Penguin Solutions, Inc. * |
|
|
| |
|
|
| |
|
|
| |
|
|
Rigetti Computing, Inc. * |
|
|
| |
|
|
Silicon Laboratories, Inc. * |
|
|
| |
|
|
SkyWater Technology, Inc. * |
|
|
| |
|
|
Ultra Clean Holdings, Inc. * |
|
|
Veeco Instruments, Inc. * |
|
|
| |
|
|
| |
| |
| |
|
|
| |
|
|
| |
|
|
| |
|
|
| |
|
|
Airship AI Holdings, Inc., Class A *(a) |
|
|
Alarm.com Holdings, Inc. * |
|
|
Alkami Technology, Inc. * |
|
|
Amplitude, Inc., Class A * |
|
|
| |
|
|
| |
|
|
| |
|
|
| |
|
|
| |
|
|
| |
|
|
| |
|
|
| |
|
|
Backblaze, Inc., Class A * |
|
|
BigBear.ai Holdings, Inc. * |
|
|
| |
|
|
Bitdeer Technologies Group, Class A * |
|
|
| |
|
|
| |
|
|
Blend Labs, Inc., Class A * |
|
|
| |
|
|
| |
|
|
| |
|
|
| |
|
|
| |
|
|
| |
|
|
Clear Secure, Inc., Class A |
|
|
Clearwater Analytics Holdings, Inc., Class A * |
|
|
| |
|
|
Commvault Systems, Inc. * |
|
|
Consensus Cloud Solutions, Inc. * |
|
|
| |
|
|
| |
|
|
| |
|
|
| |
|
|
| |
|
|
| |
|
|
| |
|
|
DigitalOcean Holdings, Inc. * |
|
|
| |
|
|
| |
|
|
| |
|
|
| |
|
|
Expensify, Inc., Class A * |
|
|
| |
|
|
| |
|
|
Freshworks, Inc., Class A * |
|
|
Grid Dynamics Holdings, Inc. * |
|
|
| |
|
|
| |
|
|
I3 Verticals, Inc., Class A * |
|
|
Information Services Group, Inc. |
|
|
| |
|
|
| |
|
|
| |
|
|
| |
|
|
| |
|
|
LiveRamp Holdings, Inc. * |
|
|
| |
|
|
Mercurity Fintech Holding, Inc. * |
|
|
| |
|
|
| |
|
|
| |
|
|
| |
|
|
| |
|
|
| |
|
|
| |
|
|
Pagaya Technologies Ltd., Class A * |
|
|
| |
|
|
| |
|
|
| |
|
|
Progress Software Corp. * |
|
|
| |
|
|
| |
|
|
| |
|
|
Rackspace Technology, Inc. * |
|
|
| |
|
|
| |
|
|
40
Schwab Equity Index Funds | Annual Holdings and Financial Statements
Schwab Small-Cap Index Fund
Portfolio Holdings as of October 31, 2025 (continued)
| |
|
|
| |
|
|
| |
|
|
| |
|
|
| |
|
|
Sapiens International Corp. NV |
|
|
SEMrush Holdings, Inc., Class A * |
|
|
| |
|
|
SoundHound AI, Inc., Class A * |
|
|
| |
|
|
Sprinklr, Inc., Class A * |
|
|
Sprout Social, Inc., Class A * |
|
|
| |
|
|
Synchronoss Technologies, Inc. * |
|
|
| |
|
|
| |
|
|
| |
|
|
| |
|
|
| |
|
|
| |
|
|
Varonis Systems, Inc., Class B * |
|
|
| |
|
|
| |
|
|
Viant Technology, Inc., Class A * |
|
|
| |
|
|
Weave Communications, Inc. * |
|
|
| |
|
|
| |
|
|
| |
|
|
| |
|
|
Zeta Global Holdings Corp., Class A * |
|
|
| |
|
|
| |
Technology Hardware & Equipment 5.4% |
| |
|
|
| |
|
|
Advanced Energy Industries, Inc. |
|
|
Aeva Technologies, Inc. * |
|
|
Applied Optoelectronics, Inc. * |
|
|
Arlo Technologies, Inc. * |
|
|
| |
|
|
| |
|
|
| |
|
|
| |
|
|
Benchmark Electronics, Inc. |
|
|
| |
|
|
| |
|
|
| |
|
|
Climb Global Solutions, Inc. |
|
|
CommScope Holding Co., Inc. * |
|
|
CompoSecure, Inc., Class A * |
|
|
| |
|
|
| |
|
|
| |
|
|
| |
|
|
| |
|
|
Digi International, Inc. * |
|
|
| |
|
|
| |
|
|
Evolv Technologies Holdings, Inc. * |
|
|
| |
|
|
| |
|
|
Frequency Electronics, Inc. * |
|
|
| |
|
|
| |
|
|
| |
|
|
Insight Enterprises, Inc. * |
|
|
| |
|
|
| |
|
|
| |
|
|
Kimball Electronics, Inc. * |
|
|
| |
|
|
Methode Electronics, Inc. |
|
|
| |
|
|
Mirion Technologies, Inc., Class A * |
|
|
M-Tron Industries, Inc. * |
|
|
Napco Security Technologies, Inc. |
|
|
| |
|
|
| |
|
|
| |
|
|
| |
|
|
| |
|
|
| |
|
|
| |
|
|
| |
|
|
| |
|
|
| |
|
|
Quantum Computing, Inc. *(a) |
|
|
Red Cat Holdings, Inc. *(a) |
|
|
Ribbon Communications, Inc. * |
|
|
Richardson Electronics Ltd. |
|
|
| |
|
|
| |
|
|
| |
|
|
| |
|
|
| |
|
|
| |
|
|
| |
|
|
Vishay Intertechnology, Inc. |
|
|
Vishay Precision Group, Inc. * |
|
|
| |
|
|
| |
|
|
| |
|
|
| |
Telecommunication Services 0.8% |
| |
|
|
| |
|
|
Bandwidth, Inc., Class A * |
|
|
Cogent Communications Holdings, Inc. |
|
|
| |
|
|
| |
|
|
| |
|
|
Liberty Latin America Ltd., Class C * |
|
|
Lumen Technologies, Inc. * |
|
|
Shenandoah Telecommunications Co. |
|
|
| |
|
|
Telephone & Data Systems, Inc. |
|
|
| |
|
|
| |
|
|
| |
| |
| |
|
|
| |
|
|
| |
|
|
Costamare Bulkers Holdings Ltd. * |
|
|
| |
|
|
Covenant Logistics Group, Inc., Class A |
|
|
| |
|
|
| |
|
|
Frontier Group Holdings, Inc. * |
|
|
FTAI Infrastructure, Inc. |
|
|
Genco Shipping & Trading Ltd. |
|
|
| |
|
|
Hertz Global Holdings, Inc. *(a) |
|
|
| |
|
|
Schwab Equity Index Funds | Annual Holdings and Financial Statements
41
Schwab Small-Cap Index Fund
Portfolio Holdings as of October 31, 2025 (continued)
| |
|
|
| |
|
|
| |
|
|
| |
|
|
| |
|
|
| |
|
|
| |
|
|
Pangaea Logistics Solutions Ltd. |
|
|
Proficient Auto Logistics, Inc. * |
|
|
Radiant Logistics, Inc. * |
|
|
| |
|
|
| |
|
|
Sky Harbour Group Corp. * |
|
|
| |
|
|
Strata Critical Medical, Inc. * |
|
|
Sun Country Airlines Holdings, Inc. * |
|
|
Universal Logistics Holdings, Inc. |
|
|
| |
|
|
| |
|
|
| |
| |
| |
|
|
American States Water Co. |
|
|
| |
|
|
| |
|
|
Brookfield Infrastructure Corp., Class A |
|
|
| |
|
|
California Water Service Group |
|
|
Chesapeake Utilities Corp. |
|
|
Consolidated Water Co. Ltd. |
|
|
Genie Energy Ltd., Class B |
|
|
Global Water Resources, Inc. |
|
|
| |
|
|
| |
|
|
Hawaiian Electric Industries, Inc. * |
|
|
| |
|
|
| |
|
|
Montauk Renewables, Inc. * |
|
|
New Jersey Resources Corp. |
|
|
Northwest Natural Holding Co. |
|
|
Northwestern Energy Group, Inc. |
|
|
| |
|
|
| |
|
|
| |
|
|
| |
|
|
Portland General Electric Co. |
|
|
| |
|
|
| |
|
|
Southwest Gas Holdings, Inc. |
|
|
| |
|
|
| |
|
|
| |
|
|
| |
|
|
| |
|
|
Total Common Stocks
(Cost $4,599,431,112) |
|
| |
|
|
RIGHTS 0.0% OF NET ASSETS |
| |
Pharmaceuticals, Biotechnology & Life Sciences 0.0% |
Aduro Biotech, Inc. CVR *(b) |
|
|
Cartesian Therapeutics, Inc. CVR *(b) |
|
|
| |
|
|
Tobira Therapeutics, Inc. CVR *(b) |
|
|
| |
|
|
Total Rights
(Cost $44,006) |
|
| |
|
|
SHORT-TERM INVESTMENTS 1.3% OF NET ASSETS |
| |
| |
State Street Institutional U.S. Government Money Market Fund, Premier Class 4.01% (d)(e) |
|
|
Total Short-Term Investments
(Cost $92,712,007) |
|
Total Investments in Securities
(Cost $4,692,187,125) |
|
| |
|
|
CURRENT VALUE/
UNREALIZED
DEPRECIATION
($) |
| |
| |
|
|
|
Russell 2000 Index, e-mini, expires 12/19/25 |
|
|
|
| |
Non-income producing security. |
| |
All or a portion of this security is on loan. Securities on loan were valued at $91,693,646. |
| |
Fair valued using significant unobservable inputs (see financial note 2(a), Securities for which no quoted value is available, for additional information). |
| |
Issuer is an affiliated company, as the investment adviser owns at least 5% of the voting securities of such company. |
| |
The rate shown is the annualized 7-day yield. |
| |
Security purchased with cash collateral received for securities on loan. |
| |
|
| |
Real Estate Investment Trust |
42
Schwab Equity Index Funds | Annual Holdings and Financial Statements
Schwab Small-Cap Index Fund
Portfolio Holdings as of October 31, 2025 (continued)
Below is a summary of the fund’s transactions with affiliated issuers and affiliated companies which are or were affiliates during the period ended October 31, 2025. An affiliated company is a company in which the investment adviser has or had an ownership of at least 5% of the voting securities of a security issue during the report period. A dash in the Value at October 31, 2024, and/or Value and Balance of Shares Held at October 31, 2025, columns means either the issuer was not held or not held as an affiliate on the stated date.
| |
|
|
|
NET REALIZED GAINS (LOSSES) |
NET CHANGE IN UNREALIZED APPRECIATION (DEPRECIATION) |
|
BALANCE OF SHARES HELD AT 10/31/25 |
|
COMMON STOCKS 0.0% OF NET ASSETS |
| |
Commercial & Professional Services 0.0% |
| |
|
|
|
|
|
|
|
|
| |
| |
Cracker Barrel Old Country Store, Inc. |
|
|
|
|
|
|
|
|
| |
Equity Real Estate Investment Trusts (REITs) 0.0% |
Diversified Healthcare Trust |
|
|
|
|
|
|
|
|
| |
|
|
|
|
|
|
|
|
| |
|
|
|
|
|
|
|
|
| |
Household & Personal Products 0.0% |
| |
|
|
|
|
|
|
|
|
| |
Media & Entertainment 0.0% |
| |
|
|
|
|
|
|
|
|
| |
|
|
|
|
|
|
|
|
The following is a summary of the inputs used to value the fund’s investments as of October 31, 2025 (see financial note 2(a) for additional information):
| |
QUOTED PRICES IN
ACTIVE MARKETS FOR
IDENTICAL ASSETS
(LEVEL 1) |
OTHER SIGNIFICANT
OBSERVABLE INPUTS
(LEVEL 2) |
SIGNIFICANT
UNOBSERVABLE INPUTS
(LEVEL 3) |
|
| |
|
|
|
|
| |
|
|
|
|
| |
|
|
|
|
Health Care Equipment & Services |
|
|
|
|
Pharmaceuticals, Biotechnology & Life Sciences |
|
|
|
|
| |
|
|
|
|
Pharmaceuticals, Biotechnology & Life Sciences |
|
|
|
|
| |
|
|
|
|
| |
|
|
|
|
| |
|
|
|
|
| |
|
|
|
|
| |
Level 3 amount shown includes securities determined to have no value at October 31, 2025. |
| |
As categorized in the Portfolio Holdings. |
| |
Futures contracts are reported at cumulative unrealized appreciation or depreciation. |
Schwab Equity Index Funds | Annual Holdings and Financial Statements
43
Schwab Small-Cap Index Fund
Statement of Assets and Liabilities
| |
Investments in securities, at value - affiliated issuers (cost $4,256,268) |
|
|
Investments in securities, at value - unaffiliated issuers (cost $4,687,930,857) including securities on loan of $91,693,646 |
|
|
| |
|
|
Deposit with broker for futures contracts |
|
|
| |
|
|
| |
|
|
| |
|
|
Income from securities on loan |
|
|
| |
|
|
Variation margin on future contracts |
|
|
| |
|
|
| |
| |
Collateral held for securities on loan |
|
|
| |
|
|
| |
|
|
| |
|
|
| |
|
|
| |
|
|
| |
|
|
| |
| |
Capital received from investors |
|
|
Total distributable earnings |
|
|
| |
|
|
44
Schwab Equity Index Funds | Annual Holdings and Financial Statements
Schwab Small-Cap Index Fund
Statement of Operations
For the period November 1, 2024 through October 31, 2025 |
| |
Dividends received from securities - unaffiliated issuers (net of foreign withholding tax of $226,739) |
|
|
| |
|
|
Dividends received from securities - affiliated issuers |
|
|
| |
|
|
| |
|
|
| |
| |
| |
|
|
| |
|
|
| |
|
|
| |
REALIZED AND UNREALIZED GAINS (LOSSES) |
Net realized losses on sales of securities - affiliated issuers |
|
|
Net realized losses on sales of securities - unaffiliated issuers |
|
|
Net realized gains on sales of in-kind redemptions - unaffiliated issuers |
|
|
Net realized losses on futures contracts |
|
|
| |
|
|
Net change in unrealized appreciation (depreciation) on securities - affiliated issuers |
|
|
Net change in unrealized appreciation (depreciation) on securities - unaffiliated issuers |
|
|
Net change in unrealized appreciation (depreciation) on futures contracts |
|
|
Net change in unrealized appreciation (depreciation) |
|
|
Net realized and unrealized gains |
|
|
Increase in net assets resulting from operations |
|
|
Schwab Equity Index Funds | Annual Holdings and Financial Statements
45
Schwab Small-Cap Index Fund
Statement of Changes in Net Assets
For the current and prior report periods
| |
| |
|
|
| |
|
|
|
| |
|
|
|
Net change in unrealized appreciation (depreciation) |
|
|
|
Increase in net assets resulting from operations |
|
|
|
| |
DISTRIBUTIONS TO SHAREHOLDERS |
| |
|
|
|
TRANSACTIONS IN FUND SHARES |
| |
|
|
| |
|
|
|
|
|
| |
|
|
|
|
|
| |
|
|
|
|
|
| |
|
|
|
|
|
Net transactions in fund shares |
|
|
|
|
|
| |
SHARES OUTSTANDING AND NET ASSETS |
| |
|
|
| |
|
|
|
|
|
| |
|
|
|
|
|
Total increase (decrease) |
|
|
|
|
|
| |
|
|
|
|
|
46
Schwab Equity Index Funds | Annual Holdings and Financial Statements
Schwab Total Stock Market Index Fund
Financial Statements
| |
|
|
|
|
|
|
| |
Net asset value at beginning of period |
|
|
|
|
|
|
Income (loss) from investment operations: |
|
|
|
|
|
|
Net investment income (loss)2 |
|
|
|
|
|
|
Net realized and unrealized gains (losses) |
|
|
|
|
|
|
Total from investment operations |
|
|
|
|
|
|
| |
|
|
|
|
|
|
Distributions from net investment income |
|
|
|
|
|
|
Distributions from net realized gains |
|
|
|
|
|
|
| |
|
|
|
|
|
|
Net asset value at end of period |
|
|
|
|
|
|
| |
|
|
|
|
|
|
| |
Ratios to average net assets: |
|
|
|
|
|
|
| |
|
|
|
|
|
|
Net investment income (loss) |
|
|
|
|
|
|
| |
|
|
|
|
|
|
Net assets, end of period (x 1,000,000) |
|
|
|
|
|
|
| |
Per-Share Data has been retroactively adjusted to reflect a 7-for-1 share split effective after the close of U.S. markets on August 15, 2025 (see financial note 9 for additional information). |
| |
Calculated based on the average shares outstanding during the period. |
| |
Ratio includes less than 0.005% of non-routine proxy expenses. |
Schwab Equity Index Funds | Annual Holdings and Financial Statements
47
Schwab Total Stock Market Index Fund
Portfolio Holdings as of October 31, 2025
| |
|
|
COMMON STOCKS 99.7% OF NET ASSETS |
| |
Automobiles & Components 2.3% |
| |
|
|
American Axle & Manufacturing Holdings, Inc. * |
|
|
| |
|
|
| |
|
|
| |
|
|
Cooper-Standard Holdings, Inc. * |
|
|
| |
|
|
| |
|
|
| |
|
|
Faraday Future Intelligent Electric, Inc. *(a) |
|
|
| |
|
|
Fox Factory Holding Corp. * |
|
|
| |
|
|
| |
|
|
| |
|
|
| |
|
|
Goodyear Tire & Rubber Co. * |
|
|
| |
|
|
| |
|
|
| |
|
|
| |
|
|
| |
|
|
Mobileye Global, Inc., Class A * |
|
|
Modine Manufacturing Co. * |
|
|
Motorcar Parts of America, Inc. * |
|
|
| |
|
|
| |
|
|
QuantumScape Corp., Class A * |
|
|
Rivian Automotive, Inc., Class A * |
|
|
| |
|
|
Standard Motor Products, Inc. |
|
|
| |
|
|
Strattec Security Corp. * |
|
|
| |
|
|
| |
|
|
| |
|
|
Winnebago Industries, Inc. |
|
|
| |
|
|
| |
|
|
| |
| |
| |
|
|
| |
|
|
Affinity Bancshares, Inc. |
|
|
Amalgamated Financial Corp. |
|
|
| |
|
|
| |
|
|
| |
|
|
| |
|
|
| |
|
|
Atlantic Union Bankshares Corp. |
|
|
Auburn National BanCorp, Inc. |
|
|
Avidbank Holdings, Inc. * |
|
|
| |
|
|
| |
|
|
| |
|
|
| |
|
|
| |
|
|
| |
|
|
| |
|
|
| |
|
|
| |
|
|
| |
|
|
Bank of the James Financial Group, Inc. |
|
|
| |
|
|
| |
|
|
| |
|
|
| |
|
|
Bankwell Financial Group, Inc. |
|
|
| |
|
|
| |
|
|
| |
|
|
| |
|
|
| |
|
|
| |
|
|
Blue Ridge Bankshares, Inc. * |
|
|
| |
|
|
Bridgewater Bancshares, Inc. * |
|
|
Broadway Financial Corp. * |
|
|
Burke & Herbert Financial Services Corp. |
|
|
Business First Bancshares, Inc. |
|
|
| |
|
|
| |
|
|
| |
|
|
| |
|
|
| |
|
|
| |
|
|
| |
|
|
Capital City Bank Group, Inc. |
|
|
Capitol Federal Financial, Inc. |
|
|
Carter Bankshares, Inc. * |
|
|
| |
|
|
| |
|
|
CB Financial Services, Inc. |
|
|
Central Pacific Financial Corp. |
|
|
| |
|
|
| |
|
|
ChoiceOne Financial Services, Inc. |
|
|
| |
|
|
Citizens & Northern Corp. |
|
|
Citizens Community Bancorp, Inc. |
|
|
Citizens Financial Group, Inc. |
|
|
Citizens Financial Services, Inc. |
|
|
| |
|
|
| |
|
|
| |
|
|
Coastal Financial Corp. * |
|
|
CoastalSouth Bancshares, Inc. * |
|
|
| |
|
|
Columbia Banking System, Inc. |
|
|
Columbia Financial, Inc. * |
|
|
| |
|
|
Commerce Bancshares, Inc. |
|
|
Community Financial System, Inc. |
|
|
Community Trust Bancorp, Inc. |
|
|
Community West Bancshares |
|
|
| |
|
|
Cullen/Frost Bankers, Inc. |
|
|
Customers Bancorp, Inc. * |
|
|
| |
|
|
Dime Community Bancshares, Inc. |
|
|
Eagle Bancorp Montana, Inc. |
|
|
| |
|
|
Eagle Financial Services, Inc. |
|
|
| |
|
|
| |
|
|
48
Schwab Equity Index Funds | Annual Holdings and Financial Statements
Schwab Total Stock Market Index Fund
Portfolio Holdings as of October 31, 2025 (continued)
| |
|
|
| |
|
|
Enterprise Financial Services Corp. |
|
|
Equity Bancshares, Inc., Class A |
|
|
Esquire Financial Holdings, Inc. |
|
|
Farmers & Merchants Bancorp, Inc. |
|
|
Farmers National Banc Corp. |
|
|
| |
|
|
| |
|
|
Fidelity D&D Bancorp, Inc. |
|
|
| |
|
|
Financial Institutions, Inc. |
|
|
| |
|
|
| |
|
|
| |
|
|
| |
|
|
First Bancorp/Southern Pines NC |
|
|
| |
|
|
| |
|
|
First Business Financial Services, Inc. |
|
|
| |
|
|
First Citizens BancShares, Inc., Class A |
|
|
First Commonwealth Financial Corp. |
|
|
First Community Bankshares, Inc. |
|
|
| |
|
|
| |
|
|
First Financial Bankshares, Inc. |
|
|
| |
|
|
| |
|
|
| |
|
|
| |
|
|
| |
|
|
First Interstate BancSystem, Inc., Class A |
|
|
| |
|
|
First Mid Bancshares, Inc. |
|
|
| |
|
|
| |
|
|
First Savings Financial Group, Inc. |
|
|
First Seacoast Bancorp, Inc. * |
|
|
First U.S. Bancshares, Inc. |
|
|
| |
|
|
First Western Financial, Inc. * |
|
|
Firstsun Capital Bancorp * |
|
|
| |
|
|
| |
|
|
| |
|
|
| |
|
|
Franklin Financial Services Corp. |
|
|
| |
|
|
| |
|
|
| |
|
|
GBank Financial Holdings, Inc. * |
|
|
German American Bancorp, Inc. |
|
|
| |
|
|
Great Southern Bancorp, Inc. |
|
|
Greene County Bancorp, Inc. |
|
|
| |
|
|
| |
|
|
| |
|
|
| |
|
|
Hawthorn Bancshares, Inc. |
|
|
| |
|
|
| |
|
|
| |
|
|
| |
|
|
Hingham Institution For Savings (a) |
|
|
| |
|
|
| |
|
|
| |
|
|
HomeTrust Bancshares, Inc. |
|
|
| |
|
|
| |
|
|
Huntington Bancshares, Inc. |
|
|
| |
|
|
Independent Bank Corp. MI |
|
|
International Bancshares Corp. |
|
|
| |
|
|
| |
|
|
John Marshall Bancorp, Inc. |
|
|
| |
|
|
| |
|
|
| |
|
|
| |
|
|
| |
|
|
| |
|
|
| |
|
|
Live Oak Bancshares, Inc. |
|
|
| |
|
|
| |
|
|
MainStreet Bancshares, Inc. |
|
|
Mechanics Bancorp, Class A * |
|
|
| |
|
|
| |
|
|
Metrocity Bankshares, Inc. |
|
|
Metropolitan Bank Holding Corp. |
|
|
| |
|
|
| |
|
|
Midland States Bancorp, Inc. |
|
|
MidWestOne Financial Group, Inc. |
|
|
| |
|
|
National Bank Holdings Corp., Class A |
|
|
National Bankshares, Inc. |
|
|
| |
|
|
| |
|
|
| |
|
|
| |
|
|
Northeast Community Bancorp, Inc. |
|
|
| |
|
|
Northpointe Bancshares, Inc. |
|
|
| |
|
|
Northwest Bancshares, Inc. |
|
|
| |
|
|
| |
|
|
| |
|
|
OceanFirst Financial Corp. |
|
|
| |
|
|
| |
|
|
| |
|
|
| |
|
|
| |
|
|
Orange County Bancorp, Inc. |
|
|
| |
|
|
Orrstown Financial Services, Inc. |
|
|
| |
|
|
| |
|
|
| |
|
|
| |
|
|
| |
|
|
Peapack-Gladstone Financial Corp. |
|
|
Peoples Bancorp of North Carolina, Inc. |
|
|
| |
|
|
Peoples Financial Services Corp. |
|
|
Pinnacle Financial Partners, Inc. |
|
|
| |
|
|
Schwab Equity Index Funds | Annual Holdings and Financial Statements
49
Schwab Total Stock Market Index Fund
Portfolio Holdings as of October 31, 2025 (continued)
| |
|
|
| |
|
|
PNC Financial Services Group, Inc. |
|
|
Ponce Financial Group, Inc. * |
|
|
| |
|
|
| |
|
|
| |
|
|
| |
|
|
Prosperity Bancshares, Inc. |
|
|
Provident Bancorp, Inc. * |
|
|
Provident Financial Holdings, Inc. |
|
|
Provident Financial Services, Inc. |
|
|
| |
|
|
| |
|
|
Red River Bancshares, Inc. |
|
|
| |
|
|
| |
|
|
Republic Bancorp, Inc., Class A |
|
|
Richmond Mutual BanCorp, Inc. (a) |
|
|
| |
|
|
| |
|
|
| |
|
|
Seacoast Banking Corp. of Florida |
|
|
ServisFirst Bancshares, Inc. |
|
|
| |
|
|
| |
|
|
Simmons First National Corp., Class A |
|
|
| |
|
|
Sound Financial Bancorp, Inc. |
|
|
South Plains Financial, Inc. |
|
|
Southern First Bancshares, Inc. * |
|
|
Southern Missouri Bancorp, Inc. |
|
|
Southside Bancshares, Inc. |
|
|
| |
|
|
| |
|
|
| |
|
|
Sterling Bancorp, Inc. *(b) |
|
|
Stock Yards Bancorp, Inc. |
|
|
| |
|
|
Texas Capital Bancshares, Inc. * |
|
|
| |
|
|
Third Coast Bancshares, Inc. * |
|
|
| |
|
|
| |
|
|
| |
|
|
| |
|
|
Triumph Financial, Inc. * |
|
|
| |
|
|
| |
|
|
| |
|
|
| |
|
|
| |
|
|
| |
|
|
| |
|
|
| |
|
|
United Community Banks, Inc. |
|
|
United Security Bancshares |
|
|
| |
|
|
| |
|
|
USCB Financial Holdings, Inc. |
|
|
| |
|
|
Virginia National Bankshares Corp. |
|
|
| |
|
|
Washington Trust Bancorp, Inc. |
|
|
| |
|
|
| |
|
|
| |
|
|
| |
|
|
| |
|
|
| |
|
|
| |
|
|
Western New England Bancorp, Inc. |
|
|
| |
|
|
| |
|
|
| |
|
|
| |
|
|
| |
| |
| |
|
|
| |
|
|
| |
|
|
| |
|
|
| |
|
|
| |
|
|
Advanced Drainage Systems, Inc. |
|
|
| |
|
|
| |
|
|
| |
|
|
| |
|
|
| |
|
|
AirJoule Technologies Corp. *(a) |
|
|
| |
|
|
Albany International Corp., Class A |
|
|
| |
|
|
| |
|
|
Allison Transmission Holdings, Inc. |
|
|
| |
|
|
Alta Equipment Group, Inc. |
|
|
Ameresco, Inc., Class A * |
|
|
American Infrastructure Corp. *(a)(b) |
|
|
American Superconductor Corp. * |
|
|
American Woodmark Corp. * |
|
|
| |
|
|
Amprius Technologies, Inc. * |
|
|
| |
|
|
| |
|
|
Applied Industrial Technologies, Inc. |
|
|
Archer Aviation, Inc., Class A * |
|
|
| |
|
|
| |
|
|
Armstrong World Industries, Inc. |
|
|
Array Technologies, Inc. * |
|
|
| |
|
|
| |
|
|
| |
|
|
| |
|
|
Atmus Filtration Technologies, Inc. |
|
|
| |
|
|
| |
|
|
Babcock & Wilcox Enterprises, Inc. * |
|
|
| |
|
|
Bloom Energy Corp., Class A * |
|
|
| |
|
|
BlueLinx Holdings, Inc. * |
|
|
| |
|
|
| |
|
|
Bowman Consulting Group Ltd., Class A * |
|
|
| |
|
|
Builders FirstSource, Inc. * |
|
|
| |
|
|
Byrna Technologies, Inc. * |
|
|
| |
|
|
| |
|
|
Carpenter Technology Corp. |
|
|
| |
|
|
50
Schwab Equity Index Funds | Annual Holdings and Financial Statements
Schwab Total Stock Market Index Fund
Portfolio Holdings as of October 31, 2025 (continued)
| |
|
|
| |
|
|
| |
|
|
ChargePoint Holdings, Inc. * |
|
|
| |
|
|
| |
|
|
| |
|
|
Comfort Systems USA, Inc. |
|
|
Concrete Pumping Holdings, Inc. |
|
|
Construction Partners, Inc., Class A * |
|
|
Core & Main, Inc., Class A * |
|
|
CPI Aerostructures, Inc. * |
|
|
| |
|
|
| |
|
|
| |
|
|
| |
|
|
Custom Truck One Source, Inc. * |
|
|
| |
|
|
Distribution Solutions Group, Inc. * |
|
|
| |
|
|
| |
|
|
| |
|
|
| |
|
|
| |
|
|
| |
|
|
| |
|
|
| |
|
|
| |
|
|
| |
|
|
| |
|
|
| |
|
|
Energy Vault Holdings, Inc. * |
|
|
Enerpac Tool Group Corp., Class A |
|
|
| |
|
|
| |
|
|
| |
|
|
Eos Energy Enterprises, Inc. *(a) |
|
|
| |
|
|
| |
|
|
| |
|
|
Everus Construction Group, Inc. * |
|
|
| |
|
|
| |
|
|
| |
|
|
Ferguson Enterprises, Inc. |
|
|
Firefly Aerospace, Inc. * |
|
|
| |
|
|
| |
|
|
| |
|
|
| |
|
|
Fortune Brands Innovations, Inc. |
|
|
Franklin Electric Co., Inc. |
|
|
FreightCar America, Inc. * |
|
|
| |
|
|
Gates Industrial Corp. PLC * |
|
|
| |
|
|
| |
|
|
Gencor Industries, Inc. * |
|
|
| |
|
|
| |
|
|
| |
|
|
Gibraltar Industries, Inc. * |
|
|
| |
|
|
| |
|
|
| |
|
|
GrafTech International Ltd. * |
|
|
| |
|
|
Granite Construction, Inc. |
|
|
Great Lakes Dredge & Dock Corp. * |
|
|
| |
|
|
| |
|
|
| |
|
|
| |
|
|
| |
|
|
Helios Technologies, Inc. |
|
|
| |
|
|
| |
|
|
| |
|
|
Hillman Solutions Corp. * |
|
|
Honeywell International, Inc. |
|
|
| |
|
|
| |
|
|
Hudson Technologies, Inc. * |
|
|
Huntington Ingalls Industries, Inc. |
|
|
| |
|
|
| |
|
|
| |
|
|
| |
|
|
| |
|
|
Illinois Tool Works, Inc. |
|
|
| |
|
|
Innovative Solutions & Support, Inc. * |
|
|
| |
|
|
Intuitive Machines, Inc., Class A * |
|
|
| |
|
|
Janus International Group, Inc. * |
|
|
| |
|
|
| |
|
|
Johnson Controls International PLC |
|
|
| |
|
|
| |
|
|
| |
|
|
| |
|
|
Kratos Defense & Security Solutions, Inc. * |
|
|
L.B. Foster Co., Class A * |
|
|
L3Harris Technologies, Inc. |
|
|
Lennox International, Inc. |
|
|
| |
|
|
| |
|
|
Lincoln Electric Holdings, Inc. |
|
|
| |
|
|
| |
|
|
| |
|
|
| |
|
|
| |
|
|
| |
|
|
| |
|
|
| |
|
|
| |
|
|
Mayville Engineering Co., Inc. * |
|
|
| |
|
|
| |
|
|
Microvast Holdings, Inc. * |
|
|
| |
|
|
| |
|
|
| |
|
|
| |
|
|
MSC Industrial Direct Co., Inc., Class A |
|
|
| |
|
|
Mueller Water Products, Inc., Class A |
|
|
| |
|
|
NANO Nuclear Energy, Inc. *(a) |
|
|
National Presto Industries, Inc. |
|
|
| |
|
|
NEXTracker, Inc., Class A * |
|
|
| |
|
|
Schwab Equity Index Funds | Annual Holdings and Financial Statements
51
Schwab Total Stock Market Index Fund
Portfolio Holdings as of October 31, 2025 (continued)
| |
|
|
| |
|
|
| |
|
|
NPK International, Inc. * |
|
|
| |
|
|
| |
|
|
NWPX Infrastructure, Inc. * |
|
|
Ocean Power Technologies, Inc. * |
|
|
| |
|
|
Optex Systems Holdings, Inc. * |
|
|
Orion Group Holdings, Inc. * |
|
|
| |
|
|
| |
|
|
| |
|
|
| |
|
|
| |
|
|
| |
|
|
| |
|
|
| |
|
|
| |
|
|
Perma-Pipe International Holdings, Inc. * |
|
|
| |
|
|
| |
|
|
Power Solutions International, Inc. * |
|
|
Preformed Line Products Co. |
|
|
| |
|
|
| |
|
|
Quanex Building Products Corp. |
|
|
| |
|
|
| |
|
|
| |
|
|
| |
|
|
| |
|
|
Resideo Technologies, Inc. * |
|
|
| |
|
|
Richtech Robotics, Inc., Class B *(a) |
|
|
| |
|
|
Rockwell Automation, Inc. |
|
|
| |
|
|
Rush Enterprises, Inc., Class A |
|
|
Satellogic, Inc., Class A * |
|
|
Sensata Technologies Holding PLC |
|
|
| |
|
|
Shoals Technologies Group, Inc., Class A * |
|
|
Simpson Manufacturing Co., Inc. |
|
|
SiteOne Landscape Supply, Inc. * |
|
|
| |
|
|
Southland Holdings, Inc. * |
|
|
Spirit AeroSystems Holdings, Inc., Class A * |
|
|
| |
|
|
| |
|
|
Standex International Corp. |
|
|
Stanley Black & Decker, Inc. |
|
|
| |
|
|
Sterling Infrastructure, Inc. * |
|
|
| |
|
|
| |
|
|
| |
|
|
| |
|
|
| |
|
|
| |
|
|
| |
|
|
| |
|
|
| |
|
|
| |
|
|
Thermon Group Holdings, Inc. * |
|
|
| |
|
|
| |
|
|
Titan International, Inc. * |
|
|
| |
|
|
| |
|
|
| |
|
|
| |
|
|
| |
|
|
| |
|
|
| |
|
|
| |
|
|
| |
|
|
| |
|
|
| |
|
|
| |
|
|
| |
|
|
| |
|
|
Vertiv Holdings Co., Class A |
|
|
| |
|
|
Virgin Galactic Holdings, Inc. *(a) |
|
|
| |
|
|
Voyager Technologies, Inc., Class A * |
|
|
| |
|
|
| |
|
|
| |
|
|
Watts Water Technologies, Inc., Class A |
|
|
WESCO International, Inc. |
|
|
Westinghouse Air Brake Technologies Corp. |
|
|
Willis Lease Finance Corp. |
|
|
| |
|
|
| |
|
|
Worthington Enterprises, Inc. |
|
|
| |
|
|
| |
|
|
| |
|
|
Zurn Elkay Water Solutions Corp. |
|
|
| |
|
|
| |
Commercial & Professional Services 1.2% |
| |
|
|
| |
|
|
| |
|
|
ACV Auctions, Inc., Class A * |
|
|
| |
|
|
| |
|
|
| |
|
|
Automatic Data Processing, Inc. |
|
|
Barrett Business Services, Inc. |
|
|
| |
|
|
BlackSky Technology, Inc. * |
|
|
Booz Allen Hamilton Holding Corp., Class A |
|
|
| |
|
|
Bridger Aerospace Group Holdings, Inc. * |
|
|
BrightView Holdings, Inc. * |
|
|
| |
|
|
Broadridge Financial Solutions, Inc. |
|
|
CACI International, Inc., Class A * |
|
|
Casella Waste Systems, Inc., Class A * |
|
|
| |
|
|
CECO Environmental Corp. * |
|
|
| |
|
|
| |
|
|
| |
|
|
| |
|
|
52
Schwab Equity Index Funds | Annual Holdings and Financial Statements
Schwab Total Stock Market Index Fund
Portfolio Holdings as of October 31, 2025 (continued)
| |
|
|
| |
|
|
| |
|
|
| |
|
|
| |
|
|
| |
|
|
CSG Systems International, Inc. |
|
|
| |
|
|
| |
|
|
| |
|
|
| |
|
|
| |
|
|
| |
|
|
ExlService Holdings, Inc. * |
|
|
| |
|
|
Falcon's Beyond Global, Inc., Class A * |
|
|
| |
|
|
| |
|
|
| |
|
|
| |
|
|
| |
|
|
Healthcare Services Group, Inc. * |
|
|
Heidrick & Struggles International, Inc. |
|
|
| |
|
|
| |
|
|
Huron Consulting Group, Inc. * |
|
|
| |
|
|
| |
|
|
| |
|
|
| |
|
|
| |
|
|
| |
|
|
Kelly Services, Inc., Class A |
|
|
| |
|
|
| |
|
|
| |
|
|
| |
|
|
Liquidity Services, Inc. * |
|
|
| |
|
|
| |
|
|
| |
|
|
| |
|
|
| |
|
|
Mobile Infrastructure Corp. * |
|
|
Montrose Environmental Group, Inc. * |
|
|
| |
|
|
| |
|
|
| |
|
|
| |
|
|
| |
|
|
| |
|
|
Paylocity Holding Corp. * |
|
|
Perma-Fix Environmental Services, Inc. * |
|
|
| |
|
|
| |
|
|
| |
|
|
| |
|
|
| |
|
|
Republic Services, Inc., Class A |
|
|
Resolute Holdings Management, Inc. * |
|
|
| |
|
|
| |
|
|
Science Applications International Corp. |
|
|
Spire Global, Inc., Class A *(a) |
|
|
SS&C Technologies Holdings, Inc. |
|
|
| |
|
|
| |
|
|
| |
|
|
| |
|
|
| |
|
|
| |
|
|
| |
|
|
| |
|
|
| |
|
|
UL Solutions, Inc., Class A |
|
|
| |
|
|
| |
|
|
| |
|
|
Verisk Analytics, Inc., Class A |
|
|
Verra Mobility Corp., Class A * |
|
|
| |
|
|
| |
|
|
| |
|
|
| |
|
|
| |
|
|
| |
Consumer Discretionary Distribution & Retail 5.5% |
Abercrombie & Fitch Co., Class A * |
|
|
Academy Sports & Outdoors, Inc. |
|
|
| |
|
|
A-Mark Precious Metals, Inc. |
|
|
| |
|
|
American Eagle Outfitters, Inc. |
|
|
America's Car-Mart, Inc. * |
|
|
| |
|
|
| |
|
|
Asbury Automotive Group, Inc. * |
|
|
| |
|
|
| |
|
|
Barnes & Noble Education, Inc. * |
|
|
| |
|
|
Bed Bath & Beyond, Inc. * |
|
|
| |
|
|
Boot Barn Holdings, Inc. * |
|
|
| |
|
|
Build-A-Bear Workshop, Inc. |
|
|
Burlington Stores, Inc. * |
|
|
| |
|
|
Camping World Holdings, Inc., Class A |
|
|
| |
|
|
| |
|
|
| |
|
|
| |
|
|
| |
|
|
Designer Brands, Inc., Class A |
|
|
Dick's Sporting Goods, Inc. |
|
|
| |
|
|
| |
|
|
| |
|
|
| |
|
|
| |
|
|
| |
|
|
Floor & Decor Holdings, Inc., Class A * |
|
|
GameStop Corp., Class A *(a) |
|
|
| |
|
|
| |
|
|
| |
|
|
GigaCloud Technology, Inc., Class A * |
|
|
| |
|
|
| |
|
|
| |
|
|
| |
|
|
Haverty Furniture Cos., Inc. |
|
|
Schwab Equity Index Funds | Annual Holdings and Financial Statements
53
Schwab Total Stock Market Index Fund
Portfolio Holdings as of October 31, 2025 (continued)
| |
|
|
| |
|
|
| |
|
|
| |
|
|
| |
|
|
Lithia Motors, Inc., Class A |
|
|
| |
|
|
| |
|
|
| |
|
|
| |
|
|
| |
|
|
National Vision Holdings, Inc. * |
|
|
| |
|
|
Ollie's Bargain Outlet Holdings, Inc. * |
|
|
OneWater Marine, Inc., Class A * |
|
|
O'Reilly Automotive, Inc. * |
|
|
Penske Automotive Group, Inc. |
|
|
Petco Health & Wellness Co., Inc., Class A * |
|
|
| |
|
|
| |
|
|
| |
|
|
| |
|
|
| |
|
|
| |
|
|
Sally Beauty Holdings, Inc. * |
|
|
Savers Value Village, Inc. * |
|
|
| |
|
|
| |
|
|
| |
|
|
Sonic Automotive, Inc., Class A |
|
|
Stitch Fix, Inc., Class A * |
|
|
| |
|
|
Tile Shop Holdings, Inc. * |
|
|
| |
|
|
| |
|
|
| |
|
|
| |
|
|
| |
|
|
| |
|
|
Victoria's Secret & Co. * |
|
|
Warby Parker, Inc., Class A * |
|
|
| |
|
|
| |
|
|
| |
|
|
| |
|
|
| |
|
|
| |
|
|
| |
Consumer Durables & Apparel 0.7% |
| |
|
|
American Outdoor Brands, Inc. * |
|
|
Bassett Furniture Industries, Inc. |
|
|
| |
|
|
| |
|
|
| |
|
|
| |
|
|
| |
|
|
Century Communities, Inc. |
|
|
| |
|
|
| |
|
|
| |
|
|
| |
|
|
| |
|
|
| |
|
|
| |
|
|
| |
|
|
| |
|
|
| |
|
|
Dream Finders Homes, Inc., Class A * |
|
|
| |
|
|
Ethan Allen Interiors, Inc. |
|
|
| |
|
|
Flexsteel Industries, Inc. |
|
|
| |
|
|
| |
|
|
G-III Apparel Group Ltd. * |
|
|
| |
|
|
Green Brick Partners, Inc. * |
|
|
Hamilton Beach Brands Holding Co., Class A |
|
|
| |
|
|
| |
|
|
| |
|
|
Hovnanian Enterprises, Inc., Class A * |
|
|
Installed Building Products, Inc. |
|
|
| |
|
|
Johnson Outdoors, Inc., Class A |
|
|
| |
|
|
| |
|
|
Lakeland Industries, Inc. |
|
|
| |
|
|
| |
|
|
| |
|
|
| |
|
|
| |
|
|
Levi Strauss & Co., Class A |
|
|
| |
|
|
| |
|
|
Lululemon Athletica, Inc. * |
|
|
| |
|
|
Malibu Boats, Inc., Class A * |
|
|
| |
|
|
MasterCraft Boat Holdings, Inc. * |
|
|
| |
|
|
| |
|
|
Mohawk Industries, Inc. * |
|
|
| |
|
|
| |
|
|
| |
|
|
| |
|
|
| |
|
|
| |
|
|
Peloton Interactive, Inc., Class A * |
|
|
| |
|
|
| |
|
|
| |
|
|
Ralph Lauren Corp., Class A |
|
|
| |
|
|
Smith & Wesson Brands, Inc. |
|
|
Smith Douglas Homes Corp. * |
|
|
Somnigroup International, Inc. |
|
|
| |
|
|
| |
|
|
| |
|
|
Superior Group of Cos., Inc. |
|
|
| |
|
|
Taylor Morrison Home Corp., Class A * |
|
|
| |
|
|
| |
|
|
Topgolf Callaway Brands Corp. * |
|
|
| |
|
|
| |
|
|
Under Armour, Inc., Class A * |
|
|
| |
|
|
| |
|
|
Wolverine World Wide, Inc. |
|
|
54
Schwab Equity Index Funds | Annual Holdings and Financial Statements
Schwab Total Stock Market Index Fund
Portfolio Holdings as of October 31, 2025 (continued)
| |
|
|
| |
|
|
| |
|
|
| |
| |
Accel Entertainment, Inc., Class A * |
|
|
| |
|
|
Adtalem Global Education, Inc. * |
|
|
| |
|
|
American Public Education, Inc. * |
|
|
| |
|
|
| |
|
|
Biglari Holdings, Inc., Class B * |
|
|
| |
|
|
| |
|
|
| |
|
|
| |
|
|
Bright Horizons Family Solutions, Inc. * |
|
|
Brinker International, Inc. * |
|
|
Caesars Entertainment, Inc. * |
|
|
Canterbury Park Holding Corp. |
|
|
| |
|
|
Carriage Services, Inc., Class A |
|
|
| |
|
|
Cheesecake Factory, Inc. (a) |
|
|
| |
|
|
Chipotle Mexican Grill, Inc., Class A * |
|
|
Choice Hotels International, Inc. |
|
|
| |
|
|
| |
|
|
Cracker Barrel Old Country Store, Inc. (a) |
|
|
| |
|
|
Dave & Buster's Entertainment, Inc. * |
|
|
| |
|
|
| |
|
|
| |
|
|
DoorDash, Inc., Class A * |
|
|
DraftKings, Inc., Class A * |
|
|
Driven Brands Holdings, Inc. * |
|
|
| |
|
|
Dutch Bros, Inc., Class A * |
|
|
El Pollo Loco Holdings, Inc. * |
|
|
European Wax Center, Inc., Class A * |
|
|
| |
|
|
First Watch Restaurant Group, Inc. * |
|
|
Flutter Entertainment PLC * |
|
|
| |
|
|
Global Business Travel Group I * |
|
|
Golden Entertainment, Inc. |
|
|
Graham Holdings Co., Class B |
|
|
Grand Canyon Education, Inc. * |
|
|
| |
|
|
Hilton Grand Vacations, Inc. * |
|
|
Hilton Worldwide Holdings, Inc. |
|
|
Hyatt Hotels Corp., Class A |
|
|
Inspired Entertainment, Inc. * |
|
|
| |
|
|
| |
|
|
Kura Sushi USA, Inc., Class A * |
|
|
| |
|
|
Laureate Education, Inc. * |
|
|
Life Time Group Holdings, Inc. * |
|
|
| |
|
|
Lincoln Educational Services Corp. * |
|
|
Lindblad Expeditions Holdings, Inc. * |
|
|
| |
|
|
Lucky Strike Entertainment Corp., Class A (a) |
|
|
Marriott International, Inc., Class A |
|
|
Marriott Vacations Worldwide Corp. |
|
|
Matthews International Corp., Class A |
|
|
| |
|
|
| |
|
|
MGM Resorts International * |
|
|
| |
|
|
Monarch Casino & Resort, Inc. |
|
|
| |
|
|
| |
|
|
Norwegian Cruise Line Holdings Ltd. * |
|
|
OneSpaWorld Holdings Ltd. |
|
|
Papa John's International, Inc. |
|
|
Penn Entertainment, Inc. * |
|
|
| |
|
|
Planet Fitness, Inc., Class A * |
|
|
Portillo's, Inc., Class A * |
|
|
Pursuit Attractions & Hospitality, Inc. * |
|
|
Rave Restaurant Group, Inc. * |
|
|
RCI Hospitality Holdings, Inc. |
|
|
Red Rock Resorts, Inc., Class A |
|
|
Royal Caribbean Cruises Ltd. |
|
|
Rush Street Interactive, Inc. * |
|
|
| |
|
|
Serve Robotics, Inc. *(a) |
|
|
Service Corp. International |
|
|
Shake Shack, Inc., Class A * |
|
|
| |
|
|
Six Flags Entertainment Corp. * |
|
|
| |
|
|
| |
|
|
Strategic Education, Inc. |
|
|
| |
|
|
Sweetgreen, Inc., Class A * |
|
|
Target Hospitality Corp. * |
|
|
Texas Roadhouse, Inc., Class A |
|
|
| |
|
|
| |
|
|
United Parks & Resorts, Inc. * |
|
|
Universal Technical Institute, Inc. * |
|
|
| |
|
|
| |
|
|
| |
|
|
| |
|
|
| |
|
|
Wyndham Hotels & Resorts, Inc. |
|
|
| |
|
|
Xponential Fitness, Inc., Class A * |
|
|
| |
|
|
| |
|
|
| |
Consumer Staples Distribution & Retail 1.7% |
Albertsons Cos., Inc., Class A |
|
|
| |
|
|
BJ's Wholesale Club Holdings, Inc. * |
|
|
Casey's General Stores, Inc. |
|
|
| |
|
|
| |
|
|
| |
|
|
| |
|
|
Grocery Outlet Holding Corp. * |
|
|
Guardian Pharmacy Services, Inc., Class A * |
|
|
Ingles Markets, Inc., Class A |
|
|
| |
|
|
Schwab Equity Index Funds | Annual Holdings and Financial Statements
55
Schwab Total Stock Market Index Fund
Portfolio Holdings as of October 31, 2025 (continued)
| |
|
|
| |
|
|
Natural Grocers by Vitamin Cottage, Inc. |
|
|
Performance Food Group Co. * |
|
|
| |
|
|
Sprouts Farmers Market, Inc. * |
|
|
| |
|
|
| |
|
|
U.S. Foods Holding Corp. * |
|
|
United Natural Foods, Inc. * |
|
|
Village Super Market, Inc., Class A |
|
|
| |
|
|
| |
|
|
| |
|
|
| |
| |
| |
|
|
| |
|
|
| |
|
|
| |
|
|
| |
|
|
| |
|
|
Atlas Energy Solutions, Inc., Class A |
|
|
Baker Hughes Co., Class A |
|
|
| |
|
|
| |
|
|
| |
|
|
| |
|
|
California Resources Corp. |
|
|
| |
|
|
Centrus Energy Corp., Class A * |
|
|
| |
|
|
| |
|
|
| |
|
|
| |
|
|
Clean Energy Fuels Corp. * |
|
|
| |
|
|
Comstock Resources, Inc. * |
|
|
| |
|
|
| |
|
|
Core Natural Resources, Inc. |
|
|
| |
|
|
Crescent Energy Co., Class A |
|
|
| |
|
|
Delek U.S. Holdings, Inc. |
|
|
| |
|
|
| |
|
|
| |
|
|
| |
|
|
| |
|
|
| |
|
|
Energy Services of America Corp. |
|
|
| |
|
|
| |
|
|
| |
|
|
Evolution Petroleum Corp. |
|
|
Excelerate Energy, Inc., Class A |
|
|
| |
|
|
Expro Group Holdings NV * |
|
|
| |
|
|
Flowco Holdings, Inc., Class A |
|
|
Forum Energy Technologies, Inc. * |
|
|
Geospace Technologies Corp. * |
|
|
| |
|
|
Granite Ridge Resources, Inc. |
|
|
| |
|
|
Gulf Island Fabrication, Inc. * |
|
|
| |
|
|
| |
|
|
| |
|
|
Helix Energy Solutions Group, Inc. * |
|
|
| |
|
|
| |
|
|
Infinity Natural Resources, Inc., Class A * |
|
|
Innovex International, Inc. * |
|
|
International Seaways, Inc. |
|
|
| |
|
|
Kinetik Holdings, Inc., Class A |
|
|
Kodiak Gas Services, Inc. |
|
|
| |
|
|
Liberty Energy, Inc., Class A |
|
|
| |
|
|
Magnolia Oil & Gas Corp., Class A |
|
|
Mammoth Energy Services, Inc. * |
|
|
| |
|
|
| |
|
|
| |
|
|
| |
|
|
NACCO Industries, Inc., Class A |
|
|
Natural Gas Services Group, Inc. |
|
|
New Fortress Energy, Inc. *(a) |
|
|
| |
|
|
| |
|
|
| |
|
|
| |
|
|
Occidental Petroleum Corp. |
|
|
Oceaneering International, Inc. * |
|
|
Oil States International, Inc. * |
|
|
| |
|
|
| |
|
|
Par Pacific Holdings, Inc. * |
|
|
Patterson-UTI Energy, Inc. |
|
|
PBF Energy, Inc., Class A |
|
|
| |
|
|
Permian Resources Corp., Class A |
|
|
| |
|
|
Prairie Operating Co. *(a) |
|
|
PrimeEnergy Resources Corp. * |
|
|
ProFrac Holding Corp., Class A * |
|
|
| |
|
|
| |
|
|
Ranger Energy Services, Inc., Class A |
|
|
REX American Resources Corp. * |
|
|
Riley Exploration Permian, Inc. |
|
|
| |
|
|
| |
|
|
| |
|
|
| |
|
|
SEACOR Marine Holdings, Inc. * |
|
|
| |
|
|
Select Water Solutions, Inc. |
|
|
| |
|
|
| |
|
|
| |
|
|
Solaris Energy Infrastructure, Inc. |
|
|
| |
|
|
| |
|
|
| |
|
|
| |
|
|
TETRA Technologies, Inc. * |
|
|
| |
|
|
| |
|
|
| |
|
|
| |
|
|
| |
|
|
56
Schwab Equity Index Funds | Annual Holdings and Financial Statements
Schwab Total Stock Market Index Fund
Portfolio Holdings as of October 31, 2025 (continued)
| |
|
|
| |
|
|
| |
|
|
| |
|
|
Venture Global, Inc., Class A |
|
|
Viper Energy, Inc., Class A |
|
|
| |
|
|
| |
|
|
| |
|
|
Weatherford International PLC |
|
|
| |
|
|
| |
|
|
| |
|
|
| |
Equity Real Estate Investment Trusts (REITs) 2.0% |
| |
|
|
| |
|
|
Alexander & Baldwin, Inc. |
|
|
| |
|
|
Alexandria Real Estate Equities, Inc. |
|
|
Alpine Income Property Trust, Inc. |
|
|
American Assets Trust, Inc. |
|
|
American Healthcare REIT, Inc. |
|
|
American Homes 4 Rent, Class A |
|
|
| |
|
|
Americold Realty Trust, Inc. |
|
|
Apartment Investment & Management Co., Class A |
|
|
Apple Hospitality REIT, Inc. |
|
|
Armada Hoffler Properties, Inc. |
|
|
AvalonBay Communities, Inc. |
|
|
Bluerock Homes Trust, Inc. |
|
|
Braemar Hotels & Resorts, Inc. |
|
|
| |
|
|
Brixmor Property Group, Inc. |
|
|
Broadstone Net Lease, Inc. |
|
|
| |
|
|
| |
|
|
| |
|
|
| |
|
|
CBL & Associates Properties, Inc. |
|
|
| |
|
|
| |
|
|
| |
|
|
| |
|
|
Community Healthcare Trust, Inc. |
|
|
| |
|
|
| |
|
|
| |
|
|
| |
|
|
| |
|
|
Curbline Properties Corp. |
|
|
DiamondRock Hospitality Co. |
|
|
Digital Realty Trust, Inc. |
|
|
Diversified Healthcare Trust |
|
|
| |
|
|
Easterly Government Properties, Inc. |
|
|
EastGroup Properties, Inc. |
|
|
| |
|
|
Empire State Realty Trust, Inc., Class A |
|
|
| |
|
|
| |
|
|
Equity LifeStyle Properties, Inc. |
|
|
| |
|
|
Essential Properties Realty Trust, Inc. |
|
|
Essex Property Trust, Inc. |
|
|
Extra Space Storage, Inc. |
|
|
| |
|
|
| |
|
|
Federal Realty Investment Trust |
|
|
First Industrial Realty Trust, Inc. |
|
|
Four Corners Property Trust, Inc. |
|
|
Franklin Street Properties Corp. |
|
|
| |
|
|
Gaming & Leisure Properties, Inc. |
|
|
| |
|
|
Gladstone Commercial Corp. |
|
|
| |
|
|
Global Medical REIT, Inc. |
|
|
| |
|
|
Healthcare Realty Trust, Inc., Class A |
|
|
Healthpeak Properties, Inc. |
|
|
Highwoods Properties, Inc. |
|
|
Host Hotels & Resorts, Inc. |
|
|
Hudson Pacific Properties, Inc. * |
|
|
Independence Realty Trust, Inc. |
|
|
Industrial Logistics Properties Trust |
|
|
Innovative Industrial Properties, Inc. |
|
|
InvenTrust Properties Corp. |
|
|
| |
|
|
| |
|
|
| |
|
|
| |
|
|
| |
|
|
| |
|
|
Lamar Advertising Co., Class A |
|
|
| |
|
|
| |
|
|
| |
|
|
| |
|
|
Medical Properties Trust, Inc. (a) |
|
|
Mid-America Apartment Communities, Inc. |
|
|
Millrose Properties, Inc., Class A (a) |
|
|
| |
|
|
National Health Investors, Inc. |
|
|
National Storage Affiliates Trust |
|
|
NET Lease Office Properties |
|
|
| |
|
|
NexPoint Diversified Real Estate Trust |
|
|
NexPoint Residential Trust, Inc. |
|
|
| |
|
|
Omega Healthcare Investors, Inc. |
|
|
One Liberty Properties, Inc. |
|
|
| |
|
|
| |
|
|
| |
|
|
Park Hotels & Resorts, Inc. |
|
|
| |
|
|
| |
|
|
Phillips Edison & Co., Inc. |
|
|
Piedmont Realty Trust, Inc., Class A |
|
|
Plymouth Industrial REIT, Inc. |
|
|
Postal Realty Trust, Inc., Class A |
|
|
| |
|
|
| |
|
|
| |
|
|
| |
|
|
| |
|
|
| |
|
|
Rexford Industrial Realty, Inc. |
|
|
| |
|
|
Ryman Hospitality Properties, Inc. |
|
|
Sabra Health Care REIT, Inc. |
|
|
| |
|
|
| |
|
|
Schwab Equity Index Funds | Annual Holdings and Financial Statements
57
Schwab Total Stock Market Index Fund
Portfolio Holdings as of October 31, 2025 (continued)
| |
|
|
SBA Communications Corp., Class A |
|
|
Service Properties Trust (c) |
|
|
| |
|
|
Simon Property Group, Inc. |
|
|
| |
|
|
| |
|
|
Smartstop Self Storage REIT, Inc. |
|
|
| |
|
|
Summit Hotel Properties, Inc. |
|
|
| |
|
|
Sunstone Hotel Investors, Inc. |
|
|
| |
|
|
| |
|
|
| |
|
|
| |
|
|
Universal Health Realty Income Trust |
|
|
| |
|
|
| |
|
|
| |
|
|
VICI Properties, Inc., Class A |
|
|
| |
|
|
| |
|
|
| |
|
|
| |
|
|
| |
|
|
Xenia Hotels & Resorts, Inc. |
|
|
| |
|
|
| |
| |
| |
|
|
Acadian Asset Management, Inc. |
|
|
ACRES Commercial Realty Corp. * |
|
|
| |
|
|
Affiliated Managers Group, Inc. |
|
|
| |
|
|
AG Mortgage Investment Trust, Inc. |
|
|
| |
|
|
| |
|
|
| |
|
|
| |
|
|
| |
|
|
Ameriprise Financial, Inc. |
|
|
Angel Oak Mortgage REIT, Inc. |
|
|
Annaly Capital Management, Inc. |
|
|
Apollo Commercial Real Estate Finance, Inc. |
|
|
Apollo Global Management, Inc. |
|
|
Arbor Realty Trust, Inc. (a) |
|
|
ARES Management Corp., Class A |
|
|
ARMOUR Residential REIT, Inc. |
|
|
Artisan Partners Asset Management, Inc., Class A |
|
|
Atlanticus Holdings Corp. * |
|
|
| |
|
|
Bank of New York Mellon Corp. |
|
|
Berkshire Hathaway, Inc., Class B * |
|
|
Better Home & Finance Holding Co. *(a) |
|
|
| |
|
|
| |
|
|
Blackstone Mortgage Trust, Inc., Class A |
|
|
| |
|
|
| |
|
|
Blue Owl Capital, Inc., Class A |
|
|
Bread Financial Holdings, Inc. |
|
|
BrightSpire Capital, Inc., Class A |
|
|
| |
|
|
| |
|
|
| |
|
|
Capital One Financial Corp. |
|
|
| |
|
|
Cass Information Systems, Inc. |
|
|
Cboe Global Markets, Inc. |
|
|
| |
|
|
Chicago Atlantic Real Estate Finance, Inc. |
|
|
Chime Financial, Inc., Class A *(a) |
|
|
| |
|
|
Claros Mortgage Trust, Inc. * |
|
|
| |
|
|
| |
|
|
Coinbase Global, Inc., Class A * |
|
|
Consumer Portfolio Services, Inc. * |
|
|
Corebridge Financial, Inc. |
|
|
| |
|
|
Credit Acceptance Corp. * |
|
|
| |
|
|
DeFi Development Corp. *(a) |
|
|
Diamond Hill Investment Group, Inc. |
|
|
DigitalBridge Group, Inc. |
|
|
Donnelley Financial Solutions, Inc. * |
|
|
| |
|
|
Ellington Financial, Inc. |
|
|
| |
|
|
Encore Capital Group, Inc. * |
|
|
Enova International, Inc. * |
|
|
| |
|
|
| |
|
|
Euronet Worldwide, Inc. * |
|
|
| |
|
|
| |
|
|
| |
|
|
FactSet Research Systems, Inc. |
|
|
Federal Agricultural Mortgage Corp., Class C |
|
|
| |
|
|
Fidelity National Information Services, Inc. |
|
|
Finance of America Cos., Inc., Class A * |
|
|
| |
|
|
| |
|
|
| |
|
|
Forge Global Holdings, Inc. * |
|
|
Franklin BSP Realty Trust, Inc. |
|
|
| |
|
|
Galaxy Digital, Inc., Class A * |
|
|
GCM Grosvenor, Inc., Class A |
|
|
| |
|
|
Goldman Sachs Group, Inc. |
|
|
Granite Point Mortgage Trust, Inc. |
|
|
| |
|
|
Green Dot Corp., Class A * |
|
|
Guild Holdings Co., Class A |
|
|
HA Sustainable Infrastructure Capital, Inc. |
|
|
Hamilton Lane, Inc., Class A |
|
|
| |
|
|
Houlihan Lokey, Inc., Class A |
|
|
| |
|
|
Interactive Brokers Group, Inc., Class A |
|
|
Intercontinental Exchange, Inc. |
|
|
International Money Express, Inc. * |
|
|
58
Schwab Equity Index Funds | Annual Holdings and Financial Statements
Schwab Total Stock Market Index Fund
Portfolio Holdings as of October 31, 2025 (continued)
| |
|
|
| |
|
|
Invesco Mortgage Capital, Inc. (a) |
|
|
Jack Henry & Associates, Inc. |
|
|
Jackson Financial, Inc., Class A |
|
|
Janus Henderson Group PLC |
|
|
Jefferies Financial Group, Inc. |
|
|
| |
|
|
| |
|
|
KKR Real Estate Finance Trust, Inc. |
|
|
Ladder Capital Corp., Class A |
|
|
| |
|
|
| |
|
|
| |
|
|
loanDepot, Inc., Class A * |
|
|
LPL Financial Holdings, Inc. |
|
|
Lument Finance Trust, Inc. |
|
|
Manhattan Bridge Capital, Inc. |
|
|
MarketAxess Holdings, Inc. |
|
|
| |
|
|
Mastercard, Inc., Class A |
|
|
Medallion Financial Corp. |
|
|
| |
|
|
| |
|
|
| |
|
|
Miami International Holdings, Inc. * |
|
|
| |
|
|
| |
|
|
| |
|
|
| |
|
|
| |
|
|
| |
|
|
| |
|
|
| |
|
|
| |
|
|
NerdWallet, Inc., Class A * |
|
|
| |
|
|
Nexpoint Real Estate Finance, Inc. |
|
|
NMI Holdings, Inc., Class A * |
|
|
| |
|
|
Old Market Capital Corp. * |
|
|
| |
|
|
| |
|
|
Open Lending Corp., Class A * |
|
|
Oportun Financial Corp. * |
|
|
Oppenheimer Holdings, Inc., Class A |
|
|
| |
|
|
Orchid Island Capital, Inc. |
|
|
| |
|
|
Paymentus Holdings, Inc., Class A * |
|
|
| |
|
|
| |
|
|
| |
|
|
PennyMac Financial Services, Inc. |
|
|
PennyMac Mortgage Investment Trust |
|
|
Perella Weinberg Partners, Class A |
|
|
| |
|
|
PJT Partners, Inc., Class A |
|
|
| |
|
|
Priority Technology Holdings, Inc. * |
|
|
| |
|
|
| |
|
|
Raymond James Financial, Inc. |
|
|
| |
|
|
| |
|
|
Regional Management Corp. |
|
|
| |
|
|
Repay Holdings Corp., Class A * |
|
|
| |
|
|
| |
|
|
Rithm Property Trust, Inc. |
|
|
Robinhood Markets, Inc., Class A * |
|
|
Rocket Cos., Inc., Class A |
|
|
| |
|
|
Security National Financial Corp., Class A * |
|
|
| |
|
|
Seven Hills Realty Trust *(a) |
|
|
| |
|
|
Shift4 Payments, Inc., Class A * |
|
|
Silvercrest Asset Management Group, Inc., Class A |
|
|
| |
|
|
SoFi Technologies, Inc. * |
|
|
Starwood Property Trust, Inc. |
|
|
| |
|
|
StepStone Group, Inc., Class A |
|
|
| |
|
|
| |
|
|
Sunrise Realty Trust, Inc. |
|
|
| |
|
|
| |
|
|
T. Rowe Price Group, Inc. |
|
|
| |
|
|
TPG RE Finance Trust, Inc. |
|
|
| |
|
|
Tradeweb Markets, Inc., Class A |
|
|
| |
|
|
Two Harbors Investment Corp. |
|
|
| |
|
|
| |
|
|
Velocity Financial, Inc. * |
|
|
Victory Capital Holdings, Inc., Class A |
|
|
Virtu Financial, Inc., Class A |
|
|
Virtus Investment Partners, Inc. |
|
|
| |
|
|
| |
|
|
| |
|
|
Waterstone Financial, Inc. |
|
|
| |
|
|
| |
|
|
| |
|
|
| |
|
|
| |
|
|
| |
Food, Beverage & Tobacco 1.9% |
| |
|
|
| |
|
|
Archer-Daniels-Midland Co. |
|
|
| |
|
|
| |
|
|
Boston Beer Co., Inc., Class A * |
|
|
| |
|
|
Brown-Forman Corp., Class B |
|
|
| |
|
|
| |
|
|
| |
|
|
| |
|
|
| |
|
|
| |
|
|
Coca-Cola Consolidated, Inc. |
|
|
| |
|
|
Constellation Brands, Inc., Class A |
|
|
Darling Ingredients, Inc. * |
|
|
| |
|
|
Fresh Del Monte Produce, Inc. |
|
|
| |
|
|
Schwab Equity Index Funds | Annual Holdings and Financial Statements
59
Schwab Total Stock Market Index Fund
Portfolio Holdings as of October 31, 2025 (continued)
| |
|
|
| |
|
|
Hain Celestial Group, Inc. * |
|
|
| |
|
|
| |
|
|
| |
|
|
| |
|
|
| |
|
|
John B Sanfilippo & Son, Inc. |
|
|
| |
|
|
| |
|
|
| |
|
|
Lamb Weston Holdings, Inc. |
|
|
| |
|
|
| |
|
|
| |
|
|
| |
|
|
McCormick & Co., Inc. - Non Voting Shares |
|
|
| |
|
|
Molson Coors Beverage Co., Class B |
|
|
Mondelez International, Inc., Class A |
|
|
| |
|
|
National Beverage Corp. * |
|
|
| |
|
|
Philip Morris International, Inc. |
|
|
| |
|
|
| |
|
|
| |
|
|
| |
|
|
Seneca Foods Corp., Class A * |
|
|
| |
|
|
| |
|
|
Tootsie Roll Industries, Inc. |
|
|
| |
|
|
Turning Point Brands, Inc. |
|
|
Tyson Foods, Inc., Class A |
|
|
| |
|
|
| |
|
|
| |
|
|
| |
|
|
| |
|
|
| |
|
|
| |
|
|
| |
Health Care Equipment & Services 3.7% |
| |
|
|
Acadia Healthcare Co., Inc. * |
|
|
| |
|
|
AdaptHealth Corp., Class A * |
|
|
| |
|
|
| |
|
|
| |
|
|
Alignment Healthcare, Inc. * |
|
|
Alphatec Holdings, Inc. * |
|
|
AMN Healthcare Services, Inc. * |
|
|
| |
|
|
Anteris Technologies Global Corp. * |
|
|
| |
|
|
| |
|
|
| |
|
|
| |
|
|
| |
|
|
Aveanna Healthcare Holdings, Inc. * |
|
|
| |
|
|
Baxter International, Inc. |
|
|
| |
|
|
| |
|
|
| |
|
|
Bioventus, Inc., Class A * |
|
|
Boston Scientific Corp. * |
|
|
BrightSpring Health Services, Inc. * |
|
|
Brookdale Senior Living, Inc. * |
|
|
Butterfly Network, Inc. * |
|
|
| |
|
|
Castle Biosciences, Inc. * |
|
|
| |
|
|
| |
|
|
| |
|
|
| |
|
|
| |
|
|
| |
|
|
| |
|
|
| |
|
|
Clover Health Investments Corp., Class A * |
|
|
Community Health Systems, Inc. * |
|
|
Concentra Group Holdings Parent, Inc. |
|
|
| |
|
|
| |
|
|
| |
|
|
Cross Country Healthcare, Inc. * |
|
|
| |
|
|
| |
|
|
| |
|
|
Definitive Healthcare Corp. * |
|
|
| |
|
|
| |
|
|
| |
|
|
| |
|
|
Doximity, Inc., Class A * |
|
|
Edwards Lifesciences Corp. * |
|
|
| |
|
|
| |
|
|
| |
|
|
| |
|
|
| |
|
|
| |
|
|
| |
|
|
| |
|
|
Evolent Health, Inc., Class A * |
|
|
| |
|
|
| |
|
|
GE HealthCare Technologies, Inc. |
|
|
| |
|
|
| |
|
|
Globus Medical, Inc., Class A * |
|
|
GoodRx Holdings, Inc., Class A * |
|
|
| |
|
|
| |
|
|
| |
|
|
| |
|
|
| |
|
|
| |
|
|
| |
|
|
| |
|
|
| |
|
|
Hims & Hers Health, Inc. * |
|
|
Hinge Health, Inc., Class A * |
|
|
| |
|
|
| |
|
|
| |
|
|
IDEXX Laboratories, Inc. * |
|
|
InfuSystem Holdings, Inc. * |
|
|
| |
|
|
Inspire Medical Systems, Inc. * |
|
|
60
Schwab Equity Index Funds | Annual Holdings and Financial Statements
Schwab Total Stock Market Index Fund
Portfolio Holdings as of October 31, 2025 (continued)
| |
|
|
| |
|
|
| |
|
|
Integra LifeSciences Holdings Corp. * |
|
|
Intuitive Surgical, Inc. * |
|
|
| |
|
|
iRhythm Technologies, Inc. * |
|
|
Kestra Medical Technologies Ltd. * |
|
|
Kewaunee Scientific Corp. * |
|
|
| |
|
|
KORU Medical Systems, Inc. * |
|
|
| |
|
|
Lantheus Holdings, Inc. * |
|
|
| |
|
|
| |
|
|
| |
|
|
LifeStance Health Group, Inc. * |
|
|
| |
|
|
| |
|
|
| |
|
|
| |
|
|
Merit Medical Systems, Inc. * |
|
|
Milestone Scientific, Inc. * |
|
|
Molina Healthcare, Inc. * |
|
|
National HealthCare Corp. |
|
|
| |
|
|
| |
|
|
| |
|
|
| |
|
|
| |
|
|
| |
|
|
| |
|
|
OmniAb, Inc., Class A *(b) |
|
|
OmniAb, Inc., Class B *(b) |
|
|
| |
|
|
Oncology Institute, Inc. * |
|
|
| |
|
|
| |
|
|
Option Care Health, Inc. * |
|
|
OraSure Technologies, Inc. * |
|
|
| |
|
|
| |
|
|
| |
|
|
| |
|
|
| |
|
|
Pediatrix Medical Group, Inc. * |
|
|
| |
|
|
| |
|
|
| |
|
|
| |
|
|
Privia Health Group, Inc. * |
|
|
PROCEPT BioRobotics Corp. * |
|
|
| |
|
|
| |
|
|
Pulse Biosciences, Inc. * |
|
|
| |
|
|
| |
|
|
| |
|
|
| |
|
|
| |
|
|
| |
|
|
| |
|
|
| |
|
|
Select Medical Holdings Corp. |
|
|
Semler Scientific, Inc. * |
|
|
Senseonics Holdings, Inc. * |
|
|
| |
|
|
| |
|
|
| |
|
|
| |
|
|
Sonida Senior Living, Inc. * |
|
|
| |
|
|
| |
|
|
| |
|
|
| |
|
|
| |
|
|
| |
|
|
Tactile Systems Technology, Inc. * |
|
|
| |
|
|
Tandem Diabetes Care, Inc. * |
|
|
| |
|
|
| |
|
|
| |
|
|
TransMedics Group, Inc. * |
|
|
Treace Medical Concepts, Inc. * |
|
|
| |
|
|
U.S. Physical Therapy, Inc. |
|
|
| |
|
|
| |
|
|
Universal Health Services, Inc., Class B |
|
|
Utah Medical Products, Inc. |
|
|
| |
|
|
Veeva Systems, Inc., Class A * |
|
|
Viemed Healthcare, Inc. * |
|
|
| |
|
|
| |
|
|
Zimmer Biomet Holdings, Inc. |
|
|
| |
|
|
| |
Household & Personal Products 0.8% |
| |
|
|
| |
|
|
Central Garden & Pet Co. * |
|
|
Central Garden & Pet Co., Class A * |
|
|
Church & Dwight Co., Inc. |
|
|
| |
|
|
| |
|
|
| |
|
|
Edgewell Personal Care Co. |
|
|
| |
|
|
| |
|
|
Estee Lauder Cos., Inc., Class A |
|
|
| |
|
|
| |
|
|
| |
|
|
| |
|
|
| |
|
|
| |
|
|
| |
|
|
Natural Health Trends Corp. |
|
|
Nature's Sunshine Products, Inc. * |
|
|
Nu Skin Enterprises, Inc., Class A |
|
|
| |
|
|
| |
|
|
| |
|
|
Reynolds Consumer Products, Inc. |
|
|
Spectrum Brands Holdings, Inc. |
|
|
| |
|
|
| |
|
|
USANA Health Sciences, Inc. * |
|
|
| |
|
|
| |
|
|
| |
Schwab Equity Index Funds | Annual Holdings and Financial Statements
61
Schwab Total Stock Market Index Fund
Portfolio Holdings as of October 31, 2025 (continued)
| |
|
|
| |
Abacus Global Management, Inc. * |
|
|
| |
|
|
| |
|
|
Ambac Financial Group, Inc. * |
|
|
American Coastal Insurance Corp., Class C |
|
|
American Financial Group, Inc. |
|
|
American International Group, Inc. |
|
|
| |
|
|
| |
|
|
| |
|
|
| |
|
|
| |
|
|
| |
|
|
Axis Capital Holdings Ltd. |
|
|
Baldwin Insurance Group, Inc., Class A * |
|
|
Bowhead Specialty Holdings, Inc. * |
|
|
Brighthouse Financial, Inc. * |
|
|
| |
|
|
| |
|
|
Cincinnati Financial Corp. |
|
|
| |
|
|
| |
|
|
CNO Financial Group, Inc. |
|
|
| |
|
|
Donegal Group, Inc., Class A |
|
|
| |
|
|
| |
|
|
Erie Indemnity Co., Class A |
|
|
| |
|
|
F&G Annuities & Life, Inc. |
|
|
Fidelity National Financial, Inc. |
|
|
First American Financial Corp. |
|
|
Genworth Financial, Inc., Class A * |
|
|
| |
|
|
Goosehead Insurance, Inc., Class A |
|
|
Greenlight Capital Re Ltd., Class A * |
|
|
| |
|
|
Hanover Insurance Group, Inc. |
|
|
Hartford Insurance Group, Inc. |
|
|
| |
|
|
Heritage Insurance Holdings, Inc. * |
|
|
| |
|
|
Horace Mann Educators Corp. |
|
|
| |
|
|
James River Group Holdings Ltd. |
|
|
| |
|
|
| |
|
|
| |
|
|
Kingsway Financial Services, Inc. * |
|
|
Kinsale Capital Group, Inc. |
|
|
| |
|
|
| |
|
|
| |
|
|
| |
|
|
Marsh & McLennan Cos., Inc. |
|
|
| |
|
|
| |
|
|
| |
|
|
| |
|
|
Old Republic International Corp. |
|
|
Oscar Health, Inc., Class A * |
|
|
| |
|
|
| |
|
|
Principal Financial Group, Inc. |
|
|
| |
|
|
| |
|
|
| |
|
|
Prudential Financial, Inc. |
|
|
Reinsurance Group of America, Inc. |
|
|
RenaissanceRe Holdings Ltd. |
|
|
| |
|
|
| |
|
|
Ryan Specialty Holdings, Inc., Class A |
|
|
Safety Insurance Group, Inc. |
|
|
Selective Insurance Group, Inc. |
|
|
| |
|
|
| |
|
|
Skyward Specialty Insurance Group, Inc. * |
|
|
Slide Insurance Holdings, Inc. * |
|
|
Stewart Information Services Corp. |
|
|
| |
|
|
| |
|
|
| |
|
|
| |
|
|
| |
|
|
Universal Insurance Holdings, Inc. |
|
|
| |
|
|
| |
|
|
White Mountains Insurance Group Ltd. |
|
|
| |
|
|
| |
|
|
| |
| |
| |
|
|
Air Products & Chemicals, Inc. |
|
|
| |
|
|
| |
|
|
Alpha Metallurgical Resources, Inc. * |
|
|
| |
|
|
| |
|
|
American Battery Technology Co. * |
|
|
| |
|
|
| |
|
|
| |
|
|
| |
|
|
| |
|
|
| |
|
|
| |
|
|
| |
|
|
| |
|
|
Axalta Coating Systems Ltd. * |
|
|
| |
|
|
| |
|
|
| |
|
|
| |
|
|
| |
|
|
CF Industries Holdings, Inc. |
|
|
| |
|
|
| |
|
|
| |
|
|
| |
|
|
| |
|
|
Compass Minerals International, Inc. * |
|
|
| |
|
|
Core Molding Technologies, Inc. * |
|
|
| |
|
|
| |
|
|
| |
|
|
| |
|
|
| |
|
|
62
Schwab Equity Index Funds | Annual Holdings and Financial Statements
Schwab Total Stock Market Index Fund
Portfolio Holdings as of October 31, 2025 (continued)
| |
|
|
| |
|
|
| |
|
|
| |
|
|
| |
|
|
| |
|
|
| |
|
|
Flotek Industries, Inc. * |
|
|
| |
|
|
| |
|
|
Friedman Industries, Inc. |
|
|
Graphic Packaging Holding Co. |
|
|
| |
|
|
| |
|
|
| |
|
|
| |
|
|
| |
|
|
Hycroft Mining Holding Corp., Class A * |
|
|
Idaho Strategic Resources, Inc. * |
|
|
| |
|
|
| |
|
|
International Flavors & Fragrances, Inc. |
|
|
| |
|
|
| |
|
|
| |
|
|
| |
|
|
| |
|
|
| |
|
|
| |
|
|
| |
|
|
| |
|
|
| |
|
|
LyondellBasell Industries NV, Class A |
|
|
| |
|
|
Martin Marietta Materials, Inc. |
|
|
| |
|
|
| |
|
|
| |
|
|
| |
|
|
Minerals Technologies, Inc. |
|
|
| |
|
|
| |
|
|
| |
|
|
| |
|
|
| |
|
|
Northern Technologies International Corp. |
|
|
| |
|
|
| |
|
|
| |
|
|
| |
|
|
| |
|
|
| |
|
|
Packaging Corp. of America |
|
|
Perimeter Solutions, Inc. * |
|
|
| |
|
|
PureCycle Technologies, Inc. * |
|
|
| |
|
|
Ramaco Resources, Inc., Class A * |
|
|
Ranpak Holdings Corp., Class A * |
|
|
Rayonier Advanced Materials, Inc. * |
|
|
| |
|
|
| |
|
|
| |
|
|
| |
|
|
| |
|
|
| |
|
|
| |
|
|
Sensient Technologies Corp. |
|
|
| |
|
|
| |
|
|
| |
|
|
| |
|
|
Solitario Resources Corp. * |
|
|
Solstice Advanced Materials, Inc. * |
|
|
| |
|
|
| |
|
|
| |
|
|
| |
|
|
| |
|
|
| |
|
|
| |
|
|
| |
|
|
| |
|
|
U.S. Lime & Minerals, Inc. |
|
|
USA Rare Earth, Inc. *(a) |
|
|
| |
|
|
| |
|
|
| |
|
|
| |
|
|
| |
|
|
| |
|
|
| |
Media & Entertainment 8.6% |
Advantage Solutions, Inc. * |
|
|
| |
|
|
| |
|
|
Altice USA, Inc., Class A * |
|
|
AMC Entertainment Holdings, Inc., Class A * |
|
|
AMC Networks, Inc., Class A * |
|
|
| |
|
|
Arena Group Holdings, Inc. * |
|
|
Atlanta Braves Holdings, Inc., Class C * |
|
|
Boston Omaha Corp., Class A * |
|
|
| |
|
|
| |
|
|
| |
|
|
| |
|
|
Charter Communications, Inc., Class A * |
|
|
| |
|
|
Clear Channel Outdoor Holdings, Inc. * |
|
|
| |
|
|
| |
|
|
| |
|
|
DoubleVerify Holdings, Inc. * |
|
|
EchoStar Corp., Class A * |
|
|
| |
|
|
| |
|
|
Entravision Communications Corp., Class A |
|
|
Eventbrite, Inc., Class A * |
|
|
EverQuote, Inc., Class A * |
|
|
EW Scripps Co., Class A *(c) |
|
|
| |
|
|
| |
|
|
| |
|
|
| |
|
|
| |
|
|
| |
|
|
| |
|
|
Schwab Equity Index Funds | Annual Holdings and Financial Statements
63
Schwab Total Stock Market Index Fund
Portfolio Holdings as of October 31, 2025 (continued)
| |
|
|
Ibotta, Inc., Class A *(a) |
|
|
iHeartMedia, Inc., Class A * |
|
|
Integral Ad Science Holding Corp. * |
|
|
Interpublic Group of Cos., Inc. |
|
|
| |
|
|
John Wiley & Sons, Inc., Class A |
|
|
Liberty Broadband Corp., Class C * |
|
|
Liberty Media Corp.-Liberty Formula One, Class C * |
|
|
Liberty Media Corp.-Liberty Live, Class C * |
|
|
Lionsgate Studios Corp. * |
|
|
Live Nation Entertainment, Inc. * |
|
|
| |
|
|
Madison Square Garden Entertainment Corp., Class A * |
|
|
Madison Square Garden Sports Corp. * |
|
|
| |
|
|
| |
|
|
| |
|
|
| |
|
|
MediaAlpha, Inc., Class A * |
|
|
Meta Platforms, Inc., Class A |
|
|
| |
|
|
| |
|
|
| |
|
|
New York Times Co., Class A |
|
|
| |
|
|
Nexstar Media Group, Inc., Class A |
|
|
Nextdoor Holdings, Inc. * |
|
|
NIQ Global Intelligence PLC * |
|
|
| |
|
|
Paramount Skydance Corp., Class B (a) |
|
|
Pinterest, Inc., Class A * |
|
|
| |
|
|
| |
|
|
PubMatic, Inc., Class A * |
|
|
| |
|
|
| |
|
|
| |
|
|
| |
|
|
| |
|
|
| |
|
|
Saga Communications, Inc., Class A |
|
|
| |
|
|
| |
|
|
| |
|
|
| |
|
|
| |
|
|
| |
|
|
Sphere Entertainment Co. * |
|
|
Stagwell, Inc., Class A * |
|
|
Starz Entertainment Corp. * |
|
|
Take-Two Interactive Software, Inc. * |
|
|
| |
|
|
| |
|
|
| |
|
|
| |
|
|
| |
|
|
Townsquare Media, Inc., Class A |
|
|
Trade Desk, Inc., Class A * |
|
|
| |
|
|
| |
|
|
| |
|
|
| |
|
|
Trump Media & Technology Group Corp. * |
|
|
| |
|
|
| |
|
|
Warner Bros Discovery, Inc. * |
|
|
Warner Music Group Corp., Class A |
|
|
Webtoon Entertainment, Inc. *(a) |
|
|
| |
|
|
| |
|
|
| |
|
|
| |
|
|
ZipRecruiter, Inc., Class A * |
|
|
ZoomInfo Technologies, Inc., Class A * |
|
|
| |
|
|
| |
Pharmaceuticals, Biotechnology & Life Sciences 5.7% |
10X Genomics, Inc., Class A * |
|
|
4D Molecular Therapeutics, Inc. * |
|
|
| |
|
|
Abeona Therapeutics, Inc. * |
|
|
| |
|
|
ACADIA Pharmaceuticals, Inc. * |
|
|
Achieve Life Sciences, Inc. *(a) |
|
|
Aclaris Therapeutics, Inc. * |
|
|
Adaptive Biotechnologies Corp. * |
|
|
| |
|
|
| |
|
|
Agilent Technologies, Inc. |
|
|
Agios Pharmaceuticals, Inc. * |
|
|
Akebia Therapeutics, Inc. * |
|
|
Akero Therapeutics, Inc. * |
|
|
Aldeyra Therapeutics, Inc. * |
|
|
| |
|
|
| |
|
|
Allogene Therapeutics, Inc. * |
|
|
Alnylam Pharmaceuticals, Inc. * |
|
|
| |
|
|
| |
|
|
| |
|
|
| |
|
|
| |
|
|
Amicus Therapeutics, Inc. * |
|
|
Amneal Pharmaceuticals, Inc. * |
|
|
Amphastar Pharmaceuticals, Inc. * |
|
|
Amylyx Pharmaceuticals, Inc. * |
|
|
| |
|
|
Anavex Life Sciences Corp. *(a) |
|
|
ANI Pharmaceuticals, Inc. * |
|
|
Anixa Biosciences, Inc. * |
|
|
| |
|
|
Apellis Pharmaceuticals, Inc. * |
|
|
Apogee Therapeutics, Inc. * |
|
|
Aquestive Therapeutics, Inc. * |
|
|
Arbutus Biopharma Corp. * |
|
|
| |
|
|
Arcturus Therapeutics Holdings, Inc. * |
|
|
Arcus Biosciences, Inc. * |
|
|
Arcutis Biotherapeutics, Inc. * |
|
|
| |
|
|
ArriVent Biopharma, Inc. * |
|
|
Arrowhead Pharmaceuticals, Inc. * |
|
|
ARS Pharmaceuticals, Inc. * |
|
|
| |
|
|
Assembly Biosciences, Inc. * |
|
|
Astria Therapeutics, Inc. * |
|
|
Atara Biotherapeutics, Inc. * |
|
|
Atea Pharmaceuticals, Inc. * |
|
|
64
Schwab Equity Index Funds | Annual Holdings and Financial Statements
Schwab Total Stock Market Index Fund
Portfolio Holdings as of October 31, 2025 (continued)
| |
|
|
Atossa Therapeutics, Inc. * |
|
|
| |
|
|
| |
|
|
Avadel Pharmaceuticals PLC * |
|
|
| |
|
|
Avidity Biosciences, Inc. * |
|
|
| |
|
|
Axsome Therapeutics, Inc. * |
|
|
| |
|
|
Beam Therapeutics, Inc. * |
|
|
Benitec Biopharma, Inc. * |
|
|
Bicara Therapeutics, Inc. * |
|
|
| |
|
|
BioCryst Pharmaceuticals, Inc. * |
|
|
| |
|
|
| |
|
|
BioLife Solutions, Inc. * |
|
|
BioMarin Pharmaceutical, Inc. * |
|
|
Bio-Rad Laboratories, Inc., Class A * |
|
|
| |
|
|
| |
|
|
Black Diamond Therapeutics, Inc. * |
|
|
BridgeBio Oncology Therapeutics, Inc. * |
|
|
| |
|
|
| |
|
|
| |
|
|
| |
|
|
| |
|
|
Candel Therapeutics, Inc. *(a) |
|
|
Capricor Therapeutics, Inc. *(a) |
|
|
Cardiff Oncology, Inc. *(a) |
|
|
| |
|
|
Caribou Biosciences, Inc. * |
|
|
| |
|
|
Catalyst Pharmaceuticals, Inc. * |
|
|
| |
|
|
Celldex Therapeutics, Inc. * |
|
|
| |
|
|
Champions Oncology, Inc. * |
|
|
Charles River Laboratories International, Inc. * |
|
|
Cidara Therapeutics, Inc. * |
|
|
| |
|
|
Cogent Biosciences, Inc. * |
|
|
Cognition Therapeutics, Inc. * |
|
|
Coherus Oncology, Inc. *(a) |
|
|
Collegium Pharmaceutical, Inc. * |
|
|
Compass Therapeutics, Inc. * |
|
|
Contineum Therapeutics, Inc., Class A * |
|
|
Corbus Pharmaceuticals Holdings, Inc. * |
|
|
Corcept Therapeutics, Inc. * |
|
|
| |
|
|
Corvus Pharmaceuticals, Inc. * |
|
|
Coya Therapeutics, Inc. * |
|
|
Crinetics Pharmaceuticals, Inc. * |
|
|
| |
|
|
| |
|
|
Cullinan Therapeutics, Inc. * |
|
|
Cytek Biosciences, Inc. * |
|
|
| |
|
|
CytomX Therapeutics, Inc. * |
|
|
| |
|
|
Day One Biopharmaceuticals, Inc. * |
|
|
Denali Therapeutics, Inc. * |
|
|
Design Therapeutics, Inc. * |
|
|
| |
|
|
DiaMedica Therapeutics, Inc. * |
|
|
Dianthus Therapeutics, Inc. * |
|
|
| |
|
|
Dynavax Technologies Corp. * |
|
|
Dyne Therapeutics, Inc. * |
|
|
Edgewise Therapeutics, Inc. * |
|
|
| |
|
|
Elanco Animal Health, Inc. * |
|
|
Eledon Pharmaceuticals, Inc. * |
|
|
| |
|
|
Emergent BioSolutions, Inc. * |
|
|
Enanta Pharmaceuticals, Inc. * |
|
|
Enliven Therapeutics, Inc. * |
|
|
| |
|
|
Esperion Therapeutics, Inc. * |
|
|
| |
|
|
Eton Pharmaceuticals, Inc. * |
|
|
| |
|
|
| |
|
|
| |
|
|
EyePoint Pharmaceuticals, Inc. * |
|
|
Foghorn Therapeutics, Inc. * |
|
|
| |
|
|
Fulcrum Therapeutics, Inc. * |
|
|
Galectin Therapeutics, Inc. *(a) |
|
|
| |
|
|
| |
|
|
| |
|
|
Ginkgo Bioworks Holdings, Inc. * |
|
|
| |
|
|
| |
|
|
Greenwich Lifesciences, Inc. *(a) |
|
|
Halozyme Therapeutics, Inc. * |
|
|
Harmony Biosciences Holdings, Inc. * |
|
|
| |
|
|
Heron Therapeutics, Inc. *(a) |
|
|
| |
|
|
Ideaya Biosciences, Inc. * |
|
|
| |
|
|
Immuneering Corp., Class A *(a) |
|
|
| |
|
|
| |
|
|
| |
|
|
| |
|
|
| |
|
|
| |
|
|
Inhibrx Biosciences, Inc. * |
|
|
| |
|
|
Inovio Pharmaceuticals, Inc. *(a) |
|
|
| |
|
|
| |
|
|
Intellia Therapeutics, Inc. * |
|
|
Ionis Pharmaceuticals, Inc. * |
|
|
Iovance Biotherapeutics, Inc. * |
|
|
| |
|
|
Ironwood Pharmaceuticals, Inc., Class A * |
|
|
| |
|
|
Janux Therapeutics, Inc. * |
|
|
Jazz Pharmaceuticals PLC * |
|
|
| |
|
|
KalVista Pharmaceuticals, Inc. * |
|
|
Karyopharm Therapeutics, Inc. * |
|
|
Keros Therapeutics, Inc. * |
|
|
| |
|
|
| |
|
|
| |
|
|
| |
|
|
Schwab Equity Index Funds | Annual Holdings and Financial Statements
65
Schwab Total Stock Market Index Fund
Portfolio Holdings as of October 31, 2025 (continued)
| |
|
|
Kymera Therapeutics, Inc. * |
|
|
Larimar Therapeutics, Inc. * |
|
|
LENZ Therapeutics, Inc. * |
|
|
Lexeo Therapeutics, Inc. * |
|
|
Lexicon Pharmaceuticals, Inc. * |
|
|
Lifecore Biomedical, Inc. * |
|
|
Ligand Pharmaceuticals, Inc. * |
|
|
Lineage Cell Therapeutics, Inc. *(a) |
|
|
| |
|
|
| |
|
|
Lyell Immunopharma, Inc. * |
|
|
| |
|
|
Madrigal Pharmaceuticals, Inc. * |
|
|
| |
|
|
Maravai LifeSciences Holdings, Inc., Class A * |
|
|
Maze Therapeutics, Inc. * |
|
|
| |
|
|
| |
|
|
| |
|
|
| |
|
|
Merrimack Pharmaceuticals, Inc. *(b) |
|
|
| |
|
|
| |
|
|
Mettler-Toledo International, Inc. * |
|
|
| |
|
|
Mind Medicine MindMed, Inc. * |
|
|
Mineralys Therapeutics, Inc. * |
|
|
Mirum Pharmaceuticals, Inc. * |
|
|
| |
|
|
Monopar Therapeutics, Inc. * |
|
|
Monte Rosa Therapeutics, Inc. * |
|
|
| |
|
|
| |
|
|
| |
|
|
Neumora Therapeutics, Inc. * |
|
|
Neurocrine Biosciences, Inc. * |
|
|
| |
|
|
Niagen Bioscience, Inc. * |
|
|
| |
|
|
| |
|
|
Nurix Therapeutics, Inc. * |
|
|
Nuvalent, Inc., Class A * |
|
|
| |
|
|
Nuvectis Pharma, Inc. *(a) |
|
|
| |
|
|
Ocular Therapeutix, Inc. * |
|
|
Olema Pharmaceuticals, Inc. * |
|
|
Omeros Corp., Class B *(a) |
|
|
| |
|
|
Organogenesis Holdings, Inc., Class A * |
|
|
| |
|
|
ORIC Pharmaceuticals, Inc. * |
|
|
Oruka Therapeutics, Inc. * |
|
|
Pacific Biosciences of California, Inc. *(a) |
|
|
Pacira BioSciences, Inc. * |
|
|
Palvella Therapeutics, Inc. * |
|
|
| |
|
|
| |
|
|
Perspective Therapeutics, Inc. * |
|
|
| |
|
|
Phathom Pharmaceuticals, Inc. * |
|
|
Phibro Animal Health Corp., Class A |
|
|
Praxis Precision Medicines, Inc. * |
|
|
| |
|
|
Prestige Consumer Healthcare, Inc. * |
|
|
| |
|
|
| |
|
|
| |
|
|
Protagonist Therapeutics, Inc. * |
|
|
Protara Therapeutics, Inc. * |
|
|
| |
|
|
| |
|
|
Puma Biotechnology, Inc. * |
|
|
| |
|
|
| |
|
|
Rapport Therapeutics, Inc. * |
|
|
RAPT Therapeutics, Inc. * |
|
|
Recursion Pharmaceuticals, Inc., Class A *(a) |
|
|
Regeneron Pharmaceuticals, Inc. |
|
|
| |
|
|
Relay Therapeutics, Inc. * |
|
|
| |
|
|
| |
|
|
| |
|
|
Revolution Medicines, Inc. * |
|
|
| |
|
|
| |
|
|
Rhythm Pharmaceuticals, Inc. * |
|
|
Rigel Pharmaceuticals, Inc. * |
|
|
Rocket Pharmaceuticals, Inc. * |
|
|
| |
|
|
Royalty Pharma PLC, Class A |
|
|
Sagimet Biosciences, Inc., Class A * |
|
|
Sana Biotechnology, Inc. * |
|
|
Sangamo Therapeutics, Inc. * |
|
|
Sarepta Therapeutics, Inc. * |
|
|
| |
|
|
Scholar Rock Holding Corp. * |
|
|
| |
|
|
SELLAS Life Sciences Group, Inc. *(a) |
|
|
| |
|
|
Sera Prognostics, Inc., Class A * |
|
|
| |
|
|
| |
|
|
Sionna Therapeutics, Inc. * |
|
|
Soleno Therapeutics, Inc. * |
|
|
Solid Biosciences, Inc. * |
|
|
| |
|
|
Spero Therapeutics, Inc. * |
|
|
Spyre Therapeutics, Inc. * |
|
|
Standard BioTools, Inc. * |
|
|
Stoke Therapeutics, Inc. * |
|
|
Summit Therapeutics, Inc. *(a) |
|
|
Supernus Pharmaceuticals, Inc. * |
|
|
Syndax Pharmaceuticals, Inc. * |
|
|
Tango Therapeutics, Inc. * |
|
|
Tarsus Pharmaceuticals, Inc. * |
|
|
Taysha Gene Therapies, Inc. * |
|
|
Tectonic Therapeutic, Inc. * |
|
|
| |
|
|
Tenaya Therapeutics, Inc. * |
|
|
Terns Pharmaceuticals, Inc. * |
|
|
| |
|
|
Theravance Biopharma, Inc. * |
|
|
Thermo Fisher Scientific, Inc. |
|
|
Third Harmonic Bio, Inc. *(b) |
|
|
Tonix Pharmaceuticals Holding Corp. * |
|
|
Travere Therapeutics, Inc. * |
|
|
Trevi Therapeutics, Inc. * |
|
|
TriSalus Life Sciences, Inc. * |
|
|
TuHURA Biosciences, Inc. * |
|
|
Tvardi Therapeutics, Inc. *(a) |
|
|
| |
|
|
66
Schwab Equity Index Funds | Annual Holdings and Financial Statements
Schwab Total Stock Market Index Fund
Portfolio Holdings as of October 31, 2025 (continued)
| |
|
|
| |
|
|
Ultragenyx Pharmaceutical, Inc. * |
|
|
| |
|
|
United Therapeutics Corp. * |
|
|
| |
|
|
Vanda Pharmaceuticals, Inc. * |
|
|
| |
|
|
Ventyx Biosciences, Inc. * |
|
|
Vera Therapeutics, Inc., Class A * |
|
|
| |
|
|
| |
|
|
| |
|
|
Vertex Pharmaceuticals, Inc. * |
|
|
| |
|
|
| |
|
|
Vigil Neuroscience, Inc. *(b) |
|
|
Viking Therapeutics, Inc. * |
|
|
Vir Biotechnology, Inc. * |
|
|
Viridian Therapeutics, Inc. * |
|
|
Vistagen Therapeutics, Inc. * |
|
|
Voyager Therapeutics, Inc. * |
|
|
| |
|
|
WaVe Life Sciences Ltd. * |
|
|
West Pharmaceutical Services, Inc. |
|
|
| |
|
|
Xeris Biopharma Holdings, Inc. * |
|
|
| |
|
|
Zenas Biopharma, Inc. *(a) |
|
|
Zentalis Pharmaceuticals, Inc. * |
|
|
Zevra Therapeutics, Inc. * |
|
|
| |
|
|
| |
|
|
| |
Real Estate Management & Development 0.2% |
| |
|
|
Anywhere Real Estate, Inc. * |
|
|
CBRE Group, Inc., Class A * |
|
|
| |
|
|
| |
|
|
Cushman & Wakefield PLC * |
|
|
| |
|
|
| |
|
|
| |
|
|
| |
|
|
Howard Hughes Holdings, Inc. * |
|
|
Jones Lang LaSalle, Inc. * |
|
|
Kennedy-Wilson Holdings, Inc. |
|
|
| |
|
|
Maui Land & Pineapple Co., Inc. * |
|
|
Newmark Group, Inc., Class A |
|
|
Opendoor Technologies, Inc. * |
|
|
RE/MAX Holdings, Inc., Class A * |
|
|
| |
|
|
Seaport Entertainment Group, Inc. * |
|
|
Seritage Growth Properties, Class A * |
|
|
| |
|
|
| |
|
|
Stratus Properties, Inc. * |
|
|
| |
|
|
Zillow Group, Inc., Class C * |
|
|
| |
|
|
| |
Semiconductors & Semiconductor Equipment 13.6% |
ACM Research, Inc., Class A * |
|
|
Advanced Micro Devices, Inc. * |
|
|
| |
|
|
| |
|
|
| |
|
|
Allegro MicroSystems, Inc. * |
|
|
Alpha & Omega Semiconductor Ltd. * |
|
|
| |
|
|
| |
|
|
| |
|
|
| |
|
|
| |
|
|
Axcelis Technologies, Inc. * |
|
|
| |
|
|
Blaize Holdings, Inc. *(a) |
|
|
| |
|
|
| |
|
|
| |
|
|
| |
|
|
Credo Technology Group Holding Ltd. * |
|
|
| |
|
|
| |
|
|
| |
|
|
Everspin Technologies, Inc. * |
|
|
| |
|
|
| |
|
|
| |
|
|
| |
|
|
indie Semiconductor, Inc., Class A *(a) |
|
|
| |
|
|
| |
|
|
| |
|
|
| |
|
|
Kulicke & Soffa Industries, Inc. |
|
|
| |
|
|
Lattice Semiconductor Corp. * |
|
|
MACOM Technology Solutions Holdings, Inc. * |
|
|
| |
|
|
| |
|
|
Microchip Technology, Inc. |
|
|
| |
|
|
| |
|
|
Monolithic Power Systems, Inc. |
|
|
Navitas Semiconductor Corp., Class A *(a) |
|
|
| |
|
|
| |
|
|
| |
|
|
| |
|
|
| |
|
|
| |
|
|
Penguin Solutions, Inc. * |
|
|
| |
|
|
| |
|
|
| |
|
|
| |
|
|
| |
|
|
| |
|
|
Rigetti Computing, Inc. * |
|
|
| |
|
|
Silicon Laboratories, Inc. * |
|
|
| |
|
|
SkyWater Technology, Inc. * |
|
|
| |
|
|
SolarEdge Technologies, Inc. * |
|
|
| |
|
|
| |
|
|
| |
|
|
Ultra Clean Holdings, Inc. * |
|
|
| |
|
|
Schwab Equity Index Funds | Annual Holdings and Financial Statements
67
Schwab Total Stock Market Index Fund
Portfolio Holdings as of October 31, 2025 (continued)
| |
|
|
Veeco Instruments, Inc. * |
|
|
| |
|
|
| |
Software & Services 12.0% |
| |
|
|
| |
|
|
| |
|
|
| |
|
|
| |
|
|
| |
|
|
| |
|
|
Airship AI Holdings, Inc., Class A * |
|
|
Akamai Technologies, Inc. * |
|
|
Alarm.com Holdings, Inc. * |
|
|
Alkami Technology, Inc. * |
|
|
Amplitude, Inc., Class A * |
|
|
Appfolio, Inc., Class A * |
|
|
| |
|
|
| |
|
|
AppLovin Corp., Class A * |
|
|
| |
|
|
| |
|
|
| |
|
|
Atlassian Corp., Class A * |
|
|
| |
|
|
Aurora Innovation, Inc. * |
|
|
| |
|
|
| |
|
|
Backblaze, Inc., Class A * |
|
|
Bentley Systems, Inc., Class B |
|
|
BigBear.ai Holdings, Inc. * |
|
|
| |
|
|
| |
|
|
BitMine Immersion Technologies, Inc. * |
|
|
| |
|
|
| |
|
|
Blend Labs, Inc., Class A * |
|
|
| |
|
|
| |
|
|
| |
|
|
Cadence Design Systems, Inc. * |
|
|
CCC Intelligent Solutions Holdings, Inc. * |
|
|
| |
|
|
| |
|
|
Circle Internet Group, Inc. *(a) |
|
|
| |
|
|
Clear Secure, Inc., Class A |
|
|
Clearwater Analytics Holdings, Inc., Class A * |
|
|
Cloudflare, Inc., Class A * |
|
|
Cognizant Technology Solutions Corp., Class A |
|
|
| |
|
|
Commvault Systems, Inc. * |
|
|
Confluent, Inc., Class A * |
|
|
Consensus Cloud Solutions, Inc. * |
|
|
| |
|
|
CoreWeave, Inc., Class A * |
|
|
Crowdstrike Holdings, Inc., Class A * |
|
|
| |
|
|
| |
|
|
| |
|
|
| |
|
|
| |
|
|
DigitalOcean Holdings, Inc. * |
|
|
| |
|
|
Docusign, Inc., Class A * |
|
|
Dolby Laboratories, Inc., Class A |
|
|
| |
|
|
| |
|
|
| |
|
|
| |
|
|
| |
|
|
| |
|
|
| |
|
|
| |
|
|
| |
|
|
Exodus Movement, Inc., Class A * |
|
|
Expensify, Inc., Class A * |
|
|
| |
|
|
| |
|
|
| |
|
|
| |
|
|
Freshworks, Inc., Class A * |
|
|
| |
|
|
| |
|
|
| |
|
|
| |
|
|
Grid Dynamics Holdings, Inc. * |
|
|
Guidewire Software, Inc. * |
|
|
| |
|
|
| |
|
|
| |
|
|
I3 Verticals, Inc., Class A * |
|
|
Informatica, Inc., Class A * |
|
|
Information Services Group, Inc. |
|
|
| |
|
|
| |
|
|
| |
|
|
International Business Machines Corp. |
|
|
| |
|
|
| |
|
|
| |
|
|
| |
|
|
| |
|
|
| |
|
|
| |
|
|
LiveRamp Holdings, Inc. * |
|
|
Manhattan Associates, Inc. * |
|
|
| |
|
|
| |
|
|
| |
|
|
| |
|
|
| |
|
|
| |
|
|
| |
|
|
| |
|
|
| |
|
|
| |
|
|
| |
|
|
| |
|
|
| |
|
|
| |
|
|
| |
|
|
| |
|
|
Palantir Technologies, Inc., Class A * |
|
|
Palo Alto Networks, Inc. * |
|
|
| |
|
|
| |
|
|
Pivotal Software, Inc. *(b) |
|
|
| |
|
|
Procore Technologies, Inc. * |
|
|
Progress Software Corp. * |
|
|
68
Schwab Equity Index Funds | Annual Holdings and Financial Statements
Schwab Total Stock Market Index Fund
Portfolio Holdings as of October 31, 2025 (continued)
| |
|
|
| |
|
|
| |
|
|
| |
|
|
| |
|
|
Rackspace Technology, Inc. * |
|
|
| |
|
|
| |
|
|
| |
|
|
| |
|
|
Research Solutions, Inc. * |
|
|
| |
|
|
RingCentral, Inc., Class A * |
|
|
| |
|
|
| |
|
|
| |
|
|
| |
|
|
| |
|
|
| |
|
|
SEMrush Holdings, Inc., Class A * |
|
|
SentinelOne, Inc., Class A * |
|
|
| |
|
|
ServiceTitan, Inc., Class A * |
|
|
Snowflake, Inc., Class A * |
|
|
SoundHound AI, Inc., Class A * |
|
|
| |
|
|
Sprinklr, Inc., Class A * |
|
|
Sprout Social, Inc., Class A * |
|
|
| |
|
|
| |
|
|
Strategy, Inc., Class A * |
|
|
| |
|
|
| |
|
|
| |
|
|
| |
|
|
| |
|
|
| |
|
|
| |
|
|
| |
|
|
| |
|
|
Tyler Technologies, Inc. * |
|
|
| |
|
|
| |
|
|
| |
|
|
| |
|
|
Varonis Systems, Inc., Class B * |
|
|
| |
|
|
| |
|
|
| |
|
|
| |
|
|
Viant Technology, Inc., Class A * |
|
|
Weave Communications, Inc. * |
|
|
| |
|
|
| |
|
|
| |
|
|
| |
|
|
| |
|
|
| |
|
|
Zeta Global Holdings Corp., Class A * |
|
|
Zoom Communications, Inc. * |
|
|
| |
|
|
| |
|
|
| |
Technology Hardware & Equipment 8.5% |
| |
|
|
| |
|
|
Advanced Energy Industries, Inc. |
|
|
Aeva Technologies, Inc. * |
|
|
| |
|
|
| |
|
|
| |
|
|
| |
|
|
Applied Optoelectronics, Inc. * |
|
|
| |
|
|
Arlo Technologies, Inc. * |
|
|
Arrow Electronics, Inc. * |
|
|
| |
|
|
| |
|
|
| |
|
|
| |
|
|
| |
|
|
| |
|
|
Benchmark Electronics, Inc. |
|
|
| |
|
|
| |
|
|
| |
|
|
| |
|
|
| |
|
|
| |
|
|
Climb Global Solutions, Inc. |
|
|
| |
|
|
| |
|
|
CommScope Holding Co., Inc. * |
|
|
CompoSecure, Inc., Class A * |
|
|
| |
|
|
| |
|
|
| |
|
|
| |
|
|
| |
|
|
| |
|
|
Dell Technologies, Inc., Class C |
|
|
| |
|
|
Digi International, Inc. * |
|
|
| |
|
|
| |
|
|
Evolv Technologies Holdings, Inc. * |
|
|
| |
|
|
| |
|
|
| |
|
|
| |
|
|
Frequency Electronics, Inc. * |
|
|
| |
|
|
| |
|
|
Hewlett Packard Enterprise Co. |
|
|
| |
|
|
| |
|
|
| |
|
|
| |
|
|
Insight Enterprises, Inc. * |
|
|
| |
|
|
| |
|
|
| |
|
|
| |
|
|
Keysight Technologies, Inc. * |
|
|
Kimball Electronics, Inc. * |
|
|
| |
|
|
| |
|
|
LightPath Technologies, Inc., Class A * |
|
|
| |
|
|
| |
|
|
Lumentum Holdings, Inc. * |
|
|
| |
|
|
Mirion Technologies, Inc., Class A * |
|
|
| |
|
|
M-Tron Industries, Inc. * |
|
|
Napco Security Technologies, Inc. |
|
|
| |
|
|
Schwab Equity Index Funds | Annual Holdings and Financial Statements
69
Schwab Total Stock Market Index Fund
Portfolio Holdings as of October 31, 2025 (continued)
| |
|
|
| |
|
|
| |
|
|
| |
|
|
| |
|
|
| |
|
|
| |
|
|
| |
|
|
| |
|
|
| |
|
|
| |
|
|
| |
|
|
| |
|
|
Pure Storage, Inc., Class A * |
|
|
Quantum Computing, Inc. *(a) |
|
|
| |
|
|
Red Cat Holdings, Inc. *(a) |
|
|
ReElement Technologies LLC *(a)(b) |
|
|
Research Frontiers, Inc. * |
|
|
| |
|
|
Ribbon Communications, Inc. * |
|
|
Richardson Electronics Ltd. |
|
|
| |
|
|
| |
|
|
| |
|
|
| |
|
|
Seagate Technology Holdings PLC |
|
|
| |
|
|
Super Micro Computer, Inc. * |
|
|
| |
|
|
| |
|
|
Teledyne Technologies, Inc. * |
|
|
TransAct Technologies, Inc. * |
|
|
| |
|
|
| |
|
|
| |
|
|
| |
|
|
| |
|
|
| |
|
|
| |
|
|
Vishay Intertechnology, Inc. |
|
|
Vishay Precision Group, Inc. * |
|
|
| |
|
|
| |
|
|
| |
|
|
Wrap Technologies, Inc. *(a) |
|
|
| |
|
|
Zebra Technologies Corp., Class A * |
|
|
| |
|
|
| |
Telecommunication Services 0.8% |
| |
|
|
Array Digital Infrastructure, Inc. |
|
|
| |
|
|
| |
|
|
| |
|
|
Bandwidth, Inc., Class A * |
|
|
Cogent Communications Holdings, Inc. |
|
|
Frontier Communications Parent, Inc. * |
|
|
| |
|
|
GCI Liberty, Inc., Class C * |
|
|
| |
|
|
| |
|
|
| |
|
|
Iridium Communications, Inc. |
|
|
Liberty Global Ltd., Class C * |
|
|
| |
|
|
Liberty Latin America Ltd., Class C * |
|
|
Lumen Technologies, Inc. * |
|
|
NII Holdings, Inc. Escrow *(b) |
|
|
Shenandoah Telecommunications Co. |
|
|
| |
|
|
Telephone & Data Systems, Inc. |
|
|
| |
|
|
| |
|
|
Verizon Communications, Inc. |
|
|
| |
|
|
| |
| |
| |
|
|
| |
|
|
American Airlines Group, Inc. * |
|
|
| |
|
|
Avis Budget Group, Inc. * |
|
|
CH Robinson Worldwide, Inc. |
|
|
Covenant Logistics Group, Inc., Class A |
|
|
| |
|
|
| |
|
|
Expeditors International of Washington, Inc. |
|
|
| |
|
|
| |
|
|
Frontier Group Holdings, Inc. * |
|
|
FTAI Infrastructure, Inc. |
|
|
Genco Shipping & Trading Ltd. |
|
|
| |
|
|
| |
|
|
Hertz Global Holdings, Inc. *(a) |
|
|
| |
|
|
JB Hunt Transport Services, Inc. |
|
|
| |
|
|
| |
|
|
| |
|
|
Knight-Swift Transportation Holdings, Inc. |
|
|
| |
|
|
| |
|
|
| |
|
|
| |
|
|
| |
|
|
Old Dominion Freight Line, Inc. |
|
|
Pangaea Logistics Solutions Ltd. |
|
|
Proficient Auto Logistics, Inc. * |
|
|
Radiant Logistics, Inc. * |
|
|
| |
|
|
| |
|
|
| |
|
|
Schneider National, Inc., Class B |
|
|
Sky Harbour Group Corp. * |
|
|
| |
|
|
| |
|
|
Strata Critical Medical, Inc. * |
|
|
Sun Country Airlines Holdings, Inc. * |
|
|
Uber Technologies, Inc. * |
|
|
U-Haul Holding Co., Non Voting Shares |
|
|
| |
|
|
United Airlines Holdings, Inc. * |
|
|
United Parcel Service, Inc., Class B |
|
|
Universal Logistics Holdings, Inc. |
|
|
| |
|
|
Wheels Up Experience, Inc. * |
|
|
70
Schwab Equity Index Funds | Annual Holdings and Financial Statements
Schwab Total Stock Market Index Fund
Portfolio Holdings as of October 31, 2025 (continued)
| |
|
|
| |
|
|
| |
|
|
| |
| |
| |
|
|
| |
|
|
| |
|
|
| |
|
|
American Electric Power Co., Inc. |
|
|
American States Water Co. |
|
|
American Water Works Co., Inc. |
|
|
Artesian Resources Corp., Class A |
|
|
| |
|
|
| |
|
|
| |
|
|
| |
|
|
California Water Service Group |
|
|
| |
|
|
Chesapeake Utilities Corp. |
|
|
Clearway Energy, Inc., Class C |
|
|
| |
|
|
Consolidated Edison, Inc. |
|
|
Consolidated Water Co. Ltd. |
|
|
Constellation Energy Corp. |
|
|
| |
|
|
| |
|
|
| |
|
|
| |
|
|
| |
|
|
Essential Utilities, Inc. |
|
|
| |
|
|
| |
|
|
| |
|
|
| |
|
|
Genie Energy Ltd., Class B |
|
|
Global Water Resources, Inc. |
|
|
| |
|
|
| |
|
|
Hawaiian Electric Industries, Inc. * |
|
|
| |
|
|
MDU Resources Group, Inc. |
|
|
| |
|
|
| |
|
|
| |
|
|
New Jersey Resources Corp. |
|
|
| |
|
|
| |
|
|
Northwest Natural Holding Co. |
|
|
Northwestern Energy Group, Inc. |
|
|
| |
|
|
| |
|
|
| |
|
|
| |
|
|
| |
|
|
| |
|
|
| |
|
|
Pinnacle West Capital Corp. |
|
|
Portland General Electric Co. |
|
|
| |
|
|
Public Service Enterprise Group, Inc. |
|
|
| |
|
|
| |
|
|
| |
|
|
| |
|
|
Southwest Gas Holdings, Inc. |
|
|
| |
|
|
| |
|
|
| |
|
|
| |
|
|
| |
|
|
| |
|
|
| |
|
|
| |
|
|
| |
|
|
| |
|
|
| |
|
|
Total Common Stocks
(Cost $12,146,419,075) |
|
| |
RIGHTS 0.0% OF NET ASSETS |
| |
Pharmaceuticals, Biotechnology & Life Sciences 0.0% |
Aduro Biotech, Inc. CVR *(b) |
|
|
Cartesian Therapeutics, Inc. CVR *(b) |
|
|
Checkpoint Therapeutics, Inc. CVR *(b) |
|
|
Cyteir Therapeutics, Inc. CVR *(b) |
|
|
Frequency Therapeutics, Inc. CVR *(b) |
|
|
F-star Therapeutics, Inc. Agonist CVR *(b) |
|
|
F-star Therapeutics, Inc. Antagonist CVR *(b) |
|
|
Homology Medicines, Inc. CVR *(b) |
|
|
| |
|
|
Magenta Therapeutics, Inc. CVR *(b) |
|
|
Miromatrix Medical, Inc. CVR *(b) |
|
|
Pardes Biosciences, Inc. CVR *(b) |
|
|
| |
|
|
Surface Oncology, Inc. CVR *(b) |
|
|
Tectonic Therapeutic, Inc. CVR *(b) |
|
|
Zynerba Pharmaceuticals, Inc. CVR *(b) |
|
|
| |
|
|
Total Rights
(Cost $31,744) |
|
| |
WARRANTS 0.0% OF NET ASSETS |
| |
| |
DeFi Development Corp. expires 01/21/28, *(a)(b) |
|
|
| |
|
| |
|
|
SHORT-TERM INVESTMENTS 0.1% OF NET ASSETS |
| |
| |
State Street Institutional U.S. Government Money Market Fund, Premier Class 4.01% (e)(f) |
|
|
Total Short-Term Investments
(Cost $34,130,714) |
|
Total Investments in Securities
(Cost $12,180,581,533) |
|
Schwab Equity Index Funds | Annual Holdings and Financial Statements
71
Schwab Total Stock Market Index Fund
Portfolio Holdings as of October 31, 2025 (continued)
| |
|
|
CURRENT VALUE/
UNREALIZED
APPRECIATION
($) |
| |
| |
|
|
|
Russell 2000 Index, e-mini, expires 12/19/25 |
|
|
|
S&P 500 Index, e-mini, expires 12/19/25 |
|
|
|
| |
|
|
|
| |
Non-income producing security. |
| |
All or a portion of this security is on loan. Securities on loan were valued at $33,194,524. |
| |
Fair valued using significant unobservable inputs (see financial note 2(a), Securities for which no quoted value is available, for additional information). |
| |
Issuer is an affiliated company, as the investment adviser owns at least 5% of the voting securities of such company. |
| |
Issuer is affiliated with the fund’s investment adviser. |
| |
The rate shown is the annualized 7-day yield. |
| |
Security purchased with cash collateral received for securities on loan. |
| |
|
| |
Real Estate Investment Trust |
Below is a summary of the fund’s transactions with affiliated issuers and affiliated companies which are or were affiliates during the period ended October 31, 2025. An affiliated company is a company in which the investment adviser has or had an ownership of at least 5% of the voting securities of a security issue during the report period. A dash in the Value at October 31, 2024, and/or Value and Balance of Shares Held at October 31, 2025, columns means either the issuer was not held or not held as an affiliate on the stated date.
| |
|
|
|
NET REALIZED GAINS (LOSSES) |
NET CHANGE IN UNREALIZED APPRECIATION (DEPRECIATION) |
|
BALANCE OF SHARES HELD AT 10/31/25 |
|
COMMON STOCKS 0.2% OF NET ASSETS |
| |
Commercial & Professional Services 0.0% |
| |
|
|
|
|
|
|
|
|
| |
Consumer Discretionary Distribution & Retail 0.0% |
| |
|
|
|
|
|
|
|
|
| |
Consumer Durables & Apparel 0.0% |
| |
|
|
|
|
|
|
|
|
| |
| |
Cracker Barrel Old Country Store, Inc. |
|
|
|
|
|
|
|
|
| |
Equity Real Estate Investment Trusts (REITs) 0.0% |
Diversified Healthcare Trust |
|
|
|
|
|
|
|
|
| |
|
|
|
|
|
|
|
|
| |
|
|
|
|
|
|
|
|
| |
| |
| |
|
|
|
|
|
|
|
|
| |
Household & Personal Products 0.0% |
| |
|
|
|
|
|
|
|
|
| |
Media & Entertainment 0.0% |
| |
|
|
|
|
|
|
|
|
| |
Pharmaceuticals, Biotechnology & Life Sciences 0.0% |
Emergent BioSolutions, Inc. |
|
|
|
|
|
|
|
|
| |
|
|
|
|
|
|
|
|
72
Schwab Equity Index Funds | Annual Holdings and Financial Statements
Schwab Total Stock Market Index Fund
Portfolio Holdings as of October 31, 2025 (continued)
The following is a summary of the inputs used to value the fund’s investments as of October 31, 2025 (see financial note 2(a) for additional information):
| |
QUOTED PRICES IN
ACTIVE MARKETS FOR
IDENTICAL ASSETS
(LEVEL 1) |
OTHER SIGNIFICANT
OBSERVABLE INPUTS
(LEVEL 2) |
SIGNIFICANT
UNOBSERVABLE INPUTS
(LEVEL 3) |
|
| |
|
|
|
|
| |
|
|
|
|
| |
|
|
|
|
| |
|
|
|
|
Health Care Equipment & Services |
|
|
|
|
| |
|
|
|
|
Pharmaceuticals, Biotechnology & Life Sciences |
|
|
|
|
| |
|
|
|
|
Technology Hardware & Equipment |
|
|
|
|
Telecommunication Services |
|
|
|
|
| |
|
|
|
|
Pharmaceuticals, Biotechnology & Life Sciences |
|
|
|
|
| |
|
|
|
|
| |
|
|
|
|
| |
|
|
|
|
| |
|
|
|
|
| |
|
|
|
|
| |
Level 3 amount shown includes securities determined to have no value at October 31, 2025. |
| |
As categorized in the Portfolio Holdings. |
| |
Futures contracts are reported at cumulative unrealized appreciation or depreciation. |
Schwab Equity Index Funds | Annual Holdings and Financial Statements
73
Schwab Total Stock Market Index Fund
Statement of Assets and Liabilities
| |
Investments in securities, at value - affiliated issuers (cost $38,396,513) |
|
|
Investments in securities, at value - unaffiliated issuers (cost $12,142,185,020) including securities on loan of $33,194,524 |
|
|
| |
|
|
Deposit with broker for futures contracts |
|
|
| |
|
|
| |
|
|
| |
|
|
Variation margin on future contracts |
|
|
Income from securities on loan |
|
|
| |
|
|
| |
| |
Collateral held for securities on loan |
|
|
| |
|
|
| |
|
|
| |
|
|
| |
|
|
| |
|
|
| |
|
|
| |
| |
Capital received from investors |
|
|
Total distributable earnings |
|
|
| |
|
|
74
Schwab Equity Index Funds | Annual Holdings and Financial Statements
Schwab Total Stock Market Index Fund
Statement of Operations
For the period November 1, 2024 through October 31, 2025 |
| |
Dividends received from securities - unaffiliated issuers (net of foreign withholding tax of $116,493) |
|
|
| |
|
|
Dividends received from securities - affiliated issuers |
|
|
| |
|
|
| |
|
|
| |
| |
| |
|
|
| |
|
|
| |
|
|
| |
REALIZED AND UNREALIZED GAINS (LOSSES) |
Net realized losses on sales of securities - affiliated issuers |
|
|
Net realized losses on sales of securities - unaffiliated issuers |
|
|
Net realized gains on futures contracts |
|
|
| |
|
|
Net change in unrealized appreciation (depreciation) on securities - affiliated issuers |
|
|
Net change in unrealized appreciation (depreciation) on securities - unaffiliated issuers |
|
|
Net change in unrealized appreciation (depreciation) on futures contracts |
|
|
Net change in unrealized appreciation (depreciation) |
|
|
Net realized and unrealized gains |
|
|
Increase in net assets resulting from operations |
|
|
Schwab Equity Index Funds | Annual Holdings and Financial Statements
75
Schwab Total Stock Market Index Fund
Statement of Changes in Net Assets
For the current and prior report periods
| |
| |
|
|
| |
|
|
|
| |
|
|
|
Net change in unrealized appreciation (depreciation) |
|
|
|
Increase in net assets resulting from operations |
|
|
|
| |
DISTRIBUTIONS TO SHAREHOLDERS |
| |
|
|
|
TRANSACTIONS IN FUND SHARES1 |
| |
|
|
| |
|
|
|
|
|
| |
|
|
|
|
|
| |
|
|
|
|
|
| |
|
|
|
|
|
Net transactions in fund shares |
|
|
|
|
|
| |
SHARES OUTSTANDING AND NET ASSETS1 |
| |
|
|
| |
|
|
|
|
|
| |
|
|
|
|
|
| |
|
|
|
|
|
| |
|
|
|
|
|
| |
For the period ended October 31, 2025, and the prior report period, transactions in fund shares have been retroactively adjusted to reflect a 7-for-1 share split effective after the close of U.S. markets on August 15, 2025. The retroactive adjustment of the share split does not change the transaction in fund shares values (see financial note 9 for additional information). |
76
Schwab Equity Index Funds | Annual Holdings and Financial Statements
Schwab U.S. Large-Cap Growth Index Fund
Financial Statements
| |
|
|
|
|
|
|
| |
Net asset value at beginning of period |
|
|
|
|
|
|
Income (loss) from investment operations: |
|
|
|
|
|
|
Net investment income (loss)2 |
|
|
|
|
|
|
Net realized and unrealized gains (losses) |
|
|
|
|
|
|
Total from investment operations |
|
|
|
|
|
|
| |
|
|
|
|
|
|
Distributions from net investment income |
|
|
|
|
|
|
Distributions from net realized gains |
|
|
|
|
|
|
| |
|
|
|
|
|
|
Net asset value at end of period |
|
|
|
|
|
|
| |
|
|
|
|
|
|
| |
Ratios to average net assets: |
|
|
|
|
|
|
| |
|
|
|
|
|
|
Net investment income (loss) |
|
|
|
|
|
|
| |
|
|
|
|
|
|
Net assets, end of period (x 1,000,000) |
|
|
|
|
|
|
| |
Per-Share Data has been retroactively adjusted to reflect a 8-for-1 share split effective after the close of U.S. markets on August 15, 2025 (see financial note 9 for additional information). |
| |
Calculated based on the average shares outstanding during the period. |
| |
Ratio includes less than 0.005% of non-routine proxy expenses. |
| |
Portfolio turnover rate excludes in-kind transactions. |
Schwab Equity Index Funds | Annual Holdings and Financial Statements
77
Schwab U.S. Large-Cap Growth Index Fund
Portfolio Holdings as of October 31, 2025
| |
|
|
COMMON STOCKS 99.6% OF NET ASSETS |
| |
Automobiles & Components 3.9% |
| |
|
|
| |
| |
| |
|
|
| |
|
|
NU Holdings Ltd., Class A * |
|
|
Pinnacle Financial Partners, Inc. |
|
|
| |
|
|
| |
|
|
| |
|
|
| |
| |
| |
|
|
| |
|
|
Allison Transmission Holdings, Inc. |
|
|
Armstrong World Industries, Inc. |
|
|
| |
|
|
| |
|
|
| |
|
|
| |
|
|
Carpenter Technology Corp. |
|
|
| |
|
|
Comfort Systems USA, Inc. |
|
|
Core & Main, Inc., Class A * |
|
|
| |
|
|
| |
|
|
Ferguson Enterprises, Inc. |
|
|
| |
|
|
| |
|
|
| |
|
|
| |
|
|
| |
|
|
Illinois Tool Works, Inc. |
|
|
| |
|
|
Lennox International, Inc. |
|
|
| |
|
|
| |
|
|
| |
|
|
| |
|
|
| |
|
|
| |
|
|
| |
|
|
Rockwell Automation, Inc. |
|
|
Simpson Manufacturing Co., Inc. |
|
|
SiteOne Landscape Supply, Inc. * |
|
|
Spirit AeroSystems Holdings, Inc., Class A * |
|
|
| |
|
|
| |
|
|
| |
|
|
Vertiv Holdings Co., Class A |
|
|
| |
|
|
| |
|
|
| |
|
|
| |
Commercial & Professional Services 1.2% |
Automatic Data Processing, Inc. |
|
|
Booz Allen Hamilton Holding Corp., Class A |
|
|
Broadridge Financial Solutions, Inc. |
|
|
| |
|
|
| |
|
|
| |
|
|
| |
|
|
| |
|
|
ExlService Holdings, Inc. * |
|
|
| |
|
|
| |
|
|
| |
|
|
Paylocity Holding Corp. * |
|
|
| |
|
|
| |
|
|
| |
|
|
| |
|
|
Verisk Analytics, Inc., Class A |
|
|
| |
|
|
| |
|
|
| |
Consumer Discretionary Distribution & Retail 6.4% |
| |
|
|
| |
|
|
Burlington Stores, Inc. * |
|
|
| |
|
|
| |
|
|
| |
|
|
| |
|
|
Floor & Decor Holdings, Inc., Class A * |
|
|
| |
|
|
Lithia Motors, Inc., Class A |
|
|
| |
|
|
O'Reilly Automotive, Inc. * |
|
|
| |
|
|
| |
|
|
| |
|
|
| |
|
|
| |
|
|
| |
|
|
| |
|
|
| |
|
|
| |
|
|
| |
|
|
| |
Consumer Durables & Apparel 0.2% |
Birkenstock Holding PLC * |
|
|
| |
|
|
Lululemon Athletica, Inc. * |
|
|
| |
|
|
Ralph Lauren Corp., Class A |
|
|
| |
|
|
Somnigroup International, Inc. |
|
|
| |
|
|
| |
|
|
| |
|
|
| |
| |
| |
|
|
| |
|
|
Bright Horizons Family Solutions, Inc. * |
|
|
| |
|
|
| |
|
|
Chipotle Mexican Grill, Inc., Class A * |
|
|
Choice Hotels International, Inc. |
|
|
| |
|
|
| |
|
|
| |
|
|
DoorDash, Inc., Class A * |
|
|
78
Schwab Equity Index Funds | Annual Holdings and Financial Statements
Schwab U.S. Large-Cap Growth Index Fund
Portfolio Holdings as of October 31, 2025 (continued)
| |
|
|
DraftKings, Inc., Class A * |
|
|
| |
|
|
Dutch Bros, Inc., Class A * |
|
|
| |
|
|
Flutter Entertainment PLC * |
|
|
Grand Canyon Education, Inc. * |
|
|
| |
|
|
Hilton Worldwide Holdings, Inc. |
|
|
| |
|
|
| |
|
|
Marriott International, Inc., Class A |
|
|
| |
|
|
Norwegian Cruise Line Holdings Ltd. * |
|
|
Planet Fitness, Inc., Class A * |
|
|
Restaurant Brands International, Inc. |
|
|
Royal Caribbean Cruises Ltd. |
|
|
| |
|
|
Texas Roadhouse, Inc., Class A |
|
|
| |
|
|
| |
|
|
| |
|
|
| |
|
|
| |
|
|
Wyndham Hotels & Resorts, Inc. |
|
|
| |
|
|
| |
|
|
| |
Consumer Staples Distribution & Retail 1.5% |
BJ's Wholesale Club Holdings, Inc. * |
|
|
Casey's General Stores, Inc. |
|
|
| |
|
|
Performance Food Group Co. * |
|
|
Sprouts Farmers Market, Inc. * |
|
|
| |
|
|
| |
|
|
| |
|
|
| |
| |
| |
|
|
| |
|
|
| |
|
|
| |
|
|
| |
|
|
| |
|
|
| |
|
|
| |
|
|
| |
Equity Real Estate Investment Trusts (REITs) 0.4% |
| |
|
|
Lamar Advertising Co., Class A |
|
|
| |
|
|
Simon Property Group, Inc. |
|
|
| |
|
|
| |
|
|
| |
|
|
| |
| |
| |
|
|
| |
|
|
| |
|
|
Ameriprise Financial, Inc. |
|
|
Apollo Global Management, Inc. |
|
|
ARES Management Corp., Class A |
|
|
Bank of New York Mellon Corp. |
|
|
| |
|
|
| |
|
|
| |
|
|
Blue Owl Capital, Inc., Class A |
|
|
Brookfield Asset Management Ltd., Class A |
|
|
| |
|
|
Coinbase Global, Inc., Class A * |
|
|
| |
|
|
Credit Acceptance Corp. * |
|
|
| |
|
|
FactSet Research Systems, Inc. |
|
|
| |
|
|
Freedom Holding Corp. *(b) |
|
|
Goldman Sachs Group, Inc. |
|
|
Hamilton Lane, Inc., Class A |
|
|
Houlihan Lokey, Inc., Class A |
|
|
Interactive Brokers Group, Inc., Class A |
|
|
Jefferies Financial Group, Inc. |
|
|
| |
|
|
| |
|
|
LPL Financial Holdings, Inc. |
|
|
Mastercard, Inc., Class A |
|
|
| |
|
|
| |
|
|
| |
|
|
Robinhood Markets, Inc., Class A * |
|
|
Shift4 Payments, Inc., Class A * |
|
|
| |
|
|
SoFi Technologies, Inc. * |
|
|
| |
|
|
| |
|
|
Tradeweb Markets, Inc., Class A |
|
|
| |
|
|
| |
|
|
| |
|
|
| |
|
|
| |
|
|
| |
Food, Beverage & Tobacco 0.7% |
| |
|
|
| |
|
|
Coca-Cola Consolidated, Inc. |
|
|
Darling Ingredients, Inc. * |
|
|
| |
|
|
| |
|
|
| |
|
|
| |
|
|
| |
|
|
| |
Health Care Equipment & Services 1.9% |
Boston Scientific Corp. * |
|
|
| |
|
|
| |
|
|
| |
|
|
| |
|
|
| |
|
|
| |
|
|
Doximity, Inc., Class A * |
|
|
| |
|
|
IDEXX Laboratories, Inc. * |
|
|
Inspire Medical Systems, Inc. * |
|
|
| |
|
|
Intuitive Surgical, Inc. * |
|
|
| |
|
|
| |
|
|
Molina Healthcare, Inc. * |
|
|
Schwab Equity Index Funds | Annual Holdings and Financial Statements
79
Schwab U.S. Large-Cap Growth Index Fund
Portfolio Holdings as of October 31, 2025 (continued)
| |
|
|
| |
|
|
| |
|
|
| |
|
|
Veeva Systems, Inc., Class A * |
|
|
| |
|
|
| |
Household & Personal Products 0.1% |
| |
|
|
| |
|
|
| |
|
|
| |
| |
| |
|
|
| |
|
|
| |
|
|
| |
|
|
Kinsale Capital Group, Inc. |
|
|
| |
|
|
Marsh & McLennan Cos., Inc. |
|
|
| |
|
|
| |
|
|
Ryan Specialty Holdings, Inc., Class A |
|
|
| |
|
|
| |
| |
| |
|
|
| |
|
|
| |
|
|
James Hardie Industries PLC, ADR * |
|
|
| |
|
|
| |
|
|
| |
|
|
| |
Media & Entertainment 11.2% |
| |
|
|
| |
|
|
DoubleVerify Holdings, Inc. * |
|
|
Liberty Broadband Corp., Class C * |
|
|
Liberty Media Corp.-Liberty Formula One, Class C * |
|
|
Live Nation Entertainment, Inc. * |
|
|
Meta Platforms, Inc., Class A |
|
|
| |
|
|
Nexstar Media Group, Inc., Class A |
|
|
NIQ Global Intelligence PLC * |
|
|
Pinterest, Inc., Class A * |
|
|
| |
|
|
| |
|
|
| |
|
|
| |
|
|
Take-Two Interactive Software, Inc. * |
|
|
| |
|
|
Trade Desk, Inc., Class A * |
|
|
Trump Media & Technology Group Corp. * |
|
|
| |
|
|
| |
Pharmaceuticals, Biotechnology & Life Sciences 5.0% |
| |
|
|
Alnylam Pharmaceuticals, Inc. * |
|
|
| |
|
|
Apellis Pharmaceuticals, Inc. * |
|
|
| |
|
|
| |
|
|
Caris Life Sciences, Inc. * |
|
|
Corcept Therapeutics, Inc. * |
|
|
| |
|
|
| |
|
|
| |
|
|
| |
|
|
Halozyme Therapeutics, Inc. * |
|
|
| |
|
|
| |
|
|
Ionis Pharmaceuticals, Inc. * |
|
|
| |
|
|
| |
|
|
Neurocrine Biosciences, Inc. * |
|
|
| |
|
|
Sarepta Therapeutics, Inc. * |
|
|
| |
|
|
Summit Therapeutics, Inc. *(b) |
|
|
| |
|
|
Ultragenyx Pharmaceutical, Inc. * |
|
|
Vertex Pharmaceuticals, Inc. * |
|
|
Viking Therapeutics, Inc. * |
|
|
| |
|
|
| |
|
|
| |
|
|
| |
Real Estate Management & Development 0.0% |
CBRE Group, Inc., Class A * |
|
|
| |
|
|
Jones Lang LaSalle, Inc. * |
|
|
| |
|
|
| |
Semiconductors & Semiconductor Equipment 21.3% |
Advanced Micro Devices, Inc. * |
|
|
| |
|
|
| |
|
|
| |
|
|
| |
|
|
| |
|
|
| |
|
|
| |
|
|
Lattice Semiconductor Corp. * |
|
|
MACOM Technology Solutions Holdings, Inc. * |
|
|
| |
|
|
Monolithic Power Systems, Inc. |
|
|
| |
|
|
| |
|
|
| |
|
|
| |
|
|
| |
|
|
| |
Software & Services 19.5% |
| |
|
|
Appfolio, Inc., Class A * |
|
|
AppLovin Corp., Class A * |
|
|
Atlassian Corp., Class A * |
|
|
| |
|
|
Bentley Systems, Inc., Class B |
|
|
Cadence Design Systems, Inc. * |
|
|
Circle Internet Group, Inc. *(b) |
|
|
Cloudflare, Inc., Class A * |
|
|
Confluent, Inc., Class A * |
|
|
Crowdstrike Holdings, Inc., Class A * |
|
|
| |
|
|
Docusign, Inc., Class A * |
|
|
80
Schwab Equity Index Funds | Annual Holdings and Financial Statements
Schwab U.S. Large-Cap Growth Index Fund
Portfolio Holdings as of October 31, 2025 (continued)
| |
|
|
| |
|
|
| |
|
|
| |
|
|
| |
|
|
| |
|
|
| |
|
|
| |
|
|
| |
|
|
| |
|
|
| |
|
|
Guidewire Software, Inc. * |
|
|
| |
|
|
| |
|
|
| |
|
|
Manhattan Associates, Inc. * |
|
|
| |
|
|
| |
|
|
| |
|
|
| |
|
|
| |
|
|
| |
|
|
Palantir Technologies, Inc., Class A * |
|
|
Palo Alto Networks, Inc. * |
|
|
| |
|
|
Procore Technologies, Inc. * |
|
|
| |
|
|
RingCentral, Inc., Class A * |
|
|
| |
|
|
| |
|
|
| |
|
|
SentinelOne, Inc., Class A * |
|
|
| |
|
|
Snowflake, Inc., Class A * |
|
|
Strategy, Inc., Class A * |
|
|
| |
|
|
| |
|
|
| |
|
|
Tyler Technologies, Inc. * |
|
|
| |
|
|
| |
|
|
| |
|
|
| |
|
|
| |
Technology Hardware & Equipment 12.7% |
| |
|
|
| |
|
|
| |
|
|
| |
|
|
Dell Technologies, Inc., Class C |
|
|
| |
|
|
Lumentum Holdings, Inc. * |
|
|
| |
|
|
| |
|
|
Pure Storage, Inc., Class A * |
|
|
Super Micro Computer, Inc. * |
|
|
| |
|
|
| |
|
|
| |
Telecommunication Services 0.0% |
| |
|
|
GCI Liberty, Inc., Class C * |
|
|
Iridium Communications, Inc. |
|
|
| |
|
|
| |
| |
|
|
| |
| |
|
|
American Airlines Group, Inc. * |
|
|
Avis Budget Group, Inc. * |
|
|
| |
|
|
Old Dominion Freight Line, Inc. |
|
|
| |
|
|
Uber Technologies, Inc. * |
|
|
U-Haul Holding Co., Non Voting Shares |
|
|
| |
|
|
| |
|
|
| |
|
|
| |
| |
| |
|
|
| |
|
|
| |
|
|
Total Common Stocks
(Cost $2,629,569,061) |
|
| |
INVESTMENT COMPANIES 0.1% OF NET ASSETS |
| |
| |
iShares Russell 1000 Growth ETF (b) |
|
|
Total Investment Companies
(Cost $5,436,255) |
|
| |
|
|
SHORT-TERM INVESTMENTS 0.4% OF NET ASSETS |
| |
| |
State Street Institutional U.S. Government Money Market Fund, Premier Class 4.01% (c) |
|
|
State Street Institutional U.S. Government Money Market Fund, Premier Class 4.01% (c)(d) |
|
|
| |
|
|
Total Short-Term Investments
(Cost $17,007,475) |
|
Total Investments in Securities
(Cost $2,652,012,791) |
|
Schwab Equity Index Funds | Annual Holdings and Financial Statements
81
Schwab U.S. Large-Cap Growth Index Fund
Portfolio Holdings as of October 31, 2025 (continued)
| |
|
|
CURRENT VALUE/
UNREALIZED
APPRECIATION
(DEPRECIATION)
($) |
| |
| |
|
|
|
NASDAQ 100 Index, e-mini, expires 12/19/25 |
|
|
|
S&P 500 Index, e-mini, expires 12/19/25 |
|
|
|
| |
|
|
|
| |
Non-income producing security. |
| |
Issuer is affiliated with the fund’s investment adviser. |
| |
All or a portion of this security is on loan. Securities on loan were valued at $1,435,513. |
| |
The rate shown is the annualized 7-day yield. |
| |
Security purchased with cash collateral received for securities on loan. |
| |
American Depositary Receipt |
| |
|
Below is a summary of the fund’s transactions with affiliated issuers during the period ended October 31, 2025:
| |
|
|
|
NET REALIZED GAINS (LOSSES) |
NET CHANGE IN UNREALIZED APPRECIATION (DEPRECIATION) |
|
BALANCE OF SHARES HELD AT 10/31/25 |
|
COMMON STOCKS 0.0% OF NET ASSETS |
| |
| |
| |
|
|
|
|
|
|
|
|
The following is a summary of the inputs used to value the fund’s investments as of October 31, 2025 (see financial note 2(a) for additional information):
| |
QUOTED PRICES IN
ACTIVE MARKETS FOR
IDENTICAL ASSETS
(LEVEL 1) |
OTHER SIGNIFICANT
OBSERVABLE INPUTS
(LEVEL 2) |
SIGNIFICANT
UNOBSERVABLE INPUTS
(LEVEL 3) |
|
| |
|
|
|
|
| |
|
|
|
|
| |
|
|
|
|
| |
|
|
|
|
| |
|
|
|
|
| |
|
|
|
|
| |
|
|
|
|
| |
|
|
|
|
| |
As categorized in the Portfolio Holdings. |
| |
Futures contracts are reported at cumulative unrealized appreciation or depreciation. |
82
Schwab Equity Index Funds | Annual Holdings and Financial Statements
Schwab U.S. Large-Cap Growth Index Fund
Statement of Assets and Liabilities
| |
Investments in securities, at value - affiliated issuers (cost $1,539,640) |
|
|
Investments in securities, at value - unaffiliated issuers (cost $2,650,473,151) including securities on loan of $1,435,513 |
|
|
Deposit with broker for futures contracts |
|
|
| |
|
|
| |
|
|
| |
|
|
Variation margin on future contracts |
|
|
Income from securities on loan |
|
|
| |
|
|
| |
| |
Collateral held for securities on loan |
|
|
| |
|
|
| |
|
|
| |
|
|
| |
|
|
| |
|
|
| |
| |
Capital received from investors |
|
|
Total distributable earnings |
|
|
| |
|
|
Schwab Equity Index Funds | Annual Holdings and Financial Statements
83
Schwab U.S. Large-Cap Growth Index Fund
Statement of Operations
For the period November 1, 2024 through October 31, 2025 |
| |
Dividends received from securities - unaffiliated issuers (net of foreign withholding tax of $1,518) |
|
|
| |
|
|
Dividends received from securities - affiliated issuers |
|
|
| |
|
|
| |
|
|
| |
| |
| |
|
|
| |
|
|
| |
|
|
| |
REALIZED AND UNREALIZED GAINS (LOSSES) |
Net realized gains on sales of securities - affiliated issuers |
|
|
Net realized gains on sales of securities - unaffiliated issuers |
|
|
Net realized gains on sales of in-kind redemptions - unaffiliated issuers |
|
|
Net realized gains on futures contracts |
|
|
| |
|
|
Net change in unrealized appreciation (depreciation) on securities - affiliated issuers |
|
|
Net change in unrealized appreciation (depreciation) on securities - unaffiliated issuers |
|
|
Net change in unrealized appreciation (depreciation) on futures contracts |
|
|
Net change in unrealized appreciation (depreciation) |
|
|
Net realized and unrealized gains |
|
|
Increase in net assets resulting from operations |
|
|
84
Schwab Equity Index Funds | Annual Holdings and Financial Statements
Schwab U.S. Large-Cap Growth Index Fund
Statement of Changes in Net Assets
For the current and prior report periods
| |
| |
|
|
| |
|
|
|
| |
|
|
|
Net change in unrealized appreciation (depreciation) |
|
|
|
Increase in net assets resulting from operations |
|
|
|
| |
DISTRIBUTIONS TO SHAREHOLDERS |
| |
|
|
|
TRANSACTIONS IN FUND SHARES1 |
| |
|
|
| |
|
|
|
|
|
| |
|
|
|
|
|
| |
|
|
|
|
|
| |
|
|
|
|
|
Net transactions in fund shares |
|
|
|
|
|
| |
SHARES OUTSTANDING AND NET ASSETS1 |
| |
|
|
| |
|
|
|
|
|
| |
|
|
|
|
|
| |
|
|
|
|
|
| |
|
|
|
|
|
| |
For the period ended October 31, 2025, and the prior report period, transactions in fund shares have been retroactively adjusted to reflect a 8-for-1 share split effective after the close of U.S. markets on August 15, 2025. The retroactive adjustment of the share split does not change the transaction in fund shares values (see financial note 9 for additional information). |
Schwab Equity Index Funds | Annual Holdings and Financial Statements
85
Schwab U.S. Large-Cap Value Index Fund
Financial Statements
| |
|
|
|
|
|
|
| |
Net asset value at beginning of period |
|
|
|
|
|
|
Income (loss) from investment operations: |
|
|
|
|
|
|
Net investment income (loss)2 |
|
|
|
|
|
|
Net realized and unrealized gains (losses) |
|
|
|
|
|
|
Total from investment operations |
|
|
|
|
|
|
| |
|
|
|
|
|
|
Distributions from net investment income |
|
|
|
|
|
|
Distributions from net realized gains |
|
|
|
|
|
|
| |
|
|
|
|
|
|
Net asset value at end of period |
|
|
|
|
|
|
| |
|
|
|
|
|
|
| |
Ratios to average net assets: |
|
|
|
|
|
|
| |
|
|
|
|
|
|
Net investment income (loss) |
|
|
|
|
|
|
| |
|
|
|
|
|
|
Net assets, end of period (x 1,000,000) |
|
|
|
|
|
|
| |
Per-Share Data has been retroactively adjusted to reflect a 4-for-1 share split effective after the close of U.S. markets on August 15, 2025 (see financial note 9 for additional information). |
| |
Calculated based on the average shares outstanding during the period. |
| |
Ratio includes less than 0.005% of non-routine proxy expenses. |
| |
Portfolio turnover rate excludes in-kind transactions. |
86
Schwab Equity Index Funds | Annual Holdings and Financial Statements
Schwab U.S. Large-Cap Value Index Fund
Portfolio Holdings as of October 31, 2025
| |
|
|
COMMON STOCKS 99.5% OF NET ASSETS |
| |
Automobiles & Components 0.6% |
| |
|
|
| |
|
|
| |
|
|
| |
|
|
| |
|
|
| |
|
|
| |
|
|
| |
|
|
QuantumScape Corp., Class A * |
|
|
Rivian Automotive, Inc., Class A * |
|
|
| |
|
|
| |
|
|
| |
| |
| |
|
|
| |
|
|
| |
|
|
| |
|
|
Citizens Financial Group, Inc. |
|
|
Columbia Banking System, Inc. |
|
|
| |
|
|
Commerce Bancshares, Inc. |
|
|
Cullen/Frost Bankers, Inc. |
|
|
| |
|
|
| |
|
|
First Citizens BancShares, Inc., Class A |
|
|
| |
|
|
| |
|
|
| |
|
|
Huntington Bancshares, Inc. |
|
|
| |
|
|
| |
|
|
| |
|
|
Pinnacle Financial Partners, Inc. |
|
|
PNC Financial Services Group, Inc. |
|
|
| |
|
|
Prosperity Bancshares, Inc. |
|
|
| |
|
|
| |
|
|
| |
|
|
| |
|
|
| |
|
|
| |
|
|
| |
|
|
| |
|
|
| |
|
|
| |
|
|
| |
|
|
| |
|
|
| |
| |
| |
|
|
| |
|
|
| |
|
|
Advanced Drainage Systems, Inc. |
|
|
| |
|
|
| |
|
|
| |
|
|
| |
|
|
Allison Transmission Holdings, Inc. |
|
|
| |
|
|
| |
|
|
| |
|
|
Applied Industrial Technologies, Inc. |
|
|
Armstrong World Industries, Inc. |
|
|
| |
|
|
| |
|
|
Builders FirstSource, Inc. * |
|
|
| |
|
|
| |
|
|
Carpenter Technology Corp. |
|
|
| |
|
|
| |
|
|
| |
|
|
Core & Main, Inc., Class A * |
|
|
| |
|
|
| |
|
|
| |
|
|
| |
|
|
| |
|
|
| |
|
|
| |
|
|
| |
|
|
| |
|
|
| |
|
|
Everus Construction Group, Inc. * |
|
|
| |
|
|
Ferguson Enterprises, Inc. |
|
|
| |
|
|
| |
|
|
Fortune Brands Innovations, Inc. |
|
|
Gates Industrial Corp. PLC * |
|
|
| |
|
|
| |
|
|
| |
|
|
| |
|
|
| |
|
|
Honeywell International, Inc. |
|
|
| |
|
|
Huntington Ingalls Industries, Inc. |
|
|
| |
|
|
Illinois Tool Works, Inc. |
|
|
| |
|
|
| |
|
|
Johnson Controls International PLC |
|
|
L3Harris Technologies, Inc. |
|
|
| |
|
|
Lincoln Electric Holdings, Inc. |
|
|
| |
|
|
| |
|
|
| |
|
|
| |
|
|
| |
|
|
MSC Industrial Direct Co., Inc., Class A |
|
|
| |
|
|
| |
|
|
| |
|
|
| |
|
|
| |
|
|
| |
|
|
| |
|
|
| |
|
|
| |
|
|
| |
|
|
| |
|
|
| |
|
|
| |
|
|
| |
|
|
Rockwell Automation, Inc. |
|
|
| |
|
|
Schwab Equity Index Funds | Annual Holdings and Financial Statements
87
Schwab U.S. Large-Cap Value Index Fund
Portfolio Holdings as of October 31, 2025 (continued)
| |
|
|
Sensata Technologies Holding PLC |
|
|
Simpson Manufacturing Co., Inc. |
|
|
SiteOne Landscape Supply, Inc. * |
|
|
| |
|
|
Spirit AeroSystems Holdings, Inc., Class A * |
|
|
| |
|
|
Stanley Black & Decker, Inc. |
|
|
| |
|
|
| |
|
|
| |
|
|
| |
|
|
| |
|
|
| |
|
|
| |
|
|
| |
|
|
WESCO International, Inc. |
|
|
Westinghouse Air Brake Technologies Corp. |
|
|
| |
|
|
| |
|
|
| |
|
|
| |
|
|
| |
|
|
| |
Commercial & Professional Services 1.1% |
| |
|
|
Automatic Data Processing, Inc. |
|
|
Broadridge Financial Solutions, Inc. |
|
|
CACI International, Inc., Class A * |
|
|
| |
|
|
| |
|
|
| |
|
|
| |
|
|
| |
|
|
| |
|
|
| |
|
|
| |
|
|
| |
|
|
| |
|
|
| |
|
|
| |
|
|
| |
|
|
| |
|
|
| |
|
|
| |
|
|
Paylocity Holding Corp. * |
|
|
| |
|
|
Republic Services, Inc., Class A |
|
|
| |
|
|
Science Applications International Corp. |
|
|
SS&C Technologies Holdings, Inc. |
|
|
| |
|
|
| |
|
|
| |
|
|
Verisk Analytics, Inc., Class A |
|
|
| |
|
|
| |
Consumer Discretionary Distribution & Retail 4.3% |
| |
|
|
| |
|
|
| |
|
|
| |
|
|
| |
|
|
| |
|
|
Dick's Sporting Goods, Inc. |
|
|
| |
|
|
| |
|
|
| |
|
|
| |
|
|
| |
|
|
Floor & Decor Holdings, Inc., Class A * |
|
|
GameStop Corp., Class A * |
|
|
| |
|
|
| |
|
|
| |
|
|
Lithia Motors, Inc., Class A |
|
|
| |
|
|
| |
|
|
| |
|
|
Ollie's Bargain Outlet Holdings, Inc. * |
|
|
O'Reilly Automotive, Inc. * |
|
|
Penske Automotive Group, Inc. |
|
|
| |
|
|
| |
|
|
| |
|
|
| |
|
|
| |
|
|
| |
|
|
| |
|
|
| |
|
|
| |
|
|
| |
Consumer Durables & Apparel 1.1% |
| |
|
|
Birkenstock Holding PLC * |
|
|
| |
|
|
| |
|
|
| |
|
|
| |
|
|
| |
|
|
| |
|
|
| |
|
|
Lululemon Athletica, Inc. * |
|
|
| |
|
|
Mohawk Industries, Inc. * |
|
|
| |
|
|
| |
|
|
| |
|
|
| |
|
|
| |
|
|
Ralph Lauren Corp., Class A |
|
|
| |
|
|
| |
|
|
| |
|
|
| |
|
|
Under Armour, Inc., Class A * |
|
|
| |
|
|
| |
|
|
| |
|
|
| |
|
|
| |
| |
| |
|
|
| |
|
|
| |
|
|
| |
|
|
Bright Horizons Family Solutions, Inc. * |
|
|
Caesars Entertainment, Inc. * |
|
|
| |
|
|
Choice Hotels International, Inc. |
|
|
| |
|
|
| |
|
|
88
Schwab Equity Index Funds | Annual Holdings and Financial Statements
Schwab U.S. Large-Cap Value Index Fund
Portfolio Holdings as of October 31, 2025 (continued)
| |
|
|
| |
|
|
Flutter Entertainment PLC * |
|
|
Grand Canyon Education, Inc. * |
|
|
| |
|
|
Hyatt Hotels Corp., Class A |
|
|
Marriott International, Inc., Class A |
|
|
| |
|
|
MGM Resorts International * |
|
|
Norwegian Cruise Line Holdings Ltd. * |
|
|
Penn Entertainment, Inc. * |
|
|
Restaurant Brands International, Inc. |
|
|
Service Corp. International |
|
|
| |
|
|
| |
|
|
| |
|
|
| |
|
|
Wyndham Hotels & Resorts, Inc. |
|
|
| |
|
|
| |
|
|
| |
|
|
| |
Consumer Staples Distribution & Retail 2.1% |
Albertsons Cos., Inc., Class A |
|
|
BJ's Wholesale Club Holdings, Inc. * |
|
|
Casey's General Stores, Inc. |
|
|
| |
|
|
| |
|
|
| |
|
|
| |
|
|
Performance Food Group Co. * |
|
|
| |
|
|
| |
|
|
U.S. Foods Holding Corp. * |
|
|
| |
|
|
| |
|
|
| |
| |
| |
|
|
| |
|
|
| |
|
|
Baker Hughes Co., Class A |
|
|
| |
|
|
| |
|
|
| |
|
|
| |
|
|
| |
|
|
| |
|
|
| |
|
|
| |
|
|
| |
|
|
| |
|
|
| |
|
|
| |
|
|
| |
|
|
| |
|
|
| |
|
|
| |
|
|
| |
|
|
| |
|
|
| |
|
|
Occidental Petroleum Corp. |
|
|
| |
|
|
| |
|
|
Permian Resources Corp., Class A |
|
|
| |
|
|
| |
|
|
| |
|
|
| |
|
|
| |
|
|
| |
|
|
Viper Energy, Inc., Class A |
|
|
Weatherford International PLC |
|
|
| |
|
|
| |
|
|
| |
Equity Real Estate Investment Trusts (REITs) 3.7% |
| |
|
|
Alexandria Real Estate Equities, Inc. |
|
|
American Homes 4 Rent, Class A |
|
|
Americold Realty Trust, Inc. |
|
|
AvalonBay Communities, Inc. |
|
|
Brixmor Property Group, Inc. |
|
|
| |
|
|
| |
|
|
| |
|
|
| |
|
|
| |
|
|
Digital Realty Trust, Inc. |
|
|
EastGroup Properties, Inc. |
|
|
| |
|
|
| |
|
|
Equity LifeStyle Properties, Inc. |
|
|
| |
|
|
Essex Property Trust, Inc. |
|
|
Extra Space Storage, Inc. |
|
|
Federal Realty Investment Trust |
|
|
First Industrial Realty Trust, Inc. |
|
|
Gaming & Leisure Properties, Inc. |
|
|
Healthcare Realty Trust, Inc., Class A |
|
|
Healthpeak Properties, Inc. |
|
|
Highwoods Properties, Inc. |
|
|
Host Hotels & Resorts, Inc. |
|
|
| |
|
|
| |
|
|
| |
|
|
| |
|
|
| |
|
|
Medical Properties Trust, Inc. (a) |
|
|
Mid-America Apartment Communities, Inc. |
|
|
Millrose Properties, Inc., Class A |
|
|
National Storage Affiliates Trust |
|
|
| |
|
|
Omega Healthcare Investors, Inc. |
|
|
Park Hotels & Resorts, Inc. |
|
|
| |
|
|
| |
|
|
| |
|
|
| |
|
|
| |
|
|
Rexford Industrial Realty, Inc. |
|
|
SBA Communications Corp., Class A |
|
|
Simon Property Group, Inc. |
|
|
| |
|
|
| |
|
|
| |
|
|
| |
|
|
VICI Properties, Inc., Class A |
|
|
| |
|
|
| |
|
|
| |
|
|
| |
|
|
| |
|
|
| |
Schwab Equity Index Funds | Annual Holdings and Financial Statements
89
Schwab U.S. Large-Cap Value Index Fund
Portfolio Holdings as of October 31, 2025 (continued)
| |
|
|
| |
Affiliated Managers Group, Inc. |
|
|
| |
|
|
| |
|
|
| |
|
|
| |
|
|
Ameriprise Financial, Inc. |
|
|
Annaly Capital Management, Inc. |
|
|
Apollo Global Management, Inc. |
|
|
Bank of New York Mellon Corp. |
|
|
Berkshire Hathaway, Inc., Class B * |
|
|
| |
|
|
| |
|
|
Brookfield Asset Management Ltd., Class A |
|
|
Capital One Financial Corp. |
|
|
| |
|
|
Cboe Global Markets, Inc. |
|
|
| |
|
|
| |
|
|
Coinbase Global, Inc., Class A * |
|
|
Corebridge Financial, Inc. |
|
|
Credit Acceptance Corp. * |
|
|
Euronet Worldwide, Inc. * |
|
|
| |
|
|
FactSet Research Systems, Inc. |
|
|
Fidelity National Information Services, Inc. |
|
|
| |
|
|
| |
|
|
| |
|
|
| |
|
|
Goldman Sachs Group, Inc. |
|
|
Hamilton Lane, Inc., Class A |
|
|
Houlihan Lokey, Inc., Class A |
|
|
Interactive Brokers Group, Inc., Class A |
|
|
Intercontinental Exchange, Inc. |
|
|
| |
|
|
Jack Henry & Associates, Inc. |
|
|
Janus Henderson Group PLC |
|
|
Jefferies Financial Group, Inc. |
|
|
| |
|
|
| |
|
|
MarketAxess Holdings, Inc. |
|
|
| |
|
|
| |
|
|
| |
|
|
| |
|
|
| |
|
|
| |
|
|
| |
|
|
| |
|
|
Raymond James Financial, Inc. |
|
|
| |
|
|
Robinhood Markets, Inc., Class A * |
|
|
Rocket Cos., Inc., Class A |
|
|
| |
|
|
| |
|
|
| |
|
|
SoFi Technologies, Inc. * |
|
|
Starwood Property Trust, Inc. |
|
|
| |
|
|
| |
|
|
| |
|
|
T. Rowe Price Group, Inc. |
|
|
| |
|
|
Tradeweb Markets, Inc., Class A |
|
|
| |
|
|
| |
|
|
Virtu Financial, Inc., Class A |
|
|
| |
|
|
| |
|
|
| |
|
|
| |
|
|
| |
|
|
| |
Food, Beverage & Tobacco 3.5% |
| |
|
|
Archer-Daniels-Midland Co. |
|
|
Boston Beer Co., Inc., Class A * |
|
|
Brown-Forman Corp., Class B |
|
|
| |
|
|
| |
|
|
| |
|
|
Coca-Cola Consolidated, Inc. |
|
|
| |
|
|
Constellation Brands, Inc., Class A |
|
|
Darling Ingredients, Inc. * |
|
|
| |
|
|
| |
|
|
| |
|
|
| |
|
|
| |
|
|
| |
|
|
| |
|
|
| |
|
|
| |
|
|
| |
|
|
Lamb Weston Holdings, Inc. |
|
|
McCormick & Co., Inc. - Non Voting Shares |
|
|
Molson Coors Beverage Co., Class B |
|
|
Mondelez International, Inc., Class A |
|
|
| |
|
|
Philip Morris International, Inc. |
|
|
| |
|
|
| |
|
|
| |
|
|
| |
|
|
| |
|
|
Tyson Foods, Inc., Class A |
|
|
| |
|
|
| |
Health Care Equipment & Services 5.5% |
| |
|
|
Acadia Healthcare Co., Inc. * |
|
|
| |
|
|
Baxter International, Inc. |
|
|
| |
|
|
Boston Scientific Corp. * |
|
|
| |
|
|
| |
|
|
| |
|
|
| |
|
|
| |
|
|
| |
|
|
| |
|
|
| |
|
|
Edwards Lifesciences Corp. * |
|
|
| |
|
|
| |
|
|
| |
|
|
GE HealthCare Technologies, Inc. |
|
|
Globus Medical, Inc., Class A * |
|
|
| |
|
|
90
Schwab Equity Index Funds | Annual Holdings and Financial Statements
Schwab U.S. Large-Cap Value Index Fund
Portfolio Holdings as of October 31, 2025 (continued)
| |
|
|
| |
|
|
| |
|
|
| |
|
|
| |
|
|
| |
|
|
| |
|
|
Molina Healthcare, Inc. * |
|
|
| |
|
|
| |
|
|
| |
|
|
| |
|
|
| |
|
|
| |
|
|
| |
|
|
| |
|
|
Universal Health Services, Inc., Class B |
|
|
Veeva Systems, Inc., Class A * |
|
|
Zimmer Biomet Holdings, Inc. |
|
|
| |
|
|
| |
Household & Personal Products 1.7% |
| |
|
|
Church & Dwight Co., Inc. |
|
|
| |
|
|
| |
|
|
| |
|
|
| |
|
|
Estee Lauder Cos., Inc., Class A |
|
|
| |
|
|
| |
|
|
| |
|
|
Reynolds Consumer Products, Inc. |
|
|
| |
|
|
| |
| |
| |
|
|
| |
|
|
American Financial Group, Inc. |
|
|
American International Group, Inc. |
|
|
| |
|
|
| |
|
|
| |
|
|
| |
|
|
| |
|
|
Axis Capital Holdings Ltd. |
|
|
Brighthouse Financial, Inc. * |
|
|
| |
|
|
| |
|
|
Cincinnati Financial Corp. |
|
|
| |
|
|
| |
|
|
Fidelity National Financial, Inc. |
|
|
First American Financial Corp. |
|
|
| |
|
|
Hanover Insurance Group, Inc. |
|
|
Hartford Insurance Group, Inc. |
|
|
| |
|
|
| |
|
|
| |
|
|
| |
|
|
Marsh & McLennan Cos., Inc. |
|
|
| |
|
|
Old Republic International Corp. |
|
|
| |
|
|
Principal Financial Group, Inc. |
|
|
| |
|
|
| |
|
|
Prudential Financial, Inc. |
|
|
Reinsurance Group of America, Inc. |
|
|
RenaissanceRe Holdings Ltd. |
|
|
| |
|
|
| |
|
|
| |
|
|
| |
|
|
White Mountains Insurance Group Ltd. |
|
|
| |
|
|
| |
|
|
| |
| |
Air Products & Chemicals, Inc. |
|
|
| |
|
|
| |
|
|
| |
|
|
| |
|
|
| |
|
|
| |
|
|
| |
|
|
Axalta Coating Systems Ltd. * |
|
|
| |
|
|
| |
|
|
CF Industries Holdings, Inc. |
|
|
| |
|
|
| |
|
|
| |
|
|
| |
|
|
| |
|
|
| |
|
|
| |
|
|
| |
|
|
| |
|
|
| |
|
|
| |
|
|
| |
|
|
Graphic Packaging Holding Co. |
|
|
| |
|
|
International Flavors & Fragrances, Inc. |
|
|
| |
|
|
James Hardie Industries PLC, ADR * |
|
|
| |
|
|
| |
|
|
LyondellBasell Industries NV, Class A |
|
|
Martin Marietta Materials, Inc. |
|
|
| |
|
|
| |
|
|
| |
|
|
| |
|
|
| |
|
|
| |
|
|
Packaging Corp. of America |
|
|
| |
|
|
| |
|
|
| |
|
|
| |
|
|
| |
|
|
| |
|
|
| |
|
|
| |
|
|
| |
|
|
Solstice Advanced Materials, Inc. * |
|
|
| |
|
|
| |
|
|
| |
|
|
| |
|
|
Schwab Equity Index Funds | Annual Holdings and Financial Statements
91
Schwab U.S. Large-Cap Value Index Fund
Portfolio Holdings as of October 31, 2025 (continued)
| |
|
|
| |
|
|
| |
|
|
| |
Media & Entertainment 6.6% |
| |
|
|
| |
|
|
Charter Communications, Inc., Class A * |
|
|
| |
|
|
DoubleVerify Holdings, Inc. * |
|
|
| |
|
|
| |
|
|
| |
|
|
Interpublic Group of Cos., Inc. |
|
|
Liberty Broadband Corp., Class C * |
|
|
Liberty Media Corp.-Liberty Formula One, Class C * |
|
|
Liberty Media Corp.-Liberty Live, Class C * |
|
|
Madison Square Garden Sports Corp. * |
|
|
| |
|
|
Meta Platforms, Inc., Class A |
|
|
New York Times Co., Class A |
|
|
| |
|
|
Nexstar Media Group, Inc., Class A |
|
|
NIQ Global Intelligence PLC * |
|
|
| |
|
|
Pinterest, Inc., Class A * |
|
|
| |
|
|
| |
|
|
Take-Two Interactive Software, Inc. * |
|
|
| |
|
|
Trump Media & Technology Group Corp. * |
|
|
| |
|
|
Warner Bros Discovery, Inc. * |
|
|
ZoomInfo Technologies, Inc., Class A * |
|
|
| |
|
|
| |
Pharmaceuticals, Biotechnology & Life Sciences 6.3% |
Agilent Technologies, Inc. |
|
|
| |
|
|
| |
|
|
| |
|
|
BioMarin Pharmaceutical, Inc. * |
|
|
Bio-Rad Laboratories, Inc., Class A * |
|
|
| |
|
|
| |
|
|
| |
|
|
Caris Life Sciences, Inc. * |
|
|
Charles River Laboratories International, Inc. * |
|
|
| |
|
|
Elanco Animal Health, Inc. * |
|
|
| |
|
|
| |
|
|
| |
|
|
| |
|
|
| |
|
|
| |
|
|
Ionis Pharmaceuticals, Inc. * |
|
|
| |
|
|
Jazz Pharmaceuticals PLC * |
|
|
| |
|
|
| |
|
|
Mettler-Toledo International, Inc. * |
|
|
| |
|
|
Neurocrine Biosciences, Inc. * |
|
|
| |
|
|
| |
|
|
| |
|
|
| |
|
|
| |
|
|
Regeneron Pharmaceuticals, Inc. |
|
|
| |
|
|
Revolution Medicines, Inc. * |
|
|
| |
|
|
| |
|
|
Royalty Pharma PLC, Class A |
|
|
Sarepta Therapeutics, Inc. * |
|
|
| |
|
|
Thermo Fisher Scientific, Inc. |
|
|
United Therapeutics Corp. * |
|
|
| |
|
|
Viking Therapeutics, Inc. * |
|
|
| |
|
|
West Pharmaceutical Services, Inc. |
|
|
| |
|
|
| |
|
|
| |
Real Estate Management & Development 0.3% |
CBRE Group, Inc., Class A * |
|
|
| |
|
|
Howard Hughes Holdings, Inc. * |
|
|
Jones Lang LaSalle, Inc. * |
|
|
Zillow Group, Inc., Class C * |
|
|
| |
|
|
| |
Semiconductors & Semiconductor Equipment 4.6% |
Advanced Micro Devices, Inc. * |
|
|
Allegro MicroSystems, Inc. * |
|
|
| |
|
|
| |
|
|
| |
|
|
| |
|
|
| |
|
|
| |
|
|
| |
|
|
| |
|
|
Lattice Semiconductor Corp. * |
|
|
MACOM Technology Solutions Holdings, Inc. * |
|
|
| |
|
|
Microchip Technology, Inc. |
|
|
| |
|
|
| |
|
|
| |
|
|
| |
|
|
| |
|
|
| |
|
|
| |
|
|
| |
|
|
| |
|
|
| |
|
|
| |
|
|
| |
| |
| |
|
|
Akamai Technologies, Inc. * |
|
|
| |
|
|
Aurora Innovation, Inc. * |
|
|
| |
|
|
CCC Intelligent Solutions Holdings, Inc. * |
|
|
Circle Internet Group, Inc. *(a) |
|
|
92
Schwab Equity Index Funds | Annual Holdings and Financial Statements
Schwab U.S. Large-Cap Value Index Fund
Portfolio Holdings as of October 31, 2025 (continued)
| |
|
|
Cognizant Technology Solutions Corp., Class A |
|
|
Docusign, Inc., Class A * |
|
|
Dolby Laboratories, Inc., Class A |
|
|
| |
|
|
| |
|
|
| |
|
|
| |
|
|
| |
|
|
| |
|
|
Informatica, Inc., Class A * |
|
|
International Business Machines Corp. |
|
|
| |
|
|
| |
|
|
| |
|
|
| |
|
|
| |
|
|
| |
|
|
| |
|
|
| |
|
|
| |
|
|
| |
|
|
| |
|
|
SentinelOne, Inc., Class A * |
|
|
Strategy, Inc., Class A * |
|
|
| |
|
|
| |
|
|
| |
|
|
Tyler Technologies, Inc. * |
|
|
| |
|
|
| |
|
|
| |
|
|
Zoom Communications, Inc. * |
|
|
| |
|
|
| |
Technology Hardware & Equipment 3.0% |
Arrow Electronics, Inc. * |
|
|
| |
|
|
| |
|
|
| |
|
|
| |
|
|
| |
|
|
| |
|
|
| |
|
|
| |
|
|
Dell Technologies, Inc., Class C |
|
|
| |
|
|
| |
|
|
Hewlett Packard Enterprise Co. |
|
|
| |
|
|
Ingram Micro Holding Corp. |
|
|
| |
|
|
| |
|
|
Keysight Technologies, Inc. * |
|
|
| |
|
|
Lumentum Holdings, Inc. * |
|
|
| |
|
|
| |
|
|
Pure Storage, Inc., Class A * |
|
|
| |
|
|
| |
|
|
Super Micro Computer, Inc. * |
|
|
| |
|
|
Teledyne Technologies, Inc. * |
|
|
| |
|
|
| |
|
|
| |
|
|
| |
|
|
Zebra Technologies Corp., Class A * |
|
|
| |
|
|
| |
Telecommunication Services 1.6% |
| |
|
|
| |
|
|
Frontier Communications Parent, Inc. * |
|
|
| |
|
|
GCI Liberty, Inc., Class C * |
|
|
Iridium Communications, Inc. |
|
|
Liberty Global Ltd., Class C * |
|
|
Millicom International Cellular SA |
|
|
| |
|
|
Verizon Communications, Inc. |
|
|
| |
|
|
| |
| |
| |
|
|
American Airlines Group, Inc. * |
|
|
Avis Budget Group, Inc. * |
|
|
CH Robinson Worldwide, Inc. |
|
|
| |
|
|
| |
|
|
Expeditors International of Washington, Inc. |
|
|
| |
|
|
| |
|
|
JB Hunt Transport Services, Inc. |
|
|
| |
|
|
Knight-Swift Transportation Holdings, Inc. |
|
|
| |
|
|
| |
|
|
| |
|
|
Old Dominion Freight Line, Inc. |
|
|
| |
|
|
| |
|
|
Schneider National, Inc., Class B |
|
|
| |
|
|
U-Haul Holding Co., Non Voting Shares |
|
|
| |
|
|
United Airlines Holdings, Inc. * |
|
|
United Parcel Service, Inc., Class B |
|
|
| |
|
|
| |
|
|
| |
| |
| |
|
|
| |
|
|
| |
|
|
American Electric Power Co., Inc. |
|
|
American Water Works Co., Inc. |
|
|
| |
|
|
Brookfield Renewable Corp. |
|
|
| |
|
|
Clearway Energy, Inc., Class C |
|
|
| |
|
|
Consolidated Edison, Inc. |
|
|
Constellation Energy Corp. |
|
|
| |
|
|
| |
|
|
| |
|
|
| |
|
|
| |
|
|
Essential Utilities, Inc. |
|
|
| |
|
|
Schwab Equity Index Funds | Annual Holdings and Financial Statements
93
Schwab U.S. Large-Cap Value Index Fund
Portfolio Holdings as of October 31, 2025 (continued)
| |
|
|
| |
|
|
| |
|
|
| |
|
|
| |
|
|
MDU Resources Group, Inc. |
|
|
| |
|
|
| |
|
|
| |
|
|
| |
|
|
| |
|
|
Pinnacle West Capital Corp. |
|
|
| |
|
|
Public Service Enterprise Group, Inc. |
|
|
| |
|
|
| |
|
|
| |
|
|
| |
|
|
| |
|
|
| |
|
|
| |
|
|
Total Common Stocks
(Cost $645,798,910) |
|
| |
INVESTMENT COMPANIES 0.2% OF NET ASSETS |
| |
| |
iShares Russell 1000 Value ETF |
|
|
Total Investment Companies
(Cost $1,197,376) |
|
| |
|
|
SHORT-TERM INVESTMENTS 0.2% OF NET ASSETS |
| |
| |
State Street Institutional U.S. Government Money Market Fund, Premier Class 4.01% (d) |
|
|
State Street Institutional U.S. Government Money Market Fund, Premier Class 4.01% (d)(e) |
|
|
| |
|
|
Total Short-Term Investments
(Cost $2,195,539) |
|
Total Investments in Securities
(Cost $649,191,825) |
|
| |
|
|
CURRENT VALUE/
UNREALIZED
APPRECIATION
(DEPRECIATION)
($) |
| |
| |
|
|
|
DJIA CBOT, e-mini, expires 12/19/25 |
|
|
|
S&P 400 Mid-Cap Index, e-mini, expires 12/19/25 |
|
|
|
| |
|
|
|
| |
Non-income producing security. |
| |
All or a portion of this security is on loan. Securities on loan were valued at $273,887. |
| |
Issuer is affiliated with the fund’s investment adviser. |
| |
Fair valued using significant unobservable inputs (see financial note 2(a), Securities for which no quoted value is available, for additional information). |
| |
The rate shown is the annualized 7-day yield. |
| |
Security purchased with cash collateral received for securities on loan. |
| |
American Depositary Receipt |
| |
|
| |
|
| |
Real Estate Investment Trust |
Below is a summary of the fund’s transactions with affiliated issuers during the period ended October 31, 2025:
| |
|
|
|
NET REALIZED GAINS (LOSSES) |
NET CHANGE IN UNREALIZED APPRECIATION (DEPRECIATION) |
|
BALANCE OF SHARES HELD AT 10/31/25 |
|
COMMON STOCKS 0.5% OF NET ASSETS |
| |
| |
| |
|
|
|
|
|
|
|
|
94
Schwab Equity Index Funds | Annual Holdings and Financial Statements
Schwab U.S. Large-Cap Value Index Fund
Portfolio Holdings as of October 31, 2025 (continued)
The following is a summary of the inputs used to value the fund’s investments as of October 31, 2025 (see financial note 2(a) for additional information):
| |
QUOTED PRICES IN
ACTIVE MARKETS FOR
IDENTICAL ASSETS
(LEVEL 1) |
OTHER SIGNIFICANT
OBSERVABLE INPUTS
(LEVEL 2) |
SIGNIFICANT
UNOBSERVABLE INPUTS
(LEVEL 3) |
|
| |
|
|
|
|
| |
|
|
|
|
Telecommunication Services |
|
|
|
|
| |
|
|
|
|
| |
|
|
|
|
| |
|
|
|
|
| |
|
|
|
|
| |
|
|
|
|
| |
|
|
|
|
| |
Level 3 amount shown includes securities determined to have no value at October 31, 2025. |
| |
As categorized in the Portfolio Holdings. |
| |
Futures contracts are reported at cumulative unrealized appreciation or depreciation. |
Schwab Equity Index Funds | Annual Holdings and Financial Statements
95
Schwab U.S. Large-Cap Value Index Fund
Statement of Assets and Liabilities
| |
Investments in securities, at value - affiliated issuers (cost $2,637,879) |
|
|
Investments in securities, at value - unaffiliated issuers (cost $646,553,946) including securities on loan of $273,887 |
|
|
Deposit with broker for futures contracts |
|
|
| |
|
|
| |
|
|
| |
|
|
Variation margin on future contracts |
|
|
Income from securities on loan |
|
|
| |
|
|
| |
| |
Collateral held for securities on loan |
|
|
| |
|
|
| |
|
|
| |
|
|
| |
|
|
| |
|
|
| |
| |
Capital received from investors |
|
|
Total distributable earnings |
|
|
| |
|
|
96
Schwab Equity Index Funds | Annual Holdings and Financial Statements
Schwab U.S. Large-Cap Value Index Fund
Statement of Operations
For the period November 1, 2024 through October 31, 2025 |
| |
Dividends received from securities - unaffiliated issuers (net of foreign withholding tax of $4,888) |
|
|
Dividends received from securities - affiliated issuers |
|
|
| |
|
|
| |
|
|
| |
|
|
| |
| |
| |
|
|
| |
|
|
| |
|
|
| |
REALIZED AND UNREALIZED GAINS (LOSSES) |
Net realized losses on sales of securities - affiliated issuers |
|
|
Net realized losses on sales of securities - unaffiliated issuers |
|
|
Net realized gains on sales of in-kind redemptions - affiliated issuers |
|
|
Net realized gains on sales of in-kind redemptions - unaffiliated issuers |
|
|
Net realized gains on futures contracts |
|
|
| |
|
|
Net change in unrealized appreciation (depreciation) on securities - affiliated issuers |
|
|
Net change in unrealized appreciation (depreciation) on securities - unaffiliated issuers |
|
|
Net change in unrealized appreciation (depreciation) on futures contracts |
|
|
Net change in unrealized appreciation (depreciation) |
|
|
Net realized and unrealized gains |
|
|
Increase in net assets resulting from operations |
|
|
Schwab Equity Index Funds | Annual Holdings and Financial Statements
97
Schwab U.S. Large-Cap Value Index Fund
Statement of Changes in Net Assets
For the current and prior report periods
| |
| |
|
|
| |
|
|
|
| |
|
|
|
Net change in unrealized appreciation (depreciation) |
|
|
|
Increase in net assets resulting from operations |
|
|
|
| |
DISTRIBUTIONS TO SHAREHOLDERS |
| |
|
|
|
TRANSACTIONS IN FUND SHARES1 |
| |
|
|
| |
|
|
|
|
|
| |
|
|
|
|
|
| |
|
|
|
|
|
| |
|
|
|
|
|
Net transactions in fund shares |
|
|
|
|
|
| |
SHARES OUTSTANDING AND NET ASSETS1 |
| |
|
|
| |
|
|
|
|
|
| |
|
|
|
|
|
| |
|
|
|
|
|
| |
|
|
|
|
|
| |
For the period ended October 31, 2025, and the prior report period, transactions in fund shares have been retroactively adjusted to reflect a 4-for-1 share split effective after the close of U.S. markets on August 15, 2025. The retroactive adjustment of the share split does not change the transaction in fund shares values (see financial note 9 for additional information). |
98
Schwab Equity Index Funds | Annual Holdings and Financial Statements
Schwab U.S. Mid-Cap Index Fund
Financial Statements
| |
|
|
|
|
|
|
| |
Net asset value at beginning of period |
|
|
|
|
|
|
Income (loss) from investment operations: |
|
|
|
|
|
|
Net investment income (loss)2 |
|
|
|
|
|
|
Net realized and unrealized gains (losses) |
|
|
|
|
|
|
Total from investment operations |
|
|
|
|
|
|
| |
|
|
|
|
|
|
Distributions from net investment income |
|
|
|
|
|
|
Distributions from net realized gains |
|
|
|
|
|
|
| |
|
|
|
|
|
|
Net asset value at end of period |
|
|
|
|
|
|
| |
|
|
|
|
|
|
| |
Ratios to average net assets: |
|
|
|
|
|
|
| |
|
|
|
|
|
|
Net investment income (loss) |
|
|
|
|
|
|
| |
|
|
|
|
|
|
Net assets, end of period (x 1,000,000) |
|
|
|
|
|
|
| |
Per-Share Data has been retroactively adjusted to reflect a 5-for-1 share split effective after the close of U.S. markets on August 15, 2025 (see financial note 9 for additional information). |
| |
Calculated based on the average shares outstanding during the period. |
| |
Ratio includes less than 0.005% of non-routine proxy expenses. |
| |
Portfolio turnover rate excludes in-kind transactions. |
Schwab Equity Index Funds | Annual Holdings and Financial Statements
99
Schwab U.S. Mid-Cap Index Fund
Portfolio Holdings as of October 31, 2025
| |
|
|
COMMON STOCKS 99.4% OF NET ASSETS |
| |
Automobiles & Components 0.9% |
| |
|
|
| |
|
|
| |
|
|
| |
|
|
| |
|
|
| |
|
|
| |
|
|
QuantumScape Corp., Class A * |
|
|
Rivian Automotive, Inc., Class A * |
|
|
| |
|
|
| |
|
|
| |
| |
| |
|
|
| |
|
|
Citizens Financial Group, Inc. |
|
|
Columbia Banking System, Inc. |
|
|
| |
|
|
Commerce Bancshares, Inc. |
|
|
Cullen/Frost Bankers, Inc. |
|
|
| |
|
|
| |
|
|
First Citizens BancShares, Inc., Class A |
|
|
| |
|
|
| |
|
|
| |
|
|
Huntington Bancshares, Inc. |
|
|
| |
|
|
| |
|
|
Pinnacle Financial Partners, Inc. |
|
|
| |
|
|
Prosperity Bancshares, Inc. |
|
|
| |
|
|
| |
|
|
| |
|
|
| |
|
|
| |
|
|
| |
|
|
| |
|
|
| |
|
|
| |
|
|
| |
| |
| |
|
|
| |
|
|
| |
|
|
Advanced Drainage Systems, Inc. |
|
|
| |
|
|
| |
|
|
| |
|
|
| |
|
|
Allison Transmission Holdings, Inc. |
|
|
| |
|
|
| |
|
|
Applied Industrial Technologies, Inc. |
|
|
Armstrong World Industries, Inc. |
|
|
| |
|
|
| |
|
|
Builders FirstSource, Inc. * |
|
|
| |
|
|
| |
|
|
| |
|
|
Carpenter Technology Corp. |
|
|
| |
|
|
Comfort Systems USA, Inc. |
|
|
Core & Main, Inc., Class A * |
|
|
| |
|
|
| |
|
|
| |
|
|
| |
|
|
| |
|
|
| |
|
|
| |
|
|
Everus Construction Group, Inc. * |
|
|
| |
|
|
Ferguson Enterprises, Inc. |
|
|
| |
|
|
| |
|
|
Fortune Brands Innovations, Inc. |
|
|
| |
|
|
Gates Industrial Corp. PLC * |
|
|
| |
|
|
| |
|
|
| |
|
|
| |
|
|
| |
|
|
| |
|
|
| |
|
|
Huntington Ingalls Industries, Inc. |
|
|
| |
|
|
| |
|
|
| |
|
|
| |
|
|
L3Harris Technologies, Inc. |
|
|
Lennox International, Inc. |
|
|
| |
|
|
Lincoln Electric Holdings, Inc. |
|
|
| |
|
|
| |
|
|
| |
|
|
| |
|
|
MSC Industrial Direct Co., Inc., Class A |
|
|
| |
|
|
| |
|
|
| |
|
|
| |
|
|
| |
|
|
| |
|
|
| |
|
|
| |
|
|
| |
|
|
| |
|
|
| |
|
|
| |
|
|
Rockwell Automation, Inc. |
|
|
Sensata Technologies Holding PLC |
|
|
Simpson Manufacturing Co., Inc. |
|
|
SiteOne Landscape Supply, Inc. * |
|
|
| |
|
|
Spirit AeroSystems Holdings, Inc., Class A * |
|
|
| |
|
|
Stanley Black & Decker, Inc. |
|
|
| |
|
|
| |
|
|
| |
|
|
| |
|
|
| |
|
|
| |
|
|
Vertiv Holdings Co., Class A |
|
|
100
Schwab Equity Index Funds | Annual Holdings and Financial Statements
Schwab U.S. Mid-Cap Index Fund
Portfolio Holdings as of October 31, 2025 (continued)
| |
|
|
| |
|
|
WESCO International, Inc. |
|
|
Westinghouse Air Brake Technologies Corp. |
|
|
| |
|
|
| |
|
|
| |
|
|
| |
|
|
| |
|
|
| |
Commercial & Professional Services 3.0% |
| |
|
|
Booz Allen Hamilton Holding Corp., Class A |
|
|
Broadridge Financial Solutions, Inc. |
|
|
CACI International, Inc., Class A * |
|
|
| |
|
|
| |
|
|
| |
|
|
| |
|
|
| |
|
|
ExlService Holdings, Inc. * |
|
|
| |
|
|
| |
|
|
| |
|
|
| |
|
|
| |
|
|
| |
|
|
| |
|
|
| |
|
|
| |
|
|
| |
|
|
Paylocity Holding Corp. * |
|
|
| |
|
|
| |
|
|
| |
|
|
Science Applications International Corp. |
|
|
SS&C Technologies Holdings, Inc. |
|
|
| |
|
|
| |
|
|
| |
|
|
Verisk Analytics, Inc., Class A |
|
|
| |
|
|
| |
Consumer Discretionary Distribution & Retail 3.5% |
| |
|
|
| |
|
|
| |
|
|
Burlington Stores, Inc. * |
|
|
| |
|
|
| |
|
|
| |
|
|
| |
|
|
Dick's Sporting Goods, Inc. |
|
|
| |
|
|
| |
|
|
| |
|
|
| |
|
|
Floor & Decor Holdings, Inc., Class A * |
|
|
GameStop Corp., Class A * |
|
|
| |
|
|
| |
|
|
Lithia Motors, Inc., Class A |
|
|
| |
|
|
| |
|
|
| |
|
|
| |
|
|
Ollie's Bargain Outlet Holdings, Inc. * |
|
|
Penske Automotive Group, Inc. |
|
|
| |
|
|
| |
|
|
| |
|
|
| |
|
|
| |
|
|
| |
|
|
| |
|
|
| |
|
|
| |
|
|
| |
Consumer Durables & Apparel 2.6% |
| |
|
|
Birkenstock Holding PLC * |
|
|
| |
|
|
| |
|
|
| |
|
|
| |
|
|
| |
|
|
| |
|
|
| |
|
|
| |
|
|
Lululemon Athletica, Inc. * |
|
|
| |
|
|
Mohawk Industries, Inc. * |
|
|
| |
|
|
| |
|
|
| |
|
|
| |
|
|
| |
|
|
Ralph Lauren Corp., Class A |
|
|
| |
|
|
Somnigroup International, Inc. |
|
|
| |
|
|
| |
|
|
| |
|
|
Under Armour, Inc., Class A * |
|
|
| |
|
|
| |
|
|
| |
|
|
| |
|
|
| |
| |
| |
|
|
| |
|
|
| |
|
|
Bright Horizons Family Solutions, Inc. * |
|
|
Caesars Entertainment, Inc. * |
|
|
| |
|
|
| |
|
|
Choice Hotels International, Inc. |
|
|
| |
|
|
| |
|
|
| |
|
|
DraftKings, Inc., Class A * |
|
|
| |
|
|
Dutch Bros, Inc., Class A * |
|
|
| |
|
|
Flutter Entertainment PLC * |
|
|
Grand Canyon Education, Inc. * |
|
|
| |
|
|
Hilton Worldwide Holdings, Inc. |
|
|
Hyatt Hotels Corp., Class A |
|
|
| |
|
|
| |
|
|
Schwab Equity Index Funds | Annual Holdings and Financial Statements
101
Schwab U.S. Mid-Cap Index Fund
Portfolio Holdings as of October 31, 2025 (continued)
| |
|
|
MGM Resorts International * |
|
|
Norwegian Cruise Line Holdings Ltd. * |
|
|
Penn Entertainment, Inc. * |
|
|
Planet Fitness, Inc., Class A * |
|
|
Restaurant Brands International, Inc. |
|
|
Royal Caribbean Cruises Ltd. |
|
|
Service Corp. International |
|
|
Texas Roadhouse, Inc., Class A |
|
|
| |
|
|
| |
|
|
| |
|
|
| |
|
|
| |
|
|
Wyndham Hotels & Resorts, Inc. |
|
|
| |
|
|
| |
|
|
| |
|
|
| |
Consumer Staples Distribution & Retail 1.6% |
Albertsons Cos., Inc., Class A |
|
|
BJ's Wholesale Club Holdings, Inc. * |
|
|
Casey's General Stores, Inc. |
|
|
| |
|
|
| |
|
|
| |
|
|
| |
|
|
Performance Food Group Co. * |
|
|
Sprouts Farmers Market, Inc. * |
|
|
| |
|
|
U.S. Foods Holding Corp. * |
|
|
| |
|
|
| |
| |
| |
|
|
| |
|
|
| |
|
|
Baker Hughes Co., Class A |
|
|
| |
|
|
| |
|
|
| |
|
|
| |
|
|
| |
|
|
| |
|
|
| |
|
|
| |
|
|
| |
|
|
| |
|
|
| |
|
|
| |
|
|
| |
|
|
| |
|
|
| |
|
|
Occidental Petroleum Corp. |
|
|
| |
|
|
| |
|
|
Permian Resources Corp., Class A |
|
|
| |
|
|
| |
|
|
| |
|
|
| |
|
|
| |
|
|
| |
|
|
Viper Energy, Inc., Class A |
|
|
Weatherford International PLC |
|
|
| |
|
|
| |
| |
|
|
Equity Real Estate Investment Trusts (REITs) 6.1% |
| |
|
|
Alexandria Real Estate Equities, Inc. |
|
|
American Homes 4 Rent, Class A |
|
|
Americold Realty Trust, Inc. |
|
|
AvalonBay Communities, Inc. |
|
|
Brixmor Property Group, Inc. |
|
|
| |
|
|
| |
|
|
| |
|
|
| |
|
|
| |
|
|
Digital Realty Trust, Inc. |
|
|
EastGroup Properties, Inc. |
|
|
| |
|
|
Equity LifeStyle Properties, Inc. |
|
|
| |
|
|
Essex Property Trust, Inc. |
|
|
Extra Space Storage, Inc. |
|
|
Federal Realty Investment Trust |
|
|
First Industrial Realty Trust, Inc. |
|
|
Gaming & Leisure Properties, Inc. |
|
|
Healthcare Realty Trust, Inc., Class A |
|
|
Healthpeak Properties, Inc. |
|
|
Highwoods Properties, Inc. |
|
|
Host Hotels & Resorts, Inc. |
|
|
| |
|
|
| |
|
|
| |
|
|
| |
|
|
Lamar Advertising Co., Class A |
|
|
| |
|
|
Medical Properties Trust, Inc. |
|
|
Mid-America Apartment Communities, Inc. |
|
|
Millrose Properties, Inc., Class A |
|
|
National Storage Affiliates Trust |
|
|
| |
|
|
Omega Healthcare Investors, Inc. |
|
|
Park Hotels & Resorts, Inc. |
|
|
| |
|
|
| |
|
|
| |
|
|
Rexford Industrial Realty, Inc. |
|
|
SBA Communications Corp., Class A |
|
|
Simon Property Group, Inc. |
|
|
| |
|
|
| |
|
|
| |
|
|
| |
|
|
VICI Properties, Inc., Class A |
|
|
| |
|
|
| |
|
|
| |
|
|
| |
|
|
| |
| |
Affiliated Managers Group, Inc. |
|
|
| |
|
|
| |
|
|
| |
|
|
Ameriprise Financial, Inc. |
|
|
Annaly Capital Management, Inc. |
|
|
ARES Management Corp., Class A |
|
|
Bank of New York Mellon Corp. |
|
|
| |
|
|
102
Schwab Equity Index Funds | Annual Holdings and Financial Statements
Schwab U.S. Mid-Cap Index Fund
Portfolio Holdings as of October 31, 2025 (continued)
| |
|
|
Blue Owl Capital, Inc., Class A |
|
|
| |
|
|
Cboe Global Markets, Inc. |
|
|
Coinbase Global, Inc., Class A * |
|
|
Corebridge Financial, Inc. |
|
|
| |
|
|
Credit Acceptance Corp. * |
|
|
| |
|
|
Euronet Worldwide, Inc. * |
|
|
| |
|
|
FactSet Research Systems, Inc. |
|
|
Fidelity National Information Services, Inc. |
|
|
| |
|
|
Freedom Holding Corp. *(a) |
|
|
| |
|
|
Hamilton Lane, Inc., Class A |
|
|
Houlihan Lokey, Inc., Class A |
|
|
| |
|
|
Jack Henry & Associates, Inc. |
|
|
Janus Henderson Group PLC |
|
|
Jefferies Financial Group, Inc. |
|
|
| |
|
|
LPL Financial Holdings, Inc. |
|
|
MarketAxess Holdings, Inc. |
|
|
| |
|
|
| |
|
|
| |
|
|
| |
|
|
| |
|
|
| |
|
|
Raymond James Financial, Inc. |
|
|
| |
|
|
Robinhood Markets, Inc., Class A * |
|
|
Rocket Cos., Inc., Class A |
|
|
| |
|
|
Shift4 Payments, Inc., Class A * |
|
|
| |
|
|
SoFi Technologies, Inc. * |
|
|
Starwood Property Trust, Inc. |
|
|
| |
|
|
| |
|
|
| |
|
|
T. Rowe Price Group, Inc. |
|
|
| |
|
|
| |
|
|
Tradeweb Markets, Inc., Class A |
|
|
| |
|
|
Virtu Financial, Inc., Class A |
|
|
| |
|
|
| |
|
|
| |
|
|
| |
|
|
| |
|
|
| |
Food, Beverage & Tobacco 2.3% |
Archer-Daniels-Midland Co. |
|
|
Boston Beer Co., Inc., Class A * |
|
|
Brown-Forman Corp., Class B |
|
|
| |
|
|
| |
|
|
| |
|
|
Coca-Cola Consolidated, Inc. |
|
|
| |
|
|
Constellation Brands, Inc., Class A |
|
|
Darling Ingredients, Inc. * |
|
|
| |
|
|
| |
|
|
| |
|
|
| |
|
|
| |
|
|
| |
|
|
| |
|
|
| |
|
|
| |
|
|
| |
|
|
Lamb Weston Holdings, Inc. |
|
|
McCormick & Co., Inc. - Non Voting Shares |
|
|
Molson Coors Beverage Co., Class B |
|
|
| |
|
|
| |
|
|
| |
|
|
| |
|
|
| |
|
|
Tyson Foods, Inc., Class A |
|
|
| |
|
|
| |
Health Care Equipment & Services 5.0% |
Acadia Healthcare Co., Inc. * |
|
|
| |
|
|
Baxter International, Inc. |
|
|
| |
|
|
| |
|
|
| |
|
|
| |
|
|
| |
|
|
| |
|
|
| |
|
|
| |
|
|
| |
|
|
Doximity, Inc., Class A * |
|
|
| |
|
|
| |
|
|
GE HealthCare Technologies, Inc. |
|
|
Globus Medical, Inc., Class A * |
|
|
| |
|
|
| |
|
|
| |
|
|
IDEXX Laboratories, Inc. * |
|
|
Inspire Medical Systems, Inc. * |
|
|
| |
|
|
| |
|
|
| |
|
|
Molina Healthcare, Inc. * |
|
|
| |
|
|
| |
|
|
| |
|
|
| |
|
|
| |
|
|
| |
|
|
| |
|
|
Universal Health Services, Inc., Class B |
|
|
Veeva Systems, Inc., Class A * |
|
|
Zimmer Biomet Holdings, Inc. |
|
|
| |
|
|
| |
Household & Personal Products 0.8% |
| |
|
|
Church & Dwight Co., Inc. |
|
|
| |
|
|
| |
|
|
| |
|
|
Estee Lauder Cos., Inc., Class A |
|
|
Schwab Equity Index Funds | Annual Holdings and Financial Statements
103
Schwab U.S. Mid-Cap Index Fund
Portfolio Holdings as of October 31, 2025 (continued)
| |
|
|
| |
|
|
Reynolds Consumer Products, Inc. |
|
|
| |
|
|
| |
| |
| |
|
|
American Financial Group, Inc. |
|
|
| |
|
|
| |
|
|
| |
|
|
Axis Capital Holdings Ltd. |
|
|
Brighthouse Financial, Inc. * |
|
|
| |
|
|
Cincinnati Financial Corp. |
|
|
| |
|
|
| |
|
|
Fidelity National Financial, Inc. |
|
|
First American Financial Corp. |
|
|
| |
|
|
Hanover Insurance Group, Inc. |
|
|
Hartford Insurance Group, Inc. |
|
|
| |
|
|
Kinsale Capital Group, Inc. |
|
|
| |
|
|
| |
|
|
| |
|
|
Old Republic International Corp. |
|
|
| |
|
|
Principal Financial Group, Inc. |
|
|
Prudential Financial, Inc. |
|
|
Reinsurance Group of America, Inc. |
|
|
RenaissanceRe Holdings Ltd. |
|
|
| |
|
|
Ryan Specialty Holdings, Inc., Class A |
|
|
| |
|
|
| |
|
|
White Mountains Insurance Group Ltd. |
|
|
| |
|
|
| |
|
|
| |
| |
| |
|
|
| |
|
|
| |
|
|
| |
|
|
| |
|
|
| |
|
|
| |
|
|
Axalta Coating Systems Ltd. * |
|
|
| |
|
|
| |
|
|
CF Industries Holdings, Inc. |
|
|
| |
|
|
| |
|
|
| |
|
|
| |
|
|
| |
|
|
| |
|
|
| |
|
|
| |
|
|
| |
|
|
Graphic Packaging Holding Co. |
|
|
| |
|
|
International Flavors & Fragrances, Inc. |
|
|
| |
|
|
James Hardie Industries PLC, ADR * |
|
|
| |
|
|
| |
|
|
LyondellBasell Industries NV, Class A |
|
|
Martin Marietta Materials, Inc. |
|
|
| |
|
|
| |
|
|
| |
|
|
| |
|
|
| |
|
|
Packaging Corp. of America |
|
|
| |
|
|
| |
|
|
| |
|
|
| |
|
|
| |
|
|
| |
|
|
| |
|
|
| |
|
|
| |
|
|
| |
|
|
| |
|
|
| |
|
|
| |
|
|
| |
Media & Entertainment 3.9% |
Charter Communications, Inc., Class A * |
|
|
DoubleVerify Holdings, Inc. * |
|
|
| |
|
|
| |
|
|
| |
|
|
Interpublic Group of Cos., Inc. |
|
|
Liberty Broadband Corp., Class C * |
|
|
Liberty Media Corp.-Liberty Formula One, Class C * |
|
|
Liberty Media Corp.-Liberty Live, Class C * |
|
|
Live Nation Entertainment, Inc. * |
|
|
Madison Square Garden Sports Corp. * |
|
|
| |
|
|
New York Times Co., Class A |
|
|
| |
|
|
Nexstar Media Group, Inc., Class A |
|
|
NIQ Global Intelligence PLC * |
|
|
| |
|
|
Pinterest, Inc., Class A * |
|
|
| |
|
|
| |
|
|
| |
|
|
| |
|
|
Take-Two Interactive Software, Inc. * |
|
|
| |
|
|
Trade Desk, Inc., Class A * |
|
|
Trump Media & Technology Group Corp. * |
|
|
Warner Bros Discovery, Inc. * |
|
|
ZoomInfo Technologies, Inc., Class A * |
|
|
| |
|
|
| |
Pharmaceuticals, Biotechnology & Life Sciences 4.8% |
Agilent Technologies, Inc. |
|
|
Alnylam Pharmaceuticals, Inc. * |
|
|
Apellis Pharmaceuticals, Inc. * |
|
|
| |
|
|
| |
|
|
BioMarin Pharmaceutical, Inc. * |
|
|
Bio-Rad Laboratories, Inc., Class A * |
|
|
| |
|
|
104
Schwab Equity Index Funds | Annual Holdings and Financial Statements
Schwab U.S. Mid-Cap Index Fund
Portfolio Holdings as of October 31, 2025 (continued)
| |
|
|
| |
|
|
Caris Life Sciences, Inc. * |
|
|
Charles River Laboratories International, Inc. * |
|
|
Corcept Therapeutics, Inc. * |
|
|
Elanco Animal Health, Inc. * |
|
|
| |
|
|
| |
|
|
Halozyme Therapeutics, Inc. * |
|
|
| |
|
|
| |
|
|
| |
|
|
Ionis Pharmaceuticals, Inc. * |
|
|
| |
|
|
Jazz Pharmaceuticals PLC * |
|
|
| |
|
|
Mettler-Toledo International, Inc. * |
|
|
| |
|
|
| |
|
|
Neurocrine Biosciences, Inc. * |
|
|
| |
|
|
| |
|
|
| |
|
|
| |
|
|
Revolution Medicines, Inc. * |
|
|
| |
|
|
| |
|
|
Royalty Pharma PLC, Class A |
|
|
Sarepta Therapeutics, Inc. * |
|
|
| |
|
|
Summit Therapeutics, Inc. *(a) |
|
|
| |
|
|
Ultragenyx Pharmaceutical, Inc. * |
|
|
United Therapeutics Corp. * |
|
|
| |
|
|
Viking Therapeutics, Inc. * |
|
|
| |
|
|
West Pharmaceutical Services, Inc. |
|
|
| |
|
|
| |
Real Estate Management & Development 0.8% |
CBRE Group, Inc., Class A * |
|
|
| |
|
|
Howard Hughes Holdings, Inc. * |
|
|
Jones Lang LaSalle, Inc. * |
|
|
Zillow Group, Inc., Class C * |
|
|
| |
|
|
| |
Semiconductors & Semiconductor Equipment 2.2% |
Allegro MicroSystems, Inc. * |
|
|
| |
|
|
| |
|
|
| |
|
|
| |
|
|
| |
|
|
| |
|
|
| |
|
|
Lattice Semiconductor Corp. * |
|
|
MACOM Technology Solutions Holdings, Inc. * |
|
|
Microchip Technology, Inc. |
|
|
| |
|
|
Monolithic Power Systems, Inc. |
|
|
| |
|
|
| |
|
|
| |
|
|
| |
|
|
| |
|
|
| |
|
|
| |
|
|
| |
|
|
| |
| |
Akamai Technologies, Inc. * |
|
|
| |
|
|
Appfolio, Inc., Class A * |
|
|
Aurora Innovation, Inc. * |
|
|
Bentley Systems, Inc., Class B |
|
|
| |
|
|
CCC Intelligent Solutions Holdings, Inc. * |
|
|
Circle Internet Group, Inc. *(a) |
|
|
Cloudflare, Inc., Class A * |
|
|
Cognizant Technology Solutions Corp., Class A |
|
|
Confluent, Inc., Class A * |
|
|
| |
|
|
Docusign, Inc., Class A * |
|
|
Dolby Laboratories, Inc., Class A |
|
|
| |
|
|
| |
|
|
| |
|
|
| |
|
|
| |
|
|
| |
|
|
| |
|
|
| |
|
|
| |
|
|
| |
|
|
| |
|
|
Guidewire Software, Inc. * |
|
|
| |
|
|
Informatica, Inc., Class A * |
|
|
| |
|
|
Manhattan Associates, Inc. * |
|
|
| |
|
|
| |
|
|
| |
|
|
| |
|
|
| |
|
|
Procore Technologies, Inc. * |
|
|
| |
|
|
RingCentral, Inc., Class A * |
|
|
| |
|
|
| |
|
|
| |
|
|
SentinelOne, Inc., Class A * |
|
|
| |
|
|
| |
|
|
Tyler Technologies, Inc. * |
|
|
| |
|
|
| |
|
|
| |
|
|
Zoom Communications, Inc. * |
|
|
| |
|
|
| |
|
|
| |
Technology Hardware & Equipment 4.6% |
Arrow Electronics, Inc. * |
|
|
| |
|
|
| |
|
|
| |
|
|
| |
|
|
| |
|
|
Schwab Equity Index Funds | Annual Holdings and Financial Statements
105
Schwab U.S. Mid-Cap Index Fund
Portfolio Holdings as of October 31, 2025 (continued)
| |
|
|
| |
|
|
| |
|
|
| |
|
|
| |
|
|
Hewlett Packard Enterprise Co. |
|
|
| |
|
|
Ingram Micro Holding Corp. |
|
|
| |
|
|
| |
|
|
Keysight Technologies, Inc. * |
|
|
| |
|
|
Lumentum Holdings, Inc. * |
|
|
| |
|
|
Pure Storage, Inc., Class A * |
|
|
| |
|
|
| |
|
|
Super Micro Computer, Inc. * |
|
|
| |
|
|
Teledyne Technologies, Inc. * |
|
|
| |
|
|
| |
|
|
| |
|
|
| |
|
|
Zebra Technologies Corp., Class A * |
|
|
| |
|
|
| |
Telecommunication Services 0.3% |
| |
|
|
Frontier Communications Parent, Inc. * |
|
|
| |
|
|
GCI Liberty, Inc., Class C * |
|
|
Iridium Communications, Inc. |
|
|
Liberty Global Ltd., Class C * |
|
|
Millicom International Cellular SA |
|
|
| |
|
|
| |
| |
| |
|
|
American Airlines Group, Inc. * |
|
|
Avis Budget Group, Inc. * |
|
|
CH Robinson Worldwide, Inc. |
|
|
| |
|
|
Expeditors International of Washington, Inc. |
|
|
| |
|
|
JB Hunt Transport Services, Inc. |
|
|
| |
|
|
Knight-Swift Transportation Holdings, Inc. |
|
|
| |
|
|
| |
|
|
Old Dominion Freight Line, Inc. |
|
|
| |
|
|
| |
|
|
Schneider National, Inc., Class B |
|
|
| |
|
|
U-Haul Holding Co., Non Voting Shares |
|
|
United Airlines Holdings, Inc. * |
|
|
| |
|
|
| |
|
|
| |
| |
| |
|
|
| |
|
|
| |
|
|
| |
|
|
American Water Works Co., Inc. |
|
|
| |
|
|
Brookfield Renewable Corp. |
|
|
| |
|
|
Clearway Energy, Inc., Class C |
|
|
| |
|
|
Consolidated Edison, Inc. |
|
|
| |
|
|
| |
|
|
| |
|
|
Essential Utilities, Inc. |
|
|
| |
|
|
| |
|
|
| |
|
|
| |
|
|
| |
|
|
MDU Resources Group, Inc. |
|
|
| |
|
|
| |
|
|
| |
|
|
| |
|
|
| |
|
|
Pinnacle West Capital Corp. |
|
|
| |
|
|
Public Service Enterprise Group, Inc. |
|
|
| |
|
|
| |
|
|
| |
|
|
| |
|
|
| |
|
|
| |
|
|
Total Common Stocks
(Cost $1,708,773,346) |
|
| |
INVESTMENT COMPANIES 0.2% OF NET ASSETS |
| |
| |
iShares Russell Mid-Cap ETF |
|
|
Total Investment Companies
(Cost $3,279,802) |
|
| |
|
|
SHORT-TERM INVESTMENTS 0.4% OF NET ASSETS |
| |
| |
State Street Institutional U.S. Government Money Market Fund, Premier Class 4.01% (c) |
|
|
State Street Institutional U.S. Government Money Market Fund, Premier Class 4.01% (c)(d) |
|
|
| |
|
|
Total Short-Term Investments
(Cost $9,148,170) |
|
Total Investments in Securities
(Cost $1,721,201,318) |
|
106
Schwab Equity Index Funds | Annual Holdings and Financial Statements
Schwab U.S. Mid-Cap Index Fund
Portfolio Holdings as of October 31, 2025 (continued)
| |
|
|
CURRENT VALUE/
UNREALIZED
DEPRECIATION
($) |
| |
| |
|
|
|
S&P 400 Mid-Cap Index, e-mini, expires 12/19/25 |
|
|
|
| |
Non-income producing security. |
| |
All or a portion of this security is on loan. Securities on loan were valued at $2,145,568. |
| |
Fair valued using significant unobservable inputs (see financial note 2(a), Securities for which no quoted value is available, for additional information). |
| |
The rate shown is the annualized 7-day yield. |
| |
Security purchased with cash collateral received for securities on loan. |
| |
American Depositary Receipt |
| |
|
| |
Real Estate Investment Trust |
The following is a summary of the inputs used to value the fund’s investments as of October 31, 2025 (see financial note 2(a) for additional information):
| |
QUOTED PRICES IN
ACTIVE MARKETS FOR
IDENTICAL ASSETS
(LEVEL 1) |
OTHER SIGNIFICANT
OBSERVABLE INPUTS
(LEVEL 2) |
SIGNIFICANT
UNOBSERVABLE INPUTS
(LEVEL 3) |
|
| |
|
|
|
|
| |
|
|
|
|
Telecommunication Services |
|
|
|
|
| |
|
|
|
|
| |
|
|
|
|
| |
|
|
|
|
| |
|
|
|
|
| |
|
|
|
|
| |
Level 3 amount shown includes securities determined to have no value at October 31, 2025. |
| |
As categorized in the Portfolio Holdings. |
| |
Futures contracts are reported at cumulative unrealized appreciation or depreciation. |
Schwab Equity Index Funds | Annual Holdings and Financial Statements
107
Schwab U.S. Mid-Cap Index Fund
Statement of Assets and Liabilities
| |
Investments in securities, at value - unaffiliated issuers (cost $1,721,201,318) including securities on loan of $2,145,568 |
|
|
Deposit with broker for futures contracts |
|
|
| |
|
|
| |
|
|
| |
|
|
Variation margin on future contracts |
|
|
Income from securities on loan |
|
|
| |
|
|
| |
| |
Collateral held for securities on loan |
|
|
| |
|
|
| |
|
|
| |
|
|
| |
|
|
| |
|
|
| |
| |
Capital received from investors |
|
|
Total distributable earnings |
|
|
| |
|
|
108
Schwab Equity Index Funds | Annual Holdings and Financial Statements
Schwab U.S. Mid-Cap Index Fund
Statement of Operations
For the period November 1, 2024 through October 31, 2025 |
| |
Dividends received from securities - unaffiliated issuers (net of foreign withholding tax of $26,992) |
|
|
| |
|
|
| |
|
|
| |
|
|
| |
| |
| |
|
|
| |
|
|
| |
|
|
| |
REALIZED AND UNREALIZED GAINS (LOSSES) |
Net realized losses on sales of securities - unaffiliated issuers |
|
|
Net realized gains on sales of in-kind redemptions - unaffiliated issuers |
|
|
Net realized losses on futures contracts |
|
|
| |
|
|
Net change in unrealized appreciation (depreciation) on securities - unaffiliated issuers |
|
|
Net change in unrealized appreciation (depreciation) on futures contracts |
|
|
Net change in unrealized appreciation (depreciation) |
|
|
Net realized and unrealized gains |
|
|
Increase in net assets resulting from operations |
|
|
Schwab Equity Index Funds | Annual Holdings and Financial Statements
109
Schwab U.S. Mid-Cap Index Fund
Statement of Changes in Net Assets
For the current and prior report periods
| |
| |
|
|
| |
|
|
|
| |
|
|
|
Net change in unrealized appreciation (depreciation) |
|
|
|
Increase in net assets resulting from operations |
|
|
|
| |
DISTRIBUTIONS TO SHAREHOLDERS |
| |
|
|
|
TRANSACTIONS IN FUND SHARES1 |
| |
|
|
| |
|
|
|
|
|
| |
|
|
|
|
|
| |
|
|
|
|
|
| |
|
|
|
|
|
Net transactions in fund shares |
|
|
|
|
|
| |
SHARES OUTSTANDING AND NET ASSETS1 |
| |
|
|
| |
|
|
|
|
|
| |
|
|
|
|
|
| |
|
|
|
|
|
| |
|
|
|
|
|
| |
For the period ended October 31, 2025, and the prior report period, transactions in fund shares have been retroactively adjusted to reflect a 5-for-1 share split effective after the close of U.S. markets on August 15, 2025. The retroactive adjustment of the share split does not change the transaction in fund shares values (see financial note 9 for additional information). |
110
Schwab Equity Index Funds | Annual Holdings and Financial Statements
Schwab International Index Fund
Financial Statements
| |
|
|
|
|
|
|
| |
Net asset value at beginning of period |
|
|
|
|
|
|
Income (loss) from investment operations: |
|
|
|
|
|
|
Net investment income (loss)1 |
|
|
|
|
|
|
Net realized and unrealized gains (losses) |
|
|
|
|
|
|
Total from investment operations |
|
|
|
|
|
|
| |
|
|
|
|
|
|
Distributions from net investment income |
|
|
|
|
|
|
Net asset value at end of period |
|
|
|
|
|
|
| |
|
|
|
|
|
|
| |
Ratios to average net assets: |
|
|
|
|
|
|
| |
|
|
|
|
|
|
Net investment income (loss) |
|
|
|
|
|
|
| |
|
|
|
|
|
|
Net assets, end of period (x 1,000,000) |
|
|
|
|
|
|
| |
Calculated based on the average shares outstanding during the period. |
| |
Ratio includes less than 0.005% of non-routine proxy expenses. |
Schwab Equity Index Funds | Annual Holdings and Financial Statements
111
Schwab International Index Fund
Portfolio Holdings as of October 31, 2025
| |
|
|
COMMON STOCKS 98.9% OF NET ASSETS |
| |
| |
| |
|
|
| |
|
|
| |
|
|
| |
|
|
| |
|
|
| |
|
|
| |
|
|
| |
|
|
| |
|
|
| |
|
|
Commonwealth Bank of Australia |
|
|
| |
|
|
| |
|
|
| |
|
|
| |
|
|
| |
|
|
Insurance Australia Group Ltd. |
|
|
James Hardie Industries PLC, CDI * |
|
|
| |
|
|
| |
|
|
| |
|
|
National Australia Bank Ltd. |
|
|
Northern Star Resources Ltd. |
|
|
| |
|
|
| |
|
|
| |
|
|
| |
|
|
| |
|
|
| |
|
|
| |
|
|
| |
|
|
| |
|
|
| |
|
|
| |
|
|
| |
|
|
| |
|
|
| |
|
|
| |
|
|
| |
|
|
| |
|
|
Washington H Soul Pattinson & Co. Ltd. |
|
|
| |
|
|
| |
|
|
| |
|
|
Woodside Energy Group Ltd. |
|
|
| |
|
|
| |
|
|
| |
|
|
| |
| |
| |
|
|
| |
|
|
| |
|
|
| |
|
|
| |
| |
| |
|
|
| |
|
|
| |
|
|
| |
|
|
| |
|
|
| |
|
|
Groupe Bruxelles Lambert NV |
|
|
| |
|
|
| |
|
|
| |
|
|
| |
|
|
| |
|
|
| |
|
|
| |
| |
AP Moller - Maersk AS, Class A |
|
|
AP Moller - Maersk AS, Class B |
|
|
| |
|
|
| |
|
|
| |
|
|
| |
|
|
| |
|
|
| |
|
|
| |
|
|
Novonesis Novozymes B, Class B |
|
|
| |
|
|
| |
|
|
| |
|
|
| |
|
|
| |
|
|
| |
|
|
| |
| |
| |
|
|
| |
|
|
| |
|
|
| |
|
|
| |
|
|
| |
|
|
| |
|
|
| |
|
|
| |
|
|
| |
|
|
| |
|
|
| |
|
|
| |
|
|
| |
|
|
| |
| |
| |
|
|
| |
|
|
| |
|
|
| |
|
|
| |
|
|
| |
|
|
| |
|
|
| |
|
|
| |
|
|
| |
|
|
| |
|
|
| |
|
|
| |
|
|
| |
|
|
| |
|
|
| |
|
|
| |
|
|
Cie Generale des Etablissements Michelin SCA |
|
|
| |
|
|
112
Schwab Equity Index Funds | Annual Holdings and Financial Statements
Schwab International Index Fund
Portfolio Holdings as of October 31, 2025 (continued)
| |
|
|
| |
|
|
| |
|
|
| |
|
|
| |
|
|
| |
|
|
| |
|
|
| |
|
|
| |
|
|
| |
|
|
| |
|
|
| |
|
|
| |
|
|
| |
|
|
| |
|
|
| |
|
|
| |
|
|
| |
|
|
| |
|
|
| |
|
|
LVMH Moet Hennessy Louis Vuitton SE |
|
|
| |
|
|
| |
|
|
| |
|
|
| |
|
|
| |
|
|
| |
|
|
| |
|
|
| |
|
|
| |
|
|
| |
|
|
| |
|
|
| |
|
|
| |
|
|
| |
|
|
| |
|
|
Unibail-Rodamco-Westfield * |
|
|
| |
|
|
| |
|
|
| |
|
|
| |
| |
| |
|
|
| |
|
|
| |
|
|
| |
|
|
Bayerische Motoren Werke AG |
|
|
| |
|
|
| |
|
|
| |
|
|
| |
|
|
| |
|
|
CTS Eventim AG & Co. KGaA |
|
|
| |
|
|
| |
|
|
| |
|
|
| |
|
|
| |
|
|
| |
|
|
| |
|
|
| |
|
|
| |
|
|
Fresenius Medical Care AG |
|
|
| |
|
|
| |
|
|
| |
|
|
| |
|
|
| |
|
|
| |
|
|
| |
|
|
| |
|
|
| |
|
|
| |
|
|
| |
|
|
| |
|
|
| |
|
|
Muenchener Rueckversicherungs-Gesellschaft AG in Muenchen |
|
|
| |
|
|
| |
|
|
| |
|
|
| |
|
|
| |
|
|
| |
|
|
| |
|
|
| |
|
|
| |
|
|
| |
|
|
| |
|
|
| |
|
|
| |
|
|
| |
|
|
| |
|
|
| |
| |
| |
|
|
BOC Hong Kong Holdings Ltd. |
|
|
| |
|
|
CK Hutchison Holdings Ltd. |
|
|
CK Infrastructure Holdings Ltd. |
|
|
| |
|
|
| |
|
|
Galaxy Entertainment Group Ltd. |
|
|
| |
|
|
Henderson Land Development Co. Ltd. |
|
|
| |
|
|
Hong Kong & China Gas Co. Ltd. |
|
|
Hong Kong Exchanges & Clearing Ltd. |
|
|
Hongkong Land Holdings Ltd. |
|
|
Jardine Matheson Holdings Ltd. |
|
|
| |
|
|
| |
|
|
Power Assets Holdings Ltd. |
|
|
| |
|
|
| |
|
|
SITC International Holdings Co. Ltd. |
|
|
Sun Hung Kai Properties Ltd. |
|
|
Swire Pacific Ltd., A Shares |
|
|
Techtronic Industries Co. Ltd. |
|
|
| |
|
|
| |
|
|
Wharf Real Estate Investment Co. Ltd. |
|
|
| |
|
|
| |
| |
| |
|
|
Bank of Ireland Group PLC |
|
|
| |
|
|
| |
|
|
Schwab Equity Index Funds | Annual Holdings and Financial Statements
113
Schwab International Index Fund
Portfolio Holdings as of October 31, 2025 (continued)
| |
|
|
| |
|
|
| |
|
|
| |
| |
| |
|
|
| |
|
|
| |
|
|
Check Point Software Technologies Ltd. * |
|
|
| |
|
|
| |
|
|
| |
|
|
Israel Discount Bank Ltd., A Shares |
|
|
Mizrahi Tefahot Bank Ltd. |
|
|
| |
|
|
| |
|
|
| |
|
|
| |
|
|
Teva Pharmaceutical Industries Ltd., ADR * |
|
|
| |
|
|
| |
|
|
| |
| |
| |
|
|
Banca Monte dei Paschi di Siena SpA |
|
|
| |
|
|
| |
|
|
| |
|
|
| |
|
|
| |
|
|
| |
|
|
FinecoBank Banca Fineco SpA |
|
|
| |
|
|
Infrastrutture Wireless Italiane SpA |
|
|
| |
|
|
| |
|
|
| |
|
|
| |
|
|
| |
|
|
| |
|
|
Recordati Industria Chimica e Farmaceutica SpA |
|
|
| |
|
|
| |
|
|
| |
|
|
| |
|
|
Terna - Rete Elettrica Nazionale |
|
|
| |
|
|
| |
|
|
| |
|
|
| |
| |
| |
|
|
| |
|
|
| |
|
|
| |
|
|
| |
|
|
| |
|
|
Asahi Group Holdings Ltd. |
|
|
| |
|
|
| |
|
|
| |
|
|
Bandai Namco Holdings, Inc. |
|
|
| |
|
|
| |
|
|
| |
|
|
| |
|
|
Central Japan Railway Co. |
|
|
| |
|
|
Chubu Electric Power Co., Inc. |
|
|
Chugai Pharmaceutical Co. Ltd. |
|
|
Dai Nippon Printing Co. Ltd. |
|
|
| |
|
|
Dai-ichi Life Holdings, Inc. |
|
|
| |
|
|
| |
|
|
Daito Trust Construction Co. Ltd. |
|
|
Daiwa House Industry Co. Ltd. |
|
|
Daiwa Securities Group, Inc. |
|
|
| |
|
|
| |
|
|
| |
|
|
| |
|
|
| |
|
|
| |
|
|
| |
|
|
| |
|
|
| |
|
|
| |
|
|
| |
|
|
Hankyu Hanshin Holdings, Inc. |
|
|
| |
|
|
| |
|
|
| |
|
|
| |
|
|
| |
|
|
| |
|
|
| |
|
|
| |
|
|
| |
|
|
| |
|
|
| |
|
|
Japan Exchange Group, Inc. |
|
|
| |
|
|
Japan Post Holdings Co. Ltd. |
|
|
Japan Post Insurance Co. Ltd. |
|
|
| |
|
|
| |
|
|
| |
|
|
Kansai Electric Power Co., Inc. |
|
|
| |
|
|
Kawasaki Heavy Industries Ltd. |
|
|
Kawasaki Kisen Kaisha Ltd. |
|
|
| |
|
|
| |
|
|
| |
|
|
| |
|
|
| |
|
|
| |
|
|
| |
|
|
| |
|
|
| |
|
|
| |
|
|
| |
|
|
| |
|
|
| |
|
|
| |
|
|
| |
|
|
| |
|
|
| |
|
|
| |
|
|
Mitsubishi Chemical Group Corp. |
|
|
| |
|
|
114
Schwab Equity Index Funds | Annual Holdings and Financial Statements
Schwab International Index Fund
Portfolio Holdings as of October 31, 2025 (continued)
| |
|
|
Mitsubishi Electric Corp. |
|
|
Mitsubishi Estate Co. Ltd. |
|
|
Mitsubishi HC Capital, Inc. |
|
|
Mitsubishi Heavy Industries Ltd. |
|
|
Mitsubishi UFJ Financial Group, Inc. |
|
|
| |
|
|
| |
|
|
| |
|
|
Mizuho Financial Group, Inc. |
|
|
| |
|
|
MS&AD Insurance Group Holdings, Inc. |
|
|
Murata Manufacturing Co. Ltd. |
|
|
| |
|
|
| |
|
|
| |
|
|
| |
|
|
Nippon Building Fund, Inc. |
|
|
Nippon Paint Holdings Co. Ltd. |
|
|
Nippon Sanso Holdings Corp. |
|
|
| |
|
|
| |
|
|
| |
|
|
Nissin Foods Holdings Co. Ltd. |
|
|
| |
|
|
| |
|
|
| |
|
|
Nomura Research Institute Ltd. |
|
|
| |
|
|
| |
|
|
| |
|
|
| |
|
|
| |
|
|
| |
|
|
| |
|
|
| |
|
|
| |
|
|
| |
|
|
Pan Pacific International Holdings Corp. |
|
|
| |
|
|
| |
|
|
Recruit Holdings Co. Ltd. |
|
|
Renesas Electronics Corp. |
|
|
| |
|
|
| |
|
|
| |
|
|
| |
|
|
| |
|
|
| |
|
|
| |
|
|
Sekisui Chemical Co. Ltd. |
|
|
| |
|
|
Seven & i Holdings Co. Ltd. |
|
|
| |
|
|
| |
|
|
| |
|
|
Shin-Etsu Chemical Co. Ltd. |
|
|
| |
|
|
| |
|
|
| |
|
|
| |
|
|
| |
|
|
| |
|
|
Sony Financial Group, Inc. * |
|
|
| |
|
|
| |
|
|
| |
|
|
| |
|
|
Sumitomo Electric Industries Ltd. |
|
|
Sumitomo Metal Mining Co. Ltd. |
|
|
Sumitomo Mitsui Financial Group, Inc. |
|
|
Sumitomo Mitsui Trust Group, Inc. |
|
|
Sumitomo Realty & Development Co. Ltd. |
|
|
Suntory Beverage & Food Ltd. |
|
|
| |
|
|
| |
|
|
| |
|
|
| |
|
|
Takeda Pharmaceutical Co. Ltd. |
|
|
| |
|
|
| |
|
|
| |
|
|
| |
|
|
Tokio Marine Holdings, Inc. |
|
|
| |
|
|
| |
|
|
| |
|
|
| |
|
|
| |
|
|
| |
|
|
| |
|
|
| |
|
|
| |
|
|
| |
|
|
| |
|
|
| |
|
|
| |
|
|
| |
|
|
| |
|
|
Yokohama Financial Group, Inc. |
|
|
| |
|
|
| |
|
|
| |
|
|
| |
| |
| |
|
|
| |
|
|
| |
|
|
| |
|
|
| |
|
|
| |
|
|
| |
|
|
| |
|
|
BE Semiconductor Industries NV |
|
|
Coca-Cola Europacific Partners PLC |
|
|
| |
|
|
| |
|
|
| |
|
|
| |
|
|
| |
|
|
| |
|
|
| |
|
|
| |
|
|
| |
|
|
Koninklijke Ahold Delhaize NV |
|
|
| |
|
|
| |
|
|
| |
|
|
| |
|
|
| |
|
|
| |
|
|
Schwab Equity Index Funds | Annual Holdings and Financial Statements
115
Schwab International Index Fund
Portfolio Holdings as of October 31, 2025 (continued)
| |
|
|
| |
|
|
| |
|
|
| |
| |
Auckland International Airport Ltd. |
|
|
| |
|
|
Fisher & Paykel Healthcare Corp. Ltd. |
|
|
| |
|
|
| |
|
|
| |
|
|
| |
| |
| |
|
|
| |
|
|
| |
|
|
Gjensidige Forsikring ASA |
|
|
| |
|
|
| |
|
|
| |
|
|
| |
|
|
| |
|
|
| |
|
|
| |
|
|
| |
|
|
| |
| |
Banco Comercial Portugues SA, Class R |
|
|
| |
|
|
| |
|
|
| |
|
|
| |
|
|
| |
|
|
| |
| |
| |
|
|
CapitaLand Integrated Commercial Trust |
|
|
CapitaLand Investment Ltd. |
|
|
| |
|
|
| |
|
|
Grab Holdings Ltd., Class A * |
|
|
| |
|
|
Oversea-Chinese Banking Corp. Ltd. |
|
|
| |
|
|
| |
|
|
| |
|
|
| |
|
|
Singapore Technologies Engineering Ltd. |
|
|
Singapore Telecommunications Ltd. |
|
|
United Overseas Bank Ltd. |
|
|
Wilmar International Ltd. |
|
|
Yangzijiang Shipbuilding Holdings Ltd. |
|
|
| |
|
|
| |
| |
| |
|
|
ACS Actividades de Construccion y Servicios SA |
|
|
| |
|
|
| |
|
|
| |
|
|
Banco Bilbao Vizcaya Argentaria SA |
|
|
| |
|
|
| |
|
|
| |
|
|
| |
|
|
| |
|
|
| |
|
|
| |
|
|
| |
|
|
| |
|
|
Industria de Diseno Textil SA |
|
|
International Consolidated Airlines Group SA |
|
|
| |
|
|
| |
|
|
| |
|
|
| |
|
|
| |
| |
| |
|
|
| |
|
|
| |
|
|
| |
|
|
| |
|
|
| |
|
|
| |
|
|
| |
|
|
| |
|
|
| |
|
|
| |
|
|
| |
|
|
Fastighets AB Balder, B Shares * |
|
|
H & M Hennes & Mauritz AB, B Shares |
|
|
| |
|
|
| |
|
|
Industrivarden AB, A Shares |
|
|
Industrivarden AB, C Shares |
|
|
| |
|
|
Investment AB Latour, B Shares |
|
|
| |
|
|
L E Lundbergforetagen AB, B Shares |
|
|
| |
|
|
Nibe Industrier AB, B Shares |
|
|
| |
|
|
| |
|
|
| |
|
|
| |
|
|
Skandinaviska Enskilda Banken AB, A Shares |
|
|
| |
|
|
| |
|
|
| |
|
|
Svenska Cellulosa AB SCA, B Shares |
|
|
Svenska Handelsbanken AB, A Shares |
|
|
| |
|
|
Swedish Orphan Biovitrum AB * |
|
|
| |
|
|
Telefonaktiebolaget LM Ericsson, B Shares |
|
|
| |
|
|
| |
|
|
116
Schwab Equity Index Funds | Annual Holdings and Financial Statements
Schwab International Index Fund
Portfolio Holdings as of October 31, 2025 (continued)
| |
|
|
| |
|
|
| |
|
|
| |
| |
| |
|
|
| |
|
|
| |
|
|
| |
|
|
| |
|
|
Banque Cantonale Vaudoise |
|
|
| |
|
|
| |
|
|
| |
|
|
Chocoladefabriken Lindt & Spruengli AG |
|
|
Chocoladefabriken Lindt & Spruengli AG, Participation Certificates |
|
|
Cie Financiere Richemont SA, Class A |
|
|
| |
|
|
| |
|
|
| |
|
|
| |
|
|
| |
|
|
| |
|
|
| |
|
|
Kuehne & Nagel International AG |
|
|
Logitech International SA |
|
|
| |
|
|
| |
|
|
| |
|
|
Partners Group Holding AG |
|
|
| |
|
|
Roche Holding AG, Bearer Shares |
|
|
| |
|
|
| |
|
|
Schindler Holding AG, Participation Certificates |
|
|
| |
|
|
| |
|
|
| |
|
|
| |
|
|
| |
|
|
Swatch Group AG, Bearer Shares |
|
|
| |
|
|
| |
|
|
| |
|
|
| |
|
|
| |
|
|
| |
|
|
Zurich Insurance Group AG |
|
|
| |
|
|
| |
| |
| |
|
|
| |
|
|
| |
|
|
| |
|
|
| |
|
|
Associated British Foods PLC |
|
|
| |
|
|
| |
|
|
| |
|
|
| |
|
|
| |
|
|
| |
|
|
| |
|
|
| |
|
|
British American Tobacco PLC |
|
|
| |
|
|
| |
|
|
| |
|
|
| |
|
|
| |
|
|
| |
|
|
| |
|
|
| |
|
|
| |
|
|
| |
|
|
| |
|
|
| |
|
|
| |
|
|
| |
|
|
Hikma Pharmaceuticals PLC |
|
|
| |
|
|
| |
|
|
| |
|
|
InterContinental Hotels Group PLC |
|
|
| |
|
|
| |
|
|
| |
|
|
| |
|
|
Land Securities Group PLC |
|
|
Legal & General Group PLC |
|
|
| |
|
|
London Stock Exchange Group PLC |
|
|
| |
|
|
Marks & Spencer Group PLC |
|
|
| |
|
|
| |
|
|
| |
|
|
| |
|
|
| |
|
|
| |
|
|
| |
|
|
Phoenix Group Holdings PLC |
|
|
| |
|
|
Reckitt Benckiser Group PLC |
|
|
| |
|
|
| |
|
|
| |
|
|
| |
|
|
| |
|
|
| |
|
|
| |
|
|
| |
|
|
| |
|
|
| |
|
|
| |
|
|
| |
|
|
| |
|
|
| |
|
|
| |
|
|
| |
|
|
United Utilities Group PLC |
|
|
| |
|
|
| |
|
|
| |
|
|
| |
|
|
| |
|
|
Total Common Stocks
(Cost $7,050,236,488) |
|
| |
Schwab Equity Index Funds | Annual Holdings and Financial Statements
117
Schwab International Index Fund
Portfolio Holdings as of October 31, 2025 (continued)
| |
|
|
PREFERRED STOCKS 0.3% OF NET ASSETS |
| |
| |
Bayerische Motoren Werke AG |
|
|
| |
|
|
| |
|
|
Porsche Automobil Holding SE |
|
|
| |
|
|
| |
|
|
| |
|
|
Total Preferred Stocks
(Cost $41,159,267) |
|
| |
|
|
SHORT-TERM INVESTMENTS 0.0% OF NET ASSETS |
| |
| |
State Street Institutional U.S. Government Money Market Fund, Premier Class 4.01% (c)(d) |
|
|
Total Short-Term Investments
(Cost $3,776,240) |
|
| |
|
|
Total Investments in Securities
(Cost $7,095,171,995) |
|
| |
|
|
| |
|
|
| |
|
|
| |
|
|
| |
|
|
CURRENT VALUE/
UNREALIZED
APPRECIATION
($) |
| |
| |
|
|
|
MSCI EAFE Index, expires 12/19/25 |
|
|
|
| |
Non-income producing security. |
| |
All or a portion of this security is on loan. Securities on loan were valued at $3,544,561. |
| |
Fair valued using significant unobservable inputs (see financial note 2(a), Securities for which no quoted value is available, for additional information). |
| |
The rate shown is the annualized 7-day yield. |
| |
Security purchased with cash collateral received for securities on loan. |
| |
American Depositary Receipt |
| |
CHESS Depositary Interest |
| |
Global Depositary Receipt |
| |
Real Estate Investment Trust |
The following is a summary of the inputs used to value the fund’s investments as of October 31, 2025 (see financial note 2(a) for additional information):
| |
QUOTED PRICES IN
ACTIVE MARKETS FOR
IDENTICAL ASSETS
(LEVEL 1) |
OTHER SIGNIFICANT
OBSERVABLE INPUTS
(LEVEL 2) |
SIGNIFICANT
UNOBSERVABLE INPUTS
(LEVEL 3) |
|
| |
|
|
|
|
| |
|
|
|
|
| |
|
|
|
|
| |
|
|
|
|
118
Schwab Equity Index Funds | Annual Holdings and Financial Statements
Schwab International Index Fund
Portfolio Holdings as of October 31, 2025 (continued)
| |
QUOTED PRICES IN ACTIVE MARKETS FOR IDENTICAL ASSETS (LEVEL 1) |
OTHER SIGNIFICANT OBSERVABLE INPUTS (LEVEL 2) |
SIGNIFICANT UNOBSERVABLE INPUTS (LEVEL 3) |
|
| |
|
|
|
|
| |
|
|
|
|
| |
|
|
|
|
| |
|
|
|
|
| |
|
|
|
|
| |
|
|
|
|
| |
|
|
|
|
| |
|
|
|
|
| |
|
|
|
|
| |
|
|
|
|
| |
|
|
|
|
| |
|
|
|
|
| |
|
|
|
|
| |
Level 3 amount shown includes securities determined to have no value at October 31, 2025. |
| |
As categorized in the Portfolio Holdings. |
| |
Futures contracts are reported at cumulative unrealized appreciation or depreciation. |
Schwab Equity Index Funds | Annual Holdings and Financial Statements
119
Schwab International Index Fund
Statement of Assets and Liabilities
| |
Investments in securities, at value - unaffiliated issuers (cost $7,095,171,995) including securities on loan of $3,544,561 |
|
|
| |
|
|
Foreign currency, at value (cost $5,822,133) |
|
|
Deposit with broker for futures contracts |
|
|
| |
|
|
| |
|
|
| |
|
|
| |
|
|
Income from securities on loan |
|
|
| |
|
|
| |
| |
Collateral held for securities on loan |
|
|
| |
|
|
| |
|
|
| |
|
|
| |
|
|
Variation margin on futures contracts |
|
|
| |
|
|
| |
|
|
| |
| |
Capital received from investors |
|
|
Total distributable earnings |
|
|
| |
|
|
120
Schwab Equity Index Funds | Annual Holdings and Financial Statements
Schwab International Index Fund
Statement of Operations
For the period November 1, 2024 through October 31, 2025 |
| |
Dividends received from securities - unaffiliated issuers (net of foreign withholding tax of $32,353,895) |
|
|
| |
|
|
| |
|
|
| |
|
|
| |
| |
| |
|
|
| |
|
|
| |
|
|
| |
|
|
| |
|
|
| |
|
|
| |
REALIZED AND UNREALIZED GAINS (LOSSES) |
Net realized losses on sales of securities - unaffiliated issuers |
|
|
Net realized gains on futures contracts |
|
|
Net realized gains on foreign currency transactions |
|
|
| |
|
|
Net change in unrealized appreciation (depreciation) on securities - unaffiliated issuers |
|
|
Net change in unrealized appreciation (depreciation) on futures contracts |
|
|
Net change in unrealized appreciation (depreciation) on foreign currency translations |
|
|
Net change in unrealized appreciation (depreciation) |
|
|
Net realized and unrealized gains |
|
|
Increase in net assets resulting from operations |
|
|
| |
Professional fees associated with the filing of foreign withholding tax claims in the European Union are deemed to be non-contingent and non-routine expenses of the fund (see financial notes 2(d) and 3 for additional information). |
Schwab Equity Index Funds | Annual Holdings and Financial Statements
121
Schwab International Index Fund
Statement of Changes in Net Assets
For the current and prior report periods
| |
| |
|
|
| |
|
|
|
| |
|
|
|
Net change in unrealized appreciation (depreciation) |
|
|
|
Increase in net assets resulting from operations |
|
|
|
| |
DISTRIBUTIONS TO SHAREHOLDERS |
| |
|
|
|
TRANSACTIONS IN FUND SHARES |
| |
|
|
| |
|
|
|
|
|
| |
|
|
|
|
|
| |
|
|
|
|
|
| |
|
|
|
|
|
Net transactions in fund shares |
|
|
|
|
|
| |
SHARES OUTSTANDING AND NET ASSETS |
| |
|
|
| |
|
|
|
|
|
| |
|
|
|
|
|
| |
|
|
|
|
|
| |
|
|
|
|
|
122
Schwab Equity Index Funds | Annual Holdings and Financial Statements
Schwab Equity Index Funds
1. Business Structure of the Funds:
Each of the funds in this report is a series of Schwab Capital Trust, except Schwab 1000 Index Fund, which is a series of Schwab Investments. Both Schwab Capital Trust and Schwab Investments (the trusts) are no-load, open-end management investment companies. Each trust is organized as a Massachusetts business trust and is registered under the Investment Company Act of 1940, as amended (the 1940 Act). The list below shows all the operational funds in the trusts as of the end of the period, including the funds discussed in this report, which are highlighted:
| |
Schwab S&P 500 Index Fund |
|
Schwab Small-Cap Index Fund |
|
Schwab Total Stock Market Index Fund |
|
Schwab U.S. Large-Cap Growth Index Fund |
|
Schwab U.S. Large-Cap Value Index Fund |
|
Schwab U.S. Mid-Cap Index Fund |
Schwab Fundamental U.S. Large Company Index Fund |
Schwab International Index Fund |
Schwab Fundamental U.S. Small Company Index Fund |
Schwab MarketTrack All Equity Portfolio™ |
Schwab Fundamental International Equity Index Fund |
Schwab MarketTrack Growth Portfolio™ |
Schwab Fundamental International Small Equity Index Fund |
Schwab MarketTrack Balanced Portfolio™ |
Schwab Fundamental Emerging Markets Equity Index Fund |
Schwab MarketTrack Conservative Portfolio™ |
Schwab Fundamental Global Real Estate Index Fund |
Schwab International Opportunities Fund |
Schwab Target 2010 Index Fund |
| |
Schwab Target 2015 Index Fund |
| |
Schwab Target 2020 Index Fund |
Schwab Dividend Equity Fund |
Schwab Target 2025 Index Fund |
Schwab Large-Cap Growth Fund |
Schwab Target 2030 Index Fund |
Schwab Small-Cap Equity Fund |
Schwab Target 2035 Index Fund |
| |
Schwab Target 2040 Index Fund |
Schwab International Core Equity Fund |
Schwab Target 2045 Index Fund |
| |
Schwab Target 2050 Index Fund |
| |
Schwab Target 2055 Index Fund |
| |
Schwab Target 2060 Index Fund |
| |
Schwab Target 2065 Index Fund |
| |
Schwab Monthly Income Fund – Target Payout |
| |
Schwab Monthly Income Fund – Flexible Payout |
| |
Schwab Monthly Income Fund – Income Payout |
| |
|
| |
| |
Schwab Tax-Free Bond Fund |
Schwab Treasury Inflation Protected Securities Index Fund |
Schwab California Tax-Free Bond Fund |
Schwab U.S. Aggregate Bond Index Fund |
Schwab Opportunistic Municipal Bond Fund |
Schwab Short-Term Bond Index Fund |
Schwab Global Real Estate Fund |
Each fund offers one share class. Shares are bought and sold at closing net asset value per share, which is the price for all outstanding shares of a fund. Each share has a par value of 1/1,000 of a cent, and the funds’ Board of Trustees may authorize the issuance of as many shares as necessary.
Each fund maintains its own account for purposes of holding assets and accounting, and is considered a separate entity for tax purposes. Within its account, each fund may also keep certain assets in segregated accounts, as required by securities law. The "Schwab Funds Complex" includes The Charles Schwab Family of Funds, Schwab Capital Trust, Schwab Investments, Schwab Annuity Portfolios, Schwab Strategic Trust and Laudus Trust.
The Schwab S&P 500 Index Fund’s goal is to track the total return of the S&P 500® Index.
The Schwab 1000 Index Fund’s goal is to match the total return of the Schwab 1000 Index®.
The Schwab Small-Cap Index Fund’s goal is to track the performance of a benchmark index that measures the total return of small capitalization U.S. Stocks.
The Schwab Total Stock Market Index Fund’s goal is to track the total return of the entire U.S. stock market, as measured by the Dow Jones U.S. Total Stock Market IndexSM.
Schwab Equity Index Funds | Annual Holdings and Financial Statements
123
Schwab Equity Index Funds
Financial Notes (continued)
1. Business Structure of the Funds (continued):
The Schwab U.S. Large-Cap Growth Index Fund’s goal is to track the performance of a benchmark index that measures the total return of large capitalization U.S. growth stocks.
The Schwab U.S. Large-Cap Value Index Fund’s goal is to track the performance of a benchmark index that measures the total return of large capitalization U.S. value stocks.
The Schwab U.S. Mid-Cap Index Fund’s goal is to track the performance of a benchmark index that measures the total return of mid capitalization U.S. stocks.
The Schwab International Index Fund’s goal is to track the performance of a benchmark index that measures the total return of large, publicly traded non-U.S. companies from countries with developed equity markets outside of the United States.
2. Significant Accounting Policies: The following is a summary of the significant accounting policies the funds use in their preparation of financial statements. The funds follow the investment company accounting and reporting guidance of the Financial Accounting Standards Board (FASB) Accounting Standard Codification (ASC) Topic 946 Financial Services — Investment Companies. The accounting policies are in conformity with accounting principles generally accepted in the United States of America (GAAP).
In this reporting period, the funds adopted FASB Accounting Standards Update 2023-07, ASC Topic 280 Segment Reporting (Topic 280) Improvements to Reportable Segment Disclosures. Adoption of the new standard impacted financial statement disclosures only and did not affect the funds’ financial position or the results of operations. An operating segment is defined in Topic 280 as a component of a public entity that engages in business activities from which it may recognize revenues and incur expenses, has operating results that are regularly reviewed by the public entity’s chief operating decision maker (CODM) to make decisions about resources to be allocated to the segment and assess its performance, and has discrete financial information available. The management committee of each fund’s investment adviser acts as the funds’ CODM. The CODM has determined that each fund operates as a single operating segment given each fund has a single defined investment strategy disclosed in its respective prospectus. The discrete financial information in the form of each fund’s portfolio composition, total returns, expense ratios and changes in net assets (i.e., changes in net assets resulting from operations, shares sold and shares redeemed), which is used by the CODM to assess performance against the prospectus and to make resource allocation decisions with respect to the funds, is presented within each of the fund’s financial statements.
The funds may invest in mutual funds and exchange-traded funds, which are referred to as "underlying funds." For more information about the underlying funds’ operations and policies, please refer to those funds’ semiannual and annual reports and holdings and financial statements, which are filed in Form N-CSR with the U.S. Securities and Exchange Commission (SEC) and available on the SEC’s website at www.sec.gov.
Pursuant to Rule 2a-5 under the 1940 Act, the Board of Trustees has designated authority to a Valuation Designee, the funds’ investment adviser, to make fair valuation determinations under adopted procedures, subject to Board of Trustees oversight. The investment adviser has formed a Pricing Committee to administer the pricing and valuation of portfolio securities and other assets and liabilities as well as to ensure that prices used for internal purposes or provided by third parties reasonably reflect fair value. The Valuation Designee may utilize independent pricing services, quotations from securities and financial instrument dealers and other market sources to determine fair value.
Securities held in each fund’s portfolio are valued every business day. The following valuation policies and procedures are used by the Valuation Designee to value various types of securities:
● Securities traded on an exchange or over-the-counter: Traded securities are valued at the closing value for the day, or, on days when no closing value has been reported, at the mean of the most recent bid and ask quotes. Securities that are primarily traded on foreign exchanges are valued at the official closing price or the last sales price on the exchange where the securities are principally traded with these values then translated into U.S. dollars at the current exchange rate, unless these securities are fair valued as discussed below.
● Foreign equity security fair valuation: The Valuation Designee has adopted procedures to fair value foreign equity securities that are traded in markets that close prior to the valuation of a fund’s holdings. By fair valuing securities whose prices may have been affected by events occurring after the close of trading, the Valuation Designee seeks to establish prices that investors might expect to realize upon the current sales of these securities. This methodology is designed to deter “arbitrage”
124
Schwab Equity Index Funds | Annual Holdings and Financial Statements
Schwab Equity Index Funds
Financial Notes (continued)
2. Significant Accounting Policies (continued):
market timers, who seek to exploit delays between the change in the value of a fund’s portfolio holdings and the net asset value of a fund’s shares and seeks to help ensure that the prices at which a fund’s shares are purchased and redeemed are fair and do not result in dilution of shareholder interest or other harm to shareholders. When fair value pricing is used at the open or close of a reporting period, it may cause a temporary divergence between the return of a fund and that of its comparative index or benchmark.
● Futures contracts: Futures contracts are valued at their settlement prices as of the close of their exchanges.
● Mutual funds: Mutual funds are valued at their respective net asset values.
● Securities for which no quoted value is available: The Valuation Designee has adopted procedures to fair value a fund’s securities when market prices are not “readily available” or are unreliable. For example, a security may be fair valued when it’s de-listed or its trading is halted or suspended; when a security’s primary pricing source is unable or unwilling to provide a price; or when a security’s primary trading market is closed during regular market hours. Fair value determinations are made in good faith in accordance with adopted valuation procedures. The Valuation Designee considers a number of factors, including unobservable market inputs, when arriving at fair value. The Valuation Designee may employ methods such as the review of related or comparable assets or liabilities, related market activities, recent transactions, market multiples, book values, transactional back-testing, disposition analysis and other relevant information. Due to the subjective and variable nature of fair value pricing, there can be no assurance that a fund could obtain the fair value assigned to the security upon the sale of such security.
In accordance with the authoritative guidance on fair value measurements and disclosures under GAAP, the funds disclose the fair value of their investments in a hierarchy that prioritizes the significant inputs to valuation methods used to measure the fair value. The hierarchy gives the highest priority to valuations based upon unadjusted quoted prices in active markets for identical assets or liabilities (Level 1 measurements) and the lowest priority to valuations based upon unobservable inputs that are significant to the valuation (Level 3 measurements). If inputs used to measure the financial instruments fall within different levels of the hierarchy, the categorization is based on the lowest level input that is significant to the valuation. If it is determined that either the volume and/or level of activity for an asset or liability has significantly decreased (from normal conditions for that asset or liability) or price quotations or observable inputs are not associated with orderly transactions, increased analysis and the Valuation Designee’s judgment will be required to estimate fair value.
The three levels of the fair value hierarchy are as follows:
● Level 1 — quoted prices in active markets for identical investments — Investments whose values are based on quoted market prices in active markets. These generally include active listed equities, mutual funds, exchange-traded funds and futures contracts. Mutual funds and exchange-traded funds are classified as Level 1 prices, without consideration to the classification level of the underlying securities held which could be Level 1, Level 2, or Level 3 in the fair value hierarchy.
● Level 2 — other significant observable inputs (including quoted prices for similar securities, interest rates, prepayment speeds, credit risk, etc.) — Investments that trade in markets that are not considered to be active, but whose values are based on quoted market prices, dealer quotations or valuations provided by alternative pricing sources supported by observable inputs are classified as Level 2 prices. These generally include forward foreign currency exchange contracts, U.S. government and sovereign obligations, most government agency securities, investment-grade corporate bonds, certain mortgage products, less liquid listed equities, and state, municipal and provincial obligations. In addition, international securities whose markets close hours before the valuation of a fund’s holdings may require fair valuations due to significant movement in the U.S. markets occurring after the daily close of foreign markets. The Valuation Designee has approved a vendor that calculates fair valuations of international equity securities based on a number of factors that appear to correlate to the movements in the U.S. markets.
● Level 3 — significant unobservable inputs (including the Valuation Designee’s assumptions in determining the fair value of investments) — Investments whose values are classified as Level 3 prices have significant unobservable inputs, as they may trade infrequently or not at all. When observable prices are not readily available for these securities, one or more valuation methods are used for which sufficient and reliable data is available. The inputs used in estimating the value of Level 3 prices may include the original transaction price, quoted prices for similar securities or assets in active markets, completed or pending third-party transactions in the underlying investment or comparable issuers, and changes in financial ratios or cash flows. Level 3 prices may also be adjusted to reflect illiquidity and/or non-transferability, with the amount of such discount estimated in the absence of market information. Assumptions used due to the lack of observable inputs may significantly impact the resulting fair value and therefore a fund’s results of operations.
Schwab Equity Index Funds | Annual Holdings and Financial Statements
125
Schwab Equity Index Funds
Financial Notes (continued)
2. Significant Accounting Policies (continued):
The inputs or methodology used for valuing securities are not necessarily an indication of the risk associated with investing in those securities.
The levels associated with valuing the funds’ investments as of October 31, 2025, are disclosed in each fund’s Portfolio Holdings.
(b) Accounting Policies for certain Portfolio Investments (if held):
Futures Contracts: Futures contracts are instruments that represent an agreement between two parties that obligates one party to buy, and the other party to sell, specific instruments at an agreed upon price on a stipulated future date. A fund must give the broker a deposit of cash and/or securities (initial margin) whenever it enters into a futures contract. The amount of the deposit may vary from one contract to another. Subsequent payments (variation margin) are made or received by a fund depending on the daily fluctuations in the value of the futures contract and are accounted for as unrealized appreciation or depreciation until the contract is closed, at which time the gains or losses are realized. Futures contracts are traded publicly on exchanges, and their value may change daily.
Cash Investments: The funds may invest a portion of their assets in cash. Cash includes cash bank balances in an interest-bearing demand deposit account with maturity on demand by the funds.
Securities Lending: Under the trusts’ Securities Lending Program, a fund (lender) may make short-term loans of its securities to another party (borrower) to generate additional revenue for the fund. The borrower pledges collateral in the form of cash, securities issued or fully guaranteed by the U.S. government or foreign governments, or letters of credit issued by a bank. Collateral at the individual loan level is required to be maintained on a daily marked-to-market basis in an amount at least equal to the current value of the securities loaned. The lending agent provides a fund with indemnification against borrower default (the borrower fails to return the security on loan) reducing the risk of loss as a result of default. The cash collateral of securities loaned is currently invested in money market portfolios operating pursuant to Rule 2a-7 under the 1940 Act. Each fund bears the risk of loss with respect to the investment of cash collateral. The terms of the securities lending agreement allow the funds or the lending agent to terminate any loan at any given time and the securities must be returned within the earlier of the standard trade settlement period or the specified time period under the relevant securities lending agreement. Securities lending income, as disclosed in each fund’s Statement of Operations, if applicable, represents the income earned from the investment of the cash collateral plus any fees paid by borrowers, less the fees paid to the lending agent and broker rebates which are subject to adjustments pursuant to the securities lending agreement. On loans not collateralized by cash, a fee is received from the borrower, and is allocated between a fund and the lending agent. The aggregate market value of securities loaned will not at any time exceed one-third of the total assets of a fund, including collateral received from the loan. Securities lending fees paid to the unaffiliated lending agent start at 9% of gross lending revenue, with subsequent breakpoints to a low of 5%. In this context, the gross lending revenue equals the income received from the investment of cash collateral and fees paid by borrowers less any rebates paid to the borrowers. Any expenses charged by the cash collateral fund are in addition to these fees. All remaining revenue is retained by the fund, as applicable. No portion of lending revenue is paid to or retained by the investment adviser or any of its affiliates.
As of October 31, 2025, the funds had securities on loan, all of which were classified as common stocks. The value of securities on loan and the related collateral as of October 31, 2025, are disclosed in each fund’s Portfolio Holdings and Statement of Assets and Liabilities.
Passive Foreign Investment Companies: Certain funds may own shares in certain foreign corporations that meet the Internal Revenue Code, as amended, definition of a Passive Foreign Investment Company (PFIC). The funds may elect for tax purposes to mark-to-market annually the shares of each PFIC lot held and would be required to distribute as ordinary income to shareholders any such marked-to-market gains (as well as any gains realized on sale).
Central Securities Depositories Regulation: The Central Securities Depositories Regulation (CSDR) introduced measures for the authorization and supervision of European Union Central Security Depositories and created a common set of prudential, organizational, and conduct of business standards at a European level. CSDR is designed to support securities settlement and operational aspects of securities settlement, including the provision of shorter settlement periods; mandatory buy-ins; and cash penalties, to prevent and address settlement fails. CSDR measures are aimed to prevent settlement fails by ensuring that all transaction details are provided to facilitate settlement, as well as further incentivizing timely settlement by imposing cash penalty fines and buy-ins. Certain funds may be subject to pay cash penalties and may also receive cash penalties with certain counterparties in instances where there are settlement fails. These cash penalties are included in net realized gains (losses) on sales of securities — unaffiliated issuers in each fund’s Statement of Operations, if any.
126
Schwab Equity Index Funds | Annual Holdings and Financial Statements
Schwab Equity Index Funds
Financial Notes (continued)
2. Significant Accounting Policies (continued):
(c) Security Transactions:
Security transactions are recorded as of the date the order to buy or sell the security is executed. Realized gains and losses from security transactions are based on the identified costs of the securities involved.
Assets and liabilities denominated in foreign currencies are reported in U.S. dollars. For assets and liabilities held on a given date, the dollar value is based on market exchange rates in effect on that date. Transactions involving foreign currencies, including purchases, sales, income receipts and expense payments, are calculated using exchange rates in effect on the transaction date. Realized foreign exchange gains or losses arise from sales of foreign currencies, currency gains or losses realized between the trade and settlement dates on securities transactions and the differences between the recorded amounts of dividends, interest, and foreign withholding taxes and the U.S. dollar equivalent of the amounts actually received or paid. Net unrealized foreign exchange appreciation or depreciation arises from changes in foreign exchange rates on foreign denominated assets and liabilities other than investments in securities held at the end of the reporting period. These realized and unrealized foreign exchange gains or losses are reported in foreign currency transactions or translations, if any, in each fund’s Statement of Operations. The funds do not isolate the portion of the fluctuations on investments resulting from changes in foreign currency exchange rates from the fluctuations in market prices of investments held. Such fluctuations are included with the net realized and unrealized gain or loss from investments, if any.
Gains realized by the funds on the sale of securities in certain foreign countries may be subject to non-U.S. taxes. In those instances, the funds record a liability based on unrealized appreciation to provide for potential non-U.S. taxes payable upon the sale of these securities.
When a fund closes out a futures contract position, it calculates the difference between the value of the position at the beginning and at the end of the contract, and records a realized gain or loss accordingly.
Interest income is recorded as it accrues. Dividends and distributions from portfolio securities and underlying funds are recorded on the date they are effective (the ex-dividend date), although the funds record certain foreign security dividends on the date the ex-dividend date is confirmed. Non-cash dividends in the form of additional securities are recorded on the ex-dividend date at fair value, if any. Any distributions from underlying funds are recorded in accordance with the character of the distributions as designated by the underlying funds.
Income received from foreign sources may result in withholding tax. Withholding taxes are accrued at the same time as the related income if the tax rate is fixed and known, unless a tax withheld is reclaimable from the local tax authorities and there are no significant uncertainties on collectibility in which case it is recorded as receivable. If the tax rate is not known or estimable, such expense or reclaim receivable is recorded when the net proceeds are received.
The Schwab International Index Fund filed claims to recover taxes previously withheld in certain European Union countries on the basis that those countries had purportedly violated certain provisions in the Treaty on the Functioning of the European Union. These filings are subject to various administrative and judicial proceedings within these countries, and all professional fees associated with these filings have been paid by the investment adviser. The professional fees related to European Union foreign withholding tax claims are non-contingent and non-routine expenses which are subject to repayment to the investment adviser (see financial note 3 for additional information).
For U.S. income tax purposes, European Union reclaims received reduce the amounts of foreign taxes that the fund passes through to its shareholders. If European Union reclaims received exceed foreign withholding taxes paid, the Schwab International Index Fund will evaluate the requirements for entering into a closing agreement with the Internal Revenue Service (IRS) to address any prior years’ U.S. income tax liabilities attributable to fund shareholders resulting from the recovery of foreign taxes. The closing agreement would result in the fund paying a compliance fee to the IRS, on behalf of its shareholders, representing the estimated tax savings generated from foreign tax credits claimed by fund shareholders on their tax returns in prior years. During the period ended October 31, 2025, the Schwab International Index Fund did not incur any compliance fees.
Pursuant to the Amended and Restated Investment Advisory and Administration Agreement between the investment adviser and the trusts, the investment adviser pays the operating expenses of each fund, excluding acquired fund fees and expenses, taxes, any brokerage expenses, and extraordinary or non-routine expenses. Taxes, any brokerage expenses and extraordinary or non-routine expenses that are specific to a fund are charged directly to the fund. Acquired fund fees and expenses are indirect expenses incurred by a fund through its investments in underlying funds and are reflected in the net asset values of the underlying funds.
Schwab Equity Index Funds | Annual Holdings and Financial Statements
127
Schwab Equity Index Funds
Financial Notes (continued)
2. Significant Accounting Policies (continued):
(f) Distributions to Shareholders:
The funds make distributions from net investment income and net realized capital gains, if any, once a year. To receive a distribution, you must be a registered shareholder on the record date. Distributions are paid to shareholders on the payable date.
(g) Accounting Estimates:
The accounting policies described in this report conform to GAAP. Notwithstanding this, shareholders should understand that in order to follow these principles, fund management has to make estimates and assumptions that affect the information reported in the financial statements. It’s possible that once the results are known, they may turn out to be different from these estimates and these differences may be material.
(h) Federal Income Taxes:
The funds intend to meet federal income and excise tax requirements for regulated investment companies under subchapter M of the Internal Revenue Code, as amended. Accordingly, the funds distribute substantially all of their net investment income and net realized capital gains, if any, to their shareholders each year. As long as a fund meets the tax requirements, it is not required to pay federal income tax.
Certain funds may be subject to foreign taxes (a portion of which may be reclaimable) on income, corporate events, foreign currency exchanges and capital gains on investments. All foreign taxes are recorded in accordance with the applicable foreign tax regulations and rates that exist in foreign markets in which a fund invests. These foreign taxes, if any, are paid by the funds and are disclosed in each fund’s Statement of Operations. Foreign taxes accrued as of October 31, 2025, if any, are reflected in each fund’s Statement of Assets and Liabilities.
Under the funds’ organizational documents, the officers and trustees are indemnified against certain liabilities arising out of the performance of their duties to the funds. In addition, in the normal course of business the funds enter into contracts with their vendors and others that provide general indemnifications. The funds’ maximum exposure under these arrangements is unknown as this would involve future claims that may be made against the funds. However, based on experience, the funds expect the risk of loss attributable to these arrangements to be remote.
(k) Recent Accounting Pronouncements:
In December 2023, the FASB issued ASU 2023-09 Income Taxes (Topic 740): Improvements to Income Tax Disclosures. The amendments were issued to enhance the transparency and decision usefulness of income tax disclosures primarily related to rate reconciliation and income taxes paid information. The guidance is effective for annual periods beginning after December 15, 2024, and with early adoption permitted. At this time, management is evaluating the impact of this amendment but believes it will not have a material impact on the financial statements and income tax disclosures.
3. Affiliates and Affiliated Transactions: Charles Schwab Investment Management, Inc., dba Schwab Asset Management, a wholly owned subsidiary of The Charles Schwab Corporation, serves as each fund’s investment adviser and administrator pursuant to the Amended and Restated Investment Advisory and Administration Agreement between the investment adviser and the trusts.
For its advisory and administrative services to the funds, the investment adviser is entitled to receive an annual fee, payable monthly, based on a percentage of each fund’s average daily net assets as follows:
SCHWAB S&P 500 INDEX FUND |
|
SCHWAB SMALL-CAP INDEX FUND |
SCHWAB TOTAL STOCK MARKET INDEX FUND |
SCHWAB U.S. LARGE-CAP GROWTH INDEX FUND |
SCHWAB U.S. LARGE-CAP VALUE INDEX FUND |
SCHWAB U.S. MID-CAP INDEX FUND |
SCHWAB INTERNATIONAL INDEX FUND |
| |
|
|
|
|
|
|
|
128
Schwab Equity Index Funds | Annual Holdings and Financial Statements
Schwab Equity Index Funds
Financial Notes (continued)
3. Affiliates and Affiliated Transactions (continued):
Investments from Affiliates
Funds in the Schwab Funds Complex may own shares of other funds in the Schwab Funds Complex. The table below reflects the percentage of shares of each fund in this report that is owned by other funds in the Schwab Funds Complex as of October 31, 2025, as applicable:
| |
|
| |
SCHWAB S&P 500 INDEX FUND |
SCHWAB SMALL-CAP INDEX FUND |
SCHWAB U.S. LARGE-CAP GROWTH INDEX FUND |
SCHWAB U.S. MID-CAP INDEX FUND |
SCHWAB INTERNATIONAL INDEX FUND |
Schwab MarketTrack All Equity Portfolio |
|
|
|
|
|
Schwab MarketTrack Balanced Portfolio |
|
|
|
|
|
Schwab MarketTrack Conservative Portfolio |
|
|
|
|
|
Schwab MarketTrack Growth Portfolio |
|
|
|
|
|
| |
|
|
|
|
|
| |
|
|
|
|
|
| |
|
|
|
|
|
| |
|
|
|
|
|
| |
|
|
|
|
|
| |
|
|
|
|
|
| |
|
|
|
|
|
| |
|
|
|
|
|
| |
|
|
|
|
|
| |
|
|
|
|
|
| |
|
|
|
|
|
| |
|
|
|
|
|
Other Affiliated Transactions
The professional fees related to European Union foreign withholding tax claims discussed in financial note 2(d) are non-contingent and non-routine expenses. The investment adviser agreed to pay these professional fees, on behalf of the Schwab International Index Fund, subject to reimbursement by the fund to the investment adviser to the extent the fund is able to successfully recover tax claims in the future.
During the period ended October 31, 2025, the professional fees incurred by the Schwab International Index Fund and paid by the investment adviser were $83,909, as shown as Professional fees in the fund’s Statement of Operations.
During the period ended October 31, 2025, the Schwab International Index Fund did not recover any previously withheld foreign taxes and made no reimbursement to the investment adviser.
As of October 31, 2025, the balance of professional fees related to foreign withholding tax claims subject to future reimbursement by the Schwab International Index Fund to the investment adviser was $141,564.
No other amounts for additional foreign withholding tax claims are reflected in the financial statements due to the uncertainty surrounding the ultimate resolution of proceedings, the likelihood of receipt of these claims, and the potential timing of payment.
The funds may engage in direct transactions with other funds in the Schwab Funds Complex in accordance with procedures adopted by the Board of Trustees pursuant to Rule 17a-7 under the 1940 Act. When one fund is seeking to sell a security that another fund is seeking to buy, an interfund transaction can allow both funds to benefit by reducing transaction costs while allowing each fund to execute the transaction at the current market price. This practice is limited to funds that share the same investment
Schwab Equity Index Funds | Annual Holdings and Financial Statements
129
Schwab Equity Index Funds
Financial Notes (continued)
3. Affiliates and Affiliated Transactions (continued):
adviser. The net realized gains or losses on sales of interfund transactions, if any, are recorded in Net realized gains (losses) on sales of securities — unaffiliated issuers in the Statement of Operations. For the period ended October 31, 2025, each fund’s purchases and sales of securities with other funds in the Schwab Funds Complex as well as any net realized gains (losses) were as follows:
| |
|
|
NET REALIZED GAINS (LOSSES) |
Schwab S&P 500 Index Fund |
|
|
|
| |
|
|
|
Schwab Small-Cap Index Fund |
|
|
|
Schwab Total Stock Market Index Fund |
|
|
|
Schwab U.S. Large-Cap Growth Index Fund |
|
|
|
Schwab U.S. Large-Cap Value Index Fund |
|
|
|
Schwab U.S. Mid-Cap Index Fund |
|
|
|
Schwab International Index Fund |
|
|
|
Interfund Borrowing and Lending
Pursuant to an exemptive order issued by the SEC, the funds may enter into interfund borrowing and lending transactions with other funds in the Schwab Funds Complex. All loans are for temporary or emergency purposes and the interest rate to be charged will be the average of the overnight repurchase agreement rate and the short-term bank loan rate. All loans are subject to numerous conditions designed to ensure fair and equitable treatment of all participating funds. The interfund lending facility is subject to the oversight and periodic review by the Board of Trustees. The funds had no interfund borrowing or lending activity during the period.
The Board of Trustees may include people who are officers and/or directors of the investment adviser or its affiliates. Federal securities law limits the percentage of such “interested persons” who may serve on a trust’s board, and the trusts were in compliance with these limitations throughout the report period. The funds did not pay any interested persons or non-interested persons (independent trustees). The independent trustees are paid by the investment adviser pursuant to the Advisory Agreement where the investment adviser pays the operational expenses of each fund which includes trustee fees.
During the period, the funds were participants with other funds in the Schwab Funds Complex in a joint, syndicated, committed $1.2 billion line of credit (the Syndicated Credit Facility), which matured on September 25, 2025. On September 25, 2025, the Syndicated Credit Facility was amended to run for a new 28 day period with the line of credit amount remaining unchanged, maturing on October 23, 2025. On October 23, 2025, the Syndicated Credit Facility was amended to run for a new 364 day period with the line of credit amount remaining unchanged, maturing on October 22, 2026. Under the terms of the Syndicated Credit Facility, in addition to the investment adviser paying the interest charged on any borrowings by a fund, the investment adviser paid a commitment fee of 0.15% per annum on the funds’ proportionate share of the unused portion of the Syndicated Credit Facility.
During the period, the funds were participants with other funds in the Schwab Funds Complex in a joint, unsecured, uncommitted $400 million line of credit (the Uncommitted Credit Facility) with State Street Bank and Trust Company, which matured on September 25, 2025. On September 25, 2025, the Uncommitted Credit Facility was amended to run for a new 28 day period with the line of credit amount remaining unchanged, maturing on October 23, 2025. On October 23, 2025, the Uncommitted Credit Facility was amended to run for a new 364 day period with the line of credit amount remaining unchanged, maturing on October 22, 2026. Under the terms of the Uncommitted Credit Facility, the investment adviser pays interest on the amount a fund borrows. There were no borrowings by any of the funds from either line of credit during the period.
The funds also have access to custodian overdraft facilities. A fund may have utilized the overdraft facility and incurred an interest expense, which is paid by the investment adviser, if any. The interest expense is determined based on a negotiated rate above the current Federal Funds Rate.
Certain funds entered into futures contracts during the report period to equitize available cash.
130
Schwab Equity Index Funds | Annual Holdings and Financial Statements
Schwab Equity Index Funds
Financial Notes (continued)
6. Derivatives (continued):
As of October 31, 2025, the Statement of Assets and Liabilities included the following financial derivative instrument fair values held at period end:
| |
|
|
| |
|
|
Schwab S&P 500 Index Fund |
|
|
| |
|
|
| |
|
|
| |
|
|
Schwab Total Stock Market Index Fund |
|
|
| |
|
|
Schwab U.S. Large-Cap Growth Index Fund |
|
|
| |
|
|
Schwab U.S. Large-Cap Value Index Fund |
|
|
| |
|
|
Schwab International Index Fund |
|
|
| |
|
|
| |
|
| |
Includes cumulative unrealized appreciation of futures contracts as reported in each fund’s Portfolio Holdings. Only current day’s variation margin on futures contracts is reported in the Statement of Assets and Liabilities. |
| |
|
|
| |
|
|
| |
|
|
Schwab Small-Cap Index Fund |
|
|
| |
|
|
Schwab U.S. Large-Cap Growth Index Fund |
|
|
| |
|
|
Schwab U.S. Large-Cap Value Index Fund |
|
|
| |
|
|
Schwab U.S. Mid-Cap Index Fund |
|
|
| |
|
|
| |
|
| |
Includes cumulative unrealized depreciation of futures contracts as reported in each fund’s Portfolio Holdings. Only current day’s variation margin on futures contracts is reported in the Statement of Assets and Liabilities. |
Schwab Equity Index Funds | Annual Holdings and Financial Statements
131
Schwab Equity Index Funds
Financial Notes (continued)
6. Derivatives (continued):
The effects of the derivative contracts in the Statement of Operations for the period ended October 31, 2025, were:
| |
|
|
Net Realized Gains (Losses) |
|
|
Schwab S&P 500 Index Fund |
|
|
| |
|
|
| |
|
|
| |
|
|
Schwab Small-Cap Index Fund |
|
|
| |
|
|
Schwab Total Stock Market Index Fund |
|
|
| |
|
|
Schwab U.S. Large-Cap Growth Index Fund |
|
|
| |
|
|
Schwab U.S. Large-Cap Value Index Fund |
|
|
| |
|
|
Schwab U.S. Mid-Cap Index Fund |
|
|
| |
|
|
Schwab International Index Fund |
|
|
| |
|
|
| |
|
| |
Statement of Operations location: Net realized gains (losses) on futures contracts. |
Net Change in Unrealized Appreciation (Depreciation) |
|
|
Schwab S&P 500 Index Fund |
|
|
| |
|
|
| |
|
|
| |
|
|
Schwab Small-Cap Index Fund |
|
|
| |
|
|
Schwab Total Stock Market Index Fund |
|
|
| |
|
|
Schwab U.S. Large-Cap Growth Index Fund |
|
|
| |
|
|
Schwab U.S. Large-Cap Value Index Fund |
|
|
| |
|
|
Schwab U.S. Mid-Cap Index Fund |
|
|
| |
|
|
Schwab International Index Fund |
|
|
| |
|
|
| |
|
| |
Statement of Operations location: Net change in unrealized appreciation (depreciation) on futures contracts. |
132
Schwab Equity Index Funds | Annual Holdings and Financial Statements
Schwab Equity Index Funds
Financial Notes (continued)
6. Derivatives (continued):
During the period ended October 31, 2025, the month-end average notional amounts of futures contracts held by the funds and the month-end average number of contracts held were as follows:
| |
|
|
Schwab S&P 500 Index Fund |
|
|
| |
|
|
Schwab Small-Cap Index Fund |
|
|
Schwab Total Stock Market Index Fund |
|
|
Schwab U.S. Large-Cap Growth Index Fund |
|
|
Schwab U.S. Large-Cap Value Index Fund |
|
|
Schwab U.S. Mid-Cap Index Fund |
|
|
Schwab International Index Fund |
|
|
7. Purchases and Sales of Investment Securities: For the period ended October 31, 2025, purchases and sales of securities (excluding in-kind transactions and short-term obligations) were as follows:
| |
|
|
Schwab S&P 500 Index Fund |
|
|
| |
|
|
Schwab Small-Cap Index Fund |
|
|
Schwab Total Stock Market Index Fund |
|
|
Schwab U.S. Large-Cap Growth Index Fund |
|
|
Schwab U.S. Large-Cap Value Index Fund |
|
|
Schwab U.S. Mid-Cap Index Fund |
|
|
Schwab International Index Fund |
|
|
During the period ended October 31, 2025, the following funds had transactions in connection with in-kind transactions:
| |
IN-KIND PURCHASES
OF SECURITIES |
IN-KIND SALES
OF SECURITIES |
| |
|
|
Schwab Small-Cap Index Fund |
|
|
Schwab U.S. Large-Cap Growth Index Fund |
|
|
Schwab U.S. Large-Cap Value Index Fund |
|
|
Schwab U.S. Mid-Cap Index Fund |
|
|
The funds may realize net capital gains or losses resulting from in-kind redemptions. Because such gains or losses are not taxable to the funds and are not distributed to existing fund shareholders, the gains or losses are reclassified from accumulated net realized gains or losses to capital received from investors at the end of the funds’ tax year. These reclassifications have no effect on net assets or net asset values. The net realized gains or losses on sales of in-kind redemptions for the period ended October 31, 2025, are disclosed in the funds’ Statements of Operations, if any.
Schwab Equity Index Funds | Annual Holdings and Financial Statements
133
Schwab Equity Index Funds
Financial Notes (continued)
8. Federal Income Taxes:
As of October 31, 2025, the tax basis cost of the funds’ investments and gross unrealized appreciation and depreciation were as follows:
| |
|
GROSS UNREALIZED
APPRECIATION |
GROSS UNREALIZED
DEPRECIATION |
NET UNREALIZED
APPRECIATION
(DEPRECIATION) |
Schwab S&P 500 Index Fund |
|
|
|
|
| |
|
|
|
|
Schwab Small-Cap Index Fund |
|
|
|
|
Schwab Total Stock Market Index Fund |
|
|
|
|
Schwab U.S. Large-Cap Growth Index Fund |
|
|
|
|
Schwab U.S. Large-Cap Value Index Fund |
|
|
|
|
Schwab U.S. Mid-Cap Index Fund |
|
|
|
|
Schwab International Index Fund |
|
|
|
|
The primary differences between book basis and tax basis unrealized appreciation or unrealized depreciation of investments are the tax deferral of losses on wash sales, the realization for tax purposes of unrealized appreciation or depreciation on futures contracts, the realization for tax purposes of unrealized appreciation on investments in PFICs and partnership investments. The tax cost of the funds’ investments, disclosed above, have been adjusted from their book amounts to reflect these unrealized appreciation or depreciation differences, as applicable.
As of October 31, 2025, the components of distributable earnings on a tax basis were as follows:
| |
UNDISTRIBUTED
ORDINARY
INCOME |
UNDISTRIBUTED
LONG-TERM
CAPITAL GAINS |
NET UNREALIZED
APPRECIATION
(DEPRECIATION)
ON INVESTMENTS |
NET OTHER UNREALIZED
APPRECIATION
(DEPRECIATION) |
CAPITAL LOSS
CARRYFORWARDS
AND OTHER LOSSES |
|
Schwab S&P 500 Index Fund |
|
|
|
|
|
|
| |
|
|
|
|
|
|
Schwab Small-Cap Index Fund |
|
|
|
|
|
|
Schwab Total Stock Market Index Fund |
|
|
|
|
|
|
Schwab U.S. Large-Cap Growth Index Fund |
|
|
|
|
|
|
Schwab U.S. Large-Cap Value Index Fund |
|
|
|
|
|
|
Schwab U.S. Mid-Cap Index Fund |
|
|
|
|
|
|
Schwab International Index Fund |
|
|
|
|
|
|
Capital loss carryforwards have no expiration and may be used to offset future realized capital gains for federal income tax purposes. As of October 31, 2025, the funds had capital loss carryforwards available as follows:
| |
|
Schwab S&P 500 Index Fund |
|
| |
|
Schwab Small-Cap Index Fund |
|
Schwab Total Stock Market Index Fund |
|
Schwab U.S. Large-Cap Growth Index Fund |
|
Schwab U.S. Large-Cap Value Index Fund |
|
Schwab U.S. Mid-Cap Index Fund |
|
Schwab International Index Fund |
|
134
Schwab Equity Index Funds | Annual Holdings and Financial Statements
Schwab Equity Index Funds
Financial Notes (continued)
8. Federal Income Taxes (continued):
For the fiscal year ended October 31, 2025, the funds had capital loss carryforwards utilized as follows:
| |
|
Schwab S&P 500 Index Fund |
|
| |
|
Schwab Small-Cap Index Fund |
|
Schwab Total Stock Market Index Fund |
|
Schwab U.S. Large-Cap Growth Index Fund |
|
Schwab U.S. Large-Cap Value Index Fund |
|
Schwab U.S. Mid-Cap Index Fund |
|
Schwab International Index Fund |
|
The tax basis components of distributions paid during the current and prior fiscal years were as follows:
| |
CURRENT FISCAL YEAR END DISTRIBUTIONS |
PRIOR FISCAL YEAR END DISTRIBUTIONS |
| |
|
|
|
|
Schwab S&P 500 Index Fund |
|
|
|
|
| |
|
|
|
|
Schwab Small-Cap Index Fund |
|
|
|
|
Schwab Total Stock Market Index Fund |
|
|
|
|
Schwab U.S. Large-Cap Growth Index Fund |
|
|
|
|
Schwab U.S. Large-Cap Value Index Fund |
|
|
|
|
Schwab U.S. Mid-Cap Index Fund |
|
|
|
|
Schwab International Index Fund |
|
|
|
|
Distributions paid to shareholders are based on net investment income and net realized gains determined on a tax basis, which may differ from net investment income and net realized gains for financial reporting purposes. These differences reflect the differing character of certain income items and net realized gains and losses for financial statement and tax purposes, and may result in reclassification among certain capital accounts in the financial statements. The funds may also designate a portion of the amount paid to redeeming shareholders as a distribution for tax purposes.
Permanent book and tax basis differences may result in reclassifications between components of net assets as required. The adjustments will have no impact on net assets or the results of operations.
As of October 31, 2025, management has reviewed the tax positions for open periods (for federal purposes, three years from the date of filing and for state purposes, four years from the date of filing) as applicable to the funds, and has determined that no provision for income tax is required in the funds’ financial statements. The funds recognize interest and penalties, if any, related to unrecognized tax benefits as income tax expense in each fund’s Statement of Operations. During the fiscal year ended October 31, 2025, the funds did not incur any interest or penalties.
Schwab Equity Index Funds | Annual Holdings and Financial Statements
135
Schwab Equity Index Funds
Financial Notes (continued)
9. Share Splits:
On June 5, 2025, the Board of Trustees authorized the following share splits for the below funds:
| |
|
Schwab S&P 500 Index Fund |
|
| |
|
Schwab Total Stock Market Index Fund |
|
Schwab U.S. Large-Cap Growth Index Fund |
|
Schwab U.S. Large-Cap Value Index Fund |
|
Schwab U.S. Mid-Cap Index Fund |
|
| |
|
| |
|
These share splits applied to shareholders of record as of the close of U.S. markets on August 14, 2025, and paid after the close of U.S. markets on August 15, 2025. Shares began trading at their post-split price on August 18, 2025. These share splits increased the number of shares outstanding and decreased the NAV per share. The share splits did not change the total market value of a shareholder’s investment. The Financial Highlights and Statement of Changes in Net Assets for the funds have been retroactively adjusted to reflect the share split in the current and prior periods presented.
Management has determined there are no subsequent events or transactions through the date the financial statements were issued that would have materially impacted the financial statements as presented.
136
Schwab Equity Index Funds | Annual Holdings and Financial Statements
Schwab Equity Index Funds
Report of Independent Registered Public Accounting Firm
To the Board of Trustees of Schwab Investments and Schwab Capital Trust and Shareholders of Schwab 1000 Index Fund, Schwab S&P 500 Index Fund, Schwab Small-Cap Index Fund, Schwab Total Stock Market Index Fund, Schwab U.S. Large-Cap Growth Index Fund, Schwab U.S. Large-Cap Value Index Fund, Schwab U.S. Mid-Cap Index Fund, and Schwab International Index Fund:
Opinion on the Financial Statements and Financial Highlights
We have audited the accompanying statements of assets and liabilities, including the portfolio holdings, of Schwab 1000 Index Fund, one of the funds constituting Schwab Investments, and Schwab S&P 500 Index Fund, Schwab Small-Cap Index Fund, Schwab Total Stock Market Index Fund, Schwab U.S. Large-Cap Growth Index Fund, Schwab U.S. Large-Cap Value Index Fund, Schwab U.S. Mid-Cap Index Fund, and Schwab International Index Fund (the “Funds”), seven of the funds constituting Schwab Capital Trust, as of October 31, 2025, the related statements of operations for the year then ended, the statements of changes in net assets for each of the two years in the period then ended, the financial highlights for each of the five years in the period then ended, and the related notes (collectively referred to as the “financial statements and financial highlights”). In our opinion, the financial statements and financial highlights present fairly, in all material respects, the financial position of each of the Funds as of October 31, 2025, and the results of their operations for the year then ended, the changes in their net assets for each of the two years in the period then ended, and the financial highlights for each of the five years in the period then ended in conformity with accounting principles generally accepted in the United States of America.
These financial statements and financial highlights are the responsibility of the Funds’ management. Our responsibility is to express an opinion on the Funds’ financial statements and financial highlights based on our audits. We are a public accounting firm registered with the Public Company Accounting Oversight Board (United States) (PCAOB) and are required to be independent with respect to the Funds in accordance with the U.S. federal securities laws and the applicable rules and regulations of the Securities and Exchange Commission and the PCAOB.
We conducted our audits in accordance with the standards of the PCAOB. Those standards require that we plan and perform the audit to obtain reasonable assurance about whether the financial statements and financial highlights are free of material misstatement, whether due to error or fraud. The Funds are not required to have, nor were we engaged to perform, an audit of their internal control over financial reporting. As part of our audits we are required to obtain an understanding of internal control over financial reporting but not for the purpose of expressing an opinion on the effectiveness of the Funds’ internal control over financial reporting. Accordingly, we express no such opinion.
Our audits included performing procedures to assess the risks of material misstatement of the financial statements and financial highlights, whether due to error or fraud, and performing procedures that respond to those risks. Such procedures included examining, on a test basis, evidence regarding the amounts and disclosures in the financial statements and financial highlights. Our audits also included evaluating the accounting principles used and significant estimates made by management, as well as evaluating the overall presentation of the financial statements and financial highlights. Our procedures included confirmation of securities owned as of October 31, 2025, by correspondence with the custodian and brokers; when replies were not received from brokers, we performed other auditing procedures. We believe that our audits provide a reasonable basis for our opinion.
Deloitte & Touche LLP
Denver, Colorado
December 16, 2025
We have served as the auditor of one or more investment companies in the Schwab Funds Complex since 2020.
Schwab Equity Index Funds | Annual Holdings and Financial Statements
137
Changes in and Disagreements with Accountants for Open-End Management Investment Companies
138
Schwab Equity Index Funds | Annual Holdings and Financial Statements
Proxy Disclosures for Open-End Management Investment Companies
Schwab Equity Index Funds | Annual Holdings and Financial Statements
139
Remuneration Paid to Directors, Officers, and Others of Open-End Management Investment Companies
The remuneration paid to directors, officers and others are included under Item 7 (Financial Statements and Financial Highlights for Open-End Management Investment Companies).
140
Schwab Equity Index Funds | Annual Holdings and Financial Statements
Schwab Equity Index Funds
Investment Advisory Agreement Approval
The Investment Company Act of 1940, as amended (the 1940 Act), requires that the continuation of a fund’s investment advisory agreement must be specifically approved (1) by the vote of the trustees or by a vote of the shareholders of the fund, and (2) by the vote of a majority of the trustees who are not parties to the investment advisory agreement or “interested persons” of any party thereto (the Independent Trustees), cast in person at a meeting called for the purpose of voting on such approval. In connection with such approvals, the fund’s trustees must request and evaluate, and the investment adviser is required to furnish, such information as may be reasonably necessary to evaluate the terms of the investment advisory agreement.
The Board of Trustees (the Board or the Trustees, as appropriate) calls and holds one or more meetings each year that are dedicated, in whole or in part, to considering whether to renew the amended and restated investment advisory and administration agreements (the Agreements) between Schwab Capital Trust and Schwab Investments (collectively, the Trusts) and Charles Schwab Investment Management, Inc. (dba Schwab Asset Management) (the investment adviser) with respect to the existing funds in the Trusts, including Schwab S&P 500 Index Fund, Schwab 1000 Index Fund, Schwab Small-Cap Index Fund, Schwab Total Stock Market Index Fund, Schwab International Index Fund, Schwab U.S. Large-Cap Growth Index Fund, Schwab U.S. Large-Cap Value Index Fund, and Schwab U.S. Mid-Cap Index Fund (each, a Fund and collectively, the Funds), and to review certain other agreements pursuant to which the investment adviser provides investment advisory services to certain other registered investment companies. In preparation for the meeting(s), the Board requests and reviews a wide variety of materials provided by the investment adviser, including information about the investment adviser’s affiliates, personnel, business goals and priorities, profitability, oversight of third-party service providers, corporate structure and operations. As part of the renewal process, the Independent Trustees’ legal counsel, on behalf of the Independent Trustees, sends an information request letter to the investment adviser seeking certain relevant information. The responses by the investment adviser are provided to the Trustees in the Board materials for their review prior to their meeting, and the Trustees are provided with the opportunity to request any additional materials. The Board also receives data provided by an independent provider of investment company data. This information is in addition to the detailed information about the Funds that the Board reviews during the course of each year, including information that relates to the Funds’ operations and performance, legal and compliance matters, risk management, portfolio turnover, and sales and marketing activity. In considering the renewal, the Independent Trustees receive advice from Independent Trustees’ legal counsel, including a memorandum regarding
the responsibilities of trustees for the approval of investment advisory agreements. In addition, the Independent Trustees participate in question and answer sessions with representatives of the investment adviser and meet in executive session outside the presence of Fund management.
The Board, including a majority of the Independent Trustees, considered information specifically relating to the continuance of the Agreements with respect to the Funds at meetings held on May 7, 2025 and June 5, 2025, and approved the renewal of the Agreements with respect to the Funds for an additional one-year term at the meeting on June 5, 2025 called for the purpose of voting on such approval.
The Board’s approval of the continuance of the Agreements with respect to the Funds was based on consideration and evaluation of a variety of specific factors discussed at these meetings and at prior meetings, including:
1.
the nature, extent and quality of the services provided to each Fund under the Agreements, including the resources of the investment adviser and its affiliates dedicated to the Funds;
2.
each Fund’s investment performance and how it compared to that of certain other comparable mutual funds and benchmark data;
3.
each Fund’s expenses and how those expenses compared to those of certain other similar mutual funds;
4.
the profitability of the investment adviser and its affiliates, including Charles Schwab & Co., Inc. (Schwab), with respect to each Fund, including both direct and indirect benefits accruing to the investment adviser and its affiliates; and
5.
the extent to which economies of scale would be realized as each Fund grows and whether fee levels in the Agreements reflect those economies of scale for the benefit of Fund investors.
Nature, Extent and Quality of Services. The Board considered the nature, extent and quality of the services provided by the investment adviser to the Funds and the resources of the investment adviser and its affiliates dedicated to the Funds. In this regard, the Trustees evaluated, among other things, the investment adviser’s experience, track record, compliance program, resources dedicated to hiring and retaining skilled personnel and specialized talent, and information security resources. The Trustees also considered information provided by the investment adviser relating to services and support provided with respect to each Fund’s portfolio management team, portfolio strategy, and internal investment guidelines, as well as trading infrastructure, liquidity management, product design and analysis, shareholder communications, securities valuation, and vendor and risk oversight. The Trustees also
Schwab Equity Index Funds | Annual Holdings and Financial Statements
141
Schwab Equity Index Funds
considered the investment adviser’s continued investment in its infrastructure, including the investment adviser’s technology and use of data, business continuity, cybersecurity, due diligence, risk management processes, and information security programs. The Trustees considered Schwab’s overall financial condition and reputation as a full service brokerage firm, as well as the wide range of products, services, and account features that benefit Fund shareholders who are brokerage clients of Schwab. Following such evaluation, the Board concluded, within the context of its full deliberations, that the nature, extent and quality of services provided by the investment adviser to the Funds and the resources of the investment adviser and its affiliates dedicated to the Funds supported renewal of the Agreements with respect to the Funds.
Fund Performance. The Board considered each Fund’s performance in determining whether to renew the Agreements with respect to such Fund. Specifically, the Trustees considered each Fund’s performance relative to a peer category of other mutual funds and applicable indices/benchmarks, in light of total return and the market environment, as well as in consideration of each Fund’s investment style and strategy. As part of this review, the Trustees considered the composition of the peer category, selection criteria and the reputation of the independent provider of investment company data who prepared the peer category analysis. In evaluating the performance of each Fund, the Trustees considered the risk profile for such Fund and such Fund’s demonstrated performance in tracking its benchmark index. The Trustees noted that the Funds had closely tracked their respective indexes in 2024, with all of the Funds performing in their expected performance ranges. The Trustees further considered the level of Fund performance in the context of their review of Fund expenses and the investment adviser’s profitability discussed below and also noted that the Board and a designated committee of the Board review performance throughout the year. Following such evaluation, the Board concluded, within the context of its full deliberations, that the performance of each Fund supported renewal of the Agreements with respect to such Fund.
Fund Expenses. With respect to each Fund’s expenses, the Trustees considered the rate of compensation called for by the Agreements, and each Fund’s net operating expense ratio, in each case, in comparison to those of other similar mutual funds, such peer groups and comparisons having been selected and calculated by an independent provider of investment company data. The investment adviser reported to the Board, and the Board took into account, the risk assumed by the investment adviser in the development of the Funds and provision of services as well as the competitive marketplace for financial products. The Trustees also considered fees charged by the investment adviser to ETFs, other mutual funds and to other types of accounts, but, with respect to such other types of accounts, accorded less weight to such comparisons due to the different legal, regulatory, compliance and operating
features of mutual funds as compared to these other types of accounts, and any differences in the nature and scope of the services the investment adviser provides to these other accounts, as well as differences in the market for these types of accounts. Following such evaluation, the Board concluded, within the context of its full deliberations, that the expenses of each Fund are reasonable and supported renewal of the Agreements with respect to such Fund.
Profitability. The Trustees considered the compensation flowing to the investment adviser and its affiliates, directly or indirectly and reviewed profitability on a pre-tax basis, without regard to distribution expenses. The Trustees reviewed the profitability of the investment adviser relating to the Schwab fund complex as a whole, noting the benefits to Fund shareholders of being part of the Schwab fund complex, including the allocations of certain costs across the Funds and other funds in the complex. The Trustees also considered any other benefits derived by the investment adviser from its relationship with the Funds, such as whether, by virtue of its management of the Funds, the investment adviser obtains investment information or other research resources that aid it in providing advisory services to other clients. The Trustees considered whether the compensation and profitability with respect to the Funds under the Agreements and other service agreements were reasonable in light of the quality of all services rendered to the Funds by the investment adviser and its affiliates. The Trustees noted that the investment adviser continues to invest substantial sums in its business in order to provide enhanced research capabilities, services and systems to benefit the Funds. Based on this evaluation, the Board concluded, within the context of its full deliberations, that the profitability of the investment adviser with respect to each Fund is reasonable and supported renewal of the Agreements with respect to such Fund.
Economies of Scale. Although the Trustees recognized the difficulty of determining economies of scale with precision, and although the Funds do not have breakpoints in their advisory fees, the Trustees considered the potential existence of any economies of scale by way of the relatively low advisory fee and unitary fee structure of the Funds and whether those are passed along to a Fund’s shareholders through (i) the enhancement of services provided to the Funds in return for fees paid, including through the investment adviser’s continued investment in its infrastructure, and use of data and technology, increasing expertise and capabilities in key areas (including portfolio and trade operations), and improving business continuity, cybersecurity, due diligence and information security programs, which are designed to provide enhanced services to the Funds and their shareholders; and (ii) pricing a fund to scale and keeping overall expenses down as the fund grows. Based on this evaluation, the Board concluded, within the context of its full deliberations, that each Fund obtains reasonable benefits from economies of scale.
* * * * * * * * * * * * * * * * * * * * * * * * * * * * * * * * * * * * * * * *
142
Schwab Equity Index Funds | Annual Holdings and Financial Statements
Schwab Equity Index Funds
In the course of their deliberations, the Trustees may have accorded different weights to various factors and did not identify any particular information or factor that was all important or controlling. Based on the Trustees’ deliberation and their evaluation of the information described above, the Board, including all of the Independent Trustees, approved the continuation of the Agreements with respect to the Funds and
concluded that the compensation under the Agreements with respect to the Funds is fair and reasonable in light of the services provided and the related expenses borne by the investment adviser and its affiliates and such other matters as the Trustees considered to be relevant in the exercise of their reasonable judgment.
Schwab Equity Index Funds | Annual Holdings and Financial Statements
143
Annual Holdings and Financial Statements | October 31, 2025
Schwab Fundamental Index* Funds
Schwab Fundamental
U.S. Large Company Index Fund
(formerly Schwab Fundamental
US Large Company Index Fund)
Schwab Fundamental
U.S. Small Company Index Fund
(formerly Schwab Fundamental
US Small Company Index Fund)
Schwab Fundamental International
Equity Index Fund
(formerly Schwab Fundamental International
Large Company Index Fund)
Schwab Fundamental International
Small Equity Index Fund
(formerly Schwab Fundamental International
Small Company Index Fund)
Schwab Fundamental Emerging
Markets Equity Index Fund
(formerly Schwab Fundamental Emerging
Markets Large Company Index Fund)
*
SCHWAB is a registered trademark of Charles Schwab & Co., Inc.
FUNDAMENTAL INDEX is a registered trademark of Research Affiliates LLC.
Fund investment adviser: Charles Schwab Investment Management, Inc., dba Schwab Asset Management®
Distributor: Charles Schwab & Co., Inc. (Schwab)
The Sector/Industry classifications in this report use the Global Industry Classification Standard (GICS) which was developed by and is the exclusive property of MSCI Inc. (MSCI) and Standard & Poor’s (S&P). GICS is a service mark of MSCI and S&P and has been licensed for use by Schwab. The Industry classifications used in the Portfolio Holdings are sub-categories of Sector classifications.
Schwab Fundamental Index Funds | Annual Holdings and Financial Statements
1
Schwab Fundamental U.S. Large Company Index Fund
Financial Statements
| |
|
|
|
|
|
|
| |
Net asset value at beginning of period |
|
|
|
|
|
|
Income (loss) from investment operations: |
|
|
|
|
|
|
Net investment income (loss)1 |
|
|
|
|
|
|
Net realized and unrealized gains (losses) |
|
|
|
|
|
|
Total from investment operations |
|
|
|
|
|
|
| |
|
|
|
|
|
|
Distributions from net investment income |
|
|
|
|
|
|
Distributions from net realized gains |
|
|
|
|
|
|
| |
|
|
|
|
|
|
Net asset value at end of period |
|
|
|
|
|
|
| |
|
|
|
|
|
|
| |
Ratios to average net assets: |
|
|
|
|
|
|
| |
|
|
|
|
|
|
Net investment income (loss) |
|
|
|
|
|
|
| |
|
|
|
|
|
|
Net assets, end of period (x 1,000,000) |
|
|
|
|
|
|
| |
Calculated based on the average shares outstanding during the period. |
| |
Ratio includes less than 0.005% of non-routine proxy expenses. |
| |
Portfolio turnover rate excludes in-kind transactions. |
2
Schwab Fundamental Index Funds | Annual Holdings and Financial Statements
Schwab Fundamental U.S. Large Company Index Fund
Portfolio Holdings as of October 31, 2025
| |
|
|
COMMON STOCKS 99.8% OF NET ASSETS |
| |
Automobiles & Components 2.1% |
| |
|
|
| |
|
|
| |
|
|
| |
|
|
| |
|
|
| |
|
|
| |
|
|
Goodyear Tire & Rubber Co. * |
|
|
| |
|
|
| |
|
|
| |
|
|
| |
|
|
| |
|
|
| |
| |
| |
|
|
| |
|
|
Citizens Financial Group, Inc. |
|
|
| |
|
|
| |
|
|
| |
|
|
First Citizens BancShares, Inc., Class A |
|
|
| |
|
|
| |
|
|
Huntington Bancshares, Inc. |
|
|
| |
|
|
| |
|
|
| |
|
|
PNC Financial Services Group, Inc. |
|
|
| |
|
|
| |
|
|
| |
|
|
| |
|
|
| |
|
|
| |
|
|
| |
|
|
| |
|
|
| |
| |
| |
|
|
| |
|
|
| |
|
|
| |
|
|
| |
|
|
| |
|
|
Allison Transmission Holdings, Inc. |
|
|
| |
|
|
| |
|
|
| |
|
|
| |
|
|
Builders FirstSource, Inc. * |
|
|
| |
|
|
| |
|
|
| |
|
|
| |
|
|
| |
|
|
| |
|
|
| |
|
|
| |
|
|
| |
|
|
| |
|
|
| |
|
|
| |
|
|
| |
|
|
| |
|
|
Ferguson Enterprises, Inc. |
|
|
| |
|
|
| |
|
|
Fortune Brands Innovations, Inc. |
|
|
Gates Industrial Corp. PLC * |
|
|
| |
|
|
| |
|
|
| |
|
|
| |
|
|
| |
|
|
Honeywell International, Inc. |
|
|
| |
|
|
| |
|
|
Huntington Ingalls Industries, Inc. |
|
|
| |
|
|
Illinois Tool Works, Inc. |
|
|
| |
|
|
| |
|
|
Johnson Controls International PLC |
|
|
L3Harris Technologies, Inc. |
|
|
Lennox International, Inc. |
|
|
Lincoln Electric Holdings, Inc. |
|
|
| |
|
|
| |
|
|
| |
|
|
| |
|
|
MSC Industrial Direct Co., Inc., Class A |
|
|
| |
|
|
| |
|
|
| |
|
|
| |
|
|
| |
|
|
| |
|
|
| |
|
|
| |
|
|
| |
|
|
| |
|
|
| |
|
|
| |
|
|
Resideo Technologies, Inc. * |
|
|
Rockwell Automation, Inc. |
|
|
| |
|
|
Rush Enterprises, Inc., Class A |
|
|
Sensata Technologies Holding PLC |
|
|
| |
|
|
Stanley Black & Decker, Inc. |
|
|
| |
|
|
| |
|
|
| |
|
|
| |
|
|
| |
|
|
| |
|
|
| |
|
|
WESCO International, Inc. |
|
|
Westinghouse Air Brake Technologies Corp. |
|
|
| |
|
|
| |
|
|
| |
|
|
| |
|
|
| |
Commercial & Professional Services 0.9% |
| |
|
|
Automatic Data Processing, Inc. |
|
|
Schwab Fundamental Index Funds | Annual Holdings and Financial Statements
3
Schwab Fundamental U.S. Large Company Index Fund
Portfolio Holdings as of October 31, 2025 (continued)
| |
|
|
Booz Allen Hamilton Holding Corp., Class A |
|
|
Broadridge Financial Solutions, Inc. |
|
|
CACI International, Inc., Class A * |
|
|
| |
|
|
| |
|
|
| |
|
|
| |
|
|
| |
|
|
| |
|
|
| |
|
|
| |
|
|
| |
|
|
| |
|
|
| |
|
|
Republic Services, Inc., Class A |
|
|
| |
|
|
Science Applications International Corp. |
|
|
SS&C Technologies Holdings, Inc. |
|
|
| |
|
|
| |
|
|
Verisk Analytics, Inc., Class A |
|
|
| |
|
|
| |
|
|
| |
Consumer Discretionary Distribution & Retail 4.5% |
Academy Sports & Outdoors, Inc. |
|
|
| |
|
|
| |
|
|
American Eagle Outfitters, Inc. |
|
|
Asbury Automotive Group, Inc. * |
|
|
| |
|
|
| |
|
|
| |
|
|
| |
|
|
Burlington Stores, Inc. * |
|
|
| |
|
|
Dick's Sporting Goods, Inc. |
|
|
| |
|
|
| |
|
|
| |
|
|
| |
|
|
| |
|
|
| |
|
|
Lithia Motors, Inc., Class A |
|
|
| |
|
|
| |
|
|
| |
|
|
| |
|
|
| |
|
|
O'Reilly Automotive, Inc. * |
|
|
Penske Automotive Group, Inc. |
|
|
| |
|
|
| |
|
|
| |
|
|
| |
|
|
| |
|
|
| |
|
|
| |
|
|
| |
|
|
| |
|
|
| |
Consumer Durables & Apparel 1.5% |
| |
|
|
| |
|
|
| |
|
|
| |
|
|
| |
|
|
| |
|
|
| |
|
|
| |
|
|
| |
|
|
| |
|
|
| |
|
|
| |
|
|
| |
|
|
| |
|
|
| |
|
|
Mohawk Industries, Inc. * |
|
|
| |
|
|
| |
|
|
| |
|
|
| |
|
|
| |
|
|
| |
|
|
Ralph Lauren Corp., Class A |
|
|
Somnigroup International, Inc. |
|
|
| |
|
|
Taylor Morrison Home Corp., Class A * |
|
|
| |
|
|
| |
|
|
| |
|
|
| |
|
|
| |
|
|
| |
|
|
| |
| |
| |
|
|
| |
|
|
| |
|
|
Caesars Entertainment, Inc. * |
|
|
| |
|
|
Chipotle Mexican Grill, Inc., Class A * |
|
|
| |
|
|
| |
|
|
| |
|
|
Flutter Entertainment PLC * |
|
|
Hilton Worldwide Holdings, Inc. |
|
|
| |
|
|
Marriott International, Inc., Class A |
|
|
Marriott Vacations Worldwide Corp. |
|
|
| |
|
|
MGM Resorts International * |
|
|
Penn Entertainment, Inc. * |
|
|
Royal Caribbean Cruises Ltd. |
|
|
Service Corp. International |
|
|
| |
|
|
Texas Roadhouse, Inc., Class A |
|
|
| |
|
|
| |
|
|
| |
|
|
| |
Consumer Staples Distribution & Retail 2.9% |
Albertsons Cos., Inc., Class A |
|
|
| |
|
|
BJ's Wholesale Club Holdings, Inc. * |
|
|
Casey's General Stores, Inc. |
|
|
| |
|
|
| |
|
|
| |
|
|
| |
|
|
Performance Food Group Co. * |
|
|
4
Schwab Fundamental Index Funds | Annual Holdings and Financial Statements
Schwab Fundamental U.S. Large Company Index Fund
Portfolio Holdings as of October 31, 2025 (continued)
| |
|
|
Sprouts Farmers Market, Inc. * |
|
|
| |
|
|
| |
|
|
U.S. Foods Holding Corp. * |
|
|
United Natural Foods, Inc. * |
|
|
| |
|
|
| |
|
|
| |
| |
| |
|
|
| |
|
|
Baker Hughes Co., Class A |
|
|
California Resources Corp. |
|
|
| |
|
|
| |
|
|
| |
|
|
| |
|
|
| |
|
|
| |
|
|
| |
|
|
Delek U.S. Holdings, Inc. |
|
|
| |
|
|
| |
|
|
| |
|
|
| |
|
|
| |
|
|
| |
|
|
| |
|
|
| |
|
|
| |
|
|
| |
|
|
| |
|
|
| |
|
|
| |
|
|
| |
|
|
Occidental Petroleum Corp. |
|
|
| |
|
|
| |
|
|
Patterson-UTI Energy, Inc. |
|
|
PBF Energy, Inc., Class A |
|
|
| |
|
|
| |
|
|
| |
|
|
| |
|
|
| |
|
|
| |
|
|
| |
|
|
| |
|
|
| |
|
|
| |
|
|
| |
|
|
| |
Equity Real Estate Investment Trusts (REITs) 1.5% |
Alexandria Real Estate Equities, Inc. |
|
|
| |
|
|
AvalonBay Communities, Inc. |
|
|
Brixmor Property Group, Inc. |
|
|
| |
|
|
| |
|
|
| |
|
|
Digital Realty Trust, Inc. |
|
|
| |
|
|
| |
|
|
Essex Property Trust, Inc. |
|
|
Extra Space Storage, Inc. |
|
|
Gaming & Leisure Properties, Inc. |
|
|
| |
|
|
Healthpeak Properties, Inc. |
|
|
Host Hotels & Resorts, Inc. |
|
|
| |
|
|
| |
|
|
| |
|
|
Lamar Advertising Co., Class A |
|
|
Medical Properties Trust, Inc. (b) |
|
|
Mid-America Apartment Communities, Inc. |
|
|
Millrose Properties, Inc., Class A |
|
|
Park Hotels & Resorts, Inc. |
|
|
| |
|
|
| |
|
|
| |
|
|
| |
|
|
SBA Communications Corp., Class A |
|
|
Simon Property Group, Inc. |
|
|
| |
|
|
| |
|
|
| |
|
|
VICI Properties, Inc., Class A |
|
|
| |
|
|
| |
|
|
| |
|
|
| |
|
|
| |
|
|
| |
| |
Affiliated Managers Group, Inc. |
|
|
| |
|
|
| |
|
|
| |
|
|
Ameriprise Financial, Inc. |
|
|
Annaly Capital Management, Inc. |
|
|
Apollo Global Management, Inc. |
|
|
Bank of New York Mellon Corp. |
|
|
Berkshire Hathaway, Inc., Class A * |
|
|
Berkshire Hathaway, Inc., Class B * |
|
|
| |
|
|
| |
|
|
| |
|
|
Bread Financial Holdings, Inc. |
|
|
Capital One Financial Corp. |
|
|
| |
|
|
| |
|
|
| |
|
|
Corebridge Financial, Inc. |
|
|
| |
|
|
| |
|
|
| |
|
|
Fidelity National Information Services, Inc. |
|
|
| |
|
|
| |
|
|
| |
|
|
Goldman Sachs Group, Inc. |
|
|
Intercontinental Exchange, Inc. |
|
|
| |
|
|
Jack Henry & Associates, Inc. |
|
|
Jackson Financial, Inc., Class A |
|
|
Janus Henderson Group PLC |
|
|
Jefferies Financial Group, Inc. |
|
|
| |
|
|
LPL Financial Holdings, Inc. |
|
|
Mastercard, Inc., Class A |
|
|
| |
|
|
| |
|
|
Schwab Fundamental Index Funds | Annual Holdings and Financial Statements
5
Schwab Fundamental U.S. Large Company Index Fund
Portfolio Holdings as of October 31, 2025 (continued)
| |
|
|
| |
|
|
| |
|
|
| |
|
|
| |
|
|
| |
|
|
| |
|
|
| |
|
|
| |
|
|
Raymond James Financial, Inc. |
|
|
| |
|
|
| |
|
|
| |
|
|
| |
|
|
Starwood Property Trust, Inc. |
|
|
| |
|
|
| |
|
|
| |
|
|
T. Rowe Price Group, Inc. |
|
|
| |
|
|
| |
|
|
| |
|
|
| |
|
|
| |
Food, Beverage & Tobacco 3.2% |
| |
|
|
Archer-Daniels-Midland Co. |
|
|
Brown-Forman Corp., Class B |
|
|
| |
|
|
| |
|
|
| |
|
|
| |
|
|
Constellation Brands, Inc., Class A |
|
|
Darling Ingredients, Inc. * |
|
|
| |
|
|
| |
|
|
| |
|
|
| |
|
|
| |
|
|
| |
|
|
| |
|
|
| |
|
|
| |
|
|
Lamb Weston Holdings, Inc. |
|
|
McCormick & Co., Inc. - Non Voting Shares |
|
|
Molson Coors Beverage Co., Class B |
|
|
Mondelez International, Inc., Class A |
|
|
| |
|
|
| |
|
|
Philip Morris International, Inc. |
|
|
| |
|
|
Tyson Foods, Inc., Class A |
|
|
| |
|
|
| |
Health Care Equipment & Services 5.9% |
| |
|
|
| |
|
|
AMN Healthcare Services, Inc. * |
|
|
Baxter International, Inc. |
|
|
| |
|
|
Boston Scientific Corp. * |
|
|
| |
|
|
| |
|
|
| |
|
|
| |
|
|
Community Health Systems, Inc. * |
|
|
| |
|
|
| |
|
|
| |
|
|
| |
|
|
| |
|
|
Edwards Lifesciences Corp. * |
|
|
| |
|
|
| |
|
|
GE HealthCare Technologies, Inc. |
|
|
| |
|
|
| |
|
|
| |
|
|
| |
|
|
IDEXX Laboratories, Inc. * |
|
|
Intuitive Surgical, Inc. * |
|
|
| |
|
|
| |
|
|
Molina Healthcare, Inc. * |
|
|
| |
|
|
| |
|
|
| |
|
|
| |
|
|
| |
|
|
| |
|
|
| |
|
|
| |
|
|
| |
|
|
Universal Health Services, Inc., Class B |
|
|
Zimmer Biomet Holdings, Inc. |
|
|
| |
|
|
| |
Household & Personal Products 1.1% |
Church & Dwight Co., Inc. |
|
|
| |
|
|
| |
|
|
Estee Lauder Cos., Inc., Class A |
|
|
| |
|
|
| |
|
|
| |
|
|
| |
|
|
| |
| |
| |
|
|
| |
|
|
American Financial Group, Inc. |
|
|
American International Group, Inc. |
|
|
| |
|
|
| |
|
|
| |
|
|
| |
|
|
| |
|
|
Cincinnati Financial Corp. |
|
|
CNO Financial Group, Inc. |
|
|
Fidelity National Financial, Inc. |
|
|
First American Financial Corp. |
|
|
Genworth Financial, Inc., Class A * |
|
|
| |
|
|
Hanover Insurance Group, Inc. |
|
|
Hartford Insurance Group, Inc. |
|
|
| |
|
|
| |
|
|
| |
|
|
Marsh & McLennan Cos., Inc. |
|
|
| |
|
|
Old Republic International Corp. |
|
|
| |
|
|
Principal Financial Group, Inc. |
|
|
6
Schwab Fundamental Index Funds | Annual Holdings and Financial Statements
Schwab Fundamental U.S. Large Company Index Fund
Portfolio Holdings as of October 31, 2025 (continued)
| |
|
|
| |
|
|
Prudential Financial, Inc. |
|
|
Reinsurance Group of America, Inc. |
|
|
| |
|
|
| |
|
|
| |
|
|
| |
|
|
| |
|
|
| |
| |
Air Products & Chemicals, Inc. |
|
|
| |
|
|
| |
|
|
Alpha Metallurgical Resources, Inc. * |
|
|
| |
|
|
| |
|
|
| |
|
|
| |
|
|
Axalta Coating Systems Ltd. * |
|
|
| |
|
|
| |
|
|
CF Industries Holdings, Inc. |
|
|
| |
|
|
| |
|
|
| |
|
|
| |
|
|
| |
|
|
| |
|
|
| |
|
|
| |
|
|
| |
|
|
| |
|
|
| |
|
|
| |
|
|
| |
|
|
Graphic Packaging Holding Co. |
|
|
| |
|
|
International Flavors & Fragrances, Inc. |
|
|
| |
|
|
| |
|
|
| |
|
|
LyondellBasell Industries NV, Class A |
|
|
Martin Marietta Materials, Inc. |
|
|
| |
|
|
| |
|
|
| |
|
|
| |
|
|
| |
|
|
Packaging Corp. of America |
|
|
| |
|
|
| |
|
|
| |
|
|
| |
|
|
| |
|
|
Solstice Advanced Materials, Inc. * |
|
|
| |
|
|
| |
|
|
| |
|
|
| |
|
|
| |
|
|
| |
Media & Entertainment 7.9% |
| |
|
|
| |
|
|
Altice USA, Inc., Class A * |
|
|
Charter Communications, Inc., Class A * |
|
|
| |
|
|
| |
|
|
| |
|
|
| |
|
|
Interpublic Group of Cos., Inc. |
|
|
Lionsgate Studios Corp. * |
|
|
Meta Platforms, Inc., Class A |
|
|
| |
|
|
| |
|
|
Nexstar Media Group, Inc., Class A |
|
|
| |
|
|
Paramount Skydance Corp., Class B |
|
|
| |
|
|
Take-Two Interactive Software, Inc. * |
|
|
| |
|
|
| |
|
|
Warner Bros Discovery, Inc. * |
|
|
| |
|
|
| |
Pharmaceuticals, Biotechnology & Life Sciences 6.1% |
| |
|
|
Agilent Technologies, Inc. |
|
|
| |
|
|
| |
|
|
| |
|
|
| |
|
|
Charles River Laboratories International, Inc. * |
|
|
| |
|
|
Elanco Animal Health, Inc. * |
|
|
| |
|
|
| |
|
|
| |
|
|
| |
|
|
Jazz Pharmaceuticals PLC * |
|
|
| |
|
|
| |
|
|
Mettler-Toledo International, Inc. * |
|
|
| |
|
|
| |
|
|
| |
|
|
Regeneron Pharmaceuticals, Inc. |
|
|
| |
|
|
Thermo Fisher Scientific, Inc. |
|
|
United Therapeutics Corp. * |
|
|
Vertex Pharmaceuticals, Inc. * |
|
|
| |
|
|
| |
|
|
West Pharmaceutical Services, Inc. |
|
|
| |
|
|
| |
|
|
| |
Real Estate Management & Development 0.2% |
CBRE Group, Inc., Class A * |
|
|
Cushman & Wakefield PLC * |
|
|
Jones Lang LaSalle, Inc. * |
|
|
| |
|
|
| |
Semiconductors & Semiconductor Equipment 5.6% |
Advanced Micro Devices, Inc. * |
|
|
| |
|
|
| |
|
|
| |
|
|
| |
|
|
| |
|
|
| |
|
|
Schwab Fundamental Index Funds | Annual Holdings and Financial Statements
7
Schwab Fundamental U.S. Large Company Index Fund
Portfolio Holdings as of October 31, 2025 (continued)
| |
|
|
| |
|
|
| |
|
|
Microchip Technology, Inc. |
|
|
| |
|
|
| |
|
|
| |
|
|
| |
|
|
| |
|
|
| |
|
|
| |
|
|
| |
|
|
| |
|
|
| |
|
|
| |
| |
| |
|
|
| |
|
|
Akamai Technologies, Inc. * |
|
|
| |
|
|
| |
|
|
| |
|
|
Cadence Design Systems, Inc. * |
|
|
Cognizant Technology Solutions Corp., Class A |
|
|
| |
|
|
| |
|
|
| |
|
|
| |
|
|
| |
|
|
| |
|
|
International Business Machines Corp. |
|
|
| |
|
|
| |
|
|
| |
|
|
| |
|
|
Palo Alto Networks, Inc. * |
|
|
| |
|
|
| |
|
|
| |
|
|
| |
|
|
Zoom Communications, Inc. * |
|
|
| |
|
|
| |
Technology Hardware & Equipment 7.5% |
| |
|
|
| |
|
|
| |
|
|
Arrow Electronics, Inc. * |
|
|
| |
|
|
| |
|
|
| |
|
|
| |
|
|
| |
|
|
| |
|
|
Dell Technologies, Inc., Class C |
|
|
| |
|
|
| |
|
|
Hewlett Packard Enterprise Co. |
|
|
| |
|
|
Insight Enterprises, Inc. * |
|
|
| |
|
|
Keysight Technologies, Inc. * |
|
|
| |
|
|
| |
|
|
| |
|
|
| |
|
|
| |
|
|
| |
|
|
Seagate Technology Holdings PLC |
|
|
| |
|
|
| |
|
|
Teledyne Technologies, Inc. * |
|
|
| |
|
|
Vishay Intertechnology, Inc. |
|
|
| |
|
|
| |
|
|
Zebra Technologies Corp., Class A * |
|
|
| |
|
|
| |
Telecommunication Services 2.5% |
| |
|
|
Frontier Communications Parent, Inc. * |
|
|
Liberty Global Ltd., Class C * |
|
|
Liberty Latin America Ltd., Class C * |
|
|
Lumen Technologies, Inc. * |
|
|
Telephone & Data Systems, Inc. |
|
|
| |
|
|
Verizon Communications, Inc. |
|
|
| |
|
|
| |
| |
| |
|
|
American Airlines Group, Inc. * |
|
|
Avis Budget Group, Inc. * |
|
|
CH Robinson Worldwide, Inc. |
|
|
| |
|
|
| |
|
|
Expeditors International of Washington, Inc. |
|
|
| |
|
|
| |
|
|
Hertz Global Holdings, Inc. *(b) |
|
|
| |
|
|
JB Hunt Transport Services, Inc. |
|
|
Knight-Swift Transportation Holdings, Inc. |
|
|
| |
|
|
| |
|
|
| |
|
|
Old Dominion Freight Line, Inc. |
|
|
| |
|
|
| |
|
|
Uber Technologies, Inc. * |
|
|
U-Haul Holding Co., Non Voting Shares |
|
|
| |
|
|
United Parcel Service, Inc., Class B |
|
|
| |
|
|
| |
|
|
| |
| |
| |
|
|
| |
|
|
| |
|
|
American Electric Power Co., Inc. |
|
|
American Water Works Co., Inc. |
|
|
| |
|
|
| |
|
|
| |
|
|
Consolidated Edison, Inc. |
|
|
Constellation Energy Corp. |
|
|
| |
|
|
| |
|
|
8
Schwab Fundamental Index Funds | Annual Holdings and Financial Statements
Schwab Fundamental U.S. Large Company Index Fund
Portfolio Holdings as of October 31, 2025 (continued)
| |
|
|
| |
|
|
| |
|
|
| |
|
|
Essential Utilities, Inc. |
|
|
| |
|
|
| |
|
|
| |
|
|
| |
|
|
MDU Resources Group, Inc. |
|
|
| |
|
|
| |
|
|
| |
|
|
| |
|
|
| |
|
|
| |
|
|
Pinnacle West Capital Corp. |
|
|
Portland General Electric Co. |
|
|
| |
|
|
Public Service Enterprise Group, Inc. |
|
|
| |
|
|
| |
|
|
| |
|
|
| |
|
|
| |
|
|
| |
|
|
| |
|
|
Total Common Stocks
(Cost $6,153,932,380) |
|
| |
|
|
SHORT-TERM INVESTMENTS 0.2% OF NET ASSETS |
| |
| |
State Street Institutional U.S. Government Money Market Fund, Premier Class 4.01% (d) |
|
|
State Street Institutional U.S. Government Money Market Fund, Premier Class 4.01% (d)(e) |
|
|
| |
|
|
Total Short-Term Investments
(Cost $19,296,161) |
|
Total Investments in Securities
(Cost $6,173,228,541) |
|
| |
|
|
CURRENT VALUE/
UNREALIZED
APPRECIATION
($) |
| |
| |
|
|
|
S&P 500 Index, e-mini, expires 12/19/25 |
|
|
|
| |
Non-income producing security. |
| |
Issuer is an affiliated company, as the investment adviser owns at least 5% of the voting securities of such company. |
| |
All or a portion of this security is on loan. Securities on loan were valued at $2,958,030. |
| |
Issuer is affiliated with the fund’s investment adviser. |
| |
The rate shown is the annualized 7-day yield. |
| |
Security purchased with cash collateral received for securities on loan. |
| |
Real Estate Investment Trust |
Below is a summary of the fund’s transactions with affiliated issuers and companies which are or were affiliates during the period ended October 31, 2025. An affiliated company is a company in which the investment adviser has or had an ownership of at least 5% of the voting securities of a security issue during the report period. A dash in the Value at October 31, 2024, and/or Value and Balance of Shares Held at October 31, 2025, columns means either the issuer was not held or not held as an affiliate on the stated date.
| |
|
|
|
NET REALIZED GAINS (LOSSES) |
NET CHANGE IN UNREALIZED APPRECIATION (DEPRECIATION) |
|
BALANCE OF SHARES HELD AT 10/31/25 |
|
COMMON STOCKS 0.2% OF NET ASSETS |
| |
Consumer Discretionary Distribution & Retail 0.0% |
| |
|
|
|
|
|
|
|
|
| |
Schwab Fundamental Index Funds | Annual Holdings and Financial Statements
9
Schwab Fundamental U.S. Large Company Index Fund
Portfolio Holdings as of October 31, 2025 (continued)
| |
|
|
|
NET REALIZED GAINS (LOSSES) |
NET CHANGE IN UNREALIZED APPRECIATION (DEPRECIATION) |
|
BALANCE OF SHARES HELD AT 10/31/25 |
|
| |
| |
|
|
|
|
|
|
|
|
| |
|
|
|
|
|
|
|
|
The following is a summary of the inputs used to value the fund’s investments as of October 31, 2025 (see financial note 2(a) for additional information):
| |
QUOTED PRICES IN
ACTIVE MARKETS FOR
IDENTICAL ASSETS
(LEVEL 1) |
OTHER SIGNIFICANT
OBSERVABLE INPUTS
(LEVEL 2) |
SIGNIFICANT
UNOBSERVABLE INPUTS
(LEVEL 3) |
|
| |
|
|
|
|
| |
|
|
|
|
| |
|
|
|
|
| |
|
|
|
|
| |
|
|
|
|
| |
As categorized in the Portfolio Holdings. |
| |
Futures contracts are reported at cumulative unrealized appreciation or depreciation. |
10
Schwab Fundamental Index Funds | Annual Holdings and Financial Statements
Schwab Fundamental U.S. Large Company Index Fund
Statement of Assets and Liabilities
| |
Investments in securities, at value - affiliated issuers (cost $10,353,614) |
|
|
Investments in securities, at value - unaffiliated issuers (cost $6,162,874,927) including securities on loan of $2,958,030 |
|
|
Deposit with broker for futures contracts |
|
|
| |
|
|
| |
|
|
| |
|
|
Variation margin on future contracts |
|
|
Income from securities on loan |
|
|
| |
|
|
| |
| |
Collateral held for securities on loan |
|
|
| |
|
|
| |
|
|
| |
|
|
| |
|
|
| |
|
|
| |
| |
Capital received from investors |
|
|
Total distributable earnings |
|
|
| |
|
|
Schwab Fundamental Index Funds | Annual Holdings and Financial Statements
11
Schwab Fundamental U.S. Large Company Index Fund
Statement of Operations
For the period November 1, 2024 through October 31, 2025 |
| |
Dividends received from securities - unaffiliated issuers (net of foreign withholding tax of $136,581) |
|
|
Dividends received from securities - affiliated issuers |
|
|
| |
|
|
| |
|
|
| |
|
|
| |
| |
| |
|
|
| |
|
|
| |
|
|
| |
REALIZED AND UNREALIZED GAINS (LOSSES) |
Net realized losses on sales of securities - affiliated issuers |
|
|
Net realized gains on sales of securities - unaffiliated issuers |
|
|
Net realized gains on sales of in-kind redemptions - affiliated issuers |
|
|
Net realized gains on sales of in-kind redemptions - unaffiliated issuers |
|
|
Net realized gains on futures contracts |
|
|
| |
|
|
Net change in unrealized appreciation (depreciation) on securities - affiliated issuers |
|
|
Net change in unrealized appreciation (depreciation) on securities - unaffiliated issuers |
|
|
Net change in unrealized appreciation (depreciation) on futures contracts |
|
|
Net change in unrealized appreciation (depreciation) |
|
|
Net realized and unrealized gains |
|
|
Increase in net assets resulting from operations |
|
|
12
Schwab Fundamental Index Funds | Annual Holdings and Financial Statements
Schwab Fundamental U.S. Large Company Index Fund
Statement of Changes in Net Assets
For the current and prior report periods
| |
| |
|
|
| |
|
|
|
| |
|
|
|
Net change in unrealized appreciation (depreciation) |
|
|
|
Increase in net assets resulting from operations |
|
|
|
| |
DISTRIBUTIONS TO SHAREHOLDERS |
| |
|
|
|
TRANSACTIONS IN FUND SHARES |
| |
|
|
| |
|
|
|
|
|
| |
|
|
|
|
|
| |
|
|
|
|
|
| |
|
|
|
|
|
Net transactions in fund shares |
|
|
|
|
|
| |
SHARES OUTSTANDING AND NET ASSETS |
| |
|
|
| |
|
|
|
|
|
| |
|
|
|
|
|
| |
|
|
|
|
|
| |
|
|
|
|
|
Schwab Fundamental Index Funds | Annual Holdings and Financial Statements
13
Schwab Fundamental U.S. Small Company Index Fund
Financial Statements
| |
|
|
|
|
|
|
| |
Net asset value at beginning of period |
|
|
|
|
|
|
Income (loss) from investment operations: |
|
|
|
|
|
|
Net investment income (loss)1 |
|
|
|
|
|
|
Net realized and unrealized gains (losses) |
|
|
|
|
|
|
Total from investment operations |
|
|
|
|
|
|
| |
|
|
|
|
|
|
Distributions from net investment income |
|
|
|
|
|
|
Distributions from net realized gains |
|
|
|
|
|
|
| |
|
|
|
|
|
|
Net asset value at end of period |
|
|
|
|
|
|
| |
|
|
|
|
|
|
| |
Ratios to average net assets: |
|
|
|
|
|
|
| |
|
|
|
|
|
|
Net investment income (loss) |
|
|
|
|
|
|
| |
|
|
|
|
|
|
Net assets, end of period (x 1,000,000) |
|
|
|
|
|
|
| |
Calculated based on the average shares outstanding during the period. |
| |
Ratio includes less than 0.005% of non-routine proxy expenses. |
| |
Portfolio turnover rate excludes in-kind transactions. |
14
Schwab Fundamental Index Funds | Annual Holdings and Financial Statements
Schwab Fundamental U.S. Small Company Index Fund
Portfolio Holdings as of October 31, 2025
| |
|
|
COMMON STOCKS 99.7% OF NET ASSETS |
| |
Automobiles & Components 1.6% |
American Axle & Manufacturing Holdings, Inc. * |
|
|
| |
|
|
Fox Factory Holding Corp. * |
|
|
| |
|
|
| |
|
|
Modine Manufacturing Co. * |
|
|
| |
|
|
| |
|
|
Rivian Automotive, Inc., Class A * |
|
|
Standard Motor Products, Inc. |
|
|
| |
|
|
Winnebago Industries, Inc. |
|
|
| |
|
|
| |
| |
| |
|
|
| |
|
|
Atlantic Union Bankshares Corp. |
|
|
| |
|
|
| |
|
|
| |
|
|
| |
|
|
| |
|
|
| |
|
|
| |
|
|
| |
|
|
| |
|
|
Capitol Federal Financial, Inc. |
|
|
| |
|
|
| |
|
|
Columbia Banking System, Inc. |
|
|
Commerce Bancshares, Inc. |
|
|
Community Financial System, Inc. |
|
|
Cullen/Frost Bankers, Inc. |
|
|
Customers Bancorp, Inc. * |
|
|
| |
|
|
Dime Community Bancshares, Inc. |
|
|
| |
|
|
| |
|
|
Enterprise Financial Services Corp. |
|
|
| |
|
|
First Bancorp/Southern Pines NC |
|
|
| |
|
|
First Commonwealth Financial Corp. |
|
|
| |
|
|
First Financial Bankshares, Inc. |
|
|
| |
|
|
First Interstate BancSystem, Inc., Class A |
|
|
| |
|
|
| |
|
|
| |
|
|
| |
|
|
| |
|
|
| |
|
|
| |
|
|
| |
|
|
| |
|
|
International Bancshares Corp. |
|
|
| |
|
|
| |
|
|
Mechanics Bancorp, Class A * |
|
|
National Bank Holdings Corp., Class A |
|
|
| |
|
|
Northwest Bancshares, Inc. |
|
|
OceanFirst Financial Corp. |
|
|
| |
|
|
| |
|
|
| |
|
|
Pinnacle Financial Partners, Inc. |
|
|
| |
|
|
Prosperity Bancshares, Inc. |
|
|
Provident Financial Services, Inc. |
|
|
| |
|
|
| |
|
|
Seacoast Banking Corp. of Florida |
|
|
ServisFirst Bancshares, Inc. |
|
|
Simmons First National Corp., Class A |
|
|
Southside Bancshares, Inc. |
|
|
| |
|
|
Texas Capital Bancshares, Inc. * |
|
|
| |
|
|
| |
|
|
Triumph Financial, Inc. * |
|
|
| |
|
|
| |
|
|
| |
|
|
United Community Banks, Inc. |
|
|
| |
|
|
| |
|
|
| |
|
|
| |
|
|
| |
|
|
| |
|
|
| |
|
|
| |
|
|
| |
|
|
| |
| |
| |
|
|
| |
|
|
Advanced Drainage Systems, Inc. |
|
|
| |
|
|
| |
|
|
| |
|
|
Albany International Corp., Class A |
|
|
American Woodmark Corp. * |
|
|
| |
|
|
| |
|
|
Applied Industrial Technologies, Inc. |
|
|
| |
|
|
Armstrong World Industries, Inc. |
|
|
| |
|
|
| |
|
|
| |
|
|
Atmus Filtration Technologies, Inc. |
|
|
| |
|
|
| |
|
|
BlueLinx Holdings, Inc. * |
|
|
| |
|
|
Carpenter Technology Corp. |
|
|
| |
|
|
| |
|
|
Comfort Systems USA, Inc. |
|
|
Construction Partners, Inc., Class A * |
|
|
Core & Main, Inc., Class A * |
|
|
| |
|
|
| |
|
|
Schwab Fundamental Index Funds | Annual Holdings and Financial Statements
15
Schwab Fundamental U.S. Small Company Index Fund
Portfolio Holdings as of October 31, 2025 (continued)
| |
|
|
| |
|
|
| |
|
|
| |
|
|
| |
|
|
| |
|
|
| |
|
|
Enerpac Tool Group Corp., Class A |
|
|
| |
|
|
| |
|
|
| |
|
|
| |
|
|
Everus Construction Group, Inc. * |
|
|
| |
|
|
| |
|
|
Franklin Electric Co., Inc. |
|
|
| |
|
|
Gates Industrial Corp. PLC * |
|
|
| |
|
|
Gibraltar Industries, Inc. * |
|
|
GrafTech International Ltd. * |
|
|
Granite Construction, Inc. |
|
|
| |
|
|
| |
|
|
| |
|
|
| |
|
|
Helios Technologies, Inc. |
|
|
| |
|
|
| |
|
|
| |
|
|
Hillman Solutions Corp. * |
|
|
| |
|
|
Janus International Group, Inc. * |
|
|
| |
|
|
| |
|
|
| |
|
|
| |
|
|
Kratos Defense & Security Solutions, Inc. * |
|
|
Lennox International, Inc. |
|
|
| |
|
|
| |
|
|
| |
|
|
| |
|
|
| |
|
|
| |
|
|
| |
|
|
| |
|
|
| |
|
|
MSC Industrial Direct Co., Inc., Class A |
|
|
Mueller Water Products, Inc., Class A |
|
|
| |
|
|
NEXTracker, Inc., Class A * |
|
|
NPK International, Inc. * |
|
|
| |
|
|
| |
|
|
Quanex Building Products Corp. |
|
|
| |
|
|
| |
|
|
Simpson Manufacturing Co., Inc. |
|
|
SiteOne Landscape Supply, Inc. * |
|
|
Spirit AeroSystems Holdings, Inc., Class A * |
|
|
| |
|
|
Standex International Corp. |
|
|
Sterling Infrastructure, Inc. * |
|
|
| |
|
|
| |
|
|
| |
|
|
| |
|
|
Titan International, Inc. * |
|
|
| |
|
|
| |
|
|
| |
|
|
| |
|
|
| |
|
|
| |
|
|
Vertiv Holdings Co., Class A |
|
|
| |
|
|
| |
|
|
Watts Water Technologies, Inc., Class A |
|
|
| |
|
|
| |
|
|
Worthington Enterprises, Inc. |
|
|
Zurn Elkay Water Solutions Corp. |
|
|
| |
|
|
| |
Commercial & Professional Services 4.7% |
| |
|
|
| |
|
|
| |
|
|
Barrett Business Services, Inc. |
|
|
| |
|
|
BrightView Holdings, Inc. * |
|
|
| |
|
|
Casella Waste Systems, Inc., Class A * |
|
|
| |
|
|
| |
|
|
| |
|
|
| |
|
|
| |
|
|
| |
|
|
CSG Systems International, Inc. |
|
|
| |
|
|
| |
|
|
| |
|
|
| |
|
|
ExlService Holdings, Inc. * |
|
|
| |
|
|
| |
|
|
| |
|
|
Healthcare Services Group, Inc. * |
|
|
Heidrick & Struggles International, Inc. |
|
|
| |
|
|
Huron Consulting Group, Inc. * |
|
|
| |
|
|
| |
|
|
| |
|
|
Kelly Services, Inc., Class A |
|
|
| |
|
|
| |
|
|
| |
|
|
| |
|
|
| |
|
|
| |
|
|
| |
|
|
| |
|
|
| |
|
|
Resources Connection, Inc. |
|
|
| |
|
|
| |
|
|
| |
|
|
| |
|
|
| |
|
|
| |
|
|
UL Solutions, Inc., Class A |
|
|
| |
|
|
16
Schwab Fundamental Index Funds | Annual Holdings and Financial Statements
Schwab Fundamental U.S. Small Company Index Fund
Portfolio Holdings as of October 31, 2025 (continued)
| |
|
|
| |
|
|
Verra Mobility Corp., Class A * |
|
|
| |
|
|
| |
|
|
| |
Consumer Discretionary Distribution & Retail 4.3% |
1-800-Flowers.com, Inc., Class A *(b) |
|
|
Abercrombie & Fitch Co., Class A * |
|
|
A-Mark Precious Metals, Inc. |
|
|
American Eagle Outfitters, Inc. |
|
|
America's Car-Mart, Inc. * |
|
|
| |
|
|
Boot Barn Holdings, Inc. * |
|
|
| |
|
|
| |
|
|
Camping World Holdings, Inc., Class A |
|
|
| |
|
|
Designer Brands, Inc., Class A (b) |
|
|
| |
|
|
| |
|
|
| |
|
|
Floor & Decor Holdings, Inc., Class A * |
|
|
GameStop Corp., Class A * |
|
|
| |
|
|
| |
|
|
Haverty Furniture Cos., Inc. |
|
|
| |
|
|
| |
|
|
National Vision Holdings, Inc. * |
|
|
Ollie's Bargain Outlet Holdings, Inc. * |
|
|
OneWater Marine, Inc., Class A * |
|
|
Petco Health & Wellness Co., Inc., Class A * |
|
|
| |
|
|
Sally Beauty Holdings, Inc. * |
|
|
| |
|
|
| |
|
|
| |
|
|
Sonic Automotive, Inc., Class A |
|
|
Stitch Fix, Inc., Class A * |
|
|
| |
|
|
| |
|
|
| |
|
|
Victoria's Secret & Co. * |
|
|
| |
|
|
| |
|
|
| |
|
|
| |
Consumer Durables & Apparel 3.2% |
| |
|
|
| |
|
|
| |
|
|
Century Communities, Inc. |
|
|
| |
|
|
| |
|
|
| |
|
|
Ethan Allen Interiors, Inc. |
|
|
G-III Apparel Group Ltd. * |
|
|
| |
|
|
Green Brick Partners, Inc. * |
|
|
| |
|
|
| |
|
|
Hovnanian Enterprises, Inc., Class A * |
|
|
Installed Building Products, Inc. |
|
|
| |
|
|
| |
|
|
| |
|
|
| |
|
|
Levi Strauss & Co., Class A |
|
|
| |
|
|
| |
|
|
Malibu Boats, Inc., Class A * |
|
|
MasterCraft Boat Holdings, Inc. * |
|
|
| |
|
|
| |
|
|
| |
|
|
Peloton Interactive, Inc., Class A * |
|
|
| |
|
|
Smith & Wesson Brands, Inc. |
|
|
| |
|
|
| |
|
|
| |
|
|
| |
|
|
Topgolf Callaway Brands Corp. * |
|
|
Under Armour, Inc., Class A * |
|
|
Wolverine World Wide, Inc. |
|
|
| |
|
|
| |
|
|
| |
| |
| |
|
|
Adtalem Global Education, Inc. * |
|
|
| |
|
|
| |
|
|
| |
|
|
| |
|
|
Bright Horizons Family Solutions, Inc. * |
|
|
| |
|
|
Brinker International, Inc. * |
|
|
| |
|
|
| |
|
|
Choice Hotels International, Inc. |
|
|
| |
|
|
Cracker Barrel Old Country Store, Inc. (b) |
|
|
Dave & Buster's Entertainment, Inc. * |
|
|
| |
|
|
DoorDash, Inc., Class A * |
|
|
| |
|
|
Golden Entertainment, Inc. |
|
|
Graham Holdings Co., Class B |
|
|
Grand Canyon Education, Inc. * |
|
|
| |
|
|
Hilton Grand Vacations, Inc. * |
|
|
Hyatt Hotels Corp., Class A |
|
|
| |
|
|
Laureate Education, Inc. * |
|
|
| |
|
|
Matthews International Corp., Class A |
|
|
Papa John's International, Inc. |
|
|
| |
|
|
Planet Fitness, Inc., Class A * |
|
|
Red Rock Resorts, Inc., Class A |
|
|
Royal Caribbean Cruises Ltd. |
|
|
| |
|
|
Six Flags Entertainment Corp. * |
|
|
Strategic Education, Inc. |
|
|
| |
|
|
Texas Roadhouse, Inc., Class A |
|
|
| |
|
|
United Parks & Resorts, Inc. * |
|
|
| |
|
|
| |
|
|
Wyndham Hotels & Resorts, Inc. |
|
|
Schwab Fundamental Index Funds | Annual Holdings and Financial Statements
17
Schwab Fundamental U.S. Small Company Index Fund
Portfolio Holdings as of October 31, 2025 (continued)
| |
|
|
| |
|
|
| |
|
|
| |
Consumer Staples Distribution & Retail 0.9% |
| |
|
|
| |
|
|
Grocery Outlet Holding Corp. * |
|
|
Ingles Markets, Inc., Class A |
|
|
| |
|
|
| |
|
|
Village Super Market, Inc., Class A |
|
|
| |
|
|
| |
|
|
| |
| |
| |
|
|
| |
|
|
| |
|
|
| |
|
|
| |
|
|
California Resources Corp. |
|
|
| |
|
|
| |
|
|
| |
|
|
Comstock Resources, Inc. * |
|
|
| |
|
|
Core Natural Resources, Inc. |
|
|
Crescent Energy Co., Class A |
|
|
| |
|
|
Delek U.S. Holdings, Inc. |
|
|
| |
|
|
| |
|
|
Expro Group Holdings NV * |
|
|
| |
|
|
| |
|
|
Helix Energy Solutions Group, Inc. * |
|
|
| |
|
|
International Seaways, Inc. |
|
|
Kodiak Gas Services, Inc. |
|
|
| |
|
|
Liberty Energy, Inc., Class A |
|
|
Magnolia Oil & Gas Corp., Class A |
|
|
| |
|
|
| |
|
|
New Fortress Energy, Inc. *(b) |
|
|
| |
|
|
| |
|
|
Oceaneering International, Inc. * |
|
|
Oil States International, Inc. * |
|
|
Par Pacific Holdings, Inc. * |
|
|
Patterson-UTI Energy, Inc. |
|
|
Permian Resources Corp., Class A |
|
|
| |
|
|
| |
|
|
REX American Resources Corp. * |
|
|
| |
|
|
Select Water Solutions, Inc. |
|
|
| |
|
|
| |
|
|
| |
|
|
| |
|
|
| |
|
|
| |
|
|
| |
|
|
| |
|
|
| |
|
|
| |
|
|
Weatherford International PLC |
|
|
| |
|
|
| |
Equity Real Estate Investment Trusts (REITs) 7.4% |
| |
|
|
| |
|
|
Alexander & Baldwin, Inc. |
|
|
American Assets Trust, Inc. |
|
|
American Healthcare REIT, Inc. |
|
|
American Homes 4 Rent, Class A |
|
|
Americold Realty Trust, Inc. |
|
|
Apple Hospitality REIT, Inc. |
|
|
| |
|
|
Brixmor Property Group, Inc. |
|
|
Broadstone Net Lease, Inc. |
|
|
| |
|
|
| |
|
|
| |
|
|
| |
|
|
| |
|
|
DiamondRock Hospitality Co. |
|
|
Diversified Healthcare Trust |
|
|
| |
|
|
Easterly Government Properties, Inc. |
|
|
EastGroup Properties, Inc. |
|
|
| |
|
|
Empire State Realty Trust, Inc., Class A |
|
|
| |
|
|
Equity LifeStyle Properties, Inc. |
|
|
Essential Properties Realty Trust, Inc. |
|
|
Federal Realty Investment Trust |
|
|
First Industrial Realty Trust, Inc. |
|
|
Four Corners Property Trust, Inc. |
|
|
| |
|
|
Healthcare Realty Trust, Inc., Class A |
|
|
Highwoods Properties, Inc. |
|
|
Hudson Pacific Properties, Inc. * |
|
|
Independence Realty Trust, Inc. |
|
|
Innovative Industrial Properties, Inc. |
|
|
InvenTrust Properties Corp. |
|
|
| |
|
|
| |
|
|
| |
|
|
| |
|
|
| |
|
|
| |
|
|
| |
|
|
Medical Properties Trust, Inc. (b) |
|
|
National Health Investors, Inc. |
|
|
National Storage Affiliates Trust |
|
|
| |
|
|
Omega Healthcare Investors, Inc. |
|
|
| |
|
|
| |
|
|
Park Hotels & Resorts, Inc. |
|
|
| |
|
|
| |
|
|
Phillips Edison & Co., Inc. |
|
|
Piedmont Realty Trust, Inc., Class A |
|
|
| |
|
|
| |
|
|
Rexford Industrial Realty, Inc. |
|
|
| |
|
|
Ryman Hospitality Properties, Inc. |
|
|
Sabra Health Care REIT, Inc. |
|
|
Service Properties Trust (a) |
|
|
| |
|
|
18
Schwab Fundamental Index Funds | Annual Holdings and Financial Statements
Schwab Fundamental U.S. Small Company Index Fund
Portfolio Holdings as of October 31, 2025 (continued)
| |
|
|
| |
|
|
| |
|
|
| |
|
|
Summit Hotel Properties, Inc. |
|
|
Sunstone Hotel Investors, Inc. |
|
|
| |
|
|
| |
|
|
| |
|
|
| |
|
|
Xenia Hotels & Resorts, Inc. |
|
|
| |
|
|
| |
| |
Acadian Asset Management, Inc. |
|
|
| |
|
|
| |
|
|
Apollo Commercial Real Estate Finance, Inc. |
|
|
Apollo Global Management, Inc. |
|
|
Arbor Realty Trust, Inc. (b) |
|
|
ARES Management Corp., Class A |
|
|
Artisan Partners Asset Management, Inc., Class A |
|
|
B Riley Financial, Inc. *(b) |
|
|
| |
|
|
Blackstone Mortgage Trust, Inc., Class A |
|
|
BrightSpire Capital, Inc., Class A |
|
|
| |
|
|
Claros Mortgage Trust, Inc. * |
|
|
| |
|
|
Coinbase Global, Inc., Class A * |
|
|
Credit Acceptance Corp. * |
|
|
DigitalBridge Group, Inc. |
|
|
Donnelley Financial Solutions, Inc. * |
|
|
| |
|
|
Encore Capital Group, Inc. * |
|
|
Enova International, Inc. * |
|
|
| |
|
|
Euronet Worldwide, Inc. * |
|
|
| |
|
|
FactSet Research Systems, Inc. |
|
|
Federal Agricultural Mortgage Corp., Class C |
|
|
| |
|
|
| |
|
|
Franklin BSP Realty Trust, Inc. |
|
|
Green Dot Corp., Class A * |
|
|
Hamilton Lane, Inc., Class A |
|
|
Houlihan Lokey, Inc., Class A |
|
|
Interactive Brokers Group, Inc., Class A |
|
|
Janus Henderson Group PLC |
|
|
KKR Real Estate Finance Trust, Inc. |
|
|
Ladder Capital Corp., Class A |
|
|
| |
|
|
loanDepot, Inc., Class A * |
|
|
MarketAxess Holdings, Inc. |
|
|
| |
|
|
| |
|
|
| |
|
|
| |
|
|
| |
|
|
| |
|
|
NMI Holdings, Inc., Class A * |
|
|
Oppenheimer Holdings, Inc., Class A |
|
|
| |
|
|
PennyMac Financial Services, Inc. |
|
|
PennyMac Mortgage Investment Trust |
|
|
| |
|
|
| |
|
|
PJT Partners, Inc., Class A |
|
|
| |
|
|
| |
|
|
| |
|
|
| |
|
|
| |
|
|
Regional Management Corp. |
|
|
Rocket Cos., Inc., Class A |
|
|
Shift4 Payments, Inc., Class A * |
|
|
| |
|
|
| |
|
|
TPG RE Finance Trust, Inc. |
|
|
| |
|
|
Tradeweb Markets, Inc., Class A |
|
|
Two Harbors Investment Corp. |
|
|
Victory Capital Holdings, Inc., Class A |
|
|
Virtu Financial, Inc., Class A |
|
|
Virtus Investment Partners, Inc. |
|
|
| |
|
|
| |
|
|
| |
|
|
| |
|
|
| |
Food, Beverage & Tobacco 1.7% |
| |
|
|
Boston Beer Co., Inc., Class A * |
|
|
| |
|
|
| |
|
|
Coca-Cola Consolidated, Inc. |
|
|
Fresh Del Monte Produce, Inc. |
|
|
Hain Celestial Group, Inc. * |
|
|
| |
|
|
John B Sanfilippo & Son, Inc. |
|
|
| |
|
|
| |
|
|
| |
|
|
| |
|
|
| |
|
|
Seneca Foods Corp., Class A * |
|
|
| |
|
|
| |
|
|
| |
|
|
| |
|
|
| |
Health Care Equipment & Services 4.3% |
Acadia Healthcare Co., Inc. * |
|
|
AdaptHealth Corp., Class A * |
|
|
| |
|
|
| |
|
|
AMN Healthcare Services, Inc. * |
|
|
| |
|
|
| |
|
|
BrightSpring Health Services, Inc. * |
|
|
Brookdale Senior Living, Inc. * |
|
|
| |
|
|
| |
|
|
Clover Health Investments Corp., Class A * |
|
|
Concentra Group Holdings Parent, Inc. |
|
|
| |
|
|
Cross Country Healthcare, Inc. * |
|
|
| |
|
|
| |
|
|
| |
|
|
| |
|
|
Schwab Fundamental Index Funds | Annual Holdings and Financial Statements
19
Schwab Fundamental U.S. Small Company Index Fund
Portfolio Holdings as of October 31, 2025 (continued)
| |
|
|
| |
|
|
| |
|
|
Evolent Health, Inc., Class A * |
|
|
| |
|
|
Globus Medical, Inc., Class A * |
|
|
| |
|
|
| |
|
|
| |
|
|
| |
|
|
| |
|
|
Integra LifeSciences Holdings Corp. * |
|
|
Lantheus Holdings, Inc. * |
|
|
| |
|
|
| |
|
|
Merit Medical Systems, Inc. * |
|
|
National HealthCare Corp. |
|
|
| |
|
|
OmniAb, Inc., Class A *(c) |
|
|
OmniAb, Inc., Class B *(c) |
|
|
| |
|
|
Option Care Health, Inc. * |
|
|
| |
|
|
Pediatrix Medical Group, Inc. * |
|
|
| |
|
|
| |
|
|
Privia Health Group, Inc. * |
|
|
| |
|
|
| |
|
|
Select Medical Holdings Corp. |
|
|
| |
|
|
| |
|
|
| |
|
|
Veeva Systems, Inc., Class A * |
|
|
| |
|
|
| |
|
|
| |
Household & Personal Products 1.2% |
| |
|
|
Central Garden & Pet Co. * |
|
|
Central Garden & Pet Co., Class A * |
|
|
| |
|
|
Edgewell Personal Care Co. |
|
|
| |
|
|
| |
|
|
| |
|
|
| |
|
|
| |
|
|
Nu Skin Enterprises, Inc., Class A |
|
|
Reynolds Consumer Products, Inc. |
|
|
Spectrum Brands Holdings, Inc. |
|
|
USANA Health Sciences, Inc. * |
|
|
| |
|
|
| |
|
|
| |
| |
| |
|
|
Brighthouse Financial, Inc. * |
|
|
| |
|
|
| |
|
|
Erie Indemnity Co., Class A |
|
|
Hanover Insurance Group, Inc. |
|
|
Horace Mann Educators Corp. |
|
|
| |
|
|
Kinsale Capital Group, Inc. |
|
|
| |
|
|
| |
|
|
| |
|
|
| |
|
|
Safety Insurance Group, Inc. |
|
|
Selective Insurance Group, Inc. |
|
|
Stewart Information Services Corp. |
|
|
White Mountains Insurance Group Ltd. |
|
|
| |
|
|
| |
| |
| |
|
|
Alpha Metallurgical Resources, Inc. * |
|
|
Ardagh Metal Packaging SA |
|
|
| |
|
|
| |
|
|
| |
|
|
| |
|
|
| |
|
|
| |
|
|
Compass Minerals International, Inc. * |
|
|
| |
|
|
| |
|
|
| |
|
|
| |
|
|
| |
|
|
| |
|
|
| |
|
|
| |
|
|
| |
|
|
| |
|
|
| |
|
|
| |
|
|
| |
|
|
| |
|
|
| |
|
|
| |
|
|
| |
|
|
Minerals Technologies, Inc. |
|
|
| |
|
|
| |
|
|
| |
|
|
| |
|
|
| |
|
|
Perimeter Solutions, Inc. * |
|
|
| |
|
|
Rayonier Advanced Materials, Inc. * |
|
|
| |
|
|
| |
|
|
| |
|
|
Sensient Technologies Corp. |
|
|
| |
|
|
| |
|
|
| |
|
|
| |
|
|
| |
|
|
| |
|
|
| |
|
|
| |
|
|
| |
|
|
| |
|
|
| |
|
|
| |
|
|
| |
Media & Entertainment 3.5% |
Advantage Solutions, Inc. * |
|
|
AMC Entertainment Holdings, Inc., Class A * |
|
|
AMC Networks, Inc., Class A * |
|
|
20
Schwab Fundamental Index Funds | Annual Holdings and Financial Statements
Schwab Fundamental U.S. Small Company Index Fund
Portfolio Holdings as of October 31, 2025 (continued)
| |
|
|
| |
|
|
| |
|
|
| |
|
|
| |
|
|
| |
|
|
Clear Channel Outdoor Holdings, Inc. * |
|
|
EchoStar Corp., Class A * |
|
|
EW Scripps Co., Class A *(a) |
|
|
| |
|
|
| |
|
|
| |
|
|
iHeartMedia, Inc., Class A * |
|
|
John Wiley & Sons, Inc., Class A |
|
|
Liberty Broadband Corp., Class C * |
|
|
Liberty Media Corp.-Liberty Formula One, Class C * |
|
|
Lionsgate Studios Corp. * |
|
|
Live Nation Entertainment, Inc. * |
|
|
| |
|
|
New York Times Co., Class A |
|
|
Pinterest, Inc., Class A * |
|
|
| |
|
|
| |
|
|
| |
|
|
| |
|
|
| |
|
|
| |
|
|
| |
|
|
Trade Desk, Inc., Class A * |
|
|
| |
|
|
Warner Music Group Corp., Class A |
|
|
| |
|
|
| |
|
|
| |
|
|
ZoomInfo Technologies, Inc., Class A * |
|
|
| |
|
|
| |
Pharmaceuticals, Biotechnology & Life Sciences 3.0% |
Amneal Pharmaceuticals, Inc. * |
|
|
| |
|
|
BioMarin Pharmaceutical, Inc. * |
|
|
Bio-Rad Laboratories, Inc., Class A * |
|
|
| |
|
|
| |
|
|
Charles River Laboratories International, Inc. * |
|
|
Collegium Pharmaceutical, Inc. * |
|
|
Corcept Therapeutics, Inc. * |
|
|
Elanco Animal Health, Inc. * |
|
|
Emergent BioSolutions, Inc. * |
|
|
| |
|
|
| |
|
|
| |
|
|
Halozyme Therapeutics, Inc. * |
|
|
| |
|
|
| |
|
|
Ironwood Pharmaceuticals, Inc., Class A * |
|
|
Jazz Pharmaceuticals PLC * |
|
|
| |
|
|
| |
|
|
Neurocrine Biosciences, Inc. * |
|
|
Pacira BioSciences, Inc. * |
|
|
Prestige Consumer Healthcare, Inc. * |
|
|
| |
|
|
Royalty Pharma PLC, Class A |
|
|
| |
|
|
| |
|
|
Supernus Pharmaceuticals, Inc. * |
|
|
United Therapeutics Corp. * |
|
|
Vir Biotechnology, Inc. * |
|
|
| |
|
|
| |
Real Estate Management & Development 1.9% |
Anywhere Real Estate, Inc. * |
|
|
| |
|
|
| |
|
|
Cushman & Wakefield PLC * |
|
|
| |
|
|
Howard Hughes Holdings, Inc. * |
|
|
Kennedy-Wilson Holdings, Inc. |
|
|
| |
|
|
Newmark Group, Inc., Class A |
|
|
Opendoor Technologies, Inc. * |
|
|
Zillow Group, Inc., Class C * |
|
|
| |
|
|
| |
Semiconductors & Semiconductor Equipment 3.2% |
Allegro MicroSystems, Inc. * |
|
|
Alpha & Omega Semiconductor Ltd. * |
|
|
| |
|
|
Axcelis Technologies, Inc. * |
|
|
| |
|
|
| |
|
|
| |
|
|
| |
|
|
| |
|
|
| |
|
|
| |
|
|
| |
|
|
| |
|
|
Lattice Semiconductor Corp. * |
|
|
MACOM Technology Solutions Holdings, Inc. * |
|
|
| |
|
|
| |
|
|
Monolithic Power Systems, Inc. |
|
|
| |
|
|
Penguin Solutions, Inc. * |
|
|
| |
|
|
| |
|
|
| |
|
|
| |
|
|
Silicon Laboratories, Inc. * |
|
|
| |
|
|
Ultra Clean Holdings, Inc. * |
|
|
| |
|
|
| |
|
|
| |
| |
| |
|
|
Alarm.com Holdings, Inc. * |
|
|
AppLovin Corp., Class A * |
|
|
Bentley Systems, Inc., Class B |
|
|
| |
|
|
CCC Intelligent Solutions Holdings, Inc. * |
|
|
Commvault Systems, Inc. * |
|
|
Consensus Cloud Solutions, Inc. * |
|
|
Crowdstrike Holdings, Inc., Class A * |
|
|
| |
|
|
DigitalOcean Holdings, Inc. * |
|
|
Docusign, Inc., Class A * |
|
|
Dolby Laboratories, Inc., Class A |
|
|
Schwab Fundamental Index Funds | Annual Holdings and Financial Statements
21
Schwab Fundamental U.S. Small Company Index Fund
Portfolio Holdings as of October 31, 2025 (continued)
| |
|
|
| |
|
|
| |
|
|
| |
|
|
| |
|
|
Guidewire Software, Inc. * |
|
|
| |
|
|
| |
|
|
LiveRamp Holdings, Inc. * |
|
|
Manhattan Associates, Inc. * |
|
|
| |
|
|
| |
|
|
Palantir Technologies, Inc., Class A * |
|
|
Progress Software Corp. * |
|
|
| |
|
|
| |
|
|
RingCentral, Inc., Class A * |
|
|
| |
|
|
Snowflake, Inc., Class A * |
|
|
| |
|
|
| |
|
|
| |
|
|
Tyler Technologies, Inc. * |
|
|
| |
|
|
| |
|
|
| |
|
|
| |
|
|
| |
|
|
Zoom Communications, Inc. * |
|
|
| |
|
|
| |
Technology Hardware & Equipment 5.3% |
Advanced Energy Industries, Inc. |
|
|
| |
|
|
| |
|
|
Benchmark Electronics, Inc. |
|
|
| |
|
|
| |
|
|
| |
|
|
CommScope Holding Co., Inc. * |
|
|
| |
|
|
| |
|
|
| |
|
|
Ingram Micro Holding Corp. |
|
|
| |
|
|
| |
|
|
Kimball Electronics, Inc. * |
|
|
| |
|
|
| |
|
|
Lumentum Holdings, Inc. * |
|
|
Methode Electronics, Inc. |
|
|
| |
|
|
| |
|
|
| |
|
|
| |
|
|
| |
|
|
| |
|
|
Pure Storage, Inc., Class A * |
|
|
| |
|
|
| |
|
|
Super Micro Computer, Inc. * |
|
|
| |
|
|
| |
|
|
| |
|
|
Vishay Intertechnology, Inc. |
|
|
| |
|
|
| |
|
|
| |
| |
|
|
Telecommunication Services 0.5% |
Array Digital Infrastructure, Inc. |
|
|
Cogent Communications Holdings, Inc. |
|
|
| |
|
|
GCI Liberty, Inc., Class C * |
|
|
| |
|
|
| |
|
|
Iridium Communications, Inc. |
|
|
Liberty Latin America Ltd., Class C * |
|
|
Shenandoah Telecommunications Co. |
|
|
| |
|
|
| |
|
|
| |
| |
| |
|
|
American Airlines Group, Inc. * |
|
|
| |
|
|
Covenant Logistics Group, Inc., Class A |
|
|
| |
|
|
Genco Shipping & Trading Ltd. |
|
|
Global Ship Lease, Inc., Class A |
|
|
| |
|
|
| |
|
|
| |
|
|
| |
|
|
| |
|
|
| |
|
|
| |
|
|
Schneider National, Inc., Class B |
|
|
| |
|
|
| |
|
|
Sun Country Airlines Holdings, Inc. * |
|
|
United Airlines Holdings, Inc. * |
|
|
| |
|
|
| |
|
|
| |
|
|
| |
| |
| |
|
|
American States Water Co. |
|
|
| |
|
|
| |
|
|
California Water Service Group |
|
|
Chesapeake Utilities Corp. |
|
|
Clearway Energy, Inc., Class C |
|
|
Essential Utilities, Inc. |
|
|
| |
|
|
Hawaiian Electric Industries, Inc. * |
|
|
| |
|
|
MDU Resources Group, Inc. |
|
|
| |
|
|
New Jersey Resources Corp. |
|
|
Northwest Natural Holding Co. |
|
|
Northwestern Energy Group, Inc. |
|
|
| |
|
|
| |
|
|
| |
|
|
Southwest Gas Holdings, Inc. |
|
|
| |
|
|
| |
|
|
| |
|
|
22
Schwab Fundamental Index Funds | Annual Holdings and Financial Statements
Schwab Fundamental U.S. Small Company Index Fund
Portfolio Holdings as of October 31, 2025 (continued)
| |
|
|
| |
|
|
| |
|
|
Total Common Stocks
(Cost $1,288,390,384) |
|
| |
|
|
SHORT-TERM INVESTMENTS 0.5% OF NET ASSETS |
| |
| |
State Street Institutional U.S. Government Money Market Fund, Premier Class 4.01% (d) |
|
|
State Street Institutional U.S. Government Money Market Fund, Premier Class 4.01% (d)(e) |
|
|
| |
|
|
Total Short-Term Investments
(Cost $7,585,132) |
|
Total Investments in Securities
(Cost $1,295,975,516) |
|
| |
|
|
CURRENT VALUE/
UNREALIZED
APPRECIATION
($) |
| |
| |
|
|
|
Russell 2000 Index, e-mini, expires 12/19/25 |
|
|
|
| |
Non-income producing security. |
| |
Issuer is an affiliated company, as the investment adviser owns at least 5% of the voting securities of such company. |
| |
All or a portion of this security is on loan. Securities on loan were valued at $4,741,545. |
| |
Fair valued using significant unobservable inputs (see financial note 2(a), Securities for which no quoted value is available, for additional information). |
| |
The rate shown is the annualized 7-day yield. |
| |
Security purchased with cash collateral received for securities on loan. |
| |
Real Estate Investment Trust |
Below is a summary of the fund’s transactions with affiliated issuers and companies which are or were affiliates during the period ended October 31, 2025. An affiliated company is a company in which the investment adviser has or had an ownership of at least 5% of the voting securities of a security issue during the report period. A dash in the Value at October 31, 2024, and/or Value and Balance of Shares Held at October 31, 2025, columns means either the issuer was not held or not held as an affiliate on the stated date.
| |
|
|
|
NET REALIZED GAINS (LOSSES) |
NET CHANGE IN UNREALIZED APPRECIATION (DEPRECIATION) |
|
BALANCE OF SHARES HELD AT 10/31/25 |
|
COMMON STOCKS 0.3% OF NET ASSETS |
| |
Commercial & Professional Services 0.0% |
| |
|
|
|
|
|
|
|
|
| |
| |
Cracker Barrel Old Country Store, Inc. |
|
|
|
|
|
|
|
|
| |
Equity Real Estate Investment Trusts (REITs) 0.1% |
Diversified Healthcare Trust |
|
|
|
|
|
|
|
|
| |
|
|
|
|
|
|
|
|
| |
|
|
|
|
|
|
|
|
| |
Household & Personal Products 0.1% |
| |
|
|
|
|
|
|
|
|
| |
Media & Entertainment 0.1% |
| |
|
|
|
|
|
|
|
|
| |
Pharmaceuticals, Biotechnology & Life Sciences 0.0% |
Emergent BioSolutions, Inc. |
|
|
|
|
|
|
|
|
| |
|
|
|
|
|
|
|
|
Schwab Fundamental Index Funds | Annual Holdings and Financial Statements
23
Schwab Fundamental U.S. Small Company Index Fund
Portfolio Holdings as of October 31, 2025 (continued)
The following is a summary of the inputs used to value the fund’s investments as of October 31, 2025 (see financial note 2(a) for additional information):
| |
QUOTED PRICES IN
ACTIVE MARKETS FOR
IDENTICAL ASSETS
(LEVEL 1) |
OTHER SIGNIFICANT
OBSERVABLE INPUTS
(LEVEL 2) |
SIGNIFICANT
UNOBSERVABLE INPUTS
(LEVEL 3) |
|
| |
|
|
|
|
| |
|
|
|
|
Health Care Equipment & Services |
|
|
|
|
Telecommunication Services |
|
|
|
|
| |
|
|
|
|
| |
|
|
|
|
| |
|
|
|
|
| |
Level 3 amount shown includes securities determined to have no value at October 31, 2025. |
| |
As categorized in the Portfolio Holdings. |
| |
Futures contracts are reported at cumulative unrealized appreciation or depreciation. |
24
Schwab Fundamental Index Funds | Annual Holdings and Financial Statements
Schwab Fundamental U.S. Small Company Index Fund
Statement of Assets and Liabilities
| |
Investments in securities, at value - affiliated issuers (cost $8,895,534) |
|
|
Investments in securities, at value - unaffiliated issuers (cost $1,287,079,982) including securities on loan of $4,741,545 |
|
|
| |
|
|
Deposit with broker for futures contracts |
|
|
| |
|
|
| |
|
|
| |
|
|
Income from securities on loan |
|
|
Variation margin on future contracts |
|
|
| |
|
|
| |
| |
Collateral held for securities on loan |
|
|
| |
|
|
| |
|
|
| |
|
|
| |
|
|
| |
|
|
| |
| |
Capital received from investors |
|
|
Total distributable earnings |
|
|
| |
|
|
Schwab Fundamental Index Funds | Annual Holdings and Financial Statements
25
Schwab Fundamental U.S. Small Company Index Fund
Statement of Operations
For the period November 1, 2024 through October 31, 2025 |
| |
Dividends received from securities - unaffiliated issuers (net of foreign withholding tax of $5,253) |
|
|
Dividends received from securities - affiliated issuers |
|
|
| |
|
|
| |
|
|
| |
|
|
| |
| |
| |
|
|
| |
|
|
| |
|
|
| |
REALIZED AND UNREALIZED GAINS (LOSSES) |
Net realized losses on sales of securities - affiliated issuers |
|
|
Net realized gains on sales of securities - unaffiliated issuers |
|
|
Net realized gains on sales of in-kind redemptions - affiliated issuers |
|
|
Net realized gains on sales of in-kind redemptions - unaffiliated issuers |
|
|
Net realized gains on futures contracts |
|
|
| |
|
|
Net change in unrealized appreciation (depreciation) on securities - affiliated issuers |
|
|
Net change in unrealized appreciation (depreciation) on securities - unaffiliated issuers |
|
|
Net change in unrealized appreciation (depreciation) on futures contracts |
|
|
Net change in unrealized appreciation (depreciation) on foreign currency translations |
|
|
Net change in unrealized appreciation (depreciation) |
|
|
Net realized and unrealized gains |
|
|
Increase in net assets resulting from operations |
|
|
26
Schwab Fundamental Index Funds | Annual Holdings and Financial Statements
Schwab Fundamental U.S. Small Company Index Fund
Statement of Changes in Net Assets
For the current and prior report periods
| |
| |
|
|
| |
|
|
|
| |
|
|
|
Net change in unrealized appreciation (depreciation) |
|
|
|
Increase in net assets resulting from operations |
|
|
|
| |
DISTRIBUTIONS TO SHAREHOLDERS |
| |
|
|
|
TRANSACTIONS IN FUND SHARES |
| |
|
|
| |
|
|
|
|
|
| |
|
|
|
|
|
| |
|
|
|
|
|
| |
|
|
|
|
|
Net transactions in fund shares |
|
|
|
|
|
| |
SHARES OUTSTANDING AND NET ASSETS |
| |
|
|
| |
|
|
|
|
|
| |
|
|
|
|
|
Total increase (decrease) |
|
|
|
|
|
| |
|
|
|
|
|
Schwab Fundamental Index Funds | Annual Holdings and Financial Statements
27
Schwab Fundamental International Equity Index Fund
Financial Statements
| |
|
|
|
|
|
|
| |
Net asset value at beginning of period |
|
|
|
|
|
|
Income (loss) from investment operations: |
|
|
|
|
|
|
Net investment income (loss)1 |
|
|
|
|
|
|
Net realized and unrealized gains (losses) |
|
|
|
|
|
|
Total from investment operations |
|
|
|
|
|
|
| |
|
|
|
|
|
|
Distributions from net investment income |
|
|
|
|
|
|
Net asset value at end of period |
|
|
|
|
|
|
| |
|
|
|
|
|
|
| |
Ratios to average net assets: |
|
|
|
|
|
|
| |
|
|
|
|
|
|
Net investment income (loss) |
|
|
|
|
|
|
| |
|
|
|
|
|
|
Net assets, end of period (x 1,000,000) |
|
|
|
|
|
|
| |
Calculated based on the average shares outstanding during the period. |
| |
Ratio includes less than 0.005% of non-routine proxy expenses. |
28
Schwab Fundamental Index Funds | Annual Holdings and Financial Statements
Schwab Fundamental International Equity Index Fund
Portfolio Holdings as of October 31, 2025
| |
|
|
COMMON STOCKS 97.8% OF NET ASSETS |
| |
| |
| |
|
|
| |
|
|
| |
|
|
| |
|
|
| |
|
|
| |
|
|
| |
|
|
| |
|
|
| |
|
|
| |
|
|
Commonwealth Bank of Australia |
|
|
| |
|
|
| |
|
|
| |
|
|
| |
|
|
| |
|
|
| |
|
|
| |
|
|
Insurance Australia Group Ltd. |
|
|
| |
|
|
| |
|
|
| |
|
|
| |
|
|
| |
|
|
| |
|
|
| |
|
|
National Australia Bank Ltd. |
|
|
Northern Star Resources Ltd. |
|
|
| |
|
|
| |
|
|
| |
|
|
| |
|
|
| |
|
|
| |
|
|
| |
|
|
| |
|
|
| |
|
|
| |
|
|
| |
|
|
| |
|
|
| |
|
|
| |
|
|
Treasury Wine Estates Ltd. |
|
|
| |
|
|
| |
|
|
| |
|
|
| |
|
|
Woodside Energy Group Ltd. |
|
|
| |
|
|
| |
|
|
| |
|
|
| |
| |
| |
|
|
| |
|
|
| |
|
|
| |
|
|
Raiffeisen Bank International AG |
|
|
| |
|
|
| |
|
|
| |
|
|
| |
|
|
| |
| |
| |
|
|
| |
|
|
| |
|
|
| |
|
|
| |
|
|
| |
|
|
| |
|
|
| |
|
|
| |
| |
| |
|
|
Algonquin Power & Utilities Corp. |
|
|
Alimentation Couche-Tard, Inc. |
|
|
| |
|
|
| |
|
|
| |
|
|
| |
|
|
| |
|
|
| |
|
|
| |
|
|
| |
|
|
Bausch Health Cos., Inc. * |
|
|
| |
|
|
| |
|
|
Brookfield Infrastructure Corp., Class A |
|
|
Canadian Imperial Bank of Commerce |
|
|
Canadian National Railway Co. |
|
|
Canadian Natural Resources Ltd. |
|
|
Canadian Pacific Kansas City Ltd. |
|
|
Canadian Tire Corp. Ltd., Class A (a) |
|
|
| |
|
|
CCL Industries, Inc., Class B |
|
|
| |
|
|
| |
|
|
Constellation Software, Inc. |
|
|
| |
|
|
Element Fleet Management Corp. |
|
|
| |
|
|
| |
|
|
| |
|
|
Fairfax Financial Holdings Ltd. |
|
|
Finning International, Inc. |
|
|
First Quantum Minerals Ltd. * |
|
|
| |
|
|
| |
|
|
| |
|
|
| |
|
|
| |
|
|
| |
|
|
| |
|
|
| |
|
|
| |
|
|
| |
|
|
| |
|
|
| |
|
|
| |
|
|
| |
|
|
Magna International, Inc. |
|
|
| |
|
|
| |
|
|
| |
|
|
| |
|
|
Schwab Fundamental Index Funds | Annual Holdings and Financial Statements
29
Schwab Fundamental International Equity Index Fund
Portfolio Holdings as of October 31, 2025 (continued)
| |
|
|
| |
|
|
| |
|
|
| |
|
|
| |
|
|
| |
|
|
| |
|
|
| |
|
|
| |
|
|
Restaurant Brands International, Inc. |
|
|
Rogers Communications, Inc., Class B |
|
|
| |
|
|
| |
|
|
| |
|
|
| |
|
|
| |
|
|
| |
|
|
Teck Resources Ltd., Class B |
|
|
| |
|
|
| |
|
|
| |
|
|
| |
|
|
| |
|
|
| |
|
|
| |
|
|
| |
|
|
West Fraser Timber Co. Ltd. |
|
|
Wheaton Precious Metals Corp. |
|
|
| |
|
|
| |
|
|
| |
|
|
| |
| |
| |
|
|
GCL Technology Holdings Ltd. * |
|
|
| |
|
|
SITC International Holdings Co. Ltd. |
|
|
| |
|
|
| |
| |
AP Moller - Maersk AS, Class A |
|
|
AP Moller - Maersk AS, Class B |
|
|
| |
|
|
| |
|
|
| |
|
|
| |
|
|
| |
|
|
| |
|
|
| |
|
|
Novonesis Novozymes B, Class B |
|
|
| |
|
|
| |
|
|
| |
|
|
| |
|
|
| |
|
|
| |
| |
| |
|
|
| |
|
|
| |
|
|
| |
|
|
| |
|
|
| |
|
|
| |
|
|
| |
|
|
| |
|
|
| |
|
|
| |
|
|
| |
|
|
| |
|
|
| |
|
|
| |
|
|
| |
| |
| |
|
|
| |
|
|
| |
|
|
| |
|
|
| |
|
|
| |
|
|
| |
|
|
| |
|
|
| |
|
|
| |
|
|
| |
|
|
| |
|
|
| |
|
|
Cie Generale des Etablissements Michelin SCA |
|
|
| |
|
|
| |
|
|
| |
|
|
| |
|
|
| |
|
|
| |
|
|
| |
|
|
| |
|
|
| |
|
|
| |
|
|
| |
|
|
| |
|
|
| |
|
|
| |
|
|
| |
|
|
| |
|
|
LVMH Moet Hennessy Louis Vuitton SE |
|
|
| |
|
|
| |
|
|
| |
|
|
| |
|
|
| |
|
|
| |
|
|
| |
|
|
| |
|
|
| |
|
|
| |
|
|
| |
|
|
| |
|
|
| |
|
|
| |
|
|
| |
|
|
| |
|
|
Unibail-Rodamco-Westfield * |
|
|
| |
|
|
| |
|
|
| |
|
|
| |
|
|
| |
|
|
| |
|
|
| |
| |
| |
|
|
| |
|
|
30
Schwab Fundamental Index Funds | Annual Holdings and Financial Statements
Schwab Fundamental International Equity Index Fund
Portfolio Holdings as of October 31, 2025 (continued)
| |
|
|
| |
|
|
| |
|
|
| |
|
|
| |
|
|
Bayerische Motoren Werke AG |
|
|
| |
|
|
| |
|
|
| |
|
|
| |
|
|
| |
|
|
| |
|
|
| |
|
|
| |
|
|
| |
|
|
| |
|
|
| |
|
|
| |
|
|
| |
|
|
| |
|
|
Fresenius Medical Care AG |
|
|
| |
|
|
| |
|
|
| |
|
|
| |
|
|
| |
|
|
| |
|
|
| |
|
|
| |
|
|
| |
|
|
| |
|
|
| |
|
|
| |
|
|
| |
|
|
| |
|
|
Muenchener Rueckversicherungs-Gesellschaft AG in Muenchen |
|
|
| |
|
|
| |
|
|
| |
|
|
| |
|
|
| |
|
|
| |
|
|
| |
|
|
| |
|
|
| |
|
|
| |
|
|
| |
|
|
| |
|
|
| |
|
|
| |
|
|
| |
|
|
| |
| |
| |
|
|
| |
|
|
| |
|
|
Galaxy Entertainment Group Ltd. |
|
|
| |
|
|
| |
|
|
Hong Kong & China Gas Co. Ltd. |
|
|
Hong Kong Exchanges & Clearing Ltd. |
|
|
| |
|
|
| |
|
|
New World Development Co. Ltd. * |
|
|
Pacific Basin Shipping Ltd. |
|
|
Sun Hung Kai Properties Ltd. |
|
|
| |
|
|
Swire Pacific Ltd., A Shares |
|
|
Swire Pacific Ltd., B Shares |
|
|
Techtronic Industries Co. Ltd. |
|
|
| |
|
|
Wharf Real Estate Investment Co. Ltd. |
|
|
Yue Yuen Industrial Holdings Ltd. |
|
|
| |
|
|
| |
| |
Jardine Matheson Holdings Ltd. |
|
|
| |
| |
| |
|
|
| |
|
|
Bank of Ireland Group PLC |
|
|
| |
|
|
Flutter Entertainment PLC * |
|
|
| |
|
|
| |
|
|
James Hardie Industries PLC, CDI * |
|
|
| |
|
|
| |
|
|
| |
|
|
| |
|
|
| |
|
|
| |
|
|
| |
|
|
| |
|
|
| |
|
|
| |
| |
| |
|
|
| |
| |
| |
|
|
| |
|
|
Check Point Software Technologies Ltd. * |
|
|
| |
|
|
Israel Discount Bank Ltd., A Shares |
|
|
Mizrahi Tefahot Bank Ltd. |
|
|
| |
|
|
Teva Pharmaceutical Industries Ltd., ADR * |
|
|
ZIM Integrated Shipping Services Ltd. (a) |
|
|
| |
|
|
| |
| |
| |
|
|
| |
|
|
| |
|
|
| |
|
|
| |
|
|
| |
|
|
| |
|
|
| |
|
|
| |
|
|
| |
|
|
| |
|
|
| |
|
|
| |
|
|
| |
|
|
Terna - Rete Elettrica Nazionale |
|
|
| |
|
|
Schwab Fundamental Index Funds | Annual Holdings and Financial Statements
31
Schwab Fundamental International Equity Index Fund
Portfolio Holdings as of October 31, 2025 (continued)
| |
|
|
| |
|
|
| |
|
|
| |
| |
| |
|
|
| |
|
|
| |
|
|
| |
|
|
| |
|
|
| |
|
|
| |
|
|
| |
|
|
| |
|
|
| |
|
|
Asahi Group Holdings Ltd. |
|
|
| |
|
|
| |
|
|
Bandai Namco Holdings, Inc. |
|
|
| |
|
|
| |
|
|
| |
|
|
Central Japan Railway Co. |
|
|
Chubu Electric Power Co., Inc. |
|
|
Chugai Pharmaceutical Co. Ltd. |
|
|
Chugoku Electric Power Co., Inc. |
|
|
Coca-Cola Bottlers Japan Holdings, Inc. |
|
|
| |
|
|
Cosmo Energy Holdings Co. Ltd. |
|
|
Dai Nippon Printing Co. Ltd. |
|
|
| |
|
|
Dai-ichi Life Holdings, Inc. |
|
|
| |
|
|
| |
|
|
Daito Trust Construction Co. Ltd. |
|
|
Daiwa House Industry Co. Ltd. |
|
|
Daiwa Securities Group, Inc. |
|
|
Daiwabo Holdings Co. Ltd. |
|
|
| |
|
|
| |
|
|
| |
|
|
| |
|
|
| |
|
|
| |
|
|
| |
|
|
| |
|
|
| |
|
|
Electric Power Development Co. Ltd. |
|
|
| |
|
|
| |
|
|
| |
|
|
| |
|
|
| |
|
|
Fuji Media Holdings, Inc. |
|
|
| |
|
|
| |
|
|
| |
|
|
Furukawa Electric Co. Ltd. |
|
|
Hakuhodo DY Holdings, Inc. |
|
|
Hankyu Hanshin Holdings, Inc. |
|
|
| |
|
|
| |
|
|
| |
|
|
Hitachi Construction Machinery Co. Ltd. |
|
|
| |
|
|
| |
|
|
| |
|
|
| |
|
|
| |
|
|
| |
|
|
| |
|
|
Iida Group Holdings Co. Ltd. |
|
|
| |
|
|
Isetan Mitsukoshi Holdings Ltd. |
|
|
| |
|
|
| |
|
|
| |
|
|
| |
|
|
| |
|
|
Japan Post Holdings Co. Ltd. |
|
|
Japan Post Insurance Co. Ltd. |
|
|
| |
|
|
| |
|
|
| |
|
|
| |
|
|
| |
|
|
Kansai Electric Power Co., Inc. |
|
|
| |
|
|
| |
|
|
Kawasaki Heavy Industries Ltd. |
|
|
Kawasaki Kisen Kaisha Ltd. |
|
|
| |
|
|
| |
|
|
| |
|
|
| |
|
|
Kintetsu Group Holdings Co. Ltd. |
|
|
| |
|
|
| |
|
|
Koito Manufacturing Co. Ltd. |
|
|
| |
|
|
| |
|
|
| |
|
|
| |
|
|
| |
|
|
| |
|
|
Kyushu Electric Power Co., Inc. |
|
|
| |
|
|
| |
|
|
| |
|
|
| |
|
|
| |
|
|
| |
|
|
| |
|
|
| |
|
|
| |
|
|
| |
|
|
Mitsubishi Chemical Group Corp. |
|
|
| |
|
|
Mitsubishi Electric Corp. |
|
|
Mitsubishi Estate Co. Ltd. |
|
|
Mitsubishi Gas Chemical Co., Inc. |
|
|
Mitsubishi HC Capital, Inc. |
|
|
Mitsubishi Heavy Industries Ltd. |
|
|
Mitsubishi Materials Corp. |
|
|
| |
|
|
Mitsubishi UFJ Financial Group, Inc. |
|
|
| |
|
|
| |
|
|
| |
|
|
| |
|
|
| |
|
|
Mizuho Financial Group, Inc. |
|
|
MS&AD Insurance Group Holdings, Inc. |
|
|
Murata Manufacturing Co. Ltd. |
|
|
| |
|
|
| |
|
|
| |
|
|
32
Schwab Fundamental Index Funds | Annual Holdings and Financial Statements
Schwab Fundamental International Equity Index Fund
Portfolio Holdings as of October 31, 2025 (continued)
| |
|
|
| |
|
|
| |
|
|
| |
|
|
| |
|
|
| |
|
|
| |
|
|
| |
|
|
Nippon Express Holdings, Inc. |
|
|
Nippon Paper Industries Co. Ltd. |
|
|
Nippon Sanso Holdings Corp. |
|
|
| |
|
|
| |
|
|
| |
|
|
Nisshin Seifun Group, Inc. |
|
|
Nissin Foods Holdings Co. Ltd. |
|
|
| |
|
|
| |
|
|
| |
|
|
| |
|
|
| |
|
|
Nomura Research Institute Ltd. |
|
|
| |
|
|
| |
|
|
| |
|
|
| |
|
|
| |
|
|
| |
|
|
Ono Pharmaceutical Co. Ltd. |
|
|
| |
|
|
| |
|
|
| |
|
|
| |
|
|
Pan Pacific International Holdings Corp. |
|
|
| |
|
|
| |
|
|
Recruit Holdings Co. Ltd. |
|
|
Renesas Electronics Corp. |
|
|
| |
|
|
| |
|
|
| |
|
|
| |
|
|
| |
|
|
| |
|
|
| |
|
|
| |
|
|
| |
|
|
| |
|
|
| |
|
|
| |
|
|
Sekisui Chemical Co. Ltd. |
|
|
| |
|
|
Seven & i Holdings Co. Ltd. |
|
|
| |
|
|
| |
|
|
| |
|
|
| |
|
|
| |
|
|
| |
|
|
Shin-Etsu Chemical Co. Ltd. |
|
|
| |
|
|
| |
|
|
| |
|
|
| |
|
|
| |
|
|
| |
|
|
| |
|
|
Sony Financial Group, Inc. * |
|
|
| |
|
|
| |
|
|
Stanley Electric Co. Ltd. |
|
|
| |
|
|
| |
|
|
Sumitomo Chemical Co. Ltd. |
|
|
| |
|
|
Sumitomo Electric Industries Ltd. |
|
|
Sumitomo Forestry Co. Ltd. |
|
|
Sumitomo Heavy Industries Ltd. |
|
|
Sumitomo Metal Mining Co. Ltd. |
|
|
Sumitomo Mitsui Financial Group, Inc. |
|
|
Sumitomo Mitsui Trust Group, Inc. |
|
|
Sumitomo Realty & Development Co. Ltd. |
|
|
Sumitomo Rubber Industries Ltd. |
|
|
Suntory Beverage & Food Ltd. |
|
|
| |
|
|
| |
|
|
| |
|
|
| |
|
|
| |
|
|
| |
|
|
| |
|
|
Takeda Pharmaceutical Co. Ltd. |
|
|
| |
|
|
| |
|
|
| |
|
|
| |
|
|
| |
|
|
| |
|
|
Tohoku Electric Power Co., Inc. |
|
|
Tokio Marine Holdings, Inc. |
|
|
Tokyo Electric Power Co. Holdings, Inc. * |
|
|
| |
|
|
| |
|
|
| |
|
|
Tokyu Fudosan Holdings Corp. |
|
|
| |
|
|
| |
|
|
| |
|
|
| |
|
|
Toyo Seikan Group Holdings Ltd. |
|
|
| |
|
|
| |
|
|
| |
|
|
| |
|
|
| |
|
|
| |
|
|
| |
|
|
| |
|
|
| |
|
|
| |
|
|
| |
|
|
| |
|
|
| |
|
|
| |
|
|
| |
|
|
| |
|
|
| |
|
|
| |
|
|
| |
|
|
| |
| |
| |
|
|
| |
|
|
| |
|
|
International Workplace Group PLC |
|
|
| |
|
|
Schwab Fundamental Index Funds | Annual Holdings and Financial Statements
33
Schwab Fundamental International Equity Index Fund
Portfolio Holdings as of October 31, 2025 (continued)
| |
|
|
| |
|
|
| |
|
|
| |
| |
| |
|
|
| |
|
|
B&M European Value Retail SA |
|
|
| |
|
|
Millicom International Cellular SA |
|
|
| |
|
|
| |
|
|
| |
|
|
| |
|
|
| |
| |
Golden Agri-Resources Ltd. |
|
|
| |
| |
| |
|
|
| |
|
|
| |
|
|
| |
|
|
| |
|
|
| |
|
|
| |
|
|
| |
|
|
| |
|
|
| |
|
|
| |
|
|
| |
|
|
| |
|
|
| |
|
|
| |
|
|
Koninklijke Ahold Delhaize NV |
|
|
| |
|
|
| |
|
|
| |
|
|
| |
|
|
| |
|
|
| |
|
|
| |
|
|
| |
|
|
| |
|
|
| |
|
|
| |
|
|
| |
|
|
| |
|
|
| |
| |
| |
|
|
| |
|
|
| |
|
|
| |
| |
| |
|
|
| |
|
|
| |
|
|
| |
|
|
| |
|
|
| |
|
|
| |
|
|
| |
|
|
| |
|
|
| |
|
|
| |
|
|
| |
| |
Bank Polska Kasa Opieki SA |
|
|
| |
|
|
| |
|
|
PGE Polska Grupa Energetyczna SA * |
|
|
Powszechna Kasa Oszczednosci Bank Polski SA |
|
|
Powszechny Zaklad Ubezpieczen SA |
|
|
Tauron Polska Energia SA * |
|
|
| |
|
|
| |
| |
| |
|
|
| |
|
|
| |
|
|
| |
|
|
| |
| |
BNK Financial Group, Inc. |
|
|
| |
|
|
| |
|
|
| |
|
|
| |
|
|
Doosan Enerbility Co. Ltd. * |
|
|
| |
|
|
GS Engineering & Construction Corp. |
|
|
| |
|
|
Hana Financial Group, Inc. |
|
|
Hankook Tire & Technology Co. Ltd. |
|
|
| |
|
|
| |
|
|
| |
|
|
| |
|
|
Hyundai Engineering & Construction Co. Ltd. |
|
|
| |
|
|
| |
|
|
| |
|
|
| |
|
|
| |
|
|
| |
|
|
| |
|
|
Korea Electric Power Corp. |
|
|
| |
|
|
| |
|
|
Korean Air Lines Co. Ltd. |
|
|
| |
|
|
| |
|
|
Kumho Petrochemical Co. Ltd. |
|
|
| |
|
|
| |
|
|
| |
|
|
| |
|
|
| |
|
|
| |
|
|
| |
|
|
| |
|
|
| |
|
|
| |
|
|
Posco International Corp. |
|
|
| |
|
|
Samsung Electro-Mechanics Co. Ltd. |
|
|
34
Schwab Fundamental Index Funds | Annual Holdings and Financial Statements
Schwab Fundamental International Equity Index Fund
Portfolio Holdings as of October 31, 2025 (continued)
| |
|
|
Samsung Electronics Co. Ltd. |
|
|
Samsung Fire & Marine Insurance Co. Ltd. |
|
|
Samsung Life Insurance Co. Ltd. |
|
|
| |
|
|
| |
|
|
Shinhan Financial Group Co. Ltd. |
|
|
| |
|
|
| |
|
|
| |
|
|
| |
|
|
| |
|
|
Woori Financial Group, Inc. |
|
|
| |
|
|
| |
| |
| |
|
|
| |
|
|
| |
|
|
| |
|
|
Oversea-Chinese Banking Corp. Ltd. |
|
|
| |
|
|
Singapore Telecommunications Ltd. |
|
|
United Overseas Bank Ltd. |
|
|
| |
|
|
Wilmar International Ltd. |
|
|
| |
|
|
| |
| |
| |
|
|
| |
| |
| |
|
|
| |
|
|
ACS Actividades de Construccion y Servicios SA |
|
|
| |
|
|
| |
|
|
Banco Bilbao Vizcaya Argentaria SA |
|
|
| |
|
|
| |
|
|
| |
|
|
| |
|
|
| |
|
|
| |
|
|
| |
|
|
| |
|
|
Industria de Diseno Textil SA |
|
|
International Consolidated Airlines Group SA |
|
|
| |
|
|
| |
|
|
| |
|
|
| |
|
|
| |
|
|
| |
|
|
| |
| |
| |
|
|
| |
|
|
| |
|
|
| |
|
|
| |
|
|
Electrolux AB, B Shares * |
|
|
| |
|
|
| |
|
|
| |
|
|
| |
|
|
H & M Hennes & Mauritz AB, B Shares |
|
|
| |
|
|
| |
|
|
| |
|
|
| |
|
|
Skandinaviska Enskilda Banken AB, A Shares |
|
|
| |
|
|
| |
|
|
| |
|
|
| |
|
|
Svenska Cellulosa AB SCA, B Shares |
|
|
Svenska Handelsbanken AB, A Shares |
|
|
| |
|
|
| |
|
|
Telefonaktiebolaget LM Ericsson, B Shares |
|
|
| |
|
|
| |
|
|
| |
|
|
| |
|
|
Volvo Car AB, B Shares *(a) |
|
|
| |
|
|
| |
| |
| |
|
|
| |
|
|
| |
|
|
| |
|
|
| |
|
|
| |
|
|
| |
|
|
Chocoladefabriken Lindt & Spruengli AG |
|
|
Chocoladefabriken Lindt & Spruengli AG, Participation Certificates |
|
|
Cie Financiere Richemont SA, Class A |
|
|
| |
|
|
| |
|
|
| |
|
|
| |
|
|
| |
|
|
| |
|
|
| |
|
|
Kuehne & Nagel International AG |
|
|
Logitech International SA |
|
|
| |
|
|
| |
|
|
| |
|
|
Partners Group Holding AG |
|
|
| |
|
|
Roche Holding AG, Bearer Shares |
|
|
| |
|
|
| |
|
|
Schindler Holding AG, Participation Certificates |
|
|
| |
|
|
| |
|
|
| |
|
|
Sunrise Communications AG, Class A |
|
|
| |
|
|
Swatch Group AG, Bearer Shares |
|
|
| |
|
|
| |
|
|
| |
|
|
Schwab Fundamental Index Funds | Annual Holdings and Financial Statements
35
Schwab Fundamental International Equity Index Fund
Portfolio Holdings as of October 31, 2025 (continued)
| |
|
|
| |
|
|
| |
|
|
Zurich Insurance Group AG |
|
|
| |
|
|
| |
| |
| |
|
|
| |
|
|
| |
|
|
| |
|
|
| |
|
|
| |
|
|
| |
|
|
| |
|
|
Associated British Foods PLC |
|
|
| |
|
|
| |
|
|
| |
|
|
| |
|
|
| |
|
|
| |
|
|
| |
|
|
Berkeley Group Holdings PLC |
|
|
| |
|
|
British American Tobacco PLC |
|
|
| |
|
|
| |
|
|
| |
|
|
| |
|
|
CK Hutchison Holdings Ltd. |
|
|
Coca-Cola Europacific Partners PLC |
|
|
| |
|
|
| |
|
|
| |
|
|
| |
|
|
| |
|
|
| |
|
|
| |
|
|
| |
|
|
| |
|
|
| |
|
|
| |
|
|
| |
|
|
| |
|
|
| |
|
|
| |
|
|
| |
|
|
| |
|
|
| |
|
|
| |
|
|
| |
|
|
| |
|
|
| |
|
|
| |
|
|
Legal & General Group PLC |
|
|
| |
|
|
London Stock Exchange Group PLC |
|
|
| |
|
|
Marks & Spencer Group PLC |
|
|
| |
|
|
| |
|
|
| |
|
|
| |
|
|
| |
|
|
| |
|
|
| |
|
|
Phoenix Group Holdings PLC |
|
|
| |
|
|
| |
|
|
Reckitt Benckiser Group PLC |
|
|
| |
|
|
| |
|
|
| |
|
|
| |
|
|
| |
|
|
| |
|
|
| |
|
|
| |
|
|
| |
|
|
| |
|
|
| |
|
|
| |
|
|
| |
|
|
| |
|
|
| |
|
|
| |
|
|
| |
|
|
| |
|
|
United Utilities Group PLC |
|
|
| |
|
|
| |
|
|
| |
|
|
| |
| |
| |
|
|
| |
|
|
Coronado Global Resources, Inc., CDI (a) |
|
|
Ferguson Enterprises, Inc. |
|
|
Lululemon Athletica, Inc. * |
|
|
| |
|
|
Total Common Stocks
(Cost $2,536,698,995) |
|
| |
PREFERRED STOCKS 1.4% OF NET ASSETS |
| |
| |
Bayerische Motoren Werke AG |
|
|
| |
|
|
| |
|
|
| |
|
|
Porsche Automobil Holding SE |
|
|
| |
|
|
| |
|
|
| |
| |
Telecom Italia SpA - RSP * |
|
|
| |
| |
| |
|
|
| |
|
|
| |
|
|
| |
|
|
Samsung Electronics Co. Ltd. |
|
|
Samsung Fire & Marine Insurance Co. Ltd. |
|
|
| |
|
|
| |
36
Schwab Fundamental Index Funds | Annual Holdings and Financial Statements
Schwab Fundamental International Equity Index Fund
Portfolio Holdings as of October 31, 2025 (continued)
| |
|
|
| |
| |
|
|
Total Preferred Stocks
(Cost $45,507,579) |
|
| |
WARRANTS 0.0% OF NET ASSETS |
| |
| |
Constellation Software, Inc. |
| |
|
|
| |
|
| |
|
|
SHORT-TERM INVESTMENTS 0.2% OF NET ASSETS |
| |
| |
State Street Institutional U.S. Government Money Market Fund, Premier Class 4.01% (d)(e) |
|
|
Total Short-Term Investments
(Cost $8,369,419) |
|
Total Investments in Securities
(Cost $2,590,575,993) |
|
| |
|
|
CURRENT VALUE/
UNREALIZED
DEPRECIATION
($) |
| |
| |
|
|
|
MSCI EAFE Index, expires 12/19/25 |
|
|
|
| |
Non-income producing security. |
| |
All or a portion of this security is on loan. Securities on loan were valued at $8,070,701. |
| |
Security is traded on separate exchanges for the same issuer. |
| |
Fair valued using significant unobservable inputs (see financial note 2(a), Securities for which no quoted value is available, for additional information). |
| |
The rate shown is the annualized 7-day yield. |
| |
Security purchased with cash collateral received for securities on loan. |
| |
American Depositary Receipt |
| |
CHESS Depositary Interest |
| |
Global Depositary Receipt |
| |
Real Estate Investment Trust |
| |
Risparmio (Savings Shares) |
The following is a summary of the inputs used to value the fund’s investments as of October 31, 2025 (see financial note 2(a) for additional information):
| |
QUOTED PRICES IN
ACTIVE MARKETS FOR
IDENTICAL ASSETS
(LEVEL 1) |
OTHER SIGNIFICANT
OBSERVABLE INPUTS
(LEVEL 2) |
SIGNIFICANT
UNOBSERVABLE INPUTS
(LEVEL 3) |
|
| |
|
|
|
|
| |
|
|
|
|
| |
|
|
|
|
| |
|
|
|
|
| |
|
|
|
|
| |
|
|
|
|
| |
|
|
|
|
| |
|
|
|
|
| |
|
|
|
|
Schwab Fundamental Index Funds | Annual Holdings and Financial Statements
37
Schwab Fundamental International Equity Index Fund
Portfolio Holdings as of October 31, 2025 (continued)
| |
QUOTED PRICES IN ACTIVE MARKETS FOR IDENTICAL ASSETS (LEVEL 1) |
OTHER SIGNIFICANT OBSERVABLE INPUTS (LEVEL 2) |
SIGNIFICANT UNOBSERVABLE INPUTS (LEVEL 3) |
|
| |
|
|
|
|
| |
|
|
|
|
| |
|
|
|
|
| |
|
|
|
|
| |
|
|
|
|
| |
|
|
|
|
| |
|
|
|
|
| |
|
|
|
|
| |
|
|
|
|
| |
|
|
|
|
| |
|
|
|
|
| |
|
|
|
|
| |
|
|
|
|
| |
|
|
|
|
| |
|
|
|
|
| |
|
|
|
|
| |
|
|
|
|
| |
|
|
|
|
| |
As categorized in the Portfolio Holdings. |
| |
Futures contracts are reported at cumulative unrealized appreciation or depreciation. |
38
Schwab Fundamental Index Funds | Annual Holdings and Financial Statements
Schwab Fundamental International Equity Index Fund
Statement of Assets and Liabilities
| |
Investments in securities, at value - unaffiliated issuers (cost $2,590,575,993) including securities on loan of $8,070,701 |
|
|
| |
|
|
Foreign currency, at value (cost $1,860,789) |
|
|
Deposit with broker for futures contracts |
|
|
| |
|
|
| |
|
|
| |
|
|
| |
|
|
| |
|
|
Income from securities on loan |
|
|
| |
|
|
| |
| |
Collateral held for securities on loan |
|
|
| |
|
|
| |
|
|
| |
|
|
Variation margin on futures contracts |
|
|
| |
|
|
| |
|
|
| |
| |
Capital received from investors |
|
|
Total distributable earnings |
|
|
| |
|
|
Schwab Fundamental Index Funds | Annual Holdings and Financial Statements
39
Schwab Fundamental International Equity Index Fund
Statement of Operations
For the period November 1, 2024 through October 31, 2025 |
| |
Dividends received from securities - unaffiliated issuers (net of foreign withholding tax of $13,270,371) |
|
|
| |
|
|
Interest received from securities - unaffiliated issuers |
|
|
| |
|
|
| |
|
|
| |
| |
| |
|
|
| |
|
|
| |
|
|
| |
|
|
| |
|
|
| |
|
|
| |
REALIZED AND UNREALIZED GAINS (LOSSES) |
Net realized gains on sales of securities - unaffiliated issuers |
|
|
Net realized gains on futures contracts |
|
|
Net realized gains on foreign currency transactions |
|
|
| |
|
|
Net change in unrealized appreciation (depreciation) on securities - unaffiliated issuers |
|
|
Net change in unrealized appreciation (depreciation) on futures contracts |
|
|
Net change in unrealized appreciation (depreciation) on foreign currency translations |
|
|
Net change in unrealized appreciation (depreciation) |
|
|
Net realized and unrealized gains |
|
|
Increase in net assets resulting from operations |
|
|
| |
Professional fees associated with the filing of foreign withholding tax claims in the European Union are deemed to be non-contingent and non-routine expenses of the fund (see financial notes 2(d) and 3 for additional information). |
40
Schwab Fundamental Index Funds | Annual Holdings and Financial Statements
Schwab Fundamental International Equity Index Fund
Statement of Changes in Net Assets
For the current and prior report periods
| |
| |
|
|
| |
|
|
|
| |
|
|
|
Net change in unrealized appreciation (depreciation) |
|
|
|
Increase in net assets resulting from operations |
|
|
|
| |
DISTRIBUTIONS TO SHAREHOLDERS |
| |
|
|
|
TRANSACTIONS IN FUND SHARES |
| |
|
|
| |
|
|
|
|
|
| |
|
|
|
|
|
| |
|
|
|
|
|
| |
|
|
|
|
|
Net transactions in fund shares |
|
|
|
|
|
| |
SHARES OUTSTANDING AND NET ASSETS |
| |
|
|
| |
|
|
|
|
|
| |
|
|
|
|
|
| |
|
|
|
|
|
| |
|
|
|
|
|
Schwab Fundamental Index Funds | Annual Holdings and Financial Statements
41
Schwab Fundamental International Small Equity Index Fund
Financial Statements
| |
|
|
|
|
|
|
| |
Net asset value at beginning of period |
|
|
|
|
|
|
Income (loss) from investment operations: |
|
|
|
|
|
|
Net investment income (loss)1 |
|
|
|
|
|
|
Net realized and unrealized gains (losses) |
|
|
|
|
|
|
Total from investment operations |
|
|
|
|
|
|
| |
|
|
|
|
|
|
Distributions from net investment income |
|
|
|
|
|
|
Distributions from net realized gains |
|
|
|
|
|
|
| |
|
|
|
|
|
|
Net asset value at end of period |
|
|
|
|
|
|
| |
|
|
|
|
|
|
| |
Ratios to average net assets: |
|
|
|
|
|
|
| |
|
|
|
|
|
|
Net investment income (loss) |
|
|
|
|
|
|
| |
|
|
|
|
|
|
Net assets, end of period (x 1,000,000) |
|
|
|
|
|
|
| |
Calculated based on the average shares outstanding during the period. |
| |
Ratio includes less than 0.005% of non-routine proxy expenses. |
42
Schwab Fundamental Index Funds | Annual Holdings and Financial Statements
Schwab Fundamental International Small Equity Index Fund
Portfolio Holdings as of October 31, 2025
| |
|
|
COMMON STOCKS 98.6% OF NET ASSETS |
| |
| |
| |
|
|
| |
|
|
| |
|
|
| |
|
|
| |
|
|
| |
|
|
| |
|
|
| |
|
|
| |
|
|
| |
|
|
| |
|
|
| |
|
|
Bendigo & Adelaide Bank Ltd. |
|
|
| |
|
|
| |
|
|
| |
|
|
| |
|
|
| |
|
|
Cleanaway Waste Management Ltd. |
|
|
| |
|
|
| |
|
|
| |
|
|
| |
|
|
| |
|
|
Domino's Pizza Enterprises Ltd. |
|
|
| |
|
|
| |
|
|
| |
|
|
FleetPartners Group Ltd. * |
|
|
Flight Centre Travel Group Ltd. |
|
|
| |
|
|
| |
|
|
| |
|
|
Harvey Norman Holdings Ltd. |
|
|
| |
|
|
| |
|
|
| |
|
|
| |
|
|
| |
|
|
| |
|
|
Insignia Financial Ltd. * |
|
|
| |
|
|
| |
|
|
| |
|
|
| |
|
|
Magellan Financial Group Ltd. |
|
|
| |
|
|
| |
|
|
| |
|
|
| |
|
|
| |
|
|
| |
|
|
Nine Entertainment Co. Holdings Ltd. |
|
|
| |
|
|
| |
|
|
| |
|
|
| |
|
|
| |
|
|
| |
|
|
| |
|
|
| |
|
|
| |
|
|
| |
|
|
| |
|
|
| |
|
|
| |
|
|
| |
|
|
| |
|
|
| |
|
|
| |
|
|
Reliance Worldwide Corp. Ltd. |
|
|
| |
|
|
Sandfire Resources Ltd. * |
|
|
| |
|
|
| |
|
|
| |
|
|
| |
|
|
| |
|
|
| |
|
|
| |
|
|
Star Entertainment Group Ltd. * |
|
|
| |
|
|
| |
|
|
| |
|
|
| |
|
|
Treasury Wine Estates Ltd. |
|
|
Ventia Services Group Pty. Ltd. |
|
|
| |
|
|
West African Resources Ltd. *(a) |
|
|
| |
|
|
| |
|
|
| |
| |
| |
|
|
AT&S Austria Technologie & Systemtechnik AG * |
|
|
| |
|
|
| |
|
|
| |
|
|
| |
|
|
| |
|
|
| |
|
|
| |
|
|
| |
|
|
| |
|
|
| |
|
|
Vienna Insurance Group AG Wiener Versicherung Gruppe |
|
|
| |
|
|
| |
| |
Ackermans & van Haaren NV |
|
|
| |
|
|
| |
|
|
| |
|
|
| |
|
|
| |
|
|
| |
|
|
| |
|
|
| |
|
|
| |
|
|
| |
|
|
| |
|
|
| |
|
|
| |
|
|
| |
|
|
| |
|
|
| |
|
|
| |
|
|
Schwab Fundamental Index Funds | Annual Holdings and Financial Statements
43
Schwab Fundamental International Small Equity Index Fund
Portfolio Holdings as of October 31, 2025 (continued)
| |
|
|
| |
|
|
| |
|
|
| |
|
|
| |
| |
| |
|
|
| |
| |
| |
|
|
| |
|
|
| |
|
|
| |
|
|
Alamos Gold, Inc., Class A |
|
|
| |
|
|
Allied Properties Real Estate Investment Trust |
|
|
| |
|
|
| |
|
|
| |
|
|
Artis Real Estate Investment Trust |
|
|
| |
|
|
| |
|
|
| |
|
|
Badger Infrastructure Solutions Ltd. |
|
|
| |
|
|
| |
|
|
| |
|
|
| |
|
|
Boardwalk Real Estate Investment Trust |
|
|
Bombardier, Inc., Class B * |
|
|
| |
|
|
| |
|
|
Brookfield Business Corp., Class A |
|
|
Brookfield Infrastructure Corp., Class A |
|
|
Brookfield Renewable Corp. |
|
|
Brookfield Wealth Solutions Ltd. * |
|
|
| |
|
|
| |
|
|
| |
|
|
Canaccord Genuity Group, Inc. |
|
|
Canada Goose Holdings, Inc. * |
|
|
| |
|
|
Canadian Apartment Properties REIT |
|
|
| |
|
|
Canadian Utilities Ltd., Class A |
|
|
| |
|
|
| |
|
|
| |
|
|
| |
|
|
| |
|
|
| |
|
|
| |
|
|
| |
|
|
CES Energy Solutions Corp. |
|
|
Chartwell Retirement Residences |
|
|
Chemtrade Logistics Income Fund |
|
|
China Gold International Resources Corp. Ltd. |
|
|
Choice Properties Real Estate Investment Trust |
|
|
Cogeco Communications, Inc. |
|
|
Colliers International Group, Inc. |
|
|
Crombie Real Estate Investment Trust |
|
|
CT Real Estate Investment Trust |
|
|
Curaleaf Holdings, Inc. * |
|
|
| |
|
|
| |
|
|
Descartes Systems Group, Inc. * |
|
|
| |
|
|
Dream Industrial Real Estate Investment Trust |
|
|
| |
|
|
| |
|
|
Element Fleet Management Corp. |
|
|
| |
|
|
| |
|
|
| |
|
|
| |
|
|
| |
|
|
| |
|
|
| |
|
|
First Capital Real Estate Investment Trust |
|
|
First Majestic Silver Corp. |
|
|
| |
|
|
| |
|
|
| |
|
|
| |
|
|
| |
|
|
Granite Real Estate Investment Trust |
|
|
H&R Real Estate Investment Trust |
|
|
| |
|
|
| |
|
|
| |
|
|
| |
|
|
International Petroleum Corp. * |
|
|
Killam Apartment Real Estate Investment Trust |
|
|
Labrador Iron Ore Royalty Corp. |
|
|
Lassonde Industries, Inc., Class A |
|
|
Laurentian Bank of Canada |
|
|
| |
|
|
| |
|
|
Martinrea International, Inc. |
|
|
| |
|
|
| |
|
|
| |
|
|
| |
|
|
| |
|
|
| |
|
|
Northwest Healthcare Properties Real Estate Investment Trust |
|
|
| |
|
|
| |
|
|
| |
|
|
| |
|
|
| |
|
|
Pan American Silver Corp. |
|
|
Paramount Resources Ltd., Class A |
|
|
| |
|
|
| |
|
|
Peyto Exploration & Development Corp. |
|
|
Precision Drilling Corp. * |
|
|
Premium Brands Holdings Corp. |
|
|
| |
|
|
| |
|
|
RioCan Real Estate Investment Trust |
|
|
| |
|
|
Sagicor Financial Co. Ltd. |
|
|
Secure Waste Infrastructure Corp. |
|
|
| |
|
|
Sienna Senior Living, Inc. |
|
|
SmartCentres Real Estate Investment Trust |
|
|
| |
|
|
| |
|
|
44
Schwab Fundamental Index Funds | Annual Holdings and Financial Statements
Schwab Fundamental International Small Equity Index Fund
Portfolio Holdings as of October 31, 2025 (continued)
| |
|
|
| |
|
|
| |
|
|
| |
|
|
Tamarack Valley Energy Ltd. |
|
|
Teekay Tankers Ltd., Class A |
|
|
TELUS International CDA, Inc. * |
|
|
| |
|
|
Torex Gold Resources, Inc. * |
|
|
| |
|
|
Transcontinental, Inc., Class A |
|
|
| |
|
|
| |
|
|
| |
|
|
| |
|
|
| |
| |
Alibaba Health Information Technology Ltd. * |
|
|
Bosideng International Holdings Ltd. |
|
|
Budweiser Brewing Co. APAC Ltd. |
|
|
China Medical System Holdings Ltd. |
|
|
China Water Affairs Group Ltd. |
|
|
Chow Tai Fook Jewellery Group Ltd. |
|
|
| |
|
|
GCL Technology Holdings Ltd. *(b) |
|
|
Health & Happiness H&H International Holdings Ltd. |
|
|
Hopson Development Holdings Ltd. * |
|
|
| |
|
|
| |
|
|
Lee & Man Paper Manufacturing Ltd. |
|
|
| |
|
|
Sino Biopharmaceutical Ltd. |
|
|
Towngas Smart Energy Co. Ltd. * |
|
|
| |
|
|
Want Want China Holdings Ltd. |
|
|
Xinyi Glass Holdings Ltd. |
|
|
| |
|
|
| |
| |
| |
|
|
| |
| |
| |
|
|
| |
|
|
| |
|
|
| |
|
|
| |
|
|
| |
|
|
| |
|
|
| |
|
|
| |
|
|
| |
|
|
| |
|
|
| |
|
|
| |
|
|
NTG Nordic Transport Group AS * |
|
|
| |
|
|
Ringkjoebing Landbobank AS |
|
|
| |
|
|
| |
|
|
Scandinavian Tobacco Group AS, A Shares |
|
|
| |
|
|
| |
|
|
| |
|
|
| |
|
|
| |
|
|
| |
| |
| |
|
|
| |
|
|
| |
|
|
| |
|
|
| |
|
|
| |
|
|
| |
|
|
| |
|
|
| |
|
|
Metsa Board OYJ, B Shares (b) |
|
|
| |
|
|
| |
|
|
| |
|
|
| |
|
|
| |
|
|
| |
|
|
| |
|
|
| |
|
|
| |
|
|
| |
|
|
| |
| |
| |
|
|
| |
|
|
| |
|
|
| |
|
|
| |
|
|
| |
|
|
| |
|
|
| |
|
|
| |
|
|
| |
|
|
| |
|
|
Constellium SE, Class A * |
|
|
| |
|
|
| |
|
|
| |
|
|
| |
|
|
| |
|
|
| |
|
|
| |
|
|
| |
|
|
Eutelsat Communications SACA *(b) |
|
|
| |
|
|
| |
|
|
Gaztransport Et Technigaz SA |
|
|
| |
|
|
| |
|
|
| |
|
|
ID Logistics Group SACA * |
|
|
| |
|
|
| |
|
|
| |
|
|
| |
|
|
| |
|
|
| |
|
|
| |
|
|
| |
|
|
| |
|
|
| |
|
|
| |
|
|
| |
|
|
Schwab Fundamental Index Funds | Annual Holdings and Financial Statements
45
Schwab Fundamental International Small Equity Index Fund
Portfolio Holdings as of October 31, 2025 (continued)
| |
|
|
| |
|
|
| |
|
|
| |
|
|
| |
|
|
| |
|
|
| |
|
|
| |
|
|
| |
|
|
| |
|
|
| |
|
|
Television Francaise 1 SA |
|
|
| |
|
|
Ubisoft Entertainment SA * |
|
|
| |
|
|
| |
|
|
| |
|
|
| |
|
|
| |
|
|
| |
|
|
| |
|
|
| |
| |
| |
|
|
| |
|
|
| |
|
|
| |
|
|
| |
|
|
| |
|
|
Carl Zeiss Meditec AG, Bearer Shares |
|
|
| |
|
|
| |
|
|
CTS Eventim AG & Co. KGaA |
|
|
| |
|
|
Deutsche Pfandbriefbank AG |
|
|
| |
|
|
| |
|
|
DWS Group GmbH & Co. KGaA |
|
|
| |
|
|
| |
|
|
Fraport AG Frankfurt Airport Services Worldwide * |
|
|
| |
|
|
| |
|
|
| |
|
|
| |
|
|
| |
|
|
| |
|
|
Hornbach Holding AG & Co. KGaA |
|
|
| |
|
|
| |
|
|
| |
|
|
| |
|
|
| |
|
|
| |
|
|
| |
|
|
| |
|
|
| |
|
|
| |
|
|
| |
|
|
| |
|
|
| |
|
|
| |
|
|
| |
|
|
| |
|
|
| |
|
|
| |
|
|
| |
|
|
| |
|
|
| |
|
|
| |
|
|
| |
|
|
| |
|
|
| |
|
|
| |
|
|
| |
|
|
| |
|
|
| |
|
|
| |
|
|
| |
|
|
Wuestenrot & Wuerttembergische AG |
|
|
| |
|
|
| |
| |
| |
|
|
| |
|
|
| |
|
|
| |
| |
| |
|
|
| |
|
|
Brightoil Petroleum Holdings Ltd. *(a) |
|
|
Cafe de Coral Holdings Ltd. |
|
|
Cathay Pacific Airways Ltd. |
|
|
CK Infrastructure Holdings Ltd. |
|
|
Cowell e Holdings, Inc. * |
|
|
Crystal International Group Ltd. |
|
|
| |
|
|
Dah Sing Financial Holdings Ltd. |
|
|
DFI Retail Group Holdings Ltd. |
|
|
Fortune Real Estate Investment Trust |
|
|
| |
|
|
Galaxy Entertainment Group Ltd. |
|
|
Grand Pharmaceutical Group Ltd. |
|
|
| |
|
|
Hang Lung Properties Ltd. |
|
|
Henderson Land Development Co. Ltd. |
|
|
HK Electric Investments & HK Electric Investments Ltd. |
|
|
| |
|
|
Hongkong Land Holdings Ltd. |
|
|
Hysan Development Co. Ltd. |
|
|
Johnson Electric Holdings Ltd. |
|
|
| |
|
|
Kingboard Laminates Holdings Ltd. |
|
|
Luk Fook Holdings International Ltd. |
|
|
| |
|
|
Melco Resorts & Entertainment Ltd., ADR * |
|
|
| |
|
|
Nine Dragons Paper Holdings Ltd. * |
|
|
PAX Global Technology Ltd. |
|
|
| |
|
|
| |
|
|
| |
|
|
| |
|
|
Stella International Holdings Ltd. |
|
|
| |
|
|
| |
|
|
United Laboratories International Holdings Ltd. |
|
|
Vitasoy International Holdings Ltd. |
|
|
| |
|
|
| |
|
|
46
Schwab Fundamental Index Funds | Annual Holdings and Financial Statements
Schwab Fundamental International Small Equity Index Fund
Portfolio Holdings as of October 31, 2025 (continued)
| |
|
|
Wharf Real Estate Investment Co. Ltd. |
|
|
| |
|
|
| |
| |
| |
|
|
| |
| |
| |
|
|
| |
|
|
| |
|
|
| |
|
|
| |
|
|
| |
|
|
| |
|
|
Glenveagh Properties PLC * |
|
|
| |
|
|
| |
|
|
| |
|
|
| |
|
|
| |
| |
Alony Hetz Properties & Investments Ltd. |
|
|
| |
|
|
| |
|
|
Bezeq The Israeli Telecommunication Corp. Ltd. |
|
|
| |
|
|
Clal Insurance Enterprises Holdings Ltd. |
|
|
Delek Automotive Systems Ltd. |
|
|
| |
|
|
| |
|
|
| |
|
|
| |
|
|
| |
|
|
| |
|
|
Fattal Holdings 1998 Ltd. * |
|
|
| |
|
|
First International Bank of Israel Ltd. |
|
|
Formula Systems 1985 Ltd. |
|
|
| |
|
|
| |
|
|
Harel Insurance Investments & Financial Services Ltd. |
|
|
| |
|
|
| |
|
|
| |
|
|
| |
|
|
Mivne Real Estate KD Ltd. |
|
|
Mizrahi Tefahot Bank Ltd. |
|
|
| |
|
|
| |
|
|
| |
|
|
Partner Communications Co. Ltd. |
|
|
| |
|
|
| |
|
|
| |
|
|
Rami Levy Chain Stores Hashikma Marketing 2006 Ltd. |
|
|
| |
|
|
| |
|
|
| |
|
|
| |
|
|
Tower Semiconductor Ltd. * |
|
|
| |
|
|
| |
| |
|
|
| |
| |
|
|
| |
|
|
| |
|
|
| |
|
|
| |
|
|
Banca Monte dei Paschi di Siena SpA |
|
|
Banca Popolare di Sondrio SpA |
|
|
| |
|
|
| |
|
|
CIR SpA-Compagnie Industriali * |
|
|
Danieli & C Officine Meccaniche SpA |
|
|
| |
|
|
| |
|
|
| |
|
|
| |
|
|
FinecoBank Banca Fineco SpA |
|
|
| |
|
|
Infrastrutture Wireless Italiane SpA |
|
|
| |
|
|
| |
|
|
| |
|
|
| |
|
|
| |
|
|
| |
|
|
| |
|
|
| |
|
|
| |
|
|
| |
|
|
Recordati Industria Chimica e Farmaceutica SpA |
|
|
| |
|
|
| |
|
|
Salvatore Ferragamo SpA *(b) |
|
|
| |
|
|
| |
|
|
| |
|
|
| |
|
|
| |
|
|
| |
| |
| |
|
|
| |
|
|
| |
|
|
| |
|
|
| |
|
|
| |
|
|
Advance Residence Investment Corp. |
|
|
AEON Financial Service Co. Ltd. |
|
|
AEON REIT Investment Corp. |
|
|
| |
|
|
| |
|
|
| |
|
|
| |
|
|
| |
|
|
| |
|
|
| |
|
|
| |
|
|
| |
|
|
| |
|
|
| |
|
|
| |
|
|
| |
|
|
| |
|
|
| |
|
|
| |
|
|
Schwab Fundamental Index Funds | Annual Holdings and Financial Statements
47
Schwab Fundamental International Small Equity Index Fund
Portfolio Holdings as of October 31, 2025 (continued)
| |
|
|
| |
|
|
| |
|
|
| |
|
|
| |
|
|
| |
|
|
| |
|
|
| |
|
|
Bando Chemical Industries Ltd. |
|
|
| |
|
|
| |
|
|
| |
|
|
| |
|
|
Blue Zones Holdings Co. Ltd. |
|
|
| |
|
|
| |
|
|
| |
|
|
Canon Marketing Japan, Inc. |
|
|
| |
|
|
| |
|
|
| |
|
|
| |
|
|
| |
|
|
| |
|
|
Chugin Financial Group, Inc. |
|
|
Chugoku Marine Paints Ltd. |
|
|
| |
|
|
| |
|
|
| |
|
|
Cosmos Pharmaceutical Corp. |
|
|
Create SD Holdings Co. Ltd. |
|
|
| |
|
|
| |
|
|
| |
|
|
| |
|
|
| |
|
|
| |
|
|
| |
|
|
| |
|
|
| |
|
|
Daishi Hokuetsu Financial Group, Inc. |
|
|
Daiwa House REIT Investment Corp. |
|
|
Daiwa Office Investment Corp. |
|
|
Daiwa Securities Living Investments Corp. |
|
|
| |
|
|
| |
|
|
| |
|
|
| |
|
|
| |
|
|
| |
|
|
Doutor Nichires Holdings Co. Ltd. |
|
|
| |
|
|
| |
|
|
DyDo Group Holdings, Inc. |
|
|
| |
|
|
| |
|
|
| |
|
|
| |
|
|
| |
|
|
| |
|
|
| |
|
|
| |
|
|
| |
|
|
| |
|
|
| |
|
|
Frontier Real Estate Investment Corp. |
|
|
| |
|
|
| |
|
|
Fuji Media Holdings, Inc. |
|
|
| |
|
|
| |
|
|
Fuji Seal International, Inc. |
|
|
| |
|
|
| |
|
|
| |
|
|
Fukuoka Financial Group, Inc. |
|
|
Fukuyama Transporting Co. Ltd. |
|
|
| |
|
|
Futaba Industrial Co. Ltd. |
|
|
Fuyo General Lease Co. Ltd. |
|
|
| |
|
|
| |
|
|
| |
|
|
| |
|
|
| |
|
|
| |
|
|
| |
|
|
| |
|
|
GungHo Online Entertainment, Inc. |
|
|
| |
|
|
| |
|
|
H.U. Group Holdings, Inc. |
|
|
| |
|
|
| |
|
|
Hakuhodo DY Holdings, Inc. |
|
|
| |
|
|
| |
|
|
| |
|
|
| |
|
|
| |
|
|
Heiwa Real Estate Co. Ltd. |
|
|
| |
|
|
| |
|
|
| |
|
|
| |
|
|
| |
|
|
Hisamitsu Pharmaceutical Co., Inc. |
|
|
| |
|
|
Hokkaido Electric Power Co., Inc. |
|
|
| |
|
|
Hokuhoku Financial Group, Inc. |
|
|
Hokuriku Electric Power Co. |
|
|
| |
|
|
| |
|
|
| |
|
|
| |
|
|
| |
|
|
| |
|
|
| |
|
|
| |
|
|
| |
|
|
| |
|
|
Inaba Denki Sangyo Co. Ltd. |
|
|
| |
|
|
Industrial & Infrastructure Fund Investment Corp. |
|
|
| |
|
|
Internet Initiative Japan, Inc. |
|
|
Invincible Investment Corp. |
|
|
| |
|
|
| |
|
|
Itoham Yonekyu Holdings, Inc. |
|
|
| |
|
|
| |
|
|
J Front Retailing Co. Ltd. |
|
|
| |
|
|
| |
|
|
Japan Airport Terminal Co. Ltd. |
|
|
48
Schwab Fundamental Index Funds | Annual Holdings and Financial Statements
Schwab Fundamental International Small Equity Index Fund
Portfolio Holdings as of October 31, 2025 (continued)
| |
|
|
Japan Aviation Electronics Industry Ltd. |
|
|
| |
|
|
Japan Exchange Group, Inc. |
|
|
Japan Hotel REIT Investment Corp. |
|
|
| |
|
|
Japan Logistics Fund, Inc. |
|
|
Japan Metropolitan Fund Invest |
|
|
Japan Petroleum Exploration Co. Ltd. |
|
|
Japan Prime Realty Investment Corp. |
|
|
Japan Pulp & Paper Co. Ltd. |
|
|
Japan Real Estate Investment Corp. |
|
|
| |
|
|
Japan Wool Textile Co. Ltd. |
|
|
| |
|
|
| |
|
|
| |
|
|
Juroku Financial Group, Inc. |
|
|
| |
|
|
| |
|
|
Kaga Electronics Co. Ltd. |
|
|
| |
|
|
| |
|
|
Kaken Pharmaceutical Co. Ltd. |
|
|
| |
|
|
| |
|
|
| |
|
|
| |
|
|
| |
|
|
| |
|
|
| |
|
|
| |
|
|
| |
|
|
KDX Realty Investment Corp. |
|
|
| |
|
|
| |
|
|
| |
|
|
Keisei Electric Railway Co. Ltd. |
|
|
| |
|
|
| |
|
|
| |
|
|
| |
|
|
| |
|
|
Kobayashi Pharmaceutical Co. Ltd. |
|
|
| |
|
|
Koei Tecmo Holdings Co. Ltd. |
|
|
| |
|
|
| |
|
|
| |
|
|
| |
|
|
| |
|
|
| |
|
|
Konoike Transport Co. Ltd. |
|
|
| |
|
|
| |
|
|
| |
|
|
Kumiai Chemical Industry Co. Ltd. |
|
|
| |
|
|
| |
|
|
Kurita Water Industries Ltd. |
|
|
Kusuri No. Aoki Holdings Co. Ltd. |
|
|
| |
|
|
| |
|
|
Kyokuto Kaihatsu Kogyo Co. Ltd. |
|
|
Kyorin Pharmaceutical Co. Ltd. |
|
|
Kyoritsu Maintenance Co. Ltd. |
|
|
Kyoto Financial Group, Inc. |
|
|
| |
|
|
Kyushu Financial Group, Inc. |
|
|
| |
|
|
| |
|
|
| |
|
|
| |
|
|
| |
|
|
| |
|
|
| |
|
|
| |
|
|
| |
|
|
| |
|
|
Makino Milling Machine Co. Ltd. |
|
|
| |
|
|
| |
|
|
| |
|
|
| |
|
|
Maruzen Showa Unyu Co. Ltd. |
|
|
| |
|
|
| |
|
|
McDonald's Holdings Co. Japan Ltd. |
|
|
| |
|
|
Mebuki Financial Group, Inc. |
|
|
| |
|
|
Megmilk Snow Brand Co. Ltd. |
|
|
| |
|
|
Meiko Electronics Co. Ltd. |
|
|
MEITEC Group Holdings, Inc. |
|
|
| |
|
|
| |
|
|
| |
|
|
Mitsubishi HC Capital, Inc. |
|
|
Mitsubishi Logisnext Co. Ltd. |
|
|
Mitsubishi Logistics Corp. |
|
|
Mitsubishi Pencil Co. Ltd. |
|
|
| |
|
|
| |
|
|
Mitsui Fudosan Accommodations Fund, Inc. |
|
|
| |
|
|
Mitsui-Soko Holdings Co. Ltd. |
|
|
Mitsuuroko Group Holdings Co. Ltd. |
|
|
| |
|
|
| |
|
|
| |
|
|
| |
|
|
Mochida Pharmaceutical Co. Ltd. |
|
|
| |
|
|
| |
|
|
| |
|
|
Morinaga Milk Industry Co. Ltd. |
|
|
| |
|
|
| |
|
|
Musashi Seimitsu Industry Co. Ltd. |
|
|
| |
|
|
| |
|
|
| |
|
|
| |
|
|
Nankai Electric Railway Co. Ltd. |
|
|
| |
|
|
| |
|
|
| |
|
|
| |
|
|
| |
|
|
| |
|
|
| |
|
|
| |
|
|
| |
|
|
Nihon M&A Center Holdings, Inc. |
|
|
Nihon Parkerizing Co. Ltd. |
|
|
| |
|
|
Schwab Fundamental Index Funds | Annual Holdings and Financial Statements
49
Schwab Fundamental International Small Equity Index Fund
Portfolio Holdings as of October 31, 2025 (continued)
| |
|
|
| |
|
|
| |
|
|
Nippon Building Fund, Inc. |
|
|
Nippon Densetsu Kogyo Co. Ltd. |
|
|
Nippon Electric Glass Co. Ltd. |
|
|
| |
|
|
| |
|
|
Nippon Light Metal Holdings Co. Ltd. |
|
|
Nippon Paint Holdings Co. Ltd. |
|
|
Nippon Prologis REIT, Inc. |
|
|
Nippon Sanso Holdings Corp. |
|
|
| |
|
|
| |
|
|
| |
|
|
| |
|
|
Nippon Television Holdings, Inc. |
|
|
| |
|
|
Nishimatsu Construction Co. Ltd. |
|
|
Nishimatsuya Chain Co. Ltd. |
|
|
Nishi-Nippon Financial Holdings, Inc. |
|
|
Nishi-Nippon Railroad Co. Ltd. |
|
|
| |
|
|
| |
|
|
Nisshin Oillio Group Ltd. |
|
|
| |
|
|
| |
|
|
| |
|
|
| |
|
|
| |
|
|
| |
|
|
| |
|
|
| |
|
|
| |
|
|
Nomura Real Estate Holdings, Inc. |
|
|
Nomura Real Estate Master Fund, Inc. |
|
|
| |
|
|
| |
|
|
| |
|
|
| |
|
|
| |
|
|
NS United Kaiun Kaisha Ltd. |
|
|
| |
|
|
| |
|
|
NTT UD REIT Investment Corp. |
|
|
| |
|
|
Odakyu Electric Railway Co. Ltd. |
|
|
| |
|
|
| |
|
|
Oki Electric Industry Co. Ltd. |
|
|
Okinawa Cellular Telephone Co. |
|
|
| |
|
|
| |
|
|
| |
|
|
Open House Group Co. Ltd. |
|
|
| |
|
|
| |
|
|
| |
|
|
| |
|
|
| |
|
|
| |
|
|
| |
|
|
| |
|
|
Pacific Industrial Co. Ltd. |
|
|
| |
|
|
Paramount Bed Holdings Co. Ltd. |
|
|
| |
|
|
| |
|
|
Penta-Ocean Construction Co. Ltd. |
|
|
| |
|
|
| |
|
|
| |
|
|
| |
|
|
Pola Orbis Holdings, Inc. |
|
|
| |
|
|
| |
|
|
| |
|
|
| |
|
|
| |
|
|
| |
|
|
| |
|
|
| |
|
|
| |
|
|
| |
|
|
Rohto Pharmaceutical Co. Ltd. |
|
|
| |
|
|
| |
|
|
| |
|
|
| |
|
|
Sakai Moving Service Co. Ltd. |
|
|
| |
|
|
| |
|
|
| |
|
|
| |
|
|
| |
|
|
| |
|
|
Sanken Electric Co. Ltd. * |
|
|
Sanki Engineering Co. Ltd. |
|
|
| |
|
|
Santen Pharmaceutical Co. Ltd. |
|
|
Sanyo Chemical Industries Ltd. |
|
|
| |
|
|
| |
|
|
Sawai Group Holdings Co. Ltd. |
|
|
| |
|
|
| |
|
|
| |
|
|
| |
|
|
Sega Sammy Holdings, Inc. |
|
|
| |
|
|
| |
|
|
| |
|
|
| |
|
|
| |
|
|
| |
|
|
Senko Group Holdings Co. Ltd. |
|
|
| |
|
|
| |
|
|
| |
|
|
Shibaura Machine Co. Ltd. |
|
|
| |
|
|
| |
|
|
Shikoku Electric Power Co., Inc. |
|
|
Shinmaywa Industries Ltd. |
|
|
Ship Healthcare Holdings, Inc. |
|
|
Shizuoka Financial Group, Inc. |
|
|
SHO-BOND Holdings Co. Ltd. |
|
|
| |
|
|
| |
|
|
| |
|
|
SKY Perfect JSAT Holdings, Inc. |
|
|
Skylark Holdings Co. Ltd. |
|
|
| |
|
|
| |
|
|
Square Enix Holdings Co. Ltd. |
|
|
| |
|
|
| |
|
|
Sumitomo Bakelite Co. Ltd. |
|
|
50
Schwab Fundamental Index Funds | Annual Holdings and Financial Statements
Schwab Fundamental International Small Equity Index Fund
Portfolio Holdings as of October 31, 2025 (continued)
| |
|
|
Sumitomo Densetsu Co. Ltd. |
|
|
Sumitomo Osaka Cement Co. Ltd. |
|
|
Sumitomo Pharma Co. Ltd. * |
|
|
| |
|
|
Sumitomo Warehouse Co. Ltd. |
|
|
| |
|
|
| |
|
|
| |
|
|
| |
|
|
Tachibana Eletech Co. Ltd. |
|
|
| |
|
|
Taihei Dengyo Kaisha Ltd. |
|
|
| |
|
|
| |
|
|
Takamatsu Construction Group Co. Ltd. |
|
|
| |
|
|
| |
|
|
Takasago International Corp. |
|
|
Takasago Thermal Engineering Co. Ltd. |
|
|
| |
|
|
Takeuchi Manufacturing Co. Ltd. |
|
|
| |
|
|
| |
|
|
| |
|
|
| |
|
|
| |
|
|
| |
|
|
| |
|
|
| |
|
|
| |
|
|
| |
|
|
| |
|
|
| |
|
|
| |
|
|
| |
|
|
| |
|
|
| |
|
|
| |
|
|
| |
|
|
| |
|
|
| |
|
|
Tokyo Kiraboshi Financial Group, Inc. |
|
|
| |
|
|
Tokyo Ohka Kogyo Co. Ltd. |
|
|
| |
|
|
Tokyo Steel Manufacturing Co. Ltd. |
|
|
| |
|
|
Tokyu Construction Co. Ltd. |
|
|
| |
|
|
| |
|
|
| |
|
|
| |
|
|
| |
|
|
Towa Pharmaceutical Co. Ltd. |
|
|
Toyo Construction Co. Ltd. |
|
|
| |
|
|
| |
|
|
| |
|
|
| |
|
|
| |
|
|
| |
|
|
| |
|
|
| |
|
|
| |
|
|
| |
|
|
| |
|
|
| |
|
|
| |
|
|
| |
|
|
| |
|
|
| |
|
|
| |
|
|
United Super Markets Holdings, Inc. |
|
|
United Urban Investment Corp. |
|
|
| |
|
|
| |
|
|
| |
|
|
| |
|
|
| |
|
|
| |
|
|
| |
|
|
| |
|
|
| |
|
|
| |
|
|
Yamae Group Holdings Co. Ltd. |
|
|
Yamaguchi Financial Group, Inc. |
|
|
| |
|
|
| |
|
|
| |
|
|
| |
|
|
Yokogawa Bridge Holdings Corp. |
|
|
Yokohama Financial Group, Inc. |
|
|
Yoshinoya Holdings Co. Ltd. |
|
|
| |
|
|
| |
|
|
| |
|
|
| |
|
|
| |
|
|
| |
|
|
| |
|
|
| |
|
|
| |
|
|
| |
| |
| |
|
|
| |
|
|
International Workplace Group PLC |
|
|
| |
|
|
| |
|
|
| |
|
|
| |
| |
| |
|
|
| |
|
|
| |
|
|
| |
|
|
| |
|
|
| |
|
|
| |
|
|
| |
|
|
| |
|
|
| |
|
|
| |
| |
| |
|
|
| |
|
|
| |
|
|
| |
| |
| |
|
|
| |
|
|
| |
|
|
| |
|
|
Schwab Fundamental Index Funds | Annual Holdings and Financial Statements
51
Schwab Fundamental International Small Equity Index Fund
Portfolio Holdings as of October 31, 2025 (continued)
| |
|
|
BE Semiconductor Industries NV |
|
|
| |
|
|
| |
|
|
| |
|
|
| |
|
|
| |
|
|
Eurocommercial Properties NV |
|
|
| |
|
|
| |
|
|
| |
|
|
| |
|
|
| |
|
|
| |
|
|
| |
|
|
| |
|
|
| |
|
|
MFE-MediaForEurope NV, Class A |
|
|
MFE-MediaForEurope NV, Class B |
|
|
| |
|
|
| |
|
|
| |
|
|
| |
|
|
| |
|
|
| |
|
|
| |
|
|
| |
|
|
| |
|
|
| |
| |
| |
|
|
| |
|
|
Auckland International Airport Ltd. |
|
|
| |
|
|
| |
|
|
| |
|
|
Fisher & Paykel Healthcare Corp. Ltd. |
|
|
| |
|
|
| |
|
|
| |
|
|
| |
|
|
| |
|
|
SKYCITY Entertainment Group Ltd. * |
|
|
| |
|
|
| |
|
|
| |
| |
| |
|
|
| |
|
|
| |
|
|
| |
|
|
| |
|
|
| |
|
|
| |
|
|
| |
|
|
| |
|
|
| |
|
|
| |
|
|
Gjensidige Forsikring ASA |
|
|
| |
|
|
| |
|
|
| |
|
|
| |
|
|
| |
|
|
Nordic Semiconductor ASA * |
|
|
Norwegian Air Shuttle ASA |
|
|
| |
|
|
| |
|
|
| |
|
|
| |
|
|
| |
|
|
| |
|
|
| |
|
|
| |
|
|
SpareBank 1 Sor-Norge ASA |
|
|
| |
|
|
| |
|
|
| |
|
|
| |
|
|
| |
|
|
| |
|
|
| |
|
|
Vend Marketplaces ASA, B Shares |
|
|
| |
|
|
Wilh Wilhelmsen Holding ASA, Class A |
|
|
Wilh Wilhelmsen Holding ASA, Class B |
|
|
| |
|
|
| |
| |
| |
|
|
| |
|
|
| |
|
|
| |
|
|
| |
|
|
| |
|
|
| |
|
|
| |
|
|
| |
|
|
| |
|
|
| |
|
|
| |
|
|
Jastrzebska Spolka Weglowa SA * |
|
|
| |
|
|
| |
|
|
| |
|
|
| |
|
|
| |
|
|
Tauron Polska Energia SA * |
|
|
| |
|
|
| |
| |
Banco Comercial Portugues SA, Class R |
|
|
| |
|
|
| |
|
|
REN - Redes Energeticas Nacionais SGPS SA |
|
|
| |
|
|
| |
|
|
| |
| |
| |
|
|
Amorepacific Holdings Corp. |
|
|
| |
|
|
| |
|
|
| |
|
|
| |
|
|
| |
|
|
| |
|
|
| |
|
|
| |
|
|
| |
|
|
Daeduck Electronics Co. Ltd. |
|
|
| |
|
|
52
Schwab Fundamental Index Funds | Annual Holdings and Financial Statements
Schwab Fundamental International Small Equity Index Fund
Portfolio Holdings as of October 31, 2025 (continued)
| |
|
|
Daewoo Engineering & Construction Co. Ltd. * |
|
|
Daishin Securities Co. Ltd. |
|
|
| |
|
|
| |
|
|
| |
|
|
| |
|
|
| |
|
|
Dongjin Semichem Co. Ltd. |
|
|
Dongwon Industries Co. Ltd. |
|
|
| |
|
|
| |
|
|
DoubleDown Interactive Co. Ltd., ADR * |
|
|
| |
|
|
| |
|
|
| |
|
|
| |
|
|
| |
|
|
GS Engineering & Construction Corp. |
|
|
| |
|
|
| |
|
|
| |
|
|
| |
|
|
| |
|
|
| |
|
|
Hanwha Aerospace Co. Ltd. |
|
|
Hanwha General Insurance Co. Ltd. * |
|
|
Hanwha Life Insurance Co. Ltd. * |
|
|
| |
|
|
HD Hyundai Construction Equipment Co. Ltd. |
|
|
HD Hyundai Infracore Co. Ltd. * |
|
|
| |
|
|
HD Korea Shipbuilding & Offshore Engineering Co. Ltd. |
|
|
| |
|
|
HDC Hyundai Development Co-Engineering & Construction, Class E |
|
|
| |
|
|
| |
|
|
| |
|
|
HS Hyosung Advanced Materials Corp. |
|
|
| |
|
|
| |
|
|
| |
|
|
Hyundai Department Store Co. Ltd. |
|
|
Hyundai Elevator Co. Ltd. |
|
|
| |
|
|
Hyundai Home Shopping Network Corp. |
|
|
Hyundai Marine & Fire Insurance Co. Ltd. * |
|
|
| |
|
|
| |
|
|
iM Financial Group Co. Ltd. |
|
|
| |
|
|
| |
|
|
JB Financial Group Co. Ltd. |
|
|
| |
|
|
| |
|
|
| |
|
|
| |
|
|
KEPCO Plant Service & Engineering Co. Ltd. |
|
|
| |
|
|
| |
|
|
KIWOOM Securities Co. Ltd. |
|
|
| |
|
|
| |
|
|
Korea Aerospace Industries Ltd. |
|
|
Korea Investment Holdings Co. Ltd. |
|
|
Korea Petrochemical Ind Co. Ltd. |
|
|
| |
|
|
| |
|
|
| |
|
|
Kwang Dong Pharmaceutical Co. Ltd. |
|
|
| |
|
|
LG Energy Solution Ltd. * |
|
|
Lotte Chilsung Beverage Co. Ltd. |
|
|
| |
|
|
LOTTE Fine Chemical Co. Ltd. |
|
|
| |
|
|
| |
|
|
| |
|
|
| |
|
|
| |
|
|
| |
|
|
| |
|
|
Macquarie Korea Infrastructure Fund |
|
|
| |
|
|
Meritz Financial Group, Inc. |
|
|
Mirae Asset Securities Co. Ltd. |
|
|
| |
|
|
| |
|
|
| |
|
|
NH Investment & Securities Co. Ltd. |
|
|
| |
|
|
| |
|
|
| |
|
|
| |
|
|
| |
|
|
| |
|
|
| |
|
|
| |
|
|
| |
|
|
| |
|
|
POSCO Future M Co. Ltd. * |
|
|
Posco International Corp. |
|
|
| |
|
|
| |
|
|
Samsung Biologics Co. Ltd. *(a) |
|
|
| |
|
|
| |
|
|
Samsung Heavy Industries Co. Ltd. * |
|
|
Samsung Life Insurance Co. Ltd. |
|
|
Samsung Securities Co. Ltd. |
|
|
Samyang Holdings Corp. *(a) |
|
|
| |
|
|
SeAH Besteel Holdings Corp. |
|
|
SeAH Steel Holdings Corp. |
|
|
| |
|
|
Seoul Semiconductor Co. Ltd. * |
|
|
| |
|
|
| |
|
|
| |
|
|
| |
|
|
| |
|
|
| |
|
|
| |
|
|
| |
|
|
| |
|
|
| |
|
|
| |
|
|
| |
|
|
Taekwang Industrial Co. Ltd. |
|
|
Taihan Cable & Solution Co. Ltd. * |
|
|
| |
|
|
Schwab Fundamental Index Funds | Annual Holdings and Financial Statements
53
Schwab Fundamental International Small Equity Index Fund
Portfolio Holdings as of October 31, 2025 (continued)
| |
|
|
| |
|
|
| |
|
|
Youngone Holdings Co. Ltd. |
|
|
| |
|
|
| |
|
|
| |
| |
| |
|
|
| |
|
|
| |
|
|
CapitaLand Integrated Commercial Trust |
|
|
CapitaLand Investment Ltd. |
|
|
| |
|
|
| |
|
|
Frasers Logistics & Commercial Trust |
|
|
| |
|
|
Grab Holdings Ltd., Class A * |
|
|
| |
|
|
Hutchison Port Holdings Trust, U Shares |
|
|
| |
|
|
Jardine Cycle & Carriage Ltd. |
|
|
Keppel Infrastructure Trust |
|
|
| |
|
|
Mapletree Industrial Trust |
|
|
Mapletree Logistics Trust |
|
|
Mapletree Pan Asia Commercial Trust |
|
|
| |
|
|
| |
|
|
| |
|
|
| |
|
|
| |
|
|
| |
|
|
| |
|
|
| |
|
|
Singapore Technologies Engineering Ltd. |
|
|
| |
|
|
| |
|
|
| |
|
|
| |
|
|
| |
| |
Abengoa SA, B Shares *(a) |
|
|
| |
|
|
| |
|
|
Atresmedia Corp. de Medios de Comunicacion SA |
|
|
| |
|
|
| |
|
|
| |
|
|
| |
|
|
Construcciones y Auxiliar de Ferrocarriles SA |
|
|
Corp. ACCIONA Energias Renovables SA |
|
|
| |
|
|
| |
|
|
| |
|
|
| |
|
|
Ence Energia y Celulosa SA (b) |
|
|
| |
|
|
| |
|
|
| |
|
|
Grupo Catalana Occidente SA |
|
|
| |
|
|
Linea Directa Aseguradora SA Cia de Seguros y Reaseguros |
|
|
| |
|
|
| |
|
|
| |
|
|
Merlin Properties Socimi SA |
|
|
| |
|
|
Prosegur Cia de Seguridad SA |
|
|
| |
|
|
| |
|
|
| |
|
|
| |
|
|
| |
|
|
| |
|
|
| |
| |
| |
|
|
| |
|
|
| |
|
|
| |
|
|
| |
|
|
| |
|
|
| |
|
|
| |
|
|
Asmodee Group AB, Class B * |
|
|
| |
|
|
| |
|
|
| |
|
|
| |
|
|
| |
|
|
| |
|
|
| |
|
|
| |
|
|
| |
|
|
| |
|
|
Corem Property Group AB, B Shares |
|
|
| |
|
|
Electrolux Professional AB, B Shares |
|
|
| |
|
|
| |
|
|
| |
|
|
| |
|
|
| |
|
|
Fastighets AB Balder, B Shares * |
|
|
| |
|
|
| |
|
|
| |
|
|
| |
|
|
| |
|
|
Investment AB Latour, B Shares |
|
|
| |
|
|
| |
|
|
Lagercrantz Group AB, B Shares |
|
|
| |
|
|
| |
|
|
| |
|
|
| |
|
|
| |
|
|
| |
|
|
| |
|
|
New Wave Group AB, B Shares |
|
|
Nibe Industrier AB, B Shares |
|
|
| |
|
|
| |
|
|
| |
|
|
| |
|
|
| |
|
|
| |
|
|
Samhallsbyggnadsbolaget i Norden AB * |
|
|
| |
|
|
| |
|
|
54
Schwab Fundamental Index Funds | Annual Holdings and Financial Statements
Schwab Fundamental International Small Equity Index Fund
Portfolio Holdings as of October 31, 2025 (continued)
| |
|
|
| |
|
|
Svenska Cellulosa AB SCA, B Shares |
|
|
| |
|
|
Swedish Orphan Biovitrum AB * |
|
|
| |
|
|
| |
|
|
| |
|
|
| |
| |
| |
|
|
| |
|
|
| |
|
|
| |
|
|
| |
|
|
| |
|
|
Banque Cantonale Vaudoise |
|
|
| |
|
|
| |
|
|
BeOne Medicines Ltd., Class H * |
|
|
| |
|
|
Bossard Holding AG, Class A |
|
|
| |
|
|
Burckhardt Compression Holding AG |
|
|
| |
|
|
| |
|
|
| |
|
|
| |
|
|
| |
|
|
| |
|
|
| |
|
|
| |
|
|
| |
|
|
| |
|
|
| |
|
|
| |
|
|
| |
|
|
| |
|
|
| |
|
|
| |
|
|
| |
|
|
| |
|
|
| |
|
|
| |
|
|
| |
|
|
| |
|
|
| |
|
|
| |
|
|
| |
|
|
OC Oerlikon Corp. AG Pfaffikon |
|
|
| |
|
|
| |
|
|
| |
|
|
| |
|
|
| |
|
|
| |
|
|
St. Galler Kantonalbank AG |
|
|
| |
|
|
| |
|
|
| |
|
|
| |
|
|
Swissquote Group Holding SA |
|
|
| |
|
|
| |
|
|
| |
|
|
| |
|
|
| |
|
|
| |
|
|
| |
|
|
| |
| |
| |
|
|
| |
| |
| |
|
|
| |
|
|
| |
|
|
| |
|
|
| |
|
|
| |
|
|
| |
|
|
Babcock International Group PLC |
|
|
| |
|
|
| |
|
|
| |
|
|
| |
|
|
| |
|
|
| |
|
|
| |
|
|
| |
|
|
| |
|
|
Close Brothers Group PLC * |
|
|
| |
|
|
| |
|
|
| |
|
|
| |
|
|
Crest Nicholson Holdings PLC |
|
|
| |
|
|
| |
|
|
| |
|
|
Diversified Energy Co. PLC |
|
|
| |
|
|
| |
|
|
| |
|
|
| |
|
|
| |
|
|
| |
|
|
| |
|
|
| |
|
|
| |
|
|
| |
|
|
| |
|
|
| |
|
|
| |
|
|
| |
|
|
| |
|
|
| |
|
|
| |
|
|
| |
|
|
| |
|
|
| |
|
|
| |
|
|
| |
|
|
| |
|
|
| |
|
|
Hikma Pharmaceuticals PLC |
|
|
| |
|
|
| |
|
|
| |
|
|
| |
|
|
| |
|
|
| |
|
|
| |
|
|
Schwab Fundamental Index Funds | Annual Holdings and Financial Statements
55
Schwab Fundamental International Small Equity Index Fund
Portfolio Holdings as of October 31, 2025 (continued)
| |
|
|
| |
|
|
InterContinental Hotels Group PLC |
|
|
| |
|
|
| |
|
|
| |
|
|
| |
|
|
| |
|
|
Johnson Service Group PLC |
|
|
Jupiter Fund Management PLC |
|
|
| |
|
|
| |
|
|
| |
|
|
| |
|
|
Land Securities Group PLC |
|
|
| |
|
|
LondonMetric Property PLC |
|
|
| |
|
|
Mitchells & Butlers PLC * |
|
|
| |
|
|
| |
|
|
| |
|
|
Morgan Advanced Materials PLC |
|
|
| |
|
|
| |
|
|
| |
|
|
| |
|
|
| |
|
|
| |
|
|
Paragon Banking Group PLC |
|
|
| |
|
|
| |
|
|
Pinewood Technologies Group PLC * |
|
|
Polar Capital Holdings PLC |
|
|
| |
|
|
Primary Health Properties PLC |
|
|
| |
|
|
| |
|
|
| |
|
|
| |
|
|
| |
|
|
| |
|
|
| |
|
|
| |
|
|
| |
|
|
| |
|
|
| |
|
|
| |
|
|
| |
|
|
| |
|
|
| |
|
|
| |
|
|
| |
|
|
| |
|
|
| |
|
|
| |
|
|
Spire Healthcare Group PLC |
|
|
| |
|
|
| |
|
|
| |
|
|
| |
|
|
| |
|
|
| |
|
|
| |
|
|
| |
|
|
| |
|
|
| |
|
|
| |
|
|
| |
|
|
| |
|
|
| |
|
|
Watches of Switzerland Group PLC * |
|
|
| |
|
|
| |
|
|
| |
|
|
| |
|
|
| |
|
|
| |
| |
Coronado Global Resources, Inc., CDI (b) |
|
|
Kulicke & Soffa Industries, Inc. |
|
|
Magnachip Semiconductor Corp. * |
|
|
Mercer International, Inc. |
|
|
SolarEdge Technologies, Inc. * |
|
|
| |
|
|
Total Common Stocks
(Cost $460,755,572) |
|
| |
PREFERRED STOCKS 0.5% OF NET ASSETS |
| |
| |
Draegerwerk AG & Co. KGaA |
|
|
| |
|
|
| |
|
|
| |
|
|
| |
|
|
| |
|
|
| |
|
|
| |
| |
Danieli & C Officine Meccaniche SpA - RSP |
|
|
| |
| |
| |
|
|
Daishin Securities Co. Ltd. |
|
|
| |
|
|
Total Preferred Stocks
(Cost $2,169,980) |
|
| |
RIGHTS 0.0% OF NET ASSETS |
| |
| |
| |
expires 11/10/25, strike CHF 17.00 *(b) |
|
|
| |
| |
| |
expires 11/13/25, strike NOK 0.50 *(a) |
|
|
| |
| |
| |
| |
|
|
Total Rights
(Cost $51,154) |
|
| |
56
Schwab Fundamental Index Funds | Annual Holdings and Financial Statements
Schwab Fundamental International Small Equity Index Fund
Portfolio Holdings as of October 31, 2025 (continued)
| |
|
|
WARRANTS 0.0% OF NET ASSETS |
| |
| |
| |
| |
|
|
| |
|
| |
|
|
SHORT-TERM INVESTMENTS 0.5% OF NET ASSETS |
| |
| |
State Street Institutional U.S. Government Money Market Fund, Premier Class 4.01% (c)(d) |
|
|
Total Short-Term Investments
(Cost $3,363,911) |
|
Total Investments in Securities
(Cost $466,340,617) |
|
| |
|
|
CURRENT VALUE/
UNREALIZED
APPRECIATION
($) |
| |
| |
|
|
|
MSCI EAFE Index, expires 12/19/25 |
|
|
|
| |
Non-income producing security. |
| |
Fair valued using significant unobservable inputs (see financial note 2(a), Securities for which no quoted value is available, for additional information). |
| |
All or a portion of this security is on loan. Securities on loan were valued at $3,124,553. |
| |
The rate shown is the annualized 7-day yield. |
| |
Security purchased with cash collateral received for securities on loan. |
| |
American Depositary Receipt |
| |
CHESS Depositary Interest |
| |
|
| |
Real Estate Investment Trust |
| |
Risparmio (Savings Shares) |
| |
|
| |
|
The following is a summary of the inputs used to value the fund’s investments as of October 31, 2025 (see financial note 2(a) for additional information):
| |
QUOTED PRICES IN
ACTIVE MARKETS FOR
IDENTICAL ASSETS
(LEVEL 1) |
OTHER SIGNIFICANT
OBSERVABLE INPUTS
(LEVEL 2) |
SIGNIFICANT
UNOBSERVABLE INPUTS
(LEVEL 3) |
|
| |
|
|
|
|
| |
|
|
|
|
| |
|
|
|
|
| |
|
|
|
|
| |
|
|
|
|
| |
|
|
|
|
| |
|
|
|
|
| |
|
|
|
|
| |
|
|
|
|
| |
|
|
|
|
| |
|
|
|
|
Schwab Fundamental Index Funds | Annual Holdings and Financial Statements
57
Schwab Fundamental International Small Equity Index Fund
Portfolio Holdings as of October 31, 2025 (continued)
| |
QUOTED PRICES IN ACTIVE MARKETS FOR IDENTICAL ASSETS (LEVEL 1) |
OTHER SIGNIFICANT OBSERVABLE INPUTS (LEVEL 2) |
SIGNIFICANT UNOBSERVABLE INPUTS (LEVEL 3) |
|
| |
|
|
|
|
| |
|
|
|
|
| |
|
|
|
|
| |
|
|
|
|
| |
|
|
|
|
| |
|
|
|
|
| |
|
|
|
|
| |
|
|
|
|
| |
|
|
|
|
| |
|
|
|
|
| |
|
|
|
|
| |
|
|
|
|
| |
|
|
|
|
| |
|
|
|
|
| |
|
|
|
|
| |
|
|
|
|
| |
|
|
|
|
| |
|
|
|
|
| |
|
|
|
|
| |
|
|
|
|
| |
|
|
|
|
| |
|
|
|
|
| |
|
|
|
|
| |
|
|
|
|
| |
|
|
|
|
| |
|
|
|
|
| |
|
|
|
|
| |
|
|
|
|
| |
|
|
|
|
| |
|
|
|
|
| |
Level 3 amount shown includes securities determined to have no value at October 31, 2025. |
| |
As categorized in the Portfolio Holdings. |
| |
Futures contracts are reported at cumulative unrealized appreciation or depreciation. |
58
Schwab Fundamental Index Funds | Annual Holdings and Financial Statements
Schwab Fundamental International Small Equity Index Fund
Statement of Assets and Liabilities
| |
Investments in securities, at value - unaffiliated issuers (cost $466,340,617) including securities on loan of $3,124,553 |
|
|
| |
|
|
Foreign currency, at value (cost $832,474) |
|
|
Deposit with broker for futures contracts |
|
|
| |
|
|
| |
|
|
| |
|
|
| |
|
|
Income from securities on loan |
|
|
| |
|
|
| |
| |
Collateral held for securities on loan |
|
|
| |
|
|
| |
|
|
| |
|
|
| |
|
|
Variation margin on futures contracts |
|
|
| |
|
|
| |
|
|
| |
| |
Capital received from investors |
|
|
Total distributable earnings |
|
|
| |
|
|
Schwab Fundamental Index Funds | Annual Holdings and Financial Statements
59
Schwab Fundamental International Small Equity Index Fund
Statement of Operations
For the period November 1, 2024 through October 31, 2025 |
| |
Dividends received from securities - unaffiliated issuers (net of foreign withholding tax of $2,223,796) |
|
|
| |
|
|
Interest received from securities - unaffiliated issuers |
|
|
| |
|
|
| |
|
|
| |
| |
| |
|
|
| |
|
|
| |
|
|
| |
|
|
| |
|
|
| |
|
|
| |
REALIZED AND UNREALIZED GAINS (LOSSES) |
Net realized gains on sales of securities - unaffiliated issuers |
|
|
Net realized gains on futures contracts |
|
|
Net realized gains on foreign currency transactions |
|
|
| |
|
|
Net change in unrealized appreciation (depreciation) on securities - unaffiliated issuers |
|
|
Net change in unrealized appreciation (depreciation) on futures contracts |
|
|
Net change in unrealized appreciation (depreciation) on foreign currency translations |
|
|
Net change in unrealized appreciation (depreciation) |
|
|
Net realized and unrealized gains |
|
|
Increase in net assets resulting from operations |
|
|
| |
Professional fees associated with the filing of foreign withholding tax claims in the European Union are deemed to be non-contingent and non-routine expenses of the fund (see financial notes 2(d) and 3 for additional information). |
60
Schwab Fundamental Index Funds | Annual Holdings and Financial Statements
Schwab Fundamental International Small Equity Index Fund
Statement of Changes in Net Assets
For the current and prior report periods
| |
| |
|
|
| |
|
|
|
| |
|
|
|
Net change in unrealized appreciation (depreciation) |
|
|
|
Increase in net assets resulting from operations |
|
|
|
| |
DISTRIBUTIONS TO SHAREHOLDERS |
| |
|
|
|
TRANSACTIONS IN FUND SHARES |
| |
|
|
| |
|
|
|
|
|
| |
|
|
|
|
|
| |
|
|
|
|
|
| |
|
|
|
|
|
Net transactions in fund shares |
|
|
|
|
|
| |
SHARES OUTSTANDING AND NET ASSETS |
| |
|
|
| |
|
|
|
|
|
| |
|
|
|
|
|
Total increase (decrease) |
|
|
|
|
|
| |
|
|
|
|
|
Schwab Fundamental Index Funds | Annual Holdings and Financial Statements
61
Schwab Fundamental Emerging Markets Equity Index Fund
Financial Statements
| |
|
|
|
|
|
|
| |
Net asset value at beginning of period |
|
|
|
|
|
|
Income (loss) from investment operations: |
|
|
|
|
|
|
Net investment income (loss)1 |
|
|
|
|
|
|
Net realized and unrealized gains (losses) |
|
|
|
|
|
|
Total from investment operations |
|
|
|
|
|
|
| |
|
|
|
|
|
|
Distributions from net investment income |
|
|
|
|
|
|
Net asset value at end of period |
|
|
|
|
|
|
| |
|
|
|
|
|
|
| |
Ratios to average net assets: |
|
|
|
|
|
|
| |
|
|
|
|
|
|
Net investment income (loss) |
|
|
|
|
|
|
| |
|
|
|
|
|
|
Net assets, end of period (x 1,000,000) |
|
|
|
|
|
|
| |
Calculated based on the average shares outstanding during the period. |
| |
Ratio includes less than 0.005% of non-routine proxy expenses. |
62
Schwab Fundamental Index Funds | Annual Holdings and Financial Statements
Schwab Fundamental Emerging Markets Equity Index Fund
Portfolio Holdings as of October 31, 2025
| |
|
|
COMMON STOCKS 95.1% OF NET ASSETS |
| |
| |
| |
|
|
B3 SA - Brasil Bolsa Balcao |
|
|
| |
|
|
| |
|
|
Banco Santander Brasil SA |
|
|
Centrais Eletricas Brasileiras SA |
|
|
Cia de Saneamento Basico do Estado de Sao Paulo SABESP |
|
|
Cia Energetica de Minas Gerais |
|
|
Cia Paranaense de Energia - Copel |
|
|
Cia Siderurgica Nacional SA |
|
|
| |
|
|
| |
|
|
| |
|
|
| |
|
|
| |
|
|
| |
|
|
| |
|
|
Petroleo Brasileiro SA - Petrobras |
|
|
| |
|
|
| |
|
|
Ultrapar Participacoes SA |
|
|
| |
|
|
| |
|
|
| |
|
|
| |
| |
| |
|
|
| |
|
|
| |
|
|
| |
|
|
| |
|
|
| |
|
|
| |
| |
Agile Group Holdings Ltd. * |
|
|
Agricultural Bank of China Ltd., A Shares |
|
|
Agricultural Bank of China Ltd., H Shares |
|
|
Alibaba Group Holding Ltd. |
|
|
Aluminum Corp. of China Ltd., A Shares |
|
|
Aluminum Corp. of China Ltd., H Shares |
|
|
Anhui Conch Cement Co. Ltd., A Shares |
|
|
Anhui Conch Cement Co. Ltd., H Shares |
|
|
ANTA Sports Products Ltd. |
|
|
BAIC Motor Corp. Ltd., H Shares * |
|
|
| |
|
|
Bank of Beijing Co. Ltd., A Shares |
|
|
Bank of China Ltd., A Shares |
|
|
Bank of China Ltd., H Shares |
|
|
Bank of Communications Co. Ltd., A Shares |
|
|
Bank of Communications Co. Ltd., H Shares |
|
|
BOE Technology Group Co. Ltd., A Shares |
|
|
| |
|
|
| |
|
|
CGN Power Co. Ltd., A Shares |
|
|
CGN Power Co. Ltd., H Shares |
|
|
| |
|
|
China CITIC Bank Corp. Ltd., A Shares |
|
|
China CITIC Bank Corp. Ltd., H Shares |
|
|
China Coal Energy Co. Ltd., A Shares |
|
|
China Coal Energy Co. Ltd., H Shares |
|
|
China Communications Services Corp. Ltd., H Shares |
|
|
China Construction Bank Corp., A Shares |
|
|
China Construction Bank Corp., H Shares |
|
|
China Everbright Bank Co. Ltd., A Shares |
|
|
China Everbright Bank Co. Ltd., H Shares |
|
|
China Hongqiao Group Ltd. |
|
|
China Life Insurance Co. Ltd., A Shares |
|
|
China Life Insurance Co. Ltd., H Shares |
|
|
China Mengniu Dairy Co. Ltd. |
|
|
China Merchants Bank Co. Ltd., A Shares |
|
|
China Merchants Bank Co. Ltd., H Shares |
|
|
China Minsheng Banking Corp. Ltd., A Shares |
|
|
China Minsheng Banking Corp. Ltd., H Shares |
|
|
China National Building Material Co. Ltd., H Shares |
|
|
China Pacific Insurance Group Co. Ltd., A Shares |
|
|
China Pacific Insurance Group Co. Ltd., H Shares |
|
|
China Petroleum & Chemical Corp., A Shares |
|
|
China Petroleum & Chemical Corp., H Shares |
|
|
China Railway Group Ltd., A Shares |
|
|
China Railway Group Ltd., H Shares |
|
|
China Resources Gas Group Ltd. |
|
|
China Resources Land Ltd. |
|
|
China Shenhua Energy Co. Ltd., A Shares |
|
|
China Shenhua Energy Co. Ltd., H Shares |
|
|
China State Construction Engineering Corp. Ltd., A Shares |
|
|
China Tower Corp. Ltd., H Shares |
|
|
China United Network Communications Ltd., A Shares |
|
|
China Vanke Co. Ltd., A Shares * |
|
|
China Vanke Co. Ltd., H Shares *(a) |
|
|
China Yongda Automobiles Services Holdings Ltd. |
|
|
CITIC Securities Co. Ltd., A Shares |
|
|
CITIC Securities Co. Ltd., H Shares |
|
|
COSCO SHIPPING Holdings Co. Ltd., A Shares |
|
|
COSCO SHIPPING Holdings Co. Ltd., H Shares |
|
|
CRRC Corp. Ltd., A Shares |
|
|
CRRC Corp. Ltd., H Shares |
|
|
Daqo New Energy Corp., ADR * |
|
|
| |
|
|
Geely Automobile Holdings Ltd. |
|
|
Gree Electric Appliances, Inc. of Zhuhai, A Shares |
|
|
Schwab Fundamental Index Funds | Annual Holdings and Financial Statements
63
Schwab Fundamental Emerging Markets Equity Index Fund
Portfolio Holdings as of October 31, 2025 (continued)
| |
|
|
Guangzhou R&F Properties Co. Ltd., H Shares *(a) |
|
|
Haier Smart Home Co. Ltd., A Shares |
|
|
Haier Smart Home Co. Ltd., H Shares |
|
|
| |
|
|
Huaneng Power International, Inc., A Shares |
|
|
Huaneng Power International, Inc., H Shares |
|
|
Industrial & Commercial Bank of China Ltd., A Shares |
|
|
Industrial & Commercial Bank of China Ltd., H Shares |
|
|
Industrial Bank Co. Ltd., A Shares |
|
|
| |
|
|
| |
|
|
Jiangxi Copper Co. Ltd., A Shares |
|
|
Jiangxi Copper Co. Ltd., H Shares |
|
|
JinkoSolar Holding Co. Ltd., ADR |
|
|
| |
|
|
| |
|
|
Kweichow Moutai Co. Ltd., A Shares |
|
|
| |
|
|
Longfor Group Holdings Ltd. |
|
|
Lufax Holding Ltd., ADR * |
|
|
| |
|
|
Midea Group Co. Ltd., A Shares |
|
|
| |
|
|
PDD Holdings, Inc., ADR * |
|
|
People's Insurance Co. Group of China Ltd., A Shares |
|
|
People's Insurance Co. Group of China Ltd., H Shares |
|
|
PetroChina Co. Ltd., A Shares |
|
|
PetroChina Co. Ltd., H Shares |
|
|
PICC Property & Casualty Co. Ltd., H Shares |
|
|
Ping An Bank Co. Ltd., A Shares |
|
|
Ping An Insurance Group Co. of China Ltd., A Shares |
|
|
Ping An Insurance Group Co. of China Ltd., H Shares |
|
|
Poly Developments & Holdings Group Co. Ltd., A Shares |
|
|
Postal Savings Bank of China Co. Ltd., A Shares |
|
|
Postal Savings Bank of China Co. Ltd., H Shares |
|
|
| |
|
|
Shanghai Pudong Development Bank Co. Ltd., A Shares |
|
|
Shenzhou International Group Holdings Ltd. |
|
|
Sinopharm Group Co. Ltd., H Shares |
|
|
Sunac China Holdings Ltd. *(a) |
|
|
Sunny Optical Technology Group Co. Ltd. |
|
|
| |
|
|
Vipshop Holdings Ltd., ADR |
|
|
Weichai Power Co. Ltd., A Shares |
|
|
Weichai Power Co. Ltd., H Shares |
|
|
| |
|
|
Yankuang Energy Group Co. Ltd., A Shares |
|
|
Yankuang Energy Group Co. Ltd., H Shares |
|
|
Zhongsheng Group Holdings Ltd. |
|
|
| |
|
|
Zijin Mining Group Co. Ltd., A Shares |
|
|
Zijin Mining Group Co. Ltd., H Shares |
|
|
| |
|
|
ZTO Express Cayman, Inc., ADR |
|
|
| |
|
|
| |
| |
| |
|
|
| |
|
|
| |
|
|
| |
| |
| |
|
|
| |
| |
| |
|
|
Motor Oil Hellas Corinth Refineries SA |
|
|
National Bank of Greece SA |
|
|
| |
|
|
| |
| |
BOC Hong Kong Holdings Ltd. |
|
|
China Everbright Environment Group Ltd. |
|
|
China Jinmao Holdings Group Ltd. |
|
|
China Overseas Land & Investment Ltd. |
|
|
China Resources Power Holdings Co. Ltd. |
|
|
China Taiping Insurance Holdings Co. Ltd. |
|
|
| |
|
|
CSPC Pharmaceutical Group Ltd. |
|
|
| |
|
|
| |
|
|
Orient Overseas International Ltd. |
|
|
| |
|
|
| |
| |
MOL Hungarian Oil & Gas PLC |
|
|
| |
|
|
| |
|
|
| |
| |
| |
|
|
| |
|
|
Bharat Petroleum Corp. Ltd. |
|
|
| |
|
|
| |
|
|
| |
|
|
| |
|
|
| |
|
|
| |
|
|
| |
|
|
Hindustan Petroleum Corp. Ltd. |
|
|
| |
|
|
| |
|
|
| |
|
|
| |
|
|
| |
|
|
| |
|
|
| |
|
|
| |
|
|
64
Schwab Fundamental Index Funds | Annual Holdings and Financial Statements
Schwab Fundamental Emerging Markets Equity Index Fund
Portfolio Holdings as of October 31, 2025 (continued)
| |
|
|
| |
|
|
| |
|
|
| |
|
|
| |
|
|
| |
|
|
Oil & Natural Gas Corp. Ltd. |
|
|
| |
|
|
Power Grid Corp. of India Ltd. |
|
|
| |
|
|
| |
|
|
| |
|
|
| |
|
|
Steel Authority of India Ltd. |
|
|
Sun Pharmaceutical Industries Ltd. |
|
|
Tata Consultancy Services Ltd. |
|
|
| |
|
|
Tata Motors Passenger Vehicles Limited |
|
|
| |
|
|
| |
|
|
| |
|
|
| |
|
|
| |
|
|
| |
|
|
| |
|
|
| |
| |
Alamtri Resources Indonesia Tbk. PT |
|
|
Astra International Tbk. PT |
|
|
Bank Central Asia Tbk. PT |
|
|
Bank Mandiri Persero Tbk. PT |
|
|
Bank Rakyat Indonesia Persero Tbk. PT |
|
|
Telkom Indonesia Persero Tbk. PT, Class B |
|
|
| |
|
|
| |
|
|
| |
| |
Kuwait Finance House KSCP |
|
|
Mobile Telecommunications Co. KSCP |
|
|
National Bank of Kuwait SAKP |
|
|
| |
|
|
| |
| |
| |
|
|
| |
|
|
| |
|
|
| |
|
|
| |
|
|
| |
|
|
| |
|
|
| |
| |
| |
|
|
America Movil SAB de CV, Series B |
|
|
Cemex SAB de CV, Series CPO |
|
|
Controladora Alpek SAB de CV * |
|
|
Fibra Uno Administracion SA de CV |
|
|
Fomento Economico Mexicano SAB de CV |
|
|
Grupo Bimbo SAB de CV, Series A |
|
|
Grupo Comercial Chedraui SA de CV |
|
|
Grupo Financiero Banorte SAB de CV, O Shares |
|
|
Grupo Mexico SAB de CV, Series B |
|
|
| |
|
|
Grupo Televisa SAB, Series CPO |
|
|
| |
|
|
Orbia Advance Corp. SAB de CV |
|
|
Wal-Mart de Mexico SAB de CV |
|
|
| |
|
|
| |
| |
| |
|
|
| |
| |
| |
|
|
| |
|
|
| |
|
|
| |
|
|
| |
|
|
| |
|
|
| |
| |
| |
|
|
| |
|
|
Saudi Arabian Mining Co. * |
|
|
| |
|
|
Saudi Basic Industries Corp. |
|
|
| |
|
|
| |
|
|
| |
|
|
| |
|
|
| |
| |
| |
|
|
| |
|
|
| |
|
|
| |
|
|
| |
|
|
| |
|
|
Impala Platinum Holdings Ltd. |
|
|
| |
|
|
| |
|
|
| |
|
|
| |
|
|
| |
|
|
| |
|
|
| |
|
|
| |
|
|
Sibanye Stillwater Ltd. * |
|
|
| |
|
|
| |
|
|
| |
|
|
| |
|
|
| |
| |
| |
|
|
ASE Technology Holding Co. Ltd. |
|
|
| |
|
|
| |
|
|
| |
|
|
Catcher Technology Co. Ltd. |
|
|
Cathay Financial Holding Co. Ltd. |
|
|
Chailease Holding Co. Ltd. |
|
|
| |
|
|
Chunghwa Telecom Co. Ltd. |
|
|
| |
|
|
CTBC Financial Holding Co. Ltd. |
|
|
Schwab Fundamental Index Funds | Annual Holdings and Financial Statements
65
Schwab Fundamental Emerging Markets Equity Index Fund
Portfolio Holdings as of October 31, 2025 (continued)
| |
|
|
| |
|
|
E.Sun Financial Holding Co. Ltd. |
|
|
| |
|
|
Evergreen Marine Corp. Taiwan Ltd. |
|
|
Far Eastern New Century Corp. |
|
|
Far EasTone Telecommunications Co. Ltd. |
|
|
First Financial Holding Co. Ltd. |
|
|
Formosa Chemicals & Fibre Corp. |
|
|
Formosa Petrochemical Corp. |
|
|
| |
|
|
Fubon Financial Holding Co. Ltd. |
|
|
Hon Hai Precision Industry Co. Ltd. |
|
|
| |
|
|
| |
|
|
KGI Financial Holding Co. Ltd. |
|
|
Largan Precision Co. Ltd. |
|
|
Lite-On Technology Corp., ADR |
|
|
| |
|
|
Mega Financial Holding Co. Ltd. |
|
|
Micro-Star International Co. Ltd. |
|
|
| |
|
|
Novatek Microelectronics Corp. |
|
|
| |
|
|
| |
|
|
Powertech Technology, Inc. |
|
|
| |
|
|
Realtek Semiconductor Corp. |
|
|
Synnex Technology International Corp. |
|
|
| |
|
|
Taiwan Semiconductor Manufacturing Co. Ltd. |
|
|
TCC Group Holdings Co. Ltd. |
|
|
TS Financial Holding Co. Ltd. |
|
|
Unimicron Technology Corp. |
|
|
Uni-President Enterprises Corp. |
|
|
United Microelectronics Corp. |
|
|
| |
|
|
| |
|
|
| |
|
|
WT Microelectronics Co. Ltd. |
|
|
| |
|
|
Yang Ming Marine Transport Corp. |
|
|
Yuanta Financial Holding Co. Ltd. |
|
|
Zhen Ding Technology Holding Ltd. |
|
|
| |
|
|
| |
| |
Advanced Info Service PCL NVDR |
|
|
| |
|
|
| |
|
|
Charoen Pokphand Foods PCL NVDR |
|
|
| |
|
|
| |
|
|
PTT Exploration & Production PCL NVDR |
|
|
PTT Global Chemical PCL NVDR |
|
|
| |
|
|
| |
|
|
| |
|
|
| |
|
|
| |
|
|
| |
| |
| |
|
|
BIM Birlesik Magazalar AS |
|
|
| |
|
|
Eregli Demir ve Celik Fabrikalari TAS |
|
|
Haci Omer Sabanci Holding AS |
|
|
| |
|
|
| |
|
|
Turkcell Iletisim Hizmetleri AS |
|
|
Turkiye Is Bankasi AS, Class C |
|
|
Turkiye Petrol Rafinerileri AS |
|
|
Yapi ve Kredi Bankasi AS * |
|
|
| |
|
|
| |
United Arab Emirates 0.8% |
Dubai Electricity & Water Authority PJSC |
|
|
| |
|
|
| |
|
|
Emirates Telecommunications Group Co. PJSC |
|
|
First Abu Dhabi Bank PJSC |
|
|
| |
|
|
| |
| |
| |
|
|
Total Common Stocks
(Cost $873,526,954) |
|
| |
PREFERRED STOCKS 4.3% OF NET ASSETS |
| |
| |
| |
|
|
Centrais Eletricas Brasileiras SA, B Shares |
|
|
Cia Energetica de Minas Gerais |
|
|
Cia Paranaense de Energia - Copel, B Shares |
|
|
| |
|
|
| |
|
|
| |
|
|
Petroleo Brasileiro SA - Petrobras |
|
|
| |
|
|
| |
|
|
| |
| |
Sociedad Quimica y Minera de Chile SA, B Shares * |
|
|
| |
| |
| |
|
|
Total Preferred Stocks
(Cost $44,720,477) |
|
66
Schwab Fundamental Index Funds | Annual Holdings and Financial Statements
Schwab Fundamental Emerging Markets Equity Index Fund
Portfolio Holdings as of October 31, 2025 (continued)
| |
|
|
SHORT-TERM INVESTMENTS 0.3% OF NET ASSETS |
| |
| |
State Street Institutional U.S. Government Money Market Fund, Premier Class 4.01% (c)(d) |
|
|
Total Short-Term Investments
(Cost $4,202,472) |
|
Total Investments in Securities
(Cost $922,449,903) |
|
| |
|
|
CURRENT VALUE/
UNREALIZED
APPRECIATION
($) |
| |
| |
|
|
|
MSCI Emerging Markets Index, expires 12/19/25 |
|
|
|
| |
Non-income producing security. |
| |
All or a portion of this security is on loan. Securities on loan were valued at $4,011,521. |
| |
Fair valued using significant unobservable inputs (see financial note 2(a), Securities for which no quoted value is available, for additional information). |
| |
The rate shown is the annualized 7-day yield. |
| |
Security purchased with cash collateral received for securities on loan. |
| |
American Depositary Receipt |
| |
Non-Voting Depositary Receipt |
| |
|
| |
Includes holdings within sectors that are less than 1.0% of net assets. |
The following is a summary of the inputs used to value the fund’s investments as of October 31, 2025 (see financial note 2(a) for additional information):
| |
QUOTED PRICES IN
ACTIVE MARKETS FOR
IDENTICAL ASSETS
(LEVEL 1) |
OTHER SIGNIFICANT
OBSERVABLE INPUTS
(LEVEL 2) |
SIGNIFICANT
UNOBSERVABLE INPUTS
(LEVEL 3) |
|
| |
|
|
|
|
| |
|
|
|
|
| |
|
|
|
|
| |
|
|
|
|
| |
|
|
|
|
| |
|
|
|
|
| |
|
|
|
|
| |
|
|
|
|
| |
|
|
|
|
| |
|
|
|
|
| |
|
|
|
|
| |
|
|
|
|
| |
|
|
|
|
| |
|
|
|
|
| |
|
|
|
|
| |
|
|
|
|
Schwab Fundamental Index Funds | Annual Holdings and Financial Statements
67
Schwab Fundamental Emerging Markets Equity Index Fund
Portfolio Holdings as of October 31, 2025 (continued)
| |
QUOTED PRICES IN ACTIVE MARKETS FOR IDENTICAL ASSETS (LEVEL 1) |
OTHER SIGNIFICANT OBSERVABLE INPUTS (LEVEL 2) |
SIGNIFICANT UNOBSERVABLE INPUTS (LEVEL 3) |
|
| |
|
|
|
|
| |
|
|
|
|
| |
|
|
|
|
| |
|
|
|
|
| |
|
|
|
|
| |
|
|
|
|
| |
|
|
|
|
| |
As categorized in the Portfolio Holdings. |
| |
Futures contracts are reported at cumulative unrealized appreciation or depreciation. |
68
Schwab Fundamental Index Funds | Annual Holdings and Financial Statements
Schwab Fundamental Emerging Markets Equity Index Fund
Statement of Assets and Liabilities
| |
Investments in securities, at value - unaffiliated issuers (cost $922,449,903) including securities on loan of $4,011,521 |
|
|
| |
|
|
Foreign currency, at value (cost $1,129,977) |
|
|
Deposit with broker for futures contracts |
|
|
| |
|
|
| |
|
|
| |
|
|
Income from securities on loan |
|
|
| |
|
|
| |
| |
Collateral held for securities on loan |
|
|
| |
|
|
Foreign capital gains tax |
|
|
| |
|
|
| |
|
|
Variation margin on futures contracts |
|
|
| |
|
|
| |
|
|
| |
| |
Capital received from investors |
|
|
Total distributable earnings |
|
|
| |
|
|
Schwab Fundamental Index Funds | Annual Holdings and Financial Statements
69
Schwab Fundamental Emerging Markets Equity Index Fund
Statement of Operations
For the period November 1, 2024 through October 31, 2025 |
| |
Dividends received from securities - unaffiliated issuers (net of foreign withholding tax of $5,235,608) |
|
|
| |
|
|
| |
|
|
| |
|
|
| |
| |
| |
|
|
| |
|
|
| |
|
|
| |
REALIZED AND UNREALIZED GAINS (LOSSES) |
Net realized gains on sales of securities - unaffiliated issuers (net of foreign capital gains tax paid of $1,223,607) |
|
|
Net realized gains on futures contracts |
|
|
Net realized losses on foreign currency transactions |
|
|
| |
|
|
Net change in unrealized appreciation (depreciation) on securities - unaffiliated issuers (net of change in foreign capital gains tax of $451,777) |
|
|
Net change in unrealized appreciation (depreciation) on futures contracts |
|
|
Net change in unrealized appreciation (depreciation) on foreign currency translations |
|
|
Net change in unrealized appreciation (depreciation) |
|
|
Net realized and unrealized gains |
|
|
Increase in net assets resulting from operations |
|
|
70
Schwab Fundamental Index Funds | Annual Holdings and Financial Statements
Schwab Fundamental Emerging Markets Equity Index Fund
Statement of Changes in Net Assets
For the current and prior report periods
| |
| |
|
|
| |
|
|
|
| |
|
|
|
Net change in unrealized appreciation (depreciation) |
|
|
|
Increase in net assets resulting from operations |
|
|
|
| |
DISTRIBUTIONS TO SHAREHOLDERS |
| |
|
|
|
TRANSACTIONS IN FUND SHARES |
| |
|
|
| |
|
|
|
|
|
| |
|
|
|
|
|
| |
|
|
|
|
|
| |
|
|
|
|
|
Net transactions in fund shares |
|
|
|
|
|
| |
SHARES OUTSTANDING AND NET ASSETS |
| |
|
|
| |
|
|
|
|
|
| |
|
|
|
|
|
| |
|
|
|
|
|
| |
|
|
|
|
|
Schwab Fundamental Index Funds | Annual Holdings and Financial Statements
71
Schwab Fundamental Index Funds
1. Business Structure of the Funds:
Each of the funds in this report is a series of Schwab Capital Trust (the trust), a no-load, open-end management investment company. The trust is organized as a Massachusetts business trust and is registered under the Investment Company Act of 1940, as amended (the 1940 Act). The list below shows all the operational funds in the trust as of the end of the period, including the funds discussed in this report, which are highlighted:
| |
Schwab Fundamental U.S. Large Company Index Fund |
|
Schwab Fundamental U.S. Small Company Index Fund |
|
Schwab Fundamental International Equity Index Fund |
|
Schwab Fundamental International Small Equity Index Fund |
|
Schwab Fundamental Emerging Markets Equity Index Fund |
|
Schwab Fundamental Global Real Estate Index Fund |
|
Schwab S&P 500 Index Fund |
|
Schwab Small-Cap Index Fund |
|
Schwab U.S. Large-Cap Growth Index Fund |
|
Schwab U.S. Large-Cap Value Index Fund |
|
Schwab U.S. Mid-Cap Index Fund |
|
Schwab Total Stock Market Index Fund |
Schwab Target 2010 Index Fund |
Schwab International Index Fund |
Schwab Target 2015 Index Fund |
Schwab MarketTrack All Equity Portfolio™ |
Schwab Target 2020 Index Fund |
Schwab MarketTrack Growth Portfolio™ |
Schwab Target 2025 Index Fund |
Schwab MarketTrack Balanced Portfolio™ |
Schwab Target 2030 Index Fund |
Schwab MarketTrack Conservative Portfolio™ |
Schwab Target 2035 Index Fund |
Schwab International Opportunities Fund |
Schwab Target 2040 Index Fund |
| |
Schwab Target 2045 Index Fund |
| |
Schwab Target 2050 Index Fund |
Schwab Dividend Equity Fund |
Schwab Target 2055 Index Fund |
Schwab Large-Cap Growth Fund |
Schwab Target 2060 Index Fund |
Schwab Small-Cap Equity Fund |
Schwab Target 2065 Index Fund |
| |
Schwab Monthly Income Fund - Target Payout |
Schwab International Core Equity Fund |
Schwab Monthly Income Fund - Flexible Payout |
| |
Schwab Monthly Income Fund - Income Payout |
Each fund offers one share class. Shares are bought and sold at closing net asset value per share, which is the price for all outstanding shares of a fund. Each share has a par value of 1/1,000 of a cent, and the funds’ Board of Trustees may authorize the issuance of as many shares as necessary.
Each fund maintains its own account for purposes of holding assets and accounting, and is considered a separate entity for tax purposes. Within its account, each fund may also keep certain assets in segregated accounts, as required by securities law. The "Schwab Funds Complex" includes The Charles Schwab Family of Funds, Schwab Capital Trust, Schwab Investments, Schwab Annuity Portfolios, Schwab Strategic Trust and Laudus Trust.
The Schwab Fundamental U.S. Large Company Index Fund’s goal is to track as closely as possible, before fees and expenses, the total return of an index that measures the performance of large U.S. companies based on their fundamental size and weight.
The Schwab Fundamental U.S. Small Company Index Fund’s goal is to track as closely as possible, before fees and expenses, the total return of an index that measures the performance of small U.S. companies based on their fundamental size and weight.
The Schwab Fundamental International Equity Index Fund’s goal is to track as closely as possible, before fees and expenses, the total return of an index that measures the performance of large non-U.S. developed market companies based on their fundamental size and weight.
The Schwab Fundamental International Small Equity Index Fund’s goal is to track as closely as possible, before fees and expenses, the total return of an index that measures the performance of small non-U.S. developed market companies based on their fundamental size and weight.
72
Schwab Fundamental Index Funds | Annual Holdings and Financial Statements
Schwab Fundamental Index Funds
Financial Notes (continued)
1. Business Structure of the Funds (continued):
The Schwab Fundamental Emerging Markets Equity Index Fund’s goal is to track as closely as possible, before fees and expenses, the total return of an index that measures the performance of large sized companies, based on their fundamental size and weight, in emerging market countries.
2. Significant Accounting Policies: The following is a summary of the significant accounting policies the funds use in their preparation of financial statements. The funds follow the investment company accounting and reporting guidance of the Financial Accounting Standards Board (FASB) Accounting Standard Codification (ASC) Topic 946 Financial Services — Investment Companies. The accounting policies are in conformity with accounting principles generally accepted in the United States of America (GAAP).
In this reporting period, the funds adopted FASB Accounting Standards Update 2023-07, ASC Topic 280 Segment Reporting (Topic 280) Improvements to Reportable Segment Disclosures. Adoption of the new standard impacted financial statement disclosures only and did not affect the funds’ financial position or the results of operations. An operating segment is defined in Topic 280 as a component of a public entity that engages in business activities from which it may recognize revenues and incur expenses, has operating results that are regularly reviewed by the public entity’s chief operating decision maker (CODM) to make decisions about resources to be allocated to the segment and assess its performance, and has discrete financial information available. The management committee of each fund’s investment adviser acts as the funds’ CODM. The CODM has determined that each fund operates as a single operating segment given each fund has a single defined investment strategy disclosed in its respective prospectus. The discrete financial information in the form of each fund’s portfolio composition, total returns, expense ratios and changes in net assets (i.e., changes in net assets resulting from operations, shares sold and shares redeemed), which is used by the CODM to assess performance against the prospectus and to make resource allocation decisions with respect to the funds, is presented within each of the fund’s financial statements.
The funds may invest in mutual funds and exchange-traded funds, which are referred to as "underlying funds." For more information about the underlying funds’ operations and policies, please refer to those funds’ semiannual and annual reports and holdings and financial statements, which are filed in Form N-CSR with the U.S. Securities and Exchange Commission (SEC) and available on the SEC’s website at www.sec.gov.
Pursuant to Rule 2a-5 under the 1940 Act, the Board of Trustees has designated authority to a Valuation Designee, the funds’ investment adviser, to make fair valuation determinations under adopted procedures, subject to Board of Trustees oversight. The investment adviser has formed a Pricing Committee to administer the pricing and valuation of portfolio securities and other assets and liabilities as well as to ensure that prices used for internal purposes or provided by third parties reasonably reflect fair value. The Valuation Designee may utilize independent pricing services, quotations from securities and financial instrument dealers and other market sources to determine fair value.
Securities held in each fund’s portfolio are valued every business day. The following valuation policies and procedures are used by the Valuation Designee to value various types of securities:
● Securities traded on an exchange or over-the-counter: Traded securities are valued at the closing value for the day, or, on days when no closing value has been reported, at the mean of the most recent bid and ask quotes. Securities that are primarily traded on foreign exchanges are valued at the official closing price or the last sales price on the exchange where the securities are principally traded with these values then translated into U.S. dollars at the current exchange rate, unless these securities are fair valued as discussed below.
● Foreign equity security fair valuation: The Valuation Designee has adopted procedures to fair value foreign equity securities that are traded in markets that close prior to the valuation of a fund’s holdings. By fair valuing securities whose prices may have been affected by events occurring after the close of trading, the Valuation Designee seeks to establish prices that investors might expect to realize upon the current sales of these securities. This methodology is designed to deter “arbitrage” market timers, who seek to exploit delays between the change in the value of a fund’s portfolio holdings and the net asset value of a fund’s shares and seeks to help ensure that the prices at which a fund’s shares are purchased and redeemed are fair and do not result in dilution of shareholder interest or other harm to shareholders. When fair value pricing is used at the open or close of a reporting period, it may cause a temporary divergence between the return of a fund and that of its comparative index or benchmark.
● Futures contracts: Futures contracts are valued at their settlement prices as of the close of their exchanges.
Schwab Fundamental Index Funds | Annual Holdings and Financial Statements
73
Schwab Fundamental Index Funds
Financial Notes (continued)
2. Significant Accounting Policies (continued):
● Mutual funds: Mutual funds are valued at their respective net asset values.
● Securities for which no quoted value is available: The Valuation Designee has adopted procedures to fair value a fund’s securities when market prices are not “readily available” or are unreliable. For example, a security may be fair valued when it’s de-listed or its trading is halted or suspended; when a security’s primary pricing source is unable or unwilling to provide a price; or when a security’s primary trading market is closed during regular market hours. Fair value determinations are made in good faith in accordance with adopted valuation procedures. The Valuation Designee considers a number of factors, including unobservable market inputs, when arriving at fair value. The Valuation Designee may employ methods such as the review of related or comparable assets or liabilities, related market activities, recent transactions, market multiples, book values, transactional back-testing, disposition analysis and other relevant information. Due to the subjective and variable nature of fair value pricing, there can be no assurance that a fund could obtain the fair value assigned to the security upon the sale of such security.
In accordance with the authoritative guidance on fair value measurements and disclosures under GAAP, the funds disclose the fair value of their investments in a hierarchy that prioritizes the significant inputs to valuation methods used to measure the fair value. The hierarchy gives the highest priority to valuations based upon unadjusted quoted prices in active markets for identical assets or liabilities (Level 1 measurements) and the lowest priority to valuations based upon unobservable inputs that are significant to the valuation (Level 3 measurements). If inputs used to measure the financial instruments fall within different levels of the hierarchy, the categorization is based on the lowest level input that is significant to the valuation. If it is determined that either the volume and/or level of activity for an asset or liability has significantly decreased (from normal conditions for that asset or liability) or price quotations or observable inputs are not associated with orderly transactions, increased analysis and the Valuation Designee’s judgment will be required to estimate fair value.
The three levels of the fair value hierarchy are as follows:
● Level 1 — quoted prices in active markets for identical investments — Investments whose values are based on quoted market prices in active markets. These generally include active listed equities, mutual funds, exchange-traded funds and futures contracts. Mutual funds and exchange-traded funds are classified as Level 1 prices, without consideration to the classification level of the underlying securities held which could be Level 1, Level 2, or Level 3 in the fair value hierarchy.
● Level 2 — other significant observable inputs (including quoted prices for similar securities, interest rates, prepayment speeds, credit risk, etc.) — Investments that trade in markets that are not considered to be active, but whose values are based on quoted market prices, dealer quotations or valuations provided by alternative pricing sources supported by observable inputs are classified as Level 2 prices. These generally include forward foreign currency exchange contracts, U.S. government and sovereign obligations, most government agency securities, investment-grade corporate bonds, certain mortgage products, less liquid listed equities, and state, municipal and provincial obligations. In addition, international securities whose markets close hours before the valuation of a fund’s holdings may require fair valuations due to significant movement in the U.S. markets occurring after the daily close of foreign markets. The Valuation Designee has approved a vendor that calculates fair valuations of international equity securities based on a number of factors that appear to correlate to the movements in the U.S. markets.
● Level 3 — significant unobservable inputs (including the Valuation Designee’s assumptions in determining the fair value of investments) — Investments whose values are classified as Level 3 prices have significant unobservable inputs, as they may trade infrequently or not at all. When observable prices are not readily available for these securities, one or more valuation methods are used for which sufficient and reliable data is available. The inputs used in estimating the value of Level 3 prices may include the original transaction price, quoted prices for similar securities or assets in active markets, completed or pending third-party transactions in the underlying investment or comparable issuers, and changes in financial ratios or cash flows. Level 3 prices may also be adjusted to reflect illiquidity and/or non-transferability, with the amount of such discount estimated in the absence of market information. Assumptions used due to the lack of observable inputs may significantly impact the resulting fair value and therefore a fund’s results of operations.
The inputs or methodology used for valuing securities are not necessarily an indication of the risk associated with investing in those securities.
The levels associated with valuing the funds’ investments as of October 31, 2025, are disclosed in each fund’s Portfolio Holdings.
74
Schwab Fundamental Index Funds | Annual Holdings and Financial Statements
Schwab Fundamental Index Funds
Financial Notes (continued)
2. Significant Accounting Policies (continued):
(b) Accounting Policies for certain Portfolio Investments (if held):
Futures Contracts: Futures contracts are instruments that represent an agreement between two parties that obligates one party to buy, and the other party to sell, specific instruments at an agreed upon price on a stipulated future date. A fund must give the broker a deposit of cash and/or securities (initial margin) whenever it enters into a futures contract. The amount of the deposit may vary from one contract to another. Subsequent payments (variation margin) are made or received by a fund depending on the daily fluctuations in the value of the futures contract and are accounted for as unrealized appreciation or depreciation until the contract is closed, at which time the gains or losses are realized. Futures contracts are traded publicly on exchanges, and their value may change daily.
Cash Investments: The funds, except for Schwab Fundamental U.S. Large Company Index Fund and Schwab Fundamental U.S. Small Company Index Fund, may invest a portion of their assets in cash. Cash includes cash bank balances in an interest-bearing demand deposit account with maturity on demand by the funds.
Securities Lending: Under the trust’s Securities Lending Program, a fund (lender) may make short-term loans of its securities to another party (borrower) to generate additional revenue for the fund. The borrower pledges collateral in the form of cash, securities issued or fully guaranteed by the U.S. government or foreign governments, or letters of credit issued by a bank. Collateral at the individual loan level is required to be maintained on a daily marked-to-market basis in an amount at least equal to the current value of the securities loaned. The lending agent provides a fund with indemnification against borrower default (the borrower fails to return the security on loan) reducing the risk of loss as a result of default. The cash collateral of securities loaned is currently invested in money market portfolios operating pursuant to Rule 2a-7 under the 1940 Act. Each fund bears the risk of loss with respect to the investment of cash collateral. The terms of the securities lending agreement allow the funds or the lending agent to terminate any loan at any given time and the securities must be returned within the earlier of the standard trade settlement period or the specified time period under the relevant securities lending agreement. Securities lending income, as disclosed in each fund’s Statement of Operations, if applicable, represents the income earned from the investment of the cash collateral plus any fees paid by borrowers, less the fees paid to the lending agent and broker rebates which are subject to adjustments pursuant to the securities lending agreement. On loans not collateralized by cash, a fee is received from the borrower, and is allocated between a fund and the lending agent. The aggregate market value of securities loaned will not at any time exceed one-third of the total assets of a fund, including collateral received from the loan. Securities lending fees paid to the unaffiliated lending agent start at 9% of gross lending revenue, with subsequent breakpoints to a low of 5%. In this context, the gross lending revenue equals the income received from the investment of cash collateral and fees paid by borrowers less any rebates paid to the borrowers. Any expenses charged by the cash collateral fund are in addition to these fees. All remaining revenue is retained by the fund, as applicable. No portion of lending revenue is paid to or retained by the investment adviser or any of its affiliates.
As of October 31, 2025, the funds had securities on loan, all of which were classified as common stocks and rights. The value of securities on loan and the related collateral as of October 31, 2025, are disclosed in each fund’s Portfolio Holdings and Statement of Assets and Liabilities.
Passive Foreign Investment Companies: Certain funds may own shares in certain foreign corporations that meet the Internal Revenue Code, as amended, definition of a Passive Foreign Investment Company (PFIC). The funds may elect for tax purposes to mark-to-market annually the shares of each PFIC lot held and would be required to distribute as ordinary income to shareholders any such marked-to-market gains (as well as any gains realized on sale).
Central Securities Depositories Regulation: The Central Securities Depositories Regulation (CSDR) introduced measures for the authorization and supervision of European Union Central Security Depositories and created a common set of prudential, organizational, and conduct of business standards at a European level. CSDR is designed to support securities settlement and operational aspects of securities settlement, including the provision of shorter settlement periods; mandatory buy-ins; and cash penalties, to prevent and address settlement fails. CSDR measures are aimed to prevent settlement fails by ensuring that all transaction details are provided to facilitate settlement, as well as further incentivizing timely settlement by imposing cash penalty fines and buy-ins. Certain funds may be subject to pay cash penalties and may also receive cash penalties with certain counterparties in instances where there are settlement fails. These cash penalties are included in net realized gains (losses) on sales of securities — unaffiliated issuers in each fund’s Statement of Operations, if any.
(c) Security Transactions:
Security transactions are recorded as of the date the order to buy or sell the security is executed. Realized gains and losses from security transactions are based on the identified costs of the securities involved.
Schwab Fundamental Index Funds | Annual Holdings and Financial Statements
75
Schwab Fundamental Index Funds
Financial Notes (continued)
2. Significant Accounting Policies (continued):
Assets and liabilities denominated in foreign currencies are reported in U.S. dollars. For assets and liabilities held on a given date, the dollar value is based on market exchange rates in effect on that date. Transactions involving foreign currencies, including purchases, sales, income receipts and expense payments, are calculated using exchange rates in effect on the transaction date. Realized foreign exchange gains or losses arise from sales of foreign currencies, currency gains or losses realized between the trade and settlement dates on securities transactions and the differences between the recorded amounts of dividends, interest, and foreign withholding taxes and the U.S. dollar equivalent of the amounts actually received or paid. Net unrealized foreign exchange appreciation or depreciation arises from changes in foreign exchange rates on foreign denominated assets and liabilities other than investments in securities held at the end of the reporting period. These realized and unrealized foreign exchange gains or losses are reported in foreign currency transactions or translations, if any, in each fund’s Statement of Operations. The funds do not isolate the portion of the fluctuations on investments resulting from changes in foreign currency exchange rates from the fluctuations in market prices of investments held. Such fluctuations are included with the net realized and unrealized gain or loss from investments, if any.
Gains realized by the funds on the sale of securities in certain foreign countries may be subject to non-U.S. taxes. In those instances, the funds record a liability based on unrealized appreciation to provide for potential non-U.S. taxes payable upon the sale of these securities.
When a fund closes out a futures contract position, it calculates the difference between the value of the position at the beginning and at the end of the contract, and records a realized gain or loss accordingly.
Interest income is recorded as it accrues. Dividends and distributions from portfolio securities and underlying funds are recorded on the date they are effective (the ex-dividend date), although the funds record certain foreign security dividends on the date the ex-dividend date is confirmed. Non-cash dividends in the form of additional securities are recorded on the ex-dividend date at fair value, if any. Any distributions from underlying funds are recorded in accordance with the character of the distributions as designated by the underlying funds.
Income received from foreign sources may result in withholding tax. Withholding taxes are accrued at the same time as the related income if the tax rate is fixed and known, unless a tax withheld is reclaimable from the local tax authorities and there are no significant uncertainties on collectibility in which case it is recorded as receivable. If the tax rate is not known or estimable, such expense or reclaim receivable is recorded when the net proceeds are received.
The Schwab Fundamental International Equity Index Fund and Schwab Fundamental International Small Equity Index Fund filed claims to recover taxes previously withheld in certain European Union countries on the basis that those countries had purportedly violated certain provisions in the Treaty on the Functioning of the European Union. These filings are subject to various administrative and judicial proceedings within these countries, and all professional fees associated with these filings have been paid by the investment adviser. The professional fees related to European Union foreign withholding tax claims are non-contingent and non-routine expenses which are subject to repayment to the investment adviser (see financial note 3 for additional information).
For U.S. income tax purposes, European Union reclaims received reduce the amounts of foreign taxes that the fund passes through to its shareholders. If European Union reclaims received exceed foreign withholding taxes paid, the Schwab Fundamental International Equity Index Fund and Schwab Fundamental International Small Equity Index Fund will evaluate the requirements for entering into a closing agreement with the Internal Revenue Service (IRS) to address any prior years’ U.S. income tax liabilities attributable to fund shareholders resulting from the recovery of foreign taxes. The closing agreement would result in the fund paying a compliance fee to the IRS, on behalf of its shareholders, representing the estimated tax savings generated from foreign tax credits claimed by fund shareholders on their tax returns in prior years. During the period ended October 31, 2025, the Schwab Fundamental International Equity Index Fund and Schwab Fundamental International Small Equity Index Fund did not incur any compliance fees.
Pursuant to the Amended and Restated Investment Advisory and Administration Agreement between the investment adviser and the trust, the investment adviser pays the operating expenses of each fund, excluding acquired fund fees and expenses, taxes, any brokerage expenses, and extraordinary or non-routine expenses. Taxes, any brokerage expenses and extraordinary or non-routine expenses that are specific to a fund are charged directly to the fund. Acquired fund fees and expenses are indirect expenses incurred by a fund through its investments in underlying funds and are reflected in the net asset values of the underlying funds.
76
Schwab Fundamental Index Funds | Annual Holdings and Financial Statements
Schwab Fundamental Index Funds
Financial Notes (continued)
2. Significant Accounting Policies (continued):
(f) Distributions to Shareholders:
The funds make distributions from net investment income and net realized capital gains, if any, once a year. To receive a distribution, you must be a registered shareholder on the record date. Distributions are paid to shareholders on the payable date.
(g) Accounting Estimates:
The accounting policies described in this report conform to GAAP. Notwithstanding this, shareholders should understand that in order to follow these principles, fund management has to make estimates and assumptions that affect the information reported in the financial statements. It’s possible that once the results are known, they may turn out to be different from these estimates and these differences may be material.
(h) Federal Income Taxes:
The funds intend to meet federal income and excise tax requirements for regulated investment companies under subchapter M of the Internal Revenue Code, as amended. Accordingly, the funds distribute substantially all of their net investment income and net realized capital gains, if any, to their shareholders each year. As long as a fund meets the tax requirements, it is not required to pay federal income tax.
Certain funds may be subject to foreign taxes (a portion of which may be reclaimable) on income, corporate events, foreign currency exchanges and capital gains on investments. All foreign taxes are recorded in accordance with the applicable foreign tax regulations and rates that exist in foreign markets in which a fund invests. These foreign taxes, if any, are paid by the funds and are disclosed in each fund’s Statement of Operations. Foreign taxes accrued as of October 31, 2025, if any, are reflected in each fund’s Statement of Assets and Liabilities.
Under the funds’ organizational documents, the officers and trustees are indemnified against certain liabilities arising out of the performance of their duties to the funds. In addition, in the normal course of business the funds enter into contracts with their vendors and others that provide general indemnifications. The funds’ maximum exposure under these arrangements is unknown as this would involve future claims that may be made against the funds. However, based on experience, the funds expect the risk of loss attributable to these arrangements to be remote.
(k) Recent Accounting Pronouncements:
In December 2023, the FASB issued ASU 2023-09 Income Taxes (Topic 740): Improvements to Income Tax Disclosures. The amendments were issued to enhance the transparency and decision usefulness of income tax disclosures primarily related to rate reconciliation and income taxes paid information. The guidance is effective for annual periods beginning after December 15, 2024, and with early adoption permitted. At this time, management is evaluating the impact of this amendment but believes it will not have a material impact on the financial statements and income tax disclosures.
3. Affiliates and Affiliated Transactions: Charles Schwab Investment Management, Inc., dba Schwab Asset Management, a wholly owned subsidiary of The Charles Schwab Corporation, serves as each fund’s investment adviser and administrator pursuant to the Amended and Restated Investment Advisory and Administration Agreement between the investment adviser and the trust.
For its advisory and administrative services to the funds, the investment adviser is entitled to receive an annual fee, payable monthly, based on a percentage of each fund’s average daily net assets as follows:
SCHWAB FUNDAMENTAL U.S. LARGE COMPANY INDEX FUND |
SCHWAB FUNDAMENTAL U.S. SMALL COMPANY INDEX FUND |
SCHWAB FUNDAMENTAL INTERNATIONAL EQUITY INDEX FUND |
SCHWAB FUNDAMENTAL INTERNATIONAL SMALL EQUITY INDEX FUND |
SCHWAB FUNDAMENTAL EMERGING MARKETS EQUITY INDEX FUND |
| |
|
|
|
|
Schwab Fundamental Index Funds | Annual Holdings and Financial Statements
77
Schwab Fundamental Index Funds
Financial Notes (continued)
3. Affiliates and Affiliated Transactions (continued):
Investments from Affiliates
Funds in the Schwab Funds Complex may own shares of other funds in the Schwab Funds Complex. The table below reflects the percentage of shares of each fund in this report that is owned by other funds in the Schwab Funds Complex as of October 31, 2025, as applicable:
| |
|
| |
SCHWAB FUNDAMENTAL U.S. LARGE COMPANY INDEX FUND |
SCHWAB FUNDAMENTAL U.S. SMALL COMPANY INDEX FUND |
SCHWAB FUNDAMENTAL INTERNATIONAL EQUITY INDEX FUND |
SCHWAB FUNDAMENTAL INTERNATIONAL SMALL EQUITY INDEX FUND |
SCHWAB FUNDAMENTAL EMERGING MARKETS EQUITY INDEX FUND |
Schwab MarketTrack All Equity Portfolio |
|
|
|
|
|
Schwab MarketTrack Balanced Portfolio |
|
|
|
|
|
Schwab MarketTrack Conservative Portfolio |
|
|
|
|
|
Schwab MarketTrack Growth Portfolio |
|
|
|
|
|
| |
|
|
|
|
|
| |
|
|
|
|
|
| |
|
|
|
|
|
| |
|
|
|
|
|
| |
|
|
|
|
|
| |
|
|
|
|
|
| |
|
|
|
|
|
| |
|
|
|
|
|
| |
|
|
|
|
|
| |
|
|
|
|
|
| |
|
|
|
|
|
| |
|
|
|
|
|
Other Affiliated Transactions
The professional fees related to European Union foreign withholding tax claims discussed in financial note 2(d) are non-contingent and non-routine expenses. The investment adviser agreed to pay these professional fees, on behalf of the Schwab Fundamental International Equity Index Fund, Schwab International Small Equity Index Fund, and Schwab Fundamental Emerging Markets Equity Index Fund, subject to reimbursement by the funds to the investment adviser to the extent the funds are able to successfully recover tax claims in the future.
During the period ended October 31, 2025, the professional fees incurred by the Schwab Fundamental International Equity Index Fund and Schwab Fundamental International Small Equity Index Fund and paid by the investment adviser were $14,790 and $3,445, respectively, as shown as Professional fees in each fund’s Statement of Operations.
During the period ended October 31, 2025, the Schwab Fundamental International Small Equity Index Fund recovered previously withheld foreign taxes from Finland. The payments received by the fund amounted to $110,553 which includes $5,232 of interest income and is recorded as Dividends received from securities — unaffiliated issuers in the fund’s Statement of Operations. The investment adviser paid upfront professional fees associated with recovering these foreign taxes in the amount of $12,404, which was reimbursed to the investment adviser by the fund and is also recorded as Dividends received from securities — unaffiliated issuers in the fund’s Statement of Operations. The Schwab Fundamental International Equity Index Fund did not recover any previously withheld foreign taxes and made no reimbursements to the investment adviser.
As of October 31, 2025, the balance of professional fees related to foreign withholding tax claims subject to future reimbursement by the Schwab Fundamental International Equity Index Fund to the investment adviser was $30,874. The Schwab Fundamental International Small Equity Index Fund had no balance of professional fees related to foreign withholding tax claims subject to future reimbursement by the fund to the investment adviser.
78
Schwab Fundamental Index Funds | Annual Holdings and Financial Statements
Schwab Fundamental Index Funds
Financial Notes (continued)
3. Affiliates and Affiliated Transactions (continued):
No other amounts for additional foreign withholding tax claims are reflected in the financial statements due to the uncertainty surrounding the ultimate resolution of proceedings, the likelihood of receipt of these claims, and the potential timing of payment.
The funds may engage in direct transactions with other funds in the Schwab Funds Complex in accordance with procedures adopted by the Board of Trustees pursuant to Rule 17a-7 under the 1940 Act. When one fund is seeking to sell a security that another fund is seeking to buy, an interfund transaction can allow both funds to benefit by reducing transaction costs while allowing each fund to execute the transaction at the current market price. This practice is limited to funds that share the same investment adviser. The net realized gains or losses on sales of interfund transactions, if any, are recorded in Net realized gains (losses) on sales of securities — unaffiliated issuers in the Statement of Operations. For the period ended October 31, 2025, each fund’s purchases and sales of securities with other funds in the Schwab Funds Complex as well as any net realized gains (losses) were as follows:
| |
|
|
NET REALIZED GAINS (LOSSES) |
Schwab Fundamental U.S. Large Company Index Fund |
|
|
|
Schwab Fundamental U.S. Small Company Index Fund |
|
|
|
Schwab Fundamental International Equity Index Fund |
|
|
|
Schwab Fundamental International Small Equity Index Fund |
|
|
|
Schwab Fundamental Emerging Markets Equity Index Fund |
|
|
|
Interfund Borrowing and Lending
Pursuant to an exemptive order issued by the SEC, the funds may enter into interfund borrowing and lending transactions with other funds in the Schwab Funds Complex. All loans are for temporary or emergency purposes and the interest rate to be charged will be the average of the overnight repurchase agreement rate and the short-term bank loan rate. All loans are subject to numerous conditions designed to ensure fair and equitable treatment of all participating funds. The interfund lending facility is subject to the oversight and periodic review by the Board of Trustees. The funds had no interfund borrowing or lending activity during the period.
The Board of Trustees may include people who are officers and/or directors of the investment adviser or its affiliates. Federal securities law limits the percentage of such “interested persons” who may serve on a trust’s board, and the trust was in compliance with these limitations throughout the report period. The funds did not pay any interested persons or non-interested persons (independent trustees). The independent trustees are paid by the investment adviser pursuant to the Advisory Agreement where the investment adviser pays the operational expenses of each fund which includes trustee fees.
During the period, the funds were participants with other funds in the Schwab Funds Complex in a joint, syndicated, committed $1.2 billion line of credit (the Syndicated Credit Facility), which matured on September 25, 2025. On September 25, 2025, the Syndicated Credit Facility was amended to run for a new 28 day period with the line of credit amount remaining unchanged, maturing on October 23, 2025. On October 23, 2025, the Syndicated Credit Facility was amended to run for a new 364 day period with the line of credit amount remaining unchanged, maturing on October 22, 2026. Under the terms of the Syndicated Credit Facility, in addition to the investment adviser paying the interest charged on any borrowings by a fund, the investment adviser paid a commitment fee of 0.15% per annum on the funds’ proportionate share of the unused portion of the Syndicated Credit Facility.
During the period, the funds were participants with other funds in the Schwab Funds Complex in a joint, unsecured, uncommitted $400 million line of credit (the Uncommitted Credit Facility) with State Street Bank and Trust Company, which matured on September 25, 2025. On September 25, 2025, the Uncommitted Credit Facility was amended to run for a new 28 day period with the line of credit amount remaining unchanged, maturing on October 23, 2025. On October 23, 2025, the Uncommitted Credit Facility was amended to run for a new 364 day period with the line of credit amount remaining unchanged, maturing on October 22, 2026. Under the terms of the Uncommitted Credit Facility, the investment adviser pays interest on the amount a fund borrows. There were no borrowings by any of the funds from either line of credit during the period.
Schwab Fundamental Index Funds | Annual Holdings and Financial Statements
79
Schwab Fundamental Index Funds
Financial Notes (continued)
5. Borrowing from Banks (continued):
The funds also have access to custodian overdraft facilities. A fund may have utilized the overdraft facility and incurred an interest expense, which is paid by the investment adviser, if any. The interest expense is determined based on a negotiated rate above the current Federal Funds Rate.
Certain funds entered into futures contracts during the report period to equitize available cash.
As of October 31, 2025, the Statement of Assets and Liabilities included the following financial derivative instrument fair values held at period end:
| |
|
|
| |
|
|
Schwab Fundamental U.S. Large Company Index Fund |
|
|
| |
|
|
Schwab Fundamental U.S. Small Company Index Fund |
|
|
| |
|
|
Schwab Fundamental International Small Equity Index Fund |
|
|
| |
|
|
Schwab Fundamental Emerging Markets Equity Index Fund |
|
|
| |
|
|
| |
|
| |
Includes cumulative unrealized appreciation of futures contracts as reported in each fund’s Portfolio Holdings. Only current day’s variation margin on futures contracts is reported in the Statement of Assets and Liabilities. |
| |
|
|
Schwab Fundamental International Equity Index Fund |
|
|
| |
|
|
| |
|
| |
Includes cumulative unrealized depreciation of futures contracts as reported in each fund’s Portfolio Holdings. Only current day’s variation margin on futures contracts is reported in the Statement of Assets and Liabilities. |
The effects of the derivative contracts in the Statement of Operations for the period ended October 31, 2025, were:
| |
|
|
Net Realized Gains (Losses) |
|
|
Schwab Fundamental U.S. Large Company Index Fund |
|
|
| |
|
|
Schwab Fundamental U.S. Small Company Index Fund |
|
|
| |
|
|
Schwab Fundamental International Equity Index Fund |
|
|
| |
|
|
Schwab Fundamental International Small Equity Index Fund |
|
|
| |
|
|
Schwab Fundamental Emerging Markets Equity Index Fund |
|
|
| |
|
|
| |
|
| |
Statement of Operations location: Net realized gains (losses) on futures contracts. |
80
Schwab Fundamental Index Funds | Annual Holdings and Financial Statements
Schwab Fundamental Index Funds
Financial Notes (continued)
6. Derivatives (continued):
Net Change in Unrealized Appreciation (Depreciation) |
|
|
Schwab Fundamental U.S. Large Company Index Fund |
|
|
| |
|
|
Schwab Fundamental U.S. Small Company Index Fund |
|
|
| |
|
|
Schwab Fundamental International Equity Index Fund |
|
|
| |
|
|
Schwab Fundamental International Small Equity Index Fund |
|
|
| |
|
|
Schwab Fundamental Emerging Markets Equity Index Fund |
|
|
| |
|
|
| |
|
| |
Statement of Operations location: Net change in unrealized appreciation (depreciation) on futures contracts. |
During the period ended October 31, 2025, the month-end average notional amounts of futures contracts held by the funds and the month-end average number of contracts held were as follows:
| |
|
|
Schwab Fundamental U.S. Large Company Index Fund |
|
|
Schwab Fundamental U.S. Small Company Index Fund |
|
|
Schwab Fundamental International Equity Index Fund |
|
|
Schwab Fundamental International Small Equity Index Fund |
|
|
Schwab Fundamental Emerging Markets Equity Index Fund |
|
|
7. Purchases and Sales of Investment Securities: For the period ended October 31, 2025, purchases and sales of securities (excluding in-kind transactions and short-term obligations) were as follows:
| |
|
|
Schwab Fundamental U.S. Large Company Index Fund |
|
|
Schwab Fundamental U.S. Small Company Index Fund |
|
|
Schwab Fundamental International Equity Index Fund |
|
|
Schwab Fundamental International Small Equity Index Fund |
|
|
Schwab Fundamental Emerging Markets Equity Index Fund |
|
|
During the period ended October 31, 2025, the following funds had transactions in connection with in-kind transactions:
| |
IN-KIND PURCHASES
OF SECURITIES |
IN-KIND SALES
OF SECURITIES |
Schwab Fundamental U.S. Large Company Index Fund |
|
|
Schwab Fundamental U.S. Small Company Index Fund |
|
|
The funds may realize net capital gains or losses resulting from in-kind redemptions. Because such gains or losses are not taxable to the funds and are not distributed to existing fund shareholders, the gains or losses are reclassified from accumulated net realized gains or losses to capital received from investors at the end of the funds’ tax year. These reclassifications have no effect on net assets or net asset values. The net realized gains or losses on sales of in-kind redemptions for the period ended October 31, 2025, are disclosed in the funds’ Statements of Operations, if any.
Schwab Fundamental Index Funds | Annual Holdings and Financial Statements
81
Schwab Fundamental Index Funds
Financial Notes (continued)
8. Federal Income Taxes:
As of October 31, 2025, the tax basis cost of the funds’ investments and gross unrealized appreciation and depreciation were as follows:
| |
|
GROSS UNREALIZED
APPRECIATION |
GROSS UNREALIZED
DEPRECIATION |
NET UNREALIZED
APPRECIATION
(DEPRECIATION) |
Schwab Fundamental U.S. Large Company Index Fund |
|
|
|
|
Schwab Fundamental U.S. Small Company Index Fund |
|
|
|
|
Schwab Fundamental International Equity Index Fund |
|
|
|
|
Schwab Fundamental International Small Equity Index Fund |
|
|
|
|
Schwab Fundamental Emerging Markets Equity Index Fund |
|
|
|
|
The primary differences between book basis and tax basis unrealized appreciation or unrealized depreciation of investments are the tax deferral of losses on wash sales, the realization for tax purposes of unrealized appreciation or depreciation on futures contracts, the realization for tax purposes of unrealized appreciation on investments in PFICs and partnership investments. The tax cost of the funds’ investments, disclosed above, have been adjusted from their book amounts to reflect these unrealized appreciation or depreciation differences, as applicable.
As of October 31, 2025, the components of distributable earnings on a tax basis were as follows:
| |
UNDISTRIBUTED
ORDINARY
INCOME |
UNDISTRIBUTED
LONG-TERM
CAPITAL GAINS |
NET UNREALIZED
APPRECIATION
(DEPRECIATION)
ON INVESTMENTS |
NET OTHER UNREALIZED
APPRECIATION
(DEPRECIATION) |
CAPITAL LOSS
CARRYFORWARDS
AND OTHER LOSSES |
|
Schwab Fundamental U.S. Large Company Index Fund |
|
|
|
|
|
|
Schwab Fundamental U.S. Small Company Index Fund |
|
|
|
|
|
|
Schwab Fundamental International Equity Index Fund |
|
|
|
|
|
|
Schwab Fundamental International Small Equity Index Fund |
|
|
|
|
|
|
Schwab Fundamental Emerging Markets Equity Index Fund |
|
|
|
|
|
|
Capital loss carryforwards have no expiration and may be used to offset future realized capital gains for federal income tax purposes. As of October 31, 2025, the funds had capital loss carryforwards available as follows:
| |
|
Schwab Fundamental U.S. Large Company Index Fund |
|
Schwab Fundamental U.S. Small Company Index Fund |
|
Schwab Fundamental International Equity Index Fund |
|
Schwab Fundamental International Small Equity Index Fund |
|
Schwab Fundamental Emerging Markets Equity Index Fund |
|
For the fiscal year ended October 31, 2025, the funds had capital loss carryforwards utilized as follows:
| |
|
Schwab Fundamental U.S. Large Company Index Fund |
|
Schwab Fundamental U.S. Small Company Index Fund |
|
Schwab Fundamental International Equity Index Fund |
|
Schwab Fundamental International Small Equity Index Fund |
|
Schwab Fundamental Emerging Markets Equity Index Fund |
|
82
Schwab Fundamental Index Funds | Annual Holdings and Financial Statements
Schwab Fundamental Index Funds
Financial Notes (continued)
8. Federal Income Taxes (continued):
The tax basis components of distributions paid during the current and prior fiscal years were as follows:
| |
CURRENT FISCAL YEAR END DISTRIBUTIONS |
PRIOR FISCAL YEAR END DISTRIBUTIONS |
| |
|
|
|
|
Schwab Fundamental U.S. Large Company Index Fund |
|
|
|
|
Schwab Fundamental U.S. Small Company Index Fund |
|
|
|
|
Schwab Fundamental International Equity Index Fund |
|
|
|
|
Schwab Fundamental International Small Equity Index Fund |
|
|
|
|
Schwab Fundamental Emerging Markets Equity Index Fund |
|
|
|
|
Distributions paid to shareholders are based on net investment income and net realized gains determined on a tax basis, which may differ from net investment income and net realized gains for financial reporting purposes. These differences reflect the differing character of certain income items and net realized gains and losses for financial statement and tax purposes, and may result in reclassification among certain capital accounts in the financial statements. The funds may also designate a portion of the amount paid to redeeming shareholders as a distribution for tax purposes.
Permanent book and tax basis differences may result in reclassifications between components of net assets as required. The adjustments will have no impact on net assets or the results of operations.
As of October 31, 2025, management has reviewed the tax positions for open periods (for federal purposes, three years from the date of filing and for state purposes, four years from the date of filing) as applicable to the funds, and has determined that no provision for income tax is required in the funds’ financial statements. The funds recognize interest and penalties, if any, related to unrecognized tax benefits as income tax expense in each fund’s Statement of Operations. During the fiscal year ended October 31, 2025, the funds did not incur any interest or penalties.
Management has determined there are no subsequent events or transactions through the date the financial statements were issued that would have materially impacted the financial statements as presented.
Schwab Fundamental Index Funds | Annual Holdings and Financial Statements
83
Schwab Fundamental Index Funds
Report of Independent Registered Public Accounting Firm
To the Board of Trustees of Schwab Capital Trust and Shareholders of Schwab Fundamental U.S. Large Company Index Fund (formerly Schwab Fundamental US Large Company Index Fund), Schwab Fundamental U.S. Small Company Index Fund (formerly Schwab Fundamental US Small Company Index Fund), Schwab Fundamental International Equity Index Fund (formerly Schwab Fundamental International Large Company Index Fund), Schwab Fundamental International Small Equity Index Fund (formerly Schwab Fundamental International Small Company Index Fund), and Schwab Fundamental Emerging Markets Equity Index Fund (formerly Schwab Fundamental Emerging Markets Large Company Index Fund):
Opinion on the Financial Statements and Financial Highlights
We have audited the accompanying statements of assets and liabilities, including the portfolio holdings, of Schwab Fundamental U.S. Large Company Index Fund, Schwab Fundamental U.S. Small Company Index Fund, Schwab Fundamental International Equity Index Fund, Schwab Fundamental International Small Equity Index Fund, and Schwab Fundamental Emerging Markets Equity Index Fund (the “Funds”), five of the Funds constituting Schwab Capital Trust, as of October 31, 2025, the related statements of operations for the year then ended, the statements of changes in net assets for each of the two years in the period then ended, the financial highlights for each of the five years in the period then ended, and the related notes (collectively referred to as the “financial statements and financial highlights”). In our opinion, the financial statements and financial highlights present fairly, in all material respects, the financial position of each of the Funds as of October 31, 2025, and the results of their operations for the year then ended, the changes in their net assets for each of the two years in the period then ended, and the financial highlights for each of the five years in the period then ended in conformity with accounting principles generally accepted in the United States of America.
These financial statements and financial highlights are the responsibility of the Funds’ management. Our responsibility is to express an opinion on the Funds’ financial statements and financial highlights based on our audits. We are a public accounting firm registered with the Public Company Accounting Oversight Board (United States) (PCAOB) and are required to be independent with respect to the Funds in accordance with the U.S. federal securities laws and the applicable rules and regulations of the Securities and Exchange Commission and the PCAOB.
We conducted our audits in accordance with the standards of the PCAOB. Those standards require that we plan and perform the audit to obtain reasonable assurance about whether the financial statements and financial highlights are free of material misstatement, whether due to error or fraud. The Funds are not required to have, nor were we engaged to perform, an audit of their internal control over financial reporting. As part of our audits we are required to obtain an understanding of internal control over financial reporting but not for the purpose of expressing an opinion on the effectiveness of the Funds’ internal control over financial reporting. Accordingly, we express no such opinion.
Our audits included performing procedures to assess the risks of material misstatement of the financial statements and financial highlights, whether due to error or fraud, and performing procedures that respond to those risks. Such procedures included examining, on a test basis, evidence regarding the amounts and disclosures in the financial statements and financial highlights. Our audits also included evaluating the accounting principles used and significant estimates made by management, as well as evaluating the overall presentation of the financial statements and financial highlights. Our procedures included confirmation of securities owned as of October 31, 2025, by correspondence with the custodian and brokers; when replies were not received from brokers, we performed other auditing procedures. We believe that our audits provide a reasonable basis for our opinion.
Deloitte & Touche LLP
Denver, Colorado
December 16, 2025
We have served as the auditor of one or more investment companies in the Schwab Funds Complex since 2020.
84
Schwab Fundamental Index Funds | Annual Holdings and Financial Statements
Changes in and Disagreements with Accountants for Open-End Management Investment Companies
Schwab Fundamental Index Funds | Annual Holdings and Financial Statements
85
Proxy Disclosures for Open-End Management Investment Companies
86
Schwab Fundamental Index Funds | Annual Holdings and Financial Statements
Remuneration Paid to Directors, Officers, and Others of Open-End Management Investment Companies
The remuneration paid to directors, officers and others are included under Item 7 (Financial Statements and Financial Highlights for Open-End Management Investment Companies).
Schwab Fundamental Index Funds | Annual Holdings and Financial Statements
87
Schwab Fundamental Index Funds
Investment Advisory Agreement Approval
The Investment Company Act of 1940, as amended (the 1940 Act), requires that the continuation of a fund’s investment advisory agreement must be specifically approved (1) by the vote of the trustees or by a vote of the shareholders of the fund, and (2) by the vote of a majority of the trustees who are not parties to the investment advisory agreement or “interested persons” of any party thereto (the Independent Trustees), cast in person at a meeting called for the purpose of voting on such approval. In connection with such approvals, the fund’s trustees must request and evaluate, and the investment adviser is required to furnish, such information as may be reasonably necessary to evaluate the terms of the investment advisory agreement.
The Board of Trustees (the Board or the Trustees, as appropriate) calls and holds one or more meetings each year that are dedicated, in whole or in part, to considering whether to renew the investment advisory and administration agreement (the Agreement) between Schwab Capital Trust (the Trust) and Charles Schwab Investment Management, Inc. (dba Schwab Asset Management) (the investment adviser) with respect to the existing funds in the Trust, including Schwab Fundamental U.S. Large Company Index Fund, Schwab Fundamental U.S. Small Company Index Fund, Schwab Fundamental International Equity Index Fund, Schwab Fundamental International Small Equity Index Fund and Schwab Fundamental Emerging Markets Equity Index Fund (each, a Fund and collectively, the Funds), and to review certain other agreements pursuant to which the investment adviser provides investment advisory services to certain other registered investment companies. In preparation for the meeting(s), the Board requests and reviews a wide variety of materials provided by the investment adviser, including information about the investment adviser’s affiliates, personnel, business goals and priorities, profitability, oversight of third-party service providers, corporate structure and operations. As part of the renewal process, the Independent Trustees’ legal counsel, on behalf of the Independent Trustees, sends an information request letter to the investment adviser seeking certain relevant information. The responses by the investment adviser are provided to the Trustees in the Board materials for their review prior to their meeting, and the Trustees are provided with the opportunity to request any additional materials. The Board also receives data provided by an independent provider of investment company data. This information is in addition to the detailed information about the Funds that the Board reviews during the course of each year, including information that relates to the Funds’ operations and performance, legal and compliance matters, risk management, portfolio turnover, and sales and marketing activity. In considering the renewal, the Independent Trustees receive advice from Independent Trustees’ legal counsel, including a memorandum regarding the responsibilities of trustees for the
approval of investment advisory agreements. In addition, the Independent Trustees participate in question and answer sessions with representatives of the investment adviser and meet in executive session outside the presence of Fund management.
The Board, including a majority of the Independent Trustees, considered information specifically relating to the continuance of the Agreement with respect to the Funds at meetings held on May 7, 2025 and June 5, 2025, and approved the renewal of the Agreement with respect to the Funds for an additional one-year term at the meeting on June 5, 2025 called for the purpose of voting on such approval.
The Board’s approval of the continuance of the Agreement with respect to the Funds was based on consideration and evaluation of a variety of specific factors discussed at these meetings and at prior meetings, including:
1.
the nature, extent and quality of the services provided to each Fund under the Agreement, including the resources of the investment adviser and its affiliates dedicated to the Funds;
2.
each Fund’s investment performance and how it compared to that of certain other comparable mutual funds and benchmark data;
3.
each Fund’s expenses and how those expenses compared to those of certain other similar mutual funds;
4.
the profitability of the investment adviser and its affiliates, including Charles Schwab & Co., Inc. (Schwab), with respect to each Fund, including both direct and indirect benefits accruing to the investment adviser and its affiliates; and
5.
the extent to which economies of scale would be realized as each Fund grows and whether fee levels in the Agreement reflect those economies of scale for the benefit of Fund investors.
Nature, Extent and Quality of Services. The Board considered the nature, extent and quality of the services provided by the investment adviser to the Funds and the resources of the investment adviser and its affiliates dedicated to the Funds. In this regard, the Trustees evaluated, among other things, the investment adviser’s experience, track record, compliance program, resources dedicated to hiring and retaining skilled personnel and specialized talent, and information security resources. The Trustees also considered information provided by the investment adviser relating to services and support provided with respect to each Fund’s portfolio management team, portfolio strategy, and internal investment guidelines, as well as trading infrastructure, liquidity management, product design and analysis, shareholder communications, securities valuation, and vendor and risk oversight. The Trustees also
88
Schwab Fundamental Index Funds | Annual Holdings and Financial Statements
Schwab Fundamental Index Funds
considered the investment adviser’s continued investment in its infrastructure, including the investment adviser’s technology and use of data, business continuity, cybersecurity, due diligence, risk management processes, and information security programs. The Trustees considered Schwab’s overall financial condition and reputation as a full service brokerage firm, as well as the wide range of products, services and account features that benefit Fund shareholders who are brokerage clients of Schwab. Following such evaluation, the Board concluded, within the context of its full deliberations, that the nature, extent and quality of services provided by the investment adviser to the Funds and the resources of the investment adviser and its affiliates dedicated to the Funds supported renewal of the Agreement with respect to the Funds.
Fund Performance. The Board considered each Fund’s performance in determining whether to renew the Agreement with respect to such Fund. Specifically, the Trustees considered each Fund’s performance relative to a peer category of other mutual funds and applicable indices/benchmarks, in light of total return and the market environment, as well as in consideration of each Fund’s investment style and strategy. As part of this review, the Trustees considered the composition of the peer category, selection criteria and the reputation of the independent provider of investment company data who prepared the peer category analysis. In evaluating the performance of each Fund, the Trustees considered the risk profile for such Fund and such Fund’s demonstrated performance in tracking its benchmark index. The Trustees noted that the Funds had closely tracked their respective indexes in 2024, with all of the Funds performing in their expected performance ranges. The Trustees further considered the level of Fund performance in the context of their review of Fund expenses and the investment adviser’s profitability discussed below and also noted that the Board and a designated committee of the Board review performance throughout the year. Following such evaluation, the Board concluded, within the context of its full deliberations, that the performance of each Fund supported renewal of the Agreement with respect to such Fund.
Fund Expenses. With respect to each Fund’s expenses, the Trustees considered the rate of compensation called for by the Agreement, and each Fund’s net operating expense ratio, in each case, in comparison to those of other similar mutual funds, such peer groups and comparisons having been selected and calculated by an independent provider of investment company data. The investment adviser reported to the Board, and the Board took into account, the risk assumed by the investment adviser in the development of the Funds and provision of services as well as the competitive marketplace for financial products. The Trustees also considered fees charged by the investment adviser to ETFs, other mutual funds and to other types of accounts, but, with respect to such other types of accounts, accorded less weight to such comparisons due to the different legal, regulatory, compliance and operating
features of mutual funds as compared to these other types of accounts, and any differences in the nature and scope of the services the investment adviser provides to these other accounts, as well as differences in the market for these types of accounts. Following such evaluation, the Board concluded, within the context of its full deliberations, that the expenses of each Fund are reasonable and supported renewal of the Agreement with respect to such Fund.
Profitability. The Trustees considered the compensation flowing to the investment adviser and its affiliates, directly or indirectly and reviewed profitability on a pre-tax basis, without regard to distribution expenses. The Trustees reviewed the profitability of the investment adviser relating to the Schwab fund complex as a whole, noting the benefits to Fund shareholders of being part of the Schwab fund complex, including the allocations of certain costs across the Funds and other funds in the complex. The Trustees also considered any other benefits derived by the investment adviser from its relationship with the Funds, such as whether, by virtue of its management of the Funds, the investment adviser obtains investment information or other research resources that aid it in providing advisory services to other clients. The Trustees considered whether the compensation and profitability with respect to the Funds under the Agreement and other service agreements were reasonable in light of the quality of all services rendered to the Funds by the investment adviser and its affiliates. The Trustees noted that the investment adviser continues to invest substantial sums in its business in order to provide enhanced research capabilities, services and systems to benefit the Funds. Based on this evaluation, the Board concluded, within the context of its full deliberations, that the profitability of the investment adviser with respect to each Fund is reasonable and supported renewal of the Agreement with respect to such Fund.
Economies of Scale. Although the Trustees recognized the difficulty of determining economies of scale with precision, and although the Funds do not have breakpoints in their advisory fees, the Trustees considered the potential existence of any economies of scale by way of the relatively low advisory fee and unitary fee structure of the Funds and whether those are passed along to a Fund’s shareholders through (i) the enhancement of services provided to the Funds in return for fees paid, including through the investment adviser’s continued investment in its infrastructure, and use of data and technology, increasing expertise and capabilities in key areas (including portfolio and trade operations), and improving business continuity, cybersecurity, due diligence and information security programs, which are designed to provide enhanced services to the Funds and their shareholders; and (ii) pricing a fund to scale and keeping overall expenses down as the fund grows. Based on this evaluation, the Board concluded, within the context of its full deliberations, that each Fund obtains reasonable benefits from economies of scale.
* * * * * * * * * * * * * * * * * * * * * * * * * * * * * * * * * * * * * * * *
Schwab Fundamental Index Funds | Annual Holdings and Financial Statements
89
Schwab Fundamental Index Funds
In the course of their deliberations, the Trustees may have accorded different weights to various factors and did not identify any particular information or factor that was all important or controlling. Based on the Trustees’ deliberation and their evaluation of the information described above, the Board, including all of the Independent Trustees, approved the continuation of the Agreement with respect to the Funds and
concluded that the compensation under the Agreement with respect to the Funds is fair and reasonable in light of the services provided and the related expenses borne by the investment adviser and its affiliates and such other matters as the Trustees considered to be relevant in the exercise of their reasonable judgment.
90
Schwab Fundamental Index Funds | Annual Holdings and Financial Statements
Annual Holdings and Financial Statements | October 31, 2025
Schwab Multi-Asset Funds
Schwab MarketTrack
All Equity Portfolio™
Schwab MarketTrack
Growth Portfolio™
Schwab MarketTrack
Balanced Portfolio™
Schwab MarketTrack
Conservative Portfolio™
Fund investment adviser: Charles Schwab Investment Management, Inc., dba Schwab Asset Management®
Distributor: Charles Schwab & Co., Inc. (Schwab)
Schwab Multi-Asset Funds | Annual Holdings and Financial Statements
1
Financial Statements
| |
|
|
|
|
|
|
| |
Net asset value at beginning of period |
|
|
|
|
|
|
Income (loss) from investment operations: |
|
|
|
|
|
|
Net investment income (loss)1 |
|
|
|
|
|
|
Net realized and unrealized gains (losses) |
|
|
|
|
|
|
Total from investment operations |
|
|
|
|
|
|
| |
|
|
|
|
|
|
Distributions from net investment income |
|
|
|
|
|
|
Distributions from net realized gains |
|
|
|
|
|
|
| |
|
|
|
|
|
|
Net asset value at end of period |
|
|
|
|
|
|
| |
|
|
|
|
|
|
| |
Ratios to average net assets: |
|
|
|
|
|
|
| |
|
|
|
|
|
|
| |
|
|
|
|
|
|
Net investment income (loss) |
|
|
|
|
|
|
| |
|
|
|
|
|
|
Net assets, end of period (x 1,000,000) |
|
|
|
|
|
|
| |
Calculated based on the average shares outstanding during the period. |
| |
Ratio excludes acquired fund fees and expenses, which are indirect expenses incurred by the fund through its investments in underlying funds. |
| |
Ratio includes less than 0.005% of non-routine proxy expenses. |
2
Schwab Multi-Asset Funds | Annual Holdings and Financial Statements
Portfolio Holdings as of October 31, 2025
This section includes a summary of the fund’s transactions with its affiliated underlying funds during the period.
| |
|
|
|
NET REALIZED GAINS (LOSSES) |
NET CHANGE IN UNREALIZED APPRECIATION (DEPRECIATION) |
|
BALANCE OF SHARES HELD AT 10/31/25 |
|
AFFILIATED UNDERLYING FUNDS 99.4% OF NET ASSETS |
| |
| |
| |
| |
|
|
|
|
|
|
|
|
Schwab Select Large Cap Growth Fund * |
|
|
|
|
|
|
|
|
| |
|
|
|
|
|
|
|
|
| |
Schwab Small-Cap Equity Fund |
|
|
|
|
|
|
|
|
| |
|
|
|
|
|
|
|
|
| |
International Stocks 9.9% |
| |
Schwab International Opportunities Fund |
|
|
|
|
|
|
|
|
| |
| |
Intermediate-Term Bond 36.2% |
Schwab U.S. Aggregate Bond Index Fund |
|
|
|
|
|
|
|
|
| |
| |
Schwab Government Money Fund, Ultra |
|
|
|
|
|
|
|
|
Total Affiliated Underlying Funds
(Cost $605,803,633) |
|
|
|
|
|
|
|
|
| |
UNAFFILIATED UNDERLYING FUNDS 0.6% OF NET ASSETS |
| |
| |
State Street Institutional U.S. Government Money Market Fund, Premier Class, 4.01% (b) |
|
|
|
|
|
|
|
|
Total Unaffiliated Underlying Funds
(Cost $4,305,125) |
|
|
|
|
|
|
|
|
Total Investments in Securities
(Cost $610,108,758) |
|
|
|
|
|
|
|
|
| |
Non-income producing security. |
| |
Distributions received include distributions from net investment income and capital gains, if any, from the underlying funds. Amounts shown are only presented for affiliated underlying funds, which are presented in the corresponding line-item in the Statement of Operations, if applicable (see financial note 2(c) for additional information). |
| |
The rate shown is the annualized 7-day yield. |
At October 31, 2025, all of the fund’s investment securities were classified as Level 1 (see financial note 2(a) for additional
information).
Schwab Multi-Asset Funds | Annual Holdings and Financial Statements
3
Statement of Assets and Liabilities
| |
Investments in securities, at value - affiliated issuers (cost $605,803,633) |
|
|
Investments in securities, at value - unaffiliated issuers (cost $4,305,125) |
|
|
| |
|
|
| |
|
|
| |
|
|
| |
|
|
Due from investment adviser |
|
|
| |
|
|
| |
|
|
| |
| |
| |
|
|
| |
|
|
| |
|
|
Independent trustees’ fees |
|
|
| |
|
|
| |
|
|
| |
|
|
| |
| |
Capital received from investors |
|
|
Total distributable earnings |
|
|
| |
|
|
4
Schwab Multi-Asset Funds | Annual Holdings and Financial Statements
Statement of Operations
For the period November 1, 2024 through October 31, 2025 |
| |
Dividends received from securities - affiliated issuers |
|
|
Dividends received from securities - unaffiliated issuers |
|
|
| |
|
|
| |
| |
| |
|
|
| |
|
|
Portfolio accounting fees |
|
|
| |
|
|
Independent trustees’ fees |
|
|
| |
|
|
| |
|
|
| |
|
|
| |
|
|
| |
|
|
| |
|
|
| |
|
|
| |
REALIZED AND UNREALIZED GAINS (LOSSES) |
Realized capital gain distributions received from underlying funds - affiliated issuers |
|
|
Net realized losses on sales of securities - affiliated issuers |
|
|
| |
|
|
Net change in unrealized appreciation (depreciation) on securities - affiliated issuers |
|
|
Net realized and unrealized gains |
|
|
Increase in net assets resulting from operations |
|
|
Schwab Multi-Asset Funds | Annual Holdings and Financial Statements
5
Statement of Changes in Net Assets
For the current and prior report periods
| |
| |
|
|
| |
|
|
|
| |
|
|
|
Net change in unrealized appreciation (depreciation) |
|
|
|
Increase in net assets resulting from operations |
|
|
|
| |
DISTRIBUTIONS TO SHAREHOLDERS |
| |
|
|
|
TRANSACTIONS IN FUND SHARES |
| |
|
|
| |
|
|
|
|
|
| |
|
|
|
|
|
| |
|
|
|
|
|
| |
|
|
|
|
|
Net transactions in fund shares |
|
|
|
|
|
| |
SHARES OUTSTANDING AND NET ASSETS |
| |
|
|
| |
|
|
|
|
|
| |
|
|
|
|
|
Total increase (decrease) |
|
|
|
|
|
| |
|
|
|
|
|
6
Schwab Multi-Asset Funds | Annual Holdings and Financial Statements
Schwab MarketTrack All Equity Portfolio
Financial Statements
| |
|
|
|
|
|
|
| |
Net asset value at beginning of period |
|
|
|
|
|
|
Income (loss) from investment operations: |
|
|
|
|
|
|
Net investment income (loss)1 |
|
|
|
|
|
|
Net realized and unrealized gains (losses) |
|
|
|
|
|
|
Total from investment operations |
|
|
|
|
|
|
| |
|
|
|
|
|
|
Distributions from net investment income |
|
|
|
|
|
|
Distributions from net realized gains |
|
|
|
|
|
|
| |
|
|
|
|
|
|
Net asset value at end of period |
|
|
|
|
|
|
| |
|
|
|
|
|
|
| |
Ratios to average net assets: |
|
|
|
|
|
|
| |
|
|
|
|
|
|
| |
|
|
|
|
|
|
Net investment income (loss) |
|
|
|
|
|
|
| |
|
|
|
|
|
|
Net assets, end of period (x 1,000,000) |
|
|
|
|
|
|
| |
Calculated based on the average shares outstanding during the period. |
| |
Ratio excludes acquired fund fees and expenses, which are indirect expenses incurred by the fund through its investments in underlying funds. |
| |
Ratio includes less than 0.005% of non-routine proxy expenses. |
Schwab Multi-Asset Funds | Annual Holdings and Financial Statements
7
Schwab MarketTrack All Equity Portfolio
Portfolio Holdings as of October 31, 2025
This section includes a summary of the fund’s transactions with its affiliated underlying funds during the period.
| |
|
|
|
NET REALIZED GAINS (LOSSES) |
NET CHANGE IN UNREALIZED APPRECIATION (DEPRECIATION) |
|
BALANCE OF SHARES HELD AT 10/31/25 |
|
AFFILIATED UNDERLYING FUNDS 99.6% OF NET ASSETS |
| |
| |
| |
Schwab Fundamental U.S. Large Company Index Fund |
|
|
|
|
|
|
|
|
Schwab S&P 500 Index Fund |
|
|
|
|
|
|
|
|
Schwab U.S. Large-Cap Growth Index Fund |
|
|
|
|
|
|
|
|
| |
|
|
|
|
|
|
|
|
| |
Schwab Fundamental U.S. Small Company Index Fund |
|
|
|
|
|
|
|
|
Schwab Small-Cap Index Fund |
|
|
|
|
|
|
|
|
| |
|
|
|
|
|
|
|
|
| |
|
|
|
|
|
|
|
|
| |
International Stocks 35.9% |
| |
Schwab Fundamental International Equity Index Fund |
|
|
|
|
|
|
|
|
Schwab Fundamental International Small Equity Index Fund |
|
|
|
|
|
|
|
|
Schwab International Index Fund |
|
|
|
|
|
|
|
|
| |
|
|
|
|
|
|
|
|
| |
Schwab Emerging Markets Equity ETF |
|
|
|
|
|
|
|
|
Schwab Fundamental Emerging Markets Equity Index Fund |
|
|
|
|
|
|
|
|
| |
|
|
|
|
|
|
|
|
| |
|
|
|
|
|
|
|
|
| |
| |
| |
| |
|
|
|
|
|
|
|
|
Total Affiliated Underlying Funds
(Cost $525,256,827) |
|
|
|
|
|
|
|
|
Total Investments in Securities
(Cost $525,256,827) |
|
|
|
|
|
|
|
|
| |
Distributions received include distributions from net investment income and capital gains, if any, from the underlying funds. Amounts shown are only presented for affiliated underlying funds, which are presented in the corresponding line-item in the Statement of Operations, if applicable (see financial note 2(d) for additional information). |
| |
|
| |
Real Estate Investment Trust |
At October 31, 2025, all of the fund’s investment securities were classified as Level 1 (see financial note 2(a) for additional
information).
8
Schwab Multi-Asset Funds | Annual Holdings and Financial Statements
Schwab MarketTrack All Equity Portfolio
Statement of Assets and Liabilities
| |
Investments in securities, at value - affiliated issuers (cost $525,256,827) |
|
|
| |
|
|
| |
|
|
| |
|
|
| |
|
|
| |
|
|
| |
|
|
| |
| |
| |
|
|
| |
|
|
| |
|
|
| |
|
|
Investment adviser and administrator fees |
|
|
Independent trustees’ fees |
|
|
| |
|
|
| |
|
|
| |
|
|
| |
| |
Capital received from investors |
|
|
Total distributable earnings |
|
|
| |
|
|
Schwab Multi-Asset Funds | Annual Holdings and Financial Statements
9
Schwab MarketTrack All Equity Portfolio
Statement of Operations
For the period November 1, 2024 through October 31, 2025 |
| |
Dividends received from securities - affiliated issuers |
|
|
| |
|
|
| |
|
|
| |
| |
| |
|
|
Investment adviser and administrator fees |
|
|
| |
|
|
| |
|
|
| |
|
|
Portfolio accounting fees |
|
|
Independent trustees’ fees |
|
|
| |
|
|
| |
|
|
| |
|
|
| |
|
|
| |
|
|
| |
REALIZED AND UNREALIZED GAINS (LOSSES) |
Realized capital gain distributions received from underlying funds - affiliated issuers |
|
|
Net realized gains on sales of securities - affiliated issuers |
|
|
| |
|
|
Net change in unrealized appreciation (depreciation) on securities - affiliated issuers |
|
|
Net realized and unrealized gains |
|
|
Increase in net assets resulting from operations |
|
|
10
Schwab Multi-Asset Funds | Annual Holdings and Financial Statements
Schwab MarketTrack All Equity Portfolio
Statement of Changes in Net Assets
For the current and prior report periods
| |
| |
|
|
| |
|
|
|
| |
|
|
|
Net change in unrealized appreciation (depreciation) |
|
|
|
Increase in net assets resulting from operations |
|
|
|
| |
DISTRIBUTIONS TO SHAREHOLDERS |
| |
|
|
|
TRANSACTIONS IN FUND SHARES |
| |
|
|
| |
|
|
|
|
|
| |
|
|
|
|
|
| |
|
|
|
|
|
| |
|
|
|
|
|
Net transactions in fund shares |
|
|
|
|
|
| |
SHARES OUTSTANDING AND NET ASSETS |
| |
|
|
| |
|
|
|
|
|
| |
|
|
|
|
|
Total increase (decrease) |
|
|
|
|
|
| |
|
|
|
|
|
Schwab Multi-Asset Funds | Annual Holdings and Financial Statements
11
Schwab MarketTrack Growth Portfolio
Financial Statements
| |
|
|
|
|
|
|
| |
Net asset value at beginning of period |
|
|
|
|
|
|
Income (loss) from investment operations: |
|
|
|
|
|
|
Net investment income (loss)1 |
|
|
|
|
|
|
Net realized and unrealized gains (losses) |
|
|
|
|
|
|
Total from investment operations |
|
|
|
|
|
|
| |
|
|
|
|
|
|
Distributions from net investment income |
|
|
|
|
|
|
Distributions from net realized gains |
|
|
|
|
|
|
| |
|
|
|
|
|
|
Net asset value at end of period |
|
|
|
|
|
|
| |
|
|
|
|
|
|
| |
Ratios to average net assets: |
|
|
|
|
|
|
| |
|
|
|
|
|
|
| |
|
|
|
|
|
|
Net investment income (loss) |
|
|
|
|
|
|
| |
|
|
|
|
|
|
Net assets, end of period (x 1,000,000) |
|
|
|
|
|
|
| |
Calculated based on the average shares outstanding during the period. |
| |
Ratio excludes acquired fund fees and expenses, which are indirect expenses incurred by the fund through its investments in underlying funds. |
| |
Ratio includes less than 0.005% of non-routine proxy expenses. |
12
Schwab Multi-Asset Funds | Annual Holdings and Financial Statements
Schwab MarketTrack Growth Portfolio
Portfolio Holdings as of October 31, 2025
This section includes a summary of the fund’s transactions with its affiliated underlying funds during the period.
| |
|
|
|
NET REALIZED GAINS (LOSSES) |
NET CHANGE IN UNREALIZED APPRECIATION (DEPRECIATION) |
|
BALANCE OF SHARES HELD AT 10/31/25 |
|
AFFILIATED UNDERLYING FUNDS 99.3% OF NET ASSETS |
| |
| |
| |
Schwab Fundamental U.S. Large Company Index Fund |
|
|
|
|
|
|
|
|
Schwab S&P 500 Index Fund |
|
|
|
|
|
|
|
|
Schwab U.S. Large-Cap Growth Index Fund |
|
|
|
|
|
|
|
|
| |
|
|
|
|
|
|
|
|
| |
Schwab Fundamental U.S. Small Company Index Fund |
|
|
|
|
|
|
|
|
Schwab Small-Cap Index Fund |
|
|
|
|
|
|
|
|
| |
|
|
|
|
|
|
|
|
| |
|
|
|
|
|
|
|
|
| |
International Stocks 25.8% |
| |
Schwab Fundamental International Equity Index Fund |
|
|
|
|
|
|
|
|
Schwab Fundamental International Small Equity Index Fund |
|
|
|
|
|
|
|
|
Schwab International Index Fund |
|
|
|
|
|
|
|
|
| |
|
|
|
|
|
|
|
|
| |
Schwab Emerging Markets Equity ETF |
|
|
|
|
|
|
|
|
Schwab Fundamental Emerging Markets Equity Index Fund |
|
|
|
|
|
|
|
|
| |
|
|
|
|
|
|
|
|
| |
|
|
|
|
|
|
|
|
| |
| |
| |
| |
|
|
|
|
|
|
|
|
| |
| |
Intermediate-Term Bond 16.0% |
Schwab U.S. Aggregate Bond Index Fund |
|
|
|
|
|
|
|
|
| |
| |
Schwab Government Money Fund, |
|
|
|
|
|
|
|
|
Total Affiliated Underlying Funds
(Cost $585,830,030) |
|
|
|
|
|
|
|
|
Total Investments in Securities
(Cost $585,830,030) |
|
|
|
|
|
|
|
|
Schwab Multi-Asset Funds | Annual Holdings and Financial Statements
13
Schwab MarketTrack Growth Portfolio
Portfolio Holdings as of October 31, 2025 (continued)
| |
Distributions received include distributions from net investment income and capital gains, if any, from the underlying funds. Amounts shown are only presented for affiliated underlying funds, which are presented in the corresponding line-item in the Statement of Operations, if applicable (see financial note 2(d) for additional information). |
| |
The rate shown is the annualized 7-day yield. |
| |
|
| |
Real Estate Investment Trust |
At October 31, 2025, all of the fund’s investment securities were classified as Level 1 (see financial note 2(a) for additional
information).
14
Schwab Multi-Asset Funds | Annual Holdings and Financial Statements
Schwab MarketTrack Growth Portfolio
Statement of Assets and Liabilities
| |
Investments in securities, at value - affiliated issuers (cost $585,830,030) |
|
|
| |
|
|
| |
|
|
| |
|
|
| |
|
|
| |
|
|
| |
|
|
| |
|
|
| |
| |
| |
|
|
| |
|
|
| |
|
|
Investment adviser and administrator fees |
|
|
| |
|
|
Independent trustees’ fees |
|
|
| |
|
|
| |
|
|
| |
|
|
| |
| |
Capital received from investors |
|
|
Total distributable earnings |
|
|
| |
|
|
Schwab Multi-Asset Funds | Annual Holdings and Financial Statements
15
Schwab MarketTrack Growth Portfolio
Statement of Operations
For the period November 1, 2024 through October 31, 2025 |
| |
Dividends received from securities - affiliated issuers |
|
|
| |
|
|
| |
|
|
| |
| |
| |
|
|
Investment adviser and administrator fees |
|
|
| |
|
|
| |
|
|
Portfolio accounting fees |
|
|
| |
|
|
Independent trustees’ fees |
|
|
| |
|
|
| |
|
|
| |
|
|
| |
|
|
| |
|
|
| |
REALIZED AND UNREALIZED GAINS (LOSSES) |
Realized capital gain distributions received from underlying funds - affiliated issuers |
|
|
Net realized gains on sales of securities - affiliated issuers |
|
|
| |
|
|
Net change in unrealized appreciation (depreciation) on securities - affiliated issuers |
|
|
Net realized and unrealized gains |
|
|
Increase in net assets resulting from operations |
|
|
16
Schwab Multi-Asset Funds | Annual Holdings and Financial Statements
Schwab MarketTrack Growth Portfolio
Statement of Changes in Net Assets
For the current and prior report periods
| |
| |
|
|
| |
|
|
|
| |
|
|
|
Net change in unrealized appreciation (depreciation) |
|
|
|
Increase in net assets resulting from operations |
|
|
|
| |
DISTRIBUTIONS TO SHAREHOLDERS |
| |
|
|
|
TRANSACTIONS IN FUND SHARES |
| |
|
|
| |
|
|
|
|
|
| |
|
|
|
|
|
| |
|
|
|
|
|
| |
|
|
|
|
|
Net transactions in fund shares |
|
|
|
|
|
| |
SHARES OUTSTANDING AND NET ASSETS |
| |
|
|
| |
|
|
|
|
|
| |
|
|
|
|
|
Total increase (decrease) |
|
|
|
|
|
| |
|
|
|
|
|
Schwab Multi-Asset Funds | Annual Holdings and Financial Statements
17
Schwab MarketTrack Balanced Portfolio
Financial Statements
| |
|
|
|
|
|
|
| |
Net asset value at beginning of period |
|
|
|
|
|
|
Income (loss) from investment operations: |
|
|
|
|
|
|
Net investment income (loss)1 |
|
|
|
|
|
|
Net realized and unrealized gains (losses) |
|
|
|
|
|
|
Total from investment operations |
|
|
|
|
|
|
| |
|
|
|
|
|
|
Distributions from net investment income |
|
|
|
|
|
|
Distributions from net realized gains |
|
|
|
|
|
|
| |
|
|
|
|
|
|
Net asset value at end of period |
|
|
|
|
|
|
| |
|
|
|
|
|
|
| |
Ratios to average net assets: |
|
|
|
|
|
|
| |
|
|
|
|
|
|
| |
|
|
|
|
|
|
Net investment income (loss) |
|
|
|
|
|
|
| |
|
|
|
|
|
|
Net assets, end of period (x 1,000,000) |
|
|
|
|
|
|
| |
Calculated based on the average shares outstanding during the period. |
| |
Ratio excludes acquired fund fees and expenses, which are indirect expenses incurred by the fund through its investments in underlying funds. |
| |
Ratio includes less than 0.005% of non-routine proxy expenses. |
18
Schwab Multi-Asset Funds | Annual Holdings and Financial Statements
Schwab MarketTrack Balanced Portfolio
Portfolio Holdings as of October 31, 2025
This section includes a summary of the fund’s transactions with its affiliated underlying funds during the period.
| |
|
|
|
NET REALIZED GAINS (LOSSES) |
NET CHANGE IN UNREALIZED APPRECIATION (DEPRECIATION) |
|
BALANCE OF SHARES HELD AT 10/31/25 |
|
AFFILIATED UNDERLYING FUNDS 99.4% OF NET ASSETS |
| |
| |
| |
Schwab Fundamental U.S. Large Company Index Fund |
|
|
|
|
|
|
|
|
Schwab S&P 500 Index Fund |
|
|
|
|
|
|
|
|
Schwab U.S. Large-Cap Growth Index Fund |
|
|
|
|
|
|
|
|
| |
|
|
|
|
|
|
|
|
| |
Schwab Fundamental U.S. Small Company Index Fund |
|
|
|
|
|
|
|
|
Schwab Small-Cap Index Fund |
|
|
|
|
|
|
|
|
| |
|
|
|
|
|
|
|
|
| |
|
|
|
|
|
|
|
|
| |
International Stocks 18.0% |
| |
Schwab Fundamental International Equity Index Fund |
|
|
|
|
|
|
|
|
Schwab Fundamental International Small Equity Index Fund |
|
|
|
|
|
|
|
|
Schwab International Index Fund |
|
|
|
|
|
|
|
|
| |
|
|
|
|
|
|
|
|
| |
Schwab Fundamental Emerging Markets Equity Index Fund |
|
|
|
|
|
|
|
|
| |
|
|
|
|
|
|
|
|
| |
| |
| |
| |
|
|
|
|
|
|
|
|
| |
| |
Intermediate-Term Bond 32.0% |
Schwab High Yield Bond ETF |
|
|
|
|
|
|
|
|
Schwab U.S. Aggregate Bond Index Fund |
|
|
|
|
|
|
|
|
| |
|
|
|
|
|
|
|
|
| |
Schwab Short-Term Bond Index Fund |
|
|
|
|
|
|
|
|
| |
|
|
|
|
|
|
|
|
| |
Schwab Multi-Asset Funds | Annual Holdings and Financial Statements
19
Schwab MarketTrack Balanced Portfolio
Portfolio Holdings as of October 31, 2025 (continued)
| |
|
|
|
NET REALIZED GAINS (LOSSES) |
NET CHANGE IN UNREALIZED APPRECIATION (DEPRECIATION) |
|
BALANCE OF SHARES HELD AT 10/31/25 |
DISTRIBUTIONS RECEIVED(a) |
| |
Schwab Government Money Fund, Ultra |
|
|
|
|
|
|
|
|
Total Affiliated Underlying Funds
(Cost $411,498,265) |
|
|
|
|
|
|
|
|
Total Investments in Securities
(Cost $411,498,265) |
|
|
|
|
|
|
|
|
| |
Distributions received include distributions from net investment income and capital gains, if any, from the underlying funds. Amounts shown are only presented for affiliated underlying funds, which are presented in the corresponding line-item in the Statement of Operations, if applicable (see financial note 2(d) for additional information). |
| |
The rate shown is the annualized 7-day yield. |
| |
|
| |
Real Estate Investment Trust |
At October 31, 2025, all of the fund’s investment securities were classified as Level 1 (see notes to portfolio holdings for additional
information).
20
Schwab Multi-Asset Funds | Annual Holdings and Financial Statements
Schwab MarketTrack Balanced Portfolio
Statement of Assets and Liabilities
| |
Investments in securities, at value - affiliated issuers (cost $411,498,265) |
|
|
| |
|
|
| |
|
|
| |
|
|
| |
|
|
| |
|
|
| |
|
|
| |
|
|
| |
| |
| |
|
|
| |
|
|
| |
|
|
| |
|
|
Investment adviser and administrator fees |
|
|
Independent trustees’ fees |
|
|
| |
|
|
| |
|
|
| |
|
|
| |
| |
Capital received from investors |
|
|
Total distributable earnings |
|
|
| |
|
|
Schwab Multi-Asset Funds | Annual Holdings and Financial Statements
21
Schwab MarketTrack Balanced Portfolio
Statement of Operations
For the period November 1, 2024 through October 31, 2025 |
| |
Dividends received from securities - affiliated issuers |
|
|
| |
|
|
| |
|
|
| |
| |
| |
|
|
Investment adviser and administrator fees |
|
|
| |
|
|
| |
|
|
Portfolio accounting fees |
|
|
| |
|
|
Independent trustees’ fees |
|
|
| |
|
|
| |
|
|
| |
|
|
| |
|
|
| |
|
|
| |
REALIZED AND UNREALIZED GAINS (LOSSES) |
Realized capital gain distributions received from underlying funds - affiliated issuers |
|
|
Net realized gains on sales of securities - affiliated issuers |
|
|
| |
|
|
Net change in unrealized appreciation (depreciation) on securities - affiliated issuers |
|
|
Net realized and unrealized gains |
|
|
Increase in net assets resulting from operations |
|
|
22
Schwab Multi-Asset Funds | Annual Holdings and Financial Statements
Schwab MarketTrack Balanced Portfolio
Statement of Changes in Net Assets
For the current and prior report periods
| |
| |
|
|
| |
|
|
|
| |
|
|
|
Net change in unrealized appreciation (depreciation) |
|
|
|
Increase in net assets resulting from operations |
|
|
|
| |
DISTRIBUTIONS TO SHAREHOLDERS |
| |
|
|
|
TRANSACTIONS IN FUND SHARES |
| |
|
|
| |
|
|
|
|
|
| |
|
|
|
|
|
| |
|
|
|
|
|
| |
|
|
|
|
|
Net transactions in fund shares |
|
|
|
|
|
| |
SHARES OUTSTANDING AND NET ASSETS |
| |
|
|
| |
|
|
|
|
|
| |
|
|
|
|
|
Total increase (decrease) |
|
|
|
|
|
| |
|
|
|
|
|
Schwab Multi-Asset Funds | Annual Holdings and Financial Statements
23
Schwab MarketTrack Conservative Portfolio
Financial Statements
| |
|
|
|
|
|
|
| |
Net asset value at beginning of period |
|
|
|
|
|
|
Income (loss) from investment operations: |
|
|
|
|
|
|
Net investment income (loss)1 |
|
|
|
|
|
|
Net realized and unrealized gains (losses) |
|
|
|
|
|
|
Total from investment operations |
|
|
|
|
|
|
| |
|
|
|
|
|
|
Distributions from net investment income |
|
|
|
|
|
|
Distributions from net realized gains |
|
|
|
|
|
|
| |
|
|
|
|
|
|
Net asset value at end of period |
|
|
|
|
|
|
| |
|
|
|
|
|
|
| |
Ratios to average net assets: |
|
|
|
|
|
|
| |
|
|
|
|
|
|
| |
|
|
|
|
|
|
Net investment income (loss) |
|
|
|
|
|
|
| |
|
|
|
|
|
|
Net assets, end of period (x 1,000,000) |
|
|
|
|
|
|
| |
Calculated based on the average shares outstanding during the period. |
| |
Ratio excludes acquired fund fees and expenses, which are indirect expenses incurred by the fund through its investments in underlying funds. |
| |
Ratio includes less than 0.005% of non-routine proxy expenses. |
24
Schwab Multi-Asset Funds | Annual Holdings and Financial Statements
Schwab MarketTrack Conservative Portfolio
Portfolio Holdings as of October 31, 2025
This section includes a summary of the fund’s transactions with its affiliated underlying funds during the period.
| |
|
|
|
NET REALIZED GAINS (LOSSES) |
NET CHANGE IN UNREALIZED APPRECIATION (DEPRECIATION) |
|
BALANCE OF SHARES HELD AT 10/31/25 |
|
AFFILIATED UNDERLYING FUNDS 99.5% OF NET ASSETS |
| |
| |
| |
Schwab Fundamental U.S. Large Company Index Fund |
|
|
|
|
|
|
|
|
Schwab S&P 500 Index Fund |
|
|
|
|
|
|
|
|
Schwab U.S. Large-Cap Growth Index Fund |
|
|
|
|
|
|
|
|
| |
|
|
|
|
|
|
|
|
| |
Schwab Fundamental U.S. Small Company Index Fund |
|
|
|
|
|
|
|
|
Schwab Small-Cap Index Fund |
|
|
|
|
|
|
|
|
| |
|
|
|
|
|
|
|
|
| |
|
|
|
|
|
|
|
|
| |
International Stocks 12.1% |
| |
Schwab Fundamental International Equity Index Fund |
|
|
|
|
|
|
|
|
Schwab Fundamental International Small Equity Index Fund |
|
|
|
|
|
|
|
|
Schwab International Index Fund |
|
|
|
|
|
|
|
|
| |
|
|
|
|
|
|
|
|
| |
Schwab Fundamental Emerging Markets Equity Index Fund |
|
|
|
|
|
|
|
|
| |
|
|
|
|
|
|
|
|
| |
| |
| |
| |
|
|
|
|
|
|
|
|
| |
| |
Intermediate-Term Bond 49.7% |
Schwab High Yield Bond ETF |
|
|
|
|
|
|
|
|
Schwab U.S. Aggregate Bond Index Fund |
|
|
|
|
|
|
|
|
| |
|
|
|
|
|
|
|
|
| |
Schwab Short-Term Bond Index Fund |
|
|
|
|
|
|
|
|
| |
|
|
|
|
|
|
|
|
| |
| |
Schwab Government Money Fund, Ultra |
|
|
|
|
|
|
|
|
Total Affiliated Underlying Funds
(Cost $158,170,620) |
|
|
|
|
|
|
|
|
Total Investments in Securities
(Cost $158,170,620) |
|
|
|
|
|
|
|
|
Schwab Multi-Asset Funds | Annual Holdings and Financial Statements
25
Schwab MarketTrack Conservative Portfolio
Portfolio Holdings as of October 31, 2025 (continued)
| |
Distributions received include distributions from net investment income and capital gains, if any, from the underlying funds. Amounts shown are only presented for affiliated underlying funds, which are presented in the corresponding line-item in the Statement of Operations, if applicable (see financial note 2(d) for additional information). |
| |
The rate shown is the annualized 7-day yield. |
| |
|
| |
Real Estate Investment Trust |
At October 31, 2025, all of the fund’s investment securities were classified as Level 1 (see financial note 2(a) for additional
information).
26
Schwab Multi-Asset Funds | Annual Holdings and Financial Statements
Schwab MarketTrack Conservative Portfolio
Statement of Assets and Liabilities
| |
Investments in securities, at value - affiliated issuers (cost $158,170,620) |
|
|
| |
|
|
| |
|
|
| |
|
|
| |
|
|
| |
|
|
| |
|
|
| |
|
|
| |
| |
| |
|
|
| |
|
|
| |
|
|
| |
|
|
Investment adviser and administrator fees |
|
|
Independent trustees’ fees |
|
|
| |
|
|
| |
|
|
| |
|
|
| |
| |
Capital received from investors |
|
|
Total distributable earnings |
|
|
| |
|
|
Schwab Multi-Asset Funds | Annual Holdings and Financial Statements
27
Schwab MarketTrack Conservative Portfolio
Statement of Operations
For the period November 1, 2024 through October 31, 2025 |
| |
Dividends received from securities - affiliated issuers |
|
|
| |
|
|
| |
|
|
| |
| |
| |
|
|
Investment adviser and administrator fees |
|
|
| |
|
|
| |
|
|
Portfolio accounting fees |
|
|
Independent trustees’ fees |
|
|
| |
|
|
| |
|
|
| |
|
|
| |
|
|
| |
|
|
| |
|
|
| |
REALIZED AND UNREALIZED GAINS (LOSSES) |
Realized capital gain distributions received from underlying funds - affiliated issuers |
|
|
Net realized gains on sales of securities - affiliated issuers |
|
|
| |
|
|
Net change in unrealized appreciation (depreciation) on securities - affiliated issuers |
|
|
Net realized and unrealized gains |
|
|
Increase in net assets resulting from operations |
|
|
28
Schwab Multi-Asset Funds | Annual Holdings and Financial Statements
Schwab MarketTrack Conservative Portfolio
Statement of Changes in Net Assets
For the current and prior report periods
| |
| |
|
|
| |
|
|
|
| |
|
|
|
Net change in unrealized appreciation (depreciation) |
|
|
|
Increase in net assets resulting from operations |
|
|
|
| |
DISTRIBUTIONS TO SHAREHOLDERS |
| |
|
|
|
TRANSACTIONS IN FUND SHARES |
| |
|
|
| |
|
|
|
|
|
| |
|
|
|
|
|
| |
|
|
|
|
|
| |
|
|
|
|
|
Net transactions in fund shares |
|
|
|
|
|
| |
SHARES OUTSTANDING AND NET ASSETS |
| |
|
|
| |
|
|
|
|
|
| |
|
|
|
|
|
Total increase (decrease) |
|
|
|
|
|
| |
|
|
|
|
|
Schwab Multi-Asset Funds | Annual Holdings and Financial Statements
29
Financial Statements
| |
|
|
|
|
|
|
| |
Net asset value at beginning of period |
|
|
|
|
|
|
Income (loss) from investment operations: |
|
|
|
|
|
|
Net investment income (loss)1 |
|
|
|
|
|
|
Net realized and unrealized gains (losses) |
|
|
|
|
|
|
Total from investment operations |
|
|
|
|
|
|
| |
|
|
|
|
|
|
Distributions from net investment income |
|
|
|
|
|
|
Distributions from net realized gains |
|
|
|
|
|
|
| |
|
|
|
|
|
|
Net asset value at end of period |
|
|
|
|
|
|
| |
|
|
|
|
|
|
| |
Ratios to average net assets: |
|
|
|
|
|
|
| |
|
|
|
|
|
|
| |
|
|
|
|
|
|
Net investment income (loss) |
|
|
|
|
|
|
| |
|
|
|
|
|
|
Net assets, end of period (x 1,000,000) |
|
|
|
|
|
|
| |
Calculated based on the average shares outstanding during the period. |
| |
Ratio excludes acquired fund fees and expenses, which are indirect expenses incurred by the fund through its investments in underlying funds. |
| |
Ratio includes less than 0.005% of non-routine proxy expenses. |
30
Schwab Multi-Asset Funds | Annual Holdings and Financial Statements
Portfolio Holdings as of October 31, 2025
This section includes a summary of the fund’s transactions with its affiliated underlying funds during the period.
| |
|
|
|
NET REALIZED GAINS (LOSSES) |
NET CHANGE IN UNREALIZED APPRECIATION (DEPRECIATION) |
|
BALANCE OF SHARES HELD AT 10/31/25 |
|
AFFILIATED UNDERLYING FUNDS 76.4% OF NET ASSETS |
| |
| |
| |
| |
|
|
|
|
|
|
|
|
Schwab Fundamental U.S. Large Company Index Fund |
|
|
|
|
|
|
|
|
Schwab S&P 500 Index Fund |
|
|
|
|
|
|
|
|
Schwab Select Large Cap Growth Fund * |
|
|
|
|
|
|
|
|
| |
|
|
|
|
|
|
|
|
| |
Schwab U.S. Mid-Cap Index Fund |
|
|
|
|
|
|
|
|
| |
Schwab Small-Cap Equity Fund |
|
|
|
|
|
|
|
|
| |
|
|
|
|
|
|
|
|
| |
International Stocks 7.5% |
| |
Schwab Fundamental International Equity Index Fund |
|
|
|
|
|
|
|
|
Schwab International Core Equity Fund |
|
|
|
|
|
|
|
|
Schwab International Opportunities Fund |
|
|
|
|
|
|
|
|
| |
|
|
|
|
|
|
|
|
| |
| |
| |
Schwab Global Real Estate Fund |
|
|
|
|
|
|
|
|
| |
| |
Inflation-Protected Bond 7.0% |
Schwab Treasury Inflation Protected Securities Index Fund |
|
|
|
|
|
|
|
|
Intermediate-Term Bond 27.9% |
Schwab U.S. Aggregate Bond Index Fund |
|
|
|
|
|
|
|
|
| |
Schwab Short-Term Bond Index Fund |
|
|
|
|
|
|
|
|
| |
|
|
|
|
|
|
|
|
| |
| |
Schwab Government Money Fund, Ultra |
|
|
|
|
|
|
|
|
Total Affiliated Underlying Funds
(Cost $26,165,046) |
|
|
|
|
|
|
|
|
| |
Schwab Multi-Asset Funds | Annual Holdings and Financial Statements
31
Portfolio Holdings as of October 31, 2025 (continued)
| |
|
|
|
NET REALIZED GAINS (LOSSES) |
NET CHANGE IN UNREALIZED APPRECIATION (DEPRECIATION) |
|
BALANCE OF SHARES HELD AT 10/31/25 |
DISTRIBUTIONS RECEIVED(a) |
UNAFFILIATED UNDERLYING FUNDS 23.0% OF NET ASSETS |
| |
| |
| |
Dodge & Cox Stock Fund, Class I |
|
|
|
|
|
|
|
|
PGIM Jennison Growth Fund, Class R6 |
|
|
|
|
|
|
|
|
| |
|
|
|
|
|
|
|
|
| |
Driehaus Small Cap Growth Fund, Institutional Class |
|
|
|
|
|
|
|
|
| |
|
|
|
|
|
|
|
|
| |
| |
Intermediate-Term Bond 17.2% |
Allspring Core Plus Bond Fund, Class R6 |
|
|
|
|
|
|
|
|
Baird Aggregate Bond Fund, Institutional Class |
|
|
|
|
|
|
|
|
Loomis Sayles Investment Grade Bond Fund, Class Y |
|
|
|
|
|
|
|
|
| |
|
|
|
|
|
|
|
|
| |
PIMCO International Bond Fund (U.S. Dollar-Hedged), Institutional Class |
|
|
|
|
|
|
|
|
| |
|
|
|
|
|
|
|
|
Total Unaffiliated Underlying Funds
(Cost $9,445,721) |
|
|
|
|
|
|
|
|
Total Investments in Securities
(Cost $35,610,767) |
|
|
|
|
|
|
|
|
| |
Non-income producing security. |
| |
Distributions received include distributions from net investment income and capital gains, if any, from the underlying funds. Amounts shown are only presented for affiliated underlying funds, which are presented in the corresponding line-item in the Statement of Operations, if applicable (see financial note 2(d) for additional information). |
| |
The rate shown is the annualized 7-day yield. |
At October 31, 2025, all of the fund’s investment securities were classified as Level 1 (see financial note 2(a) for additional
information).
32
Schwab Multi-Asset Funds | Annual Holdings and Financial Statements
Statement of Assets and Liabilities
| |
Investments in securities, at value - affiliated issuers (cost $26,165,046) |
|
|
Investments in securities, at value - unaffiliated issuers (cost $9,445,721) |
|
|
| |
|
|
| |
|
|
| |
|
|
| |
|
|
Due from investment adviser |
|
|
| |
|
|
| |
|
|
| |
|
|
| |
| |
| |
|
|
| |
|
|
| |
|
|
Independent trustees’ fees |
|
|
| |
|
|
| |
|
|
| |
|
|
| |
| |
Capital received from investors |
|
|
Total distributable earnings |
|
|
| |
|
|
Schwab Multi-Asset Funds | Annual Holdings and Financial Statements
33
Statement of Operations
For the period November 1, 2024 through October 31, 2025 |
| |
Dividends received from securities - affiliated issuers |
|
|
Dividends received from securities - unaffiliated issuers |
|
|
| |
|
|
| |
|
|
| |
| |
| |
|
|
| |
|
|
Portfolio accounting fees |
|
|
Independent trustees’ fees |
|
|
| |
|
|
| |
|
|
| |
|
|
| |
|
|
| |
|
|
| |
|
|
| |
|
|
| |
|
|
| |
REALIZED AND UNREALIZED GAINS (LOSSES) |
Realized capital gain distributions received from underlying funds - affiliated issuers |
|
|
Realized capital gain distributions received from underlying funds - unaffiliated issuers |
|
|
Net realized gains on sales of securities - affiliated issuers |
|
|
Net realized gains on sales of securities - unaffiliated issuers |
|
|
| |
|
|
Net change in unrealized appreciation (depreciation) on securities - affiliated issuers |
|
|
Net change in unrealized appreciation (depreciation) on securities - unaffiliated issuers |
|
|
Net change in unrealized appreciation (depreciation) |
|
|
Net realized and unrealized gains |
|
|
Increase in net assets resulting from operations |
|
|
34
Schwab Multi-Asset Funds | Annual Holdings and Financial Statements
Statement of Changes in Net Assets
For the current and prior report periods
| |
| |
|
|
| |
|
|
|
| |
|
|
|
Net change in unrealized appreciation (depreciation) |
|
|
|
Increase in net assets resulting from operations |
|
|
|
| |
DISTRIBUTIONS TO SHAREHOLDERS |
| |
|
|
|
TRANSACTIONS IN FUND SHARES |
| |
|
|
| |
|
|
|
|
|
| |
|
|
|
|
|
| |
|
|
|
|
|
| |
|
|
|
|
|
Net transactions in fund shares |
|
|
|
|
|
| |
SHARES OUTSTANDING AND NET ASSETS |
| |
|
|
| |
|
|
|
|
|
| |
|
|
|
|
|
| |
|
|
|
|
|
| |
|
|
|
|
|
Schwab Multi-Asset Funds | Annual Holdings and Financial Statements
35
Financial Statements
| |
|
|
|
|
|
|
| |
Net asset value at beginning of period |
|
|
|
|
|
|
Income (loss) from investment operations: |
|
|
|
|
|
|
Net investment income (loss)1 |
|
|
|
|
|
|
Net realized and unrealized gains (losses) |
|
|
|
|
|
|
Total from investment operations |
|
|
|
|
|
|
| |
|
|
|
|
|
|
Distributions from net investment income |
|
|
|
|
|
|
Distributions from net realized gains |
|
|
|
|
|
|
| |
|
|
|
|
|
|
Net asset value at end of period |
|
|
|
|
|
|
| |
|
|
|
|
|
|
| |
Ratios to average net assets: |
|
|
|
|
|
|
| |
|
|
|
|
|
|
| |
|
|
|
|
|
|
Net investment income (loss) |
|
|
|
|
|
|
| |
|
|
|
|
|
|
Net assets, end of period (x 1,000,000) |
|
|
|
|
|
|
| |
Calculated based on the average shares outstanding during the period. |
| |
Ratio excludes acquired fund fees and expenses, which are indirect expenses incurred by the fund through its investments in underlying funds. |
| |
Ratio includes less than 0.005% of non-routine proxy expenses. |
36
Schwab Multi-Asset Funds | Annual Holdings and Financial Statements
Portfolio Holdings as of October 31, 2025
This section includes a summary of the fund’s transactions with its affiliated underlying funds during the period.
| |
|
|
|
NET REALIZED GAINS (LOSSES) |
NET CHANGE IN UNREALIZED APPRECIATION (DEPRECIATION) |
|
BALANCE OF SHARES HELD AT 10/31/25 |
|
AFFILIATED UNDERLYING FUNDS 76.7% OF NET ASSETS |
| |
| |
| |
| |
|
|
|
|
|
|
|
|
Schwab Fundamental U.S. Large Company Index Fund |
|
|
|
|
|
|
|
|
Schwab S&P 500 Index Fund |
|
|
|
|
|
|
|
|
Schwab Select Large Cap Growth Fund * |
|
|
|
|
|
|
|
|
| |
|
|
|
|
|
|
|
|
| |
Schwab U.S. Mid-Cap Index Fund |
|
|
|
|
|
|
|
|
| |
Schwab Small-Cap Equity Fund |
|
|
|
|
|
|
|
|
| |
|
|
|
|
|
|
|
|
| |
International Stocks 8.9% |
| |
Schwab Fundamental International Equity Index Fund |
|
|
|
|
|
|
|
|
Schwab International Core Equity Fund |
|
|
|
|
|
|
|
|
Schwab International Opportunities Fund |
|
|
|
|
|
|
|
|
| |
|
|
|
|
|
|
|
|
| |
| |
| |
Schwab Global Real Estate Fund |
|
|
|
|
|
|
|
|
| |
| |
Inflation-Protected Bond 6.4% |
Schwab Treasury Inflation Protected Securities Index Fund |
|
|
|
|
|
|
|
|
Intermediate-Term Bond 25.4% |
Schwab U.S. Aggregate Bond Index Fund |
|
|
|
|
|
|
|
|
| |
Schwab Short-Term Bond Index Fund |
|
|
|
|
|
|
|
|
| |
|
|
|
|
|
|
|
|
| |
| |
Schwab Government Money Fund, Ultra |
|
|
|
|
|
|
|
|
Total Affiliated Underlying Funds
(Cost $27,842,513) |
|
|
|
|
|
|
|
|
| |
Schwab Multi-Asset Funds | Annual Holdings and Financial Statements
37
Portfolio Holdings as of October 31, 2025 (continued)
| |
|
|
|
NET REALIZED GAINS (LOSSES) |
NET CHANGE IN UNREALIZED APPRECIATION (DEPRECIATION) |
|
BALANCE OF SHARES HELD AT 10/31/25 |
DISTRIBUTIONS RECEIVED(a) |
UNAFFILIATED UNDERLYING FUNDS 22.8% OF NET ASSETS |
| |
| |
| |
Dodge & Cox Stock Fund, Class I |
|
|
|
|
|
|
|
|
PGIM Jennison Growth Fund, Class R6 |
|
|
|
|
|
|
|
|
| |
|
|
|
|
|
|
|
|
| |
Driehaus Small Cap Growth Fund, Institutional Class |
|
|
|
|
|
|
|
|
| |
|
|
|
|
|
|
|
|
| |
| |
Intermediate-Term Bond 16.4% |
Allspring Core Plus Bond Fund, Class R6 |
|
|
|
|
|
|
|
|
Baird Aggregate Bond Fund, Institutional Class |
|
|
|
|
|
|
|
|
Loomis Sayles Investment Grade Bond Fund, Class Y |
|
|
|
|
|
|
|
|
| |
|
|
|
|
|
|
|
|
| |
PIMCO International Bond Fund (U.S. Dollar-Hedged), Institutional Class |
|
|
|
|
|
|
|
|
| |
|
|
|
|
|
|
|
|
Total Unaffiliated Underlying Funds
(Cost $10,208,453) |
|
|
|
|
|
|
|
|
Total Investments in Securities
(Cost $38,050,966) |
|
|
|
|
|
|
|
|
| |
Non-income producing security. |
| |
Distributions received include distributions from net investment income and capital gains, if any, from the underlying funds. Amounts shown are only presented for affiliated underlying funds, which are presented in the corresponding line-item in the Statement of Operations, if applicable (see financial note 2(d) for additional information). |
| |
The rate shown is the annualized 7-day yield. |
At October 31, 2025, all of the fund’s investment securities were classified as Level 1 (see financial note 2(a) for additional
information).
38
Schwab Multi-Asset Funds | Annual Holdings and Financial Statements
Statement of Assets and Liabilities
| |
Investments in securities, at value - affiliated issuers (cost $27,842,513) |
|
|
Investments in securities, at value - unaffiliated issuers (cost $10,208,453) |
|
|
| |
|
|
| |
|
|
| |
|
|
Due from investment adviser |
|
|
| |
|
|
| |
|
|
| |
|
|
| |
| |
| |
|
|
| |
|
|
| |
|
|
Independent trustees’ fees |
|
|
| |
|
|
| |
|
|
| |
|
|
| |
| |
Capital received from investors |
|
|
Total distributable earnings |
|
|
| |
|
|
Schwab Multi-Asset Funds | Annual Holdings and Financial Statements
39
Statement of Operations
For the period November 1, 2024 through October 31, 2025 |
| |
Dividends received from securities - affiliated issuers |
|
|
Dividends received from securities - unaffiliated issuers |
|
|
| |
|
|
| |
|
|
| |
| |
| |
|
|
| |
|
|
Portfolio accounting fees |
|
|
Independent trustees’ fees |
|
|
| |
|
|
| |
|
|
| |
|
|
| |
|
|
| |
|
|
| |
|
|
| |
|
|
| |
|
|
| |
REALIZED AND UNREALIZED GAINS (LOSSES) |
Realized capital gain distributions received from underlying funds - affiliated issuers |
|
|
Realized capital gain distributions received from underlying funds - unaffiliated issuers |
|
|
Net realized gains on sales of securities - affiliated issuers |
|
|
Net realized gains on sales of securities - unaffiliated issuers |
|
|
| |
|
|
Net change in unrealized appreciation (depreciation) on securities - affiliated issuers |
|
|
Net change in unrealized appreciation (depreciation) on securities - unaffiliated issuers |
|
|
Net change in unrealized appreciation (depreciation) |
|
|
Net realized and unrealized gains |
|
|
Increase in net assets resulting from operations |
|
|
40
Schwab Multi-Asset Funds | Annual Holdings and Financial Statements
Statement of Changes in Net Assets
For the current and prior report periods
| |
| |
|
|
| |
|
|
|
| |
|
|
|
Net change in unrealized appreciation (depreciation) |
|
|
|
Increase in net assets resulting from operations |
|
|
|
| |
DISTRIBUTIONS TO SHAREHOLDERS |
| |
|
|
|
TRANSACTIONS IN FUND SHARES |
| |
|
|
| |
|
|
|
|
|
| |
|
|
|
|
|
| |
|
|
|
|
|
| |
|
|
|
|
|
Net transactions in fund shares |
|
|
|
|
|
| |
SHARES OUTSTANDING AND NET ASSETS |
| |
|
|
| |
|
|
|
|
|
| |
|
|
|
|
|
| |
|
|
|
|
|
| |
|
|
|
|
|
Schwab Multi-Asset Funds | Annual Holdings and Financial Statements
41
Financial Statements
| |
|
|
|
|
|
|
| |
Net asset value at beginning of period |
|
|
|
|
|
|
Income (loss) from investment operations: |
|
|
|
|
|
|
Net investment income (loss)1 |
|
|
|
|
|
|
Net realized and unrealized gains (losses) |
|
|
|
|
|
|
Total from investment operations |
|
|
|
|
|
|
| |
|
|
|
|
|
|
Distributions from net investment income |
|
|
|
|
|
|
Distributions from net realized gains |
|
|
|
|
|
|
| |
|
|
|
|
|
|
Net asset value at end of period |
|
|
|
|
|
|
| |
|
|
|
|
|
|
| |
Ratios to average net assets: |
|
|
|
|
|
|
| |
|
|
|
|
|
|
| |
|
|
|
|
|
|
Net investment income (loss) |
|
|
|
|
|
|
| |
|
|
|
|
|
|
Net assets, end of period (x 1,000,000) |
|
|
|
|
|
|
| |
Calculated based on the average shares outstanding during the period. |
| |
Ratio excludes acquired fund fees and expenses, which are indirect expenses incurred by the fund through its investments in underlying funds. |
| |
Ratio includes less than 0.005% of non-routine proxy expenses. |
42
Schwab Multi-Asset Funds | Annual Holdings and Financial Statements
Portfolio Holdings as of October 31, 2025
This section includes a summary of the fund’s transactions with its affiliated underlying funds during the period.
| |
|
|
|
NET REALIZED GAINS (LOSSES) |
NET CHANGE IN UNREALIZED APPRECIATION (DEPRECIATION) |
|
BALANCE OF SHARES HELD AT 10/31/25 |
|
AFFILIATED UNDERLYING FUNDS 77.0% OF NET ASSETS |
| |
| |
| |
| |
|
|
|
|
|
|
|
|
Schwab Fundamental U.S. Large Company Index Fund |
|
|
|
|
|
|
|
|
Schwab S&P 500 Index Fund |
|
|
|
|
|
|
|
|
Schwab Select Large Cap Growth Fund * |
|
|
|
|
|
|
|
|
| |
|
|
|
|
|
|
|
|
| |
Schwab U.S. Mid-Cap Index Fund |
|
|
|
|
|
|
|
|
| |
Schwab Small-Cap Equity Fund |
|
|
|
|
|
|
|
|
| |
|
|
|
|
|
|
|
|
| |
International Stocks 9.8% |
| |
Schwab Fundamental International Equity Index Fund |
|
|
|
|
|
|
|
|
Schwab International Core Equity Fund |
|
|
|
|
|
|
|
|
Schwab International Opportunities Fund |
|
|
|
|
|
|
|
|
| |
|
|
|
|
|
|
|
|
| |
| |
| |
Schwab Global Real Estate Fund |
|
|
|
|
|
|
|
|
| |
| |
Inflation-Protected Bond 6.2% |
Schwab Treasury Inflation Protected Securities Index Fund |
|
|
|
|
|
|
|
|
Intermediate-Term Bond 24.1% |
Schwab U.S. Aggregate Bond Index Fund |
|
|
|
|
|
|
|
|
| |
Schwab Short-Term Bond Index Fund |
|
|
|
|
|
|
|
|
| |
|
|
|
|
|
|
|
|
| |
| |
Schwab Government Money Fund, Ultra |
|
|
|
|
|
|
|
|
Total Affiliated Underlying Funds
(Cost $173,208,655) |
|
|
|
|
|
|
|
|
| |
Schwab Multi-Asset Funds | Annual Holdings and Financial Statements
43
Portfolio Holdings as of October 31, 2025 (continued)
| |
|
|
|
NET REALIZED GAINS (LOSSES) |
NET CHANGE IN UNREALIZED APPRECIATION (DEPRECIATION) |
|
BALANCE OF SHARES HELD AT 10/31/25 |
DISTRIBUTIONS RECEIVED(a) |
UNAFFILIATED UNDERLYING FUNDS 22.6% OF NET ASSETS |
| |
| |
| |
Dodge & Cox Stock Fund, Class I |
|
|
|
|
|
|
|
|
PGIM Jennison Growth Fund, Class R6 |
|
|
|
|
|
|
|
|
| |
|
|
|
|
|
|
|
|
| |
Driehaus Small Cap Growth Fund, Institutional Class |
|
|
|
|
|
|
|
|
| |
|
|
|
|
|
|
|
|
| |
| |
Intermediate-Term Bond 16.1% |
Allspring Core Plus Bond Fund, Class R6 |
|
|
|
|
|
|
|
|
Baird Aggregate Bond Fund, Institutional Class |
|
|
|
|
|
|
|
|
Loomis Sayles Investment Grade Bond Fund, Class Y |
|
|
|
|
|
|
|
|
| |
|
|
|
|
|
|
|
|
| |
PIMCO International Bond Fund (U.S. Dollar-Hedged), Institutional Class |
|
|
|
|
|
|
|
|
| |
|
|
|
|
|
|
|
|
Total Unaffiliated Underlying Funds
(Cost $64,283,106) |
|
|
|
|
|
|
|
|
Total Investments in Securities
(Cost $237,491,761) |
|
|
|
|
|
|
|
|
| |
Non-income producing security. |
| |
Distributions received include distributions from net investment income and capital gains, if any, from the underlying funds. Amounts shown are only presented for affiliated underlying funds, which are presented in the corresponding line-item in the Statement of Operations, if applicable (see financial note 2(d) for additional information). |
| |
The rate shown is the annualized 7-day yield. |
At October 31, 2025, all of the fund’s investment securities were classified as Level 1 (see financial note 2(a) for additional
information).
44
Schwab Multi-Asset Funds | Annual Holdings and Financial Statements
Statement of Assets and Liabilities
| |
Investments in securities, at value - affiliated issuers (cost $173,208,655) |
|
|
Investments in securities, at value - unaffiliated issuers (cost $64,283,106) |
|
|
| |
|
|
| |
|
|
| |
|
|
| |
|
|
| |
|
|
Due from investment adviser |
|
|
| |
|
|
| |
|
|
| |
| |
| |
|
|
| |
|
|
| |
|
|
Independent trustees’ fees |
|
|
| |
|
|
| |
|
|
| |
|
|
| |
| |
Capital received from investors |
|
|
Total distributable earnings |
|
|
| |
|
|
Schwab Multi-Asset Funds | Annual Holdings and Financial Statements
45
Statement of Operations
For the period November 1, 2024 through October 31, 2025 |
| |
Dividends received from securities - affiliated issuers |
|
|
Dividends received from securities - unaffiliated issuers |
|
|
| |
|
|
| |
|
|
| |
| |
| |
|
|
| |
|
|
Portfolio accounting fees |
|
|
Independent trustees’ fees |
|
|
| |
|
|
| |
|
|
| |
|
|
| |
|
|
| |
|
|
| |
|
|
| |
|
|
| |
|
|
| |
REALIZED AND UNREALIZED GAINS (LOSSES) |
Realized capital gain distributions received from underlying funds - affiliated issuers |
|
|
Realized capital gain distributions received from underlying funds - unaffiliated issuers |
|
|
Net realized gains on sales of securities - affiliated issuers |
|
|
Net realized gains on sales of securities - unaffiliated issuers |
|
|
| |
|
|
Net change in unrealized appreciation (depreciation) on securities - affiliated issuers |
|
|
Net change in unrealized appreciation (depreciation) on securities - unaffiliated issuers |
|
|
Net change in unrealized appreciation (depreciation) |
|
|
Net realized and unrealized gains |
|
|
Increase in net assets resulting from operations |
|
|
46
Schwab Multi-Asset Funds | Annual Holdings and Financial Statements
Statement of Changes in Net Assets
For the current and prior report periods
| |
| |
|
|
| |
|
|
|
| |
|
|
|
Net change in unrealized appreciation (depreciation) |
|
|
|
Increase in net assets resulting from operations |
|
|
|
| |
DISTRIBUTIONS TO SHAREHOLDERS |
| |
|
|
|
TRANSACTIONS IN FUND SHARES |
| |
|
|
| |
|
|
|
|
|
| |
|
|
|
|
|
| |
|
|
|
|
|
| |
|
|
|
|
|
Net transactions in fund shares |
|
|
|
|
|
| |
SHARES OUTSTANDING AND NET ASSETS |
| |
|
|
| |
|
|
|
|
|
| |
|
|
|
|
|
| |
|
|
|
|
|
| |
|
|
|
|
|
Schwab Multi-Asset Funds | Annual Holdings and Financial Statements
47
Financial Statements
| |
|
|
|
|
|
|
| |
Net asset value at beginning of period |
|
|
|
|
|
|
Income (loss) from investment operations: |
|
|
|
|
|
|
Net investment income (loss)1 |
|
|
|
|
|
|
Net realized and unrealized gains (losses) |
|
|
|
|
|
|
Total from investment operations |
|
|
|
|
|
|
| |
|
|
|
|
|
|
Distributions from net investment income |
|
|
|
|
|
|
Distributions from net realized gains |
|
|
|
|
|
|
| |
|
|
|
|
|
|
Net asset value at end of period |
|
|
|
|
|
|
| |
|
|
|
|
|
|
| |
Ratios to average net assets: |
|
|
|
|
|
|
| |
|
|
|
|
|
|
| |
|
|
|
|
|
|
Net investment income (loss) |
|
|
|
|
|
|
| |
|
|
|
|
|
|
Net assets, end of period (x 1,000,000) |
|
|
|
|
|
|
| |
Calculated based on the average shares outstanding during the period. |
| |
Ratio excludes acquired fund fees and expenses, which are indirect expenses incurred by the fund through its investments in underlying funds. |
| |
Ratio includes less than 0.005% of non-routine proxy expenses. |
48
Schwab Multi-Asset Funds | Annual Holdings and Financial Statements
Portfolio Holdings as of October 31, 2025
This section includes a summary of the fund’s transactions with its affiliated underlying funds during the period.
| |
|
|
|
NET REALIZED GAINS (LOSSES) |
NET CHANGE IN UNREALIZED APPRECIATION (DEPRECIATION) |
|
BALANCE OF SHARES HELD AT 10/31/25 |
|
AFFILIATED UNDERLYING FUNDS 77.0% OF NET ASSETS |
| |
| |
| |
| |
|
|
|
|
|
|
|
|
Schwab Fundamental U.S. Large Company Index Fund |
|
|
|
|
|
|
|
|
Schwab S&P 500 Index Fund |
|
|
|
|
|
|
|
|
Schwab Select Large Cap Growth Fund * |
|
|
|
|
|
|
|
|
| |
|
|
|
|
|
|
|
|
| |
Schwab U.S. Mid-Cap Index Fund |
|
|
|
|
|
|
|
|
| |
Schwab Small-Cap Equity Fund |
|
|
|
|
|
|
|
|
| |
|
|
|
|
|
|
|
|
| |
International Stocks 10.7% |
| |
Schwab Fundamental International Equity Index Fund |
|
|
|
|
|
|
|
|
Schwab International Core Equity Fund |
|
|
|
|
|
|
|
|
Schwab International Opportunities Fund |
|
|
|
|
|
|
|
|
| |
|
|
|
|
|
|
|
|
| |
| |
| |
Schwab Global Real Estate Fund |
|
|
|
|
|
|
|
|
| |
| |
Inflation-Protected Bond 6.0% |
Schwab Treasury Inflation Protected Securities Index Fund |
|
|
|
|
|
|
|
|
Intermediate-Term Bond 22.9% |
Schwab U.S. Aggregate Bond Index Fund |
|
|
|
|
|
|
|
|
| |
Schwab Short-Term Bond Index Fund |
|
|
|
|
|
|
|
|
| |
|
|
|
|
|
|
|
|
| |
| |
Schwab Government Money Fund, Ultra |
|
|
|
|
|
|
|
|
Total Affiliated Underlying Funds
(Cost $244,713,893) |
|
|
|
|
|
|
|
|
| |
Schwab Multi-Asset Funds | Annual Holdings and Financial Statements
49
Portfolio Holdings as of October 31, 2025 (continued)
| |
|
|
|
NET REALIZED GAINS (LOSSES) |
NET CHANGE IN UNREALIZED APPRECIATION (DEPRECIATION) |
|
BALANCE OF SHARES HELD AT 10/31/25 |
DISTRIBUTIONS RECEIVED(a) |
UNAFFILIATED UNDERLYING FUNDS 22.5% OF NET ASSETS |
| |
| |
| |
Dodge & Cox Stock Fund, Class I |
|
|
|
|
|
|
|
|
PGIM Jennison Growth Fund, Class R6 |
|
|
|
|
|
|
|
|
| |
|
|
|
|
|
|
|
|
| |
Driehaus Small Cap Growth Fund, Institutional Class |
|
|
|
|
|
|
|
|
| |
|
|
|
|
|
|
|
|
| |
| |
Intermediate-Term Bond 15.6% |
Allspring Core Plus Bond Fund, Class R6 |
|
|
|
|
|
|
|
|
Baird Aggregate Bond Fund, Institutional Class |
|
|
|
|
|
|
|
|
Loomis Sayles Investment Grade Bond Fund, Class Y |
|
|
|
|
|
|
|
|
| |
|
|
|
|
|
|
|
|
| |
PIMCO International Bond Fund (U.S. Dollar-Hedged), Institutional Class |
|
|
|
|
|
|
|
|
| |
|
|
|
|
|
|
|
|
Total Unaffiliated Underlying Funds
(Cost $90,798,210) |
|
|
|
|
|
|
|
|
Total Investments in Securities
(Cost $335,512,103) |
|
|
|
|
|
|
|
|
| |
Non-income producing security. |
| |
Distributions received include distributions from net investment income and capital gains, if any, from the underlying funds. Amounts shown are only presented for affiliated underlying funds, which are presented in the corresponding line-item in the Statement of Operations, if applicable (see financial note 2(d) for additional information). |
| |
The rate shown is the annualized 7-day yield. |
At October 31, 2025, all of the fund’s investment securities were classified as Level 1 (see financial note 2(a) for additional
information).
50
Schwab Multi-Asset Funds | Annual Holdings and Financial Statements
Statement of Assets and Liabilities
| |
Investments in securities, at value - affiliated issuers (cost $244,713,893) |
|
|
Investments in securities, at value - unaffiliated issuers (cost $90,798,210) |
|
|
| |
|
|
| |
|
|
| |
|
|
| |
|
|
| |
|
|
Due from investment adviser |
|
|
| |
|
|
| |
|
|
| |
| |
| |
|
|
| |
|
|
| |
|
|
Independent trustees’ fees |
|
|
| |
|
|
| |
|
|
| |
|
|
| |
| |
Capital received from investors |
|
|
Total distributable earnings |
|
|
| |
|
|
Schwab Multi-Asset Funds | Annual Holdings and Financial Statements
51
Statement of Operations
For the period November 1, 2024 through October 31, 2025 |
| |
Dividends received from securities - affiliated issuers |
|
|
Dividends received from securities - unaffiliated issuers |
|
|
| |
|
|
| |
|
|
| |
| |
| |
|
|
| |
|
|
Portfolio accounting fees |
|
|
Independent trustees’ fees |
|
|
| |
|
|
| |
|
|
| |
|
|
| |
|
|
| |
|
|
| |
|
|
| |
|
|
| |
|
|
| |
REALIZED AND UNREALIZED GAINS (LOSSES) |
Realized capital gain distributions received from underlying funds - affiliated issuers |
|
|
Realized capital gain distributions received from underlying funds - unaffiliated issuers |
|
|
Net realized gains on sales of securities - affiliated issuers |
|
|
Net realized gains on sales of securities - unaffiliated issuers |
|
|
| |
|
|
Net change in unrealized appreciation (depreciation) on securities - affiliated issuers |
|
|
Net change in unrealized appreciation (depreciation) on securities - unaffiliated issuers |
|
|
Net change in unrealized appreciation (depreciation) |
|
|
Net realized and unrealized gains |
|
|
Increase in net assets resulting from operations |
|
|
52
Schwab Multi-Asset Funds | Annual Holdings and Financial Statements
Statement of Changes in Net Assets
For the current and prior report periods
| |
| |
|
|
| |
|
|
|
| |
|
|
|
Net change in unrealized appreciation (depreciation) |
|
|
|
Increase in net assets resulting from operations |
|
|
|
| |
DISTRIBUTIONS TO SHAREHOLDERS |
| |
|
|
|
TRANSACTIONS IN FUND SHARES |
| |
|
|
| |
|
|
|
|
|
| |
|
|
|
|
|
| |
|
|
|
|
|
| |
|
|
|
|
|
Net transactions in fund shares |
|
|
|
|
|
| |
SHARES OUTSTANDING AND NET ASSETS |
| |
|
|
| |
|
|
|
|
|
| |
|
|
|
|
|
Total increase (decrease) |
|
|
|
|
|
| |
|
|
|
|
|
Schwab Multi-Asset Funds | Annual Holdings and Financial Statements
53
Financial Statements
| |
|
|
|
|
|
|
| |
Net asset value at beginning of period |
|
|
|
|
|
|
Income (loss) from investment operations: |
|
|
|
|
|
|
Net investment income (loss)1 |
|
|
|
|
|
|
Net realized and unrealized gains (losses) |
|
|
|
|
|
|
Total from investment operations |
|
|
|
|
|
|
| |
|
|
|
|
|
|
Distributions from net investment income |
|
|
|
|
|
|
Distributions from net realized gains |
|
|
|
|
|
|
| |
|
|
|
|
|
|
Net asset value at end of period |
|
|
|
|
|
|
| |
|
|
|
|
|
|
| |
Ratios to average net assets: |
|
|
|
|
|
|
| |
|
|
|
|
|
|
| |
|
|
|
|
|
|
Net investment income (loss) |
|
|
|
|
|
|
| |
|
|
|
|
|
|
Net assets, end of period (x 1,000,000) |
|
|
|
|
|
|
| |
Calculated based on the average shares outstanding during the period. |
| |
Ratio excludes acquired fund fees and expenses, which are indirect expenses incurred by the fund through its investments in underlying funds. |
| |
Ratio includes less than 0.005% of non-routine proxy expenses. |
54
Schwab Multi-Asset Funds | Annual Holdings and Financial Statements
Portfolio Holdings as of October 31, 2025
This section includes a summary of the fund’s transactions with its affiliated underlying funds during the period.
| |
|
|
|
NET REALIZED GAINS (LOSSES) |
NET CHANGE IN UNREALIZED APPRECIATION (DEPRECIATION) |
|
BALANCE OF SHARES HELD AT 10/31/25 |
|
AFFILIATED UNDERLYING FUNDS 75.8% OF NET ASSETS |
| |
| |
| |
| |
|
|
|
|
|
|
|
|
Schwab Fundamental U.S. Large Company Index Fund |
|
|
|
|
|
|
|
|
Schwab S&P 500 Index Fund |
|
|
|
|
|
|
|
|
Schwab Select Large Cap Growth Fund * |
|
|
|
|
|
|
|
|
| |
|
|
|
|
|
|
|
|
| |
Schwab U.S. Mid-Cap Index Fund |
|
|
|
|
|
|
|
|
| |
Schwab Small-Cap Equity Fund |
|
|
|
|
|
|
|
|
| |
|
|
|
|
|
|
|
|
| |
International Stocks 15.6% |
| |
Schwab Fundamental International Equity Index Fund |
|
|
|
|
|
|
|
|
Schwab International Core Equity Fund |
|
|
|
|
|
|
|
|
Schwab International Opportunities Fund |
|
|
|
|
|
|
|
|
| |
|
|
|
|
|
|
|
|
| |
| |
| |
Schwab Global Real Estate Fund |
|
|
|
|
|
|
|
|
| |
| |
Inflation-Protected Bond 2.2% |
Schwab Treasury Inflation Protected Securities Index Fund |
|
|
|
|
|
|
|
|
Intermediate-Term Bond 15.5% |
Schwab U.S. Aggregate Bond Index Fund |
|
|
|
|
|
|
|
|
| |
Schwab Short-Term Bond Index Fund |
|
|
|
|
|
|
|
|
| |
|
|
|
|
|
|
|
|
| |
| |
Schwab Government Money Fund, Ultra |
|
|
|
|
|
|
|
|
Total Affiliated Underlying Funds
(Cost $512,457,020) |
|
|
|
|
|
|
|
|
| |
Schwab Multi-Asset Funds | Annual Holdings and Financial Statements
55
Portfolio Holdings as of October 31, 2025 (continued)
| |
|
|
|
NET REALIZED GAINS (LOSSES) |
NET CHANGE IN UNREALIZED APPRECIATION (DEPRECIATION) |
|
BALANCE OF SHARES HELD AT 10/31/25 |
DISTRIBUTIONS RECEIVED(a) |
UNAFFILIATED UNDERLYING FUNDS 23.7% OF NET ASSETS |
| |
| |
| |
Dodge & Cox Stock Fund, Class I |
|
|
|
|
|
|
|
|
PGIM Jennison Growth Fund, Class R6 |
|
|
|
|
|
|
|
|
| |
|
|
|
|
|
|
|
|
| |
Driehaus Small Cap Growth Fund, Institutional Class |
|
|
|
|
|
|
|
|
| |
|
|
|
|
|
|
|
|
| |
International Stocks 1.0% |
| |
Goldman Sachs Emerging Markets Equity Insights Fund, Institutional Class |
|
|
|
|
|
|
|
|
| |
| |
Intermediate-Term Bond 12.8% |
Allspring Core Plus Bond Fund, Class R6 |
|
|
|
|
|
|
|
|
Baird Aggregate Bond Fund, Institutional Class |
|
|
|
|
|
|
|
|
Loomis Sayles Investment Grade Bond Fund, Class Y |
|
|
|
|
|
|
|
|
| |
|
|
|
|
|
|
|
|
| |
PIMCO International Bond Fund (U.S. Dollar-Hedged), Institutional Class |
|
|
|
|
|
|
|
|
| |
|
|
|
|
|
|
|
|
Total Unaffiliated Underlying Funds
(Cost $225,357,375) |
|
|
|
|
|
|
|
|
Total Investments in Securities
(Cost $737,814,395) |
|
|
|
|
|
|
|
|
| |
Non-income producing security. |
| |
Distributions received include distributions from net investment income and capital gains, if any, from the underlying funds. Amounts shown are only presented for affiliated underlying funds, which are presented in the corresponding line-item in the Statement of Operations, if applicable (see financial note 2(d) for additional information). |
| |
The rate shown is the annualized 7-day yield. |
At October 31, 2025, all of the fund’s investment securities were classified as Level 1 (see financial note 2(a) for additional
information).
56
Schwab Multi-Asset Funds | Annual Holdings and Financial Statements
Statement of Assets and Liabilities
| |
Investments in securities, at value - affiliated issuers (cost $512,457,020) |
|
|
Investments in securities, at value - unaffiliated issuers (cost $225,357,375) |
|
|
| |
|
|
| |
|
|
| |
|
|
| |
|
|
| |
|
|
Due from investment adviser |
|
|
| |
|
|
| |
|
|
| |
| |
| |
|
|
| |
|
|
| |
|
|
Independent trustees’ fees |
|
|
| |
|
|
| |
|
|
| |
|
|
| |
| |
Capital received from investors |
|
|
Total distributable earnings |
|
|
| |
|
|
Schwab Multi-Asset Funds | Annual Holdings and Financial Statements
57
Statement of Operations
For the period November 1, 2024 through October 31, 2025 |
| |
Dividends received from securities - affiliated issuers |
|
|
Dividends received from securities - unaffiliated issuers |
|
|
| |
|
|
| |
|
|
| |
| |
| |
|
|
| |
|
|
Portfolio accounting fees |
|
|
| |
|
|
Independent trustees’ fees |
|
|
| |
|
|
| |
|
|
| |
|
|
| |
|
|
| |
|
|
| |
|
|
| |
REALIZED AND UNREALIZED GAINS (LOSSES) |
Realized capital gain distributions received from underlying funds - affiliated issuers |
|
|
Realized capital gain distributions received from underlying funds - unaffiliated issuers |
|
|
Net realized gains on sales of securities - affiliated issuers |
|
|
Net realized gains on sales of securities - unaffiliated issuers |
|
|
| |
|
|
Net change in unrealized appreciation (depreciation) on securities - affiliated issuers |
|
|
Net change in unrealized appreciation (depreciation) on securities - unaffiliated issuers |
|
|
Net change in unrealized appreciation (depreciation) |
|
|
Net realized and unrealized gains |
|
|
Increase in net assets resulting from operations |
|
|
58
Schwab Multi-Asset Funds | Annual Holdings and Financial Statements
Statement of Changes in Net Assets
For the current and prior report periods
| |
| |
|
|
| |
|
|
|
| |
|
|
|
Net change in unrealized appreciation (depreciation) |
|
|
|
Increase in net assets resulting from operations |
|
|
|
| |
DISTRIBUTIONS TO SHAREHOLDERS |
| |
|
|
|
TRANSACTIONS IN FUND SHARES |
| |
|
|
| |
|
|
|
|
|
| |
|
|
|
|
|
| |
|
|
|
|
|
| |
|
|
|
|
|
Net transactions in fund shares |
|
|
|
|
|
| |
SHARES OUTSTANDING AND NET ASSETS |
| |
|
|
| |
|
|
|
|
|
| |
|
|
|
|
|
Total increase (decrease) |
|
|
|
|
|
| |
|
|
|
|
|
Schwab Multi-Asset Funds | Annual Holdings and Financial Statements
59
Financial Statements
| |
|
|
|
|
|
|
| |
Net asset value at beginning of period |
|
|
|
|
|
|
Income (loss) from investment operations: |
|
|
|
|
|
|
Net investment income (loss)1 |
|
|
|
|
|
|
Net realized and unrealized gains (losses) |
|
|
|
|
|
|
Total from investment operations |
|
|
|
|
|
|
| |
|
|
|
|
|
|
Distributions from net investment income |
|
|
|
|
|
|
Distributions from net realized gains |
|
|
|
|
|
|
| |
|
|
|
|
|
|
Net asset value at end of period |
|
|
|
|
|
|
| |
|
|
|
|
|
|
| |
Ratios to average net assets: |
|
|
|
|
|
|
| |
|
|
|
|
|
|
| |
|
|
|
|
|
|
Net investment income (loss) |
|
|
|
|
|
|
| |
|
|
|
|
|
|
Net assets, end of period (x 1,000,000) |
|
|
|
|
|
|
| |
Calculated based on the average shares outstanding during the period. |
| |
Ratio excludes acquired fund fees and expenses, which are indirect expenses incurred by the fund through its investments in underlying funds. |
| |
Ratio includes less than 0.005% of non-routine proxy expenses. |
60
Schwab Multi-Asset Funds | Annual Holdings and Financial Statements
Portfolio Holdings as of October 31, 2025
This section includes a summary of the fund’s transactions with its affiliated underlying funds during the period.
| |
|
|
|
NET REALIZED GAINS (LOSSES) |
NET CHANGE IN UNREALIZED APPRECIATION (DEPRECIATION) |
|
BALANCE OF SHARES HELD AT 10/31/25 |
|
AFFILIATED UNDERLYING FUNDS 75.6% OF NET ASSETS |
| |
| |
| |
| |
|
|
|
|
|
|
|
|
Schwab Fundamental U.S. Large Company Index Fund |
|
|
|
|
|
|
|
|
Schwab S&P 500 Index Fund |
|
|
|
|
|
|
|
|
Schwab Select Large Cap Growth Fund * |
|
|
|
|
|
|
|
|
| |
|
|
|
|
|
|
|
|
| |
Schwab U.S. Mid-Cap Index Fund |
|
|
|
|
|
|
|
|
| |
Schwab Small-Cap Equity Fund |
|
|
|
|
|
|
|
|
| |
|
|
|
|
|
|
|
|
| |
International Stocks 18.6% |
| |
Schwab Fundamental International Equity Index Fund |
|
|
|
|
|
|
|
|
Schwab International Core Equity Fund |
|
|
|
|
|
|
|
|
Schwab International Opportunities Fund |
|
|
|
|
|
|
|
|
| |
|
|
|
|
|
|
|
|
| |
| |
| |
Schwab Global Real Estate Fund |
|
|
|
|
|
|
|
|
| |
| |
Inflation-Protected Bond 0.4% |
Schwab Treasury Inflation Protected Securities Index Fund |
|
|
|
|
|
|
|
|
Intermediate-Term Bond 10.6% |
Schwab U.S. Aggregate Bond Index Fund |
|
|
|
|
|
|
|
|
| |
Schwab Short-Term Bond Index Fund |
|
|
|
|
|
|
|
|
| |
|
|
|
|
|
|
|
|
| |
| |
Schwab Government Money Fund, Ultra |
|
|
|
|
|
|
|
|
Total Affiliated Underlying Funds
(Cost $332,023,161) |
|
|
|
|
|
|
|
|
| |
Schwab Multi-Asset Funds | Annual Holdings and Financial Statements
61
Portfolio Holdings as of October 31, 2025 (continued)
| |
|
|
|
NET REALIZED GAINS (LOSSES) |
NET CHANGE IN UNREALIZED APPRECIATION (DEPRECIATION) |
|
BALANCE OF SHARES HELD AT 10/31/25 |
DISTRIBUTIONS RECEIVED(a) |
UNAFFILIATED UNDERLYING FUNDS 23.8% OF NET ASSETS |
| |
| |
| |
Dodge & Cox Stock Fund, Class I |
|
|
|
|
|
|
|
|
PGIM Jennison Growth Fund, Class R6 |
|
|
|
|
|
|
|
|
| |
|
|
|
|
|
|
|
|
| |
Driehaus Small Cap Growth Fund, Institutional Class |
|
|
|
|
|
|
|
|
| |
|
|
|
|
|
|
|
|
| |
International Stocks 1.9% |
| |
Goldman Sachs Emerging Markets Equity Insights Fund, Institutional Class |
|
|
|
|
|
|
|
|
| |
| |
Intermediate-Term Bond 10.2% |
Allspring Core Plus Bond Fund, Class R6 |
|
|
|
|
|
|
|
|
Baird Aggregate Bond Fund, Institutional Class |
|
|
|
|
|
|
|
|
Loomis Sayles Investment Grade Bond Fund, Class Y |
|
|
|
|
|
|
|
|
| |
|
|
|
|
|
|
|
|
| |
PIMCO International Bond Fund (U.S. Dollar-Hedged), Institutional Class |
|
|
|
|
|
|
|
|
| |
|
|
|
|
|
|
|
|
Total Unaffiliated Underlying Funds
(Cost $144,409,045) |
|
|
|
|
|
|
|
|
Total Investments in Securities
(Cost $476,432,206) |
|
|
|
|
|
|
|
|
| |
Non-income producing security. |
| |
Distributions received include distributions from net investment income and capital gains, if any, from the underlying funds. Amounts shown are only presented for affiliated underlying funds, which are presented in the corresponding line-item in the Statement of Operations, if applicable (see financial note 2(d) for additional information). |
| |
The rate shown is the annualized 7-day yield. |
At October 31, 2025, all of the fund’s investment securities were classified as Level 1 (see financial note 2(a) for additional
information).
62
Schwab Multi-Asset Funds | Annual Holdings and Financial Statements
Statement of Assets and Liabilities
| |
Investments in securities, at value - affiliated issuers (cost $332,023,161) |
|
|
Investments in securities, at value - unaffiliated issuers (cost $144,409,045) |
|
|
| |
|
|
| |
|
|
| |
|
|
| |
|
|
| |
|
|
Due from investment adviser |
|
|
| |
|
|
| |
|
|
| |
| |
| |
|
|
| |
|
|
| |
|
|
Independent trustees’ fees |
|
|
| |
|
|
| |
|
|
| |
|
|
| |
| |
Capital received from investors |
|
|
Total distributable earnings |
|
|
| |
|
|
Schwab Multi-Asset Funds | Annual Holdings and Financial Statements
63
Statement of Operations
For the period November 1, 2024 through October 31, 2025 |
| |
Dividends received from securities - affiliated issuers |
|
|
Dividends received from securities - unaffiliated issuers |
|
|
| |
|
|
| |
|
|
| |
| |
| |
|
|
| |
|
|
Portfolio accounting fees |
|
|
| |
|
|
Independent trustees’ fees |
|
|
| |
|
|
| |
|
|
| |
|
|
| |
|
|
| |
|
|
| |
|
|
| |
REALIZED AND UNREALIZED GAINS (LOSSES) |
Realized capital gain distributions received from underlying funds - affiliated issuers |
|
|
Realized capital gain distributions received from underlying funds - unaffiliated issuers |
|
|
Net realized gains on sales of securities - affiliated issuers |
|
|
Net realized gains on sales of securities - unaffiliated issuers |
|
|
| |
|
|
Net change in unrealized appreciation (depreciation) on securities - affiliated issuers |
|
|
Net change in unrealized appreciation (depreciation) on securities - unaffiliated issuers |
|
|
Net change in unrealized appreciation (depreciation) |
|
|
Net realized and unrealized gains |
|
|
Increase in net assets resulting from operations |
|
|
64
Schwab Multi-Asset Funds | Annual Holdings and Financial Statements
Statement of Changes in Net Assets
For the current and prior report periods
| |
| |
|
|
| |
|
|
|
| |
|
|
|
Net change in unrealized appreciation (depreciation) |
|
|
|
Increase in net assets resulting from operations |
|
|
|
| |
DISTRIBUTIONS TO SHAREHOLDERS |
| |
|
|
|
TRANSACTIONS IN FUND SHARES |
| |
|
|
| |
|
|
|
|
|
| |
|
|
|
|
|
| |
|
|
|
|
|
| |
|
|
|
|
|
Net transactions in fund shares |
|
|
|
|
|
| |
SHARES OUTSTANDING AND NET ASSETS |
| |
|
|
| |
|
|
|
|
|
| |
|
|
|
|
|
Total increase (decrease) |
|
|
|
|
|
| |
|
|
|
|
|
Schwab Multi-Asset Funds | Annual Holdings and Financial Statements
65
Financial Statements
| |
|
|
|
|
|
|
| |
Net asset value at beginning of period |
|
|
|
|
|
|
Income (loss) from investment operations: |
|
|
|
|
|
|
Net investment income (loss)1 |
|
|
|
|
|
|
Net realized and unrealized gains (losses) |
|
|
|
|
|
|
Total from investment operations |
|
|
|
|
|
|
| |
|
|
|
|
|
|
Distributions from net investment income |
|
|
|
|
|
|
Distributions from net realized gains |
|
|
|
|
|
|
| |
|
|
|
|
|
|
Net asset value at end of period |
|
|
|
|
|
|
| |
|
|
|
|
|
|
| |
Ratios to average net assets: |
|
|
|
|
|
|
| |
|
|
|
|
|
|
| |
|
|
|
|
|
|
Net investment income (loss) |
|
|
|
|
|
|
| |
|
|
|
|
|
|
Net assets, end of period (x 1,000,000) |
|
|
|
|
|
|
| |
Calculated based on the average shares outstanding during the period. |
| |
Ratio excludes acquired fund fees and expenses, which are indirect expenses incurred by the fund through its investments in underlying funds. |
| |
Ratio includes less than 0.005% of non-routine proxy expenses. |
66
Schwab Multi-Asset Funds | Annual Holdings and Financial Statements
Portfolio Holdings as of October 31, 2025
This section includes a summary of the fund’s transactions with its affiliated underlying funds during the period.
| |
|
|
|
NET REALIZED GAINS (LOSSES) |
NET CHANGE IN UNREALIZED APPRECIATION (DEPRECIATION) |
|
BALANCE OF SHARES HELD AT 10/31/25 |
|
AFFILIATED UNDERLYING FUNDS 77.2% OF NET ASSETS |
| |
| |
| |
| |
|
|
|
|
|
|
|
|
Schwab Fundamental U.S. Large Company Index Fund |
|
|
|
|
|
|
|
|
Schwab S&P 500 Index Fund |
|
|
|
|
|
|
|
|
Schwab Select Large Cap Growth Fund * |
|
|
|
|
|
|
|
|
| |
|
|
|
|
|
|
|
|
| |
Schwab U.S. Mid-Cap Index Fund |
|
|
|
|
|
|
|
|
| |
Schwab Small-Cap Equity Fund |
|
|
|
|
|
|
|
|
| |
|
|
|
|
|
|
|
|
| |
International Stocks 21.1% |
| |
Schwab Fundamental International Equity Index Fund |
|
|
|
|
|
|
|
|
Schwab International Core Equity Fund |
|
|
|
|
|
|
|
|
Schwab International Opportunities Fund |
|
|
|
|
|
|
|
|
| |
|
|
|
|
|
|
|
|
| |
| |
| |
Schwab Global Real Estate Fund |
|
|
|
|
|
|
|
|
| |
| |
Intermediate-Term Bond 7.2% |
Schwab U.S. Aggregate Bond Index Fund |
|
|
|
|
|
|
|
|
| |
Schwab Short-Term Bond Index Fund |
|
|
|
|
|
|
|
|
| |
|
|
|
|
|
|
|
|
| |
| |
Schwab Government Money Fund, Ultra |
|
|
|
|
|
|
|
|
Total Affiliated Underlying Funds
(Cost $601,618,320) |
|
|
|
|
|
|
|
|
| |
UNAFFILIATED UNDERLYING FUNDS 22.2% OF NET ASSETS |
| |
| |
| |
Dodge & Cox Stock Fund, Class I |
|
|
|
|
|
|
|
|
PGIM Jennison Growth Fund, Class R6 |
|
|
|
|
|
|
|
|
| |
|
|
|
|
|
|
|
|
Schwab Multi-Asset Funds | Annual Holdings and Financial Statements
67
Portfolio Holdings as of October 31, 2025 (continued)
| |
|
|
|
NET REALIZED GAINS (LOSSES) |
NET CHANGE IN UNREALIZED APPRECIATION (DEPRECIATION) |
|
BALANCE OF SHARES HELD AT 10/31/25 |
DISTRIBUTIONS RECEIVED(a) |
| |
Driehaus Small Cap Growth Fund, Institutional Class |
|
|
|
|
|
|
|
|
| |
|
|
|
|
|
|
|
|
| |
International Stocks 2.7% |
| |
Goldman Sachs Emerging Markets Equity Insights Fund, Institutional Class |
|
|
|
|
|
|
|
|
| |
| |
Intermediate-Term Bond 7.9% |
Allspring Core Plus Bond Fund, Class R6 |
|
|
|
|
|
|
|
|
Baird Aggregate Bond Fund, Institutional Class |
|
|
|
|
|
|
|
|
Loomis Sayles Investment Grade Bond Fund, Class Y |
|
|
|
|
|
|
|
|
| |
|
|
|
|
|
|
|
|
| |
PIMCO International Bond Fund (U.S. Dollar-Hedged), Institutional Class |
|
|
|
|
|
|
|
|
| |
|
|
|
|
|
|
|
|
Total Unaffiliated Underlying Funds
(Cost $259,710,510) |
|
|
|
|
|
|
|
|
Total Investments in Securities
(Cost $861,328,830) |
|
|
|
|
|
|
|
|
| |
Non-income producing security. |
| |
Distributions received include distributions from net investment income and capital gains, if any, from the underlying funds. Amounts shown are only presented for affiliated underlying funds, which are presented in the corresponding line-item in the Statement of Operations, if applicable (see financial note 2(d) for additional information). |
| |
The rate shown is the annualized 7-day yield. |
At October 31, 2025, all of the fund’s investment securities were classified as Level 1 (see financial note 2(a) for additional
information).
68
Schwab Multi-Asset Funds | Annual Holdings and Financial Statements
Statement of Assets and Liabilities
| |
Investments in securities, at value - affiliated issuers (cost $601,618,320) |
|
|
Investments in securities, at value - unaffiliated issuers (cost $259,710,510) |
|
|
| |
|
|
| |
|
|
| |
|
|
| |
|
|
| |
|
|
Due from investment adviser |
|
|
| |
|
|
| |
|
|
| |
| |
| |
|
|
| |
|
|
| |
|
|
Independent trustees’ fees |
|
|
| |
|
|
| |
|
|
| |
|
|
| |
| |
Capital received from investors |
|
|
Total distributable earnings |
|
|
| |
|
|
Schwab Multi-Asset Funds | Annual Holdings and Financial Statements
69
Statement of Operations
For the period November 1, 2024 through October 31, 2025 |
| |
Dividends received from securities - affiliated issuers |
|
|
Dividends received from securities - unaffiliated issuers |
|
|
| |
|
|
| |
|
|
| |
| |
| |
|
|
| |
|
|
Portfolio accounting fees |
|
|
| |
|
|
Independent trustees’ fees |
|
|
| |
|
|
| |
|
|
| |
|
|
| |
|
|
| |
|
|
| |
|
|
| |
REALIZED AND UNREALIZED GAINS (LOSSES) |
Realized capital gain distributions received from underlying funds - affiliated issuers |
|
|
Realized capital gain distributions received from underlying funds - unaffiliated issuers |
|
|
Net realized gains on sales of securities - affiliated issuers |
|
|
Net realized gains on sales of securities - unaffiliated issuers |
|
|
| |
|
|
Net change in unrealized appreciation (depreciation) on securities - affiliated issuers |
|
|
Net change in unrealized appreciation (depreciation) on securities - unaffiliated issuers |
|
|
Net change in unrealized appreciation (depreciation) |
|
|
Net realized and unrealized gains |
|
|
Increase in net assets resulting from operations |
|
|
70
Schwab Multi-Asset Funds | Annual Holdings and Financial Statements
Statement of Changes in Net Assets
For the current and prior report periods
| |
| |
|
|
| |
|
|
|
| |
|
|
|
Net change in unrealized appreciation (depreciation) |
|
|
|
Increase in net assets resulting from operations |
|
|
|
| |
DISTRIBUTIONS TO SHAREHOLDERS |
| |
|
|
|
TRANSACTIONS IN FUND SHARES |
| |
|
|
| |
|
|
|
|
|
| |
|
|
|
|
|
| |
|
|
|
|
|
| |
|
|
|
|
|
Net transactions in fund shares |
|
|
|
|
|
| |
SHARES OUTSTANDING AND NET ASSETS |
| |
|
|
| |
|
|
|
|
|
| |
|
|
|
|
|
Total increase (decrease) |
|
|
|
|
|
| |
|
|
|
|
|
Schwab Multi-Asset Funds | Annual Holdings and Financial Statements
71
Financial Statements
| |
|
|
|
|
|
|
| |
Net asset value at beginning of period |
|
|
|
|
|
|
Income (loss) from investment operations: |
|
|
|
|
|
|
Net investment income (loss)1 |
|
|
|
|
|
|
Net realized and unrealized gains (losses) |
|
|
|
|
|
|
Total from investment operations |
|
|
|
|
|
|
| |
|
|
|
|
|
|
Distributions from net investment income |
|
|
|
|
|
|
Distributions from net realized gains |
|
|
|
|
|
|
| |
|
|
|
|
|
|
Net asset value at end of period |
|
|
|
|
|
|
| |
|
|
|
|
|
|
| |
Ratios to average net assets: |
|
|
|
|
|
|
| |
|
|
|
|
|
|
| |
|
|
|
|
|
|
Net investment income (loss) |
|
|
|
|
|
|
| |
|
|
|
|
|
|
Net assets, end of period (x 1,000,000) |
|
|
|
|
|
|
| |
Calculated based on the average shares outstanding during the period. |
| |
Ratio excludes acquired fund fees and expenses, which are indirect expenses incurred by the fund through its investments in underlying funds. |
| |
Ratio includes less than 0.005% of non-routine proxy expenses. |
72
Schwab Multi-Asset Funds | Annual Holdings and Financial Statements
Portfolio Holdings as of October 31, 2025
This section includes a summary of the fund’s transactions with its affiliated underlying funds during the period.
| |
|
|
|
NET REALIZED GAINS (LOSSES) |
NET CHANGE IN UNREALIZED APPRECIATION (DEPRECIATION) |
|
BALANCE OF SHARES HELD AT 10/31/25 |
|
AFFILIATED UNDERLYING FUNDS 78.3% OF NET ASSETS |
| |
| |
| |
| |
|
|
|
|
|
|
|
|
Schwab Fundamental U.S. Large Company Index Fund |
|
|
|
|
|
|
|
|
Schwab S&P 500 Index Fund |
|
|
|
|
|
|
|
|
Schwab Select Large Cap Growth Fund * |
|
|
|
|
|
|
|
|
| |
|
|
|
|
|
|
|
|
| |
Schwab U.S. Mid-Cap Index Fund |
|
|
|
|
|
|
|
|
| |
Schwab Small-Cap Equity Fund |
|
|
|
|
|
|
|
|
| |
|
|
|
|
|
|
|
|
| |
International Stocks 23.0% |
| |
Schwab Fundamental International Equity Index Fund |
|
|
|
|
|
|
|
|
Schwab International Core Equity Fund |
|
|
|
|
|
|
|
|
Schwab International Opportunities Fund |
|
|
|
|
|
|
|
|
| |
|
|
|
|
|
|
|
|
| |
| |
| |
Schwab Global Real Estate Fund |
|
|
|
|
|
|
|
|
| |
| |
Intermediate-Term Bond 4.4% |
Schwab U.S. Aggregate Bond Index Fund |
|
|
|
|
|
|
|
|
| |
Schwab Short-Term Bond Index Fund |
|
|
|
|
|
|
|
|
| |
|
|
|
|
|
|
|
|
| |
| |
Schwab Government Money Fund, Ultra |
|
|
|
|
|
|
|
|
Total Affiliated Underlying Funds
(Cost $196,481,250) |
|
|
|
|
|
|
|
|
| |
UNAFFILIATED UNDERLYING FUNDS 21.1% OF NET ASSETS |
| |
| |
| |
Dodge & Cox Stock Fund, Class I |
|
|
|
|
|
|
|
|
PGIM Jennison Growth Fund, Class R6 |
|
|
|
|
|
|
|
|
| |
|
|
|
|
|
|
|
|
Schwab Multi-Asset Funds | Annual Holdings and Financial Statements
73
Portfolio Holdings as of October 31, 2025 (continued)
| |
|
|
|
NET REALIZED GAINS (LOSSES) |
NET CHANGE IN UNREALIZED APPRECIATION (DEPRECIATION) |
|
BALANCE OF SHARES HELD AT 10/31/25 |
DISTRIBUTIONS RECEIVED(a) |
| |
Driehaus Small Cap Growth Fund, Institutional Class |
|
|
|
|
|
|
|
|
| |
|
|
|
|
|
|
|
|
| |
International Stocks 3.8% |
| |
Goldman Sachs Emerging Markets Equity Insights Fund, Institutional Class |
|
|
|
|
|
|
|
|
| |
| |
Intermediate-Term Bond 5.6% |
Allspring Core Plus Bond Fund, Class R6 |
|
|
|
|
|
|
|
|
Baird Aggregate Bond Fund, Institutional Class |
|
|
|
|
|
|
|
|
Loomis Sayles Investment Grade Bond Fund, Class Y |
|
|
|
|
|
|
|
|
| |
|
|
|
|
|
|
|
|
| |
PIMCO International Bond Fund (U.S. Dollar-Hedged), Institutional Class |
|
|
|
|
|
|
|
|
| |
|
|
|
|
|
|
|
|
Total Unaffiliated Underlying Funds
(Cost $67,372,163) |
|
|
|
|
|
|
|
|
Total Investments in Securities
(Cost $263,853,413) |
|
|
|
|
|
|
|
|
| |
Non-income producing security. |
| |
Distributions received include distributions from net investment income and capital gains, if any, from the underlying funds. Amounts shown are only presented for affiliated underlying funds, which are presented in the corresponding line-item in the Statement of Operations, if applicable (see financial note 2(d) for additional information). |
| |
The rate shown is the annualized 7-day yield. |
At October 31, 2025, all of the fund’s investment securities were classified as Level 1 (see financial note 2(a) for additional
information).
74
Schwab Multi-Asset Funds | Annual Holdings and Financial Statements
Statement of Assets and Liabilities
| |
Investments in securities, at value - affiliated issuers (cost $196,481,250) |
|
|
Investments in securities, at value - unaffiliated issuers (cost $67,372,163) |
|
|
| |
|
|
| |
|
|
| |
|
|
| |
|
|
Due from investment adviser |
|
|
| |
|
|
| |
|
|
| |
| |
| |
|
|
| |
|
|
| |
|
|
Independent trustees’ fees |
|
|
| |
|
|
| |
|
|
| |
|
|
| |
| |
Capital received from investors |
|
|
Total distributable earnings |
|
|
| |
|
|
Schwab Multi-Asset Funds | Annual Holdings and Financial Statements
75
Statement of Operations
For the period November 1, 2024 through October 31, 2025 |
| |
Dividends received from securities - affiliated issuers |
|
|
Dividends received from securities - unaffiliated issuers |
|
|
| |
|
|
| |
|
|
| |
| |
| |
|
|
| |
|
|
Portfolio accounting fees |
|
|
| |
|
|
Independent trustees’ fees |
|
|
| |
|
|
| |
|
|
| |
|
|
| |
|
|
| |
|
|
| |
|
|
| |
REALIZED AND UNREALIZED GAINS (LOSSES) |
Realized capital gain distributions received from underlying funds - affiliated issuers |
|
|
Realized capital gain distributions received from underlying funds - unaffiliated issuers |
|
|
Net realized gains on sales of securities - affiliated issuers |
|
|
Net realized gains on sales of securities - unaffiliated issuers |
|
|
| |
|
|
Net change in unrealized appreciation (depreciation) on securities - affiliated issuers |
|
|
Net change in unrealized appreciation (depreciation) on securities - unaffiliated issuers |
|
|
Net change in unrealized appreciation (depreciation) |
|
|
Net realized and unrealized gains |
|
|
Increase in net assets resulting from operations |
|
|
76
Schwab Multi-Asset Funds | Annual Holdings and Financial Statements
Statement of Changes in Net Assets
For the current and prior report periods
| |
| |
|
|
| |
|
|
|
| |
|
|
|
Net change in unrealized appreciation (depreciation) |
|
|
|
Increase in net assets resulting from operations |
|
|
|
| |
DISTRIBUTIONS TO SHAREHOLDERS |
| |
|
|
|
TRANSACTIONS IN FUND SHARES |
| |
|
|
| |
|
|
|
|
|
| |
|
|
|
|
|
| |
|
|
|
|
|
| |
|
|
|
|
|
Net transactions in fund shares |
|
|
|
|
|
| |
SHARES OUTSTANDING AND NET ASSETS |
| |
|
|
| |
|
|
|
|
|
| |
|
|
|
|
|
| |
|
|
|
|
|
| |
|
|
|
|
|
Schwab Multi-Asset Funds | Annual Holdings and Financial Statements
77
Financial Statements
| |
|
|
|
|
|
|
| |
Net asset value at beginning of period |
|
|
|
|
|
|
Income (loss) from investment operations: |
|
|
|
|
|
|
Net investment income (loss)1 |
|
|
|
|
|
|
Net realized and unrealized gains (losses) |
|
|
|
|
|
|
Total from investment operations |
|
|
|
|
|
|
| |
|
|
|
|
|
|
Distributions from net investment income |
|
|
|
|
|
|
Distributions from net realized gains |
|
|
|
|
|
|
| |
|
|
|
|
|
|
Net asset value at end of period |
|
|
|
|
|
|
| |
|
|
|
|
|
|
| |
Ratios to average net assets: |
|
|
|
|
|
|
| |
|
|
|
|
|
|
| |
|
|
|
|
|
|
Net investment income (loss) |
|
|
|
|
|
|
| |
|
|
|
|
|
|
Net assets, end of period (x 1,000,000) |
|
|
|
|
|
|
| |
Calculated based on the average shares outstanding during the period. |
| |
Ratio excludes acquired fund fees and expenses, which are indirect expenses incurred by the fund through its investments in underlying funds. |
| |
Ratio includes less than 0.005% of non-routine proxy expenses. |
78
Schwab Multi-Asset Funds | Annual Holdings and Financial Statements
Portfolio Holdings as of October 31, 2025
This section includes a summary of the fund’s transactions with its affiliated underlying funds during the period.
| |
|
|
|
NET REALIZED GAINS (LOSSES) |
NET CHANGE IN UNREALIZED APPRECIATION (DEPRECIATION) |
|
BALANCE OF SHARES HELD AT 10/31/25 |
|
AFFILIATED UNDERLYING FUNDS 79.8% OF NET ASSETS |
| |
| |
| |
| |
|
|
|
|
|
|
|
|
Schwab Fundamental U.S. Large Company Index Fund |
|
|
|
|
|
|
|
|
Schwab S&P 500 Index Fund |
|
|
|
|
|
|
|
|
Schwab Select Large Cap Growth Fund * |
|
|
|
|
|
|
|
|
| |
|
|
|
|
|
|
|
|
| |
Schwab U.S. Mid-Cap Index Fund |
|
|
|
|
|
|
|
|
| |
Schwab Small-Cap Equity Fund |
|
|
|
|
|
|
|
|
| |
|
|
|
|
|
|
|
|
| |
International Stocks 25.0% |
| |
Schwab Fundamental International Equity Index Fund |
|
|
|
|
|
|
|
|
Schwab International Core Equity Fund |
|
|
|
|
|
|
|
|
Schwab International Opportunities Fund |
|
|
|
|
|
|
|
|
| |
|
|
|
|
|
|
|
|
| |
| |
| |
Schwab Global Real Estate Fund |
|
|
|
|
|
|
|
|
| |
| |
Intermediate-Term Bond 2.7% |
Schwab U.S. Aggregate Bond Index Fund |
|
|
|
|
|
|
|
|
| |
Schwab Short-Term Bond Index Fund |
|
|
|
|
|
|
|
|
| |
|
|
|
|
|
|
|
|
| |
| |
Schwab Government Money Fund, Ultra |
|
|
|
|
|
|
|
|
Total Affiliated Underlying Funds
(Cost $203,355,829) |
|
|
|
|
|
|
|
|
| |
UNAFFILIATED UNDERLYING FUNDS 19.7% OF NET ASSETS |
| |
| |
| |
Dodge & Cox Stock Fund, Class I |
|
|
|
|
|
|
|
|
PGIM Jennison Growth Fund, Class R6 |
|
|
|
|
|
|
|
|
| |
|
|
|
|
|
|
|
|
Schwab Multi-Asset Funds | Annual Holdings and Financial Statements
79
Portfolio Holdings as of October 31, 2025 (continued)
| |
|
|
|
NET REALIZED GAINS (LOSSES) |
NET CHANGE IN UNREALIZED APPRECIATION (DEPRECIATION) |
|
BALANCE OF SHARES HELD AT 10/31/25 |
DISTRIBUTIONS RECEIVED(a) |
| |
Driehaus Small Cap Growth Fund, Institutional Class |
|
|
|
|
|
|
|
|
| |
|
|
|
|
|
|
|
|
| |
International Stocks 5.1% |
| |
Goldman Sachs Emerging Markets Equity Insights Fund, Institutional Class |
|
|
|
|
|
|
|
|
| |
| |
Intermediate-Term Bond 3.6% |
Allspring Core Plus Bond Fund, Class R6 |
|
|
|
|
|
|
|
|
Baird Aggregate Bond Fund, Institutional Class |
|
|
|
|
|
|
|
|
Loomis Sayles Investment Grade Bond Fund, Class Y |
|
|
|
|
|
|
|
|
| |
|
|
|
|
|
|
|
|
| |
PIMCO International Bond Fund (U.S. Dollar-Hedged), Institutional Class |
|
|
|
|
|
|
|
|
| |
|
|
|
|
|
|
|
|
Total Unaffiliated Underlying Funds
(Cost $62,753,176) |
|
|
|
|
|
|
|
|
Total Investments in Securities
(Cost $266,109,005) |
|
|
|
|
|
|
|
|
| |
Non-income producing security. |
| |
Distributions received include distributions from net investment income and capital gains, if any, from the underlying funds. Amounts shown are only presented for affiliated underlying funds, which are presented in the corresponding line-item in the Statement of Operations, if applicable (see financial note 2(d) for additional information). |
| |
The rate shown is the annualized 7-day yield. |
At October 31, 2025, all of the fund’s investment securities were classified as Level 1 (see financial note 2(a) for additional
information).
80
Schwab Multi-Asset Funds | Annual Holdings and Financial Statements
Statement of Assets and Liabilities
| |
Investments in securities, at value - affiliated issuers (cost $203,355,829) |
|
|
Investments in securities, at value - unaffiliated issuers (cost $62,753,176) |
|
|
| |
|
|
| |
|
|
| |
|
|
| |
|
|
Due from investment adviser |
|
|
| |
|
|
| |
|
|
| |
| |
| |
|
|
| |
|
|
| |
|
|
Independent trustees’ fees |
|
|
| |
|
|
| |
|
|
| |
|
|
| |
| |
Capital received from investors |
|
|
Total distributable earnings |
|
|
| |
|
|
Schwab Multi-Asset Funds | Annual Holdings and Financial Statements
81
Statement of Operations
For the period November 1, 2024 through October 31, 2025 |
| |
Dividends received from securities - affiliated issuers |
|
|
Dividends received from securities - unaffiliated issuers |
|
|
| |
|
|
| |
|
|
| |
| |
| |
|
|
| |
|
|
Portfolio accounting fees |
|
|
| |
|
|
Independent trustees’ fees |
|
|
| |
|
|
| |
|
|
| |
|
|
| |
|
|
| |
|
|
| |
|
|
| |
REALIZED AND UNREALIZED GAINS (LOSSES) |
Realized capital gain distributions received from underlying funds - affiliated issuers |
|
|
Realized capital gain distributions received from underlying funds - unaffiliated issuers |
|
|
Net realized losses on sales of securities - affiliated issuers |
|
|
Net realized gains on sales of securities - unaffiliated issuers |
|
|
| |
|
|
Net change in unrealized appreciation (depreciation) on securities - affiliated issuers |
|
|
Net change in unrealized appreciation (depreciation) on securities - unaffiliated issuers |
|
|
Net change in unrealized appreciation (depreciation) |
|
|
Net realized and unrealized gains |
|
|
Increase in net assets resulting from operations |
|
|
82
Schwab Multi-Asset Funds | Annual Holdings and Financial Statements
Statement of Changes in Net Assets
For the current and prior report periods
| |
| |
|
|
| |
|
|
|
| |
|
|
|
Net change in unrealized appreciation (depreciation) |
|
|
|
Increase in net assets resulting from operations |
|
|
|
| |
DISTRIBUTIONS TO SHAREHOLDERS |
| |
|
|
|
TRANSACTIONS IN FUND SHARES |
| |
|
|
| |
|
|
|
|
|
| |
|
|
|
|
|
| |
|
|
|
|
|
| |
|
|
|
|
|
Net transactions in fund shares |
|
|
|
|
|
| |
SHARES OUTSTANDING AND NET ASSETS |
| |
|
|
| |
|
|
|
|
|
| |
|
|
|
|
|
| |
|
|
|
|
|
| |
|
|
|
|
|
Schwab Multi-Asset Funds | Annual Holdings and Financial Statements
83
Financial Statements
| |
|
|
|
|
|
|
| |
Net asset value at beginning of period |
|
|
|
|
|
|
Income (loss) from investment operations: |
|
|
|
|
|
|
Net investment income (loss)1 |
|
|
|
|
|
|
Net realized and unrealized gains (losses) |
|
|
|
|
|
|
Total from investment operations |
|
|
|
|
|
|
| |
|
|
|
|
|
|
Distributions from net investment income |
|
|
|
|
|
|
Distributions from net realized gains |
|
|
|
|
|
|
| |
|
|
|
|
|
|
Net asset value at end of period |
|
|
|
|
|
|
| |
|
|
|
|
|
|
| |
Ratios to average net assets: |
|
|
|
|
|
|
| |
|
|
|
|
|
|
| |
|
|
|
|
|
|
Net investment income (loss) |
|
|
|
|
|
|
| |
|
|
|
|
|
|
Net assets, end of period (x 1,000,000) |
|
|
|
|
|
|
| |
Calculated based on the average shares outstanding during the period. |
| |
Ratio excludes acquired fund fees and expenses, which are indirect expenses incurred by the fund through its investments in underlying funds. |
| |
Ratio includes less than 0.005% of non-routine proxy expenses. |
84
Schwab Multi-Asset Funds | Annual Holdings and Financial Statements
Portfolio Holdings as of October 31, 2025
This section includes a summary of the fund’s transactions with its affiliated underlying funds during the period.
| |
|
|
|
NET REALIZED GAINS (LOSSES) |
NET CHANGE IN UNREALIZED APPRECIATION (DEPRECIATION) |
|
BALANCE OF SHARES HELD AT 10/31/25 |
|
AFFILIATED UNDERLYING FUNDS 80.2% OF NET ASSETS |
| |
| |
| |
| |
|
|
|
|
|
|
|
|
Schwab Fundamental U.S. Large Company Index Fund |
|
|
|
|
|
|
|
|
Schwab S&P 500 Index Fund |
|
|
|
|
|
|
|
|
Schwab Select Large Cap Growth Fund * |
|
|
|
|
|
|
|
|
| |
|
|
|
|
|
|
|
|
| |
Schwab U.S. Mid-Cap Index Fund |
|
|
|
|
|
|
|
|
| |
Schwab Small-Cap Equity Fund |
|
|
|
|
|
|
|
|
| |
|
|
|
|
|
|
|
|
| |
International Stocks 25.1% |
| |
Schwab Fundamental International Equity Index Fund |
|
|
|
|
|
|
|
|
Schwab International Core Equity Fund |
|
|
|
|
|
|
|
|
Schwab International Opportunities Fund |
|
|
|
|
|
|
|
|
| |
|
|
|
|
|
|
|
|
| |
| |
| |
Schwab Global Real Estate Fund |
|
|
|
|
|
|
|
|
| |
| |
Intermediate-Term Bond 1.8% |
Schwab U.S. Aggregate Bond Index Fund |
|
|
|
|
|
|
|
|
| |
Schwab Short-Term Bond Index Fund |
|
|
|
|
|
|
|
|
| |
|
|
|
|
|
|
|
|
Total Affiliated Underlying Funds
(Cost $151,750,368) |
|
|
|
|
|
|
|
|
| |
UNAFFILIATED UNDERLYING FUNDS 19.3% OF NET ASSETS |
| |
| |
| |
Dodge & Cox Stock Fund, Class I |
|
|
|
|
|
|
|
|
PGIM Jennison Growth Fund, Class R6 |
|
|
|
|
|
|
|
|
| |
|
|
|
|
|
|
|
|
| |
Driehaus Small Cap Growth Fund, Institutional Class |
|
|
|
|
|
|
|
|
| |
|
|
|
|
|
|
|
|
| |
Schwab Multi-Asset Funds | Annual Holdings and Financial Statements
85
Portfolio Holdings as of October 31, 2025 (continued)
| |
|
|
|
NET REALIZED GAINS (LOSSES) |
NET CHANGE IN UNREALIZED APPRECIATION (DEPRECIATION) |
|
BALANCE OF SHARES HELD AT 10/31/25 |
DISTRIBUTIONS RECEIVED(a) |
International Stocks 5.5% |
| |
Goldman Sachs Emerging Markets Equity Insights Fund, Institutional Class |
|
|
|
|
|
|
|
|
| |
| |
Intermediate-Term Bond 2.6% |
Allspring Core Plus Bond Fund, Class R6 |
|
|
|
|
|
|
|
|
Baird Aggregate Bond Fund, Institutional Class |
|
|
|
|
|
|
|
|
Loomis Sayles Investment Grade Bond Fund, Class Y |
|
|
|
|
|
|
|
|
| |
|
|
|
|
|
|
|
|
| |
PIMCO International Bond Fund (U.S. Dollar-Hedged), Institutional Class |
|
|
|
|
|
|
|
|
| |
|
|
|
|
|
|
|
|
Total Unaffiliated Underlying Funds
(Cost $43,975,404) |
|
|
|
|
|
|
|
|
Total Investments in Securities
(Cost $195,725,772) |
|
|
|
|
|
|
|
|
| |
Non-income producing security. |
| |
Distributions received include distributions from net investment income and capital gains, if any, from the underlying funds. Amounts shown are only presented for affiliated underlying funds, which are presented in the corresponding line-item in the Statement of Operations, if applicable (see financial note 2(d) for additional information). |
At October 31, 2025, all of the fund’s investment securities were classified as Level 1 (see financial note 2(a) for additional
information).
86
Schwab Multi-Asset Funds | Annual Holdings and Financial Statements
Statement of Assets and Liabilities
| |
Investments in securities, at value - affiliated issuers (cost $151,750,368) |
|
|
Investments in securities, at value - unaffiliated issuers (cost $43,975,404) |
|
|
| |
|
|
| |
|
|
| |
|
|
| |
|
|
Due from investment adviser |
|
|
| |
|
|
| |
|
|
| |
| |
| |
|
|
| |
|
|
| |
|
|
Independent trustees’ fees |
|
|
| |
|
|
| |
|
|
| |
|
|
| |
| |
Capital received from investors |
|
|
Total distributable earnings |
|
|
| |
|
|
Schwab Multi-Asset Funds | Annual Holdings and Financial Statements
87
Statement of Operations
For the period November 1, 2024 through October 31, 2025 |
| |
Dividends received from securities - affiliated issuers |
|
|
Dividends received from securities - unaffiliated issuers |
|
|
| |
|
|
| |
|
|
| |
| |
Portfolio accounting fees |
|
|
| |
|
|
| |
|
|
| |
|
|
Independent trustees’ fees |
|
|
| |
|
|
| |
|
|
| |
|
|
| |
|
|
| |
|
|
| |
|
|
| |
REALIZED AND UNREALIZED GAINS (LOSSES) |
Realized capital gain distributions received from underlying funds - affiliated issuers |
|
|
Realized capital gain distributions received from underlying funds - unaffiliated issuers |
|
|
Net realized losses on sales of securities - affiliated issuers |
|
|
Net realized gains on sales of securities - unaffiliated issuers |
|
|
| |
|
|
Net change in unrealized appreciation (depreciation) on securities - affiliated issuers |
|
|
Net change in unrealized appreciation (depreciation) on securities - unaffiliated issuers |
|
|
Net change in unrealized appreciation (depreciation) |
|
|
Net realized and unrealized gains |
|
|
Increase in net assets resulting from operations |
|
|
88
Schwab Multi-Asset Funds | Annual Holdings and Financial Statements
Statement of Changes in Net Assets
For the current and prior report periods
| |
| |
|
|
| |
|
|
|
| |
|
|
|
Net change in unrealized appreciation (depreciation) |
|
|
|
Increase in net assets resulting from operations |
|
|
|
| |
DISTRIBUTIONS TO SHAREHOLDERS |
| |
|
|
|
TRANSACTIONS IN FUND SHARES |
| |
|
|
| |
|
|
|
|
|
| |
|
|
|
|
|
| |
|
|
|
|
|
| |
|
|
|
|
|
Net transactions in fund shares |
|
|
|
|
|
| |
SHARES OUTSTANDING AND NET ASSETS |
| |
|
|
| |
|
|
|
|
|
| |
|
|
|
|
|
| |
|
|
|
|
|
| |
|
|
|
|
|
Schwab Multi-Asset Funds | Annual Holdings and Financial Statements
89
Financial Statements
| |
|
|
|
|
|
|
| |
Net asset value at beginning of period |
|
|
|
|
|
|
Income (loss) from investment operations: |
|
|
|
|
|
|
Net investment income (loss)1 |
|
|
|
|
|
|
Net realized and unrealized gains (losses) |
|
|
|
|
|
|
Total from investment operations |
|
|
|
|
|
|
| |
|
|
|
|
|
|
Distributions from net investment income |
|
|
|
|
|
|
Distributions from net realized gains |
|
|
|
|
|
|
| |
|
|
|
|
|
|
Net asset value at end of period |
|
|
|
|
|
|
| |
|
|
|
|
|
|
| |
Ratios to average net assets: |
|
|
|
|
|
|
| |
|
|
|
|
|
|
| |
|
|
|
|
|
|
Net investment income (loss) |
|
|
|
|
|
|
| |
|
|
|
|
|
|
Net assets, end of period (x 1,000,000) |
|
|
|
|
|
|
| |
Calculated based on the average shares outstanding during the period. |
| |
Ratio excludes acquired fund fees and expenses, which are indirect expenses incurred by the fund through its investments in underlying funds. |
| |
Ratio includes less than 0.005% of non-routine proxy expenses. |
90
Schwab Multi-Asset Funds | Annual Holdings and Financial Statements
Portfolio Holdings as of October 31, 2025
This section includes a summary of the fund’s transactions with its affiliated underlying funds during the period.
| |
|
|
|
NET REALIZED GAINS (LOSSES) |
NET CHANGE IN UNREALIZED APPRECIATION (DEPRECIATION) |
|
BALANCE OF SHARES HELD AT 10/31/25 |
|
AFFILIATED UNDERLYING FUNDS 80.1% OF NET ASSETS |
| |
| |
| |
| |
|
|
|
|
|
|
|
|
Schwab Fundamental U.S. Large Company Index Fund |
|
|
|
|
|
|
|
|
Schwab S&P 500 Index Fund |
|
|
|
|
|
|
|
|
Schwab Select Large Cap Growth Fund * |
|
|
|
|
|
|
|
|
| |
|
|
|
|
|
|
|
|
| |
Schwab U.S. Mid-Cap Index Fund |
|
|
|
|
|
|
|
|
| |
Schwab Small-Cap Equity Fund |
|
|
|
|
|
|
|
|
| |
|
|
|
|
|
|
|
|
| |
International Stocks 25.4% |
| |
Schwab Fundamental International Equity Index Fund |
|
|
|
|
|
|
|
|
Schwab International Core Equity Fund |
|
|
|
|
|
|
|
|
Schwab International Opportunities Fund |
|
|
|
|
|
|
|
|
| |
|
|
|
|
|
|
|
|
| |
| |
| |
Schwab Global Real Estate Fund |
|
|
|
|
|
|
|
|
| |
| |
Intermediate-Term Bond 1.4% |
Schwab U.S. Aggregate Bond Index Fund |
|
|
|
|
|
|
|
|
| |
Schwab Short-Term Bond Index Fund |
|
|
|
|
|
|
|
|
| |
|
|
|
|
|
|
|
|
Total Affiliated Underlying Funds
(Cost $71,574,492) |
|
|
|
|
|
|
|
|
| |
UNAFFILIATED UNDERLYING FUNDS 19.3% OF NET ASSETS |
| |
| |
| |
Dodge & Cox Stock Fund, Class I |
|
|
|
|
|
|
|
|
PGIM Jennison Growth Fund, Class R6 |
|
|
|
|
|
|
|
|
| |
|
|
|
|
|
|
|
|
| |
Driehaus Small Cap Growth Fund, Institutional Class |
|
|
|
|
|
|
|
|
| |
|
|
|
|
|
|
|
|
| |
Schwab Multi-Asset Funds | Annual Holdings and Financial Statements
91
Portfolio Holdings as of October 31, 2025 (continued)
| |
|
|
|
NET REALIZED GAINS (LOSSES) |
NET CHANGE IN UNREALIZED APPRECIATION (DEPRECIATION) |
|
BALANCE OF SHARES HELD AT 10/31/25 |
DISTRIBUTIONS RECEIVED(a) |
International Stocks 5.9% |
| |
Goldman Sachs Emerging Markets Equity Insights Fund, Institutional Class |
|
|
|
|
|
|
|
|
| |
| |
Intermediate-Term Bond 1.8% |
Allspring Core Plus Bond Fund, Class R6 |
|
|
|
|
|
|
|
|
Loomis Sayles Investment Grade Bond Fund, Class Y |
|
|
|
|
|
|
|
|
| |
|
|
|
|
|
|
|
|
| |
PIMCO International Bond Fund (U.S. Dollar-Hedged), Institutional Class |
|
|
|
|
|
|
|
|
| |
|
|
|
|
|
|
|
|
Total Unaffiliated Underlying Funds
(Cost $19,475,964) |
|
|
|
|
|
|
|
|
Total Investments in Securities
(Cost $91,050,456) |
|
|
|
|
|
|
|
|
| |
Non-income producing security. |
| |
Distributions received include distributions from net investment income and capital gains, if any, from the underlying funds. Amounts shown are only presented for affiliated underlying funds, which are presented in the corresponding line-item in the Statement of Operations, if applicable (see financial note 2(d) for additional information). |
At October 31, 2025, all of the fund’s investment securities were classified as Level 1 (see financial note 2(a) for additional
information).
92
Schwab Multi-Asset Funds | Annual Holdings and Financial Statements
Statement of Assets and Liabilities
| |
Investments in securities, at value - affiliated issuers (cost $71,574,492) |
|
|
Investments in securities, at value - unaffiliated issuers (cost $19,475,964) |
|
|
| |
|
|
| |
|
|
| |
|
|
| |
|
|
Due from investment adviser |
|
|
| |
|
|
| |
|
|
| |
| |
| |
|
|
| |
|
|
| |
|
|
Independent trustees’ fees |
|
|
| |
|
|
| |
|
|
| |
|
|
| |
| |
Capital received from investors |
|
|
Total distributable earnings |
|
|
| |
|
|
Schwab Multi-Asset Funds | Annual Holdings and Financial Statements
93
Statement of Operations
For the period November 1, 2024 through October 31, 2025 |
| |
Dividends received from securities - affiliated issuers |
|
|
Dividends received from securities - unaffiliated issuers |
|
|
| |
|
|
| |
|
|
| |
| |
| |
|
|
| |
|
|
Portfolio accounting fees |
|
|
| |
|
|
Independent trustees’ fees |
|
|
| |
|
|
| |
|
|
| |
|
|
| |
|
|
| |
|
|
| |
|
|
| |
REALIZED AND UNREALIZED GAINS (LOSSES) |
Realized capital gain distributions received from underlying funds - affiliated issuers |
|
|
Realized capital gain distributions received from underlying funds - unaffiliated issuers |
|
|
Net realized losses on sales of securities - affiliated issuers |
|
|
Net realized gains on sales of securities - unaffiliated issuers |
|
|
| |
|
|
Net change in unrealized appreciation (depreciation) on securities - affiliated issuers |
|
|
Net change in unrealized appreciation (depreciation) on securities - unaffiliated issuers |
|
|
Net change in unrealized appreciation (depreciation) |
|
|
Net realized and unrealized gains |
|
|
Increase in net assets resulting from operations |
|
|
94
Schwab Multi-Asset Funds | Annual Holdings and Financial Statements
Statement of Changes in Net Assets
For the current and prior report periods
| |
| |
|
|
| |
|
|
|
| |
|
|
|
Net change in unrealized appreciation (depreciation) |
|
|
|
Increase in net assets resulting from operations |
|
|
|
| |
DISTRIBUTIONS TO SHAREHOLDERS |
| |
|
|
|
TRANSACTIONS IN FUND SHARES |
| |
|
|
| |
|
|
|
|
|
| |
|
|
|
|
|
| |
|
|
|
|
|
| |
|
|
|
|
|
Net transactions in fund shares |
|
|
|
|
|
| |
SHARES OUTSTANDING AND NET ASSETS |
| |
|
|
| |
|
|
|
|
|
| |
|
|
|
|
|
| |
|
|
|
|
|
| |
|
|
|
|
|
Schwab Multi-Asset Funds | Annual Holdings and Financial Statements
95
Financial Statements
| |
|
|
|
|
|
|
| |
Net asset value at beginning of period |
|
|
|
|
|
|
Income (loss) from investment operations: |
|
|
|
|
|
|
Net investment income (loss)2 |
|
|
|
|
|
|
Net realized and unrealized gains (losses) |
|
|
|
|
|
|
Total from investment operations |
|
|
|
|
|
|
| |
|
|
|
|
|
|
Distributions from net investment income |
|
|
|
|
|
|
Distributions from net realized gains |
|
|
|
|
|
|
| |
|
|
|
|
|
|
Net asset value at end of period |
|
|
|
|
|
|
| |
|
|
|
|
|
|
| |
Ratios to average net assets: |
|
|
|
|
|
|
| |
|
|
|
|
|
|
| |
|
|
|
|
|
|
Net investment income (loss) |
|
|
|
|
|
|
| |
|
|
|
|
|
|
Net assets, end of period (x 1,000,000) |
|
|
|
|
|
|
| |
Commencement of operations. |
| |
Calculated based on the average shares outstanding during the period. |
| |
|
| |
Ratio excludes acquired fund fees and expenses, which are indirect expenses incurred by the fund through its investments in underlying funds. |
| |
Ratio includes less than 0.005% of non-routine proxy expenses. |
| |
|
96
Schwab Multi-Asset Funds | Annual Holdings and Financial Statements
Portfolio Holdings as of October 31, 2025
This section includes a summary of the fund’s transactions with its affiliated underlying funds during the period.
| |
|
|
|
NET REALIZED GAINS (LOSSES) |
NET CHANGE IN UNREALIZED APPRECIATION (DEPRECIATION) |
|
BALANCE OF SHARES HELD AT 10/31/25 |
|
AFFILIATED UNDERLYING FUNDS 81.0% OF NET ASSETS |
| |
| |
| |
| |
|
|
|
|
|
|
|
|
Schwab Fundamental U.S. Large Company Index Fund |
|
|
|
|
|
|
|
|
Schwab S&P 500 Index Fund |
|
|
|
|
|
|
|
|
Schwab Select Large Cap Growth Fund * |
|
|
|
|
|
|
|
|
| |
|
|
|
|
|
|
|
|
| |
Schwab U.S. Mid-Cap Index Fund |
|
|
|
|
|
|
|
|
| |
Schwab Small-Cap Equity Fund |
|
|
|
|
|
|
|
|
| |
|
|
|
|
|
|
|
|
| |
International Stocks 26.1% |
| |
Schwab Fundamental International Equity Index Fund |
|
|
|
|
|
|
|
|
Schwab International Core Equity Fund |
|
|
|
|
|
|
|
|
Schwab International Opportunities Fund |
|
|
|
|
|
|
|
|
| |
|
|
|
|
|
|
|
|
| |
| |
| |
Schwab Global Real Estate Fund |
|
|
|
|
|
|
|
|
| |
| |
Intermediate-Term Bond 0.6% |
Schwab U.S. Aggregate Bond Index Fund |
|
|
|
|
|
|
|
|
| |
Schwab Short-Term Bond Index Fund |
|
|
|
|
|
|
|
|
| |
|
|
|
|
|
|
|
|
Total Affiliated Underlying Funds
(Cost $25,862,812) |
|
|
|
|
|
|
|
|
| |
UNAFFILIATED UNDERLYING FUNDS 18.5% OF NET ASSETS |
| |
| |
| |
Dodge & Cox Stock Fund, Class I |
|
|
|
|
|
|
|
|
PGIM Jennison Growth Fund, Class R6 |
|
|
|
|
|
|
|
|
| |
|
|
|
|
|
|
|
|
| |
Driehaus Small Cap Growth Fund, Institutional Class |
|
|
|
|
|
|
|
|
| |
|
|
|
|
|
|
|
|
| |
Schwab Multi-Asset Funds | Annual Holdings and Financial Statements
97
Portfolio Holdings as of October 31, 2025 (continued)
| |
|
|
|
NET REALIZED GAINS (LOSSES) |
NET CHANGE IN UNREALIZED APPRECIATION (DEPRECIATION) |
|
BALANCE OF SHARES HELD AT 10/31/25 |
DISTRIBUTIONS RECEIVED(a) |
International Stocks 6.3% |
| |
Goldman Sachs Emerging Markets Equity Insights Fund, Institutional Class |
|
|
|
|
|
|
|
|
| |
| |
Intermediate-Term Bond 0.9% |
Loomis Sayles Investment Grade Bond Fund, Class Y |
|
|
|
|
|
|
|
|
| |
PIMCO International Bond Fund (U.S. Dollar-Hedged), Institutional Class |
|
|
|
|
|
|
|
|
| |
|
|
|
|
|
|
|
|
Total Unaffiliated Underlying Funds
(Cost $6,283,467) |
|
|
|
|
|
|
|
|
Total Investments in Securities
(Cost $32,146,279) |
|
|
|
|
|
|
|
|
| |
Non-income producing security. |
| |
Distributions received include distributions from net investment income and capital gains, if any, from the underlying funds. Amounts shown are only presented for affiliated underlying funds, which are presented in the corresponding line-item in the Statement of Operations, if applicable (see financial note 2(d) for additional information). |
At October 31, 2025, all of the fund’s investment securities were classified as Level 1 (see financial note 2(a) for additional
information).
98
Schwab Multi-Asset Funds | Annual Holdings and Financial Statements
Statement of Assets and Liabilities
| |
Investments in securities, at value - affiliated issuers (cost $25,862,812) |
|
|
Investments in securities, at value - unaffiliated issuers (cost $6,283,467) |
|
|
| |
|
|
| |
|
|
| |
|
|
Due from investment adviser |
|
|
| |
|
|
| |
|
|
| |
|
|
| |
| |
| |
|
|
| |
|
|
| |
|
|
Independent trustees’ fees |
|
|
| |
|
|
| |
|
|
| |
|
|
| |
| |
Capital received from investors |
|
|
Total distributable earnings |
|
|
| |
|
|
Schwab Multi-Asset Funds | Annual Holdings and Financial Statements
99
Statement of Operations
For the period November 1, 2024 through October 31, 2025 |
| |
Dividends received from securities - affiliated issuers |
|
|
Dividends received from securities - unaffiliated issuers |
|
|
| |
|
|
| |
|
|
| |
| |
| |
|
|
| |
|
|
Portfolio accounting fees |
|
|
Independent trustees’ fees |
|
|
| |
|
|
| |
|
|
| |
|
|
| |
|
|
| |
|
|
| |
|
|
| |
|
|
| |
|
|
| |
REALIZED AND UNREALIZED GAINS (LOSSES) |
Realized capital gain distributions received from underlying funds - affiliated issuers |
|
|
Realized capital gain distributions received from underlying funds - unaffiliated issuers |
|
|
Net realized gains on sales of securities - affiliated issuers |
|
|
Net realized gains on sales of securities - unaffiliated issuers |
|
|
| |
|
|
Net change in unrealized appreciation (depreciation) on securities - affiliated issuers |
|
|
Net change in unrealized appreciation (depreciation) on securities - unaffiliated issuers |
|
|
Net change in unrealized appreciation (depreciation) |
|
|
Net realized and unrealized gains |
|
|
Increase in net assets resulting from operations |
|
|
100
Schwab Multi-Asset Funds | Annual Holdings and Financial Statements
Statement of Changes in Net Assets
For the current and prior report periods
| |
| |
|
|
| |
|
|
|
| |
|
|
|
Net change in unrealized appreciation (depreciation) |
|
|
|
Increase in net assets resulting from operations |
|
|
|
| |
DISTRIBUTIONS TO SHAREHOLDERS |
| |
|
|
|
TRANSACTIONS IN FUND SHARES |
| |
|
|
| |
|
|
|
|
|
| |
|
|
|
|
|
| |
|
|
|
|
|
| |
|
|
|
|
|
Net transactions in fund shares |
|
|
|
|
|
| |
SHARES OUTSTANDING AND NET ASSETS |
| |
|
|
| |
|
|
|
|
|
| |
|
|
|
|
|
| |
|
|
|
|
|
| |
|
|
|
|
|
Schwab Multi-Asset Funds | Annual Holdings and Financial Statements
101
1. Business Structure of the Funds:
Each of the funds in this report is a series of Schwab Capital Trust (the trust), a no-load, open-end management investment company. The trust is organized as a Massachusetts business trust and is registered under the Investment Company Act of 1940, as amended (the 1940 Act). The list below shows all the operational funds in the trust as of the end of the period, including the funds discussed in this report, which are highlighted:
| |
| |
Schwab Dividend Equity Fund |
Schwab MarketTrack All Equity Portfolio |
Schwab Large-Cap Growth Fund |
Schwab MarketTrack Growth Portfolio |
Schwab Small-Cap Equity Fund |
Schwab MarketTrack Balanced Portfolio |
|
Schwab MarketTrack Conservative Portfolio |
Schwab International Core Equity Fund |
| |
Schwab Fundamental U.S. Large Company Index Fund |
| |
Schwab Fundamental U.S. Small Company Index Fund |
| |
Schwab Fundamental International Equity Index Fund |
| |
Schwab Fundamental International Small Equity Index Fund |
| |
Schwab Fundamental Emerging Markets Equity Index Fund |
| |
Schwab Fundamental Global Real Estate Index Fund |
| |
Schwab Target 2010 Index Fund |
| |
Schwab Target 2015 Index Fund |
| |
Schwab Target 2020 Index Fund |
| |
Schwab Target 2025 Index Fund |
| |
Schwab Target 2030 Index Fund |
| |
Schwab Target 2035 Index Fund |
Schwab S&P 500 Index Fund |
Schwab Target 2040 Index Fund |
Schwab Small-Cap Index Fund |
Schwab Target 2045 Index Fund |
Schwab Total Stock Market Index Fund |
Schwab Target 2050 Index Fund |
Schwab U.S. Large-Cap Growth Index Fund |
Schwab Target 2055 Index Fund |
Schwab U.S. Large-Cap Value Index Fund |
Schwab Target 2060 Index Fund |
Schwab U.S. Mid-Cap Index Fund |
Schwab Target 2065 Index Fund |
Schwab International Index Fund |
Schwab Monthly Income Fund - Target Payout |
Schwab International Opportunities Fund |
Schwab Monthly Income Fund - Flexible Payout |
| |
Schwab Monthly Income Fund - Income Payout |
Each fund is considered a “fund of funds” because it invests in other exchange-traded funds or mutual funds. Each of the funds seeks to achieve its investment objective by investing in affiliated Schwab mutual funds, Schwab ETFs, and unaffiliated third-party exchange-traded funds and mutual funds (referred to herein as unaffiliated funds and, together with Schwab ETFs and Schwab mutual funds, as the "underlying funds"). Each fund invests in the underlying funds in accordance with its target portfolio allocation.
Each fund offers one share class. Shares are bought and sold at closing net asset value per share, which is the price for all outstanding shares of a fund. Each share has a par value of 1/1,000 of a cent, and the funds’ Board of Trustees may authorize the issuance of as many shares as necessary.
Each fund maintains its own account for purposes of holding assets and accounting, and is considered a separate entity for tax purposes. Within its account, each fund may also keep certain assets in segregated accounts, as required by securities law. The "Schwab Funds Complex" includes The Charles Schwab Family of Funds, Schwab Capital Trust, Schwab Investments, Schwab Annuity Portfolios, Schwab Strategic Trust and Laudus Trust.
The Schwab Balanced Fund seeks capital growth and income.
The Schwab MarketTrack All Equity Portfolio seeks high capital growth through an all-stock portfolio.
The Schwab MarketTrack Growth Portfolio seeks seeks high capital growth with less volatility than an all-stock portfolio.
The Schwab MarketTrack Balanced Portfolio seeks both capital growth and income.
The Schwab MarketTrack Conservative Portfolio seeks income and more growth potential than an all-bond portfolio.
The Schwab MarketTrack All Equity Portfolio, Schwab MarketTrack Growth Portfolio, Schwab MarketTrack Balanced Portfolio and Schwab MarketTrack Conservative Portfolio are referred to collectively as the Schwab MarketTrack Portfolios.
102
Schwab Multi-Asset Funds | Annual Holdings and Financial Statements
Financial Notes (continued)
1. Business Structure of the Funds (continued):
The Schwab Target 2010 Fund, Schwab Target 2015 Fund, Schwab Target 2020 Fund, Schwab Target 2025 Fund, Schwab Target 2030 Fund, Schwab Target 2035 Fund, Schwab Target 2040 Fund, Schwab Target 2045 Fund, Schwab Target 2050 Fund, Schwab Target 2055 Fund, Schwab Target 2060 Fund and Schwab Target 2065 Fund (collectively, the Schwab Target Funds) seek to provide capital appreciation and income consistent with their current asset allocation.
2. Significant Accounting Policies: The following is a summary of the significant accounting policies the funds use in their preparation of financial statements. The funds follow the investment company accounting and reporting guidance of the Financial Accounting Standards Board (FASB) Accounting Standard Codification (ASC) Topic 946 Financial Services — Investment Companies. The accounting policies are in conformity with accounting principles generally accepted in the United States of America (GAAP).
In this reporting period, the funds adopted FASB Accounting Standards Update 2023-07, ASC Topic 280 Segment Reporting (Topic 280) Improvements to Reportable Segment Disclosures. Adoption of the new standard impacted financial statement disclosures only and did not affect the funds’ financial position or the results of operations. An operating segment is defined in Topic 280 as a component of a public entity that engages in business activities from which it may recognize revenues and incur expenses, has operating results that are regularly reviewed by the public entity’s chief operating decision maker (CODM) to make decisions about resources to be allocated to the segment and assess its performance, and has discrete financial information available. The management committee of each fund’s investment adviser acts as the funds’ CODM. The CODM has determined that each fund operates as a single operating segment given each fund has a single defined investment strategy disclosed in its respective prospectus. The discrete financial information in the form of each fund’s portfolio composition, total returns, expense ratios and changes in net assets (i.e., changes in net assets resulting from operations, shares sold and shares redeemed), which is used by the CODM to assess performance against the prospectus and to make resource allocation decisions with respect to the funds, is presented within each of the fund’s financial statements.
The financial statements of the funds should be read in conjunction with the underlying funds’ financial statements. For more information about the underlying funds’ operations and policies, please refer to those funds’ semiannual and annual reports and holdings and financial statements, which are filed in Form N-CSR with the U.S. Securities and Exchange Commission (SEC) and available on the SEC’s website at www.sec.gov.
Pursuant to Rule 2a-5 under the 1940 Act, the Board of Trustees has designated authority to a Valuation Designee, the funds’ investment adviser, to make fair valuation determinations under adopted procedures, subject to Board of Trustees oversight. The investment adviser has formed a Pricing Committee to administer the pricing and valuation of portfolio securities and other assets and liabilities as well as to ensure that prices used for internal purposes or provided by third parties reasonably reflect fair value. The Valuation Designee may utilize independent pricing services, quotations from securities and financial instrument dealers and other market sources to determine fair value.
Securities held in each fund’s portfolio are valued every business day. The following valuation policies and procedures are used by the Valuation Designee to value various types of securities:
● Securities traded on an exchange or over-the-counter: Traded securities are valued at the closing value for the day, or, on days when no closing value has been reported, at the mean of the most recent bid and ask quotes.
● Mutual funds: Mutual funds are valued at their respective net asset values.
● Securities for which no quoted value is available: The Valuation Designee has adopted procedures to fair value a fund’s securities when market prices are not “readily available” or are unreliable. For example, a security may be fair valued when it’s de-listed or its trading is halted or suspended; when a security’s primary pricing source is unable or unwilling to provide a price; or when a security’s primary trading market is closed during regular market hours. Fair value determinations are made in good faith in accordance with adopted valuation procedures. The Valuation Designee considers a number of factors, including unobservable market inputs, when arriving at fair value. The Valuation Designee may employ methods such as the review of related or comparable assets or liabilities, related market activities, recent transactions, market multiples, book values, transactional back-testing, disposition analysis and other relevant information. Due to the subjective and variable nature of fair value pricing, there can be no assurance that a fund could obtain the fair value assigned to the security upon the sale of such security.
Schwab Multi-Asset Funds | Annual Holdings and Financial Statements
103
Financial Notes (continued)
2. Significant Accounting Policies (continued):
In accordance with the authoritative guidance on fair value measurements and disclosures under GAAP, the funds disclose the fair value of their investments in a hierarchy that prioritizes the significant inputs to valuation methods used to measure the fair value. The hierarchy gives the highest priority to valuations based upon unadjusted quoted prices in active markets for identical assets or liabilities (Level 1 measurements) and the lowest priority to valuations based upon unobservable inputs that are significant to the valuation (Level 3 measurements). If inputs used to measure the financial instruments fall within different levels of the hierarchy, the categorization is based on the lowest level input that is significant to the valuation. If it is determined that either the volume and/or level of activity for an asset or liability has significantly decreased (from normal conditions for that asset or liability) or price quotations or observable inputs are not associated with orderly transactions, increased analysis and the Valuation Designee’s judgment will be required to estimate fair value.
The three levels of the fair value hierarchy are as follows:
● Level 1 — quoted prices in active markets for identical investments — Investments whose values are based on quoted market prices in active markets. These generally include active listed equities, mutual funds, exchange-traded funds and futures contracts. Mutual funds and exchange-traded funds are classified as Level 1 prices, without consideration to the classification level of the underlying securities held which could be Level 1, Level 2, or Level 3 in the fair value hierarchy.
● Level 2 — other significant observable inputs (including quoted prices for similar securities, interest rates, prepayment speeds, credit risk, etc.) — Investments that trade in markets that are not considered to be active, but whose values are based on quoted market prices, dealer quotations or valuations provided by alternative pricing sources supported by observable inputs are classified as Level 2 prices. These generally include forward foreign currency exchange contracts, U.S. government and sovereign obligations, most government agency securities, investment-grade corporate bonds, certain mortgage products, less liquid listed equities, and state, municipal and provincial obligations.
● Level 3 — significant unobservable inputs (including the Valuation Designee’s assumptions in determining the fair value of investments) — Investments whose values are classified as Level 3 prices have significant unobservable inputs, as they may trade infrequently or not at all. When observable prices are not readily available for these securities, one or more valuation methods are used for which sufficient and reliable data is available. The inputs used in estimating the value of Level 3 prices may include the original transaction price, quoted prices for similar securities or assets in active markets, completed or pending third-party transactions in the underlying investment or comparable issuers, and changes in financial ratios or cash flows. Level 3 prices may also be adjusted to reflect illiquidity and/or non-transferability, with the amount of such discount estimated in the absence of market information. Assumptions used due to the lack of observable inputs may significantly impact the resulting fair value and therefore a fund’s results of operations.
The inputs or methodology used for valuing securities are not necessarily an indication of the risk associated with investing in those securities.
The levels associated with valuing the funds’ investments as of October 31, 2025, are disclosed in each fund’s Portfolio Holdings.
(b) Accounting Policies for certain Portfolio Investments (if held):
Cash Investments: The funds may invest a portion of their assets in cash. Cash includes cash bank balances in an interest-bearing demand deposit account with maturity on demand by the funds.
(c) Security Transactions:
Security transactions are recorded as of the date the order to buy or sell the security is executed. Realized gains and losses from security transactions are based on the identified costs of the securities involved.
Interest income is recorded as it accrues. Dividends and distributions from portfolio securities and underlying funds are recorded on the date they are effective (the ex-dividend date). Any distributions from underlying funds are recorded in accordance with the character of the distributions as designated by the underlying funds.
Expenses that are specific to a fund are charged directly to the fund. Expenses that are common to more than one fund in the Schwab Funds Complex generally are allocated among those funds in proportion to their average daily net assets. Each fund bears its share of the acquired fund fees and expenses of the underlying funds, which are indirect expenses incurred by a fund through its investments in the underlying funds and are reflected in the net asset values of the underlying funds.
104
Schwab Multi-Asset Funds | Annual Holdings and Financial Statements
Financial Notes (continued)
2. Significant Accounting Policies (continued):
(f) Distributions to Shareholders:
The funds make distributions from net investment income and net realized capital gains, if any, once a year, except for the Schwab MarketTrack Conservative Portfolio which typically makes distributions from net investment income at the end of each calendar quarter. To receive a distribution, you must be a registered shareholder on the record date. Distributions are paid to shareholders on the payable date.
(g) Accounting Estimates:
The accounting policies described in this report conform to GAAP. Notwithstanding this, shareholders should understand that in order to follow these principles, fund management has to make estimates and assumptions that affect the information reported in the financial statements. It’s possible that once the results are known, they may turn out to be different from these estimates and these differences may be material.
(h) Federal Income Taxes:
The funds intend to meet federal income and excise tax requirements for regulated investment companies under subchapter M of the Internal Revenue Code, as amended. Accordingly, the funds distribute substantially all of their net investment income and net realized capital gains, if any, to their shareholders each year. As long as a fund meets the tax requirements, it is not required to pay federal income tax.
Under the funds’ organizational documents, the officers and trustees are indemnified against certain liabilities arising out of the performance of their duties to the funds. In addition, in the normal course of business the funds enter into contracts with their vendors and others that provide general indemnifications. The funds’ maximum exposure under these arrangements is unknown as this would involve future claims that may be made against the funds. However, based on experience, the funds expect the risk of loss attributable to these arrangements to be remote.
(j) Recent Accounting Pronouncements:
In December 2023, the FASB issued ASU 2023-09 Income Taxes (Topic 740): Improvements to Income Tax Disclosures. The amendments were issued to enhance the transparency and decision usefulness of income tax disclosures primarily related to rate reconciliation and income taxes paid information. The guidance is effective for annual periods beginning after December 15, 2024, and with early adoption permitted. At this time, management is evaluating the impact of this amendment but believes it will not have a material impact on the financial statements and income tax disclosures.
3. Affiliates and Affiliated Transactions: Charles Schwab Investment Management, Inc., dba Schwab Asset Management, a wholly owned subsidiary of The Charles Schwab Corporation, serves as each fund’s investment adviser and administrator pursuant to the Amended and Restated Investment Advisory and Administration Agreement between the investment adviser and the trust.
For its advisory and administrative services to the funds, the investment adviser is entitled to receive an annual fee, payable monthly, based on a percentage of each fund’s average daily net assets as follows:
| |
SCHWAB MARKETTRACK ALL EQUITY PORTFOLIO |
SCHWAB MARKETTRACK GROWTH PORTFOLIO |
SCHWAB MARKETTRACK BALANCED PORTFOLIO |
SCHWAB MARKETTRACK CONSERVATIVE PORTFOLIO |
|
|
|
|
|
| |
|
|
|
|
|
|
|
|
|
Schwab Multi-Asset Funds | Annual Holdings and Financial Statements
105
Financial Notes (continued)
3. Affiliates and Affiliated Transactions (continued):
Shareholder Servicing
The Board of Trustees has adopted a Shareholder Servicing Plan (the Plan) on behalf of the funds, except the Schwab Balanced Fund and Schwab Target Funds. The Plan enables each fund to bear expenses relating to the provision by financial intermediaries, including Charles Schwab & Co., Inc. (Schwab), a broker-dealer affiliate of the investment adviser, (together, service providers), of certain account maintenance, customer liaison and shareholder services to the current shareholders of the funds.
Pursuant to the Plan, each fund’s shares, except the Schwab Balanced Fund and Schwab Target Funds, are subject to an annual shareholder servicing fee up to 0.25%. The shareholder servicing fee paid to a particular service provider is made pursuant to its written agreement with Schwab, as distributor of the funds (or, in the case of payments made to Schwab acting as a service provider, pursuant to Schwab’s written agreement with the funds). Payments under the Plan are made as described above without regard to whether the fee is more or less than the service provider’s actual cost of providing the services, and if more, such excess may be retained as profit by the service provider.
The investment adviser and its affiliates have agreed with the trust, for so long as the investment adviser serves as the investment adviser to the funds, in which the agreement may only be amended or terminated with the approval of the Board of Trustees, to limit the total annual fund operating expenses charged, excluding interest, taxes and certain non-routine expenses, as follows:
| |
SCHWAB MARKETTRACK ALL EQUITY PORTFOLIO |
SCHWAB MARKETTRACK GROWTH PORTFOLIO |
SCHWAB MARKETTRACK BALANCED PORTFOLIO |
SCHWAB MARKETTRACK CONSERVATIVE PORTFOLIO |
|
|
|
|
|
| |
|
|
|
|
|
|
|
|
|
The agreement to limit the funds’ total expenses charged is limited to each fund’s direct operating expenses and, therefore, does not apply to acquired fund fees and expenses, which are indirect expenses incurred by a fund through its investments in the underlying funds.
106
Schwab Multi-Asset Funds | Annual Holdings and Financial Statements
Financial Notes (continued)
3. Affiliates and Affiliated Transactions (continued):
Investments in Affiliates
The funds may engage in certain transactions involving affiliated parties. Pursuant to an exemptive order issued by the SEC, each fund may invest in affiliated funds. As of October 31, 2025, each fund’s ownership percentage of affiliated fund’s shares is as follows:
| |
|
SCHWAB MARKETTRACK ALL EQUITY PORTFOLIO |
SCHWAB MARKETTRACK GROWTH PORTFOLIO |
SCHWAB MARKETTRACK BALANCED PORTFOLIO |
SCHWAB MARKETTRACK CONSERVATIVE PORTFOLIO |
|
| |
|
|
|
|
|
|
Schwab Emerging Markets Equity ETF |
|
|
|
|
|
|
Schwab Fundamental Emerging Markets Equity Index Fund |
|
|
|
|
|
|
Schwab Fundamental International Equity Index Fund |
|
|
|
|
|
|
Schwab Fundamental International Small Equity Index Fund |
|
|
|
|
|
|
Schwab Fundamental U.S. Large Company Index Fund |
|
|
|
|
|
|
Schwab Fundamental U.S. Small Company Index Fund |
|
|
|
|
|
|
Schwab Global Real Estate Fund |
|
|
|
|
|
|
Schwab Government Money Fund, Ultra Shares |
|
|
|
|
|
|
Schwab High Yield Bond ETF |
|
|
|
|
|
|
Schwab International Core Equity Fund |
|
|
|
|
|
|
Schwab International Index Fund |
|
|
|
|
|
|
Schwab International Opportunities Fund |
|
|
|
|
|
|
Schwab S&P 500 Index Fund |
|
|
|
|
|
|
Schwab Select Large Cap Growth Fund |
|
|
|
|
|
|
Schwab Short-Term Bond Index Fund |
|
|
|
|
|
|
Schwab Small-Cap Equity Fund |
|
|
|
|
|
|
Schwab Small-Cap Index Fund |
|
|
|
|
|
|
Schwab Treasury Inflation Protected Securities Index Fund |
|
|
|
|
|
|
Schwab U.S. Aggregate Bond Index Fund |
|
|
|
|
|
|
Schwab U.S. Large-Cap Growth Index Fund |
|
|
|
|
|
|
Schwab U.S. Mid Cap Index Fund |
|
|
|
|
|
|
| |
|
|
|
|
|
|
Schwab Multi-Asset Funds | Annual Holdings and Financial Statements
107
Financial Notes (continued)
3. Affiliates and Affiliated Transactions (continued):
| |
|
|
|
|
|
|
| |
|
|
|
|
|
|
Schwab Emerging Markets Equity ETF |
|
|
|
|
|
|
Schwab Fundamental Emerging Markets Equity Index Fund |
|
|
|
|
|
|
Schwab Fundamental International Equity Index Fund |
|
|
|
|
|
|
Schwab Fundamental International Small Equity Index Fund |
|
|
|
|
|
|
Schwab Fundamental U.S. Large Company Index Fund |
|
|
|
|
|
|
Schwab Fundamental U.S. Small Company Index Fund |
|
|
|
|
|
|
Schwab Global Real Estate Fund |
|
|
|
|
|
|
Schwab International Opportunities Fund |
|
|
|
|
|
|
Schwab International Core Equity Fund |
|
|
|
|
|
|
Schwab International Index Fund |
|
|
|
|
|
|
Schwab S&P 500 Index Fund |
|
|
|
|
|
|
Schwab Short-Term Bond Index Fund |
|
|
|
|
|
|
Schwab Select Large Cap Growth Fund |
|
|
|
|
|
|
Schwab Small-Cap Equity Fund |
|
|
|
|
|
|
Schwab Small-Cap Index Fund |
|
|
|
|
|
|
Schwab Treasury Inflation Protected Securities Index Fund |
|
|
|
|
|
|
Schwab U.S. Aggregate Bond Index Fund |
|
|
|
|
|
|
Schwab U.S. Large-Cap Growth Index Fund |
|
|
|
|
|
|
Schwab U.S. Mid Cap Index Fund |
|
|
|
|
|
|
| |
|
|
|
|
|
|
Schwab Government Money Fund, Ultra Shares |
|
|
|
|
|
|
Schwab High Yield Bond ETF |
|
|
|
|
|
|
108
Schwab Multi-Asset Funds | Annual Holdings and Financial Statements
Financial Notes (continued)
3. Affiliates and Affiliated Transactions (continued):
| |
|
|
|
|
|
| |
|
|
|
|
|
Schwab Emerging Markets Equity ETF |
|
|
|
|
|
Schwab Fundamental Emerging Markets Equity Index Fund |
|
|
|
|
|
Schwab Fundamental International Equity Index Fund |
|
|
|
|
|
Schwab Fundamental International Small Equity Index Fund |
|
|
|
|
|
Schwab Fundamental U.S. Large Company Index Fund |
|
|
|
|
|
Schwab Fundamental U.S. Small Company Index Fund |
|
|
|
|
|
Schwab Global Real Estate Fund |
|
|
|
|
|
Schwab International Opportunities Fund |
|
|
|
|
|
Schwab International Core Equity Fund |
|
|
|
|
|
Schwab International Index Fund |
|
|
|
|
|
Schwab S&P 500 Index Fund |
|
|
|
|
|
Schwab Short-Term Bond Index Fund |
|
|
|
|
|
Schwab Select Large Cap Growth Fund |
|
|
|
|
|
Schwab Small-Cap Equity Fund |
|
|
|
|
|
Schwab Treasury Inflation Protected Securities Index Fund |
|
|
|
|
|
Schwab U.S. Aggregate Bond Index Fund |
|
|
|
|
|
Schwab U.S. Large-Cap Growth Index Fund |
|
|
|
|
|
Schwab U.S. Mid Cap Index Fund |
|
|
|
|
|
| |
|
|
|
|
|
Schwab Government Money Fund, Ultra Shares |
|
|
|
|
|
Schwab High Yield Bond ETF |
|
|
|
|
|
The funds may engage in direct transactions with other funds in the Schwab Funds Complex in accordance with procedures adopted by the Board of Trustees pursuant to Rule 17a-7 under the 1940 Act. When one fund is seeking to sell a security that another fund is seeking to buy, an interfund transaction can allow both funds to benefit by reducing transaction costs while allowing each fund to execute the transaction at the current market price. This practice is limited to funds that share the same investment adviser. The net realized gains or losses on sales of interfund transactions, if any, are recorded in Net realized gains (losses) on sales of securities — affiliated issuers in the Statement of Operations. For the period ended October 31, 2025, each fund’s purchases and sales of securities with other funds in the Schwab Funds Complex as well as any net realized gains (losses) were as follows:
| |
|
|
NET REALIZED GAINS (LOSSES) |
Schwab MarketTrack All Equity Portfolio |
|
|
|
Schwab MarketTrack Growth Portfolio |
|
|
|
Schwab MarketTrack Balanced Portfolio |
|
|
|
Schwab MarketTrack Conservative Portfolio |
|
|
|
Interfund Borrowing and Lending
Pursuant to an exemptive order issued by the SEC, the funds may enter into interfund borrowing and lending transactions with other funds in the Schwab Funds Complex. All loans are for temporary or emergency purposes and the interest rate to be charged will be the average of the overnight repurchase agreement rate and the short-term bank loan rate. All loans are subject to numerous conditions designed to ensure fair and equitable treatment of all participating funds. The interfund lending facility is subject to the oversight and periodic review by the Board of Trustees. The funds had no interfund borrowing or lending activity during the period.
Schwab Multi-Asset Funds | Annual Holdings and Financial Statements
109
Financial Notes (continued)
4. Board of Trustees:
The Board of Trustees may include people who are officers and/or directors of the investment adviser or its affiliates. Federal securities law limits the percentage of such “interested persons” who may serve on a trust’s board, and the trust was in compliance with these limitations throughout the report period. The funds did not pay any of these interested persons for their services as trustees, but did pay non-interested persons (independent trustees), as noted in each fund’s Statement of Operations.
During the period, the funds were participants with other funds in the Schwab Funds Complex in a joint, syndicated, committed $1.2 billion line of credit (the Syndicated Credit Facility), which matured on September 25, 2025. On September 25, 2025, the Syndicated Credit Facility was amended to run for a new 28 day period with the line of credit amount remaining unchanged, maturing on October 23, 2025. On October 23, 2025, the Syndicated Credit Facility was amended to run for a new 364 day period with the line of credit amount remaining unchanged, maturing on October 22, 2026. Under the terms of the Syndicated Credit Facility, in addition to the interest charged on any borrowings by a fund, each fund paid a commitment fee of 0.15% per annum on the funds’ proportionate share of the unused portion of the Syndicated Credit Facility.
During the period, the funds were participants with other funds in the Schwab Funds Complex in a joint, unsecured, uncommitted $400 million line of credit (the Uncommitted Credit Facility) with State Street Bank and Trust Company, which matured on September 25, 2025. On September 25, 2025, the Uncommitted Credit Facility was amended to run for a new 28 day period with the line of credit amount remaining unchanged, maturing on October 23, 2025. On October 23, 2025, the Uncommitted Credit Facility was amended to run for a new 364 day period with the line of credit amount remaining unchanged, maturing on October 22, 2026. Under the terms of the Uncommitted Credit Facility, each fund pays interest on the amount a fund borrows. There were no borrowings by any of the funds from either line of credit during the period.
The funds also have access to custodian overdraft facilities. A fund may have utilized the overdraft facility and incurred an interest expense, which is disclosed in each fund’s Statement of Operations, if any. The interest expense is determined based on a negotiated rate above the current Federal Funds Rate.
6. Purchases and Sales of Investment Securities: For the period ended October 31, 2025, purchases and sales of securities (excluding short-term obligations) were as follows:
| |
|
|
| |
|
|
Schwab MarketTrack All Equity Portfolio |
|
|
Schwab MarketTrack Growth Portfolio |
|
|
Schwab MarketTrack Balanced Portfolio |
|
|
Schwab MarketTrack Conservative Portfolio |
|
|
| |
|
|
| |
|
|
| |
|
|
| |
|
|
| |
|
|
| |
|
|
| |
|
|
| |
|
|
| |
|
|
| |
|
|
| |
|
|
| |
|
|
110
Schwab Multi-Asset Funds | Annual Holdings and Financial Statements
Financial Notes (continued)
7. Federal Income Taxes:
As of October 31, 2025, the tax basis cost of the funds’ investments and gross unrealized appreciation and depreciation were as follows:
| |
|
GROSS UNREALIZED
APPRECIATION |
GROSS UNREALIZED
DEPRECIATION |
NET UNREALIZED
APPRECIATION
(DEPRECIATION) |
| |
|
|
|
|
Schwab MarketTrack All Equity Portfolio |
|
|
|
|
Schwab MarketTrack Growth Portfolio |
|
|
|
|
Schwab MarketTrack Balanced Portfolio |
|
|
|
|
Schwab MarketTrack Conservative Portfolio |
|
|
|
|
| |
|
|
|
|
| |
|
|
|
|
| |
|
|
|
|
| |
|
|
|
|
| |
|
|
|
|
| |
|
|
|
|
| |
|
|
|
|
| |
|
|
|
|
| |
|
|
|
|
| |
|
|
|
|
| |
|
|
|
|
| |
|
|
|
|
The primary difference between book basis and tax basis unrealized appreciation or unrealized depreciation of investments is the tax deferral of losses on wash sales. The tax cost of the funds’ investments, disclosed above, have been adjusted from their book amounts to reflect these unrealized appreciation or depreciation differences, as applicable.
As of October 31, 2025, the components of distributable earnings on a tax basis were as follows:
| |
UNDISTRIBUTED
ORDINARY
INCOME |
UNDISTRIBUTED
LONG-TERM
CAPITAL GAINS |
NET UNREALIZED
APPRECIATION
(DEPRECIATION)
ON INVESTMENTS |
|
| |
|
|
|
|
Schwab MarketTrack All Equity Portfolio |
|
|
|
|
Schwab MarketTrack Growth Portfolio |
|
|
|
|
Schwab MarketTrack Balanced Portfolio |
|
|
|
|
Schwab MarketTrack Conservative Portfolio |
|
|
|
|
| |
|
|
|
|
| |
|
|
|
|
| |
|
|
|
|
| |
|
|
|
|
| |
|
|
|
|
| |
|
|
|
|
| |
|
|
|
|
| |
|
|
|
|
| |
|
|
|
|
| |
|
|
|
|
| |
|
|
|
|
| |
|
|
|
|
Schwab Multi-Asset Funds | Annual Holdings and Financial Statements
111
Financial Notes (continued)
7. Federal Income Taxes (continued):
As of October 31, 2025, the funds had no capital loss carryforwards available to offset future realized capital gains for federal income tax purposes.
The tax basis components of distributions paid during the current and prior fiscal years were as follows:
| |
CURRENT FISCAL YEAR END DISTRIBUTIONS |
PRIOR FISCAL YEAR END DISTRIBUTIONS |
| |
|
|
|
|
| |
|
|
|
|
Schwab MarketTrack All Equity Portfolio |
|
|
|
|
Schwab MarketTrack Growth Portfolio |
|
|
|
|
Schwab MarketTrack Balanced Portfolio |
|
|
|
|
Schwab MarketTrack Conservative Portfolio |
|
|
|
|
| |
|
|
|
|
| |
|
|
|
|
| |
|
|
|
|
| |
|
|
|
|
| |
|
|
|
|
| |
|
|
|
|
| |
|
|
|
|
| |
|
|
|
|
| |
|
|
|
|
| |
|
|
|
|
| |
|
|
|
|
| |
|
|
|
|
Distributions paid to shareholders are based on net investment income and net realized gains determined on a tax basis, which may differ from net investment income and net realized gains for financial reporting purposes. These differences reflect the differing character of certain income items and net realized gains and losses for financial statement and tax purposes, and may result in reclassification among certain capital accounts in the financial statements. The funds may also designate a portion of the amount paid to redeeming shareholders as a distribution for tax purposes.
Permanent book and tax basis differences may result in reclassifications between components of net assets as required. The adjustments will have no impact on net assets or the results of operations.
As of October 31, 2025, management has reviewed the tax positions for open periods (for federal purposes, three years from the date of filing and for state purposes, four years from the date of filing) as applicable to the funds, and has determined that no provision for income tax is required in the funds’ financial statements. The funds recognize interest and penalties, if any, related to unrecognized tax benefits as income tax expense in each fund’s Statement of Operations. During the fiscal year ended October 31, 2025, the funds did not incur any interest or penalties.
Management has determined there are no subsequent events or transactions through the date the financial statements were issued that would have materially impacted the financial statements as presented.
112
Schwab Multi-Asset Funds | Annual Holdings and Financial Statements
Report of Independent Registered Public Accounting Firm
To the Board of Trustees of Schwab Capital Trust and Shareholders of Schwab Balanced Fund, Schwab MarketTrack All Equity Portfolio, Schwab MarketTrack Growth Portfolio, Schwab MarketTrack Balanced Portfolio, Schwab MarketTrack Conservative Portfolio, Schwab Target 2010 Fund, Schwab Target 2015 Fund, Schwab Target 2020 Fund, Schwab Target 2025 Fund, Schwab Target 2030 Fund, Schwab Target 2035 Fund, Schwab Target 2040 Fund, Schwab Target 2045 Fund, Schwab Target 2050 Fund, Schwab Target 2055 Fund, Schwab Target 2060 Fund, and Schwab Target 2065 Fund:
Opinion on the Financial Statements and Financial Highlights
We have audited the accompanying statements of assets and liabilities, including the portfolio holdings, of Schwab Balanced Fund, Schwab MarketTrack All Equity Portfolio, Schwab MarketTrack Growth Portfolio, Schwab MarketTrack Balanced Portfolio, Schwab MarketTrack Conservative Portfolio, Schwab Target 2010 Fund, Schwab Target 2015 Fund, Schwab Target 2020 Fund, Schwab Target 2025 Fund, Schwab Target 2030 Fund, Schwab Target 2035 Fund, Schwab Target 2040 Fund, Schwab Target 2045 Fund, Schwab Target 2050 Fund, Schwab Target 2055 Fund, Schwab Target 2060 Fund, and Schwab Target 2065 Fund (the “Funds”), seventeen of the Funds constituting Schwab Capital Trust, as of October 31, 2025, the related statements of operations for the year then ended, the statements of changes in net assets for each of the two years in the period then ended, the financial highlights for each of the five years in the period then ended (excluding Schwab Target 2065 Fund); the related statement of operations for the year then ended, the statements of changes in net assets for each of the two years in the period then ended, the financial highlights for each of the four years in the period then ended and for the period from February 26, 2021 (commencement of operations) through October 31, 2021 for Schwab Target 2065 Fund; and the related notes (collectively referred to as the “financial statements and financial highlights”). In our opinion, the financial statements and financial highlights present fairly, in all material respects, the financial position of each of the Funds (excluding Schwab Target 2065 Fund) as of October 31, 2025, and the results of their operations for the year then ended, the changes in their net assets for each of the two years in the period then ended, and the financial highlights for each of the five years in the period then ended in conformity with accounting principles generally accepted in the United States of America. Also, in our opinion, the financial statements and financial highlights present fairly, in all material respects, the financial position of Schwab Target 2065 Fund as of October 31, 2025, and the results of its operations for the year then ended, the changes in net assets for each of the two years in the period then ended, and financial highlights for each of the four years in the period then ended and for the period from February 26, 2021 (commencement of operations) through October 31, 2021 in conformity with accounting principles generally accepted in the United States of America.
These financial statements and financial highlights are the responsibility of the Funds’ management. Our responsibility is to express an opinion on the Funds’ financial statements and financial highlights based on our audits. We are a public accounting firm registered with the Public Company Accounting Oversight Board (United States) (PCAOB) and are required to be independent with respect to the Funds in accordance with the U.S. federal securities laws and the applicable rules and regulations of the Securities and Exchange Commission and the PCAOB.
We conducted our audits in accordance with the standards of the PCAOB. Those standards require that we plan and perform the audit to obtain reasonable assurance about whether the financial statements and financial highlights are free of material misstatement, whether due to error or fraud. The Funds are not required to have, nor were we engaged to perform, an audit of their internal control over financial reporting. As part of our audits we are required to obtain an understanding of internal control over financial reporting but not for the purpose of expressing an opinion on the effectiveness of the Funds’ internal control over financial reporting. Accordingly, we express no such opinion.
Our audits included performing procedures to assess the risks of material misstatement of the financial statements and financial highlights, whether due to error or fraud, and performing procedures that respond to those risks. Such procedures included examining, on a test basis, evidence regarding the amounts and disclosures in the financial statements and financial highlights. Our audits also included evaluating the accounting principles used and significant estimates made by management, as well as evaluating the overall presentation of the financial statements and financial highlights. Our procedures included confirmation of securities owned as of October 31, 2025, by correspondence with the custodian, transfer agent, and brokers; when replies were not received from brokers, we performed other auditing procedures. We believe that our audits provide a reasonable basis for our opinion.
Deloitte & Touche LLP
Denver, Colorado
December 16, 2025
We have served as the auditor of one or more investment companies in the Schwab Funds Complex since 2020.
Schwab Multi-Asset Funds | Annual Holdings and Financial Statements
113
Changes in and Disagreements with Accountants for Open-End Management Investment Companies
114
Schwab Multi-Asset Funds | Annual Holdings and Financial Statements
Proxy Disclosures for Open-End Management Investment Companies
Schwab Multi-Asset Funds | Annual Holdings and Financial Statements
115
Remuneration Paid to Directors, Officers, and Others of Open-End Management Investment Companies
The remuneration paid to directors, officers and others are included under Item 7 (Financial Statements and Financial Highlights for Open-End Management Investment Companies).
116
Schwab Multi-Asset Funds | Annual Holdings and Financial Statements
Investment Advisory Agreement Approval
Approval of Renewal of Investment Advisory Agreement – Schwab Balanced Fund
The Investment Company Act of 1940, as amended (the 1940 Act), requires that the continuation of a fund’s investment advisory agreement must be specifically approved (1) by the vote of the trustees or by a vote of the shareholders of the fund, and (2) by the vote of a majority of the trustees who are not parties to the investment advisory agreement or “interested persons” of any party thereto (the Independent Trustees), cast in person at a meeting called for the purpose of voting on such approval. In connection with such approvals, the fund’s trustees must request and evaluate, and the investment adviser is required to furnish, such information as may be reasonably necessary to evaluate the terms of the investment advisory agreement.
The Board of Trustees (the Board or the Trustees, as appropriate) calls and holds one or more meetings each year that are dedicated, in whole or in part, to considering whether to renew the investment advisory and administration agreement (the Agreement) between Schwab Capital Trust (the Trust) and Charles Schwab Investment Management, Inc. (dba Schwab Asset Management) (the investment adviser) with respect to the existing funds in the Trust, including Schwab Balanced Fund (the Fund), and to review certain other agreements pursuant to which the investment adviser provides investment advisory services to certain other registered investment companies. In preparation for the meeting(s), the Board requests and reviews a wide variety of materials provided by the investment adviser, including information about the investment adviser’s affiliates, personnel, business goals and priorities, profitability, oversight of third-party service providers, corporate structure and operations. As part of the renewal process, the Independent Trustees’ legal counsel, on behalf of the Independent Trustees, sends an information request letter to the investment adviser seeking certain relevant information. The responses by the investment adviser are provided to the Trustees in the Board materials for their review prior to their meeting, and the Trustees are provided with the opportunity to request any additional materials. The Board also receives data provided by an independent provider of investment company data. This information is in addition to the detailed information about the Fund that the Board reviews during the course of each year, including information that relates to the Fund’s operations and performance, legal and compliance matters, risk management, portfolio turnover, and sales and marketing activity. In considering the renewal, the Independent Trustees receive advice from Independent Trustees’ legal counsel, including a memorandum regarding the responsibilities of trustees for the approval of investment advisory agreements. In addition, the Independent Trustees participate in question and answer sessions with
representatives of the investment adviser and meet in executive session outside the presence of Fund management.
The Board, including a majority of the Independent Trustees, considered information specifically relating to the continuance of the Agreement with respect to the Fund at meetings held on May 7, 2025 and June 5, 2025, and approved the renewal of the Agreement with respect to the Fund for an additional one-year term at the meeting on June 5, 2025 called for the purpose of voting on such approval.
The Board’s approval of the continuance of the Agreement with respect to the Fund was based on consideration and evaluation of a variety of specific factors discussed at these meetings and at prior meetings, including:
1.
the nature, extent and quality of the services provided to the Fund under the Agreement, including the resources of the investment adviser and its affiliates dedicated to the Fund;
2.
the Fund’s investment performance and how it compared to that of certain other comparable mutual funds and benchmark data;
3.
the Fund’s expenses and how those expenses compared to those of certain other similar mutual funds;
4.
the profitability of the investment adviser and its affiliates, including Charles Schwab & Co., Inc. (Schwab), with respect to the Fund, including both direct and indirect benefits accruing to the investment adviser and its affiliates; and
5.
the extent to which economies of scale would be realized as the Fund grows and whether fee levels in the Agreement reflect those economies of scale for the benefit of Fund investors.
Nature, Extent and Quality of Services. The Board considered the nature, extent and quality of the services provided by the investment adviser to the Fund and the resources of the investment adviser and its affiliates dedicated to the Fund. In this regard, the Trustees evaluated, among other things, the investment adviser’s experience, track record, compliance program, resources dedicated to hiring and retaining skilled personnel and specialized talent, and information security resources. The Trustees also considered information provided by the investment adviser relating to services and support provided with respect to the Fund’s portfolio management team, portfolio strategy, and internal investment guidelines, as well as trading infrastructure, liquidity management, product design and analysis, shareholder communications, securities valuation, and vendor and risk oversight. The Trustees also considered the investment adviser’s continued investment in its infrastructure, including the investment adviser’s technology and use of data, business continuity, cybersecurity,
Schwab Multi-Asset Funds | Annual Holdings and Financial Statements
117
due diligence, risk management processes, and information security programs. The Trustees considered Schwab’s overall financial condition and reputation as a full service brokerage firm as well as the wide range of products, services and account features that benefit Fund shareholders who are brokerage clients of Schwab. Following such evaluation, the Board concluded, within the context of its full deliberations, that the nature, extent and quality of services provided by the investment adviser to the Fund and the resources of the investment adviser and its affiliates dedicated to the Fund supported renewal of the Agreement.
Fund Performance. The Board considered the Fund’s performance in determining whether to renew the Agreement with respect to the Fund. Specifically, the Trustees considered the Fund’s performance relative to a peer category of other mutual funds and applicable indices/benchmarks, in light of total return and the market environment, as well as in consideration of the Fund’s investment style and strategy. As part of this review, the Trustees considered the composition of the peer category, selection criteria and the reputation of the independent provider of investment company data who prepared the peer category analysis. In evaluating the performance of the Fund, the Trustees considered the risk profile for the Fund and the appropriateness of the benchmark used to compare the performance of the Fund. The Trustees further considered the level of Fund performance in the context of their review of Fund expenses and the investment adviser’s profitability discussed below and also noted that the Board and a designated committee of the Board review performance throughout the year. Following such evaluation, the Board concluded, within the context of its full deliberations, that the performance of the Fund supported renewal of the Agreement.
Fund Expenses. With respect to the Fund’s expenses, the Trustees considered the rate of compensation called for by the Agreement and the Fund’s net operating expense ratio, in each case, in comparison to those of other similar mutual funds, such peer groups and comparisons having been selected and calculated by an independent provider of investment company data. The investment adviser reported to the Board, and the Board took into account, the risk assumed by the investment adviser in the development of the Fund and provision of services as well as the competitive marketplace for financial products. The Trustees considered the effects of the investment adviser’s and Schwab’s practice of waiving certain fees to prevent total annual operating expenses of the Fund from exceeding a specified cap. The Trustees also considered the investment adviser’s contractual commitment to limit the total annual operating expenses of the Fund for so long as the investment adviser serves as the adviser to the Fund. The Trustees also considered that the investment adviser is not charging any management fees at the Fund level; it being understood that there are management fees at the underlying fund level. The Trustees also considered fees charged by the investment adviser to other mutual funds and to other types of
accounts, but, with respect to such other types of accounts, accorded less weight to such comparisons due to the different legal, regulatory, compliance and operating features of mutual funds as compared to these other types of accounts, and any differences in the nature and scope of the services the investment adviser provides to these other accounts and any differences in the market for these types of accounts. The Trustees noted that shareholders of the Fund indirectly pay their pro rata share of the fees and expenses of the underlying funds in which the Fund invests. Following such evaluation, the Board concluded, within the context of its full deliberations, that the expenses of the Fund are reasonable and supported renewal of the Agreement.
Profitability. The Trustees considered the compensation flowing to the investment adviser and its affiliates, directly or indirectly and reviewed profitability on a pre-tax basis, without regard to distribution expenses. The Trustees reviewed the profitability of the investment adviser relating to the Schwab fund complex as a whole, noting the benefits to Fund shareholders of being part of the Schwab fund complex, including the allocations of certain costs across the Fund and other funds in the complex. The Trustees considered that the investment adviser is not charging any management fees at the Fund level; it being understood that there is a management fee at the underlying fund level. The Trustees also considered any other benefits derived by the investment adviser from its relationship with the Fund, such as whether, by virtue of its management of the Fund, the investment adviser obtains investment information or other research resources that aid it in providing advisory services to other clients. Also, because the Fund invests a portion of its assets in other funds within the Schwab fund complex, the Trustees considered that the investment adviser indirectly benefits from the Fund’s investments in other underlying funds managed by the investment adviser. The Trustees considered whether the compensation and profitability with respect to the Fund under the Agreement and other service agreements were reasonable in light of the quality of all services rendered to the Fund by the investment adviser and its affiliates. The Trustees noted that the investment adviser continues to invest substantial sums in its business in order to provide enhanced research capabilities, services and systems to benefit the Fund. Based on this evaluation, the Board concluded, within the context of its full deliberations, that the profitability of the investment adviser is reasonable and supported renewal of the Agreement.
Economies of Scale. Although the Trustees recognized the difficulty of determining economies of scale with precision and although the Fund does not directly bear advisory fees at the Fund level, the Trustees considered the potential existence of any economies of scale and whether those are passed along to the Fund’s shareholders through (i) the enhancement of services provided to the Fund in return for fees paid, including through the investment adviser’s continued investment in its infrastructure, and use of data and technology, increasing expertise and capabilities in key areas (including portfolio and
118
Schwab Multi-Asset Funds | Annual Holdings and Financial Statements
trade operations), and improving business continuity, cybersecurity, due diligence and information security programs, which are designed to provide enhanced services to the Fund and its shareholders; (ii) fee waivers or expense caps by the investment adviser and its affiliates for those funds in the Schwab fund complex with such features; and (iii) pricing a fund to scale and keeping overall expenses down as the fund grows. The Trustees considered that the investment adviser and its affiliates may employ contractual expense caps to protect shareholders from higher fees, including for example, when fund assets are relatively small. Based on this evaluation, the Board concluded, within the context of its full deliberations, that the Fund obtains reasonable benefits from economies of scale.
* * * * * * * * * * * * * * * * * * * * * * * * * * * * * * * * * * * * * * * *
In the course of their deliberations, the Trustees may have accorded different weights to various factors and did not identify any particular information or factor that was all important or controlling. Based on the Trustees’ deliberation and their evaluation of the information described above, the Board, including all of the Independent Trustees, approved the continuation of the Agreement with respect to the Fund and concluded that the compensation under the Agreement with respect to the Fund is fair and reasonable in light of the services provided and the related expenses borne by the investment adviser and its affiliates and such other matters as the Trustees considered to be relevant in the exercise of their reasonable judgment.
Approval of Renewal of Investment Advisory Agreement – Schwab MarketTrack Portfolios
The Investment Company Act of 1940, as amended (the 1940 Act), requires that the continuation of a fund’s investment advisory agreement must be specifically approved (1) by the vote of the trustees or by a vote of the shareholders of the fund, and (2) by the vote of a majority of the trustees who are not parties to the investment advisory agreement or “interested persons” of any party thereto (the Independent Trustees), cast in person at a meeting called for the purpose of voting on such approval. In connection with such approvals, the fund’s trustees must request and evaluate, and the investment adviser is required to furnish, such information as may be reasonably necessary to evaluate the terms of the investment advisory agreement.
The Board of Trustees (the Board or the Trustees, as appropriate) calls and holds one or more meetings each year that are dedicated, in whole or in part, to considering whether to renew the investment advisory and administration agreement (the Agreement) between Schwab Capital Trust (the Trust) and Charles Schwab Investment Management, Inc. (dba Schwab Asset Management) (the investment adviser) with respect to the existing funds in the Trust, including Schwab MarketTrack All Equity Portfolio, Schwab MarketTrack Growth Portfolio, Schwab MarketTrack Balanced Portfolio and Schwab MarketTrack Conservative Portfolio (each, a Fund and
collectively, the Funds), and to review certain other agreements pursuant to which the investment adviser provides investment advisory services to certain other registered investment companies. In preparation for the meeting(s), the Board requests and reviews a wide variety of materials provided by the investment adviser, including information about the investment adviser’s affiliates, personnel, business goals and priorities, profitability, oversight of third-party service providers, corporate structure and operations. As part of the renewal process, the Independent Trustees’ legal counsel, on behalf of the Independent Trustees, sends an information request letter to the investment adviser seeking certain relevant information. The responses by the investment adviser are provided to the Trustees in the Board materials for their review prior to their meeting, and the Trustees are provided with the opportunity to request any additional materials. The Board also receives data provided by an independent provider of investment company data. This information is in addition to the detailed information about the Funds that the Board reviews during the course of each year, including information that relates to the Funds’ operations and performance, legal and compliance matters, risk management, portfolio turnover, and sales and marketing activity. In considering the renewal, the Independent Trustees receive advice from Independent Trustees’ legal counsel, including a memorandum regarding the responsibilities of trustees for the approval of investment advisory agreements. In addition, the Independent Trustees participate in question and answer sessions with representatives of the investment adviser and meet in executive session outside the presence of Fund management.
The Board, including a majority of the Independent Trustees, considered information specifically relating to the continuance of the Agreement with respect to the Funds at meetings held on May 7, 2025 and June 5, 2025, and approved the renewal of the Agreement with respect to the Funds for an additional one-year term at the meeting on June 5, 2025 called for the purpose of voting on such approval.
The Board’s approval of the continuance of the Agreement with respect to the Funds was based on consideration and evaluation of a variety of specific factors discussed at these meetings and at prior meetings, including:
1.
the nature, extent and quality of the services provided to each Fund under the Agreement, including the resources of the investment adviser and its affiliates dedicated to the Funds;
2.
each Fund’s investment performance and how it compared to that of certain other comparable mutual funds and benchmark data;
3.
each Fund’s expenses and how those expenses compared to those of certain other similar mutual funds;
Schwab Multi-Asset Funds | Annual Holdings and Financial Statements
119
4.
the profitability of the investment adviser and its affiliates, including Charles Schwab & Co., Inc. (Schwab), with respect to each Fund, including both direct and indirect benefits accruing to the investment adviser and its affiliates; and
5.
the extent to which economies of scale would be realized as each Fund grows and whether fee levels in the Agreement reflect those economies of scale for the benefit of Fund investors.
Nature, Extent and Quality of Services. The Board considered the nature, extent and quality of the services provided by the investment adviser to the Funds and the resources of the investment adviser and its affiliates dedicated to the Funds. In this regard, the Trustees evaluated, among other things, the investment adviser’s experience, track record, compliance program, resources dedicated to hiring and retaining skilled personnel and specialized talent, and information security resources. The Trustees also considered information provided by the investment adviser relating to services and support provided with respect to each Fund’s portfolio management team, portfolio strategy, and internal investment guidelines, as well as trading infrastructure, liquidity management, product design and analysis, shareholder communications, securities valuation, and vendor and risk oversight. The Trustees also considered the investment adviser’s continued investment in its infrastructure, including the investment adviser’s technology and use of data, business continuity, cybersecurity, due diligence, risk management processes, and information security programs. The Trustees considered Schwab’s overall financial condition and reputation as a full service brokerage firm, as well as the wide range of products, services and account features that benefit Fund shareholders who are brokerage clients of Schwab. Following such evaluation, the Board concluded, within the context of its full deliberations, that the nature, extent and quality of services provided by the investment adviser to the Funds and the resources of the investment adviser and its affiliates dedicated to the Funds supported renewal of the Agreement with respect to the Funds.
Fund Performance. The Board considered each Fund’s performance in determining whether to renew the Agreement with respect to such Fund. Specifically, the Trustees considered each Fund’s performance relative to a peer category of other mutual funds and applicable indices/benchmarks, in light of total return and the market environment, as well as in consideration of each Fund’s investment style and strategy. As part of this review, the Trustees considered the composition of the peer category, selection criteria and the reputation of the independent provider of investment company data who prepared the peer category analysis. The Trustees further considered the level of Fund performance in the context of their review of Fund expenses and the investment adviser’s profitability discussed below and also noted that the Board and a designated committee of the Board review performance throughout the
year. Although Schwab MarketTrack Conservative Portfolio and Schwab MarketTrack All Equity Portfolio each had performance that ranked in the fourth quartile of a relevant peer group for more than one performance period considered, the Board concluded that other factors relevant to performance supported renewal of the Agreement with respect to each Fund including that the underperformance was attributable, to a significant extent, to investment decisions by the investment adviser that were reasonable and consistent with each Fund’s investment objective and policies and that the investment adviser had taken steps designed to help improve performance. Following such evaluation, the Board concluded, within the context of its full deliberations, that the performance of each Fund supported renewal of the Agreement with respect to such Fund.
Fund Expenses. With respect to each Fund’s expenses, the Trustees considered the rate of compensation called for by the Agreement, and each Fund’s net operating expense ratio, in each case, in comparison to those of other similar mutual funds, such peer groups and comparisons having been selected and calculated by an independent provider of investment company data. The investment adviser reported to the Board, and the Board took into account, the risk assumed by the investment adviser in the development of the Funds and provision of services as well as the competitive marketplace for financial products. The Trustees also considered the investment adviser’s contractual commitment to limit the operating expense of each Fund for so long as it serves as the adviser to the Fund. The Trustees also considered fees charged by the investment adviser to other mutual funds and to other types of accounts, but, with respect to such other types of accounts, accorded less weight to such comparisons due to the different legal, regulatory, compliance and operating features of mutual funds as compared to these other types of accounts, and any differences in the nature and scope of the services the investment adviser provides to these other accounts, and any differences in the market for these types of accounts. The Trustees noted that shareholders of the Funds indirectly pay their pro rata share of the fees and expenses of the underlying funds in which the Funds invest. Following such evaluation, the Board concluded, within the context of its full deliberations, that the expenses of each Fund are reasonable and supported renewal of the Agreement with respect to such Fund.
Profitability. The Trustees considered the compensation flowing to the investment adviser and its affiliates, directly or indirectly and reviewed profitability on a pre-tax basis, without regard to distribution expenses. The Trustees reviewed the profitability of the investment adviser relating to the Schwab fund complex as a whole, noting the benefits to Fund shareholders of being part of the Schwab fund complex, including the allocations of certain costs across the Funds and other funds in the complex. The Trustees also considered any other benefits derived by the investment adviser from its relationship with the Funds, such as whether, by virtue of its
120
Schwab Multi-Asset Funds | Annual Holdings and Financial Statements
management of the Funds, the investment adviser obtains investment information or other research resources that aid it in providing advisory services to other clients. Also, because each Fund invests a portion of its assets in other funds within the Schwab fund complex, the Trustees considered the indirect benefits to the investment adviser from such Fund’s investments in other underlying funds managed by the investment adviser. The Trustees considered whether the compensation and profitability with respect to the Funds under the Agreement and other service agreements were reasonable in light of the quality of all services rendered to the Funds by the investment adviser and its affiliates. The Trustees noted that the investment adviser continues to invest substantial sums in its business in order to provide enhanced research capabilities, services and systems to benefit the Funds. Based on this evaluation, the Board concluded, within the context of its full deliberations, that the profitability of the investment adviser with respect to each Fund is reasonable and supported renewal of the Agreement with respect to such Fund.
Economies of Scale. Although the Trustees recognized the difficulty of determining economies of scale with precision, and although the Funds do not have breakpoints in their advisory fees, the Trustees considered the potential existence of any economies of scale and whether those are passed along to a Fund’s shareholders through (i) the enhancement of services provided to the Funds in return for fees paid, including through the investment adviser’s continued investment in its infrastructure, and use of data and technology, increasing expertise and capabilities in key areas (including portfolio and trade operations), and improving business continuity, cybersecurity, due diligence and information security programs, which are designed to provide enhanced services to the Funds and their shareholders; and (ii) pricing a fund to scale and keeping overall expenses down as the fund grows. The Trustees considered that the investment adviser and its affiliates employ contractual expense caps to protect shareholders from higher fees, including for example, when fund assets are relatively small. Based on this evaluation, the Board concluded, within the context of its full deliberations, that each Fund obtains reasonable benefits from economies of scale.
* * * * * * * * * * * * * * * * * * * * * * * * * * * * * * * * * * * * * * * *
In the course of their deliberations, the Trustees may have accorded different weights to various factors and did not identify any particular information or factor that was all important or controlling. Based on the Trustees’ deliberation and their evaluation of the information described above, the Board, including all of the Independent Trustees, approved the continuation of the Agreement with respect to the Funds and concluded that the compensation under the Agreement with respect to the Funds is fair and reasonable in light of the services provided and the related expenses borne by the investment adviser and its affiliates and such other matters as the Trustees considered to be relevant in the exercise of their reasonable judgment.
Approval of Renewal of Investment Advisory Agreement – Schwab Target Funds
The Investment Company Act of 1940, as amended (the 1940 Act), requires that the continuation of a fund’s investment advisory agreement must be specifically approved (1) by the vote of the trustees or by a vote of the shareholders of the fund, and (2) by the vote of a majority of the trustees who are not parties to the investment advisory agreement or “interested persons” of any party thereto (the Independent Trustees), cast in person at a meeting called for the purpose of voting on such approval. In connection with such approvals, the fund’s trustees must request and evaluate, and the investment adviser is required to furnish, such information as may be reasonably necessary to evaluate the terms of the investment advisory agreement.
The Board of Trustees (the Board or the Trustees, as appropriate) calls and holds one or more meetings each year that are dedicated, in whole or in part, to considering whether to renew the investment advisory and administration agreement (the Agreement) between Schwab Capital Trust (the Trust) and Charles Schwab Investment Management, Inc. (dba Schwab Asset Management) (the investment adviser) with respect to the existing funds in the Trust, including Schwab Target 2010 Fund, Schwab Target 2015 Fund, Schwab Target 2020 Fund, Schwab Target 2025 Fund, Schwab Target 2030 Fund, Schwab Target 2035 Fund, Schwab Target 2040 Fund, Schwab Target 2045 Fund, Schwab Target 2050 Fund, Schwab Target 2055 Fund, Schwab Target 2060 Fund and Schwab Target 2065 Fund (the Funds), and to review certain other agreements pursuant to which the investment adviser provides investment advisory services to certain other registered investment companies. In preparation for the meeting(s), the Board requests and reviews a wide variety of materials provided by the investment adviser, including information about the investment adviser’s affiliates, personnel, business goals and priorities, profitability, oversight of third-party service providers, corporate structure and operations. As part of the renewal process, the Independent Trustees’ legal counsel, on behalf of the Independent Trustees, sends an information request letter to the investment adviser seeking certain relevant information. The responses by the investment adviser are provided to the Trustees in the Board materials for their review prior to their meeting, and the Trustees are provided with the opportunity to request any additional materials. The Board also receives data provided by an independent provider of investment company data. This information is in addition to the detailed information about the Funds that the Board reviews during the course of each year, including information that relates to the Funds’ operations and performance, legal and compliance matters, risk management, portfolio turnover, and sales and marketing activity. In considering the renewal, the Independent Trustees receive advice from Independent Trustees’ legal counsel, including a memorandum regarding the responsibilities of trustees for the approval of investment advisory agreements. In addition, the
Schwab Multi-Asset Funds | Annual Holdings and Financial Statements
121
Independent Trustees participate in question and answer sessions with representatives of the investment adviser and meet in executive session outside the presence of Fund management.
The Board, including a majority of the Independent Trustees, considered information specifically relating to the continuance of the Agreement with respect to the Funds at meetings held on May 7, 2025 and June 5, 2025, and approved the renewal of the Agreement with respect to the Funds for an additional one-year term at the meeting on June 5, 2025 called for the purpose of voting on such approval.
The Board’s approval of the continuance of the Agreement with respect to the Funds was based on consideration and evaluation of a variety of specific factors discussed at these meetings and at prior meetings, including:
1.
the nature, extent and quality of the services provided to each Fund under the Agreement, including the resources of the investment adviser and its affiliates dedicated to the Funds;
2.
each Fund’s investment performance and how it compared to that of certain other comparable mutual funds and benchmark data;
3.
each Fund’s expenses and how those expenses compared to those of certain other similar mutual funds;
4.
the profitability of the investment adviser and its affiliates, including Charles Schwab & Co., Inc. (Schwab), with respect to each Fund, including both direct and indirect benefits accruing to the investment adviser and its affiliates; and
5.
the extent to which economies of scale would be realized as each Fund grows and whether fee levels in the Agreement reflect those economies of scale for the benefit of Fund investors.
Nature, Extent and Quality of Services. The Board considered the nature, extent and quality of the services provided by the investment adviser to the Funds and the resources of the investment adviser and its affiliates dedicated to the Funds. In this regard, the Trustees evaluated, among other things, the investment adviser’s experience, track record, compliance program, resources dedicated to hiring and retaining skilled personnel and specialized talent, and information security resources. The Trustees also considered information provided by the investment adviser relating to services and support provided with respect to each Fund’s portfolio management team, portfolio strategy, and internal investment guidelines, as well as trading infrastructure, liquidity management, product design and analysis, shareholder communications, securities valuation, and vendor and risk oversight. The Trustees also considered the investment adviser’s continued investment in its infrastructure, including the investment adviser’s technology and use of data, business continuity, cybersecurity, due diligence, risk management processes, and information
security programs. The Trustees considered Schwab’s overall financial condition and reputation as a full service brokerage firm, as well as the wide range of products, services and account features that benefit Fund shareholders who are brokerage clients of Schwab. Following such evaluation, the Board concluded, within the context of its full deliberations, that the nature, extent and quality of services provided by the investment adviser to the Funds and the resources of the investment adviser and its affiliates dedicated to the Funds supported renewal of the Agreement with respect to the Funds.
Fund Performance. The Board considered each Fund’s performance in determining whether to renew the Agreement with respect to such Fund. Specifically, the Trustees considered each Fund’s performance relative to a peer category of other mutual funds and applicable indices/benchmarks, in light of total return and the market environment, as well as in consideration of each Fund’s investment style and strategy. As part of this review, the Trustees considered the composition of the peer category, selection criteria and the reputation of the independent provider of investment company data who prepared the peer category analysis. In evaluating the performance of each Fund, the Trustees considered the risk profile for such Fund and the appropriateness of the benchmark used to compare the performance of each Fund. The Trustees further considered the level of Fund performance in the context of their review of Fund expenses and the investment adviser’s profitability discussed below and also noted that the Board and a designated committee of the Board review performance throughout the year. The Board also considered that, in January 2025, CSIM had implemented enhancements to each Fund’s real estate investment trust, U.S. large-cap, international equity and emerging markets equity allocations. Following such evaluation, the Board concluded, within the context of its full deliberations, that the performance of each Fund supported renewal of the Agreement with respect to such Fund.
Fund Expenses. With respect to each Fund’s expenses, the Trustees considered the rate of compensation called for by the Agreement and each Fund’s net operating expense ratio, in each case, in comparison to those of other similar mutual funds, such peer groups and comparisons having been selected and calculated by an independent provider of investment company data. The investment adviser reported to the Board, and the Board took into account, the risk assumed by the investment adviser in the development of the Funds and provision of services as well as the competitive marketplace for financial products. The Trustees considered the effects of the investment adviser’s and Schwab’s practice of waiving certain fees to prevent total annual operating expenses of each Fund from exceeding a specified cap. The Trustees also considered the investment adviser’s contractual commitment to limit the total annual operating expenses of each Fund for so long as the investment adviser serves as the adviser to the Fund. The
122
Schwab Multi-Asset Funds | Annual Holdings and Financial Statements
Trustees also considered fees charged by the investment adviser to other mutual funds and to other types of accounts, but, with respect to such other types of accounts, accorded less weight to such comparisons due to the different legal, regulatory, compliance and operating features of mutual funds as compared to these other types of accounts, and any differences in the nature and scope of the services the investment adviser provides to these other accounts, and any differences in the market for these types of accounts. The Trustees noted that shareholders of the Funds indirectly pay their pro rata share of the fees and expenses of the underlying funds in which the Funds invest. Following such evaluation, the Board concluded, within the context of its full deliberations, that the expenses of each Fund are reasonable and supported renewal of the Agreement with respect to such Fund.
Profitability. The Trustees considered the compensation flowing to the investment adviser and its affiliates, directly or indirectly and reviewed profitability on a pre-tax basis, without regard to distribution expenses. The Trustees reviewed the profitability of the investment adviser relating to the Schwab fund complex as a whole, noting the benefits to Fund shareholders of being part of the Schwab fund complex, including the allocations of certain costs across the Funds and other funds in the complex. The Trustees also considered any other benefits derived by the investment adviser from its relationship with the Funds, such as whether, by virtue of its management of the Funds, the investment adviser obtains investment information or other research resources that aid it in providing advisory services to other clients. Also, because each Fund invests a portion of its assets in other funds within the Schwab fund complex, the Trustees considered the indirect benefits to the investment adviser from such Fund’s investments in other underlying funds managed by the investment adviser. The Trustees considered whether the compensation and profitability with respect to the Funds under the Agreement and other service agreements were reasonable in light of the quality of all services rendered to the Funds by the investment adviser and its affiliates. The Trustees noted that the investment adviser continues to invest substantial sums in its business in order to provide enhanced research
capabilities, services and systems to benefit the Funds. Based on this evaluation, the Board concluded, within the context of its full deliberations, that the profitability of the investment adviser with respect to each Fund is reasonable and supported renewal of the Agreement with respect to such Fund.
Economies of Scale. Although the Trustees recognized the difficulty of determining economies of scale with precision, the Trustees considered the potential existence of any economies of scale and whether those are passed along to a Fund’s shareholders through (i) the enhancement of services provided to the Funds in return for fees paid, including through the investment adviser’s continued investment in its infrastructure, and use of data and technology, increasing expertise and capabilities in key areas (including portfolio and trade operations), and improving business continuity, cybersecurity, due diligence and information security programs, which are designed to provide enhanced services to the Funds and their shareholders; and (ii) pricing a fund to scale and keeping overall expenses down as the fund grows. The Trustees considered that the investment adviser and its affiliates employ contractual expense caps to protect shareholders from higher fees, including for example, when fund assets are relatively small. Based on this evaluation, the Board concluded, within the context of its full deliberations, that each Fund obtains reasonable benefits from economies of scale.
* * * * * * * * * * * * * * * * * * * * * * * * * * * * * * * * * * * * * * * *
In the course of their deliberations, the Trustees may have accorded different weights to various factors and did not identify any particular information or factor that was all important or controlling. Based on the Trustees’ deliberation and their evaluation of the information described above, the Board, including all of the Independent Trustees, approved the continuation of the Agreement with respect to the Funds and concluded that the compensation under the Agreement with respect to the Funds is fair and reasonable in light of the services provided and the related expenses borne by the investment adviser and its affiliates and such other matters as the Trustees considered to be relevant in the exercise of their reasonable judgment.
Schwab Multi-Asset Funds | Annual Holdings and Financial Statements
123
Item 8: Changes in and Disagreements with Accountants for Open-End Management Investment Companies.
The changes in and disagreements with accountants for open-end management investment companies are included under Item 7 of this Form.
Item 9: Proxy Disclosures for Open-End Management Investment Companies.
The proxy disclosures for open-end management investment companies are included under Item 7 of this Form.
Item 10: Remuneration Paid to Directors, Officers, and Others of Open-End Management Investment Companies.
The remuneration paid to directors, officers and others are included under Item 7 of this Form.
Item 11: Statement Regarding Basis for Approval of Investment Advisory Contract.
The statement regarding basis for approval of investment advisory contract is included under Item 7 of this Form.
Item 12: Disclosure of Proxy Voting Policies and Procedures for Closed-End Management Investment Companies.
Not applicable.
Item 13: Portfolio Managers of Closed-End Management Investment Companies.
Not applicable.
Item 14: Purchases of Equity Securities by Closed-End Management Investment Company and Affiliated Purchasers.
Not applicable.
Item 15: Submission of Matters to a Vote of Security Holders.
Not applicable.
Item 16: Controls and Procedures.
(a) Based on their evaluation of Registrant’s disclosure controls and procedures, as of a date within 90 days of the filing date, Registrant’s Principal Executive Officer, Omar Aguilar and Registrant’s Principal Financial Officer, Dana Smith, have concluded that Registrant’s disclosure controls and procedures are: (i) reasonably designed to ensure that information required to be disclosed in this report is appropriately communicated to Registrant’s officers to allow timely decisions regarding disclosures required in this report; (ii) reasonably designed to ensure that information required to be disclosed in this report is recorded, processed, summarized and reported in a timely manner; and (iii) are effective in achieving the goals described in (i) and (ii) above.
(b) During the period covered by this report, there have been no changes in Registrant’s internal control over financial reporting that the above officers believe to have materially affected, or to be reasonably likely to materially affect, Registrant’s internal control over financial reporting.
Item 17: Disclosure of Securities Lending Activities for Closed-End Management Investment Companies.
Not applicable.
Item 18: Recovery of Erroneously Awarded Compensation.
(a) Not applicable.
(b) Not applicable
Pursuant to the requirements of the Securities Exchange Act of 1934 and the Investment Company Act of 1940, the registrant has duly caused this report to be signed on its behalf by the undersigned, thereunto duly authorized.
(Registrant) Schwab Capital Trust
|
|
|
| By: |
|
/s/ Omar Aguilar |
|
|
Omar Aguilar |
|
|
Principal Executive Officer (Chief Executive Officer) |
|
|
| Date: |
|
December 16, 2025 |
Pursuant to the requirements of the Securities Exchange Act of 1934 and the Investment Company Act of 1940, this report has been signed below by the following persons on behalf of the registrant and in the capacities and on the dates indicated.
|
|
|
| By: |
|
/s/ Omar Aguilar |
|
|
Omar Aguilar |
|
|
Principal Executive Officer (Chief Executive Officer) |
|
|
| Date: |
|
December 16, 2025 |
|
|
|
| By: |
|
/s/ Dana Smith |
|
|
Dana Smith |
|
|
Principal Financial Officer (Chief Financial Officer) |
|
|
| Date: |
|
December 16, 2025 |
Code of Business Conduct and Ethics for Principal Executive and Senior Financial Officers (F/B)
Schwab Funds:
The Charles Schwab Family of Funds
Laudus Trust
Schwab Investments
Schwab Capital Trust
Schwab Annuity Portfolios
Schwab ETFs:
Schwab Strategic Trust
(the
“Funds” or the “Trusts”)
Code of Business Conduct and Ethics for Principal Executive and Senior Financial Officers (F/B)
Category: Code of Ethics and Personal Obligations
|
|
|
| Policy Type |
|
Fund / Board |
| Regulatory Authority, Rule(s) and
Regulation(s) |
|
This Code constitutes the sole code of ethics adopted by the Funds for purposes of Section 406 of the
Sarbanes-Oxley Act of 2002 and the rules and forms applicable to registered investment companies thereunder. Insofar as other policies or procedures of the Funds, CSIM, CSIM’s affiliates, The Charles
Schwab Corporation or other Fund service providers govern or purport to govern the behavior or activities of an Officer who is subject to this Code, they are superseded by this Code to the extent that they conflict with the provisions of this Code.
CSIM’s, the Funds’ and Charles Schwab & Co. Inc.’s (as distributor) joint code of ethics under Rule 17j-1 pursuant to the 1940 Act and Rule
204A-1 of the Advisers Act, and CSIM’s, CSIM’s affiliates’, and The Charles Schwab Corporation’s policies and procedures set forth in their respective compliance manuals and elsewhere
are separate requirements applying to the Officers and are not part of this Code. |
|
|
| Associated Policies and
Standards |
|
CSIM/Fund Policy and Procedures
Charles Schwab Corporation (CSC) Policies and Standards
|
|
|
| Approval Date |
|
December 9, 2025 |
Note: CSIM and Fund Policies and Procedures may have additional or more restrictive requirements than those contained in CSC
Policies and Standards.
The information contained herein is the
property of The Charles Schwab Corporation (CSC) and is not for distribution outside of CSC without prior permission of the Chief Compliance Officer of the Funds or CSIM, as applicable, or their designee.
1
Code of Business Conduct and Ethics for Principal Executive and Senior Financial Officers (F/B)
A. Overview: Policy Purpose and Objectives
I. SCOPE
This Code of Business Conduct and
Ethics (the “Code”) for the Schwab Funds and Schwab ETFs (the “Funds”) covers the Principal Executive Officer and Principal Financial Officer and any other officers who serve a similar function (each an “Officer”)
of all of the investment companies within the Funds’ complex and applies to their service to the Funds.
II. INTRODUCTION
The Funds are committed to the highest standards of ethical conduct. The Code consists of an outline of policies regarding conduct pertaining to legal
compliance, personal conflicts of interest, confidentiality and privacy, and certain business practices. You are responsible for reviewing the Code and for acting in compliance with the Code in your daily activities.
The Code is not exhaustive; it provides guidance for carrying out your responsibilities on behalf of the Funds and observing the highest standards of ethical
conduct. Because the Code does not address every possible situation that may arise, you are responsible for exercising good judgment, applying ethical principles, and raising questions when in doubt. Your integrity and good judgment reflect on the
Funds’ brand and reputation, and are the foundation of trust for our shareholder and business relationships.
If you are unsure of what to do in any
situation or how to interpret the provisions of the Code, seek guidance before you act. Use the Funds’ resources, including the Chief Legal Officer or the Chief Compliance Officer. If you feel that it is not appropriate to discuss a matter
with the Chief Legal Officer or the Chief Compliance Officer, you may contact the Ombudsperson for The Charles Schwab Corporation.
CONTACT INFORMATION
|
|
|
|
|
| Title |
|
Name |
|
Phone Number |
| Chief Compliance Officer |
|
Mark Hunter |
|
512-682-7627 |
|
|
|
| Chief Legal Officer of Schwab Funds and Schwab
ETFs |
|
Catherine MacGregor |
|
415-667-0650 |
|
|
|
| The Charles Schwab Corporation
Ombudsperson |
|
Amy Pimentel, Esq, McDermott Will &
Schulte LLP |
|
617-535-3948 |
B. Procedures and Responsibilities
I. POLICIES
In executing your
responsibilities on behalf of the Funds, your conduct should reflect positively on the Funds. A strong personal sense of ethics should always play a significant role in guiding you towards a proper course of action. The appearance of impropriety can
be as harmful to the Funds’ reputation as improper conduct.
The information contained herein is the
property of The Charles Schwab Corporation (CSC) and is not for distribution outside of CSC without prior permission of the Chief Compliance Officer of the Funds or CSIM, as applicable, or their designee.
2
Code of Business Conduct and Ethics for Principal Executive and Senior Financial Officers (F/B)
The Funds’ business is subject to various laws, rules and regulations, including federal securities and
state and local laws. Although you are not expected to know the details of the myriad of laws governing our business, you are expected to be familiar with and comply with policies and procedures that apply to your business unit and complete any
required training that applies to you (e.g., training regarding privacy or anti-money laundering).
A. PERSONAL CONFLICTS
OF INTEREST
It is important that you do not place yourself in a position that would cloud your judgment in carrying out the
business affairs of the Funds. A “personal conflict of interest” occurs when your private interest interferes in any way — or even appears to interfere — with the interests of the Funds. You have a duty to report any material
transaction or relationship to the Chief Compliance Officer that reasonably could be expected to be or to create a conflict of interest with the Funds.
Officers, in addition to their obligation to the Funds, may also be an officer or employee of CSIM or a CSIM affiliate. As a result, this Code recognizes that
the Officers will, in the normal course of their duties (whether formally for the Funds, for CSIM, for CSIM’s affiliate or for more than one entity), be involved in establishing policies and implementing decisions that will have different
effects on CSIM, CSIM’s affiliates and the Funds. The participation of the Officers in such activities is inherent in the contractual relationship between the Funds and CSIM and is consistent with the performance by the Officers of their
duties as officers of the Funds. Thus, if performed in conformity with the provisions of the Investment Company Act of 1940, as amended (the “1940 Act”), and the Investment Advisers Act of 1940, as amended (the “Advisers
Act”), such activities will be deemed under the Code to have been handled ethically. In addition, it is recognized by the Trustees that the Officers may also be officers or employees of one or more other investment companies covered by this or
other codes.
B. INSIDE INFORMATION
Do not trade on inside information or disclose inside information to anyone except those who have a need to know it in order to fulfill their responsibilities
for the Funds and in accordance with the Funds’ policy. This applies to information regarding the Funds, The Charles Schwab Corporation and its subsidiaries, and any other publicly traded company.
Generally, material information is any information that an investor would likely consider important in deciding whether to buy, sell or hold securities or
that could affect the market price of the securities. Examples include actual or estimated financial results or change in dividends; significant discoveries or product developments; possible mergers, acquisitions or divestitures; major changes in
business strategies; obtaining or losing significant contracts; and threatened major litigation or related developments. If you have or receive information and are unsure whether it is within the definition of inside information or whether its
release might be contrary to a fiduciary or other obligation, contact the Chief Compliance Officer prior to disclosing any such information.
You must not
use the Funds’ non-public holdings or transactions information in any way to influence your trades or the trades of other shareholders, including those of other employees, officers and directors. Trading
ahead of shareholder or the Funds’ transactions (frontrunning) and following shareholder or the Funds’ transactions (piggybacking or shadowing) is prohibited.
The information contained herein is the
property of The Charles Schwab Corporation (CSC) and is not for distribution outside of CSC without prior permission of the Chief Compliance Officer of the Funds or CSIM, as applicable, or their designee.
3
Code of Business Conduct and Ethics for Principal Executive and Senior Financial Officers (F/B)
C. ACCEPTANCE OF GIFTS OR
ENTERTAINMENT
You must not accept gifts or entertainment from shareholders, vendors, suppliers, competitors or other employees where they
present a conflict of interest or create the appearance of impropriety. You must adhere to the CSIM and The Charles Schwab Corporation policies regarding gifts and entertainment, and apply the more stringent restrictions. In addition, if you are an
employee of another CSIM affiliate you must also adhere to that affiliate’s policies regarding gifts and entertainment, and apply the more stringent restrictions.
D. CONFIDENTIALITY OF INFORMATION AND PRIVACY
Information concerning the identity of the Funds’ underlying shareholders and their transactions and accounts is confidential. Such information may not
be disclosed to persons working on behalf of the Funds except as they may need to know it in order to fulfill their responsibilities to the Funds. You may not disclose such information to anyone or any firm outside the Funds unless (i) the
outside firm needs to know the information in order to perform services for the Funds and is bound to maintain its confidentiality; (ii) when the shareholder has consented or been given an opportunity to request that the information not be
shared; (iii) as required by law; or (iv) as authorized by the Chief Legal Officer or Chief Compliance Officer.
The Funds are committed to
safeguarding their customers’ privacy. We do not sell any personally identifiable customer information. Sharing of such information with third parties is limited to situations related to the processing and servicing of customer accounts, and
to specifically delineated exceptions in the federal privacy law. We share information with our affiliates to the extent permitted by federal law. You must be familiar with the procedural and systemic safeguards we maintain to protect this
information.
You have the responsibility to safeguard the Funds’ proprietary information. Proprietary information includes intellectual property
(copyrights, trademarks or patents or trade secrets), particular know-how (business or organizational designs, or business, marketing or service plans or ideas) and sensitive information about the Funds (databases, records, salary information or
unpublished financial reports).
E. PROTECTION AND USE OF FUNDS’
ASSETS
You are obligated to protect the Funds’ assets and ensure their efficient use. Theft, carelessness and waste have a direct
impact on the Funds. The Funds’ equipment should not be used for non-Funds’ business, though incidental personal use may be permitted.
F. FINANCIAL DISCLOSURES
The
Funds are committed to providing full, fair, accurate, timely and understandable disclosure in reports and documents that the Funds file with, or submit to, the Securities and Exchange Commission and other regulatory agencies and in other public
communications made by the Funds. You are required to comply with the Funds’ policies and procedures to provide such full, fair, accurate, timely and understandable disclosure.
G. CONDUCT OF AUDITS
Neither you nor any other person acting under your direction shall directly or indirectly take any action to fraudulently influence, coerce, manipulate, or
mislead any independent public or certified public accountant engaged in the performance of an audit or review of the Funds’ financial statements.
The information contained herein is the
property of The Charles Schwab Corporation (CSC) and is not for distribution outside of CSC without prior permission of the Chief Compliance Officer of the Funds or CSIM, as applicable, or their designee.
4
Code of Business Conduct and Ethics for Principal Executive and Senior Financial Officers (F/B)
Types of conduct that constitute improper influence include, but are not limited to, directly or indirectly:
| |
• |
|
Offering or paying bribes or other financial incentives, including offering future employment or contracts for non-audit services |
| |
• |
|
Providing an auditor with inaccurate or misleading legal analysis |
| |
• |
|
Threatening to cancel or canceling existing non-audit or audit
engagements if the auditor objects to the issuer’s accounting |
| |
• |
|
Seeking to have a partner removed from the audit engagement because the partner objects to |
| |
• |
|
Making physical threats |
H. SALES PRACTICES
If you
transact business for shareholders, you are required to know and observe the Funds’ specific policies and procedures for shareholder sales and transactions, such as the content and use of sales materials, documentation for transactions,
quotations and suitability. Likewise, if you transact business with third parties (such as vendors or suppliers), you will be required to know and observe the Funds’ policies and procedures for such transactions, such as marketing policies,
procedures for performing due diligence on third parties, and obtaining proper authorizations for any agreements. You must be familiar with any enumerated policies and procedures governing your sales activities and use good judgment in complying
with them.
I. COMPETITION AND FAIR DEALING
We operate our business fairly and honestly. We seek competitive advantage through performance and never through unethical or illegal business practices. It is
our policy to comply with anti-trust laws. These laws are complex and not easily summarized, but at a minimum require that there be no agreement or understanding between the Funds and their competitors that affect prices, terms or conditions of sale
or that unreasonably restrain full and fair competition. You must always respect the rights of and deal fairly with the Funds’ shareholders and competitors. You must never take unfair advantage of anyone through manipulation, concealment,
abuse of privileged information, misrepresentation of material facts, or any other unfair dealing practice.
J. PROHIBITION
OF BRIBERY AND KICKBACKS
Our policies prohibit bribery or kickbacks of any kind and to anyone
in the conduct of our business. The U.S. government has a number of laws and regulations applicable specifically to business gratuities that may be offered to or accepted by U.S. and foreign government personnel. The promise, offer or delivery to an
official or employee of the U.S. government or an official, employee or candidate of a foreign government of a gift, favor, payment or other gratuity in violation of these rules would not only violate the Funds’ policy but could also be a
criminal offense. Similarly, federal law, as well as the laws of many states, prohibits engaging in “commercial bribery.” Commercial bribery involves soliciting, demanding or agreeing to accept anything of value from any person intending
to influence or be rewarded in connection with any business or transaction, and prohibits all such behavior, for example, with respect to vendors, competitors, shareholders, and government employees.
K. WAIVERS
Waivers of the Code may be made only
by the Trustees and will be promptly disclosed publicly as required by law.
The information contained herein is the
property of The Charles Schwab Corporation (CSC) and is not for distribution outside of CSC without prior permission of the Chief Compliance Officer of the Funds or CSIM, as applicable, or their designee.
5
Code of Business Conduct and Ethics for Principal Executive and Senior Financial Officers (F/B)
L. CODE AMENDMENTS
This Code may not be amended except in written form, which is specifically approved or ratified by a majority of the Trustees including a majority of the
independent Trustees. Any amendments will, to the extent required, be disclosed in accordance with law.
M. CONFIDENTIALITY
All reports and records prepared or maintained pursuant to this Code will be considered confidential and shall be maintained and protected accordingly. Except
as otherwise required by law or this Code, such matters shall not be disclosed to anyone other than the Trustees, CSIM, The Charles Schwab Corporation and their respective counsel. However, nothing contained in this Code or in any applicable
employment or severance agreement(s) should be interpreted as prohibiting employees or former employees from voluntarily communicating with the Securities and Exchange Commission or other authorities regarding possible violations of law or from
recovering a whistleblower award.
II. ESCALATION AND PROHIBITION AGAINST
RETALIATION
If you know of, or reasonably believe there is, a violation of this Code, you must report that information immediately to
the Funds’ Chief Compliance Officer. Depending on the possible violation, you may also be required to report it pursuant to The Charles Schwab Corporation Code of Business Conduct and CSIM and/or CSIM’s affiliate’s compliance
policies and procedures. You should not conduct preliminary investigations unless authorized to do so by the Compliance Department.
No Officer will be
retaliated against for making a good faith complaint or for bringing inappropriate conduct to the attention of the Funds’ personnel, Ombudsperson of The Charles Schwab Corporation or Trustees, for assisting another employee or applicant in
making a good faith report, for cooperating in an investigation, or for filing an administrative claim with a state or federal governmental agency. Any Officer who in good faith raises an issue regarding a possible violation of law, regulation or
company policy or any suspected illegal or unethical behavior will be protected from retaliation.
If you have violated the Code, however, making a report
will not protect you from the consequences of your actions. You can be subject to discipline up to and including termination of employment if you violate the Code or fail to report violations that come to your attention.
Any employee who engages in retaliatory conduct in violation of our policies will be subject to disciplinary action, up to and including termination of
employment. If you reasonably believe retaliatory conduct has occurred, you must report such conduct to the Funds’ Chief Compliance Officer.
III. PROCEDURES
A.
OFFICERS
| |
• |
|
Read and be familiar with conduct rules outlined in the Code, and periodically review them.
|
| |
• |
|
Affirm in writing to the Trustees that you have received, read and understand the Code. |
| |
• |
|
Annually affirm to the Trustees that you have complied with the requirements of the Code. |
| |
• |
|
Comply with the conduct standards outlined in this Code in all dealings and actions, including those with
shareholders, the public, and vendors. |
| |
• |
|
Report any material transaction or relationship to the Chief Compliance Officer that reasonably could be expected
to be or to create a personal conflict of interest with the Funds. |
The information contained herein is the
property of The Charles Schwab Corporation (CSC) and is not for distribution outside of CSC without prior permission of the Chief Compliance Officer of the Funds or CSIM, as applicable, or their designee.
6
Code of Business Conduct and Ethics for Principal Executive and Senior Financial Officers (F/B)
| |
• |
|
Report in a timely manner to the Chief Compliance Officer any conduct that may constitute a violation of the
Code, the Funds’ policies, or laws, rules and regulations. |
| |
• |
|
Raise questions or concerns about conduct issues with your supervisor, the Chief Legal Officer or Chief
Compliance Officer, and seek advice when in doubt. |
| |
• |
|
Cooperate with management during fact-finding investigations and comply with any confidentiality rules imposed.
|
B. CHIEF COMPLIANCE OFFICER
| |
• |
|
The Chief Compliance Officer, upon becoming notified of potential violation of this Code, will conduct,
facilitate or delegate a review of the matter and will report to the Chairperson of the affected Fund’s Audit, Compliance and Valuation Committee any violations of this Code that he or she believes to be material. |
| |
• |
|
The Chief Compliance Officer, upon becoming notified of a personal conflict of interest between an Officer and
the Funds that the Chief Compliance Officer deems to be material, will report the issue to the Chairperson of the affected Fund’s Audit, Compliance and Valuation Committee and will work with the Chief Legal Officer and other appropriate
parties to ensure that any required disclosures are made. |
C. TRUSTEES
| |
• |
|
The Board of Trustees will consider appropriate action to address any violations of the Code that they deem to be
material, which may include review of and appropriate modification to applicable policies and procedures, notification to appropriate personnel of CSIM or its board of directors, notification to appropriate personnel of The Charles Schwab
Corporation or its board of directors, or a recommendation to dismiss the Officer. |
C. Recordkeeping Requirements
You must be familiar with the Funds’ record retention policies and always retain or destroy records according to them. In the event of litigation,
governmental investigation or the threat of such action, you should consult the Chief Legal Officer or the Chief Compliance Officer regarding record retention.
The Funds’ books, records and accounts must conform both to applicable legal requirements and to the Funds’ internal controls and policies.
Unrecorded or “off-the-books” funds or assets are prohibited
unless permitted by applicable law or regulation. Business records must not contain exaggeration, derogatory remarks, guesswork, or inappropriate characterizations of people and companies. This applies equally to email, internal memoranda, formal
reports, and all other forms of business records.
|
|
|
| Version History |
|
Adopted Schwab Funds: June 15, 2011; Schwab ETFs: August 4, 2011.
Revised August 8, 2013; December 11, 2015; August 25, 2016; December 11, 2017; September 25, 2018 (no changes); December 12,
2019; November 3, 2020; October 7, 2021; December 13, 2022; December 11, 2023; December 19, 2024; December 9, 2025 |
The information contained herein is the
property of The Charles Schwab Corporation (CSC) and is not for distribution outside of CSC without prior permission of the Chief Compliance Officer of the Funds or CSIM, as applicable, or their designee.
7
CERTIFICATIONS
I, Omar Aguilar, certify that:
1. I have reviewed this report
on Form N-CSR of Schwab Capital Trust;
2. Based on my knowledge, this report does not contain any untrue
statement of a material fact or omit to state a material fact necessary to make the statements made, in light of the circumstances under which such statements were made, not misleading with respect to the period covered by this report;
3. Based on my knowledge, the financial statements, and other financial information included in this report, fairly present in all material respects the
financial condition, results of operations, changes in net assets, and cash flows (if the financial statements are required to include a statement of cash flows) of the registrant as of, and for, the periods presented in this report;
4. The registrant’s other certifying officer(s) and I are responsible for establishing and maintaining disclosure controls and procedures (as defined in
Rule 30a-3(c) under the Investment Company Act of 1940) and internal control over financial reporting (as defined in Rule 30a-3(d) under the Investment Company Act of
1940) for the registrant and have:
a) Designed such disclosure controls and procedures, or caused such disclosure controls and procedures to be designed
under our supervision, to ensure that material information relating to the registrant, including its consolidated subsidiaries, is made known to us by others within those entities, particularly during the period in which this report is being
prepared;
b) Designed such internal control over financial reporting, or caused such internal control over financial reporting to be designed under our
supervision, to provide reasonable assurance regarding the reliability of financial reporting and the preparation of financial statements for external purposes in accordance with generally accepted accounting principles;
c) Evaluated the effectiveness of the registrant’s disclosure controls and procedures and presented in this report our conclusions about the
effectiveness of the disclosure controls and procedures, as of a date within 90 days prior to the filing date of this report based on such evaluation; and
d) Disclosed in this report any change in the registrant’s internal control over financial reporting that occurred during the period covered by this
report that has materially affected, or is reasonably likely to materially affect, the registrant’s internal control over financial reporting; and
5. The registrant’s other certifying officer(s) and I have disclosed to the registrant’s auditors and the audit committee of the
registrant’s Board of Trustees (or persons performing the equivalent functions):
a) All significant deficiencies and material weaknesses in the
design or operation of internal control over financial reporting which are reasonably likely to adversely affect the registrant’s ability to record, process, summarize, and report financial information; and
b) Any fraud, whether or not material, that involves management or other employees who have a significant role in the registrant’s internal control over
financial reporting.
|
|
|
|
|
| Date: December 16, 2025 |
|
|
|
/s/ Omar Aguilar |
|
|
|
|
Omar Aguilar |
|
|
|
|
Principal Executive Officer (Chief Executive Officer) |
CERTIFICATIONS
I, Dana Smith, certify that:
1. I have reviewed this report on
Form N-CSR of Schwab Capital Trust;
2. Based on my knowledge, this report does not contain any untrue statement
of a material fact or omit to state a material fact necessary to make the statements made, in light of the circumstances under which such statements were made, not misleading with respect to the period covered by this report;
3. Based on my knowledge, the financial statements, and other financial information included in this report, fairly present in all material respects the
financial condition, results of operations, changes in net assets, and cash flows (if the financial statements are required to include a statement of cash flows) of the registrant as of, and for, the periods presented in this report;
4. The registrant’s other certifying officer and I are responsible for establishing and maintaining disclosure controls and procedures (as defined in
Rule 30a-3(c) under the Investment Company Act of 1940) and internal control over financial reporting (as defined in Rule 30a-3(d) under the Investment Company Act of
1940) for the registrant and have:
a) Designed such disclosure controls and procedures, or caused such disclosure controls and procedures to be designed
under our supervision, to ensure that material information relating to the registrant, including its consolidated subsidiaries, is made known to us by others within those entities, particularly during the period in which this report is being
prepared;
b) Designed such internal control over financial reporting, or caused such internal control over financial reporting to be designed under our
supervision, to provide reasonable assurance regarding the reliability of financial reporting and the preparation of financial statements for external purposes in accordance with generally accepted accounting principles;
c) Evaluated the effectiveness of the registrant’s disclosure controls and procedures and presented in this report our conclusions about the
effectiveness of the disclosure controls and procedures, as of a date within 90 days prior to the filing date of this report based on such evaluation; and
d) Disclosed in this report any change in the registrant’s internal control over financial reporting that occurred during the period covered by this
report that has materially affected, or is reasonably likely to materially affect, the registrant’s internal control over financial reporting; and
5. The registrant’s other certifying officer(s) and I have disclosed to the registrant’s auditors and the audit committee of the
registrant’s Board of Trustees (or persons performing the equivalent functions):
a) All significant deficiencies and material weaknesses in the
design or operation of internal control over financial reporting which are reasonably likely to adversely affect the registrant’s ability to record, process, summarize, and report financial information; and
b) Any fraud, whether or not material, that involves management or other employees who have a significant role in the registrant’s internal control over
financial reporting.
|
|
|
|
|
| Date: December 16, 2025 |
|
|
|
/s/ Dana Smith |
|
|
|
|
Dana Smith |
|
|
|
|
Principal Financial Officer (Chief Financial Officer) |
CERTIFICATION PURSUANT TO 18 U.S.C. SECTION 1350,
AS ADOPTED PURSUANT TO SECTION 906 OF THE
SARBANES-OXLEY ACT OF 2002
In connection
with the Annual Report for Schwab Capital Trust (the “Funds”) on Form N-CSR for the period ended October 31, 2025 (“periodic report”), each of the undersigned, being the Principal
Executive Officer and Principal Financial Officer, respectively, hereby certifies, pursuant to 18 U.S.C. section 1350, as adopted pursuant to section 906 of the Sarbanes-Oxley Act of 2002, that to the best of my knowledge:
(1) The periodic report fully complies with the requirements of section 13(a) or 15(d) of the Securities Exchange Act of 1934; and
(2) The information contained in the periodic report fairly presents, in all material respects, the financial condition and results of operations of the Funds
for the period presented therein.
|
|
|
|
|
| /s/ Omar Aguilar |
|
|
|
Date: December 16, 2025 |
| Omar Aguilar |
|
|
|
|
| Principal Executive Officer (Chief Executive Officer) |
|
|
|
|
|
|
|
|
|
| /s/ Dana Smith |
|
|
|
Date: December 16, 2025 |
| Dana Smith |
|
|
|
|
| Principal Financial Officer (Chief Financial Officer) |
|
|
|
|
This certification is being furnished to the Securities and Exchange Commission solely pursuant to 18 U.S.C. section 1350 and
is not being filed as part of the Form N-CSR with the Commission.
v3.25.4
| X |
- DefinitionBoolean flag that is true when the XBRL content amends previously-filed or accepted submission.
| Name: |
dei_AmendmentFlag |
| Namespace Prefix: |
dei_ |
| Data Type: |
xbrli:booleanItemType |
| Balance Type: |
na |
| Period Type: |
duration |
|
| X |
- DefinitionFor the EDGAR submission types of Form 8-K: the date of the report, the date of the earliest event reported; for the EDGAR submission types of Form N-1A: the filing date; for all other submission types: the end of the reporting or transition period. The format of the date is YYYY-MM-DD.
| Name: |
dei_DocumentPeriodEndDate |
| Namespace Prefix: |
dei_ |
| Data Type: |
xbrli:dateItemType |
| Balance Type: |
na |
| Period Type: |
duration |
|
| X |
- DefinitionThe type of document being provided (such as 10-K, 10-Q, 485BPOS, etc). The document type is limited to the same value as the supporting SEC submission type, or the word 'Other'.
| Name: |
dei_DocumentType |
| Namespace Prefix: |
dei_ |
| Data Type: |
dei:submissionTypeItemType |
| Balance Type: |
na |
| Period Type: |
duration |
|
| X |
- DefinitionA unique 10-digit SEC-issued value to identify entities that have filed disclosures with the SEC. It is commonly abbreviated as CIK. Reference 1: http://www.xbrl.org/2003/role/presentationRef
-Publisher SEC
-Name Exchange Act
-Number 240
-Section 12
-Subsection b-2
| Name: |
dei_EntityCentralIndexKey |
| Namespace Prefix: |
dei_ |
| Data Type: |
dei:centralIndexKeyItemType |
| Balance Type: |
na |
| Period Type: |
duration |
|
| X |
- DefinitionOne of: N-1A (Mutual Fund), N-1 (Open-End Separate Account with No Variable Annuities), N-2 (Closed-End Investment Company), N-3 (Separate Account Registered as Open-End Management Investment Company), N-4 (Variable Annuity UIT Separate Account), N-5 (Small Business Investment Company), N-6 (Variable Life UIT Separate Account), S-1 or S-3 (Face Amount Certificate Company), S-6 (UIT, Non-Insurance Product). Reference 1: http://www.xbrl.org/2003/role/presentationRef
-Publisher SEC
-Name Regulation S-T
-Number 232
-Section 313
| Name: |
dei_EntityInvCompanyType |
| Namespace Prefix: |
dei_ |
| Data Type: |
dei:invCompanyType |
| Balance Type: |
na |
| Period Type: |
duration |
|
| X |
- DefinitionThe exact name of the entity filing the report as specified in its charter, which is required by forms filed with the SEC. Reference 1: http://www.xbrl.org/2003/role/presentationRef
-Publisher SEC
-Name Exchange Act
-Number 240
-Section 12
-Subsection b-2
| Name: |
dei_EntityRegistrantName |
| Namespace Prefix: |
dei_ |
| Data Type: |
xbrli:normalizedStringItemType |
| Balance Type: |
na |
| Period Type: |
duration |
|
| X |
- ReferencesReference 1: http://www.xbrl.org/2003/role/presentationRef
-Publisher SEC
-Name Form N-1A
-Section 27A
-Subsection d
-Paragraph 2
-Subparagraph instruction
-Clause 7
| Name: |
oef_ShareholderReportLineItems |
| Namespace Prefix: |
oef_ |
| Data Type: |
xbrli:stringItemType |
| Balance Type: |
na |
| Period Type: |
duration |
|
v3.25.4
Shareholder Report
|
12 Months Ended |
|
Oct. 31, 2025
USD ($)
Holding
|
|---|
| Shareholder Report [Line Items] |
|
|
| Document Type |
N-CSR
|
|
| Amendment Flag |
false
|
|
| Registrant Name |
Schwab Capital Trust
|
|
| Entity Central Index Key |
0000904333
|
|
| Entity Investment Company Type |
N-1A
|
|
| Document Period End Date |
Oct. 31, 2025
|
|
| Schwab International Opportunities Fund |
|
|
| Shareholder Report [Line Items] |
|
|
| Fund Name |
Schwab International Opportunities Fund
|
|
| Class Name |
Schwab International Opportunities Fund
|
|
| Trading Symbol |
SWMIX
|
|
| Annual or Semi-Annual Statement [Text Block] |
This annual shareholder report contains important information about the fund for the period of November 1, 2024, to October 31, 2025.
|
|
| Shareholder Report Annual or Semi-Annual |
annual shareholder report
|
|
| Additional Information [Text Block] |
You can find additional information about the fund at www.schwabassetmanagement.com/prospectus . You can also request this information by calling or by sending an email request to orders@mysummaryprospectus.com . |
|
| Additional Information Phone Number |
1-866-414-6349
|
|
| Additional Information Email |
orders@mysummaryprospectus.com
|
|
| Additional Information Website |
www.schwabassetmanagement.com/prospectus
|
|
| Expenses [Text Block] |
FUND COSTS FOR THE LAST year ENDED October 31, 2025 (BASED ON A HYPOTHETICAL $10,000 INVESTMENT)
|
|
|
Schwab International Opportunities Fund |
|
|
|
|
| Expenses Paid, Amount |
$ 94
|
|
| Expense Ratio, Percent |
0.84%
|
|
| Factors Affecting Performance [Text Block] |
MANAGEMENT’S DISCUSSION OF FUND PERFORMANCE For the 12-month period ended October 31, 2025, the fund returned 23.82%. The MSCI EAFE ® Index (Net) 1 the 12-month reporting period, all four of the fund’s active subadvisers posted positive returns. Columbia Management Investment Advisers, LLC (Columbia) outperformed its comparative index. As of October 31, 2025, Columbia managed 27.6% of the fund’s net assets. ■ Contributed to total return: ● Japanese securities, including Mitsubishi UFJ Financial Group, Inc. ● Securities from the Netherlands ■ Detracted from total return: ● Danish securities, including Class B holdings of Novo Nordisk AS ● Securities from Kazakhstan ■ From an individual security perspective: ● Class A holdings of Societe Generale SA were the largest contributor to total return (Columbia’s position was sold prior to the end of the reporting period) ● Class B holdings of Novo Nordisk AS were the largest detractor from total return American Century Investment Management, Inc. (American Century) outperformed its comparative index. As of October 31, 2025, American Century managed 19.5% of the fund’s net assets. ■ Contributed to total return: ● Japanese securities, including Ryohin Keikaku Co. Ltd. ■ Detracted from total return: ● Indian securities, including KEI Industries Ltd. (American Century’s position was sold prior to the end of the reporting period) ■ From an individual security perspective: ● Lundin Gold, Inc. was the largest contributor to total return ● NEXTDC Ltd. was the largest detractor from total return Baillie Gifford Overseas Limited (Baillie Gifford) outperformed its comparative index. As of October 31, 2025, Baillie Gifford managed 10.6% of the fund’s net assets. ■ Contributed to total return: ● Swedish securities, including Spotify Technology SA ● Securities from the United States ■ Detracted from total return: ● German securities, including Delivery Hero SE ■ From an individual security perspective: ● Spotify Technology SA was the largest contributor to total return ● Class B holdings of Meituan were the largest detractor from total return Harris Associates L.P. (Harris) underperformed its comparative index. As of October 31, 2025, Harris managed 8.7% of the fund’s net assets. ■ Detracted from total return: ● Indonesian securities, including Bank Mandiri Persero Tbk. PT ■ Contributed to total return: ● German securities, including Continental AG ■ From an individual security perspective: ● WPP PLC was the largest detractor from total return (Harris’ position was sold prior to the end of the reporting period) ● Continental AG was the largest contributor to total return Schwab Asset Management seeks to track the performance of the FTSE Developed ex US Quality Factor Index. The fund’s allocation to Schwab Asset Management performed in line with this objective, generally tracking its comparative index. As of October 31, 2025, Schwab Asset Management managed 33.6% of the fund’s net assets . ■ Contributed to total return: ● Securities from the United Kingdom, including Rolls-Royce Holdings PLC ● Securities from the Republic of Korea ■ Detracted from total return: ● Danish securities, including Class B holdings of Novo Nordisk AS Portfolio holdings may have changed since the report date . The net version of the index reflects reinvested dividends net of withholding taxes but reflects no deductions for expenses or other taxes. |
|
| Performance Past Does Not Indicate Future [Text] |
The performance data quoted represents past performance. Past performance does not guarantee future results.
|
|
| Line Graph [Table Text Block] |
Performance of Hypothetical $10,000 Investment (October 31, 2015 - October 31, 2025) All total returns on this page assume dividends and distributions were reinvested. Index figures do not include trading and management costs, which would lower performance. Indices are unmanaged and cannot be invested in directly. Performance results less than one year are not annualized. For index definitions, please see www.schwabassetmanagement.com/glossary. Fund expenses may have been partially absorbed by the investment adviser and its affiliates. Without these reductions, the fund’s returns would have been lower. These returns do not reflect the deduction of taxes that a shareholder would pay on fund distributions or the redemption of fund shares. The fund commenced operations on October 16, 1996 which became the Schwab International Opportunities Fund Investor Shares. The Investor Shares were consolidated into Select Shares on February 26, 2019. The performance presented is that of the former Select Shares which commenced operations on April 2, 2004. The fund’s performance relative to the index may be affected by fair-value pricing and timing differences in foreign exchange calculations. The net version of the index reflects reinvested dividends net of withholding taxes but reflects no deductions for expenses or other taxes. |
|
| Average Annual Return [Table Text Block] |
Average Annual Total Returns
|
|
|
|
Fund: Schwab International Opportunities Fund (04/02/2004) 1,2,3 |
|
|
|
|
|
|
| All total returns on this page assume dividends and distributions were reinvested. Index figures do not include trading and management costs, which would lower performance. Indices are unmanaged and cannot be invested in directly. Performance results less than one year are not annualized. For index definitions, please see www.schwabassetmanagement.com/glossary. Fund expenses may have been partially absorbed by the investment adviser and its affiliates. Without these reductions, the fund’s returns would have been lower. These returns do not reflect the deduction of taxes that a shareholder would pay on fund distributions or the redemption of fund shares. The fund commenced operations on October 16, 1996 which became the Schwab International Opportunities Fund Investor Shares. The Investor Shares were consolidated into Select Shares on February 26, 2019. The performance presented is that of the former Select Shares which commenced operations on April 2, 2004. The fund’s performance relative to the index may be affected by fair-value pricing and timing differences in foreign exchange calculations. The net version of the index reflects reinvested dividends net of withholding taxes but reflects no deductions for expenses or other taxes. |
|
| Performance Inception Date |
Apr. 02, 2004
|
|
| No Deduction of Taxes [Text Block] |
These returns do not reflect the deduction of taxes that a shareholder would pay on fund distributions or the redemption of fund shares.
|
|
| Updated Performance Information Location [Text Block] |
To obtain performance information current to the most recent month end, please visit www.schwabassetmanagement.com/prospectus |
|
| Net Assets |
$ 1,173,000,000
|
|
| Holdings Count | Holding |
1,024
|
|
| Advisory Fees Paid, Amount |
$ 6,848,933
|
|
| Investment Company, Portfolio Turnover |
69.00%
|
|
| Additional Fund Statistics [Text Block] |
|
|
|
|
|
|
Advisory Fees Paid by the Fund |
|
Weighted Average Market Cap (millions) |
|
Price/Earnings Ratio (P/E) |
|
|
|
Foreign Tax Paid and Passed Through |
|
Gross Income From Foreign Sources |
|
Qualified Dividend Income |
|
|
|
| Holdings [Text Block] |
Sector Weightings % of Investments 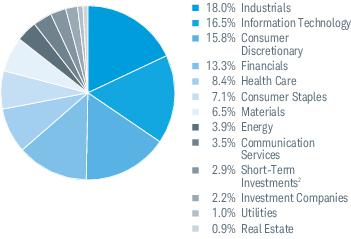 Top Equity Holdings % of Net 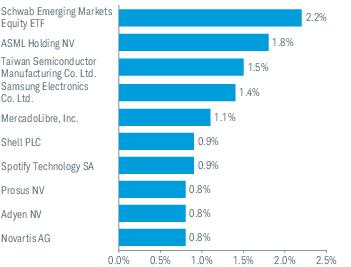 Top Country Weightings % of Investments 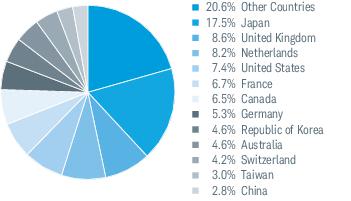 Portfolio holdings may have changed since the report date . The Sector/Industry classifications in this report use the Global Industry Classification Standard (GICS) which was developed by and is the exclusive property of MSCI Inc. (MSCI) and Standard & Poor’s (S&P). GICS is a service mark of MSCI and S&P and has been licensed for use by Charles Schwab & Co ., Inc. Includes the fund’s position(s) in money market mutual funds registered under the Investment Company Act of 1940, as . |
|
| Largest Holdings [Text Block] |
Top Equity Holdings % of Net Portfolio holdings may have changed since the report date . |
|
| Schwab Core Equity Fund |
|
|
| Shareholder Report [Line Items] |
|
|
| Fund Name |
Schwab Core Equity Fund
|
|
| Class Name |
Schwab Core Equity Fund
|
|
| Trading Symbol |
SWANX
|
|
| Annual or Semi-Annual Statement [Text Block] |
This annual shareholder report contains important information about the fund for the period of November 1, 2024, to October 31, 2025.
|
|
| Shareholder Report Annual or Semi-Annual |
annual shareholder report
|
|
| Additional Information [Text Block] |
You can find additional information about the fund at www.schwabassetmanagement.com/prospectus . You can also request this information by calling 1-866-414-6349 or by sending an email request to orders@mysummaryprospectus.com .
|
|
| Additional Information Phone Number |
1-866-414-6349
|
|
| Additional Information Email |
orders@mysummaryprospectus.com
|
|
| Additional Information Website |
www.schwabassetmanagement.com/prospectus
|
|
| Expenses [Text Block] |
FUND COSTS FOR THE LAST year ENDED October 31, 2025 (BASED ON A HYPOTHETICAL $10,000 INVESTMENT) |
|
| Expenses Paid, Amount |
$ 79
|
|
| Expense Ratio, Percent |
0.73%
|
|
| Factors Affecting Performance [Text Block] |
MANAGEMENT’S DISCUSSION OF FUND PERFORMANCE For the 12-month reporting period ended October 31, 2025, the fund returned 16.89%. The S&P 500 ® Index returned 21.45%. Top detractors from total return: ■ Health care sector securities, including UnitedHealth Group, Inc. ■ Financials sector securities Top contributors to total return: ■ Information technology sector securities, including NVIDIA Corp. ■ Communication services sector securities From an individual security perspective: ■ Fidelity National Information Services, Inc. was the largest detractor from total return ■ NVIDIA Corp. was the largest contributor to total return Portfolio holdings may have changed since the report date. |
|
| Performance Past Does Not Indicate Future [Text] |
The performance data quoted represents past performance. Past performance does not guarantee future results.
|
|
| Line Graph [Table Text Block] |
Performance of Hypothetical $10,000 Investment (October 31, 2015 - October 31, 2025) 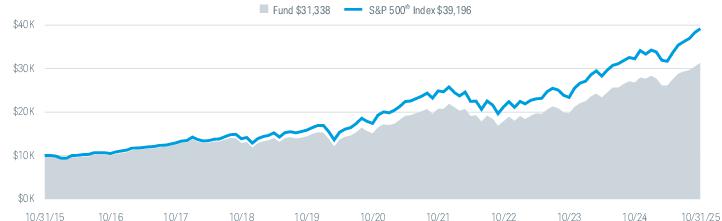 All total returns on this page assume dividends and distributions were reinvested. Index figures do not include trading and management costs, which would lower performance. Indices are unmanaged and cannot be invested in directly. Performance results less than one year are not annualized. For index definitions, please see www.schwabassetmanagement.com/glossary. Fund expenses may have been partially absorbed by the investment adviser and its affiliates. Without these reductions, the fund’s returns would have been lower. These returns do not reflect the deduction of taxes that a shareholder would pay on fund distributions or the redemption of fund shares. |
|
| Average Annual Return [Table Text Block] |
Average Annual Total Returns
|
|
|
|
Fund: Schwab Core Equity Fund (07/01/1996) 1 |
|
|
|
|
|
|
| All total returns on this page assume dividends and distributions were reinvested. Index figures do not include trading and management costs, which would lower performance. Indices are unmanaged and cannot be invested in directly. Performance results less than one year are not annualized. For index definitions, please see www.schwabassetmanagement.com/glossary. Fund expenses may have been partially absorbed by the investment adviser and its affiliates. Without these reductions, the fund’s returns would have been lower. These returns do not reflect the deduction of taxes that a shareholder would pay on fund distributions or the redemption of fund shares. |
|
| Performance Inception Date |
Jul. 01, 1996
|
|
| No Deduction of Taxes [Text Block] |
These returns do not reflect the deduction of taxes that a shareholder would pay on fund distributions or the redemption of fund shares.
|
|
| Updated Performance Information Location [Text Block] |
To obtain performance information current to the most recent month end, please visit www.schwabassetmanagement.com/prospectus |
|
| Net Assets |
$ 1,549,000,000
|
|
| Holdings Count | Holding |
54
|
|
| Advisory Fees Paid, Amount |
$ 6,903,533
|
|
| Investment Company, Portfolio Turnover |
20.00%
|
|
| Additional Fund Statistics [Text Block] |
|
|
|
|
|
|
Advisory Fees Paid by the Fund |
|
Weighted Average Market Cap (millions) |
|
Price/Earnings Ratio (P/E) |
|
|
|
Dividends Received Deduction |
|
Qualified Dividend Income |
|
Long Term Capital Gain Distribution |
|
|
|
| Holdings [Text Block] |
Sector Weightings % of Investments  Top Equity Holdings % of Net Assets 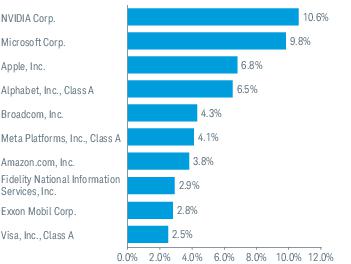 Portfolio holdings may have changed since the report date. The Sector/Industry classifications in this report use the Global Industry Classification Standard (GICS) which was developed by and is the exclusive property of MSCI Inc. (MSCI) and Standard & Poor’s (S&P). GICS is a service mark of MSCI and S&P and has been licensed for use by Charles Schwab & Co., Inc. Includes the fund’s position(s) in money market mutual funds registered under the Investment Company Act of 1940, as amended. |
|
| Largest Holdings [Text Block] |
Top Equity Holdings % of Net Assets Portfolio holdings may have changed since the report date. |
|
| Schwab Dividend Equity Fund |
|
|
| Shareholder Report [Line Items] |
|
|
| Fund Name |
Schwab Dividend Equity Fund
|
|
| Class Name |
Schwab Dividend Equity Fund
|
|
| Trading Symbol |
SWDSX
|
|
| Annual or Semi-Annual Statement [Text Block] |
This annual shareholder report contains important information about the fund for the period of November 1, 2024, to October 31, 2025.
|
|
| Shareholder Report Annual or Semi-Annual |
annual shareholder report
|
|
| Additional Information [Text Block] |
You can find additional information about the fund at www.schwabassetmanagement.com/prospectus . You can also request this information by calling or by sending an email request to orders@mysummaryprospectus.com .
|
|
| Additional Information Phone Number |
1-866-414-6349
|
|
| Additional Information Email |
orders@mysummaryprospectus.com
|
|
| Additional Information Website |
www.schwabassetmanagement.com/prospectus
|
|
| Expenses [Text Block] |
FUND COSTS FOR THE LAST year ENDED October 31, 2025 (BASED ON A HYPOTHETICAL $10,000 INVESTMENT)
|
|
|
Schwab Dividend Equity Fund |
|
|
|
|
| Expenses Paid, Amount |
$ 94
|
|
| Expense Ratio, Percent |
0.89%
|
|
| Factors Affecting Performance [Text Block] |
MANAGEMENT’S DISCUSSION OF FUND PERFORMANCE For the 12-month reporting period ended October 31, 2025, the fund returned 10.73%. The S&P 500 ® Index, which serves as the fund’s regulatory index and provides a broad measure of market performance, returned 21.45%. The Russell 1000 ® Value Index, which returned 11.15%, is the fund’s additional index, and is more representative of the fund’s investment universe than the regulatory index. ■ Lower yielding dividend stocks drove returns of the fund and the Russell 1000 ® Value Index with performance driven by advancements in artificial intelligence (AI) within the information technology and communications services sectors ■ As of October 31, 2025, the fund’s dividend yield was 2.36%, higher than the 1.92% dividend yield of the index. As of October 31, 2025, the fund’s 30-Day SEC yield was 1.62%. ■ Top detractors from total return: ● Health care sector securities, including UnitedHealth Group, Inc. (which was sold prior to the end of the reporting period) ● Real estate sector securities ■ Top contributors to total return: ● Information technology sector securities, including Broadcom, Inc. ● Financials sector securities ■ From an individual security perspective: ● UnitedHealth Group, Inc. was the largest detractor from total return ● Broadcom, Inc. was the largest contributor to total return Portfolio holdings may have changed since the report date. |
|
| Performance Past Does Not Indicate Future [Text] |
The performance data quoted represents past performance. Past performance does not guarantee future results.
|
|
| Line Graph [Table Text Block] |
Performance of Hypothetical $10,000 Investment (October 31, 2015 - October 31, 2025) All total returns on this page assume dividends and distributions were reinvested. Index figures do not include trading and management costs, which would lower performance. Indices are unmanaged and cannot be invested in directly. Performance results less than one year are not annualized. For index definitions, please see www.schwabassetmanagement.com/glossary. Fund expenses may have been partially absorbed by the investment adviser and its affiliates. Without these reductions, the fund’s returns would have been lower. These returns do not reflect the deduction of taxes that a shareholder would pay on fund distributions or the redemption of fund shares. The fund’s performance relative to the index may be affected by fair-value pricing and timing differences in foreign exchange calculations. The S&P 500 ® Index serves as the fund’s regulatory index and provides a broad measure of market performance. The Russell 1000 ® Value Index is the fund’s additional index and is more representative of the fund’s investment universe than the regulatory index. |
|
| Average Annual Return [Table Text Block] |
Average Annual Total Returns
|
|
|
|
Fund: Schwab Dividend Equity Fund (09/02/2003) 1,2 |
|
|
|
|
|
|
|
Russell 1000 ® Value Index |
|
|
| All total returns on this page assume dividends and distributions were reinvested. Index figures do not include trading and management costs, which would lower performance. Indices are unmanaged and cannot be invested in directly. Performance results less than one year are not annualized. For index definitions, please see www.schwabassetmanagement.com/glossary. Fund expenses may have been partially absorbed by the investment adviser and its affiliates. Without these reductions, the fund’s returns would have been lower. These returns do not reflect the deduction of taxes that a shareholder would pay on fund distributions or the redemption of fund shares. The fund’s performance relative to the index may be affected by fair-value pricing and timing differences in foreign exchange calculations. The S&P 500 ® Index serves as the fund’s regulatory index and provides a broad measure of market performance. The Russell 1000 ® Value Index is the fund’s additional index and is more representative of the fund’s investment universe than the regulatory index. |
|
| Performance Inception Date |
Sep. 02, 2003
|
|
| No Deduction of Taxes [Text Block] |
These returns do not reflect the deduction of taxes that a shareholder would pay on fund distributions or the redemption of fund shares.
|
|
| Updated Performance Information Location [Text Block] |
To obtain performance information current to the most recent month end, please visit www.schwabassetmanagement.com/prospectus |
|
| Net Assets |
$ 583,000,000
|
|
| Holdings Count | Holding |
63
|
|
| Advisory Fees Paid, Amount |
$ 3,413,302
|
|
| Investment Company, Portfolio Turnover |
8.00%
|
|
| Additional Fund Statistics [Text Block] |
|
|
|
|
|
|
Advisory Fees Paid by the Fund |
|
Weighted Average Market Cap (millions) |
|
Price/Earnings Ratio (P/E) |
|
|
|
|
|
Dividends Received Deduction |
|
Qualified Dividend Income |
|
Long Term Capital Gain Distribution |
|
|
|
| Holdings [Text Block] |
Sector Weightings % of Investments 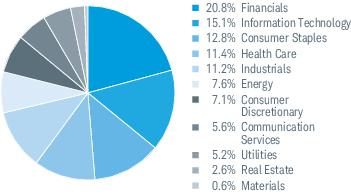 Top Equity Holdings % of Net Assets 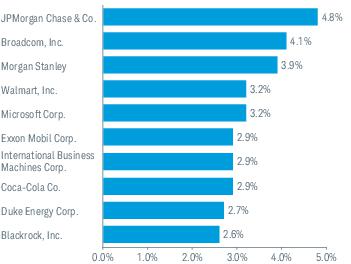 Portfolio holdings may have changed since the report date. The Sector/Industry classifications in this report use the Global Industry Classification Standard (GICS) which was developed by and is the exclusive property of MSCI Inc. (MSCI) and Standard & Poor’s (S&P). GICS is a s ervice mark of MSCI and S &P and has been licensed for use by Charles Schwab & Co., Inc. |
|
| Largest Holdings [Text Block] |
Top Equity Holdings % of Net Assets Portfolio holdings may have changed since the report date. |
|
| Schwab Large-Cap Growth Fund |
|
|
| Shareholder Report [Line Items] |
|
|
| Fund Name |
Schwab Large-Cap Growth Fund
|
|
| Class Name |
Schwab Large-Cap Growth Fund
|
|
| Trading Symbol |
SWLSX
|
|
| Annual or Semi-Annual Statement [Text Block] |
This annual shareholder report contains important information about the fund for the period of November 1, 2024, to October 31, 2025.
|
|
| Shareholder Report Annual or Semi-Annual |
annual shareholder report
|
|
| Additional Information [Text Block] |
You can find additional information about the fund at www.schwabassetmanagement.com/prospectus . You can also request this information by calling or by sending an email request to orders@mysummaryprospectus.com .
|
|
| Additional Information Phone Number |
1-866-414-6349
|
|
| Additional Information Email |
orders@mysummaryprospectus.com
|
|
| Additional Information Website |
www.schwabassetmanagement.com/prospectus
|
|
| Expenses [Text Block] |
FUND COSTS FOR THE LAST year ENDED October 31, 2025 (BASED ON A HYPOTHETICAL $10,000 INVESTMENT)
|
|
|
Schwab Large-Cap Growth Fund* |
|
| Expenses were reduced by a contractual fee waiver in effect for so long as th e investment adviser serves as adviser to the fund. |
|
| Expenses Paid, Amount |
$ 114
|
[1] |
| Expense Ratio, Percent |
0.99%
|
[1] |
| Factors Affecting Performance [Text Block] |
MANAGEMENT’S DISCUSSION OF FUND PERFORMANCE For the 12-month reporting period ended October 31, 2025, the fund returned 29.65%. The S&P 500 ® Index, which serves as the fund’s regulatory index and provides a broad measure of market performance, returned 21.45%. The Russell 1000 ® Growth Index, which returned 30.52%, is the fund’s additional index, and is more repr esentative of the fund’s investment universe than the regulatory index. ■ Large-cap growth stocks outperformed the broader market primarily driven by advancements in artificial intelligence (AI) within the information technology sector and strong sales and earnings growth of mega-capitalization companies ■ Top detractors from total return: ● Health care sector securities, including Thermo Fisher Scientific, Inc. (which was sold prior to the end of the reporting period) ● Energy sector securities ■ Top contributors to total return: ● Information technology sector securities, including NVIDIA Corp. ● Communication services sector securities ■ From an individual security perspective: ● Class A holdings of Accenture PLC were the largest detractor from total return ● NVIDIA Corp. was the largest contributor to total return Portfolio holdings may have changed since the report date. |
|
| Performance Past Does Not Indicate Future [Text] |
The performance data quoted represents past performance. Past performance does not guarantee future results.
|
|
| Line Graph [Table Text Block] |
Performance of Hypothetical $10,000 Investment (October 31, 2015 - October 31, 2025) All total returns on this page assume dividends and distributions were reinvested. Index figures do not include trading and management costs, which would lower performance. Indices are unmanaged and cannot be invested in directly. Performance results less than one year are not annualized. For index definitions, please see www.schwabassetmanagement.com/glossary. Fund expenses may have been partially absorbed by the investment adviser and its affiliates. Without these reductions, the fund’s returns would have been lower. These returns do not reflect the deduction of taxes that a shareholder would pay on fund distributions or the redemption of fund shares. The S&P 500 ® Index serves as the fund’s regulatory index and provides a broad measure of market performance. The Russell 1000 ® Growth Index is the fund’s additional index and is more representative of the fund’s investment universe than the regulatory index. |
|
| Average Annual Return [Table Text Block] |
Average Annual Total Returns
|
|
|
|
Fund: Schwab Large-Cap Growth Fund (10/03/2005) 1 |
|
|
|
|
|
|
|
Russell 1000 ® Growth Index |
|
|
| All total returns on this page assume dividends and distributions were reinvested. Index figures do not include trading and management costs, which would lower performance. Indices are unmanaged and cannot be invested in directly. Performance results less than one year are not annualized. For index definitions, please see www.schwabassetmanagement.com/glossary. Fund expenses may have been partially absorbed by the investment adviser and its affiliates. Without these reductions, the fund’s returns would have been lower. These returns do not reflect the deduction of taxes that a shareholder would pay on fund distributions or the redemption of fund shares. The S&P 500 ® Index serves as the fund’s regulatory index and provides a broad measure of market performance. The Russell 1000 ® Growth Index is the fund’s additional index and is more representative of the fund’s investment universe than the regulatory index. |
|
| Performance Inception Date |
Oct. 03, 2005
|
|
| No Deduction of Taxes [Text Block] |
These returns do not reflect the deduction of taxes that a shareholder would pay on fund distributions or the redemption of fund shares.
|
|
| Updated Performance Information Location [Text Block] |
To obtain performance information current to the most recent month end, please visit www.schwabassetmanagement.com/prospectus |
|
| Net Assets |
$ 617,000,000
|
|
| Holdings Count | Holding |
58
|
|
| Advisory Fees Paid, Amount |
$ 3,685,561
|
|
| Investment Company, Portfolio Turnover |
22.00%
|
|
| Additional Fund Statistics [Text Block] |
|
|
|
|
|
|
Advisory Fees Paid by the Fund |
|
Weighted Average Market Cap (millions) |
|
Price/Earnings Ratio (P/E) |
|
|
|
Long Term Capital Gain Distribution |
|
|
|
| Holdings [Text Block] |
Sector Weightings % of Investments 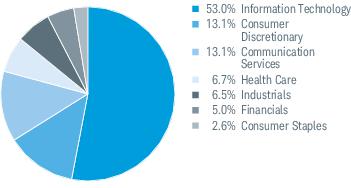 Top Equity Holdings % of Net Assets 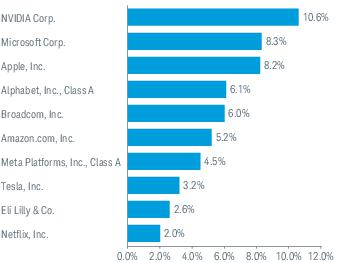 Portfolio holdings may have changed since the report date. The Sector/Industry classifications in this report use the Global Industry Classification Standard (GICS) which was developed by and is the exclusive property of MSCI Inc. (MSCI) and Standard & Poor’s (S&P). GICS is a service mark of MSCI and S&P and has been licensed for use b y Charle s Schwab & Co., Inc. |
|
| Largest Holdings [Text Block] |
Top Equity Holdings % of Net Assets Portfolio holdings may have changed since the report date. |
|
| Schwab Small-Cap Equity Fund |
|
|
| Shareholder Report [Line Items] |
|
|
| Fund Name |
Schwab Small-Cap Equity Fund
|
|
| Class Name |
Schwab Small-Cap Equity Fund
|
|
| Trading Symbol |
SWSCX
|
|
| Annual or Semi-Annual Statement [Text Block] |
This annual shareholder report contains important information about the fund for the period of November 1, 2024, to October 31, 2025.
|
|
| Shareholder Report Annual or Semi-Annual |
annual shareholder report
|
|
| Additional Information [Text Block] |
You can find additional information about the fund at www.schwabassetmanagement.com/prospectus . You can also request this information by calling or by sending an email request to orders@mysummaryprospectus.com .
|
|
| Additional Information Phone Number |
1-866-414-6349
|
|
| Additional Information Email |
orders@mysummaryprospectus.com
|
|
| Additional Information Website |
www.schwabassetmanagement.com/prospectus
|
|
| Expenses [Text Block] |
FUND COSTS FOR THE LAST year ENDED October 31, 2025 (BASED ON A HYPOTHETICAL $10,000 INVESTMENT)
|
|
|
Schwab Small-Cap Equity Fund |
|
|
|
|
| Expenses Paid, Amount |
$ 116
|
|
| Expense Ratio, Percent |
1.09%
|
|
| Factors Affecting Performance [Text Block] |
MANAGEMENT’S DISCUSSION OF FUND PERFORMANCE For the 12-month reporting period ended October 31, 2025, the fund returned 12.59%. The S&P 500 ® Index, which serves as the fund’s regulatory index and provides a broad measure of market performance, returned 21.45%. The Russell 2000 ® Index, which returned 14.41%, is the fund’s additional index, and is more representative of the fund’s investment universe than the regulatory index. ■ Small-cap stocks underperformed the broader market primarily driven by advancements in artificial intelligence (AI) within the information technology sector and strong sales and earnings growth of mega-capitalization companies ■ Top detractors from total return: ● Real estate sector securities, including Innovative Industrial Properties, Inc. (which was sold prior to the end of the reporting period) ● Communication services sector securities ■ Top contributors to total return: ● Industrials sector securities, including Class A holdings of Bloom Energy Corp. ● Health care sector securities ■ From an individual security perspective: ● Vaxcyte, Inc. was the largest detractor from total return (which was sold prior to the end of the reporting period) ● Class A holdings of Bloom Energy Corp. were the largest contributor to total return Portfolio holdings may have changed since the report date. |
|
| Performance Past Does Not Indicate Future [Text] |
The performance data quoted represents past performance. Past performance does not guarantee future results.
|
|
| Line Graph [Table Text Block] |
Performance of Hypothetical $10,000 Investment (October 31, 2015 - October 31, 2025) All total returns on this page assume dividends and distributions were reinvested. Index figures do not include trading and management costs, which would lower performance. Indices are unmanaged and cannot be invested in directly. Performance results less than one year are not annualized. For index definitions, please see www.schwabassetmanagement.com/glossary. Fund expenses may have been partially absorbed by the investment adviser and its affiliates. Without these reductions, the fund’s returns would have been lower. These returns do not reflect the deduction of taxes that a shareholder would pay on fund distributions or the redemption of fund shares. The S&P 500 ® Index serves as the fund’s regulatory index and provides a broad measure of market performance. The Russell 2000 ® Index is the fund’s additional index and is more representative of the fund’s investment universe than the regulatory index. |
|
| Average Annual Return [Table Text Block] |
Average Annual Total Returns
|
|
|
|
Fund: Schwab Small-Cap Equity Fund (07/01/2003) 1 |
|
|
|
|
|
|
|
|
|
|
| All total returns on this page assume dividends and distributions were reinvested. Index figures do not include trading and management costs, which would lower performance. Indices are unmanaged and cannot be invested in directly. Performance results less than one year are not annualized. For index definitions, please see www.schwabassetmanagement.com/glossary. Fund expenses may have been partially absorbed by the investment adviser and its affiliates. Without these reductions, the fund’s returns would have been lower. These returns do not reflect the deduction of taxes that a shareholder would pay on fund distributions or the redemption of fund shares. The S&P 500 ® Index serves as the fund’s regulatory index and provides a broad measure of market performance. The Russell 2000 ® Index is the fund’s additional index and is more representative of the fund’s investment universe than the regulatory index. |
|
| Performance Inception Date |
Jul. 01, 2003
|
|
| No Deduction of Taxes [Text Block] |
These returns do not reflect the deduction of taxes that a shareholder would pay on fund distributions or the redemption of fund shares.
|
|
| Updated Performance Information Location [Text Block] |
To obtain performance information current to the most recent month end, please visit www.schwabassetmanagement.com/prospectus |
|
| Net Assets |
$ 646,000,000
|
|
| Holdings Count | Holding |
340
|
|
| Advisory Fees Paid, Amount |
$ 4,957,681
|
|
| Investment Company, Portfolio Turnover |
108.00%
|
|
| Additional Fund Statistics [Text Block] |
|
|
|
|
|
|
Advisory Fees Paid by the Fund |
|
Weighted Average Market Cap (millions) |
|
Price/Earnings Ratio (P/E) |
|
|
|
Dividends Received Deduction |
|
Qualified Dividend Income |
|
Long Term Capital Gain Distribution |
|
Qualified Business Income (199A) |
|
|
|
| Holdings [Text Block] |
Sector Weightings % of Investments 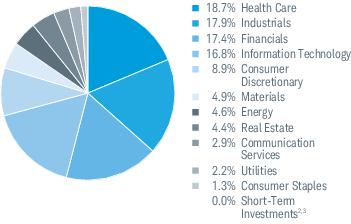 Top Equity Holdings % of Net Assets 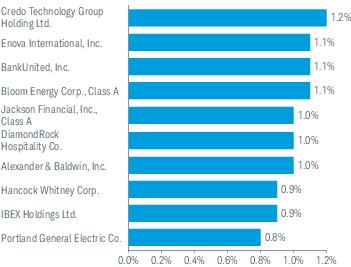 Portfolio holdings may have changed since the report date. The Sector/Industry classifications in this report use the Global Industry Classification Standard (GICS) which was developed by and is the exclusive property of MSCI Inc. (MSCI) and Standard & Poor’s (S&P). GICS is a service mark of MSCI and S&P and has been licensed for use by Charles Schwab & Co., Inc. Includes the fund’s position(s) in money market mutual funds registered under the Investment Company Act of 1940, as amended. |
|
| Largest Holdings [Text Block] |
Top Equity Holdings % of Net Assets Portfolio holdings may have changed since the report date. |
|
| Schwab Health Care Fund |
|
|
| Shareholder Report [Line Items] |
|
|
| Fund Name |
Schwab Health Care Fund
|
|
| Class Name |
Schwab Health Care Fund
|
|
| Trading Symbol |
SWHFX
|
|
| Annual or Semi-Annual Statement [Text Block] |
This annual shareholder report contains important information about the fund for the period of November 1, 2024, to October 31, 2025.
|
|
| Shareholder Report Annual or Semi-Annual |
annual shareholder report
|
|
| Additional Information [Text Block] |
You can find additional information about the fund at www.schwabassetmanagement.com/prospectus . You can also request this information by calling or by sending an email request to orders@mysummaryprospectus.com .
|
|
| Additional Information Phone Number |
1-866-414-6349
|
|
| Additional Information Email |
orders@mysummaryprospectus.com
|
|
| Additional Information Website |
www.schwabassetmanagement.com/prospectus
|
|
| Expenses [Text Block] |
FUND COSTS FOR THE LAST year ENDED October 31, 2025 (BASED ON A HYPOTHETICAL $10,000 INVESTMENT) |
|
| Expenses Paid, Amount |
$ 80
|
|
| Expense Ratio, Percent |
0.80%
|
|
| Factors Affecting Performance [Text Block] |
MANAGEMENT’S DISCUSSION OF FUND PERFORMANCE For the 12-month reporting period ended October 31, 2025, the fund returned 0.20%. The S&P 500 ® Index, which serves as the fund’s regulatory index and provides a broad measure of market performance, returned 21.45%. The Dow Jones Global Health Care Index, which returned 0.93%, is the fund’s additional index, and is more representative of the fund’s investment universe than the regulatory index. ■ Health care stocks underperformed the broader market as the health care sector is typically more defensive and has lower volatility than the broader market and tends to underperform in periods of strong growth ■ Top detractors from total return: ● Managed health care sub-industry securities, including UnitedHealth Group, Inc. ● Health care services sub-industry securities ■ Top contributors to total return: ● Health care distributors sub-industry securities, including McKesson Corp. ● Biotechnology sub-industry securities ■ From an individual security perspective: ● UnitedHealth Group, Inc. was the largest detractor from total return ● Johnson & Johnson was the largest contributor to total return Portfolio holdings may have changed since the report date. |
|
| Performance Past Does Not Indicate Future [Text] |
The performance data quoted represents past performance. Past performance does not guarantee future results.
|
|
| Line Graph [Table Text Block] |
Performance of Hypothetical $10,000 Investment (October 31, 2015 - October 31, 2025) 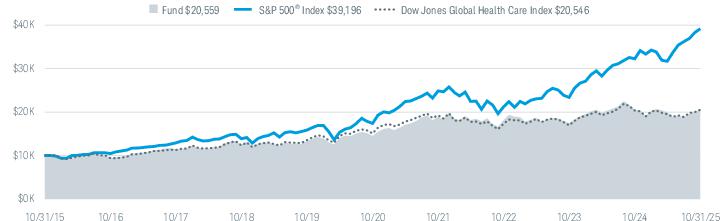 All total returns on this page assume dividends and distributions were reinvested. Index figures do not include trading and management costs, which would lower performance. Indices are unmanaged and cannot be invested in directly. Performance results less than one year are not annualized. For index definitions, please see www.schwabassetmanagement.com/glossary. Fund expenses may have been partially absorbed by the investment adviser and its affiliates. Without these reductions, the fund’s returns would have been lower. These returns do not reflect the deduction of taxes that a shareholder would pay on fund distributions or the redemption of fund shares. The fund’s performance relative to the index may be affected by fair-value pricing and timing differences in foreign exchange calculations. The S&P 500 ® Index serves as the fund’s regulatory index and provides a broad measure of market performance. The Dow Jones Global Health Care Index is the fund’s additional index and is more representative of the fund’s investment universe than the regulatory index. |
|
| Average Annual Return [Table Text Block] |
Average Annual Total Returns
|
|
|
|
Fund: Schwab Health Care Fund (07/03/2000) 1,2 |
|
|
|
|
|
|
|
Dow Jones Global Health Care Index |
|
|
| All total returns on this page assume dividends and distributions were reinvested. Index figures do not include trading and management costs, which would lower performance. Indices are unmanaged and cannot be invested in directly. Performance results less than one year are not annualized. For index definitions, please see www.schwabassetmanagement.com/glossary. Fund expenses may have been partially absorbed by the investment adviser and its affiliates. Without these reductions, the fund’s returns would have been lower. These returns do not reflect the deduction of taxes that a shareholder would pay on fund distributions or the redemption of fund shares. The fund’s performance relative to the index may be affected by fair-value pricing and timing differences in foreign exchange calculations. The S&P 500 ® Index serves as the fund’s regulatory index and provides a broad measure of market performance. The Dow Jones Global Health Care Index is the fund’s additional index and is more representative of the fund’s investment universe than the regulatory index. |
|
| Performance Inception Date |
Jul. 03, 2000
|
|
| No Deduction of Taxes [Text Block] |
These returns do not reflect the deduction of taxes that a shareholder would pay on fund distributions or the redemption of fund shares.
|
|
| Updated Performance Information Location [Text Block] |
To obtain performance information current to the most recent month end, please visit www.schwabassetmanagement.com/prospectus |
|
| Net Assets |
$ 640,000,000
|
|
| Holdings Count | Holding |
83
|
|
| Advisory Fees Paid, Amount |
$ 3,649,317
|
|
| Investment Company, Portfolio Turnover |
41.00%
|
|
| Additional Fund Statistics [Text Block] |
|
|
|
|
|
|
Advisory Fees Paid by the Fund |
|
Weighted Average Market Cap (millions) |
|
Price/Earnings Ratio (P/E) |
|
|
|
Dividends Received Deduction |
|
Qualified Dividend Income |
|
Long Term Capital Gain Distribution |
|
|
|
| Holdings [Text Block] |
Industry Weightings % of Investments Top Equity Holdings % of Net Assets Top Country Weightings % of Investments Portfolio holdings may have changed since the report date. The Sector/Industry classifications in this report use the Global Industry Classification Standard (GICS) which was developed by and is the exclusive property of MSCI Inc. (MSCI) and Standard & Poor’s (S&P). GICS is a service mark of MSCI and S&P and has been licensed for use by Charles Schwab & Co., Inc. |
|
| Largest Holdings [Text Block] |
Top Equity Holdings % of Net Assets Portfolio holdings may have changed since the report date. |
|
| Schwab International Core Equity Fund |
|
|
| Shareholder Report [Line Items] |
|
|
| Fund Name |
Schwab International Core Equity Fund
|
|
| Class Name |
Schwab International Core Equity Fund
|
|
| Trading Symbol |
SICNX
|
|
| Annual or Semi-Annual Statement [Text Block] |
This annual shareholder report contains important information about the fund for the period of November 1, 2024, to October 31, 2025.
|
|
| Shareholder Report Annual or Semi-Annual |
annual shareholder report
|
|
| Additional Information [Text Block] |
You can find additional information about the fund at www.schwabassetmanagement.com/prospectus . You can also request this information by calling or by sending an email request to orders@mysummaryprospectus.com .
|
|
| Additional Information Phone Number |
1-866-414-6349
|
|
| Additional Information Email |
orders@mysummaryprospectus.com
|
|
| Additional Information Website |
www.schwabassetmanagement.com/prospectus
|
|
| Expenses [Text Block] |
FUND COSTS FOR THE LAST year ENDED October 31, 2025 (BASED ON A HYPOTHETICAL $10,000 INVESTMENT)
|
|
|
Schwab International Core Equity Fund* |
|
| Expenses were reduced by a contractual fee waiver in effect for so long as the investment adviser serves as adviser to the fund. |
|
| Expenses Paid, Amount |
$ 98
|
[1] |
| Expense Ratio, Percent |
0.86%
|
[1] |
| Factors Affecting Performance [Text Block] |
MANAGEMENT’S DISCUSSION OF FUND PERFORMANCE For the 12-month reporting period ended October 31, 2025, the fund returned 28.77%. The MSCI EAFE ® Index (Net) 1 which returned 23.03%. Top contributors to total return: ■ Securities from the United Kingdom, including HSBC Holdings PLC Top detractors from total return: ■ Danish securities, including Class B holdings of Novo Nordisk AS From an individual security perspective: ■ Heidelberg Materials AG was the largest contributor to total return ■ Class B holdings of Novo Nordisk AS were the largest detractor from total return Portfolio holdings may have changed since the report date. The net version of the index reflects reinvested dividends net of withholding taxes but reflects no deductions for expenses or other taxes. |
|
| Performance Past Does Not Indicate Future [Text] |
The performance data quoted represents past performance. Past performance does not guarantee future results.
|
|
| Line Graph [Table Text Block] |
Performance of Hypothetical $10,000 Investment (October 31, 2015 - October 31, 2025) All total returns on this page assume dividends and distributions were reinvested. Index figures do not include trading and management costs, which would lower performance. Indices are unmanaged and cannot be invested in directly. Performance results less than one year are not annualized. For index definitions, please see www.schwabassetmanagement.com/glossary. Fund expenses may have been partially absorbed by the investment adviser and its affiliates. Without these reductions, the fund’s returns would have been lower. These returns do not reflect the deduction of taxes that a shareholder would pay on fund distributions or the redemption of fund shares. The fund’s performance relative to the index may be affected by fair-value pricing and timing differences in foreign exchange calculations. The net version of the index reflects reinvested dividends net of withholding taxes but reflects no deductions for expenses or other taxes. |
|
| Average Annual Return [Table Text Block] |
Average Annual Total Returns
|
|
|
|
Fund: Schwab International Core Equity Fund (05/30/2008) 1,2 |
|
|
|
|
|
|
| All total returns on this page assume dividends and distributions were reinvested. Index figures do not include trading and management costs, which would lower performance. Indices are unmanaged and cannot be invested in directly. Performance results less than one year are not annualized. For index definitions, please see www.schwabassetmanagement.com/glossary. Fund expenses may have been partially absorbed by the investment adviser and its affiliates. Without these reductions, the fund’s returns would have been lower. These returns do not reflect the deduction of taxes that a shareholder would pay on fund distributions or the redemption of fund shares. The fund’s performance relative to the index may be affected by fair-value pricing and timing differences in foreign exchange calculations. The net version of the index reflects reinvested dividends net of withholding taxes but reflects no deductions for expenses or other taxes. |
|
| Performance Inception Date |
May 30, 2008
|
|
| No Deduction of Taxes [Text Block] |
These returns do not reflect the deduction of taxes that a shareholder would pay on fund distributions or the redemption of fund shares.
|
|
| Updated Performance Information Location [Text Block] |
To obtain performance information current to the most recent month end, please visit www.schwabassetmanagement.com/prospectus |
|
| Net Assets |
$ 831,000,000
|
|
| Holdings Count | Holding |
146
|
|
| Advisory Fees Paid, Amount |
$ 4,081,658
|
|
| Investment Company, Portfolio Turnover |
76.00%
|
|
| Additional Fund Statistics [Text Block] |
|
|
|
|
|
|
Advisory Fees Paid by the Fund |
|
Weighted Average Market Cap (millions) |
|
Price/Earnings Ratio (P/E) |
|
|
|
Foreign Tax Paid and Passed Through |
|
Gross Income From Foreign Sources |
|
Qualified Dividend Income |
|
|
|
| Holdings [Text Block] |
Sector Weightings % of Investments Top Equity Holdings % of Net Assets Top Country Weightings % of Investments Portfolio holdings may have changed since the report date. The Sector/Industry classifications in this report use the Global Industry Classification Standard (GICS) which was developed by and is the exclusive property of MSCI Inc. (MSCI) and Standard & Poor’s (S&P). GICS is a service mark of MSCI and S&P and has been licensed for use by Charles Schwab & Co., Inc. |
|
| Largest Holdings [Text Block] |
Top Equity Holdings % of Net Assets Portfolio holdings may have changed since the report date. |
|
| Schwab S&P 500 Index Fund |
|
|
| Shareholder Report [Line Items] |
|
|
| Fund Name |
Schwab S&P 500 Index Fund
|
|
| Class Name |
Schwab S&P 500 Index Fund
|
|
| Trading Symbol |
SWPPX
|
|
| Annual or Semi-Annual Statement [Text Block] |
This annual shareholder report contains important information about the fund for the period of November 1, 2024, to October 31, 2025.
|
|
| Shareholder Report Annual or Semi-Annual |
annual shareholder report
|
|
| Additional Information [Text Block] |
You can find additional information about the fund at www.schwabassetmanagement.com/prospectus . You can also request this information by calling or by sending an email request to orders@mysummaryprospectus.com .
|
|
| Material Fund Change Notice [Text Block] |
This report describes changes to the fund that occurred during the reporting period.
|
|
| Additional Information Phone Number |
1-866-414-6349
|
|
| Additional Information Email |
orders@mysummaryprospectus.com
|
|
| Additional Information Website |
www.schwabassetmanagement.com/prospectus
|
|
| Expenses [Text Block] |
FUND COSTS FOR THE LAST year ENDED October 31, 2025 (BASED ON A HYPOTHETICAL $10,000 INVESTMENT)
|
|
|
Schwab S&P 500 Index Fund |
|
|
|
|
| Expenses Paid, Amount |
$ 2
|
|
| Expense Ratio, Percent |
0.02%
|
|
| Factors Affecting Performance [Text Block] |
MANAGEMENT’S DISCUSSION OF FUND PERFORMANCE For the 12-month reporting period ended October 31, 2025, the fund returned 21.43%. The S&P 500 ® Index returned 21.45% during the same period. Differences between the return of the fund and the return of the S&P 500 ® Index may be attributable to, among other things, the operational and transactional costs incurred by the fund and not the index. Top detractors from total return: ■ Health care sector securities, including UnitedHealth Group, Inc. ■ Materials sector securities Top contributors to total return: ■ Information technology sector securities, including NVIDIA Corp. ■ Communication services sector securities Portfolio holdings may have changed since the report date. |
|
| Performance Past Does Not Indicate Future [Text] |
The performance data quoted represents past performance. Past performance does not guarantee future results.
|
|
| Line Graph [Table Text Block] |
Performance of Hypothetical $10,000 Investment (October 31, 2015 - October 31, 2025) All total returns on this page assume dividends and distributions were reinvested. Index figures do not include trading and management costs, which would lower performance. Indices are unmanaged and cannot be invested in directly. Performance results less than one year are not annualized. For index definitions, please see www.schwabassetmanagement.com/glossary. Index ownership – “Standard & Poor’s ® ,” “S&P ® ,” and “S&P 500 ® ” are registered trademarks of Standard & Poor’s Financial Services LLC (S&P), and “Dow Jones ® ” is a registered trademark of Dow Jones Trademark Holdings LLC (Dow Jones) and have been licensed for use by S&P Dow Jones Indices LLC and its affiliates and sublicensed for certain purposes by Charles Schwab Investment Management, Inc. The “S&P 500 ® Index” is a product of S&P Dow Jones Indices LLC or its affiliates, and has been licensed for use by Charles Schwab Investment Management, Inc. The Schwab S&P 500 Index Fund is not sponsored, endorsed, sold or promoted by S&P Dow Jones Indices LLC, Dow Jones, S&P, or their respective affiliates, and neither S&P Dow Jones Indices LLC, Dow Jones, S&P, nor their respective affiliates make any representation regarding the advisability of investing in the fund. Performance does not reflect the deduction of taxes that a shareholder would pay on fund distributions or the redemption of fund shares. |
|
| Average Annual Return [Table Text Block] |
Average Annual Total Returns
|
|
|
|
Fund: Schwab S&P 500 Index Fund (05/19/1997) 1 |
|
|
|
|
|
|
| All total returns on this page assume dividends and distributions were reinvested. Index figures do not include trading and management costs, which would lower performance. Indices are unmanaged and cannot be invested in directly. Performance results less than one year are not annualized. For index definitions, please see www.schwabassetmanagement.com/glossary. Index ownership – “Standard & Poor’s ® ,” “S&P ® ,” and “S&P 500 ® ” are registered trademarks of Standard & Poor’s Financial Services LLC (S&P), and “Dow Jones ® ” is a registered trademark of Dow Jones Trademark Holdings LLC (Dow Jones) and have been licensed for use by S&P Dow Jones Indices LLC and its affiliates and sublicensed for certain purposes by Charles Schwab Investment Management, Inc. The “S&P 500 ® Index” is a product of S&P Dow Jones Indices LLC or its affiliates, and has been licensed for use by Charles Schwab Investment Management, Inc. The Schwab S&P 500 Index Fund is not sponsored, endorsed, sold or promoted by S&P Dow Jones Indices LLC, Dow Jones, S&P, or their respective affiliates, and neither S&P Dow Jones Indices LLC, Dow Jones, S&P, nor their respective affiliates make any representation regarding the advisability of investing in the fund. Performance does not reflect the deduction of taxes that a shareholder would pay on fund distributions or the redemption of fund shares. |
|
| Performance Inception Date |
May 19, 1997
|
|
| No Deduction of Taxes [Text Block] |
Performance does not reflect the deduction of taxes that a shareholder would pay on fund distributions or the redemption of fund shares.
|
|
| Updated Performance Information Location [Text Block] |
To obtain performance information current to the most recent month end, please visit www.schwabassetmanagement.com/prospectus |
|
| Net Assets |
$ 130,454,000,000
|
|
| Holdings Count | Holding |
502
|
|
| Advisory Fees Paid, Amount |
$ 22,994,531
|
|
| Investment Company, Portfolio Turnover |
3.00%
|
|
| Additional Fund Statistics [Text Block] |
|
|
|
|
|
|
Advisory Fees Paid by the Fund |
|
Weighted Average Market Cap (millions) |
|
Price/Earnings Ratio (P/E) |
|
|
|
Dividends Received Deduction |
|
Qualified Dividend Income |
|
Qualified Business Income (199A) |
|
|
|
| Holdings [Text Block] |
Sector Weightings % of Investments Top Equity Holdings % of Net Assets Portfolio holdings may have changed since the report date. The Sector/Industry classifications in this report use the Global Industry Classification Standard (GICS) which was developed by and is the exclusive property of MSCI Inc. (MSCI) and Standard & Poor’s (S&P). GICS is a service mark of MSCI and S&P and has been licensed for use by Charles Schwab & Co., Inc. Includes the fund’s position(s) in money market mutual funds registered under the Investment Company Act of 1940, as amended . |
|
| Largest Holdings [Text Block] |
Top Equity Holdings % of Net Assets Portfolio holdings may have changed since the report date. |
|
| Material Fund Change [Text Block] |
This is a summary of certain changes to the fund since November 1, 2024. For more complete information, you may review the fund’s prospectus at www.schwabassetmanagement.com/prospectus or upon request by calling or by sending an email request to orders@mysummaryprospectus.com . ■ On June 5, 2025, the Board of Trustees authorized a 6-for-1 share split for the fund, which applied to shareholders of record as of the close of U.S. markets on August 14, 2025. Certain of the fund’s financial statements were retroactively adjusted for the period ended October 31, 2025, and all prior periods, to reflect the share split. |
|
| Summary of Change Legend [Text Block] |
This is a summary of certain changes to the fund since November 1, 2024. For more complete information, you may review the fund’s prospectus at www.schwabassetmanagement.com/prospectus or upon request by calling or by sending an email request to orders@mysummaryprospectus.com . |
|
| Updated Prospectus Phone Number |
1-866-414-6349
|
|
| Updated Prospectus Email Address |
orders@mysummaryprospectus.com
|
|
| Updated Prospectus Web Address |
www.schwabassetmanagement.com/prospectus
|
|
| Schwab Small-Cap Index Fund |
|
|
| Shareholder Report [Line Items] |
|
|
| Fund Name |
Schwab Small-Cap Index Fund
|
|
| Class Name |
Schwab Small-Cap Index Fund
|
|
| Trading Symbol |
SWSSX
|
|
| Annual or Semi-Annual Statement [Text Block] |
This annual shareholder report contains important information about the fund for the period of November 1, 2024, to October 31, 2025.
|
|
| Shareholder Report Annual or Semi-Annual |
annual shareholder report
|
|
| Additional Information [Text Block] |
You can find additional information about the fund at www.schwabassetmanagement.com/prospectus . You can also request this information by calling or by sending an email request to orders@mysummaryprospectus.com . |
|
| Additional Information Phone Number |
1-866-414-6349
|
|
| Additional Information Email |
orders@mysummaryprospectus.com
|
|
| Additional Information Website |
www.schwabassetmanagement.com/prospectus
|
|
| Expenses [Text Block] |
FUND COSTS FOR THE LAST year ENDED October 31, 2025 (BASED ON A HYPOTHETICAL $10,000 INVESTMENT)
|
|
|
Schwab Small-Cap Index Fund |
|
|
|
|
| Expenses Paid, Amount |
$ 4
|
|
| Expense Ratio, Percent |
0.04%
|
|
| Factors Affecting Performance [Text Block] |
MANAGEMENT’S DISCUSSION OF FUND PERFORMANCE For the 12-month reporting period ended October 31, 2025, the fund returned 14.50%. The S&P 500 ® Index, which serves as the fund’s regulatory index and provides a broad measure of market performance, returned 21.45%. The fund generally invests in securities that are included in the Russell 2000 ® Index, which returned 14.41% during the same period. The fund does not seek to track the regulatory index. Top contributors to total return: ■ Industrials sector securities, including Class A holdings of Bloom Energy Corp. ■ Information technology sector securities Top detractors from total return: ■ Real estate sector securities, including Innovative Industrial Properties, Inc. ■ While there were no additional sectors that detracted from the total return of the fund, consumer staples sector securities were the smallest contributors to total return Portfolio holdings may have changed since the report date. |
|
| Performance Past Does Not Indicate Future [Text] |
The performance data quoted represents past performance. Past performance does not guarantee future results.
|
|
| Line Graph [Table Text Block] |
Performance of Hypothetical $10,000 Investment (October 31, 2015 - October 31, 2025) All total returns on this page assume dividends and distributions were reinvested. Index figures do not include trading and management costs, which would lower performance. Indices are unmanaged and cannot be invested in directly. Performance results less than one year are not annualized. For index definitions, please see www.schwabassetmanagement.com/glossary. Index ownership – “Russell 2000 ® ” is a registered mark of the Frank Russell Company (Russell) and has been licensed for use by the Schwab Small-Cap Index Fund. The Schwab Small-Cap Index Fund is not sponsored, endorsed, sold or promoted by Russell and Russell makes no representation regarding the advisability of investing in the fund. Performance does not reflect the deduction of taxes that a shareholder would pay on fund distributions or the redemption of fund shares. The S&P 500 ® Index serves as the fund’s regulatory index and provides a broad measure of market performance. The fund generally invests in securities that are included in the Russell 2000 ® Index. The fund does not seek to track the regulatory index. |
|
| Average Annual Return [Table Text Block] |
Average Annual Total Returns
|
|
|
|
Fund: Schwab Small-Cap Index Fund (05/19/1997) 1 |
|
|
|
|
|
|
|
|
|
|
| All total returns on this page assume dividends and distributions were reinvested. Index figures do not include trading and management costs, which would lower performance. Indices are unmanaged and cannot be invested in directly. Performance results less than one year are not annualized. For index definitions, please see www.schwabassetmanagement.com/glossary. Index ownership – “Russell 2000 ® ” is a registered mark of the Frank Russell Company (Russell) and has been licensed for use by the Schwab Small-Cap Index Fund. The Schwab Small-Cap Index Fund is not sponsored, endorsed, sold or promoted by Russell and Russell makes no representation regarding the advisability of investing in the fund. Performance does not reflect the deduction of taxes that a shareholder would pay on fund distributions or the redemption of fund shares. The S&P 500 ® Index serves as the fund’s regulatory index and provides a broad measure of market performance. The fund generally invests in securities that are included in the Russell 2000 ® Index. The fund does not seek to track the regulatory index. |
|
| Performance Inception Date |
May 19, 1997
|
|
| No Deduction of Taxes [Text Block] |
Performance does not reflect the deduction of taxes that a shareholder would pay on fund distributions or the redemption of fund shares.
|
|
| Updated Performance Information Location [Text Block] |
To obtain performance information current to the most recent month end, please visit www.schwabassetmanagement.com/prospectus |
|
| Net Assets |
$ 7,193,000,000
|
|
| Holdings Count | Holding |
1,962
|
|
| Advisory Fees Paid, Amount |
$ 2,624,440
|
|
| Investment Company, Portfolio Turnover |
12.00%
|
|
| Additional Fund Statistics [Text Block] |
|
|
|
|
(excludes in-kind transactions) |
|
Advisory Fees Paid by the Fund |
|
Weighted Average Market Cap (millions) |
|
Price/Earnings Ratio (P/E) |
|
|
|
Dividends Received Deduction |
|
Qualified Dividend Income |
|
Qualified Business Income (199A) |
|
|
|
| Holdings [Text Block] |
Sector Weightings % of Investments Top Equity Holdings % of Net Assets Portfolio holdings may have changed since the report date. The Sector/Industry classifications in this report use the Global Industry Classification Standard (GICS) which was developed by and is the exclusive property of MSCI Inc. (MSCI) and Standard & Poor’s (S&P). GICS is a service mark of MSCI and S&P and has been licensed for use by Charles Schwab & Co., Inc. Includes the fund’s position(s) in money market mutual funds registered under the Investment Company Act of 1940, as amended. |
|
| Largest Holdings [Text Block] |
Top Equity Holdings % of Net Assets Portfolio holdings may have changed since the report date. |
|
| Schwab Total Stock Market Index Fund |
|
|
| Shareholder Report [Line Items] |
|
|
| Fund Name |
Schwab Total Stock Market Index Fund
|
|
| Class Name |
Schwab Total Stock Market Index Fund
|
|
| Trading Symbol |
SWTSX
|
|
| Annual or Semi-Annual Statement [Text Block] |
This annual shareholder report contains important information about the fund for the period of November 1, 2024, to October 31, 2025.
|
|
| Shareholder Report Annual or Semi-Annual |
annual shareholder report
|
|
| Additional Information [Text Block] |
You can find additional information about the fund at www.schwabassetmanagement.com/prospectus . You can also request this information by calling or by sending an email request to orders@mysummaryprospectus.com .
|
|
| Material Fund Change Notice [Text Block] |
This report describes changes to the fund that occurred during the reporting period.
|
|
| Additional Information Phone Number |
1-866-414-6349
|
|
| Additional Information Email |
orders@mysummaryprospectus.com
|
|
| Additional Information Website |
www.schwabassetmanagement.com/prospectus
|
|
| Expenses [Text Block] |
FUND COSTS FOR THE LAST year ENDED October 31, 2025 (BASED ON A HYPOTHETICAL $10,000 INVESTMENT)
|
|
|
Schwab Total Stock Market Index Fund |
|
|
|
|
| Expenses Paid, Amount |
$ 3
|
|
| Expense Ratio, Percent |
0.03%
|
|
| Factors Affecting Performance [Text Block] |
MANAGEMENT’S DISCUSSION OF FUND PERFORMANCE For the 12-month reporting period ended October 31, 2025, the fund returned 20.85%. The Dow Jones U.S. Total Stock Market Index SM returned 20.90% during the same period. Differences between the return of the fund and the return of the Dow Jones U.S. Total Stock Market Index SM may be attributable to, among other things, the operational and trans actional c osts incurred by the fund and not the index. Top detractors from total return: ■ Health care sector securities, including UnitedHealth Group, Inc. ■ Real estate sector securities Top contributors to total return: ■ Information technology sector securit ies, in cluding NVIDIA Corp. ■ Communication services sector securities Portfolio holdings may have changed since the report date. |
|
| Performance Past Does Not Indicate Future [Text] |
The performance data quoted represents past performance. Past performance does not guarantee future results.
|
|
| Line Graph [Table Text Block] |
Performance of Hypothetical $10,000 Investment (October 31, 2015 - October 31, 2025) All total returns on this page assume dividends and distributions were reinvested. Index figures do not include trading and management costs, which would lower performance. Indices are unmanaged and cannot be invested in directly. Performance results less than one year are not annualized. For index definitions, please see www.schwabassetmanagement.com/glossary. Index ownership – “Standard & Poor’s ® ” and “S&P ® ” are registered trademarks of Standard & Poor’s Financial Services LLC (S&P), and “Dow Jones ® ” is a registered trademark of Dow Jones Trademark Holdings LLC (Dow Jones) and have been licensed for use by S&P Dow Jones Indices LLC and its affiliates and sublicensed for certain purposes by Charles Schwab Investment Management, Inc. The “Dow Jones U.S. Total Stock Market Index SM ” is a product of S&P Dow Jones Indices LLC or its affiliates, and has been licensed for use by Charles Schwab Investment Management, Inc. The Schwab Total Stock Market Index Fund is not sponsored, endorsed, sold or promoted by S&P Dow Jones Indices LLC, Dow Jones, S&P, or their respective affiliates, and neither S&P Dow Jones Indices LLC, Dow Jones, S&P, nor their respective affiliates make any representation regarding the advisability of investing in the fund. Performance does not reflect the deduction of taxes that a shareholder would pay on fund distributions or the redemption of fund shares. |
|
| Average Annual Return [Table Text Block] |
Average Annual Total Returns
|
|
|
|
Fund: Schwab Total Stock Market Index Fund (06/01/1999) 1 |
|
|
|
Dow Jones U.S. Total Stock Market Index SM |
|
|
| All total returns on this page assume dividends and distributions were reinvested. Index figures do not include trading and management costs, which would lower performance. Indices are unmanaged and cannot be invested in directly. Performance results less than one year are not annualized. For index definitions, please see www.schwabassetmanagement.com/glossary. Index ownership – “Standard & Poor’s ® ” and “S&P ® ” are registered trademarks of Standard & Poor’s Financial Services LLC (S&P), and “Dow Jones ® ” is a registered trademark of Dow Jones Trademark Holdings LLC (Dow Jones) and have been licensed for use by S&P Dow Jones Indices LLC and its affiliates and sublicensed for certain purposes by Charles Schwab Investment Management, Inc. The “Dow Jones U.S. Total Stock Market Index SM ” is a product of S&P Dow Jones Indices LLC or its affiliates, and has been licensed for use by Charles Schwab Investment Management, Inc. The Schwab Total Stock Market Index Fund is not sponsored, endorsed, sold or promoted by S&P Dow Jones Indices LLC, Dow Jones, S&P, or their respective affiliates, and neither S&P Dow Jones Indices LLC, Dow Jones, S&P, nor their respective affiliates make any representation regarding the advisability of investing in the fund. Performance does not reflect the deduction of taxes that a shareholder would pay on fund distributions or the redemption of fund shares. |
|
| Performance Inception Date |
Jun. 01, 1999
|
|
| No Deduction of Taxes [Text Block] |
Performance does not reflect the deduction of taxes that a shareholder would pay on fund distributions or the redemption of fund shares.
|
|
| Updated Performance Information Location [Text Block] |
To obtain performance information current to the most recent month end, please visit www.schwabassetmanagement.com/prospectus |
|
| Net Assets |
$ 31,970,000,000
|
|
| Holdings Count | Holding |
3,018
|
|
| Advisory Fees Paid, Amount |
$ 8,471,431
|
|
| Investment Company, Portfolio Turnover |
3.00%
|
|
| Additional Fund Statistics [Text Block] |
|
|
|
|
|
|
Advisory Fees Paid by the Fund |
|
Weighted Average Market Cap (millions) |
|
Price/Earnings Ratio (P/E) |
|
|
|
Dividends Received Deduction |
|
Qualified Dividend Income |
|
Qualified Business Income (199A) |
|
|
|
| Holdings [Text Block] |
Sector Weightings % of Investments 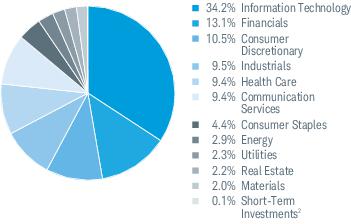 Top Equity Holdings % of Net Assets 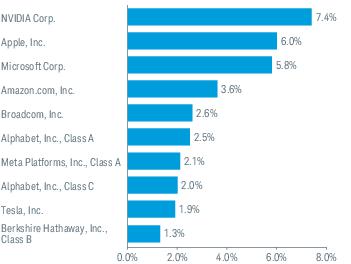 Portfolio holdings may have changed since the report date. The Sector/Industry classifications in this report use the Global Industry Classification Standard (GICS) which was developed by and is the exclusive property of MSCI Inc. (MSCI) and Standard & Poor’s (S&P). GICS is a service mark of MSCI and S&P and has been licensed for use by Charles Schwab & Co., Inc. Includes the fund’s position(s) in money market mutual funds registered under the Investment Company Act of 1940, as amended. |
|
| Largest Holdings [Text Block] |
Top Equity Holdings % of Net Assets Portfolio holdings may have changed since the report date. |
|
| Material Fund Change [Text Block] |
This is a summary of certain changes to the fund since November 1, 2024. For more complete information, you may review the fund’s Annual Holdings and Financial Statements at www.schwabassetmanagement.com/prospectus or upon request by calling or by sending an email request to orders@mysummaryprospectus.com . ■ On June 5, 2025, the Board of Trustees authorized a 7-for-1 share split for the fund, which applied to shareholders of record as of the close of U.S. markets on August 14, 2025. Certain of the fund’s financial statements were retroactively adjusted for the period ended October 31, 2025, and all prior periods, to reflect the share split. |
|
| Summary of Change Legend [Text Block] |
This is a summary of certain changes to the fund since November 1, 2024. For more complete information, you may review the fund’s Annual Holdings and Financial Statements at www.schwabassetmanagement.com/prospectus or upon request by calling or by sending an email request to orders@mysummaryprospectus.com .
|
|
| Schwab U.S. Large-Cap Growth Index Fund |
|
|
| Shareholder Report [Line Items] |
|
|
| Fund Name |
Schwab U.S. Large-Cap Growth Index Fund
|
|
| Class Name |
Schwab U.S. Large-Cap Growth Index Fund
|
|
| Trading Symbol |
SWLGX
|
|
| Annual or Semi-Annual Statement [Text Block] |
This annual shareholder report contains important information about the fund for the period of November 1, 2024, to October 31, 2025.
|
|
| Shareholder Report Annual or Semi-Annual |
annual shareholder report
|
|
| Additional Information [Text Block] |
You can find additional information about the fund at www.schwabassetmanagement.com/prospectus . You can also request this information by calling or by sending an email request to orders@mysummaryprospectus.com .
|
|
| Material Fund Change Notice [Text Block] |
This report describes changes to the fund that occurred during the reporting period.
|
|
| Additional Information Phone Number |
1-866-414-6349
|
|
| Additional Information Email |
orders@mysummaryprospectus.com
|
|
| Additional Information Website |
www.schwabassetmanagement.com/prospectus
|
|
| Expenses [Text Block] |
FUND COSTS FOR THE LAST year ENDED October 31, 2025 (BASED ON A HYPOTHETICAL $10,000 INVESTMENT)
|
|
|
Schwab U.S. Large-Cap Growth Index Fund |
|
|
|
|
| Expenses Paid, Amount |
$ 4
|
|
| Expense Ratio, Percent |
0.035%
|
|
| Factors Affecting Performance [Text Block] |
MANAGEMENT’S DISCUSSION OF FUND PERFORMANCE For the 12-month reporting period ended October 31, 2025, the fu n d returned 30.44%. The S&P 500 ® Index, which serves as the fund’s regulatory index and provides a broad measure of market performance, returned 21.45%. The fund generally invests in securities that are included in the Russell 1000 ® Growth Index, which returned 30.52% during the same period. The fund does not seek to track the regulatory index. Differences between the return of the fund and the return of the Russell 1000 ® Growth Index may be attributable to, among other things, the operational and transactional costs incurred by the fund and not the index. Top detractors from to tal return: ■ Real estate sector securities, including American Tower Corp. ■ Consumer staples sector securities Top contributors to total return: ■ Information technology sector securities, including NVIDIA Corp. ■ Communication services sector securities Portfolio holdings may have changed since the re po rt d ate. |
|
| Performance Past Does Not Indicate Future [Text] |
The performance data quoted represents past performance. Past performance does not guarantee future results.
|
|
| Line Graph [Table Text Block] |
Performance of Hypothetical $10,000 Investment (December 20, 2017 - O ctobe r 31, 2025) 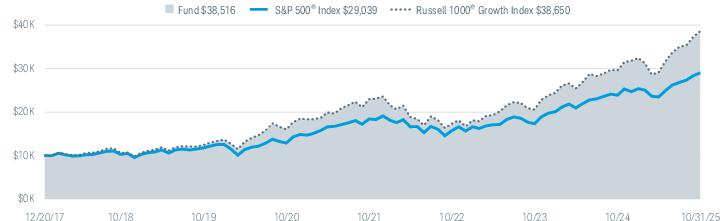 All total returns on this page assume dividends and distributions were reinvested. Index figures do not include trading and management costs, which would lower performance. Indices are unmanaged and cannot be invested in directly. Performance results less than one year are not annualized. For index definitions, please see www.schwabassetmanagement.com/glossary. Index ownership – The Russell 1000 ® Growth Index is a registered mark of the Frank Russell Company (Russell) and has been licensed for use by the Schwab U.S. Large-Cap Growth Index Fund. The Schwab U.S. Large-Cap Growth Index Fund is not sponsored, endorsed, sold or promoted by Russell and Russell makes no representation regarding the advisability of investing in the fund. Performance does not reflect the deduction of taxes that a shareholder would pay on fund distributions or the redemption of fund shares. The S&P 500 ® Index serves as the fund’s regulatory index and provides a broad measure of market performance. The fund generally invests in securities that are included in the Russell 1000 ® Growth Index. The fund does not seek to track the regulatory index. |
|
| Average Annual Return [Table Text Block] |
|
|
|
|
Fund: Schwab U.S. Large-Cap Growth Index Fund (12/20/2017) 1 |
|
|
|
|
|
|
|
|
|
|
| All total returns on this page assume dividends and distributions were reinvested. Index figures do not include trading and management costs, which would lower performance. Indices are unmanaged and cannot be invested in directly. Performance results less than one year are not annualized. For index definitions, please see www.schwabassetmanagement.com/glossary. Index ownership – The Russell 1000 ® Growth Index is a registered mark of the Frank Russell Company (Russell) and has been licensed for use by the Schwab U.S. Large-Cap Growth Index Fund. The Schwab U.S. Large-Cap Growth Index Fund is not sponsored, endorsed, sold or promoted by Russell and Russell makes no representation regarding the advisability of investing in the fund. Performance does not reflect the deduction of taxes that a shareholder would pay on fund distributions or the redemption of fund shares. The S&P 500 ® Index serves as the fund’s regulatory index and provides a broad measure of market performance. The fund generally invests in securities that are included in the Russell 1000 ® Growth Index. The fund does not seek to track the regulatory index. |
|
| Performance Inception Date |
Dec. 20, 2017
|
|
| No Deduction of Taxes [Text Block] |
Performance does not reflect the deduction of taxes that a shareholder would pay on fund distributions or the redemption of fund shares.
|
|
| Updated Performance Information Location [Text Block] |
To obtain performance information current to the most recent month end, please visit www.schwabassetmanagement.com/prospectus |
|
| Net Assets |
$ 4,565,000,000
|
|
| Holdings Count | Holding |
388
|
|
| Advisory Fees Paid, Amount |
$ 1,235,933
|
|
| Investment Company, Portfolio Turnover |
16.00%
|
|
| Additional Fund Statistics [Text Block] |
|
|
|
|
(excludes in-kind transactions) |
|
Advisory Fees Paid by the Fund |
|
Weighted Average Market Cap (millions) |
|
Price/Earnings Ratio (P/E) |
|
|
|
Dividends Received Deduction |
|
Qualified Dividend Income |
|
Qualified Business Income (199A) |
|
|
|
| Holdings [Text Block] |
Sector Weightings % of In vest ments 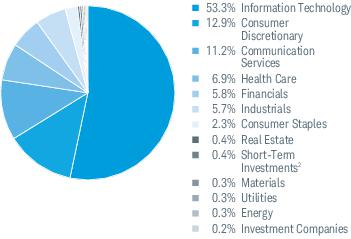 Top Equity Holdi ngs % of N et Assets 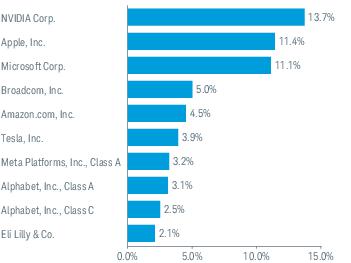 Portfolio holdings may have changed since the rep ort dat e. The Sector/Industry classifications in this report use the Global Industry Classification Standard (GICS) which was developed by and is the exclusive property of MSCI Inc. (MSCI) and Standard & Poor’s (S&P). GICS is a service mark of MSCI and S&P and has been licensed for use by Charles Schwab & Co., Inc. Includes the fund’s position(s) in money market mutual funds registered under the Investment Company Act of 1940, as amended. |
|
| Largest Holdings [Text Block] |
Top Equity Holdi ngs % of N et Assets Portfolio holdings may have changed since the rep ort dat e. |
|
| Material Fund Change [Text Block] |
This is a summary of certain changes to the fund since November 1, 2024. For more complete information, you may review the fund’s Annual Holdings and Financial Statements at www.schwabassetmanagement.com/prospectus or upon request by calling or by sending an email request to orders@mysummaryprospectus.com . ■ On June 5, 2025, the Board of Trustees authorized a 8-for-1 share split for the fund, which applied to shareholders of record as of the close of U.S. markets on August 14, 2025. Certain of the fund’s fi nan cial statements were retroactively adjusted for the period ended October 31, 2025, and all prior periods, to reflect the share split. |
|
| Summary of Change Legend [Text Block] |
This is a summary of certain changes to the fund since November 1, 2024. For more complete information, you may review the fund’s Annual Holdings and Financial Statements at www.schwabassetmanagement.com/prospectus or upon request by calling or by sending an email request to orders@mysummaryprospectus.com .
|
|
| Schwab U.S. Large-Cap Value Index Fund |
|
|
| Shareholder Report [Line Items] |
|
|
| Fund Name |
Schwab U.S. Large-Cap Value Index Fund
|
|
| Class Name |
Schwab U.S. Large-Cap Value Index Fund
|
|
| Trading Symbol |
SWLVX
|
|
| Annual or Semi-Annual Statement [Text Block] |
This annual shareholder report contains important information about the fund for the period of November 1, 2024, to October 31, 2025.
|
|
| Shareholder Report Annual or Semi-Annual |
annual shareholder report
|
|
| Additional Information [Text Block] |
You can find additional information about the fund at www.schwabassetmanagement.com/prospectus . You can also request this information by calling or by sending an email request to orders@mysummaryprospectus.com .
|
|
| Material Fund Change Notice [Text Block] |
This report describes changes to the fund that occurred during the reporting period.
|
|
| Additional Information Phone Number |
1-866-414-6349
|
|
| Additional Information Email |
orders@mysummaryprospectus.com
|
|
| Additional Information Website |
www.schwabassetmanagement.com/prospectus
|
|
| Expenses [Text Block] |
FUND COSTS FOR THE LAST year ENDED October 31, 2025 (BASED ON A HYPOTHETICAL $10,000 IN VESTMEN T)
|
|
|
Schwab U.S. Large-Cap Value Index Fund |
|
|
|
|
| Expenses Paid, Amount |
$ 4
|
|
| Expense Ratio, Percent |
0.035%
|
|
| Factors Affecting Performance [Text Block] |
MANAGEMENT’S DISCUSSION OF FUND PERFORMANCE For the 12-month reporting period ended October 31, 2025, the fund returned 11.13%. The S&P 500 ® Index, which serves as the fund’s regulatory index and provides a broad measure of market performance, returned 21.45%. The fund generally invests in securities that are included in the Russell 1000 ® Value Index, which returned 11.15% during the same period. The fund does not seek to track the regulatory index. Differences between the return of the fund and the return of the Russell 1000 ® Value Index may be attributable to, among other things, the operational and transactional costs incurred by the fund and not the index. Top detractors from total return: ■ Health care sector securities, including UnitedHealth Group, Inc. ■ Materials sector securities Top contributors to total return: ■ Financials sector securities, including JPMorgan Chase & Co. ■ Industrials sector securities Portfolio holdings may have changed since the report date. |
|
| Performance Past Does Not Indicate Future [Text] |
The performance data quoted represents past performance. Past performance does not guarantee future results.
|
|
| Line Graph [Table Text Block] |
Performance of Hypothetical $10,000 Investment (December 20, 2017 - Octob er 31 , 2025) 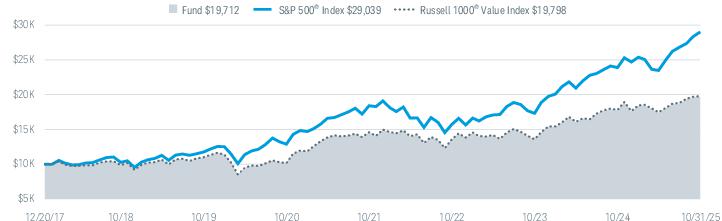 All total returns on this page assume dividends and distributions were reinvested. Index figures do not include trading and management costs, which would lower performance. Indices are unmanaged and cannot be invested in directly. Performance results less than one year are not annualized. For index definitions, please see www.schwabassetmanagement.com/glossary. Index ownership – The Russell 1000 ® Value Index is a registered mark of the Frank Russell Company (Russell) and has been licensed for use by the Schwab U.S. Large-Cap Value Index Fund. The Schwab U.S. Large-Cap Value Index Fund is not sponsored, endorsed, sold or promoted by Russell and Russell makes no representation regarding the advisability of investing in the fund. Performance does not reflect the deduction of taxes that a shareholder would pay on fund distributions or the redemption of fund shares. The S&P 500 ® Index serves as the fund’s regulatory index and provides a broad measure of market performance. The fund generally invests in securities that are included in the Russell 1000 ® Value Index. The fund does not seek to track the regulatory index. |
|
| Average Annual Return [Table Text Block] |
|
|
|
|
Fund: Schwab U.S. Large-Cap Value Index Fund (12/20/2017) 1 |
|
|
|
|
|
|
|
Russell 1000 ® Value Index |
|
|
| All total returns on this page assume dividends and distributions were reinvested. Index figures do not include trading and management costs, which would lower performance. Indices are unmanaged and cannot be invested in directly. Performance results less than one year are not annualized. For index definitions, please see www.schwabassetmanagement.com/glossary. Index ownership – The Russell 1000 ® Value Index is a registered mark of the Frank Russell Company (Russell) and has been licensed for use by the Schwab U.S. Large-Cap Value Index Fund. The Schwab U.S. Large-Cap Value Index Fund is not sponsored, endorsed, sold or promoted by Russell and Russell makes no representation regarding the advisability of investing in the fund. Performance does not reflect the deduction of taxes that a shareholder would pay on fund distributions or the redemption of fund shares. The S&P 500 ® Index serves as the fund’s regulatory index and provides a broad measure of market performance. The fund generally invests in securities that are included in the Russell 1000 ® Value Index. The fund does not seek to track the regulatory index. |
|
| Performance Inception Date |
Dec. 20, 2017
|
|
| No Deduction of Taxes [Text Block] |
Performance does not reflect the deduction of taxes that a shareholder would pay on fund distributions or the redemption of fund shares.
|
|
| Updated Performance Information Location [Text Block] |
To obtain performance information current to the most recent month end, please visit www.schwabassetmanagement.com/prospectus |
|
| Net Assets |
$ 919,000,000
|
|
| Holdings Count | Holding |
860
|
|
| Advisory Fees Paid, Amount |
$ 290,473
|
|
| Investment Company, Portfolio Turnover |
16.00%
|
|
| Additional Fund Statistics [Text Block] |
|
|
|
|
(excludes in-kind transactions) |
|
Advisory Fees Paid by the Fund |
|
Weighted Average Market Cap (millions) |
|
Price/Earnings Ratio (P/E) |
|
|
|
Dividends Received Deduction |
|
Qualified Dividend Income |
|
Long Term Capital Gain Distribution |
|
Qualified Business Income (199A) |
|
|
|
| Holdings [Text Block] |
Sector Weightings % of Investments 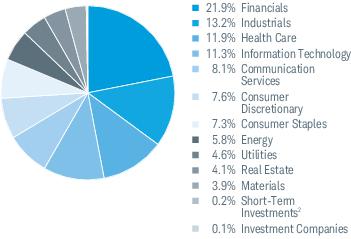 Top Equity Holdings % of Net Assets 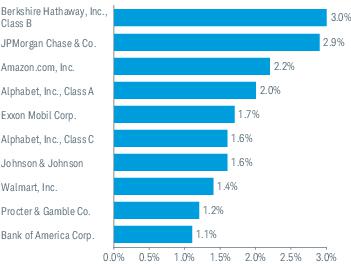 Portfolio holdings may have changed since the rep ort date . The Sector/Industry classifications in this report use the Global Industry Classification Standard (GICS) which was developed by and is the exclusive property of MSCI Inc. (MSCI) and Standard & Poor’s (S&P). GICS is a service mark of MSCI and S&P and has been licensed for use by Charles Schwab & Co., Inc. Includes the fund’s position(s) in money market mutual funds registered under the Investment Company Act of 1940 , as amended. |
|
| Largest Holdings [Text Block] |
Top Equity Holdings % of Net Assets Portfolio holdings may have changed since the rep ort date . |
|
| Material Fund Change [Text Block] |
This is a summary of certain changes to the fund since November 1, 2024. For more complete information, you may review the fund’s Annual Holdings and Financial Statements at www.schwabassetmanagement.com/prospectus or upon request by calling or by sending an email request to orders@mysummaryprospectus.com . ■ On June 5, 2025, the Board of Trustees authorized a 4-for-1 share split for the fund, which applied to sh areholders of record as of the close of U.S. markets on August 14, 2025. Certain of the fund’s financial statements were retroactively adjusted for the period ended October 31, 2025, and all prior periods, to reflect the share split. |
|
| Summary of Change Legend [Text Block] |
This is a summary of certain changes to the fund since November 1, 2024. For more complete information, you may review the fund’s Annual Holdings and Financial Statements at www.schwabassetmanagement.com/prospectus or upon request by calling or by sending an email request to orders@mysummaryprospectus.com .
|
|
| Schwab U.S. Mid-Cap Index Fund |
|
|
| Shareholder Report [Line Items] |
|
|
| Fund Name |
Schwab U.S. Mid-Cap Index Fund
|
|
| Class Name |
Schwab U.S. Mid-Cap Index Fund
|
|
| Trading Symbol |
SWMCX
|
|
| Annual or Semi-Annual Statement [Text Block] |
This annual shareholder report contains important information about the fund for the period of November 1, 2024, to October 31, 2025.
|
|
| Shareholder Report Annual or Semi-Annual |
annual shareholder report
|
|
| Additional Information [Text Block] |
You can find additional information about the fund at www.schwabassetmanagement.com/prospectus . You can also request this information by calling or by sending an email request to orders@mysummaryprospectus.com .
|
|
| Material Fund Change Notice [Text Block] |
This report describes changes to the fund that occurred during the reporting period.
|
|
| Additional Information Phone Number |
1-866-414-6349
|
|
| Additional Information Email |
orders@mysummaryprospectus.com
|
|
| Additional Information Website |
www.schwabassetmanagement.com/prospectus
|
|
| Expenses [Text Block] |
FUND COSTS FOR THE LAST year ENDED October 31, 2025 (BASED ON A HYPOTHETICAL $10,000 INVESTMENT)
|
|
|
Schwab U.S. Mid-Cap Index Fund |
|
|
|
|
| Expenses Paid, Amount |
$ 4
|
|
| Expense Ratio, Percent |
0.04%
|
|
| Factors Affecting Performance [Text Block] |
MANAGEMENT’S DISCUSSION OF FUND PERFORMANCE For the 12-month reporting period ended October 31, 2025, the fund returned 10.68%. The S&P 500 ® Index, which serves as the fund’s regulatory index and provides a broad measure of market performance, returned 21.45%. The fund generally invests in securities that are included in the Russell Midcap ® Index, which returned 10.79% during the same period. The fund does not seek to track the regulatory index. Differences between the return of the fund and the return of the Russell Midcap ® Index may be attributable to, among other things, the operational and transactional costs incurred by the fund and not the index. Top detractors from total return: ■ Materials sector securities, including Dow, Inc. ■ Real estate sector securities Top contributors to total return: ■ Information technology sector securities, including Class A holdings of Palantir Technologies, Inc. (which was sold prior to the end of the reporting period) ■ Financials sector securities Portfolio holdings may have changed since the report date. |
|
| Performance Past Does Not Indicate Future [Text] |
The performance data quoted represents past performance. Past performance does not guarantee future results.
|
|
| Line Graph [Table Text Block] |
Performance of Hypothetical $10,000 Investment (December 20, 2017 - October 31, 2025) 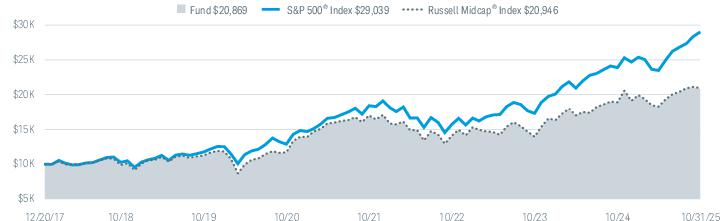 All total returns on this page assume dividends and distributions were reinvested. Index figures do not include trading and management costs, which would lower performance. Indices are unmanaged and cannot be invested in directly. Performance results less than one year are not annualized. For index definitions, please see www.schwabassetmanagement.com/glossary. Index ownership – The Russell Midcap ® Index is a registered mark of the Frank Russell Company (Russell) and has been licensed for use by the Schwab U.S. Mid-Cap Index Fund. The Schwab U.S. Mid-Cap Index Fund is not sponsored, endorsed, sold or promoted by Russell and Russell makes no representation regarding the advisability of investing in the fund. Performance does not reflect the deduction of taxes that a shareholder would pay on fund distributions or the redemption of fund shares. The S&P 500 ® Index serves as the fund’s regulatory index and provides a broad measure of market performance. The fund generally invests in securities that are included in the Russell Midcap ® Index. The fund does not seek to track the regulatory index. |
|
| Average Annual Return [Table Text Block] |
|
|
|
|
Fund: Schwab U.S. Mid-Cap Index Fund (12/20/2017) 1 |
|
|
|
|
|
|
|
|
|
|
| All total returns on this page assume dividends and distributions were reinvested. Index figures do not include trading and management costs, which would lower performance. Indices are unmanaged and cannot be invested in directly. Performance results less than one year are not annualized. For index definitions, please see www.schwabassetmanagement.com/glossary. Index ownership – The Russell Midcap ® Index is a registered mark of the Frank Russell Company (Russell) and has been licensed for use by the Schwab U.S. Mid-Cap Index Fund. The Schwab U.S. Mid-Cap Index Fund is not sponsored, endorsed, sold or promoted by Russell and Russell makes no representation regarding the advisability of investing in the fund. Performance does not reflect the deduction of taxes that a shareholder would pay on fund distributions or the redemption of fund shares. The S&P 500 ® Index serves as the fund’s regulatory index and provides a broad measure of market performance. The fund generally invests in securities that are included in the Russell Midcap ® Index. The fund does not seek to track the regulatory index. |
|
| Performance Inception Date |
Dec. 20, 2017
|
|
| No Deduction of Taxes [Text Block] |
Performance does not reflect the deduction of taxes that a shareholder would pay on fund distributions or the redemption of fund shares.
|
|
| Updated Performance Information Location [Text Block] |
To obtain performance information current to the most recent month end, please visit www.schwabassetmanagement.com/prospectus |
|
| Net Assets |
$ 2,209,000,000
|
|
| Holdings Count | Holding |
801
|
|
| Advisory Fees Paid, Amount |
$ 773,313
|
|
| Investment Company, Portfolio Turnover |
11.00%
|
|
| Additional Fund Statistics [Text Block] |
|
|
|
|
(excludes in-kind transactions) |
|
Advisory Fees Paid by the Fund |
|
Weighted Average Market Cap (millions) |
|
Price/Earnings Ratio (P/E) |
|
|
|
Dividends Received Deduction |
|
Qualified Dividend Income |
|
Long Term Capital Gain Distribution |
|
Qualified Business Income (199A) |
|
|
|
| Holdings [Text Block] |
Sector Weightings % of Investments 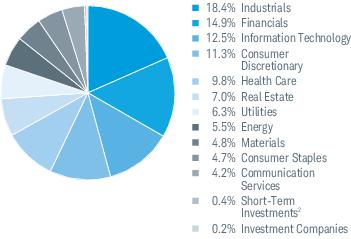 Top Equity Holdings % of Net Assets 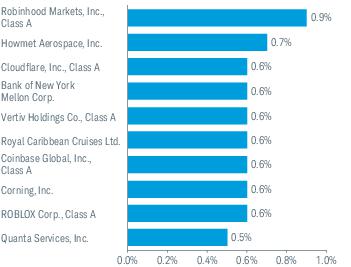 Portfolio holdings may have changed since the report date. The Sector/Industry classifications in this report use the Global Industry Classification Standard (GICS) which was developed by and is the exclusive property of MSCI Inc. (MSCI) and Standard & Poor’s (S&P). GICS is a service mark of MSCI and S&P and has been licensed for use by Charles Schwab & Co., Inc. Includes the fund’s position(s) in money market mutual funds registered under the Investment Company Act of 1940, as amended. |
|
| Largest Holdings [Text Block] |
Top Equity Holdings % of Net Assets Portfolio holdings may have changed since the report date. |
|
| Material Fund Change [Text Block] |
This is a summary of certain changes to the fund since November 1, 2024. For more complete information, you may review the fund’s Annual Holdings and Financial Statements at www.schwabassetmanagement.com/prospectus or upon request by calling or by sending an email request to orders@mysummaryprospectus.com . ■ On June 5, 2025, the Board of Trustees authorized a 5-for-1 share split for the fund, which applied to shareholders of record as of the close of U.S. markets on August 14, 2025. Certain of the fund’s financial statements were retroactively adjusted for the period ended October 31, 2025, and all prior periods, to reflect the share split. |
|
| Summary of Change Legend [Text Block] |
This is a summary of certain changes to the fund since November 1, 2024. For more complete information, you may review the fund’s Annual Holdings and Financial Statements at www.schwabassetmanagement.com/prospectus or upon request by calling or by sending an email request to orders@mysummaryprospectus.com .
|
|
| Schwab International Index Fund |
|
|
| Shareholder Report [Line Items] |
|
|
| Fund Name |
Schwab International Index Fund
|
|
| Class Name |
Schwab International Index Fund
|
|
| Trading Symbol |
SWISX
|
|
| Annual or Semi-Annual Statement [Text Block] |
This annual shareholder report contains important information about the fund for the period of November 1, 2024, to October 31, 2025.
|
|
| Shareholder Report Annual or Semi-Annual |
annual shareholder report
|
|
| Additional Information [Text Block] |
You can find additional information about the fund at www.schwabassetmanagement.com/prospectus . You can also request this information by calling or by sending an email request to orders@mysummaryprospectus.com .
|
|
| Additional Information Phone Number |
1-866-414-6349
|
|
| Additional Information Email |
orders@mysummaryprospectus.com
|
|
| Additional Information Website |
www.schwabassetmanagement.com/prospectus
|
|
| Expenses [Text Block] |
FUND COSTS FOR THE LAST year ENDED October 31, 2025 (BASED ON A HYPOTHETICAL $10,000 INVESTMENT)
|
|
|
Schwab International Index Fund |
|
|
|
|
| Expenses Paid, Amount |
$ 7
|
|
| Expense Ratio, Percent |
0.06%
|
|
| Factors Affecting Performance [Text Block] |
MANAGEMENT’S DISCUSSION OF FUND PERFORMANCE For the 12-month reporting period ended October 31, 2025, the fund returned 23.33%. The MSCI EAFE ® 1 returned 23.03% during the same period. Top contributors to total return: ■ Japanese securities, including SoftBank Group Corp. ■ Securities from the United Kingdom Top detractors from total return: ■ Danish securities, including Class B holdings of Novo Nordisk AS ■ Securities from New Zealand Portfolio holdings may have changed since the report date. The net version of the index reflects reinvested dividends net of withholding taxes but reflects no deductions for expenses or other taxes. |
|
| Performance Past Does Not Indicate Future [Text] |
The performance data quoted represents past performance. Past performance does not guarantee future results.
|
|
| Line Graph [Table Text Block] |
Performance of Hypothetical $10,000 Investment (October 31, 2015 - October 31, 2025) All total returns on this page assume dividends and distributions were reinvested. Index figures do not include trading and management costs, which would lower performance. Indices are unmanaged and cannot be invested in directly. Performance results less than one year are not annualized. For index definitions, please see www.schwabassetmanagement.com/glossary. Index ownership – “MSCI EAFE ® ” is a registered mark of MSCI and has been licensed for use by the Schwab International Index Fund. The Schwab International Index Fund is not sponsored, endorsed, sold or promoted by MSCI and MSCI bears no liability with respect to the fund. The Statement of Additional Information contains a more detailed description of the limited relationship MSCI has with the fund. Performance does not reflect the deduction of taxes that a shareholder would pay on fund distributions or the redemption of fund shares. The fund’s performance relative to the index may be affected by fair-value pricing and timing differences in foreign exchange calculations. The net version of the index reflects reinvested dividends net of withholding taxes but reflects no deductions for expenses or other taxes. |
|
| Average Annual Return [Table Text Block] |
Average Annual Total Returns
|
|
|
|
Fund: Schwab International Index Fund (05/19/1997) 1,2 |
|
|
|
|
|
|
| All total returns on this page assume dividends and distributions were reinvested. Index figures do not include trading and management costs, which would lower performance. Indices are unmanaged and cannot be invested in directly. Performance results less than one year are not annualized. For index definitions, please see www.schwabassetmanagement.com/glossary. Index ownership – “MSCI EAFE ® ” is a registered mark of MSCI and has been licensed for use by the Schwab International Index Fund. The Schwab International Index Fund is not sponsored, endorsed, sold or promoted by MSCI and MSCI bears no liability with respect to the fund. The Statement of Additional Information contains a more detailed description of the limited relationship MSCI has with the fund. Performance does not reflect the deduction of taxes that a shareholder would pay on fund distributions or the redemption of fund shares. The fund’s performance relative to the index may be affected by fair-value pricing and timing differences in foreign exchange calculations. The net version of the index reflects reinvested dividends net of withholding taxes but reflects no deductions for expenses or other taxes. |
|
| Performance Inception Date |
May 19, 1997
|
|
| No Deduction of Taxes [Text Block] |
Performance does not reflect the deduction of taxes that a shareholder would pay on fund distributions or the redemption of fund shares.
|
|
| Updated Performance Information Location [Text Block] |
To obtain performance information current to the most recent month end, please visit www.schwabassetmanagement.com/prospectus |
|
| Net Assets |
$ 12,402,000,000
|
|
| Holdings Count | Holding |
695
|
|
| Advisory Fees Paid, Amount |
$ 6,571,561
|
|
| Investment Company, Portfolio Turnover |
10.00%
|
|
| Additional Fund Statistics [Text Block] |
|
|
|
|
|
|
Advisory Fees Paid by the Fund |
|
Weighted Average Market Cap (millions) |
|
Price/Earnings Ratio (P/E) |
|
|
|
Foreign Tax Paid and Passed Through |
|
Gross Income From Foreign Sources |
|
Qualified Dividend Income |
|
|
|
| Holdings [Text Block] |
Sector Weightings % of Investments 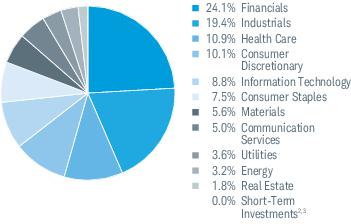 Top Equity Holdings % of Net Assets 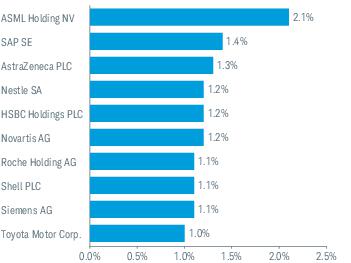 Top Country Weightings % of Investments 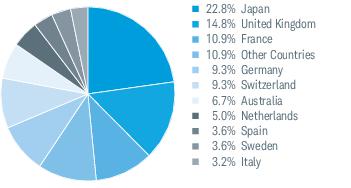 Portfolio holdings may have changed since the report date. The Sector/Industry classifications in this report use the Global Industry Cla ssifica tion Standard (GICS) which was developed by and is the exclusive property of MSCI Inc. (MSCI) and Standard & Poor’s (S&P). GICS is a service mark of MSCI and S&P and has been licensed for use by Charles Schwab & Co., Inc. Includes the fund’s position(s) in money market mutual funds registered under the Investment Company Act of 1940, as amended. |
|
| Largest Holdings [Text Block] |
Top Equity Holdings % of Net Assets Portfolio holdings may have changed since the report date. |
|
| Schwab Fundamental U.S. Large Company Index Fund |
|
|
| Shareholder Report [Line Items] |
|
|
| Fund Name |
Schwab Fundamental U.S. Large Company Index Fund
|
|
| Class Name |
Schwab Fundamental U.S. Large Company Index Fund
|
|
| Trading Symbol |
SFLNX
|
|
| Annual or Semi-Annual Statement [Text Block] |
This annual shareholder report contains important information about the fund for the period of November 1, 2024, to October 31, 2025.
|
|
| Shareholder Report Annual or Semi-Annual |
annual shareholder report
|
|
| Additional Information [Text Block] |
You can find additional information about the fund at www.schwabassetmanagement.com/prospectus . You can also request this information by calling or by sending an email request to orders@mysummaryprospectus.com .
|
|
| Additional Information Phone Number |
1-866-414-6349
|
|
| Additional Information Email |
orders@mysummaryprospectus.com
|
|
| Additional Information Website |
www.schwabassetmanagement.com/prospectus
|
|
| Expenses [Text Block] |
FUND COSTS FOR THE LAST year ENDED October 31, 2025 (BASED ON A HYPOTHETICAL $10,000 INVESTMENT)
|
|
|
Schwab Fundamental U.S. Large Company Index Fund |
|
|
|
|
| Expenses Paid, Amount |
$ 27
|
|
| Expense Ratio, Percent |
0.25%
|
|
| Factors Affecting Performance [Text Block] |
MANAGEMENT’S DISCUSSION OF FUND PERFORMANCE For the 12-month reporting period ended October 31, 2025, the fund returned 14.48%. The Russell 1000 ® Index, which serves as the fund’s regulatory index and provides a broad measure of market performance, returned 21.14%. The fund generally invests in securities that are included in the RAFI Fundamental High Liquidity US Large Index which returned 14.72% during the same period. The fund does not seek to track the regulatory index. Differences between the return of the fund and the return of the RAFI Fundamental High Liquidity US Large Index may be attributable to, among other things, the operational and transactional costs incurred by the fund and not the index. Top detractors from total return: ■ Health care sector securities, including UnitedHealth Group, Inc. ■ Materials sector securities Top contributors to total return: ■ Information technology sector securities, including Microsoft Corp. ■ Financials sector securities Portfolio holdings may have changed since the report date. |
|
| Performance Past Does Not Indicate Future [Text] |
The performance data quoted represents past performance. Past performance does not guarantee future results.
|
|
| Line Graph [Table Text Block] |
Performance of Hypothetical $10,000 Investment (October 31, 2015 - October 31, 2025) 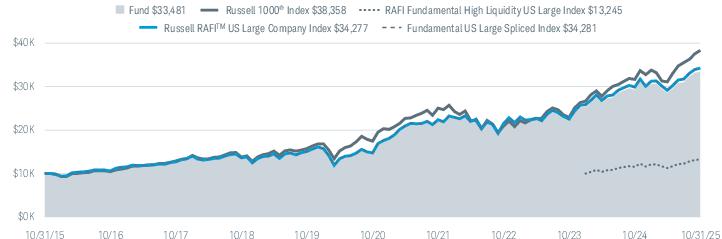 All total returns on this page assume dividends and distributions were reinvested. Index figures do not include trading and management costs, which would lower performance. Indices are unmanaged and cannot be invested in directly. Performance results less than one year are not annualized. For index definitions, please see www.schwabassetmanagement.com/glossary. Index ownership – The RAFI Fundamental High Liquidity US Large Index (the Index) is a service mark of RAFI Indices, LLC or its affiliates (collectively, RAFI) and has been licensed for use by Charles Schwab Investment Management, Inc. The intellectual and other property rights to the Index are owned by or licensed to RAFI. The Schwab Fundamental U.S. Large Company Index Fund is not sponsored, endorsed, sold or promoted by RAFI, its agents or service providers (collectively, the RAFI Parties). The RAFI Parties: (i) make no representation or warranty as to the results to be obtained from the use of the Index or otherwise; and (ii) shall not be liable (whether in negligence or otherwise) to any person for any error in the Index. For full disclaimer, please see the fund’s statement of additional information. Performance does not reflect the deduction of taxes that a shareholder would pay on fund distributions or the redemption of fund shares. The Russell 1000 ® Index serves as the fund’s regulatory index and provides a broad measure of market performance. The fund generally invests in securities that are included in the RAFI Fundamental High Liquidity US Large Index. The fund does not seek to track the regulatory index. Effective June 21, 2024, the fund changed its comparative index from the Russell RAFI™ US Large Company Index to the RAFI Fundamental High Liquidity US Large Index in connection with a change to the fund’s investment objective and investment strategy to invest its assets in accordance with the index. The inception date of the RAFI Fundamental High Liquidity US Large Index is January 31, 2024. The fund began tracking the index after the close of business on June 21, 2024. |
|
| Average Annual Return [Table Text Block] |
Average Annual Total Returns
|
|
|
|
Fund: Schwab Fundamental U.S. Large Company Index Fund (04/02/2007) 1 |
|
|
|
|
|
|
|
RAFI Fundamental High Liquidity US Large Index 3 |
|
|
|
Russell RAFI TM US Large Company Index |
|
|
|
Fundamental US Large Spliced Index |
|
|
| All total returns on this page assume dividends and distributions were reinvested. Index figures do not include trading and management costs, which would lower performance. Indices are unmanaged and cannot be invested in directly. Performance results less than one year are not annualized. For index definitions, please see www.schwabassetmanagement.com/glossary. Index ownership – The RAFI Fundamental High Liquidity US Large Index (the Index) is a service mark of RAFI Indices, LLC or its affiliates (collectively, RAFI) and has been licensed for use by Charles Schwab Investment Management, Inc. The intellectual and other property rights to the Index are owned by or licensed to RAFI. The Schwab Fundamental U.S. Large Company Index Fund is not sponsored, endorsed, sold or promoted by RAFI, its agents or service providers (collectively, the RAFI Parties). The RAFI Parties: (i) make no representation or warranty as to the results to be obtained from the use of the Index or otherwise; and (ii) shall not be liable (whether in negligence or otherwise) to any person for any error in the Index. For full disclaimer, please see the fund’s statement of additional information. Performance does not reflect the deduction of taxes that a shareholder would pay on fund distributions or the redemption of fund shares. The Russell 1000 ® Index serves as the fund’s regulatory index and provides a broad measure of market performance. The fund generally invests in securities that are included in the RAFI Fundamental High Liquidity US Large Index. The fund does not seek to track the regulatory index. Effective June 21, 2024, the fund changed its comparative index from the Russell RAFI™ US Large Company Index to the RAFI Fundamental High Liquidity US Large Index in connection with a change to the fund’s investment objective and investment strategy to invest its assets in accordance with the index. The inception date of the RAFI Fundamental High Liquidity US Large Index is January 31, 2024. The fund began tracking the index after the close of business on June 21, 2024. |
|
| Performance Inception Date |
Apr. 02, 2007
|
|
| No Deduction of Taxes [Text Block] |
Performance does not reflect the deduction of taxes that a shareholder would pay on fund distributions or the redemption of fund shares.
|
|
| Performance Table Market Index Changed [Text Block] |
Effective June 21, 2024, the fund changed its comparative index from the Russell RAFI™ US Large Company Index to the RAFI Fundamental High Liquidity US Large Index in connection with a change to the fund’s investment objective and investment strategy to invest its assets in accordance with the index. The inception date of the RAFI Fundamental High Liquidity US Large Index is January 31, 2024. The fund began tracking the index after the close of business on June 21, 2024.
|
|
| Updated Performance Information Location [Text Block] |
To obtain performance information current to the most recent month end, please visit www.schwabassetmanagement.com/prospectus |
|
| Net Assets |
$ 10,559,000,000
|
|
| Holdings Count | Holding |
731
|
|
| Advisory Fees Paid, Amount |
$ 24,530,589
|
|
| Investment Company, Portfolio Turnover |
10.00%
|
|
| Additional Fund Statistics [Text Block] |
|
|
|
|
(excludes in-kind transactions) |
|
Advisory Fees Paid by the Fund |
|
Weighted Average Market Cap (millions) |
|
Price/Earnings Ratio (P/E) |
|
|
|
Dividends Received Deduction |
|
Qualified Dividend Income |
|
|
|
| Holdings [Text Block] |
 Top Equity Holdings % of Net Assets 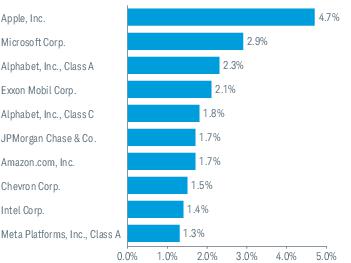 Portfolio holdings may have changed since the report da te. The Sector/Industry classifications in this report use the Global Industry Classification Standard (GICS) which was developed by and is the exclusive property of MSCI Inc. (MSCI) and Standard & Poor’s (S&P). GICS is a service mark of MSCI and S&P and has been licensed for use by Charles Schwab & Co., Inc. Includes the fund’s position(s) in money market mutual funds registered under the Investment Company Act of 1940, as amended. |
|
| Largest Holdings [Text Block] |
Top Equity Holdings % of Net Assets Portfolio holdings may have changed since the report da te. |
|
| Schwab Fundamental U.S. Small Company Index Fund |
|
|
| Shareholder Report [Line Items] |
|
|
| Fund Name |
Schwab Fundamental U.S. Small Company Index Fund
|
|
| Class Name |
Schwab Fundamental U.S. Small Company Index Fund
|
|
| Trading Symbol |
SFSNX
|
|
| Annual or Semi-Annual Statement [Text Block] |
This annual shareholder report contains important information about the fund for the period of November 1, 2024, to October 31, 2025.
|
|
| Shareholder Report Annual or Semi-Annual |
annual shareholder report
|
|
| Additional Information [Text Block] |
You can find additional information about the fund at www.schwabassetmanagement.com/prospectus . You can also request this information by calling or by sending an email request to orders@mysummaryprospectus.com .
|
|
| Additional Information Phone Number |
1-866-414-6349
|
|
| Additional Information Email |
orders@mysummaryprospectus.com
|
|
| Additional Information Website |
www.schwabassetmanagement.com/prospectus
|
|
| Expenses [Text Block] |
FUND COSTS FOR THE LAST year ENDED October 31, 2025 (BASED ON A HYPOTHETICAL $10,000 INVESTMENT)
|
|
|
Schwab Fundamental U.S. Small Company Index Fund |
|
|
|
|
| Expenses Paid, Amount |
$ 26
|
|
| Expense Ratio, Percent |
0.25%
|
|
| Factors Affecting Performance [Text Block] |
MANAGEMENT’S DISCUSSION OF FUND PERFORMANCE For the 12-month reporting period ended October 31, 2025, the fund returned 6.16%. The S&P 500 ® Index, which serves as the fund’s regulatory index and provides a broad measure of market performance, returned 21.45%. The fund generally invests in securities that are included in the RAFI Fundamental High Liquidity US Small Index which returned 6.32% during the same period. The fund does not seek to track the regulatory index. Differences between the return of the fund and the return of the RAFI Fundamental High Liquidity US Small Index may be attributable to, among other things, the operational and transactional costs incurred by the fund and not the index. Top detractors from total return: ■ Consumer staples sector securities, including Spectrum Brands Holdings, Inc. ■ Health care sector securities Top contributors to total return: ■ Information technology sector securities, including ViaSat, Inc. ■ Industrials sector securities Portfolio holdings may have changed since the report date. |
|
| Performance Past Does Not Indicate Future [Text] |
The performance data quoted represents past performance. Past performance does not guarantee future results.
|
|
| Line Graph [Table Text Block] |
Performance of Hypothetical $10,000 Investment (October 31, 2015 - October 31, 2025) All total returns on this page assume dividends and distributions were reinvested. Index figures do not include trading and management costs, which would lower performance. Indices are unmanaged and cannot be invested in directly. Performance results less than one year are not annualized. For index definitions, please see www.schwabassetmanagement.com/glossary. Index ownership – The RAFI Fundamental High Liquidity US Small Index (the Index) is a service mark of RAFI Indices, LLC or its affiliates (collectively, RAFI) and has been licensed for use by Charles Schwab Investment Management, Inc. The intellectual and other property rights to the Index are owned by or licensed to RAFI. The Schwab Fundamental U.S. Small Company Index Fund is not sponsored, endorsed, sold or promoted by RAFI, its agents or service providers (collectively, the RAFI Parties). The RAFI Parties: (i) make no representation or warranty as to the results to be obtained from the use of the Index or otherwise; and (ii) shall not be liable (whether in negligence or otherwise) to any person for any error in the Index. For full disclaimer, please see the fund’s statement of additional information. Performance does not reflect the deduction of taxes that a shareholder would pay on fund distributions or the redemption of fund shares. The S&P 500 ® Index serves as the fund’s regulatory index and provides a broad measure of market performance. The fund generally invests in securities that are included in the RAFI Fundamental High Liquidity US Small Index. The fund does not seek to track the regulatory index. Effective June 21, 2024, the fund changed its comparative index from the Russell RAFI™ US Small Company Index to the RAFI Fundamental High Liquidity US Small Index in connection with a change to the fund’s investment objective and investment strategy to invest its assets in accordance with the index. The inception date of the RAFI Fundamental High Liquidity US Small Index is January 31, 2024. The fund began tracking the index after the close of business on June 21, 2024. |
|
| Average Annual Return [Table Text Block] |
Average Annual Total Returns
|
|
|
|
Fund: Schwab Fundamental U.S. Small Company Index Fund (04/02/2007) 1 |
|
|
|
|
|
|
|
RAFI Fundamental High Liquidity US Small Index 3 |
|
|
|
Russell RAFI TM US Small Company Index |
|
|
|
Fundamental US Small Spliced Index |
|
|
|
|
|
|
| All total returns on this page assume dividends and distributions were reinvested. Index figures do not include trading and management costs, which would lower performance. Indices are unmanaged and cannot be invested in directly. Performance results less than one year are not annualized. For index definitions, please see www.schwabassetmanagement.com/glossary. Index ownership – The RAFI Fundamental High Liquidity US Small Index (the Index) is a service mark of RAFI Indices, LLC or its affiliates (collectively, RAFI) and has been licensed for use by Charles Schwab Investment Management, Inc. The intellectual and other property rights to the Index are owned by or licensed to RAFI. The Schwab Fundamental U.S. Small Company Index Fund is not sponsored, endorsed, sold or promoted by RAFI, its agents or service providers (collectively, the RAFI Parties). The RAFI Parties: (i) make no representation or warranty as to the results to be obtained from the use of the Index or otherwise; and (ii) shall not be liable (whether in negligence or otherwise) to any person for any error in the Index. For full disclaimer, please see the fund’s statement of additional information. Performance does not reflect the deduction of taxes that a shareholder would pay on fund distributions or the redemption of fund shares. The S&P 500 ® Index serves as the fund’s regulatory index and provides a broad measure of market performance. The fund generally invests in securities that are included in the RAFI Fundamental High Liquidity US Small Index. The fund does not seek to track the regulatory index. Effective June 21, 2024, the fund changed its comparative index from the Russell RAFI™ US Small Company Index to the RAFI Fundamental High Liquidity US Small Index in connection with a change to the fund’s investment objective and investment strategy to invest its assets in accordance with the index. The inception date of the RAFI Fundamental High Liquidity US Small Index is January 31, 2024. The fund began tracking the index after the close of business on June 21, 2024. |
|
| Performance Inception Date |
Apr. 02, 2007
|
|
| No Deduction of Taxes [Text Block] |
Performance does not reflect the deduction of taxes that a shareholder would pay on fund distributions or the redemption of fund shares.
|
|
| Performance Table Market Index Changed [Text Block] |
Effective June 21, 2024, the fund changed its comparative index from the Russell RAFI™ US Small Company Index to the RAFI Fundamental High Liquidity US Small Index in connection with a change to the fund’s investment objective and investment strategy to invest its assets in accordance with the index. The inception date of the RAFI Fundamental High Liquidity US Small Index is January 31, 2024. The fund began tracking the index after the close of business on June 21, 2024.
|
|
| Updated Performance Information Location [Text Block] |
To obtain performance information current to the most recent month end, please visit www.schwabassetmanagement.com/prospectus |
|
| Net Assets |
$ 1,747,000,000
|
|
| Holdings Count | Holding |
969
|
|
| Advisory Fees Paid, Amount |
$ 4,371,488
|
|
| Investment Company, Portfolio Turnover |
30.00%
|
|
| Additional Fund Statistics [Text Block] |
|
|
|
|
(excludes in-kind transactions) |
|
Advisory Fees Paid by the Fund |
|
Weighted Average Market Cap (millions) |
|
Price/Earnings Ratio (P/E) |
|
|
|
Dividends Received Deduction |
|
Qualified Dividend Income |
|
Qualified Business Income (199A) |
|
|
|
| Holdings [Text Block] |
Sector Weightings % of Investments Top Equity Holdings % of Net Assets Portfolio holdings may have changed since the report date. The Sector/Industry classifications in this report use the Global Industry Classification Standard (GICS) which was developed by and is the exclusive property of MSCI Inc. (MSCI) and Standard & Poor’s (S&P). GICS is a service mark of MSCI and S&P and has been licensed for use by Charles Schwab & Co., Inc. Includes the fund’s position(s) in money market mutual funds registered under the Investment Company Act of 1940, as amended. |
|
| Largest Holdings [Text Block] |
Top Equity Holdings % of Net Assets Portfolio holdings may have changed since the report date. |
|
| Schwab Fundamental International Equity Index Fund |
|
|
| Shareholder Report [Line Items] |
|
|
| Fund Name |
Schwab Fundamental International Equity Index Fund
|
|
| Class Name |
Schwab Fundamental International Equity Index Fund
|
|
| Trading Symbol |
SFNNX
|
|
| Annual or Semi-Annual Statement [Text Block] |
This annual shareholder report contains important information about the fund for the period of November 1, 2024, to October 31, 2025.
|
|
| Shareholder Report Annual or Semi-Annual |
annual shareholder report
|
|
| Additional Information [Text Block] |
You can find additional information about the fund at www.schwabassetmanagement.com/prospectus . You can also request this information by calling or by sending an email request to orders@mysummaryprospectus.com .
|
|
| Additional Information Phone Number |
1-866-414-6349
|
|
| Additional Information Email |
orders@mysummaryprospectus.com
|
|
| Additional Information Website |
www.schwabassetmanagement.com/prospectus
|
|
| Expenses [Text Block] |
FUND COSTS FOR THE LAST year ENDED October 31, 2025 (BASED ON A HYPOTHETICAL $10,000 INVESTMENT)
|
|
|
Schwab Fundamental International Equity Index Fund |
|
|
|
|
| Expenses Paid, Amount |
$ 29
|
|
| Expense Ratio, Percent |
0.25%
|
|
| Factors Affecting Performance [Text Block] |
MANAGEMENT’S DISCUSSION OF FUND PERFORMANCE For the 12-month reporting period ended October 31, 2025, the fund returned 28.74%. The MSCI EAFE ® Index (Net) 1 , which serves as the fund’s regulatory index and provides a broad measure of market performance, returned 23.03%. The fund generally invests in securities that are included in the RAFI Fundamental High Liquidity Developed ex US Large Index (Net) 1 which returned 28.47% during the same period. The fund does not seek to track the regulatory index. Top contributors to total return: ■ Japanese securities, including SoftBank Group Corp. ■ Securities from the United Kingdom Top detractors from total return: ■ Danish securities, including Class B holdings of Novo Nordisk AS ■ Securities from New Zealand Portfolio holdings may have changed since the report date. The net version of the index reflects reinvested dividends net of withholding taxes but reflects no deductions for expenses or other taxes. |
|
| Performance Past Does Not Indicate Future [Text] |
The performance data quoted represents past performance. Past performance does not guarantee future results.
|
|
| Line Graph [Table Text Block] |
Performance of Hypothetical $10,000 Investment (October 31, 2015 - October 31, 2025) All total returns on this page assume dividends and distributions were reinvested. Index figures do not include trading and management costs, which would lower performance. Indices are unmanaged and cannot be invested in directly. Performance results less than one year are not annualized. For index definitions, please see www.schwabassetmanagement.com/glossary. Index ownership – The RAFI Fundamental High Liquidity Developed ex US Large Index (the Index) is a service mark of RAFI Indices, LLC or its affiliates (collectively, RAFI) and has been licensed for use by Charles Schwab Investment Management, Inc. The intellectual and other property rights to the Index are owned by or licensed to RAFI. The Schwab Fundamental International Equity Index Fund is not sponsored, endorsed, sold or promoted by RAFI, its agents or service providers (collectively, the RAFI Parties). The RAFI Parties: (i) make no representation or warranty as to the results to be obtained from the use of the Index or otherwise; and (ii) shall not be liable (whether in negligence or otherwise) to any person for any error in the Index. For full disclaimer, please see the fund’s statement of additional information. Performance does not reflect the deduction of taxes that a shareholder would pay on fund distributions or the redemption of fund shares. The fund’s performance relative to the index may be affected by fair-value pricing and timing differences in foreign exchange calculations. The net version of the index reflects reinvested dividends net of withholding taxes but reflects no deductions for expenses or other taxes. The MSCI EAFE ® Index (Net) serves as the fund’s regulatory index and provides a broad measure of market performance. The fund generally invests in securities that are included in the RAFI Fundamental High Liquidity Developed ex US Large Index (Net). The fund does not seek to track the regulatory index. Effective June 21, 2024, the fund changed its comparative index from the Russell RAFI™ Developed ex US Large Company Index (Net) to the RAFI Fundamental High Liquidity Developed ex US Large Index (Net) in connection with a change to the fund’s investment objective and investment strategy to invest its assets in accordance with the index. The inception date of the RAFI Fundamental High Liquidity Developed ex US Large Index (Net) is January 31, 2024. The fund began tracking the index after the close of business on June 21, 2024. |
|
| Average Annual Return [Table Text Block] |
Average Annual Total Returns
|
|
|
|
Fund: Schwab Fundamental International Equity Index Fund (04/02/2007) 1,2 |
|
|
|
MSCI EAFE ® Index (Net) 3,4 |
|
|
|
RAFI Fundamental High Liquidity Developed ex US Large Index (Net) 3,5 |
|
|
|
Russell RAFI TM Developed ex US Large Company Index (Net) 3 |
|
|
|
Fundamental Developed ex US Large Spliced Index |
|
|
| All total returns on this page assume dividends and distributions were reinvested. Index figures do not include trading and management costs, which would lower performance. Indices are unmanaged and cannot be invested in directly. Performance results less than one year are not annualized. For index definitions, please see www.schwabassetmanagement.com/glossary. Index ownership – The RAFI Fundamental High Liquidity Developed ex US Large Index (the Index) is a service mark of RAFI Indices, LLC or its affiliates (collectively, RAFI) and has been licensed for use by Charles Schwab Investment Management, Inc. The intellectual and other property rights to the Index are owned by or licensed to RAFI. The Schwab Fundamental International Equity Index Fund is not sponsored, endorsed, sold or promoted by RAFI, its agents or service providers (collectively, the RAFI Parties). The RAFI Parties: (i) make no representation or warranty as to the results to be obtained from the use of the Index or otherwise; and (ii) shall not be liable (whether in negligence or otherwise) to any person for any error in the Index. For full disclaimer, please see the fund’s statement of additional information. Performance does not reflect the deduction of taxes that a shareholder would pay on fund distributions or the redemption of fund shares. The fund’s performance relative to the index may be affected by fair-value pricing and timing differences in foreign exchange calculations. The net version of the index reflects reinvested dividends net of withholding taxes but reflects no deductions for expenses or other taxes. The MSCI EAFE ® Index (Net) serves as the fund’s regulatory index and provides a broad measure of market performance. The fund generally invests in securities that are included in the RAFI Fundamental High Liquidity Developed ex US Large Index (Net). The fund does not seek to track the regulatory index. Effective June 21, 2024, the fund changed its comparative index from the Russell RAFI™ Developed ex US Large Company Index (Net) to the RAFI Fundamental High Liquidity Developed ex US Large Index (Net) in connection with a change to the fund’s investment objective and investment strategy to invest its assets in accordance with the index. The inception date of the RAFI Fundamental High Liquidity Developed ex US Large Index (Net) is January 31, 2024. The fund began tracking the index after the close of business on June 21, 2024. |
|
| Performance Inception Date |
Apr. 02, 2007
|
|
| No Deduction of Taxes [Text Block] |
Performance does not reflect the deduction of taxes that a shareholder would pay on fund distributions or the redemption of fund shares.
|
|
| Performance Table Market Index Changed [Text Block] |
Effective June 21, 2024, the fund changed its comparative index from the Russell RAFI™ Developed ex US Large Company Index (Net) to the RAFI Fundamental High Liquidity Developed ex US Large Index (Net) in connection with a change to the fund’s investment objective and investment strategy to invest its assets in accordance with the index. The inception date of the RAFI Fundamental High Liquidity Developed ex US Large Index (Net) is January 31, 2024. The fund began tracking the index after the close of business on June 21, 2024.
|
|
| Updated Performance Information Location [Text Block] |
To obtain performance information current to the most recent month end, please visit www.schwabassetmanagement.com/prospectus
|
|
| Net Assets |
$ 3,824,000,000
|
|
| Holdings Count | Holding |
925
|
|
| Advisory Fees Paid, Amount |
$ 8,247,882
|
|
| Investment Company, Portfolio Turnover |
20.00%
|
|
| Additional Fund Statistics [Text Block] |
|
|
|
|
|
|
Advisory Fees Paid by the Fund |
|
Weighted Average Market Cap (millions) |
|
Price/Earnings Ratio (P/E) |
|
|
|
Foreign Tax Paid and Passed Through |
|
Gross Income From Foreign Sources |
|
Qualified Dividend Income |
|
|
|
| Holdings [Text Block] |
Sector Weightings % of Investments Top Equity Holdings % of Net Assets Top Country Weightings % of Investments Portfolio holdings may have changed since the report date. The Sector/Industry classifications in this report use the Global Industry Classification Standard (GICS) which was developed by and is the exclusive propert y of MSCI Inc. (MSCI) and Standard & Poor’s (S&P). GICS is a service mark of MSCI and S&P and has been licensed for use by Charles Schwab & Co., Inc. Includes the fund’s position(s) in money market mutual funds registered under the Investment Company Act of 1940, as amended. |
|
| Largest Holdings [Text Block] |
Top Equity Holdings % of Net Assets Portfolio holdings may have changed since the report date. |
|
| Schwab Fundamental International Small Equity Index Fund |
|
|
| Shareholder Report [Line Items] |
|
|
| Fund Name |
Schwab Fundamental International Small Equity Index Fund
|
|
| Class Name |
Schwab Fundamental International Small Equity Index Fund
|
|
| Trading Symbol |
SFILX
|
|
| Annual or Semi-Annual Statement [Text Block] |
This annual shareholder report contains important information about the fund for the period of November 1, 2024, to October 31, 2025.
|
|
| Shareholder Report Annual or Semi-Annual |
annual shareholder report
|
|
| Additional Information [Text Block] |
You can find additional information about the fund at www.schwabassetmanagement.com/prospectus . You can also request this information by calling or by sending an email request to orders@mysummaryprospectus.com .
|
|
| Additional Information Phone Number |
1-866-414-6349
|
|
| Additional Information Email |
orders@mysummaryprospectus.com
|
|
| Additional Information Website |
www.schwabassetmanagement.com/prospectus
|
|
| Expenses [Text Block] |
FUND COSTS FOR THE LAST year ENDED October 31, 2025 (BASED ON A HYPOTHETICAL $10,000 INVESTMENT)
|
|
|
Schwab Fundamental International Small Equity Index Fund |
|
|
|
|
| Expenses Paid, Amount |
$ 44
|
|
| Expense Ratio, Percent |
0.39%
|
|
| Factors Affecting Performance [Text Block] |
MANAGEMENT’S DISCUSSION OF FUND PERFORMANCE For the 12-month reporting period ended October 31, 2025, the fund returned 27.67%. The MSCI EAFE ® Index (Net) 1 , which serves as the fund’s regulatory index and provides a broad measure of market performance, returned 23.03%. The fund generally invests in securities that are included in the RAFI Fundamental High Liquidity Developed ex US Small Index (Net) 1 which returned 27.92% during the same period. The fund does not seek to track the regulatory index. Differences between the return of the fund and the return of the RAFI Fundamental High Liquidity Developed ex US Small Index (Net) 1 may be attributable to, among other things, the operational and transactional costs incurred by the fund and not the index. Over the reporting period, no sectors detracted from the return of the fund. However, the smallest contributors to total return were: ■ Peruvian securities, including Hochschild Mining PLC (which was sold prior to the end of the reporting period) Top contributors to total return: ■ Japanese securities, including Ibiden Co. Ltd. Portfolio holdings may have changed since the report date. The net version of the index reflects reinvested dividends net of withholding taxes but reflects no deductions for expenses or other taxes. |
|
| Performance Past Does Not Indicate Future [Text] |
The performance data quoted represents past performance. Past performance does not guarantee future results.
|
|
| Line Graph [Table Text Block] |
Performance of Hypothetical $10,000 Investment (October 31, 2015 - October 31, 2025) 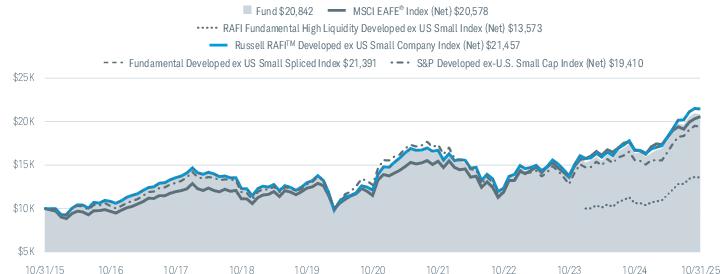 All total returns on this page assume dividends and distributions were reinvested. Index figures do not include trading and management costs, which would lower performanc e. Indices are unmanaged and cannot be invested in directly. Performance results less than one year are not annualized. For index definitions, please see www.schwabassetmanagement.com/glossary. Index ownership – The RAFI Fundamental High Liquidity Developed ex US Small Index (the Index) is a service mark of RAFI Indices, LLC or its affiliates (collectively, RAFI) and has been licensed for use by Charles Schwab Investment Management, Inc. The intellectual and other property rights to the Index are owned by or licensed to RAFI. The Schwab Fundamental International Small Equity Index Fund is not sponsored, endorsed, sold or promoted by RAFI, its agents or service providers (collectively, the RAFI Parties). The RAFI Parties: (i) make no representation or warranty as to the results to be obtained from the use of the Index or otherwise; and (ii) shall not be liable (whether in negligence or otherwise) to any person for any error in the Index. For full disclaimer, please see the fund’s statement of additional information. Performance does not reflect the deduction of taxes that a shareholder would pay on fund distributions or the redemption of fund shares. The fund’s performance relative to the index may be affected by fair-value pricing and timing differences in foreign exchange calculations. The net version of the index reflects reinvested dividends net of withholding taxes but reflects no deductions for expenses or other taxes. The MSCI EAFE ® Index (Net) serves as the fund’s regulatory index and provides a broad measure of market performance. The fund generally invests in securities that are included in the RAFI Fundamental High Liquidity Developed ex US Small Index (Net). The fund does not seek to track the regulatory index. Effective June 21, 2024, the fund changed its comparative index from the Russell RAFI™ Developed ex US Small Company Index (Net) to the RAFI Fundamental High Liquidity Developed ex US Small Index (Net) in connection with a change to the fund’s investment objective and investment strategy to invest its assets in accordance with the index. The inception date of the RAFI Fundamental High Liquidity Developed ex US Small Index (Net) is January 31, 2024. The fund began tracking the index after the close of business on June 21, 2024. |
|
| Average Annual Return [Table Text Block] |
Average Annual Total Returns
|
|
|
|
Fund: Schwab Fundamental International Small Equity Index Fund (01/31/2008) 1,2 |
|
|
|
MSCI EAFE ® Index (Net) 3,4 |
|
|
|
RAFI Fundamental High Liquidity Developed ex US Small Index (Net) 3,5 |
|
|
|
Russell RAFI TM Developed ex US Small Company Index (Net) 3 |
|
|
|
Fundamental Developed ex US Small Spliced Index |
|
|
|
S&P Developed ex-U.S. Small Cap Index (Net) 3 |
|
|
| All total returns on this page assume dividends and distributions were reinvested. Index figures do not include trading and management costs, which would lower performanc e. Indices are unmanaged and cannot be invested in directly. Performance results less than one year are not annualized. For index definitions, please see www.schwabassetmanagement.com/glossary. Index ownership – The RAFI Fundamental High Liquidity Developed ex US Small Index (the Index) is a service mark of RAFI Indices, LLC or its affiliates (collectively, RAFI) and has been licensed for use by Charles Schwab Investment Management, Inc. The intellectual and other property rights to the Index are owned by or licensed to RAFI. The Schwab Fundamental International Small Equity Index Fund is not sponsored, endorsed, sold or promoted by RAFI, its agents or service providers (collectively, the RAFI Parties). The RAFI Parties: (i) make no representation or warranty as to the results to be obtained from the use of the Index or otherwise; and (ii) shall not be liable (whether in negligence or otherwise) to any person for any error in the Index. For full disclaimer, please see the fund’s statement of additional information. Performance does not reflect the deduction of taxes that a shareholder would pay on fund distributions or the redemption of fund shares. The fund’s performance relative to the index may be affected by fair-value pricing and timing differences in foreign exchange calculations. The net version of the index reflects reinvested dividends net of withholding taxes but reflects no deductions for expenses or other taxes. The MSCI EAFE ® Index (Net) serves as the fund’s regulatory index and provides a broad measure of market performance. The fund generally invests in securities that are included in the RAFI Fundamental High Liquidity Developed ex US Small Index (Net). The fund does not seek to track the regulatory index. Effective June 21, 2024, the fund changed its comparative index from the Russell RAFI™ Developed ex US Small Company Index (Net) to the RAFI Fundamental High Liquidity Developed ex US Small Index (Net) in connection with a change to the fund’s investment objective and investment strategy to invest its assets in accordance with the index. The inception date of the RAFI Fundamental High Liquidity Developed ex US Small Index (Net) is January 31, 2024. The fund began tracking the index after the close of business on June 21, 2024. |
|
| Performance Inception Date |
Jan. 31, 2008
|
|
| No Deduction of Taxes [Text Block] |
Performance does not reflect the deduction of taxes that a shareholder would pay on fund distributions or the redemption of fund shares.
|
|
| Performance Table Market Index Changed [Text Block] |
Effective June 21, 2024, the fund changed its comparative index from the Russell RAFI™ Developed ex US Small Company Index (Net) to the RAFI Fundamental High Liquidity Developed ex US Small Index (Net) in connection with a change to the fund’s investment objective and investment strategy to invest its assets in accordance with the index. The inception date of the RAFI Fundamental High Liquidity Developed ex US Small Index (Net) is January 31, 2024. The fund began tracking the index after the close of business on June 21, 2024.
|
|
| Updated Performance Information Location [Text Block] |
To obtain performance information current to the most recent month end, please visit www.schwabassetmanagement.com/prospectus |
|
| Net Assets |
$ 666,000,000
|
|
| Holdings Count | Holding |
1,695
|
|
| Advisory Fees Paid, Amount |
$ 2,365,972
|
|
| Investment Company, Portfolio Turnover |
27.00%
|
|
| Additional Fund Statistics [Text Block] |
|
|
|
|
|
|
Advisory Fees Paid by the Fund |
|
Weighted Average Market Cap (millions) |
|
Price/Earnings Ratio (P/E) |
|
|
|
Foreign Tax Paid and Passed Through |
|
Gross Income From Foreign Sources |
|
Qualified Dividend Income |
|
Long Term Capital Gain Distribution |
|
|
|
| Holdings [Text Block] |
Sector Weightings % of Investments 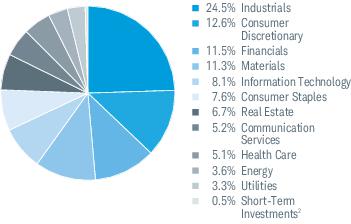 Top Equity Holdings % of Net Assets 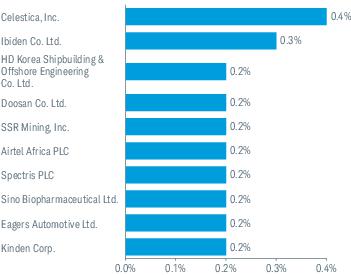 Top Country Weightings % of Investments 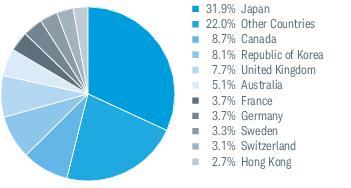 Portfolio holdings may have changed since the report date. The Sector/Industry classifications in this report use the Global Industry Classification Standard (GICS) which was developed by and is the exclusive property of MSCI Inc. (MS CI) and Standard & Poor’s (S&P). GICS is a service mark of MSCI and S&P and has been licensed for use by Charles Schwab & Co., Inc. Includes the fund’s position(s) in money market mutual funds registered under the Investment Company Act of 1940, as amended. |
|
| Largest Holdings [Text Block] |
Top Equity Holdings % of Net Assets Portfolio holdings may have changed since the report date. |
|
| Schwab Fundamental Emerging Markets Equity Index Fund |
|
|
| Shareholder Report [Line Items] |
|
|
| Fund Name |
Schwab Fundamental Emerging Markets Equity Index Fund
|
|
| Class Name |
Schwab Fundamental Emerging Markets Equity Index Fund
|
|
| Trading Symbol |
SFENX
|
|
| Annual or Semi-Annual Statement [Text Block] |
This annual shareholder report contains important information about the fund for the period of November 1, 2024, to October 31, 2025.
|
|
| Shareholder Report Annual or Semi-Annual |
annual shareholder report
|
|
| Additional Information [Text Block] |
You can find additional information about the fund at www.schwabassetmanagement.com/prospectus . You can also request this information by calling or by sending an email request to orders@mysummaryprospectus.com .
|
|
| Additional Information Phone Number |
1-866-414-6349
|
|
| Additional Information Email |
orders@mysummaryprospectus.com
|
|
| Additional Information Website |
www.schwabassetmanagement.com/prospectus
|
|
| Expenses [Text Block] |
FUND COSTS FOR THE LAST year ENDED October 31, 2025 (BASED ON A HYPOTHETICAL $10,000 INVESTMENT)
|
|
|
Schwab Fundamental Emerging Markets Equity Index Fund |
|
|
|
|
| Expenses Paid, Amount |
$ 44
|
|
| Expense Ratio, Percent |
0.39%
|
|
| Factors Affecting Performance [Text Block] |
MANAGEMENT’S DISCUSSION OF FUND PERFORMANCE For the 12-month reporting period ended October 31, 2025, the fund returned 23.27%. The MSCI Emerging Markets Index (Net) 1 , which serves as the fund’s regulatory index and provides a broad measure of market performance, returned 27.91%. The fund generally invests in securities that are included in the RAFI Fundamental High Liquidity Emerging Markets Index (Net) 1 which returned 23.42% during the same period. The fund does not seek to track the regulatory index. Differences between the return of the fund and the return of the RAFI Fundamental High Liquidity Emerging Markets Index (Net) 1 may be attributable to, among other things, the operational and transactional costs incurred by the fund and not the index. Top detractors from total return: ■ Indian securities, including Infosys Ltd. Top contributors to total return: ■ Chinese securities, including Alibaba Group Holding Ltd. Portfolio holdings may have changed since the report date. The net version of the index reflects reinvested dividends net of withholding taxes but reflects no deductions for expenses or other taxes. |
|
| Performance Past Does Not Indicate Future [Text] |
The performance data quoted represents past performance. Past performance does not guarantee future results.
|
|
| Line Graph [Table Text Block] |
Performance of Hypothetical $10,000 Investment (October 31, 2015 - October 31, 2025) All total returns on this page assume dividends and distributions were reinvested. Index figures do not include trading and management costs, which would lower performan ce. Indices are unmanaged and cannot be invested in directly. Performance results less than one year are not annualized. For index definitions, please see www.schwabassetmanagement.com/glossary. Index ownership – The RAFI Fundamental High Liquidity Emerging Markets Index (the Index) is a service mark of RAFI Indices, LLC or its affiliates (collectively, RAFI) and has been licensed for use by Charles Schwab Investment Management, Inc. The intellectual and other property rights to the Index are owned by or licensed to RAFI. The Schwab Fundamental Emerging Markets Equity Index Fund is not sponsored, endorsed, sold or promoted by RAFI, its agents or service providers (collectively, the RAFI Parties). The RAFI Parties: (i) make no representation or warranty as to the results to be obtained from the use of the Index or otherwise; and (ii) shall not be liable (whether in negligence or otherwise) to any person for any error in the Index. For full disclaimer, please see the fund’s statement of additional information. Performance does not reflect the deduction of taxes that a shareholder would pay on fund distributions or the redemption of fund shares. The fund’s performance relative to the index may be affected by fair-value pricing and timing differences in foreign exchange calculations. The net version of the index reflects reinvested dividends net of withholding taxes but reflects no deductions for expenses or other taxes. The MSCI Emerging Markets Index (Net) serves as the fund’s regulatory index and provides a broad measure of market performance. The fund generally invests in securities that are included in the RAFI Fundamental High Liquidity Emerging Markets Index (Net). The fund does not seek to track the regulatory index. Effective June 21, 2024, the fund changed its comparative index from the Russell RAFI™ Emerging Markets Large Company Index (Net) to the RAFI Fundamental High Liquidity Emerging Markets Index (Net) in connection with a change to the fund’s investment objective and investment strategy to invest its assets in accordance with the index. The inception date of the RAFI Fundamental High Liquidity Emerging Markets Index (Net) is January 31, 2024. The fund began tracking the index after the close of business on June 21, 2024. |
|
| Average Annual Return [Table Text Block] |
Average Annual Total Returns
|
|
|
|
Fund: Schwab Fundamental Emerging Markets Equity Index Fund (01/31/2008) 1,2 |
|
|
|
MSCI Emerging Markets Index (Net) 3,4 |
|
|
|
RAFI Fundamental High Liquidity Emerging Markets Index (Net) 3,5 |
|
|
|
Russell RAFI TM Emerging Markets Large Company Index (Net) 3 |
|
|
|
Fundamental Emerging Markets Spliced Index |
|
|
| All total returns on this page assume dividends and distributions were reinvested. Index figures do not include trading and management costs, which would lower performan ce. Indices are unmanaged and cannot be invested in directly. Performance results less than one year are not annualized. For index definitions, please see www.schwabassetmanagement.com/glossary. Index ownership – The RAFI Fundamental High Liquidity Emerging Markets Index (the Index) is a service mark of RAFI Indices, LLC or its affiliates (collectively, RAFI) and has been licensed for use by Charles Schwab Investment Management, Inc. The intellectual and other property rights to the Index are owned by or licensed to RAFI. The Schwab Fundamental Emerging Markets Equity Index Fund is not sponsored, endorsed, sold or promoted by RAFI, its agents or service providers (collectively, the RAFI Parties). The RAFI Parties: (i) make no representation or warranty as to the results to be obtained from the use of the Index or otherwise; and (ii) shall not be liable (whether in negligence or otherwise) to any person for any error in the Index. For full disclaimer, please see the fund’s statement of additional information. Performance does not reflect the deduction of taxes that a shareholder would pay on fund distributions or the redemption of fund shares. The fund’s performance relative to the index may be affected by fair-value pricing and timing differences in foreign exchange calculations. The net version of the index reflects reinvested dividends net of withholding taxes but reflects no deductions for expenses or other taxes. The MSCI Emerging Markets Index (Net) serves as the fund’s regulatory index and provides a broad measure of market performance. The fund generally invests in securities that are included in the RAFI Fundamental High Liquidity Emerging Markets Index (Net). The fund does not seek to track the regulatory index. Effective June 21, 2024, the fund changed its comparative index from the Russell RAFI™ Emerging Markets Large Company Index (Net) to the RAFI Fundamental High Liquidity Emerging Markets Index (Net) in connection with a change to the fund’s investment objective and investment strategy to invest its assets in accordance with the index. The inception date of the RAFI Fundamental High Liquidity Emerging Markets Index (Net) is January 31, 2024. The fund began tracking the index after the close of business on June 21, 2024. |
|
| Performance Inception Date |
Jan. 31, 2008
|
|
| No Deduction of Taxes [Text Block] |
Performance does not reflect the deduction of taxes that a shareholder would pay on fund distributions or the redemption of fund shares.
|
|
| Performance Table Market Index Changed [Text Block] |
Effective June 21, 2024, the fund changed its comparative index from the Russell RAFI™ Emerging Markets Large Company Index (Net) to the RAFI Fundamental High Liquidity Emerging Markets Index (Net) in connection with a change to the fund’s investment objective and investment strategy to invest its assets in accordance with the index. The inception date of the RAFI Fundamental High Liquidity Emerging Markets Index (Net) is January 31, 2024. The fund began tracking the index after the close of business on June 21, 2024.
|
|
| Updated Performance Information Location [Text Block] |
To obtain performance information current to the most recent month end, please visit www.schwabassetmanagement.com/prospectus |
|
| Net Assets |
$ 1,340,000,000
|
|
| Holdings Count | Holding |
365
|
|
| Advisory Fees Paid, Amount |
$ 4,125,808
|
|
| Investment Company, Portfolio Turnover |
21.00%
|
|
| Additional Fund Statistics [Text Block] |
|
|
|
|
|
|
Advisory Fees Paid by the Fund |
|
Weighted Average Market Cap (millions) |
|
Price/Earnings Ratio (P/E) |
|
|
|
Foreign Tax Paid and Passed Through |
|
Gross Income From Foreign Sources |
|
Qualified Dividend Income |
|
|
|
| Holdings [Text Block] |
Sector Weightings % of Investments Top Equity Holdings % of Net Assets Top Country Weightings % of Investments Portfolio holdings may have changed since the report date. The Sector/Industry classifications in this report use the Global Industry Classification Standard (GICS) which was developed by and is the exclusive property of MSCI Inc. (MSCI) and Standard & Poor’s (S&P). GICS is a service mark of MSCI and S&P and has been licensed for use by Charles Schwab & Co., Inc. Includes the fund’s position(s) in money market mutual funds registered under the Investment Company Act of 1940, as amended. |
|
| Largest Holdings [Text Block] |
Top Equity Holdings % of Net Assets Portfolio holdings may have changed since the report date. |
|
| Schwab Balanced Fund |
|
|
| Shareholder Report [Line Items] |
|
|
| Fund Name |
Schwab Balanced Fund
|
|
| Class Name |
Schwab Balanced Fund
|
|
| Trading Symbol |
SWOBX
|
|
| Annual or Semi-Annual Statement [Text Block] |
This annual shareholder report contains important information about the fund for the period of November 1, 2024, to October 31, 2025.
|
|
| Shareholder Report Annual or Semi-Annual |
annual shareholder report
|
|
| Additional Information [Text Block] |
You can find additional information about the fund at www.schwabassetmanagement.com/prospectus . You can also request this information by calling or by sending an email request to orders@mysummaryprospectus.com .
|
|
| Additional Information Phone Number |
1-866-414-6349
|
|
| Additional Information Email |
orders@mysummaryprospectus.com
|
|
| Additional Information Website |
www.schwabassetmanagement.com/prospectus
|
|
| Expenses [Text Block] |
FUND COSTS FOR THE LAST year ENDED October 31, 2025 (BASED ON A HYPOTHETICAL $10,000 INVESTMENT)
* Expenses were reduced by a contractual fee waiver in effect for so long as the investment adviser serves as adviser to the fund. This agreement to limit the total annual fund operating expenses is limited to the fund’s direct operating expenses and, therefore, does not apply to acquired fund fees and expenses (AFFE), which are indirect expenses incurred by the fund through its investments in the underlying funds.
|
|
| Expenses Paid, Amount |
$ 0
|
[2] |
| Expense Ratio, Percent |
0.00%
|
[2] |
| Factors Affecting Performance [Text Block] |
MANAGEMENT’S DISCUSSION OF FUND PERFORMANCE For the 12-month reporting period ended October 31, 2025, the fund returned 14.27%. The S&P 500 ® Index, which provides a broad measure of equity market performance, and the Bloomberg US Aggregate Bond Index, which provides a broad measure of bond market performance, returned 21.45% and 6.16%, respectively. The fund’s internally calculated comparative index, the Balanced Blended Index (the composite index), returned 14.90%. ■ Asset allocations were broadly in line with those of the composite index ■ Top contributors to total return: ● Schwab Core Equity Fund ● Schwab Select Large Cap Growth Fund ■ Over the reporting period, there were no detractors from the return of the fund. However, the smallest contributors to total return were: ● Schwab Small-Cap Equity Fund ● Schwab International Opportunities Fund Portfolio holdings may have changed since the report date. |
|
| Performance Past Does Not Indicate Future [Text] |
The performance data quoted represents past performance. Past performance does not guarantee future results.
|
|
| Line Graph [Table Text Block] |
Performance of Hypothetical $10,000 Investment (October 31, 2015 - October 31, 2025) 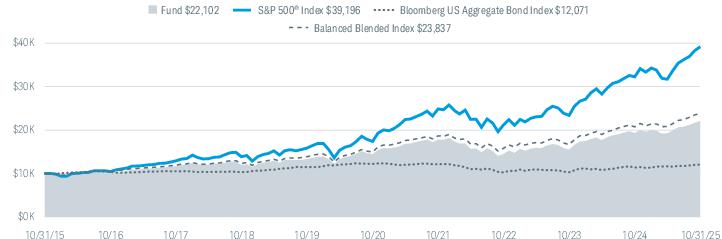 All total returns on this page assume dividends and distributions were reinvested. Index figures do not include trading and management costs, which would lower performance. Indices are unmanaged and cannot be invested in directly. Performance results less than one year are not annualized. For index definitions, please see www.schwabassetmanagement.com/glossary. Fund expenses may have been partially absorbed by the investment adviser and its affiliates. Without these reductions, the fund’s returns would have been lower. These returns do not reflect the deduction of taxes that a shareholder would pay on fund distributions or the redemption of fund shares. |
|
| Average Annual Return [Table Text Block] |
Average Annual Total Returns
|
|
|
|
Fund: Schwab Balanced Fund (11/18/1996) 1 |
|
|
|
|
|
|
|
Bloomberg US Aggregate Bond Index |
|
|
|
|
|
|
| All total returns on this page assume dividends and distributions were reinvested. Index figures do not include trading and management costs, which would lower performance. Indices are unmanaged and cannot be invested in directly. Performance results less than one year are not annualized. For index definitions, please see www.schwabassetmanagement.com/glossary. Fund expenses may have been partially absorbed by the investment adviser and its affiliates. Without these reductions, the fund’s returns would have been lower. These returns do not reflect the deduction of taxes that a shareholder would pay on fund distributions or the redemption of fund shares. |
|
| Performance Inception Date |
Nov. 18, 1996
|
|
| No Deduction of Taxes [Text Block] |
These returns do not reflect the deduction of taxes that a shareholder would pay on fund distributions or the redemption of fund shares.
|
|
| Updated Performance Information Location [Text Block] |
To obtain performance information current to the most recent month end, please visit www.schwabassetmanagement.com/prospectus |
|
| Net Assets |
$ 738,000,000
|
|
| Holdings Count | Holding |
7
|
|
| Advisory Fees Paid, Amount |
$ 0
|
|
| Investment Company, Portfolio Turnover |
12.00%
|
|
| Additional Fund Statistics [Text Block] |
|
|
|
|
|
|
Advisory Fees Paid by the Fund |
|
Foreign Tax Paid and Passed Through |
|
Gross Income From Foreign Sources |
|
Dividends Received Deduction |
|
Qualified Dividend Income |
|
Long Term Capital Gain Distribution |
|
Qualified Business Income (199A) |
|
Business Interest Deduction (163j) |
|
|
|
| Holdings [Text Block] |
Asset Class Weightings % of Investments 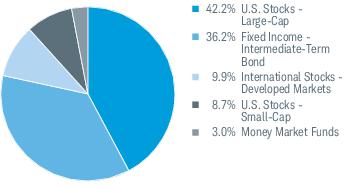 Top Holdings % of Net Assets 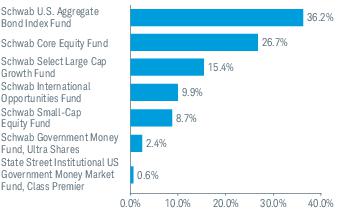 Portfolio holdings may have changed since the report da te. The holdings listed exclude any temporary liquidity investments. |
|
| Largest Holdings [Text Block] |
Top Holdings % of Net Assets Portfolio holdings may have changed since the report da te. The holdings listed exclude any temporary liquidity investments. |
|
| Schwab MarketTrack All Equity Portfolio |
|
|
| Shareholder Report [Line Items] |
|
|
| Fund Name |
Schwab MarketTrack All Equity Portfolio™
|
|
| Class Name |
Schwab MarketTrack All Equity Portfolio™
|
|
| Trading Symbol |
SWEGX
|
|
| Annual or Semi-Annual Statement [Text Block] |
This annual shareholder report contains important information about the fund for the period of November 1, 2024, to October 31, 2025.
|
|
| Shareholder Report Annual or Semi-Annual |
annual shareholder report
|
|
| Additional Information [Text Block] |
You can find additional information about the fund at www.schwabassetmanagement.com/prospectus . You can also request this information by calling or by sending an email request to orders@mysummaryprospectus.com .
|
|
| Additional Information Phone Number |
1-866-414-6349
|
|
| Additional Information Email |
orders@mysummaryprospectus.com
|
|
| Additional Information Website |
www.schwabassetmanagement.com/prospectus
|
|
| Expenses [Text Block] |
FUND COSTS FOR THE LAST year ENDED October 31, 2025 (BASED ON A HYPOTHETICAL $10,000 INVESTMENT)
|
|
|
Schwab MarketTrack All Equity Porfolio |
|
|
|
|
| Expenses Paid, Amount |
$ 42
|
|
| Expense Ratio, Percent |
0.38%
|
|
| Factors Affecting Performance [Text Block] |
MANAGEMENT’S DISCUSSION OF FUND PERFORMANCE For the 12-month reporting period ended October 31, 2025, the fund returned 19.80%. The S&P 500 ® Index, which provides a broad measure of equity market performance, returned 21.45%. The fund’s custom blended comparative index, the All Equity Composite Index (the composite index), returned 20.32%. ■ Asset allocations were broadly in line with those of the composite index ■ Top contributors to total return: ● Schwab S&P 500 Index Fund ● Schwab International Index Fund ■ Top detractors from total return: ● While there were no additional underlying funds that detracted from the total return of the fund, Schwab Emerging Markets Equity ETF was the smallest contributor to total return Portfolio holdings may have changed since the report date. |
|
| Performance Past Does Not Indicate Future [Text] |
The performance data quoted represents past performance. Past performance does not guarantee future results.
|
|
| Line Graph [Table Text Block] |
Performance of Hypothetical $10,000 Investment (October 31, 2015 - October 31, 2025) 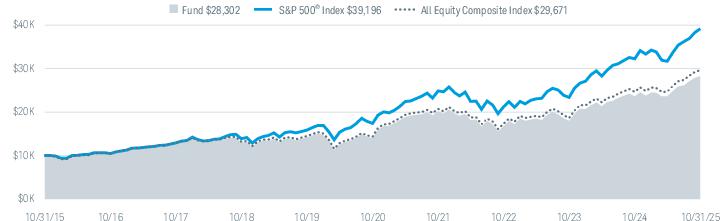 All total returns on this page assume dividends and distributions were reinvested. Index figures do not include trading and management costs, which would lower performance. Indices are unmanaged and cannot be invested in directly. Performance results less than one year are not annualized. For index definitions, please see www.schwabassetmanagement.com/glossary. Fund expenses may have been partially absorbed by the investment adviser and its affiliates. Without these reductions, the fund’s returns would have been lower. These returns do not reflect the deduction of taxes that a shareholder would pay on fund distributions or the redemption of fund shares. |
|
| Average Annual Return [Table Text Block] |
Average Annual Total Returns
|
|
|
|
Fund: Schwab MarketTrack All Equity Portfolio (05/19/1998) 1 |
|
|
|
|
|
|
|
All Equity Composite Index |
|
|
| All total returns on this page assume dividends and distributions were reinvested. Index figures do not include trading and management costs, which would lower performance. Indices are unmanaged and cannot be invested in directly. Performance results less than one year are not annualized. For index definitions, please see www.schwabassetmanagement.com/glossary. Fund expenses may have been partially absorbed by the investment adviser and its affiliates. Without these reductions, the fund’s returns would have been lower. These returns do not reflect the deduction of taxes that a shareholder would pay on fund distributions or the redemption of fund shares. |
|
| Performance Inception Date |
May 19, 1998
|
|
| No Deduction of Taxes [Text Block] |
These returns do not reflect the deduction of taxes that a shareholder would pay on fund distributions or the redemption of fund shares.
|
|
| Updated Performance Information Location [Text Block] |
To obtain performance information current to the most recent month end, please visit www.schwabassetmanagement.com/prospectus |
|
| Net Assets |
$ 1,079,000,000
|
|
| Holdings Count | Holding |
11
|
|
| Advisory Fees Paid, Amount |
$ 1,268,642
|
|
| Investment Company, Portfolio Turnover |
20.00%
|
|
| Additional Fund Statistics [Text Block] |
|
|
|
|
|
|
Advisory Fees Paid by the Fund |
|
Foreign Tax Paid and Passed Through |
|
Gross Income From Foreign Sources |
|
Dividends Received Deduction |
|
Qualified Dividend Income |
|
Long Term Capital Gain Distribution |
|
Qualified Business Income (199A) |
|
|
|
| Holdings [Text Block] |
Asset Class Weightings % of Investments 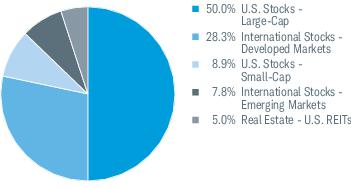 Top Holdings % of Net Assets 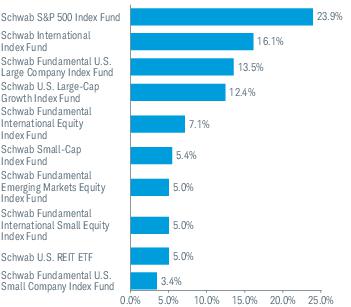 Portfolio holdings may have changed since the report date. |
|
| Largest Holdings [Text Block] |
Top Holdings % of Net Assets Portfolio holdings may have changed since the report date. |
|
| Schwab MarketTrack Growth Portfolio |
|
|
| Shareholder Report [Line Items] |
|
|
| Fund Name |
Schwab MarketTrack Growth Portfolio™
|
|
| Class Name |
Schwab MarketTrack Growth Portfolio™
|
|
| Trading Symbol |
SWHGX
|
|
| Annual or Semi-Annual Statement [Text Block] |
This annual shareholder report contains important information about the fund for the period of November 1, 2024, to October 31, 2025.
|
|
| Shareholder Report Annual or Semi-Annual |
annual shareholder report
|
|
| Additional Information [Text Block] |
You can find additional information about the fund at www.schwabassetmanagement.com/prospectus . You can also request this information by calling or by sending an email request to orders@mysummaryprospectus.com .
|
|
| Additional Information Phone Number |
1-866-414-6349
|
|
| Additional Information Email |
orders@mysummaryprospectus.com
|
|
| Additional Information Website |
www.schwabassetmanagement.com/prospectus
|
|
| Expenses [Text Block] |
FUND COSTS FOR THE LAST year ENDED October 31, 2025 (BASED ON A HYPOTHETICAL $10,000 INVESTMENT)
|
|
|
Schwab MarketTrack Growth Porfolio |
|
|
|
|
| Expenses Paid, Amount |
$ 41
|
|
| Expense Ratio, Percent |
0.38%
|
|
| Factors Affecting Performance [Text Block] |
MANAGEMENT’S DISCUSSION OF FUND PERFORMANCE For the 12-month reporting period ended October 31, 2025, the fund returned 16.79%. The S&P 500 ® Index, which provides a broad measure of equity market performance, and the Bloomberg US Aggregate Bond Index, which provides a broad measure of bond market performance, returned 21.45% and 6.16%, respectively. The fund’s custom blended comparative index, the Growth Composite Index (the composite index), returned 17.30%. ■ Asset allocations were broadly in line with those of the composite index ■ Top contributors to total return: ● Schwab S&P 500 Index Fund ● Schwab International Index Fund ■ Top detractors from total return: ● While there were no additional underlying funds that detracted from the total return of the fund, Schwab Emerging Markets Equity ETF was the smallest contributor to total return Portfolio holdings may have changed since the report date. |
|
| Performance Past Does Not Indicate Future [Text] |
The performance data quoted represents past performance. Past performance does not guarantee future results.
|
|
| Line Graph [Table Text Block] |
Performance of Hypothetical $10,000 Investment (October 31, 2015 - October 31, 2025) 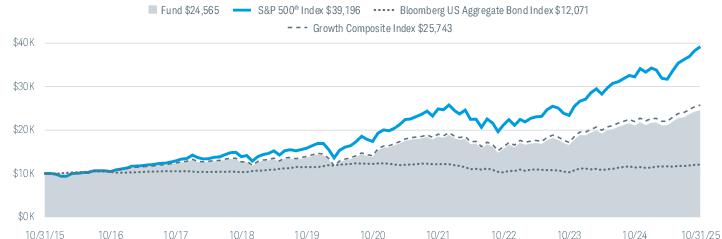 All total returns on this page assume dividends and distributions were reinvested. Index figures do not include trading and management costs, which would lower performance. Indices are unmanaged and cannot be invested in directly. Performance results less than one year are not annualized. For index definitions, please see www.schwabassetmanagement.com/glossary. Fund expenses may have been partially absorbed by the investment adviser and its affiliates. Without these reductions, the fund’s returns would have been lower. These returns do not reflect the deduction of taxes that a shareholder would pay on fund distributions or the redemption of fund shares. |
|
| Average Annual Return [Table Text Block] |
Average Annual Total Returns
|
|
|
|
Fund: Schwab MarketTrack Growth Portfolio (11/20/1995) 1 |
|
|
|
|
|
|
|
Bloomberg US Aggregate Bond Index |
|
|
|
|
|
|
| All total returns on this page assume dividends and distributions were reinvested. Index figures do not include trading and management costs, which would lower performance. Indices are unmanaged and cannot be invested in directly. Performance results less than one year are not annualized. For index definitions, please see www.schwabassetmanagement.com/glossary. Fund expenses may have been partially absorbed by the investment adviser and its affiliates. Without these reductions, the fund’s returns would have been lower. These returns do not reflect the deduction of taxes that a shareholder would pay on fund distributions or the redemption of fund shares. |
|
| Performance Inception Date |
Nov. 20, 1995
|
|
| No Deduction of Taxes [Text Block] |
These returns do not reflect the deduction of taxes that a shareholder would pay on fund distributions or the redemption of fund shares.
|
|
| Updated Performance Information Location [Text Block] |
To obtain performance information current to the most recent month end, please visit www.schwabassetmanagement.com/prospectus |
|
| Net Assets |
$ 1,050,000,000
|
|
| Holdings Count | Holding |
13
|
|
| Advisory Fees Paid, Amount |
$ 1,278,492
|
|
| Investment Company, Portfolio Turnover |
18.00%
|
|
| Additional Fund Statistics [Text Block] |
|
|
|
|
|
|
Advisory Fees Paid by the Fund |
|
Foreign Tax Paid and Passed Through |
|
Gross Income From Foreign Sources |
|
Dividends Received Deduction |
|
Qualified Dividend Income |
|
Long Term Capital Gain Distribution |
|
Qualified Business Income (199A) |
|
Business Interest Deduction (163j) |
|
|
|
| Holdings [Text Block] |
Asset Class Weightings % of Investments 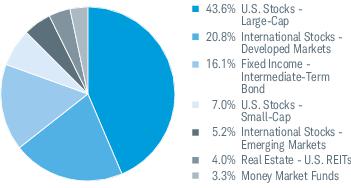 Top Holdings % of Net Assets 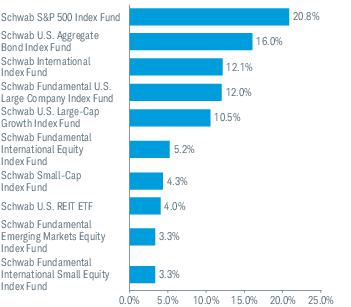 Portfolio holdings may have changed since the report date. |
|
| Largest Holdings [Text Block] |
Top Holdings % of Net Assets Portfolio holdings may have changed since the report date. |
|
| Schwab MarketTrack Balanced Portfolio™ |
|
|
| Shareholder Report [Line Items] |
|
|
| Fund Name |
Schwab MarketTrack Balanced Portfolio™
|
|
| Class Name |
Schwab MarketTrack Balanced Portfolio™
|
|
| Trading Symbol |
SWBGX
|
|
| Annual or Semi-Annual Statement [Text Block] |
This annual shareholder report contains important information about the fund for the period of November 1, 2024, to October 31, 2025.
|
|
| Shareholder Report Annual or Semi-Annual |
annual shareholder report
|
|
| Additional Information [Text Block] |
You can find additional information about the fund at www.schwabassetmanagement.com/prospectus . You can also request this information by calling or by sending an email request to orders@mysummaryprospectus.com .
|
|
| Additional Information Phone Number |
1-866-414-6349
|
|
| Additional Information Email |
orders@mysummaryprospectus.com
|
|
| Additional Information Website |
www.schwabassetmanagement.com/prospectus
|
|
| Expenses [Text Block] |
FUND COSTS FOR THE LAST year ENDED October 31, 2025 (BASED ON A HYPOTHETICAL $10,000 INVESTMENT)
|
|
|
Schwab MarketTrack Balanced Portfolio |
|
|
|
|
| Expenses Paid, Amount |
$ 42
|
|
| Expense Ratio, Percent |
0.39%
|
|
| Factors Affecting Performance [Text Block] |
MANAGEMENT’S DISCUSSION OF FUND PERFORMANCE For the 12-month reporting period ended October 31, 2025, the fund returned 13.97%. The S&P 500 ® Index, which provides a broad measure of equity market performance, and the Bloomberg US Aggregate Bond Index, which provides a broad measure of bond market performance, returned 21.45% and 6.16%, respectively. The fund’s custom blended comparative index, the Balanced Composite Index (the composite index), returned 14.49%. ■ Asset allocations were broadly in line with those of the composite index ■ Top contributors to total return: ● Schwab S&P 500 Index Fund ● Schwab U.S. Aggregate Bond Index Fund ■ Top detractors from total return: ● Schwab High Yield Bond ETF Portfolio holdings may have changed since the report date. |
|
| Performance Past Does Not Indicate Future [Text] |
The performance data quoted represents past performance. Past performance does not guarantee future results.
|
|
| Line Graph [Table Text Block] |
Performance of Hypothetical $10,000 Investment (October 31, 2015 - October 31, 2025) 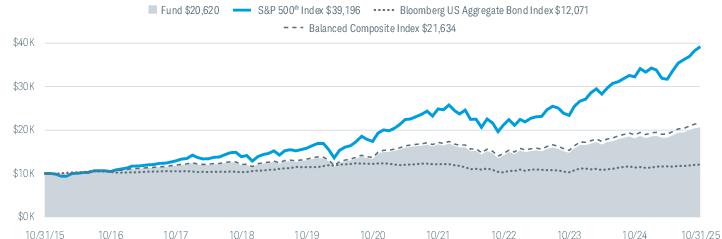 All total returns on this page assume dividends and distributions were reinvested. Index figures do not include trading and management costs, which would lower performance. Indices are unmanaged and cannot be invested in directly. Performance results less than one year are not annualized. For index definitions, please see www.schwabassetmanagement.com/glossary. Fund expenses may have been partially absorbed by the investment adviser and its affiliates. Without these reductions, the fund’s returns would have been lower. These returns do not reflect the deduction of taxes that a shareholder would pay on fund distributions or the redemption of fund shares. |
|
| Average Annual Return [Table Text Block] |
Average Annual Total Returns
|
|
|
|
Fund: Schwab MarketTrack Balanced Portfolio (11/20/1995) 1 |
|
|
|
|
|
|
|
Bloomberg US Aggregate Bond Index |
|
|
|
|
|
|
| All total returns on this page assume dividends and distributions were reinvested. Index figures do not include trading and management costs, which would lower performance. Indices are unmanaged and cannot be invested in directly. Performance results less than one year are not annualized. For index definitions, please see www.schwabassetmanagement.com/glossary. Fund expenses may have been partially absorbed by the investment adviser and its affiliates. Without these reductions, the fund’s returns would have been lower. These returns do not reflect the deduction of taxes that a shareholder would pay on fund distributions or the redemption of fund shares. |
|
| Performance Inception Date |
Nov. 20, 1995
|
|
| No Deduction of Taxes [Text Block] |
These returns do not reflect the deduction of taxes that a shareholder would pay on fund distributions or the redemption of fund shares.
|
|
| Updated Performance Information Location [Text Block] |
To obtain performance information current to the most recent month end, please visit www.schwabassetmanagement.com/prospectus |
|
| Net Assets |
$ 627,000,000
|
|
| Holdings Count | Holding |
14
|
|
| Advisory Fees Paid, Amount |
$ 775,672
|
|
| Investment Company, Portfolio Turnover |
21.00%
|
|
| Additional Fund Statistics [Text Block] |
|
|
|
|
|
|
Advisory Fees Paid by the Fund |
|
Foreign Tax Paid and Passed Through |
|
Gross Income From Foreign Sources |
|
Dividends Received Deduction |
|
Qualified Dividend Income |
|
Long Term Capital Gain Distribution |
|
Qualified Business Income (199A) |
|
Business Interest Deduction (163j) |
|
|
|
| Holdings [Text Block] |
Asset Class Weightings % of Investments 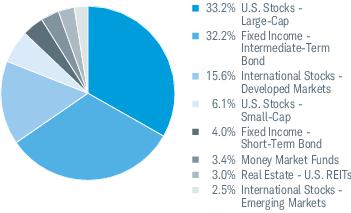 Top Holdings % of Net Assets Portfolio holdings may have changed since the report date. |
|
| Largest Holdings [Text Block] |
Top Holdings % of Net Assets Portfolio holdings may have changed since the report date. |
|
| Schwab MarketTrack Conservative Portfolio™ |
|
|
| Shareholder Report [Line Items] |
|
|
| Fund Name |
Schwab MarketTrack Conservative Portfolio™
|
|
| Class Name |
Schwab MarketTrack Conservative Portfolio™
|
|
| Trading Symbol |
SWCGX
|
|
| Annual or Semi-Annual Statement [Text Block] |
This annual shareholder report contains important information about the fund for the period of November 1, 2024, to October 31, 2025.
|
|
| Shareholder Report Annual or Semi-Annual |
annual shareholder report
|
|
| Additional Information [Text Block] |
You can find additional information about the fund at www.schwabassetmanagement.com/prospectus . You can also request this information by calling or by sending an email request to orders@mysummaryprospectus.com .
|
|
| Additional Information Phone Number |
1-866-414-6349
|
|
| Additional Information Email |
orders@mysummaryprospectus.com
|
|
| Additional Information Website |
www.schwabassetmanagement.com/prospectus
|
|
| Expenses [Text Block] |
FUND COSTS FOR THE LAST year ENDED October 31, 2025 (BASED ON A HYPOTHETICAL $10,000 INVESTMENT)
|
|
|
Schwab MarketTrack Conservative Portfolio |
|
|
|
|
| Expenses Paid, Amount |
$ 43
|
|
| Expense Ratio, Percent |
0.41%
|
|
| Factors Affecting Performance [Text Block] |
MANAGEMENT’S DISCUSSION OF FUND PERFORMANCE For the 12-month reporting period ended October 31, 2025, the fund returned 11.12%. The S&P 500 ® Index, which provides a broad measure of equity market performance, and the Bloomberg US Aggregate Bond Index, which provides a broad measure of bond market performance, returned 21.45% and 6.16%, respectively. The fund’s custom blended comparative index, the Conservative Composite Index (the composite index), returned 11.59%. ■ Asset allocations were broadly in line with those of the composite index ■ Top contributors to total return: ● Schwab U.S. Aggregate Bond Index Fund ● Schwab S&P 500 Index Fund ■ Top detractors from total return: ● Schwab High Yield Bond ETF Portfolio holdings may have changed since the report date. |
|
| Performance Past Does Not Indicate Future [Text] |
The performance data quoted represents past performance. Past performance does not guarantee future results.
|
|
| Line Graph [Table Text Block] |
Performance of Hypothetical $10,000 Investment (October 31, 2015 - October 31, 2025) 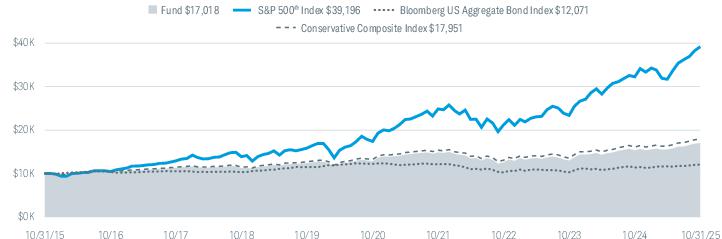 All total returns on this page assume dividends and distributions were reinvested. Index figures do not include trading and management costs, which would lower performance. Indices are unmanaged and cannot be invested in directly. Performance results less than one year are not annualized. For index definitions, please see www.schwabassetmanagement.com/glossary. Fund expenses may have been partially absorbed by the investment adviser and its affiliates. Without these reductions, the fund’s returns would have been lower. These returns do not reflect the deduction of taxes that a shareholder would pay on fund distributions or the redemption of fund shares. |
|
| Average Annual Return [Table Text Block] |
Average Annual Total Returns
|
|
|
|
Fund: Schwab MarketTrack Conservative Portfolio (11/20/1995) 1 |
|
|
|
|
|
|
|
Bloomberg US Aggregate Bond Index |
|
|
|
Conservative Composite Index |
|
|
| All total returns on this page assume dividends and distributions were reinvested. Index figures do not include trading and management costs, which would lower performance. Indices are unmanaged and cannot be invested in directly. Performance results less than one year are not annualized. For index definitions, please see www.schwabassetmanagement.com/glossary. Fund expenses may have been partially absorbed by the investment adviser and its affiliates. Without these reductions, the fund’s returns would have been lower. These returns do not reflect the deduction of taxes that a shareholder would pay on fund distributions or the redemption of fund shares. |
|
| Performance Inception Date |
Nov. 20, 1995
|
|
| No Deduction of Taxes [Text Block] |
These returns do not reflect the deduction of taxes that a shareholder would pay on fund distributions or the redemption of fund shares.
|
|
| Updated Performance Information Location [Text Block] |
To obtain performance information current to the most recent month end, please visit www.schwabassetmanagement.com/prospectus |
|
| Net Assets |
$ 206,000,000
|
|
| Holdings Count | Holding |
14
|
|
| Advisory Fees Paid, Amount |
$ 259,762
|
|
| Investment Company, Portfolio Turnover |
23.00%
|
|
| Additional Fund Statistics [Text Block] |
|
|
|
|
|
|
Advisory Fees Paid by the Fund |
|
Foreign Tax Paid and Passed Through |
|
Gross Income From Foreign Sources |
|
Dividends Received Deduction |
|
Qualified Dividend Income |
|
Long Term Capital Gain Distribution |
|
Qualified Business Income (199A) |
|
Business Interest Deduction (163j) |
|
|
|
| Holdings [Text Block] |
Asset Class Weightings % of Investments 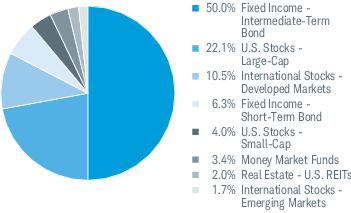 Top Holdings % of Net Assets 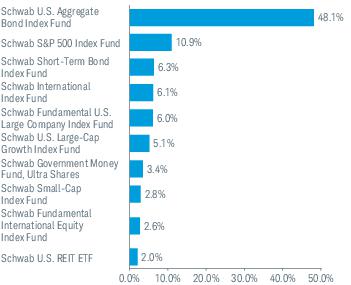 Portfolio holdings may have changed since the report date. |
|
| Largest Holdings [Text Block] |
Top Holdings % of Net Assets Portfolio holdings may have changed since the report date. |
|
| Schwab Target 2010 Fund |
|
|
| Shareholder Report [Line Items] |
|
|
| Fund Name |
Schwab Target 2010 Fund
|
|
| Class Name |
Schwab Target 2010 Fund
|
|
| Trading Symbol |
SWBRX
|
|
| Annual or Semi-Annual Statement [Text Block] |
This annual shareholder report contains important information about the fund for the period of November 1, 2024, to October 31, 2025.
|
|
| Shareholder Report Annual or Semi-Annual |
annual shareholder report
|
|
| Additional Information [Text Block] |
You can find additional information about the fund at www.schwabassetmanagement.com/prospectus . You can also request this information by calling or by sending an email request to orders@mysummaryprospectus.com .
|
|
| Additional Information Phone Number |
1-866-414-6349
|
|
| Additional Information Email |
orders@mysummaryprospectus.com
|
|
| Additional Information Website |
www.schwabassetmanagement.com/prospectus
|
|
| Expenses [Text Block] |
FUND COSTS FOR THE LAST year ENDED October 31, 2025 (BASED ON A HYPOTHETICAL $10,000 INVESTMENT)
* Expenses were reduced by a contractual fee waiver in effect for so long as the investment adviser serves as adviser to the fund. This agreement to limit the total annual fund operating expenses is limited to the fund’s direct operating expenses and, therefore, does not apply to acquired fund fees and expenses (AFFE), which are indirect expenses incurred by the fund through its investments in the underlying funds.
|
|
| Expenses Paid, Amount |
$ 0
|
[2] |
| Expense Ratio, Percent |
0.00%
|
[2] |
| Factors Affecting Performance [Text Block] |
MANAGEMENT’S DISCUSSION OF FUND PERFORMANCE For the 12-month reporting period ended October 31, 2025, the 2010 Fund returned 10.75%. The Dow Jones U.S. Total Stock Market Index SM , which provides a broad measure of equity market performance, and the Bloomberg US Aggregate Bond Index, which provides a broad measure of bond market performance, returned 20.90% and 6.16%, respectively. The 2010 Fund’s internally calculated comparative index, the Target 2010 Composite Index (the composite index), returned 10.76%. ■ Asset allocations were broadly in line with those of the composite index ■ Top contributors to total return: ● Schwab S&P 500 Index Fund ● Schwab U.S. Aggregate Bond Index Fund ■ Over the reporting period, there were no detractors from the return of the fund. However, the smallest contributors to total return were: ● ClearBridge Small Cap Growth Fund (Class IS) (which was sold prior to the end of the reporting period) ● Loomis Sayles Investment Grade Bond Fund (Class Y) Portfolio holdings may have changed since the report date. |
|
| Performance Past Does Not Indicate Future [Text] |
The performance data quoted represents past performance. Past performance does not guarantee future results.
|
|
| Line Graph [Table Text Block] |
Performance of Hypothetical $10,000 Investment (October 31, 2015 - October 31, 2025) 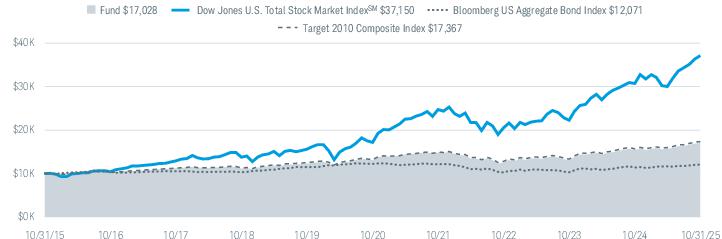 All total returns on this page assume dividends and distributions were reinvested. Index figures do not include trading and management costs, which would lower performance. Indices are unmanaged and cannot be invested in directly. Performance results less than one year are not annualized. For index definitions, please see www.schwabassetmanagement.com/glossary. Fund expenses may have been partially absorbed by the investment adviser and its affiliates. Without these reductions, the fund’s returns would have been lower. These returns do not reflect the deduction of taxes that a shareholder would pay on fund distributions or the redemption of fund shares. |
|
| Average Annual Return [Table Text Block] |
Average Annual Total Returns
|
|
|
|
Fund: Schwab Target 2010 Fund (07/01/2005) 1 |
|
|
|
Dow Jones U.S. Total Stock Market Index SM |
|
|
|
Bloomberg US Aggregate Bond Index |
|
|
|
Target 2010 Composite Index |
|
|
| All total returns on this page assume dividends and distributions were reinvested. Index figures do not include trading and management costs, which would lower performance. Indices are unmanaged and cannot be invested in directly. Performance results less than one year are not annualized. For index definitions, please see www.schwabassetmanagement.com/glossary. Fund expenses may have been partially absorbed by the investment adviser and its affiliates. Without these reductions, the fund’s returns would have been lower. These returns do not reflect the deduction of taxes that a shareholder would pay on fund distributions or the redemption of fund shares. |
|
| Performance Inception Date |
Jul. 01, 2005
|
|
| No Deduction of Taxes [Text Block] |
These returns do not reflect the deduction of taxes that a shareholder would pay on fund distributions or the redemption of fund shares.
|
|
| Updated Performance Information Location [Text Block] |
To obtain performance information current to the most recent month end, please visit www.schwabassetmanagement.com/prospectus |
|
| Net Assets |
$ 43,000,000
|
|
| Holdings Count | Holding |
21
|
|
| Advisory Fees Paid, Amount |
$ 0
|
|
| Investment Company, Portfolio Turnover |
16.00%
|
|
| Additional Fund Statistics [Text Block] |
|
|
|
|
|
|
Advisory Fees Paid by the Fund |
|
Foreign Tax Paid and Passed Through |
|
Gross Income From Foreign Sources |
|
Dividends Received Deduction |
|
Qualified Dividend Income |
|
Long Term Capital Gain Distribution |
|
Qualified Business Income (199A) |
|
Business Interest Deduction (163j) |
|
|
|
| Holdings [Text Block] |
Asset Class Weightings % of Investments 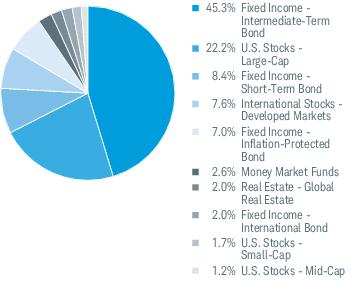 Top Holdings % of Net Assets 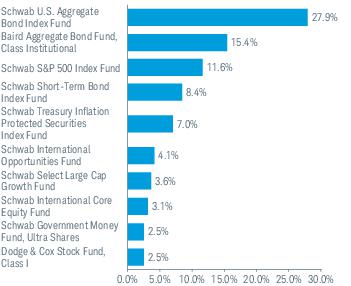 Portfolio holdings may have changed since the report date. |
|
| Largest Holdings [Text Block] |
Top Holdings % of Net Assets Portfolio holdings may have changed since the report date. |
|
| Schwab Target 2015 Fund |
|
|
| Shareholder Report [Line Items] |
|
|
| Fund Name |
Schwab Target 2015 Fund
|
|
| Class Name |
Schwab Target 2015 Fund
|
|
| Trading Symbol |
SWGRX
|
|
| Annual or Semi-Annual Statement [Text Block] |
This annual shareholder report contains important information about the fund for the period of November 1, 2024, to October 31, 2025.
|
|
| Shareholder Report Annual or Semi-Annual |
annual shareholder report
|
|
| Additional Information [Text Block] |
You can find additional information about the fund at www.schwabassetmanagement.com/prospectus . You can also request this information by calling or by sending an email request to orders@mysummaryprospectus.com .
|
|
| Additional Information Phone Number |
1-866-414-6349
|
|
| Additional Information Email |
orders@mysummaryprospectus.com
|
|
| Additional Information Website |
www.schwabassetmanagement.com/prospectus
|
|
| Expenses [Text Block] |
FUND COSTS FOR THE LAST year ENDED October 31, 2025 (BASED ON A HYPOTHETICAL $10,000 INVESTMENT)
* Expenses were reduced by a contractual fee waiver in effect for so long as the investment adviser serves as adviser to the fund. This agreement to limit the total annual fund operating expenses is limited to the fund’s direct operating expenses and, therefore, does not apply to acquired fund fees and expenses (AFFE), which are indirect expenses incurred by the fund through its investments in the underlying funds.
|
|
| Expenses Paid, Amount |
$ 0
|
[2] |
| Expense Ratio, Percent |
0.00%
|
[2] |
| Factors Affecting Performance [Text Block] |
MANAGEMENT’S DISCUSSION OF FUND PERFORMANCE For the 12-month reporting period ended October 31, 2025, the 2015 Fund returned 11.39%. The Dow Jones U.S. Total Stock Market Index SM , which provides a broad measure of equity market performance, and the Bloomberg US Aggregate Bond Index, which provides a broad measure of bond market performance, returned 20.90% and 6.16%, respectively. The 2015 Fund’s internally calculated comparative index, the Target 2015 Composite Index (the composite index), returned 11.37%. ■ Asset allocations were broadly in line with those of the composite index ■ Top contributors to total return: ● Schwab S&P 500 Index Fund ● Schwab U.S. Aggregate Bond Index Fund ■ Over the reporting period, there were no detractors from the return of the fund. However, the smallest contributors to total return were: ● ClearBridge Small Cap Growth Fund (Class IS) (which was sold prior to the end of the reporting period) ● Driehaus Small Cap Growth Fund (Institutional Shares) Portfolio holdings may have changed since the report date. |
|
| Performance Past Does Not Indicate Future [Text] |
The performance data quoted represents past performance. Past performance does not guarantee future results.
|
|
| Line Graph [Table Text Block] |
Performance of Hypothetical $10,000 Investment (October 31, 2015 - October 31, 2025) 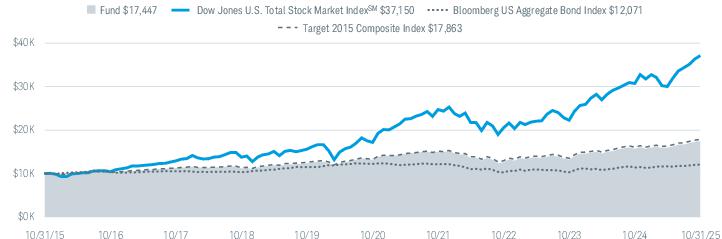 All total returns on this page assume dividends and distributions were reinvested. Index figures do not include trading and management costs, which would lower performance. Indices are unmanaged and cannot be invested in directly. Performance results less than one year are not annualized. For index definitions, please see www.schwabassetmanagement.com/glossary. Fund expenses may have been partially absorbed by the investment adviser and its affiliates. Without these reductions, the fund’s returns would have been lower. These returns do not reflect the deduction of taxes that a shareholder would pay on fund distributions or the redemption of fund shares. |
|
| Average Annual Return [Table Text Block] |
Average Annual Total Returns
|
|
|
|
Fund: Schwab Target 2015 Fund (03/12/2008) 1 |
|
|
|
Dow Jones U.S. Total Stock Market Index SM |
|
|
|
Bloomberg US Aggregate Bond Index |
|
|
|
Target 2015 Composite Index |
|
|
| All total returns on this page assume dividends and distributions were reinvested. Index figures do not include trading and management costs, which would lower performance. Indices are unmanaged and cannot be invested in directly. Performance results less than one year are not annualized. For index definitions, please see www.schwabassetmanagement.com/glossary. Fund expenses may have been partially absorbed by the investment adviser and its affiliates. Without these reductions, the fund’s returns would have been lower. These returns do not reflect the deduction of taxes that a shareholder would pay on fund distributions or the redemption of fund shares. |
|
| Performance Inception Date |
Mar. 12, 2008
|
|
| No Deduction of Taxes [Text Block] |
These returns do not reflect the deduction of taxes that a shareholder would pay on fund distributions or the redemption of fund shares.
|
|
| Updated Performance Information Location [Text Block] |
To obtain performance information current to the most recent month end, please visit www.schwabassetmanagement.com/prospectus |
|
| Net Assets |
$ 47,000,000
|
|
| Holdings Count | Holding |
21
|
|
| Advisory Fees Paid, Amount |
$ 0
|
|
| Investment Company, Portfolio Turnover |
17.00%
|
|
| Additional Fund Statistics [Text Block] |
|
|
|
|
|
|
Advisory Fees Paid by the Fund |
|
Foreign Tax Paid and Passed Through |
|
Gross Income From Foreign Sources |
|
Dividends Received Deduction |
|
Qualified Dividend Income |
|
Long Term Capital Gain Distribution |
|
Qualified Business Income (199A) |
|
Business Interest Deduction (163j) |
|
|
|
| Holdings [Text Block] |
Asset Class Weightings % of Investments  Top Holdings % of Net Assets 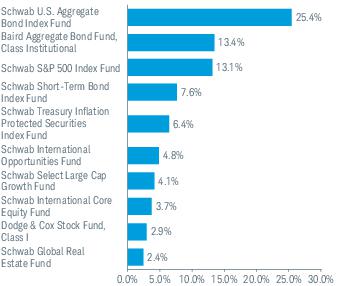 Portfolio holdings may have changed since the report date. |
|
| Largest Holdings [Text Block] |
Top Holdings % of Net Assets Portfolio holdings may have changed since the report date. |
|
| Schwab Target 2020 Fund |
|
|
| Shareholder Report [Line Items] |
|
|
| Fund Name |
Schwab Target 2020 Fund
|
|
| Class Name |
Schwab Target 2020 Fund
|
|
| Trading Symbol |
SWCRX
|
|
| Annual or Semi-Annual Statement [Text Block] |
This annual shareholder report contains important information about the fund for the period of November 1, 2024, to October 31, 2025.
|
|
| Shareholder Report Annual or Semi-Annual |
annual shareholder report
|
|
| Additional Information [Text Block] |
You can find additional information about the fund at www.schwabassetmanagement.com/prospectus . You can also request this information by calling or by sending an email request to orders@mysummaryprospectus.com .
|
|
| Additional Information Phone Number |
1-866-414-6349
|
|
| Additional Information Email |
orders@mysummaryprospectus.com
|
|
| Additional Information Website |
www.schwabassetmanagement.com/prospectus
|
|
| Expenses [Text Block] |
FUND COSTS FOR THE LAST year ENDED October 31, 2025 (BASED ON A HYPOTHETICAL $10,000 INVESTMENT)
* Expenses were reduced by a contractual fee waiver in effect for so long as the investment adviser serves as adviser to the fund. This agreement to limit the total annual fund operating expenses is limited to the fund’s direct operating expenses and, therefore, does not apply to acquired fund fees and expenses (AFFE), which are indirect expenses incurred by the fund through its investments in the underlying funds.
|
|
| Expenses Paid, Amount |
$ 0
|
[2] |
| Expense Ratio, Percent |
0.00%
|
[2] |
| Factors Affecting Performance [Text Block] |
MANAGEMENT’S DISCUSSION OF FUND PERFORMANCE For the 12-month reporting period ended October 31, 2025, the 2020 Fund returned 11.79%. The Dow Jones U.S. Total Stock Market Index SM , which provides a broad measure of equity market performance, and the Bloomberg US Aggregate Bond Index, which provides a broad measure of bond market performance, returned 20.90% and 6.16%, respectively. The 2020 Fund’s internally calculated comparative index, the Target 2020 Composite Index (the composite index), returned 11.78%. ■ Asset allocations were broadly in line with those of the composite index ■ Top contributors to total return: ● Schwab S&P 500 Index Fund ● Schwab U.S. Aggregate Bond Index Fund ■ Over the reporting period, there were no detractors from the return of the fund. However, the smallest contributors to total return were: ● Driehaus Small Cap Growth Fund (Institutional Shares) ● ClearBridge Small Cap Growth Fund (Class IS) (which was sold prior to the end of the reporting period) Portfolio holdings may have changed since the report date. |
|
| Performance Past Does Not Indicate Future [Text] |
The performance data quoted represents past performance. Past performance does not guarantee future results.
|
|
| Line Graph [Table Text Block] |
Performance of Hypothetical $10,000 Investment (October 31, 2015 - October 31, 2025) 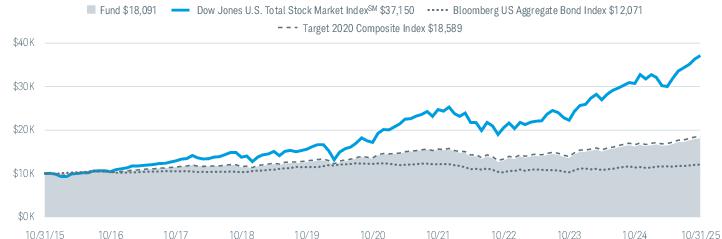 All total returns on this page assume dividends and distributions were reinvested. Index figures do not include trading and management costs, which would lower performance. Indices are unmanaged and cannot be invested in directly. Performance results less than one year are not annualized. For index definitions, please see www.schwabassetmanagement.com/glossary. Fund expenses may have been partially absorbed by the investment adviser and its affiliates. Without these reductions, the fund’s returns would have been lower. These returns do not reflect the deduction of taxes that a shareholder would pay on fund distributions or the redemption of fund shares. |
|
| Average Annual Return [Table Text Block] |
Average Annual Total Returns
|
|
|
|
Fund: Schwab Target 2020 Fund (07/01/2005) 1 |
|
|
|
Dow Jones U.S. Total Stock Market Index SM |
|
|
|
Bloomberg US Aggregate Bond Index |
|
|
|
Target 2020 Composite Index |
|
|
| All total returns on this page assume dividends and distributions were reinvested. Index figures do not include trading and management costs, which would lower performance. Indices are unmanaged and cannot be invested in directly. Performance results less than one year are not annualized. For index definitions, please see www.schwabassetmanagement.com/glossary. Fund expenses may have been partially absorbed by the investment adviser and its affiliates. Without these reductions, the fund’s returns would have been lower. These returns do not reflect the deduction of taxes that a shareholder would pay on fund distributions or the redemption of fund shares. |
|
| Performance Inception Date |
Jul. 01, 2005
|
|
| No Deduction of Taxes [Text Block] |
These returns do not reflect the deduction of taxes that a shareholder would pay on fund distributions or the redemption of fund shares.
|
|
| Updated Performance Information Location [Text Block] |
To obtain performance information current to the most recent month end, please visit www.schwabassetmanagement.com/prospectus |
|
| Net Assets |
$ 296,000,000
|
|
| Holdings Count | Holding |
21
|
|
| Advisory Fees Paid, Amount |
$ 0
|
|
| Investment Company, Portfolio Turnover |
9.00%
|
|
| Additional Fund Statistics [Text Block] |
|
|
|
|
|
|
Advisory Fees Paid by the Fund |
|
Foreign Tax Paid and Passed Through |
|
Gross Income From Foreign Sources |
|
Dividends Received Deduction |
|
Qualified Dividend Income |
|
Long Term Capital Gain Distribution |
|
Qualified Business Income (199A) |
|
Business Interest Deduction (163j) |
|
|
|
| Holdings [Text Block] |
Asset Class Weightings % of Investments 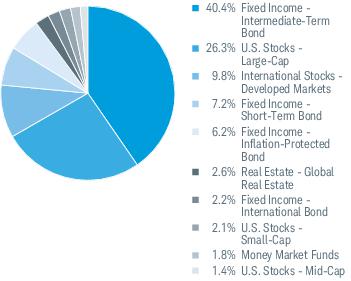 Top Holdings % of Net Assets 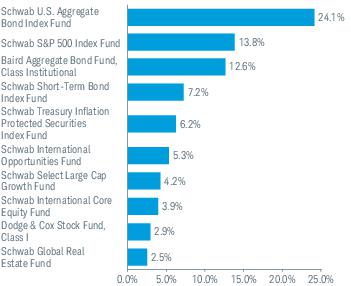 Portfolio holdings may have changed since the report date. |
|
| Largest Holdings [Text Block] |
Top Holdings % of Net Assets Portfolio holdings may have changed since the report date. |
|
| Schwab Target 2025 Index Fund |
|
|
| Shareholder Report [Line Items] |
|
|
| Fund Name |
Schwab Target 2025 Fund
|
|
| Class Name |
Schwab Target 2025 Fund
|
|
| Trading Symbol |
SWHRX
|
|
| Annual or Semi-Annual Statement [Text Block] |
This annual shareholder report contains important information about the fund for the period of November 1, 2024, to October 31, 2025.
|
|
| Shareholder Report Annual or Semi-Annual |
annual shareholder report
|
|
| Additional Information [Text Block] |
You can find additional information about the fund at www.schwabassetmanagement.com/prospectus . You can also request this information by calling or by sending an email request to orders@mysummaryprospectus.com .
|
|
| Additional Information Phone Number |
1-866-414-6349
|
|
| Additional Information Email |
orders@mysummaryprospectus.com
|
|
| Additional Information Website |
www.schwabassetmanagement.com/prospectus
|
|
| Expenses [Text Block] |
FUND COSTS FOR THE LAST year ENDED October 31, 2025 (BASED ON A HYPOTHETICAL $10,000 INVESTMENT)
* Expenses were reduced by a contractual fee waiver in effect for so long as the investment adviser serves as adviser to the fund. This agreement to limit the total annual fund operating expenses is limited to the fund’s direct operating expenses and, therefore, does not apply to acquired fund fees and expenses (AFFE), which are indirect expenses incurred by the fund through its investments in the underlying funds.
|
|
| Expenses Paid, Amount |
$ 0
|
[2] |
| Expense Ratio, Percent |
0.00%
|
[2] |
| Factors Affecting Performance [Text Block] |
MANAGEMENT’S DISCUSSION OF FUND PERFORMANCE For the 12-month reporting period ended October 31, 2025, the 2025 Fund returned 12.30%. The Dow Jones U.S. Total Stock Market Index SM , which provides a broad measure of equity market performance, and the Bloomberg US Aggregate Bond Index, which provides a broad measure of bond market performance, returned 20.90% and 6.16%, respectively. The 2025 Fund’s internally calculated comparative index, the Target 2025 Composite Index (the composite index), returned 12.19%. ■ Asset allocations were broadly in line with those of the composite index ■ Top contributors to total return: ● Schwab S&P 500 Index Fund ● Schwab U.S. Aggregate Bond Index Fund ■ Top detractors from total return: ● Goldman Sachs Emerging Markets Equity Insights Fund (Institutional Class) (which was sold prior to the end of the reporting period) ● While there were no additional underlying funds that detracted from the total return of the fund, ClearBridge Small Cap Growth Fund (Class IS) was the smallest contributor to total return (which was sold prior to the end of the reporting period) Portfolio holdings may have changed since the report date.
|
|
| Performance Past Does Not Indicate Future [Text] |
The performance data quoted represents past performance. Past performance does not guarantee future results.
|
|
| Line Graph [Table Text Block] |
Performance of Hypothetical $10,000 Investment (October 31, 2015 - October 31, 2025) 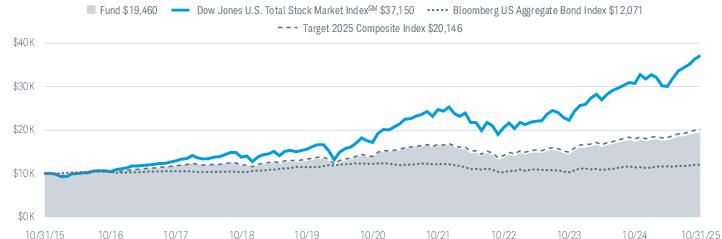 All total returns on this page assume dividends and distributions were reinvested. Index figures do not include trading and management costs, which would lower performance. Indices are unmanaged and cannot be invested in directly. Performance results less than one year are not annualized. For index definitions, please see www.schwabassetmanagement.com/glossary. Fund expenses may have been partially absorbed by the investment adviser and its affiliates. Without these reductions, the fund’s returns would have been lower. These returns do not reflect the deduction of taxes that a shareholder would pay on fund distributions or the redemption of fund shares. |
|
| Average Annual Return [Table Text Block] |
Average Annual Total Returns
|
|
|
|
Fund: Schwab Target 2025 Fund (03/12/2008) 1 |
|
|
|
Dow Jones U.S. Total Stock Market Index SM |
|
|
|
Bloomberg US Aggregate Bond Index |
|
|
|
Target 2025 Composite Index |
|
|
| All total returns on this page assume dividends and distributions were reinvested. Index figures do not include trading and management costs, which would lower performance. Indices are unmanaged and cannot be invested in directly. Performance results less than one year are not annualized. For index definitions, please see www.schwabassetmanagement.com/glossary. 1 Fund expenses may have been partially absorbed by the investment adviser and its affiliates. Without these reductions, the fund’s returns would have been lower. These returns do not reflect the deduction of taxes that a shareholder would pay on fund distributions or the redemption of fund shares.
|
|
| Performance Inception Date |
Mar. 12, 2008
|
|
| No Deduction of Taxes [Text Block] |
These returns do not reflect the deduction of taxes that a shareholder would pay on fund distributions or the redemption of fund shares.
|
|
| Updated Performance Information Location [Text Block] |
To obtain performance information current to the most recent month end, please visit www.schwabassetmanagement.com/prospectus |
|
| Net Assets |
$ 425,000,000
|
|
| Holdings Count | Holding |
21
|
|
| Advisory Fees Paid, Amount |
$ 0
|
|
| Investment Company, Portfolio Turnover |
13.00%
|
|
| Additional Fund Statistics [Text Block] |
|
|
|
|
|
|
Advisory Fees Paid by the Fund |
|
Foreign Tax Paid and Passed Through |
|
Gross Income From Foreign Sources |
|
Dividends Received Deduction |
|
Qualified Dividend Income |
|
Long Term Capital Gain Distribution |
|
Qualified Business Income (199A) |
|
Business Interest Deduction (163j) |
|
|
|
| Holdings [Text Block] |
Asset Class Weightings % of Investments 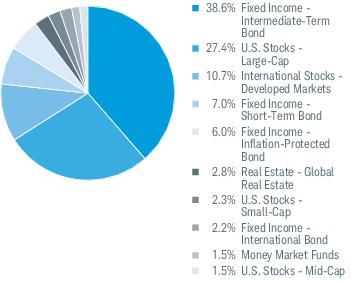 Top Holdings % of Net Assets 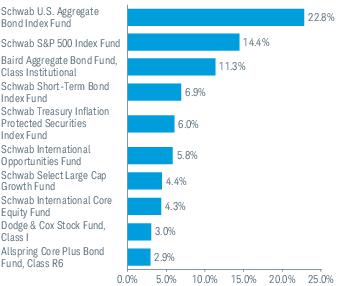 Portfolio holdings may have changed since the report date. |
|
| Largest Holdings [Text Block] |
Top Holdings % of Net Assets Portfolio holdings may have changed since the report date. |
|
| Schwab Target 2030 Fund |
|
|
| Shareholder Report [Line Items] |
|
|
| Fund Name |
Schwab Target 2030 Fund
|
|
| Class Name |
Schwab Target 2030 Fund
|
|
| Trading Symbol |
SWDRX
|
|
| Annual or Semi-Annual Statement [Text Block] |
This annual shareholder report contains important information about the fund for the period of November 1, 2024, to October 31, 2025.
|
|
| Shareholder Report Annual or Semi-Annual |
annual shareholder report
|
|
| Additional Information [Text Block] |
You can find additional information about the fund at www.schwabassetmanagement.com/prospectus . You can also request this information by calling or by sending an email request to orders@mysummaryprospectus.com .
|
|
| Additional Information Phone Number |
1-866-414-6349
|
|
| Additional Information Email |
orders@mysummaryprospectus.com
|
|
| Additional Information Website |
www.schwabassetmanagement.com/prospectus
|
|
| Expenses [Text Block] |
FUND COSTS FOR THE LAST year ENDED October 31, 2025 (BASED ON A HYPOTHETICAL $10,000 INVESTMENT)
* Expenses were reduced by a contractual fee waiver in effect for so long as the investment adviser serves as adviser to the fund. This agreement to limit the total annual fund operating expenses is limited to the fund’s direct operating expenses and, therefore, does not apply to acquired fund fees and expenses (AFFE), which are indirect expenses incurred by the fund through its investments in the underlying funds.
|
|
| Expenses Paid, Amount |
$ 0
|
[2] |
| Expense Ratio, Percent |
0.00%
|
[2] |
| Factors Affecting Performance [Text Block] |
MANAGEMENT’S DISCUSSION OF FUND PERFORMANCE For the 12-month reporting period ended October 31, 2025, the 2030 Fund returned 14.42%. The Dow Jones U.S. Total Stock Market Index SM , which provides a broad measure of equity market performance, and the Bloomberg US Aggregate Bond Index, which provides a broad measure of bond market performance, returned 20.90% and 6.16%, respectively. The 2030 Fund’s internally calculated comparative index, the Target 2030 Composite Index (the composite index), returned 14.30%. ■ Asset allocations were broadly in line with those of the composite index ■ Top contributors to total return: ● Schwab S&P 500 Index Fund ● Schwab International Opportunities Fund ■ Over the reporting period, there were no detractors from the return of the fund. However, the smallest contributors to total return were: ● ClearBridge Small Cap Growth Fund (Class IS) (which was sold prior to the end of the reporting period) ● Driehaus Small Cap Growth Fund (Institutional Shares) Portfolio holdings may have changed since the report date. |
|
| Performance Past Does Not Indicate Future [Text] |
The performance data quoted represents past performance. Past performance does not guarantee future results.
|
|
| Line Graph [Table Text Block] |
Performance of Hypothetical $10,000 Investment (October 31, 2015 - October 31, 2025)  All total returns on this page assume dividends and distributions were reinvested. Index figures do not include trading and management costs, which would lower performance. Indices are unmanaged and cannot be invested in directly. Performance results less than one year are not annualized. For index definitions, please see www.schwabassetmanagement.com/glossary. Fund expenses may have been partially absorbed by the investment adviser and its affiliates. Without these reductions, the fund’s returns would have been lower. These returns do not reflect the deduction of taxes that a shareholder would pay on fund distributions or the redemption of fund shares. |
|
| Average Annual Return [Table Text Block] |
Average Annual Total Returns
|
|
|
|
Fund: Schwab Target 2030 Fund (07/01/2005) 1 |
|
|
|
Dow Jones U.S. Total Stock Market Index SM |
|
|
|
Bloomberg US Aggregate Bond Index |
|
|
|
Target 2030 Composite Index |
|
|
| All total returns on this page assume dividends and distributions were reinvested. Index figures do not include trading and management costs, which would lower performance. Indices are unmanaged and cannot be invested in directly. Performance results less than one year are not annualized. For index definitions, please see www.schwabassetmanagement.com/glossary. Fund expenses may have been partially absorbed by the investment adviser and its affiliates. Without these reductions, the fund’s returns would have been lower. These returns do not reflect the deduction of taxes that a shareholder would pay on fund distributions or the redemption of fund shares. |
|
| Performance Inception Date |
Jul. 01, 2005
|
|
| No Deduction of Taxes [Text Block] |
These returns do not reflect the deduction of taxes that a shareholder would pay on fund distributions or the redemption of fund shares.
|
|
| Updated Performance Information Location [Text Block] |
To obtain performance information current to the most recent month end, please visit www.schwabassetmanagement.com/prospectus |
|
| Net Assets |
$ 1,031,000,000
|
|
| Holdings Count | Holding |
22
|
|
| Advisory Fees Paid, Amount |
$ 0
|
|
| Investment Company, Portfolio Turnover |
14.00%
|
|
| Additional Fund Statistics [Text Block] |
|
|
|
|
|
|
Advisory Fees Paid by the Fund |
|
Foreign Tax Paid and Passed Through |
|
Gross Income From Foreign Sources |
|
Dividends Received Deduction |
|
Qualified Dividend Income |
|
Long Term Capital Gain Distribution |
|
Qualified Business Income (199A) |
|
Business Interest Deduction (163j) |
|
|
|
| Holdings [Text Block] |
Asset Class Weightings % of Investments 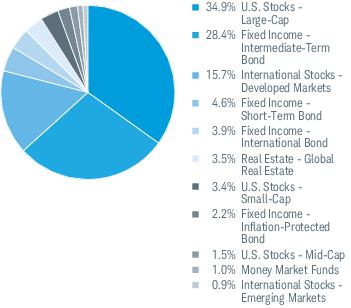 Top Holdings % of Net Assets 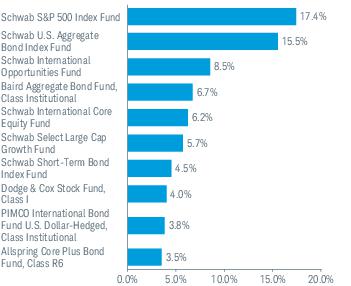 Portfolio holdings may have changed since the report date. |
|
| Largest Holdings [Text Block] |
Top Holdings % of Net Assets Portfolio holdings may have changed since the report date. |
|
| Schwab Target 2035 Fund |
|
|
| Shareholder Report [Line Items] |
|
|
| Fund Name |
Schwab Target 2035 Fund
|
|
| Class Name |
Schwab Target 2035 Fund
|
|
| Trading Symbol |
SWIRX
|
|
| Annual or Semi-Annual Statement [Text Block] |
This annual shareholder report contains important information about the fund for the period of November 1, 2024, to October 31, 2025.
|
|
| Shareholder Report Annual or Semi-Annual |
annual shareholder report
|
|
| Additional Information [Text Block] |
You can find additional information about the fund at www.schwabassetmanagement.com/prospectus . You can also request this information by calling or by sending an email request to orders@mysummaryprospectus.com .
|
|
| Additional Information Phone Number |
1-866-414-6349
|
|
| Additional Information Email |
orders@mysummaryprospectus.com
|
|
| Additional Information Website |
www.schwabassetmanagement.com/prospectus
|
|
| Expenses [Text Block] |
FUND COSTS FOR THE LAST year ENDED October 31, 2025 (BASED ON A HYPOTHETICAL $10,000 INVESTMENT)
* Expenses were reduced by a contractual fee waiver in effect for so long as the investment adviser serves as adviser to the fund. This agreement to limit the total annual fund operating expenses is limited to the fund’s direct operating expenses and, therefore, does not apply to acquired fund fees and expenses (AFFE), which are indirect expenses incurred by the fund through its investments in the underlying funds.
|
|
| Expenses Paid, Amount |
$ 0
|
[2] |
| Expense Ratio, Percent |
0.00%
|
[2] |
| Factors Affecting Performance [Text Block] |
MANAGEMENT’S DISCUSSION OF FUND PERFORMANCE For the 12-month reporting period ended October 31, 2025, the 2035 Fund returned 15.99%. The Dow Jones U.S. Total Stock Market Index SM , which provides a broad measure of equity market performance, and the Bloomberg US Aggregate Bond Index, which provides a broad measure of bond market performance, returned 20.90% and 6.16%, respectively. The 2035 Fund’s internally calculated comparative index, the Target 2035 Composite Index (the composite index), returned 15.87%. ■ Asset allocations were broadly in line with those of the composite index ■ Top contributors to total return: ● Schwab S&P 500 Index Fund ● Schwab International Opportunities Fund ■ Over the reporting period, there were no detractors from the return of the fund. However, the smallest contributors to total return were: ● Schwab Treasury Inflation Protected Securities Index Fund ● ClearBridge Small Cap Growth Fund (Class IS) (which was sold prior to the end of the reporting period) Portfolio holdings may have changed since the report date. |
|
| Performance Past Does Not Indicate Future [Text] |
The performance data quoted represents past performance. Past performance does not guarantee future results.
|
|
| Line Graph [Table Text Block] |
Performance of Hypothetical $10,000 Investment (October 31, 2015 - October 31, 2025) 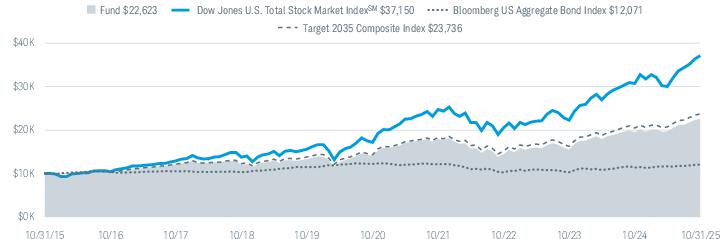 All total returns on this page assume dividends and distributions were reinvested. Index figures do not include trading and management costs, which would lower performance. Indices are unmanaged and cannot be invested in directly. Performance results less than one year are not annualized. For index definitions, please see www.schwabassetmanagement.com/glossary. Fund expenses may have been partially absorbed by the investment adviser and its affiliates. Without these reductions, the fund’s returns would have been lower. These returns do not reflect the deduction of taxes that a shareholder would pay on fund distributions or the redemption of fund shares. |
|
| Average Annual Return [Table Text Block] |
Average Annual Total Returns
|
|
|
|
Fund: Schwab Target 2035 Fund (03/12/2008) 1 |
|
|
|
Dow Jones U.S. Total Stock Market Index SM |
|
|
|
Bloomberg US Aggregate Bond Index |
|
|
|
Target 2035 Composite Index |
|
|
| All total returns on this page assume dividends and distributions were reinvested. Index figures do not include trading and management costs, which would lower performance. Indices are unmanaged and cannot be invested in directly. Performance results less than one year are not annualized. For index definitions, please see www.schwabassetmanagement.com/glossary. Fund expenses may have been partially absorbed by the investment adviser and its affiliates. Without these reductions, the fund’s returns would have been lower. These returns do not reflect the deduction of taxes that a shareholder would pay on fund distributions or the redemption of fund shares. |
|
| Performance Inception Date |
Mar. 12, 2008
|
|
| No Deduction of Taxes [Text Block] |
These returns do not reflect the deduction of taxes that a shareholder would pay on fund distributions or the redemption of fund shares.
|
|
| Updated Performance Information Location [Text Block] |
To obtain performance information current to the most recent month end, please visit www.schwabassetmanagement.com/prospectus |
|
| Net Assets |
$ 670,000,000
|
|
| Holdings Count | Holding |
22
|
|
| Advisory Fees Paid, Amount |
$ 0
|
|
| Investment Company, Portfolio Turnover |
15.00%
|
|
| Additional Fund Statistics [Text Block] |
|
|
|
|
|
|
Advisory Fees Paid by the Fund |
|
Foreign Tax Paid and Passed Through |
|
Gross Income From Foreign Sources |
|
Dividends Received Deduction |
|
Qualified Dividend Income |
|
Long Term Capital Gain Distribution |
|
Qualified Business Income (199A) |
|
Business Interest Deduction (163j) |
|
|
|
| Holdings [Text Block] |
Asset Class Weightings % of Investments 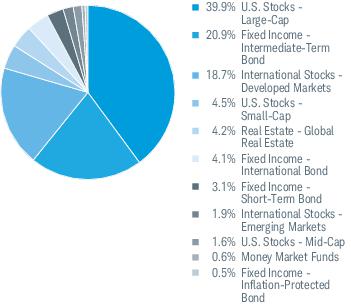 Top Holdings % of Net Assets 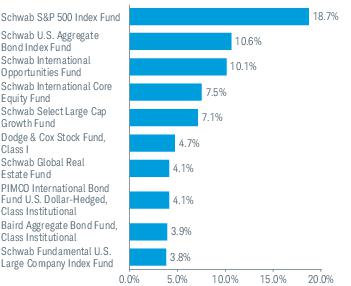 Portfolio holdings may have changed since the report date. |
|
| Largest Holdings [Text Block] |
Top Holdings % of Net Assets Portfolio holdings may have changed since the report date. |
|
| Schwab Target 2040 Fund |
|
|
| Shareholder Report [Line Items] |
|
|
| Fund Name |
Schwab Target 2040 Fund
|
|
| Class Name |
Schwab Target 2040 Fund
|
|
| Trading Symbol |
SWERX
|
|
| Annual or Semi-Annual Statement [Text Block] |
This annual shareholder report contains important information about the fund for the period of November 1, 2024, to October 31, 2025.
|
|
| Shareholder Report Annual or Semi-Annual |
annual shareholder report
|
|
| Additional Information [Text Block] |
You can find additional information about the fund at www.schwabassetmanagement.com/prospectus . You can also request this information by calling or by sending an email request to orders@mysummaryprospectus.com .
|
|
| Additional Information Phone Number |
1-866-414-6349
|
|
| Additional Information Email |
orders@mysummaryprospectus.com
|
|
| Additional Information Website |
www.schwabassetmanagement.com/prospectus
|
|
| Expenses [Text Block] |
FUND COSTS FOR THE LAST year ENDED October 31, 2025 (BASED ON A HYPOTHETICAL $10,000 INVESTMENT) Expenses were reduced by a contractual fee waiver in effect for so long as the investment adviser serves as adviser to the fund. This agreement to limit the total annual fund operating expenses is limited to the fund’s direct operating expenses and, therefore, does not apply to acquired fund fees and expenses (AFFE), which are indirect expenses incurred by the fund through its investments in the underlying funds. |
|
| Expenses Paid, Amount |
$ 0
|
[2] |
| Expense Ratio, Percent |
0.00%
|
[2] |
| Factors Affecting Performance [Text Block] |
MANAGEMENT’S DISCUSSION OF FUND PERFORMANCE For the 12-month reporting period ended October 31, 2025, the 2040 Fund returned 17.14%. The Dow Jones U.S. Total Stock Market Index SM , which provides a broad measure of equity market performance, and the Bloomberg US Aggregate Bond Index, which provides a broad measure of bond market performance, returned 20.90% and 6.16%, respectively. The 2040 Fund’s internally calculated comparative index, the Target 2040 Composite Index (the composite index), returned 17.12%. ■ Asset allocations were broadly in line with those of the composite index ■ Top contributors to total return: ● Schwab S&P 500 Index Fund ● Schwab International Opportunities Fund ■ Over the reporting period, there were no detractors from the return of the fund. However, the smallest contributors to total return were: ● Allspring Core Plus Bond Fund (Class R6) ● Schwab Short-Term Bond Index Fund Portfolio holdings may have changed since the report date. |
|
| Performance Past Does Not Indicate Future [Text] |
The performance data quoted represents past performance. Past performance does not guarantee future results.
|
|
| Line Graph [Table Text Block] |
Performance of Hypothetical $10,000 Investment (October 31, 2015 - October 31, 2025) All total returns on this page assume dividends and distributions were reinvested. Index figures do not include trading and management costs, which would lower performance. Indices are unmanaged and cannot be invested in directly. Performance results less than one year are not annualized. For index definitions, please see www.schwabassetmanagement.com/glossary. Fund expenses may have been partially absorbed by the investment adviser and its affiliates. Without these reductions, the fund’s returns would have been lower. These returns do not reflect the deduction of taxes that a shareholder would pay on fund distributions or the redemption of fund shares. |
|
| Average Annual Return [Table Text Block] |
Average Annual Total Returns
|
|
|
|
Fund: Schwab Target 2040 Fund ( 07/01/2005) 1 |
|
|
|
Dow Jones U.S. Total Stock Market Index SM |
|
|
|
Bloomberg US Aggregate Bond Index |
|
|
|
Target 2040 Composite Index |
|
|
| All total returns on this page assume dividends and distributions were reinvested. Index figures do not include trading and management costs, which would lower performance. Indices are unmanaged and cannot be invested in directly. Performance results less than one year are not annualized. For index definitions, please see www.schwabassetmanagement.com/glossary. Fund expenses may have been partially absorbed by the investment adviser and its affiliates. Without these reductions, the fund’s returns would have been lower. These returns do not reflect the deduction of taxes that a shareholder would pay on fund distributions or the redemption of fund shares. |
|
| Performance Inception Date |
Jul. 01, 2005
|
|
| No Deduction of Taxes [Text Block] |
These returns do not reflect the deduction of taxes that a shareholder would pay on fund distributions or the redemption of fund shares.
|
|
| Updated Performance Information Location [Text Block] |
To obtain performance information current to the most recent month end, please visit www.schwabassetmanagement.com/prospectus |
|
| Net Assets |
$ 1,313,000,000
|
|
| Holdings Count | Holding |
21
|
|
| Advisory Fees Paid, Amount |
$ 0
|
|
| Investment Company, Portfolio Turnover |
12.00%
|
|
| Additional Fund Statistics [Text Block] |
|
|
|
|
|
|
Advisory Fees Paid by the Fund |
|
Foreign Tax Paid and Passed Through |
|
Gross Income From Foreign Sources |
|
Dividends Received Deduction |
|
Qualified Dividend Income |
|
Long Term Capital Gain Distribution |
|
Qualified Business Income (199A) |
|
Business Interest Deduction (163j) |
|
|
|
| Holdings [Text Block] |
Asset Class Weightings % of Investments Top Holdings % of Net Assets Portfolio holdings may have changed since the report date. |
|
| Largest Holdings [Text Block] |
Top Holdings % of Net Assets Portfolio holdings may have changed since the report date. |
|
| Schwab Target 2045 Fund |
|
|
| Shareholder Report [Line Items] |
|
|
| Fund Name |
Schwab Target 2045 Fund
|
|
| Class Name |
Schwab Target 2045 Fund
|
|
| Trading Symbol |
SWMRX
|
|
| Annual or Semi-Annual Statement [Text Block] |
This annual shareholder report contains important information about the fund for the period of November 1, 2024, to October 31, 2025.
|
|
| Shareholder Report Annual or Semi-Annual |
annual shareholder report
|
|
| Additional Information [Text Block] |
You can find additional information about the fund at www.schwabassetmanagement.com/prospectus . You can also request this information by calling or by sending an email request to orders@mysummaryprospectus.com .
|
|
| Additional Information Phone Number |
1-866-414-6349
|
|
| Additional Information Email |
orders@mysummaryprospectus.com
|
|
| Additional Information Website |
www.schwabassetmanagement.com/prospectus
|
|
| Expenses [Text Block] |
FUND COSTS FOR THE LAST year ENDED October 31, 2025 (BASED ON A HYPOTHETICAL $10,000 INVESTMENT) Expenses were reduced by a contractual fee waiver in effect for so long as the investment adviser serves as adviser to the fund. This agreement to limit the total annual fund operating expenses is limited to the fund’s direct operating expenses and, therefore, does not apply to acquired fund fees and expenses (AFFE), which are indirect expenses incurred by the fund through its investments in the underlying funds. |
|
| Expenses Paid, Amount |
$ 0
|
[2] |
| Expense Ratio, Percent |
0.00%
|
[2] |
| Factors Affecting Performance [Text Block] |
MANAGEMENT’S DISCUSSION OF FUND PERFORMANCE For the 12-month reporting period ended October 31, 2025, the 2045 Fund returned 18.24%. The Dow Jones U.S. Total Stock Market Index SM , which provides a broad measure of equity market performance, and the Bloomberg US Aggregate Bond Index, which provides a broad measure of bond market performance, returned 20.90% and 6.16%, respectively. The 2045 Fund’s internally calculated comparative index, the Target 2045 Composite Index (the composite index), returned 18.20%. ■ Asset allocations were broadly in line with those of the composite index ■ Top contributors to total return: ● Schwab S&P 500 Index Fund ● Schwab International Opportunities Fund ■ Over the reporting period, there were no detractors from the return of the fund. However, the smallest contributors to total return were: ● Allspring Core Plus Bond Fund (Class R6) ● Schwab Short-Term Bond Index Fund Portfolio holdings may have changed since the report date. |
|
| Performance Past Does Not Indicate Future [Text] |
The performance data quoted represents past performance. Past performance does not guarantee future results.
|
|
| Line Graph [Table Text Block] |
Performance of Hypothetical $10,000 Investment (October 31, 2015 - October 31, 2025) All total returns on this page assume dividends and distributions were reinvested. Index figures do not include trading and management costs, which would lower performance. Indices are unmanaged and cannot be invested in directly. Performance results less than one year are not annualized. For index definitions, please see www.schwabassetmanagement.com/glossary. Fund expenses may have been partially absorbed by the investment adviser and its affiliates. Without these reductions, the fund’s returns would have been lower. These returns do not reflect the deduction of taxes that a shareholder would pay on fund distributions or the redemption of fund shares. |
|
| Average Annual Return [Table Text Block] |
Average Annual Total Returns
|
|
|
|
Fund: Schwab Target 2045 Fund (01/23/2013) 1 |
|
|
|
Dow Jones U.S. Total Stock Market Index SM |
|
|
|
Bloomberg US Aggregate Bond Index |
|
|
|
Target 2045 Composite Index |
|
|
| All total returns on this page assume dividends and distributions were reinvested. Index figures do not include trading and management costs, which would lower performance. Indices are unmanaged and cannot be invested in directly. Performance results less than one year are not annualized. For index definitions, please see www.schwabassetmanagement.com/glossary. Fund expenses may have been partially absorbed by the investment adviser and its affiliates. Without these reductions, the fund’s returns would have been lower. These returns do not reflect the deduction of taxes that a shareholder would pay on fund distributions or the redemption of fund shares. |
|
| Performance Inception Date |
Jan. 23, 2013
|
|
| No Deduction of Taxes [Text Block] |
These returns do not reflect the deduction of taxes that a shareholder would pay on fund distributions or the redemption of fund shares.
|
|
| Updated Performance Information Location [Text Block] |
To obtain performance information current to the most recent month end, please visit www.schwabassetmanagement.com/prospectus |
|
| Net Assets |
$ 367,000,000
|
|
| Holdings Count | Holding |
21
|
|
| Advisory Fees Paid, Amount |
$ 0
|
|
| Investment Company, Portfolio Turnover |
9.00%
|
|
| Additional Fund Statistics [Text Block] |
|
|
|
|
|
|
Advisory Fees Paid by the Fund |
|
Foreign Tax Paid and Passed Through |
|
Gross Income From Foreign Sources |
|
Dividends Received Deduction |
|
Qualified Dividend Income |
|
Long Term Capital Gain Distribution |
|
Qualified Business Income (199A) |
|
Business Interest Deduction (163j) |
|
|
|
| Holdings [Text Block] |
Asset Class Weightings % of Investments 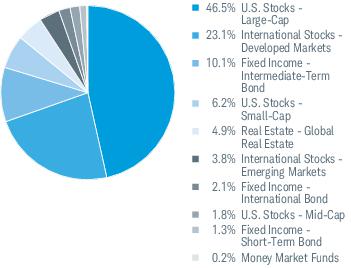 Top Holdings % of Net Assets 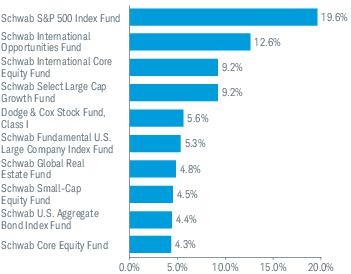 Portfolio holdings may have changed since the report date. |
|
| Largest Holdings [Text Block] |
Top Holdings % of Net Assets
Portfolio holdings may have changed since the report date. |
|
| Schwab Target 2050 Fund |
|
|
| Shareholder Report [Line Items] |
|
|
| Fund Name |
Schwab Target 2050 Fund
|
|
| Class Name |
Schwab Target 2050 Fund
|
|
| Trading Symbol |
SWNRX
|
|
| Annual or Semi-Annual Statement [Text Block] |
This annual shareholder report contains important information about the fund for the period of November 1, 2024, to October 31, 2025.
|
|
| Shareholder Report Annual or Semi-Annual |
annual shareholder report
|
|
| Additional Information [Text Block] |
You can find additional information about the fund at www.schwabassetmanagement.com/prospectus . You can also request this information by calling or by sending an email request to orders@mysummaryprospectus.com .
|
|
| Additional Information Phone Number |
1-866-414-6349
|
|
| Additional Information Email |
orders@mysummaryprospectus.com
|
|
| Additional Information Website |
www.schwabassetmanagement.com/prospectus
|
|
| Expenses [Text Block] |
FUND COSTS FOR THE LAST year ENDED October 31, 2025 (BASED ON A HYPOTHETICAL $10,000 INVESTMENT) Expenses were reduced by a contractual fee waiver in effect for so long as the investment adviser serves as adviser to the fund. This agreement to limit the total annual fund operating expenses is limited to the fund’s direct operating expenses and, therefore, does not apply to acquired fund fees and expenses (AFFE), which are indirect expenses incurred by the fund through its investments in the underlying funds. |
|
| Expenses Paid, Amount |
$ 0
|
[2] |
| Expense Ratio, Percent |
0.00%
|
[2] |
| Factors Affecting Performance [Text Block] |
MANAGEMENT’S DISCUSSION OF FUND PERFORMANCE For the 12-month reporting period ended October 31, 2025 , the 2050 Fund returned 18.96%. The Dow Jones U.S. Total Stock Market Index SM , which provides a broad measure of equity market performance, and the Bloomberg US Aggregate Bond Index, which provides a broad measure of bond market performance, returned 20.90% and 6.16%, respectively. The 2050 Fund’s internally calculated comparative index, the Target 2050 Composite Index (the composite index), returned 18.98%. ■ Asset allocations were broadly in line with those of the composite index ■ Top contributors to total return: ● Schwab S&P 500 Index Fund ● Schwab International Opportunities Fund ■ Over the reporting period, there were no detractors from the return of the fund. However, the smallest contributors to total return were: ● Allspring Core Plus Bond Fund (Class R6) ● Schwab Short-Term Bond Index Fund Portfolio holdings may have changed since the report date. |
|
| Performance Past Does Not Indicate Future [Text] |
The performance data quoted represents past performance. Past performance does not guarantee future results.
|
|
| Line Graph [Table Text Block] |
Performance of Hypothetical $10,000 Investment (October 31, 2015 - October 31, 2025) 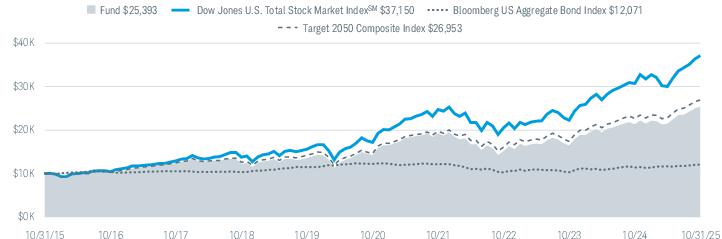 All total returns on this page assume dividends and distributions were reinvested. Index figures do not include trading and management costs, which would lower performance. Indices are unmanaged and cannot be invested in directly. Performance results less than one year are not annualized. For index definitions, please see www.schwabassetmanagement.com/glossary. Fund expenses may have been partially absorbed by the investment adviser and its affiliates. Without these reductions, the fund’s returns would have been lower. These returns do not reflect the deduction of taxes that a shareholder would pay on fund distributions or the redemption of fund shares. |
|
| Average Annual Return [Table Text Block] |
Average Annual Total Returns
|
|
|
|
Fund: Schwab Target 2050 Fund (01/23/2013) 1 |
|
|
|
Dow Jones U.S. Total Stock Market Index SM |
|
|
|
Bloomberg US Aggregate Bond Index |
|
|
|
Target 2050 Composite Index |
|
|
| All total returns on this page assume dividends and distributions were reinvested. Index figures do not include trading and management costs, which would lower performance. Indices are unmanaged and cannot be invested in directly. Performance results less than one year are not annualized. For index definitions, please see www.schwabassetmanagement.com/glossary. Fund expenses may have been partially absorbed by the investment adviser and its affiliates. Without these reductions, the fund’s returns would have been lower. These returns do not reflect the deduction of taxes that a shareholder would pay on fund distributions or the redemption of fund shares. |
|
| Performance Inception Date |
Jan. 23, 2013
|
|
| No Deduction of Taxes [Text Block] |
These returns do not reflect the deduction of taxes that a shareholder would pay on fund distributions or the redemption of fund shares.
|
|
| Updated Performance Information Location [Text Block] |
To obtain performance information current to the most recent month end, please visit www.schwabassetmanagement.com/prospectus |
|
| Net Assets |
$ 376,000,000
|
|
| Holdings Count | Holding |
21
|
|
| Advisory Fees Paid, Amount |
$ 0
|
|
| Investment Company, Portfolio Turnover |
7.00%
|
|
| Additional Fund Statistics [Text Block] |
|
|
|
|
|
|
Advisory Fees Paid by the Fund |
|
Foreign Tax Paid and Passed Through |
|
Gross Income From Foreign Sources |
|
Dividends Received Deduction |
|
Qualified Dividend Income |
|
Long Term Capital Gain Distribution |
|
Qualified Business Income (199A) |
|
Business Interest Deduction (163j) |
|
|
|
| Holdings [Text Block] |
Asset Class Weightings % of Investments Top Holdings % of Net Assets Portfolio holdings may have changed since the report date. |
|
| Largest Holdings [Text Block] |
Top Holdings % of Net Assets Portfolio holdings may have changed since the report date. |
|
| Schwab Target 2055 Fund |
|
|
| Shareholder Report [Line Items] |
|
|
| Fund Name |
Schwab Target 2055 Fund
|
|
| Class Name |
Schwab Target 2055 Fund
|
|
| Trading Symbol |
SWORX
|
|
| Annual or Semi-Annual Statement [Text Block] |
This annual shareholder report contains important information about the fund for the period of November 1, 2024, to October 31, 2025.
|
|
| Shareholder Report Annual or Semi-Annual |
annual shareholder report
|
|
| Additional Information [Text Block] |
You can find additional information about the fund at www.schwabassetmanagement.com/prospectus . You can also request this information by calling or by sending an email request to orders@mysummaryprospectus.com .
|
|
| Additional Information Phone Number |
1-866-414-6349
|
|
| Additional Information Email |
orders@mysummaryprospectus.com
|
|
| Additional Information Website |
www.schwabassetmanagement.com/prospectus
|
|
| Expenses [Text Block] |
FUND COSTS FOR THE LAST year ENDED October 31, 2025 (BASED ON A HYPOTHETICAL $10,000 INVESTMENT) Expenses were reduced by a contractual fee waiver in effect for so long as the investment adviser serves as adviser to the fund. This agreement to limit the total annual fund operating expenses is limited to the fund’s direct operating expenses and, therefore, does not apply to acquired fund fees and expenses (AFFE), which are indirect expenses incurred by the fund through its investments in the underlying funds. |
|
| Expenses Paid, Amount |
$ 0
|
[2] |
| Expense Ratio, Percent |
0.00%
|
[2] |
| Factors Affecting Performance [Text Block] |
MANAGEMENT’S DISCUSSION OF FUND PERFORMANCE For the 12-month reporting period ended October 31, 2025, the 2055 Fund returned 19.44%. The Dow Jones U.S. Total Stock Market Index SM , which provides a broad measure of equity market performance, and the Bloomberg US Aggregate Bond Index, which provides a broad measure of bond market performance, returned 20.90% and 6.16%, respectively. The 2055 Fund’s internally calculated comparative index, the Target 2055 Composite Index (the composite index), returned 19.43%. ■ Asset allocations were broadly in line with those of the composite index ■ Top contributors to total return: ● Schwab S&P 500 Index Fund ● Schwab International Opportunities Fund ■ Over the reporting period, there were no detractors from the return of the fund. However, the smallest contributors to total return were: ● Baird Aggregate Bond Fund (Institutional Class) ● Schwab Short-Term Bond Index Fund Portfolio holdings may have changed since the report date. |
|
| Performance Past Does Not Indicate Future [Text] |
The performance data quoted represents past performance. Past performance does not guarantee future results.
|
|
| Line Graph [Table Text Block] |
Performance of Hypothetical $10,000 Investment (October 31, 2015 - October 31, 2025) All total returns on this page assume dividends and distributions were reinvested. Index figures do not include trading and management costs, which would lower performance. Indices are unmanaged and cannot be invested in directly. Performance results less than one year are not annualized. For index definitions, please see www.schwabassetmanagement.com/glossary. Fund expenses may have been partially absorbed by the investment adviser and its affiliates. Without these reductions, the fund’s returns would have been lower. These returns do not reflect the deduction of taxes that a shareholder would pay on fund distributions or the redemption of fund shares. |
|
| Average Annual Return [Table Text Block] |
Average Annual Total Returns
|
|
|
|
Fund: Schwab Target 2055 Fund (01/23/2013) 1 |
|
|
|
Dow Jones U.S. Total Stock Market Index SM |
|
|
|
Bloomberg US Aggregate Bond Index |
|
|
|
Target 2055 Composite Index |
|
|
| All total returns on this page assume dividends and distributions were reinvested. Index figures do not include trading and management costs, which would lower performance. Indices are unmanaged and cannot be invested in directly. Performance results less than one year are not annualized. For index definitions, please see www.schwabassetmanagement.com/glossary. Fund expenses may have been partially absorbed by the investment adviser and its affiliates. Without these reductions, the fund’s returns would have been lower. These returns do not reflect the deduction of taxes that a shareholder would pay on fund distributions or the redemption of fund shares. |
|
| Performance Inception Date |
Jan. 23, 2013
|
|
| No Deduction of Taxes [Text Block] |
These returns do not reflect the deduction of taxes that a shareholder would pay on fund distributions or the redemption of fund shares.
|
|
| Updated Performance Information Location [Text Block] |
To obtain performance information current to the most recent month end, please visit www.schwabassetmanagement.com/prospectus |
|
| Net Assets |
$ 273,000,000
|
|
| Holdings Count | Holding |
20
|
|
| Advisory Fees Paid, Amount |
$ 0
|
|
| Investment Company, Portfolio Turnover |
6.00%
|
|
| Additional Fund Statistics [Text Block] |
|
|
|
|
|
|
Advisory Fees Paid by the Fund |
|
Foreign Tax Paid and Passed Through |
|
Gross Income From Foreign Sources |
|
Dividends Received Deduction |
|
Qualified Dividend Income |
|
Long Term Capital Gain Distribution |
|
Qualified Business Income (199A) |
|
Business Interest Deduction (163j) |
|
|
|
| Holdings [Text Block] |
Asset Class Weightings % of Investments 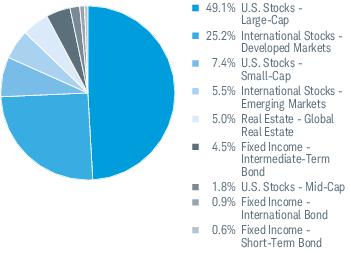 Top Holdings % of Net Assets 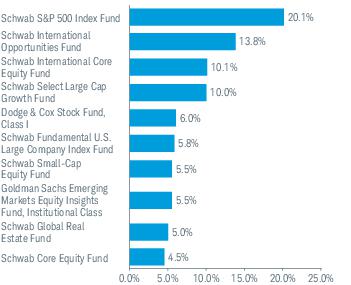 Portfolio holdings may have changed since the report date. |
|
| Largest Holdings [Text Block] |
Top Holdings % of Net Assets Portfolio holdings may have changed since the report date. |
|
| Schwab Target 2060 Fund |
|
|
| Shareholder Report [Line Items] |
|
|
| Fund Name |
Schwab Target 2060 Fund
|
|
| Class Name |
Schwab Target 2060 Fund
|
|
| Trading Symbol |
SWPRX
|
|
| Annual or Semi-Annual Statement [Text Block] |
This annual shareholder report contains important information about the fund for the period of November 1, 2024, to October 31, 2025.
|
|
| Shareholder Report Annual or Semi-Annual |
annual shareholder report
|
|
| Additional Information [Text Block] |
You can find additional information about the fund at www.schwabassetmanagement.com/prospectus . You can also request this information by calling or by sending an email request to orders@mysummaryprospectus.com .
|
|
| Additional Information Phone Number |
1-866-414-6349
|
|
| Additional Information Email |
orders@mysummaryprospectus.com
|
|
| Additional Information Website |
www.schwabassetmanagement.com/prospectus
|
|
| Expenses [Text Block] |
FUND COSTS FOR THE LAST year ENDED October 31, 2025 (BASED ON A HYPOTHETICAL $10,000 INVESTMENT) Expenses were reduced by a contractual fee waiver in effect for so long as the investment adviser serves as adviser to the fund. This agreement to limit the total annual fund operating expenses is limited to the fund’s direct operating expenses and, therefore, does not apply to acquired fund fees and expenses (AFFE), which are indirect expenses incurred by the fund through its investments in the underlying funds. |
|
| Expenses Paid, Amount |
$ 0
|
[2] |
| Expense Ratio, Percent |
0.00%
|
[2] |
| Factors Affecting Performance [Text Block] |
MANAGEMENT’S DISCUSSION OF FUND PERFORMANCE For the 12-month reporting period ended October 31, 2025, the 2060 Fund returned 19.90%. The Dow Jones U.S. Total Stock Market Index SM , which provides a broad measure of equity market performance, and the Bloomberg US Aggregate Bond Index, which provides a broad measure of bond market performance, returned 20.90% and 6.16%, respectively. The 2060 Fund’s internally calculated comparative index, the Target 2060 Composite Index (the composite index), returned 19.74%. ■ Asset allocations were broadly in line with those of the composite index ■ Top contributors to total return: ● Schwab S&P 500 Index Fund ● Schwab International Opportunities Fund ■ Over the reporting period, there were no detractors from the return of the fund. However, the smallest contributors to total return were: ● Allspring Core Plus Bond Fund (Class R6) ● Schwab Short-Term Bond Index Fund Portfolio holdings may have changed since the report date. |
|
| Performance Past Does Not Indicate Future [Text] |
The performance data quoted represents past performance. Past performance does not guarantee future results.
|
|
| Line Graph [Table Text Block] |
Performance of Hypothetical $10,000 Investment (August 25, 2016 - October 31, 2025) All total returns on this page assume dividends and distributions were reinvested. Index figures do not include trading and management costs, which would lower performance. Indices are unmanaged and cannot be invested in directly. Performance results less than one year are not annualized. For index definitions, please see www.schwabassetmanagement.com/glossary. Fund expenses may have been partially absorbed by the investment adviser and its affiliates. Without these reductions, the fund’s returns would have been lower. These returns do not reflect the deduction of taxes that a shareholder would pay on fund distributions or the redemption of fund shares. |
|
| Average Annual Return [Table Text Block] |
Average Annual Total Returns
|
|
|
|
Fund: Schwab Target 2060 Fund (08/25/2016) 1 |
|
|
|
Dow Jones U.S. Total Stock Market Index SM |
|
|
|
Bloomberg US Aggregate Bond Index |
|
|
|
Target 2060 Composite Index |
|
|
| All total returns on this page assume dividends and distributions were reinvested. Index figures do not include trading and management costs, which would lower performance. Indices are unmanaged and cannot be invested in directly. Performance results less than one year are not annualized. For index definitions, please see www.schwabassetmanagement.com/glossary. Fund expenses may have been partially absorbed by the investment adviser and its affiliates. Without these reductions, the fund’s returns would have been lower. These returns do not reflect the deduction of taxes that a shareholder would pay on fund distributions or the redemption of fund shares. |
|
| Performance Inception Date |
Aug. 25, 2016
|
|
| No Deduction of Taxes [Text Block] |
These returns do not reflect the deduction of taxes that a shareholder would pay on fund distributions or the redemption of fund shares.
|
|
| Updated Performance Information Location [Text Block] |
To obtain performance information current to the most recent month end, please visit www.schwabassetmanagement.com/prospectus |
|
| Net Assets |
$ 120,000,000
|
|
| Holdings Count | Holding |
19
|
|
| Advisory Fees Paid, Amount |
$ 0
|
|
| Investment Company, Portfolio Turnover |
5.00%
|
|
| Additional Fund Statistics [Text Block] |
|
|
|
|
|
|
Advisory Fees Paid by the Fund |
|
Foreign Tax Paid and Passed Through |
|
Gross Income From Foreign Sources |
|
Dividends Received Deduction |
|
Qualified Dividend Income |
|
Long Term Capital Gain Distribution |
|
Qualified Business Income (199A) |
|
Business Interest Deduction (163j) |
|
|
|
| Holdings [Text Block] |
Asset Class Weightings % of Investments 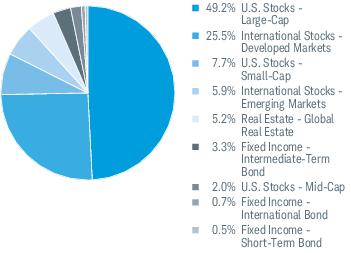 Top Holdings % of Net Assets 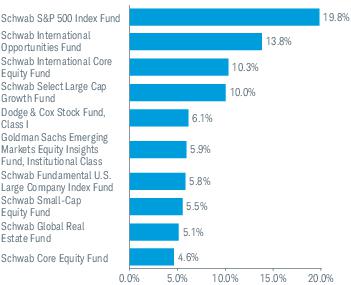 Portfolio holdings may have changed since the report date . |
|
| Largest Holdings [Text Block] |
Top Holdings % of Net Assets Portfolio holdings may have changed since the report date . |
|
| Schwab Target 2065 Fund |
|
|
| Shareholder Report [Line Items] |
|
|
| Fund Name |
Schwab Target 2065 Fund
|
|
| Class Name |
Schwab Target 2065 Fund
|
|
| Trading Symbol |
SWQRX
|
|
| Annual or Semi-Annual Statement [Text Block] |
This annual shareholder report contains important information about the fund for the period of November 1, 2024, to October 31, 2025.
|
|
| Shareholder Report Annual or Semi-Annual |
annual shareholder report
|
|
| Additional Information [Text Block] |
You can find additional information about the fund at www.schwabassetmanagement.com/prospectus . You can also request this information by calling or by sending an email request to orders@mysummaryprospectus.com . |
|
| Additional Information Phone Number |
1-866-414-6349
|
|
| Additional Information Email |
orders@mysummaryprospectus.com
|
|
| Additional Information Website |
www.schwabassetmanagement.com/prospectus
|
|
| Expenses [Text Block] |
FUND COSTS FOR THE LAST year ENDED October 31, 2025 (BASED ON A HYPOTHETICAL $10,000 INVESTMENT)
* Expenses were reduced by a contractual fee waiver in effect for so long as the investment adviser serves as adviser to the fund. This agreement to limit the total annual fund operating expenses is limited to the fund’s direct operating expenses and, therefore, does not apply to acquired fund fees and expenses (AFFE), which are indirect expenses incurred by the fund through its investments in the underlying funds.
|
|
| Expenses Paid, Amount |
$ 0
|
[2] |
| Expense Ratio, Percent |
0.00%
|
[2] |
| Factors Affecting Performance [Text Block] |
MANAGEMENT’S DISCUSSION OF FUND PERFORMANCE For the 12-month reporting period ended October 31, 2025, the 2065 Fund returned 20.09%. The Dow Jones U.S. Total Stock Market Index SM , which provides a broad measure of equity market performance, and the Bloomberg US Aggregate Bond Index, which provides a broad measure of bond market performance, returned 20.90% and 6.16%, respectively. The 2065 Fund’s internally calculate d com parative index, the Target 2065 Composite Index (the composite index), returned 20.05%. ■ Asset allocations were broadly in line with those of the composite index ■ Top contributors to total return: ● Schwab S&P 500 Index Fund ● Schwab International Opportunities Fund ■ Over the reporting period, there were no detractors from the return of the fund. However, the smallest contributors to total return were: ● Schwab U.S. Aggregate Bond Index Fund ● Schwab Short-Term Bond Index Fund Portfolio holdings may have changed since the report date. |
|
| Performance Past Does Not Indicate Future [Text] |
The performance data quoted represents past performance. Past performance does not guarantee future results.
|
|
| Line Graph [Table Text Block] |
Performance of Hypothetical $10,000 Investment (February 25, 2021 - October 31, 2025) 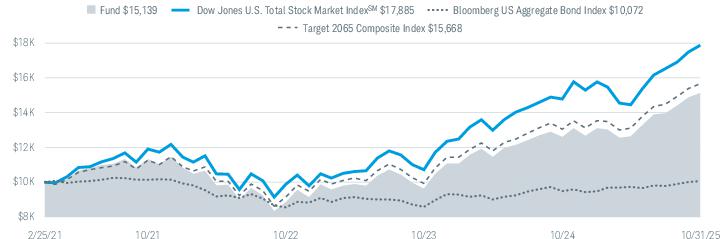 All total returns on this page assume dividends and distributions were reinvested. Index figures do not include trading and management costs, which would lower performance. Indices are unmanaged and cannot be invested in directly. Performance results less than one year are not annualized. For index definitions, please see www.schwabassetmanagement.com/glossary. Fund expenses may have been partially absorbed by the investment adviser and its affiliates. Without these reductions, the fund’s returns would have been lower. These returns do not reflect the deduction of taxes that a shareholder would pay on fund distributions or the redemption of fund shares. |
|
| Average Annual Return [Table Text Block] |
Average Annual Total Returns
|
|
|
Fund: Schwab Target 2065 Fund (02/25/2021) 1 |
|
|
Dow Jones U.S. Total Stock Market Index SM |
|
|
Bloomberg US Aggregate Bond Index |
|
|
Target 2065 Composite Index |
|
| All total returns on this page assume dividends and distributions were reinvested. Index figures do not include trading and management costs, which would lower performance. Indices are unmanaged and cannot be invested in directly. Performance results less than one year are not annualized. For index definitions, please see www.schwabassetmanagement.com/glossary. Fund expenses may have been partially absorbed by the investment adviser and its affiliates. Without these reductions, the fund’s returns would have been lower. These returns do not reflect the deduction of taxes that a shareholder would pay on fund distributions or the redemption of fund shares. |
|
| Performance Inception Date |
Feb. 25, 2021
|
|
| No Deduction of Taxes [Text Block] |
These returns do not reflect the deduction of taxes that a shareholder would pay on fund distributions or the redemption of fund shares.
|
|
| Updated Performance Information Location [Text Block] |
To obtain performance information current to the most recent month end, please visit www.schwabassetmanagement.com/prospectus |
|
| Net Assets |
$ 40,000,000
|
|
| Holdings Count | Holding |
18
|
|
| Advisory Fees Paid, Amount |
$ 0
|
|
| Investment Company, Portfolio Turnover |
4.00%
|
|
| Additional Fund Statistics [Text Block] |
|
|
|
|
|
|
Advisory Fees Paid by the Fund |
|
Foreign Tax Paid and Passed Through |
|
Gross Income From Foreign Sources |
|
Dividends Received Deduction |
|
Qualified Dividend Income |
|
Long Term Capital Gain Distribution |
|
Qualified Business Income (199A) |
|
Business Interest Deduction (163j) |
|
|
|
| Holdings [Text Block] |
Asset Class Weightings % of Investments 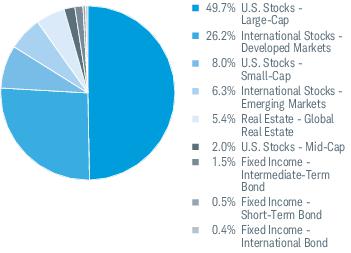 Top Holdings % of Net Assets  Portfolio holdings may have changed since the report date. |
|
| Largest Holdings [Text Block] |
Top Holdings % of Net Assets Portfolio holdings may have changed since the report date. |
|
|
|
| X |
- DefinitionBoolean flag that is true when the XBRL content amends previously-filed or accepted submission.
| Name: |
dei_AmendmentFlag |
| Namespace Prefix: |
dei_ |
| Data Type: |
xbrli:booleanItemType |
| Balance Type: |
na |
| Period Type: |
duration |
|
| X |
- DefinitionFor the EDGAR submission types of Form 8-K: the date of the report, the date of the earliest event reported; for the EDGAR submission types of Form N-1A: the filing date; for all other submission types: the end of the reporting or transition period. The format of the date is YYYY-MM-DD.
| Name: |
dei_DocumentPeriodEndDate |
| Namespace Prefix: |
dei_ |
| Data Type: |
xbrli:dateItemType |
| Balance Type: |
na |
| Period Type: |
duration |
|
| X |
- DefinitionThe type of document being provided (such as 10-K, 10-Q, 485BPOS, etc). The document type is limited to the same value as the supporting SEC submission type, or the word 'Other'.
| Name: |
dei_DocumentType |
| Namespace Prefix: |
dei_ |
| Data Type: |
dei:submissionTypeItemType |
| Balance Type: |
na |
| Period Type: |
duration |
|
| X |
- DefinitionA unique 10-digit SEC-issued value to identify entities that have filed disclosures with the SEC. It is commonly abbreviated as CIK. Reference 1: http://www.xbrl.org/2003/role/presentationRef
-Publisher SEC
-Name Exchange Act
-Number 240
-Section 12
-Subsection b-2
| Name: |
dei_EntityCentralIndexKey |
| Namespace Prefix: |
dei_ |
| Data Type: |
dei:centralIndexKeyItemType |
| Balance Type: |
na |
| Period Type: |
duration |
|
| X |
- DefinitionOne of: N-1A (Mutual Fund), N-1 (Open-End Separate Account with No Variable Annuities), N-2 (Closed-End Investment Company), N-3 (Separate Account Registered as Open-End Management Investment Company), N-4 (Variable Annuity UIT Separate Account), N-5 (Small Business Investment Company), N-6 (Variable Life UIT Separate Account), S-1 or S-3 (Face Amount Certificate Company), S-6 (UIT, Non-Insurance Product). Reference 1: http://www.xbrl.org/2003/role/presentationRef
-Publisher SEC
-Name Regulation S-T
-Number 232
-Section 313
| Name: |
dei_EntityInvCompanyType |
| Namespace Prefix: |
dei_ |
| Data Type: |
dei:invCompanyType |
| Balance Type: |
na |
| Period Type: |
duration |
|
| X |
- DefinitionThe exact name of the entity filing the report as specified in its charter, which is required by forms filed with the SEC. Reference 1: http://www.xbrl.org/2003/role/presentationRef
-Publisher SEC
-Name Exchange Act
-Number 240
-Section 12
-Subsection b-2
| Name: |
dei_EntityRegistrantName |
| Namespace Prefix: |
dei_ |
| Data Type: |
xbrli:normalizedStringItemType |
| Balance Type: |
na |
| Period Type: |
duration |
|
| X |
- DefinitionTrading symbol of an instrument as listed on an exchange.
| Name: |
dei_TradingSymbol |
| Namespace Prefix: |
dei_ |
| Data Type: |
dei:tradingSymbolItemType |
| Balance Type: |
na |
| Period Type: |
duration |
|
| X |
- ReferencesReference 1: http://www.xbrl.org/2003/role/presentationRef
-Publisher SEC
-Name Form N-1A
-Section 27A
-Subsection e
| Name: |
oef_AddlFundStatisticsTextBlock |
| Namespace Prefix: |
oef_ |
| Data Type: |
dtr-types:textBlockItemType |
| Balance Type: |
na |
| Period Type: |
duration |
|
| X |
- ReferencesReference 1: http://www.xbrl.org/2003/role/presentationRef
-Publisher SEC
-Name Form N-1A
-Section 27A
-Subsection b
-Paragraph instruction
-Subparagraph 2
| Name: |
oef_AddlInfoEmail |
| Namespace Prefix: |
oef_ |
| Data Type: |
xbrli:stringItemType |
| Balance Type: |
na |
| Period Type: |
duration |
|
| X |
- ReferencesReference 1: http://www.xbrl.org/2003/role/presentationRef
-Publisher SEC
-Name Form N-1A
-Section 27A
-Subsection b
-Paragraph instruction
-Subparagraph 2
| Name: |
oef_AddlInfoPhoneNumber |
| Namespace Prefix: |
oef_ |
| Data Type: |
xbrli:stringItemType |
| Balance Type: |
na |
| Period Type: |
duration |
|
| X |
- ReferencesReference 1: http://www.xbrl.org/2003/role/presentationRef
-Publisher SEC
-Name Form N-1A
-Section 27A
-Subsection b
-Paragraph 4
| Name: |
oef_AddlInfoTextBlock |
| Namespace Prefix: |
oef_ |
| Data Type: |
dtr-types:textBlockItemType |
| Balance Type: |
na |
| Period Type: |
duration |
|
| X |
- ReferencesReference 1: http://www.xbrl.org/2003/role/presentationRef
-Publisher SEC
-Name Form N-1A
-Section 27A
-Subsection b
-Paragraph instruction
-Subparagraph 2
| Name: |
oef_AddlInfoWebsite |
| Namespace Prefix: |
oef_ |
| Data Type: |
xbrli:stringItemType |
| Balance Type: |
na |
| Period Type: |
duration |
|
| X |
- ReferencesReference 1: http://www.xbrl.org/2003/role/presentationRef
-Publisher SEC
-Name Form N-1A
-Section 27A
-Subsection e
| Name: |
oef_AdvisoryFeesPaidAmt |
| Namespace Prefix: |
oef_ |
| Data Type: |
xbrli:monetaryItemType |
| Balance Type: |
na |
| Period Type: |
duration |
|
| X |
- ReferencesReference 1: http://www.xbrl.org/2003/role/presentationRef
-Publisher SEC
-Name Form N-1A
-Section 27A
-Subsection b
-Paragraph 3
| Name: |
oef_AnnlOrSemiAnnlStatementTextBlock |
| Namespace Prefix: |
oef_ |
| Data Type: |
dtr-types:textBlockItemType |
| Balance Type: |
na |
| Period Type: |
duration |
|
| X |
- ReferencesReference 1: http://www.xbrl.org/2003/role/presentationRef
-Publisher SEC
-Name Form N-1A
-Section 27A
-Subsection d
-Paragraph 2
-Subparagraph instruction
-Clause 7
| Name: |
oef_AvgAnnlRtrTableTextBlock |
| Namespace Prefix: |
oef_ |
| Data Type: |
dtr-types:textBlockItemType |
| Balance Type: |
na |
| Period Type: |
duration |
|
| X |
- ReferencesReference 1: http://www.xbrl.org/2003/role/presentationRef
-Publisher SEC
-Name Form N-1A
-Section 27A
-Subsection b
-Paragraph instruction
-Subparagraph 2
| Name: |
oef_ClassName |
| Namespace Prefix: |
oef_ |
| Data Type: |
dei:securityTitleItemType |
| Balance Type: |
na |
| Period Type: |
duration |
|
| X |
- ReferencesReference 1: http://www.xbrl.org/2003/role/presentationRef
-Publisher SEC
-Name Form N-1A
-Section 27A
-Subsection c
-Paragraph iii
| Name: |
oef_ExpenseRatioPct |
| Namespace Prefix: |
oef_ |
| Data Type: |
dtr-types:percentItemType |
| Balance Type: |
na |
| Period Type: |
duration |
|
| X |
- ReferencesReference 1: http://www.xbrl.org/2003/role/presentationRef
-Publisher SEC
-Name Form N-1A
-Section 27A
-Subsection c
-Paragraph ii
| Name: |
oef_ExpensesPaidAmt |
| Namespace Prefix: |
oef_ |
| Data Type: |
xbrli:monetaryItemType |
| Balance Type: |
na |
| Period Type: |
duration |
|
| X |
- ReferencesReference 1: http://www.xbrl.org/2003/role/presentationRef
-Publisher SEC
-Name Form N-1A
-Section 27A
-Subsection c
| Name: |
oef_ExpensesTextBlock |
| Namespace Prefix: |
oef_ |
| Data Type: |
dtr-types:textBlockItemType |
| Balance Type: |
na |
| Period Type: |
duration |
|
| X |
- ReferencesReference 1: http://www.xbrl.org/2003/role/presentationRef
-Publisher SEC
-Name Form N-1A
-Section 27A
-Subsection d
-Paragraph 1
| Name: |
oef_FactorsAffectingPerfTextBlock |
| Namespace Prefix: |
oef_ |
| Data Type: |
dtr-types:textBlockItemType |
| Balance Type: |
na |
| Period Type: |
duration |
|
| X |
- ReferencesReference 1: http://www.xbrl.org/2003/role/presentationRef
-Publisher SEC
-Name Form N-1A
-Section 27A
-Subsection b
-Paragraph 1
| Name: |
oef_FundName |
| Namespace Prefix: |
oef_ |
| Data Type: |
xbrli:normalizedStringItemType |
| Balance Type: |
na |
| Period Type: |
duration |
|
| X |
- ReferencesReference 1: http://www.xbrl.org/2003/role/presentationRef
-Publisher SEC
-Name Form N-1A
-Section 27A
-Subsection e
| Name: |
oef_HoldingsCount |
| Namespace Prefix: |
oef_ |
| Data Type: |
xbrli:integerItemType |
| Balance Type: |
na |
| Period Type: |
instant |
|
| X |
- ReferencesReference 1: http://www.xbrl.org/2003/role/presentationRef
-Publisher SEC
-Name Form N-1A
-Section 27A
-Subsection f
| Name: |
oef_HoldingsTableTextBlock |
| Namespace Prefix: |
oef_ |
| Data Type: |
dtr-types:textBlockItemType |
| Balance Type: |
na |
| Period Type: |
duration |
|
| X |
- ReferencesReference 1: http://www.xbrl.org/2003/role/presentationRef
-Publisher SEC
-Name Form N-1A
-Section 27A
-Subsection f
| Name: |
oef_LargestHoldingsTableTextBlock |
| Namespace Prefix: |
oef_ |
| Data Type: |
dtr-types:textBlockItemType |
| Balance Type: |
na |
| Period Type: |
duration |
|
| X |
- ReferencesReference 1: http://www.xbrl.org/2003/role/presentationRef
-Publisher SEC
-Name Form N-1A
-Section 27A
-Subsection d
-Paragraph 2
| Name: |
oef_LineGraphTableTextBlock |
| Namespace Prefix: |
oef_ |
| Data Type: |
dtr-types:textBlockItemType |
| Balance Type: |
na |
| Period Type: |
duration |
|
| X |
- ReferencesReference 1: http://www.xbrl.org/2003/role/presentationRef
-Publisher SEC
-Name Form N-1A
-Section 27A
-Subsection b
-Paragraph 5
| Name: |
oef_MaterialFundChngNoticeTextBlock |
| Namespace Prefix: |
oef_ |
| Data Type: |
dtr-types:textBlockItemType |
| Balance Type: |
na |
| Period Type: |
duration |
|
| X |
- ReferencesReference 1: http://www.xbrl.org/2003/role/presentationRef
-Publisher SEC
-Name Form N-1A
-Section 27A
-Subsection g
| Name: |
oef_MaterialFundChngTextBlock |
| Namespace Prefix: |
oef_ |
| Data Type: |
dtr-types:textBlockItemType |
| Balance Type: |
na |
| Period Type: |
duration |
|
| X |
- ReferencesReference 1: http://www.xbrl.org/2003/role/presentationRef
-Publisher SEC
-Name Form N-1A
-Section 27A
-Subsection d
-Paragraph 2
-Subparagraph iii
-Clause B
| Name: |
oef_NoDeductionOfTaxesTextBlock |
| Namespace Prefix: |
oef_ |
| Data Type: |
dtr-types:textBlockItemType |
| Balance Type: |
na |
| Period Type: |
duration |
|
| X |
- ReferencesReference 1: http://www.xbrl.org/2003/role/presentationRef
-Publisher SEC
-Name Form N-1A
-Section 27A
-Subsection d
-Paragraph 2
-Subparagraph i
| Name: |
oef_PerfInceptionDate |
| Namespace Prefix: |
oef_ |
| Data Type: |
xbrli:dateItemType |
| Balance Type: |
na |
| Period Type: |
duration |
|
| X |
- ReferencesReference 1: http://www.xbrl.org/2003/role/presentationRef
-Publisher SEC
-Name Form N-1A
-Section 27A
-Subsection d
-Paragraph 2
-Subparagraph instruction
-Clause 8
| Name: |
oef_PerfTableMarketIndexChngdTextBlock |
| Namespace Prefix: |
oef_ |
| Data Type: |
dtr-types:textBlockItemType |
| Balance Type: |
na |
| Period Type: |
duration |
|
| X |
- ReferencesReference 1: http://www.xbrl.org/2003/role/presentationRef
-Publisher SEC
-Name Form N-1A
-Section 27A
-Subsection b
-Paragraph 3
| Name: |
oef_ShareholderReportAnnualOrSemiAnnual |
| Namespace Prefix: |
oef_ |
| Data Type: |
oef:shareholderReportTypeItemType |
| Balance Type: |
na |
| Period Type: |
duration |
|
| X |
- ReferencesReference 1: http://www.xbrl.org/2003/role/presentationRef
-Publisher SEC
-Name Form N-1A
-Section 27A
-Subsection d
-Paragraph 2
-Subparagraph instruction
-Clause 7
| Name: |
oef_ShareholderReportLineItems |
| Namespace Prefix: |
oef_ |
| Data Type: |
xbrli:stringItemType |
| Balance Type: |
na |
| Period Type: |
duration |
|
| X |
- ReferencesReference 1: http://www.xbrl.org/2003/role/presentationRef
-Publisher SEC
-Name Form N-1A
-Section 27A
-Subsection g
-Paragraph instruction
-Subparagraph 2
| Name: |
oef_SummaryOfChngLegendTextBlock |
| Namespace Prefix: |
oef_ |
| Data Type: |
dtr-types:textBlockItemType |
| Balance Type: |
na |
| Period Type: |
duration |
|
| X |
- ReferencesReference 1: http://www.xbrl.org/2003/role/presentationRef
-Publisher SEC
-Name Form N-1A
-Section 27A
-Subsection d
-Paragraph 2
-Subparagraph instruction
-Clause 15
| Name: |
oef_UpdPerfInfoLocationTextBlock |
| Namespace Prefix: |
oef_ |
| Data Type: |
dtr-types:textBlockItemType |
| Balance Type: |
na |
| Period Type: |
duration |
|
| X |
- ReferencesReference 1: http://www.xbrl.org/2003/role/presentationRef
-Publisher SEC
-Name Form N-1A
-Section 27A
-Subsection g
-Paragraph instruction
-Subparagraph 2
| Name: |
oef_UpdProspectusEmailAddress |
| Namespace Prefix: |
oef_ |
| Data Type: |
xbrli:stringItemType |
| Balance Type: |
na |
| Period Type: |
duration |
|
| X |
- ReferencesReference 1: http://www.xbrl.org/2003/role/presentationRef
-Publisher SEC
-Name Form N-1A
-Section 27A
-Subsection g
-Paragraph instruction
-Subparagraph 2
| Name: |
oef_UpdProspectusPhoneNumber |
| Namespace Prefix: |
oef_ |
| Data Type: |
xbrli:stringItemType |
| Balance Type: |
na |
| Period Type: |
duration |
|
| X |
- ReferencesReference 1: http://www.xbrl.org/2003/role/presentationRef
-Publisher SEC
-Name Form N-1A
-Section 27A
-Subsection g
-Paragraph instruction
-Subparagraph 2
| Name: |
oef_UpdProspectusWebAddress |
| Namespace Prefix: |
oef_ |
| Data Type: |
xbrli:stringItemType |
| Balance Type: |
na |
| Period Type: |
duration |
|
| X |
- DefinitionAmount of net assets (liabilities). Reference 1: http://fasb.org/us-gaap/role/ref/legacyRef
-Name Accounting Standards Codification
-Section 50
-Paragraph 1
-SubTopic 30
-Topic 205
-Publisher FASB
-URI https://asc.fasb.org/1943274/2147479910/205-30-50-1
| Name: |
us-gaap_AssetsNet |
| Namespace Prefix: |
us-gaap_ |
| Data Type: |
xbrli:monetaryItemType |
| Balance Type: |
debit |
| Period Type: |
instant |
|
| X |
- DefinitionPercentage of lesser of purchase or sale of portfolio securities to average value of portfolio securities owned. Reference 1: http://www.xbrl.org/2009/role/commonPracticeRef
-Topic 946
-SubTopic 205
-Name Accounting Standards Codification
-Section 50
-Paragraph 27
-Publisher FASB
-URI https://asc.fasb.org/1943274/2147478494/946-205-50-27
| Name: |
us-gaap_InvestmentCompanyPortfolioTurnover |
| Namespace Prefix: |
us-gaap_ |
| Data Type: |
dtr-types:percentItemType |
| Balance Type: |
na |
| Period Type: |
duration |
|
| X |
- Details
| Name: |
oef_ClassAxis=cik0000904333_C000017890Member |
| Namespace Prefix: |
|
| Data Type: |
na |
| Balance Type: |
|
| Period Type: |
|
|
| X |
- Details
| Name: |
oef_ClassAxis=cik0000904333_C000015013Member |
| Namespace Prefix: |
|
| Data Type: |
na |
| Balance Type: |
|
| Period Type: |
|
|
| X |
- Details
| Name: |
oef_ClassAxis=cik0000904333_C000015015Member |
| Namespace Prefix: |
|
| Data Type: |
na |
| Balance Type: |
|
| Period Type: |
|
|
| X |
- Details
| Name: |
oef_ClassAxis=cik0000904333_C000015012Member |
| Namespace Prefix: |
|
| Data Type: |
na |
| Balance Type: |
|
| Period Type: |
|
|
| X |
- Details
| Name: |
oef_ClassAxis=cik0000904333_C000015017Member |
| Namespace Prefix: |
|
| Data Type: |
na |
| Balance Type: |
|
| Period Type: |
|
|
| X |
- Details
| Name: |
oef_ClassAxis=cik0000904333_C000015021Member |
| Namespace Prefix: |
|
| Data Type: |
na |
| Balance Type: |
|
| Period Type: |
|
|
| X |
- Details
| Name: |
oef_ClassAxis=cik0000904333_C000063316Member |
| Namespace Prefix: |
|
| Data Type: |
na |
| Balance Type: |
|
| Period Type: |
|
|
| X |
- Details
| Name: |
oef_ClassAxis=cik0000904333_C000016166Member |
| Namespace Prefix: |
|
| Data Type: |
na |
| Balance Type: |
|
| Period Type: |
|
|
| X |
- Details
| Name: |
oef_ClassAxis=cik0000904333_C000016169Member |
| Namespace Prefix: |
|
| Data Type: |
na |
| Balance Type: |
|
| Period Type: |
|
|
| X |
- Details
| Name: |
oef_ClassAxis=cik0000904333_C000016171Member |
| Namespace Prefix: |
|
| Data Type: |
na |
| Balance Type: |
|
| Period Type: |
|
|
| X |
- Details
| Name: |
oef_ClassAxis=cik0000904333_C000195502Member |
| Namespace Prefix: |
|
| Data Type: |
na |
| Balance Type: |
|
| Period Type: |
|
|
| X |
- Details
| Name: |
oef_ClassAxis=cik0000904333_C000195503Member |
| Namespace Prefix: |
|
| Data Type: |
na |
| Balance Type: |
|
| Period Type: |
|
|
| X |
- Details
| Name: |
oef_ClassAxis=cik0000904333_C000195504Member |
| Namespace Prefix: |
|
| Data Type: |
na |
| Balance Type: |
|
| Period Type: |
|
|
| X |
- Details
| Name: |
oef_ClassAxis=cik0000904333_C000016173Member |
| Namespace Prefix: |
|
| Data Type: |
na |
| Balance Type: |
|
| Period Type: |
|
|
| X |
- Details
| Name: |
oef_ClassAxis=cik0000904333_C000046821Member |
| Namespace Prefix: |
|
| Data Type: |
na |
| Balance Type: |
|
| Period Type: |
|
|
| X |
- Details
| Name: |
oef_ClassAxis=cik0000904333_C000046824Member |
| Namespace Prefix: |
|
| Data Type: |
na |
| Balance Type: |
|
| Period Type: |
|
|
| X |
- Details
| Name: |
oef_ClassAxis=cik0000904333_C000046827Member |
| Namespace Prefix: |
|
| Data Type: |
na |
| Balance Type: |
|
| Period Type: |
|
|
| X |
- Details
| Name: |
oef_ClassAxis=cik0000904333_C000055855Member |
| Namespace Prefix: |
|
| Data Type: |
na |
| Balance Type: |
|
| Period Type: |
|
|
| X |
- Details
| Name: |
oef_ClassAxis=cik0000904333_C000055852Member |
| Namespace Prefix: |
|
| Data Type: |
na |
| Balance Type: |
|
| Period Type: |
|
|
| X |
- Details
| Name: |
oef_ClassAxis=cik0000904333_C000017885Member |
| Namespace Prefix: |
|
| Data Type: |
na |
| Balance Type: |
|
| Period Type: |
|
|
| X |
- Details
| Name: |
oef_ClassAxis=cik0000904333_C000016175Member |
| Namespace Prefix: |
|
| Data Type: |
na |
| Balance Type: |
|
| Period Type: |
|
|
| X |
- Details
| Name: |
oef_ClassAxis=cik0000904333_C000016177Member |
| Namespace Prefix: |
|
| Data Type: |
na |
| Balance Type: |
|
| Period Type: |
|
|
| X |
- Details
| Name: |
oef_ClassAxis=cik0000904333_C000016178Member |
| Namespace Prefix: |
|
| Data Type: |
na |
| Balance Type: |
|
| Period Type: |
|
|
| X |
- Details
| Name: |
oef_ClassAxis=cik0000904333_C000016180Member |
| Namespace Prefix: |
|
| Data Type: |
na |
| Balance Type: |
|
| Period Type: |
|
|
| X |
- Details
| Name: |
oef_ClassAxis=cik0000904333_C000015023Member |
| Namespace Prefix: |
|
| Data Type: |
na |
| Balance Type: |
|
| Period Type: |
|
|
| X |
- Details
| Name: |
oef_ClassAxis=cik0000904333_C000059131Member |
| Namespace Prefix: |
|
| Data Type: |
na |
| Balance Type: |
|
| Period Type: |
|
|
| X |
- Details
| Name: |
oef_ClassAxis=cik0000904333_C000015024Member |
| Namespace Prefix: |
|
| Data Type: |
na |
| Balance Type: |
|
| Period Type: |
|
|
| X |
- Details
| Name: |
oef_ClassAxis=cik0000904333_C000059132Member |
| Namespace Prefix: |
|
| Data Type: |
na |
| Balance Type: |
|
| Period Type: |
|
|
| X |
- Details
| Name: |
oef_ClassAxis=cik0000904333_C000015025Member |
| Namespace Prefix: |
|
| Data Type: |
na |
| Balance Type: |
|
| Period Type: |
|
|
| X |
- Details
| Name: |
oef_ClassAxis=cik0000904333_C000059133Member |
| Namespace Prefix: |
|
| Data Type: |
na |
| Balance Type: |
|
| Period Type: |
|
|
| X |
- Details
| Name: |
oef_ClassAxis=cik0000904333_C000015026Member |
| Namespace Prefix: |
|
| Data Type: |
na |
| Balance Type: |
|
| Period Type: |
|
|
| X |
- Details
| Name: |
oef_ClassAxis=cik0000904333_C000122183Member |
| Namespace Prefix: |
|
| Data Type: |
na |
| Balance Type: |
|
| Period Type: |
|
|
| X |
- Details
| Name: |
oef_ClassAxis=cik0000904333_C000122184Member |
| Namespace Prefix: |
|
| Data Type: |
na |
| Balance Type: |
|
| Period Type: |
|
|
| X |
- Details
| Name: |
oef_ClassAxis=cik0000904333_C000122185Member |
| Namespace Prefix: |
|
| Data Type: |
na |
| Balance Type: |
|
| Period Type: |
|
|
| X |
- Details
| Name: |
oef_ClassAxis=cik0000904333_C000172771Member |
| Namespace Prefix: |
|
| Data Type: |
na |
| Balance Type: |
|
| Period Type: |
|
|
| X |
- Details
| Name: |
oef_ClassAxis=cik0000904333_C000225748Member |
| Namespace Prefix: |
|
| Data Type: |
na |
| Balance Type: |
|
| Period Type: |
|
|
v3.25.4
Shareholder Report, Line Graph (Details) - USD ($)
|
|
|
|
|
|
8 Months Ended |
9 Months Ended |
10 Months Ended |
12 Months Ended |
14 Months Ended |
20 Months Ended |
21 Months Ended |
22 Months Ended |
24 Months Ended |
26 Months Ended |
32 Months Ended |
34 Months Ended |
36 Months Ended |
38 Months Ended |
44 Months Ended |
46 Months Ended |
48 Months Ended |
50 Months Ended |
56 Months Ended |
58 Months Ended |
60 Months Ended |
62 Months Ended |
70 Months Ended |
72 Months Ended |
74 Months Ended |
82 Months Ended |
84 Months Ended |
86 Months Ended |
94 Months Ended |
96 Months Ended |
98 Months Ended |
108 Months Ended |
110 Months Ended |
120 Months Ended |
Jan. 31, 2024 |
Feb. 25, 2021 |
Dec. 20, 2017 |
Aug. 25, 2016 |
Oct. 31, 2015 |
Oct. 31, 2021 |
Oct. 31, 2024 |
Oct. 31, 2018 |
Oct. 31, 2025 |
Oct. 31, 2016 |
Oct. 31, 2017 |
Oct. 31, 2022 |
Oct. 31, 2025 |
Oct. 31, 2019 |
Oct. 31, 2017 |
Oct. 31, 2018 |
Oct. 31, 2023 |
Oct. 31, 2020 |
Oct. 31, 2018 |
Oct. 31, 2019 |
Oct. 31, 2024 |
Oct. 31, 2021 |
Oct. 31, 2019 |
Oct. 31, 2020 |
Oct. 31, 2025 |
Oct. 31, 2022 |
Oct. 31, 2020 |
Oct. 31, 2021 |
Oct. 31, 2023 |
Oct. 31, 2021 |
Oct. 31, 2022 |
Oct. 31, 2024 |
Oct. 31, 2022 |
Oct. 31, 2023 |
Oct. 31, 2025 |
Oct. 31, 2023 |
Oct. 31, 2024 |
Oct. 31, 2024 |
Oct. 31, 2025 |
Oct. 31, 2025 |
| Schwab International Opportunities Fund |
|
|
|
|
|
|
|
|
|
|
|
|
|
|
|
|
|
|
|
|
|
|
|
|
|
|
|
|
|
|
|
|
|
|
|
|
|
|
|
|
|
| Account Value [Line Items] |
|
|
|
|
|
|
|
|
|
|
|
|
|
|
|
|
|
|
|
|
|
|
|
|
|
|
|
|
|
|
|
|
|
|
|
|
|
|
|
|
|
| Line Graph and Table Measure Name |
|
|
|
|
|
|
|
|
|
Schwab International Opportunities Fund
|
|
|
|
|
|
|
|
|
|
|
|
|
|
|
|
|
|
|
|
|
|
|
|
|
|
|
|
|
|
|
|
| Accumulated Value |
[1],[2] |
|
|
|
|
$ 10,000
|
|
|
|
|
$ 9,999.87
|
|
|
|
|
$ 12,852.26
|
|
|
|
$ 11,427.08
|
|
|
|
$ 12,627.13
|
|
|
|
$ 13,707.78
|
|
|
$ 18,299.67
|
|
|
$ 11,926.71
|
|
|
$ 12,779.35
|
|
$ 15,430.9
|
|
$ 19,106.09
|
| Schwab Core Equity Fund |
|
|
|
|
|
|
|
|
|
|
|
|
|
|
|
|
|
|
|
|
|
|
|
|
|
|
|
|
|
|
|
|
|
|
|
|
|
|
|
|
|
| Account Value [Line Items] |
|
|
|
|
|
|
|
|
|
|
|
|
|
|
|
|
|
|
|
|
|
|
|
|
|
|
|
|
|
|
|
|
|
|
|
|
|
|
|
|
|
| Line Graph and Table Measure Name |
|
|
|
|
|
|
|
|
|
Schwab Core Equity Fund
|
|
|
|
|
|
|
|
|
|
|
|
|
|
|
|
|
|
|
|
|
|
|
|
|
|
|
|
|
|
|
|
| Accumulated Value |
[1] |
|
|
|
|
10,000
|
|
|
|
|
9,949.77
|
|
|
|
|
12,536.95
|
|
|
|
12,876.69
|
|
|
|
14,424.29
|
|
|
|
15,095.7
|
|
|
20,775.11
|
|
|
17,900.22
|
|
|
19,688.02
|
|
26,809.42
|
|
31,337.87
|
| Schwab Dividend Equity Fund |
|
|
|
|
|
|
|
|
|
|
|
|
|
|
|
|
|
|
|
|
|
|
|
|
|
|
|
|
|
|
|
|
|
|
|
|
|
|
|
|
|
| Account Value [Line Items] |
|
|
|
|
|
|
|
|
|
|
|
|
|
|
|
|
|
|
|
|
|
|
|
|
|
|
|
|
|
|
|
|
|
|
|
|
|
|
|
|
|
| Line Graph and Table Measure Name |
|
|
|
|
|
|
|
|
|
Schwab Dividend Equity Fund
|
|
|
|
|
|
|
|
|
|
|
|
|
|
|
|
|
|
|
|
|
|
|
|
|
|
|
|
|
|
|
|
| Accumulated Value |
[1],[3] |
|
|
|
|
10,000
|
|
|
|
|
10,025.71
|
|
|
|
|
12,150.29
|
|
|
|
12,073.73
|
|
|
|
13,134.41
|
|
|
|
11,386.89
|
|
|
16,212.66
|
|
|
15,571.31
|
|
|
15,301.08
|
|
20,096.36
|
|
22,254.58
|
| Schwab Large-Cap Growth Fund |
|
|
|
|
|
|
|
|
|
|
|
|
|
|
|
|
|
|
|
|
|
|
|
|
|
|
|
|
|
|
|
|
|
|
|
|
|
|
|
|
|
| Account Value [Line Items] |
|
|
|
|
|
|
|
|
|
|
|
|
|
|
|
|
|
|
|
|
|
|
|
|
|
|
|
|
|
|
|
|
|
|
|
|
|
|
|
|
|
| Line Graph and Table Measure Name |
|
|
|
|
|
|
|
|
|
Schwab Large-Cap Growth Fund
|
|
|
|
|
|
|
|
|
|
|
|
|
|
|
|
|
|
|
|
|
|
|
|
|
|
|
|
|
|
|
|
| Accumulated Value |
[1] |
|
|
|
|
10,000
|
|
|
|
|
10,054.15
|
|
|
|
|
12,879.13
|
|
|
|
13,453.74
|
|
|
|
15,092.01
|
|
|
|
18,352.28
|
|
|
25,768.95
|
|
|
19,984.86
|
|
|
23,855.25
|
|
33,409.13
|
|
43,315.61
|
| Schwab Small-Cap Equity Fund |
|
|
|
|
|
|
|
|
|
|
|
|
|
|
|
|
|
|
|
|
|
|
|
|
|
|
|
|
|
|
|
|
|
|
|
|
|
|
|
|
|
| Account Value [Line Items] |
|
|
|
|
|
|
|
|
|
|
|
|
|
|
|
|
|
|
|
|
|
|
|
|
|
|
|
|
|
|
|
|
|
|
|
|
|
|
|
|
|
| Line Graph and Table Measure Name |
|
|
|
|
|
|
|
|
|
Schwab Small-Cap Equity Fund
|
|
|
|
|
|
|
|
|
|
|
|
|
|
|
|
|
|
|
|
|
|
|
|
|
|
|
|
|
|
|
|
| Accumulated Value |
[1] |
|
|
|
|
10,000
|
|
|
|
|
10,146.75
|
|
|
|
|
12,772.02
|
|
|
|
12,947.62
|
|
|
|
12,958
|
|
|
|
11,680.97
|
|
|
18,520.72
|
|
|
16,622.66
|
|
|
16,010.28
|
|
21,153.49
|
|
23,815.67
|
| Schwab Health Care Fund |
|
|
|
|
|
|
|
|
|
|
|
|
|
|
|
|
|
|
|
|
|
|
|
|
|
|
|
|
|
|
|
|
|
|
|
|
|
|
|
|
|
| Account Value [Line Items] |
|
|
|
|
|
|
|
|
|
|
|
|
|
|
|
|
|
|
|
|
|
|
|
|
|
|
|
|
|
|
|
|
|
|
|
|
|
|
|
|
|
| Line Graph and Table Measure Name |
|
|
|
|
|
|
|
|
|
Schwab Health Care Fund
|
|
|
|
|
|
|
|
|
|
|
|
|
|
|
|
|
|
|
|
|
|
|
|
|
|
|
|
|
|
|
|
| Accumulated Value |
[1],[3] |
|
|
|
|
10,000
|
|
|
|
|
9,422
|
|
|
|
|
11,410.38
|
|
|
|
12,451.73
|
|
|
|
13,262.04
|
|
|
|
14,530.76
|
|
|
18,892.36
|
|
|
18,171.31
|
|
|
17,436.7
|
|
20,510.09
|
|
20,558.54
|
| Schwab International Core Equity Fund |
|
|
|
|
|
|
|
|
|
|
|
|
|
|
|
|
|
|
|
|
|
|
|
|
|
|
|
|
|
|
|
|
|
|
|
|
|
|
|
|
|
| Account Value [Line Items] |
|
|
|
|
|
|
|
|
|
|
|
|
|
|
|
|
|
|
|
|
|
|
|
|
|
|
|
|
|
|
|
|
|
|
|
|
|
|
|
|
|
| Line Graph and Table Measure Name |
|
|
|
|
|
|
|
|
|
Schwab International Core Equity Fund
|
|
|
|
|
|
|
|
|
|
|
|
|
|
|
|
|
|
|
|
|
|
|
|
|
|
|
|
|
|
|
|
| Accumulated Value |
[1],[3] |
|
|
|
|
10,000
|
|
|
|
|
9,759.4
|
|
|
|
|
12,255.74
|
|
|
|
10,762.56
|
|
|
|
11,524.32
|
|
|
|
10,831.31
|
|
|
13,876.83
|
|
|
10,768.53
|
|
|
12,571.11
|
|
15,855.19
|
|
20,417.2
|
| Schwab S&P 500 Index Fund |
|
|
|
|
|
|
|
|
|
|
|
|
|
|
|
|
|
|
|
|
|
|
|
|
|
|
|
|
|
|
|
|
|
|
|
|
|
|
|
|
|
| Account Value [Line Items] |
|
|
|
|
|
|
|
|
|
|
|
|
|
|
|
|
|
|
|
|
|
|
|
|
|
|
|
|
|
|
|
|
|
|
|
|
|
|
|
|
|
| Line Graph and Table Measure Name |
|
|
|
|
|
|
|
|
|
Schwab S&P 500 Index Fund
|
|
|
|
|
|
|
|
|
|
|
|
|
|
|
|
|
|
|
|
|
|
|
|
|
|
|
|
|
|
|
|
| Accumulated Value |
[4] |
|
|
|
|
10,000
|
|
|
|
|
10,440.08
|
|
|
|
|
12,899.95
|
|
|
|
13,840.42
|
|
|
|
15,819.51
|
|
|
|
17,352.91
|
|
|
24,795.72
|
|
|
21,167.22
|
|
|
23,307.88
|
|
32,154.29
|
|
39,046.41
|
| Schwab Small-Cap Index Fund |
|
|
|
|
|
|
|
|
|
|
|
|
|
|
|
|
|
|
|
|
|
|
|
|
|
|
|
|
|
|
|
|
|
|
|
|
|
|
|
|
|
| Account Value [Line Items] |
|
|
|
|
|
|
|
|
|
|
|
|
|
|
|
|
|
|
|
|
|
|
|
|
|
|
|
|
|
|
|
|
|
|
|
|
|
|
|
|
|
| Line Graph and Table Measure Name |
|
|
|
|
|
|
|
|
|
Schwab Small-Cap Index Fund
|
|
|
|
|
|
|
|
|
|
|
|
|
|
|
|
|
|
|
|
|
|
|
|
|
|
|
|
|
|
|
|
| Accumulated Value |
[4] |
|
|
|
|
10,000
|
|
|
|
|
10,416.61
|
|
|
|
|
13,316.69
|
|
|
|
13,573.99
|
|
|
|
14,245.64
|
|
|
|
14,245.72
|
|
|
21,485.45
|
|
|
17,505.05
|
|
|
16,022.3
|
|
21,491.92
|
|
24,607.22
|
| Schwab Total Stock Market Index Fund |
|
|
|
|
|
|
|
|
|
|
|
|
|
|
|
|
|
|
|
|
|
|
|
|
|
|
|
|
|
|
|
|
|
|
|
|
|
|
|
|
|
| Account Value [Line Items] |
|
|
|
|
|
|
|
|
|
|
|
|
|
|
|
|
|
|
|
|
|
|
|
|
|
|
|
|
|
|
|
|
|
|
|
|
|
|
|
|
|
| Line Graph and Table Measure Name |
|
|
|
|
|
|
|
|
|
Schwab Total Stock Market Index Fund
|
|
|
|
|
|
|
|
|
|
|
|
|
|
|
|
|
|
|
|
|
|
|
|
|
|
|
|
|
|
|
|
| Accumulated Value |
[4] |
|
|
|
|
10,000
|
|
|
|
|
10,419.04
|
|
|
|
|
12,908.79
|
|
|
|
13,749.07
|
|
|
|
15,587.56
|
|
|
|
17,137.24
|
|
|
24,679.82
|
|
|
20,498.41
|
|
|
22,215.44
|
|
30,653.78
|
|
37,046.21
|
| Schwab U.S. Large-Cap Growth Index Fund |
|
|
|
|
|
|
|
|
|
|
|
|
|
|
|
|
|
|
|
|
|
|
|
|
|
|
|
|
|
|
|
|
|
|
|
|
|
|
|
|
|
| Account Value [Line Items] |
|
|
|
|
|
|
|
|
|
|
|
|
|
|
|
|
|
|
|
|
|
|
|
|
|
|
|
|
|
|
|
|
|
|
|
|
|
|
|
|
|
| Line Graph and Table Measure Name |
|
|
|
|
|
|
|
|
|
Schwab U.S. Large-Cap Growth Index Fund
|
|
|
|
|
|
|
|
|
|
|
|
|
|
|
|
|
|
|
|
|
|
|
|
|
|
|
|
|
|
|
|
| Accumulated Value |
[4] |
|
|
$ 9,940
|
|
|
|
|
$ 10,592.5
|
|
|
|
|
|
$ 12,397.34
|
|
|
|
$ 16,011.86
|
|
|
|
$ 22,919.16
|
|
|
|
$ 17,274.29
|
|
|
$ 20,537.3
|
|
|
$ 29,527.1
|
|
|
$ 38,515.84
|
|
|
|
|
|
| Schwab U.S. Large-Cap Value Index Fund |
|
|
|
|
|
|
|
|
|
|
|
|
|
|
|
|
|
|
|
|
|
|
|
|
|
|
|
|
|
|
|
|
|
|
|
|
|
|
|
|
|
| Account Value [Line Items] |
|
|
|
|
|
|
|
|
|
|
|
|
|
|
|
|
|
|
|
|
|
|
|
|
|
|
|
|
|
|
|
|
|
|
|
|
|
|
|
|
|
| Line Graph and Table Measure Name |
|
|
|
|
|
|
|
|
|
Schwab U.S. Large-Cap Value Index Fund
|
|
|
|
|
|
|
|
|
|
|
|
|
|
|
|
|
|
|
|
|
|
|
|
|
|
|
|
|
|
|
|
| Accumulated Value |
[4] |
|
|
10,030
|
|
|
|
|
9,877.5
|
|
|
|
|
|
10,971.68
|
|
|
|
10,127.99
|
|
|
|
14,553.57
|
|
|
|
13,528.96
|
|
|
13,543.23
|
|
|
17,737.53
|
|
|
19,712.11
|
|
|
|
|
|
| Schwab U.S. Mid-Cap Index Fund |
|
|
|
|
|
|
|
|
|
|
|
|
|
|
|
|
|
|
|
|
|
|
|
|
|
|
|
|
|
|
|
|
|
|
|
|
|
|
|
|
|
| Account Value [Line Items] |
|
|
|
|
|
|
|
|
|
|
|
|
|
|
|
|
|
|
|
|
|
|
|
|
|
|
|
|
|
|
|
|
|
|
|
|
|
|
|
|
|
| Line Graph and Table Measure Name |
|
|
|
|
|
|
|
|
|
Schwab U.S. Mid-Cap Index Fund
|
|
|
|
|
|
|
|
|
|
|
|
|
|
|
|
|
|
|
|
|
|
|
|
|
|
|
|
|
|
|
|
| Accumulated Value |
[4] |
|
|
10,040
|
|
|
|
|
9,887.5
|
|
|
|
|
|
11,233.47
|
|
|
|
11,687.73
|
|
|
|
16,988.42
|
|
|
|
14,075.42
|
|
|
13,930.55
|
|
|
18,855.11
|
|
|
20,869.24
|
|
|
|
|
|
| Schwab International Index Fund |
|
|
|
|
|
|
|
|
|
|
|
|
|
|
|
|
|
|
|
|
|
|
|
|
|
|
|
|
|
|
|
|
|
|
|
|
|
|
|
|
|
| Account Value [Line Items] |
|
|
|
|
|
|
|
|
|
|
|
|
|
|
|
|
|
|
|
|
|
|
|
|
|
|
|
|
|
|
|
|
|
|
|
|
|
|
|
|
|
| Line Graph and Table Measure Name |
|
|
|
|
|
|
|
|
|
Schwab International Index Fund
|
|
|
|
|
|
|
|
|
|
|
|
|
|
|
|
|
|
|
|
|
|
|
|
|
|
|
|
|
|
|
|
| Accumulated Value |
[3],[4] |
|
|
|
|
10,000
|
|
|
|
|
9,736.09
|
|
|
|
|
12,049.69
|
|
|
|
11,193.36
|
|
|
|
12,454.76
|
|
|
|
11,637.49
|
|
|
15,621.67
|
|
|
12,009.35
|
|
|
13,846.74
|
|
16,922.46
|
|
20,871.03
|
| Schwab Fundamental U.S. Large Company Index Fund |
|
|
|
|
|
|
|
|
|
|
|
|
|
|
|
|
|
|
|
|
|
|
|
|
|
|
|
|
|
|
|
|
|
|
|
|
|
|
|
|
|
| Account Value [Line Items] |
|
|
|
|
|
|
|
|
|
|
|
|
|
|
|
|
|
|
|
|
|
|
|
|
|
|
|
|
|
|
|
|
|
|
|
|
|
|
|
|
|
| Line Graph and Table Measure Name |
|
|
|
|
|
|
|
|
|
Schwab Fundamental U.S. Large Company Index Fund
|
|
|
|
|
|
|
|
|
|
|
|
|
|
|
|
|
|
|
|
|
|
|
|
|
|
|
|
|
|
|
|
| Accumulated Value |
[4] |
|
|
|
|
10,000
|
|
|
|
|
10,561.05
|
|
|
|
|
12,640.49
|
|
|
|
13,503.94
|
|
|
|
14,930.47
|
|
|
|
14,582.55
|
|
|
22,068.03
|
|
|
21,144.65
|
|
|
22,090.96
|
|
29,246.93
|
|
33,481.37
|
| Schwab Fundamental U.S. Small Company Index Fund |
|
|
|
|
|
|
|
|
|
|
|
|
|
|
|
|
|
|
|
|
|
|
|
|
|
|
|
|
|
|
|
|
|
|
|
|
|
|
|
|
|
| Account Value [Line Items] |
|
|
|
|
|
|
|
|
|
|
|
|
|
|
|
|
|
|
|
|
|
|
|
|
|
|
|
|
|
|
|
|
|
|
|
|
|
|
|
|
|
| Line Graph and Table Measure Name |
|
|
|
|
|
|
|
|
|
Schwab Fundamental U.S. Small Company Index Fund
|
|
|
|
|
|
|
|
|
|
|
|
|
|
|
|
|
|
|
|
|
|
|
|
|
|
|
|
|
|
|
|
| Accumulated Value |
[4] |
|
|
|
|
10,000
|
|
|
|
|
10,536.9
|
|
|
|
|
12,954.35
|
|
|
|
13,264.95
|
|
|
|
14,009.47
|
|
|
|
12,550.06
|
|
|
20,547.75
|
|
|
18,212.49
|
|
|
17,658.18
|
|
22,994.57
|
|
24,411.42
|
| Schwab Fundamental International Equity Index Fund |
|
|
|
|
|
|
|
|
|
|
|
|
|
|
|
|
|
|
|
|
|
|
|
|
|
|
|
|
|
|
|
|
|
|
|
|
|
|
|
|
|
| Account Value [Line Items] |
|
|
|
|
|
|
|
|
|
|
|
|
|
|
|
|
|
|
|
|
|
|
|
|
|
|
|
|
|
|
|
|
|
|
|
|
|
|
|
|
|
| Line Graph and Table Measure Name |
|
|
|
|
|
|
|
|
|
Schwab Fundamental International Equity Index Fund
|
|
|
|
|
|
|
|
|
|
|
|
|
|
|
|
|
|
|
|
|
|
|
|
|
|
|
|
|
|
|
|
| Accumulated Value |
[3],[4] |
|
|
|
|
10,000
|
|
|
|
|
10,006.72
|
|
|
|
|
12,391.62
|
|
|
|
11,582.61
|
|
|
|
12,398.33
|
|
|
|
10,750.87
|
|
|
15,484.43
|
|
|
12,813.97
|
|
|
15,043.21
|
|
18,012.5
|
|
23,188.53
|
| Schwab Fundamental International Small Equity Index Fund |
|
|
|
|
|
|
|
|
|
|
|
|
|
|
|
|
|
|
|
|
|
|
|
|
|
|
|
|
|
|
|
|
|
|
|
|
|
|
|
|
|
| Account Value [Line Items] |
|
|
|
|
|
|
|
|
|
|
|
|
|
|
|
|
|
|
|
|
|
|
|
|
|
|
|
|
|
|
|
|
|
|
|
|
|
|
|
|
|
| Line Graph and Table Measure Name |
|
|
|
|
|
|
|
|
|
Schwab Fundamental International Small Equity Index Fund
|
|
|
|
|
|
|
|
|
|
|
|
|
|
|
|
|
|
|
|
|
|
|
|
|
|
|
|
|
|
|
|
| Accumulated Value |
[3],[4] |
|
|
|
|
10,000
|
|
|
|
|
10,829.11
|
|
|
|
|
13,560.86
|
|
|
|
12,233.65
|
|
|
|
12,861.6
|
|
|
|
12,053.79
|
|
|
16,544.19
|
|
|
12,142.01
|
|
|
13,569.4
|
|
16,325.06
|
|
20,842.08
|
| Schwab Fundamental Emerging Markets Equity Index Fund |
|
|
|
|
|
|
|
|
|
|
|
|
|
|
|
|
|
|
|
|
|
|
|
|
|
|
|
|
|
|
|
|
|
|
|
|
|
|
|
|
|
| Account Value [Line Items] |
|
|
|
|
|
|
|
|
|
|
|
|
|
|
|
|
|
|
|
|
|
|
|
|
|
|
|
|
|
|
|
|
|
|
|
|
|
|
|
|
|
| Line Graph and Table Measure Name |
|
|
|
|
|
|
|
|
|
Schwab Fundamental Emerging Markets Equity Index Fund
|
|
|
|
|
|
|
|
|
|
|
|
|
|
|
|
|
|
|
|
|
|
|
|
|
|
|
|
|
|
|
|
| Accumulated Value |
[3],[4] |
|
|
|
|
10,000
|
|
|
|
|
12,164.31
|
|
|
|
|
14,835.22
|
|
|
|
13,931.3
|
|
|
|
15,426.37
|
|
|
|
12,990.73
|
|
|
18,262.4
|
|
|
13,723.13
|
|
|
15,800.58
|
|
20,408.74
|
|
25,157.68
|
| Schwab Balanced Fund |
|
|
|
|
|
|
|
|
|
|
|
|
|
|
|
|
|
|
|
|
|
|
|
|
|
|
|
|
|
|
|
|
|
|
|
|
|
|
|
|
|
| Account Value [Line Items] |
|
|
|
|
|
|
|
|
|
|
|
|
|
|
|
|
|
|
|
|
|
|
|
|
|
|
|
|
|
|
|
|
|
|
|
|
|
|
|
|
|
| Line Graph and Table Measure Name |
|
|
|
|
|
|
|
|
|
Schwab Balanced Fund
|
|
|
|
|
|
|
|
|
|
|
|
|
|
|
|
|
|
|
|
|
|
|
|
|
|
|
|
|
|
|
|
| Accumulated Value |
[1] |
|
|
|
|
10,000
|
|
|
|
|
10,140.59
|
|
|
|
|
11,753.24
|
|
|
|
11,980.99
|
|
|
|
13,321.27
|
|
|
|
14,463.66
|
|
|
17,818.57
|
|
|
14,520.29
|
|
|
15,498.63
|
|
19,341.82
|
|
22,102.1
|
| Schwab MarketTrack All Equity Portfolio |
|
|
|
|
|
|
|
|
|
|
|
|
|
|
|
|
|
|
|
|
|
|
|
|
|
|
|
|
|
|
|
|
|
|
|
|
|
|
|
|
|
| Account Value [Line Items] |
|
|
|
|
|
|
|
|
|
|
|
|
|
|
|
|
|
|
|
|
|
|
|
|
|
|
|
|
|
|
|
|
|
|
|
|
|
|
|
|
|
| Line Graph and Table Measure Name |
|
|
|
|
|
|
|
|
|
Schwab MarketTrack All Equity Portfolio
|
|
|
|
|
|
|
|
|
|
|
|
|
|
|
|
|
|
|
|
|
|
|
|
|
|
|
|
|
|
|
|
| Accumulated Value |
[1] |
|
|
|
|
10,000
|
|
|
|
|
10,399.03
|
|
|
|
|
12,824.93
|
|
|
|
12,966.29
|
|
|
|
14,208.22
|
|
|
|
14,017.05
|
|
|
20,170.39
|
|
|
16,762.95
|
|
|
17,990.27
|
|
23,624.19
|
|
28,301.88
|
| Schwab MarketTrack Growth Portfolio |
|
|
|
|
|
|
|
|
|
|
|
|
|
|
|
|
|
|
|
|
|
|
|
|
|
|
|
|
|
|
|
|
|
|
|
|
|
|
|
|
|
| Account Value [Line Items] |
|
|
|
|
|
|
|
|
|
|
|
|
|
|
|
|
|
|
|
|
|
|
|
|
|
|
|
|
|
|
|
|
|
|
|
|
|
|
|
|
|
| Line Graph and Table Measure Name |
|
|
|
|
|
|
|
|
|
Schwab MarketTrack Growth Portfolio
|
|
|
|
|
|
|
|
|
|
|
|
|
|
|
|
|
|
|
|
|
|
|
|
|
|
|
|
|
|
|
|
| Accumulated Value |
[1] |
|
|
|
|
10,000
|
|
|
|
|
10,388.23
|
|
|
|
|
12,311.88
|
|
|
|
12,469.8
|
|
|
|
13,699.14
|
|
|
|
13,799.92
|
|
|
18,536.08
|
|
|
15,659.16
|
|
|
16,547.94
|
|
21,033.67
|
|
24,564.66
|
| Schwab MarketTrack Balanced Portfolio™ |
|
|
|
|
|
|
|
|
|
|
|
|
|
|
|
|
|
|
|
|
|
|
|
|
|
|
|
|
|
|
|
|
|
|
|
|
|
|
|
|
|
| Account Value [Line Items] |
|
|
|
|
|
|
|
|
|
|
|
|
|
|
|
|
|
|
|
|
|
|
|
|
|
|
|
|
|
|
|
|
|
|
|
|
|
|
|
|
|
| Line Graph and Table Measure Name |
|
|
|
|
|
|
|
|
|
Schwab MarketTrack Balanced Portfolio
|
|
|
|
|
|
|
|
|
|
|
|
|
|
|
|
|
|
|
|
|
|
|
|
|
|
|
|
|
|
|
|
| Accumulated Value |
[1] |
|
|
|
|
10,000
|
|
|
|
|
10,392.24
|
|
|
|
|
11,816.56
|
|
|
|
11,868.81
|
|
|
|
13,072.14
|
|
|
|
13,381.42
|
|
|
16,681.45
|
|
|
14,126.3
|
|
|
14,758.43
|
|
18,093.11
|
|
20,619.85
|
| Schwab MarketTrack Conservative Portfolio™ |
|
|
|
|
|
|
|
|
|
|
|
|
|
|
|
|
|
|
|
|
|
|
|
|
|
|
|
|
|
|
|
|
|
|
|
|
|
|
|
|
|
| Account Value [Line Items] |
|
|
|
|
|
|
|
|
|
|
|
|
|
|
|
|
|
|
|
|
|
|
|
|
|
|
|
|
|
|
|
|
|
|
|
|
|
|
|
|
|
| Line Graph and Table Measure Name |
|
|
|
|
|
|
|
|
|
Schwab MarketTrack Conservative Portfolio
|
|
|
|
|
|
|
|
|
|
|
|
|
|
|
|
|
|
|
|
|
|
|
|
|
|
|
|
|
|
|
|
| Accumulated Value |
[1] |
|
|
|
|
10,000
|
|
|
|
|
10,368.02
|
|
|
|
|
11,308.69
|
|
|
|
11,253.62
|
|
|
|
12,413.93
|
|
|
|
12,857.46
|
|
|
14,850.23
|
|
|
12,588.95
|
|
|
12,967.69
|
|
15,315.76
|
|
17,018.2
|
| Schwab Target 2010 Fund |
|
|
|
|
|
|
|
|
|
|
|
|
|
|
|
|
|
|
|
|
|
|
|
|
|
|
|
|
|
|
|
|
|
|
|
|
|
|
|
|
|
| Account Value [Line Items] |
|
|
|
|
|
|
|
|
|
|
|
|
|
|
|
|
|
|
|
|
|
|
|
|
|
|
|
|
|
|
|
|
|
|
|
|
|
|
|
|
|
| Line Graph and Table Measure Name |
|
|
|
|
|
|
|
|
|
Schwab Target 2010 Fund
|
|
|
|
|
|
|
|
|
|
|
|
|
|
|
|
|
|
|
|
|
|
|
|
|
|
|
|
|
|
|
|
| Accumulated Value |
[1] |
|
|
|
|
10,000
|
|
|
|
|
10,267.56
|
|
|
|
|
11,202.85
|
|
|
|
11,144.32
|
|
|
|
12,305.87
|
|
|
|
13,091.31
|
|
|
14,854.04
|
|
|
12,523.72
|
|
|
13,054.51
|
|
15,374.64
|
|
17,027.92
|
| Schwab Target 2015 Fund |
|
|
|
|
|
|
|
|
|
|
|
|
|
|
|
|
|
|
|
|
|
|
|
|
|
|
|
|
|
|
|
|
|
|
|
|
|
|
|
|
|
| Account Value [Line Items] |
|
|
|
|
|
|
|
|
|
|
|
|
|
|
|
|
|
|
|
|
|
|
|
|
|
|
|
|
|
|
|
|
|
|
|
|
|
|
|
|
|
| Line Graph and Table Measure Name |
|
|
|
|
|
|
|
|
|
Schwab Target 2015 Fund
|
|
|
|
|
|
|
|
|
|
|
|
|
|
|
|
|
|
|
|
|
|
|
|
|
|
|
|
|
|
|
|
| Accumulated Value |
[1] |
|
|
|
|
10,000
|
|
|
|
|
10,259.21
|
|
|
|
|
11,251.75
|
|
|
|
11,187.77
|
|
|
|
12,360.26
|
|
|
|
13,151.94
|
|
|
15,063.78
|
|
|
12,631.64
|
|
|
13,203.9
|
|
15,663.12
|
|
17,446.61
|
| Schwab Target 2020 Fund |
|
|
|
|
|
|
|
|
|
|
|
|
|
|
|
|
|
|
|
|
|
|
|
|
|
|
|
|
|
|
|
|
|
|
|
|
|
|
|
|
|
| Account Value [Line Items] |
|
|
|
|
|
|
|
|
|
|
|
|
|
|
|
|
|
|
|
|
|
|
|
|
|
|
|
|
|
|
|
|
|
|
|
|
|
|
|
|
|
| Line Graph and Table Measure Name |
|
|
|
|
|
|
|
|
|
Schwab Target 2020 Fund
|
|
|
|
|
|
|
|
|
|
|
|
|
|
|
|
|
|
|
|
|
|
|
|
|
|
|
|
|
|
|
|
| Accumulated Value |
[1] |
|
|
|
|
10,000
|
|
|
|
|
10,205.04
|
|
|
|
|
11,458.37
|
|
|
|
11,421.43
|
|
|
|
12,630.04
|
|
|
|
13,429.9
|
|
|
15,481.21
|
|
|
12,949.73
|
|
|
13,555.68
|
|
16,183.48
|
|
18,091.04
|
| Schwab Target 2025 Index Fund |
|
|
|
|
|
|
|
|
|
|
|
|
|
|
|
|
|
|
|
|
|
|
|
|
|
|
|
|
|
|
|
|
|
|
|
|
|
|
|
|
|
| Account Value [Line Items] |
|
|
|
|
|
|
|
|
|
|
|
|
|
|
|
|
|
|
|
|
|
|
|
|
|
|
|
|
|
|
|
|
|
|
|
|
|
|
|
|
|
| Line Graph and Table Measure Name |
|
|
|
|
|
|
|
|
|
Schwab Target 2025 Fund
|
|
|
|
|
|
|
|
|
|
|
|
|
|
|
|
|
|
|
|
|
|
|
|
|
|
|
|
|
|
|
|
| Accumulated Value |
[1] |
|
|
|
|
10,000
|
|
|
|
|
10,200.81
|
|
|
|
|
11,747.98
|
|
|
|
11,685.21
|
|
|
|
12,946.34
|
|
|
|
13,720.06
|
|
|
16,498.47
|
|
|
13,628.61
|
|
|
14,372.92
|
|
17,328.92
|
|
19,460.38
|
| Schwab Target 2030 Fund |
|
|
|
|
|
|
|
|
|
|
|
|
|
|
|
|
|
|
|
|
|
|
|
|
|
|
|
|
|
|
|
|
|
|
|
|
|
|
|
|
|
| Account Value [Line Items] |
|
|
|
|
|
|
|
|
|
|
|
|
|
|
|
|
|
|
|
|
|
|
|
|
|
|
|
|
|
|
|
|
|
|
|
|
|
|
|
|
|
| Line Graph and Table Measure Name |
|
|
|
|
|
|
|
|
|
Schwab Target 2030 Fund
|
|
|
|
|
|
|
|
|
|
|
|
|
|
|
|
|
|
|
|
|
|
|
|
|
|
|
|
|
|
|
|
| Accumulated Value |
[1] |
|
|
|
|
10,000
|
|
|
|
|
10,171.94
|
|
|
|
|
11,949.16
|
|
|
|
11,859.51
|
|
|
|
13,157.15
|
|
|
|
13,921.1
|
|
|
17,315.58
|
|
|
14,109.86
|
|
|
15,029.94
|
|
18,575.29
|
|
21,252.99
|
| Schwab Target 2035 Fund |
|
|
|
|
|
|
|
|
|
|
|
|
|
|
|
|
|
|
|
|
|
|
|
|
|
|
|
|
|
|
|
|
|
|
|
|
|
|
|
|
|
| Account Value [Line Items] |
|
|
|
|
|
|
|
|
|
|
|
|
|
|
|
|
|
|
|
|
|
|
|
|
|
|
|
|
|
|
|
|
|
|
|
|
|
|
|
|
|
| Line Graph and Table Measure Name |
|
|
|
|
|
|
|
|
|
Schwab Target 2035 Fund
|
|
|
|
|
|
|
|
|
|
|
|
|
|
|
|
|
|
|
|
|
|
|
|
|
|
|
|
|
|
|
|
| Accumulated Value |
[1] |
|
|
|
|
10,000
|
|
|
|
|
10,163.15
|
|
|
|
|
12,113.93
|
|
|
|
12,007.34
|
|
|
|
13,315.76
|
|
|
|
14,049.88
|
|
|
17,949.63
|
|
|
14,466
|
|
|
15,510.58
|
|
19,504.73
|
|
22,622.62
|
| Schwab Target 2040 Fund |
|
|
|
|
|
|
|
|
|
|
|
|
|
|
|
|
|
|
|
|
|
|
|
|
|
|
|
|
|
|
|
|
|
|
|
|
|
|
|
|
|
| Account Value [Line Items] |
|
|
|
|
|
|
|
|
|
|
|
|
|
|
|
|
|
|
|
|
|
|
|
|
|
|
|
|
|
|
|
|
|
|
|
|
|
|
|
|
|
| Line Graph and Table Measure Name |
|
|
|
|
|
|
|
|
|
Schwab Target 2040 Fund
|
|
|
|
|
|
|
|
|
|
|
|
|
|
|
|
|
|
|
|
|
|
|
|
|
|
|
|
|
|
|
|
| Accumulated Value |
[1] |
|
|
|
|
10,000
|
|
|
|
|
10,138.33
|
|
|
|
|
12,269.07
|
|
|
|
12,125.94
|
|
|
|
13,448.2
|
|
|
|
14,161.98
|
|
|
18,490.93
|
|
|
14,774.29
|
|
|
15,924.59
|
|
20,302.78
|
|
23,783.54
|
| Schwab Target 2045 Fund |
|
|
|
|
|
|
|
|
|
|
|
|
|
|
|
|
|
|
|
|
|
|
|
|
|
|
|
|
|
|
|
|
|
|
|
|
|
|
|
|
|
| Account Value [Line Items] |
|
|
|
|
|
|
|
|
|
|
|
|
|
|
|
|
|
|
|
|
|
|
|
|
|
|
|
|
|
|
|
|
|
|
|
|
|
|
|
|
|
| Line Graph and Table Measure Name |
|
|
|
|
|
|
|
|
|
Schwab Target 2045 Fund
|
|
|
|
|
|
|
|
|
|
|
|
|
|
|
|
|
|
|
|
|
|
|
|
|
|
|
|
|
|
|
|
| Accumulated Value |
[1] |
|
|
|
|
10,000
|
|
|
|
|
10,139.76
|
|
|
|
|
12,382.12
|
|
|
|
12,205.05
|
|
|
|
13,537.04
|
|
|
|
14,226.87
|
|
|
18,940.07
|
|
|
15,008.21
|
|
|
16,245.41
|
|
20,926.11
|
|
24,743.69
|
| Schwab Target 2050 Fund |
|
|
|
|
|
|
|
|
|
|
|
|
|
|
|
|
|
|
|
|
|
|
|
|
|
|
|
|
|
|
|
|
|
|
|
|
|
|
|
|
|
| Account Value [Line Items] |
|
|
|
|
|
|
|
|
|
|
|
|
|
|
|
|
|
|
|
|
|
|
|
|
|
|
|
|
|
|
|
|
|
|
|
|
|
|
|
|
|
| Line Graph and Table Measure Name |
|
|
|
|
|
|
|
|
|
Schwab Target 2050 Fund
|
|
|
|
|
|
|
|
|
|
|
|
|
|
|
|
|
|
|
|
|
|
|
|
|
|
|
|
|
|
|
|
| Accumulated Value |
[1] |
|
|
|
|
10,000
|
|
|
|
|
10,138.99
|
|
|
|
|
12,438.22
|
|
|
|
12,251.03
|
|
|
|
13,583.21
|
|
|
|
14,257.46
|
|
|
19,222.96
|
|
|
15,144.61
|
|
|
16,450.34
|
|
21,345.95
|
|
25,393.43
|
| Schwab Target 2055 Fund |
|
|
|
|
|
|
|
|
|
|
|
|
|
|
|
|
|
|
|
|
|
|
|
|
|
|
|
|
|
|
|
|
|
|
|
|
|
|
|
|
|
| Account Value [Line Items] |
|
|
|
|
|
|
|
|
|
|
|
|
|
|
|
|
|
|
|
|
|
|
|
|
|
|
|
|
|
|
|
|
|
|
|
|
|
|
|
|
|
| Line Graph and Table Measure Name |
|
|
|
|
|
|
|
|
|
Schwab Target 2055 Fund
|
|
|
|
|
|
|
|
|
|
|
|
|
|
|
|
|
|
|
|
|
|
|
|
|
|
|
|
|
|
|
|
| Accumulated Value |
[1] |
|
|
|
|
10,000
|
|
|
|
|
10,127.53
|
|
|
|
|
12,492.71
|
|
|
|
12,306.49
|
|
|
|
13,627.25
|
|
|
|
14,289.6
|
|
|
19,403.74
|
|
|
15,223.3
|
|
|
16,534.89
|
|
21,521.71
|
|
25,706.16
|
| Schwab Target 2060 Fund |
|
|
|
|
|
|
|
|
|
|
|
|
|
|
|
|
|
|
|
|
|
|
|
|
|
|
|
|
|
|
|
|
|
|
|
|
|
|
|
|
|
| Account Value [Line Items] |
|
|
|
|
|
|
|
|
|
|
|
|
|
|
|
|
|
|
|
|
|
|
|
|
|
|
|
|
|
|
|
|
|
|
|
|
|
|
|
|
|
| Line Graph and Table Measure Name |
|
|
|
|
|
|
|
|
|
Schwab Target 2060 Fund
|
|
|
|
|
|
|
|
|
|
|
|
|
|
|
|
|
|
|
|
|
|
|
|
|
|
|
|
|
|
|
|
| Accumulated Value |
[1] |
|
|
|
$ 9,980
|
|
|
|
|
|
|
$ 12,153.12
|
|
|
|
|
$ 11,953.74
|
|
|
|
$ 13,251.07
|
|
|
|
$ 13,877.34
|
|
|
|
$ 18,996.87
|
|
|
$ 14,840.63
|
|
|
$ 16,149.92
|
|
|
$ 21,083.78
|
|
$ 25,278.66
|
|
| Schwab Target 2065 Fund |
|
|
|
|
|
|
|
|
|
|
|
|
|
|
|
|
|
|
|
|
|
|
|
|
|
|
|
|
|
|
|
|
|
|
|
|
|
|
|
|
|
| Account Value [Line Items] |
|
|
|
|
|
|
|
|
|
|
|
|
|
|
|
|
|
|
|
|
|
|
|
|
|
|
|
|
|
|
|
|
|
|
|
|
|
|
|
|
|
| Line Graph and Table Measure Name |
|
|
|
|
|
|
|
|
|
Schwab Target 2065 Fund
|
|
|
|
|
|
|
|
|
|
|
|
|
|
|
|
|
|
|
|
|
|
|
|
|
|
|
|
|
|
|
|
| Accumulated Value |
[1] |
|
$ 9,930
|
|
|
|
$ 11,330
|
|
|
|
|
|
$ 8,861.91
|
|
|
|
|
$ 9,637.52
|
|
|
|
$ 12,606.24
|
|
|
|
$ 15,139.31
|
|
|
|
|
|
|
|
|
|
|
|
|
|
|
|
| Russell 1000 Index [Member] |
|
|
|
|
|
|
|
|
|
|
|
|
|
|
|
|
|
|
|
|
|
|
|
|
|
|
|
|
|
|
|
|
|
|
|
|
|
|
|
|
|
| Account Value [Line Items] |
|
|
|
|
|
|
|
|
|
|
|
|
|
|
|
|
|
|
|
|
|
|
|
|
|
|
|
|
|
|
|
|
|
|
|
|
|
|
|
|
|
| Line Graph and Table Measure Name |
[5] |
|
|
|
|
|
|
|
|
Russell 1000® Index
|
|
|
|
|
|
|
|
|
|
|
|
|
|
|
|
|
|
|
|
|
|
|
|
|
|
|
|
|
|
|
|
| Accumulated Value |
|
|
|
|
|
10,000
|
|
|
|
|
10,425.55
|
|
|
|
|
12,893.13
|
|
|
|
13,792.79
|
|
|
|
15,744.77
|
|
|
|
17,455.57
|
|
|
25,050.76
|
|
|
20,947.9
|
|
|
22,934.58
|
|
31,665.5
|
|
38,358.29
|
| MSCI EAFE® Index (Net) [Member] |
|
|
|
|
|
|
|
|
|
|
|
|
|
|
|
|
|
|
|
|
|
|
|
|
|
|
|
|
|
|
|
|
|
|
|
|
|
|
|
|
|
| Account Value [Line Items] |
|
|
|
|
|
|
|
|
|
|
|
|
|
|
|
|
|
|
|
|
|
|
|
|
|
|
|
|
|
|
|
|
|
|
|
|
|
|
|
|
|
| Line Graph and Table Measure Name |
[6],[7],[8] |
|
|
|
|
|
|
|
|
MSCI EAFE® Index (Net)
|
|
|
|
|
|
|
|
|
|
|
|
|
|
|
|
|
|
|
|
|
|
|
|
|
|
|
|
|
|
|
|
| Accumulated Value |
[8] |
|
|
|
|
10,000
|
|
|
|
|
9,677.34
|
|
|
|
|
11,945.47
|
|
|
|
11,126.68
|
|
|
|
12,355.49
|
|
|
|
11,507.37
|
|
|
15,440.64
|
|
|
11,889.47
|
|
|
13,601.66
|
|
16,725.42
|
|
20,577.58
|
| MSCI Emerging Markets Index (Net) [Member] |
|
|
|
|
|
|
|
|
|
|
|
|
|
|
|
|
|
|
|
|
|
|
|
|
|
|
|
|
|
|
|
|
|
|
|
|
|
|
|
|
|
| Account Value [Line Items] |
|
|
|
|
|
|
|
|
|
|
|
|
|
|
|
|
|
|
|
|
|
|
|
|
|
|
|
|
|
|
|
|
|
|
|
|
|
|
|
|
|
| Line Graph and Table Measure Name |
[8],[9] |
|
|
|
|
|
|
|
|
MSCI Emerging Markets Index (Net)
|
|
|
|
|
|
|
|
|
|
|
|
|
|
|
|
|
|
|
|
|
|
|
|
|
|
|
|
|
|
|
|
| Accumulated Value |
[8] |
|
|
|
|
10,000
|
|
|
|
|
10,926.74
|
|
|
|
|
13,816.95
|
|
|
|
12,087.59
|
|
|
|
13,520.69
|
|
|
|
14,636.36
|
|
|
17,118.74
|
|
|
11,807.42
|
|
|
13,082.54
|
|
16,394.41
|
|
20,970.82
|
| Standard & Poor's 500 Index [Member] |
|
|
|
|
|
|
|
|
|
|
|
|
|
|
|
|
|
|
|
|
|
|
|
|
|
|
|
|
|
|
|
|
|
|
|
|
|
|
|
|
|
| Account Value [Line Items] |
|
|
|
|
|
|
|
|
|
|
|
|
|
|
|
|
|
|
|
|
|
|
|
|
|
|
|
|
|
|
|
|
|
|
|
|
|
|
|
|
|
| Line Graph and Table Measure Name |
[10],[11],[12],[13],[14],[15],[16],[17],[18] |
|
|
|
|
|
|
|
|
S&P 500® Index
|
|
|
|
|
|
|
|
|
|
|
|
|
|
|
|
|
|
|
|
|
|
|
|
|
|
|
|
|
|
|
|
| Accumulated Value |
|
|
|
9,975.76
|
|
10,000
|
|
|
10,275.69
|
|
10,450.91
|
|
|
|
11,747.8
|
12,920.7
|
|
|
12,888.57
|
13,869.89
|
|
|
18,419.57
|
15,856.91
|
|
|
15,728.28
|
17,396.7
|
|
17,323.57
|
24,862.31
|
|
23,909.48
|
21,229.67
|
|
29,038.66
|
23,382.95
|
|
32,272.47
|
|
39,195.7
|
| Dow Jones U S Total Stock Market Index [Member] |
|
|
|
|
|
|
|
|
|
|
|
|
|
|
|
|
|
|
|
|
|
|
|
|
|
|
|
|
|
|
|
|
|
|
|
|
|
|
|
|
|
| Account Value [Line Items] |
|
|
|
|
|
|
|
|
|
|
|
|
|
|
|
|
|
|
|
|
|
|
|
|
|
|
|
|
|
|
|
|
|
|
|
|
|
|
|
|
|
| Line Graph and Table Measure Name |
|
|
|
|
|
|
|
|
|
Dow Jones U.S. Total Stock Market IndexSM
|
|
|
|
|
|
|
|
|
|
|
|
|
|
|
|
|
|
|
|
|
|
|
|
|
|
|
|
|
|
|
|
| Accumulated Value |
|
|
9,969.03
|
|
9,991.8
|
10,000
|
11,907.16
|
|
|
|
10,420.71
|
12,135.65
|
9,889.61
|
|
|
12,917.34
|
12,931.76
|
10,719.76
|
|
13,764.73
|
14,663.77
|
14,792.66
|
|
15,608.32
|
16,128.42
|
17,884.9
|
|
17,167.3
|
23,236.39
|
|
24,733.12
|
19,299.21
|
|
20,542.34
|
20,919.22
|
|
22,266.69
|
28,867.32
|
30,726.76
|
34,901.72
|
37,149.85
|
| Bloomberg US Aggregate Bond Index [Member] |
|
|
|
|
|
|
|
|
|
|
|
|
|
|
|
|
|
|
|
|
|
|
|
|
|
|
|
|
|
|
|
|
|
|
|
|
|
|
|
|
|
| Account Value [Line Items] |
|
|
|
|
|
|
|
|
|
|
|
|
|
|
|
|
|
|
|
|
|
|
|
|
|
|
|
|
|
|
|
|
|
|
|
|
|
|
|
|
|
| Line Graph and Table Measure Name |
|
|
|
|
|
|
|
|
|
Bloomberg US Aggregate Bond Index
|
|
|
|
|
|
|
|
|
|
|
|
|
|
|
|
|
|
|
|
|
|
|
|
|
|
|
|
|
|
|
|
| Accumulated Value |
|
|
10,083.72
|
|
9,996.44
|
10,000
|
10,142.46
|
|
|
|
10,437.05
|
10,003.62
|
8,551.87
|
|
|
10,531.22
|
9,798.2
|
8,582.31
|
|
10,314.97
|
10,925.92
|
9,487.42
|
|
11,502.15
|
11,601.94
|
10,071.77
|
|
12,213.83
|
11,546.48
|
|
12,155.45
|
9,735.7
|
|
10,249.17
|
9,770.36
|
|
10,285.65
|
10,800.76
|
11,370.4
|
11,466
|
12,070.72
|
| Russell 2000 Index [Member] |
|
|
|
|
|
|
|
|
|
|
|
|
|
|
|
|
|
|
|
|
|
|
|
|
|
|
|
|
|
|
|
|
|
|
|
|
|
|
|
|
|
| Account Value [Line Items] |
|
|
|
|
|
|
|
|
|
|
|
|
|
|
|
|
|
|
|
|
|
|
|
|
|
|
|
|
|
|
|
|
|
|
|
|
|
|
|
|
|
| Line Graph and Table Measure Name |
|
|
|
|
|
|
|
|
|
Russell 2000® Index
|
|
|
|
|
|
|
|
|
|
|
|
|
|
|
|
|
|
|
|
|
|
|
|
|
|
|
|
|
|
|
|
| Accumulated Value |
|
|
|
|
|
10,000
|
|
|
|
|
10,411.27
|
|
|
|
|
13,310.67
|
|
|
|
13,557.34
|
|
|
|
14,222.29
|
|
|
|
14,202.78
|
|
|
21,417.95
|
|
|
17,446.87
|
|
|
15,952.56
|
|
21,388.36
|
|
24,471.29
|
| Dow Jones Global Health Care Index [Member] |
|
|
|
|
|
|
|
|
|
|
|
|
|
|
|
|
|
|
|
|
|
|
|
|
|
|
|
|
|
|
|
|
|
|
|
|
|
|
|
|
|
| Account Value [Line Items] |
|
|
|
|
|
|
|
|
|
|
|
|
|
|
|
|
|
|
|
|
|
|
|
|
|
|
|
|
|
|
|
|
|
|
|
|
|
|
|
|
|
| Line Graph and Table Measure Name |
|
|
|
|
|
|
|
|
|
Dow Jones Global Health Care Index
|
|
|
|
|
|
|
|
|
|
|
|
|
|
|
|
|
|
|
|
|
|
|
|
|
|
|
|
|
|
|
|
| Accumulated Value |
|
|
|
|
|
10,000
|
|
|
|
|
9,394.97
|
|
|
|
|
11,271.34
|
|
|
|
12,334.15
|
|
|
|
13,534.25
|
|
|
|
15,108.12
|
|
|
19,239.2
|
|
|
17,310.21
|
|
|
16,962.14
|
|
20,356.25
|
|
20,545.7
|
| Russell 1000 Growth Index [Member] |
|
|
|
|
|
|
|
|
|
|
|
|
|
|
|
|
|
|
|
|
|
|
|
|
|
|
|
|
|
|
|
|
|
|
|
|
|
|
|
|
|
| Account Value [Line Items] |
|
|
|
|
|
|
|
|
|
|
|
|
|
|
|
|
|
|
|
|
|
|
|
|
|
|
|
|
|
|
|
|
|
|
|
|
|
|
|
|
|
| Line Graph and Table Measure Name |
|
|
|
|
|
|
|
|
|
Russell 1000® Growth Index
|
|
|
|
|
|
|
|
|
|
|
|
|
|
|
|
|
|
|
|
|
|
|
|
|
|
|
|
|
|
|
|
| Accumulated Value |
|
|
|
9,939.29
|
|
10,000
|
|
|
10,597.07
|
|
10,228.21
|
|
|
|
12,409.43
|
13,267.18
|
|
|
16,035.27
|
14,688.38
|
|
|
22,963.9
|
17,200.46
|
|
|
17,315.6
|
22,226.17
|
|
20,596.97
|
31,829.8
|
|
29,611.52
|
24,000.8
|
|
38,650.34
|
28,549.05
|
|
41,043.95
|
|
53,572.47
|
| Russell 1000 Value Index [Member] |
|
|
|
|
|
|
|
|
|
|
|
|
|
|
|
|
|
|
|
|
|
|
|
|
|
|
|
|
|
|
|
|
|
|
|
|
|
|
|
|
|
| Account Value [Line Items] |
|
|
|
|
|
|
|
|
|
|
|
|
|
|
|
|
|
|
|
|
|
|
|
|
|
|
|
|
|
|
|
|
|
|
|
|
|
|
|
|
|
| Line Graph and Table Measure Name |
|
|
|
|
|
|
|
|
|
Russell 1000® Value Index
|
|
|
|
|
|
|
|
|
|
|
|
|
|
|
|
|
|
|
|
|
|
|
|
|
|
|
|
|
|
|
|
| Accumulated Value |
|
|
|
10,028.67
|
|
10,000
|
|
|
9,881.77
|
|
10,637.08
|
|
|
|
10,989.82
|
12,528.44
|
|
|
10,158.4
|
12,908.68
|
|
|
14,603.4
|
14,356.13
|
|
|
13,581.57
|
13,270.04
|
|
13,599.75
|
19,076.58
|
|
17,812.46
|
17,741.75
|
|
19,798.24
|
17,765.51
|
|
23,268.62
|
|
25,862.66
|
| Russell Midcap® Index |
|
|
|
|
|
|
|
|
|
|
|
|
|
|
|
|
|
|
|
|
|
|
|
|
|
|
|
|
|
|
|
|
|
|
|
|
|
|
|
|
|
| Account Value [Line Items] |
|
|
|
|
|
|
|
|
|
|
|
|
|
|
|
|
|
|
|
|
|
|
|
|
|
|
|
|
|
|
|
|
|
|
|
|
|
|
|
|
|
| Line Graph and Table Measure Name |
|
|
|
|
|
|
|
|
|
Russell Midcap® Index
|
|
|
|
|
|
|
|
|
|
|
|
|
|
|
|
|
|
|
|
|
|
|
|
|
|
|
|
|
|
|
|
| Accumulated Value |
|
|
|
$ 10,039.2
|
|
|
|
|
$ 9,891.9
|
|
|
|
|
|
$ 11,248.93
|
|
|
|
$ 11,712.84
|
|
|
|
$ 17,029.94
|
|
|
|
$ 14,106.44
|
|
|
$ 13,964.45
|
|
|
$ 18,907.12
|
|
|
$ 20,946.48
|
|
|
|
|
|
| RAFI Fundamental High Liquidity US Large Index [Member] |
|
|
|
|
|
|
|
|
|
|
|
|
|
|
|
|
|
|
|
|
|
|
|
|
|
|
|
|
|
|
|
|
|
|
|
|
|
|
|
|
|
| Account Value [Line Items] |
|
|
|
|
|
|
|
|
|
|
|
|
|
|
|
|
|
|
|
|
|
|
|
|
|
|
|
|
|
|
|
|
|
|
|
|
|
|
|
|
|
| Line Graph and Table Measure Name |
[19] |
|
|
|
|
|
|
|
|
RAFI Fundamental High Liquidity US Large Index
|
|
|
|
|
|
|
|
|
|
|
|
|
|
|
|
|
|
|
|
|
|
|
|
|
|
|
|
|
|
|
|
| Accumulated Value |
[19] |
$ 10,000
|
|
|
|
|
|
$ 11,546
|
|
|
|
|
|
$ 13,245.3
|
|
|
|
|
|
|
|
|
|
|
|
|
|
|
|
|
|
|
|
|
|
|
|
|
|
|
|
| Fundamental US Large Spliced Index [Member] |
|
|
|
|
|
|
|
|
|
|
|
|
|
|
|
|
|
|
|
|
|
|
|
|
|
|
|
|
|
|
|
|
|
|
|
|
|
|
|
|
|
| Account Value [Line Items] |
|
|
|
|
|
|
|
|
|
|
|
|
|
|
|
|
|
|
|
|
|
|
|
|
|
|
|
|
|
|
|
|
|
|
|
|
|
|
|
|
|
| Line Graph and Table Measure Name |
|
|
|
|
|
|
|
|
|
Fundamental US Large Spliced Index
|
|
|
|
|
|
|
|
|
|
|
|
|
|
|
|
|
|
|
|
|
|
|
|
|
|
|
|
|
|
|
|
| Accumulated Value |
|
|
|
|
|
10,000
|
|
|
|
|
10,594.2
|
|
|
|
|
12,714.92
|
|
|
|
13,616.97
|
|
|
|
15,088.61
|
|
|
|
14,756.88
|
|
|
22,387.41
|
|
|
21,519.2
|
|
|
22,527.98
|
|
29,882.97
|
|
34,281.05
|
| Russell RAFI US Large Company Index [Member] |
|
|
|
|
|
|
|
|
|
|
|
|
|
|
|
|
|
|
|
|
|
|
|
|
|
|
|
|
|
|
|
|
|
|
|
|
|
|
|
|
|
| Account Value [Line Items] |
|
|
|
|
|
|
|
|
|
|
|
|
|
|
|
|
|
|
|
|
|
|
|
|
|
|
|
|
|
|
|
|
|
|
|
|
|
|
|
|
|
| Line Graph and Table Measure Name |
|
|
|
|
|
|
|
|
|
Russell RAFITM US Large Company Index
|
|
|
|
|
|
|
|
|
|
|
|
|
|
|
|
|
|
|
|
|
|
|
|
|
|
|
|
|
|
|
|
| Accumulated Value |
|
|
|
|
|
10,000
|
|
|
|
|
10,594.2
|
|
|
|
|
12,714.92
|
|
|
|
13,616.97
|
|
|
|
15,088.61
|
|
|
|
14,756.88
|
|
|
22,387.41
|
|
|
21,519.2
|
|
|
22,527.98
|
|
29,899.99
|
|
34,277.49
|
| RAFI Fundamental High Liquidity US Small Index [Member] |
|
|
|
|
|
|
|
|
|
|
|
|
|
|
|
|
|
|
|
|
|
|
|
|
|
|
|
|
|
|
|
|
|
|
|
|
|
|
|
|
|
| Account Value [Line Items] |
|
|
|
|
|
|
|
|
|
|
|
|
|
|
|
|
|
|
|
|
|
|
|
|
|
|
|
|
|
|
|
|
|
|
|
|
|
|
|
|
|
| Line Graph and Table Measure Name |
[20] |
|
|
|
|
|
|
|
|
RAFI Fundamental High Liquidity US Small Index
|
|
|
|
|
|
|
|
|
|
|
|
|
|
|
|
|
|
|
|
|
|
|
|
|
|
|
|
|
|
|
|
| Accumulated Value |
[20] |
10,000
|
|
|
|
|
|
11,150.9
|
|
|
|
|
|
11,855.9
|
|
|
|
|
|
|
|
|
|
|
|
|
|
|
|
|
|
|
|
|
|
|
|
|
|
|
|
| Russell RAFI US Small Company Index [Member] |
|
|
|
|
|
|
|
|
|
|
|
|
|
|
|
|
|
|
|
|
|
|
|
|
|
|
|
|
|
|
|
|
|
|
|
|
|
|
|
|
|
| Account Value [Line Items] |
|
|
|
|
|
|
|
|
|
|
|
|
|
|
|
|
|
|
|
|
|
|
|
|
|
|
|
|
|
|
|
|
|
|
|
|
|
|
|
|
|
| Line Graph and Table Measure Name |
|
|
|
|
|
|
|
|
|
Russell RAFITM US Small Company Index
|
|
|
|
|
|
|
|
|
|
|
|
|
|
|
|
|
|
|
|
|
|
|
|
|
|
|
|
|
|
|
|
| Accumulated Value |
|
|
|
|
|
10,000
|
|
|
|
|
10,562.74
|
|
|
|
|
13,009.02
|
|
|
|
13,350.05
|
|
|
|
14,130.61
|
|
|
|
12,658.13
|
|
|
20,772.35
|
|
|
18,449.01
|
|
|
17,924.22
|
|
23,377.8
|
|
24,956.31
|
| Fundamental US Small Spliced Index [Member] |
|
|
|
|
|
|
|
|
|
|
|
|
|
|
|
|
|
|
|
|
|
|
|
|
|
|
|
|
|
|
|
|
|
|
|
|
|
|
|
|
|
| Account Value [Line Items] |
|
|
|
|
|
|
|
|
|
|
|
|
|
|
|
|
|
|
|
|
|
|
|
|
|
|
|
|
|
|
|
|
|
|
|
|
|
|
|
|
|
| Line Graph and Table Measure Name |
|
|
|
|
|
|
|
|
|
Fundamental US Small Spliced Index
|
|
|
|
|
|
|
|
|
|
|
|
|
|
|
|
|
|
|
|
|
|
|
|
|
|
|
|
|
|
|
|
| Accumulated Value |
|
|
|
|
|
10,000
|
|
|
|
|
10,562.74
|
|
|
|
|
13,009.02
|
|
|
|
13,350.05
|
|
|
|
14,130.61
|
|
|
|
12,658.13
|
|
|
20,772.35
|
|
|
18,449.01
|
|
|
17,924.22
|
|
|
|
24,838.41
|
| RAFI Fundamental High Liquidity Developed ex US Large Index (Net) [Member] |
|
|
|
|
|
|
|
|
|
|
|
|
|
|
|
|
|
|
|
|
|
|
|
|
|
|
|
|
|
|
|
|
|
|
|
|
|
|
|
|
|
| Account Value [Line Items] |
|
|
|
|
|
|
|
|
|
|
|
|
|
|
|
|
|
|
|
|
|
|
|
|
|
|
|
|
|
|
|
|
|
|
|
|
|
|
|
|
|
| Line Graph and Table Measure Name |
[8],[21] |
|
|
|
|
|
|
|
|
RAFI Fundamental High Liquidity Developed ex US Large Index (Net)
|
|
|
|
|
|
|
|
|
|
|
|
|
|
|
|
|
|
|
|
|
|
|
|
|
|
|
|
|
|
|
|
| Accumulated Value |
[8],[21] |
10,000
|
|
|
|
|
|
10,657.9
|
|
|
|
|
|
13,691.8
|
|
|
|
|
|
|
|
|
|
|
|
|
|
|
|
|
|
|
|
|
|
|
|
|
|
|
|
| Russell RAFI Developed ex US Large Company Index Net [Member] |
|
|
|
|
|
|
|
|
|
|
|
|
|
|
|
|
|
|
|
|
|
|
|
|
|
|
|
|
|
|
|
|
|
|
|
|
|
|
|
|
|
| Account Value [Line Items] |
|
|
|
|
|
|
|
|
|
|
|
|
|
|
|
|
|
|
|
|
|
|
|
|
|
|
|
|
|
|
|
|
|
|
|
|
|
|
|
|
|
| Line Graph and Table Measure Name |
[8] |
|
|
|
|
|
|
|
|
Russell RAFITM Developed ex US Large Company Index (Net)
|
|
|
|
|
|
|
|
|
|
|
|
|
|
|
|
|
|
|
|
|
|
|
|
|
|
|
|
|
|
|
|
| Accumulated Value |
[8] |
|
|
|
|
10,000
|
|
|
|
|
9,991.16
|
|
|
|
|
12,358.42
|
|
|
|
11,616.01
|
|
|
|
12,422
|
|
|
|
10,711.93
|
|
|
15,494.61
|
|
|
12,887.89
|
|
|
15,055.84
|
|
18,199.33
|
|
23,388.94
|
| Fundamental Developed ex US Large Spliced Index [Member] |
|
|
|
|
|
|
|
|
|
|
|
|
|
|
|
|
|
|
|
|
|
|
|
|
|
|
|
|
|
|
|
|
|
|
|
|
|
|
|
|
|
| Account Value [Line Items] |
|
|
|
|
|
|
|
|
|
|
|
|
|
|
|
|
|
|
|
|
|
|
|
|
|
|
|
|
|
|
|
|
|
|
|
|
|
|
|
|
|
| Line Graph and Table Measure Name |
|
|
|
|
|
|
|
|
|
Fundamental Developed ex US Large Spliced Index
|
|
|
|
|
|
|
|
|
|
|
|
|
|
|
|
|
|
|
|
|
|
|
|
|
|
|
|
|
|
|
|
| Accumulated Value |
|
|
|
|
|
10,000
|
|
|
|
|
9,991.16
|
|
|
|
|
12,358.42
|
|
|
|
11,616.01
|
|
|
|
12,422
|
|
|
|
10,711.93
|
|
|
15,494.61
|
|
|
12,887.89
|
|
|
15,055.84
|
|
18,188.59
|
|
23,366.19
|
| RAFI Fundamental High Liquidity Developed ex US Small Index (Net) [Member] |
|
|
|
|
|
|
|
|
|
|
|
|
|
|
|
|
|
|
|
|
|
|
|
|
|
|
|
|
|
|
|
|
|
|
|
|
|
|
|
|
|
| Account Value [Line Items] |
|
|
|
|
|
|
|
|
|
|
|
|
|
|
|
|
|
|
|
|
|
|
|
|
|
|
|
|
|
|
|
|
|
|
|
|
|
|
|
|
|
| Line Graph and Table Measure Name |
[8],[22] |
|
|
|
|
|
|
|
|
RAFI Fundamental High Liquidity Developed ex US Small Index (Net)
|
|
|
|
|
|
|
|
|
|
|
|
|
|
|
|
|
|
|
|
|
|
|
|
|
|
|
|
|
|
|
|
| Accumulated Value |
[8],[22] |
10,000
|
|
|
|
|
|
10,610
|
|
|
|
|
|
13,572.7
|
|
|
|
|
|
|
|
|
|
|
|
|
|
|
|
|
|
|
|
|
|
|
|
|
|
|
|
| Russell RAFI Developed ex US Small Company Index (Net) [Member] |
|
|
|
|
|
|
|
|
|
|
|
|
|
|
|
|
|
|
|
|
|
|
|
|
|
|
|
|
|
|
|
|
|
|
|
|
|
|
|
|
|
| Account Value [Line Items] |
|
|
|
|
|
|
|
|
|
|
|
|
|
|
|
|
|
|
|
|
|
|
|
|
|
|
|
|
|
|
|
|
|
|
|
|
|
|
|
|
|
| Line Graph and Table Measure Name |
[8] |
|
|
|
|
|
|
|
|
Russell RAFITM Developed ex US Small Company Index (Net)
|
|
|
|
|
|
|
|
|
|
|
|
|
|
|
|
|
|
|
|
|
|
|
|
|
|
|
|
|
|
|
|
| Accumulated Value |
[8] |
|
|
|
|
10,000
|
|
|
|
|
10,820.92
|
|
|
|
|
13,558.1
|
|
|
|
12,297.59
|
|
|
|
12,974.68
|
|
|
|
12,132.53
|
|
|
16,712.16
|
|
|
12,344.11
|
|
|
13,756.71
|
|
16,702.23
|
|
21,456.92
|
| Fundamental Developed ex US Small Spliced Index [Member] |
|
|
|
|
|
|
|
|
|
|
|
|
|
|
|
|
|
|
|
|
|
|
|
|
|
|
|
|
|
|
|
|
|
|
|
|
|
|
|
|
|
| Account Value [Line Items] |
|
|
|
|
|
|
|
|
|
|
|
|
|
|
|
|
|
|
|
|
|
|
|
|
|
|
|
|
|
|
|
|
|
|
|
|
|
|
|
|
|
| Line Graph and Table Measure Name |
|
|
|
|
|
|
|
|
|
Fundamental Developed ex US Small Spliced Index
|
|
|
|
|
|
|
|
|
|
|
|
|
|
|
|
|
|
|
|
|
|
|
|
|
|
|
|
|
|
|
|
| Accumulated Value |
|
|
|
|
|
10,000
|
|
|
|
|
10,820.92
|
|
|
|
|
13,558.1
|
|
|
|
12,297.59
|
|
|
|
12,974.68
|
|
|
|
12,132.53
|
|
|
16,712.16
|
|
|
12,344.11
|
|
|
13,756.71
|
|
16,721.76
|
|
21,391.09
|
| S&P Developed ex-U.S. Small Cap Index (Net) [Member] |
|
|
|
|
|
|
|
|
|
|
|
|
|
|
|
|
|
|
|
|
|
|
|
|
|
|
|
|
|
|
|
|
|
|
|
|
|
|
|
|
|
| Account Value [Line Items] |
|
|
|
|
|
|
|
|
|
|
|
|
|
|
|
|
|
|
|
|
|
|
|
|
|
|
|
|
|
|
|
|
|
|
|
|
|
|
|
|
|
| Line Graph and Table Measure Name |
[8] |
|
|
|
|
|
|
|
|
S&P Developed ex-U.S. Small Cap Index (Net)
|
|
|
|
|
|
|
|
|
|
|
|
|
|
|
|
|
|
|
|
|
|
|
|
|
|
|
|
|
|
|
|
| Accumulated Value |
[8] |
|
|
|
|
10,000
|
|
|
|
|
10,290.14
|
|
|
|
|
12,951.57
|
|
|
|
11,907.08
|
|
|
|
12,788.32
|
|
|
|
12,720.61
|
|
|
17,349.01
|
|
|
11,979.08
|
|
|
12,805.06
|
|
15,571.05
|
|
19,409.61
|
| RAFI Fundamental High Liquidity Emerging Markets Index (Net) [Member] |
|
|
|
|
|
|
|
|
|
|
|
|
|
|
|
|
|
|
|
|
|
|
|
|
|
|
|
|
|
|
|
|
|
|
|
|
|
|
|
|
|
| Account Value [Line Items] |
|
|
|
|
|
|
|
|
|
|
|
|
|
|
|
|
|
|
|
|
|
|
|
|
|
|
|
|
|
|
|
|
|
|
|
|
|
|
|
|
|
| Line Graph and Table Measure Name |
[8],[23] |
|
|
|
|
|
|
|
|
RAFI Fundamental High Liquidity Emerging Markets Index (Net)
|
|
|
|
|
|
|
|
|
|
|
|
|
|
|
|
|
|
|
|
|
|
|
|
|
|
|
|
|
|
|
|
| Accumulated Value |
[8],[23] |
$ 10,000
|
|
|
|
|
|
$ 11,984.4
|
|
|
|
|
|
$ 14,791.5
|
|
|
|
|
|
|
|
|
|
|
|
|
|
|
|
|
|
|
|
|
|
|
|
|
|
|
|
| Russell RAFITM Emerging Markets Large Company Index (Net) [Member] |
|
|
|
|
|
|
|
|
|
|
|
|
|
|
|
|
|
|
|
|
|
|
|
|
|
|
|
|
|
|
|
|
|
|
|
|
|
|
|
|
|
| Account Value [Line Items] |
|
|
|
|
|
|
|
|
|
|
|
|
|
|
|
|
|
|
|
|
|
|
|
|
|
|
|
|
|
|
|
|
|
|
|
|
|
|
|
|
|
| Line Graph and Table Measure Name |
[8] |
|
|
|
|
|
|
|
|
Russell RAFITM Emerging Markets Large Company Index (Net)
|
|
|
|
|
|
|
|
|
|
|
|
|
|
|
|
|
|
|
|
|
|
|
|
|
|
|
|
|
|
|
|
| Accumulated Value |
[8] |
|
|
|
|
10,000
|
|
|
|
|
12,248.01
|
|
|
|
|
14,993.44
|
|
|
|
14,144.6
|
|
|
|
15,776.96
|
|
|
|
13,367
|
|
|
18,992.59
|
|
|
14,134.03
|
|
|
16,382.04
|
|
21,505.95
|
|
26,774.58
|
| Fundamental Emerging Markets Spliced Index [Member] |
|
|
|
|
|
|
|
|
|
|
|
|
|
|
|
|
|
|
|
|
|
|
|
|
|
|
|
|
|
|
|
|
|
|
|
|
|
|
|
|
|
| Account Value [Line Items] |
|
|
|
|
|
|
|
|
|
|
|
|
|
|
|
|
|
|
|
|
|
|
|
|
|
|
|
|
|
|
|
|
|
|
|
|
|
|
|
|
|
| Line Graph and Table Measure Name |
|
|
|
|
|
|
|
|
|
Fundamental Emerging Markets Spliced Index
|
|
|
|
|
|
|
|
|
|
|
|
|
|
|
|
|
|
|
|
|
|
|
|
|
|
|
|
|
|
|
|
| Accumulated Value |
|
|
|
|
|
10,000
|
|
|
|
|
12,248.01
|
|
|
|
|
14,993.44
|
|
|
|
14,144.6
|
|
|
|
15,776.96
|
|
|
|
13,367
|
|
|
18,992.59
|
|
|
14,134.03
|
|
|
16,382.04
|
|
21,526.02
|
|
26,568.04
|
| Balanced Blended Index [Member] |
|
|
|
|
|
|
|
|
|
|
|
|
|
|
|
|
|
|
|
|
|
|
|
|
|
|
|
|
|
|
|
|
|
|
|
|
|
|
|
|
|
| Account Value [Line Items] |
|
|
|
|
|
|
|
|
|
|
|
|
|
|
|
|
|
|
|
|
|
|
|
|
|
|
|
|
|
|
|
|
|
|
|
|
|
|
|
|
|
| Line Graph and Table Measure Name |
|
|
|
|
|
|
|
|
|
Balanced Blended Index
|
|
|
|
|
|
|
|
|
|
|
|
|
|
|
|
|
|
|
|
|
|
|
|
|
|
|
|
|
|
|
|
| Accumulated Value |
|
|
|
|
|
10,000
|
|
|
|
|
10,431.65
|
|
|
|
|
11,941.81
|
|
|
|
12,343.58
|
|
|
|
13,868.32
|
|
|
|
14,965.74
|
|
|
18,680.31
|
|
|
15,818.89
|
|
|
16,648.23
|
|
20,745.98
|
|
23,836.97
|
| All Equity Composite Index [Member] |
|
|
|
|
|
|
|
|
|
|
|
|
|
|
|
|
|
|
|
|
|
|
|
|
|
|
|
|
|
|
|
|
|
|
|
|
|
|
|
|
|
| Account Value [Line Items] |
|
|
|
|
|
|
|
|
|
|
|
|
|
|
|
|
|
|
|
|
|
|
|
|
|
|
|
|
|
|
|
|
|
|
|
|
|
|
|
|
|
| Line Graph and Table Measure Name |
|
|
|
|
|
|
|
|
|
All Equity Composite Index
|
|
|
|
|
|
|
|
|
|
|
|
|
|
|
|
|
|
|
|
|
|
|
|
|
|
|
|
|
|
|
|
| Accumulated Value |
|
|
|
|
|
10,000
|
|
|
|
|
10,448.96
|
|
|
|
|
12,948.63
|
|
|
|
13,170.86
|
|
|
|
14,503.57
|
|
|
|
14,350.84
|
|
|
20,745.19
|
|
|
17,320.85
|
|
|
18,649.07
|
|
24,659.64
|
|
29,670.98
|
| Growth Composite Index [Member] |
|
|
|
|
|
|
|
|
|
|
|
|
|
|
|
|
|
|
|
|
|
|
|
|
|
|
|
|
|
|
|
|
|
|
|
|
|
|
|
|
|
| Account Value [Line Items] |
|
|
|
|
|
|
|
|
|
|
|
|
|
|
|
|
|
|
|
|
|
|
|
|
|
|
|
|
|
|
|
|
|
|
|
|
|
|
|
|
|
| Line Graph and Table Measure Name |
|
|
|
|
|
|
|
|
|
Growth Composite Index
|
|
|
|
|
|
|
|
|
|
|
|
|
|
|
|
|
|
|
|
|
|
|
|
|
|
|
|
|
|
|
|
| Accumulated Value |
|
|
|
|
|
10,000
|
|
|
|
|
10,442.31
|
|
|
|
|
12,430.12
|
|
|
|
12,653.81
|
|
|
|
13,968.58
|
|
|
|
14,116.24
|
|
|
19,058.13
|
|
|
16,179.96
|
|
|
17,156.81
|
|
21,945.91
|
|
25,743.29
|
| Balanced Composite Index [Member] |
|
|
|
|
|
|
|
|
|
|
|
|
|
|
|
|
|
|
|
|
|
|
|
|
|
|
|
|
|
|
|
|
|
|
|
|
|
|
|
|
|
| Account Value [Line Items] |
|
|
|
|
|
|
|
|
|
|
|
|
|
|
|
|
|
|
|
|
|
|
|
|
|
|
|
|
|
|
|
|
|
|
|
|
|
|
|
|
|
| Line Graph and Table Measure Name |
|
|
|
|
|
|
|
|
|
Balanced Composite Index
|
|
|
|
|
|
|
|
|
|
|
|
|
|
|
|
|
|
|
|
|
|
|
|
|
|
|
|
|
|
|
|
| Accumulated Value |
|
|
|
|
|
10,000
|
|
|
|
|
10,443.88
|
|
|
|
|
11,934.21
|
|
|
|
12,046.92
|
|
|
|
13,345.69
|
|
|
|
13,706.65
|
|
|
17,169.09
|
|
|
14,608.8
|
|
|
15,320.34
|
|
18,895.28
|
|
21,633.77
|
| Conservative Composite Index [Member] |
|
|
|
|
|
|
|
|
|
|
|
|
|
|
|
|
|
|
|
|
|
|
|
|
|
|
|
|
|
|
|
|
|
|
|
|
|
|
|
|
|
| Account Value [Line Items] |
|
|
|
|
|
|
|
|
|
|
|
|
|
|
|
|
|
|
|
|
|
|
|
|
|
|
|
|
|
|
|
|
|
|
|
|
|
|
|
|
|
| Line Graph and Table Measure Name |
|
|
|
|
|
|
|
|
|
Conservative Composite Index
|
|
|
|
|
|
|
|
|
|
|
|
|
|
|
|
|
|
|
|
|
|
|
|
|
|
|
|
|
|
|
|
| Accumulated Value |
|
|
|
|
|
10,000
|
|
|
|
|
10,440.02
|
|
|
|
|
11,448.54
|
|
|
|
11,453.86
|
|
|
|
12,715.78
|
|
|
|
13,223.93
|
|
|
15,360.18
|
|
|
13,080.55
|
|
|
13,533.65
|
|
16,086.04
|
|
17,950.97
|
| Target 2010 Composite Index [Member] |
|
|
|
|
|
|
|
|
|
|
|
|
|
|
|
|
|
|
|
|
|
|
|
|
|
|
|
|
|
|
|
|
|
|
|
|
|
|
|
|
|
| Account Value [Line Items] |
|
|
|
|
|
|
|
|
|
|
|
|
|
|
|
|
|
|
|
|
|
|
|
|
|
|
|
|
|
|
|
|
|
|
|
|
|
|
|
|
|
| Line Graph and Table Measure Name |
|
|
|
|
|
|
|
|
|
Target 2010 Composite Index
|
|
|
|
|
|
|
|
|
|
|
|
|
|
|
|
|
|
|
|
|
|
|
|
|
|
|
|
|
|
|
|
| Accumulated Value |
|
|
|
|
|
10,000
|
|
|
|
|
10,344.36
|
|
|
|
|
11,238.86
|
|
|
|
11,278.87
|
|
|
|
12,530.93
|
|
|
|
13,187.64
|
|
|
14,931.42
|
|
|
12,801.86
|
|
|
13,316.24
|
|
15,679.64
|
|
17,366.79
|
| Target 2015 Composite Index [Member] |
|
|
|
|
|
|
|
|
|
|
|
|
|
|
|
|
|
|
|
|
|
|
|
|
|
|
|
|
|
|
|
|
|
|
|
|
|
|
|
|
|
| Account Value [Line Items] |
|
|
|
|
|
|
|
|
|
|
|
|
|
|
|
|
|
|
|
|
|
|
|
|
|
|
|
|
|
|
|
|
|
|
|
|
|
|
|
|
|
| Line Graph and Table Measure Name |
|
|
|
|
|
|
|
|
|
Target 2015 Composite Index
|
|
|
|
|
|
|
|
|
|
|
|
|
|
|
|
|
|
|
|
|
|
|
|
|
|
|
|
|
|
|
|
| Accumulated Value |
|
|
|
|
|
10,000
|
|
|
|
|
10,344.62
|
|
|
|
|
11,288.52
|
|
|
|
11,332.95
|
|
|
|
12,605.57
|
|
|
|
13,251.49
|
|
|
15,152.28
|
|
|
12,955.58
|
|
|
13,517.78
|
|
16,040.03
|
|
17,863.29
|
| Target 2020 Composite Index [Member] |
|
|
|
|
|
|
|
|
|
|
|
|
|
|
|
|
|
|
|
|
|
|
|
|
|
|
|
|
|
|
|
|
|
|
|
|
|
|
|
|
|
| Account Value [Line Items] |
|
|
|
|
|
|
|
|
|
|
|
|
|
|
|
|
|
|
|
|
|
|
|
|
|
|
|
|
|
|
|
|
|
|
|
|
|
|
|
|
|
| Line Graph and Table Measure Name |
|
|
|
|
|
|
|
|
|
Target 2020 Composite Index
|
|
|
|
|
|
|
|
|
|
|
|
|
|
|
|
|
|
|
|
|
|
|
|
|
|
|
|
|
|
|
|
| Accumulated Value |
|
|
|
|
|
10,000
|
|
|
|
|
10,312.17
|
|
|
|
|
11,503.68
|
|
|
|
11,593.4
|
|
|
|
12,918.11
|
|
|
|
13,577.37
|
|
|
15,627.49
|
|
|
13,335.01
|
|
|
13,943.75
|
|
16,629.47
|
|
18,588.88
|
| Target 2025 Composite Index [Member] |
|
|
|
|
|
|
|
|
|
|
|
|
|
|
|
|
|
|
|
|
|
|
|
|
|
|
|
|
|
|
|
|
|
|
|
|
|
|
|
|
|
| Account Value [Line Items] |
|
|
|
|
|
|
|
|
|
|
|
|
|
|
|
|
|
|
|
|
|
|
|
|
|
|
|
|
|
|
|
|
|
|
|
|
|
|
|
|
|
| Line Graph and Table Measure Name |
|
|
|
|
|
|
|
|
|
Target 2025 Composite Index
|
|
|
|
|
|
|
|
|
|
|
|
|
|
|
|
|
|
|
|
|
|
|
|
|
|
|
|
|
|
|
|
| Accumulated Value |
|
|
|
|
|
10,000
|
|
|
|
|
10,306.31
|
|
|
|
|
11,776.07
|
|
|
|
11,890.43
|
|
|
|
13,316.09
|
|
|
|
13,910.18
|
|
|
16,702.69
|
|
|
14,140.54
|
|
|
14,895.53
|
|
17,957.87
|
|
20,146.41
|
| Target 2030 Composite Index [Member] |
|
|
|
|
|
|
|
|
|
|
|
|
|
|
|
|
|
|
|
|
|
|
|
|
|
|
|
|
|
|
|
|
|
|
|
|
|
|
|
|
|
| Account Value [Line Items] |
|
|
|
|
|
|
|
|
|
|
|
|
|
|
|
|
|
|
|
|
|
|
|
|
|
|
|
|
|
|
|
|
|
|
|
|
|
|
|
|
|
| Line Graph and Table Measure Name |
|
|
|
|
|
|
|
|
|
Target 2030 Composite Index
|
|
|
|
|
|
|
|
|
|
|
|
|
|
|
|
|
|
|
|
|
|
|
|
|
|
|
|
|
|
|
|
| Accumulated Value |
|
|
|
|
|
10,000
|
|
|
|
|
10,298.26
|
|
|
|
|
11,978.76
|
|
|
|
12,105.43
|
|
|
|
13,596.37
|
|
|
|
14,137.09
|
|
|
17,574.68
|
|
|
14,735.76
|
|
|
15,668.72
|
|
19,374.69
|
|
22,145.64
|
| Target 2035 Composite Index [Member] |
|
|
|
|
|
|
|
|
|
|
|
|
|
|
|
|
|
|
|
|
|
|
|
|
|
|
|
|
|
|
|
|
|
|
|
|
|
|
|
|
|
| Account Value [Line Items] |
|
|
|
|
|
|
|
|
|
|
|
|
|
|
|
|
|
|
|
|
|
|
|
|
|
|
|
|
|
|
|
|
|
|
|
|
|
|
|
|
|
| Line Graph and Table Measure Name |
|
|
|
|
|
|
|
|
|
Target 2035 Composite Index
|
|
|
|
|
|
|
|
|
|
|
|
|
|
|
|
|
|
|
|
|
|
|
|
|
|
|
|
|
|
|
|
| Accumulated Value |
|
|
|
|
|
10,000
|
|
|
|
|
10,290.78
|
|
|
|
|
12,148.46
|
|
|
|
12,283.54
|
|
|
|
13,818.06
|
|
|
|
14,319.56
|
|
|
18,280.77
|
|
|
15,202.51
|
|
|
16,268.49
|
|
20,485.63
|
|
23,735.98
|
| Target 2040 Composite Index [Member] |
|
|
|
|
|
|
|
|
|
|
|
|
|
|
|
|
|
|
|
|
|
|
|
|
|
|
|
|
|
|
|
|
|
|
|
|
|
|
|
|
|
| Account Value [Line Items] |
|
|
|
|
|
|
|
|
|
|
|
|
|
|
|
|
|
|
|
|
|
|
|
|
|
|
|
|
|
|
|
|
|
|
|
|
|
|
|
|
|
| Line Graph and Table Measure Name |
|
|
|
|
|
|
|
|
|
Target 2040 Composite Index
|
|
|
|
|
|
|
|
|
|
|
|
|
|
|
|
|
|
|
|
|
|
|
|
|
|
|
|
|
|
|
|
| Accumulated Value |
|
|
|
|
|
10,000
|
|
|
|
|
10,282.72
|
|
|
|
|
12,309.05
|
|
|
|
12,448.44
|
|
|
|
14,018.03
|
|
|
|
14,484.73
|
|
|
18,909.61
|
|
|
15,612.39
|
|
|
16,786.8
|
|
21,441.01
|
|
25,112.76
|
| Target 2045 Composite Index [Member] |
|
|
|
|
|
|
|
|
|
|
|
|
|
|
|
|
|
|
|
|
|
|
|
|
|
|
|
|
|
|
|
|
|
|
|
|
|
|
|
|
|
| Account Value [Line Items] |
|
|
|
|
|
|
|
|
|
|
|
|
|
|
|
|
|
|
|
|
|
|
|
|
|
|
|
|
|
|
|
|
|
|
|
|
|
|
|
|
|
| Line Graph and Table Measure Name |
|
|
|
|
|
|
|
|
|
Target 2045 Composite Index
|
|
|
|
|
|
|
|
|
|
|
|
|
|
|
|
|
|
|
|
|
|
|
|
|
|
|
|
|
|
|
|
| Accumulated Value |
|
|
|
|
|
10,000
|
|
|
|
|
10,279.46
|
|
|
|
|
12,414.97
|
|
|
|
12,548.82
|
|
|
|
14,141.05
|
|
|
|
14,565
|
|
|
19,410.54
|
|
|
15,921.07
|
|
|
17,181.75
|
|
22,203.04
|
|
26,243.45
|
| Target 2050 Composite Index [Member] |
|
|
|
|
|
|
|
|
|
|
|
|
|
|
|
|
|
|
|
|
|
|
|
|
|
|
|
|
|
|
|
|
|
|
|
|
|
|
|
|
|
| Account Value [Line Items] |
|
|
|
|
|
|
|
|
|
|
|
|
|
|
|
|
|
|
|
|
|
|
|
|
|
|
|
|
|
|
|
|
|
|
|
|
|
|
|
|
|
| Line Graph and Table Measure Name |
|
|
|
|
|
|
|
|
|
Target 2050 Composite Index
|
|
|
|
|
|
|
|
|
|
|
|
|
|
|
|
|
|
|
|
|
|
|
|
|
|
|
|
|
|
|
|
| Accumulated Value |
|
|
|
|
|
10,000
|
|
|
|
|
10,275.21
|
|
|
|
|
12,477.58
|
|
|
|
12,608.17
|
|
|
|
14,212.01
|
|
|
|
14,610.1
|
|
|
19,701.51
|
|
|
16,092.27
|
|
|
17,399.8
|
|
22,652.75
|
|
26,952.72
|
| Target 2055 Composite Index [Member] |
|
|
|
|
|
|
|
|
|
|
|
|
|
|
|
|
|
|
|
|
|
|
|
|
|
|
|
|
|
|
|
|
|
|
|
|
|
|
|
|
|
| Account Value [Line Items] |
|
|
|
|
|
|
|
|
|
|
|
|
|
|
|
|
|
|
|
|
|
|
|
|
|
|
|
|
|
|
|
|
|
|
|
|
|
|
|
|
|
| Line Graph and Table Measure Name |
|
|
|
|
|
|
|
|
|
Target 2055 Composite Index
|
|
|
|
|
|
|
|
|
|
|
|
|
|
|
|
|
|
|
|
|
|
|
|
|
|
|
|
|
|
|
|
| Accumulated Value |
|
|
|
|
|
$ 10,000
|
|
|
|
|
$ 10,270.14
|
|
|
|
|
$ 12,536.02
|
|
|
|
$ 12,664.33
|
|
|
|
$ 14,277.53
|
|
|
|
$ 14,658.11
|
|
|
$ 19,920.73
|
|
|
$ 16,229.19
|
|
|
$ 17,567.7
|
|
$ 22,966.52
|
|
$ 27,428.26
|
| Target 2060 Composite Index [Member] |
|
|
|
|
|
|
|
|
|
|
|
|
|
|
|
|
|
|
|
|
|
|
|
|
|
|
|
|
|
|
|
|
|
|
|
|
|
|
|
|
|
| Account Value [Line Items] |
|
|
|
|
|
|
|
|
|
|
|
|
|
|
|
|
|
|
|
|
|
|
|
|
|
|
|
|
|
|
|
|
|
|
|
|
|
|
|
|
|
| Line Graph and Table Measure Name |
|
|
|
|
|
|
|
|
|
Target 2060 Composite Index
|
|
|
|
|
|
|
|
|
|
|
|
|
|
|
|
|
|
|
|
|
|
|
|
|
|
|
|
|
|
|
|
| Accumulated Value |
|
|
|
|
$ 9,970.92
|
|
|
|
|
|
|
$ 11,972
|
|
|
|
|
$ 12,087.84
|
|
|
|
$ 13,629.59
|
|
|
|
$ 13,972.31
|
|
|
|
$ 19,134.41
|
|
|
$ 15,554.73
|
|
|
$ 16,857.06
|
|
|
$ 22,109.19
|
|
$ 26,474.22
|
|
| Target 2065 Composite Index [Member] |
|
|
|
|
|
|
|
|
|
|
|
|
|
|
|
|
|
|
|
|
|
|
|
|
|
|
|
|
|
|
|
|
|
|
|
|
|
|
|
|
|
| Account Value [Line Items] |
|
|
|
|
|
|
|
|
|
|
|
|
|
|
|
|
|
|
|
|
|
|
|
|
|
|
|
|
|
|
|
|
|
|
|
|
|
|
|
|
|
| Line Graph and Table Measure Name |
|
|
|
|
|
|
|
|
|
Target 2065 Composite Index
|
|
|
|
|
|
|
|
|
|
|
|
|
|
|
|
|
|
|
|
|
|
|
|
|
|
|
|
|
|
|
|
| Accumulated Value |
|
|
$ 9,875.96
|
|
|
|
$ 11,272.53
|
|
|
|
|
|
$ 9,157.44
|
|
|
|
|
$ 9,928.24
|
|
|
|
$ 13,052.06
|
|
|
|
$ 15,668.41
|
|
|
|
|
|
|
|
|
|
|
|
|
|
|
|
|
|
| X |
- ReferencesReference 1: http://www.xbrl.org/2003/role/presentationRef
-Publisher SEC
-Name Form N-1A
-Section 27A
-Subsection d
-Paragraph 2
-Subparagraph i
| Name: |
oef_AccmVal |
| Namespace Prefix: |
oef_ |
| Data Type: |
xbrli:monetaryItemType |
| Balance Type: |
na |
| Period Type: |
duration |
|
| X |
- ReferencesReference 1: http://www.xbrl.org/2003/role/presentationRef
-Publisher SEC
-Name Form N-1A
-Section 27A
-Subsection d
-Paragraph 2
| Name: |
oef_AccountValueLineItems |
| Namespace Prefix: |
oef_ |
| Data Type: |
xbrli:stringItemType |
| Balance Type: |
na |
| Period Type: |
duration |
|
| X |
- ReferencesReference 1: http://www.xbrl.org/2003/role/presentationRef
-Publisher SEC
-Name Form N-1A
-Section 27A
-Subsection d
-Paragraph 2
-Subparagraph i
| Name: |
oef_LineGraphAndTableMeasureName |
| Namespace Prefix: |
oef_ |
| Data Type: |
xbrli:stringItemType |
| Balance Type: |
na |
| Period Type: |
duration |
|
| X |
- Details
| Name: |
oef_ClassAxis=cik0000904333_C000017890Member |
| Namespace Prefix: |
|
| Data Type: |
na |
| Balance Type: |
|
| Period Type: |
|
|
| X |
- Details
| Name: |
oef_ClassAxis=cik0000904333_C000015013Member |
| Namespace Prefix: |
|
| Data Type: |
na |
| Balance Type: |
|
| Period Type: |
|
|
| X |
- Details
| Name: |
oef_ClassAxis=cik0000904333_C000015015Member |
| Namespace Prefix: |
|
| Data Type: |
na |
| Balance Type: |
|
| Period Type: |
|
|
| X |
- Details
| Name: |
oef_ClassAxis=cik0000904333_C000015012Member |
| Namespace Prefix: |
|
| Data Type: |
na |
| Balance Type: |
|
| Period Type: |
|
|
| X |
- Details
| Name: |
oef_ClassAxis=cik0000904333_C000015017Member |
| Namespace Prefix: |
|
| Data Type: |
na |
| Balance Type: |
|
| Period Type: |
|
|
| X |
- Details
| Name: |
oef_ClassAxis=cik0000904333_C000015021Member |
| Namespace Prefix: |
|
| Data Type: |
na |
| Balance Type: |
|
| Period Type: |
|
|
| X |
- Details
| Name: |
oef_ClassAxis=cik0000904333_C000063316Member |
| Namespace Prefix: |
|
| Data Type: |
na |
| Balance Type: |
|
| Period Type: |
|
|
| X |
- Details
| Name: |
oef_ClassAxis=cik0000904333_C000016166Member |
| Namespace Prefix: |
|
| Data Type: |
na |
| Balance Type: |
|
| Period Type: |
|
|
| X |
- Details
| Name: |
oef_ClassAxis=cik0000904333_C000016169Member |
| Namespace Prefix: |
|
| Data Type: |
na |
| Balance Type: |
|
| Period Type: |
|
|
| X |
- Details
| Name: |
oef_ClassAxis=cik0000904333_C000016171Member |
| Namespace Prefix: |
|
| Data Type: |
na |
| Balance Type: |
|
| Period Type: |
|
|
| X |
- Details
| Name: |
oef_ClassAxis=cik0000904333_C000195502Member |
| Namespace Prefix: |
|
| Data Type: |
na |
| Balance Type: |
|
| Period Type: |
|
|
| X |
- Details
| Name: |
oef_ClassAxis=cik0000904333_C000195503Member |
| Namespace Prefix: |
|
| Data Type: |
na |
| Balance Type: |
|
| Period Type: |
|
|
| X |
- Details
| Name: |
oef_ClassAxis=cik0000904333_C000195504Member |
| Namespace Prefix: |
|
| Data Type: |
na |
| Balance Type: |
|
| Period Type: |
|
|
| X |
- Details
| Name: |
oef_ClassAxis=cik0000904333_C000016173Member |
| Namespace Prefix: |
|
| Data Type: |
na |
| Balance Type: |
|
| Period Type: |
|
|
| X |
- Details
| Name: |
oef_ClassAxis=cik0000904333_C000046821Member |
| Namespace Prefix: |
|
| Data Type: |
na |
| Balance Type: |
|
| Period Type: |
|
|
| X |
- Details
| Name: |
oef_ClassAxis=cik0000904333_C000046824Member |
| Namespace Prefix: |
|
| Data Type: |
na |
| Balance Type: |
|
| Period Type: |
|
|
| X |
- Details
| Name: |
oef_ClassAxis=cik0000904333_C000046827Member |
| Namespace Prefix: |
|
| Data Type: |
na |
| Balance Type: |
|
| Period Type: |
|
|
| X |
- Details
| Name: |
oef_ClassAxis=cik0000904333_C000055855Member |
| Namespace Prefix: |
|
| Data Type: |
na |
| Balance Type: |
|
| Period Type: |
|
|
| X |
- Details
| Name: |
oef_ClassAxis=cik0000904333_C000055852Member |
| Namespace Prefix: |
|
| Data Type: |
na |
| Balance Type: |
|
| Period Type: |
|
|
| X |
- Details
| Name: |
oef_ClassAxis=cik0000904333_C000017885Member |
| Namespace Prefix: |
|
| Data Type: |
na |
| Balance Type: |
|
| Period Type: |
|
|
| X |
- Details
| Name: |
oef_ClassAxis=cik0000904333_C000016175Member |
| Namespace Prefix: |
|
| Data Type: |
na |
| Balance Type: |
|
| Period Type: |
|
|
| X |
- Details
| Name: |
oef_ClassAxis=cik0000904333_C000016177Member |
| Namespace Prefix: |
|
| Data Type: |
na |
| Balance Type: |
|
| Period Type: |
|
|
| X |
- Details
| Name: |
oef_ClassAxis=cik0000904333_C000016178Member |
| Namespace Prefix: |
|
| Data Type: |
na |
| Balance Type: |
|
| Period Type: |
|
|
| X |
- Details
| Name: |
oef_ClassAxis=cik0000904333_C000016180Member |
| Namespace Prefix: |
|
| Data Type: |
na |
| Balance Type: |
|
| Period Type: |
|
|
| X |
- Details
| Name: |
oef_ClassAxis=cik0000904333_C000015023Member |
| Namespace Prefix: |
|
| Data Type: |
na |
| Balance Type: |
|
| Period Type: |
|
|
| X |
- Details
| Name: |
oef_ClassAxis=cik0000904333_C000059131Member |
| Namespace Prefix: |
|
| Data Type: |
na |
| Balance Type: |
|
| Period Type: |
|
|
| X |
- Details
| Name: |
oef_ClassAxis=cik0000904333_C000015024Member |
| Namespace Prefix: |
|
| Data Type: |
na |
| Balance Type: |
|
| Period Type: |
|
|
| X |
- Details
| Name: |
oef_ClassAxis=cik0000904333_C000059132Member |
| Namespace Prefix: |
|
| Data Type: |
na |
| Balance Type: |
|
| Period Type: |
|
|
| X |
- Details
| Name: |
oef_ClassAxis=cik0000904333_C000015025Member |
| Namespace Prefix: |
|
| Data Type: |
na |
| Balance Type: |
|
| Period Type: |
|
|
| X |
- Details
| Name: |
oef_ClassAxis=cik0000904333_C000059133Member |
| Namespace Prefix: |
|
| Data Type: |
na |
| Balance Type: |
|
| Period Type: |
|
|
| X |
- Details
| Name: |
oef_ClassAxis=cik0000904333_C000015026Member |
| Namespace Prefix: |
|
| Data Type: |
na |
| Balance Type: |
|
| Period Type: |
|
|
| X |
- Details
| Name: |
oef_ClassAxis=cik0000904333_C000122183Member |
| Namespace Prefix: |
|
| Data Type: |
na |
| Balance Type: |
|
| Period Type: |
|
|
| X |
- Details
| Name: |
oef_ClassAxis=cik0000904333_C000122184Member |
| Namespace Prefix: |
|
| Data Type: |
na |
| Balance Type: |
|
| Period Type: |
|
|
| X |
- Details
| Name: |
oef_ClassAxis=cik0000904333_C000122185Member |
| Namespace Prefix: |
|
| Data Type: |
na |
| Balance Type: |
|
| Period Type: |
|
|
| X |
- Details
| Name: |
oef_ClassAxis=cik0000904333_C000172771Member |
| Namespace Prefix: |
|
| Data Type: |
na |
| Balance Type: |
|
| Period Type: |
|
|
| X |
- Details
| Name: |
oef_ClassAxis=cik0000904333_C000225748Member |
| Namespace Prefix: |
|
| Data Type: |
na |
| Balance Type: |
|
| Period Type: |
|
|
| X |
- Details
| Name: |
oef_BroadBasedIndexAxis=cik0000904333_Russell1000IndexMember |
| Namespace Prefix: |
|
| Data Type: |
na |
| Balance Type: |
|
| Period Type: |
|
|
| X |
- Details
| Name: |
oef_BroadBasedIndexAxis=cik0000904333_MSCIEAFEIndexNetMember |
| Namespace Prefix: |
|
| Data Type: |
na |
| Balance Type: |
|
| Period Type: |
|
|
| X |
- Details
| Name: |
oef_BroadBasedIndexAxis=cik0000904333_MSCIEmergingMarketsIndexNetMember |
| Namespace Prefix: |
|
| Data Type: |
na |
| Balance Type: |
|
| Period Type: |
|
|
| X |
- Details
| Name: |
oef_BroadBasedIndexAxis=us-gaap_StandardPoors500IndexMember |
| Namespace Prefix: |
|
| Data Type: |
na |
| Balance Type: |
|
| Period Type: |
|
|
| X |
- Details
| Name: |
oef_BroadBasedIndexAxis=cik0000904333_DowJonesUSTotalStockMarketIndexMember |
| Namespace Prefix: |
|
| Data Type: |
na |
| Balance Type: |
|
| Period Type: |
|
|
| X |
- Details
| Name: |
oef_BroadBasedIndexAxis=cik0000904333_BloombergUSAggregateBondIndexMember |
| Namespace Prefix: |
|
| Data Type: |
na |
| Balance Type: |
|
| Period Type: |
|
|
| X |
- Details
| Name: |
oef_AdditionalIndexAxis=cik0000904333_Russell2000IndexMember |
| Namespace Prefix: |
|
| Data Type: |
na |
| Balance Type: |
|
| Period Type: |
|
|
| X |
- Details
| Name: |
oef_AdditionalIndexAxis=cik0000904333_DowJonesGlobalHealthCareIndexMember |
| Namespace Prefix: |
|
| Data Type: |
na |
| Balance Type: |
|
| Period Type: |
|
|
| X |
- Details
| Name: |
oef_AdditionalIndexAxis=cik0000904333_Russell1000GrowthIndexMember |
| Namespace Prefix: |
|
| Data Type: |
na |
| Balance Type: |
|
| Period Type: |
|
|
| X |
- Details
| Name: |
oef_AdditionalIndexAxis=cik0000904333_Russell1000ValueIndexMember |
| Namespace Prefix: |
|
| Data Type: |
na |
| Balance Type: |
|
| Period Type: |
|
|
| X |
- Details
| Name: |
oef_AdditionalIndexAxis=cik0000904333_RussellMidcapIndexMember |
| Namespace Prefix: |
|
| Data Type: |
na |
| Balance Type: |
|
| Period Type: |
|
|
| X |
- Details
| Name: |
oef_AdditionalIndexAxis=cik0000904333_RAFIFundamentalHighLiquidityUSLargeIndexMember |
| Namespace Prefix: |
|
| Data Type: |
na |
| Balance Type: |
|
| Period Type: |
|
|
| X |
- Details
| Name: |
oef_AdditionalIndexAxis=cik0000904333_FundamentalUSLargeSplicedIndexMember |
| Namespace Prefix: |
|
| Data Type: |
na |
| Balance Type: |
|
| Period Type: |
|
|
| X |
- Details
| Name: |
oef_AdditionalIndexAxis=cik0000904333_RussellRAFIUSLargeCompanyIndexMember |
| Namespace Prefix: |
|
| Data Type: |
na |
| Balance Type: |
|
| Period Type: |
|
|
| X |
- Details
| Name: |
oef_AdditionalIndexAxis=cik0000904333_RAFIFundamentalHighLiquidityUSSmallIndexMember |
| Namespace Prefix: |
|
| Data Type: |
na |
| Balance Type: |
|
| Period Type: |
|
|
| X |
- Details
| Name: |
oef_AdditionalIndexAxis=cik0000904333_RussellRAFIUSSmallCompanyIndexMember |
| Namespace Prefix: |
|
| Data Type: |
na |
| Balance Type: |
|
| Period Type: |
|
|
| X |
- Details
| Name: |
oef_AdditionalIndexAxis=cik0000904333_FundamentalUSSmallSplicedIndexMember |
| Namespace Prefix: |
|
| Data Type: |
na |
| Balance Type: |
|
| Period Type: |
|
|
| X |
- Details
| Name: |
oef_AdditionalIndexAxis=cik0000904333_RAFIFundamentalHighLiquidityDevelopedexUSLargeIndexNetMember |
| Namespace Prefix: |
|
| Data Type: |
na |
| Balance Type: |
|
| Period Type: |
|
|
| X |
- Details
| Name: |
oef_AdditionalIndexAxis=cik0000904333_RussellRAFIDevelopedexUSLargeCompanyIndexNetMember |
| Namespace Prefix: |
|
| Data Type: |
na |
| Balance Type: |
|
| Period Type: |
|
|
| X |
- Details
| Name: |
oef_AdditionalIndexAxis=cik0000904333_FundamentalDevelopedexUSLargeSplicedIndexMember |
| Namespace Prefix: |
|
| Data Type: |
na |
| Balance Type: |
|
| Period Type: |
|
|
| X |
- Details
| Name: |
oef_AdditionalIndexAxis=cik0000904333_RAFIFundamentalHighLiquidityDevelopedExUSSmallIndexNetMember |
| Namespace Prefix: |
|
| Data Type: |
na |
| Balance Type: |
|
| Period Type: |
|
|
| X |
- Details
| Name: |
oef_AdditionalIndexAxis=cik0000904333_RussellRAFIDevelopedexUSSmallCompanyIndexNetMember |
| Namespace Prefix: |
|
| Data Type: |
na |
| Balance Type: |
|
| Period Type: |
|
|
| X |
- Details
| Name: |
oef_AdditionalIndexAxis=cik0000904333_FundamentalDevelopedExUSSmallSplicedIndexMember |
| Namespace Prefix: |
|
| Data Type: |
na |
| Balance Type: |
|
| Period Type: |
|
|
| X |
- Details
| Name: |
oef_AdditionalIndexAxis=cik0000904333_SAndPDevelopedExUSSmallCapIndexNetMember |
| Namespace Prefix: |
|
| Data Type: |
na |
| Balance Type: |
|
| Period Type: |
|
|
| X |
- Details
| Name: |
oef_AdditionalIndexAxis=cik0000904333_RAFIFundamentalHighLiquidityEmergingMarketsIndexNetMember |
| Namespace Prefix: |
|
| Data Type: |
na |
| Balance Type: |
|
| Period Type: |
|
|
| X |
- Details
| Name: |
oef_AdditionalIndexAxis=cik0000904333_RussellRAFITMEmergingMarketsLargeCompanyIndexNetMember |
| Namespace Prefix: |
|
| Data Type: |
na |
| Balance Type: |
|
| Period Type: |
|
|
| X |
- Details
| Name: |
oef_AdditionalIndexAxis=cik0000904333_FundamentalEmergingMarketsSplicedIndexMember |
| Namespace Prefix: |
|
| Data Type: |
na |
| Balance Type: |
|
| Period Type: |
|
|
| X |
- Details
| Name: |
oef_AdditionalIndexAxis=cik0000904333_BalancedBlendedIndexMember |
| Namespace Prefix: |
|
| Data Type: |
na |
| Balance Type: |
|
| Period Type: |
|
|
| X |
- Details
| Name: |
oef_AdditionalIndexAxis=cik0000904333_AllEquityCompositeIndexMember |
| Namespace Prefix: |
|
| Data Type: |
na |
| Balance Type: |
|
| Period Type: |
|
|
| X |
- Details
| Name: |
oef_AdditionalIndexAxis=cik0000904333_GrowthCompositeIndexMember |
| Namespace Prefix: |
|
| Data Type: |
na |
| Balance Type: |
|
| Period Type: |
|
|
| X |
- Details
| Name: |
oef_AdditionalIndexAxis=cik0000904333_BalancedCompositeIndexMember |
| Namespace Prefix: |
|
| Data Type: |
na |
| Balance Type: |
|
| Period Type: |
|
|
| X |
- Details
| Name: |
oef_AdditionalIndexAxis=cik0000904333_ConservativeCompositeIndexMember |
| Namespace Prefix: |
|
| Data Type: |
na |
| Balance Type: |
|
| Period Type: |
|
|
| X |
- Details
| Name: |
oef_AdditionalIndexAxis=cik0000904333_Target2010CompositeIndexMember |
| Namespace Prefix: |
|
| Data Type: |
na |
| Balance Type: |
|
| Period Type: |
|
|
| X |
- Details
| Name: |
oef_AdditionalIndexAxis=cik0000904333_Target2015CompositeIndexMember |
| Namespace Prefix: |
|
| Data Type: |
na |
| Balance Type: |
|
| Period Type: |
|
|
| X |
- Details
| Name: |
oef_AdditionalIndexAxis=cik0000904333_Target2020CompositeIndexMember |
| Namespace Prefix: |
|
| Data Type: |
na |
| Balance Type: |
|
| Period Type: |
|
|
| X |
- Details
| Name: |
oef_AdditionalIndexAxis=cik0000904333_Target2025CompositeIndexMember |
| Namespace Prefix: |
|
| Data Type: |
na |
| Balance Type: |
|
| Period Type: |
|
|
| X |
- Details
| Name: |
oef_AdditionalIndexAxis=cik0000904333_Target2030CompositeIndexMember |
| Namespace Prefix: |
|
| Data Type: |
na |
| Balance Type: |
|
| Period Type: |
|
|
| X |
- Details
| Name: |
oef_AdditionalIndexAxis=cik0000904333_Target2035CompositeIndexMember |
| Namespace Prefix: |
|
| Data Type: |
na |
| Balance Type: |
|
| Period Type: |
|
|
| X |
- Details
| Name: |
oef_AdditionalIndexAxis=cik0000904333_Target2040CompositeIndexMember |
| Namespace Prefix: |
|
| Data Type: |
na |
| Balance Type: |
|
| Period Type: |
|
|
| X |
- Details
| Name: |
oef_AdditionalIndexAxis=cik0000904333_Target2045CompositeIndexMember |
| Namespace Prefix: |
|
| Data Type: |
na |
| Balance Type: |
|
| Period Type: |
|
|
| X |
- Details
| Name: |
oef_AdditionalIndexAxis=cik0000904333_Target2050CompositeIndexMember |
| Namespace Prefix: |
|
| Data Type: |
na |
| Balance Type: |
|
| Period Type: |
|
|
| X |
- Details
| Name: |
oef_AdditionalIndexAxis=cik0000904333_Target2055CompositeIndexMember |
| Namespace Prefix: |
|
| Data Type: |
na |
| Balance Type: |
|
| Period Type: |
|
|
| X |
- Details
| Name: |
oef_AdditionalIndexAxis=cik0000904333_Target2060CompositeIndexMember |
| Namespace Prefix: |
|
| Data Type: |
na |
| Balance Type: |
|
| Period Type: |
|
|
| X |
- Details
| Name: |
oef_AdditionalIndexAxis=cik0000904333_Target2065CompositeIndexMember |
| Namespace Prefix: |
|
| Data Type: |
na |
| Balance Type: |
|
| Period Type: |
|
|
v3.25.4
Shareholder Report, Average Annual Return (Details)
|
12 Months Ended |
56 Months Ended |
60 Months Ended |
94 Months Ended |
110 Months Ended |
120 Months Ended |
Oct. 31, 2025 |
Oct. 31, 2025 |
Oct. 31, 2025 |
Oct. 31, 2025 |
Oct. 31, 2025 |
Oct. 31, 2025 |
| Schwab International Opportunities Fund |
|
|
|
|
|
|
|
| Average Annual Return [Line Items] |
|
|
|
|
|
|
|
| Line Graph and Table Measure Name |
|
Schwab International Opportunities Fund
|
|
|
|
|
|
| Average Annual Return, Percent |
[1],[2],[3] |
23.82%
|
|
6.87%
|
|
|
6.69%
|
| Schwab Core Equity Fund |
|
|
|
|
|
|
|
| Average Annual Return [Line Items] |
|
|
|
|
|
|
|
| Line Graph and Table Measure Name |
|
Schwab Core Equity Fund
|
|
|
|
|
|
| Average Annual Return, Percent |
[1] |
16.89%
|
|
15.73%
|
|
|
12.10%
|
| Schwab Dividend Equity Fund |
|
|
|
|
|
|
|
| Average Annual Return [Line Items] |
|
|
|
|
|
|
|
| Line Graph and Table Measure Name |
|
Schwab Dividend Equity Fund
|
|
|
|
|
|
| Average Annual Return, Percent |
[1],[3] |
10.73%
|
|
14.34%
|
|
|
8.33%
|
| Schwab Large-Cap Growth Fund |
|
|
|
|
|
|
|
| Average Annual Return [Line Items] |
|
|
|
|
|
|
|
| Line Graph and Table Measure Name |
|
Schwab Large-Cap Growth Fund
|
|
|
|
|
|
| Average Annual Return, Percent |
[1] |
29.65%
|
|
18.74%
|
|
|
15.79%
|
| Schwab Small-Cap Equity Fund |
|
|
|
|
|
|
|
| Average Annual Return [Line Items] |
|
|
|
|
|
|
|
| Line Graph and Table Measure Name |
|
Schwab Small-Cap Equity Fund
|
|
|
|
|
|
| Average Annual Return, Percent |
[1] |
12.59%
|
|
15.31%
|
|
|
9.07%
|
| Schwab Health Care Fund |
|
|
|
|
|
|
|
| Average Annual Return [Line Items] |
|
|
|
|
|
|
|
| Line Graph and Table Measure Name |
|
Schwab Health Care Fund
|
|
|
|
|
|
| Average Annual Return, Percent |
[1],[3] |
0.20%
|
|
7.19%
|
|
|
7.47%
|
| Schwab International Core Equity Fund |
|
|
|
|
|
|
|
| Average Annual Return [Line Items] |
|
|
|
|
|
|
|
| Line Graph and Table Measure Name |
|
Schwab International Core Equity Fund
|
|
|
|
|
|
| Average Annual Return, Percent |
[1],[3] |
28.77%
|
|
13.52%
|
|
|
7.40%
|
| Schwab S&P 500 Index Fund |
|
|
|
|
|
|
|
| Average Annual Return [Line Items] |
|
|
|
|
|
|
|
| Line Graph and Table Measure Name |
|
Schwab S&P 500 Index Fund
|
|
|
|
|
|
| Average Annual Return, Percent |
[4] |
21.43%
|
|
17.61%
|
|
|
14.59%
|
| Schwab Small-Cap Index Fund |
|
|
|
|
|
|
|
| Average Annual Return [Line Items] |
|
|
|
|
|
|
|
| Line Graph and Table Measure Name |
|
Schwab Small-Cap Index Fund
|
|
|
|
|
|
| Average Annual Return, Percent |
[4] |
14.50%
|
|
11.55%
|
|
|
9.42%
|
| Schwab Total Stock Market Index Fund |
|
|
|
|
|
|
|
| Average Annual Return [Line Items] |
|
|
|
|
|
|
|
| Line Graph and Table Measure Name |
|
Schwab Total Stock Market Index Fund
|
|
|
|
|
|
| Average Annual Return, Percent |
[4] |
20.85%
|
|
16.67%
|
|
|
13.99%
|
| Schwab U.S. Large-Cap Growth Index Fund |
|
|
|
|
|
|
|
| Average Annual Return [Line Items] |
|
|
|
|
|
|
|
| Line Graph and Table Measure Name |
|
Schwab U.S. Large-Cap Growth Index Fund
|
|
|
|
|
|
| Average Annual Return, Percent |
[4] |
30.44%
|
|
19.19%
|
18.70%
|
|
|
| Schwab U.S. Large-Cap Value Index Fund |
|
|
|
|
|
|
|
| Average Annual Return [Line Items] |
|
|
|
|
|
|
|
| Line Graph and Table Measure Name |
|
Schwab U.S. Large-Cap Value Index Fund
|
|
|
|
|
|
| Average Annual Return, Percent |
[4] |
11.13%
|
|
14.25%
|
9.01%
|
|
|
| Schwab U.S. Mid-Cap Index Fund |
|
|
|
|
|
|
|
| Average Annual Return [Line Items] |
|
|
|
|
|
|
|
| Line Graph and Table Measure Name |
|
Schwab U.S. Mid-Cap Index Fund
|
|
|
|
|
|
| Average Annual Return, Percent |
[4] |
10.68%
|
|
12.29%
|
9.80%
|
|
|
| Schwab International Index Fund |
|
|
|
|
|
|
|
| Average Annual Return [Line Items] |
|
|
|
|
|
|
|
| Line Graph and Table Measure Name |
|
Schwab International Index Fund
|
|
|
|
|
|
| Average Annual Return, Percent |
[3],[4] |
23.33%
|
|
12.39%
|
|
|
7.64%
|
| Schwab Fundamental U.S. Large Company Index Fund |
|
|
|
|
|
|
|
| Average Annual Return [Line Items] |
|
|
|
|
|
|
|
| Line Graph and Table Measure Name |
|
Schwab Fundamental U.S. Large Company Index Fund
|
|
|
|
|
|
| Average Annual Return, Percent |
[4] |
14.48%
|
|
18.08%
|
|
|
12.84%
|
| Schwab Fundamental U.S. Small Company Index Fund |
|
|
|
|
|
|
|
| Average Annual Return [Line Items] |
|
|
|
|
|
|
|
| Line Graph and Table Measure Name |
|
Schwab Fundamental U.S. Small Company Index Fund
|
|
|
|
|
|
| Average Annual Return, Percent |
[4] |
6.16%
|
|
14.23%
|
|
|
9.34%
|
| Schwab Fundamental International Equity Index Fund |
|
|
|
|
|
|
|
| Average Annual Return [Line Items] |
|
|
|
|
|
|
|
| Line Graph and Table Measure Name |
|
Schwab Fundamental International Equity Index Fund
|
|
|
|
|
|
| Average Annual Return, Percent |
[3],[4] |
28.74%
|
|
16.62%
|
|
|
8.77%
|
| Schwab Fundamental International Small Equity Index Fund |
|
|
|
|
|
|
|
| Average Annual Return [Line Items] |
|
|
|
|
|
|
|
| Line Graph and Table Measure Name |
|
Schwab Fundamental International Small Equity Index Fund
|
|
|
|
|
|
| Average Annual Return, Percent |
[3],[4] |
27.67%
|
|
11.57%
|
|
|
7.62%
|
| Schwab Fundamental Emerging Markets Equity Index Fund |
|
|
|
|
|
|
|
| Average Annual Return [Line Items] |
|
|
|
|
|
|
|
| Line Graph and Table Measure Name |
|
Schwab Fundamental Emerging Markets Equity Index Fund
|
|
|
|
|
|
| Average Annual Return, Percent |
[3],[4] |
23.27%
|
|
14.13%
|
|
|
9.66%
|
| Schwab Balanced Fund |
|
|
|
|
|
|
|
| Average Annual Return [Line Items] |
|
|
|
|
|
|
|
| Line Graph and Table Measure Name |
|
Schwab Balanced Fund
|
|
|
|
|
|
| Average Annual Return, Percent |
[1] |
14.27%
|
|
8.85%
|
|
|
8.25%
|
| Schwab MarketTrack All Equity Portfolio |
|
|
|
|
|
|
|
| Average Annual Return [Line Items] |
|
|
|
|
|
|
|
| Line Graph and Table Measure Name |
|
Schwab MarketTrack All Equity Portfolio
|
|
|
|
|
|
| Average Annual Return, Percent |
[1] |
19.80%
|
|
15.09%
|
|
|
10.96%
|
| Schwab MarketTrack Growth Portfolio |
|
|
|
|
|
|
|
| Average Annual Return [Line Items] |
|
|
|
|
|
|
|
| Line Graph and Table Measure Name |
|
Schwab MarketTrack Growth Portfolio
|
|
|
|
|
|
| Average Annual Return, Percent |
[1] |
16.79%
|
|
12.22%
|
|
|
9.40%
|
| Schwab MarketTrack Balanced Portfolio™ |
|
|
|
|
|
|
|
| Average Annual Return [Line Items] |
|
|
|
|
|
|
|
| Line Graph and Table Measure Name |
|
Schwab MarketTrack Balanced Portfolio
|
|
|
|
|
|
| Average Annual Return, Percent |
[1] |
13.97%
|
|
9.03%
|
|
|
7.50%
|
| Schwab MarketTrack Conservative Portfolio™ |
|
|
|
|
|
|
|
| Average Annual Return [Line Items] |
|
|
|
|
|
|
|
| Line Graph and Table Measure Name |
|
Schwab MarketTrack Conservative Portfolio
|
|
|
|
|
|
| Average Annual Return, Percent |
[1] |
11.12%
|
|
5.77%
|
|
|
5.46%
|
| Schwab Target 2010 Fund |
|
|
|
|
|
|
|
| Average Annual Return [Line Items] |
|
|
|
|
|
|
|
| Line Graph and Table Measure Name |
|
Schwab Target 2010 Fund
|
|
|
|
|
|
| Average Annual Return, Percent |
[1] |
10.75%
|
|
5.40%
|
|
|
5.47%
|
| Schwab Target 2015 Fund |
|
|
|
|
|
|
|
| Average Annual Return [Line Items] |
|
|
|
|
|
|
|
| Line Graph and Table Measure Name |
|
Schwab Target 2015 Fund
|
|
|
|
|
|
| Average Annual Return, Percent |
[1] |
11.39%
|
|
5.81%
|
|
|
5.72%
|
| Schwab Target 2020 Fund |
|
|
|
|
|
|
|
| Average Annual Return [Line Items] |
|
|
|
|
|
|
|
| Line Graph and Table Measure Name |
|
Schwab Target 2020 Fund
|
|
|
|
|
|
| Average Annual Return, Percent |
[1] |
11.79%
|
|
6.14%
|
|
|
6.11%
|
| Schwab Target 2025 Index Fund |
|
|
|
|
|
|
|
| Average Annual Return [Line Items] |
|
|
|
|
|
|
|
| Line Graph and Table Measure Name |
|
Schwab Target 2025 Fund
|
|
|
|
|
|
| Average Annual Return, Percent |
[1] |
12.30%
|
|
7.24%
|
|
|
6.88%
|
| Schwab Target 2030 Fund |
|
|
|
|
|
|
|
| Average Annual Return [Line Items] |
|
|
|
|
|
|
|
| Line Graph and Table Measure Name |
|
Schwab Target 2030 Fund
|
|
|
|
|
|
| Average Annual Return, Percent |
[1] |
14.42%
|
|
8.83%
|
|
|
7.83%
|
| Schwab Target 2035 Fund |
|
|
|
|
|
|
|
| Average Annual Return [Line Items] |
|
|
|
|
|
|
|
| Line Graph and Table Measure Name |
|
Schwab Target 2035 Fund
|
|
|
|
|
|
| Average Annual Return, Percent |
[1] |
15.99%
|
|
10.00%
|
|
|
8.51%
|
| Schwab Target 2040 Fund |
|
|
|
|
|
|
|
| Average Annual Return [Line Items] |
|
|
|
|
|
|
|
| Line Graph and Table Measure Name |
|
Schwab Target 2040 Fund
|
|
|
|
|
|
| Average Annual Return, Percent |
[1] |
17.14%
|
|
10.93%
|
|
|
9.05%
|
| Schwab Target 2045 Fund |
|
|
|
|
|
|
|
| Average Annual Return [Line Items] |
|
|
|
|
|
|
|
| Line Graph and Table Measure Name |
|
Schwab Target 2045 Fund
|
|
|
|
|
|
| Average Annual Return, Percent |
[1] |
18.24%
|
|
11.70%
|
|
|
9.48%
|
| Schwab Target 2050 Fund |
|
|
|
|
|
|
|
| Average Annual Return [Line Items] |
|
|
|
|
|
|
|
| Line Graph and Table Measure Name |
|
Schwab Target 2050 Fund
|
|
|
|
|
|
| Average Annual Return, Percent |
[1] |
18.96%
|
|
12.24%
|
|
|
9.77%
|
| Schwab Target 2055 Fund |
|
|
|
|
|
|
|
| Average Annual Return [Line Items] |
|
|
|
|
|
|
|
| Line Graph and Table Measure Name |
|
Schwab Target 2055 Fund
|
|
|
|
|
|
| Average Annual Return, Percent |
[1] |
19.44%
|
|
12.46%
|
|
|
9.90%
|
| Schwab Target 2060 Fund |
|
|
|
|
|
|
|
| Average Annual Return [Line Items] |
|
|
|
|
|
|
|
| Line Graph and Table Measure Name |
|
Schwab Target 2060 Fund
|
|
|
|
|
|
| Average Annual Return, Percent |
[1] |
19.90%
|
|
12.74%
|
|
10.63%
|
|
| Schwab Target 2065 Fund |
|
|
|
|
|
|
|
| Average Annual Return [Line Items] |
|
|
|
|
|
|
|
| Line Graph and Table Measure Name |
|
Schwab Target 2065 Fund
|
|
|
|
|
|
| Average Annual Return, Percent |
[1] |
20.09%
|
9.27%
|
|
|
|
|
| MSCI EAFE Index Net [Member] |
|
|
|
|
|
|
|
| Average Annual Return [Line Items] |
|
|
|
|
|
|
|
| Line Graph and Table Measure Name |
[5],[6],[7] |
MSCI EAFE® Index (Net)
|
|
|
|
|
|
| Average Annual Return, Percent |
[7] |
23.03%
|
|
12.33%
|
|
|
7.48%
|
| Standard & Poor's 500 Index [Member] |
|
|
|
|
|
|
|
| Average Annual Return [Line Items] |
|
|
|
|
|
|
|
| Line Graph and Table Measure Name |
[8],[9],[10],[11],[12],[13],[14],[15],[16] |
S&P 500® Index
|
|
|
|
|
|
| Average Annual Return, Percent |
|
21.45%
|
|
17.64%
|
14.51%
|
|
14.64%
|
| Dow Jones U S Total Stock Market Index [Member] |
|
|
|
|
|
|
|
| Average Annual Return [Line Items] |
|
|
|
|
|
|
|
| Line Graph and Table Measure Name |
|
Dow Jones U.S. Total Stock Market IndexSM
|
|
|
|
|
|
| Average Annual Return, Percent |
|
20.90%
|
13.23%
|
16.69%
|
|
14.59%
|
14.02%
|
| Russell 1000 Index [Member] |
|
|
|
|
|
|
|
| Average Annual Return [Line Items] |
|
|
|
|
|
|
|
| Line Graph and Table Measure Name |
[17] |
Russell 1000® Index
|
|
|
|
|
|
| Average Annual Return, Percent |
|
21.14%
|
|
17.05%
|
|
|
14.39%
|
| MSCI Emerging Markets Index (Net) [Member] |
|
|
|
|
|
|
|
| Average Annual Return [Line Items] |
|
|
|
|
|
|
|
| Line Graph and Table Measure Name |
[7],[18] |
MSCI Emerging Markets Index (Net)
|
|
|
|
|
|
| Average Annual Return, Percent |
[7] |
27.91%
|
|
7.46%
|
|
|
7.69%
|
| Bloomberg US Aggregate Bond Index [Member] |
|
|
|
|
|
|
|
| Average Annual Return [Line Items] |
|
|
|
|
|
|
|
| Line Graph and Table Measure Name |
|
Bloomberg US Aggregate Bond Index
|
|
|
|
|
|
| Average Annual Return, Percent |
|
6.16%
|
0.15%
|
(0.24%)
|
|
1.51%
|
1.90%
|
| Russell 1000 Value Index [Member] |
|
|
|
|
|
|
|
| Average Annual Return [Line Items] |
|
|
|
|
|
|
|
| Line Graph and Table Measure Name |
|
Russell 1000® Value Index
|
|
|
|
|
|
| Average Annual Return, Percent |
|
11.15%
|
|
14.28%
|
9.07%
|
|
9.97%
|
| Russell 1000 Growth Index [Member] |
|
|
|
|
|
|
|
| Average Annual Return [Line Items] |
|
|
|
|
|
|
|
| Line Graph and Table Measure Name |
|
Russell 1000® Growth Index
|
|
|
|
|
|
| Average Annual Return, Percent |
|
30.52%
|
|
19.24%
|
18.75%
|
|
18.28%
|
| Russell 2000 Index [Member] |
|
|
|
|
|
|
|
| Average Annual Return [Line Items] |
|
|
|
|
|
|
|
| Line Graph and Table Measure Name |
|
Russell 2000® Index
|
|
|
|
|
|
| Average Annual Return, Percent |
|
14.41%
|
|
11.50%
|
|
|
9.36%
|
| Dow Jones Global Health Care Index [Member] |
|
|
|
|
|
|
|
| Average Annual Return [Line Items] |
|
|
|
|
|
|
|
| Line Graph and Table Measure Name |
|
Dow Jones Global Health Care Index
|
|
|
|
|
|
| Average Annual Return, Percent |
|
0.93%
|
|
6.34%
|
|
|
7.47%
|
| Russell Midcap® Index |
|
|
|
|
|
|
|
| Average Annual Return [Line Items] |
|
|
|
|
|
|
|
| Line Graph and Table Measure Name |
|
Russell Midcap® Index
|
|
|
|
|
|
| Average Annual Return, Percent |
|
10.79%
|
|
12.33%
|
9.86%
|
|
|
| RAFI Fundamental High Liquidity US Large Index [Member] |
|
|
|
|
|
|
|
| Average Annual Return [Line Items] |
|
|
|
|
|
|
|
| Line Graph and Table Measure Name |
[19] |
RAFI Fundamental High Liquidity US Large Index
|
|
|
|
|
|
| Average Annual Return, Percent |
[19] |
14.72%
|
|
|
|
|
|
| Russell RAFI US Large Company Index [Member] |
|
|
|
|
|
|
|
| Average Annual Return [Line Items] |
|
|
|
|
|
|
|
| Line Graph and Table Measure Name |
|
Russell RAFITM US Large Company Index
|
|
|
|
|
|
| Average Annual Return, Percent |
|
14.64%
|
|
18.36%
|
|
|
13.11%
|
| Fundamental US Large Spliced Index [Member] |
|
|
|
|
|
|
|
| Average Annual Return [Line Items] |
|
|
|
|
|
|
|
| Line Graph and Table Measure Name |
|
Fundamental US Large Spliced Index
|
|
|
|
|
|
| Average Annual Return, Percent |
|
14.72%
|
|
18.36%
|
|
|
13.11%
|
| RAFI Fundamental High Liquidity US Small Index [Member] |
|
|
|
|
|
|
|
| Average Annual Return [Line Items] |
|
|
|
|
|
|
|
| Line Graph and Table Measure Name |
[20] |
RAFI Fundamental High Liquidity US Small Index
|
|
|
|
|
|
| Average Annual Return, Percent |
[20] |
6.32%
|
|
|
|
|
|
| Russell RAFI US Small Company Index [Member] |
|
|
|
|
|
|
|
| Average Annual Return [Line Items] |
|
|
|
|
|
|
|
| Line Graph and Table Measure Name |
|
Russell RAFITM US Small Company Index
|
|
|
|
|
|
| Average Annual Return, Percent |
|
6.75%
|
|
14.54%
|
|
|
9.58%
|
| Fundamental US Small Spliced Index [Member] |
|
|
|
|
|
|
|
| Average Annual Return [Line Items] |
|
|
|
|
|
|
|
| Line Graph and Table Measure Name |
|
Fundamental US Small Spliced Index
|
|
|
|
|
|
| Average Annual Return, Percent |
|
6.32%
|
|
14.43%
|
|
|
9.52%
|
| RAFI Fundamental High Liquidity Developed ex US Large Index (Net) [Member] |
|
|
|
|
|
|
|
| Average Annual Return [Line Items] |
|
|
|
|
|
|
|
| Line Graph and Table Measure Name |
[7],[21] |
RAFI Fundamental High Liquidity Developed ex US Large Index (Net)
|
|
|
|
|
|
| Average Annual Return, Percent |
[7],[21] |
28.47%
|
|
|
|
|
|
| Russell RAFI Developed ex US Large Company Index Net [Member] |
|
|
|
|
|
|
|
| Average Annual Return [Line Items] |
|
|
|
|
|
|
|
| Line Graph and Table Measure Name |
[7] |
Russell RAFITM Developed ex US Large Company Index (Net)
|
|
|
|
|
|
| Average Annual Return, Percent |
[7] |
28.52%
|
|
16.90%
|
|
|
8.87%
|
| Fundamental Developed ex US Large Spliced Index [Member] |
|
|
|
|
|
|
|
| Average Annual Return [Line Items] |
|
|
|
|
|
|
|
| Line Graph and Table Measure Name |
|
Fundamental Developed ex US Large Spliced Index
|
|
|
|
|
|
| Average Annual Return, Percent |
|
28.47%
|
|
16.88%
|
|
|
8.86%
|
| RAFI Fundamental High Liquidity Developed ex US Small Index (Net) [Member] |
|
|
|
|
|
|
|
| Average Annual Return [Line Items] |
|
|
|
|
|
|
|
| Line Graph and Table Measure Name |
[7],[22] |
RAFI Fundamental High Liquidity Developed ex US Small Index (Net)
|
|
|
|
|
|
| Average Annual Return, Percent |
[7],[22] |
27.92%
|
|
|
|
|
|
| Russell RAFI Developed ex US Small Company Index (Net) [Member] |
|
|
|
|
|
|
|
| Average Annual Return [Line Items] |
|
|
|
|
|
|
|
| Line Graph and Table Measure Name |
[7] |
Russell RAFITM Developed ex US Small Company Index (Net)
|
|
|
|
|
|
| Average Annual Return, Percent |
[7] |
28.47%
|
|
12.08%
|
|
|
7.93%
|
| Fundamental Developed ex US Small Spliced Index [Member] |
|
|
|
|
|
|
|
| Average Annual Return [Line Items] |
|
|
|
|
|
|
|
| Line Graph and Table Measure Name |
|
Fundamental Developed ex US Small Spliced Index
|
|
|
|
|
|
| Average Annual Return, Percent |
|
27.92%
|
|
12.01%
|
|
|
7.90%
|
| S&P Developed ex-U.S. Small Cap Index (Net) [Member] |
|
|
|
|
|
|
|
| Average Annual Return [Line Items] |
|
|
|
|
|
|
|
| Line Graph and Table Measure Name |
[7] |
S&P Developed ex-U.S. Small Cap Index (Net)
|
|
|
|
|
|
| Average Annual Return, Percent |
[7] |
24.65%
|
|
8.82%
|
|
|
6.86%
|
| RAFI Fundamental High Liquidity Emerging Markets Index (Net) [Member] |
|
|
|
|
|
|
|
| Average Annual Return [Line Items] |
|
|
|
|
|
|
|
| Line Graph and Table Measure Name |
[7],[23] |
RAFI Fundamental High Liquidity Emerging Markets Index (Net)
|
|
|
|
|
|
| Average Annual Return, Percent |
[7],[23] |
23.42%
|
|
|
|
|
|
| Russell RAFITM Emerging Markets Large Company Index (Net) [Member] |
|
|
|
|
|
|
|
| Average Annual Return [Line Items] |
|
|
|
|
|
|
|
| Line Graph and Table Measure Name |
[7] |
Russell RAFITM Emerging Markets Large Company Index (Net)
|
|
|
|
|
|
| Average Annual Return, Percent |
[7] |
24.50%
|
|
14.90%
|
|
|
10.35%
|
| Fundamental Emerging Markets Spliced Index [Member] |
|
|
|
|
|
|
|
| Average Annual Return [Line Items] |
|
|
|
|
|
|
|
| Line Graph and Table Measure Name |
|
Fundamental Emerging Markets Spliced Index
|
|
|
|
|
|
| Average Annual Return, Percent |
|
23.42%
|
|
14.73%
|
|
|
10.26%
|
| Balanced Blended Index [Member] |
|
|
|
|
|
|
|
| Average Annual Return [Line Items] |
|
|
|
|
|
|
|
| Line Graph and Table Measure Name |
|
Balanced Blended Index
|
|
|
|
|
|
| Average Annual Return, Percent |
|
14.90%
|
|
9.76%
|
|
|
9.07%
|
| All Equity Composite Index [Member] |
|
|
|
|
|
|
|
| Average Annual Return [Line Items] |
|
|
|
|
|
|
|
| Line Graph and Table Measure Name |
|
All Equity Composite Index
|
|
|
|
|
|
| Average Annual Return, Percent |
|
20.32%
|
|
15.64%
|
|
|
11.49%
|
| Growth Composite Index [Member] |
|
|
|
|
|
|
|
| Average Annual Return [Line Items] |
|
|
|
|
|
|
|
| Line Graph and Table Measure Name |
|
Growth Composite Index
|
|
|
|
|
|
| Average Annual Return, Percent |
|
17.30%
|
|
12.77%
|
|
|
9.92%
|
| Balanced Composite Index [Member] |
|
|
|
|
|
|
|
| Average Annual Return [Line Items] |
|
|
|
|
|
|
|
| Line Graph and Table Measure Name |
|
Balanced Composite Index
|
|
|
|
|
|
| Average Annual Return, Percent |
|
14.49%
|
|
9.56%
|
|
|
8.02%
|
| Conservative Composite Index [Member] |
|
|
|
|
|
|
|
| Average Annual Return [Line Items] |
|
|
|
|
|
|
|
| Line Graph and Table Measure Name |
|
Conservative Composite Index
|
|
|
|
|
|
| Average Annual Return, Percent |
|
11.59%
|
|
6.30%
|
|
|
6.03%
|
| Target 2010 Composite Index [Member] |
|
|
|
|
|
|
|
| Average Annual Return [Line Items] |
|
|
|
|
|
|
|
| Line Graph and Table Measure Name |
|
Target 2010 Composite Index
|
|
|
|
|
|
| Average Annual Return, Percent |
|
10.76%
|
|
5.66%
|
|
|
5.67%
|
| Target 2015 Composite Index [Member] |
|
|
|
|
|
|
|
| Average Annual Return [Line Items] |
|
|
|
|
|
|
|
| Line Graph and Table Measure Name |
|
Target 2015 Composite Index
|
|
|
|
|
|
| Average Annual Return, Percent |
|
11.37%
|
|
6.15%
|
|
|
5.97%
|
| Target 2020 Composite Index [Member] |
|
|
|
|
|
|
|
| Average Annual Return [Line Items] |
|
|
|
|
|
|
|
| Line Graph and Table Measure Name |
|
Target 2020 Composite Index
|
|
|
|
|
|
| Average Annual Return, Percent |
|
11.78%
|
|
6.48%
|
|
|
6.40%
|
| Target 2025 Composite Index [Member] |
|
|
|
|
|
|
|
| Average Annual Return [Line Items] |
|
|
|
|
|
|
|
| Line Graph and Table Measure Name |
|
Target 2025 Composite Index
|
|
|
|
|
|
| Average Annual Return, Percent |
|
12.19%
|
|
7.69%
|
|
|
7.26%
|
| Target 2030 Composite Index [Member] |
|
|
|
|
|
|
|
| Average Annual Return [Line Items] |
|
|
|
|
|
|
|
| Line Graph and Table Measure Name |
|
Target 2030 Composite Index
|
|
|
|
|
|
| Average Annual Return, Percent |
|
14.30%
|
|
9.39%
|
|
|
8.28%
|
| Target 2035 Composite Index [Member] |
|
|
|
|
|
|
|
| Average Annual Return [Line Items] |
|
|
|
|
|
|
|
| Line Graph and Table Measure Name |
|
Target 2035 Composite Index
|
|
|
|
|
|
| Average Annual Return, Percent |
|
15.87%
|
|
10.64%
|
|
|
9.03%
|
| Target 2040 Composite Index [Member] |
|
|
|
|
|
|
|
| Average Annual Return [Line Items] |
|
|
|
|
|
|
|
| Line Graph and Table Measure Name |
|
Target 2040 Composite Index
|
|
|
|
|
|
| Average Annual Return, Percent |
|
17.12%
|
|
11.63%
|
|
|
9.65%
|
| Target 2045 Composite Index [Member] |
|
|
|
|
|
|
|
| Average Annual Return [Line Items] |
|
|
|
|
|
|
|
| Line Graph and Table Measure Name |
|
Target 2045 Composite Index
|
|
|
|
|
|
| Average Annual Return, Percent |
|
18.20%
|
|
12.50%
|
|
|
10.13%
|
| Target 2050 Composite Index [Member] |
|
|
|
|
|
|
|
| Average Annual Return [Line Items] |
|
|
|
|
|
|
|
| Line Graph and Table Measure Name |
|
Target 2050 Composite Index
|
|
|
|
|
|
| Average Annual Return, Percent |
|
18.98%
|
|
13.03%
|
|
|
10.42%
|
| Target 2055 Composite Index [Member] |
|
|
|
|
|
|
|
| Average Annual Return [Line Items] |
|
|
|
|
|
|
|
| Line Graph and Table Measure Name |
|
Target 2055 Composite Index
|
|
|
|
|
|
| Average Annual Return, Percent |
|
19.43%
|
|
13.35%
|
|
|
10.62%
|
| Target 2060 Composite Index [Member] |
|
|
|
|
|
|
|
| Average Annual Return [Line Items] |
|
|
|
|
|
|
|
| Line Graph and Table Measure Name |
|
Target 2060 Composite Index
|
|
|
|
|
|
| Average Annual Return, Percent |
|
19.74%
|
|
13.63%
|
|
11.18%
|
|
| Target 2065 Composite Index [Member] |
|
|
|
|
|
|
|
| Average Annual Return [Line Items] |
|
|
|
|
|
|
|
| Line Graph and Table Measure Name |
|
Target 2065 Composite Index
|
|
|
|
|
|
| Average Annual Return, Percent |
|
20.05%
|
10.07%
|
|
|
|
|
|
|
| X |
- ReferencesReference 1: http://www.xbrl.org/2003/role/presentationRef
-Publisher SEC
-Name Form N-1A
-Section 4
-Subsection b
-Paragraph 2
-Subparagraph iii
| Name: |
oef_AverageAnnualReturnLineItems |
| Namespace Prefix: |
oef_ |
| Data Type: |
xbrli:stringItemType |
| Balance Type: |
na |
| Period Type: |
duration |
|
| X |
- ReferencesReference 1: http://www.xbrl.org/2003/role/presentationRef
-Publisher SEC
-Name Form N-1A
-Section 27A
-Subsection d
-Paragraph 2
-Subparagraph instruction
-Clause 7
| Name: |
oef_AvgAnnlRtrPct |
| Namespace Prefix: |
oef_ |
| Data Type: |
dtr-types:percentItemType |
| Balance Type: |
na |
| Period Type: |
duration |
|
| X |
- ReferencesReference 1: http://www.xbrl.org/2003/role/presentationRef
-Publisher SEC
-Name Form N-1A
-Section 27A
-Subsection d
-Paragraph 2
-Subparagraph i
| Name: |
oef_LineGraphAndTableMeasureName |
| Namespace Prefix: |
oef_ |
| Data Type: |
xbrli:stringItemType |
| Balance Type: |
na |
| Period Type: |
duration |
|
| X |
- Details
| Name: |
oef_ClassAxis=cik0000904333_C000017890Member |
| Namespace Prefix: |
|
| Data Type: |
na |
| Balance Type: |
|
| Period Type: |
|
|
| X |
- Details
| Name: |
oef_ClassAxis=cik0000904333_C000015013Member |
| Namespace Prefix: |
|
| Data Type: |
na |
| Balance Type: |
|
| Period Type: |
|
|
| X |
- Details
| Name: |
oef_ClassAxis=cik0000904333_C000015015Member |
| Namespace Prefix: |
|
| Data Type: |
na |
| Balance Type: |
|
| Period Type: |
|
|
| X |
- Details
| Name: |
oef_ClassAxis=cik0000904333_C000015012Member |
| Namespace Prefix: |
|
| Data Type: |
na |
| Balance Type: |
|
| Period Type: |
|
|
| X |
- Details
| Name: |
oef_ClassAxis=cik0000904333_C000015017Member |
| Namespace Prefix: |
|
| Data Type: |
na |
| Balance Type: |
|
| Period Type: |
|
|
| X |
- Details
| Name: |
oef_ClassAxis=cik0000904333_C000015021Member |
| Namespace Prefix: |
|
| Data Type: |
na |
| Balance Type: |
|
| Period Type: |
|
|
| X |
- Details
| Name: |
oef_ClassAxis=cik0000904333_C000063316Member |
| Namespace Prefix: |
|
| Data Type: |
na |
| Balance Type: |
|
| Period Type: |
|
|
| X |
- Details
| Name: |
oef_ClassAxis=cik0000904333_C000016166Member |
| Namespace Prefix: |
|
| Data Type: |
na |
| Balance Type: |
|
| Period Type: |
|
|
| X |
- Details
| Name: |
oef_ClassAxis=cik0000904333_C000016169Member |
| Namespace Prefix: |
|
| Data Type: |
na |
| Balance Type: |
|
| Period Type: |
|
|
| X |
- Details
| Name: |
oef_ClassAxis=cik0000904333_C000016171Member |
| Namespace Prefix: |
|
| Data Type: |
na |
| Balance Type: |
|
| Period Type: |
|
|
| X |
- Details
| Name: |
oef_ClassAxis=cik0000904333_C000195502Member |
| Namespace Prefix: |
|
| Data Type: |
na |
| Balance Type: |
|
| Period Type: |
|
|
| X |
- Details
| Name: |
oef_ClassAxis=cik0000904333_C000195503Member |
| Namespace Prefix: |
|
| Data Type: |
na |
| Balance Type: |
|
| Period Type: |
|
|
| X |
- Details
| Name: |
oef_ClassAxis=cik0000904333_C000195504Member |
| Namespace Prefix: |
|
| Data Type: |
na |
| Balance Type: |
|
| Period Type: |
|
|
| X |
- Details
| Name: |
oef_ClassAxis=cik0000904333_C000016173Member |
| Namespace Prefix: |
|
| Data Type: |
na |
| Balance Type: |
|
| Period Type: |
|
|
| X |
- Details
| Name: |
oef_ClassAxis=cik0000904333_C000046821Member |
| Namespace Prefix: |
|
| Data Type: |
na |
| Balance Type: |
|
| Period Type: |
|
|
| X |
- Details
| Name: |
oef_ClassAxis=cik0000904333_C000046824Member |
| Namespace Prefix: |
|
| Data Type: |
na |
| Balance Type: |
|
| Period Type: |
|
|
| X |
- Details
| Name: |
oef_ClassAxis=cik0000904333_C000046827Member |
| Namespace Prefix: |
|
| Data Type: |
na |
| Balance Type: |
|
| Period Type: |
|
|
| X |
- Details
| Name: |
oef_ClassAxis=cik0000904333_C000055855Member |
| Namespace Prefix: |
|
| Data Type: |
na |
| Balance Type: |
|
| Period Type: |
|
|
| X |
- Details
| Name: |
oef_ClassAxis=cik0000904333_C000055852Member |
| Namespace Prefix: |
|
| Data Type: |
na |
| Balance Type: |
|
| Period Type: |
|
|
| X |
- Details
| Name: |
oef_ClassAxis=cik0000904333_C000017885Member |
| Namespace Prefix: |
|
| Data Type: |
na |
| Balance Type: |
|
| Period Type: |
|
|
| X |
- Details
| Name: |
oef_ClassAxis=cik0000904333_C000016175Member |
| Namespace Prefix: |
|
| Data Type: |
na |
| Balance Type: |
|
| Period Type: |
|
|
| X |
- Details
| Name: |
oef_ClassAxis=cik0000904333_C000016177Member |
| Namespace Prefix: |
|
| Data Type: |
na |
| Balance Type: |
|
| Period Type: |
|
|
| X |
- Details
| Name: |
oef_ClassAxis=cik0000904333_C000016178Member |
| Namespace Prefix: |
|
| Data Type: |
na |
| Balance Type: |
|
| Period Type: |
|
|
| X |
- Details
| Name: |
oef_ClassAxis=cik0000904333_C000016180Member |
| Namespace Prefix: |
|
| Data Type: |
na |
| Balance Type: |
|
| Period Type: |
|
|
| X |
- Details
| Name: |
oef_ClassAxis=cik0000904333_C000015023Member |
| Namespace Prefix: |
|
| Data Type: |
na |
| Balance Type: |
|
| Period Type: |
|
|
| X |
- Details
| Name: |
oef_ClassAxis=cik0000904333_C000059131Member |
| Namespace Prefix: |
|
| Data Type: |
na |
| Balance Type: |
|
| Period Type: |
|
|
| X |
- Details
| Name: |
oef_ClassAxis=cik0000904333_C000015024Member |
| Namespace Prefix: |
|
| Data Type: |
na |
| Balance Type: |
|
| Period Type: |
|
|
| X |
- Details
| Name: |
oef_ClassAxis=cik0000904333_C000059132Member |
| Namespace Prefix: |
|
| Data Type: |
na |
| Balance Type: |
|
| Period Type: |
|
|
| X |
- Details
| Name: |
oef_ClassAxis=cik0000904333_C000015025Member |
| Namespace Prefix: |
|
| Data Type: |
na |
| Balance Type: |
|
| Period Type: |
|
|
| X |
- Details
| Name: |
oef_ClassAxis=cik0000904333_C000059133Member |
| Namespace Prefix: |
|
| Data Type: |
na |
| Balance Type: |
|
| Period Type: |
|
|
| X |
- Details
| Name: |
oef_ClassAxis=cik0000904333_C000015026Member |
| Namespace Prefix: |
|
| Data Type: |
na |
| Balance Type: |
|
| Period Type: |
|
|
| X |
- Details
| Name: |
oef_ClassAxis=cik0000904333_C000122183Member |
| Namespace Prefix: |
|
| Data Type: |
na |
| Balance Type: |
|
| Period Type: |
|
|
| X |
- Details
| Name: |
oef_ClassAxis=cik0000904333_C000122184Member |
| Namespace Prefix: |
|
| Data Type: |
na |
| Balance Type: |
|
| Period Type: |
|
|
| X |
- Details
| Name: |
oef_ClassAxis=cik0000904333_C000122185Member |
| Namespace Prefix: |
|
| Data Type: |
na |
| Balance Type: |
|
| Period Type: |
|
|
| X |
- Details
| Name: |
oef_ClassAxis=cik0000904333_C000172771Member |
| Namespace Prefix: |
|
| Data Type: |
na |
| Balance Type: |
|
| Period Type: |
|
|
| X |
- Details
| Name: |
oef_ClassAxis=cik0000904333_C000225748Member |
| Namespace Prefix: |
|
| Data Type: |
na |
| Balance Type: |
|
| Period Type: |
|
|
| X |
- Details
| Name: |
oef_BroadBasedIndexAxis=cik0000904333_MSCIEAFEIndexNetMember |
| Namespace Prefix: |
|
| Data Type: |
na |
| Balance Type: |
|
| Period Type: |
|
|
| X |
- Details
| Name: |
oef_BroadBasedIndexAxis=us-gaap_StandardPoors500IndexMember |
| Namespace Prefix: |
|
| Data Type: |
na |
| Balance Type: |
|
| Period Type: |
|
|
| X |
- Details
| Name: |
oef_BroadBasedIndexAxis=cik0000904333_DowJonesUSTotalStockMarketIndexMember |
| Namespace Prefix: |
|
| Data Type: |
na |
| Balance Type: |
|
| Period Type: |
|
|
| X |
- Details
| Name: |
oef_BroadBasedIndexAxis=cik0000904333_Russell1000IndexMember |
| Namespace Prefix: |
|
| Data Type: |
na |
| Balance Type: |
|
| Period Type: |
|
|
| X |
- Details
| Name: |
oef_BroadBasedIndexAxis=cik0000904333_MSCIEmergingMarketsIndexNetMember |
| Namespace Prefix: |
|
| Data Type: |
na |
| Balance Type: |
|
| Period Type: |
|
|
| X |
- Details
| Name: |
oef_BroadBasedIndexAxis=cik0000904333_BloombergUSAggregateBondIndexMember |
| Namespace Prefix: |
|
| Data Type: |
na |
| Balance Type: |
|
| Period Type: |
|
|
| X |
- Details
| Name: |
oef_AdditionalIndexAxis=cik0000904333_Russell1000ValueIndexMember |
| Namespace Prefix: |
|
| Data Type: |
na |
| Balance Type: |
|
| Period Type: |
|
|
| X |
- Details
| Name: |
oef_AdditionalIndexAxis=cik0000904333_Russell1000GrowthIndexMember |
| Namespace Prefix: |
|
| Data Type: |
na |
| Balance Type: |
|
| Period Type: |
|
|
| X |
- Details
| Name: |
oef_AdditionalIndexAxis=cik0000904333_Russell2000IndexMember |
| Namespace Prefix: |
|
| Data Type: |
na |
| Balance Type: |
|
| Period Type: |
|
|
| X |
- Details
| Name: |
oef_AdditionalIndexAxis=cik0000904333_DowJonesGlobalHealthCareIndexMember |
| Namespace Prefix: |
|
| Data Type: |
na |
| Balance Type: |
|
| Period Type: |
|
|
| X |
- Details
| Name: |
oef_AdditionalIndexAxis=cik0000904333_RussellMidcapIndexMember |
| Namespace Prefix: |
|
| Data Type: |
na |
| Balance Type: |
|
| Period Type: |
|
|
| X |
- Details
| Name: |
oef_AdditionalIndexAxis=cik0000904333_RAFIFundamentalHighLiquidityUSLargeIndexMember |
| Namespace Prefix: |
|
| Data Type: |
na |
| Balance Type: |
|
| Period Type: |
|
|
| X |
- Details
| Name: |
oef_AdditionalIndexAxis=cik0000904333_RussellRAFIUSLargeCompanyIndexMember |
| Namespace Prefix: |
|
| Data Type: |
na |
| Balance Type: |
|
| Period Type: |
|
|
| X |
- Details
| Name: |
oef_AdditionalIndexAxis=cik0000904333_FundamentalUSLargeSplicedIndexMember |
| Namespace Prefix: |
|
| Data Type: |
na |
| Balance Type: |
|
| Period Type: |
|
|
| X |
- Details
| Name: |
oef_AdditionalIndexAxis=cik0000904333_RAFIFundamentalHighLiquidityUSSmallIndexMember |
| Namespace Prefix: |
|
| Data Type: |
na |
| Balance Type: |
|
| Period Type: |
|
|
| X |
- Details
| Name: |
oef_AdditionalIndexAxis=cik0000904333_RussellRAFIUSSmallCompanyIndexMember |
| Namespace Prefix: |
|
| Data Type: |
na |
| Balance Type: |
|
| Period Type: |
|
|
| X |
- Details
| Name: |
oef_AdditionalIndexAxis=cik0000904333_FundamentalUSSmallSplicedIndexMember |
| Namespace Prefix: |
|
| Data Type: |
na |
| Balance Type: |
|
| Period Type: |
|
|
| X |
- Details
| Name: |
oef_AdditionalIndexAxis=cik0000904333_RAFIFundamentalHighLiquidityDevelopedexUSLargeIndexNetMember |
| Namespace Prefix: |
|
| Data Type: |
na |
| Balance Type: |
|
| Period Type: |
|
|
| X |
- Details
| Name: |
oef_AdditionalIndexAxis=cik0000904333_RussellRAFIDevelopedexUSLargeCompanyIndexNetMember |
| Namespace Prefix: |
|
| Data Type: |
na |
| Balance Type: |
|
| Period Type: |
|
|
| X |
- Details
| Name: |
oef_AdditionalIndexAxis=cik0000904333_FundamentalDevelopedexUSLargeSplicedIndexMember |
| Namespace Prefix: |
|
| Data Type: |
na |
| Balance Type: |
|
| Period Type: |
|
|
| X |
- Details
| Name: |
oef_AdditionalIndexAxis=cik0000904333_RAFIFundamentalHighLiquidityDevelopedExUSSmallIndexNetMember |
| Namespace Prefix: |
|
| Data Type: |
na |
| Balance Type: |
|
| Period Type: |
|
|
| X |
- Details
| Name: |
oef_AdditionalIndexAxis=cik0000904333_RussellRAFIDevelopedexUSSmallCompanyIndexNetMember |
| Namespace Prefix: |
|
| Data Type: |
na |
| Balance Type: |
|
| Period Type: |
|
|
| X |
- Details
| Name: |
oef_AdditionalIndexAxis=cik0000904333_FundamentalDevelopedExUSSmallSplicedIndexMember |
| Namespace Prefix: |
|
| Data Type: |
na |
| Balance Type: |
|
| Period Type: |
|
|
| X |
- Details
| Name: |
oef_AdditionalIndexAxis=cik0000904333_SAndPDevelopedExUSSmallCapIndexNetMember |
| Namespace Prefix: |
|
| Data Type: |
na |
| Balance Type: |
|
| Period Type: |
|
|
| X |
- Details
| Name: |
oef_AdditionalIndexAxis=cik0000904333_RAFIFundamentalHighLiquidityEmergingMarketsIndexNetMember |
| Namespace Prefix: |
|
| Data Type: |
na |
| Balance Type: |
|
| Period Type: |
|
|
| X |
- Details
| Name: |
oef_AdditionalIndexAxis=cik0000904333_RussellRAFITMEmergingMarketsLargeCompanyIndexNetMember |
| Namespace Prefix: |
|
| Data Type: |
na |
| Balance Type: |
|
| Period Type: |
|
|
| X |
- Details
| Name: |
oef_AdditionalIndexAxis=cik0000904333_FundamentalEmergingMarketsSplicedIndexMember |
| Namespace Prefix: |
|
| Data Type: |
na |
| Balance Type: |
|
| Period Type: |
|
|
| X |
- Details
| Name: |
oef_AdditionalIndexAxis=cik0000904333_BalancedBlendedIndexMember |
| Namespace Prefix: |
|
| Data Type: |
na |
| Balance Type: |
|
| Period Type: |
|
|
| X |
- Details
| Name: |
oef_AdditionalIndexAxis=cik0000904333_AllEquityCompositeIndexMember |
| Namespace Prefix: |
|
| Data Type: |
na |
| Balance Type: |
|
| Period Type: |
|
|
| X |
- Details
| Name: |
oef_AdditionalIndexAxis=cik0000904333_GrowthCompositeIndexMember |
| Namespace Prefix: |
|
| Data Type: |
na |
| Balance Type: |
|
| Period Type: |
|
|
| X |
- Details
| Name: |
oef_AdditionalIndexAxis=cik0000904333_BalancedCompositeIndexMember |
| Namespace Prefix: |
|
| Data Type: |
na |
| Balance Type: |
|
| Period Type: |
|
|
| X |
- Details
| Name: |
oef_AdditionalIndexAxis=cik0000904333_ConservativeCompositeIndexMember |
| Namespace Prefix: |
|
| Data Type: |
na |
| Balance Type: |
|
| Period Type: |
|
|
| X |
- Details
| Name: |
oef_AdditionalIndexAxis=cik0000904333_Target2010CompositeIndexMember |
| Namespace Prefix: |
|
| Data Type: |
na |
| Balance Type: |
|
| Period Type: |
|
|
| X |
- Details
| Name: |
oef_AdditionalIndexAxis=cik0000904333_Target2015CompositeIndexMember |
| Namespace Prefix: |
|
| Data Type: |
na |
| Balance Type: |
|
| Period Type: |
|
|
| X |
- Details
| Name: |
oef_AdditionalIndexAxis=cik0000904333_Target2020CompositeIndexMember |
| Namespace Prefix: |
|
| Data Type: |
na |
| Balance Type: |
|
| Period Type: |
|
|
| X |
- Details
| Name: |
oef_AdditionalIndexAxis=cik0000904333_Target2025CompositeIndexMember |
| Namespace Prefix: |
|
| Data Type: |
na |
| Balance Type: |
|
| Period Type: |
|
|
| X |
- Details
| Name: |
oef_AdditionalIndexAxis=cik0000904333_Target2030CompositeIndexMember |
| Namespace Prefix: |
|
| Data Type: |
na |
| Balance Type: |
|
| Period Type: |
|
|
| X |
- Details
| Name: |
oef_AdditionalIndexAxis=cik0000904333_Target2035CompositeIndexMember |
| Namespace Prefix: |
|
| Data Type: |
na |
| Balance Type: |
|
| Period Type: |
|
|
| X |
- Details
| Name: |
oef_AdditionalIndexAxis=cik0000904333_Target2040CompositeIndexMember |
| Namespace Prefix: |
|
| Data Type: |
na |
| Balance Type: |
|
| Period Type: |
|
|
| X |
- Details
| Name: |
oef_AdditionalIndexAxis=cik0000904333_Target2045CompositeIndexMember |
| Namespace Prefix: |
|
| Data Type: |
na |
| Balance Type: |
|
| Period Type: |
|
|
| X |
- Details
| Name: |
oef_AdditionalIndexAxis=cik0000904333_Target2050CompositeIndexMember |
| Namespace Prefix: |
|
| Data Type: |
na |
| Balance Type: |
|
| Period Type: |
|
|
| X |
- Details
| Name: |
oef_AdditionalIndexAxis=cik0000904333_Target2055CompositeIndexMember |
| Namespace Prefix: |
|
| Data Type: |
na |
| Balance Type: |
|
| Period Type: |
|
|
| X |
- Details
| Name: |
oef_AdditionalIndexAxis=cik0000904333_Target2060CompositeIndexMember |
| Namespace Prefix: |
|
| Data Type: |
na |
| Balance Type: |
|
| Period Type: |
|
|
| X |
- Details
| Name: |
oef_AdditionalIndexAxis=cik0000904333_Target2065CompositeIndexMember |
| Namespace Prefix: |
|
| Data Type: |
na |
| Balance Type: |
|
| Period Type: |
|
|
v3.25.4
Shareholder Report, Holdings (Details)
|
Oct. 31, 2025 |
| Schwab International Opportunities Fund | Schwab Emerging Markets Equity ETF [Member] |
|
|
| Holdings [Line Items] |
|
|
| Percent of Net Asset Value |
2.20%
|
|
| Schwab International Opportunities Fund | MercadoLibre, Inc. [Member] |
|
|
| Holdings [Line Items] |
|
|
| Percent of Net Asset Value |
1.10%
|
|
| Schwab International Opportunities Fund | Spotify Technology SA [Member] |
|
|
| Holdings [Line Items] |
|
|
| Percent of Net Asset Value |
0.90%
|
|
| Schwab International Opportunities Fund | Prosus NV [Member] |
|
|
| Holdings [Line Items] |
|
|
| Percent of Net Asset Value |
0.80%
|
|
| Schwab International Opportunities Fund | Adyen NV [Member] |
|
|
| Holdings [Line Items] |
|
|
| Percent of Net Asset Value |
0.80%
|
|
| Schwab International Opportunities Fund | ASML Holding NV [Member] |
|
|
| Holdings [Line Items] |
|
|
| Percent of Net Asset Value |
1.80%
|
|
| Schwab International Opportunities Fund | Novartis AG [Member] |
|
|
| Holdings [Line Items] |
|
|
| Percent of Net Asset Value |
0.80%
|
|
| Schwab International Opportunities Fund | Samsung Electronics Co, Ltd. [Member] |
|
|
| Holdings [Line Items] |
|
|
| Percent of Net Asset Value |
1.40%
|
|
| Schwab International Opportunities Fund | Shell PLC [Member] |
|
|
| Holdings [Line Items] |
|
|
| Percent of Net Asset Value |
0.90%
|
|
| Schwab International Opportunities Fund | Taiwan Semiconductor Manufacturing Co. Ltd [Member] |
|
|
| Holdings [Line Items] |
|
|
| Percent of Net Asset Value |
1.50%
|
|
| Schwab International Opportunities Fund | Investment Companies [Member] |
|
|
| Holdings [Line Items] |
|
|
| Percent of Total Investments |
2.20%
|
[1] |
| Schwab International Opportunities Fund | Financials [Member] |
|
|
| Holdings [Line Items] |
|
|
| Percent of Total Investments |
13.30%
|
[1] |
| Schwab International Opportunities Fund | Information Technology Sector [Member] |
|
|
| Holdings [Line Items] |
|
|
| Percent of Total Investments |
16.50%
|
[1] |
| Schwab International Opportunities Fund | Materials Sector [Member] |
|
|
| Holdings [Line Items] |
|
|
| Percent of Total Investments |
6.50%
|
[1] |
| Schwab International Opportunities Fund | Energy Sector [Member] |
|
|
| Holdings [Line Items] |
|
|
| Percent of Total Investments |
3.90%
|
[1] |
| Schwab International Opportunities Fund | Consumer Discretionary Sector [Member] |
|
|
| Holdings [Line Items] |
|
|
| Percent of Total Investments |
15.80%
|
[1] |
| Schwab International Opportunities Fund | Communications Sector [Member] |
|
|
| Holdings [Line Items] |
|
|
| Percent of Total Investments |
3.50%
|
[1] |
| Schwab International Opportunities Fund | Industrial Sector [Member] |
|
|
| Holdings [Line Items] |
|
|
| Percent of Total Investments |
18.00%
|
[1] |
| Schwab International Opportunities Fund | Consumer Staples Sector [Member] |
|
|
| Holdings [Line Items] |
|
|
| Percent of Total Investments |
7.10%
|
[1] |
| Schwab International Opportunities Fund | Utilities Sector [Member] |
|
|
| Holdings [Line Items] |
|
|
| Percent of Total Investments |
1.00%
|
[1] |
| Schwab International Opportunities Fund | Real Estate Sector [Member] |
|
|
| Holdings [Line Items] |
|
|
| Percent of Total Investments |
0.90%
|
[1] |
| Schwab International Opportunities Fund | Healthcare Sector [Member] |
|
|
| Holdings [Line Items] |
|
|
| Percent of Total Investments |
8.40%
|
[1] |
| Schwab International Opportunities Fund | Short-Term Investments [Member] |
|
|
| Holdings [Line Items] |
|
|
| Percent of Total Investments |
2.90%
|
[1],[2] |
| Schwab International Opportunities Fund | UNITED STATES |
|
|
| Holdings [Line Items] |
|
|
| Percent of Total Investments |
7.40%
|
[1] |
| Schwab International Opportunities Fund | NETHERLANDS |
|
|
| Holdings [Line Items] |
|
|
| Percent of Total Investments |
8.20%
|
[1] |
| Schwab International Opportunities Fund | JAPAN |
|
|
| Holdings [Line Items] |
|
|
| Percent of Total Investments |
17.50%
|
[1] |
| Schwab International Opportunities Fund | CANADA |
|
|
| Holdings [Line Items] |
|
|
| Percent of Total Investments |
6.50%
|
[1] |
| Schwab International Opportunities Fund | KOREA, REPUBLIC OF |
|
|
| Holdings [Line Items] |
|
|
| Percent of Total Investments |
4.60%
|
[1] |
| Schwab International Opportunities Fund | UNITED KINGDOM |
|
|
| Holdings [Line Items] |
|
|
| Percent of Total Investments |
8.60%
|
[1] |
| Schwab International Opportunities Fund | AUSTRALIA |
|
|
| Holdings [Line Items] |
|
|
| Percent of Total Investments |
4.60%
|
[1] |
| Schwab International Opportunities Fund | FRANCE |
|
|
| Holdings [Line Items] |
|
|
| Percent of Total Investments |
6.70%
|
[1] |
| Schwab International Opportunities Fund | GERMANY |
|
|
| Holdings [Line Items] |
|
|
| Percent of Total Investments |
5.30%
|
[1] |
| Schwab International Opportunities Fund | SWITZERLAND |
|
|
| Holdings [Line Items] |
|
|
| Percent of Total Investments |
4.20%
|
[1] |
| Schwab International Opportunities Fund | CHINA |
|
|
| Holdings [Line Items] |
|
|
| Percent of Total Investments |
2.80%
|
[1] |
| Schwab International Opportunities Fund | TAIWAN |
|
|
| Holdings [Line Items] |
|
|
| Percent of Total Investments |
3.00%
|
[1] |
| Schwab International Opportunities Fund | Other Countries [Member] |
|
|
| Holdings [Line Items] |
|
|
| Percent of Total Investments |
20.60%
|
[1] |
| Schwab Core Equity Fund | Fidelity National Information Services, Inc. [Member] |
|
|
| Holdings [Line Items] |
|
|
| Percent of Net Asset Value |
2.90%
|
|
| Schwab Core Equity Fund | Visa, Inc., Class A [Member] |
|
|
| Holdings [Line Items] |
|
|
| Percent of Net Asset Value |
2.50%
|
|
| Schwab Core Equity Fund | NVIDIA Corp. [Member] |
|
|
| Holdings [Line Items] |
|
|
| Percent of Net Asset Value |
10.60%
|
|
| Schwab Core Equity Fund | Broadcom, Inc. [Member] |
|
|
| Holdings [Line Items] |
|
|
| Percent of Net Asset Value |
4.30%
|
|
| Schwab Core Equity Fund | Apple, Inc. [Member] |
|
|
| Holdings [Line Items] |
|
|
| Percent of Net Asset Value |
6.80%
|
|
| Schwab Core Equity Fund | Microsoft Corp. [Member] |
|
|
| Holdings [Line Items] |
|
|
| Percent of Net Asset Value |
9.80%
|
|
| Schwab Core Equity Fund | Alphabet, Inc., Class A [Member] |
|
|
| Holdings [Line Items] |
|
|
| Percent of Net Asset Value |
6.50%
|
|
| Schwab Core Equity Fund | Exxon Mobil Corp. [Member] |
|
|
| Holdings [Line Items] |
|
|
| Percent of Net Asset Value |
2.80%
|
|
| Schwab Core Equity Fund | Amazon.com, Inc. [Member] |
|
|
| Holdings [Line Items] |
|
|
| Percent of Net Asset Value |
3.80%
|
|
| Schwab Core Equity Fund | Meta Platforms, Inc., Class A [Member] |
|
|
| Holdings [Line Items] |
|
|
| Percent of Net Asset Value |
4.10%
|
|
| Schwab Core Equity Fund | Financials [Member] |
|
|
| Holdings [Line Items] |
|
|
| Percent of Total Investments |
11.90%
|
|
| Schwab Core Equity Fund | Information Technology Sector [Member] |
|
|
| Holdings [Line Items] |
|
|
| Percent of Total Investments |
39.00%
|
|
| Schwab Core Equity Fund | Materials Sector [Member] |
|
|
| Holdings [Line Items] |
|
|
| Percent of Total Investments |
1.00%
|
|
| Schwab Core Equity Fund | Energy Sector [Member] |
|
|
| Holdings [Line Items] |
|
|
| Percent of Total Investments |
3.90%
|
|
| Schwab Core Equity Fund | Consumer Discretionary Sector [Member] |
|
|
| Holdings [Line Items] |
|
|
| Percent of Total Investments |
5.60%
|
|
| Schwab Core Equity Fund | Communications Sector [Member] |
|
|
| Holdings [Line Items] |
|
|
| Percent of Total Investments |
10.60%
|
|
| Schwab Core Equity Fund | Industrial Sector [Member] |
|
|
| Holdings [Line Items] |
|
|
| Percent of Total Investments |
7.20%
|
|
| Schwab Core Equity Fund | Consumer Staples Sector [Member] |
|
|
| Holdings [Line Items] |
|
|
| Percent of Total Investments |
4.30%
|
|
| Schwab Core Equity Fund | Utilities Sector [Member] |
|
|
| Holdings [Line Items] |
|
|
| Percent of Total Investments |
3.80%
|
|
| Schwab Core Equity Fund | Real Estate Sector [Member] |
|
|
| Holdings [Line Items] |
|
|
| Percent of Total Investments |
0.50%
|
|
| Schwab Core Equity Fund | Healthcare Sector [Member] |
|
|
| Holdings [Line Items] |
|
|
| Percent of Total Investments |
12.00%
|
|
| Schwab Core Equity Fund | Short-Term Investments [Member] |
|
|
| Holdings [Line Items] |
|
|
| Percent of Total Investments |
0.20%
|
[2] |
| Schwab Dividend Equity Fund | Morgan Stanley [Member] |
|
|
| Holdings [Line Items] |
|
|
| Percent of Net Asset Value |
3.90%
|
|
| Schwab Dividend Equity Fund | International Business Machines Corp. [Member] |
|
|
| Holdings [Line Items] |
|
|
| Percent of Net Asset Value |
2.90%
|
|
| Schwab Dividend Equity Fund | Coca-Cola Co. [Member] |
|
|
| Holdings [Line Items] |
|
|
| Percent of Net Asset Value |
2.90%
|
|
| Schwab Dividend Equity Fund | Duke Energy Corp. [Member] |
|
|
| Holdings [Line Items] |
|
|
| Percent of Net Asset Value |
2.70%
|
|
| Schwab Dividend Equity Fund | Blackrock, Inc. [Member] |
|
|
| Holdings [Line Items] |
|
|
| Percent of Net Asset Value |
2.60%
|
|
| Schwab Dividend Equity Fund | Broadcom, Inc. [Member] |
|
|
| Holdings [Line Items] |
|
|
| Percent of Net Asset Value |
4.10%
|
|
| Schwab Dividend Equity Fund | Walmart, Inc. [Member] |
|
|
| Holdings [Line Items] |
|
|
| Percent of Net Asset Value |
3.20%
|
|
| Schwab Dividend Equity Fund | Microsoft Corp. [Member] |
|
|
| Holdings [Line Items] |
|
|
| Percent of Net Asset Value |
3.20%
|
|
| Schwab Dividend Equity Fund | Exxon Mobil Corp. [Member] |
|
|
| Holdings [Line Items] |
|
|
| Percent of Net Asset Value |
2.90%
|
|
| Schwab Dividend Equity Fund | JPMorgan Chase & Co. [Member] |
|
|
| Holdings [Line Items] |
|
|
| Percent of Net Asset Value |
4.80%
|
|
| Schwab Dividend Equity Fund | Financials [Member] |
|
|
| Holdings [Line Items] |
|
|
| Percent of Total Investments |
20.80%
|
|
| Schwab Dividend Equity Fund | Information Technology Sector [Member] |
|
|
| Holdings [Line Items] |
|
|
| Percent of Total Investments |
15.10%
|
|
| Schwab Dividend Equity Fund | Materials Sector [Member] |
|
|
| Holdings [Line Items] |
|
|
| Percent of Total Investments |
0.60%
|
|
| Schwab Dividend Equity Fund | Energy Sector [Member] |
|
|
| Holdings [Line Items] |
|
|
| Percent of Total Investments |
7.60%
|
|
| Schwab Dividend Equity Fund | Consumer Discretionary Sector [Member] |
|
|
| Holdings [Line Items] |
|
|
| Percent of Total Investments |
7.10%
|
|
| Schwab Dividend Equity Fund | Communications Sector [Member] |
|
|
| Holdings [Line Items] |
|
|
| Percent of Total Investments |
5.60%
|
|
| Schwab Dividend Equity Fund | Industrial Sector [Member] |
|
|
| Holdings [Line Items] |
|
|
| Percent of Total Investments |
11.20%
|
|
| Schwab Dividend Equity Fund | Consumer Staples Sector [Member] |
|
|
| Holdings [Line Items] |
|
|
| Percent of Total Investments |
12.80%
|
|
| Schwab Dividend Equity Fund | Utilities Sector [Member] |
|
|
| Holdings [Line Items] |
|
|
| Percent of Total Investments |
5.20%
|
|
| Schwab Dividend Equity Fund | Real Estate Sector [Member] |
|
|
| Holdings [Line Items] |
|
|
| Percent of Total Investments |
2.60%
|
|
| Schwab Dividend Equity Fund | Healthcare Sector [Member] |
|
|
| Holdings [Line Items] |
|
|
| Percent of Total Investments |
11.40%
|
|
| Schwab Large-Cap Growth Fund | Netflix, Inc. [Member] |
|
|
| Holdings [Line Items] |
|
|
| Percent of Net Asset Value |
2.00%
|
|
| Schwab Large-Cap Growth Fund | NVIDIA Corp. [Member] |
|
|
| Holdings [Line Items] |
|
|
| Percent of Net Asset Value |
10.60%
|
|
| Schwab Large-Cap Growth Fund | Broadcom, Inc. [Member] |
|
|
| Holdings [Line Items] |
|
|
| Percent of Net Asset Value |
6.00%
|
|
| Schwab Large-Cap Growth Fund | Tesla, Inc. [Member] |
|
|
| Holdings [Line Items] |
|
|
| Percent of Net Asset Value |
3.20%
|
|
| Schwab Large-Cap Growth Fund | Eli Lilly & Co. [Member] |
|
|
| Holdings [Line Items] |
|
|
| Percent of Net Asset Value |
2.60%
|
|
| Schwab Large-Cap Growth Fund | Apple, Inc. [Member] |
|
|
| Holdings [Line Items] |
|
|
| Percent of Net Asset Value |
8.20%
|
|
| Schwab Large-Cap Growth Fund | Microsoft Corp. [Member] |
|
|
| Holdings [Line Items] |
|
|
| Percent of Net Asset Value |
8.30%
|
|
| Schwab Large-Cap Growth Fund | Alphabet, Inc., Class A [Member] |
|
|
| Holdings [Line Items] |
|
|
| Percent of Net Asset Value |
6.10%
|
|
| Schwab Large-Cap Growth Fund | Amazon.com, Inc. [Member] |
|
|
| Holdings [Line Items] |
|
|
| Percent of Net Asset Value |
5.20%
|
|
| Schwab Large-Cap Growth Fund | Meta Platforms, Inc., Class A [Member] |
|
|
| Holdings [Line Items] |
|
|
| Percent of Net Asset Value |
4.50%
|
|
| Schwab Large-Cap Growth Fund | Financials [Member] |
|
|
| Holdings [Line Items] |
|
|
| Percent of Total Investments |
5.00%
|
|
| Schwab Large-Cap Growth Fund | Information Technology Sector [Member] |
|
|
| Holdings [Line Items] |
|
|
| Percent of Total Investments |
53.00%
|
|
| Schwab Large-Cap Growth Fund | Consumer Discretionary Sector [Member] |
|
|
| Holdings [Line Items] |
|
|
| Percent of Total Investments |
13.10%
|
|
| Schwab Large-Cap Growth Fund | Communications Sector [Member] |
|
|
| Holdings [Line Items] |
|
|
| Percent of Total Investments |
13.10%
|
|
| Schwab Large-Cap Growth Fund | Industrial Sector [Member] |
|
|
| Holdings [Line Items] |
|
|
| Percent of Total Investments |
6.50%
|
|
| Schwab Large-Cap Growth Fund | Consumer Staples Sector [Member] |
|
|
| Holdings [Line Items] |
|
|
| Percent of Total Investments |
2.60%
|
|
| Schwab Large-Cap Growth Fund | Healthcare Sector [Member] |
|
|
| Holdings [Line Items] |
|
|
| Percent of Total Investments |
6.70%
|
|
| Schwab Small-Cap Equity Fund | Enova International, Inc. [Member] |
|
|
| Holdings [Line Items] |
|
|
| Percent of Net Asset Value |
1.10%
|
|
| Schwab Small-Cap Equity Fund | BankUnited, Inc. [Member] |
|
|
| Holdings [Line Items] |
|
|
| Percent of Net Asset Value |
1.10%
|
|
| Schwab Small-Cap Equity Fund | Jackson Financial, Inc., Class A [Member] |
|
|
| Holdings [Line Items] |
|
|
| Percent of Net Asset Value |
1.00%
|
|
| Schwab Small-Cap Equity Fund | DiamondRock Hospitality Co. [Member] |
|
|
| Holdings [Line Items] |
|
|
| Percent of Net Asset Value |
1.00%
|
|
| Schwab Small-Cap Equity Fund | Alexander & Baldwin, Inc. [Member] |
|
|
| Holdings [Line Items] |
|
|
| Percent of Net Asset Value |
1.00%
|
|
| Schwab Small-Cap Equity Fund | Hancock Whitney Corp. [Member] |
|
|
| Holdings [Line Items] |
|
|
| Percent of Net Asset Value |
0.90%
|
|
| Schwab Small-Cap Equity Fund | IBEX Holdings Ltd. [Member] |
|
|
| Holdings [Line Items] |
|
|
| Percent of Net Asset Value |
0.90%
|
|
| Schwab Small-Cap Equity Fund | Portland General Electric Co. [Member] |
|
|
| Holdings [Line Items] |
|
|
| Percent of Net Asset Value |
0.80%
|
|
| Schwab Small-Cap Equity Fund | Bloom Energy Corp., Class A [Member] |
|
|
| Holdings [Line Items] |
|
|
| Percent of Net Asset Value |
1.10%
|
|
| Schwab Small-Cap Equity Fund | Credo Technology Group Holding Ltd. [Member] |
|
|
| Holdings [Line Items] |
|
|
| Percent of Net Asset Value |
1.20%
|
|
| Schwab Small-Cap Equity Fund | Financials [Member] |
|
|
| Holdings [Line Items] |
|
|
| Percent of Total Investments |
17.40%
|
[1] |
| Schwab Small-Cap Equity Fund | Information Technology Sector [Member] |
|
|
| Holdings [Line Items] |
|
|
| Percent of Total Investments |
16.80%
|
[1] |
| Schwab Small-Cap Equity Fund | Materials Sector [Member] |
|
|
| Holdings [Line Items] |
|
|
| Percent of Total Investments |
4.90%
|
[1] |
| Schwab Small-Cap Equity Fund | Energy Sector [Member] |
|
|
| Holdings [Line Items] |
|
|
| Percent of Total Investments |
4.60%
|
[1] |
| Schwab Small-Cap Equity Fund | Consumer Discretionary Sector [Member] |
|
|
| Holdings [Line Items] |
|
|
| Percent of Total Investments |
8.90%
|
[1] |
| Schwab Small-Cap Equity Fund | Communications Sector [Member] |
|
|
| Holdings [Line Items] |
|
|
| Percent of Total Investments |
2.90%
|
[1] |
| Schwab Small-Cap Equity Fund | Industrial Sector [Member] |
|
|
| Holdings [Line Items] |
|
|
| Percent of Total Investments |
17.90%
|
[1] |
| Schwab Small-Cap Equity Fund | Consumer Staples Sector [Member] |
|
|
| Holdings [Line Items] |
|
|
| Percent of Total Investments |
1.30%
|
[1] |
| Schwab Small-Cap Equity Fund | Utilities Sector [Member] |
|
|
| Holdings [Line Items] |
|
|
| Percent of Total Investments |
2.20%
|
[1] |
| Schwab Small-Cap Equity Fund | Real Estate Sector [Member] |
|
|
| Holdings [Line Items] |
|
|
| Percent of Total Investments |
4.40%
|
[1] |
| Schwab Small-Cap Equity Fund | Healthcare Sector [Member] |
|
|
| Holdings [Line Items] |
|
|
| Percent of Total Investments |
18.70%
|
[1] |
| Schwab Small-Cap Equity Fund | Short-Term Investments [Member] |
|
|
| Holdings [Line Items] |
|
|
| Percent of Total Investments |
0.00%
|
[1],[2],[3] |
| Schwab Health Care Fund | AbbVie, Inc. [Member] |
|
|
| Holdings [Line Items] |
|
|
| Percent of Net Asset Value |
6.30%
|
|
| Schwab Health Care Fund | UnitedHealth Group, Inc. [Member] |
|
|
| Holdings [Line Items] |
|
|
| Percent of Net Asset Value |
4.60%
|
|
| Schwab Health Care Fund | Thermo Fisher Scientific, Inc. [Member] |
|
|
| Holdings [Line Items] |
|
|
| Percent of Net Asset Value |
4.10%
|
|
| Schwab Health Care Fund | Boston Scientific Corp. [Member] |
|
|
| Holdings [Line Items] |
|
|
| Percent of Net Asset Value |
3.80%
|
|
| Schwab Health Care Fund | Stryker Corp. [Member] |
|
|
| Holdings [Line Items] |
|
|
| Percent of Net Asset Value |
3.50%
|
|
| Schwab Health Care Fund | Amgen, Inc. [Member] |
|
|
| Holdings [Line Items] |
|
|
| Percent of Net Asset Value |
3.30%
|
|
| Schwab Health Care Fund | Merck & Co., Inc. [Member] |
|
|
| Holdings [Line Items] |
|
|
| Percent of Net Asset Value |
3.10%
|
|
| Schwab Health Care Fund | Eli Lilly & Co. [Member] |
|
|
| Holdings [Line Items] |
|
|
| Percent of Net Asset Value |
11.00%
|
|
| Schwab Health Care Fund | Johnson & Johnson [Member] |
|
|
| Holdings [Line Items] |
|
|
| Percent of Net Asset Value |
5.80%
|
|
| Schwab Health Care Fund | Novartis AG [Member] |
|
|
| Holdings [Line Items] |
|
|
| Percent of Net Asset Value |
3.10%
|
|
| Schwab Health Care Fund | Pharmaceuticals [Member] |
|
|
| Holdings [Line Items] |
|
|
| Percent of Total Investments |
39.30%
|
|
| Schwab Health Care Fund | Biotechnology [Member] |
|
|
| Holdings [Line Items] |
|
|
| Percent of Total Investments |
19.80%
|
|
| Schwab Health Care Fund | Health Care Equipment [Member] |
|
|
| Holdings [Line Items] |
|
|
| Percent of Total Investments |
16.30%
|
|
| Schwab Health Care Fund | Life Sciences Tools & Services [Member] |
|
|
| Holdings [Line Items] |
|
|
| Percent of Total Investments |
9.20%
|
|
| Schwab Health Care Fund | Managed Health Care [Member] |
|
|
| Holdings [Line Items] |
|
|
| Percent of Total Investments |
5.60%
|
|
| Schwab Health Care Fund | Health Care Distributors [Member] |
|
|
| Holdings [Line Items] |
|
|
| Percent of Total Investments |
4.70%
|
|
| Schwab Health Care Fund | Health Care Services [Member] |
|
|
| Holdings [Line Items] |
|
|
| Percent of Total Investments |
2.30%
|
|
| Schwab Health Care Fund | Health Care Facilities [Member] |
|
|
| Holdings [Line Items] |
|
|
| Percent of Total Investments |
1.40%
|
|
| Schwab Health Care Fund | Health Care Supplies [Member] |
|
|
| Holdings [Line Items] |
|
|
| Percent of Total Investments |
1.40%
|
|
| Schwab Health Care Fund | UNITED STATES |
|
|
| Holdings [Line Items] |
|
|
| Percent of Total Investments |
78.80%
|
|
| Schwab Health Care Fund | IRELAND |
|
|
| Holdings [Line Items] |
|
|
| Percent of Total Investments |
2.90%
|
|
| Schwab Health Care Fund | JAPAN |
|
|
| Holdings [Line Items] |
|
|
| Percent of Total Investments |
3.30%
|
|
| Schwab Health Care Fund | UNITED KINGDOM |
|
|
| Holdings [Line Items] |
|
|
| Percent of Total Investments |
4.10%
|
|
| Schwab Health Care Fund | SWITZERLAND |
|
|
| Holdings [Line Items] |
|
|
| Percent of Total Investments |
5.10%
|
|
| Schwab Health Care Fund | Other Countries [Member] |
|
|
| Holdings [Line Items] |
|
|
| Percent of Total Investments |
5.80%
|
|
| Schwab International Core Equity Fund | Sony Group Corp [Member] |
|
|
| Holdings [Line Items] |
|
|
| Percent of Net Asset Value |
2.40%
|
|
| Schwab International Core Equity Fund | Rolls-Royce Holdings PLC [Member] |
|
|
| Holdings [Line Items] |
|
|
| Percent of Net Asset Value |
1.80%
|
|
| Schwab International Core Equity Fund | ABB Ltd. [Member] |
|
|
| Holdings [Line Items] |
|
|
| Percent of Net Asset Value |
1.60%
|
|
| Schwab International Core Equity Fund | BNP Paribas SA [Member] |
|
|
| Holdings [Line Items] |
|
|
| Percent of Net Asset Value |
1.60%
|
|
| Schwab International Core Equity Fund | ASML Holding NV [Member] |
|
|
| Holdings [Line Items] |
|
|
| Percent of Net Asset Value |
2.20%
|
|
| Schwab International Core Equity Fund | AstraZeneca PLC [Member] |
|
|
| Holdings [Line Items] |
|
|
| Percent of Net Asset Value |
1.70%
|
|
| Schwab International Core Equity Fund | Novartis AG [Member] |
|
|
| Holdings [Line Items] |
|
|
| Percent of Net Asset Value |
2.30%
|
|
| Schwab International Core Equity Fund | Shell PLC [Member] |
|
|
| Holdings [Line Items] |
|
|
| Percent of Net Asset Value |
1.90%
|
|
| Schwab International Core Equity Fund | HSBC Holdings PLC [Member] |
|
|
| Holdings [Line Items] |
|
|
| Percent of Net Asset Value |
2.10%
|
|
| Schwab International Core Equity Fund | Roche Holding AG [Member] |
|
|
| Holdings [Line Items] |
|
|
| Percent of Net Asset Value |
2.00%
|
|
| Schwab International Core Equity Fund | Financials [Member] |
|
|
| Holdings [Line Items] |
|
|
| Percent of Total Investments |
21.70%
|
|
| Schwab International Core Equity Fund | Information Technology Sector [Member] |
|
|
| Holdings [Line Items] |
|
|
| Percent of Total Investments |
10.40%
|
|
| Schwab International Core Equity Fund | Materials Sector [Member] |
|
|
| Holdings [Line Items] |
|
|
| Percent of Total Investments |
6.70%
|
|
| Schwab International Core Equity Fund | Energy Sector [Member] |
|
|
| Holdings [Line Items] |
|
|
| Percent of Total Investments |
3.90%
|
|
| Schwab International Core Equity Fund | Consumer Discretionary Sector [Member] |
|
|
| Holdings [Line Items] |
|
|
| Percent of Total Investments |
11.10%
|
|
| Schwab International Core Equity Fund | Communications Sector [Member] |
|
|
| Holdings [Line Items] |
|
|
| Percent of Total Investments |
5.30%
|
|
| Schwab International Core Equity Fund | Industrial Sector [Member] |
|
|
| Holdings [Line Items] |
|
|
| Percent of Total Investments |
19.50%
|
|
| Schwab International Core Equity Fund | Consumer Staples Sector [Member] |
|
|
| Holdings [Line Items] |
|
|
| Percent of Total Investments |
6.80%
|
|
| Schwab International Core Equity Fund | Utilities Sector [Member] |
|
|
| Holdings [Line Items] |
|
|
| Percent of Total Investments |
1.20%
|
|
| Schwab International Core Equity Fund | Real Estate Sector [Member] |
|
|
| Holdings [Line Items] |
|
|
| Percent of Total Investments |
1.00%
|
|
| Schwab International Core Equity Fund | Healthcare Sector [Member] |
|
|
| Holdings [Line Items] |
|
|
| Percent of Total Investments |
12.40%
|
|
| Schwab International Core Equity Fund | ITALY |
|
|
| Holdings [Line Items] |
|
|
| Percent of Total Investments |
2.00%
|
|
| Schwab International Core Equity Fund | SPAIN |
|
|
| Holdings [Line Items] |
|
|
| Percent of Total Investments |
4.80%
|
|
| Schwab International Core Equity Fund | NETHERLANDS |
|
|
| Holdings [Line Items] |
|
|
| Percent of Total Investments |
5.10%
|
|
| Schwab International Core Equity Fund | JAPAN |
|
|
| Holdings [Line Items] |
|
|
| Percent of Total Investments |
19.70%
|
|
| Schwab International Core Equity Fund | KOREA, REPUBLIC OF |
|
|
| Holdings [Line Items] |
|
|
| Percent of Total Investments |
2.20%
|
|
| Schwab International Core Equity Fund | UNITED KINGDOM |
|
|
| Holdings [Line Items] |
|
|
| Percent of Total Investments |
15.60%
|
|
| Schwab International Core Equity Fund | AUSTRALIA |
|
|
| Holdings [Line Items] |
|
|
| Percent of Total Investments |
4.40%
|
|
| Schwab International Core Equity Fund | FRANCE |
|
|
| Holdings [Line Items] |
|
|
| Percent of Total Investments |
8.90%
|
|
| Schwab International Core Equity Fund | GERMANY |
|
|
| Holdings [Line Items] |
|
|
| Percent of Total Investments |
8.00%
|
|
| Schwab International Core Equity Fund | SWEDEN |
|
|
| Holdings [Line Items] |
|
|
| Percent of Total Investments |
2.30%
|
|
| Schwab International Core Equity Fund | SWITZERLAND |
|
|
| Holdings [Line Items] |
|
|
| Percent of Total Investments |
10.40%
|
|
| Schwab International Core Equity Fund | CHINA |
|
|
| Holdings [Line Items] |
|
|
| Percent of Total Investments |
3.30%
|
|
| Schwab International Core Equity Fund | Other Countries [Member] |
|
|
| Holdings [Line Items] |
|
|
| Percent of Total Investments |
13.30%
|
|
| Schwab S&P 500 Index Fund | NVIDIA Corp. [Member] |
|
|
| Holdings [Line Items] |
|
|
| Percent of Net Asset Value |
8.40%
|
|
| Schwab S&P 500 Index Fund | Broadcom, Inc. [Member] |
|
|
| Holdings [Line Items] |
|
|
| Percent of Net Asset Value |
3.00%
|
|
| Schwab S&P 500 Index Fund | Tesla, Inc. [Member] |
|
|
| Holdings [Line Items] |
|
|
| Percent of Net Asset Value |
2.20%
|
|
| Schwab S&P 500 Index Fund | Berkshire Hathaway, Inc., Class B [Member] |
|
|
| Holdings [Line Items] |
|
|
| Percent of Net Asset Value |
1.50%
|
|
| Schwab S&P 500 Index Fund | Apple, Inc. [Member] |
|
|
| Holdings [Line Items] |
|
|
| Percent of Net Asset Value |
6.90%
|
|
| Schwab S&P 500 Index Fund | Microsoft Corp. [Member] |
|
|
| Holdings [Line Items] |
|
|
| Percent of Net Asset Value |
6.60%
|
|
| Schwab S&P 500 Index Fund | Alphabet, Inc., Class A [Member] |
|
|
| Holdings [Line Items] |
|
|
| Percent of Net Asset Value |
2.80%
|
|
| Schwab S&P 500 Index Fund | Alphabet, Inc., Class C [Member] |
|
|
| Holdings [Line Items] |
|
|
| Percent of Net Asset Value |
2.20%
|
|
| Schwab S&P 500 Index Fund | Amazon.com, Inc. [Member] |
|
|
| Holdings [Line Items] |
|
|
| Percent of Net Asset Value |
4.10%
|
|
| Schwab S&P 500 Index Fund | Meta Platforms, Inc., Class A [Member] |
|
|
| Holdings [Line Items] |
|
|
| Percent of Net Asset Value |
2.40%
|
|
| Schwab S&P 500 Index Fund | Financials [Member] |
|
|
| Holdings [Line Items] |
|
|
| Percent of Total Investments |
12.90%
|
[1] |
| Schwab S&P 500 Index Fund | Information Technology Sector [Member] |
|
|
| Holdings [Line Items] |
|
|
| Percent of Total Investments |
36.10%
|
[1] |
| Schwab S&P 500 Index Fund | Materials Sector [Member] |
|
|
| Holdings [Line Items] |
|
|
| Percent of Total Investments |
1.70%
|
[1] |
| Schwab S&P 500 Index Fund | Energy Sector [Member] |
|
|
| Holdings [Line Items] |
|
|
| Percent of Total Investments |
2.80%
|
[1] |
| Schwab S&P 500 Index Fund | Consumer Discretionary Sector [Member] |
|
|
| Holdings [Line Items] |
|
|
| Percent of Total Investments |
10.50%
|
[1] |
| Schwab S&P 500 Index Fund | Communications Sector [Member] |
|
|
| Holdings [Line Items] |
|
|
| Percent of Total Investments |
10.10%
|
[1] |
| Schwab S&P 500 Index Fund | Industrial Sector [Member] |
|
|
| Holdings [Line Items] |
|
|
| Percent of Total Investments |
8.10%
|
[1] |
| Schwab S&P 500 Index Fund | Consumer Staples Sector [Member] |
|
|
| Holdings [Line Items] |
|
|
| Percent of Total Investments |
4.70%
|
[1] |
| Schwab S&P 500 Index Fund | Utilities Sector [Member] |
|
|
| Holdings [Line Items] |
|
|
| Percent of Total Investments |
2.30%
|
[1] |
| Schwab S&P 500 Index Fund | Real Estate Sector [Member] |
|
|
| Holdings [Line Items] |
|
|
| Percent of Total Investments |
1.80%
|
[1] |
| Schwab S&P 500 Index Fund | Healthcare Sector [Member] |
|
|
| Holdings [Line Items] |
|
|
| Percent of Total Investments |
9.00%
|
[1] |
| Schwab S&P 500 Index Fund | Short-Term Investments [Member] |
|
|
| Holdings [Line Items] |
|
|
| Percent of Total Investments |
0.00%
|
[1],[2],[3] |
| Schwab Small-Cap Index Fund | Bloom Energy Corp., Class A [Member] |
|
|
| Holdings [Line Items] |
|
|
| Percent of Net Asset Value |
1.00%
|
|
| Schwab Small-Cap Index Fund | Credo Technology Group Holding Ltd. [Member] |
|
|
| Holdings [Line Items] |
|
|
| Percent of Net Asset Value |
1.00%
|
|
| Schwab Small-Cap Index Fund | IonQ, Inc. [Member] |
|
|
| Holdings [Line Items] |
|
|
| Percent of Net Asset Value |
0.60%
|
|
| Schwab Small-Cap Index Fund | Fabrinet [Member] |
|
|
| Holdings [Line Items] |
|
|
| Percent of Net Asset Value |
0.60%
|
|
| Schwab Small-Cap Index Fund | Kratos Defense & Security Solutions, Inc. [Member] |
|
|
| Holdings [Line Items] |
|
|
| Percent of Net Asset Value |
0.50%
|
|
| Schwab Small-Cap Index Fund | NEXTracker, Inc., Class A [Member] |
|
|
| Holdings [Line Items] |
|
|
| Percent of Net Asset Value |
0.50%
|
|
| Schwab Small-Cap Index Fund | Oklo, Inc. [Member] |
|
|
| Holdings [Line Items] |
|
|
| Percent of Net Asset Value |
0.50%
|
|
| Schwab Small-Cap Index Fund | Rigetti Computing, Inc. [Member] |
|
|
| Holdings [Line Items] |
|
|
| Percent of Net Asset Value |
0.50%
|
|
| Schwab Small-Cap Index Fund | AeroVironment, Inc. [Member] |
|
|
| Holdings [Line Items] |
|
|
| Percent of Net Asset Value |
0.40%
|
|
| Schwab Small-Cap Index Fund | D-Wave Quantum, Inc. [Member] |
|
|
| Holdings [Line Items] |
|
|
| Percent of Net Asset Value |
0.40%
|
|
| Schwab Small-Cap Index Fund | Financials [Member] |
|
|
| Holdings [Line Items] |
|
|
| Percent of Total Investments |
16.60%
|
[1] |
| Schwab Small-Cap Index Fund | Information Technology Sector [Member] |
|
|
| Holdings [Line Items] |
|
|
| Percent of Total Investments |
16.20%
|
[1] |
| Schwab Small-Cap Index Fund | Materials Sector [Member] |
|
|
| Holdings [Line Items] |
|
|
| Percent of Total Investments |
4.00%
|
[1] |
| Schwab Small-Cap Index Fund | Energy Sector [Member] |
|
|
| Holdings [Line Items] |
|
|
| Percent of Total Investments |
4.90%
|
[1] |
| Schwab Small-Cap Index Fund | Consumer Discretionary Sector [Member] |
|
|
| Holdings [Line Items] |
|
|
| Percent of Total Investments |
8.90%
|
[1] |
| Schwab Small-Cap Index Fund | Communications Sector [Member] |
|
|
| Holdings [Line Items] |
|
|
| Percent of Total Investments |
2.80%
|
[1] |
| Schwab Small-Cap Index Fund | Industrial Sector [Member] |
|
|
| Holdings [Line Items] |
|
|
| Percent of Total Investments |
17.90%
|
[1] |
| Schwab Small-Cap Index Fund | Consumer Staples Sector [Member] |
|
|
| Holdings [Line Items] |
|
|
| Percent of Total Investments |
1.80%
|
[1] |
| Schwab Small-Cap Index Fund | Utilities Sector [Member] |
|
|
| Holdings [Line Items] |
|
|
| Percent of Total Investments |
3.30%
|
[1] |
| Schwab Small-Cap Index Fund | Real Estate Sector [Member] |
|
|
| Holdings [Line Items] |
|
|
| Percent of Total Investments |
5.50%
|
[1] |
| Schwab Small-Cap Index Fund | Healthcare Sector [Member] |
|
|
| Holdings [Line Items] |
|
|
| Percent of Total Investments |
16.80%
|
[1] |
| Schwab Small-Cap Index Fund | Short-Term Investments [Member] |
|
|
| Holdings [Line Items] |
|
|
| Percent of Total Investments |
1.30%
|
[1],[2] |
| Schwab Total Stock Market Index Fund | NVIDIA Corp. [Member] |
|
|
| Holdings [Line Items] |
|
|
| Percent of Net Asset Value |
7.40%
|
|
| Schwab Total Stock Market Index Fund | Broadcom, Inc. [Member] |
|
|
| Holdings [Line Items] |
|
|
| Percent of Net Asset Value |
2.60%
|
|
| Schwab Total Stock Market Index Fund | Tesla, Inc. [Member] |
|
|
| Holdings [Line Items] |
|
|
| Percent of Net Asset Value |
1.90%
|
|
| Schwab Total Stock Market Index Fund | Berkshire Hathaway, Inc., Class B [Member] |
|
|
| Holdings [Line Items] |
|
|
| Percent of Net Asset Value |
1.30%
|
|
| Schwab Total Stock Market Index Fund | Apple, Inc. [Member] |
|
|
| Holdings [Line Items] |
|
|
| Percent of Net Asset Value |
6.00%
|
|
| Schwab Total Stock Market Index Fund | Microsoft Corp. [Member] |
|
|
| Holdings [Line Items] |
|
|
| Percent of Net Asset Value |
5.80%
|
|
| Schwab Total Stock Market Index Fund | Alphabet, Inc., Class A [Member] |
|
|
| Holdings [Line Items] |
|
|
| Percent of Net Asset Value |
2.50%
|
|
| Schwab Total Stock Market Index Fund | Alphabet, Inc., Class C [Member] |
|
|
| Holdings [Line Items] |
|
|
| Percent of Net Asset Value |
2.00%
|
|
| Schwab Total Stock Market Index Fund | Amazon.com, Inc. [Member] |
|
|
| Holdings [Line Items] |
|
|
| Percent of Net Asset Value |
3.60%
|
|
| Schwab Total Stock Market Index Fund | Meta Platforms, Inc., Class A [Member] |
|
|
| Holdings [Line Items] |
|
|
| Percent of Net Asset Value |
2.10%
|
|
| Schwab Total Stock Market Index Fund | Financials [Member] |
|
|
| Holdings [Line Items] |
|
|
| Percent of Total Investments |
13.10%
|
[1] |
| Schwab Total Stock Market Index Fund | Information Technology Sector [Member] |
|
|
| Holdings [Line Items] |
|
|
| Percent of Total Investments |
34.20%
|
[1] |
| Schwab Total Stock Market Index Fund | Materials Sector [Member] |
|
|
| Holdings [Line Items] |
|
|
| Percent of Total Investments |
2.00%
|
[1] |
| Schwab Total Stock Market Index Fund | Energy Sector [Member] |
|
|
| Holdings [Line Items] |
|
|
| Percent of Total Investments |
2.90%
|
[1] |
| Schwab Total Stock Market Index Fund | Consumer Discretionary Sector [Member] |
|
|
| Holdings [Line Items] |
|
|
| Percent of Total Investments |
10.50%
|
[1] |
| Schwab Total Stock Market Index Fund | Communications Sector [Member] |
|
|
| Holdings [Line Items] |
|
|
| Percent of Total Investments |
9.40%
|
[1] |
| Schwab Total Stock Market Index Fund | Industrial Sector [Member] |
|
|
| Holdings [Line Items] |
|
|
| Percent of Total Investments |
9.50%
|
[1] |
| Schwab Total Stock Market Index Fund | Consumer Staples Sector [Member] |
|
|
| Holdings [Line Items] |
|
|
| Percent of Total Investments |
4.40%
|
[1] |
| Schwab Total Stock Market Index Fund | Utilities Sector [Member] |
|
|
| Holdings [Line Items] |
|
|
| Percent of Total Investments |
2.30%
|
[1] |
| Schwab Total Stock Market Index Fund | Real Estate Sector [Member] |
|
|
| Holdings [Line Items] |
|
|
| Percent of Total Investments |
2.20%
|
[1] |
| Schwab Total Stock Market Index Fund | Healthcare Sector [Member] |
|
|
| Holdings [Line Items] |
|
|
| Percent of Total Investments |
9.40%
|
[1] |
| Schwab Total Stock Market Index Fund | Short-Term Investments [Member] |
|
|
| Holdings [Line Items] |
|
|
| Percent of Total Investments |
0.10%
|
[1],[2] |
| Schwab U.S. Large-Cap Growth Index Fund | NVIDIA Corp. [Member] |
|
|
| Holdings [Line Items] |
|
|
| Percent of Net Asset Value |
13.70%
|
|
| Schwab U.S. Large-Cap Growth Index Fund | Broadcom, Inc. [Member] |
|
|
| Holdings [Line Items] |
|
|
| Percent of Net Asset Value |
5.00%
|
|
| Schwab U.S. Large-Cap Growth Index Fund | Tesla, Inc. [Member] |
|
|
| Holdings [Line Items] |
|
|
| Percent of Net Asset Value |
3.90%
|
|
| Schwab U.S. Large-Cap Growth Index Fund | Eli Lilly & Co. [Member] |
|
|
| Holdings [Line Items] |
|
|
| Percent of Net Asset Value |
2.10%
|
|
| Schwab U.S. Large-Cap Growth Index Fund | Apple, Inc. [Member] |
|
|
| Holdings [Line Items] |
|
|
| Percent of Net Asset Value |
11.40%
|
|
| Schwab U.S. Large-Cap Growth Index Fund | Microsoft Corp. [Member] |
|
|
| Holdings [Line Items] |
|
|
| Percent of Net Asset Value |
11.10%
|
|
| Schwab U.S. Large-Cap Growth Index Fund | Alphabet, Inc., Class A [Member] |
|
|
| Holdings [Line Items] |
|
|
| Percent of Net Asset Value |
3.10%
|
|
| Schwab U.S. Large-Cap Growth Index Fund | Alphabet, Inc., Class C [Member] |
|
|
| Holdings [Line Items] |
|
|
| Percent of Net Asset Value |
2.50%
|
|
| Schwab U.S. Large-Cap Growth Index Fund | Amazon.com, Inc. [Member] |
|
|
| Holdings [Line Items] |
|
|
| Percent of Net Asset Value |
4.50%
|
|
| Schwab U.S. Large-Cap Growth Index Fund | Meta Platforms, Inc., Class A [Member] |
|
|
| Holdings [Line Items] |
|
|
| Percent of Net Asset Value |
3.20%
|
|
| Schwab U.S. Large-Cap Growth Index Fund | Investment Companies [Member] |
|
|
| Holdings [Line Items] |
|
|
| Percent of Total Investments |
0.20%
|
[1] |
| Schwab U.S. Large-Cap Growth Index Fund | Financials [Member] |
|
|
| Holdings [Line Items] |
|
|
| Percent of Total Investments |
5.80%
|
[1] |
| Schwab U.S. Large-Cap Growth Index Fund | Information Technology Sector [Member] |
|
|
| Holdings [Line Items] |
|
|
| Percent of Total Investments |
53.30%
|
[1] |
| Schwab U.S. Large-Cap Growth Index Fund | Materials Sector [Member] |
|
|
| Holdings [Line Items] |
|
|
| Percent of Total Investments |
0.30%
|
[1] |
| Schwab U.S. Large-Cap Growth Index Fund | Energy Sector [Member] |
|
|
| Holdings [Line Items] |
|
|
| Percent of Total Investments |
0.30%
|
[1] |
| Schwab U.S. Large-Cap Growth Index Fund | Consumer Discretionary Sector [Member] |
|
|
| Holdings [Line Items] |
|
|
| Percent of Total Investments |
12.90%
|
[1] |
| Schwab U.S. Large-Cap Growth Index Fund | Communications Sector [Member] |
|
|
| Holdings [Line Items] |
|
|
| Percent of Total Investments |
11.20%
|
[1] |
| Schwab U.S. Large-Cap Growth Index Fund | Industrial Sector [Member] |
|
|
| Holdings [Line Items] |
|
|
| Percent of Total Investments |
5.70%
|
[1] |
| Schwab U.S. Large-Cap Growth Index Fund | Consumer Staples Sector [Member] |
|
|
| Holdings [Line Items] |
|
|
| Percent of Total Investments |
2.30%
|
[1] |
| Schwab U.S. Large-Cap Growth Index Fund | Utilities Sector [Member] |
|
|
| Holdings [Line Items] |
|
|
| Percent of Total Investments |
0.30%
|
[1] |
| Schwab U.S. Large-Cap Growth Index Fund | Real Estate Sector [Member] |
|
|
| Holdings [Line Items] |
|
|
| Percent of Total Investments |
0.40%
|
[1] |
| Schwab U.S. Large-Cap Growth Index Fund | Healthcare Sector [Member] |
|
|
| Holdings [Line Items] |
|
|
| Percent of Total Investments |
6.90%
|
[1] |
| Schwab U.S. Large-Cap Growth Index Fund | Short-Term Investments [Member] |
|
|
| Holdings [Line Items] |
|
|
| Percent of Total Investments |
0.40%
|
[1],[2] |
| Schwab U.S. Large-Cap Value Index Fund | Berkshire Hathaway, Inc., Class B [Member] |
|
|
| Holdings [Line Items] |
|
|
| Percent of Net Asset Value |
3.00%
|
|
| Schwab U.S. Large-Cap Value Index Fund | Johnson & Johnson [Member] |
|
|
| Holdings [Line Items] |
|
|
| Percent of Net Asset Value |
1.60%
|
|
| Schwab U.S. Large-Cap Value Index Fund | Walmart, Inc. [Member] |
|
|
| Holdings [Line Items] |
|
|
| Percent of Net Asset Value |
1.40%
|
|
| Schwab U.S. Large-Cap Value Index Fund | Procter & Gamble Co. [Member] |
|
|
| Holdings [Line Items] |
|
|
| Percent of Net Asset Value |
1.20%
|
|
| Schwab U.S. Large-Cap Value Index Fund | Bank of America Corp. [Member] |
|
|
| Holdings [Line Items] |
|
|
| Percent of Net Asset Value |
1.10%
|
|
| Schwab U.S. Large-Cap Value Index Fund | Alphabet, Inc., Class A [Member] |
|
|
| Holdings [Line Items] |
|
|
| Percent of Net Asset Value |
2.00%
|
|
| Schwab U.S. Large-Cap Value Index Fund | Exxon Mobil Corp. [Member] |
|
|
| Holdings [Line Items] |
|
|
| Percent of Net Asset Value |
1.70%
|
|
| Schwab U.S. Large-Cap Value Index Fund | Alphabet, Inc., Class C [Member] |
|
|
| Holdings [Line Items] |
|
|
| Percent of Net Asset Value |
1.60%
|
|
| Schwab U.S. Large-Cap Value Index Fund | JPMorgan Chase & Co. [Member] |
|
|
| Holdings [Line Items] |
|
|
| Percent of Net Asset Value |
2.90%
|
|
| Schwab U.S. Large-Cap Value Index Fund | Amazon.com, Inc. [Member] |
|
|
| Holdings [Line Items] |
|
|
| Percent of Net Asset Value |
2.20%
|
|
| Schwab U.S. Large-Cap Value Index Fund | Investment Companies [Member] |
|
|
| Holdings [Line Items] |
|
|
| Percent of Total Investments |
0.10%
|
[1] |
| Schwab U.S. Large-Cap Value Index Fund | Financials [Member] |
|
|
| Holdings [Line Items] |
|
|
| Percent of Total Investments |
21.90%
|
[1] |
| Schwab U.S. Large-Cap Value Index Fund | Information Technology Sector [Member] |
|
|
| Holdings [Line Items] |
|
|
| Percent of Total Investments |
11.30%
|
[1] |
| Schwab U.S. Large-Cap Value Index Fund | Materials Sector [Member] |
|
|
| Holdings [Line Items] |
|
|
| Percent of Total Investments |
3.90%
|
[1] |
| Schwab U.S. Large-Cap Value Index Fund | Energy Sector [Member] |
|
|
| Holdings [Line Items] |
|
|
| Percent of Total Investments |
5.80%
|
[1] |
| Schwab U.S. Large-Cap Value Index Fund | Consumer Discretionary Sector [Member] |
|
|
| Holdings [Line Items] |
|
|
| Percent of Total Investments |
7.60%
|
[1] |
| Schwab U.S. Large-Cap Value Index Fund | Communications Sector [Member] |
|
|
| Holdings [Line Items] |
|
|
| Percent of Total Investments |
8.10%
|
[1] |
| Schwab U.S. Large-Cap Value Index Fund | Industrial Sector [Member] |
|
|
| Holdings [Line Items] |
|
|
| Percent of Total Investments |
13.20%
|
[1] |
| Schwab U.S. Large-Cap Value Index Fund | Consumer Staples Sector [Member] |
|
|
| Holdings [Line Items] |
|
|
| Percent of Total Investments |
7.30%
|
[1] |
| Schwab U.S. Large-Cap Value Index Fund | Utilities Sector [Member] |
|
|
| Holdings [Line Items] |
|
|
| Percent of Total Investments |
4.60%
|
[1] |
| Schwab U.S. Large-Cap Value Index Fund | Real Estate Sector [Member] |
|
|
| Holdings [Line Items] |
|
|
| Percent of Total Investments |
4.10%
|
[1] |
| Schwab U.S. Large-Cap Value Index Fund | Healthcare Sector [Member] |
|
|
| Holdings [Line Items] |
|
|
| Percent of Total Investments |
11.90%
|
[1] |
| Schwab U.S. Large-Cap Value Index Fund | Short-Term Investments [Member] |
|
|
| Holdings [Line Items] |
|
|
| Percent of Total Investments |
0.20%
|
[1],[2] |
| Schwab U.S. Mid-Cap Index Fund | Robinhood Markets, Inc., Class A [Member] |
|
|
| Holdings [Line Items] |
|
|
| Percent of Net Asset Value |
0.90%
|
|
| Schwab U.S. Mid-Cap Index Fund | Howmet Aerospace, Inc. [Member] |
|
|
| Holdings [Line Items] |
|
|
| Percent of Net Asset Value |
0.70%
|
|
| Schwab U.S. Mid-Cap Index Fund | Cloudflare, Inc., Class A [Member] |
|
|
| Holdings [Line Items] |
|
|
| Percent of Net Asset Value |
0.60%
|
|
| Schwab U.S. Mid-Cap Index Fund | Bank of New York Mellon Corp. [Member] |
|
|
| Holdings [Line Items] |
|
|
| Percent of Net Asset Value |
0.60%
|
|
| Schwab U.S. Mid-Cap Index Fund | Vertiv Holdings Co., Class A [Member] |
|
|
| Holdings [Line Items] |
|
|
| Percent of Net Asset Value |
0.60%
|
|
| Schwab U.S. Mid-Cap Index Fund | Royal Caribbean Cruises Ltd. [Member] |
|
|
| Holdings [Line Items] |
|
|
| Percent of Net Asset Value |
0.60%
|
|
| Schwab U.S. Mid-Cap Index Fund | Coinbase Global, Inc., Class A [Member] |
|
|
| Holdings [Line Items] |
|
|
| Percent of Net Asset Value |
0.60%
|
|
| Schwab U.S. Mid-Cap Index Fund | Corning, Inc. [Member] |
|
|
| Holdings [Line Items] |
|
|
| Percent of Net Asset Value |
0.60%
|
|
| Schwab U.S. Mid-Cap Index Fund | ROBLOX Corp., Class A [Member] |
|
|
| Holdings [Line Items] |
|
|
| Percent of Net Asset Value |
0.60%
|
|
| Schwab U.S. Mid-Cap Index Fund | Quanta Services, Inc. [Member] |
|
|
| Holdings [Line Items] |
|
|
| Percent of Net Asset Value |
0.50%
|
|
| Schwab U.S. Mid-Cap Index Fund | Investment Companies [Member] |
|
|
| Holdings [Line Items] |
|
|
| Percent of Total Investments |
0.20%
|
[1] |
| Schwab U.S. Mid-Cap Index Fund | Financials [Member] |
|
|
| Holdings [Line Items] |
|
|
| Percent of Total Investments |
14.90%
|
[1] |
| Schwab U.S. Mid-Cap Index Fund | Information Technology Sector [Member] |
|
|
| Holdings [Line Items] |
|
|
| Percent of Total Investments |
12.50%
|
[1] |
| Schwab U.S. Mid-Cap Index Fund | Materials Sector [Member] |
|
|
| Holdings [Line Items] |
|
|
| Percent of Total Investments |
4.80%
|
[1] |
| Schwab U.S. Mid-Cap Index Fund | Energy Sector [Member] |
|
|
| Holdings [Line Items] |
|
|
| Percent of Total Investments |
5.50%
|
[1] |
| Schwab U.S. Mid-Cap Index Fund | Consumer Discretionary Sector [Member] |
|
|
| Holdings [Line Items] |
|
|
| Percent of Total Investments |
11.30%
|
[1] |
| Schwab U.S. Mid-Cap Index Fund | Communications Sector [Member] |
|
|
| Holdings [Line Items] |
|
|
| Percent of Total Investments |
4.20%
|
[1] |
| Schwab U.S. Mid-Cap Index Fund | Industrial Sector [Member] |
|
|
| Holdings [Line Items] |
|
|
| Percent of Total Investments |
18.40%
|
[1] |
| Schwab U.S. Mid-Cap Index Fund | Consumer Staples Sector [Member] |
|
|
| Holdings [Line Items] |
|
|
| Percent of Total Investments |
4.70%
|
[1] |
| Schwab U.S. Mid-Cap Index Fund | Utilities Sector [Member] |
|
|
| Holdings [Line Items] |
|
|
| Percent of Total Investments |
6.30%
|
[1] |
| Schwab U.S. Mid-Cap Index Fund | Real Estate Sector [Member] |
|
|
| Holdings [Line Items] |
|
|
| Percent of Total Investments |
7.00%
|
[1] |
| Schwab U.S. Mid-Cap Index Fund | Healthcare Sector [Member] |
|
|
| Holdings [Line Items] |
|
|
| Percent of Total Investments |
9.80%
|
[1] |
| Schwab U.S. Mid-Cap Index Fund | Short-Term Investments [Member] |
|
|
| Holdings [Line Items] |
|
|
| Percent of Total Investments |
0.40%
|
[1],[2] |
| Schwab International Index Fund | ASML Holding NV [Member] |
|
|
| Holdings [Line Items] |
|
|
| Percent of Net Asset Value |
2.10%
|
|
| Schwab International Index Fund | SAP SE [Member] |
|
|
| Holdings [Line Items] |
|
|
| Percent of Net Asset Value |
1.40%
|
|
| Schwab International Index Fund | AstraZeneca PLC [Member] |
|
|
| Holdings [Line Items] |
|
|
| Percent of Net Asset Value |
1.30%
|
|
| Schwab International Index Fund | Nestle SA [Member] |
|
|
| Holdings [Line Items] |
|
|
| Percent of Net Asset Value |
1.20%
|
|
| Schwab International Index Fund | Novartis AG [Member] |
|
|
| Holdings [Line Items] |
|
|
| Percent of Net Asset Value |
1.20%
|
|
| Schwab International Index Fund | Siemens AG [Member] |
|
|
| Holdings [Line Items] |
|
|
| Percent of Net Asset Value |
1.10%
|
|
| Schwab International Index Fund | Shell PLC [Member] |
|
|
| Holdings [Line Items] |
|
|
| Percent of Net Asset Value |
1.10%
|
|
| Schwab International Index Fund | Toyota Motor Corp. [Member] |
|
|
| Holdings [Line Items] |
|
|
| Percent of Net Asset Value |
1.00%
|
|
| Schwab International Index Fund | HSBC Holdings PLC [Member] |
|
|
| Holdings [Line Items] |
|
|
| Percent of Net Asset Value |
1.20%
|
|
| Schwab International Index Fund | Roche Holding AG [Member] |
|
|
| Holdings [Line Items] |
|
|
| Percent of Net Asset Value |
1.10%
|
|
| Schwab International Index Fund | Financials [Member] |
|
|
| Holdings [Line Items] |
|
|
| Percent of Total Investments |
24.10%
|
[1] |
| Schwab International Index Fund | Information Technology Sector [Member] |
|
|
| Holdings [Line Items] |
|
|
| Percent of Total Investments |
8.80%
|
[1] |
| Schwab International Index Fund | Materials Sector [Member] |
|
|
| Holdings [Line Items] |
|
|
| Percent of Total Investments |
5.60%
|
[1] |
| Schwab International Index Fund | Energy Sector [Member] |
|
|
| Holdings [Line Items] |
|
|
| Percent of Total Investments |
3.20%
|
[1] |
| Schwab International Index Fund | Consumer Discretionary Sector [Member] |
|
|
| Holdings [Line Items] |
|
|
| Percent of Total Investments |
10.10%
|
[1] |
| Schwab International Index Fund | Communications Sector [Member] |
|
|
| Holdings [Line Items] |
|
|
| Percent of Total Investments |
5.00%
|
[1] |
| Schwab International Index Fund | Industrial Sector [Member] |
|
|
| Holdings [Line Items] |
|
|
| Percent of Total Investments |
19.40%
|
[1] |
| Schwab International Index Fund | Consumer Staples Sector [Member] |
|
|
| Holdings [Line Items] |
|
|
| Percent of Total Investments |
7.50%
|
[1] |
| Schwab International Index Fund | Utilities Sector [Member] |
|
|
| Holdings [Line Items] |
|
|
| Percent of Total Investments |
3.60%
|
[1] |
| Schwab International Index Fund | Real Estate Sector [Member] |
|
|
| Holdings [Line Items] |
|
|
| Percent of Total Investments |
1.80%
|
[1] |
| Schwab International Index Fund | Healthcare Sector [Member] |
|
|
| Holdings [Line Items] |
|
|
| Percent of Total Investments |
10.90%
|
[1] |
| Schwab International Index Fund | Short-Term Investments [Member] |
|
|
| Holdings [Line Items] |
|
|
| Percent of Total Investments |
0.00%
|
[1],[2],[3] |
| Schwab International Index Fund | ITALY |
|
|
| Holdings [Line Items] |
|
|
| Percent of Total Investments |
3.20%
|
[1] |
| Schwab International Index Fund | SPAIN |
|
|
| Holdings [Line Items] |
|
|
| Percent of Total Investments |
3.60%
|
[1] |
| Schwab International Index Fund | NETHERLANDS |
|
|
| Holdings [Line Items] |
|
|
| Percent of Total Investments |
5.00%
|
[1] |
| Schwab International Index Fund | JAPAN |
|
|
| Holdings [Line Items] |
|
|
| Percent of Total Investments |
22.80%
|
[1] |
| Schwab International Index Fund | UNITED KINGDOM |
|
|
| Holdings [Line Items] |
|
|
| Percent of Total Investments |
14.80%
|
[1] |
| Schwab International Index Fund | AUSTRALIA |
|
|
| Holdings [Line Items] |
|
|
| Percent of Total Investments |
6.70%
|
[1] |
| Schwab International Index Fund | FRANCE |
|
|
| Holdings [Line Items] |
|
|
| Percent of Total Investments |
10.90%
|
[1] |
| Schwab International Index Fund | GERMANY |
|
|
| Holdings [Line Items] |
|
|
| Percent of Total Investments |
9.30%
|
[1] |
| Schwab International Index Fund | SWEDEN |
|
|
| Holdings [Line Items] |
|
|
| Percent of Total Investments |
3.60%
|
[1] |
| Schwab International Index Fund | SWITZERLAND |
|
|
| Holdings [Line Items] |
|
|
| Percent of Total Investments |
9.30%
|
[1] |
| Schwab International Index Fund | Other Countries [Member] |
|
|
| Holdings [Line Items] |
|
|
| Percent of Total Investments |
10.90%
|
[1] |
| Schwab Fundamental U.S. Large Company Index Fund | Apple, Inc. [Member] |
|
|
| Holdings [Line Items] |
|
|
| Percent of Net Asset Value |
4.70%
|
|
| Schwab Fundamental U.S. Large Company Index Fund | Microsoft Corp. [Member] |
|
|
| Holdings [Line Items] |
|
|
| Percent of Net Asset Value |
2.90%
|
|
| Schwab Fundamental U.S. Large Company Index Fund | Alphabet, Inc., Class A [Member] |
|
|
| Holdings [Line Items] |
|
|
| Percent of Net Asset Value |
2.30%
|
|
| Schwab Fundamental U.S. Large Company Index Fund | Exxon Mobil Corp. [Member] |
|
|
| Holdings [Line Items] |
|
|
| Percent of Net Asset Value |
2.10%
|
|
| Schwab Fundamental U.S. Large Company Index Fund | Alphabet, Inc., Class C [Member] |
|
|
| Holdings [Line Items] |
|
|
| Percent of Net Asset Value |
1.80%
|
|
| Schwab Fundamental U.S. Large Company Index Fund | JPMorgan Chase & Co. [Member] |
|
|
| Holdings [Line Items] |
|
|
| Percent of Net Asset Value |
1.70%
|
|
| Schwab Fundamental U.S. Large Company Index Fund | Amazon.com, Inc. [Member] |
|
|
| Holdings [Line Items] |
|
|
| Percent of Net Asset Value |
1.70%
|
|
| Schwab Fundamental U.S. Large Company Index Fund | Chevron Corp. [Member] |
|
|
| Holdings [Line Items] |
|
|
| Percent of Net Asset Value |
1.50%
|
|
| Schwab Fundamental U.S. Large Company Index Fund | Intel Corp. [Member] |
|
|
| Holdings [Line Items] |
|
|
| Percent of Net Asset Value |
1.40%
|
|
| Schwab Fundamental U.S. Large Company Index Fund | Meta Platforms, Inc., Class A [Member] |
|
|
| Holdings [Line Items] |
|
|
| Percent of Net Asset Value |
1.30%
|
|
| Schwab Fundamental U.S. Large Company Index Fund | Financials [Member] |
|
|
| Holdings [Line Items] |
|
|
| Percent of Total Investments |
15.80%
|
[1] |
| Schwab Fundamental U.S. Large Company Index Fund | Information Technology Sector [Member] |
|
|
| Holdings [Line Items] |
|
|
| Percent of Total Investments |
18.40%
|
[1] |
| Schwab Fundamental U.S. Large Company Index Fund | Materials Sector [Member] |
|
|
| Holdings [Line Items] |
|
|
| Percent of Total Investments |
3.50%
|
[1] |
| Schwab Fundamental U.S. Large Company Index Fund | Energy Sector [Member] |
|
|
| Holdings [Line Items] |
|
|
| Percent of Total Investments |
8.40%
|
[1] |
| Schwab Fundamental U.S. Large Company Index Fund | Consumer Discretionary Sector [Member] |
|
|
| Holdings [Line Items] |
|
|
| Percent of Total Investments |
9.30%
|
[1] |
| Schwab Fundamental U.S. Large Company Index Fund | Communications Sector [Member] |
|
|
| Holdings [Line Items] |
|
|
| Percent of Total Investments |
10.40%
|
[1] |
| Schwab Fundamental U.S. Large Company Index Fund | Industrial Sector [Member] |
|
|
| Holdings [Line Items] |
|
|
| Percent of Total Investments |
9.60%
|
[1] |
| Schwab Fundamental U.S. Large Company Index Fund | Consumer Staples Sector [Member] |
|
|
| Holdings [Line Items] |
|
|
| Percent of Total Investments |
7.30%
|
[1] |
| Schwab Fundamental U.S. Large Company Index Fund | Utilities Sector [Member] |
|
|
| Holdings [Line Items] |
|
|
| Percent of Total Investments |
3.50%
|
[1] |
| Schwab Fundamental U.S. Large Company Index Fund | Real Estate Sector [Member] |
|
|
| Holdings [Line Items] |
|
|
| Percent of Total Investments |
1.60%
|
[1] |
| Schwab Fundamental U.S. Large Company Index Fund | Healthcare Sector [Member] |
|
|
| Holdings [Line Items] |
|
|
| Percent of Total Investments |
12.00%
|
[1] |
| Schwab Fundamental U.S. Large Company Index Fund | Short-Term Investments [Member] |
|
|
| Holdings [Line Items] |
|
|
| Percent of Total Investments |
0.20%
|
[1],[2] |
| Schwab Fundamental U.S. Small Company Index Fund | Opendoor Technologies Inc [Member] |
|
|
| Holdings [Line Items] |
|
|
| Percent of Net Asset Value |
0.60%
|
|
| Schwab Fundamental U.S. Small Company Index Fund | Viasat, Inc. [Member] |
|
|
| Holdings [Line Items] |
|
|
| Percent of Net Asset Value |
0.60%
|
|
| Schwab Fundamental U.S. Small Company Index Fund | Lumentum Holdings, Inc. [Member] |
|
|
| Holdings [Line Items] |
|
|
| Percent of Net Asset Value |
0.40%
|
|
| Schwab Fundamental U.S. Small Company Index Fund | Rocket Cos., Inc., Class A [Member] |
|
|
| Holdings [Line Items] |
|
|
| Percent of Net Asset Value |
0.40%
|
|
| Schwab Fundamental U.S. Small Company Index Fund | EchoStar Corp., Class A [Member] |
|
|
| Holdings [Line Items] |
|
|
| Percent of Net Asset Value |
0.40%
|
|
| Schwab Fundamental U.S. Small Company Index Fund | CommScope Holding Co., Inc. [Member] |
|
|
| Holdings [Line Items] |
|
|
| Percent of Net Asset Value |
0.40%
|
|
| Schwab Fundamental U.S. Small Company Index Fund | Comfort Systems USA, Inc. [Member] |
|
|
| Holdings [Line Items] |
|
|
| Percent of Net Asset Value |
0.40%
|
|
| Schwab Fundamental U.S. Small Company Index Fund | Anywhere Real Estate, Inc. [Member] |
|
|
| Holdings [Line Items] |
|
|
| Percent of Net Asset Value |
0.40%
|
|
| Schwab Fundamental U.S. Small Company Index Fund | TTM Technologies, Inc. [Member] |
|
|
| Holdings [Line Items] |
|
|
| Percent of Net Asset Value |
0.30%
|
|
| Schwab Fundamental U.S. Small Company Index Fund | Delek U.S. Holdings, Inc. [Member] |
|
|
| Holdings [Line Items] |
|
|
| Percent of Net Asset Value |
0.30%
|
|
| Schwab Fundamental U.S. Small Company Index Fund | Financials [Member] |
|
|
| Holdings [Line Items] |
|
|
| Percent of Total Investments |
15.80%
|
[1] |
| Schwab Fundamental U.S. Small Company Index Fund | Information Technology Sector [Member] |
|
|
| Holdings [Line Items] |
|
|
| Percent of Total Investments |
12.10%
|
[1] |
| Schwab Fundamental U.S. Small Company Index Fund | Materials Sector [Member] |
|
|
| Holdings [Line Items] |
|
|
| Percent of Total Investments |
5.10%
|
[1] |
| Schwab Fundamental U.S. Small Company Index Fund | Energy Sector [Member] |
|
|
| Holdings [Line Items] |
|
|
| Percent of Total Investments |
5.00%
|
[1] |
| Schwab Fundamental U.S. Small Company Index Fund | Consumer Discretionary Sector [Member] |
|
|
| Holdings [Line Items] |
|
|
| Percent of Total Investments |
13.70%
|
[1] |
| Schwab Fundamental U.S. Small Company Index Fund | Communications Sector [Member] |
|
|
| Holdings [Line Items] |
|
|
| Percent of Total Investments |
4.00%
|
[1] |
| Schwab Fundamental U.S. Small Company Index Fund | Industrial Sector [Member] |
|
|
| Holdings [Line Items] |
|
|
| Percent of Total Investments |
20.30%
|
[1] |
| Schwab Fundamental U.S. Small Company Index Fund | Consumer Staples Sector [Member] |
|
|
| Holdings [Line Items] |
|
|
| Percent of Total Investments |
3.80%
|
[1] |
| Schwab Fundamental U.S. Small Company Index Fund | Utilities Sector [Member] |
|
|
| Holdings [Line Items] |
|
|
| Percent of Total Investments |
3.30%
|
[1] |
| Schwab Fundamental U.S. Small Company Index Fund | Real Estate Sector [Member] |
|
|
| Holdings [Line Items] |
|
|
| Percent of Total Investments |
9.30%
|
[1] |
| Schwab Fundamental U.S. Small Company Index Fund | Healthcare Sector [Member] |
|
|
| Holdings [Line Items] |
|
|
| Percent of Total Investments |
7.20%
|
[1] |
| Schwab Fundamental U.S. Small Company Index Fund | Short-Term Investments [Member] |
|
|
| Holdings [Line Items] |
|
|
| Percent of Total Investments |
0.40%
|
[1],[2] |
| Schwab Fundamental International Equity Index Fund | Samsung Electronics Co, Ltd. [Member] |
|
|
| Holdings [Line Items] |
|
|
| Percent of Net Asset Value |
3.10%
|
|
| Schwab Fundamental International Equity Index Fund | Shell PLC [Member] |
|
|
| Holdings [Line Items] |
|
|
| Percent of Net Asset Value |
2.30%
|
|
| Schwab Fundamental International Equity Index Fund | TotalEnergies SE [Member] |
|
|
| Holdings [Line Items] |
|
|
| Percent of Net Asset Value |
1.40%
|
|
| Schwab Fundamental International Equity Index Fund | Toyota Motor Corp. [Member] |
|
|
| Holdings [Line Items] |
|
|
| Percent of Net Asset Value |
1.20%
|
|
| Schwab Fundamental International Equity Index Fund | BP PLC [Member] |
|
|
| Holdings [Line Items] |
|
|
| Percent of Net Asset Value |
1.10%
|
|
| Schwab Fundamental International Equity Index Fund | Glencore PLC [Member] |
|
|
| Holdings [Line Items] |
|
|
| Percent of Net Asset Value |
0.90%
|
|
| Schwab Fundamental International Equity Index Fund | HSBC Holdings PLC [Member] |
|
|
| Holdings [Line Items] |
|
|
| Percent of Net Asset Value |
0.90%
|
|
| Schwab Fundamental International Equity Index Fund | Banco Santander SA [Member] |
|
|
| Holdings [Line Items] |
|
|
| Percent of Net Asset Value |
0.90%
|
|
| Schwab Fundamental International Equity Index Fund | BHP Group Ltd. [Member] |
|
|
| Holdings [Line Items] |
|
|
| Percent of Net Asset Value |
0.90%
|
|
| Schwab Fundamental International Equity Index Fund | Roche Holding AG [Member] |
|
|
| Holdings [Line Items] |
|
|
| Percent of Net Asset Value |
0.80%
|
|
| Schwab Fundamental International Equity Index Fund | Financials [Member] |
|
|
| Holdings [Line Items] |
|
|
| Percent of Total Investments |
17.70%
|
[1] |
| Schwab Fundamental International Equity Index Fund | Information Technology Sector [Member] |
|
|
| Holdings [Line Items] |
|
|
| Percent of Total Investments |
8.60%
|
[1] |
| Schwab Fundamental International Equity Index Fund | Materials Sector [Member] |
|
|
| Holdings [Line Items] |
|
|
| Percent of Total Investments |
11.00%
|
[1] |
| Schwab Fundamental International Equity Index Fund | Energy Sector [Member] |
|
|
| Holdings [Line Items] |
|
|
| Percent of Total Investments |
9.80%
|
[1] |
| Schwab Fundamental International Equity Index Fund | Consumer Discretionary Sector [Member] |
|
|
| Holdings [Line Items] |
|
|
| Percent of Total Investments |
12.30%
|
[1] |
| Schwab Fundamental International Equity Index Fund | Communications Sector [Member] |
|
|
| Holdings [Line Items] |
|
|
| Percent of Total Investments |
5.30%
|
[1] |
| Schwab Fundamental International Equity Index Fund | Industrial Sector [Member] |
|
|
| Holdings [Line Items] |
|
|
| Percent of Total Investments |
15.80%
|
[1] |
| Schwab Fundamental International Equity Index Fund | Consumer Staples Sector [Member] |
|
|
| Holdings [Line Items] |
|
|
| Percent of Total Investments |
7.50%
|
[1] |
| Schwab Fundamental International Equity Index Fund | Utilities Sector [Member] |
|
|
| Holdings [Line Items] |
|
|
| Percent of Total Investments |
4.30%
|
[1] |
| Schwab Fundamental International Equity Index Fund | Real Estate Sector [Member] |
|
|
| Holdings [Line Items] |
|
|
| Percent of Total Investments |
1.00%
|
[1] |
| Schwab Fundamental International Equity Index Fund | Healthcare Sector [Member] |
|
|
| Holdings [Line Items] |
|
|
| Percent of Total Investments |
6.50%
|
[1] |
| Schwab Fundamental International Equity Index Fund | Short-Term Investments [Member] |
|
|
| Holdings [Line Items] |
|
|
| Percent of Total Investments |
0.20%
|
[1],[2] |
| Schwab Fundamental International Equity Index Fund | SPAIN |
|
|
| Holdings [Line Items] |
|
|
| Percent of Total Investments |
3.20%
|
[1] |
| Schwab Fundamental International Equity Index Fund | NETHERLANDS |
|
|
| Holdings [Line Items] |
|
|
| Percent of Total Investments |
3.10%
|
[1] |
| Schwab Fundamental International Equity Index Fund | JAPAN |
|
|
| Holdings [Line Items] |
|
|
| Percent of Total Investments |
24.20%
|
[1] |
| Schwab Fundamental International Equity Index Fund | CANADA |
|
|
| Holdings [Line Items] |
|
|
| Percent of Total Investments |
8.10%
|
[1] |
| Schwab Fundamental International Equity Index Fund | KOREA, REPUBLIC OF |
|
|
| Holdings [Line Items] |
|
|
| Percent of Total Investments |
8.20%
|
[1] |
| Schwab Fundamental International Equity Index Fund | UNITED KINGDOM |
|
|
| Holdings [Line Items] |
|
|
| Percent of Total Investments |
14.00%
|
[1] |
| Schwab Fundamental International Equity Index Fund | AUSTRALIA |
|
|
| Holdings [Line Items] |
|
|
| Percent of Total Investments |
4.50%
|
[1] |
| Schwab Fundamental International Equity Index Fund | FRANCE |
|
|
| Holdings [Line Items] |
|
|
| Percent of Total Investments |
8.00%
|
[1] |
| Schwab Fundamental International Equity Index Fund | GERMANY |
|
|
| Holdings [Line Items] |
|
|
| Percent of Total Investments |
8.20%
|
[1] |
| Schwab Fundamental International Equity Index Fund | SWITZERLAND |
|
|
| Holdings [Line Items] |
|
|
| Percent of Total Investments |
4.60%
|
[1] |
| Schwab Fundamental International Equity Index Fund | Other Countries [Member] |
|
|
| Holdings [Line Items] |
|
|
| Percent of Total Investments |
13.90%
|
[1] |
| Schwab Fundamental International Small Equity Index Fund | Celestica, Inc. [Member] |
|
|
| Holdings [Line Items] |
|
|
| Percent of Net Asset Value |
0.40%
|
|
| Schwab Fundamental International Small Equity Index Fund | Ibiden Co. Ltd. [Member] |
|
|
| Holdings [Line Items] |
|
|
| Percent of Net Asset Value |
0.30%
|
|
| Schwab Fundamental International Small Equity Index Fund | HD Korea Shipbuilding & Offshore Engineering Co. Ltd. [Member] |
|
|
| Holdings [Line Items] |
|
|
| Percent of Net Asset Value |
0.20%
|
|
| Schwab Fundamental International Small Equity Index Fund | Doosan Co. Ltd. [Member] |
|
|
| Holdings [Line Items] |
|
|
| Percent of Net Asset Value |
0.20%
|
|
| Schwab Fundamental International Small Equity Index Fund | SSR Mining, Inc. [Member] |
|
|
| Holdings [Line Items] |
|
|
| Percent of Net Asset Value |
0.20%
|
|
| Schwab Fundamental International Small Equity Index Fund | Airtel Africa PLC [Member] |
|
|
| Holdings [Line Items] |
|
|
| Percent of Net Asset Value |
0.20%
|
|
| Schwab Fundamental International Small Equity Index Fund | Spectris PLC [Member] |
|
|
| Holdings [Line Items] |
|
|
| Percent of Net Asset Value |
0.20%
|
|
| Schwab Fundamental International Small Equity Index Fund | Sino Biopharmaceutical Ltd. [Member] |
|
|
| Holdings [Line Items] |
|
|
| Percent of Net Asset Value |
0.20%
|
|
| Schwab Fundamental International Small Equity Index Fund | Eagers Automotive Ltd. [Member] |
|
|
| Holdings [Line Items] |
|
|
| Percent of Net Asset Value |
0.20%
|
|
| Schwab Fundamental International Small Equity Index Fund | Kinden Corp. [Member] |
|
|
| Holdings [Line Items] |
|
|
| Percent of Net Asset Value |
0.20%
|
|
| Schwab Fundamental International Small Equity Index Fund | Financials [Member] |
|
|
| Holdings [Line Items] |
|
|
| Percent of Total Investments |
11.50%
|
[1] |
| Schwab Fundamental International Small Equity Index Fund | Information Technology Sector [Member] |
|
|
| Holdings [Line Items] |
|
|
| Percent of Total Investments |
8.10%
|
[1] |
| Schwab Fundamental International Small Equity Index Fund | Materials Sector [Member] |
|
|
| Holdings [Line Items] |
|
|
| Percent of Total Investments |
11.30%
|
[1] |
| Schwab Fundamental International Small Equity Index Fund | Energy Sector [Member] |
|
|
| Holdings [Line Items] |
|
|
| Percent of Total Investments |
3.60%
|
[1] |
| Schwab Fundamental International Small Equity Index Fund | Consumer Discretionary Sector [Member] |
|
|
| Holdings [Line Items] |
|
|
| Percent of Total Investments |
12.60%
|
[1] |
| Schwab Fundamental International Small Equity Index Fund | Communications Sector [Member] |
|
|
| Holdings [Line Items] |
|
|
| Percent of Total Investments |
5.20%
|
[1] |
| Schwab Fundamental International Small Equity Index Fund | Industrial Sector [Member] |
|
|
| Holdings [Line Items] |
|
|
| Percent of Total Investments |
24.50%
|
[1] |
| Schwab Fundamental International Small Equity Index Fund | Consumer Staples Sector [Member] |
|
|
| Holdings [Line Items] |
|
|
| Percent of Total Investments |
7.60%
|
[1] |
| Schwab Fundamental International Small Equity Index Fund | Utilities Sector [Member] |
|
|
| Holdings [Line Items] |
|
|
| Percent of Total Investments |
3.30%
|
[1] |
| Schwab Fundamental International Small Equity Index Fund | Real Estate Sector [Member] |
|
|
| Holdings [Line Items] |
|
|
| Percent of Total Investments |
6.70%
|
[1] |
| Schwab Fundamental International Small Equity Index Fund | Healthcare Sector [Member] |
|
|
| Holdings [Line Items] |
|
|
| Percent of Total Investments |
5.10%
|
[1] |
| Schwab Fundamental International Small Equity Index Fund | Short-Term Investments [Member] |
|
|
| Holdings [Line Items] |
|
|
| Percent of Total Investments |
0.50%
|
[1],[2] |
| Schwab Fundamental International Small Equity Index Fund | JAPAN |
|
|
| Holdings [Line Items] |
|
|
| Percent of Total Investments |
31.90%
|
[1] |
| Schwab Fundamental International Small Equity Index Fund | CANADA |
|
|
| Holdings [Line Items] |
|
|
| Percent of Total Investments |
8.70%
|
[1] |
| Schwab Fundamental International Small Equity Index Fund | KOREA, REPUBLIC OF |
|
|
| Holdings [Line Items] |
|
|
| Percent of Total Investments |
8.10%
|
[1] |
| Schwab Fundamental International Small Equity Index Fund | UNITED KINGDOM |
|
|
| Holdings [Line Items] |
|
|
| Percent of Total Investments |
7.70%
|
[1] |
| Schwab Fundamental International Small Equity Index Fund | AUSTRALIA |
|
|
| Holdings [Line Items] |
|
|
| Percent of Total Investments |
5.10%
|
[1] |
| Schwab Fundamental International Small Equity Index Fund | FRANCE |
|
|
| Holdings [Line Items] |
|
|
| Percent of Total Investments |
3.70%
|
[1] |
| Schwab Fundamental International Small Equity Index Fund | GERMANY |
|
|
| Holdings [Line Items] |
|
|
| Percent of Total Investments |
3.70%
|
[1] |
| Schwab Fundamental International Small Equity Index Fund | SWEDEN |
|
|
| Holdings [Line Items] |
|
|
| Percent of Total Investments |
3.30%
|
[1] |
| Schwab Fundamental International Small Equity Index Fund | SWITZERLAND |
|
|
| Holdings [Line Items] |
|
|
| Percent of Total Investments |
3.10%
|
[1] |
| Schwab Fundamental International Small Equity Index Fund | HONG KONG |
|
|
| Holdings [Line Items] |
|
|
| Percent of Total Investments |
2.70%
|
[1] |
| Schwab Fundamental International Small Equity Index Fund | Other Countries [Member] |
|
|
| Holdings [Line Items] |
|
|
| Percent of Total Investments |
22.00%
|
[1] |
| Schwab Fundamental Emerging Markets Equity Index Fund | Taiwan Semiconductor Manufacturing Co. Ltd [Member] |
|
|
| Holdings [Line Items] |
|
|
| Percent of Net Asset Value |
5.20%
|
|
| Schwab Fundamental Emerging Markets Equity Index Fund | Alibaba Group Holding Ltd. [Member] |
|
|
| Holdings [Line Items] |
|
|
| Percent of Net Asset Value |
4.30%
|
|
| Schwab Fundamental Emerging Markets Equity Index Fund | Hon Hai Precision Industry Co. Ltd. [Member] |
|
|
| Holdings [Line Items] |
|
|
| Percent of Net Asset Value |
3.40%
|
|
| Schwab Fundamental Emerging Markets Equity Index Fund | China Construction Bank Corp., H Shares [Member] |
|
|
| Holdings [Line Items] |
|
|
| Percent of Net Asset Value |
2.80%
|
|
| Schwab Fundamental Emerging Markets Equity Index Fund | Vale SA [Member] |
|
|
| Holdings [Line Items] |
|
|
| Percent of Net Asset Value |
2.70%
|
|
| Schwab Fundamental Emerging Markets Equity Index Fund | Tencent Holdings Ltd. [Member] |
|
|
| Holdings [Line Items] |
|
|
| Percent of Net Asset Value |
2.70%
|
|
| Schwab Fundamental Emerging Markets Equity Index Fund | Petroleo Brasileiro SA - Petrobras - Preferred Stock [Member] |
|
|
| Holdings [Line Items] |
|
|
| Percent of Net Asset Value |
1.70%
|
|
| Schwab Fundamental Emerging Markets Equity Index Fund | Petroleo Brasileiro SA - Petrobras - Common Stock [Member] |
|
|
| Holdings [Line Items] |
|
|
| Percent of Net Asset Value |
1.60%
|
|
| Schwab Fundamental Emerging Markets Equity Index Fund | Industrial & Commercial Bank of China Ltd., H Shares [Member] |
|
|
| Holdings [Line Items] |
|
|
| Percent of Net Asset Value |
1.30%
|
|
| Schwab Fundamental Emerging Markets Equity Index Fund | JD.com, Inc. [Member] |
|
|
| Holdings [Line Items] |
|
|
| Percent of Net Asset Value |
1.30%
|
|
| Schwab Fundamental Emerging Markets Equity Index Fund | Financials [Member] |
|
|
| Holdings [Line Items] |
|
|
| Percent of Total Investments |
25.00%
|
[1] |
| Schwab Fundamental Emerging Markets Equity Index Fund | Information Technology Sector [Member] |
|
|
| Holdings [Line Items] |
|
|
| Percent of Total Investments |
16.90%
|
[1] |
| Schwab Fundamental Emerging Markets Equity Index Fund | Materials Sector [Member] |
|
|
| Holdings [Line Items] |
|
|
| Percent of Total Investments |
13.60%
|
[1] |
| Schwab Fundamental Emerging Markets Equity Index Fund | Energy Sector [Member] |
|
|
| Holdings [Line Items] |
|
|
| Percent of Total Investments |
12.00%
|
[1] |
| Schwab Fundamental Emerging Markets Equity Index Fund | Consumer Discretionary Sector [Member] |
|
|
| Holdings [Line Items] |
|
|
| Percent of Total Investments |
10.30%
|
[1] |
| Schwab Fundamental Emerging Markets Equity Index Fund | Communications Sector [Member] |
|
|
| Holdings [Line Items] |
|
|
| Percent of Total Investments |
8.40%
|
[1] |
| Schwab Fundamental Emerging Markets Equity Index Fund | Industrial Sector [Member] |
|
|
| Holdings [Line Items] |
|
|
| Percent of Total Investments |
4.80%
|
[1] |
| Schwab Fundamental Emerging Markets Equity Index Fund | Consumer Staples Sector [Member] |
|
|
| Holdings [Line Items] |
|
|
| Percent of Total Investments |
3.50%
|
[1] |
| Schwab Fundamental Emerging Markets Equity Index Fund | Utilities Sector [Member] |
|
|
| Holdings [Line Items] |
|
|
| Percent of Total Investments |
2.80%
|
[1] |
| Schwab Fundamental Emerging Markets Equity Index Fund | Real Estate Sector [Member] |
|
|
| Holdings [Line Items] |
|
|
| Percent of Total Investments |
1.80%
|
[1] |
| Schwab Fundamental Emerging Markets Equity Index Fund | Healthcare Sector [Member] |
|
|
| Holdings [Line Items] |
|
|
| Percent of Total Investments |
0.60%
|
[1] |
| Schwab Fundamental Emerging Markets Equity Index Fund | Short-Term Investments [Member] |
|
|
| Holdings [Line Items] |
|
|
| Percent of Total Investments |
0.30%
|
[1],[2] |
| Schwab Fundamental Emerging Markets Equity Index Fund | CHINA |
|
|
| Holdings [Line Items] |
|
|
| Percent of Total Investments |
34.10%
|
[1] |
| Schwab Fundamental Emerging Markets Equity Index Fund | TAIWAN |
|
|
| Holdings [Line Items] |
|
|
| Percent of Total Investments |
19.40%
|
[1] |
| Schwab Fundamental Emerging Markets Equity Index Fund | BRAZIL |
|
|
| Holdings [Line Items] |
|
|
| Percent of Total Investments |
11.40%
|
[1] |
| Schwab Fundamental Emerging Markets Equity Index Fund | SOUTH AFRICA |
|
|
| Holdings [Line Items] |
|
|
| Percent of Total Investments |
5.00%
|
[1] |
| Schwab Fundamental Emerging Markets Equity Index Fund | MEXICO |
|
|
| Holdings [Line Items] |
|
|
| Percent of Total Investments |
4.10%
|
[1] |
| Schwab Fundamental Emerging Markets Equity Index Fund | THAILAND |
|
|
| Holdings [Line Items] |
|
|
| Percent of Total Investments |
2.70%
|
[1] |
| Schwab Fundamental Emerging Markets Equity Index Fund | HONG KONG |
|
|
| Holdings [Line Items] |
|
|
| Percent of Total Investments |
2.50%
|
[1] |
| Schwab Fundamental Emerging Markets Equity Index Fund | INDIA |
|
|
| Holdings [Line Items] |
|
|
| Percent of Total Investments |
10.10%
|
[1] |
| Schwab Fundamental Emerging Markets Equity Index Fund | Other Countries [Member] |
|
|
| Holdings [Line Items] |
|
|
| Percent of Total Investments |
10.70%
|
[1] |
| Schwab Balanced Fund | State Street Institutional US Government Money Market Fund, Class Premier [Member] |
|
|
| Holdings [Line Items] |
|
|
| Percent of Net Asset Value |
0.60%
|
[4] |
| Schwab Balanced Fund | Schwab Government Money Fund, Ultra Shares [Member] |
|
|
| Holdings [Line Items] |
|
|
| Percent of Net Asset Value |
2.40%
|
[4] |
| Schwab Balanced Fund | Schwab U.S. Aggregate Bond Index Fund [Member] |
|
|
| Holdings [Line Items] |
|
|
| Percent of Net Asset Value |
36.20%
|
[4] |
| Schwab Balanced Fund | Schwab International Opportunities Fund [Member] |
|
|
| Holdings [Line Items] |
|
|
| Percent of Net Asset Value |
9.90%
|
[4] |
| Schwab Balanced Fund | Schwab Select Large Cap Growth Fund [Member] |
|
|
| Holdings [Line Items] |
|
|
| Percent of Net Asset Value |
15.40%
|
[4] |
| Schwab Balanced Fund | Schwab Small-Cap Equity Fund [Member] |
|
|
| Holdings [Line Items] |
|
|
| Percent of Net Asset Value |
8.70%
|
[4] |
| Schwab Balanced Fund | Schwab Core Equity Fund [Member] |
|
|
| Holdings [Line Items] |
|
|
| Percent of Net Asset Value |
26.70%
|
[4] |
| Schwab Balanced Fund | Money Market Funds [Member] |
|
|
| Holdings [Line Items] |
|
|
| Percent of Total Investments |
3.00%
|
|
| Schwab Balanced Fund | U.S. Stocks - Large-Cap [Member] |
|
|
| Holdings [Line Items] |
|
|
| Percent of Total Investments |
42.20%
|
|
| Schwab Balanced Fund | International Stocks - Developed Markets [Member] |
|
|
| Holdings [Line Items] |
|
|
| Percent of Total Investments |
9.90%
|
|
| Schwab Balanced Fund | U.S. Stocks - Small-Cap [Member] |
|
|
| Holdings [Line Items] |
|
|
| Percent of Total Investments |
8.70%
|
|
| Schwab Balanced Fund | Fixed Income - Intermediate-Term Bond [Member] |
|
|
| Holdings [Line Items] |
|
|
| Percent of Total Investments |
36.20%
|
|
| Schwab MarketTrack All Equity Portfolio | Schwab Fundamental U.S. Small Company Index Fund [Member] |
|
|
| Holdings [Line Items] |
|
|
| Percent of Net Asset Value |
3.40%
|
|
| Schwab MarketTrack All Equity Portfolio | Schwab Fundamental Emerging Markets Equity Index Fund [Member] |
|
|
| Holdings [Line Items] |
|
|
| Percent of Net Asset Value |
5.00%
|
|
| Schwab MarketTrack All Equity Portfolio | Schwab Fundamental International Small Equity Index Fund [Member] |
|
|
| Holdings [Line Items] |
|
|
| Percent of Net Asset Value |
5.00%
|
|
| Schwab MarketTrack All Equity Portfolio | Schwab International Index Fund [Member] |
|
|
| Holdings [Line Items] |
|
|
| Percent of Net Asset Value |
16.10%
|
|
| Schwab MarketTrack All Equity Portfolio | Schwab U.S. Large-Cap Growth Index Fund [Member] |
|
|
| Holdings [Line Items] |
|
|
| Percent of Net Asset Value |
12.40%
|
|
| Schwab MarketTrack All Equity Portfolio | Schwab Small-Cap Index Fund [Member] |
|
|
| Holdings [Line Items] |
|
|
| Percent of Net Asset Value |
5.40%
|
|
| Schwab MarketTrack All Equity Portfolio | Schwab Fundamental International Equity Index Fund [Member] |
|
|
| Holdings [Line Items] |
|
|
| Percent of Net Asset Value |
7.10%
|
|
| Schwab MarketTrack All Equity Portfolio | Schwab U.S. REIT ETF [Member] |
|
|
| Holdings [Line Items] |
|
|
| Percent of Net Asset Value |
5.00%
|
|
| Schwab MarketTrack All Equity Portfolio | Schwab S&P 500 Index Fund [Member] |
|
|
| Holdings [Line Items] |
|
|
| Percent of Net Asset Value |
23.90%
|
|
| Schwab MarketTrack All Equity Portfolio | Schwab Fundamental U.S. Large Company Index Fund [Member] |
|
|
| Holdings [Line Items] |
|
|
| Percent of Net Asset Value |
13.50%
|
|
| Schwab MarketTrack All Equity Portfolio | Real Estate - U.S. REITs [Member] |
|
|
| Holdings [Line Items] |
|
|
| Percent of Total Investments |
5.00%
|
|
| Schwab MarketTrack All Equity Portfolio | U.S. Stocks - Large-Cap [Member] |
|
|
| Holdings [Line Items] |
|
|
| Percent of Total Investments |
50.00%
|
|
| Schwab MarketTrack All Equity Portfolio | International Stocks - Developed Markets [Member] |
|
|
| Holdings [Line Items] |
|
|
| Percent of Total Investments |
28.30%
|
|
| Schwab MarketTrack All Equity Portfolio | U.S. Stocks - Small-Cap [Member] |
|
|
| Holdings [Line Items] |
|
|
| Percent of Total Investments |
8.90%
|
|
| Schwab MarketTrack All Equity Portfolio | International Stocks - Emerging Markets [Member] |
|
|
| Holdings [Line Items] |
|
|
| Percent of Total Investments |
7.80%
|
|
| Schwab MarketTrack Growth Portfolio | Schwab Fundamental Emerging Markets Equity Index Fund [Member] |
|
|
| Holdings [Line Items] |
|
|
| Percent of Net Asset Value |
3.30%
|
|
| Schwab MarketTrack Growth Portfolio | Schwab Fundamental International Small Equity Index Fund [Member] |
|
|
| Holdings [Line Items] |
|
|
| Percent of Net Asset Value |
3.30%
|
|
| Schwab MarketTrack Growth Portfolio | Schwab International Index Fund [Member] |
|
|
| Holdings [Line Items] |
|
|
| Percent of Net Asset Value |
12.10%
|
|
| Schwab MarketTrack Growth Portfolio | Schwab U.S. Large-Cap Growth Index Fund [Member] |
|
|
| Holdings [Line Items] |
|
|
| Percent of Net Asset Value |
10.50%
|
|
| Schwab MarketTrack Growth Portfolio | Schwab Small-Cap Index Fund [Member] |
|
|
| Holdings [Line Items] |
|
|
| Percent of Net Asset Value |
4.30%
|
|
| Schwab MarketTrack Growth Portfolio | Schwab Fundamental International Equity Index Fund [Member] |
|
|
| Holdings [Line Items] |
|
|
| Percent of Net Asset Value |
5.20%
|
|
| Schwab MarketTrack Growth Portfolio | Schwab U.S. REIT ETF [Member] |
|
|
| Holdings [Line Items] |
|
|
| Percent of Net Asset Value |
4.00%
|
|
| Schwab MarketTrack Growth Portfolio | Schwab U.S. Aggregate Bond Index Fund [Member] |
|
|
| Holdings [Line Items] |
|
|
| Percent of Net Asset Value |
16.00%
|
|
| Schwab MarketTrack Growth Portfolio | Schwab S&P 500 Index Fund [Member] |
|
|
| Holdings [Line Items] |
|
|
| Percent of Net Asset Value |
20.80%
|
|
| Schwab MarketTrack Growth Portfolio | Schwab Fundamental U.S. Large Company Index Fund [Member] |
|
|
| Holdings [Line Items] |
|
|
| Percent of Net Asset Value |
12.00%
|
|
| Schwab MarketTrack Growth Portfolio | Real Estate - U.S. REITs [Member] |
|
|
| Holdings [Line Items] |
|
|
| Percent of Total Investments |
4.00%
|
|
| Schwab MarketTrack Growth Portfolio | Money Market Funds [Member] |
|
|
| Holdings [Line Items] |
|
|
| Percent of Total Investments |
3.30%
|
|
| Schwab MarketTrack Growth Portfolio | U.S. Stocks - Large-Cap [Member] |
|
|
| Holdings [Line Items] |
|
|
| Percent of Total Investments |
43.60%
|
|
| Schwab MarketTrack Growth Portfolio | International Stocks - Developed Markets [Member] |
|
|
| Holdings [Line Items] |
|
|
| Percent of Total Investments |
20.80%
|
|
| Schwab MarketTrack Growth Portfolio | U.S. Stocks - Small-Cap [Member] |
|
|
| Holdings [Line Items] |
|
|
| Percent of Total Investments |
7.00%
|
|
| Schwab MarketTrack Growth Portfolio | International Stocks - Emerging Markets [Member] |
|
|
| Holdings [Line Items] |
|
|
| Percent of Total Investments |
5.20%
|
|
| Schwab MarketTrack Growth Portfolio | Fixed Income - Intermediate-Term Bond [Member] |
|
|
| Holdings [Line Items] |
|
|
| Percent of Total Investments |
16.10%
|
|
| Schwab MarketTrack Balanced Portfolio™ | Schwab International Index Fund [Member] |
|
|
| Holdings [Line Items] |
|
|
| Percent of Net Asset Value |
9.10%
|
|
| Schwab MarketTrack Balanced Portfolio™ | Schwab U.S. Large-Cap Growth Index Fund [Member] |
|
|
| Holdings [Line Items] |
|
|
| Percent of Net Asset Value |
8.40%
|
|
| Schwab MarketTrack Balanced Portfolio™ | Schwab Small-Cap Index Fund [Member] |
|
|
| Holdings [Line Items] |
|
|
| Percent of Net Asset Value |
4.20%
|
|
| Schwab MarketTrack Balanced Portfolio™ | Schwab Fundamental International Equity Index Fund [Member] |
|
|
| Holdings [Line Items] |
|
|
| Percent of Net Asset Value |
3.90%
|
|
| Schwab MarketTrack Balanced Portfolio™ | Schwab U.S. REIT ETF [Member] |
|
|
| Holdings [Line Items] |
|
|
| Percent of Net Asset Value |
3.00%
|
|
| Schwab MarketTrack Balanced Portfolio™ | Schwab Government Money Fund, Ultra Shares [Member] |
|
|
| Holdings [Line Items] |
|
|
| Percent of Net Asset Value |
3.30%
|
|
| Schwab MarketTrack Balanced Portfolio™ | Schwab Short-Term Bond Index Fund [Member] |
|
|
| Holdings [Line Items] |
|
|
| Percent of Net Asset Value |
4.00%
|
|
| Schwab MarketTrack Balanced Portfolio™ | Schwab U.S. Aggregate Bond Index Fund [Member] |
|
|
| Holdings [Line Items] |
|
|
| Percent of Net Asset Value |
30.50%
|
|
| Schwab MarketTrack Balanced Portfolio™ | Schwab S&P 500 Index Fund [Member] |
|
|
| Holdings [Line Items] |
|
|
| Percent of Net Asset Value |
15.50%
|
|
| Schwab MarketTrack Balanced Portfolio™ | Schwab Fundamental U.S. Large Company Index Fund [Member] |
|
|
| Holdings [Line Items] |
|
|
| Percent of Net Asset Value |
9.00%
|
|
| Schwab MarketTrack Balanced Portfolio™ | Real Estate - U.S. REITs [Member] |
|
|
| Holdings [Line Items] |
|
|
| Percent of Total Investments |
3.00%
|
|
| Schwab MarketTrack Balanced Portfolio™ | Money Market Funds [Member] |
|
|
| Holdings [Line Items] |
|
|
| Percent of Total Investments |
3.40%
|
|
| Schwab MarketTrack Balanced Portfolio™ | U.S. Stocks - Large-Cap [Member] |
|
|
| Holdings [Line Items] |
|
|
| Percent of Total Investments |
33.20%
|
|
| Schwab MarketTrack Balanced Portfolio™ | International Stocks - Developed Markets [Member] |
|
|
| Holdings [Line Items] |
|
|
| Percent of Total Investments |
15.60%
|
|
| Schwab MarketTrack Balanced Portfolio™ | U.S. Stocks - Small-Cap [Member] |
|
|
| Holdings [Line Items] |
|
|
| Percent of Total Investments |
6.10%
|
|
| Schwab MarketTrack Balanced Portfolio™ | International Stocks - Emerging Markets [Member] |
|
|
| Holdings [Line Items] |
|
|
| Percent of Total Investments |
2.50%
|
|
| Schwab MarketTrack Balanced Portfolio™ | Fixed Income - Intermediate-Term Bond [Member] |
|
|
| Holdings [Line Items] |
|
|
| Percent of Total Investments |
32.20%
|
|
| Schwab MarketTrack Balanced Portfolio™ | Fixed Income - Short-Term Bond [Member] |
|
|
| Holdings [Line Items] |
|
|
| Percent of Total Investments |
4.00%
|
|
| Schwab MarketTrack Conservative Portfolio™ | Schwab International Index Fund [Member] |
|
|
| Holdings [Line Items] |
|
|
| Percent of Net Asset Value |
6.10%
|
|
| Schwab MarketTrack Conservative Portfolio™ | Schwab U.S. Large-Cap Growth Index Fund [Member] |
|
|
| Holdings [Line Items] |
|
|
| Percent of Net Asset Value |
5.10%
|
|
| Schwab MarketTrack Conservative Portfolio™ | Schwab Small-Cap Index Fund [Member] |
|
|
| Holdings [Line Items] |
|
|
| Percent of Net Asset Value |
2.80%
|
|
| Schwab MarketTrack Conservative Portfolio™ | Schwab Fundamental International Equity Index Fund [Member] |
|
|
| Holdings [Line Items] |
|
|
| Percent of Net Asset Value |
2.60%
|
|
| Schwab MarketTrack Conservative Portfolio™ | Schwab U.S. REIT ETF [Member] |
|
|
| Holdings [Line Items] |
|
|
| Percent of Net Asset Value |
2.00%
|
|
| Schwab MarketTrack Conservative Portfolio™ | Schwab Government Money Fund, Ultra Shares [Member] |
|
|
| Holdings [Line Items] |
|
|
| Percent of Net Asset Value |
3.40%
|
|
| Schwab MarketTrack Conservative Portfolio™ | Schwab Short-Term Bond Index Fund [Member] |
|
|
| Holdings [Line Items] |
|
|
| Percent of Net Asset Value |
6.30%
|
|
| Schwab MarketTrack Conservative Portfolio™ | Schwab U.S. Aggregate Bond Index Fund [Member] |
|
|
| Holdings [Line Items] |
|
|
| Percent of Net Asset Value |
48.10%
|
|
| Schwab MarketTrack Conservative Portfolio™ | Schwab S&P 500 Index Fund [Member] |
|
|
| Holdings [Line Items] |
|
|
| Percent of Net Asset Value |
10.90%
|
|
| Schwab MarketTrack Conservative Portfolio™ | Schwab Fundamental U.S. Large Company Index Fund [Member] |
|
|
| Holdings [Line Items] |
|
|
| Percent of Net Asset Value |
6.00%
|
|
| Schwab MarketTrack Conservative Portfolio™ | Real Estate - U.S. REITs [Member] |
|
|
| Holdings [Line Items] |
|
|
| Percent of Total Investments |
2.00%
|
|
| Schwab MarketTrack Conservative Portfolio™ | Money Market Funds [Member] |
|
|
| Holdings [Line Items] |
|
|
| Percent of Total Investments |
3.40%
|
|
| Schwab MarketTrack Conservative Portfolio™ | U.S. Stocks - Large-Cap [Member] |
|
|
| Holdings [Line Items] |
|
|
| Percent of Total Investments |
22.10%
|
|
| Schwab MarketTrack Conservative Portfolio™ | International Stocks - Developed Markets [Member] |
|
|
| Holdings [Line Items] |
|
|
| Percent of Total Investments |
10.50%
|
|
| Schwab MarketTrack Conservative Portfolio™ | U.S. Stocks - Small-Cap [Member] |
|
|
| Holdings [Line Items] |
|
|
| Percent of Total Investments |
4.00%
|
|
| Schwab MarketTrack Conservative Portfolio™ | International Stocks - Emerging Markets [Member] |
|
|
| Holdings [Line Items] |
|
|
| Percent of Total Investments |
1.70%
|
|
| Schwab MarketTrack Conservative Portfolio™ | Fixed Income - Intermediate-Term Bond [Member] |
|
|
| Holdings [Line Items] |
|
|
| Percent of Total Investments |
50.00%
|
|
| Schwab MarketTrack Conservative Portfolio™ | Fixed Income - Short-Term Bond [Member] |
|
|
| Holdings [Line Items] |
|
|
| Percent of Total Investments |
6.30%
|
|
| Schwab Target 2010 Fund | Schwab Government Money Fund, Ultra Shares [Member] |
|
|
| Holdings [Line Items] |
|
|
| Percent of Net Asset Value |
2.50%
|
|
| Schwab Target 2010 Fund | Schwab Treasury Inflation Protected Securities Index Fund [Member] |
|
|
| Holdings [Line Items] |
|
|
| Percent of Net Asset Value |
7.00%
|
|
| Schwab Target 2010 Fund | Schwab Short-Term Bond Index Fund [Member] |
|
|
| Holdings [Line Items] |
|
|
| Percent of Net Asset Value |
8.40%
|
|
| Schwab Target 2010 Fund | Baird Aggregate Bond Fund, Class Institutional [Member] |
|
|
| Holdings [Line Items] |
|
|
| Percent of Net Asset Value |
15.40%
|
|
| Schwab Target 2010 Fund | Schwab U.S. Aggregate Bond Index Fund [Member] |
|
|
| Holdings [Line Items] |
|
|
| Percent of Net Asset Value |
27.90%
|
|
| Schwab Target 2010 Fund | Schwab S&P 500 Index Fund [Member] |
|
|
| Holdings [Line Items] |
|
|
| Percent of Net Asset Value |
11.60%
|
|
| Schwab Target 2010 Fund | Schwab International Opportunities Fund [Member] |
|
|
| Holdings [Line Items] |
|
|
| Percent of Net Asset Value |
4.10%
|
|
| Schwab Target 2010 Fund | Schwab International Core Equity Fund [Member] |
|
|
| Holdings [Line Items] |
|
|
| Percent of Net Asset Value |
3.10%
|
|
| Schwab Target 2010 Fund | Schwab Select Large Cap Growth Fund [Member] |
|
|
| Holdings [Line Items] |
|
|
| Percent of Net Asset Value |
3.60%
|
|
| Schwab Target 2010 Fund | Dodge & Cox Stock Fund, Class I [Member] |
|
|
| Holdings [Line Items] |
|
|
| Percent of Net Asset Value |
2.50%
|
|
| Schwab Target 2010 Fund | Fixed Income - Inflation-Protected Bond [Member] |
|
|
| Holdings [Line Items] |
|
|
| Percent of Total Investments |
7.00%
|
|
| Schwab Target 2010 Fund | Money Market Funds [Member] |
|
|
| Holdings [Line Items] |
|
|
| Percent of Total Investments |
2.60%
|
|
| Schwab Target 2010 Fund | U.S. Stocks - Large-Cap [Member] |
|
|
| Holdings [Line Items] |
|
|
| Percent of Total Investments |
22.20%
|
|
| Schwab Target 2010 Fund | International Stocks - Developed Markets [Member] |
|
|
| Holdings [Line Items] |
|
|
| Percent of Total Investments |
7.60%
|
|
| Schwab Target 2010 Fund | U.S. Stocks - Small-Cap [Member] |
|
|
| Holdings [Line Items] |
|
|
| Percent of Total Investments |
1.70%
|
|
| Schwab Target 2010 Fund | Real Estate - Global Real Estate [Member] |
|
|
| Holdings [Line Items] |
|
|
| Percent of Total Investments |
2.00%
|
|
| Schwab Target 2010 Fund | U.S. Stocks - Mid-Cap [Member] |
|
|
| Holdings [Line Items] |
|
|
| Percent of Total Investments |
1.20%
|
|
| Schwab Target 2010 Fund | Fixed Income - Intermediate-Term Bond [Member] |
|
|
| Holdings [Line Items] |
|
|
| Percent of Total Investments |
45.30%
|
|
| Schwab Target 2010 Fund | Fixed Income - Short-Term Bond [Member] |
|
|
| Holdings [Line Items] |
|
|
| Percent of Total Investments |
8.40%
|
|
| Schwab Target 2010 Fund | Fixed Income - International Bond [Member] |
|
|
| Holdings [Line Items] |
|
|
| Percent of Total Investments |
2.00%
|
|
| Schwab Target 2015 Fund | Schwab Treasury Inflation Protected Securities Index Fund [Member] |
|
|
| Holdings [Line Items] |
|
|
| Percent of Net Asset Value |
6.40%
|
|
| Schwab Target 2015 Fund | Schwab Short-Term Bond Index Fund [Member] |
|
|
| Holdings [Line Items] |
|
|
| Percent of Net Asset Value |
7.60%
|
|
| Schwab Target 2015 Fund | Baird Aggregate Bond Fund, Class Institutional [Member] |
|
|
| Holdings [Line Items] |
|
|
| Percent of Net Asset Value |
13.40%
|
|
| Schwab Target 2015 Fund | Schwab U.S. Aggregate Bond Index Fund [Member] |
|
|
| Holdings [Line Items] |
|
|
| Percent of Net Asset Value |
25.40%
|
|
| Schwab Target 2015 Fund | Schwab S&P 500 Index Fund [Member] |
|
|
| Holdings [Line Items] |
|
|
| Percent of Net Asset Value |
13.10%
|
|
| Schwab Target 2015 Fund | Schwab International Opportunities Fund [Member] |
|
|
| Holdings [Line Items] |
|
|
| Percent of Net Asset Value |
4.80%
|
|
| Schwab Target 2015 Fund | Schwab International Core Equity Fund [Member] |
|
|
| Holdings [Line Items] |
|
|
| Percent of Net Asset Value |
3.70%
|
|
| Schwab Target 2015 Fund | Schwab Select Large Cap Growth Fund [Member] |
|
|
| Holdings [Line Items] |
|
|
| Percent of Net Asset Value |
4.10%
|
|
| Schwab Target 2015 Fund | Dodge & Cox Stock Fund, Class I [Member] |
|
|
| Holdings [Line Items] |
|
|
| Percent of Net Asset Value |
2.90%
|
|
| Schwab Target 2015 Fund | Schwab Global Real Estate Fund [Member] |
|
|
| Holdings [Line Items] |
|
|
| Percent of Net Asset Value |
2.40%
|
|
| Schwab Target 2015 Fund | Fixed Income - Inflation-Protected Bond [Member] |
|
|
| Holdings [Line Items] |
|
|
| Percent of Total Investments |
6.50%
|
|
| Schwab Target 2015 Fund | Money Market Funds [Member] |
|
|
| Holdings [Line Items] |
|
|
| Percent of Total Investments |
2.10%
|
|
| Schwab Target 2015 Fund | U.S. Stocks - Large-Cap [Member] |
|
|
| Holdings [Line Items] |
|
|
| Percent of Total Investments |
25.00%
|
|
| Schwab Target 2015 Fund | International Stocks - Developed Markets [Member] |
|
|
| Holdings [Line Items] |
|
|
| Percent of Total Investments |
8.90%
|
|
| Schwab Target 2015 Fund | U.S. Stocks - Small-Cap [Member] |
|
|
| Holdings [Line Items] |
|
|
| Percent of Total Investments |
2.00%
|
|
| Schwab Target 2015 Fund | Real Estate - Global Real Estate [Member] |
|
|
| Holdings [Line Items] |
|
|
| Percent of Total Investments |
2.40%
|
|
| Schwab Target 2015 Fund | U.S. Stocks - Mid-Cap [Member] |
|
|
| Holdings [Line Items] |
|
|
| Percent of Total Investments |
1.30%
|
|
| Schwab Target 2015 Fund | Fixed Income - Intermediate-Term Bond [Member] |
|
|
| Holdings [Line Items] |
|
|
| Percent of Total Investments |
42.10%
|
|
| Schwab Target 2015 Fund | Fixed Income - Short-Term Bond [Member] |
|
|
| Holdings [Line Items] |
|
|
| Percent of Total Investments |
7.60%
|
|
| Schwab Target 2015 Fund | Fixed Income - International Bond [Member] |
|
|
| Holdings [Line Items] |
|
|
| Percent of Total Investments |
2.10%
|
|
| Schwab Target 2020 Fund | Schwab Treasury Inflation Protected Securities Index Fund [Member] |
|
|
| Holdings [Line Items] |
|
|
| Percent of Net Asset Value |
6.20%
|
|
| Schwab Target 2020 Fund | Schwab Short-Term Bond Index Fund [Member] |
|
|
| Holdings [Line Items] |
|
|
| Percent of Net Asset Value |
7.20%
|
|
| Schwab Target 2020 Fund | Baird Aggregate Bond Fund, Class Institutional [Member] |
|
|
| Holdings [Line Items] |
|
|
| Percent of Net Asset Value |
12.60%
|
|
| Schwab Target 2020 Fund | Schwab U.S. Aggregate Bond Index Fund [Member] |
|
|
| Holdings [Line Items] |
|
|
| Percent of Net Asset Value |
24.10%
|
|
| Schwab Target 2020 Fund | Schwab S&P 500 Index Fund [Member] |
|
|
| Holdings [Line Items] |
|
|
| Percent of Net Asset Value |
13.80%
|
|
| Schwab Target 2020 Fund | Schwab International Opportunities Fund [Member] |
|
|
| Holdings [Line Items] |
|
|
| Percent of Net Asset Value |
5.30%
|
|
| Schwab Target 2020 Fund | Schwab International Core Equity Fund [Member] |
|
|
| Holdings [Line Items] |
|
|
| Percent of Net Asset Value |
3.90%
|
|
| Schwab Target 2020 Fund | Schwab Select Large Cap Growth Fund [Member] |
|
|
| Holdings [Line Items] |
|
|
| Percent of Net Asset Value |
4.20%
|
|
| Schwab Target 2020 Fund | Dodge & Cox Stock Fund, Class I [Member] |
|
|
| Holdings [Line Items] |
|
|
| Percent of Net Asset Value |
2.90%
|
|
| Schwab Target 2020 Fund | Schwab Global Real Estate Fund [Member] |
|
|
| Holdings [Line Items] |
|
|
| Percent of Net Asset Value |
2.50%
|
|
| Schwab Target 2020 Fund | Fixed Income - Inflation-Protected Bond [Member] |
|
|
| Holdings [Line Items] |
|
|
| Percent of Total Investments |
6.20%
|
|
| Schwab Target 2020 Fund | Money Market Funds [Member] |
|
|
| Holdings [Line Items] |
|
|
| Percent of Total Investments |
1.80%
|
|
| Schwab Target 2020 Fund | U.S. Stocks - Large-Cap [Member] |
|
|
| Holdings [Line Items] |
|
|
| Percent of Total Investments |
26.30%
|
|
| Schwab Target 2020 Fund | International Stocks - Developed Markets [Member] |
|
|
| Holdings [Line Items] |
|
|
| Percent of Total Investments |
9.80%
|
|
| Schwab Target 2020 Fund | U.S. Stocks - Small-Cap [Member] |
|
|
| Holdings [Line Items] |
|
|
| Percent of Total Investments |
2.10%
|
|
| Schwab Target 2020 Fund | Real Estate - Global Real Estate [Member] |
|
|
| Holdings [Line Items] |
|
|
| Percent of Total Investments |
2.60%
|
|
| Schwab Target 2020 Fund | U.S. Stocks - Mid-Cap [Member] |
|
|
| Holdings [Line Items] |
|
|
| Percent of Total Investments |
1.40%
|
|
| Schwab Target 2020 Fund | Fixed Income - Intermediate-Term Bond [Member] |
|
|
| Holdings [Line Items] |
|
|
| Percent of Total Investments |
40.40%
|
|
| Schwab Target 2020 Fund | Fixed Income - Short-Term Bond [Member] |
|
|
| Holdings [Line Items] |
|
|
| Percent of Total Investments |
7.20%
|
|
| Schwab Target 2020 Fund | Fixed Income - International Bond [Member] |
|
|
| Holdings [Line Items] |
|
|
| Percent of Total Investments |
2.20%
|
|
| Schwab Target 2025 Index Fund | Schwab Treasury Inflation Protected Securities Index Fund [Member] |
|
|
| Holdings [Line Items] |
|
|
| Percent of Net Asset Value |
6.00%
|
|
| Schwab Target 2025 Index Fund | Schwab Short-Term Bond Index Fund [Member] |
|
|
| Holdings [Line Items] |
|
|
| Percent of Net Asset Value |
6.90%
|
|
| Schwab Target 2025 Index Fund | Allspring Core Plus Bond Fund, Class R6 [Member] |
|
|
| Holdings [Line Items] |
|
|
| Percent of Net Asset Value |
2.90%
|
|
| Schwab Target 2025 Index Fund | Baird Aggregate Bond Fund, Class Institutional [Member] |
|
|
| Holdings [Line Items] |
|
|
| Percent of Net Asset Value |
11.30%
|
|
| Schwab Target 2025 Index Fund | Schwab U.S. Aggregate Bond Index Fund [Member] |
|
|
| Holdings [Line Items] |
|
|
| Percent of Net Asset Value |
22.80%
|
|
| Schwab Target 2025 Index Fund | Schwab S&P 500 Index Fund [Member] |
|
|
| Holdings [Line Items] |
|
|
| Percent of Net Asset Value |
14.40%
|
|
| Schwab Target 2025 Index Fund | Schwab International Opportunities Fund [Member] |
|
|
| Holdings [Line Items] |
|
|
| Percent of Net Asset Value |
5.80%
|
|
| Schwab Target 2025 Index Fund | Schwab International Core Equity Fund [Member] |
|
|
| Holdings [Line Items] |
|
|
| Percent of Net Asset Value |
4.30%
|
|
| Schwab Target 2025 Index Fund | Schwab Select Large Cap Growth Fund [Member] |
|
|
| Holdings [Line Items] |
|
|
| Percent of Net Asset Value |
4.40%
|
|
| Schwab Target 2025 Index Fund | Dodge & Cox Stock Fund, Class I [Member] |
|
|
| Holdings [Line Items] |
|
|
| Percent of Net Asset Value |
3.00%
|
|
| Schwab Target 2025 Index Fund | Fixed Income - Inflation-Protected Bond [Member] |
|
|
| Holdings [Line Items] |
|
|
| Percent of Total Investments |
6.00%
|
|
| Schwab Target 2025 Index Fund | Money Market Funds [Member] |
|
|
| Holdings [Line Items] |
|
|
| Percent of Total Investments |
1.50%
|
|
| Schwab Target 2025 Index Fund | U.S. Stocks - Large-Cap [Member] |
|
|
| Holdings [Line Items] |
|
|
| Percent of Total Investments |
27.40%
|
|
| Schwab Target 2025 Index Fund | International Stocks - Developed Markets [Member] |
|
|
| Holdings [Line Items] |
|
|
| Percent of Total Investments |
10.70%
|
|
| Schwab Target 2025 Index Fund | U.S. Stocks - Small-Cap [Member] |
|
|
| Holdings [Line Items] |
|
|
| Percent of Total Investments |
2.30%
|
|
| Schwab Target 2025 Index Fund | Real Estate - Global Real Estate [Member] |
|
|
| Holdings [Line Items] |
|
|
| Percent of Total Investments |
2.80%
|
|
| Schwab Target 2025 Index Fund | U.S. Stocks - Mid-Cap [Member] |
|
|
| Holdings [Line Items] |
|
|
| Percent of Total Investments |
1.50%
|
|
| Schwab Target 2025 Index Fund | Fixed Income - Intermediate-Term Bond [Member] |
|
|
| Holdings [Line Items] |
|
|
| Percent of Total Investments |
38.60%
|
|
| Schwab Target 2025 Index Fund | Fixed Income - Short-Term Bond [Member] |
|
|
| Holdings [Line Items] |
|
|
| Percent of Total Investments |
7.00%
|
|
| Schwab Target 2025 Index Fund | Fixed Income - International Bond [Member] |
|
|
| Holdings [Line Items] |
|
|
| Percent of Total Investments |
2.20%
|
|
| Schwab Target 2030 Fund | Schwab Short-Term Bond Index Fund [Member] |
|
|
| Holdings [Line Items] |
|
|
| Percent of Net Asset Value |
4.50%
|
|
| Schwab Target 2030 Fund | Allspring Core Plus Bond Fund, Class R6 [Member] |
|
|
| Holdings [Line Items] |
|
|
| Percent of Net Asset Value |
3.50%
|
|
| Schwab Target 2030 Fund | PIMCO International Bond Fund U.S. Dollar-Hedged, Class Institutional [Member] |
|
|
| Holdings [Line Items] |
|
|
| Percent of Net Asset Value |
3.80%
|
|
| Schwab Target 2030 Fund | Baird Aggregate Bond Fund, Class Institutional [Member] |
|
|
| Holdings [Line Items] |
|
|
| Percent of Net Asset Value |
6.70%
|
|
| Schwab Target 2030 Fund | Schwab U.S. Aggregate Bond Index Fund [Member] |
|
|
| Holdings [Line Items] |
|
|
| Percent of Net Asset Value |
15.50%
|
|
| Schwab Target 2030 Fund | Schwab S&P 500 Index Fund [Member] |
|
|
| Holdings [Line Items] |
|
|
| Percent of Net Asset Value |
17.40%
|
|
| Schwab Target 2030 Fund | Schwab International Opportunities Fund [Member] |
|
|
| Holdings [Line Items] |
|
|
| Percent of Net Asset Value |
8.50%
|
|
| Schwab Target 2030 Fund | Schwab International Core Equity Fund [Member] |
|
|
| Holdings [Line Items] |
|
|
| Percent of Net Asset Value |
6.20%
|
|
| Schwab Target 2030 Fund | Schwab Select Large Cap Growth Fund [Member] |
|
|
| Holdings [Line Items] |
|
|
| Percent of Net Asset Value |
5.70%
|
|
| Schwab Target 2030 Fund | Dodge & Cox Stock Fund, Class I [Member] |
|
|
| Holdings [Line Items] |
|
|
| Percent of Net Asset Value |
4.00%
|
|
| Schwab Target 2030 Fund | Fixed Income - Inflation-Protected Bond [Member] |
|
|
| Holdings [Line Items] |
|
|
| Percent of Total Investments |
2.20%
|
|
| Schwab Target 2030 Fund | Money Market Funds [Member] |
|
|
| Holdings [Line Items] |
|
|
| Percent of Total Investments |
1.00%
|
|
| Schwab Target 2030 Fund | U.S. Stocks - Large-Cap [Member] |
|
|
| Holdings [Line Items] |
|
|
| Percent of Total Investments |
34.90%
|
|
| Schwab Target 2030 Fund | International Stocks - Developed Markets [Member] |
|
|
| Holdings [Line Items] |
|
|
| Percent of Total Investments |
15.70%
|
|
| Schwab Target 2030 Fund | U.S. Stocks - Small-Cap [Member] |
|
|
| Holdings [Line Items] |
|
|
| Percent of Total Investments |
3.40%
|
|
| Schwab Target 2030 Fund | International Stocks - Emerging Markets [Member] |
|
|
| Holdings [Line Items] |
|
|
| Percent of Total Investments |
0.90%
|
|
| Schwab Target 2030 Fund | Real Estate - Global Real Estate [Member] |
|
|
| Holdings [Line Items] |
|
|
| Percent of Total Investments |
3.50%
|
|
| Schwab Target 2030 Fund | U.S. Stocks - Mid-Cap [Member] |
|
|
| Holdings [Line Items] |
|
|
| Percent of Total Investments |
1.50%
|
|
| Schwab Target 2030 Fund | Fixed Income - Intermediate-Term Bond [Member] |
|
|
| Holdings [Line Items] |
|
|
| Percent of Total Investments |
28.40%
|
|
| Schwab Target 2030 Fund | Fixed Income - Short-Term Bond [Member] |
|
|
| Holdings [Line Items] |
|
|
| Percent of Total Investments |
4.60%
|
|
| Schwab Target 2030 Fund | Fixed Income - International Bond [Member] |
|
|
| Holdings [Line Items] |
|
|
| Percent of Total Investments |
3.90%
|
|
| Schwab Target 2035 Fund | PIMCO International Bond Fund U.S. Dollar-Hedged, Class Institutional [Member] |
|
|
| Holdings [Line Items] |
|
|
| Percent of Net Asset Value |
4.10%
|
|
| Schwab Target 2035 Fund | Baird Aggregate Bond Fund, Class Institutional [Member] |
|
|
| Holdings [Line Items] |
|
|
| Percent of Net Asset Value |
3.90%
|
|
| Schwab Target 2035 Fund | Schwab U.S. Aggregate Bond Index Fund [Member] |
|
|
| Holdings [Line Items] |
|
|
| Percent of Net Asset Value |
10.60%
|
|
| Schwab Target 2035 Fund | Schwab S&P 500 Index Fund [Member] |
|
|
| Holdings [Line Items] |
|
|
| Percent of Net Asset Value |
18.70%
|
|
| Schwab Target 2035 Fund | Schwab International Opportunities Fund [Member] |
|
|
| Holdings [Line Items] |
|
|
| Percent of Net Asset Value |
10.10%
|
|
| Schwab Target 2035 Fund | Schwab International Core Equity Fund [Member] |
|
|
| Holdings [Line Items] |
|
|
| Percent of Net Asset Value |
7.50%
|
|
| Schwab Target 2035 Fund | Schwab Select Large Cap Growth Fund [Member] |
|
|
| Holdings [Line Items] |
|
|
| Percent of Net Asset Value |
7.10%
|
|
| Schwab Target 2035 Fund | Dodge & Cox Stock Fund, Class I [Member] |
|
|
| Holdings [Line Items] |
|
|
| Percent of Net Asset Value |
4.70%
|
|
| Schwab Target 2035 Fund | Schwab Fundamental U.S. Large Company Index Fund [Member] |
|
|
| Holdings [Line Items] |
|
|
| Percent of Net Asset Value |
3.80%
|
|
| Schwab Target 2035 Fund | Schwab Global Real Estate Fund [Member] |
|
|
| Holdings [Line Items] |
|
|
| Percent of Net Asset Value |
4.10%
|
|
| Schwab Target 2035 Fund | Fixed Income - Inflation-Protected Bond [Member] |
|
|
| Holdings [Line Items] |
|
|
| Percent of Total Investments |
0.50%
|
|
| Schwab Target 2035 Fund | Money Market Funds [Member] |
|
|
| Holdings [Line Items] |
|
|
| Percent of Total Investments |
0.60%
|
|
| Schwab Target 2035 Fund | U.S. Stocks - Large-Cap [Member] |
|
|
| Holdings [Line Items] |
|
|
| Percent of Total Investments |
39.90%
|
|
| Schwab Target 2035 Fund | International Stocks - Developed Markets [Member] |
|
|
| Holdings [Line Items] |
|
|
| Percent of Total Investments |
18.70%
|
|
| Schwab Target 2035 Fund | U.S. Stocks - Small-Cap [Member] |
|
|
| Holdings [Line Items] |
|
|
| Percent of Total Investments |
4.50%
|
|
| Schwab Target 2035 Fund | International Stocks - Emerging Markets [Member] |
|
|
| Holdings [Line Items] |
|
|
| Percent of Total Investments |
1.90%
|
|
| Schwab Target 2035 Fund | Real Estate - Global Real Estate [Member] |
|
|
| Holdings [Line Items] |
|
|
| Percent of Total Investments |
4.20%
|
|
| Schwab Target 2035 Fund | U.S. Stocks - Mid-Cap [Member] |
|
|
| Holdings [Line Items] |
|
|
| Percent of Total Investments |
1.60%
|
|
| Schwab Target 2035 Fund | Fixed Income - Intermediate-Term Bond [Member] |
|
|
| Holdings [Line Items] |
|
|
| Percent of Total Investments |
20.90%
|
|
| Schwab Target 2035 Fund | Fixed Income - Short-Term Bond [Member] |
|
|
| Holdings [Line Items] |
|
|
| Percent of Total Investments |
3.10%
|
|
| Schwab Target 2035 Fund | Fixed Income - International Bond [Member] |
|
|
| Holdings [Line Items] |
|
|
| Percent of Total Investments |
4.10%
|
|
| Schwab Target 2040 Fund | Schwab U.S. Aggregate Bond Index Fund [Member] |
|
|
| Holdings [Line Items] |
|
|
| Percent of Net Asset Value |
7.20%
|
|
| Schwab Target 2040 Fund | Schwab S&P 500 Index Fund [Member] |
|
|
| Holdings [Line Items] |
|
|
| Percent of Net Asset Value |
19.40%
|
|
| Schwab Target 2040 Fund | Schwab International Opportunities Fund [Member] |
|
|
| Holdings [Line Items] |
|
|
| Percent of Net Asset Value |
11.60%
|
|
| Schwab Target 2040 Fund | Schwab International Core Equity Fund [Member] |
|
|
| Holdings [Line Items] |
|
|
| Percent of Net Asset Value |
8.40%
|
|
| Schwab Target 2040 Fund | Schwab Select Large Cap Growth Fund [Member] |
|
|
| Holdings [Line Items] |
|
|
| Percent of Net Asset Value |
8.10%
|
|
| Schwab Target 2040 Fund | Dodge & Cox Stock Fund, Class I [Member] |
|
|
| Holdings [Line Items] |
|
|
| Percent of Net Asset Value |
5.20%
|
|
| Schwab Target 2040 Fund | Schwab Fundamental U.S. Large Company Index Fund [Member] |
|
|
| Holdings [Line Items] |
|
|
| Percent of Net Asset Value |
4.70%
|
|
| Schwab Target 2040 Fund | Schwab Small-Cap Equity Fund [Member] |
|
|
| Holdings [Line Items] |
|
|
| Percent of Net Asset Value |
4.20%
|
|
| Schwab Target 2040 Fund | Schwab Global Real Estate Fund [Member] |
|
|
| Holdings [Line Items] |
|
|
| Percent of Net Asset Value |
4.40%
|
|
| Schwab Target 2040 Fund | Schwab Core Equity Fund [Member] |
|
|
| Holdings [Line Items] |
|
|
| Percent of Net Asset Value |
4.00%
|
|
| Schwab Target 2040 Fund | Money Market Funds [Member] |
|
|
| Holdings [Line Items] |
|
|
| Percent of Total Investments |
0.40%
|
|
| Schwab Target 2040 Fund | U.S. Stocks - Large-Cap [Member] |
|
|
| Holdings [Line Items] |
|
|
| Percent of Total Investments |
43.70%
|
|
| Schwab Target 2040 Fund | International Stocks - Developed Markets [Member] |
|
|
| Holdings [Line Items] |
|
|
| Percent of Total Investments |
21.20%
|
|
| Schwab Target 2040 Fund | U.S. Stocks - Small-Cap [Member] |
|
|
| Holdings [Line Items] |
|
|
| Percent of Total Investments |
5.40%
|
|
| Schwab Target 2040 Fund | International Stocks - Emerging Markets [Member] |
|
|
| Holdings [Line Items] |
|
|
| Percent of Total Investments |
2.70%
|
|
| Schwab Target 2040 Fund | Real Estate - Global Real Estate [Member] |
|
|
| Holdings [Line Items] |
|
|
| Percent of Total Investments |
4.50%
|
|
| Schwab Target 2040 Fund | U.S. Stocks - Mid-Cap [Member] |
|
|
| Holdings [Line Items] |
|
|
| Percent of Total Investments |
1.70%
|
|
| Schwab Target 2040 Fund | Fixed Income - Intermediate-Term Bond [Member] |
|
|
| Holdings [Line Items] |
|
|
| Percent of Total Investments |
15.20%
|
|
| Schwab Target 2040 Fund | Fixed Income - Short-Term Bond [Member] |
|
|
| Holdings [Line Items] |
|
|
| Percent of Total Investments |
2.10%
|
|
| Schwab Target 2040 Fund | Fixed Income - International Bond [Member] |
|
|
| Holdings [Line Items] |
|
|
| Percent of Total Investments |
3.10%
|
|
| Schwab Target 2045 Fund | Schwab U.S. Aggregate Bond Index Fund [Member] |
|
|
| Holdings [Line Items] |
|
|
| Percent of Net Asset Value |
4.40%
|
|
| Schwab Target 2045 Fund | Schwab S&P 500 Index Fund [Member] |
|
|
| Holdings [Line Items] |
|
|
| Percent of Net Asset Value |
19.60%
|
|
| Schwab Target 2045 Fund | Schwab International Opportunities Fund [Member] |
|
|
| Holdings [Line Items] |
|
|
| Percent of Net Asset Value |
12.60%
|
|
| Schwab Target 2045 Fund | Schwab International Core Equity Fund [Member] |
|
|
| Holdings [Line Items] |
|
|
| Percent of Net Asset Value |
9.20%
|
|
| Schwab Target 2045 Fund | Schwab Select Large Cap Growth Fund [Member] |
|
|
| Holdings [Line Items] |
|
|
| Percent of Net Asset Value |
9.20%
|
|
| Schwab Target 2045 Fund | Dodge & Cox Stock Fund, Class I [Member] |
|
|
| Holdings [Line Items] |
|
|
| Percent of Net Asset Value |
5.60%
|
|
| Schwab Target 2045 Fund | Schwab Fundamental U.S. Large Company Index Fund [Member] |
|
|
| Holdings [Line Items] |
|
|
| Percent of Net Asset Value |
5.30%
|
|
| Schwab Target 2045 Fund | Schwab Small-Cap Equity Fund [Member] |
|
|
| Holdings [Line Items] |
|
|
| Percent of Net Asset Value |
4.50%
|
|
| Schwab Target 2045 Fund | Schwab Global Real Estate Fund [Member] |
|
|
| Holdings [Line Items] |
|
|
| Percent of Net Asset Value |
4.80%
|
|
| Schwab Target 2045 Fund | Schwab Core Equity Fund [Member] |
|
|
| Holdings [Line Items] |
|
|
| Percent of Net Asset Value |
4.30%
|
|
| Schwab Target 2045 Fund | Money Market Funds [Member] |
|
|
| Holdings [Line Items] |
|
|
| Percent of Total Investments |
0.20%
|
|
| Schwab Target 2045 Fund | U.S. Stocks - Large-Cap [Member] |
|
|
| Holdings [Line Items] |
|
|
| Percent of Total Investments |
46.50%
|
|
| Schwab Target 2045 Fund | International Stocks - Developed Markets [Member] |
|
|
| Holdings [Line Items] |
|
|
| Percent of Total Investments |
23.10%
|
|
| Schwab Target 2045 Fund | U.S. Stocks - Small-Cap [Member] |
|
|
| Holdings [Line Items] |
|
|
| Percent of Total Investments |
6.20%
|
|
| Schwab Target 2045 Fund | International Stocks - Emerging Markets [Member] |
|
|
| Holdings [Line Items] |
|
|
| Percent of Total Investments |
3.80%
|
|
| Schwab Target 2045 Fund | Real Estate - Global Real Estate [Member] |
|
|
| Holdings [Line Items] |
|
|
| Percent of Total Investments |
4.90%
|
|
| Schwab Target 2045 Fund | U.S. Stocks - Mid-Cap [Member] |
|
|
| Holdings [Line Items] |
|
|
| Percent of Total Investments |
1.80%
|
|
| Schwab Target 2045 Fund | Fixed Income - Intermediate-Term Bond [Member] |
|
|
| Holdings [Line Items] |
|
|
| Percent of Total Investments |
10.10%
|
|
| Schwab Target 2045 Fund | Fixed Income - Short-Term Bond [Member] |
|
|
| Holdings [Line Items] |
|
|
| Percent of Total Investments |
1.30%
|
|
| Schwab Target 2045 Fund | Fixed Income - International Bond [Member] |
|
|
| Holdings [Line Items] |
|
|
| Percent of Total Investments |
2.10%
|
|
| Schwab Target 2050 Fund | Schwab S&P 500 Index Fund [Member] |
|
|
| Holdings [Line Items] |
|
|
| Percent of Net Asset Value |
20.40%
|
|
| Schwab Target 2050 Fund | Schwab International Opportunities Fund [Member] |
|
|
| Holdings [Line Items] |
|
|
| Percent of Net Asset Value |
13.70%
|
|
| Schwab Target 2050 Fund | Schwab International Core Equity Fund [Member] |
|
|
| Holdings [Line Items] |
|
|
| Percent of Net Asset Value |
10.00%
|
|
| Schwab Target 2050 Fund | Schwab Select Large Cap Growth Fund [Member] |
|
|
| Holdings [Line Items] |
|
|
| Percent of Net Asset Value |
9.40%
|
|
| Schwab Target 2050 Fund | Dodge & Cox Stock Fund, Class I [Member] |
|
|
| Holdings [Line Items] |
|
|
| Percent of Net Asset Value |
5.60%
|
|
| Schwab Target 2050 Fund | Goldman Sachs Emerging Markets Equity Insights Fund, Institutional Class [Member] |
|
|
| Holdings [Line Items] |
|
|
| Percent of Net Asset Value |
5.10%
|
|
| Schwab Target 2050 Fund | Schwab Fundamental U.S. Large Company Index Fund [Member] |
|
|
| Holdings [Line Items] |
|
|
| Percent of Net Asset Value |
5.30%
|
|
| Schwab Target 2050 Fund | Schwab Small-Cap Equity Fund [Member] |
|
|
| Holdings [Line Items] |
|
|
| Percent of Net Asset Value |
4.90%
|
|
| Schwab Target 2050 Fund | Schwab Global Real Estate Fund [Member] |
|
|
| Holdings [Line Items] |
|
|
| Percent of Net Asset Value |
5.00%
|
|
| Schwab Target 2050 Fund | Schwab Core Equity Fund [Member] |
|
|
| Holdings [Line Items] |
|
|
| Percent of Net Asset Value |
4.40%
|
|
| Schwab Target 2050 Fund | Money Market Funds [Member] |
|
|
| Holdings [Line Items] |
|
|
| Percent of Total Investments |
0.10%
|
|
| Schwab Target 2050 Fund | U.S. Stocks - Large-Cap [Member] |
|
|
| Holdings [Line Items] |
|
|
| Percent of Total Investments |
47.70%
|
|
| Schwab Target 2050 Fund | International Stocks - Developed Markets [Member] |
|
|
| Holdings [Line Items] |
|
|
| Percent of Total Investments |
25.20%
|
|
| Schwab Target 2050 Fund | U.S. Stocks - Small-Cap [Member] |
|
|
| Holdings [Line Items] |
|
|
| Percent of Total Investments |
6.50%
|
|
| Schwab Target 2050 Fund | International Stocks - Emerging Markets [Member] |
|
|
| Holdings [Line Items] |
|
|
| Percent of Total Investments |
5.10%
|
|
| Schwab Target 2050 Fund | Real Estate - Global Real Estate [Member] |
|
|
| Holdings [Line Items] |
|
|
| Percent of Total Investments |
5.00%
|
|
| Schwab Target 2050 Fund | U.S. Stocks - Mid-Cap [Member] |
|
|
| Holdings [Line Items] |
|
|
| Percent of Total Investments |
1.80%
|
|
| Schwab Target 2050 Fund | Fixed Income - Intermediate-Term Bond [Member] |
|
|
| Holdings [Line Items] |
|
|
| Percent of Total Investments |
6.30%
|
|
| Schwab Target 2050 Fund | Fixed Income - Short-Term Bond [Member] |
|
|
| Holdings [Line Items] |
|
|
| Percent of Total Investments |
0.90%
|
|
| Schwab Target 2050 Fund | Fixed Income - International Bond [Member] |
|
|
| Holdings [Line Items] |
|
|
| Percent of Total Investments |
1.40%
|
|
| Schwab Target 2055 Fund | Schwab S&P 500 Index Fund [Member] |
|
|
| Holdings [Line Items] |
|
|
| Percent of Net Asset Value |
20.10%
|
|
| Schwab Target 2055 Fund | Schwab International Opportunities Fund [Member] |
|
|
| Holdings [Line Items] |
|
|
| Percent of Net Asset Value |
13.80%
|
|
| Schwab Target 2055 Fund | Schwab International Core Equity Fund [Member] |
|
|
| Holdings [Line Items] |
|
|
| Percent of Net Asset Value |
10.10%
|
|
| Schwab Target 2055 Fund | Schwab Select Large Cap Growth Fund [Member] |
|
|
| Holdings [Line Items] |
|
|
| Percent of Net Asset Value |
10.00%
|
|
| Schwab Target 2055 Fund | Dodge & Cox Stock Fund, Class I [Member] |
|
|
| Holdings [Line Items] |
|
|
| Percent of Net Asset Value |
6.00%
|
|
| Schwab Target 2055 Fund | Goldman Sachs Emerging Markets Equity Insights Fund, Institutional Class [Member] |
|
|
| Holdings [Line Items] |
|
|
| Percent of Net Asset Value |
5.50%
|
|
| Schwab Target 2055 Fund | Schwab Fundamental U.S. Large Company Index Fund [Member] |
|
|
| Holdings [Line Items] |
|
|
| Percent of Net Asset Value |
5.80%
|
|
| Schwab Target 2055 Fund | Schwab Small-Cap Equity Fund [Member] |
|
|
| Holdings [Line Items] |
|
|
| Percent of Net Asset Value |
5.50%
|
|
| Schwab Target 2055 Fund | Schwab Global Real Estate Fund [Member] |
|
|
| Holdings [Line Items] |
|
|
| Percent of Net Asset Value |
5.00%
|
|
| Schwab Target 2055 Fund | Schwab Core Equity Fund [Member] |
|
|
| Holdings [Line Items] |
|
|
| Percent of Net Asset Value |
4.50%
|
|
| Schwab Target 2055 Fund | U.S. Stocks - Large-Cap [Member] |
|
|
| Holdings [Line Items] |
|
|
| Percent of Total Investments |
49.10%
|
|
| Schwab Target 2055 Fund | International Stocks - Developed Markets [Member] |
|
|
| Holdings [Line Items] |
|
|
| Percent of Total Investments |
25.20%
|
|
| Schwab Target 2055 Fund | U.S. Stocks - Small-Cap [Member] |
|
|
| Holdings [Line Items] |
|
|
| Percent of Total Investments |
7.40%
|
|
| Schwab Target 2055 Fund | International Stocks - Emerging Markets [Member] |
|
|
| Holdings [Line Items] |
|
|
| Percent of Total Investments |
5.50%
|
|
| Schwab Target 2055 Fund | Real Estate - Global Real Estate [Member] |
|
|
| Holdings [Line Items] |
|
|
| Percent of Total Investments |
5.00%
|
|
| Schwab Target 2055 Fund | U.S. Stocks - Mid-Cap [Member] |
|
|
| Holdings [Line Items] |
|
|
| Percent of Total Investments |
1.80%
|
|
| Schwab Target 2055 Fund | Fixed Income - Intermediate-Term Bond [Member] |
|
|
| Holdings [Line Items] |
|
|
| Percent of Total Investments |
4.50%
|
|
| Schwab Target 2055 Fund | Fixed Income - Short-Term Bond [Member] |
|
|
| Holdings [Line Items] |
|
|
| Percent of Total Investments |
0.60%
|
|
| Schwab Target 2055 Fund | Fixed Income - International Bond [Member] |
|
|
| Holdings [Line Items] |
|
|
| Percent of Total Investments |
0.90%
|
|
| Schwab Target 2060 Fund | Schwab S&P 500 Index Fund [Member] |
|
|
| Holdings [Line Items] |
|
|
| Percent of Net Asset Value |
19.80%
|
|
| Schwab Target 2060 Fund | Schwab International Opportunities Fund [Member] |
|
|
| Holdings [Line Items] |
|
|
| Percent of Net Asset Value |
13.80%
|
|
| Schwab Target 2060 Fund | Schwab International Core Equity Fund [Member] |
|
|
| Holdings [Line Items] |
|
|
| Percent of Net Asset Value |
10.30%
|
|
| Schwab Target 2060 Fund | Schwab Select Large Cap Growth Fund [Member] |
|
|
| Holdings [Line Items] |
|
|
| Percent of Net Asset Value |
10.00%
|
|
| Schwab Target 2060 Fund | Dodge & Cox Stock Fund, Class I [Member] |
|
|
| Holdings [Line Items] |
|
|
| Percent of Net Asset Value |
6.10%
|
|
| Schwab Target 2060 Fund | Goldman Sachs Emerging Markets Equity Insights Fund, Institutional Class [Member] |
|
|
| Holdings [Line Items] |
|
|
| Percent of Net Asset Value |
5.90%
|
|
| Schwab Target 2060 Fund | Schwab Fundamental U.S. Large Company Index Fund [Member] |
|
|
| Holdings [Line Items] |
|
|
| Percent of Net Asset Value |
5.80%
|
|
| Schwab Target 2060 Fund | Schwab Small-Cap Equity Fund [Member] |
|
|
| Holdings [Line Items] |
|
|
| Percent of Net Asset Value |
5.50%
|
|
| Schwab Target 2060 Fund | Schwab Global Real Estate Fund [Member] |
|
|
| Holdings [Line Items] |
|
|
| Percent of Net Asset Value |
5.10%
|
|
| Schwab Target 2060 Fund | Schwab Core Equity Fund [Member] |
|
|
| Holdings [Line Items] |
|
|
| Percent of Net Asset Value |
4.60%
|
|
| Schwab Target 2060 Fund | U.S. Stocks - Large-Cap [Member] |
|
|
| Holdings [Line Items] |
|
|
| Percent of Total Investments |
49.20%
|
|
| Schwab Target 2060 Fund | International Stocks - Developed Markets [Member] |
|
|
| Holdings [Line Items] |
|
|
| Percent of Total Investments |
25.50%
|
|
| Schwab Target 2060 Fund | U.S. Stocks - Small-Cap [Member] |
|
|
| Holdings [Line Items] |
|
|
| Percent of Total Investments |
7.70%
|
|
| Schwab Target 2060 Fund | International Stocks - Emerging Markets [Member] |
|
|
| Holdings [Line Items] |
|
|
| Percent of Total Investments |
5.90%
|
|
| Schwab Target 2060 Fund | Real Estate - Global Real Estate [Member] |
|
|
| Holdings [Line Items] |
|
|
| Percent of Total Investments |
5.20%
|
|
| Schwab Target 2060 Fund | U.S. Stocks - Mid-Cap [Member] |
|
|
| Holdings [Line Items] |
|
|
| Percent of Total Investments |
2.00%
|
|
| Schwab Target 2060 Fund | Fixed Income - Intermediate-Term Bond [Member] |
|
|
| Holdings [Line Items] |
|
|
| Percent of Total Investments |
3.30%
|
|
| Schwab Target 2060 Fund | Fixed Income - Short-Term Bond [Member] |
|
|
| Holdings [Line Items] |
|
|
| Percent of Total Investments |
0.50%
|
|
| Schwab Target 2060 Fund | Fixed Income - International Bond [Member] |
|
|
| Holdings [Line Items] |
|
|
| Percent of Total Investments |
0.70%
|
|
| Schwab Target 2065 Fund | Schwab S&P 500 Index Fund [Member] |
|
|
| Holdings [Line Items] |
|
|
| Percent of Net Asset Value |
19.80%
|
|
| Schwab Target 2065 Fund | Schwab International Opportunities Fund [Member] |
|
|
| Holdings [Line Items] |
|
|
| Percent of Net Asset Value |
14.10%
|
|
| Schwab Target 2065 Fund | Schwab International Core Equity Fund [Member] |
|
|
| Holdings [Line Items] |
|
|
| Percent of Net Asset Value |
10.70%
|
|
| Schwab Target 2065 Fund | Schwab Select Large Cap Growth Fund [Member] |
|
|
| Holdings [Line Items] |
|
|
| Percent of Net Asset Value |
10.10%
|
|
| Schwab Target 2065 Fund | Dodge & Cox Stock Fund, Class I [Member] |
|
|
| Holdings [Line Items] |
|
|
| Percent of Net Asset Value |
6.30%
|
|
| Schwab Target 2065 Fund | Goldman Sachs Emerging Markets Equity Insights Fund, Institutional Class [Member] |
|
|
| Holdings [Line Items] |
|
|
| Percent of Net Asset Value |
6.30%
|
|
| Schwab Target 2065 Fund | Schwab Fundamental U.S. Large Company Index Fund [Member] |
|
|
| Holdings [Line Items] |
|
|
| Percent of Net Asset Value |
6.10%
|
|
| Schwab Target 2065 Fund | Schwab Small-Cap Equity Fund [Member] |
|
|
| Holdings [Line Items] |
|
|
| Percent of Net Asset Value |
5.90%
|
|
| Schwab Target 2065 Fund | Schwab Global Real Estate Fund [Member] |
|
|
| Holdings [Line Items] |
|
|
| Percent of Net Asset Value |
5.30%
|
|
| Schwab Target 2065 Fund | Schwab Core Equity Fund [Member] |
|
|
| Holdings [Line Items] |
|
|
| Percent of Net Asset Value |
4.60%
|
|
| Schwab Target 2065 Fund | U.S. Stocks - Large-Cap [Member] |
|
|
| Holdings [Line Items] |
|
|
| Percent of Total Investments |
49.70%
|
|
| Schwab Target 2065 Fund | International Stocks - Developed Markets [Member] |
|
|
| Holdings [Line Items] |
|
|
| Percent of Total Investments |
26.20%
|
|
| Schwab Target 2065 Fund | U.S. Stocks - Small-Cap [Member] |
|
|
| Holdings [Line Items] |
|
|
| Percent of Total Investments |
8.00%
|
|
| Schwab Target 2065 Fund | International Stocks - Emerging Markets [Member] |
|
|
| Holdings [Line Items] |
|
|
| Percent of Total Investments |
6.30%
|
|
| Schwab Target 2065 Fund | Real Estate - Global Real Estate [Member] |
|
|
| Holdings [Line Items] |
|
|
| Percent of Total Investments |
5.40%
|
|
| Schwab Target 2065 Fund | U.S. Stocks - Mid-Cap [Member] |
|
|
| Holdings [Line Items] |
|
|
| Percent of Total Investments |
2.00%
|
|
| Schwab Target 2065 Fund | Fixed Income - Intermediate-Term Bond [Member] |
|
|
| Holdings [Line Items] |
|
|
| Percent of Total Investments |
1.50%
|
|
| Schwab Target 2065 Fund | Fixed Income - Short-Term Bond [Member] |
|
|
| Holdings [Line Items] |
|
|
| Percent of Total Investments |
0.50%
|
|
| Schwab Target 2065 Fund | Fixed Income - International Bond [Member] |
|
|
| Holdings [Line Items] |
|
|
| Percent of Total Investments |
0.40%
|
|
|
|
| X |
- ReferencesReference 1: http://www.xbrl.org/2003/role/presentationRef
-Publisher SEC
-Name Form N-1A
-Section 27A
-Subsection f
| Name: |
oef_HoldingsLineItems |
| Namespace Prefix: |
oef_ |
| Data Type: |
xbrli:stringItemType |
| Balance Type: |
na |
| Period Type: |
duration |
|
| X |
- ReferencesReference 1: http://www.xbrl.org/2003/role/presentationRef
-Publisher SEC
-Name Form N-1A
-Section 27A
-Subsection f
| Name: |
oef_PctOfNav |
| Namespace Prefix: |
oef_ |
| Data Type: |
dtr-types:percentItemType |
| Balance Type: |
na |
| Period Type: |
instant |
|
| X |
- ReferencesReference 1: http://www.xbrl.org/2003/role/presentationRef
-Publisher SEC
-Name Form N-1A
-Section 27A
-Subsection f
| Name: |
oef_PctOfTotalInv |
| Namespace Prefix: |
oef_ |
| Data Type: |
dtr-types:percentItemType |
| Balance Type: |
na |
| Period Type: |
instant |
|
| X |
- Details
| Name: |
oef_ClassAxis=cik0000904333_C000017890Member |
| Namespace Prefix: |
|
| Data Type: |
na |
| Balance Type: |
|
| Period Type: |
|
|
| X |
- Details
| Name: |
oef_LargestHoldingAxis=cik0000904333_SchwabEmergingMarketsEquityEtfMember |
| Namespace Prefix: |
|
| Data Type: |
na |
| Balance Type: |
|
| Period Type: |
|
|
| X |
- Details
| Name: |
oef_LargestHoldingAxis=cik0000904333_MercadoLibreIncMember |
| Namespace Prefix: |
|
| Data Type: |
na |
| Balance Type: |
|
| Period Type: |
|
|
| X |
- Details
| Name: |
oef_LargestHoldingAxis=cik0000904333_SpotifyTechnologySaMember |
| Namespace Prefix: |
|
| Data Type: |
na |
| Balance Type: |
|
| Period Type: |
|
|
| X |
- Details
| Name: |
oef_LargestHoldingAxis=cik0000904333_ProsusNvMember |
| Namespace Prefix: |
|
| Data Type: |
na |
| Balance Type: |
|
| Period Type: |
|
|
| X |
- Details
| Name: |
oef_LargestHoldingAxis=cik0000904333_AdyenNvMember |
| Namespace Prefix: |
|
| Data Type: |
na |
| Balance Type: |
|
| Period Type: |
|
|
| X |
- Details
| Name: |
oef_LargestHoldingAxis=cik0000904333_ASMLHoldingNVMember |
| Namespace Prefix: |
|
| Data Type: |
na |
| Balance Type: |
|
| Period Type: |
|
|
| X |
- Details
| Name: |
oef_LargestHoldingAxis=cik0000904333_NovartisAGMember |
| Namespace Prefix: |
|
| Data Type: |
na |
| Balance Type: |
|
| Period Type: |
|
|
| X |
- Details
| Name: |
oef_LargestHoldingAxis=cik0000904333_SamsungElectronicsCoLtdMember |
| Namespace Prefix: |
|
| Data Type: |
na |
| Balance Type: |
|
| Period Type: |
|
|
| X |
- Details
| Name: |
oef_LargestHoldingAxis=cik0000904333_ShellPLCMember |
| Namespace Prefix: |
|
| Data Type: |
na |
| Balance Type: |
|
| Period Type: |
|
|
| X |
- Details
| Name: |
oef_LargestHoldingAxis=cik0000904333_TaiwanSemiconductorManufacturingCoLtdMember |
| Namespace Prefix: |
|
| Data Type: |
na |
| Balance Type: |
|
| Period Type: |
|
|
| X |
- Details
| Name: |
oef_IndustrySectorAxis=cik0000904333_InvestmentCompaniesMember |
| Namespace Prefix: |
|
| Data Type: |
na |
| Balance Type: |
|
| Period Type: |
|
|
| X |
- Details
| Name: |
oef_IndustrySectorAxis=cik0000904333_FinancialsMember |
| Namespace Prefix: |
|
| Data Type: |
na |
| Balance Type: |
|
| Period Type: |
|
|
| X |
- Details
| Name: |
oef_IndustrySectorAxis=oef_MaterialsSectorMember |
| Namespace Prefix: |
|
| Data Type: |
na |
| Balance Type: |
|
| Period Type: |
|
|
| X |
- Details
| Name: |
oef_IndustrySectorAxis=us-gaap_EnergySectorMember |
| Namespace Prefix: |
|
| Data Type: |
na |
| Balance Type: |
|
| Period Type: |
|
|
| X |
- Details
| Name: |
oef_IndustrySectorAxis=oef_ConsumerDiscretionarySectorMember |
| Namespace Prefix: |
|
| Data Type: |
na |
| Balance Type: |
|
| Period Type: |
|
|
| X |
- Details
| Name: |
oef_IndustrySectorAxis=oef_CommunicationsSectorMember |
| Namespace Prefix: |
|
| Data Type: |
na |
| Balance Type: |
|
| Period Type: |
|
|
| X |
- Details
| Name: |
oef_IndustrySectorAxis=oef_IndustrialSectorMember |
| Namespace Prefix: |
|
| Data Type: |
na |
| Balance Type: |
|
| Period Type: |
|
|
| X |
- Details
| Name: |
oef_IndustrySectorAxis=oef_ConsumerStaplesSectorMember |
| Namespace Prefix: |
|
| Data Type: |
na |
| Balance Type: |
|
| Period Type: |
|
|
| X |
- Details
| Name: |
oef_IndustrySectorAxis=oef_UtilitiesSectorMember |
| Namespace Prefix: |
|
| Data Type: |
na |
| Balance Type: |
|
| Period Type: |
|
|
| X |
- Details
| Name: |
oef_IndustrySectorAxis=us-gaap_RealEstateSectorMember |
| Namespace Prefix: |
|
| Data Type: |
na |
| Balance Type: |
|
| Period Type: |
|
|
| X |
- Details
| Name: |
oef_IndustrySectorAxis=us-gaap_HealthcareSectorMember |
| Namespace Prefix: |
|
| Data Type: |
na |
| Balance Type: |
|
| Period Type: |
|
|
| X |
- Details
| Name: |
oef_IndustrySectorAxis=cik0000904333_ShortTermInvestmentMember |
| Namespace Prefix: |
|
| Data Type: |
na |
| Balance Type: |
|
| Period Type: |
|
|
| X |
- Details
| Name: |
oef_GeographicRegionAxis=country_US |
| Namespace Prefix: |
|
| Data Type: |
na |
| Balance Type: |
|
| Period Type: |
|
|
| X |
- Details
| Name: |
oef_GeographicRegionAxis=country_NL |
| Namespace Prefix: |
|
| Data Type: |
na |
| Balance Type: |
|
| Period Type: |
|
|
| X |
- Details
| Name: |
oef_GeographicRegionAxis=country_JP |
| Namespace Prefix: |
|
| Data Type: |
na |
| Balance Type: |
|
| Period Type: |
|
|
| X |
- Details
| Name: |
oef_GeographicRegionAxis=country_CA |
| Namespace Prefix: |
|
| Data Type: |
na |
| Balance Type: |
|
| Period Type: |
|
|
| X |
- Details
| Name: |
oef_GeographicRegionAxis=country_KR |
| Namespace Prefix: |
|
| Data Type: |
na |
| Balance Type: |
|
| Period Type: |
|
|
| X |
- Details
| Name: |
oef_GeographicRegionAxis=country_GB |
| Namespace Prefix: |
|
| Data Type: |
na |
| Balance Type: |
|
| Period Type: |
|
|
| X |
- Details
| Name: |
oef_GeographicRegionAxis=country_AU |
| Namespace Prefix: |
|
| Data Type: |
na |
| Balance Type: |
|
| Period Type: |
|
|
| X |
- Details
| Name: |
oef_GeographicRegionAxis=country_FR |
| Namespace Prefix: |
|
| Data Type: |
na |
| Balance Type: |
|
| Period Type: |
|
|
| X |
- Details
| Name: |
oef_GeographicRegionAxis=country_DE |
| Namespace Prefix: |
|
| Data Type: |
na |
| Balance Type: |
|
| Period Type: |
|
|
| X |
- Details
| Name: |
oef_GeographicRegionAxis=country_CH |
| Namespace Prefix: |
|
| Data Type: |
na |
| Balance Type: |
|
| Period Type: |
|
|
| X |
- Details
| Name: |
oef_GeographicRegionAxis=country_CN |
| Namespace Prefix: |
|
| Data Type: |
na |
| Balance Type: |
|
| Period Type: |
|
|
| X |
- Details
| Name: |
oef_GeographicRegionAxis=country_TW |
| Namespace Prefix: |
|
| Data Type: |
na |
| Balance Type: |
|
| Period Type: |
|
|
| X |
- Details
| Name: |
oef_GeographicRegionAxis=cik0000904333_OtherCountriesMember |
| Namespace Prefix: |
|
| Data Type: |
na |
| Balance Type: |
|
| Period Type: |
|
|
| X |
- Details
| Name: |
oef_ClassAxis=cik0000904333_C000015013Member |
| Namespace Prefix: |
|
| Data Type: |
na |
| Balance Type: |
|
| Period Type: |
|
|
| X |
- Details
| Name: |
oef_LargestHoldingAxis=cik0000904333_VisaIncClassAMember |
| Namespace Prefix: |
|
| Data Type: |
na |
| Balance Type: |
|
| Period Type: |
|
|
| X |
- Details
| Name: |
oef_LargestHoldingAxis=cik0000904333_NVIDIACorpMember |
| Namespace Prefix: |
|
| Data Type: |
na |
| Balance Type: |
|
| Period Type: |
|
|
| X |
- Details
| Name: |
oef_LargestHoldingAxis=cik0000904333_BroadcomIncMember |
| Namespace Prefix: |
|
| Data Type: |
na |
| Balance Type: |
|
| Period Type: |
|
|
| X |
- Details
| Name: |
oef_LargestHoldingAxis=cik0000904333_AppleIncMember |
| Namespace Prefix: |
|
| Data Type: |
na |
| Balance Type: |
|
| Period Type: |
|
|
| X |
- Details
| Name: |
oef_LargestHoldingAxis=cik0000904333_MicrosoftCorpMember |
| Namespace Prefix: |
|
| Data Type: |
na |
| Balance Type: |
|
| Period Type: |
|
|
| X |
- Details
| Name: |
oef_LargestHoldingAxis=cik0000904333_AlphabetIncClassAMember |
| Namespace Prefix: |
|
| Data Type: |
na |
| Balance Type: |
|
| Period Type: |
|
|
| X |
- Details
| Name: |
oef_LargestHoldingAxis=cik0000904333_ExxonMobilCorpMember |
| Namespace Prefix: |
|
| Data Type: |
na |
| Balance Type: |
|
| Period Type: |
|
|
| X |
- Details
| Name: |
oef_LargestHoldingAxis=cik0000904333_AmazoncomIncMember |
| Namespace Prefix: |
|
| Data Type: |
na |
| Balance Type: |
|
| Period Type: |
|
|
| X |
- Details
| Name: |
oef_ClassAxis=cik0000904333_C000015015Member |
| Namespace Prefix: |
|
| Data Type: |
na |
| Balance Type: |
|
| Period Type: |
|
|
| X |
- Details
| Name: |
oef_LargestHoldingAxis=cik0000904333_MorganStanleyMember |
| Namespace Prefix: |
|
| Data Type: |
na |
| Balance Type: |
|
| Period Type: |
|
|
| X |
- Details
| Name: |
oef_LargestHoldingAxis=cik0000904333_InternationalBusinessMachinesCorpMember |
| Namespace Prefix: |
|
| Data Type: |
na |
| Balance Type: |
|
| Period Type: |
|
|
| X |
- Details
| Name: |
oef_LargestHoldingAxis=cik0000904333_CocaColaCoMember |
| Namespace Prefix: |
|
| Data Type: |
na |
| Balance Type: |
|
| Period Type: |
|
|
| X |
- Details
| Name: |
oef_LargestHoldingAxis=cik0000904333_DukeEnergyCorpMember |
| Namespace Prefix: |
|
| Data Type: |
na |
| Balance Type: |
|
| Period Type: |
|
|
| X |
- Details
| Name: |
oef_LargestHoldingAxis=cik0000904333_BlackrockIncMember |
| Namespace Prefix: |
|
| Data Type: |
na |
| Balance Type: |
|
| Period Type: |
|
|
| X |
- Details
| Name: |
oef_LargestHoldingAxis=cik0000904333_WalmartIncMember |
| Namespace Prefix: |
|
| Data Type: |
na |
| Balance Type: |
|
| Period Type: |
|
|
| X |
- Details
| Name: |
oef_LargestHoldingAxis=cik0000904333_JPMorganChaseAndCoMember |
| Namespace Prefix: |
|
| Data Type: |
na |
| Balance Type: |
|
| Period Type: |
|
|
| X |
- Details
| Name: |
oef_ClassAxis=cik0000904333_C000015012Member |
| Namespace Prefix: |
|
| Data Type: |
na |
| Balance Type: |
|
| Period Type: |
|
|
| X |
- Details
| Name: |
oef_LargestHoldingAxis=cik0000904333_NetflixIncMember |
| Namespace Prefix: |
|
| Data Type: |
na |
| Balance Type: |
|
| Period Type: |
|
|
| X |
- Details
| Name: |
oef_LargestHoldingAxis=cik0000904333_TeslaIncMember |
| Namespace Prefix: |
|
| Data Type: |
na |
| Balance Type: |
|
| Period Type: |
|
|
| X |
- Details
| Name: |
oef_LargestHoldingAxis=cik0000904333_EliLillyAndCoMember |
| Namespace Prefix: |
|
| Data Type: |
na |
| Balance Type: |
|
| Period Type: |
|
|
| X |
- Details
| Name: |
oef_ClassAxis=cik0000904333_C000015017Member |
| Namespace Prefix: |
|
| Data Type: |
na |
| Balance Type: |
|
| Period Type: |
|
|
| X |
- Details
| Name: |
oef_LargestHoldingAxis=cik0000904333_EnovaInternationalIncMember |
| Namespace Prefix: |
|
| Data Type: |
na |
| Balance Type: |
|
| Period Type: |
|
|
| X |
- Details
| Name: |
oef_LargestHoldingAxis=cik0000904333_BankUnitedIncMember |
| Namespace Prefix: |
|
| Data Type: |
na |
| Balance Type: |
|
| Period Type: |
|
|
| X |
- Details
| Name: |
oef_LargestHoldingAxis=cik0000904333_JacksonFinancialIncClassAMember |
| Namespace Prefix: |
|
| Data Type: |
na |
| Balance Type: |
|
| Period Type: |
|
|
| X |
- Details
| Name: |
oef_LargestHoldingAxis=cik0000904333_DiamondRockHospitalityCoMember |
| Namespace Prefix: |
|
| Data Type: |
na |
| Balance Type: |
|
| Period Type: |
|
|
| X |
- Details
| Name: |
oef_LargestHoldingAxis=cik0000904333_AlexanderBaldwinIncMember |
| Namespace Prefix: |
|
| Data Type: |
na |
| Balance Type: |
|
| Period Type: |
|
|
| X |
- Details
| Name: |
oef_LargestHoldingAxis=cik0000904333_HancockWhitneyCorpMember |
| Namespace Prefix: |
|
| Data Type: |
na |
| Balance Type: |
|
| Period Type: |
|
|
| X |
- Details
| Name: |
oef_LargestHoldingAxis=cik0000904333_IBEXHoldingsLtdMember |
| Namespace Prefix: |
|
| Data Type: |
na |
| Balance Type: |
|
| Period Type: |
|
|
| X |
- Details
| Name: |
oef_LargestHoldingAxis=cik0000904333_PortlandGeneralElectricCoMember |
| Namespace Prefix: |
|
| Data Type: |
na |
| Balance Type: |
|
| Period Type: |
|
|
| X |
- Details
| Name: |
oef_LargestHoldingAxis=cik0000904333_BloomEnergyCorpClassAMember |
| Namespace Prefix: |
|
| Data Type: |
na |
| Balance Type: |
|
| Period Type: |
|
|
| X |
- Details
| Name: |
oef_LargestHoldingAxis=cik0000904333_CredoTechnologyGroupHoldingLtdMember |
| Namespace Prefix: |
|
| Data Type: |
na |
| Balance Type: |
|
| Period Type: |
|
|
| X |
- Details
| Name: |
oef_ClassAxis=cik0000904333_C000015021Member |
| Namespace Prefix: |
|
| Data Type: |
na |
| Balance Type: |
|
| Period Type: |
|
|
| X |
- Details
| Name: |
oef_LargestHoldingAxis=cik0000904333_AbbVieIncMember |
| Namespace Prefix: |
|
| Data Type: |
na |
| Balance Type: |
|
| Period Type: |
|
|
| X |
- Details
| Name: |
oef_LargestHoldingAxis=cik0000904333_UnitedHealthGroupIncMember |
| Namespace Prefix: |
|
| Data Type: |
na |
| Balance Type: |
|
| Period Type: |
|
|
| X |
- Details
| Name: |
oef_LargestHoldingAxis=cik0000904333_ThermoFisherScientificIncMember |
| Namespace Prefix: |
|
| Data Type: |
na |
| Balance Type: |
|
| Period Type: |
|
|
| X |
- Details
| Name: |
oef_LargestHoldingAxis=cik0000904333_BostonScientificCorpMember |
| Namespace Prefix: |
|
| Data Type: |
na |
| Balance Type: |
|
| Period Type: |
|
|
| X |
- Details
| Name: |
oef_LargestHoldingAxis=cik0000904333_StrykerCorpMember |
| Namespace Prefix: |
|
| Data Type: |
na |
| Balance Type: |
|
| Period Type: |
|
|
| X |
- Details
| Name: |
oef_LargestHoldingAxis=cik0000904333_AmgenIncMember |
| Namespace Prefix: |
|
| Data Type: |
na |
| Balance Type: |
|
| Period Type: |
|
|
| X |
- Details
| Name: |
oef_LargestHoldingAxis=cik0000904333_MerckAndCoIncMember |
| Namespace Prefix: |
|
| Data Type: |
na |
| Balance Type: |
|
| Period Type: |
|
|
| X |
- Details
| Name: |
oef_LargestHoldingAxis=cik0000904333_JohnsonAndJohnsonMember |
| Namespace Prefix: |
|
| Data Type: |
na |
| Balance Type: |
|
| Period Type: |
|
|
| X |
- Details
| Name: |
oef_IndustrySectorAxis=cik0000904333_PharmaceuticalsMember |
| Namespace Prefix: |
|
| Data Type: |
na |
| Balance Type: |
|
| Period Type: |
|
|
| X |
- Details
| Name: |
oef_IndustrySectorAxis=cik0000904333_BiotechnologyMember |
| Namespace Prefix: |
|
| Data Type: |
na |
| Balance Type: |
|
| Period Type: |
|
|
| X |
- Details
| Name: |
oef_IndustrySectorAxis=cik0000904333_HealthCareEquipmentMember |
| Namespace Prefix: |
|
| Data Type: |
na |
| Balance Type: |
|
| Period Type: |
|
|
| X |
- Details
| Name: |
oef_IndustrySectorAxis=cik0000904333_ManagedHealthCareMember |
| Namespace Prefix: |
|
| Data Type: |
na |
| Balance Type: |
|
| Period Type: |
|
|
| X |
- Details
| Name: |
oef_IndustrySectorAxis=cik0000904333_HealthCareDistributorsMember |
| Namespace Prefix: |
|
| Data Type: |
na |
| Balance Type: |
|
| Period Type: |
|
|
| X |
- Details
| Name: |
oef_IndustrySectorAxis=cik0000904333_HealthCareServicesMember |
| Namespace Prefix: |
|
| Data Type: |
na |
| Balance Type: |
|
| Period Type: |
|
|
| X |
- Details
| Name: |
oef_IndustrySectorAxis=cik0000904333_HealthCareFacilitiesMember |
| Namespace Prefix: |
|
| Data Type: |
na |
| Balance Type: |
|
| Period Type: |
|
|
| X |
- Details
| Name: |
oef_IndustrySectorAxis=cik0000904333_HealthCareSuppliesMember |
| Namespace Prefix: |
|
| Data Type: |
na |
| Balance Type: |
|
| Period Type: |
|
|
| X |
- Details
| Name: |
oef_GeographicRegionAxis=country_IE |
| Namespace Prefix: |
|
| Data Type: |
na |
| Balance Type: |
|
| Period Type: |
|
|
| X |
- Details
| Name: |
oef_ClassAxis=cik0000904333_C000063316Member |
| Namespace Prefix: |
|
| Data Type: |
na |
| Balance Type: |
|
| Period Type: |
|
|
| X |
- Details
| Name: |
oef_LargestHoldingAxis=cik0000904333_SonyGroupCorpMember |
| Namespace Prefix: |
|
| Data Type: |
na |
| Balance Type: |
|
| Period Type: |
|
|
| X |
- Details
| Name: |
oef_LargestHoldingAxis=cik0000904333_RollsRoyceHoldingsPLCMember |
| Namespace Prefix: |
|
| Data Type: |
na |
| Balance Type: |
|
| Period Type: |
|
|
| X |
- Details
| Name: |
oef_LargestHoldingAxis=cik0000904333_ABBLtdMember |
| Namespace Prefix: |
|
| Data Type: |
na |
| Balance Type: |
|
| Period Type: |
|
|
| X |
- Details
| Name: |
oef_LargestHoldingAxis=cik0000904333_BNPParibasSAMember |
| Namespace Prefix: |
|
| Data Type: |
na |
| Balance Type: |
|
| Period Type: |
|
|
| X |
- Details
| Name: |
oef_LargestHoldingAxis=cik0000904333_AstraZenecaPLCMember |
| Namespace Prefix: |
|
| Data Type: |
na |
| Balance Type: |
|
| Period Type: |
|
|
| X |
- Details
| Name: |
oef_LargestHoldingAxis=cik0000904333_HSBCHoldingsPLCMember |
| Namespace Prefix: |
|
| Data Type: |
na |
| Balance Type: |
|
| Period Type: |
|
|
| X |
- Details
| Name: |
oef_LargestHoldingAxis=cik0000904333_RocheHoldingAGMember |
| Namespace Prefix: |
|
| Data Type: |
na |
| Balance Type: |
|
| Period Type: |
|
|
| X |
- Details
| Name: |
oef_GeographicRegionAxis=country_IT |
| Namespace Prefix: |
|
| Data Type: |
na |
| Balance Type: |
|
| Period Type: |
|
|
| X |
- Details
| Name: |
oef_GeographicRegionAxis=country_ES |
| Namespace Prefix: |
|
| Data Type: |
na |
| Balance Type: |
|
| Period Type: |
|
|
| X |
- Details
| Name: |
oef_GeographicRegionAxis=country_SE |
| Namespace Prefix: |
|
| Data Type: |
na |
| Balance Type: |
|
| Period Type: |
|
|
| X |
- Details
| Name: |
oef_ClassAxis=cik0000904333_C000016166Member |
| Namespace Prefix: |
|
| Data Type: |
na |
| Balance Type: |
|
| Period Type: |
|
|
| X |
- Details
| Name: |
oef_LargestHoldingAxis=cik0000904333_BerkshireHathawayIncClassBMember |
| Namespace Prefix: |
|
| Data Type: |
na |
| Balance Type: |
|
| Period Type: |
|
|
| X |
- Details
| Name: |
oef_LargestHoldingAxis=cik0000904333_AlphabetIncClassCMember |
| Namespace Prefix: |
|
| Data Type: |
na |
| Balance Type: |
|
| Period Type: |
|
|
| X |
- Details
| Name: |
oef_ClassAxis=cik0000904333_C000016169Member |
| Namespace Prefix: |
|
| Data Type: |
na |
| Balance Type: |
|
| Period Type: |
|
|
| X |
- Details
| Name: |
oef_LargestHoldingAxis=cik0000904333_IonQIncMember |
| Namespace Prefix: |
|
| Data Type: |
na |
| Balance Type: |
|
| Period Type: |
|
|
| X |
- Details
| Name: |
oef_LargestHoldingAxis=cik0000904333_FabrinetMember |
| Namespace Prefix: |
|
| Data Type: |
na |
| Balance Type: |
|
| Period Type: |
|
|
| X |
- Details
| Name: |
oef_LargestHoldingAxis=cik0000904333_KratosDefenseSecuritySolutionsIncMember |
| Namespace Prefix: |
|
| Data Type: |
na |
| Balance Type: |
|
| Period Type: |
|
|
| X |
- Details
| Name: |
oef_LargestHoldingAxis=cik0000904333_OkloIncMember |
| Namespace Prefix: |
|
| Data Type: |
na |
| Balance Type: |
|
| Period Type: |
|
|
| X |
- Details
| Name: |
oef_LargestHoldingAxis=cik0000904333_RigettiComputingIncMember |
| Namespace Prefix: |
|
| Data Type: |
na |
| Balance Type: |
|
| Period Type: |
|
|
| X |
- Details
| Name: |
oef_LargestHoldingAxis=cik0000904333_AeroVironmentIncMember |
| Namespace Prefix: |
|
| Data Type: |
na |
| Balance Type: |
|
| Period Type: |
|
|
| X |
- Details
| Name: |
oef_LargestHoldingAxis=cik0000904333_DWaveQuantumIncMember |
| Namespace Prefix: |
|
| Data Type: |
na |
| Balance Type: |
|
| Period Type: |
|
|
| X |
- Details
| Name: |
oef_ClassAxis=cik0000904333_C000016171Member |
| Namespace Prefix: |
|
| Data Type: |
na |
| Balance Type: |
|
| Period Type: |
|
|
| X |
- Details
| Name: |
oef_ClassAxis=cik0000904333_C000195502Member |
| Namespace Prefix: |
|
| Data Type: |
na |
| Balance Type: |
|
| Period Type: |
|
|
| X |
- Details
| Name: |
oef_ClassAxis=cik0000904333_C000195503Member |
| Namespace Prefix: |
|
| Data Type: |
na |
| Balance Type: |
|
| Period Type: |
|
|
| X |
- Details
| Name: |
oef_LargestHoldingAxis=cik0000904333_ProcterAndGambleCoMember |
| Namespace Prefix: |
|
| Data Type: |
na |
| Balance Type: |
|
| Period Type: |
|
|
| X |
- Details
| Name: |
oef_LargestHoldingAxis=cik0000904333_BankofAmericaCorpMember |
| Namespace Prefix: |
|
| Data Type: |
na |
| Balance Type: |
|
| Period Type: |
|
|
| X |
- Details
| Name: |
oef_ClassAxis=cik0000904333_C000195504Member |
| Namespace Prefix: |
|
| Data Type: |
na |
| Balance Type: |
|
| Period Type: |
|
|
| X |
- Details
| Name: |
oef_LargestHoldingAxis=cik0000904333_RobinhoodMarketsIncClassAMember |
| Namespace Prefix: |
|
| Data Type: |
na |
| Balance Type: |
|
| Period Type: |
|
|
| X |
- Details
| Name: |
oef_LargestHoldingAxis=cik0000904333_CloudflareIncClassAMember |
| Namespace Prefix: |
|
| Data Type: |
na |
| Balance Type: |
|
| Period Type: |
|
|
| X |
- Details
| Name: |
oef_LargestHoldingAxis=cik0000904333_BankofNewYorkMellonCorpMember |
| Namespace Prefix: |
|
| Data Type: |
na |
| Balance Type: |
|
| Period Type: |
|
|
| X |
- Details
| Name: |
oef_LargestHoldingAxis=cik0000904333_VertivHoldingsCoClassAMember |
| Namespace Prefix: |
|
| Data Type: |
na |
| Balance Type: |
|
| Period Type: |
|
|
| X |
- Details
| Name: |
oef_LargestHoldingAxis=cik0000904333_RoyalCaribbeanCruisesLtdMember |
| Namespace Prefix: |
|
| Data Type: |
na |
| Balance Type: |
|
| Period Type: |
|
|
| X |
- Details
| Name: |
oef_LargestHoldingAxis=cik0000904333_CoinbaseGlobalIncClassAMember |
| Namespace Prefix: |
|
| Data Type: |
na |
| Balance Type: |
|
| Period Type: |
|
|
| X |
- Details
| Name: |
oef_LargestHoldingAxis=cik0000904333_CorningIncMember |
| Namespace Prefix: |
|
| Data Type: |
na |
| Balance Type: |
|
| Period Type: |
|
|
| X |
- Details
| Name: |
oef_LargestHoldingAxis=cik0000904333_ROBLOXCorpClassAMember |
| Namespace Prefix: |
|
| Data Type: |
na |
| Balance Type: |
|
| Period Type: |
|
|
| X |
- Details
| Name: |
oef_LargestHoldingAxis=cik0000904333_QuantaServicesIncMember |
| Namespace Prefix: |
|
| Data Type: |
na |
| Balance Type: |
|
| Period Type: |
|
|
| X |
- Details
| Name: |
oef_ClassAxis=cik0000904333_C000016173Member |
| Namespace Prefix: |
|
| Data Type: |
na |
| Balance Type: |
|
| Period Type: |
|
|
| X |
- Details
| Name: |
oef_LargestHoldingAxis=cik0000904333_SAPSEMember |
| Namespace Prefix: |
|
| Data Type: |
na |
| Balance Type: |
|
| Period Type: |
|
|
| X |
- Details
| Name: |
oef_LargestHoldingAxis=cik0000904333_NestleSAMember |
| Namespace Prefix: |
|
| Data Type: |
na |
| Balance Type: |
|
| Period Type: |
|
|
| X |
- Details
| Name: |
oef_LargestHoldingAxis=cik0000904333_SiemensAGMember |
| Namespace Prefix: |
|
| Data Type: |
na |
| Balance Type: |
|
| Period Type: |
|
|
| X |
- Details
| Name: |
oef_LargestHoldingAxis=cik0000904333_ToyotaMotorCorpMember |
| Namespace Prefix: |
|
| Data Type: |
na |
| Balance Type: |
|
| Period Type: |
|
|
| X |
- Details
| Name: |
oef_ClassAxis=cik0000904333_C000046821Member |
| Namespace Prefix: |
|
| Data Type: |
na |
| Balance Type: |
|
| Period Type: |
|
|
| X |
- Details
| Name: |
oef_LargestHoldingAxis=cik0000904333_ChevronCorpMember |
| Namespace Prefix: |
|
| Data Type: |
na |
| Balance Type: |
|
| Period Type: |
|
|
| X |
- Details
| Name: |
oef_LargestHoldingAxis=cik0000904333_IntelCorpMember |
| Namespace Prefix: |
|
| Data Type: |
na |
| Balance Type: |
|
| Period Type: |
|
|
| X |
- Details
| Name: |
oef_ClassAxis=cik0000904333_C000046824Member |
| Namespace Prefix: |
|
| Data Type: |
na |
| Balance Type: |
|
| Period Type: |
|
|
| X |
- Details
| Name: |
oef_LargestHoldingAxis=cik0000904333_OpendoorTechnologiesIncMember |
| Namespace Prefix: |
|
| Data Type: |
na |
| Balance Type: |
|
| Period Type: |
|
|
| X |
- Details
| Name: |
oef_LargestHoldingAxis=cik0000904333_ViasatIncMember |
| Namespace Prefix: |
|
| Data Type: |
na |
| Balance Type: |
|
| Period Type: |
|
|
| X |
- Details
| Name: |
oef_LargestHoldingAxis=cik0000904333_LumentumHoldingsIncMember |
| Namespace Prefix: |
|
| Data Type: |
na |
| Balance Type: |
|
| Period Type: |
|
|
| X |
- Details
| Name: |
oef_LargestHoldingAxis=cik0000904333_RocketCosIncClassAMember |
| Namespace Prefix: |
|
| Data Type: |
na |
| Balance Type: |
|
| Period Type: |
|
|
| X |
- Details
| Name: |
oef_LargestHoldingAxis=cik0000904333_EchoStarCorpClassAMember |
| Namespace Prefix: |
|
| Data Type: |
na |
| Balance Type: |
|
| Period Type: |
|
|
| X |
- Details
| Name: |
oef_LargestHoldingAxis=cik0000904333_CommScopeHoldingCoIncMember |
| Namespace Prefix: |
|
| Data Type: |
na |
| Balance Type: |
|
| Period Type: |
|
|
| X |
- Details
| Name: |
oef_LargestHoldingAxis=cik0000904333_ComfortSystemsUSAIncMember |
| Namespace Prefix: |
|
| Data Type: |
na |
| Balance Type: |
|
| Period Type: |
|
|
| X |
- Details
| Name: |
oef_LargestHoldingAxis=cik0000904333_AnywhereRealEstateIncMember |
| Namespace Prefix: |
|
| Data Type: |
na |
| Balance Type: |
|
| Period Type: |
|
|
| X |
- Details
| Name: |
oef_LargestHoldingAxis=cik0000904333_TTMTechnologiesIncMember |
| Namespace Prefix: |
|
| Data Type: |
na |
| Balance Type: |
|
| Period Type: |
|
|
| X |
- Details
| Name: |
oef_LargestHoldingAxis=cik0000904333_DelekUSHoldingsIncMember |
| Namespace Prefix: |
|
| Data Type: |
na |
| Balance Type: |
|
| Period Type: |
|
|
| X |
- Details
| Name: |
oef_ClassAxis=cik0000904333_C000046827Member |
| Namespace Prefix: |
|
| Data Type: |
na |
| Balance Type: |
|
| Period Type: |
|
|
| X |
- Details
| Name: |
oef_LargestHoldingAxis=cik0000904333_TotalEnergiesSEMember |
| Namespace Prefix: |
|
| Data Type: |
na |
| Balance Type: |
|
| Period Type: |
|
|
| X |
- Details
| Name: |
oef_LargestHoldingAxis=cik0000904333_BPPLCMember |
| Namespace Prefix: |
|
| Data Type: |
na |
| Balance Type: |
|
| Period Type: |
|
|
| X |
- Details
| Name: |
oef_LargestHoldingAxis=cik0000904333_GlencorePLCMember |
| Namespace Prefix: |
|
| Data Type: |
na |
| Balance Type: |
|
| Period Type: |
|
|
| X |
- Details
| Name: |
oef_LargestHoldingAxis=cik0000904333_BancoSantanderSAMember |
| Namespace Prefix: |
|
| Data Type: |
na |
| Balance Type: |
|
| Period Type: |
|
|
| X |
- Details
| Name: |
oef_LargestHoldingAxis=cik0000904333_BHPGroupLtdMember |
| Namespace Prefix: |
|
| Data Type: |
na |
| Balance Type: |
|
| Period Type: |
|
|
| X |
- Details
| Name: |
oef_ClassAxis=cik0000904333_C000055855Member |
| Namespace Prefix: |
|
| Data Type: |
na |
| Balance Type: |
|
| Period Type: |
|
|
| X |
- Details
| Name: |
oef_LargestHoldingAxis=cik0000904333_CelesticaIncMember |
| Namespace Prefix: |
|
| Data Type: |
na |
| Balance Type: |
|
| Period Type: |
|
|
| X |
- Details
| Name: |
oef_LargestHoldingAxis=cik0000904333_IbidenCoLtdMember |
| Namespace Prefix: |
|
| Data Type: |
na |
| Balance Type: |
|
| Period Type: |
|
|
| X |
- Details
| Name: |
oef_LargestHoldingAxis=cik0000904333_HDKoreaShipbuildingOffshoreEngineeringCoLtdMember |
| Namespace Prefix: |
|
| Data Type: |
na |
| Balance Type: |
|
| Period Type: |
|
|
| X |
- Details
| Name: |
oef_LargestHoldingAxis=cik0000904333_DoosanCoLtdMember |
| Namespace Prefix: |
|
| Data Type: |
na |
| Balance Type: |
|
| Period Type: |
|
|
| X |
- Details
| Name: |
oef_LargestHoldingAxis=cik0000904333_SSRMiningIncMember |
| Namespace Prefix: |
|
| Data Type: |
na |
| Balance Type: |
|
| Period Type: |
|
|
| X |
- Details
| Name: |
oef_LargestHoldingAxis=cik0000904333_AirtelAfricaPLCMember |
| Namespace Prefix: |
|
| Data Type: |
na |
| Balance Type: |
|
| Period Type: |
|
|
| X |
- Details
| Name: |
oef_LargestHoldingAxis=cik0000904333_SpectrisPLCMember |
| Namespace Prefix: |
|
| Data Type: |
na |
| Balance Type: |
|
| Period Type: |
|
|
| X |
- Details
| Name: |
oef_LargestHoldingAxis=cik0000904333_SinoBiopharmaceuticalLtdMember |
| Namespace Prefix: |
|
| Data Type: |
na |
| Balance Type: |
|
| Period Type: |
|
|
| X |
- Details
| Name: |
oef_LargestHoldingAxis=cik0000904333_EagersAutomotiveLtdMember |
| Namespace Prefix: |
|
| Data Type: |
na |
| Balance Type: |
|
| Period Type: |
|
|
| X |
- Details
| Name: |
oef_LargestHoldingAxis=cik0000904333_KindenCorpMember |
| Namespace Prefix: |
|
| Data Type: |
na |
| Balance Type: |
|
| Period Type: |
|
|
| X |
- Details
| Name: |
oef_GeographicRegionAxis=country_HK |
| Namespace Prefix: |
|
| Data Type: |
na |
| Balance Type: |
|
| Period Type: |
|
|
| X |
- Details
| Name: |
oef_ClassAxis=cik0000904333_C000055852Member |
| Namespace Prefix: |
|
| Data Type: |
na |
| Balance Type: |
|
| Period Type: |
|
|
| X |
- Details
| Name: |
oef_LargestHoldingAxis=cik0000904333_AlibabaGroupHoldingLtdMember |
| Namespace Prefix: |
|
| Data Type: |
na |
| Balance Type: |
|
| Period Type: |
|
|
| X |
- Details
| Name: |
oef_LargestHoldingAxis=cik0000904333_HonHaiPrecisionIndustryCoLtdMember |
| Namespace Prefix: |
|
| Data Type: |
na |
| Balance Type: |
|
| Period Type: |
|
|
| X |
- Details
| Name: |
oef_LargestHoldingAxis=cik0000904333_ChinaConstructionBankCorpHSharesMember |
| Namespace Prefix: |
|
| Data Type: |
na |
| Balance Type: |
|
| Period Type: |
|
|
| X |
- Details
| Name: |
oef_LargestHoldingAxis=cik0000904333_ValeSAMember |
| Namespace Prefix: |
|
| Data Type: |
na |
| Balance Type: |
|
| Period Type: |
|
|
| X |
- Details
| Name: |
oef_LargestHoldingAxis=cik0000904333_TencentHoldingsLtdMember |
| Namespace Prefix: |
|
| Data Type: |
na |
| Balance Type: |
|
| Period Type: |
|
|
| X |
- Details
| Name: |
oef_LargestHoldingAxis=cik0000904333_PetroleoBrasileiroSAPetrobrasPreferredStockMember |
| Namespace Prefix: |
|
| Data Type: |
na |
| Balance Type: |
|
| Period Type: |
|
|
| X |
- Details
| Name: |
oef_LargestHoldingAxis=cik0000904333_PetroleoBrasileiroSAPetrobrasCommonStockMember |
| Namespace Prefix: |
|
| Data Type: |
na |
| Balance Type: |
|
| Period Type: |
|
|
| X |
- Details
| Name: |
oef_LargestHoldingAxis=cik0000904333_IndustrialCommercialBankofChinaLtdHSharesMember |
| Namespace Prefix: |
|
| Data Type: |
na |
| Balance Type: |
|
| Period Type: |
|
|
| X |
- Details
| Name: |
oef_LargestHoldingAxis=cik0000904333_JDcomIncMember |
| Namespace Prefix: |
|
| Data Type: |
na |
| Balance Type: |
|
| Period Type: |
|
|
| X |
- Details
| Name: |
oef_GeographicRegionAxis=country_BR |
| Namespace Prefix: |
|
| Data Type: |
na |
| Balance Type: |
|
| Period Type: |
|
|
| X |
- Details
| Name: |
oef_GeographicRegionAxis=country_ZA |
| Namespace Prefix: |
|
| Data Type: |
na |
| Balance Type: |
|
| Period Type: |
|
|
| X |
- Details
| Name: |
oef_GeographicRegionAxis=country_MX |
| Namespace Prefix: |
|
| Data Type: |
na |
| Balance Type: |
|
| Period Type: |
|
|
| X |
- Details
| Name: |
oef_GeographicRegionAxis=country_TH |
| Namespace Prefix: |
|
| Data Type: |
na |
| Balance Type: |
|
| Period Type: |
|
|
| X |
- Details
| Name: |
oef_GeographicRegionAxis=country_IN |
| Namespace Prefix: |
|
| Data Type: |
na |
| Balance Type: |
|
| Period Type: |
|
|
| X |
- Details
| Name: |
oef_ClassAxis=cik0000904333_C000017885Member |
| Namespace Prefix: |
|
| Data Type: |
na |
| Balance Type: |
|
| Period Type: |
|
|
| X |
- Details
| Name: |
oef_LargestHoldingAxis=cik0000904333_StateStreetInstitutionalUSGovernmentMoneyMarketFundClassPremierMember |
| Namespace Prefix: |
|
| Data Type: |
na |
| Balance Type: |
|
| Period Type: |
|
|
| X |
- Details
| Name: |
oef_LargestHoldingAxis=cik0000904333_SchwabGovernmentMoneyFundUltraSharesMember |
| Namespace Prefix: |
|
| Data Type: |
na |
| Balance Type: |
|
| Period Type: |
|
|
| X |
- Details
| Name: |
oef_LargestHoldingAxis=cik0000904333_SchwabUSAggregateBondIndexFundMember |
| Namespace Prefix: |
|
| Data Type: |
na |
| Balance Type: |
|
| Period Type: |
|
|
| X |
- Details
| Name: |
oef_LargestHoldingAxis=cik0000904333_SchwabInternationalOpportunitiesFundMember |
| Namespace Prefix: |
|
| Data Type: |
na |
| Balance Type: |
|
| Period Type: |
|
|
| X |
- Details
| Name: |
oef_LargestHoldingAxis=cik0000904333_SchwabSelectLargeCapGrowthFundMember |
| Namespace Prefix: |
|
| Data Type: |
na |
| Balance Type: |
|
| Period Type: |
|
|
| X |
- Details
| Name: |
oef_LargestHoldingAxis=cik0000904333_SchwabSmallCapEquityFundMember |
| Namespace Prefix: |
|
| Data Type: |
na |
| Balance Type: |
|
| Period Type: |
|
|
| X |
- Details
| Name: |
oef_LargestHoldingAxis=cik0000904333_SchwabCoreEquityFundMember |
| Namespace Prefix: |
|
| Data Type: |
na |
| Balance Type: |
|
| Period Type: |
|
|
| X |
- Details
| Name: |
us-gaap_InvestmentTypeAxis=cik0000904333_MoneyMarketFundMember |
| Namespace Prefix: |
|
| Data Type: |
na |
| Balance Type: |
|
| Period Type: |
|
|
| X |
- Details
| Name: |
us-gaap_InvestmentTypeAxis=cik0000904333_USStocksLargeCapMember |
| Namespace Prefix: |
|
| Data Type: |
na |
| Balance Type: |
|
| Period Type: |
|
|
| X |
- Details
| Name: |
us-gaap_InvestmentTypeAxis=cik0000904333_InternationalStocksDevelopedMarketsMember |
| Namespace Prefix: |
|
| Data Type: |
na |
| Balance Type: |
|
| Period Type: |
|
|
| X |
- Details
| Name: |
us-gaap_InvestmentTypeAxis=cik0000904333_USStocksSmallCapMember |
| Namespace Prefix: |
|
| Data Type: |
na |
| Balance Type: |
|
| Period Type: |
|
|
| X |
- Details
| Name: |
oef_ClassAxis=cik0000904333_C000016175Member |
| Namespace Prefix: |
|
| Data Type: |
na |
| Balance Type: |
|
| Period Type: |
|
|
| X |
- Details
| Name: |
oef_LargestHoldingAxis=cik0000904333_SchwabFundamentalUSSmallCompanyIndexFundMember |
| Namespace Prefix: |
|
| Data Type: |
na |
| Balance Type: |
|
| Period Type: |
|
|
| X |
- Details
| Name: |
oef_LargestHoldingAxis=cik0000904333_SchwabFundamentalEmergingMarketsEquityIndexFundMember |
| Namespace Prefix: |
|
| Data Type: |
na |
| Balance Type: |
|
| Period Type: |
|
|
| X |
- Details
| Name: |
oef_LargestHoldingAxis=cik0000904333_SchwabFundamentalInternationalSmallEquityIndexFundMember |
| Namespace Prefix: |
|
| Data Type: |
na |
| Balance Type: |
|
| Period Type: |
|
|
| X |
- Details
| Name: |
oef_LargestHoldingAxis=cik0000904333_SchwabInternationalIndexFundMember |
| Namespace Prefix: |
|
| Data Type: |
na |
| Balance Type: |
|
| Period Type: |
|
|
| X |
- Details
| Name: |
oef_LargestHoldingAxis=cik0000904333_SchwabUSLargeCapGrowthIndexFundMember |
| Namespace Prefix: |
|
| Data Type: |
na |
| Balance Type: |
|
| Period Type: |
|
|
| X |
- Details
| Name: |
oef_LargestHoldingAxis=cik0000904333_SchwabSmallCapIndexFundMember |
| Namespace Prefix: |
|
| Data Type: |
na |
| Balance Type: |
|
| Period Type: |
|
|
| X |
- Details
| Name: |
oef_LargestHoldingAxis=cik0000904333_SchwabFundamentalInternationalEquityIndexFundMember |
| Namespace Prefix: |
|
| Data Type: |
na |
| Balance Type: |
|
| Period Type: |
|
|
| X |
- Details
| Name: |
oef_LargestHoldingAxis=cik0000904333_SchwabUSREITETFMember |
| Namespace Prefix: |
|
| Data Type: |
na |
| Balance Type: |
|
| Period Type: |
|
|
| X |
- Details
| Name: |
oef_LargestHoldingAxis=cik0000904333_SchwabSAndP500IndexFundMember |
| Namespace Prefix: |
|
| Data Type: |
na |
| Balance Type: |
|
| Period Type: |
|
|
| X |
- Details
| Name: |
oef_LargestHoldingAxis=cik0000904333_SchwabFundamentalUSLargeCompanyIndexFundMember |
| Namespace Prefix: |
|
| Data Type: |
na |
| Balance Type: |
|
| Period Type: |
|
|
| X |
- Details
| Name: |
us-gaap_InvestmentTypeAxis=cik0000904333_RealEstateUSREITsMember |
| Namespace Prefix: |
|
| Data Type: |
na |
| Balance Type: |
|
| Period Type: |
|
|
| X |
- Details
| Name: |
us-gaap_InvestmentTypeAxis=cik0000904333_InternationalStocksEmergingMarketsMember |
| Namespace Prefix: |
|
| Data Type: |
na |
| Balance Type: |
|
| Period Type: |
|
|
| X |
- Details
| Name: |
oef_ClassAxis=cik0000904333_C000016177Member |
| Namespace Prefix: |
|
| Data Type: |
na |
| Balance Type: |
|
| Period Type: |
|
|
| X |
- Details
| Name: |
oef_ClassAxis=cik0000904333_C000016178Member |
| Namespace Prefix: |
|
| Data Type: |
na |
| Balance Type: |
|
| Period Type: |
|
|
| X |
- Details
| Name: |
oef_LargestHoldingAxis=cik0000904333_SchwabShortTermBondIndexFundMember |
| Namespace Prefix: |
|
| Data Type: |
na |
| Balance Type: |
|
| Period Type: |
|
|
| X |
- Details
| Name: |
us-gaap_InvestmentTypeAxis=cik0000904333_FixedIncomeShortTermBondMember |
| Namespace Prefix: |
|
| Data Type: |
na |
| Balance Type: |
|
| Period Type: |
|
|
| X |
- Details
| Name: |
oef_ClassAxis=cik0000904333_C000016180Member |
| Namespace Prefix: |
|
| Data Type: |
na |
| Balance Type: |
|
| Period Type: |
|
|
| X |
- Details
| Name: |
oef_ClassAxis=cik0000904333_C000015023Member |
| Namespace Prefix: |
|
| Data Type: |
na |
| Balance Type: |
|
| Period Type: |
|
|
| X |
- Details
| Name: |
oef_LargestHoldingAxis=cik0000904333_SchwabTreasuryInflationProtectedSecuritiesIndexFundMember |
| Namespace Prefix: |
|
| Data Type: |
na |
| Balance Type: |
|
| Period Type: |
|
|
| X |
- Details
| Name: |
oef_LargestHoldingAxis=cik0000904333_BairdAggregateBondFundClassInstitutionalMember |
| Namespace Prefix: |
|
| Data Type: |
na |
| Balance Type: |
|
| Period Type: |
|
|
| X |
- Details
| Name: |
oef_LargestHoldingAxis=cik0000904333_SchwabInternationalCoreEquityFundMember |
| Namespace Prefix: |
|
| Data Type: |
na |
| Balance Type: |
|
| Period Type: |
|
|
| X |
- Details
| Name: |
oef_LargestHoldingAxis=cik0000904333_DodgeAndCoxStockFundClassIMember |
| Namespace Prefix: |
|
| Data Type: |
na |
| Balance Type: |
|
| Period Type: |
|
|
| X |
- Details
| Name: |
us-gaap_InvestmentTypeAxis=cik0000904333_FixedIncomeInflationProtectedBondMember |
| Namespace Prefix: |
|
| Data Type: |
na |
| Balance Type: |
|
| Period Type: |
|
|
| X |
- Details
| Name: |
us-gaap_InvestmentTypeAxis=cik0000904333_RealEstateGlobalRealEstateMember |
| Namespace Prefix: |
|
| Data Type: |
na |
| Balance Type: |
|
| Period Type: |
|
|
| X |
- Details
| Name: |
us-gaap_InvestmentTypeAxis=cik0000904333_USStocksMidCapMember |
| Namespace Prefix: |
|
| Data Type: |
na |
| Balance Type: |
|
| Period Type: |
|
|
| X |
- Details
| Name: |
us-gaap_InvestmentTypeAxis=cik0000904333_FixedIncomeInternationalBondMember |
| Namespace Prefix: |
|
| Data Type: |
na |
| Balance Type: |
|
| Period Type: |
|
|
| X |
- Details
| Name: |
oef_ClassAxis=cik0000904333_C000059131Member |
| Namespace Prefix: |
|
| Data Type: |
na |
| Balance Type: |
|
| Period Type: |
|
|
| X |
- Details
| Name: |
oef_LargestHoldingAxis=cik0000904333_SchwabGlobalRealEstateFundMember |
| Namespace Prefix: |
|
| Data Type: |
na |
| Balance Type: |
|
| Period Type: |
|
|
| X |
- Details
| Name: |
oef_ClassAxis=cik0000904333_C000015024Member |
| Namespace Prefix: |
|
| Data Type: |
na |
| Balance Type: |
|
| Period Type: |
|
|
| X |
- Details
| Name: |
oef_ClassAxis=cik0000904333_C000059132Member |
| Namespace Prefix: |
|
| Data Type: |
na |
| Balance Type: |
|
| Period Type: |
|
|
| X |
- Details
| Name: |
oef_LargestHoldingAxis=cik0000904333_AllspringCorePlusBondFundClassR6Member |
| Namespace Prefix: |
|
| Data Type: |
na |
| Balance Type: |
|
| Period Type: |
|
|
| X |
- Details
| Name: |
oef_ClassAxis=cik0000904333_C000015025Member |
| Namespace Prefix: |
|
| Data Type: |
na |
| Balance Type: |
|
| Period Type: |
|
|
| X |
- Details
| Name: |
oef_LargestHoldingAxis=cik0000904333_PIMCOInternationalBondFundUSDollarHedgedClassInstitutionalMember |
| Namespace Prefix: |
|
| Data Type: |
na |
| Balance Type: |
|
| Period Type: |
|
|
| X |
- Details
| Name: |
oef_ClassAxis=cik0000904333_C000059133Member |
| Namespace Prefix: |
|
| Data Type: |
na |
| Balance Type: |
|
| Period Type: |
|
|
| X |
- Details
| Name: |
oef_ClassAxis=cik0000904333_C000015026Member |
| Namespace Prefix: |
|
| Data Type: |
na |
| Balance Type: |
|
| Period Type: |
|
|
| X |
- Details
| Name: |
oef_ClassAxis=cik0000904333_C000122183Member |
| Namespace Prefix: |
|
| Data Type: |
na |
| Balance Type: |
|
| Period Type: |
|
|
| X |
- Details
| Name: |
oef_ClassAxis=cik0000904333_C000122184Member |
| Namespace Prefix: |
|
| Data Type: |
na |
| Balance Type: |
|
| Period Type: |
|
|
| X |
- Details
| Name: |
oef_LargestHoldingAxis=cik0000904333_GoldmanSachsEmergingMarketsEquityInsightsFundInstitutionalClassMember |
| Namespace Prefix: |
|
| Data Type: |
na |
| Balance Type: |
|
| Period Type: |
|
|
| X |
- Details
| Name: |
oef_ClassAxis=cik0000904333_C000122185Member |
| Namespace Prefix: |
|
| Data Type: |
na |
| Balance Type: |
|
| Period Type: |
|
|
| X |
- Details
| Name: |
oef_ClassAxis=cik0000904333_C000172771Member |
| Namespace Prefix: |
|
| Data Type: |
na |
| Balance Type: |
|
| Period Type: |
|
|
| X |
- Details
| Name: |
oef_ClassAxis=cik0000904333_C000225748Member |
| Namespace Prefix: |
|
| Data Type: |
na |
| Balance Type: |
|
| Period Type: |
|
|
{
"version": "2.2",
"instance": {
"d77953dncsr.htm": {
"nsprefix": "cik0000904333",
"nsuri": "http://sct.com/20251031",
"dts": {
"schema": {
"local": [
"cik0000904333-20251031.xsd"
],
"remote": [
"http://www.xbrl.org/2003/xbrl-instance-2003-12-31.xsd",
"http://www.xbrl.org/2003/xbrl-linkbase-2003-12-31.xsd",
"http://www.xbrl.org/2003/xl-2003-12-31.xsd",
"http://www.xbrl.org/2003/xlink-2003-12-31.xsd",
"http://www.xbrl.org/2005/xbrldt-2005.xsd",
"http://www.xbrl.org/2006/ref-2006-02-27.xsd",
"http://www.xbrl.org/lrr/arcrole/deprecated-2009-12-16.xsd",
"http://www.xbrl.org/lrr/arcrole/factExplanatory-2009-12-16.xsd",
"http://www.xbrl.org/lrr/role/negated-2009-12-16.xsd",
"http://www.xbrl.org/lrr/role/net-2009-12-16.xsd",
"http://www.xbrl.org/lrr/role/reference-2009-12-16.xsd",
"https://www.xbrl.org/2020/extensible-enumerations-2.0.xsd",
"https://www.xbrl.org/dtr/type/2020-01-21/types.xsd",
"https://www.xbrl.org/dtr/type/2024-01-31/types.xsd",
"https://xbrl.fasb.org/srt/2025/elts/srt-2025.xsd",
"https://xbrl.fasb.org/srt/2025/elts/srt-roles-2025.xsd",
"https://xbrl.fasb.org/srt/2025/elts/srt-types-2025.xsd",
"https://xbrl.fasb.org/us-gaap/2025/elts/us-gaap-2025.xsd",
"https://xbrl.fasb.org/us-gaap/2025/elts/us-roles-2025.xsd",
"https://xbrl.fasb.org/us-gaap/2025/elts/us-types-2025.xsd",
"https://xbrl.sec.gov/country/2025/country-2025.xsd",
"https://xbrl.sec.gov/country/2025/country-2025_def.xsd",
"https://xbrl.sec.gov/dei/2025/dei-2025.xsd",
"https://xbrl.sec.gov/oef/2025/oef-2025.xsd",
"https://xbrl.sec.gov/oef/2025/oef-2025_lab.xsd",
"https://xbrl.sec.gov/oef/2025/oef-sr-2025.xsd",
"https://xbrl.sec.gov/stpr/2025/stpr-2025.xsd"
]
},
"inline": {
"local": [
"d77953dncsr.htm"
]
}
},
"keyStandard": 44,
"keyCustom": 0,
"axisStandard": 7,
"axisCustom": 0,
"memberStandard": 33,
"memberCustom": 247,
"hidden": {
"total": 1686,
"http://xbrl.sec.gov/oef/2025": 1683,
"http://xbrl.sec.gov/dei/2025": 3
},
"contextCount": 1873,
"entityCount": 1,
"segmentCount": 280,
"elementCount": 399,
"unitCount": 3,
"baseTaxonomies": {
"http://xbrl.sec.gov/oef/2025": 3040,
"http://fasb.org/us-gaap/2025": 72,
"http://xbrl.sec.gov/dei/2025": 42
},
"report": {
"R1": {
"role": "http://xbrl.sec.gov/oef/role/NcsrCover",
"longName": "030000 - Disclosure - Form N-CSR Cover",
"shortName": "Form N-CSR Cover",
"isDefault": "true",
"groupType": "disclosure",
"subGroupType": "",
"menuCat": "Cover",
"order": "1",
"firstAnchor": {
"contextRef": "P11_01_2024To10_31_2025",
"name": "dei:DocumentType",
"unitRef": null,
"xsiNil": "false",
"lang": "en-US",
"decimals": null,
"ancestors": [
"div",
"div",
"div",
"div",
"div",
"div",
"div",
"div",
"div",
"body",
"html"
],
"reportCount": 1,
"baseRef": "d77953dncsr.htm",
"first": true
},
"uniqueAnchor": null
},
"R2": {
"role": "http://xbrl.sec.gov/oef/role/ShareholderReport",
"longName": "030001 - Disclosure - Shareholder Report",
"shortName": "Shareholder Report",
"isDefault": "false",
"groupType": "disclosure",
"subGroupType": "",
"menuCat": "Notes",
"order": "2",
"firstAnchor": {
"contextRef": "P11_01_2024To10_31_2025",
"name": "dei:DocumentType",
"unitRef": null,
"xsiNil": "false",
"lang": "en-US",
"decimals": null,
"ancestors": [
"div",
"div",
"div",
"div",
"div",
"div",
"div",
"div",
"div",
"body",
"html"
],
"reportCount": 1,
"baseRef": "d77953dncsr.htm",
"first": true
},
"uniqueAnchor": {
"contextRef": "P11_01_2024To10_31_2025_C000017890MemberoefClassAxis",
"name": "oef:FundName",
"unitRef": null,
"xsiNil": "false",
"lang": "en-US",
"decimals": null,
"ancestors": [
"oef:ClassName",
"div",
"div",
"div",
"div",
"div",
"div",
"div",
"div",
"div",
"div",
"body",
"html"
],
"reportCount": 1,
"baseRef": "d77953dncsr.htm",
"unique": true
}
},
"R3": {
"role": "http://xbrl.sec.gov/oef/role/ShareholderReportLineGraphDetails",
"longName": "040010 - Disclosure - Shareholder Report, Line Graph (Details)",
"shortName": "Shareholder Report, Line Graph (Details)",
"isDefault": "false",
"groupType": "disclosure",
"subGroupType": "details",
"menuCat": "Details",
"order": "3",
"firstAnchor": {
"contextRef": "P11_01_2024To10_31_2025_C000017890MemberoefClassAxis",
"name": "oef:LineGraphAndTableMeasureName",
"unitRef": null,
"xsiNil": "false",
"lang": "en-US",
"decimals": null,
"ancestors": [
"div",
"div",
"div",
"td",
"tr",
"table",
"div",
"oef:AvgAnnlRtrTableTextBlock",
"div",
"div",
"div",
"div",
"div",
"div",
"div",
"body",
"html"
],
"reportCount": 1,
"baseRef": "d77953dncsr.htm",
"first": true
},
"uniqueAnchor": null
},
"R4": {
"role": "http://xbrl.sec.gov/oef/role/ShareholderReportAverageAnnualReturnDetails",
"longName": "040015 - Disclosure - Shareholder Report, Average Annual Return (Details)",
"shortName": "Shareholder Report, Average Annual Return (Details)",
"isDefault": "false",
"groupType": "disclosure",
"subGroupType": "details",
"menuCat": "Details",
"order": "4",
"firstAnchor": {
"contextRef": "P11_01_2024To10_31_2025_C000017890MemberoefClassAxis",
"name": "oef:LineGraphAndTableMeasureName",
"unitRef": null,
"xsiNil": "false",
"lang": "en-US",
"decimals": null,
"ancestors": [
"div",
"div",
"div",
"td",
"tr",
"table",
"div",
"oef:AvgAnnlRtrTableTextBlock",
"div",
"div",
"div",
"div",
"div",
"div",
"div",
"body",
"html"
],
"reportCount": 1,
"baseRef": "d77953dncsr.htm",
"first": true
},
"uniqueAnchor": {
"contextRef": "P11_01_2024To10_31_2025_C000017890MemberoefClassAxis",
"name": "oef:AvgAnnlRtrPct",
"unitRef": "Unit_pure",
"xsiNil": "false",
"lang": null,
"decimals": "INF",
"ancestors": [
"div",
"div",
"div",
"div",
"td",
"tr",
"table",
"div",
"oef:AvgAnnlRtrTableTextBlock",
"div",
"div",
"div",
"div",
"div",
"div",
"div",
"body",
"html"
],
"reportCount": 1,
"baseRef": "d77953dncsr.htm",
"unique": true
}
},
"R5": {
"role": "http://xbrl.sec.gov/oef/role/ShareholderReportHoldingsDetails",
"longName": "040020 - Disclosure - Shareholder Report, Holdings (Details)",
"shortName": "Shareholder Report, Holdings (Details)",
"isDefault": "false",
"groupType": "disclosure",
"subGroupType": "details",
"menuCat": "Details",
"order": "5",
"firstAnchor": null,
"uniqueAnchor": null
}
},
"tag": {
"cik0000904333_ABBLtdMember": {
"xbrltype": "domainItemType",
"nsuri": "http://sct.com/20251031",
"localname": "ABBLtdMember",
"presentation": [
"http://xbrl.sec.gov/oef/role/ShareholderReportHoldingsDetails"
],
"lang": {
"en-us": {
"role": {
"label": "ABB Ltd. [Member]"
}
}
},
"auth_ref": []
},
"cik0000904333_ASMLHoldingNVMember": {
"xbrltype": "domainItemType",
"nsuri": "http://sct.com/20251031",
"localname": "ASMLHoldingNVMember",
"presentation": [
"http://xbrl.sec.gov/oef/role/ShareholderReportHoldingsDetails"
],
"lang": {
"en-us": {
"role": {
"label": "ASML Holding NV [Member]"
}
}
},
"auth_ref": []
},
"country_AU": {
"xbrltype": "domainItemType",
"nsuri": "http://xbrl.sec.gov/country/2025",
"localname": "AU",
"presentation": [
"http://xbrl.sec.gov/oef/role/ShareholderReportHoldingsDetails"
],
"lang": {
"en-us": {
"role": {
"label": "AUSTRALIA",
"terseLabel": "Australia"
}
}
},
"auth_ref": []
},
"cik0000904333_AbbVieIncMember": {
"xbrltype": "domainItemType",
"nsuri": "http://sct.com/20251031",
"localname": "AbbVieIncMember",
"presentation": [
"http://xbrl.sec.gov/oef/role/ShareholderReportHoldingsDetails"
],
"lang": {
"en-us": {
"role": {
"label": "AbbVie, Inc. [Member]"
}
}
},
"auth_ref": []
},
"oef_AccmVal": {
"xbrltype": "monetaryItemType",
"nsuri": "http://xbrl.sec.gov/oef/2025",
"localname": "AccmVal",
"presentation": [
"http://xbrl.sec.gov/oef/role/ShareholderReportLineGraphDetails"
],
"lang": {
"en-us": {
"role": {
"label": "Accumulated Value"
}
}
},
"auth_ref": [
"r38"
]
},
"oef_AccountValueLineItems": {
"xbrltype": "stringItemType",
"nsuri": "http://xbrl.sec.gov/oef/2025",
"localname": "AccountValueLineItems",
"presentation": [
"http://xbrl.sec.gov/oef/role/ShareholderReportLineGraphDetails"
],
"lang": {
"en-us": {
"role": {
"label": "Account Value [Line Items]"
}
}
},
"auth_ref": [
"r37"
]
},
"oef_AccountValueTable": {
"xbrltype": "stringItemType",
"nsuri": "http://xbrl.sec.gov/oef/2025",
"localname": "AccountValueTable",
"presentation": [
"http://xbrl.sec.gov/oef/role/ShareholderReportLineGraphDetails"
],
"lang": {
"en-us": {
"role": {
"label": "Account Value [Table]"
}
}
},
"auth_ref": [
"r37"
]
},
"oef_AccountValueTableAbstract": {
"xbrltype": "stringItemType",
"nsuri": "http://xbrl.sec.gov/oef/2025",
"localname": "AccountValueTableAbstract",
"lang": {
"en-us": {
"role": {
"label": "Account Value Table [Abstract]"
}
}
},
"auth_ref": [
"r37"
]
},
"oef_AccountantChngDate": {
"xbrltype": "dateItemType",
"nsuri": "http://xbrl.sec.gov/oef/2025",
"localname": "AccountantChngDate",
"presentation": [
"http://xbrl.sec.gov/oef/role/ShareholderReport"
],
"lang": {
"en-us": {
"role": {
"label": "Accountant Change Date"
}
}
},
"auth_ref": [
"r61"
]
},
"oef_AccountantChngDisagreementsTextBlock": {
"xbrltype": "textBlockItemType",
"nsuri": "http://xbrl.sec.gov/oef/2025",
"localname": "AccountantChngDisagreementsTextBlock",
"presentation": [
"http://xbrl.sec.gov/oef/role/ShareholderReport"
],
"lang": {
"en-us": {
"role": {
"label": "Accountant Change Disagreements [Text Block]"
}
}
},
"auth_ref": [
"r62"
]
},
"oef_AccountantChngStatementTextBlock": {
"xbrltype": "textBlockItemType",
"nsuri": "http://xbrl.sec.gov/oef/2025",
"localname": "AccountantChngStatementTextBlock",
"presentation": [
"http://xbrl.sec.gov/oef/role/ShareholderReport"
],
"lang": {
"en-us": {
"role": {
"label": "Accountant Change Statement [Text Block]"
}
}
},
"auth_ref": [
"r61"
]
},
"oef_AdditionalIndexAxis": {
"xbrltype": "stringItemType",
"nsuri": "http://xbrl.sec.gov/oef/2025",
"localname": "AdditionalIndexAxis",
"presentation": [
"http://xbrl.sec.gov/oef/role/ShareholderReportAverageAnnualReturnDetails",
"http://xbrl.sec.gov/oef/role/ShareholderReportLineGraphDetails"
],
"lang": {
"en-us": {
"role": {
"label": "Additional Index [Axis]"
}
}
},
"auth_ref": [
"r37"
]
},
"oef_AdditionalIndexDomain": {
"xbrltype": "domainItemType",
"nsuri": "http://xbrl.sec.gov/oef/2025",
"localname": "AdditionalIndexDomain",
"presentation": [
"http://xbrl.sec.gov/oef/role/ShareholderReportAverageAnnualReturnDetails",
"http://xbrl.sec.gov/oef/role/ShareholderReportLineGraphDetails"
],
"lang": {
"en-us": {
"role": {
"label": "Additional Index [Domain]"
}
}
},
"auth_ref": [
"r37"
]
},
"oef_AddlFundStatisticsSignificanceOrLimitsTextBlock": {
"xbrltype": "textBlockItemType",
"nsuri": "http://xbrl.sec.gov/oef/2025",
"localname": "AddlFundStatisticsSignificanceOrLimitsTextBlock",
"presentation": [
"http://xbrl.sec.gov/oef/role/ShareholderReport"
],
"lang": {
"en-us": {
"role": {
"label": "Additional Fund Statistics Significance or Limits [Text Block]"
}
}
},
"auth_ref": [
"r51"
]
},
"oef_AddlFundStatisticsTextBlock": {
"xbrltype": "textBlockItemType",
"nsuri": "http://xbrl.sec.gov/oef/2025",
"localname": "AddlFundStatisticsTextBlock",
"presentation": [
"http://xbrl.sec.gov/oef/role/ShareholderReport"
],
"lang": {
"en-us": {
"role": {
"label": "Additional Fund Statistics [Text Block]"
}
}
},
"auth_ref": [
"r50"
]
},
"oef_AddlInfoEmail": {
"xbrltype": "stringItemType",
"nsuri": "http://xbrl.sec.gov/oef/2025",
"localname": "AddlInfoEmail",
"presentation": [
"http://xbrl.sec.gov/oef/role/ShareholderReport"
],
"lang": {
"en-us": {
"role": {
"label": "Additional Information Email"
}
}
},
"auth_ref": [
"r29"
]
},
"oef_AddlInfoPhoneNumber": {
"xbrltype": "stringItemType",
"nsuri": "http://xbrl.sec.gov/oef/2025",
"localname": "AddlInfoPhoneNumber",
"presentation": [
"http://xbrl.sec.gov/oef/role/ShareholderReport"
],
"lang": {
"en-us": {
"role": {
"label": "Additional Information Phone Number"
}
}
},
"auth_ref": [
"r29"
]
},
"oef_AddlInfoTextBlock": {
"xbrltype": "textBlockItemType",
"nsuri": "http://xbrl.sec.gov/oef/2025",
"localname": "AddlInfoTextBlock",
"presentation": [
"http://xbrl.sec.gov/oef/role/ShareholderReport"
],
"lang": {
"en-us": {
"role": {
"label": "Additional Information [Text Block]"
}
}
},
"auth_ref": [
"r27"
]
},
"oef_AddlInfoWebsite": {
"xbrltype": "stringItemType",
"nsuri": "http://xbrl.sec.gov/oef/2025",
"localname": "AddlInfoWebsite",
"presentation": [
"http://xbrl.sec.gov/oef/role/ShareholderReport"
],
"lang": {
"en-us": {
"role": {
"label": "Additional Information Website"
}
}
},
"auth_ref": [
"r29"
]
},
"oef_AdvisoryFeesPaidAmt": {
"xbrltype": "monetaryItemType",
"nsuri": "http://xbrl.sec.gov/oef/2025",
"localname": "AdvisoryFeesPaidAmt",
"presentation": [
"http://xbrl.sec.gov/oef/role/ShareholderReport"
],
"lang": {
"en-us": {
"role": {
"label": "Advisory Fees Paid, Amount"
}
}
},
"auth_ref": [
"r50"
]
},
"cik0000904333_AdyenNvMember": {
"xbrltype": "domainItemType",
"nsuri": "http://sct.com/20251031",
"localname": "AdyenNvMember",
"presentation": [
"http://xbrl.sec.gov/oef/role/ShareholderReportHoldingsDetails"
],
"lang": {
"en-us": {
"role": {
"label": "Adyen NV [Member]"
}
}
},
"auth_ref": []
},
"cik0000904333_AeroVironmentIncMember": {
"xbrltype": "domainItemType",
"nsuri": "http://sct.com/20251031",
"localname": "AeroVironmentIncMember",
"presentation": [
"http://xbrl.sec.gov/oef/role/ShareholderReportHoldingsDetails"
],
"lang": {
"en-us": {
"role": {
"label": "AeroVironment, Inc. [Member]"
}
}
},
"auth_ref": []
},
"cik0000904333_AirtelAfricaPLCMember": {
"xbrltype": "domainItemType",
"nsuri": "http://sct.com/20251031",
"localname": "AirtelAfricaPLCMember",
"presentation": [
"http://xbrl.sec.gov/oef/role/ShareholderReportHoldingsDetails"
],
"lang": {
"en-us": {
"role": {
"label": "Airtel Africa PLC [Member]"
}
}
},
"auth_ref": []
},
"cik0000904333_AlexanderBaldwinIncMember": {
"xbrltype": "domainItemType",
"nsuri": "http://sct.com/20251031",
"localname": "AlexanderBaldwinIncMember",
"presentation": [
"http://xbrl.sec.gov/oef/role/ShareholderReportHoldingsDetails"
],
"lang": {
"en-us": {
"role": {
"label": "Alexander & Baldwin, Inc. [Member]"
}
}
},
"auth_ref": []
},
"cik0000904333_AlibabaGroupHoldingLtdMember": {
"xbrltype": "domainItemType",
"nsuri": "http://sct.com/20251031",
"localname": "AlibabaGroupHoldingLtdMember",
"presentation": [
"http://xbrl.sec.gov/oef/role/ShareholderReportHoldingsDetails"
],
"lang": {
"en-us": {
"role": {
"label": "Alibaba Group Holding Ltd. [Member]"
}
}
},
"auth_ref": []
},
"cik0000904333_AllEquityCompositeIndexMember": {
"xbrltype": "domainItemType",
"nsuri": "http://sct.com/20251031",
"localname": "AllEquityCompositeIndexMember",
"presentation": [
"http://xbrl.sec.gov/oef/role/ShareholderReportAverageAnnualReturnDetails",
"http://xbrl.sec.gov/oef/role/ShareholderReportLineGraphDetails"
],
"lang": {
"en-us": {
"role": {
"label": "All Equity Composite Index [Member]"
}
}
},
"auth_ref": []
},
"cik0000904333_AllspringCorePlusBondFundClassR6Member": {
"xbrltype": "domainItemType",
"nsuri": "http://sct.com/20251031",
"localname": "AllspringCorePlusBondFundClassR6Member",
"presentation": [
"http://xbrl.sec.gov/oef/role/ShareholderReportHoldingsDetails"
],
"lang": {
"en-us": {
"role": {
"label": "Allspring Core Plus Bond Fund, Class R6 [Member]"
}
}
},
"auth_ref": []
},
"cik0000904333_AlphabetIncClassAMember": {
"xbrltype": "domainItemType",
"nsuri": "http://sct.com/20251031",
"localname": "AlphabetIncClassAMember",
"presentation": [
"http://xbrl.sec.gov/oef/role/ShareholderReportHoldingsDetails"
],
"lang": {
"en-us": {
"role": {
"label": "Alphabet, Inc., Class A [Member]"
}
}
},
"auth_ref": []
},
"cik0000904333_AlphabetIncClassCMember": {
"xbrltype": "domainItemType",
"nsuri": "http://sct.com/20251031",
"localname": "AlphabetIncClassCMember",
"presentation": [
"http://xbrl.sec.gov/oef/role/ShareholderReportHoldingsDetails"
],
"lang": {
"en-us": {
"role": {
"label": "Alphabet, Inc., Class C [Member]"
}
}
},
"auth_ref": []
},
"cik0000904333_AmazoncomIncMember": {
"xbrltype": "domainItemType",
"nsuri": "http://sct.com/20251031",
"localname": "AmazoncomIncMember",
"presentation": [
"http://xbrl.sec.gov/oef/role/ShareholderReportHoldingsDetails"
],
"lang": {
"en-us": {
"role": {
"label": "Amazon.com, Inc. [Member]"
}
}
},
"auth_ref": []
},
"dei_AmendmentDescription": {
"xbrltype": "stringItemType",
"nsuri": "http://xbrl.sec.gov/dei/2025",
"localname": "AmendmentDescription",
"presentation": [
"http://xbrl.sec.gov/oef/role/NcsrCover",
"http://xbrl.sec.gov/oef/role/ShareholderReport"
],
"lang": {
"en-us": {
"role": {
"label": "Amendment Description",
"documentation": "Description of changes contained within amended document."
}
}
},
"auth_ref": []
},
"dei_AmendmentFlag": {
"xbrltype": "booleanItemType",
"nsuri": "http://xbrl.sec.gov/dei/2025",
"localname": "AmendmentFlag",
"presentation": [
"http://xbrl.sec.gov/oef/role/NcsrCover",
"http://xbrl.sec.gov/oef/role/ShareholderReport"
],
"lang": {
"en-us": {
"role": {
"label": "Amendment Flag",
"documentation": "Boolean flag that is true when the XBRL content amends previously-filed or accepted submission."
}
}
},
"auth_ref": []
},
"cik0000904333_AmgenIncMember": {
"xbrltype": "domainItemType",
"nsuri": "http://sct.com/20251031",
"localname": "AmgenIncMember",
"presentation": [
"http://xbrl.sec.gov/oef/role/ShareholderReportHoldingsDetails"
],
"lang": {
"en-us": {
"role": {
"label": "Amgen, Inc. [Member]"
}
}
},
"auth_ref": []
},
"oef_AnnlOrSemiAnnlStatementTextBlock": {
"xbrltype": "textBlockItemType",
"nsuri": "http://xbrl.sec.gov/oef/2025",
"localname": "AnnlOrSemiAnnlStatementTextBlock",
"presentation": [
"http://xbrl.sec.gov/oef/role/ShareholderReport"
],
"lang": {
"en-us": {
"role": {
"label": "Annual or Semi-Annual Statement [Text Block]"
}
}
},
"auth_ref": [
"r26"
]
},
"cik0000904333_AnywhereRealEstateIncMember": {
"xbrltype": "domainItemType",
"nsuri": "http://sct.com/20251031",
"localname": "AnywhereRealEstateIncMember",
"presentation": [
"http://xbrl.sec.gov/oef/role/ShareholderReportHoldingsDetails"
],
"lang": {
"en-us": {
"role": {
"label": "Anywhere Real Estate, Inc. [Member]"
}
}
},
"auth_ref": []
},
"cik0000904333_AppleIncMember": {
"xbrltype": "domainItemType",
"nsuri": "http://sct.com/20251031",
"localname": "AppleIncMember",
"presentation": [
"http://xbrl.sec.gov/oef/role/ShareholderReportHoldingsDetails"
],
"lang": {
"en-us": {
"role": {
"label": "Apple, Inc. [Member]"
}
}
},
"auth_ref": []
},
"us-gaap_AssetsNet": {
"xbrltype": "monetaryItemType",
"nsuri": "http://fasb.org/us-gaap/2025",
"localname": "AssetsNet",
"crdr": "debit",
"presentation": [
"http://xbrl.sec.gov/oef/role/ShareholderReport"
],
"lang": {
"en-us": {
"role": {
"label": "Net Assets",
"documentation": "Amount of net assets (liabilities)."
}
}
},
"auth_ref": [
"r0"
]
},
"cik0000904333_AstraZenecaPLCMember": {
"xbrltype": "domainItemType",
"nsuri": "http://sct.com/20251031",
"localname": "AstraZenecaPLCMember",
"presentation": [
"http://xbrl.sec.gov/oef/role/ShareholderReportHoldingsDetails"
],
"lang": {
"en-us": {
"role": {
"label": "AstraZeneca PLC [Member]"
}
}
},
"auth_ref": []
},
"oef_AverageAnnualReturnAbstract": {
"xbrltype": "stringItemType",
"nsuri": "http://xbrl.sec.gov/oef/2025",
"localname": "AverageAnnualReturnAbstract",
"lang": {
"en-us": {
"role": {
"label": "Average Annual Return:"
}
}
},
"auth_ref": [
"r65"
]
},
"oef_AverageAnnualReturnLineItems": {
"xbrltype": "stringItemType",
"nsuri": "http://xbrl.sec.gov/oef/2025",
"localname": "AverageAnnualReturnLineItems",
"presentation": [
"http://xbrl.sec.gov/oef/role/ShareholderReportAverageAnnualReturnDetails"
],
"lang": {
"en-us": {
"role": {
"label": "Average Annual Return [Line Items]"
}
}
},
"auth_ref": [
"r65"
]
},
"oef_AverageAnnualReturnTable": {
"xbrltype": "stringItemType",
"nsuri": "http://xbrl.sec.gov/oef/2025",
"localname": "AverageAnnualReturnTable",
"presentation": [
"http://xbrl.sec.gov/oef/role/ShareholderReportAverageAnnualReturnDetails"
],
"lang": {
"en-us": {
"role": {
"label": "Average Annual Return [Table]"
}
}
},
"auth_ref": [
"r65"
]
},
"oef_AvgAnnlRtrPct": {
"xbrltype": "percentItemType",
"nsuri": "http://xbrl.sec.gov/oef/2025",
"localname": "AvgAnnlRtrPct",
"presentation": [
"http://xbrl.sec.gov/oef/role/ShareholderReportAverageAnnualReturnDetails"
],
"lang": {
"en-us": {
"role": {
"label": "Average Annual Return, Percent"
}
}
},
"auth_ref": [
"r44"
]
},
"oef_AvgAnnlRtrTableTextBlock": {
"xbrltype": "textBlockItemType",
"nsuri": "http://xbrl.sec.gov/oef/2025",
"localname": "AvgAnnlRtrTableTextBlock",
"presentation": [
"http://xbrl.sec.gov/oef/role/ShareholderReport"
],
"lang": {
"en-us": {
"role": {
"label": "Average Annual Return [Table Text Block]"
}
}
},
"auth_ref": [
"r44"
]
},
"cik0000904333_BHPGroupLtdMember": {
"xbrltype": "domainItemType",
"nsuri": "http://sct.com/20251031",
"localname": "BHPGroupLtdMember",
"presentation": [
"http://xbrl.sec.gov/oef/role/ShareholderReportHoldingsDetails"
],
"lang": {
"en-us": {
"role": {
"label": "BHP Group Ltd. [Member]"
}
}
},
"auth_ref": []
},
"cik0000904333_BNPParibasSAMember": {
"xbrltype": "domainItemType",
"nsuri": "http://sct.com/20251031",
"localname": "BNPParibasSAMember",
"presentation": [
"http://xbrl.sec.gov/oef/role/ShareholderReportHoldingsDetails"
],
"lang": {
"en-us": {
"role": {
"label": "BNP Paribas SA [Member]"
}
}
},
"auth_ref": []
},
"cik0000904333_BPPLCMember": {
"xbrltype": "domainItemType",
"nsuri": "http://sct.com/20251031",
"localname": "BPPLCMember",
"presentation": [
"http://xbrl.sec.gov/oef/role/ShareholderReportHoldingsDetails"
],
"lang": {
"en-us": {
"role": {
"label": "BP PLC [Member]"
}
}
},
"auth_ref": []
},
"country_BR": {
"xbrltype": "domainItemType",
"nsuri": "http://xbrl.sec.gov/country/2025",
"localname": "BR",
"presentation": [
"http://xbrl.sec.gov/oef/role/ShareholderReportHoldingsDetails"
],
"lang": {
"en-us": {
"role": {
"label": "BRAZIL"
}
}
},
"auth_ref": []
},
"cik0000904333_BairdAggregateBondFundClassInstitutionalMember": {
"xbrltype": "domainItemType",
"nsuri": "http://sct.com/20251031",
"localname": "BairdAggregateBondFundClassInstitutionalMember",
"presentation": [
"http://xbrl.sec.gov/oef/role/ShareholderReportHoldingsDetails"
],
"lang": {
"en-us": {
"role": {
"label": "Baird Aggregate Bond Fund, Class Institutional [Member]"
}
}
},
"auth_ref": []
},
"cik0000904333_BalancedBlendedIndexMember": {
"xbrltype": "domainItemType",
"nsuri": "http://sct.com/20251031",
"localname": "BalancedBlendedIndexMember",
"presentation": [
"http://xbrl.sec.gov/oef/role/ShareholderReportAverageAnnualReturnDetails",
"http://xbrl.sec.gov/oef/role/ShareholderReportLineGraphDetails"
],
"lang": {
"en-us": {
"role": {
"label": "Balanced Blended Index [Member]"
}
}
},
"auth_ref": []
},
"cik0000904333_BalancedCompositeIndexMember": {
"xbrltype": "domainItemType",
"nsuri": "http://sct.com/20251031",
"localname": "BalancedCompositeIndexMember",
"presentation": [
"http://xbrl.sec.gov/oef/role/ShareholderReportAverageAnnualReturnDetails",
"http://xbrl.sec.gov/oef/role/ShareholderReportLineGraphDetails"
],
"lang": {
"en-us": {
"role": {
"label": "Balanced Composite Index [Member]"
}
}
},
"auth_ref": []
},
"cik0000904333_BancoSantanderSAMember": {
"xbrltype": "domainItemType",
"nsuri": "http://sct.com/20251031",
"localname": "BancoSantanderSAMember",
"presentation": [
"http://xbrl.sec.gov/oef/role/ShareholderReportHoldingsDetails"
],
"lang": {
"en-us": {
"role": {
"label": "Banco Santander SA [Member]"
}
}
},
"auth_ref": []
},
"cik0000904333_BankUnitedIncMember": {
"xbrltype": "domainItemType",
"nsuri": "http://sct.com/20251031",
"localname": "BankUnitedIncMember",
"presentation": [
"http://xbrl.sec.gov/oef/role/ShareholderReportHoldingsDetails"
],
"lang": {
"en-us": {
"role": {
"label": "BankUnited, Inc. [Member]"
}
}
},
"auth_ref": []
},
"cik0000904333_BankofAmericaCorpMember": {
"xbrltype": "domainItemType",
"nsuri": "http://sct.com/20251031",
"localname": "BankofAmericaCorpMember",
"presentation": [
"http://xbrl.sec.gov/oef/role/ShareholderReportHoldingsDetails"
],
"lang": {
"en-us": {
"role": {
"label": "Bank of America Corp. [Member]"
}
}
},
"auth_ref": []
},
"cik0000904333_BankofNewYorkMellonCorpMember": {
"xbrltype": "domainItemType",
"nsuri": "http://sct.com/20251031",
"localname": "BankofNewYorkMellonCorpMember",
"presentation": [
"http://xbrl.sec.gov/oef/role/ShareholderReportHoldingsDetails"
],
"lang": {
"en-us": {
"role": {
"label": "Bank of New York Mellon Corp. [Member]"
}
}
},
"auth_ref": []
},
"cik0000904333_BerkshireHathawayIncClassBMember": {
"xbrltype": "domainItemType",
"nsuri": "http://sct.com/20251031",
"localname": "BerkshireHathawayIncClassBMember",
"presentation": [
"http://xbrl.sec.gov/oef/role/ShareholderReportHoldingsDetails"
],
"lang": {
"en-us": {
"role": {
"label": "Berkshire Hathaway, Inc., Class B [Member]"
}
}
},
"auth_ref": []
},
"cik0000904333_BiotechnologyMember": {
"xbrltype": "domainItemType",
"nsuri": "http://sct.com/20251031",
"localname": "BiotechnologyMember",
"presentation": [
"http://xbrl.sec.gov/oef/role/ShareholderReportHoldingsDetails"
],
"lang": {
"en-us": {
"role": {
"label": "Biotechnology [Member]"
}
}
},
"auth_ref": []
},
"cik0000904333_BlackrockIncMember": {
"xbrltype": "domainItemType",
"nsuri": "http://sct.com/20251031",
"localname": "BlackrockIncMember",
"presentation": [
"http://xbrl.sec.gov/oef/role/ShareholderReportHoldingsDetails"
],
"lang": {
"en-us": {
"role": {
"label": "Blackrock, Inc. [Member]"
}
}
},
"auth_ref": []
},
"cik0000904333_BloomEnergyCorpClassAMember": {
"xbrltype": "domainItemType",
"nsuri": "http://sct.com/20251031",
"localname": "BloomEnergyCorpClassAMember",
"presentation": [
"http://xbrl.sec.gov/oef/role/ShareholderReportHoldingsDetails"
],
"lang": {
"en-us": {
"role": {
"label": "Bloom Energy Corp., Class A [Member]"
}
}
},
"auth_ref": []
},
"cik0000904333_BloombergUSAggregateBondIndexMember": {
"xbrltype": "domainItemType",
"nsuri": "http://sct.com/20251031",
"localname": "BloombergUSAggregateBondIndexMember",
"presentation": [
"http://xbrl.sec.gov/oef/role/ShareholderReportAverageAnnualReturnDetails",
"http://xbrl.sec.gov/oef/role/ShareholderReportLineGraphDetails"
],
"lang": {
"en-us": {
"role": {
"label": "Bloomberg US Aggregate Bond Index [Member]"
}
}
},
"auth_ref": []
},
"cik0000904333_BostonScientificCorpMember": {
"xbrltype": "domainItemType",
"nsuri": "http://sct.com/20251031",
"localname": "BostonScientificCorpMember",
"presentation": [
"http://xbrl.sec.gov/oef/role/ShareholderReportHoldingsDetails"
],
"lang": {
"en-us": {
"role": {
"label": "Boston Scientific Corp. [Member]"
}
}
},
"auth_ref": []
},
"oef_BroadBasedIndexAxis": {
"xbrltype": "stringItemType",
"nsuri": "http://xbrl.sec.gov/oef/2025",
"localname": "BroadBasedIndexAxis",
"presentation": [
"http://xbrl.sec.gov/oef/role/ShareholderReportAverageAnnualReturnDetails",
"http://xbrl.sec.gov/oef/role/ShareholderReportLineGraphDetails"
],
"lang": {
"en-us": {
"role": {
"label": "Broad Based Index [Axis]"
}
}
},
"auth_ref": [
"r37"
]
},
"oef_BroadBasedIndexDomain": {
"xbrltype": "domainItemType",
"nsuri": "http://xbrl.sec.gov/oef/2025",
"localname": "BroadBasedIndexDomain",
"presentation": [
"http://xbrl.sec.gov/oef/role/ShareholderReportAverageAnnualReturnDetails",
"http://xbrl.sec.gov/oef/role/ShareholderReportLineGraphDetails"
],
"lang": {
"en-us": {
"role": {
"label": "Broad Based Index [Domain]"
}
}
},
"auth_ref": [
"r37"
]
},
"cik0000904333_BroadcomIncMember": {
"xbrltype": "domainItemType",
"nsuri": "http://sct.com/20251031",
"localname": "BroadcomIncMember",
"presentation": [
"http://xbrl.sec.gov/oef/role/ShareholderReportHoldingsDetails"
],
"lang": {
"en-us": {
"role": {
"label": "Broadcom, Inc. [Member]"
}
}
},
"auth_ref": []
},
"cik0000904333_C000015012Member": {
"xbrltype": "domainItemType",
"nsuri": "http://sct.com/20251031",
"localname": "C000015012Member",
"presentation": [
"http://xbrl.sec.gov/oef/role/ShareholderReport",
"http://xbrl.sec.gov/oef/role/ShareholderReportAverageAnnualReturnDetails",
"http://xbrl.sec.gov/oef/role/ShareholderReportHoldingsDetails",
"http://xbrl.sec.gov/oef/role/ShareholderReportLineGraphDetails"
],
"lang": {
"en-us": {
"role": {
"label": "C000015012 [Member]",
"terseLabel": "Schwab Large-Cap Growth Fund"
}
}
},
"auth_ref": []
},
"cik0000904333_C000015013Member": {
"xbrltype": "domainItemType",
"nsuri": "http://sct.com/20251031",
"localname": "C000015013Member",
"presentation": [
"http://xbrl.sec.gov/oef/role/ShareholderReport",
"http://xbrl.sec.gov/oef/role/ShareholderReportAverageAnnualReturnDetails",
"http://xbrl.sec.gov/oef/role/ShareholderReportHoldingsDetails",
"http://xbrl.sec.gov/oef/role/ShareholderReportLineGraphDetails"
],
"lang": {
"en-us": {
"role": {
"label": "C000015013 [Member]",
"terseLabel": "Schwab Core Equity Fund"
}
}
},
"auth_ref": []
},
"cik0000904333_C000015015Member": {
"xbrltype": "domainItemType",
"nsuri": "http://sct.com/20251031",
"localname": "C000015015Member",
"presentation": [
"http://xbrl.sec.gov/oef/role/ShareholderReport",
"http://xbrl.sec.gov/oef/role/ShareholderReportAverageAnnualReturnDetails",
"http://xbrl.sec.gov/oef/role/ShareholderReportHoldingsDetails",
"http://xbrl.sec.gov/oef/role/ShareholderReportLineGraphDetails"
],
"lang": {
"en-us": {
"role": {
"label": "C000015015 [Member]",
"terseLabel": "Schwab Dividend Equity Fund"
}
}
},
"auth_ref": []
},
"cik0000904333_C000015017Member": {
"xbrltype": "domainItemType",
"nsuri": "http://sct.com/20251031",
"localname": "C000015017Member",
"presentation": [
"http://xbrl.sec.gov/oef/role/ShareholderReport",
"http://xbrl.sec.gov/oef/role/ShareholderReportAverageAnnualReturnDetails",
"http://xbrl.sec.gov/oef/role/ShareholderReportHoldingsDetails",
"http://xbrl.sec.gov/oef/role/ShareholderReportLineGraphDetails"
],
"lang": {
"en-us": {
"role": {
"label": "C000015017 [Member]",
"terseLabel": "Schwab Small-Cap Equity Fund"
}
}
},
"auth_ref": []
},
"cik0000904333_C000015021Member": {
"xbrltype": "domainItemType",
"nsuri": "http://sct.com/20251031",
"localname": "C000015021Member",
"presentation": [
"http://xbrl.sec.gov/oef/role/ShareholderReport",
"http://xbrl.sec.gov/oef/role/ShareholderReportAverageAnnualReturnDetails",
"http://xbrl.sec.gov/oef/role/ShareholderReportHoldingsDetails",
"http://xbrl.sec.gov/oef/role/ShareholderReportLineGraphDetails"
],
"lang": {
"en-us": {
"role": {
"label": "C000015021 [Member]",
"terseLabel": "Schwab Health Care Fund"
}
}
},
"auth_ref": []
},
"cik0000904333_C000015023Member": {
"xbrltype": "domainItemType",
"nsuri": "http://sct.com/20251031",
"localname": "C000015023Member",
"presentation": [
"http://xbrl.sec.gov/oef/role/ShareholderReport",
"http://xbrl.sec.gov/oef/role/ShareholderReportAverageAnnualReturnDetails",
"http://xbrl.sec.gov/oef/role/ShareholderReportHoldingsDetails",
"http://xbrl.sec.gov/oef/role/ShareholderReportLineGraphDetails"
],
"lang": {
"en-us": {
"role": {
"label": "C000015023 [Member]",
"terseLabel": "Schwab Target 2010 Fund"
}
}
},
"auth_ref": []
},
"cik0000904333_C000015024Member": {
"xbrltype": "domainItemType",
"nsuri": "http://sct.com/20251031",
"localname": "C000015024Member",
"presentation": [
"http://xbrl.sec.gov/oef/role/ShareholderReport",
"http://xbrl.sec.gov/oef/role/ShareholderReportAverageAnnualReturnDetails",
"http://xbrl.sec.gov/oef/role/ShareholderReportHoldingsDetails",
"http://xbrl.sec.gov/oef/role/ShareholderReportLineGraphDetails"
],
"lang": {
"en-us": {
"role": {
"label": "C000015024 [Member]",
"terseLabel": "Schwab Target 2020 Fund"
}
}
},
"auth_ref": []
},
"cik0000904333_C000015025Member": {
"xbrltype": "domainItemType",
"nsuri": "http://sct.com/20251031",
"localname": "C000015025Member",
"presentation": [
"http://xbrl.sec.gov/oef/role/ShareholderReport",
"http://xbrl.sec.gov/oef/role/ShareholderReportAverageAnnualReturnDetails",
"http://xbrl.sec.gov/oef/role/ShareholderReportHoldingsDetails",
"http://xbrl.sec.gov/oef/role/ShareholderReportLineGraphDetails"
],
"lang": {
"en-us": {
"role": {
"label": "C000015025 [Member]",
"terseLabel": "Schwab Target 2030 Fund"
}
}
},
"auth_ref": []
},
"cik0000904333_C000015026Member": {
"xbrltype": "domainItemType",
"nsuri": "http://sct.com/20251031",
"localname": "C000015026Member",
"presentation": [
"http://xbrl.sec.gov/oef/role/ShareholderReport",
"http://xbrl.sec.gov/oef/role/ShareholderReportAverageAnnualReturnDetails",
"http://xbrl.sec.gov/oef/role/ShareholderReportHoldingsDetails",
"http://xbrl.sec.gov/oef/role/ShareholderReportLineGraphDetails"
],
"lang": {
"en-us": {
"role": {
"label": "C000015026 [Member]",
"terseLabel": "Schwab Target 2040 Fund"
}
}
},
"auth_ref": []
},
"cik0000904333_C000016166Member": {
"xbrltype": "domainItemType",
"nsuri": "http://sct.com/20251031",
"localname": "C000016166Member",
"presentation": [
"http://xbrl.sec.gov/oef/role/ShareholderReport",
"http://xbrl.sec.gov/oef/role/ShareholderReportAverageAnnualReturnDetails",
"http://xbrl.sec.gov/oef/role/ShareholderReportHoldingsDetails",
"http://xbrl.sec.gov/oef/role/ShareholderReportLineGraphDetails"
],
"lang": {
"en-us": {
"role": {
"label": "C000016166 [Member]",
"terseLabel": "Schwab S&P 500 Index Fund"
}
}
},
"auth_ref": []
},
"cik0000904333_C000016169Member": {
"xbrltype": "domainItemType",
"nsuri": "http://sct.com/20251031",
"localname": "C000016169Member",
"presentation": [
"http://xbrl.sec.gov/oef/role/ShareholderReport",
"http://xbrl.sec.gov/oef/role/ShareholderReportAverageAnnualReturnDetails",
"http://xbrl.sec.gov/oef/role/ShareholderReportHoldingsDetails",
"http://xbrl.sec.gov/oef/role/ShareholderReportLineGraphDetails"
],
"lang": {
"en-us": {
"role": {
"label": "C000016169 [Member]",
"verboseLabel": "Schwab Small-Cap Index Fund"
}
}
},
"auth_ref": []
},
"cik0000904333_C000016171Member": {
"xbrltype": "domainItemType",
"nsuri": "http://sct.com/20251031",
"localname": "C000016171Member",
"presentation": [
"http://xbrl.sec.gov/oef/role/ShareholderReport",
"http://xbrl.sec.gov/oef/role/ShareholderReportAverageAnnualReturnDetails",
"http://xbrl.sec.gov/oef/role/ShareholderReportHoldingsDetails",
"http://xbrl.sec.gov/oef/role/ShareholderReportLineGraphDetails"
],
"lang": {
"en-us": {
"role": {
"label": "C000016171 [Member]",
"terseLabel": "Schwab Total Stock Market Index Fund"
}
}
},
"auth_ref": []
},
"cik0000904333_C000016173Member": {
"xbrltype": "domainItemType",
"nsuri": "http://sct.com/20251031",
"localname": "C000016173Member",
"presentation": [
"http://xbrl.sec.gov/oef/role/ShareholderReport",
"http://xbrl.sec.gov/oef/role/ShareholderReportAverageAnnualReturnDetails",
"http://xbrl.sec.gov/oef/role/ShareholderReportHoldingsDetails",
"http://xbrl.sec.gov/oef/role/ShareholderReportLineGraphDetails"
],
"lang": {
"en-us": {
"role": {
"label": "C000016173 [Member]",
"verboseLabel": "Schwab International Index Fund"
}
}
},
"auth_ref": []
},
"cik0000904333_C000016175Member": {
"xbrltype": "domainItemType",
"nsuri": "http://sct.com/20251031",
"localname": "C000016175Member",
"presentation": [
"http://xbrl.sec.gov/oef/role/ShareholderReport",
"http://xbrl.sec.gov/oef/role/ShareholderReportAverageAnnualReturnDetails",
"http://xbrl.sec.gov/oef/role/ShareholderReportHoldingsDetails",
"http://xbrl.sec.gov/oef/role/ShareholderReportLineGraphDetails"
],
"lang": {
"en-us": {
"role": {
"label": "C000016175 [Member]",
"terseLabel": "Schwab MarketTrack All Equity Portfolio"
}
}
},
"auth_ref": []
},
"cik0000904333_C000016177Member": {
"xbrltype": "domainItemType",
"nsuri": "http://sct.com/20251031",
"localname": "C000016177Member",
"presentation": [
"http://xbrl.sec.gov/oef/role/ShareholderReport",
"http://xbrl.sec.gov/oef/role/ShareholderReportAverageAnnualReturnDetails",
"http://xbrl.sec.gov/oef/role/ShareholderReportHoldingsDetails",
"http://xbrl.sec.gov/oef/role/ShareholderReportLineGraphDetails"
],
"lang": {
"en-us": {
"role": {
"label": "C000016177 [Member]",
"terseLabel": "Schwab MarketTrack Growth Portfolio"
}
}
},
"auth_ref": []
},
"cik0000904333_C000016178Member": {
"xbrltype": "domainItemType",
"nsuri": "http://sct.com/20251031",
"localname": "C000016178Member",
"presentation": [
"http://xbrl.sec.gov/oef/role/ShareholderReport",
"http://xbrl.sec.gov/oef/role/ShareholderReportAverageAnnualReturnDetails",
"http://xbrl.sec.gov/oef/role/ShareholderReportHoldingsDetails",
"http://xbrl.sec.gov/oef/role/ShareholderReportLineGraphDetails"
],
"lang": {
"en-us": {
"role": {
"label": "C000016178 [Member]",
"terseLabel": "Schwab MarketTrack Balanced Portfolio\u2122"
}
}
},
"auth_ref": []
},
"cik0000904333_C000016180Member": {
"xbrltype": "domainItemType",
"nsuri": "http://sct.com/20251031",
"localname": "C000016180Member",
"presentation": [
"http://xbrl.sec.gov/oef/role/ShareholderReport",
"http://xbrl.sec.gov/oef/role/ShareholderReportAverageAnnualReturnDetails",
"http://xbrl.sec.gov/oef/role/ShareholderReportHoldingsDetails",
"http://xbrl.sec.gov/oef/role/ShareholderReportLineGraphDetails"
],
"lang": {
"en-us": {
"role": {
"label": "C000016180 [Member]",
"terseLabel": "Schwab MarketTrack Conservative Portfolio\u2122"
}
}
},
"auth_ref": []
},
"cik0000904333_C000017885Member": {
"xbrltype": "domainItemType",
"nsuri": "http://sct.com/20251031",
"localname": "C000017885Member",
"presentation": [
"http://xbrl.sec.gov/oef/role/ShareholderReport",
"http://xbrl.sec.gov/oef/role/ShareholderReportAverageAnnualReturnDetails",
"http://xbrl.sec.gov/oef/role/ShareholderReportHoldingsDetails",
"http://xbrl.sec.gov/oef/role/ShareholderReportLineGraphDetails"
],
"lang": {
"en-us": {
"role": {
"label": "C000017885 [Member]",
"terseLabel": "Schwab Balanced Fund"
}
}
},
"auth_ref": []
},
"cik0000904333_C000017890Member": {
"xbrltype": "domainItemType",
"nsuri": "http://sct.com/20251031",
"localname": "C000017890Member",
"presentation": [
"http://xbrl.sec.gov/oef/role/ShareholderReport",
"http://xbrl.sec.gov/oef/role/ShareholderReportAverageAnnualReturnDetails",
"http://xbrl.sec.gov/oef/role/ShareholderReportHoldingsDetails",
"http://xbrl.sec.gov/oef/role/ShareholderReportLineGraphDetails"
],
"lang": {
"en-us": {
"role": {
"label": "C000017890 [Member]",
"terseLabel": "Schwab\u00a0International Opportunities Fund"
}
}
},
"auth_ref": []
},
"cik0000904333_C000046821Member": {
"xbrltype": "domainItemType",
"nsuri": "http://sct.com/20251031",
"localname": "C000046821Member",
"presentation": [
"http://xbrl.sec.gov/oef/role/ShareholderReport",
"http://xbrl.sec.gov/oef/role/ShareholderReportAverageAnnualReturnDetails",
"http://xbrl.sec.gov/oef/role/ShareholderReportHoldingsDetails",
"http://xbrl.sec.gov/oef/role/ShareholderReportLineGraphDetails"
],
"lang": {
"en-us": {
"role": {
"label": "C000046821 [Member]",
"terseLabel": "Schwab Fundamental U.S. Large Company Index Fund"
}
}
},
"auth_ref": []
},
"cik0000904333_C000046824Member": {
"xbrltype": "domainItemType",
"nsuri": "http://sct.com/20251031",
"localname": "C000046824Member",
"presentation": [
"http://xbrl.sec.gov/oef/role/ShareholderReport",
"http://xbrl.sec.gov/oef/role/ShareholderReportAverageAnnualReturnDetails",
"http://xbrl.sec.gov/oef/role/ShareholderReportHoldingsDetails",
"http://xbrl.sec.gov/oef/role/ShareholderReportLineGraphDetails"
],
"lang": {
"en-us": {
"role": {
"label": "C000046824 [Member]",
"terseLabel": "Schwab Fundamental U.S. Small Company Index Fund"
}
}
},
"auth_ref": []
},
"cik0000904333_C000046827Member": {
"xbrltype": "domainItemType",
"nsuri": "http://sct.com/20251031",
"localname": "C000046827Member",
"presentation": [
"http://xbrl.sec.gov/oef/role/ShareholderReport",
"http://xbrl.sec.gov/oef/role/ShareholderReportAverageAnnualReturnDetails",
"http://xbrl.sec.gov/oef/role/ShareholderReportHoldingsDetails",
"http://xbrl.sec.gov/oef/role/ShareholderReportLineGraphDetails"
],
"lang": {
"en-us": {
"role": {
"label": "C000046827 [Member]",
"terseLabel": "Schwab Fundamental International Equity Index Fund"
}
}
},
"auth_ref": []
},
"cik0000904333_C000055852Member": {
"xbrltype": "domainItemType",
"nsuri": "http://sct.com/20251031",
"localname": "C000055852Member",
"presentation": [
"http://xbrl.sec.gov/oef/role/ShareholderReport",
"http://xbrl.sec.gov/oef/role/ShareholderReportAverageAnnualReturnDetails",
"http://xbrl.sec.gov/oef/role/ShareholderReportHoldingsDetails",
"http://xbrl.sec.gov/oef/role/ShareholderReportLineGraphDetails"
],
"lang": {
"en-us": {
"role": {
"label": "C000055852 [Member]",
"terseLabel": "Schwab Fundamental Emerging Markets Equity Index Fund"
}
}
},
"auth_ref": []
},
"cik0000904333_C000055855Member": {
"xbrltype": "domainItemType",
"nsuri": "http://sct.com/20251031",
"localname": "C000055855Member",
"presentation": [
"http://xbrl.sec.gov/oef/role/ShareholderReport",
"http://xbrl.sec.gov/oef/role/ShareholderReportAverageAnnualReturnDetails",
"http://xbrl.sec.gov/oef/role/ShareholderReportHoldingsDetails",
"http://xbrl.sec.gov/oef/role/ShareholderReportLineGraphDetails"
],
"lang": {
"en-us": {
"role": {
"label": "C000055855 [Member]",
"terseLabel": "Schwab Fundamental International Small Equity Index Fund"
}
}
},
"auth_ref": []
},
"cik0000904333_C000059131Member": {
"xbrltype": "domainItemType",
"nsuri": "http://sct.com/20251031",
"localname": "C000059131Member",
"presentation": [
"http://xbrl.sec.gov/oef/role/ShareholderReport",
"http://xbrl.sec.gov/oef/role/ShareholderReportAverageAnnualReturnDetails",
"http://xbrl.sec.gov/oef/role/ShareholderReportHoldingsDetails",
"http://xbrl.sec.gov/oef/role/ShareholderReportLineGraphDetails"
],
"lang": {
"en-us": {
"role": {
"label": "C000059131 [Member]",
"terseLabel": "Schwab Target 2015 Fund"
}
}
},
"auth_ref": []
},
"cik0000904333_C000059132Member": {
"xbrltype": "domainItemType",
"nsuri": "http://sct.com/20251031",
"localname": "C000059132Member",
"presentation": [
"http://xbrl.sec.gov/oef/role/ShareholderReport",
"http://xbrl.sec.gov/oef/role/ShareholderReportAverageAnnualReturnDetails",
"http://xbrl.sec.gov/oef/role/ShareholderReportHoldingsDetails",
"http://xbrl.sec.gov/oef/role/ShareholderReportLineGraphDetails"
],
"lang": {
"en-us": {
"role": {
"label": "C000059132 [Member]",
"terseLabel": "Schwab Target 2025 Index Fund"
}
}
},
"auth_ref": []
},
"cik0000904333_C000059133Member": {
"xbrltype": "domainItemType",
"nsuri": "http://sct.com/20251031",
"localname": "C000059133Member",
"presentation": [
"http://xbrl.sec.gov/oef/role/ShareholderReport",
"http://xbrl.sec.gov/oef/role/ShareholderReportAverageAnnualReturnDetails",
"http://xbrl.sec.gov/oef/role/ShareholderReportHoldingsDetails",
"http://xbrl.sec.gov/oef/role/ShareholderReportLineGraphDetails"
],
"lang": {
"en-us": {
"role": {
"label": "C000059133 [Member]",
"terseLabel": "Schwab Target 2035 Fund"
}
}
},
"auth_ref": []
},
"cik0000904333_C000063316Member": {
"xbrltype": "domainItemType",
"nsuri": "http://sct.com/20251031",
"localname": "C000063316Member",
"presentation": [
"http://xbrl.sec.gov/oef/role/ShareholderReport",
"http://xbrl.sec.gov/oef/role/ShareholderReportAverageAnnualReturnDetails",
"http://xbrl.sec.gov/oef/role/ShareholderReportHoldingsDetails",
"http://xbrl.sec.gov/oef/role/ShareholderReportLineGraphDetails"
],
"lang": {
"en-us": {
"role": {
"label": "C000063316 [Member]",
"verboseLabel": "Schwab International Core Equity Fund"
}
}
},
"auth_ref": []
},
"cik0000904333_C000122183Member": {
"xbrltype": "domainItemType",
"nsuri": "http://sct.com/20251031",
"localname": "C000122183Member",
"presentation": [
"http://xbrl.sec.gov/oef/role/ShareholderReport",
"http://xbrl.sec.gov/oef/role/ShareholderReportAverageAnnualReturnDetails",
"http://xbrl.sec.gov/oef/role/ShareholderReportHoldingsDetails",
"http://xbrl.sec.gov/oef/role/ShareholderReportLineGraphDetails"
],
"lang": {
"en-us": {
"role": {
"label": "C000122183 [Member]",
"verboseLabel": "Schwab Target 2045 Fund"
}
}
},
"auth_ref": []
},
"cik0000904333_C000122184Member": {
"xbrltype": "domainItemType",
"nsuri": "http://sct.com/20251031",
"localname": "C000122184Member",
"presentation": [
"http://xbrl.sec.gov/oef/role/ShareholderReport",
"http://xbrl.sec.gov/oef/role/ShareholderReportAverageAnnualReturnDetails",
"http://xbrl.sec.gov/oef/role/ShareholderReportHoldingsDetails",
"http://xbrl.sec.gov/oef/role/ShareholderReportLineGraphDetails"
],
"lang": {
"en-us": {
"role": {
"label": "C000122184 [Member]",
"terseLabel": "Schwab Target 2050 Fund"
}
}
},
"auth_ref": []
},
"cik0000904333_C000122185Member": {
"xbrltype": "domainItemType",
"nsuri": "http://sct.com/20251031",
"localname": "C000122185Member",
"presentation": [
"http://xbrl.sec.gov/oef/role/ShareholderReport",
"http://xbrl.sec.gov/oef/role/ShareholderReportAverageAnnualReturnDetails",
"http://xbrl.sec.gov/oef/role/ShareholderReportHoldingsDetails",
"http://xbrl.sec.gov/oef/role/ShareholderReportLineGraphDetails"
],
"lang": {
"en-us": {
"role": {
"label": "C000122185 [Member]",
"terseLabel": "Schwab Target 2055 Fund"
}
}
},
"auth_ref": []
},
"cik0000904333_C000172771Member": {
"xbrltype": "domainItemType",
"nsuri": "http://sct.com/20251031",
"localname": "C000172771Member",
"presentation": [
"http://xbrl.sec.gov/oef/role/ShareholderReport",
"http://xbrl.sec.gov/oef/role/ShareholderReportAverageAnnualReturnDetails",
"http://xbrl.sec.gov/oef/role/ShareholderReportHoldingsDetails",
"http://xbrl.sec.gov/oef/role/ShareholderReportLineGraphDetails"
],
"lang": {
"en-us": {
"role": {
"label": "C000172771 [Member]",
"terseLabel": "Schwab Target 2060 Fund"
}
}
},
"auth_ref": []
},
"cik0000904333_C000195502Member": {
"xbrltype": "domainItemType",
"nsuri": "http://sct.com/20251031",
"localname": "C000195502Member",
"presentation": [
"http://xbrl.sec.gov/oef/role/ShareholderReport",
"http://xbrl.sec.gov/oef/role/ShareholderReportAverageAnnualReturnDetails",
"http://xbrl.sec.gov/oef/role/ShareholderReportHoldingsDetails",
"http://xbrl.sec.gov/oef/role/ShareholderReportLineGraphDetails"
],
"lang": {
"en-us": {
"role": {
"label": "C000195502 [Member]",
"terseLabel": "Schwab U.S. Large-Cap Growth Index Fund"
}
}
},
"auth_ref": []
},
"cik0000904333_C000195503Member": {
"xbrltype": "domainItemType",
"nsuri": "http://sct.com/20251031",
"localname": "C000195503Member",
"presentation": [
"http://xbrl.sec.gov/oef/role/ShareholderReport",
"http://xbrl.sec.gov/oef/role/ShareholderReportAverageAnnualReturnDetails",
"http://xbrl.sec.gov/oef/role/ShareholderReportHoldingsDetails",
"http://xbrl.sec.gov/oef/role/ShareholderReportLineGraphDetails"
],
"lang": {
"en-us": {
"role": {
"label": "C000195503 [Member]",
"terseLabel": "Schwab U.S. Large-Cap Value Index Fund"
}
}
},
"auth_ref": []
},
"cik0000904333_C000195504Member": {
"xbrltype": "domainItemType",
"nsuri": "http://sct.com/20251031",
"localname": "C000195504Member",
"presentation": [
"http://xbrl.sec.gov/oef/role/ShareholderReport",
"http://xbrl.sec.gov/oef/role/ShareholderReportAverageAnnualReturnDetails",
"http://xbrl.sec.gov/oef/role/ShareholderReportHoldingsDetails",
"http://xbrl.sec.gov/oef/role/ShareholderReportLineGraphDetails"
],
"lang": {
"en-us": {
"role": {
"label": "C000195504 [Member]",
"terseLabel": "Schwab U.S. Mid-Cap Index Fund"
}
}
},
"auth_ref": []
},
"cik0000904333_C000225748Member": {
"xbrltype": "domainItemType",
"nsuri": "http://sct.com/20251031",
"localname": "C000225748Member",
"presentation": [
"http://xbrl.sec.gov/oef/role/ShareholderReport",
"http://xbrl.sec.gov/oef/role/ShareholderReportAverageAnnualReturnDetails",
"http://xbrl.sec.gov/oef/role/ShareholderReportHoldingsDetails",
"http://xbrl.sec.gov/oef/role/ShareholderReportLineGraphDetails"
],
"lang": {
"en-us": {
"role": {
"label": "C000225748 [Member]",
"terseLabel": "Schwab Target 2065 Fund"
}
}
},
"auth_ref": []
},
"country_CA": {
"xbrltype": "domainItemType",
"nsuri": "http://xbrl.sec.gov/country/2025",
"localname": "CA",
"presentation": [
"http://xbrl.sec.gov/oef/role/ShareholderReportHoldingsDetails"
],
"lang": {
"en-us": {
"role": {
"label": "CANADA",
"terseLabel": "Canada"
}
}
},
"auth_ref": []
},
"country_CH": {
"xbrltype": "domainItemType",
"nsuri": "http://xbrl.sec.gov/country/2025",
"localname": "CH",
"presentation": [
"http://xbrl.sec.gov/oef/role/ShareholderReportHoldingsDetails"
],
"lang": {
"en-us": {
"role": {
"label": "SWITZERLAND",
"terseLabel": "Switzerland"
}
}
},
"auth_ref": []
},
"country_CN": {
"xbrltype": "domainItemType",
"nsuri": "http://xbrl.sec.gov/country/2025",
"localname": "CN",
"presentation": [
"http://xbrl.sec.gov/oef/role/ShareholderReportHoldingsDetails"
],
"lang": {
"en-us": {
"role": {
"label": "CHINA",
"terseLabel": "China"
}
}
},
"auth_ref": []
},
"cik0000904333_CelesticaIncMember": {
"xbrltype": "domainItemType",
"nsuri": "http://sct.com/20251031",
"localname": "CelesticaIncMember",
"presentation": [
"http://xbrl.sec.gov/oef/role/ShareholderReportHoldingsDetails"
],
"lang": {
"en-us": {
"role": {
"label": "Celestica, Inc. [Member]"
}
}
},
"auth_ref": []
},
"cik0000904333_ChevronCorpMember": {
"xbrltype": "domainItemType",
"nsuri": "http://sct.com/20251031",
"localname": "ChevronCorpMember",
"presentation": [
"http://xbrl.sec.gov/oef/role/ShareholderReportHoldingsDetails"
],
"lang": {
"en-us": {
"role": {
"label": "Chevron Corp. [Member]"
}
}
},
"auth_ref": []
},
"cik0000904333_ChinaConstructionBankCorpHSharesMember": {
"xbrltype": "domainItemType",
"nsuri": "http://sct.com/20251031",
"localname": "ChinaConstructionBankCorpHSharesMember",
"presentation": [
"http://xbrl.sec.gov/oef/role/ShareholderReportHoldingsDetails"
],
"lang": {
"en-us": {
"role": {
"label": "China Construction Bank Corp., H Shares [Member]"
}
}
},
"auth_ref": []
},
"oef_ClassAxis": {
"xbrltype": "stringItemType",
"nsuri": "http://xbrl.sec.gov/oef/2025",
"localname": "ClassAxis",
"presentation": [
"http://xbrl.sec.gov/oef/role/ShareholderReport",
"http://xbrl.sec.gov/oef/role/ShareholderReportAverageAnnualReturnDetails",
"http://xbrl.sec.gov/oef/role/ShareholderReportHoldingsDetails",
"http://xbrl.sec.gov/oef/role/ShareholderReportLineGraphDetails"
],
"lang": {
"en-us": {
"role": {
"label": "Class [Axis]"
}
}
},
"auth_ref": [
"r24"
]
},
"oef_ClassName": {
"xbrltype": "securityTitleItemType",
"nsuri": "http://xbrl.sec.gov/oef/2025",
"localname": "ClassName",
"presentation": [
"http://xbrl.sec.gov/oef/role/ShareholderReport"
],
"lang": {
"en-us": {
"role": {
"label": "Class Name"
}
}
},
"auth_ref": [
"r29"
]
},
"cik0000904333_CloudflareIncClassAMember": {
"xbrltype": "domainItemType",
"nsuri": "http://sct.com/20251031",
"localname": "CloudflareIncClassAMember",
"presentation": [
"http://xbrl.sec.gov/oef/role/ShareholderReportHoldingsDetails"
],
"lang": {
"en-us": {
"role": {
"label": "Cloudflare, Inc., Class A [Member]"
}
}
},
"auth_ref": []
},
"cik0000904333_CocaColaCoMember": {
"xbrltype": "domainItemType",
"nsuri": "http://sct.com/20251031",
"localname": "CocaColaCoMember",
"presentation": [
"http://xbrl.sec.gov/oef/role/ShareholderReportHoldingsDetails"
],
"lang": {
"en-us": {
"role": {
"label": "Coca-Cola Co. [Member]"
}
}
},
"auth_ref": []
},
"cik0000904333_CoinbaseGlobalIncClassAMember": {
"xbrltype": "domainItemType",
"nsuri": "http://sct.com/20251031",
"localname": "CoinbaseGlobalIncClassAMember",
"presentation": [
"http://xbrl.sec.gov/oef/role/ShareholderReportHoldingsDetails"
],
"lang": {
"en-us": {
"role": {
"label": "Coinbase Global, Inc., Class A [Member]"
}
}
},
"auth_ref": []
},
"cik0000904333_ComfortSystemsUSAIncMember": {
"xbrltype": "domainItemType",
"nsuri": "http://sct.com/20251031",
"localname": "ComfortSystemsUSAIncMember",
"presentation": [
"http://xbrl.sec.gov/oef/role/ShareholderReportHoldingsDetails"
],
"lang": {
"en-us": {
"role": {
"label": "Comfort Systems USA, Inc. [Member]"
}
}
},
"auth_ref": []
},
"cik0000904333_CommScopeHoldingCoIncMember": {
"xbrltype": "domainItemType",
"nsuri": "http://sct.com/20251031",
"localname": "CommScopeHoldingCoIncMember",
"presentation": [
"http://xbrl.sec.gov/oef/role/ShareholderReportHoldingsDetails"
],
"lang": {
"en-us": {
"role": {
"label": "CommScope Holding Co., Inc. [Member]"
}
}
},
"auth_ref": []
},
"oef_CommunicationsSectorMember": {
"xbrltype": "domainItemType",
"nsuri": "http://xbrl.sec.gov/oef/2025",
"localname": "CommunicationsSectorMember",
"presentation": [
"http://xbrl.sec.gov/oef/role/ShareholderReportHoldingsDetails"
],
"lang": {
"en-us": {
"role": {
"label": "Communications Sector [Member]"
}
}
},
"auth_ref": [
"r52"
]
},
"cik0000904333_ConservativeCompositeIndexMember": {
"xbrltype": "domainItemType",
"nsuri": "http://sct.com/20251031",
"localname": "ConservativeCompositeIndexMember",
"presentation": [
"http://xbrl.sec.gov/oef/role/ShareholderReportAverageAnnualReturnDetails",
"http://xbrl.sec.gov/oef/role/ShareholderReportLineGraphDetails"
],
"lang": {
"en-us": {
"role": {
"label": "Conservative Composite Index [Member]"
}
}
},
"auth_ref": []
},
"oef_ConsumerDiscretionarySectorMember": {
"xbrltype": "domainItemType",
"nsuri": "http://xbrl.sec.gov/oef/2025",
"localname": "ConsumerDiscretionarySectorMember",
"presentation": [
"http://xbrl.sec.gov/oef/role/ShareholderReportHoldingsDetails"
],
"lang": {
"en-us": {
"role": {
"label": "Consumer Discretionary Sector [Member]"
}
}
},
"auth_ref": [
"r52"
]
},
"oef_ConsumerStaplesSectorMember": {
"xbrltype": "domainItemType",
"nsuri": "http://xbrl.sec.gov/oef/2025",
"localname": "ConsumerStaplesSectorMember",
"presentation": [
"http://xbrl.sec.gov/oef/role/ShareholderReportHoldingsDetails"
],
"lang": {
"en-us": {
"role": {
"label": "Consumer Staples Sector [Member]"
}
}
},
"auth_ref": [
"r52"
]
},
"cik0000904333_CorningIncMember": {
"xbrltype": "domainItemType",
"nsuri": "http://sct.com/20251031",
"localname": "CorningIncMember",
"presentation": [
"http://xbrl.sec.gov/oef/role/ShareholderReportHoldingsDetails"
],
"lang": {
"en-us": {
"role": {
"label": "Corning, Inc. [Member]"
}
}
},
"auth_ref": []
},
"dei_CoverAbstract": {
"xbrltype": "stringItemType",
"nsuri": "http://xbrl.sec.gov/dei/2025",
"localname": "CoverAbstract",
"lang": {
"en-us": {
"role": {
"documentation": "Cover page."
}
}
},
"auth_ref": []
},
"oef_CreditQualityAxis": {
"xbrltype": "stringItemType",
"nsuri": "http://xbrl.sec.gov/oef/2025",
"localname": "CreditQualityAxis",
"presentation": [
"http://xbrl.sec.gov/oef/role/ShareholderReportHoldingsDetails"
],
"lang": {
"en-us": {
"role": {
"label": "Credit Quality [Axis]"
}
}
},
"auth_ref": [
"r52"
]
},
"oef_CreditQualityDomain": {
"xbrltype": "domainItemType",
"nsuri": "http://xbrl.sec.gov/oef/2025",
"localname": "CreditQualityDomain",
"presentation": [
"http://xbrl.sec.gov/oef/role/ShareholderReportHoldingsDetails"
],
"lang": {
"en-us": {
"role": {
"label": "Credit Quality [Domain]"
}
}
},
"auth_ref": [
"r52"
]
},
"oef_CreditQualityExplanationTextBlock": {
"xbrltype": "textBlockItemType",
"nsuri": "http://xbrl.sec.gov/oef/2025",
"localname": "CreditQualityExplanationTextBlock",
"presentation": [
"http://xbrl.sec.gov/oef/role/ShareholderReport"
],
"lang": {
"en-us": {
"role": {
"label": "Credit Quality Explanation [Text Block]"
}
}
},
"auth_ref": [
"r52"
]
},
"oef_CreditRatingsSelectionTextBlock": {
"xbrltype": "textBlockItemType",
"nsuri": "http://xbrl.sec.gov/oef/2025",
"localname": "CreditRatingsSelectionTextBlock",
"presentation": [
"http://xbrl.sec.gov/oef/role/ShareholderReport"
],
"lang": {
"en-us": {
"role": {
"label": "Credit Ratings Selection [Text Block]"
}
}
},
"auth_ref": [
"r52"
]
},
"cik0000904333_CredoTechnologyGroupHoldingLtdMember": {
"xbrltype": "domainItemType",
"nsuri": "http://sct.com/20251031",
"localname": "CredoTechnologyGroupHoldingLtdMember",
"presentation": [
"http://xbrl.sec.gov/oef/role/ShareholderReportHoldingsDetails"
],
"lang": {
"en-us": {
"role": {
"label": "Credo Technology Group Holding Ltd. [Member]"
}
}
},
"auth_ref": []
},
"country_DE": {
"xbrltype": "domainItemType",
"nsuri": "http://xbrl.sec.gov/country/2025",
"localname": "DE",
"presentation": [
"http://xbrl.sec.gov/oef/role/ShareholderReportHoldingsDetails"
],
"lang": {
"en-us": {
"role": {
"label": "GERMANY",
"terseLabel": "Germany"
}
}
},
"auth_ref": []
},
"cik0000904333_DWaveQuantumIncMember": {
"xbrltype": "domainItemType",
"nsuri": "http://sct.com/20251031",
"localname": "DWaveQuantumIncMember",
"presentation": [
"http://xbrl.sec.gov/oef/role/ShareholderReportHoldingsDetails"
],
"lang": {
"en-us": {
"role": {
"label": "D-Wave Quantum, Inc. [Member]"
}
}
},
"auth_ref": []
},
"cik0000904333_DelekUSHoldingsIncMember": {
"xbrltype": "domainItemType",
"nsuri": "http://sct.com/20251031",
"localname": "DelekUSHoldingsIncMember",
"presentation": [
"http://xbrl.sec.gov/oef/role/ShareholderReportHoldingsDetails"
],
"lang": {
"en-us": {
"role": {
"label": "Delek U.S. Holdings, Inc. [Member]"
}
}
},
"auth_ref": []
},
"cik0000904333_DiamondRockHospitalityCoMember": {
"xbrltype": "domainItemType",
"nsuri": "http://sct.com/20251031",
"localname": "DiamondRockHospitalityCoMember",
"presentation": [
"http://xbrl.sec.gov/oef/role/ShareholderReportHoldingsDetails"
],
"lang": {
"en-us": {
"role": {
"label": "DiamondRock Hospitality Co. [Member]"
}
}
},
"auth_ref": []
},
"oef_DistOfCapitalTextBlock": {
"xbrltype": "textBlockItemType",
"nsuri": "http://xbrl.sec.gov/oef/2025",
"localname": "DistOfCapitalTextBlock",
"presentation": [
"http://xbrl.sec.gov/oef/role/ShareholderReport"
],
"lang": {
"en-us": {
"role": {
"label": "Distribution of Capital [Text Block]"
}
}
},
"auth_ref": [
"r46"
]
},
"dei_DocumentPeriodEndDate": {
"xbrltype": "dateItemType",
"nsuri": "http://xbrl.sec.gov/dei/2025",
"localname": "DocumentPeriodEndDate",
"presentation": [
"http://xbrl.sec.gov/oef/role/NcsrCover",
"http://xbrl.sec.gov/oef/role/ShareholderReport"
],
"lang": {
"en-us": {
"role": {
"label": "Document Period End Date",
"documentation": "For the EDGAR submission types of Form 8-K: the date of the report, the date of the earliest event reported; for the EDGAR submission types of Form N-1A: the filing date; for all other submission types: the end of the reporting or transition period. The format of the date is YYYY-MM-DD."
}
}
},
"auth_ref": []
},
"dei_DocumentType": {
"xbrltype": "submissionTypeItemType",
"nsuri": "http://xbrl.sec.gov/dei/2025",
"localname": "DocumentType",
"presentation": [
"http://xbrl.sec.gov/oef/role/NcsrCover",
"http://xbrl.sec.gov/oef/role/ShareholderReport"
],
"lang": {
"en-us": {
"role": {
"label": "Document Type",
"documentation": "The type of document being provided (such as 10-K, 10-Q, 485BPOS, etc). The document type is limited to the same value as the supporting SEC submission type, or the word 'Other'."
}
}
},
"auth_ref": []
},
"cik0000904333_DodgeAndCoxStockFundClassIMember": {
"xbrltype": "domainItemType",
"nsuri": "http://sct.com/20251031",
"localname": "DodgeAndCoxStockFundClassIMember",
"presentation": [
"http://xbrl.sec.gov/oef/role/ShareholderReportHoldingsDetails"
],
"lang": {
"en-us": {
"role": {
"label": "Dodge & Cox Stock Fund, Class I [Member]",
"terseLabel": "Dodge & Cox Stock Fund Class I [Member]"
}
}
},
"auth_ref": []
},
"cik0000904333_DoosanCoLtdMember": {
"xbrltype": "domainItemType",
"nsuri": "http://sct.com/20251031",
"localname": "DoosanCoLtdMember",
"presentation": [
"http://xbrl.sec.gov/oef/role/ShareholderReportHoldingsDetails"
],
"lang": {
"en-us": {
"role": {
"label": "Doosan Co. Ltd. [Member]"
}
}
},
"auth_ref": []
},
"cik0000904333_DowJonesGlobalHealthCareIndexMember": {
"xbrltype": "domainItemType",
"nsuri": "http://sct.com/20251031",
"localname": "DowJonesGlobalHealthCareIndexMember",
"presentation": [
"http://xbrl.sec.gov/oef/role/ShareholderReportAverageAnnualReturnDetails",
"http://xbrl.sec.gov/oef/role/ShareholderReportLineGraphDetails"
],
"lang": {
"en-us": {
"role": {
"label": "Dow Jones Global Health Care Index [Member]"
}
}
},
"auth_ref": []
},
"cik0000904333_DowJonesUSTotalStockMarketIndexMember": {
"xbrltype": "domainItemType",
"nsuri": "http://sct.com/20251031",
"localname": "DowJonesUSTotalStockMarketIndexMember",
"presentation": [
"http://xbrl.sec.gov/oef/role/ShareholderReportAverageAnnualReturnDetails",
"http://xbrl.sec.gov/oef/role/ShareholderReportLineGraphDetails"
],
"lang": {
"en-us": {
"role": {
"label": "Dow Jones U S Total Stock Market Index [Member]"
}
}
},
"auth_ref": []
},
"cik0000904333_DukeEnergyCorpMember": {
"xbrltype": "domainItemType",
"nsuri": "http://sct.com/20251031",
"localname": "DukeEnergyCorpMember",
"presentation": [
"http://xbrl.sec.gov/oef/role/ShareholderReportHoldingsDetails"
],
"lang": {
"en-us": {
"role": {
"label": "Duke Energy Corp. [Member]"
}
}
},
"auth_ref": []
},
"country_ES": {
"xbrltype": "domainItemType",
"nsuri": "http://xbrl.sec.gov/country/2025",
"localname": "ES",
"presentation": [
"http://xbrl.sec.gov/oef/role/ShareholderReportHoldingsDetails"
],
"lang": {
"en-us": {
"role": {
"label": "SPAIN"
}
}
},
"auth_ref": []
},
"cik0000904333_EagersAutomotiveLtdMember": {
"xbrltype": "domainItemType",
"nsuri": "http://sct.com/20251031",
"localname": "EagersAutomotiveLtdMember",
"presentation": [
"http://xbrl.sec.gov/oef/role/ShareholderReportHoldingsDetails"
],
"lang": {
"en-us": {
"role": {
"label": "Eagers Automotive Ltd. [Member]"
}
}
},
"auth_ref": []
},
"cik0000904333_EchoStarCorpClassAMember": {
"xbrltype": "domainItemType",
"nsuri": "http://sct.com/20251031",
"localname": "EchoStarCorpClassAMember",
"presentation": [
"http://xbrl.sec.gov/oef/role/ShareholderReportHoldingsDetails"
],
"lang": {
"en-us": {
"role": {
"label": "EchoStar Corp., Class A [Member]"
}
}
},
"auth_ref": []
},
"cik0000904333_EliLillyAndCoMember": {
"xbrltype": "domainItemType",
"nsuri": "http://sct.com/20251031",
"localname": "EliLillyAndCoMember",
"presentation": [
"http://xbrl.sec.gov/oef/role/ShareholderReportHoldingsDetails"
],
"lang": {
"en-us": {
"role": {
"label": "Eli Lilly & Co. [Member]"
}
}
},
"auth_ref": []
},
"us-gaap_EnergySectorMember": {
"xbrltype": "domainItemType",
"nsuri": "http://fasb.org/us-gaap/2025",
"localname": "EnergySectorMember",
"presentation": [
"http://xbrl.sec.gov/oef/role/ShareholderReportHoldingsDetails"
],
"lang": {
"en-us": {
"role": {
"label": "Energy Sector [Member]",
"documentation": "Sector of economy consisting of companies engaged in business activity related to energy."
}
}
},
"auth_ref": [
"r18",
"r19",
"r20",
"r68",
"r69",
"r70",
"r74"
]
},
"cik0000904333_EnovaInternationalIncMember": {
"xbrltype": "domainItemType",
"nsuri": "http://sct.com/20251031",
"localname": "EnovaInternationalIncMember",
"presentation": [
"http://xbrl.sec.gov/oef/role/ShareholderReportHoldingsDetails"
],
"lang": {
"en-us": {
"role": {
"label": "Enova International, Inc. [Member]"
}
}
},
"auth_ref": []
},
"dei_EntityCentralIndexKey": {
"xbrltype": "centralIndexKeyItemType",
"nsuri": "http://xbrl.sec.gov/dei/2025",
"localname": "EntityCentralIndexKey",
"presentation": [
"http://xbrl.sec.gov/oef/role/NcsrCover",
"http://xbrl.sec.gov/oef/role/ShareholderReport"
],
"lang": {
"en-us": {
"role": {
"label": "Entity Central Index Key",
"documentation": "A unique 10-digit SEC-issued value to identify entities that have filed disclosures with the SEC. It is commonly abbreviated as CIK."
}
}
},
"auth_ref": [
"r22"
]
},
"dei_EntityDomain": {
"xbrltype": "domainItemType",
"nsuri": "http://xbrl.sec.gov/dei/2025",
"localname": "EntityDomain",
"presentation": [
"http://xbrl.sec.gov/oef/role/ShareholderReportAverageAnnualReturnDetails"
],
"lang": {
"en-us": {
"role": {
"label": "Series",
"documentation": "All the names of the entities being reported upon in a document. Any legal structure used to conduct activities or to hold assets. Some examples of such structures are corporations, partnerships, limited liability companies, grantor trusts, and other trusts. This item does not include business and geographical segments which are included in the geographical or business segments domains."
}
}
},
"auth_ref": []
},
"dei_EntityInvCompanyType": {
"xbrltype": "invCompanyType",
"nsuri": "http://xbrl.sec.gov/dei/2025",
"localname": "EntityInvCompanyType",
"presentation": [
"http://xbrl.sec.gov/oef/role/NcsrCover",
"http://xbrl.sec.gov/oef/role/ShareholderReport"
],
"lang": {
"en-us": {
"role": {
"label": "Entity Investment Company Type",
"documentation": "One of: N-1A (Mutual Fund), N-1 (Open-End Separate Account with No Variable Annuities), N-2 (Closed-End Investment Company), N-3 (Separate Account Registered as Open-End Management Investment Company), N-4 (Variable Annuity UIT Separate Account), N-5 (Small Business Investment Company), N-6 (Variable Life UIT Separate Account), S-1 or S-3 (Face Amount Certificate Company), S-6 (UIT, Non-Insurance Product)."
}
}
},
"auth_ref": [
"r66"
]
},
"dei_EntityRegistrantName": {
"xbrltype": "normalizedStringItemType",
"nsuri": "http://xbrl.sec.gov/dei/2025",
"localname": "EntityRegistrantName",
"presentation": [
"http://xbrl.sec.gov/oef/role/NcsrCover",
"http://xbrl.sec.gov/oef/role/ShareholderReport"
],
"lang": {
"en-us": {
"role": {
"label": "Registrant Name",
"documentation": "The exact name of the entity filing the report as specified in its charter, which is required by forms filed with the SEC."
}
}
},
"auth_ref": [
"r22"
]
},
"oef_EtfDiscountNumDays": {
"xbrltype": "integerItemType",
"nsuri": "http://xbrl.sec.gov/oef/2025",
"localname": "EtfDiscountNumDays",
"presentation": [
"http://xbrl.sec.gov/oef/role/ShareholderReport"
],
"lang": {
"en-us": {
"role": {
"label": "ETF Discount, Number of Days"
}
}
},
"auth_ref": [
"r47"
]
},
"oef_EtfPastPerfTextBlock": {
"xbrltype": "textBlockItemType",
"nsuri": "http://xbrl.sec.gov/oef/2025",
"localname": "EtfPastPerfTextBlock",
"presentation": [
"http://xbrl.sec.gov/oef/role/ShareholderReport"
],
"lang": {
"en-us": {
"role": {
"label": "ETF Past Performance [Text Block]"
}
}
},
"auth_ref": [
"r49"
]
},
"oef_EtfPremiumDiscountTextBlock": {
"xbrltype": "textBlockItemType",
"nsuri": "http://xbrl.sec.gov/oef/2025",
"localname": "EtfPremiumDiscountTextBlock",
"presentation": [
"http://xbrl.sec.gov/oef/role/ShareholderReport"
],
"lang": {
"en-us": {
"role": {
"label": "ETF Premium Discount [Text Block]"
}
}
},
"auth_ref": [
"r47"
]
},
"oef_EtfPremiumNumDays": {
"xbrltype": "integerItemType",
"nsuri": "http://xbrl.sec.gov/oef/2025",
"localname": "EtfPremiumNumDays",
"presentation": [
"http://xbrl.sec.gov/oef/role/ShareholderReport"
],
"lang": {
"en-us": {
"role": {
"label": "ETF Premium, Number of Days"
}
}
},
"auth_ref": [
"r47"
]
},
"oef_EtfPurchaseExplanationTextBlock": {
"xbrltype": "textBlockItemType",
"nsuri": "http://xbrl.sec.gov/oef/2025",
"localname": "EtfPurchaseExplanationTextBlock",
"presentation": [
"http://xbrl.sec.gov/oef/role/ShareholderReport"
],
"lang": {
"en-us": {
"role": {
"label": "ETF Purchase Explanation [Text Block]"
}
}
},
"auth_ref": [
"r48"
]
},
"oef_ExpenseRatioPct": {
"xbrltype": "percentItemType",
"nsuri": "http://xbrl.sec.gov/oef/2025",
"localname": "ExpenseRatioPct",
"presentation": [
"http://xbrl.sec.gov/oef/role/ShareholderReport"
],
"lang": {
"en-us": {
"role": {
"label": "Expense Ratio, Percent"
}
}
},
"auth_ref": [
"r32"
]
},
"oef_ExpensesExclExtraordinaryExpensesPct": {
"xbrltype": "percentItemType",
"nsuri": "http://xbrl.sec.gov/oef/2025",
"localname": "ExpensesExclExtraordinaryExpensesPct",
"presentation": [
"http://xbrl.sec.gov/oef/role/ShareholderReport"
],
"lang": {
"en-us": {
"role": {
"label": "Expenses Excluding Extraordinary Expenses, Percent"
}
}
},
"auth_ref": [
"r35"
]
},
"oef_ExpensesPaidAmt": {
"xbrltype": "monetaryItemType",
"nsuri": "http://xbrl.sec.gov/oef/2025",
"localname": "ExpensesPaidAmt",
"presentation": [
"http://xbrl.sec.gov/oef/role/ShareholderReport"
],
"lang": {
"en-us": {
"role": {
"label": "Expenses Paid, Amount"
}
}
},
"auth_ref": [
"r31"
]
},
"oef_ExpensesRepresentBothMasterAndFeeder": {
"xbrltype": "stringItemType",
"nsuri": "http://xbrl.sec.gov/oef/2025",
"localname": "ExpensesRepresentBothMasterAndFeeder",
"presentation": [
"http://xbrl.sec.gov/oef/role/ShareholderReport"
],
"lang": {
"en-us": {
"role": {
"label": "Expenses Represent Both Master and Feeder [Text]"
}
}
},
"auth_ref": [
"r33",
"r63"
]
},
"oef_ExpensesShortPeriodFnTextBlock": {
"xbrltype": "textBlockItemType",
"nsuri": "http://xbrl.sec.gov/oef/2025",
"localname": "ExpensesShortPeriodFnTextBlock",
"presentation": [
"http://xbrl.sec.gov/oef/role/ShareholderReport"
],
"lang": {
"en-us": {
"role": {
"label": "Expenses Short Period Footnote [Text Block]"
}
}
},
"auth_ref": [
"r34"
]
},
"oef_ExpensesTextBlock": {
"xbrltype": "textBlockItemType",
"nsuri": "http://xbrl.sec.gov/oef/2025",
"localname": "ExpensesTextBlock",
"presentation": [
"http://xbrl.sec.gov/oef/role/ShareholderReport"
],
"lang": {
"en-us": {
"role": {
"label": "Expenses [Text Block]"
}
}
},
"auth_ref": [
"r30"
]
},
"oef_ExposureBasisExplanationTextBlock": {
"xbrltype": "textBlockItemType",
"nsuri": "http://xbrl.sec.gov/oef/2025",
"localname": "ExposureBasisExplanationTextBlock",
"presentation": [
"http://xbrl.sec.gov/oef/role/ShareholderReport"
],
"lang": {
"en-us": {
"role": {
"label": "Exposure Basis Explanation [Text Block]"
}
}
},
"auth_ref": [
"r52"
]
},
"oef_ExtraordinaryExpensesFnTextBlock": {
"xbrltype": "textBlockItemType",
"nsuri": "http://xbrl.sec.gov/oef/2025",
"localname": "ExtraordinaryExpensesFnTextBlock",
"presentation": [
"http://xbrl.sec.gov/oef/role/ShareholderReport"
],
"lang": {
"en-us": {
"role": {
"label": "Extraordinary Expenses Footnote [Text Block]"
}
}
},
"auth_ref": [
"r35"
]
},
"cik0000904333_ExxonMobilCorpMember": {
"xbrltype": "domainItemType",
"nsuri": "http://sct.com/20251031",
"localname": "ExxonMobilCorpMember",
"presentation": [
"http://xbrl.sec.gov/oef/role/ShareholderReportHoldingsDetails"
],
"lang": {
"en-us": {
"role": {
"label": "Exxon Mobil Corp. [Member]"
}
}
},
"auth_ref": []
},
"country_FR": {
"xbrltype": "domainItemType",
"nsuri": "http://xbrl.sec.gov/country/2025",
"localname": "FR",
"presentation": [
"http://xbrl.sec.gov/oef/role/ShareholderReportHoldingsDetails"
],
"lang": {
"en-us": {
"role": {
"label": "FRANCE",
"terseLabel": "France"
}
}
},
"auth_ref": []
},
"cik0000904333_FabrinetMember": {
"xbrltype": "domainItemType",
"nsuri": "http://sct.com/20251031",
"localname": "FabrinetMember",
"presentation": [
"http://xbrl.sec.gov/oef/role/ShareholderReportHoldingsDetails"
],
"lang": {
"en-us": {
"role": {
"label": "Fabrinet [Member]"
}
}
},
"auth_ref": []
},
"oef_FactorsAffectingPerfTextBlock": {
"xbrltype": "textBlockItemType",
"nsuri": "http://xbrl.sec.gov/oef/2025",
"localname": "FactorsAffectingPerfTextBlock",
"presentation": [
"http://xbrl.sec.gov/oef/role/ShareholderReport"
],
"lang": {
"en-us": {
"role": {
"label": "Factors Affecting Performance [Text Block]"
}
}
},
"auth_ref": [
"r36"
]
},
"cik0000904333_FidelityNationalInformationServicesIncMember": {
"xbrltype": "domainItemType",
"nsuri": "http://sct.com/20251031",
"localname": "FidelityNationalInformationServicesIncMember",
"presentation": [
"http://xbrl.sec.gov/oef/role/ShareholderReportHoldingsDetails"
],
"lang": {
"en-us": {
"role": {
"label": "Fidelity National Information Services, Inc. [Member]"
}
}
},
"auth_ref": []
},
"cik0000904333_FinancialsMember": {
"xbrltype": "domainItemType",
"nsuri": "http://sct.com/20251031",
"localname": "FinancialsMember",
"presentation": [
"http://xbrl.sec.gov/oef/role/ShareholderReportHoldingsDetails"
],
"lang": {
"en-us": {
"role": {
"label": "Financials [Member]"
}
}
},
"auth_ref": []
},
"cik0000904333_FixedIncomeInflationProtectedBondMember": {
"xbrltype": "domainItemType",
"nsuri": "http://sct.com/20251031",
"localname": "FixedIncomeInflationProtectedBondMember",
"presentation": [
"http://xbrl.sec.gov/oef/role/ShareholderReportHoldingsDetails"
],
"lang": {
"en-us": {
"role": {
"label": "Fixed Income - Inflation-Protected Bond [Member]"
}
}
},
"auth_ref": []
},
"cik0000904333_FixedIncomeIntermediateTermBondMember": {
"xbrltype": "domainItemType",
"nsuri": "http://sct.com/20251031",
"localname": "FixedIncomeIntermediateTermBondMember",
"presentation": [
"http://xbrl.sec.gov/oef/role/ShareholderReportHoldingsDetails"
],
"lang": {
"en-us": {
"role": {
"label": "Fixed Income - Intermediate-Term Bond [Member]"
}
}
},
"auth_ref": []
},
"cik0000904333_FixedIncomeInternationalBondMember": {
"xbrltype": "domainItemType",
"nsuri": "http://sct.com/20251031",
"localname": "FixedIncomeInternationalBondMember",
"presentation": [
"http://xbrl.sec.gov/oef/role/ShareholderReportHoldingsDetails"
],
"lang": {
"en-us": {
"role": {
"label": "Fixed Income - International Bond [Member]"
}
}
},
"auth_ref": []
},
"cik0000904333_FixedIncomeShortTermBondMember": {
"xbrltype": "domainItemType",
"nsuri": "http://sct.com/20251031",
"localname": "FixedIncomeShortTermBondMember",
"presentation": [
"http://xbrl.sec.gov/oef/role/ShareholderReportHoldingsDetails"
],
"lang": {
"en-us": {
"role": {
"label": "Fixed Income - Short-Term Bond [Member]"
}
}
},
"auth_ref": []
},
"oef_FundName": {
"xbrltype": "normalizedStringItemType",
"nsuri": "http://xbrl.sec.gov/oef/2025",
"localname": "FundName",
"presentation": [
"http://xbrl.sec.gov/oef/role/ShareholderReport"
],
"lang": {
"en-us": {
"role": {
"label": "Fund Name"
}
}
},
"auth_ref": [
"r25"
]
},
"cik0000904333_FundamentalDevelopedExUSSmallSplicedIndexMember": {
"xbrltype": "domainItemType",
"nsuri": "http://sct.com/20251031",
"localname": "FundamentalDevelopedExUSSmallSplicedIndexMember",
"presentation": [
"http://xbrl.sec.gov/oef/role/ShareholderReportAverageAnnualReturnDetails",
"http://xbrl.sec.gov/oef/role/ShareholderReportLineGraphDetails"
],
"lang": {
"en-us": {
"role": {
"label": "Fundamental Developed ex US Small Spliced Index [Member]"
}
}
},
"auth_ref": []
},
"cik0000904333_FundamentalDevelopedexUSLargeSplicedIndexMember": {
"xbrltype": "domainItemType",
"nsuri": "http://sct.com/20251031",
"localname": "FundamentalDevelopedexUSLargeSplicedIndexMember",
"presentation": [
"http://xbrl.sec.gov/oef/role/ShareholderReportAverageAnnualReturnDetails",
"http://xbrl.sec.gov/oef/role/ShareholderReportLineGraphDetails"
],
"lang": {
"en-us": {
"role": {
"label": "Fundamental Developed ex US Large Spliced Index [Member]"
}
}
},
"auth_ref": []
},
"cik0000904333_FundamentalEmergingMarketsSplicedIndexMember": {
"xbrltype": "domainItemType",
"nsuri": "http://sct.com/20251031",
"localname": "FundamentalEmergingMarketsSplicedIndexMember",
"presentation": [
"http://xbrl.sec.gov/oef/role/ShareholderReportAverageAnnualReturnDetails",
"http://xbrl.sec.gov/oef/role/ShareholderReportLineGraphDetails"
],
"lang": {
"en-us": {
"role": {
"label": "Fundamental Emerging Markets Spliced Index [Member]"
}
}
},
"auth_ref": []
},
"cik0000904333_FundamentalUSLargeSplicedIndexMember": {
"xbrltype": "domainItemType",
"nsuri": "http://sct.com/20251031",
"localname": "FundamentalUSLargeSplicedIndexMember",
"presentation": [
"http://xbrl.sec.gov/oef/role/ShareholderReportAverageAnnualReturnDetails",
"http://xbrl.sec.gov/oef/role/ShareholderReportLineGraphDetails"
],
"lang": {
"en-us": {
"role": {
"label": "Fundamental US Large Spliced Index [Member]"
}
}
},
"auth_ref": []
},
"cik0000904333_FundamentalUSSmallSplicedIndexMember": {
"xbrltype": "domainItemType",
"nsuri": "http://sct.com/20251031",
"localname": "FundamentalUSSmallSplicedIndexMember",
"presentation": [
"http://xbrl.sec.gov/oef/role/ShareholderReportAverageAnnualReturnDetails",
"http://xbrl.sec.gov/oef/role/ShareholderReportLineGraphDetails"
],
"lang": {
"en-us": {
"role": {
"label": "Fundamental US Small Spliced Index [Member]"
}
}
},
"auth_ref": []
},
"country_GB": {
"xbrltype": "domainItemType",
"nsuri": "http://xbrl.sec.gov/country/2025",
"localname": "GB",
"presentation": [
"http://xbrl.sec.gov/oef/role/ShareholderReportHoldingsDetails"
],
"lang": {
"en-us": {
"role": {
"label": "UNITED KINGDOM",
"terseLabel": "United Kingdom"
}
}
},
"auth_ref": []
},
"oef_GeographicRegionAxis": {
"xbrltype": "stringItemType",
"nsuri": "http://xbrl.sec.gov/oef/2025",
"localname": "GeographicRegionAxis",
"presentation": [
"http://xbrl.sec.gov/oef/role/ShareholderReportHoldingsDetails"
],
"lang": {
"en-us": {
"role": {
"label": "Geographic Region [Axis]"
}
}
},
"auth_ref": [
"r52"
]
},
"oef_GeographicRegionDomain": {
"xbrltype": "domainItemType",
"nsuri": "http://xbrl.sec.gov/oef/2025",
"localname": "GeographicRegionDomain",
"presentation": [
"http://xbrl.sec.gov/oef/role/ShareholderReportHoldingsDetails"
],
"lang": {
"en-us": {
"role": {
"label": "Geographic Region [Domain]"
}
}
},
"auth_ref": [
"r52"
]
},
"cik0000904333_GlencorePLCMember": {
"xbrltype": "domainItemType",
"nsuri": "http://sct.com/20251031",
"localname": "GlencorePLCMember",
"presentation": [
"http://xbrl.sec.gov/oef/role/ShareholderReportHoldingsDetails"
],
"lang": {
"en-us": {
"role": {
"label": "Glencore PLC [Member]"
}
}
},
"auth_ref": []
},
"cik0000904333_GoldmanSachsEmergingMarketsEquityInsightsFundInstitutionalClassMember": {
"xbrltype": "domainItemType",
"nsuri": "http://sct.com/20251031",
"localname": "GoldmanSachsEmergingMarketsEquityInsightsFundInstitutionalClassMember",
"presentation": [
"http://xbrl.sec.gov/oef/role/ShareholderReportHoldingsDetails"
],
"lang": {
"en-us": {
"role": {
"label": "Goldman Sachs Emerging Markets Equity Insights Fund, Institutional Class [Member]"
}
}
},
"auth_ref": []
},
"cik0000904333_GrowthCompositeIndexMember": {
"xbrltype": "domainItemType",
"nsuri": "http://sct.com/20251031",
"localname": "GrowthCompositeIndexMember",
"presentation": [
"http://xbrl.sec.gov/oef/role/ShareholderReportAverageAnnualReturnDetails",
"http://xbrl.sec.gov/oef/role/ShareholderReportLineGraphDetails"
],
"lang": {
"en-us": {
"role": {
"label": "Growth Composite Index [Member]"
}
}
},
"auth_ref": []
},
"cik0000904333_HDKoreaShipbuildingOffshoreEngineeringCoLtdMember": {
"xbrltype": "domainItemType",
"nsuri": "http://sct.com/20251031",
"localname": "HDKoreaShipbuildingOffshoreEngineeringCoLtdMember",
"presentation": [
"http://xbrl.sec.gov/oef/role/ShareholderReportHoldingsDetails"
],
"lang": {
"en-us": {
"role": {
"label": "HD Korea Shipbuilding & Offshore Engineering Co. Ltd. [Member]"
}
}
},
"auth_ref": []
},
"country_HK": {
"xbrltype": "domainItemType",
"nsuri": "http://xbrl.sec.gov/country/2025",
"localname": "HK",
"presentation": [
"http://xbrl.sec.gov/oef/role/ShareholderReportHoldingsDetails"
],
"lang": {
"en-us": {
"role": {
"label": "HONG KONG"
}
}
},
"auth_ref": []
},
"cik0000904333_HSBCHoldingsPLCMember": {
"xbrltype": "domainItemType",
"nsuri": "http://sct.com/20251031",
"localname": "HSBCHoldingsPLCMember",
"presentation": [
"http://xbrl.sec.gov/oef/role/ShareholderReportHoldingsDetails"
],
"lang": {
"en-us": {
"role": {
"label": "HSBC Holdings PLC [Member]"
}
}
},
"auth_ref": []
},
"cik0000904333_HancockWhitneyCorpMember": {
"xbrltype": "domainItemType",
"nsuri": "http://sct.com/20251031",
"localname": "HancockWhitneyCorpMember",
"presentation": [
"http://xbrl.sec.gov/oef/role/ShareholderReportHoldingsDetails"
],
"lang": {
"en-us": {
"role": {
"label": "Hancock Whitney Corp. [Member]"
}
}
},
"auth_ref": []
},
"cik0000904333_HealthCareDistributorsMember": {
"xbrltype": "domainItemType",
"nsuri": "http://sct.com/20251031",
"localname": "HealthCareDistributorsMember",
"presentation": [
"http://xbrl.sec.gov/oef/role/ShareholderReportHoldingsDetails"
],
"lang": {
"en-us": {
"role": {
"label": "Health Care Distributors [Member]"
}
}
},
"auth_ref": []
},
"cik0000904333_HealthCareEquipmentMember": {
"xbrltype": "domainItemType",
"nsuri": "http://sct.com/20251031",
"localname": "HealthCareEquipmentMember",
"presentation": [
"http://xbrl.sec.gov/oef/role/ShareholderReportHoldingsDetails"
],
"lang": {
"en-us": {
"role": {
"label": "Health Care Equipment [Member]"
}
}
},
"auth_ref": []
},
"cik0000904333_HealthCareFacilitiesMember": {
"xbrltype": "domainItemType",
"nsuri": "http://sct.com/20251031",
"localname": "HealthCareFacilitiesMember",
"presentation": [
"http://xbrl.sec.gov/oef/role/ShareholderReportHoldingsDetails"
],
"lang": {
"en-us": {
"role": {
"label": "Health Care Facilities [Member]"
}
}
},
"auth_ref": []
},
"cik0000904333_HealthCareServicesMember": {
"xbrltype": "domainItemType",
"nsuri": "http://sct.com/20251031",
"localname": "HealthCareServicesMember",
"presentation": [
"http://xbrl.sec.gov/oef/role/ShareholderReportHoldingsDetails"
],
"lang": {
"en-us": {
"role": {
"label": "Health Care Services [Member]"
}
}
},
"auth_ref": []
},
"cik0000904333_HealthCareSuppliesMember": {
"xbrltype": "domainItemType",
"nsuri": "http://sct.com/20251031",
"localname": "HealthCareSuppliesMember",
"presentation": [
"http://xbrl.sec.gov/oef/role/ShareholderReportHoldingsDetails"
],
"lang": {
"en-us": {
"role": {
"label": "Health Care Supplies [Member]"
}
}
},
"auth_ref": []
},
"us-gaap_HealthcareSectorMember": {
"xbrltype": "domainItemType",
"nsuri": "http://fasb.org/us-gaap/2025",
"localname": "HealthcareSectorMember",
"presentation": [
"http://xbrl.sec.gov/oef/role/ShareholderReportHoldingsDetails"
],
"lang": {
"en-us": {
"role": {
"label": "Healthcare Sector [Member]",
"documentation": "Sector of the economy consisting of companies engaged in healthcare-related business activities."
}
}
},
"auth_ref": [
"r18",
"r19",
"r20",
"r21",
"r68",
"r69",
"r70",
"r74"
]
},
"oef_HoldingsAbstract": {
"xbrltype": "stringItemType",
"nsuri": "http://xbrl.sec.gov/oef/2025",
"localname": "HoldingsAbstract",
"lang": {
"en-us": {
"role": {
"label": "Holdings [Abstract]"
}
}
},
"auth_ref": [
"r52"
]
},
"oef_HoldingsCount": {
"xbrltype": "integerItemType",
"nsuri": "http://xbrl.sec.gov/oef/2025",
"localname": "HoldingsCount",
"presentation": [
"http://xbrl.sec.gov/oef/role/ShareholderReport"
],
"lang": {
"en-us": {
"role": {
"label": "Holdings Count"
}
}
},
"auth_ref": [
"r50"
]
},
"oef_HoldingsLineItems": {
"xbrltype": "stringItemType",
"nsuri": "http://xbrl.sec.gov/oef/2025",
"localname": "HoldingsLineItems",
"presentation": [
"http://xbrl.sec.gov/oef/role/ShareholderReportHoldingsDetails"
],
"lang": {
"en-us": {
"role": {
"label": "Holdings [Line Items]"
}
}
},
"auth_ref": [
"r52"
]
},
"oef_HoldingsTable": {
"xbrltype": "stringItemType",
"nsuri": "http://xbrl.sec.gov/oef/2025",
"localname": "HoldingsTable",
"presentation": [
"http://xbrl.sec.gov/oef/role/ShareholderReportHoldingsDetails"
],
"lang": {
"en-us": {
"role": {
"label": "Holdings [Table]"
}
}
},
"auth_ref": [
"r52"
]
},
"oef_HoldingsTableTextBlock": {
"xbrltype": "textBlockItemType",
"nsuri": "http://xbrl.sec.gov/oef/2025",
"localname": "HoldingsTableTextBlock",
"presentation": [
"http://xbrl.sec.gov/oef/role/ShareholderReport"
],
"lang": {
"en-us": {
"role": {
"label": "Holdings [Text Block]"
}
}
},
"auth_ref": [
"r52"
]
},
"cik0000904333_HonHaiPrecisionIndustryCoLtdMember": {
"xbrltype": "domainItemType",
"nsuri": "http://sct.com/20251031",
"localname": "HonHaiPrecisionIndustryCoLtdMember",
"presentation": [
"http://xbrl.sec.gov/oef/role/ShareholderReportHoldingsDetails"
],
"lang": {
"en-us": {
"role": {
"label": "Hon Hai Precision Industry Co. Ltd. [Member]"
}
}
},
"auth_ref": []
},
"cik0000904333_HowmetAerospaceIncMember": {
"xbrltype": "domainItemType",
"nsuri": "http://sct.com/20251031",
"localname": "HowmetAerospaceIncMember",
"presentation": [
"http://xbrl.sec.gov/oef/role/ShareholderReportHoldingsDetails"
],
"lang": {
"en-us": {
"role": {
"label": "Howmet Aerospace, Inc. [Member]"
}
}
},
"auth_ref": []
},
"cik0000904333_IBEXHoldingsLtdMember": {
"xbrltype": "domainItemType",
"nsuri": "http://sct.com/20251031",
"localname": "IBEXHoldingsLtdMember",
"presentation": [
"http://xbrl.sec.gov/oef/role/ShareholderReportHoldingsDetails"
],
"lang": {
"en-us": {
"role": {
"label": "IBEX Holdings Ltd. [Member]"
}
}
},
"auth_ref": []
},
"country_IE": {
"xbrltype": "domainItemType",
"nsuri": "http://xbrl.sec.gov/country/2025",
"localname": "IE",
"presentation": [
"http://xbrl.sec.gov/oef/role/ShareholderReportHoldingsDetails"
],
"lang": {
"en-us": {
"role": {
"label": "IRELAND"
}
}
},
"auth_ref": []
},
"country_IN": {
"xbrltype": "domainItemType",
"nsuri": "http://xbrl.sec.gov/country/2025",
"localname": "IN",
"presentation": [
"http://xbrl.sec.gov/oef/role/ShareholderReportHoldingsDetails"
],
"lang": {
"en-us": {
"role": {
"label": "INDIA"
}
}
},
"auth_ref": []
},
"country_IT": {
"xbrltype": "domainItemType",
"nsuri": "http://xbrl.sec.gov/country/2025",
"localname": "IT",
"presentation": [
"http://xbrl.sec.gov/oef/role/ShareholderReportHoldingsDetails"
],
"lang": {
"en-us": {
"role": {
"label": "ITALY"
}
}
},
"auth_ref": []
},
"cik0000904333_IbidenCoLtdMember": {
"xbrltype": "domainItemType",
"nsuri": "http://sct.com/20251031",
"localname": "IbidenCoLtdMember",
"presentation": [
"http://xbrl.sec.gov/oef/role/ShareholderReportHoldingsDetails"
],
"lang": {
"en-us": {
"role": {
"label": "Ibiden Co. Ltd. [Member]"
}
}
},
"auth_ref": []
},
"oef_InabilityToMeetDistLevelTextBlock": {
"xbrltype": "textBlockItemType",
"nsuri": "http://xbrl.sec.gov/oef/2025",
"localname": "InabilityToMeetDistLevelTextBlock",
"presentation": [
"http://xbrl.sec.gov/oef/role/ShareholderReport"
],
"lang": {
"en-us": {
"role": {
"label": "Inability to Meet Distribution Level [Text Block]"
}
}
},
"auth_ref": [
"r46"
]
},
"cik0000904333_IndustrialCommercialBankofChinaLtdHSharesMember": {
"xbrltype": "domainItemType",
"nsuri": "http://sct.com/20251031",
"localname": "IndustrialCommercialBankofChinaLtdHSharesMember",
"presentation": [
"http://xbrl.sec.gov/oef/role/ShareholderReportHoldingsDetails"
],
"lang": {
"en-us": {
"role": {
"label": "Industrial & Commercial Bank of China Ltd., H Shares [Member]"
}
}
},
"auth_ref": []
},
"oef_IndustrialSectorMember": {
"xbrltype": "domainItemType",
"nsuri": "http://xbrl.sec.gov/oef/2025",
"localname": "IndustrialSectorMember",
"presentation": [
"http://xbrl.sec.gov/oef/role/ShareholderReportHoldingsDetails"
],
"lang": {
"en-us": {
"role": {
"label": "Industrial Sector [Member]"
}
}
},
"auth_ref": [
"r52"
]
},
"oef_IndustrySectorAxis": {
"xbrltype": "stringItemType",
"nsuri": "http://xbrl.sec.gov/oef/2025",
"localname": "IndustrySectorAxis",
"presentation": [
"http://xbrl.sec.gov/oef/role/ShareholderReportHoldingsDetails"
],
"lang": {
"en-us": {
"role": {
"label": "Industry Sector [Axis]"
}
}
},
"auth_ref": [
"r52"
]
},
"oef_IndustrySectorDomain": {
"xbrltype": "domainItemType",
"nsuri": "http://xbrl.sec.gov/oef/2025",
"localname": "IndustrySectorDomain",
"presentation": [
"http://xbrl.sec.gov/oef/role/ShareholderReportHoldingsDetails"
],
"lang": {
"en-us": {
"role": {
"label": "Industry Sector [Domain]"
}
}
},
"auth_ref": [
"r52"
]
},
"oef_InformationTechnologySectorMember": {
"xbrltype": "domainItemType",
"nsuri": "http://xbrl.sec.gov/oef/2025",
"localname": "InformationTechnologySectorMember",
"presentation": [
"http://xbrl.sec.gov/oef/role/ShareholderReportHoldingsDetails"
],
"lang": {
"en-us": {
"role": {
"label": "Information Technology Sector [Member]"
}
}
},
"auth_ref": [
"r52"
]
},
"cik0000904333_IntelCorpMember": {
"xbrltype": "domainItemType",
"nsuri": "http://sct.com/20251031",
"localname": "IntelCorpMember",
"presentation": [
"http://xbrl.sec.gov/oef/role/ShareholderReportHoldingsDetails"
],
"lang": {
"en-us": {
"role": {
"label": "Intel Corp. [Member]"
}
}
},
"auth_ref": []
},
"cik0000904333_InternationalBusinessMachinesCorpMember": {
"xbrltype": "domainItemType",
"nsuri": "http://sct.com/20251031",
"localname": "InternationalBusinessMachinesCorpMember",
"presentation": [
"http://xbrl.sec.gov/oef/role/ShareholderReportHoldingsDetails"
],
"lang": {
"en-us": {
"role": {
"label": "International Business Machines Corp. [Member]"
}
}
},
"auth_ref": []
},
"cik0000904333_InternationalStocksDevelopedMarketsMember": {
"xbrltype": "domainItemType",
"nsuri": "http://sct.com/20251031",
"localname": "InternationalStocksDevelopedMarketsMember",
"presentation": [
"http://xbrl.sec.gov/oef/role/ShareholderReportHoldingsDetails"
],
"lang": {
"en-us": {
"role": {
"label": "International Stocks - Developed Markets [Member]"
}
}
},
"auth_ref": []
},
"cik0000904333_InternationalStocksEmergingMarketsMember": {
"xbrltype": "domainItemType",
"nsuri": "http://sct.com/20251031",
"localname": "InternationalStocksEmergingMarketsMember",
"presentation": [
"http://xbrl.sec.gov/oef/role/ShareholderReportHoldingsDetails"
],
"lang": {
"en-us": {
"role": {
"label": "International Stocks - Emerging Markets [Member]"
}
}
},
"auth_ref": []
},
"cik0000904333_InvestmentCompaniesMember": {
"xbrltype": "domainItemType",
"nsuri": "http://sct.com/20251031",
"localname": "InvestmentCompaniesMember",
"presentation": [
"http://xbrl.sec.gov/oef/role/ShareholderReportHoldingsDetails"
],
"lang": {
"en-us": {
"role": {
"label": "Investment Companies [Member]",
"verboseLabel": "Investment Companies [Member]"
}
}
},
"auth_ref": []
},
"us-gaap_InvestmentCompanyPortfolioTurnover": {
"xbrltype": "percentItemType",
"nsuri": "http://fasb.org/us-gaap/2025",
"localname": "InvestmentCompanyPortfolioTurnover",
"presentation": [
"http://xbrl.sec.gov/oef/role/ShareholderReport"
],
"lang": {
"en-us": {
"role": {
"label": "Investment Company, Portfolio Turnover",
"documentation": "Percentage of lesser of purchase or sale of portfolio securities to average value of portfolio securities owned."
}
}
},
"auth_ref": [
"r67"
]
},
"us-gaap_InvestmentTypeAxis": {
"xbrltype": "stringItemType",
"nsuri": "http://fasb.org/us-gaap/2025",
"localname": "InvestmentTypeAxis",
"presentation": [
"http://xbrl.sec.gov/oef/role/ShareholderReportHoldingsDetails"
],
"lang": {
"en-us": {
"role": {
"label": "Investment Type [Axis]",
"documentation": "Information by type of investments."
}
}
},
"auth_ref": [
"r1",
"r2",
"r3",
"r4",
"r5",
"r6",
"r7",
"r8",
"r9",
"r10",
"r11",
"r12",
"r13",
"r14",
"r15",
"r16",
"r21"
]
},
"us-gaap_InvestmentTypeCategorizationMember": {
"xbrltype": "domainItemType",
"nsuri": "http://fasb.org/us-gaap/2025",
"localname": "InvestmentTypeCategorizationMember",
"presentation": [
"http://xbrl.sec.gov/oef/role/ShareholderReportHoldingsDetails"
],
"lang": {
"en-us": {
"role": {
"documentation": "Asset obtained to generate income or appreciate in value."
}
}
},
"auth_ref": [
"r1",
"r2",
"r3",
"r4",
"r5",
"r6",
"r7",
"r8",
"r9",
"r10",
"r11",
"r12",
"r13",
"r14",
"r15",
"r16",
"r21"
]
},
"cik0000904333_IonQIncMember": {
"xbrltype": "domainItemType",
"nsuri": "http://sct.com/20251031",
"localname": "IonQIncMember",
"presentation": [
"http://xbrl.sec.gov/oef/role/ShareholderReportHoldingsDetails"
],
"lang": {
"en-us": {
"role": {
"label": "IonQ, Inc. [Member]"
}
}
},
"auth_ref": []
},
"cik0000904333_JDcomIncMember": {
"xbrltype": "domainItemType",
"nsuri": "http://sct.com/20251031",
"localname": "JDcomIncMember",
"presentation": [
"http://xbrl.sec.gov/oef/role/ShareholderReportHoldingsDetails"
],
"lang": {
"en-us": {
"role": {
"label": "JD.com, Inc. [Member]"
}
}
},
"auth_ref": []
},
"country_JP": {
"xbrltype": "domainItemType",
"nsuri": "http://xbrl.sec.gov/country/2025",
"localname": "JP",
"presentation": [
"http://xbrl.sec.gov/oef/role/ShareholderReportHoldingsDetails"
],
"lang": {
"en-us": {
"role": {
"label": "JAPAN",
"terseLabel": "Japan"
}
}
},
"auth_ref": []
},
"cik0000904333_JPMorganChaseAndCoMember": {
"xbrltype": "domainItemType",
"nsuri": "http://sct.com/20251031",
"localname": "JPMorganChaseAndCoMember",
"presentation": [
"http://xbrl.sec.gov/oef/role/ShareholderReportHoldingsDetails"
],
"lang": {
"en-us": {
"role": {
"label": "JPMorgan Chase & Co. [Member]",
"terseLabel": "JPMorgan Chase & Co. [Member]"
}
}
},
"auth_ref": []
},
"cik0000904333_JacksonFinancialIncClassAMember": {
"xbrltype": "domainItemType",
"nsuri": "http://sct.com/20251031",
"localname": "JacksonFinancialIncClassAMember",
"presentation": [
"http://xbrl.sec.gov/oef/role/ShareholderReportHoldingsDetails"
],
"lang": {
"en-us": {
"role": {
"label": "Jackson Financial, Inc., Class A [Member]"
}
}
},
"auth_ref": []
},
"cik0000904333_JohnsonAndJohnsonMember": {
"xbrltype": "domainItemType",
"nsuri": "http://sct.com/20251031",
"localname": "JohnsonAndJohnsonMember",
"presentation": [
"http://xbrl.sec.gov/oef/role/ShareholderReportHoldingsDetails"
],
"lang": {
"en-us": {
"role": {
"label": "Johnson & Johnson [Member]"
}
}
},
"auth_ref": []
},
"country_KR": {
"xbrltype": "domainItemType",
"nsuri": "http://xbrl.sec.gov/country/2025",
"localname": "KR",
"presentation": [
"http://xbrl.sec.gov/oef/role/ShareholderReportHoldingsDetails"
],
"lang": {
"en-us": {
"role": {
"label": "KOREA, REPUBLIC OF",
"terseLabel": "Republic of Korea"
}
}
},
"auth_ref": []
},
"cik0000904333_KindenCorpMember": {
"xbrltype": "domainItemType",
"nsuri": "http://sct.com/20251031",
"localname": "KindenCorpMember",
"presentation": [
"http://xbrl.sec.gov/oef/role/ShareholderReportHoldingsDetails"
],
"lang": {
"en-us": {
"role": {
"label": "Kinden Corp. [Member]"
}
}
},
"auth_ref": []
},
"cik0000904333_KratosDefenseSecuritySolutionsIncMember": {
"xbrltype": "domainItemType",
"nsuri": "http://sct.com/20251031",
"localname": "KratosDefenseSecuritySolutionsIncMember",
"presentation": [
"http://xbrl.sec.gov/oef/role/ShareholderReportHoldingsDetails"
],
"lang": {
"en-us": {
"role": {
"label": "Kratos Defense & Security Solutions, Inc. [Member]"
}
}
},
"auth_ref": []
},
"oef_LargestHoldingAxis": {
"xbrltype": "stringItemType",
"nsuri": "http://xbrl.sec.gov/oef/2025",
"localname": "LargestHoldingAxis",
"presentation": [
"http://xbrl.sec.gov/oef/role/ShareholderReportHoldingsDetails"
],
"lang": {
"en-us": {
"role": {
"label": "Largest Holding [Axis]"
}
}
},
"auth_ref": [
"r52"
]
},
"oef_LargestHoldingsDomain": {
"xbrltype": "domainItemType",
"nsuri": "http://xbrl.sec.gov/oef/2025",
"localname": "LargestHoldingsDomain",
"presentation": [
"http://xbrl.sec.gov/oef/role/ShareholderReportHoldingsDetails"
],
"lang": {
"en-us": {
"role": {
"label": "Largest Holdings [Domain]"
}
}
},
"auth_ref": [
"r52"
]
},
"oef_LargestHoldingsTableTextBlock": {
"xbrltype": "textBlockItemType",
"nsuri": "http://xbrl.sec.gov/oef/2025",
"localname": "LargestHoldingsTableTextBlock",
"presentation": [
"http://xbrl.sec.gov/oef/role/ShareholderReport"
],
"lang": {
"en-us": {
"role": {
"label": "Largest Holdings [Text Block]"
}
}
},
"auth_ref": [
"r52"
]
},
"dei_LegalEntityAxis": {
"xbrltype": "stringItemType",
"nsuri": "http://xbrl.sec.gov/dei/2025",
"localname": "LegalEntityAxis",
"presentation": [
"http://xbrl.sec.gov/oef/role/ShareholderReportAverageAnnualReturnDetails"
],
"lang": {
"en-us": {
"role": {
"label": "Series [Axis]",
"documentation": "The set of legal entities associated with a report."
}
}
},
"auth_ref": []
},
"cik0000904333_LifeSciencesToolsAndServicesMember": {
"xbrltype": "domainItemType",
"nsuri": "http://sct.com/20251031",
"localname": "LifeSciencesToolsAndServicesMember",
"presentation": [
"http://xbrl.sec.gov/oef/role/ShareholderReportHoldingsDetails"
],
"lang": {
"en-us": {
"role": {
"label": "Life Sciences Tools & Services [Member]"
}
}
},
"auth_ref": []
},
"oef_LineGraphAndTableMeasureName": {
"xbrltype": "stringItemType",
"nsuri": "http://xbrl.sec.gov/oef/2025",
"localname": "LineGraphAndTableMeasureName",
"presentation": [
"http://xbrl.sec.gov/oef/role/ShareholderReportAverageAnnualReturnDetails",
"http://xbrl.sec.gov/oef/role/ShareholderReportLineGraphDetails"
],
"lang": {
"en-us": {
"role": {
"label": "Line Graph and Table Measure Name"
}
}
},
"auth_ref": [
"r38"
]
},
"oef_LineGraphTableTextBlock": {
"xbrltype": "textBlockItemType",
"nsuri": "http://xbrl.sec.gov/oef/2025",
"localname": "LineGraphTableTextBlock",
"presentation": [
"http://xbrl.sec.gov/oef/role/ShareholderReport"
],
"lang": {
"en-us": {
"role": {
"label": "Line Graph [Table Text Block]"
}
}
},
"auth_ref": [
"r37"
]
},
"cik0000904333_LumentumHoldingsIncMember": {
"xbrltype": "domainItemType",
"nsuri": "http://sct.com/20251031",
"localname": "LumentumHoldingsIncMember",
"presentation": [
"http://xbrl.sec.gov/oef/role/ShareholderReportHoldingsDetails"
],
"lang": {
"en-us": {
"role": {
"label": "Lumentum Holdings, Inc. [Member]"
}
}
},
"auth_ref": []
},
"cik0000904333_MSCIEAFEIndexNetMember": {
"xbrltype": "domainItemType",
"nsuri": "http://sct.com/20251031",
"localname": "MSCIEAFEIndexNetMember",
"presentation": [
"http://xbrl.sec.gov/oef/role/ShareholderReportAverageAnnualReturnDetails",
"http://xbrl.sec.gov/oef/role/ShareholderReportLineGraphDetails"
],
"lang": {
"en-us": {
"role": {
"label": "MSCI EAFE\u00ae Index (Net) [Member]",
"terseLabel": "MSCI EAFE Index Net [Member]"
}
}
},
"auth_ref": []
},
"cik0000904333_MSCIEmergingMarketsIndexNetMember": {
"xbrltype": "domainItemType",
"nsuri": "http://sct.com/20251031",
"localname": "MSCIEmergingMarketsIndexNetMember",
"presentation": [
"http://xbrl.sec.gov/oef/role/ShareholderReportAverageAnnualReturnDetails",
"http://xbrl.sec.gov/oef/role/ShareholderReportLineGraphDetails"
],
"lang": {
"en-us": {
"role": {
"label": "MSCI Emerging Markets Index (Net) [Member]"
}
}
},
"auth_ref": []
},
"country_MX": {
"xbrltype": "domainItemType",
"nsuri": "http://xbrl.sec.gov/country/2025",
"localname": "MX",
"presentation": [
"http://xbrl.sec.gov/oef/role/ShareholderReportHoldingsDetails"
],
"lang": {
"en-us": {
"role": {
"label": "MEXICO"
}
}
},
"auth_ref": []
},
"cik0000904333_ManagedHealthCareMember": {
"xbrltype": "domainItemType",
"nsuri": "http://sct.com/20251031",
"localname": "ManagedHealthCareMember",
"presentation": [
"http://xbrl.sec.gov/oef/role/ShareholderReportHoldingsDetails"
],
"lang": {
"en-us": {
"role": {
"label": "Managed Health Care [Member]"
}
}
},
"auth_ref": []
},
"oef_MaterialChngDate": {
"xbrltype": "dateItemType",
"nsuri": "http://xbrl.sec.gov/oef/2025",
"localname": "MaterialChngDate",
"presentation": [
"http://xbrl.sec.gov/oef/role/ShareholderReport"
],
"lang": {
"en-us": {
"role": {
"label": "Material Change Date"
}
}
},
"auth_ref": [
"r42"
]
},
"oef_MaterialChngDescriptionTextBlock": {
"xbrltype": "textBlockItemType",
"nsuri": "http://xbrl.sec.gov/oef/2025",
"localname": "MaterialChngDescriptionTextBlock",
"presentation": [
"http://xbrl.sec.gov/oef/role/ShareholderReport"
],
"lang": {
"en-us": {
"role": {
"label": "Material Change Description [Text Block]"
}
}
},
"auth_ref": [
"r42"
]
},
"oef_MaterialFundChngAdviserTextBlock": {
"xbrltype": "textBlockItemType",
"nsuri": "http://xbrl.sec.gov/oef/2025",
"localname": "MaterialFundChngAdviserTextBlock",
"presentation": [
"http://xbrl.sec.gov/oef/role/ShareholderReport"
],
"lang": {
"en-us": {
"role": {
"label": "Material Fund Change Adviser [Text Block]"
}
}
},
"auth_ref": [
"r59"
]
},
"oef_MaterialFundChngExpensesTextBlock": {
"xbrltype": "textBlockItemType",
"nsuri": "http://xbrl.sec.gov/oef/2025",
"localname": "MaterialFundChngExpensesTextBlock",
"presentation": [
"http://xbrl.sec.gov/oef/role/ShareholderReport"
],
"lang": {
"en-us": {
"role": {
"label": "Material Fund Change Expenses [Text Block]"
}
}
},
"auth_ref": [
"r56"
]
},
"oef_MaterialFundChngNameTextBlock": {
"xbrltype": "textBlockItemType",
"nsuri": "http://xbrl.sec.gov/oef/2025",
"localname": "MaterialFundChngNameTextBlock",
"presentation": [
"http://xbrl.sec.gov/oef/role/ShareholderReport"
],
"lang": {
"en-us": {
"role": {
"label": "Material Fund Change Name [Text Block]"
}
}
},
"auth_ref": [
"r54"
]
},
"oef_MaterialFundChngNoticeTextBlock": {
"xbrltype": "textBlockItemType",
"nsuri": "http://xbrl.sec.gov/oef/2025",
"localname": "MaterialFundChngNoticeTextBlock",
"presentation": [
"http://xbrl.sec.gov/oef/role/ShareholderReport"
],
"lang": {
"en-us": {
"role": {
"label": "Material Fund Change Notice [Text Block]"
}
}
},
"auth_ref": [
"r28"
]
},
"oef_MaterialFundChngObjectivesTextBlock": {
"xbrltype": "textBlockItemType",
"nsuri": "http://xbrl.sec.gov/oef/2025",
"localname": "MaterialFundChngObjectivesTextBlock",
"presentation": [
"http://xbrl.sec.gov/oef/role/ShareholderReport"
],
"lang": {
"en-us": {
"role": {
"label": "Material Fund Change Objectives [Text Block]"
}
}
},
"auth_ref": [
"r55"
]
},
"oef_MaterialFundChngRisksChngTextBlock": {
"xbrltype": "textBlockItemType",
"nsuri": "http://xbrl.sec.gov/oef/2025",
"localname": "MaterialFundChngRisksChngTextBlock",
"presentation": [
"http://xbrl.sec.gov/oef/role/ShareholderReport"
],
"lang": {
"en-us": {
"role": {
"label": "Material Fund Change Risks Change [Text Block]"
}
}
},
"auth_ref": [
"r58"
]
},
"oef_MaterialFundChngStrategiesTextBlock": {
"xbrltype": "textBlockItemType",
"nsuri": "http://xbrl.sec.gov/oef/2025",
"localname": "MaterialFundChngStrategiesTextBlock",
"presentation": [
"http://xbrl.sec.gov/oef/role/ShareholderReport"
],
"lang": {
"en-us": {
"role": {
"label": "Material Fund Change Strategies [Text Block]"
}
}
},
"auth_ref": [
"r57"
]
},
"oef_MaterialFundChngTextBlock": {
"xbrltype": "textBlockItemType",
"nsuri": "http://xbrl.sec.gov/oef/2025",
"localname": "MaterialFundChngTextBlock",
"presentation": [
"http://xbrl.sec.gov/oef/role/ShareholderReport"
],
"lang": {
"en-us": {
"role": {
"label": "Material Fund Change [Text Block]"
}
}
},
"auth_ref": [
"r53"
]
},
"oef_MaterialsSectorMember": {
"xbrltype": "domainItemType",
"nsuri": "http://xbrl.sec.gov/oef/2025",
"localname": "MaterialsSectorMember",
"presentation": [
"http://xbrl.sec.gov/oef/role/ShareholderReportHoldingsDetails"
],
"lang": {
"en-us": {
"role": {
"label": "Materials Sector [Member]"
}
}
},
"auth_ref": [
"r52"
]
},
"oef_MaturityAxis": {
"xbrltype": "stringItemType",
"nsuri": "http://xbrl.sec.gov/oef/2025",
"localname": "MaturityAxis",
"presentation": [
"http://xbrl.sec.gov/oef/role/ShareholderReportHoldingsDetails"
],
"lang": {
"en-us": {
"role": {
"label": "Maturity [Axis]"
}
}
},
"auth_ref": [
"r52"
]
},
"oef_MaturityDomain": {
"xbrltype": "domainItemType",
"nsuri": "http://xbrl.sec.gov/oef/2025",
"localname": "MaturityDomain",
"presentation": [
"http://xbrl.sec.gov/oef/role/ShareholderReportHoldingsDetails"
],
"lang": {
"en-us": {
"role": {
"label": "Maturity [Domain]"
}
}
},
"auth_ref": [
"r52"
]
},
"cik0000904333_MercadoLibreIncMember": {
"xbrltype": "domainItemType",
"nsuri": "http://sct.com/20251031",
"localname": "MercadoLibreIncMember",
"presentation": [
"http://xbrl.sec.gov/oef/role/ShareholderReportHoldingsDetails"
],
"lang": {
"en-us": {
"role": {
"label": "MercadoLibre, Inc. [Member]"
}
}
},
"auth_ref": []
},
"cik0000904333_MerckAndCoIncMember": {
"xbrltype": "domainItemType",
"nsuri": "http://sct.com/20251031",
"localname": "MerckAndCoIncMember",
"presentation": [
"http://xbrl.sec.gov/oef/role/ShareholderReportHoldingsDetails"
],
"lang": {
"en-us": {
"role": {
"label": "Merck & Co., Inc. [Member]"
}
}
},
"auth_ref": []
},
"cik0000904333_MetaPlatformsIncClassAMember": {
"xbrltype": "domainItemType",
"nsuri": "http://sct.com/20251031",
"localname": "MetaPlatformsIncClassAMember",
"presentation": [
"http://xbrl.sec.gov/oef/role/ShareholderReportHoldingsDetails"
],
"lang": {
"en-us": {
"role": {
"label": "Meta Platforms, Inc., Class A [Member]"
}
}
},
"auth_ref": []
},
"cik0000904333_MicrosoftCorpMember": {
"xbrltype": "domainItemType",
"nsuri": "http://sct.com/20251031",
"localname": "MicrosoftCorpMember",
"presentation": [
"http://xbrl.sec.gov/oef/role/ShareholderReportHoldingsDetails"
],
"lang": {
"en-us": {
"role": {
"label": "Microsoft Corp. [Member]"
}
}
},
"auth_ref": []
},
"cik0000904333_MoneyMarketFundMember": {
"xbrltype": "domainItemType",
"nsuri": "http://sct.com/20251031",
"localname": "MoneyMarketFundMember",
"presentation": [
"http://xbrl.sec.gov/oef/role/ShareholderReportHoldingsDetails"
],
"lang": {
"en-us": {
"role": {
"label": "Money Market Funds [Member]"
}
}
},
"auth_ref": []
},
"cik0000904333_MorganStanleyMember": {
"xbrltype": "domainItemType",
"nsuri": "http://sct.com/20251031",
"localname": "MorganStanleyMember",
"presentation": [
"http://xbrl.sec.gov/oef/role/ShareholderReportHoldingsDetails"
],
"lang": {
"en-us": {
"role": {
"label": "Morgan Stanley [Member]"
}
}
},
"auth_ref": []
},
"cik0000904333_NEXTrackerIncClassAMember": {
"xbrltype": "domainItemType",
"nsuri": "http://sct.com/20251031",
"localname": "NEXTrackerIncClassAMember",
"presentation": [
"http://xbrl.sec.gov/oef/role/ShareholderReportHoldingsDetails"
],
"lang": {
"en-us": {
"role": {
"label": "NEXTracker, Inc., Class A [Member]"
}
}
},
"auth_ref": []
},
"country_NL": {
"xbrltype": "domainItemType",
"nsuri": "http://xbrl.sec.gov/country/2025",
"localname": "NL",
"presentation": [
"http://xbrl.sec.gov/oef/role/ShareholderReportHoldingsDetails"
],
"lang": {
"en-us": {
"role": {
"label": "NETHERLANDS",
"terseLabel": "Netherlands"
}
}
},
"auth_ref": []
},
"cik0000904333_NVIDIACorpMember": {
"xbrltype": "domainItemType",
"nsuri": "http://sct.com/20251031",
"localname": "NVIDIACorpMember",
"presentation": [
"http://xbrl.sec.gov/oef/role/ShareholderReportHoldingsDetails"
],
"lang": {
"en-us": {
"role": {
"label": "NVIDIA Corp [Member]",
"terseLabel": "NVIDIA Corp. [Member]"
}
}
},
"auth_ref": []
},
"cik0000904333_NestleSAMember": {
"xbrltype": "domainItemType",
"nsuri": "http://sct.com/20251031",
"localname": "NestleSAMember",
"presentation": [
"http://xbrl.sec.gov/oef/role/ShareholderReportHoldingsDetails"
],
"lang": {
"en-us": {
"role": {
"label": "Nestle SA [Member]"
}
}
},
"auth_ref": []
},
"cik0000904333_NetflixIncMember": {
"xbrltype": "domainItemType",
"nsuri": "http://sct.com/20251031",
"localname": "NetflixIncMember",
"presentation": [
"http://xbrl.sec.gov/oef/role/ShareholderReportHoldingsDetails"
],
"lang": {
"en-us": {
"role": {
"label": "Netflix, Inc. [Member]"
}
}
},
"auth_ref": []
},
"oef_NoDeductionOfTaxesTextBlock": {
"xbrltype": "textBlockItemType",
"nsuri": "http://xbrl.sec.gov/oef/2025",
"localname": "NoDeductionOfTaxesTextBlock",
"presentation": [
"http://xbrl.sec.gov/oef/role/ShareholderReport"
],
"lang": {
"en-us": {
"role": {
"label": "No Deduction of Taxes [Text Block]"
}
}
},
"auth_ref": [
"r39"
]
},
"dei_NoTradingSymbolFlag": {
"xbrltype": "trueItemType",
"nsuri": "http://xbrl.sec.gov/dei/2025",
"localname": "NoTradingSymbolFlag",
"presentation": [
"http://xbrl.sec.gov/oef/role/ShareholderReport"
],
"lang": {
"en-us": {
"role": {
"documentation": "Boolean flag that is true only for a security having no trading symbol."
}
}
},
"auth_ref": []
},
"cik0000904333_NovartisAGMember": {
"xbrltype": "domainItemType",
"nsuri": "http://sct.com/20251031",
"localname": "NovartisAGMember",
"presentation": [
"http://xbrl.sec.gov/oef/role/ShareholderReportHoldingsDetails"
],
"lang": {
"en-us": {
"role": {
"label": "Novartis AG [Member]"
}
}
},
"auth_ref": []
},
"cik0000904333_OkloIncMember": {
"xbrltype": "domainItemType",
"nsuri": "http://sct.com/20251031",
"localname": "OkloIncMember",
"presentation": [
"http://xbrl.sec.gov/oef/role/ShareholderReportHoldingsDetails"
],
"lang": {
"en-us": {
"role": {
"label": "Oklo, Inc. [Member]"
}
}
},
"auth_ref": []
},
"cik0000904333_OpendoorTechnologiesIncMember": {
"xbrltype": "domainItemType",
"nsuri": "http://sct.com/20251031",
"localname": "OpendoorTechnologiesIncMember",
"presentation": [
"http://xbrl.sec.gov/oef/role/ShareholderReportHoldingsDetails"
],
"lang": {
"en-us": {
"role": {
"label": "Opendoor Technologies Inc [Member]"
}
}
},
"auth_ref": []
},
"oef_OtherCategory1Axis": {
"xbrltype": "stringItemType",
"nsuri": "http://xbrl.sec.gov/oef/2025",
"localname": "OtherCategory1Axis",
"presentation": [
"http://xbrl.sec.gov/oef/role/ShareholderReportHoldingsDetails"
],
"lang": {
"en-us": {
"role": {
"label": "Other Category 1 [Axis]"
}
}
},
"auth_ref": [
"r52"
]
},
"oef_OtherCategory1Domain": {
"xbrltype": "domainItemType",
"nsuri": "http://xbrl.sec.gov/oef/2025",
"localname": "OtherCategory1Domain",
"presentation": [
"http://xbrl.sec.gov/oef/role/ShareholderReportHoldingsDetails"
],
"lang": {
"en-us": {
"role": {
"label": "Other Category 1 [Domain]"
}
}
},
"auth_ref": [
"r52"
]
},
"oef_OtherCategory2Axis": {
"xbrltype": "stringItemType",
"nsuri": "http://xbrl.sec.gov/oef/2025",
"localname": "OtherCategory2Axis",
"presentation": [
"http://xbrl.sec.gov/oef/role/ShareholderReportHoldingsDetails"
],
"lang": {
"en-us": {
"role": {
"label": "Other Category 2 [Axis]"
}
}
},
"auth_ref": [
"r52"
]
},
"oef_OtherCategory2Domain": {
"xbrltype": "domainItemType",
"nsuri": "http://xbrl.sec.gov/oef/2025",
"localname": "OtherCategory2Domain",
"presentation": [
"http://xbrl.sec.gov/oef/role/ShareholderReportHoldingsDetails"
],
"lang": {
"en-us": {
"role": {
"label": "Other Category 2 [Domain]"
}
}
},
"auth_ref": [
"r52"
]
},
"cik0000904333_OtherCountriesMember": {
"xbrltype": "domainItemType",
"nsuri": "http://sct.com/20251031",
"localname": "OtherCountriesMember",
"presentation": [
"http://xbrl.sec.gov/oef/role/ShareholderReportHoldingsDetails"
],
"lang": {
"en-us": {
"role": {
"label": "Other Countries [Member]"
}
}
},
"auth_ref": []
},
"cik0000904333_PIMCOInternationalBondFundUSDollarHedgedClassInstitutionalMember": {
"xbrltype": "domainItemType",
"nsuri": "http://sct.com/20251031",
"localname": "PIMCOInternationalBondFundUSDollarHedgedClassInstitutionalMember",
"presentation": [
"http://xbrl.sec.gov/oef/role/ShareholderReportHoldingsDetails"
],
"lang": {
"en-us": {
"role": {
"label": "PIMCO International Bond Fund U.S. Dollar-Hedged, Class Institutional [Member]"
}
}
},
"auth_ref": []
},
"oef_PctOfNav": {
"xbrltype": "percentItemType",
"nsuri": "http://xbrl.sec.gov/oef/2025",
"localname": "PctOfNav",
"presentation": [
"http://xbrl.sec.gov/oef/role/ShareholderReportHoldingsDetails"
],
"lang": {
"en-us": {
"role": {
"label": "Percent of Net Asset Value"
}
}
},
"auth_ref": [
"r52"
]
},
"oef_PctOfNetLongExposure": {
"xbrltype": "percentItemType",
"nsuri": "http://xbrl.sec.gov/oef/2025",
"localname": "PctOfNetLongExposure",
"presentation": [
"http://xbrl.sec.gov/oef/role/ShareholderReportHoldingsDetails"
],
"lang": {
"en-us": {
"role": {
"label": "Percent of Net Long Exposure"
}
}
},
"auth_ref": [
"r52"
]
},
"oef_PctOfNetShortExposure": {
"xbrltype": "percentItemType",
"nsuri": "http://xbrl.sec.gov/oef/2025",
"localname": "PctOfNetShortExposure",
"presentation": [
"http://xbrl.sec.gov/oef/role/ShareholderReportHoldingsDetails"
],
"lang": {
"en-us": {
"role": {
"label": "Percent of Net Short Exposure"
}
}
},
"auth_ref": [
"r52"
]
},
"oef_PctOfTotalInv": {
"xbrltype": "percentItemType",
"nsuri": "http://xbrl.sec.gov/oef/2025",
"localname": "PctOfTotalInv",
"presentation": [
"http://xbrl.sec.gov/oef/role/ShareholderReportHoldingsDetails"
],
"lang": {
"en-us": {
"role": {
"label": "Percent of Total Investments"
}
}
},
"auth_ref": [
"r52"
]
},
"oef_PctOfTotalLongExposure": {
"xbrltype": "percentItemType",
"nsuri": "http://xbrl.sec.gov/oef/2025",
"localname": "PctOfTotalLongExposure",
"presentation": [
"http://xbrl.sec.gov/oef/role/ShareholderReportHoldingsDetails"
],
"lang": {
"en-us": {
"role": {
"label": "Percent of Total Long Exposure"
}
}
},
"auth_ref": [
"r52"
]
},
"oef_PctOfTotalShortExposure": {
"xbrltype": "percentItemType",
"nsuri": "http://xbrl.sec.gov/oef/2025",
"localname": "PctOfTotalShortExposure",
"presentation": [
"http://xbrl.sec.gov/oef/role/ShareholderReportHoldingsDetails"
],
"lang": {
"en-us": {
"role": {
"label": "Percent of Total Short Exposure"
}
}
},
"auth_ref": [
"r52"
]
},
"oef_PerfInceptionDate": {
"xbrltype": "dateItemType",
"nsuri": "http://xbrl.sec.gov/oef/2025",
"localname": "PerfInceptionDate",
"presentation": [
"http://xbrl.sec.gov/oef/role/ShareholderReport"
],
"lang": {
"en-us": {
"role": {
"label": "Performance Inception Date"
}
}
},
"auth_ref": [
"r38"
]
},
"oef_PerfTableMarketIndexChngdTextBlock": {
"xbrltype": "textBlockItemType",
"nsuri": "http://xbrl.sec.gov/oef/2025",
"localname": "PerfTableMarketIndexChngdTextBlock",
"presentation": [
"http://xbrl.sec.gov/oef/role/ShareholderReport"
],
"lang": {
"en-us": {
"role": {
"label": "Performance Table Market Index Changed [Text Block]"
}
}
},
"auth_ref": [
"r45"
]
},
"oef_PerformancePastDoesNotIndicateFuture": {
"xbrltype": "stringItemType",
"nsuri": "http://xbrl.sec.gov/oef/2025",
"localname": "PerformancePastDoesNotIndicateFuture",
"presentation": [
"http://xbrl.sec.gov/oef/role/ShareholderReport"
],
"lang": {
"en-us": {
"role": {
"label": "Performance Past Does Not Indicate Future [Text]"
}
}
},
"auth_ref": [
"r40",
"r64"
]
},
"cik0000904333_PetroleoBrasileiroSAPetrobrasCommonStockMember": {
"xbrltype": "domainItemType",
"nsuri": "http://sct.com/20251031",
"localname": "PetroleoBrasileiroSAPetrobrasCommonStockMember",
"presentation": [
"http://xbrl.sec.gov/oef/role/ShareholderReportHoldingsDetails"
],
"lang": {
"en-us": {
"role": {
"label": "Petroleo Brasileiro SA - Petrobras - Common Stock [Member]"
}
}
},
"auth_ref": []
},
"cik0000904333_PetroleoBrasileiroSAPetrobrasPreferredStockMember": {
"xbrltype": "domainItemType",
"nsuri": "http://sct.com/20251031",
"localname": "PetroleoBrasileiroSAPetrobrasPreferredStockMember",
"presentation": [
"http://xbrl.sec.gov/oef/role/ShareholderReportHoldingsDetails"
],
"lang": {
"en-us": {
"role": {
"label": "Petroleo Brasileiro SA - Petrobras - Preferred Stock [Member]"
}
}
},
"auth_ref": []
},
"cik0000904333_PharmaceuticalsMember": {
"xbrltype": "domainItemType",
"nsuri": "http://sct.com/20251031",
"localname": "PharmaceuticalsMember",
"presentation": [
"http://xbrl.sec.gov/oef/role/ShareholderReportHoldingsDetails"
],
"lang": {
"en-us": {
"role": {
"label": "Pharmaceuticals [Member]"
}
}
},
"auth_ref": []
},
"cik0000904333_PortlandGeneralElectricCoMember": {
"xbrltype": "domainItemType",
"nsuri": "http://sct.com/20251031",
"localname": "PortlandGeneralElectricCoMember",
"presentation": [
"http://xbrl.sec.gov/oef/role/ShareholderReportHoldingsDetails"
],
"lang": {
"en-us": {
"role": {
"label": "Portland General Electric Co. [Member]"
}
}
},
"auth_ref": []
},
"oef_PreviousInvestmentAdviserTextBlock": {
"xbrltype": "textBlockItemType",
"nsuri": "http://xbrl.sec.gov/oef/2025",
"localname": "PreviousInvestmentAdviserTextBlock",
"presentation": [
"http://xbrl.sec.gov/oef/role/ShareholderReport"
],
"lang": {
"en-us": {
"role": {
"label": "Previous Investment Adviser [Text Block]"
}
}
},
"auth_ref": [
"r41"
]
},
"oef_PriorMarketIndexComparisonTextBlock": {
"xbrltype": "textBlockItemType",
"nsuri": "http://xbrl.sec.gov/oef/2025",
"localname": "PriorMarketIndexComparisonTextBlock",
"presentation": [
"http://xbrl.sec.gov/oef/role/ShareholderReport"
],
"lang": {
"en-us": {
"role": {
"label": "Prior Market Index Comparison [Text Block]"
}
}
},
"auth_ref": [
"r45"
]
},
"cik0000904333_ProcterAndGambleCoMember": {
"xbrltype": "domainItemType",
"nsuri": "http://sct.com/20251031",
"localname": "ProcterAndGambleCoMember",
"presentation": [
"http://xbrl.sec.gov/oef/role/ShareholderReportHoldingsDetails"
],
"lang": {
"en-us": {
"role": {
"label": "Procter & Gamble Co. [Member]"
}
}
},
"auth_ref": []
},
"cik0000904333_ProsusNvMember": {
"xbrltype": "domainItemType",
"nsuri": "http://sct.com/20251031",
"localname": "ProsusNvMember",
"presentation": [
"http://xbrl.sec.gov/oef/role/ShareholderReportHoldingsDetails"
],
"lang": {
"en-us": {
"role": {
"label": "Prosus NV [Member]"
}
}
},
"auth_ref": []
},
"cik0000904333_QuantaServicesIncMember": {
"xbrltype": "domainItemType",
"nsuri": "http://sct.com/20251031",
"localname": "QuantaServicesIncMember",
"presentation": [
"http://xbrl.sec.gov/oef/role/ShareholderReportHoldingsDetails"
],
"lang": {
"en-us": {
"role": {
"label": "Quanta Services, Inc. [Member]"
}
}
},
"auth_ref": []
},
"cik0000904333_RAFIFundamentalHighLiquidityDevelopedExUSSmallIndexNetMember": {
"xbrltype": "domainItemType",
"nsuri": "http://sct.com/20251031",
"localname": "RAFIFundamentalHighLiquidityDevelopedExUSSmallIndexNetMember",
"presentation": [
"http://xbrl.sec.gov/oef/role/ShareholderReportAverageAnnualReturnDetails",
"http://xbrl.sec.gov/oef/role/ShareholderReportLineGraphDetails"
],
"lang": {
"en-us": {
"role": {
"label": "RAFI Fundamental High Liquidity Developed ex US Small Index (Net) [Member]"
}
}
},
"auth_ref": []
},
"cik0000904333_RAFIFundamentalHighLiquidityDevelopedexUSLargeIndexNetMember": {
"xbrltype": "domainItemType",
"nsuri": "http://sct.com/20251031",
"localname": "RAFIFundamentalHighLiquidityDevelopedexUSLargeIndexNetMember",
"presentation": [
"http://xbrl.sec.gov/oef/role/ShareholderReportAverageAnnualReturnDetails",
"http://xbrl.sec.gov/oef/role/ShareholderReportLineGraphDetails"
],
"lang": {
"en-us": {
"role": {
"label": "RAFI Fundamental High Liquidity Developed ex US Large Index (Net) [Member]"
}
}
},
"auth_ref": []
},
"cik0000904333_RAFIFundamentalHighLiquidityEmergingMarketsIndexNetMember": {
"xbrltype": "domainItemType",
"nsuri": "http://sct.com/20251031",
"localname": "RAFIFundamentalHighLiquidityEmergingMarketsIndexNetMember",
"presentation": [
"http://xbrl.sec.gov/oef/role/ShareholderReportAverageAnnualReturnDetails",
"http://xbrl.sec.gov/oef/role/ShareholderReportLineGraphDetails"
],
"lang": {
"en-us": {
"role": {
"label": "RAFI Fundamental High Liquidity Emerging Markets Index (Net) [Member]"
}
}
},
"auth_ref": []
},
"cik0000904333_RAFIFundamentalHighLiquidityUSLargeIndexMember": {
"xbrltype": "domainItemType",
"nsuri": "http://sct.com/20251031",
"localname": "RAFIFundamentalHighLiquidityUSLargeIndexMember",
"presentation": [
"http://xbrl.sec.gov/oef/role/ShareholderReportAverageAnnualReturnDetails",
"http://xbrl.sec.gov/oef/role/ShareholderReportLineGraphDetails"
],
"lang": {
"en-us": {
"role": {
"label": "RAFI Fundamental High Liquidity US Large Index [Member]"
}
}
},
"auth_ref": []
},
"cik0000904333_RAFIFundamentalHighLiquidityUSSmallIndexMember": {
"xbrltype": "domainItemType",
"nsuri": "http://sct.com/20251031",
"localname": "RAFIFundamentalHighLiquidityUSSmallIndexMember",
"presentation": [
"http://xbrl.sec.gov/oef/role/ShareholderReportAverageAnnualReturnDetails",
"http://xbrl.sec.gov/oef/role/ShareholderReportLineGraphDetails"
],
"lang": {
"en-us": {
"role": {
"label": "RAFI Fundamental High Liquidity US Small Index [Member]"
}
}
},
"auth_ref": []
},
"cik0000904333_ROBLOXCorpClassAMember": {
"xbrltype": "domainItemType",
"nsuri": "http://sct.com/20251031",
"localname": "ROBLOXCorpClassAMember",
"presentation": [
"http://xbrl.sec.gov/oef/role/ShareholderReportHoldingsDetails"
],
"lang": {
"en-us": {
"role": {
"label": "ROBLOX Corp., Class A [Member]"
}
}
},
"auth_ref": []
},
"cik0000904333_RealEstateGlobalRealEstateMember": {
"xbrltype": "domainItemType",
"nsuri": "http://sct.com/20251031",
"localname": "RealEstateGlobalRealEstateMember",
"presentation": [
"http://xbrl.sec.gov/oef/role/ShareholderReportHoldingsDetails"
],
"lang": {
"en-us": {
"role": {
"label": "Real Estate - Global Real Estate [Member]"
}
}
},
"auth_ref": []
},
"us-gaap_RealEstateSectorMember": {
"xbrltype": "domainItemType",
"nsuri": "http://fasb.org/us-gaap/2025",
"localname": "RealEstateSectorMember",
"presentation": [
"http://xbrl.sec.gov/oef/role/ShareholderReportHoldingsDetails"
],
"lang": {
"en-us": {
"role": {
"label": "Real Estate Sector [Member]",
"documentation": "Sector of the economy consisting of companies engaged in real estate business activities."
}
}
},
"auth_ref": [
"r17",
"r18",
"r68",
"r69",
"r70",
"r74"
]
},
"cik0000904333_RealEstateUSREITsMember": {
"xbrltype": "domainItemType",
"nsuri": "http://sct.com/20251031",
"localname": "RealEstateUSREITsMember",
"presentation": [
"http://xbrl.sec.gov/oef/role/ShareholderReportHoldingsDetails"
],
"lang": {
"en-us": {
"role": {
"label": "Real Estate - U.S. REITs [Member]"
}
}
},
"auth_ref": []
},
"cik0000904333_RigettiComputingIncMember": {
"xbrltype": "domainItemType",
"nsuri": "http://sct.com/20251031",
"localname": "RigettiComputingIncMember",
"presentation": [
"http://xbrl.sec.gov/oef/role/ShareholderReportHoldingsDetails"
],
"lang": {
"en-us": {
"role": {
"label": "Rigetti Computing, Inc. [Member]"
}
}
},
"auth_ref": []
},
"cik0000904333_RobinhoodMarketsIncClassAMember": {
"xbrltype": "domainItemType",
"nsuri": "http://sct.com/20251031",
"localname": "RobinhoodMarketsIncClassAMember",
"presentation": [
"http://xbrl.sec.gov/oef/role/ShareholderReportHoldingsDetails"
],
"lang": {
"en-us": {
"role": {
"label": "Robinhood Markets, Inc., Class A [Member]"
}
}
},
"auth_ref": []
},
"cik0000904333_RocheHoldingAGMember": {
"xbrltype": "domainItemType",
"nsuri": "http://sct.com/20251031",
"localname": "RocheHoldingAGMember",
"presentation": [
"http://xbrl.sec.gov/oef/role/ShareholderReportHoldingsDetails"
],
"lang": {
"en-us": {
"role": {
"label": "Roche Holding AG [Member]"
}
}
},
"auth_ref": []
},
"cik0000904333_RocketCosIncClassAMember": {
"xbrltype": "domainItemType",
"nsuri": "http://sct.com/20251031",
"localname": "RocketCosIncClassAMember",
"presentation": [
"http://xbrl.sec.gov/oef/role/ShareholderReportHoldingsDetails"
],
"lang": {
"en-us": {
"role": {
"label": "Rocket Cos., Inc., Class A [Member]"
}
}
},
"auth_ref": []
},
"cik0000904333_RollsRoyceHoldingsPLCMember": {
"xbrltype": "domainItemType",
"nsuri": "http://sct.com/20251031",
"localname": "RollsRoyceHoldingsPLCMember",
"presentation": [
"http://xbrl.sec.gov/oef/role/ShareholderReportHoldingsDetails"
],
"lang": {
"en-us": {
"role": {
"label": "Rolls-Royce Holdings PLC [Member]"
}
}
},
"auth_ref": []
},
"cik0000904333_RoyalCaribbeanCruisesLtdMember": {
"xbrltype": "domainItemType",
"nsuri": "http://sct.com/20251031",
"localname": "RoyalCaribbeanCruisesLtdMember",
"presentation": [
"http://xbrl.sec.gov/oef/role/ShareholderReportHoldingsDetails"
],
"lang": {
"en-us": {
"role": {
"label": "Royal Caribbean Cruises Ltd. [Member]"
}
}
},
"auth_ref": []
},
"cik0000904333_Russell1000GrowthIndexMember": {
"xbrltype": "domainItemType",
"nsuri": "http://sct.com/20251031",
"localname": "Russell1000GrowthIndexMember",
"presentation": [
"http://xbrl.sec.gov/oef/role/ShareholderReportAverageAnnualReturnDetails",
"http://xbrl.sec.gov/oef/role/ShareholderReportLineGraphDetails"
],
"lang": {
"en-us": {
"role": {
"label": "Russell 1000 Growth Index [Member]"
}
}
},
"auth_ref": []
},
"cik0000904333_Russell1000IndexMember": {
"xbrltype": "domainItemType",
"nsuri": "http://sct.com/20251031",
"localname": "Russell1000IndexMember",
"presentation": [
"http://xbrl.sec.gov/oef/role/ShareholderReportAverageAnnualReturnDetails",
"http://xbrl.sec.gov/oef/role/ShareholderReportLineGraphDetails"
],
"lang": {
"en-us": {
"role": {
"label": "Russell 1000 Index [Member]"
}
}
},
"auth_ref": []
},
"cik0000904333_Russell1000ValueIndexMember": {
"xbrltype": "domainItemType",
"nsuri": "http://sct.com/20251031",
"localname": "Russell1000ValueIndexMember",
"presentation": [
"http://xbrl.sec.gov/oef/role/ShareholderReportAverageAnnualReturnDetails",
"http://xbrl.sec.gov/oef/role/ShareholderReportLineGraphDetails"
],
"lang": {
"en-us": {
"role": {
"label": "Russell 1000 Value Index [Member]"
}
}
},
"auth_ref": []
},
"cik0000904333_Russell2000IndexMember": {
"xbrltype": "domainItemType",
"nsuri": "http://sct.com/20251031",
"localname": "Russell2000IndexMember",
"presentation": [
"http://xbrl.sec.gov/oef/role/ShareholderReportAverageAnnualReturnDetails",
"http://xbrl.sec.gov/oef/role/ShareholderReportLineGraphDetails"
],
"lang": {
"en-us": {
"role": {
"label": "Russell 2000 Index [Member]"
}
}
},
"auth_ref": []
},
"cik0000904333_RussellMidcapIndexMember": {
"xbrltype": "domainItemType",
"nsuri": "http://sct.com/20251031",
"localname": "RussellMidcapIndexMember",
"presentation": [
"http://xbrl.sec.gov/oef/role/ShareholderReportAverageAnnualReturnDetails",
"http://xbrl.sec.gov/oef/role/ShareholderReportLineGraphDetails"
],
"lang": {
"en-us": {
"role": {
"label": "Russell Midcap Index [Member]",
"terseLabel": "Russell Midcap\u00ae Index"
}
}
},
"auth_ref": []
},
"cik0000904333_RussellRAFIDevelopedexUSLargeCompanyIndexNetMember": {
"xbrltype": "domainItemType",
"nsuri": "http://sct.com/20251031",
"localname": "RussellRAFIDevelopedexUSLargeCompanyIndexNetMember",
"presentation": [
"http://xbrl.sec.gov/oef/role/ShareholderReportAverageAnnualReturnDetails",
"http://xbrl.sec.gov/oef/role/ShareholderReportLineGraphDetails"
],
"lang": {
"en-us": {
"role": {
"label": "Russell RAFI Developed ex US Large Company Index Net [Member]"
}
}
},
"auth_ref": []
},
"cik0000904333_RussellRAFIDevelopedexUSSmallCompanyIndexNetMember": {
"xbrltype": "domainItemType",
"nsuri": "http://sct.com/20251031",
"localname": "RussellRAFIDevelopedexUSSmallCompanyIndexNetMember",
"presentation": [
"http://xbrl.sec.gov/oef/role/ShareholderReportAverageAnnualReturnDetails",
"http://xbrl.sec.gov/oef/role/ShareholderReportLineGraphDetails"
],
"lang": {
"en-us": {
"role": {
"label": "Russell RAFI Developed ex US Small Company Index (Net) [Member]"
}
}
},
"auth_ref": []
},
"cik0000904333_RussellRAFITMEmergingMarketsLargeCompanyIndexNetMember": {
"xbrltype": "domainItemType",
"nsuri": "http://sct.com/20251031",
"localname": "RussellRAFITMEmergingMarketsLargeCompanyIndexNetMember",
"presentation": [
"http://xbrl.sec.gov/oef/role/ShareholderReportAverageAnnualReturnDetails",
"http://xbrl.sec.gov/oef/role/ShareholderReportLineGraphDetails"
],
"lang": {
"en-us": {
"role": {
"label": "Russell RAFITM Emerging Markets Large Company Index (Net) [Member]"
}
}
},
"auth_ref": []
},
"cik0000904333_RussellRAFIUSLargeCompanyIndexMember": {
"xbrltype": "domainItemType",
"nsuri": "http://sct.com/20251031",
"localname": "RussellRAFIUSLargeCompanyIndexMember",
"presentation": [
"http://xbrl.sec.gov/oef/role/ShareholderReportAverageAnnualReturnDetails",
"http://xbrl.sec.gov/oef/role/ShareholderReportLineGraphDetails"
],
"lang": {
"en-us": {
"role": {
"label": "Russell RAFI US Large Company Index [Member]"
}
}
},
"auth_ref": []
},
"cik0000904333_RussellRAFIUSSmallCompanyIndexMember": {
"xbrltype": "domainItemType",
"nsuri": "http://sct.com/20251031",
"localname": "RussellRAFIUSSmallCompanyIndexMember",
"presentation": [
"http://xbrl.sec.gov/oef/role/ShareholderReportAverageAnnualReturnDetails",
"http://xbrl.sec.gov/oef/role/ShareholderReportLineGraphDetails"
],
"lang": {
"en-us": {
"role": {
"label": "Russell RAFI US Small Company Index [Member]"
}
}
},
"auth_ref": []
},
"cik0000904333_SAPSEMember": {
"xbrltype": "domainItemType",
"nsuri": "http://sct.com/20251031",
"localname": "SAPSEMember",
"presentation": [
"http://xbrl.sec.gov/oef/role/ShareholderReportHoldingsDetails"
],
"lang": {
"en-us": {
"role": {
"label": "SAP SE [Member]"
}
}
},
"auth_ref": []
},
"cik0000904333_SAndPDevelopedExUSSmallCapIndexNetMember": {
"xbrltype": "domainItemType",
"nsuri": "http://sct.com/20251031",
"localname": "SAndPDevelopedExUSSmallCapIndexNetMember",
"presentation": [
"http://xbrl.sec.gov/oef/role/ShareholderReportAverageAnnualReturnDetails",
"http://xbrl.sec.gov/oef/role/ShareholderReportLineGraphDetails"
],
"lang": {
"en-us": {
"role": {
"label": "S&P Developed ex-U.S. Small Cap Index (Net) [Member]"
}
}
},
"auth_ref": []
},
"country_SE": {
"xbrltype": "domainItemType",
"nsuri": "http://xbrl.sec.gov/country/2025",
"localname": "SE",
"presentation": [
"http://xbrl.sec.gov/oef/role/ShareholderReportHoldingsDetails"
],
"lang": {
"en-us": {
"role": {
"label": "SWEDEN"
}
}
},
"auth_ref": []
},
"cik0000904333_SSRMiningIncMember": {
"xbrltype": "domainItemType",
"nsuri": "http://sct.com/20251031",
"localname": "SSRMiningIncMember",
"presentation": [
"http://xbrl.sec.gov/oef/role/ShareholderReportHoldingsDetails"
],
"lang": {
"en-us": {
"role": {
"label": "SSR Mining, Inc. [Member]"
}
}
},
"auth_ref": []
},
"oef_SalesLoadAxis": {
"xbrltype": "stringItemType",
"nsuri": "http://xbrl.sec.gov/oef/2025",
"localname": "SalesLoadAxis",
"presentation": [
"http://xbrl.sec.gov/oef/role/ShareholderReportAverageAnnualReturnDetails"
],
"lang": {
"en-us": {
"role": {
"label": "Sales Load [Axis]"
}
}
},
"auth_ref": [
"r44"
]
},
"cik0000904333_SamsungElectronicsCoLtdMember": {
"xbrltype": "domainItemType",
"nsuri": "http://sct.com/20251031",
"localname": "SamsungElectronicsCoLtdMember",
"presentation": [
"http://xbrl.sec.gov/oef/role/ShareholderReportHoldingsDetails"
],
"lang": {
"en-us": {
"role": {
"label": "Samsung Electronics Co, Ltd. [Member]"
}
}
},
"auth_ref": []
},
"cik0000904333_SchwabCoreEquityFundMember": {
"xbrltype": "domainItemType",
"nsuri": "http://sct.com/20251031",
"localname": "SchwabCoreEquityFundMember",
"presentation": [
"http://xbrl.sec.gov/oef/role/ShareholderReportHoldingsDetails"
],
"lang": {
"en-us": {
"role": {
"label": "Schwab Core Equity Fund [Member]"
}
}
},
"auth_ref": []
},
"cik0000904333_SchwabEmergingMarketsEquityEtfMember": {
"xbrltype": "domainItemType",
"nsuri": "http://sct.com/20251031",
"localname": "SchwabEmergingMarketsEquityEtfMember",
"presentation": [
"http://xbrl.sec.gov/oef/role/ShareholderReportHoldingsDetails"
],
"lang": {
"en-us": {
"role": {
"label": "Schwab Emerging Markets Equity ETF [Member]"
}
}
},
"auth_ref": []
},
"cik0000904333_SchwabFundamentalEmergingMarketsEquityIndexFundMember": {
"xbrltype": "domainItemType",
"nsuri": "http://sct.com/20251031",
"localname": "SchwabFundamentalEmergingMarketsEquityIndexFundMember",
"presentation": [
"http://xbrl.sec.gov/oef/role/ShareholderReportHoldingsDetails"
],
"lang": {
"en-us": {
"role": {
"label": "Schwab Fundamental Emerging Markets Equity Index Fund [Member]"
}
}
},
"auth_ref": []
},
"cik0000904333_SchwabFundamentalInternationalEquityIndexFundMember": {
"xbrltype": "domainItemType",
"nsuri": "http://sct.com/20251031",
"localname": "SchwabFundamentalInternationalEquityIndexFundMember",
"presentation": [
"http://xbrl.sec.gov/oef/role/ShareholderReportHoldingsDetails"
],
"lang": {
"en-us": {
"role": {
"label": "Schwab Fundamental International Equity Index Fund [Member]"
}
}
},
"auth_ref": []
},
"cik0000904333_SchwabFundamentalInternationalSmallEquityIndexFundMember": {
"xbrltype": "domainItemType",
"nsuri": "http://sct.com/20251031",
"localname": "SchwabFundamentalInternationalSmallEquityIndexFundMember",
"presentation": [
"http://xbrl.sec.gov/oef/role/ShareholderReportHoldingsDetails"
],
"lang": {
"en-us": {
"role": {
"label": "Schwab Fundamental International Small Equity Index Fund [Member]"
}
}
},
"auth_ref": []
},
"cik0000904333_SchwabFundamentalUSLargeCompanyIndexFundMember": {
"xbrltype": "domainItemType",
"nsuri": "http://sct.com/20251031",
"localname": "SchwabFundamentalUSLargeCompanyIndexFundMember",
"presentation": [
"http://xbrl.sec.gov/oef/role/ShareholderReportHoldingsDetails"
],
"lang": {
"en-us": {
"role": {
"label": "Schwab Fundamental U.S. Large Company Index Fund [Member]"
}
}
},
"auth_ref": []
},
"cik0000904333_SchwabFundamentalUSSmallCompanyIndexFundMember": {
"xbrltype": "domainItemType",
"nsuri": "http://sct.com/20251031",
"localname": "SchwabFundamentalUSSmallCompanyIndexFundMember",
"presentation": [
"http://xbrl.sec.gov/oef/role/ShareholderReportHoldingsDetails"
],
"lang": {
"en-us": {
"role": {
"label": "Schwab Fundamental U.S. Small Company Index Fund [Member]"
}
}
},
"auth_ref": []
},
"cik0000904333_SchwabGlobalRealEstateFundMember": {
"xbrltype": "domainItemType",
"nsuri": "http://sct.com/20251031",
"localname": "SchwabGlobalRealEstateFundMember",
"presentation": [
"http://xbrl.sec.gov/oef/role/ShareholderReportHoldingsDetails"
],
"lang": {
"en-us": {
"role": {
"label": "Schwab Global Real Estate Fund [Member]"
}
}
},
"auth_ref": []
},
"cik0000904333_SchwabGovernmentMoneyFundUltraSharesMember": {
"xbrltype": "domainItemType",
"nsuri": "http://sct.com/20251031",
"localname": "SchwabGovernmentMoneyFundUltraSharesMember",
"presentation": [
"http://xbrl.sec.gov/oef/role/ShareholderReportHoldingsDetails"
],
"lang": {
"en-us": {
"role": {
"label": "Schwab Government Money Fund, Ultra Shares [Member]"
}
}
},
"auth_ref": []
},
"cik0000904333_SchwabInternationalCoreEquityFundMember": {
"xbrltype": "domainItemType",
"nsuri": "http://sct.com/20251031",
"localname": "SchwabInternationalCoreEquityFundMember",
"presentation": [
"http://xbrl.sec.gov/oef/role/ShareholderReportHoldingsDetails"
],
"lang": {
"en-us": {
"role": {
"label": "Schwab International Core Equity Fund [Member]"
}
}
},
"auth_ref": []
},
"cik0000904333_SchwabInternationalIndexFundMember": {
"xbrltype": "domainItemType",
"nsuri": "http://sct.com/20251031",
"localname": "SchwabInternationalIndexFundMember",
"presentation": [
"http://xbrl.sec.gov/oef/role/ShareholderReportHoldingsDetails"
],
"lang": {
"en-us": {
"role": {
"label": "Schwab International Index Fund [Member]"
}
}
},
"auth_ref": []
},
"cik0000904333_SchwabInternationalOpportunitiesFundMember": {
"xbrltype": "domainItemType",
"nsuri": "http://sct.com/20251031",
"localname": "SchwabInternationalOpportunitiesFundMember",
"presentation": [
"http://xbrl.sec.gov/oef/role/ShareholderReportHoldingsDetails"
],
"lang": {
"en-us": {
"role": {
"label": "Schwab International Opportunities Fund [Member]"
}
}
},
"auth_ref": []
},
"cik0000904333_SchwabSAndP500IndexFundMember": {
"xbrltype": "domainItemType",
"nsuri": "http://sct.com/20251031",
"localname": "SchwabSAndP500IndexFundMember",
"presentation": [
"http://xbrl.sec.gov/oef/role/ShareholderReportHoldingsDetails"
],
"lang": {
"en-us": {
"role": {
"label": "Schwab S&P 500 Index Fund [Member]"
}
}
},
"auth_ref": []
},
"cik0000904333_SchwabSelectLargeCapGrowthFundMember": {
"xbrltype": "domainItemType",
"nsuri": "http://sct.com/20251031",
"localname": "SchwabSelectLargeCapGrowthFundMember",
"presentation": [
"http://xbrl.sec.gov/oef/role/ShareholderReportHoldingsDetails"
],
"lang": {
"en-us": {
"role": {
"label": "Schwab Select Large Cap Growth Fund [Member]"
}
}
},
"auth_ref": []
},
"cik0000904333_SchwabShortTermBondIndexFundMember": {
"xbrltype": "domainItemType",
"nsuri": "http://sct.com/20251031",
"localname": "SchwabShortTermBondIndexFundMember",
"presentation": [
"http://xbrl.sec.gov/oef/role/ShareholderReportHoldingsDetails"
],
"lang": {
"en-us": {
"role": {
"label": "Schwab Short-Term Bond Index Fund [Member]"
}
}
},
"auth_ref": []
},
"cik0000904333_SchwabSmallCapEquityFundMember": {
"xbrltype": "domainItemType",
"nsuri": "http://sct.com/20251031",
"localname": "SchwabSmallCapEquityFundMember",
"presentation": [
"http://xbrl.sec.gov/oef/role/ShareholderReportHoldingsDetails"
],
"lang": {
"en-us": {
"role": {
"label": "Schwab Small-Cap Equity Fund [Member]"
}
}
},
"auth_ref": []
},
"cik0000904333_SchwabSmallCapIndexFundMember": {
"xbrltype": "domainItemType",
"nsuri": "http://sct.com/20251031",
"localname": "SchwabSmallCapIndexFundMember",
"presentation": [
"http://xbrl.sec.gov/oef/role/ShareholderReportHoldingsDetails"
],
"lang": {
"en-us": {
"role": {
"label": "Schwab Small-Cap Index Fund [Member]"
}
}
},
"auth_ref": []
},
"cik0000904333_SchwabTreasuryInflationProtectedSecuritiesIndexFundMember": {
"xbrltype": "domainItemType",
"nsuri": "http://sct.com/20251031",
"localname": "SchwabTreasuryInflationProtectedSecuritiesIndexFundMember",
"presentation": [
"http://xbrl.sec.gov/oef/role/ShareholderReportHoldingsDetails"
],
"lang": {
"en-us": {
"role": {
"label": "Schwab Treasury Inflation Protected Securities Index Fund [Member]"
}
}
},
"auth_ref": []
},
"cik0000904333_SchwabUSAggregateBondIndexFundMember": {
"xbrltype": "domainItemType",
"nsuri": "http://sct.com/20251031",
"localname": "SchwabUSAggregateBondIndexFundMember",
"presentation": [
"http://xbrl.sec.gov/oef/role/ShareholderReportHoldingsDetails"
],
"lang": {
"en-us": {
"role": {
"label": "Schwab U.S. Aggregate Bond Index Fund [Member]"
}
}
},
"auth_ref": []
},
"cik0000904333_SchwabUSLargeCapGrowthIndexFundMember": {
"xbrltype": "domainItemType",
"nsuri": "http://sct.com/20251031",
"localname": "SchwabUSLargeCapGrowthIndexFundMember",
"presentation": [
"http://xbrl.sec.gov/oef/role/ShareholderReportHoldingsDetails"
],
"lang": {
"en-us": {
"role": {
"label": "Schwab U.S. Large-Cap Growth Index Fund [Member]"
}
}
},
"auth_ref": []
},
"cik0000904333_SchwabUSREITETFMember": {
"xbrltype": "domainItemType",
"nsuri": "http://sct.com/20251031",
"localname": "SchwabUSREITETFMember",
"presentation": [
"http://xbrl.sec.gov/oef/role/ShareholderReportHoldingsDetails"
],
"lang": {
"en-us": {
"role": {
"label": "Schwab U.S. REIT ETF [Member]"
}
}
},
"auth_ref": []
},
"dei_SecurityExchangeName": {
"xbrltype": "edgarExchangeCodeItemType",
"nsuri": "http://xbrl.sec.gov/dei/2025",
"localname": "SecurityExchangeName",
"presentation": [
"http://xbrl.sec.gov/oef/role/ShareholderReport"
],
"lang": {
"en-us": {
"role": {
"label": "Security Exchange Name",
"terseLabel": "Exchange",
"documentation": "Name of the Exchange on which a security is registered."
}
}
},
"auth_ref": [
"r23"
]
},
"oef_ShareClassDomain": {
"xbrltype": "domainItemType",
"nsuri": "http://xbrl.sec.gov/oef/2025",
"localname": "ShareClassDomain",
"presentation": [
"http://xbrl.sec.gov/oef/role/ShareholderReport",
"http://xbrl.sec.gov/oef/role/ShareholderReportAverageAnnualReturnDetails",
"http://xbrl.sec.gov/oef/role/ShareholderReportHoldingsDetails",
"http://xbrl.sec.gov/oef/role/ShareholderReportLineGraphDetails"
],
"lang": {
"en-us": {
"role": {
"label": "Share Classes"
}
}
},
"auth_ref": [
"r24"
]
},
"oef_ShareholderReportAbstract": {
"xbrltype": "stringItemType",
"nsuri": "http://xbrl.sec.gov/oef/2025",
"localname": "ShareholderReportAbstract",
"lang": {
"en-us": {
"role": {
"label": "Shareholder Report [Abstract]"
}
}
},
"auth_ref": [
"r44"
]
},
"oef_ShareholderReportAnnualOrSemiAnnual": {
"xbrltype": "shareholderReportTypeItemType",
"nsuri": "http://xbrl.sec.gov/oef/2025",
"localname": "ShareholderReportAnnualOrSemiAnnual",
"presentation": [
"http://xbrl.sec.gov/oef/role/ShareholderReport"
],
"lang": {
"en-us": {
"role": {
"label": "Shareholder Report Annual or Semi-Annual"
}
}
},
"auth_ref": [
"r26"
]
},
"oef_ShareholderReportLineItems": {
"xbrltype": "stringItemType",
"nsuri": "http://xbrl.sec.gov/oef/2025",
"localname": "ShareholderReportLineItems",
"presentation": [
"http://xbrl.sec.gov/oef/role/NcsrCover",
"http://xbrl.sec.gov/oef/role/ShareholderReport"
],
"lang": {
"en-us": {
"role": {
"label": "Shareholder Report [Line Items]"
}
}
},
"auth_ref": [
"r44"
]
},
"oef_ShareholderReportTable": {
"xbrltype": "stringItemType",
"nsuri": "http://xbrl.sec.gov/oef/2025",
"localname": "ShareholderReportTable",
"presentation": [
"http://xbrl.sec.gov/oef/role/NcsrCover",
"http://xbrl.sec.gov/oef/role/ShareholderReport"
],
"lang": {
"en-us": {
"role": {
"label": "Shareholder Report [Table]"
}
}
},
"auth_ref": [
"r44"
]
},
"cik0000904333_ShellPLCMember": {
"xbrltype": "domainItemType",
"nsuri": "http://sct.com/20251031",
"localname": "ShellPLCMember",
"presentation": [
"http://xbrl.sec.gov/oef/role/ShareholderReportHoldingsDetails"
],
"lang": {
"en-us": {
"role": {
"label": "Shell PLC [Member]"
}
}
},
"auth_ref": []
},
"cik0000904333_ShortTermInvestmentMember": {
"xbrltype": "domainItemType",
"nsuri": "http://sct.com/20251031",
"localname": "ShortTermInvestmentMember",
"presentation": [
"http://xbrl.sec.gov/oef/role/ShareholderReportHoldingsDetails"
],
"lang": {
"en-us": {
"role": {
"label": "Short Term Investment [Member]",
"verboseLabel": "Short-Term Investments [Member]"
}
}
},
"auth_ref": []
},
"cik0000904333_SiemensAGMember": {
"xbrltype": "domainItemType",
"nsuri": "http://sct.com/20251031",
"localname": "SiemensAGMember",
"presentation": [
"http://xbrl.sec.gov/oef/role/ShareholderReportHoldingsDetails"
],
"lang": {
"en-us": {
"role": {
"label": "Siemens AG [Member]"
}
}
},
"auth_ref": []
},
"cik0000904333_SinoBiopharmaceuticalLtdMember": {
"xbrltype": "domainItemType",
"nsuri": "http://sct.com/20251031",
"localname": "SinoBiopharmaceuticalLtdMember",
"presentation": [
"http://xbrl.sec.gov/oef/role/ShareholderReportHoldingsDetails"
],
"lang": {
"en-us": {
"role": {
"label": "Sino Biopharmaceutical Ltd. [Member]"
}
}
},
"auth_ref": []
},
"cik0000904333_SonyGroupCorpMember": {
"xbrltype": "domainItemType",
"nsuri": "http://sct.com/20251031",
"localname": "SonyGroupCorpMember",
"presentation": [
"http://xbrl.sec.gov/oef/role/ShareholderReportHoldingsDetails"
],
"lang": {
"en-us": {
"role": {
"label": "Sony Group Corp [Member]"
}
}
},
"auth_ref": []
},
"cik0000904333_SpectrisPLCMember": {
"xbrltype": "domainItemType",
"nsuri": "http://sct.com/20251031",
"localname": "SpectrisPLCMember",
"presentation": [
"http://xbrl.sec.gov/oef/role/ShareholderReportHoldingsDetails"
],
"lang": {
"en-us": {
"role": {
"label": "Spectris PLC [Member]"
}
}
},
"auth_ref": []
},
"cik0000904333_SpotifyTechnologySaMember": {
"xbrltype": "domainItemType",
"nsuri": "http://sct.com/20251031",
"localname": "SpotifyTechnologySaMember",
"presentation": [
"http://xbrl.sec.gov/oef/role/ShareholderReportHoldingsDetails"
],
"lang": {
"en-us": {
"role": {
"label": "Spotify Technology SA [Member]"
}
}
},
"auth_ref": []
},
"us-gaap_StandardPoors500IndexMember": {
"xbrltype": "domainItemType",
"nsuri": "http://fasb.org/us-gaap/2025",
"localname": "StandardPoors500IndexMember",
"presentation": [
"http://xbrl.sec.gov/oef/role/ShareholderReportAverageAnnualReturnDetails",
"http://xbrl.sec.gov/oef/role/ShareholderReportLineGraphDetails"
],
"lang": {
"en-us": {
"role": {
"label": "Standard & Poor's 500 Index [Member]",
"terseLabel": "S&P 500\u00ae Index",
"documentation": "Index of 500 large companies trading on stock exchanges in United States of America (US)."
}
}
},
"auth_ref": [
"r71",
"r72",
"r73"
]
},
"cik0000904333_StateStreetInstitutionalUSGovernmentMoneyMarketFundClassPremierMember": {
"xbrltype": "domainItemType",
"nsuri": "http://sct.com/20251031",
"localname": "StateStreetInstitutionalUSGovernmentMoneyMarketFundClassPremierMember",
"presentation": [
"http://xbrl.sec.gov/oef/role/ShareholderReportHoldingsDetails"
],
"lang": {
"en-us": {
"role": {
"label": "State Street Institutional US Government Money Market Fund, Class Premier [Member]"
}
}
},
"auth_ref": []
},
"cik0000904333_StrykerCorpMember": {
"xbrltype": "domainItemType",
"nsuri": "http://sct.com/20251031",
"localname": "StrykerCorpMember",
"presentation": [
"http://xbrl.sec.gov/oef/role/ShareholderReportHoldingsDetails"
],
"lang": {
"en-us": {
"role": {
"label": "Stryker Corp. [Member]"
}
}
},
"auth_ref": []
},
"oef_SummaryOfChngLegendTextBlock": {
"xbrltype": "textBlockItemType",
"nsuri": "http://xbrl.sec.gov/oef/2025",
"localname": "SummaryOfChngLegendTextBlock",
"presentation": [
"http://xbrl.sec.gov/oef/role/ShareholderReport"
],
"lang": {
"en-us": {
"role": {
"label": "Summary of Change Legend [Text Block]"
}
}
},
"auth_ref": [
"r60"
]
},
"country_TH": {
"xbrltype": "domainItemType",
"nsuri": "http://xbrl.sec.gov/country/2025",
"localname": "TH",
"presentation": [
"http://xbrl.sec.gov/oef/role/ShareholderReportHoldingsDetails"
],
"lang": {
"en-us": {
"role": {
"label": "THAILAND"
}
}
},
"auth_ref": []
},
"cik0000904333_TTMTechnologiesIncMember": {
"xbrltype": "domainItemType",
"nsuri": "http://sct.com/20251031",
"localname": "TTMTechnologiesIncMember",
"presentation": [
"http://xbrl.sec.gov/oef/role/ShareholderReportHoldingsDetails"
],
"lang": {
"en-us": {
"role": {
"label": "TTM Technologies, Inc. [Member]"
}
}
},
"auth_ref": []
},
"country_TW": {
"xbrltype": "domainItemType",
"nsuri": "http://xbrl.sec.gov/country/2025",
"localname": "TW",
"presentation": [
"http://xbrl.sec.gov/oef/role/ShareholderReportHoldingsDetails"
],
"lang": {
"en-us": {
"role": {
"label": "TAIWAN",
"terseLabel": "Taiwan"
}
}
},
"auth_ref": []
},
"cik0000904333_TaiwanSemiconductorManufacturingCoLtdMember": {
"xbrltype": "domainItemType",
"nsuri": "http://sct.com/20251031",
"localname": "TaiwanSemiconductorManufacturingCoLtdMember",
"presentation": [
"http://xbrl.sec.gov/oef/role/ShareholderReportHoldingsDetails"
],
"lang": {
"en-us": {
"role": {
"label": "Taiwan Semiconductor Manufacturing Co. Ltd [Member]"
}
}
},
"auth_ref": []
},
"cik0000904333_Target2010CompositeIndexMember": {
"xbrltype": "domainItemType",
"nsuri": "http://sct.com/20251031",
"localname": "Target2010CompositeIndexMember",
"presentation": [
"http://xbrl.sec.gov/oef/role/ShareholderReportAverageAnnualReturnDetails",
"http://xbrl.sec.gov/oef/role/ShareholderReportLineGraphDetails"
],
"lang": {
"en-us": {
"role": {
"label": "Target 2010 Composite Index [Member]"
}
}
},
"auth_ref": []
},
"cik0000904333_Target2015CompositeIndexMember": {
"xbrltype": "domainItemType",
"nsuri": "http://sct.com/20251031",
"localname": "Target2015CompositeIndexMember",
"presentation": [
"http://xbrl.sec.gov/oef/role/ShareholderReportAverageAnnualReturnDetails",
"http://xbrl.sec.gov/oef/role/ShareholderReportLineGraphDetails"
],
"lang": {
"en-us": {
"role": {
"label": "Target 2015 Composite Index [Member]"
}
}
},
"auth_ref": []
},
"cik0000904333_Target2020CompositeIndexMember": {
"xbrltype": "domainItemType",
"nsuri": "http://sct.com/20251031",
"localname": "Target2020CompositeIndexMember",
"presentation": [
"http://xbrl.sec.gov/oef/role/ShareholderReportAverageAnnualReturnDetails",
"http://xbrl.sec.gov/oef/role/ShareholderReportLineGraphDetails"
],
"lang": {
"en-us": {
"role": {
"label": "Target 2020 Composite Index [Member]"
}
}
},
"auth_ref": []
},
"cik0000904333_Target2025CompositeIndexMember": {
"xbrltype": "domainItemType",
"nsuri": "http://sct.com/20251031",
"localname": "Target2025CompositeIndexMember",
"presentation": [
"http://xbrl.sec.gov/oef/role/ShareholderReportAverageAnnualReturnDetails",
"http://xbrl.sec.gov/oef/role/ShareholderReportLineGraphDetails"
],
"lang": {
"en-us": {
"role": {
"label": "Target 2025 Composite Index [Member]"
}
}
},
"auth_ref": []
},
"cik0000904333_Target2030CompositeIndexMember": {
"xbrltype": "domainItemType",
"nsuri": "http://sct.com/20251031",
"localname": "Target2030CompositeIndexMember",
"presentation": [
"http://xbrl.sec.gov/oef/role/ShareholderReportAverageAnnualReturnDetails",
"http://xbrl.sec.gov/oef/role/ShareholderReportLineGraphDetails"
],
"lang": {
"en-us": {
"role": {
"label": "Target 2030 Composite Index [Member]"
}
}
},
"auth_ref": []
},
"cik0000904333_Target2035CompositeIndexMember": {
"xbrltype": "domainItemType",
"nsuri": "http://sct.com/20251031",
"localname": "Target2035CompositeIndexMember",
"presentation": [
"http://xbrl.sec.gov/oef/role/ShareholderReportAverageAnnualReturnDetails",
"http://xbrl.sec.gov/oef/role/ShareholderReportLineGraphDetails"
],
"lang": {
"en-us": {
"role": {
"label": "Target 2035 Composite Index [Member]"
}
}
},
"auth_ref": []
},
"cik0000904333_Target2040CompositeIndexMember": {
"xbrltype": "domainItemType",
"nsuri": "http://sct.com/20251031",
"localname": "Target2040CompositeIndexMember",
"presentation": [
"http://xbrl.sec.gov/oef/role/ShareholderReportAverageAnnualReturnDetails",
"http://xbrl.sec.gov/oef/role/ShareholderReportLineGraphDetails"
],
"lang": {
"en-us": {
"role": {
"label": "Target 2040 Composite Index [Member]"
}
}
},
"auth_ref": []
},
"cik0000904333_Target2045CompositeIndexMember": {
"xbrltype": "domainItemType",
"nsuri": "http://sct.com/20251031",
"localname": "Target2045CompositeIndexMember",
"presentation": [
"http://xbrl.sec.gov/oef/role/ShareholderReportAverageAnnualReturnDetails",
"http://xbrl.sec.gov/oef/role/ShareholderReportLineGraphDetails"
],
"lang": {
"en-us": {
"role": {
"label": "Target 2045 Composite Index [Member]"
}
}
},
"auth_ref": []
},
"cik0000904333_Target2050CompositeIndexMember": {
"xbrltype": "domainItemType",
"nsuri": "http://sct.com/20251031",
"localname": "Target2050CompositeIndexMember",
"presentation": [
"http://xbrl.sec.gov/oef/role/ShareholderReportAverageAnnualReturnDetails",
"http://xbrl.sec.gov/oef/role/ShareholderReportLineGraphDetails"
],
"lang": {
"en-us": {
"role": {
"label": "Target 2050 Composite Index [Member]"
}
}
},
"auth_ref": []
},
"cik0000904333_Target2055CompositeIndexMember": {
"xbrltype": "domainItemType",
"nsuri": "http://sct.com/20251031",
"localname": "Target2055CompositeIndexMember",
"presentation": [
"http://xbrl.sec.gov/oef/role/ShareholderReportAverageAnnualReturnDetails",
"http://xbrl.sec.gov/oef/role/ShareholderReportLineGraphDetails"
],
"lang": {
"en-us": {
"role": {
"label": "Target 2055 Composite Index [Member]"
}
}
},
"auth_ref": []
},
"cik0000904333_Target2060CompositeIndexMember": {
"xbrltype": "domainItemType",
"nsuri": "http://sct.com/20251031",
"localname": "Target2060CompositeIndexMember",
"presentation": [
"http://xbrl.sec.gov/oef/role/ShareholderReportAverageAnnualReturnDetails",
"http://xbrl.sec.gov/oef/role/ShareholderReportLineGraphDetails"
],
"lang": {
"en-us": {
"role": {
"label": "Target 2060 Composite Index [Member]"
}
}
},
"auth_ref": []
},
"cik0000904333_Target2065CompositeIndexMember": {
"xbrltype": "domainItemType",
"nsuri": "http://sct.com/20251031",
"localname": "Target2065CompositeIndexMember",
"presentation": [
"http://xbrl.sec.gov/oef/role/ShareholderReportAverageAnnualReturnDetails",
"http://xbrl.sec.gov/oef/role/ShareholderReportLineGraphDetails"
],
"lang": {
"en-us": {
"role": {
"label": "Target 2065 Composite Index [Member]"
}
}
},
"auth_ref": []
},
"cik0000904333_TencentHoldingsLtdMember": {
"xbrltype": "domainItemType",
"nsuri": "http://sct.com/20251031",
"localname": "TencentHoldingsLtdMember",
"presentation": [
"http://xbrl.sec.gov/oef/role/ShareholderReportHoldingsDetails"
],
"lang": {
"en-us": {
"role": {
"label": "Tencent Holdings Ltd. [Member]"
}
}
},
"auth_ref": []
},
"cik0000904333_TeslaIncMember": {
"xbrltype": "domainItemType",
"nsuri": "http://sct.com/20251031",
"localname": "TeslaIncMember",
"presentation": [
"http://xbrl.sec.gov/oef/role/ShareholderReportHoldingsDetails"
],
"lang": {
"en-us": {
"role": {
"label": "Tesla, Inc. [Member]"
}
}
},
"auth_ref": []
},
"cik0000904333_ThermoFisherScientificIncMember": {
"xbrltype": "domainItemType",
"nsuri": "http://sct.com/20251031",
"localname": "ThermoFisherScientificIncMember",
"presentation": [
"http://xbrl.sec.gov/oef/role/ShareholderReportHoldingsDetails"
],
"lang": {
"en-us": {
"role": {
"label": "Thermo Fisher Scientific, Inc. [Member]"
}
}
},
"auth_ref": []
},
"cik0000904333_TotalEnergiesSEMember": {
"xbrltype": "domainItemType",
"nsuri": "http://sct.com/20251031",
"localname": "TotalEnergiesSEMember",
"presentation": [
"http://xbrl.sec.gov/oef/role/ShareholderReportHoldingsDetails"
],
"lang": {
"en-us": {
"role": {
"label": "TotalEnergies SE [Member]"
}
}
},
"auth_ref": []
},
"cik0000904333_ToyotaMotorCorpMember": {
"xbrltype": "domainItemType",
"nsuri": "http://sct.com/20251031",
"localname": "ToyotaMotorCorpMember",
"presentation": [
"http://xbrl.sec.gov/oef/role/ShareholderReportHoldingsDetails"
],
"lang": {
"en-us": {
"role": {
"label": "Toyota Motor Corp. [Member]"
}
}
},
"auth_ref": []
},
"dei_TradingSymbol": {
"xbrltype": "tradingSymbolItemType",
"nsuri": "http://xbrl.sec.gov/dei/2025",
"localname": "TradingSymbol",
"presentation": [
"http://xbrl.sec.gov/oef/role/ShareholderReport"
],
"lang": {
"en-us": {
"role": {
"label": "Trading Symbol",
"terseLabel": "Ticker",
"documentation": "Trading symbol of an instrument as listed on an exchange."
}
}
},
"auth_ref": []
},
"country_US": {
"xbrltype": "domainItemType",
"nsuri": "http://xbrl.sec.gov/country/2025",
"localname": "US",
"presentation": [
"http://xbrl.sec.gov/oef/role/ShareholderReportHoldingsDetails"
],
"lang": {
"en-us": {
"role": {
"label": "UNITED STATES",
"terseLabel": "United States"
}
}
},
"auth_ref": []
},
"cik0000904333_USStocksLargeCapMember": {
"xbrltype": "domainItemType",
"nsuri": "http://sct.com/20251031",
"localname": "USStocksLargeCapMember",
"presentation": [
"http://xbrl.sec.gov/oef/role/ShareholderReportHoldingsDetails"
],
"lang": {
"en-us": {
"role": {
"label": "U.S. Stocks - Large-Cap [Member]"
}
}
},
"auth_ref": []
},
"cik0000904333_USStocksMidCapMember": {
"xbrltype": "domainItemType",
"nsuri": "http://sct.com/20251031",
"localname": "USStocksMidCapMember",
"presentation": [
"http://xbrl.sec.gov/oef/role/ShareholderReportHoldingsDetails"
],
"lang": {
"en-us": {
"role": {
"label": "U.S. Stocks - Mid-Cap [Member]"
}
}
},
"auth_ref": []
},
"cik0000904333_USStocksSmallCapMember": {
"xbrltype": "domainItemType",
"nsuri": "http://sct.com/20251031",
"localname": "USStocksSmallCapMember",
"presentation": [
"http://xbrl.sec.gov/oef/role/ShareholderReportHoldingsDetails"
],
"lang": {
"en-us": {
"role": {
"label": "U.S. Stocks - Small-Cap [Member]"
}
}
},
"auth_ref": []
},
"cik0000904333_UnitedHealthGroupIncMember": {
"xbrltype": "domainItemType",
"nsuri": "http://sct.com/20251031",
"localname": "UnitedHealthGroupIncMember",
"presentation": [
"http://xbrl.sec.gov/oef/role/ShareholderReportHoldingsDetails"
],
"lang": {
"en-us": {
"role": {
"label": "UnitedHealth Group, Inc. [Member]"
}
}
},
"auth_ref": []
},
"oef_UpdPerfInfoLocationTextBlock": {
"xbrltype": "textBlockItemType",
"nsuri": "http://xbrl.sec.gov/oef/2025",
"localname": "UpdPerfInfoLocationTextBlock",
"presentation": [
"http://xbrl.sec.gov/oef/role/ShareholderReport"
],
"lang": {
"en-us": {
"role": {
"label": "Updated Performance Information Location [Text Block]"
}
}
},
"auth_ref": [
"r43"
]
},
"oef_UpdProspectusEmailAddress": {
"xbrltype": "stringItemType",
"nsuri": "http://xbrl.sec.gov/oef/2025",
"localname": "UpdProspectusEmailAddress",
"presentation": [
"http://xbrl.sec.gov/oef/role/ShareholderReport"
],
"lang": {
"en-us": {
"role": {
"label": "Updated Prospectus Email Address"
}
}
},
"auth_ref": [
"r60"
]
},
"oef_UpdProspectusPhoneNumber": {
"xbrltype": "stringItemType",
"nsuri": "http://xbrl.sec.gov/oef/2025",
"localname": "UpdProspectusPhoneNumber",
"presentation": [
"http://xbrl.sec.gov/oef/role/ShareholderReport"
],
"lang": {
"en-us": {
"role": {
"label": "Updated Prospectus Phone Number"
}
}
},
"auth_ref": [
"r60"
]
},
"oef_UpdProspectusWebAddress": {
"xbrltype": "stringItemType",
"nsuri": "http://xbrl.sec.gov/oef/2025",
"localname": "UpdProspectusWebAddress",
"presentation": [
"http://xbrl.sec.gov/oef/role/ShareholderReport"
],
"lang": {
"en-us": {
"role": {
"label": "Updated Prospectus Web Address"
}
}
},
"auth_ref": [
"r60"
]
},
"oef_UtilitiesSectorMember": {
"xbrltype": "domainItemType",
"nsuri": "http://xbrl.sec.gov/oef/2025",
"localname": "UtilitiesSectorMember",
"presentation": [
"http://xbrl.sec.gov/oef/role/ShareholderReportHoldingsDetails"
],
"lang": {
"en-us": {
"role": {
"label": "Utilities Sector [Member]"
}
}
},
"auth_ref": [
"r52"
]
},
"cik0000904333_ValeSAMember": {
"xbrltype": "domainItemType",
"nsuri": "http://sct.com/20251031",
"localname": "ValeSAMember",
"presentation": [
"http://xbrl.sec.gov/oef/role/ShareholderReportHoldingsDetails"
],
"lang": {
"en-us": {
"role": {
"label": "Vale SA [Member]"
}
}
},
"auth_ref": []
},
"cik0000904333_VertivHoldingsCoClassAMember": {
"xbrltype": "domainItemType",
"nsuri": "http://sct.com/20251031",
"localname": "VertivHoldingsCoClassAMember",
"presentation": [
"http://xbrl.sec.gov/oef/role/ShareholderReportHoldingsDetails"
],
"lang": {
"en-us": {
"role": {
"label": "Vertiv Holdings Co., Class A [Member]"
}
}
},
"auth_ref": []
},
"cik0000904333_ViasatIncMember": {
"xbrltype": "domainItemType",
"nsuri": "http://sct.com/20251031",
"localname": "ViasatIncMember",
"presentation": [
"http://xbrl.sec.gov/oef/role/ShareholderReportHoldingsDetails"
],
"lang": {
"en-us": {
"role": {
"label": "Viasat, Inc. [Member]"
}
}
},
"auth_ref": []
},
"cik0000904333_VisaIncClassAMember": {
"xbrltype": "domainItemType",
"nsuri": "http://sct.com/20251031",
"localname": "VisaIncClassAMember",
"presentation": [
"http://xbrl.sec.gov/oef/role/ShareholderReportHoldingsDetails"
],
"lang": {
"en-us": {
"role": {
"label": "Visa, Inc., Class A [Member]"
}
}
},
"auth_ref": []
},
"cik0000904333_WalmartIncMember": {
"xbrltype": "domainItemType",
"nsuri": "http://sct.com/20251031",
"localname": "WalmartIncMember",
"presentation": [
"http://xbrl.sec.gov/oef/role/ShareholderReportHoldingsDetails"
],
"lang": {
"en-us": {
"role": {
"label": "Walmart, Inc. [Member]"
}
}
},
"auth_ref": []
},
"oef_WithSalesLoadMember": {
"xbrltype": "domainItemType",
"nsuri": "http://xbrl.sec.gov/oef/2025",
"localname": "WithSalesLoadMember",
"presentation": [
"http://xbrl.sec.gov/oef/role/ShareholderReportAverageAnnualReturnDetails"
],
"lang": {
"en-us": {
"role": {
"label": "With Sales Load [Member]"
}
}
},
"auth_ref": [
"r44"
]
},
"oef_WithoutSalesLoadMember": {
"xbrltype": "domainItemType",
"nsuri": "http://xbrl.sec.gov/oef/2025",
"localname": "WithoutSalesLoadMember",
"presentation": [
"http://xbrl.sec.gov/oef/role/ShareholderReportAverageAnnualReturnDetails"
],
"lang": {
"en-us": {
"role": {
"label": "Without Sales Load [Member]"
}
}
},
"auth_ref": [
"r44"
]
},
"country_ZA": {
"xbrltype": "domainItemType",
"nsuri": "http://xbrl.sec.gov/country/2025",
"localname": "ZA",
"presentation": [
"http://xbrl.sec.gov/oef/role/ShareholderReportHoldingsDetails"
],
"lang": {
"en-us": {
"role": {
"label": "SOUTH AFRICA"
}
}
},
"auth_ref": []
}
}
}
},
"std_ref": {
"r0": {
"role": "http://fasb.org/us-gaap/role/ref/legacyRef",
"Name": "Accounting Standards Codification",
"Section": "50",
"Paragraph": "1",
"SubTopic": "30",
"Topic": "205",
"Publisher": "FASB",
"URI": "https://asc.fasb.org/1943274/2147479910/205-30-50-1"
},
"r1": {
"role": "http://www.xbrl.org/2003/role/disclosureRef",
"Topic": "946",
"SubTopic": "210",
"Name": "Accounting Standards Codification",
"Section": "50",
"Paragraph": "1",
"Subparagraph": "(b)(1)",
"Publisher": "FASB",
"URI": "https://asc.fasb.org/1943274/2147478795/946-210-50-1"
},
"r2": {
"role": "http://www.xbrl.org/2003/role/disclosureRef",
"Topic": "946",
"SubTopic": "210",
"Name": "Accounting Standards Codification",
"Section": "50",
"Paragraph": "1",
"Subparagraph": "(c)(1)",
"Publisher": "FASB",
"URI": "https://asc.fasb.org/1943274/2147478795/946-210-50-1"
},
"r3": {
"role": "http://www.xbrl.org/2003/role/disclosureRef",
"Topic": "946",
"SubTopic": "210",
"Name": "Accounting Standards Codification",
"Section": "50",
"Paragraph": "1",
"Subparagraph": "(c)(2)",
"Publisher": "FASB",
"URI": "https://asc.fasb.org/1943274/2147478795/946-210-50-1"
},
"r4": {
"role": "http://www.xbrl.org/2003/role/disclosureRef",
"Topic": "946",
"SubTopic": "210",
"Name": "Accounting Standards Codification",
"Section": "50",
"Paragraph": "6",
"Subparagraph": "(a)(1)",
"Publisher": "FASB",
"URI": "https://asc.fasb.org/1943274/2147478795/946-210-50-6"
},
"r5": {
"role": "http://www.xbrl.org/2003/role/disclosureRef",
"Topic": "946",
"SubTopic": "210",
"Name": "Accounting Standards Codification",
"Section": "50",
"Paragraph": "6",
"Subparagraph": "(c)",
"Publisher": "FASB",
"URI": "https://asc.fasb.org/1943274/2147478795/946-210-50-6"
},
"r6": {
"role": "http://www.xbrl.org/2003/role/disclosureRef",
"Topic": "946",
"SubTopic": "320",
"Name": "Accounting Standards Codification",
"Section": "S99",
"Paragraph": "1",
"Subparagraph": "(SX 210.12-12(Column A)(Footnote 1))",
"Publisher": "FASB",
"URI": "https://asc.fasb.org/1943274/2147477271/946-320-S99-1"
},
"r7": {
"role": "http://www.xbrl.org/2003/role/disclosureRef",
"Topic": "946",
"SubTopic": "320",
"Name": "Accounting Standards Codification",
"Section": "S99",
"Paragraph": "1",
"Subparagraph": "(SX 210.12-12(Column C)(Footnote 5))",
"Publisher": "FASB",
"URI": "https://asc.fasb.org/1943274/2147477271/946-320-S99-1"
},
"r8": {
"role": "http://www.xbrl.org/2003/role/disclosureRef",
"Topic": "946",
"SubTopic": "320",
"Name": "Accounting Standards Codification",
"Section": "S99",
"Paragraph": "2",
"Subparagraph": "(SX 210.12-12A(Column C)(Footnote 4))",
"Publisher": "FASB",
"URI": "https://asc.fasb.org/1943274/2147477271/946-320-S99-2"
},
"r9": {
"role": "http://www.xbrl.org/2003/role/disclosureRef",
"Topic": "946",
"SubTopic": "320",
"Name": "Accounting Standards Codification",
"Section": "S99",
"Paragraph": "3",
"Subparagraph": "(SX 210.12-12B(Column A)(Footnote 7))",
"Publisher": "FASB",
"URI": "https://asc.fasb.org/1943274/2147477271/946-320-S99-3"
},
"r10": {
"role": "http://www.xbrl.org/2003/role/disclosureRef",
"Topic": "946",
"SubTopic": "320",
"Name": "Accounting Standards Codification",
"Section": "S99",
"Paragraph": "3",
"Subparagraph": "(SX 210.12-12B(Column C)(Footnote 2))",
"Publisher": "FASB",
"URI": "https://asc.fasb.org/1943274/2147477271/946-320-S99-3"
},
"r11": {
"role": "http://www.xbrl.org/2003/role/disclosureRef",
"Topic": "946",
"SubTopic": "320",
"Name": "Accounting Standards Codification",
"Section": "S99",
"Paragraph": "5D",
"Subparagraph": "(SX 210.12-13D(Column A)(Footnote 2)(i))",
"Publisher": "FASB",
"URI": "https://asc.fasb.org/1943274/2147477271/946-320-S99-5D"
},
"r12": {
"role": "http://www.xbrl.org/2003/role/disclosureRef",
"Topic": "946",
"SubTopic": "320",
"Name": "Accounting Standards Codification",
"Section": "S99",
"Paragraph": "6",
"Subparagraph": "(SX 210.12-14(Column F)(Footnote 7))",
"Publisher": "FASB",
"URI": "https://asc.fasb.org/1943274/2147477271/946-320-S99-6"
},
"r13": {
"role": "http://www.xbrl.org/2003/role/disclosureRef",
"Topic": "946",
"SubTopic": "320",
"Name": "Accounting Standards Codification",
"Section": "S99",
"Paragraph": "7",
"Subparagraph": "(SX 210.12-15(Column A))",
"Publisher": "FASB",
"URI": "https://asc.fasb.org/1943274/2147477271/946-320-S99-7"
},
"r14": {
"role": "http://www.xbrl.org/2003/role/disclosureRef",
"Topic": "946",
"SubTopic": "320",
"Name": "Accounting Standards Codification",
"Section": "S99",
"Paragraph": "7",
"Subparagraph": "(SX 210.12-15(Column B))",
"Publisher": "FASB",
"URI": "https://asc.fasb.org/1943274/2147477271/946-320-S99-7"
},
"r15": {
"role": "http://www.xbrl.org/2003/role/disclosureRef",
"Topic": "946",
"SubTopic": "320",
"Name": "Accounting Standards Codification",
"Section": "S99",
"Paragraph": "7",
"Subparagraph": "(SX 210.12-15(Column C))",
"Publisher": "FASB",
"URI": "https://asc.fasb.org/1943274/2147477271/946-320-S99-7"
},
"r16": {
"role": "http://www.xbrl.org/2003/role/disclosureRef",
"Topic": "946",
"SubTopic": "320",
"Name": "Accounting Standards Codification",
"Section": "S99",
"Paragraph": "7",
"Subparagraph": "(SX 210.12-15(Column D))",
"Publisher": "FASB",
"URI": "https://asc.fasb.org/1943274/2147477271/946-320-S99-7"
},
"r17": {
"role": "http://www.xbrl.org/2003/role/exampleRef",
"Topic": "326",
"SubTopic": "20",
"Name": "Accounting Standards Codification",
"Section": "55",
"Paragraph": "12",
"Subparagraph": "(c)(1)",
"Publisher": "FASB",
"URI": "https://asc.fasb.org/1943274/2147479294/326-20-55-12"
},
"r18": {
"role": "http://www.xbrl.org/2003/role/exampleRef",
"Topic": "820",
"SubTopic": "10",
"Name": "Accounting Standards Codification",
"Section": "55",
"Paragraph": "100",
"Publisher": "FASB",
"URI": "https://asc.fasb.org/1943274/2147482078/820-10-55-100"
},
"r19": {
"role": "http://www.xbrl.org/2003/role/exampleRef",
"Topic": "820",
"SubTopic": "10",
"Name": "Accounting Standards Codification",
"Section": "55",
"Paragraph": "101",
"Publisher": "FASB",
"URI": "https://asc.fasb.org/1943274/2147482078/820-10-55-101"
},
"r20": {
"role": "http://www.xbrl.org/2003/role/exampleRef",
"Topic": "820",
"SubTopic": "10",
"Name": "Accounting Standards Codification",
"Section": "55",
"Paragraph": "103",
"Publisher": "FASB",
"URI": "https://asc.fasb.org/1943274/2147482078/820-10-55-103"
},
"r21": {
"role": "http://www.xbrl.org/2003/role/exampleRef",
"Topic": "946",
"SubTopic": "210",
"Name": "Accounting Standards Codification",
"Section": "55",
"Paragraph": "1",
"Publisher": "FASB",
"URI": "https://asc.fasb.org/1943274/2147477439/946-210-55-1"
},
"r22": {
"role": "http://www.xbrl.org/2003/role/presentationRef",
"Publisher": "SEC",
"Name": "Exchange Act",
"Number": "240",
"Section": "12",
"Subsection": "b-2"
},
"r23": {
"role": "http://www.xbrl.org/2003/role/presentationRef",
"Publisher": "SEC",
"Name": "Exchange Act",
"Number": "240",
"Section": "12",
"Subsection": "d1-1"
},
"r24": {
"role": "http://www.xbrl.org/2003/role/presentationRef",
"Publisher": "SEC",
"Name": "Form N-1A",
"Section": "1",
"Subsection": "a",
"Paragraph": "1"
},
"r25": {
"role": "http://www.xbrl.org/2003/role/presentationRef",
"Publisher": "SEC",
"Name": "Form N-1A",
"Section": "27A",
"Subsection": "b",
"Paragraph": "1"
},
"r26": {
"role": "http://www.xbrl.org/2003/role/presentationRef",
"Publisher": "SEC",
"Name": "Form N-1A",
"Section": "27A",
"Subsection": "b",
"Paragraph": "3"
},
"r27": {
"role": "http://www.xbrl.org/2003/role/presentationRef",
"Publisher": "SEC",
"Name": "Form N-1A",
"Section": "27A",
"Subsection": "b",
"Paragraph": "4"
},
"r28": {
"role": "http://www.xbrl.org/2003/role/presentationRef",
"Publisher": "SEC",
"Name": "Form N-1A",
"Section": "27A",
"Subsection": "b",
"Paragraph": "5"
},
"r29": {
"role": "http://www.xbrl.org/2003/role/presentationRef",
"Publisher": "SEC",
"Name": "Form N-1A",
"Section": "27A",
"Subsection": "b",
"Paragraph": "instruction",
"Subparagraph": "2"
},
"r30": {
"role": "http://www.xbrl.org/2003/role/presentationRef",
"Publisher": "SEC",
"Name": "Form N-1A",
"Section": "27A",
"Subsection": "c"
},
"r31": {
"role": "http://www.xbrl.org/2003/role/presentationRef",
"Publisher": "SEC",
"Name": "Form N-1A",
"Section": "27A",
"Subsection": "c",
"Paragraph": "ii"
},
"r32": {
"role": "http://www.xbrl.org/2003/role/presentationRef",
"Publisher": "SEC",
"Name": "Form N-1A",
"Section": "27A",
"Subsection": "c",
"Paragraph": "iii"
},
"r33": {
"role": "http://www.xbrl.org/2003/role/presentationRef",
"Publisher": "SEC",
"Name": "Form N-1A",
"Section": "27A",
"Subsection": "c",
"Paragraph": "instruction",
"Sentence": "1",
"Clause": "b"
},
"r34": {
"role": "http://www.xbrl.org/2003/role/presentationRef",
"Publisher": "SEC",
"Name": "Form N-1A",
"Section": "27A",
"Subsection": "c",
"Paragraph": "instruction",
"Subparagraph": "1",
"Clause": "c"
},
"r35": {
"role": "http://www.xbrl.org/2003/role/presentationRef",
"Publisher": "SEC",
"Name": "Form N-1A",
"Section": "27A",
"Subsection": "c",
"Paragraph": "instruction",
"Subparagraph": "1",
"Clause": "d"
},
"r36": {
"role": "http://www.xbrl.org/2003/role/presentationRef",
"Publisher": "SEC",
"Name": "Form N-1A",
"Section": "27A",
"Subsection": "d",
"Paragraph": "1"
},
"r37": {
"role": "http://www.xbrl.org/2003/role/presentationRef",
"Publisher": "SEC",
"Name": "Form N-1A",
"Section": "27A",
"Subsection": "d",
"Paragraph": "2"
},
"r38": {
"role": "http://www.xbrl.org/2003/role/presentationRef",
"Publisher": "SEC",
"Name": "Form N-1A",
"Section": "27A",
"Subsection": "d",
"Paragraph": "2",
"Subparagraph": "i"
},
"r39": {
"role": "http://www.xbrl.org/2003/role/presentationRef",
"Publisher": "SEC",
"Name": "Form N-1A",
"Section": "27A",
"Subsection": "d",
"Paragraph": "2",
"Subparagraph": "iii",
"Clause": "B"
},
"r40": {
"role": "http://www.xbrl.org/2003/role/presentationRef",
"Publisher": "SEC",
"Name": "Form N-1A",
"Section": "27A",
"Subsection": "d",
"Paragraph": "2",
"Subparagraph": "iiii",
"Clause": "A"
},
"r41": {
"role": "http://www.xbrl.org/2003/role/presentationRef",
"Publisher": "SEC",
"Name": "Form N-1A",
"Section": "27A",
"Subsection": "d",
"Paragraph": "2",
"Subparagraph": "instruction",
"Clause": "12"
},
"r42": {
"role": "http://www.xbrl.org/2003/role/presentationRef",
"Publisher": "SEC",
"Name": "Form N-1A",
"Section": "27A",
"Subsection": "d",
"Paragraph": "2",
"Subparagraph": "instruction",
"Clause": "14"
},
"r43": {
"role": "http://www.xbrl.org/2003/role/presentationRef",
"Publisher": "SEC",
"Name": "Form N-1A",
"Section": "27A",
"Subsection": "d",
"Paragraph": "2",
"Subparagraph": "instruction",
"Clause": "15"
},
"r44": {
"role": "http://www.xbrl.org/2003/role/presentationRef",
"Publisher": "SEC",
"Name": "Form N-1A",
"Section": "27A",
"Subsection": "d",
"Paragraph": "2",
"Subparagraph": "instruction",
"Clause": "7"
},
"r45": {
"role": "http://www.xbrl.org/2003/role/presentationRef",
"Publisher": "SEC",
"Name": "Form N-1A",
"Section": "27A",
"Subsection": "d",
"Paragraph": "2",
"Subparagraph": "instruction",
"Clause": "8"
},
"r46": {
"role": "http://www.xbrl.org/2003/role/presentationRef",
"Publisher": "SEC",
"Name": "Form N-1A",
"Section": "27A",
"Subsection": "d",
"Paragraph": "3"
},
"r47": {
"role": "http://www.xbrl.org/2003/role/presentationRef",
"Publisher": "SEC",
"Name": "Form N-1A",
"Section": "27A",
"Subsection": "d",
"Paragraph": "4"
},
"r48": {
"role": "http://www.xbrl.org/2003/role/presentationRef",
"Publisher": "SEC",
"Name": "Form N-1A",
"Section": "27A",
"Subsection": "d",
"Paragraph": "4",
"Subparagraph": "instruction",
"Clause": "3"
},
"r49": {
"role": "http://www.xbrl.org/2003/role/presentationRef",
"Publisher": "SEC",
"Name": "Form N-1A",
"Section": "27A",
"Subsection": "d",
"Paragraph": "4",
"Subparagraph": "instruction",
"Clause": "4"
},
"r50": {
"role": "http://www.xbrl.org/2003/role/presentationRef",
"Publisher": "SEC",
"Name": "Form N-1A",
"Section": "27A",
"Subsection": "e"
},
"r51": {
"role": "http://www.xbrl.org/2003/role/presentationRef",
"Publisher": "SEC",
"Name": "Form N-1A",
"Section": "27A",
"Subsection": "e",
"Paragraph": "instruction",
"Subparagraph": "6"
},
"r52": {
"role": "http://www.xbrl.org/2003/role/presentationRef",
"Publisher": "SEC",
"Name": "Form N-1A",
"Section": "27A",
"Subsection": "f"
},
"r53": {
"role": "http://www.xbrl.org/2003/role/presentationRef",
"Publisher": "SEC",
"Name": "Form N-1A",
"Section": "27A",
"Subsection": "g"
},
"r54": {
"role": "http://www.xbrl.org/2003/role/presentationRef",
"Publisher": "SEC",
"Name": "Form N-1A",
"Section": "27A",
"Subsection": "g",
"Paragraph": "1"
},
"r55": {
"role": "http://www.xbrl.org/2003/role/presentationRef",
"Publisher": "SEC",
"Name": "Form N-1A",
"Section": "27A",
"Subsection": "g",
"Paragraph": "2"
},
"r56": {
"role": "http://www.xbrl.org/2003/role/presentationRef",
"Publisher": "SEC",
"Name": "Form N-1A",
"Section": "27A",
"Subsection": "g",
"Paragraph": "3"
},
"r57": {
"role": "http://www.xbrl.org/2003/role/presentationRef",
"Publisher": "SEC",
"Name": "Form N-1A",
"Section": "27A",
"Subsection": "g",
"Paragraph": "4"
},
"r58": {
"role": "http://www.xbrl.org/2003/role/presentationRef",
"Publisher": "SEC",
"Name": "Form N-1A",
"Section": "27A",
"Subsection": "g",
"Paragraph": "5"
},
"r59": {
"role": "http://www.xbrl.org/2003/role/presentationRef",
"Publisher": "SEC",
"Name": "Form N-1A",
"Section": "27A",
"Subsection": "g",
"Paragraph": "6"
},
"r60": {
"role": "http://www.xbrl.org/2003/role/presentationRef",
"Publisher": "SEC",
"Name": "Form N-1A",
"Section": "27A",
"Subsection": "g",
"Paragraph": "instruction",
"Subparagraph": "2"
},
"r61": {
"role": "http://www.xbrl.org/2003/role/presentationRef",
"Publisher": "SEC",
"Name": "Form N-1A",
"Section": "27A",
"Subsection": "h",
"Paragraph": "1"
},
"r62": {
"role": "http://www.xbrl.org/2003/role/presentationRef",
"Publisher": "SEC",
"Name": "Form N-1A",
"Section": "27A",
"Subsection": "h",
"Paragraph": "2"
},
"r63": {
"role": "http://www.xbrl.org/2003/role/presentationRef",
"Publisher": "SEC",
"Name": "Form N-1A",
"Section": "3",
"Subsection": "instruction",
"Paragraph": "1",
"Subparagraph": "d",
"Sentence": "i"
},
"r64": {
"role": "http://www.xbrl.org/2003/role/presentationRef",
"Publisher": "SEC",
"Name": "Form N-1A",
"Section": "4",
"Subsection": "b",
"Paragraph": "2",
"Subparagraph": "i"
},
"r65": {
"role": "http://www.xbrl.org/2003/role/presentationRef",
"Publisher": "SEC",
"Name": "Form N-1A",
"Section": "4",
"Subsection": "b",
"Paragraph": "2",
"Subparagraph": "iii"
},
"r66": {
"role": "http://www.xbrl.org/2003/role/presentationRef",
"Publisher": "SEC",
"Name": "Regulation S-T",
"Number": "232",
"Section": "313"
},
"r67": {
"role": "http://www.xbrl.org/2009/role/commonPracticeRef",
"Topic": "946",
"SubTopic": "205",
"Name": "Accounting Standards Codification",
"Section": "50",
"Paragraph": "27",
"Publisher": "FASB",
"URI": "https://asc.fasb.org/1943274/2147478494/946-205-50-27"
},
"r68": {
"role": "http://www.xbrl.org/2009/role/commonPracticeRef",
"Topic": "946",
"SubTopic": "320",
"Name": "Accounting Standards Codification",
"Section": "S99",
"Paragraph": "1",
"Subparagraph": "(SX 210.12-12(Column A)(Footnote 2)(ii))",
"Publisher": "FASB",
"URI": "https://asc.fasb.org/1943274/2147477271/946-320-S99-1"
},
"r69": {
"role": "http://www.xbrl.org/2009/role/commonPracticeRef",
"Topic": "946",
"SubTopic": "320",
"Name": "Accounting Standards Codification",
"Section": "S99",
"Paragraph": "2",
"Subparagraph": "(SX 210.12-12A(Column A)(Footnote 2))",
"Publisher": "FASB",
"URI": "https://asc.fasb.org/1943274/2147477271/946-320-S99-2"
},
"r70": {
"role": "http://www.xbrl.org/2009/role/commonPracticeRef",
"Topic": "946",
"SubTopic": "320",
"Name": "Accounting Standards Codification",
"Section": "S99",
"Paragraph": "3",
"Subparagraph": "(SX 210.12-12B(Column A)(Footnote 1)(b))",
"Publisher": "FASB",
"URI": "https://asc.fasb.org/1943274/2147477271/946-320-S99-3"
},
"r71": {
"role": "http://www.xbrl.org/2009/role/commonPracticeRef",
"Topic": "946",
"SubTopic": "320",
"Name": "Accounting Standards Codification",
"Section": "S99",
"Paragraph": "5",
"Subparagraph": "(SX 210.12-13(Column A)(Footnote 3))",
"Publisher": "FASB",
"URI": "https://asc.fasb.org/1943274/2147477271/946-320-S99-5"
},
"r72": {
"role": "http://www.xbrl.org/2009/role/commonPracticeRef",
"Topic": "946",
"SubTopic": "320",
"Name": "Accounting Standards Codification",
"Section": "S99",
"Paragraph": "5C",
"Subparagraph": "(SX 210.12-13C(Column A)(Footnote 3))",
"Publisher": "FASB",
"URI": "https://asc.fasb.org/1943274/2147477271/946-320-S99-5C"
},
"r73": {
"role": "http://www.xbrl.org/2009/role/commonPracticeRef",
"Topic": "946",
"SubTopic": "320",
"Name": "Accounting Standards Codification",
"Section": "S99",
"Paragraph": "5C",
"Subparagraph": "(SX 210.12-13C(Column B)(Footnote 3))",
"Publisher": "FASB",
"URI": "https://asc.fasb.org/1943274/2147477271/946-320-S99-5C"
},
"r74": {
"role": "http://www.xbrl.org/2009/role/commonPracticeRef",
"Topic": "946",
"SubTopic": "320",
"Name": "Accounting Standards Codification",
"Section": "S99",
"Paragraph": "6",
"Subparagraph": "(SX 210.12-14(Column A)(Footnote 2))",
"Publisher": "FASB",
"URI": "https://asc.fasb.org/1943274/2147477271/946-320-S99-6"
}
}
}