UNITED STATES
SECURITIES AND EXCHANGE COMMISSION
Washington, D.C. 20549
FORM N-CSR
CERTIFIED
SHAREHOLDER REPORT OF REGISTERED
MANAGEMENT INVESTMENT COMPANIES
Investment Company Act File number: 811-06563
Calvert World Values Fund, Inc.
(Exact Name of Registrant as Specified in Charter)
1825
Connecticut Avenue NW, Suite 400, Washington, DC 20009
(Address of Principal Executive Offices)
Deidre E. Walsh
Two
International Place, Boston, Massachusetts 02110
(Name and Address of Agent for Service)
(202) 238-2200
(Registrant’s telephone number)
September 30
Date
of Fiscal Year End
March 31, 2022
Date of Reporting Period
Item 1. Report to Stockholders.
Calvert
Mid-Cap Fund
Semiannual Report
March 31, 2022
Commodity Futures Trading Commission Registration. The Commodity Futures Trading Commission (“CFTC”) has adopted regulations that subject registered investment companies and advisers to regulation by the CFTC if a fund invests more than a
prescribed level of its assets in certain CFTC-regulated instruments (including futures, certain options and swap agreements) or markets itself as providing investment exposure to such instruments. The adviser has claimed an exclusion from the
definition of “commodity pool operator” under the Commodity Exchange Act with respect to its management of the Fund and the other funds it manages. Accordingly, neither the Fund nor the adviser is subject to CFTC regulation.
Fund shares are not insured by the FDIC and are not deposits or
other obligations of, or guaranteed by, any depository institution. Shares are subject to investment risks, including possible loss of principal invested.
This report must be preceded or accompanied by a current
summary prospectus or prospectus. Before investing, investors should consider carefully the investment objective, risks, and charges and expenses of a mutual fund. This and other important information is contained in the summary prospectus and
prospectus, which can be obtained from a financial intermediary. Prospective investors should read the prospectus carefully before investing. For further information, please call 1-800-368-2745.
Choose Planet-friendly E-delivery!
Sign up now for on-line statements, prospectuses, and fund
reports. In less than five minutes you can help reduce paper mail and lower fund costs.
Just go to
www.calvert.com. If you already have an online account with the Calvert funds, click on Login to access your Account and select the documents you would like to receive via e-mail.
If you’re new to online account access, click on Login,
then Register to create your user name and password. Once you’re in, click on the E-delivery sign-up on the Account Portfolio page and follow the quick, easy steps.
Note: If your shares are not
held directly with the Calvert funds but through a brokerage firm, you must contact your broker for electronic delivery options available through their firm.
Semiannual Report March 31, 2022
Calvert
Mid-Cap Fund
Calvert
Mid-Cap Fund
March 31, 2022
Performance
Portfolio Manager(s) Charles B.
Gaffney of Calvert Research and Management
| %
Average Annual Total Returns1,2 |
Class
Inception Date |
Performance
Inception Date |
Six
Months |
One
Year |
Five
Years |
Ten
Years |
| Class
A at NAV |
10/31/1994
|
10/31/1994
|
(1.22)%
|
1.93%
|
10.10%
|
9.19%
|
| Class
A with 4.75% Maximum Sales Charge |
—
|
—
|
(5.90)
|
(2.91)
|
9.03
|
8.66
|
| Class
C at NAV |
10/31/1994
|
10/31/1994
|
(1.53)
|
1.22
|
9.28
|
8.52
|
| Class
C with 1% Maximum Sales Charge |
—
|
—
|
(2.35)
|
0.39
|
9.28
|
8.52
|
| Class
I at NAV |
06/03/2003
|
10/31/1994
|
(1.08)
|
2.21
|
10.43
|
9.65
|
|
| Russell
Midcap® Index |
—
|
—
|
0.39%
|
6.92%
|
12.61%
|
12.85%
|
| %
Total Annual Operating Expense Ratios3 |
Class
A |
Class
C |
Class
I |
| Gross
|
1.22%
|
1.98%
|
0.97%
|
| Net
|
1.18
|
1.93
|
0.93
|
See Endnotes and Additional Disclosures in this report.
Past performance is no guarantee of future results. Returns are historical and
are calculated by determining the percentage change in net asset value (NAV) or offering price (as applicable) with all distributions reinvested. Investment return and principal value will fluctuate so that shares, when redeemed, may be worth more
or less than their original cost. Performance for periods less than or equal to one year is cumulative. Performance is for the stated time period only; due to market volatility, current Fund performance may be lower or higher than the quoted return.
For performance as of the most recent month-end, please refer to www.calvert.com.
Calvert
Mid-Cap Fund
March 31, 2022
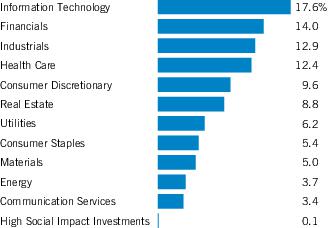
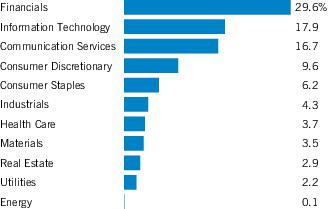
Sector Allocation (% of net assets)*
*Excludes cash
and cash equivalents.
| Top
10 Holdings (% of net assets)* |
|
| Baker
Hughes Co. |
3.7%
|
| Xcel
Energy, Inc. |
2.5
|
| Assurant,
Inc. |
2.3
|
| Lamar
Advertising Co., Class A |
2.3
|
| Mid-America
Apartment Communities, Inc. |
2.3
|
| Healthpeak
Properties, Inc. |
2.2
|
| Tradeweb
Markets, Inc., Class A |
2.2
|
| WEX,
Inc. |
2.1
|
| Verisk
Analytics, Inc. |
2.1
|
| Travelers
Cos., Inc. (The) |
2.1
|
| Total
|
23.8%
|
| *
|
Excludes
cash and cash equivalents. |
Calvert
Mid-Cap Fund
March 31, 2022
Endnotes and
Additional Disclosures
| 1 |
Russell Midcap® Index is an unmanaged index of U.S. mid-cap stocks. Unless otherwise stated, index returns do not reflect the effect of any applicable sales charges, commissions, expenses,
taxes or leverage, as applicable. It is not possible to invest directly in an index. |
|
2 |
Total
Returns at NAV do not include applicable sales charges. If sales charges were deducted, the returns would be lower. Total Returns shown with maximum sales charge reflect the stated maximum sales charge. Unless otherwise stated, performance does not
reflect the deduction of taxes on Fund distributions or redemptions of Fund shares.Effective November 5, 2020, Class C shares automatically convert to Class A shares eight years after purchase. The average annual
total returns listed for Class C reflect conversion to Class A shares after eight years. Prior to November 5, 2020, Class C shares automatically converted to Class A shares ten years after purchase.Calvert Research
and Management became the investment adviser to the Fund on December 31, 2016. Performance reflected prior to such date is that of the Fund’s former investment adviser. |
|
3 |
Source:
Fund prospectus. Net expense ratios reflect a contractual expense reimbursement that continues through 1/31/23. The expense ratios for the current reporting period can be found in the Financial Highlights section of this report. Performance
reflects expenses waived and/or reimbursed, if applicable. Without such waivers and/or reimbursements, performance would have been lower.Fund profile subject to change due to active management. |
Calvert
Mid-Cap Fund
March 31, 2022
Example
As a Fund shareholder, you incur two types of costs: (1)
transaction costs, including sales charges (loads) on purchases and redemption fees (if applicable); and (2) ongoing costs, including management fees; distribution and/or service fees; and other Fund expenses. This Example is intended to help you
understand your ongoing costs (in dollars) of Fund investing and to compare these costs with the ongoing costs of investing in other mutual funds. The Example is based on an investment of $1,000 invested at the beginning of the period and held for
the entire period (October 1, 2021 to March 31, 2022).
Actual Expenses
The first section of the table below provides information about
actual account values and actual expenses. You may use the information in this section, together with the amount you invested, to estimate the expenses that you paid over the period. Simply divide your account value by $1,000 (for example, an $8,600
account value divided by $1,000 = 8.6), then multiply the result by the number in the first section under the heading entitled “Expenses Paid During Period” to estimate the expenses you paid on your account during this period.
Hypothetical Example for Comparison Purposes
The second section of the table below provides information
about hypothetical account values and hypothetical expenses based on the actual Fund expense ratio and an assumed rate of return of 5% per year (before expenses), which is not the actual Fund return. The hypothetical account values and expenses may
not be used to estimate the actual ending account balance or expenses you paid for the period. You may use this information to compare the ongoing costs of investing in the Fund and other funds. To do so, compare this 5% hypothetical example with
the 5% hypothetical examples that appear in the shareholder reports of the other funds.
Please note that the expenses shown in the table are meant to
highlight your ongoing costs only and do not reflect any transactional costs, such as sales charges (loads) or redemption fees (if applicable). Therefore, the second section of the table is useful in comparing ongoing costs only, and will not help
you determine the relative total costs of owning different funds. In addition, if these transactional costs were included, your costs would be higher.
| |
Beginning
Account Value
(10/1/21) |
Ending
Account Value
(3/31/22) |
Expenses
Paid
During Period*
(10/1/21 – 3/31/22) |
Annualized
Expense
Ratio |
| Actual
|
|
|
|
|
| Class
A |
$1,000.00
|
$
987.80 |
$5.85
** |
1.18%
|
| Class
C |
$1,000.00
|
$
984.70 |
$9.55
** |
1.93%
|
| Class
I |
$1,000.00
|
$
989.20 |
$4.61
** |
0.93%
|
| Hypothetical
|
|
|
|
|
| (5%
return per year before expenses) |
|
|
|
|
| Class
A |
$1,000.00
|
$1,019.05
|
$5.94
** |
1.18%
|
| Class
C |
$1,000.00
|
$1,015.31
|
$9.70
** |
1.93%
|
| Class
I |
$1,000.00
|
$1,020.29
|
$4.68
** |
0.93%
|
| *
|
Expenses
are equal to the Fund's annualized expense ratio for the indicated Class, multiplied by the average account value over the period, multiplied by 182/365 (to reflect the one-half year period). The Example assumes that the $1,000 was invested at the
net asset value per share determined at the close of business on September 30, 2021. |
| **
|
Absent
a waiver and/or reimbursement of expenses by an affiliate, expenses would be higher. |
Calvert
Mid-Cap Fund
March 31, 2022
Schedule of
Investments (Unaudited)
| Security
|
Shares
|
Value
|
| Auto
Components — 1.6% |
|
| Aptiv
PLC(1) |
|
41,138
|
$
4,924,630 |
| |
|
|
$ 4,924,630
|
| Banks
— 3.1% |
|
| Commerce
Bancshares, Inc. |
|
68,281
|
$
4,888,237 |
| KeyCorp
|
|
222,948
|
4,989,576
|
| |
|
|
$ 9,877,813
|
| Beverages
— 1.1% |
|
| Coca-Cola
Europacific Partners PLC |
|
69,460
|
$
3,376,451 |
| |
|
|
$
3,376,451 |
| Biotechnology
— 0.8% |
|
| Neurocrine
Biosciences, Inc.(1) |
|
27,576
|
$
2,585,250 |
| |
|
|
$
2,585,250 |
| Building
Products — 0.8% |
|
| AZEK
Co., Inc. (The)(1) |
|
102,725
|
$
2,551,689 |
| |
|
|
$
2,551,689 |
| Capital
Markets — 5.4% |
|
| Morningstar,
Inc. |
|
23,398
|
$
6,391,632 |
| Raymond
James Financial, Inc. |
|
35,607
|
3,913,565
|
| Tradeweb
Markets, Inc., Class A |
|
77,563
|
6,815,461
|
| |
|
|
$
17,120,658 |
| Chemicals
— 1.2% |
|
| FMC
Corp. |
|
30,099
|
$
3,960,125 |
| |
|
|
$
3,960,125 |
| Commercial
Services & Supplies — 2.7% |
|
| GFL
Environmental, Inc. |
|
121,279
|
$
3,944,490 |
| Tetra
Tech, Inc. |
|
28,300
|
4,667,802
|
| |
|
|
$
8,612,292 |
| Communications
Equipment — 2.6% |
|
| F5,
Inc.(1) |
|
16,694
|
$
3,488,211 |
| Motorola
Solutions, Inc. |
|
19,315
|
4,678,093
|
| |
|
|
$
8,166,304 |
| Containers
& Packaging — 2.4% |
|
| AptarGroup,
Inc. |
|
27,323
|
$
3,210,452 |
| Packaging
Corp. of America |
|
28,336
|
4,423,533
|
| |
|
|
$
7,633,985 |
| Security
|
Shares
|
Value
|
| Diversified
Consumer Services — 2.4% |
|
| Bright
Horizons Family Solutions, Inc.(1) |
|
27,077
|
$
3,592,847 |
| Terminix
Global Holdings, Inc.(1) |
|
90,804
|
4,143,387
|
| |
|
|
$ 7,736,234
|
| Electric
Utilities — 2.5% |
|
| Xcel
Energy, Inc. |
|
108,930
|
$
7,861,478 |
| |
|
|
$ 7,861,478
|
| Electrical
Equipment — 1.8% |
|
| AMETEK,
Inc. |
|
42,339
|
$
5,638,708 |
| |
|
|
$
5,638,708 |
| Electronic
Equipment, Instruments & Components — 1.3% |
|
| TE
Connectivity, Ltd. |
|
30,686
|
$
4,019,252 |
| |
|
|
$
4,019,252 |
| Energy
Equipment & Services — 3.7% |
|
| Baker
Hughes Co. |
|
320,090
|
$
11,654,477 |
| |
|
|
$
11,654,477 |
| Entertainment
— 1.9% |
|
| Electronic
Arts, Inc. |
|
46,424
|
$
5,873,100 |
| |
|
|
$
5,873,100 |
| Equity
Real Estate Investment Trusts (REITs) — 8.8% |
|
| EastGroup
Properties, Inc. |
|
31,353
|
$
6,373,438 |
| Healthpeak
Properties, Inc. |
|
206,317
|
7,082,862
|
| Lamar
Advertising Co., Class A |
|
61,750
|
7,174,115
|
| Mid-America
Apartment Communities, Inc. |
|
34,086
|
7,139,313
|
| |
|
|
$
27,769,728 |
| Food
& Staples Retailing — 2.8% |
|
| BJ's
Wholesale Club Holdings, Inc.(1) |
|
67,757
|
$
4,581,051 |
| Performance
Food Group Co.(1) |
|
82,401
|
4,195,035
|
| |
|
|
$
8,776,086 |
| Food
Products — 1.6% |
|
| Hershey
Co. (The) |
|
22,831
|
$
4,945,880 |
| |
|
|
$
4,945,880 |
| Health
Care Equipment & Supplies — 3.1% |
|
| Envista
Holdings Corp.(1) |
|
94,046
|
$
4,580,981 |
| Teleflex,
Inc. |
|
14,875
|
5,278,096
|
| |
|
|
$
9,859,077 |
6
See Notes to Financial Statements.
Calvert
Mid-Cap Fund
March 31, 2022
Schedule of
Investments (Unaudited) — continued
| Security
|
Shares
|
Value
|
| Health
Care Providers & Services — 3.3% |
|
| LHC
Group, Inc.(1) |
|
21,798
|
$
3,675,143 |
| R1
RCM, Inc.(1) |
|
246,933
|
6,607,927
|
| |
|
|
$ 10,283,070
|
| Hotels,
Restaurants & Leisure — 1.1% |
|
| Wyndham
Hotels & Resorts, Inc. |
|
39,356
|
$
3,333,060 |
| |
|
|
$ 3,333,060
|
| Independent
Power and Renewable Electricity Producers — 1.8% |
|
| NextEra
Energy Partners, L.P. |
|
69,633
|
$
5,804,607 |
| |
|
|
$
5,804,607 |
| Insurance
— 5.4% |
|
| Allstate
Corp. (The) |
|
23,963
|
$
3,319,115 |
| Assurant,
Inc. |
|
39,750
|
7,227,743
|
| Travelers
Cos., Inc. (The) |
|
36,370
|
6,645,890
|
| |
|
|
$
17,192,748 |
| Interactive
Media & Services — 1.5% |
|
| CarGurus,
Inc.(1) |
|
115,619
|
$
4,909,183 |
| |
|
|
$
4,909,183 |
| IT
Services — 5.0% |
|
| Broadridge
Financial Solutions, Inc. |
|
36,237
|
$
5,642,463 |
| Euronet
Worldwide, Inc.(1) |
|
25,980
|
3,381,297
|
| WEX,
Inc.(1) |
|
37,519
|
6,695,266
|
| |
|
|
$
15,719,026 |
| Life
Sciences Tools & Services — 5.2% |
|
| Agilent
Technologies, Inc. |
|
37,576
|
$
4,972,432 |
| Avantor,
Inc.(1) |
|
103,725
|
3,507,980
|
| PerkinElmer,
Inc. |
|
21,255
|
3,708,147
|
| Waters
Corp.(1) |
|
13,503
|
4,191,196
|
| |
|
|
$
16,379,755 |
| Machinery
— 4.2% |
|
| Colfax
Corp.(1) |
|
97,207
|
$
3,867,867 |
| Stanley
Black & Decker, Inc. |
|
20,250
|
2,830,747
|
| Westinghouse
Air Brake Technologies Corp. |
|
68,597
|
6,596,973
|
| |
|
|
$
13,295,587 |
| Metals
& Mining — 1.4% |
|
| Steel
Dynamics, Inc. |
|
51,524
|
$
4,298,647 |
| |
|
|
$
4,298,647 |
| Security
|
Shares
|
Value
|
| Multi-Utilities
— 1.8% |
|
| Sempra
Energy |
|
34,624
|
$
5,820,987 |
| |
|
|
$ 5,820,987
|
| Professional
Services — 3.4% |
|
| Booz
Allen Hamilton Holding Corp. |
|
46,150
|
$
4,053,816 |
| Verisk
Analytics, Inc. |
|
31,137
|
6,682,934
|
| |
|
|
$ 10,736,750
|
| Semiconductors
& Semiconductor Equipment — 3.0% |
|
| Entegris,
Inc. |
|
22,008
|
$
2,888,770 |
| ON
Semiconductor Corp.(1) |
|
37,727
|
2,362,087
|
| Teradyne,
Inc. |
|
35,390
|
4,184,160
|
| |
|
|
$
9,435,017 |
| Software
— 5.8% |
|
| ANSYS,
Inc.(1) |
|
13,907
|
$
4,417,559 |
| Bill.com
Holdings, Inc.(1) |
|
18,152
|
4,116,692
|
| Black
Knight, Inc.(1) |
|
67,756
|
3,929,170
|
| Fair
Isaac Corp.(1) |
|
12,282
|
5,729,062
|
| |
|
|
$
18,192,483 |
| Specialty
Retail — 4.5% |
|
| Bath
& Body Works, Inc. |
|
92,776
|
$
4,434,693 |
| Ross
Stores, Inc. |
|
64,872
|
5,868,321
|
| Ulta
Beauty, Inc.(1) |
|
10,002
|
3,982,996
|
| |
|
|
$
14,286,010 |
Total
Common Stocks
(identified cost $263,035,570) |
|
|
$312,630,147
|
| High
Social Impact Investments — 0.1% |
| Security
|
Principal
Amount
(000's omitted) |
Value
|
| Calvert
Impact Capital, Inc., Community Investment Notes, 1.50%, 12/15/23(2)(3) |
$
|
360
|
$
342,695 |
| ImpactAssets,
Inc., Global Sustainable Agriculture Notes, 0.00%, 11/3/22(3)(4) |
|
31
|
29,596
|
Total
High Social Impact Investments
(identified cost $390,923) |
|
|
$ 372,291
|
7
See Notes to Financial Statements.
Calvert
Mid-Cap Fund
March 31, 2022
Schedule of
Investments (Unaudited) — continued
| Short-Term
Investments — 0.9% |
|
|
|
| Description
|
Units
|
Value
|
| Calvert
Cash Reserves Fund, LLC, 0.14%(5) |
|
2,757,099
|
$
2,756,824 |
Total
Short-Term Investments
(identified cost $2,756,927) |
|
|
$ 2,756,824
|
Total
Investments — 100.0%
(identified cost $266,183,420) |
|
|
$315,759,262
|
| Other
Assets, Less Liabilities — 0.0%(6) |
|
|
$ 7,316
|
| Net
Assets — 100.0% |
|
|
$315,766,578
|
| The
percentage shown for each investment category in the Schedule of Investments is based on net assets. |
|
(1) |
Non-income
producing security. |
|
(2) |
May
be deemed to be an affiliated company (see Note 7). |
|
(3) |
Restricted
security. Total market value of restricted securities amounts to $372,291, which represents 0.1% of the net assets of the Fund as of March 31, 2022. |
|
(4) |
Notes
carry an interest rate that varies by period and is contingent on the performance of the underlying portfolio of loans to borrowers. The coupon rate shown represents the rate in effect at March 31, 2022. |
|
(5) |
Affiliated
investment company, which invests in high quality, U.S. dollar denominated money market instruments. The rate shown is the annualized seven-day yield as of March 31, 2022. |
|
(6) |
Amount
is less than 0.05%. |
Restricted Securities
| Description
|
Acquisition
Dates |
Cost
|
| Calvert
Impact Capital, Inc., Community Investment Notes, 1.50%, 12/15/23 |
12/14/20
|
$360,000
|
| ImpactAssets,
Inc., Global Sustainable Agriculture Notes, 0.00%, 11/3/22 |
11/13/15
|
30,923
|
8
See Notes to Financial Statements.
Calvert
Mid-Cap Fund
March 31, 2022
Statement of Assets
and Liabilities (Unaudited)
| |
March 31,
2022 |
| Assets
|
|
| Investments
in securities of unaffiliated issuers, at value (identified cost $263,066,493) |
$
312,659,743 |
| Investments
in securities of affiliated issuers, at value (identified cost $3,116,927) |
3,099,519
|
| Receivable
for capital shares sold |
281,884
|
| Dividends
and interest receivable |
237,250
|
| Dividends
and interest receivable - affiliated |
1,837
|
| Securities
lending income receivable |
197
|
| Receivable
from affiliate |
13,240
|
| Directors'
deferred compensation plan |
188,050
|
| Total
assets |
$316,481,720
|
| Liabilities
|
|
| Payable
for capital shares redeemed |
$
156,934 |
| Payable
to affiliates: |
|
| Investment
advisory fee |
170,474
|
| Administrative
fee |
31,472
|
| Distribution
and service fees |
42,804
|
| Sub-transfer
agency fee |
21,035
|
| Directors'
deferred compensation plan |
188,050
|
| Accrued
expenses |
104,373
|
| Total
liabilities |
$
715,142 |
| Net
Assets |
$315,766,578
|
| Sources
of Net Assets |
|
| Paid-in
capital |
$
265,998,794 |
| Distributable
earnings |
49,767,784
|
| Net
Assets |
$315,766,578
|
| Class
A Shares |
|
| Net
Assets |
$
180,029,742 |
| Shares
Outstanding |
4,946,921
|
Net
Asset Value and Redemption Price Per Share
(net assets ÷ shares of beneficial interest outstanding) |
$
36.39 |
Maximum
Offering Price Per Share
(100 ÷ 95.25 of net asset value per share) |
$
38.20 |
| Class
C Shares |
|
| Net
Assets |
$
6,567,529 |
| Shares
Outstanding |
293,253
|
Net
Asset Value and Offering Price Per Share*
(net assets ÷ shares of beneficial interest outstanding) |
$
22.40 |
| Class
I Shares |
|
| Net
Assets |
$
129,169,307 |
| Shares
Outstanding |
2,887,373
|
Net
Asset Value, Offering Price and Redemption Price Per Share
(net assets ÷ shares of beneficial interest outstanding) |
$
44.74 |
| On
sales of $50,000 or more, the offering price of Class A shares is reduced. |
| *
|
Redemption
price per share is equal to the net asset value less any applicable contingent deferred sales charge. |
9
See Notes to Financial Statements.
Calvert
Mid-Cap Fund
March 31, 2022
Statement of
Operations (Unaudited)
| |
Six
Months Ended |
| |
March
31, 2022 |
| Investment
Income |
|
| Dividend
income (net of foreign taxes withheld of $443) |
$
1,885,041 |
| Dividend
income - affiliated issuers |
840
|
| Interest
income |
61
|
| Interest
income - affiliated issuers |
2,700
|
| Securities
lending income, net |
4,121
|
| Total
investment income |
$
1,892,763 |
| Expenses
|
|
| Investment
advisory fee |
$
1,048,194 |
| Administrative
fee |
193,513
|
| Distribution
and service fees: |
|
| Class
A |
229,809
|
| Class
C |
35,167
|
| Directors'
fees and expenses |
6,364
|
| Custodian
fees |
4,160
|
| Transfer
agency fees and expenses |
192,207
|
| Accounting
fees |
36,050
|
| Professional
fees |
15,796
|
| Registration
fees |
35,884
|
| Reports
to shareholders |
10,360
|
| Miscellaneous
|
8,389
|
| Total
expenses |
$
1,815,893 |
| Waiver
and/or reimbursement of expenses by affiliate |
$
(50,452) |
| Net
expenses |
$
1,765,441 |
| Net
investment income |
$
127,322 |
| Realized
and Unrealized Gain (Loss) |
|
| Net
realized gain (loss): |
|
| Investment
securities |
$
5,699,568 |
| Investment
securities - affiliated issuers |
(932)
|
| Foreign
currency transactions |
850
|
| Net
realized gain |
$
5,699,486 |
| Change
in unrealized appreciation (depreciation): |
|
| Investment
securities |
$
(9,877,481) |
| Investment
securities - affiliated issuers |
(11,785)
|
| Net
change in unrealized appreciation (depreciation) |
$(9,889,266)
|
| Net
realized and unrealized loss |
$(4,189,780)
|
| Net
decrease in net assets from operations |
$(4,062,458)
|
10
See Notes to Financial Statements.
Calvert
Mid-Cap Fund
March 31, 2022
Statements of
Changes in Net Assets
| |
Six
Months Ended
March 31, 2022
(Unaudited) |
Year
Ended
September 30,
2021 |
| Increase
(Decrease) in Net Assets |
|
|
| From
operations: |
|
|
| Net
investment income (loss) |
$
127,322 |
$
(688,234) |
| Net
realized gain |
5,699,486
|
40,068,200
|
| Net
change in unrealized appreciation (depreciation) |
(9,889,266)
|
18,161,340
|
| Net
increase (decrease) in net assets from operations |
$
(4,062,458) |
$
57,541,306 |
| Distributions
to shareholders: |
|
|
| Class
A |
$
(22,683,315) |
$
(1,449,640) |
| Class
C |
(1,286,727)
|
(106,024)
|
| Class
I |
(14,188,530)
|
(801,809)
|
| Total
distributions to shareholders |
$
(38,158,572) |
$
(2,357,473) |
| Capital
share transactions: |
|
|
| Class
A |
$
20,900,560 |
$
352,323 |
| Class
C |
482,385
|
(3,016,708)
|
| Class
I |
22,754,036
|
27,105,326
|
| Net
increase in net assets from capital share transactions |
$
44,136,981 |
$
24,440,941 |
| Net
increase in net assets |
$
1,915,951 |
$
79,624,774 |
| Net
Assets |
|
|
| At
beginning of period |
$
313,850,627 |
$
234,225,853 |
| At
end of period |
$315,766,578
|
$313,850,627
|
11
See Notes to Financial Statements.
Calvert
Mid-Cap Fund
March 31, 2022
| |
Class
A |
| |
Six
Months Ended
March 31, 2022
(Unaudited) |
Year
Ended September 30, |
| |
2021
|
2020
|
2019
|
2018
|
2017
|
| Net
asset value — Beginning of period |
$
41.79 |
$
33.96 |
$
34.69 |
$
34.84 |
$
33.40 |
$
29.68 |
| Income
(Loss) From Operations |
|
|
|
|
|
|
| Net
investment income (loss)(1) |
$
(0.00)(2) |
$
(0.12) |
$
0.05 |
$
0.09 |
$
0.07 |
$
0.20 |
| Net
realized and unrealized gain (loss) |
(0.24)
|
8.28
|
1.07
|
1.85
|
4.59
|
3.68
|
| Total
income (loss) from operations |
$
(0.24) |
$
8.16 |
$
1.12 |
$
1.94 |
$
4.66 |
$
3.88 |
| Less
Distributions |
|
|
|
|
|
|
| From
net investment income |
$
— |
$
(0.00)(2) |
$
(0.03) |
$
(0.08) |
$
(0.04) |
$
(0.15) |
| From
net realized gain |
(5.16)
|
(0.33)
|
(1.82)
|
(2.01)
|
(3.18)
|
(0.01)
|
| Total
distributions |
$
(5.16) |
$
(0.33) |
$
(1.85) |
$
(2.09) |
$
(3.22) |
$
(0.16) |
| Net
asset value — End of period |
$
36.39 |
$
41.79 |
$
33.96 |
$
34.69 |
$
34.84 |
$
33.40 |
| Total
Return(3) |
(1.22)%
(4) |
24.13%
|
3.20%
|
6.56%
|
15.04%
|
13.11%
|
| Ratios/Supplemental
Data |
|
|
|
|
|
|
| Net
assets, end of period (000’s omitted) |
$180,030
|
$183,991
|
$149,112
|
$158,005
|
$157,046
|
$159,951
|
| Ratios
(as a percentage of average daily net assets):(5) |
|
|
|
|
|
|
| Total
expenses |
1.21%
(6) |
1.22%
|
1.26%
|
1.30%
|
1.28%
|
1.34%
|
| Net
expenses |
1.18%
(6) |
1.18%
|
1.18%
|
1.19%
|
1.21%
|
1.21%
|
| Net
investment income (loss) |
(0.01)%
(6) |
(0.30)%
|
0.15%
|
0.27%
|
0.22%
|
0.64%
|
| Portfolio
Turnover |
37%
(4) |
79%
|
70%
|
83%
|
62%
|
162%
|
|
(1) |
Computed
using average shares outstanding. |
|
(2) |
Amount
is less than $(0.005). |
|
(3) |
Returns
are historical and are calculated by determining the percentage change in net asset value with all distributions reinvested and do not reflect the effect of sales charges, if any. |
|
(4) |
Not
annualized. |
|
(5) |
Total
expenses do not reflect amounts reimbursed and/or waived by the adviser and certain of its affiliates, if applicable. Net expenses are net of all reductions and represent the net expenses paid by the Fund. |
|
(6) |
Annualized.
|
12
See Notes to Financial Statements.
Calvert
Mid-Cap Fund
March 31, 2022
Financial
Highlights — continued
| |
Class
C |
| |
Six
Months Ended
March 31, 2022
(Unaudited) |
Year
Ended September 30, |
| |
2021
|
2020
|
2019
|
2018
|
2017
|
| Net
asset value — Beginning of period |
$
27.53 |
$
22.64 |
$
23.83 |
$
24.65 |
$
24.55 |
$
21.87 |
| Income
(Loss) From Operations |
|
|
|
|
|
|
| Net
investment loss(1) |
$
(0.09) |
$
(0.28) |
$
(0.14) |
$
(0.11) |
$
(0.12) |
$
(0.03) |
| Net
realized and unrealized gain (loss) |
(0.07)
|
5.50
|
0.73
|
1.23
|
3.27
|
2.72
|
| Total
income (loss) from operations |
$
(0.16) |
$
5.22 |
$
0.59 |
$
1.12 |
$
3.15 |
$
2.69 |
| Less
Distributions |
|
|
|
|
|
|
| From
net realized gain |
$
(4.97) |
$
(0.33) |
$
(1.78) |
$
(1.94) |
$
(3.05) |
$
(0.01) |
| Total
distributions |
$
(4.97) |
$
(0.33) |
$
(1.78) |
$
(1.94) |
$
(3.05) |
$
(0.01) |
| Net
asset value — End of period |
$22.40
|
$27.53
|
$22.64
|
$
23.83 |
$
24.65 |
$
24.55 |
| Total
Return(2) |
(1.53)%
(3) |
23.20%
|
2.40%
|
5.77%
|
14.20%
|
12.29%
|
| Ratios/Supplemental
Data |
|
|
|
|
|
|
| Net
assets, end of period (000’s omitted) |
$
6,568 |
$
7,469 |
$
8,787 |
$14,535
|
$17,043
|
$18,146
|
| Ratios
(as a percentage of average daily net assets):(4) |
|
|
|
|
|
|
| Total
expenses |
1.96%
(5) |
1.98%
|
2.01%
|
2.05%
|
2.03%
|
2.18%
|
| Net
expenses |
1.93%
(5) |
1.93%
|
1.93%
|
1.94%
|
1.96%
|
1.96%
|
| Net
investment loss |
(0.77)%
(5) |
(1.05)%
|
(0.62)%
|
(0.49)%
|
(0.53)%
|
(0.12)%
|
| Portfolio
Turnover |
37%
(3) |
79%
|
70%
|
83%
|
62%
|
162%
|
|
(1) |
Computed
using average shares outstanding. |
|
(2) |
Returns
are historical and are calculated by determining the percentage change in net asset value with all distributions reinvested and do not reflect the effect of sales charges, if any. |
|
(3) |
Not
annualized. |
|
(4) |
Total
expenses do not reflect amounts reimbursed and/or waived by the adviser and certain of its affiliates, if applicable. Net expenses are net of all reductions and represent the net expenses paid by the Fund. |
|
(5) |
Annualized.
|
13
See Notes to Financial Statements.
Calvert
Mid-Cap Fund
March 31, 2022
Financial
Highlights — continued
| |
Class
I |
| |
Six
Months Ended
March 31, 2022
(Unaudited) |
Year
Ended September 30, |
| |
2021
|
2020
|
2019
|
2018
|
2017
|
| Net
asset value — Beginning of period |
$
50.28 |
$
40.77 |
$
41.25 |
$
40.97 |
$
38.70 |
$
34.38 |
| Income
(Loss) From Operations |
|
|
|
|
|
|
| Net
investment income (loss)(1) |
$
0.06 |
$
(0.03) |
$
0.16 |
$
0.21 |
$
0.23 |
$
0.41 |
| Net
realized and unrealized gain (loss) |
(0.34)
|
9.95
|
1.27
|
2.24
|
5.37
|
4.22
|
| Total
income (loss) from operations |
$
(0.28) |
$
9.92 |
$
1.43 |
$
2.45 |
$
5.60 |
$
4.63 |
| Less
Distributions |
|
|
|
|
|
|
| From
net investment income |
$
(0.08) |
$
(0.08) |
$
(0.09) |
$
(0.16) |
$
(0.15) |
$
(0.30) |
| From
net realized gain |
(5.18)
|
(0.33)
|
(1.82)
|
(2.01)
|
(3.18)
|
(0.01)
|
| Total
distributions |
$
(5.26) |
$
(0.41) |
$
(1.91) |
$
(2.17) |
$
(3.33) |
$
(0.31) |
| Net
asset value — End of period |
$
44.74 |
$
50.28 |
$
40.77 |
$
41.25 |
$
40.97 |
$
38.70 |
| Total
Return(2) |
(1.08)%
(3) |
24.45%
|
3.45%
|
6.85%
|
15.48%
|
13.53%
|
| Ratios/Supplemental
Data |
|
|
|
|
|
|
| Net
assets, end of period (000’s omitted) |
$129,169
|
$122,391
|
$76,327
|
$46,533
|
$93,198
|
$68,748
|
| Ratios
(as a percentage of average daily net assets):(4) |
|
|
|
|
|
|
| Total
expenses |
0.96%
(5) |
0.97%
|
1.01%
|
1.05%
|
1.03%
|
0.88%
|
| Net
expenses |
0.93%
(5) |
0.93%
|
0.93%
|
0.91%
|
0.86%
|
0.86%
|
| Net
investment income (loss) |
0.25%
(5) |
(0.06)%
|
0.40%
|
0.54%
|
0.59%
|
1.14%
|
| Portfolio
Turnover |
37%
(3) |
79%
|
70%
|
83%
|
62%
|
162%
|
|
(1) |
Computed
using average shares outstanding. |
|
(2) |
Returns
are historical and are calculated by determining the percentage change in net asset value with all distributions reinvested and do not reflect the effect of sales charges, if any. |
|
(3) |
Not
annualized. |
|
(4) |
Total
expenses do not reflect amounts reimbursed and/or waived by the adviser and certain of its affiliates, if applicable. Net expenses are net of all reductions and represent the net expenses paid by the Fund. |
|
(5) |
Annualized.
|
14
See Notes to Financial Statements.
Calvert
Mid-Cap Fund
March 31, 2022
Notes to Financial
Statements (Unaudited)
1 Significant Accounting Policies
Calvert Mid-Cap Fund (the Fund) is a diversified series of
Calvert World Values Fund, Inc. (the Corporation). The Corporation is a Maryland corporation registered under the Investment Company Act of 1940, as amended (the 1940 Act), as an open-end management investment company. The investment objective of
the Fund is to seek to provide long-term capital appreciation by investing primarily in mid-cap stocks.
The Fund offers three classes of shares. Class A shares are
generally sold subject to a sales charge imposed at time of purchase. Effective April 29, 2022, the maximum sales charge payable upon purchase of Class A shares was increased to 5.25%. A contingent deferred sales charge of 0.80% (1.00% effective
April 29, 2022) may apply to certain redemptions of Class A shares for accounts for which no sales charge was paid, if redeemed within 12 months of purchase. Class C shares are sold without a front-end sales charge, and with certain exceptions, are
charged a contingent deferred sales charge of 1% on shares redeemed within 12 months of purchase. Class C shares are only available for purchase through a financial intermediary. Effective November 5, 2020, Class C shares automatically convert to
Class A shares eight years after their purchase as described in the Fund’s prospectus. Class I shares are sold at net asset value, are not subject to a sales charge and are sold only to certain eligible investors. Each class represents a pro
rata interest in the Fund, but votes separately on class-specific matters and is subject to different expenses.
The Fund applies the accounting and reporting guidance in the
Financial Accounting Standards Board (FASB) Accounting Standards Codification Topic 946, Financial Services – Investment Companies (ASC 946). Subsequent events, if any, through the date that the
financial statements were issued have been evaluated in the preparation of the financial statements.
A Investment
Valuation— Net asset value per share is determined every business day as of the close of the regular session of the New York Stock Exchange (generally 4:00 p.m. Eastern time).
The Fund uses independent pricing services approved by the Board of Directors (the Board) to value its investments wherever possible. Investments for which market quotations are not available or deemed not reliable are fair valued in good faith
under the direction of the Board.
U.S. generally
accepted accounting principles (U.S. GAAP) establishes a disclosure hierarchy that categorizes the inputs to valuation techniques used to value assets and liabilities at measurement date. These inputs are summarized in the three broad levels listed
below:
Level 1 - quoted prices in active markets for
identical securities
Level 2 - other significant
observable inputs (including quoted prices for similar securities, interest rates, prepayment speeds, credit risk, etc.)
Level 3 - significant unobservable inputs (including the
Fund’s own assumptions in determining the fair value of investments)
The inputs or methodologies used for valuing securities are not
necessarily an indication of the risk associated with investing in those securities.
Valuation techniques used to value the Fund’s investments
by major category are as follows:
Equity Securities. Equity securities (including warrants and rights) listed on a U.S. securities exchange generally are valued at the last sale or closing price as reported by an independent pricing service on the primary market or
exchange on which they are traded and are categorized as Level 1 in the hierarchy. Equity securities listed on the NASDAQ National Market System are valued at the NASDAQ official closing price and are categorized as Level 1 in the hierarchy.
Unlisted or listed securities for which closing sales prices or closing quotations are not available are valued at the mean between the latest available bid and ask prices and are categorized as Level 2 in the hierarchy.
Debt Securities. Debt
securities are generally valued based on valuations provided by third party pricing services, as derived from such services’ pricing models. Inputs to the models may include, but are not limited to, reported trades, executable bid and ask
prices, broker/dealer quotations, prices or yields of securities with similar characteristics, interest rates, anticipated prepayments, benchmark curves or information pertaining to the issuer, as well as industry and economic events. Accordingly,
debt securities are generally categorized as Level 2 in the hierarchy. Short-term debt securities with a remaining maturity at time of purchase of more than sixty days are valued based on valuations provided by a third party pricing service. Such
securities are generally categorized as Level 2 in the hierarchy. Short-term debt securities of sufficient credit quality purchased with remaining maturities of sixty days or less for which a valuation from a third party pricing service is not
readily available may be valued at amortized cost, which approximates fair value, and are categorized as Level 2 in the hierarchy.
Affiliated Fund. Calvert Cash
Reserves Fund, LLC (Cash Reserves Fund) is an affiliated investment company managed by Calvert Research and Management (CRM). While Cash Reserves Fund is not a registered money market mutual fund, it conducts all of its investment activities in
accordance with the requirements of Rule 2a-7 under the 1940 Act. Investments in Cash Reserves Fund are valued at the closing net asset value per unit on the valuation day and are categorized as Level 2 in the hierarchy. Cash Reserves Fund generally
values its investment securities based on available market quotations provided by a third party pricing service.
Other Securities. Investments
in registered investment companies (including money market funds) that do not trade on an exchange are valued at the net asset value per share on the valuation day and are categorized as Level 1 in the hierarchy.
Fair Valuation. If a market
value cannot be determined for a security using the methodologies described above, or if, in the good faith opinion of the Fund's adviser, the market value does not constitute a readily available market quotation, or if a significant event has
occurred that would materially affect the value of the security, the security will be fair valued as determined in good faith by or at the direction of the Board in a manner that most fairly reflects the
Calvert
Mid-Cap Fund
March 31, 2022
Notes to Financial
Statements (Unaudited) — continued
security’s
“fair value”, which is the amount that the Fund might reasonably expect to receive for the security upon its current sale in the ordinary course. Each such determination is based on a consideration of relevant factors, which are likely
to vary from one pricing context to another. These factors may include, but are not limited to, the type of security, the existence of any contractual restrictions on the security’s disposition, the price and extent of public trading in
similar securities of the issuer or of comparable companies or entities, quotations or relevant information obtained from broker/dealers or other market participants, information obtained from the issuer, analysts, and/or the appropriate stock
exchange (for exchange-traded securities), an analysis of the company’s or entity’s financial statements, and an evaluation of the forces that influence the issuer and the market(s) in which the security is purchased and sold.
The values assigned to fair value investments are based on
available information and do not necessarily represent amounts that might ultimately be realized. Further, due to the inherent uncertainty of valuations of such investments, the fair values may differ significantly from the values that would have
been used had an active market existed, and the differences could be material.
The following table summarizes the market value of the Fund's
holdings as of March 31, 2022, based on the inputs used to value them:
| Asset
Description |
Level
1 |
Level
2 |
Level
3 |
Total
|
| Common
Stocks |
$
312,630,147(1) |
$
— |
$
— |
$
312,630,147 |
| High
Social Impact Investments |
—
|
372,291
|
—
|
372,291
|
| Short-Term
Investments |
—
|
2,756,824
|
—
|
2,756,824
|
| Total
Investments |
$312,630,147
|
$3,129,115
|
$ —
|
$315,759,262
|
|
(1) |
The
level classification by major category of investments is the same as the category presentation in the Schedule of Investments. |
B Investment Transactions and Income— Investment transactions for financial statement purposes are accounted for on trade date. Realized gains and losses are recorded on an identified cost basis and may include
proceeds from litigation. Dividend income is recorded on the ex-dividend date for dividends received in cash and/or securities or, in
the case of dividends on certain foreign securities, as soon as the Fund is informed of the ex-dividend date. Non-cash dividends are
recorded at the fair value of the securities received. Withholding taxes on foreign dividends, if any, have been provided for in
accordance with the Fund's understanding of the applicable country’s tax rules and rates. Distributions received that represent
a return of capital are recorded as a reduction of cost of investments. Distributions received that represent a capital gain are recorded as a realized gain. Interest income, which includes amortization of premium and accretion of discount on debt securities, is accrued as earned.
C Share Class Accounting— Realized and unrealized gains and losses and net investment income and losses, other than class-specific expenses, are allocated daily to each class of shares based upon the
relative net assets of each class to the total net assets of the Fund. Expenses arising in connection with a specific class are charged directly to that class.
D Foreign Currency Transactions— The Fund’s accounting records are maintained in U.S. dollars. For valuation of assets and liabilities on each date of net asset value determination, foreign denominations
are converted into U.S. dollars using the current exchange rate. Security transactions, income and expenses are translated at the prevailing rate of exchange on the date of the event. Recognized gains or losses on investment transactions
attributable to changes in foreign currency exchange rates are recorded for financial statement purposes as net realized gains and losses on investments. That portion of unrealized gains and losses on investments that results from fluctuations in
foreign currency exchange rates is not separately disclosed.
E Restricted Securities— The Fund may invest in securities that are subject to legal or contractual restrictions on resale. Generally, these securities may only be sold publicly upon registration under
the Securities Act of 1933 or in transactions exempt from such registration. Information regarding restricted securities (excluding Rule 144A securities) is included at the end of the Schedule of Investments.
F Distributions to Shareholders— Distributions to shareholders are recorded by the Fund on ex-dividend date. Distributions from net investment income and distributions from net realized capital gains, if any, are
paid at least annually. Distributions are declared separately for each class of shares. Distributions are determined in accordance with income tax regulations, which may differ from U.S. GAAP; accordingly, periodic reclassifications are made within
the Fund's capital accounts to reflect income and gains available for distribution under income tax regulations.
G Estimates— The preparation of financial statements in conformity with U.S. GAAP requires management to make estimates and assumptions that affect the reported amounts of assets and liabilities and disclosure of contingent assets
and liabilities at the date of the financial statements and the reported amounts of increases and decreases in net assets from operations during the reporting period. Actual results could differ from those estimates.
H
Indemnifications— The Corporation’s By-Laws provide for indemnification for Directors or officers of the Corporation and certain other parties, to the fullest extent
permitted by Maryland law and the 1940 Act, provided certain conditions are met. Additionally, in the normal course of business, the Fund enters into agreements with service providers that may contain indemnification clauses. The Fund’s
maximum exposure under these arrangements is unknown as this would involve future claims that may be made against the Fund that have not yet occurred.
Calvert
Mid-Cap Fund
March 31, 2022
Notes to Financial
Statements (Unaudited) — continued
I Federal Income
Taxes— No provision for federal income or excise tax is required since the Fund intends to continue to qualify as a regulated investment company under the Internal Revenue Code
and to distribute substantially all of its taxable earnings.
Management has analyzed the Fund's tax positions taken for all
open federal income tax years and has concluded that no provision for federal income tax is required in the Fund's financial statements. A Fund's federal tax return is subject to examination by the Internal Revenue Service for a period of three
years from the date of filing.
J Interim
Financial Statements— The interim financial statements relating to March 31, 2022 and for the six months then ended have not been audited by an independent registered public
accounting firm, but in the opinion of the Fund's management, reflect all adjustments, consisting only of normal recurring adjustments, necessary for the fair presentation of the financial statements.
2 Related Party Transactions
The investment advisory fee is earned by CRM, an indirect,
wholly-owned subsidiary of Morgan Stanley, as compensation for investment advisory services rendered to the Fund. The investment advisory fee is computed at the annual rate of 0.65% of the Fund's average daily net assets and is payable monthly. For
the six months ended March 31, 2022, the investment advisory fee amounted to $1,048,194. CRM does not receive a fee for advisory services provided to Cash Reserves Fund.
CRM has agreed to reimburse the Fund’s operating expenses
to the extent that total annual operating expenses (relating to ordinary operating expenses only and excluding expenses such as brokerage commissions, acquired fund fees and expenses of unaffiliated funds, borrowing costs, taxes or litigation
expenses) exceed 1.18%, 1.93% and 0.93% for Class A, Class C and Class I, respectively, of such class's average daily net assets. The expense reimbursement agreement with CRM may be changed or terminated after January 31, 2023. For the six months
ended March 31, 2022, CRM waived or reimbursed expenses of $50,452.
The administrative fee is earned by CRM as compensation for
administrative services rendered to the Fund. The fee is computed at an annual rate of 0.12% of the Fund’s average daily net assets attributable to Class A, Class C and Class I and is payable monthly. For the six months ended March 31, 2022,
CRM was paid administrative fees of $193,513.
The Fund
has in effect a distribution plan for Class A shares (Class A Plan) pursuant to Rule 12b-1 under the 1940 Act. Pursuant to the Class A Plan, the Fund pays Eaton Vance Distributors, Inc. (EVD), an affiliate of CRM and the Fund’s principal
underwriter, a distribution and service fee of 0.25% per annum of its average daily net assets attributable to Class A shares for distribution services and facilities provided to the Fund by EVD, as well as for personal services and/or the
maintenance of shareholder accounts. The Fund also has in effect a distribution plan for Class C shares (Class C Plan) pursuant to Rule 12b-1 under the 1940 Act. Pursuant to the Class C Plan, the Fund pays EVD amounts equal to 0.75% per annum of its
average daily net assets attributable to Class C shares for providing ongoing distribution services and facilities to the Fund. In addition, pursuant to the Class C Plan, the Fund also makes payments of service fees to EVD, financial intermediaries
and other persons in amounts equal to 0.25% per annum of its average daily net assets attributable to that class. Service fees paid or accrued are for personal services and/or the maintenance of shareholder accounts. Distribution and service fees
paid or accrued for the six months ended March 31, 2022 amounted to $229,809 and $35,167 for Class A shares and Class C shares, respectively.
The Fund was informed that EVD received $12,776 as its portion
of the sales charge on sales of Class A shares for the six months ended March 31, 2022. The Fund was also informed that EVD received less than $100 and $212 of contingent deferred sales charges paid by Class A and Class C shareholders, respectively,
for the same period.
Eaton Vance Management (EVM), an
affiliate of CRM, provides sub-transfer agency and related services to the Fund pursuant to a Sub-Transfer Agency Support Services Agreement. For the six months ended March 31, 2022, sub-transfer agency fees and expenses incurred to EVM amounted to
$27,927 and are included in transfer agency fees and expenses on the Statement of Operations.
Each Director of the Fund who is not an employee of CRM or its
affiliates receives an annual fee of $214,000 ($154,000 prior to January 1, 2022), plus an annual Committee fee ranging from $8,500 to $16,500 depending on the Committee. The Board chair receives an additional $30,000 annual fee, Committee chairs
receive an additional $6,000 annual fee and the special equities liaison receives an additional $2,500 annual fee. Eligible Directors may participate in a Deferred Compensation Plan (the Plan). Amounts deferred under the Plan are treated as though
equal dollar amounts had been invested in shares of the Fund or other Calvert funds selected by the Directors. The Fund purchases shares of the funds selected equal to the dollar amounts deferred under the Plan, resulting in an asset equal to the
deferred compensation liability. Obligations of the Plan are paid solely from the Fund's assets. Directors’ fees are allocated to each of the Calvert funds served. Salaries and fees of officers and Directors of the Fund who are employees of
CRM or its affiliates are paid by CRM.
3 Investment Activity
During the six months ended March 31, 2022, the cost of
purchases and proceeds from sales of investments, other than short-term securities, were $129,880,892 and $119,650,019, respectively.
Calvert
Mid-Cap Fund
March 31, 2022
Notes to Financial
Statements (Unaudited) — continued
4 Distributions to Shareholders and Income Tax
Information
The cost and unrealized appreciation
(depreciation) of investments of the Fund at March 31, 2022, as determined on a federal income tax basis, were as follows:
| Aggregate
cost |
$267,021,432
|
| Gross
unrealized appreciation |
$
53,079,262 |
| Gross
unrealized depreciation |
(4,341,432)
|
| Net
unrealized appreciation |
$
48,737,830 |
5 Securities Lending
To generate additional income, the Fund may lend its securities
pursuant to a securities lending agency agreement with State Street Bank and Trust Company (SSBT), the securities lending agent. Security loans are subject to termination by the Fund at any time and, therefore, are not considered illiquid
investments. The Fund requires that the loan be continuously collateralized by either cash or securities in an amount at least equal to the market value of the securities on loan. The market value of securities loaned is determined daily and any
additional required collateral is delivered to the Fund on the next business day. Cash collateral is generally invested in a money market fund registered under the 1940 Act that is managed by an affiliate of SSBT. Any gain or loss in the market
price of the loaned securities that might occur and any interest earned or dividends declared during the term of the loan would accrue to the account of the Fund. Income earned on the investment of collateral, net of broker rebates and other
expenses incurred by the securities lending agent, is split between the Fund and the securities lending agent based on agreed upon contractual terms. Non-cash collateral, if any, is held by the lending agent on behalf of the Fund and cannot be sold
or re-pledged by the Fund; accordingly, such collateral is not reflected in the Statement of Assets and Liabilities.
The risks associated with lending portfolio securities include,
but are not limited to, possible delays in receiving additional collateral or in the recovery of the loaned securities, possible loss of rights to the collateral should the borrower fail financially, as well as risk of loss in the value of the
collateral or the value of the investments made with the collateral. The securities lending agent shall indemnify the Fund in the case of default of any securities borrower.
The Fund did not have any securities on loan at March 31,
2022.
6 Line of Credit
The Fund participates with other portfolios and funds managed
by EVM and its affiliates, including CRM, in an $800 million unsecured line of credit with a group of banks, which is in effect through October 25, 2022. Borrowings are made by the Fund solely for temporary purposes related to redemptions and other
short-term cash needs. Interest is charged to the Fund based on its borrowings at an amount above either the Secured Overnight Financing Rate (SOFR) or Federal Funds rate. In addition, a fee computed at an annual rate of 0.15% on the daily unused
portion of the line of credit is allocated among the participating portfolios and funds at the end of each quarter. In connection with the renewal of the agreement in October 2021, an arrangement fee of $150,000 was incurred that was allocated to
the participating portfolios and funds. Because the line of credit is not available exclusively to the Fund, it may be unable to borrow some or all of its requested amounts at any particular time.
The Fund had no borrowings outstanding pursuant to its line of
credit at March 31, 2022. The Fund did not have any significant borrowings or allocated fees during the six months ended March 31, 2022.
7 Affiliated Issuers and Funds
The Fund has invested a portion of its assets in notes (the
Notes) issued by Calvert Impact Capital, Inc. (CIC) pursuant to exemptive relief granted by the U.S. Securities and Exchange Commission (the SEC). There are certain potential points of affiliation between the Fund and CIC. CRM has licensed use of
the Calvert name to CIC and provides other types of support. CRM’s President and Chief Executive Officer (and the only director/trustee on the Fund Board that is an “interested person” of the Fund) serves on the CIC Board. In
addition, another director/trustee on the Fund Board serves as a director emeritus on the CIC Board.
Calvert
Mid-Cap Fund
March 31, 2022
Notes to Financial
Statements (Unaudited) — continued
At
March 31, 2022, the value of the Fund’s investment in the Notes and affiliated funds was $3,099,519, which represents 1.0% of the Fund’s net assets. Transactions in the Notes and affiliated funds by the Fund for the six months ended
March 31, 2022 were as follows:
| Name
|
Value,
beginning
of period |
Purchases
|
Sales
proceeds |
Net
realized
gain
(loss) |
Change
in
unrealized
appreciation
(depreciation) |
Value,
end of
period |
Interest/
Dividend
income |
Principal
amount/Units,
end of period |
| High
Social Impact Investments |
|
|
|
|
|
|
|
|
| Calvert
Impact Capital, Inc., Community Investment Notes, 1.50%, 12/15/23(1) |
$ 353,819
|
$
— |
$
— |
$
— |
$
(11,124) |
$
342,695 |
$
2,700 |
$ 360,000
|
| Short-Term
Investments |
|
|
|
|
|
|
| Calvert
Cash Reserves Fund, LLC |
5,583,915
|
22,919,544
|
(25,745,042)
|
(932)
|
(661)
|
2,756,824
|
840
|
2,757,099
|
| Totals
|
|
|
|
$(932)
|
$(11,785)
|
$3,099,519
|
$3,540
|
|
8 Capital
Shares
The Corporation may issue its shares in one or
more series (such as the Fund). The authorized shares of the Fund consist of 75,000,000 common shares, $0.01 par value, for each Class.
Transactions in capital shares for the six months ended March
31, 2022 and the year ended September 30, 2021 were as follows:
| |
Six
Months Ended
March 31, 2022
(Unaudited) |
|
Year
Ended
September 30, 2021 |
| |
Shares
|
Amount
|
|
Shares
|
Amount
|
| Class
A |
|
|
|
|
|
| Shares
sold |
208,979
|
$
8,106,666 |
|
375,750
|
$
15,160,623 |
| Reinvestment
of distributions |
569,409
|
21,853,905
|
|
36,990
|
1,395,999
|
| Shares
redeemed |
(246,115)
|
(9,538,193)
|
|
(465,944)
|
(18,704,612)
|
| Converted
from Class C |
12,068
|
478,182
|
|
65,033
|
2,500,313
|
| Net
increase |
544,341
|
$
20,900,560 |
|
11,829
|
$
352,323 |
| Class
C |
|
|
|
|
|
| Shares
sold |
12,023
|
$
295,731 |
|
39,443
|
$
1,049,807 |
| Reinvestment
of distributions |
53,032
|
1,255,259
|
|
4,145
|
103,674
|
| Shares
redeemed |
(24,076)
|
(590,423)
|
|
(62,534)
|
(1,669,876)
|
| Converted
to Class A |
(18,992)
|
(478,182)
|
|
(97,920)
|
(2,500,313)
|
| Net
increase (decrease) |
21,987
|
$
482,385 |
|
(116,866)
|
$
(3,016,708) |
| Class
I |
|
|
|
|
|
| Shares
sold |
642,037
|
$
31,513,431 |
|
1,050,276
|
$
50,894,880 |
| Reinvestment
of distributions |
296,205
|
13,963,127
|
|
17,429
|
789,688
|
| Shares
redeemed |
(485,078)
|
(22,722,522)
|
|
(505,501)
|
(24,579,242)
|
| Net
increase |
453,164
|
$
22,754,036 |
|
562,204
|
$
27,105,326 |
Calvert
Mid-Cap Fund
March 31, 2022
Notes to Financial
Statements (Unaudited) — continued
9 Risks and Uncertainties
Pandemic Risk
An outbreak of respiratory disease caused by a novel
coronavirus was first detected in China in late 2019 and subsequently spread internationally. This coronavirus has resulted in closing borders, enhanced health screenings, changes to healthcare service preparation and delivery, quarantines,
cancellations, disruptions to supply chains and customer activity, as well as general concern and uncertainty. Health crises caused by outbreaks, such as the coronavirus outbreak, may exacerbate other pre-existing political, social and economic
risks and disrupt normal market conditions and operations. The impact of this outbreak has negatively affected the worldwide economy, the economies of individual countries, individual companies, and the market in general, and may continue to do so
in significant and unforeseen ways, as may other epidemics and pandemics that may arise in the future. Any such impact could adversely affect the Fund's performance, or the performance of the securities in which the Fund invests.
Calvert
Mid-Cap Fund
March 31, 2022
| Officers
|
Hope L.
Brown
Chief Compliance Officer |
Deidre E.
Walsh
Vice President, Secretary and
Chief Legal Officer |
James F.
Kirchner
Treasurer |
| Directors
|
Alice
Gresham Bullock
Chairperson |
| Richard L.
Baird, Jr. |
| Cari M.
Dominguez |
| John G.
Guffey, Jr. |
| Miles D.
Harper, III |
| Joy V. Jones
|
| John H.
Streur* |
| Anthony A.
Williams |
| *Interested
Director and President |
| Privacy
Notice |
April 2021
|
| FACTS
|
WHAT
DOES EATON VANCE DO WITH YOUR
PERSONAL INFORMATION? |
| Why?
|
Financial
companies choose how they share your personal information. Federal law gives consumers the right to limit some but not all sharing. Federal law also requires us to tell you how we collect, share, and protect your personal information. Please read
this notice carefully to understand what we do. |
| |
|
| What?
|
The
types of personal information we collect and share depend on the product or service you have with us. This information can include:■ Social Security number and income
■
investment experience and risk tolerance
■
checking account number and wire transfer instructions |
| |
|
| How?
|
All
financial companies need to share customers’ personal information to run their everyday business. In the section below, we list the reasons financial companies can share their customers’ personal information; the reasons Eaton Vance
chooses to share; and whether you can limit this sharing. |
Reasons
we can share your
personal information |
Does
Eaton Vance
share? |
Can
you limit
this sharing? |
| For
our everyday business purposes — such as to process your transactions, maintain your account(s), respond to court orders and legal investigations, or report to credit bureaus |
Yes
|
No
|
| For
our marketing purposes — to offer our products and services to you |
Yes
|
No
|
| For
joint marketing with other financial companies |
No
|
We
don’t share |
| For
our investment management affiliates’ everyday business purposes — information about your transactions, experiences, and creditworthiness |
Yes
|
Yes
|
| For
our affiliates’ everyday business purposes — information about your transactions and experiences |
Yes
|
No
|
| For
our affiliates’ everyday business purposes — information about your creditworthiness |
No
|
We
don’t share |
| For
our investment management affiliates to market to you |
Yes
|
Yes
|
| For
our affiliates to market to you |
No
|
We
don’t share |
| For
nonaffiliates to market to you |
No
|
We
don’t share |
To
limit our
sharing |
Call
toll-free 1-800-368-2745 or email: CRMPrivacy@calvert.comPlease note:If you are a new customer, we can begin sharing your information 30 days from the date we sent this notice. When you are no longer our customer, we continue to share your information as described in this notice. However, you can contact us at any time to limit our
sharing. |
| Questions?
|
Call
toll-free 1-800-368-2745 or email: CRMPrivacy@calvert.com |
| Privacy
Notice — continued |
April 2021
|
| Who
we are |
| Who
is providing this notice? |
Eaton
Vance Management, Eaton Vance Distributors, Inc., Eaton Vance Trust Company, Eaton Vance Management (International) Limited, Eaton Vance Advisers International Ltd., Eaton Vance Global Advisors Limited, Eaton Vance Management’s Real Estate
Investment Group, Boston Management and Research, Calvert Research and Management, Eaton Vance and Calvert Fund Families and our investment advisory affiliates (“Eaton Vance”) (see Investment Management Affiliates definition below)
|
| What
we do |
How
does Eaton Vance
protect my personal
information? |
To
protect your personal information from unauthorized access and use, we use security measures that comply with federal law. These measures include computer safeguards and secured files and buildings. We have policies governing the proper handling of
customer information by personnel and requiring third parties that provide support to adhere to appropriate security standards with respect to such information. |
How
does Eaton Vance
collect my personal
information? |
We
collect your personal information, for example, when you■ open an account or make deposits or withdrawals from your
account
■
buy securities from us or make a wire transfer
■
give us your contact informationWe also collect your personal information from others, such as credit bureaus, affiliates, or other companies. |
| Why
can’t I limit all sharing? |
Federal
law gives you the right to limit only■ sharing for affiliates’ everyday business purposes — information
about your creditworthiness
■
affiliates from using your information to market to you
■
sharing for nonaffiliates to market to youState laws and individual companies may give you additional rights
to limit sharing. See below for more on your rights under state law. |
| Definitions
|
Investment
Management
Affiliates |
Eaton
Vance Investment Management Affiliates include registered investment advisers, registered broker- dealers, and registered and unregistered funds. Investment Management Affiliates does not include entities associated with Morgan Stanley Wealth
Management, such as Morgan Stanley Smith Barney LLC and Morgan Stanley & Co. |
| Affiliates
|
Companies
related by common ownership or control. They can be financial and nonfinancial companies.■ Our affiliates include companies with a Morgan Stanley name and financial companies such as Morgan Stanley Smith Barney LLC and Morgan Stanley & Co. |
| Nonaffiliates
|
Companies
not related by common ownership or control. They can be financial and nonfinancial companies.■ Eaton Vance does not share with nonaffiliates so they can market to you. |
| Joint
marketing |
A
formal agreement between nonaffiliated financial companies that together market financial products or services to
you.■ Eaton Vance doesn’t jointly market. |
| Other
important information |
| Vermont:
Except as permitted by law, we will not share personal information we collect about Vermont residents with Nonaffiliates unless you provide us with your written consent to share such
information.California: Except as permitted by law, we will not share personal information we collect about California residents with Nonaffiliates and we will limit sharing
such personal information with our Affiliates to comply with California privacy laws that apply to us. |
Delivery of Shareholder Documents. The Securities and Exchange Commission (SEC) permits funds to deliver only one copy of shareholder documents, including prospectuses, proxy statements and shareholder reports, to fund investors with
multiple accounts at the same residential or post office box address. This practice is often called “householding” and it helps eliminate duplicate mailings to shareholders. Calvert funds, or your financial intermediary, may household the mailing of your documents indefinitely unless you instruct Calvert funds, or your financial intermediary, otherwise. If you would prefer that your Calvert fund documents not be householded, please contact Calvert funds at 1-800-368-2745, or contact your financial intermediary. Your instructions that householding not
apply to delivery of your Calvert fund documents will typically be effective within 30 days of receipt by Calvert funds or your financial intermediary.
Portfolio Holdings. Each Calvert fund files a schedule of portfolio holdings on Part F to Form N-PORT with the SEC. Certain information filed on Form N-PORT may be viewed on the Calvert website at www.calvert.com, by calling
Calvert at 1-800-368-2745 or in the EDGAR database on the SEC’s website at www.sec.gov.
Proxy Voting. The Proxy Voting Guidelines that each Calvert fund uses to determine how to vote proxies relating to portfolio securities is provided as an Appendix to the fund’s Statement of Additional Information.
The Statement of Additional Information can be obtained free of charge by calling the Calvert funds at 1-800-368-2745, by visiting the Calvert funds’ website at www.calvert.com or visiting the SEC’s website at www.sec.gov. Information
regarding how a Calvert fund voted proxies relating to portfolio securities during the most recent 12-month period ended June 30 is available by calling Calvert funds, by visiting the Calvert funds’ website at www.calvert.com or by visiting
the SEC’s website at www.sec.gov.
Investment Adviser and Administrator
Calvert Research and Management
1825 Connecticut Avenue NW, Suite 400
Washington, DC 20009
Principal Underwriter*
Eaton Vance Distributors, Inc.
Two International Place
Boston, MA 02110
(617) 482-8260
Custodian
State Street Bank and Trust Company
State Street Financial Center, One Lincoln Street
Boston, MA 02111
Transfer Agent
DST Asset Manager Solutions, Inc.
2000 Crown Colony Drive
Quincy, MA 02169
Fund Offices
1825 Connecticut Avenue NW, Suite 400
Washington, DC 20009
* FINRA
BrokerCheck. Investors may check the background of their Investment Professional by contacting the Financial Industry Regulatory Authority (FINRA). FINRA BrokerCheck is a free tool to help investors check the professional background of
current and former FINRA-registered securities firms and brokers. FINRA BrokerCheck is available by calling 1-800-289-9999 and at www.FINRA.org. The FINRA BrokerCheck brochure describing this program is available to investors at www.FINRA.org.
Printed on recycled paper.
24210 3.31.22
Calvert
International Opportunities Fund
Semiannual Report
March 31, 2022
Commodity Futures Trading Commission Registration. The Commodity Futures Trading Commission (“CFTC”) has adopted regulations that subject registered investment companies and advisers to regulation by the CFTC if a fund invests more than a
prescribed level of its assets in certain CFTC-regulated instruments (including futures, certain options and swap agreements) or markets itself as providing investment exposure to such instruments. The adviser has claimed an exclusion from the
definition of “commodity pool operator” under the Commodity Exchange Act with respect to its management of the Fund and the other funds it manages. Accordingly, neither the Fund nor the adviser is subject to CFTC regulation.
Fund shares are not insured by the FDIC and are not deposits or
other obligations of, or guaranteed by, any depository institution. Shares are subject to investment risks, including possible loss of principal invested.
This report must be preceded or accompanied by a current
summary prospectus or prospectus. Before investing, investors should consider carefully the investment objective, risks, and charges and expenses of a mutual fund. This and other important information is contained in the summary prospectus and
prospectus, which can be obtained from a financial intermediary. Prospective investors should read the prospectus carefully before investing. For further information, please call 1-800-368-2745.
Choose Planet-friendly E-delivery!
Sign up now for on-line statements, prospectuses, and fund
reports. In less than five minutes you can help reduce paper mail and lower fund costs.
Just go to
www.calvert.com. If you already have an online account with the Calvert funds, click on Login to access your Account and select the documents you would like to receive via e-mail.
If you’re new to online account access, click on Login,
then Register to create your user name and password. Once you’re in, click on the E-delivery sign-up on the Account Portfolio page and follow the quick, easy steps.
Note: If your shares are not
held directly with the Calvert funds but through a brokerage firm, you must contact your broker for electronic delivery options available through their firm.
Semiannual Report March 31, 2022
Calvert
International Opportunities Fund
Calvert
International Opportunities Fund
March 31, 2022
Performance
Portfolio Manager(s) Aidan M.
Farrell of MSIM Fund Management (Ireland) Limited
| %
Average Annual Total Returns1,2 |
Class
Inception Date |
Performance
Inception Date |
Six
Months |
One
Year |
Five
Years |
Ten
Years |
| Class
A at NAV |
05/31/2007
|
05/31/2007
|
(13.06)%
|
(5.47)%
|
8.18%
|
8.07%
|
| Class
A with 4.75% Maximum Sales Charge |
—
|
—
|
(17.18)
|
(9.94)
|
7.13
|
7.55
|
| Class
C at NAV |
07/31/2007
|
05/31/2007
|
(13.37)
|
(6.16)
|
7.39
|
7.36
|
| Class
C with 1% Maximum Sales Charge |
—
|
—
|
(14.18)
|
(7.04)
|
7.39
|
7.36
|
| Class
I at NAV |
05/31/2007
|
05/31/2007
|
(12.94)
|
(5.21)
|
8.49
|
8.46
|
| Class
R6 at NAV |
02/01/2019
|
05/31/2007
|
(12.89)
|
(5.15)
|
8.53
|
8.48
|
|
| MSCI
EAFE Small/Mid Cap Index |
—
|
—
|
(8.02)%
|
(3.96)%
|
6.76%
|
7.52%
|
| %
Total Annual Operating Expense Ratios3 |
Class
A |
Class
C |
Class
I |
Class
R6 |
| |
1.31%
|
2.06%
|
1.06%
|
0.98%
|
See Endnotes and Additional Disclosures in this report.
Past performance is no guarantee of future results. Returns are historical and
are calculated by determining the percentage change in net asset value (NAV) or offering price (as applicable) with all distributions reinvested. Investment return and principal value will fluctuate so that shares, when redeemed, may be worth more
or less than their original cost. Performance for periods less than or equal to one year is cumulative. Performance is for the stated time period only; due to market volatility, current Fund performance may be lower or higher than the quoted return.
For performance as of the most recent month-end, please refer to www.calvert.com.
Calvert
International Opportunities Fund
March 31, 2022
Sector Allocation (% of net assets)*
* Excludes cash
and cash equivalents.
| Top
10 Holdings (% of net assets)* |
|
| WiseTech
Global, Ltd. |
1.8%
|
| RWS
Holdings PLC |
1.5
|
| ATS
Automation Tooling Systems, Inc. |
1.5
|
| Sdiptech
AB, Class B |
1.4
|
| VGP
NV |
1.4
|
| Volution
Group PLC |
1.4
|
| Vanguard
MSCI Australian Small Companies Index ETF |
1.4
|
| Ashtead
Group PLC |
1.4
|
| Diploma
PLC |
1.3
|
| Aalberts
NV |
1.3
|
| Total
|
14.4%
|
| *
|
Excludes
cash and cash equivalents. |
Calvert
International Opportunities Fund
March 31, 2022
Endnotes and
Additional Disclosures
| 1 |
MSCI EAFE Small/Mid Cap
Index is an unmanaged index of small & mid-capitalization equities in the developed markets, excluding the U.S. and Canada. MSCI indexes are net of foreign withholding taxes. Source: MSCI. MSCI data may not be reproduced or used for any other
purpose. MSCI provides no warranties, has not prepared or approved this report, and has no liability hereunder. Unless otherwise stated, index returns do not reflect the effect of any applicable sales charges, commissions, expenses, taxes or
leverage, as applicable. It is not possible to invest directly in an index. |
|
2 |
Total
Returns at NAV do not include applicable sales charges. If sales charges were deducted, the returns would be lower. Total Returns shown with maximum sales charge reflect the stated maximum sales charge. Unless otherwise stated, performance does not
reflect the deduction of taxes on Fund distributions or redemptions of Fund shares.Performance prior to the inception date of a class may be linked to the performance of an older class of the Fund. This linked
performance is adjusted for any applicable sales charge, but is not adjusted for class expense differences. If adjusted for such differences, the performance would be different. The performance of Class R6 is linked to Class I. Performance presented
in the Financial Highlights included in the financial statements is not linked.Effective November 5, 2020, Class C shares automatically convert to Class A shares eight years after purchase. The average annual total
returns listed for Class C reflect conversion to Class A shares after eight years. Prior to November 5, 2020, Class C shares automatically converted to Class A shares ten years after purchase.Calvert Research and
Management became the investment adviser to the Fund on December 31, 2016. Performance reflected prior to such date is that of the Fund’s former investment adviser. |
|
3 |
Source:
Fund prospectus. The expense ratios for the current reporting period can be found in the Financial Highlights section of this report. Performance reflects expenses waived and/or reimbursed, if applicable. Without such waivers and/or reimbursements,
performance would have been lower. |
Calvert
International Opportunities Fund
March 31, 2022
Example
As a Fund shareholder, you incur two types of costs: (1)
transaction costs, including sales charges (loads) on purchases and redemption fees (if applicable); and (2) ongoing costs, including management fees; distribution and/or service fees; and other Fund expenses. This Example is intended to help you
understand your ongoing costs (in dollars) of Fund investing and to compare these costs with the ongoing costs of investing in other mutual funds. The Example is based on an investment of $1,000 invested at the beginning of the period and held for
the entire period (October 1, 2021 to March 31, 2022).
Actual Expenses
The first section of the table below provides information about
actual account values and actual expenses. You may use the information in this section, together with the amount you invested, to estimate the expenses that you paid over the period. Simply divide your account value by $1,000 (for example, an $8,600
account value divided by $1,000 = 8.6), then multiply the result by the number in the first section under the heading entitled “Expenses Paid During Period” to estimate the expenses you paid on your account during this period.
Hypothetical Example for Comparison Purposes
The second section of the table below provides information
about hypothetical account values and hypothetical expenses based on the actual Fund expense ratio and an assumed rate of return of 5% per year (before expenses), which is not the actual Fund return. The hypothetical account values and expenses may
not be used to estimate the actual ending account balance or expenses you paid for the period. You may use this information to compare the ongoing costs of investing in the Fund and other funds. To do so, compare this 5% hypothetical example with
the 5% hypothetical examples that appear in the shareholder reports of the other funds.
Please note that the expenses shown in the table are meant to
highlight your ongoing costs only and do not reflect any transactional costs, such as sales charges (loads) or redemption fees (if applicable). Therefore, the second section of the table is useful in comparing ongoing costs only, and will not help
you determine the relative total costs of owning different funds. In addition, if these transactional costs were included, your costs would be higher.
| |
Beginning
Account Value
(10/1/21) |
Ending
Account Value
(3/31/22) |
Expenses
Paid
During Period*
(10/1/21 – 3/31/22) |
Annualized
Expense
Ratio |
| Actual
|
|
|
|
|
| Class
A |
$1,000.00
|
$
869.40 |
$
6.06 |
1.30%
|
| Class
C |
$1,000.00
|
$
866.30 |
$
9.54 |
2.05%
|
| Class
I |
$1,000.00
|
$
870.60 |
$
4.90 |
1.05%
|
| Class
R6 |
$1,000.00
|
$
871.10 |
$
4.52 |
0.97%
|
| Hypothetical
|
|
|
|
|
| (5%
return per year before expenses) |
|
|
|
|
| Class
A |
$1,000.00
|
$1,018.45
|
$
6.54 |
1.30%
|
| Class
C |
$1,000.00
|
$1,014.71
|
$10.30
|
2.05%
|
| Class
I |
$1,000.00
|
$1,019.70
|
$
5.29 |
1.05%
|
| Class
R6 |
$1,000.00
|
$1,020.09
|
$
4.89 |
0.97%
|
| *
|
Expenses
are equal to the Fund's annualized expense ratio for the indicated Class, multiplied by the average account value over the period, multiplied by 182/365 (to reflect the one-half year period). The Example assumes that the $1,000 was invested at the
net asset value per share determined at the close of business on September 30, 2021. |
Calvert
International Opportunities Fund
March 31, 2022
Schedule of
Investments (Unaudited)
| Security
|
Shares
|
Value
|
| Australia
— 5.8% |
|
| Bapcor,
Ltd. |
|
676,173
|
$
3,223,055 |
| BlueScope
Steel, Ltd. |
|
89,851
|
1,397,192
|
| carsales.com,
Ltd. |
|
322,420
|
4,991,482
|
| Dexus
|
|
473,292
|
3,863,326
|
| Steadfast
Group, Ltd. |
|
1,284,706
|
4,575,050
|
| WiseTech
Global, Ltd. |
|
210,124
|
7,908,811
|
| |
|
|
$ 25,958,916
|
| Austria
— 2.0% |
|
| ams-OSRAM
AG(1) |
|
302,961
|
$
4,637,423 |
| BAWAG
Group AG(2) |
|
87,873
|
4,433,990
|
| |
|
|
$
9,071,413 |
| Belgium
— 3.8% |
|
| Azelis
Group NV(1) |
|
225,046
|
$
5,428,765 |
| KBC
Group NV |
|
28,666
|
2,056,761
|
| VGP
NV |
|
25,062
|
6,414,499
|
| Xior
Student Housing NV |
|
58,956
|
3,293,003
|
| |
|
|
$
17,193,028 |
| Canada
— 3.1% |
|
| Agnico
Eagle Mines, Ltd. |
|
30,932
|
$
1,892,811 |
| ATS
Automation Tooling Systems, Inc.(1) |
|
187,304
|
6,757,118
|
| CAE,
Inc.(1) |
|
103,759
|
2,700,730
|
| TMX
Group, Ltd. |
|
24,037
|
2,472,245
|
| |
|
|
$
13,822,904 |
| France
— 0.6% |
|
| Rubis
SCA |
|
89,601
|
$
2,633,630 |
| |
|
|
$
2,633,630 |
| Germany
— 1.3% |
|
| Jenoptik
AG |
|
100,464
|
$
3,022,644 |
| Norma
Group SE |
|
95,015
|
2,728,268
|
| |
|
|
$
5,750,912 |
| Ireland
— 1.4% |
|
| Irish
Residential Properties REIT PLC |
|
1,972,872
|
$
3,171,194 |
| Kerry
Group PLC, Class A |
|
29,005
|
3,240,661
|
| |
|
|
$
6,411,855 |
| Italy
— 7.3% |
|
| Amplifon
SpA |
|
101,465
|
$
4,515,682 |
| BFF
Bank SpA(2) |
|
688,071
|
5,107,594
|
| DiaSorin
SpA |
|
32,419
|
5,063,623
|
| FinecoBank
Banca Fineco SpA |
|
369,009
|
5,597,897
|
| Security
|
Shares
|
Value
|
| Italy
(continued) |
|
| Interpump
Group SpA(3) |
|
55,199
|
$
2,766,003 |
| MARR
SpA |
|
299,958
|
4,955,836
|
| Moncler
SpA |
|
89,881
|
4,986,763
|
| |
|
|
$ 32,993,398
|
| Japan
— 24.7% |
|
| As
One Corp. |
|
88,600
|
$
5,228,047 |
| Asahi
Intecc Co., Ltd. |
|
244,400
|
4,767,912
|
| Chiba
Bank, Ltd. (The) |
|
450,882
|
2,651,059
|
| Cosmos
Pharmaceutical Corp. |
|
32,200
|
3,902,596
|
| Dip
Corp. |
|
93,200
|
2,541,912
|
| Fukuoka
Financial Group, Inc. |
|
142,808
|
2,755,611
|
| Goldwin,
Inc. |
|
54,400
|
2,751,254
|
| JMDC,
Inc.(1) |
|
91,600
|
4,993,193
|
| Kewpie
Corp. |
|
105,033
|
2,012,503
|
| Kose
Corp. |
|
27,661
|
2,894,047
|
| K's
Holdings Corp. |
|
419,405
|
4,322,894
|
| Kuraray
Co., Ltd. |
|
509,340
|
4,384,392
|
| Kyoritsu
Maintenance Co., Ltd. |
|
131,078
|
4,928,173
|
| LaSalle
Logiport REIT |
|
2,128
|
3,060,802
|
| Lion
Corp.(3) |
|
356,506
|
3,973,317
|
| Makita
Corp. |
|
97,485
|
3,119,187
|
| Mitsubishi
Research Institute, Inc. |
|
176,800
|
5,777,302
|
| Mitsui
Fudosan Logistics Park, Inc. |
|
723
|
3,409,413
|
| Miura
Co., Ltd. |
|
216,386
|
5,331,636
|
| Nohmi
Bosai, Ltd. |
|
315,380
|
5,020,560
|
| Nomura
Co., Ltd.(3) |
|
594,684
|
4,457,404
|
| Sakata
Seed Corp. |
|
114,337
|
3,466,001
|
| Sankyu,
Inc. |
|
115,032
|
3,749,377
|
| Sanwa
Holdings Corp. |
|
549,500
|
5,561,346
|
| Ship
Healthcare Holdings, Inc. |
|
101,976
|
1,652,064
|
| SUMCO
Corp. |
|
271,828
|
4,448,448
|
| Tosei
Corp. |
|
504,000
|
4,805,179
|
| Yamaha
Corp. |
|
119,262
|
5,182,658
|
| |
|
|
$111,148,287
|
| Luxembourg
— 0.3% |
|
| APERAM
S.A. |
|
30,888
|
$
1,365,153 |
| |
|
|
$
1,365,153 |
| Netherlands
— 4.9% |
|
| Aalberts
NV |
|
111,507
|
$
5,778,991 |
| BE
Semiconductor Industries NV |
|
42,229
|
3,599,739
|
| Euronext
NV(2) |
|
44,917
|
4,080,603
|
| IMCD
NV |
|
31,731
|
5,413,066
|
| NN
Group NV |
|
62,213
|
3,152,876
|
| |
|
|
$
22,025,275 |
6
See Notes to Financial Statements.
Calvert
International Opportunities Fund
March 31, 2022
Schedule of
Investments (Unaudited) — continued
| Security
|
Shares
|
Value
|
| New
Zealand — 0.6% |
|
| Fisher
& Paykel Healthcare Corp., Ltd. |
|
161,863
|
$
2,716,091 |
| |
|
|
$ 2,716,091
|
| Norway
— 1.6% |
|
| Norsk
Hydro ASA |
|
138,149
|
$
1,342,238 |
| SmartCraft
ASA(1) |
|
2,011,401
|
4,070,853
|
| SpareBank
1 SR-Bank ASA |
|
124,429
|
1,894,117
|
| |
|
|
$ 7,307,208
|
| Portugal
— 0.6% |
|
| NOS
SGPS S.A. |
|
605,195
|
$
2,549,993 |
| |
|
|
$
2,549,993 |
| Singapore
— 2.3% |
|
| Daiwa
House Logistics Trust(1) |
|
7,715,880
|
$
4,806,008 |
| Frasers
Logistics & Commercial Trust |
|
2,602,100
|
2,790,849
|
| XP
Power, Ltd. |
|
61,836
|
2,809,492
|
| |
|
|
$
10,406,349 |
| Spain
— 1.8% |
|
| Acciona
S.A. |
|
18,615
|
$
3,557,980 |
| Inmobiliaria
Colonial Socimi S.A. |
|
495,790
|
4,519,558
|
| |
|
|
$
8,077,538 |
| Sweden
— 7.2% |
|
| AddTech
AB, Class B |
|
131,281
|
$
2,520,373 |
| Autoliv,
Inc. |
|
46,937
|
3,587,864
|
| Boliden
AB |
|
63,602
|
3,208,415
|
| Bravida
Holding AB(2) |
|
420,252
|
4,832,317
|
| Bufab
AB |
|
105,384
|
3,745,036
|
| Indutrade
AB |
|
178,197
|
4,481,505
|
| Lagercrantz
Group AB, Class B |
|
327,490
|
3,705,706
|
| Sdiptech
AB, Class B(1) |
|
168,912
|
6,477,340
|
| |
|
|
$
32,558,556 |
| Switzerland
— 4.3% |
|
| Galenica
AG(2) |
|
37,992
|
$
2,924,861 |
| Logitech
International S.A. |
|
50,733
|
3,771,092
|
| PolyPeptide
Group AG(1)(2) |
|
43,913
|
3,474,096
|
| Straumann
Holding AG |
|
3,119
|
4,980,065
|
| VZ
Holding AG |
|
41,998
|
3,972,724
|
| |
|
|
$
19,122,838 |
| United
Kingdom — 22.8% |
|
| Abcam
PLC(1) |
|
256,384
|
$
4,634,160 |
| Ashtead
Group PLC |
|
96,056
|
6,048,108
|
| Bellway
PLC |
|
72,728
|
2,311,893
|
| Bodycote
PLC |
|
260,860
|
2,153,985
|
| Security
|
Shares
|
Value
|
| United
Kingdom (continued) |
|
| Capital
& Counties Properties PLC |
|
1,623,679
|
$
3,705,148 |
| Compass
Group PLC |
|
115,620
|
2,488,153
|
| Cranswick
PLC |
|
111,542
|
5,148,610
|
| Dechra
Pharmaceuticals PLC |
|
78,436
|
4,164,328
|
| Diploma
PLC |
|
173,553
|
5,958,209
|
| Dr.
Martens PLC |
|
895,225
|
2,783,307
|
| Games
Workshop Group PLC |
|
53,422
|
5,079,980
|
| Greggs
PLC |
|
127,780
|
4,103,985
|
| Halma
PLC |
|
114,025
|
3,730,567
|
| Howden
Joinery Group PLC |
|
479,275
|
4,804,745
|
| InterContinental
Hotels Group PLC |
|
74,279
|
5,023,827
|
| JTC
PLC(2)(3) |
|
344,651
|
3,811,028
|
| Judges
Scientific PLC |
|
54,512
|
4,898,625
|
| Nomad
Foods, Ltd.(1) |
|
105,820
|
2,389,416
|
| RWS
Holdings PLC |
|
1,407,439
|
6,830,784
|
| St.
James's Place PLC |
|
246,891
|
4,654,730
|
| Volution
Group PLC |
|
1,163,187
|
6,349,321
|
| Watches
of Switzerland Group PLC(1)(2) |
|
281,170
|
4,178,357
|
| Weir
Group PLC (The) |
|
138,224
|
2,949,682
|
| Wise
PLC(1) |
|
665,731
|
4,304,340
|
| |
|
|
$102,505,288
|
Total
Common Stocks
(identified cost $414,242,553) |
|
|
$433,618,632
|
| Exchange-Traded
Funds — 2.6% |
| Security
|
Shares
|
Value
|
| Equity
Funds — 2.6% |
|
| iShares
MSCI Hong Kong ETF(3) |
|
158,386
|
$
3,574,772 |
| iShares
MSCI Singapore ETF(3) |
|
85,912
|
1,790,406
|
| Vanguard
MSCI Australian Small Companies Index ETF |
|
116,383
|
6,239,391
|
Total
Exchange-Traded Funds
(identified cost $11,283,058) |
|
|
$ 11,604,569
|
| High
Social Impact Investments — 0.1% |
| Security
|
Principal
Amount
(000's omitted) |
Value
|
| Calvert
Impact Capital, Inc., Community Investment Notes, 1.50%, 12/15/23(4)(5) |
$
|
560
|
$
533,081 |
| ImpactAssets,
Inc., Global Sustainable Agriculture Notes, 0.00%, 11/3/22(5)(6) |
|
11
|
10,631
|
Total
High Social Impact Investments
(identified cost $571,108) |
|
|
$ 543,712
|
7
See Notes to Financial Statements.
Calvert
International Opportunities Fund
March 31, 2022
Schedule of
Investments (Unaudited) — continued
| Short-Term
Investments — 2.1% |
| Affiliated
Fund — 1.2% |
| Description
|
Units
|
Value
|
| Calvert
Cash Reserves Fund, LLC, 0.14%(7) |
|
5,684,558
|
$
5,683,990 |
Total
Affiliated Fund
(identified cost $5,683,554) |
|
|
$ 5,683,990
|
| Securities
Lending Collateral — 0.9% |
| Security
|
Shares
|
Value
|
| State
Street Navigator Securities Lending Government Money Market Portfolio, 0.29%(8) |
|
3,899,985
|
$
3,899,985 |
Total
Securities Lending Collateral
(identified cost $3,899,985) |
|
|
$ 3,899,985
|
Total
Short-Term Investments
(identified cost $9,583,539) |
|
|
$ 9,583,975
|
Total
Investments — 101.2%
(identified cost $435,680,258) |
|
$
455,350,888 |
| Other
Assets, Less Liabilities — (1.2)% |
|
$
(5,514,171) |
| Net
Assets — 100.0% |
|
$
449,836,717 |
| The
percentage shown for each investment category in the Schedule of Investments is based on net assets. |
|
(1) |
Non-income
producing security. |
|
(2) |
Security
exempt from registration under Rule 144A of the Securities Act of 1933, as amended. These securities may be sold in certain transactions in reliance on an exemption from registration (normally to qualified institutional buyers). At March 31, 2022,
the aggregate value of these securities is $32,842,846 or 7.3% of the Fund's net assets. |
|
(3) |
All
or a portion of this security was on loan at March 31, 2022. The aggregate market value of securities on loan at March 31, 2022 was $6,032,457. |
|
(4) |
May be
deemed to be an affiliated company (see Note 7). |
|
(5) |
Restricted
security. Total market value of restricted securities amounts to $543,712, which represents 0.1% of the net assets of the Fund as of March 31, 2022. |
|
(6) |
Notes
carry an interest rate that varies by period and is contingent on the performance of the underlying portfolio of loans to borrowers. The coupon rate shown represents the rate in effect at March 31, 2022. |
|
(7) |
Affiliated
investment company, which invests in high quality, U.S. dollar denominated money market instruments. The rate shown is the annualized seven-day yield as of March 31, 2022. |
|
(8) |
Represents
investment of cash collateral received in connection with securities lending. |
At March 31, 2022, the concentration of the Fund’s
investments in the various sectors, determined as a percentage of net assets, was as follows:
| Economic
Sectors |
%
of Net Assets |
| Industrials
|
26.4%
|
| Consumer
Discretionary |
12.2
|
| Information
Technology |
12.0
|
| Financials
|
11.4
|
| Health
Care |
10.9
|
| Real
Estate |
9.8
|
| Consumer
Staples |
7.1
|
| Materials
|
3.0
|
| Exchange-Traded
Funds |
2.6
|
| Communication
Services |
2.2
|
| Utilities
|
1.4
|
| High
Social Impact Investments |
0.1
|
| Total
|
99.1%
|
Restricted Securities
| Description
|
Acquisition
Dates |
Cost
|
| Calvert
Impact Capital, Inc., Community Investment Notes, 1.50%, 12/15/23 |
12/14/20
|
$560,000
|
| ImpactAssets,
Inc., Global Sustainable Agriculture Notes, 0.00%, 11/3/22 |
11/13/15
|
11,108
|
8
See Notes to Financial Statements.
Calvert
International Opportunities Fund
March 31, 2022
Statement of Assets
and Liabilities (Unaudited)
| |
March 31,
2022 |
| Assets
|
|
Investments
in securities of unaffiliated issuers, at value (identified cost $429,436,704) - including
$6,032,457 of securities on loan |
$
449,133,817 |
| Investments
in securities of affiliated issuers, at value (identified cost $6,243,554) |
6,217,071
|
| Cash
denominated in foreign currency, at value (cost $10,657) |
10,625
|
| Receivable
for investments sold |
2,015,893
|
| Receivable
for capital shares sold |
997,933
|
| Dividends
and interest receivable |
1,242,504
|
| Dividends
and interest receivable - affiliated |
2,829
|
| Securities
lending income receivable |
7,975
|
| Tax
reclaims receivable |
510,708
|
| Directors'
deferred compensation plan |
207,404
|
| Total
assets |
$460,346,759
|
| Liabilities
|
|
| Payable
for investments purchased |
$
5,443,359 |
| Payable
for capital shares redeemed |
411,804
|
| Deposits
for securities loaned |
3,899,985
|
| Payable
to affiliates: |
|
| Investment
advisory fee |
285,773
|
| Administrative
fee |
45,724
|
| Distribution
and service fees |
21,989
|
| Sub-transfer
agency fee |
8,756
|
| Directors'
deferred compensation plan |
207,404
|
| Other
|
11,386
|
| Accrued
expenses |
173,862
|
| Total
liabilities |
$
10,510,042 |
| Net
Assets |
$449,836,717
|
| Sources
of Net Assets |
|
| Paid-in
capital |
$
426,225,412 |
| Distributable
earnings |
23,611,305
|
| Net
Assets |
$449,836,717
|
| Class
A Shares |
|
| Net
Assets |
$
83,147,040 |
| Shares
Outstanding |
4,560,949
|
Net
Asset Value and Redemption Price Per Share
(net assets ÷ shares of beneficial interest outstanding) |
$
18.23 |
Maximum
Offering Price Per Share
(100 ÷ 95.25 of net asset value per share) |
$
19.14 |
| Class
C Shares |
|
| Net
Assets |
$
5,267,166 |
| Shares
Outstanding |
297,134
|
Net
Asset Value and Offering Price Per Share*
(net assets ÷ shares of beneficial interest outstanding) |
$
17.73 |
9
See Notes to Financial Statements.
Calvert
International Opportunities Fund
March 31, 2022
Statement of Assets
and Liabilities (Unaudited) — continued
| |
March 31,
2022 |
| Class
I Shares |
|
| Net
Assets |
$
304,713,273 |
| Shares
Outstanding |
17,110,825
|
Net
Asset Value, Offering Price and Redemption Price Per Share
(net assets ÷ shares of beneficial interest outstanding) |
$
17.81 |
| Class
R6 Shares |
|
| Net
Assets |
$
56,709,238 |
| Shares
Outstanding |
3,185,944
|
Net
Asset Value, Offering Price and Redemption Price Per Share
(net assets ÷ shares of beneficial interest outstanding) |
$
17.80 |
| On
sales of $50,000 or more, the offering price of Class A shares is reduced. |
| *
|
Redemption
price per share is equal to the net asset value less any applicable contingent deferred sales charge. |
10
See Notes to Financial Statements.
Calvert
International Opportunities Fund
March 31, 2022
Statement of
Operations (Unaudited)
| |
Six
Months Ended |
| |
March
31, 2022 |
| Investment
Income |
|
| Dividend
income (net of foreign taxes withheld of $363,124) |
$
4,380,748 |
| Dividend
income - affiliated issuers |
2,610
|
| Interest
income |
553
|
| Interest
income - affiliated issuers |
4,200
|
| Securities
lending income, net |
44,467
|
| Total
investment income |
$
4,432,578 |
| Expenses
|
|
| Investment
advisory fee |
$
1,871,789 |
| Administrative
fee |
299,486
|
| Distribution
and service fees: |
|
| Class
A |
113,491
|
| Class
C |
29,653
|
| Directors'
fees and expenses |
9,467
|
| Custodian
fees |
29,468
|
| Transfer
agency fees and expenses |
207,042
|
| Accounting
fees |
63,164
|
| Professional
fees |
17,888
|
| Registration
fees |
46,056
|
| Reports
to shareholders |
17,240
|
| Miscellaneous
|
29,856
|
| Total
expenses |
$
2,734,600 |
| Net
investment income |
$
1,697,978 |
| Realized
and Unrealized Gain (Loss) |
|
| Net
realized gain (loss): |
|
| Investment
securities |
$
8,351,547 |
| Investment
securities - affiliated issuers |
(685)
|
| Foreign
currency transactions |
25,556
|
| Net
realized gain |
$
8,376,418 |
| Change
in unrealized appreciation (depreciation): |
|
| Investment
securities |
$
(77,317,819) |
| Investment
securities - affiliated issuers |
(17,775)
|
| Foreign
currency |
(18,324)
|
| Net
change in unrealized appreciation (depreciation) |
$(77,353,918)
|
| Net
realized and unrealized loss |
$(68,977,500)
|
| Net
decrease in net assets from operations |
$(67,279,522)
|
11
See Notes to Financial Statements.
Calvert
International Opportunities Fund
March 31, 2022
Statements of
Changes in Net Assets
| |
Six
Months Ended
March 31, 2022
(Unaudited) |
Year
Ended
September 30,
2021 |
| Increase
(Decrease) in Net Assets |
|
|
| From
operations: |
|
|
| Net
investment income |
$
1,697,978 |
$
2,644,080 |
| Net
realized gain |
8,376,418
|
65,782,386
|
| Net
change in unrealized appreciation (depreciation) |
(77,353,918)
|
31,295,662
|
| Net
increase (decrease) in net assets from operations |
$
(67,279,522) |
$
99,722,128 |
| Distributions
to shareholders: |
|
|
| Class
A |
$
(6,524,091) |
$
(413,572) |
| Class
C |
(390,242)
|
—
|
| Class
I |
(26,006,670)
|
(2,243,218)
|
| Class
R6 |
(4,768,045)
|
(497,493)
|
| Total
distributions to shareholders |
$
(37,689,048) |
$
(3,154,283) |
| Capital
share transactions: |
|
|
| Class
A |
$
9,857,555 |
$
5,722,020 |
| Class
C |
207,419
|
(555,571)
|
| Class
I |
28,067,469
|
29,139,228
|
| Class
R6 |
1,641,416
|
6,866,062
|
| Net
increase in net assets from capital share transactions |
$
39,773,859 |
$
41,171,739 |
| Net
increase (decrease) in net assets |
$
(65,194,711) |
$137,739,584
|
| Net
Assets |
|
|
| At
beginning of period |
$
515,031,428 |
$
377,291,844 |
| At
end of period |
$449,836,717
|
$515,031,428
|
12
See Notes to Financial Statements.
Calvert
International Opportunities Fund
March 31, 2022
| |
Class
A |
| |
Six
Months Ended
March 31, 2022
(Unaudited) |
Year
Ended September 30, |
| |
2021
|
2020
|
2019
|
2018
|
2017
|
| Net
asset value — Beginning of period |
$
22.54 |
$
18.01 |
$
16.18 |
$
18.86 |
$
18.70 |
$
14.78 |
| Income
(Loss) From Operations |
|
|
|
|
|
|
| Net
investment income(1) |
$
0.05 |
$
0.08 |
$
0.07 |
$
0.18 |
$
0.17 |
$
0.03 |
| Net
realized and unrealized gain (loss) |
(2.80)
|
4.56
|
1.95
|
(1.51)
|
1.20
|
4.04
|
| Total
income (loss) from operations |
$
(2.75) |
$
4.64 |
$
2.02 |
$
(1.33) |
$
1.37 |
$
4.07 |
| Less
Distributions |
|
|
|
|
|
|
| From
net investment income |
$
(0.27) |
$
(0.11) |
$
(0.19) |
$
(0.23) |
$
(0.24) |
$
(0.15) |
| From
net realized gain |
(1.29)
|
—
|
—
|
(1.12)
|
(0.97)
|
—
|
| Total
distributions |
$
(1.56) |
$
(0.11) |
$
(0.19) |
$
(1.35) |
$
(1.21) |
$
(0.15) |
| Net
asset value — End of period |
$
18.23 |
$
22.54 |
$
18.01 |
$
16.18 |
$
18.86 |
$
18.70 |
| Total
Return(2) |
(13.06)%
(3) |
25.83%
|
12.57%
|
(6.77)%
|
7.62%
|
27.89%
|
| Ratios/Supplemental
Data |
|
|
|
|
|
|
| Net
assets, end of period (000’s omitted) |
$83,147
|
$92,236
|
$68,940
|
$64,070
|
$65,994
|
$50,552
|
| Ratios
(as a percentage of average daily net assets):(4) |
|
|
|
|
|
|
| Total
expenses |
1.30%
(5) |
1.30%
|
1.32%
|
1.37%
|
1.38%
|
1.48%
|
| Net
expenses |
1.30%
(5) |
1.30%
|
1.32%
|
1.35%
|
1.38%
|
1.48%
|
| Net
investment income |
0.48%
(5) |
0.36%
|
0.42%
|
1.15%
|
0.91%
|
0.18%
|
| Portfolio
Turnover |
21%
(3) |
54%
|
62%
|
60%
|
60%
|
158%
|
|
(1) |
Computed
using average shares outstanding. |
|
(2) |
Returns
are historical and are calculated by determining the percentage change in net asset value with all distributions reinvested and do not reflect the effect of sales charges, if any. |
|
(3) |
Not
annualized. |
|
(4) |
Total
expenses do not reflect amounts reimbursed and/or waived by the adviser and certain of its affiliates, if applicable. Net expenses are net of all reductions and represent the net expenses paid by the Fund. |
|
(5) |
Annualized.
|
13
See Notes to Financial Statements.
Calvert
International Opportunities Fund
March 31, 2022
Financial
Highlights — continued
| |
Class
C |
| |
Six
Months Ended
March 31, 2022
(Unaudited) |
Year
Ended September 30, |
| |
2021
|
2020
|
2019
|
2018
|
2017
|
| Net
asset value — Beginning of period |
$
21.87 |
$
17.51 |
$
15.74 |
$
18.37 |
$
18.29 |
$
14.43 |
| Income
(Loss) From Operations |
|
|
|
|
|
|
| Net
investment income (loss)(1) |
$
(0.03) |
$
(0.08) |
$
(0.06) |
$
0.06 |
$
0.03 |
$
(0.04) |
| Net
realized and unrealized gain (loss) |
(2.72)
|
4.44
|
1.90
|
(1.47)
|
1.18
|
3.91
|
| Total
income (loss) from operations |
$
(2.75) |
$
4.36 |
$
1.84 |
$
(1.41) |
$
1.21 |
$
3.87 |
| Less
Distributions |
|
|
|
|
|
|
| From
net investment income |
$
(0.10) |
$
— |
$
(0.07) |
$
(0.10) |
$
(0.16) |
$
(0.01) |
| From
net realized gain |
(1.29)
|
—
|
—
|
(1.12)
|
(0.97)
|
—
|
| Total
distributions |
$
(1.39) |
$
— |
$
(0.07) |
$
(1.22) |
$
(1.13) |
$
(0.01) |
| Net
asset value — End of period |
$
17.73 |
$21.87
|
$17.51
|
$15.74
|
$18.37
|
$18.29
|
| Total
Return(2) |
(13.37)%
(3) |
24.90%
|
11.68%
|
(7.49)%
|
6.92%
|
26.83%
|
| Ratios/Supplemental
Data |
|
|
|
|
|
|
| Net
assets, end of period (000’s omitted) |
$
5,267 |
$
6,260 |
$
5,527 |
$
6,532 |
$
7,603 |
$
5,850 |
| Ratios
(as a percentage of average daily net assets):(4) |
|
|
|
|
|
|
| Total
expenses |
2.05%
(5) |
2.05%
|
2.08%
|
2.12%
|
2.13%
|
2.61%
|
| Net
expenses |
2.05%
(5) |
2.05%
|
2.08%
|
2.10%
|
2.13%
|
2.30%
|
| Net
investment income (loss) |
(0.27)%
(5) |
(0.40)%
|
(0.37)%
|
0.38%
|
0.18%
|
(0.24)%
|
| Portfolio
Turnover |
21%
(3) |
54%
|
62%
|
60%
|
60%
|
158%
|
|
(1) |
Computed
using average shares outstanding. |
|
(2) |
Returns
are historical and are calculated by determining the percentage change in net asset value with all distributions reinvested and do not reflect the effect of sales charges, if any. |
|
(3) |
Not
annualized. |
|
(4) |
Total
expenses do not reflect amounts reimbursed and/or waived by the adviser and certain of its affiliates, if applicable. Net expenses are net of all reductions and represent the net expenses paid by the Fund. |
|
(5) |
Annualized.
|
14
See Notes to Financial Statements.
Calvert
International Opportunities Fund
March 31, 2022
Financial
Highlights — continued
| |
Class
I |
| |
Six
Months Ended
March 31, 2022
(Unaudited) |
Year
Ended September 30, |
| |
2021
|
2020
|
2019
|
2018
|
2017
|
| Net
asset value — Beginning of period |
$
22.08 |
$
17.64 |
$
15.86 |
$
18.52 |
$
18.42 |
$
14.56 |
| Income
(Loss) From Operations |
|
|
|
|
|
|
| Net
investment income(1) |
$
0.07 |
$
0.13 |
$
0.11 |
$
0.22 |
$
0.23 |
$
0.17 |
| Net
realized and unrealized gain (loss) |
(2.73)
|
4.47
|
1.90
|
(1.49)
|
1.17
|
3.90
|
| Total
income (loss) from operations |
$
(2.66) |
$
4.60 |
$
2.01 |
$
(1.27) |
$
1.40 |
$
4.07 |
| Less
Distributions |
|
|
|
|
|
|
| From
net investment income |
$
(0.32) |
$
(0.16) |
$
(0.23) |
$
(0.27) |
$
(0.33) |
$
(0.21) |
| From
net realized gain |
(1.29)
|
—
|
—
|
(1.12)
|
(0.97)
|
—
|
| Total
distributions |
$
(1.61) |
$
(0.16) |
$
(0.23) |
$
(1.39) |
$
(1.30) |
$
(0.21) |
| Net
asset value — End of period |
$
17.81 |
$
22.08 |
$
17.64 |
$
15.86 |
$
18.52 |
$
18.42 |
| Total
Return(2) |
(12.94)%
(3) |
26.17%
|
12.77%
|
(6.50)%
|
7.95%
|
28.44%
|
| Ratios/Supplemental
Data |
|
|
|
|
|
|
| Net
assets, end of period (000’s omitted) |
$304,713
|
$348,044
|
$254,350
|
$222,546
|
$230,748
|
$115,698
|
| Ratios
(as a percentage of average daily net assets):(4) |
|
|
|
|
|
|
| Total
expenses |
1.05%
(5) |
1.05%
|
1.07%
|
1.12%
|
1.13%
|
1.07%
|
| Net
expenses |
1.05%
(5) |
1.05%
|
1.07%
|
1.10%
|
1.13%
|
1.07%
|
| Net
investment income |
0.73%
(5) |
0.62%
|
0.67%
|
1.41%
|
1.23%
|
1.06%
|
| Portfolio
Turnover |
21%
(3) |
54%
|
62%
|
60%
|
60%
|
158%
|
|
(1) |
Computed
using average shares outstanding. |
|
(2) |
Returns
are historical and are calculated by determining the percentage change in net asset value with all distributions reinvested and do not reflect the effect of sales charges, if any. |
|
(3) |
Not
annualized. |
|
(4) |
Total
expenses do not reflect amounts reimbursed and/or waived by the adviser and certain of its affiliates, if applicable. Net expenses are net of all reductions and represent the net expenses paid by the Fund. |
|
(5) |
Annualized.
|
15
See Notes to Financial Statements.
Calvert
International Opportunities Fund
March 31, 2022
Financial
Highlights — continued
| |
Class
R6 |
| |
Six
Months Ended
March 31, 2022
(Unaudited) |
Year
Ended September 30, |
Period
Ended
September 30, |
| |
2021
|
2020
|
2019
(1) |
| Net
asset value — Beginning of period |
$
22.07 |
$
17.64 |
$
15.86 |
$
15.14 |
| Income
(Loss) From Operations |
|
|
|
|
| Net
investment income(2) |
$
0.08 |
$
0.14 |
$
0.12 |
$
0.16 |
| Net
realized and unrealized gain (loss) |
(2.72)
|
4.46
|
1.91
|
0.56
|
| Total
income (loss) from operations |
$
(2.64) |
$
4.60 |
$
2.03 |
$
0.72 |
| Less
Distributions |
|
|
|
|
| From
net investment income |
$
(0.34) |
$
(0.17) |
$
(0.25) |
$
— |
| From
net realized gain |
(1.29)
|
—
|
—
|
—
|
| Total
distributions |
$
(1.63) |
$
(0.17) |
$
(0.25) |
$
— |
| Net
asset value — End of period |
$
17.80 |
$
22.07 |
$
17.64 |
$
15.86 |
| Total
Return(3) |
(12.89)%
(4) |
26.21%
|
12.87%
|
4.76%
(4) |
| Ratios/Supplemental
Data |
|
|
|
|
| Net
assets, end of period (000’s omitted) |
$56,709
|
$68,492
|
$48,475
|
$43,489
|
| Ratios
(as a percentage of average daily net assets):(5) |
|
|
|
|
| Total
expenses |
0.97%
(6) |
0.97%
|
1.00%
|
1.08%
(6) |
| Net
expenses |
0.97%
(6) |
0.97%
|
1.00%
|
1.05%
(6) |
| Net
investment income |
0.81%
(6) |
0.69%
|
0.74%
|
1.53%
(6) |
| Portfolio
Turnover |
21%
(4) |
54%
|
62%
|
60%
(7) |
|
(1) |
For
the period from the commencement of operations, February 1, 2019, to September 30, 2019. |
|
(2) |
Computed
using average shares outstanding. |
|
(3) |
Returns
are historical and are calculated by determining the percentage change in net asset value with all distributions reinvested and do not reflect the effect of sales charges, if any. |
|
(4) |
Not
annualized. |
|
(5) |
Total
expenses do not reflect amounts reimbursed and/or waived by the adviser and certain of its affiliates, if applicable. Net expenses are net of all reductions and represent the net expenses paid by the Fund. |
|
(6) |
Annualized.
|
|
(7) |
For
the year ended September 30, 2019. |
16
See Notes to Financial Statements.
Calvert
International Opportunities Fund
March 31, 2022
Notes to Financial
Statements (Unaudited)
1 Significant Accounting Policies
Calvert International Opportunities Fund (the Fund) is a
diversified series of Calvert World Values Fund, Inc. (the Corporation). The Corporation is a Maryland corporation registered under the Investment Company Act of 1940, as amended (the 1940 Act), as an open-end management investment company. The
investment objective of the Fund is to seek long-term capital appreciation. The Fund invests primarily in common and preferred stocks of non-U.S. small-cap to mid-cap companies.
The Fund offers four classes of shares. Class A shares are
generally sold subject to a sales charge imposed at time of purchase. Effective April 29, 2022, the maximum sales charge payable upon purchase of Class A shares was increased to 5.25%. A contingent deferred sales charge of 0.80% (1.00% effective
April 29, 2022) may apply to certain redemptions of Class A shares for accounts for which no sales charge was paid, if redeemed within 12 months of purchase. Class C shares are sold without a front-end sales charge, and with certain exceptions, are
charged a contingent deferred sales charge of 1% on shares redeemed within 12 months of purchase. Class C shares are only available for purchase through a financial intermediary. Effective November 5, 2020, Class C shares automatically convert to
Class A shares eight years after their purchase as described in the Fund's prospectus. Class I and Class R6 shares are sold at net asset value, are not subject to a sales charge and are sold only to certain eligible investors. Each class represents
a pro rata interest in the Fund, but votes separately on class-specific matters and is subject to different expenses.
The Fund applies the accounting and reporting guidance in the
Financial Accounting Standards Board (FASB) Accounting Standards Codification Topic 946, Financial Services – Investment Companies (ASC 946). Subsequent events, if any, through the date that the
financial statements were issued have been evaluated in the preparation of the financial statements.
A Investment
Valuation— Net asset value per share is determined every business day as of the close of the regular session of the New York Stock Exchange (generally 4:00 p.m. Eastern time).
The Fund uses independent pricing services approved by the Board of Directors (the Board) to value its investments wherever possible. Investments for which market quotations are not available or deemed not reliable are fair valued in good faith
under the direction of the Board.
U.S. generally
accepted accounting principles (U.S. GAAP) establishes a disclosure hierarchy that categorizes the inputs to valuation techniques used to value assets and liabilities at measurement date. These inputs are summarized in the three broad levels listed
below:
Level 1 - quoted prices in active markets for
identical securities
Level 2 - other significant
observable inputs (including quoted prices for similar securities, interest rates, prepayment speeds, credit risk, etc.)
Level 3 - significant unobservable inputs (including the
Fund’s own assumptions in determining the fair value of investments)
The inputs or methodologies used for valuing securities are not
necessarily an indication of the risk associated with investing in those securities.
Valuation techniques used to value the Fund’s investments
by major category are as follows:
Equity Securities. Equity securities (including warrants and rights) listed on a U.S. securities exchange generally are valued at the last sale or closing price as reported by an independent pricing service on the primary market or
exchange on which they are traded and are categorized as Level 1 in the hierarchy. Equity securities listed on the NASDAQ National Market System are valued at the NASDAQ official closing price and are categorized as Level 1 in the hierarchy.
Unlisted or listed securities for which closing sales prices or closing quotations are not available are valued at the mean between the latest available bid and ask prices and are categorized as Level 2 in the hierarchy. The daily valuation of
exchange-traded foreign securities generally is determined as of the close of trading on the principal exchange on which such securities trade. Events occurring after the close of trading on foreign exchanges may result in adjustments to the
valuation of foreign securities to more accurately reflect their fair value as of the close of regular trading on the New York Stock Exchange. When valuing foreign equity securities that meet certain criteria, the Fund's Board has approved the use
of a fair value service that values such securities to reflect market trading that occurs after the close of the applicable foreign markets of comparable securities or other instruments that have a strong correlation to the fair-valued securities.
Such securities are categorized as Level 2 in the hierarchy.
Debt Securities. Debt
securities are generally valued based on valuations provided by third party pricing services, as derived from such services’ pricing models. Inputs to the models may include, but are not limited to, reported trades, executable bid and ask
prices, broker/dealer quotations, prices or yields of securities with similar characteristics, interest rates, anticipated prepayments, benchmark curves or information pertaining to the issuer, as well as industry and economic events. Accordingly,
debt securities are generally categorized as Level 2 in the hierarchy. Short-term debt securities with a remaining maturity at time of purchase of more than sixty days are valued based on valuations provided by a third party pricing service. Such
securities are generally categorized as Level 2 in the hierarchy. Short-term debt securities of sufficient credit quality purchased with remaining maturities of sixty days or less for which a valuation from a third party pricing service is not
readily available may be valued at amortized cost, which approximates fair value, and are categorized as Level 2 in the hierarchy.
Affiliated Fund. Calvert Cash
Reserves Fund, LLC (Cash Reserves Fund) is an affiliated investment company managed by Calvert Research and Management (CRM). While Cash Reserves Fund is not a registered money market mutual fund, it conducts all of its investment activities in
accordance with the requirements of Rule 2a-7 under the 1940 Act. Investments in Cash Reserves Fund are valued at the closing net asset value per unit on the valuation day and are categorized as Level 2 in the hierarchy. Cash Reserves Fund generally
values its investment securities based on available market quotations provided by a third party pricing service.
Calvert
International Opportunities Fund
March 31, 2022
Notes to Financial
Statements (Unaudited) — continued
Other
Securities. Investments in registered investment companies (including money market funds) that do not trade on an exchange are valued at the net asset value per share on the valuation day and are categorized as
Level 1 in the hierarchy.
Fair Valuation. If a market value cannot be determined for a security using the methodologies described above, or if, in the good faith opinion of the Fund's adviser, the market value does not constitute a readily available market
quotation, or if a significant event has occurred that would materially affect the value of the security, the security will be fair valued as determined in good faith by or at the direction of the Board in a manner that most fairly reflects the
security’s “fair value”, which is the amount that the Fund might reasonably expect to receive for the security upon its current sale in the ordinary course. Each such determination is based on a consideration of relevant factors,
which are likely to vary from one pricing context to another. These factors may include, but are not limited to, the type of security, the existence of any contractual restrictions on the security’s disposition, the price and extent of public
trading in similar securities of the issuer or of comparable companies or entities, quotations or relevant information obtained from broker/dealers or other market participants, information obtained from the issuer, analysts, and/or the appropriate
stock exchange (for exchange-traded securities), an analysis of the company’s or entity’s financial statements, and an evaluation of the forces that influence the issuer and the market(s) in which the security is purchased and
sold.
The values assigned to fair value
investments are based on available information and do not necessarily represent amounts that might ultimately be realized. Further, due to the inherent uncertainty of valuations of such investments, the fair values may differ significantly from the
values that would have been used had an active market existed, and the differences could be material.
The following table summarizes the market value of the Fund's
holdings as of March 31, 2022, based on the inputs used to value them:
| Asset
Description |
Level
1 |
Level
2 |
Level
3 |
Total
|
| Common
Stocks: |
|
|
|
|
| Australia
|
$
— |
$
25,958,916 |
$
— |
$
25,958,916 |
| Austria
|
—
|
9,071,413
|
—
|
9,071,413
|
| Belgium
|
—
|
17,193,028
|
—
|
17,193,028
|
| Canada
|
13,822,904
|
—
|
—
|
13,822,904
|
| France
|
—
|
2,633,630
|
—
|
2,633,630
|
| Germany
|
—
|
5,750,912
|
—
|
5,750,912
|
| Ireland
|
—
|
6,411,855
|
—
|
6,411,855
|
| Italy
|
—
|
32,993,398
|
—
|
32,993,398
|
| Japan
|
—
|
111,148,287
|
—
|
111,148,287
|
| Luxembourg
|
—
|
1,365,153
|
—
|
1,365,153
|
| Netherlands
|
—
|
22,025,275
|
—
|
22,025,275
|
| New
Zealand |
—
|
2,716,091
|
—
|
2,716,091
|
| Norway
|
—
|
7,307,208
|
—
|
7,307,208
|
| Portugal
|
—
|
2,549,993
|
—
|
2,549,993
|
| Singapore
|
—
|
10,406,349
|
—
|
10,406,349
|
| Spain
|
—
|
8,077,538
|
—
|
8,077,538
|
| Sweden
|
3,587,864
|
28,970,692
|
—
|
32,558,556
|
| Switzerland
|
—
|
19,122,838
|
—
|
19,122,838
|
| United
Kingdom |
2,389,416
|
100,115,872
|
—
|
102,505,288
|
| Total
Common Stocks |
$19,800,184
|
$413,818,448
(1) |
$ —
|
$433,618,632
|
| Exchange-Traded
Funds |
$
5,365,178 |
$
6,239,391 |
$
— |
$
11,604,569 |
| High
Social Impact Investments |
—
|
543,712
|
—
|
543,712
|
| Short-Term
Investments: |
|
|
|
|
| Affiliated
Fund |
—
|
5,683,990
|
—
|
5,683,990
|
| Securities
Lending Collateral |
3,899,985
|
—
|
—
|
3,899,985
|
| Total
Investments |
$29,065,347
|
$426,285,541
|
$ —
|
$455,350,888
|
|
(1) |
Includes
foreign equity securities whose values were adjusted to reflect market trading of comparable securities or other correlated instruments that occurred after the close of trading in their applicable foreign markets. |
Calvert
International Opportunities Fund
March 31, 2022
Notes to Financial
Statements (Unaudited) — continued
B Investment Transactions and Income— Investment transactions for financial statement purposes are accounted for on trade date. Realized gains and losses are recorded on an identified cost basis and may include
proceeds from litigation. Dividend income is recorded on the ex-dividend date for dividends received in cash and/or securities or, in
the case of dividends on certain foreign securities, as soon as the Fund is informed of the ex-dividend date. Non-cash dividends are
recorded at the fair value of the securities received. Withholding taxes on foreign dividends, if any, have been provided for in
accordance with the Fund's understanding of the applicable country’s tax rules and rates. Distributions received that represent
a return of capital are recorded as a reduction of cost of investments. Distributions received that represent a capital gain are recorded as a realized gain. Interest income, which includes amortization of premium and accretion of discount on debt securities, is accrued as earned.
C Share Class Accounting— Realized and unrealized gains and losses and net investment income and losses, other than class-specific expenses, are allocated daily to each class of shares based upon the
relative net assets of each class to the total net assets of the Fund. Expenses arising in connection with a specific class are charged directly to that class. Sub-accounting, recordkeeping and similar administrative fees payable to financial intermediaries, which are a component of transfer agency fees and expenses on the Statement of Operations, are not allocated to Class R6
shares.
D Foreign Currency Transactions— The Fund’s accounting records are maintained in U.S. dollars. For valuation of assets and liabilities on each date of net asset value determination, foreign denominations
are converted into U.S. dollars using the current exchange rate. Security transactions, income and expenses are translated at the prevailing rate of exchange on the date of the event. Recognized gains or losses on investment transactions
attributable to changes in foreign currency exchange rates are recorded for financial statement purposes as net realized gains and losses on investments. That portion of unrealized gains and losses on investments that results from fluctuations in
foreign currency exchange rates is not separately disclosed.
E Restricted Securities— The Fund may invest in securities that are subject to legal or contractual restrictions on resale. Generally, these securities may only be sold publicly upon registration under
the Securities Act of 1933 or in transactions exempt from such registration. Information regarding restricted securities (excluding Rule 144A securities) is included at the end of the Schedule of Investments.
F Distributions to Shareholders— Distributions to shareholders are recorded by the Fund on ex-dividend date. Distributions from net investment income and distributions from net realized capital gains, if any, are
paid at least annually. Distributions are declared separately for each class of shares. Distributions are determined in accordance with income tax regulations, which may differ from U.S. GAAP; accordingly, periodic reclassifications are made within
the Fund's capital accounts to reflect income and gains available for distribution under income tax regulations.
G Estimates— The preparation of financial statements in conformity with U.S. GAAP requires management to make estimates and assumptions that affect the reported amounts of assets and liabilities and disclosure of contingent assets
and liabilities at the date of the financial statements and the reported amounts of increases and decreases in net assets from operations during the reporting period. Actual results could differ from those estimates.
H
Indemnifications— The Corporation’s By-Laws provide for indemnification for Directors or officers of the Corporation and certain other parties, to the fullest extent
permitted by Maryland law and the 1940 Act, provided certain conditions are met. Additionally, in the normal course of business, the Fund enters into agreements with service providers that may contain indemnification clauses. The Fund’s
maximum exposure under these arrangements is unknown as this would involve future claims that may be made against the Fund that have not yet occurred.
I Federal Income
Taxes— No provision for federal income or excise tax is required since the Fund intends to continue to qualify as a regulated investment company under the Internal Revenue Code
and to distribute substantially all of its taxable earnings.
Management has analyzed the Fund's tax positions taken for all
open federal income tax years and has concluded that no provision for federal income tax is required in the Fund's financial statements. A Fund's federal tax return is subject to examination by the Internal Revenue Service for a period of three
years from the date of filing.
J Interim
Financial Statements— The interim financial statements relating to March 31, 2022 and for the six months then ended have not been audited by an independent registered public
accounting firm, but in the opinion of the Fund's management, reflect all adjustments, consisting only of normal recurring adjustments, necessary for the fair presentation of the financial statements.
2 Related Party Transactions
The investment advisory fee is earned by CRM, an indirect,
wholly-owned subsidiary of Morgan Stanley, as compensation for investment advisory services rendered to the Fund. The investment advisory fee is computed at the annual rate of 0.75% of the Fund’s average daily net assets and is payable
monthly. For the six months ended March 31, 2022, the investment advisory fee amounted to $1,871,789. CRM does not receive a fee for advisory services provided to Cash Reserves Fund.
Calvert
International Opportunities Fund
March 31, 2022
Notes to Financial
Statements (Unaudited) — continued
Pursuant to an investment sub-advisory agreement, CRM has
delegated a portion of the investment management of the Fund to Eaton Vance Advisers International Ltd. (EVAIL), an affiliate of CRM and an indirect, wholly-owned subsidiary of Morgan Stanley. Effective October 1, 2021, EVAIL uses the portfolio
management, research and other resources of its affiliate, MSIM Fund Management (Ireland) Limited (MSIM FMIL), in rendering investment advisory services to the Fund. MSIM FMIL has entered into a Memorandum of Understanding with EVAIL pursuant to
which MSIM FMIL is considered a participating affiliate of the sub-adviser as that term is used in relief granted by the staff of the U.S. Securities and Exchange Commission allowing U.S. registered investment advisers to use portfolio management or
research resources of unregistered advisory affiliates subject to the supervision of a U.S. registered adviser. CRM pays EVAIL a portion of its investment advisory fee for sub-advisory services provided to the Fund.
CRM and EVAIL have agreed to reimburse the Fund’s
operating expenses to the extent that total annual operating expenses (relating to ordinary operating expenses only and excluding expenses such as brokerage commissions, acquired fund fees and expenses of unaffiliated funds, borrowing costs, taxes
or litigation expenses) exceed 1.34%, 2.09%, 1.09% and 1.05% for Class A, Class C, Class I and Class R6, respectively, of such class’s average daily net assets. The expense reimbursement agreement may be changed or terminated after January 31,
2023. For the six months ended March 31, 2022, no expenses were waived or reimbursed by CRM and EVAIL.
The administrative fee is earned by CRM as compensation for
administrative services rendered to the Fund. The fee is computed at an annual rate of 0.12% of the Fund’s average daily net assets attributable to Class A, Class C, Class I and Class R6 and is payable monthly. For the six months ended March
31, 2022, CRM was paid administrative fees of $299,486.
The Fund has in effect a distribution plan for Class A shares
(Class A Plan) pursuant to Rule 12b-1 under the 1940 Act. Pursuant to the Class A Plan, the Fund pays Eaton Vance Distributors, Inc. (EVD), an affiliate of CRM and the Fund’s principal underwriter, a distribution and service fee of 0.25% per
annum of its average daily net assets attributable to Class A shares for distribution services and facilities provided to the Fund by EVD, as well as for personal services and/or the maintenance of shareholder accounts. The Fund also has in effect a
distribution plan for Class C shares (Class C Plan) pursuant to Rule 12b-1 under the 1940 Act. Pursuant to the Class C Plan, the Fund pays EVD amounts equal to 0.75% per annum of its average daily net assets attributable to Class C shares for
providing ongoing distribution services and facilities to the Fund. In addition, pursuant to the Class C Plan, the Fund also makes payments of service fees to EVD, financial intermediaries and other persons in amounts equal to 0.25% per annum of its
average daily net assets attributable to that class. Service fees paid or accrued are for personal services and/or the maintenance of shareholder accounts. Distribution and service fees paid or accrued for the six months ended March 31, 2022
amounted to $113,491 and $29,653 for Class A shares and Class C shares, respectively.
The Fund was informed that EVD received $9,649 as its portion
of the sales charge on sales of Class A shares for the six months ended March 31, 2022. The Fund was also informed that EVD received $764 and $251 of contingent deferred sales charges paid by Class A and Class C shareholders, respectively, for the
same period.
Eaton Vance Management (EVM), an affiliate
of CRM, provides sub-transfer agency and related services to the Fund pursuant to a Sub-Transfer Agency Support Services Agreement. For the six months ended March 31, 2022, sub-transfer agency fees and expenses incurred to EVM amounted to $10,658
and are included in transfer agency fees and expenses on the Statement of Operations.
Each Director of the Fund who is not an employee of CRM or its
affiliates receives an annual fee of $214,000 ($154,000 prior to January 1, 2022), plus an annual Committee fee ranging from $8,500 to $16,500 depending on the Committee. The Board chair receives an additional $30,000 annual fee, Committee chairs
receive an additional $6,000 annual fee and the special equities liaison receives an additional $2,500 annual fee. Eligible Directors may participate in a Deferred Compensation Plan (the Plan). Amounts deferred under the Plan are treated as though
equal dollar amounts had been invested in shares of the Fund or other Calvert funds selected by the Directors. The Fund purchases shares of the funds selected equal to the dollar amounts deferred under the Plan, resulting in an asset equal to the
deferred compensation liability. Obligations of the Plan are paid solely from the Fund's assets. Directors’ fees are allocated to each of the Calvert funds served. Salaries and fees of officers and Directors of the Fund who are employees of
CRM or its affiliates are paid by CRM.
3 Investment Activity
During the six months ended March 31, 2022, the cost of
purchases and proceeds from sales of investments, other than short-term securities, were $117,001,695 and $104,453,710, respectively.
Calvert
International Opportunities Fund
March 31, 2022
Notes to Financial
Statements (Unaudited) — continued
4 Distributions to Shareholders and Income Tax
Information
The cost and unrealized appreciation
(depreciation) of investments of the Fund at March 31, 2022, as determined on a federal income tax basis, were as follows:
| Aggregate
cost |
$440,248,831
|
| Gross
unrealized appreciation |
$
53,060,226 |
| Gross
unrealized depreciation |
(37,958,169)
|
| Net
unrealized appreciation |
$
15,102,057 |
5 Securities Lending
To generate additional income, the Fund may lend its securities
pursuant to a securities lending agency agreement with State Street Bank and Trust Company (SSBT), the securities lending agent. Security loans are subject to termination by the Fund at any time and, therefore, are not considered illiquid
investments. The Fund requires that the loan be continuously collateralized by either cash or securities in an amount at least equal to the market value of the securities on loan. The market value of securities loaned is determined daily and any
additional required collateral is delivered to the Fund on the next business day. Cash collateral is generally invested in a money market fund registered under the 1940 Act that is managed by an affiliate of SSBT. Any gain or loss in the market
price of the loaned securities that might occur and any interest earned or dividends declared during the term of the loan would accrue to the account of the Fund. Income earned on the investment of collateral, net of broker rebates and other
expenses incurred by the securities lending agent, is split between the Fund and the securities lending agent based on agreed upon contractual terms. Non-cash collateral, if any, is held by the lending agent on behalf of the Fund and cannot be sold
or re-pledged by the Fund; accordingly, such collateral is not reflected in the Statement of Assets and Liabilities.
The risks associated with lending portfolio securities include,
but are not limited to, possible delays in receiving additional collateral or in the recovery of the loaned securities, possible loss of rights to the collateral should the borrower fail financially, as well as risk of loss in the value of the
collateral or the value of the investments made with the collateral. The securities lending agent shall indemnify the Fund in the case of default of any securities borrower.
At March 31, 2022, the total value of securities on loan was
$6,032,457 and the total value of collateral received was $6,370,284, comprised of cash of $3,899,985 and U.S. government and/or agencies securities of $2,470,299.
The following table provides a breakdown of securities lending
transactions accounted for as secured borrowings, the obligations by class of collateral pledged, and the remaining contractual maturity of those transactions as of March 31, 2022.
| |
Remaining
Contractual Maturity of the Transactions |
| |
Overnight
and
Continuous |
<30
days |
30
to 90 days |
>90
days |
Total
|
| Common
Stocks |
$
43,760 |
$
— |
$
— |
$
— |
$
43,760 |
| Exchange-Traded
Funds |
3,856,225
|
—
|
—
|
—
|
3,856,225
|
| Total
|
$3,899,985
|
$ —
|
$ —
|
$ —
|
$3,899,985
|
The carrying amount of the liability
for deposits for securities loaned at March 31, 2022 approximated its fair value. If measured at fair value, such liability would have been considered as Level 2 in the fair value hierarchy (see Note 1A) at March 31, 2022.
6 Line of Credit
The Fund participates with other portfolios and funds managed
by EVM and its affiliates, including CRM, in an $800 million unsecured line of credit with a group of banks, which is in effect through October 25, 2022. Borrowings are made by the Fund solely for temporary purposes related to redemptions and other
short-term cash needs. Interest is charged to the Fund based on its borrowings at an amount above either the Secured Overnight Financing Rate (SOFR) or Federal Funds rate. In addition, a fee computed at an annual rate of 0.15% on the daily unused
portion of the line of credit is allocated among the participating portfolios and funds at the end of each quarter. In connection with the renewal of the agreement in October 2021, an arrangement fee of $150,000 was incurred that was allocated to
the participating portfolios and funds. Because the line of credit is not available exclusively to the Fund, it may be unable to borrow some or all of its requested amounts at any particular time.
The Fund had no borrowings pursuant to its line of credit
during the six months ended March 31, 2022.
Calvert
International Opportunities Fund
March 31, 2022
Notes to Financial
Statements (Unaudited) — continued
7 Affiliated Companies and Funds
The Fund has invested a portion of its assets in notes (the
Notes) issued by Calvert Impact Capital, Inc. (CIC) pursuant to exemptive relief granted by the U.S. Securities and Exchange Commission (the SEC). There are certain potential points of affiliation between the Fund and CIC. CRM has licensed use of
the Calvert name to CIC and provides other types of support. CRM’s President and Chief Executive Officer (and the only director/trustee on the Fund Board that is an “interested person” of the Fund) serves on the CIC Board. In
addition, another director/trustee on the Fund Board serves as a director emeritus on the CIC Board.
At March 31, 2022, the value of the Fund’s investment in
the Notes and affiliated funds was $6,217,071, which represents 1.4% of the Fund’s net assets. Transactions in the Notes and affiliated funds by the Fund for the six months ended March 31, 2022 were as follows:
| Name
|
Value,
beginning
of period |
Purchases
|
Sales
proceeds |
Net
realized
gain
(loss) |
Change
in
unrealized
appreciation
(depreciation) |
Value,
end of
period |
Interest/
Dividend
income |
Principal
amount/Units,
end of period |
| High
Social Impact Investments |
|
|
|
|
|
|
|
|
| Calvert
Impact Capital, Inc., Community Investment Notes, 1.50%, 12/15/23(1) |
$ 550,385
|
$
— |
$
— |
$
— |
$
(17,304) |
$
533,081 |
$
4,200 |
$ 560,000
|
| Short-Term
Investments |
|
|
|
|
|
|
| Calvert
Cash Reserves Fund, LLC |
9,284,016
|
53,705,807
|
(57,304,677)
|
(685)
|
(471)
|
5,683,990
|
2,610
|
5,684,558
|
| Totals
|
|
|
|
$(685)
|
$(17,775)
|
$6,217,071
|
$6,810
|
|
8 Capital
Shares
The Corporation may issue its shares in one or
more series (such as the Fund). The authorized shares of the Fund consist of 75,000,000 common shares, $0.01 par value, for each Class.
Transactions in capital shares for the six months ended March
31, 2022 and the year ended September 30, 2021 were as follows:
| |
Six
Months Ended
March 31, 2022
(Unaudited) |
|
Year
Ended
September 30, 2021 |
| |
Shares
|
Amount
|
|
Shares
|
Amount
|
| Class
A |
|
|
|
|
|
| Shares
sold |
450,900
|
$
9,337,748 |
|
760,083
|
$
16,175,778 |
| Reinvestment
of distributions |
304,379
|
6,349,351
|
|
19,781
|
396,014
|
| Shares
redeemed |
(294,622)
|
(5,984,666)
|
|
(541,451)
|
(11,369,638)
|
| Converted
from Class C |
7,594
|
155,122
|
|
26,177
|
519,866
|
| Net
increase |
468,251
|
$
9,857,555 |
|
264,590
|
$
5,722,020 |
| Class
C |
|
|
|
|
|
| Shares
sold |
12,579
|
$
253,024 |
|
34,930
|
$
722,561 |
| Reinvestment
of distributions |
16,712
|
339,750
|
|
—
|
—
|
| Shares
redeemed |
(10,611)
|
(230,233)
|
|
(37,361)
|
(758,266)
|
| Converted
to Class A |
(7,820)
|
(155,122)
|
|
(26,938)
|
(519,866)
|
| Net
increase (decrease) |
10,860
|
$
207,419 |
|
(29,369)
|
$
(555,571) |
| Class
I |
|
|
|
|
|
| Shares
sold |
2,468,005
|
$
49,750,183 |
|
5,018,088
|
$103,872,491
|
| Reinvestment
of distributions |
1,144,540
|
23,314,281
|
|
101,329
|
1,984,025
|
| Shares
redeemed |
(2,266,378)
|
(44,996,995)
|
|
(3,771,380)
|
(76,717,288)
|
| Net
increase |
1,346,167
|
$
28,067,469 |
|
1,348,037
|
$
29,139,228 |
Calvert
International Opportunities Fund
March 31, 2022
Notes to Financial
Statements (Unaudited) — continued
| |
Six
Months Ended
March 31, 2022
(Unaudited) |
|
Year
Ended
September 30, 2021 |
| |
Shares
|
Amount
|
|
Shares
|
Amount
|
| Class
R6 |
|
|
|
|
|
| Shares
sold |
314,025
|
$
6,447,180 |
|
564,906
|
$
11,061,998 |
| Reinvestment
of distributions |
234,302
|
4,768,045
|
|
25,434
|
497,493
|
| Shares
redeemed |
(465,287)
|
(9,573,809)
|
|
(235,237)
|
(4,693,429)
|
| Net
increase |
83,040
|
$
1,641,416 |
|
355,103
|
$
6,866,062 |
9 Risks and Uncertainties
Risks Associated with Foreign Investments
Foreign investments can be adversely affected by political,
economic and market developments abroad, including the imposition of economic and other sanctions by the United States or another country. There may be less publicly available information about foreign issuers because they may not be subject to
reporting practices, requirements or regulations comparable to those to which United States companies are subject. Foreign markets may be smaller, less liquid and more volatile than the major markets in the United States. Trading in foreign markets
typically involves higher expense than trading in the United States. The Fund may have difficulties enforcing its legal or contractual rights in a foreign country. Securities that trade or are denominated in currencies other than the U.S. dollar may
be adversely affected by fluctuations in currency exchange rates.
Pandemic Risk
An outbreak of respiratory disease caused by a novel
coronavirus was first detected in China in late 2019 and subsequently spread internationally. This coronavirus has resulted in closing borders, enhanced health screenings, changes to healthcare service preparation and delivery, quarantines,
cancellations, disruptions to supply chains and customer activity, as well as general concern and uncertainty. Health crises caused by outbreaks, such as the coronavirus outbreak, may exacerbate other pre-existing political, social and economic
risks and disrupt normal market conditions and operations. The impact of this outbreak has negatively affected the worldwide economy, the economies of individual countries, individual companies, and the market in general, and may continue to do so
in significant and unforeseen ways, as may other epidemics and pandemics that may arise in the future. Any such impact could adversely affect the Fund's performance, or the performance of the securities in which the Fund invests.
Calvert
International Opportunities Fund
March 31, 2022
| Officers
|
Hope L.
Brown
Chief Compliance Officer |
Deidre E.
Walsh
Vice President, Secretary and
Chief Legal Officer |
James F.
Kirchner
Treasurer |
| Directors
|
Alice
Gresham Bullock
Chairperson |
| Richard L.
Baird, Jr. |
| Cari M.
Dominguez |
| John G.
Guffey, Jr. |
| Miles D.
Harper, III |
| Joy V. Jones
|
| John H.
Streur* |
| Anthony A.
Williams |
| *Interested
Director and President |
| Privacy
Notice |
April 2021
|
| FACTS
|
WHAT
DOES EATON VANCE DO WITH YOUR
PERSONAL INFORMATION? |
| Why?
|
Financial
companies choose how they share your personal information. Federal law gives consumers the right to limit some but not all sharing. Federal law also requires us to tell you how we collect, share, and protect your personal information. Please read
this notice carefully to understand what we do. |
| |
|
| What?
|
The
types of personal information we collect and share depend on the product or service you have with us. This information can include:■ Social Security number and income
■
investment experience and risk tolerance
■
checking account number and wire transfer instructions |
| |
|
| How?
|
All
financial companies need to share customers’ personal information to run their everyday business. In the section below, we list the reasons financial companies can share their customers’ personal information; the reasons Eaton Vance
chooses to share; and whether you can limit this sharing. |
Reasons
we can share your
personal information |
Does
Eaton Vance
share? |
Can
you limit
this sharing? |
| For
our everyday business purposes — such as to process your transactions, maintain your account(s), respond to court orders and legal investigations, or report to credit bureaus |
Yes
|
No
|
| For
our marketing purposes — to offer our products and services to you |
Yes
|
No
|
| For
joint marketing with other financial companies |
No
|
We
don’t share |
| For
our investment management affiliates’ everyday business purposes — information about your transactions, experiences, and creditworthiness |
Yes
|
Yes
|
| For
our affiliates’ everyday business purposes — information about your transactions and experiences |
Yes
|
No
|
| For
our affiliates’ everyday business purposes — information about your creditworthiness |
No
|
We
don’t share |
| For
our investment management affiliates to market to you |
Yes
|
Yes
|
| For
our affiliates to market to you |
No
|
We
don’t share |
| For
nonaffiliates to market to you |
No
|
We
don’t share |
To
limit our
sharing |
Call
toll-free 1-800-368-2745 or email: CRMPrivacy@calvert.comPlease note:If you are a new customer, we can begin sharing your information 30 days from the date we sent this notice. When you are no longer our customer, we continue to share your information as described in this notice. However, you can contact us at any time to limit our
sharing. |
| Questions?
|
Call
toll-free 1-800-368-2745 or email: CRMPrivacy@calvert.com |
| Privacy
Notice — continued |
April 2021
|
| Who
we are |
| Who
is providing this notice? |
Eaton
Vance Management, Eaton Vance Distributors, Inc., Eaton Vance Trust Company, Eaton Vance Management (International) Limited, Eaton Vance Advisers International Ltd., Eaton Vance Global Advisors Limited, Eaton Vance Management’s Real Estate
Investment Group, Boston Management and Research, Calvert Research and Management, Eaton Vance and Calvert Fund Families and our investment advisory affiliates (“Eaton Vance”) (see Investment Management Affiliates definition below)
|
| What
we do |
How
does Eaton Vance
protect my personal
information? |
To
protect your personal information from unauthorized access and use, we use security measures that comply with federal law. These measures include computer safeguards and secured files and buildings. We have policies governing the proper handling of
customer information by personnel and requiring third parties that provide support to adhere to appropriate security standards with respect to such information. |
How
does Eaton Vance
collect my personal
information? |
We
collect your personal information, for example, when you■ open an account or make deposits or withdrawals from your
account
■
buy securities from us or make a wire transfer
■
give us your contact informationWe also collect your personal information from others, such as credit bureaus, affiliates, or other companies. |
| Why
can’t I limit all sharing? |
Federal
law gives you the right to limit only■ sharing for affiliates’ everyday business purposes — information
about your creditworthiness
■
affiliates from using your information to market to you
■
sharing for nonaffiliates to market to youState laws and individual companies may give you additional rights
to limit sharing. See below for more on your rights under state law. |
| Definitions
|
Investment
Management
Affiliates |
Eaton
Vance Investment Management Affiliates include registered investment advisers, registered broker- dealers, and registered and unregistered funds. Investment Management Affiliates does not include entities associated with Morgan Stanley Wealth
Management, such as Morgan Stanley Smith Barney LLC and Morgan Stanley & Co. |
| Affiliates
|
Companies
related by common ownership or control. They can be financial and nonfinancial companies.■ Our affiliates include companies with a Morgan Stanley name and financial companies such as Morgan Stanley Smith Barney LLC and Morgan Stanley & Co. |
| Nonaffiliates
|
Companies
not related by common ownership or control. They can be financial and nonfinancial companies.■ Eaton Vance does not share with nonaffiliates so they can market to you. |
| Joint
marketing |
A
formal agreement between nonaffiliated financial companies that together market financial products or services to
you.■ Eaton Vance doesn’t jointly market. |
| Other
important information |
| Vermont:
Except as permitted by law, we will not share personal information we collect about Vermont residents with Nonaffiliates unless you provide us with your written consent to share such
information.California: Except as permitted by law, we will not share personal information we collect about California residents with Nonaffiliates and we will limit sharing
such personal information with our Affiliates to comply with California privacy laws that apply to us. |
Delivery of Shareholder Documents. The Securities and Exchange Commission (SEC) permits funds to deliver only one copy of shareholder documents, including prospectuses, proxy statements and shareholder reports, to fund investors with
multiple accounts at the same residential or post office box address. This practice is often called “householding” and it helps eliminate duplicate mailings to shareholders. Calvert funds, or your financial intermediary, may household the mailing of your documents indefinitely unless you instruct Calvert funds, or your financial intermediary, otherwise. If you would prefer that your Calvert fund documents not be householded, please contact Calvert funds at 1-800-368-2745, or contact your financial intermediary. Your instructions that householding not
apply to delivery of your Calvert fund documents will typically be effective within 30 days of receipt by Calvert funds or your financial intermediary.
Portfolio Holdings. Each Calvert fund files a schedule of portfolio holdings on Part F to Form N-PORT with the SEC. Certain information filed on Form N-PORT may be viewed on the Calvert website at www.calvert.com, by calling
Calvert at 1-800-368-2745 or in the EDGAR database on the SEC’s website at www.sec.gov.
Proxy Voting. The Proxy Voting Guidelines that each Calvert fund uses to determine how to vote proxies relating to portfolio securities is provided as an Appendix to the fund’s Statement of Additional Information.
The Statement of Additional Information can be obtained free of charge by calling the Calvert funds at 1-800-368-2745, by visiting the Calvert funds’ website at www.calvert.com or visiting the SEC’s website at www.sec.gov. Information
regarding how a Calvert fund voted proxies relating to portfolio securities during the most recent 12-month period ended June 30 is available by calling Calvert funds, by visiting the Calvert funds’ website at www.calvert.com or by visiting
the SEC’s website at www.sec.gov.
This Page Intentionally Left
Blank
Investment Adviser and Administrator
Calvert Research and Management
1825 Connecticut Avenue NW, Suite 400
Washington, DC 20009
Investment Sub-Adviser
Eaton Vance Advisers International Ltd.
125 Old Broad Street
London, EC2N 1AR
Principal Underwriter*
Eaton Vance Distributors, Inc.
Two International Place
Boston, MA 02110
(617) 482-8260
Custodian
State Street Bank and Trust Company
State Street Financial Center, One Lincoln Street
Boston, MA 02111
Transfer Agent
DST Asset Manager Solutions, Inc.
2000 Crown Colony Drive
Quincy, MA 02169
Fund Offices
1825 Connecticut Avenue NW, Suite 400
Washington, DC 20009
* FINRA
BrokerCheck. Investors may check the background of their Investment Professional by contacting the Financial Industry Regulatory Authority (FINRA). FINRA BrokerCheck is a free tool to help investors check the professional background of
current and former FINRA-registered securities firms and brokers. FINRA BrokerCheck is available by calling 1-800-289-9999 and at www.FINRA.org. The FINRA BrokerCheck brochure describing this program is available to investors at www.FINRA.org.
Printed on recycled paper.
24212 3.31.22
Calvert
International Equity Fund
Semiannual Report
March 31, 2022
Commodity Futures Trading Commission Registration. The Commodity Futures Trading Commission (“CFTC”) has adopted regulations that subject registered investment companies and advisers to regulation by the CFTC if a fund invests more than a
prescribed level of its assets in certain CFTC-regulated instruments (including futures, certain options and swap agreements) or markets itself as providing investment exposure to such instruments. The adviser has claimed an exclusion from the
definition of “commodity pool operator” under the Commodity Exchange Act with respect to its management of the Fund and the other funds it manages. Accordingly, neither the Fund nor the adviser is subject to CFTC regulation.
Fund shares are not insured by the FDIC and are not deposits or
other obligations of, or guaranteed by, any depository institution. Shares are subject to investment risks, including possible loss of principal invested.
This report must be preceded or accompanied by a current
summary prospectus or prospectus. Before investing, investors should consider carefully the investment objective, risks, and charges and expenses of a mutual fund. This and other important information is contained in the summary prospectus and
prospectus, which can be obtained from a financial intermediary. Prospective investors should read the prospectus carefully before investing. For further information, please call 1-800-368-2745.
Choose Planet-friendly E-delivery!
Sign up now for on-line statements, prospectuses, and fund
reports. In less than five minutes you can help reduce paper mail and lower fund costs.
Just go to
www.calvert.com. If you already have an online account with the Calvert funds, click on Login to access your Account and select the documents you would like to receive via e-mail.
If you’re new to online account access, click on Login,
then Register to create your user name and password. Once you’re in, click on the E-delivery sign-up on the Account Portfolio page and follow the quick, easy steps.
Note: If your shares are not
held directly with the Calvert funds but through a brokerage firm, you must contact your broker for electronic delivery options available through their firm.
Semiannual Report March 31, 2022
Calvert
International Equity Fund
Calvert
International Equity Fund
March 31, 2022
Performance
Portfolio Manager(s)
Christopher M. Dyer, CFA and Ian Kirwan, each of Eaton Vance Advisers International Ltd.
| %
Average Annual Total Returns1,2 |
Class
Inception Date |
Performance
Inception Date |
Six
Months |
One
Year |
Five
Years |
Ten
Years |
| Class
A at NAV |
07/02/1992
|
07/02/1992
|
(5.85)%
|
(0.41)%
|
9.46%
|
6.61%
|
| Class
A with 4.75% Maximum Sales Charge |
—
|
—
|
(10.33)
|
(5.14)
|
8.40
|
6.09
|
| Class
C at NAV |
03/01/1994
|
07/02/1992
|
(6.27)
|
(1.21)
|
8.64
|
5.91
|
| Class
C with 1% Maximum Sales Charge |
—
|
—
|
(7.14)
|
(2.13)
|
8.64
|
5.91
|
| Class
I at NAV |
02/26/1999
|
07/02/1992
|
(5.78)
|
(0.20)
|
9.79
|
7.07
|
| Class
R6 at NAV |
03/07/2019
|
07/02/1992
|
(5.75)
|
(0.13)
|
9.82
|
7.09
|
|
| MSCI
EAFE Index |
—
|
—
|
(3.38)%
|
1.16%
|
6.71%
|
6.27%
|
| %
Total Annual Operating Expense Ratios3 |
Class
A |
Class
C |
Class
I |
Class
R6 |
| Gross
|
1.20%
|
1.95%
|
0.95%
|
0.91%
|
| Net
|
1.14
|
1.89
|
0.89
|
0.85
|
See Endnotes and Additional Disclosures in this report.
Past performance is no guarantee of future results. Returns are historical and
are calculated by determining the percentage change in net asset value (NAV) or offering price (as applicable) with all distributions reinvested. Investment return and principal value will fluctuate so that shares, when redeemed, may be worth more
or less than their original cost. Performance for periods less than or equal to one year is cumulative. Performance is for the stated time period only; due to market volatility, current Fund performance may be lower or higher than the quoted return.
For performance as of the most recent month-end, please refer to www.calvert.com.
Calvert
International Equity Fund
March 31, 2022
Sector Allocation (% of net assets)*
* Excludes cash
and cash equivalents.
| Top
10 Holdings (% of net assets)* |
|
| Nestle
S.A. |
5.6%
|
| AstraZeneca
PLC |
3.8
|
| Iberdrola
S.A. |
3.8
|
| Sanofi
|
3.5
|
| RELX
PLC |
3.3
|
| ASML
Holding NV |
3.1
|
| Compass
Group PLC |
3.0
|
| adidas
AG |
3.0
|
| AIA
Group, Ltd. |
3.0
|
| Reckitt
Benckiser Group PLC |
3.0
|
| Total
|
35.1%
|
| *
|
Excludes
cash and cash equivalents. |
Calvert
International Equity Fund
March 31, 2022
Endnotes and
Additional Disclosures
| 1 |
MSCI EAFE Index is an
unmanaged index of equities in the developed markets, excluding the U.S. and Canada. MSCI indexes are net of foreign withholding taxes. Source: MSCI. MSCI data may not be reproduced or used for any other purpose. MSCI provides no warranties, has not
prepared or approved this report, and has no liability hereunder. Unless otherwise stated, index returns do not reflect the effect of any applicable sales charges, commissions, expenses, taxes or leverage, as applicable. It is not possible to invest
directly in an index. |
|
2 |
Total
Returns at NAV do not include applicable sales charges. If sales charges were deducted, the returns would be lower. Total Returns shown with maximum sales charge reflect the stated maximum sales charge. Unless otherwise stated, performance does not
reflect the deduction of taxes on Fund distributions or redemptions of Fund shares.Performance prior to the inception date of a class may be linked to the performance of an older class of the Fund. This linked
performance is adjusted for any applicable sales charge, but is not adjusted for class expense differences. If adjusted for such differences, the performance would be different. The performance of Class R6 is linked to Class I. Performance presented
in the Financial Highlights included in the financial statements is not linked.Effective November 5, 2020, Class C shares automatically convert to Class A shares eight years after purchase. The average annual total
returns listed for Class C reflect conversion to Class A shares after eight years. Prior to November 5, 2020, Class C shares automatically converted to Class A shares ten years after purchase.Calvert Research and
Management became the investment adviser to the Fund on December 31, 2016. Performance reflected prior to such date is that of the Fund’s former investment adviser. |
|
3 |
Source:
Fund prospectus. Net expense ratios reflect a contractual expense reimbursement that continues through 1/31/23. The expense ratios for the current reporting period can be found in the Financial Highlights section of this report. Performance
reflects expenses waived and/or reimbursed, if applicable. Without such waivers and/or reimbursements, performance would have been lower. |
| |
Fund profile subject to
change due to active management. |
Calvert
International Equity Fund
March 31, 2022
Example
As a Fund shareholder, you incur two types of costs: (1)
transaction costs, including sales charges (loads) on purchases and redemption fees (if applicable); and (2) ongoing costs, including management fees; distribution and/or service fees; and other Fund expenses. This Example is intended to help you
understand your ongoing costs (in dollars) of Fund investing and to compare these costs with the ongoing costs of investing in other mutual funds. The Example is based on an investment of $1,000 invested at the beginning of the period and held for
the entire period (October 1, 2021 to March 31, 2022).
Actual Expenses
The first section of the table below provides information about
actual account values and actual expenses. You may use the information in this section, together with the amount you invested, to estimate the expenses that you paid over the period. Simply divide your account value by $1,000 (for example, an $8,600
account value divided by $1,000 = 8.6), then multiply the result by the number in the first section under the heading entitled “Expenses Paid During Period” to estimate the expenses you paid on your account during this period.
Hypothetical Example for Comparison Purposes
The second section of the table below provides information
about hypothetical account values and hypothetical expenses based on the actual Fund expense ratio and an assumed rate of return of 5% per year (before expenses), which is not the actual Fund return. The hypothetical account values and expenses may
not be used to estimate the actual ending account balance or expenses you paid for the period. You may use this information to compare the ongoing costs of investing in the Fund and other funds. To do so, compare this 5% hypothetical example with
the 5% hypothetical examples that appear in the shareholder reports of the other funds.
Please note that the expenses shown in the table are meant to
highlight your ongoing costs only and do not reflect any transactional costs, such as sales charges (loads) or redemption fees (if applicable). Therefore, the second section of the table is useful in comparing ongoing costs only, and will not help
you determine the relative total costs of owning different funds. In addition, if these transactional costs were included, your costs would be higher.
| |
Beginning
Account Value
(10/1/21) |
Ending
Account Value
(3/31/22) |
Expenses
Paid
During Period*
(10/1/21 – 3/31/22) |
Annualized
Expense
Ratio |
| Actual
|
|
|
|
|
| Class
A |
$1,000.00
|
$
941.50 |
$5.52
** |
1.14%
|
| Class
C |
$1,000.00
|
$
937.30 |
$9.13
** |
1.89%
|
| Class
I |
$1,000.00
|
$
942.20 |
$4.31
** |
0.89%
|
| Class
R6 |
$1,000.00
|
$
942.50 |
$4.12
** |
0.85%
|
| Hypothetical
|
|
|
|
|
| (5%
return per year before expenses) |
|
|
|
|
| Class
A |
$1,000.00
|
$1,019.25
|
$5.74
** |
1.14%
|
| Class
C |
$1,000.00
|
$1,015.51
|
$9.50
** |
1.89%
|
| Class
I |
$1,000.00
|
$1,020.49
|
$4.48
** |
0.89%
|
| Class
R6 |
$1,000.00
|
$1,020.69
|
$4.28
** |
0.85%
|
| *
|
Expenses
are equal to the Fund's annualized expense ratio for the indicated Class, multiplied by the average account value over the period, multiplied by 182/365 (to reflect the one-half year period). The Example assumes that the $1,000 was invested at the
net asset value per share determined at the close of business on September 30, 2021. |
| **
|
Absent
a waiver and/or reimbursement of expenses by affiliates, expenses would be higher. |
Calvert
International Equity Fund
March 31, 2022
Schedule of
Investments (Unaudited)
| Security
|
Shares
|
Value
|
| Australia
— 2.7% |
|
| CSL,
Ltd. |
|
117,030
|
$
23,364,172 |
| |
|
|
$ 23,364,172
|
| Belgium
— 2.3% |
|
| KBC
Group NV |
|
274,407
|
$
19,688,470 |
| |
|
|
$ 19,688,470
|
| Denmark
— 2.5% |
|
| Novo
Nordisk A/S, Class B |
|
194,247
|
$
21,545,115 |
| |
|
|
$ 21,545,115
|
| France
— 10.8% |
|
| LVMH
Moet Hennessy Louis Vuitton SE |
|
29,620
|
$
21,142,717 |
| Safran
S.A. |
|
174,672
|
20,565,088
|
| Sanofi
|
|
298,777
|
30,546,837
|
| Schneider
Electric SE |
|
132,022
|
22,165,216
|
| |
|
|
$
94,419,858 |
| Germany
— 7.2% |
|
| adidas
AG |
|
113,318
|
$
26,406,027 |
| Infineon
Technologies AG |
|
391,314
|
13,238,154
|
| Siemens
AG |
|
168,375
|
23,314,424
|
| |
|
|
$
62,958,605 |
| Hong
Kong — 3.0% |
|
| AIA
Group, Ltd. |
|
2,493,705
|
$
26,038,962 |
| |
|
|
$
26,038,962 |
| India
— 1.9% |
|
| HDFC
Bank, Ltd. |
|
864,614
|
$
16,648,337 |
| |
|
|
$
16,648,337 |
| Ireland
— 1.8% |
|
| Kingspan
Group PLC |
|
159,349
|
$
15,575,847 |
| |
|
|
$
15,575,847 |
| Japan
— 9.8% |
|
| Keyence
Corp. |
|
25,567
|
$
11,855,480 |
| Kose
Corp. |
|
108,400
|
11,341,407
|
| Olympus
Corp. |
|
831,200
|
15,753,390
|
| Recruit
Holdings Co., Ltd. |
|
350,507
|
15,228,483
|
| SMC
Corp. |
|
20,900
|
11,682,973
|
| Yamaha
Corp. |
|
454,500
|
19,750,785
|
| |
|
|
$
85,612,518 |
| Security
|
Shares
|
Value
|
| Netherlands
— 3.1% |
|
| ASML
Holding NV |
|
40,124
|
$
26,811,718 |
| |
|
|
$ 26,811,718
|
| New
Zealand — 1.6% |
|
| Fisher
& Paykel Healthcare Corp., Ltd. |
|
832,942
|
$
13,976,922 |
| |
|
|
$ 13,976,922
|
| Singapore
— 2.5% |
|
| DBS
Group Holdings, Ltd. |
|
847,028
|
$
22,193,999 |
| |
|
|
$ 22,193,999
|
| South
Africa — 1.3% |
|
| Vodacom
Group, Ltd. |
|
1,050,329
|
$
11,477,182 |
| |
|
|
$
11,477,182 |
| Spain
— 5.6% |
|
| Amadeus
IT Group S.A.(1) |
|
246,013
|
$
15,995,281 |
| Iberdrola
S.A. |
|
3,024,350
|
33,056,051
|
| |
|
|
$
49,051,332 |
| Sweden
— 5.7% |
|
| Assa
Abloy AB, Class B |
|
576,667
|
$
15,500,568 |
| Indutrade
AB |
|
609,729
|
15,334,173
|
| Svenska
Handelsbanken AB, Class A(2) |
|
2,038,754
|
18,747,229
|
| |
|
|
$
49,581,970 |
| Switzerland
— 9.5% |
|
| Lonza
Group AG |
|
30,917
|
$
22,402,560 |
| Nestle
S.A. |
|
377,828
|
49,124,692
|
| Straumann
Holding AG |
|
6,741
|
10,763,264
|
| |
|
|
$
82,290,516 |
| Taiwan
— 1.2% |
|
| Taiwan
Semiconductor Manufacturing Co., Ltd. ADR |
|
97,593
|
$
10,175,046 |
| |
|
|
$
10,175,046 |
| United
Kingdom — 26.4% |
|
| Abcam
PLC(1) |
|
776,390
|
$
14,033,308 |
| Ashtead
Group PLC |
|
179,379
|
11,294,490
|
| AstraZeneca
PLC |
|
251,949
|
33,411,688
|
| Compass
Group PLC |
|
1,229,164
|
26,451,718
|
| Halma
PLC |
|
466,645
|
15,267,271
|
| InterContinental
Hotels Group PLC |
|
300,919
|
20,352,522
|
| London
Stock Exchange Group PLC |
|
200,639
|
20,922,742
|
| Reckitt
Benckiser Group PLC |
|
339,096
|
25,868,246
|
| RELX
PLC |
|
913,457
|
28,424,706
|
| Vodafone
Group PLC |
|
12,859,399
|
21,086,639
|
6
See Notes to Financial Statements.
Calvert
International Equity Fund
March 31, 2022
Schedule of
Investments (Unaudited) — continued
| Security
|
Shares
|
Value
|
| United
Kingdom (continued) |
|
| Weir
Group PLC (The) |
|
593,715
|
$
12,669,799 |
| |
|
|
$229,783,129
|
Total
Common Stocks
(identified cost $776,756,541) |
|
|
$861,193,698
|
| High
Social Impact Investments — 0.1% |
| Security
|
Principal
Amount
(000's omitted) |
Value
|
| Calvert
Impact Capital, Inc., Community Investment Notes, 1.50%, 12/15/23(3)(4) |
$
|
880
|
$
837,698 |
| ImpactAssets,
Inc., Global Sustainable Agriculture Notes, 0.00%, 11/3/22(4)(5) |
|
22
|
21,072
|
Total
High Social Impact Investments
(identified cost $902,017) |
|
|
$ 858,770
|
| Preferred
Stocks — 0.0%(6) |
| Security
|
Shares
|
Value
|
| Venture
Capital — 0.0%(6) |
|
| Bioceptive,
Inc.: |
|
|
|
| Series
A(1)(4)(7) |
|
582,574
|
$
0 |
| Series
B(1)(4)(7) |
|
40,523
|
0
|
| FINAE,
Series D(1)(4)(7) |
|
2,597,442
|
130,590
|
Total
Preferred Stocks
(identified cost $491,304) |
|
|
$ 130,590
|
| Venture
Capital Limited Partnership Interests — 0.2% |
| Security
|
|
|
Value
|
| Africa
Renewable Energy Fund L.P.(1)(4)(7) |
|
|
$
1,195,190 |
| Emerald
Sustainability Fund I L.P.(1)(4)(7) |
|
|
54,112
|
| gNet
Defta Development Holding LLC(1)(3)(4)(7) |
|
|
224,649
|
| SEAF
India International Growth Fund L.P.(1)(4)(7) |
|
|
937
|
Total
Venture Capital Limited Partnership Interests
(identified cost $1,980,867) |
|
|
$ 1,474,888
|
| Short-Term
Investments — 0.0%(6) |
| Description
|
Units
|
Value
|
| Calvert
Cash Reserves Fund, LLC, 0.14%(8) |
|
551,434
|
$
551,379 |
Total
Short-Term Investments
(identified cost $551,379) |
|
|
$ 551,379
|
Total
Investments — 99.2%
(identified cost $780,682,108) |
|
$864,209,325
|
| Other
Assets, Less Liabilities — 0.8% |
|
$ 6,651,162
|
| Net
Assets — 100.0% |
|
$870,860,487
|
| The
percentage shown for each investment category in the Schedule of Investments is based on net assets. |
|
(1) |
Non-income
producing security. |
|
(2) |
All
or a portion of this security was on loan at March 31, 2022. The aggregate market value of securities on loan at March 31, 2022 was $2,067,640. |
|
(3) |
May
be deemed to be an affiliated company (see Note 7). |
|
(4) |
Restricted
security. Total market value of restricted securities amounts to $2,464,248, which represents 0.3% of the net assets of the Fund as of March 31, 2022. |
|
(5) |
Notes
carry an interest rate that varies by period and is contingent on the performance of the underlying portfolio of loans to borrowers. The coupon rate shown represents the rate in effect at March 31, 2022. |
|
(6) |
Amount
is less than 0.05%. |
|
(7) |
For
fair value measurement disclosure purposes, security is categorized as Level 3 (see Note 1A). |
|
(8) |
Affiliated
investment company, which invests in high quality, U.S. dollar denominated money market instruments. The rate shown is the annualized seven-day yield as of March 31, 2022. |
At March 31, 2022, the concentration of the Fund’s
investments in the various sectors, determined as a percentage of net assets, was as follows:
| Economic
Sectors |
%
of Net Assets |
| Industrials
|
22.0%
|
| Health
Care |
21.3
|
| Financials
|
14.3
|
| Consumer
Discretionary |
13.1
|
| Information
Technology |
10.7
|
| Consumer
Staples |
9.9
|
| Utilities
|
3.8
|
| Communication
Services |
3.8
|
| Venture
Capital |
0.2
|
| High
Social Impact Investments |
0.1
|
| Total
|
99.2%
|
7
See Notes to Financial Statements.
Calvert
International Equity Fund
March 31, 2022
Schedule of
Investments (Unaudited) — continued
Restricted
Securities
| Description
|
Acquisition
Dates |
Cost
|
| Africa
Renewable Energy Fund L.P. |
4/17/14-5/13/19
|
$986,557
|
| Bioceptive,
Inc., Series A |
10/26/12-12/18/13
|
252,445
|
| Bioceptive,
Inc., Series B |
1/7/16
|
16,250
|
| Calvert
Impact Capital, Inc., Community Investment Notes, 1.50%, 12/15/23 |
12/14/20
|
880,000
|
| Emerald
Sustainability Fund I L.P. |
7/19/01-5/17/11
|
393,935
|
| FINAE,
Series D |
2/28/11-11/16/15
|
222,609
|
| gNet
Defta Development Holding LLC |
8/30/05
|
400,000
|
| ImpactAssets,
Inc., Global Sustainable Agriculture Notes, 0.00%, 11/3/22 |
11/13/15
|
22,017
|
| SEAF
India International Growth Fund L.P. |
3/22/05-5/24/10
|
200,375
|
| Abbreviations:
|
| ADR
|
– American
Depositary Receipt |
8
See Notes to Financial Statements.
Calvert
International Equity Fund
March 31, 2022
Statement of Assets
and Liabilities (Unaudited)
| |
March 31,
2022 |
| Assets
|
|
Investments
in securities of unaffiliated issuers, at value (identified cost $778,850,729) - including
$2,067,640 of securities on loan |
$
862,595,599 |
| Investments
in securities of affiliated issuers, at value (identified cost $1,831,379) |
1,613,726
|
| Cash
denominated in foreign currency, at value (cost $990,001) |
975,391
|
| Receivable
for investments sold |
8,190,120
|
| Receivable
for capital shares sold |
1,400,045
|
| Dividends
and interest receivable |
1,077,254
|
| Dividends
and interest receivable - affiliated |
4,531
|
| Securities
lending income receivable |
9,325
|
| Tax
reclaims receivable |
961,297
|
| Receivable
from affiliates |
42,206
|
| Directors'
deferred compensation plan |
142,705
|
| Other
assets |
1,077
|
| Total
assets |
$877,013,276
|
| Liabilities
|
|
| Payable
for investments purchased |
$
4,250,803 |
| Payable
for capital shares redeemed |
604,638
|
| Payable
for foreign capital gains taxes |
289,164
|
| Payable
to affiliates: |
|
| Investment
advisory fee |
480,492
|
| Administrative
fee |
86,942
|
| Distribution
and service fees |
43,515
|
| Sub-transfer
agency fee |
24,093
|
| Directors'
deferred compensation plan |
142,705
|
| Accrued
expenses |
230,437
|
| Total
liabilities |
$
6,152,789 |
| Commitments
and contingent liabilities (Note 10) |
|
| Net
Assets |
$870,860,487
|
| Sources
of Net Assets |
|
| Paid-in
capital |
$
776,895,288 |
| Distributable
earnings |
93,965,199
|
| Net
Assets |
$870,860,487
|
| Class
A Shares |
|
| Net
Assets |
$
204,439,193 |
| Shares
Outstanding |
9,252,438
|
Net
Asset Value and Redemption Price Per Share
(net assets ÷ shares of beneficial interest outstanding) |
$
22.10 |
Maximum
Offering Price Per Share
(100 ÷ 95.25 of net asset value per share) |
$
23.20 |
| Class
C Shares |
|
| Net
Assets |
$
6,316,984 |
| Shares
Outstanding |
339,770
|
Net
Asset Value and Offering Price Per Share*
(net assets ÷ shares of beneficial interest outstanding) |
$
18.59 |
9
See Notes to Financial Statements.
Calvert
International Equity Fund
March 31, 2022
Statement of Assets
and Liabilities (Unaudited) — continued
| |
March 31,
2022 |
| Class
I Shares |
|
| Net
Assets |
$
498,482,741 |
| Shares
Outstanding |
21,007,204
|
Net
Asset Value, Offering Price and Redemption Price Per Share
(net assets ÷ shares of beneficial interest outstanding) |
$
23.73 |
| Class
R6 Shares |
|
| Net
Assets |
$
161,621,569 |
| Shares
Outstanding |
6,823,002
|
Net
Asset Value, Offering Price and Redemption Price Per Share
(net assets ÷ shares of beneficial interest outstanding) |
$
23.69 |
| On
sales of $50,000 or more, the offering price of Class A shares is reduced. |
| *
|
Redemption
price per share is equal to the net asset value less any applicable contingent deferred sales charge. |
10
See Notes to Financial Statements.
Calvert
International Equity Fund
March 31, 2022
Statement of
Operations (Unaudited)
| |
Six
Months Ended |
| |
March
31, 2022 |
| Investment
Income |
|
| Dividend
income (net of foreign taxes withheld of $998,950) |
$
6,782,911 |
| Dividend
income - affiliated issuers |
1,953
|
| Non-cash
dividend income |
522,647
|
| Interest
income |
43
|
| Interest
income - affiliated issuers |
6,600
|
| Securities
lending income, net |
117,876
|
| Total
investment income |
$
7,432,030 |
| Expenses
|
|
| Investment
advisory fee |
$
2,983,907 |
| Administrative
fee |
540,519
|
| Distribution
and service fees: |
|
| Class
A |
235,367
|
| Class
C |
35,752
|
| Directors'
fees and expenses |
17,422
|
| Custodian
fees |
48,969
|
| Transfer
agency fees and expenses |
380,048
|
| Accounting
fees |
104,069
|
| Professional
fees |
24,128
|
| Registration
fees |
63,045
|
| Reports
to shareholders |
17,746
|
| Miscellaneous
|
29,876
|
| Total
expenses |
$
4,480,848 |
| Waiver
and/or reimbursement of expenses by affiliates |
$
(228,519) |
| Net
expenses |
$
4,252,329 |
| Net
investment income |
$
3,179,701 |
| Realized
and Unrealized Gain (Loss) |
|
| Net
realized gain (loss): |
|
| Investment
securities (net of foreign capital gains taxes of $6,577) |
$
20,408,712 |
| Investment
securities - affiliated issuers |
1,249
|
| Foreign
currency transactions |
(11,668)
|
| Net
realized gain |
$
20,398,293 |
| Change
in unrealized appreciation (depreciation): |
|
| Investment
securities (including net increase in payable for foreign capital gains taxes of $289,164) |
$
(77,239,636) |
| Investment
securities - affiliated issuers |
(34,711)
|
| Foreign
currency |
(27,422)
|
| Net
change in unrealized appreciation (depreciation) |
$(77,301,769)
|
| Net
realized and unrealized loss |
$(56,903,476)
|
| Net
decrease in net assets from operations |
$(53,723,775)
|
11
See Notes to Financial Statements.
Calvert
International Equity Fund
March 31, 2022
Statements of
Changes in Net Assets
| |
Six
Months Ended
March 31, 2022
(Unaudited) |
Year
Ended
September 30,
2021 |
| Increase
(Decrease) in Net Assets |
|
|
| From
operations: |
|
|
| Net
investment income |
$
3,179,701 |
$
4,502,444 |
| Net
realized gain |
20,398,293
|
56,441,711
|
| Net
change in unrealized appreciation (depreciation) |
(77,301,769)
|
86,903,672
|
| Net
increase (decrease) in net assets from operations |
$
(53,723,775) |
$147,847,827
|
| Distributions
to shareholders: |
|
|
| Class
A |
$
(11,969,862) |
$
(313,091) |
| Class
C |
(506,133)
|
—
|
| Class
I |
(34,004,747)
|
(1,619,435)
|
| Class
R6 |
(10,457,460)
|
(712,823)
|
| Total
distributions to shareholders |
$
(56,938,202) |
$
(2,645,349) |
| Capital
share transactions: |
|
|
| Class
A |
$
36,533,943 |
$
18,954,832 |
| Class
C |
(237,572)
|
5,633
|
| Class
I |
39,900,047
|
164,196,275
|
| Class
R6 |
22,159,242
|
8,652,717
|
| Net
increase in net assets from capital share transactions |
$
98,355,660 |
$191,809,457
|
| Net
increase (decrease) in net assets |
$
(12,306,317) |
$337,011,935
|
| Net
Assets |
|
|
| At
beginning of period |
$
883,166,804 |
$
546,154,869 |
| At
end of period |
$870,860,487
|
$883,166,804
|
12
See Notes to Financial Statements.
Calvert
International Equity Fund
March 31, 2022
| |
Class
A |
| |
Six
Months Ended
March 31, 2022
(Unaudited) |
Year
Ended September 30, |
| |
2021
|
2020
|
2019
|
2018
|
2017
|
| Net
asset value — Beginning of period |
$
25.06 |
$
20.35 |
$
18.18 |
$
17.53 |
$
17.10 |
$
15.49 |
| Income
(Loss) From Operations |
|
|
|
|
|
|
| Net
investment income(1) |
$
0.06 |
$
0.08 |
$
0.06 |
$
0.22 |
$
0.19 |
$
0.17 |
| Net
realized and unrealized gain (loss) |
(1.42)
|
4.67
|
2.30
|
0.61
|
0.50
|
1.84
|
| Total
income (loss) from operations |
$
(1.36) |
$
4.75 |
$
2.36 |
$
0.83 |
$
0.69 |
$
2.01 |
| Less
Distributions |
|
|
|
|
|
|
| From
net investment income |
$
(0.23) |
$
(0.04) |
$
(0.19) |
$
(0.18) |
$
(0.26) |
$
(0.40) |
| From
net realized gain |
(1.37)
|
—
|
—
|
—
|
—
|
—
|
| Total
distributions |
$
(1.60) |
$
(0.04) |
$
(0.19) |
$
(0.18) |
$
(0.26) |
$
(0.40) |
| Net
asset value — End of period |
$
22.10 |
$
25.06 |
$
20.35 |
$
18.18 |
$
17.53 |
$
17.10 |
| Total
Return(2) |
(5.85)%
(3) |
23.38%
|
13.02%
|
4.93%
|
4.02%
|
13.43%
|
| Ratios/Supplemental
Data |
|
|
|
|
|
|
| Net
assets, end of period (000’s omitted) |
$204,439
|
$190,998
|
$138,810
|
$112,923
|
$114,915
|
$126,669
|
| Ratios
(as a percentage of average daily net assets):(4) |
|
|
|
|
|
|
| Total
expenses |
1.19%
(5) |
1.20%
|
1.27%
|
1.46%
|
1.47%
|
1.58%
|
| Net
expenses |
1.14%
(5) |
1.14%
|
1.14%
|
1.27%
|
1.32%
|
1.35%
|
| Net
investment income |
0.53%
(5) |
0.34%
|
0.33%
|
1.26%
|
1.09%
|
1.08%
|
| Portfolio
Turnover |
24%
(3) |
38%
|
47%
|
51%
|
48%
|
138%
|
|
(1) |
Computed
using average shares outstanding. |
|
(2) |
Returns
are historical and are calculated by determining the percentage change in net asset value with all distributions reinvested and do not reflect the effect of sales charges, if any. |
|
(3) |
Not
annualized. |
|
(4) |
Total
expenses do not reflect amounts reimbursed and/or waived by the adviser and certain of its affiliates, if applicable. Net expenses are net of all reductions and represent the net expenses paid by the Fund. |
|
(5) |
Annualized.
|
13
See Notes to Financial Statements.
Calvert
International Equity Fund
March 31, 2022
Financial
Highlights — continued
| |
Class
C |
| |
Six
Months Ended
March 31, 2022
(Unaudited) |
Year
Ended September 30, |
| |
2021
|
2020
|
2019
|
2018
|
2017
|
| Net
asset value — Beginning of period |
$
21.28 |
$
17.37 |
$
15.54 |
$
15.00 |
$
14.68 |
$
13.31 |
| Income
(Loss) From Operations |
|
|
|
|
|
|
| Net
investment income (loss)(1) |
$
(0.03) |
$
(0.09) |
$
(0.07) |
$
0.03 |
$
0.06 |
$
0.05 |
| Net
realized and unrealized gain (loss) |
(1.20)
|
4.00
|
1.96
|
0.58
|
0.42
|
1.59
|
| Total
income (loss) from operations |
$
(1.23) |
$
3.91 |
$
1.89 |
$
0.61 |
$
0.48 |
$
1.64 |
| Less
Distributions |
|
|
|
|
|
|
| From
net investment income |
$
(0.09) |
$
— |
$
(0.06) |
$
(0.07) |
$
(0.16) |
$
(0.27) |
| From
net realized gain |
(1.37)
|
—
|
—
|
—
|
—
|
—
|
| Total
distributions |
$
(1.46) |
$
— |
$
(0.06) |
$
(0.07) |
$
(0.16) |
$
(0.27) |
| Net
asset value — End of period |
$18.59
|
$21.28
|
$17.37
|
$15.54
|
$
15.00 |
$
14.68 |
| Total
Return(2) |
(6.27)%
(3) |
22.51%
|
12.17%
|
4.15%
|
3.23%
|
12.60%
|
| Ratios/Supplemental
Data |
|
|
|
|
|
|
| Net
assets, end of period (000’s omitted) |
$
6,317 |
$
7,485 |
$
6,157 |
$
6,122 |
$11,149
|
$12,013
|
| Ratios
(as a percentage of average daily net assets):(4) |
|
|
|
|
|
|
| Total
expenses |
1.95%
(5) |
1.95%
|
2.02%
|
2.21%
|
2.22%
|
2.54%
|
| Net
expenses |
1.89%
(5) |
1.89%
|
1.89%
|
2.03%
|
2.07%
|
2.10%
|
| Net
investment income (loss) |
(0.26)%
(5) |
(0.42)%
|
(0.43)%
|
0.23%
|
0.39%
|
0.35%
|
| Portfolio
Turnover |
24%
(3) |
38%
|
47%
|
51%
|
48%
|
138%
|
|
(1) |
Computed
using average shares outstanding. |
|
(2) |
Returns
are historical and are calculated by determining the percentage change in net asset value with all distributions reinvested and do not reflect the effect of sales charges, if any. |
|
(3) |
Not
annualized. |
|
(4) |
Total
expenses do not reflect amounts reimbursed and/or waived by the adviser and certain of its affiliates, if applicable. Net expenses are net of all reductions and represent the net expenses paid by the Fund. |
|
(5) |
Annualized.
|
14
See Notes to Financial Statements.
Calvert
International Equity Fund
March 31, 2022
Financial
Highlights — continued
| |
Class
I |
| |
Six
Months Ended
March 31, 2022
(Unaudited) |
Year
Ended September 30, |
| |
2021
|
2020
|
2019
|
2018
|
2017
|
| Net
asset value — Beginning of period |
$
26.83 |
$
21.77 |
$
19.43 |
$
18.72 |
$
18.24 |
$
16.53 |
| Income
(Loss) From Operations |
|
|
|
|
|
|
| Net
investment income(1) |
$
0.10 |
$
0.16 |
$
0.13 |
$
0.28 |
$
0.27 |
$
0.21 |
| Net
realized and unrealized gain (loss) |
(1.54)
|
5.00
|
2.45
|
0.66
|
0.53
|
2.01
|
| Total
income (loss) from operations |
$
(1.44) |
$
5.16 |
$
2.58 |
$
0.94 |
$
0.80 |
$
2.22 |
| Less
Distributions |
|
|
|
|
|
|
| From
net investment income |
$
(0.29) |
$
(0.10) |
$
(0.24) |
$
(0.23) |
$
(0.32) |
$
(0.51) |
| From
net realized gain |
(1.37)
|
—
|
—
|
—
|
—
|
—
|
| Total
distributions |
$
(1.66) |
$
(0.10) |
$
(0.24) |
$
(0.23) |
$
(0.32) |
$
(0.51) |
| Net
asset value — End of period |
$
23.73 |
$
26.83 |
$
21.77 |
$
19.43 |
$
18.72 |
$
18.24 |
| Total
Return(2) |
(5.78)%
(3) |
23.75%
|
13.31%
|
5.25%
|
4.37%
|
13.89%
|
| Ratios/Supplemental
Data |
|
|
|
|
|
|
| Net
assets, end of period (000’s omitted) |
$498,483
|
$524,521
|
$279,039
|
$82,261
|
$64,739
|
$72,503
|
| Ratios
(as a percentage of average daily net assets):(4) |
|
|
|
|
|
|
| Total
expenses |
0.94%
(5) |
0.95%
|
1.02%
|
1.20%
|
1.22%
|
1.06%
|
| Net
expenses |
0.89%
(5) |
0.89%
|
0.89%
|
0.98%
|
0.95%
|
0.96%
|
| Net
investment income |
0.75%
(5) |
0.63%
|
0.61%
|
1.52%
|
1.44%
|
1.28%
|
| Portfolio
Turnover |
24%
(3) |
38%
|
47%
|
51%
|
48%
|
138%
|
|
(1) |
Computed
using average shares outstanding. |
|
(2) |
Returns
are historical and are calculated by determining the percentage change in net asset value with all distributions reinvested and do not reflect the effect of sales charges, if any. |
|
(3) |
Not
annualized. |
|
(4) |
Total
expenses do not reflect amounts reimbursed and/or waived by the adviser and certain of its affiliates, if applicable. Net expenses are net of all reductions and represent the net expenses paid by the Fund. |
|
(5) |
Annualized.
|
15
See Notes to Financial Statements.
Calvert
International Equity Fund
March 31, 2022
Financial
Highlights — continued
| |
Class
R6 |
| |
Six
Months Ended
March 31, 2022
(Unaudited) |
Year
Ended September 30, |
Period
Ended
September 30, |
| |
2021
|
2020
|
2019
(1) |
| Net
asset value — Beginning of period |
$
26.80 |
$
21.76 |
$
19.44 |
$
17.79 |
| Income
(Loss) From Operations |
|
|
|
|
| Net
investment income(2) |
$
0.10 |
$
0.16 |
$
0.13 |
$
0.28 |
| Net
realized and unrealized gain (loss) |
(1.53)
|
5.00
|
2.46
|
1.37
|
| Total
income (loss) from operations |
$
(1.43) |
$
5.16 |
$
2.59 |
$
1.65 |
| Less
Distributions |
|
|
|
|
| From
net investment income |
$
(0.31) |
$
(0.12) |
$
(0.27) |
$
— |
| From
net realized gain |
(1.37)
|
—
|
—
|
—
|
| Total
distributions |
$
(1.68) |
$
(0.12) |
$
(0.27) |
$
— |
| Net
asset value — End of period |
$
23.69 |
$
26.80 |
$
21.76 |
$
19.44 |
| Total
Return(3) |
(5.75)%
(4) |
23.79%
|
13.34%
|
9.27%
(4) |
| Ratios/Supplemental
Data |
|
|
|
|
| Net
assets, end of period (000’s omitted) |
$161,622
|
$160,163
|
$122,150
|
$49,332
|
| Ratios
(as a percentage of average daily net assets):(5) |
|
|
|
|
| Total
expenses |
0.90%
(6) |
0.91%
|
0.98%
|
1.14%
(6) |
| Net
expenses |
0.85%
(6) |
0.85%
|
0.85%
|
0.96%
(6) |
| Net
investment income |
0.80%
(6) |
0.63%
|
0.64%
|
2.62%
(6) |
| Portfolio
Turnover |
24%
(4) |
38%
|
47%
|
51%
(7) |
|
(1) |
For
the period from the commencement of operations, March 7, 2019, to September 30, 2019. |
|
(2) |
Computed
using average shares outstanding. |
|
(3) |
Returns
are historical and are calculated by determining the percentage change in net asset value with all distributions reinvested and do not reflect the effect of sales charges, if any. |
|
(4) |
Not
annualized. |
|
(5) |
Total
expenses do not reflect amounts reimbursed and/or waived by the adviser and certain of its affiliates, if applicable. Net expenses are net of all reductions and represent the net expenses paid by the Fund. |
|
(6) |
Annualized.
|
|
(7) |
For
the year ended September 30, 2019. |
16
See Notes to Financial Statements.
Calvert
International Equity Fund
March 31, 2022
Notes to Financial
Statements (Unaudited)
1 Significant Accounting Policies
Calvert International Equity Fund (the Fund) is a diversified
series of Calvert World Values Fund, Inc. (the Corporation). The Corporation is a Maryland corporation registered under the Investment Company Act of 1940, as amended (the 1940 Act), as an open-end management investment company. The investment
objective of the Fund is to seek to provide a high total return consistent with reasonable risk by investing primarily in a diversified portfolio of stocks. The Fund invests primarily in equity securities of foreign companies.
The Fund offers four classes of shares. Class A shares are
generally sold subject to a sales charge imposed at time of purchase. Effective April 29, 2022, the maximum sales charge payable upon purchase of Class A shares was increased to 5.25%. A contingent deferred sales charge of 0.80% (1.00% effective
April 29, 2022) may apply to certain redemptions of Class A shares for accounts for which no sales charge was paid, if redeemed within 12 months of purchase. Class C shares are sold without a front-end sales charge, and with certain exceptions, are
charged a contingent deferred sales charge of 1% on shares redeemed within 12 months of purchase. Class C shares are only available for purchase through a financial intermediary. Effective November 5, 2020, Class C shares automatically convert to
Class A shares eight years after their purchase as described in the Fund’s prospectus. Class I and Class R6 shares are sold at net asset value, are not subject to a sales charge and are sold only to certain eligible investors. Each class
represents a pro rata interest in the Fund, but votes separately on class-specific matters and is subject to different expenses.
The Fund applies the accounting and reporting guidance in the
Financial Accounting Standards Board (FASB) Accounting Standards Codification Topic 946, Financial Services – Investment Companies (ASC 946). Subsequent events, if any, through the date that the
financial statements were issued have been evaluated in the preparation of the financial statements.
A Investment
Valuation— Net asset value per share is determined every business day as of the close of the regular session of the New York Stock Exchange (generally 4:00 p.m. Eastern time).
The Fund uses independent pricing services approved by the Board of Directors (the Board) to value its investments wherever possible. Investments for which market quotations are not available or deemed not reliable are fair valued in good faith
under the direction of the Board.
U.S. generally
accepted accounting principles (U.S. GAAP) establishes a disclosure hierarchy that categorizes the inputs to valuation techniques used to value assets and liabilities at measurement date. These inputs are summarized in the three broad levels listed
below:
Level 1 - quoted prices in active markets for
identical securities
Level 2 - other significant
observable inputs (including quoted prices for similar securities, interest rates, prepayment speeds, credit risk, etc.)
Level 3 - significant unobservable inputs (including the
Fund’s own assumptions in determining the fair value of investments)
The inputs or methodologies used for valuing securities are not
necessarily an indication of the risk associated with investing in those securities.
Valuation techniques used to value the Fund’s investments
by major category are as follows:
Equity Securities. Equity securities (including warrants and rights) listed on a U.S. securities exchange generally are valued at the last sale or closing price as reported by an independent pricing service on the primary market or
exchange on which they are traded and are categorized as Level 1 in the hierarchy. Equity securities listed on the NASDAQ National Market System are valued at the NASDAQ official closing price and are categorized as Level 1 in the hierarchy.
Unlisted or listed securities for which closing sales prices or closing quotations are not available are valued at the mean between the latest available bid and ask prices and are categorized as Level 2 in the hierarchy. The daily valuation of
exchange-traded foreign securities generally is determined as of the close of trading on the principal exchange on which such securities trade. Events occurring after the close of trading on foreign exchanges may result in adjustments to the
valuation of foreign securities to more accurately reflect their fair value as of the close of regular trading on the New York Stock Exchange. When valuing foreign equity securities that meet certain criteria, the Fund’s Board has approved the
use of a fair value service that values such securities to reflect market trading that occurs after the close of the applicable foreign markets of comparable securities or other instruments that have a strong correlation to the fair-valued
securities. Such securities are categorized as Level 2 in the hierarchy.
Debt Securities. Debt
securities are generally valued based on valuations provided by third party pricing services, as derived from such services’ pricing models. Inputs to the models may include, but are not limited to, reported trades, executable bid and ask
prices, broker/dealer quotations, prices or yields of securities with similar characteristics, interest rates, anticipated prepayments, benchmark curves or information pertaining to the issuer, as well as industry and economic events. Accordingly,
debt securities are generally categorized as Level 2 in the hierarchy. Short-term debt securities with a remaining maturity at time of purchase of more than sixty days are valued based on valuations provided by a third party pricing service. Such
securities are generally categorized as Level 2 in the hierarchy. Short-term debt securities of sufficient credit quality purchased with remaining maturities of sixty days or less for which a valuation from a third party pricing service is not
readily available may be valued at amortized cost, which approximates fair value, and are categorized as Level 2 in the hierarchy.
Venture Capital Securities.
Venture capital securities for which market quotations are not readily available are generally categorized as Level 3 in the hierarchy. Venture capital equity securities are generally valued using the most appropriate and applicable method to
measure fair value in light of each company’s situation. Methods may include market, income, options-pricing or cost approaches with discounts as appropriate based on assumptions of liquidation or exit risk. Examples of the market approach are
subsequent rounds of financing, comparable transactions, and revenue times an industry multiple. An example of the income approach is the discounted cash flow model. Examples of the cost approach are replacement cost, salvage value, or
Calvert
International Equity Fund
March 31, 2022
Notes to Financial
Statements (Unaudited) — continued
net asset value. The
options-pricing method treats common stock and preferred stock as call options on the enterprise value with strike price based on the preferred stock liquidation preference. Venture capital limited partnership interests are valued at the fair value
reported by the general partner of the partnership, adjusted as necessary to reflect subsequent capital calls and distributions and any other available information. In some cases, adjustments may be made to account for daily pricing of material
public holdings within the partnership.
Affiliated Fund. Calvert Cash Reserves Fund, LLC (Cash Reserves Fund) is an affiliated investment company managed by Calvert Research and Management (CRM). While Cash Reserves Fund is not a registered money market mutual fund, it
conducts all of its investment activities in accordance with the requirements of Rule 2a-7 under the 1940 Act. Investments in Cash Reserves Fund are valued at the closing net asset value per unit on the valuation day and are categorized as Level 2
in the hierarchy. Cash Reserves Fund generally values its investment securities based on available market quotations provided by a third party pricing service.
Other Securities. Investments
in registered investment companies (including money market funds) that do not trade on an exchange are valued at the net asset value per share on the valuation day and are categorized as Level 1 in the hierarchy.
Fair Valuation. If a market
value cannot be determined for a security using the methodologies described above, or if, in the good faith opinion of the Fund's adviser, the market value does not constitute a readily available market quotation, or if a significant event has
occurred that would materially affect the value of the security, the security will be fair valued as determined in good faith by or at the direction of the Board in a manner that most fairly reflects the security’s “fair value”,
which is the amount that the Fund might reasonably expect to receive for the security upon its current sale in the ordinary course. Each such determination is based on a consideration of relevant factors, which are likely to vary from one pricing
context to another. These factors may include, but are not limited to, the type of security, the existence of any contractual restrictions on the security’s disposition, the price and extent of public trading in similar securities of the
issuer or of comparable companies or entities, quotations or relevant information obtained from broker/dealers or other market participants, information obtained from the issuer, analysts, and/or the appropriate stock exchange (for exchange-traded
securities), an analysis of the company’s or entity’s financial statements, and an evaluation of the forces that influence the issuer and the market(s) in which the security is purchased and sold.
The values assigned to fair value investments are based on
available information and do not necessarily represent amounts that might ultimately be realized. Further, due to the inherent uncertainty of valuations of such investments, the fair values may differ significantly from the values that would have
been used had an active market existed, and the differences could be material.
The following table summarizes the market value of the Fund's
holdings as of March 31, 2022, based on the inputs used to value them:
| Asset
Description |
Level
1 |
Level
2 |
Level
3(1) |
Total
|
| Common
Stocks: |
|
|
|
|
| Australia
|
$
— |
$
23,364,172 |
$
— |
$
23,364,172 |
| Belgium
|
—
|
19,688,470
|
—
|
19,688,470
|
| Denmark
|
—
|
21,545,115
|
—
|
21,545,115
|
| France
|
—
|
94,419,858
|
—
|
94,419,858
|
| Germany
|
—
|
62,958,605
|
—
|
62,958,605
|
| Hong
Kong |
—
|
26,038,962
|
—
|
26,038,962
|
| India
|
—
|
16,648,337
|
—
|
16,648,337
|
| Ireland
|
—
|
15,575,847
|
—
|
15,575,847
|
| Japan
|
—
|
85,612,518
|
—
|
85,612,518
|
| Netherlands
|
—
|
26,811,718
|
—
|
26,811,718
|
| New
Zealand |
—
|
13,976,922
|
—
|
13,976,922
|
| Singapore
|
—
|
22,193,999
|
—
|
22,193,999
|
| South
Africa |
—
|
11,477,182
|
—
|
11,477,182
|
| Spain
|
—
|
49,051,332
|
—
|
49,051,332
|
| Sweden
|
—
|
49,581,970
|
—
|
49,581,970
|
| Switzerland
|
—
|
82,290,516
|
—
|
82,290,516
|
| Taiwan
|
10,175,046
|
—
|
—
|
10,175,046
|
| United
Kingdom |
—
|
229,783,129
|
—
|
229,783,129
|
| Total
Common Stocks |
$10,175,046
|
$851,018,652
(2) |
$
— |
$861,193,698
|
| High
Social Impact Investments |
$
— |
$
858,770 |
$
— |
$
858,770 |
| Preferred
Stocks - Venture Capital |
—
|
—
|
130,590
|
130,590
|
Calvert
International Equity Fund
March 31, 2022
Notes to Financial
Statements (Unaudited) — continued
| Asset
Description (continued) |
Level
1 |
Level
2 |
Level
3(1) |
Total
|
| Venture
Capital Limited Partnership Interests |
$
— |
$
— |
$
1,474,888 |
$
1,474,888 |
| Short-Term
Investments |
—
|
551,379
|
—
|
551,379
|
| Total
Investments |
$10,175,046
|
$852,428,801
|
$1,605,478
|
$864,209,325
|
|
(1) |
None
of the unobservable inputs for Level 3 assets, individually or collectively, had a material impact on the Fund. |
|
(2) |
Includes
foreign equity securities whose values were adjusted to reflect market trading of comparable securities or other correlated instruments that occurred after the close of trading in their applicable foreign markets. |
Level 3 investments at the beginning and/or end of the period
in relation to net assets were not significant and accordingly, a reconciliation of Level 3 assets for the six months ended March 31, 2022 is not presented.
B Investment Transactions and Income— Investment transactions for financial statement purposes are accounted for on trade date. Realized gains and losses are recorded on an identified cost basis and may include
proceeds from litigation. Dividend income is recorded on the ex-dividend date for dividends received in cash and/or securities or, in
the case of dividends on certain foreign securities, as soon as the Fund is informed of the ex-dividend date. Non-cash dividends are
recorded at the fair value of the securities received. Withholding taxes on foreign dividends, if any, have been provided for in
accordance with the Fund's understanding of the applicable country’s tax rules and rates. In consideration of recent decisions
rendered by European courts, the Fund has filed additional tax reclaims for previously withheld taxes on dividends earned in certain European Union countries. These filings are subject to various administrative and judicial proceedings within these
countries. Due to the uncertainty as to the ultimate resolution of these proceedings, the likelihood of receipt of these reclaims, and the potential timing of payment, no amounts are reflected in the financial statements for such outstanding
reclaims.
Distributions received that represent a return of
capital are recorded as a reduction of cost of investments. Distributions received that represent a capital gain are recorded as a realized gain. Interest income, which includes amortization of premium and
accretion of discount on debt securities, is accrued as earned.
C Share Class Accounting— Realized and unrealized gains and losses and net investment income and losses, other than class-specific expenses, are allocated daily to each class of shares based upon the
relative net assets of each class to the total net assets of the Fund. Expenses arising in connection with a specific class are charged directly to that class. Sub-accounting, recordkeeping and similar administrative fees payable to financial intermediaries, which are a component of transfer agency fees and expenses on the Statement of Operations, are not allocated to Class R6
shares.
D Foreign Currency Transactions— The Fund’s accounting records are maintained in U.S. dollars. For valuation of assets and liabilities on each date of net asset value determination, foreign denominations
are converted into U.S. dollars using the current exchange rate. Security transactions, income and expenses are translated at the prevailing rate of exchange on the date of the event. Recognized gains or losses on investment transactions
attributable to changes in foreign currency exchange rates are recorded for financial statement purposes as net realized gains and losses on investments. That portion of unrealized gains and losses on investments that results from fluctuations in
foreign currency exchange rates is not separately disclosed.
E Restricted Securities— The Fund may invest in securities that are subject to legal or contractual restrictions on resale. Generally, these securities may only be sold publicly upon registration under
the Securities Act of 1933 or in transactions exempt from such registration. Information regarding restricted securities (excluding Rule 144A securities) is included at the end of the Schedule of Investments.
F Distributions to Shareholders— Distributions to shareholders are recorded by the Fund on ex-dividend date. Distributions from net investment income and distributions from net realized capital gains, if any, are
paid at least annually. Distributions are declared separately for each class of shares. Distributions are determined in accordance with income tax regulations, which may differ from U.S. GAAP; accordingly, periodic reclassifications are made within
the Fund's capital accounts to reflect income and gains available for distribution under income tax regulations.
G Estimates— The preparation of financial statements in conformity with U.S. GAAP requires management to make estimates and assumptions that affect the reported amounts of assets and liabilities and disclosure of contingent assets
and liabilities at the date of the financial statements and the reported amounts of increases and decreases in net assets from operations during the reporting period. Actual results could differ from those estimates.
H
Indemnifications— The Corporation’s By-Laws provide for indemnification for Directors or officers of the Corporation and certain other parties, to the fullest extent
permitted by Maryland law and the 1940 Act, provided certain conditions are met. Additionally, in the normal course of business, the Fund enters into agreements with service providers that may contain indemnification clauses. The Fund’s
maximum exposure under these arrangements is unknown as this would involve future claims that may be made against the Fund that have not yet occurred.
I Federal Income
Taxes— No provision for federal income or excise tax is required since the Fund intends to continue to qualify as a regulated investment company under the Internal Revenue Code
and to distribute substantially all of its taxable earnings.
Calvert
International Equity Fund
March 31, 2022
Notes to Financial
Statements (Unaudited) — continued
In
addition to the requirements of the Internal Revenue Code, the Fund may also be subject to local taxes on the recognition of capital gains in certain countries. In determining the daily net asset value, the Fund estimates the accrual for such taxes,
if any, based on the unrealized appreciation on certain portfolio securities and the related tax rates. Taxes attributable to unrealized appreciation are included in the change in unrealized appreciation (depreciation) on investments. Capital gains
taxes on securities sold are included in net realized gain (loss) on investments.
Management has analyzed the Fund's tax positions taken for all
open federal income tax years and has concluded that no provision for federal income tax is required in the Fund's financial statements. A Fund's federal tax return is subject to examination by the Internal Revenue Service for a period of three
years from the date of filing.
J Interim
Financial Statements— The interim financial statements relating to March 31, 2022 and for the six months then ended have not been audited by an independent registered public
accounting firm, but in the opinion of the Fund's management, reflect all adjustments, consisting only of normal recurring adjustments, necessary for the fair presentation of the financial statements.
2 Related Party Transactions
The investment advisory fee is earned by CRM, an indirect,
wholly-owned subsidiary of Morgan Stanley, as compensation for investment advisory services rendered to the Fund. The investment advisory fee is computed at an annual rate as a percentage of the Fund’s average daily net assets as follows and
is payable monthly:
| Average
Daily Net Assets |
Annual
Fee
Rate |
| Up
to and including $250 million |
0.68%
|
| Over
$250 million up to and including $500 million |
0.665%
|
| Over
$500 million |
0.65%
|
For the six months ended March 31,
2022, the investment advisory fee amounted to $2,983,907 or 0.66% (annualized) of the Fund’s average daily net assets. CRM does not receive a fee for advisory services provided to Cash Reserves Fund.
Pursuant to an investment sub-advisory agreement, CRM has
delegated the investment management of the Fund to Eaton Vance Advisers International Ltd. (EVAIL), an affiliate of CRM and an indirect, wholly-owned subsidiary of Morgan Stanley. CRM pays EVAIL a portion of its investment advisory fee for
sub-advisory services provided to the Fund.
CRM and EVAIL
have agreed to reimburse the Fund’s operating expenses to the extent that total annual operating expenses (relating to ordinary operating expenses only and excluding expenses such as brokerage commissions, acquired fund fees and expenses of
unaffiliated funds, borrowing costs, taxes or litigation expenses) exceed 1.14%, 1.89%, 0.89% and 0.85% for Class A, Class C, Class I and Class R6, respectively, of such class’s average daily net assets. The expense reimbursement agreement may
be changed or terminated after January 31, 2023. For the six months ended March 31, 2022, CRM and EVAIL waived or reimbursed expenses in total of $228,519.
The administrative fee is earned by CRM as compensation for
administrative services rendered to the Fund. The fee is computed at an annual rate of 0.12% of the Fund’s average daily net assets attributable to Class A, Class C, Class I and Class R6 and is payable monthly. For the six months ended March
31, 2022, CRM was paid administrative fees of $540,519.
The Fund has in effect a distribution plan for Class A shares
(Class A Plan) pursuant to Rule 12b-1 under the 1940 Act. Pursuant to the Class A Plan, the Fund pays Eaton Vance Distributors, Inc. (EVD), an affiliate of CRM and the Fund’s principal underwriter, a distribution and service fee of 0.25% per
annum of its average daily net assets attributable to Class A shares for distribution services and facilities provided to the Fund by EVD, as well as for personal services and/or the maintenance of shareholder accounts. The Fund also has in effect a
distribution plan for Class C shares (Class C Plan) pursuant to Rule 12b-1 under the 1940 Act. Pursuant to the Class C Plan, the Fund pays EVD amounts equal to 0.75% per annum of its average daily net assets attributable to Class C shares for
providing ongoing distribution services and facilities to the Fund. In addition, pursuant to the Class C Plan, the Fund also makes payments of service fees to EVD, financial intermediaries and other persons in amounts equal to 0.25% per annum of its
average daily net assets attributable to that class. Service fees paid or accrued are for personal services and/or the maintenance of shareholder accounts. Distribution and service fees paid or accrued for the six months ended March 31, 2022
amounted to $235,367 and $35,752 for Class A shares and Class C shares, respectively.
The Fund was informed that EVD received $14,910 as its portion
of the sales charge on sales of Class A shares for the six months ended March 31, 2022. The Fund was also informed that EVD received $859 and $1,056 of contingent deferred sales charges paid by Class A and Class C shareholders, respectively, for the
same period.
Calvert
International Equity Fund
March 31, 2022
Notes to Financial
Statements (Unaudited) — continued
Eaton
Vance Management (EVM), an affiliate of CRM, provides sub-transfer agency and related services to the Fund pursuant to a Sub-Transfer Agency Support Services Agreement. For the six months ended March 31, 2022, sub-transfer agency fees and expenses
incurred to EVM amounted to $30,910 and are included in transfer agency fees and expenses on the Statement of Operations.
Each Director of the Fund who is not an employee of CRM or its
affiliates receives an annual fee of $214,000 ($154,000 prior to January 1, 2022), plus an annual Committee fee ranging from $8,500 to $16,500 depending on the Committee. The Board chair receives an additional $30,000 annual fee, Committee chairs
receive an additional $6,000 annual fee and the special equities liaison receives an additional $2,500 annual fee. Eligible Directors may participate in a Deferred Compensation Plan (the Plan). Amounts deferred under the Plan are treated as though
equal dollar amounts had been invested in shares of the Fund or other Calvert funds selected by the Directors. The Fund purchases shares of the funds selected equal to the dollar amounts deferred under the Plan, resulting in an asset equal to the
deferred compensation liability. Obligations of the Plan are paid solely from the Fund's assets. Directors’ fees are allocated to each of the Calvert funds served. Salaries and fees of officers and Directors of the Fund who are employees of
CRM or its affiliates are paid by CRM.
3 Investment Activity
During the six months ended March 31, 2022, the cost of
purchases and proceeds from sales of investments, other than short-term securities, were $262,928,304 and $217,873,590, respectively.
4 Distributions to Shareholders and Income Tax
Information
The cost and unrealized appreciation
(depreciation) of investments of the Fund at March 31, 2022, as determined on a federal income tax basis, were as follows:
| Aggregate
cost |
$780,753,917
|
| Gross
unrealized appreciation |
$
117,400,636 |
| Gross
unrealized depreciation |
(33,945,228)
|
| Net
unrealized appreciation |
$
83,455,408 |
5 Securities Lending
To generate additional income, the Fund may lend its securities
pursuant to a securities lending agency agreement with State Street Bank and Trust Company (SSBT), the securities lending agent. Security loans are subject to termination by the Fund at any time and, therefore, are not considered illiquid
investments. The Fund requires that the loan be continuously collateralized by either cash or securities in an amount at least equal to the market value of the securities on loan. The market value of securities loaned is determined daily and any
additional required collateral is delivered to the Fund on the next business day. Cash collateral is generally invested in a money market fund registered under the 1940 Act that is managed by an affiliate of SSBT. Any gain or loss in the market
price of the loaned securities that might occur and any interest earned or dividends declared during the term of the loan would accrue to the account of the Fund. Income earned on the investment of collateral, net of broker rebates and other
expenses incurred by the securities lending agent, is split between the Fund and the securities lending agent based on agreed upon contractual terms. Non-cash collateral, if any, is held by the lending agent on behalf of the Fund and cannot be sold
or re-pledged by the Fund; accordingly, such collateral is not reflected in the Statement of Assets and Liabilities.
The risks associated with lending portfolio securities include,
but are not limited to, possible delays in receiving additional collateral or in the recovery of the loaned securities, possible loss of rights to the collateral should the borrower fail financially, as well as risk of loss in the value of the
collateral or the value of the investments made with the collateral. The securities lending agent shall indemnify the Fund in the case of default of any securities borrower.
At March 31, 2022, the total value of securities on loan was
$2,067,640 and the total value of collateral received was $2,415,298, comprised of U.S. government and/or agencies securities.
Calvert
International Equity Fund
March 31, 2022
Notes to Financial
Statements (Unaudited) — continued
6 Line of Credit
The Fund participates with other portfolios and funds managed
by EVM and its affiliates, including CRM, in an $800 million unsecured line of credit with a group of banks, which is in effect through October 25, 2022. Borrowings are made by the Fund solely for temporary purposes related to redemptions and other
short-term cash needs. Interest is charged to the Fund based on its borrowings at an amount above either the Secured Overnight Financing Rate (SOFR) or Federal Funds rate. In addition, a fee computed at an annual rate of 0.15% on the daily unused
portion of the line of credit is allocated among the participating portfolios and funds at the end of each quarter. In connection with the renewal of the agreement in October 2021, an arrangement fee of $150,000 was incurred that was allocated to
the participating portfolios and funds. Because the line of credit is not available exclusively to the Fund, it may be unable to borrow some or all of its requested amounts at any particular time.
The Fund had no borrowings outstanding pursuant to its line of
credit at March 31, 2022. The Fund did not have any significant borrowings or allocated fees during the six months ended March 31, 2022.
7 Affiliated Companies and Funds
The Fund has invested a portion of its assets in notes (the
Notes) issued by Calvert Impact Capital, Inc. (CIC) pursuant to exemptive relief granted by the U.S. Securities and Exchange Commission (the SEC). There are certain potential points of affiliation between the Fund and CIC. CRM has licensed use of
the Calvert name to CIC and provides other types of support. CRM’s President and Chief Executive Officer (and the only director/trustee on the Fund Board that is an “interested person” of the Fund) serves on the CIC Board. In
addition, another director/trustee on the Fund Board serves as a director emeritus on the CIC Board.
In addition to the Notes, the Fund may also invest in companies
that are considered affiliated companies because the Fund has a direct or indirect ownership of, control of, or voting power of 5 percent or more of the outstanding voting shares of the company, or the company is under common ownership or control
with the Fund. At March 31, 2022, the value of the Fund's investment in the Notes and affiliated companies and funds was $1,613,726, which represents 0.2% of the Fund's net assets. Transactions in the Notes and affiliated companies and funds by the
Fund for the six months ended March 31, 2022 were as follows:
| Name
|
Value,
beginning
of period |
Purchases
|
Sales
proceeds |
Net
realized
gain
(loss) |
Change
in
unrealized
appreciation
(depreciation) |
Value,
end of
period |
Interest/
Dividend
income |
Principal
amount/Units,
end of period |
| High
Social Impact Investments |
|
|
|
|
|
|
|
|
| Calvert
Impact Capital, Inc., Community Investment Notes, 1.50%, 12/15/23(1) |
$ 864,890
|
$
— |
$
— |
$
— |
$
(27,192) |
$
837,698 |
$
6,600 |
$880,000
|
| Venture
Capital Limited Partnership Interests |
|
|
|
|
|
|
|
|
| gNet
Defta Development Holding LLC(1)(2)(3) |
231,604
|
—
|
—
|
—
|
(6,955)
|
224,649
|
—
|
—
|
| Short-Term
Investments |
|
|
|
|
|
|
| Calvert
Cash Reserves Fund, LLC |
5,635,556
|
149,605,470
|
(154,690,332)
|
1,249
|
(564)
|
551,379
|
1,953
|
551,434
|
| Totals
|
|
|
|
$1,249
|
$(34,711)
|
$1,613,726
|
$8,553
|
|
|
(1) |
Restricted
security. |
|
(2) |
For
fair value measurement disclosure purposes, security is categorized as Level 3 (see Note 1A). |
|
(3) |
Non-income
producing security. |
8 Capital Shares
The Corporation may issue its shares in one or more series
(such as the Fund). The authorized shares of the Fund consist of 75,000,000 common shares, $0.01 par value, for each Class.
Calvert
International Equity Fund
March 31, 2022
Notes to Financial
Statements (Unaudited) — continued
Transactions in capital shares for the six months ended March
31, 2022 and the year ended September 30, 2021 were as follows:
| |
Six
Months Ended
March 31, 2022
(Unaudited) |
|
Year
Ended
September 30, 2021 |
| |
Shares
|
Amount
|
|
Shares
|
Amount
|
| Class
A |
|
|
|
|
|
| Shares
sold |
1,882,254
|
$
42,795,569 |
|
1,643,681
|
$
39,373,904 |
| Reinvestment
of distributions |
484,064
|
11,496,510
|
|
12,947
|
297,262
|
| Shares
redeemed |
(750,747)
|
(18,143,606)
|
|
(907,802)
|
(21,869,874)
|
| Converted
from Class C |
16,140
|
385,470
|
|
50,240
|
1,153,540
|
| Net
increase |
1,631,711
|
$
36,533,943 |
|
799,066
|
$
18,954,832 |
| Class
C |
|
|
|
|
|
| Shares
sold |
20,575
|
$
433,651 |
|
111,587
|
$
2,286,086 |
| Reinvestment
of distributions |
24,796
|
496,666
|
|
—
|
—
|
| Shares
redeemed |
(38,294)
|
(782,419)
|
|
(55,316)
|
(1,126,913)
|
| Converted
to Class A |
(19,105)
|
(385,470)
|
|
(58,945)
|
(1,153,540)
|
| Net
increase (decrease) |
(12,028)
|
$
(237,572) |
|
(2,674)
|
$
5,633 |
| Class
I |
|
|
|
|
|
| Shares
sold |
4,628,560
|
$
117,975,648 |
|
12,693,224
|
$
319,563,633 |
| Reinvestment
of distributions |
1,290,290
|
32,889,495
|
|
63,273
|
1,552,097
|
| Shares
redeemed |
(4,463,967)
|
(110,965,096)
|
|
(6,021,538)
|
(156,919,455)
|
| Net
increase |
1,454,883
|
$
39,900,047 |
|
6,734,959
|
$
164,196,275 |
| Class
R6 |
|
|
|
|
|
| Shares
sold |
1,856,677
|
$
47,328,344 |
|
1,815,279
|
$
45,216,469 |
| Reinvestment
of distributions |
365,740
|
9,304,424
|
|
25,420
|
622,531
|
| Shares
redeemed |
(1,376,195)
|
(34,473,526)
|
|
(1,477,180)
|
(37,186,283)
|
| Net
increase |
846,222
|
$
22,159,242 |
|
363,519
|
$
8,652,717 |
9 Risks and Uncertainties
Risks Associated with Foreign Investments
Foreign investments can be adversely affected by political,
economic and market developments abroad, including the imposition of economic and other sanctions by the United States or another country. There may be less publicly available information about foreign issuers because they may not be subject to
reporting practices, requirements or regulations comparable to those to which United States companies are subject. Foreign markets may be smaller, less liquid and more volatile than the major markets in the United States. Trading in foreign markets
typically involves higher expense than trading in the United States. The Fund may have difficulties enforcing its legal or contractual rights in a foreign country. Securities that trade or are denominated in currencies other than the U.S. dollar may
be adversely affected by fluctuations in currency exchange rates.
Pandemic Risk
An outbreak of respiratory disease caused by a novel
coronavirus was first detected in China in late 2019 and subsequently spread internationally. This coronavirus has resulted in closing borders, enhanced health screenings, changes to healthcare service preparation and delivery, quarantines,
cancellations, disruptions to supply chains and customer activity, as well as general concern and uncertainty. Health crises caused by outbreaks, such as the coronavirus outbreak, may exacerbate other pre-existing political, social and economic
risks and disrupt normal market conditions and operations. The impact of this outbreak has negatively affected the worldwide economy, the economies of individual countries, individual companies, and the market in general, and may continue to do so
in significant and unforeseen ways, as may other epidemics and pandemics that may arise in the future. Any such impact could adversely affect the Fund's performance, or the performance of the securities in which the Fund invests.
Calvert
International Equity Fund
March 31, 2022
Notes to Financial
Statements (Unaudited) — continued
10 Capital Commitments
In connection with certain venture capital and/or limited
partnership investments, the Fund is committed to future capital calls, which will increase the Fund’s investment in these securities. The aggregate amount of the future capital commitments totaled $27,949 at March 31, 2022. The Fund had
sufficient cash and/or securities to cover these commitments.
The Fund's unfunded capital commitments by investment at March
31, 2022 were as follows:
| Name
of Investment |
Unfunded
Commitment |
| Africa
Renewable Energy Fund L.P. |
$
10,449 |
| SEAF
India International Growth Fund L.P. |
17,500
|
| Total
|
$27,949
|
Calvert
International Equity Fund
March 31, 2022
| Officers
|
Hope L.
Brown
Chief Compliance Officer |
Deidre E.
Walsh
Vice President, Secretary and
Chief Legal Officer |
James F.
Kirchner
Treasurer |
| Directors
|
Alice
Gresham Bullock
Chairperson |
| Richard L.
Baird, Jr. |
| Cari M.
Dominguez |
| John G.
Guffey, Jr. |
| Miles D.
Harper, III |
| Joy V. Jones
|
| John H.
Streur* |
| Anthony A.
Williams |
| *Interested
Director and President |
| Privacy
Notice |
April 2021
|
| FACTS
|
WHAT
DOES EATON VANCE DO WITH YOUR
PERSONAL INFORMATION? |
| Why?
|
Financial
companies choose how they share your personal information. Federal law gives consumers the right to limit some but not all sharing. Federal law also requires us to tell you how we collect, share, and protect your personal information. Please read
this notice carefully to understand what we do. |
| |
|
| What?
|
The
types of personal information we collect and share depend on the product or service you have with us. This information can include:■ Social Security number and income
■
investment experience and risk tolerance
■
checking account number and wire transfer instructions |
| |
|
| How?
|
All
financial companies need to share customers’ personal information to run their everyday business. In the section below, we list the reasons financial companies can share their customers’ personal information; the reasons Eaton Vance
chooses to share; and whether you can limit this sharing. |
Reasons
we can share your
personal information |
Does
Eaton Vance
share? |
Can
you limit
this sharing? |
| For
our everyday business purposes — such as to process your transactions, maintain your account(s), respond to court orders and legal investigations, or report to credit bureaus |
Yes
|
No
|
| For
our marketing purposes — to offer our products and services to you |
Yes
|
No
|
| For
joint marketing with other financial companies |
No
|
We
don’t share |
| For
our investment management affiliates’ everyday business purposes — information about your transactions, experiences, and creditworthiness |
Yes
|
Yes
|
| For
our affiliates’ everyday business purposes — information about your transactions and experiences |
Yes
|
No
|
| For
our affiliates’ everyday business purposes — information about your creditworthiness |
No
|
We
don’t share |
| For
our investment management affiliates to market to you |
Yes
|
Yes
|
| For
our affiliates to market to you |
No
|
We
don’t share |
| For
nonaffiliates to market to you |
No
|
We
don’t share |
To
limit our
sharing |
Call
toll-free 1-800-368-2745 or email: CRMPrivacy@calvert.comPlease note:If you are a new customer, we can begin sharing your information 30 days from the date we sent this notice. When you are no longer our customer, we continue to share your information as described in this notice. However, you can contact us at any time to limit our
sharing. |
| Questions?
|
Call
toll-free 1-800-368-2745 or email: CRMPrivacy@calvert.com |
| Privacy
Notice — continued |
April 2021
|
| Who
we are |
| Who
is providing this notice? |
Eaton
Vance Management, Eaton Vance Distributors, Inc., Eaton Vance Trust Company, Eaton Vance Management (International) Limited, Eaton Vance Advisers International Ltd., Eaton Vance Global Advisors Limited, Eaton Vance Management’s Real Estate
Investment Group, Boston Management and Research, Calvert Research and Management, Eaton Vance and Calvert Fund Families and our investment advisory affiliates (“Eaton Vance”) (see Investment Management Affiliates definition below)
|
| What
we do |
How
does Eaton Vance
protect my personal
information? |
To
protect your personal information from unauthorized access and use, we use security measures that comply with federal law. These measures include computer safeguards and secured files and buildings. We have policies governing the proper handling of
customer information by personnel and requiring third parties that provide support to adhere to appropriate security standards with respect to such information. |
How
does Eaton Vance
collect my personal
information? |
We
collect your personal information, for example, when you■ open an account or make deposits or withdrawals from your
account
■
buy securities from us or make a wire transfer
■
give us your contact informationWe also collect your personal information from others, such as credit bureaus, affiliates, or other companies. |
| Why
can’t I limit all sharing? |
Federal
law gives you the right to limit only■ sharing for affiliates’ everyday business purposes — information
about your creditworthiness
■
affiliates from using your information to market to you
■
sharing for nonaffiliates to market to youState laws and individual companies may give you additional rights
to limit sharing. See below for more on your rights under state law. |
| Definitions
|
Investment
Management
Affiliates |
Eaton
Vance Investment Management Affiliates include registered investment advisers, registered broker- dealers, and registered and unregistered funds. Investment Management Affiliates does not include entities associated with Morgan Stanley Wealth
Management, such as Morgan Stanley Smith Barney LLC and Morgan Stanley & Co. |
| Affiliates
|
Companies
related by common ownership or control. They can be financial and nonfinancial companies.■ Our affiliates include companies with a Morgan Stanley name and financial companies such as Morgan Stanley Smith Barney LLC and Morgan Stanley & Co. |
| Nonaffiliates
|
Companies
not related by common ownership or control. They can be financial and nonfinancial companies.■ Eaton Vance does not share with nonaffiliates so they can market to you. |
| Joint
marketing |
A
formal agreement between nonaffiliated financial companies that together market financial products or services to
you.■ Eaton Vance doesn’t jointly market. |
| Other
important information |
| Vermont:
Except as permitted by law, we will not share personal information we collect about Vermont residents with Nonaffiliates unless you provide us with your written consent to share such
information.California: Except as permitted by law, we will not share personal information we collect about California residents with Nonaffiliates and we will limit sharing
such personal information with our Affiliates to comply with California privacy laws that apply to us. |
Delivery of Shareholder Documents. The Securities and Exchange Commission (SEC) permits funds to deliver only one copy of shareholder documents, including prospectuses, proxy statements and shareholder reports, to fund investors with
multiple accounts at the same residential or post office box address. This practice is often called “householding” and it helps eliminate duplicate mailings to shareholders. Calvert funds, or your financial intermediary, may household the mailing of your documents indefinitely unless you instruct Calvert funds, or your financial intermediary, otherwise. If you would prefer that your Calvert fund documents not be householded, please contact Calvert funds at 1-800-368-2745, or contact your financial intermediary. Your instructions that householding not
apply to delivery of your Calvert fund documents will typically be effective within 30 days of receipt by Calvert funds or your financial intermediary.
Portfolio Holdings. Each Calvert fund files a schedule of portfolio holdings on Part F to Form N-PORT with the SEC. Certain information filed on Form N-PORT may be viewed on the Calvert website at www.calvert.com, by calling
Calvert at 1-800-368-2745 or in the EDGAR database on the SEC’s website at www.sec.gov.
Proxy Voting. The Proxy Voting Guidelines that each Calvert fund uses to determine how to vote proxies relating to portfolio securities is provided as an Appendix to the fund’s Statement of Additional Information.
The Statement of Additional Information can be obtained free of charge by calling the Calvert funds at 1-800-368-2745, by visiting the Calvert funds’ website at www.calvert.com or visiting the SEC’s website at www.sec.gov. Information
regarding how a Calvert fund voted proxies relating to portfolio securities during the most recent 12-month period ended June 30 is available by calling Calvert funds, by visiting the Calvert funds’ website at www.calvert.com or by visiting
the SEC’s website at www.sec.gov.
Investment Adviser and Administrator
Calvert Research and Management
1825 Connecticut Avenue NW, Suite 400
Washington, DC 20009
Investment Sub-Adviser
Eaton Vance Advisers International Ltd.
125 Old Broad Street
London, EC2N 1AR
Principal Underwriter*
Eaton Vance Distributors, Inc.
Two International Place
Boston, MA 02110
(617) 482-8260
Custodian
State Street Bank and Trust Company
State Street Financial Center, One Lincoln Street
Boston, MA 02111
Transfer Agent
DST Asset Manager Solutions, Inc.
2000 Crown Colony Drive
Quincy, MA 02169
Fund Offices
1825 Connecticut Avenue NW, Suite 400
Washington, DC 20009
* FINRA
BrokerCheck. Investors may check the background of their Investment Professional by contacting the Financial Industry Regulatory Authority (FINRA). FINRA BrokerCheck is a free tool to help investors check the professional background of
current and former FINRA-registered securities firms and brokers. FINRA BrokerCheck is available by calling 1-800-289-9999 and at www.FINRA.org. The FINRA BrokerCheck brochure describing this program is available to investors at www.FINRA.org.
Printed on recycled paper.
24208 3.31.22
Calvert
Emerging Markets Equity Fund
Semiannual Report
March 31, 2022
Commodity Futures Trading Commission Registration. The Commodity Futures Trading Commission (“CFTC”) has adopted regulations that subject registered investment companies and advisers to regulation by the CFTC if a fund invests more than a
prescribed level of its assets in certain CFTC-regulated instruments (including futures, certain options and swap agreements) or markets itself as providing investment exposure to such instruments. The adviser has claimed an exclusion from the
definition of “commodity pool operator” under the Commodity Exchange Act with respect to its management of the Fund and the other funds it manages. Accordingly, neither the Fund nor the adviser is subject to CFTC regulation.
Fund shares are not insured by the FDIC and are not deposits or
other obligations of, or guaranteed by, any depository institution. Shares are subject to investment risks, including possible loss of principal invested.
This report must be preceded or accompanied by a current
summary prospectus or prospectus. Before investing, investors should consider carefully the investment objective, risks, and charges and expenses of a mutual fund. This and other important information is contained in the summary prospectus and
prospectus, which can be obtained from a financial intermediary. Prospective investors should read the prospectus carefully before investing. For further information, please call 1-800-368-2745.
Choose Planet-friendly E-delivery!
Sign up now for on-line statements, prospectuses, and fund
reports. In less than five minutes you can help reduce paper mail and lower fund costs.
Just go to
www.calvert.com. If you already have an online account with the Calvert funds, click on Login to access your Account and select the documents you would like to receive via e-mail.
If you’re new to online account access, click on Login,
then Register to create your user name and password. Once you’re in, click on the E-delivery sign-up on the Account Portfolio page and follow the quick, easy steps.
Note: If your shares are not
held directly with the Calvert funds but through a brokerage firm, you must contact your broker for electronic delivery options available through their firm.
Semiannual Report March 31, 2022
Calvert
Emerging Markets Equity Fund
Calvert
Emerging Markets Equity Fund
March 31, 2022
Performance
Portfolio Manager(s) Kunjal
Gala and Vivek Bhutoria, CFA, each of Hermes Investment Management Limited
| %
Average Annual Total Returns1,2 |
Class
Inception Date |
Performance
Inception Date |
Six
Months |
One
Year |
Five
Years |
Since
Inception |
| Class
A at NAV |
10/29/2012
|
10/29/2012
|
(11.94)%
|
(18.14)%
|
6.69%
|
6.16%
|
| Class
A with 4.75% Maximum Sales Charge |
—
|
—
|
(16.13)
|
(22.04)
|
5.66
|
5.61
|
| Class
C at NAV |
10/29/2012
|
10/29/2012
|
(12.25)
|
(18.75)
|
5.89
|
5.41
|
| Class
C with 1% Maximum Sales Charge |
—
|
—
|
(13.12)
|
(19.56)
|
5.89
|
5.41
|
| Class
I at NAV |
10/29/2012
|
10/29/2012
|
(11.78)
|
(17.93)
|
6.99
|
6.49
|
| Class
R6 at NAV |
02/01/2018
|
10/29/2012
|
(11.78)
|
(17.87)
|
7.01
|
6.51
|
|
| MSCI
Emerging Markets Index |
—
|
—
|
(8.20)%
|
(11.37)%
|
5.97%
|
3.90%
|
| %
Total Annual Operating Expense Ratios3 |
Class
A |
Class
C |
Class
I |
Class
R6 |
| Gross
|
1.27%
|
2.02%
|
1.02%
|
0.94%
|
| Net
|
1.24
|
1.99
|
0.99
|
0.92
|
See Endnotes and Additional Disclosures in this report.
Past performance is no guarantee of future results. Returns are historical and
are calculated by determining the percentage change in net asset value (NAV) or offering price (as applicable) with all distributions reinvested. Investment return and principal value will fluctuate so that shares, when redeemed, may be worth more
or less than their original cost. Performance for periods less than or equal to one year is cumulative. Performance is for the stated time period only; due to market volatility, current Fund performance may be lower or higher than the quoted return.
For performance as of the most recent month-end, please refer to www.calvert.com.
Calvert
Emerging Markets Equity Fund
March 31, 2022
Sector Allocation (% of net assets)*
* Excludes cash
and cash equivalents.
| Top
10 Holdings (% of net assets)* |
|
| Taiwan
Semiconductor Manufacturing Co., Ltd. |
8.0%
|
| Samsung
Electronics Co., Ltd. |
7.4
|
| Tencent
Holdings, Ltd. |
5.4
|
| Alibaba
Group Holding, Ltd. |
4.4
|
| JD.com,
Inc., Class A |
2.9
|
| China
Merchants Bank Co., Ltd., Class H |
2.7
|
| NARI
Technology Co., Ltd., Class A |
2.6
|
| Bank
Rakyat Indonesia Persero Tbk PT |
2.5
|
| Techtronic
Industries Co., Ltd. |
2.4
|
| AIA
Group, Ltd. |
2.3
|
| Total
|
40.6%
|
| *
|
Excludes
cash and cash equivalents. |
Calvert
Emerging Markets Equity Fund
March 31, 2022
Endnotes and
Additional Disclosures
| 1 |
MSCI Emerging Markets Index
is an unmanaged index of emerging markets common stocks. MSCI indexes are net of foreign withholding taxes. Source: MSCI. MSCI data may not be reproduced or used for any other purpose. MSCI provides no warranties, has not prepared or approved this
report, and has no liability hereunder. Unless otherwise stated, index returns do not reflect the effect of any applicable sales charges, commissions, expenses, taxes or leverage, as applicable. It is not possible to invest directly in an index.
|
|
2 |
Total
Returns at NAV do not include applicable sales charges. If sales charges were deducted, the returns would be lower. Total Returns shown with maximum sales charge reflect the stated maximum sales charge. Unless otherwise stated, performance does not
reflect the deduction of taxes on Fund distributions or redemptions of Fund shares.Performance prior to the inception date of a class may be linked to the performance of an older class of the Fund. This linked
performance is adjusted for any applicable sales charge, but is not adjusted for class expense differences. If adjusted for such differences, the performance would be different. The performance of Class R6 is linked to Class I. Performance since
inception for an index, if presented, is the performance since the Fund’s or oldest share class’ inception, as applicable. Performance presented in the Financial Highlights included in the financial statements is not
linked.Effective November 5, 2020, Class C shares automatically convert to Class A shares eight years after purchase. The average annual total returns listed for Class C reflect conversion to Class A shares after
eight years. Prior to November 5, 2020, Class C shares automatically converted to Class A shares ten years after purchase.Calvert Research and Management became the investment adviser to the Fund on December 31,
2016. Performance reflected prior to such date is that of the Fund’s former investment adviser. |
|
3 |
Source:
Fund prospectus. Net expense ratios reflect a contractual expense reimbursement that continues through 1/31/23. The expense ratios for the current reporting period can be found in the Financial Highlights section of this report. Performance
reflects expenses waived and/or reimbursed, if applicable. Without such waivers and/or reimbursements, performance would have been lower. |
| |
Fund profile subject to
change due to active management. |
Calvert
Emerging Markets Equity Fund
March 31, 2022
Example
As a Fund shareholder, you incur two types of costs: (1)
transaction costs, including sales charges (loads) on purchases and redemption fees (if applicable); and (2) ongoing costs, including management fees; distribution and/or service fees; and other Fund expenses. This Example is intended to help you
understand your ongoing costs (in dollars) of Fund investing and to compare these costs with the ongoing costs of investing in other mutual funds. The Example is based on an investment of $1,000 invested at the beginning of the period and held for
the entire period (October 1, 2021 to March 31, 2022).
Actual Expenses
The first section of the table below provides information about
actual account values and actual expenses. You may use the information in this section, together with the amount you invested, to estimate the expenses that you paid over the period. Simply divide your account value by $1,000 (for example, an $8,600
account value divided by $1,000 = 8.6), then multiply the result by the number in the first section under the heading entitled “Expenses Paid During Period” to estimate the expenses you paid on your account during this period.
Hypothetical Example for Comparison Purposes
The second section of the table below provides information
about hypothetical account values and hypothetical expenses based on the actual Fund expense ratio and an assumed rate of return of 5% per year (before expenses), which is not the actual Fund return. The hypothetical account values and expenses may
not be used to estimate the actual ending account balance or expenses you paid for the period. You may use this information to compare the ongoing costs of investing in the Fund and other funds. To do so, compare this 5% hypothetical example with
the 5% hypothetical examples that appear in the shareholder reports of the other funds.
Please note that the expenses shown in the table are meant to
highlight your ongoing costs only and do not reflect any transactional costs, such as sales charges (loads) or redemption fees (if applicable). Therefore, the second section of the table is useful in comparing ongoing costs only, and will not help
you determine the relative total costs of owning different funds. In addition, if these transactional costs were included, your costs would be higher.
| |
Beginning
Account Value
(10/1/21) |
Ending
Account Value
(3/31/22) |
Expenses
Paid
During Period*
(10/1/21 – 3/31/22) |
Annualized
Expense
Ratio |
| Actual
|
|
|
|
|
| Class
A |
$1,000.00
|
$
880.60 |
$
5.81** |
1.24%
|
| Class
C |
$1,000.00
|
$
877.50 |
$
9.31** |
1.99%
|
| Class
I |
$1,000.00
|
$
882.20 |
$
4.65** |
0.99%
|
| Class
R6 |
$1,000.00
|
$
882.20 |
$
4.32** |
0.92%
|
| Hypothetical
|
|
|
|
|
| (5%
return per year before expenses) |
|
|
|
|
| Class
A |
$1,000.00
|
$1,018.75
|
$
6.24** |
1.24%
|
| Class
C |
$1,000.00
|
$1,015.01
|
$10.00
** |
1.99%
|
| Class
I |
$1,000.00
|
$1,020.00
|
$
4.99** |
0.99%
|
| Class
R6 |
$1,000.00
|
$1,020.34
|
$
4.63** |
0.92%
|
| *
|
Expenses
are equal to the Fund's annualized expense ratio for the indicated Class, multiplied by the average account value over the period, multiplied by 182/365 (to reflect the one-half year period). The Example assumes that the $1,000 was invested at the
net asset value per share determined at the close of business on September 30, 2021. |
| **
|
Absent
a waiver and/or reimbursement of expenses by an affiliate, expenses would be higher. |
Calvert
Emerging Markets Equity Fund
March 31, 2022
Schedule of
Investments (Unaudited)
| Security
|
Shares
|
Value
|
| Brazil
— 5.7% |
|
| Hapvida
Participacoes e Investimentos S.A.(1) |
|
27,177,145
|
$
67,585,385 |
| Magazine
Luiza S.A. |
|
18,390,300
|
26,343,316
|
| Natura
& Co. Holding S.A.(2) |
|
9,524,304
|
52,112,059
|
| WEG
S.A. |
|
7,651,600
|
56,040,431
|
| |
|
|
$ 202,081,191
|
| Chile
— 1.8% |
|
| Banco
de Chile |
|
582,124,818
|
$
62,351,366 |
| |
|
|
$ 62,351,366
|
| China
— 25.3% |
|
| Alibaba
Group Holding, Ltd.(2) |
|
11,412,613
|
$
155,744,635 |
| Autohome,
Inc. ADR |
|
470,342
|
14,303,100
|
| China
Communications Services Corp., Ltd., Class H |
|
57,453,563
|
25,906,369
|
| China
Merchants Bank Co., Ltd., Class H |
|
12,411,500
|
96,616,346
|
| Hangzhou
Tigermed Consulting Co., Ltd., Class A |
|
2,827,719
|
47,686,589
|
| Hundsun
Technologies, Inc., Class A |
|
6,214,172
|
43,391,240
|
| JD.com,
Inc., Class A(2) |
|
3,634,387
|
103,270,636
|
| Midea
Group Co., Ltd. |
|
2,472,489
|
22,052,791
|
| NARI
Technology Co., Ltd., Class A |
|
18,744,580
|
92,370,043
|
| Shenzhen
International Holdings, Ltd. |
|
2,990,326
|
3,145,294
|
| Silergy
Corp. |
|
263,000
|
30,836,954
|
| Tencent
Holdings, Ltd. |
|
4,125,796
|
190,175,857
|
| Wuxi
Biologics Cayman, Inc.(1)(2) |
|
3,046,000
|
24,187,055
|
| Zhongji
Innolight Co., Ltd., Class A |
|
8,717,231
|
43,215,837
|
| |
|
|
$
892,902,746 |
| Hong
Kong — 6.0% |
|
| AIA
Group, Ltd. |
|
7,650,928
|
$
79,890,051 |
| Samsonite
International S.A.(1)(2) |
|
16,689,896
|
37,341,721
|
| SITC
International Holdings Co., Ltd. |
|
3,511,482
|
12,278,621
|
| Techtronic
Industries Co., Ltd. |
|
5,226,290
|
83,732,812
|
| |
|
|
$
213,243,205 |
| Hungary
— 1.0% |
|
| Richter
Gedeon Nyrt |
|
1,756,063
|
$
37,067,904 |
| |
|
|
$
37,067,904 |
| India
— 12.3% |
|
| Bajaj
Finserv, Ltd. |
|
203,689
|
$
45,366,097 |
| Bharat
Forge, Ltd. |
|
3,307,451
|
30,338,699
|
| Container
Corp. of India, Ltd. |
|
3,262,856
|
28,719,475
|
| Dabur
India, Ltd. |
|
4,963,802
|
35,063,369
|
| Hero
MotoCorp, Ltd. |
|
1,032,450
|
31,023,705
|
| ICICI
Bank, Ltd. |
|
7,708,423
|
73,563,003
|
| Motherson
Sumi Systems, Ltd. |
|
17,438,594
|
31,894,424
|
| Security
|
Shares
|
Value
|
| India
(continued) |
|
| Motherson
Sumi Wiring India, Ltd.(2) |
|
13,809,415
|
$
11,772,857 |
| SBI
Life Insurance Co., Ltd.(1) |
|
2,947,453
|
43,330,099
|
| State
Bank of India |
|
8,038,383
|
51,908,437
|
| Tech
Mahindra, Ltd. |
|
2,688,718
|
52,919,878
|
| |
|
|
$ 435,900,043
|
| Indonesia
— 4.0% |
|
| Bank
Central Asia Tbk PT |
|
94,239,100
|
$
52,383,288 |
| Bank
Rakyat Indonesia Persero Tbk PT |
|
270,603,707
|
87,400,841
|
| |
|
|
$
139,784,129 |
| Malaysia
— 1.7% |
|
| Press
Metal Aluminium Holdings Bhd |
|
39,954,000
|
$
58,817,229 |
| |
|
|
$
58,817,229 |
| Mexico
— 5.1% |
|
| Grupo
Aeroportuario del Pacifico SAB de CV, Class B |
|
2,395,063
|
$
38,608,801 |
| Grupo
Financiero Banorte SAB de CV, Class O |
|
10,244,426
|
77,165,405
|
| Wal-Mart
de Mexico SAB de CV |
|
15,347,677
|
62,895,382
|
| |
|
|
$
178,669,588 |
| Peru
— 2.1% |
|
| Credicorp,
Ltd. |
|
423,624
|
$
72,808,257 |
| |
|
|
$
72,808,257 |
| South
Africa — 3.0% |
|
| Clicks
Group, Ltd. |
|
1,750,076
|
$
37,048,117 |
| Prosus
NV |
|
656,728
|
35,285,379
|
| Shoprite
Holdings, Ltd. |
|
2,178,644
|
35,164,605
|
| |
|
|
$
107,498,101 |
| South
Korea — 10.6% |
|
| KB
Financial Group, Inc. |
|
1,152,187
|
$
57,740,548 |
| LG
Chem, Ltd. |
|
125,808
|
54,973,872
|
| Samsung
Electronics Co., Ltd. |
|
4,590,306
|
262,670,924
|
| |
|
|
$
375,385,344 |
| Sweden
— 1.5% |
|
| Epiroc
AB, Class A |
|
2,554,887
|
$
54,646,089 |
| |
|
|
$
54,646,089 |
| Taiwan
— 14.9% |
|
| Accton
Technology Corp. |
|
7,833,000
|
$
60,228,024 |
| Delta
Electronics, Inc. |
|
8,453,000
|
78,373,882
|
| LandMark
Optoelectronics Corp. |
|
4,284,900
|
27,296,728
|
| Taiwan
Semiconductor Manufacturing Co., Ltd. |
|
13,866,000
|
284,440,372
|
| Win
Semiconductors Corp. |
|
1,868,000
|
17,190,436
|
6
See Notes to Financial Statements.
Calvert
Emerging Markets Equity Fund
March 31, 2022
Schedule of
Investments (Unaudited) — continued
| Security
|
Shares
|
Value
|
| Taiwan
(continued) |
|
| Wiwynn
Corp. |
|
1,694,000
|
$
59,758,179 |
| |
|
|
$ 527,287,621
|
| United
States — 1.5% |
|
| Micron
Technology, Inc. |
|
687,948
|
$
53,584,270 |
| |
|
|
$ 53,584,270
|
Total
Common Stocks
(identified cost $3,211,141,803) |
|
|
$3,412,027,083
|
| High
Social Impact Investments — 0.1% |
| Security
|
Principal
Amount
(000's omitted) |
Value
|
| Calvert
Impact Capital, Inc., Community Investment Notes, 1.50%, 12/15/23(3)(4) |
$
|
5,170
|
$
4,921,478 |
| ImpactAssets,
Inc., Global Sustainable Agriculture Notes, 0.00%, 11/3/22(4)(5) |
|
4
|
4,119
|
Total
High Social Impact Investments
(identified cost $5,174,303) |
|
|
$ 4,925,597
|
| Short-Term
Investments — 2.3% |
| Description
|
Units
|
Value
|
| Calvert
Cash Reserves Fund, LLC, 0.14%(6) |
|
79,961,856
|
$
79,953,859 |
Total
Short-Term Investments
(identified cost $79,949,359) |
|
|
$ 79,953,859
|
Total
Investments — 98.9%
(identified cost $3,296,265,465) |
|
$3,496,906,539
|
| Other
Assets, Less Liabilities — 1.1% |
|
$ 38,644,638
|
| Net
Assets — 100.0% |
|
$3,535,551,177
|
| The
percentage shown for each investment category in the Schedule of Investments is based on net assets. |
|
(1) |
Security
exempt from registration under Rule 144A of the Securities Act of 1933, as amended. These securities may be sold in certain transactions in reliance on an exemption from registration (normally to qualified institutional buyers). At March 31, 2022,
the aggregate value of these securities is $172,444,260 or 4.9% of the Fund's net assets. |
|
(2) |
Non-income
producing security. |
|
(3) |
May
be deemed to be an affiliated company (see Note 7). |
|
(4) |
Restricted
security. Total market value of restricted securities amounts to $4,925,597, which represents 0.1% of the net assets of the Fund as of March 31, 2022. |
|
(5) |
Notes
carry an interest rate that varies by period and is contingent on the performance of the underlying portfolio of loans to borrowers. The coupon rate shown represents the rate in effect at March 31, 2022. |
|
(6) |
Affiliated
investment company, which invests in high quality, U.S. dollar denominated money market instruments. The rate shown is the annualized seven-day yield as of March 31, 2022. |
At March 31, 2022, the concentration of the Fund’s
investments in the various sectors, determined as a percentage of net assets, was as follows:
| Economic
Sectors |
%
of Net Assets |
| Information
Technology |
28.7%
|
| Financials
|
22.6
|
| Consumer
Discretionary |
13.7
|
| Industrials
|
11.2
|
| Consumer
Staples |
6.3
|
| Communication
Services |
5.8
|
| Health
Care |
5.0
|
| Materials
|
3.2
|
| High
Social Impact Investments |
0.1
|
| Total
|
96.6%
|
Restricted Securities
| Description
|
Acquisition
Dates |
Cost
|
| Calvert
Impact Capital, Inc., Community Investment Notes, 1.50%, 12/15/23 |
12/14/20
|
$5,170,000
|
| ImpactAssets,
Inc., Global Sustainable Agriculture Notes, 0.00%, 11/3/22 |
11/13/15
|
4,303
|
| Abbreviations:
|
| ADR
|
– American
Depositary Receipt |
7
See Notes to Financial Statements.
Calvert
Emerging Markets Equity Fund
March 31, 2022
Statement of Assets
and Liabilities (Unaudited)
| |
March 31,
2022 |
| Assets
|
|
| Investments
in securities of unaffiliated issuers, at value (identified cost $3,211,146,106) |
$
3,412,031,202 |
| Investments
in securities of affiliated issuers, at value (identified cost $85,119,359) |
84,875,337
|
| Cash
denominated in foreign currency, at value (cost $28,598,471) |
28,549,068
|
| Receivable
for investments sold |
13,906,005
|
| Receivable
for capital shares sold |
20,147,122
|
| Dividends
and interest receivable |
12,123,733
|
| Dividends
and interest receivable - affiliated |
27,739
|
| Securities
lending income receivable |
679
|
| Directors'
deferred compensation plan |
853,551
|
| Other
assets |
239,207
|
| Total
assets |
$3,572,753,643
|
| Liabilities
|
|
| Payable
for investments purchased |
$
11,368,212 |
| Payable
for capital shares redeemed |
11,071,989
|
| Payable
for foreign capital gain taxes |
9,980,079
|
| Payable
to affiliates: |
|
| Investment
advisory fee |
2,183,098
|
| Administrative
fee |
349,296
|
| Distribution
and service fees |
80,974
|
| Sub-transfer
agency fee |
70,712
|
| Directors'
deferred compensation plan |
853,551
|
| Other
|
87,521
|
| Accrued
expenses |
1,157,034
|
| Total
liabilities |
$
37,202,466 |
| Net
Assets |
$3,535,551,177
|
| Sources
of Net Assets |
|
| Paid-in
capital |
$
3,256,801,716 |
| Distributable
earnings |
278,749,461
|
| Net
Assets |
$3,535,551,177
|
| Class
A Shares |
|
| Net
Assets |
$
381,869,299 |
| Shares
Outstanding |
20,739,173
|
Net
Asset Value and Redemption Price Per Share
(net assets ÷ shares of beneficial interest outstanding) |
$
18.41 |
Maximum
Offering Price Per Share
(100 ÷ 95.25 of net asset value per share) |
$
19.33 |
| Class
C Shares |
|
| Net
Assets |
$
26,938,117 |
| Shares
Outstanding |
1,515,925
|
Net
Asset Value and Offering Price Per Share*
(net assets ÷ shares of beneficial interest outstanding) |
$
17.77 |
8
See Notes to Financial Statements.
Calvert
Emerging Markets Equity Fund
March 31, 2022
Statement of Assets
and Liabilities (Unaudited) — continued
| |
March 31,
2022 |
| Class
I Shares |
|
| Net
Assets |
$
2,725,829,901 |
| Shares
Outstanding |
146,808,186
|
Net
Asset Value, Offering Price and Redemption Price Per Share
(net assets ÷ shares of beneficial interest outstanding) |
$
18.57 |
| Class
R6 Shares |
|
| Net
Assets |
$
400,913,860 |
| Shares
Outstanding |
21,646,259
|
Net
Asset Value, Offering Price and Redemption Price Per Share
(net assets ÷ shares of beneficial interest outstanding) |
$
18.52 |
| On
sales of $50,000 or more, the offering price of Class A shares is reduced. |
| *
|
Redemption
price per share is equal to the net asset value less any applicable contingent deferred sales charge. |
9
See Notes to Financial Statements.
Calvert
Emerging Markets Equity Fund
March 31, 2022
Statement of
Operations (Unaudited)
| |
Six
Months Ended |
| |
March
31, 2022 |
| Investment
Income |
|
| Dividend
income (net of foreign taxes withheld of $5,120,773) |
$
31,079,627 |
| Dividend
income - affiliated issuers |
9,619
|
| Interest
income (net of foreign taxes withheld of $1) |
17
|
| Interest
income - affiliated issuers |
38,775
|
| Securities
lending income, net |
12,137
|
| Total
investment income |
$
31,140,175 |
| Expenses
|
|
| Investment
advisory fee |
$
14,436,315 |
| Administrative
fee |
2,309,810
|
| Distribution
and service fees: |
|
| Class
A |
282,937
|
| Class
C |
155,525
|
| Directors'
fees and expenses |
72,192
|
| Custodian
fees |
439,526
|
| Transfer
agency fees and expenses |
1,601,745
|
| Accounting
fees |
258,742
|
| Professional
fees |
94,006
|
| Registration
fees |
153,408
|
| Reports
to shareholders |
112,915
|
| Miscellaneous
|
70,198
|
| Total
expenses |
$
19,987,319 |
| Waiver
and/or reimbursement of expenses by affiliate |
$
(636,946) |
| Net
expenses |
$
19,350,373 |
| Net
investment income |
$
11,789,802 |
| Realized
and Unrealized Gain (Loss) |
|
| Net
realized gain (loss): |
|
| Investment
securities (net of foreign capital gains taxes of $11,339,281) |
$
109,786,169 |
| Investment
securities - affiliated issuers |
(8,694)
|
| Foreign
currency transactions |
(3,436,992)
|
| Net
realized gain |
$
106,340,483 |
| Change
in unrealized appreciation (depreciation): |
|
| Investment
securities (including net decrease in payable for foreign capital gains taxes of $16,485,366) |
$
(567,021,609) |
| Investment
securities - affiliated issuers |
(155,254)
|
| Foreign
currency |
(87,579)
|
| Net
change in unrealized appreciation (depreciation) |
$(567,264,442)
|
| Net
realized and unrealized loss |
$(460,923,959)
|
| Net
decrease in net assets from operations |
$(449,134,157)
|
10
See Notes to Financial Statements.
Calvert
Emerging Markets Equity Fund
March 31, 2022
Statements of
Changes in Net Assets
| |
Six
Months Ended
March 31, 2022
(Unaudited) |
Year
Ended
September 30,
2021 |
| Increase
(Decrease) in Net Assets |
|
|
| From
operations: |
|
|
| Net
investment income |
$
11,789,802 |
$
29,727,866 |
| Net
realized gain |
106,340,483
|
99,843,177
|
| Net
change in unrealized appreciation (depreciation) |
(567,264,442)
|
314,373,812
|
| Net
increase (decrease) in net assets from operations |
$
(449,134,157) |
$
443,944,855 |
| Distributions
to shareholders: |
|
|
| Class
A |
$
(725,054) |
$
(716,932) |
| Class
I |
(23,624,539)
|
(13,667,112)
|
| Class
R6 |
(4,343,502)
|
(1,855,013)
|
| Total
distributions to shareholders |
$
(28,693,095) |
$
(16,239,057) |
| Capital
share transactions: |
|
|
| Class
A |
$
108,795,811 |
$
92,770,986 |
| Class
C |
(2,406,056)
|
(1,983,892)
|
| Class
I |
(238,231,596)
|
467,857,670
|
| Class
R6 |
(58,858,262)
|
169,097,679
|
| Net
increase (decrease) in net assets from capital share transactions |
$
(190,700,103) |
$
727,742,443 |
| Net
increase (decrease) in net assets |
$
(668,527,355) |
$1,155,448,241
|
| Net
Assets |
|
|
| At
beginning of period |
$
4,204,078,532 |
$
3,048,630,291 |
| At
end of period |
$3,535,551,177
|
$4,204,078,532
|
11
See Notes to Financial Statements.
Calvert
Emerging Markets Equity Fund
March 31, 2022
| |
Class
A |
| |
Six
Months Ended
March 31, 2022
(Unaudited) |
Year
Ended September 30, |
| |
2021
|
2020
|
2019
|
2018
|
2017
|
| Net
asset value — Beginning of period |
$
20.98 |
$
18.33 |
$
16.05 |
$
15.55 |
$
16.33 |
$
12.94 |
| Income
(Loss) From Operations |
|
|
|
|
|
|
| Net
investment income(1) |
$
0.05 |
$
0.12 |
$
0.09 |
$
0.17 |
$
0.19 |
$
0.10 |
| Net
realized and unrealized gain (loss) |
(2.55)
|
2.59
|
2.27
|
0.45
|
(0.94)
|
3.36
|
| Total
income (loss) from operations |
$
(2.50) |
$
2.71 |
$
2.36 |
$
0.62 |
$
(0.75) |
$
3.46 |
| Less
Distributions |
|
|
|
|
|
|
| From
net investment income |
$
(0.07) |
$
(0.06) |
$
(0.08) |
$
(0.12) |
$
(0.03) |
$
(0.07) |
| Total
distributions |
$
(0.07) |
$
(0.06) |
$
(0.08) |
$
(0.12) |
$
(0.03) |
$
(0.07) |
| Net
asset value — End of period |
$
18.41 |
$
20.98 |
$
18.33 |
$
16.05 |
$
15.55 |
$
16.33 |
| Total
Return(2) |
(11.94)%
(3) |
14.70%
|
14.82%
|
4.02%
|
(4.62)%
|
26.89%
|
| Ratios/Supplemental
Data |
|
|
|
|
|
|
| Net
assets, end of period (000’s omitted) |
$381,869
|
$290,117
|
$173,728
|
$132,066
|
$155,735
|
$62,432
|
| Ratios
(as a percentage of average daily net assets):(4) |
|
|
|
|
|
|
| Total
expenses |
1.27%
(5) |
1.27%
|
1.27%
|
1.41%
|
1.56%
|
1.80%
|
| Net
expenses |
1.24%
(5) |
1.24%
|
1.24%
|
1.25%
|
1.27%
|
1.27%
|
| Net
investment income |
0.47%
(5) |
0.54%
|
0.54%
|
1.06%
|
1.15%
|
0.73%
|
| Portfolio
Turnover |
35%
(3) |
36%
|
38%
|
32%
|
27%
|
36%
|
|
(1) |
Computed
using average shares outstanding. |
|
(2) |
Returns
are historical and are calculated by determining the percentage change in net asset value with all distributions reinvested and do not reflect the effect of sales charges, if any. |
|
(3) |
Not
annualized. |
|
(4) |
Total
expenses do not reflect amounts reimbursed and/or waived by the adviser and certain of its affiliates, if applicable. Net expenses are net of all reductions and represent the net expenses paid by the Fund. |
|
(5) |
Annualized.
|
12
See Notes to Financial Statements.
Calvert
Emerging Markets Equity Fund
March 31, 2022
Financial
Highlights — continued
| |
Class
C |
| |
Six
Months Ended
March 31, 2022
(Unaudited) |
Year
Ended September 30, |
| |
2021
|
2020
|
2019
|
2018
|
2017
|
| Net
asset value — Beginning of period |
$
20.25 |
$
17.78 |
$
15.62 |
$
15.18 |
$
16.04 |
$
12.76 |
| Income
(Loss) From Operations |
|
|
|
|
|
|
| Net
investment income (loss)(1) |
$
(0.04) |
$
(0.07) |
$
(0.04) |
$
0.05 |
$
0.10 |
$
0.01 |
| Net
realized and unrealized gain (loss) |
(2.44)
|
2.54
|
2.20
|
0.45
|
(0.96)
|
3.29
|
| Total
income (loss) from operations |
$
(2.48) |
$
2.47 |
$
2.16 |
$
0.50 |
$
(0.86) |
$
3.30 |
| Less
Distributions |
|
|
|
|
|
|
| From
net investment income |
$
— |
$
— |
$
— |
$
(0.06) |
$
— |
$
(0.02) |
| Total
distributions |
$
— |
$
— |
$
— |
$
(0.06) |
$
— |
$
(0.02) |
| Net
asset value — End of period |
$
17.77 |
$
20.25 |
$
17.78 |
$
15.62 |
$
15.18 |
$16.04
|
| Total
Return(2) |
(12.25)%
(3) |
13.83%
|
13.89%
|
3.33%
|
(5.36)%
|
25.88%
|
| Ratios/Supplemental
Data |
|
|
|
|
|
|
| Net
assets, end of period (000’s omitted) |
$26,938
|
$33,249
|
$30,938
|
$28,794
|
$24,286
|
$
4,627 |
| Ratios
(as a percentage of average daily net assets):(4) |
|
|
|
|
|
|
| Total
expenses |
2.03%
(5) |
2.02%
|
2.02%
|
2.16%
|
2.31%
|
3.69%
|
| Net
expenses |
1.99%
(5) |
1.99%
|
1.99%
|
2.00%
|
2.02%
|
2.02%
|
| Net
investment income (loss) |
(0.38)%
(5) |
(0.32)%
|
(0.22)%
|
0.35%
|
0.60%
|
0.08%
|
| Portfolio
Turnover |
35%
(3) |
36%
|
38%
|
32%
|
27%
|
36%
|
|
(1) |
Computed
using average shares outstanding. |
|
(2) |
Returns
are historical and are calculated by determining the percentage change in net asset value with all distributions reinvested and do not reflect the effect of sales charges, if any. |
|
(3) |
Not
annualized. |
|
(4) |
Total
expenses do not reflect amounts reimbursed and/or waived by the adviser and certain of its affiliates, if applicable. Net expenses are net of all reductions and represent the net expenses paid by the Fund. |
|
(5) |
Annualized.
|
13
See Notes to Financial Statements.
Calvert
Emerging Markets Equity Fund
March 31, 2022
Financial
Highlights — continued
| |
Class
I |
| |
Six
Months Ended
March 31, 2022
(Unaudited) |
Year
Ended September 30, |
| |
2021
|
2020
|
2019
|
2018
|
2017
|
| Net
asset value — Beginning of period |
$
21.21 |
$
18.52 |
$
16.22 |
$
15.73 |
$
16.48 |
$
13.06 |
| Income
(Loss) From Operations |
|
|
|
|
|
|
| Net
investment income(1) |
$
0.06 |
$
0.16 |
$
0.13 |
$
0.22 |
$
0.29 |
$
0.17 |
| Net
realized and unrealized gain (loss) |
(2.54)
|
2.62
|
2.29
|
0.45
|
(0.99)
|
3.35
|
| Total
income (loss) from operations |
$
(2.48) |
$
2.78 |
$
2.42 |
$
0.67 |
$
(0.70) |
$
3.52 |
| Less
Distributions |
|
|
|
|
|
|
| From
net investment income |
$
(0.16) |
$
(0.09) |
$
(0.12) |
$
(0.18) |
$
(0.05) |
$
(0.10) |
| Total
distributions |
$
(0.16) |
$
(0.09) |
$
(0.12) |
$
(0.18) |
$
(0.05) |
$
(0.10) |
| Net
asset value — End of period |
$
18.57 |
$
21.21 |
$
18.52 |
$
16.22 |
$
15.73 |
$
16.48 |
| Total
Return(2) |
(11.78)%
(3) |
14.94%
|
15.07%
|
4.36%
|
(4.30)%
|
27.27%
|
| Ratios/Supplemental
Data |
|
|
|
|
|
|
| Net
assets, end of period (000’s omitted) |
$2,725,830
|
$3,357,833
|
$2,530,135
|
$1,817,479
|
$1,012,574
|
$126,398
|
| Ratios
(as a percentage of average daily net assets):(4) |
|
|
|
|
|
|
| Total
expenses |
1.03%
(5) |
1.02%
|
1.02%
|
1.15%
|
1.32%
|
1.32%
|
| Net
expenses |
0.99%
(5) |
0.99%
|
0.99%
|
0.97%
|
0.92%
|
0.92%
|
| Net
investment income |
0.62%
(5) |
0.71%
|
0.79%
|
1.41%
|
1.71%
|
1.20%
|
| Portfolio
Turnover |
35%
(3) |
36%
|
38%
|
32%
|
27%
|
36%
|
|
(1) |
Computed
using average shares outstanding. |
|
(2) |
Returns
are historical and are calculated by determining the percentage change in net asset value with all distributions reinvested and do not reflect the effect of sales charges, if any. |
|
(3) |
Not
annualized. |
|
(4) |
Total
expenses do not reflect amounts reimbursed and/or waived by the adviser and certain of its affiliates, if applicable. Net expenses are net of all reductions and represent the net expenses paid by the Fund. |
|
(5) |
Annualized.
|
14
See Notes to Financial Statements.
Calvert
Emerging Markets Equity Fund
March 31, 2022
Financial
Highlights — continued
| |
Class
R6 |
| |
Six
Months Ended
March 31, 2022
(Unaudited) |
Year
Ended September 30, |
Period
Ended
September 30, |
| |
2021
|
2020
|
2019
|
2018
(1) |
| Net
asset value — Beginning of period |
$
21.18 |
$
18.49 |
$
16.19 |
$
15.72 |
$
18.65 |
| Income
(Loss) From Operations |
|
|
|
|
|
| Net
investment income(2) |
$
0.07 |
$
0.17 |
$
0.14 |
$
0.27 |
$
0.26 |
| Net
realized and unrealized gain (loss) |
(2.55)
|
2.62
|
2.30
|
0.40
|
(3.19)
|
| Total
income (loss) from operations |
$
(2.48) |
$
2.79 |
$
2.44 |
$
0.67 |
$
(2.93) |
| Less
Distributions |
|
|
|
|
|
| From
net investment income |
$
(0.18) |
$
(0.10) |
$
(0.14) |
$
(0.20) |
$
— |
| Total
distributions |
$
(0.18) |
$
(0.10) |
$
(0.14) |
$
(0.20) |
$
— |
| Net
asset value — End of period |
$
18.52 |
$
21.18 |
$
18.49 |
$
16.19 |
$
15.72 |
| Total
Return(3) |
(11.78)%
(4) |
15.09%
|
15.13%
|
4.35%
|
(15.71)%
(4) |
| Ratios/Supplemental
Data |
|
|
|
|
|
| Net
assets, end of period (000’s omitted) |
$400,914
|
$522,879
|
$313,830
|
$218,601
|
$10,217
|
| Ratios
(as a percentage of average daily net assets):(5) |
|
|
|
|
|
| Total
expenses |
0.95%
(6) |
0.94%
|
0.95%
|
1.06%
|
1.24%
(6) |
| Net
expenses |
0.92%
(6) |
0.92%
|
0.92%
|
0.92%
|
0.92%
(6) |
| Net
investment income |
0.68%
(6) |
0.78%
|
0.84%
|
1.67%
|
2.48%
(6) |
| Portfolio
Turnover |
35%
(4) |
36%
|
38%
|
32%
|
27%
(7) |
|
(1) |
From
February 1, 2018 inception. |
|
(2) |
Computed
using average shares outstanding. |
|
(3) |
Returns
are historical and are calculated by determining the percentage change in net asset value with all distributions reinvested and do not reflect the effect of sales charges, if any. |
|
(4) |
Not
annualized. |
|
(5) |
Total
expenses do not reflect amounts reimbursed and/or waived by the adviser and certain of its affiliates, if applicable. Net expenses are net of all reductions and represent the net expenses paid by the Fund. |
|
(6) |
Annualized.
|
|
(7) |
For
the year ended September 30, 2018. |
15
See Notes to Financial Statements.
Calvert
Emerging Markets Equity Fund
March 31, 2022
Notes to Financial
Statements (Unaudited)
1 Significant Accounting Policies
Calvert Emerging Markets Equity Fund (the Fund) is a
diversified series of Calvert World Values Fund, Inc. (the Corporation). The Corporation is a Maryland corporation registered under the Investment Company Act of 1940, as amended (the 1940 Act), as an open-end management investment company. The
investment objective of the Fund is to seek long-term capital appreciation by investing primarily in equity securities of companies located in emerging market countries.
The Fund offers four classes of shares. Class A shares are
generally sold subject to a sales charge imposed at time of purchase. Effective April 29, 2022, the maximum sales charge payable upon purchase of Class A shares was increased to 5.25%. A contingent deferred sales charge of 0.80% (1.00% effective
April 29, 2022) may apply to certain redemptions of Class A shares for accounts for which no sales charge was paid, if redeemed within 12 months of purchase. Class C shares are sold without a front-end sales charge, and with certain exceptions, are
charged a contingent deferred sales charge of 1% on shares redeemed within 12 months of purchase. Class C shares are only available for purchase through a financial intermediary. Effective November 5, 2020, Class C shares automatically convert to
Class A shares eight years after their purchase as described in the Fund's prospectus. Class I and Class R6 shares are sold at net asset value, are not subject to a sales charge and are sold only to certain eligible investors. Each class represents
a pro rata interest in the Fund, but votes separately on class-specific matters and is subject to different expenses.
The Fund applies the accounting and reporting guidance in the
Financial Accounting Standards Board (FASB) Accounting Standards Codification Topic 946, Financial Services – Investment Companies (ASC 946). Subsequent events, if any, through the date that the
financial statements were issued have been evaluated in the preparation of the financial statements.
A Investment
Valuation— Net asset value per share is determined every business day as of the close of the regular session of the New York Stock Exchange (generally 4:00 p.m. Eastern time).
The Fund uses independent pricing services approved by the Board of Directors (the Board) to value its investments wherever possible. Investments for which market quotations are not available or deemed not reliable are fair valued in good faith
under the direction of the Board.
U.S. generally
accepted accounting principles (U.S. GAAP) establishes a disclosure hierarchy that categorizes the inputs to valuation techniques used to value assets and liabilities at measurement date. These inputs are summarized in the three broad levels listed
below:
Level 1 - quoted prices in active markets for
identical securities
Level 2 - other significant
observable inputs (including quoted prices for similar securities, interest rates, prepayment speeds, credit risk, etc.)
Level 3 - significant unobservable inputs (including the
Fund’s own assumptions in determining the fair value of investments)
The inputs or methodologies used for valuing securities are not
necessarily an indication of the risk associated with investing in those securities.
Valuation techniques used to value the Fund’s investments
by major category are as follows:
Equity Securities. Equity securities (including warrants and rights) listed on a U.S. securities exchange generally are valued at the last sale or closing price as reported by an independent pricing service on the primary market or
exchange on which they are traded and are categorized as Level 1 in the hierarchy. Equity securities listed on the NASDAQ National Market System are valued at the NASDAQ official closing price and are categorized as Level 1 in the hierarchy.
Unlisted or listed securities for which closing sales prices or closing quotations are not available are valued at the mean between the latest available bid and ask prices and are categorized as Level 2 in the hierarchy. The daily valuation of
exchange-traded foreign securities generally is determined as of the close of trading on the principal exchange on which such securities trade. Events occurring after the close of trading on foreign exchanges may result in adjustments to the
valuation of foreign securities to more accurately reflect their fair value as of the close of regular trading on the New York Stock Exchange. When valuing foreign equity securities that meet certain criteria, the Fund's Board has approved the use
of a fair value service that values such securities to reflect market trading that occurs after the close of the applicable foreign markets of comparable securities or other instruments that have a strong correlation to the fair-valued securities.
Such securities are categorized as Level 2 in the hierarchy.
Debt Securities. Debt
securities are generally valued based on valuations provided by third party pricing services, as derived from such services’ pricing models. Inputs to the models may include, but are not limited to, reported trades, executable bid and ask
prices, broker/dealer quotations, prices or yields of securities with similar characteristics, interest rates, anticipated prepayments, benchmark curves or information pertaining to the issuer, as well as industry and economic events. Accordingly,
debt securities are generally categorized as Level 2 in the hierarchy. Short-term debt securities with a remaining maturity at time of purchase of more than sixty days are valued based on valuations provided by a third party pricing service. Such
securities are generally categorized as Level 2 in the hierarchy. Short-term debt securities of sufficient credit quality purchased with remaining maturities of sixty days or less for which a valuation from a third party pricing service is not
readily available may be valued at amortized cost, which approximates fair value, and are categorized as Level 2 in the hierarchy.
Affiliated Fund. Calvert Cash
Reserves Fund, LLC (Cash Reserves Fund) is an affiliated investment company managed by Calvert Research and Management (CRM). While Cash Reserves Fund is not a registered money market mutual fund, it conducts all of its investment activities in
accordance with the requirements of Rule 2a-7 under the 1940 Act. Investments in Cash Reserves Fund are valued at the closing net asset value per unit on the valuation day and are categorized as Level 2 in the hierarchy. Cash Reserves Fund generally
values its investment securities based on available market quotations provided by a third party pricing service.
Calvert
Emerging Markets Equity Fund
March 31, 2022
Notes to Financial
Statements (Unaudited) — continued
Other
Securities. Investments in registered investment companies (including money market funds) that do not trade on an exchange are valued at the net asset value per share on the valuation day and are categorized as
Level 1 in the hierarchy.
Fair Valuation. If a market value cannot be determined for a security using the methodologies described above, or if, in the good faith opinion of the Fund's adviser, the market value does not constitute a readily available market
quotation, or if a significant event has occurred that would materially affect the value of the security, the security will be fair valued as determined in good faith by or at the direction of the Board in a manner that most fairly reflects the
security’s “fair value”, which is the amount that the Fund might reasonably expect to receive for the security upon its current sale in the ordinary course. Each such determination is based on a consideration of relevant factors,
which are likely to vary from one pricing context to another. These factors may include, but are not limited to, the type of security, the existence of any contractual restrictions on the security’s disposition, the price and extent of public
trading in similar securities of the issuer or of comparable companies or entities, quotations or relevant information obtained from broker/dealers or other market participants, information obtained from the issuer, analysts, and/or the appropriate
stock exchange (for exchange-traded securities), an analysis of the company’s or entity’s financial statements, and an evaluation of the forces that influence the issuer and the market(s) in which the security is purchased and
sold.
The values assigned to fair value
investments are based on available information and do not necessarily represent amounts that might ultimately be realized. Further, due to the inherent uncertainty of valuations of such investments, the fair values may differ significantly from the
values that would have been used had an active market existed, and the differences could be material.
The following table summarizes the market value of the Fund's
holdings as of March 31, 2022, based on the inputs used to value them:
| Asset
Description |
Level
1 |
Level
2 |
Level
3 |
Total
|
| Common
Stocks: |
|
|
|
|
| Brazil
|
$
202,081,191 |
$
— |
$
— |
$
202,081,191 |
| Chile
|
—
|
62,351,366
|
—
|
62,351,366
|
| China
|
14,303,100
|
878,599,646
|
—
|
892,902,746
|
| Hong
Kong |
—
|
213,243,205
|
—
|
213,243,205
|
| Hungary
|
—
|
37,067,904
|
—
|
37,067,904
|
| India
|
11,772,857
|
424,127,186
|
—
|
435,900,043
|
| Indonesia
|
—
|
139,784,129
|
—
|
139,784,129
|
| Malaysia
|
—
|
58,817,229
|
—
|
58,817,229
|
| Mexico
|
178,669,588
|
—
|
—
|
178,669,588
|
| Peru
|
72,808,257
|
—
|
—
|
72,808,257
|
| South
Africa |
—
|
107,498,101
|
—
|
107,498,101
|
| South
Korea |
—
|
375,385,344
|
—
|
375,385,344
|
| Sweden
|
—
|
54,646,089
|
—
|
54,646,089
|
| Taiwan
|
—
|
527,287,621
|
—
|
527,287,621
|
| United
States |
53,584,270
|
—
|
—
|
53,584,270
|
| Total
Common Stocks |
$533,219,263
|
$2,878,807,820
(1) |
$ —
|
$3,412,027,083
|
| High
Social Impact Investments |
$
— |
$
4,925,597 |
$
— |
$
4,925,597 |
| Short-Term
Investments |
—
|
79,953,859
|
—
|
79,953,859
|
| Total
Investments |
$533,219,263
|
$2,963,687,276
|
$ —
|
$3,496,906,539
|
|
(1) |
Includes
foreign equity securities whose values were adjusted to reflect market trading of comparable securities or other correlated instruments that occurred after the close of trading in their applicable foreign markets. |
B Investment Transactions and Income— Investment transactions for financial statement purposes are accounted for on trade date. Realized gains and losses are recorded on an identified cost basis and may include
proceeds from litigation. Dividend income is recorded on the ex-dividend date for dividends received in cash and/or securities or, in
the case of dividends on certain foreign securities, as soon as the Fund is informed of the ex-dividend date. Non-cash dividends are
recorded at the fair value of the securities received. Withholding taxes on foreign dividends and interest, if any, have been provided
for in accordance with the Fund's understanding of the applicable country’s tax rules and rates. Distributions received that
represent a return of capital are recorded as a reduction of cost of investments. Distributions received that represent a capital gain are recorded as a realized gain.
Interest income, which includes amortization of premium and accretion of discount on debt securities, is accrued as earned.
Calvert
Emerging Markets Equity Fund
March 31, 2022
Notes to Financial
Statements (Unaudited) — continued
C Share Class Accounting— Realized and unrealized gains and losses and net investment income and losses, other than class-specific expenses, are allocated daily to each class of shares based upon the
relative net assets of each class to the total net assets of the Fund. Expenses arising in connection with a specific class are charged directly to that class. Sub-accounting, recordkeeping and similar administrative fees payable to financial
intermediaries, which are a component of transfer agency fees and expenses on the Statement of Operations, are not allocated to Class R6 shares.
D Foreign Currency Transactions— The Fund’s accounting records are maintained in U.S. dollars. For valuation of assets and liabilities on each date of net asset value determination, foreign denominations
are converted into U.S. dollars using the current exchange rate. Security transactions, income and expenses are translated at the prevailing rate of exchange on the date of the event. Recognized gains or losses on investment transactions
attributable to changes in foreign currency exchange rates are recorded for financial statement purposes as net realized gains and losses on investments. That portion of unrealized gains and losses on investments that results from fluctuations in
foreign currency exchange rates is not separately disclosed.
E Restricted Securities— The Fund may invest in securities that are subject to legal or contractual restrictions on resale. Generally, these securities may only be sold publicly upon registration under
the Securities Act of 1933 or in transactions exempt from such registration. Information regarding restricted securities (excluding Rule 144A securities) is included at the end of the Schedule of Investments.
F Distributions to Shareholders— Distributions to shareholders are recorded by the Fund on ex-dividend date. Distributions from net investment income and distributions from net realized capital gains, if any, are
paid at least annually. Distributions are declared separately for each class of shares. Distributions are determined in accordance with income tax regulations, which may differ from U.S. GAAP; accordingly, periodic reclassifications are made within
the Fund's capital accounts to reflect income and gains available for distribution under income tax regulations.
G Estimates— The preparation of financial statements in conformity with U.S. GAAP requires management to make estimates and assumptions that affect the reported amounts of assets and liabilities and disclosure of contingent assets
and liabilities at the date of the financial statements and the reported amounts of increases and decreases in net assets from operations during the reporting period. Actual results could differ from those estimates.
H
Indemnifications— The Corporation’s By-Laws provide for indemnification for Directors or officers of the Corporation and certain other parties, to the fullest extent
permitted by Maryland law and the 1940 Act, provided certain conditions are met. Additionally, in the normal course of business, the Fund enters into agreements with service providers that may contain indemnification clauses. The Fund’s
maximum exposure under these arrangements is unknown as this would involve future claims that may be made against the Fund that have not yet occurred.
I Federal Income
Taxes— No provision for federal income or excise tax is required since the Fund intends to continue to qualify as a regulated investment company under the Internal Revenue Code
and to distribute substantially all of its taxable earnings.
In addition to the requirements of the Internal Revenue Code,
the Fund may also be subject to local taxes on the recognition of capital gains in certain countries. In determining the daily net asset value, the Fund estimates the accrual for such taxes, if any, based on the unrealized appreciation on certain
portfolio securities and the related tax rates. Taxes attributable to unrealized appreciation are included in the change in unrealized appreciation (depreciation) on investments. Capital gains taxes on securities sold are included in net realized
gain (loss) on investments.
Management has analyzed the
Fund's tax positions taken for all open federal income tax years and has concluded that no provision for federal income tax is required in the Fund's financial statements. A Fund's federal tax return is subject to examination by the Internal Revenue
Service for a period of three years from the date of filing.
J Interim Financial Statements— The interim financial statements relating to March 31, 2022 and for the six months then ended have not been audited by an independent registered public accounting firm, but in the
opinion of the Fund's management, reflect all adjustments, consisting only of normal recurring adjustments, necessary for the fair presentation of the financial statements.
2 Related Party Transactions
The investment advisory fee is earned by CRM, an indirect,
wholly-owned subsidiary of Morgan Stanley, as compensation for investment advisory services rendered to the Fund. The investment advisory fee is computed at an annual rate of 0.75% of the Fund’s average daily net assets and is payable monthly.
For the six months ended March 31, 2022, the investment advisory fee amounted to $14,436,315. CRM does not receive a fee for advisory services provided to Cash Reserves Fund.
Pursuant to an investment sub-advisory agreement, CRM has
delegated the investment management of the Fund to Hermes Investment Management Limited (Hermes). CRM pays Hermes a portion of its investment advisory fee for sub-advisory services provided to the Fund.
CRM has agreed to reimburse the Fund’s operating expenses
to the extent that total annual operating expenses (relating to ordinary operating expenses only and excluding expenses such as brokerage commissions, acquired fund fees and expenses of unaffiliated funds, borrowing costs, taxes or litigation
expenses) exceed 1.24%, 1.99%, 0.99% and 0.92% for Class A, Class C, Class I and Class R6, respectively, of such class’s average daily net assets. The expense reimbursement agreement with CRM may be changed or terminated after January 31,
2023. For the six months ended March 31, 2022, CRM waived or reimbursed expenses of $636,946.
Calvert
Emerging Markets Equity Fund
March 31, 2022
Notes to Financial
Statements (Unaudited) — continued
The
administrative fee is earned by CRM as compensation for administrative services rendered to the Fund. The fee is computed at an annual rate of 0.12% of the Fund’s average daily net assets attributable to Class A, Class C, Class I and Class R6
and is payable monthly. For the six months ended March 31, 2022, CRM was paid administrative fees of $2,309,810.
The Fund has in effect a distribution plan for Class A shares
(Class A Plan) pursuant to Rule 12b-1 under the 1940 Act. Pursuant to the Class A Plan, the Fund pays Eaton Vance Distributors, Inc. (EVD), an affiliate of CRM and the Fund’s principal underwriter, a distribution and service fee of 0.25% per
annum of its average daily net assets attributable to Class A shares for distribution services and facilities provided to the Fund by EVD, as well as for personal services and/or the maintenance of shareholder accounts. The Fund also has in effect a
distribution plan for Class C shares (Class C Plan) pursuant to Rule 12b-1 under the 1940 Act. Pursuant to the Class C Plan, the Fund pays EVD amounts equal to 0.75% per annum of its average daily net assets attributable to Class C shares for
providing ongoing distribution services and facilities to the Fund. In addition, pursuant to the Class C Plan, the Fund also makes payments of service fees to EVD, financial intermediaries and other persons in amounts equal to 0.25% per annum of its
average daily net assets attributable to that class. Service fees paid or accrued are for personal services and/or the maintenance of shareholder accounts. Distribution and service fees paid or accrued for the six months ended March 31, 2022
amounted to $282,937 and $155,525 for Class A shares and Class C shares, respectively.
The Fund was informed that EVD received $13,502 as its portion
of the sales charge on sales of Class A shares for the six months ended March 31, 2022. The Fund was also informed that EVD received $100 and $5,000 of contingent deferred sales charges paid by Class A and Class C shareholders, respectively, for the
same period. The Fund was informed that Morgan Stanley affiliated broker-dealers, which may be deemed to be affiliates of CRM and EVD, also received a portion of the sales charge on sales of Class A shares from for the six months ended March 31,
2022 in the amount of $226.
Eaton Vance Management (EVM),
an affiliate of CRM, provides sub-transfer agency and related services to the Fund pursuant to a Sub-Transfer Agency Support Services Agreement. For the six months ended March 31, 2022, sub-transfer agency fees and expenses incurred to EVM amounted
to $103,656 and are included in transfer agency fees and expenses on the Statement of Operations.
Each Director of the Fund who is not an employee of CRM or its
affiliates receives an annual fee of $214,000 ($154,000 prior to January 1, 2022), plus an annual Committee fee ranging from $8,500 to $16,500 depending on the Committee. The Board chair receives an additional $30,000 annual fee, Committee chairs
receive an additional $6,000 annual fee and the special equities liaison receives an additional $2,500 annual fee. Eligible Directors may participate in a Deferred Compensation Plan (the Plan). Amounts deferred under the Plan are treated as though
equal dollar amounts had been invested in shares of the Fund or other Calvert funds selected by the Directors. The Fund purchases shares of the funds selected equal to the dollar amounts deferred under the Plan, resulting in an asset equal to the
deferred compensation liability. Obligations of the Plan are paid solely from the Fund's assets. Directors’ fees are allocated to each of the Calvert funds served. Salaries and fees of officers and Directors of the Fund who are employees of
CRM or its affiliates are paid by CRM.
3 Investment Activity
During the six months ended March 31, 2022, the cost of
purchases and proceeds from sales of investments, other than short-term securities, were $1,350,509,216 and $1,659,856,394, respectively.
4 Distributions to Shareholders and Income Tax
Information
At September 30, 2021, the Fund, for federal
income tax purposes, had deferred capital losses of $2,054,758 which would reduce the Fund’s taxable income arising from future net realized gains on investment transactions, if any, to the extent permitted by the Internal Revenue Code, and
thus would reduce the amount of distributions to shareholders, which would otherwise be necessary to relieve the Fund of any liability for federal income or excise tax. The deferred capital losses are treated as arising on the first day of the
Fund’s next taxable year, can be carried forward for an unlimited period, and retain the same short-term or long-term character as when originally deferred. Of the deferred capital losses at September 30, 2021, $2,054,758 are short-term.
The cost and unrealized appreciation (depreciation) of
investments of the Fund at March 31, 2022, as determined on a federal income tax basis, were as follows:
| Aggregate
cost |
$3,324,089,368
|
| Gross
unrealized appreciation |
$
546,306,130 |
| Gross
unrealized depreciation |
(373,488,959)
|
| Net
unrealized appreciation |
$
172,817,171 |
Calvert
Emerging Markets Equity Fund
March 31, 2022
Notes to Financial
Statements (Unaudited) — continued
5 Securities Lending
To generate additional income, the Fund may lend its securities
pursuant to a securities lending agency agreement with State Street Bank and Trust Company (SSBT), the securities lending agent. Security loans are subject to termination by the Fund at any time and, therefore, are not considered illiquid
investments. The Fund requires that the loan be continuously collateralized by either cash or securities in an amount at least equal to the market value of the securities on loan. The market value of securities loaned is determined daily and any
additional required collateral is delivered to the Fund on the next business day. Cash collateral is generally invested in a money market fund registered under the 1940 Act that is managed by an affiliate of SSBT. Any gain or loss in the market
price of the loaned securities that might occur and any interest earned or dividends declared during the term of the loan would accrue to the account of the Fund. Income earned on the investment of collateral, net of broker rebates and other
expenses incurred by the securities lending agent, is split between the Fund and the securities lending agent based on agreed upon contractual terms. Non-cash collateral, if any, is held by the lending agent on behalf of the Fund and cannot be sold
or re-pledged by the Fund; accordingly, such collateral is not reflected in the Statement of Assets and Liabilities.
The risks associated with lending portfolio securities include,
but are not limited to, possible delays in receiving additional collateral or in the recovery of the loaned securities, possible loss of rights to the collateral should the borrower fail financially, as well as risk of loss in the value of the
collateral or the value of the investments made with the collateral. The securities lending agent shall indemnify the Fund in the case of default of any securities borrower.
The Fund did not have any securities on loan at March 31,
2022.
6 Line of Credit
The Fund participates with other portfolios and funds managed
by EVM and its affiliates, including CRM, in an $800 million unsecured line of credit with a group of banks, which is in effect through October 25, 2022. Borrowings are made by the Fund solely for temporary purposes related to redemptions and other
short-term cash needs. Interest is charged to the Fund based on its borrowings at an amount above either the Secured Overnight Financing Rate (SOFR) or Federal Funds rate. In addition, a fee computed at an annual rate of 0.15% on the daily unused
portion of the line of credit is allocated among the participating portfolios and funds at the end of each quarter. In connection with the renewal of the agreement in October 2021, an arrangement fee of $150,000 was incurred that was allocated to
the participating portfolios and funds. Because the line of credit is not available exclusively to the Fund, it may be unable to borrow some or all of its requested amounts at any particular time.
The Fund had no borrowings outstanding pursuant to its line of
credit at March 31, 2022. The Fund did not have any significant borrowings or allocated fees during the six months ended March 31, 2022.
7 Affiliated Companies and Funds
The Fund has invested a portion of its assets in notes (the
Notes) issued by Calvert Impact Capital, Inc. (CIC) pursuant to exemptive relief granted by the U.S. Securities and Exchange Commission (the SEC). There are certain potential points of affiliation between the Fund and CIC. CRM has licensed use of
the Calvert name to CIC and provides other types of support. CRM’s President and Chief Executive Officer (and the only director/trustee on the Fund Board that is an “interested person” of the Fund) serves on the CIC Board. In
addition, another director/trustee on the Fund Board serves as a director emeritus on the CIC Board.
At March 31, 2022, the value of the Fund’s investment in
the Notes and affiliated funds was $84,875,337, which represents 2.4% of the Fund’s net assets. Transactions in the Notes and affiliated funds by the Fund for the six months ended March 31, 2022 were as follows:
| Name
|
Value,
beginning
of period |
Purchases
|
Sales
proceeds |
Net
realized
gain
(loss) |
Change
in
unrealized
appreciation
(depreciation) |
Value,
end of
period |
Interest/
Dividend
income |
Principal
amount/Units,
end of period |
| High
Social Impact Investments |
|
|
|
|
|
|
|
|
| Calvert
Impact Capital, Inc., Community Investment Notes, 1.50%, 12/15/23(1) |
$5,081,231
|
$
— |
$
— |
$
— |
$
(159,753) |
$
4,921,478 |
$
38,775 |
$ 5,170,000
|
| Short-Term
Investments |
|
|
|
|
|
|
| Calvert
Cash Reserves Fund, LLC |
6,784,347
|
602,785,414
|
(529,611,707)
|
(8,694)
|
4,499
|
79,953,859
|
9,619
|
79,961,856
|
| Totals
|
|
|
|
$(8,694)
|
$
(155,254) |
$84,875,337
|
$48,394
|
|
8 Capital
Shares
The Corporation may issue its shares in one or
more series (such as the Fund). The authorized shares of the Fund consist of 75,000,000 common shares, $0.01 par value, for each Class.
Calvert
Emerging Markets Equity Fund
March 31, 2022
Notes to Financial
Statements (Unaudited) — continued
Transactions in capital shares for the six months ended March
31, 2022 and the year ended September 30, 2021 were as follows:
| |
Six
Months Ended
March 31, 2022
(Unaudited) |
|
Year
Ended
September 30, 2021 |
| |
Shares
|
Amount
|
|
Shares
|
Amount
|
| Class
A |
|
|
|
|
|
| Shares
sold |
15,895,388
|
$
291,705,097 |
|
15,904,646
|
$
347,555,284 |
| Reinvestment
of distributions |
27,819
|
559,156
|
|
31,266
|
677,539
|
| Shares
redeemed |
(9,016,300)
|
(183,490,279)
|
|
(11,585,367)
|
(255,550,144)
|
| Converted
from Class C |
1,119
|
21,837
|
|
4,116
|
88,307
|
| Net
increase |
6,908,026
|
$
108,795,811 |
|
4,354,661
|
$
92,770,986 |
| Class
C |
|
|
|
|
|
| Shares
sold |
55,392
|
$
1,069,783 |
|
382,860
|
$
8,383,949 |
| Shares
redeemed |
(180,363)
|
(3,454,002)
|
|
(476,281)
|
(10,279,534)
|
| Converted
to Class A |
(1,159)
|
(21,837)
|
|
(4,252)
|
(88,307)
|
| Net
decrease |
(126,130)
|
$
(2,406,056) |
|
(97,673)
|
$
(1,983,892) |
| Class
I |
|
|
|
|
|
| Shares
sold |
28,775,748
|
$
576,879,764 |
|
73,886,174
|
$
1,643,627,034 |
| Reinvestment
of distributions |
1,114,340
|
22,565,377
|
|
587,397
|
12,852,247
|
| Shares
redeemed |
(41,371,372)
|
(837,676,737)
|
|
(52,783,871)
|
(1,188,621,611)
|
| Net
increase (decrease) |
(11,481,284)
|
$(238,231,596)
|
|
21,689,700
|
$
467,857,670 |
| Class
R6 |
|
|
|
|
|
| Shares
sold |
2,639,375
|
$
53,372,072 |
|
13,330,886
|
$
293,926,149 |
| Reinvestment
of distributions |
164,920
|
3,331,380
|
|
77,754
|
1,697,360
|
| Shares
redeemed |
(5,846,583)
|
(115,561,714)
|
|
(5,694,908)
|
(126,525,830)
|
| Net
increase (decrease) |
(3,042,288)
|
$
(58,858,262) |
|
7,713,732
|
$
169,097,679 |
9 Risks and Uncertainties
Risks Associated with Foreign Investments
Foreign investments can be adversely affected by political,
economic and market developments abroad, including the imposition of economic and other sanctions by the United States or another country. There may be less publicly available information about foreign issuers because they may not be subject to
reporting practices, requirements or regulations comparable to those to which United States companies are subject. Foreign markets may be smaller, less liquid and more volatile than the major markets in the United States. Trading in foreign markets
typically involves higher expense than trading in the United States. The Fund may have difficulties enforcing its legal or contractual rights in a foreign country. Securities that trade or are denominated in currencies other than the U.S. dollar may
be adversely affected by fluctuations in currency exchange rates.
Emerging market securities often involve greater risks than
developed market securities. Investment markets within emerging market countries are typically smaller, less liquid, less developed and more volatile than those in more developed markets like the United States, and may be focused in certain economic
sectors. The information available about an emerging market issuer may be less reliable than for comparable issuers in more developed capital markets. Governmental actions can have a significant effect on the economic conditions in emerging market
countries. It may be more difficult to make a claim or obtain a judgment in the courts of these countries than it is in the United States. The possibility of fraud, negligence, undue influence being exerted by an issuer or refusal to recognize
ownership exists in some emerging markets. Disruptions due to work stoppages and trading improprieties in foreign securities markets have caused such markets to close. Emerging market securities are also subject to speculative trading, which
contributes to their volatility.
Calvert
Emerging Markets Equity Fund
March 31, 2022
Notes to Financial
Statements (Unaudited) — continued
Pandemic
Risk
An outbreak of respiratory disease caused by a novel
coronavirus was first detected in China in late 2019 and subsequently spread internationally. This coronavirus has resulted in closing borders, enhanced health screenings, changes to healthcare service preparation and delivery, quarantines,
cancellations, disruptions to supply chains and customer activity, as well as general concern and uncertainty. Health crises caused by outbreaks, such as the coronavirus outbreak, may exacerbate other pre-existing political, social and economic
risks and disrupt normal market conditions and operations. The impact of this outbreak has negatively affected the worldwide economy, the economies of individual countries, individual companies, and the market in general, and may continue to do so
in significant and unforeseen ways, as may other epidemics and pandemics that may arise in the future. Any such impact could adversely affect the Fund's performance, or the performance of the securities in which the Fund invests.
Calvert
Emerging Markets Equity Fund
March 31, 2022
| Officers
|
Hope L.
Brown
Chief Compliance Officer |
Deidre E.
Walsh
Vice President, Secretary and
Chief Legal Officer |
James F.
Kirchner
Treasurer |
| Directors
|
Alice
Gresham Bullock
Chairperson |
| Richard L.
Baird, Jr. |
| Cari M.
Dominguez |
| John G.
Guffey, Jr. |
| Miles D.
Harper, III |
| Joy V. Jones
|
| John H.
Streur* |
| Anthony A.
Williams |
| *Interested
Director and President |
| Privacy
Notice |
April 2021
|
| FACTS
|
WHAT
DOES EATON VANCE DO WITH YOUR
PERSONAL INFORMATION? |
| Why?
|
Financial
companies choose how they share your personal information. Federal law gives consumers the right to limit some but not all sharing. Federal law also requires us to tell you how we collect, share, and protect your personal information. Please read
this notice carefully to understand what we do. |
| |
|
| What?
|
The
types of personal information we collect and share depend on the product or service you have with us. This information can include:■ Social Security number and income
■
investment experience and risk tolerance
■
checking account number and wire transfer instructions |
| |
|
| How?
|
All
financial companies need to share customers’ personal information to run their everyday business. In the section below, we list the reasons financial companies can share their customers’ personal information; the reasons Eaton Vance
chooses to share; and whether you can limit this sharing. |
Reasons
we can share your
personal information |
Does
Eaton Vance
share? |
Can
you limit
this sharing? |
| For
our everyday business purposes — such as to process your transactions, maintain your account(s), respond to court orders and legal investigations, or report to credit bureaus |
Yes
|
No
|
| For
our marketing purposes — to offer our products and services to you |
Yes
|
No
|
| For
joint marketing with other financial companies |
No
|
We
don’t share |
| For
our investment management affiliates’ everyday business purposes — information about your transactions, experiences, and creditworthiness |
Yes
|
Yes
|
| For
our affiliates’ everyday business purposes — information about your transactions and experiences |
Yes
|
No
|
| For
our affiliates’ everyday business purposes — information about your creditworthiness |
No
|
We
don’t share |
| For
our investment management affiliates to market to you |
Yes
|
Yes
|
| For
our affiliates to market to you |
No
|
We
don’t share |
| For
nonaffiliates to market to you |
No
|
We
don’t share |
To
limit our
sharing |
Call
toll-free 1-800-368-2745 or email: CRMPrivacy@calvert.comPlease note:If you are a new customer, we can begin sharing your information 30 days from the date we sent this notice. When you are no longer our customer, we continue to share your information as described in this notice. However, you can contact us at any time to limit our
sharing. |
| Questions?
|
Call
toll-free 1-800-368-2745 or email: CRMPrivacy@calvert.com |
| Privacy
Notice — continued |
April 2021
|
| Who
we are |
| Who
is providing this notice? |
Eaton
Vance Management, Eaton Vance Distributors, Inc., Eaton Vance Trust Company, Eaton Vance Management (International) Limited, Eaton Vance Advisers International Ltd., Eaton Vance Global Advisors Limited, Eaton Vance Management’s Real Estate
Investment Group, Boston Management and Research, Calvert Research and Management, Eaton Vance and Calvert Fund Families and our investment advisory affiliates (“Eaton Vance”) (see Investment Management Affiliates definition below)
|
| What
we do |
How
does Eaton Vance
protect my personal
information? |
To
protect your personal information from unauthorized access and use, we use security measures that comply with federal law. These measures include computer safeguards and secured files and buildings. We have policies governing the proper handling of
customer information by personnel and requiring third parties that provide support to adhere to appropriate security standards with respect to such information. |
How
does Eaton Vance
collect my personal
information? |
We
collect your personal information, for example, when you■ open an account or make deposits or withdrawals from your
account
■
buy securities from us or make a wire transfer
■
give us your contact informationWe also collect your personal information from others, such as credit bureaus, affiliates, or other companies. |
| Why
can’t I limit all sharing? |
Federal
law gives you the right to limit only■ sharing for affiliates’ everyday business purposes — information
about your creditworthiness
■
affiliates from using your information to market to you
■
sharing for nonaffiliates to market to youState laws and individual companies may give you additional rights
to limit sharing. See below for more on your rights under state law. |
| Definitions
|
Investment
Management
Affiliates |
Eaton
Vance Investment Management Affiliates include registered investment advisers, registered broker- dealers, and registered and unregistered funds. Investment Management Affiliates does not include entities associated with Morgan Stanley Wealth
Management, such as Morgan Stanley Smith Barney LLC and Morgan Stanley & Co. |
| Affiliates
|
Companies
related by common ownership or control. They can be financial and nonfinancial companies.■ Our affiliates include companies with a Morgan Stanley name and financial companies such as Morgan Stanley Smith Barney LLC and Morgan Stanley & Co. |
| Nonaffiliates
|
Companies
not related by common ownership or control. They can be financial and nonfinancial companies.■ Eaton Vance does not share with nonaffiliates so they can market to you. |
| Joint
marketing |
A
formal agreement between nonaffiliated financial companies that together market financial products or services to
you.■ Eaton Vance doesn’t jointly market. |
| Other
important information |
| Vermont:
Except as permitted by law, we will not share personal information we collect about Vermont residents with Nonaffiliates unless you provide us with your written consent to share such
information.California: Except as permitted by law, we will not share personal information we collect about California residents with Nonaffiliates and we will limit sharing
such personal information with our Affiliates to comply with California privacy laws that apply to us. |
Delivery of Shareholder Documents. The Securities and Exchange Commission (SEC) permits funds to deliver only one copy of shareholder documents, including prospectuses, proxy statements and shareholder reports, to fund investors with
multiple accounts at the same residential or post office box address. This practice is often called “householding” and it helps eliminate duplicate mailings to shareholders. Calvert funds, or your financial intermediary, may household the mailing of your documents indefinitely unless you instruct Calvert funds, or your financial intermediary, otherwise. If you would prefer that your Calvert fund documents not be householded, please contact Calvert funds at 1-800-368-2745, or contact your financial intermediary. Your instructions that householding not
apply to delivery of your Calvert fund documents will typically be effective within 30 days of receipt by Calvert funds or your financial intermediary.
Portfolio Holdings. Each Calvert fund files a schedule of portfolio holdings on Part F to Form N-PORT with the SEC. Certain information filed on Form N-PORT may be viewed on the Calvert website at www.calvert.com, by calling
Calvert at 1-800-368-2745 or in the EDGAR database on the SEC’s website at www.sec.gov.
Proxy Voting. The Proxy Voting Guidelines that each Calvert fund uses to determine how to vote proxies relating to portfolio securities is provided as an Appendix to the fund’s Statement of Additional Information.
The Statement of Additional Information can be obtained free of charge by calling the Calvert funds at 1-800-368-2745, by visiting the Calvert funds’ website at www.calvert.com or visiting the SEC’s website at www.sec.gov. Information
regarding how a Calvert fund voted proxies relating to portfolio securities during the most recent 12-month period ended June 30 is available by calling Calvert funds, by visiting the Calvert funds’ website at www.calvert.com or by visiting
the SEC’s website at www.sec.gov.
This Page Intentionally Left
Blank
This Page Intentionally Left
Blank
Investment Adviser and Administrator
Calvert Research and Management
1825 Connecticut Avenue NW, Suite 400
Washington, DC 20009
Investment Sub-Adviser
Hermes Investment Management Limited
150 Cheapside
London EC2V 6ET
Principal Underwriter*
Eaton Vance Distributors, Inc.
Two International Place
Boston, MA 02110
(617) 482-8260
Custodian
State Street Bank and Trust Company
State Street Financial Center, One Lincoln Street
Boston, MA 02111
Transfer Agent
DST Asset Manager Solutions, Inc.
2000 Crown Colony Drive
Quincy, MA 02169
Fund Offices
1825 Connecticut Avenue NW, Suite 400
Washington, DC 20009
* FINRA
BrokerCheck. Investors may check the background of their Investment Professional by contacting the Financial Industry Regulatory Authority (FINRA). FINRA BrokerCheck is a free tool to help investors check the professional background of
current and former FINRA-registered securities firms and brokers. FINRA BrokerCheck is available by calling 1-800-289-9999 and at www.FINRA.org. The FINRA BrokerCheck brochure describing this program is available to investors at www.FINRA.org.
Printed on recycled paper.
24214 3.31.22
Calvert
Emerging Markets Advancement Fund
Semiannual Report
March 31, 2022
Commodity Futures Trading Commission Registration. The Commodity Futures Trading Commission (“CFTC”) has adopted regulations that subject registered investment companies and advisers to regulation by the CFTC if a fund invests more than a
prescribed level of its assets in certain CFTC-regulated instruments (including futures, certain options and swap agreements) or markets itself as providing investment exposure to such instruments. The adviser has claimed an exclusion from the
definition of “commodity pool operator” under the Commodity Exchange Act with respect to its management of the Fund and the other funds it manages. Accordingly, neither the Fund nor the adviser is subject to CFTC regulation.
Fund shares are not insured by the FDIC and are not deposits or
other obligations of, or guaranteed by, any depository institution. Shares are subject to investment risks, including possible loss of principal invested.
This report must be preceded or accompanied by a current
summary prospectus or prospectus. Before investing, investors should consider carefully the investment objective, risks, and charges and expenses of a mutual fund. This and other important information is contained in the summary prospectus and
prospectus, which can be obtained from a financial intermediary. Prospective investors should read the prospectus carefully before investing. For further information, please call 1-800-368-2745.
Choose Planet-friendly E-delivery!
Sign up now for on-line statements, prospectuses, and fund
reports. In less than five minutes you can help reduce paper mail and lower fund costs.
Just go to
www.calvert.com. If you already have an online account with the Calvert funds, click on Login to access your Account and select the documents you would like to receive via e-mail.
If you’re new to online account access, click on Login,
then Register to create your user name and password. Once you’re in, click on the E-delivery sign-up on the Account Portfolio page and follow the quick, easy steps.
Note: If your shares are not
held directly with the Calvert funds but through a brokerage firm, you must contact your broker for electronic delivery options available through their firm.
Semiannual Report March 31, 2022
Calvert
Emerging Markets Advancement Fund
Calvert
Emerging Markets Advancement Fund
March 31, 2022
Performance
Portfolio Manager(s) Marshall
Stocker, Ph.D., CFA of Calvert Research and Management
| %
Average Annual Total Returns1,2 |
Class
Inception Date |
Performance
Inception Date |
Six
Months |
One
Year |
Five
Years |
Since
Inception |
| Class
A at NAV |
10/01/2019
|
10/01/2019
|
(1.06)%
|
(5.04)%
|
—%
|
8.75%
|
| Class
A with 4.75% Maximum Sales Charge |
—
|
—
|
(5.77)
|
(9.53)
|
—
|
6.65
|
| Class
I at NAV |
10/01/2019
|
10/01/2019
|
(0.97)
|
(4.80)
|
—
|
8.98
|
|
| MSCI
Emerging Markets Index |
—
|
—
|
(8.20)%
|
(11.37)%
|
5.97%
|
7.66%
|
| Calvert
Emerging Markets Index |
—
|
—
|
(8.22)
|
(11.98)
|
—
|
7.97
|
| %
Total Annual Operating Expense Ratios3 |
Class
A |
Class
I |
| Gross
|
1.41%
|
1.16%
|
| Net
|
1.20
|
0.95
|
See Endnotes and Additional Disclosures in this report.
Past performance is no guarantee of future results. Returns are historical and
are calculated by determining the percentage change in net asset value (NAV) or offering price (as applicable) with all distributions reinvested. Investment return and principal value will fluctuate so that shares, when redeemed, may be worth more
or less than their original cost. Performance for periods less than or equal to one year is cumulative. Performance is for the stated time period only; due to market volatility, current Fund performance may be lower or higher than the quoted return.
For performance as of the most recent month-end, please refer to www.calvert.com.
Calvert
Emerging Markets Advancement Fund
March 31, 2022
Sector Allocation (% of net assets)*
* Excludes cash
and cash equivalents.
| Top
10 Holdings (% of net assets)* |
|
| Taiwan
Semiconductor Manufacturing Co., Ltd. |
6.1%
|
| Samsung
Electronics Co., Ltd. |
5.1
|
| Hellenic
Telecommunications Organization S.A. |
4.4
|
| Commercial
International Bank Egypt SAE |
4.4
|
| Tencent
Holdings, Ltd. |
3.9
|
| First
Abu Dhabi Bank PJSC |
3.4
|
| Eurobank
Ergasias S.A. |
2.8
|
| International
Holdings Co. PJSC |
2.1
|
| Bank
Central Asia Tbk PT |
2.0
|
| National
Bank of Greece S.A. |
1.9
|
| Total
|
36.1%
|
| *
|
Excludes
cash and cash equivalents. |
Calvert
Emerging Markets Advancement Fund
March 31, 2022
Endnotes and
Additional Disclosures
| 1 |
MSCI Emerging Markets Index
is an unmanaged index of emerging markets common stocks. MSCI indexes are net of foreign withholding taxes. Source: MSCI. MSCI data may not be reproduced or used for any other purpose. MSCI provides no warranties, has not prepared or approved this
report, and has no liability hereunder. The Calvert Emerging Markets Index (the Index) is composed of equity securities of companies that are located in or tied economically to countries that Calvert Research and Management has classified as
emerging market countries and that meet certain environmental, social and governance criteria. The Index is reconstituted annually and rebalanced quarterly. Unless otherwise stated, index returns do not reflect the effect of any applicable sales
charges, commissions, expenses, taxes or leverage, as applicable. It is not possible to invest directly in an index. |
|
2 |
Total
Returns at NAV do not include applicable sales charges. If sales charges were deducted, the returns would be lower. Total Returns shown with maximum sales charge reflect the stated maximum sales charge. Unless otherwise stated, performance does not
reflect the deduction of taxes on Fund distributions or redemptions of Fund shares. Performance since inception for an index, if presented, is the performance since the Fund's or oldest share class' inception, as applicable. |
|
3 |
Source:
Fund prospectus. Net expense ratios reflect a contractual expense reimbursement that continues through 1/31/23. The expense ratios for the current reporting period can be found in the Financial Highlights section of this report. Performance
reflects expenses waived and/or reimbursed, if applicable. Without such waivers and/or reimbursements, performance would have been lower. |
| |
Fund profile subject to
change due to active management. |
Calvert
Emerging Markets Advancement Fund
March 31, 2022
Example
As a Fund shareholder, you incur two types of costs: (1)
transaction costs, including sales charges (loads) on purchases and redemption fees (if applicable); and (2) ongoing costs, including management fees; distribution and/or service fees; and other Fund expenses. This Example is intended to help you
understand your ongoing costs (in dollars) of Fund investing and to compare these costs with the ongoing costs of investing in other mutual funds. The Example is based on an investment of $1,000 invested at the beginning of the period and held for
the entire period (October 1, 2021 to March 31, 2022).
Actual Expenses
The first section of the table below provides information about
actual account values and actual expenses. You may use the information in this section, together with the amount you invested, to estimate the expenses that you paid over the period. Simply divide your account value by $1,000 (for example, an $8,600
account value divided by $1,000 = 8.6), then multiply the result by the number in the first section under the heading entitled “Expenses Paid During Period” to estimate the expenses you paid on your account during this period.
Hypothetical Example for Comparison Purposes
The second section of the table below provides information
about hypothetical account values and hypothetical expenses based on the actual Fund expense ratio and an assumed rate of return of 5% per year (before expenses), which is not the actual Fund return. The hypothetical account values and expenses may
not be used to estimate the actual ending account balance or expenses you paid for the period. You may use this information to compare the ongoing costs of investing in the Fund and other funds. To do so, compare this 5% hypothetical example with
the 5% hypothetical examples that appear in the shareholder reports of the other funds.
Please note that the expenses shown in the table are meant to
highlight your ongoing costs only and do not reflect any transactional costs, such as sales charges (loads) or redemption fees (if applicable). Therefore, the second section of the table is useful in comparing ongoing costs only, and will not help
you determine the relative total costs of owning different funds. In addition, if these transactional costs were included, your costs would be higher.
| |
Beginning
Account Value
(10/1/21) |
Ending
Account Value
(3/31/22) |
Expenses
Paid
During Period*
(10/1/21 – 3/31/22) |
Annualized
Expense
Ratio |
| Actual
|
|
|
|
|
| Class
A |
$1,000.00
|
$
989.40 |
$6.15
** |
1.24%
|
| Class
I |
$1,000.00
|
$
990.30 |
$4.91
** |
0.99%
|
| Hypothetical
|
|
|
|
|
| (5%
return per year before expenses) |
|
|
|
|
| Class
A |
$1,000.00
|
$1,018.75
|
$6.24
** |
1.24%
|
| Class
I |
$1,000.00
|
$1,020.00
|
$4.99
** |
0.99%
|
| *
|
Expenses
are equal to the Fund's annualized expense ratio for the indicated Class, multiplied by the average account value over the period, multiplied by 182/365 (to reflect the one-half year period). The Example assumes that the $1,000 was invested at the
net asset value per share determined at the close of business on September 30, 2021. |
| **
|
Absent
a waiver and/or reimbursement of expenses by an affiliate, expenses would be higher. |
Calvert
Emerging Markets Advancement Fund
March 31, 2022
Schedule of
Investments (Unaudited)
| Security
|
Shares
|
Value
|
| Brazil
— 9.2% |
|
| Alpargatas
S.A., PFC Shares |
|
3,051
|
$ 16,706
|
| Americanas
S.A. |
|
26,196
|
179,645
|
| Americanas
S.A. |
|
560
|
3,778
|
| Atacadao
S.A. |
|
22,481
|
106,336
|
| Azul
S.A., PFC Shares(1) |
|
15,659
|
78,672
|
| B3
S.A. - Brasil Bolsa Balcao |
|
201,229
|
663,994
|
| Banco
Bradesco S.A., PFC Shares |
|
101,135
|
472,001
|
| Banco
do Brasil S.A. |
|
22,259
|
162,230
|
| BB
Seguridade Participacoes S.A. |
|
26,572
|
142,653
|
| Bradespar
S.A., PFC Shares |
|
10,076
|
70,009
|
| BRF
S.A.(1) |
|
26,068
|
101,785
|
| Cia
de Saneamento Basico do Estado de Sao Paulo |
|
16,521
|
165,555
|
| Cia
de Transmissao de Energia Eletrica Paulista |
|
10,041
|
55,762
|
| Cia
Energetica de Minas Gerais, PFC Shares |
|
58,892
|
188,141
|
| Cia
Paranaense de Energia, Class B, PFC Shares |
|
24,786
|
39,357
|
| Dexco
S.A. |
|
3,454
|
10,650
|
| Engie
Brasil Energia S.A. |
|
13,744
|
124,823
|
| Equatorial
Energia S.A. |
|
47,907
|
273,795
|
| Hapvida
Participacoes e Investimentos S.A.(2) |
|
146,135
|
363,416
|
| Hypera
S.A. |
|
13,685
|
111,267
|
| Itau
Unibanco Holding S.A., PFC Shares |
|
100,582
|
580,543
|
| Itausa
- Investimentos Itau S.A., PFC Shares |
|
129,920
|
293,347
|
| Klabin
S.A. |
|
271,306
|
265,548
|
| Localiza
Rent a Car S.A. |
|
30,348
|
389,465
|
| Locaweb
Servicos de Internet S.A.(1)(2) |
|
5,095
|
10,808
|
| Lojas
Renner S.A. |
|
31,149
|
179,918
|
| Magazine
Luiza S.A. |
|
99,911
|
143,118
|
| Metalurgica
Gerdau S.A., PFC Shares |
|
42,819
|
110,262
|
| Multiplan
Empreendimentos Imobiliarios S.A. |
|
14,416
|
74,123
|
| Natura
& Co. Holding S.A.(1) |
|
29,056
|
158,979
|
| Neoenergia
S.A. |
|
5,834
|
21,101
|
| Pagseguro
Digital, Ltd., Class A(1) |
|
6,278
|
125,874
|
| Porto
Seguro S.A. |
|
3,200
|
14,188
|
| Raia
Drogasil S.A. |
|
38,187
|
192,016
|
| StoneCo,
Ltd., Class A(1) |
|
7,516
|
87,937
|
| Sul
America S.A. |
|
5,771
|
41,673
|
| Telefonica
Brasil S.A. |
|
13,935
|
157,144
|
| TIM
S.A. |
|
28,940
|
83,822
|
| TOTVS
S.A. |
|
17,679
|
135,088
|
| Usinas
Siderurgicas de Minas Gerais S.A. Usiminas, Class A, PFC Shares |
|
26,355
|
77,332
|
| Via
S.A.(1) |
|
22,847
|
20,011
|
| WEG
S.A. |
|
57,029
|
417,681
|
| XP,
Inc., Class A(1) |
|
4,595
|
138,310
|
| Security
|
Shares
|
Value
|
| Brazil
(continued) |
|
| XP,
Inc. BDR(1) |
|
1,629
|
$
49,099 |
| |
|
|
$ 7,097,962
|
| Canada
— 0.0%(3) |
|
| Atlas
Corp.(4) |
|
1,170
|
$
17,176 |
| |
|
|
$ 17,176
|
| China
— 20.7% |
|
| 360
DigiTech, Inc. |
|
3,702
|
$
56,974 |
| 3SBio,
Inc.(1)(2) |
|
6,000
|
4,879
|
| Airtac
International Group |
|
4,139
|
133,072
|
| Akeso,
Inc.(1)(2)(4) |
|
2,000
|
4,187
|
| A-Living
Smart City Services Co., Ltd., Class H(2)(4) |
|
2,750
|
3,807
|
| ANTA
Sports Products, Ltd. |
|
19,000
|
235,695
|
| Autohome,
Inc. ADR |
|
1,827
|
55,559
|
| Bank
of Communications Co., Ltd., Class H |
|
453,000
|
324,310
|
| Baozun,
Inc. ADR(1) |
|
810
|
6,950
|
| BeiGene,
Ltd.(1)(4) |
|
15,000
|
220,014
|
| Beijing
Enterprises Water Group, Ltd. |
|
106,000
|
32,430
|
| Bilibili,
Inc. ADR(1)(4) |
|
4,601
|
117,694
|
| BYD
Co., Ltd., Class H |
|
12,000
|
333,783
|
| BYD
Electronic International Co., Ltd.(4) |
|
16,000
|
31,706
|
| CanSino
Biologics, Inc., Class H(1)(2) |
|
200
|
3,183
|
| China
CITIC Bank Corp, Ltd., Class H |
|
279,000
|
140,790
|
| China
Communications Services Corp., Ltd., Class H |
|
16,000
|
7,215
|
| China
Conch Environment Protection Holdings, Ltd.(1) |
|
24,500
|
30,651
|
| China
Conch Venture Holdings, Ltd. |
|
47,000
|
137,014
|
| China
Everbright Bank Co., Ltd., Class H |
|
20,000
|
7,546
|
| China
Everbright Environment Group, Ltd. |
|
88,000
|
52,818
|
| China
International Capital Corp., Ltd., Class H(2) |
|
47,200
|
104,346
|
| China
International Marine Containers Group Co., Ltd. |
|
3,200
|
5,208
|
| China
Lesso Group Holdings, Ltd. |
|
35,000
|
42,009
|
| China
Literature, Ltd.(1)(2) |
|
7,200
|
29,487
|
| China
Longyuan Power Group Corp., Ltd., Class H |
|
67,000
|
150,599
|
| China
Medical System Holdings, Ltd. |
|
4,000
|
6,238
|
| China
Meidong Auto Holdings, Ltd. |
|
24,000
|
91,212
|
| China
Mengniu Dairy Co., Ltd. |
|
53,000
|
284,154
|
| China
Merchants Bank Co., Ltd., Class H |
|
60,000
|
467,065
|
| China
Minsheng Banking Corp., Ltd., Class H |
|
226,000
|
84,773
|
| China
National Building Material Co., Ltd., Class H |
|
128,000
|
157,445
|
| China
Resources Land, Ltd. |
|
60,000
|
277,809
|
| China
Ruyi Holdings, Ltd.(1)(4) |
|
16,000
|
4,289
|
| China
Tower Corp, Ltd., Class H(2) |
|
952,000
|
106,569
|
| China
Vanke Co., Ltd., Class H |
|
40,000
|
89,971
|
| China
Yongda Automobiles Services Holdings, Ltd. |
|
45,500
|
49,157
|
| Chinasoft
International, Ltd. |
|
72,000
|
59,015
|
| Chongqing
Iron & Steel Co., Ltd., Class H(1) |
|
54,000
|
8,183
|
6
See Notes to Financial Statements.
Calvert
Emerging Markets Advancement Fund
March 31, 2022
Schedule of
Investments (Unaudited) — continued
| Security
|
Shares
|
Value
|
| China
(continued) |
|
| CIFI
Ever Sunshine Services Group, Ltd. |
|
14,000
|
$ 18,663
|
| Country
Garden Holdings Co., Ltd.(4) |
|
147,000
|
112,529
|
| Country
Garden Services Holdings Co., Ltd. |
|
43,000
|
181,143
|
| CSPC
Pharmaceutical Group, Ltd. |
|
147,600
|
169,127
|
| Dada
Nexus, Ltd. ADR(1) |
|
716
|
6,537
|
| Dali
Foods Group Co., Ltd.(2) |
|
17,500
|
9,130
|
| ENN
Energy Holdings, Ltd. |
|
13,400
|
200,141
|
| Far
East Horizon, Ltd. |
|
53,000
|
47,256
|
| Flat
Glass Group Co., Ltd., Class H(4) |
|
14,000
|
53,450
|
| Fuyao
Glass Industry Group Co., Ltd., Class H(2) |
|
16,400
|
66,587
|
| Gaotu
Techedu, Inc.(1) |
|
1,010
|
1,737
|
| GDS
Holdings, Ltd. ADR(1) |
|
3,509
|
137,728
|
| Geely
Automobile Holdings, Ltd. |
|
99,000
|
153,353
|
| Genscript
Biotech Corp.(1) |
|
20,000
|
62,740
|
| GOME
Retail Holdings, Ltd.(1)(4) |
|
321,000
|
19,905
|
| Great
Wall Motor Co., Ltd., Class H |
|
63,500
|
99,662
|
| Greentown
China Holdings, Ltd. |
|
4,000
|
7,235
|
| Greentown
Service Group Co., Ltd. |
|
8,000
|
7,977
|
| Guangdong
Investment, Ltd. |
|
60,000
|
81,746
|
| Guangzhou
Automobile Group Co., Ltd., Class H |
|
32,000
|
26,386
|
| Haidilao
International Holding, Ltd.(2)(4) |
|
33,000
|
63,494
|
| Haitong
Securities Co., Ltd., Class H |
|
87,200
|
66,264
|
| Hangzhou
Tigermed Consulting Co., Ltd., Class H(2) |
|
400
|
4,824
|
| Hansoh
Pharmaceutical Group Co., Ltd.(2) |
|
4,000
|
6,651
|
| Hengan
International Group Co., Ltd. |
|
18,500
|
85,244
|
| Huatai
Securities Co., Ltd., Class H(2) |
|
50,000
|
76,515
|
| Huazhu
Group, Ltd. ADR |
|
3,179
|
104,875
|
| Hygeia
Healthcare Holdings Co., Ltd.(2) |
|
800
|
3,069
|
| I-Mab
ADR(1) |
|
240
|
3,898
|
| Innovent
Biologics, Inc.(1)(2) |
|
22,000
|
74,033
|
| JD.com,
Inc. ADR(1) |
|
13,680
|
791,662
|
| JD.com,
Inc., Class A(1) |
|
3,273
|
93,002
|
| Jiangsu
Expressway Co., Ltd., Class H |
|
12,000
|
12,532
|
| Jinke
Smart Services Group Co., Ltd., Class H |
|
1,400
|
5,010
|
| Jinxin
Fertility Group, Ltd.(1)(2) |
|
5,000
|
3,793
|
| Jiumaojiu
International Holdings, Ltd.(2)(4) |
|
15,000
|
31,730
|
| Kingdee
International Software Group Co., Ltd.(1) |
|
55,000
|
120,501
|
| Kingsoft
Cloud Holdings, Ltd. ADR(1)(4) |
|
440
|
2,671
|
| Kingsoft
Corp., Ltd. |
|
21,200
|
67,536
|
| Li
Ning Co., Ltd. |
|
33,500
|
284,460
|
| Lifetech
Scientific Corp.(1) |
|
12,000
|
3,965
|
| Longfor
Group Holdings, Ltd.(2) |
|
40,000
|
204,607
|
| Meituan,
Class B(1)(2) |
|
54,000
|
1,022,973
|
| Ming
Yuan Cloud Group Holdings, Ltd.(4) |
|
2,000
|
2,695
|
| NetEase,
Inc. ADR |
|
6,016
|
539,575
|
| New
Oriental Education & Technology Group, Inc. ADR(1) |
|
22,399
|
25,759
|
| NIO,
Inc. ADR(1) |
|
18,857
|
396,940
|
| Security
|
Shares
|
Value
|
| China
(continued) |
|
| Nongfu
Spring Co., Ltd., Class H(2)(4) |
|
39,200
|
$
206,646 |
| OneConnect
Financial Technology Co., Ltd.(1) |
|
3,890
|
5,485
|
| Pharmaron
Beijing Co., Ltd.(2) |
|
400
|
4,811
|
| Pinduoduo,
Inc. ADR(1) |
|
7,260
|
291,199
|
| Ping
An Healthcare and Technology Co., Ltd.(1)(2)(4) |
|
1,700
|
4,394
|
| Postal
Savings Bank of China Co., Ltd., Class H(2) |
|
291,000
|
234,327
|
| Qingdao
Port International Co., Ltd., Class H(2) |
|
89,000
|
45,451
|
| Shandong
Weigao Group Medical Polymer Co., Ltd., Class H |
|
48,400
|
51,406
|
| Shanghai
Fosun Pharmaceutical Group Co., Ltd., Class H |
|
1,500
|
7,269
|
| Shenzhen
International Holdings, Ltd. |
|
6,500
|
6,837
|
| Sinopharm
Group Co., Ltd., Class H |
|
26,400
|
59,929
|
| Sunac
Services Holdings, Ltd., Class H(1)(2)(4) |
|
8,000
|
4,881
|
| Sunny
Optical Technology Group Co., Ltd. |
|
11,700
|
185,811
|
| TAL
Education Group ADR(1)(4) |
|
2,999
|
9,027
|
| Tencent
Holdings, Ltd. |
|
66,100
|
3,046,836
|
| Tencent
Music Entertainment Group(1) |
|
14,788
|
72,018
|
| Tingyi
(Cayman Islands) Holding Corp. |
|
46,000
|
77,135
|
| Tongcheng
Travel Holdings, Ltd.(1) |
|
26,800
|
47,223
|
| Topsports
International Holdings, Ltd.(2) |
|
86,000
|
71,478
|
| TravelSky
Technology, Ltd., Class H |
|
5,000
|
7,173
|
| Trip.com
Group, Ltd. ADR(1) |
|
11,196
|
258,851
|
| Venus
MedTech Hangzhou, Inc., Class H(1)(2)(4) |
|
2,000
|
4,081
|
| Vipshop
Holdings, Ltd. ADR(1) |
|
13,068
|
117,612
|
| Want
Want China Holdings, Ltd. |
|
135,000
|
124,570
|
| Weibo
Corp. ADR(1) |
|
1,468
|
35,981
|
| Weichai
Power Co., Ltd., Class H |
|
60,000
|
94,044
|
| Weimob,
Inc.(1)(2)(4) |
|
6,000
|
3,827
|
| WuXi
AppTec Co., Ltd., Class H(2) |
|
6,480
|
101,243
|
| WuXi
Biologics Cayman, Inc.(1)(2) |
|
46,000
|
365,267
|
| Xinyi
Solar Holdings, Ltd. |
|
102,000
|
177,518
|
| XPENG,
Inc. ADR(1) |
|
5,593
|
154,311
|
| Yadea
Group Holdings, Ltd.(2) |
|
4,000
|
6,127
|
| Yeahka,
Ltd.(1)(4) |
|
2,400
|
7,284
|
| Yihai
International Holding Ltd.(4) |
|
10,000
|
28,402
|
| Yum
China Holdings, Inc. |
|
7,224
|
300,085
|
| Zai
Lab, Ltd. ADR(1) |
|
1,392
|
61,220
|
| Zhejiang
Expressway Co., Ltd., Class H |
|
6,000
|
5,029
|
| Zhongsheng
Group Holdings, Ltd. |
|
18,000
|
126,562
|
| Zhuzhou
CRRC Times Electric Co., Ltd., Class H |
|
18,000
|
69,692
|
| Zoomlion
Heavy Industry Science and Technology Co., Ltd., Class H(4) |
|
9,000
|
5,682
|
| |
|
|
$16,005,840
|
| Egypt
— 4.4% |
|
| Commercial
International Bank Egypt SAE(1) |
|
1,354,970
|
$
3,414,166 |
| |
|
|
$
3,414,166 |
7
See Notes to Financial Statements.
Calvert
Emerging Markets Advancement Fund
March 31, 2022
Schedule of
Investments (Unaudited) — continued
| Security
|
Shares
|
Value
|
| Greece
— 9.1% |
|
| Eurobank
Ergasias S.A.(1) |
|
1,842,582
|
$
2,155,641 |
| Hellenic
Telecommunications Organization S.A. |
|
189,702
|
3,430,214
|
| National
Bank of Greece S.A.(1) |
|
389,221
|
1,433,634
|
| |
|
|
$ 7,019,489
|
| Hong
Kong — 1.0% |
|
| Alibaba
Health Information Technology, Ltd.(1) |
|
104,000
|
$
65,819 |
| Bosideng
International Holdings, Ltd. |
|
56,000
|
25,947
|
| China
Gas Holdings, Ltd. |
|
87,800
|
111,908
|
| China
Overseas Land & Investment, Ltd. |
|
86,000
|
255,913
|
| China
Resources Gas Group, Ltd. |
|
18,000
|
75,760
|
| China
State Construction International Holdings, Ltd. |
|
42,000
|
55,695
|
| China
Traditional Chinese Medicine Holdings Co., Ltd. |
|
20,000
|
10,385
|
| Jinmao
Property Services Co., Ltd.(1)(4) |
|
302
|
191
|
| JS
Global Lifestyle Co., Ltd.(2) |
|
14,500
|
16,854
|
| Microport
Scientific Corp.(4) |
|
2,000
|
4,450
|
| Nine
Dragons Paper Holdings, Ltd. |
|
59,000
|
51,233
|
| Sino
Biopharmaceutical, Ltd. |
|
167,500
|
104,005
|
| Sun
Art Retail Group, Ltd.(4) |
|
16,000
|
5,783
|
| |
|
|
$
783,943 |
| Indonesia
— 8.7% |
|
| Bank
Central Asia Tbk PT |
|
2,826,400
|
$
1,571,069 |
| Bank
Jago Tbk PT(1) |
|
278,500
|
283,794
|
| Bank
Mandiri Persero Tbk PT |
|
986,400
|
541,004
|
| Bank
Negara Indonesia Persero Tbk PT |
|
405,400
|
231,622
|
| Bank
Rakyat Indonesia Persero Tbk PT |
|
3,439,143
|
1,110,790
|
| Elang
Mahkota Teknologi Tbk PT(1) |
|
580,400
|
98,721
|
| Indah
Kiat Pulp & Paper Tbk PT |
|
191,900
|
105,371
|
| Indofood
CBP Sukses Makmur Tbk PT |
|
411,900
|
210,466
|
| Kalbe
Farma Tbk PT |
|
1,552,200
|
174,009
|
| Merdeka
Copper Gold Tbk PT(1) |
|
2,226,400
|
699,430
|
| Sarana
Menara Nusantara Tbk PT |
|
1,930,200
|
143,639
|
| Telkom
Indonesia Persero Tbk PT |
|
3,682,300
|
1,171,528
|
| Tower
Bersama Infrastructure Tbk PT |
|
665,600
|
132,717
|
| Unilever
Indonesia Tbk PT |
|
1,063,400
|
270,437
|
| |
|
|
$
6,744,597 |
| Malaysia
— 4.9% |
|
| Axiata
Group Bhd |
|
122,300
|
$
110,176 |
| CIMB
Group Holdings Bhd |
|
189,700
|
240,305
|
| DiGi.Com
Bhd |
|
146,400
|
135,562
|
| Hartalega
Holdings Bhd |
|
180,300
|
208,049
|
| Hong
Leong Bank Bhd |
|
21,600
|
103,584
|
| Hong
Leong Financial Group Bhd |
|
7,300
|
33,985
|
| IHH
Healthcare Bhd |
|
143,100
|
210,347
|
| Kuala
Lumpur Kepong Bhd |
|
43,900
|
263,159
|
| Security
|
Shares
|
Value
|
| Malaysia
(continued) |
|
| Malayan
Banking Bhd |
|
180,300
|
$
383,176 |
| Maxis
Bhd |
|
104,500
|
97,467
|
| Nestle
Malaysia Bhd |
|
5,300
|
168,304
|
| Petronas
Dagangan Bhd |
|
20,500
|
99,400
|
| Petronas
Gas Bhd |
|
39,200
|
155,162
|
| PPB
Group Bhd |
|
53,900
|
219,233
|
| Press
Metal Aluminium Holdings Bhd |
|
213,400
|
314,151
|
| Public
Bank Bhd |
|
446,200
|
494,961
|
| QL
Resources Bhd |
|
84,200
|
100,630
|
| RHB
Bank Bhd |
|
47,600
|
67,472
|
| Sime
Darby Bhd |
|
188,800
|
107,535
|
| Supermax
Corp. Bhd |
|
119,866
|
33,644
|
| Telekom
Malaysia Bhd |
|
52,300
|
60,751
|
| Top
Glove Corp. Bhd |
|
213,600
|
97,561
|
| Westports
Holdings Bhd |
|
106,600
|
101,313
|
| |
|
|
$
3,805,927 |
| South
Korea — 13.5% |
|
| Alteogen,
Inc.(1) |
|
748
|
$
34,549 |
| AMOREPACIFIC
Corp. |
|
537
|
70,395
|
| AMOREPACIFIC
Group |
|
762
|
27,433
|
| CJ
CheilJedang Corp. |
|
280
|
84,882
|
| CJ
ENM Co., Ltd. |
|
201
|
21,637
|
| Coway
Co., Ltd. |
|
736
|
41,485
|
| Daewoo
Engineering & Construction Co., Ltd.(1) |
|
6,069
|
34,786
|
| Doosan
Fuel Cell Co., Ltd.(1) |
|
892
|
29,782
|
| Doosan
Heavy Industries & Construction Co., Ltd.(1) |
|
8,809
|
146,627
|
| Ecopro
BM Co., Ltd. |
|
219
|
70,774
|
| Fila
Holdings Corp. |
|
1,197
|
30,798
|
| Green
Cross Corp. |
|
129
|
21,404
|
| GS
Engineering & Construction Corp. |
|
1,262
|
47,924
|
| Hana
Financial Group, Inc. |
|
3,468
|
137,933
|
| Hanjin
Kal Corp.(1) |
|
519
|
26,374
|
| Hanmi
Pharm Co., Ltd. |
|
180
|
40,550
|
| Hanmi
Science Co., Ltd. |
|
771
|
28,260
|
| Hanon
Systems |
|
4,247
|
41,097
|
| HLB,
Inc.(1) |
|
2,207
|
55,382
|
| HMM
Co., Ltd. |
|
5,280
|
125,778
|
| Hotel
Shilla Co., Ltd. |
|
489
|
32,528
|
| HYBE
Co., Ltd.(1) |
|
368
|
93,002
|
| Hyosung
TNC Corp. |
|
49
|
18,606
|
| Hyundai
Engineering & Construction Co., Ltd. |
|
1,481
|
57,980
|
| Hyundai
Engineering & Construction Co., Ltd., PFC Shares |
|
15
|
1,000
|
| Hyundai
Glovis Co., Ltd. |
|
312
|
49,196
|
| Hyundai
Mobis Co., Ltd. |
|
1,004
|
176,956
|
| Hyundai
Motor Co. |
|
2,555
|
376,967
|
| Industrial
Bank of Korea |
|
2,763
|
24,553
|
8
See Notes to Financial Statements.
Calvert
Emerging Markets Advancement Fund
March 31, 2022
Schedule of
Investments (Unaudited) — continued
| Security
|
Shares
|
Value
|
| South
Korea (continued) |
|
| Kakao
Corp. |
|
4,974
|
$
432,333 |
| Kakao
Games Corp.(1) |
|
631
|
40,229
|
| KB
Financial Group, Inc. |
|
4,895
|
245,307
|
| Kia
Corp. |
|
4,573
|
276,978
|
| Korea
Investment Holdings Co., Ltd. |
|
751
|
48,247
|
| KT
Corp. |
|
1,810
|
53,016
|
| LG
Chem, Ltd. |
|
895
|
391,085
|
| LG
Display Co., Ltd. |
|
3,164
|
53,336
|
| LG
Electronics, Inc. |
|
1,916
|
188,464
|
| LG
Household & Health Care, Ltd. |
|
151
|
106,517
|
| LG
Innotek Co., Ltd. |
|
229
|
72,305
|
| Lotte
Chemical Corp. |
|
393
|
67,451
|
| Mirae
Asset Securities Co., Ltd. |
|
6,175
|
43,348
|
| NAVER
Corp. |
|
2,194
|
609,776
|
| Netmarble
Corp.(2) |
|
324
|
29,609
|
| Orion
Corp. of Republic of Korea |
|
748
|
54,467
|
| Samsung
C&T Corp. |
|
1,647
|
153,781
|
| Samsung
Electro-Mechanics Co., Ltd. |
|
918
|
123,604
|
| Samsung
Electronics Co., Ltd. |
|
68,571
|
3,923,836
|
| Samsung
Engineering Co., Ltd.(1) |
|
3,045
|
65,355
|
| Samsung
Heavy Industries Co., Ltd.(1) |
|
15,383
|
71,629
|
| Samsung
SDS Co., Ltd. |
|
543
|
61,604
|
| Samsung
Securities Co., Ltd. |
|
993
|
34,100
|
| Shin
Poong Pharmaceutical Co., Ltd.(1) |
|
1,153
|
36,439
|
| Shinhan
Financial Group Co., Ltd. |
|
4,979
|
169,130
|
| SK
Biopharmaceuticals Co., Ltd.(1) |
|
754
|
55,535
|
| SK
Hynix, Inc. |
|
8,088
|
778,059
|
| SK
Square Co., Ltd.(1) |
|
1,436
|
66,792
|
| SK
Telecom Co., Ltd. |
|
1,625
|
75,982
|
| SsangYong
C&E Co., Ltd. |
|
2,590
|
17,539
|
| Woori
Financial Group, Inc. |
|
6,136
|
76,907
|
| Yuhan
Corp. |
|
1,728
|
82,904
|
| |
|
|
$10,454,302
|
| Taiwan
— 14.8% |
|
| Accton
Technology Corp. |
|
6,000
|
$
46,134 |
| Acer,
Inc. |
|
26,000
|
26,949
|
| Advantech
Co., Ltd. |
|
5,299
|
67,899
|
| ASE
Technology Holding Co., Ltd. |
|
40,000
|
142,539
|
| ASPEED
Technology, Inc. |
|
1,000
|
112,569
|
| AU
Optronics Corp. |
|
92,000
|
62,749
|
| Catcher
Technology Co., Ltd. |
|
17,000
|
85,286
|
| Cathay
Financial Holding Co., Ltd. |
|
92,000
|
205,357
|
| Chailease
Holding Co., Ltd. |
|
15,070
|
132,184
|
| Chang
Hwa Commercial Bank, Ltd. |
|
39,915
|
26,602
|
| China
Development Financial Holding Corp, PFC Shares(1) |
|
14,970
|
4,802
|
| China
Development Financial Holding Corp. |
|
182,406
|
121,066
|
| Security
|
Shares
|
Value
|
| Taiwan
(continued) |
|
| China
Steel Corp. |
|
187,000
|
$ 252,121
|
| Chroma
ATE, Inc. |
|
9,000
|
56,124
|
| Chunghwa
Telecom Co., Ltd. |
|
45,000
|
199,299
|
| Compal
Electronics, Inc. |
|
46,000
|
42,850
|
| CTBC
Financial Holding Co., Ltd. |
|
245,000
|
249,681
|
| Delta
Electronics, Inc. |
|
24,000
|
222,521
|
| E.Sun
Financial Holding Co., Ltd. |
|
92,799
|
106,469
|
| Eclat
Textile Co., Ltd. |
|
2,000
|
33,109
|
| Eva
Airways Corp.(1) |
|
27,000
|
29,845
|
| Evergreen
Marine Corp. Taiwan, Ltd. |
|
31,000
|
144,093
|
| Far
Eastern New Century Corp. |
|
25,000
|
26,419
|
| Far
EasTone Telecommunications Co., Ltd. |
|
19,000
|
48,683
|
| Feng
TAY Enterprise Co., Ltd. |
|
4,000
|
26,600
|
| First
Financial Holding Co., Ltd. |
|
128,881
|
127,450
|
| Fubon
Financial Holding Co., Ltd. |
|
84,458
|
224,254
|
| Fubon
Financial Holding Co., Ltd., PFC Shares(1) |
|
1,252
|
2,626
|
| Giant
Manufacturing Co., Ltd. |
|
3,000
|
27,155
|
| Globalwafers
Co., Ltd. |
|
2,000
|
46,550
|
| Hiwin
Technologies Corp. |
|
6,401
|
53,128
|
| Hotai
Motor Co., Ltd. |
|
4,000
|
82,923
|
| Hua
Nan Financial Holdings Co., Ltd. |
|
108,617
|
91,879
|
| Innolux
Corp. |
|
111,000
|
64,287
|
| Inventec
Corp. |
|
30,000
|
25,716
|
| Largan
Precision Co., Ltd. |
|
1,000
|
65,369
|
| Lite-On
Technology Corp. |
|
24,000
|
56,707
|
| Macronix
International Co., Ltd. |
|
17,000
|
23,489
|
| MediaTek,
Inc. |
|
17,000
|
529,049
|
| Mega
Financial Holding Co., Ltd. |
|
132,000
|
197,103
|
| Merida
Industry Co., Ltd. |
|
2,000
|
17,551
|
| Micro-Star
International Co., Ltd. |
|
9,000
|
40,407
|
| momo.com,
Inc. |
|
1,000
|
32,504
|
| Nan
Ya Printed Circuit Board Corp. |
|
2,000
|
35,901
|
| Nanya
Technology Corp. |
|
13,000
|
31,011
|
| Nien
Made Enterprise Co., Ltd. |
|
1,000
|
11,642
|
| Novatek
Microelectronics Corp. |
|
7,000
|
102,926
|
| Oneness
Biotech Co., Ltd.(1) |
|
4,000
|
29,838
|
| Parade
Technologies, Ltd. |
|
1,000
|
62,498
|
| Pou
Chen Corp. |
|
19,000
|
20,800
|
| Powertech
Technology, Inc. |
|
6,000
|
19,765
|
| President
Chain Store Corp. |
|
6,000
|
55,032
|
| Quanta
Computer, Inc. |
|
30,000
|
91,874
|
| Realtek
Semiconductor Corp. |
|
5,000
|
74,274
|
| Ruentex
Development Co., Ltd. |
|
11,200
|
30,703
|
| Shanghai
Commercial & Savings Bank, Ltd. (The) |
|
49,000
|
85,395
|
| Shin
Kong Financial Holding Co., Ltd. |
|
131,011
|
49,037
|
| Sino-American
Silicon Products, Inc. |
|
5,000
|
30,623
|
| SinoPac
Financial Holdings Co., Ltd. |
|
154,000
|
98,491
|
9
See Notes to Financial Statements.
Calvert
Emerging Markets Advancement Fund
March 31, 2022
Schedule of
Investments (Unaudited) — continued
| Security
|
Shares
|
Value
|
| Taiwan
(continued) |
|
| Synnex
Technology International Corp. |
|
15,000
|
$
39,154 |
| Ta
Chen Stainless Pipe Co., Ltd. |
|
34,482
|
58,321
|
| Taishin
Financial Holding Co., Ltd. |
|
150,032
|
106,729
|
| Taiwan
Cooperative Financial Holding Co., Ltd. |
|
118,950
|
122,085
|
| Taiwan
Glass Industry Corp. |
|
19,000
|
16,529
|
| Taiwan
High Speed Rail Corp. |
|
22,000
|
22,102
|
| Taiwan
Mobile Co., Ltd. |
|
19,000
|
69,527
|
| Taiwan
Semiconductor Manufacturing Co., Ltd. |
|
229,000
|
4,697,595
|
| Unimicron
Technology Corp. |
|
15,000
|
127,852
|
| Uni-President
Enterprises Corp. |
|
51,000
|
116,390
|
| United
Microelectronics Corp. |
|
158,000
|
290,155
|
| Vanguard
International Semiconductor Corp. |
|
10,000
|
43,060
|
| Voltronic
Power Technology Corp. |
|
2,050
|
103,454
|
| Walsin
Lihwa Corp. |
|
61,000
|
62,033
|
| Walsin
Technology Corp. |
|
8,000
|
39,130
|
| Wan
Hai Lines, Ltd. |
|
15,100
|
82,693
|
| Win
Semiconductors Corp. |
|
4,000
|
36,810
|
| Winbond
Electronics Corp. |
|
32,000
|
34,275
|
| Wistron
Corp. |
|
32,000
|
33,119
|
| Wiwynn
Corp. |
|
1,000
|
35,276
|
| WPG
Holdings, Ltd. |
|
21,000
|
40,911
|
| Yageo
Corp. |
|
4,000
|
59,709
|
| Yang
Ming Marine Transport Corp.(1) |
|
22,000
|
94,317
|
| Yuanta
Financial Holding Co., Ltd. |
|
100,400
|
91,980
|
| |
|
|
$11,433,113
|
| United
Arab Emirates — 10.4% |
|
| Abu
Dhabi Commercial Bank PJSC |
|
297,515
|
$
847,800 |
| Aldar
Properties PJSC |
|
606,462
|
811,845
|
| Dubai
Islamic Bank PJSC |
|
198,475
|
332,380
|
| Emaar
Development PJSC(1) |
|
146,134
|
176,151
|
| Emirates
Integrated Telecommunications Co. PJSC |
|
82,803
|
146,291
|
| Emirates
Telecommunications Group Co. PJSC |
|
138,855
|
1,398,300
|
| First
Abu Dhabi Bank PJSC |
|
415,589
|
2,666,770
|
| International
Holdings Co. PJSC(1) |
|
32,319
|
1,654,789
|
| |
|
|
$
8,034,326 |
Total
Common Stocks
(identified cost $67,808,624) |
|
|
$74,810,841
|
| Short-Term
Investments — 1.9% |
| Affiliated
Fund — 1.5% |
| Description
|
Units
|
Value
|
| Calvert
Cash Reserves Fund, LLC, 0.14%(5) |
|
1,145,293
|
$
1,145,179 |
Total
Affiliated Fund
(identified cost $1,145,179) |
|
|
$ 1,145,179
|
| Securities
Lending Collateral — 0.4% |
| Security
|
Shares
|
Value
|
| State
Street Navigator Securities Lending Government Money Market Portfolio, 0.29%(6) |
|
329,614
|
$
329,614 |
Total
Securities Lending Collateral
(identified cost $329,614) |
|
|
$ 329,614
|
Total
Short-Term Investments
(identified cost $1,474,793) |
|
|
$ 1,474,793
|
Total
Investments — 98.6%
(identified cost $69,283,417) |
|
$76,285,634
|
| Other
Assets, Less Liabilities — 1.4% |
|
$ 1,078,333
|
| Net
Assets — 100.0% |
|
$77,363,967
|
| The
percentage shown for each investment category in the Schedule of Investments is based on net assets. |
|
(1) |
Non-income
producing security. |
|
(2) |
Security
exempt from registration under Rule 144A of the Securities Act of 1933, as amended. These securities may be sold in certain transactions in reliance on an exemption from registration (normally to qualified institutional buyers). At March 31, 2022,
the aggregate value of these securities is $3,297,084 or 4.3% of the Fund's net assets. |
|
(3) |
Amount
is less than 0.05%. |
|
(4) |
All
or a portion of this security was on loan at March 31, 2022. The aggregate market value of securities on loan at March 31, 2022 was $840,357. |
|
(5) |
Affiliated
investment company, which invests in high quality, U.S. dollar denominated money market instruments. The rate shown is the annualized seven-day yield as of March 31, 2022. |
|
(6) |
Represents
investment of cash collateral received in connection with securities lending. |
10
See Notes to Financial Statements.
Calvert
Emerging Markets Advancement Fund
March 31, 2022
Schedule of
Investments (Unaudited) — continued
At
March 31, 2022, the concentration of the Fund’s investments in the various sectors, determined as a percentage of net assets, was as follows:
| Economic
Sectors |
%
of Net Assets |
| Financials
|
29.6%
|
| Information
Technology |
17.9
|
| Communication
Services |
16.7
|
| Consumer
Discretionary |
9.6
|
| Consumer
Staples |
6.2
|
| Industrials
|
4.3
|
| Health
Care |
3.7
|
| Materials
|
3.5
|
| Real
Estate |
2.9
|
| Utilities
|
2.2
|
| Energy
|
0.1
|
| Total
|
96.7%
|
Forward Foreign Currency Exchange Contracts
| Currency
Purchased |
Currency
Sold |
Counterparty
|
Settlement
Date |
Unrealized
Appreciation |
Unrealized
(Depreciation) |
| USD
|
5,961,962
|
EUR
|
5,351,463
|
Standard
Chartered Bank |
4/8/22
|
$
41,265 |
$
— |
| USD
|
568,407
|
EUR
|
512,042
|
Standard
Chartered Bank |
4/8/22
|
1,898
|
—
|
| AED
|
246,000
|
USD
|
66,939
|
Standard
Chartered Bank |
5/31/22
|
41
|
—
|
| USD
|
2,885,885
|
AED
|
10,600,000
|
Standard
Chartered Bank |
5/31/22
|
—
|
(213)
|
| USD
|
119,957
|
AED
|
443,000
|
Standard
Chartered Bank |
5/31/22
|
—
|
(660)
|
| USD
|
346,596
|
AED
|
1,275,750
|
Standard
Chartered Bank |
5/31/22
|
—
|
(757)
|
| USD
|
404,754
|
AED
|
1,495,000
|
Standard
Chartered Bank |
5/31/22
|
—
|
(2,295)
|
| USD
|
1,035,295
|
AED
|
3,825,000
|
Standard
Chartered Bank |
5/31/22
|
—
|
(6,151)
|
| USD
|
11,204,814
|
CNH
|
71,230,000
|
Goldman
Sachs International |
5/31/22
|
33,834
|
—
|
| USD
|
2,719,215
|
CNH
|
17,300,000
|
Standard
Chartered Bank |
5/31/22
|
6,061
|
—
|
| USD
|
1,792,366
|
CNH
|
11,500,000
|
Standard
Chartered Bank |
5/31/22
|
—
|
(11,176)
|
| USD
|
1,367,804
|
CNH
|
8,700,000
|
UBS
AG |
5/31/22
|
3,386
|
—
|
| USD
|
653,399
|
AED
|
2,400,000
|
Standard
Chartered Bank |
4/19/23
|
—
|
(46)
|
| USD
|
290,239
|
AED
|
1,067,092
|
Standard
Chartered Bank |
4/19/23
|
—
|
(297)
|
| USD
|
1,329,859
|
AED
|
4,888,826
|
Standard
Chartered Bank |
4/19/23
|
—
|
(1,215)
|
| |
|
|
|
|
|
$86,485
|
$(22,810)
|
Futures Contracts
| Description
|
Number
of
Contracts |
Position
|
Expiration
Date |
Notional
Amount |
Value/
Unrealized
Appreciation
(Depreciation) |
| Equity
Futures |
|
|
|
|
|
| MSCI
Emerging Markets Index |
41
|
Long
|
6/17/22
|
$2,307,275
|
$
(37,528) |
| |
|
|
|
|
$(37,528)
|
11
See Notes to Financial Statements.
Calvert
Emerging Markets Advancement Fund
March 31, 2022
Schedule of
Investments (Unaudited) — continued
| Abbreviations:
|
| ADR
|
– American
Depositary Receipt |
| BDR
|
– Brazilian
Depositary Receipt |
| PFC
Shares |
– Preference
Shares |
| Currency
Abbreviations: |
| AED
|
– United
Arab Emirates Dirham |
| CNH
|
– Yuan
Renminbi Offshore |
| EUR
|
– Euro
|
| USD
|
– United
States Dollar |
12
See Notes to Financial Statements.
Calvert
Emerging Markets Advancement Fund
March 31, 2022
Statement of Assets
and Liabilities (Unaudited)
| |
March 31,
2022 |
| Assets
|
|
Investments
in securities of unaffiliated issuers, at value (identified cost $68,138,238) - including
$840,357 of securities on loan |
$
75,140,455 |
| Investments
in securities of affiliated issuers, at value (identified cost $1,145,179) |
1,145,179
|
| Receivable
for open forward foreign currency exchange contracts |
86,485
|
| Cash
|
403,340
|
| Deposits
at broker for futures contracts |
150,625
|
| Deposits
for derivatives collateral - forward foreign currency exchange contracts |
120,000
|
| Cash
denominated in foreign currency, at value (cost $821,714) |
663,146
|
| Receivable
for capital shares sold |
509,286
|
| Dividends
receivable |
275,039
|
| Dividends
receivable - affiliated |
216
|
| Securities
lending income receivable |
381
|
| Receivable
from affiliate |
60,873
|
| Directors'
deferred compensation plan |
625
|
| Other
assets |
5,372
|
| Total
assets |
$78,561,022
|
| Liabilities
|
|
| Cash
collateral due to broker |
$
120,000 |
| Payable
for variation margin on open futures contracts |
32,413
|
| Payable
for open forward foreign currency exchange contracts |
22,810
|
| Payable
for investments purchased |
568,302
|
| Payable
for capital shares redeemed |
20,055
|
| Deposits
for securities loaned |
329,614
|
| Payable
to affiliates: |
|
| Investment
advisory fee |
39,588
|
| Administrative
fee |
7,541
|
| Distribution
and service fees |
167
|
| Sub-transfer
agency fee |
717
|
| Directors'
deferred compensation plan |
625
|
| Accrued
expenses |
55,223
|
| Total
liabilities |
$
1,197,055 |
| Net
Assets |
$77,363,967
|
| Sources
of Net Assets |
|
| Paid-in
capital |
$
71,761,994 |
| Distributable
earnings |
5,601,973
|
| Net
Assets |
$77,363,967
|
| Class
A Shares |
|
| Net
Assets |
$
1,119,685 |
| Shares
Outstanding |
95,478
|
Net
Asset Value and Redemption Price Per Share
(net assets ÷ shares of beneficial interest outstanding) |
$
11.73 |
Maximum
Offering Price Per Share
(100 ÷ 95.25 of net asset value per share) |
$
12.31 |
13
See Notes to Financial Statements.
Calvert
Emerging Markets Advancement Fund
March 31, 2022
Statement of Assets
and Liabilities (Unaudited) — continued
| |
March 31,
2022 |
| Class
I Shares |
|
| Net
Assets |
$
76,244,282 |
| Shares
Outstanding |
6,470,309
|
Net
Asset Value, Offering Price and Redemption Price Per Share
(net assets ÷ shares of beneficial interest outstanding) |
$
11.78 |
| On
sales of $50,000 or more, the offering price of Class A shares is reduced. |
14
See Notes to Financial Statements.
Calvert
Emerging Markets Advancement Fund
March 31, 2022
Statement of
Operations (Unaudited)
| |
Six
Months Ended |
| |
March
31, 2022 |
| Investment
Income |
|
| Dividend
income (net of foreign taxes withheld of $71,768) |
$
659,170 |
| Dividend
income - affiliated issuers |
1,659
|
| Securities
lending income, net |
2,231
|
| Total
investment income |
$
663,060 |
| Expenses
|
|
| Investment
advisory fee |
$
202,920 |
| Administrative
fee |
38,651
|
| Distribution
and service fees: |
|
| Class
A |
778
|
| Directors'
fees and expenses |
1,346
|
| Custodian
fees |
42,581
|
| Transfer
agency fees and expenses |
2,142
|
| Accounting
fees |
16,156
|
| Professional
fees |
17,378
|
| Registration
fees |
19,988
|
| Reports
to shareholders |
772
|
| Miscellaneous
|
11,547
|
| Total
expenses |
$
354,259 |
| Waiver
and/or reimbursement of expenses by affiliate |
$
(34,293) |
| Net
expenses |
$
319,966 |
| Net
investment income |
$
343,094 |
| Realized
and Unrealized Gain (Loss) |
|
| Net
realized gain (loss): |
|
| Investment
securities |
$
(1,307,630) |
| Investment
securities - affiliated issuers |
(220)
|
| Futures
contracts |
(197,808)
|
| Foreign
currency transactions |
19,068
|
| Forward
foreign currency exchange contracts |
94,819
|
| Payment
by affiliate for loss on investment in violation of restrictions |
58,702
|
| Net
realized loss |
$(1,333,069)
|
| Change
in unrealized appreciation (depreciation): |
|
| Investment
securities |
$
28,302 |
| Investment
securities - affiliated issuers |
(640)
|
| Futures
contracts |
27,619
|
| Foreign
currency |
(161,716)
|
| Forward
foreign currency exchange contracts |
60,649
|
| Net
change in unrealized appreciation (depreciation) |
$
(45,786) |
| Net
realized and unrealized loss |
$(1,378,855)
|
| Net
decrease in net assets from operations |
$(1,035,761)
|
15
See Notes to Financial Statements.
Calvert
Emerging Markets Advancement Fund
March 31, 2022
Statements of
Changes in Net Assets
| |
Six
Months Ended
March 31, 2022
(Unaudited) |
Year
Ended
September 30,
2021 |
| Increase
(Decrease) in Net Assets |
|
|
| From
operations: |
|
|
| Net
investment income |
$
343,094 |
$
353,436 |
| Net
realized gain (loss) |
(1,333,069)
|
3,653,390
|
| Net
change in unrealized appreciation (depreciation) |
(45,786)
|
2,931,529
|
| Net
increase (decrease) in net assets from operations |
$
(1,035,761) |
$
6,938,355 |
| Distributions
to shareholders: |
|
|
| Class
A |
$
(24,218) |
$
(101) |
| Class
I |
(2,583,124)
|
(63,570)
|
| Total
distributions to shareholders |
$
(2,607,342) |
$
(63,671) |
| Capital
share transactions: |
|
|
| Class
A |
$
684,096 |
$
380,062 |
| Class
I |
22,073,558
|
9,111,866
|
| Net
increase in net assets from capital share transactions |
$22,757,654
|
$
9,491,928 |
| Net
increase in net assets |
$19,114,551
|
$16,366,612
|
| Net
Assets |
|
|
| At
beginning of period |
$
58,249,416 |
$
41,882,804 |
| At
end of period |
$77,363,967
|
$58,249,416
|
16
See Notes to Financial Statements.
Calvert
Emerging Markets Advancement Fund
March 31, 2022
| |
Class
A |
| |
Six
Months Ended
March 31, 2022
(Unaudited) |
Year
Ended September 30, |
| |
2021
|
2020
(1) |
| Net
asset value — Beginning of period |
$
12.39 |
$
10.64 |
$
10.00 |
| Income
(Loss) From Operations |
|
|
|
| Net
investment income(2) |
$
0.06 |
$
0.09 |
$
0.10 |
| Net
realized and unrealized gain (loss) |
(0.18)
|
1.67
|
0.59
|
| Total
income (loss) from operations |
$
(0.12) |
$
1.76 |
$
0.69 |
| Less
Distributions |
|
|
|
| From
net investment income |
$
(0.06) |
$
(0.01) |
$
— |
| From
net realized gain |
(0.48)
|
—
|
(0.05)
|
| Total
distributions |
$
(0.54) |
$
(0.01) |
$
(0.05) |
| Net
asset value — End of period |
$11.73
|
$12.39
|
$10.64
|
| Total
Return(3) |
(1.06)%
(4) |
16.54%
|
6.94%
|
| Ratios/Supplemental
Data |
|
|
|
| Net
assets, end of period (000’s omitted) |
$
1,120 |
$
477 |
$
91 |
| Ratios
(as a percentage of average daily net assets):(5) |
|
|
|
| Total
expenses |
1.35%
(6)(7) |
1.41%
|
1.83%
|
| Net
expenses |
1.24%
(6)(7) |
1.20%
|
1.20%
|
| Net
investment income |
0.92%
(7) |
0.68%
|
0.99%
|
| Portfolio
Turnover |
21%
(4) |
64%
|
66%
|
|
(1) |
The
Fund commenced operations on October 1, 2019. |
|
(2) |
Computed
using average shares outstanding. |
|
(3) |
Returns
are historical and are calculated by determining the percentage change in net asset value with all distributions reinvested and do not reflect the effect of sales charges, if any. |
|
(4) |
Not
annualized. |
|
(5) |
Total
expenses do not reflect amounts reimbursed and/or waived by the adviser and certain of its affiliates, if applicable. Net expenses are net of all reductions and represent the net expenses paid by the Fund. |
|
(6) |
Includes
interest expense from bank overdrafts of 0.04%. |
|
(7) |
Annualized.
|
17
See Notes to Financial Statements.
Calvert
Emerging Markets Advancement Fund
March 31, 2022
Financial
Highlights — continued
| |
Class
I |
| |
Six
Months Ended
March 31, 2022
(Unaudited) |
Year
Ended September 30, |
| |
2021
|
2020
(1) |
| Net
asset value — Beginning of period |
$
12.44 |
$
10.66 |
$
10.00 |
| Income
(Loss) From Operations |
|
|
|
| Net
investment income(2) |
$
0.07 |
$
0.09 |
$
0.12 |
| Net
realized and unrealized gain (loss) |
(0.18)
|
1.71
|
0.59
|
| Total
income (loss) from operations |
$
(0.11) |
$
1.80 |
$
0.71 |
| Less
Distributions |
|
|
|
| From
net investment income |
$
(0.07) |
$
(0.02) |
$
— |
| From
net realized gain |
(0.48)
|
—
|
(0.05)
|
| Total
distributions |
$
(0.55) |
$
(0.02) |
$
(0.05) |
| Net
asset value — End of period |
$
11.78 |
$
12.44 |
$
10.66 |
| Total
Return(3) |
(0.97)%
(4) |
16.85%
|
7.14%
|
| Ratios/Supplemental
Data |
|
|
|
| Net
assets, end of period (000’s omitted) |
$76,244
|
$57,772
|
$41,792
|
| Ratios
(as a percentage of average daily net assets):(5) |
|
|
|
| Total
expenses |
1.10%
(6)(7) |
1.16%
|
1.58%
|
| Net
expenses |
0.99%
(6)(7) |
0.95%
|
0.95%
|
| Net
investment income |
1.07%
(7) |
0.71%
|
1.15%
|
| Portfolio
Turnover |
21%
(4) |
64%
|
66%
|
|
(1) |
The
Fund commenced operations on October 1, 2019. |
|
(2) |
Computed
using average shares outstanding. |
|
(3) |
Returns
are historical and are calculated by determining the percentage change in net asset value with all distributions reinvested and do not reflect the effect of sales charges, if any. |
|
(4) |
Not
annualized. |
|
(5) |
Total
expenses do not reflect amounts reimbursed and/or waived by the adviser and certain of its affiliates, if applicable. Net expenses are net of all reductions and represent the net expenses paid by the Fund. |
|
(6) |
Includes
interest expense from bank overdrafts of 0.04%. |
|
(7) |
Annualized.
|
18
See Notes to Financial Statements.
Calvert
Emerging Markets Advancement Fund
March 31, 2022
Notes to Financial
Statements (Unaudited)
1 Significant Accounting Policies
Calvert Emerging Markets Advancement Fund (the Fund) is a
diversified series of Calvert World Values Fund, Inc. (the Corporation). The Corporation is a Maryland corporation registered under the Investment Company Act of 1940, as amended (the 1940 Act), as an open-end management investment company. The
investment objective of the Fund is total return.
The
Fund offers two classes of shares. Class A shares are generally sold subject to a sales charge imposed at time of purchase. Effective April 29, 2022, the maximum sales charge payable upon purchase of Class A shares was increased to 5.25%. A
contingent deferred sales charge of 0.80% (1.00% effective April 29, 2022) may apply to certain redemptions of Class A shares for accounts for which no sales charge was paid, if redeemed within 12 months of purchase. Class I shares are sold at net
asset value, are not subject to a sales charge and are sold only to certain eligible investors. Each class represents a pro rata interest in the Fund, but votes separately on class-specific matters and is subject to different expenses.
The Fund applies the accounting and reporting guidance in the
Financial Accounting Standards Board (FASB) Accounting Standards Codification Topic 946, Financial Services – Investment Companies (ASC 946). Subsequent events, if any, through the date that the
financial statements were issued have been evaluated in the preparation of the financial statements.
A Investment
Valuation— Net asset value per share is determined every business day as of the close of the regular session of the New York Stock Exchange (generally 4:00 p.m. Eastern time).
The Fund uses independent pricing services approved by the Board of Directors (the Board) to value its investments wherever possible. Investments for which market quotations are not available or deemed not reliable are fair valued in good faith
under the direction of the Board.
U.S. generally
accepted accounting principles (U.S. GAAP) establishes a disclosure hierarchy that categorizes the inputs to valuation techniques used to value assets and liabilities at measurement date. These inputs are summarized in the three broad levels listed
below:
Level 1 - quoted prices in active markets for
identical securities
Level 2 - other significant
observable inputs (including quoted prices for similar securities, interest rates, prepayment speeds, credit risk, etc.)
Level 3 - significant unobservable inputs (including the
Fund’s own assumptions in determining the fair value of investments)
The inputs or methodologies used for valuing securities are not
necessarily an indication of the risk associated with investing in those securities.
Valuation techniques used to value the Fund’s investments
by major category are as follows:
Equity Securities. Equity securities (including warrants and rights) listed on a U.S. securities exchange generally are valued at the last sale or closing price as reported by an independent pricing service on the primary market or
exchange on which they are traded and are categorized as Level 1 in the hierarchy. Equity securities listed on the NASDAQ National Market System are valued at the NASDAQ official closing price and are categorized as Level 1 in the hierarchy.
Unlisted or listed securities for which closing sales prices or closing quotations are not available are valued at the mean between the latest available bid and ask prices and are categorized as Level 2 in the hierarchy. The daily valuation of
exchange-traded foreign securities generally is determined as of the close of trading on the principal exchange on which such securities trade. Events occurring after the close of trading on foreign exchanges may result in adjustments to the
valuation of foreign securities to more accurately reflect their fair value as of the close of regular trading on the New York Stock Exchange. When valuing foreign equity securities that meet certain criteria, the Fund's Board has approved the use
of a fair value service that values such securities to reflect market trading that occurs after the close of the applicable foreign markets of comparable securities or other instruments that have a strong correlation to the fair-valued securities.
Such securities are categorized as Level 2 in the hierarchy.
Affiliated Fund. Calvert Cash
Reserves Fund, LLC (Cash Reserves Fund) is an affiliated investment company managed by Calvert Research and Management (CRM). While Cash Reserves Fund is not a registered money market mutual fund, it conducts all of its investment activities in
accordance with the requirements of Rule 2a-7 under the 1940 Act. Investments in Cash Reserves Fund are valued at the closing net asset value per unit on the valuation day and are categorized as Level 2 in the hierarchy. Cash Reserves Fund generally
values its investment securities based on available market quotations provided by a third party pricing service.
Other Securities. Investments
in registered investment companies (including money market funds) that do not trade on an exchange are valued at the net asset value per share on the valuation day and are categorized as Level 1 in the hierarchy.
Derivatives. Futures contracts
are valued at unrealized appreciation (depreciation) based on the settlement price established each day by the board of trade or exchange on which they are traded and are categorized as Level 1 or Level 2 in the hierarchy. Forward foreign currency exchange contracts are generally valued at the mean of the average bid and average ask prices that are
reported by currency dealers to a third party pricing service at the valuation time. Such third party pricing service valuations are supplied for specific settlement periods and the Fund's forward foreign currency exchange contracts are valued at an
interpolated rate between the closest preceding and subsequent settlement period reported by the third party pricing service and are categorized as Level 2 in the hierarchy.
Fair Valuation. If a market
value cannot be determined for a security using the methodologies described above, or if, in the good faith opinion of the Fund's adviser, the market value does not constitute a readily available market quotation, or if a significant event has
occurred that would materially affect the value of the security, the security will be fair valued as determined in good faith by or at the direction of the Board in a manner that most fairly reflects the
Calvert
Emerging Markets Advancement Fund
March 31, 2022
Notes to Financial
Statements (Unaudited) — continued
security’s
“fair value”, which is the amount that the Fund might reasonably expect to receive for the security upon its current sale in the ordinary course. Each such determination is based on a consideration of relevant factors, which are likely
to vary from one pricing context to another. These factors may include, but are not limited to, the type of security, the existence of any contractual restrictions on the security’s disposition, the price and extent of public trading in
similar securities of the issuer or of comparable companies or entities, quotations or relevant information obtained from broker/dealers or other market participants, information obtained from the issuer, analysts, and/or the appropriate stock
exchange (for exchange-traded securities), an analysis of the company’s or entity’s financial statements, and an evaluation of the forces that influence the issuer and the market(s) in which the security is purchased and sold.
The values assigned to fair value investments are based on
available information and do not necessarily represent amounts that might ultimately be realized. Further, due to the inherent uncertainty of valuations of such investments, the fair values may differ significantly from the values that would have
been used had an active market existed, and the differences could be material.
The following table summarizes the market value of the Fund's
holdings as of March 31, 2022, based on the inputs used to value them:
| Asset
Description |
Level
1 |
Level
2 |
Level
3 |
Total
|
| Common
Stocks: |
|
|
|
|
| Brazil
|
$
7,097,962 |
$
— |
$
— |
$
7,097,962 |
| Canada
|
17,176
|
—
|
—
|
17,176
|
| China
|
3,584,999
|
12,420,841
|
—
|
16,005,840
|
| Egypt
|
—
|
3,414,166
|
—
|
3,414,166
|
| Greece
|
—
|
7,019,489
|
—
|
7,019,489
|
| Hong
Kong |
—
|
783,943
|
—
|
783,943
|
| Indonesia
|
—
|
6,744,597
|
—
|
6,744,597
|
| Malaysia
|
—
|
3,805,927
|
—
|
3,805,927
|
| South
Korea |
—
|
10,454,302
|
—
|
10,454,302
|
| Taiwan
|
4,802
|
11,428,311
|
—
|
11,433,113
|
| United
Arab Emirates |
—
|
8,034,326
|
—
|
8,034,326
|
| Total
Common Stocks |
$10,704,939
|
$64,105,902
(1) |
$ —
|
$74,810,841
|
| Short-Term
Investments: |
|
|
|
|
| Affiliated
Fund |
$
— |
$
1,145,179 |
$
— |
$
1,145,179 |
| Securities
Lending Collateral |
329,614
|
—
|
—
|
329,614
|
| Total
Investments |
$11,034,553
|
$
65,251,081 |
$ —
|
$76,285,634
|
| Forward
Foreign Currency Exchange Contracts |
$
— |
$
86,485 |
$
— |
$
86,485 |
| Total
|
$11,034,553
|
$
65,337,566 |
$ —
|
$76,372,119
|
| Liability
Description |
|
|
|
|
| Forward
Foreign Currency Exchange Contracts |
$
— |
$
(22,810) |
$
— |
$
(22,810) |
| Futures
Contracts |
(37,528)
|
—
|
—
|
(37,528)
|
| Total
|
$
(37,528) |
$
(22,810) |
$ —
|
$
(60,338) |
|
(1) |
Includes
foreign equity securities whose values were adjusted to reflect market trading of comparable securities or other correlated instruments that occurred after the close of trading in their applicable foreign markets. |
B Investment Transactions and Income— Investment transactions for financial statement purposes are accounted for on trade date. Realized gains and losses are recorded on an identified cost basis and may include
proceeds from litigation. Dividend income is recorded on the ex-dividend date for dividends received in cash and/or securities or, in
the case of dividends on certain foreign securities, as soon as the Fund is informed of the ex-dividend date. Non-cash dividends are
recorded at the fair value of the securities received. Withholding taxes on foreign dividends, if any, have been provided for in
accordance with the Fund's understanding of the applicable country’s tax rules and rates. Distributions received that represent
a return of capital are recorded as a reduction of cost of investments. Distributions received that represent a capital gain are recorded as a realized gain.
Calvert
Emerging Markets Advancement Fund
March 31, 2022
Notes to Financial
Statements (Unaudited) — continued
C Share Class Accounting— Realized and unrealized gains and losses and net investment income and losses, other than class-specific expenses, are allocated daily to each class of shares based upon the
relative net assets of each class to the total net assets of the Fund. Expenses arising in connection with a specific class are charged directly to that class.
D Foreign Currency Transactions— The Fund’s accounting records are maintained in U.S. dollars. For valuation of assets and liabilities on each date of net asset value determination, foreign denominations
are converted into U.S. dollars using the current exchange rate. Security transactions, income and expenses are translated at the prevailing rate of exchange on the date of the event. Recognized gains or losses on investment transactions
attributable to changes in foreign currency exchange rates are recorded for financial statement purposes as net realized gains and losses on investments. That portion of unrealized gains and losses on investments that results from fluctuations in
foreign currency exchange rates is not separately disclosed.
E Futures
Contracts— The Fund may enter into futures contracts to buy or sell a financial instrument for a set price at a future date. Initial margin deposits of either cash or
securities as required by the broker are made upon entering into the contract. While the contract is open, daily variation margin payments are made to or received from the broker reflecting the daily change in market value of the contract and are
recorded for financial reporting purposes as unrealized gains or losses by the Fund. When a futures contract is closed, a realized gain or loss is recorded equal to the difference between the opening and closing value of the contract. The risks
associated with entering into futures contracts may include the possible illiquidity of the secondary market which would limit the Fund’s ability to close out a futures contract prior to the settlement date, an imperfect correlation between
the value of the contracts and the underlying financial instruments, or that the counterparty will fail to perform its obligations under the contracts’ terms. Futures contracts are designed by boards of trade, which are designated
“contracts markets” by the Commodities Futures Trading Commission. Futures contracts trade on the contracts markets in a manner that is similar to the way a stock trades on a stock exchange, and the boards of trade, through their
clearing corporations, guarantee the futures contracts against default. As a result, there is minimal counterparty credit risk to the Fund.
F Forward Foreign Currency Exchange Contracts— The Fund may enter into forward foreign currency exchange contracts for the purchase or sale of a specific foreign currency at a fixed price on a future date. The forward foreign
currency exchange contracts are adjusted by the daily exchange rate of the underlying currency and any gains or losses are recorded as unrealized until such time as the contracts have been closed. Risks may arise upon entering these contracts from
the potential inability of counterparties to meet the terms of their contracts and from movements in the value of a foreign currency relative to the U.S. dollar.
G Distributions to Shareholders— Distributions to shareholders are recorded by the Fund on ex-dividend date. Distributions from net investment income and distributions from net realized capital gains, if any, are
paid at least annually. Distributions are declared separately for each class of shares. Distributions are determined in accordance with income tax regulations, which may differ from U.S. GAAP; accordingly, periodic reclassifications are made within
the Fund's capital accounts to reflect income and gains available for distribution under income tax regulations.
H Estimates— The preparation of financial statements in conformity with U.S. GAAP requires management to make estimates and assumptions that affect the reported amounts of assets and liabilities and disclosure of contingent assets
and liabilities at the date of the financial statements and the reported amounts of increases and decreases in net assets from operations during the reporting period. Actual results could differ from those estimates.
I
Indemnifications— The Corporation’s By-Laws provide for indemnification for Directors or officers of the Corporation and certain other parties, to the fullest extent
permitted by Maryland law and the 1940 Act, provided certain conditions are met. Additionally, in the normal course of business, the Fund enters into agreements with service providers that may contain indemnification clauses. The Fund’s
maximum exposure under these arrangements is unknown as this would involve future claims that may be made against the Fund that have not yet occurred.
J Federal Income
Taxes— No provision for federal income or excise tax is required since the Fund intends to continue to qualify as a regulated investment company under the Internal Revenue Code
and to distribute substantially all of its taxable earnings.
Management has analyzed the Fund's tax positions taken for all
open federal income tax years and has concluded that no provision for federal income tax is required in the Fund's financial statements. A Fund's federal tax return is subject to examination by the Internal Revenue Service for a period of three
years from the date of filing.
K Interim
Financial Statements— The interim financial statements relating to March 31, 2022 and for the six months then ended have not been audited by an independent registered public
accounting firm, but in the opinion of the Fund's management, reflect all adjustments, consisting only of normal recurring adjustments, necessary for the fair presentation of the financial statements.
2 Related Party Transactions
The investment advisory fee is earned by CRM, an indirect,
wholly-owned subsidiary of Morgan Stanley, as compensation for investment advisory services rendered to the Fund. The investment advisory fee is computed at the annual rate of 0.63% of the Fund’s average daily net assets and is payable
monthly. For the six months ended March 31, 2022, the investment advisory fee amounted to $202,920. CRM does not receive a fee for advisory services provided to Cash Reserves Fund.
Calvert
Emerging Markets Advancement Fund
March 31, 2022
Notes to Financial
Statements (Unaudited) — continued
CRM
has agreed to reimburse the Fund’s operating expenses to the extent that total annual operating expenses (relating to ordinary operating expenses only and excluding expenses such as brokerage commissions, acquired fund fees and expenses of
unaffiliated funds, borrowing costs, taxes or litigation expenses) exceed 1.20% and 0.95% for Class A and Class I, respectively, of such class’s average daily net assets. The expense reimbursement agreement with CRM may be changed or
terminated after January 31, 2022. For the six months ended March 31, 2022, CRM waived or reimbursed expenses of $34,293.
The administrative fee is earned by CRM as compensation for
administrative services rendered to the Fund. The fee is computed at an annual rate of 0.12% of the Fund’s average daily net assets attributable to Class A and Class I and is payable monthly. For the six months ended March 31, 2022, CRM was
paid administrative fees of $38,651.
The Fund has in
effect a distribution plan for Class A shares (Class A Plan) pursuant to Rule 12b-1 under the 1940 Act. Pursuant to the Class A Plan, the Fund pays Eaton Vance Distributors, Inc. (EVD), an affiliate of CRM and the Fund’s principal underwriter,
a distribution and service fee of 0.25% per annum of its average daily net assets attributable to Class A shares for distribution services and facilities provided to the Fund by EVD, as well as for personal services and/or the maintenance of
shareholder accounts. Distribution and service fees paid or accrued for the six months ended March 31, 2022 amounted to $778 for Class A shares.
The Fund was informed that EVD received $365 as its portion of
the sales charge on sales of Class A shares and no contingent deferred sales charges paid by Fund shareholders for the six months ended March 31, 2022.
Eaton Vance Management (EVM), an affiliate of CRM, provides
sub-transfer agency and related services to the Fund pursuant to a Sub-Transfer Agency Support Services Agreement. For the six months ended March 31, 2022, sub-transfer agency fees and expenses incurred to EVM amounted to $304 and are included in
transfer agency fees and expenses on the Statement of Operations.
Each Director of the Fund who is not an employee of CRM or its
affiliates receives an annual fee of $214,000 ($154,000 prior to January 1, 2022), plus an annual Committee fee ranging from $8,500 to $16,500 depending on the Committee. The Board chair receives an additional $30,000 annual fee, Committee chairs
receive an additional $6,000 annual fee and the special equities liaison receives an additional $2,500 annual fee. Eligible Directors may participate in a Deferred Compensation Plan (the Plan). Amounts deferred under the Plan are treated as though
equal dollar amounts had been invested in shares of the Fund or other Calvert funds selected by the Directors. The Fund purchases shares of the funds selected equal to the dollar amounts deferred under the Plan, resulting in an asset equal to the
deferred compensation liability. Obligations of the Plan are paid solely from the Fund's assets. Directors’ fees are allocated to each of the Calvert funds served. Salaries and fees of officers and Directors of the Fund who are employees of
CRM or its affiliates are paid by CRM.
During the six
months ended March 31, 2022, CRM agreed to reimburse the Fund $58,702 for a loss from an investment which did not meet the Fund's investment guidelines. The reimbursement is included in Receivable from affiliate on the Statement of Assets and
Liabilities. The impact of the reimbursement was less than $0.01 per share for each class and had no significant impact on total return.
3 Investment Activity
During the six months ended March 31, 2022, the cost of
purchases and proceeds from sales of investments, other than short-term securities, were $37,503,831 and $13,016,040, respectively.
4 Distributions to Shareholders and Income Tax
Information
The cost and unrealized appreciation
(depreciation) of investments, including open derivative contracts, of the Fund at March 31, 2022, as determined on a federal income tax basis, were as follows:
| Aggregate
cost |
$69,468,623
|
| Gross
unrealized appreciation |
$
10,938,950 |
| Gross
unrealized depreciation |
(4,095,792)
|
| Net
unrealized appreciation |
$
6,843,158 |
Calvert
Emerging Markets Advancement Fund
March 31, 2022
Notes to Financial
Statements (Unaudited) — continued
5 Financial Instruments
The Fund may trade in financial instruments with off-balance
sheet risk in the normal course of its investing activities. These financial instruments may include forward foreign currency exchange contracts and futures contracts and may involve, to a varying degree, elements of risk in excess of the amounts
recognized for financial statement purposes. The notional or contractual amounts of these instruments represent the investment the Fund has in particular classes of financial instruments and do not necessarily represent the amounts potentially
subject to risk. The measurement of the risks associated with these instruments is meaningful only when all related and offsetting transactions are considered. A summary of obligations under these financial instruments at March 31, 2022 is included
in the Schedule of Investments. At March 31, 2022, the Fund had sufficient cash and/or securities to cover commitments under these contracts.
In the normal course of pursuing its investment objective, the
Fund is subject to the following risks:
Equity Price
Risk: During the six months ended March 31, 2022, the Fund entered into equity futures contracts to enhance total return, to manage certain investment risks and/or as a substitute for the purchase of securities.
Foreign Exchange Risk: During the six months ended March 31,
2022, the Fund entered into forward foreign currency exchange contracts to seek to hedge against fluctuations in currency exchange rates and/or as a substitute for the purchase or sale of securities or currencies.
The Fund enters into forward foreign currency exchange
contracts that may contain provisions whereby the counterparty may terminate the contract under certain conditions, including but not limited to a decline in the Fund’s net assets below a certain level over a certain period of time, which
would trigger a payment by the Fund for those derivatives in a liability position. At March 31, 2022, the fair value of derivatives with credit-related contingent features in a net liability position was $22,810. At March 31, 2022, there were no
assets pledged by the Fund for such liability.
The
over-the-counter (OTC) derivatives in which the Fund invests are subject to the risk that the counterparty to the contract fails to perform its obligations under the contract. To mitigate this risk, the Fund has entered into an International Swaps
and Derivatives Association, Inc. Master Agreement (“ISDA Master Agreement”) or similar agreement with its derivative counterparties. An ISDA Master Agreement is a bilateral agreement between the Fund and a counterparty that governs
certain OTC derivatives and typically contains, among other things, set-off provisions in the event of a default and/or termination event as defined under the relevant ISDA Master Agreement. Under an ISDA Master Agreement, the Fund may, under
certain circumstances, offset with the counterparty certain derivative financial instruments’ payables and/or receivables with collateral held and/or posted and create one single net payment. The provisions of the ISDA Master Agreement
typically permit a single net payment in the event of default including the bankruptcy or insolvency of the counterparty. However, bankruptcy or insolvency laws of a particular jurisdiction may impose restrictions on or prohibitions against the
right of offset in bankruptcy or insolvency. Certain ISDA Master Agreements allow counterparties to OTC derivatives to terminate derivative contracts prior to maturity in the event the Fund’s net assets decline by a stated percentage or the
Fund fails to meet the terms of its ISDA Master Agreement(s), which would cause the counterparty to accelerate payment by the Fund of any net liability owed to it.
The collateral requirements for derivatives traded under an
ISDA Master Agreement are governed by a Credit Support Annex to the ISDA Master Agreement. Collateral requirements are determined at the close of business each day and are typically based on changes in market values for each transaction under an
ISDA Master Agreement and netted into one amount for such agreement. Generally, the amount of collateral due from or to a counterparty is subject to a minimum transfer threshold amount before a transfer is required, which may vary by counterparty.
Collateral pledged for the benefit of the Fund and/or counterparty is held in segregated accounts by the Fund’s custodian and cannot be sold, re-pledged, assigned or otherwise used while pledged. The portion of such collateral representing
cash, if any, is reflected as deposits for derivatives collateral and, in the case of cash pledged by a counterparty for the benefit of the Fund, a corresponding liability on the Statement of Assets and Liabilities. Securities pledged by the Fund as
collateral, if any, are identified as such in the Schedule of Investments. The carrying amount of the liability for cash collateral due to broker at March 31, 2022 approximated its fair value. If measured at fair value, such liability would have
been considered as Level 2 in the fair value hierarchy (see Note 1A) at March 31, 2022.
Calvert
Emerging Markets Advancement Fund
March 31, 2022
Notes to Financial
Statements (Unaudited) — continued
At
March 31, 2022, the fair value of open derivative instruments (not considered to be hedging instruments for accounting disclosure purposes) by risk exposure was as follows:
| Risk
|
Derivative
|
Statement
of Assets and Liabilities Caption |
Assets
|
Liabilities
|
| Foreign
exchange |
Forward
foreign currency exchange contracts |
Receivable/Payable
for open forward foreign currency
exchange contracts |
$
86,485 |
$
(22,810) |
| Equity
price |
Futures
contracts |
Distributable
earnings |
—
|
(37,528)
(1) |
| Total
|
|
|
$86,485
|
$(60,338)
|
| Derivatives
not subject to master netting agreements |
$
— |
$(37,528)
|
| Total
Derivatives subject to master netting agreements |
$86,485
|
$(22,810)
|
|
(1) |
Only
the current day's variation margin is reported within the Statement of Assets and Liabilities as Receivable or Payable for variation margin on open futures contracts, as applicable. |
The Fund’s derivative assets and liabilities at fair
value by risk, which are reported gross in the Statement of Assets and Liabilities, are presented in the table above. The following tables present the Fund’s derivative assets and liabilities by counterparty, net of amounts available for
offset under a master netting agreement and net of the related collateral received by the Fund for such assets and pledged by the Fund for such liabilities as of March 31, 2022.
| Counterparty
|
Derivative
Assets Subject to
Master Netting
Agreement |
Derivatives
Available
for Offset |
Non-cash
Collateral
Received(a) |
Cash
Collateral
Received(a) |
Net
Amount
of Derivative
Assets(b) |
Total
Cash
Collateral
Received |
| Goldman
Sachs International |
$
33,834 |
$
— |
$
— |
$
(33,834) |
$
— |
$
120,000 |
| Standard
Chartered Bank |
49,265
|
(22,810)
|
—
|
—
|
26,455
|
—
|
| UBS
AG |
3,386
|
—
|
—
|
—
|
3,386
|
—
|
| |
$86,485
|
$(22,810)
|
$ —
|
$(33,834)
|
$29,841
|
$120,000
|
| Counterparty
|
Derivative
Liabilities Subject to
Master Netting
Agreement |
Derivatives
Available
for Offset |
Non-cash
Collateral
Pledged(a) |
Cash
Collateral
Pledged(a) |
Net
Amount
of Derivative
Liabilities(c) |
Total
Cash
Collateral
Pledged |
| Standard
Chartered Bank |
$(22,810)
|
$22,810
|
$ —
|
$ —
|
$ —
|
$
— |
| Total
— Deposits for derivatives collateral — forward foreign currency exchange contracts |
$120,000
|
|
(a) |
In
some instances, the total collateral received and/or pledged may be more than the amount shown due to overcollateralization. |
|
(b) |
Net
amount represents the net amount due from the counterparty in the event of default. |
|
(c) |
Net
amount represents the net amount payable to the counterparty in the event of default. |
Calvert
Emerging Markets Advancement Fund
March 31, 2022
Notes to Financial
Statements (Unaudited) — continued
The
effect of derivative instruments (not considered to be hedging instruments for accounting disclosure purposes) on the Statement of Operations by risk exposure for the six months ended March 31, 2022 was as follows:
| Statement
of Operations Caption |
Equity
price |
Foreign
exchange |
Total
|
| Net
realized gain (loss): |
|
|
|
| Forward
foreign currency exchange contracts |
$
— |
$
94,819 |
$
94,819 |
| Futures
contracts |
(197,808)
|
—
|
(197,808)
|
| Total
|
$(197,808)
|
$94,819
|
$(102,989)
|
| Change
in unrealized appreciation (depreciation): |
|
|
|
| Forward
foreign currency exchange contracts |
$
— |
$
60,649 |
$
60,649 |
| Futures
contracts |
27,619
|
—
|
27,619
|
| Total
|
$
27,619 |
$60,649
|
$
88,268 |
The average notional cost of futures contracts and average
notional amounts of other derivative contracts outstanding during the six months ended March 31, 2022, which are indicative of the volume of these derivative types, were approximately as follows:
Futures
Contracts — Long |
Forward
Foreign Currency
Exchange Contracts* |
| $3,373,000
|
$20,169,000
|
| *
|
The
average notional amount for forward foreign currency exchange contracts is based on the absolute value of notional amounts of currency purchased and currency sold. |
6 Overdraft Advances
Pursuant to the custodian agreement, State Street Bank and
Trust Company (SSBT) may, in its discretion, advance funds to the Fund to make properly authorized payments. When such payments result in an overdraft, the Fund is obligated to repay SSBT at the current rate of interest charged by SSBT for secured
loans (currently, the Federal Funds rate plus 2%). This obligation is payable on demand to SSBT. SSBT has a lien on the Fund's assets to the extent of any overdraft. The Fund had no payment due to SSBT pursuant to the foregoing arrangement at March
31, 2022. For the six months ended March 31, 2022, the Fund incurred interest expense on overdraft advances of $13,057, which is included in custodian fees on the Statement of Operations.
7 Securities Lending
To generate additional income, the Fund may lend its securities
pursuant to a securities lending agency agreement with SSBT, the securities lending agent. Security loans are subject to termination by the Fund at any time and, therefore, are not considered illiquid investments. The Fund requires that the loan be
continuously collateralized by either cash or securities in an amount at least equal to the market value of the securities on loan. The market value of securities loaned is determined daily and any additional required collateral is delivered to the
Fund on the next business day. Cash collateral is generally invested in a money market fund registered under the 1940 Act that is managed by an affiliate of SSBT. Any gain or loss in the market price of the loaned securities that might occur and any
interest earned or dividends declared during the term of the loan would accrue to the account of the Fund. Income earned on the investment of collateral, net of broker rebates and other expenses incurred by the securities lending agent, is split
between the Fund and the securities lending agent based on agreed upon contractual terms. Non-cash collateral, if any, is held by the lending agent on behalf of the Fund and cannot be sold or re-pledged by the Fund; accordingly, such collateral is
not reflected in the Statement of Assets and Liabilities.
The risks associated with lending portfolio securities include,
but are not limited to, possible delays in receiving additional collateral or in the recovery of the loaned securities, possible loss of rights to the collateral should the borrower fail financially, as well as risk of loss in the value of the
collateral or the value of the investments made with the collateral. The securities lending agent shall indemnify the Fund in the case of default of any securities borrower.
At March 31, 2022, the total value of securities on loan was
$840,357 and the total value of collateral received was $937,910, comprised of cash of $329,614 and U.S. government and/or agencies securities of $608,296.
Calvert
Emerging Markets Advancement Fund
March 31, 2022
Notes to Financial
Statements (Unaudited) — continued
The
following table provides a breakdown of securities lending transactions accounted for as secured borrowings, the obligations by class of collateral pledged, and the remaining contractual maturity of those transactions as of March 31, 2022.
| |
Remaining
Contractual Maturity of the Transactions |
| |
Overnight
and
Continuous |
<30
days |
30
to 90 days |
>90
days |
Total
|
| Common
Stocks |
$329,614
|
$ —
|
$ —
|
$ —
|
$329,614
|
The carrying amount of the liability
for deposits for securities loaned at March 31, 2022 approximated its fair value. If measured at fair value, such liability would have been considered as Level 2 in the fair value hierarchy (see Note 1A) at March 31, 2022.
8 Line of Credit
The Fund participates with other portfolios and funds managed
by EVM and its affiliates, including CRM, in an $800 million unsecured line of credit with a group of banks, which is in effect through October 25, 2022. Borrowings are made by the Fund solely for temporary purposes related to redemptions and other
short-term cash needs. Interest is charged to the Fund based on its borrowings at an amount above either the Secured Overnight Financing Rate (SOFR) or Federal Funds rate. In addition, a fee computed at an annual rate of 0.15% on the daily unused
portion of the line of credit is allocated among the participating portfolios and funds at the end of each quarter. In connection with the renewal of the agreement in October 2021, an arrangement fee of $150,000 was incurred that was allocated to
the participating portfolios and funds. Because the line of credit is not available exclusively to the Fund, it may be unable to borrow some or all of its requested amounts at any particular time.
The Fund had no borrowings outstanding pursuant to its line of
credit at March 31, 2022. The Fund did not have any significant borrowings or allocated fees during the six months ended March 31, 2022.
9 Affiliated Funds
At March 31, 2022, the value of the Fund’s investment in
affiliated funds was $1,145,179, which represents 1.5% of the Fund’s net assets. Transactions in affiliated funds by the Fund for the six months ended March 31, 2022 were as follows:
| Name
|
Value,
beginning
of period |
Purchases
|
Sales
proceeds |
Net
realized
gain
(loss) |
Change
in
unrealized
appreciation
(depreciation) |
Value,
end of
period |
Dividend
income |
Units,
end of
period |
| Short-Term
Investments |
|
|
|
|
|
|
| Calvert
Cash Reserves Fund, LLC |
$6,412,205
|
$17,571,235
|
$(22,837,401)
|
$(220)
|
$(640)
|
$1,145,179
|
$1,659
|
1,145,293
|
10 Capital Shares
The Corporation may issue its shares in one or more series
(such as the Fund). The authorized shares of the Fund consist of 75,000,000 common shares, $0.01 par value, for each Class.
Transactions in capital shares for the six months ended March
31, 2022 and the year ended September 30, 2021 were as follows:
| |
Six
Months Ended
March 31, 2022
(Unaudited) |
|
Year
Ended
September 30, 2021 |
| |
Shares
|
Amount
|
|
Shares
|
Amount
|
| Class
A |
|
|
|
|
|
| Shares
sold |
56,249
|
$
676,040 |
|
39,025
|
$
499,974 |
| Reinvestment
of distributions |
2,006
|
24,218
|
|
8
|
101
|
| Shares
redeemed |
(1,284)
|
(16,162)
|
|
(9,108)
|
(120,013)
|
| Net
increase |
56,971
|
$
684,096 |
|
29,925
|
$
380,062 |
Calvert
Emerging Markets Advancement Fund
March 31, 2022
Notes to Financial
Statements (Unaudited) — continued
| |
Six
Months Ended
March 31, 2022
(Unaudited) |
|
Year
Ended
September 30, 2021 |
| |
Shares
|
Amount
|
|
Shares
|
Amount
|
| Class
I |
|
|
|
|
|
| Shares
sold |
1,804,521
|
$
21,876,028 |
|
1,285,217
|
$16,497,865
|
| Reinvestment
of distributions |
213,126
|
2,583,084
|
|
5,118
|
63,565
|
| Shares
redeemed |
(190,204)
|
(2,385,554)
|
|
(568,417)
|
(7,449,564)
|
| Net
increase |
1,827,443
|
$22,073,558
|
|
721,918
|
$
9,111,866 |
At March 31, 2022, EVM, Calvert Conservative Allocation Fund,
Calvert Moderate Allocation Fund and Calvert Growth Allocation Fund owned in the aggregate 77.6% of the value of the outstanding shares of the Fund.
11 Risks and Uncertainties
Risks Associated with Foreign Investments
Foreign investments can be adversely affected by political,
economic and market developments abroad, including the imposition of economic and other sanctions by the United States or another country. There may be less publicly available information about foreign issuers because they may not be subject to
reporting practices, requirements or regulations comparable to those to which United States companies are subject. Foreign markets may be smaller, less liquid and more volatile than the major markets in the United States. Trading in foreign markets
typically involves higher expense than trading in the United States. The Fund may have difficulties enforcing its legal or contractual rights in a foreign country. Securities that trade or are denominated in currencies other than the U.S. dollar may
be adversely affected by fluctuations in currency exchange rates.
Emerging market securities often involve greater risks than
developed market securities. Investment markets within emerging market countries are typically smaller, less liquid, less developed and more volatile than those in more developed markets like the United States, and may be focused in certain economic
sectors. The information available about an emerging market issuer may be less reliable than for comparable issuers in more developed capital markets. Governmental actions can have a significant effect on the economic conditions in emerging market
countries. It may be more difficult to make a claim or obtain a judgment in the courts of these countries than it is in the United States. The possibility of fraud, negligence, undue influence being exerted by an issuer or refusal to recognize
ownership exists in some emerging markets. Disruptions due to work stoppages and trading improprieties in foreign securities markets have caused such markets to close. Emerging market securities are also subject to speculative trading, which
contributes to their volatility.
Pandemic Risk
An outbreak of respiratory disease caused by a novel
coronavirus was first detected in China in late 2019 and subsequently spread internationally. This coronavirus has resulted in closing borders, enhanced health screenings, changes to healthcare service preparation and delivery, quarantines,
cancellations, disruptions to supply chains and customer activity, as well as general concern and uncertainty. Health crises caused by outbreaks, such as the coronavirus outbreak, may exacerbate other pre-existing political, social and economic
risks and disrupt normal market conditions and operations. The impact of this outbreak has negatively affected the worldwide economy, the economies of individual countries, individual companies, and the market in general, and may continue to do so
in significant and unforeseen ways, as may other epidemics and pandemics that may arise in the future. Any such impact could adversely affect the Fund's performance, or the performance of the securities in which the Fund invests.
Calvert
Emerging Markets Advancement Fund
March 31, 2022
| Officers
|
Hope L.
Brown
Chief Compliance Officer |
Deidre E.
Walsh
Vice President, Secretary and
Chief Legal Officer |
James F.
Kirchner
Treasurer |
| Directors
|
Alice
Gresham Bullock
Chairperson |
| Richard L.
Baird, Jr. |
| Cari M.
Dominguez |
| John G.
Guffey, Jr. |
| Miles D.
Harper, III |
| Joy V. Jones
|
| John H.
Streur* |
| Anthony A.
Williams |
| *Interested
Director and President |
| Privacy
Notice |
April 2021
|
| FACTS
|
WHAT
DOES EATON VANCE DO WITH YOUR
PERSONAL INFORMATION? |
| Why?
|
Financial
companies choose how they share your personal information. Federal law gives consumers the right to limit some but not all sharing. Federal law also requires us to tell you how we collect, share, and protect your personal information. Please read
this notice carefully to understand what we do. |
| |
|
| What?
|
The
types of personal information we collect and share depend on the product or service you have with us. This information can include:■ Social Security number and income
■
investment experience and risk tolerance
■
checking account number and wire transfer instructions |
| |
|
| How?
|
All
financial companies need to share customers’ personal information to run their everyday business. In the section below, we list the reasons financial companies can share their customers’ personal information; the reasons Eaton Vance
chooses to share; and whether you can limit this sharing. |
Reasons
we can share your
personal information |
Does
Eaton Vance
share? |
Can
you limit
this sharing? |
| For
our everyday business purposes — such as to process your transactions, maintain your account(s), respond to court orders and legal investigations, or report to credit bureaus |
Yes
|
No
|
| For
our marketing purposes — to offer our products and services to you |
Yes
|
No
|
| For
joint marketing with other financial companies |
No
|
We
don’t share |
| For
our investment management affiliates’ everyday business purposes — information about your transactions, experiences, and creditworthiness |
Yes
|
Yes
|
| For
our affiliates’ everyday business purposes — information about your transactions and experiences |
Yes
|
No
|
| For
our affiliates’ everyday business purposes — information about your creditworthiness |
No
|
We
don’t share |
| For
our investment management affiliates to market to you |
Yes
|
Yes
|
| For
our affiliates to market to you |
No
|
We
don’t share |
| For
nonaffiliates to market to you |
No
|
We
don’t share |
To
limit our
sharing |
Call
toll-free 1-800-368-2745 or email: CRMPrivacy@calvert.comPlease note:If you are a new customer, we can begin sharing your information 30 days from the date we sent this notice. When you are no longer our customer, we continue to share your information as described in this notice. However, you can contact us at any time to limit our
sharing. |
| Questions?
|
Call
toll-free 1-800-368-2745 or email: CRMPrivacy@calvert.com |
| Privacy
Notice — continued |
April 2021
|
| Who
we are |
| Who
is providing this notice? |
Eaton
Vance Management, Eaton Vance Distributors, Inc., Eaton Vance Trust Company, Eaton Vance Management (International) Limited, Eaton Vance Advisers International Ltd., Eaton Vance Global Advisors Limited, Eaton Vance Management’s Real Estate
Investment Group, Boston Management and Research, Calvert Research and Management, Eaton Vance and Calvert Fund Families and our investment advisory affiliates (“Eaton Vance”) (see Investment Management Affiliates definition below)
|
| What
we do |
How
does Eaton Vance
protect my personal
information? |
To
protect your personal information from unauthorized access and use, we use security measures that comply with federal law. These measures include computer safeguards and secured files and buildings. We have policies governing the proper handling of
customer information by personnel and requiring third parties that provide support to adhere to appropriate security standards with respect to such information. |
How
does Eaton Vance
collect my personal
information? |
We
collect your personal information, for example, when you■ open an account or make deposits or withdrawals from your
account
■
buy securities from us or make a wire transfer
■
give us your contact informationWe also collect your personal information from others, such as credit bureaus, affiliates, or other companies. |
| Why
can’t I limit all sharing? |
Federal
law gives you the right to limit only■ sharing for affiliates’ everyday business purposes — information
about your creditworthiness
■
affiliates from using your information to market to you
■
sharing for nonaffiliates to market to youState laws and individual companies may give you additional rights
to limit sharing. See below for more on your rights under state law. |
| Definitions
|
Investment
Management
Affiliates |
Eaton
Vance Investment Management Affiliates include registered investment advisers, registered broker- dealers, and registered and unregistered funds. Investment Management Affiliates does not include entities associated with Morgan Stanley Wealth
Management, such as Morgan Stanley Smith Barney LLC and Morgan Stanley & Co. |
| Affiliates
|
Companies
related by common ownership or control. They can be financial and nonfinancial companies.■ Our affiliates include companies with a Morgan Stanley name and financial companies such as Morgan Stanley Smith Barney LLC and Morgan Stanley & Co. |
| Nonaffiliates
|
Companies
not related by common ownership or control. They can be financial and nonfinancial companies.■ Eaton Vance does not share with nonaffiliates so they can market to you. |
| Joint
marketing |
A
formal agreement between nonaffiliated financial companies that together market financial products or services to
you.■ Eaton Vance doesn’t jointly market. |
| Other
important information |
| Vermont:
Except as permitted by law, we will not share personal information we collect about Vermont residents with Nonaffiliates unless you provide us with your written consent to share such
information.California: Except as permitted by law, we will not share personal information we collect about California residents with Nonaffiliates and we will limit sharing
such personal information with our Affiliates to comply with California privacy laws that apply to us. |
Delivery of Shareholder Documents. The Securities and Exchange Commission (SEC) permits funds to deliver only one copy of shareholder documents, including prospectuses, proxy statements and shareholder reports, to fund investors with
multiple accounts at the same residential or post office box address. This practice is often called “householding” and it helps eliminate duplicate mailings to shareholders. Calvert funds, or your financial intermediary, may household the mailing of your documents indefinitely unless you instruct Calvert funds, or your financial intermediary, otherwise. If you would prefer that your Calvert fund documents not be householded, please contact Calvert funds at 1-800-368-2745, or contact your financial intermediary. Your instructions that householding not
apply to delivery of your Calvert fund documents will typically be effective within 30 days of receipt by Calvert funds or your financial intermediary.
Portfolio Holdings. Each Calvert fund files a schedule of portfolio holdings on Part F to Form N-PORT with the SEC. Certain information filed on Form N-PORT may be viewed on the Calvert website at www.calvert.com, by calling
Calvert at 1-800-368-2745 or in the EDGAR database on the SEC’s website at www.sec.gov.
Proxy Voting. The Proxy Voting Guidelines that each Calvert fund uses to determine how to vote proxies relating to portfolio securities is provided as an Appendix to the fund’s Statement of Additional Information.
The Statement of Additional Information can be obtained free of charge by calling the Calvert funds at 1-800-368-2745, by visiting the Calvert funds’ website at www.calvert.com or visiting the SEC’s website at www.sec.gov. Information
regarding how a Calvert fund voted proxies relating to portfolio securities during the most recent 12-month period ended June 30 is available by calling Calvert funds, by visiting the Calvert funds’ website at www.calvert.com or by visiting
the SEC’s website at www.sec.gov.
This Page Intentionally Left
Blank
Investment Adviser and Administrator
Calvert Research and Management
1825 Connecticut Avenue NW, Suite 400
Washington, DC 20009
Principal Underwriter*
Eaton Vance Distributors, Inc.
Two International Place
Boston, MA 02110
(617) 482-8260
Custodian
State Street Bank and Trust Company
State Street Financial Center, One Lincoln Street
Boston, MA 02111
Transfer Agent
DST Asset Manager Solutions, Inc.
2000 Crown Colony Drive
Quincy, MA 02169
Fund Offices
1825 Connecticut Avenue NW, Suite 400
Washington, DC 20009
* FINRA
BrokerCheck. Investors may check the background of their Investment Professional by contacting the Financial Industry Regulatory Authority (FINRA). FINRA BrokerCheck is a free tool to help investors check the professional background of
current and former FINRA-registered securities firms and brokers. FINRA BrokerCheck is available by calling 1-800-289-9999 and at www.FINRA.org. The FINRA BrokerCheck brochure describing this program is available to investors at www.FINRA.org.
Printed on recycled paper.
35354 3.31.22
Item 2. Code of Ethics.
Not required in this filing.
Item 3. Audit Committee
Financial Expert.
Not required in this filing.
Item 4. Principal Accountant Fees and Services.
Not
required in this filing.
Item 5. Audit Committee of Listed Registrants.
Not applicable.
Item 6. Schedule of Investments.
Please see schedule of investments contained in the Report to Shareholders included under Item 1 of this Form
N-CSR.
Item 7. Disclosure of Proxy Voting Policies and Procedures for
Closed-End Management Investment Companies.
Not applicable.
Item 8. Portfolio Managers of Closed-End Management Investment Companies.
Not applicable.
Item 9. Purchases of Equity Securities
by Closed-End Management Investment Company and Affiliated Purchasers.
Not applicable.
Item 10. Submission of Matters to a Vote of Security Holders.
No material changes.
Item 11. Controls and
Procedures.
(a) The registrant’s principal executive and principal financial officers have concluded that the registrant’s disclosure
controls and procedures (as defined in Rule 30a-3(c) under the Investment Company Act of 1940 Act, as amended (the “1940 Act”) are effective, based on the evaluation of these controls and procedures
required by Rule 30a-3(b) under the 1940 Act and Rules 13a-15(b) or 15d-15(b) under the Securities Exchange Act of 1934
(“Exchange Act”), as of a date within 90 days of the filing date of this report.
(b) There was no change in the registrant’s internal
control over financial reporting (as defined in Rule 30a-3(d) under the 1940 Act) that occurred during the period covered by this report that has materially affected, or is reasonably likely to materially
affect, the registrant’s internal control over financial reporting.
Item 12. Disclosure of Securities Lending Activities for Closed-End Management Investment Companies
Not applicable.
Item 13. Exhibits.
Signatures
Pursuant to the requirements of the Securities Exchange Act of 1934 and the Investment Company Act of 1940, the registrant has duly caused this report to be
signed on its behalf by the undersigned, thereunto duly authorized.
|
|
|
| Calvert World Values Fund, Inc. |
|
|
| By: |
|
/s/ John H. Streur |
|
|
John H. Streur |
|
|
President |
Date: May 24, 2022
Pursuant to the requirements of the Securities Exchange Act of 1934 and the Investment Company Act of 1940, this report has been signed below by the following
persons on behalf of the registrant and in the capacities and on the dates indicated.
|
|
|
| By: |
|
/s/ John H. Streur |
|
|
John H. Streur |
|
|
President |
Date: May 24, 2022
|
|
|
| By: |
|
/s/ James F. Kirchner |
|
|
James F. Kirchner |
|
|
Treasurer |
Date: May 24, 2022
Calvert World Values Fund, Inc.
Form N-CSR
Exhibit 13(a)(2)(i)
CERTIFICATION
I, John H. Streur, certify that:
1. I have
reviewed this report on Form N-CSR of Calvert World Values Fund, Inc.;
2. Based on my knowledge, this report does
not contain any untrue statement of a material fact or omit to state a material fact necessary to make the statements made, in light of the circumstances under which such statements were made, not misleading with respect to the period covered by
this report;
3. Based on my knowledge, the financial statements, and other financial information included in this report, fairly present in all material
respects the financial condition, results of operations, changes in net assets, and cash flows (if the financial statements are required to include a statement of cash flows) of the registrant as of, and for, the periods presented in this report;
4. The registrant’s other certifying officer(s) and I are responsible for establishing and maintaining disclosure controls and procedures (as
defined in Rule 30a-3(c) under the Investment Company Act of 1940) and internal control over financial reporting (as defined in Rule 30a-3(d) under the Investment
Company Act of 1940) for the registrant and have:
(a) Designed such disclosure controls and procedures, or caused such disclosure
controls and procedures to be designed under our supervision, to ensure that material information relating to the registrant, including its consolidated subsidiaries, is made known to us by others within those entities, particularly during the
period in which this report is being prepared;
(b) Designed such internal control over financial reporting, or caused such internal
control over financial reporting to be designed under our supervision, to provide reasonable assurance regarding the reliability of financial reporting and the preparation of financial statements for external purposes in accordance with generally
accepted accounting principles;
(c) Evaluated the effectiveness of the registrant’s disclosure controls and procedures and presented
in this report our conclusions about the effectiveness of the disclosure controls and procedures, as of a date within 90 days prior to the filing date of this report based on such evaluation; and
(d) Disclosed in this report any change in the registrant’s internal control over financial reporting that occurred during the period
covered by this report that has materially affected, or is reasonably likely to materially affect, the registrant’s internal control over financial reporting; and
5. The registrant’s other certifying officer(s) and I have disclosed to the registrant’s auditors and the audit committee of the registrant’s
board of directors (or persons performing the equivalent functions):
(a) All significant deficiencies and material weaknesses in the
design or operation of internal control over financial reporting which are reasonably likely to adversely affect the registrant’s ability to record, process, summarize, and report financial information; and
(b) Any fraud, whether or not material, that involves management or other employees who have a significant role in the registrant’s
internal control over financial reporting.
|
|
|
|
|
| Date: May 24, 2022 |
|
|
|
/s/ John H. Streur |
|
|
|
|
John H. Streur |
|
|
|
|
President |
Calvert World Values Fund, Inc.
Form N-CSR
Exhibit 13(a)(2)(ii)
CERTIFICATION
I, James F. Kirchner, certify that:
1. I have
reviewed this report on Form N-CSR of Calvert World Values Fund, Inc.;
2. Based on my knowledge, this report does
not contain any untrue statement of a material fact or omit to state a material fact necessary to make the statements made, in light of the circumstances under which such statements were made, not misleading with respect to the period covered by
this report;
3. Based on my knowledge, the financial statements, and other financial information included in this report, fairly present in all material
respects the financial condition, results of operations, changes in net assets, and cash flows (if the financial statements are required to include a statement of cash flows) of the registrant as of, and for, the periods presented in this report;
4. The registrant’s other certifying officer(s) and I are responsible for establishing and maintaining disclosure controls and procedures (as
defined in Rule 30a-3(c) under the Investment Company Act of 1940) and internal control over financial reporting (as defined in Rule 30a-3(d) under the Investment
Company Act of 1940) for the registrant and have:
(a) Designed such disclosure controls and procedures, or caused such disclosure
controls and procedures to be designed under our supervision, to ensure that material information relating to the registrant, including its consolidated subsidiaries, is made known to us by others within those entities, particularly during the
period in which this report is being prepared;
(b) Designed such internal control over financial reporting, or caused such internal
control over financial reporting to be designed under our supervision, to provide reasonable assurance regarding the reliability of financial reporting and the preparation of financial statements for external purposes in accordance with generally
accepted accounting principles;
(c) Evaluated the effectiveness of the registrant’s disclosure controls and procedures and presented
in this report our conclusions about the effectiveness of the disclosure controls and procedures, as of a date within 90 days prior to the filing date of this report based on such evaluation; and
(d) Disclosed in this report any change in the registrant’s internal control over financial reporting that occurred during the period
covered by this report that has materially affected, or is reasonably likely to materially affect, the registrant’s internal control over financial reporting; and
5. The registrant’s other certifying officer(s) and I have disclosed to the registrant’s auditors and the audit committee of the registrant’s
board of directors (or persons performing the equivalent functions):
(a) All significant deficiencies and material weaknesses in the
design or operation of internal control over financial reporting which are reasonably likely to adversely affect the registrant’s ability to record, process, summarize, and report financial information; and
(b) Any fraud, whether or not material, that involves management or other employees who have a significant role in the registrant’s
internal control over financial reporting.
|
|
|
|
|
| Date: May 24, 2022 |
|
|
|
/s/ James F. Kirchner |
|
|
|
|
James F. Kirchner |
|
|
|
|
Treasurer |
Form N-CSR Item 13(b) Exhibit
CERTIFICATION PURSUANT TO
18
U.S.C. SECTION 1350,
AS ADOPTED PURSUANT TO
SECTION 906 OF THE SARBANES-OXLEY ACT OF 2002
The undersigned hereby certify in their capacity as President and Treasurer, respectively, of Calvert World Values Fund, Inc. (the “Corporation”),
that:
| |
(a) |
the Semiannual Report of the Corporation on Form N-CSR for the period
ended March 31, 2022 (the “Report”) fully complies with the requirements of Section 13(a) or 15(d) of the Securities Exchange Act of 1934, as amended; and |
| |
(b) |
the information contained in the Report fairly presents, in all material respects, the financial condition and
the results of operations of the Corporation for such period. |
A signed original of this written statement required by section
906 has been provided to the Corporation and will be retained by the Corporation and furnished to the Securities and Exchange Commission or its staff upon request.
Calvert World Values Fund, Inc.
Date: May 24,
2022
|
| /s/ John H. Streur |
| John H. Streur |
| President |
Date: May 24, 2022
|
| /s/ James F. Kirchner |
| James F. Kirchner |
| Treasurer |