| Lithium Americas Corp. Feasibility Study, National Instrument 43-101 Technical Report for the Thacker Pass Project, Humboldt County, Nevada, USA |
Date and Signatures Page
The effective date of this report is November 2, 2022. The report issuance date is January 31, 2023. The Qualified Persons (QPs) do not believe that material changes have occurred with the assumptions or base data from the effective dates to the report's date of issuance. See Appendix A, Feasibility Study Contributors and Professional Qualifications, for certificates of qualified persons. These certificates are considered the date and signature of this report in accordance with Form 43-101F1.
 |
Page ii |
| Lithium Americas Corp. Feasibility Study, National Instrument 43-101 Technical Report for the Thacker Pass Project, Humboldt County, Nevada, USA |
Table of Contents
| Date and Signatures Page | ii |
| Table of Contents | iii |
| List of Figures and Illustrations | vii |
| List of Tables | x |
| 1 Summary | 1 |
| 1.1 Introduction | 1 |
| 1.2 Property Location, Description and Ownership | 1 |
| 1.3 Geology | 1 |
| 1.4 Deposit Types | 2 |
| 1.5 Exploration | 2 |
| 1.6 Drilling | 2 |
| 1.7 Sample Preparation, Analyses and Security | 3 |
| 1.8 Data Verification | 3 |
| 1.9 Metallurgical Testing | 4 |
| 1.10 Mineral Resources and Reserves | 5 |
| 1.11 Mine Methods | 6 |
| 1.12 Recovery Methods | 7 |
| 1.13 Infrastructure | 8 |
| 1.14 Market Studies and Contracts | 9 |
| 1.15 Capital and Operating Costs | 10 |
| 1.16 Financial Model | 12 |
| 1.17 Conclusions and Recommendations | 13 |
| 2 Introduction and Terms of Reference | 16 |
| 2.1 Sources of Information | 16 |
| 2.2 Description of Personal Inspections | 19 |
| 2.3 Units, Currency and Terms of Reference | 21 |
| 3 Reliance on Other Experts | 26 |
| 4 Property Description and Location | 27 |
| 4.1 Property Description | 27 |
| 4.2 Mineral Tenure | 30 |
| 4.3 Nature and Extent of Interest and Title | 32 |
| 4.4 Royalties, Rights and Payments | 33 |
| 4.5 Environmental Liabilities | 33 |
| 4.6 Permitting | 33 |
| 4.7 Other Factors or Risks | 34 |
| 4.8 Conclusions | 34 |
| 5 Accessibility, Climate, Local Resources, Infrastructure, and Physiography | 35 |
| 5.1 Physiography | 35 |
| 5.2 Accessibility | 35 |
| 5.3 Climate | 35 |
| 5.4 Local Resources | 37 |
| 5.5 Infrastructure | 37 |
| 5.6 Water Rights | 38 |
| 6 History | 39 |
| 6.1 Ownership History | 39 |
| 6.2 Exploration History | 39 |
 |
Page iii |
| Lithium Americas Corp. Feasibility Study, National Instrument 43-101 Technical Report for the Thacker Pass Project, Humboldt County, Nevada, USA |
| 6.3 Historic Production from the Property | 40 |
| 7 Geological Setting and Mineralization | 41 |
| 7.1 Regional Geology | 41 |
| 7.2 Geologic History of the McDermitt Caldera | 42 |
| 7.3 Mineralization | 44 |
| 8 Deposit Types | 49 |
| 8.1 Lithium Mineralization | 49 |
| 8.2 Basis of Exploration | 49 |
| 9 Exploration | 51 |
| 9.1 Thacker Pass | 51 |
| 9.2 Additional Exploration | 53 |
| 10 Drilling | 54 |
| 10.1 Type and Extent of Drilling by LAC | 54 |
| 10.2 Additional Drilling in Thacker Pass Deposit | 58 |
| 10.3 Surveying | 59 |
| 10.4 Accuracy and Reliability of Drilling Results | 59 |
| 11 Sample Preparation, Analyses, and Security | 60 |
| 11.1 LAC Site Sample Preparation | 60 |
| 11.2 Laboratory Sample Preparation | 61 |
| 11.3 Analysis | 62 |
| 11.4 Density | 62 |
| 11.5 Quality Control | 67 |
| 11.6 Qualified Person Statement | 73 |
| 12 Data Verification | 74 |
| 12.1 Site Inspection | 74 |
| 12.2 Data Verification Procedures | 76 |
| 12.3 Drill Core and Geologic Logs | 76 |
| 12.4 Verification of Drill Hole Survey | 76 |
| 12.5 Verification of Analytical Data | 79 |
| 12.6 Geological and Block Modelling | 79 |
| 12.7 Mine Design and LOM Plan | 80 |
| 12.8 Data Adequacy | 81 |
| 13 Mineral Processing and Metallurgical Testing | 82 |
| 13.1 Ore Collection for Metallurgical Testing | 82 |
| 13.2 Metallurgical Test Work by Area | 88 |
| 13.3 Beneficiation and Leaching Variability Study | 113 |
| 13.4 Specific Gravity | 116 |
| 13.5 Metallurgical Test Work Conclusions | 117 |
| 14 Mineral Resource Estimates | 118 |
| 14.1 Thacker Pass Deposit | 118 |
| 14.2 Comments | 145 |
| 15 Mineral Reserve Estimates | 146 |
| 15.1 Pit Optimization | 146 |
| 15.2 Mineral Reserves and Cutoff Grade | 148 |
| 15.3 Waste | 150 |
| 15.4 Stripping Ratio | 150 |
| 15.5 Mineral Reserve Estimate - EIS Pit | 151 |
|
Page iv |
| Lithium Americas Corp. Feasibility Study, National Instrument 43-101 Technical Report for the Thacker Pass Project, Humboldt County, Nevada, USA |
| 15.6 Comments | 151 |
| 16 Mining Methods | 152 |
| 16.1 Pit Design | 152 |
| 16.2 Mine Plan | 153 |
| 16.3 Mining Operations | 162 |
| 16.4 Equipment Selection | 164 |
| 16.5 Personnel Requirements | 166 |
| 16.6 Fuel | 167 |
| 16.7 Drilling and Blasting | 167 |
| 16.8 Dewatering | 169 |
| 17 Recovery Methods | 170 |
| 17.1 General Description | 170 |
| 17.2 Process Design Criteria | 172 |
| 17.3 Process Description | 176 |
| 17.4 Reagents | 182 |
| 17.5 Plant Water | 185 |
| 17.6 Power | 186 |
| 17.7 Air Service | 187 |
| 17.8 Quality Control | 188 |
| 17.9 Sampling | 188 |
| 17.10 Auxiliary Systems | 188 |
| 17.11 Process Control Philosophy | 189 |
| 18 Project Infrastructure | 190 |
| 18.1 Overall Site General Arrangement | 190 |
| 18.2 Process Plant General Arrangement | 190 |
| 18.3 Reagents, Consumables and Shipping | 191 |
| 18.4 Ancillary Buildings | 191 |
| 18.5 Site Access | 193 |
| 18.6 Raw Material Logistics | 195 |
| 18.7 Power Supply | 196 |
| 18.8 Sulfuric Acid Production | 202 |
| 18.9 Water Supply | 203 |
| 18.10 Waste Rock and Tailings | 204 |
| 19 Market Studies and Contracts | 208 |
| 19.1 2021 and 2022 Synopsis | 208 |
| 19.2 Supply and Demand Forecast | 208 |
| 19.3 Pricing | 209 |
| 19.4 Pricing Forecast | 209 |
| 19.5 Contracts | 210 |
| 19.6 Qualified Person Statement | 210 |
| 20 Environmental Studies, Permitting, and Social or Community Impact | 211 |
| 20.1 Introduction | 211 |
| 20.2 Permitting Pre-Planning Process | 211 |
| 20.3 Federal, State, and Local Regulatory Permitting Requirements | 213 |
| 20.4 Summary Schedule for Permitting, Approvals, and Construction | 217 |
| 20.5 Current Permitting Status | 217 |
| 20.6 Community Engagement | 217 |
| 20.7 Environmental Baseline Studies | 220 |
| 20.8 Waste Rock, Gangue, and Tailings Facility Management | 228 |
| 20.9 Social or Community Impacts | 230 |
| 20.10 Mine Reclamation and Closure | 231 |
|
Page v |
| Lithium Americas Corp. Feasibility Study, National Instrument 43-101 Technical Report for the Thacker Pass Project, Humboldt County, Nevada, USA |
| 21 Capital and Operating Costs | 233 |
| 21.1 Capital Cost Estimate | 233 |
| 21.2 Sustaining Capital Costs | 244 |
| 21.3 Operating Cost Estimate | 247 |
| 22 Economic Analysis | 262 |
| 22.1 Introduction | 262 |
| 22.2 Methodology | 262 |
| 22.3 Input Data | 263 |
| 22.4 Cash Flow | 269 |
| 22.5 Sensitivity Analysis | 273 |
| 23 Adjacent Properties | 276 |
| 24 Other Relevant Data and Information | 277 |
| 24.1 Project Execution Plan | 277 |
| 24.2 Limestone Quarry | 280 |
| 24.3 Transload Facility | 285 |
| 25 Interpretation and Conclusions | 290 |
| 25.1 Mineral Resource and Mineral Reserve Estimate | 290 |
| 25.2 Mining | 290 |
| 25.3 Infrastructure | 291 |
| 25.4 Environment | 291 |
| 25.5 Economics | 291 |
| 25.6 Metallurgy | 292 |
| 26 Recommendations | 295 |
| 26.1 Environmental Permitting | 295 |
| 26.2 Mining | 295 |
| 26.3 Exploration | 295 |
| 26.4 Metallurgical Testing | 296 |
| 26.5 Infrastructure | 298 |
| 26.6 Limestone Quarry | 298 |
| 26.7 Execution Strategy Impact | 298 |
| 27 References | 300 |
| Appendix A - Certificates of Qualified Persons | 309 |
|
Page vi |
| Lithium Americas Corp. Feasibility Study, National Instrument 43-101 Technical Report for the Thacker Pass Project, Humboldt County, Nevada, USA |
List of Figures and Illustrations
| Figure 1-1 | Overall Site General Arrangement | 8 |
| Figure 4-1 | Regional Location Map | 28 |
| Figure 4-2 | Map of Lithium Americas Corp. Mineral and Surface Control in the Vicinity of the Thacker Pass Project | 29 |
| Figure 5-1 | Photograph of the On-Site Meteorological Station, Including Tower, Solar Power Station, and Security Fence | 36 |
| Figure 7-1 | Regional Map Showing the Location of the McDermitt Caldera in the Western US | 42 |
| Figure 7-2 | Simplified Geological Map of the Southern Portion of the McDermitt Caldera and the Thacker Pass Project | 43 |
| Figure 7-3 | Interpreted and Simplified Sample Log for Drill Hole WLC-043, Li Assay Data, Alteration Phases Identified by X-ray Diffraction, and Thin Section Imagery | 45 |
| Figure 7-4 | Assay Lithium Content Plotted Against Clay X-Ray Diffraction Data from Drill Holes WLC-043, WLC-006, and WLC-067 | 47 |
| Figure 9-1 | Locations of Seismic Surveys Conducted in 2017 | 52 |
| Figure 9-2 | Results from one of the Seismic Test Lines (A-A') | 53 |
| Figure 10-1 | Drill Hole Map of Thacker Pass Deposit | 56 |
| Figure 10-2 | Photograph of Core after Geologic Logging | 57 |
| Figure 11-1 | Half Core Sawed by a Diamond Blade | 60 |
| Figure 11-2 | Workflow Diagram for Geological Samples | 61 |
| Figure 11-3 | Dry Bulk Density Sample Locations | 65 |
| Figure 11-4 | Smectite, Mixed Zone and Illite Dry Bulk Density Histogram from MacTec (2008), AMEC (2011), WLC (2010-2011), ALS (2010-2011), and BARR (2019) Geotech Studies | 66 |
| Figure 11-5 | LAC Blank Results | 68 |
| Figure 11-6 | LAC Drilling QA/QC Results (4,230 Li Standard) | 70 |
| Figure 11-7 | LAC Drilling QA/QC Results (3,378 Li Standard) | 71 |
| Figure 11-8 | LAC Drilling Duplicate Results | 72 |
| Figure 12-1 | Site Inspection Pictures | 75 |
| Figure 12-2 | Drill Hole Verification Locations | 78 |
| Figure 12-3 | Independent Verification of Lithium Grades Distribution | 79 |
| Figure 13-1 | Bulk sample drill hole locations (WLC-202, WLC-204, WLC-197, WLC-136, WLC-112 and WLC-118) | 84 |
| Figure 13-2 | Bulk material sampling | 85 |
| Figure 13-3 | Sample Locations for Leach Variability Study | 87 |
| Figure 13-4 | Lithium distribution in clay and gangue (SHRIMP analysis) | 89 |
| Figure 13-5 | Smectite and illite fines separation in a pilot crossflow separator | 92 |
| Figure 13-6 | PSD's and partition coefficients of illite and smectite in the hydraulic classifier | 93 |
| Figure 13-7 | Pilot decanter centrifuge results | 95 |
| Figure 13-8 | Large Scale Beneficiation Pilot Plant Process Flow Diagram | 97 |
|
Page vii |
| Lithium Americas Corp. Feasibility Study, National Instrument 43-101 Technical Report for the Thacker Pass Project, Humboldt County, Nevada, USA |
| Figure 13-9 | Log Washer and Attrition Scrubber | 98 |
| Figure 13-10 | Primary Cyclone, Hydraulic Classifier and Dewatering Screen | 98 |
| Figure 13-11 | Thickener and Decanter Centrifuge | 99 |
| Figure 13-12 | Coarse Gangue Rejection | 100 |
| Figure 13-13 | Campaign #3 Thickener Underflow (50% Smectite / 50% Illite) | 101 |
| Figure 13-14 | Large batch lithium leach extraction, Li ≥ 2,500 ppm, 05 acid dose | 102 |
| Figure 13-15 | Actual lithium leach extraction percentage vs model prediction | 103 |
| Figure 13-16 | Continuous v batch lithium leach extraction | 104 |
| Figure 13-17 | Lithium leach kinetics at various temperatures | 104 |
| Figure 13-18 | Lithium leach extractions for 75 µm and 38 µm particle sizes | 105 |
| Figure 13-19 | Local CaCO3 & vendor purchased comparison of pH vs limestone addition | 107 |
| Figure 13-20 | Pilot membrane filter press and resultant filter cake | 108 |
| Figure 13-21 | Wash consumption vs lithium wash recovery tests | 109 |
| Figure 13-22 | Dynamic Thickener Testing at FLSmidth | 110 |
| Figure 13-23 | Calculated Versus Measured Head Grade for Leach Testing | 114 |
| Figure 13-24 | Ore Depth (m) Versus Li Extraction (%) | 115 |
| Figure 13-25 | Mine Plan Year Versus Li Extraction (%) | 115 |
| Figure 13-26 | Comparison of Measured Versus Predicted Extraction | 116 |
| Figure 14-1 | Drilling Utilized for the Resource Estimate | 119 |
| Figure 14-2 | Seven Fault Blocks Zones Used for Grade Estimation for the Thacker Pass Deposit | 121 |
| Figure 14-3 | Lithological Cross-Sectional Views | 122 |
| Figure 14-4 | Histogram of Native Lithium Grade Versus Composited Database Lithium Grade | 125 |
| Figure 14-5 | Mineralized Zone Cross-Sections | 126 |
| Figure 14-6 | Histogram of Composited Database Lithium Grade Versus Cell Declustered Lithium Grade | 127 |
| Figure 14-7 | Block B, C, D, E, F, and G Omnidirectional Variograms in the Sub-Horizontal Plane and Downhole Variogram | 129 |
| Figure 14-8 | Ordinary Kriged Model vs Composited Declustered Database Histogram | 133 |
| Figure 14-9 | Scatter Plot of Lithium from the Block Model Versus the Composited Database | 134 |
| Figure 14-10 | HERCO Plots by Domain | 135 |
| Figure 14-11 | Swath Plot Comparison of Lithium Grades | 137 |
| Figure 14-12 | Histogram Distance to Sample | 140 |
| Figure 14-13 | Histogram Number of Holes | 141 |
| Figure 14-14 | Histogram Number of Samples | 142 |
| Figure 14-15 | Classified Resource Block Model | 143 |
| Figure 14-16 | Cross-Sectional View of Classified Block Model | 144 |
| Figure 15-1 | EIS Pit Shell | 147 |
| Figure 16-1 | Highwall Angles | 153 |
|
Page viii |
| Lithium Americas Corp. Feasibility Study, National Instrument 43-101 Technical Report for the Thacker Pass Project, Humboldt County, Nevada, USA |
| Figure 16-2 | Kilograms of Lithium Recovered per tonne of ROM Feed at Initial Cut | 154 |
| Figure 16-3 | Initial Cut | 156 |
| Figure 16-4 | Five Year Advance (Including Cross Pit Ramps) | 157 |
| Figure 16-5 | 10 Year Advance | 158 |
| Figure 16-6 | 20 Year Advance | 159 |
| Figure 16-7 | 30 Year Advance | 160 |
| Figure 16-8 | 40 Year Advance | 161 |
| Figure 16-9 | Basalt and tuff zones near the pit area | 168 |
| Figure 17-1 | Overall Simplified Process Flowsheet | 171 |
| Figure 18-1 | Overall Site General Arrangement | 190 |
| Figure 18-2 | Process Facility General Arrangement (Phase 1 Only) | 192 |
| Figure 18-3 | Site Entrances | 193 |
| Figure 18-4 | Route Junction Satellite View | 194 |
| Figure 18-5 | Thacker Pass Water Supply System | 204 |
| Figure 18-6 | CTFS Conceptual Design | 207 |
| Figure 19-1 | Lithium market balance 2020-2040 | 209 |
| Figure 20-1 | Plan of Operations and Exploration Area Permitted Boundaries | 212 |
| Figure 21-1 | Raw Materials Cost (40-Year LOM - Base Case) | 251 |
| Figure 21-2 | Raw Materials Cost (Years 1-25 of 40-Year LOM) | 252 |
| Figure 21-3 | Distribution of mining and tailings management Operational Cost (40-Year LOM - Base Case) | 257 |
| Figure 21-4 | Distribution of mining and tailings management Operational Cost (Years 1-25 of 40-Year LOM Case) | 257 |
| Figure 22-1 | Total Mined, Ore Processed and Lithium Carbonate Production by Year | 267 |
| Figure 22-2 | Total Annual Revenue by Year | 268 |
| Figure 22-3 | Undiscounted Annual Cash Flow | 270 |
| Figure 22-4 | Cumulative Discounted Cash Flow | 270 |
| Figure 22-5 | Sensitivity Analysis of Various Variables, After-Tax NPV, 8% Discount Rate | 273 |
| Figure 22-6 | Sensitivity Analysis of Various Variables, After-Tax IRR, 8% Discount Rate | 274 |
| Figure 24-1 | Limestone Quarry pit outline | 282 |
| Figure 24-2 | Limestone Quarry cross section A-A' | 283 |
| Figure 24-3 | Transload Facility Site General Arrangement | 287 |
|
Page ix |
| Lithium Americas Corp. Feasibility Study, National Instrument 43-101 Technical Report for the Thacker Pass Project, Humboldt County, Nevada, USA |
List of Tables
| Table 1-1 | LAC Drill Holes Provided in Current Database for the Thacker Pass Deposit | 3 |
| Table 1-2 | Mineral Resources Estimate as of November 2, 2022 | 5 |
| Table 1-3 | Mineral Reserves Estimate as of November 02, 2022 | 6 |
| Table 1-4 | Development Capital Cost Estimate Summary | 10 |
| Table 1-5 | 40-Year LOM Sustaining Capital Estimate Summary (Base Case) | 11 |
| Table 1-6 | First 25 Years of 40-Year LOM Sustaining Capital Estimate Summary | 11 |
| Table 1-7 | Operating Cost Estimate Summary (40-Year LOM - Base Case) | 11 |
| Table 1-8 | Operating Cost Estimate Summary (Years 1-25 of 40-Year LOM Case) | 12 |
| Table 1-9 | Production Scenario (40-Year LOM - Base Case) | 12 |
| Table 1-10 | Production Scenario - (Years 1-25 of 40-Year LOM Case) | 12 |
| Table 1-11 | Economic Evaluation - Lithium Carbonate Plant (40 Year LOM - Base Case) | 13 |
| Table 1-12 | Economic Evaluation - Lithium Carbonate Plant (Years 1-25 of 40-Year LOM Case) | 13 |
| Table 2-1 | List of Qualified Persons, Professional Designations and Site Visit Dates | 16 |
| Table 2-2 | Qualified Person Areas of Responsibility | 17 |
| Table 2-3 | Previously Filed Technical Reports | 18 |
| Table 2-4 | Abbreviations and Acronyms | 21 |
| Table 4-1 | Thacker Pass Project UM Claims Owned by LAC | 30 |
| Table 5-1 | Annual Precipitation at the Thacker Pass Project Site (in cm) | 37 |
| Table 7-1 | Chemical Analyses of Thacker Pass Smectite and Illite Clay Concentrates | 48 |
| Table 10-1 | LAC Drill Holes Provided in Current Database for the Thacker Pass Deposit | 54 |
| Table 11-1 | Bulk Density Sampling Program Summary by Lithology | 64 |
| Table 11-2 | Average Density Values | 66 |
| Table 12-1 | Drill Hole Survey Verification | 77 |
| Table 13-1 | Corresponding hole locations, depths and bulk bags collected | 83 |
| Table 13-2 | Bulk bags used for metallurgical testing | 85 |
| Table 13-3 | Samples for Variability Study | 88 |
| Table 13-4 | Summary of materials characterization testing (FLSmidth) | 89 |
| Table 13-5 | Attrition Scrubbing Test by LAC | 90 |
| Table 13-6 | Li and mass distribution of 50/50 clay slurry blend post attrition scrubbing, "intense" vs "mild + intense" | 91 |
| Table 13-7 | Process design criteria for classification, 75µm separation size, 70/30 illite/smectite blend | 91 |
| Table 13-8 | Solid-Liquid Separation test results 50/50 illite/smectite blend | 94 |
| Table 13-9 | Campaign 1 to 3 Material Balance Results | 99 |
| Table 13-10 | Campaign 4 Material Balance Results | 100 |
| Table 13-11 | Lithium leach % extraction of illite and smectite vs sulfuric acid dose | 101 |
|
Page x |
| Lithium Americas Corp. Feasibility Study, National Instrument 43-101 Technical Report for the Thacker Pass Project, Humboldt County, Nevada, USA |
| Table 13-12 | Lithium extractions for various acid dose scenarios | 102 |
| Table 13-13 | Lithium leach extractions of various 70/30 illite/smectite blends | 103 |
| Table 13-14 | Limestone purity analysis of local grab samples | 105 |
| Table 13-15 | CaCO3 consumption to achieve pH 35 in neutralization slurry | 106 |
| Table 13-16 | Data for neutralization batches using CaCO3 and Mg Precipitation solids | 108 |
| Table 13-17 | SNF Maximum Thickener Underflow Operating Density | 109 |
| Table 13-18 | Variability Study Leach Parameters | 114 |
| Table 13-19 | Specific Gravity Ranges | 116 |
| Table 14-1 | Drill Holes Used in the Grade Estimation Model | 118 |
| Table 14-2 | Native Samples Statistics | 123 |
| Table 14-3 | Block Model Origin | 124 |
| Table 14-4 | Composite Samples Statistics | 124 |
| Table 14-5 | Variogram Summary | 128 |
| Table 14-6 | Average Density Values Used in the Resource Model | 133 |
| Table 14-7 | Cutoff Grade Inputs | 138 |
| Table 14-8 | Pit Optimizer Parameters | 138 |
| Table 14-9 | Resource Classification | 142 |
| Table 14-10 | Mineral Resources Estimate as of November 2, 2022 | 145 |
| Table 15-1 | Pit Optimizer Parameters | 146 |
| Table 15-2 | Lithium Losses | 150 |
| Table 15-3 | Mineral Reserves Estimate as of November 02, 2022 | 151 |
| Table 16-1 | Pit Geometry | 152 |
| Table 16-2 | Waste Material | 162 |
| Table 16-3 | Mine Quantities Summary (tonnes in millions unless noted) | 163 |
| Table 16-4 | 5-Year Average Mine Quantities Summary (tonnes in millions unless noted) (Continued) | 164 |
| Table 16-5 | Major Equipment Specifications | 165 |
| Table 16-6 | Support Equipment | 165 |
| Table 16-7 | Scheduled Hours by Fleet | 166 |
| Table 16-8 | Personnel List | 166 |
| Table 17-1 | Process Design Criteria - Beneficiation through Neutralized Tailing | 172 |
| Table 17-2 | Process Design Criteria - Purification Plant | 173 |
| Table 17-3 | Major Process Equipment - Beneficiation/Classification/Filtering | 174 |
| Table 17-4 | Major Process Equipment - Purification Process | 175 |
| Table 17-5 | Reagent Consumption (40-Year LOM - Base Case) | 184 |
| Table 17-6 | Reagent Consumption (First 25 Years of 40-Year Case) | 184 |
| Table 17-7 | Plant Water Use | 185 |
|
Page xi |
| Lithium Americas Corp. Feasibility Study, National Instrument 43-101 Technical Report for the Thacker Pass Project, Humboldt County, Nevada, USA |
| Table 17-8 | Steam Use | 185 |
| Table 17-9 | Power Demand by Area (based on Equipment List for DFS Load Study (Rev N, supplied by ITAC) | 186 |
| Table 17-10 | Metallurgical Accounting Sampler Summary, Major Process Inlets/Outlets | 188 |
| Table 17-11 | Process Control Sampler Summary | 188 |
| Table 18-1 | Life of Mine Primary Raw Material Logistics Scheme | 195 |
| Table 18-2 | System Voltages | 198 |
| Table 18-3 | Motor Voltages | 198 |
| Table 18-4 | Electrical Load Breakdown | 199 |
| Table 18-5 | Electrical Load Generation vs Import | 199 |
| Table 18-6 | Project Power Demands | 200 |
| Table 18-7 | Design and Requirement Volumes for Stockpiles and Facilities (Millions of Cubic Yards) | 205 |
| Table 19-1 | Lithium Price Forecast (Q3 2022) | 210 |
| Table 20-1 | Key Community Engagement Summary | 217 |
| Table 20-2 | Summary of Background Groundwater Profile 1 Exceedances | 224 |
| Table 21-1 | Development Capital Cost Estimate Summary | 234 |
| Table 21-2 | Sustaining Capital Estimate Summary (40-Year LOM - Base Case) | 234 |
| Table 21-3 | First 25 Years of 40-Year LOM Sustaining Capital Estimate Summary | 235 |
| Table 21-4 | Capital Cost Spend Schedule | 236 |
| Table 21-5 | Capital Cost Summary by Phase and Area | 237 |
| Table 21-6 | Work Breakdown Structure and Associated Responsibilities | 238 |
| Table 21-7 | Composite Trade Labor Rates | 240 |
| Table 21-8 | Owner's Cost Summary | 243 |
| Table 21-9 | Summary of Sustaining Capital Costs for Mine, Plant, and Sulfuric Acid Plant ($M) | 245 |
| Table 21-10 | CTFS and CGS Expansion Area and Costs | 246 |
| Table 21-11 | Reclamation Costs | 246 |
| Table 21-12 | Lithium Americas Labor Requirements and Average Annual Cost Summary (40-Year Base Case) | 248 |
| Table 21-13 | Raw Material Purchase and Delivered Pricing | 249 |
| Table 21-14 | Raw Material Annual Consumption (40-Year LOM Base Case) | 250 |
| Table 21-15 | Raw Material Annual Consumption (Years 1-25 of 40 Year LOM) | 250 |
| Table 21-16 | Average Annual Power Cost (40 Year LOM - Base Case) | 252 |
| Table 21-17 | Average Annual Power Cost (Years 1 to 25 of 40 Year LOM) | 252 |
| Table 21-18 | Factored Maintenance Annual Allowances | 253 |
| Table 21-19 | General and Administrative Costs (40 Year LOM - Base Case) | 253 |
| Table 21-20 | General and Administrative Costs (Years 1 to 25 of 40 Year LOM) | 254 |
| Table 21-21 | Mining and Clay Tailings Operating Cost Estimate (40-Year LOM Base Case) | 256 |
|
Page xii |
| Lithium Americas Corp. Feasibility Study, National Instrument 43-101 Technical Report for the Thacker Pass Project, Humboldt County, Nevada, USA |
| Table 21-22 | Mining and Clay Tailings Operating Cost Estimate (Years 1-25 of 40 Year LOM) | 256 |
| Table 21-23 | Battery Limits for Mining Contractor Operating Cost Estimate | 258 |
| Table 21-24 | Clay and Salt Tailings Battery Limits | 258 |
| Table 21-25 | Mining Estimation Methodology | 259 |
| Table 21-26 | Average Lithium Process Operating Costs (40 Year LOM - Base Case) | 259 |
| Table 21-27 | Average Lithium Process Operating Costs (Years 1-25 of 40 Year LOM) | 260 |
| Table 21-28 | Average Sulfuric Acid Plant Operating Costs (40 Year LOM - Base Case) | 260 |
| Table 21-29 | Average Sulfuric Acid Plant Operating Costs (Years 1-25 of 40 Year LOM) | 260 |
| Table 21-30 | Project Operating Cost Summary (Years 1-40 Life of Mine - Base Case) | 261 |
| Table 21-31 | Project Operating Cost Summary (Years 1-25 of 40 Year LOM) | 261 |
| Table 22-1 | Initial Capital Costs Summary | 265 |
| Table 22-2 | Sustaining Capital Summary | 266 |
| Table 22-3 | Operating Costs Summary (40-Year LOM - Base Case) | 266 |
| Table 22-4 | Operating Costs Summary (Years 1-25 of 40 Year LOM) | 266 |
| Table 22-5 | Average Production Values (40 Year/Base Case) | 267 |
| Table 22-6 | Average Production Values (Years 1-25 of 40-Year LOM) | 267 |
| Table 22-7 | Total Annual Production and Revenue (40 Year LOM - Base Case) | 268 |
| Table 22-8 | Total Annual Production and Revenue (Years 1-25 of 40 Year LOM) | 268 |
| Table 22-9 | After-Tax Financial Model Results (40 Year LOM - Base Case) | 271 |
| Table 22-10 | After-Tax Financial Model Results (Years 1-25 of 40 Year LOM) | 271 |
| Table 22-11 | Financial Model | 272 |
| Table 22-12 | After-Tax NPV at 8% ($ Millions) and IRR | 274 |
| Table 22-13 | NPV for Various Discount Rates (40-Year LOM) | 275 |
| Table 24-1 | Overview Schedule | 279 |
| Table 24-2 | Delivered Limestone tonnes (LS) | 280 |
| Table 24-3 | Delivered and ROM tonnes | 281 |
| Table 24-4 | Pit shell material quantities and quality | 283 |
| Table 24-5 | Limestone Delivery Cost per tonne | 284 |
|
Page xiii |
| Lithium Americas Corp. Feasibility Study, National Instrument 43-101 Technical Report for the Thacker Pass Project, Humboldt County, Nevada, USA |
1 Summary
1.1 Introduction
Lithium Nevada Corp. (LNC), a wholly owned subsidiary of Lithium Americas Corp. (LAC), is advancing the Thacker Pass Project (hereafter referred to as "the Project"), which was formerly known as the Lithium Nevada Project or Stage I of the Kings Valley Lithium Project. The Project is 100% owned by LNC. The terms "LNC" and "LAC" are used throughout the report to denote the owner of the Project.
The Project encompasses the mineral claims that were formerly referred to as the Stage I area of the Kings Valley Lithium Project and includes lithium (Li) claystone mining at the Thacker Pass Deposit. This Technical Report presents the results of a Feasibility Study evaluation of the Project.
M3 Engineering & Technology Corporation (M3) was commissioned by LAC to prepare this Technical Report. In preparing this Report, M3 has relied upon input from LAC and information prepared by a number of qualified independent consulting groups particularly regarding regional geology, geological mapping, exploration, and resource estimation. See Section 2 for a full discussion of contributors to this study.
The economic analysis is based on Q3 2022 pricing for capital and operating costs.
1.2 Property Location, Description and Ownership
The Project is located in Humboldt County in northern Nevada, approximately 100 kilometers (km) north-northwest of Winnemucca, approximately 33 km west-northwest of Orovada, Nevada, and 33 km due south of the Oregon border. It is situated within 44 North (T44N), Range 34 East (R34E), and within portions of Sections 1 and 12; T44N, R35E within portions of Sections 2, 3, 4, 5, 6, 7, 8, 9, 10, 11, 12, 13, 14, 15, 16, and 17; and T44N, R36E, within portions of Sections 7, 8, 14, 15, 16, 17, 18, 19, 20, 21, 22, 23, and 29, and encompasses approximately 4,236 hectares (ha).
Section 6 of this Technical Report further describes the history of the Project, and Section 1.1 also describes ownership in brief.
1.3 Geology
The Project is located within an extinct 40x30 km supervolcano named McDermitt Caldera, which was formed approximately 16.3 million years ago (Ma) as part of a hotspot currently underneath the Yellowstone Plateau. Following an initial eruption and concurrent collapse of the McDermitt Caldera, a large lake formed in the caldera basin. This lake water was extremely enriched in lithium and resulted in the accumulation of lithium-rich clays.
Late volcanic activity uplifted the caldera, draining the lake and bringing the lithium-rich moat sediments to the surface resulting in the near-surface lithium deposit which is the subject of the Project.
The Thacker Pass Deposit sits sub-horizontally beneath a thin alluvial cover and is partially exposed at the surface. The sedimentary section consists of alternating layers of claystone and volcanic ash. Basaltic lavas occur intermittently within the sedimentary sequence. The moat sedimentary section at the Project site overlies the indurated intra-caldera Tuff of Long Ridge. A zone of silicified sedimentary rock, the Hot Pond Zone (HPZ), occurs at the base of the sedimentary section above the Tuff of Long Ridge.
Clay in the Thacker Pass Deposit includes two distinct types of clay mineral, smectite and illite. Smectite clay occurs at relatively shallow depths in the deposit and contain roughly 2,000 - 4,000 parts per million (ppm) lithium. Higher lithium contents (commonly 4,000 ppm lithium or greater) are typical for illite clay which occurs at relatively moderate to deep depths and contain values approaching 9,000 ppm lithium in terms of whole-rock assay.
|
Page 1 |
| Lithium Americas Corp. Feasibility Study, National Instrument 43-101 Technical Report for the Thacker Pass Project, Humboldt County, Nevada, USA |
1.4 Deposit Types
Lithium enrichment (>1,000 ppm) in the Thacker Pass Deposit and deposits of the Montana Mountains occur throughout the caldera lake sedimentary sequence above the intra-caldera Tuff of Long Ridge. The exact cause for the lithium enrichment in the caldera lake sediments is still up for debate. The presence of sedimentary carbonate minerals and magnesium-smectite (hectorite) throughout the lake indicates that the clays formed in a basic, alkaline, closed hydrologic system.
It is likely that two primary mechanisms play a role in the genesis of the deposit: (1) neoformation of smectite in a closed lake, rich in lithium due to the leaching of nearby and underlying volcanic glass (Benson et al., 2017b); and (2) alteration of a portion of the smectite-bearing clays to illite during intracaldera hydrothermal alteration associated with the uplift of the Montana Mountains.
Caldera lake sediments of the McDermitt Caldera contain elevated lithium concentrations compared to other sedimentary basins. Exploration results support the proposed model and have advanced the understanding of the geology of the Thacker Pass Deposit.
1.5 Exploration
Exploration programs have been carried out in the McDermitt Caldera since 1975, including the drilling campaigns identified in Section 1.6. A collar survey was completed by LAC for the 2007-2008 drilling program using a Trimble GPS (Global Positioning System). The topographic surface of the Project area was mapped by aerial photography dated July 6, 2010, by MXS, Inc. for LAC using Trimble equipment for ground control. In addition to drilling in 2017, LAC conducted five seismic survey lines along a series of historical drill holes to test the survey method's accuracy and resolution in identifying clay interfaces.
1.6 Drilling
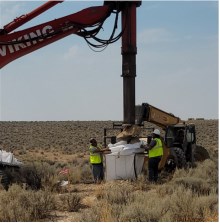
The Thacker Pass Deposit area has been explored for minerals since the 1970s by different companies and drilling campaigns. Table 1-1 categorizes the different drilling campaigns, number of holes drilled, and type of drilling utilized. Drilling methods were compared to test for sample bias, using core drilling as the standard. Rotary, sonic, and reverse circulation drilling all showed slight sample biases when compared to core drilling. Only HQ core holes were used for resource modeling to minimize the chance of sample bias. The drilling techniques, core recovery, and sample collection procedures provided results that are suitable for use in resource estimation. There are no drilling, sample, or recovery factors that materially impact the accuracy and reliability of results. The data is adequate for use in resource estimation.
|
Page 2 |
| Lithium Americas Corp. Feasibility Study, National Instrument 43-101 Technical Report for the Thacker Pass Project, Humboldt County, Nevada, USA |
Table 1-1 LAC Drill Holes Provided in Current Database for the Thacker Pass Deposit
|
Drilling |
Number |
Type |
Hole IDs in Database |
Number used in |
|
Chevron |
24 |
Rotary |
PC-84-001 through PC-84-012, PC-84-015 through PC-84-026 |
0 |
|
1 |
Core |
PC-84-014c |
0 |
|
|
LAC 2007-2010 |
230 |
HQ Core |
WLC-001 through WLC-037, WLC-040 through WLC-232 |
227 |
|
7 |
PQ Core |
WPQ-001 through WPQ-007 |
0 |
|
|
5 |
HQ Core |
Li-001 through Li-005 |
0 |
|
|
8 |
RC |
TP-001 through TP-008 |
0 |
|
|
2 |
Sonic |
WSH-001 through WSH-002 |
0 |
|
|
LAC 2017-2018 |
144 |
HQ Core |
LNC-001 through LNC-144 |
139 |
Notes: Holes WLC-040, WLC-076, WLC-183, LNC-002, LNC-012, LNC-081, LNC-083, and LNC-110 were not used in the Resource Estimate due to proximity to other core holes.
1.7 Sample Preparation, Analyses and Security
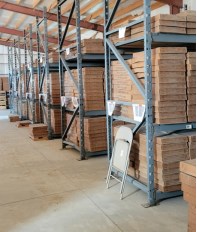
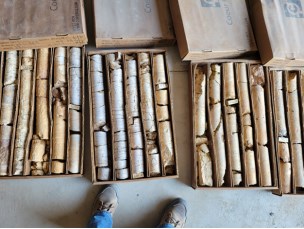
The drilled core was securely placed in core boxes and labelled at site. The boxes of drilled core were then transported to the secure LAC logging and sampling facility in Orovada, Nevada, where they were lithologically logged, photographed, cut, and sampled by LAC employees and contractors. The samples were either picked up by ALS Global (ALS) by truck or delivered to ALS in Reno, Nevada by LAC employees.
Once at ALS, the samples were dried at a maximum temperature of 60ºC. The entire sample was then crushed with a jaw crusher to 90% passing a 10-mesh screen. LAC used ALS Global's standard ME-MS61 analytical package for all of the samples collected which provides analytical results for 48 elements, including lithium. Certified analytical results were reported on the ICP-MS determinations.
Blank samples were used to check for cross-contamination between samples at the lab. Standard samples consisting of a high grade and a low grade lithium bearing claystone from the Project area were used to test the accuracy and precision of the analytical methods used at the lab. Duplicate samples are used to check the precision of the analytical methods of the lab and were taken every 30.5 m of core (i.e., they were collected downhole every 100 feet (ft)).
1.8 Data Verification
1.8.1 Mineral Resources
Certified laboratory certificates of assays were provided in pdf (Adobe Acrobat Portable Document Format) as well as comma separated value (csv) formatted files for verification of the sample assays database. Sample names, certificate identifications, and run identifications were cross referenced with the laboratory certificates and sample assay datasheet for spot checking and verification of data. No data anomalies were discovered during this check.
Quality Assurance / Quality Control (QA/QC) methodology utilized by LAC and results of these checks were discussed between LAC geologists and the QP.
Geologic logs, Access databases, and Excel spreadsheets were provided to the QP for cross validation with the Excel lithological description file. Spot checks between Excel lithological description sheets were performed against the source data with no inconsistencies found with the geologic unit descriptions.
|
Page 3 |
| Lithium Americas Corp. Feasibility Study, National Instrument 43-101 Technical Report for the Thacker Pass Project, Humboldt County, Nevada, USA |
Verification of the block model was performed by the creation of a geostatistical model and the review of its various outputs. Histograms, HERCO grade tonnage curves, and swath plots were created and analyzed to validate the accuracy of the block model.
Based on the various reviews, validation exercises and remedies outlined above, the QP concluded that the data is adequate for use for resource estimation.
1.8.2 Mineral Reserves
The Mineral Reserves QP reviewed the following as part of the mine planning, cost model and Mineral Reserves data verification.
1.9 Metallurgical Testing
Extensive metallurgical and process development testing has been performed both internally at LAC's Process Testing Center (PTC) and externally with vendors and contract commercial research organizations. Data collected from test programs has been used for flowsheet development, various equipment selection, definition of operating parameters and development of process design criteria. The most relevant metallurgical test data are discussed in Section 13.
The ore samples used for all metallurgical testing were collected from the proposed pit at the Thacker Pass Deposit. The samples spatially represent the ore body, with material collected from both undisturbed upper smectite horizons and uplifted faulted blocks that represent deeper illite horizons.
Conclusions of test work from the key areas are listed below:
|
Page 4 |
| Lithium Americas Corp. Feasibility Study, National Instrument 43-101 Technical Report for the Thacker Pass Project, Humboldt County, Nevada, USA |
Refinement and further optimization to the process continue to be made as required.
1.10 Mineral Resources and Reserves
1.10.1 Mineral Resources
The Mineral Resources estimate for the Thacker Pass Deposit is summarized in Table 1-2. Mineral Resources have been classified per the CIM 2014 Definition Standards and estimated using the 2019 CIM Best Practice Guidelines. This resource estimate uses a cutoff grade of 1,047 ppm lithium.
Table 1-2 Mineral Resources Estimate as of November 2, 2022
|
Category |
Tonnage |
Average Li |
Lithium Carbonate |
|
Measured |
534.7 |
2,450 |
7.0 |
|
Indicated |
922.5 |
1,850 |
9.1 |
|
Measured & Indicated |
1,457.2 |
2,070 |
16.1 |
|
Inferred |
297.2 |
1,870 |
3.0 |
Notes:
1. Mineral Resources that are not Mineral Reserves do not have demonstrated economic viability.
2. Mineral Resources are inclusive of 217.3 million metric tonnes (Mt) of Mineral Reserves.
3. Mineral Resources are reported using an economic break-even formula: "Operating Cost per Resource Tonne"/"Price per Recovered Tonne Lithium" * 10^6 = ppm Li Cutoff. "Operating Cost per Resource Tonne" = US$88.50, "Price per Recovered Tonne Lithium" is estimated: ("Lithium Carbonate Equivalent (LCE) Price" * 5.323 *(1 - "Royalties") * "Recovery". Variables are "LCE Price" = US$22,000/tonne Li2CO3, "Royalties" = 1.75% and "Recovery" = 73.5%.
4. Presented at a cutoff grade of 1,047 ppm Li.
5. A resource economical pit shell has been derived from performing a pit optimization estimation using Vulcan software.
6. The conversion factor for lithium to LCE is 5.323.
7. Applied density for the mineralization is 1.79 t/m3(Section 11.4)
8. Measured Mineral Resources are in blocks estimated using at least six drill holes and eighteen samples within a 262 m search radius in the horizontal plane and 5 m in the vertical direction; Indicated Mineral Resources are in blocks estimated using at least two drill holes and six to eighteen samples within a 483 m search radius in the horizontal plane and 5 m in the vertical direction; and Inferred Mineral Resources are blocks estimated with at least two drill holes and three to six samples within a search radius of 722 m in the horizontal plane and 5 m in the vertical plane.
9. Tonnages and grades have been rounded to accuracy levels deemed appropriate by the QP. Summation errors due to rounding may exist.
|
Page 5 |
| Lithium Americas Corp. Feasibility Study, National Instrument 43-101 Technical Report for the Thacker Pass Project, Humboldt County, Nevada, USA |
1.10.2 Mineral Reserves
The Mineral Reserves estimate for the Thacker Pass Deposit are based on an approved permitted pit shell developed in 2019 for the EIS. The Mineral Reserves are a modified subset of the Measured and Indicated Mineral Resources. A cutoff grade variable of kg of lithium extracted per run-of-mine (ROM) tonne was used to develop the Mineral Reserves for a 40-year mine plan producing a total life of mine (LOM) plant leach ore feed of 154.2 million dry tonnes. The leach ore feed is the ROM ore dry less the ash dry tonnes. The cutoff grade variable, kilograms of lithium extracted per tonne of ROM feed, is estimated using formulas and variables developed by LAC and is applied to each individual block of the geologic block model. The cutoff grade estimation is 1.533 kg of lithium recovered per tonne of ROM feed.
Overall reserve ore and waste tonnages are modeled using Maptek's geologic software package.
Waste consists of various types of material, including basalt, volcanic ash, alluvium and clay that does not meet the ore definition or the cutoff grade described above.
The classified Mineral Reserves are summarized in Table 1-3 for the 40-year permitted pit. This estimate uses a maximum ash percent cutoff of 85% and a cutoff grade of 1.533 kg of lithium extracted per tonne of ROM feed. Additionally, a 95% mining recovery factor is applied. A dilution percentage was not applied.
Table 1-3 Mineral Reserves Estimate as of November 02, 2022
|
Category |
Tonnage |
Average Li |
Lithium Carbonate |
|
Proven |
192.9 |
3,180 |
3.3 |
|
Probable |
24.4 |
3,010 |
0.4 |
|
Proven and Probable |
217.3 |
3,160 |
3.7 |
Note:
1. Mineral Reserves have been converted from measured and indicated Mineral Resources within the feasibility study and have demonstrated economic viability.
2. Reserves presented at an 85% maximum ash content and a cut-off grade of 1.533 kg of lithium extracted per tonne run of mine feed. A sales price of $5,400 US$/t of Li2CO3 was utilized in the pit optimization resulting in the generation of the reserve pit shell in 2019. Overall slope of 27 degrees was applied. For bedrock material pit slope was set at 47 degrees. Mining and processing cost of $57.80 per tonne of ROM feed, a processing recovery factor of 84%, and royalty cost of 1.75% were addition inputs into the pit optimization.
3. A LOM plan was developed based on equipment selection, equipment rates, labor rates, and plant feed and reagent parameters. All Mineral Reserves are within the LOM plan. The LOM plan is the basis for the economic assessment within the Technical Report, which is used to show economic viability of the Mineral Reserves.
4. Applied density for the ore is 1.79 t/m3 (Section 11.4).
5. Lithium Carbonate Equivalent is based on in-situ LCE tonnes with 95% recovery factor.
6. Tonnages and grades have been rounded to accuracy levels deemed appropriate by the QP. Summation errors due to rounding may exist.
7. The reference point at which the Mineral Reserves are defined is at the point where the ore is delivered to the run-of-mine feeder.
1.11 Mine Methods
The mining method chosen will use hydraulic excavators loading a fleet of end dump trucks. The fleet will be used for all material excavation and haulage. The material hauled includes ore, waste, and attrition scrubber reject waste. The attrition scrubber waste is oversized material removed after the ore is mixed with water.
Mining and material handling will be contracted through Sawtooth, a subsidiary of North American Coal Corporation (NAC). A mine plan has been developed to maximize recovered lithium carbonate over the life of mine.
|
Page 6 |
| Lithium Americas Corp. Feasibility Study, National Instrument 43-101 Technical Report for the Thacker Pass Project, Humboldt County, Nevada, USA |
The mine design and mine plan are based on the approved EIS permit pit shell. The truck and excavation fleet will develop several offset benches to maintain a geotechnically stable highwall slope. The bench heights are designed to enable the mine to have multiple grades of ore exposed at any given time, allowing flexibility to deliver different types and grades of ore to be blended as needed and to maintain an illite to smectite ratio feed rate in the 30:70 to 70:30 range.
The annual production rate is based on varying ore feed rates determined by the availability of sulfuric acid for the leaching process. Phase 1 (years 1-3) has an annual ore leach feed rate of 1.7 million dry tonnes and Phase 2 (years 4 to 40) has an annual leach ore feed rate of 4.0 million dry tonnes. The following is a summary of the Life-of-Mine production:
In the first five years, the mine waste will primarily be hauled to the out-of-pit waste storage area. After five years, the mine waste will primarily be dumped back into the empty pit. Mine waste will also be used for construction fill material. Ore will be hauled to a run-of-mine stockpile located to the south of the pit. The attrition scrubber reject material will be hauled to the out-of-pit waste stockpile or back into the empty pit.
1.12 Recovery Methods
The current flow sheet, material balance, and process design criteria (PDC) for the Project have been developed from metallurgical test work and a steady-state process model built in Aspen® Plus software. Design criteria, major equipment, reagent and utility consumptions, and overall recovery estimates used for lithium carbonate production forecasts provide the basis for the Project economic model. The process flow sheet consists of five key areas: beneficiation, leaching and neutralization, CCD and filtration circuit, magnesium and calcium removal (i.e., purification) and lithium carbonate production. In beneficiation, the lithium concentration of ore is on average, upgraded from approximately 3,153 ppm to approximately 4,438 ppm. Lithium is then leached from process slurry by sulfuric acid (H2SO4), with an average leach extraction of approximately 86.2% over the life-of-mine.
Major waste products include coarse gangue from beneficiation, neutralized leach residue filter cake, magnesium sulfate salts, and sodium/potassium sulfate salts. The filter cake and salts will be conveyed to a clay tailings filter stack facility which will be progressively reclaimed during the life of the Project. On average, nearly 19,000 tonnes per day (t/d) of cake and salts will be generated. Coarse gangue is generated at an average rate of 4,400 t/d.
There are five major areas contributing to lithium losses in the process plant:
|
Page 7 |
| Lithium Americas Corp. Feasibility Study, National Instrument 43-101 Technical Report for the Thacker Pass Project, Humboldt County, Nevada, USA |
Recovery of lithium during operations will fluctuate with varying ore mineralization and ore chemistry.
1.13 Infrastructure
The mining and Processing Plant operations are located within the McDermitt Caldera in northwest Nevada. Raw water is sourced via aquifer-fed wells seven miles east of the processing plant. The layout contemplates a total of two new entrances and utilizing one existing entrance from SR-293 onto the Project site. See the overall site general arrangement in Figure 1-1. The Project is planned to be constructed in two phases. To support lithium carbonate production as discussed in Section 17, Phase 1 will consist of a single sulfuric acid plant with a nominal production rate of 3,000 tonnes per day sulfuric acid. Phase 2 will begin three years later with the addition of a second sulfuric acid plant with an additional nominal production rate of 3,000 t/d.
Figure 1-1 Overall Site General Arrangement

Source: M3, 2022
1.13.1 Raw Materials
Raw materials for the Project are to be delivered to the site by over highway trucks during Phase 1 and Phase 2. Approximately 108 trucks per day will make raw material deliveries to the site. A local rail-to-truck transloading facility located in Winnemucca will allow for transfer of most raw materials for delivery to the Project site.
|
Page 8 |
| Lithium Americas Corp. Feasibility Study, National Instrument 43-101 Technical Report for the Thacker Pass Project, Humboldt County, Nevada, USA |
1.13.2 Sulfuric Acid Plant
Phase 1 and Phase 2 will each have a single sulfuric acid plant capable of producing a nominal 3,000 t/d (100 weight % H2SO4 basis) of sulfuric acid by the double contact, double absorption process. Liquid sulfur is delivered to site by truck and is unloaded into storage tanks. The sulfuric acid generated is stored and then used in the process plant. The acid plant will also generate power. Additional power will be purchased and delivered to site.
1.13.3 Clay Tailings Filter Stack (CTFS)
At full plant production, up to approximately 20,300 dry t/d of clay tailings and salts will be generated over a 40-year period, resulting in a total quantity of 272 million dry tonnes (328 million cubic yards or 250.7 million cubic meters (Mm3)) requiring secure disposal. The Clay Tailings Filter Stack (CTFS) is designed for a total quantity of 290.5 million dry tonnes (a volume of 350.4 million cubic yards or 267.9 Mm3) and can be expanded as needed to store material needing containment.
1.13.4 Power
Demand loads for Phase 1 and Phase 2 are 75.4 megawatts (MW) and 66.4 MW respectively, for a combined total of 141.8 MW demand during Phase 2. Power will be generated at the sulfuric acid plant from the steam generated from excess heat along with a maximum anticipated import load of 51.9 MW (455 gigawatt hours per year (GWh/year)). Thacker Pass is located in the service territory of Harney Electric Cooperative (HEC). A 115 kilovolt (kV) line passes through the site. Since the Nevada power market is regulated, LAC will purchase all imported power from HEC. HEC infrastructure to support this import load will need to be improved. HEC has a full requirements long-term contract to purchase 100% power from Bonneville Power Administration (BPA) through NV Energy. BPA has power available to sell, but constraints on existing transmission infrastructure to deliver the power to the HEC system are still being studied by NV Energy.
1.13.5 Water
Phase 1 and Phase 2 water demand is approximately 3.5 Mm3 (2,850 acre-ft) per year and 7.0 Mm3 (5,700 acre-ft) per year respectively. Water will be supplied from an existing well in the Quinn River Valley. Lithium Americas has a leasing agreement for Phase 1 water rights and is awaiting a hearing decision from the Nevada Division of Water Resources (NDWR) to transfer water rights to the water well location in 2023. Phase 2 water rights have been partially secured and plans to pursue other opportunities to acquire the remainder of the water requirements.
1.14 Market Studies and Contracts
Lithium demand displayed significant growth in 2021 and 2022 due to strong consumer demand for electric vehicles, with lithium carbonate pricing outpacing lithium hydroxide on the spot market. Contract pricing is expected to continue to significantly increase for battery-grade lithium chemicals with market demand balancing between lithium hydroxide and lithium carbonate towards the end of the decade. Near-term and mid-term pricing is expected to rise as demand outpaces supply with not enough lithium chemical production to ease market tightness. Long-term pricing for lithium chemicals is expected to be supported by unprecedented market demand combined with lack of supply as pressure from customers to incorporate carbon-neutral and sustainable technologies. These market conditions incentivize and support CAPEX-intensive greenfield projects.
The pricing forecast for lithium carbonate is based on the Wood Mackenzie third quarter 2022 lithium price outlook. Lithium carbonate pricing is set at $24,000 US$/t for each year for the financial model and the Resource Estimate was based on $22,000 US$/t lithium pricing.
|
Page 9 |
| Lithium Americas Corp. Feasibility Study, National Instrument 43-101 Technical Report for the Thacker Pass Project, Humboldt County, Nevada, USA |
1.15 Capital and Operating Costs
The capital cost estimate for the Project has been prepared by M3, Industrial TurnAround Corporation (ITAC), LNC, and third-party contractors in accordance with the scope of the Project. The capital cost estimate covers post-sanction early works, mine development, mining, the process plant, the transload facility, commissioning and all associated infrastructure required to allow for successful construction and operations. Development capital costs are as shown in Table 1-4.
Table 1-4 Development Capital Cost Estimate Summary
|
Description |
Ph1 Costs (US$ M) |
Ph2 Costs (US$ M) |
Responsible |
|
Mine |
|
|
|
|
Equipment Capital (Contract Mining) |
0 |
0.0 |
Sawtooth |
|
Mine Development |
51.1 |
26.3 |
Sawtooth |
|
Contingency (13.1%) |
6.7 |
3.4 |
Sawtooth |
|
Total Mine |
57.8 |
29.7 |
|
|
Process Plant and Infrastructure |
|
|
|
|
Costs (Direct & Indirect) |
1,735.4 |
1,398.5 |
M3/ITAC/EXP |
|
Contingency |
227.3 |
183.2 |
EDG |
|
Total Process Plant & Infrastructure |
1,962.7 |
1,581.7 |
|
|
Offsite - Transload Facility |
|
|
|
|
Costs (Direct & Indirect) |
69.0 |
27.1 |
Owner/Savage |
|
Contingency |
9.0 |
3.5 |
Owner/EDG |
|
Total Offsite Transload facility |
78.1 |
30.6 |
|
|
Owner's Costs |
|
|
|
|
Costs |
149.8 |
75.6 |
Owner |
|
Contingency |
19.6 |
9.9 |
Owner/EDG |
|
Total Owner's Costs |
169.4 |
85.5 |
|
|
TOTAL DEVELOPMENT CAPITAL |
2,268.0 |
1,727.5 |
|
Table 1-5 shows life of mine sustaining capital costs for the base case. Table 1-6 shows sustaining capital for the first 25 years of the 40-year life of mine.
|
Page 10 |
| Lithium Americas Corp. Feasibility Study, National Instrument 43-101 Technical Report for the Thacker Pass Project, Humboldt County, Nevada, USA |
Table 1-5 40-Year LOM Sustaining Capital Estimate Summary (Base Case)
|
Description |
*LOM Costs |
Responsible |
|
Mine |
|
|
|
Equipment Capital |
264.3 |
Sawtooth/M3 |
|
Mobile Equipment |
|
|
|
Equipment Capital |
26.6 |
Owner |
|
Process Plant and Infrastructure |
|
|
|
Process Plant |
822.9 |
Owner |
|
Sulfuric Acid Plant |
244.2 |
EXP |
|
CTFS and CGS |
149.0 |
Owner |
|
Offsite Transload Facility |
|
|
|
Transload Facility |
3.4 |
Owner |
|
TOTAL SUSTAINING CAPITAL |
$1,510.2 |
|
|
Contract Mining Capital Repayment |
$48.8 |
Sawtooth/M3 |
* Phase 2 capital costs are not included in sustaining costs
Table 1-6 First 25 Years of 40-Year LOM Sustaining Capital Estimate Summary
|
Description |
*LOM Costs (US$ M) |
Responsible |
|
Mine |
|
|
|
Equipment Capital |
180.0 |
Sawtooth/M3 |
|
Mobile Equipment |
|
|
|
Equipment Capital |
15.2 |
Owner |
|
Process Plant and Infrastructure |
|
|
|
Process Plant |
230.7 |
Owner |
|
Sulfuric Acid Plant |
104.8 |
EXP |
|
CTFS and CGS |
95.6 |
Owner |
|
Offsite Transload Facility |
|
|
|
Transload Facility |
2.1 |
Owner |
|
TOTAL SUSTAINING CAPITAL |
$628.4 |
|
|
Contract Mining Capital Repayment |
$48.8 |
Sawtooth/M3 |
* Phase 2 capital costs are not included in sustaining costs
Operating costs were developed by Sawtooth Mining, LAC, and M3. Annual operating costs are summarized by operating area: Mine, Lithium Process Plant, Sulfuric Acid Plant, and General & Administrative (G&A). Operating costs in each area include labor, maintenance materials and supplies, raw materials, outside services, among others. Average operating costs at $7,198/tonne of lithium carbonate produced, or $480.7 million per annum for all 40 years (or $6,743/tonne and $471.4 million the first 25 years). The process operating costs are based on Q1-Q4 2022 pricing. See Table 1-7 and Table 1-8.
Table 1-7 Operating Cost Estimate Summary (40-Year LOM - Base Case)
|
Area |
Annual Average |
$/tonne Product |
Percent of Total |
|
Mine |
76.4 |
1,144 |
16% |
|
Lithium Process Plant |
214.6 |
3,213 |
45% |
|
Liquid Sulfuric Acid Plant |
175.4 |
2,627 |
36% |
|
General & Administrative |
14.3 |
215 |
3% |
|
Total |
$480.7 |
7,198 |
100% |
|
Page 11 |
| Lithium Americas Corp. Feasibility Study, National Instrument 43-101 Technical Report for the Thacker Pass Project, Humboldt County, Nevada, USA |
Table 1-8 Operating Cost Estimate Summary (Years 1-25 of 40-Year LOM Case)
|
Area |
Annual Average ($-M) |
$/tonne Product |
Percent of Total |
|
Mine |
71.7 |
1,026 |
15% |
|
Lithium Process Plant |
215.9 |
3,088 |
46% |
|
Liquid Sulfuric Acid Plant |
169.4 |
2,424 |
36% |
|
General & Administrative |
14.3 |
205 |
3% |
|
Total |
$471.4 |
6,743 |
100% |
1.16 Financial Model
An economic analysis was carried out using a discounted cash flow (DCF) model, which was prepared by LAC with input from M3, ITAC, and EXP U.S. Services Inc. (EXP). The final financial model used to generate numbers in this report was audited and managed by M3, with reliance on third party experts for individual components. Annual cash flow projections were estimated for forty years based on the life of mine plan, estimates of capital expenditures, production costs, taxes, royalties, and sales from lithium carbonate production. The only revenue stream is sales of lithium carbonate.
Any investments in the Project to date are not amortized in the model.
Production profiles outlined in this technical report are limited to the Company's Proven and Probable Mineral Reserves. The production and financial outcomes from these reserves are summarized in Table 1-9 to Table 1-12. A sensitivity analysis has shown the Project is more sensitive to the lithium price than it is to either CAPEX or OPEX.
Table 1-9 Production Scenario (40-Year LOM - Base Case)
|
Category |
Units |
Value |
|
Operational Life |
years |
40 |
|
Mine and Process Plant Operational Life |
years |
40 |
|
Ore Reserve Life |
years |
40 |
|
Average Annual EBITDA |
$-M / yr |
1,093.5 |
|
After-tax Net Present Value (NPV) @ 8% Discount Rate |
$-M |
5,726.9 |
|
After-tax Internal Rate of Return (IRR) |
% |
21.4% |
|
Payback (undiscounted) |
years |
5.4 |
|
Note: Includes capital investments in years up to production |
||
Table 1-10 Production Scenario - (Years 1-25 of 40-Year LOM Case)
|
Category |
Units |
Value |
|
Operational Life |
years |
25 |
|
Mine and Process Plant Operational Life |
years |
25 |
|
Ore Reserve Life |
years |
40 |
|
Average Annual EBITDA |
$-M / yr |
1,176.2 |
|
After-tax NPV @ 8% Discount Rate |
$-M |
4,950.1 |
|
After-tax IRR |
% |
21.2% |
|
Payback (undiscounted) |
years |
5.4 |
|
Page 12 |
| Lithium Americas Corp. Feasibility Study, National Instrument 43-101 Technical Report for the Thacker Pass Project, Humboldt County, Nevada, USA |
Table 1-11 Economic Evaluation - Lithium Carbonate Plant (40 Year LOM - Base Case)
|
Category |
Units |
Value |
|
Operational Life |
years |
40 |
|
Annual Lithium Carbonate Production |
k-tonnes |
66.8 |
|
Metallurgical Recovery |
% |
73.2% |
|
Ore Reserves Production Scenario |
years |
40 |
|
Annual LCE Mined |
k-tonnes |
91.3 |
Table 1-12 Economic Evaluation - Lithium Carbonate Plant (Years 1-25 of 40-Year LOM Case)
|
Category |
Units |
Value |
|
Operational Life |
years |
25 |
|
Annual Lithium Carbonate Production |
k-tonnes |
69.9 |
|
Metallurgical Recovery |
% |
73.3% |
|
Ore Reserves Production Scenario |
years |
25 |
|
Annual LCE Mined |
k-tonnes |
95.4 |
1.17 Conclusions and Recommendations
1.17.1 Conclusions
Based upon analysis, interpretation and results of exploration, engineering, and environmental permitting carried out for the Project the following conclusions have been made:
Mineral Resource Estimate: The mineralization is at surface and made up of a claystone and ash mix that can be free dug with minimal blasting while using conventional mining equipment. The Mineral Resource estimate was updated in 2022 to 534.7 Mt of Measured Resource averaging 2,450 ppm Li for 7.0 Mt of lithium carbonate equivalent, 922.5 Mt of Indicated Resource averaging 1,850 ppm Li for 9.1 Mt of lithium carbonate equivalent and 297.2 Mt of Inferred Resource averaging 1,870 ppm Li for 3.0 Mt lithium carbonate equivalent. This resulted in a 229% increase in tonnage and 130% more lithium carbonate equivalent. A cutoff grade of 1,047 ppm Li and an open pit shell were used to constrain the resource estimate based on break even economics.
Mineral Reserve Estimate: The Mineral Reserve estimate was estimated from a 40-year pit designed to satisfy ore delivery requirements. The overall average lithium content mined is 3,160 ppm from 3,180 ppm Li Proven and 3,010 ppm Li Probable. Total ore is 217.3 Mt, of which 192.9 Mt are Proven reserves and 24.4 Mt are Probable. As a result, the total Proven and Probable Reserves of lithium carbonate equivalent is 3.7 Mt from 3.3 Mt lithium carbonate equivalent Proven and 0.4 Mt of lithium carbonate equivalent Probable.
Environmental Permits: There are no identified issues that would prevent LAC from achieving all permits and authorizations required to commence construction and operation of the Project based on the data that has been collected to date. The BLM has approved the Plan of Operations and issued its ROD. In Q1 2022, NDEP issued the two final environmental permits required for construction. The Water Pollution Control Permit (WPCP) was issued by Nevada Division of Environmental Protection-Bureau of Mining, Regulation and Reclamation (NDEP-BMRR). LAC and NDEP discussed an initial WPCP where operations would not take place below the 4,840 feet above mean sea level elevation, which is fifteen (15) feet above the pre-mining regional water table until further evaluations are completed that show that mining below the water table will not degrade the waters of the state. The Class II Air Quality Operating Permit was issued by NDEP-BAPC.
|
Page 13 |
| Lithium Americas Corp. Feasibility Study, National Instrument 43-101 Technical Report for the Thacker Pass Project, Humboldt County, Nevada, USA |
Metallurgical Processes: Metallurgical processes have been engineered from pilot testing, bench scale testing, and modeling to produce lithium carbonate using conventional unit operations arranged in a novel flowsheet. Phase 1 production capacity is designed for a nominal 40,000 t/y and an additional 40,000 t/y for Phase 2, for a combined designed nominal capacity rate of 80,000 t/y of lithium carbonate.
Water and Power: Water required for construction and production during Phase 1 is secured, in the amount of 3.5 Mm3 (2,850 acre-ft) per year. Power demand for Phase 1 and Phase 2 is engineered and the required import load of 52 MW is identified. Power is assumed to be imported from local utilities with infrastructure upgrades required before Phase 1 production begins.
Capital Requirements: Capital costs are based on Q1-Q3 2022 pricing. CAPEX spending for Phase 1 will begin three years before production begins and will include one acid plant, the necessary civil works and infrastructure to support Phase 1 production rates. Phase 2 capital spending will begin in year 4 through 7 and will add a second acid plant and duplicate the necessary processing facility equipment. Phase 1 will require $2,268 million in capital and Phase 2 will require $1,728 million for a combined capital total of $3,996 million. Sustaining capital and mine capital repayment over a 25-year mine life totals $628 million. Sustaining capital and mine capital repayment costs over 40 years total $1,510 million.
Operating Costs: Cost inputs into the model are from Q1-Q4 2022. Any investments in the Project to date are not amortized in the model. The average unit operating cost per tonne of lithium carbonate mined and produced is expected to be $7,198 for the 40-year LOM (base case) and $6,743 for the 25-year case.
Economic Results: Based on Q1-Q4 2022 capital and operating cost pricing, the economic analysis of the Project includes:
1.17.2 Recommendations
|
Page 14 |
| Lithium Americas Corp. Feasibility Study, National Instrument 43-101 Technical Report for the Thacker Pass Project, Humboldt County, Nevada, USA |
|
Page 15 |
| Lithium Americas Corp. Feasibility Study, National Instrument 43-101 Technical Report for the Thacker Pass Project, Humboldt County, Nevada, USA |
2 Introduction and Terms of Reference
This Technical Report was prepared at the request of Lithium Americas Corp., a company incorporated under the laws of British Columbia, Canada, trading under the symbol "LAC" on the Toronto Stock Exchange and the New York Stock Exchange with its corporate office at 300 - 900 West Hastings Street, Vancouver, British Columbia, Canada, V6C 1E5. Work was carried out in cooperation with Lithium Nevada Corp. (LNC), a wholly owned subsidiary of Lithium Americas Corp. (LAC), formerly known as Western Lithium USA Corp (WLC).
This document provides a summary of the feasibility study evaluation of LAC's Thacker Pass Project (the Project) and focuses on the Thacker Pass Deposit (the Deposit), formerly Stage I of the Kings Valley Project or Lithium Nevada Project. Excluded from this Technical Report are resource statements from the Montana Mountains deposit (formerly Stage II deposit of the Lithium Nevada Project), as LAC's focus is on developing a project of scale in Thacker Pass. The claims owned by LAC that are north of the Thacker Pass Project in the Montana Mountains do not form part of this mineral project.
This report was prepared in the format stipulated by National Instrument 43-101 Standards of Disclosure for Mineral Projects (NI 43-101) applicable in Canada. Mineral Resources and Mineral Reserves estimation is based on the Canadian Institute of Mining, Metallurgy and Petroleum (CIM) 2019 Estimation of Mineral Resources and Mineral Reserves Best Practice Guidelines (2019 CIM Guidelines). Definitions of Mineral Resources and Mineral Reserves are as set out in the 2014 CIM Definition Standards for Mineral Resources and Mineral Reserves.
2.1 Sources of Information
M3 Engineering & Technology Corporation (M3) was commissioned by LAC to prepare this Technical Report. In preparing this report, M3 and Industrial TurnAround Corporation (ITAC) provided engineering services and have relied upon input from LAC and information prepared by a number of qualified independent consulting groups particularly regarding regional geology, geological mapping, exploration, and resource estimation. Through its subsidiary LNC, LAC has contracted with Sawtooth, a subsidiary of The North American Coal Corporation (NAC), which is a wholly-owned subsidiary of NACCO Industries, Inc. (NYSE: NC), to provide resource and reserve estimation for this technical report. NAC has reviewed and signed off on the work provided by Sawtooth. EXP U.S. Services Inc. (EXP) reviewed the sulfuric acid plant and power plant. NewFields Mining Design & Technical Services (NewFields) contributed to work on environmental and tailings facilities. Wood Canada Limited (Wood) reviewed segments of metallurgy and the process as well as environmental concerns. EDG, Inc. (EDG) participated in the preparation of some cost elements of the estimate.
M3, Sawtooth, NACCO, NewFields, Wood, EXP and Piteau are independent companies and not associates or affiliates of LAC or any associated company of LAC. Table 2-1 lists the Qualified Persons (QP) involved with authoring this report. Table 2-2 lists the sections each QP is responsible for.
Table 2-1 List of Qualified Persons, Professional Designations and Site Visit Dates
|
Name of Qualified |
Designation |
Company |
Date of Site Visit |
|
Daniel Roth |
P.E., P. Eng. |
M3 |
April 13, 2021 |
|
Laurie Tahija |
QP-MMSA |
M3 |
No site visit |
|
Benson Chow |
RM-SME |
Sawtooth |
November 8, 2018, September 13 and 14, 2022 |
|
Eugenio Iasillo |
P.E. |
Process Engineering, LLC |
No site visit: Reno Laboratory Visit Only |
|
Kevin Martina |
P. Eng. |
Wood |
No site visit: Reno Laboratory Visit Only (December 1-3, 2021) |
|
Kevin Bahe |
P.E. |
Sawtooth |
August 12 & 13, 2019, September 13 & 14, 2022 |
|
Walter Mutler |
P. Eng. |
EXP U.S. Services Inc. |
November 2, 2022 |
|
Paul Kaplan |
P.E. |
NewFields |
No site visit |
|
Tyler Cluff |
RM-SME |
Piteau |
March 7-8, June 8, and November 7-9, 2022 |
|
Bruce Shannon |
P.E. |
ITAC |
October 18, 2020 |
|
Page 16 |
| Lithium Americas Corp. Feasibility Study, National Instrument 43-101 Technical Report for the Thacker Pass Project, Humboldt County, Nevada, USA |
Table 2-2 Qualified Person Areas of Responsibility
|
Section |
Section Name |
Qualified |
Description of |
Subsections |
|
1 |
Summary |
All QPs |
- |
- |
|
2 |
Introduction |
Daniel Roth |
- |
- |
|
3 |
Reliance on other Experts |
Daniel Roth |
- |
- |
|
4 |
Property Description and Location |
Benson Chow |
- |
- |
|
5 |
Accessibility, Climate, Local Resources, Infrastructure and Physiography |
Benson Chow |
- |
- |
|
6 |
History |
Benson Chow |
- |
- |
|
7 |
Geological Setting and Mineralization |
Benson Chow |
- |
- |
|
8 |
Deposit Types |
Benson Chow |
- |
- |
|
9 |
Exploration |
Benson Chow |
- |
- |
|
10 |
Drilling |
Benson Chow |
- |
- |
|
11 |
Sample Preparation, Analyses and Security |
Benson Chow |
- |
- |
|
12 |
Data Verification |
Benson Chow |
- |
- |
|
13 |
Mineral Processing and Metallurgical Testing |
Eugenio Iasillo |
ROM feed through neutralized tails as well as magnesium precipitation |
All except for Sections 13.2.4.1, 13.2.4.3, 13.2.5.1 to 13.2.5.3 |
|
|
|
Kevin Martina |
Magnesium sulfate crystallization to production of final product, excluding magnesium precipitation. |
13.2.4.1, 13.2.4.3, 13.2.5.1 to 13.2.5.3 |
|
14 |
Mineral Resource Estimates |
Benson Chow |
- |
- |
|
15 |
Mineral Reserve Estimates |
Kevin Bahe |
- |
- |
|
16 |
Mining Methods |
Kevin Bahe |
- |
- |
|
17 |
Recovery Methods |
Laurie Tahija |
ROM feed through neutralized tails as well as magnesium precipitation. |
Section 17.1, Tables 17-1 and 17-3 and corresponding parts of 17.2.1 in Section 17.2, 17.3.1 to 17.3.4, 17.3.5.2, 17.3.8, 17.4.1 to 17.4.3, 17.4.6, corresponding parts of 17.4.10 and 17.4.11, and 17.5 to 17.11. |
|
Page 17 |
| Lithium Americas Corp. Feasibility Study, National Instrument 43-101 Technical Report for the Thacker Pass Project, Humboldt County, Nevada, USA |
|
Section |
Section Name |
Qualified |
Description of |
Subsections |
|
|
|
Kevin Martina |
Magnesium sulfate crystallization to packaging of final product, excluding magnesium precipitation |
Tables 17-2 and 17-4 and corresponding parts of 17.2.1 in Section 17.2, Sections 17.3.5.1, 17.3.6, 17.3.7, 17.4.4, 17.4.5, 17.4.7, 17.4.8, 17.4.9 and corresponding parts of 17.4.10 and 17.4.11. |
|
18 |
Project Infrastructure |
Daniel Roth |
Access, water supply, site & process plant arrangement |
18.1, 18.2, 18.3, 18.4, 18.5, 18.6, and 18.9 |
|
|
|
Bruce Shannon |
Power supply |
18.7 |
|
|
|
Walter Mutler |
Sulfuric acid production |
18.8 |
|
|
|
Paul Kaplan |
Waste rock and tailing disposal |
18.10 |
|
19 |
Market Studies and Contracts |
Daniel Roth |
- |
- |
|
20 |
Environmental Studies, Permitting and Social or Community Impact |
Paul Kaplan |
General environmental and permitting |
All except for 20.7.4.1 to 20.7.4.6 |
|
|
|
Tyler Cluff |
Water |
Sections 20.7.4.1-20.7.4.6 |
|
21 |
Capital and Operating Costs |
Daniel Roth |
Process and infrastructure capital costs |
All except for 21.1.3, 21.2.1 and 21.3. |
|
|
|
Laurie Tahija |
Process operating costs |
Section 21.3 except 21.3.3.1 and 21.3.3.3 |
|
|
|
Kevin Bahe |
Mining costs |
21.1.3, 21.2.1, 21.3.3.1 |
|
|
|
Walter Mutler |
Sulfuric acid plant costs |
21.2.1, 21.3.3.3 |
|
22 |
Economic Analysis |
Daniel Roth |
- |
- |
|
23 |
Adjacent Properties |
Benson Chow |
- |
- |
|
24 |
Other Relevant Data and Information |
Daniel Roth |
Project Execution Plan |
24.1 |
|
|
|
Kevin Bahe |
Limestone Quarry |
24.2.1 to 24.2.4 |
|
|
|
Paul Kaplan |
Limestone Quarry Permitting |
24.2.5, 24.2.6 |
|
|
|
Daniel Roth |
Transload Facility |
24.3.1, 24.3.2 |
|
|
|
Paul Kaplan |
Transload Facility Permitting |
24.3.3 |
|
25 |
Interpretation and Conclusions |
All QPs |
- |
- |
|
26 |
Recommendations |
All QPs |
- |
- |
|
27 |
References |
N/A |
- |
- |
The Mineral Resource estimate is based on an exploration drilling program conducted in 2007 - 2010 and 2017 - 2018. Prior versions of the Mineral Resource were reported in previously filed technical reports as shown in Table 2-3.
Table 2-3 Previously Filed Technical Reports
|
Preparer |
Issuer |
Title |
Effective Date |
|
AMEC |
Western Lithium Corporation |
Kings Valley Lithium Project, Nevada USA NI 43-101 |
June 1, 2008 |
|
AMEC |
Western Lithium Corporation |
NI 43-101 Technical Report Kings Valley Lithium Nevada, USA |
December 15, 2008 |
|
URS |
Western Lithium Corporation |
Kings Valley Project NI 43-101 Technical Report Preliminary Assessment and Economic Evaluation Humboldt County, Nevada |
December 31, 2009 |
|
GeoSystems |
Western Lithium Corporation |
NI 43-101 Technical Report Stage II (South Lens) Resource Estimate Kings Valley Project |
May 15, 2010 |
|
Tetra Tech |
Western Lithium Corporation |
Preliminary Feasibility Study Kings Valley Lithium Project |
January 27, 2012 |
|
Tetra Tech |
Western Lithium Corporation |
Updated NI 43-101 Technical Report Kings Valley Property Humboldt County, Nevada |
April 30, 2014 |
|
SRK |
Lithium Americas Corporation |
Independent Technical Report for the Lithium Nevada Property, Nevada, USA |
May 31, 2016 |
|
Advisian |
Lithium Americas Corporation |
Independent Technical Report for the Thacker Pass Project, Humboldt County, Nevada, USA |
February 15, 2018 |
|
Advisian |
Lithium Americas Corporation |
Technical Report on the Pre-Feasibility Study for the Thacker Pass Project, Humboldt County, Nevada, USA |
August 1, 2018 |
|
Page 18 |
| Lithium Americas Corp. Feasibility Study, National Instrument 43-101 Technical Report for the Thacker Pass Project, Humboldt County, Nevada, USA |
The current Mineral Resource has an effective date of November 2, 2022.
2.2 Description of Personal Inspections
Daniel Roth visited the site on April 13, 2021. He reviewed the areas for the process plant, tailings facility, the water supply line, and highway tie-ins.
Mr. Benson Chow visited LAC's Thacker Pass Project site on November 8, 2018 and September 13 and 14, 2022. The purposes of the visits were to complete a QP data verification, site inspections, and independent verification of lithium grades. No material changes to the exploration drilling or site conditions have occurred on site since. During the visits, Mr. Chow completed the following tasks:
|
Page 19 |
| Lithium Americas Corp. Feasibility Study, National Instrument 43-101 Technical Report for the Thacker Pass Project, Humboldt County, Nevada, USA |
Mr. Kevin Bahe visited LAC's Thacker Pass Project site from August 12-13, 2019 and September 13-14, 2022, to complete a QP data verification site inspection. Additionally, Mr. Bahe toured the pilot plant lab in Reno, NV on July 25, 2019 and LAC's Technical Center in Reno on September 15, 2022. No material changes to the mining location or site conditions have occurred on site since. During the visits, Mr. Bahe completed the following tasks:
Bruce Shannon of ITAC visited the site on October 18, 2020. He reviewed the on-site facilities as well as off-site support facilities, including:
Walter Mutler of EXP visited the site on November 2, 2022. The highlights of his visit were as follows:
|
Page 20 |
| Lithium Americas Corp. Feasibility Study, National Instrument 43-101 Technical Report for the Thacker Pass Project, Humboldt County, Nevada, USA |
Mr. Tyler Cluff has frequently visited the Project site, including March 7-8, June 8, and November 7-9 during 2022. During the June visit he provided a tour for a surface water hydrology group. In November, he retrieved quarterly piezometric data, serviced equipment, and surveyed springs and surface water.
Eugenio Iasillo has not performed a site visit but instead visited the laboratory in Reno to review the metallurgy in December 2021.
Kevin Martina has not performed a site visit but instead visited the laboratory in Reno to review the metallurgy in December 2021.
Laurie Tahija has not performed a site visit due to her work on process design.
Paul Kaplan has not performed a site visit due to his focus on environmental and permitting review which primarily takes place off site.
2.3 Units, Currency and Terms of Reference
All units used in this report are metric unless otherwise stated. Currency in this report is in United States Dollars (US$) unless otherwise specified. Table 2-4 lists the abbreviations for technical terms used throughout the text of this report.
Table 2-4 Abbreviations and Acronyms
|
Abbreviation/Acronym |
Description |
|
' |
feet, minutes (Longitude/Latitude) |
|
" |
inches, seconds (Longitude/Latitude) |
|
% |
percent |
|
< |
Less Than |
|
> |
Greater Than |
|
° |
Degrees of Arc |
|
°C |
Degrees Celsius |
|
°F |
Degrees Fahrenheit |
|
µm |
Micrometer (10-6 meter) |
|
3D |
Three-Dimensional |
|
AACE |
Association for the Advancement of Cost Engineering International |
|
AAL |
American Assay Laboratory |
|
ACOE |
U.S. Army Corps of Engineers |
|
ActLabs |
Activation Laboratories |
|
Ai |
Bond abrasion index |
|
ALS |
ALS Global |
|
amsl |
above mean sea level |
|
ARDML |
Acid Rock Drainage and Metal Leaching |
|
ARO |
Annual Reclamation Obligation |
|
ARPA |
Native American Graves Protection and Repatriation Act |
|
As |
Arsenic |
|
BAPC |
Bureau of Air Pollution Control Contacts |
|
BFW |
Boiler Feed Water |
|
Page 21 |
| Lithium Americas Corp. Feasibility Study, National Instrument 43-101 Technical Report for the Thacker Pass Project, Humboldt County, Nevada, USA |
|
Abbreviation/Acronym |
Description |
|
BLM |
Bureau of Land Management |
|
BMRR |
Bureau of Mining Regulation and Reclamation |
|
BPA |
Department of Energy's Bonneville Power Administration |
|
BWi |
Bond ball mill work index |
|
CaCO3 |
calcium carbonate |
|
CaO |
Quicklime |
|
CAPEX |
Capital Expenditure or Capital Cost Estimate |
|
CCD |
Counter Current Decantation |
|
CGS |
Coarse Gangue Stockpile |
|
Chevron |
Chevron USA |
|
CIM |
Canadian Institute of Mining, Metallurgy and Petroleum |
|
cm |
centimeters |
|
CO2 |
Carbon dioxide |
|
CoG |
cutoff grade |
|
CPE |
Corrugated Polyethylene Pipe |
|
Cs |
Caesium |
|
CTFS |
Clay Tailings Filter Stack (Tailings Storage Facility) |
|
CWi |
Bond impact work index |
|
CY |
cubic yard(s) |
|
DCDA |
Double Contact Double Absorption |
|
DCF |
discounted cash flow |
|
DCS |
Distributed Control System |
|
deg. C or oC |
Degrees Celsius |
|
DMS |
data management system |
|
DOE |
Department of Energy |
|
DOI |
Department of the Interior |
|
DTB |
draft tube baffle |
|
EA |
Environmental Assessment |
|
EBITDA |
Earnings Before Interest, Taxes, Depreciation and Amortization |
|
EDG |
EDG, Inc. |
|
EDR |
Engineering Design Report |
|
EIS |
Environmental Impact Statement |
|
EPC |
Engineering, Procurement, and Construction |
|
EPCM |
Engineering, Procurement, and Construction Management |
|
ESA |
Endangered Species Act |
|
ET |
evapotranspiration |
|
EXP |
EXP U.S. Services Inc. |
|
Fe2(SO4)3 |
Ferric sulfate |
|
FEDINC |
Florida Engineering and Design, Inc. |
|
FEIS |
Final Environmental Impact Statement |
|
FONSI |
Finding of No Significant Impact |
|
FRP |
Fiberglass Reinforced Polymer |
|
ft |
feet or foot |
|
G&A |
General & Administrative |
|
g/cm3 |
grams per cubic centimeter |
|
g/l or g/L |
grams per liter |
|
GMS |
Growth Media Stockpile |
|
gpm |
Gallon(s) per minute |
|
GPS |
Global Positioning System |
|
Page 22 |
| Lithium Americas Corp. Feasibility Study, National Instrument 43-101 Technical Report for the Thacker Pass Project, Humboldt County, Nevada, USA |
|
Abbreviation/Acronym |
Description |
|
GRR |
Gross Revenue Royalty |
|
GWh/year |
gigawatt hours per year |
|
h |
hour |
|
H2S |
hydrogen sulfide |
|
H2SO4 |
sulfuric acid |
|
ha |
hectares |
|
HAP |
hazardous air pollutants |
|
Hazen |
Hazen Research |
|
HCT |
humidity cell test |
|
HDPE |
High Density Polyethylene |
|
HEC |
Harney Electric Cooperative |
|
HMI |
human machine interface |
|
HP |
horsepower |
|
HPTP |
Historic Properties Treatment Plan |
|
HPZ |
Hot Pond Zone |
|
HQ |
Standard "Q" wire line bit size. 96 mm outside hole diameter and 63.5 mm core diameter. |
|
HRS |
heat recovery systems |
|
Huber |
J. M. Huber Corporation |
|
Hz |
Hertz |
|
ICP |
Inductively Coupled Plasma Spectrometer |
|
ICP-AES |
Inductively Coupled Plasma Atomic Emission Spectroscopy |
|
ICP-MS |
Inductively Coupled Plasma Mass Spectroscopy |
|
in |
inch or inches |
|
IRR |
Internal Rate of Return |
|
ITAC |
Industrial TurnAround Corporation |
|
IX |
Ion Exchange |
|
K |
Potassium |
|
KCA |
Kappes Cassiday & Associates |
|
kg |
kilograms |
|
km |
kilometer |
|
kt |
thousand tonnes |
|
kV |
kilovolt |
|
kW |
kilowatt(s) |
|
kWh |
kilowatt hour(s) |
|
LAC |
Lithium Americas Corporation |
|
LCE |
Lithium Carbonate Equivalent |
|
LCT |
Lahontan cutthroat trout |
|
LFP |
Lithium Ferro Phosphate |
|
LHCSL |
low hydraulic conductivity soil layer |
|
Li |
Lithium |
|
Li2CO3 |
Lithium carbonate |
|
LiHCO3 |
lithium bicarbonate |
|
LNC |
Lithium Nevada Corporation |
|
LOM |
Life of Mine |
|
M |
million |
|
m |
meter |
|
M3 |
M3 Engineering & Technology Corporation |
|
m3/h |
cubic meters per hour |
|
Page 23 |
| Lithium Americas Corp. Feasibility Study, National Instrument 43-101 Technical Report for the Thacker Pass Project, Humboldt County, Nevada, USA |
|
Abbreviation/Acronym |
Description |
|
Ma |
million years ago |
|
MCY |
million cubic yards |
|
mg/L |
milligrams per liter |
|
MgSO4 |
Magnesium sulfate |
|
Mining Act |
Mining Act of the United States of America |
|
MLLA |
Mineral Lands Leasing Act |
|
mm |
millimeters |
|
Mm3 |
million cubic meters |
|
Mo |
Molybdenum |
|
MOA |
Memorandum of Agreement |
|
MOL |
milk of lime |
|
MOU |
Memorandum of Understanding |
|
Mt |
million tonnes |
|
MVR |
Mechanical Vapor Recompression |
|
MW |
megawatt |
|
MWh |
megawatt hour(s) |
|
MWMP |
Meteoric Water Mobility Procedure |
|
Na |
Sodium |
|
NAAQS |
National Ambient Air Quality Standards |
|
NAC |
North American Coal Corporation |
|
NDEP |
Nevada Division of Environmental Protection |
|
NDOT |
Nevada Department of Transportation |
|
NDOW |
State of Nevada Department of Wildlife |
|
NDWR |
Nevada Division of Water Resources |
|
NEPA |
National Environmental Policy Act |
|
NewFields |
NewFields Mining Design & Technical Services |
|
NFPA |
National Fire Protection Association |
|
NHPA |
National Historic Preservation Act |
|
NOI |
Notice of Intent |
|
NOx |
nitrogen oxides |
|
NPV |
Net Present Value |
|
NRV |
Nevada Reference Values |
|
OPEX |
Operational Expense or Operating Cost Estimate |
|
P&ID |
piping and instrumentation diagram |
|
PCS |
Plant Control System |
|
PDC |
Process Design Criteria |
|
PFS |
Pre-feasibility Study |
|
pH |
measure of acidity |
|
Ph1 |
Phase 1 |
|
Ph2 |
Phase 2 |
|
PoO |
Plan of Operation |
|
ppm |
parts per million |
|
PQ |
Standard "Q" wire line bit size. 122.6 mm outside hole diameter and 85 mm core diameter. |
|
PSD |
particle size distribution, Prevention of Significant Deterioration |
|
PTC |
Process Testing Center |
|
QA/QC |
Quality Assurance and Quality Control |
|
Qal |
Quaternary Alluvium |
|
QP |
Qualified Person |
|
Page 24 |
| Lithium Americas Corp. Feasibility Study, National Instrument 43-101 Technical Report for the Thacker Pass Project, Humboldt County, Nevada, USA |
|
Abbreviation/Acronym |
Description |
|
Rb |
Rubidium |
|
RC |
Reverse Circulation |
|
RO |
reverse osmosis |
|
ROD |
Record of Decision |
|
ROM |
Run-of-Mine |
|
Sample ID |
Sample Tags |
|
SAP |
Sulfuric Acid Plant |
|
Savage |
Savage Companies (transloader) |
|
Sawtooth |
Sawtooth Mining, LLC |
|
Sb |
Antimony |
|
SCR |
Selective Catalyst Reduction |
|
SHRIMP |
Sensitive High Resolution Ion Microprobe |
|
SO2 |
Sulfur dioxide |
|
SRC |
Saskatchewan Research Council |
|
SRK |
SRK Consulting (U.S.), Inc. |
|
STG |
steam turbine generator |
|
t |
Tonne (metric) |
|
t/a |
Tonnes per annum (metric) |
|
t/d |
Tonnes per day (metric) |
|
t/m3 |
Tonnes per cubic meter |
|
t/y |
Tonnes per year (metric) |
|
TDS |
total dissolved solids |
|
TIC |
total installed cost |
|
UCS |
unconfined compressive strength |
|
UM |
Unpatented Mining |
|
US EPA |
US Environmental Protection Agency |
|
US$ |
US Dollars |
|
US$/t |
United States Dollars per tonne |
|
USBM |
United States Bureau of Mines |
|
USEPA |
United States Environmental Protection Agency |
|
USFWS |
United States Department of the Interior Fish and Wildlife Service |
|
USG |
MODFLOW-USG (a water balance model) |
|
USGS |
United States Geological Survey |
|
UTM |
Universal Transverse Mercator |
|
WBS |
Work Breakdown Structure |
|
WEDC |
Western Energy Development Corporation |
|
WLC |
Western Lithium USA Corporation |
|
Wood |
Wood Canada Limited |
|
WPCP |
Water Pollution Control Permits |
|
WRSF |
Waste Rock Storage Facility |
|
wt.% |
percent by weight |
|
WWRSF |
West Waste Rock Storage Facility |
|
XRD |
X-Ray Diffraction |
|
YOY |
year-over-year |
|
ZLD |
Zero Liquid Discharge |
|
Page 25 |
| Lithium Americas Corp. Feasibility Study, National Instrument 43-101 Technical Report for the Thacker Pass Project, Humboldt County, Nevada, USA |
3 Reliance on Other Experts
In cases where the study authors have relied on contributions from third parties, the conclusions and recommendations are exclusively those of the particular QP. The results and opinions outlined in this Technical Report that are dependent on information provided by third parties are assumed to be current, accurate and complete as of the date of this report.
Information received from other experts has been reviewed for factual errors by the Qualified Persons. Any changes made as a result of these reviews did not involve any alteration to the conclusions made. Hence, the statements and opinions expressed in these documents are given in good faith and in the belief that such statements and opinions are not false and misleading at the date of these reports. These experts were relied upon for the following information:
The aerial topography was provided by GeoTerra in their report entitled, "Lidar Technical Report, Kings Valley Lithium, Presented to US Geomatics, Inc., Submitted by GeoTerra, 860 McKinley Street, Eugene, OR 97402, December 15, 2017."
The Qualified Persons have relied on other experts for property ownership and mineral tenure. Regarding mineral tenure to the property set forth in Section 4.2, the QPs have relied entirely, and without independent investigation, on the title opinion of Richard Harris, an attorney with Harris & Thompson (now Harris, Thompson and Faillers), dated February 6, 2013. The title opinion was updated and supplemented by the updated title opinion of Mr. Harris, dated November 18, 2016. Thomas P. Erwin also issued a Mineral Status Report on May 18, 2020.
|
Page 26 |
| Lithium Americas Corp. Feasibility Study, National Instrument 43-101 Technical Report for the Thacker Pass Project, Humboldt County, Nevada, USA |
4 Property Description and Location
4.1 Property Description
The Project is located in Humboldt County in northern Nevada, approximately 100 km north-northwest of Winnemucca, about 33 km west-northwest of Orovada, Nevada and 33 km due south of the Oregon border as shown on Figure 4-1. The area is sparsely populated and used primarily for ranching and farming. A total of 117 people live in Orovada, Nevada, according to the 2020 US Census for Orovada CDP, Nevada.
More specifically, the Project is situated at the southern end of the McDermitt Caldera Complex in Township 44 North (T44N), Range 34 East (R34E), and within portions of Sections 1 and 12; T44N, R35E within portions of Sections 2, 3, 4, 5, 6, 7, 8, 9, 10, 11, 12, 13, 14, 15, 16, and 17; and T44N, R36E, within portions of Sections 7, 8, 14, 15, 16, 17, 18, 19, 20, 21, 22, 23, and 29. The Project area is located on the United States Geological Survey (USGS) Thacker Pass 7.5-minute quadrangle at an approximate elevation of 1,500 m.
The Project area encompasses approximately 4,236 ha within the Plan of Operations (PoO). Figure 4-2 shows the location of the Project and the unpatented mining claims owned or controlled by LAC and property owned by LAC in northern Humboldt County, Nevada. The property lies within and is surrounded by public lands administered by the Bureau of Land Management (BLM).
 |
Page 27 |
| Lithium Americas Corp. Feasibility Study, National Instrument 43-101 Technical Report for the Thacker Pass Project, Humboldt County, Nevada, USA |
Figure 4-1 Regional Location Map

|
Page 28 |
| Lithium Americas Corp. Feasibility Study, National Instrument 43-101 Technical Report for the Thacker Pass Project, Humboldt County, Nevada, USA |
Figure 4-2 Map of Lithium Americas Corp. Mineral and Surface Control in the Vicinity of the Thacker Pass Project
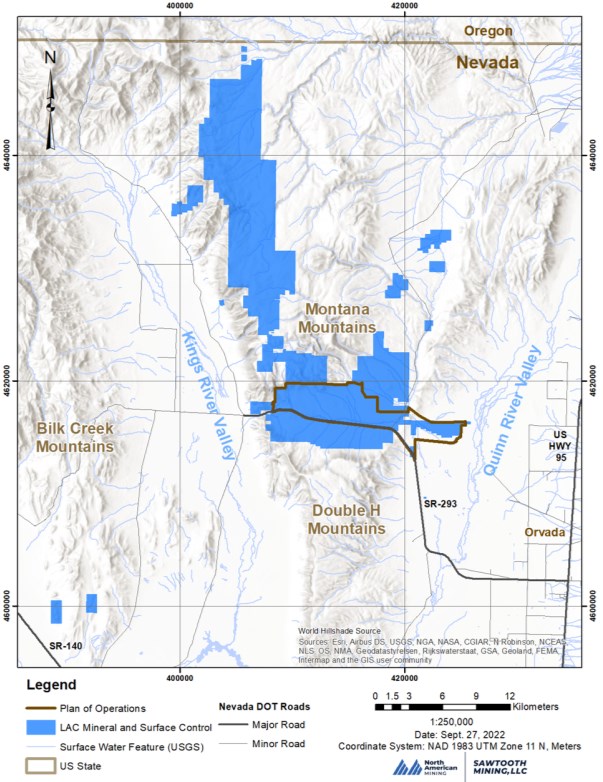
|
Page 29 |
| Lithium Americas Corp. Feasibility Study, National Instrument 43-101 Technical Report for the Thacker Pass Project, Humboldt County, Nevada, USA |
4.2 Mineral Tenure
A list of the unpatented mining claims (UM Claims) owned or controlled by LAC in northern Humboldt County, Nevada, is presented in Table 4-1. These claims include the Project area and are shown in Figure 4-2. In addition to these claims, LAC also owns 64.75 ha of private property in the Project area.
Table 4-1 Thacker Pass Project UM Claims Owned by LAC
|
Claim Name |
Claim Number |
NMC Number |
Total Claims |
|
BASIN |
1-30 |
1170660-1170689 |
30 |
|
BETA |
1-51 |
894721-894771 |
51 |
|
BLSE |
1-18 |
105235961-105235978 |
18 |
|
BPE |
1-498 |
1018964 - 1019461 |
498 |
|
BPE |
499-531 |
1030193 - 1030225 |
33 |
|
BPE |
532 |
1049234 |
1 |
|
CAMP |
1-66 |
1191376-1191441 |
66 |
|
CC Mill |
1-5 |
1122041 - 1122045 |
5 |
|
CC Mill |
6-9 |
1130820 - 1130823 |
4 |
|
CC Mill |
10-12 |
1170690 - 1170692 |
3 |
|
DELTA |
1-14 |
919508-919521 |
14 |
|
DPH |
1-22 |
1147600-1147621 |
22 |
|
ION |
1-32 |
1164510-1164541 |
32 |
|
ION |
35-50 |
1164542-1164557 |
16 |
|
ION |
53-69 |
1164558-1164574 |
17 |
|
ION |
72-85 |
1164575-1164588 |
14 |
|
ION |
86 |
1164590 |
1 |
|
ION |
87 |
1164589 |
1 |
|
ION |
88 |
1164591 |
1 |
|
ION |
90-107 |
1164592-1164609 |
18 |
|
ION |
109-132 |
1164610-1164633 |
24 |
|
ION |
135-139 |
1164634-1164638 |
5 |
|
ION |
146-149 |
1164640-1164643 |
4 |
|
ION |
153-165 |
1164644-1164656 |
13 |
|
ION |
168-175 |
1164657-1164664 |
8 |
|
ION |
184-202 |
1164665-1164683 |
19 |
|
ION |
212-232 |
1164684-1164704 |
21 |
|
ION |
240-262 |
1164705-1164727 |
23 |
|
ION |
264-286 |
1164728-1164750 |
23 |
|
ION |
300-306 |
1164751-1164757 |
7 |
|
LITH |
1-461 |
900830-901290 |
461 |
|
LITH |
463 |
901292 |
1 |
|
LITH |
465 |
901294 |
1 |
|
LITH |
467 |
901296 |
1 |
|
LITH |
469 |
901298 |
1 |
|
LITH |
471-473 |
901300-901302 |
3 |
|
LITH |
477 |
901306 |
1 |
|
LITH |
479 |
901308 |
1 |
|
LITH |
481 |
901310 |
1 |
|
LITH |
484 |
901313 |
1 |
|
LITH |
486 |
901315 |
1 |
|
LITH |
488 |
901317 |
1 |
|
LITH |
491-567 |
901320-901396 |
77 |
|
Page 30 |
| Lithium Americas Corp. Feasibility Study, National Instrument 43-101 Technical Report for the Thacker Pass Project, Humboldt County, Nevada, USA |
|
Claim Name |
Claim Number |
NMC Number |
Total Claims |
|
LITH |
586-677 |
901415-901506 |
92 |
|
LITH |
706-708 |
901535-901537 |
3 |
|
LITH |
713-732 |
901538-901557 |
20 |
|
LITH |
734-766 |
901558-901590 |
33 |
|
LITH |
785-1054 |
901609-901878 |
270 |
|
Longhorn |
2-3 |
1170694-1170695 |
2 |
|
Longhorn |
5-6 |
1170697-1170698 |
2 |
|
MHC |
1-14 |
1087803-1087816 |
14 |
|
MHC |
16-99 |
1087818-1087901 |
84 |
|
OMEGA |
1-124 |
950298-950421 |
124 |
|
Moonlight |
1 |
8001 |
1 |
|
Moonlight |
4 |
732426 |
1 |
|
NEUTRON |
31-45 |
919267- 919281 |
15 |
|
NEUTRON |
76-105 |
919282- 919311 |
30 |
|
NEUTRON |
166-189 |
919342- 919365 |
24 |
|
NEUTRON |
190 |
894562 |
1 |
|
NEUTRON |
192 |
894564 |
1 |
|
NEUTRON |
194 |
894566 |
1 |
|
NEUTRON |
196-199 |
894568-894571 |
4 |
|
NEUTRON |
200-207 |
919366-919373 |
8 |
|
NEUTRON |
209-225 |
919375 - 919391 |
17 |
|
NEUTRON |
238-239 |
894610- 894611 |
2 |
|
NEUTRON |
347 |
894719 |
1 |
|
NEUTRON |
353-366 |
900226 - 900239 |
14 |
|
NEUTRON |
379-402 |
900252 - 900275 |
24 |
|
NEUTRON |
427-450 |
900300 - 900323 |
24 |
|
NEUTRON |
475-498 |
900348 - 900371 |
24 |
|
NEUTRON |
523-546 |
900396 - 900419 |
24 |
|
NEUTRON |
555-574 |
900428 - 900447 |
20 |
|
NEUTRON |
579-585 |
900452 - 900458 |
7 |
|
NEUTRON |
586-627 |
982465 - 982506 |
42 |
|
NEUTRON PLUS |
1 |
1020688 |
1 |
|
NEUTRON PLUS |
2 |
1087902 |
1 |
|
NEUTRON R |
25R-30R |
1049235-1049240 |
6 |
|
NEUTRON R |
70R-75R |
1049241-1049246 |
6 |
|
NEUTRON R |
160R-165R |
1049247-1049252 |
6 |
|
NEUTRON R |
195R |
1049253 |
1 |
|
NEUTRON R |
208R |
1049254 |
1 |
|
NEUTRON R |
240R |
1049255 |
1 |
|
NEUTRON R |
242R |
1049256 |
1 |
|
NEUTRON R |
244R |
1049257 |
1 |
|
NEUTRON R |
246R |
1049258 |
1 |
|
NEUTRON R |
248R |
1049259 |
1 |
|
NEUTRON R |
250R |
1049260 |
1 |
|
NEUTRON R |
252R |
1049261 |
1 |
|
NEUTRON R |
254R |
1049262 |
1 |
|
NEUTRON R |
256R |
1049263 |
1 |
|
NEUTRON R |
258R |
1049264 |
1 |
|
NEUTRON R |
260R |
1049265 |
1 |
|
NEUTRON R |
262R |
1049266 |
1 |
|
NEUTRON R |
264R |
1049267 |
1 |
|
Page 31 |
| Lithium Americas Corp. Feasibility Study, National Instrument 43-101 Technical Report for the Thacker Pass Project, Humboldt County, Nevada, USA |
|
Claim Name |
Claim Number |
NMC Number |
Total Claims |
|
NEUTRON R |
270R |
1049268 |
1 |
|
NEUTRON R |
272R |
1049269 |
1 |
|
NEUTRON R |
276R |
1049270 |
1 |
|
NEUTRON R |
278R |
1049271 |
1 |
|
NEUTRON R |
280R |
1049272 |
1 |
|
NEUTRON R |
282R |
1049273 |
1 |
|
NEUTRON R |
284R-288R |
1049274-1049278 |
5 |
|
NEUTRON R |
348R |
1029479 |
1 |
|
PDC Mill |
1-18 |
1020381-1020398 |
18 |
|
PROTRON |
1-46 |
900530-900575 |
46 |
|
RAD |
1-121 |
937673-937793 |
121 |
|
ROCK |
1-20 |
1164758-1164777 |
20 |
Further details on the history and ownership of the Thacker Pass Project, and the associated claims, are in Section 6.
4.2.1 Unpatented Mining Claims and Surface Rights
The underlying title to the Thacker Pass Project properties is held through a series of UM Claims. UM Claims provide the holder with the rights to all locatable minerals on the relevant property, which includes lithium. The rights include the ability to use the claims for prospecting, mining or processing operations, and uses reasonably incident thereto, along with the right to use so much of the surface as may be necessary for such purposes or for access to adjacent land. This interest in the UM Claims remains subject to the paramount title of the US federal government. The holder of a UM Claim maintains a perpetual entitlement to the UM Claim, provided it meets the obligations for maintenance of the UM Claims as required by the Mining Act of the United States of America (the Mining Act) and associated regulations.
At this time, the principal obligation imposed on the holders of UM Claims is to pay an annual maintenance fee, which represents payment in lieu of the assessment work required under the Mining Act. The annual fee of $165.00 per claim is payable to the BLM, Department of the Interior, Nevada, in addition to a fee of $12.00 per claim paid to the county recorder of the relevant county in Nevada where the UM Claim is located. All obligations for the Thacker Pass Project UM Claims in Nevada, including annual fees to the BLM and Humboldt County, have been fulfilled.
The holder of UM Claims maintains the right to extract and sell locatable minerals, which includes lithium, subject to regulatory approvals required under Federal, State and local law. In Nevada, such approvals and permits include approval of a plan of operations by the BLM and environmental approvals. The Mining Act also does not explicitly authorize the owner of a UM Claim to sell minerals that are leasable under the Mineral Lands Leasing Act of 1920, USA, as amended (the MLLA). At this time, the MLLA is not implicated because the only mineral contemplated for mining and processing at this time is lithium.
4.3 Nature and Extent of Interest and Title
LNC is a Nevada corporation that is currently a wholly owned subsidiary of the Canadian-based LAC. LAC was formerly known as Western Lithium USA Corp (WLC). Pursuant to an agreement signed on December 20, 2007, between Western Energy Development Corporation (WEDC), a subsidiary of Western Uranium Corporation, and WLC (which was then also a subsidiary of Western Uranium Corporation), WEDC leased to WLC the Lith and Neutron claims for the purpose of lithium exploration and exploitation (the Lease).
|
Page 32 |
| Lithium Americas Corp. Feasibility Study, National Instrument 43-101 Technical Report for the Thacker Pass Project, Humboldt County, Nevada, USA |
Effective February 4, 2011, Western Uranium Corporation (WEDC), and Western Lithium USA Corp. (WLC) entered into an agreement for the purchase by WLC from WEDC of the royalties and titles for the Kings Valley Lithium Property.
In March 2011, the parties completed the transaction for the sale by WEDC to WLC of the royalties and titles constituting all of the Kings Valley Lithium Property. As a result of this transaction, the existing lease and royalty arrangements between the two companies on the Kings Valley Lithium Property, including the net smelter returns and net profits royalties on any lithium project that the company developed, were terminated. WLC acquired, directly or indirectly, control and full ownership of the Kings Valley Lithium Property mining claims and leases, excluding a gold exploration target (on the Albisu property) and a 20% royalty granted by WEDC to Cameco Global Exploration II Ltd. solely in respect of uranium (the Uranium Royalty). The UM Claims provided WLC the exclusive rights to explore, develop, and mine or otherwise produce any and all lithium deposits discovered on the claims, subject to royalty payments. The claims include the entirety of the mineralized zones in Thacker Pass and the Montana Mountains (formerly Stages 1 to Stage 5). On March 22, 2016, the company announced a name change from Western Lithium USA Corp. to Lithium Americas Corp. and the name of its Nevada-based wholly owned subsidiary was changed from Western Lithium Corp. to Lithium Nevada Corp. In 2018, LAC changed the name of its proposed lithium project to the Thacker Pass Project, reflecting the company's decision to focus the proposed development within the pass area located south of the Montana Mountains. LNC is the record owner of the UM Claims in the Project area. The current Project does not include the development of UM Claims in the Montana Mountains.
Legal access to the UM Claims is provided directly by State Route 293.
4.4 Royalties, Rights and Payments
In addition to the Uranium Royalty and those national, state and local rates identified in Section 4.2.1 of this report, the Thacker Pass Property is subject to a royalty with the Orion Mine Finance Fund I (f.n.a. RK Mine Finance [Master] Fund II L.P.) (Orion). It is a gross revenue royalty on the Thacker Pass Property in the amount of 8% of gross revenue until aggregate royalty payments equal $22 million have been paid, at which time the royalty will be reduced to 4.0% of the gross revenue on all minerals mined, produced or otherwise recovered. LAC can at any time elect to reduce the rate of the royalty to 1.75% on notice and payment of $22 million to Orion.
4.5 Environmental Liabilities
LAC has reclamation obligations for a small hectorite clay mine located within the Project area. The financial liability for this reclamation obligation, as stipulated by the BLM, is $871,336. LAC's other environmental liabilities from existing mineral exploration Projects in the vicinity of the Project area have a reclamation obligation totaling approximately $449,109. LAC currently holds a $1,357,520 reclamation bond with the BLM Nevada State Office.
There are no other known environmental liabilities associated with the Project.
4.6 Permitting
Based on information provided, or researched and reviewed, there are no federal, state or local regulatory or permitting issues identified at this time are likely to preclude overall approval of the proposed Project.
The Project is located on public lands administered by the U.S. Department of the Interior, BLM. Construction of the Project requires permits and approvals from various Federal, State, and local government agencies. Permitting status is described in more detail in Section 20.3 of this Technical Report.
|
Page 33 |
| Lithium Americas Corp. Feasibility Study, National Instrument 43-101 Technical Report for the Thacker Pass Project, Humboldt County, Nevada, USA |
Since 2008, LAC has performed extensive exploration activities at the Project site under existing approved agency permits. LAC has all necessary federal and state permits and approvals to conduct mineral exploration activities within active target areas of the Thacker Pass Project site.
A Plan of Operations and Reclamation Plan (PoO)-Plan of Operations No. N85255-for mineral exploration activities, including drilling and trenching for bulk sampling, was submitted to the BLM and the NDEP BMRR in May 2008. This PoO was analyzed by an Environmental Assessment (EA), DOI-BLM-NV-W010-2010-001-EA, in accordance with the United States National Environmental Policy Act of 1969. It was subsequently approved in January 2010 under the BLM's Surface Management Regulations contained in Title 43 of the Code of Federal Regulations, Chapter 3809. Under BLM permit N85255, twelve separate Work Plans have been submitted and approved by the BLM, authorizing continued exploration activities at site. As requested by the BLM, appropriate baseline studies that included a formal cultural resource survey were completed to support the Environmental Assessment Decision Record and Finding of No Significant Impact (FONSI) and approval of the PoO. The NDEP-BMRR issued concurrent approval for the exploration PoO, including the approval of the reclamation financial guarantee, and issued State of Nevada Reclamation Permit No. 0301 for the exploration project.
LAC further submitted the Thacker Pass Project Proposed PoO Permit Application on August 1, 2019 (LAC, 2019a). The permit application was preceded by LAC's submission of baseline environmental studies documenting the collection and reporting of data for environmental, natural, and socio-economic resources used to support mine planning and design, impact assessment, and approval process.
As part of the overall permitting and approval process, the BLM completed an analysis in accordance with the National Environmental Policy Act of 1969 (NEPA) to assess the reasonably foreseeable impacts to the human and natural environment that could result from the implementation of Project activities. As the lead Federal regulatory agency managing the NEPA process, the BLM has prepared and issued a Final Environmental Impact Statement (FEIS), (DOI-BLM-NV-W010-2020-0012-EIS) on December 3, 2020 (BLM, 2020). Following the issuance of the FEIS, BLM issued the EIS Record of Decision (ROD) and PoO Approval on January 15, 2021 (BLM, 2021). In addition, a detailed Reclamation Cost Estimate (RCE) has been prepared and submitted to both the BLM and Nevada Division of Environmental Protection-Bureau of Mining, Regulation and Reclamation (NDEP-BMRR). On October 28, 2021, the NDEP-BMRR approved the PoO with the issuance of draft Reclamation Permit 0415. On February 25, 2022, the NDEP-BMRR issued the final Reclamation Permit 0415. The BLM will require the placement of a financial guarantee (reclamation bond) to ensure that all disturbances from the mine and process site are reclaimed once mining concludes.
There are no identified issues that would prevent LAC from achieving all permits and authorizations required to commence construction and operation of the Project based on the data that has been collected to date. Ground water appropriation transfer discussions are ongoing for Phase 2 of the Project. Additional discussions regarding permitting are contained in Chapter 20.
4.7 Other Factors or Risks
The QP for this section is not aware of any other significant factors or risks that may affect access, title, or the right or ability to perform work on the property.
4.8 Conclusions
Based on information provided, or researched and reviewed, LAC is approved by the BLM and the NDEP-BMRR to conduct mineral exploration activities at the Thacker Pass Project site in accordance with Permit No. N85255.
LAC has either obtained, or initiated the process to obtain, all major necessary federal, state, and local regulatory agency permits and approvals for further advancement of the Thacker Pass Project.
|
Page 34 |
| Lithium Americas Corp. Feasibility Study, National Instrument 43-101 Technical Report for the Thacker Pass Project, Humboldt County, Nevada, USA |
5 Accessibility, Climate, Local Resources, Infrastructure, and Physiography
5.1 Physiography
The Project is located in the southern portion of the McDermitt Caldera. The Project site sits at the southern end of the Montana Mountains, with its western border occurring just east of Thacker Creek. Elevation at the Project site is approximately 1,500 m above sea level. Physiography is characterized by rolling topography trending eastward, with slopes generally ranging from 1% to 5%.
Lands within the Project footprint primarily drain eastward to Quinn River. A small portion of the proposed pit area drains west to Kings River via Thacker Creek. There are no perennially active watercourses on the Project site. A few small seeps and springs have been identified on the Project footprint, none of which are regionally significant.
Soils consist primarily of low-permeability clays intermixed with periodic shallow alluvial deposits.
Vegetation consists of low-lying sagebrush and grasslands. The area is heavily infested with cheatgrass, an unwanted invasive species in Nevada.
5.2 Accessibility
Access to the Project is via the paved US Highway 95 and paved State Route 293; travel north on US-95 from Winnemucca, Nevada, for approximately 70 km to Orovada and then travel west-northwest on State Route 293 for 33 km toward Thacker Pass to the Project site entrance. Driving time to the Project is approximately one hour from Winnemucca, and 3.5 hours from Reno. On-site access is via several gravel and dirt roads established during the exploration phase.
5.3 Climate
The climate of the Project area will not affect mining throughout the year. The life of mine (LOM) plan discussed in this Technical Report assumes mining 365 days per year. The meteorological station in Figure 5-1 has continuously operated at the Project site since 2011. The station collects temperature, precipitation, wind speed and direction, solar radiation, and relative humidity data.
|
Page 35 |
| Lithium Americas Corp. Feasibility Study, National Instrument 43-101 Technical Report for the Thacker Pass Project, Humboldt County, Nevada, USA |
Figure 5-1 Photograph of the On-Site Meteorological Station, Including Tower, Solar Power Station, and Security Fence
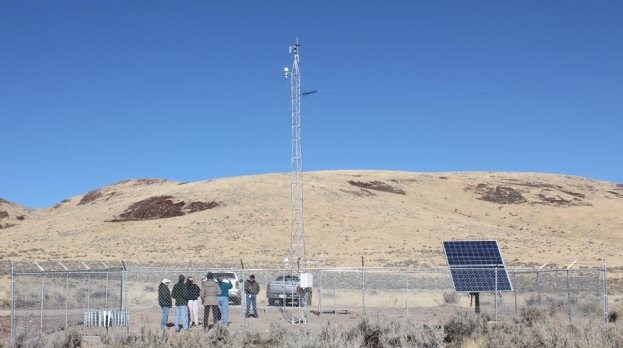
Source: LAC, 2012
5.3.1 Temperature
Northern Nevada has a high-desert climate with cold winters and hot summers. The average minimum temperature in January is -10.6°C recorded from LAC on-site meteorological station recorded between 2012 and 2021. The lowest January temperature recorded during this time period is -16.4°C recorded in 2017. The summer temperatures reach up to 35°C to 40°C. Snow can occur from October to May, although it often melts quickly. Nearby mining operations operate continuously through the winter and it is expected that the length of the operating season at the Thacker Pass Project would be year-round.
The temperature recorded in the LAC station from 2011 to 2021 ranges from -18°C to +37°C. The frost depth for the Project is 0.635 m (24 in.) based on Humboldt County Basic Design Requirements.
5.3.2 Precipitation
The area is generally dry, with annual precipitation ranging from 14.8 cm (5.8 inches) in 2020 to 39.9 cm (15.7 inches) in 2014 (Table 5-1). Winter precipitation (December to February) is higher with total monthly precipitation ranging from 0.1 cm to 9.5 cm. In the summer (June to August), precipitation is lower, with monthly precipitation ranging from 0.0 cm to 3.3 cm.
|
Page 36 |
| Lithium Americas Corp. Feasibility Study, National Instrument 43-101 Technical Report for the Thacker Pass Project, Humboldt County, Nevada, USA |
Table 5-1 Annual Precipitation at the Thacker Pass Project Site (in cm)
|
Month |
2011 |
2012 |
2013 |
2014 |
2015 |
2016 |
2017 |
2018 |
2019 |
2020 |
2021 |
|
January |
- |
4.3 |
2.4 |
1.0 |
0.9 |
6.3 |
7.6 |
1.5 |
3.5 |
4.1 |
2.4 |
|
February |
- |
0.7 |
0.4 |
5.4 |
2.0 |
0.6 |
4.1 |
1.5 |
7.1 |
0.2 |
4.7 |
|
March |
- |
2.7 |
0.8 |
7.7 |
1.1 |
3.6 |
2.4 |
5.3 |
2.4 |
2.0 |
0.4 |
|
April |
- |
3.0 |
0.7 |
3.6 |
3.0 |
2.0 |
5.4 |
3.8 |
1.7 |
0.4 |
0.4 |
|
May |
- |
0.8 |
5.5 |
1.5 |
8.9 |
5.0 |
2.3 |
4.2 |
10.0 |
1.5 |
1.3 |
|
June |
- |
1.0 |
1.1 |
0.3 |
0.9 |
2.2 |
3.3 |
1.1 |
0.9 |
1.9 |
2.6 |
|
July |
- |
1.0 |
.9 |
1.6 |
2.0 |
0.0 |
0.1 |
0.0 |
1.1 |
0.0 |
0.3 |
|
August |
1.0 |
1.3 |
1.4 |
2.7 |
0.2 |
0.0 |
1.0 |
0.0 |
0.4 |
0.5 |
0.0 |
|
September |
0.0 |
1.8 |
3.0 |
7.2 |
0.6 |
2.3 |
0.7 |
0.0 |
2.0 |
0.0 |
0.1 |
|
October |
2.9 |
2.9 |
2.5 |
1.2 |
4.4 |
3.2 |
0.7 |
3.2 |
0.0 |
0.0 |
7.6 |
|
November |
1.5 |
2.8 |
2.0 |
3.0 |
1.5 |
1.7 |
3.3 |
1.8 |
1.3 |
3.1 |
0.9 |
|
December |
0.1 |
6.9 |
0.8 |
4.5 |
9.5 |
6.9 |
0.4 |
3.9 |
6.1 |
1.0 |
4.5 |
|
Annual Total |
- |
29.2 |
21.5 |
39.9 |
35.1 |
33.9 |
31.2 |
26.2 |
36.4 |
14.8 |
25.1 |
|
Minimum Monthly |
- |
0.7 |
0.4 |
0.3 |
0.2 |
0.0 |
0.1 |
0.0 |
0.0 |
0.0 |
0.0 |
|
Maximum Monthly |
- |
6.9 |
5.5 |
7.7 |
9.5 |
6.8 |
7.6 |
5.3 |
10.0 |
4.1 |
7.6 |
Source: LAC's on-site meteorological station
5.3.3 Evaporation
Open water evaporation estimates are based on data from the Western Regional Climate Center from years 1948 through 2005 for the Rye Patch Reservoir, located approximately 90 km to the south at an elevation of 1,260 m. Using a pan coefficient of 0.7, the estimated open-water evaporation rate is 1.06 m per year.
The region is characterized by a water deficit, with estimated evaporation notably greater than recorded precipitation.
5.4 Local Resources
A long-established mining industry exists in the Winnemucca area. Local resources include all facilities and services required for large-scale mining, including an experienced workforce. The area is about 50 km north of the Sleeper gold mine (currently under care and maintenance) and 100 km northwest of the Twin Creeks, Turquoise Ridge, and Getchell gold mines.
Additionally, there are several other gold and copper mines in the area which rely on the experienced workforce and support for mining operations. Most of the workforce for this Project is expected to originate from the local population.
There are several chemical processing operations (mostly pyrometallurgy and gold processing) in the local area. Experienced operations staffing may have to be brought into the area to operate the lithium processing plant.
5.5 Infrastructure
The existing roads are maintained by the Nevada Department of Transportation. All are paved and in good repair. The roads are all-season roads but may be closed for short periods due to extreme weather during the winter season.
The nearest railroad access is in Winnemucca. This railroad is active and owned and maintained by Union Pacific. BNSF Railway has track rights to this line.
|
Page 37 |
| Lithium Americas Corp. Feasibility Study, National Instrument 43-101 Technical Report for the Thacker Pass Project, Humboldt County, Nevada, USA |
A 115 kV transmission line runs adjacent to State Route 293 through the Project site. This line is owned and operated by Harney Electric Cooperative (HEC). There is sufficient space within the Thacker Pass site to accommodate a prospective processing plant and mine support facilities, overburden placement site, waste rock storage facility, gangue storage facility, anticipated clay tailings filter stack (CTFS), water diversions, and containments. See the overall site general arrangement in Figure 18-1.
Although a natural gas transport line is located approximately 35 km to the south of the Project site, natural gas is not required for the Project.
5.6 Water Rights
LAC has existing, fully certificated water rights within the Quinn River Valley (located 25 km east of the proposed mine site) totaling nearly 1.2 Mm3 (1,000 acre-feet) annually. On April 1, 2020, LAC submitted applications to the Nevada Division of Water Resources (NDWR) to change the point of diversion, manner of use, and place of use for Nevada Water Right Permits 68633 and 68634 related to those water rights. Approval is pending review by NDWR.
In addition, LAC entered into a Water Rights Purchase Agreement with a nearby ranch on November 26, 2018, providing LAC with the right to acquire additional water rights to support the proposed Project. In relation to those water rights, LAC has applied to NDWR to change the point of diversion, manner of use, and place of use for Nevada Water Right Permits 18494, 15605, 21059, 21060, 24617, 83819, 83820, 83821. Approval is pending review by NDWR.
The change applications pending at NDWR are subject to a well-defined administrative process specified under Nevada State Water Law. Two local ranches have filed protests of the water rights change applications. NDWR held a hearing to address those protests in December 2021. A final decision is expected in 2023.
After accounting for an adjustment due to conversion from agricultural use to mining-and-milling use, LAC anticipates approval of approximately 3.5 Mm3 (2,850 acre-foot) per year to support the proposed Project for Phase 1 and double that amount for Phase 2. Water is available outside of the caldera to the east of the mine. In September 2018, LAC drilled the Quinn Production Well to a depth of 172 m (565 feet) below ground surface. The well was drilled under an approved BLM Permit N94510. In October 2018, LAC performed a 72-hour constant rate pump test on the well to evaluate well performance and aquifer parameters. The testing determined water production from QRPW18-01 is adequate to supply LAC with process water, at sustainable production rate of 909 m3/h (3,500 gpm) or over 7.9 Mm3 (6,400 acre-foot) per annum (Piteau, 2019a). Per Piteau (2019), the production rate is limited by physical constraints of the column pipe and well diameter rather than aquifer performance, suggesting that future or backup wells with larger diameters may be capable of producing higher flows. The current suite of inorganic analytes from well samples meets drinking water standards; additional water quality testing will be conducted to support an application to qualify the wells for potable water uses.
|
Page 38 |
| Lithium Americas Corp. Feasibility Study, National Instrument 43-101 Technical Report for the Thacker Pass Project, Humboldt County, Nevada, USA |
6 History
On March 22, 2016, the Project owner announced a name change from Western Lithium USA Corp. to Lithium Americas Corp. The name of the Kings Valley Project was changed to the Lithium Americas Project and was changed again in 2018 to the Thacker Pass Project (includes only the former Stage 1). In this section, any reference to WLC or the Kings Valley Project now refers to LAC and the Thacker Pass Project.
6.1 Ownership History
Chevron USA (Chevron) leased many of the claims that comprised the lithium project to the J. M. Huber Corporation (Huber) in 1986. In 1991, Chevron sold its interest in the claims to Cyprus Gold Exploration Corporation. In 1992, Huber terminated the lease. Cyprus Gold Exploration Corporation allowed the claims to lapse and provided much of the exploration data to Jim LaBret, one of the claim owners from which they had leased claims. WEDC, a Nevada corporation, leased LaBret's claims in 2005, at which time LaBret provided WEDC access to the Chevron data and access to core and other samples that were available.
Pursuant to an agreement signed on December 20, 2007, between WEDC, a subsidiary of Western Uranium Corporation, and WLC (which was then a subsidiary of Western Uranium Corporation), WEDC leased the mining claims to WLC for the purpose of lithium exploration and exploitation. This agreement granted WLC exclusive rights to explore, develop, and mine or otherwise process any and all lithium deposits discovered on the claims, subject to royalty payments. The leased area, at that time, included the entirety of the Thacker Pass Deposit and included 1,378 claims that covered over 11,000 ha.
Lithium deposits to be exploited included, but were not limited to, deposits of amblygonite, eucryptite, hectorite, lepidolite, petalite, spodumene, and bentonitic clays. Rights to all other mineral types, including base and precious metals, uranium, vanadium, and uranium-bearing or vanadium-bearing materials or ores were expressly reserved by WEDC. The term of that lease agreement was 30 years. The lease granted WLC the exclusive right to purchase the unpatented mining claims (UM Claims) comprising a designated discovery, subject to the royalty and other rights to be reserved by WEDC and subject to WLC's obligations under the deed to be executed and delivered by WEDC on the closing of the option.
In July 2008, WLC ceased to be wholly owned by Western Uranium Corporation and became an independent publicly traded company.
Effective February 4, 2011, Western Uranium Corporation, WEDC, and WLC entered into an agreement for the purchase by WLC from WEDC of the royalties and titles for the then-named Kings Valley mineral property.
In March 2011, the parties completed the transaction for the sale by WEDC to WLC of the royalties and titles constituting all of the Kings Valley mineral property. As a result of this transaction, the existing lease and royalty arrangements between the two companies on the Kings Valley property, including the Net Smelter Returns and Net Profits Royalties on any lithium project that the company developed, were terminated. WLC held control and full ownership of the then-named Kings Valley property mining claims and leases, excluding a gold exploration target (on the Albisu property) and a 20% royalty granted by WEDC to Cameco Global Exploration II Ltd. solely in respect of uranium.
6.2 Exploration History
In 1975, Chevron began an exploration program for uranium in the sediments located throughout the McDermitt Caldera. Early in Chevron's program, the USGS (who had been investigating lithium sources) alerted Chevron to the presence of anomalous concentrations of lithium associated with the caldera. Because of this, Chevron added lithium to its assays in 1978 and 1979, began a clay analysis program, and obtained samples for engineering work, though uranium remained the primary focus of exploration.
|
Page 39 |
| Lithium Americas Corp. Feasibility Study, National Instrument 43-101 Technical Report for the Thacker Pass Project, Humboldt County, Nevada, USA |
Results supported the high lithium concentrations contained in clays. From 1980 to 1987, Chevron began a drilling program that focused on lithium targets and conducted extensive metallurgical testing of the clays to determine the viability of lithium extraction.
6.3 Historic Production from the Property
Prior owners and operators of the property did not conduct any commercial lithium production from the property.
|
Page 40 |
| Lithium Americas Corp. Feasibility Study, National Instrument 43-101 Technical Report for the Thacker Pass Project, Humboldt County, Nevada, USA |
7 Geological Setting and Mineralization
The Thacker Pass Project is located within an extinct 40x30 km supervolcano named McDermitt Caldera, straddling the Oregon-Nevada border. The McDermitt Caldera formed approximately 16.3 million years ago as part of a time-transgressive hotspot currently underneath the Yellowstone Plateau of Wyoming, Idaho, and Montana. Following an initial eruption of the ignimbrite and concurrent collapse of the McDermitt Caldera, a large lake formed in the caldera basin. This lake water was extremely enriched in lithium due to extensive hydrothermal activity and natural leaching of lithium from the lithium-rich volcanic rocks associated with caldera volcanism. This resulted in the accumulation of a thick sequence of lithium-rich muddy lacustrine clays at the bottom of the lake.
Renewed volcanic activity uplifted the center of the caldera, altering some of the smectite clays to illite, draining the lake and bringing the lithium-rich moat sediments to the surface of the earth. The result of these geological processes is a high-grade, large, and near-surface lithium deposit called the Thacker Pass Project.
7.1 Regional Geology
The Thacker Pass Project is located within the McDermitt Volcanic Field, a volcanic complex with four large rhyolitic calderas that formed in the middle Miocene (Benson et al., 2017a). Volcanic activity in the McDermitt Volcanic Field occurred simultaneously with voluminous outflow of the earliest stages of the approximately 16.6 Ma to 15 Ma Columbia River flood basalt lavas. This volcanic activity was associated with impingement of the Yellowstone plume head on the continental crust (Coble and Mahood, 2012; Benson et al., 2017a). Plume head expansion underneath the lithosphere resulted in crustal melting and surficial volcanism along four distinct radial swarms centered around Steens Mountain, Oregon (Figure 7-1; Benson et al., 2017a).
The McDermitt Volcanic Field is located within the southeastern-propagating swarm of volcanism from Steens Mountain into north-central Nevada (Benson et al., 2017a). The Thacker Pass Project is located within the largest and southeastern most caldera of the McDermitt Volcanic Field, the McDermitt Caldera (Figure 7-1).
|
Page 41 |
| Lithium Americas Corp. Feasibility Study, National Instrument 43-101 Technical Report for the Thacker Pass Project, Humboldt County, Nevada, USA |
Figure 7-1 Regional Map Showing the Location of the McDermitt Caldera in the Western US
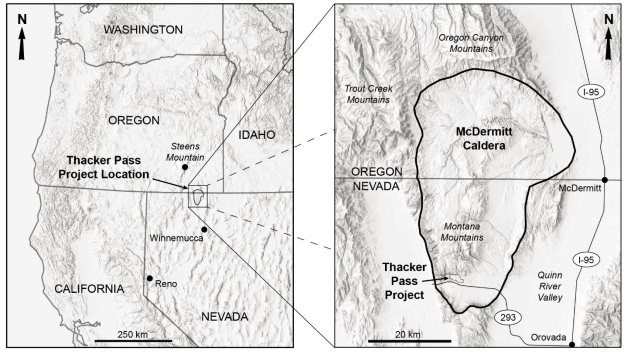
Source: Lithium Americas Corp. (2022)
7.2 Geologic History of the McDermitt Caldera
7.2.1 Pre-Caldera Volcanism
Prior to collapse of the McDermitt Caldera at 16.33 Ma, volcanism in the northern portion of the McDermitt Volcanic Field and locally small volumes of trachytic to rhyolitic lavas erupted near the present-day Oregon-Nevada border in the Trout Creek and Oregon Canyon Mountains (Figure 7-1). These lavas and the flood basalts are exposed along walls of the McDermitt Caldera and are approximately 16.5 Ma to approximately 16.3 Ma years old (Benson et al., 2017a; Henry et al., 2017).
7.2.2 Eruption of the Tuff of Long Ridge and Collapse of the McDermitt Caldera
The trachytic to rhyolitic Tuff of Long Ridge erupted at approximately 16.33 Ma and formed the 30 km by 40 km keyhole-shaped McDermitt Caldera (Figure 7-1) that straddles the Oregon-Nevada border. Rytuba and McKee (1984) and Conrad (1984) initially interpreted the McDermitt Caldera as a composite collapse structure formed on piecewise eruption of four different ignimbrites from a single magma chamber. Henry et al. (2017) refined the stratigraphy to a singular ignimbrite they call the McDermitt Tuff (herein called the Tuff of Long Ridge to avoid confusion).
Regional reconnaissance work by Benson et al. (2017a) indicates that there was one large laterally extensive and crystal-poor (<3% feldspar) caldera-forming eruption (Tuff of Long Ridge), though other smaller-volume tuffs are exposed close to the vent and their eruptions and concomitant collapses may have contributed to the peculiar shape of the caldera. An estimated approximately 500 km3 of ignimbrite ponded within the caldera during the eruption, with approximately 500 km3 spreading out across the horizon up to 60 km from the caldera (Benson et al., 2017a; Henry et al., 2017).
|
Page 42 |
| Lithium Americas Corp. Feasibility Study, National Instrument 43-101 Technical Report for the Thacker Pass Project, Humboldt County, Nevada, USA |
7.2.3 Post-Caldera Activity
Following eruption of the Tuff of Long Ridge, a large lake formed in the caldera depression. Authigenic and detrital sediments and a subordinate volume of volcanic rock (tephra, basaltic lava, rhyolitic tuff) accumulated in the bottom of the lake. Sedimentation was likely active for several hundreds of thousands of years given that nearby Miocene caldera lakes lasted approximately this long (Coble and Mahood, 2012; Benson et al., 2017a). 40Ar/39Ar dates on primary tephra and authigenic feldspar from the sedimentary sequence are as young as approximately 14.9 Ma, indicating that sedimentation and mineralization occurred for at least approximately 1.5 million years (Castor and Henry, 2020). During this interval, the caldera underwent a period of resurgence similar to that of the Valles Caldera in New Mexico (Smith and Bailey, 1968). This resurgence occurred approximately 16.2 Ma (Castor and Henry, 2020) and uplifted a large volume of intracaldera ignimbrite and caldera lake sediments that form the present-day Montana Mountains (Figure 7-2).
Figure 7-2 Simplified Geological Map of the Southern Portion of the McDermitt Caldera and the Thacker Pass Project
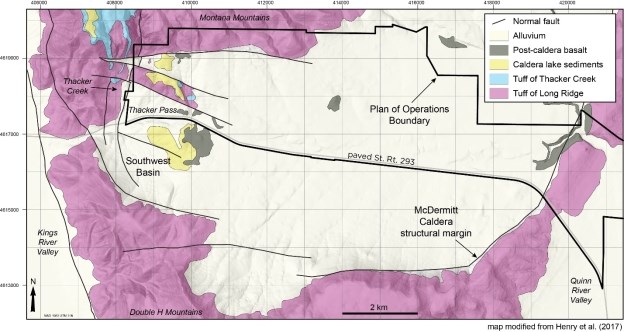
Source: Lithium Americas Corp. (2022)
Note: The lithium resources in this TRS are hosted within the Caldera Lake Sediments
A hydrothermal event associated with magmatic resurgence introduced to the system a hot, acidic fluid rich in Li, Potassium (K), Fluorine (F), Molybdenum (Mo), Cesium (Cs), Rubidium (Rb) and other elements associated with hydrothermal systems (Ingraffia et al., 2020). This fluid altered much of the smectite-bearing clays in the vicinity of Thacker Pass to a lithium-bearing illite, localized around intracaldera normal faults (Figure 7-2).
Beginning around 12 Ma, Basin and Range normal faulting associated with the extending North American lithosphere (Colgan et al., 2006; Lerch et al., 2008) caused uplift of the western half of the McDermitt Caldera and subsidence of Kings River Valley. Faults formed along reactivated ring fractures of the western McDermitt Caldera, and the Tuff of Thacker Creek. This uplift sped up the weathering and erosion of rocks within the caldera.
|
Page 43 |
| Lithium Americas Corp. Feasibility Study, National Instrument 43-101 Technical Report for the Thacker Pass Project, Humboldt County, Nevada, USA |
7.3 Mineralization
7.3.1 Thacker Pass Deposit
The Thacker Pass Deposit sits sub-horizontally beneath a thin alluvial cover at Thacker Pass and is partially exposed at the surface (Figure 7-2). The Thacker Pass Deposit contains the targeted multi-phase mining development of the Thacker Pass Project. It lies at relatively low elevations (between 1,500 m and 1,300 m) in caldera lake sediments that have been separated from the topographically higher deposits to the north due to post-caldera resurgence and Basin and Range normal faulting. Exposures of the sedimentary rocks at Thacker Pass are limited to a few drainages and isolated road cuts. Therefore, the stratigraphic sequence in the deposit is primarily derived from core drilling.
The sedimentary section, which has a maximum drilled thickness of about 160 m, consists of alternating layers of claystone and volcanic ash. Basaltic lavas occur intermittently within the sedimentary sequence. The claystone comprises 40% to 90% of the section. In many intervals, the claystone and ash are intimately intermixed. The claystones are variably brown, tan, gray, bluish-gray and black, whereas the ash is generally white or very light gray. Individual claystone-rich units may laterally reach distances of more than 152 m, though unit thickness can vary by as much as 20%. Ash-rich layers are more variable and appear to have some textures that suggest reworking. All units exhibit finely graded bedding and laminar textures that imply a shallow lacustrine (lake) depositional environment.
Surficial oxidation persists to depths of 15 m to 30 m in the moat sedimentary rock. Oxidized claystone is brown, tan, or light greenish-tan and contains iron oxide, whereas ash is white with some orange-brown iron oxide. The transition from oxidized to unoxidized rock occurs over intervals as much as 4.5 m thick.
The moat sedimentary section at Thacker Pass overlies the hard, dense, indurated intra-caldera Tuff of Long Ridge. A zone of weakly to strongly silicified sedimentary rock, the Hot Pond Zone (HPZ), occurs at the base of the sedimentary section above the Tuff of Long Ridge in most of the cores retrieved from the Thacker Pass Deposit. Both the HPZ and the underlying Tuff of Long Ridge are generally oxidized.
Core from each drill hole has been examined and drill logs have been prepared that record rock type, color, accessory minerals, textures and other features of significance. The core has mostly been divided into sample intervals for chemical analyses delineated on the basis of lithology. Figure 7-3 shows a generalized interpretation of the lithology for core hole WLC-043 which is located roughly in the middle of the proposed mine pit area. The core data is the basis of the geologic model discussed in Section 14. Cross sections showing the lithological description and lateral continuity of lithological units are shown in Figure 14-3.
|
Page 44 |
| Lithium Americas Corp. Feasibility Study, National Instrument 43-101 Technical Report for the Thacker Pass Project, Humboldt County, Nevada, USA |
Figure 7-3 Interpreted and Simplified Sample Log for Drill Hole WLC-043, Li Assay Data, Alteration Phases Identified by X-ray Diffraction, and Thin Section Imagery
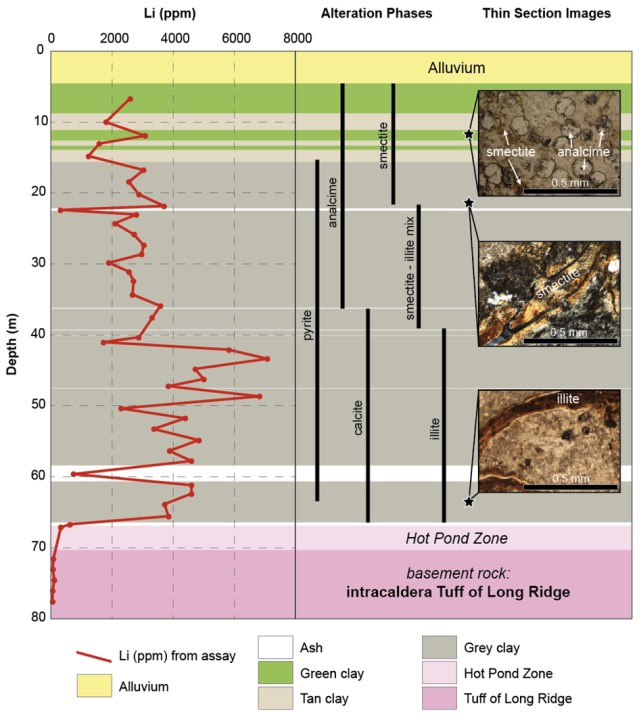
Source: Lithium Americas Corp. (2022)
Most of the moat sedimentary rocks drilled in the Thacker Pass basin contain high levels of lithium (>1,000 ppm). Intervals that consist mostly of ash or volcanic rock have lithium contents of less than 800 ppm whereas intervals dominated by claystone contain more lithium (>1,000 ppm). Many intervals have very high lithium contents (>4,000 ppm). Intervals with extreme lithium contents (>8,000 ppm) occur sporadically in the deposit.
|
Page 45 |
| Lithium Americas Corp. Feasibility Study, National Instrument 43-101 Technical Report for the Thacker Pass Project, Humboldt County, Nevada, USA |
There is no obvious change in lithium content across the boundary between oxidized and unoxidized rock. The highest lithium grades generally occur in the middle and lower parts of the sedimentary rock section, or in sections where these rocks have been uplifted to surface. Lithium grade continuity through the deposit can be visualized in Figure 14-5 which shows the high-grade mineralized zone in the deposit.
The lithium content of the Thacker Pass Deposit claystone can generally be correlated to the color and texture of the rock, as well as the amount of mixed-in ash. Intervals with the highest lithium grades (>4,000 ppm) generally contain gray to dark-gray or black claystone with less than 10% ash. Intervals of bluish-gray claystone with low ash content have moderate lithium content (generally 2,500 ppm to 3,000 ppm). Intervals of light-colored claystone (e.g., tan, light gray, greenish-tan) have lower lithium grades (generally 1,500 ppm to 2,500 ppm). Intervals of mixed claystone and ash are common and have variable lithium contents (generally 1,500 ppm to 3,000 ppm) depending on the type of claystone and proportion of ash present.
7.3.2 Mineralogy
Clay in the Thacker Pass Deposit includes two distinctly different mineral types, smectite and illite, based on chemistry and X-ray diffraction (XRD) spectra. Clay with XRD spectra that are indicative of smectite (12 - 15 Å basal spacing) occurs at relatively shallow depths in the deposit (Figure 7-4; Castor and Henry, 2020). Smectite drill intervals contain roughly 2,000 - 4,000 ppm Li (Figure 7-4). The chemistry and structure of the smectite at McDermitt is most similar to hectorite, a subtype of smectite (Na0,3(Mg,Li)3Si4O10(OH)2), though chemically the clay is intermediate between hectorite and two other smectites, stevensite and saponite (Morissette, 2012). Supported hectorite clay occurs elsewhere in the McDermitt Caldera and has been documented by several authors (e.g., Odom, 1992; Rytuba and Glanzman, 1978; Morissette, 2012; Castor and Henry, 2020).
Drill intervals with higher lithium contents (commonly 4,000 ppm Li or greater; Figure 7-4) contain clay 001 d spacing (Figure 7-4) typical for illite (Morissette, 2012; Castor and Henry, 2020). This illite clay occurs at relative moderate to deep depths in the moat sedimentary section and sporadically occurs in intervals that contain values approaching 9,000 ppm lithium in terms of a whole-rock assay, higher than what a hectorite crystal can accommodate. The Li-rich illite is similar in character to tainiolite, a subtype of illite (K2[Mg4Li2]Si8O20(OH,F)4) (Morissette, 2012; Castor and Henry, 2020). A relatively thin zone of interstratified smectite-illite clay is found between the smectite and illite-type clay (Figure 7-4; Castor and Henry, 2020). Clays in this mixed layer contain basal spacing intermediate between illite and smectite (Figure 7-4).
|
Page 46 |
| Lithium Americas Corp. Feasibility Study, National Instrument 43-101 Technical Report for the Thacker Pass Project, Humboldt County, Nevada, USA |
Figure 7-4 Assay Lithium Content Plotted Against Clay X-Ray Diffraction Data from Drill Holes WLC-043, WLC-006, and WLC-067
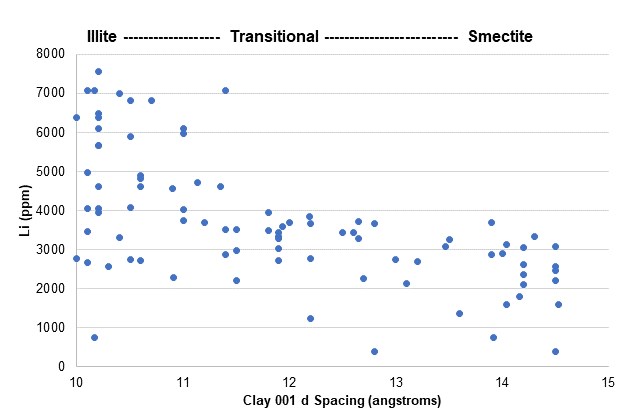
Source: Castor and Henry (2020)
Note: Blue Dots Represent Assay Data From Holes WLC-043, WLC-006, and WLC-067
X-ray diffraction data from drill holes WLC-043, WLC-006, and WLC-067 indicate that higher lithium content in the assay intervals correlates with the higher proportions of illite in the sample (Figure 7-4; Castor and Henry, 2020).
Because the assay interval (5 ft or 1.5 m) is coarser than the finely laminated sediments (often sub-cm) and can contain a variety of lithologies due to randomization, separating clay material out an individual assay interval can obtain a more accurate representation of the composition of the clay itself. Clay concentrates from different sections of the deposit were analyzed by Morissette (2012) and can be used to estimate the bulk composition of a pure clay separate. Illite clay concentrates from Thacker Pass have an average composition of 1.2 wt. % Li (12,000 ppm Li) with 10 Å basal spacing and smectite clay concentrates have an average composition of 0.5 wt. % Li (5,000 ppm Li) with approximately 15 Å basal spacing (Table 7-1).
The smectite clay concentrates at Thacker Pass have a lithium content similar to hectorite clay concentrate at Hector, California (around 5,700 ppm Li; Morissette, 2012; and higher than the average of all clay concentrates at Clayton Valley, Nevada (approximately 3,500 ppm Li average; Morissette, 2012). The illite clay concentrates at Thacker Pass contain approximately twice the concentration of lithium as the hectorite concentrate from Hector, California and approximately three times the concentration of lithium from clay concentrates in Clayton Valley, Nevada.
|
Page 47 |
| Lithium Americas Corp. Feasibility Study, National Instrument 43-101 Technical Report for the Thacker Pass Project, Humboldt County, Nevada, USA |
Table 7-1 Chemical Analyses of Thacker Pass Smectite and Illite Clay Concentrates
|
Category |
Smectite |
Illite |
|
Li (wt. %) |
0.5 |
1.2 |
|
Li2O (wt. %) |
1.1 |
2.6 |
|
Mg (wt. %) |
11.4 |
11.2 |
|
Ca (wt. %) |
0.9 |
0.2 |
|
001d Basal Spacing (Å) |
14.95 |
10 |
|
Notes: 1. All data from Morissette, C.L. (2012). "The Impact of Geological Environment on the Lithium Concentration and Structural Composition of Hectorite Clays." MS Thesis, University of Nevada-Reno, 244 p. 2. For sample preparation and analytical methodologies, see Morissette (2012). 3. Smectite data are averages of WLC03-01 and WLC03-02 in Morissette (2012), Table 9. 4. Illite data are averages of WLC03-03, WLC03-04, and WLC03-05 in Morissette (2012), Table 9. 5. 001 d basal spacing from air-dried oriented averages in Morissette (2012), Table 7 (smectites) and Table 8 (illites). 6. The conversion factor from Li2O to Li is 0.464. 7. The conversion factor from MgO to Mg is 0.6031. 8. The conversion factor from CaO to Ca is 0.7146. |
||
Other minerals in the Thacker Pass Deposit claystone include calcite, quartz, K-feldspar, plagioclase, dolomite, and fluorite. Pyrite and bitumen occur in the claystone below near-surface oxidized rock. Ash beds in the Thacker Pass Deposit contain quartz and feldspar with local analcime, and minor clay and pyrite. Zeolite minerals are typically present in the north part of the caldera, but analcime is the only zeolite present in the Thacker Pass Deposit (Glanzman and Rytuba, 1979; Castor and Henry, 2020). Carbonates (calcite and dolomite) are present throughout the deposit as primary sedimentary beds and rosettes and masses (Castor and Henry, 2020). Fluorite occurs in the mixed smectite/illite and illite zones and is interpreted by Castor and Henry (2020) to be the product of a secondary fluid. Fluorite often replaces calcite in the illitic portion of the sedimentary sequence, further supporting its genesis as a secondary fluid.
7.3.3 Discussion
The regional geological setting of this deposit is well-known and understood. The lithium bearing clays are contained within the lacustrine caldera moat sediments that are bounded by the outer wall of the caldera and inner resurgent dome. The local geological setting and degree of local lithium grade variations, within the modeled area, are adequately known for the Thacker Pass Deposit for resource estimation.
|
Page 48 |
| Lithium Americas Corp. Feasibility Study, National Instrument 43-101 Technical Report for the Thacker Pass Project, Humboldt County, Nevada, USA |
8 Deposit Types
8.1 Lithium Mineralization
Lithium enrichment (>1,000 ppm Li) in the Thacker Pass Deposit and deposits of the Montana Mountains occur throughout the caldera lake sedimentary sequence above the intra-caldera Tuff of Long Ridge. The deeper illite-rich portion of the sedimentary sequence contains higher lithium than the shallower, smectite-rich portion. The uplift of the Montana Mountains during both caldera resurgence and Basin and Range faulting led to increased rates of weathering and erosion of a large volume of caldera lake sediments. As a result, much of the sediments in the Montana Mountains have eroded away.
South of the Montana Mountains in the Thacker Pass Deposit, caldera lake sediments dip slightly away from the center of resurgence. Because of the lower elevations in Thacker Pass, a smaller volume of the original caldera lake sedimentary package eroded south of the Montana Mountains. As a result, the thickness of the sedimentary package increases with distance from the Montana Mountains. The proposed open-pit mining activity is concentrated just south of the Montana Mountains in Thacker Pass where lithium enrichment is close to the surface with minimal overburden.
8.2 Basis of Exploration
Caldera lake sediments of the McDermitt Caldera contain elevated Li concentrations compared to other sedimentary basins. Although the exact genesis of the Li enrichment processes is not fully understood, exploration activities have been based on the caldera lake model described above. Exploration results support the proposed model and have advanced the understanding of the geology of the Thacker Pass Deposit.
The exact cause for the Li enrichment in the caldera lake sediments is still up for debate. Benson et al. (2017b) demonstrated that the parent rhyolitic magmas of the McDermitt Volcanic Field were enriched in lithium due to assimilation of approximately 50% continental crust during magma genesis. In their model, eruption of the Tuff of Long Ridge and the collapse of the McDermitt Caldera resulted in a large volume of Li-enriched glass, pumice, and ash on the surface of the earth near the caldera. Subsequent weathering transported much of this lithium into the caldera which served as a structurally controlled catchment basin. Immediately following collapse, a large volume of loose Li-enriched glass and pumice was sitting within and near the edge of the caldera. This material would have had a relatively high surface area from which Li could be easily leached by meteoric and possibly hydrothermal fluids and deposited into the caldera lake.
The presence of sedimentary carbonate minerals and Mg-smectite (hectorite) throughout the lake indicates that the clays formed in a basic, alkaline, closed hydrologic system. Such conditions enable the direct precipitation of clays from solution (neoformation), the composition of which is dependent on the chemistry of the lake water (e.g., Tosca and Masterson, 2014). Because the McDermitt Caldera lake water was rich in Li and F, the primary Mg-smectite to precipitate was the Li-smectite, hectorite. The relatively low aluminum content of the clays supports an authigenic (non-detrital) genetic model for the smectites.
Ingraffia et al. (2020) hypothesize that the bulk of the Li mass within the caldera lake sediments is sourced from devitrification and degassing of glassy intracaldera tuff as sediments were accumulating in the caldera basin. Geochemical and field evidence suggests that the intracaldera Tuff of Long Ridge was emplaced at high temperatures atypical of continental rhyolitic ignimbrites (>850°C), leading to intense welding and rheomorphism (Hargrove and Sheridan, 1984; Henry et al., 2017). The cooling and degassing of this hot ignimbrite likely took place during most of the history of the caldera lake, which would add significant Li mass to the meteoric water system via hydrothermal fluids. These high-temperature fluids (>100°C) likely mixed with the lake and groundwater to lead to a basin-wide warm hydrologic system near 100°C.
|
Page 49 |
| Lithium Americas Corp. Feasibility Study, National Instrument 43-101 Technical Report for the Thacker Pass Project, Humboldt County, Nevada, USA |
The high-Li (>4,000 ppm) illitic portions of the sedimentary sequence near Thacker Pass formed when a hot, low-pH, Li- and F-rich fluid altered the smectite to illite and dissolved the disseminated carbonates. Geologic evidence for the interaction of sediments with this fluid include replacement of analcime by authigenic K-feldspar (Castor and Henry, 2020), the presence of the siliceous hot pond zone (HPZ) below the illite sediments, and high concentrations of Li, Rb, Cs, As, Mo, Sb, and other trace metals (Castor and Henry, 2020) in the illite-rich portion of the deposit. This supports a genetic model in which the initial neoformation of smectite in a closed hydrologic system was followed by hydrothermal alteration to illite in the vicinity of Thacker Pass. This explains why the illite in the Thacker Pass Deposit reaches whole-rock assay values up to 9,000 ppm Li, whereas the smectite intervals rarely exceed 4,000 ppm Li.
This neoformation-alteration model is consistent with the conclusion by Castor and Henry (2020) that burial diagenesis of tuffaceous sediments alone cannot account for the all the lithium present in the caldera. While the smectite-to-illite pattern observed is consistent with other sedimentary sequences observed in the world, simple mass modeling of burial diagenesis can only account for roughly 20% of the 640 Mt lithium carbonate maximum that Castor and Henry (2020) estimate to be contained within the McDermitt Caldera lake sediments.
|
Page 50 |
| Lithium Americas Corp. Feasibility Study, National Instrument 43-101 Technical Report for the Thacker Pass Project, Humboldt County, Nevada, USA |
9 Exploration
9.1 Thacker Pass
Prior to the 2010 drilling campaign, exploration consisted of:
a) geological mapping to delineate the limits of the McDermitt Caldera moat sedimentary rocks, and
b) drilling to determine grade and location of mineralization.
Survey work was completed prior to 1980 under Chevron's exploration program. Most of the Project area has been surveyed by airborne gamma ray spectrometry, in search of minerals such as uranium. Anomalously high concentration of lithium was discovered to be associated with the caldera. Lithium became the primary focus of exploration from 2007 onward.
A collar survey was completed by LAC for the 2007-2008 drilling program using a Trimble GPS (Global Positioning System). At that time the NAD 83 global reference system was used. Comparing LAC's survey work with that done by Chevron showed near-identical results for the easting and northings, elevations were off by approximately 3 m and were corrected in order to conform with earlier Chevron work.
The topographic surface of the Project area was mapped by aerial photography dated July 6, 2010. This information was obtained by MXS, Inc. for LAC. The flyover resolution was 0.35 m. Ground control was established by Desert-Mountain Surveying, a Nevada licensed land surveyor, using Trimble equipment. Field surveys of drill hole collars, spot-heights and ground-truthing were conducted by Mr. Dave Rowe, MXS, Inc., a Nevada licensed land surveyor, using Trimble equipment.
In addition to drilling in 2017, LAC conducted five seismic survey lines (Figure 9-1). A seismic test line was completed in July 2017 along a series of historic drill holes to test the survey method's accuracy and resolution in identifying clay interfaces. The seismic results compared favorably with drill logs. As illustrated by the yellow line in Figure 9-2, the contact between the basement (intracaldera Tuff of Long Ridge) and the caldera lake sediments (lithium resource host) slightly dips to the east. Four more seismic survey lines were commissioned in the Thacker Pass Project area (Figure 9-1). The additional seismic lines provide a more complete picture of the distribution, depth, and dip of clay horizons around the edge and center of the moat basin.
Drilling methods were compared to test for sample bias, using core drilling as the standard. Rotary, sonic, and reverse circulation drilling all showed slight sample biases when compared to core drilling. Only core holes were used for resource modeling to minimize the chance of sample bias. The QP believes that the drilling, logging, and sampling techniques procedures used are of reasonable quality and representative of the deposit. In the Thacker Pass Deposit, sample assays, geologic logging and area domains by structural faults were incorporated into the block model. This dataset is adequate for resource grade estimation.
|
Page 51 |
| Lithium Americas Corp. Feasibility Study, National Instrument 43-101 Technical Report for the Thacker Pass Project, Humboldt County, Nevada, USA |
Figure 9-1 Locations of Seismic Surveys Conducted in 2017
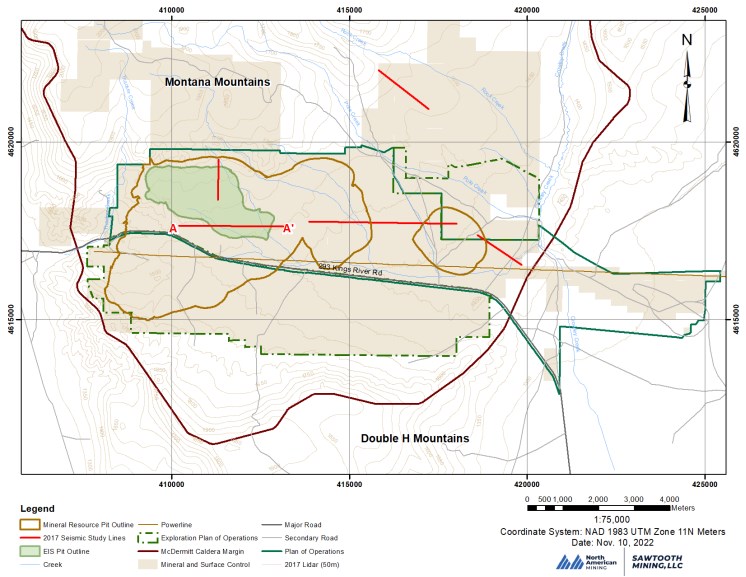
|
Page 52 |
| Lithium Americas Corp. Feasibility Study, National Instrument 43-101 Technical Report for the Thacker Pass Project, Humboldt County, Nevada, USA |
Figure 9-2 Results from one of the Seismic Test Lines (A-A')
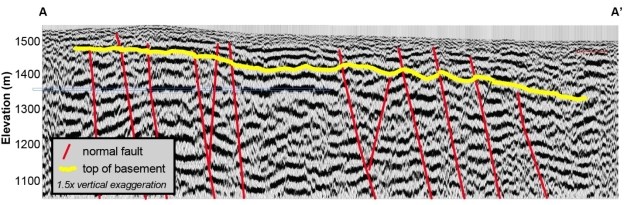
Source: Lithium Americas Corp. (2022)
9.2 Additional Exploration
Regional mapping of the McDermitt Caldera has been conducted by the Nevada Bureau of Mines. This mapping has been used to outline the McDermitt Caldera moat sediments that host the lithium bearing claystone. LAC exploration geologist, Dr. Thomas Benson, has also conducted mapping and analytical work within the southern area of the McDermitt Caldera. Collaborative analytical research with external researchers from federal labs and universities across the world is ongoing to further refine the geology of the Thacker Pass Deposit and improve the genetic model.
|
Page 53 |
| Lithium Americas Corp. Feasibility Study, National Instrument 43-101 Technical Report for the Thacker Pass Project, Humboldt County, Nevada, USA |
10 Drilling
10.1 Type and Extent of Drilling by LAC
The Thacker Pass Deposit area has been explored for minerals since the 1970s under three different drilling campaigns. Exploration began with Chevron using rotary and coring drilling methods. LAC performed two subsequent drilling campaigns in 2007-2010 and 2017-2018. The LAC drilling campaigns consisted of a combination of HQ, PQ, RC, and sonic coring and drilling methods. Table 10-1 lists a summary of holes drilled.
Table 10-1 LAC Drill Holes Provided in Current Database for the Thacker Pass Deposit
|
Drilling |
Number |
Type |
Hole IDs in Database |
Number used in |
|
Chevron |
24 |
Rotary |
PC-84-001 through PC-84-012, PC-84-015 through PC-84-026 |
0 |
|
1 |
Core |
PC-84-014c |
0 |
|
|
LAC 2007-2010 |
230 |
HQ Core |
WLC-001 through WLC-037, WLC-040 through WLC-232 |
227 |
|
7 |
PQ Core |
WPQ-001 through WPQ-007 |
0 |
|
|
5 |
HQ Core |
Li-001 through Li-005 |
0 |
|
|
8 |
RC |
TP-001 through TP-008 |
0 |
|
|
2 |
Sonic |
WSH-001 through WSH-002 |
0 |
|
|
LAC 2017-2018 |
144 |
HQ Core |
LNC-001 through LNC-144 |
139 |
Drilling methods were compared to test for sample bias, using core drilling as the standard. Rotary, sonic, and reverse circulation drilling all showed slight sample biases when compared to core drilling. Only HQ core holes were used for resource modeling to minimize the chance of sample bias.
In the Thacker Pass Deposit, sample assays, geologic logging and area domains by structural faults were incorporated into the block model. This dataset is adequate for resource grade estimation. Thirty-seven core holes (WLC-001 through WLC-037) were drilled specifically for assay and lithologic information. Eight Reverse Circulation (RC) holes were drilled to compare drilling techniques.
The RC drilling method biased assay results so the method was abandoned. Seven PQ-sized core holes were drilled with the intent to provide samples for metallurgical test work. Two sonic holes were drilled to test the drilling method; it was determined that the lithologic sample quality was not comparable to traditional core drilling and therefore sonic drilling was abandoned.
In 2008, LAC drilled five confirmation HQ core drill holes (Li-001 through Li-005) to validate the Chevron drilling results. Five historic Chevron drill holes that are broadly distributed across the Montana Mountains were selected to twin. Results demonstrated that the Chevron assay data was reliable enough to guide further exploration work. These holes were not used in the resource estimation.
From January 2010 through June 2011, August 2017 through December 2017, and June 2018 through November 2018, LAC initiated a definition drilling campaign to define a Measured and Indicated Resource for lithium (Figure 10-1). All cores were logged by geologists at a core shed located outside Orovada, NV, who recorded the hole identification number, easting, northing, elevation, total depth, and lithologic description.
|
Page 54 |
| Lithium Americas Corp. Feasibility Study, National Instrument 43-101 Technical Report for the Thacker Pass Project, Humboldt County, Nevada, USA |
LAC conducted exploration drilling in June 2017, drilling 22 widely spaced HQ core holes. Results of this work help expand the known resource to the northwest of the 2009-2010 drilling, identify a target south of the highway in an area designated the Southwest Basin (SW Basin), and further understand the local geology across Thacker Pass. All anomalous amounts of lithium occurred in clay horizons.
227 holes from the 2007-2010 campaigns and 139 holes from the 2017-2018 campaigns were used in the 2022 Mineral Resource in this report, including results from infill drilling unavailable at the time of the 2018 Mineral Resource estimate and results from holes outside the area modeled in the 2018 Mineral Resource estimate (Figure 10-1). Lithological interpretations of the drill holes from the 2007-2010 and 2017-2018 drilling campaigns are shown in Figure 14-3.
|
Page 55 |
| Lithium Americas Corp. Feasibility Study, National Instrument 43-101 Technical Report for the Thacker Pass Project, Humboldt County, Nevada, USA |
Figure 10-1 Drill Hole Map of Thacker Pass Deposit

|
Page 56 |
| Lithium Americas Corp. Feasibility Study, National Instrument 43-101 Technical Report for the Thacker Pass Project, Humboldt County, Nevada, USA |
Assays for drill holes prior to January 2010 (WLC-001 through WLC-037) had analytical work done by American Assay Laboratory (AAL) in Nevada. The AAL results failed multiple quality control checks and was determined unfit to use in the resource model. As a remedy, these holes had pulps re-assayed in 2010 by ALS Global (ALS) in Reno, Nevada who now perform all assay work for LAC. The re-assayed samples only reported lithium grade while all other results include ALS' entire ME-MS61 ICP suite of 48 elements. Assay interval length was chosen by the geologist based on lithology and claystone color. The Assay data can be visualized through Figure 14-5. Downhole assays and interpolated lithium grades are presented in the cross-sectional views.
Initially optimal drill hole spacing for Inferred, Indicated, and Measured categories was determined by geostatistical methods based on the results of the first 37 drill holes (WLC-001 through WLC-037). After LAC concluded drilling in 2017 the drill hole spacing geostatistics was re-evaluated with an additional 193 WLC holes (WLC-040 through WLC-232) and the drill hole spacing was widened for the 2018 drilling while maintaining the same Inferred, Indicated and Measured confidences. An example of the drill core used in the geologic and grade model are shown in Figure 10-2. The Chevron drill holes were excluded from consideration in the grade model due to unknown sample quality controls at the time of drilling.
Figure 10-2 Photograph of Core after Geologic Logging
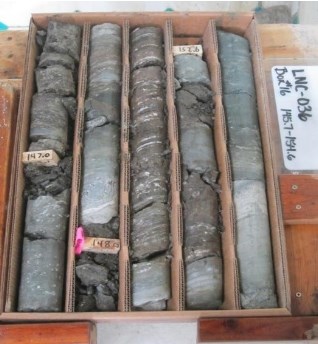
Source: Lithium Americas Corp. (2021)
10.1.1 Logging
During Chevron's exploration tenure, core was collected from the drills twice a day and descriptively logged by geologists at Chevron's field camp. Chip samples from rotary drills were logged at the drill site. Two composite samples were collected every 1.524 m (i.e., downhole samples were collected every 5 ft) and bagged. The geologist logging the hole made a chip board at the drill site. The chipboards consisted of drill cuttings glued to a 25.4 mm by 101.6 mm board whose vertical scale was 25.4 mm = 3.48 m. Lithological logging of both core and chip samples highlighted lithologic units, contacts, mineralization, alteration, and brecciation.
LAC core was collected once a day and transported back to the LAC secure core shed outside Orovada, Nevada. Core was cleaned and logged for lithology, oxidation, alteration and core recovery. All cores were photographed with high resolution digital cameras and samples were stored in locked buildings accessible by LAC personnel or contractors.
|
Page 57 |
| Lithium Americas Corp. Feasibility Study, National Instrument 43-101 Technical Report for the Thacker Pass Project, Humboldt County, Nevada, USA |
10.2 Additional Drilling in Thacker Pass Deposit
10.2.1 Clay Properties Drilling
In 2017, eight drill holes (LNC-049 through LNC-056 and LNC-086) were drilled to depths less than 16 m to collect samples for LAC's subsidiary RheoMinerals Inc. for exploration of industrial clay. These samples were not geologically logged nor assayed. These samples are not included in the resource estimation.
In August 2018 and October 2019 LAC used a large diameter auger (1 m to 1.3 m) to drill six holes up to 26 m deep for the purpose of collecting bulk claystone samples for metallurgical process testing. LNC and WLC core holes were evaluated for clay type, lithium grades and calcium grades near surface to be representative samples of the whole Thacker Pass deposit. The six auger holes twinned the selected holes such that no independent laboratories assayed the samples collected. These holes were not used in the resource model.
Another auger bulk sampling program was performed in September 2022 to collect additional claystone samples for metallurgical process testing. Seven holes up to 26 m in depth were sampled targeting varying ratios of smectite and illite claystones. Samples were collected in 48" x 48" bulk bags and transported to the LAC core shed for storage and blending. The seven auger holes twinned selected existing LNC and WLC holes; thus, the auger holes were not used in the resource model.
10.2.2 Geotechnical Drilling
In 2017, three drill holes (LNC-083 through LNC-085) were drilled to collect geotechnical information. The majority of the drill holes were drilled using normal HQ core drilling practices. Each hole had samples collected by a contract geotechnical engineer at the drill rig. After the geotechnical samples were collected, the drill hole was logged and sampled by LAC employees or contractors. The geotechnical samples were sent to Solum Consultants Ltd. for geotechnical testing.
In April 2017, two auger holes were drilled down 15 m to characterize the ground strength for infrastructure support. The geotechnical samples were sent to Solum Consultants Ltd. for geotechnical characterization. No samples were collected for assay.
In March 2019, thirty-one auger holes were drilled down an average of 15 m, with a maximum depth of 46 m, and twenty-eight trenches were dug, with a maximum depth of 7 m, to characterize the ground strength for infrastructure support. NewFields Engineering was contracted to oversee the drilling, trenching, sampling, testing and reporting of the geotechnical work. No samples were collected for assay.
In August 2019, five HQ core drill holes were drilled to collect slope stability geotechnical information for pit highwall design. All five holes were collared at existing historical core hole locations. Three of the holes were drilled at an angle; the other two were vertical. Barr Engineering was contracted to perform the geotechnical sampling, televiewer work, testing, and reporting. These holes were not assayed or included in the resource estimation. The results of their work along with prior geotechnical studies were used to determine the safety factors to use for the engineered mine pit wall slopes.
In December 2019, five auger holes were drilled down an average depth of 31 m, and twenty-one trenches were dug, with a maximum depth of 7 m, to characterize the ground strength and conditions for the CTFS. NewFields Engineering was contracted to oversee the drilling, trenching, sampling, testing and reporting of the geotechnical work. No samples were collected for assay as part of the drilling work; however, a few auger hole samples were assayed afterwards for lithium at LAC's process testing facility in Reno, NV. The sampling method did not meet LAC's standard for quality control on assays and were not used in the resource estimation.
|
Page 58 |
| Lithium Americas Corp. Feasibility Study, National Instrument 43-101 Technical Report for the Thacker Pass Project, Humboldt County, Nevada, USA |
10.3 Surveying
Claim surveying for Chevron was performed by Tyree Surveying Company, Albuquerque, New Mexico and Desert Mountain Surveying Company, Winnemucca, Nevada. According to Chevron (1980), both companies used theodolites and laser source electronic distance meters to survey the claims. Records show that both companies were contracted to survey the drill hole locations. It is presumed that the same instrumentation was used for the collar locations. The reported error was within 0.1515 m horizontally and 0.303 m vertically. The survey coordinates were reported in UTM NAD 27.
Collar surveying for LAC for the 2007-2010 drilling program used a Trimble GPS using the UTM NAD83, Zone 11 coordinate system. The collar locations for the Chevron drill holes were updated to the NAD83 coordinate system at that time. Comparing LAC survey work with what was performed by Chevron showed near identical results for the easting and northings; elevations were off by approximately 3 m and were corrected to conform to earlier Chevron work.
Collar surveying for the 2017-2018 LAC drilling campaign was conducted using a handheld Garmin 62S GPS set to UTM NAD83 Zone 11 with accuracy of ±3 m in the X and Y planes. In December 2017, a high-resolution LiDAR and aerial photo survey of Thacker Pass was conducted in November of 2017 by US Geomatics with a reported accuracy of ±0.08 m. The collar elevations of the 2017-2018 drill holes were then corrected in the drill hole database to the surveyed surface elevation. The average change was an increased elevation of 0.286 m.
From 2009 to 2010, downhole surveys were conducted on selected holes using a Boart-Longyear Trushot magnetic downhole survey tool to verify the holes were not deviating from vertical. Holes drilled in 2017-2018 were down hole surveyed using the same tool whenever the depth exceeded 30 m. All holes were drilled vertical or nearly vertical with the exception of WLC-058 (Azimuth: 180º Dip: -70º) and LNC-083 (Azimuth: 180º Dip: -60º) which were intentionally drilled at angles.
10.4 Accuracy and Reliability of Drilling Results
The Project is known for significant amounts of lithium contained in sub-horizontal clay beds in the McDermitt Caldera. Past and modern drilling results show lithium grade ranging from 2,000 ppm to 8,000 ppm lithium over great lateral extents among drill holes. There is a fairly continuous high-grade sub-horizontal clay horizon that exceeds 5,000 ppm lithium across the Project area as shown in the cross-sections in Figure 14-5. This horizon averages 1.47 m thick with an average depth of 56 m down hole. The lithium grade for several meters above and below the high-grade horizon typically ranges from 3,000 ppm to 5,000 ppm lithium. The bottom of the deposit is well defined by a hydrothermally altered oxidized ash and sediments that contain less than 500 ppm lithium, and often sub-100 ppm lithium (HPZ). All drill holes, except WLC-058 and LNC-083, are vertical which represent the down hole lithium grades as true-thickness and allows for accurate resource estimation.
The Chevron holes were not used for the resource reporting but as a general guide for exploration planning since these holes primary focus was on uranium and not lithium. RC drilled holes were not utilized in the resource model due to analytical biases generated by this drilling method. The traditional core drilling method was determined to be best suited for sampling this deposit for lithological and analytical investigations.
The drilling techniques, core recovery, and sample collection procedures provided results that are suitable for use in resource estimation. There are no drilling, sample, or recovery factors that materially impact the accuracy and reliability of results. The data is adequate for use in resource estimation.
|
Page 59 |
| Lithium Americas Corp. Feasibility Study, National Instrument 43-101 Technical Report for the Thacker Pass Project, Humboldt County, Nevada, USA |
11 Sample Preparation, Analyses, and Security
The sample preparation, analysis, security and QA/QC program employed by Chevron is uncertain, and therefore data collected by Chevron are not used for resource estimation. This section describes those activities completed for the LAC drilling campaigns from 2007-2018.
11.1 LAC Site Sample Preparation
The drilled core was securely placed in core boxes and labelled at site. The boxes of drilled core were then transported to the secure LAC logging and sampling facility in Orovada, Nevada, where they were lithologically logged, photographed, cut, and sampled by LAC employees and contractors.
Sample security was a priority during the LAC drilling campaigns. Core from the drill site was collected daily and placed in a lockable and secure core logging and sampling facility (steel-clad building) for processing. All logging and sampling activities were conducted in the secured facility. The facilities were locked when no one was present.
The lengths of the assay samples were determined by the geologist based on lithology. From 2007 to 2011 certain lithologies associated with no lithium value were not sampled for assay. These rock types are alluvium, basalt, HPZ and volcanic tuff. All drilled core collected in 2017 and 2018 was sampled for assay. Average assay sample length is 1.60 m but is dependent on lithology changes. The core was cut in half using a diamond blade saw and fresh water (Figure 11-1). Half the core was placed in a sample bag and the other half remained in the core boxes and stored in LAC's secure facility in Orovada.
Figure 11-1 Half Core Sawed by a Diamond Blade
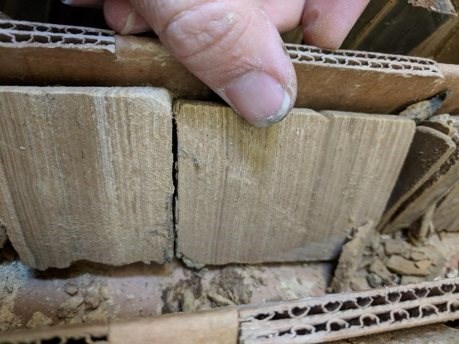
Source: Lithium Americas Corp. (2021)
To collect duplicate samples, one half of the core would be cut in half again, and the two quarters would be bagged separately. Each sample was assigned a unique blind sample identification number to ensure security and anonymity. The samples were either picked up by ALS by truck or delivered to ALS in Reno, Nevada by LAC employees.
|
Page 60 |
| Lithium Americas Corp. Feasibility Study, National Instrument 43-101 Technical Report for the Thacker Pass Project, Humboldt County, Nevada, USA |
Once at ALS, the samples were dried at a maximum temperature of 60ºC. The entire sample was then crushed with a jaw crusher to 90% passing a 10 mesh screen. Nominal 250-gram splits were taken for each sample using a riffle splitter. This split is pulverized using a ring mill to 90% passing a 150 mesh screen.
11.2 Laboratory Sample Preparation
ALS Global (ALS) of Reno, Nevada, was used as the primary assay laboratory for the LAC Thacker Pass drill program. ALS is an ISO/IEC 17025-2017-certified Quality Systems Laboratory. ALS participates in the Society of Mineral Analysts round-robin testing.
ALS is an independent laboratory without affiliation to LAC.
A sample workflow diagram for geological samples is presented in Figure 11-2.
Figure 11-2 Workflow Diagram for Geological Samples
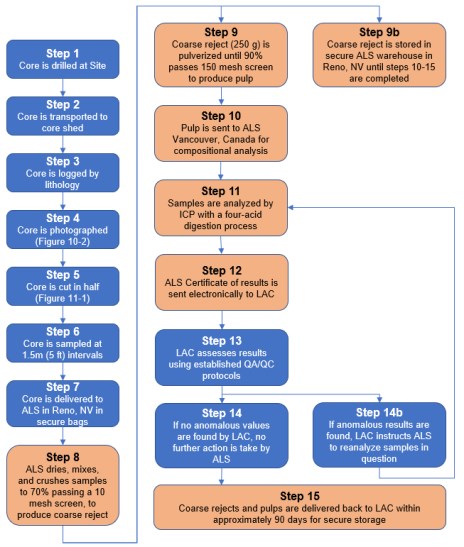
Source: Lithium Americas Corp. (2021)
|
Page 61 |
| Lithium Americas Corp. Feasibility Study, National Instrument 43-101 Technical Report for the Thacker Pass Project, Humboldt County, Nevada, USA |
11.3 Analysis
ALS Global used their standard ME-MS61 analytical package for testing of all of LAC's samples collected. This provides analytical results for 48 elements, including lithium. The method used a standard four-acid digestion followed by an atomic emission plasma spectroscopy (ICP-AES) analysis to ensure that elevated metal concentrations would not interfere with a conventional inductively coupled plasma mass spectroscopy (ICP-MS) analysis. Certified analytical results were reported on the ICP-MS determinations.
11.4 Density
Several bulk density testing campaigns have been completed within the Project area. The ASTM bulk density and moisture testing standards that have been used are detailed below:
- Bulk Density: ASTM C914-09 standards for consolidated samples.
- Bulk Density: ASTM C127 standards for aggregate samples.
- Bulk Density: ASTM D7263, Method B
- Moisture Content: ASTM D2216
The bulk density samples generally were point samples from drill core that averaged 3 inches in length. A description of the bulk density sampling programs is below and descriptive statistics by bulk density program and lithology are shown in Table 11-1. Figure 11-3 provides a visual representation of where the bulk density samples were collected within the Project area.
- MacTec Engineering and Consulting (2008) had six samples from 3 drill holes (WLC 20, 21, 22) analyzed for bulk density utilizing the ASTM standard C127 for aggregate samples. Natural moisture was also analyzed for these samples. Analysis was completed at the AAP laboratory.
- KCA (2008) had 26 samples from six drill holes (WPQ 1,2,3,5,6,7) analyzed for bulk density utilizing the ASTM standard C914 with paraffin wax for consolidated samples. Natural moisture was also analyzed for these samples. The laboratory is unknown for this analysis as the original laboratory sheets cannot be found.
|
Page 62 |
| Lithium Americas Corp. Feasibility Study, National Instrument 43-101 Technical Report for the Thacker Pass Project, Humboldt County, Nevada, USA |
- AMEC (2011) had 26 samples from six drill holes (WLC 157, 158, 181, 182, 183, 186) analyzed for bulk density utilizing the ASTM standard C914 with paraffin wax for consolidated samples. Natural moisture utilizing ASTM standard D2216 was also analyzed for these samples. The AMEC laboratories numbered 1484 and 1485 completed the analysis. This analysis was completed as part of a PFS level geotechnical study for Western Lithium USA Corporation (WLC).
- WLC analyzed 62 samples from 19 drill holes during the 2010 - 2011 WLC exploration drilling campaign. The bulk density analysis utilized the ASTM standard C914 with paraffin wax for consolidated samples and C127 for aggregate samples. All analysis was completed in the WLC core shed under the supervision of WLC geologists.
- During the WLC 2010 - 2011 exploration drilling campaign, 25 duplicate samples from 12 WLC drill holes were sent to the ALS laboratory in Reno, NV by WLC to verify WLC density values. WLC sent duplicate samples to ALS in four batches from March 2010 to January 2011. The ALS bulk density analysis utilized the ASTM standard C914 with paraffin wax for consolidated samples and C127 for aggregate samples.
- BARR (2019) had 53 samples from five drill holes analyzed for bulk density utilizing the ASTM standard D7263, Method B. Natural moisture utilizing ASTM standard D2216 was also analyzed for these samples. Analysis was completed at the IGES Laboratory in Salt Lake City, Utah. This analysis was completed as part of a geotechnical study for LAC.
|
Page 63 |
| Lithium Americas Corp. Feasibility Study, National Instrument 43-101 Technical Report for the Thacker Pass Project, Humboldt County, Nevada, USA |
Table 11-1 Bulk Density Sampling Program Summary by Lithology
|
Program / Lithology |
Average |
Dry Bulk Density (g/cm3) |
||||
|
Count |
Average |
Minimum |
Maximum |
Standard |
||
|
MacTec |
|
|
|
|
|
|
|
Claystone - Smectite |
16.80 |
3 |
1.70 |
1.44 |
1.84 |
0.22 |
|
Claystone - Mixed Zone |
18.30 |
1 |
1.92 |
- |
- |
- |
|
Claystone - lllite |
12.90 |
2 |
2.00 |
1.98 |
2.02 |
0.03 |
|
KCA |
|
|
|
|
|
|
|
Claystone |
18.35 |
14 |
1.71 |
1.46 |
1.90 |
0.13 |
|
Claystone/Ash |
14.26 |
2 |
1.70 |
1.65 |
1.74 |
0.06 |
|
Laminated - Claystone/Ash |
15.24 |
4 |
1.74 |
1.33 |
2.04 |
0.34 |
|
Ash |
18.54 |
3 |
1.46 |
1.35 |
1.58 |
0.11 |
|
Ash/Claystone |
12.23 |
3 |
1.88 |
1.51 |
2.29 |
0.39 |
|
AMEC |
|
|
|
|
|
|
|
Alluvium |
26.43 |
6 |
1.51 |
1.18 |
1.62 |
0.16 |
|
Basalt |
34.90 |
1 |
1.41 |
- |
- |
- |
|
Claystone - Smectite |
36.98 |
4 |
1.38 |
1.11 |
1.77 |
0.30 |
|
Claystone - Mixed Zone |
16.13 |
4 |
1.69 |
1.46 |
1.90 |
0.19 |
|
Claystone - lllite |
16.99 |
9 |
1.82 |
1.67 |
2.02 |
0.10 |
|
Hot Pond Zone |
4.50 |
1 |
2.07 |
- |
- |
- |
|
WLC (2010-2011) |
|
|
|
|
|
|
|
Alluvium |
2.23 |
1 |
2.36 |
- |
- |
- |
|
Basalt |
10.80 |
5 |
1.99 |
1.76 |
2.51 |
0.30 |
|
Claystone - Smectite |
24.64 |
32 |
1.68 |
1.37 |
2.18 |
0.17 |
|
Claystone - Mixed Zone |
15.81 |
7 |
1.87 |
1.39 |
2.08 |
0.24 |
|
Claystone - lllite |
17.04 |
9 |
1.78 |
1.42 |
2.01 |
0.18 |
|
Hot Pond Zone |
10.65 |
4 |
1.99 |
1.83 |
2.09 |
0.12 |
|
Volcanic |
13.91 |
4 |
1.88 |
1.63 |
2.14 |
0.21 |
|
ALS (2010-2011) |
|
|
|
|
|
|
|
Basalt |
15.41 |
4 |
1.84 |
1.65 |
2.05 |
0.18 |
|
Claystone - Smectite |
28.53 |
11 |
1.63 |
1.31 |
2.09 |
0.22 |
|
Claystone - Mixed Zone |
21.42 |
3 |
1.71 |
1.40 |
1.92 |
0.27 |
|
Claystone - lllite |
19.63 |
4 |
1.89 |
1.59 |
2.12 |
0.23 |
|
Hot Pond Zone |
7.15 |
1 |
2.19 |
- |
- |
- |
|
Volcanic |
16.27 |
2 |
1.88 |
1.63 |
2.13 |
0.35 |
|
BARR (2019) |
|
|
|
|
|
|
|
Topsoil |
15.50 |
1 |
1.70 |
- |
- |
- |
|
Basalt |
3.60 |
2 |
2.47 |
2.45 |
2.48 |
0.02 |
|
Claystone - Smectite |
22.68 |
22 |
1.57 |
1.23 |
2.34 |
0.26 |
|
Claystone - Mixed Zone |
15.84 |
9 |
1.88 |
1.65 |
2.39 |
0.23 |
|
Claystone - lllite |
14.15 |
6 |
1.90 |
1.67 |
2.27 |
0.24 |
|
Hot Pond Zone |
2.32 |
5 |
1.88 |
1.45 |
2.10 |
0.28 |
|
Volcanic |
1.90 |
1 |
2.10 |
- |
- |
- |
Note:
- 1 AMEC sample and 7 Barr samples were removed due to density values less than 1.1 g/cm3
- Sawtooth determined if the bulk density samples were in Smectite, Illite or the Mixed Clay Zone based on lithological drill hole records.
- Basalt samples were vesicular and weathered.
|
Page 64 |
| Lithium Americas Corp. Feasibility Study, National Instrument 43-101 Technical Report for the Thacker Pass Project, Humboldt County, Nevada, USA |
Figure 11-3 Dry Bulk Density Sample Locations
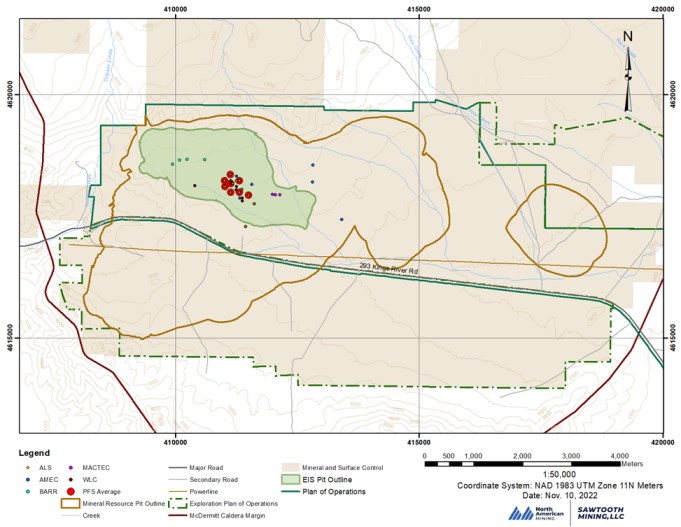
Note: KCA drill holes are not represented on the map
|
Page 65 |
| Lithium Americas Corp. Feasibility Study, National Instrument 43-101 Technical Report for the Thacker Pass Project, Humboldt County, Nevada, USA |
During the 2012 Tetra Tech Technical Report, 2014 Tetra Tech Technical Report, 2016 SRK Technical Report and 2018 Advisian Technical Report, the average density values by lithology were estimated using samples from the 2010-2011 WLC sampling campaign and ALS duplicate program. The details of this analysis are shown in Table 11-2. Several low bulk density basalt samples noted in Table 11-1 were weathered vesicular basalt close to the surface. The sample used in Table 11-2 for the average basalt bulk density was used because it was considered to be a better representation of the basalt that will be mined.
Table 11-2 Average Density Values
|
Lithology |
Source |
Dry Bulk Density (g/cm3) |
||||
|
Count |
Average |
Minimum |
Maximum |
Standard |
||
|
Claystone/Ash |
ALS and WLC |
15 |
1.79 |
1.31 |
2.12 |
0.25 |
|
Basalt |
WLC |
1 |
2.51 |
- |
- |
- |
|
Intracaldera Tuff |
WLC |
2 |
1.96 |
1.83 |
2.08 |
0.18 |
For the compilation of the current Mineral Resource and Mineral Reserve estimates, the QP reviewed all of the density values that are currently available, as described in Table 11-2, with the exception of the KCA data due to lack of data verification records. The histogram in Figure 11-4 depicts the dry bulk density values for the clay types. This histogram aligns fairly well with the average values that were estimated in the 2018 PFS report.
Based on this review, the QP has decided to continue using the average values from the previous PFS reports for this study (see Table 11-2).
Figure 11-4 Smectite, Mixed Zone and Illite Dry Bulk Density Histogram from MacTec (2008), AMEC (2011), WLC (2010-2011), ALS (2010-2011), and BARR (2019) Geotech Studies
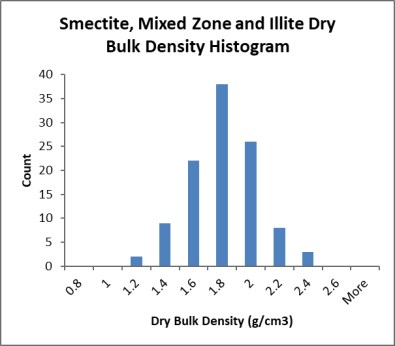
Source: Sawtooth, 2022
Factors that determine density values used by the QP include:
|
Page 66 |
| Lithium Americas Corp. Feasibility Study, National Instrument 43-101 Technical Report for the Thacker Pass Project, Humboldt County, Nevada, USA |
- While the additional Barr data does add to the total number of bulk density samples present, the Barr bulk density was estimated using a different ASTM standard than the rest of the bulk density programs. For this reason, the QP has not updated the average values for the deposit with the Barr data, however the Barr data is included in the histogram in Figure 11-4.
- The spatial representation for the total density dataset is larger than the dataset used for the PFS density averages. The QP understands that the PFS analysis focused on including the samples that were a mixture of claystone and ash. This is appropriate for the deposit as it is currently modelled due to the fact that the ore zone is a mixture of Smectite, Mixed Clay Zone, Illite, and ash bands. Including the full suite of density samples that are segregated by specific clay types will decrease the average density value because there are more Smectite (lower density) samples than other clay types, however, Sawtooth does not believe that this is representative of the deposit. Further analysis and additional drilling should be completed to better define the Smectite, Mixed Clay Zone, and Illite zones within the geological model so that average density values can be applied by clay type until there is enough data to add density values to the block model.
The QP understands that there is risk in utilizing an average bulk density value for the deposit and has taken the following steps to help mitigate that risk for the Mineral Resource and Mineral Reserve estimates presented in this report:
- As a way to show sensitivities, Mineral Resource estimates have been estimated with an average dry bulk density value of 1.54 g/cm3, 1.79 g/cm3, and 2.04 g/cm3 and results are discussed in Section 25.1.
- The Mineral Resource classification has considered proximity to bulk density samples and has downgraded the Mineral Resource confidence classification areas with little or no bulk density analysis.
- The QP recommends that additional testing be completed. The additional data should then be used to better represent the variability of the density by clay type.
11.5 Quality Control
In 2010, LAC contracted Dr. Barry Smee of Smee & Associates Consulting Ltd., an international specialist in QA/QC procedures who is familiar with the NI 43-101 reporting process, to develop a QA/QC program for exploration drilling. The program included inserting blank standards, 3,378 ppm grade standard, 4,230 ppm grade standard, and duplicate samples into the drill core sample assay sets.
In 2010-2011, for every 34 half core samples, LAC randomly inserted two standard samples (one 3,378 ppm grade and 4,230 ppm grade), one duplicate sample, and one blank sample. The 2017-2018 quality program was slightly modified to include a random blank or standard sample within every 30.48 m interval and taking a duplicate split of the core (¼ core) every 30.48 m.
The total number of blank, duplicate, and standard samples analyzed by the laboratory during LAC's drilling campaign in Thacker Pass from the 2010-2011 drilling campaign was 9.5% of the total samples assayed. LAC's 2017-2018 drilling campaign averaged 11.1% of the total samples assayed. Assaying for all drilling averaged 10.1% check samples. This does not include ALS internal check and duplicate samples.
ALS also completed their internal QA/QC program which included blanks, standards and duplicates throughout the LAC exploration programs for lithium and deleterious elements including aluminum, calcium, cesium, iron, potassium, magnesium, sodium and rubidium. The standards used by ALS and the ALS QA/QC programs have been reviewed by the QP and were utilized in the QA/QC review.
|
Page 67 |
| Lithium Americas Corp. Feasibility Study, National Instrument 43-101 Technical Report for the Thacker Pass Project, Humboldt County, Nevada, USA |
11.5.1 LAC Blank Samples
Blank samples were used to check for cross-contamination between samples at the ALS lab. Blank samples were composed of dolomite sourced from a mine near Winnemucca, Nevada. Dolomite was chosen because it is known to have low lithium content and was, therefore, a good indicator of contamination. A bulk sample was collected and sent to Dr. Smee to be homogenized and certified. A warning limit for lithium was set at 100 ppm by Dr. Smee, which is five times higher than the certified value of 20 ppm lithium. The results of the blank sample checks are presented in Figure 11-5.
In 2010-2011, LAC identified several blank standards that exceeded the 100-ppm lithium set by Dr. Smee. These samples were submitted for re-assay and their values were supported. It is likely that the high values indicate contamination in the crushing or prepping process. However, the frequency and lithium content amount are not high enough to be concerned about the overall assay results. The LAC 2017-2018 exploration program did not experience any failures of the blank standards and supports that cross-contamination at the lab did not occur.
Figure 11-5 LAC Blank Results
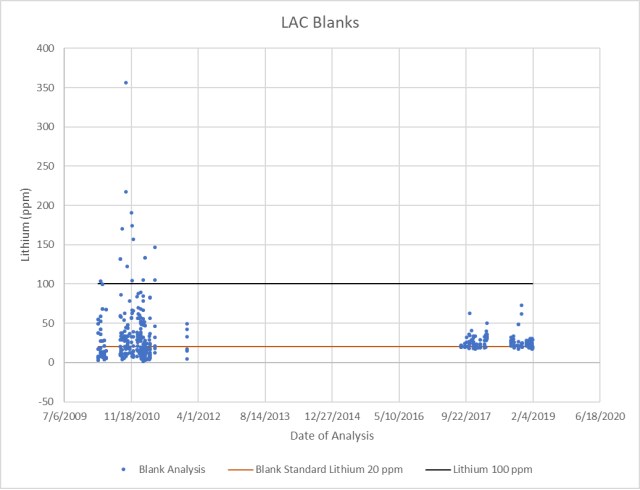
Source: Sawtooth 2022
11.5.2 LAC Standard Samples
Standard samples consisting of two lithium bearing claystone samples from the Project area were used to test the accuracy and precision of the analytical methods used at the lab. To create the standards, a round robin of assays was completed in June 2010 in which 10 standards of each type were sent to six labs for testing. The resulting assays were evaluated by Dr. Smee to determine an average lithium value. The results from two of the labs were discarded because the analytical results were substantially different as compared to the other four labs and thought to be erroneous. Dr. Smee certified each standard with a lithium grade and confidence range of two standard deviations. The first standard is certified at 3,378 ppm ±511 ppm lithium and the second standard is certified at 4,230 ppm ±850 ppm lithium.
|
Page 68 |
| Lithium Americas Corp. Feasibility Study, National Instrument 43-101 Technical Report for the Thacker Pass Project, Humboldt County, Nevada, USA |
The QP supported that the standards fell within two standard deviations of the median reported lithium grade for every batch of certified assays reported by ALS as well as within two standard deviations of the standard. Figure 11-6 and Figure 11-7 show the results for the standards quality testing program for 4,230 Li standard and 3,378 Li standard respectively.
The LAC 2010-2011 drilling experienced a number of samples falling outside two standard deviations. During this time, ALS changed their internal lithium standards used to calibrate the ICP machine in an effort to improve their consistency. This involved adding a 2,020 ppm lithium and 7,016 ppm lithium standard to their QA/QC program. The LAC 2017-2018 drilling campaigns showed a much tighter two-standard deviation bracket indicating ALS had improved their lithium assay quality.
The quality testing from the two standards was effective in supporting the quality of the results. From 2010 to 2011, samples that fell outside the ranges set by Dr. Smee were re-assayed and new assay certificates issued. No samples were required to be submitted for re-assay by LAC in 2017 or 2018. However, ALS did re-run some assays that failed their internal checks before a certificate was issued.
|
Page 69 |
| Lithium Americas Corp. Feasibility Study, National Instrument 43-101 Technical Report for the Thacker Pass Project, Humboldt County, Nevada, USA |
Figure 11-6 LAC Drilling QA/QC Results (4,230 Li Standard)
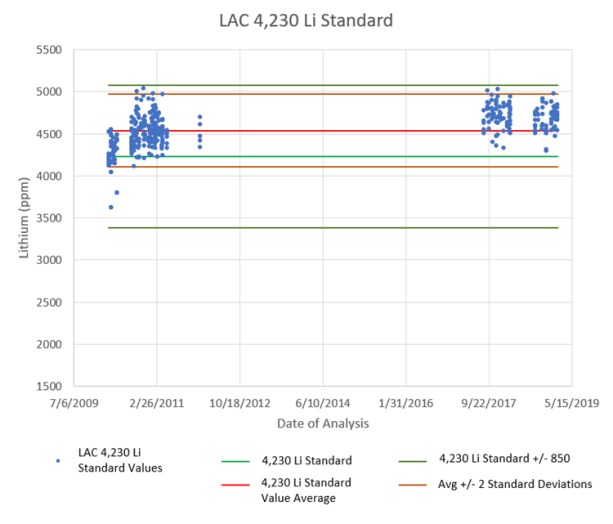
Source: Sawtooth 2022
|
Page 70 |
| Lithium Americas Corp. Feasibility Study, National Instrument 43-101 Technical Report for the Thacker Pass Project, Humboldt County, Nevada, USA |
Figure 11-7 LAC Drilling QA/QC Results (3,378 Li Standard)
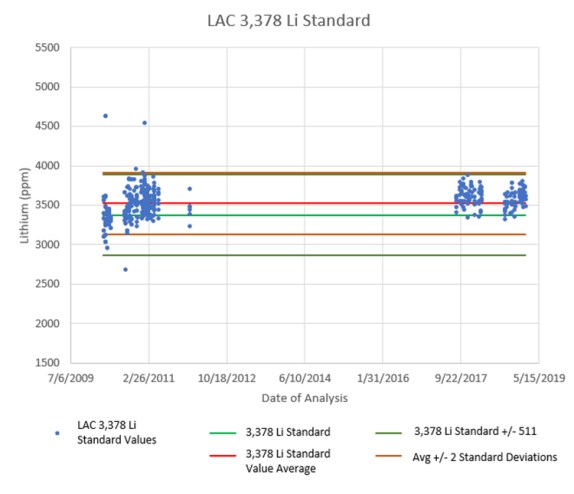
Source: Sawtooth 2022
11.5.3 Duplicate Samples
Duplicate samples are used to check the precision of the analytical methods of the lab and were taken every 30.5 m of core (every 100 ft). The duplicate samples earmarked for analysis were prepared in an identical manner as the non-duplicate samples, beginning with the cut half core being cut in half again (¼ core sampling). Each piece of quartered core was bagged and given a blind sample identification number for characterization at the lab. The results were un-blinded and paired up with the corresponding data in Microsoft Excel. The results of the duplicate sample tests are shown in Figure 11-8.
The results from the duplicate samples indicate a high level of precision in the sampling and laboratory techniques and support the quality of data and analysis process.
|
Page 71 |
| Lithium Americas Corp. Feasibility Study, National Instrument 43-101 Technical Report for the Thacker Pass Project, Humboldt County, Nevada, USA |
Figure 11-8 LAC Drilling Duplicate Results
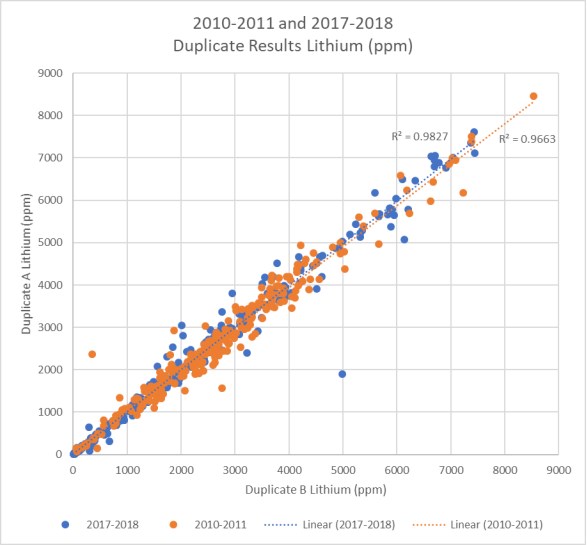
Source: Sawtooth 2022
11.5.4 Discussion of QA/QC Results
The 2010 sampling program was initially seeing a 6% failure rate of the QA/QC samples where 17% of the 4,230 Li standards were returning lithium grades exceeding three standard deviations of their tested median grade. ALS began using a new higher-grade lithium standard to improve the calibration of their ICP. Following the improved calibration process, LAC selected the 16 highest lithium values from drill holes WLC-001 through WLC-037 and WLC-040 through WLC-200 to be re-assayed. The samples were sent to both ALS and Activation Laboratories (ActLabs) in Ancaster, Ontario Canada for lithium assays. The re-assay grade for ALS and ActLabs was 5% and 3% lower than the original assay, respectively. It was concluded that the overall deposit estimate may be lower by at most 2% to 3%. For further assurance, ActLabs was chosen to run lithium assays on 112 random duplicate pulps generated by ALS in April 2011. The results were within 3% of ALS certified lithium grade.
The 2017-2018 LAC sampling programs had consistent quality control results for the duration of the campaigns. Duplicate samples returned with an R2 value of 0.9827, indicating a high-level of precision in the sampling and laboratory techniques and supporting the validity of QA/QC protocols. The duplicate grades extend from 13 ppm lithium to 7,500 ppm lithium. In addition, the blank and standards sample quality programs indicated that the accuracy and precision of the analytical process provides results that can be relied on for resource estimation.
|
Page 72 |
| Lithium Americas Corp. Feasibility Study, National Instrument 43-101 Technical Report for the Thacker Pass Project, Humboldt County, Nevada, USA |
While the QP agrees that the QA/QC program is sufficient to support Mineral Resource and Mineral Reserve estimates, the QP also recommends that the duplicate program be completed by a secondary laboratory, that the LAC standards be expanded to include a lithium grade close to 1,000 ppm, and that the LAC standards be certified to include the deleterious elements of aluminum, calcium, cesium, iron, potassium, magnesium, sodium and rubidium.
11.6 Qualified Person Statement
The QP is of the opinion that the sample preparation, security, and analytical procedures for the drill data for the Thacker Pass Deposit are adequate for use for resource estimation.
|
Page 73 |
| Lithium Americas Corp. Feasibility Study, National Instrument 43-101 Technical Report for the Thacker Pass Project, Humboldt County, Nevada, USA |
12 Data Verification
12.1 Site Inspection
12.1.1 Sawtooth Mining
Mr. Benson Chow visited LAC's Thacker Pass Project site on November 8, 2018 and September 13 and 14, 2022. The purposes of the visits were to complete a QP data verification, site inspections, and independent verification of the lithium grades. No material changes to the exploration drilling or site conditions have occurred on site since the site visits. During the visit, Mr. Chow completed the following tasks:
Pictures showing the site conditions and site inspection activities have been included as Figure 12-1.
 |
Page 74 |
| Lithium Americas Corp. Feasibility Study, National Instrument 43-101 Technical Report for the Thacker Pass Project, Humboldt County, Nevada, USA |
Figure 12-1 Site Inspection Pictures
|
|
|
|
|
LNC core shed inspection where cores were reviewed and stored. |
||
|
|
|
|
|
West waste rock storage facility location. |
Observed auger sampling of claystone/ash material. |
|
|
|
|
|
|
Field located existing drill hole for collar location and elevation verification. |
||
Source: Sawtooth, 2022
Mr. Kevin Bahe visited LAC's Thacker Pass Project site on August 12-13, 2019 and on September 13-14, 2022, to complete a QP data verification site inspection. Additionally, Mr. Bahe toured the pilot plant lab in Reno, NV on July 25, 2019 and LAC's Technical Center in Reno on September 15, 2022. No material changes to the mining location or site conditions have occurred on site since. During the visits, Mr. Bahe completed the following tasks:
|
Page 75 |
| Lithium Americas Corp. Feasibility Study, National Instrument 43-101 Technical Report for the Thacker Pass Project, Humboldt County, Nevada, USA |
12.2 Data Verification Procedures
Excel formatted electronic files containing lithological descriptions, sample assays, hole collar information, and downhole surveys were provided to Sawtooth Mining from LAC for the purpose of generating a geologic resource block model. Certified laboratory certificates of assays were provided in PDF as well as csv formatted files for verification of the sample assays database. Sample names, certificate identifications, and run identifications were cross referenced with the laboratory certificates and sample assay datasheet for spot checking and verification of data by the QP.
12.3 Drill Core and Geologic Logs
Geologic logs were consolidated from paper archives and scanned PDFs on the LAC network drives. In 2016, each drill log was transcribed into a spreadsheet using the smallest lithologic interval identified in the log to create the highest resolution dataset possible.
Subsequent geologic loggings of drill cores were entered directly into either an Access database or Excel spreadsheets. The data would then be uploaded into the LAC's Hexagon Mining Drill Hole Manager database.
Geologic logs, Access databases, and Excel spreadsheets were provided to Sawtooth Mining for cross validation with the excel lithological description file. Spot checks between excel lithological description file were performed against the source data and no inconsistencies were found with the geologic unit descriptions. Ash percentages were checked in the lithological descriptions and a minor number of discrepancies were found in the ash descriptions. It was determined that less than 0.7% of the ash data contained discrepancies in the lithological description. The QP determined that this 0.7% database error was not material but noted that it should be addressed in the future.
12.4 Verification of Drill Hole Survey
The QP located and resurveyed 18 drill holes using a hand-held GPS unit to verify the coordinates and elevations of the drill hole survey database. Table 12-1 lists the holes located and differences in the surveys and Figure 12-2 shows the locations of the drill hole locations and elevations verified by the QP. The surveyed holes matched the coordinates and elevation of the hole survey provided by LAC closely where the actual drill holes could be found. The drill holes that could not be found did not have permanent markers and are in areas where cattle have been present since the drilling concluded. The QP is satisfied with the number of drill holes that were located as well as the comparison of the collar locations.
|
Page 76 |
| Lithium Americas Corp. Feasibility Study, National Instrument 43-101 Technical Report for the Thacker Pass Project, Humboldt County, Nevada, USA |
Table 12-1 Drill Hole Survey Verification
|
DHID |
Hand Held GPS |
Drill Hole Database |
Difference |
Comment |
||||||
|
Easting |
Northing |
Elevation |
Easting |
Northing |
Elevation |
Easting |
Northing |
Elevation |
||
|
LNC 011 |
409,812 |
4,616,847 |
1,544 |
409,813 |
4,616,848 |
1,546 |
1 |
1 |
1 |
|
|
LNC 018 |
409,855 |
4,616,968 |
1,529 |
409,854 |
4,616,969 |
1,532 |
(1) |
1 |
3 |
|
|
LNC 118 |
409,898 |
4,616,826 |
1,540 |
409,898 |
4,616,825 |
1,542 |
0 |
(1) |
2 |
|
|
LNC 088 |
409,906 |
4,619,017 |
1,609 |
409,916 |
4,619,034 |
1,615 |
10 |
17 |
6 |
No hole was found, evidence for drill pad |
|
LNC 026 |
409,915 |
4,618,891 |
1,594 |
409,915 |
4,618,894 |
1,598 |
0 |
3 |
4 |
|
|
LNC 027 |
410,111 |
4,618,836 |
1,596 |
410,106 |
4,618,841 |
1,599 |
(5) |
5 |
3 |
|
|
LNC 087 |
410,115 |
4,618,979 |
1,611 |
410,104 |
4,618,990 |
1,617 |
(11) |
11 |
5 |
No hole was found, evidence for drill pad |
|
LNC 029 |
410,273 |
4,618,845 |
1,602 |
410,274 |
4,618,851 |
1,607 |
1 |
6 |
5 |
No hole was found, evidence for drill pad |
|
WLC 120 |
411,126 |
4,617,932 |
1,541 |
411,125 |
4,617,932 |
1,544 |
(1) |
(1) |
3 |
|
|
WLC 114 |
411,249 |
4,617,988 |
1,540 |
411,249 |
4,617,989 |
1,542 |
0 |
1 |
3 |
|
|
WLC 063 |
411,355 |
4,618,180 |
1,548 |
411,358 |
4,618,181 |
1,552 |
3 |
0 |
4 |
|
|
WLC 097 |
411,370 |
4,618,107 |
1,544 |
411,366 |
4,618,107 |
1,548 |
(4) |
0 |
4 |
|
|
WLC 126 |
411,503 |
4,618,158 |
1,547 |
411,503 |
4,618,160 |
1,551 |
(0) |
2 |
5 |
|
|
WLC 155 |
411,619 |
4,618,059 |
1,543 |
411,622 |
4,618,058 |
1,544 |
3 |
(1) |
1 |
|
|
WLC173 |
411,621 |
4,617,995 |
1,538 |
411,622 |
4,617,996 |
1,540 |
1 |
0 |
2 |
|
|
LNC 144 |
413,780 |
4,617,560 |
1,474 |
413,783 |
4,617,557 |
1,473 |
3 |
(3) |
(1) |
|
|
LNC 138 |
414,122 |
4,617,614 |
1,461 |
414,133 |
4,617,616 |
1,461 |
11 |
2 |
(0) |
|
|
LNC 115 |
416,598 |
4,618,477 |
1,454 |
416,598 |
4,618,476 |
1,452 |
(0) |
(1) |
(2) |
|
|
Page 77 |
| Lithium Americas Corp. Feasibility Study, National Instrument 43-101 Technical Report for the Thacker Pass Project, Humboldt County, Nevada, USA |
Figure 12-2 Drill Hole Verification Locations
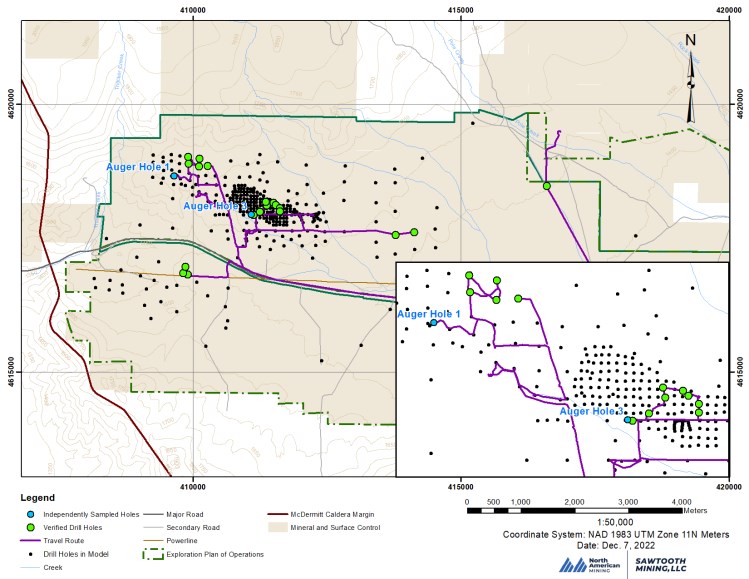
|
Page 78 |
| Lithium Americas Corp. Feasibility Study, National Instrument 43-101 Technical Report for the Thacker Pass Project, Humboldt County, Nevada, USA |
12.5 Verification of Analytical Data
The QP completed spot checks of the Excel assays datasheet used in the creation of the geologic block model by cross-referencing the assay data with the certified laboratory certificate of assays. Only HQ core holes were reviewed since HQ cores were the only holes used for the estimation of resources. No data anomalies were discovered during this check.
The QP collected samples during LAC's 2022 auger bulk sampling program for independent verification of the lithium clay/ash grades. The samples were delivered to ALS Laboratory in Reno, NV for processing and analysis. Figure 12-3 shows the distribution of lithium grades from the 28 independent samples tested by ALS. Distribution of the lithium grades from the independent verification shows distribution of grades similar to what has been reported from the drill core assays. Blank and duplicate samples were also included in the independent verification of the auger bulk samples and results of the analysis seem reasonable.
Figure 12-3 Independent Verification of Lithium Grades Distribution
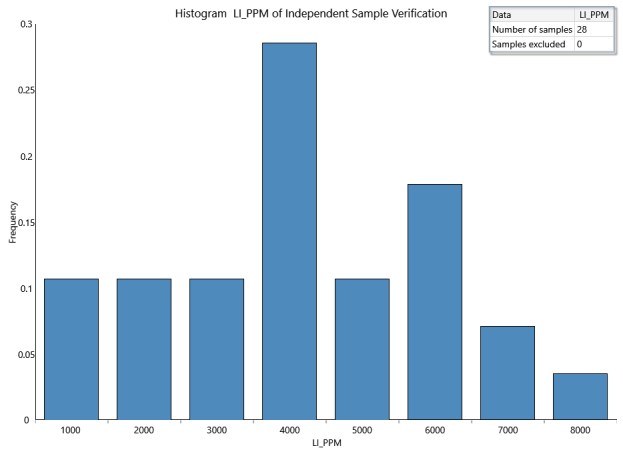
Source: Sawtooth, 2022
12.6 Geological and Block Modelling
Seismic mapping and cross-sectional investigations were the basis for the fault mapping for the Project area. The fault blocks were used as the block model domains to isolate grade among the fault blocks. Once grade was estimated in the block model using variograms, cross-sectional reviews of the grade were performed to inspect the grade displacement at the fault boundaries.
|
Page 79 |
| Lithium Americas Corp. Feasibility Study, National Instrument 43-101 Technical Report for the Thacker Pass Project, Humboldt County, Nevada, USA |
Verification of the block model was performed by the creation of a geostatistical model and the review of its various outputs. Histograms, HERCO grade tonnage curves, and swath plots were created and analyzed to validate the accuracy of the block model by the QP. The statistical analysis and results are discussed in Section 14.
12.7 Mine Design and LOM Plan
Mr. Bahe reviewed the following as part of the mine planning, cost model and Mineral Reserves data verification.
12.7.1 Geotechnical
The slope stability study completed by BARR Engineering in 2019 was reviewed by Mr. Bahe. The recommendations were implemented in the pit design. A table of slope configurations can be seen in Section 16.1.
12.7.2 Mining Method
The shallow and massive nature of the Thacker Pass deposit makes it amenable to open-pit mining methods. Per uniaxial compression strength studies done by WorleyParsons (Mar. 2018) and AMEC (May 2011), it was determined that mining of the ore clay body can be done without any drilling and blasting. Additionally, LAC was able to excavate a test pit without any drilling and blasting. Only the basalt waste material will require blasting. The mining method assumes hydraulic excavators loading a fleet of end dump trucks.
12.7.3 Pit Optimization
The pit optimization was based on initial work completed in the pre-feasibility study. The final EIS pit is limited by several physical features. The north is limited by the Montana Mountains. The west is limited by the Thacker Pass Creek watershed, and the east and south are limited by facilities (mining, waste facilities, and plant).
It is concluded that the final pit shell along with the waste/ore quantities are reasonable based on the pit optimization inputs and do provide a positive economic value.
12.7.4 Mine Design
The EIS pit was used for mine planning. Ramps are assumed to be at a maximum slope of 8%. However, there may be a few instances where ramp slope may approach 10%. Benches are designed at 50 m wide and a 10 m height with a face angle of 67 degrees.
12.7.5 Production Schedule
Production sequencing was completed using Maptek's Evolution Origin scheduling software. Ore blocks were defined based on the cutoff grade. The QP reviewed the mining sequence and found it to be reasonable and will support the plan.
12.7.6 Labor and Equipment
The QP reviewed the assumptions used for equipment fleet size estimation, including equipment capacity, availability, and utilization percentages, equipment operating hours, and haul distances. The truck fleet is adequately sized for the requirements and matches the selected excavators and loaders.
|
Page 80 |
| Lithium Americas Corp. Feasibility Study, National Instrument 43-101 Technical Report for the Thacker Pass Project, Humboldt County, Nevada, USA |
12.7.7 Economic Model
The QP reviewed the following economic model inputs: mining cost, mining quantities and mining capital. Based on the results, the project is economically viable.
12.7.8 Facilities and Materials
Through pit optimization routines the QP has verified that the facilities and materials located within the reserve pit boundary can be economically relocated when access to those areas are required during mining.
12.8 Data Adequacy
Based on the various reviews, validation exercises and remedies outlined above, the QPs concluded that the data is adequate for use for Mineral Resource and Mineral Reserve estimation.
|
Page 81 |
| Lithium Americas Corp. Feasibility Study, National Instrument 43-101 Technical Report for the Thacker Pass Project, Humboldt County, Nevada, USA |
13 Mineral Processing and Metallurgical Testing
Extensive metallurgical and process development testing has been performed both internally at LAC's Process Testing Center (PTC) and externally with both vendors and contract commercial research organizations. The main objective was to develop a viable and robust process flowsheet to produce battery grade lithium chemicals. Previous test work presented in the Pre-Feasibility Study (2018) will not be discussed in this report, but test reports are available for review. For the 2018 PFS report purposes, the metallurgical test work evaluated a similar flowsheet. The process consisted of ore preparation (upgrading) followed by a sulfuric acid leaching of lithium bearing clay. Lithium carbonate was precipitated with soda ash. Magnesium sulfate as well as sodium and potassium salts were removed via crystallization.
Data collected from test programs has been used for various equipment selection, definition of operating parameters and development of process design criteria for the current flowsheet.
The most relevant metallurgical test data are discussed in this section. Unless otherwise noted, all testing has been performed on material collected from the proposed Thacker Pass pit (see Section 13.1).
13.1 Ore Collection for Metallurgical Testing
13.1.1 Bulk Sample Collection
The ore samples used for metallurgical testing were collected from the proposed pit at the Thacker Pass deposit. Two sampling campaigns were conducted using an auger drill, one in August 2018 and another in October 2019, collecting approximately 80 t of sample in bulk bags per campaign. The bulk sample hole locations are shown in Figure 13-1, with locations superimposed on the permitted pit outline along with exploration hole locations. Bulk sample holes were selected to target both high and low lithium contents, different clay types, and the life of mine mineralogy of both clay types (Lithium Nevada, 2020). The QP was not involved in the collection of samples for testing or the initial pilot testwork completed on the samples. It is the QP's opinion that the sample type, sampling methodology and size is consistent with sampling this type of deposits. The sample size allowed for meeting the pilot test program objectives.
The holes were drilled with a 32-inch bucket auger bit. Once the bucket was full, the sample was transferred to a bulk bag and labeled (Figure 13-2). Every bulk bag holds roughly 1.5 to 2 ft of material depth in each hole; this is equivalent to approximately 0.9 t of material.
The corresponding hole locations, depths and number of bulk bags collected are outlined in Table 13-1. A reference table is provided showing which bulk bags were used for specific metallurgical tests (Table 13-2).
The samples spatially represent the mineralized deposit. The Thacker Pass pit is up to 122 m (400 ft) in depth. The sampling methodology utilized only allowed samples to be collected to a maximum depth of 26 m (85 ft). The location of the sampling was selected to collect samples that are representative of the various types and styles of mineralization of the whole deposit, namely both the upper and lower depths. The nature of the deposit is a sub-horizonal lakebed that is consistent over large lateral distances; however, there are a few younger faults that uplift lower illite clay horizons to the surface. Half the selected hole locations were in undisturbed upper smectite horizons, and half the holes in uplifted faulted blocks that represent deeper illite clay horizons.
|
Page 82 |
| Lithium Americas Corp. Feasibility Study, National Instrument 43-101 Technical Report for the Thacker Pass Project, Humboldt County, Nevada, USA |
Table 13-1 Corresponding hole locations, depths and bulk bags collected
|
Hole Reference |
Material |
Depth |
# Bags Collected |
Bulk Bag Labels |
|
WLC-204 |
Smectite |
0.6-25 (2-82) |
26 |
1(2) - 26(2) |
|
WLC-197 |
Smectite |
3-25 (10-83) |
26 |
27(2) - 52(2) |
|
WLC-112 |
Smectite |
9-17 (30-57) |
28 |
53(2) - 80(2) |
|
WLC-202 |
Illite |
10-17 (32-57) |
14 |
1(1) - 14(1) |
|
WLC-136 |
Illite |
7-24 (22-80) |
28 |
15(1) - 42(1) |
|
WLC-118 |
Illite |
5-16 (17-52) |
24 |
43(1) - 66(1) |
|
Page 83 |
| Lithium Americas Corp. Feasibility Study, National Instrument 43-101 Technical Report for the Thacker Pass Project, Humboldt County, Nevada, USA |
Figure 13-1 Bulk sample drill hole locations (WLC-202, WLC-204, WLC-197, WLC-136, WLC-112 and WLC-118)
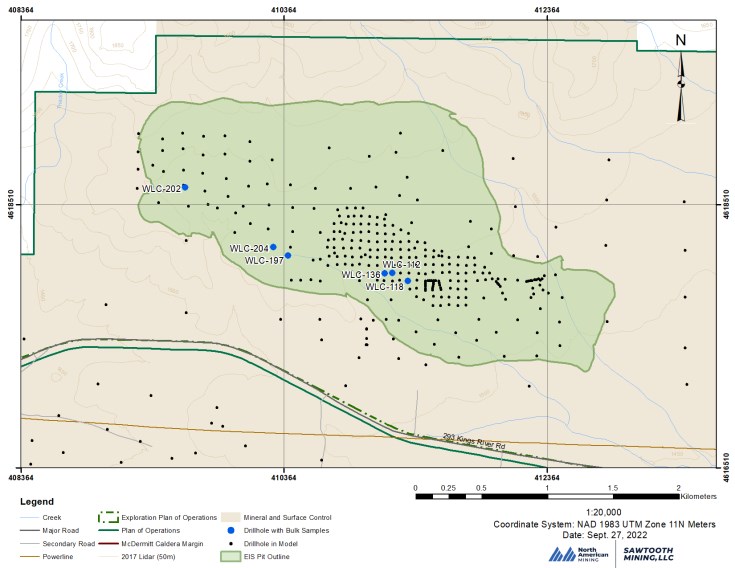
|
Page 84 |
| Lithium Americas Corp. Feasibility Study, National Instrument 43-101 Technical Report for the Thacker Pass Project, Humboldt County, Nevada, USA |
Figure 13-2 Bulk material sampling
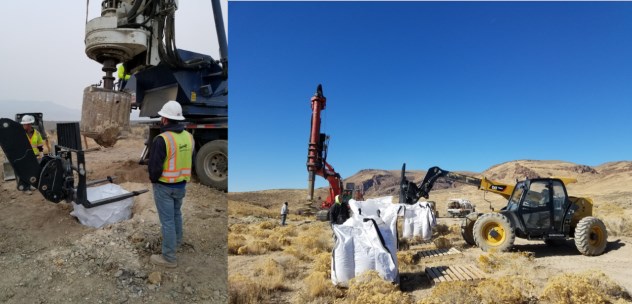
Source: LAC Bulk Sampling Campaign Photos, 2019
Table 13-2 Bulk bags used for metallurgical testing
|
Test Description |
Illite Bulk Bags |
Smectite Bulk Bags |
|
Materials Characterization |
32(1) |
2(2) |
|
Attrition Scrubbing - LAC Internal |
32(1) |
2(2) |
|
Attrition Scrubbing - Weir |
32(1) |
2(2) |
|
Eriez Crossflow |
40(1) |
19(2) |
|
FEDINC Weir Pilot Plant |
21(1), 46(1), 48(1), 66(1), 38(1), 24(1), 43(1), 18(1), 37(1), 35(1), 34(1), 25(1), 22(1), 55(1), 60(1), 29(1) |
29(2), 59(2), 61(2), 66(2), 78(2), 75(2), 39(2), 42(2), 10(2), 79(2), 77(2), 71(2), 49(2), 63(2), 26(2), 27(2), 69(2), 31(2) |
|
FLS Thickening |
3(1), 6(1), 40(1) |
25(2), 68(2), 18(2) |
|
Andritz Thickening |
3(1), 6(1), 40(1) |
25(2), 68(2), 18(2) |
|
Westech Thickening |
3(1), 6(1), 40(1) |
25(2), 68(2), 18(2) |
|
GEA Bench Scale Centrifuge |
3(1), 6(1), 40(1) |
25(2), 68(2), 18(2) |
|
GEA Pilot Scale Centrifuge |
3(1), 5(1) |
1(2), 15(2) |
|
LAC-Leach Extraction Model Development |
17(1), 44(1), 61(1), 15(1), 5(1), 2(1), 12(1), 50(1), 51(1), 8(1) |
56(2), 52(2), 12(2), 76(2), 72(2), 16(2), 3(2), 21(2), 14(2), 17(2), 9(2), 11(2), 15(2), 20(2), 19(2), 80(2) |
|
LAC-Leach Extraction (other large scale batches) |
54(1), 53(1), 45(1), 39(1), 62(1), 20(1), 23(1), 64(1), 58(1), 40(1), 10(1), 11(1), 13(1), 3(1) |
24(2), 48(2), 36(2), 40(2), 1(2), 25(2), 6(2), 8(2) |
|
Leach Extraction - Continuous Data |
12(1), 2(1), 50(1), 51(1), 8(1) |
20(2), 40(2) |
|
Hazen Leach Testing |
|
3(2) |
|
Page 85 |
| Lithium Americas Corp. Feasibility Study, National Instrument 43-101 Technical Report for the Thacker Pass Project, Humboldt County, Nevada, USA |
|
Test Description |
Illite Bulk Bags |
Smectite Bulk Bags |
|
FLS Leach Testing |
3(1), 6(1), 40(1) |
25(2), 68(2), 18(2) |
|
LAC-Limestone Reagent Efficiency |
11(1), 3(1), 58(1), 40(1) |
19(2), 25(2), 6(2) |
|
LAC-Neutralization w/ CaCO3 & Mg Precipitation Solids |
33(1), 57(1), 52(1), 26(1) |
23(2) |
|
Diemme Neutralization Slurry Filtration (bench) |
5(1) |
|
|
SNF Flocculant Screening |
26(1), 33(1) |
18(2), 23(2) |
|
LAC-Cut Size Leach Investigation |
26(1), 57(1), 33(1), 52(1) |
68(2), 23(2), 13(2), 18(2) |
|
LAC-MOL Reagent Efficiency |
8(1), 50(1), 51(1) |
|
|
LAC 70/30 Blend Leach |
33(1), 52(1), 57(1) |
18(2), 68(2) |
|
Brines - Crystallization Tests |
Composites of smectites and illites. |
|
13.1.2 Samples for Variability Study
The first five years of the mine plan are shown in the drillhole locations below in Figure 13-3. The samples tested cover all the area in years one to five. Thirty-seven composite samples out of fourteen drillholes were collected from retained assay coarse reject bags and shown in Figure 13-3.
|
Page 86 |
| Lithium Americas Corp. Feasibility Study, National Instrument 43-101 Technical Report for the Thacker Pass Project, Humboldt County, Nevada, USA |
Figure 13-3 Sample Locations for Leach Variability Study
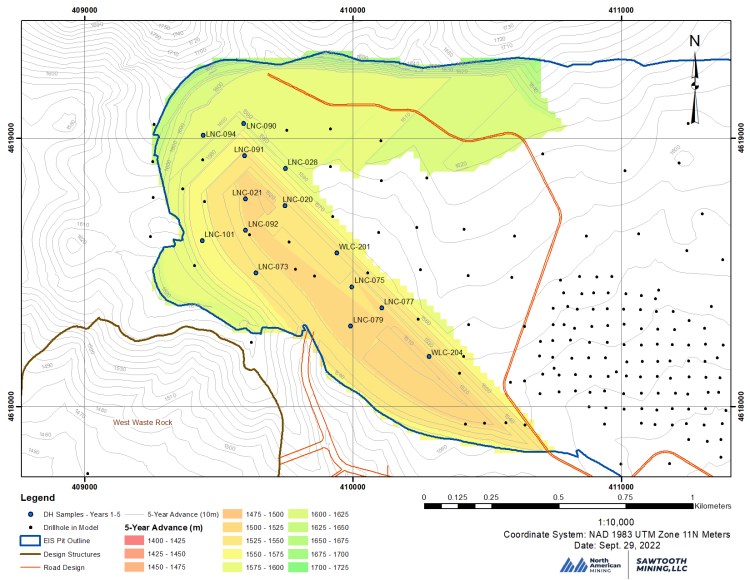
|
Page 87 |
| Lithium Americas Corp. Feasibility Study, National Instrument 43-101 Technical Report for the Thacker Pass Project, Humboldt County, Nevada, USA |
Table 13-3 Samples for Variability Study
|
Sample name |
Hole ID |
Depth |
Depth to |
Mining |
Assay1 |
||
|
[Li] ppm |
[Mg] ppm |
Ash% |
|||||
|
1+2 |
LNC-020 |
16.06 |
62.48 |
3,4,5 |
4235 |
61922 |
31% |
|
3 |
LNC-020 |
36.45 |
69.04 |
4,5 |
4740 |
59493 |
26% |
|
4+5 |
LNC-021 |
6.04 |
69.59 |
2,3,4,5 |
4094 |
59225 |
43% |
|
6 |
LNC-021 |
34.32 |
74.25 |
5 |
5658 |
63604 |
21% |
|
7+8 |
LNC-028 |
14.51 |
79.64 |
2,3 |
4315 |
60917 |
25% |
|
9 |
LNC-073 |
10.73 |
56.63 |
3 |
3341 |
38094 |
38% |
|
11 |
LNC-073 |
10.73 |
56.63 |
3 |
3341 |
38094 |
38% |
|
12+13 |
LNC-075 |
10.39 |
57.36 |
1,5 |
3783 |
59423 |
32% |
|
14 |
LNC-075 |
25.3 |
55.72 |
1,5 |
5344 |
62638 |
26% |
|
15+16 |
LNC-077 |
13.41 |
65.78 |
1,2 |
3757 |
54573 |
26% |
|
17 |
LNC-077 |
18.84 |
53.77 |
1,2 |
4784 |
73684 |
18% |
|
19 |
LNC-079 |
11.61 |
51.82 |
1 |
4746 |
57054 |
23% |
|
22 |
LNC-090 |
41.76 |
71.38 |
5 |
3387 |
44745 |
22% |
|
25 |
LNC-091 |
43.04 |
79.74 |
5 |
4333 |
47751 |
29% |
|
27 |
LNC-092 |
9.20 |
40.63 |
3,4 |
4878 |
55706 |
15% |
|
28+29 |
LNC-094 |
7.35 |
47.43 |
2,5 |
3770 |
52800 |
28% |
|
30 |
LNC-094 |
33.07 |
57.06 |
3,5 |
4220 |
52258 |
20% |
|
32 |
LNC-101 |
0 |
31.06 |
3,4 |
4322 |
47464 |
34% |
|
33+34 |
WLC-201 |
7.56 |
50.72 |
1,4,5 |
4381 |
65036 |
43% |
|
35+36 |
WLC-204 |
15.09 |
83.58 |
3,4,5 |
3266 |
55173 |
56% |
|
37 |
WLC-204 |
18.11 |
72.39 |
3 |
2902 |
46869 |
38% |
|
Average |
NA |
NA |
NA |
NA |
4171 |
55073 |
30% |
1Assay for blended samples (e.g. 1+2) are calculated from the sample assays at a 70/30 ratio.
13.2 Metallurgical Test Work by Area
13.2.1 Beneficiation
13.2.1.1 Comminution
Samples of both clay types, hard ash (intermittent layers in the clay deposit) and limestone from local sources (see Section 13.2.3.7) were submitted for materials characterization testing by Hazen and FLSmidth, Inc. Specifically, Bond ball mill work index (BWi), Bond abrasion index (Ai), Bond impact work index (CWi), and unconfined compressive strength (UCS) were measured, with results listed in Table 13-4 (Hazen, 2021).
|
Page 88 |
| Lithium Americas Corp. Feasibility Study, National Instrument 43-101 Technical Report for the Thacker Pass Project, Humboldt County, Nevada, USA |
Table 13-4 Summary of materials characterization testing (FLSmidth)
|
Material |
Bulk Bag |
BWi, |
Ai, g |
CWi, |
Approximated UCS (psi) |
|||
|
Smectite |
2(2) |
13.1 |
0.0066 |
2.8 |
508 |
- |
- |
- |
|
Illite |
32(1) |
10.1 |
0.0046 |
2.5 |
367 |
379 |
684 |
- |
|
Hard Ash (in clay deposit) |
N/A, composited from core samples |
12.2 |
0.1055 |
7.6 |
1110 |
9760 |
2151 |
2109 |
|
Limestone |
N/A, local deposit sample |
9.7 |
0.0005 |
8.8 |
6420 |
8847 |
6930 |
5163 |
The clay samples had very low work indices, and both are considered "soft" within the Hardness/Resistance to breakage ranges (CWi <10). The impact energy was also low. The hard ash and limestone samples are also considered as "soft" materials per the Bond impact work index values.
Results from this analysis were used to appropriately design and size the feeder breakers and mineral sizers to reduce run-of-mine (ROM) material down to the target size to feed downstream unit operations.
13.2.1.2 Attrition Scrubbing
Lithium is highly concentrated in the clay fraction, while gangue material has minimal lithium value. This is confirmed by analysis of ore samples via Sensitive High Resolution Ion Microprobe (SHRIMP), where lithium concentration is as high as 1.81 wt.% in the clay regions located in the boundaries of detrital grains (Figure 13-4).
Figure 13-4 Lithium distribution in clay and gangue (SHRIMP analysis)
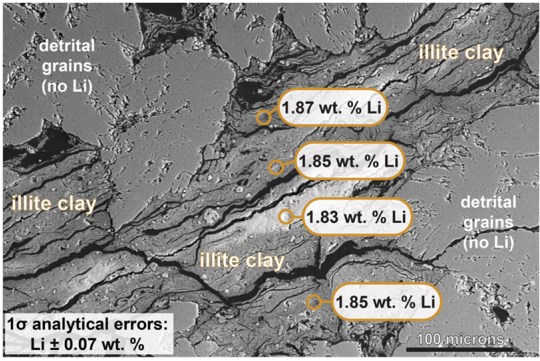
Source: Benson and Coble (in prep for submission), Hydrothermal enrichment of lithium in intracaldera claystones, 2022
|
Page 89 |
| Lithium Americas Corp. Feasibility Study, National Instrument 43-101 Technical Report for the Thacker Pass Project, Humboldt County, Nevada, USA |
Attrition scrubbing (a form of high intensity slurry mixing) has proven to be an effective technique to liberate lithium bearing clay from gangue material (detrital grains). The scrubber imparts enough energy to disperse clays to fine particles while leaving harder gangue minerals in the larger size fractions.
Attrition scrubbing tests at the PTC were done on illite, smectite, and mixtures thereof at various slurry densities and residence times (Lithium Americas Corporation, Attrition Scrubbing Bench Studies, Reno, NV: Internal Document, 2021). The discharge slurries were wet screened and assayed by size fraction to quantify mass and elemental distribution. Test results showed that optimum scrubbing conditions were achieved at 30% solids slurry density and 10 minutes residence time. At higher percent solids the slurry becomes too viscous for efficient scrubbing, and longer residence times result in overgrinding of coarse gangue. Depending on the clay blend, 88-96% of the lithium was located in particles smaller than 38 µm after scrubbing, while 79-66% of the total mass was in the same size fraction (Table 13-5). This demonstrates that attrition scrubbing can be effective to separate lithium-containing clays from coarse gangue material.
Table 13-5 Attrition Scrubbing Test by LAC
|
Size |
100% smectite |
75% smectite / |
50% smectite / |
25% smectite / |
100% illite |
|
% Passing, Li |
|||||
|
1000 |
99 |
97 |
99 |
99 |
99 |
|
500 |
99 |
97 |
99 |
99 |
99 |
|
300 |
96 |
97 |
99 |
98 |
98 |
|
150 |
93 |
94 |
97 |
97 |
98 |
|
75 |
91 |
93 |
96 |
96 |
97 |
|
53 |
90 |
92 |
95 |
94 |
97 |
|
38 |
88 |
91 |
94 |
93 |
96 |
|
Size |
% Passing, total mass |
||||
|
1000 |
98 |
94 |
91 |
88 |
86 |
|
500 |
97 |
93 |
89 |
85 |
83 |
|
300 |
94 |
92 |
87 |
83 |
80 |
|
150 |
88 |
85 |
82 |
77 |
74 |
|
75 |
83 |
80 |
78 |
72 |
70 |
|
53 |
82 |
79 |
76 |
70 |
68 |
|
38 |
79 |
76 |
73 |
68 |
66 |
Independent attrition test work performed by a process consultant (FEDINC) indicated that a "mild" scrub followed by an "intense" scrub can result in better overall clay liberation (FEDINC/Weir. Attrition Scrubbing). For a 50/50 smectite/illite blend, a 5 minute "mild" followed by 5 minute "intense" scrub resulted in 95% of lithium reporting to a minus 212 µm fraction. A single attrition stage resulted in 83% of lithium reporting to the minus 212 μm with just the 5 minute "intense" scrub (Table 13-6).
|
Page 90 |
| Lithium Americas Corp. Feasibility Study, National Instrument 43-101 Technical Report for the Thacker Pass Project, Humboldt County, Nevada, USA |
Table 13-6 Li and mass distribution of 50/50 clay slurry blend post attrition scrubbing, "intense" vs "mild + intense"
|
Size µm |
% Mass Distribution |
% Li Distribution |
||
|
Intense |
Mild + |
Intense |
Mild + |
|
|
+212 |
35 |
17 |
17 |
5 |
|
-212/+38 |
11 |
23 |
8 |
14 |
|
-38 |
53 |
60 |
76 |
80 |
The flow sheet has two stages of scrubbing: a log-washer (mild) followed by attrition scrubbers (intense). A screen on the attrition scrubber discharge will remove +1" material. It is assumed that this coarse fraction will only be 1% of the total mass in the discharge slurry. Note that in the FEDINC study, the "intense" scrub was performed at 50% solids and for five minutes, whereas internal test work has shown the optimum to be 30% solids and 10 minutes. Thus, the results of these tests demonstrate the viability of the two-stage attrition circuit. The lithium recovery design criteria is based on the data collected by LAC under best operating conditions (Table 13-5).
Pilot scale test work of the two-stage scrubbing circuit has been completed at FEDINC to confirm assumed operating conditions and lithium recoveries for the current flowsheet (FEDINC, 2022). See Section 13.2.1.6 for details.
13.2.1.3 Classification
In the process flow sheet, conventional cyclones will be utilized to achieve approximately 75 µm separation from the attrition scrubbing product. The cyclone overflow containing the major fraction of the minus 75 µm material will be directed to a thickener. The underflow from the cyclone, containing residual fines and coarse gangue will be processed through a hydraulic classifier. The hydraulic classifier overflow will be directed to the thickening stage and the underflow will be dewatered, then sent to a coarse gangue stockpile for use in mine reclamation.
Based on mine plan optimization to maximize recoverable lithium, the resultant blend to feed the plant averages 59% illite and ranges between 30 to 70%, with the remaining amount as smectite (see Sections 15 and 16). Based on the data in Table 13-5, at 75 µm approximately 4% of lithium and 28% of the total mass should report to the hydraulic classifier underflow stream as coarse gangue. However, it is assumed that the mass of material reporting to coarse gangue will be more closely aligned with the overall pit ash content, which is approximately 34%. For lithium, it is assumed that 92% of the lithium contained in the ROM material will report to the minus 75 µm overflow streams (Table 13-7).
Table 13-7 Process design criteria for classification, 75µm separation size, 70/30 illite/smectite blend
|
Separation size 75 |
Test |
Process |
Justification |
|
% Li recovered |
96 |
92 |
Minor losses of lithium due to separation inefficiency in |
|
% coarse gangue mass rejected |
28 |
34 |
Assumed to align with estimated mass % of ash in overall pit |
Samples of attrition scrubber discharge slurry of both illite and smectite generated at the PTC were submitted to Eriez Flotation Services to test size separation of clay fines and coarse gangue via a hydraulic (crossflow) separator (Eriez Flotation Division. Teeter Bed Separator Metallurgical Service Test Report for LAC. Erie, PA: s.n., 2021). This simple unit operation relies on a controlled up-flow of water in a teeter bed to make a high efficiency separation of particles based on size. An example of the size separation for both clay types can be seen in Figure 13-5, where a clear boundary layer of fines and coarse material is observed. Performance of the hydraulic classifier with primary cyclone underflow was validated at the FEDINC pilot plant (FEDINC, 2022).
|
Page 91 |
| Lithium Americas Corp. Feasibility Study, National Instrument 43-101 Technical Report for the Thacker Pass Project, Humboldt County, Nevada, USA |
Figure 13-5 Smectite and illite fines separation in a pilot crossflow separator
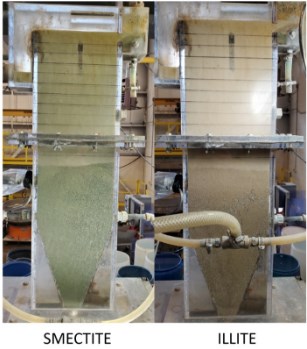
Source: Eriez Flotation Division. Teeter Bed Separator Metallurgical Service Test Report for LAC. Erie, PA: s.n., 2021
The particle size distributions (PSD) of the hydraulic classifier feed, overflow, and underflow for both illite and smectite are shown in Figure 13-6. For both materials, most fines reported to the overflow. Classification efficiency is determined by the partition coefficient, which indicates the mass % of material reporting to the overflow for a given particle size. The partition coefficients by size fraction for both materials are also shown in Figure 13-6, demonstrating that 100% of the minus 75 µm is projected to report to the overflow. The test data indicate that cross flow type separators provide an appropriate particle size separation technology. Industrial units for the flowsheet were based on material flows and a 75 µm target separation size.
|
Page 92 |
| Lithium Americas Corp. Feasibility Study, National Instrument 43-101 Technical Report for the Thacker Pass Project, Humboldt County, Nevada, USA |
Figure 13-6 PSD's and partition coefficients of illite and smectite in the hydraulic classifier
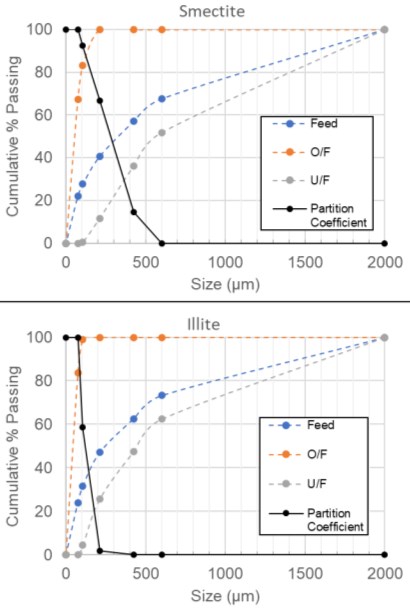
Source: Data Adapted from Eriez Flotation Division. Teeter Bed Separator Metallurgical Service Test Report for LAC. Erie, PA: s.n., 2021
It should be noted that in the process plant, the feed to the hydraulic classifier will be primary cyclone underflow and not attrition scrubber discharge slurry as evaluated at Eriez. Thus, the feed to the hydraulic classifier will have a coarser size distribution compared to the test slurry but is not anticipated to affect operation or result in additional equipment compared to the current design. Performance of the hydraulic classifier with primary cyclone underflow was validated at the FEDINC pilot plant.
13.2.1.4 Solid Liquid Separation
After classification, the clay fines are directed to a thickener to dewater and increase the percentage of solids ahead of the leaching process. The objective is to feed the leaching circuit with the highest percent solids slurry. This will allow for recovery of the maximum amount of water that can be recycled back to attrition scrubbing and classification circuits. This reduces the amount of water to be evaporated downstream. The maximum thickener underflow densities achieved in test work ranged from 20 to 39% solids.
|
Page 93 |
| Lithium Americas Corp. Feasibility Study, National Instrument 43-101 Technical Report for the Thacker Pass Project, Humboldt County, Nevada, USA |
Three illite and three smectite sample sets were sent to vendors for thickening studies:
A variety of flocculants and dosages were tested by each to determine and optimize settling rates, underflow densities, flocculant dosage rates, and scale-up parameters. Results from each independent study were closely aligned, with each vendor determining a similar achievable underflow density, flocculant type and dose. Table 13-8 shows the results of the campaign from a 50/50 blend of illite and smectite.
Table 13-8 Solid-Liquid Separation test results 50/50 illite/smectite blend
|
Supplier |
Westech |
Westech |
Westech |
Andritz |
FLS |
|
Thickener Type |
deep bed paste |
high density paste |
high rate |
high rate |
high rate |
|
design unit area (m2/(t/d)) |
0.36 |
0.36 |
0.36 |
0.12 |
0.08 |
|
Diameter (m) |
24 |
35 |
50 |
50 |
30 |
|
Feed Rate (dry t/h) |
300 |
300 |
300 |
450 |
250 |
|
Feed Density (% S) |
5-8 |
5 |
3 |
3 |
3 |
|
Discharge Density (% S) |
39 |
27-36 |
20 |
20 |
25-36 |
|
Flocculant Dosage (g/t) |
200 |
200 |
200 |
350 |
200 |
Results from the thickening tests indicate that a feed density of 3-8% followed by flocculant dosing of 200 g/t can achieve a varying discharge density of 20-39% solids in the underflow. Since none of the results indicated that clay slurry could be thickened to the target density, decanter centrifuges were considered for additional dewatering after the thickener. For design purposes, a high-rate thickener was selected with a target underflow density of 20-25% solids.
13.2.1.5 Decanter Centrifuging
Representative samples of illite and smectite thickened clay slurry were provided to vendors for bench scale decanter centrifuge testing:
Both vendors tested different operating conditions, such as slurry feed density, g-force, and flocculant dosing. Test work confirmed that thickener underflow could be further dewatered to produce slurry densities around 50% solids (49% on average). Further pilot scale testing was performed confirming the bench scale results (GEA, 2021). Figure 13-7 shows the pilot scale decanter centrifuge discharge cake solids density and a photo of the generated cake.
|
Page 94 |
| Lithium Americas Corp. Feasibility Study, National Instrument 43-101 Technical Report for the Thacker Pass Project, Humboldt County, Nevada, USA |
Figure 13-7 Pilot decanter centrifuge results
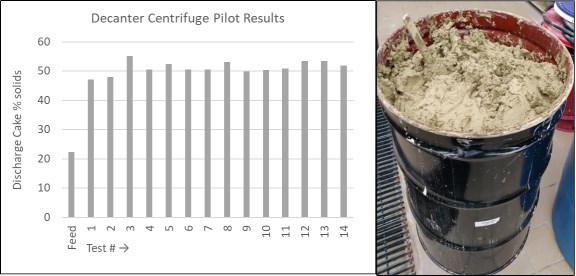
Source: Pilot Scale Decanter Centrifuge Testing. GEA. 2021
Based on these tests, decanter centrifuge equipment was selected to generate a leach feed containing approximately 50% solids from solid-liquid separation.
13.2.1.6 Large-scale Beneficiation Piloting
Large-scale piloting was performed with Weir Minerals in partnership with Florida Engineering and Design, Inc. (FEDINC) with the objective of confirming that the selected flowsheet meets Project requirements. The key parameters to be confirmed were coarse gangue rejection, lithium recovery, and pulp density of the decanter centrifuge final product sludge.
13.2.1.6.1 Scope
The scope of work was to perform pilot plant testing of the critical equipment of the current beneficiation flowsheet as shown in Figure 13-8 for samples of three (3) blends of material that was fed at a rate of 454 kg/h (1,000 pounds per hour) to the Log Washer and Attrition Scrubber, see Figure 13-9. Note that prior to feeding the material was screened to remove plus one inch.
The remainder of the pilot plant was fed at approximately 5,448 kg/h (12,000 pounds per hour) to confirm performance in the classification section at the largest scale possible, see Figure 13-10. The resulting fines from the classification circuit were then fed to a thickener followed by a decanter centrifuge, see Figure 13-11.
The mineral processing equipment installed at the pilot plant facility follows:
|
Page 95 |
| Lithium Americas Corp. Feasibility Study, National Instrument 43-101 Technical Report for the Thacker Pass Project, Humboldt County, Nevada, USA |
The flow diagram and pictures for the beneficiation and classification circuits as well as solid-liquid separation circuit are presented in Figure 13-8 through Figure 13-11.
|
Page 96 |
| Lithium Americas Corp. Feasibility Study, National Instrument 43-101 Technical Report for the Thacker Pass Project, Humboldt County, Nevada, USA |
Figure 13-8 Large Scale Beneficiation Pilot Plant Process Flow Diagram
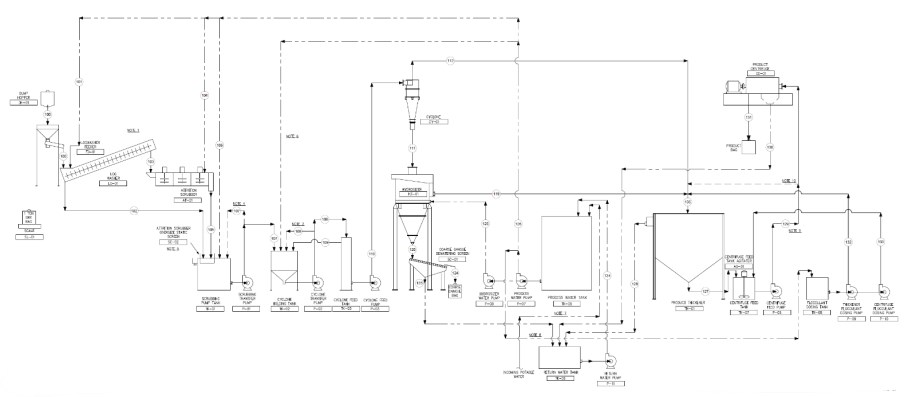
Source: FEDINC, 2022
|
Page 97 |
| Lithium Americas Corp. Feasibility Study, National Instrument 43-101 Technical Report for the Thacker Pass Project, Humboldt County, Nevada, USA |
Figure 13-9 Log Washer and Attrition Scrubber
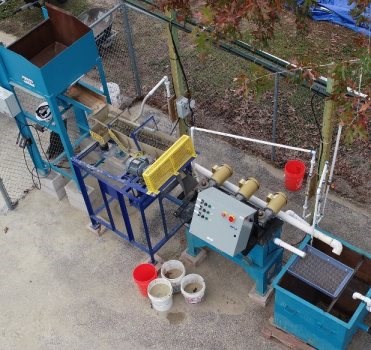
Source: FEDINC, 2022
Figure 13-10 Primary Cyclone, Hydraulic Classifier and Dewatering Screen
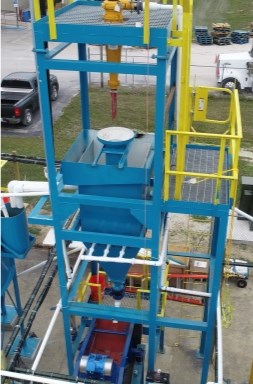
Source: FEDINC, 2022
|
Page 98 |
| Lithium Americas Corp. Feasibility Study, National Instrument 43-101 Technical Report for the Thacker Pass Project, Humboldt County, Nevada, USA |
Figure 13-11 Thickener and Decanter Centrifuge
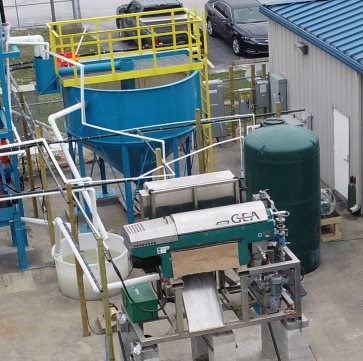
Source: FEDINC, 2022
13.2.1.6.2 Results
Mass rejection of coarse gangue was in the expected range for the life of mine. The lithium recovery for Campaigns 1, 2, and 3 was approximately 90% versus a target of 92% for this circuit. Coarse gangue rejection at the dewatering screen is shown in Figure 13-12. During the campaigns it was noted that the hydraulic classifier discharge valve was difficult to control resulting in upsets of the hydraulic classifier bed that affected separation performance. The valve was replaced with one of more appropriate size and a fourth campaign was conducted. Results from Campaigns 1 to 3 are presented in Table 13-9 (FEDINC, 2022).
Table 13-9 Campaign 1 to 3 Material Balance Results
|
Campaign |
Ore kg (lb) |
Clay Blend, |
Ore, % |
Li % |
% Coarse Gangue |
|
1 |
5,448 (12,000) |
50 / 50 |
10.4 |
89.6 |
33.0 |
|
2 |
5,448 (12,000) |
65 / 35 |
10.4 |
90.8 |
24.7 |
|
3 |
5,448 (12,000) |
50 / 50 |
10.2 |
90.3 |
33.1 |
|
|
|
|
Average |
90.2 |
30.4 |
|
Page 99 |
| Lithium Americas Corp. Feasibility Study, National Instrument 43-101 Technical Report for the Thacker Pass Project, Humboldt County, Nevada, USA |
Figure 13-12 Coarse Gangue Rejection
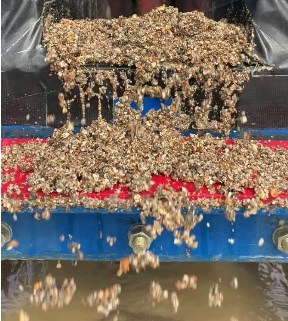
Source: FEDINC, 2022
Lithium recovery in campaign 4 was approximately 94%. This recovery is the highest obtained during pilot plant testing. Coarse gangue rejection was lower when compared to Campaigns 1 to 3. It should be noted that the feed consisted of crushed material that was originally coarser than one inch (plus one inch material) that resulted from crushed ore screening from Campaigns 1-3. This resulted in a lower amount of oversized coarse gangue material in the feed. The clay blend ratio for the composite sample used in Campaign 4 is unknown. Therefore, the coarse gangue rejection and the lithium recovery obtained are not considered representative of the deposit. Results from Campaign 4 were not used to determine expected plant recovery.
The results from this fourth campaign are outlined in Table 13-10 below.
Table 13-10 Campaign 4 Material Balance Results
|
Campaign |
Sample, kg (lb) |
Sample % Moisture |
Li % Recovery |
Coarse Gangue Rejection (%) |
|
4 |
4,792 (10,554) |
6.5 |
93.8 |
11.9 |
13.2.2 Solid - Liquid Separation Circuit
Both the thickener and the decanter centrifuge met the desired objectives. Based on test data, a final product of approximately 55% solids (by weight) from the decanter centrifuge can be expected. The particle size distribution in the thickener underflow was in a 90-95% range passing 75 microns. Campaign 3 thickener underflow particle size distributions from several samples taken are depicted in Figure 13-13. This particle size distribution is finer than the target size of 80% passing 75 microns.
|
Page 100 |
| Lithium Americas Corp. Feasibility Study, National Instrument 43-101 Technical Report for the Thacker Pass Project, Humboldt County, Nevada, USA |
Figure 13-13 Campaign #3 Thickener Underflow (50% Smectite / 50% Illite)
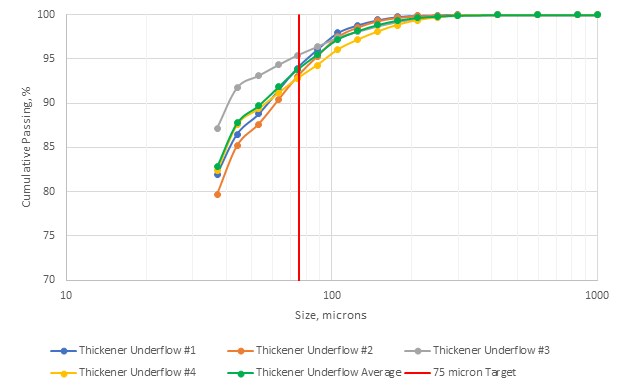
Source: FEDINC, 2022
13.2.3 Leaching and Neutralization
The concentrate product from the classification circuit is directed to the leach circuit. Lithium contained in clay rich leach feed is dissolved with sulfuric acid in agitated leach tanks. After leaching, excess acid is neutralized with limestone and recycled magnesium hydroxide prior to filtration of the neutralized leached residue.
13.2.3.1 Optimum Sulfuric Acid Dose
The objective of the leach circuit is to optimize lithium extraction. Acid dose has a strong effect on lithium leach extraction. Three samples of illite and smectite were leached by FLS at different acid dosage levels. The average extractions are shown in Table 13-11 (FLS, 2021a). For both clay types, lithium extraction increased with acid dose.
Table 13-11 Lithium leach % extraction of illite and smectite vs sulfuric acid dose
|
Clay Type |
Avg. Li head grade |
Acid dose (tonne acid/tonne solids in leach feed slurry) |
||
|
0.45 |
0.50 |
0.55 |
||
|
Lithium Leach Extraction, % |
||||
|
Illite |
4,590 |
67 |
84 |
87 |
|
Smectite |
2,909 |
71 |
83 |
91 |
Using the measured leach extractions, the optimum acid dose can be calculated. As sulfuric acid is the limiting reagent, the tonnage fed to leach is thus dictated by acid production rate (nominal 3,000 t/d Phase 1 and 6,000 t/d total for Phase 2). The total mass of lithium extracted for each acid dose scenario is calculated in Table 13-12, where the total mass of solids in leach feed slurry is based on 3,000 t/d sulfuric acid availability.
|
Page 101 |
| Lithium Americas Corp. Feasibility Study, National Instrument 43-101 Technical Report for the Thacker Pass Project, Humboldt County, Nevada, USA |
Table 13-12 Lithium extractions for various acid dose scenarios
|
Acid dose (tonne/tonne |
Solids in leach feed slurry |
Total Tonnes Li |
|
|
Illite |
Smectite |
||
|
0.45 |
6,667 |
20.5 |
13.8 |
|
0.50 |
6,000 |
23.1 |
14.5 |
|
0.55 |
5,455 |
21.7 |
14.4 |
Maximum mass of lithium extracted (23.1 t/d+14.5 t/d) occurs at a dose of 0.5 tonnes acid/tonne solids for both clay types and is used as the design acid addition rate (design = 0.49 tonne acid/tonne solids).
13.2.3.2 PTC Leach Results
LAC has performed extensive leach testing on material collected from various locations throughout the deposit (Section 13.1). Over 100 large leach batch tests were performed in 0.38 m3 tanks. Approximately 0.36 t of slurry were processed per batch. Different clay compositions and sulfuric acid doses were tested to determine the lithium leach extraction, kinetics, and sulfuric acid requirement to maximize lithium extraction. The lithium leach extraction data for all batches was selected by lithium grade (≥2,500 ppm) after removal of coarse gangue and design acid dose. The leach data results are depicted in Figure 13-14.
Figure 13-14 Large batch lithium leach extraction, Li ≥ 2,500 ppm, 0.5 acid dose
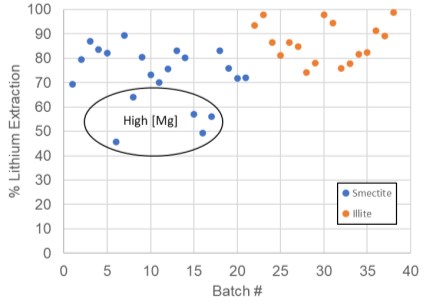
Source: LAC, 2021
On average, illite tends to have higher lithium leach extraction compared to smectite. Smectite batches where extraction was below 70% correspond to high magnesium content in the leach feed slurry (≥ 9.4 wt.% Mg). Conversely, low magnesium content corresponds with higher leach extraction.
|
Page 102 |
| Lithium Americas Corp. Feasibility Study, National Instrument 43-101 Technical Report for the Thacker Pass Project, Humboldt County, Nevada, USA |
13.2.3.3 Lithium Leach Extraction Model
The data in Figure 13-14 was used to build a multivariate model in Minitab® software. The model predicts lithium extraction based on lithium and magnesium content in the leach feed. The predicted extraction versus measured extraction is shown in Figure 13-15.
Figure 13-15 Actual lithium leach extraction percentage vs model prediction
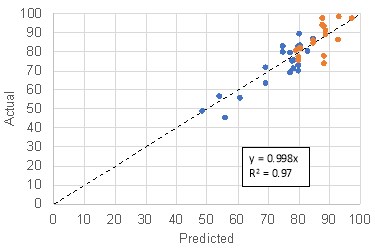
Source: LAC, 2021
The leach model was applied to the block model to optimize the mine plan for total lithium to be extracted. The results from the model indicate that a ~70/30 illite/smectite blend yields a lithium leach predicted extraction of 87% on average over the life of mine (Section 16). Since illite has lower magnesium content and thus higher lithium leach extraction, it is the primary component of the blend. Five different blends of 70/30 illite and smectite were leached at the PTC for confirmation, with an 84% average extraction (Table 13-13) (Lithium Nevada, 2021).
Table 13-13 Lithium leach extractions of various 70/30 illite/smectite blends
|
Blend |
Bulk Bag Illite |
Bulk Bag Smectite |
% Li leach extraction |
|
1 |
33(1) |
18(2) |
90% |
|
2 |
33(1) |
68(2) |
89% |
|
3 |
57(1) |
68(2) |
81% |
|
4 |
57(1) |
18(2) |
86% |
|
5 |
52(1) |
18(2) |
73% |
|
Average |
84% |
||
It should be noted that the average leach extraction was close to the average predicted leach extraction of 87% per the mine model blend. The mine plan used for this study does not allow smectite with high magnesium content to be fed to the process plant due to the low lithium leach extraction. Using the data in Figure 13-14 and excluding the low recovery smectite samples (based on ore control), average lithium leach extractions are 86.5% for illite and 78.5% for smectite. The calculated lithium leach extraction for a 70/30 blend is 84%.
|
Page 103 |
| Lithium Americas Corp. Feasibility Study, National Instrument 43-101 Technical Report for the Thacker Pass Project, Humboldt County, Nevada, USA |
13.2.3.4 Batch vs Continuous Leach
In addition to the batch leaches, continuous leach experiments have been performed in a gravity overflow reactor arrangement at the PTC. Numerous leach batches of ore have been conducted in a continuous mode with the same residence time and acid dose to compare against the data collected in the batch tanks. In Figure 13-16, a comparison of lithium leach extraction in batch vs continuous mode is shown.
Figure 13-16 Continuous v batch lithium leach extraction
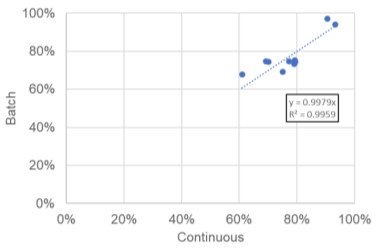
Source: LAC, 2021
Excellent agreement is observed in the data sets, further validating confidence in the batch leach data used for scale-up of the continuous process. Note that the data in Figure 13-16 is for either pure smectite or pure illite leach feed and is not representative of the average mine model blend. Thus, the data merely demonstrates agreement between batch and continuous but does not show expected leach extraction.
13.2.3.5 Leach Kinetics
In terms of kinetics, all data collected to date shows the leach reaction is relatively fast. For example, in Figure 13-17, kinetic data on a smectite sample at different temperatures is shown (Hazen, 2021b).
Figure 13-17 Lithium leach kinetics at various temperatures
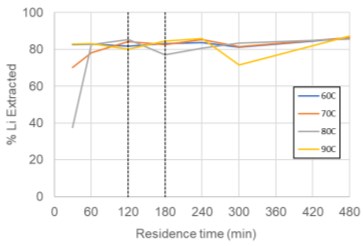
Source: Data Adapted from Hazen Research, Summary of Acid Leach Results, 2021b
|
Page 104 |
| Lithium Americas Corp. Feasibility Study, National Instrument 43-101 Technical Report for the Thacker Pass Project, Humboldt County, Nevada, USA |
The impact of temperature on lithium leach kinetics was minimal. The dashed lines show the normal plant design residence time (180 min) and the residence time in case of a tank outage/bypass for maintenance purposes (120 min). Therefore, the design residence time (180 minutes) is deemed sufficient to extract the soluble lithium present in the leach feed. Similar kinetics were observed for illite samples and are assumed to apply to blends.
13.2.3.6 Leach Feed Particle Size
Leach tests on two particle size separation sizes were performed by LAC on 4 different illite and 4 different smectite samples at the target acid dose. Separation sizes investigated were 75 µm and 38 µm. Figure 13-18 depicts the lithium leach extractions for both particle sizes evaluated (Lithium Nevada, 2021a).
Figure 13-18 Lithium leach extractions for 75 µm and 38 µm particle sizes
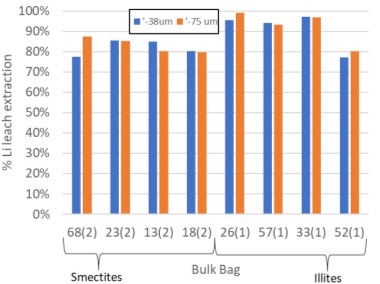
Source: Lithium Americas Corporation, Leaching Size Test Report, 2021
No significant difference in lithium leach extraction was observed between the two sizes. At the 75 µm separation size, the smectite lithium leach extraction averaged 83% while illite leach extraction averaged 92%.
13.2.3.7 Neutralization
After slurry is leached, residual acid is neutralized to raise the pH to precipitate most of the aluminum and iron in solution. LAC plans to obtain limestone from nearby sources. In Table 13-14, the results for limestone purity of the samples are shown, with assays completed by three individual sources. The purity fluctuates between 77-100% calcium carbonate, CaCO3, depending on sample location. Silica is the major impurity, with magnesium, aluminum and iron also present.
Table 13-14 Limestone purity analysis of local grab samples
|
Sample # |
Description |
CaCO3 |
MgCO3 |
SiO2 |
Al2O3 |
Fe2O3 |
Total |
|
Analysis 1 (Lhoist) |
|||||||
|
1 |
+3/8" |
96.5 |
0.7 |
0.9 |
0.0 |
0.1 |
98.4 |
|
1 |
-3/8" |
96.6 |
0.8 |
8.0 |
0.1 |
0.1 |
98.6 |
|
Page 105 |
| Lithium Americas Corp. Feasibility Study, National Instrument 43-101 Technical Report for the Thacker Pass Project, Humboldt County, Nevada, USA |
|
Sample # |
Description |
CaCO3 |
MgCO3 |
SiO2 |
Al2O3 |
Fe2O3 |
Total |
|
2 |
+3/8" |
76.9 |
0.7 |
9.1 |
0.3 |
0.2 |
99.1 |
|
2 |
-3/8" |
83.2 |
2.2 |
8.7 |
0.2 |
0.5 |
99.5 |
|
3 |
+3/8" |
81.2 |
0.7 |
16.2 |
0.1 |
0.2 |
99.0 |
|
3 |
-3/8" |
86.5 |
1.4 |
9.3 |
0.2 |
0.2 |
99.2 |
|
Analysis 2 (Western Lithium Corporation) |
|||||||
|
Sample # |
Description |
CaCO3 |
MgO |
SiO2 |
Al2O |
Fe2O3 |
- |
|
1 |
Bulk |
101.2 |
1 |
3.15 |
0.1 |
0.1 |
- |
|
3 |
Bulk |
88.1 |
3.45 |
3.05 |
0.2 |
0.1 |
- |
|
Analysis 3 (Lithium Americas Corporation) |
|||||||
|
Sample # |
Description |
CaCO3 |
Mg |
- |
Al |
Fe |
- |
|
4 |
Bulk |
92 |
4946 |
- |
716 |
2235 |
- |
|
5 |
Bulk |
92 |
4876 |
- |
668 |
1333 |
- |
Pulverized limestone has been tested as neutralization reagent at the PTC and by others. In Figure 13-19, a comparison of pulverized local limestone and vendor supplied limestone showed that the local limestone had similar efficiency to commercially available product (FLS, 2021a). The limestone consumption for all samples tested is shown in Table 13-15, where the average consumption over all samples was 0.12 g CaCO3/g solids in leach feed slurry.
Table 13-15 CaCO3 consumption to achieve pH 3.5 in neutralization slurry
|
Bulk Bag |
Type |
g CaCO3/g LF slurry for pH 3.5 |
|
25(2) |
Smectite |
0.10 |
|
18(2) |
Smectite |
0.16 |
|
68(2) |
Smectite |
0.04 |
|
6(1) |
Illite |
0.07 |
|
3(1) |
Illite |
0.18 |
|
40(1) |
Illite |
0.18 |
|
Avg. |
0.12 |
|
At the PTC, limestone consumption to achieve pH 3.5 was 0.1 kg CaCO3/kg LF solids across 11 large scale batches. In the process design criteria, limestone addition is based on controlling the neutralization outlet stream to a pH target. It will vary depending on residual acid content, iron, and aluminum solution values.
|
Page 106 |
| Lithium Americas Corp. Feasibility Study, National Instrument 43-101 Technical Report for the Thacker Pass Project, Humboldt County, Nevada, USA |
Figure 13-19 Local CaCO3 & vendor purchased comparison of pH vs limestone addition
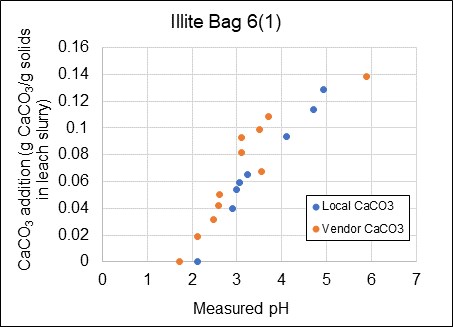 |
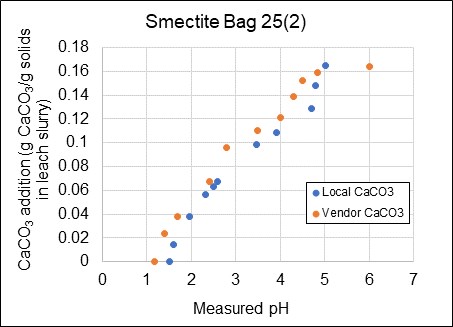 |
Source: Data Adapted from FLS. LAC Leach and Neutralization Results 2021
Large batch neutralization tests have also been performed using both CaCO3 and recycled magnesium precipitate (magnesium hydroxide/calcium sulfate solids), as currently designed in the flow sheet. In these tests, pulverized limestone was added to a target pH ~3.5, then a slurry containing magnesium precipitation solids was added to a target pH of ~7. This simulates the two-stage neutralization circuit. It has been confirmed over multiple batches that the magnesium solids are effective as a neutralization reagent and capable of bringing the final slurry pH to a target range of 6-7. Testing has confirmed that at the end of neutralization, aluminum and iron are almost completely removed (Table 13-16).
|
Page 107 |
| Lithium Americas Corp. Feasibility Study, National Instrument 43-101 Technical Report for the Thacker Pass Project, Humboldt County, Nevada, USA |
Table 13-16 Data for neutralization batches using CaCO3 and Mg Precipitation solids
|
Bag/Batch |
Initial leach slurry solution values |
Final neutralized slurry solution values |
|||
|
H2SO4 |
Al |
Fe |
Al |
Fe |
|
|
23(2)-1 |
28.5 |
6324 |
9318 |
<10 |
<10 |
|
33-1 |
35.5 |
2460 |
7198 |
<10 |
<10 |
|
57-1 |
51.5 |
3327 |
7377 |
<10 |
ND* |
|
57-2 |
41.5 |
3119 |
7001 |
<10 |
<10 |
|
52-1 |
32.6 |
3521 |
4806 |
<10 |
<10 |
|
52-2 |
42.5 |
2865 |
5113 |
ND* |
ND* |
|
26-2 |
23.1 |
2911 |
5349 |
<10 |
<10 |
*ND = non-detect
13.2.3.8 Neutralization Slurry Filtration
After neutralization, the leach residue is filtered in membrane filter presses, with the objective to generate a dry cake suitable for stacking in the CTFS, and to recover lithium in solution. Hundreds of filtration batches have been performed by LAC on a pilot scale membrane filter press. Filter cakes produced are consistently uniform, friable, and with 35 to 40% moisture content as measured drying at 105°C (Figure 13-20). Tests performed by multiple filtration equipment vendors have confirmed final filter cake characteristics:
Figure 13-20 Pilot membrane filter press and resultant filter cake
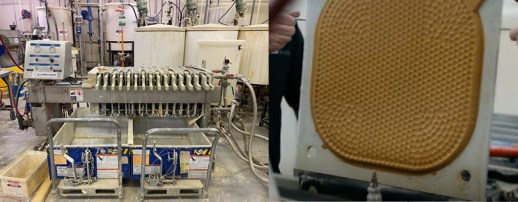
Source: LAC, 2021
Washing the filter cake to recover any residual filtrate is critical to minimize lithium losses to the CTFS. Washing tests were performed, and the wash water demand versus wash recovery is shown in Figure 13-21. One phenomenon that was observed by a filter vendor (Diemme) is filter cake breakthrough, where cracks in the filter cake provide channels for wash water to bypass the cake resulting in low wash efficiency. This was observed where wash water flow rates and pressures were high, indicating these variables must be tightly controlled for efficient washing. At optimum conditions, it was found that at a wash water consumption of ≥1.4 (mass wash water/mass solids washed), wash efficiency could exceed 90%. In the process design criteria, washing is specified as taking place in two stages, each stage having a mass of wash solution to solids ratio of 1.1 for a total of 2.2 wash consumption. In the first stage, recycled wash liquor is used, and in the second stage fresh water is used. It is assumed that this wash strategy will be able to achieve 90% recovery based on the bench scale results (Figure 13-21). At 90% wash efficiency, about 98% of the total lithium in solution is recovered (filtrate + wash solution), with ~2% loss to residual liquor entrained as moisture in the filter cake. The leached residue in the filter cake will be in a 600-700 ppm range lithium based on 87% extraction.
|
Page 108 |
| Lithium Americas Corp. Feasibility Study, National Instrument 43-101 Technical Report for the Thacker Pass Project, Humboldt County, Nevada, USA |
Figure 13-21 Wash consumption vs lithium wash recovery tests
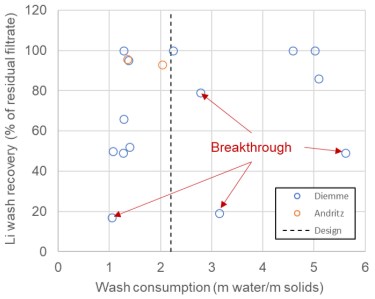
Source: Data Adapted from Diemme Testwork, 2021
Pilot plant filter cake wash testing at the manufacturer resulted in high losses of lithium on scale-up (Diemme, 2022). Based on filter cake washing test results a new wash strategy was developed.
13.2.3.9 Counter Current Decantation and Filtration
Counter Current Decantation (CCD) has been investigated as an alternative washing process technology. High density thickener test work by FLSmidth resulted in underflows from 32% to 33% using SNF AN-934SH flocculant. Flocculation was successful as shown in Figure 13-22. Parallel work with SNF for settling and rheology test work indicated that 32 to 33% solids can be expected in a CCD circuit with AN-905S flocculant. Anionic flocculant requirements were in an 80-150 g/t solids range depending on the number of stages. Table 13-17 shows the maximum operation density range for standard and high-density thickener designs per SNF. Owing to the improved underflow solids content, high density thickeners have been selected.
Table 13-17 SNF Maximum Thickener Underflow Operating Density
|
Material |
Maximum Recommended Operating Density |
Maximum Recommended Operating Density |
|
CCD1 |
29.5% - 32.0% |
33.9% - 35.3% |
|
CCD 3 |
29.5% - 32.3% |
34.6% - 36.2% |
Subsequent filtration at FLSmidth with a recessed chamber filter press (without membrane squeeze) achieved a competent cake with 39% moisture content when drying at 55 degrees Celsius. No washing occurs in the filter press.
|
Page 109 |
| Lithium Americas Corp. Feasibility Study, National Instrument 43-101 Technical Report for the Thacker Pass Project, Humboldt County, Nevada, USA |
With seven stages of CCD applying a 95% stage mixing efficiency and subsequent filtration without washing stage, losses of lithium in solution entrained as moisture in the filter cake were estimated at approximately 1%.
Figure 13-22 Dynamic Thickener Testing at FLSmidth
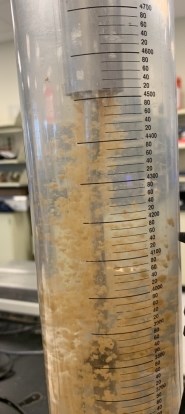
Source: Photo from FLSmidth laboratory, SLC, 2022
13.2.4 Magnesium and Calcium Removal
13.2.4.1 Magnesium Sulfate Crystallization
Magnesium is removed in a primary stage of crystallizers designed to crystallize as much magnesium as possible in the form of hydrated magnesium sulfate (MgSO4*xH2O) salts where x varies with temperature. A critical aspect of magnesium sulfate crystallization is to avoid lithium losses to the salts, because at a threshold concentration of lithium and potassium in solution, lithium can form a double salt with potassium. Therefore, understanding the LiKSO4 phase boundary limit is essential to operate the magnesium crystallizers effectively. LAC, with the assistance of a research partner, has mapped this boundary using in-situ real time monitoring tools during crystallization of brine solutions generated at the PTC. LAC now has a custom phase diagram specific to Thacker Pass brines.
In addition to the fundamental studies in progress, continuous bench and pilot scale test work on neutralized brine solution produced by LAC has been performed. The objective of these scoping studies was to verify the maximum amount of magnesium that can be removed without lithium losses. Test work was conducted on brine supplied by LAC to explore operating conditions of the crystallizer (Aquatech, 2021). First, the conditions at which lithium first starts to precipitate were identified.
|
Page 110 |
| Lithium Americas Corp. Feasibility Study, National Instrument 43-101 Technical Report for the Thacker Pass Project, Humboldt County, Nevada, USA |
At optimum conditions, crystallization was able to remove on average 79% of the incoming magnesium without lithium precipitation. This has been verified by other independent testing. Crystals were relatively large and easy to wash/dewater and remove via centrifugation.
Crystallizer sizing and target design conditions have been incorporated into the flow sheet per vendor test results and recommendations. The precipitated magnesium salts are removed and washed via centrifugation and conveyed to the CTFS, while the filtrate is processed downstream. About 3.7% of the lithium in solution is lost as residual mother liquor on the crystals based on anticipated residual moisture and wash efficiency of the centrifuge cake.
13.2.4.2 Magnesium Precipitation
The residual magnesium in the centrate that is not removed in the crystallizers is then chemically precipitated with milk of lime (MOL), where magnesium hydroxide (Mg(OH)2) and gypsum (CaSO4) are the main precipitates formed. Extensive testing on this process has been performed by LAC and by others. Testing proved (Hazen, 2021a) at a stoichiometric factor of 1, magnesium is removed from solution to a concentration of less than 15 mg/L, exhibiting good reagent efficiency in the circuit. Internal test work has verified stoichiometric addition of MOL, and a stoichiometric factor of 1.05 is used in the design criteria.
The Mg(OH)2/CaSO4 precipitates are filtered in a plate and frame filter press, similar to the neutralization slurry, and filter press sizing is based on vendor testing. The filter cakes are not washed, since they are re-pulped and sent back to neutralization, and therefore any lithium held up in cake filtrate is recycled and recovered. The filtrate is then sent downstream to calcium removal.
13.2.4.3 Calcium Precipitation
The calcium removal step takes place in reactor clarifiers, where soda ash (Na2CO3) is added to form a solid calcium carbonate (CaCO3) precipitate. Test work was performed to determine soda ash dose and clarifier sizing (Westech, 2021a). The resultant solution had less than 20 mg/L of Ca remaining. The solids are removed by passing the stream through multimedia filters, and eventually the CaCO3 is sent back to neutralization.
In a final polishing step, low levels of calcium, magnesium and any other divalent cations are removed with traditional ion exchange resin. Multiple resins were tested and found effective for hardness removal to low solution levels (<1ppm Ca). IX scoping tests to reduce boron concentrations to <1 ppm were also done successfully (Aquatech, 2022). Further testing of ion exchange resins is scheduled to be completed in Q1 2023.
13.2.5 Lithium Carbonate Production
13.2.5.1 Purification
The brine feeding the lithium carbonate (Li2CO3) purification circuit primarily contains lithium, sodium, and potassium sulfate. The objective is to produce high quality battery grade lithium carbonate. Note that crystal agglomeration and poor wash efficiency are common contributors to product contamination, and thus it is desired to grow large crystals and avoid agglomerates.
The Li2CO3 purification circuit is comprised of three stages: primary Li2CO3 crystallization, bicarbonation, and secondary Li2CO3 crystallization. Each stage has been tested (Veolia, 2020). In the 1st stage, soda ash (Na2CO3) is added to the brine in stoichiometric excess to precipitate Li2CO3 and form crystals. The crystals collected in the first stage were analyzed to be 95.8 wt% Li2CO3. A target of ≥99.5 wt% for battery grade indicated that a second stage purification is necessary to remove impurities.
|
Page 111 |
| Lithium Americas Corp. Feasibility Study, National Instrument 43-101 Technical Report for the Thacker Pass Project, Humboldt County, Nevada, USA |
The Li2CO3 crystals collected from the 1st stage were re-slurried with water and then transferred to a reactor where carbon dioxide (CO2) gas was continuously metered at controlled temperature and pressure. This reaction converts Li2CO3 to highly soluble lithium bicarbonate (LiHCO3). Solid impurities were removed in a filtration step.
The filtered brine was then fed to a 2nd stage reactor, where it was heated to thermally degas CO2 and precipitate Li2CO3. After separating and washing the crystals, a product with > 99.5 wt.% was obtained. The crystals were of sufficient size for efficient solids/liquid separation with little to no agglomerates present. The bicarbonate filtration step is critical to keep contaminants within battery product specification.
To further validate the process design, pilot Li2CO3 purification testing was performed by Aquatech International on brine generated from Thacker Pass clay (Aquatech, 2022a). The test program was designed to simulate the commercial circuit and included all stages of purification and all primary recycle streams. They demonstrated the ability to produce lithium carbonate at both the purity (>99.5 wt%) and recovery (>96.0%) as defined in the basis of design. Other key design criteria, equilibrium concentrations, reagent consumptions, and power demand were also verified throughout the test campaign.
Over 5 kg of battery quality lithium carbonate has also been produced internally at Lithium Americas' Technical Center in Reno, NV via the same purification circuit design (Lithium Nevada, 2022). There was good agreement with the Aquatech data for equilibrium solution concentrations and final product purity.
13.2.5.2 Zero Liquid Discharge Crystallization
Mother liquor from the 1st stage and a portion of mother liquor from the 2nd stage are combined and sent to the zero liquid discharge (ZLD) crystallizer with the objective of crystallizing sodium and potassium as sulfate salts by evaporation. Prior to feeding the crystallizer, sulfuric acid is added to destroy any carbonates thus preventing precipitation of lithium carbonate. Because there is a significant concentration of lithium in the ZLD feed stream, crystallization must be controlled to avoid lithium precipitation to solids, similar to the magnesium sulfate crystallizer (Section 13.2.4.1).
Continuous bench scale ZLD crystallizer tests were performed on synthetic brine solution designed to represent the feed stream composition per the process model. The test work identified the target area where lithium is still soluble, and calcium, potassium, silica, and sodium were the only precipitated species. Based on these results, the operating conditions and sizing of the circuit were designed.
To confirm the design, pilot testing of the ZLD circuit was also performed by Aquatech International during the pilot purification campaign (Aquatech, 2022a). The design mother liquor and crystals composition were verified, and it was shown that the crystallizer can be operated without loss of lithium to solids. Similarly, internal pilot testing has also confirmed that lithium loss to solids can be avoided if the mother liquor composition is controlled (Lithium Nevada, 2022).
13.2.5.3 Final Product Handling
High purity lithium carbonate crystals from the 2nd stage are removed via centrifuge and sent to drying, cooling, micronization and packaging circuits. Dryers and coolers were selected based on quoted designs from multiple vendors, with moisture properties of the final Li2CO3 crystals assumed based on test work and typical industry values.
For micronization, bulk samples were provided to multiple vendors for micronization testing with different types of mills. Based on test results (Hosokawa, 2021), equipment was sized, and jet milling was selected as the preferred technology.
A dry vibrating magnetic filter (DVMF) is included post jet milling to remove metallic contaminants. Samples were tested to establish a maximum theoretical feed rate of lithium carbonate through a DVMF. The results were used to size equipment.
|
Page 112 |
| Lithium Americas Corp. Feasibility Study, National Instrument 43-101 Technical Report for the Thacker Pass Project, Humboldt County, Nevada, USA |
The packaging system has been designed from bulk jet-milled lithium carbonate testing completed in Q1 2022. The equipment required is similar to others used in the industry and is integrated into the design of the Project.
13.2.6 Tailings
Numerous geotechnical tests have been completed on tailings material generated from the PTC. Based on this testing, stability analysis modeling has shown a stable landform can be constructed when the tailings are compacted near optimum moisture content. To achieve a stable landform, technical specifications have been prepared which identify the moisture content and compaction requirements of the tailings. Section 18 summarizes the tailings plan.
13.3 Beneficiation and Leaching Variability Study
The primary objective of the leach variability study was to confirm that materials from depth in the Thacker Pass deposit provide a similar metallurgical response to the beneficiation and leach processes. Composite samples representative of the first five years of production were procured for bench scale testing. The main parameters evaluated were as follows:
The beneficiation (attrition/scrubbing and classification) process was simulated in the laboratory to generate leach feed slurry from each composite representing various years of production. The coarse gangue removed (+75 microns) was quantified and lithium losses were evaluated. Representative test charges of leach feed (-75 microns) were generated and leached using standard leach parameters previously defined for the Project. The results from this study were used to verify the leach extraction model accuracy.
Samples were collected to geospatially represent the first five years of mine life. Twenty-one composite samples were prepared at a 70/30 illite to smectite ratio to match the mine plan. The samples were then slurried at 40% solids, attrition scrubbed for 10 minutes, and wet screened at 75-micron to remove coarse gangue. The resulting minus 75-micron slurry was then adjusted to match the design leach feed slurry density (34% solids). Removal of coarse gangue resulted in upgrading of the leach feed. Leach feed slurry lithium concentration ranged from 4,246 ppm to 6,974 ppm and magnesium from 5.7% to 8.9%. Leach testing was performed in both open cycle and locked cycle to evaluate potential hindering of leaching efficiency by elevated concentrations of dissolved salts. To simulate the level of saturation in the leach process, salts were added to the leach feed (based on the Aspen material balance) prior to leaching. The level of saturation in the leach process did not appear to impact the level of lithium extraction obtained in the composite samples evaluated.
Leaching parameters are shown in Table 13-18. Standard procedures, including a QA/QC protocol and experimental error were implemented and evaluated throughout all stages of the study. The quality control protocol included:
|
Page 113 |
| Lithium Americas Corp. Feasibility Study, National Instrument 43-101 Technical Report for the Thacker Pass Project, Humboldt County, Nevada, USA |
Table 13-18 Variability Study Leach Parameters
|
Parameter |
Unit |
Value |
|
Solids Density |
% w/w |
35-36 |
|
Acid Dose |
g acid / g solids |
0.49 |
|
Duration |
Hours |
3 |
|
Temperature |
Degrees Celsius |
60-70 |
Coarse gangue removal in wet screening ranged from 26% to 41% with a 34% average. This very closely matches the life of mine predicted ash content in the run of mine and in the design. Lithium losses in wet screening ranged from 4% to 23% with a 9% average which is very close to the process design criteria of 8%.
Five of the 21 samples were leached in both open and locked cycle with no significant difference in extraction observed. The remainder of the study was performed in locked cycle.
Three samples were leached in triplicate to measure reproducibility of the experiments. All three samples demonstrated reproducible results with standard deviations ranging from 0.9% to 1.5%. The maximum standard deviation was used to generate the error bars on Figure 13-26.
Lithium leach extraction ranged from 85.8% to 97.0% with an average of 90.8%. Samples were sent to an outside laboratory, ALS, for quality assurance. Results compared closely with those analyzed by LAC.
Per the quality control protocol, leach feed slurry was sent to an external lab to leach under the same conditions to verify LAC's lithium extraction results. The laboratory reported concerns with the mixing in the leach vessel and the mass balance results did not close. The metallurgical data from the independent laboratory have been excluded from the report. LAC plans to conduct additional leach test work at a bench scale. Representative samples will be selected that are deemed representative of the samples used in the variability study.
The LAC assayed head grades correlated well with the calculated grade (filtrate + residue) as can be seen in Figure 13-23.
Figure 13-23 Calculated Versus Measured Head Grade for Leach Testing
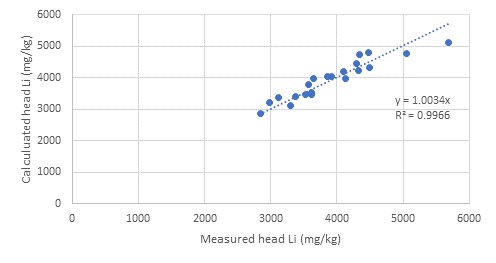
Source: LAC, 2021
|
Page 114 |
| Lithium Americas Corp. Feasibility Study, National Instrument 43-101 Technical Report for the Thacker Pass Project, Humboldt County, Nevada, USA |
Figure 13-24 and Figure 13-25 show that ore depth and mine plan year have no impact on extraction.
Figure 13-24 Ore Depth (m) Versus Li Extraction (%)
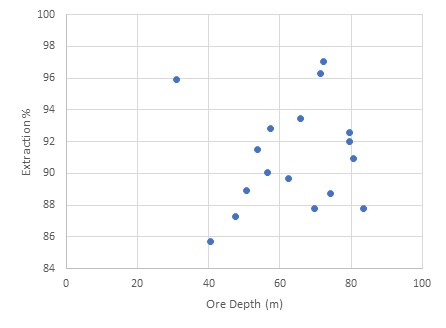
Source: Process Engineering LLC Memorandum "Variability Study Data Analysis" dated 21 April 2022
Figure 13-25 Mine Plan Year Versus Li Extraction (%)
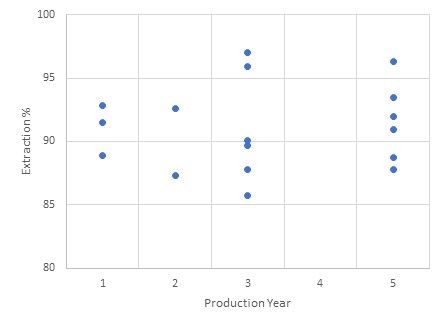
Source: Process Engineering LLC Memorandum "Variability Study Data Analysis" dated 21 April 2022
Figure 13-26 compares the measured lithium extraction results versus the empirical model that was discussed in Section 13.2.3.3. On average the model predicts approximately 3% less extraction than what was measured.
|
Page 115 |
| Lithium Americas Corp. Feasibility Study, National Instrument 43-101 Technical Report for the Thacker Pass Project, Humboldt County, Nevada, USA |
Figure 13-26 Comparison of Measured Versus Predicted Extraction

Source: LAC, 2021
The data from the leach variability study was then added to the 37 pilot plant sample dataset used for the empirical correlation. Two samples from the original dataset were statistically identified as outliers owing to extremely high aluminum. The regression was then repeated and resulted in a more accurate model with only 1% less extraction when compared with the leach variability samples.
Note that the work done by Hazen in Section 13.2.3.5 under similar conditions achieve a leach extraction of 85.0% versus 83.4% as predicted by the revised model. Similar to the variability study, the model is in range and slightly underpredicts leach extraction.
The results from this study demonstrate that the lithium extraction is independent of depth in the deposit.
13.4 Specific Gravity
Specific gravity of both clay and coarse gangue were measured on various samples during testwork at different vendor testing facilities. Test methods included gas pycnometry (ASTM D5550-14), water pycnometry (ASTM D 854 or ASTM D 854-02), and calculation from slurry weight, volume, and water density. The values for the ranges and averages are given in Table 13-19.
Table 13-19 Specific Gravity Ranges
|
Material |
Range |
Average |
|
Clay |
1.97 - 2.90 |
2.47 |
|
Coarse Gangue |
2.23 - 2.70 |
2.46 |
It is recognized that the specific gravity values in the table above differ from those in other documentation including the heat and material balance and equipment data sheets. A reconciliation will be completed in the next phase of engineering to ensure the design values in the table are used for final equipment design and sizing.
|
Page 116 |
| Lithium Americas Corp. Feasibility Study, National Instrument 43-101 Technical Report for the Thacker Pass Project, Humboldt County, Nevada, USA |
13.5 Metallurgical Test Work Conclusions
Since 2017, LAC has performed extensive metallurgical and process development testing, both internally and externally. Based on results of this test work, the following was established:
The data presented in this section has been used to establish process design criteria for the plant as discussed in Section 17. Additional testing is underway for various parts of the flowsheet with test work planned in 2022 to provide supportive data from process optimization and variability testing prior to final design.
|
Page 117 |
| Lithium Americas Corp. Feasibility Study, National Instrument 43-101 Technical Report for the Thacker Pass Project, Humboldt County, Nevada, USA |
14 Mineral Resource Estimates
This section contains forward-looking information related to the Mineral Resource estimates for the Thacker Pass Deposit. The material factors that could cause actual results to differ from the conclusions, estimates, designs, forecasts or projections include geological modeling, grade interpolations, lithium price estimates, mining cost estimates, and mine design parameters.
14.1 Thacker Pass Deposit
The current Mineral Resource estimate discussed in this Technical Report is relevant to only the Thacker Pass Deposit. The UM Claims owned by LAC in the Montana Mountains are not part of the Thacker Pass Project.
Only HQ core samples subject to the QA/QC programs outlined in Section 11 of this report and assayed by ALS Global and American Assay Laboratory (AAL) in Reno, Nevada, were used to estimate the resource.
366 drill holes were used in development of the resource block model (Table 14-1). A map of all drill holes used in the resource estimation is presented in Figure 14-1.
Table 14-1 Drill Holes Used in the Grade Estimation Model
|
Drilling |
Number |
Type |
Hole IDs in Database |
|
LAC 2007-2010 |
227 |
HQ Core |
WLC-001 through WLC-037, WLC-041 through WLC-075, WLC-077 through WLC-182, WLC-184 through WLC-232* |
|
LAC 2017-2018 |
139 |
HQ Core |
LNC-001, LNC-003 through LNC-011, LNC-013 through LNC-080, LNC-082, LNC-084 through LNC-109, LNC-111 through LNC-144* |
Note:
*Holes WLC-040, WLC-076, WLC-183, LNC-002, LNC-012, LNC-081, LNC-083, and LNC-110 were deleted due to proximity to other nearby holes which were deeper with more assays and more descriptive geological descriptions.
 |
Page 118 |
| Lithium Americas Corp. Feasibility Study, National Instrument 43-101 Technical Report for the Thacker Pass Project, Humboldt County, Nevada, USA |
Figure 14-1 Drilling Utilized for the Resource Estimate
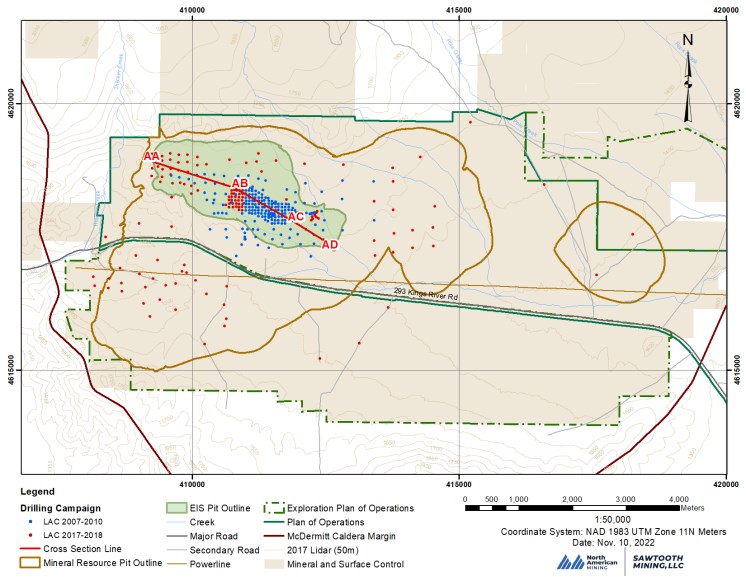
|
Page 119 |
| Lithium Americas Corp. Feasibility Study, National Instrument 43-101 Technical Report for the Thacker Pass Project, Humboldt County, Nevada, USA |
All drill holes used for the grade model except WLC-058 are essentially vertical (88.8 degrees to 90 degrees). Regular downhole gyro surveys were conducted to verify this, as described in Section 10 of this Technical Report. All mineralization thicknesses recorded are treated as true thicknesses.
All drill holes used for grade estimation were standard HQ core, drilled using standard techniques by Marcus & Marcus Exploration Inc., now known as Timberline Drilling Inc. Core is stored at a secure logging facility while being processed, then locked in CONEX containers or a warehouse after sampling was completed.
14.1.1 Geological Domains
Several faults are present in the deposit. Surface field investigations and subsurface cross-sectional analyses were performed to determine potential faults in the deposit. Subsurface fault zones were determined by identifying floor displacement between fault traces. The fault traces were connected to generate seven faulted block zones. Figure 14-2 illustrates the seven major fault blocks. These faulted block zones were used to limit the lithium grade estimation to the blocks and drill holes existing within each representative faulted block zone. Fault Block A does not contain any drilling, and therefore does not have any direct sampled grade or Mineral Resource estimates.
|
Page 120 |
| Lithium Americas Corp. Feasibility Study, National Instrument 43-101 Technical Report for the Thacker Pass Project, Humboldt County, Nevada, USA |
Figure 14-2 Seven Fault Blocks Zones Used for Grade Estimation for the Thacker Pass Deposit
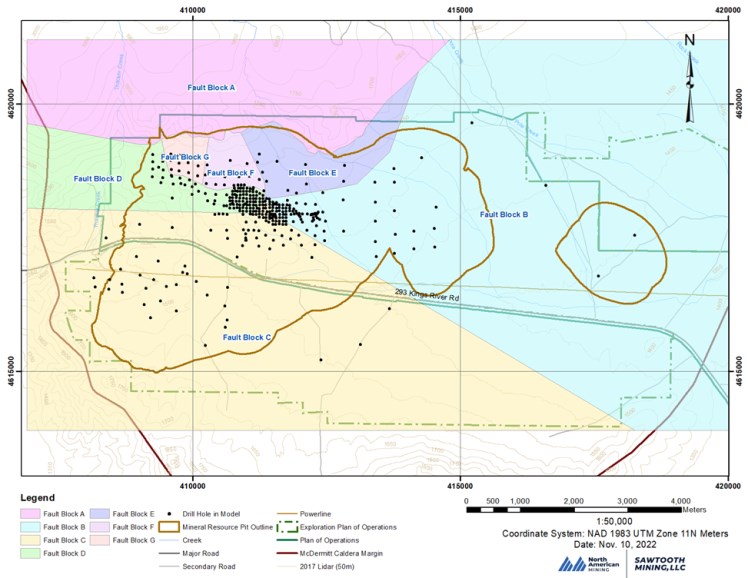
|
Page 121 |
| Lithium Americas Corp. Feasibility Study, National Instrument 43-101 Technical Report for the Thacker Pass Project, Humboldt County, Nevada, USA |
14.1.2 Geological Model
A Vulcan ISIS database was designed and populated with native geologic data from Excel datasheets containing drill hole assays, collars, lithological, and survey data which were exported from LAC's Torque database.
Alluvium (Qal) and basalt bodies were modeled through inverse distance in a gridded model with their surfaces triangulated and imported into the block model to flag representative blocks. Basement was mapped as the HPZ, basal basalt, or bottom of the mineralized zone and is shown as the low Li basal unit in cross-sectional views. No grade was interpolated into this unit. The remaining blocks were coded as ore which represents the clay/ash lithologies. Lithological cross-sectional views of the generated block model displaying the geologic units in the deposit have been included as Figure 14-3 along the AA-AB, AB-AC, and AC-AD cross-section lines. The location of the cross sections have been displayed on Figure 14-1. The block model is not rotated nor sub-blocked.
Figure 14-3 Lithological Cross-Sectional Views
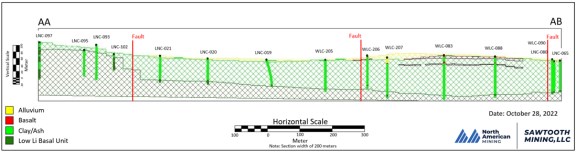
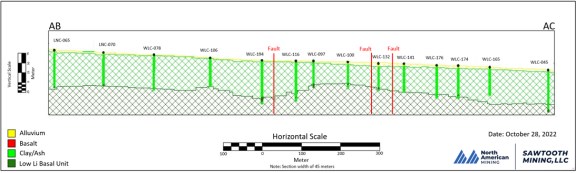
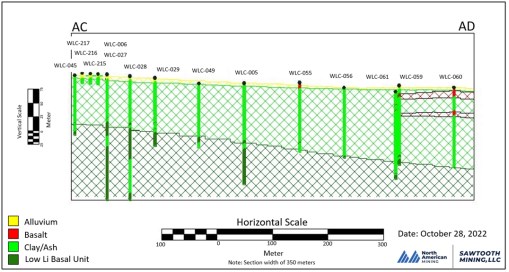
|
Page 122 |
| Lithium Americas Corp. Feasibility Study, National Instrument 43-101 Technical Report for the Thacker Pass Project, Humboldt County, Nevada, USA |
The native statistics by lithology and fault block domain are shown in Table 14-2. The majority of samples have been taken from the clay/ash sediments. Higher average grade lithium values exist in the sediments compared to the other lithologies. The average range of lithium ppm for all fault blocks is between 2,077 and 2,788 for the clay/ash sediments.
Table 14-2 Native Samples Statistics
|
Lithology |
Fault Block |
Lithium (ppm) Native Samples |
|||
|
Count |
Minimum |
Maximum |
Average |
||
|
Alluvium |
B |
90 |
16 |
3,330 |
99 |
|
Alluvium |
C |
62 |
7 |
4,360 |
309 |
|
Alluvium |
D |
64 |
27 |
4,060 |
357 |
|
Alluvium |
E |
6 |
27 |
98 |
51 |
|
Alluvium |
F |
18 |
43 |
2,390 |
359 |
|
Alluvium |
G |
27 |
31 |
3,480 |
363 |
|
Basalt |
B |
352 |
10 |
2,900 |
234 |
|
Basalt |
C |
461 |
6 |
3,630 |
150 |
|
Basalt |
D |
19 |
87 |
360 |
168 |
|
Basalt |
E |
9 |
28 |
233 |
74 |
|
Basalt |
F |
4 |
258 |
1,320 |
592 |
|
Basalt |
G |
6 |
54 |
209 |
115 |
|
Sediments |
B |
3,620 |
5 |
8,360 |
2,253 |
|
Sediments |
C |
4,961 |
3 |
8,850 |
2,077 |
|
Sediments |
D |
5,044 |
11 |
8,540 |
2,788 |
|
Sediments |
E |
525 |
31 |
6,780 |
2,235 |
|
Sediments |
F |
1,058 |
39 |
7,120 |
2,302 |
|
Sediments |
G |
584 |
52 |
7,660 |
2,707 |
|
Tuff |
B |
738 |
2 |
6,810 |
153 |
|
Tuff |
C |
884 |
2 |
4,200 |
115 |
|
Tuff |
D |
358 |
8 |
5,560 |
120 |
|
Tuff |
E |
10 |
16 |
1,370 |
353 |
|
Tuff |
F |
14 |
60 |
3,900 |
1,042 |
|
Tuff |
G |
30 |
88 |
4,080 |
1,140 |
14.1.3 Block Model
A block model was created by the QP using Maptek's Vulcan 3D subsurface geologic modeling software. A regular block model with a block size of 25 m by 25 m by 1 m was generated.
The origin of the block model is described in Table 14-3 in NAD 1983 UTM Zone 11N (meters).
|
Page 123 |
| Lithium Americas Corp. Feasibility Study, National Instrument 43-101 Technical Report for the Thacker Pass Project, Humboldt County, Nevada, USA |
Table 14-3 Block Model Origin
|
Block Model Origin |
|
|
X Coordinate |
406,900.0 |
|
Y Coordinate |
4,613,900.0 |
|
Z Coordinate |
1,100.0 |
The seven fault blocks were also loaded into the block model to allow for domaining during grade estimation.
14.1.3.1 Compositing
A composited database was created from this native ISIS database. A compositing run length of 1 m was chosen based upon mining assumptions of potential waste removal. This composited database used existing geocodes from LAC's Torque database to isolate the compositing of grades to each correlated geologic lithology. Lithium grades were interpolated for clay/ash lithologies in the block model through ordinary kriging modeling method from a 1 m composited quality database and limited to each representative fault block.
The composited statistics by lithology and fault block domain are shown in Table 14-4. The majority of the composited samples as well as the highest average lithium grades are from the clay/ash sediments. The average lithium grades range between 2,080 and 2,787 ppm in the composited database for the clay/ash sediments.
Table 14-4 Composite Samples Statistics
|
Lithology |
Fault Block |
Lithium (ppm) Composite Samples |
|||
|
Count |
Minimum |
Maximum |
Average |
||
|
Alluvium |
B |
384 |
16 |
3,330 |
122 |
|
Alluvium |
C |
182 |
7 |
4,360 |
315 |
|
Alluvium |
D |
217 |
27 |
4,650 |
375 |
|
Alluvium |
E |
28 |
27 |
98 |
51 |
|
Alluvium |
F |
48 |
43 |
2,390 |
359 |
|
Alluvium |
G |
120 |
31 |
3,480 |
408 |
|
Basalt |
B |
855 |
10 |
4,200 |
234 |
|
Basalt |
C |
1,018 |
6 |
3,270 |
143 |
|
Basalt |
D |
34 |
87 |
400 |
169 |
|
Basalt |
E |
23 |
28 |
233 |
74 |
|
Basalt |
F |
5 |
258 |
680 |
366 |
|
Basalt |
G |
10 |
59 |
1,030 |
153 |
|
Sediments |
B |
5,311 |
8 |
8,254 |
2,260 |
|
Sediments |
C |
7,502 |
3 |
8,690 |
2,080 |
|
Sediments |
D |
7,576 |
11 |
8,040 |
2,787 |
|
Sediments |
E |
804 |
34 |
6,489 |
2,232 |
|
Sediments |
F |
1,704 |
39 |
6,940 |
2,300 |
|
Sediments |
G |
886 |
60 |
7,660 |
2,727 |
|
Tuff |
B |
1,138 |
3 |
6,810 |
137 |
|
Tuff |
C |
1,452 |
2 |
2,250 |
96 |
|
Tuff |
D |
812 |
8 |
1,990 |
88 |
|
Tuff |
E |
17 |
16 |
1,370 |
353 |
|
Tuff |
F |
29 |
60 |
3,900 |
1,094 |
|
Tuff |
G |
66 |
88 |
4,080 |
1,047 |
|
Page 124 |
| Lithium Americas Corp. Feasibility Study, National Instrument 43-101 Technical Report for the Thacker Pass Project, Humboldt County, Nevada, USA |
From the native to composite length database for the ash/clay sediments, the maximum average difference between the two databases for lithium grades is only 20 ppm. The maximum individual sample difference for lithium grades between the two databases is 500 ppm. This shows the closeness between the native sampling and the composited database.
To display the distribution of lithium grades, a histogram has been generated for the native lithium data versus the composited database and have been shown in Figure 14-4. The histogram comparison shows a nearly identical distribution of lithium grades between the two datasets. The lower grade material is due to the sampling of non-ore material such as ash, alluvium, basalts, and HPZ lithologies. The use of geocodes in the composited database isolated lithium grades to each representative lithologies.
Figure 14-4 Histogram of Native Lithium Grade Versus Composited Database Lithium Grade
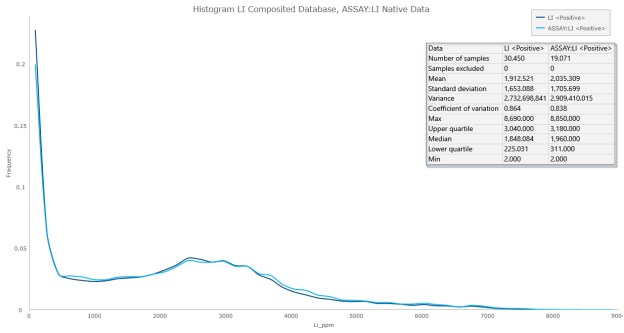
Source: Sawtooth 2021
The lithium high-grade mineralized zone is concentrated towards the bottom of the deposit as shown in the cross-sectional views in Figure 14-5. This high-grade mineralization zone is present in a large portion of the modeled area. Lower-grade materials such as alluvium and basalt exist above the mineralized zone and the basement hot pond zone (HPZ), below the mineralized zone. The HPZ has been discussed previously in Section 7 and is the base of the sedimentary section above the Tuff of Long Ridge. Lithium grades were only modeled for the clay/ash ore body and ignored for the alluvium, basalts, and basement rocks. Lithium grades are isolated to each representative fault block and offsets in the grade lateral continuities can be visualized at each fault block boundaries as shown in Figure 14-5.
|
Page 125 |
| Lithium Americas Corp. Feasibility Study, National Instrument 43-101 Technical Report for the Thacker Pass Project, Humboldt County, Nevada, USA |
Figure 14-5 Mineralized Zone Cross-Sections
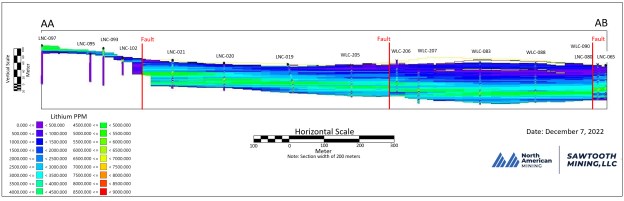
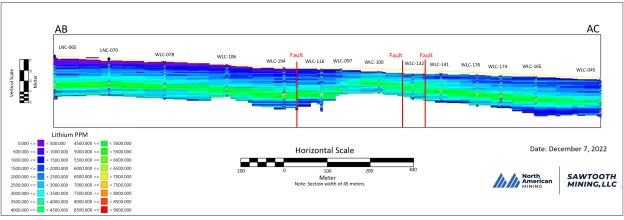
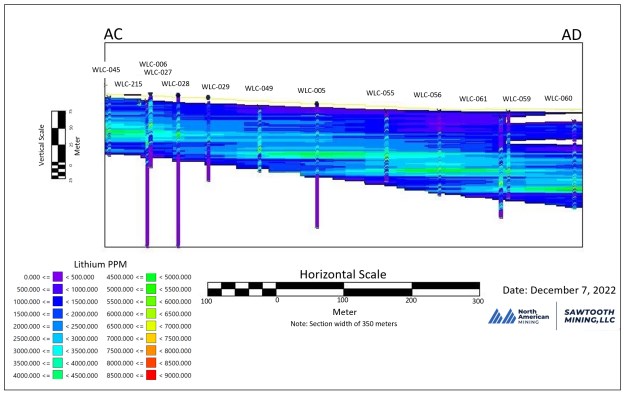
|
Page 126 |
| Lithium Americas Corp. Feasibility Study, National Instrument 43-101 Technical Report for the Thacker Pass Project, Humboldt County, Nevada, USA |
14.1.3.2 Outliers and Grade Capping
High-grade outliers were managed through the compositing routine. The highest lithium grade of 8,850 ppm in the native database was reduced to 8,690 ppm after the database compositing routine as shown on Figure 14-4. Both histograms on Figure 14-4 share the same basic shape of distribution of samples which shows that the two databases are nearly identical while containing a number of different data samples.
No grade capping was performed for this dataset since the nugget effect is low in this stratified deposit.
14.1.3.3 Cell Declustering
Cell declustering was performed for all the holes in the resource model to determine appropriate weightings for densely and sparsely sampled areas. A histogram comparing the lithium grades of the composited database versus the composited database with cell declustering weights applied has been included as Figure 14-6 to show the unbiased lithium grade accounting for data clustering. The range of lithium grades are the same when comparing the declustered histogram to the composited database histogram but the frequency of the grade distribution is different. Densely spaced holes are given less weight than widely spaced holes to minimize the clustering effect which is shown by the reduction in the frequency of grades between 2000 and 4000 on the histogram.
Figure 14-6 Histogram of Composited Database Lithium Grade Versus Cell Declustered Lithium Grade
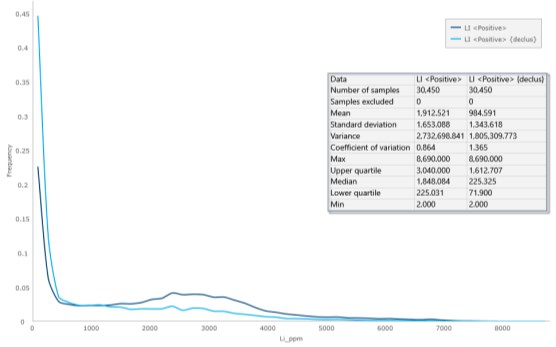
Source: Sawtooth 2021
14.1.3.4 Variography
No grade was estimated into Block A since no drilling or direct sampling exists in this block. Blocks B, C, D, and E estimated grade with interpolation distances of 1,000 m major axis by 1,000 m semi-major axis by 5 m minor axis. Blocks F and G used 500 m major axis by 500 m semi-major axis by 5 m minor axis interpolation distances for grade estimation.
|
Page 127 |
| Lithium Americas Corp. Feasibility Study, National Instrument 43-101 Technical Report for the Thacker Pass Project, Humboldt County, Nevada, USA |
Variograms were constructed for the lithium grade for all fault blocks except for block A since no grade is interpolated into this block. Fault blocks E, F, and G were merged into one domain for the purpose of generating stable variography that showed structure while still representative of the geology. A summary of the variography is given in Table 14-5, and plots of each domain's experimental and modeled variograms are shown in Figure 14-7. These variograms were used in the grade estimation for each representative domain.
Table 14-5 Variogram Summary
|
Structural |
Nugget |
Omnidirectional Sub-Horizontal Plane (X - Y) |
|||||||
|
Principal |
Semi |
First Structure |
Second Structure |
Third Structure |
|||||
|
Component |
Range |
Component |
Range |
Component |
Range |
||||
|
Block A |
--- |
--- |
--- |
--- |
--- |
--- |
--- |
--- |
--- |
|
Block B |
0.23 |
75o |
165o |
0.018 |
67 |
0.017 |
276 |
0.735 |
432 |
|
Block C |
0.26 |
120o |
210o |
0.389 |
144 |
0.091 |
298 |
0.260 |
433 |
|
Block D |
0.36 |
105o |
195o |
0.003 |
298 |
0.002 |
599 |
0.635 |
1000 |
|
Block E, F & G |
0.26 |
90o |
180o |
0.023 |
386 |
0.035 |
1221 |
0.682 |
1627 |
|
Structural |
Vertical (Z) |
|||||
|
First Structure |
Second Structure |
Third Structure |
||||
|
Component (γ) |
Range |
Component (γ) |
Range (m) |
Component |
Range |
|
|
Block A |
--- |
--- |
--- |
--- |
--- |
--- |
|
Block B |
0.018 |
45 |
0.017 |
92 |
0.735 |
167 |
|
Block C |
0.389 |
35 |
0.091 |
69 |
0.260 |
120 |
|
Block D |
0.003 |
13 |
0.002 |
23 |
0.635 |
35 |
|
Block E, F & G |
0.023 |
4 |
0.035 |
17 |
0.682 |
36 |
|
Page 128 |
| Lithium Americas Corp. Feasibility Study, National Instrument 43-101 Technical Report for the Thacker Pass Project, Humboldt County, Nevada, USA |
Figure 14-7 Block B, C, D, E, F, and G Omnidirectional Variograms in the Sub-Horizontal Plane and Downhole Variogram
Block B Variogram
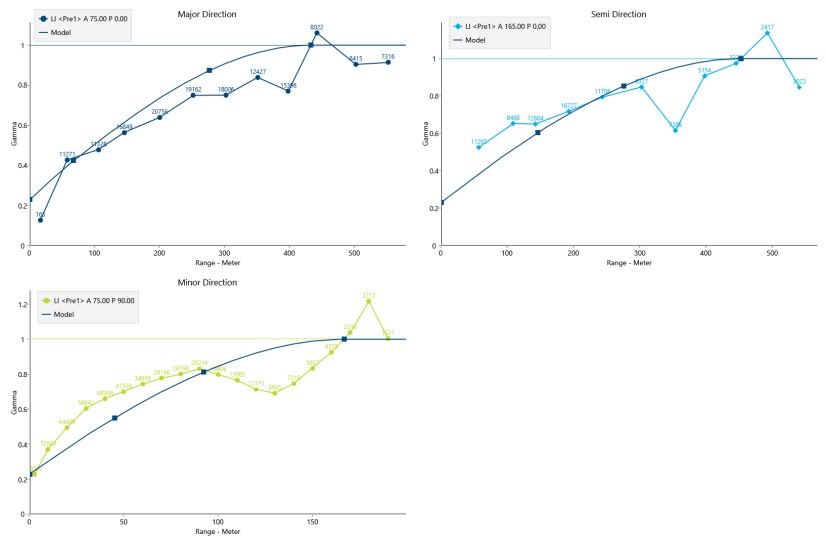
Source: Sawtooth 2021
|
Page 129 |
| Lithium Americas Corp. Feasibility Study, National Instrument 43-101 Technical Report for the Thacker Pass Project, Humboldt County, Nevada, USA |
Block C Variogram
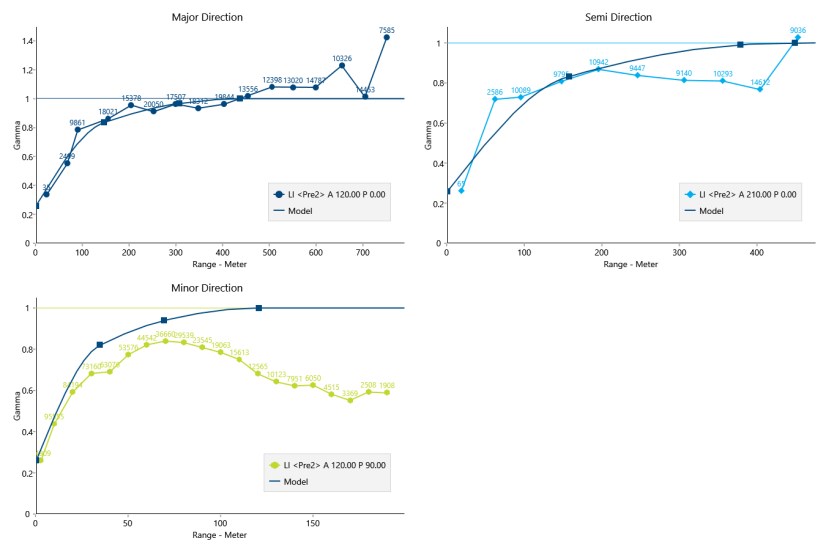
Source: Sawtooth 2021
|
Page 130 |
| Lithium Americas Corp. Feasibility Study, National Instrument 43-101 Technical Report for the Thacker Pass Project, Humboldt County, Nevada, USA |
Block D Variogram
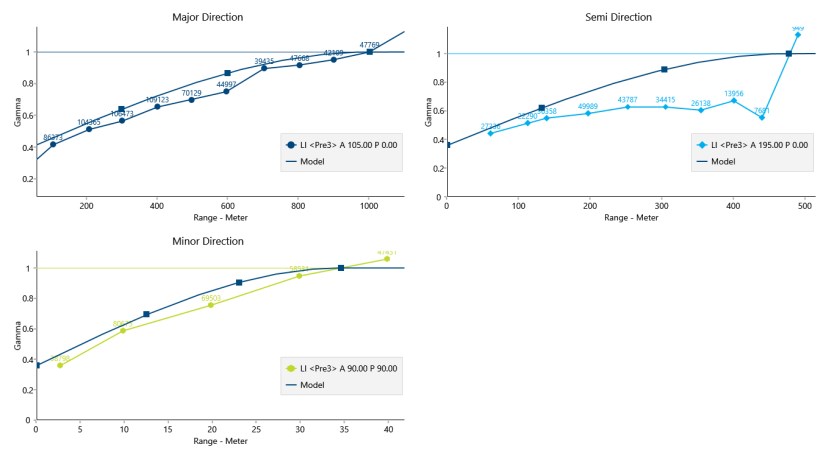
Source: Sawtooth 2021
|
Page 131 |
| Lithium Americas Corp. Feasibility Study, National Instrument 43-101 Technical Report for the Thacker Pass Project, Humboldt County, Nevada, USA |
Block E, F, and G Variogram
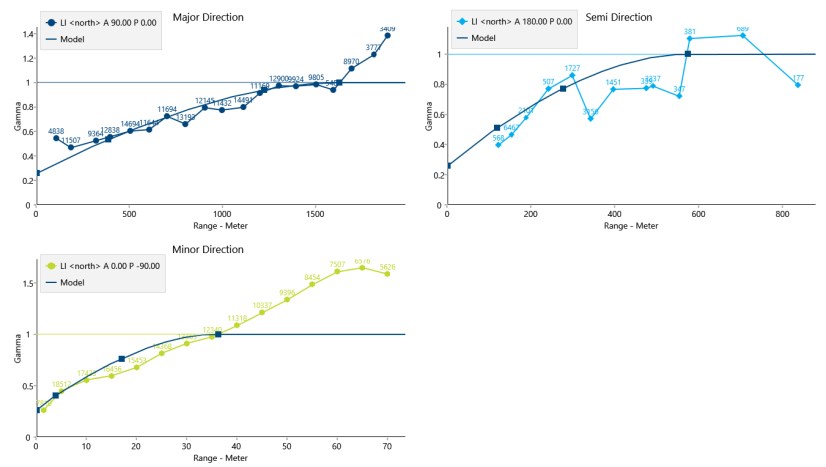
Source: Sawtooth 2021
|
Page 132 |
| Lithium Americas Corp. Feasibility Study, National Instrument 43-101 Technical Report for the Thacker Pass Project, Humboldt County, Nevada, USA |
14.1.3.5 Density Estimation
Average densities as described in Section 11.4 of this Technical Report and in Table 14-6 were included in the block model.
Table 14-6 Average Density Values Used in the Resource Model
|
Lithology |
Average of Density Determination (t/m3) |
|
Alluvium |
1.52 |
|
Claystone/ash |
1.79 |
|
Basalt |
2.51 |
|
Intracaldera Tuff |
1.96 |
14.1.3.6 Grade Estimation
Lithium grades have been estimated throughout the block model using the composited assay database with the declustered weights through an ordinary kriging modeling method. Only clay/ash mineralized material was estimated for lithium grade and each domain was estimated independently. A cross-sectional view of the lithium grade estimation results has been included as Figure 14-5 and shows the lithium grades through two different domains and only for clay/ash lithology.
14.1.3.7 Grade Estimation Validation
Results of the ordinary kriged model closely align with the declustered composited database. The difference in mean values is approximately 30 ppm of lithium between the two datasets. A histogram has been plotted to compare the ordinary kriged block model and the declustered composited database as seen in Figure 14-8.
Figure 14-8 Ordinary Kriged Model vs Composited Declustered Database Histogram
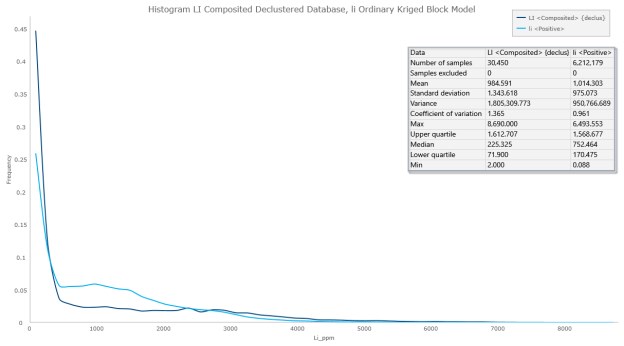
Source: Sawtooth, 2021
|
Page 133 |
| Lithium Americas Corp. Feasibility Study, National Instrument 43-101 Technical Report for the Thacker Pass Project, Humboldt County, Nevada, USA |
A scatter plot of lithium grades from the kriged block model versus lithium grades from the composited database was created to show the closeness of the model grades to the input grades. This scatter plot has been shown as Figure 14-9 with only spatially matching data points from the block centroid and composited database being compared. From this scatter plot, a Pearson's correlation coefficient of 0.904 has been estimated between the two datasets which shows a very strong positive association between the representative values from each dataset.
Figure 14-9 Scatter Plot of Lithium from the Block Model Versus the Composited Database
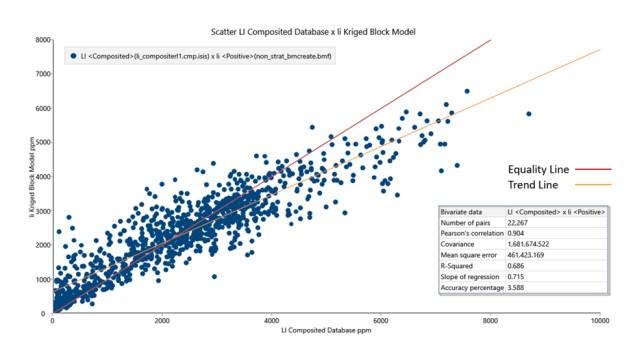
Source: Sawtooth 2022
A check of the modeled cell size lithium grade versus the composited lithium grade and the change of support for lithium grade was performed for each domain through a Herco Analyzer in Vulcan. The Herco Analyzer tests for the potential of overstating ore grades by increasing the block size to make the data distribution more Gaussian. This is accomplished by assuming a panel size larger than the modeled block size which provides a larger sampling pool of data that will remove outliers and smooth out the data distribution. A discretization setup of 5x5x5 was selected as well as a discrete gaussian diffusion modeling method. Grade weights for the block model used density values assigned in the block model while the weighting for the composited grades and support grades are based upon sample lengths. The Herco plots are shown as Figure 14-10 and represent the tonnage and lithium grades of the input data, the modeled data, and the expected best fitted Hermite polynomials determined by the Herco Analyzer.
|
Page 134 |
| Lithium Americas Corp. Feasibility Study, National Instrument 43-101 Technical Report for the Thacker Pass Project, Humboldt County, Nevada, USA |
Figure 14-10 HERCO Plots by Domain
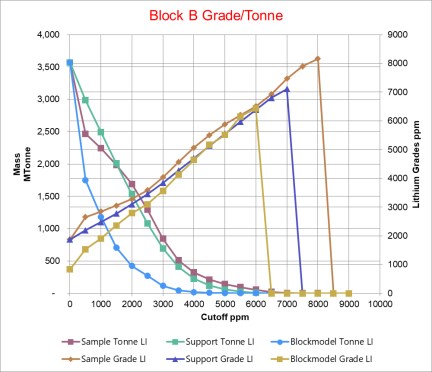
Source: Sawtooth, 2022
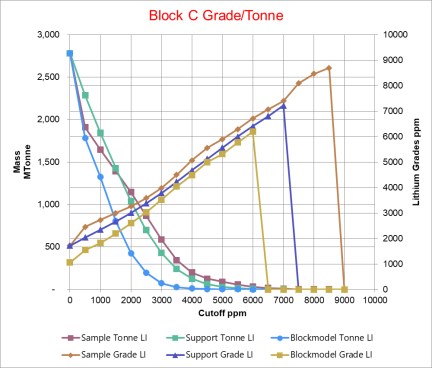
Source: Sawtooth, 2022
|
Page 135 |
| Lithium Americas Corp. Feasibility Study, National Instrument 43-101 Technical Report for the Thacker Pass Project, Humboldt County, Nevada, USA |
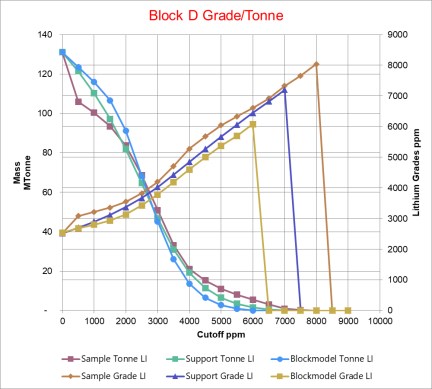
Source: Sawtooth, 2022
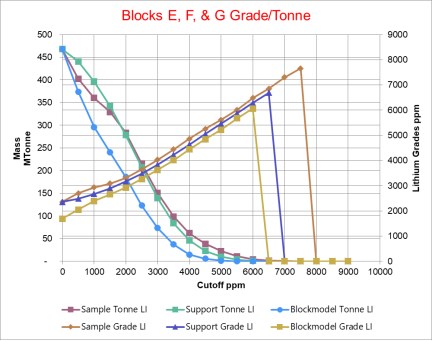
Source: Sawtooth, 2022
The plots of lithium grades are all within several hundred ppm of each other. The modeled grades are a bit lower than the composited sampled grades and the change of support grade and is due to the block model smoothing by the kriging estimation of grade. Therefore, the ordinary kriged model is not overestimating lithium grade in the model. The decrease in ordinary kriged model lithium grade seems reasonable for model block size of 25x25x1, accounts for dilution, and prevents the over-stating of grades.
|
Page 136 |
| Lithium Americas Corp. Feasibility Study, National Instrument 43-101 Technical Report for the Thacker Pass Project, Humboldt County, Nevada, USA |
A swath plot comparison among the lithium grades for the native lithium grades (LI), ordinary kriging grade estimation method lithium grades (li), inverse distance grade estimation method lithium grade (li_id), and nearest neighbor grade estimation method lithium grade (li_nn) was generated for a point in the block model. This swath plot has been included as Figure 14-11. All three grade estimation methods have ranges that are very close to each other as shown in the tightness of each plot. This closeness shows that ordinary kriging grade estimation method results in values in line with inverse distance and nearest neighbor grade estimation methods. While the native lithium grades will not match the modeled grade estimations in the X and Y directions, there is a general trend that still exist between the native lithium grades and modeled lithium grades.
Figure 14-11 Swath Plot Comparison of Lithium Grades
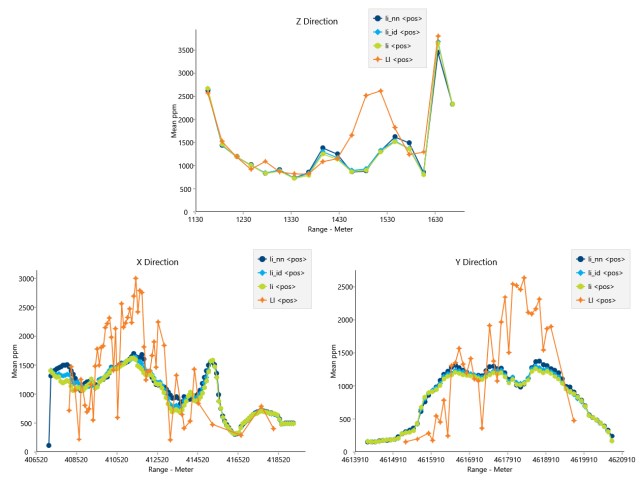
Source: Sawtooth 2022
14.1.3.8 Mass and Geometallurgical Recoveries
No mining recoveries were applied to the resource model. Plant process recovery was provided by LAC at 73.8% (40 year/base case) which was then rounded down to 73.5% for use in the pit optimization software for the generation of the economic resource pit-shell. The plant process recovery was applied uniformly throughout the model and was not coded into each individual block.
|
Page 137 |
| Lithium Americas Corp. Feasibility Study, National Instrument 43-101 Technical Report for the Thacker Pass Project, Humboldt County, Nevada, USA |
14.1.4 Cutoff Grade and Pit Optimization
The CIM 2014 Definition Standards state that a Mineral Resource is a "concentration of occurrence of solid material of economic interest in or on the Earth's crust in such form, grade or quality and quantity that there are reasonable prospects for eventual economic extraction."
For the determination of reasonable prospects for eventual economic extraction, the Mineral Resource QP has utilized a cutoff grade (CoG) for lithium ppm with inputs from Table 14-7 and the following equation. The values below have been rounded from the financial model and expected metallurgical performance over the expected 40-year mine plan.
Table 14-7 Cutoff Grade Inputs
|
Item |
Units |
Value |
|
Li2CO3 Price |
$/t |
22,000 |
|
Convert Li2CO3 to Li |
|
5.323 |
|
Li Price |
$/t |
117,040 |
|
Royalties (GRR) |
% |
1.75 |
|
Royalties (GRR) |
$/t |
2,048 |
|
Processing Recovery |
% |
73.5 |
|
Price per Recovered tonne Lithium |
$/t |
84,519 |
|
Mining Cost |
$/t |
8.50 |
|
Processing Cost |
$/t |
80.00 |
|
Operating Cost per tonne |
$/t |
88.50 |
Note:
- Cost estimates are as of Q3 2022 (See Section 21.3)
- Lithium price estimate is as of Q2 2022 (Wood Mackenzie, 2022, See Section 19.4)
- GRR refers to Gross Revenue Royalty
| Economic Mining CoG = | Operating Cost per Tonne Processed | = 1,047 ppm |
| Price per Recovered Tonne Lithium |
The resulting lithium cutoff grade is 1,047 ppm and is applied to the pit optimization process to develop the economic resource pit.
A resource constraining pit shell has been derived from performing a pit optimization estimation using Vulcan Software. The pit optimization utilized the inputs in Table 14-8 and the lithium cutoff grade of 1,047 ppm to determine the constraining resource pit shell. Figure 14-1 shows the estimated resource area determined through pit optimization.
Table 14-8 Pit Optimizer Parameters
|
Parameter |
Unit |
Value |
|
Li2CO3 |
$/t |
22,000 |
|
Li Price |
$/t |
117,040 |
|
Processing Cost (Feed - $0.98 and Processing - $80.00) |
$/t ROM |
80.98 |
|
Process Recovery |
% |
73.5 |
|
Mining Cost for Mill Feed |
$/t |
3.67 |
|
Mining Cost for Waste and Topsoil (No D&B) |
$/t |
2.53 |
|
Page 138 |
| Lithium Americas Corp. Feasibility Study, National Instrument 43-101 Technical Report for the Thacker Pass Project, Humboldt County, Nevada, USA |
|
Parameter |
Unit |
Value |
|
Mining Cost for Basalt (Included D&B) |
$/t |
3.76 |
|
Mining Recovery Factor |
% |
100 |
|
Royalties (GRR) |
$/t |
2,048 |
|
Pit Wall Slope Factor |
% |
27 |
Note:
- Cost estimates are as of Q3 2022
- Lithium price estimate is as of Q2 2022
14.1.5 Resource Classification
The CIM 2014 Definition Standards state that:
"An Inferred Mineral Resource is based on limited information and sampling gathered through appropriate sampling techniques from locations such as outcrops, trenches, pits, workings and drill holes. Inferred Mineral Resources must not be included in the economic analysis, production schedules, or estimated mine life in publicly disclosed Pre-Feasibility or Feasibility Studies, or in the Life of Mine plans and cash flow models of developed mines. Inferred Mineral Resources can only be used in economic studies as provided under NI 43-101.
There may be circumstances, where appropriate sampling, testing, and other measurements are sufficient to demonstrate data integrity, geological and grade/quality continuity of a Measured or Indicated Mineral Resource; however, quality assurance and quality control, or other information may not meet all industry norms for the disclosure of an Indicated or Measured Mineral Resource. Under these circumstances, it may be reasonable for the Qualified Person to report an Inferred Mineral Resource if the Qualified Person has taken steps to verify the information meets the requirements of an Inferred Mineral Resource.
Mineralization may be classified as an Indicated Mineral Resource by the Qualified Person when the nature, quality, quantity and distribution of data are such as to allow confident interpretation of the geological framework and to reasonably assume the continuity of mineralization. The Qualified Person must recognize the importance of the Indicated Mineral Resource category to the advancement of the feasibility of the project. An Indicated Mineral Resource estimate is of sufficient quality to support a Pre-Feasibility Study which can serve as the basis for major development decisions.
A Measured Mineral Resource is that part of a Mineral Resource for which quantity, grade or quality, densities, shape, and physical characteristics are estimated with confidence sufficient to allow the application of Modifying Factors to support detailed mine planning and final evaluation of the economic viability of the deposit.
Geological evidence is derived from detailed and reliable exploration, sampling and testing and is sufficient to confirm geological and grade or quality continuity between points of observation. A Measured Mineral Resource has a higher level of confidence than that applying to either an Indicated Mineral Resource or an Inferred Mineral Resource. It may be converted to a Proven Mineral Reserve or to a Probable Mineral Reserve."
During the grade estimation process for each domain blocks were populated with the distance to sample (meters), number of holes, and number of samples for estimation. Histograms of the distance to samples (Figure 14-12), number of holes (Figure 14-13), and number of samples for estimation (Figure 14-14) were plotted and analyzed to establish ranges for each classification class. Quartiles, minimum, median, and maximum values were used to establish the ranges for each classification. Table 14-9 outlines all the sampling requirements for each classification class.
|
Page 139 |
| Lithium Americas Corp. Feasibility Study, National Instrument 43-101 Technical Report for the Thacker Pass Project, Humboldt County, Nevada, USA |
Figure 14-12 Histogram Distance to Sample
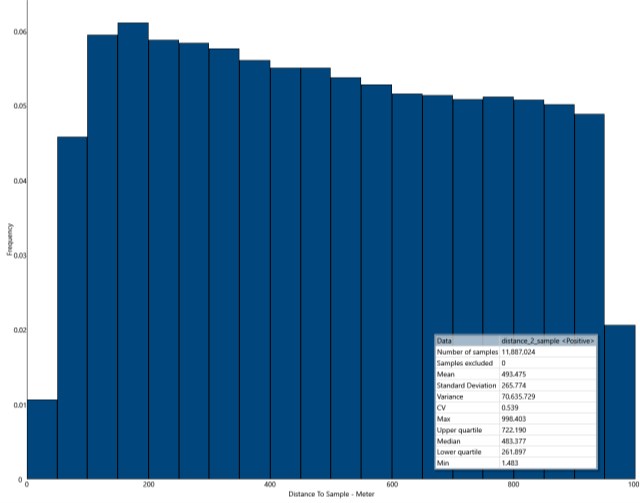
Source: Sawtooth 2022
|
Page 140 |
| Lithium Americas Corp. Feasibility Study, National Instrument 43-101 Technical Report for the Thacker Pass Project, Humboldt County, Nevada, USA |
Figure 14-13 Histogram Number of Holes
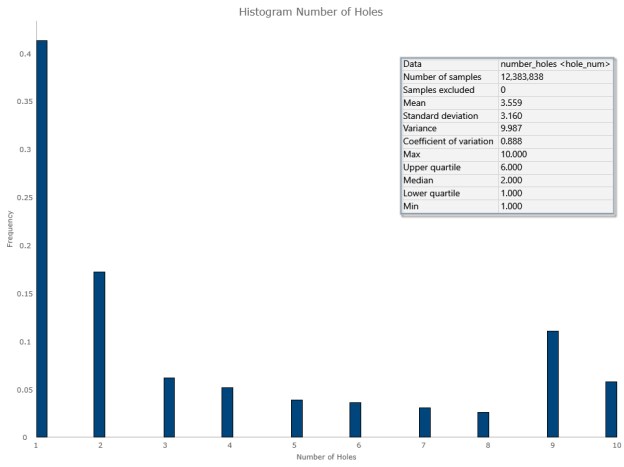
Source: Sawtooth 2022
|
Page 141 |
| Lithium Americas Corp. Feasibility Study, National Instrument 43-101 Technical Report for the Thacker Pass Project, Humboldt County, Nevada, USA |
Figure 14-14 Histogram Number of Samples
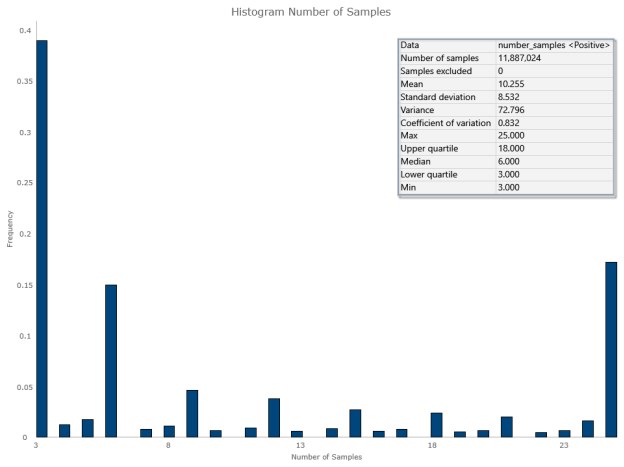
Note: Frequency on the Y axis is the 100th percent counts and the number of samples on the X axis are counts per bin.
Source: Sawtooth 2022
Table 14-9 Resource Classification
|
Category |
Distance (m) |
Holes |
Samples |
|
Measured |
262 |
6 |
18 |
|
Indicated |
483 |
2 |
6 |
|
Inferred |
722 |
2 |
3 |
Blocks were analyzed using the results in Table 14-9 and a vertical search distance of 5 m. The vertical search distance is applied during the grade estimation routine to limit sample compositing in the Z direction. The resulting classification blocks were post processed to remove isolated classification blocks and improve geologic continuity. Risk to the resources from the processing plant island and waste disposal areas constructed above potential resources was also evaluated in the post processing by modifying the classifications under these structures. Costs for the processing plant reclamation, waste disposal areas reclamation, and a cutoff grade of 1,047 ppm lithium were utilized in the evaluation of the resource classifications during the pit optimizer generation routine. Blocks matching the classification and lithium grade criteria were coded for each representative resource class. A view of the classified resource block model is presented in Figure 14-15. Figure 14-16 shows the resource classification in cross-sectional view along the AA-AB, AB-AC, and AC-AD section lines shown in Figure 14-1.
|
Page 142 |
| Lithium Americas Corp. Feasibility Study, National Instrument 43-101 Technical Report for the Thacker Pass Project, Humboldt County, Nevada, USA |
Figure 14-15 Classified Resource Block Model
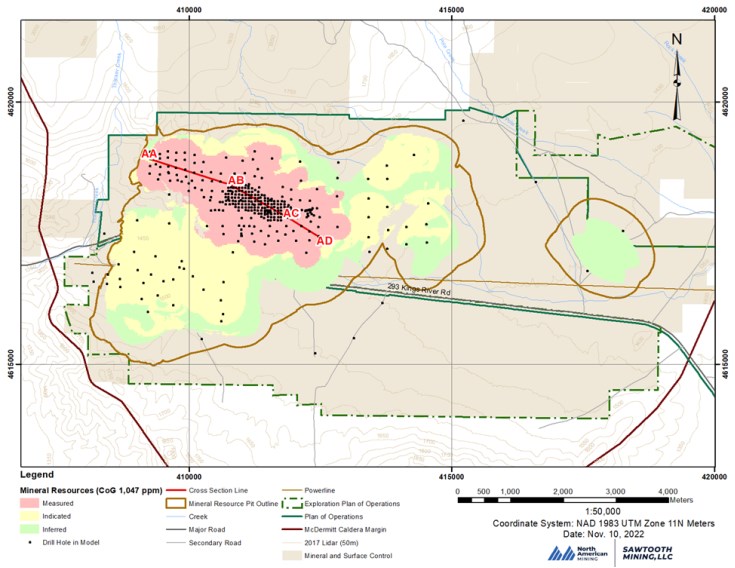
|
Page 143 |
| Lithium Americas Corp. Feasibility Study, National Instrument 43-101 Technical Report for the Thacker Pass Project, Humboldt County, Nevada, USA |
Figure 14-16 Cross-Sectional View of Classified Block Model
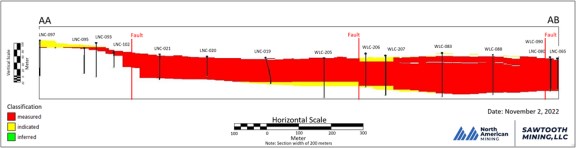
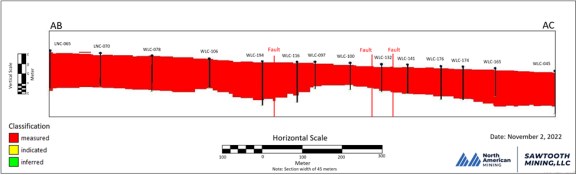
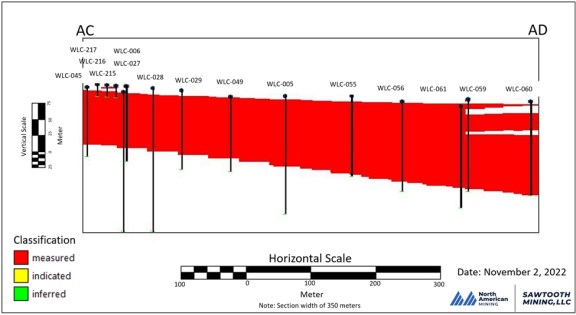
The statement of Mineral Resources for the Project with an effective date of November 2, 2022 are presented in Table 14-10. Mineral Resources are reported inclusive of Mineral Reserves. All tonnages presented are estimates and have been rounded accordingly. Mineral Resources were estimated using the 2019 CIM Best Practices Guidelines and are reported using the 2014 CIM Definition Standards.
|
Page 144 |
| Lithium Americas Corp. Feasibility Study, National Instrument 43-101 Technical Report for the Thacker Pass Project, Humboldt County, Nevada, USA |
Table 14-10 Mineral Resources Estimate as of November 2, 2022
|
Category |
Tonnage |
Average Li |
Lithium Carbonate |
|
Measured |
534.7 |
2,450 |
7.0 |
|
Indicated |
922.5 |
1,850 |
9.1 |
|
Measured & Indicated |
1,457.2 |
2,070 |
16.1 |
|
Inferred |
297.2 |
1,870 |
3.0 |
Notes:
1. Mineral Resources that are not Mineral Reserves do not have demonstrated economic viability.
2. Mineral Resources are inclusive of 217.3 million metric tonnes (Mt) of Mineral Reserves.
3. Mineral Resources are reported using an economic break-even formula: "Operating Cost per Resource Tonne"/"Price per Recovered Tonne Lithium" * 10^6 = ppm Li Cutoff. "Operating Cost per Resource Tonne" = US$88.50, "Price per Recovered Tonne Lithium" is estimated: ("Lithium Carbonate Equivalent (LCE) Price" * 5.323 *(1 - "Royalties") * "Recovery". Variables are "LCE Price" = US$22,000/tonne Li2CO3, "Royalties" = 1.75% and "Recovery" = 73.5%.
4. Presented at a cutoff grade of 1,047 ppm Li.
5. A resource economical pit shell has been derived from performing a pit optimization estimation using Vulcan software.
6. The conversion factor for lithium to LCE is 5.323.
7. Applied density for the mineralization is 1.79 t/m3 (Section 11.4)
8. Measured Mineral Resources are in blocks estimated using at least six drill holes and eighteen samples within a 262 m search radius in the horizontal plane and 5 m in the vertical direction; Indicated Mineral Resources are in blocks estimated using at least two drill holes and six to eighteen samples within a 483 m search radius in the horizontal plane and 5 m in the vertical direction; and Inferred Mineral Resources are blocks estimated with at least two drill holes and three to six samples within a search radius of 722 m in the horizontal plane and 5 m in the vertical plane.
9. Tonnages and grades have been rounded to accuracy levels deemed appropriate by the QP. Summation errors due to rounding may exist.
14.2 Comments
The QP is of the opinion that the resource estimation methodology is in general accordance with the 2019 CIM Estimation of Mineral Resources and Mineral Reserves Best Practice Guidelines and uses the definitions in 2014 CIM Definition Standards for Mineral Resources and Mineral Reserves for the classification of Mineral Resources. Potential risk factors that could affect the Mineral Resource estimates include but are not limited to large changes in the market pricing, commodity price assumptions, material density factor assumptions, future geotechnical evaluations, metallurgical recovery assumptions, mining and processing cost assumptions, and other cost estimates could affect the pit optimization parameters and therefore the cutoff grades and Mineral Resource estimates.
|
Page 145 |
| Lithium Americas Corp. Feasibility Study, National Instrument 43-101 Technical Report for the Thacker Pass Project, Humboldt County, Nevada, USA |
15 Mineral Reserve Estimates
This section contains forward-looking information related to the Mineral Reserve estimates for the Thacker Pass Deposit. The material factors that could cause actual results to differ from the conclusions, estimates, designs, forecasts or projections include geological modeling, grade interpolations, lithium price estimates, mining cost estimates, and final pit shell limits such as more detailed exploration drilling or final pit slope angle.
The Mineral Reserves are a modified subset of the Measured and Indicated Mineral Resources. In accordance with the CIM Definition Standards, the Measured and Indicated Resources were used to determine the Mineral Reserves classification as "proven" and "probable". Measured Resources does not necessarily guarantee a "proven" reserve. Measured Resources can become a "probable" reserve if modifying factors are deemed not of sufficient accuracy. Modifying factors include mining, processing, metallurgical, economic, marketing, legal, environmental, infrastructure, social and governmental factors. The Mineral Reserves estimate considers the Inferred Mineral Resources as waste.
The reference point at which the Mineral Reserves are defined is at the point where the ore is delivered to the run-of-mine feeder. Reductions attributed to plant losses have not been included in the Mineral Reserve estimate.
The Mineral Reserve estimate relies on the resource block model prepared by the QP.
15.1 Pit Optimization
The EIS pit used for mine planning was developed in 2019. The EIS pit shell was developed on the Li2CO3 pricing of $5,400/t and cost values from the PFS report. The cost and pricing used are shown in Table 15-1. The pit shell was developed using Vulcan's Pit Optimization and Automated Pit Developer. The EIS pit area was limited by a few physical boundaries, including:
Figure 15-1 shows the EIS pit shell at the end of the mine life with backfill as well as the physical boundaries mentioned above. This pit shell was used in the EIS permit application.
Table 15-1 Pit Optimizer Parameters
|
Parameter |
Unit |
Value |
|
Li2CO3 |
US$/t |
5,400 |
|
Ore Processing Cost |
US$/t ROM |
55.00 |
|
Process Recovery |
% |
84 |
|
Mining Cost for Ore |
US$/t |
2.80 |
|
Mining Recovery Factor |
% |
95 |
Note:
- Cost estimates and Lithium price are as of 2018
|
Page 146 |
| Lithium Americas Corp. Feasibility Study, National Instrument 43-101 Technical Report for the Thacker Pass Project, Humboldt County, Nevada, USA |
Figure 15-1 EIS Pit Shell

Source: Sawtooth, 2022
|
Page 147 |
| Lithium Americas Corp. Feasibility Study, National Instrument 43-101 Technical Report for the Thacker Pass Project, Humboldt County, Nevada, USA |
15.2 Mineral Reserves and Cutoff Grade
The estimate of Mineral Reserves is based on mining within an approved permitted pit shell developed in 2019 for the Environmental Impact Statement (EIS), a 40-year mine life with a total plant leach ore feed of 154.2 million dry tonnes and a cutoff grade of 1.533 kilograms of lithium recovered per run-of-mine tonne. The leach ore feed is the ROM dry tonnes less the ash tonnes.
The cutoff grade was estimated for each block in the model as discussed in the section below. The blocks were sorted based on the cutoff grade from high to low and then the leach ore tonnes were added together until the total leach ore feed tonnes were met. These blocks were labeled as mine_ore and were used in the mine scheduler.
Overall reserve ore and waste tonnages are modeled using Maptek's geologic software package. Section 14 includes a discussion of the process behind developing the geological model.
15.2.1 Cutoff Grade
The cutoff grade variable is determined using formulas and variables developed by LAC and is applied to each block of the geologic block model.
The derivations of the two key variables, ROM feed (MROM) and mass lithium recovered in kg (MLi), are discussed below:
ROM feed (MROM)
ROM feed is the mined recovered dry tonnes and is estimated as follows:
MROM = Min situ × XMining
Where:
Min situ is the dry tonnes ore in situ
XMining is the mining recovery factor of 95%
Mass lithium recovered (MLi)
First, the concentration of lithium and magnesium in the ore, LiOre and the MgOre, is translated into concentration in the leach feed slurry, LiSlurry and the MgSlurry. This is done by replicating the beneficiation process mathematically by removing the ash content of the ore (classification) and applying the beneficiation recovery loss.
| LiSlurry = LiOre | 100 | XBen. |
| 100 − %Ash |
| MgSlurry = MgOre | 100 | XBen. |
| 100 − %Ash |
Where:
LiOre = Li (ppm)/1,000,000 (Lithium assay value for block)
MgOre = Mg (ppm)/1,000,000 (Magnesium assay value for block)
XBen. = Lithium recovered in beneficiation = 92% (per LAC - see Section 13.2.1.3)
%Ash = Ash content for ore block
The basis for this variable is the lithium extraction percentage (XLi). The formula is LAC's empirical leaching model based on LiSlurry and the MgSlurry and is discussed in Section 13.2.3.3:
|
Page 148 |
| Lithium Americas Corp. Feasibility Study, National Instrument 43-101 Technical Report for the Thacker Pass Project, Humboldt County, Nevada, USA |
XLi = a + bLiSlurry + cMgSlurry + d(LiSlurry)2 + eLiSlurryMgSlurry
Where:
a = 1.390
b = 21.7
c = -14.29
d = -19,667
e = 2590
There are instances where the lithium extracted percentage is estimated over 100%. Per LAC, to be conservative, the maximum lithium percentage assumed is 96%. Therefore, if XLi was greater than 96%, 96% was used. If XLi was less than or equal to 96% the estimated percentage was used.
If XLi > XLi,max Then XLi = XLi,max.
Where:
XLi,max = 96% (maximum demonstrated lithium extraction)
Once the Lithium extracted percentage (XLi) is estimated, the percentage is used to determine the Lithium extracted per tonne of ore, Liext.
| Liext = | LiOre | × XLi × Min situ × XBen. |
| 1,000,000 |
Where:
Li = Lithium ppm for block
XLi = Lithium extraction percentage (discussed above) for block
Min situ = In situ dry tonnes of ore
XBen. = 92% Lithium recovered in beneficiation
The next factor estimated is the lithium extracted tonne mined and delivered to the ROM stockpile. Lithium extracted tonne delivered (Liext,del) is determined as follows:
Liext,del = Liext × XMining
Where:
XMining is the mining recovery factor of 95%
The final step is to estimate the mass of lithium recovered per ROM feed in kg (MLi). The formula is as follows:
| M Li = | Liext,del |
| M ROM |
Lithium Carbonate Equivalent Delivered
To estimate the lithium carbonate delivered to the ROM stockpile is as follows:
Lithium Carbonate delivered = LiOre / 1,000,000 × MROM × 5.323
|
Page 149 |
| Lithium Americas Corp. Feasibility Study, National Instrument 43-101 Technical Report for the Thacker Pass Project, Humboldt County, Nevada, USA |
Where:
5.323 = Lithium factor to convert mass of lithium to mass lithium carbonate
Final Lithium Recovery
Final Lithium recovery is estimated using the lithium extracted tonnes (Liext,del) and downstream loss percentages provided by LAC. The formula is as follows:
LiRecov = Liext,del(1 - (XFilter + XMgSO4 + XZLD)
Where:
Table 15-2 Lithium Losses
|
Symbol |
Value |
Description |
|
XFilter |
0.93% |
Lithium losses in filtration |
|
XMgSO4 |
1.05% |
Lithium losses in MgSO4 salts |
|
XZLD |
3.10% |
Lithium losses in ZLD salts |
|
LiExt,del |
Estimated |
Lithium Extracted per tonne delivered |
Final Lithium Carbonate recovered
The final lithium carbonate recovered after processing is estimated as follows:
Final lithium carbonate recovered = LiRecov x 5.323
Where:
5.323 = Lithium factor to convert mass of lithium to mass lithium carbonate
For this mine plan the estimated kilogram of lithium recovered per run-of-mine tonne cutoff grade is 1.533.
15.2.2 Dilution and Mining Recovery
The resource model is a regular block model with blocks sized 25 m (x) x 25 m (y) x 1 m (z). Due to the regular block model and the block size, dilution is considered inherent in the block model. A 95% mining recovery factor is applied to the Mineral Reserve estimate.
15.3 Waste
Waste consists of various types of material: basalt, alluvium and clay that does not meet the ore definition or the cutoff grade described above. These material type descriptions can be found in Section 7 of this study.
15.4 Stripping Ratio
The resulting stripping ratio of the designed pit is 1.51 tonnes of waste rock with ore loss and rehandle to 1 tonne of recovered ore, on a wet tonnage basis. The in-place stripping ratio is 1.34 tonnes in situ waste to 1 tonne of in situ ore.
|
Page 150 |
| Lithium Americas Corp. Feasibility Study, National Instrument 43-101 Technical Report for the Thacker Pass Project, Humboldt County, Nevada, USA |
15.5 Mineral Reserve Estimate - EIS Pit
A Mineral Reserves estimate was calculated for the EIS pit from the Vulcan geologic block model used in the Mineral Resource estimate as discussed in Section 14. The 40-year pit is designed to satisfy the ore delivery requirements.
The classified Mineral Reserves are presented in Table 15-3 for the EIS pit. This reserve estimate uses a maximum ash percent cutoff of 85% to reduce the volume of coarse gangue and a cutoff grade of 1.533 kilograms of lithium recovered per tonne of run of mine ore feed. Additionally, a 95% mining recovery factor is applied.
Table 15-3 Mineral Reserves Estimate as of November 02, 2022
|
Category |
Tonnage |
Average Li |
Lithium Carbonate |
|
Proven |
192.9 |
3,180 |
3.3 |
|
Probable |
24.4 |
3,010 |
0.4 |
|
Proven and Probable |
217.3 |
3,160 |
3.7 |
Note:
1. Mineral Reserves have been converted from measured and indicated Mineral Resources within the feasibility study and have demonstrated economic viability.
2. Reserves presented at an 85% maximum ash content and a cut-off grade of 1.533 kg of lithium extracted per tonne run of mine feed. A sales price of $5,400 US$/t of Li2CO3 was utilized in the pit optimization resulting in the generation of the reserve pit shell in 2019. Overall slope of 27 degrees was applied. For bedrock material pit slope was set at 47 degrees. Mining and processing cost of $57.80 per tonne of ROM feed, a processing recovery factor of 84%, and royalty cost of 1.75% were addition inputs into the pit optimization.
3. A LOM plan was developed based on equipment selection, equipment rates, labor rates, and plant feed and reagent parameters. All Mineral Reserves are within the LOM plan. The LOM plan is the basis for the economic assessment within the Technical Report, which is used to show economic viability of the Mineral Reserves.
4. Applied density for the ore is 1.79 t/m3 (Section 11.4).
5. Lithium Carbonate Equivalent is based on in-situ LCE tonnes with 95% recovery factor.
6. Tonnages and grades have been rounded to accuracy levels deemed appropriate by the QP. Summation errors due to rounding may exist.
7. The reference point at which the Mineral Reserves are defined is at the point where the ore is delivered to the run-of-mine feeder.
15.6 Comments
The Mineral Reserves estimate in this Technical Report is based on current knowledge, engineering constraints and permit status. The QP is of the opinion that the methodology for estimation of Mineral Reserves in this Technical Report is in general accordance with the 2019 CIM Estimation of Mineral Resources and Mineral Reserves Best Practice Guidelines, and using the definitions in 2014 CIM Definition Standards for the classification of Mineral Reserves. Large changes in the market pricing, commodity price assumptions, material density factor assumptions, future geotechnical evaluations, cost estimates or metallurgical recovery could affect the pit optimization parameters and therefore the cutoff grades and estimates of Mineral Reserves.
|
Page 151 |
| Lithium Americas Corp. Feasibility Study, National Instrument 43-101 Technical Report for the Thacker Pass Project, Humboldt County, Nevada, USA |
16 Mining Methods
This section contains forward-looking information related to the mining methods for the Thacker Pass Deposit. The material factors that could cause actual results to differ from the conclusions, estimates, designs, forecasts or projections include mine design parameters, production rates, equipment selection, and personnel requirements.
The shallow and massive nature of the deposit makes it amenable to open-pit mining methods. The mining method assumes hydraulic excavators loading a fleet of end dump trucks. This truck/excavator fleet will develop several offset benches to maintain geotechnically stable highwall slopes. These benches will also enable the mine to have multiple grades of ore exposed at any given time, allowing flexibility to deliver and blend ore as needed.
The annual production rate for the 40-year mine is based on varying plant feed leach ore rates caused by the availability of sulfuric acid for the leaching process. Phase I (years 1-3) has an annual feed rate of 1.7 million dry tonnes of ore to leach and Phase 2 (years 4-40) has 4.0 million dry tonnes of ore to leach. The rates are broken down in Table 16-3. See Section 15.4 regarding stripping requirements.
16.1 Pit Design
A highwall slope-stability study was completed by Barr Engineering Co. (BARR) in December 2019. BARR conducted geotechnical drilling, testing, and analysis to assess the geology and ground conditions. Core samples were obtained to determine material characteristics and strength properties. A minimum factor-of-safety value of 1.20 is generally acceptable for active open pit walls. However, given the possibility of long-term exposure of pit slopes in clay geological formations, a value of 1.30 was incorporated into the design for intermediate and overall slope stability. Table 16-1 summarizes the recommended slope configuration by material type per BARR.
The geotechnical analysis indicates that the geology is generally uniform across the Project site. The competence of the in-situ material in conjunction with the use of the proposed highwall angles meets or exceeds the minimum recommended factor-of-safety values for intermediate and overall slope configurations.
A bench width of 50 m and a height of 5 m was chosen. This face height is amenable to efficient loading operations while still shallow enough to allow for the removal of thicker barren horizons within the cut to minimize dilution. Double benching and increasing the bench height to 10 m before implementing offsets, will be used to increase mining depths while maintaining the inter-ramp slope requirements. Figure 16-1 shows a cross-section view of the planned highwall layback scheme for the different geological horizons.
Table 16-1 Pit Geometry
|
Material Type |
Slope |
Geometry and Configuration |
|
All Geology Formations |
Overall Pit Slope |
Design and establish a 27-degree overall slope angle through all geology formations |
|
Clay/Ash |
Inter-ramp |
Design and establish 30-meter-high maximum, 50-meter-wide, and 45-degree angle inter-ramp slopes through the clay/ash ore body |
|
Catch Bench |
Design and establish 10-meter high, 8.6-meter-wide, and 67-degree bench face angle slopes through the clay/ash ore body |
|
|
Tuff/Basalt |
Inter-ramp |
Design and establish 40-meter-high maximum, 50-meter-wide and 50-degree inter-ramp slopes through the tuff/basalt |
|
Catch Bench |
Design and establish 10-meter-high, 6-meter-wide, and 67-degree bench face angle slopes through the tuff/basalt |
 |
Page 152 |
| Lithium Americas Corp. Feasibility Study, National Instrument 43-101 Technical Report for the Thacker Pass Project, Humboldt County, Nevada, USA |
|
Material Type |
Slope |
Geometry and Configuration |
|
Alluvium (unit between Tuff and Clay/Ash) |
Inter-ramp |
Design and establish 30-meter-high maximum, 50-meter-wide, and 45-degree angle inter-ramp slopes through the alluvium |
|
Catch Bench |
Design and establish 10-meter-high, 8.6-meter-wide, and 67-degree bench face angle slopes through the alluvium |
|
|
Spoil |
Overall |
Design and establish a 27-degree overall slope through the spoil pile to a maximum height of 90 meters |
|
Lift |
Design and establish a 38-degree overall slope through the spoil lift |
Figure 16-1 Highwall Angles
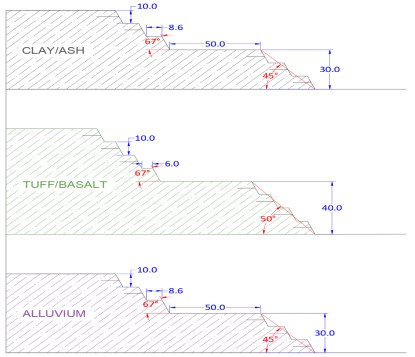
Source: Sawtooth, 2022
Note: All measurements are in meters.
16.2 Mine Plan
The initial cut location is at the mouth of the valley entering the west area. Figure 16-2 shows the initial cut and the uncovered ore with a kg lithium recovered per tonne of ROM feed greater than 4.0. The haul road will enter the initial cut area at the 1,540 m level.
|
Page 153 |
| Lithium Americas Corp. Feasibility Study, National Instrument 43-101 Technical Report for the Thacker Pass Project, Humboldt County, Nevada, USA |
Figure 16-2 Kilograms of Lithium Recovered per tonne of ROM Feed at Initial Cut
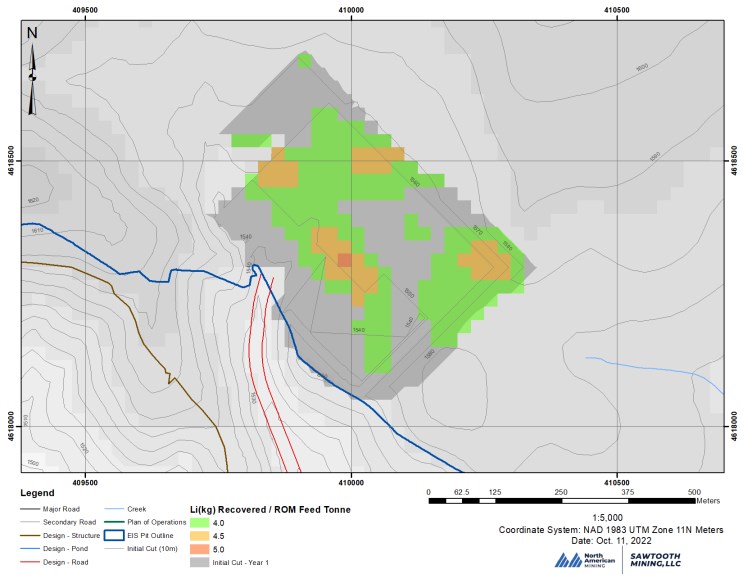
|
Page 154 |
| Lithium Americas Corp. Feasibility Study, National Instrument 43-101 Technical Report for the Thacker Pass Project, Humboldt County, Nevada, USA |
From the initial cut, mining advancement prioritized five objectives: (1) recover all ore, (2) deliver a blend of illite and smectite ore to the beneficiation circuit, (3) provide higher grade ore early in the Project life, (4) facilitate placement of waste into the previously mined pit area as soon as feasible, and (5) mine the entirety of the permitted pit area. This required initial pit advancement to first expose the west and south walls. Mining will then advance north toward the Montana Mountains and finally finish to the east.
The next several figures indicate the highwall locations at different points in time. The figures show the pit shape after various years of mining and do not show concurrent backfill that will begin early in the mine life. Figure 16-3 shows the initial cut layout. Figure 16-4 through Figure 16-8 show pit advance for 5, 10, 20, 30 and 40-year pit advances. In the first five years, the mine waste will primarily be hauled to the out-of-pit waste storage area (West Waste Rock Storage Facility). After 5 years, the mine waste will be dumped back into the mined out portions of the pit. The pit advances north and to the east. East Waste Rock Storage Facility is currently not being utilized for waste storage for the LOM plan, but was included in the permit application and is shown in the figures in this section.
Due to backfilling, the pit advances on the figures below show the stated end of year mining. However, the in-pit dump profiles have been offset a period prior to allow for the full mining extent to be visible on the figures. For example, Figure 16-7 shows end of mining at year 30 with end of in-pit dumping at year 25 (the period prior).
|
Page 155 |
| Lithium Americas Corp. Feasibility Study, National Instrument 43-101 Technical Report for the Thacker Pass Project, Humboldt County, Nevada, USA |
Figure 16-3 Initial Cut
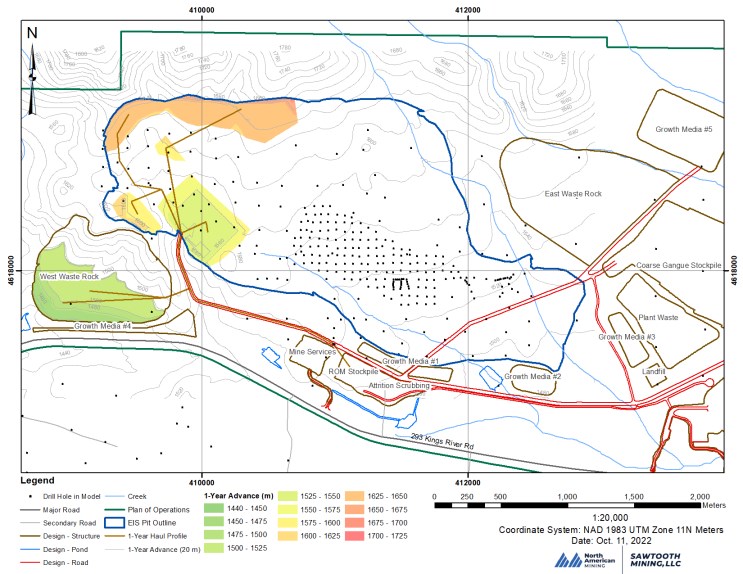
|
Page 156 |
| Lithium Americas Corp. Feasibility Study, National Instrument 43-101 Technical Report for the Thacker Pass Project, Humboldt County, Nevada, USA |
Figure 16-4 Five Year Advance (Including Cross Pit Ramps)
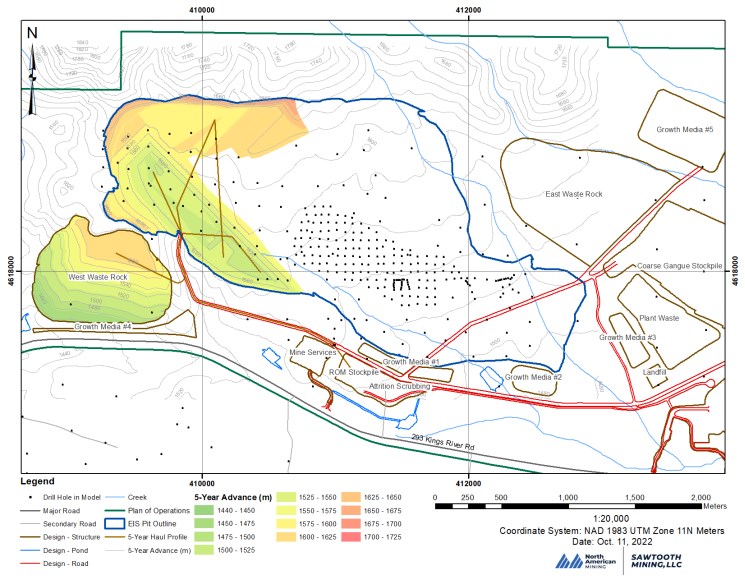
|
Page 157 |
| Lithium Americas Corp. Feasibility Study, National Instrument 43-101 Technical Report for the Thacker Pass Project, Humboldt County, Nevada, USA |
Figure 16-5 10 Year Advance

|
Page 158 |
| Lithium Americas Corp. Feasibility Study, National Instrument 43-101 Technical Report for the Thacker Pass Project, Humboldt County, Nevada, USA |
Figure 16-6 20 Year Advance

|
Page 159 |
| Lithium Americas Corp. Feasibility Study, National Instrument 43-101 Technical Report for the Thacker Pass Project, Humboldt County, Nevada, USA |
Figure 16-7 30 Year Advance
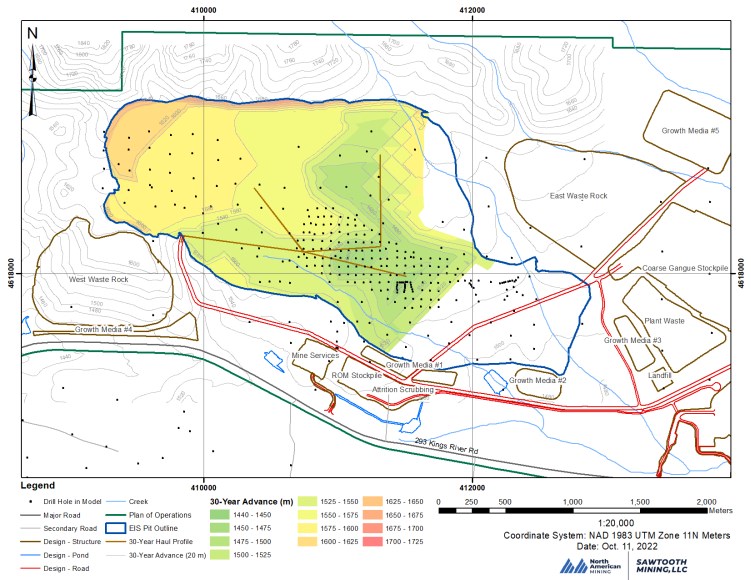
|
Page 160 |
| Lithium Americas Corp. Feasibility Study, National Instrument 43-101 Technical Report for the Thacker Pass Project, Humboldt County, Nevada, USA |
Figure 16-8 40 Year Advance
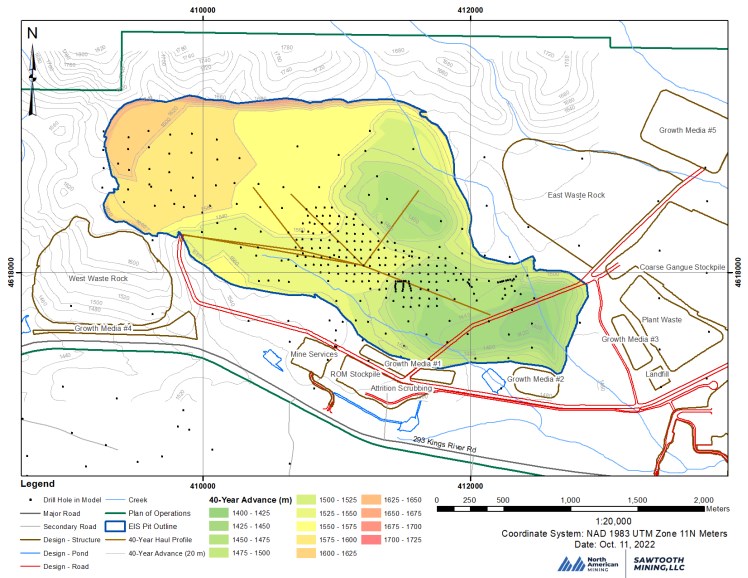
|
Page 161 |
| Lithium Americas Corp. Feasibility Study, National Instrument 43-101 Technical Report for the Thacker Pass Project, Humboldt County, Nevada, USA |
16.3 Mining Operations
Waste removal and ore removal will be done using two hydraulic excavators and a fleet of end dump trucks. The end dump truck fleet will haul the ore to the ROM stockpile and the waste will be hauled either to the West Waste Rock Storage Facility (WWRSF) or placed in previously mined sections of the pit. The end dump truck fleet will also be used to haul coarse gangue and attrition scrubber reject materials.
Due to the sequence of mining, the majority of in-pit ramps will be temporary. Additionally, cross-pit ramping will be utilized from load face to the in-pit waste dump as well as access to the main haul road. The cross-pit ramps will be dumped in using waste material. As the pit advances, portions of the in-pit ramp will be excavated to allow mining access to the lower mining faces. Removal of portions of the in-pit ramp will be considered rehandle and is accounted for in the total waste removed.
16.3.1 Waste Handling
The waste material is primarily claystone that is below the cutoff grades and/or greater than 85% ash. A breakdown of the waste material moved is shown in Table 16-2.
Table 16-2 Waste Material
|
Waste Material |
In-situ Wet Density |
Wet Tonnes |
|
Basalt |
2.56 |
20.8 |
|
Alluvium |
1.96 |
66.1 |
|
Waste |
1.92 |
240.7 |
16.3.2 Ore Handling
The determination of ore versus waste will be an ongoing process during operations carried out by an in-pit sampling program and field inspections. The sampling program will be done with a mobile drill rig. It is estimated that on each 50-meter bench, sampling will consist of two rows with drill holes at 25 to 30-meter intervals along the rows, resulting in sampling blocks of approximately 25 x 25/30 x 5 meters. This sampling interval will give one sample for every 5,600 tonnes of ore or approximately 1,000 samples per year at full production. The sample results will be mapped and provided to the planners and supervisors to develop ore delivery plans for each shift for ore hauled from the pit, to be blended with previously stockpiled ore of known and tracked quality. Additionally, a handheld ore quality detector is available to measure lithium ppm. The handheld detector will be employed for spot checks in the pit, stockpile, and feeders. Also, the sampling results will be used to update short term geological modeling.
The ore will initially be fed into two, ultimately three, feeder breakers operating 24 hours per day, seven days per week. End dump trucks hauling from the pit, in conjunction with dozers pushing off the ROM stockpile, will provide the ore feed to consistently match plant demand. While assigned to ore, the truck/excavator fleet will need to operate at a production rate higher than the delivery rate to the feeders to build inventory on the ROM stockpile. This inventory will then be used while this same truck/excavator fleet is assigned to waste removal. The ROM stockpile is designed to hold up to a 45-day inventory. The feed system from ROM stockpiles is designed to provide ore when trucks are not hauling as well as to blend between the feeders to ensure consistent quality and quantity of delivered ore.
The ROM stockpile will consist of two separate but connected stockpiles. One pile will be for smectite ore and the second will be illite ore. LAC has a target of illite to smectite ratios in the 30/70 to 70/30 range. The ore types will feed into the feeders at variable rates allowing the feed operator to keep the blend between the ore types within the ratio ranges.
|
Page 162 |
| Lithium Americas Corp. Feasibility Study, National Instrument 43-101 Technical Report for the Thacker Pass Project, Humboldt County, Nevada, USA |
16.3.3 Attrition Scrubber Reject
Blended ore from the process facility feeding system is first conveyed into the log washers, initially one, ultimately two, in which the first water is introduced to the process. From the log washers ore is transferred to the attrition scrubbers, then to a screen to remove oversize material that did not get attritted, referred to as 'attrition scrubber reject'. The attrition scrubber reject is assumed to be less than 1% of the delivered ore. The attrition scrubber reject is combined with the coarse gangue reject from the classification circuit and discharged to an intermediate stockpile. Material from the intermediate stockpile is transported, to the coarse gangue stockpile initially and eventually to backfill the pit, via haul trucks.
16.3.4 Mine Quantities
Table 16-3, is a summary of the mining quantities by year for the first 10 years. The quantities are then illustrated in 5-year annualized increments (Table 16-4).
Table 16-3 Mine Quantities Summary (tonnes in millions unless noted)
| |
Phase 1 | Phase 1 & 2 |
|
|||||||||
|
|
Y1 |
Y2 |
Y3 |
Y4 |
Y5 |
Y6 |
Y7 |
Y8 |
Y9 |
Y10 |
||
|
Dry Ore Tonnes Mined (95% Rec) |
1.7 |
2.8 |
3.3 |
4.9 |
6.5 |
6.0 |
5.8 |
6.7 |
5.9 |
6.1 |
||
|
Wet Ore Tonnes Mined (95%Rec) |
1.9 |
3.0 |
3.6 |
5.3 |
7.0 |
6.4 |
6.3 |
7.2 |
6.3 |
6.5 |
||
|
Wet In Situ Ore Tonnes (Informational) |
2.0 |
3.1 |
3.8 |
5.6 |
7.3 |
6.8 |
6.6 |
7.5 |
6.6 |
6.900 |
||
|
Plant Feed (Dry Tonnes Leach Ore) |
1.2 |
1.9 |
1.9 |
3.2 |
4.0 |
3.8 |
4.0 |
4.2 |
4.0 |
4.0 |
||
|
Average Li Concentration (ppm) |
3,496 |
3,232 |
3,186 |
3,086 |
3,194 |
3,149 |
3,170 |
3,319 |
3,327 |
3,343 |
||
|
Total Waste Tonnes (Wet) |
7.3 |
9.1 |
9.0 |
7.0 |
5.0 |
9.4 |
9.0 |
12.0 |
9.9 |
10.7 |
||
|
Growth Media Tonnes (Wet, kt) |
46.4 |
155.0 |
74.5 |
0.0 |
43.4 |
0.0 |
130.9 |
12.2 |
36.2 |
49.9 |
||
|
Total Tonnes Mined (Wet) |
9.1 |
12.1 |
12.5 |
12.3 |
12.0 |
15.8 |
15.2 |
19.1 |
16.2 |
17.3 |
||
|
ROM Ore Stockpile Feed Tonnes (Dry) |
1.5 |
2.8 |
2.8 |
5.0 |
6.6 |
6.0 |
5.9 |
6.7 |
5.9 |
6.1 |
||
|
Attrition Scrubber Reject Tonnes (Wet, kt) |
4.5 |
10.5 |
11.3 |
22.9 |
32.8 |
26.8 |
23.2 |
31.0 |
24.0 |
25.9 |
||
|
Strip Ratio (Total Waste: Ore Mined (95%REC)) |
3.91 |
3.06 |
2.52 |
1.33 |
0.72 |
1.47 |
1.43 |
1.67 |
1.57 |
1.64 |
||
|
Lithium Carbonate Tonnes (Dry, kt) Delivered |
28.2 |
47.8 |
47.4 |
82.6 |
112.6 |
100.3 |
98.9 |
118.1 |
104.5 |
108.4 |
||
|
Page 163 |
| Lithium Americas Corp. Feasibility Study, National Instrument 43-101 Technical Report for the Thacker Pass Project, Humboldt County, Nevada, USA |
Table 16-4 5-Year Average Mine Quantities Summary (tonnes in millions unless noted) (Continued)
|
|
Y11-15 |
Y16-20 |
Y21-25 |
Y26-30 |
Y31-35 |
Y36-40 |
Yearly Average |
40 Year Total |
|
Dry Ore Tonnes Mined (95% Rec) |
6.1 |
6.0 |
5.7 |
5.6 |
5.2 |
4.9 |
5.4 |
217.3 |
|
Wet Ore Tonnes Mined (95%Rec) |
6.5 |
6.5 |
6.1 |
6.0 |
5.6 |
5.2 |
5.8 |
233.1 |
|
Wet In Situ Ore Tonnes (Informational) |
6.9 |
6.8 |
6.4 |
6.3 |
5.9 |
5.5 |
6.1 |
245.3 |
|
Plant Feed (Dry Tonnes Leach Ore) |
4.1 |
4.1 |
4.0 |
4.1 |
4.1 |
4.0 |
3.9 |
154.2 |
|
Average Li Concentration (ppm) |
2,590 |
3,293 |
3,211 |
3,094 |
2,981 |
2,953 |
3, 070 |
3,070 |
|
Total Waste Tonnes (Wet) |
11.2 |
7.1 |
5.8 |
5.3 |
10.8 |
12.4 |
8.8 |
351.8 |
|
Growth Media Tonnes (Wet, kt) |
83.4 |
49.4 |
37.5 |
61.4 |
69.6 |
54.8 |
59.4 |
2,376.5 |
|
Total Tonnes Mined (Wet) |
17.8 |
13.6 |
11.9 |
11.3 |
16.4 |
17.6 |
14.6 |
584.9 |
|
ROM Ore Stockpile Feed Tonnes (Dry) |
6.1 |
6.0 |
5.7 |
5.6 |
5.2 |
4.9 |
5.4 |
217.2 |
|
Attrition Scrubber Reject Tonnes (Wet. kt) |
25.2 |
24.3 |
20.6 |
19.3 |
14.1 |
11.4 |
19.7 |
787.4 |
|
Strip Ratio (Total Waste: Ore Mined (95%REC)) |
1.72 |
1.10 |
0.95 |
0.88 |
1.94 |
2.37 |
1.53 |
1.53 |
|
Lithium Carbonate Tonnes (Dry, kt) Delivered |
104.3 |
105.7 |
97.2 |
92.6 |
82.7 |
77.8 |
91.3 |
3,650.0 |
16.4 Equipment Selection
Equipment selection was based on the annual quantities of material required to be mined. The QP consulted Caterpillar, Komatsu, and Liebherr to determine the best fleet size. After reviewing various options, 91-tonne class end dump trucks loaded by two 18-tonne class hydraulic excavators in five passes was selected. The excavators will be used to load two types of ore as well as the waste material. They will be staged to minimize movement between the multiple required dig faces. The trucks can easily be assigned or re-assigned to either machine to maintain maximum production depending on excavator downtime, changes in required material to be hauled, and haul cycle times. The excavators and trucks will be equipped with buckets and bodies specifically designed for the density of the material at Thacker Pass.
As part of the equipment evaluation, the QP looked at both the 64-tonne class end dump trucks and 140-tonne trucks. The 64-tonne class end dump truck setup requires more trucks and thus more operators. The 140-tonne class end dump truck setup would require fewer trucks, but a larger excavator and increased road widths would be necessary with the larger end dump trucks. Also, the larger fleet, with a single loader provides less flexibility to contemporaneously load in multiple areas degrading blending capabilities. The ultimate goal is to feed the processing plant consistent material types and grades. Additionally, from operational experience, the 91-tonne class end dump trucks show to be well suited for the anticipated comparable soft clay conditions.
The number of end dump trucks in the fleet will allow each loading unit to operate at a high production rate. A wheel loader will be utilized to allow a unit to be removed from operation for preventative maintenance without experiencing a significant reduction in fleet productivity as well as to increase flexibility in the operation. Equipment such as motor graders, large and small water trucks, and track dozers were selected based on requirements needed to adequately support the truck/excavator fleet.
Haul profiles were developed for each year from the location of the various loading operations to the haulage destinations including the ROM stockpile, growth media stockpiles, waste rock storage facilities and in-pit waste rock placement. Haul profiles and other Project-specific assumptions were input into TALPAC software to determine haulage cycle times. The haulage cycle times were combined with estimated loading and dump times to determine total cycle times. Based on the total cycle times, mechanical availabilities, and production efficiencies, the number of end dump trucks were assigned to each loading operation and the required operating hours were estimated.
|
Page 164 |
| Lithium Americas Corp. Feasibility Study, National Instrument 43-101 Technical Report for the Thacker Pass Project, Humboldt County, Nevada, USA |
Ore feed and stockpile maintenance will be accomplished by 475 HP dozers. This type of machine is of the appropriate size and capability to meet the 24-hour per day, 7-day per week delivery schedule. Additionally, a wheel loader will be utilized as a backup to the ore feeding operation if required.
A hydraulic excavator with a backhoe-type configuration was selected over a wheel loader or hydraulic front shovel due to its ability to better separate and remove thin waste horizons within the ore. Additionally, the track setup allows for better tractability and stability working on clay material.
A 475 HP class dozer was selected as it is well suited to handle the variable work of ore feed, pit support, and coarse gangue material storage management.
A 23-tonne front-end loader was selected to load the coarse gangue and attrition scrubber reject as well as serve as the backup for ore, waste, and ore feed. The coarse gangue material and attrition scrubber material will be discharged into a stockpile via a radial stacker. The front-end loader is the best fit for loading this loose stockpile material and matches well with the 91-tonne class end dump truck.
A list of the major equipment fleets and specifications is presented in Table 16-5.
Table 16-5 Major Equipment Specifications
|
Equipment |
Class |
Quantity |
Usage |
|
Hydraulic Excavator |
18 tonne |
2 |
Waste and Ore Removal |
|
End Dump Trucks |
91 tonne |
12 |
Ore, Waste, Attrition Scrubber Reject, |
|
Wheel Loader |
23 tonne |
1 |
Coarse Gangue, Ore, Waste, Attrition Scrubber Reject, Ore Feed |
|
Track Dozer |
475 HP |
5 |
Ore, Waste, Coarse Gangue, Ore Feed |
|
Grader |
350 HP |
3 |
All areas |
|
Water Truck (Primary) |
53k Liter |
2 |
Dust Suppression, All areas |
|
Water Truck (Secondary) |
30k Liter |
1 |
Dust Suppression, All areas |
|
Wheel Dozer |
500 HP |
1 |
Coarse Gangue, Ore, Waste |
Table 16-6 is a list of support and auxiliary equipment and number.
Table 16-6 Support Equipment
|
Equipment |
Max Quantity |
|
Light-duty vehicles |
12 |
|
Light Plants |
8 |
|
Mechanics Truck |
2 |
|
Fuel/lube truck |
1 |
|
Telehandler |
1 |
16.4.1 Equipment Productivity
The mine will operate 7 days per week, 24 hours per day. Ore, waste, coarse gangue, or clay/salt tails may be hauled on any given shift. Productivity estimations for each piece of mining equipment are based on 355 scheduled days per year by excluding holidays. However, the mine will be able to operate on holidays to provide ore to the plant. The equipment operating hours take into account mechanical availability and operational availability. The operational availability includes various items such as supervisor communication, transportation to the workplace, equipment pre-start check, and breaks.
|
Page 165 |
| Lithium Americas Corp. Feasibility Study, National Instrument 43-101 Technical Report for the Thacker Pass Project, Humboldt County, Nevada, USA |
The estimated annual production rate for the excavator is based on CAT equipment rates and internal experience. The end dump cycle times were estimated based on haul profiles which were then loaded into RPMGlobal's Talpac software. The haul profiles were developed by mining block and by year. The minimum and maximum annual scheduled hours by equipment fleet for ore and waste are presented in Table 16-7.
Table 16-7 Scheduled Hours by Fleet
|
Fleet |
Annual Scheduled |
Annual Scheduled |
|
Hydraulic Excavator |
8,116 |
16,685 |
|
End Dump Truck |
52,132 |
96,470 |
|
Track Dozer |
26,693 |
37,712 |
|
Water Truck (Primary) |
11,469 |
21,223 |
|
Motor Grader |
15,639 |
28,941 |
|
Wheel Loader |
521 |
2,262 |
|
Small Water Truck (Secondary) |
2,607 |
4,823 |
|
Wheel Dozer |
2,100 |
2,100 |
16.5 Personnel Requirements
Four crews will be utilized to cover the 168 hours per week rotating operating schedule. A Monday through Friday schedule has been included for management and technical service positions. It is assumed that local talent will be available and no fly-in-fly-out adjustments have been included.
The positions included in the labor are listed in Table 16-8. Positions listed are for mining operations including waste and ore, attrition scrubber reject, and coarse gangue.
Table 16-8 Personnel List
|
Position |
Roster |
No. |
|
Management |
|
|
|
Mine Manager |
M-F |
1 |
|
Technical Services |
|
|
|
Mining Engineers |
M-F |
3 |
|
Engineer Tech |
M-F |
1 |
|
Geologist |
M-F |
1 |
|
Operations |
|
|
|
Supervisors |
M-S |
3-4 |
|
Equipment Operators |
|
73-115 |
|
Maintenance |
|
|
|
Maintenance Planner |
M-F |
1 |
|
Page 166 |
| Lithium Americas Corp. Feasibility Study, National Instrument 43-101 Technical Report for the Thacker Pass Project, Humboldt County, Nevada, USA |
|
Position |
Roster |
No. |
|
Supervisors |
M-S |
2-4 |
|
Mechanics/Welders |
|
23-37 |
|
Electricians |
|
1 |
|
Administrative |
|
|
|
Business Manager |
M-F |
1 |
|
Accountant |
M-F |
1 |
|
Administrative / AP Clerk |
M-F |
1 |
|
Human Resources/Safety Supervisor |
M-F |
1 |
16.6 Fuel
Equipment fuel consumption rates are based on the manufacturer's recommendation along with historical data from Sawtooth affiliated mines operating similar equipment in similar conditions. Diesel fuel unit cost is estimated at $3.80 per gallon, which was developed using an August 2022 local pricing quote.
16.7 Drilling and Blasting
The "Factual Geotechnical Investigation Report for Mine Pit Area" (Mar 2018) completed by Worley Parsons and the "Prefeasibility Level Geotechnical Study Report" (May 2011) completed by AMEC were used to determine the ability to mine without blasting. The uniaxial compressive strength (UCS) test results in the AMEC data range from essentially 0 to 55.4 MPa. The UCS test results in the Worley Parsons data range from 0.61 to 21.82 MPa with an average of 7.7 MPa. The range of UCS results is within the cutting range of the excavator.
Based on reported test results, exploratory drill logs, and actual excavation of a test pit, only the basalt is expected to require blasting. However, there are bands of hard ash which may require ripping with a dozer prior to loading. The remaining waste and ore can be free dug with the hydraulic excavators. Due to the infrequency of blasting, a third-party contractor will be used for the drilling and blasting on an as needed basis.
Figure 16-9 shows the outlines of the basalt areas within the pit area. Also, an outcrop of tuff is at the entrance of the initial pit area. This tuff will be blasted and used for road base.
|
Page 167 |
| Lithium Americas Corp. Feasibility Study, National Instrument 43-101 Technical Report for the Thacker Pass Project, Humboldt County, Nevada, USA |
Figure 16-9 Basalt and tuff zones near the pit area
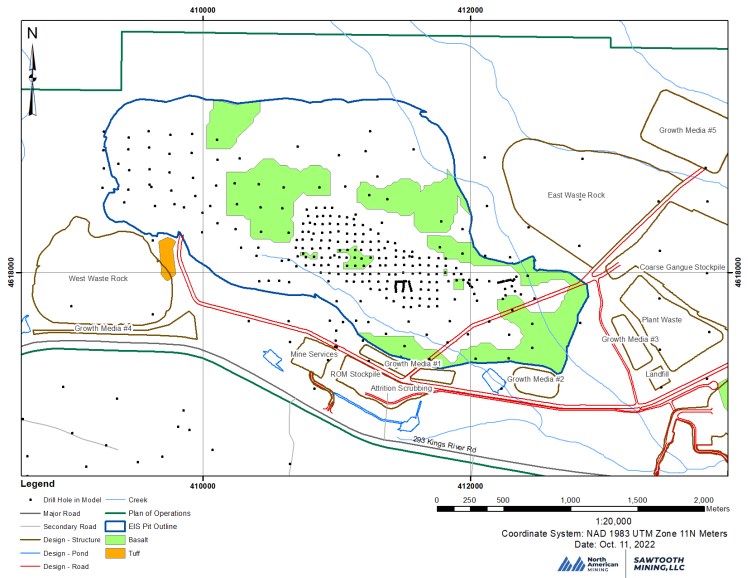
|
Page 168 |
| Lithium Americas Corp. Feasibility Study, National Instrument 43-101 Technical Report for the Thacker Pass Project, Humboldt County, Nevada, USA |
16.8 Dewatering
During the 40-year mining period, it is anticipated that appreciable groundwater is not likely in the mining operations. This assumption is based on a November 2019 report by Piteau Associates. The regional groundwater table is expected to be encountered in approximately year 15 of mining. Groundwater discharge into the pit is not expected to be more than approximately 23 m3/h (100 gpm) at peak. Dewatering wells are not anticipated to be required for these minor discharge rates. Any water encountered in the pit will be collected in sumps and utilized for in-pit dust control.
|
Page 169 |
| Lithium Americas Corp. Feasibility Study, National Instrument 43-101 Technical Report for the Thacker Pass Project, Humboldt County, Nevada, USA |
17 Recovery Methods
17.1 General Description
This Section describes the major processing areas of the operation that will recover lithium from the ore. The proposed flowsheet is based on metallurgical test results described in Section 13. The process employs industry-standard, commercially available equipment. This information serves as the basis for the development of the capital and operating costs presented in Section 21.
The Mineral Reserves are comprised of two main types of lithium bearing clay, smectite and illite, with volcanic ash and other gangue minerals mixed throughout. Both types of clay will be processed simultaneously, with a plant feed blend maintained from two separate stockpiles for each clay type. The ore will be upgraded using a wet attrition scrubbing process followed by two classification stages to remove coarse material with low lithium content, referred to as coarse gangue. The upgraded ore slurry will be processed in a leach circuit using sulfuric acid to extract the lithium from the lithium-bearing clay. The lithium-bearing solution will then be purified primarily by using crystallizers and precipitation reagents to produce battery grade lithium carbonate. Leach residue will be washed, filtered, and stacked in a tailing facility.
The Project will be constructed in two phases. Lithium carbonate production during Phase 1 is designed for a nominal 40,000 t per annum capacity while Phase 2 will double design capacity to a nominal 80,000 t per annum. The process plant will operate 24 hours/day, 365 days/year with an overall availability of 92% and a mine life of 40 years. The total amount of material processed in the mine plan is 217.2 Mt (dry). The most tonnes planned for a single year are 6.7 Mt (dry) in Year 8.
The recovery process consists of the following primary circuits:
A simplified process flowsheet is provided in Figure 17-1.
|
Page 170 |
| Lithium Americas Corp. Feasibility Study, National Instrument 43-101 Technical Report for the Thacker Pass Project, Humboldt County, Nevada, USA |
Figure 17-1 Overall Simplified Process Flowsheet
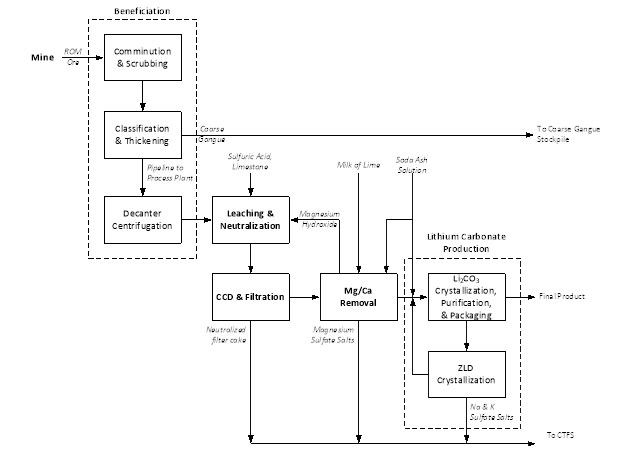
Source: LAC, 2022
In beneficiation, ROM ore is crushed then mixed with water and fed to unit operations designed to liberate lithium bearing clay from gangue material. The clay is separated from coarse gangue in classification, with coarse gangue being stockpiled and eventually used as pit backfill material. The clay fines are then sent to the first dewatering (thickening) stage. These circuits are located close to the pit. The slurry is then pumped downgradient to a second stage of dewatering (decanter centrifuging). The resulting slurry is fed to the processing plant.
The dewatered slurry is mixed with sulfuric acid (H2SO4) from the acid plant, leaching lithium and other constituents into solution. Acid availability determines leach feed rates, which in turn determines ore mining rates. The free acid contained in the resultant leached residue is neutralized with both a slurry of ground limestone and a magnesium hydroxide slurry from the magnesium precipitation circuit. The neutralized slurry is sent to a CCD circuit to recover residual lithium bearing solution and then fed to recessed chamber filter presses. The filter cake is then conveyed to the CTFS (Clay Tailings Filter Stack) as waste material for stacking.
The filtrate is sent to magnesium and calcium removal circuits where first the bulk of the magnesium is crystallized as MgSO4*xH2O salts, removed via centrifugation, and conveyed to the CTFS. Any remaining magnesium in the brine is then precipitated with milk-of-lime and separated by recessed chamber membrane filter presses. The precipitated solids are repulped and recycled back to neutralization (as stated above), eventually leaving the process with neutralized filter cake. The calcium in the liquor is removed via soda ash addition, and an ion exchange polishing step brings the divalent cation concentration to very low levels. This lithium-bearing brine is fed to the Li2CO3 production circuit where soda ash is used to precipitate lithium carbonate. A bicarbonation step is used to further remove impurities from the Li2CO3 crystals.
|
Page 171 |
| Lithium Americas Corp. Feasibility Study, National Instrument 43-101 Technical Report for the Thacker Pass Project, Humboldt County, Nevada, USA |
The final Li2CO3 crystal product is separated via centrifugation then sent to drying, micronization, cooling, dry vibrating magnetic filtration and packaging. Mother liquor from the Li2CO3 crystallizers is sent to the Zero Liquid Discharge (ZLD) crystallizer to remove Na and K as sulfate salts. The salts are sent to the CTFS while lithium remaining in the centrate is recycled back to the front of the Li2CO3 circuit and recovered.
17.2 Process Design Criteria
Process design criteria were developed by LAC's process engineering group based on in-house and vendor test results that were incorporated into the process modelling software Aspen Plus® to generate a steady-state material and energy balance. This data and criteria below were used as nominal values for equipment design/sizing. The design basis for the beneficiation facility is to process an average ROM throughput rate during Phase 1 of about 3.3 M dry tonnes per year equivalent to about 9,000 dry t/d of feed (including a 99% plant availability). Throughput from the mine to the crushing plant is targeted based on an average rejection rate of 34% of the ROM material based on low lithium content in coarse material. With approximately 6,000 dry t/d feed rate (including a 92% plant availability) to the leach plant and recoveries for the Project, the design basis results in an estimated production rate of approximately 110 t/d (40,187 t/a) of battery grade Lithium Carbonate.
Table 17-1 and Table 17-2 summarize the main process design parameters used for each phase of this study. Flow rates, based on process mass balance, Rev. F HMB, are nominal for a single phase for design purposes. Table 17-3 and Table 17-4 summarize the major process equipment used for a single phase.
Table 17-1 Process Design Criteria - Beneficiation through Neutralized Tailing
|
Parameter |
Units |
Value |
|
PLANT AVAILABILITY |
|
|
|
Operating schedule |
days/year |
365 |
|
Beneficiation |
% |
99 |
|
Process Plant |
% |
92 |
|
Acid plant (not including turnarounds) |
% |
96 |
|
THROUGHPUT |
|
|
|
Run of mine feed to plant (dry) |
t/a |
3,258,000 |
|
Run of mine feed to plant (dry) (with availability) |
t/d |
9,000 |
|
Feed to Leach (dry) |
t/a |
2,161,000 |
|
Feed to Leach (dry) (with availability) |
t/d |
6,000 |
|
CTFS total tailing (neutralized filter cake, sulfate salts) (dry) |
t/a |
3,909,000 |
|
CTFS total tailing (neutralized filter cake, sulfate salts) (dry) (with availability) |
t/d |
12,000 |
|
LCE produced (dry) |
t/a |
44,000 |
|
LCE produced (dry) (with availability) |
t/d |
131 |
|
CRUSHING |
|
|
|
ROM Li content |
ppm |
3,270 |
|
Particle size distribution (F80) |
mm |
82 |
|
Ore bulk density (transport) |
t/m3 |
1.6 |
|
Ore moisture total (loose) |
weight % |
16 |
|
Crushed particle size (P80) |
mm |
25 |
|
Feed to attrition circuit (dry) |
t/d |
5,000 |
|
Discharge screen oversize (% ROM) |
% |
1 |
|
CLASSIFICATION |
|
|
|
Feed particle size (P80) |
microns |
225 |
|
Overflow particle size (P80) |
microns |
75 |
|
Underflow particle size (P80) |
microns |
272 |
|
Page 172 |
| Lithium Americas Corp. Feasibility Study, National Instrument 43-101 Technical Report for the Thacker Pass Project, Humboldt County, Nevada, USA |
|
Parameter |
Units |
Value |
|
Coarse material rejection (dry) |
% |
33 |
|
Thickener underflow pulp density |
weight % |
20-25 |
|
Flocculant consumption |
g/t |
130 |
|
Decanter centrifuge cake density |
weight % |
55 |
|
Flocculant consumption |
g/t |
130 |
|
LEACH |
|
|
|
Feed solids Li content |
ppm |
4,563 |
|
Feed pulp density |
weight % |
30-35 |
|
Leach residence time |
minutes |
180 |
|
NEUTRALIZATION |
|
|
|
Neutralization tank (limestone) residence time |
minutes |
90 |
|
Neutralization tank (Mg(OH)2) residence time |
minutes |
60 |
|
pH in final neutralization tank |
pH |
6.5 |
|
Neutralization clarifier flocculant consumption |
g/t |
150 |
|
CCD and FILTRATION |
|
|
|
No. of CCD stages |
- |
7 |
|
Flocculant consumption (total) |
g/t |
842 |
|
Filtration residual moisture in cake |
% |
39 |
|
CCD/Filtration recovery |
% |
99 |
NOTE: 1) Flow rates based on process mass balance, Rev. F HMB, are nominal for a single phase for equipment design/sizing purposes.
2)Values rounded to the nearest thousand where appropriate.
Table 17-2 Process Design Criteria - Purification Plant
|
Parameter |
Units |
Value |
|
MAGNESIUM SULFATE CRYSTALLIZATION |
||
|
No. of stages (evaporation/crystallization) |
- |
1/3 |
|
% of Mg removed (average, based on Rev. F HMB) |
% of feed |
79 |
|
Centrifuge cake moisture |
weight % |
4 |
|
MAGNESIUM PRECIPITATION |
|
|
|
Residual magnesium content |
ppm |
5 |
|
Mg(OH)2 recycle stream pulp density |
weight % |
30 |
|
CALCIUM PRECIPITATION |
|
|
|
Residual calcium content |
ppm |
100 |
|
Underflow solids density |
weight % |
5 |
|
ION EXCHANGE |
|
|
|
Residual calcium content |
ppm |
Proprietary |
|
Residual magnesium content |
ppm |
Proprietary |
|
Residual boron content |
ppm |
Proprietary |
|
LITHIUM CARBONATE PLANT |
|
|
|
No. of stages (crystallization/bicarbonation) |
- |
2/1 |
|
2nd Stage Centrifuge Cake Moisture |
weight % |
20 |
|
ZLD Centrifuge Cake Moisture |
weight % |
15 |
|
Dryer Discharge Moisture |
weight % |
0.1 |
|
Jet Mill Discharge Particle Size (d50) |
microns |
6 |
|
Cooler Discharge Temperature |
oC |
40 |
NOTE: Design values based on 40-year LOM variability needs, but do not strictly reflect representative averages for either 25- or 40-year periods.
|
Page 173 |
| Lithium Americas Corp. Feasibility Study, National Instrument 43-101 Technical Report for the Thacker Pass Project, Humboldt County, Nevada, USA |
Table 17-3 Major Process Equipment - Beneficiation/Classification/Filtering
|
Item |
Phase 1 |
Phase 2 |
Description |
Key |
|
Feeder Breaker |
2 operating |
3 operating |
30" wide drag conveyor, dual drive 2 x 56kW, 31" pick diameter breaker, 56kW |
169 kW |
|
Mineral Sizer |
2 operating |
3 operating |
Direct Drive Crusher-Sizer, 0.6 m diameter. x 1.2 m wide |
112 kW |
|
Log Washer |
2 operating |
4 operating |
13-26 RPM |
150 kW |
|
Attrition Scrubber |
1 operating |
2 operating |
Four Cells c/w Hi-Chrome Props and SS shafts |
600 kW |
|
Attrition Scrubber Discharge Screen |
1 operating |
2 operating |
Single deck, dual vibrating motors, 1.8 m x 3.66 m, linear vibrating, 25.4 mm square opening |
13 kW |
|
Classification Cyclone Cluster |
1 operating |
2 operating |
8-Place (6 operating/2 standby), 20 inch |
P100 = 75 µm |
|
Hydraulic classifier |
1 operating |
2 operating |
3.66 m' x 3.66 m |
75 µm separation size |
|
Dewatering Screens |
1 operating |
2 operating |
Single deck, dual vibrating motors, 1.5 m x 3.66 m, linear vibrating, 0.5 x 12 mm slot |
10 kW |
|
Classification Thickener |
1 operating |
2 operating |
50 m diameter |
30 kW |
|
Classification Centrifuge |
5 operating |
10 operating |
Decanter type with variable Frequency Drive (VFD) on Main and Secondary drives |
355 kW (main) |
|
Acid Leach Tank |
3 operating |
6 operating |
10.4 m diameter x 11.3 m high, agitated, rubber lined carbon steel, closed top, scrubber |
56 kW |
|
Neutralization Tank |
2 operating |
4 operating |
10.4 m diameter x 11.3 m high, agitated, rubber lined carbon steel, closed top |
30 kW |
|
Neutralization Clarifier |
1 operating |
2 operating |
Hi-Density, 40 m diameter |
30 kW |
|
CCD Thickener |
7 operating |
14 operating |
Hi-Density, 40 m diameter |
30 kW |
|
Filter Feed Tank |
1 operating |
2 operating |
12.2 m diameter x 12.8 m high, agitated, rubber lined carbon steel, closed top |
56 kW |
|
Filter Feed Pump |
14 operating |
28 operating |
587 m3/hr @ 212 kPag initial feed rate, 100 m3/hr @ 824 kPag final feed rate, horizontal centrifugal |
56 kW |
|
Neutralization Filter |
7 operating |
14 operating |
Overhead filter press, 2.5 m x 2.5 m, 32 mm chambers |
150 kW |
|
Page 174 |
| Lithium Americas Corp. Feasibility Study, National Instrument 43-101 Technical Report for the Thacker Pass Project, Humboldt County, Nevada, USA |
Table 17-4 Major Process Equipment - Purification Process
| Item | Phase 1 Quantity |
Phase 2 Quantity |
Description | Key Criteria (each) |
| Magnesium Removal | ||||
| MgSO4 Removal System | 1 operating | 2 operating | 3 pre-evaporators and 2 crystallizer trains operating per phase Pusher type centrifuges w/VFD, 2205 duplex SS wetted parts Product contacting: Duplex 2205 Non-product contact: SS 304/316 |
27 MW |
| Magnesium Precipitation Tank | 1 operating | 2 operating | 6.1 m diameter x 7.3 m high, 181.5 m3 operating volume, agitated, carbon steel, closed top | 15 kW |
| Magnesium Precipitation Filter | 1 operating 1 standby |
2 operating 2 standby |
Overhead membrane filter press, 2.5 m x 2.5 m, 40 mm chambers, 103 plates (alternated membrane plates with recessed plates), 32 min cycle time | 63.55 kW |
| Li2CO3/ZLD Crystallization | ||||
| Calcium Precipitation Reactor Clarifier | 1 operating | 2 operating | 9.14 m dia. x 4.57 m high (straight side) w/rake drive and internal recirculation pump, carbon steel | Ca concentration proprietary |
| Calcium Precipitation Filter | 1 operating 1 standby |
2 operating | Dual media type, 3.35 m dia. x 1.83 m high (straight side), rubber lined carbon steel | Ca concentration proprietary |
| Cation Removal Ion Exchange System | 1 operating | 2 standby | Ion Exchange (IX) system w/associated acid/caustic/water tanks and pumps, lined FRP columns | Ca concentration proprietary Mg concentration proprietary |
| Boron Removal Ion Exchange System | 1 operating | 2 operating | Ion Exchange (IX) system w/associated acid/caustic/water tanks and pumps, lined FRP columns | Boron concentration proprietary |
| Li2CO3 System | 1 operating | 2 operating | Peeler type centrifuges, 316L SS wetted parts Product contacting: Duplex 2205 Non-product contact: SS 304/316 |
Target ppm Li proprietary Operating temperature proprietary |
| Li2CO3 Dryer | 1 operating | 2 operating | Paddle type w/integral baghouse, 2.57 m wide x 9.7 m long, indirect steam heated | 0.1 wt.% moisture |
| Li2CO3 Jet Mill | 1 operating | 2 operating | Fluidized bed type w/air jets and dynamic classifier, 304 SS contact parts | Particle size proprietary |
| Li2CO3 Cooler | 1 operating | 2 operating | Paddle type w/integral baghouse, 2.2 m wide x 7.575 m long, indirect water cooled | Operating temperature proprietary |
| Li2CO3 Storage Bins | 3 operating | 6 operating | Wedge bottom silo, 3.66 m dia. x 9.14 m high (straight side), 304L SS | 54 tonnes |
|
Page 175 |
| Lithium Americas Corp. Feasibility Study, National Instrument 43-101 Technical Report for the Thacker Pass Project, Humboldt County, Nevada, USA |
| Item | Phase 1 Quantity |
Phase 2 Quantity |
Description | Key Criteria (each) |
| Li2CO3 Packaging (FIBC) | 1 operating | 2 operating | FIBC packing system including pallet dispenser, slip sheet dispenser, conveyors, scales, dust collection, manual sleeve wrap station, automatic stretch wrap system, PLC | 20 x 1,000 kg bags/h or 30 x 500 kg bags/h |
| Li2CO3 Packaging (20/25 kg bags) | 1 operating | 2 operating | Bag packing system including automatic filler, bag closer, conveyors, robotic palletizer, stretch wrapper w/labeler, label printer, PLC | 480-600 bags/h |
| ZLD System | 1 operating | 2 operating | 2 Evaporators operating per phase Solid bowl type centrifuge Product contacting: 2507/6 Moly Non-product contact: SS 304/316 |
10 MW |
17.2.1 Production
Recovery of lithium during operations will fluctuate with varying ore mineralization, and process chemistries. An average LOM lithium recovery of 73.2% is used in this study. There are five major areas contributing to lithium losses in the process plant:
17.3 Process Description
17.3.1 ROM Stockpile/Feed
Ore will be delivered to two separate but connected ROM stockpiles from the mining operation using haul trucks. The ore will be segregated into stockpiles by clay type: illite and smectite. LAC has a target of illite to smectite ratios ranging between 30 to 70% illite with the remaining amount as smectite. The ore types will be fed into the variable speed feeders allowing the system operator to maintain the selected ratio.
Based on mine plan optimization to maximize recoverable lithium, the resultant blend to feed the plant averages 59% illite and ranges between 30 to 70%, with the remaining amount as smectite.
17.3.2 Beneficiation
The purpose of mineral beneficiation is to liberate the clay from the gangue and then concentrate lithium-bearing clay by rejecting coarse, non-lithium or low lithium grade gangue material.
|
Page 176 |
| Lithium Americas Corp. Feasibility Study, National Instrument 43-101 Technical Report for the Thacker Pass Project, Humboldt County, Nevada, USA |
17.3.2.1 Comminution
Material of each ore type will be pushed via dozer to a dedicated feeder breaker to reduce the material to a top size of about 150 mm, then conveyed to a mineral sizer (toothed roll crusher) for reduction to about minus 25 mm. Discharge from each mineral sizer will be combined on a common conveyor to the mineral beneficiation process. Blend ratios may be controlled via belt speeds and weightometers.
17.3.2.2 Attrition Scrubbing
Crushed ore will be conveyed to a classifying, spiral paddle mixer, commonly referred to as a log-washer, operating at 40 wt.% solids to provide hydration time and an initial separation of clay from coarse material. The fine material will report to a downstream pump box. The coarse material will be transported up the inclined log-washer, where it will discharge to an attrition scrubber with four cells, operating at 30 wt.% solids. The attrition scrubber will impart a high degree of agitation resulting in aggressive particle-on-particle contact, or scrubbing, to remove the majority of the remaining clay from coarse material. Recycled water from the downstream dewatering circuit will be used for density control in both the log washer and attrition scrubber. Slurry discharging from the attrition scrubbers will pass through a vibrating screen into a pump box. The screen will remove material coarser than 25 mm that will be combined with classification dewatering screen oversize and conveyed to an intermediate coarse gangue stockpile. The fine clay material passing through the screen will combine with the log washer fine material and will be pumped to the classification circuit. A standby log-washer, attrition scrubber, and vibrating screen will be installed to ensure high availability.
17.3.2.3 Classification
Separation of clay is achieved by a combination of hydrocyclones and a hydraulic classifier. The overflow from both the hydrocyclones and the hydraulic classifier flow by gravity to the classification thickener feed box. Solids from the hydrocyclones (cyclone underflow) report to the hydraulic classifier which rejects material primarily greater than 75 micron particles in the underflow. This will be dewatered by a vibrating screen. The screen oversize (coarse gangue) will be conveyed to an intermediate coarse gangue stockpile and then reclaimed by a front-end loader and trucked to the coarse gangue stockpile. The screen undersize will report to the classification thickener. Up to an estimated 34% of the ore fed to the process will be rejected during classification. Standby cyclones and a standby hydraulic classifier and vibrating screen will be installed to ensure high availability.
17.3.2.4 Solid-Liquid Separation (Thickening and Dewatering)
The fine clay material from the hydrocyclone and hydraulic classifier overflows (minus 75 microns) will be thickened to approximately 20-25 wt.% solids in a high-rate thickener. The thickener overflow will be collected in a recycle water tank from which it will be distributed to the various users in the classification circuit, as well as a portion being returned to the mineral beneficiation circuit. The thickener underflow will be pumped downgradient to a classification centrifuges feed tank. The underflow will be dewatered to an estimated 55 wt.% solids by multiple horizontal decanter centrifuges. The centrate will be pumped approximately 3 km back to the classification recycle water tank while the cake will be repulped primarily with downstream neutralization filter wash water and then pumped to the acid leach circuit at about 34 wt.% solids. Raw water make-up to the beneficiation circuit is pumped approximately 3 km to the classification recycle water tank and will be distributed to the water users within the classification circuit.
|
Page 177 |
| Lithium Americas Corp. Feasibility Study, National Instrument 43-101 Technical Report for the Thacker Pass Project, Humboldt County, Nevada, USA |
17.3.3 Leaching and Neutralization
17.3.3.1 Acid Leaching
Solids feed rate to the leach circuit will be largely dictated by sulfuric acid plant capacity. The leach temperature of 75-90°C will be governed by heat generated from the dilution of the sulfuric acid and acid-clay reactions.
Continuous leaching will be performed in three agitated tanks in series at 1 hour leaching time each. Acid addition will be 490 kg of 100% H2SO4 per tonne of leach feed solids. On average for the LOM an estimated 86% of the lithium will be dissolved from the clay. Due to the non-selective leaching by the acid, other elements of interest that will be leached in appreciable amounts include magnesium, calcium, potassium, sodium, iron, boron, and aluminum. The tanks will be vented to a caustic scrubber to remove entrained acid-laden droplets from the vapor streams (primarily carbon dioxide and water) generated in the leach tanks. The scrubber effluent will be pumped to the downstream neutralization circuit. The leached clay slurry at 10-50 g/L H2SO4 of residual acid will flow by gravity to the neutralization circuit.
17.3.3.2 Neutralization
A two-stage neutralization will be performed in agitated tanks, one per stage, with a retention time of 1.5 hours in the first tank and 1 hour in the second. In the first stage, a 35 wt.% slurry of ground limestone (P80 = 44 microns) will be combined with the acidic slurry to achieve a pH of 3-4. The first stage neutralization will neutralize most of the residual acid from acid leach and precipitate most of the iron and aluminum. Magnesium hydroxide recycled from the downstream magnesium precipitation circuit will be used to complete the neutralization to a pH of approximately 6.5 in the second stage. This pH will both ensure lithium solubility is at or near the maximum in the downstream magnesium sulfate crystallization circuit, and to avoid redissolution of calcium borate (a co-precipitant in the magnesium precipitation circuit). The neutralization product slurry will contain residual clay, gypsum, calcium borate and metal hydroxides. Effluents from the sulfuric acid plant tail gas scrubber, liquid sulfur tank scrubbers and transloading scrubber will be combined in an agitated tank from which it will report to the first stage neutralization tank. Slurry from the second stage neutralization tank will gravity flow to the neutralization clarifier feed tank.
Neutralized slurry will be thickened to approximately 33% solids in a high-density thickener. The overflow solution will be pumped to the magnesium sulfate evaporator feed tank. Underflow from the clarifier will be pumped to the CCD circuit for recovery of lithium in solution.
17.3.4 Countercurrent Decantation and Filtration
17.3.4.1 CCD
Clarifier underflow from the neutralization clarifier is diluted with overflow from the second stage CCD in an agitated tank that feeds the first CCD thickener. Feed in the center well is diluted internally to approximately 3% solids with clear supernatant. Slurry will be thickened to approximately 33% in a high-density thickener. The overflow from the first CCD thickener is cooled with cooling water prior to being distributed to various locations in the process plant with the excess being pumped to the magnesium sulfate evaporator feed tank. The cooling is required to avoid damage to the plastic filter plates in the downstream filter which have a temperature limit of about 75oC. Underflow from the first CCD thickener is pumped to the second stage CCD feed tank, where it is diluted with overflow from the third stage CCD. This is typical for CCD stages two through six where the underflow is pumped to the next stage CCD. Overflow from the second through the seventh stage CCD is pumped to the preceding stage CCD feed tank for dilution. Underflow from the seventh stage CCD is pumped to the filter feed tank.
Neutralization filtrate is pumped to the sixth stage CCD feed tank. Process recycle water and cooled process condensate are pumped to the seventh stage CCD feed tank for washing.
|
Page 178 |
| Lithium Americas Corp. Feasibility Study, National Instrument 43-101 Technical Report for the Thacker Pass Project, Humboldt County, Nevada, USA |
17.3.4.2 Filtration
Washed slurry will be pumped from the filter feed tank to recessed chamber filter presses to produce a 61 wt.% solids filter cake which will be conveyed to an intermediate stockpile near the Clay Tailings Filter Stack (CTFS). The filtrate, comprised of a dilute sulfate solution with lithium, magnesium, potassium, and sodium cations will be sent to the sixth stage CCD feed tank. The filters are the final stage of lithium recovery in solution. An overall 99% wash efficiency of lithium is assumed for design.
17.3.5 Magnesium and Calcium Removal
17.3.5.1 Magnesium Sulfate Crystallization
The neutralized filtrate will be concentrated by Mechanical Vapor Recompression (MVR) heated falling film evaporators prior to crystallization. The lithium concentration will be held below a target concentration leaving the evaporator to avoid crystallizing a lithium-potassium double salt. A seed recycle system will be used to minimize the amount of scaling caused by gypsum precipitation.
Magnesium will be removed from the concentrated liquor as a salt predominantly in the form of magnesium sulfate hexahydrate (MgSO4.6H2O) in three stages of crystallization. Operating conditions will be controlled in each stage to crystallize the maximum amount of magnesium possible without precipitating lithium as a lithium-potassium double salt. Water vapor and non-condensable gases will be removed from the second stage crystallizers by ejector/barometric condenser trains cooled by cooling tower water, and the third stage crystallizers will be by indirect condenser/ejector trains cooled by chilled water. Crystals will be withdrawn as a slurry from the second and third stages of crystallization and fed to pusher centrifuges where the crystals are dewatered and washed. The centrifuge cakes at 96 wt.% solids will be conveyed to an intermediate stockpile near the Clay Tailings Filter Stack (CTFS).
17.3.5.2 Magnesium Precipitation and Filtration
Liquor from the magnesium sulfate crystallizer circuit will be mixed with a 25 wt.% milk-of-lime slurry to adjust the pH to approximately 11 to precipitate magnesium as magnesium hydroxide while a corresponding amount of sulfate is removed as coprecipitated gypsum. Magnesium will be precipitated to about 5 ppm in a single agitated tank. Calcium will remain at the gypsum saturation level. The discharge from the magnesium precipitation tank will gravity flow to the magnesium precipitation filter feed tank from where it will be pumped to the recessed chamber membrane magnesium precipitation filters. The magnesium hydroxide/gypsum cake will be repulped with CCD wash solution on a batch basis then pumped to the upstream second stage of neutralization. The filtrate will be sent to the downstream calcium precipitation circuit.
17.3.6 Magnesium and Calcium Removal
17.3.6.1 Calcium Precipitation
Filtrate from the magnesium precipitation step is mixed with a 25 wt.% soda ash (Na2CO3) solution to precipitate calcium carbonate (CaCO3). Calcium will be precipitated to approximately 100 ppm in a combination reaction tank, followed by a reactor clarifier. Soda ash will be delivered to the reactor tank and ferric sulfate will be added as coagulant. The reaction tank will be maintained at about 10 g/L solids loading to act as seed material by recycling clarifier underflow slurry. The reaction tank slurry will flow by gravity into the reactor clarifier reaction chamber where it will meet circulating solids and flocculant. The clarifier overflow will contain 10 ppm or less suspended solids while the underflow will contain 5-10 wt.% solids. The majority of the underflow solids will be recycled to the reaction tank while the remainder recycles to the magnesium precipitation filter feed tank. The overflow from the clarifier will be pumped through multimedia filters for further clarification. The filters will be air scoured and backwashed with filtrate as required. The backwash will be collected in the agitated backwash tank where it will be combined with solids from the soda ash filters. The contents of the backwash tank will be metered into the calcium precipitation reaction tank.
|
Page 179 |
| Lithium Americas Corp. Feasibility Study, National Instrument 43-101 Technical Report for the Thacker Pass Project, Humboldt County, Nevada, USA |
17.3.6.2 Ion Exchange
Filtrate from the calcium precipitation circuit will be fed to an ion exchange (IX) system for the removal of hardness, primarily calcium and magnesium. The regeneration sequence will include steps for brine displacement, hydrochloric acid stripping of the adsorbed cations, rinsing and conditioning of the resin with sodium hydroxide. Calcium and magnesium in the purified solution will be reduced below the acceptable limit.
Solution from the hardness removal ion exchange will be fed to an ion exchange system for the removal of boron. The regeneration sequence will include steps for sulfuric acid stripping of the adsorbed boron, rinsing and conditioning of the resin with sodium hydroxide. Boron in the purified solution will be reduced to below the required limit.
The soda ash solution used for lithium carbonate crystallization will be treated via ion exchange to remove calcium and magnesium to below the target levels. Normally, the two IX columns will both be fed in parallel to adsorb hardness from the reagent solution. For a relatively short time however, one column will be taken offline to regenerate the resin (3% of the time is estimated). As with the other cation IX system, the stripping of the resin will be done with hydrochloric acid and the conditioning of the resin will be done using sodium hydroxide.
17.3.7 Lithium Carbonate Production
17.3.7.1 Lithium Carbonate Circuit
The lithium carbonate purification system will receive concentrated lithium sulfate solution from the ion exchange circuit as well as recycled centrate from the Zero Liquid Discharge (ZLD) crystallization circuit (see Section 17.3.7.2). Battery grade lithium carbonate will be produced by a three-stage process. In the first stage, lithium carbonate will be crystallized in a draft tube baffle (DTB) crystallizer by reacting the concentrated lithium sulfate solutions with a 25 wt.% soda ash solution. Lithium carbonate crystals withdrawn from the crystallizer will be dewatered using peeler centrifuges. The crystals will be washed using wash centrate from the second stage lithium carbonate centrifuges then repulped with both treated (RO) water and recycled centrate from the second stage lithium carbonate centrifuges. The repulp slurry will be fed to the lithium bicarbonate reactor. The centrate will report to the sodium/potassium sulfate salts crystallization circuit, or ZLD circuit.
The undissolved lithium carbonate and lithium carbonate in solution will be converted to soluble lithium bicarbonate (LiHCO3) by reaction with carbon dioxide in a forced circulation reactor. Temperature will be maintained by cooling with chilled water. Carbon dioxide (CO2) will be supplied from the second stage crystallizer condenser. Make-up will be provided from a liquid CO2 storage vessel. The lithium bicarbonate liquor will be filtered to remove insoluble material prior to feeding the second stage lithium carbonate crystallizer. The insolubles captured on cartridge type filters will be disposed of properly.
The second stage lithium carbonate crystallizer will be a DTB type and operated at a temperature where the lithium bicarbonate will be converted back to lithium carbonate crystals and carbon dioxide will be liberated. The overhead vapor will be condensed with cooling water and the non-condensable carbon dioxide will be compressed and recycled to the lithium bicarbonate reactor. Lithium carbonate crystals withdrawn from the crystallizer will be dewatered using peeler centrifuges. The crystals will be washed using hot treated water. A portion of the centrate will recycle to the lithium bicarbonate reactor feed for repulping and the remaining portion will report to the Zero Liquid Discharge crystallization circuit, or ZLD circuit.
|
Page 180 |
| Lithium Americas Corp. Feasibility Study, National Instrument 43-101 Technical Report for the Thacker Pass Project, Humboldt County, Nevada, USA |
17.3.7.2 ZLD Crystallizers
Centrates from the first stage and second stage lithium carbonate crystallizers will pass through a decarbonation step in which sulfuric acid will be added to convert the lithium carbonate to lithium sulfate while also driving off any dissolved carbon dioxide. The lithium sulfate solution will be pumped to the ZLD crystallizers for removal of sodium and potassium sulfate salts.
Sodium and potassium sulfate salts will be removed from the decarbonated lithium sulfate solution in forced circulation mechanical vapor recompression (MVR) crystallizers. Lithium will be concentrated to near the point of crystallizing the lithium-potassium double salt. Crystals at a 25 to 40 wt.% slurry density will be pumped to decanter centrifuges. The centrifuge cake at 85 to 92 wt.% solids will be conveyed to an intermediate stockpile near the Clay Tailings Filter Stack (CTFS). The centrate will be returned to the first stage lithium carbonate feed tank. A small portion of the centrate will be able to be purged to the upstream magnesium precipitation tank to control impurity concentration in the lithium carbonate circuit, if needed.
17.3.7.3 Final Product Handling
Washed centrifuge cake from the 2nd stage Li2CO3 crystallizer will be dried in an indirect steam heated dryer from which it will discharge into a lump breaker to eliminate any agglomerated material. Material from the lump breaker will discharge into a pneumatic conveying system and be transported to one of three 60 tonne storage silos. The three silos will discharge into another pneumatic conveying system that transports to a hopper from which the solids pass through a magnet to remove tramp iron prior to feeding the fluidized jet mill.
The jet mill will use compressed air provided by dedicated compressors to reduce the size of the lithium carbonate from approximately 30-130 microns down to approximately 5-8 microns. The jet mill will have a baghouse to separate the lithium carbonate from the milling and conveying air. The lithium carbonate will discharge from the baghouse into an indirect type of cooler before being pneumatically conveyed to five individual 5-tonne hoppers which then feed the Dry Vibrating Magnetic Filtration (DVMF) system. This system will be made up of scalping magnets and splitters to feed the magnetic filters. The filters will remove magnetic and partially magnetic particles from the lithium carbonate.
After the magnetic filters, the lithium carbonate will be fed into either the small bag packaging line or the bulk bag packaging line. A bar magnet will remove any tramp metal prior to each line. The small bag line will fill either 20 kg or 25 kg bags and place them on pallets. The bulk bag line will fill either 500 kg or 1000 kg bags and place them on pallets. A forklift will then transfer the loaded bags into a QC holding area before being loaded into a shipping container or truck.
A rework system will be available to reprocess out of spec material from any one of the three 60-tonne silos, the DVMF feed bins or from the bulk bag unloader. The off-spec product will be pneumatically conveyed to the Off Spec Receiving Hopper and metered into the Off-Spec Dissolution Tank. Water and sulfuric acid will be added to the tank to convert the lithium carbonate into lithium sulfate for return to the process.
17.3.8 Clay Tailings Filter Stack
17.3.8.1 Description
Neutralized clay tailings filter cake will be radially stacked in an intermediate stockpile within the lined area of the Clay Tailings Filter Stack (CTFS) storage facility. These tailings will be hauled by loader and truck to a designated location on the CTFS. Salt tailings from the magnesium sulfate crystallization circuit and the sodium/potassium sulfate salts from the ZLD circuit will be radially stacked in an intermediate stockpile separate from the neutralized clay tailings. The salt tailings will be hauled by loader and truck to a designated location on the CTFS. The CTFS will be progressively expanded and reclaimed during the life of the Project.
|
Page 181 |
| Lithium Americas Corp. Feasibility Study, National Instrument 43-101 Technical Report for the Thacker Pass Project, Humboldt County, Nevada, USA |
17.3.8.2 Management Strategy
The tailings discharge from the filters will be conveyed to an intermediate stockpile location in the southwest corner of the CTFS across from the process plant. From the stockpile, the material will be loaded with wheeled loaders hauled by end dump trucks and placed within the CTFS in lifts. During material placement, samples will be collected and tested for moisture content determination. If the moisture content of the tailings is above the specified range above the optimum moisture content, the tailings will be scarified using a motor grader, disc, rotovator or similar equipment to increase the surface area and to promote drying of the material. Frequent scarification and mixing of the materials will reduce the time required to lower the moisture content of the tailings. During the scarification and mixing process, samples will be collected for moisture content testing. Once it has been determined that the material is within the specified range of the optimum moisture content the tailings will be compacted using a vibrating and/or pad foot compactor.
The tailings placement described above will be completed in cells within each CTFS lift, with tailings being placed in designated cells until each cell is built to its designated size. This will result in numerous cells being actively dried, scarified/mixed and compacted concurrently until the desired moisture and dry density is achieved for that cell. Once the technical requirements for moisture and density are achieved the cell can then be stacked on during placement of the next lift.
17.4 Reagents
17.4.1 Sulfur
Sulfuric acid will be primarily used for leaching and will be generated on-site at the sulfuric acid plant from liquid sulfur. During summer months, the product will be 98.5 wt.% H2SO4, and in winter it will be diluted to 93.0 wt.% to avoid freezing complications. Two acid tanks, with a combined seven (7) days of storage capacity, will supply sulfuric acid to the processing plant.
Liquid sulfur will be delivered by truck from a transload facility located in Winnemucca, NV, where it is transferred from railcars to storage tanks by gravity dump. There will be about 28 days of liquid sulfur storage capacity at the sulfuric acid plant. A caustic scrubber will be installed near the sulfur storage tanks to capture H2S that can potentially off-gas during unloading and storage.
17.4.2 Limestone
Limestone will be used as a neutralizing reagent to react with any residual acid remaining after leach. Limestone will be sourced from local deposits. It will be crushed and ground at the limestone preparation plant at site. The limestone plant capacity is 28.6 t/h with a target P80 grind size of 44 µm. Ground limestone will be mixed with a slip stream of neutralization wash filtrate to make a 35 wt.% slurry for addition to the neutralization circuit.
17.4.3 Quicklime
Quicklime (CaO) will be the primary reagent for magnesium precipitation. It will be delivered in pebble form to the site by bulk trucks and transferred to a storage silo (1000-t capacity). It will be unloaded pneumatically from the trucks, with dedicated stationary blowers, for unloading two trucks simultaneously. The quicklime will then be slaked with water in a vertical mill type slaker to produce milk-of-lime (MOL or Ca(OH)2) at 25 wt.% solids and transferred to a tank with a 24-hr storage capacity. The lime slaking plant capacity is 13 t/hr.
|
Page 182 |
| Lithium Americas Corp. Feasibility Study, National Instrument 43-101 Technical Report for the Thacker Pass Project, Humboldt County, Nevada, USA |
17.4.4 Sodium Hydroxide
NaOH solution (caustic soda) will be used for off-gas scrubbers and ion exchange resin regeneration. It will be delivered via tanker truck as a 50 wt.% liquid and offloaded to a storage tank with 7 days of capacity. The caustic will be diluted to 20 wt.% during the transfer from the truck to the storage tank.
17.4.5 Soda Ash
Na2CO3 (soda ash) will be the main reagent for Li2CO3 production and will be also used for calcium precipitation. It will be delivered by bulk truck and offloaded to a 1,000-tonne silo. Soda ash will be mixed with reverse osmosis (RO) water to produce a 25 wt.% solution.
17.4.6 Flocculant
Flocculant will be used in the classification area for the thickener. Anionic flocculant will be delivered by bulk bag and transferred to a flocculant makeup system located near the thickener to create a 2 g/L solution prior to use in the plant. The flocculant package is sized for 2.4 dry t flocculant/day addition rate.
Flocculant will also be used in the classification area for the centrifuges, neutralization clarifier, and CCD thickeners and is also used in the calcium precipitation reactor clarifier. Anionic flocculant will be delivered by bulk bag and transferred to a flocculant makeup system located near the centrifuge building to create a 10 g/L solution prior to use in the plant. The flocculant package is sized for 8 dry t flocculant/day addition rate.
17.4.7 Carbon Dioxide
Carbon dioxide (CO2) will be solely used in the lithium bicarbonate reactor as part of Li2CO3 production. A significant amount of CO2 will be captured in the 2nd Stage Li2CO3 crystallizers and recycled back to the bicarbonate reactor, but makeup is needed for any losses. It will be recaptured from the process or delivered to site in liquid form by tanker truck and stored in a pressurized vessel. The liquid will be vaporized for use in the plant.
17.4.8 Ferric Sulfate
Ferric sulfate (Fe2(SO4)3) solution at 12% Fe will be used as a coagulant in calcium precipitation. It will be delivered by tanker truck in liquid form and pumped to a storage tank for use in the plant.
17.4.9 Hydrochloric Acid
HCl (hydrochloric acid) at about 35 weight% will be used to regenerate ion exchange resin used to remove hardness from process solutions. It will be delivered by tanker truck in liquid form and transferred to a storage tank for use in the plant. A scrubber will capture acid vapors generated during the filling of the storage tank.
17.4.10 Miscellaneous
Other miscellaneous chemicals will be used including dust suppressants, chemicals for RO/water treatment, antiscalants, cleaning agents, etc. Acids and other chemicals will be used in the main assay laboratory for sample analysis.
|
Page 183 |
| Lithium Americas Corp. Feasibility Study, National Instrument 43-101 Technical Report for the Thacker Pass Project, Humboldt County, Nevada, USA |
17.4.11 Raw Materials Consumptions
All major raw materials consumption estimates for process plant reagents are based on test work. In the case where test work is not available, consumption rates for minor reagents are estimated based on vendor provided information or best practices. Consumption rates in Table 17-5 are based upon expected mine plan production rates during the life of the Project. Table 17-6 shows the estimated consumption of reagents for the 25-year LOM case.
Table 17-5 Reagent Consumption (40-Year LOM - Base Case)
|
Raw Materials |
Units |
Average |
Average unit tonne |
|
Quicklime |
tonne |
140,000 |
2.10 |
|
Limestone |
tonne |
436,000 |
6.52 |
|
Soda Ash |
tonne |
248,000 |
3.71 |
|
Hydrochloric Acid 35% |
tonne |
1,400 |
0.02 |
|
Ferric Sulfate 60% |
tonne |
400 |
0.01 |
|
Caustic Soda 50% |
tonne |
7,200 |
0.11 |
|
Flocculant |
tonne |
4,500 |
0.07 |
|
Ammonia |
tonne |
400 |
0.005 |
|
Liquid Sulfur (calculated) |
tonne |
656,000 |
9.81 |
|
Water Treatment (SAP) |
Liter |
1,900 |
0.03 |
|
Diesel Off-Road |
gallon |
4,684,000 |
70.13 |
|
Diesel Highway |
gallon |
0 |
0.00 |
|
Unleaded Gasoline (Process Plant) |
gallon |
93,000 |
1.38 |
|
Propane (Process Plant) |
tonne |
1,200 |
0.02 |
|
Liquid Sulfuric Acid @ 98.5% (Purchased) |
tonne |
0 |
0.00 |
Table 17-6 Reagent Consumption (First 25 Years of 40-Year Case)
|
Raw Materials |
Units |
Average Annual |
Average unit tonne per tonne of |
|
Quicklime |
tonne |
150,000 |
2.14 |
|
Limestone |
tonne |
400,000 |
5.72 |
|
Soda Ash |
tonne |
261,000 |
3.73 |
|
Hydrochloric Acid 35% |
tonne |
1,500 |
0.02 |
|
Ferric Sulfate 60% |
tonne |
500 |
0.01 |
|
Caustic Soda 50% |
tonne |
7,200 |
0.10 |
|
Flocculant |
tonne |
4,400 |
0.06 |
|
Ammonia |
tonne |
300 |
0.004 |
|
Liquid Sulfur (calculated) |
tonne |
634,000 |
9.07 |
|
Water Treatment (SAP) |
Liter |
1,900 |
0.03 |
|
Diesel Off-Road |
gallon |
4,330,000 |
61.93 |
|
Page 184 |
| Lithium Americas Corp. Feasibility Study, National Instrument 43-101 Technical Report for the Thacker Pass Project, Humboldt County, Nevada, USA |
|
Raw Materials |
Units |
Average Annual |
Average unit tonne per tonne of |
|
Diesel Highway |
gallon |
0 |
0.00 |
|
Unleaded Gasoline (Process Plant) |
gallon |
93,000 |
1.32 |
|
Propane (Process Plant) |
tonne |
1,100 |
0.02 |
|
Liquid Sulfuric Acid @ 98.5% (Purchased) |
tonne |
0 |
0.00 |
17.5 Plant Water
The plant site will have several water systems including raw water, potable water, demineralized water, and fire water. Site water systems are described in Section 18 of this report.
17.5.1 Water Supply
Raw water is able to be introduced to various locations within the process including the mine facilities raw water tank, the mine water truck fill stand, the sulfuric acid plant, and various locations in the process plant. All make-up water for the process plant is added in the beneficiation circuit. Makeup water for the process plant accounts primarily for water lost in tails. Water evaporated during crystallization is collected as condensate and recycled for use in the process. Water estimated to be used in the plant, based on process mass balance Rev. F HMB, and for mining operations, is shown in Table 17-7. Water demand is estimated to be approximately 5% below the current allowance.
Table 17-7 Plant Water Use
|
Site Demand |
Units |
Phase 1 Value |
Phase 2 Value |
|
Raw Water |
m3/hr |
279 |
559 |
|
Potable |
m3/hr |
2 |
4 |
|
Mine Operations |
m3/hr |
100 |
200 |
|
Total Water Consumption |
m3/hr |
381 |
763 |
|
acre-ft/yr |
2,707 |
5,416 |
|
|
Available Water |
m3/hr |
402 |
803 |
|
acre-ft/yr |
2,850 |
5,700 |
17.5.2 Steam
High pressure steam is generated in the sulfuric acid plant from the conversion of liquid sulfur to sulfuric acid. This steam reports to a steam turbine generator for the production of power. To meet the steam demands of the process plant, both medium pressure (10 barg) and low pressure (4.8 barg) steams are extracted from the generator and exported to the process plant. The steam consumers and consumption rates are shown in Table 17-8.
Table 17-8 Steam Use
|
Site Demand |
Units |
Pressure Class |
Phase 1 Value |
Phase 2 Value |
|
Li2CO3 Crystallization |
kg/h |
Low |
33,800 |
67,600 |
|
ZLD Crystallization |
kg/h |
Low |
1,800 |
3,600 |
|
MgSO4 Crystallization |
kg/h |
Medium |
500 |
1,000 |
| Li2CO3 Dryer | kg/h | Medium | 1,800 | 3,600 |
| Total Steam Consumption | kg/h | 37,900 | 75,800 |
|
Page 185 |
| Lithium Americas Corp. Feasibility Study, National Instrument 43-101 Technical Report for the Thacker Pass Project, Humboldt County, Nevada, USA |
The steam consumers used internally by the sulfuric acid plant are not listed above.
Only a small portion of the steam is condensed in heat exchangers that allows it to be returned to the sulfuric acid plant for boiler feed water.
The majority of the steam is used in either steam jet ejectors (MgSO4 crystallization system) where it is condensed and combines with cooling tower water, or directly injected into a crystallizer (Li2CO3 crystallization system) where it partially condenses into the process fluid and partially evaporates water which reports to the process condensate system. The process condensate is cooled to three different temperatures using air-to-liquid coolers and a cooling tower. The condensate at the different temperatures is distributed to various users including filter cloth wash, CCD washing, solids repulping, ion exchange, RO feed, reagent systems, tail gas scrubber and cooling towers for make-up.
17.6 Power
The estimated average running load demand for the site is shown in Table 17-9. Electrical power supply is discussed in Section 18. Total imported power will be less than demand due to power generated on-site from the sulfuric acid plant. Power generated by the sulfuric acid plant is shown in Section 18.8.
Table 17-9 Power Demand by Area (based on Equipment List for DFS Load Study (Rev N, supplied by ITAC)
|
Power Demand by Area |
Phase 1 kW |
Phase 2 kW |
Phase 1+2 kW |
|
Mine Operations |
21 |
1 |
22 |
|
Crushing / Grinding |
5,829 |
4,841 |
10,671 |
|
Attrition Scrubbing Area (w/ Slurry Transfer) |
|||
|
Classification |
|||
|
Acid Leaching |
5,873 |
5,873 |
11,747 |
|
Neutralization |
|||
|
Neutralization/CCD |
|||
|
Neutralization Filtration |
|||
|
Magnesium Sulfate Crystallization |
17,773 |
17,773 |
35,546 |
|
Magnesium Precipitation |
|||
|
Magnesium Precipitation Filtration |
|||
|
Calcium Precipitation |
|||
|
Cation Removal Ion Exchange |
|||
|
Lithium Carbonate Crystallization |
12,356 |
11,966 |
24,323 |
|
Lithium Carbonate Product Handling |
|||
|
ZLD Crystallization |
|
Page 186 |
| Lithium Americas Corp. Feasibility Study, National Instrument 43-101 Technical Report for the Thacker Pass Project, Humboldt County, Nevada, USA |
|
Power Demand by Area |
Phase 1 kW |
Phase 2 kW |
Phase 1+2 kW |
|
Liquid Sulfuric Acid Plant |
14,599 |
14,561 |
29,160 |
|
Liquid Sulfur |
|||
|
SAP Gas & Strong Acid |
|||
|
Tail Gas Treatment |
|||
|
BFW and Steam System |
|||
|
Cooling Water System |
|||
|
Turbo Generator |
|||
|
Sulfuric Acid Product |
|||
|
Facility Load |
|||
|
13.8 kV Distribution and Generators |
7,952 |
2,371 |
10,323 |
|
Compressed Air |
|||
|
Water Systems |
|||
|
Tailings Disposal |
579 |
347 |
927 |
|
Reagents |
1,378 |
1,116 |
2,494 |
|
Site Security Building |
1,873 |
270 |
2,143 |
|
Admin Building |
|||
|
Plant Warehouse Building |
|||
|
Plant Maintenance Building |
|||
|
Packaging Warehouse Building |
|||
|
Plant Laboratory Building |
|||
|
Truck Facility Building |
|||
|
Well Field Security Building |
|||
|
Process Plant Control Building |
|||
|
Electric Heat Tracing Loads |
7,213 |
7,213 |
14,426 |
|
E-Houses Utilities Loads |
|||
|
Plant Lighting & Misc. Loads |
|||
|
Total |
75,446 |
66,334 |
141,780 |
17.7 Air Service
A compressed air system will be located at the attrition scrubbing and classification areas located near the mine facilities, approximately 3 km from the main processing plant. The system will be comprised of compressors, a dryer, plant, instrument air receivers, and distribution piping. All air will be dried prior to being distributed to both plant air and instrument air users. The compressors and dryer will be located in a building and the air receivers will be located outdoors.
A central compressed air system will be located at the main processing plant area and will be comprised of compressors, dryers, and air receivers. All air will be dried prior to being distributed to both plant air and instrument air users. The distribution system will be comprised of main supply headers to dedicated satellite air receivers for both plant air and instrument air in various areas of the plant. The compressors and dryers will be located in a building and the air receivers (central and satellite) will be located outdoors.
Dedicated compressors will be provided for the neutralization filters and will be located near the filter plant. The system will be comprised of three compressors (two operating and one standby), an air receiver, and distribution piping. The compressors and air receiver will be located in a building.
Dedicated compressors will be provided for the magnesium precipitation filters and will be located near the filter plant. The system will be comprised of one compressor, an air receiver, and distribution piping. The compressor and air receiver will be located in the same building as the neutralization filters compressed air equipment.
|
Page 187 |
| Lithium Americas Corp. Feasibility Study, National Instrument 43-101 Technical Report for the Thacker Pass Project, Humboldt County, Nevada, USA |
17.8 Quality Control
Sample preparation and analytical equipment will be available to handle the daily requirements of the mine and processing plant. Streams will be monitored using on-line instrumentation where appropriate, which may include pH control and reagent addition control systems. The data will be used to optimize process conditions. Routine samples of intermediate products and final products will be collected and analyzed in an assay laboratory where standard assays/analyses will be performed. The data obtained will be used for product quality control and routine process optimization. Feed and tailings samples will also be collected and subjected to routine assay.
The analytical laboratory will consist of a full set of assay instruments for lithium analysis, including an Inductively Coupled Plasma Spectrometer (ICP), and other instruments such as moisture balance, pH, and redox potential meters.
17.9 Sampling
Samplers will be installed in locations that are required for metallurgical accounting and process control purposes. Installation location and type of major sampling equipment related to the plant metallurgical balance is listed in Table 17-10. Sampling points for process control are listed in Table 17-11.
Table 17-10 Metallurgical Accounting Sampler Summary, Major Process Inlets/Outlets
|
Location |
Sampler Type |
Purpose |
Information |
|
Log Washer Feed Belt |
Cross-cut sampler |
Metallurgical Balance |
Mass and elemental feed to plant |
|
Classification-Coarse Gangue |
Cross-cut sampler |
Metallurgical Balance |
Mass and elemental loss to coarse gangue |
|
Neutralization filtration |
Cross-cut sampler |
Metallurgical Balance |
Mass and elemental loss to filter cake |
|
CTFS - salt conveyor |
Cross-cut sampler |
Metallurgical Balance |
Mass and elemental loss to salts |
|
Li2CO3 production |
In-line composite |
Metallurgical Balance, QA/QC |
Mass Li2CO3 produced, quality assurance |
Table 17-11 Process Control Sampler Summary
|
Location |
||
|
Attrition Scrubber Discharge |
MgSO4 Evaporator Feed |
Li Carbonate Feed |
|
Classification Cyclone Feed |
MgSO4 Precipitation Feed |
Li Carbonate Dryer Discharge |
|
Classification Cyclone Overflow |
IX Feed |
Na/K Sulfate Salts Feed |
|
Acid Leach Feed |
IX Discharge |
Na/K Sulfate Salts Crystals |
|
Neutralization Filtrate |
IX Product |
Na/K Sulfate Salts Purge |
17.10 Auxiliary Systems
Auxiliary systems such as reagent mixing and storage, maintenance, and office facilities, laboratory, etc. are discussed in Section 18 of this report.
|
Page 188 |
| Lithium Americas Corp. Feasibility Study, National Instrument 43-101 Technical Report for the Thacker Pass Project, Humboldt County, Nevada, USA |
17.11 Process Control Philosophy
The control philosophy for the plant is for all unit operations to be controlled by a Plant Control System (PCS) from a central control room with a satellite control room in the attrition scrubbing area. Local controls will be minimized, but options for wireless tablet-based field control stations to provide operator flexibility may be included. The control room operators will input set points, operate valves, start/stop equipment and be alerted to alarms and interlocks via the human machine interface (HMI). Data from both the Distributed Control System (DCS) and analytical laboratory will be fed to an integrated data management system (DMS). Data from both the PCS and analytical laboratory will be fed to the DMS. Vendor instrumentation packages will be integrated with the central control system. The plant central control room will be staffed by trained personnel 24 h/d.
Intelligent type motor control centers will be located in electrical rooms throughout the facilities. A network interface to the process control system will facilitate remote operation and monitoring of motor control center equipment. Field instrumentation and devices will be hardwired to the process control system except where wireless solutions are cost effective.
A site wide process control network will be established in a ring architecture wherever feasible. This will be a combination of CAT6a and fiber optic where appropriate.
|
Page 189 |
| Lithium Americas Corp. Feasibility Study, National Instrument 43-101 Technical Report for the Thacker Pass Project, Humboldt County, Nevada, USA |
18 Project Infrastructure
The Project is planned to be constructed in two phases. To support lithium carbonate production as discussed in Section 17, Phase 1 will consist of a single sulfuric acid plant with a nominal production rate of 3,000 tonnes per day sulfuric acid. Phase 2 will begin three years later with the addition of a second sulfuric acid plant with an additional nominal production rate of 3,000 t/d. Mined material and tailings will be moved by conveyors and trucks and the infrastructure needed to support these production rates are summarized in this section.
18.1 Overall Site General Arrangement
The mining and Processing Plant operations are located within the McDermitt Caldera in northwest Nevada. Lithium-rich clays are mined and fed into crushing and mineral beneficiation equipment at the mine site two miles west of the processing plant. Slurry is pumped to the Processing Plant where water is recovered and pumped back from the process for reuse. Raw water is sourced via aquifer-fed wells 7 miles east of the processing plant. See the overall site general arrangement in Figure 18-1.
Figure 18-1 Overall Site General Arrangement
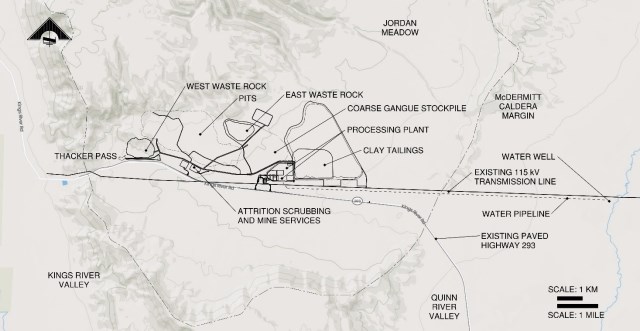
Source: M3, 2022
18.2 Process Plant General Arrangement
A portion of the process facilities encompassing mineral beneficiation and classification is located due east of the Mine Service Area near the ore body. This area includes the ROM pad, feeder breakers and mineral sizers, log washing and attrition scrubbing. Additionally, the front end of the classification circuit is located on this pad and consists of the hydrocyclone cluster, hydraulic classifiers, thickening and coarse gangue discharge and stacking system.
The remainder of the process plant is located approximately 2 miles east. The slurry is transferred to the downstream plant via a pipeline and trench along the southern edge of the haul road. See Figure 18-2 for the general arrangement layout of the process facilities. Product flows are generally clockwise starting in the western edge of the upper third zone of the layout. The remainder of the classification (centrifuges), leach, and neutralization circuits begin the process flow on this site. Next the solution is sent to the counter current decantation (CCD) circuit before being sent to the filtration area located on the northeastern side. Magnesium removal continues south to a central section of the plant before flowing west to calcium precipitation, calcium and boron ion exchange, evaporation, and lithium carbonate production followed by ZLD crystallization. The packaging system, along with the warehouse, are immediately west of the lithium carbonate plant to minimize product transfer distance. The sulfuric acid plant is situated in the southern third of the layout in recognition of prevailing winds. The traffic flow is largely one-way counterclockwise on the site perimeter with maintenance access between major process areas.
| Page 190 |
| Lithium Americas Corp. Feasibility Study, National Instrument 43-101 Technical Report for the Thacker Pass Project, Humboldt County, Nevada, USA |
A primary east-west pipe rack and a secondary north-south pipe racks contain much of the process and utility piping, electrical and instrumentation feeds.
18.3 Reagents, Consumables and Shipping
Limestone, quicklime, flocculant, and soda ash reagents are delivered to the processing plant in solid form via trucks while liquid sulfur, propane, carbon dioxide, ferric sulfate, caustic soda, and hydrochloric acid are delivered as liquids, also by trucks. The liquid sulfur delivery route has been carefully planned to remain on the southern edge of the processing facilities to minimize potential incidents with other traffic on site. Limestone and quicklime are the next highest delivery loads coming to site. As such these deliveries have been designed to stay on the north side of the process plant to similarly reduce potential traffic incidents. The remaining reagents/consumables have delivery points in the central plant at a low daily delivery rate with the exception of soda ash.
Gasoline, on and off highway diesel along with typical plant warehouse deliveries have been kept to the western portion of the plant with direct access from the main entry minimizing delivery truck exposure to the site. The large equipment warehouse house is located directly south of these facilities.
Battery-grade lithium carbonate is packaged in bags, and flexible intermediate bulk containers (FIBC or bulk bags) and are stored in a warehouse on the west side which is collocated with the plant warehouse. This design allows the advantage of a shared truck maneuvering area and ease of getting into and out of the warehouse area without entering the process area.
18.4 Ancillary Buildings
The main administration office building and analytical laboratory are located in the southwest corner of the process plant site with direct access from the highway and from the main security entrance. The administration building houses a change room, shift change area, medical areas as well as office space. A helipad is situated near to the administrative office area and the security entrance for ready access. A mill maintenance building is planned on the northeast corner of the plant in close proximity to the filtration building. Two control buildings have been provided. The main plant control building is centrally located for ease of access to the majority of the process plant site. A dedicated sulfuric acid plant control building has been provided within the sulfuric acid plant area. Lastly a small control building is planned at the mineral beneficiation area to manage the crushing, attrition, and front end of the classification unit operations.
| Page 191 |
| Lithium Americas Corp. Feasibility Study, National Instrument 43-101 Technical Report for the Thacker Pass Project, Humboldt County, Nevada, USA |
Figure 18-2 Process Facility General Arrangement (Phase 1 Only)
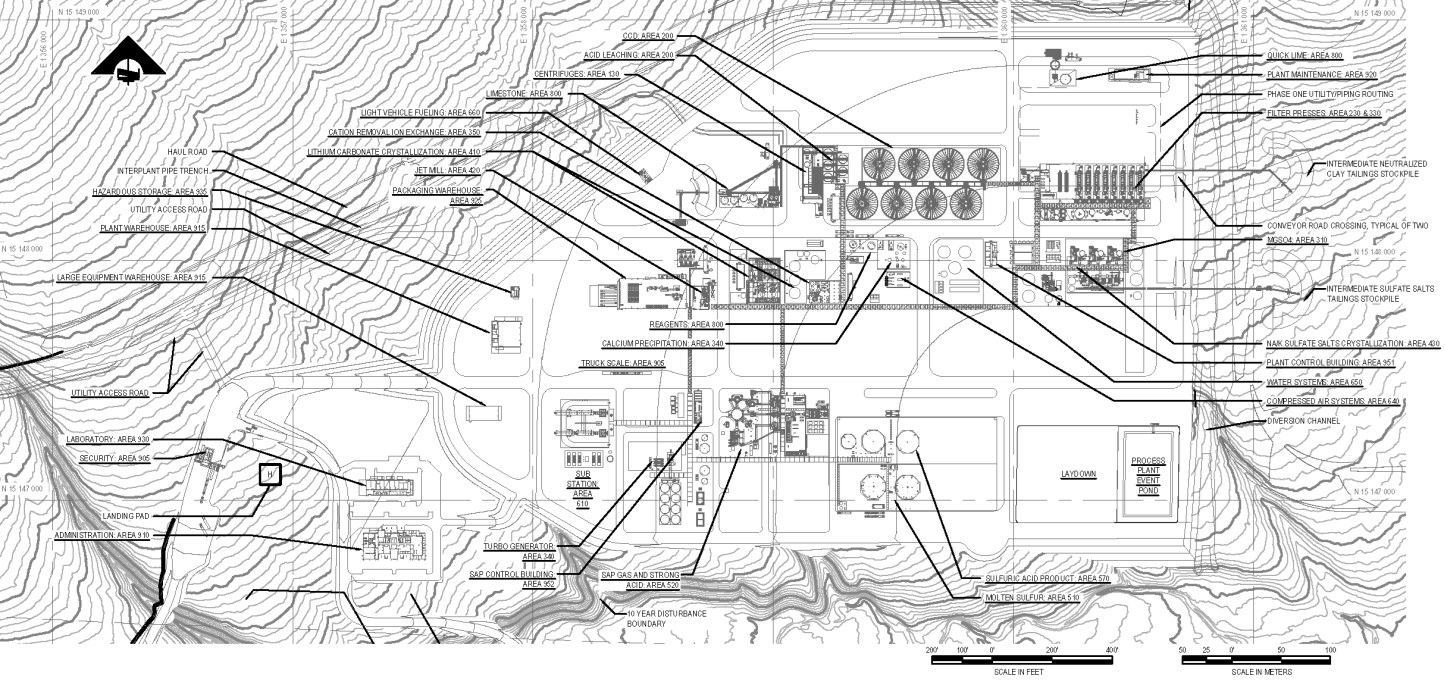
Source: M3, 2022
| Page 192 |
| Lithium Americas Corp. Feasibility Study, National Instrument 43-101 Technical Report for the Thacker Pass Project, Humboldt County, Nevada, USA |
18.5 Site Access
The Project envisions improving the junction of US-95 and SR-293 to improve and handle the planned traffic flow. The plant development contemplates a total of three new entrances and utilizes one existing entrance from SR-293 onto the Project site as depicted on Figure 18-3. Below is a description of the intended uses for each of the proposed entrance locations from SR-293 and the junction improvement.
Figure 18-3 Site Entrances
![]()
Source: M3, 2022
18.5.1 US-95 / SR-293 Junction
Located in the town of Orovada, Nevada is the junction of US route 95 and Nevada State Route 293 (see Figure 18-4). Nearly all traffic related to the construction and operations of Thacker Pass will travel north bound on US-95 and turn west at the SR-293 junction. This road junction will be upgraded to accommodate the additional traffic to site.
| Page 193 |
| Lithium Americas Corp. Feasibility Study, National Instrument 43-101 Technical Report for the Thacker Pass Project, Humboldt County, Nevada, USA |
Figure 18-4 Route Junction Satellite View
![]()
Note: US Route 95 is also called Veterans Memorial Highway.
Source: M3, 2022
18.5.2 Pole Creek Road Entrance
Pole Creek Road is an established dirt road intersecting with SR-293 on the eastern boundary of the Project site. The layout will utilize this road to establish a construction access entrance. It is expected that the vehicle types using this entrance will include legal haul tractor-trailers, concrete ready-mix trucks, flat bed deliveries for bulk materials such as structural steel/piping/etc., mobile equipment transport trucks, and wide load transports delivering plant facility equipment.
18.5.3 Administration Entrance
Approximately 11,800 ft west of Pole Creek Road is the proposed entrance for the Administrative Office facilities. This entrance is intended to service the light vehicle traffic with the goal of keeping such traffic separate from heavy truck deliveries to the processing facility operations once the process plant has been commissioned and is in regular operations. This is intended to increase traffic safety.
18.5.4 Process Facility Entrance
Approximately 535 m (1,760 ft) west of the Administration Offices entrance is the main Processing Facilities entrance. This location will be the receiving point for all heavy trucks delivering materials and equipment to the processing plant operation. Heavy truck traffic will be directed to this location in an effort to separate the heavy and light traffic with the goal of increasing traffic safety entering and exiting SR-293. During construction and prior to the need for a large quantity of heavy truck deliveries this will be used as a secondary construction entrance. There is limited light vehicle traffic planned at this location once full-scale operations are in place.
| Page 194 |
| Lithium Americas Corp. Feasibility Study, National Instrument 43-101 Technical Report for the Thacker Pass Project, Humboldt County, Nevada, USA |
18.5.5 Mine Area Entrance
Approximately 2,530 m (8,300 ft) west of the Process Facilities entrance is the Mine Site entrance. This location is intended to service the mine site personnel access and will largely receive employee's light vehicles, personnel buses, and maintenance/service vehicles. All heavy truck deliveries destined for the Mine Site will be received at either the Pole Creek Road entrance or the Process Facility entrance.
18.6 Raw Material Logistics
Raw materials for the Project are to be delivered to the site by over highway trucks during the life of mine. A local rail-to-truck transloading facility located in Winnemucca will allow for transfer of most raw materials for delivery to the Project site. A summary of the primary raw materials to be used during operations, and their logistics, are below (Table 18-1). This will include the limestone grinding and storage facility, soda ash transloading facility and the sulfur transloading facility. The cost per tonne of the raw material is included in the OPEX for the consumables.
Table 18-1 Life of Mine Primary Raw Material Logistics Scheme
| Raw Material |
Description | Approximate Truck Loads per Day |
Origin |
| Liquid Sulfur | Includes unloading, storage, and delivery to the plant via 39-tonne tanker from a transloading facility in Winnemucca, NV. | 47 | Tampa benchmark pricing + freight to Western North America; exact origin TBD |
| Soda Ash | Includes unloading, storage, and delivery to the plant via 39-tonne trailer from a transloading facility in Winnemucca, NV. | 18 | Green River, Wy |
| Quicklime | Includes unloading, storage, and delivery to the plant via 39-tonne trailer from Savage transloading facility in Golconda, NV. Optionally, may be shipped to site from a transloading facility in Winnemucca, NV with minor capital improvements. | 10 | Pilot Peak, NV or Western UT |
| Limestone | Includes operation of in-pit primary crusher, delivery to the process plant via 39-tonne trailer and secondary limestone crushing/screening/grinding plant at process plant. | 31 | (Quarried Locally) |
| Fuel | Includes diesel, unleaded gasoline, propane and their unloading, and delivery to the plant via 10,000 or 12,500 gallon trailer to site. Optionally, may be shipped to site from a transloading facility in Winnemucca, NV. | >1 | Via Winnemucca fuel market by owner or others |
| Other | Includes delivery to the plant via 21-tonne trailer of Ferric Sulfate, Hydrochloric Acid, Caustic Soda, and Flocculant direct to site. Optionally, may be shipped to site from a transloading facility in Winnemucca, NV with minor capital improvements. | >6 | Bulk flocculant direct from Riceboro, GA Low volume reagents from SLC, UT and Sparks, NV markets |
| Page 195 |
| Lithium Americas Corp. Feasibility Study, National Instrument 43-101 Technical Report for the Thacker Pass Project, Humboldt County, Nevada, USA |
18.7 Power Supply
Electrical power for the Project will be supplied by on-site power generation and via the grid connected to the nearby local electric utility cooperative, Harney Electric Cooperative (HEC) 115 kV transmission network. The Project will generate a portion of the steady-state power demand via Steam Turbine Generators (STG) driven by steam produced by the sulfuric acid plant. The remainder of steady-state loads and any peaks will be serviced by power purchased from HEC.
The main onsite electrical infrastructure comprises the following:
18.7.1 In-Plant Power Generation
The acid plant produces steam during the production of sulfuric acid. Steam generated by the acid plants will be used in the lithium processing plants and to generate approximately 90 MW of electricity.
The in-plant power generation will consist of two approximately 45 MW Steam Turbine Generators, one each on Phase 1 and Phase 2, that provide normal power to the plant and Stand-by Diesel Generators that provide power for the plant black start operation and critical loads that require backup power upon loss of normal power.
LNC will not export power from in-plant generation to the HEC grid.
18.7.2 Interconnection to Utility Grid
Thacker Pass is located in the service territory of HEC. Since the Nevada power market is regulated, LAC will purchase all imported power from HEC. HEC does not generate any power and has a full requirements contract with the Department of Energy's Bonneville Power Administration (BPA). BPA delivers hydropower produced in the Columbia River Basin. Power generated by BPA is delivered to HEC in Winnemucca, NV, via BPA's Southern Inertie and NV Energy's transmission system.
LAC submitted a Power Service Application to HEC in March of 2021. HEC then initiated an Interconnection Study for their system and a System Impact Study with BPA. Note that the wheeling of power by NV Energy is part of BPA's scope. The HEC Interconnection Study is complete and the projected upgrade costs are included in this report. With the budgeted upgrades, HEC's system can reliably support LAC's load.
BPA requested an updated load forecast and was provided with the maximum transmission capacity results from the HEC Interconnection Study to use as the maximize power availability required from BPA. HEC has signed a reimbursement agreement with BPA and BPA's Transfer Group is actively working with NV Energy. HEC has indicated that the power cost is anticipated to be approximately $60/MWh however this will only be finalized once both studies are complete. HEC has indicated that BPA power will be available for Phase 1 and 2 once NV Energy completes the Greenlink West project in December 2026. LAC, HEC and NV Energy are working together on an interim power plan for the months between commissioning and Greenlink coming online. HEC also indicated that no funds are required from LAC for upgrading NV Energy's system as these are all covered under Greenlink West.
An existing radial 115 kV transmission circuit, owned and operated by HEC, currently runs parallel to the proposed Project site. The plant location is approximately 9 miles from the Kings River Switching Substation on the 20.7-mile Kings River Switching Substation--Kings River Substation 115 kV transmission line. The line from the Kings River Switching Station will be upgraded from 3/0 conductors to 556 MCM ACSR conductors to the new point of interconnect at Thacker Pass. At Thacker Pass, HEC will add a new point of interconnect switching station to service the LAC substation and continue service to the Kings River Substation.
| Page 196 |
| Lithium Americas Corp. Feasibility Study, National Instrument 43-101 Technical Report for the Thacker Pass Project, Humboldt County, Nevada, USA |
The grid interconnection will be located approximately 305 m (1,000 ft) to the south of the proposed process plant substation adjacent to SR 293. The grid interconnection switching station will be located directly beneath the existing 115 KV transmission line. HEC will make additional communication and protection upgrades to their 115 KV network to improve reliability of service to the proposed LAC facility.
The new LAC substation will include:
Phase 1:
Phase 2: (additional equipment)
18.7.3 Power Distribution
18.7.3.1 13.8 kV Plant Distribution
The 13.8 kV main distribution substation will consist of one 13.8 kV metal-clad switchgear (3 main breakers and feeder breakers including one spare) to allow for the distribution of electrical power to the local substations in the plant. The equipment will be housed in a prefabricated electrical building (E-house) located centrally adjacent to the utility interconnection substation and the acid plant.
The main distribution substation will supply electrical power to downstream substations in each area throughout the plant at 13.8 kV, 3-phase, 60 Hz.
Power factor correction will be used where technically required to meet the minimum power factor requirements from utility.
The plant design will allow the addition of another 13.8 kV main distribution substation which will be installed in Phase 2 of the Project.
| Page 197 |
| Lithium Americas Corp. Feasibility Study, National Instrument 43-101 Technical Report for the Thacker Pass Project, Humboldt County, Nevada, USA |
18.7.3.2 System Voltages
Locally positioned substations throughout the plant will be used to transform the electrical power to a voltage suitable for utilization by the various local electrically powered equipment. The distribution voltages are summarized in Table 18-2 below.
The majority of cable runs will be supported on cable trays mounted on the pipe racks. Underground installation is used to support the well field for water supply. Ariel distribution is provided to the mine site.
Table 18-2 System Voltages
|
Equipment |
Nominal |
No of |
Frequency (Hz) |
Grounding Remarks |
|
Incoming Supply |
115 kV |
3 |
60 Hz |
TBD |
|
In-Plant Generation |
13.8 kV |
3 |
60 Hz |
Low Resistance Grounding |
|
MV Distribution |
13.8 kV |
3 |
60 Hz |
Low Resistance Grounding |
|
MV Distribution |
4.16 kV |
3 |
60 Hz |
Low Resistance grounding |
|
LV Distribution |
480 V |
3 |
60 HZ |
High Resistance grounding |
|
AC UPS |
120 V |
1 |
60 Hz |
Solid grounding |
|
Lighting |
|
|
|
TBD |
Table 18-3 Motor Voltages
| Motor HP Range | DOL* Starting |
Reduced Voltage** Starting |
Motor Rated Voltage (V) |
System Voltage (V) |
Phases |
| Below 0.5 | X | X | 115 | 120 | 1 |
| 0.5 to 200 | X | 460 | 480 | 3 | |
| Above 200 up to 6,000 | X | 4,000 | 4,160 | 3 | |
| 0.5 up to 500 | X | 460 | 480 | 3 | |
| 500 up to 6,000 | X | 4,000 | 4,160 | 3 | |
| 6,000 and above | X | X | 13,200 | 13,800 | 3 |
* Direct On Line
** Reduced Voltage Starting (soft starter or variable frequency drive)
18.7.3.3 Electrical Loads
The total connected load for the plant is calculated at 200.9 MW with a calculated operating demand of 141.8 MW. The anticipated load breakdown is summarized in Table 18-4 below. The total power generation is calculated at 89.9 MW from two sulfuric acid plants. Total power import is anticipated to be 51.9 MW (see Table 18-5).
| Page 198 |
| Lithium Americas Corp. Feasibility Study, National Instrument 43-101 Technical Report for the Thacker Pass Project, Humboldt County, Nevada, USA |
Table 18-4 Electrical Load Breakdown
|
Area |
Phase 1 |
Phase 1 |
Phase 2 |
Phase 2 |
Total |
Total |
|
(MW) |
||||||
|
Acid Plant |
20.7 |
14.6 |
20.6 |
14.6 |
41.3 |
29.2 |
|
Process Plant / Mine |
86.7 |
60.8 |
72.9 |
51.8 |
159.6 |
112.6 |
|
Total |
107.4 |
75.4 |
93.5 |
66.4 |
200.9 |
141.8 |
Table 18-5 Electrical Load Generation vs. Import
|
Power |
Phase 1 (MW) |
Phase 2 (MW) |
Total Phase 1 & Phase 2 (MW) |
|
Generation |
44.9 |
44.9 |
89.9 |
|
Import |
30.5 |
21.4 |
51.9 |
18.7.3.4 Mine Area, Mine Area Booster Pumps, Attrition Scrubbing, Classification
Power to the mine area, mine area booster pumps, Attrition Scrubbing, Classification will be supplied from the main distribution E-house switchgear by a 13.8 kV overhead distribution line on single wooden poles to the Mine e-house, transformers and switchgears to distribute the power to various loads at the required voltage. voltage.
18.7.3.5 Processing Plant
Power to the processing plant will be supplied from the main distribution substation switchgear via 13.8 kV cables routed in cable trays mounted on pipe racks to supply the process loads while providing feeders to the following areas:
Each area substation will contain all the necessary e-houses, transformers, switchgear and motor control centers to distribute the power to various loads at the required voltage within the process area.
18.7.3.6 Well Site, Booster Pumps, E-Pond Pumps, CTFS Pumps
Power to the water well site, booster pumps, e-pond pumps and CTFS pumps will be supplied from the main distribution E-house switchgear via 13.8 kV cables routed underground in conduits.
| Page 199 |
| Lithium Americas Corp. Feasibility Study, National Instrument 43-101 Technical Report for the Thacker Pass Project, Humboldt County, Nevada, USA |
18.7.4 Power Tabulation
Demand loads for Phase 1 and Phase 2 are 75.5 MW and 66.3 MW respectively, for a combined total of 141.8 MW demand during Phase 2. Power will be generated at the sulfuric acid plant from the steam generated from excess heat along with an anticipated import load of 455 GWh/year required. Thacker Pass is located in the service territory of Harney Electric Cooperative (HEC). Since the Nevada power market is regulated, LAC will purchase all imported power from HEC. HEC infrastructure to support this import load will need to be improved. The following table tabulates the power requirements for the Project.
Table 18-6 Project Power Demands
|
PHASE 1 |
|||
|
Functional |
Description |
Installed By Area |
Demand By Area |
|
050 |
Mine Operations |
175 |
20.87 |
|
110 |
ROM Feed and Log Washing |
977 |
772 |
|
120 |
Attrition Scrubbing Area (w/ Slurry Transfer) |
1,632 |
1,204 |
|
130 |
Classification |
7,107 |
3,853 |
|
210 |
Acid Leaching |
212 |
165 |
|
220 |
Neutralization Clarification |
649 |
309 |
|
225 |
Neutralization CCD |
3,453 |
1,565 |
|
230 |
Neutralization Filtration |
8,057 |
3,834 |
|
310 |
Magnesium Sulfate Crystallization |
21,736 |
16,980 |
|
320 |
Magnesium Precipitation |
66 |
33 |
|
330 |
Magnesium Precipitation Filtration |
1,048 |
528 |
|
340 |
Calcium Precipitation |
209 |
90 |
|
350 |
Cation Removal Ion Exchange |
268 |
142 |
|
410 |
Lithium Carbonate Crystallization |
3,237 |
2,426 |
|
420 |
Lithium Carbonate Product Handling |
4,877 |
3,901 |
|
430 |
Na/K Sulfate Salts Crystallization (ZLD) |
7,695 |
6,029 |
|
500 |
Liquid Sulfuric Acid Plant |
729 |
397 |
|
510 |
Liquid Sulfur |
115 |
48 |
|
520 |
SAP Gas & Strong Acid |
10,696 |
8,288 |
|
530 |
Tail Gas Treatment |
1,247 |
499 |
|
540 |
BFW and Steam System |
1,785 |
729 |
|
550 |
Cooling Water System |
345 |
145 |
|
560 |
Turbo Generator |
3,588 |
2,397 |
|
570 |
Sulfuric Acid Product |
213 |
85 |
|
|
Facility Load |
2,012 |
2,012 |
|
610 |
13.8kV Distribution and Generators |
455 |
455 |
|
640 |
Compressed Air |
1,496 |
942 |
| Page 200 |
| Lithium Americas Corp. Feasibility Study, National Instrument 43-101 Technical Report for the Thacker Pass Project, Humboldt County, Nevada, USA |
|
PHASE 1 |
|||
|
Functional |
Description |
Installed By Area |
Demand By Area |
|
650 |
Water Systems |
10,769 |
6,555 |
|
700 |
Tailings Disposal |
1,021 |
579 |
|
800 |
Reagents |
2,214 |
1,378 |
|
905 |
Site Security Building |
45 |
45 |
|
910 |
Admin Building |
500 |
500 |
|
915 |
Plant Warehouse Building |
75 |
75 |
|
920 |
Plant Maintenance Building |
500 |
300 |
|
925 |
Packaging Warehouse Building |
300 |
300 |
|
930 |
Plant Laboratory Building |
500 |
500 |
|
935 |
Truck Facility Building |
20 |
20 |
|
|
Well Field Security Building |
20 |
20 |
|
951 |
Process Plant Control Building |
113 |
113 |
|
Misc. |
Electric Heat Tracing Loads |
1,300 |
1,300 |
|
|
HVAC/LIGHTS/MISC |
5,913 |
5,913 |
|
|
Grand Total |
107,370 |
75,446 |
|
PHASE 2 |
||||
|
Functional |
Description |
Phase 2 |
Installed By Area |
Demand By Area |
|
050 |
Mine Operations |
0 |
12 |
1 |
|
110 |
ROM Feed and Log Washing |
0.5 |
488 |
386 |
|
120 |
Attrition Scrubbing Area (w/ Slurry Transfer) |
0.5 |
816 |
602 |
|
130 |
Classification |
1 |
7,107 |
3,853 |
|
210 |
Acid Leaching |
1 |
212 |
165 |
|
220 |
Neutralization Clarification |
1 |
649 |
309 |
|
225 |
Neutralization CCD |
1 |
3,453 |
1,565 |
|
230 |
Neutralization Filtration |
1 |
8,057 |
3,834 |
|
310 |
Magnesium Sulfate Crystallization |
1 |
21,736 |
16,980 |
|
320 |
Magnesium Precipitation |
1 |
66 |
33 |
|
330 |
Magnesium Precipitation Filtration |
1 |
1,048 |
528 |
|
340 |
Calcium Precipitation |
1 |
209 |
90 |
|
350 |
Cation Removal Ion Exchange |
1 |
268 |
142 |
|
410 |
Lithium Carbonate Crystallization |
1 |
3,237 |
2,426 |
|
420 |
Lithium Carbonate Product Handling |
1 |
4,389 |
3,511 |
| Page 201 |
| Lithium Americas Corp. Feasibility Study, National Instrument 43-101 Technical Report for the Thacker Pass Project, Humboldt County, Nevada, USA |
|
PHASE 2 |
||||
|
Functional |
Description |
Phase 2 |
Installed By Area |
Demand By Area |
|
430 |
Na/K Sulfate Salts Crystallization (ZLD) |
1 |
7,695 |
6,029 |
|
500 |
Liquid Sulfuric Acid Plant |
1 |
700 |
381 |
|
510 |
Liquid Sulfur |
1 |
115 |
48 |
|
520 |
SAP Gas & Strong Acid |
1 |
10,696 |
8,288 |
|
530 |
Tail Gas Treatment |
1 |
1,247 |
499 |
|
540 |
BFW and Steam System |
1 |
1,732 |
707 |
|
550 |
Cooling Water System |
1 |
345 |
145 |
|
560 |
Turbo Generator |
1 |
3,588 |
2,397 |
|
570 |
Sulfuric Acid Product |
1 |
213 |
85 |
|
|
Facility Load |
1 |
2,012 |
2,012 |
|
610 |
13.8kV Distribution and Generators |
1 |
446 |
446 |
|
640 |
Compressed Air |
1.0 |
1,496 |
942 |
|
650 |
Water Systems |
0 |
1,615 |
983 |
|
700 |
Tailings Disposal |
0.6 |
613 |
347 |
|
800 |
Reagents |
0.8 |
1,793 |
1,116 |
|
905 |
Site Security Building |
0 |
0 |
0 |
|
910 |
Admin Building |
0 |
0 |
0 |
|
915 |
Plant Warehouse Building |
0 |
0 |
0 |
|
920 |
Plant Maintenance Building |
0 |
0 |
0 |
|
925 |
Packaging Warehouse Building |
1 |
270 |
270 |
|
930 |
Plant Laboratory Building |
0 |
0 |
0 |
|
935 |
Truck Facility Building |
0 |
0 |
0 |
|
|
Well Field Security Building |
0 |
0 |
0 |
|
951 |
Process Plant Control Building |
0 |
0 |
0 |
|
Misc. |
Electric Heat Tracing Loads |
1 |
1,300 |
1,300 |
|
|
HVAC/LIGHTS/MISC |
1 |
5,913 |
5,913 |
|
|
Grand Total |
|
93,538 |
66,334 |
18.8 Sulfuric Acid Production
The sulfuric acid plants for the Project are Double Contact Double Absorption (DCDA) sulfur burning sulfuric acid plants with heat recovery systems (HRS). The plants sizing was maximized based upon the use of single pieces of equipment such as a single blower train instead of two operating in parallel, and a single waste heat boiler to optimize production versus capital.
Phase 1 and Phase 2 will each have a single sulfuric acid plant capable of producing nominal 3,000 t/d (100 weight % H2SO4 basis) of sulfuric acid by burning liquid elemental sulfur. Sulfur is delivered to site by truck and is unloaded by gravity into a single Sulfur Unloading Pit which provides sulfur to both sulfuric acid plants. The sulfuric acid generated from each plant is used in the process plant for the chemical production of lithium carbonate. The total annual operating days is based upon expected scheduled and unscheduled maintenance. Acid production is a function of the plant's nominal capacity and production over Design Capacity with production efficiency of the equipment decreasing over a three-year period until scheduled maintenance occurs. Each sulfuric acid plant has two Liquid Sulfur Storage Tanks with a combined storage capacity of 28 days. The sulfur is transferred from the tanks to the Sulfur Feed Pit and from there to the Sulfur Furnace.
| Page 202 |
| Lithium Americas Corp. Feasibility Study, National Instrument 43-101 Technical Report for the Thacker Pass Project, Humboldt County, Nevada, USA |
The chemical processes in the sulfuric acid plant include combustion of sulfur to produce SO2, catalytic conversion of SO2 to SO3 and absorption of SO3 in acid, all of which generate large amounts of excess heat. This excess heat is captured via economizers, a waste heat boiler, and super-heaters to produce steam which, in turn, is used to generate electrical power via the acid plant steam turbine generator (STG) set. Energy recovery from the absorption reaction is maximized through the use of the HRS system which generates saturated intermediate pressure steam for internal process users with the balance superheated for injection into the STG set. Low pressure steam is extracted from the STG set for use in the lithium processing plant. The individual STG power output is 45.2 MW, and each sulfuric acid internal consumption is 13.0 MW, leaving a net export of 32.2 MW from each turbine for use by the lithium processing plant.
A Tail Gas Scrubber is provided for each sulfuric acid plant where residual SO2 and acid mist in the tail gas is removed to less than US Environmental Protection Agency (US EPA) Prevention of Significant Deterioration (PSD) emission limits before the gas is expelled to atmosphere via a tail gas stack. Sodium hydroxide solution is used as the scrubbing medium and the effluent is consumed in the lithium processing plant.
Selective Catalyst Reduction (SCR)'s will be installed on both sulfuric acid plants to minimize nitrogen oxides (NOx) emissions when the second plant is built for Phase 2.
Each plant has two Sulfuric Acid Storage Tanks with a combined storage capacity of 7 days. A single Start-up Acid Tank services both sulfuric acid plants. Acid is produced at 98.5%. Acid is diluted to 93% in the winter months for freeze protection. A truck loadout facility services both sulfuric acid plants. A single Control Room also services both sulfuric acid plants.
Water use in the sulfuric acid plants is minimized by utilizing closed loop air coolers for the strong acid system, and an air-cooled condenser on the turbine generator. A small open loop cooling tower is utilized only for product acid cooling and lube oil systems.
Liquid effluents are minimized in the plant design. Reverse osmosis rejects from the Water Demineralizer are returned to a common Process Condensate Tank for re-use within the complex. Storm Water is collected by the event collection pond which services the process plant area. The strong acid sump contents, which may be acidic, are delivered to an Elemental Neutralization Facility which services both sulfuric acid plants. From the Elementary Neutralization Facility, the contents can be consumed in the Lithium Processing Plant.
Sound enclosures are provided where necessary to attenuate operational noise levels to below acceptable limits.
18.9 Water Supply
18.9.1 Water Source and System Design
The Thacker Pass water supply system is shown in Figure 18-5. The existing Quinn Raw Water Well has been tested and is able to sustain 908 m3/h (4,000 gpm) which satisfies the expected average demand servicing all potable, mining and process flow streams for Phase 2. A backup well is planned to be installed one mile west of the existing production well to maintain a constant supply of water if one well pump is down for maintenance or repairs.
| Page 203 |
| Lithium Americas Corp. Feasibility Study, National Instrument 43-101 Technical Report for the Thacker Pass Project, Humboldt County, Nevada, USA |
The hydraulic capacity of the pump and piping system from the production wells to the plant site is 908 m3/h (4,000 gpm). The Process Plant Raw/Fire Water Tank capacity is 5,680 m3 (1.5 M gallons), storing 4,770 m3 (1.26 M gallons) for 6 hours make up water, above the fire water reserve.
Figure 18-5 Thacker Pass Water Supply System
![]()
Source: M3, 2022
18.9.2 Potable Water
The combined site demand for potable water at the process plant and mine site was estimated to be approximately 100 m3/d (27,000 gallons per day), based on Phase 2 headcount plus the continuous flow demands of the potable system.
18.9.3 Fire Water
The site fire water reserve volumes for the process plant and mine site were calculated to be 908 m3 and 1,135 m3 (240,000 gallons and 300,000 gallons), respectively. These estimates were developed in accordance with National Fire Protection Association (NFPA) Codes & Standards. Fire water is fed via gravity to the Process Plant. Raw water is pumped up to the Mine Raw/Fire Water Tank where it is stored as reserve and, in the event of a fire, will be pumped to the various hydrants located throughout the mine service area.
18.10 Waste Rock and Tailings
Table 18-7 shows a summary of the volumes contained in each storage facility and the estimated volume of each facility at the end of the 40-year mine life.
| Page 204 |
| Lithium Americas Corp. Feasibility Study, National Instrument 43-101 Technical Report for the Thacker Pass Project, Humboldt County, Nevada, USA |
Table 18-7 Design and Requirement Volumes for Stockpiles and Facilities (Millions of Cubic Yards)
| Facility Name | Design Storage Mm3 (MCY) |
40 Year LOM Required Storage Mm3 (MCY) |
% of Design |
| West Waste Rock Storage Facility (WRSF) | 21.3 (27.9) | 20.2 (26.4) | 95% |
| East Waste Rock Storage Facility (WRSF) | 16.3 (21.3) | 0 (0) | 0% |
| Coarse Gangue Stockpile (CGS) | 17.5 (22.9) | 17.5 (22.9) | 100% |
| Growth Media Stockpiles (GMS) | 12.3 (16.1) | 5.0 (6.6) | 41% |
| Clay Tailings Filter Stack (CTFS) | 266.9 (349.1) | 250.7 (327.9) | 94% |
| All facilities have expansion potential. | |||
NOTE: Storage quantities largely determined by short-term processing requirements or surface area mined, and thus are not reassessed for the 25-year case separately.
18.10.1 Mine Waste Rock and Growth Media Stockpiles
Approximately 233 M wet tonnes of ore will be mined from the open pit. Once the pit is opened and established, concurrent backfill with waste rock and coarse gangue will be employed. Initially, excavation will start on the western side of the overall pit extents. The West WRSF will be located southwest of the pit and will store 21.3 Mm3 (27.9 MCY) of excavated mine waste rock material. The East WRSF was designed to the east of the pit and can store 16.3 Mm3 (21.3.2 MCY) but the latest mine plan shows it may not be needed due to the available backfill capacity in the pit. Several growth media stockpiles will store material salvaged from proposed disturbance. These stockpiles will be located southeast of the West WRSF, south of the pit, near the ROM ore stockpile, near the CGS and northeast of the East WRSF.
18.10.2 Coarse Gangue Stockpile
Coarse gangue is produced in the classification stage of the mineral processing unit operation and is conveyed into the CGS after going through a dewatering process. LAC will convey the coarse gangue material to the CGS located east of the open pit. The gangue material will include lithium content whose economic value cannot be extracted at this time with a rate of return meeting LAC's criteria, using the proposed flowsheet. The stockpile is currently designed to store approximately 17.5 Mm3 (22.9 MCY) of material. The total capacity of the coarse gangue stockpile will be used. The remaining coarse gangue generated from the process operations will be backfilled in the pit.
The CGS will be placed above existing ground that has been stripped of growth media. The stripped growth media will be placed in the growth media stockpile(s). The stripped existing ground will be lined with one foot of low hydraulic conductivity soil layer (LHCSL), which will then be covered with a material to prevent the LHCSL from drying out or cracking. Perforated Corrugated Polyethylene Pipe (CPE pipe) will be placed in the major drainages to promote drainage to the CGS Sediment Pond.
The current design for the CG has 15 m (50 ft) lift heights and 18 m (60 ft) benches graded between each lift to provide an overall stacking slope of 4H:1V. Additional stability analysis completed by NewFields show that the coarse gangue stockpile can be stacked to 3H:1V slopes and still meet the minimum stability requirements if the sands are adequately dewatered during the classification process. Additional strength testing of the coarse gangue material will be conducted during operations and side slope requirements may change in the future.
Stormwater runoff from the CGS will drain to the low point on the south side of the facility into the CGS Sediment Pond. The CGS Sediment Pond is fully lined with a single layer of HDPE geomembrane and is designed to contain runoff from a 100-year, 24-hour storm event. The sediment pond is designed to store two feet of sediment and have three feet of freeboard above the spillway invert. After storm events, water from these ponds will be pumped for use into the process circuit. Storm events greater than a 100-year, 24-hour event and up to a 500-year event will drain out of the overflow spillway into the CTFS West Diversion Channel. The peak flow from a 500-year, 24-hour storm event can pass through the spillway with one foot of freeboard to the crest of the pond. Sediment will be removed from the facility once the sediment design capacity has been reached. Riprap will be installed at the outlet of the sediment pond.
| Page 205 |
| Lithium Americas Corp. Feasibility Study, National Instrument 43-101 Technical Report for the Thacker Pass Project, Humboldt County, Nevada, USA |
18.10.3 Clay Tailings and Salt Storage
Lithium processing will produce tailings comprised of acid leach residue filter cake (clay material), magnesium sulfate salt and sodium/potassium sulfate salts, which is collectively referred to as clay tailings. The clay tailings strategy is based on consideration of the following aspects of the site plan:
Placement of clay tailings, otherwise termed as "filtered tailings", differs from conventional slurry tailings methodology and typically has higher operating costs but with the benefit of improved stability and reduced water consumption. At the tailings storage site, it is possible to reduce the tailings to a moisture content amenable to placement in the CTFS.
At the end of the leach neutralization process cycle, water from the clay tailings is recovered by solid-liquid separation (dewatering), utilizing filter presses. The filtered tailings are then transported by conveyor to the HDPE lined CTFS facility. In this state, the filtered tailings can be spread, scarified, air dried (if required) and compacted in lifts similar to the practice for typical earth embankment construction.
18.10.4 Tailings Production and Stack Design
At full plant production, up to approximately 20,300 dry tonnes per day of clay tailings and salts will be generated, resulting in a total of 272 M dry tonnes or 250.7 Mm3 (327.9 MCY) requiring secure disposal over a forty-year period. The CTFS will accommodate this volume with a stack height of up to 94.5 m (310 ft). The facility will be expanded throughout the life of the mine with an initial footprint covering nearly 0.8 km2 (9 M ft2). Future expansion would take place to the east and upslope to the north, in combination with an increased stack height. The CTFS is designed for a volume of 266.9 Mm3 (349.1 MCY) to demonstrate expansion potential, however only 250.7 Mm3 (327.9 MCY) is anticipated to be generated over the 40-year year mine life. As a result, the facility will only be constructed, and expanded over the LOM, to store the necessary amounts of volume generated.
The design of the CTFS is based on the following key considerations:
Figure 18-6 presents the CTFS conceptual design.
| Page 206 |
| Lithium Americas Corp. Feasibility Study, National Instrument 43-101 Technical Report for the Thacker Pass Project, Humboldt County, Nevada, USA |
Figure 18-6 CTFS Conceptual Design
![]()
Source: NewFields, 2022
The tailings will be stacked with a compacted structural zone around the perimeter of the facility, and a lower compaction nonstructural zone in the interior of the stack. Tailings will be placed in lifts, the thickness of which may be determined using test pads during the start of operations that meet the minimum density requirements. Concurrent with construction of each lift, a layer of waste rock material may be placed in select areas (roadways/travel lanes) on the clay tailings to provide a trafficable surface for relocating and operating vehicles and conveyors. The thickness of the waste rock layer will depend on the quality of the materials, the maximum particle size, and the construction equipment used. The waste should be considered a contingency and will be placed on an as needed basis to provide a working surface for vehicles and conveyors. The material will likely be sourced from the pit, delivered using haul trucks, and spread using a bulldozer.
The exterior slopes of the structural zone of the CTFS will be graded to provide stability based on a minimum static safety factor of 1.3. The CTFS will be fully lined with an HDPE geomembrane, underlain with a six-inch liner bedding material. The facility will include an underdrain collection system above the geomembrane to collect drainage from the stack. Drainage from the stack will report to the geomembrane-lined reclaim pond.
With an arid climate averaging 31.2 cm (12.3 in) per annum of precipitation, the evaporation rate will exceed precipitation.
The approach to protecting the environment is based on the following factors:
| Page 207 |
| Lithium Americas Corp. Feasibility Study, National Instrument 43-101 Technical Report for the Thacker Pass Project, Humboldt County, Nevada, USA |
19 Market Studies and Contracts
19.1 2021 and 2022 Synopsis
Lithium demand displayed significant growth in 2021 and 2022 due to strong consumer demand for electric vehicles, increased product offerings and government policies to encourage electrification. Battery Grade supply in 2022 is estimated at 465.7 kt lithium carbonate equivalent (LCE) with an additional 9.8 kt LCE from secondary sources, totaling an expected 475.5 kt LCE supply (Wood Mackenzie, 2022). This is an increase in supply of 78.6 kt LCE from 2021, or 20% growth year-over-year (YOY).
Increases in production from Albemarle, SQM and Chinese suppliers were predominantly responsible for supply growth. Supply is not forecasted to meet demand in 2022, and an estimated supply deficit of nearly 67 kt LCE is expected (excluding inventory impacts). The tight market resulted in strong upward pressure on prices to all-time highs in the spot market. Fastmarkets battery grade, spot price (DDP Europe and US) reached $72,500/t for battery grade lithium carbonate in October, 2022. Contract pricing for battery grade lithium chemicals also increased throughout 2022, settling around $52,000/t for hydroxide and $39,000/t for carbonate in Q3 2022 (Wood Mackenzie, 2022). As spot prices are a leading indicator, contract pricing is expected to significantly increase in 2023 for battery grade lithium chemicals.
19.2 Supply and Demand Forecast
Demand is forecasted to increase from electrification of the transportation sector and stationary storage supported by government policy in the EU, North America, and Asia. Sales of passenger and light duty electric vehicles are expected to increase from 5.8 million in 2021 to over 15 million in 2025 (approximately 15% of total vehicles sold). By 2030, approximately 31% of all passenger vehicles sold are forecasted to be electric.
Unit sales of medium duty and heavy-duty vehicles, such as buses and e-trucks, are also expected to grow 26% by 2025. The size of battery packs is forecasted to increase for passenger vehicles, from 40 kWh in 2021 to nearly 50 kWh by 2025 (Benchmark Mineral Intelligence, 2021).
The timely and successful ramp-up of refined lithium operations will be critical to meeting demand growth. Many new projects have focused on battery grade lithium hydroxide (using spodumene feedstock typically from Australia), which will likely lead to a tight carbonate market in the mid-term. The majority of proposed lithium feedstock greenfield and expansion projects are located in China, Argentina, Australia and Chile and vary considerably in probability of success. Supply forecasts to 2040 are presented in Figure 19-1.
Benchmark Mineral Intelligence (2021) estimates global lithium demand will double by 2024 to 970 kt and reach 2,570 kt by 2030 (Figure 19-1). Supply deficits are expected to increase significantly in 2022 to over 100 kt lithium carbonate. By 2024 the deficit is estimated at 220 kt and 963 kt by 2030. This trend is forecasted to continue to at least 2040. Roskill (2021), later acquired by Wood Mackenzie, has a similar demand/deficit forecast in 2030, although the supply deficit in 2024 is estimated to be 104 kt.
| Page 208 |
| Lithium Americas Corp. Feasibility Study, National Instrument 43-101 Technical Report for the Thacker Pass Project, Humboldt County, Nevada, USA |
Figure 19-1 Lithium market balance 2020-2040
![]()
Source: Benchmark Mineral Intelligence, 2021
Going forward, the market demand is expected to be balanced between lithium carbonate and lithium hydroxide towards the end of the decade. Advancements in LFP technology, namely improvements in energy density and lower costs which have resulted in surging customer orders, are expected to drive this balance going forward.
19.3 Pricing
In the near term, both spot and contract prices are expected to continue to rise as demand outpaces supply, with not enough additional tonnage available to ease market tightness; this will be exacerbated by the expectation of rising spodumene feedstock costs.
In the mid-term, pricing between hydroxide and carbonate are not expected to widen significantly. Rising prices are expected to incentivize investment in new projects, many of these announcements are from within China or by Chinese companies with little to no feedstock offtake arrangements. A shortage of primary mined supply is expected to maintain upward pricing pressure.
In the long term, unprecedented market demand combined with lack of supply is expected to support pricing required to incentivize CAPEX-intensive greenfield projects. In addition, pressure from customers to incorporate carbon-neutral and sustainable technologies will further increase CAPEX and operational costs that will be reflected in pricing.
19.4 Pricing Forecast
Base case lithium carbonate pricing is simplified as a fixed $24,000 per tonne, which is the long-term price forecast of Wood Mackenzie's third quarter 2022 report (Wood Mackenzie, 2022). Owing to timing of resource and reserve estimation, Wood Mackenzie's second quarter 2022 report (Wood Mackenzie, 2022) was used at $22,000 per tonne lithium carbonate.
| Page 209 |
| Lithium Americas Corp. Feasibility Study, National Instrument 43-101 Technical Report for the Thacker Pass Project, Humboldt County, Nevada, USA |
Table 19-1 Lithium Price Forecast (Q3 2022)
|
Lithium Carbonate |
2023 |
2024 |
2025 |
2026 |
2027 |
2028 |
2029 |
2030 |
2031 |
2032 / LT |
|
Contract, CIF |
58,684 |
56,223 |
47,788 |
42,500 |
36,000 |
29,000 |
26,000 |
24,000 |
23,500 |
24,000 |
|
Note: Real prices used, where available. |
||||||||||
|
1. Prices assume straight-line from final yearly forecast to LT price. |
||||||||||
|
2. 2032 / LT represents lithium carbonate pricing beyond 2032 |
||||||||||
19.5 Contracts
LAC does not currently have any offtake contracts or agreements in place for the Thacker Pass Project.
A contract mining agreement with Sawtooth has been entered into for the Thacker Pass Project. LAC is under contract with Bechtel for Engineering Procurement and Construction Management (EPCM) services and is finalizing contracts with various equipment vendors.
19.6 Qualified Person Statement
Daniel Roth, the QP responsible for this section of the Technical Report has reviewed the studies, forecasts and analysis presented herein and confirms that the results support the assumptions made in this Technical Report.
| Page 210 |
| Lithium Americas Corp. Feasibility Study, National Instrument 43-101 Technical Report for the Thacker Pass Project, Humboldt County, Nevada, USA |
20 Environmental Studies, Permitting, and Social or Community Impact
This section summarizes the available information on environmental, permitting, and social/community factors related to the construction, operation, reclamation, and closure of LAC's Thacker Pass Project (the Project). The units in this section are given in metric with the original imperial (i.e., US standard units) in parentheses to maintain consistency with permitting documentation.
20.1 Introduction
The Project is located on public lands administered by the U.S. Department of the Interior, Bureau of Land Management (BLM). Construction of the Project requires permits and approvals from various Federal, State, and local government agencies.
The process for BLM authorization includes the submission of a proposed Mine Plan of Operations (PoO, previously defined) and Reclamation Plan for approval by the agency. LAC submitted the Thacker Pass Project Proposed PoO and Reclamation Plan Permit Application on August 1, 2019 (LAC, 2019a). The permit application was preceded by LAC's submission of baseline environmental studies documenting the collection and reporting of data for environmental, natural, and socio-economic resources used to support mine planning and design, impact assessment, and approval processes.
As part of the overall permitting and approval process, the BLM completed an analysis in accordance with the National Environmental Policy Act of 1969 (NEPA) to assess the reasonably foreseeable impacts to the human and natural environment that could result from the implementation of Project activities. As the lead Federal regulatory agency managing the NEPA process, the BLM prepared and issued a Final Environmental Impact Statement (FEIS), (DOI-BLM-NV-W010-2020-0012-EIS) on December 3, 2020 (BLM, 2020). Following the issuance of the FEIS, BLM issued the EIS Record of Decision (ROD) and Plan of Operations Approval on January 15, 2021 (BLM, 2021). In addition, a detailed Reclamation Cost Estimate (RCE) has been prepared and submitted to both the BLM and Nevada Division of Environmental Protection-Bureau of Mining, Regulation and Reclamation (NDEP-BMRR). On October 28, 2021, the NDEP-BMRR approved the PoO with the issuance of draft Reclamation Permit 0415. On February 25, 2022, the NDEP-BMRR issued the final Reclamation Permit 0415. The BLM will require the placement of a financial guarantee (reclamation bond) to ensure that all disturbances from the mine and process site are reclaimed once mining concludes.
Regulatory agencies that formally cooperated or participated in the preparation of the EIS included NDEP-BMRR; the United States Environmental Protection Agency (USEPA); the United States Department of the Interior Fish and Wildlife Service (USFWS); the State of Nevada Department of Wildlife (NDOW); and Humboldt County.
There are no identified issues that are expected to prevent LAC from achieving all permits and authorizations required to commence construction and operation of the Project based on the data that has been collected to date.
20.2 Permitting Pre-Planning Process
To prepare for the NEPA and environmental permitting processes, LAC submitted baseline environmental data and engaged with regulatory agencies prior to submitting the PoO to the BLM and NDEP-BMRR. Beginning in January 2012, LNC (then known as Western Lithium Corp.) presented to the BLM an initial project overview and a summary of existing baseline information. Over the next several years, LAC redesigned the Project to concentrate on developing the resource at Thacker Pass. LAC made changes to the Project as a direct result of engaging with regulators and community members, evaluating environmental resources, and concluding a supplemental exploration program in the Thacker Pass Area.
| Page 211 |
| Lithium Americas Corp. Feasibility Study, National Instrument 43-101 Technical Report for the Thacker Pass Project, Humboldt County, Nevada, USA |
In December 2017, LAC presented the updated conceptual PoO to the BLM. In January 2018, LAC met with key permitting agencies including the BLM, USFWS, NDOW and NDEP-BMRR to provide detail on the hydrological baseline characterization, followed in June 2018 by a meeting with NDEP-BMRR and BLM to address the geochemistry baseline characterization program. On October 5, 2018, LAC formally submitted the Conceptual Mine Plan of Operations and Reclamation Permit Application to the BLM and NDEP-BMRR, proposing to explore, develop, construct, operate, reclaim, and close an open pit lithium claystone mining and lithium processing operation at Thacker Pass (LAC, 2018). LAC completed baseline data collection by December 2018 and early 2019 and submitted baseline environmental reports to the BLM.
In developing the Project, LAC engaged in meetings with BLM, NDEP-BMRR and other regulatory agencies, and received guidance from agencies on the direction of all baseline studies and ecological-resource priorities. Baseline data was collected with the oversight from BLM, NDEP, NDOW, and USFWS. LAC and its consultants prepared baseline data collection work plans (SRK 2019, Piteau 2018e), which were submitted to BLM for review and approval prior to finalizing the baseline data collection. The full content of the PoO was based on an iterative process. Technical data was derived from the engineering design process and from the environmental baseline study efforts.
LAC's Thacker Pass Project Proposed PoO was submitted to the BLM and NDEP-BMRR, on August 1, 2019 (LAC 2019a), to describe a proposed Project that would encompass approximately 4,236 hectares (10,468 acres) with an estimated disturbance footprint of approximately 2,244 hectares (5,545 acres). A new Exploration Plan of Operations was also proposed at the same time (LAC, 2019b) to perform mineral exploration in areas south and east of the Project area. The boundaries of these two Plan of Operations areas are shown on Figure 20-1. On September 6, 2019, the BLM acknowledged receipt of the Thacker Pass Project PoO, deemed the PoO technically complete, and assigned the Project BLM Case File Number NVN098596. Responding to agency comments, LAC revised the PoO and submitted the latest version on October 15, 2021. As required by the BLM, LAC's PoO includes mine and processing design information and mining methods, waste rock management plan, quality assurance plan, stormwater plan, spill prevention plan, reclamation plan, monitoring plan, and an interim management plan.
Figure 20-1 Plan of Operations and Exploration Area Permitted Boundaries
![]()
Source: LAC, 2022
To obtain necessary Federal and State permits, LAC continues to engage with regulatory agencies including USFWS, NDEP, Nevada Division of Water Resources (NDWR), NDOW, and Nevada Department of Transportation (NDOT).
| Page 212 |
| Lithium Americas Corp. Feasibility Study, National Instrument 43-101 Technical Report for the Thacker Pass Project, Humboldt County, Nevada, USA |
The engagements leading up to the submission of the mine PoO provided the BLM and other agencies with an opportunity to understand the Project and prepare for the EIS process prior to BLM's issuance of a Notice of Intent (NOI) to prepare an EIS issued in January 2020.
20.3 Federal, State, and Local Regulatory Permitting Requirements
A review by multiple administrative agencies is undertaken to obtain all required Federal, State, and local agency permits and approvals necessary to construct, operate and ultimately reclaim and close the proposed Project.
The following permits are explained in the sections below.
20.3.1 Federal Permits
20.3.1.1 Bureau of Land Management
As lead Federal agency, BLM's Winnemucca District Office managed the NEPA process for the PoO with participation from cooperating Federal, State, and local agencies. BLM approval for the proposed Project was provided in accordance with the General Mining Law, which provides a statutory right to mine, and related Surface Management Regulations contained in 43 CFR 3809.
The BLM determined that LAC's proposed PoO under 43 CFR 3809 was a "major Federal action," and the agency sequentially initiated the review of the Project for compliance with NEPA. Consultations regarding historic properties and locations of Native American Religious Concern were conducted by the BLM between 2018-2021 pursuant to the National Historic Preservation Act (NHPA) and implementing regulations at 36 CFR 800 in compliance and accordance with the BLM-Nevada State Historic Preservation Office (SHPO) 2014 State Protocol Agreement. The BLM coordinates NEPA and NHPA Section 106 compliance by using the NEPA scoping process to partially fulfill NHPA public notification requirements to seek input from the public and other consulting parties on the Project and its effects on historic properties. The BLM further coordinated with the USEPA regarding environmental justice issues. BLM also consulted with USFWS, which provided an official list of Threatened and Endangered Species that could potentially occur within the Project area and served as a cooperating agency in the development of the EIS. As the state agency with jurisdiction and expertise related to wildlife, NDOW also participated as a cooperating agency in discussions regarding wildlife and special status species habitat, reclamation strategy, and other wildlife issues. Potential effects to Bald and Golden Eagles were analyzed to assist USFWS evaluation of the applicant's application for an Incidental Golden Eagle Take Permit under the Bald and Golden Eagle Protection Act (50 CFR 22) (the impacts were programmatically analyzed in the PEIS [USFWS, 2016a]). USFWS issued a Record of Decision approving the Eagle Take Permit on March 8, 2022, followed by issuance of the permit on April 8, 2022.
| Page 213 |
| Lithium Americas Corp. Feasibility Study, National Instrument 43-101 Technical Report for the Thacker Pass Project, Humboldt County, Nevada, USA |
20.3.1.2 Environmental Documentation Process
NEPA provided a public process for analyzing and disclosing to the public the direct and cumulative impacts to the human environment that could result from the proposed action and selected alternatives; taking a 'hard look' at impacts and assessing the level of significance for identified impact from the Project and alternatives; and proposing mitigation measures if needed to reduce the potential impact from the selected proposed action. Following the NEPA analysis and review process, a ROD was prepared to document the Federal agency's decision(s) concerning a proposed action for which the agency has prepared the EIS. The ROD states what the decision is; identifies the alternatives considered, including the environmentally preferred alternative; and discusses mitigation plans, including any enforcement and monitoring commitments. After preparing the Draft and Final EIS documents, BLM issued a Record of Decision (ROD) and Plan of Operations Approval on January 15, 2021 (BLM, 2021).
In compliance with the January 15, 2020 EIS ROD Conditions of Approval, and in compliance with State Mitigation Regulation Nevada Administrative Code (NAC) 232.400-232, on March 21, 2022, LNC fulfilled its initial compensatory mitigation obligation regarding sage-grouse, in coordination with the State of Nevada Sagebrush Ecosystem Council. LNC also completed its initial mitigation commitments under the Eagle Take Permit in April 2022.
20.3.2 State Permits
NDEP-BMRR is the primary State agency regulating mining. There are three branches within BMRR: Regulation, Reclamation, and Closure. NDEP-BAPC works closely with NDEP-BMRR on mining projects and issues permits to construct facilities that emit gases or particulate matter to the atmosphere. NDWR issues an appropriation to use groundwater for mining, milling, and domestic purposes.
The State of Nevada does not have the equivalent of the Federal NEPA process requiring an impact assessment. However, most State permits and authorizations require public notice and a comment period after the completion of an administrative and technical review of the proposed facilities permit before approval. There is also a baseline characterization requirement that is accomplished using baseline data acquired during the preparation of the PoO.
20.3.2.1 Water Pollution Control Permit
NDEP-BMRR Regulation Branch administers the State of Nevada WPCP application process for the mine, ore processing, and operation of the fluid management system in accordance with Nevada Administrative Code (NAC) 445A.350 through NAC 445A.447. A WPCP includes requirements for the management and monitoring of the mine and ore processing operations, including the fluid management system, to prevent the degradation of waters of the state (NAC 445A.424). The permit also includes procedures for temporary, seasonal, and tentative permanent closure of mine and ore processing operations.
On April 3, 2020, LAC submitted the Thacker Pass Project WPCP Application to the Regulation Branch. The application included an Engineering Design Report (EDR) for the Clay Tailings Filter Stack (CTFS), Waste Rock Storage Facility (WRSF), Coarse Gangue Stockpile (CGS), mine facilities, and process plant components. On October 29, 2020, May 3, 2021, and August 30, 2021, LAC received formal comments from NDEP-BMRR regarding the WPCP application. LAC addressed the comments received to date. On October 28, 2021, NDEP-BMRR issued Notice of Proposed Action, Beginning of Public Comment Period, Notice of Public Hearing, and Thacker Pass Project Draft WPCP NEV2020104. A public hearing was held on December 1, 2021, and the public comment period ended on December 8, 2021. The final WPCP (NEV2020104) was issued on February 25, 2022 and became effective March 12, 2022. The final WPCP will likely need to be modified in accordance with the most recent engineering updates and be reviewed and approved by NDEP-BMRR.
| Page 214 |
| Lithium Americas Corp. Feasibility Study, National Instrument 43-101 Technical Report for the Thacker Pass Project, Humboldt County, Nevada, USA |
A WPCP is valid for a duration of 5 years, provided the operator remains in compliance with the regulations. LAC would be expected to apply for permit renewals in 5-year increments during the mine life. In line with this NDEP-BMRR requirement, the BLM-issued ROD includes a stipulation requiring adaptive mitigation, including updating the groundwater model every five years to include new data. The final WPCP states that operations will not take place below the 1,475 m (4,840 ft) above mean sea level elevation, which is 4.5 m (15 ft) above the pre-mining regional water table. Prior to mining below the water table (which is not expected to take place for approximately 15 years at Phase 2 production rates), LAC would be required to submit, for NDEP review and approval, a revised WPCP application. That application would include a then-current groundwater model which evaluates the impacts and demonstrates waters of the State will not be degraded. Alignment with federal authorizations would also be sought as may be required. Based on current modeling, several approaches to long-term water management for operations below the water table have been identified. Those measures include in-pit water pumping with passive water treatment, and the creation of a hydraulic sink to control contaminants through a modified backfill plan. Other options would be studied prior to submitting an updated application, including the use of an adsorption amendment for backfill material placed below the water table.
20.3.2.2 Reclamation Permit
NDEP-BMRR Reclamation Branch issues a Reclamation Permit for the Project, in accordance with NAC 519A, to reclaim and close the mine, ore processing, and related transportation facilities in the unanticipated event of a default by the operator.
The PoO submittal to the BLM and NDEP-BMRR contains the Reclamation Permit Application. The application is reviewed concurrently by both the BLM and NDEP-BMRR under a Memorandum of Understanding (MOU) between these two agencies. NDEP-BMRR has cooperatively reviewed the PoO and has accepted the Reclamation Permit Application to establish a financial guarantee for reclamation activities meeting Federal and State requirements to ensure that adequate funds are available to reclaim and close the site.
A draft RCE was developed and was included as an attachment to the WPCP application, submitted to NDEP-BMRR. The revised RCE was submitted October 15, 2021, for final approval. On October 28, 2021, NDEP-BMRR Reclamation Branch issued Notice of Intent and draft Reclamation Permit (Permit 0415) for the Thacker Pass Project. The final Reclamation Permit was issued on February 25, 2022. The Project will be bonded under LAC's existing BLM Statewide Bond, BLM Bond Number NVB001750.
20.3.2.3 Air Quality Permit
NDEP-BAPC issues Air Quality Permits for the construction and operation of mine and process facilities to maintain ambient air quality. Permits are issued in accordance with NAC 445B.001 through NAC 445B.3689. NDEP-BAPC has primacy for air quality activities in Humboldt County under the Federal Clean Air Act of 1970, as amended. Based on the Project design and the analyses by Air Sciences, LAC applied for a Class II Air Quality Operating Permit from the NDEP-BAPC, which is a permit typical for facilities that emit less than 90 tonnes (100 short tons) per year for any one regulated pollutant, emit less than 23 tonnes (25 short tons) per year for total hazardous air pollutants (HAP), and emit less than 9 tonnes (10 short tons) per year of any one HAP. The Class II Air Quality Operating Permit Application was submitted to NDEP-BAPC on January 22, 2021. On October 18, 2021, NDEP-BAPC made a preliminary determination to issue a Class II Air Quality Operating for the Thacker Pass Project; Permit Number AP1479-4334. The public comment period for the proposed permit was open from October 18, 2021 through November 18, 2021. The final Class II Air Quality Operating Permit (AP1479-4334) was issued February 25, 2022. The final Class II Air Quality Operating Permit will likely need to be modified in accordance with the most recent engineering updates and approved by NDEP-BAPC.
| Page 215 |
| Lithium Americas Corp. Feasibility Study, National Instrument 43-101 Technical Report for the Thacker Pass Project, Humboldt County, Nevada, USA |
The Thacker Pass Project NEPA Air Quality Impact Analysis Report (Air Sciences, 2019a) indicates the proposed Project meets the criteria to be considered a minor source for new source review, in particular:
Given that the facility-wide potential process source emissions for the proposed Project are expected to be below the 90 tonne (100 short ton) per year threshold for the Title V program, the proposed Project would be considered a minor source, not subject to Title V permitting. Additionally, the facility-wide HAP emissions for the proposed Project are expected to be less than 9 tonnes (10 short tons) per year for a single HAP and less than 23 tonnes (25 short tons) per year for all HAP emissions in aggregate. Therefore, the proposed Project is considered to be an area source for National Emission Standards for Hazardous Air Pollutants applicability.
20.3.2.4 Groundwater Appropriation
Approvals to use groundwater for mining, milling, and domestic purposes are issued by NDWR, typically for the life of the mine. On April 1, 2020, LAC submitted applications to NDWR to change the point of diversion, manner of use, and place of use for Nevada Water Right Permits 68633 and 68634. These water rights would be transferred from the LAC-owned ranch east of the Project site. Additional applications to change the point of diversion, manner of use, and place of use for Nevada Water Right Permits 18494, 15605, 21059, 21060, 24617, 83819, 83820, 83821 were submitted August 11, 2020. These water rights would be transferred from a ranch east of the Project site pursuant to a purchase agreement with the nearby ranch. A total of 3,515 million liters (2,850 acre-feet) of water rights are currently proposed to be transferred to Thacker Pass. Additional water rights would need to be acquired and transferred for Phase 2 of the Project.
Two ranches, one in the Quinn River Valley and one in the King's River Valley, have protested the transfer of the water rights. LAC believes that the transfer applications comply with the State standards. A water rights hearing occurred December 1 to December 8, 2021, and the decision by the Nevada State Engineer regarding the water rights transfer is pending.
20.3.3 Humboldt County Permits
The Humboldt County Regional Planning Department (HCRPD) has the responsibility to issue a conditional use permit (similar to zoning) allowing for mining and processing land use at the Project. LAC holds a conditional use permit issued by the HCRPD in 2013 for initially the Kings Valley Clay Mine (which was proposed in 2013 but never fully developed), which the HCRPD confirmed is current and valid for the Thacker Pass Project on July 8, 2021.
The County Building Department will issue various permits to construct and inhabit structures and facilities at the Project, including building, electrical, plumbing and mechanical permits and inspections.
Other Federal, State and Humboldt County agencies will issue additional permits, approvals, notices, or concurrences for various mine operations and activities in accordance with applicable Federal, State and county ordinances, guidelines, laws, and regulations. Existing permits will be regularly reviewed and assessed. Should engineering design changes be proposed, LAC will apply for and obtain appropriate permit modifications and/or amendments, as needed.
| Page 216 |
| Lithium Americas Corp. Feasibility Study, National Instrument 43-101 Technical Report for the Thacker Pass Project, Humboldt County, Nevada, USA |
20.4 Summary Schedule for Permitting, Approvals, and Construction
The Project is being considered in two phases, lasting 40 years. LAC will utilize existing surface transportation infrastructure (highways) to service the Project. The following is a summary schedule for permitting, approvals and construction:
20.5 Current Permitting Status
Multiple activities have been completed or are underway to develop the required information for permitting the Project. Engagement with various permitting agencies, the local community, and the Native American communities is an ongoing process.
20.6 Community Engagement
LAC has developed a Community Engagement Plan (LAC, 2022), recognizing that the support of stakeholders is important to the success of the Project. The Project was designed to reflect information collected during numerous stakeholder meetings.
A summary of community engagement activities performed to date is provided in Table 20-1.
Table 20-1 Key Community Engagement Summary
|
Date |
Event |
|
September 30, 2009 |
Introduction letter to Nevada Bighorns Unlimited |
|
September 21, 2013 |
Orovada Community Picnic/Project update |
|
October 10, 2013 |
Update to Humboldt County Commissioners |
|
November 2, 2015 |
Update to Humboldt County Commissioners |
|
April 9, 2016 |
Update to Humboldt Hunt Club |
|
May 8, 2017 |
Update to Trout Unlimited |
|
June 15, 2017 |
Update to Fort McDermitt Paiute and Shoshone Tribal Leaders |
|
June 15, 2017 |
Update to Humboldt County Commission member |
|
July 27, 2017 |
Orovada Community Picnic/Project update |
|
November 1, 2017 |
Update to Humboldt County Commission member |
|
February 6, 2018 |
Update to Trout Unlimited |
|
July 27, 2018 |
Town Hall Meeting in Winnemucca |
|
July 27, 2018 |
Community gathering in Orovada |
|
October 3, 2018 |
Tour of Thacker Pass site for Fort McDermitt Paiute and Shoshone Tribal leaders |
| Page 217 |
| Lithium Americas Corp. Feasibility Study, National Instrument 43-101 Technical Report for the Thacker Pass Project, Humboldt County, Nevada, USA |
|
Date |
Event |
|
October 17,2018 |
Update to Humboldt Hunt Club |
|
November 7, 2018 |
Presentation to the Coalition for Nevada Wildlife |
|
April 24, 2019 |
Presentation to Winnemucca Rotary |
|
April 27, 2019 |
Update to Humboldt Hunt Club |
|
May 30, 2019 |
Presentation and tour of R&D Facility1 for Great Basin Resource Watch |
|
September 4, 2019 |
Tour of R&D Facility for Winnemucca stakeholders |
|
October 10, 2019 |
Tour of R&D Facility for Nevada Commission on Mineral Resources |
|
November 26, 2019 |
Project update to Trout Unlimited |
|
January 29, 2020 |
Meeting with Fort McDermitt Paiute and Shoshone Tribal leaders |
|
January 29, 2020 |
Orovada Community Open House/Project update |
|
January 30, 2020 |
Winnemucca Community Open House/Project update |
|
March 11, 2020 |
Fort McDermitt Paiute and Shoshone Tribe Open House/Project Update/Job Fair |
|
July 6, 2020 |
Update to Humboldt County Commissioners |
|
July 20, 2020 |
Presentation to the Reno Rotary |
|
August 4, 2020 |
Meeting with Humboldt County Commissioner |
|
August 24, 2020 |
Presentation to the Nevada Legislative Energy Committee |
|
September 17, 2020 |
Presentation to the Humboldt County Chamber of Commerce |
|
Sept - Oct, 2020 |
BuildNV Core Construction Training Program Winnemucca session |
|
October 20, 2020 |
Presentation to the Nevada Mineral Exploration Coalition |
|
October 22, 2020 |
Presentation to University of Nevada, Reno Energy Policy Class |
|
Nov - Dec, 2020 |
BuildNV Core Construction Training Program Fort McDermitt session |
|
February 9, 2021 |
Project Update to Fort McDermitt Paiute and Shoshone Tribal Council |
|
February 19, 2021 |
Meeting with Maxine Redstar, Fort McDermitt Tribal Chair |
|
April 5, 2021 |
Update to Humboldt County Commissioners |
|
April 5, 2021 |
McDermitt /Fort McDermitt Community Meeting/Project Update |
|
April 6, 2021 |
Orovada Community Meeting/Project Update |
|
April 14, 2021 |
Orovada Community Meeting/Orovada Elementary School Discussion |
|
2021 |
Held multiple meetings with Thacker Passed Concerned Citizens Group, Orovada |
|
2021 |
Held multiple meetings with Fort McDermitt to discuss proposed benefits |
|
October 28, 2021 |
Winnemucca Futures Presentation, Winnemucca |
|
November 17, 2021 |
TPCC Working Group |
|
November 18, 2021 |
Meeting with Humboldt County Undersheriff and Office Manager |
|
November 18, 2021 |
Meeting with Fort McDermitt Vice Chair and Council member to discuss potential community improvements |
|
January 11, 2022 |
Presented to Fort McDermitt Tribal Council, discussed engagement agreement |
|
January 27, 2022 |
TPCC working group: developed agenda for future workshop |
|
February 8, 2022 |
Fort McDermitt Tribal Council, commission voted to establish new engagement agreement with Lithium Nevada |
|
February 17, 2022 |
TPCC Working Group |
|
March 11, 2022 |
LNC sponsors Cultural Monitor Training for Fort McDermitt tribal members |
|
March 30, 2022 |
TPCC Working Group |
|
April 25, 2022 |
TPCC Working Group- NDEP presentation |
|
May 3, 2022 |
Humboldt County Chamber members luncheon- LNC Thacker Pass update |
| Page 218 |
| Lithium Americas Corp. Feasibility Study, National Instrument 43-101 Technical Report for the Thacker Pass Project, Humboldt County, Nevada, USA |
|
Date |
Event |
|
June 23, 2022 |
Fort McDermitt Paiute Shoshone Tribe cultural committee visit to Thacker Pass to learn about cultural mitigation work |
|
June 29, 2022 |
Meeting with Maxine Redstar, Fort McDermitt Tribal Chair, and Becky Crutcher, Fort McDermitt Councilman, Benefits Agreement |
|
July 20, 2022 |
Lithium Americas Technical Center Grand Opening |
|
August 11, 2022 |
Fort McDermitt Tribal Council approves MOA- formal engagement and consultation with LNC |
|
October 20, 2022 |
Lithium Americas signs community benefits agreement with Fort McDermitt Paiute and Shoshone Tribe |
|
October 26, 2022 |
Winnemucca Futures Presentation, Winnemucca |
|
November 3, 2022 |
Mining into the Future, Winnemucca |
|
1 Lithium Americas Corp. Research and Development Facility, located in Reno, Nevada. Note: This is a select list; many additional stakeholder meetings have taken place that have not been listed. |
|
Numerous laws and regulations require the BLM to consider Native American cultural and religious concerns. These include the NHPA, the American Indian Religious Freedom Act of 1978, Executive Order 13007 (Indian Sacred Sites), Executive Order 13175 (Consultation and Coordination with Tribal Governments), the Native American Graves Protection and Repatriation Act, the ARPA, as well as NEPA and the FLPMA. Secretarial Order No. 3317, issued in December 2011, updates, expands and clarifies the Department of Interior's policy on consultation with Native American tribes. The BLM also utilizes H-8120-1 (General Procedural Guidance for Native American Consultation) and National Register Bulletin 38 (Guidelines for Evaluating and Documenting Traditional Cultural Properties). In connection with LAC's previously proposed Kings Valley Clay Mine Project (at Thacker Pass) and in coordination with the BLM, letters requesting consultation were sent to the Fort McDermitt Paiute and Shoshone Tribe and the Summit Lake Paiute Tribe on April 10, 2013. The BLM held consultation meetings with the Fort McDermitt Paiute and Shoshone Tribe on April 15, 2013 and the Summit Lake Paiute Tribe on April 20 and May 18, 2013.
As part of the Thacker Pass Project, the BLM Winnemucca District Office initiated the Native American Consultation process. Consultation regarding historic properties and locations of Native American Religious Concerns were conducted by the BLM via mail and personal correspondence in 2018 and 2019 pursuant to the NHPA and implementing regulations at 36 CFR 800 in compliance and accordance with the BLM-SHPO 2014 State Protocol Agreement. On July 29, 2020, the BLM Winnemucca District Office sent formal consultation letters to the Fort McDermitt Paiute and Shoshone Tribe, Pyramid Lake Paiute Tribe, Summit Lake Paiute Tribe, and Winnemucca Indian Colony. In late October 2020, letters were again sent by the BLM to several tribes asking for their assistance in identifying any cultural values, religious beliefs, sacred places and traditional places of Native American people which could be affected by BLM actions on public lands, and where feasible to seek opinions and agreement on measures to protect those tribal interests. As the lead federal agency, the BLM prepared the MOU for the Project and continues to facilitate all ongoing Project-related consultation.
LAC has also independently engaged with the Fort McDermitt Paiute and Shoshone Tribe between 2017 and 2020 (as described in Lithium Nevada Corp., 2020). On July 29, 2019, LAC and the Fort McDermitt Paiute and Shoshone Tribe entered into a Project engagement agreement to facilitate meaningful interaction between LAC and the Fort McDermitt Paiute and Shoshone Tribe. In February and March 2020, LAC held one-on-one meetings with tribal members to provide information about workforce development and employment opportunities and conduct job skills analysis of several tribal members.
The in-person work was discontinued during most of the COVID pandemic, but LAC continued to discuss employment opportunities with tribal members through virtual meetings and phone communication. In November 2020, LAC worked with members of the Fort McDermitt Paiute Shoshone Tribe to bring the BuildNV Core Construction Training Program to Fort McDermitt. Eleven participants successfully completed the program. In February and April 2021, LAC presented a Project update to the Fort McDermitt Tribal Council and hosted a community meeting in McDermitt to discuss and provide answers regarding the Thacker Pass Project. In August 2021 and January 2022, LAC had meetings with Tribal Council members to present a conceptual benefits package and on October 20, 2022, LAC signed a community benefits agreement with Fort McDermitt Paiute and Shoshone Tribe. In October 2021 and October 2022, LAC sponsored a Heavy Equipment Operator Training course held in Fort McDermitt in October 2021 for fourteen participants, and in October 2022 for sixteen participants who received certificates for learning to safely operate various pieces of heavy equipment.
| Page 219 |
| Lithium Americas Corp. Feasibility Study, National Instrument 43-101 Technical Report for the Thacker Pass Project, Humboldt County, Nevada, USA |
20.7 Environmental Baseline Studies
Since 2010, LAC has conducted an extensive baseline characterization study and data collection program for the Project. These studies initially focused on surveys within an approximate 1,497-hectare (3,700-acre) boundary of the previous Project concept, in the immediate vicinity of the pit and plant layout proposed by Western Lithium Corp. In 2018, the baseline study program was expanded to encompass over 7,527 hectares (18,600 acres). All baseline studies were substantially completed in 2018 and early 2019. Targeted geochemistry humidity cell test (HCT) laboratory testing was completed in late 2020.
The baseline study program was conducted to characterize existing environmental and social resources and support the completion of the multi- Federal and State agency permitting and approval program, and the anticipated environmental documentation process that is required under NEPA. This baseline program includes, but is not limited to, studies for the following standard resource topics:
The following sections summarize key baseline studies. Baseline data collection and impact studies were completed between 2018-2020.
20.7.1 Climate/Weather Monitoring
In August 2011, LAC installed a weather station at the Project site to collect site-specific meteorological data to support engineering design, reclamation efforts, the air quality permitting and approval program and the NEPA documentation process. Hourly on-site weather data has been continuously collected since 2011. Data is downloaded and archived on a quarterly basis. Parameters include wind speed and direction, temperature at 2-m and 10-m, relative humidity, precipitation, barometric pressure, and solar radiation.
| Page 220 |
| Lithium Americas Corp. Feasibility Study, National Instrument 43-101 Technical Report for the Thacker Pass Project, Humboldt County, Nevada, USA |
20.7.2 Wildlife
The Project area contains habitat for a variety of wildlife typical of the Great Basin Region. Habitat is predominantly sagebrush, intermixed with salt desert scrub and invasive grasslands and forblands. The BLM identifies areas in which the Project lies as Greater Sage-Grouse priority habitat. BLM considers Greater Sage-Grouse to be a sensitive species and has regulations to protect the species and its habitat.
Since 2008, LAC has performed (via independent biological contractors) six separate field surveys for sage grouse in Thacker Pass (Enviroscientists, 2008; Enviroscientists, 2010; JBR, 2012a; JBR, 2012b; Great Basin Ecology, 2012; Great Basin Ecology, 2013). The purpose of the surveys included assessing the quality of habitat and Greater Sage-Grouse use. The sage grouse is a game bird that BLM has identified as a special status species. Sage grouse lek sites have not been identified in the Project area but have been documented north of the Project in the Montana Mountains. Baseline studies indicated that habitat located in the Project area has been considerably modified by recent and historical wildfires and contiguous infestations of invasive annual grasses, primarily cheatgrass. The landscape is generally devoid of healthy sagebrush assemblages, with patchy occurrences of sagebrush. LAC has fulfilled initial sage grouse compensatory mitigation commitments as described in Section 20.3.1.1.
NDOW regularly monitors Greater Sage-Grouse leks and performs lek counts within the Montana Mountains, north of the proposed Project site. These data are available for use by LAC during the mine permitting and approval process and the NEPA environmental documentation process.
In March 2018, LAC hired SWCA Environmental Consultants to perform additional environmental baseline surveys in the expanded 18,686-acre Project area, for general wildlife, general vegetation, special status species, and Greater Sage-Grouse habitat surveys. Updated surveys were completed in Q3 2018 (SWCA, 2018a; SWCA, 2018b; SWCA, 2019a; SWCA, 2019b).
In February 2018, LAC hired Wildlife Resource Consultants to perform aerial presence and ground territory surveys for raptors. Surveys within a 16-km (10-mile) radius of the Project site were completed in 2018 and 2019 (WRC, 2018a, 2019). Surveys within a 3-km (2-mile) radius of the Project site were completed in 2019, 2020, 2021, and 2022 (WRC, 2019, 2020, 2021, 2022). Two active golden eagle nests were identified in 2022 (WRC, 2022) within Thacker Canyon, approximately 0.6 km (0.4 mile) from the Proposed PoO boundary. The Project operation will not directly interfere with the nest; LAC could conduct operations without a permit, potentially with some seasonal restrictions. The USFWS issued a Record of Decision approving issuance of the permit in March 2022 and then issued the final Incidental Take Permit on April 8, 2022. The Company has initiated mitigation stipulated by the permit.
Lahontan cutthroat trout (LCT), listed as threatened under the Endangered Species Act (ESA), is known to exist in portions of the Crowley Creek-Quinn River watershed. No LCT occur in Thacker Creek. No LCT were observed in the lower reaches of Pole Creek or in the lower reaches of Crowley Creek (below the confluence of Rock Creek), both which are considered intermittent and ephemeral. A 1995 U.S. Fish and Wildlife Report and subsequent summaries have not identified naturally occurring LCT or habitat in upper Pole Creek. According to NDOW, LCT habitat may occur in the upper reaches of Pole Creek, located approximately three miles north of the Project area; and in the upper reaches of Crowley Creek, above the confluence of Rock Creek, located approximately three miles northeast of the Project area.
In October 2011, and June 2012, NDOW attempted to introduce LCT in the upper reach of Pole Creek. According to NDOW, LCT was observed in upper Pole Creek in 2014, but no LCT were observed or identified in 2015. To date, stocking efforts have not demonstrated survival or habitat there. According to hydrological modeling conducting by Piteau Associates, no measurable impacts to the upper or middle Pole Creek surface flow are simulated (Piteau, 2020c). In November 2020, per regulations 50 CFR Part 402 and Section 7 of the Endangered Species Act, the BLM requested informal consultation with the USFWS regarding the Project (Consultation Code: 08NVD00-2020-SLI-0619) (BLM, 2020). The BLM also prepared a Biological Assessment and determined the Project may affect, but is not likely to adversely affect, the threatened LCT in the Thacker Pass Lithium Mine Project area (BLM, 2020). On December 4, 2020, the USFWS concurred with the BLM's determination that the Proposed Project may affect, but is not likely to adversely affect, LCT over the life of the Project (USFWS File No. 2021-I-0041) (USFWS, 2020).
| Page 221 |
| Lithium Americas Corp. Feasibility Study, National Instrument 43-101 Technical Report for the Thacker Pass Project, Humboldt County, Nevada, USA |
In March 2018, LAC hired Wildlife Resource Consultants to perform Spring Snail surveys in proximity to the Project. The spring snail surveys were completed in Q3 2018 (WRC, 2018). The Kings River pyrg was found to occur at 13 undeveloped springs in the larger survey area; however, it was not found to occur within the Project Boundary. The Kings River pyrg is not a BLM special status species, though it is an NDOW species of conservation priority.
20.7.3 Cultural Resources
In March 2018, LAC hired Far Western Anthropological Group to perform a Class III Cultural Resource Survey within the approximately 7,527-hectare (18,600-acre) baseline study area. The cultural resource survey was completed in Q3 2018 (McCabe, 2012; Young, 2018). The cultural resource survey has been reviewed and approved by both the BLM and SHPO.
In consultation with SHPO, the BLM determined to resolve adverse effects as to historic artifacts and other historic properties within the Project area. To specify how those effects would be resolved, the BLM created a Memorandum of Agreement (MOA) and Historic Properties Treatment Plan (HPTP). Draft copies of the MOA and HPTP were mailed to local tribes and the SHPO for review and comment in September 2020. The MOA and HPTP contain descriptions of the historic properties involved, the mitigation research design, mitigation methods, and the specific actions to be taken at each historic property. In general, mitigation for physical effects to historic properties-including both prehistoric and historic resources-would involve data recovery (e.g., excavation, publications) to learn as much as possible about the property prior to its destruction, and mitigation for visual effects to historic properties would involve interpretation for the public (e.g., research, publications, interpretive signage). The BLM edited the MOA based on comments it received. In late October 2020, letters were sent to several tribes asking for their assistance in identifying any cultural values, religious beliefs, sacred places and traditional places of Native American people which could be affected by BLM actions on public lands, and where feasible to seek opinions and agreement on measures to protect those tribal interests. The letter sent to tribes also provided a copy of the MOA final version and invited their signature as a concurring party. Tribes were again invited to submit additional comments and meet further with the BLM. The SHPO signed the MOA as a Signatory on November 5, 2020. LAC was invited to be a concurring party to the MOA, and LAC provided signature on December 2, 2020.
The MOA and HPTP serve as the comprehensive guide for the implementation of cultural resources treatment measures in response to adverse effects identified by BLM in consultation with Nevada SHPO and also through the NEPA compliance framework presented in the Project EIS. The content of the Project's HPTP, coupled with dynamic Project planning and adherence to the MOA stipulations, will mitigate direct and indirect impacts to Historic Properties during the Project's construction and future exploration activity. As the lead federal agency, the BLM generated the MOA and facilitates all on-going, Project-related consultation.
20.7.4 Water Resources
Water resource studies for the Quinn River Basin and Kings River Basin were conducted through series of reconnaissance reports commissioned by the Nevada Division of Water Resources (NDWR) (Malmberg, 1966; Huxel, 1966; Visher, 1957; Zones, 1963). Although these studies focused on water supply and availability from the alluvial basins, they provide some discussion on bedrock conditions in the Thacker Pass vicinity.
Project scale hydrogeologic studies began in 2011 with a groundwater investigation and was conducted by Lumos and Associates which included monitoring well drilling, testing, and spring surveying (Lumos, 2011a, Lumos, 2011b). Continuous spring surveying was conducted by SRK between 2011 to 2013. SRK visited most spring locations for at least 4 quarters (SRK, 2011a, 2011b, 2012a, 2012b, 2012c, 2012d, 2013). Seven (7) additional wells were drilled by LNC with oversight from Schlumberger Water Services in 2011, of which 5 wells have been continuously monitored to present (SWS, 2013). An initial basin-scale groundwater model spanning Kings and Quinn River hydrographic basin was developed to identify potential groundwater quantity impacts (SWS, 2013). These investigations focused on a smaller open pit plan.
| Page 222 |
| Lithium Americas Corp. Feasibility Study, National Instrument 43-101 Technical Report for the Thacker Pass Project, Humboldt County, Nevada, USA |
In 2018, a supplemental investigation began, focused on characterizing conditions for the larger 2018 pit configuration at Thacker Pass. This included 4 additional monitoring wells, 9 piezometers, 2 production wells, 3 surface water gaging stations, and the resumption of seep and spring monitoring. The work is summarized in the Baseline Hydrological Data Collection Report (Piteau, 2019a). A numerical groundwater model was updated to evaluate potential water related impacts to surface and groundwater resources including the potential to generate a pit lake and pit lake geochemistry. A Fate and Transport analysis was also performed to assess the potential migration of pore water in the proposed pit backfill on the groundwater system. The results are summarized in "Thacker Pass Project Water Quantity and Quality Impacts Report Revision 1" (Piteau, 2020). In August 2021, a revised analysis was completed for a 2,850 acre-ft/yr water supply abstraction (Piteau, 2021).
A summary of the hydrogeological results is described in the following sections: groundwater setting and availability at Thacker Pass (20.7.4.1), groundwater quality across the Project (0), seeps and springs monitoring (20.7.4.3), surface water features adjacent to the Project (20.7.4.4) and their status as Waters of the US (20.7.4.5), water related impacts as evaluated from a numerical groundwater model (20.7.4.6), and monitoring and mitigation plans to evaluate water resources and mitigate mining related impacts during operations and post-closure (20.7.4.7).
20.7.4.1 Groundwater Setting
The proposed Project site resides along a hydrographic basin divide between two designated hydrographic basins: the Kings River Valley to the west and the Quinn River Valley to the east. Water rights in both basins have been fully allocated, with perennial yields of 17,000 and 60,000 acre-feet per year, respectively.
Recharge of the Quinn River and Kings River valleys begins in the adjacent mountain blocks, which have elevations that are 5,000 feet above mean sea level (amsl). Recharge is distributed to the alluvial basin via two processes: (1) deep bedrock recharge from infiltration of direct precipitation and snowmelt in bedrock mountain blocks; and (2) runoff recharge derived from infiltration of surface water runoff as it flows from mountain blocks across alluvium material along basin margins.
Groundwater discharge from the Quinn River and Kings River valleys occurs primarily through four processes: (1) evapotranspiration through phreatophytes; (2) extraction by irrigation wells; (3) natural discharge at seeps and springs; and (4) groundwater outflow to adjacent basins. Irrigation extraction is currently the largest component of groundwater discharge.
Groundwater levels have been monitored in the vicinity of the Thacker Pass Project at a series of monitoring wells since 2011. Groundwater levels are typically 4,625 feet amsl to 5,034 feet amsl. The highest water levels were observed at monitoring well WSH-7 (approximately 5,285 feet amsl) north of the proposed open pit. The anomalously high water level is attributed to the location of the well north (upgradient) of the principal E-W fault that functions as a hydraulic flow barrier. Water levels in the western portion of the proposed Project decline to an elevation of approximately 4,625 feet amsl, observed at piezometer PZ18-05 located along the western margin of the Project site. This is approximately 20 feet higher than the headwaters of Thacker Creek. East of the proposed CTFS and open pit, water levels decline to 4,513 feet amsl, observed at monitoring well MW18-02, which serves as the down gradient monitoring point. Water level data indicated the groundwater divide is approximately 3,500 feet east of the hydrographic divide. The groundwater divide corresponds with a corridor of elevated water levels in monitoring well WSH-7 (5,285 feet amsl), monitoring well PH-1 (5,034 feet amsl), and monitoring well WSH-17 (4,861 feet amsl) which are compartmentalized by minor faults that act as flow barriers (Piteau 2018a; Piteau 2019a; Piteau 2020).
| Page 223 |
| Lithium Americas Corp. Feasibility Study, National Instrument 43-101 Technical Report for the Thacker Pass Project, Humboldt County, Nevada, USA |
Water bearing rock units adjacent to the open pit consist of claystone, interbedded claystone / ash, volcanic tuff, and lava flows. Claystone / ash bedrock units are the most transmissive bedrock units, although still considered low permeability materials, owing to the greater abundance of interbedded ash layers. The presence of interbedded ash functions as a secondary permeability pathway to transmit groundwater flow because they interconnect transmissive beds of ash in a broader fabric of claystone at the mesoscopic scale. The presence of faults, even with minor offset, can impede groundwater flow through i) truncating ash beds against low permeability claystone and ii) the intrinsically low permeability materials themselves. The other bedrock units of volcanic tuff and lava flows possess crystalline rock matrices with very little intrinsic permeability. Hydrologic testing confirmed the low permeability character of bedrock materials and indicated that faults were barriers perpendicular to flow. The bedrock and structural compartmentalization surrounding the open pit is not conducive to sustain high volumes of flow.
Water supply potential from the mine site is expected to be minimal. Therefore, the Project water supply targeted the more transmissive alluvium sediments in Quinn River Valley. A water supply well (Quinn River Production Well) was drilled and tested in 2018. The well was step tested at 1,500 gpm, 2,000 gpm, 2,593 gpm, and 3,473 gpm for 30-minute intervals which yielded drawdowns of 13 ft, 19 ft, 25.6 ft, and 36.5 ft respectively. A 72-hour constant rate pumping test was conducted on the well at a rate of 2516 gpm, which yielded a maximum drawdown of approximately 29 ft in the Quinn River Production Well.
20.7.4.2 Groundwater Quality
Groundwater major ion chemistry ranges from calcium/sodium bicarbonate to calcium/sodium - sulfate types, possessing nearly equal components of calcium and sodium cations. Major ion chemistry of seeps and springs is similar to that of monitoring wells with slightly higher calcium composition. The similarity between major ion chemistry of groundwater and perennial seeps and springs can be attributed to the seeps and springs being locations where groundwater discharges at ground surface, and the groundwater expressed at seeps and springs having relatively short flow paths and residence times.
Groundwater in the Project area has naturally elevated background concentrations of several constituents (arsenic, fluoride, iron, manganese) that exceed Nevada Reference Values (NRVs). Profile I standards set forth Nevada's reference values for drinking water. A summary of groundwater Profile I exceedances in the existing groundwater is presented in Table 20-2. Detailed groundwater chemistry and groundwater quality information can be found in the Water Quantity and Quality Impacts Report (Piteau, 2019a).
Table 20-2 Summary of Background Groundwater Profile 1 Exceedances
|
Constituent |
Wells (82 total samples) |
||
|
No. Exceedance |
Percentage |
Key Wells |
|
|
Aluminum |
5 |
6 |
WSH-04 |
|
Antimony |
5 |
6 |
PH-1, WSH-13, WSH-14 |
|
Arsenic |
61 |
66 |
Most Wells |
|
Fluoride |
26 |
35 |
WSH-Series Wells |
|
Iron |
5 |
5 |
PH-1, MW18-04 |
|
Manganese |
1 |
1 |
- |
20.7.4.3 Seeps and Springs
Spring and seep monitoring began in 2011 and continued through 2019. Surveying followed BLM guidelines, consisting of measuring a location, flow rate, field parameters, water chemistry. In addition, photographs, a summary of riparian vegetation, and a site description were documented. In 2018 the spring and seep sampling program was expanded from historical surveys to include 52 spring and seep sampling locations. (Lumos, 2011b, SRK, 2011a, 2011b, 2012a, 2012b, 2012c, 2012d, 2013, Piteau, 2018b; Piteau, 2018c; Piteau, 2018d; Piteau, 2018e, Piteau, 2019b).
| Page 224 |
| Lithium Americas Corp. Feasibility Study, National Instrument 43-101 Technical Report for the Thacker Pass Project, Humboldt County, Nevada, USA |
Spring surveying identified 21 perennial springs, including those in the Thacker Creek spring system. A subset of 17 perennial and ephemeral springs have been selected by regulatory agencies for continued quarterly monitoring throughout mine operations. Spring monitoring for this subset started in 2021.
20.7.4.4 Surface Water
Lands within the proposed Project area primarily drain eastward in the direction of the Quinn River Valley. A small portion of the proposed mine pit area and the West Waste Rock Storage Facility are in the Kings Valley hydrographic basin and thus drains west in the direction of Thacker Creek and subsequently to the Kings River Valley.
Perennial and intermittent surface water creeks located near the Project area include Thacker Creek, Pole Creek, Rock Creek, and Crowley Creek. Thacker Creek is a perennial stream fed by springs. It is the stream nearest the proposed Project area. Pole Creek and Rock Creek are intermittent streams whose headwaters are in the Montana Mountains. These streams ultimately discharge to Crowley Creek when flow is present. Pole Creek has discontinuous flow with reaches that are perennial and seasonally dry (intermittent) during portions of the year. The lower reach of Crowley Creek, below the confluence with Rock Creek, is intermittent, experiencing dry conditions during summer months, while the upper reach is perennial.
In April 2018, surface water monitoring stations were established in Crowley Creek, Upper Thacker Creek, and Lower Thacker Creek to assess baseline flow conditions, evapotranspiration (ET) consumption, and to monitor stream responses to storm events. Key findings from one year of stream flow monitoring include the following:
More details are available in Thacker Pass Project Baseline Hydrological Data Collection Report (Piteau, 2019a).
20.7.4.5 Waters of the US
Redhorse Corporation performed a formal Waters of the U.S. Delineation (including wetlands delineation) within the revised 18,686-acre Project area (Redhorse, 2018). On February 8, 2019, the U.S. Army Corps of Engineers (ACOE) Sacramento District concurred with the findings of the 2018 Redhorse Corporation delineation report (ACOE, 2019). Specifically, the ACOE determined that aquatic resources within the survey area are isolated and have no apparent interstate or foreign commerce connection. Hence, they are not designated as Waters of the United States and are not within the jurisdiction of the ACOE (SPK-2011-01263).
20.7.4.6 Water Balance
A groundwater flow model was developed in MODFLOW-USG (USG) finite difference numerical code and simulates saturated/unsaturated groundwater flow in bedrock and alluvial hydrostratigraphic units. The model domain is centered on Thacker Pass and extends into portions of the alluvial basins in Kings River and Quinn River. The groundwater model was calibrated to water level measurements, pumping tests, groundwater discharge measurements from springs and surface water flow, and water balance estimates for the Quinn River and Kings River basins. Model predictive runs were designed to estimate the potential for water quantity impacts within the study area that would result from the proposed Project.
| Page 225 |
| Lithium Americas Corp. Feasibility Study, National Instrument 43-101 Technical Report for the Thacker Pass Project, Humboldt County, Nevada, USA |
A forward-looking water quantity impacts analysis was performed based on pumping 2,850 acre-feet annually (for Phase I) and 5,700 acre-feet annually (for Phase 2) from the Quinn River Production Well, east of the proposed Project site (Piteau, 2020). Water level drawdown was simulated during mining and for a period of 300 years after mining. Two 10-foot isopleth drawdowns are present corresponding to pumping from Quinn River Valley and mining at Thacker Pass. A 10-foot drawdown contour was used as the point of reliable impacts prediction.
Considering proposed Phase 2 operations, the 10-foot drawdown isopleths related to Project mining is limited to an approximately 2.5-mile radius centered on the South sub-pit, where dewatering is predicted to be greatest. The end of mining drawdown isopleth does not extend to the Thacker Creek spring system, or to the upper reaches of Pole Creek or upper Crowley Creek where Lahontan Cutthroat Trout habitat has been mapped. At the higher Phase 2 production rates, drawdown in the Thacker Pass area extends into the southern portion of the Montana Mountains, potentially affecting several springs and man-made impoundments. Surface water flows are predicted to be minimally impacted, with any changes in groundwater discharge being less than the measurement error. Since the bedrock water table at Thacker Pass is not expected to be impacted until later in the mine life, LAC currently has not sought a water right associated with pit-dewatering but would need to consider such an authorization in advance of pit dewatering below the bedrock water table.
To evaluate the effects of groundwater extraction for water supply from the Quinn River Valley alluvial aquifer, extraction at a rate of 2,850 acre-feet per year (Phase 1) and 5,700 acre-feet per year (Phase 2) were simulated and groundwater elevations in the alluvial aquifer were predicted. The Phase 1 simulations show a 10-foot drawdown isopleth centered at the Quinn River Production Well, reaching approximately 1.25 miles from the extraction well at the maximum extent. One stock watering well is located within this modeled contour but is expected to be capable of continued operation because it maintains over 60 ft of saturated well screen. A sub-irrigated field outside the 10-ft drawdown isopleth is supported by surface water infiltration but will nevertheless be monitored for effects from ground water extraction which may affect groundwater gradients. The expected 10-foot drawdown in Quinn River Valley at the conclusion of proposed Phase 2 operations is predicted to expand beyond the Phase 1 drawdown isopleth in Quinn River Valley but does not intersect any additional stock water wells.
20.7.4.7 Monitoring and Mitigation Plan
A mitigation plan was prepared as part of BLM approved operations which addresses possible conflicts with regards to adjacent water rights and stakeholders. The mitigation plan incorporates monitoring and provides mitigation for stock water supply and feed.
Under direction from the ROD, LAC will monitor groundwater sources and will maintain water quality and quantity for wildlife, livestock, and human consumption to the State of Nevada standards. LAC will regularly monitor groundwater levels in designated wells as part of the mine's Water Pollution Control Permit (WPCP) and LAC's own proposed monitoring and mitigation plan. LAC will routinely update the groundwater model using the collected monitoring data as part of the WPCP requirement. The BLM recommends continued monitoring in conjunction with the mine's WPCP, and may require additional monitoring of seeps, springs, and non-mining wells outside the groundwater model boundary, if necessary. If monitoring finds that the Project results in drawdown to seeps and springs within the Project boundary, the BLM will require LAC to develop alternative sources for wildlife and livestock use.
As data are collected from the field, LAC will update the groundwater model with firsthand information on a schedule not to exceed five (5) years from the previous modelling. If such updated models continue to support the assumption that the backfilled pits would exhibit flow-through at low rates with some quality degradation, LAC will adopt appropriate mitigation early, prior to mining below the bedrock water table, to minimize or eliminate the risk of groundwater impairment through strategies determined with BLM and NDEP concurrence.
| Page 226 |
| Lithium Americas Corp. Feasibility Study, National Instrument 43-101 Technical Report for the Thacker Pass Project, Humboldt County, Nevada, USA |
LAC will monitor the proposed activity to identify or prevent impacts according to the operating plans and permits submitted with the Mine Plan of Operations and the WPCP.
20.7.4.8 Geochemical Characterization
The Project will generate waste rock, coarse gangue, and mineral clay tailings material from the beneficiation of ore. BLM Instruction Memorandum NV-2013-046, Nevada Bureau of Land Management Rock Characterization Resources and Water Analysis Guidance for Mining Activities (BLM, September 19, 2013) outlines the rock and water resources data information that needs to be collected under 43 CFR 3809.401(b)(2) and 3809.401(c)(1) for mine PoO. Additional guidance on mine waste characterization was issued by the NDEP-BMRR on March 22, 2019, pursuant to the WPCP program and associated NAC 445A regulations. LAC's investigation of the potential for development of Acid Rock Drainage and Metal Leaching (ARDML) from waste rock, ore, gangue, and tailings associated with the proposed Project was pursued in accordance with these guidelines.
Since 2011, SRK Consulting (U.S.), Inc. ('SRK') has been engaged to characterize baseline geochemical conditions prior to the start of proposed mining operations. Geochemical testing of mine waste materials provides a basis for assessment of the potential for ARDML, prediction of contact water quality (i.e., surface water and groundwater that contacts waste rock, ore, gangue, pit walls, or tailings), and evaluation of options for design, construction, and closure of the mine facilities. The results of the geochemistry testing performed to date is summarized in the Baseline Geochemical Characterization Report for the Thacker Pass Project (SRK, 2020a). The study describes the composition of waste rock, ore, gangue and tailings and potential impacts of material weathering in the Project study area.
The characterization study performed by SRK involved the collection and analysis of a combined total of 285 samples representative of waste rock, ore, gangue, and tailings for static geochemical testing with 20 representative samples submitted for kinetic testing. The results demonstrate that the waste rock, ore, and gangue will be net neutralizing with a low potential for acid generation and metal leaching. Although the excess of neutralizing capacity means that net acid conditions are unlikely to develop, there is still a potential for the ore and waste to leach some constituents of concern under neutral to alkaline conditions, in particular antimony and arsenic.
As with the waste rock and ore, the gangue material is also net neutralizing and has a potential to leach antimony and arsenic under neutral to alkaline conditions. There are differences in some of the constituent concentrations for the gangue material compared to the ore feed material, including increased concentrations of aluminum, arsenic, antimony, iron, and manganese. This is presumably a result of the breakdown of mineral grains during the wet attrition process and the enrichment of these constituents in the coarse gangue fraction. Conversely, calcium, chloride, sodium, sulfate, and total dissolved solids (TDS) concentrations are lower in the coarse gangue material compared to the ore feed material, indicating these constituents are rinsed from the ore material during the attrition process.
The current results for the tailings material indicate that the clay tailings do not contain appreciable sulfide sulfur and are unlikely to generate acid from the oxidation of sulfides. In Meteoric Water Mobility Procedure (MWMP) testing, certain constituents were leached under low pH conditions at concentrations above Profile I NRVs. These results can be attributed to the presence of residual sulfuric acid from the leaching process that is flushed from the material during the MWMP. The tailings facility will be constructed as a zero-discharge facility. Tailings material will be stored on lined containment and covered with waste rock/growth media at closure; therefore, no degradation to groundwater is expected.
| Page 227 |
| Lithium Americas Corp. Feasibility Study, National Instrument 43-101 Technical Report for the Thacker Pass Project, Humboldt County, Nevada, USA |
20.7.5 Air Quality
Air Sciences has prepared an air quality impact analysis report and greenhouse gas emissions and downstream emissions reduction report based on the PoO final process design (Air Sciences, 2019a; Air Sciences, 2019b). The air quality analysis quantified and evaluated the impacts on ambient air quality resulting from the Project. The modeled maximum concentrations and the estimated total ambient concentrations (modeled concentrations plus background concentrations) were compared with the applicable National Ambient Air Quality Standards (NAAQS). In addition, the estimated total ambient concentrations for the Project were also compared with the corresponding NAAQS and Nevada Ambient Air Quality Standards (NvAAQS). The modeling performed determined the estimated maximum total ambient concentrations for all the pollutants and averaging periods are below the applicable NAAQS and NvAAQS. Additionally, Air Sciences completed an odor analysis (Air Sciences, 2020) for the proposed Project based on results from air dispersion modeling completed for the quality impact analysis report (Air Sciences, 2019a). Sulfur dioxide (SO2) and hydrogen sulfide (H2S) emissions were analyzed for their potential to produce odors outside of the proposed Project boundary. Modeling results show that both SO2 and H2S concentrations are below their odor thresholds outside of the proposed Project boundary and no detectable odor from the Project is expected.
20.8 Waste Rock, Gangue, and Tailings Facility Management
The management and site monitoring of waste rock, coarse gangue, and tailings storage facilities, during operations and closure are key issues for any mine and ore processing operation located in the State of Nevada. BLM requires that mining and processing operations on public lands prevent unnecessary or undue degradation of the land. State requirements mandate that mine, ore processing, and fluid management system operations do not degrade waters of the State.
20.8.1 Waste Rock and Gangue Storage and Management
Waste rock from the open pit will be used as fill for Project infrastructure, managed through the construction of a surface WRSF, and backfilled in the pit. Coarse gangue will be stored in the CGS facility or backfilled in the pit. The footprints of both the West and (if necessary) East WRSF will be lined with 0.3 m (1 ft) of compacted low hydraulic conductivity soil layer (LHCSL) overlain by a LHCSL cover layer. An underdrain collection system is designed in the major natural drainages to promote drainage to a single-lined sediment pond. Runoff collected in the pond will be pumped for use in the process circuit.
The footprint of the ROM Stockpile will have a 0.3 m (1 ft) thick compacted LHCSL base layer overlain by 0.6 m (2 ft) of overliner which the ore material will be stacked on. The footprint of the coarse gangue stockpile will be lined with 0.3 m (1 ft) of compacted LHCSL overlain by a LHCSL cover layer. An underdrain collection system is designed in the major natural drainages to promote drainage to a single-lined sediment pond. Runoff collected in the pond will be pumped for use in the process circuit.
A detailed Waste Rock and Gangue Management Plan has been prepared for the Project (SRK, 2021).
20.8.2 Tailings Storage and Management
Lithium processing will produce tailings composed of neutralized filter cake (mostly residual clay, gypsum, and iron and aluminum hydroxide precipitates), magnesium sulfate salt, and sodium/potassium sulfate salts. These products are collectively referred to as clay tailings. The clay tailings will be placed in a CTFS, which will be a geomembrane-lined zero-discharge storage facility, located east of the process plant. Two conveyors will be used to transport the tailings material from the process plant to the CTFS. The first conveyor will transport the clay material and the neutralized filter cake. The second conveyor will transport the magnesium sulfate salt and the sodium/potassium sulfate salts. The area below the conveyors will be lined with 2-mm (80-mil) high density polyethylene (HDPE) geomembrane for secondary containment. From the temporary stockpiles at the conveyor endpoints, material will be transported with mechanical equipment, placed in lifts and scarified to increase the surface area of material that is exposed to sun and wind to accelerate the drying process. Once the target moisture range is achieved, the tailings will be compacted. Tailings material will be stored on lined containment and covered with waste rock/growth media at closure.
| Page 228 |
| Lithium Americas Corp. Feasibility Study, National Instrument 43-101 Technical Report for the Thacker Pass Project, Humboldt County, Nevada, USA |
20.8.3 Stormwater Management
Stormwater infrastructure at the Project is designed to protect water quality and mitigate erosion potential onsite. Stormwater events will be managed per State design standards. A Stormwater Pollution Prevention Plan was submitted with the PoO as well as the WPCP application. Upon closure, all facilities will have a soil cover placed on top and be vegetated to reduce infiltration and erosion potential. Stormwater management at the Thacker Pass Mine site is described in the following Sections.
20.8.3.1 Waste Rock Storage Facility
The WRSFs will be lined with one-foot of compacted LHCSL overlain by a 0.6 m (2 ft) thick cover layer designed to promote drainage to single-lined sediment ponds. The ponds are sized to hold the 100-year, 24-hour storm event. Runoff collected in the ponds will be pumped for use into the process circuit.
20.8.3.2 Mine Facilities
Stormwater management for the Mine Facility will include channels designed to convey the 100-year, 24-hour design storm. LAC will construct unlined sediment ponds to improve water quality of runoff coming from the Mine Facilities Area. Diversion channels and berms will be constructed to capture run-off from the area and direct the flow to sediment ponds to allow sediments to settle. At a minimum, unlined ponds in the Mine Facilities area will be sized to contain a 2-year, 24-hour storm event. The geomembrane lined pond (Mine Facilities Pond 2) will be sized to contain a 100-year, 24-hour storm event. Water will be pumped to the process circuit from the lined pond or released to natural drainage for the unlined ponds.
20.8.3.3 ROM Stockpile, Attrition Scrubbing
Stormwater management for the facility will include channels designed to convey the 100-year, 24-hour design storm. The ROM stockpile will have a 0.3 m (1 ft) thick compacted LHCSL overlain by 0.6 m (2 ft) of overliner which the ore material will be stacked on. Runoff from the ROM stockpile and the Attrition Scrubbing Area will drain to a single-lined pond (Mine Facilities Pond 2). The pond will be sized to hold a 100-year, 24-hour storm event plus sediment storage. Water from this pond will be pumped for use in the process circuit.
20.8.3.4 Coarse Gangue Stockpile
The CGS will be lined with one foot of compacted LHCSL overlain by cover material to prevent the LHCSL from drying out or cracking. Runoff from the CGS will drain into a single-lined sediment pond. The CGS pond will be sized to hold a 100-year, 24-hour storm event, plus sediment storage. Runoff collected in the pond will be pumped for use into the process circuit. The road around the CGS serves as a stormwater diversion berm and is designed to convey the 100-year, 24-hour storm flows. Riprap will be used in areas of concentrated inflows and outflows for erosion control.
20.8.3.5 Clay Tailings Filter Stack
Diversion channels sized to convey the 100-year, 24-hour storm will be constructed to manage non-contact stormwater around the perimeter of the CTFS. Most of the stormwater runoff will be intercepted by the West CTFS diversion channel where it will be directed to natural drainage to the south. The remaining stormwater will be intercepted and routed along the east side of the CTFS.
| Page 229 |
| Lithium Americas Corp. Feasibility Study, National Instrument 43-101 Technical Report for the Thacker Pass Project, Humboldt County, Nevada, USA |
Stormwater runoff within the CTFS will be collected and will report to one or more of the double-lined Reclaim Ponds. Water collected in the ponds will not be discharged as part of the stormwater management. Water in the Reclaim Ponds will be pumped to the Process Plant to be used as make-up water for processing operations or will evaporate. The Reclaim Ponds are also designed to hold runoff from the 100-year, 24-hour storm plus operating inventory, sediment storage and three feet of freeboard.
20.8.3.6 Process Plant
Stormwater runoff around the Process Plant Area will be conveyed using channels or pipes or will be diverted using a series of berms or other BMP's. Diverted stormwater which contains just runoff from disturbed areas will be directed to either a sediment pond(s) or the CTFS West Diversion Channel. For stormwater runoff that is considered to be contact water, it will be captured and routed to the HDPE lined Plant Event Pond where it can be stored until it can be treated or reintroduced back into the plant system. The haul road to the north of the Process Plant diverts most of stormwater runoff from undisturbed areas upstream to natural drainages around the site. Rip rap will be placed in areas with concentrated flows and scour velocities to prevent erosion.
Tanks and buildings in the Process Plant with solutions that can degrade the waters of the State will have secondary containment structures that are sized for 110 percent of the largest tank or vessel in the area plus precipitation from a 100-year, 24-hour storm event, if applicable.
Two conveyor crossings from the process plant to the CTFS will have secondary containment where required in the form of conveyor pans beneath the conveyor systems and/or the 2 mm (80-mil) HDPE liner within the CTFS draining to a contained area.
20.8.4 Post-Closure Monitoring
The primary goal of conducting post-mining monitoring will be to demonstrate that the Project site does not degrade groundwater and surface water in the Project area. Consequently, groundwater, surface water and erosion and revegetation monitoring will continue for at least five years after cessation of mining, processing, and closure operations.
20.8.5 Site Monitoring
All Federal, State, and County agencies will require monitoring of the mine, ore processing operations, and the fluid management system to ensure compliance with the Project permits. BLM monitoring requirements were issued as part of the ROD under its Surface Management Regulations contained in 43 CFR 3809. NDEP-BMRR monitoring requirements are included in the WPCP issued for the Project in accordance with the regulations contained in NAC 445A.350 through NAC 445A.447.
20.9 Social or Community Impacts
During operations, it is expected that most employees will be sourced from the surrounding area, which already has established social and community infrastructure including housing, retail and commercial facilities such as stores and restaurants; and public service infrastructure including schools, medical and public safety departments and fire and police/sheriff departments.
Based on the projected mine life, the number of potential hourly and salaried positions, and the projected salary ranges, Project operations would have a long-term positive impact to direct, indirect, and induced local and regional economics. Phase 2 full production will require approximately 500 direct employees to support the Project, with the average annual salary estimated at $90,000. An additional and positive economic benefit would be the creation of short-term positions for construction activities. It is estimated that approximately 1,000 temporary construction jobs will be created. Additional jobs will be created through ancillary and support services, such as transportation, maintenance, and supplies.
| Page 230 |
| Lithium Americas Corp. Feasibility Study, National Instrument 43-101 Technical Report for the Thacker Pass Project, Humboldt County, Nevada, USA |
The economic study titled: Social, Economic and Fiscal Impact for New Lithium Operations in Humboldt County, Nevada; prepared by the University of Nevada, Reno; University Center for Economic Development (Borden & Harris, 2019), showed that both lithium mine and processing plant operations have positive economic and fiscal contributions to Humboldt County and the State of Nevada through increased economic activity, employment, household incomes and tax receipts.
The Fort McDermitt Tribe is located approximately 56 km (35 miles) from the Thacker Pass Project site. LAC and the Tribe have devoted more than 20 meetings to focus on an agreement to solidify engagement and improvements at the Fort McDermitt community. A community benefits agreement was signed by LAC and the Fort McDermitt Paiute and Shoshone tribe in October 2022. The benefits agreement will provide infrastructure development, training and employment opportunities, support for cultural education and preservation, and synergistic business and contracting opportunities. Over the past three years, LAC has organized several training events for Tribe members, including basic construction skills, heavy equipment operator training and specialized cultural monitor training for archeological work. In addition, when LAC begins construction of the Project, LAC has committed to construct a community center that includes a daycare, preschool, cultural facility and playground, as well as a separate greenhouse to provide food crops and revenue from seeds/seedlings for reclamation projects.
For nearly two years, LAC has met regularly with the community of Orovada, which is 19 km (12 miles) from the Thacker Pass Project site and is the closest community to the Project. The purpose of the meetings was to identify community concerns and explore ways to address them. The meetings began informally and were open to the entire community. Eventually, the community formed a committee to work with LAC. A facilitator was hired to manage a process that focused on priority concerns and resolution. The committee and LAC have addressed issues such as the local K-8 school and determined that a new school should be built in Orovada. The community has agreed to a new location and LAC has worked with the BLM to secure the site for the Humboldt County School District. LAC has also completed a preliminary design for the school and is moving forward with detailed engineering and construction planning.
The Orovada committee has also addressed issues identified as being of the highest priority to the community, including improvements to local roads (LAC is rebuilding the intersection of U.S. 95 and S.R. 293), air quality monitoring (a monitor will likely be installed at the new K-8 school), and water monitoring (the committee decided that independent monitoring is not necessary).
20.10 Mine Reclamation and Closure
Reclamation and closure of the mine, ore processing, and transportation operations will be completed in accordance with the approved PoO and Reclamation Plan, and the Tentative Plan for Permanent Closure as approved by NDEP-BMRR. On October 28, 2021, NDEP-BMRR Reclamation Branch issued Notice of Intent and draft Reclamation Permit (Permit 0415) for the Thacker Pass Project. The final Reclamation Permit was issued on February 25, 2022. The Project will be bonded under LAC's existing BLM Statewide Bond, BLM Bond Number NVB001750.
Reclamation and closure plans are required to be updated on a regular basis, in consultation with BLM and NDEP-BMRR, to ensure compliance with the following requirements:
The post-mining land use requirements will require the establishment of a sagebrush vegetation community to restore the area to the pre-mining land uses of wildlife habitat, livestock grazing, and dispersed recreation.
| Page 231 |
| Lithium Americas Corp. Feasibility Study, National Instrument 43-101 Technical Report for the Thacker Pass Project, Humboldt County, Nevada, USA |
Project facilities will be reclaimed using standard reclamation techniques and procedures as summarized in the following list:
BLM and NDEP-BMRR have initiated a long-term trust fund program for mining properties as part of the Federal and State permitting program to provide for the funding of long-term water management and related compliance obligations for site maintenance and monitoring activities following the completion of final reclamation and closure activities. If determined to be applicable, the financial method for securing and placement of the trust fund, the trust fund cost and the fund's duration are determined based on the characteristics of the Project. Consultation with BLM and NDEP-BMRR during the permitting and renewal processes would determine the necessity of a long-term trust fund program. Due to the environmental setting and proposed water management approach for the Project, it is not certain a long-term trust fund will be required. Estimated reclamation costs are discussed as part of sustaining capital costs in Section 21.2.
| Page 232 |
| Lithium Americas Corp. Feasibility Study, National Instrument 43-101 Technical Report for the Thacker Pass Project, Humboldt County, Nevada, USA |
21 Capital and Operating Costs
21.1 Capital Cost Estimate
21.1.1 Summary
The capital cost estimate for the Thacker Pass Project has been prepared by M3, ITAC and LAC to include capital cost estimating data developed by M3, ITAC, EXP, Sawtooth, EDG, LAC and third-party contractors in accordance with the scope of the Project. The capital cost estimate covers post-sanction early works, mine development, mining, the process plant, the transload facility, commissioning and all associated infrastructure required to allow for successful construction and operations.
Process and infrastructure capital costs are based on Q1-Q3 2022 pricing. Mine capital estimates are based on Q2 2022 pricing. Sulfuric Acid Plant and power plant equipment pricing is based on Q2 2021 pricing and were not escalated to 2022 pricing. The estimate has been prepared to a target accuracy of ±15% as per Association for the Advancement of Cost Engineering (AACE) International's Class 3 estimate. Closure costs were estimated to a scoping level by NewFields. Note that the tables in this section were rounded to a limited number of significant figures and therefore some summation errors may be present.
The cost estimates presented in this section pertain to three categories of capital costs:
Development capital costs include the engineering, procurement, and construction management (EPCM) estimate as well as the LAC estimate for the LAC scope costs. Sustaining capital costs for the Thacker Pass Project have been estimated and are primarily for continued development of the clay tailings filter stack and coarse gangue stockpile, mining activities, sulfuric acid plant, and plant and infrastructure sustaining capital expenditures.
Development capital costs commence with detailed engineering and site early works following project sanction by the owner and continue to mechanical completion and commissioning. Mining pre-production costs have been capitalized and are included under development capital. The capital costs for years after commencement of production are carried as sustaining capital. Pre-sanction costs from completion of this Technical Report to project sanction, including environmental impact assessments, permit approvals and other property costs are excluded from this report and these costs are not included in the development capital.
Direct costs include the costs of all equipment and materials and the associated contractors required to perform installation and construction. The contractor indirects are included in the direct cost estimate as a percent of direct labor cost. EPCM / Project indirects were detailed out in a resource plan to account for all identified costs, then budgeted as a percent of construction and equipment to be distributed through the process areas. In general, these costs include:
Contract mining capital repayment includes the 60-month financed repayment of the miner's mobile equipment assets acquired prior to the start of operation.
| Page 233 |
| Lithium Americas Corp. Feasibility Study, National Instrument 43-101 Technical Report for the Thacker Pass Project, Humboldt County, Nevada, USA |
Table 21-1 summarizes the development capital cost estimate developed for the Project.
Table 21-1 Development Capital Cost Estimate Summary
|
Description |
Ph1 Costs (US$ M) |
Ph2 Costs (US$ M) |
Responsible |
|
Mine |
|
|
|
|
Equipment Capital (Contract Mining) |
0 |
0 |
Sawtooth |
|
Mine Development |
51.1 |
26.3 |
Sawtooth |
|
Contingency (13.1%) |
6.7 |
3.4 |
Sawtooth/EDG |
|
Total Mine |
57.8 |
29.7 |
|
|
Process Plant and Infrastructure |
|
|
|
|
Costs (Directs & Indirects) |
1735.4 |
1398.5 |
M3/ITAC |
|
Contingency (13.1%) |
227.3 |
183.2 |
M3/ITAC/EDG |
|
Total Process Plant and Infrastructure |
1962.7 |
1581.7 |
|
|
Offsite - Transload Facility |
|
|
|
|
Costs (Directs & Indirects) |
69.0 |
27.1 |
Owner/Savage |
|
Contingency (13.1%) |
9.0 |
3.5 |
Owner/EDG |
|
Total Offsite - Transload Facility |
78.1 |
30.6 |
|
|
Owner's Costs |
|
|
|
|
Costs |
149.8 |
75.6 |
Owner |
|
Contingency (13.1%) |
19.6 |
9.9 |
Owner/EDG |
|
Total Owner's Costs |
169.4 |
85.5 |
|
|
TOTAL DEVELOPMENT CAPITAL |
2,268.0 |
1727.5 |
|
Due to rounding, some totals may not correspond with the sum of the separate figures.
Sustaining Capital costs for the base case totaling US$1,510.2 million have been estimated over the Life of Mine (LOM), as outlined in Table 21-2. Table 21-4 shows the sustaining capital for the first 25 years of the 40-year life of mine.
Table 21-2 Sustaining Capital Estimate Summary (40-Year LOM - Base Case)
|
Description |
*LOM Costs (US$ M) |
Responsible |
|
Mine |
|
|
|
Equipment Capital |
264.3 |
Sawtooth/M3 |
|
Mobile Equipment |
|
|
|
Equipment Capital |
26.6 |
Owner |
|
Process Plant and Infrastructure |
|
|
|
Process Plant |
822.9 |
Owner |
|
Sulfuric Acid Plant |
244.2 |
EXP |
|
CTFS and CGS |
149.0 |
Owner |
|
Offsite Transload Facility |
|
|
|
Transload Facility |
3.4 |
Owner |
|
TOTAL SUSTAINING CAPITAL |
1,510.2 |
|
|
Contract Mining Capital Repayment |
48.8 |
Owner |
|
* Phase 2 capital costs are not included in sustaining costs |
||
| Page 234 |
| Lithium Americas Corp. Feasibility Study, National Instrument 43-101 Technical Report for the Thacker Pass Project, Humboldt County, Nevada, USA |
Table 21-3 First 25 Years of 40-Year LOM Sustaining Capital Estimate Summary
|
Description |
*LOM Costs (US$ M) |
Responsible |
|
Mine |
|
|
|
Equipment Capital |
180.06 |
Sawtooth/M3 |
|
Mobile Equipment |
|
|
|
Equipment Capital |
15.16 |
Owner |
|
Process Plant and Infrastructure |
|
|
|
Process Plant |
230.67 |
Owner |
|
Sulfuric Acid Plant |
104.83 |
EXP |
|
CTFS and CGS |
95.57 |
Owner |
|
Offsite Transload Facility |
|
|
|
Transload Facility |
2.12 |
Owner |
|
TOTAL SUSTAINING CAPITAL |
628.40 |
|
|
Contract Mining Capital Repayment |
48.8 |
Sawtooth/M3 |
* Phase 2 capital costs are not included in sustaining costs
The yearly summarized spend schedule, including sustaining and closure capital, is provided in Table 21-4.
| Page 235 |
| Lithium Americas Corp. Feasibility Study, National Instrument 43-101 Technical Report for the Thacker Pass Project, Humboldt County, Nevada, USA |
Table 21-4 Capital Cost Spend Schedule
|
Operation Year |
-3 |
-2 |
-1 |
1 |
2 |
3 |
4 |
5 |
6 |
7 |
8 |
9 |
10 |
11-15 |
16-20 |
21-25 |
26-30 |
31-35 |
36-40 |
40+ |
TOTAL |
|
Development Capital Phase 1 (US$ M) |
|||||||||||||||||||||
|
Mine Development |
4.6 |
27.2 |
24.9 |
1.2 |
|
|
|
|
|
|
|
|
|
|
|
|
|
|
|
|
57.8 |
|
Process Plant & Infrastructure |
157.0 |
922.5 |
844.0 |
39.3 |
|
|
|
|
|
|
|
|
|
|
|
|
|
|
|
|
1962.7 |
|
Offsite Transload Facility |
6.2 |
36.7 |
33.6 |
1.6 |
|
|
|
|
|
|
|
|
|
|
|
|
|
|
|
|
78.1 |
|
Owner's Cost |
13.6 |
79.6 |
72.8 |
3.4 |
|
|
|
|
|
|
|
|
|
|
|
|
|
|
|
|
169.4 |
|
Development Capital Phase 2 (US$ M) |
|||||||||||||||||||||
|
Mine Development |
|
|
|
2.4 |
14.0 |
12.8 |
0.6 |
|
|
|
|
|
|
|
|
|
|
|
|
|
29.7 |
|
Process Plant & Infrastructure |
|
|
|
126.5 |
743.4 |
680.1 |
31.6 |
|
|
|
|
|
|
|
|
|
|
|
|
|
1581.7 |
|
Offsite Transload Facility |
|
|
|
2.4 |
14.4 |
13.2 |
0.6 |
|
|
|
|
|
|
|
|
|
|
|
|
|
30.6 |
|
Owner's Cost |
|
|
|
6.8 |
40.2 |
36.8 |
1.7 |
|
|
|
|
|
|
|
|
|
|
|
|
|
85.5 |
|
Sustaining Capital (US$ M) |
|||||||||||||||||||||
|
Mine Equipment & Capital Recovery |
|
|
|
4.4 |
12.2 |
15.9 |
13.4 |
12.5 |
7.6 |
2.6 |
5.7 |
0.3 |
7.9 |
51.6 |
26.3 |
19.7 |
46.9 |
35.1 |
2.2 |
0.0 |
264.3 |
|
Mobile Equipment |
|
|
|
0.0 |
0.0 |
0.5 |
0.0 |
0.0 |
1.5 |
0.0 |
0.0 |
0.0 |
0.0 |
7.1 |
1.7 |
4.4 |
4.4 |
3.5 |
3.5 |
0.0 |
26.6 |
|
Process Plant |
|
|
|
0.0 |
0.0 |
0.0 |
0.0 |
1.4 |
0.0 |
0.0 |
1.4 |
0.0 |
1.4 |
4.4 |
30.5 |
191.6 |
555.0 |
37.2 |
0.0 |
0.0 |
822.9 |
|
Sulfuric Acid Plant |
|
|
|
0.0 |
0.0 |
2.3 |
0.0 |
0.0 |
2.6 |
2.3 |
0.0 |
5.1 |
2.6 |
22.3 |
26.0 |
41.6 |
33.7 |
48.9 |
56.8 |
0.0 |
244.2 |
|
CTFS and CGS |
|
|
|
0.0 |
0.0 |
0.0 |
0.0 |
5.6 |
5.6 |
5.6 |
5.6 |
5.6 |
4.4 |
22.9 |
24.3 |
15.6 |
16.6 |
20.4 |
16.4 |
0.0 |
149.0 |
|
Offsite Transload Facility |
|
|
|
0.0 |
0.1 |
0.1 |
0.1 |
0.1 |
0.1 |
0.1 |
0.1 |
0.1 |
0.1 |
0.6 |
0.3 |
0.6 |
0.3 |
0.6 |
0.3 |
0.0 |
3.4 |
|
Closure Costs (US$M) |
|||||||||||||||||||||
|
Closure |
|
|
|
|
|
|
|
|
|
|
|
|
|
|
|
|
|
|
|
53.5 |
53.5 |
|
Annual Capital Expenditure |
181.4 |
1,066.0 |
975.2 |
187.9 |
824.2 |
761.6 |
48.0 |
19.6 |
17.5 |
10.5 |
12.8 |
11.1 |
16.4 |
109.0 |
109.2 |
273.6 |
656.8 |
145.8 |
79.2 |
53.5 |
5,559.2 |
Note: Due to rounding, some totals in this table may not correspond with the sum of the separate figures.
| Page 236 |
| Lithium Americas Corp. Feasibility Study, National Instrument 43-101 Technical Report for the Thacker Pass Project, Humboldt County, Nevada, USA |
21.1.2 Estimate Basis
21.1.2.1 Scope of Estimate
This section documents the basis of the total installed cost (TIC) estimate of Phase 1 and Phase 2 of the Project for the processing and packaging of battery grade lithium carbonate.
The Project schedule used as the basis of the estimate assumes site construction in early 2023. Production is expected to begin three years after construction starts.
Capital costs are based on Q1-Q4 2022 pricing including process equipment, labor, materials and other costs.
21.1.2.2 Estimate Tabulation
Table 21-5 shows the capital cost summary by phase and area.
Table 21-5 Capital Cost Summary by Phase and Area
|
Estimate Area Description |
Phase 1 |
Phase 1 |
Phase 2 |
Phase 2 Total |
|
Mid-Year 2022 |
MTO Based |
Mid-Year 2022 |
Factored from |
|
|
|
All values stated in 2022 $Millions |
|||
|
01-Mine Area Infrastructure |
$1.3 |
$51.1 |
$0.0 |
$26.3 |
|
02-Site Development & Facilities |
$1.7 |
$133.8 |
$0.0 |
$33.4 |
|
03-SAP (Sulfuric Acid Plant) |
$112.9 |
$322.7 |
$113.4 |
$283.2 |
|
04-Mineral Beneficiation |
$35.3 |
$129.0 |
$31.3 |
$108.9 |
|
05-Leach & Neutralization |
$87.2 |
$314.1 |
$95.5 |
$301.4 |
|
06-Magnesium / Calcium Removal |
$104.0 |
$227.8 |
$114.3 |
$216.0 |
|
07-Lithium Carbonate Production |
$111.9 |
$283.5 |
$121.0 |
$260.8 |
|
08-Lithium Products (Not Used) |
$0.0 |
$0.0 |
$0.0 |
$0.0 |
|
09-Reagents |
$21.0 |
$73.4 |
$19.4 |
$58.8 |
|
10-Sitewide Utilities |
$45.9 |
$188.4 |
$29.8 |
$134.5 |
|
11-Tailings |
$3.1 |
$62.7 |
$1.6 |
$1.5 |
|
Subtotal |
$524.3 |
$1,786.4 |
$526.3 |
$1,424.8 |
|
Contingency (13.1%) |
$68.7 |
$234.0 |
$68.9 |
$186.6 |
|
Process & Infrastructure Total |
$593.0 |
$2,020.5 |
$595.2 |
$1,611.4 |
|
12-Transload Facility |
$0.0 |
$69.1 |
$0.0 |
$27.1 |
|
Contingency on Transload (13.1%) |
$0.0 |
$9.0 |
|
$3.5 |
|
Subtotal |
$0.0 |
$78.1 |
$0.0 |
$30.6 |
|
13-Operations / Owners Cost |
$0.0 |
$149.8 |
$0.0 |
$75.6 |
|
Contingency on Owners Cost (13.1%) |
$0.0 |
$19.6 |
$0.0 |
$9.9 |
|
Subtotal |
$0.0 |
$169.4 |
$0.0 |
$85.5 |
|
Material and Labor Escalation (not budgeted) |
$0.0 |
$0.0 |
$0.0 |
$0.0 |
|
Total Estimated Project Cost |
$593.0 |
$2,268.0 |
$595.2 |
$1,727.5 |
Table 21-6 defines the functional and process areas that are contained in each of the identified estimate sections shown Table 21-5.
| Page 237 |
| Lithium Americas Corp. Feasibility Study, National Instrument 43-101 Technical Report for the Thacker Pass Project, Humboldt County, Nevada, USA |
Table 21-6 Work Breakdown Structure and Associated Responsibilities
|
Process Area |
WBS |
Process Systems |
Engineering |
|
|
1 |
Mine Area Infrastructure |
050 |
Mine Site |
NAC |
|
052 |
Mine Shop |
NAC |
||
|
054 |
Waste Stockpiles |
NAC |
||
|
060 |
ROM Handling |
NAC |
||
|
070 |
Waste Rock |
NAC |
||
|
800 |
Limestone mining/crushing |
M3 |
||
|
2 |
Site Development and Facilities |
090 |
Roads and Parking Areas |
M3 |
|
613 |
Buried Utilities |
M3 |
||
|
630 |
Site Development, Drainage and Collection |
M3 |
||
|
630 |
Temporary Facilities |
M3 |
||
|
660 |
Fuel Systems |
M3 |
||
|
670 |
Sewage Treatment |
M3 |
||
|
900 |
Ancillary Facilities |
M3 |
||
|
905 |
Site Security Building (905-BG-001) |
M3 |
||
|
910 |
Administration Buildings (910-BG-001) |
M3 |
||
|
915 |
Plant Warehouse Building (915-BG-001) |
M3 |
||
|
920 |
Plant Maintenance Building (920-BG-001) |
M3 |
||
|
925 |
Packaging Warehouse Building (925-BG-001) |
M3 |
||
|
930 |
Plant Laboratory Building (930-BG-001) |
M3 |
||
|
950 |
Operations Control |
M3 |
||
|
960 |
Heavy Equipment Wash Station |
M3 |
||
|
3 |
Sulfuric Acid Plant Area |
500 |
Sulfuric Acid Plant |
EXP |
|
510 |
Molten Sulfur |
EXP |
||
|
520 |
Sulfuric Acid Plant Gas and Strong Acid |
EXP |
||
|
530 |
Tail Gas Treatment |
EXP |
||
|
540 |
BFW and Steam System |
EXP |
||
|
540 |
Maintenance Boiler |
EXP |
||
|
550 |
Cooling Water System |
EXP |
||
|
560 |
Turbine Generator |
EXP |
||
|
570 |
Sulfuric Acid Product |
EXP |
||
|
510 |
Sulfur Vapor Recovery & Scrubber |
EXP |
||
|
500 |
Caustic Unloading/Storage Tank |
EXP |
||
|
4 |
Mineral |
100 |
Mineral Beneficiation |
M3 |
|
110 |
ROM Crushing |
M3 |
||
|
120 |
Attrition Scrubbing |
M3 |
||
|
130 |
Classification |
M3 |
||
|
5 |
Leach and Neutralization |
200 |
Leaching and Neutralization |
M3 |
|
210 |
Acid Leaching |
M3 |
||
|
220 |
Neutralization |
M3 |
||
|
230 |
Neutralization Filtration |
M3 |
||
|
6 |
Magnesium / Calcium |
300 |
Magnesium/Calcium Removal |
ITAC |
|
310 |
Magnesium Sulfate Crystallization |
ITAC |
||
|
320 |
Magnesium Precipitation |
M3 |
||
|
330 |
Magnesium Precipitation Filtration |
M3 |
||
|
340 |
Calcium Precipitation |
ITAC |
||
|
350 |
Cation Removal Ion Exchange |
ITAC |
||
|
7 |
Li2CO3 and LiOH |
400 |
Lithium Carbonate/Lithium Hydroxide Production |
ITAC |
|
410 |
Lithium Carbonate Crystallization |
ITAC |
||
|
420 |
Lithium Carbonate Product Handling |
ITAC |
||
|
430 |
Na/K Sulfate Salts Crystallization (ZLD Plant) |
ITAC |
||
|
8 |
Lithium Products |
970 |
Lithium Products Handling |
LAC |
|
9 |
Reagents |
800 |
Liquid CO2 Storage and Distribution |
ITAC |
|
800 |
Flocculant (Classification) |
M3 |
||
|
800 |
Caustic Soda Distribution (outside Sulfuric Acid Plant) |
ITAC |
||
|
800 |
Limestone |
M3 |
||
|
800 |
Lime |
M3 |
||
|
800 |
Soda Ash |
ITAC |
||
| Page 238 |
| Lithium Americas Corp. Feasibility Study, National Instrument 43-101 Technical Report for the Thacker Pass Project, Humboldt County, Nevada, USA |
|
Process Area |
WBS |
Process Systems |
Engineering |
|
|
10 |
Utilities |
600 |
Sitewide Utilities |
ITAC |
|
610 |
Temporary Power |
ITAC |
||
|
610 |
Substation |
ITAC |
||
|
610 |
E-Buildings |
ITAC |
||
|
610 |
Lighting, Grounding, Communications, Security |
ITAC |
||
|
612 |
M/V O/H Lines |
ITAC |
||
|
614 |
Fiber Optic & Plant Wide Telecomms (incl. Towers) |
ITAC |
||
|
620 |
Steam Distribution |
ITAC |
||
|
640 |
Compressed Air |
ITAC |
||
|
650 |
Water Systems |
M3 |
||
|
690 |
Sitewide Utilities Misc Scope |
ITAC |
||
|
11 |
Tailings |
700 |
Tailings Disposal |
M3 |
|
12 |
Transload Facility |
990 |
Transload Facility |
LAC |
21.1.2.3 Design and Estimate Responsibilities
The following engineering firms and contractors have been involved in the FEL/FEED work for the Project to this point:
M3 - Engineering lead for the following process areas of the Project: site plan, mineral beneficiation, leach and neutralization, magnesium/calcium removal (magnesium precipitation only), select reagents, and tailings. Prepared preliminary engineering/design and material take offs (MTO) for all process areas listed above. Specified and solicited equipment quotes for process equipment within M3 scope boundaries. Created detailed construction estimate pricing for all civil, concrete, and ancillary facility items across the Project based on MTOs that were created by M3, Sawtooth and ITAC.
Industrial TurnAround Corporation/ITAC Engineers P.C. (ITAC) - Engineering lead for all or part of the following process areas of the Project: magnesium and calcium removal, lithium carbonate production, reagents, utilities, power distribution from utility to various plan areas, and sitewide process controls and automation system. Prepared preliminary engineering/design and material take offs (MTO) for all process areas listed above. Specified and solicited equipment quotes for process equipment within ITAC scope boundaries. Created detailed construction estimates for all electrical and controls items across the Project based on MTO that were created by M3 and ITAC. Assembled the final overall estimate using the detailed construction estimates from M3, Graywolf, and ITAC.
GrayWolf - Produced detailed construction estimates for all mechanical equipment, piping, structural steel, and rigging across the Project based on MTO that were created by M3 and ITAC. Provided constructability input for the Feasibility Estimate Level 3 work. Provided federated 3D model and animations for overall plant site.
EXP - Engineering lead for the sulfuric acid plant. Provided TIC Report and pricing based on reimbursable EPCM execution model of the sulfuric acid plant which can be converted to turnkey basis upon LAC request.
Sawtooth Mining (subsidiary of North American Coal Corporation (NAC)) - Prepared pricing FEL/FEED pricing for mining areas and operations.
NewFields - Prepared preliminary site land, topographical, and geotechnical surveys. NewFields also prepared construction estimates for much of their design (waste rock, course gangue, storm water, haul roadways, CTFS, and closure). They have and continue to provide various permitting services to Owner.
EDG - Provided a third-party cost estimate review, risk assessment, and design allowance and contingency recommendations of the deterministic Phase 1 and Phase 2 estimates.
| Page 239 |
| Lithium Americas Corp. Feasibility Study, National Instrument 43-101 Technical Report for the Thacker Pass Project, Humboldt County, Nevada, USA |
21.1.2.4 Maturity of Engineering Documents
As of the date of this report the key estimating documents, which are piping and instrumentation diagrams (P&IDs), process general arrangement drawings, electrical single lines, site plans, site grading plan, piping line list, equipment list, valve lists, electrical load list, specifications, and ancillary building general arrangement drawings are substantially complete in an issued for review status. However, the estimate presently requires revisions based on receipt of updated equipment information that had not been received in time for this report. These areas are equipment related to lithium carbonate and ZLD (from Veolia), magnesium sulfate (from Aquatech) and CCD (from FLSmidth).
The Owner's intent is that the P&IDs will be "frozen" when the final Estimate Report is issued, although it is probable that minor changes may be made during the design process. The equipment arrangement drawings will be considered baseline design documents subject to revisions based on final design and on certified equipment drawings that will drive such design features as equipment footprints, required maintenance spaces, etc. In addition, the other key estimating documents listed above will be subject to revisions driven by certified equipment submittals, design refinements, and any Owner-initiated changes to be documented through a management of change process.
21.1.2.5 Labor Rates
Due to the size and location of the work, per diems and payment of overtime are required to attract qualified craft to the area. The construction labor rates are built-up composite rates based on the estimated quantities of direct labor crafts (superintendent, general foremen, journeymen, apprentice, and laborer). Built-up labor costs were furnished by ITAC, NewFields, Graywolf, and M3. These rates are inclusive of projected overtime, fringes, small tools, construction equipment, and per-diem. Trade indirects (non-working supervision) were then applied along with customary overhead and profit. The resulting composite rates were used for each construction discipline estimate. A factor for non-productive time and congestion or difficulty was assessed for each trade and applied accordingly. See Table 21-7 for composite trade labor rates.
Table 21-7 Composite Trade Labor Rates
|
Position |
Full Labor Rate |
|
Site Civil Composite Rate |
$67.53* to $106.46 |
|
Concrete Composite Rate |
$95.83 |
|
Mechanical Composite Rate |
$111.07 |
|
Electrical / Instrument Composite Rate |
$126.76 |
| *Long-term local hires with no per diem. |
21.1.2.6 Contingency
Contingency accounts for estimating inaccuracies on the scope as defined by the engineering documents and is not intended to cover the costs of scope additions or additional field labor overtime to achieve schedule compression. The Project will manage and account for Contingency in budget reports.
21.1.2.7 Exclusions
Exclusions were as follows:
| Page 240 |
| Lithium Americas Corp. Feasibility Study, National Instrument 43-101 Technical Report for the Thacker Pass Project, Humboldt County, Nevada, USA |
Final selection of suppliers may impact construction costs. All costs are considered budgetary since detailed technical specifications were not prepared and competitive quotes were not obtained.
Estimate does not include cost impact of potential vendor or contractor performance or process guarantees, liquidated damages or specialty insurances.
Construction costs include the costs of construction equipment and contractor support activities that include materials off-loading, storage, handling, preparation, etc.
Based on expected system operating requirements, the basis of design and cost estimate accounted for a steady-state electrical load only.
Travel time for craft personnel from the man camp to the job site is not included in the cost estimate. The costs of buses and fuel are included in the cost estimate
The basis of design and the cost estimate do not include field disconnects and field start/stops.
Allowance for weather delays is included in the estimate as a 5% weather allowance on labor but not included for schedule. Construction during wintertime has the potential to significantly lower productivity and to cause delays due to inclement weather.
The estimate does not include the cost of downtime.
The estimate includes factored costs for capital spares included in Owner's cost but excludes a detailed account of capital spares.
The estimate does not include allowances for escalation of equipment, materials, and labor costs.
21.1.3 Mine Capital Costs
Mine development costs are estimated to be $57.8 million for Phase I and $29.7 million for Phase 2. These costs are summarized in Table 21-4. Mine development costs include initial facilities and infrastructure.
21.1.3.1 Mine Facilities
The site chosen for the Mine facilities is located west of the Process Facility along Nevada State Route 293. The site is located outside of future mining operations and maximizes the ability to support both the short and long-term mining operations. Construction of the initial facilities is projected to begin three years before production is expected to start, or year -3. The construction of the permanent office/shop is projected to occur in year 3 of production. Facilities are listed below:
Initial Office (Phase 1)
Initial Shop (Phase 1)
Permanent Office/Shop (Phase 2)
Initial Warehouse (Phase 1)
Outside Warehouse Area (Phase 1
Lube System (Phase 1)
Fuel Farm (Phase 1)
| Page 241 |
| Lithium Americas Corp. Feasibility Study, National Instrument 43-101 Technical Report for the Thacker Pass Project, Humboldt County, Nevada, USA |
Equipment Wash (Phase 1)
Parking Lot (Phase 1)
Lighting and Fencing (Phase 1)
21.1.3.2 Infrastructure
An infrastructure of roads, ponds, diversions, and other Mine-related features will be built during the Mine construction phase to serve over the life of the mine. These projects will be developed prior to the commissioning of the Process Facility.
21.1.4 Transload Facility Capital Costs
Transload facility capital cost is estimated to be $78.1 million for Phase 1 and $30.6 million for Phase 2 and is summarized in Table 21-4. The facility will be constructed in the town of Winnemucca, NV by LAC to support Phase 1 and Phase 2 bulk materials required for the Project, identified in Section 18. Sustaining capital is estimated to be $3.4 million for the life of mine.
21.1.5 Owner's Costs
Owner's costs were developed by LAC and are estimated specifically within the capital execution phase of the Project. Estimated Owner's Cost are divided into eleven categories and are included in the Project's estimate. Table 21-8 summarizes the Owners Costs estimate.
The items included in the individual Owners Cost categories include are:
| Page 242 |
| Lithium Americas Corp. Feasibility Study, National Instrument 43-101 Technical Report for the Thacker Pass Project, Humboldt County, Nevada, USA |
Table 21-8 Owner's Cost Summary
|
# |
Category |
Phase 1 |
Phase 2 |
||
|
Estimated |
% |
Estimated |
% |
||
|
1 |
Pre-Executing Costs |
$23.26 |
16% |
$9.22 |
12% |
|
2 |
Facility Equipment Costs |
$25.82 |
17% |
$11.61 |
15% |
|
3 |
Owners Project Costs |
$39.01 |
26% |
$29.71 |
39% |
|
4 |
Permitting & Legal Costs |
$18.94 |
13% |
$7.14 |
9% |
|
5 |
Project Direct Costs |
$10.63 |
7% |
$8.57 |
11% |
|
6 |
External (Non-Project) Costs |
$18.23 |
12% |
$5.75 |
8% |
|
7 |
Operational Readiness Costs |
$0.61 |
0% |
$0.05 |
0% |
|
8 |
Finance (Tax Rebate) |
($5.00) |
-3% |
$0.00 |
0% |
|
9 |
Business System Costs |
$4.00 |
3% |
$0.88 |
1% |
|
10 |
Process Consumable Costs |
$7.79 |
5% |
$1.95 |
3% |
|
11 |
Mobile Equipment Costs |
$6.52 |
4% |
$0.73 |
1% |
|
|
Subtotal |
$149.82 |
100% |
$75.59 |
100% |
|
|
Contingency |
$19.63 |
|
$9.90 |
|
|
|
Total |
$169.44 |
|
$85.49 |
|
21.1.6 Potential Risks
21.1.6.1 Process Areas in Development
At the time of this report, process development in Project areas from Counter Current Decantation and Filtration, Magnesium Sulfate through Lithium Carbonate and ZLD continues with LAC and multiple suppliers. Current Capital Cost estimates are from 2021 (MTO-based) for an Aquatech Magnesium Sulfate process and a Veolia Lithium Carbonate plant. ZLD is currently budgeted by doubling (2x) the 2020 MTO-based estimate for the Aquatech 20k ZLD plant. Costs in these areas (as well as associated reagent and utility systems and other facility provisions) may change as the process is finalized, at which time LAC expects to complete detailed, MTO-based estimates in these areas which will be used to update this report.
21.1.6.2 COVID-19 Pandemic
Due to the ongoing impacts of the COVID-19 pandemic and the potential of further shutdowns, shortages, delays, and other wide-reaching effects, the current environment assigns risk to the Project's equipment and materials procurement activities and construction activities due to limited resource availability and physical distancing.
| Page 243 |
| Lithium Americas Corp. Feasibility Study, National Instrument 43-101 Technical Report for the Thacker Pass Project, Humboldt County, Nevada, USA |
21.1.6.3 Change of Execution Strategy
The Project cost and schedule will be affected by shifting the Project delivery method or scope.
21.1.6.4 Risk Mitigation
Engage construction partners early in design to ensure constructability.
Utilize a strong Construction Management Team experienced in safely and effectively coordinating multiple site and industrial contractors.
Implement robust Project Controls to regularly provide information to the Project Manager for use in monitoring resources and deliveries and controlling the Project cost, schedule, earned values, field progress, and change management.
21.2 Sustaining Capital Costs
Sustaining capital costs are based on Q1-Q3 2022 pricing.
21.2.1 Mine, Plant, and Sulfuric Acid Plant Sustaining Capital Cost
Sustaining capital costs for the Thacker Pass Project have been estimated and are primarily for continued development of the clay tailings filter stack and coarse gangue stockpile, mining activities, sulfuric acid plant, and other sustaining plant and infrastructure expenditures. Sustaining capital costs for the clay tailings filter stack and coarse gangue stockpile include the years those facilities need to be expanded for stockpiling capacities (provided by NewFields; MTO). Mining sustaining capital costs reflect the cost of replacing the mobile mining fleet to handle the provision of ore to the process plant as well as stripping and placement of waste material (provided by Sawtooth; itemized). Sustaining capital costs for the sulfuric acid plants are expected to occur every three years (provided by EXP; itemized). Sustaining capital for the general plant is factored from the Project equipment list based on Standard Useful Lives of equipment provided in Attachment 10 of the DOE's 2015 Financial Management Handbook (provided by ITAC/M3). Sustaining capital costs allotted for the life of the Project are shown in Table 21-9.
| Page 244 |
| Lithium Americas Corp. Feasibility Study, National Instrument 43-101 Technical Report for the Thacker Pass Project, Humboldt County, Nevada, USA |
Table 21-9 Summary of Sustaining Capital Costs for Mine, Plant, and Sulfuric Acid Plant ($M)
|
Year |
Mining Equipment & |
Mobile |
Plant & |
Sulfuric |
CTFS |
Offsite |
Total |
|
1 |
4.4 |
0.0 |
0.0 |
0.0 |
0.0 |
0.0 |
4.4 |
|
2 |
12.2 |
0.0 |
0.0 |
0.0 |
0.0 |
0.1 |
12.3 |
|
3 |
15.9 |
0.5 |
0.0 |
2.3 |
0.0 |
0.1 |
18.8 |
|
4 |
13.4 |
0.0 |
0.0 |
0.0 |
0.0 |
0.1 |
13.4 |
|
5 |
12.5 |
0.0 |
1.4 |
0.0 |
5.6 |
0.1 |
19.6 |
|
6 |
7.6 |
1.5 |
0.0 |
2.6 |
5.6 |
0.1 |
17.5 |
|
7 |
2.6 |
0.0 |
0.0 |
2.3 |
5.6 |
0.1 |
10.5 |
|
8 |
5.7 |
0.0 |
1.4 |
0.0 |
5.6 |
0.1 |
12.8 |
|
9 |
0.3 |
0.0 |
0.0 |
5.1 |
5.6 |
0.1 |
11.1 |
|
10 |
7.9 |
0.0 |
1.4 |
2.6 |
4.4 |
0.1 |
16.4 |
|
11-15 |
51.6 |
7.1 |
4.4 |
22.3 |
22.9 |
0.6 |
109.0 |
|
16-20 |
26.3 |
1.7 |
30.5 |
26.0 |
24.3 |
0.3 |
109.2 |
|
21-25 |
19.7 |
4.4 |
191.6 |
41.6 |
15.6 |
0.6 |
273.6 |
|
26-30 |
46.9 |
4.4 |
555.0 |
33.7 |
16.6 |
0.3 |
656.8 |
|
31-35 |
35.1 |
3.5 |
37.2 |
48.9 |
20.4 |
0.6 |
145.8 |
|
36-40 |
2.2 |
3.5 |
0.0 |
56.8 |
16.4 |
0.3 |
79.2 |
|
41+ |
Closure Reclamation |
|
53.5 |
||||
|
Total |
264.3 |
26.6 |
826.2 |
244.2 |
149.0 |
3.4 |
1,563.7 |
*Costs shown in this table are in millions of dollars. Due to rounding, some totals in this table may not correspond with the sum of the separate figures.
The estimated sustaining capital costs for the expansion of the Thacker Pass Project are estimated in Q3 2022 dollars.
21.2.2 Stockpile and Filter Stack Sustaining Capital Costs
The coarse gangue stockpile (CGS) and clay tailings filter stack (CTFS) will require expansions over the life of the Project. The initial construction costs of the CGS and CTFS are captured in the initial capital plan. Each facility will initially be constructed to support operations through Phase 1, or year 3. Their overall design and permitted square footages are summarized in Section 18. Expansions will occur the year before either facility is expected to reach the capacity of the previously constructed footprint. The sustaining capital timing for these expansions is determined from mining and processing mass balances along with a reasonable footprint to support operations for multiple years before the next expansion is required. The price per square foot to expand the facilities is determined from engineered estimates from Sawtooth, M3 and NewFields and the initial construction estimates of the CGS and CTFS. The price per square foot includes civil works, synthetic liner deployment, collection systems, over liner and equipment and labor to construct the facility. See Table 21-10.
Coarse Gangue Stockpile: the stockpile of reject material generated from the beneficiation circuit. The material to be stockpiled on this facility will be used for pit backfill and does not require any expansion in years 16-25 as coarse gangue will likely be directly hauled from beneficiation and dumped in the pit. Total sustaining capital is estimated to be $15.7M from 808 thousand m2 (8.7 million sqft) of expanded footprint.
Clay Tailings Filter Stack: the storage facility of clay tailings generated from the neutralization circuit and sulfate salts. Total sustaining capital is estimated to be $133.3 from 4.2 Mm2 (45.5 million square feet) of expanded footprint over the forty-year mine life.
| Page 245 |
| Lithium Americas Corp. Feasibility Study, National Instrument 43-101 Technical Report for the Thacker Pass Project, Humboldt County, Nevada, USA |
Table 21-10 CTFS and CGS Expansion Area and Costs
|
Year |
CTFS and CGS Expansions |
CTFS |
CGS |
|||||
|
Million Sqft |
US$-M |
Million Sqft |
$/sqft |
US$-M |
Million Sqft |
$/sqft |
US$-M |
|
|
1 |
- |
- |
- |
- |
- |
- |
- |
- |
|
2 |
- |
- |
- |
- |
- |
- |
- |
- |
|
3 |
- |
- |
- |
- |
- |
- |
- |
- |
|
4 |
- |
- |
- |
- |
- |
- |
- |
- |
|
5 |
2.6 |
$5.6 |
1.3 |
$2.61 |
$3.3 |
1.3 |
$1.79 |
$2.3 |
|
6 |
2.6 |
$5.6 |
1.3 |
$2.61 |
$3.3 |
1.3 |
$1.79 |
$2.3 |
|
7 |
2.6 |
$5.6 |
1.3 |
$2.61 |
$3.3 |
1.3 |
$1.79 |
$2.3 |
|
8 |
2.6 |
$5.6 |
1.3 |
$2.61 |
$3.3 |
1.3 |
$1.79 |
$2.3 |
|
9 |
2.6 |
$5.6 |
1.3 |
$2.61 |
$3.3 |
1.3 |
$1.79 |
$2.3 |
|
10 |
1.5 |
$4.4 |
1.1 |
$3.37 |
$3.5 |
0.5 |
$1.80 |
$0.8 |
|
11-15 |
7.9 |
$22.9 |
6.1 |
$3.28 |
$19.6 |
1.8 |
$1.80 |
$3.3 |
|
16-20 |
8.3 |
$24.3 |
8.3 |
$2.92 |
$24.3 |
- |
- |
- |
|
21-25 |
5.4 |
$15.6 |
5.4 |
$2.92 |
$15.6 |
- |
- |
- |
|
26-30 |
5.7 |
$16.6 |
5.7 |
$2.92 |
$16.6 |
- |
- |
- |
|
31-35 |
7.0 |
$20.4 |
7.0 |
$2.92 |
$20.4 |
- |
- |
- |
|
35-40 |
5.6 |
$16.4 |
5.6 |
$2.92 |
$16.4 |
- |
- |
- |
|
41+ |
- |
- |
- |
- |
- |
- |
- |
- |
|
Total |
54.3 |
$149.0 |
45.5 |
$2.92 |
$133.3 |
8.7 |
$1.79 |
$15.7 |
21.2.3 Closure Costs
Closure costs are estimated from NewFields based upon necessary reclamation, remediation, and closure of the 40-year facility. These closure costs of $53.5M will be updated as operations continue, and concurrent reclamation takes place. Site overhead during closure will be a corporate cost. Closure is expected to take place after production concludes in year 40. See Table 21-11.
Table 21-11 Reclamation Costs
|
Category |
Costs ($-M) |
|
Waste Rock Dumps |
12.72 |
|
Pit |
0.08 |
|
Haul Roads |
0.31 |
|
Access Roads |
0.10 |
|
Process Ponds |
3.47 |
|
Yards |
1.22 |
|
Growth Media Stockpile |
0.06 |
|
Landfills |
0 |
|
Foundations and Buildings |
8.99 |
|
Sediment Ponds |
0.03 |
|
Wells |
0.04 |
|
Monitoring Wells |
0.38 |
|
Waste Disposal |
12.29 |
|
Miscellaneous |
2.55 |
|
Equipment Removal |
0.42 |
|
Exploration Drillhole |
0 |
|
Exploration Roads and Pads |
0.12 |
|
Indirect Costs |
10.70 |
|
Total |
$53.50 |
| Page 246 |
| Lithium Americas Corp. Feasibility Study, National Instrument 43-101 Technical Report for the Thacker Pass Project, Humboldt County, Nevada, USA |
21.2.4 Pre-Sanction Costs
For the purposes of this study, there are several work activities upon the completion of the feasibility study that have been considered pre-sanction and are not included in this capital cost estimate. These include:
Investments in the Project to date were not included in the economic analysis (and are not amortized in the model).
21.3 Operating Cost Estimate
21.3.1 Basis of Estimate
21.3.1.1 Estimating Base Date and Accuracy Range
Cost inputs into the model ranged from Q2 to Q4 2022 pricing. The estimate is prepared on an annual basis and includes all site-related operating costs associated with the production of lithium carbonate.
For the purposes of this study, all operating costs incurred from Project award, up to but excluding commissioning, are deemed preproduction costs and have been included in the CAPEX, as they are considered part of construction.
21.3.1.2 Responsibilities
Direct costs were developed by LAC for the process operating area and Sawtooth Mining for the mining area. The input from each party was assembled and reviewed by LAC and M3 Engineering to generate the master Project OPEX.
The responsibilities for developing the operating costs are as follows:
21.3.1.3 Estimating Methodology
21.3.1.3.1 Estimate Structure
Operating costs have been organized into four main areas: Mining, Lithium Processing, Sulfuric Acid Plant and General and Administrative costs. Each area has several sub areas defined by the estimating team. The mine life, and concurrent processing operations, is defined to be 40 years.
Operating costs are further divided among ten expense types: Mining, Process Labor, Raw Materials, Fuel (non-mining), Inbound Logistics, Power, Maintenance/Parts/Outside Services, Supplies, Tailings Placement and General and Administration.
| Page 247 |
| Lithium Americas Corp. Feasibility Study, National Instrument 43-101 Technical Report for the Thacker Pass Project, Humboldt County, Nevada, USA |
21.3.1.4 Data Sources
The following data sources were used to prepare the OPEX estimate:
21.3.2 Elements of Costs
21.3.2.1 Labor
Labor for the Project will require staffing for a 24 hour per day, seven day per week operation. All 24-hour operations are based on a four (4) shift rotation of 12-hour shifts. Non-shift labor is based on a 40-hour work week. Due to the proximity of Winnemucca to the mine site, no camp is required at the mine site. Bus transportation will be provided to and from the site. Bus capital is included in Owner's cost for housing.
The labor costs for this Project were estimated based on the expected salaries in the region along with a payroll burdens allowance of 30% and a 10% overtime allowance for hourly labor. A master labor list was compiled by LAC with input from Pray and Company for all positions including process plant, sulfuric acid plant, management, and support staff.
The labor requirements and average annual cost are summarized by OPEX area in Table 21-12. Management includes shift supervisor through General Manager. Labor includes hourly staff.
Table 21-12 Lithium Americas Labor Requirements and Average Annual Cost Summary (40-Year Base Case)
|
Unit |
Annual Average |
Annual Average Cost ($-M) |
|
Plant Area |
|
|
|
Lithium Processing |
|
|
|
Plant Management and Supervision |
6 |
$1.0 |
|
Plant Labor |
109 |
$12.8 |
|
Liquid Sulfuric Acid Plant |
|
|
|
SAP Management and Supervision |
6 |
$1.1 |
|
SAP Labor |
30 |
$3.8 |
|
SAP Maintenance |
6 |
$0.8 |
|
Maintenance |
|
|
|
Maintenance Management and Supervision |
12 |
$2.1 |
| Page 248 |
| Lithium Americas Corp. Feasibility Study, National Instrument 43-101 Technical Report for the Thacker Pass Project, Humboldt County, Nevada, USA |
|
Unit |
Annual Average |
Annual Average Cost ($-M) |
|
Maintenance Labor |
62 |
$8.0 |
|
Technical Services |
|
|
|
Laboratory and Quality Control |
16 |
$1.8 |
|
Engineering |
8 |
$1.3 |
|
IT & Data Services |
6 |
$0.8 |
|
General and Administrative |
|
|
|
Management and Administrative |
5 |
$1.3 |
|
Health, Safety & Environment |
10 |
$1.6 |
|
Human Resources |
3 |
$0.5 |
|
Finance |
4 |
$0.6 |
|
Supply Chain |
11 |
$1.2 |
|
Total |
294 |
$38.7 |
|
Mining and Clay Tailings Area |
|
|
|
Mine Management |
20 |
$4.0 |
|
Mining and Tailings Labor |
152 |
$21.1 |
|
Maintenance labor |
49 |
$7.44 |
|
Total |
221 |
$32.4 |
NOTE: Phase 2 yearly labor required is the same for 40-year base case and 25-year case.
21.3.2.2 Raw Materials
Materials consumed by the process are estimated using unit consumption rates or are consumed at a fixed rate each year. The reagent consumption rates are sourced from the process design criteria. Usage rates were based on test work, mine plan modeling, and Aspen Plus® mass balance modelling estimations.
Consumption rates of liquid sulfur, sodium hydroxide ('caustic soda') and water treatment chemicals for the acid plant were developed and provided by EXP.
Consumption rates of fuel were estimated from mobile and fixed equipment expected hours of operation, utilization, and fuel burn rates.
Usage rates of sulfuric acid were assumed to be equal to the yearly estimated maximum produced from the sulfuric acid plant, per EXP.
Unit pricing for raw materials was based on discussions with suppliers and benchmarking data. Table 21-13 represents the purchase price and delivered price for each major raw material and Table 21-14 represents the expected annual consumption rates.
Table 21-13 Raw Material Purchase and Delivered Pricing
|
Raw Materials |
$/unit |
Purchase Price |
Purchase and Delivery to Project Site Price |
|
Liquid Sulfuric Acid Purchased |
$/tonne |
0 |
0 |
|
Quicklime |
$/tonne |
153 |
214 |
|
Limestone |
$/tonne |
34 |
34 |
|
Soda Ash |
$/tonne |
221 |
249 |
|
Hydrochloric Acid 35% |
$/tonne |
377 |
394 |
|
Ferric Sulfate 60% |
$/tonne |
461 |
492 |
| Page 249 |
| Lithium Americas Corp. Feasibility Study, National Instrument 43-101 Technical Report for the Thacker Pass Project, Humboldt County, Nevada, USA |
|
Raw Materials |
$/unit |
Purchase Price |
Purchase and Delivery to Project Site Price |
|
Caustic Soda 50% |
$/tonne |
689 |
714 |
|
Flocculant |
$/tonne |
4,960 |
5,495 |
|
Ammonia |
$/tonne |
607 |
858 |
|
Liquid Sulfur |
$/tonne |
148 |
249 |
|
Propane |
$/tonne |
1,422 |
1,422 |
|
Diesel Off Road |
$/gal |
3.8 |
4 |
|
Diesel Highway |
$/gal |
4.3 |
4 |
|
Gasoline |
$/gal |
3.9 |
4 |
|
Water Treatment |
$/l |
5 |
5 |
Table 21-14 Raw Material Annual Consumption (40-Year LOM Base Case)
|
Raw Materials |
Unit |
Average Annual |
Average unit tonne per tonne of |
|
Quicklime |
tonne |
139,942 |
2.10 |
|
Limestone |
tonne |
435,614 |
6.52 |
|
Soda Ash |
tonne |
247,857 |
3.71 |
|
Hydrochloric Acid 35% |
tonne |
1,385 |
0.02 |
|
Ferric Sulfate 60% |
tonne |
376 |
0.01 |
|
Caustic Soda 50% |
tonne |
7,150 |
0.11 |
|
Flocculant |
tonne |
4,481 |
0.07 |
|
Ammonia |
tonne |
304 |
0.005 |
|
Liquid Sulfur (estimated) |
tonne |
655,407 |
9.81 |
|
Water Treatment (SAP) |
Liter |
1,884 |
0.03 |
|
Diesel Off-Road |
gallon |
4,683,350 |
70.13 |
|
Diesel Highway |
gallon |
0 |
0.00 |
|
Unleaded Gasoline (Process Plant) |
gallon |
92,320 |
1.38 |
|
Propane (Process Plant) |
tonne |
1,129 |
0.02 |
|
Liquid Sulfuric Acid @ 98.5% (Purchased) |
tonne |
0 |
0.00 |
Table 21-15 Raw Material Annual Consumption (Years 1-25 of 40 Year LOM)
|
Raw Materials |
Unit |
Average Annual |
Average unit tonne per tonne of |
|
Quicklime |
tonne |
149,355 |
2.14 |
|
Limestone |
tonne |
399,709 |
5.72 |
|
Soda Ash |
tonne |
260,656 |
3.73 |
|
Hydrochloric Acid 35% |
tonne |
1,465 |
0.02 |
|
Ferric Sulfate 60% |
tonne |
401 |
0.01 |
|
Caustic Soda 50% |
tonne |
7,123 |
0.10 |
|
Flocculant |
tonne |
4,318 |
0.06 |
|
Ammonia |
tonne |
289 |
0.004 |
|
Liquid Sulfur (estimated) |
tonne |
633,884 |
9.07 |
|
Water Treatment (SAP) |
Liter |
1,822 |
0.03 |
| Page 250 |
| Lithium Americas Corp. Feasibility Study, National Instrument 43-101 Technical Report for the Thacker Pass Project, Humboldt County, Nevada, USA |
|
Raw Materials |
Unit |
Average Annual |
Average unit tonne per tonne of |
|
Diesel Off-Road |
gallon |
4,329,711 |
61.93 |
|
Diesel Highway |
gallon |
0 |
0.00 |
|
Unleaded Gasoline (Process Plant) |
gallon |
92,391 |
1.32 |
|
Propane (Process Plant) |
tonne |
1,092 |
0.02 |
|
Liquid Sulfuric Acid @ 98.5% (Purchased) |
tonne |
0 |
0.00 |
Figure 21-1 presents the raw materials distribution over the first 40 years of operations as part of the base case. Figure 21-2 presents the raw materials distribution over the first 25 years of operation for the 25-year case.
Figure 21-1 Raw Materials Cost (40-Year LOM - Base Case)
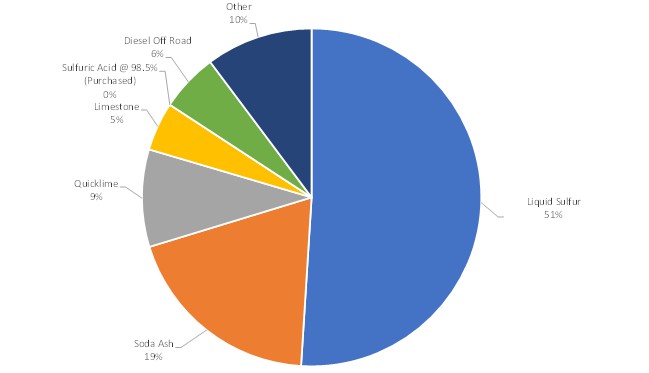
Source: M3, 2022
| Page 251 |
| Lithium Americas Corp. Feasibility Study, National Instrument 43-101 Technical Report for the Thacker Pass Project, Humboldt County, Nevada, USA |
Figure 21-2 Raw Materials Cost (Years 1-25 of 40-Year LOM)
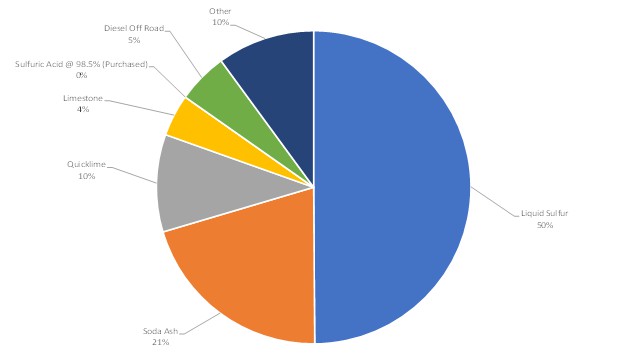
Source: M3, 2022
21.3.2.3 Power
Electrical power costs are based on a rate of US$60/MWh, following research and discussions with potential electricity suppliers. This includes wheeling charges. Electrical power consumption and estimates were based on equipment connected loads and load analysis. Table 21-16 presents the annual average power cost by area over the 40-year life of mine. Table 21-17 shows this for years 1 to 25 of the life of mine.
The cost of net power imported is estimated by subtracting the power generated on site in the Acid Plants from the overall power required and multiplying by the power cost.
Table 21-16 Average Annual Power Cost (40 Year LOM - Base Case)
|
Power |
GWh/y |
Average ($-M) |
$/tonne Product |
|
Lithium Processing |
881.3 |
52.9 |
792 |
|
Acid Plant |
236.5 |
14.2 |
212 |
|
Generation |
-705.5 |
-42.3 |
-634 |
|
Net Power Import |
412.3 |
24.7 |
370 |
Table 21-17 Average Annual Power Cost (Years 1 to 25 of 40 Year LOM)
|
Power |
GWh/y |
Average ($-M) |
$/tonne Product |
|
Lithium Processing |
853.8 |
51.2 |
733 |
|
Acid Plant |
228.7 |
13.7 |
196 |
|
Generation |
-682.3 |
-40.9 |
-586 |
|
Net Power Import |
0.0 |
24.7 |
343 |
| Page 252 |
| Lithium Americas Corp. Feasibility Study, National Instrument 43-101 Technical Report for the Thacker Pass Project, Humboldt County, Nevada, USA |
21.3.2.4 Maintenance and Supplies
Sulfuric Acid Plant maintenance is estimated by an itemized 40-year activities and labor hours list provided by EXP. The maintenance budget for the sulfuric acid plant is thus compiled via non-capital parts budget and a subset of the staffing plan. No factors are used. All outside labor and services are assumed to be capitalized with major equipment rebuilds, etc. as presented in the yearly cash flow for the acid plant.
Lithium Processing maintenance allowances and outside services include supplies, such as spare parts, repair materials, miscellaneous consumables, and third-party support required for general maintenance from operating activities. The allowances for fixed mechanical equipment, electrical, instrumentation, mobile equipment (non-mining) are based on a factored percentage of installed mechanical and electrical equipment capital values. Outside Services are a factor of total maintenance cost. Factors are assumed to be constant for all periods of operation (i.e., 40-year base case and 25-year case).
Factored maintenance, supplies, and outside service costs for process activities (non-mining activities) are summarized in Table 21-18.
Table 21-18 Factored Maintenance Annual Allowances
|
Unit |
Allowance |
Allowance ($-M/yr Avg) |
|
Lithium Processing |
|
|
|
Fixed Mechanical Maintenance |
3% |
20.8 |
|
Electrical, Instrumentation & Automation |
2% |
4.2 |
|
Mobile Equipment (non-mining) |
3% |
0.2 |
|
Maintenance Parts and Supplies |
- |
4.5 |
|
Outside Services |
10% |
2.1 |
|
Sulfuric Acid Plant |
|
|
|
Fixed Mechanical Maintenance |
0% |
0.0 |
|
Electrical, Instrumentation & Automation |
0% |
0.0 |
|
Outside Services |
0% |
0.0 |
21.3.2.5 General & Administrative
General and Administrative costs include costs related to the Process Plant and Sulfuric Acid Plant areas, for which a fixed amount is allotted each year. These include items such as salaries for nonproduction staff, software licenses, legal costs, insurance, as well as administrative costs such as office supplies, administrative services and fees, environmental health and safety, public relations, and other costs.
Table 21-19 General and Administrative Costs (40 Year LOM - Base Case)
|
General & Administrative |
Annual Average ($-M) |
$/tonne Product |
|
Salaries & Fringes |
9.1 |
136 |
|
Accounting (excluding labor) |
0.1 |
1 |
|
Safety (excluding labor) |
0.1 |
1 |
|
Human Resources (excluding labor) |
0.1 |
1 |
|
Environmental Dept. (excluding Labor |
0.2 |
2 |
|
Security (excluding labor) |
0.5 |
7 |
| Page 253 |
| Lithium Americas Corp. Feasibility Study, National Instrument 43-101 Technical Report for the Thacker Pass Project, Humboldt County, Nevada, USA |
|
General & Administrative |
Annual Average ($-M) |
$/tonne Product |
|
Janitorial Services (contract) |
0.1 |
1 |
|
Community Relations (excluding labor) |
0.1 |
2 |
|
Office Operating Supplies and Postage |
0.0 |
0 |
|
Phone/Communications |
0.1 |
1 |
|
Licenses, Fees, and Taxes |
0.1 |
1 |
|
Legal |
0.5 |
7 |
|
Insurances |
0.1 |
2 |
|
Subs, Dues, Mining Leases, Water Rights |
0.1 |
1 |
|
Travel, Lodging, and Meals |
0.1 |
2 |
|
Training |
0.3 |
4 |
|
Travel - busing |
1.2 |
18 |
|
Rentals |
0.9 |
13 |
|
Relocation |
0.1 |
1 |
|
IT |
0.9 |
14 |
|
Total |
$14.3 |
$214.5 |
Table 21-20 General and Administrative Costs (Years 1 to 25 of 40 Year LOM)
|
General & Administrative |
Annual Average ($-M) |
$/tonne Product |
|
Salaries & Fringes |
9.1 |
130 |
|
Accounting (excluding labor) |
0.1 |
1 |
|
Safety (excluding labor) |
0.1 |
1 |
|
Human Resources (excluding labor) |
0.1 |
1 |
|
Environmental Dept. (excluding Labor |
0.2 |
2 |
|
Security (excluding labor) |
0.5 |
7 |
|
Janitorial Services (contract) |
0.1 |
1 |
|
Community Relations (excluding labor) |
0.1 |
2 |
|
Office Operating Supplies and Postage |
0.0 |
0 |
|
Phone/Communications |
0.1 |
1 |
|
Licenses, Fees, and Taxes |
0.1 |
1 |
|
Legal |
0.5 |
7 |
|
Insurances |
0.1 |
2 |
|
Subs, Dues, Mining Leases, Water Rights |
0.1 |
1 |
|
Travel, Lodging, and Meals |
0.1 |
2 |
|
Training |
0.3 |
4 |
|
Travel - busing |
1.2 |
17 |
|
Rentals |
0.9 |
12 |
|
Relocation |
0.1 |
1 |
|
IT |
0.9 |
13 |
|
Total |
$14.3 |
$205.2 |
| Page 254 |
| Lithium Americas Corp. Feasibility Study, National Instrument 43-101 Technical Report for the Thacker Pass Project, Humboldt County, Nevada, USA |
21.3.3 Operating Cost Areas
21.3.3.1 Mining and Clay Tailings Operating Cost Areas
21.3.3.1.1 Mining and Clay Tailings Operating Cost
Mining operating costs are driven by work effort. Specifically, the ore requirements of the process facility determine the total volume of waste that must be moved to expose the ore to be mined and delivered. This annual requirement is used to estimate equipment hours, the major driver of the mine's operating costs. Factors such as waste-to-ore ratio, haul distance and haul profile influence work effort and operating costs. Hauling and storage of the waste material, attrition scrubber reject, and coarse gangue is included as part of the mine operations.
Operating costs to load, haul and stack the clay and salt tailings are based on volume. Additionally, costs are added to dry and compact most of the clay tailings into a structural fill to surround and contain the salt tailings. The volume of clay and salt tailings is determined by the throughput of the process plant and the consistency of the ore. The annual volume of the two types of tailings, as well as the haul distance and profile, is used to estimate equipment hours, the major driver of operating costs.
The mining and clay tailings operating cost includes the following:
A summary of the Mining and Clay Tailings Operating Cost Estimate for the 40-year base case) and for the 25 years are provided in Table 21-21 and Table 21-22, respectively.
| Page 255 |
| Lithium Americas Corp. Feasibility Study, National Instrument 43-101 Technical Report for the Thacker Pass Project, Humboldt County, Nevada, USA |
Table 21-21 Mining and Clay Tailings Operating Cost Estimate (40-Year LOM Base Case)
|
Mining and Tailings Cost |
Annual Average ($-M) |
$/tonne Mined (ore+waste) |
$/tonne Product |
|
Mine Management |
4.0 |
0.3 |
60.0 |
|
Mine Labor |
21.1 |
1.4 |
315.7 |
|
Maintenance Labor |
7.4 |
0.5 |
110.1 |
|
Equipment Costs |
30.8 |
2.1 |
460.6 |
|
Other (Including contractor profit) |
13.2 |
0.9 |
197.5 |
|
Capital Recovery |
|
0.0 |
0.0 |
|
Total |
$76.4 |
$5.2 |
$1,143.8 |
Table 21-22 Mining and Clay Tailings Operating Cost Estimate (Years 1-25 of 40 Year LOM)
|
Mining and Tailings Cost |
Annual Average ($-M) |
$/tonne Mined (ore+waste) |
$/tonne Product |
|
Mine Management |
4.0 |
0.3 |
56.5 |
|
Mine Labor |
19.4 |
1.4 |
277.8 |
|
Maintenance Labor |
6.8 |
0.5 |
96.6 |
|
Equipment Costs |
28.4 |
2.0 |
406.5 |
|
Other (Including contractor profit) |
13.2 |
0.9 |
188.9 |
|
Capital Recovery |
|
0.0 |
0.0 |
|
Total |
$71.7 |
$5.0 |
$1,026.3 |
Figure 21-3 and Figure 21-4 present the distribution of the mining and tailings operating expenses for the 40-year base case and for 25 years, respectively.
| Page 256 |
| Lithium Americas Corp. Feasibility Study, National Instrument 43-101 Technical Report for the Thacker Pass Project, Humboldt County, Nevada, USA |
Figure 21-3 Distribution of mining and tailings management Operational Cost (40-Year LOM - Base Case)
![]()
Source: Sawtooth, 2022
Figure 21-4 Distribution of mining and tailings management Operational Cost (Years 1-25 of 40-Year LOM Case)
![]()
Source: Sawtooth, 2022
| Page 257 |
| Lithium Americas Corp. Feasibility Study, National Instrument 43-101 Technical Report for the Thacker Pass Project, Humboldt County, Nevada, USA |
21.3.3.1.2 Mining Battery Limits
The battery limits for the mining contractor's portion of the operating cost estimate are presented in Table 21-23.
Table 21-23 Battery Limits for Mining Contractor Operating Cost Estimate
|
Mining Scope |
Battery Limit |
Outside Mining Scope |
|
All operating costs necessary to mine and haul ore to the ROM stockpiles and feed ore into the feeders with a dozer. |
ROM stockpile feeder loading |
Costs associated with the feeder breakers, attrition scrubbers, and slurry pipeline. |
|
All operating costs necessary to excavate and haul waste material from the pit to the waste rock storage. |
waste rock storage |
No outside scope is associated with this operation. |
|
All operating costs necessary to grub, excavate and haul growth media either to stockpiles or to final placement on regraded spoil. |
disturbance area |
No outside scope is associated with this operation. |
|
All operating costs necessary to haul coarse gangue from the processing plant to the coarse gangue stockpile. |
coarse gangue stacker conveyor head pulley. |
Equipment, maintenance, and labor associated with the initial stacking of coarse gangue. |
|
All operating costs necessary to haul attrition scrubber reject material to the waste rock storage facility. |
attrition scrubber reject conveyor head pulley. |
Equipment, maintenance, and labor associated with attrition scrubber operations. |
|
All mine facilities maintenance. |
ROM side of concrete push wall, electrical substation at shop/office facilities site, main water supply tank. |
All water lines and electric power lines and equipment necessary to feed the mine facilities. |
21.3.3.1.3 Clay and Salt Tailings Battery Limits
The battery limits for the clay and salt haulage and stacking portion of the operating cost estimate are presented in Table 21-24.
Table 21-24 Clay and Salt Tailings Battery Limits
|
Clay and Salt Tailings Scope |
Battery Limit |
Outside Mining Scope |
|
Hauling, stacking, and final compaction of salt and clay waste. |
clay and salt stacker conveyors' head pulleys |
The cost associated with equipment, maintenance, and labor required to operate the clay and salt radial stackers. |
|
The cost associated with haul road maintenance. |
clay and salt stacker conveyors' head pulleys |
The cost associated with maintenance of Clay Tailings Filter Stack: piping, liner repair, ponds, pumps, and lighting. |
21.3.3.1.4 Estimation Methodology
The OPEX estimation for both mining and clay tailings relies on a series of budgetary quotations, but also internal databases and historical pricing. Table 21-25 presents a description of the estimation methodology and the items estimated under that methodology.
| Page 258 |
| Lithium Americas Corp. Feasibility Study, National Instrument 43-101 Technical Report for the Thacker Pass Project, Humboldt County, Nevada, USA |
Table 21-25 Mining Estimation Methodology
|
Methodology |
Items |
|
Budgetary Quotations |
Diesel price, Contractor Drilling and Blasting cost |
|
Software |
RPM Global's TALPAC software to determine end dump travel times |
|
Internal Databases |
Sawtooth and affiliates equipment rates and operating cost database Sawtooth and affiliates salary labor rates and benefits |
|
Historical Pricing |
Monthly diesel pricing for Winnemucca, Nevada region |
|
Public Information |
CAT handbook for equipment rates |
21.3.3.1.5 Source of Data
Quotations were received from Komatsu, and Caterpillar. Sawtooth Mining contracted with a local human resource consulting firm, Pray and Company, to develop labor rates for the Winnemucca region.
Sawtooth used its internal database for estimating operating costs for the equipment used in this Project. For equipment not in the database, the costs were either estimated by factoring the costs to a similar piece of equipment by their respective horsepower, or by using CostMine by Glacier Resource Innovation Group as a reference.
21.3.3.2 Lithium Processing
Process operating costs were estimated based upon a production commissioning curve, ramp up, and steady-state operation for Phase 1 and Phase 2 facility expansions. The plant design data includes the use of the AspenPlus® material balance based on steady-state conditions. The design steady state lithium carbonate annual production rate was estimated based on the average annual mine plan data for that year.
The labor roster and mobile equipment fleet for the process areas are fixed. Consumption of raw materials, power and other items that are considered variable, are estimated separately each year based on the material balance and the tonnes of ore processed, tonnes of sulfuric acid produced, and lithium carbonate produced, as applicable.
Process and administrative operating costs are presented with indicative life of mine average operating costs per tonne lithium carbonate produced and Life of Mine (LOM) annual averages, as provided in Table 21-26 and Table 21-27.
Table 21-26 Average Lithium Process Operating Costs (40 Year LOM - Base Case)
|
Lithium Processing |
Average ($-M) |
$/tonne Product |
|
Labor |
23.4 |
350 |
|
Raw Materials |
117.8 |
1,763 |
|
Fuel (non-mining) |
1.4 |
21 |
|
Raw Material Logistics |
16.1 |
241 |
|
Net Power Imported1 |
24.7 |
370 |
|
Maintenance, Parts, Outside Services |
26.7 |
399 |
|
Supplies |
4.5 |
68 |
|
Total |
$214.6 |
$3,213 |
| Page 259 |
| Lithium Americas Corp. Feasibility Study, National Instrument 43-101 Technical Report for the Thacker Pass Project, Humboldt County, Nevada, USA |
Table 21-27 Average Lithium Process Operating Costs (Years 1-25 of 40 Year LOM)
|
Lithium Processing |
Average ($-M) |
$/tonne Product |
|
Labor |
23.1 |
330 |
|
Raw Materials |
120.0 |
1,717 |
|
Fuel (non-mining) |
1.4 |
20 |
|
Raw Material Logistics |
17.0 |
243 |
|
Net Power Imported1 |
24.0 |
343 |
|
Maintenance, Parts, Outside Services |
25.7 |
368 |
|
Supplies |
4.6 |
66 |
|
Total |
$215.9 |
$3,088 |
21.3.3.3 Sulfuric Acid Plant
Table 21-28 and Table 21-29 present the Sulfuric Acid Plant operating cost summary to operate the facility.
Table 21-28 Average Sulfuric Acid Plant Operating Costs (40 Year LOM - Base Case)
|
Liquid Sulfuric Acid Plant |
Annual Average ($-M) |
$/tonne Acid Produced |
$/tonne Product |
|
Labor |
5.6 |
3 |
84 |
|
Liquid Sulphur |
163.4 |
82 |
2,447 |
|
Other Consumables |
5.0 |
3 |
75 |
|
Maintenance Part/Repairs |
1.4 |
1 |
21 |
|
Total |
$175.4 |
$87.5 |
$2,627 |
Table 21-29 Average Sulfuric Acid Plant Operating Costs (Years 1-25 of 40 Year LOM)
|
Liquid Sulfuric Acid Plant |
Annual Average ($-M) |
$/tonne Acid Produced |
$/tonne Product |
|
Labor |
5.6 |
3 |
80 |
|
Liquid Sulphur |
158.0 |
82 |
2,261 |
|
Other Consumables |
4.9 |
3 |
70 |
|
Maintenance Part/Repairs |
1.0 |
0 |
14 |
|
Total |
$169.4 |
$87.4 |
$2,424 |
21.3.4 Summary of Operating Costs
Table 21-30 and Table 21-31 present a summary of the Project operating costs.
| Page 260 |
| Lithium Americas Corp. Feasibility Study, National Instrument 43-101 Technical Report for the Thacker Pass Project, Humboldt County, Nevada, USA |
Table 21-30 Project Operating Cost Summary (Years 1-40 Life of Mine - Base Case)
|
Area |
Annual Average ($-M) |
$/tonne Product |
Percent of Total |
|
Mine |
76.4 |
1,143.8 |
16% |
|
Lithium Process Plant |
214.6 |
3,212.9 |
45% |
|
Liquid Sulfuric Acid Plant |
175.4 |
2,626.8 |
36% |
|
General & Administrative |
14.3 |
214.5 |
3% |
|
Total |
$480.7 |
7,198 |
100% |
Table 21-31 Project Operating Cost Summary (Years 1-25 of 40 Year LOM)
|
Area |
Annual Average ($-M) |
$/tonne Product |
Percent of Total |
|
Mine |
71.7 |
1,026.3 |
15% |
|
Lithium Process Plant |
215.9 |
3,087.7 |
46% |
|
Liquid Sulfuric Acid Plant |
169.4 |
2,423.7 |
36% |
|
General & Administrative |
14.3 |
205.2 |
3% |
|
Total |
$471.4 |
6,743 |
100% |
21.3.5 Exclusions
The following items are excluded from the OPEX estimate:
The following items were also excluded from the Operating Cost Estimate, but are included in the financial model:
| Page 261 |
| Lithium Americas Corp. Feasibility Study, National Instrument 43-101 Technical Report for the Thacker Pass Project, Humboldt County, Nevada, USA |
22 Economic Analysis
22.1 Introduction
An economic analysis was conducted to assess the economic feasibility of constructing and operating the Thacker Pass Project. The analysis was based on the July 21, 2022 mine plan and production schedule prepared by Sawtooth Mining, capital and operating expenditures prepared by Lithium Americas. This mine plan's cutoff grades and extraction assumptions were provided by LAC's 2021 40 Year Ore Control file, version 2 rev 2.
Based on Q2 - Q4 2022 pricing, the economic evaluation presents the after-tax net present value (NPV), payback period, and the after-tax internal rate of return (IRR) for the Project based on annual cash flow projections.
This economic analysis includes sensitivities to variations in selling prices, various operating costs, initial and sustaining capital costs, overall lithium production recovery, and discount rate. All cases assume maximum utilization of the acid plant's available acid and power, with lithium production fluctuating by year according to mine plan and plant performance as predicted by yearly heat/mass balance simulations in Aspen Plus®, conducted by LAC. Note that the tables in this section were rounded to a limited number of significant figures and therefore some summation errors may be present.
It should also be noted that the results of the economic analysis discussed in this report represent forward-looking information as defined under AACE. The results are dependent upon inputs that are subject to several known and unknown risks, uncertainties, and other factors that may cause actual results to differ materially from those presented herein. Forward looking information includes the following:
Additional risks to the forward-looking information include:
22.2 Methodology
The analysis was carried out using a discounted cash flow (DCF) model, which was prepared by LAC with input from ITAC, M3 and EXP. Detailed review along with final edits and documentation were compiled by M3 for the purpose of this feasibility study, with contributions from other entities as noted in Section 22.3.1. Annual cash flow projections were estimated for forty years based on the life of mine plan, estimates of capital expenditures, production costs, taxes, royalties and sales.
| Page 262 |
| Lithium Americas Corp. Feasibility Study, National Instrument 43-101 Technical Report for the Thacker Pass Project, Humboldt County, Nevada, USA |
Cash flows for each year are totaled and discounted based on the assumption of even distribution of cash flow over the forty-year mine life. The Project timeline starts with "Year -3" for construction and "Year 1" being the start of production.
The only revenue stream is sales of lithium carbonate.
Cost inputs into the model are based on Q2 to Q4 2022 pricing, and the discount period commences Q2 2023.
22.3 Input Data
22.3.1 Sources of Information
Details of the scope and assumptions of the CAPEX and OPEX are defined in the basis of estimate, which is provided in Section 21 of this report.
Tax assumptions and royalty obligations were provided by LAC. The market analysis in Section 19 was used to set realistic lithium carbonate pricing.
The model includes a financial analysis to estimate the annual tax burden, including indicative earnings and cash flow statements for the Project.
Financial model inputs were received from multiple sources, as outlined in the following sections. M3 provided high level auditing of the info provided by each contributing party for the data contributing to the final financial metrics of the Project and against guiding documents (process design criteria, heat and mass balance, etc.) and verified functionality of formulas for standard economic estimations within the model.
22.3.1.1 Development CAPEX
Capital costs are based on Q2-Q4 2022 pricing and meet the accuracy of a Class 3 AACE estimate.
22.3.1.2 Reagent Pricing
Reagent quotes were solicited and received by LAC from Q2- Q4 2022 Fuels, sulfur, and ammonia pricing are based on commodity rolling averages or cost projections.
22.3.1.3 Reclaim SRCE Costs and Quantities
Reclamation costs input tab was provided by NewFields, which draws on work from Sawtooth Mining and M3 civil/structural design.
22.3.1.4 CGS/CTFS Costs and Quantities
Costs and quantities for coarse gangue storage and clay filtered tailings stack were received from NewFields/Sawtooth, and manually inputted into the financial model yearly cash flow by M3.
| Page 263 |
| Lithium Americas Corp. Feasibility Study, National Instrument 43-101 Technical Report for the Thacker Pass Project, Humboldt County, Nevada, USA |
22.3.1.5 Mine Plan and Mining OPEX
Mine plan and mine plan summary input tabs were provided by Sawtooth to document yearly waste, ore, tailings volumes, and feed lithium values to the financial model. The mine plan was developed in conjunction with LAC's ore control file for determining cutoff grades by ore block composition, and also coordinates with the 40-year heat-mass balance Aspen process simulations conducted by the LNC process group.
22.3.1.6 Sulfuric Acid Plant SUSEX, Labor, and Maintenance
EXP provided anticipated yearly sulfur, other materials, labor, power demand/generation, availability, and adjusted yearly capacity that could be expected from the plant operating at maximum capacity throughout its lifetime. EXP in conjunction with consultant Kevin Bryan provided itemized yearly parts and labor costs for planned activities necessary to extend acid plant life to 40 years. M3 categorized all items off this list into either capital or non-capital (i.e., maintenance) costs, and applied them to the financial model accordingly. No general maintenance factors above these itemized costs were assumed.
22.3.1.7 Labor
The QP audited the salaries and staffing plan provided in November 2021 by Pray and Company against historical projects of similar scope and size. Headcount was believed to be slightly higher than average, but within the expected range. No adjustments were found to be necessary except for additional management positions required for sulfuric acid plant maintenance management.
22.3.1.8 Power
Demand and connected load for both process and ancillaries were compiled by ITAC into a single input table and submitted to M3. This table represents the equipment list with diversity factors applied, ancillary power design documents, and unallocated capacity included in the ITAC electrical design. The electrical MTO for the CAPEX estimate used in this report reflects the Q2 2021 EXP acid plant design.
22.3.1.9 Mobile Equipment
The QP audited the mobile equipment schedule provided by LAC and escalated costs for light and medium equipment by 13% to be within the expected range. Prices for some items of equipment reflect used market value.
22.3.1.10 Maintenance and Supplies
Maintenance and supplies were adopted from the original LAC model with minor adjustments by the QP.
22.3.1.11 Manual Reagent Inputs
Process plant hydrochloric acid and caustic soda were provided directly by LAC process engineering and were not reflected in the Aspen heat and mass balance models used. The values provided reflect a synthesis of third-party test work, in-house pilot plant data, vendor projections, HSC software modeled concentrations, and statistical regression to estimate the consumptions of these two reagents around the acid leach scrubber and ion exchange circuits.
22.3.1.12 Process Modeling Software Outputs (Aspen)
Aspen process modeling outputs determined yearly numbers for lithium sales, reagent usage, water usage, and utility steam/cooling demand used in the financial model. 40 unique process model files were assembled to represent yearly averages for each year during the LOM. Outputs for these 40 files were linked to a financial model excel input sheet provided to M3. Copies of the 40 files were uploaded to the M3 data room for the study but were not individually audited other than confirming reasonable similarity to the design case heat and mass balance stream tables (000-PR-HMB Rev F).
| Page 264 |
| Lithium Americas Corp. Feasibility Study, National Instrument 43-101 Technical Report for the Thacker Pass Project, Humboldt County, Nevada, USA |
The QP conducted extensive spot checks with LAC in the design case Aspen process simulation file used to produce the heat and mass balance stream tables used for design. M3 and LAC adjusted the model's inputs and architecture as necessary to ensure congruence with test work data, the process design criteria, and pilot plant data for key parameters with large financial impact.
22.3.1.13 General Accounting and Figures
Model architecture, inputs, and estimation methodology was reconstructed, verified, or augmented by the QP for standard financial outputs (sensitivity analysis, depreciation, yearly cash flow organization, financial metrics, taxes, displayed discount rates, etc.). Royalty and transportation costs were provided by LAC.
22.3.2 Sunk Costs
Investments in the Project to date were not included in the economic analysis (and are not amortized in the model).
22.3.3 Initial Capital
Initial capital costs are divided among the two construction phases: Phase 1 and Phase 2. The totals for each phase are presented in Table 22-1. Though Phase 1 has been optimized to exclude all Phase 2 pre-investment possible, it inherently includes the majority of civil earth works and site infrastructure to support Phase 2, construction of one acid plant, and construction of the mineral and chemical processing facility to produce nominally 40,000 t of lithium carbonate per year. Phase 2 includes the addition of a second acid plant and construction of the mineral and chemical processing facility to produce an additional nominal 40,000 t of lithium carbonate per year.
Table 22-1 Initial Capital Costs Summary
|
Category |
Phase 1 CAPEX |
Phase 2 CAPEX |
Total |
|
Initial Capital ($-M) |
2,268 |
1,728 |
3,996 |
|
% of Total |
57% |
43% |
100% |
22.3.4 Sustaining Capital
Sustaining capital is provided for the mining, plant equipment and infrastructure, sulfuric acid plants, Winnemucca transload terminal, stockpile and tailings areas of the Project over the forty-year mine life. The tailings costs (provided by NewFields; MTO) include future expansions of the facility over the life of the Project when additional capacity is required. Mining sustaining capital (provided by Sawtooth; itemized) supports equipment replacement at scheduled intervals after the equipment has reached its useful operational life. The sulfuric acid plant requires regular scheduled capital maintenance every three years (provided by EXP; Itemized). Sustaining capital for the general plant is factored from the Project equipment list based on Standard Useful Lives of equipment provided in Attachment 10 of the DOE's 2015 Financial Management Handbook (provided by ITAC/M3). Sustaining capital for each area is presented in Table 22-2.
| Page 265 |
| Lithium Americas Corp. Feasibility Study, National Instrument 43-101 Technical Report for the Thacker Pass Project, Humboldt County, Nevada, USA |
Table 22-2 Sustaining Capital Summary
| LOM | Mining | Plant & Infrastructure |
Sulfuric Acid Plant |
CTFS and CGS Stockpiles |
Final Reclamation |
Total Cost (US$-M) |
| (US$-M) | (US$-M) | (US$-M) | (US$-M) | (US$-M) | ||
| Total | $264.3 | $852.8 | $244.2 | $149.0 | $53.5 | $1,563.8 |
22.3.5 Operating Costs
The estimated total annual operating expenditures (OPEX) over the forty-year mine life is US$480.7 million, or US$7,198/t of lithium carbonate produced. Table 22-3 presents the Operating Costs for each area for the 40-year Life of Mine - Base Case. Table 22-4 presents the Operating Costs for each area only for the first 25 years of the 40-year Life of Mine plan.
Table 22-3 Operating Costs Summary (40-Year LOM - Base Case)
|
Area |
Annual Average ($-M) |
$/tonne Product |
Percent of Total |
|
Mine |
76.4 |
1,143.8 |
16% |
|
Lithium Process Plant |
214.6 |
3,212.9 |
45% |
|
Liquid Sulfuric Acid Plant |
175.4 |
2,626.8 |
36% |
|
General & Administrative |
14.3 |
214.5 |
3% |
|
Total |
$480.7 |
7,198 |
100% |
Table 22-4 Operating Costs Summary (Years 1-25 of 40 Year LOM)
|
Area |
Annual Average ($-M) |
$/tonne Product |
Percent of Total |
|
Mine |
71.7 |
1,026.3 |
15% |
|
Lithium Process Plant |
215.9 |
3,087.7 |
46% |
|
Liquid Sulfuric Acid Plant |
169.4 |
2,423.7 |
36% |
|
General & Administrative |
14.3 |
205.2 |
3% |
|
Total |
$471.4 |
6,743 |
100% |
22.3.6 Escalation
The economic analysis excludes cost escalation and accordingly, also excludes revenue escalation (see Section 22.3.8)
22.3.7 Production
Phase 1 Project is designed for a nominal production rate of 40,000 t/y of lithium carbonate and begins production in year 1 through year 3. Phase 2 production is anticipated to begin in year 4 and includes the addition of a second acid plant and processing infrastructure to double production with a nominal production rate of 80,000 t/y of lithium carbonate. Actual production varies with the grade of ore mined in each year with an expected mine life of 40 years.
Regarding ramp-up, a lower tonnage is expected for the first year in each of Phase 1 and Phase 2. See the financial model in Table 22-11 regarding the expected yearly cash flow.
| Page 266 |
| Lithium Americas Corp. Feasibility Study, National Instrument 43-101 Technical Report for the Thacker Pass Project, Humboldt County, Nevada, USA |
Production profiles summarized below are limited to the Company's proven and probable ore reserves. The production and financial outcomes from these reserves are summarized in Table 22-5 and Table 22-6.
Table 22-5 Average Production Values (40 Year/Base Case)
|
Item |
Units |
Value |
|
Lithium Carbonate Plant Production |
|
|
|
Operational Life |
years |
40 |
|
Annual Lithium Carbonate Production - 40 years |
kt |
66.8 |
|
Metallurgical Recovery - 40 Years |
% |
73.2% |
|
Mine Production |
|
|
|
Ore Reserves Production Scenario |
years |
40 |
|
Annual LCE Mined - 40 years |
kt |
91.3 |
Table 22-6 Average Production Values (Years 1-25 of 40-Year LOM)
|
Item |
Units |
Value |
|
Lithium Carbonate Plant Production |
|
|
|
Operational Life |
years |
25 |
|
Annual Lithium Carbonate Production - 25 years |
kt |
69.9 |
|
Metallurgical Recovery - 25 Years |
% |
73.3% |
|
Mine Production |
|
|
|
Ore Reserves Production Scenario |
years |
25 |
|
Annual LCE Mined - 25 years |
kt |
95.4 |
Figure 22-1 shows the total mined, total ore processed and total lithium carbonate production for each year.
Figure 22-1 Total Mined, Ore Processed and Lithium Carbonate Production by Year
![]()
Source: M3, 2022
| Page 267 |
| Lithium Americas Corp. Feasibility Study, National Instrument 43-101 Technical Report for the Thacker Pass Project, Humboldt County, Nevada, USA |
22.3.8 Revenues
Product selling prices have been forecasted over the study period (See Section 19). The base case value for price selling was set at $24,000/t. Sensitivities are discussed in Section 22.5.
Total annual revenues by year are shown in Figure 22-2 and summarized in Table 22-7 and Table 22-8.
Figure 22-2 Total Annual Revenue by Year
![]()
Source: M3, 2022
Table 22-7 Total Annual Production and Revenue (40 Year LOM - Base Case)
|
Production and Revenue |
Annual Average |
Total |
|
Lithium Carbonate Production (t) |
66,783 |
2,671,318 |
|
Lithium Carbonate Revenue ($-M) |
$1,603 |
$64,112 |
|
Annual Lithium Carbonate Selling Price ($/t) |
$24,000 |
|
Table 22-8 Total Annual Production and Revenue (Years 1-25 of 40 Year LOM)
|
Production and Revenue |
Annual Average |
Total |
|
Lithium Carbonate Production (t) |
69,911 |
1,747,777 |
|
Lithium Carbonate Revenue ($-M) |
$1,678 |
$41,947 |
|
Annual Lithium Carbonate Selling Price ($/t) |
$24,000 |
|
22.3.9 Financing
Lithium Americas is contemplating multiple options for funding the construction and operation of the Project. Financial modeling has considered multiple discount rates to account for various funding avenues. Project financing costs are excluded from the model.
22.3.10 Discount Rate
A discount rate of 8% per year has been applied to the model, though other levels from 6-16% are also included for Project assessment at various risk profiles and financing options.
| Page 268 |
| Lithium Americas Corp. Feasibility Study, National Instrument 43-101 Technical Report for the Thacker Pass Project, Humboldt County, Nevada, USA |
22.3.11 Taxes
The modeling is broken into the following categories: Operational Taxes (which are eligible deductions to arrive at taxable income) and Corporate Net Income Taxes. The 10% operating cost tax credit under the US Inflation Reduction Act for "Advanced Manufacturing Production" has been applied during the first 10 years of Project operation. The legislation specifies phase-out of this credit after 10 years. Future legislation may extend the duration allowable to claim this credit.
22.3.11.1 Operational Taxes
Payroll taxes are included in salary burdens applied in the OPEX. These include social security, Medicare, federal and state unemployment, Nevada modified business tax, workers compensation and health insurance.
Property tax is assessed by the Nevada Centrally Assessed Properties group on any property operating a mine and/or mill supporting a mine. Tax is 3% to 3.5% of the assessed value, which is estimated at 35% of the taxable value of the property. The property tax owed each year is estimated as 1.1% of the net book value at the close of the prior year plus current year expenditures with no depreciation.
Currently, Humboldt County does not maintain a revenue-based business license for mining operations. No business license costs are included.
22.3.11.2 Corporate Net Income Taxes
In Nevada, lithium mining activities are taxed at 2-5% of net proceeds, depending on the ratio of net proceeds to gross proceeds. Net proceeds are estimated as equal to gross profit for purposes of this study. A tax rate of 5% is applicable to the Thacker Pass Project.
Revenue subject to a net proceeds of minerals tax is exempt from the Nevada Commerce tax; therefore, the Nevada Commerce tax is excluded from the study.
The current corporate income tax rate applicable to the Project under the Tax Cut and Jobs Act is 21% of taxable income.
At the time of this report, a tax reform is being proposed by the US administration that has the potential to increase corporate income taxes in the US. Whether the tax reform will be passed into law remains uncertain, as does the potential impact to corporate income tax rates generally, including the potential impact of any increase on the Project. An increase to the federal corporate income tax rate from 21% to 25% would result in a reduction in after-tax IRR (at the 8% discount rate) of 0.4% and a reduction in after-tax NPV (at the 8% discount rate) of $257 million.
22.3.12 Royalties
The Project is subject to a 1.75% royalty on net revenue produced directly from ore, subject to a buy-down right. This royalty has been included in the economic model on the assumption that the Project owner will exercise its buy-down right to reduce the royalty from 8.0% to 1.75% by making an upfront payment of US$22 million in the first year of operations. At US$24,000/t lithium carbonate the ongoing annual royalty payments will average $428/t lithium carbonate sold over the 40-year LOM (base case).
22.4 Cash Flow
Undiscounted annual cash flows, including CAPEX, OPEX, and net revenues (pre-tax) are presented in Figure 22-3.
| Page 269 |
| Lithium Americas Corp. Feasibility Study, National Instrument 43-101 Technical Report for the Thacker Pass Project, Humboldt County, Nevada, USA |
Figure 22-3 Undiscounted Annual Cash Flow
![]()
Source: M3, 2022
Cumulative discounted cash flow at the 8% discount rate is presented in Figure 22-4.
Figure 22-4 Cumulative Discounted Cash Flow
![]()
Source: M3, 2022
For the Base Case financial assumptions outlined in Section 22.3, the Project financial performance is measured through Net Present value, Internal Rate of Return and Payback periods. The after-tax financial model results are summarized in Table 22-9.
| Page 270 |
| Lithium Americas Corp. Feasibility Study, National Instrument 43-101 Technical Report for the Thacker Pass Project, Humboldt County, Nevada, USA |
Table 22-9 After-Tax Financial Model Results (40 Year LOM - Base Case)
|
Production Scenario |
Unit |
Values |
|
Operational Life |
years |
40 |
|
Mine and Process Plant Operational Life |
years |
40 |
|
Ore Reserve Life |
years |
40 |
|
Average annual EBITDA |
$-M / y |
1,093.5 |
|
After-tax Net Present Value ("NPV") @ 8% discount rate |
$-M |
5,727.0 |
|
After-tax Internal Rate of Return |
% |
21.4% |
|
Payback (undiscounted) |
years |
5.4 |
|
*includes capital investments in years up to production |
|
|
Table 22-10 After-Tax Financial Model Results (Years 1-25 of 40 Year LOM)
|
Production Scenario |
Unit |
Values |
|
Operational Life |
years |
25 |
|
Mine and Process Plant Operational Life |
years |
25 |
|
Ore Reserve Life |
years |
40 |
|
Average annual EBITDA |
$-M / y |
1,176.2 |
|
After-tax Net Present Value ("NPV") @ 8% discount rate |
$-M |
4,950.1 |
|
After-tax Internal Rate of Return |
% |
21.2% |
|
Payback (undiscounted) |
years |
5.4 |
Table 22-11 presents the detailed cash flow model for the Project.
| Page 271 |
| Lithium Americas Corp. Feasibility Study, National Instrument 43-101 Technical Report for the Thacker Pass Project, Humboldt County, Nevada, USA |
Table 22-11 Financial Model
| 1-25year | 21-40yrs | LOM | Year -3 | Year -2 | Year -1 | Year 1 | Year 2 | Year 3 | Year 4 | Year 5 | Year 6 | Year 7 | Year 8 | Year 9 | Year 10 | Year 11 | Year 12 | Year 13 | Year 14 | Year 15 | Year 16 | Year 17 | Year 18 | Year 19 | Year 20 | Year 21 | Year 22 | Year 23 | Year 24 | Year 25 | Year 26 | Year 27 | Year 28 | Year 29 | Year 30 | Year 31 | Year 32 | Year 33 | Year 34 | Year 35 | Year 36 | Year 37 | Year 38 | Year 39 | Year 40 | Year 41 | |||
| Process Plant Production | |||||||||||||||||||||||||||||||||||||||||||||||||
| Total Ore Mined (95% Rec wet) | ktonne | 233,073 | 148,848 | 114,743 | 233,073 | - | - | 1,859 | 2,979 | 3,564 | 5,273 | 6,961 | 6,416 | 6,260 | 7,170 | 6,316 | 6,533 | 6,919 | 6,318 | 6,390 | 6,665 | 6,368 | 6,487 | 6,766 | 6,301 | 6,373 | 6,413 | 6,177 | 6,093 | 6,385 | 5,936 | 5,926 | 6,271 | 6,135 | 5,886 | 6,082 | 5,770 | 5,767 | 5,922 | 5,547 | 5,332 | 5,370 | 4,907 | 5,583 | 5,714 | 5,063 | 4,876 | - | |
| Total Waste Mined (waste) | ktonne | 351,792 | 209,241 | 171,558 | 351,792 | - | - | 7,275 | 9,107 | 8,967 | 7,039 | 5,003 | 9,420 | 8,962 | 11,969 | 9,924 | 10,729 | 10,116 | 9,734 | 12,573 | 13,139 | 10,665 | 7,120 | 5,694 | 7,720 | 7,921 | 7,157 | 6,613 | 6,286 | 6,545 | 5,455 | 4,108 | 3,507 | 3,909 | 4,400 | 6,161 | 8,602 | 9,516 | 11,902 | 10,618 | 11,426 | 10,625 | 12,472 | 13,877 | 9,625 | 12,825 | 13,087 | - | |
| Total Mined (ore + waste + growth media) | ktonne | 587,242 | 359,536 | 287,418 | 587,242 | - | - | 9,225 | 12,241 | 12,606 | 12,312 | 12,007 | 15,836 | 15,352 | 19,151 | 16,276 | 17,312 | 17,118 | 16,136 | 19,046 | 19,887 | 17,116 | 13,657 | 12,510 | 14,071 | 14,344 | 13,620 | 12,827 | 12,416 | 12,968 | 11,429 | 10,071 | 9,839 | 10,105 | 10,348 | 12,305 | 14,434 | 15,353 | 17,894 | 16,234 | 16,828 | 16,064 | 17,434 | 19,514 | 15,393 | 17,942 | 18,018 | - | |
| Total Tailings Moved (CTFS and CGS) | ktonne | 451,619 | 280,534 | 230,239 | 451,619 | - | - | 3,265 | 5,727 | 5,676 | 9,923 | 12,776 | 11,857 | 11,974 | 13,128 | 11,972 | 12,233 | 12,877 | 11,960 | 12,090 | 12,621 | 12,010 | 12,186 | 12,723 | 11,943 | 12,072 | 12,370 | 11,818 | 11,792 | 12,342 | 11,577 | 11,624 | 12,228 | 11,777 | 11,584 | 12,038 | 11,411 | 11,465 | 11,878 | 11,187 | 11,029 | 11,324 | 10,547 | 11,328 | 11,859 | 10,703 | 10,725 | - | |
| Leach Ore Processed (dry) | ktonne | 154,200 | 93,210 | 81,185 | 154,200 | - | - | 1,156 | 1,938 | 1,889 | 3,195 | 3,999 | 3,836 | 4,009 | 4,201 | 3,978 | 4,019 | 4,201 | 3,978 | 4,019 | 4,201 | 3,978 | 4,019 | 4,201 | 3,978 | 4,019 | 4,201 | 3,978 | 4,019 | 4,201 | 3,978 | 4,019 | 4,201 | 3,978 | 4,019 | 4,201 | 3,978 | 4,019 | 4,201 | 3,978 | 4,019 | 4,201 | 3,978 | 4,019 | 4,201 | 3,978 | 4,019 | - | |
| LCE Mined | ktonne | 3,650 | 2,385 | 1,751 | 3,650 | 28.213 | 47.781 | 47.394 | 82.563 | 112.600 | 100.268 | 98.931 | 118.098 | 104.498 | 108.377 | 114.956 | 101.725 | 100.172 | 104.688 | 100.013 | 101.208 | 110.273 | 104.346 | 102.575 | 110.110 | 102.059 | 98.442 | 102.969 | 93.056 | 89.687 | 98.351 | 94.974 | 87.593 | 93.387 | 88.601 | 87.758 | 87.906 | 82.552 | 78.715 | 76.343 | 66.303 | 91.042 | 84.483 | 73.928 | 73.103 | - | |||
| Li PPM Head Grade | ppm | 3,155 | 3,244 | 3,256 | 3,155 | 3,496 | 3,232 | 3,186 | 3,086 | 3,194 | 3,149 | 3,170 | 3,319 | 3,327 | 3,343 | 3,348 | 3,245 | 3,159 | 3,165 | 3,165 | 3,144 | 3,284 | 3,337 | 3,243 | 3,460 | 3,330 | 3,256 | 3,250 | 3,159 | 3,050 | 3,160 | 3,120 | 2,999 | 3,094 | 3,094 | 3,066 | 2,991 | 2,999 | 2,975 | 2,865 | 2,723 | 3,259 | 2,884 | 2,943 | 2,930 | - | |||
| LCE Produced/Sold | ktonne | 2,671 | 1,748 | 1,279 | 2,671.318 | - | - | 20.731 | 36.403 | 35.068 | 61.988 | 83.796 | 75.702 | 72.102 | 86.934 | 75.593 | 78.975 | 84.704 | 75.585 | 74.773 | 76.985 | 72.978 | 73.102 | 79.632 | 74.811 | 73.557 | 79.293 | 74.012 | 71.748 | 75.293 | 68.442 | 65.568 | 72.962 | 70.974 | 64.603 | 68.326 | 64.441 | 63.996 | 64.139 | 58.438 | 57.409 | 55.913 | 46.606 | 67.123 | 62.850 | 52.503 | 53.259 | - | |
| % Li Recovery | % | 73.2% | 73.3% | 73% | 73.2% | 73% | 76% | 74% | 75% | 74% | 75% | 73% | 74% | 72% | 73% | 74% | 74% | 75% | 74% | 73% | 72% | 72% | 72% | 72% | 72% | 73% | 73% | 73% | 74% | 73% | 74% | 75% | 74% | 73% | 73% | 73% | 73% | 71% | 73% | 73% | 70% | 74% | 74% | 71% | 73% | 0% | |||
| Liquid Sulfuric Acid -Sold | ktonne | - | - | - | - | - | - | - | - | - | - | - | - | - | - | - | - | - | - | - | - | - | - | - | - | - | - | - | - | - | - | - | - | - | - | - | - | - | - | - | - | - | - | - | - | ||||
| Selling Price | |||||||||||||||||||||||||||||||||||||||||||||||||
| LCE Sale Price | $/mt | $275 | $282 | $267 | $275 | $24,000 | $24,000 | $24,000 | $24,000 | $24,000 | $24,000 | $24,000 | $24,000 | $24,000 | $24,000 | $24,000 | $24,000 | $24,000 | $24,000 | $24,000 | $24,000 | $24,000 | $24,000 | $24,000 | $24,000 | $24,000 | $24,000 | $24,000 | $24,000 | $24,000 | $24,000 | $24,000 | $24,000 | $24,000 | $24,000 | $24,000 | $24,000 | $24,000 | $24,000 | $24,000 | $24,000 | $24,000 | $24,000 | $24,000 | $24,000 | $0 | |||
| Liquid Sulfuric Acid | $/mt | $90 | $90 | $90 | $90 | $78 | $75 | $76 | $74 | $73 | $73 | $73 | $73 | $73 | $73 | $73 | $73 | $73 | $73 | $73 | $73 | $73 | $73 | $73 | $73 | $73 | $73 | $73 | $74 | $74 | $73 | $74 | $74 | $73 | $74 | $74 | $74 | $74 | $74 | $74 | $74 | $74 | $74 | $74 | $74 | $0 | |||
| Revenues | $000 | ||||||||||||||||||||||||||||||||||||||||||||||||
| LCE | 64,111,640 | 41,946,640 | 30,686,517 | $64,111,640 | $497,541 | $873,679 | $841,637 | $1,487,712 | $2,011,108 | $1,816,843 | $1,730,458 | $2,086,426 | $1,814,225 | $1,895,403 | $2,032,907 | $1,814,033 | $1,794,548 | $1,847,645 | $1,751,466 | $1,754,438 | $1,911,178 | $1,795,475 | $1,765,366 | $1,903,035 | $1,776,293 | $1,721,952 | $1,807,032 | $1,642,616 | $1,573,624 | $1,751,080 | $1,703,386 | $1,550,477 | $1,639,827 | $1,546,586 | $1,535,898 | $1,539,328 | $1,402,516 | $1,377,806 | $1,341,922 | $1,118,538 | $1,610,945 | $1,508,402 | $1,260,073 | $1,278,215 | $0 | ||||
| Selling Fee | - | - | - | $0 | $0 | $0 | $0 | $0 | $0 | $0 | $0 | $0 | $0 | $0 | $0 | $0 | $0 | $0 | $0 | $0 | $0 | $0 | $0 | $0 | $0 | $0 | $0 | $0 | $0 | $0 | $0 | $0 | $0 | $0 | $0 | $0 | $0 | $0 | $0 | $0 | $0 | $0 | $0 | $0 | $0 | ||||
| Transportation | - | - | - | $0 | $0 | $0 | $0 | $0 | $0 | $0 | $0 | $0 | $0 | $0 | $0 | $0 | $0 | $0 | $0 | $0 | $0 | $0 | $0 | $0 | $0 | $0 | $0 | $0 | $0 | $0 | $0 | $0 | $0 | $0 | $0 | $0 | $0 | $0 | $0 | $0 | $0 | $0 | $0 | $0 | $0 | ||||
| Liquid Sulfuric Acid | - | - | - | $0 | $0 | $0 | $0 | $0 | $0 | $0 | $0 | $0 | $0 | $0 | $0 | $0 | $0 | $0 | $0 | $0 | $0 | $0 | $0 | $0 | $0 | $0 | $0 | $0 | $0 | $0 | $0 | $0 | $0 | $0 | $0 | $0 | $0 | $0 | $0 | $0 | $0 | $0 | $0 | $0 | $0 | ||||
| Net Revenues | 64,111,640 | 41,946,640 | 30,686,517 | $64,111,640 | $0 | $0 | $0 | $497,541 | $873,679 | $841,637 | $1,487,712 | $2,011,108 | $1,816,843 | $1,730,458 | $2,086,426 | $1,814,225 | $1,895,403 | $2,032,907 | $1,814,033 | $1,794,548 | $1,847,645 | $1,751,466 | $1,754,438 | $1,911,178 | $1,795,475 | $1,765,366 | $1,903,035 | $1,776,293 | $1,721,952 | $1,807,032 | $1,642,616 | $1,573,624 | $1,751,080 | $1,703,386 | $1,550,477 | $1,639,827 | $1,546,586 | $1,535,898 | $1,539,328 | $1,402,516 | $1,377,806 | $1,341,922 | $1,118,538 | $1,610,945 | $1,508,402 | $1,260,073 | $1,278,215 | $0 | |
| LCE sales price | $24,000 | $24,000 | $24,000 | $24,000 | $24,000 | $24,000 | $24,000 | $24,000 | $24,000 | $24,000 | $24,000 | $24,000 | $24,000 | $24,000 | $24,000 | $24,000 | $24,000 | $24,000 | $24,000 | $24,000 | $24,000 | $24,000 | $24,000 | $24,000 | $24,000 | $24,000 | $24,000 | $24,000 | $24,000 | $24,000 | $24,000 | $24,000 | $24,000 | $24,000 | $24,000 | $24,000 | $24,000 | $24,000 | $24,000 | $24,000 | $24,000 | $24,000 | $24,000 | $24,000 | $0 | ||||
| Operating Cost | $000 | ||||||||||||||||||||||||||||||||||||||||||||||||
| Mining - $ | 1,922,736 | 1,157,653 | 993,608 | $1,922,736 | $23,456 | $36,810 | $27,157 | $41,111 | $44,581 | $46,316 | $45,292 | $55,296 | $47,666 | $49,566 | $55,463 | $51,315 | $56,654 | $61,593 | $51,007 | $46,009 | $46,599 | $48,268 | $48,439 | $46,529 | $47,060 | $47,012 | $48,107 | $44,283 | $42,062 | $40,987 | $43,928 | $42,472 | $48,185 | $49,820 | $51,140 | $54,803 | $50,945 | $55,638 | $51,494 | $52,182 | $58,799 | $52,639 | $55,189 | $56,863 | $0 | ||||
| Mining $/mt (ore+waste) | $3.22 | $3.46 | $3.27 | $2.54 | $3.01 | $2.15 | $3.34 | $3.71 | $2.92 | $2.95 | $2.89 | $2.93 | $2.86 | $3.24 | $3.18 | $2.97 | $3.10 | $2.98 | $3.37 | $3.73 | $3.43 | $3.38 | $3.42 | $3.67 | $3.79 | $3.71 | $3.87 | $4.18 | $4.17 | $4.35 | $4.10 | $3.92 | $3.45 | $3.33 | $3.06 | $3.14 | $3.31 | $3.21 | $2.99 | $3.01 | $3.42 | $3.08 | $3.16 | ||||||
| Process Labor - $ | 1,159,279 | 715,842 | 591,250 | $1,159,279 | $20,275 | $20,275 | $24,919 | $29,562 | $29,562 | $29,562 | $29,562 | $29,562 | $29,562 | $29,562 | $29,562 | $29,562 | $29,562 | $29,562 | $29,562 | $29,562 | $29,562 | $29,562 | $29,562 | $29,562 | $29,562 | $29,562 | $29,562 | $29,562 | $29,562 | $29,562 | $29,562 | $29,562 | $29,562 | $29,562 | $29,562 | $29,562 | $29,562 | $29,562 | $29,562 | $29,562 | $29,562 | $29,562 | $29,562 | $29,562 | $0 | ||||
| Labor $/mt LCE sold | $434 | $410 | $462 | $434 | $978 | $557 | $711 | $477 | $353 | $391 | $410 | $340 | $391 | $374 | $349 | $391 | $395 | $384 | $405 | $404 | $371 | $395 | $402 | $373 | $399 | $412 | $393 | $432 | $451 | $405 | $417 | $458 | $433 | $459 | $462 | $461 | $506 | $515 | $529 | $634 | $440 | $470 | $563 | $555 | |||||
| Raw Materials - $ | 8,699,752 | 5,412,773 | 4,434,870 | $8,699,752 | $66,110 | $114,074 | $108,792 | $188,561 | $241,553 | $226,964 | $230,143 | $251,908 | $231,950 | $236,560 | $249,742 | $232,176 | $232,589 | $242,276 | $229,622 | $230,617 | $245,173 | $230,509 | $231,343 | $244,220 | $230,337 | $229,728 | $240,732 | $224,410 | $222,684 | $237,923 | $227,479 | $222,174 | $232,261 | $220,009 | $222,255 | $228,317 | $214,079 | $215,914 | $216,281 | $192,373 | $224,417 | $227,694 | $200,621 | $205,181 | $0 | ||||
| Reagents $/mt LCE sold | $3,257 | $3,097 | $3,469 | $3,257 | $3,189 | $3,134 | $3,102 | $3,042 | $2,883 | $2,998 | $3,192 | $2,898 | $3,068 | $2,995 | $2,948 | $3,072 | $3,111 | $3,147 | $3,146 | $3,155 | $3,079 | $3,081 | $3,145 | $3,080 | $3,112 | $3,202 | $3,197 | $3,279 | $3,396 | $3,261 | $3,205 | $3,439 | $3,399 | $3,414 | $3,473 | $3,560 | $3,663 | $3,761 | $3,868 | $4,128 | $3,343 | $3,623 | $3,821 | $3,853 | |||||
| Fuel (non-mining) - $ | 55,531 | 34,637 | 27,858 | $55,531 | $1,270 | $1,353 | $1,370 | $1,393 | $1,393 | $1,393 | $1,393 | $1,393 | $1,393 | $1,393 | $1,393 | $1,393 | $1,393 | $1,393 | $1,393 | $1,393 | $1,393 | $1,393 | $1,393 | $1,393 | $1,393 | $1,393 | $1,393 | $1,393 | $1,393 | $1,393 | $1,393 | $1,393 | $1,393 | $1,393 | $1,393 | $1,393 | $1,393 | $1,393 | $1,393 | $1,393 | $1,393 | $1,393 | $1,393 | $1,393 | $0 | ||||
| Fuel $/mt LCE sold | $20 | $22 | $21 | $61 | $37 | $39 | $22 | $17 | $18 | $19 | $16 | $18 | $18 | $16 | $18 | $19 | $18 | $19 | $19 | $17 | $19 | $19 | $18 | $19 | $19 | $19 | $20 | $21 | $19 | $20 | $22 | $20 | $22 | $22 | $22 | $24 | $24 | $25 | $30 | $21 | $22 | $27 | $26 | ||||||
| Raw Materials Logistics - $ | 3,392,200 | 2,086,416 | 1,752,425 | $3,392,200 | $25,577 | $43,418 | $42,023 | $71,810 | $91,583 | $86,816 | $89,134 | $95,860 | $89,382 | $90,843 | $95,414 | $89,361 | $89,762 | $93,692 | $88,806 | $89,264 | $94,283 | $88,958 | $89,621 | $94,168 | $88,973 | $89,230 | $93,312 | $87,570 | $87,556 | $92,675 | $88,276 | $87,370 | $91,364 | $86,568 | $87,415 | $90,488 | $85,258 | $85,872 | $87,646 | $79,326 | $87,986 | $90,413 | $81,609 | $83,517 | $0 | ||||
| Raw Materials Logistics $/mt LCE sold | $1,270 | $1,194 | $1,371 | $1,270 | $1,234 | $1,193 | $1,198 | $1,158 | $1,093 | $1,147 | $1,236 | $1,103 | $1,182 | $1,150 | $1,126 | $1,182 | $1,200 | $1,217 | $1,217 | $1,221 | $1,184 | $1,189 | $1,218 | $1,188 | $1,202 | $1,244 | $1,239 | $1,279 | $1,335 | $1,270 | $1,244 | $1,352 | $1,337 | $1,343 | $1,366 | $1,411 | $1,459 | $1,496 | $1,568 | $1,702 | $1,311 | $1,439 | $1,554 | $1,568 | |||||
| Power - $ | 989,421 | 600,251 | 518,740 | $989,421 | $7,335 | $14,425 | $14,895 | $20,566 | $25,089 | $25,133 | $25,805 | $26,097 | $25,879 | $25,858 | $26,097 | $25,879 | $25,858 | $26,097 | $25,879 | $25,858 | $26,097 | $25,879 | $25,858 | $26,097 | $25,879 | $25,858 | $26,097 | $25,879 | $25,858 | $26,097 | $25,879 | $25,858 | $26,097 | $25,879 | $25,858 | $26,097 | $25,879 | $25,858 | $26,097 | $25,879 | $25,858 | $26,097 | $25,879 | $25,858 | $0 | ||||
| Power $/mt LCE sold | $370 | $343 | $406 | $370 | $354 | $396 | $425 | $332 | $299 | $332 | $358 | $300 | $342 | $327 | $308 | $342 | $346 | $339 | $355 | $354 | $328 | $346 | $352 | $329 | $350 | $360 | $347 | $378 | $394 | $358 | $365 | $400 | $382 | $402 | $404 | $407 | $443 | $450 | $467 | $555 | $385 | $415 | $493 | $486 | |||||
| Maintenance, Parts, Outside Services - $ | 1,121,970 | 667,211 | 604,058 | $1,121,970 | $7,645 | $11,281 | $15,192 | $21,463 | $24,333 | $28,708 | $28,800 | $28,800 | $28,896 | $29,017 | $29,036 | $29,158 | $29,259 | $29,259 | $29,359 | $29,441 | $29,460 | $29,542 | $29,622 | $29,642 | $29,723 | $29,805 | $29,843 | $29,905 | $30,023 | $30,023 | $30,111 | $30,164 | $30,164 | $30,216 | $30,269 | $30,269 | $30,321 | $30,374 | $30,374 | $30,426 | $30,479 | $30,479 | $30,531 | $30,560 | $0 | ||||
| Maint $/mt LCE sold | $420 | $382 | $472 | $420 | $369 | $310 | $433 | $346 | $290 | $379 | $399 | $331 | $382 | $367 | $343 | $386 | $391 | $380 | $402 | $403 | $370 | $395 | $403 | $374 | $402 | $415 | $396 | $437 | $458 | $411 | $424 | $467 | $441 | $469 | $473 | $472 | $519 | $529 | $543 | $653 | $454 | $485 | $582 | $574 | |||||
| Supplies - $ | 181,577 | 115,553 | 89,685 | $181,577 | $2,850 | $2,498 | $2,451 | $3,758 | $6,220 | $4,636 | $4,510 | $5,029 | $4,632 | $6,051 | $4,951 | $4,632 | $4,604 | $4,681 | $5,841 | $4,545 | $4,774 | $4,605 | $4,561 | $6,062 | $4,577 | $4,498 | $4,622 | $4,382 | $5,582 | $4,540 | $4,471 | $4,248 | $4,378 | $5,542 | $4,227 | $4,232 | $4,032 | $3,996 | $5,244 | $3,618 | $4,336 | $4,186 | $3,824 | $5,151 | $0 | ||||
| Supplies $/mt LCE sold | $68 | $66 | $70 | $68 | $137 | $69 | $70 | $61 | $74 | $61 | $63 | $58 | $61 | $77 | $58 | $61 | $62 | $61 | $80 | $62 | $60 | $62 | $62 | $76 | $62 | $63 | $61 | $64 | $85 | $62 | $63 | $66 | $64 | $86 | $66 | $66 | $69 | $70 | $94 | $78 | $65 | $67 | $73 | $97 | |||||
| Tailings Placement - $ | 1,132,742 | 636,068 | 654,145 | $1,132,742 | $5,399 | $6,995 | $11,060 | $17,388 | $22,629 | $21,414 | $23,681 | $24,992 | $23,071 | $24,511 | $29,551 | $28,018 | $32,501 | $26,467 | $27,533 | $29,325 | $32,982 | $28,066 | $30,766 | $32,247 | $29,578 | $30,060 | $35,535 | $28,703 | $33,595 | $33,838 | $29,743 | $30,703 | $28,810 | $33,075 | $30,433 | $35,313 | $32,062 | $35,033 | $34,578 | $33,547 | $32,350 | $38,833 | $34,987 | $33,370 | $0 | ||||
| Tailings $/mt LCE sold | $424 | $364 | $512 | $424 | $2 | $1 | $2 | $2 | $2 | $2 | $2 | $2 | $2 | $2 | $2 | $2 | $3 | $2 | $2 | $2 | $3 | $2 | $3 | $3 | $3 | $3 | $3 | $2 | $3 | $3 | $3 | $3 | $2 | $3 | $3 | $3 | $3 | $3 | $3 | $3 | $3 | $3 | $3 | $3 | |||||
| G&A - $ | 573,019 | 358,632 | 285,850 | $573,019 | $14,850 | $14,600 | $14,596 | $14,443 | $14,293 | $14,293 | $14,293 | $14,293 | $14,293 | $14,293 | $14,293 | $14,293 | $14,293 | $14,293 | $14,293 | $14,293 | $14,293 | $14,293 | $14,293 | $14,293 | $14,293 | $14,293 | $14,293 | $14,293 | $14,293 | $14,293 | $14,293 | $14,293 | $14,293 | $14,293 | $14,293 | $14,293 | $14,293 | $14,293 | $14,293 | $14,293 | $14,293 | $14,293 | $14,293 | $14,293 | $0 | ||||
| G&A $/mt LCE sold | $215 | $205 | $224 | $215 | $716 | $401 | $416 | $233 | $171 | $189 | $198 | $164 | $189 | $181 | $169 | $189 | $191 | $186 | $196 | $196 | $179 | $191 | $194 | $180 | $193 | $199 | $190 | $209 | $218 | $196 | $201 | $221 | $209 | $222 | $223 | $223 | $245 | $249 | $256 | $307 | $213 | $227 | $272 | $268 | |||||
| Total Operating Cost | ` | 19,228,227 | 11,785,035 | 9,952,490 | $19,228,227 | $0 | $0 | $0 | $174,768 | $265,728 | $262,455 | $410,055 | $501,234 | $485,236 | $492,613 | $533,230 | $496,724 | $507,655 | $535,503 | $505,786 | $516,474 | $529,312 | $503,294 | $500,307 | $524,615 | $501,075 | $505,460 | $524,213 | $501,376 | $501,438 | $523,496 | $490,381 | $492,608 | $511,330 | $495,134 | $488,236 | $506,506 | $496,357 | $496,844 | $514,767 | $487,825 | $497,933 | $496,961 | $462,599 | $509,473 | $515,590 | $477,889 | $485,748 | $0 |
| $/mt LCE sold | $7,198 | $6,743 | $7,784 | $7,198 | $8,430 | $7,300 | $7,484 | $6,615 | $5,982 | $6,410 | $6,832 | $6,134 | $6,571 | $6,428 | $6,322 | $6,692 | $6,907 | $6,876 | $6,897 | $6,844 | $6,588 | $6,698 | $6,872 | $6,611 | $6,774 | $6,989 | $6,953 | $7,165 | $7,513 | $7,008 | $6,976 | $7,557 | $7,413 | $7,702 | $7,764 | $8,026 | $8,348 | $8,673 | $8,888 | $9,926 | $7,590 | $8,203 | $9,102 | $9,120 | |||||
| $/mt LCE moving average | $8,430 | $7,710 | $7,624 | $7,218 | $6,783 | $6,693 | $6,719 | $6,611 | $6,606 | $6,583 | $6,552 | $6,566 | $6,595 | $6,618 | $6,638 | $6,652 | $6,648 | $6,651 | $6,663 | $6,660 | $6,666 | $6,681 | $6,694 | $6,713 | $6,743 | $6,754 | $6,762 | $6,788 | $6,809 | $6,837 | $6,864 | $6,898 | $6,935 | $6,978 | $7,023 | $7,078 | $7,092 | $7,119 | $7,159 | $7,198 | $7,198 | ||||||||
| $433 | $428 | ||||||||||||||||||||||||||||||||||||||||||||||||
| Royalties (1.75% of Net LCE Rev) | 1,143,954 | 756,066 | 537,014 | $1,143,954 | $30,707 | $15,289 | $14,729 | $26,035 | $35,194 | $31,795 | $30,283 | $36,512 | $31,749 | $33,170 | $35,576 | $31,746 | $31,405 | $32,334 | $30,651 | $30,703 | $33,446 | $31,421 | $30,894 | $33,303 | $31,085 | $30,134 | $31,623 | $28,746 | $27,538 | $30,644 | $29,809 | $27,133 | $28,697 | $27,065 | $26,878 | $26,938 | $24,544 | $24,112 | $23,484 | $19,574 | $28,192 | $26,397 | $22,051 | $22,369 | $0 | ||||
| Salvage Value | (9,341) | - | - | -$9,341 | - | - | - | - | - | - | - | - | - | - | - | - | - | - | - | - | - | - | - | - | - | - | - | - | - | - | - | - | - | - | - | - | - | - | - | - | - | - | - | - | (9,341) | ||||
| Reclamation & Closure | 53,496 | - | - | $53,496 | - | - | - | - | - | - | - | - | - | - | - | - | - | - | - | - | - | - | - | - | - | - | - | - | - | - | - | - | - | - | - | - | - | - | - | - | - | - | - | - | 53,496 | ||||
| Total Production Cost | 20,416,335 | 12,541,101 | 10,489,504 | $20,372,181 | $0 | $0 | $0 | $205,475 | $281,017 | $277,184 | $436,090 | $536,428 | $517,031 | $522,896 | $569,743 | $528,473 | $540,825 | $571,079 | $537,532 | $547,879 | $561,646 | $533,945 | $531,010 | $558,060 | $532,496 | $536,354 | $557,516 | $532,461 | $531,572 | $555,119 | $519,127 | $520,146 | $541,974 | $524,943 | $515,370 | $535,203 | $523,422 | $523,722 | $541,705 | $512,369 | $522,044 | $520,445 | $482,173 | $537,665 | $541,987 | $499,940 | $508,117 | $44,154 | |
| Operating Income (EBITDA) | 43,695,304 | 29,405,538 | 20,152,858 | $43,695,304 | $0 | $0 | $0 | $292,066 | $592,662 | $564,453 | $1,051,622 | $1,474,680 | $1,299,812 | $1,207,562 | $1,516,683 | $1,285,753 | $1,354,578 | $1,461,828 | $1,276,501 | $1,246,669 | $1,285,999 | $1,217,521 | $1,223,428 | $1,353,117 | $1,262,979 | $1,229,012 | $1,345,518 | $1,243,831 | $1,190,380 | $1,251,913 | $1,123,490 | $1,053,478 | $1,209,106 | $1,178,442 | $1,035,107 | $1,104,624 | $1,023,164 | $1,012,176 | $997,623 | $890,147 | $855,762 | $821,478 | $636,365 | $1,073,280 | $966,415 | $760,133 | $770,098 | -$44,154 | |
| Depreciation | |||||||||||||||||||||||||||||||||||||||||||||||||
| Initial Capital | 3,995,500 | 3,995,500 | - | $3,995,500 | $343,846 | $705,302 | $725,835 | $629,395 | $454,664 | $385,960 | $357,947 | $249,167 | $105,628 | $36,215 | $1,541 | $0 | $0 | $0 | $0 | $0 | $0 | $0 | $0 | $0 | $0 | $0 | $0 | $0 | $0 | $0 | $0 | $0 | $0 | $0 | $0 | $0 | $0 | $0 | $0 | $0 | $0 | $0 | $0 | $0 | $0 | ||||
| Sustaining Capital | 1,461,539 | 431,826 | 1,213,541 | $1,461,539 | $0 | $0 | $919 | $2,298 | $4,349 | $6,870 | $8,072 | $9,132 | $10,213 | $11,567 | $13,252 | $14,945 | $15,720 | $18,447 | $21,489 | $23,168 | $22,976 | $20,366 | $21,312 | $22,903 | $36,177 | $44,264 | $34,486 | $28,468 | $40,433 | $88,226 | $108,349 | $80,969 | $62,304 | $94,701 | $125,740 | $102,953 | $72,519 | $51,776 | $51,309 | $52,281 | $40,081 | $24,058 | $18,632 | $55,815 | $0 | ||||
| Total Depreciation | 5,457,039 | 4,427,326 | 1,213,541 | $5,457,039 | $0 | $0 | $0 | $343,846 | $705,302 | $726,753 | $631,693 | $459,013 | $392,830 | $366,019 | $258,298 | $115,841 | $47,783 | $14,793 | $14,945 | $15,720 | $18,447 | $21,489 | $23,168 | $22,976 | $20,366 | $21,312 | $22,903 | $36,177 | $44,264 | $34,486 | $28,468 | $40,433 | $88,226 | $108,349 | $80,969 | $62,304 | $94,701 | $125,740 | $102,953 | $72,519 | $51,776 | $51,309 | $52,281 | $40,081 | $24,058 | $18,632 | $55,815 | $0 | |
| Net Income after Depreciation | 38,238,266 | 24,978,212 | 18,983,472 | $38,238,266 | $0 | $0 | $0 | -$51,780 | -$112,640 | -$162,300 | $419,929 | $1,015,667 | $906,983 | $841,543 | $1,258,385 | $1,169,912 | $1,306,796 | $1,447,035 | $1,261,556 | $1,230,949 | $1,267,552 | $1,196,032 | $1,200,260 | $1,330,142 | $1,242,613 | $1,207,701 | $1,322,615 | $1,207,654 | $1,146,116 | $1,217,427 | $1,095,021 | $1,013,045 | $1,120,880 | $1,070,093 | $954,138 | $1,042,320 | $928,463 | $886,436 | $894,670 | $817,628 | $803,986 | $770,169 | $584,085 | $1,033,198 | $942,358 | $741,501 | $714,283 | -$44,154 | |
| Property Tax | 216,632 | 181,401 | 44,025 | $216,632 | $1,996 | $13,721 | $24,449 | $22,734 | $24,041 | $24,425 | $18,003 | $13,168 | $9,041 | $5,130 | $2,429 | $1,276 | $930 | $943 | $1,014 | $1,003 | $1,192 | $1,192 | $1,287 | $1,158 | $1,108 | $1,192 | $1,174 | $2,052 | $1,743 | $1,453 | $1,353 | $2,194 | $4,319 | $3,365 | $2,688 | $2,388 | $4,609 | $3,704 | $2,729 | $2,318 | $1,973 | $1,719 | $1,467 | $1,324 | $1,105 | $985 | $537 | $0 | |
| Net Proceeds of Mineral Tax | 1,948,982 | 1,276,329 | 959,126 | $1,948,982 | $0 | $0 | $0 | $21,406 | $51,285 | $45,834 | $42,570 | $63,452 | $58,992 | $65,847 | $72,887 | $63,584 | $62,064 | $63,907 | $60,305 | $60,513 | $67,032 | $62,632 | $60,890 | $66,655 | $60,884 | $57,807 | $61,395 | $55,241 | $51,145 | $56,555 | $54,000 | $48,195 | $52,623 | $46,919 | $44,819 | $45,248 | $41,369 | $40,697 | $39,005 | $29,667 | $52,169 | $47,633 | $37,553 | $36,200 | $0 | ||||
| Income Taxes | 6,216,975 | 4,076,360 | 3,076,254 | $6,216,975 | $0 | $0 | $0 | $0 | $153,591 | $138,872 | $127,811 | $202,739 | $191,385 | $216,815 | $241,611 | $209,670 | $204,012 | $210,085 | $198,044 | $198,819 | $221,105 | $206,321 | $200,050 | $219,792 | $199,789 | $188,768 | $201,024 | $180,409 | $165,648 | $183,058 | $174,031 | $154,432 | $169,957 | $149,398 | $141,260 | $142,820 | $130,616 | $128,463 | $122,546 | $90,590 | $168,803 | $153,048 | $118,721 | $112,871 | $0 | ||||
| Adv. Manuf. Production Credit | (301,669) | (301,669) | - | -$301,669 | 0 | - | - | - | - | (50,123) | (48,524) | (49,261) | (53,323) | (49,672) | (50,766) | - | - | - | - | - | - | - | - | - | - | - | - | - | - | - | - | - | - | - | - | - | - | - | - | - | - | - | - | - | - | - | |||
| Net Income after Taxes | 30,157,346 | 19,745,791 | 14,904,066 | $30,157,346 | -$1,996 | -$13,721 | -$24,449 | -$74,514 | -$136,682 | -$186,725 | $380,519 | $847,746 | $761,759 | $715,294 | $1,043,088 | $967,932 | $1,073,968 | $1,131,594 | $987,288 | $963,871 | $992,368 | $936,491 | $939,641 | $1,040,847 | $972,553 | $945,568 | $1,034,994 | $944,929 | $897,798 | $953,555 | $858,018 | $794,058 | $876,947 | $838,697 | $748,823 | $817,354 | $727,537 | $696,652 | $703,873 | $643,325 | $632,852 | $606,898 | $462,361 | $810,901 | $740,572 | $584,242 | $564,676 | -$44,154 | |
| Cash Flow | $000 | ||||||||||||||||||||||||||||||||||||||||||||||||
| Net Income after Depreciation | 38,238,266 | 24,978,212 | 18,983,472 | $38,238,266 | -$51,780 | -$112,640 | -$162,300 | $419,929 | $1,015,667 | $906,983 | $841,543 | $1,258,385 | $1,169,912 | $1,306,796 | $1,447,035 | $1,261,556 | $1,230,949 | $1,267,552 | $1,196,032 | $1,200,260 | $1,330,142 | $1,242,613 | $1,207,701 | $1,322,615 | $1,207,654 | $1,146,116 | $1,217,427 | $1,095,021 | $1,013,045 | $1,120,880 | $1,070,093 | $954,138 | $1,042,320 | $928,463 | $886,436 | $894,670 | $817,628 | $803,986 | $770,169 | $584,085 | $1,033,198 | $942,358 | $741,501 | $714,283 | -$44,154 | ||||
| Add back Depreciation | 5,457,039 | 4,427,326 | 1,213,541 | $5,457,039 | $343,846 | $705,302 | $726,753 | $631,693 | $459,013 | $392,830 | $366,019 | $258,298 | $115,841 | $47,783 | $14,793 | $14,945 | $15,720 | $18,447 | $21,489 | $23,168 | $22,976 | $20,366 | $21,312 | $22,903 | $36,177 | $44,264 | $34,486 | $28,468 | $40,433 | $88,226 | $108,349 | $80,969 | $62,304 | $94,701 | $125,740 | $102,953 | $72,519 | $51,776 | $51,309 | $52,281 | $40,081 | $24,058 | $18,632 | $55,815 | $0 | ||||
| Working Capital | |||||||||||||||||||||||||||||||||||||||||||||||||
| Account Receivables | (3,512,967) | (2,298,446) | (1,681,453) | -$3,512,967 | -$27,263 | -$47,873 | -$46,117 | -$81,518 | -$110,198 | -$99,553 | -$94,820 | -$114,325 | -$99,410 | -$103,858 | -$111,392 | -$99,399 | -$98,331 | -$101,241 | -$95,971 | -$96,134 | -$104,722 | -$98,382 | -$96,732 | -$104,276 | -$97,331 | -$94,354 | -$99,015 | -$90,006 | -$86,226 | -$95,950 | -$93,336 | -$84,958 | -$89,854 | -$84,744 | -$84,159 | -$84,347 | -$76,850 | -$75,496 | -$73,530 | -$61,290 | -$88,271 | -$82,652 | -$69,045 | -$70,039 | $0 | ||||
| Accounts Payable | 1,580,402 | 968,633 | 818,013 | $1,580,402 | $14,364 | $21,841 | $21,572 | $33,703 | $41,197 | $39,882 | $40,489 | $43,827 | $40,827 | $41,725 | $44,014 | $41,571 | $42,450 | $43,505 | $41,367 | $41,121 | $43,119 | $41,184 | $41,545 | $43,086 | $41,209 | $41,214 | $43,027 | $40,305 | $40,488 | $42,027 | $40,696 | $40,129 | $41,631 | $40,796 | $40,836 | $42,310 | $40,095 | $40,926 | $40,846 | $38,022 | $41,875 | $42,377 | $39,279 | $39,924 | $0 | ||||
| Inventory - Parts, Supplies | - | - | $0 | $0 | $0 | $0 | $0 | $0 | $0 | $0 | $0 | $0 | $0 | $0 | $0 | $0 | $0 | $0 | $0 | $0 | |||||||||||||||||||||||||||||
| Total Working Capital | - | (45,738) | 31,075 | $0 | $0 | -$12,898 | -$13,134 | $1,487 | -$23,270 | -$21,185 | $9,330 | $5,340 | -$16,167 | $11,915 | -$3,550 | -$5,246 | $9,551 | $1,946 | -$1,854 | $3,132 | -$408 | -$6,591 | $4,405 | $2,010 | -$6,002 | $5,068 | $2,983 | -$2,849 | $6,287 | $3,963 | -$8,185 | $1,282 | $7,812 | -$3,394 | $4,275 | $626 | $1,285 | $5,282 | $2,185 | $1,886 | $9,416 | -$23,128 | $6,121 | $10,508 | -$348 | $30,115 | |||
| Capital Expenditures | $000 | ||||||||||||||||||||||||||||||||||||||||||||||||
| Initial Capital | 3,995,500 | 3,995,500 | - | $3,995,500 | $181,440 | $1,065,960 | $975,240 | $183,560 | $811,925 | $742,825 | $34,550 | $0 | $0 | $0 | $0 | $0 | $0 | $0 | $0 | $0 | $0 | $0 | $0 | $0 | $0 | $0 | $0 | $0 | $0 | $0 | $0 | $0 | $0 | $0 | $0 | $0 | $0 | $0 | $0 | $0 | $0 | $0 | $0 | $0 | $0 | $0 | $0 | $0 | |
| Sustaining Capital | 1,461,539 | 582,496 | 1,155,566 | $1,461,539 | 0 | 0 | 0 | 0 | 0 | 6,431 | 5,063 | 13,883 | 12,468 | 9,682 | 12,736 | 11,037 | 16,353 | 15,985 | 21,403 | 14,682 | 35,676 | 21,488 | 31,785 | 11,201 | 15,820 | 28,983 | 21,298 | 115,960 | 16,179 | 8,150 | 19,314 | 116,921 | 281,409 | 21,655 | 19,425 | 34,976 | 296,611 | 43,520 | 14,266 | 35,172 | 20,457 | 28,214 | 29,369 | 27,086 | 4,090 | 7,719 | 15,074 | 0 | |
| Sawtooth Capital Recovery | 48,778 | 48,778 | - | $48,778 | 0 | 0 | 0 | 4,373 | 12,229 | 12,349 | 8,302 | 5,608 | 5,120 | 797 | 0 | 0 | 0 | 0 | 0 | 0 | 0 | 0 | 0 | 0 | 0 | 0 | 0 | 0 | 0 | 0 | 0 | 0 | 0 | 0 | 0 | 0 | 0 | 0 | 0 | 0 | 0 | 0 | 0 | 0 | 0 | 0 | 0 | 0 | |
| Total Capital Expenditures | 5,505,817 | 4,626,774 | 1,155,566 | $5,505,817 | $181,440 | $1,065,960 | $975,240 | $187,933 | $824,154 | $761,605 | $47,915 | $19,492 | $17,588 | $10,480 | $12,736 | $11,037 | $16,353 | $15,985 | $21,403 | $14,682 | $35,676 | $21,488 | $31,785 | $11,201 | $15,820 | $28,983 | $21,298 | $115,960 | $16,179 | $8,150 | $19,314 | $116,921 | $281,409 | $21,655 | $19,425 | $34,976 | $296,611 | $43,520 | $14,266 | $35,172 | $20,457 | $28,214 | $29,369 | $27,086 | $4,090 | $7,719 | $15,074 | $0 | |
| CAPEX intensity ($/mt LCE) | $2,061 | $2,647 | $904 | $2,061 | 0.0 | 0.0 | 2.0 | 1.6 | 4.3 | 4.0 | 3.1 | 3.8 | 3.3 | 4.9 | 4.8 | 6.6 | 4.6 | 11.3 | 6.8 | 10.1 | 3.4 | 4.7 | 8.9 | 6.2 | 34.8 | 5.0 | 2.5 | 6.1 | 38.3 | 89.0 | 6.9 | 6.5 | 11.3 | 95.9 | 14.2 | 4.8 | 11.7 | 6.9 | 9.8 | 10.8 | 8.3 | 1.4 | 2.6 | 5.1 | |||||
| Cash Flow before Taxes | $000 | 38,189,487 | 24,733,026 | 19,072,521 | $38,189,487 | -$181,440 | -$1,065,960 | -$975,240 | $91,235 | -$244,626 | -$195,665 | $980,438 | $1,434,003 | $1,291,555 | $1,202,422 | $1,487,781 | $1,286,630 | $1,334,676 | $1,440,598 | $1,264,649 | $1,233,934 | $1,248,469 | $1,199,165 | $1,191,235 | $1,335,326 | $1,251,565 | $1,202,039 | $1,318,219 | $1,132,939 | $1,177,184 | $1,240,914 | $1,110,463 | $940,520 | $919,512 | $1,158,070 | $1,023,494 | $1,066,254 | $730,827 | $969,282 | $984,642 | $860,257 | $837,490 | $795,150 | $616,412 | $1,023,065 | $968,447 | $762,923 | $754,676 | -$14,040 |
| Cummulative Cash Flow before Taxes | -$181,440 | -$1,247,400 | -$2,222,640 | -$2,131,405 | -$2,376,031 | -$2,571,696 | -$1,591,258 | -$157,255 | $1,134,300 | $2,336,722 | $3,824,502 | $5,111,133 | $6,445,808 | $7,886,406 | $9,151,056 | $10,384,990 | $11,633,458 | $12,832,623 | $14,023,858 | $15,359,183 | $16,610,748 | $17,812,787 | $19,131,006 | $20,263,945 | $21,441,129 | $22,682,043 | $23,792,506 | $24,733,026 | $25,652,538 | $26,810,608 | $27,834,102 | $28,900,356 | $29,631,183 | $30,600,465 | $31,585,107 | $32,445,364 | $33,282,854 | $34,078,004 | $34,694,416 | $35,717,481 | $36,685,929 | $37,448,851 | $38,203,527 | $38,189,487 | |||||
| Taxes | 8,080,920 | 5,232,421 | 4,079,405 | $8,080,920 | $1,996 | $13,721 | $24,449 | $22,734 | $24,041 | $24,425 | $39,410 | $167,921 | $145,224 | $126,249 | $215,298 | $201,980 | $232,827 | $315,441 | $274,268 | $267,079 | $275,184 | $259,541 | $260,620 | $289,294 | $270,060 | $262,133 | $287,621 | $262,725 | $248,318 | $263,872 | $237,003 | $218,987 | $243,932 | $231,396 | $205,315 | $224,967 | $200,926 | $189,783 | $190,797 | $174,303 | $171,134 | $163,271 | $121,724 | $222,297 | $201,786 | $157,259 | $149,607 | $0 | |
| Cash Flow after Taxes | $000 | 30,108,567 | 19,500,605 | 14,993,116 | $30,108,567 | -$183,436 | -$1,079,681 | -$999,689 | $68,501 | -$268,667 | -$220,090 | $941,028 | $1,266,083 | $1,146,331 | $1,076,173 | $1,272,483 | $1,084,650 | $1,101,848 | $1,125,157 | $990,382 | $966,855 | $973,285 | $939,624 | $930,615 | $1,046,031 | $981,505 | $939,907 | $1,030,598 | $870,213 | $928,866 | $977,041 | $873,460 | $721,533 | $675,580 | $926,673 | $818,178 | $841,287 | $529,901 | $779,499 | $793,845 | $685,953 | $666,355 | $631,880 | $494,689 | $800,768 | $766,661 | $605,663 | $605,069 | -$14,040 |
| Cummulative Cash Flow after Taxes | -$183,436 | -$1,263,117 | -$2,262,806 | -$2,194,305 | -$2,462,973 | -$2,683,062 | -$1,742,034 | -$475,951 | $670,379 | $1,746,552 | $3,019,035 | $4,103,685 | $5,205,534 | $6,330,690 | $7,321,072 | $8,287,927 | $9,261,212 | $10,200,835 | $11,131,450 | $12,177,482 | $13,158,987 | $14,098,893 | $15,129,491 | $15,999,705 | $16,928,571 | $17,905,612 | $18,779,072 | $19,500,605 | $20,176,185 | $21,102,858 | $21,921,037 | $22,762,324 | $23,292,225 | $24,071,724 | $24,865,569 | $25,551,522 | $26,217,878 | $26,849,757 | $27,344,446 | $28,145,214 | $28,911,875 | $29,517,538 | $30,122,607 | $30,108,567 | |||||
| Period | 0 | 1 | 2 | 3 | 4 | 5 | 6 | 7 | 8 | 9 | 10 | 11 | 12 | 13 | 14 | 15 | 16 | 17 | 18 | 19 | 20 | 21 | 22 | 23 | 24 | 25 | 26 | 27 | 28 | 29 | 30 | 31 | 32 | 33 | 34 | 35 | 36 | 37 | 38 | 39 | 40 | 41 | 42 | 42 | |||||
| Discounted Cash Flow after Taxes @ 0% | -$183,436 | -$1,079,681 | -$999,689 | $68,501 | -$268,667 | -$220,090 | $941,028 | $1,266,083 | $1,146,331 | $1,076,173 | $1,272,483 | $1,084,650 | $1,101,848 | $1,125,157 | $990,382 | $966,855 | $973,285 | $939,624 | $930,615 | $1,046,031 | $981,505 | $939,907 | $1,030,598 | $870,213 | $928,866 | $977,041 | $873,460 | $721,533 | $675,580 | $926,673 | $818,178 | $841,287 | $529,901 | $779,499 | $793,845 | $685,953 | $666,355 | $631,880 | $494,689 | $800,768 | $766,661 | $605,663 | $605,069 | -$14,040 | |||||
| Cumulative Discounted cashflow after taxes @ 0% | -$183,436 | -$1,263,117 | -$2,262,806 | -$2,194,305 | -$2,462,973 | -$2,683,062 | -$1,742,034 | -$475,951 | $670,379 | $1,746,552 | $3,019,035 | $4,103,685 | $5,205,534 | $6,330,690 | $7,321,072 | $8,287,927 | $9,261,212 | $10,200,835 | $11,131,450 | $12,177,482 | $13,158,987 | $14,098,893 | $15,129,491 | $15,999,705 | $16,928,571 | $17,905,612 | $18,779,072 | $19,500,605 | $20,176,185 | $21,102,858 | $21,921,037 | $22,762,324 | $23,292,225 | $24,071,724 | $24,865,569 | $25,551,522 | $26,217,878 | $26,849,757 | $27,344,446 | $28,145,214 | $28,911,875 | $29,517,538 | $30,122,607 | $30,108,567 |
|
Economic Indicators before Taxes |
|
|
25 Yr LoM |
|
40 Yr LoM |
|
NPV with mid-year convention |
|
NPV @ 0% |
0.0% |
|
$24,733,026 |
|
$38,189,487 |
|
|
|
NPV @ 6% |
6.0% |
|
$8,990,703 |
|
$10,836,234 |
|
10,827,003 |
|
NPV @ 8% |
8.0% |
|
$6,502,472 |
|
$7,490,888 |
|
7,482,674 |
|
NPV @ 10% |
10.0% |
|
$4,698,227 |
|
$5,236,790 |
|
5,229,714 |
|
NPV @ 12% |
12.0% |
|
$3,369,044 |
|
$3,667,306 |
|
3,661,294 |
|
NPV @ 16% |
16.0% |
|
$1,623,028 |
|
$1,718,738 |
|
1,714,465 |
|
IRR |
|
|
23.8% |
|
23.9% |
|
23.9% |
|
Payback |
Years |
|
5.1 |
|
5.1 |
|
|
|
|
|
|
|
|
|
|
|
|
Economic Indicators after Taxes |
|
|
25 Yr LoM |
|
40 Yr LoM |
|
NPV with mid-year convention |
|
NPV @ 0% |
0.0% |
|
$19,500,605 |
|
$30,108,567 |
|
|
|
NPV @ 6% |
6.0% |
|
$6,947,487 |
|
$8,398,919 |
|
8,391,585 |
|
NPV @ 8% |
8.0% |
|
$4,950,134 |
|
$5,726,852 |
|
5,720,319 |
|
NPV @ 10% |
10.0% |
|
$3,497,855 |
|
$3,920,727 |
|
3,915,096 |
|
NPV @ 12% |
12.0% |
|
$2,425,349 |
|
$2,659,351 |
|
2,654,570 |
|
NPV @ 16% |
16.0% |
|
$1,012,718 |
|
$1,087,688 |
|
1,084,310 |
|
IRR |
|
|
21.2% |
|
21.37% |
|
21.4% |
|
Payback |
Years |
|
5.4 |
|
5.4 |
|
|
|
Payback (discounted) |
Years |
|
5.4 |
|
5.4 |
|
|
| Page 272 |
| Lithium Americas Corp. Feasibility Study, National Instrument 43-101 Technical Report for the Thacker Pass Project, Humboldt County, Nevada, USA |
22.5 Sensitivity Analysis
A sensitivity analysis was performed to examine variables in the economic model to understand the impact of the variables on the Project value and economics. The variables examined are lithium carbonate selling price, recovery, OPEX, CAPEX and liquid sulfur price. The change in Project NPV was estimated based on the defined increase or decrease of the particular variable. The results of this sensitivity analysis are presented on an after-tax basis in Figure 22-5 for Project NPV and Figure 22-6 for IRR.
Figure 22-5 Sensitivity Analysis of Various Variables, After-Tax NPV, 8% Discount Rate
![]()
Source: M3, 2022
| Page 273 |
| Lithium Americas Corp. Feasibility Study, National Instrument 43-101 Technical Report for the Thacker Pass Project, Humboldt County, Nevada, USA |
Figure 22-6 Sensitivity Analysis of Various Variables, After-Tax IRR, 8% Discount Rate
![]()
Source: M3, 2022
The analysis demonstrates high sensitivity to lithium carbonate price, overall plant production, and operating costs. The Project is relatively insensitive to changes in initial capital or to sustaining capital costs.
Table 22-12 presents NPV and IRR at a range of discount rates for three lithium carbonate product selling price cases: -50% (downside), 0% (base-fixed), and +50% (high).
Table 22-12 After-Tax NPV at 8% ($ Millions) and IRR
|
Economic Indicator |
Unit |
Value |
|
|
NPV @ 8% |
$ millions |
$5,727 |
|
|
IRR |
% |
21.4% |
|
|
Payback |
Years |
5.4 |
|
|
Payback (discounted) |
Years |
5.4 |
|
|
Selling Price ($/tonne) |
$12,000 |
$24,000 |
$36,000 |
|
NPV ($-M) |
($623) |
$5,727 |
$11,829 |
|
IRR (%) |
6.0% |
21.4% |
31.9% |
Table 22-13 presents the sensitivity of NPV to different discount rates.
| Page 274 |
| Lithium Americas Corp. Feasibility Study, National Instrument 43-101 Technical Report for the Thacker Pass Project, Humboldt County, Nevada, USA |
Table 22-13 NPV for Various Discount Rates (40-Year LOM)
|
Economic Indicators after Taxes |
Years 1-25 of |
40-Year LoM |
|
NPV @ 0% |
$19,500,605 |
$30,108,567 |
|
NPV @ 6% |
$6,947,487 |
$8,398,919 |
|
NPV @ 8% |
$4,950,134 |
$5,726,852 |
|
NPV @ 10% |
$3,497,855 |
$3,920,727 |
|
NPV @ 12% |
$2,425,349 |
$2,659,351 |
|
NPV @ 16% |
$1,012,718 |
$1,087,688 |
| Page 275 |
| Lithium Americas Corp. Feasibility Study, National Instrument 43-101 Technical Report for the Thacker Pass Project, Humboldt County, Nevada, USA |
23 Adjacent Properties
There are no adjacent properties that bear on the lithium properties and there are no nearby operating mines.
| Page 276 |
| Lithium Americas Corp. Feasibility Study, National Instrument 43-101 Technical Report for the Thacker Pass Project, Humboldt County, Nevada, USA |
24 Other Relevant Data and Information
24.1 Project Execution Plan
A proposed Project execution plan describes, at a high level, how the Project could be carried out. This plan contains an overall description of what the main work focuses are, Project organization, the estimated schedule, and where important aspects of the Project will be carried out. Key milestones of the proposed plan include the following:
24.1.1 Focus
The proposed Project execution plan incorporates an integrated strategy for engineering, procurement, and construction management (EPCM).
The majority of mechanical and electrical equipment required for the Project will be procured within North America. Concrete, building construction materials and timber products will be sourced primarily in the Western US region. Structural and miscellaneous steel, piping, tanks, electrical and miscellaneous process equipment will be largely sourced within the US, and to the extent practical, within the region. Some commodities, such as structural steel and fabricated piping materials, may be sourced out of country depending on cost and schedule.
24.1.2 Engineering
The Project will enter the basic engineering phase, followed by detailed engineering. During the engineering phase, priorities for long lead procurement and early construction will be identified to that support the overall construction schedule. Engineering must be completed to the point that key procurement and construction activities have been decided contractually prior to the Project's Notice to Proceed. Some funding may need to be committed to achieve this status.
24.1.3 Procurement
Equipment and bulk material suppliers will be selected through a competitive bidding process. Similarly, construction contractors will be selected through a pre-qualification process followed by a competitive bidding process. The Project will employ a combination of lump sum and unit price contracts as appropriate for the level of engineering and scope definition available at the time contracts are awarded.
Procurement of long lead equipment and materials will be scheduled with their relevant engineering tasks. This will allow the applicable vendor information to be incorporated into the design drawings and facilitate the delivery of equipment to site at the appropriate time, as well as support the overall Project schedule. Particular emphasis will be placed on procuring the material and contract services required to establish the temporary construction infrastructure required for the construction program.
Construction documents need to be completed for bidding, bids offered and received, and contractors accepted and prepared to begin work before the Full Notice to Proceed. Contractors will be selected, and a hold will be put on their contracts awaiting the release of funds and the notice to proceed.
| Page 277 |
| Lithium Americas Corp. Feasibility Study, National Instrument 43-101 Technical Report for the Thacker Pass Project, Humboldt County, Nevada, USA |
24.1.4 Project Services
The EPCM contractor will be responsible for management and control of the various Project activities and will ensure that the team has appropriate resources to accomplish LAC's objectives. The EPCM integrated Project services system from construction documents through procurement, cost control, Project accounts, warehousing, and start-up.
24.1.5 Construction Management
Construction will be completed in two phases for the plant, with Phase 2 concluding four years after the Phase 1 ends.
The construction program will start with Early Works after the Notice to Proceed. The completion of well water pipeline will be of the highest priority which will provide construction water to the mass civil works. It will be necessary to get the large earth-moving equipment onto the site to begin major work. This work will include the clearing and grubbing of the Process Plant building pads, access roads, tailings facility, and Mine Infrastructure.
Process Plant Area construction will begin in area blocks as mass grading is completed from South to North, starting with the Sulfuric Acid Plant, then moving to the Lithium Carbonate/ Magnesium Sulfate units, and finally the Mineral Beneficiation / Leach & Neutralization units. Once completed with the Process Plant building pads, civil crews will move onto the Mine Facilities, ROM, and Attrition Scrubbing areas with process construction to follow. Ancillary Facilities and other site infrastructure will continue installation throughout the schedule as areas become available and are of secondary importance to the critical path. Process Plant construction will finish with Commissioning. Ramp-up to 100% capacity should last less than one year following construction completion of each phase.
24.1.6 Contracting
A combination of vertical, horizontal, and design construction contracts will be employed as best suits the work to be performed, and as best suits the degree of engineering and scope definition available at the time of award. A site-installed concrete batch plant will supply concrete to all construction contractors. A site-installed crushing and screening operation will be initiated to provide engineered soils materials (sand and gravel) for the benefit of the Project. The Owner-furnished Temporary Housing Facilities will be available to all construction contractors at their option. Should they opt out, they may provide for their own housing. Camp operations will be provided by LAC. Early piping and earthwork contractors will be expected to provide their housing, as they will be on site prior to the completion of the housing facilities.
24.1.7 Labor
Construction labor will largely be sourced from regional general and specialty contractors. The labor market in northern Nevada and the surrounding region has been stressed in recent years similar to the overall labor market in the US. Provisions have been made in the plan of execution to account for attracting workers to the Project. The region has a mix of unionized and non-union labor.
24.1.8 Construction Completion and Turn-Over Procedure
The Construction Completion Procedure is part of the Construction Quality Plan. Contractors are to enter into contractual agreements with LAC to perform certain portions of the work, which includes quality control of their work. Facilities will be verified and accepted in a stepwise documented process of mechanical completion and pre-operational testing. The main steps are as follows:
| Page 278 |
| Lithium Americas Corp. Feasibility Study, National Instrument 43-101 Technical Report for the Thacker Pass Project, Humboldt County, Nevada, USA |
24.1.9 Quality Plan
A Project-specific quality plan will be developed and implemented. The quality plan is a management tool for the EPCM contractor to maintain the quality of construction and installation on every aspect of a project. The plan will be developed during the engineering phase and available prior to the start of construction. The quality plan is designed to check for compliance with various technical and accounting activities that will take place.
24.1.10 Health and Safety Plan
The Health and Safety Plan (HASP) will be established for the construction of the Thacker Pass Project and any other authorized work at the Project site. The HASP covers both contractor personnel and operational personnel working at the Project site and on any other sites authorized for Project work.
The HASP specifies regulatory compliance requirements, training, certifications, and medical requirements necessary for Project completion by contractors. Along with the Operations Procedures, the HASP is to be followed by all contractor personnel working at the site.
24.1.11 Temporary Housing Transition
Temporary housing facilities will be built as a construction camp and made available for use by the Project workforce at their discretion. Workers may also elect to arrange their own accommodation in the area. The temporary housing facilities are expected to be used for Phase 1 of the Project, and then maintained for future use during Phase 2.
24.1.12 Project Schedule
At the present time, a tentative overview schedule is shown in Table 24-1.
Table 24-1 Overview Schedule
![]()
Source: M3, 2022
| Page 279 |
| Lithium Americas Corp. Feasibility Study, National Instrument 43-101 Technical Report for the Thacker Pass Project, Humboldt County, Nevada, USA |
24.2 Limestone Quarry
One of the main reagents used in processing is limestone. In order to keep costs down and ensure consistent supply, LAC has evaluated several sources of limestone including existing market sources and two new sources located in Humboldt County. The sources in Humboldt County nearest to the Thacker Pass site are expected to provide more favorable transportation costs and vehicular emissions when compared to the projects that are further away.
LAC has evaluated one regional project (the "Limestone Quarry") in relation to the economics and schedule for availability of limestone product. The estimated delivery cost for limestone from this property was estimated to be $34.24/t. The pricing was based on a high-level scoping study. Additional work and information will be needed to confirm the limestone quantity, quality and delivery cost.
24.2.1 Geology
Geological mapping and initial exploration drilling have been completed at the Limestone Quarry to define the limestone extents and grade. Eight drill holes have intersected the limestone zone. These drill holes were logged by LAC geologists and sampled at selected points along the core length for analysis. The point samples were designed to include one limestone and one chert sample for every logged interval (3-6 m).
The field mapping data along with the exploration drilling results were utilized to build a 3-D geological model to define the limestone zone for a scoping level analysis. Within the limestone zone, the drilling results were interpolated into a block model to better define the lithology in the limestone zone as limestone, chert, cherty-limestone, and volcanic waste. The assay point samples were then interpolated in the block model to estimate the grade of the limestone zone based on lithology.
Bulk density has not been sampled for the Limestone Quarry. The following bulk density assumptions were used based on the SME Mining Engineering Handbook, Geological Survey Bulletin 1144-E (Manger 1963), and Thacker Pass values for volcanic waste:
It is recommended that the limestone core be analyzed as full-length samples, rather than point samples, to better define the density, grade, neutralization, and physical characteristics. The current geological and block models demonstrate a scoping level analysis, but this is subject to change based on additional sampling and analysis of the core.
24.2.2 Quantity and Quality
LAC provided a range of delivered limestone tonnes. The range of limestone tonnes over the 40-year life of mine are in Table 24-2. The grade required is 77-100% CaCO3 Purity (Average 88%).
Table 24-2 Delivered Limestone tonnes (LS)
|
|
Minimum LS MT |
Average LS MT |
Maximum LS MT |
|
Delivered |
14.4 |
17.9 |
23.0 |
To validate that the limestone ore body has the required tonnes of limestone as shown in Table 24-2 and the required grade, a pit shell was developed in the block model using the parameters below.
| Page 280 |
| Lithium Americas Corp. Feasibility Study, National Instrument 43-101 Technical Report for the Thacker Pass Project, Humboldt County, Nevada, USA |
A Run of Mine (ROM) limestone tonnage was achieved by applying the 10% loss to the delivered limestone tonnes. Table 24-3 shows the ROM limestone tonnes required to be mined along with the limestone tonnes required to be delivered.
Table 24-3 Delivered and ROM tonnes
|
|
Minimum LS MT |
Average LS MT |
Maximum LS MT |
|
Delivered |
14.4 |
17.9 |
23.0 |
|
ROM |
16.0 |
19.9 |
25.5 |
The 40-year pit shell that was developed in the block model is shown below in Figure 24-1.
| Page 281 |
| Lithium Americas Corp. Feasibility Study, National Instrument 43-101 Technical Report for the Thacker Pass Project, Humboldt County, Nevada, USA |
Figure 24-1 Limestone Quarry pit outline
![]()
A cross-section of the orebody is shown below in Figure 24-2.
| Page 282 |
| Lithium Americas Corp. Feasibility Study, National Instrument 43-101 Technical Report for the Thacker Pass Project, Humboldt County, Nevada, USA |
Figure 24-2 Limestone Quarry cross section A-A'
![]()
The tonnes of limestone at a cut-off-grade of 60% CaCO3 and waste for the pit shell are shown in Table 24-4. The 10% loss in limestone was added into the waste category.
Table 24-4 Pit shell material quantities and quality
|
Bench Height (m) |
Cumulative |
Cumulative Limestone |
Cumulative Waste (Mt) |
|
1410 |
88.7 |
0.2 |
0.5 |
|
1380 |
89.2 |
3.1 |
5.0 |
|
1350 |
90.4 |
9.5 |
10.1 |
|
1320 |
90.8 |
17.0 |
13.9 |
|
1290 |
90.7 |
24.0 |
17.4 |
|
1260 |
90.7 |
28.4 |
20.2 |
24.2.3 Mining Method
The process to mine and deliver the limestone to Thacker Pass is as follows:
| Page 283 |
| Lithium Americas Corp. Feasibility Study, National Instrument 43-101 Technical Report for the Thacker Pass Project, Humboldt County, Nevada, USA |
24.2.4 Costs
The mining, crushing, and transportation costs have been estimated at a scoping study level with the following assumptions:
Table 24-5 shows the breakdown of costs by category for the delivery of limestone to Thacker Pass.
Table 24-5 Limestone Delivery Cost per tonne
|
Category |
$/tonne |
Description |
|
D&B/LHD/Crushing |
$3.14 |
D&B, crushing, LHD and equipment/labor cost |
|
On-highway haulage |
$24.55 |
Contractor haulage, loading cost |
|
Support |
$0.49 |
Equipment/labor cost |
|
Water haulage to the site |
$0.47 |
The contractor cost to haul water to the site |
|
Other |
$4.90 |
Supervisor, contingency (waste haulage and other), overhead, profit |
|
Capital |
$0.69 |
Equipment capital |
|
Operating & Capital Total |
$34.24 |
|
Available LAC drilling data for Limestone Quarry has been evaluated and quality checked. Haulage routes are under development.
24.2.5 Permitting
LAC has been collecting baseline environmental data to characterize conditions at the Limestone Quarry (see Section 24.2.6). Shortly after a quarry plan is developed, LAC will initiate permitting of the Limestone Quarry. LAC is expecting that permitting of the limestone source will require approval of a Plan of Operations from the Bureau of Land Management (BLM) and state permits including a Water Pollution Control Permit, air quality permit, and reclamation permit.
| Page 284 |
| Lithium Americas Corp. Feasibility Study, National Instrument 43-101 Technical Report for the Thacker Pass Project, Humboldt County, Nevada, USA |
The Limestone Quarry is expected to encompass a smaller footprint than the Thacker Pass Project. Based on experience with permitting the Thacker Pass Project and considering current NEPA guidance from the U.S. Council on Environmental Quality, LAC anticipates that permits could be secured within 2 years.
This schedule would allow for the Limestone Quarry to provide a source of metallurgical grade limestone to the Thacker Pass Project (and potentially other buyers) in advance of Thacker Pass commissioning. The anticipated schedule for completing permitting by mid-2025 also allows for approximately one year of buffer time in advance of commissioning, to account for unforeseen delays relating to scoping and permitting of the Limestone Quarry. Existing market sources are expected to be available for short-term supply of limestone in the event of any delays with advancing the Limestone Quarry.
24.2.6 Baseline Characterization
LAC completed initial baseline studies in 2021 to characterize existing conditions in the Limestone Quarry Project area. Biological baseline studies included soils, vegetation communities, special status plants, noxious weeds and invasive species, raptors, burrowing owls, migratory birds, kangaroo mice, pygmy rabbits, bats, greater sage grouse, and other wildlife.
Cultural baseline surveys included a Class III Cultural inventory and a Paleontological Resources Evaluation. The inventory was sent to the BLM and the State Historic Preservation Office (SHPO). Paleontological surveys determined that proposed excavation of limestone will not negatively impact significant fossil-bearing units.
Hydrologic baseline studies included seep and spring monitoring and groundwater monitoring. Initial data collection suggests deep piezometric levels below the Project area, ranging from approximately 60 feet to 500 feet. No aquatic resources are present in the Project area. Features do not have a connection to interstate of foreign commerce, are not tributaries, and do not meet the significant nexus standard. The Jurisdictional Determination for Aquatic Resources was submitted to the US Army Corps of Engineers and is pending approval.
Once a quarry plan is developed and LNC initiate consultations with the BLM resources specialists, additional baseline data collection may be required.
24.3 Transload Facility
High volume raw materials are generally expected to be shipped by rail to a transload facility to be constructed for the Thacker Pass Project in Winnemucca, NV. Quicklime is anticipated to be shipped via the Graymont-owned existing Golconda terminal. The Winnemucca facility is designed for molten sulfur, which requires a receiving site capable of fully melting tankers prior to unloading. The switch yard of the facility will allow for warm storage/melting of 48 rail tankers, which represents 4 days storage for Phase 1 of the Project, and 2 days storage for Phase 2. Incidental to warm storage will be a variable number of other tankers on site as fresh shipments are dropped off and empty tankers retrieved.
The design of the transload facility has been advanced to an FEL-2 level of design by Savage Services Corporation (Savage) for the purpose of this study (+30%/-15%). Currently, only molten sulfur to tank, soda ash direct to truck, and miscellaneous bulk liquid direct to truck are captured in Phase 1 construction costs for the Thacker Pass Winnemucca transload terminal. Miscellaneous, low-volume palletized shipments may also be offloaded direct to truck without construction of a dedicated spur (caustic, antiscalant, HCL, diesel, sulfuric acid, etc.). All capital costs for the Winnemucca transload terminal are assumed to be borne by the Thacker Pass Project, and all operating costs are assumed to be borne by the integrator operating the terminal.
Phase 1 capital and operating costs assume the following exclusions for other reagents, though they may be reevaluated for Phase 2 to optimize logistics costs:
| Page 285 |
| Lithium Americas Corp. Feasibility Study, National Instrument 43-101 Technical Report for the Thacker Pass Project, Humboldt County, Nevada, USA |
Full design assumptions may be found in Savage's 11/8/22 "Transload Terminal FEL Summary Report" Revision 2. Figure 24-3 shows the overall site layout for both phases of the proposed facility.
| Page 286 |
| Lithium Americas Corp. Feasibility Study, National Instrument 43-101 Technical Report for the Thacker Pass Project, Humboldt County, Nevada, USA |
Figure 24-3 Transload Facility Site General Arrangement
![]()
Note: Green signifies Phase 1 and Purple signifies Phase 2.
Source: Savage Services Corporation, 2022
| Page 287 |
| Lithium Americas Corp. Feasibility Study, National Instrument 43-101 Technical Report for the Thacker Pass Project, Humboldt County, Nevada, USA |
24.3.1 Design Criteria
The Winnemucca transload terminal CAPEX estimate includes the scope described below for each phase. This capacity is believed by the integrator (Savage Services Corporation) to comfortably exceed the nominal demand of 340,000 t/a of sulfur for each phase, given constraints associated with sulfur shipments. The following scope is assumed for each phase of Project operation:
1. Phase 1 - (1,000 TPD molten sulfur)
a. Installation of a switch on the Nevada Sub
b. Spurs for Drop, Pull, Index and RIP.
c. Sulfur unloading spurs, platforms, sump and (2) pumps (P‐101A/B)
d. Sulfur tank (TK‐101)
e. (2) pumps for the truck loading rack, (P‐203A/B)
f. Sulfur truck loading rack; (2) spot, double sided
g. Soda Ash transloading spur, silo and truck loading area
h. Boilers;(2) primary and (1) spare for steaming up to 36 railcars, heat tracing & tank coils (F‐101A/B/C)
i. Bulk liquid transload spur and road, for mobile transloading equipment
j. Supporting utilities including electrical infrastructure, a caustic scrubber, fire water and supplied breathing air.
k. Roads and buildings
2. Phase 2 - (2,000 TPD molten sulfur)
a. Additional sulfur storage tank (TK‐102)
b. Pump (P‐303C) to support the new truck loading rack
c. Completion of the rail loop with roads running parallel to the tracks
d. Additional truck loading rack; (2) spot, single sided
e. Sulfur unloading spur extensions with a new (3) spot rack and pump
f. Quicklime transloading spur, silo and truck loading area
g. Additional (2) boilers (F‐101D/E)
24.3.2 Cost Basis
Capital costs for this report are developed by Savage to an FEL 2 level of (+30%/-15%), according to the design criteria in the preceding section with the following exclusions:
1. Boiler capacity to meet NFPA snuffing steam standards
2. Savage overhead and profit and/or any fees
3. Permitting costs/fees, wildlife and environmental studies
4. Builder's risk insurance
5. Underground utility protection, modification or moves
6. Guardhouse
7. Fire suppression halogen system
8. NV Energy power distribution modifications or supply
(Note: escalation was mistakenly listed as an exclusion in the latest Savage report documentation, though it has subsequently been confirmed that escalation was applied to bring all costs to 2022 dollars)
Currently, only modest capital increases are considered in the Phase 2 Winnemucca transload facility. OPEX optimization may drive exploration into additional options during Phase 2, such as flocculant handling through transload, installation of additional silos, and/or purchasing of dedicated trucks to be driven by cross-trained transload operators. These costs are not included in CAPEX or OPEX estimates used in this report, but represent potential savings to be considered during the next design phase.
| Page 288 |
| Lithium Americas Corp. Feasibility Study, National Instrument 43-101 Technical Report for the Thacker Pass Project, Humboldt County, Nevada, USA |
Transload operating costs assumed for this study come from three sources:
24.3.3 Permitting
LAC has evaluated several locations for a transloading facility in or near the city of Winnemucca Nevada to allow for the transfer of raw materials including liquid sulfur, soda ash and quicklime for delivery to the Project site. Upon finalizing the location and design, permitting of the transloading facility will commence. Based on the current design, LAC is expecting permitting will require an air quality permit from the state, as well as several smaller permits required by the state and county.
| Page 289 |
| Lithium Americas Corp. Feasibility Study, National Instrument 43-101 Technical Report for the Thacker Pass Project, Humboldt County, Nevada, USA |
25 Interpretation and Conclusions
The mineralization within the volcanogenic clays in the Thacker Pass Project area are of economic grade and suited to open-pit mining operations. The proven and probable Mineral Reserves were estimated from forecasted lithium carbonate sales price, capital investment required for mine and processing plant development, operating costs for mine and processing plant production, mineral and metallurgical process data engineered to produce lithium carbonate economically, and ability to acquire all necessary permits and approvals.
The Project is viable at this stage of development based on the findings in this report, provided the mentioned risks are mitigated and the design development process shows continued favorable results from the designed process. The recommendations as described in Section 26 are typical design development tasks and/or are studies with potential to optimize efficiency, reduce operational and financial risk, or lower capital cost.
25.1 Mineral Resource and Mineral Reserve Estimate
The Thacker Pass Project is set in the moat sediments of a large extinct caldera. The nature of the deposit is sub-horizontal with consistent grades over large lateral distances. The mineralization is at or near surface and made up of a claystone and ash mix that can be free dug without blasting using conventional mining equipment. The 2022 Resource Estimate updated the resource to 534.7 Mt of Measured Resource averaging 2,450 ppm Li for 7.0 Mt of lithium carbonate equivalent, 922.5 Mt of Indicated Resource averaging 1,850 ppm Li for 9.1 Mt of lithium carbonate equivalent and 297.2 Mt of Inferred Resource averaging 1,870 ppm Li for 3.0 Mt lithium carbonate equivalent. When compared to the 2018 PFS, additional drilling, expanding the modeled resource area and using November 2019 CIM resource estimation guidelines resulted in a 229% increase in tonnage, -30% lower Li (ppm) grade and 130% more lithium carbonate equivalent. A cutoff grade of 1,047 ppm Li and an open pit shell were used to constrain the resource estimate based on break even economics. The cost to remove constructed structures is included in this economic evaluation.
Bulk density for claystone/ash mineralization at 1.54 g/cm3 and 2.04 g/cm3 were applied to the resources and tonnages were re-estimated to show the effect of bulk density sensitivities. This resulted in an increase in mineralization tonnes by 14% when compared to the default density of 1.79 g/cm3, assuming a 2.04 g/cm3 bulk density factor and a decrease in mineralization tonnes by 14% compared to the default density of 1.79 g/cm3 when assuming a 1.54 g/cm3 bulk density factor.
The proven and probable Mineral Reserve ore tonnages for a 40-year mine life constitute 217.3 Mt. Proven and Probable Mineral Reserves total 3.7 Mt lithium carbonate equivalent over the 40-year mine life.
Illite mineralization has a higher recovery than smectite and mixed zone mineralization. Additional studies or exploration should be performed to identify if more illite mineralization exists within the PoO boundary.
25.2 Mining
Since the completion of the PFS report dated August 1st, 2018:
| Page 290 |
| Lithium Americas Corp. Feasibility Study, National Instrument 43-101 Technical Report for the Thacker Pass Project, Humboldt County, Nevada, USA |
25.3 Infrastructure
Infrastructure required for the execution and operation of the Project can be delivered. The Project resides in a mining jurisdiction where labor, housing, and support is available. Key aspects of the infrastructure include:
25.4 Environment
Work to-date has demonstrated that the Project can expect to receive all necessary environmental permits and licenses. The key risks that may impact the Project include:
25.5 Economics
The economic analysis of the Project includes:
| Page 291 |
| Lithium Americas Corp. Feasibility Study, National Instrument 43-101 Technical Report for the Thacker Pass Project, Humboldt County, Nevada, USA |
The Project economics are most sensitive to the selling price of lithium carbonate. A low-end sales price that is 50% below the projected selling price results in a decline in NPV (8%, after-tax) to -$623 M, whereas a 50% higher selling price increases the NPV (8%, after tax) to $11,829 M. IRR is estimated at 6.0% and 31.9% respectively.
The Project is less sensitive to production levels. A ±10% variation in extraction of lithium results in a corresponding increase/decrease in IRR of -2.4% and +2.4%, respectively%. CAPEX sensitivity of ±20% has an IRR effect of -1.3% or +1.3%. Sulfur price affects IRR -1.0% or +0.6% for the levels considered (+80% -50%). All other raw materials, mining, power, and operating labor affect IRR sensitivity by less than 0.3% each for the ranges presented in this report.
Overall, the Project is resilient to market changes in raw materials, lithium extraction fluctuations, and CAPEX.
25.6 Metallurgy
Metallurgical and process development testing performed to-date has been used for flowsheet development, various equipment selection, definition of operating parameters and development of process design criteria. All test work was performed on material collected from the proposed pit at the Thacker Pass deposit and is considered representative of the ore body. In instances where data was not available, assumptions were made based on best industry practices and recommendations, and/or from best estimates by the LAC engineering team and process consultants familiar with the metallurgical processes associated with the Thacker Pass Project and lithium production.
The Project will be the first of its kind with respect to lithium extraction, and therefore lithium carbonate production, from clay mineralization. As such, technical challenges could occur. The technology utilized in this Project is not new to mineral, metallurgical and chemical processing; however, it is being used in a novel way.
25.6.1 Attrition Scrubbing
Attrition scrubbing has proven to be an effective method to separate lithium containing clays from coarse gangue material. This is done to upgrade the clay feed to the plant and remove non-valuable material as waste. The flowsheet includes two stages of attrition scrubbing. The first "mild" stage of scrubbing is performed in a log washer and removes the easily separable clay from ROM via washing under mild agitation. In the second "intense" stage, the log washer discharge solids are sent to attrition scrubbers to separate the remaining clay by high intensity agitation.
25.6.2 Classification
The attrition scrubber discharge slurry is classified using hydrocyclones followed by hydraulic classifiers to separate clay from gangue mineralization. The hydrocyclone circuit was designed based on a target separation size of 75µm. The cyclone underflow is fed to a hydraulic classifier which further separates any clay present. Test work has demonstrated that cyclones combined with a hydraulic classifier can make a very sharp separation at 75µm. The hydraulic classifier underflow discharges onto dewatering screens to further recover clay fines. Based on large-scale pilot testing, the mass of coarse gangue rejected aligns with the expected LOM pit ash content (approximately 34% of total mass). Pilot testing validated a lithium recovery of 92% reporting to the clay (fines) fraction.
| Page 292 |
| Lithium Americas Corp. Feasibility Study, National Instrument 43-101 Technical Report for the Thacker Pass Project, Humboldt County, Nevada, USA |
25.6.3 Solid-Liquid Separation
The lithium bearing clay slurry will be dewatered in two stages, a high-rate thickener to achieve 20-25% solids followed by decanter centrifuges to generate a discharge slurry of 55% solids. The thickener design and flocculant dosage were based on independent bench scale test work by four vendors. Pilot scale testing of a decanter centrifuge has confirmed, over multiple batches, that 55% solids is achievable.
25.6.4 Acid leaching
Based on external acid leaching bench scale testing, an acid dose of approximately 490 kg H2SO4/tonne leach feed solids was found to be optimal to maximize lithium production. This was used as the design acid addition. Large scale batch leaching of clay has been performed by LAC over the past 3 years, and these data were used to build an empirical predictive model of lithium leach extraction as a function of the slurry composition. This model was used to optimize the mine plan to maximize lithium production. Based on the mine plan and leach correlation and the beneficiation and leach variability study, an average of approximately 87% lithium extraction is expected in the acid leach circuit.
25.6.5 Neutralization
Pulverized limestone and recycled magnesium hydroxide-bearing solids from the magnesium precipitation circuit have proven effective to neutralize residual acid in the leach residue and bring the final pH to a target of approximately 6.5. It has been confirmed that lithium in solution does not precipitate during the neutralization step. Test work has demonstrated good reagent efficiency and has been used for consumption estimates. The target limestone particle size of 44 microns was developed through pilot testing.
25.6.6 Neutralized Slurry CCD & Filtration
A combined CCD and filtration circuit was selected to minimize losses of lithium contained in the residual moisture in the filter cake. The circuit consists of seven stages of CCD coupled with a final stage of filtration in recessed plate filter presses. Recovery of lithium in solution for the circuit is estimated to be approximately 99%. Geotechnical testing shows the filter cakes are suitable for stacking.
25.6.7 Calcium, Magnesium and Boron Removal
Pilot scale tests have demonstrated that on average 79% of magnesium in neutralized brine can be removed via a flash cooling crystallization approach (Aquatech, 2021). A multistage MgSO4 cooling crystallization circuit has been selected for the flowsheet. The residual magnesium in the liquor discharging the crystallization circuit is removed by addition of milk-of-lime in the magnesium precipitation circuit. Testing has demonstrated that low levels of magnesium can be achieved at high reagent efficiency (Hazen, 2021a). Calcium is primarily removed by precipitation with Na2CO3 followed by ion exchange. Bench scale testing has shown that calcium can be reduced to low levels in a dilute brine using sodium carbonate without precipitating lithium. Ion Exchange following calcium precipitation has been tested and found to reduce divalent ion concentrations, i.e., Ca and Mg, to very low levels. Boron is subsequently removed to very low levels from the brine via ion exchange (Aquatech, 2022b). Pilot testing of Ion Exchange columns is in progress and will be completed in Q1 2023.
Calcium and magnesium are removed from the concentrated soda ash solution using ion exchange prior to being used in the lithium carbonate crystallization circuit.
| Page 293 |
| Lithium Americas Corp. Feasibility Study, National Instrument 43-101 Technical Report for the Thacker Pass Project, Humboldt County, Nevada, USA |
25.6.8 Lithium Carbonate Purification & Crystallization
Pilot scale test work has confirmed a conventional three-stage circuit for Li2CO3 production including primary Li2CO3 purification, lithium bicarbonate dissolution and secondary Li2CO3 purification is necessary to achieve battery quality product (Veolia, 2020).
Additional pilot scale simulation of the commercial circuit verified key design criteria, equilibrium concentrations, reagent consumptions, and power demand. Over 19 kg of battery quality lithium carbonate (>99.5 wt%) were produced with an overall circuit lithium recovery of >96.0% (Aquatech, 2022a). LAC has produced over 5 kg of battery quality lithium carbonate following the same process design criteria that were confirmed during the Aquatech testing. This work was completed at their Technical Center in Reno, NV with the same three-stage circuit (Lithium Nevada, 2022).
25.6.9 ZLD Crystallization
Pilot scale test work has shown sodium and potassium can be removed as sulfate salts in a conventional ZLD crystallization system without crystallization of lithium. It has also verified the design ZLD mother liquor and crystals composition and demonstrated no loss of lithium to crystals (Aquatech, 2022a). Similarly, internal pilot testing at the LAC Technical Center has confirmed that lithium loss to crystals can be avoided if the mother liquor composition is controlled (Lithium Nevada, 2022).
25.6.10 Water and Reagents
Sufficient water supply is permitted for the current flowsheet design and operating parameters. The water demand is estimated to be approximately 5% below currently available limits. Even small demand increases above current estimates have the potential to impact production if additional water rights are not obtained.
A number of recirculating water inputs and outputs for the heat/mass balance are currently rectified outside of the steady-state Aspen process model with a linked excel sheet that assumes fixed temperatures and concentrations. No critical concerns have been identified that would impact process performance or reagent consumption. A complete heat/mass balance to account for raw water requirements for the entire process would minimize risk and uncertainties associated with the Project.
| Page 294 |
| Lithium Americas Corp. Feasibility Study, National Instrument 43-101 Technical Report for the Thacker Pass Project, Humboldt County, Nevada, USA |
26 Recommendations
Lithium Americas has performed an FEL-3 level estimate based on 2022 pricing for the Project and expects to receive final permits in 2023 to begin construction. Next steps include:
The sections that follow describe areas that have recommendations for increasing Project certainty.
26.1 Environmental Permitting
It is recommended LAC continue their current permitting strategy to develop positive community support and streamline final Project approval as outlined below. Costs for these activities are carried in the LAC 2022 operating budget.
26.2 Mining
It is recommended that a material density and swell factor study/test should be done on the ore and waste material. The study will involve excavating and loading of ore and waste material. The study will aid in ensuring that mining equipment (haul truck beds and excavator buckets) is properly sized. The estimated cost for the study/test is $500,000.
26.3 Exploration
Developmental drilling in the northwest area of the pit shell should be performed to better define the resources in the initial mine pit area. The northern margins along the Montana Mountains should be drilled to further define the contact between the ore body and the mountains. The eastern boundaries of the permitted pit should be drilled to better delineate the clay to basalt contact and to better understand the correlations between the different basalt flows. Acquiring additional samples and assays to better understand the lithium mineralization at this contact would further refine the resource model. Additional exploration in the areas that are permitted for exploration (Figure 20-1) is recommended to target additional illite clays. The cost for the proposed additional exploration, drilling, testing and studies is estimated in the range of $3 million to $5 million.
| Page 295 |
| Lithium Americas Corp. Feasibility Study, National Instrument 43-101 Technical Report for the Thacker Pass Project, Humboldt County, Nevada, USA |
Additional studies or exploration should be performed to identify the extent of illite mineralization in order to improve lithium production and the sites economics. This program could include:
Additional geological model refinements could include: updated block size selection, updated fault trace mapping, updated basalt zone domaining, updated lithological domaining, updated resource classification, and updated composite length selection. These improvements will likely have minimal impacts on the global Mineral Resource grade and tonnage estimates, but could allow for changes at the local level.
26.4 Metallurgical Testing
Major recommendations are listed below and grouped by process areas.
The LAC pilot plant in Reno, NV will be used for future testing in support of detailed engineering for the Project. Preparation of samples required by equipment manufacturers may be necessary to support equipment selection. The cost estimated is $100,000.
26.4.1 Solid-Liquid Separation
To reduce CAPEX and OPEX, test other decanter centrifuge and flocculant manufacturers. The estimated cost is $50,000.
The thickener underflow rheology should be evaluated and the pump and pipeline design confirmed by an expert in slurry flow. The estimated cost is $120,000.
26.4.2 Acid leaching
The areas of opportunity identified include fast leach kinetics and acid dosage.
The fast leach kinetics merit further investigation. Leach optimization studies should be conducted to fine tune the leach parameters in an attempt to reduce operating costs. Leach extraction efficiency is a primary focus of LAC, and those investigations will take place both internally and with independent research partners.
Sensitivity analysis shows that improvement of leach extraction will result in a significant improvement in Project economics. The estimated cost is $200,000.
| Page 296 |
| Lithium Americas Corp. Feasibility Study, National Instrument 43-101 Technical Report for the Thacker Pass Project, Humboldt County, Nevada, USA |
Corroborative testing will be necessary to ensure the validity of the optimized leach parameters. Have an external laboratory perform leach testing in parallel to LAC and compare results. The estimated cost is $20,000.
Slurry level of agitation merits further study to ensure that sufficient mixing in plant equipment matches lab parameters. Mixing studies should be conducted to develop leach slurry rheology data required for agitator design. Energy requirements will be determined on the optimum design for agitation of the leach vessels. The estimated cost for this study is $50,000.
The leach slurry rheology should be evaluated, and agitator design confirmed by an expert in mixer design. The estimated cost is $120,000.
26.4.3 Neutralization
It is recommended to verify that contaminants will not build up in the neutralization circuit due to the recycled magnesium precipitation stream. LAC has budgeted and will perform testing that will include the recycle stream in 2022.
The neutralized slurry rheology should be evaluated. The estimated cost is $20,000.
26.4.4 Neutralized Slurry CCD & Filtration
To reduce OPEX, test other flocculants. The estimated cost is $50,000.
Pilot scale filtration testing should be performed on washed, neutralized slurry to confirm the number of CCD stages and filters in the design. Li losses should be evaluated as well to confirm the estimates included in the design criteria. The estimated cost is $70,000.
26.4.5 Calcium, Magnesium and Boron Removal
It is recommended to perform bench scale testing to determine the minimum concentration of calcium achievable without precipitating lithium in a lithium-concentrated brine. It is also recommended to perform testing on various IX resins to confirm efficacy for the divalent ion removal from the brine and soda ash solution, and boron removal from the brine. Pilot testing is currently underway to generate data that will be used for final column design, as well as operating and regeneration conditions. The testing is expected to be complete in Q1 2023. The estimated cost is $20,000.
26.4.6 General
26.4.6.1 Specific Gravity
Testing is recommended to validate specific gravity and viscosity measurements of solids and solutions used to size equipment in various stages of the process. This will ensure that equipment and piping are properly sized. The estimated cost is $50,000.
26.4.6.2 Steady State Aspen Process Model
It is recommended to incorporate all recirculating water inputs/outputs into the Aspen process model to automatically account for the energy and water flows throughout the process. This will more accurately estimate the water consumption and the design parameters for equipment that is sized based on the heat balance, but more importantly eliminate risk for errors associated with manual input and the inability to reconcile streams in other areas of the process. The estimated cost is $20,000.
| Page 297 |
| Lithium Americas Corp. Feasibility Study, National Instrument 43-101 Technical Report for the Thacker Pass Project, Humboldt County, Nevada, USA |
26.5 Infrastructure
It is recommended that the Bonneville Power Administration (BPA), Harney Electric (HEC) and LAC finalize interim power planning and complete contracting for Phase 1 and Phase 2 power import.
It is recommended that contingency plans be developed to commission and potentially operate the facility at reduced capacity for an extended duration if BPA import power availability is delayed beyond schedule requirements for Phase 1.
It is recommended to secure water rights for Phase 2 after Phase 1 becomes operational. Required funds to acquire additional water rights are included in the initial capital costs. Additionally, water table levels should be monitored at production wells and surrounding monitoring wells throughout operation to ensure the aquifer levels continue to support water demand for the Project.
It is recommended that further studies be done to determine available aggregate material on site for construction use. Not having sufficient quality aggregate material on-site or nearby could negatively affect construction costs. The estimated cost of the studies is $300,000.
26.6 Limestone Quarry
Analysis of the limestone core as full-length samples is recommended, rather than point samples, to better define the density, grade, neutralization, and physical characteristics. Current geological and block modelling demonstrates a scoping level analysis but is subject to change based on additional sampling and analysis of the core. The estimated cost is $35,000. Equipment size and other affected areas should also be reviewed based on the quality.
It is recommended that the limestone model be updated based on updated sampling and analysis of core, and that a detailed mine plan be developed based on the updated model. The estimated cost is $200,000.
It is recommended that work for all permit applications be started. Permit work includes a Plan of Operation for submission to the BLM, along with state permits including a Water Pollution Control Permit, Air Quality Permit, and Reclamation Permit.
It is recommended that surface rights be acquired for road from highway to mine area. The access road will need to be upgraded. It is also recommended that additional mining claims or surface rights be acquired to expand the processing area if needed and for a waste dump.
It is recommended that water rights be acquired so a well can be drilled. Water will be used for dust suppression, crushing and haulage. The estimated cost is $500,000.
26.7 Execution Strategy Impact
Any project associated with emerging products or commodities will present unique market risks. The Thacker Pass Project requires use of a new process that has a high capital investment requirement. The United States and other major world economies have experienced historically high inflation during the compilation of this report. Lithium prices have experienced historic volatility over the past 4 years. It will likely continue to vary in the short term as major automakers endeavor to expand electric vehicle offerings to the mass market and transition away from fossil fuel energy; this requires extreme increases in energy storage capacity, both on and off grid. Third party market reports highlight the projected range for stable lithium prices but are not able to account for the effects of such volatility coupled with high inflation. Due to these factors, the Project faces two distinctly different market risk profiles for the short versus long term.
| Page 298 |
| Lithium Americas Corp. Feasibility Study, National Instrument 43-101 Technical Report for the Thacker Pass Project, Humboldt County, Nevada, USA |
Short term, the risk of Project overspending is high, due to inflationary pressures. The risk to the selling price of lithium carbonate in the short term, however, is relatively lower, despite volatility. Inflation has historically tended to prop up all commodity and equipment prices agnostically. 5-to-10-year demand is high due to capacity constraints and demand from automotive industry pre-orders.
| Page 299 |
| Lithium Americas Corp. Feasibility Study, National Instrument 43-101 Technical Report for the Thacker Pass Project, Humboldt County, Nevada, USA |
27 References
AACE (2020). AACE International Recommended Practice No. 47R-11, Cost Estimate Classification System - As Applied in Engineering, Procurement, and Construction for the Mining and Mineral Process Industries, AACE International, Morgantown, WV. 07 August 2020.
Advisian (2018). Independent Technical Report for the Thacker Pass Project, Humboldt County, Nevada, USA; Effective Date: 15 February 2018. Filing Date: 17 May 2018.
Air Sciences, Inc. (2019a). Lithium Nevada - Thacker Pass Project NEPA Air Quality Impact Analysis Report. Prepared for Lithium Nevada Corp. Draft November 2019 (Revised December 2019).
Air Sciences, Inc. (2019b). Thacker Pass Project, Greenhouse Gas Emissions Report and Potential Downstream GHG Emissions Reduction. Draft November 2019 (Revised December 2019).
Air Sciences, Inc. (2020). Lithium Nevada Thacker Pass Project Odor Impact Analysis. Prepared for Lithium Nevada Corp. May 4, 2020 (May 2020)
Air Sciences, Inc. (2021a). Thacker Pass Project Class II Air Quality Operating Permit Application. Prepared for Lithium Nevada Corporation. January 2021.
Air Sciences, Inc. (2021b). Thacker Pass Project Air Quality Impacts Analysis. Prepared for Lithium Nevada Corporation. January 2021, Revised July 2021.
AMEC (2011). Prefeasibility Level Geotechnical Study Report, Kings Valley Lithium Project. March 2011.
AMEC (2011a). Prefeasibility Level Geotechnical Study Report. May 2011.
Andritz Separation Technologies (2021). Bench Centrifuge Testing Report.
Andritz Separation Technologies (2021). Laboratory Report LNC Thickening Studies.
Aquatech (2021). MgSO4 Crystallization Pilot Testing Reference # P30082.
Aquatech (2022a). Aquatech International Technical Report, Lithium Carbonate Pilot Test, October 28, 2022.
Aquatech (2022b). Resin Testing Document - 4.8.22.
ASTM (American Society for Testing and Materials) 2011. ASTM D2487-11 - Standard Practice for Classification of Soils for Engineering Practices.
ASTM Standard C127-15, Standard Test Method for Relative Density (Specific Gravity) and Absorption of Coarse Aggregate.
ASTM Standard C914-09, Standard Test Method for Bulk Density and Volume of Solid Refractories by Wax Immersion.
ASTM Standard D2216-19, Standard Test Method for Laboratory Determination of Water (Moisture) Content of Soil and Rock by Mass.
ASTM Standard D7263-21, Standard Test Method for Laboratory Determination of Density and Unit Weight of Soil Specimens.
| Page 300 |
| Lithium Americas Corp. Feasibility Study, National Instrument 43-101 Technical Report for the Thacker Pass Project, Humboldt County, Nevada, USA |
Barr Engineering (2019). Thacker Pass Highwall Slope Study Prepared for Lithium Nevada Corporate and North American Coal Corporation. 20 December 2019.
Barr Engineering (2020). Thacker Pass Haul Road Design Prepared for Lithium Nevada Corporation and North American Coal Corporation. 09 October 2020.
Benchmark Mineral Intelligence (2021). Lithium Forecast Q3 2021.
Benson, T. R., Mahood, G. A., & Grove, M. (2017a). Geology and 40Ar/39Ar geochronology of the middle Miocene McDermitt volcanic field, Oregon and Nevada: Silicic volcanism associated with propagating flood basalt dikes at initiation of the Yellowstone hotspot. Bulletin of the Geological Society of America, 129(9-10). https://doi.org/10.1130/B31642.1
Benson, T.R., Coble, M.A., Rytuba, J.J., and Mahood, G.A. (2017b). Lithium Enrichment in Intracontinental Rhyolite Magmas Leads to Li Deposits in Caldera Basins. Nature Communications, 8(1). https://doi.org/10.1038/s41467-017-00234-y.
Borden, Buddy and Tom Harris (2018, Revised 2019). Social, Economic and Fiscal Impact for New Lithium Operations in Humboldt County, Nevada. University of Nevada, Reno; University Center for Economic Development. December 2018 (Revised September 2019).
Bureau of Land Management (BLM) (2008, revised 2013). NV-2013-046 Nevada Bureau of Land Management Rock Characterization Resources and Water Analysis Guidance for Mining Activities (BLM, September 19, 2013).
Bureau of Land Management; Instruction Memorandum No. NV-2011-004; Guidance for Permitting 3809 Plans of Operation; 5 November 2010.
Canadian Institute of Mining, Metallurgy and Petroleum (CIM) Definition Standards for Mineral Resources and Mineral Reserves. May 2014.
Carew, T.J. and Rossi, E.M. (2016). Independent Technical Report for the Lithium Nevada Property, Nevada, USA. Prepared by SRK Consulting (Canada) Inc., June 2016. NI 43-101 Technical Report, filed on www.sedar.com. http://lithiumamericas.com/wp-content/uploads/2016/07/NI43101_Lithium_Nevada.pdf .
Castor, S. B., & Henry, C. D. (2020). Lithium‐Rich Claystone in the McDermitt Caldera, Nevada, USA: Geologic, Mineralogical, and Geochemical Characteristics and Possible Origin. Minerals, 10(68), 1-39. https://doi.org/10.3390/min10010068
Castor, S.B., (2010) Mineralogy of Western Lithium Corporation core holes WLC-43, WLC-62, WLC-65, and WLC-67, Thacker Pass, Nevada: unpublished report for Western Lithium Corporation.
CFEM (Canadian Foundation Engineering Manual). 2006. Canadian Geotechnical Society. Fourth Edition. January 2007.
Coble, M.A. and Mahood, G.A. (2012). Initial Impingement of the Yellowstone Plume Located by Widespread Silicic Volcanism Contemporaneous with Columbia River Flood Basalts. Geology, 40(7), 655-658. https://doi.org/10.1130/G32692.1.
Colgan, J. P., Dumitru, T. a., McWilliams, M., & Miller, E. L. (2006). Timing of Cenozoic volcanism and Basin and Range extension in northwestern Nevada: New constraints from the northern Pine Forest Range. Geological Society of America Bulletin, 118(1-2), 126-139. https://doi.org/10.1130/B25681.1
| Page 301 |
| Lithium Americas Corp. Feasibility Study, National Instrument 43-101 Technical Report for the Thacker Pass Project, Humboldt County, Nevada, USA |
Colgan, J.P., Dumitru, T.A., Reiners, P.W., Wooden, J.L., and Miller, E.L. (2006). Cenozoic Tectonic Evolution of the Basin and Range Province in Northwestern Nevada. American Journal of Science, 306(8), 616-654. https://doi.org/10.2475/08.2006.02.
Conrad, W.K. (1984), The mineralogy and petrology of compositionally zoned ash flow tuffs, and related silicic volcanic rocks from the McDermitt caldera complex, Nevada-Oregon: Journal of Geophysical Research, v. 89, no. B10, p. 8639-8664, https://doi.org/10.1029/JB089iB10p08639
Department of the Army (2019). U.S. Army Corps of Engineers, Sacramento District (ACOE). 2019. Regulatory Division (SPK-2011-01263). Approved Jurisdictional Determination. Thacker Pass Project. Dated 8 February 2019.
Diemme (2021). LNC Filtration Testing Report. 2021.
Diemme (2022). Aqseptence Group srl (Diemme), Lugo, Italy, Lithium Nevada Corporation Filtration Test Report, Report LAB321129, prepared by Gross - Kaswalder, 16 Feb 2022.
Enviroscientists, Inc. (2008). Memorandum Results for the Kings Valley Lithium Exploration Project Pygmy Rabbit Survey, Humboldt County, Nevada. Prepared by Ms. Sara Thorne, Enviroscientists, Inc., Prepared for Mr. Dennis Bryan, Western Lithium Corporation and Mr. Ken Detweiler, Bureau of Land Management. 3 December 2008.
Enviroscientists, Inc. (2010). Memorandum Results for the Kings Valley Lithium Amended Plan of Operations Biological Survey, Humboldt County, Nevada. Prepared by Ms. Sara Thorne, Enviroscientists, Inc., Prepared for Ms. Celeste Mimnaugh and Ms. Janet Hook, Bureau of Land Management. November 16, 2010.
Eriez Flotation Division (2021). Teeter Bed Separator Metallurgical Service Test Report for LNC. Erie, PA: s.n., 2021.
Erwin, Thomas P. (2020). Mineral Status Report. File No. 96310.003. Erwin, Thompson Faillers. May 18, 2020.
FEDINC (2022). Beneficiation Pilot Plant, Thacker Pass Deposit, Humboldt County, Nevada. Prepared for Lithium Nevada Corporation. Prepared by FEDINC. Florida Engineering and Design, Inc. 255 County Road 555 South, Bartow, FL. 33830-7702. (863)665-6363. FEDINC Project No. 21-1966. June 2022. Weir.
FEDINC/Weir (No date). Attrition Scrubbing.
FLS (2021). LNC Pre-Leach Thickening and Rheology Test Report.
FLS (2021a). LNC Leach and Neutralization Results. 2021.
GEA (2021). Bench Scale Decanter Centrifuge Testing Report.
GEA (2021a). Pilot Scale Decanter Centrifuge Testing.
Glanzman, R. K., & Rytuba, J. J. (1979). Zeolie-clay mineral zonation of volcaniclastic sediments within the McDermitt Caldera Complex of Nevada and Oregon. USGS Open-File Report, 79-1668.
Glanzman, R.K. and Winsor (1982). Status report on the King's River Lithium Project. Chevron Resources Internal Resources Internal Report. 12 February 1982.
| Page 302 |
| Lithium Americas Corp. Feasibility Study, National Instrument 43-101 Technical Report for the Thacker Pass Project, Humboldt County, Nevada, USA |
Great Basin Ecology, Inc. (2012). Sage-Grouse Habitat Assessment - Kings Valley Lithium Project Area. Report Prepared for Western Lithium Corporation. September 2012.
Great Basin Ecology, Inc. (2013). 2013 Kings Valley Clay Mine Project 2013 Winter Sage-Grouse Survey. Report Prepared for Western Lithium Corporation. March 2013; Revised November 2013.
Harris, Richard W. (2016). Updated Title Opinion on Kings Valley Project, Humboldt County, Nevada (November 2016 Update). Harris, Thompson & Faillers. 18 November 2016.
Hazen Research (2021). Materials Characterization Testing.
Hazen Research (2021a). MgSO4 and Liming Experiments Report. 2021.
Hazen Research (2021b). Summary of Acid Leach Results. 2021.
Henry, C. D., Castor, S. B., Starkel, W. A., Ellis, B. S., Wolff, J. A., Laravie, J. A., Mcintosh, W. C., & Heizler, M. T. (2017). Geology and evolution of the McDermitt caldera, northern Nevada and southeastern Oregon, western USA. Geosphere, 13(4), 1-47. https://doi.org/10.1130/GES01454.1
Hosakawa Micron Powder Systems (2021). Feasibility of Size Reduction of Lithium Carbonate via the Alpine AFG Model 400 Fluidized Bed Jet Mill Test Number 2021-1093.
Hudson, D.M. (2008) Analysis of diamond drill holes WLC-005c, WLC-011c, WLC-012c, WLC-019c, Thacker Pass Project, Humboldt County, Nevada, report to Western Lithium Corporation. May 2008, 41 p.
Huxel J.R, C.J., Parkes (1966). Effects of Irrigation Development on the Water Supply of Quinn River Valley Area, Nevada and Oregon 1950-64. Water Resource Bulletin No. 34.
Ingraffia, James T., Ressel, Michael W., Benson, Thomas R. (2020). Thacker Pass Lithium Clay Deposit, McDermitt Caldera, North-Central Nevada: Devitrification of McDermitt Tuff as the Main Lithium Source. 2020.
JBR Environmental Consultants, Inc. (2012a). Baseline Biological Survey Report, Western Lithium Corporation, Kings Valley Lithium Project, Humboldt County, Nevada. 9 July 2012.
JBR Environmental Consultants, Inc. (2012b). Winter Greater Sage-Grouse Survey Report Western Lithium Corporation Kings Valley Lithium Project Humboldt County, Nevada. 4 April 2012.
Kappes Cassiday & Associates (KCA). (2010). King's Valley Lithium Project: Metallurgical Test Work Summary. Prepared by: Kappes Cassiday & Associates. February 2010.
Lerch, D.W., Miller, E., McWilliams, M., and Colgan, J. (2008). Tectonic and Magmatic Evolution of the Northwestern Basin and Range and Its Transition to Unextended Volcanic Plateaus: Black Rock Range, Nevada. Geological Society of America Bulletin, 120(3-4), 300-311. https://doi.org/10.1130/B26151.1.
Lithium Americas Corp. (2018a); Press Release Announcing Preliminary Feasibility Study Results for the Thacker Pass Project; Issued 21 June 21 2018.
Lithium Nevada Corp. (2020). Bulk Sampling Packet.
Lithium Nevada Corp. (2021). Attrition Scrubbing Bench Studies. Reno, NV : Internal Document, 2021.
| Page 303 |
| Lithium Americas Corp. Feasibility Study, National Instrument 43-101 Technical Report for the Thacker Pass Project, Humboldt County, Nevada, USA |
Lithium Nevada Corp. (2022). Lithium Americas Technical Center - Li2CO3 Continuous Operation, August 8, 2022
Lithium Nevada Corp. (LNC) (2018). Thacker Pass Project Conceptual Plan of Operations and Conceptual Reclamation Plan and Permit Application. 5 October 2018.
Lithium Nevada Corp. (LNC) (2019a). Thacker Pass Project Proposed Plan of Operations and Reclamation Plan Permit Application. July (Revised October 2019, Revised December 2020, Revised October 15, 2021).
Lithium Nevada Corp. (LNC) (2020). Thacker Pass Project N98586 Community Relations, Tribal Coordination. Technical Memorandum. To Ken Loda, BLM Humboldt River Field Office. From Catherine Clark, Lithium Nevada Corp. 11 May 2020.
Lithium Nevada Corporation (2021). Smectite and Illite Blend Leaching Report. 2021.
Lithium Nevada Corporation (2021a). Leaching Size Test Report. 2021.
Lithium Nevada Corp. (LNC) (2022). Thacker Pass Project 2022 Community Relations Engagement Plan.
Lumos (2011a). Preliminary Groundwater Investigation for the Kings Valley Lithium Project (Stage I Property. May 2011.
Lumos (2011b). Kings Valley Lithium Project Spring Survey. July 2011.
MacTec Engineering and Consulting (2008). Absorption and Specific Gravity Test Results, March 2008.
Malmberg, G. T., Worts, G. F., 1966. Water Resources Bulletin No. 31. The Effects of Pumping on the Hydrology of Kings River Valley, Humboldt County, Nevada, 1957-64.
Manger, Edward (1963), Porosity and Bulk Density of Sedimentary Rocks. Geological Survey Bulletin 1144-E
McCabe, et. al. (2012). Volume 1: Report, A Class III Inventory of a 2,256 Acre Parcel for Western Lithium's Kings Valley Lithium Project, Humboldt County, Nevada. BLM Report Number CR2-3157(P). Prepared by Far Western Anthropological Research Group, Davis, California. April 2012.
Metso Outotec (2021). Filtration Testing Report. 2021.
Morissette, C. L. (2012). The impact of geological environment on the lithium concentration and structural composition of hectorite clays. MS Thesis, UNR. 244 pages.
Nevada Bureau of Mines and Geology; Special Publication L-6; State and Federal Permits Required in Nevada Before Mining or Milling Can Begin; Compiled by Lucia M. Patterson, Nevada Division of Minerals. February 2015.
Nevada Division of Environmental Protection Bureau of Mining Regulation and Reclamation (NDEP-BMRR) (2019). Nevada Modified Sobek Procedure Summary 1. 22 March 2019.
Odom, I.E. (1992). Hectorite deposits in the McDermitt Caldera of Nevada. Mining Engineering. v. 44. no. 6., p. 586-589.
Parker, H.M. and Dohm, C.E. (2014). Evolution of Mineral Resource Classification from 1980 to 2014 and Current Best Practice. Finex 2014 Julius Wernher Lecture.
| Page 304 |
| Lithium Americas Corp. Feasibility Study, National Instrument 43-101 Technical Report for the Thacker Pass Project, Humboldt County, Nevada, USA |
Piteau Associates USA Ltd. (2018a). Lithium Nevada Corporation, Lithium Nevada Corp. Baseline and Model Workplan. August 2018. (*Baseline data collection and water quantity/quality impacts assessment workplan).
Piteau Associates USA Ltd. (2018b). Lithium Nevada Corporation, Seep and Spring Survey Report Q1 2018, 23 May 2018.
Piteau Associates USA Ltd. (2018c). Lithium Nevada Corporation, Seep and Spring Survey Report Q2 2018, 28 August 2018.
Piteau Associates USA Ltd. (2018d). Lithium Nevada Corporation, Seep and Spring Survey Report Q3 2018, 30 October 2018.
Piteau Associates USA Ltd. (2018e). Lithium Nevada Corporation, Seep and Spring Survey Report Q4 2018. 25 January 2019. Piteau Associates USA Ltd. (2019a). Thacker Pass Project Baseline Hydrological Data Collection Report, Prepared by Piteau Associates, August 2019.
Piteau Associates USA Ltd. (2019a). Thacker Pass Project Baseline Hydrological Data Collection Report, Prepared by Piteau Associates, August 2019.
Piteau Associates USA Ltd. (2019b). Lithium Nevada Corporation, Addendum to the Seep and Spring Survey Report Q2 2019. 22 July 2019.
Piteau Associates USA Ltd. (2020). Thacker Pass Project Water Quantity and Quality Impacts Report Revision 1. May 2020.
Piteau Associates USA Ltd. (2021). Thacker Pass Project Water Quantity and Quality Impacts for 2850 Acre-Ft/YR Water Supply Production. August 2021.
Redhorse Corporation (2018). SPK-2011-01263 Aquatic Resource Delineation Report, Lithium Nevada Corporation, Thacker Pass Project 2018 (18,686 acres). 17 August 2018.
Roskill (2021). Lithium 18th Edition Update 1 - October 2021 (v2).
Rytuba, J. J., & Glanzman, R. K. (1978). Relation of Mercury, Uranium, and Lithium deposits to the McDermitt Caldera Complex, Nevada-Oregon. USGS Open-File Report, 78-926, 1-28. https://doi.org/10.1017/CBO9781107415324.004
Rytuba, J.J. and McKee, E.H. (1984). Peralkaline Ash Flow Tuffs and Calderas of the McDermitt Volcanic Field, Southeast Oregon and North Central Nevada. Journal of Geophysical Research, 89, 8616-8628.
Rytuba. J.J. and Glanzman, R.K. (1979). Relation of Mercury, Uranium, and Lithium Deposits to the McDermitt Caldera Complex, Nevada-Oregon; in, Ridge, J.D., ed., Papers on Mineral Deposits of Western North America. The International Association on the Genesis of Ore Deposits Fifth Quadrennial Symposium Proceedings, v. II. Nevada Bureau of Mines and Geology. Report 33, 1979. 109117 pp.
Savage (2022). Transload Terminal FEL Summary Report, Issued for Information, Issued to Lithium Nevada. Savage Services Corporation. November 8, 2022.
Schlumberger Water Services (2013). Western Lithium Corporation Kings Valley Lithium Project Groundwater Quantity and Quality Impact Analysis. Revision 3. August 2013.
| Page 305 |
| Lithium Americas Corp. Feasibility Study, National Instrument 43-101 Technical Report for the Thacker Pass Project, Humboldt County, Nevada, USA |
Schlumberger Water Services (2014). Evaluation of Water Supply for the Western Lithium Kings Valley Project.
SME Mining Engineering Handbook, 2nd Edition, Volume 2, Table E. Material properties and Characteristics, pg. A-33
Smith, R. and Bailey, R. (1968). Resurgent Cauldrons. Geological Society of America Memoirs, 116, 613-662. https://doi.org/10.1130/MEM116-p613.
Sohr, Julia (2017). IUPAC-NIST Solubility Data Series. 104. Lithium Sulfate and its Double Salts in Aqueous Solutions. Julia Sohr, Wolfgang Voigt, Dewen Zeng. s.l. : J. Phys. Chem. Ref. Data. , 2017, Vol. 46.
SRK Consulting (2012). Kings Valley Lithium Project Waste Rock Characterization Program Summary - Update (Memo). Submitted April 27, 2012.
SRK Consulting (2015). Waste Rock Characterization in Support of the Bulk Sample Test Pit; Memorandum from Tom Gray to NDEP-BMRR; Submitted March 9, 2015.
SRK Consulting (2016). Independent Technical Report for the Lithium Nevada Property, Nevada, USA; Stage I and Stage II Resource Estimate; Effective Date: May 31, 2016 (SRK Technical Report).
SRK Consulting, (U.S.), Inc. (2019). Waste Rock and Ore Geochemical Characterization Work Plan for the Thacker Pass Project. 14 February 2019
SRK Consulting, (U.S.), Inc. (2020). Baseline Geochemical Characterization Report for the Thacker Pass Project. Report Prepared for Lithium Nevada. 10 January 2020 (Revised December 2020).
SRK Consulting, (U.S.), Inc. (2021). Waste Rock and Gangue Management Plan for the Thacker Pass Pro SRK, 2011a. Western Lithium Corporation Spring and Seep Survey, Kings Valley Lithium Project. September 2011.
SRK, 2011a. Western Lithium Corporation Spring and Seep Survey, Kings Valley Lithium Project. September 2011.
SRK (2011b). Western Lithium Corporation Spring and Seep Survey, Kings Valley Lithium Project. December 2011.
SRK (2012a). Western Lithium Corporation Spring and Seep Survey, Kings Valley Lithium Project. March 2012.
SRK (2012b). Western Lithium Corporation Spring and Seep Survey, Kings Valley Lithium Project. June 2012.
SRK (2012c). Western Lithium Corporation Spring and Seep Survey, Kings Valley Lithium Project. September 2012.
SRK (2012d). Western Lithium Corporation Spring and Seep Survey, Kings Valley Lithium Project. December 2012.
SRK (2013). Western Lithium Corporation Spring and Seep Survey, Kings Valley Lithium Project. March 2013.
SWCA Environmental Consultants (2018a). Lithium Nevada Corporation Ambient Noise Baseline Analysis. August 2018.
| Page 306 |
| Lithium Americas Corp. Feasibility Study, National Instrument 43-101 Technical Report for the Thacker Pass Project, Humboldt County, Nevada, USA |
SWCA Environmental Consultants (2018b). Thacker Pass Project Botanical Baseline Surveys. October 2018.
SWCA Environmental Consultants (2019a). Thacker Pass Project Wildlife Baseline Surveys, February 2019 (Final).
SWCA Environmental Consultants (2019b). Thacker Pass Project Greater Sage-Grouse Habitat Quantification Report. March 2019.
Tetra Tech (2012). Preliminary Feasibility Study, Kings Valley Lithium Project; Humboldt County, Nevada; 27 January 2012.
Tetra Tech (2014). NI 43-101 Technical Report: King's Valley Property Humboldt County, Nevada. Prepared by Tetra Tech, 2014.
Tetra Tech (2014a). Preliminary Feasibility Study, Lithium Nevada Project, Humboldt County, Nevada, Effective Date of Stage 1 Resource Estimate; Effective Date: June 28, 2014 (Tetra Tech Prefeasibility Study).
U.S. Department of the Interior, Bureau of Land Management (2020). Thacker Pass Lithium Mine Project Final Environmental Impact Statement DOI-BLM-NV-W010-2020-0012-EIS. December 4, 2020.
U.S. Department of the Interior, Bureau of Land Management (2020). Memorandum. Request for informal consultation on the Thacker Pass Lithium Mine Project (Consultation Code: 08NVD00-2020-SLI-0619). 6 November 2020.
U.S. Department of the Interior, Bureau of Land Management (2021). Thacker Pass Lithium Mine Project Record of Decision and Plan of Operations Approval DOI-BLM-NV-W010-2020-0012-EIS. January 2021.
URS (2010). Western Lithium Kings Valley Project NI 43-101 Technical Report, Preliminary Assessment and Economic Evaluation Humboldt County, Nevada.
US Energy Information Administration's August short term energy diesel forecast for 2022
US Fish and Wildlife Service (USFWS) (1995). Recovery Plan for Lahontan Cutthroat Trout. Region 1, Portland Oregon. January 1995.
US Fish and Wildlife Service (USFWS) (2020). Memorandum. Informal Consultation on the Proposed Thacker Pass Project, Humboldt County, Nevada. December 4, 2020. File No. 2021-I-0041.
USBM Bulletin 691 (1988)
Veolia Water Technologies (2020). Thacker Pass Project Lithium Carbonate Production PCS #5300219071.
Visher, F. N., 1957. Water Resources Bulletin No. 14. Geology and Ground-Water Resources of Quinn River Valley, Humboldt County, Nevada.
Worley Parsons (2018). Factual Geotechnical Investigation Report for Mine Pit Area. March 2018.
Westech (2021). Westech Testing Report Bench Scale Sedimentation & Rheology Studies, Lithium Nevada Thacker Pass. 2021.
Westech (2021a). Westech CaCO3 Testing, Lithium Nevada Thacker Pass. 2021.
| Page 307 |
| Lithium Americas Corp. Feasibility Study, National Instrument 43-101 Technical Report for the Thacker Pass Project, Humboldt County, Nevada, USA |
Wildlife Resource Consultants LLC (WRC) (2018). Lithium Nevada 2018 Springsnail (Pyrgulopsis spp.) Survey. 19 December 2018.
Wildlife Resource Consultants LLC (WRC) 2018a. Lithium Nevada Thacker Pass Project, 2018 Golden Eagle and raptor nesting survey. Report prepared for Lithium Nevada Corporation, Reno, NV.
Wildlife Resource Consultants LLC (WRC) (2019a). Lithium Nevada Thacker Pass Project. 2018 Golden Eagle and Raptor Nesting Surveys. Revised 15 January 2019.
Wildlife Resource Consultants LLC (WRC) (2019b). Lithium Nevada Thacker Pass Project. 2019. Golden Eagle and Raptor Nesting Surveys. 21 June 2019.
Wildlife Resource Consultants LLC (WRC) (2019c). Lithium Nevada 2019 Supplemental Springsnail (Pyrgulopsis spp.) Survey. 29 June 2019.
Wildlife Resource Consultants LLC (WRC) (2020). Lithium Nevada Thacker Pass Project. 2020 Golden Eagle Nesting Surveys. 1 September 2020.
Wildlife Resource Consultants LLC (WRC) (2021). Lithium Nevada Thacker Pass Project. 2021 Golden Eagle Nesting Surveys. 17 September 2021.
Wildlife Resource Consultants LLC (WRC) (2022). Lithium Nevada Thacker Pass Project. 2022 Golden Eagle and raptor nesting survey. Report prepared for Lithium Nevada Corporation, Reno, NV, 14 September 2022.
Wood Mackenzie (2022). Global lithium 10-year investment horizon outlook, Pederson & Liu, Wood Mackenzie. September 2022.
Young, D. Craig (2018). Volume I: Technical Report, Class III Inventory of 12,963 Acres for Lithium Nevada's Thacker Pass Project, Humboldt County, Nevada, BLM Report CR2-3402(P). September 2018. Draft. Revised 1 November 2019.
Zones, C. P., 1963. Ground Water in the Alluvium of Kings River Valley Humboldt County, Nevada. Geologic Survey Water-Supply Paper 1619-L.
| Page 308 |
| Lithium Americas Corp. Feasibility Study, National Instrument 43-101 Technical Report for the Thacker Pass Project, Humboldt County, Nevada, USA |
Appendix A - Certificates of Qualified Persons
| Page 309 |
CERTIFICATE OF QUALIFIED PERSON
I, Daniel Roth, P.E., P. Eng. do hereby certify that:
1. I am currently employed as a project manager and civil engineer at M3 Engineering & Technology Corp. located at 2051 West Sunset Rd, Suite 101, Tucson, AZ 85704.
2. This certificate applies to the technical report entitled, "Feasibility Study, National Instrument 43-101 Technical Report for the Thacker Pass Project, Humboldt County, Nevada, USA" prepared for Lithium Americas Corp. (the "Issuer") with an effective date of November 2, 2022 (the "Technical Report").
3. I graduated with a Bachelor of Science degree in Civil Engineering from The University of Manitoba in 1990.
4. I am a registered professional engineer in good standing in the following jurisdictions:
5. I have worked continuously as a design engineer, engineering, and project manager since 1990, a period of 30 years. I have worked in the minerals industry as a project manager for M3 Engineering & Technology Corporation since 2003, with extensive experience in hard rock mine process plant and infrastructure design and construction, environmental permitting review, as well as development of capital cost estimates, operating cost estimates, financial analyses, preliminary economic assessments, pre-feasibility, and feasibility studies.
6. I have read the definition of "qualified person" set out in National Instrument 43-101 ("NI 43-101") and certify that by reason of my education, affiliation with a professional association (as defined in NI 43-101) and past relevant work experience, I fulfill the requirements to be a "qualified person" for the purposes of NI 43-101.
7. I am responsible for Sections 2, 3, 18.1, 18.2, 18.3, 18.4, 18.5, 18.6, 18.9, 19, 21 (except for 21.1.3, 21.2.1 and 21.3), 22, and corresponding sections of 1, 25, 26 and 27 of the Technical Report.
8. I have had no prior involvement with the property that is the subject of the Technical Report. I visited the property that is the subject of the Technical Report on April 13, 2021 for one day.
9. As of the effective date of the Technical Report, to the best of my knowledge, information and belief, the parts of the Technical Report that I am responsible for contain all scientific and technical information that is required to be disclosed to make the Technical Report not misleading.
10. I am independent of the Issuer and its subsidiaries as defined by Section 1.5 of NI 43-101.
11. I have read NI 43-101 and Form 43-101F1. The sections of the Technical Report that I am responsible for have been prepared in compliance with that instrument and form.
Dated this 31st day of January, 2023.
| (Signed) "Daniel Roth" | ||
| Signature of Qualified Person | ||
| Daniel Roth | ||
| Print Name of Qualified Person |
CERTIFICATE OF QUALIFIED PERSON
I, Laurie M. Tahija, MMSA-Q.P. do hereby certify that:
1. I am currently employed as Senior Vice President by M3 Engineering & Technology Corporation, 2051 W. Sunset Road, Ste. 101, Tucson, Arizona 85704, USA.
2. This certificate applies to the technical report entitled, "Feasibility Study, National Instrument 43-101 Technical Report for the Thacker Pass Project, Humboldt County, Nevada, USA" prepared for Lithium Americas Corp. (the "Issuer") with an effective date of November 2, 2022 (the "Technical Report").
3. I am a graduate of Montana College of Mineral Science and Technology, in Butte, Montana and received a Bachelor of Science degree in Mineral Processing Engineering in 1981. I have practiced mineral processing for 40 years. I have over twenty (20) years of plant operations and project management experience at a variety of mines including both precious metals and base metals. I have worked both in the United States (Nevada, Idaho, California) and overseas (Papua New Guinea, China, Chile, Mexico) at existing operations and at new operations during construction and startup, continuing into operation. My relevant experience for the purpose of this technical report is:
I belong to the following professional associations:
I am recognized as a Qualified Professional (QP) member (#01399QP) with special expertise in Metallurgy/Processing by the Mining and Metallurgical Society of America (MMSA).
4. I have not visited the property that is the subject of the Technical Report.
5. I am responsible for Section 17.1, Tables 17-1 and 17-3 and corresponding parts of 17.2.1 in Section 17.2, 17.3.1 to 17.3.4, 17.3.5.2, 17.3.8, 17.4.1 to 17.4.3, 17.4.6, corresponding parts of 17.4.10 and 17.4.11, and 17.5 to 17.11, 21.3 (except 21.3.3.1 and 21.3.3.3), as well as contributions to Sections 1, 25, 26 and 27 of the Technical Report.
6. I am independent of the Issuer and its subsidiaries as defined by Section 1.5 of National instrument 43-101 ("NI 43-101").
7. I have had no prior involvement with the property that is the subject of the Technical Report.
8. I have read the definition of "qualified person" set out in NI 43-101 and certify that by reason of my education, affiliation with a professional association (as defined in NI 43-101) and past relevant work experience, I fulfill the requirements to be a "qualified person" for the purposes of NI 43-101.
9. I have read NI 43-101 and Form 43-101F1. The sections of the Technical Report that I am responsible for have been prepared in compliance with that instrument and form.
10. As of the effective date of the Technical Report, to the best of my knowledge, information and belief, the Technical Report contains all scientific and technical information that is required to be disclosed to make the Technical Report not misleading.
Dated this 31st day of January 2023.
| (Signed) "Laurie M. Tahija" | ||
| Signature of Qualified Person | ||
| Laurie M. Tahija | ||
| Print Name of Qualified Person |
CERTIFICATE OF QUALIFIED PERSON
I, Benson Chow, R.P.G., RM-SME, do hereby certify that:
1. I am Principal Geologist of:
Sawtooth Mining, LLC, a subsidiary of
NACCO Industries, Inc.
5340 Legacy Drive, Suite #300
Plano, TX 75024
2. This certificate applies to the technical report entitled, "Feasibility Study, National Instrument 43-101 Technical Report for the Thacker Pass Project, Humboldt County, Nevada, USA" prepared for Lithium Americas Corp. (the "Issuer") with an effective date of November 2, 2022 (the "Technical Report").
3. I graduated with a Bachelor of Science degree in Geosciences from Mississippi State University in 1998.
4. I am a Professional Geoscientist in good standing in Texas in the area of geology, license #10794, a Registered Professional Geologist in good standing in Mississippi in the area of geology, license #0715, and a Professional Geoscientist in good standing in Louisiana, license #664. I am also a Registered Member in the area of geology and resource modeling in good standing with the Society for Mining, Metallurgy & Exploration (SME), ID 4317057.
5. I have 23 years of relevant experience in mining, geology, exploration, mineral resource public disclosure, and environmental permitting work that is relevant to be qualified as a qualified Person (QP) for this Technical Report.
6. I am experienced in conducting geological investigations and exploration related to surface mining operations. I have supervised, completed or participated in several exploration data verification and validation programs, mineral resource models and due diligence studies on numerous surface projects of similar ore types, geological characteristics and type of operations as the Thacker Pass deposit.
7. I have read the definition of "Qualified Person" set out in National Instrument 43-101 ("NI 43-101") and certify that by reason of my education, affiliation with a professional association (as defined in NI 43-101) and past relevant work experience, I fulfill the requirements to be a "Qualified Person" for the purposes of NI 43-101.
8. I am responsible for Sections 4, 5, 6, 7, 8, 9, 10, 11, 12, 14, and 23 and corresponding sections of 1, 25, 26 and 27 of the Technical Report.
9. I visited the project site on November 18, 2018, and September 13 and 14, 2022. I have had prior involvement with the property that is the subject of the Technical Report. Sawtooth Mining has been working on a geologic model and mine plan for the Thacker Pass Project since 2018 and entered into a contract (the "Mining Agreement") with the project's owner, Lithium Nevada, Corp., a wholly owned subsidiary of the Issuer, to provide mining services on May 16, 2019. I have been involved in those prior activities.
I have had no other involvement with the project or collaboration with the Issuer or any of its subsidiaries.
10. I am independent of the Issuer and its subsidiaries as defined by Section 1.5 of NI 43-101.
11. I have read NI 43-101 and Form 43-101F1, and the sections of the Technical Report that I am responsible for have been prepared in compliance with that instrument and form.
12. As of the effective date of the Technical Report, to the best of my knowledge, information and belief, the part of the Technical Report that I am responsible for contains all scientific and technical information that is required to be disclosed to make the Technical Report not misleading.
Signed and dated this 31st day of January, 2023.
| (Signed) "Benson Chow" | ||
| Signature of Qualified Person | ||
| Benson Chow | ||
| Print Name of Qualified Person |
CERTIFICATE OF QUALIFIED PERSON
I, Eugenio Iasillo, P. E. do hereby certify that:
1. I am currently employed as Principal at Process Engineering LLC:
Process Engineering LLC
1676 West Aristides Street
Tucson Arizona 85704
2. I graduated with a B.S. degree in Chemical Engineering in 1975 from Universidad Michoacana de San Nicolas de Hidalgo (UMSNH) in the state of Michoacan, Mexico. I also attended the Extractive Metallurgy Master's program at the University of Arizona (1985-1988).
3. This certificate applies to the technical report entitled, "Feasibility Study, National Instrument 43-101 Technical Report for the Thacker Pass Project, Humboldt County, Nevada, USA" prepared for Lithium Americas Corp. (the "Issuer") with an effective date of November 2, 2022 (the "Technical Report").
4. I am a registered Professional Engineer in good standing in Arizona in the areas of Mining Engineering and Mineral Processing. Arizona professional registration number is 28209. I am Professional member of the Society for Mining, Metallurgy and Exploration, Inc.
5. I have worked as a Metallurgist, Process Engineer and Manager of mineral processing plants and metallurgical research facilities for a total of 46 years. Relevant experience in lithium bearing clays projects include Bacanora Minerals (2014) in northern Mexico, where I reviewed existing metallurgical test work, pilot plant data, flow sheet design, mass balance calculations as well as process evaluation. Scope of work included definition of process equipment required for continuous production of 35,000 TPA commercial grade lithium carbonate.
6. I have read the definition of "Qualified Person" set out in National Instrument 43-101 ("NI 43-101") and certify that by reason of my education, affiliation with a professional association (as defined in NI 43-101) and past relevant work experience, I fulfill the requirements to be a "Qualified Person" for the purposes of NI 43-101.
7. I am responsible for Section 13 including portions describing Run-of Mine (ROM) ore feed through neutralization of tailings as well as magnesium precipitation. This comprises all parts of Section 13 except for Sections 13.2.4.1, 13.2.4.3, and 13.2.5.1 to 13.2.5.3. I am furthermore responsible for corresponding sections of 1, 25, 26 and 27 of the Technical Report.
8. I have not visited the project site.
9. I do not have prior involvement with the property that is the subject of the Technical Report.
10. As of the effective date of the technical report, to the best of my knowledge, information and belief, the parts of the Technical Report that I am responsible for contain all scientific and technical information that is required to be disclosed to make the Technical Report not misleading.
11. I am independent of the Issuer and its subsidiaries as defined by section 1.5 of NI 43-101.
12. I have read NI 43-101 and Form 43-101F1, and the sections of the Technical Report that I am responsible for have been prepared in compliance with that instrument and form.
Signed and dated this 31st day of January 2023.
| (signed and sealed) "EUGENIO IASILLO" | ||
| Signature of Qualified Person | ||
| EUGENIO IASILLO | ||
| Print Name of Qualified Person |
![]()
CERTIFICATE OF QUALIFIED PERSON
I, Kevin R. Martina, P. Eng., as an author of this report entitled "Feasibility Study, National Instrument 43-101 Technical Report for the Thacker Pass Project, Humboldt County, Nevada, USA" with effective date of November 2, 2022, prepared for Lithium Americas Corp. (the "Issuer"), do hereby certify that:
1. I am a Senior Process Specialist with Wood Canada Limited, of Suite 301-121 Research Drive, Saskatoon, SK, S7N 1K2.
2. I graduated from the University of Saskatchewan in 1998 with a Bachelor of Science degree in Chemical Engineering.
3. I am registered as a member of the Association of Professional Engineers and Geoscientists of Saskatchewan (APEGS) license number 10483. I have worked as a chemical engineer for a total of 24 years since my graduation. My relevant experience for the purpose of this technical report is as follows:
4. I have read the definition of "qualified person" set out in the National Instrument 43-101 ("NI 43-101") and certify that by reason of my education, affiliation with a professional association (as defined in NI 43-101) and past relevant work experience, I fulfill the requirements to be a "qualified person" for the purposes of NI 43-101, for the content of the technical report that I take responsibility.
5. I have visited the Lithium Nevada laboratory and technical development center in Reno, Nevada on December 1st to 3rd, 2021. During this visit, metallurgical data along with their collection methods were reviewed and verified. This formed the basis for subsequent process reviews and recommendations for the design. I have not been to the Thacker Pass property.as all the test work pertaining to my area of responsibility was being conducted at the technical development center.
6. I am responsible for Sections 13.2.4.1, 13.2.4.3, 13.2.5.1 to 13.2.5.3, Tables 17-2 and 17-4 and corresponding parts of 17.2.1 in Section 17.2, Sections 17.3.5.1, 17.3.6, 17.3.7, 17.4.4, 17.4.5, 17.4.7, 17.4.8, 17.4.9 and corresponding parts of 17.4.10 and 17.4.11, as well as contributions to sections 1.9, 1.17, 25.6.7 to 25.6.9, 26.4.5 and 27 of the Technical Report.
7. I am independent of the Issuer applying the test set out in Section 1.5 of NI 43-101.
8. I have not had prior involvement with the Issuer's Thacker Pass project.
9. I have read NI 43-101, and the sections of the Technical Report that I am responsible for have been prepared in compliance with NI 43-101 and Form 43-101F1.
10. At the effective date of the Technical Report, to the best of my knowledge, information, and belief, the sections of the technical report for which I am responsible contain all scientific and technical information that is required to be disclosed to make the technical report not misleading.
Dated this 31st day of January 2023.
| (Signed) "Kevin R. Martina" | ||
| Signature of Qualified Person | ||
| Kevin R. Martina, P. Eng. | ||
| Print Name of Qualified Person |
CERTIFICATE OF QUALIFIED PERSON
I, Kevin A. Bahe, P.E., do hereby certify that:
1. I am a Principal Mining Engineer of:
Sawtooth Mining, LLC, a subsidiary of
NACCO Industries, Inc.
5340 Legacy Drive, Suite #300
Plano, TX 75024
2. This certification applies to the technical report entitled "Feasibility Study, National Instrument 43-101 Technical Report for the Thacker Pass Project, Humbolt County, Nevada, USA" prepared by Lithium Americas Corp. (the "Issuer") with an effective date of November 02, 2022 (the "Technical Report").
3. I graduated with a Bachelor of Science in Mining Engineering from New Mexico Institute of Mining and Technology in 1988 and a Master's in Business Administration in 2005.
4. I am a registered Professional Engineer in good standing in the state of New Mexico in the area of Mining Engineering, license #17850. I am also a Registered member of the Society of Mining, Metallurgy and Exploration, Inc. in good standing, #121480.
5. I have worked as a mining engineer for a total of 28 years. My experience that is pertinent to be qualified as a Qualified Person (QP) for this Technical Report (TP) includes: developing mine reserves/resource models, mine plan scheduling, mineral resource/reserves reporting, developing mine designs for draglines & truck/shovel operations, environmental permitting for surface operations and mineral reserve/resource public disclosure reporting.
6. I have read the definition of "Qualified Person" set out in National Instrument 43-101 ("NI 43-101") and certify that by reason of my education, affiliation with a professional association (as defined in NI 43-101) and past relevant work experience, I fulfill the requirements to be a "Qualified Person" for the purposes of NI 43-101.
7. I am responsible for Sections 15, 16, 21.1.3, 21.2.1, 21.3.3.1, 24.2.1 to 24.2.4, and corresponding parts of Sections 1, 25, 26, and 27 of the technical report.
8. I visited the project site on August 12 & 13, 2019, and on September 13 & 14, 2022. I have prior involvement with the property that is the subject of the Technical Report. Sawtooth Mining has been working on the geological model and mine plan/costing for the Thacker Pass Project since 2018 and was contracted as the Issuer's contract mine service provider on May 2019.
I have had no additional involvement with the project or collaboration or collaboration with the Issuer or its subsidiaries.
9. As of the date of this certificate, to the best of my knowledge, information, and belief, the Technical Report contains all scientific and technical information that is required to be disclosed to make the Technical Report not misleading.
10. I have reviewed the test for independence in Section 1.5 of NI 43-101, including the examples provided in Section 1.5(1)(a) - (h), and I am independent of Lithium Nevada, Corp., and its parent company, Lithium Americas Corp.
11. I have read National Instrument 43-101 and Form 43-101F1, and the sections of the Technical Report that I am responsible for have been prepared in compliance with that instrument and form.
12. I consent to the filing of the Technical Report with any stock exchange and other regulatory authority and any publication by them, including electronic publication in the public company files on their websites accessible by the public, of the Technical Report.
Signed and dated this 31st day of January, 2023.
| (signed) "Kevin A. Bahe" | ||
| Signature of Qualified Person | ||
| Kevin A. Bahe | ||
| Print Name of Qualified Person |
CERTIFICATE OF QUALIFIED PERSON
I, Walter Mutler, P.Eng, do hereby certify that:
1. I am Senior Vice President of:
Exp U.S. Services Inc.
11339 Clay Road, Suite 550
Houston, Texas 77041
U.S.A.
2. I graduated with a Bachelor of Science in Mechanical Engineering from the Technical University of Istanbul.
3. I am a Professional Engineer in good standing in the Province of Ontario in the areas of Mechanical Engineering (No. 90258617).
4. I have worked as an engineer for a total of 42 years. My experience includes over 30 years of designing and managing sulfuric acid plants. During the last 20 years, I was a project sponsor for more than 20 sulfuric acid plant designs and project construction in North America, Europe, and South America. The following FEED and bankable feasibility projects are some of my relevant experience in sulfuric acid production for leaching of various metals like nickel, and copper: Goro Nickel Caledonia, Ambatovy Nickel Madagaskar, Baja Mining Mexico and Jifco Phosphoric/sulfuric acid plant in Jordan.
5. I have read the definition of "Qualified Person" set out in National Instrument 43-101 ("NI 43-101") and certify that by reason of my education, affiliation with a professional association (as defined in NI 43-101) and past relevant work experience, I fulfill the requirements to be a "Qualified Person" for the purposes of NI 43-101.
6. I am an author for the preparation of the technical report titled "Feasibility Study, National Instrument 43-101 Technical Report for the Thacker Pass Project, Humboldt County, Nevada, USA" prepared for Lithium Americas Corp. (the "Issuer") with an effective date of November 2, 2022 (the "Technical Report").
7. I and am responsible for Sections 18.8, 21.2.1, 21.3.3.3, and corresponding sections of 1, 25, 26 and 27 of the Technical Report.
8. I visited the project site on November 2, 2022.
9. I have not had prior involvement with the property that is the subject of the Technical Report.
10. As of the effective date of the Technical Report, to the best of my knowledge, information and belief, the parts of the Technical Report that I am responsible for contain all scientific and technical information that is required to be disclosed to make the Technical Report not misleading.
11. I am independent of the Issuer and its subsidiaries as defined by Section 1.5 of NI 43-101.
12. I have read NI 43-101 and Form 43-101F1, and the sections of the Technical Report that I am responsible for have been prepared in compliance with that instrument and form.
Signed and dated this 31st of January, 2023.
| (Signed and sealed) "Walter Mutler" | ||
| Signature of Qualified Person | ||
| Walter Mutler | ||
| Print Name of Qualified Person |
![]()
CERTIFICATE OF QUALIFIED PERSON
Paul Kaplan
I, Paul Kaplan, P.E., do hereby certify that:
1. I am a Principal Engineer of:
NewFields Mining Design & Technical Services
1301 N. McCarran Boulevard, Suite 101
Sparks, Nevada 89431
U.S.A.
2. I am a graduate of Arizona State University, Tempe, Arizona, USA with a B.S. in Civil Engineering in 1980 and in 1983 with an M.S. in Civil Engineering.
3. I am a Professional Engineer in good standing in the following states in the USA: Nevada (8034), Washington (50215), Montana (16917), Utah (7667), Arizona (19234) and California (C46683).
4. I have worked as a Civil Engineer for a total of 39 years continuously since my graduation. My experience as an engineer includes designing and managing mine development and expansion projects including tailings storage, heap leach facilities, mine waste storage, surface and process water management and other civil engineering related infrastructure.
5. I have read the definition of "Qualified Person" set out in National Instrument 43-101 ("NI 43-101") and certify that by reason of my education, affiliation with a professional association (as defined in NI 43-101) and past relevant work experience, I fulfill the requirements to be a "Qualified Person" for the purposes of NI 43-101.
6. I am responsible for parts of Sections 18.10 and 20 (excluding Sections 20.7.4.1 to 20.7.4.6), and corresponding sections of 1, 25 and 26 of the technical report titled "Feasibility Study, National Instrument 43-101 Technical Report for the Thacker Pass Project, Humboldt County, Nevada, USA" dated effective November 2, 2022 (the "Technical Report").
7. I have had no prior involvement with the property that is the subject of the Technical Report. I have not visited the project site since joining NewFields.
8. As of the date of this certificate, to the best of my knowledge, information and belief, the sections of the Technical Report that I am responsible for contain all scientific and technical information that is required to be disclosed to make the Technical Report not misleading.
9. I am independent of the issuer applying all of the tests in Section 1.5 of NI 43-101.
10. I have read NI 43-101 and Form 43-101F1, and the Technical Report has been prepared in compliance with that instrument and form.
11. I consent to the filing of the Technical Report with any stock exchange and other regulatory authority and any publication by them, including electronic publication in the public company files on their websites accessible by the public, of the Technical Report.
Signed and dated this 31st day of January, 2023.
| (signed and sealed) "Paul Kaplan" | ||
| Paul Kaplan, P.E. | ||
| Principal, NewFields |
CERTIFICATE OF QUALIFIED PERSON
Tyler Cluff
I, Tyler Cluff, P.G., RM-SME, do hereby certify that:
1. I am employed as a senior hydrogeologist and operations manager at Piteau Associates located at 9090 Double Diamond Blvd Suite 1 Reno, NV 89521.
2. I graduated with a Master of Science degree in Hydrogeology from the University of Nevada Reno in 2007 and a Bachelor of Science degree in Geology from Weber State University in 2004.
3. I am a Professional Geologist in good standing in the state of California (No. 8827).
4. I have worked as a geologist for a total of 15 years. My experience includes hydrogeologic investigation, monitoring, and numerical modeling in the mining and industrial sectors. Such experience includes drilling oversight, instrumentation, and testing of geologic formations. Well and pump design for dewatering and sustainable water supply operations with associated capital and operational cost estimates. Numerical model construction, calibration, prediction, and review for the purposes of environmental permitting of facilities and/or infrastructure design.
5. I have read the definition of "Qualified Person" set out in National Instrument 43-101 ("NI 43-101") and certify that by reason of my education, affiliation with a professional association (as defined in NI 43-101) and past relevant work experience, I fulfill the requirements to be a "Qualified Person" for the purposes of NI 43-101.
6. I am a contributing author for the preparation of the technical report titled "Feasibility Study, National Instrument 43-101 Technical Report for the Thacker Pass Project, Humboldt County, Nevada, USA" prepared for Lithium Nevada Corp. ("LNC") with an effective date of November 2, 2022 (the "Technical Report"); and am responsible for Sections 20.7.4.1 to 20.7.4.6. I have visited the project site on March 7 to 8, June 8, and November 7 to 9, 2022.
7. I have had prior involvement with the property that is the subject of the Technical Report. Previous site work includes the baseline water resources characterization program, the water quantity and quality environmental impacts assessment studies, support developing monitoring and mitigation plans, and water rights acquisition.
8. As of the date of this certificate, to the best of my knowledge, information and belief, the Technical Report contains all scientific and technical information that is required to be disclosed to make the Technical Report not misleading.
9. I am independent of the issuer applying all of the tests in Section 1.5 of National Instrument 43-101.
10. I have read National Instrument 43-101 and Form 43-101F1, and the Technical Report has been prepared in compliance with that instrument and form.
11. I consent to the filing of the Technical Report with any stock exchange and other regulatory authority and any publication by them, including electronic publication in the public company files on their websites accessible by the public, of the Technical Report.
Signed and dated this 31st of January, 2023.
| (signed) "Tyler Cluff" | ||
| Signature of Qualified Person | ||
| Tyler Cluff | ||
| Print Name of Qualified Person |

Certificate of Qualified Person
I, Bruce A. Shannon, P.E., as Project Director overseeing the development and pricing of the Thacker Pass Project Power Distribution System for Lithium Americas Corp., do hereby certify that:
1. I am Vice President of Design Build for ITAC Engineers & Constructors located at 3100 Smoketree Court Suite 800 Raleigh, NC 27604.
2. I graduated from the University of Tennessee in 1988 with a Bachelor of Science degree in Electrical Engineering.
3. I am currently licensed as a Professional Engineer in North Carolina (License No. 026161)
4. I have worked as an electrical engineer for a total of 34 years since my graduation. My relevant experience for the purpose of this technical report is:
5. I have read the definition of "qualified person" set out in the National Instrument 43-101 (NI 43-101) and certify that by reason of my education, affiliation with a professional association (as defined in NI 43-101) and past relevant work experience, I fulfill the requirements to be a "qualified person" for the purposes of NI 43-101, for the content of the technical report that I take responsibility.
6. I have visited the pilot plant in Reno, Nevada and the mine/plant site at Thacker Pass on October 18, 2020.
7. I am responsible for Section 18.7 and corresponding sections of 1, 25, 26 and 27 of the technical report entitled, "Feasibility Study, National Instrument 43-101 Technical Report for the Thacker Pass Project, Humboldt County, Nevada, USA" prepared for Lithium Americas Corp. (the "Issuer") with an effective date of November 2, 2022.
8. I am independent of the Issuer applying the test set out in Section 1.5 of NI 43-101.
9. I have been involved with scope development and estimating for the Transload facility in Winnemucca, NV as well as the Thacker Pass Project since early 2020 and have extensive knowledge of the power requirements for the project.
10. I have read NI 43-101, and the sections of the Technical Report that I am responsible for have been prepared in compliance with NI 43-101 and Form 43-101F1.
11. At the effective date of the Technical Report, to the best of my knowledge, information, and belief, the sections of the technical report for which I am responsible contain all scientific and technical information that is required to be disclosed to make the technical report not misleading.
Dated this 31st day of January, 2023
| (Signed) "Bruce A. Shannon" | ||
| Signature of Qualified Person | ||
| Bruce A. Shannon, P.E. | ||
| Print Name of Qualified Person |
| Engineering |
|
| 13141 N. Enon Church Road | Chester, VA 23836 804.414.1100 | itac.us.com |