
abrdn Healthcare Opportunities Fund (THQ)
Semi-Annual Report
March 31, 2025
aberdeeninvestments.com
UNITED STATES
SECURITIES AND EXCHANGE COMMISSION
Washington, D.C. 20549
FORM N-CSR
CERTIFIED SHAREHOLDER REPORT OF REGISTERED MANAGEMENT INVESTMENT COMPANIES
| Investment Company Act file number: | 811-22955 |
| Exact name of registrant as specified in charter: | abrdn Healthcare Opportunities Fund |
| Address of principal executive offices: | 1900 Market Street, Suite 200 Philadelphia, PA 19103 |
| Name and address of agent for service: | Sharon Ferrari abrdn Inc. 1900 Market Street Suite 200 Philadelphia, PA 19103 |
| Registrant’s telephone number, including area code: | 1-800-522-5465 |
| Date of fiscal year end: | September 30 |
| Date of reporting period: | March 31, 2025 |
Item 1. Reports to Stockholders.
(a) A copy of the report transmitted to shareholders pursuant to Rule 30e-1 under the Investment Company Act of 1940 (the “1940 Act”) is filed herewith.
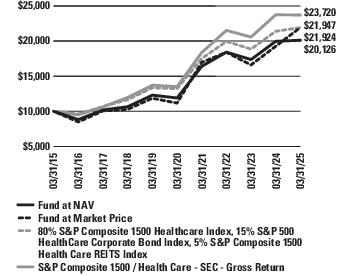
| 1 | Past performance is no guarantee of future results. Investment returns and principal value will fluctuate and shares, when sold, may be worth more or less than original cost. Current performance may be lower or higher than the performance quoted. NAV return data include investment management fees, custodial charges and administrative fees (such as Trustee and legal fees) and assumes the reinvestment of all distributions. |
| 2 | Assuming the reinvestment of dividends and distributions. |
| 3 | The Fund’s total return is based on the reported NAV for each financial reporting period end and may differ from what is reported on the Financial Highlights due to financial statement rounding or adjustments. |
| 4 | The S&P Composite 1500® Health Care Index is an unmanaged index that comprises those companies included in the S&P Composite 1500 that are classified as members of the GICS® Health Care sector. S&P 500® Health Care Corporate Bond Index, a subindex of the S&P 500 Bond Index, seeks to measure the performance of the U.S. corporate debt issued by constituents in the health care sector of the S&P 500. The S&P 500 Bond Index is designed to be a corporate-bond counterpart to the S&P 500. The S&P Composite 1500 Health Care REITs Index comprises those companies included in the S&P Composite 1500 that are classified as members of the GICS Health Care REITS industry. Indexes are unmanaged and have been provided for comparison purposes only. No fees or expenses are reflected. You cannot invest directly in an index. |
| abrdn Healthcare Opportunities Fund | 1 |
| 2 | abrdn Healthcare Opportunities Fund |
| 6 Months | 1 Year | 3 Years | 5 Years | 10 Years | |
| Net Asset Value (NAV) | -6.41% | 0.77% | 2.99% | 11.08% | 7.24% |
| Market Price | -1.51% | 13.89% | 6.03% | 14.46% | 8.18% |
| 80% S&P Composite 1500 Healthcare Index, 15% S&P 500 HealthCare Corporate Bond Index, 5% S&P Composite 1500 Health Care REITS Index | -3.66% | 2.45% | 3.18% | 10.65% | 8.17% |
| S&P Composite 1500 Healthcare Index | -4.83% | -0.13% | 3.29% | 11.91% | 9.02% |
| abrdn Healthcare Opportunities Fund | 3 |
| Asset Allocation | |
| Common Stocks | 105.0% |
| Non-Convertible Notes | 18.2% |
| Convertible Preferred Stocks | 2.9% |
| Short-Term Investments | 0.9% |
| Call Options Written | - |
| Liabilities in Excess of Other Assets | (27.0%) |
| 100.0% |
| Industries | |
| Pharmaceuticals | 33.2% |
| Health Care Equipment & Supplies | 28.3% |
| Health Care Providers & Services | 26.8% |
| Biotechnology | 23.2% |
| Life Sciences Tools & Services | 7.4% |
| Health Care REITs | 7.0% |
| Health Care Technology | 0.2% |
| Short-Term Investments | 0.9% |
| Liabilities in Excess of Other Assets | (27.0%) |
| 100.0% |
| Top Ten Holdings | |
| Eli Lilly & Co. | 11.7% |
| UnitedHealth Group, Inc. | 10.9% |
| AbbVie, Inc. | 6.6% |
| Abbott Laboratories | 6.3% |
| Merck & Co., Inc. | 4.6% |
| Thermo Fisher Scientific, Inc. | 4.1% |
| Medtronic PLC | 3.6% |
| Johnson & Johnson | 3.6% |
| Intuitive Surgical, Inc. | 3.4% |
| Elevance Health, Inc. | 3.1% |
| 4 | abrdn Healthcare Opportunities Fund |
| abrdn Healthcare Opportunities Fund | 5 |
| 6 | abrdn Healthcare Opportunities Fund |
| Number of Contracts (100 shares each) | Notional Amount ($) | Value ($) | |
| Option Contracts Written—0.0% | |||
| Call Options Written—0.0% | |||
| Abbott Laboratories Apr25 135 Call | 200 | (2,700,000) | (46,000) |
| AbbVie, Inc. Apr25 215 Call | 100 | (2,150,000) | (8,800) |
| Acadia Healthcare Co., Inc. APR25 35 CALL | 801 | (2,803,500) | (12,015) |
| Amgen, Inc. Apr25 330 Call | 82 | (2,706,000) | (9,840) |
| Becton Dickinson & Co. Apr25 240 Call | 90 | (2,160,000) | (9,000) |
| BioMarin Pharmaceutical, Inc. Apr25 75 Call | 286 | (2,145,000) | (11,440) |
| Boston Scientific Corp. Apr25 100 Call | 108 | (1,080,000) | (32,400) |
| Cytokinetics, Inc. Apr25 50 Call | 216 | (1,080,000) | (11,880) |
| Gilead Sciences, Inc. Apr25 115 Call | 141 | (1,621,500) | (21,150) |
| Illumina, Inc. Apr25 90 Call | 180 | (1,620,000) | (6,300) |
| Intuitive Surgical, Inc. Apr25 520 Call | 31 | (1,612,000) | (4,495) |
| Medtronic PLC Apr25 95 Call | 227 | (2,156,500) | (5,902) |
| Pfizer, Inc. APR25 27 CALL | 995 | (2,686,500) | (1,990) |
| Regeneron Pharmaceuticals, Inc. Apr25 680 Call | 24 | (1,632,000) | (9,600) |
| Regeneron Pharmaceuticals, Inc. Apr25 680 Call | 24 | (1,632,000) | (3,120) |
| Sarepta Therapeutics, Inc. Apr25 85 Call | 508 | (4,318,000) | (7,620) |
| Tenet Healthcare Corp. Apr25 135 Call | 159 | (2,146,500) | (77,115) |
| Thermo Fisher Scientific, Inc. Apr25 540 Call | 40 | (2,160,000) | (4,080) |
| UnitedHealth Group, Inc. Apr25 530 Call | 51 | (2,703,000) | (92,055) |
| Zoetis, Inc. Apr25 170 Call | 95 | (1,615,000) | (12,350) |
| Total Call Options Written (Premiums received $(659,385)) | (387,152) | ||
| abrdn Healthcare Opportunities Fund | 7 |
| Assets | |
| Investments, at value (cost $928,020,946) | $ 1,058,149,586 |
| Short-term investment, at value (cost $7,217,599) | 7,217,599 |
| Receivable for investments sold | 3,695,543 |
| Interest and dividends receivable | 2,223,118 |
| Receivable for common shares issued | 160,559 |
| Prepaid expenses in connection with bank loan | 5,496 |
| Prepaid expenses | 94,462 |
| Total assets | 1,071,546,363 |
| Liabilities | |
| Revolving Credit Facility payable | 225,000,000 |
| Payable for investments purchased | 3,691,910 |
| Interest payable on line of credit | 2,306,833 |
| Investment advisory fees payable (Note 3) | 914,602 |
| Written options, at value (premiums received$659,385) | 387,152 |
| Trustee fees payable | 31,523 |
| Administration fees payable | 12,725 |
| Investor relations fees payable (Note 3) | 6,018 |
| Other accrued expenses | 368,850 |
| Total liabilities | 232,719,613 |
| Commitments and Contingencies (Notes 7 & 10) | |
| Net Assets | $838,826,750 |
| Composition of Net Assets | |
| Common stock (par value $0.010 per share) (Note 5) | $ 413,792 |
| Paid-in capital in excess of par | 759,496,772 |
| Distributable earnings | 78,916,186 |
| Net Assets | $838,826,750 |
| Net asset value per share based on 41,379,167 shares issued and outstanding | $20.27 |
| 8 | abrdn Healthcare Opportunities Fund |
| Net Investment Income | |
| Investment Income: | |
| Dividends | $ 8,164,758 |
| Interest and amortization of discount and premium and other income | 3,736,853 |
| Total investment income | 11,901,611 |
| Expenses: | |
| Investment advisory fee (Note 3) | 5,465,528 |
| Legal fees and expenses | 119,690 |
| Reports to shareholders and proxy solicitation | 79,307 |
| Trustees' fees and expenses | 70,089 |
| Independent auditors’ fees and tax expenses | 65,440 |
| Investor relations fees and expenses (Note 3) | 43,667 |
| Insurance expense | 34,587 |
| Custodian’s fees and expenses | 30,688 |
| Administration fee | 23,026 |
| Transfer agent’s fees and expenses | 10,467 |
| Bank loan fees and expenses | 2,647 |
| Miscellaneous | 171,586 |
| Total operating expenses, excluding interest expense | 6,116,722 |
| Interest expense | 6,607,757 |
| Total expenses | 12,724,479 |
| Net Investment Loss | (822,868) |
| Net Realized/Unrealized Gain/(Loss): | |
| Net realized gain/(loss) from: | |
| Investments | 7,758,584 |
| Written options | 732,481 |
| 8,491,065 | |
| Net change in unrealized appreciation/depreciation on: | |
| Investments | (68,657,487) |
| Written options | 81,811 |
| (68,575,676) | |
| Net realized and unrealized gain from investments and written options | (60,084,611) |
| Change in Net Assets Resulting from Operations | $(60,907,479) |
| abrdn Healthcare Opportunities Fund | 9 |
| For the Six-Month Period Ended March 31, 2025 (unaudited) | For the Year Ended September 30, 2024 | |
| Increase/(Decrease) in Net Assets: | ||
| Operations: | ||
| Net investment loss | $(822,868) | $(3,891,912) |
| Net realized gain from investments and written options | 8,491,065 | 42,465,748 |
| Net change in unrealized appreciation/depreciation investments, milestone interests and written options | (68,575,676) | 150,988,597 |
| Net increase/(decrease) in net assets resulting from operations | (60,907,479) | 189,562,433 |
| Distributions to Shareholders From: | ||
| Distributable earnings | (44,668,643) | (45,221,413) |
| Return of capital | – | (32,941,565) |
| Net decrease in net assets from distributions | (44,668,643) | (78,162,978) |
| Reinvestment of dividends resulting in the issuance of 23,109 and 0 shares of common stock, respectively | 480,570 | – |
| Change in net assets | (105,095,552) | 111,399,455 |
| Net Assets: | ||
| Beginning of period | 943,922,302 | 832,522,847 |
| End of period | $838,826,750 | $943,922,302 |
| 10 | abrdn Healthcare Opportunities Fund |
| Cash flows from operating activities: | |
| Net increase/(decrease) in net assets resulting from operations | $ (60,907,479) |
| Adjustments to reconcile net increase in net assets resulting from operations to net cash provided by operating activities: | |
| Investments purchased | (171,136,804) |
| Investments sold and principal repayments | 161,433,437 |
| Proceeds from option contracts written | 983,291 |
| Net change in short-term investments | 54,179,765 |
| Net amortization/accretion of premium/(discount) | (21,530) |
| Decrease in interest, dividends and other receivables | 51,279 |
| Decrease in prepaid expenses | 27,680 |
| Decrease in interest payable on Revolving Credit Facility | (411,451) |
| Decrease in accrued investment advisory fee payable | (62,544) |
| Increase in other accrued expenses | 128,377 |
| Net change in unrealized depreciation of investments and options | 68,575,676 |
| Net realized gain on investments transactions and options | (8,491,065) |
| Net cash provided by operating activities | 44,348,632 |
| Cash flows from financing activities: | |
| Distributions paid to shareholders | (44,348,632) |
| Net cash used in financing activities | (44,348,632) |
| Unrestricted and restricted cash and foreign currency, beginning of period | – |
| Unrestricted and restricted cash and foreign currency, end of period | $– |
| Supplemental disclosure of cash flow information: | |
| Cash paid for interest and fees on borrowing | $7,019,208 |
| abrdn Healthcare Opportunities Fund | 11 |
| For the Six-Month Period Ended March 31, | For the Fiscal Years Ended September 30, | |||||
| 2025 (unaudited) | 2024 (a) | 2023 | 2022 (b) | 2021 (b) | 2020 (b) | |
| PER SHARE OPERATING PERFORMANCE: | ||||||
| Net asset value per common share, beginning of period | $22.82 | $20.13 | $20.20 | $23.64 | $20.28 | $18.80 |
| Net investment income/(loss)(c) | (0.02) | (0.09) | (0.06) | 0.01 | 0.16 | 0.13 |
| Net realized and unrealized gains/(losses) on investments, written options and foreign currency transactions | (1.45) | 4.67 | 1.34 | (2.10) | 4.55 | 2.69 |
| Total from investment operations applicable to common shareholders | (1.47) | 4.58 | 1.28 | (2.09) | 4.71 | 2.82 |
| Distributions to common shareholders from: | ||||||
| Net investment income | (1.08) | (0.54) | (0.18) | (0.04) | (0.91) | (0.71) |
| Net realized gains | – | (0.55) | (1.17) | (1.31) | (0.44) | (0.64) |
| Return of capital | – | (0.80) | – | – | – | – |
| Total distributions | (1.08) | (1.89) | (1.35) | (1.35) | (1.35) | (1.35) |
| Effect of Fund shares repurchased | – | – | – | – | – | 0.01 |
| Net asset value per common share, end of period | $20.27 | $22.82 | $20.13 | $20.20 | $23.64 | $20.28 |
| Market price, end of period | $20.64 | $22.08 | $16.98 | $18.12 | $22.65 | $18.09 |
| Total Investment Return Based on(d): | ||||||
| Market price | (1.51%) | 42.99% | 0.56% | (14.84%) | 33.28% | 11.71% |
| Net asset value | (6.41%) | 24.66% | 6.94% | (9.08%) | 24.14% | 16.30% |
| Ratio to Average Net Assets Applicable to Common Shareholders/Supplementary Data: | ||||||
| Net assets applicable to common shareholders, end of period (000 omitted) | $838,827 | $943,922 | $832,523 | $835,567 | $977,364 | $838,429 |
| Average net assets applicable to common shareholders (000 omitted) | $871,109 | $890,367 | $885,296 | $947,190 | $942,855 | $824,606 |
| Gross operating expenses | 2.93%(e) | 3.10% | 2.95% | 1.87% | 1.66% | 2.05% |
| Net operating expenses, net of fee waivers and excluding interest expense | 1.41%(e) | 1.42% | 1.47% | 1.46% | 1.44% | 1.48% |
| Net Investment income (loss) | (0.19%)(e) | (0.44%) | (0.28%) | 0.05% | 0.69% | 0.63% |
| Portfolio turnover | 15%(f) | 43% | 44% | 49% | 58% | 59% |
| Senior securities (loan facility) outstanding (000 omitted) | $225,000 | $225,000 | $225,000 | $225,000 | $225,000 | $225,000 |
| Asset coverage ratio on senior securities at period end(g) | 473% | 520% | 470% | 471% | 534% | 473% |
| Asset coverage per $1000 on senior securities at period end(h) | $4,728 | $5,195 | $4,700 | $4,714 | $5,344 | $4,726 |
| (a) | Effective October 27, 2023, abrdn Inc. became the investment adviser of the Fund. Prior to October 27, 2023, the Fund was managed by Tekla Capital Management, LLC. Members of the portfolio management team from Tekla joined abrdn Inc., and continue to manage the Fund.See accompanying Notes to Financial Statements. |
| 12 | abrdn Healthcare Opportunities Fund |
| (b) | Beginning with the year ended September 30, 2023, the Fund’s financial statements were audited by KPMG LLP. Previous years were audited by a different independent registered public accounting firm. |
| (c) | Based on average shares outstanding. |
| (d) | Total investment return based on market value is calculated assuming that shares of the Fund’s common stock were purchased at the closing market price as of the beginning of the period, dividends, capital gains and other distributions were reinvested as provided for in the Fund’s dividend reinvestment plan and then sold at the closing market price per share on the last day of the period. The computation does not reflect any sales commission investors may incur in purchasing or selling shares of the Fund. The total investment return based on the net asset value is similarly computed except that the Fund’s net asset value is substituted for the closing market value. |
| (e) | Annualized. |
| (f) | Not annualized. |
| (g) | Asset coverage ratio is calculated by dividing net assets as of each fiscal period end plus the amount of any borrowings for investment purposes outstanding as of each fiscal period end by the amount of any borrowings as of each fiscal period end, and then multiplying by $1,000. |
| (h) | Asset coverage ratio is calculated by dividing net assets plus the amount of any borrowings for investment purposes by the amount of any senior securities, which includes the Revolving Credit Facility and then multiplying by $1,000. |
| abrdn Healthcare Opportunities Fund | 13 |
| 14 | abrdn Healthcare Opportunities Fund |
| abrdn Healthcare Opportunities Fund | 15 |
| Security Type | Standard Inputs |
| Foreign equities utilizing a fair value factor | Depositary receipts, indices, futures, sector indices/ETFs, exchange rates, and local exchange opening and closing prices of each security. |
| Investments, at Value | Level 1 – Quoted Prices | Level 2 – Other Significant Observable Inputs | Level 3 – Significant Unobservable Inputs | Total |
| Assets | ||||
| Investments in Securities | ||||
| Common Stocks | $880,542,968 | $– | $9,881 | $880,552,849 |
| Non-Convertible Notes | – | 152,883,826 | – | 152,883,826 |
| Convertible Preferred Stocks | – | – | 24,712,911 | 24,712,911 |
| Short-Term Investment | 7,217,599 | – | – | 7,217,599 |
| Total Investments | $887,760,567 | $152,883,826 | $24,722,792 | $1,065,367,185 |
| Total Investment Assets | $887,760,567 | $152,883,826 | $24,722,792 | $1,065,367,185 |
| Liabilities | ||||
| Other Financial Instruments | ||||
| Written Options | $(387,152) | $– | $– | $(387,152) |
| Total Investment Liabilities | $(387,152) | $– | $– | $(387,152) |
| Rollforward of Level 3 Fair Value Measurements For the Six Months Ended March 31, 2025 | |||||
| Investments in Securities | Balance as of September 30, 2024 | Net Realized Gain (Loss) and Change in Unrealized Appreciation/ Depreciation | Net Purchases and conversions | Balance as of March 31, 2025 | Net Change in Unrealized Appreciation/ Depreciation from Investments Held at March 31, 2025 |
| Common Stocks | |||||
| Pharmaceuticals | $9,881 | $0 | $0 | $9,881 | $0 |
| Convertible Preferred Stocks | |||||
| Biotechnology | 10,559,974 | (8,001) | 6,674,641 | 17,226,614 | (8,001) |
| Health Care Equipment & Supplies | 19 | 0 | 0 | 19 | 0 |
| Pharmaceuticals | 7,486,278 | (589) | 589 | 7,486,278 | (589) |
| Total | $18,056,152 | $(8,590) | $6,675,230 | $24,722,792 | $(8,590) |
| 16 | abrdn Healthcare Opportunities Fund |
| Description | Fair Value at 03/31/25 | Valuation Technique (s) | Unobservable Inputs | Range | Weighted Average | Relationship Between Fair Value and Input; if input value increases then Fair Value: |
| Common Stocks | $9,881 | Income approach | Probability of events Timing of events | 46.00% 4.40 years | 46.00% 4.40 years | Increase Decrease |
| Convertible Preferred Stocks | $24,712,911 | Market approach | Transaction Price(a) | N/A | N/A | Increase |
| Total | $24,722,792 |
| (a) | The valuation technique used as a basis to approximate fair value of these investments is based on a transaction price or subsequent financing rounds. |
| abrdn Healthcare Opportunities Fund | 17 |
| Risk Exposure Category | |||||||
| Interest Rate Contracts | Foreign Currency Contracts | Credit Contracts | Equity Contracts | Commodity Contracts | Other | Total | |
| Liabilities: | |||||||
| Unrealized depreciation on: | |||||||
| Written Options, market value | $– | $– | $– | $387,152 | $– | $– | $387,152 |
| Total | $– | $– | $– | $387,152 | $– | $– | $387,152 |
| Risk Exposure Category | ||||||
| Interest Rate Contracts | Foreign Currency Contracts | Credit Contracts | Equity Contracts | Commodity Contracts | Total | |
| Realized Gain/(Loss) on Derivatives Recognized as a Result of Operations: | ||||||
| Written Options | $– | $– | $– | $732,481 | $– | $732,481 |
| Total | $– | $– | $– | $732,481 | $– | $732,481 |
| 18 | abrdn Healthcare Opportunities Fund |
| Risk Exposure Category | ||||||
| Interest Rate Contracts | Foreign Currency Contracts | Credit Contracts | Equity Contracts | Commodity Contracts | Total | |
| Net Change in Unrealized Appreciation/Depreciation on Derivatives Recognized as a Result of Operations: | ||||||
| Written Options | $– | $– | $– | $81,811 | $– | $81,811 |
| Total | $– | $– | $– | $81,811 | $– | $81,811 |
| abrdn Healthcare Opportunities Fund | 19 |
| 20 | abrdn Healthcare Opportunities Fund |
| Security | Acquisition Date | Cost | Carrying Value per Unit | Value |
| Abcuro, Inc., Series B — Convertible Preferred Stock | 8/10/23, 12/19/23 | $3,302,342 | $5.49 | $3,299,990 |
| Abcuro, Inc., Series C1 — Convertible Preferred Stock | 2/7/25 | 803,419 | 6.04 | 803,419 |
| Atalanta Therapeutics, Series B — Convertible Preferred Stock | 10/11/25 | 3,501,659 | 1.80 | 3,499,999 |
| Endeavor Biomedicines, Inc., Series B — Convertible Preferred Stock | 1/21/22 | 3,507,496 | 6.53 | 4,842,153 |
| Endeavor Biomedicines, Inc., Series C — Convertible Preferred Stock | 4/19/24 | 894,707 | 6.52 | 894,125 |
| Engrail Therapeutics, Inc., Series B — Convertible Preferred Stock | 3/14/24 | 1,750,589 | 1.06 | 1,750,000 |
| Glycomine, Inc., Series C — Convertible Preferred Stock | 7/22/24, 3/26/25 | 4,124,754 | 0.60 | 4,123,222 |
| IO Light Holdinigs, Inc., Series A2 — Convertible Preferred Stock | 4/30/20, 5/17/21, 9/15/21 | 628,537 | 0.00* | 19 |
| Seismic Therapeutics, Inc., Series B — Convertible Preferred Stock | 8/30/24 | 3,307,188 | 4.52 | 3,299,984 |
| Third Arc Bio, Inc., Series A — Convertible Preferred Stock | 7/15/24 | 2,207,836 | 2.10 | 2,200,000 |
| Total | $24,028,527 | $24,712,911 |
| * | Carrying value is less than $0.01. |
| abrdn Healthcare Opportunities Fund | 21 |
| 22 | abrdn Healthcare Opportunities Fund |
| abrdn Healthcare Opportunities Fund | 23 |
| 24 | abrdn Healthcare Opportunities Fund |
| abrdn Healthcare Opportunities Fund | 25 |
| 26 | abrdn Healthcare Opportunities Fund |
| Tax Cost of Securities | Unrealized Appreciation | Unrealized Depreciation | Net Unrealized Appreciation/ (Depreciation) |
| $946,652,041 | $214,374,258 | $(95,386,881) | $118,987,377 |
| abrdn Healthcare Opportunities Fund | 27 |
| 28 | abrdn Healthcare Opportunities Fund |
| abrdn Healthcare Opportunities Fund | 29 |

(b) Not applicable.
Item 2. Code of Ethics.
This item is inapplicable to semi-annual report on Form N-CSR.
Item 3. Audit Committee Financial Expert.
This item is inapplicable to semi-annual report on Form N-CSR.
Item 4. Principal Accountant Fees and Services.
This item is inapplicable to semi-annual report on Form N-CSR.
Item 5. Audit Committee of Listed Registrants.
This item is inapplicable to semi-annual report on Form N-CSR.
Item 6. Schedule of Investments.
(a) Schedule of Investments in securities of unaffiliated issuers as of close of the reporting period is included as part of the Report to Shareholders filed under Item 1 of this Form N-CSR.
(b) Not applicable.
Item 7. Financial Statements and Financial Highlights for Open-End Management Investment Companies.
Not applicable.
Item 8. Changes in and Disagreements with Accountants for Open-End Management Investment Companies.
Not applicable.
Item 9. Proxy Disclosures for Open-End Management Investment Companies.
Not applicable.
Item 10. Remuneration Paid to Directors, Officers, and Others of Open-End Management Investment Companies.
Not applicable.
Item 11. Statement Regarding Basis for Approval of Investment Advisory Contract.
Not applicable.
Item 12. Disclosure of Proxy Voting Policies and Procedures for Closed-End Management Investment Companies.
This item is inapplicable to semi-annual report on Form N-CSR.
Item 13. Portfolio Managers of Closed-End Management Investment Companies.
(a) Not applicable to semi-annual report on Form N-CSR.
(b) There has been no change, as of the date of this filing, in any of the portfolio managers identified in response to paragraph (a)(1) of this Item in the registrant’s most recently filed annual report on Form N-CSR.
Item 14. Purchases of Equity Securities by Closed-End Management Investment Company and Affiliated Purchasers.
| Period | (a) Total No. of Shares Purchased | (b) Average Price Paid per Share | (c) Total No. of Shares Purchased as Part of Publicly Announced Plans or Programs(1) | (d) Maximum No. of Shares that May Yet Be Purchased Under the Plans or Programs(1) | |||||||||||||
| Month #1 (Oct. 1, 2024 — Oct. 31, 2024) | — | — | — | 4,962,797 | |||||||||||||
| Month #2 (Nov. 1, 2024 — Nov. 30, 2024) | — | — | — | 4,962,797 | |||||||||||||
| Month #3 (Dec. 1, 2024 — Dec. 31, 2024) | — | — | — | 4,962,797 | |||||||||||||
| Month #4 (Jan. 1, 2025 — Jan. 31, 2025) | — | — | — | 4,962,797 | |||||||||||||
| Month #5 (Feb. 1, 2025 — Feb. 28, 2025) | — | — | — | 4,962,797 | |||||||||||||
| Month #6 (Mar. 1, 2025 — Mar. 31, 2025) | — | — | — | 4,962,797 | |||||||||||||
| Total | — | $ | — | — | |||||||||||||
| (1) | On March 19, 2015, the share repurchase program was announced, which has been subsequently reviewed and approved by the Board of Trustees. In March 2024, the Board approved the renewal of the repurchase program to allow the Fund to repurchase up to 12% of its outstanding shares in the open market for a one-year period ending July 14, 2025. |
Item 15. Submission of Matters to a Vote of Security Holders.
During the period ended March 31, 2025, there were no material changes to the procedures by which shareholders may recommend nominees to the Registrant’s Board of Trustees.
Item 16. Controls and Procedures.
| (a) | The Registrant’s principal executive and principal financial officers, or persons performing similar functions, have concluded that the Registrant’s disclosure controls and procedures (as defined in Rule 30a-3(c) under the Investment Company Act of 1940 (the “Act”) (17 CFR 270.30a-3(c))) are effective, as of a date within 90 days of the filing date of the report that includes the disclosure required by this paragraph, based on the evaluation of these controls and procedures required by Rule 30a-3(b) under the Act (17 CFR 270.30a3(b)) and Rule 13a-15(b) or 15d-15(b) under the Securities Exchange Act of 1934, as amended (17 CFR 240.13a-15(b) or 240.15d15(b)). |
| (b) | There were no changes in the Registrant’s internal control over financial reporting (as defined in Rule 30a-3(d) under the Act (17 CFR 270.30a-3(d))) that occurred during the period covered by this report that has materially affected, or is reasonably likely to materially affect, the Registrant’s internal control over financial reporting. |
Item 17. Disclosure of Securities Lending Activities for Closed-End Management Investment Companies
Not applicable
Item 18. Recovery of Erroneously Awarded Compensation
Not appliable
Item 19. Exhibits.
| (a)(1) | Not applicable. |
| (a)(2) | Any policy required by the listing standards adopted pursuant to Rule 10D-1 under the Exchange Act (17 CFR 240.10D-1) by the registered national securities exchange or registered national securities association upon which the registrant’s securities are listed. Not applicable. |
| (a)(3) | The certifications of the registrant as required by Rule 30a-2(a) under the Act are exhibits to this Form N-CSR . |
| (a)(4) | Any written solicitation to purchase securities under Rule 23c-1 under the 1940 Act (17 CFR 270.23c-1) sent or given during the period covered by the report by or on behalf of the registrant to 10 or more persons. Not applicable. |
| (a)(5) | Change in Registrant’s independent public accountant. Not applicable. |
| (b) | The certifications of the registrant as required by Rule 30a-2(b) under the Act are exhibits to this Form N-CSR . |
| (c) | A copy of the Registrant’s notices to stockholders, which accompanied distributions paid, pursuant to the Registrant’s Managed Distribution Policy since the Registrant’s last filed N-CSR, are filed herewith as Exhibits (c)(1), (c)(2), (c)(3), (c)(4), (c)(5) and (c)(6) as required by the terms of the Registrant’s SEC exemptive order. |
SIGNATURES
Pursuant to the requirements of the Securities Exchange Act of 1934 and the Investment Company Act of 1940, the Registrant has duly caused this report to be signed on its behalf by the undersigned, thereunto duly authorized.
abrdn Healthcare Opportunities Fund
| By: | /s/ Alan Goodson | |
| Alan Goodson, | ||
| Principal Executive Officer of abrdn Healthcare Opportunities Fund |
Date: June 9, 2025
Pursuant to the requirements of the Securities Exchange Act of 1934 and the Investment Company Act of 1940, this report has been signed below by the following persons on behalf of the Registrant and in the capacities and on the dates indicated.
| By: | /s/ Alan Goodson | |
| Alan Goodson, | ||
| Principal Executive Officer of abrdn Healthcare Opportunities Fund |
Date: June 9, 2025
| By: | /s/ Sharon Ferrari | |
| Sharon Ferrari, | ||
| Principal Financial Officer of abrdn Healthcare Opportunities Fund |
Date: June 9, 2025
Exhibit 99.CERT
Certification Pursuant to Rule 30a-2(a) under the 1940 Act and Section 302 of the Sarbanes-Oxley Act
I, Sharon Ferrari, certify that:
| 1. | I have reviewed this report on Form N-CSR of abrdn Healthcare Opportunities Fund (the “Registrant”); |
| 2. | Based on my knowledge, this report does not contain any untrue statement of a material fact or omit to state a material fact necessary to make the statements made, in light of the circumstances under which such statements were made, not misleading with respect to the period covered by this report; |
| 3. | Based on my knowledge, the financial statements, and other financial information included in this report, fairly present in all material respects the financial condition, results of operations, changes in net assets, and cash flows (if the financial statements are required to include a statement of cash flows) of the Registrant as of, and for, the periods presented in this report; |
| 4. | The Registrant’s other certifying officer(s) and I are responsible for establishing and maintaining disclosure controls and procedures (as defined in Rule 30a-3(c) under the Investment Company Act of 1940) and internal control over financial reporting (as defined in Rule 30a-3(d) under the Investment Company Act of 1940) for the Registrant and have: |
| (a) | Designed such disclosure controls and procedures, or caused such disclosure controls and procedures to be designed under our supervision, to ensure that material information relating to the Registrant, including its consolidated subsidiaries, is made known to us by others within those entities, particularly during the period in which this report is being prepared; |
| (b) | Designed such internal control over financial reporting, or caused such internal control over financial reporting to be designed under our supervision, to provide reasonable assurance regarding the reliability of financial reporting and the preparation of financial statements for external purposes in accordance with generally accepted accounting principles; |
| (c) | Evaluated the effectiveness of the Registrant’s disclosure controls and procedures and presented in this report our conclusions about the effectiveness of the disclosure controls and procedures, as of a date within 90 days prior to the filing date of this report based on such evaluation; and |
| (d) | Disclosed in this report any change in the Registrant’s internal control over financial reporting that occurred during the period covered by this report that has materially affected, or is reasonably likely to materially affect, the Registrant’s internal control over financial reporting; and |
| 5. | The Registrant’s other certifying officer(s) and I have disclosed to the Registrant’s auditors and the audit committee of the Registrant’s board of directors (or persons performing the equivalent functions): |
| (a) | All significant deficiencies and material weaknesses in the design or operation of internal control over financial reporting which are reasonably likely to adversely affect the Registrant’s ability to record, process, summarize, and report financial information; and |
| (b) | Any fraud, whether or not material, that involves management or other employees who have a significant role in the Registrant’s internal control over financial reporting. |
Date June 9, 2025
| /s/ Sharon Ferrari | |
| Sharon Ferrari | |
| Principal Financial Officer |
Certification Pursuant to Rule 30a-2(a) under the 1940 Act and Section 302 of the Sarbanes-Oxley Act
I, Alan Goodson, certify that:
| 1. | I have reviewed this report on Form N-CSR of abrdn Healthcare Opportunities Fund (the “Registrant”); |
| 2. | Based on my knowledge, this report does not contain any untrue statement of a material fact or omit to state a material fact necessary to make the statements made, in light of the circumstances under which such statements were made, not misleading with respect to the period covered by this report; |
| 3. | Based on my knowledge, the financial statements, and other financial information included in this report, fairly present in all material respects the financial condition, results of operations, changes in net assets, and cash flows (if the financial statements are required to include a statement of cash flows) of the Registrant as of, and for, the periods presented in this report; |
| 4. | The Registrant’s other certifying officer(s) and I are responsible for establishing and maintaining disclosure controls and procedures (as defined in Rule 30a-3(c) under the Investment Company Act of 1940) and internal control over financial reporting (as defined in Rule 30a-3(d) under the Investment Company Act of 1940) for the Registrant and have: |
| (a) | Designed such disclosure controls and procedures, or caused such disclosure controls and procedures to be designed under our supervision, to ensure that material information relating to the Registrant, including its consolidated subsidiaries, is made known to us by others within those entities, particularly during the period in which this report is being prepared; |
| (b) | Designed such internal control over financial reporting, or caused such internal control over financial reporting to be designed under our supervision, to provide reasonable assurance regarding the reliability of financial reporting and the preparation of financial statements for external purposes in accordance with generally accepted accounting principles; |
| (c) | Evaluated the effectiveness of the Registrant’s disclosure controls and procedures and presented in this report our conclusions about the effectiveness of the disclosure controls and procedures, as of a date within 90 days prior to the filing date of this report based on such evaluation; and |
| (d) | Disclosed in this report any change in the Registrant’s internal control over financial reporting that occurred during the period covered by this report that has materially affected, or is reasonably likely to materially affect, the Registrant’s internal control over financial reporting; and |
| 5. | The Registrant’s other certifying officer(s) and I have disclosed to the Registrant’s auditors and the audit committee of the Registrant’s board of directors (or persons performing the equivalent functions): |
| (a) | All significant deficiencies and material weaknesses in the design or operation of internal control over financial reporting which are reasonably likely to adversely affect the Registrant’s ability to record, process, summarize, and report financial information; and |
| (b) | Any fraud, whether or not material, that involves management or other employees who have a significant role in the Registrant’s internal control over financial reporting. |
Date: June 9, 2025
| /s/ Alan Goodson | |
| Alan Goodson | |
| Principal Executive Officer |
Exhibit 99.906CERT
Certification Pursuant to Rule 30a-2(b) under the 1940 Act and Section 906 of the Sarbanes-Oxley Act
Alan Goodson, Principal Executive Officer, and Sharon Ferrari, Principal Financial Officer, of abrdn Healthcare Opportunities Fund (the “Registrant”), each certify that:
| 1. | The Registrant’s periodic report on Form N-CSR for the period ended March 31, 2025 (the “Form N-CSR”) fully complies with the requirements of Section 13(a) or Section 15(d) of the Securities Exchange Act of 1934, as amended, as applicable; and |
| 2. | The information contained in the Form N-CSR fairly presents, in all material respects, the financial condition and results of operations of the Registrant. |
| PRINCIPAL EXECUTIVE OFFICER | |
| abrdn Healthcare Opportunities Fund | |
| /s/ Alan Goodson | |
| Alan Goodson | |
| Date: June 9, 2025 | |
| PRINCIPAL FINANCIAL OFFICER | |
| abrdn Healthcare Opportunities Fund | |
| /s/ Sharon Ferrari | |
| Sharon Ferrari | |
| Date: June 9, 2025 |
This certification is being furnished solely pursuant to Section 906 of the Sarbanes-Oxley Act of 2002 and is not being filed as part of Form N-CSR or as a separate disclosure document. A signed original of this written statement, or other document authenticating, acknowledging, or otherwise adopting the signature that appears in typed form within the electronic version of this written statement required by Section 906, has been provided to the Registrant and will be retained by the Registrant and furnished to the Securities and Exchange Commission or its staff upon request.
Exhibit 99.(c)(1)


FOR IMMEDIATE RELEASE
For More Information Contact:
abrdn U.S. Closed-End Funds
Investor Relations
1-800-522-5465
Investor.Relations@abrdn.com
ABRDN U.S. CLOSED-END FUNDS
ANNOUNCE DISTRIBUTION PAYMENT DETAILS
(Philadelphia, January 10, 2025) - The abrdn U.S. Closed-End Funds (NYSE: ASGI, HQH, HQL, IFN, JEQ, THQ), (NYSE American: IAF) (the “Funds” or individually the “Fund”), today announced that the Funds paid the distributions noted in the table below on January 10, 2025, on a per share basis to all shareholders of record as of December 30, 2024 (ex-dividend date December 30, 2024). These dates apply to the Funds listed below with the exception of abrdn Healthcare Investors (HQH), abrdn Life Sciences Investors (HQL), abrdn Australia Equity Fund, Inc. (IAF), the India Fund Inc. (IFN) and abrdn Japan Equity Fund, Inc. (JEQ) which paid on January 10, 2025, to all shareholders of record as of November 21, 2024 (ex-dividend date November 21, 2024)
| Ticker | Exchange | Fund | Amount | |||||
| ASGI | NYSE | abrdn Global Infrastructure Income Fund | $ | 0.2000 | ||||
| HQH | NYSE | abrdn Healthcare Investors | $ | 0.6200 | ||||
| HQL | NYSE | abrdn Life Sciences Investors | $ | 0.5000 | ||||
| IAF | NYSE American | abrdn Australia Equity Fund, Inc. | $ | 0.1300 | ||||
| IFN | NYSE | The India Fund, Inc. | $ | 0.9300 | ||||
| JEQ | NYSE | abrdn Japan Equity Fund, Inc. | $ | 0.1200 | ||||
| THQ | NYSE | abrdn Healthcare Opportunities Fund | $ | 0.1800 | ||||
Each Fund has adopted a distribution policy to provide investors with a stable distribution out of current income, supplemented by realized capital gains and, to the extent necessary, paid-in capital.
For the abrdn Healthcare Investors (HQH), abrdn Life Sciences Investors (HQL), abrdn Australia Equity Fund, Inc. (IAF), the India Fund Inc. (IFN) and abrdn Japan Equity Fund, Inc. (JEQ) the stock distributions were automatically paid in newly issued shares of the Fund unless otherwise instructed by the shareholder to be paid in cash. Shares of common stock were issued at the lower of the net asset value (“NAV”) per share or the market price per share with a floor for the NAV of not less than 95% of the market price on December 17, 2024. The reinvestment prices per share for these distributions were as follows: $16.83 for abrdn Healthcare Investors (HQH); $13.87 for abrdn Life Sciences Investors (HQL); $4.35 for abrdn Australia Equity Fund, Inc. (IAF); $16.8 for the India Fund, Inc. (IFN) and $5.81 for abrdn Japan Equity Fund, Inc. (JEQ). Fractional shares were generally settled in cash, except for registered shareholders with book entry accounts at Computershare Investor Services who had whole and fractional shares added to their account.
To have received the abrdn Healthcare Investors (HQH), abrdn Life Sciences Investors (HQL), abrdn Australia Equity Fund, Inc. (IAF), the India Fund Inc. (IFN) and abrdn Japan Equity Fund, Inc. (JEQ) quarterly distributions payable in January 2025 in cash instead of shares of common stock, for shareholders who hold shares in “street name,” the bank, brokerage or nominee who holds the shares must have advised the Depository Trust Company as to the full and fractional shares for which they want the distribution paid in cash by December 16, 2024; and for shares that are held in registered form, written notification for the election of cash by registered shareholders must have been received by Computershare Investor Services prior to December 16, 2024.
Under applicable U.S. tax rules, the amount and character of distributable income for each Fund’s fiscal year can be finally determined only as of the end of the Fund’s fiscal year. However, under Section 19 of the Investment Company Act of 1940, as amended (the “1940 Act”) and related rules, the Funds may be required to indicate to shareholders the estimated source of certain distributions to shareholders.
The following tables set forth the estimated amounts of the sources of the distributions for purposes of Section 19 of the 1940 Act and the rules adopted thereunder. The tables have been computed based on generally accepted accounting principles. The tables include estimated amounts and percentages for the current distributions paid this month as well as for the cumulative distributions paid relating to fiscal year to date, from the following sources: net investment income; net realized short-term capital gains; net realized long-term capital gains; and return of capital. The estimated compositions of the distributions may vary because the estimated composition may be impacted by future income, expenses and realized gains and losses on securities and currencies.
The Funds’ estimated sources of the current distribution paid this month and for its current fiscal year to date are as follows:
| Estimated Amounts of Current Distribution per Share | ||||||||||||||||||||||||||||||||||||
| Fund | Distribution Amount | Net Investment Income | Net Realized Short-Term Gains** | Net Realized Long-Term Gains | Return of Capital | |||||||||||||||||||||||||||||||
| ASGI | $ | 0.2000 | $ | 0.0120 | 6 | % | - | - | - | - | $ | 0.1880 | 94 | % | ||||||||||||||||||||||
| HQH | $ | 0.6200 | - | - | - | - | - | - | $ | 0.6200 | 100 | % | ||||||||||||||||||||||||
| HQL | $ | 0.5000 | - | - | $ | 0.1985 | 40 | % | - | - | $ | 0.3015 | 60 | % | ||||||||||||||||||||||
| IAF | $ | 0.1300 | $ | 0.0117 | 9 | % | - | - | $ | 0.0104 | 8 | % | $ | 0.1079 | 83 | % | ||||||||||||||||||||
| IFN | $ | 0.9300 | - | - | - | - | $ | 0.9300 | 100 | % | - | - | ||||||||||||||||||||||||
| JEQ | $ | 0.1200 | - | - | - | - | - | - | $ | 0.1200 | 100 | % | ||||||||||||||||||||||||
| THQ | $ | 0.1800 | - | - | $ | 0.0234 | 13 | % | - | - | $ | 0.1566 | 87 | % | ||||||||||||||||||||||
| Estimated Amounts of Fiscal Year* to Date Cumulative Distributions per Share | ||||||||||||||||||||||||||||||||||||
| Fund | Distribution Amount | Net Investment Income | Net Realized Short-Term Gains ** | Net Realized Long-Term Gains | Return of Capital | |||||||||||||||||||||||||||||||
| ASGI | $ | 0.6200 | $ | 0.0372 | 6 | % | - | - | - | - | $ | 0.5828 | 94 | % | ||||||||||||||||||||||
| HQH | $ | 0.6200 | - | - | - | - | - | - | $ | 0.6200 | 100 | % | ||||||||||||||||||||||||
| HQL | $ | 0.5000 | - | - | $ | 0.1985 | 40 | % | - | - | $ | 0.3015 | 60 | % | ||||||||||||||||||||||
| IAF | $ | 0.1300 | $ | 0.0117 | 9 | % | - | - | $ | 0.0104 | 8 | % | $ | 0.1079 | 83 | % | ||||||||||||||||||||
| IFN | $ | 2.300 | - | - | - | - | $ | 2.3000 | 100 | % | - | - | ||||||||||||||||||||||||
| JEQ | $ | 0.1200 | - | - | - | - | - | - | $ | 0.1200 | 100 | % | ||||||||||||||||||||||||
| THQ | $ | 0.5400 | - | - | $ | 0.0702 | 13 | % | - | - | 0.4698 | 87 | % | |||||||||||||||||||||||
* ASGI, HQH, HQL and THQ have a 9/30 fiscal year end. IAF and JEQ have a 10/31 fiscal year end. IFN has a 12/31 fiscal year end.
**includes currency gains
Where the estimated amounts above show a portion of the distribution to be a “Return of Capital,” it means that Fund estimates that it has distributed more than its income and capital gains; therefore, a portion of your distribution may be a return of capital. A return of capital may occur for example, when some or all the money that you invested in a Fund is paid back to you. A return of capital distribution does not necessarily reflect the Fund’s investment performance and should not be confused with “yield” or “income.”
The amounts and sources of distributions reported in this notice are only estimates and are not being provided for tax reporting purposes. The final determination of the source of all distributions for the current year will only be made after year-end. The actual amounts and sources of the amounts for tax reporting purposes will depend upon the Fund’s investment experience during the remainder of the fiscal year and may be subject to change based on tax regulations. After the end of each calendar year, a Form 1099-DIV will be sent to shareholders for the prior calendar year that will tell you how to report these distributions for federal income tax purposes.
The following tables provide the Funds’ total return performance based on net asset value (NAV) over various time periods compared to the Funds’ annualized and cumulative distribution rates.
| Fund Performance and Distribution Rate Information | ||||||||||||||||
| Fund | Average Annual Total Return on NAV for the 5 Year Period Ending 11/30/20241 | Current Fiscal Period’s Annualized Distribution Rate on NAV | Cumulative Total Return on NAV1 | Cumulative Distribution Rate on NAV2 | ||||||||||||
| ASGI3 | 8.79 | %3 | 11.79 | % | -1.73 | % | 2.01 | % | ||||||||
| THQ | 8.82 | % | 10.05 | % | -4.20 | % | 1.68 | % | ||||||||
1 Return data is net of all Fund expenses and fees and assumes the reinvestment of all distributions reinvested at prices obtained under the Fund’s dividend reinvestment plan.
2 Based on the Fund’s NAV as of November 30, 2024.
3 The Fund launched within the past 5 years; the performance and distribution rate information presented reflects data from inception (July 29, 2020) through November 30, 2024.
| Fund Performance and Distribution Rate Information | ||||||||||||||||
| Fund | Average
Annual Total Return on NAV for the 5 Year Period Ending 10/31/20241 | Current Fiscal Period’s Annualized Distribution Rate on NAV | Cumulative Total Return on NAV1 | Cumulative Distribution Rate on NAV2 | ||||||||||||
| HQH | 7.97 | % | N/A | * | -2.31 | % | N/A | * | ||||||||
| HQL | 7.91 | % | N/A | * | -1.16 | % | N/A | * | ||||||||
| IAF | 8.58 | % | 9.36 | % | 32.38 | % | 9.36 | % | ||||||||
| IFN | 9.71 | % | 9.60 | % | 16.79 | % | 7.07 | % | ||||||||
| JEQ | 2.99 | % | 6.47 | % | 24.10 | % | 6.47 | % | ||||||||
1 Return data is net of all Fund expenses and fees and assumes the reinvestment of all distributions reinvested at prices obtained under the Fund’s dividend reinvestment plan.
2 Based on the Fund’s NAV as of October 31, 2024.
*The Fund’s fiscal period to date is October 1, 202 to October 31, 2024, and there were no distributions in this period.
Shareholders should not draw any conclusions about a Fund’s investment performance from the amount of the Fund’s current distributions or from the terms of the distribution policy (the “Distribution Policy”).
While NAV performance may be indicative of the Fund’s investment performance, it does not measure the value of a shareholder’s investment in the Fund. The value of a shareholder’s investment in the Fund is determined by the Fund’s market price, which is based on the supply and demand for the Fund’s shares in the open market.
Pursuant to an exemptive order granted by the Securities and Exchange Commission, the Funds may distribute any long-term capital gains more frequently than the limits provided in Section 19(b) under the 1940 Act and Rule 19b-1 thereunder. Therefore, distributions paid by the Funds during the year may include net income, short-term capital gains, long-term capital gains and/or a return of capital. Net income dividends and short-term capital gain dividends, while generally taxable at ordinary income rates, may be eligible, to the extent of qualified dividend income earned by the Funds, to be taxed at a lower rate not to exceed the maximum rate applicable to your long-term capital gains. Distributions made in any calendar year in excess of investment company taxable income and net capital gain are treated as taxable ordinary dividends to the extent of undistributed earnings and profits, and then as a return of capital that reduces the adjusted basis in the shares held. To the extent return of capital distributions exceed the adjusted basis in the shares held, capital gain is recognized with a holding period based on the period the shares have been held at the date such amount is received.
The payment of distributions in accordance with the Distribution Policy may result in a decrease in the Fund’s net assets. A decrease in the Fund’s net assets may cause an increase in the Fund’s annual operating expense ratio and a decrease in the Fund’s market price per share to the extent the market price correlates closely to the Fund’s net asset value per share. The Distribution Policy may also negatively affect the Fund’s investment activities to the extent that the Fund is required to hold larger cash positions than it typically would hold or to the extent that the Fund must liquidate securities that it would not have sold, for the purpose of paying the distribution. Each Fund’s Board has the right to amend, suspend or terminate the Distribution Policy at any time. The amendment, suspension or termination of the Distribution Policy may affect the Fund’s market price per share. Investors should consult their tax advisor regarding federal, state, and local tax considerations that may be applicable in their particular circumstances.
Circular 230 disclosure: To ensure compliance with requirements imposed by the U.S. Treasury, we inform you that any U.S. tax advice contained in this communication (including any attachments) is not intended or written to be used, and cannot be used, for the purpose of (i) avoiding penalties under the Internal Revenue Code or (ii) promoting, marketing or recommending to another party any transaction or matter addressed herein.
In the United States, abrdn is the marketing name for the following affiliated, registered investment advisers: abrdn Inc., abrdn Investments Limited, and abrdn Asia Limited.
Closed-end funds are traded on the secondary market through one of the stock exchanges. A Fund’s investment return and principal value will fluctuate so that an investor’s shares may be worth more or less than the original cost. Shares of closed-end funds may trade above (a premium) or below (a discount) the net asset value (NAV) of the fund’s portfolio. There is no assurance that a Fund will achieve its investment objective. Past performance does not guarantee future results.
abrdn.com/en-us/cefinvestorcenter
###
Exhibit 99.(c)(2)
FOR IMMEDIATE RELEASE
For More Information Contact:
abrdn U.S. Closed-End Funds
Investor Relations
1-800-522-5465
Investor.Relations@abrdn.com
ABRDN U.S. CLOSED-END FUNDS
ANNOUNCE DISTRIBUTION PAYMENT DETAILS
(Philadelphia, January 31, 2025) - The abrdn U.S. Closed-End Funds (NYSE: ASGI, THQ) (the “Funds” or individually the “Fund”), today announced that the Funds paid the distributions noted in the table below on January 31, 2025, on a per share basis to all shareholders of record as of January 24, 2025 (ex-dividend date January 24, 2025).
| Ticker | Exchange | Fund | Amount | |||||
| ASGI | NYSE | abrdn Global Infrastructure Income Fund | $ | 0.2000 | ||||
| THQ | NYSE | abrdn Healthcare Opportunities Fund | $ | 0.1800 | ||||
Each Fund has adopted a distribution policy to provide investors with a stable distribution out of current income, supplemented by realized capital gains and, to the extent necessary, paid-in capital.
Under applicable U.S. tax rules, the amount and character of distributable income for each Fund’s fiscal year can be finally determined only as of the end of the Fund’s fiscal year. However, under Section 19 of the Investment Company Act of 1940, as amended (the “1940 Act”) and related rules, the Funds may be required to indicate to shareholders the estimated source of certain distributions to shareholders.
The following tables set forth the estimated amounts of the sources of the distributions for purposes of Section 19 of the 1940 Act and the rules adopted thereunder. The tables have been computed based on generally accepted accounting principles. The tables include estimated amounts and percentages for the current distributions paid this month as well as for the cumulative distributions paid relating to fiscal year to date, from the following sources: net investment income; net realized short-term capital gains; net realized long-term capital gains; and return of capital. The estimated compositions of the distributions may vary because the estimated composition may be impacted by future income, expenses and realized gains and losses on securities and currencies.
The Funds’ estimated sources of the current distribution paid this month and for its current fiscal year to date are as follows:
| Estimated Amounts of Current Distribution per Share | ||||||||||||||||||||||||||||||||||||
| Fund | Distribution Amount | Net
Investment Income | Net Realized Short-Term Gains** | Net Realized Long-Term Gains | Return of Capital | |||||||||||||||||||||||||||||||
| ASGI | $ | 0.2000 | $ | 0.0080 | 4 | % | $ | 0.0020 | 1 | % | $ | 0.0820 | 41 | % | $ | 0.1080 | 54 | % | ||||||||||||||||||
| THQ | $ | 0.1800 | - | - | - | - | - | - | $ | 0.1800 | 100 | % | ||||||||||||||||||||||||
| Estimated Amounts of Fiscal Year* to Date Cumulative Distributions per Share | ||||||||||||||||||||||||||||||||||||
| Fund | Distribution Amount | Net
Investment Income | Net Realized Short-Term Gains** | Net Realized Long-Term Gains | Return of Capital | |||||||||||||||||||||||||||||||
| ASGI | $ | 0.8200 | $ | 0.0328 | 4 | % | $ | 0.0082 | 1 | % | $ | 0.3362 | 41 | % | $ | 0.4428 | 54 | % | ||||||||||||||||||
| THQ | $ | 0.7200 | - | - | - | - | - | - | $ | 0.7200 | 100 | % | ||||||||||||||||||||||||
* ASGI and THQ have a 9/30 fiscal year end.
**includes currency gains
Where the estimated amounts above show a portion of the distribution to be a “Return of Capital,” it means that Fund estimates that it has distributed more than its income and capital gains; therefore, a portion of your distribution may be a return of capital. A return of capital may occur for example, when some or all the money that you invested in a Fund is paid back to you. A return of capital distribution does not necessarily reflect the Fund’s investment performance and should not be confused with “yield” or “income.”
The amounts and sources of distributions reported in this notice are only estimates and are not being provided for tax reporting purposes. The final determination of the source of all distributions for the current year will only be made after year-end. The actual amounts and sources of the amounts for tax reporting purposes will depend upon the Fund’s investment experience during the remainder of the fiscal year and may be subject to change based on tax regulations. After the end of each calendar year, a Form 1099-DIV will be sent to shareholders for the prior calendar year that will tell you how to report these distributions for federal income tax purposes.
The following tables provide the Funds’ total return performance based on net asset value (NAV) over various time periods compared to the Funds’ annualized and cumulative distribution rates.
| Fund Performance and Distribution Rate Information | ||||||||||||||||
| Fund | Average Annual Total Return on NAV for the 5 Year Period Ending 12/31/20241 | Current Fiscal Period’s Annualized Distribution Rate on NAV | Cumulative Total Return on NAV1 | Cumulative Distribution Rate on NAV2 | ||||||||||||
| ASGI3 | 7.36 | %3 | 12.60 | % | -6.65 | % | 3.19 | % | ||||||||
| THQ | 6.73 | % | 10.84 | % | -10.35 | % | 2.71 | % | ||||||||
1 Return data is net of all Fund expenses and fees and assumes the reinvestment of all distributions reinvested at prices obtained under the Fund’s dividend reinvestment plan.
2Based on the Fund’s NAV as of December 31, 2024.
3 The Fund launched within the past 5 years; the performance and distribution rate information presented reflects data from inception (July 29, 2020) through December 31, 2024.
Shareholders should not draw any conclusions about a Fund’s investment performance from the amount of the Fund’s current distributions or from the terms of the distribution policy (the “Distribution Policy”).
While NAV performance may be indicative of the Fund’s investment performance, it does not measure the value of a shareholder’s investment in the Fund. The value of a shareholder’s investment in the Fund is determined by the Fund’s market price, which is based on the supply and demand for the Fund’s shares in the open market.
Pursuant to an exemptive order granted by the Securities and Exchange Commission, the Funds may distribute any long-term capital gains more frequently than the limits provided in Section 19(b) under the 1940 Act and Rule 19b-1 thereunder. Therefore, distributions paid by the Funds during the year may include net income, short-term capital gains, long-term capital gains and/or a return of capital. Net income dividends and short-term capital gain dividends, while generally taxable at ordinary income rates, may be eligible, to the extent of qualified dividend income earned by the Funds, to be taxed at a lower rate not to exceed the maximum rate applicable to your long-term capital gains. Distributions made in any calendar year in excess of investment company taxable income and net capital gain are treated as taxable ordinary dividends to the extent of undistributed earnings and profits, and then as a return of capital that reduces the adjusted basis in the shares held. To the extent return of capital distributions exceed the adjusted basis in the shares held, capital gain is recognized with a holding period based on the period the shares have been held at the date such amount is received.
The payment of distributions in accordance with the Distribution Policy may result in a decrease in the Fund’s net assets. A decrease in the Fund’s net assets may cause an increase in the Fund’s annual operating expense ratio and a decrease in the Fund’s market price per share to the extent the market price correlates closely to the Fund’s net asset value per share. The Distribution Policy may also negatively affect the Fund’s investment activities to the extent that the Fund is required to hold larger cash positions than it typically would hold or to the extent that the Fund must liquidate securities that it would not have sold, for the purpose of paying the distribution. Each Fund’s Board has the right to amend, suspend or terminate the Distribution Policy at any time. The amendment, suspension or termination of the Distribution Policy may affect the Fund’s market price per share. Investors should consult their tax advisor regarding federal, state, and local tax considerations that may be applicable in their particular circumstances.
Circular 230 disclosure: To ensure compliance with requirements imposed by the U.S. Treasury, we inform you that any U.S. tax advice contained in this communication (including any attachments) is not intended or written to be used, and cannot be used, for the purpose of (i) avoiding penalties under the Internal Revenue Code or (ii) promoting, marketing or recommending to another party any transaction or matter addressed herein.
In the United States, abrdn is the marketing name for the following affiliated, registered investment advisers: abrdn Inc., abrdn Investments Limited, and abrdn Asia Limited.
Closed-end funds are traded on the secondary market through one of the stock exchanges. A Fund’s investment return and principal value will fluctuate so that an investor’s shares may be worth more or less than the original cost. Shares of closed-end funds may trade above (a premium) or below (a discount) the net asset value (NAV) of the fund’s portfolio. There is no assurance that a Fund will achieve its investment objective. Past performance does not guarantee future results.
abrdn.com/en-us/cefinvestorcenter
###
Exhibit 99.(c)(3)
FOR IMMEDIATE RELEASE
For More Information Contact:
abrdn U.S. Closed-End Funds
Investor Relations
1-800-522-5465
Investor.Relations@abrdn.com
ABRDN U.S. CLOSED-END FUNDS
ANNOUNCE DISTRIBUTION PAYMENT DETAILS
(Philadelphia, February 28, 2025) - The abrdn U.S. Closed-End Funds (NYSE: ASGI, THQ) (the “Funds” or individually the “Fund”), today announced that the Funds paid the distributions noted in the table below on February 28, 2025, on a per share basis to all shareholders of record as of February 21, 2025 (ex-dividend date February 21, 2025).
| Ticker | Exchange | Fund | Amount | |||||||
| ASGI | NYSE | abrdn Global Infrastructure Income Fund | $ | 0.1900 | ||||||
| THQ | NYSE | abrdn Healthcare Opportunities Fund | $ | 0.1800 | ||||||
Each Fund has adopted a distribution policy to provide investors with a stable distribution out of current income, supplemented by realized capital gains and, to the extent necessary, paid-in capital.
Under applicable U.S. tax rules, the amount and character of distributable income for each Fund’s fiscal year can be finally determined only as of the end of the Fund’s fiscal year. However, under Section 19 of the Investment Company Act of 1940, as amended (the “1940 Act”) and related rules, the Funds may be required to indicate to shareholders the estimated source of certain distributions to shareholders.
The following tables set forth the estimated amounts of the sources of the distributions for purposes of Section 19 of the 1940 Act and the rules adopted thereunder. The tables have been computed based on generally accepted accounting principles. The tables include estimated amounts and percentages for the current distributions paid this month as well as for the cumulative distributions paid relating to fiscal year to date, from the following sources: net investment income; net realized short-term capital gains; net realized long-term capital gains; and return of capital. The estimated compositions of the distributions may vary because the estimated composition may be impacted by future income, expenses and realized gains and losses on securities and currencies.
The Funds’ estimated sources of the current distribution paid this month and for its current fiscal year to date are as follows:
| Estimated Amounts of Current Distribution per Share | ||||||||||||||||||||||||||||||||||||
| Fund | Distribution Amount | Net Investment Income | Net
Realized Short-Term Gains ** | Net Realized Long-Term Gains | Return of Capital | |||||||||||||||||||||||||||||||
| ASGI | $ | 0.1900 | $ | 0.0114 | 6 | % | $ | 0.0019 | 1 | % | $ | 0.0893 | 47 | % | $ | 0.0874 | 46 | % | ||||||||||||||||||
| THQ | $ | 0.1800 | - | - | $ | 0.0234 | 13 | % | - | - | $ | 0.1566 | 87 | % | ||||||||||||||||||||||
| Estimated Amounts of Fiscal Year* to Date Cumulative Distributions per Share | ||||||||||||||||||||||||||||||||||||
| Fund | Distribution Amount | Net Investment Income | Net
Realized Short-Term Gains ** | Net
Realized Long-Term Gains | Return of Capital | |||||||||||||||||||||||||||||||
| ASGI | $ | 1.0100 | $ | 0.0606 | 6 | % | $ | 0.0101 | 1 | % | $ | 0.4747 | 47 | % | $ | 0.4646 | 46 | % | ||||||||||||||||||
| THQ | $ | 0.9000 | - | - | $ | 0.1170 | 13 | % | - | - | $ | 0.7830 | 87 | % | ||||||||||||||||||||||
* ASGI and THQ have a 9/30 fiscal year end.
**includes currency gains
Where the estimated amounts above show a portion of the distribution to be a “Return of Capital,” it means that Fund estimates that it has distributed more than its income and capital gains; therefore, a portion of your distribution may be a return of capital. A return of capital may occur for example, when some or all the money that you invested in a Fund is paid back to you. A return of capital distribution does not necessarily reflect the Fund’s investment performance and should not be confused with “yield” or “income.”
The amounts and sources of distributions reported in this notice are only estimates and are not being provided for tax reporting purposes. The final determination of the source of all distributions for the current year will only be made after year-end. The actual amounts and sources of the amounts for tax reporting purposes will depend upon the Fund’s investment experience during the remainder of the fiscal year and may be subject to change based on tax regulations. After the end of each calendar year, a Form 1099-DIV will be sent to shareholders for the prior calendar year that will tell you how to report these distributions for federal income tax purposes.
The following tables provide the Funds’ total return performance based on net asset value (NAV) over various time periods compared to the Funds’ annualized and cumulative distribution rates.
| Fund Performance and Distribution Rate Information | ||||||||||||||||
| Fund | Average Annual Total Return on NAV for the 5 Year Period Ending 01/31/20251 | Current Fiscal Period’s Annualized Distribution Rate on NAV | Cumulative Total Return on NAV1 | Cumulative Distribution Rate on NAV2 | ||||||||||||
| ASGI3 | 7.65 | %3 | 12.06 | % | -4.95 | % | 4.16 | % | ||||||||
| THQ | 8.68 | % | 10.24 | % | -4.26 | % | 3.41 | % | ||||||||
1 Return data is net of all Fund expenses and fees and assumes the reinvestment of all distributions reinvested at prices obtained under the Fund’s dividend reinvestment plan.
2Based on the Fund’s NAV as of December 31, 2024.
3 The Fund launched within the past 5 years; the performance and distribution rate information presented reflects data from inception (July 29, 2020) through December 31, 2024.
Shareholders should not draw any conclusions about a Fund’s investment performance from the amount of the Fund’s current distributions or from the terms of the distribution policy (the “Distribution Policy”).
While NAV performance may be indicative of the Fund’s investment performance, it does not measure the value of a shareholder’s investment in the Fund. The value of a shareholder’s investment in the Fund is determined by the Fund’s market price, which is based on the supply and demand for the Fund’s shares in the open market.
Pursuant to an exemptive order granted by the Securities and Exchange Commission, the Funds may distribute any long-term capital gains more frequently than the limits provided in Section 19(b) under the 1940 Act and Rule 19b-1 thereunder. Therefore, distributions paid by the Funds during the year may include net income, short-term capital gains, long-term capital gains and/or a return of capital. Net income dividends and short-term capital gain dividends, while generally taxable at ordinary income rates, may be eligible, to the extent of qualified dividend income earned by the Funds, to be taxed at a lower rate not to exceed the maximum rate applicable to your long-term capital gains. Distributions made in any calendar year in excess of investment company taxable income and net capital gain are treated as taxable ordinary dividends to the extent of undistributed earnings and profits, and then as a return of capital that reduces the adjusted basis in the shares held. To the extent return of capital distributions exceed the adjusted basis in the shares held, capital gain is recognized with a holding period based on the period the shares have been held at the date such amount is received.
The payment of distributions in accordance with the Distribution Policy may result in a decrease in the Fund’s net assets. A decrease in the Fund’s net assets may cause an increase in the Fund’s annual operating expense ratio and a decrease in the Fund’s market price per share to the extent the market price correlates closely to the Fund’s net asset value per share. The Distribution Policy may also negatively affect the Fund’s investment activities to the extent that the Fund is required to hold larger cash positions than it typically would hold or to the extent that the Fund must liquidate securities that it would not have sold, for the purpose of paying the distribution. Each Fund’s Board has the right to amend, suspend or terminate the Distribution Policy at any time. The amendment, suspension or termination of the Distribution Policy may affect the Fund’s market price per share. Investors should consult their tax advisor regarding federal, state, and local tax considerations that may be applicable in their particular circumstances.
Circular 230 disclosure: To ensure compliance with requirements imposed by the U.S. Treasury, we inform you that any U.S. tax advice contained in this communication (including any attachments) is not intended or written to be used, and cannot be used, for the purpose of (i) avoiding penalties under the Internal Revenue Code or (ii) promoting, marketing or recommending to another party any transaction or matter addressed herein.
In the United States, abrdn is the marketing name for the following affiliated, registered investment advisers: abrdn Inc., abrdn Investments Limited, and abrdn Asia Limited.
Closed-end funds are traded on the secondary market through one of the stock exchanges. A Fund’s investment return and principal value will fluctuate so that an investor’s shares may be worth more or less than the original cost. Shares of closed-end funds may trade above (a premium) or below (a discount) the net asset value (NAV) of the fund’s portfolio. There is no assurance that a Fund will achieve its investment objective. Past performance does not guarantee future results.
abrdn.com/en-us/cefinvestorcenter
###
Exhibit 99.(c)(4)

FOR IMMEDIATE RELEASE
For More Information Contact:
Aberdeen U.S. Closed-End Funds
Investor Relations
1-800-522-5465
Investor.Relations@aberdeenplc.com
ABERDEEN U.S. CLOSED-END FUNDS
ANNOUNCE DISTRIBUTION PAYMENT DETAILS
(Philadelphia, March 31, 2025) - The Aberdeen U.S. Closed-End Funds (NYSE: ASGI, HQH, HQL, IFN, JEQ, THQ), (NYSE American: IAF) (the “Funds” or individually the “Fund”), today announced that the Funds paid the distributions noted in the table below on March 31, 2025, on a per share basis to all shareholders of record as of March 25, 2025 (ex-dividend date March 25, 2025). These dates apply to the Funds listed below with the exception of abrdn Healthcare Investors (HQH), abrdn Life Sciences Investors (HQL), abrdn Australia Equity Fund, Inc. (IAF), the India Fund Inc. (IFN) and abrdn Japan Equity Fund, Inc. (JEQ) which paid on March 31, 2025, to all shareholders of record as of February 21, 2025 (ex-dividend date February 21, 2025).
| Ticker | Exchange | Fund | Amount | |||||
| ASGI | NYSE | abrdn Global Infrastructure Income Fund | $ | 0.1900 | ||||
| HQH | NYSE | abrdn Healthcare Investors | $ | 0.5700 | ||||
| HQL | NYSE | abrdn Life Sciences Investors | $ | 0.4700 | ||||
| IAF | NYSE American | abrdn Australia Equity Fund, Inc. | $ | 0.1200 | ||||
| IFN | NYSE | The India Fund, Inc. | $ | 0.4600 | ||||
| JEQ | NYSE | abrdn Japan Equity Fund, Inc. | $ | 0.1100 | ||||
| THQ | NYSE | abrdn Healthcare Opportunities Fund | $ | 0.1800 | ||||
Each Fund has adopted a distribution policy to provide investors with a stable distribution out of current income, supplemented by realized capital gains and, to the extent necessary, paid-in capital.
For the abrdn Healthcare Investors (HQH), abrdn Life Sciences Investors (HQL), abrdn Australia Equity Fund, Inc. (IAF), the India Fund Inc. (IFN) and abrdn Japan Equity Fund, Inc. (JEQ) the stock distributions were automatically paid in newly issued shares of the Fund unless otherwise instructed by the shareholder to be paid in cash. Shares of common stock were issued at the lower of the net asset value (“NAV”) per share or the market price per share with a floor for the NAV of not less than 95% of the market price on March 19, 2025. The reinvestment prices per share for these distributions were as follows: $16.63 for abrdn Healthcare Investors (HQH); $12.99 for abrdn Life Sciences Investors (HQL); $4.045 for abrdn Australia Equity Fund, Inc. (IAF); $15.45 for the India Fund, Inc. (IFN) and $6.73 for abrdn Japan Equity Fund, Inc. (JEQ). Fractional shares were generally settled in cash, except for registered shareholders with book entry accounts at Computershare Investor Services who had whole and fractional shares added to their account.
To have received the abrdn Healthcare Investors (HQH), abrdn Life Sciences Investors (HQL), abrdn Australia Equity Fund, Inc. (IAF), the India Fund Inc. (IFN) and abrdn Japan Equity Fund, Inc. (JEQ) quarterly distributions payable in March 2025 in cash instead of shares of common stock, for shareholders who hold shares in “street name,” the bank, brokerage or nominee who holds the shares must have advised the Depository Trust Company as to the full and fractional shares for which they want the distribution paid in cash by March 18, 2025; and for shares that are held in registered form, written notification for the election of cash by registered shareholders must have been received by Computershare Investor Services prior to March 18, 2025.
As announced on March 11, 2025, to avoid potential disruption to the timing of the proposed tender offer, the Board of Directors of JEQ suspended the Fund’s managed distribution policy after payment of this distribution payable.
Under applicable U.S. tax rules, the amount and character of distributable income for each Fund’s fiscal year can be finally determined only as of the end of the Fund’s fiscal year. However, under Section 19 of the Investment Company Act of 1940, as amended (the “1940 Act”) and related rules, the Funds may be required to indicate to shareholders the estimated source of certain distributions to shareholders.
The following tables set forth the estimated amounts of the sources of the distributions for purposes of Section 19 of the 1940 Act and the rules adopted thereunder. The tables have been computed based on generally accepted accounting principles. The tables include estimated amounts and percentages for the current distributions paid this month as well as for the cumulative distributions paid relating to fiscal year to date, from the following sources: net investment income; net realized short-term capital gains; net realized long-term capital gains; and return of capital. The estimated compositions of the distributions may vary because the estimated composition may be impacted by future income, expenses and realized gains and losses on securities and currencies.
The Funds’ estimated sources of the current distribution paid this month and for its current fiscal year to date are as follows:
| Estimated Amounts of Current Distribution per Share | ||||||||||||||||||||||||||||||||||||
| Fund | Distribution Amount | Net Investment Income | Net Realized Short-Term Gains** | Net Realized Long-Term Gains | Return of Capital | |||||||||||||||||||||||||||||||
| ASGI | $ | 0.1900 | $ | 0.0133 | 7 | % | - | - | $ | 0.1140 | 60 | % | $ | 0.0627 | 33 | % | ||||||||||||||||||||
| HQH | $ | 0.5700 | - | - | $ | 0.0456 | 8 | % | - | - | $ | 0.5244 | 92 | % | ||||||||||||||||||||||
| HQL | $ | 0.4700 | - | - | $ | 0.1260 | 27 | % | - | - | $ | 0.3440 | 73 | % | ||||||||||||||||||||||
| IAF | $ | 0.1200 | $ | 0.0180 | 15 | % | - | - | $ | 0.0264 | 22 | % | $ | 0.0756 | 63 | % | ||||||||||||||||||||
| IFN | $ | 0.4600 | - | - | - | - | $ | 0.4600 | 100 | % | - | - | ||||||||||||||||||||||||
| JEQ | $ | 0.1100 | $ | 0.0242 | 22 | % | - | - | - | - | $ | 0.0858 | 78 | % | ||||||||||||||||||||||
| THQ | $ | 0.1800 | - | - | $ | 0.0198 | 11 | % | - | - | $ | 0.1602 | 89 | % | ||||||||||||||||||||||
| Estimated Amounts of Fiscal Year* to Date Cumulative Distributions per Share | ||||||||||||||||||||||||||||||||||||
| Fund | Distribution Amount | Net Investment Income | Net Realized Short-Term Gains** | Net Realized Long-Term Gains | Return of Capital | |||||||||||||||||||||||||||||||
| ASGI | $ | 1.2000 | $ | 0.0840 | 7 | % | - | - | $ | 0.7200 | 60 | % | $ | 0.3960 | 33 | % | ||||||||||||||||||||
| HQH | $ | 1.1900 | - | - | $ | 0.0952 | 8 | % | - | - | $ | 1.0948 | 92 | % | ||||||||||||||||||||||
| HQL | $ | 0.9700 | - | - | $ | 0.2600 | 27 | % | - | - | $ | 0.7100 | 73 | % | ||||||||||||||||||||||
| IAF | $ | 0.2500 | $ | 0.0375 | 15 | % | - | - | $ | 0.0550 | 22 | % | $ | 0.1575 | 63 | % | ||||||||||||||||||||
| IFN | $ | 0.4600 | - | - | - | - | $ | 0.4600 | 100 | % | - | - | ||||||||||||||||||||||||
| JEQ | $ | 0.2300 | $ | 0.0506 | 22 | % | - | - | - | - | $ | 0.1794 | 78 | % | ||||||||||||||||||||||
| THQ | $ | 1.0800 | - | - | $ | 0.1188 | 11 | % | - | - | $ | 0.9612 | 89 | % | ||||||||||||||||||||||
* ASGI, HQH, HQL and THQ have a 9/30 fiscal year end. IAF and JEQ have a 10/31 fiscal year end. IFN has a 12/31 fiscal year end.
**includes currency gains
Where the estimated amounts above show a portion of the distribution to be a “Return of Capital,” it means that Fund estimates that it has distributed more than its income and capital gains; therefore, a portion of your distribution may be a return of capital. A return of capital may occur for example, when some or all the money that you invested in a Fund is paid back to you. A return of capital distribution does not necessarily reflect the Fund’s investment performance and should not be confused with “yield” or “income.”
The amounts and sources of distributions reported in this notice are only estimates and are not being provided for tax reporting purposes. The final determination of the source of all distributions for the current year will only be made after year-end. The actual amounts and sources of the amounts for tax reporting purposes will depend upon the Fund’s investment experience during the remainder of the fiscal year and may be subject to change based on tax regulations. After the end of each calendar year, a Form 1099-DIV will be sent to shareholders for the prior calendar year that will tell you how to report these distributions for federal income tax purposes.
The following tables provide the Funds’ total return performance based on net asset value (NAV) over various time periods compared to the Funds’ annualized and cumulative distribution rates.
| Fund Performance and Distribution Rate Information | ||||||||||||||||
| Fund | Average Annual Total Return on NAV for the 5 Year Period Ending 02/28/20251 | Current Fiscal Period’s Annualized Distribution Rate on NAV | Cumulative Total Return on NAV1 | Cumulative Distribution Rate on NAV2 | ||||||||||||
| ASGI3 | 8.10 | %3 | 11.89 | % | -2.55 | % | 5.07 | % | ||||||||
| THQ | 10.04 | % | 10.27 | % | -3.71 | % | 4.28 | % | ||||||||
1 Return data is net of all Fund expenses and fees and assumes the reinvestment of all distributions reinvested at prices obtained under the Fund’s dividend reinvestment plan.
2 Based on the Fund’s NAV as of February 28, 2025.
3 The Fund launched within the past 5 years; the performance and distribution rate information presented reflects data from inception (July 29, 2020) through February 28, 2025.
| Fund Performance and Distribution Rate Information | ||||||||||||||||
| Fund | Average Annual Total Return on NAV for the 5 Year Period Ending 01/31/20251 | Current Fiscal Period’s Annualized Distribution Rate on NAV | Cumulative Total Return on NAV1 | Cumulative Distribution Rate on NAV2 | ||||||||||||
| HQH | 7.34 | % | 12.70 | % | -0.35 | % | 3.17 | % | ||||||||
| HQL | 6.83 | % | 12.75 | % | -0.76 | % | 3.19 | % | ||||||||
| IAF | 8.09 | % | 10.57 | % | 0.94 | % | 2.67 | % | ||||||||
| IFN | 8.25 | % | N/A | * | -5.95 | % | N/A | * | ||||||||
| JEQ | 3.41 | % | 6.87 | % | 2.51 | % | 1.72 | % | ||||||||
1 Return data is net of all Fund expenses and fees and assumes the reinvestment of all distributions reinvested at prices obtained under the Fund’s dividend reinvestment plan.
2 Based on the Fund’s NAV as of January 31, 2025.
Shareholders should not draw any conclusions about a Fund’s investment performance from the amount of the Fund’s current distributions or from the terms of the distribution policy (the “Distribution Policy”).
While NAV performance may be indicative of the Fund’s investment performance, it does not measure the value of a shareholder’s investment in the Fund. The value of a shareholder’s investment in the Fund is determined by the Fund’s market price, which is based on the supply and demand for the Fund’s shares in the open market.
Pursuant to an exemptive order granted by the Securities and Exchange Commission, the Funds may distribute any long-term capital gains more frequently than the limits provided in Section 19(b) under the 1940 Act and Rule 19b-1 thereunder. Therefore, distributions paid by the Funds during the year may include net income, short-term capital gains, long-term capital gains and/or a return of capital. Net income dividends and short-term capital gain dividends, while generally taxable at ordinary income rates, may be eligible, to the extent of qualified dividend income earned by the Funds, to be taxed at a lower rate not to exceed the maximum rate applicable to your long-term capital gains. Distributions made in any calendar year in excess of investment company taxable income and net capital gain are treated as taxable ordinary dividends to the extent of undistributed earnings and profits, and then as a return of capital that reduces the adjusted basis in the shares held. To the extent return of capital distributions exceed the adjusted basis in the shares held, capital gain is recognized with a holding period based on the period the shares have been held at the date such amount is received.
The payment of distributions in accordance with the Distribution Policy may result in a decrease in the Fund’s net assets. A decrease in the Fund’s net assets may cause an increase in the Fund’s annual operating expense ratio and a decrease in the Fund’s market price per share to the extent the market price correlates closely to the Fund’s net asset value per share. The Distribution Policy may also negatively affect the Fund’s investment activities to the extent that the Fund is required to hold larger cash positions than it typically would hold or to the extent that the Fund must liquidate securities that it would not have sold, for the purpose of paying the distribution. Each Fund’s Board has the right to amend, suspend or terminate the Distribution Policy at any time. The amendment, suspension or termination of the Distribution Policy may affect the Fund’s market price per share. Investors should consult their tax advisor regarding federal, state, and local tax considerations that may be applicable in their particular circumstances.
Circular 230 disclosure: To ensure compliance with requirements imposed by the U.S. Treasury, we inform you that any U.S. tax advice contained in this communication (including any attachments) is not intended or written to be used, and cannot be used, for the purpose of (i) avoiding penalties under the Internal Revenue Code or (ii) promoting, marketing or recommending to another party any transaction or matter addressed herein.
In the United States, Aberdeen Investments is the marketing name for the following affiliated, registered investment advisers: abrdn Inc., abrdn Investments Limited, and abrdn Asia Limited.
Closed-end funds are traded on the secondary market through one of the stock exchanges. A Fund’s investment return and principal value will fluctuate so that an investor’s shares may be worth more or less than the original cost. Shares of closed-end funds may trade above (a premium) or below (a discount) the net asset value (NAV) of the fund’s portfolio. There is no assurance that a Fund will achieve its investment objective. Past performance does not guarantee future results.
Closed end funds | Aberdeen
###
Exhibit 99.(c)(5)
FOR IMMEDIATE RELEASE
For More Information Contact:
Aberdeen Investments U.S. Closed-End Funds
Investor Relations
1-800-522-5465
Investor.Relations@aberdeenplc.com
ABERDEEN INVESTMENTS U.S. CLOSED-END FUNDS
ANNOUNCE DISTRIBUTION PAYMENT DETAILS
(Philadelphia, April 30, 2025) - The Aberdeen Investments U.S. Closed-End Funds (NYSE: ASGI, THQ) (the “Funds” or individually the “Fund”), today announced that the Funds paid the distributions noted in the table below on April 30, 2025, on a per share basis to all shareholders of record as of April 23, 2025 (ex-dividend date April 23, 2025).
| Ticker | Exchange | Fund | Amount | |||||
| ASGI | NYSE | abrdn Global Infrastructure Income Fund | $ | 0.2000 | ||||
| THQ | NYSE | abrdn Healthcare Opportunities Fund | $ | 0.1800 | ||||
Each Fund has adopted a distribution policy to provide investors with a stable distribution out of current income, supplemented by realized capital gains and, to the extent necessary, paid-in capital.
Under applicable U.S. tax rules, the amount and character of distributable income for each Fund’s fiscal year can be finally determined only as of the end of the Fund’s fiscal year. However, under Section 19 of the Investment Company Act of 1940, as amended (the “1940 Act”) and related rules, the Funds may be required to indicate to shareholders the estimated source of certain distributions to shareholders.
The following tables set forth the estimated amounts of the sources of the distributions for purposes of Section 19 of the 1940 Act and the rules adopted thereunder. The tables have been computed based on generally accepted accounting principles. The tables include estimated amounts and percentages for the current distributions paid this month as well as for the cumulative distributions paid relating to fiscal year to date, from the following sources: net investment income; net realized short-term capital gains; net realized long-term capital gains; and return of capital. The estimated compositions of the distributions may vary because the estimated composition may be impacted by future income, expenses and realized gains and losses on securities and currencies.
The Funds’ estimated sources of the current distribution paid this month and for its current fiscal year to date are as follows:
| Estimated Amounts of Current Distribution per Share | ||||||||||||||||||||||||||||||||||||
| Fund | Distribution Amount | Net Investment Income | Net Realized Short-Term Gains** | Net Realized Long-Term Gains | Return of Capital | |||||||||||||||||||||||||||||||
| ASGI | $ | 0.2000 | $ | 0.0180 | 9 | % | $ | 0.0020 | 1 | % | $ | 0.1100 | 55 | % | $ | 0.0700 | 35 | % | ||||||||||||||||||
| THQ | $ | 0.1800 | - | - | $ | 0.0342 | 19 | % | - | - | $ | 0.1458 | 81 | % | ||||||||||||||||||||||
| Estimated Amounts of Fiscal Year* to Date Cumulative Distributions per Share | ||||||||||||||||||||||||||||||||||||
| Fund | Distribution Amount | Net Investment Income | Net Realized Short-Term Gains ** | Net Realized Long-Term Gains | Return of Capital | |||||||||||||||||||||||||||||||
| ASGI | $ | 1.4000 | $ | 0.1260 | 9 | % | $ | 0.0140 | 1 | % | $ | 0.7700 | 55 | % | $ | 0.4900 | 35 | % | ||||||||||||||||||
| THQ | $ | 1.2600 | - | - | $ | 0.2394 | 19 | % | - | - | $ | 1.0206 | 81 | % | ||||||||||||||||||||||
* ASGI and THQ have a 9/30 fiscal year end.
**includes currency gains
Where the estimated amounts above show a portion of the distribution to be a “Return of Capital,” it means that Fund estimates that it has distributed more than its income and capital gains; therefore, a portion of your distribution may be a return of capital. A return of capital may occur for example, when some or all the money that you invested in a Fund is paid back to you. A return of capital distribution does not necessarily reflect the Fund’s investment performance and should not be confused with “yield” or “income.”
The amounts and sources of distributions reported in this notice are only estimates and are not being provided for tax reporting purposes. The final determination of the source of all distributions for the current year will only be made after year-end. The actual amounts and sources of the amounts for tax reporting purposes will depend upon the Fund’s investment experience during the remainder of the fiscal year and may be subject to change based on tax regulations. After the end of each calendar year, a Form 1099-DIV will be sent to shareholders for the prior calendar year that will tell you how to report these distributions for federal income tax purposes.
The following tables provide the Funds’ total return performance based on net asset value (NAV) over various time periods compared to the Funds’ annualized and cumulative distribution rates.
| Fund Performance and Distribution Rate Information | ||||||||||||||||
| Fund | Average Annual Total Return on NAV for the 5 Year Period Ending 03/31/20251 | Current Fiscal Period’s Annualized Distribution Rate on NAV | Cumulative Total Return on NAV1 | Cumulative Distribution Rate on NAV2 | ||||||||||||
| ASGI3 | 8.68 | %3 | 11.63 | % | 0.57 | % | 5.92 | % | ||||||||
| THQ | 11.08 | % | 10.66 | % | -6.41 | % | 5.33 | % | ||||||||
1 Return data is net of all Fund expenses and fees and assumes the reinvestment of all distributions reinvested at prices obtained under the Fund’s dividend reinvestment plan.
2Based on the Fund’s NAV as of March 31, 2025.
3 The Fund launched within the past 5 years; the performance and distribution rate information presented reflects data from inception (July 29, 2020) through March 31, 2025.
Shareholders should not draw any conclusions about a Fund’s investment performance from the amount of the Fund’s current distributions or from the terms of the distribution policy (the “Distribution Policy”).
While NAV performance may be indicative of the Fund’s investment performance, it does not measure the value of a shareholder’s investment in the Fund. The value of a shareholder’s investment in the Fund is determined by the Fund’s market price, which is based on the supply and demand for the Fund’s shares in the open market.
Pursuant to an exemptive order granted by the Securities and Exchange Commission, the Funds may distribute any long-term capital gains more frequently than the limits provided in Section 19(b) under the 1940 Act and Rule 19b-1 thereunder. Therefore, distributions paid by the Funds during the year may include net income, short-term capital gains, long-term capital gains and/or a return of capital. Net income dividends and short-term capital gain dividends, while generally taxable at ordinary income rates, may be eligible, to the extent of qualified dividend income earned by the Funds, to be taxed at a lower rate not to exceed the maximum rate applicable to your long-term capital gains. Distributions made in any calendar year in excess of investment company taxable income and net capital gain are treated as taxable ordinary dividends to the extent of undistributed earnings and profits, and then as a return of capital that reduces the adjusted basis in the shares held. To the extent return of capital distributions exceed the adjusted basis in the shares held, capital gain is recognized with a holding period based on the period the shares have been held at the date such amount is received.
The payment of distributions in accordance with the Distribution Policy may result in a decrease in the Fund’s net assets. A decrease in the Fund’s net assets may cause an increase in the Fund’s annual operating expense ratio and a decrease in the Fund’s market price per share to the extent the market price correlates closely to the Fund’s net asset value per share. The Distribution Policy may also negatively affect the Fund’s investment activities to the extent that the Fund is required to hold larger cash positions than it typically would hold or to the extent that the Fund must liquidate securities that it would not have sold, for the purpose of paying the distribution. Each Fund’s Board has the right to amend, suspend or terminate the Distribution Policy at any time. The amendment, suspension or termination of the Distribution Policy may affect the Fund’s market price per share. Investors should consult their tax advisor regarding federal, state, and local tax considerations that may be applicable in their particular circumstances.
Circular 230 disclosure: To ensure compliance with requirements imposed by the U.S. Treasury, we inform you that any U.S. tax advice contained in this communication (including any attachments) is not intended or written to be used, and cannot be used, for the purpose of (i) avoiding penalties under the Internal Revenue Code or (ii) promoting, marketing or recommending to another party any transaction or matter addressed herein.
In the United States, Aberdeen Investments is the marketing name for the following affiliated, registered investment advisers: abrdn Inc., abrdn Investments Limited, and abrdn Asia Limited.
Closed-end funds are traded on the secondary market through one of the stock exchanges. A Fund’s investment return and principal value will fluctuate so that an investor’s shares may be worth more or less than the original cost. Shares of closed-end funds may trade above (a premium) or below (a discount) the net asset value (NAV) of the fund’s portfolio. There is no assurance that a Fund will achieve its investment objective. Past performance does not guarantee future results.
Closed end funds | Aberdeen
###
Exhibit 99.(c)(6)
FOR IMMEDIATE RELEASE
For More Information Contact:
Aberdeen Investments U.S. Closed-End Funds
Investor Relations
1-800-522-5465
Investor.Relations@aberdeenplc.com
ABERDEEN INVESTMENTS
U.S. CLOSED-END FUNDS
ANNOUNCE DISTRIBUTION PAYMENT DETAILS
(Philadelphia, May 30, 2025) - The Aberdeen Investments U.S. Closed-End Funds (NYSE: ASGI, THQ) (the “Funds” or individually the “Fund”), today announced that the Funds paid the distributions noted in the table below on May 30, 2025, on a per share basis to all shareholders of record as of May 22, 2025 (ex-dividend date May 22, 2025).
| Ticker | Exchange | Fund | Amount | |||||
| ASGI | NYSE | abrdn Global Infrastructure Income Fund | $ | 0.2000 | ||||
| THQ | NYSE | abrdn Healthcare Opportunities Fund | $ | 0.1800 | ||||
Each Fund has adopted a distribution policy to provide investors with a stable distribution out of current income, supplemented by realized capital gains and, to the extent necessary, paid-in capital.
Under applicable U.S. tax rules, the amount and character of distributable income for each Fund’s fiscal year can be finally determined only as of the end of the Fund’s fiscal year. However, under Section 19 of the Investment Company Act of 1940, as amended (the “1940 Act”) and related rules, the Funds may be required to indicate to shareholders the estimated source of certain distributions to shareholders.
The following tables set forth the estimated amounts of the sources of the distributions for purposes of Section 19 of the 1940 Act and the rules adopted thereunder. The tables have been computed based on generally accepted accounting principles. The tables include estimated amounts and percentages for the current distributions paid this month as well as for the cumulative distributions paid relating to fiscal year to date, from the following sources: net investment income; net realized short-term capital gains; net realized long-term capital gains; and return of capital. The estimated compositions of the distributions may vary because the estimated composition may be impacted by future income, expenses and realized gains and losses on securities and currencies.
The Funds’ estimated sources of the current distribution paid this month and for its current fiscal year to date are as follows:
| Estimated Amounts of Current Distribution per Share | ||||||||||||||||||||||||||||||||||||
| Fund | Distribution Amount | Net Investment Income | Net Realized Short-Term Gains** | Net Realized Long-Term Gains | Return of Capital | |||||||||||||||||||||||||||||||
| ASGI | $ | 0.2000 | $ | 0.0240 | 12 | % | $ | 0.0020 | 1 | % | $ | 0.1040 | 52 | % | $ | 0.0700 | 35 | % | ||||||||||||||||||
| THQ | $ | 0.1800 | - | - | $ | 0.0180 | 10 | % | - | - | $ | 0.1620 | 90 | % | ||||||||||||||||||||||
| Estimated Amounts of Fiscal Year* to Date Cumulative Distributions per Share | ||||||||||||||||||||||||||||||||||||
| Fund | Distribution Amount | Net Investment Income | Net Realized Short-Term Gains ** | Net Realized Long-Term Gains | Return of Capital | |||||||||||||||||||||||||||||||
| ASGI | $ | 1.6000 | $ | 0.1920 | 12 | % | $ | 0.0160 | 1 | % | $ | 0.8320 | 52 | % | $ | 0.5600 | 35 | % | ||||||||||||||||||
| THQ | $ | 1.4400 | - | - | $ | 0.1440 | 10 | % | - | - | $ | 1.2960 | 90 | % | ||||||||||||||||||||||
* ASGI and THQ have a 9/30 fiscal year end.
**includes currency gains
Where the estimated amounts above show a portion of the distribution to be a “Return of Capital,” it means that Fund estimates that it has distributed more than its income and capital gains; therefore, a portion of your distribution may be a return of capital. A return of capital may occur for example, when some or all the money that you invested in a Fund is paid back to you. A return of capital distribution does not necessarily reflect the Fund’s investment performance and should not be confused with “yield” or “income.”
The amounts and sources of distributions reported in this notice are only estimates and are not being provided for tax reporting purposes. The final determination of the source of all distributions for the current year will only be made after year-end. The actual amounts and sources of the amounts for tax reporting purposes will depend upon the Fund’s investment experience during the remainder of the fiscal year and may be subject to change based on tax regulations. After the end of each calendar year, a Form 1099-DIV will be sent to shareholders for the prior calendar year that will tell you how to report these distributions for federal income tax purposes.
The following tables provide the Funds’ total return performance based on net asset value (NAV) over various time periods compared to the Funds’ annualized and cumulative distribution rates.
| Fund Performance and Distribution Rate Information | ||||||||||||||||
| Fund | Average Annual Total Return on NAV for the 5 Year Period Ending 04/30/20251 | Current Fiscal Period’s Annualized Distribution Rate on NAV | Cumulative Total Return on NAV1 | Cumulative Distribution Rate on NAV2 | ||||||||||||
| ASGI3 | 9.44 | %3 | 11.59 | % | 4.70 | % | 6.72 | % | ||||||||
| THQ | 7.37 | % | 11.26 | % | -10.61 | % | 6.57 | % | ||||||||
1 Return data is net of all Fund expenses and fees and assumes the reinvestment of all distributions reinvested at prices obtained under the Fund’s dividend reinvestment plan.
2Based on the Fund’s NAV as of April 30, 2025.
3 The Fund launched within the past 5 years; the performance and distribution rate information presented reflects data from inception (July 29, 2020) through April 30, 2025.
Shareholders should not draw any conclusions about a Fund’s investment performance from the amount of the Fund’s current distributions or from the terms of the distribution policy (the “Distribution Policy”).
While NAV performance may be indicative of the Fund’s investment performance, it does not measure the value of a shareholder’s investment in the Fund. The value of a shareholder’s investment in the Fund is determined by the Fund’s market price, which is based on the supply and demand for the Fund’s shares in the open market.
Pursuant to an exemptive order granted by the Securities and Exchange Commission, the Funds may distribute any long-term capital gains more frequently than the limits provided in Section 19(b) under the 1940 Act and Rule 19b-1 thereunder. Therefore, distributions paid by the Funds during the year may include net income, short-term capital gains, long-term capital gains and/or a return of capital. Net income dividends and short-term capital gain dividends, while generally taxable at ordinary income rates, may be eligible, to the extent of qualified dividend income earned by the Funds, to be taxed at a lower rate not to exceed the maximum rate applicable to your long-term capital gains. Distributions made in any calendar year in excess of investment company taxable income and net capital gain are treated as taxable ordinary dividends to the extent of undistributed earnings and profits, and then as a return of capital that reduces the adjusted basis in the shares held. To the extent return of capital distributions exceed the adjusted basis in the shares held, capital gain is recognized with a holding period based on the period the shares have been held at the date such amount is received.
The payment of distributions in accordance with the Distribution Policy may result in a decrease in the Fund’s net assets. A decrease in the Fund’s net assets may cause an increase in the Fund’s annual operating expense ratio and a decrease in the Fund’s market price per share to the extent the market price correlates closely to the Fund’s net asset value per share. The Distribution Policy may also negatively affect the Fund’s investment activities to the extent that the Fund is required to hold larger cash positions than it typically would hold or to the extent that the Fund must liquidate securities that it would not have sold, for the purpose of paying the distribution. Each Fund’s Board has the right to amend, suspend or terminate the Distribution Policy at any time. The amendment, suspension or termination of the Distribution Policy may affect the Fund’s market price per share. Investors should consult their tax advisor regarding federal, state, and local tax considerations that may be applicable in their particular circumstances.
Circular 230 disclosure: To ensure compliance with requirements imposed by the U.S. Treasury, we inform you that any U.S. tax advice contained in this communication (including any attachments) is not intended or written to be used, and cannot be used, for the purpose of (i) avoiding penalties under the Internal Revenue Code or (ii) promoting, marketing or recommending to another party any transaction or matter addressed herein.
Aberdeen Investments Global is the trade name of Aberdeen's investments business, herein referred to as "Aberdeen Investments" or "Aberdeen". In the United States, Aberdeen Investments refers to the following affiliated, registered investment advisers: abrdn Inc., abrdn Investments Limited, and abrdn Asia Limited.
Closed-end funds are traded on the secondary market through one of the stock exchanges. A Fund’s investment return and principal value will fluctuate so that an investor’s shares may be worth more or less than the original cost. Shares of closed-end funds may trade above (a premium) or below (a discount) the net asset value (NAV) of the fund’s portfolio. There is no assurance that a Fund will achieve its investment objective. Past performance does not guarantee future results.
Closed end funds | Aberdeen
###