
UNITED STATES
SECURITIES AND EXCHANGE COMMISSION
Washington, D.C. 20549
FORM N-CSR
CERTIFIED SHAREHOLDER REPORT OF REGISTERED
MANAGEMENT INVESTMENT COMPANIES
| Investment Company Act file number | 811-02224 | |
| MML Series Investment Fund | ||
| (Exact name of registrant as specified in charter) | ||
| 1295 State Street, Springfield, MA 01111 | ||
| (Address of principal executive offices) | (Zip code) | |
| Paul LaPiana | ||
| 1295 State Street, Springfield, MA 01111 | ||
| (Name and address of agent for service) | ||
| Registrant's telephone number, including area code: | (413) 744-1000 |
| Date of fiscal year end: | 12/31/2022 |
| Date of reporting period: | 12/31/2022 |
Item 1. Reports to Stockholders.
| (a) | The Report to Stockholders is attached herewith. |
Table of Contents |
|
MML Sustainable Equity Fund (formerly known as MML Growth & Income Fund) |
|
This material must be preceded or accompanied by a current prospectus (or summary prospectus, if available) for the MML Series Investment Fund. Investors should consider a Fund’s investment objective, risks, and charges and expenses carefully before investing. This and other information about the investment company is available in the prospectus (or summary prospectus, if available). Read it carefully before investing.
[THIS PAGE INTENTIONALLY LEFT BLANK]
MML Series Investment Fund Annual Report – President’s Letter to Shareholders (Unaudited) |
To Our Shareholders

Paul LaPiana
“At MassMutual, our goal is to help you build the future you want for yourself and your family. We want to help you with your retirement plans today, so you can feel more comfortable about tomorrow.”
December 31, 2022
Continued market volatility challenges retirement investors
I am pleased to present you with the MML Series Investment Fund Annual Report. During the fiscal year ended December 31, 2022, U.S. stocks were down over 18%, with many investors concerned about the likelihood of a recession, as the U.S. Federal Reserve Board (the “Fed”) aggressively tightened monetary policy to combat heightened inflation. Stocks in foreign developed markets and emerging markets also experienced significant losses in the fiscal year, hurt by elevated energy prices, a strengthening U.S. dollar, and concerns that consumer spending and corporate earnings growth would slow. U.S. bond investors experienced negative returns in the rising interest rate environment, fueled by aggressive interest rate hikes by the Fed that were aimed at reducing demand-driven inflationary pressures.
Suggestions for retirement investors under any market conditions
|
● |
You are likely in it for the long term. Retirement planning involves what financial professionals refer to as “long-term investing,” since most people save and invest for retirement throughout their working years. Even in retirement, many individuals will systematically withdraw their retirement savings over a number of years, keeping a portion of their funds invested. Although the financial markets will go up and down, individuals who take a long-term approach to investing don’t focus on current headlines – because they realize that they have time to ride out the downturns. |
|
● |
Keep contributing. While you have no control over the investment markets, you can control how often and how much you contribute to your retirement account. Saving as much as possible and increasing your contributions regularly is one way retirement investors can help boost their retirement savings, regardless of the performance of the stock and bond markets. |
|
● |
Invest continually.1 Financial professionals often advise their clients to stay in the market, regardless of short-term results. Here’s why: Those who can invest in all market conditions have the potential to be rewarded even during market downturns, when more favorable prices may enable them to accumulate larger positions. |
|
● |
Monitor your asset allocation and diversify. Stocks, bonds, and short-term/money market investments are asset classes that tend to behave differently, depending upon the economic and market environment. These broad asset classes contain an even greater array of asset sub-categories (such as small-cap stocks, international stocks, and high-yield bonds). Most financial professionals agree that investors can take advantage of different opportunities in the market and reduce the risk of over-exposure to one or two poorly performing asset types by selecting a number of investments that represent a mix of asset classes and sub-categories. |
1 Systematic investing and asset allocation do not ensure a profit or protect against loss in a declining market. Systematic investing involves continuous investment in securities regardless of fluctuating price levels. Investors should consider their ability to continue investing through periods of low price levels.
1
MML Series Investment Fund Annual Report – President’s Letter to Shareholders (Unaudited) (Continued) |
Is this a good time to track your progress?
If you work with a financial professional, you may wish to consider checking in with him or her to help you determine if:
|
● |
you are saving enough for retirement – and, if in retirement, you are withdrawing an appropriate amount each year, based on your personal circumstances; |
|
● |
your retirement account is invested appropriately for all market conditions, based on your goals and objectives, as well as your investment time horizon; and |
|
● |
you are taking steps to help reduce your longevity risk, which is the chance that you could “run out” of retirement savings during your lifetime. |
Get to where you want to be
At MassMutual, our goal is to help you build the future you want for yourself and your family. We want to help you with your retirement plans today, so you can feel more comfortable about tomorrow. That’s why we continue to encourage you to maintain perspective when it comes to retirement investing, regardless of any headline-making events. MassMutual’s view is that changing market conditions have the potential to reward patient investors. Thank you for your continued confidence and trust in MassMutual.
Sincerely,

Paul LaPiana
President
MML Series Investment Fund
MML Investment Advisers, LLC
The information provided is the opinion of MML Investment Advisers, LLC (MML Advisers) and is subject to change without notice. It is not to be construed as tax, legal, or investment advice. Past performance does not guarantee future results.
Underwriter: MML Distributors, LLC. (MMLD) Member FINRA and SIPC (www.FINRA.org and www.SIPC.org), 1295 State Street, Springfield, MA 01111-0001. MMLD is a wholly-owned subsidiary of MassMutual. Investment advisory services provided to the Funds by MML Advisers, a wholly-owned subsidiary of MassMutual.
© 2023 Massachusetts Mutual Life Insurance Company (MassMutual®), Springfield, MA 01111-0001. All rights reserved www.MassMutual.com.
MM202401-303982
2
MML Series Investment Fund Annual Report – Economic and Market Overview (Unaudited) |
Continued market volatility challenges retirement investors
During the fiscal year ended December 31, 2022, U.S. stocks were down over 18%, with many investors concerned about the likelihood of a recession, as the U.S. Federal Reserve Board (the “Fed”) aggressively tightened monetary policy to combat heightened inflation. Stocks in foreign developed markets and emerging markets also experienced significant losses in the fiscal year, hurt by elevated energy prices, the strengthening U.S. dollar, and concerns that consumer spending and corporate earnings growth would slow. U.S. bond investors experienced negative returns in the rising interest rate environment, fueled by aggressive interest rate hikes by the Fed that were aimed at reducing demand-driven inflationary pressures.
Market Highlights
|
● |
For the reporting period from January 1, 2022 through December 31, 2022, U.S. stocks were down over 18%, in a market environment where the Fed aggressively raised interest rates in an effort to combat heightened inflation. |
|
● |
In the first quarter of 2022, investors in both stocks and bonds were challenged by a sharp rise in energy prices after Russia’s unexpected invasion of Ukraine, a stalled economic stimulus plan, and the Fed raising interest rates for the first time since 2018. |
|
● |
The second quarter of 2022 was another difficult quarter, as the Fed continued to raise interest rates, investor concerns over high inflation, and concerns about the potential of an impending global recession dominated the narrative. |
|
● |
The third quarter of 2022 was an extension of the difficult second quarter, with continued inflationary pressures, weakening economic data, and aggressive Fed interest rate hikes. |
|
● |
In the fourth quarter of 2022, investors experienced a bear market rally, as their concerns persisted regarding high inflation, high interest rates, and the potential of an impending global recession. |
|
● |
Foreign stocks in developed markets and emerging markets also experienced losses in the fiscal year, against the backdrop of Russia’s invasion of Ukraine (and the resulting economic sanctions that kept energy prices elevated), the strengthening U.S. dollar, and threatened consumer spending and corporate earnings growth. |
|
● |
U.S. bond investors experienced negative returns in the rising interest rate environment, fueled by an increase in short-term interest rates, heighted inflationary pressures, and the reversal of monetary and fiscal policy support. |
Market Environment
For the fiscal year beginning on January 1, 2022, global stock investors experienced significant losses. U.S. stocks fell sharply in the period in response, with the S&P 500 Index®* (“S&P 500”) entering bear market territory after declining more than 20% from its previous highs. Investors sought safety from high inflation, rising interest rates, and the increasing possibility of a recession. Consumer sentiment fell sharply, down 15.7% in the period1, as high inflation – driven by rising energy, food, and housing costs – overwhelmed low unemployment and strong wage growth. As of November 2022, consumer loan levels were at record highs, having increased by 11.8% year-over-year2, as more Americans are borrowing to make ends meet in these inflationary times.
* Indexes referenced, other than the MSCI Indexes, are unmanaged, do not incur fees, expenses, or taxes, and cannot be purchased directly for investment. The MSCI Indexes are unmanaged, do not incur fees or expenses, and cannot be purchased directly for investment.
1 University of Michigan: Consumer Sentiment (UMCSENT), retrieved from FRED, Federal Reserve Bank of St. Louis;
https://fred.stlouisfed.org/series/UMCSENT, December 23, 2022.
2 Board of Governors of the Federal Reserve System (US), Consumer Loans, All Commercial Banks [CONSUMER], retrieved from FRED, Federal Reserve Bank of St. Louis; https://fred.stlouisfed.org/series/CONSUMER, December 30, 2022.
3
MML Series Investment Fund Annual Report – Economic and Market Overview (Unaudited) (Continued) |
As a result, the broad market S&P 500 fell 18.11% for the period. The technology-heavy NASDAQ Composite Index performed even worse, dropping 32.54%. The more economically sensitive Dow Jones Industrial AverageSM was down 6.86%. During the reporting period, small-cap stocks underperformed their larger-cap peers, while value stocks outperformed their growth brethren. The communication services, consumer discretionary, information technology, and real estate sectors were all down by 25% or more for the period. The energy sector was the strongest performer for the fiscal year, up 65.72%, aided by a 6.6% increase in the price of West Texas Intermediate (WTI) crude oil. The utilities sector also ended the period positively, gaining 1.57% for the period.
Developed international markets, as measured by the MSCI EAFE® Index, generally outperformed their domestic peers, ending the fiscal year down 14.45%. Emerging-market stocks, as measured by the MSCI Emerging Markets Index, also fell sharply, ending down 20.09% for the period. Investors sold off developed international and emerging-market stocks on concerns that higher interest rates and commodity prices would impair consumer spending and corporate earnings growth.
Bond yields rose sharply during the fiscal year, with the 10-year U.S. Treasury bond yield rising from a low of 1.63% on January 1, 2022 to close the period at 3.88%. Rising yields generally produce falling bond prices; consequently, bond index returns suffered. The Bloomberg U.S. Aggregate Bond Index ended the period down 13.01%. Investment-grade corporate bonds fared even worse. The Bloomberg U.S. Corporate Bond Index, which tracks investment-grade corporate bonds, ended the period with a 15.76% loss. The Bloomberg U.S. Corporate High-Yield Bond Index also ended in negative territory, declining 11.19% for the period.
Review and maintain your strategy
MassMutual is committed to putting our clients’ needs first. We use our innovative open-architecture platform to craft solutions that can help deliver in all stages of the investor’s journey. From building potential wealth to retiring comfortably, we work continually to help investors secure their futures and protect the ones they love. While the current market volatility, including the reality of market sell-offs, can test an investor’s mettle, we’d like to remind you that, as a retirement investor, it’s important to maintain perspective and have realistic expectations about the future performance of your investment accounts. As described in this report, financial markets can reverse suddenly with little or no notice. That’s why we continue to believe that retirement investors should create and maintain a plan that focuses on their goals, how long they have to invest, and how comfortable they are with market volatility. Our multi-managed and sub-advised mutual funds tap into the deep expertise of seasoned asset managers who are committed to helping long-term investors prepare for retirement – in all market conditions. As always, we recommend that you work with a personal financial professional, who can help you define an investment strategy that aligns with your comfort level with respect to market volatility, how long you have to save and invest, and your specific financial goals. Thank you for your confidence in MassMutual.
The information provided is the opinion of MML Investment Advisers, LLC (MML Advisers) and is subject to change without notice. It is not to be construed as tax, legal, or investment advice. Past performance does not guarantee future results.
Underwriter: MML Distributors, LLC. (MMLD) Member FINRA and SIPC (www.FINRA.org and www.SIPC.org), 1295 State Street, Springfield, MA 01111-0001. MMLD is a wholly-owned subsidiary of MassMutual. Investment advisory services provided to the Funds by MML Advisers, a wholly-owned subsidiary of MassMutual.
© 2023 Massachusetts Mutual Life Insurance Company (MassMutual®), Springfield, MA 01111-0001. All rights reserved www.MassMutual.com.
4
MML Allocation Series – Portfolio Manager Report (Unaudited) |
What are the investment approaches of the Funds that constitute the MML Allocation Series (the “Series”), and who is the Series’ investment adviser?
The MML Allocation Series comprises five Funds – each of which has a “fund of funds” structure. The five Funds in the Series are MML Conservative Allocation Fund, MML Balanced Allocation Fund, MML Moderate Allocation Fund, MML Growth Allocation Fund, and MML Aggressive Allocation Fund.
Each Fund seeks to achieve as high a total return over time as is considered consistent with prudent investment risk, preservation of capital, and recognition of the Fund’s stated asset allocation. Each Fund invests in a combination of U.S. domestic and international mutual funds (“MML Underlying Funds”) using an asset allocation strategy. MML Underlying Funds will include a combination of series of the MML Series Investment Fund and MML Series Investment Fund II (advised by MML Investment Advisers, LLC (“MML Advisers”), a wholly-owned subsidiary of Massachusetts Mutual Life Insurance Company (MassMutual), and may also include other, non-affiliated mutual funds. The MML Underlying Funds may invest in various asset classes, including equity securities, fixed income securities, and money market instruments. The Series’ investment adviser is MML Advisers.
Each Fund will normally invest most of its assets in MML Underlying Funds advised by MML Advisers; each Fund will normally invest no more than 10% of its assets in mutual funds not advised by MML Advisers (referred to here as “non-affiliated” funds). Each Fund’s assets are allocated to its MML Underlying Funds according to an asset allocation strategy stated below.
|
● |
MML Conservative Allocation Fund: Approximately 35% to 45% in equity funds and 55% to 65% in fixed income funds, including money market funds. |
|
● |
MML Balanced Allocation Fund: Approximately 45% to 55% in equity funds and 45% to 55% in fixed income funds, including money market funds. |
|
● |
MML Moderate Allocation Fund: Approximately 55% to 65% in equity funds and 35% to 45% in fixed income funds, including money market funds. |
|
● |
MML Growth Allocation Fund: Approximately 70% to 80% in equity funds and 20% to 30% in fixed income funds, including money market funds. |
|
● |
MML Aggressive Allocation Fund: Approximately 85% to 95% in equity funds and 5% to 15% in fixed income funds, including money market funds. |
How did each Fund perform during the 12 months ended December 31, 2022?
Fund’s Initial |
Custom |
Russell 3000® |
MSCI ACWI |
Bloomberg U.S. |
|
MML Conservative |
|||||
Allocation Fund |
-14.74% |
-14.98% |
-19.21% |
-16.00% |
-13.01%* |
MML Balanced |
|||||
Allocation Fund |
-14.73% |
-15.51% |
-19.21%* |
-16.00% |
-13.01% |
MML Moderate |
|||||
Allocation Fund |
-14.97% |
-16.05% |
-19.21%* |
-16.00% |
-13.01% |
MML Growth |
|||||
Allocation Fund |
-15.30% |
-16.88% |
-19.21%* |
-16.00% |
-13.01% |
MML Aggressive |
|||||
Allocation Fund |
-15.90% |
-17.75% |
-19.21%* |
-16.00% |
-13.01% |
* Benchmark return
5
MML Allocation Series – Portfolio Manager Report (Unaudited) (Continued) |
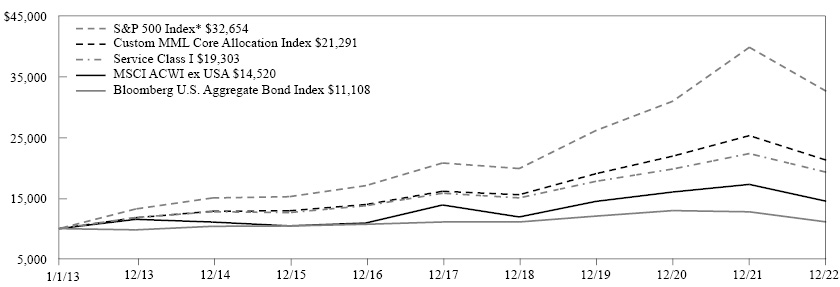
Each of the MML Allocation Series Funds outperformed its respective Custom Index, the Russell 3000 Index, and the MSCI ACWI ex USA Index. All five Funds underperformed the Bloomberg U.S. Aggregate Bond Index for the full year.
MML Allocation Fund Series Custom Indexes
|
● |
The Custom MML Conservative Allocation Index comprises the Bloomberg U.S. Aggregate Bond, Russell 3000, and MSCI ACWI ex USA Indexes. The weightings of each index are 60%, 30%, and 10%, respectively. |
|
● |
The Custom MML Balanced Allocation Index comprises the Bloomberg U.S. Aggregate Bond, Russell 3000, and MSCI ACWI ex USA Indexes. The weightings of each index are 50%, 37.5%, and 12.5%, respectively. |
|
● |
The Custom MML Moderate Allocation Index comprises the Bloomberg U.S. Aggregate Bond, Russell 3000, and MSCI ACWI ex USA Indexes. The weightings of each index are 40%, 45%, and 15%, respectively. |
|
● |
The Custom MML Growth Allocation Index comprises the Bloomberg U.S. Aggregate Bond, Russell 3000, and MSCI ACWI ex USA Indexes. The weightings of each index are 25%, 56.25%, and 18.75%, respectively. |
|
● |
The Custom MML Aggressive Allocation Index comprises the Bloomberg U.S. Aggregate Bond, Russell 3000, and MSCI ACWI ex USA Indexes. The weightings of each index are 10%, 67.5%, and 22.5%, respectively. |
|
● |
Bloomberg U.S. Aggregate Bond Index measures the performance of investment grade, U.S. dollar-denominated, fixed-rate taxable bond market securities, including Treasuries, government-related and corporate securities, mortgage-backed securities (MBS) (agency fixed-rate and hybrid ARM pass-throughs), asset-backed securities (ABS), and commercial mortgage-backed securities (CMBS). The Index does not reflect any deduction for fees or expenses and cannot be purchased directly by investors. |
|
● |
The MSCI All Country World Index (ACWI) ex USA measures the performance of the large- and mid-cap segments of the particular regions, excluding U.S. equity securities, including developed and emerging markets. It is free float-adjusted market-capitalization weighted. The Index does not reflect any deduction for fees or expenses and cannot be purchased directly by investors. |
|
● |
The Russell 3000 Index measures the performance of the 3000 largest U.S. companies representing approximately 98% of the investable U.S. equity market. It is market-capitalization weighted. The Index does not reflect any deduction for fees, expenses, or taxes and cannot be purchased directly by investors. |
For a discussion on the economic and market environment during the 12-month period ended December 31, 2022, please see the Economic and Market Review, beginning on page 3.
Investment adviser discussion of factors that contributed to the Funds’ performance
For the year ended December 31, 2022, the Series Funds delivered negative returns, as stocks underperformed fixed-income investments in 2022. Consequently, those Series Funds with higher equity allocations underperformed their Series Funds counterparts with higher fixed-income allocations.
For the fiscal year ended December 31, 2022, global stock investors experienced significant losses. During that time, investors sought safety from high inflation, rising interest rates, and the increasing possibility of a recession. As a result, the broad market S&P 500 Index® fell 18.11% for the period. The technology-heavy NASDAQ Composite Index performed even worse, dropping 32.54% for the period. The more economically sensitive Dow Jones Industrial AverageSM was down 6.86% for the period.
During the reporting period, small-cap stocks underperformed their larger-cap peers, while value stocks outperformed their growth brethren. Developed international markets outperformed their domestic peers, ending the fiscal year down 14.45% as measured by the MSCI EAFE® Index. Emerging-market stocks, as measured by the MSCI Emerging Markets Index, also fell sharply, ending down 20.09% for the period. Some investors sold off developed international and emerging-market stocks on concerns that higher interest rates and commodity prices would impair consumer spending and corporate earnings growth.
Bond yields rose sharply during the fiscal year, with the 10-year U.S. Treasury bond yield rising from a low of 1.63% on January 1, 2022 to close the period at 3.88%. Rising yields generally produce falling bond prices; consequently, bond index returns suffered. The Bloomberg U.S. Aggregate Bond Index ended the period down 13.01%. Investment-grade corporate bonds fared
6
MML Allocation Series – Portfolio Manager Report (Unaudited) (Continued) |
even worse. The Bloomberg U.S. Corporate Bond Index, which tracks investment-grade corporate bonds, ended the period with a 15.76% loss. The Bloomberg U.S. Corporate High-Yield Bond Index also ended in negative territory, declining 11.19% over the period.
Manager selection contributed to overall performance in 2022. Strong performance by the MML Income and Growth, MML Equity and Income, MML Fundamental Value, MML Focused Equity, and MML Mid Cap Value Funds helped overall performance. Weak performance by the MML Blue Chip Growth, MML Small/Mid Cap Value, MML Foreign, MML Strategic Emerging Markets, MML Managed Bond, MML Total Return Bond, and MML Inflation-Protection and Income Funds were significant drivers of underperformance.
Investment adviser outlook
Despite the stock market sell-off in 2022, we view the stock markets as extended and valuations high relative to market history. In MML Advisers’ view, while the prospect of positive economic and corporate earnings growth supports a bull case, MML Advisers believes that more clarity on the slowing of economic growth, persistency of inflation, labor costs, China’s COVID-19 policy, and the impact of monetary policy tightening is needed for the allocation to stocks to increase. Against this backdrop, we believe that diversification across global assets for investors could be a sensible approach for what, in our view, could be a bumpy economic ride.
7
MML Allocation Series – Portfolio Manager Report (Unaudited) (Continued) |
MML Conservative Allocation Fund |
|
Fixed Income Funds |
59.0% |
Equity Funds |
41.1% |
Total Long-Term Investments |
100.1% |
Other Assets & Liabilities |
(0.1)% |
Net Assets |
100.0% |
MML Moderate Allocation Fund |
|
Equity Funds |
61.2% |
Fixed Income Funds |
38.9% |
Total Long-Term Investments |
100.1% |
Other Assets & Liabilities |
(0.1)% |
Net Assets |
100.0% |
MML Balanced Allocation Fund |
|
Fixed Income Funds |
50.7% |
Equity Funds |
49.4% |
Total Long-Term Investments |
100.1% |
Other Assets & Liabilities |
(0.1)% |
Net Assets |
100.0% |
MML Growth Allocation Fund |
|
Equity Funds |
75.5% |
Fixed Income Funds |
24.6% |
Total Long-Term Investments |
100.1% |
Other Assets & Liabilities |
(0.1)% |
Net Assets |
100.0% |
MML Aggressive Allocation Fund |
|
Equity Funds |
89.5% |
Fixed Income Funds |
10.6% |
Total Long-Term Investments |
100.1% |
Other Assets & Liabilities |
(0.1)% |
Net Assets |
100.0% |
8
MML Conservative Allocation Fund – Portfolio Manager Report (Unaudited) (Continued) |
GROWTH OF $10,000 INVESTMENT - INITIAL CLASS
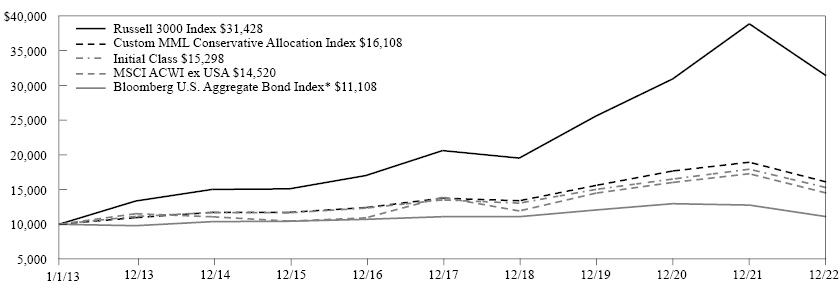
The graph above illustrates a representative class of the Fund’s historical performance for the past 10 fiscal years or since inception (for Funds lacking 10-year records) in comparison to its benchmark index, as well as one or more additional indexes, if applicable. The performance of other share classes will be greater than or less than the class depicted above.
Average Annual Total Returns (for the periods ended 12/31/2022) |
||||
|
Inception Date |
1 Year |
5 Years |
10 Years |
Initial Class |
08/31/2007 |
-14.74% |
2.50% |
4.34% |
Service Class |
08/15/2008 |
-14.91% |
2.27% |
4.09% |
Bloomberg U.S. Aggregate Bond Index* |
-13.01% |
0.02% |
1.06% |
|
Russell 3000 Index |
-19.21% |
8.79% |
12.13% |
|
MSCI ACWI ex USA |
-16.00% |
0.88% |
3.80% |
|
Custom MML Conservative Allocation Index |
-14.98% |
3.19% |
4.88% |
|
* Benchmark
Generally accepted accounting principles require adjustments to be made to the net assets of the Fund at period end for financial reporting purposes only, and as such, the total return based on the unadjusted net asset value per share may differ from the total return reported in the financial highlights.
Performance results in the graph and table reflect the percentage change in net asset value, including reinvestment of dividends and capital gains distributions. Investors should note that the Fund is a professionally managed mutual fund, while the index or indexes shown above are unmanaged, cannot be purchased directly, and, with the exception of any peer group index, do not incur expenses.
Performance data quoted in the graph and table represents past performance; past performance is not predictive of future results. The investment return and principal value of shares of the Fund fluctuate, so your shares, when sold, may be worth more or less than their original cost. Current performance of the Fund may be lower or higher than the performance quoted. The performance shown does not reflect the deduction of taxes, if any, that a shareholder would pay on Fund distributions or the redemption of Fund shares. Performance data current to the most recent month end may be obtained by calling 1-888-309-3539.
Investors should read the Fund’s prospectus with regard to the Fund’s investment objectives, risks, and charges and expenses in conjunction with these financial statements. The Fund’s return reflects changes in the net asset value per share without the deduction of any product charges (e.g., cost of insurance, mortality and expense risk charges, administrative fees, and CDSL). The inclusion of these charges would have reduced the performance shown here.
9
MML Balanced Allocation Fund – Portfolio Manager Report (Unaudited) (Continued) |
GROWTH OF $10,000 INVESTMENT - INITIAL CLASS
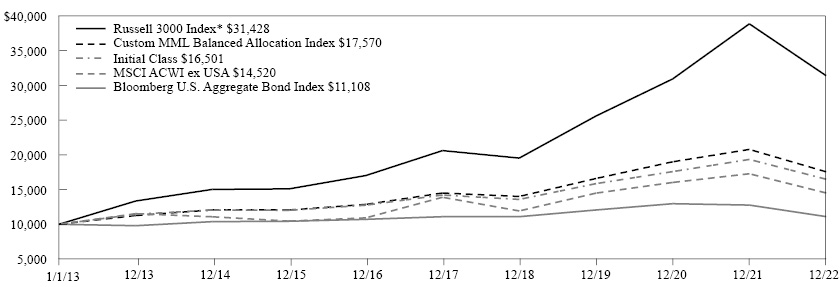
The graph above illustrates a representative class of the Fund’s historical performance for the past 10 fiscal years or since inception (for Funds lacking 10-year records) in comparison to its benchmark index, as well as one or more additional indexes, if applicable. The performance of other share classes will be greater than or less than the class depicted above.
Average Annual Total Returns (for the periods ended 12/31/2022) |
||||
|
Inception Date |
1 Year |
5 Years |
10 Years |
Initial Class |
08/31/2007 |
-14.73% |
3.02% |
5.14% |
Service Class |
08/15/2008 |
-14.97% |
2.77% |
4.87% |
Russell 3000 Index* |
-19.21% |
8.79% |
12.13% |
|
Bloomberg U.S. Aggregate Bond Index |
-13.01% |
0.02% |
1.06% |
|
MSCI ACWI ex USA |
-16.00% |
0.88% |
3.80% |
|
Custom MML Balanced Allocation Index |
-15.51% |
3.90% |
5.80% |
|
* Benchmark
Generally accepted accounting principles require adjustments to be made to the net assets of the Fund at period end for financial reporting purposes only, and as such, the total return based on the unadjusted net asset value per share may differ from the total return reported in the financial highlights.
Performance results in the graph and table reflect the percentage change in net asset value, including reinvestment of dividends and capital gains distributions. Investors should note that the Fund is a professionally managed mutual fund, while the index or indexes shown above are unmanaged, cannot be purchased directly, and, with the exception of any peer group index, do not incur expenses.
Performance data quoted in the graph and table represents past performance; past performance is not predictive of future results. The investment return and principal value of shares of the Fund fluctuate, so your shares, when sold, may be worth more or less than their original cost. Current performance of the Fund may be lower or higher than the performance quoted. The performance shown does not reflect the deduction of taxes, if any, that a shareholder would pay on Fund distributions or the redemption of Fund shares. Performance data current to the most recent month end may be obtained by calling 1-888-309-3539.
Investors should read the Fund’s prospectus with regard to the Fund’s investment objectives, risks, and charges and expenses in conjunction with these financial statements. The Fund’s return reflects changes in the net asset value per share without the deduction of any product charges (e.g., cost of insurance, mortality and expense risk charges, administrative fees, and CDSL). The inclusion of these charges would have reduced the performance shown here.
10
MML Moderate Allocation Fund – Portfolio Manager Report (Unaudited) (Continued) |
GROWTH OF $10,000 INVESTMENT - INITIAL CLASS
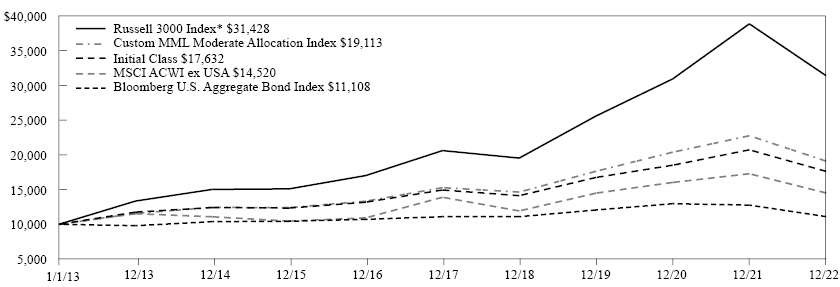
The graph above illustrates a representative class of the Fund’s historical performance for the past 10 fiscal years or since inception (for Funds lacking 10-year records) in comparison to its benchmark index, as well as one or more additional indexes, if applicable. The performance of other share classes will be greater than or less than the class depicted above.
Average Annual Total Returns (for the periods ended 12/31/2022) |
||||
|
Inception Date |
1 Year |
5 Years |
10 Years |
Initial Class |
08/31/2007 |
-14.97% |
3.36% |
5.84% |
Service Class |
08/15/2008 |
-15.12% |
3.11% |
5.58% |
Russell 3000 Index* |
-19.21% |
8.79% |
12.13% |
|
Bloomberg U.S. Aggregate Bond Index |
-13.01% |
0.02% |
1.06% |
|
MSCI ACWI ex USA |
-16.00% |
0.88% |
3.80% |
|
Custom MML Moderate Allocation Index |
-16.05% |
4.57% |
6.69% |
|
* Benchmark
Generally accepted accounting principles require adjustments to be made to the net assets of the Fund at period end for financial reporting purposes only, and as such, the total return based on the unadjusted net asset value per share may differ from the total return reported in the financial highlights.
Performance results in the graph and table reflect the percentage change in net asset value, including reinvestment of dividends and capital gains distributions. Investors should note that the Fund is a professionally managed mutual fund, while the index or indexes shown above are unmanaged, cannot be purchased directly, and, with the exception of any peer group index, do not incur expenses.
Performance data quoted in the graph and table represents past performance; past performance is not predictive of future results. The investment return and principal value of shares of the Fund fluctuate, so your shares, when sold, may be worth more or less than their original cost. Current performance of the Fund may be lower or higher than the performance quoted. The performance shown does not reflect the deduction of taxes, if any, that a shareholder would pay on Fund distributions or the redemption of Fund shares. Performance data current to the most recent month end may be obtained by calling 1-888-309-3539.
Investors should read the Fund’s prospectus with regard to the Fund’s investment objectives, risks, and charges and expenses in conjunction with these financial statements. The Fund’s return reflects changes in the net asset value per share without the deduction of any product charges (e.g., cost of insurance, mortality and expense risk charges, administrative fees, and CDSL). The inclusion of these charges would have reduced the performance shown here.
11
MML Growth Allocation Fund – Portfolio Manager Report (Unaudited) (Continued) |
GROWTH OF $10,000 INVESTMENT - INITIAL CLASS
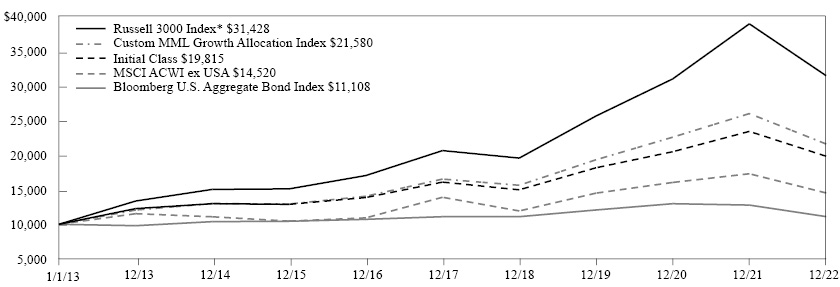
The graph above illustrates a representative class of the Fund’s historical performance for the past 10 fiscal years or since inception (for Funds lacking 10-year records) in comparison to its benchmark index, as well as one or more additional indexes, if applicable. The performance of other share classes will be greater than or less than the class depicted above.
Average Annual Total Returns (for the periods ended 12/31/2022) |
||||
|
Inception Date |
1 Year |
5 Years |
10 Years |
Initial Class |
08/31/2007 |
-15.30% |
4.27% |
7.08% |
Service Class |
08/15/2008 |
-15.45% |
4.01% |
6.80% |
Russell 3000 Index* |
-19.21% |
8.79% |
12.13% |
|
Bloomberg U.S. Aggregate Bond Index |
-13.01% |
0.02% |
1.06% |
|
MSCI ACWI ex USA |
-16.00% |
0.88% |
3.80% |
|
Custom MML Growth Allocation Index |
-16.88% |
5.49% |
8.00% |
|
* Benchmark
Generally accepted accounting principles require adjustments to be made to the net assets of the Fund at period end for financial reporting purposes only, and as such, the total return based on the unadjusted net asset value per share may differ from the total return reported in the financial highlights.
Performance results in the graph and table reflect the percentage change in net asset value, including reinvestment of dividends and capital gains distributions. Investors should note that the Fund is a professionally managed mutual fund, while the index or indexes shown above are unmanaged, cannot be purchased directly, and, with the exception of any peer group index, do not incur expenses.
Performance data quoted in the graph and table represents past performance; past performance is not predictive of future results. The investment return and principal value of shares of the Fund fluctuate, so your shares, when sold, may be worth more or less than their original cost. Current performance of the Fund may be lower or higher than the performance quoted. The performance shown does not reflect the deduction of taxes, if any, that a shareholder would pay on Fund distributions or the redemption of Fund shares. Performance data current to the most recent month end may be obtained by calling 1-888-309-3539.
Investors should read the Fund’s prospectus with regard to the Fund’s investment objectives, risks, and charges and expenses in conjunction with these financial statements. The Fund’s return reflects changes in the net asset value per share without the deduction of any product charges (e.g., cost of insurance, mortality and expense risk charges, administrative fees, and CDSL). The inclusion of these charges would have reduced the performance shown here.
12
MML Aggressive Allocation Fund – Portfolio Manager Report (Unaudited) (Continued) |
GROWTH OF $10,000 INVESTMENT - INITIAL CLASS

The graph above illustrates a representative class of the Fund’s historical performance for the past 10 fiscal years or since inception (for Funds lacking 10-year records) in comparison to its benchmark index, as well as one or more additional indexes, if applicable. The performance of other share classes will be greater than or less than the class depicted above.
Average Annual Total Returns (for the periods ended 12/31/2022) |
||||
|
Inception Date |
1 Year |
5 Years |
10 Years |
Initial Class |
08/31/2007 |
-15.90% |
4.83% |
8.12% |
Service Class |
08/15/2008 |
-16.13% |
4.56% |
7.85% |
Russell 3000 Index* |
-19.21% |
8.79% |
12.13% |
|
Bloomberg U.S. Aggregate Bond Index |
-13.01% |
0.02% |
1.06% |
|
MSCI ACWI ex USA |
-16.00% |
0.88% |
3.80% |
|
Custom MML Aggressive Allocation Index |
-17.75% |
6.32% |
9.25% |
|
* Benchmark
Generally accepted accounting principles require adjustments to be made to the net assets of the Fund at period end for financial reporting purposes only, and as such, the total return based on the unadjusted net asset value per share may differ from the total return reported in the financial highlights.
Performance results in the graph and table reflect the percentage change in net asset value, including reinvestment of dividends and capital gains distributions. Investors should note that the Fund is a professionally managed mutual fund, while the index or indexes shown above are unmanaged, cannot be purchased directly, and, with the exception of any peer group index, do not incur expenses.
Performance data quoted in the graph and table represents past performance; past performance is not predictive of future results. The investment return and principal value of shares of the Fund fluctuate, so your shares, when sold, may be worth more or less than their original cost. Current performance of the Fund may be lower or higher than the performance quoted. The performance shown does not reflect the deduction of taxes, if any, that a shareholder would pay on Fund distributions or the redemption of Fund shares. Performance data current to the most recent month end may be obtained by calling 1-888-309-3539.
Investors should read the Fund’s prospectus with regard to the Fund’s investment objectives, risks, and charges and expenses in conjunction with these financial statements. The Fund’s return reflects changes in the net asset value per share without the deduction of any product charges (e.g., cost of insurance, mortality and expense risk charges, administrative fees, and CDSL). The inclusion of these charges would have reduced the performance shown here.
13
MML American Funds Growth Fund – Portfolio Manager Report (Unaudited) |
What is the investment approach of MML American Funds Growth Fund, and who is the Fund’s investment adviser?
The Fund seeks to provide investors with growth of capital through a “master feeder” relationship. (See page 235 of this report for information about the “master feeder” relationship.) The Fund invests all of its assets in Class 1 shares of the American Funds Insurance Series – Growth Fund (the “Master Growth Fund”), a series of the American Funds Insurance Series, a registered open-end investment company, managed by Capital Research and Management Company (Capital Research) with substantially the same investment objective. The Master Growth Fund invests primarily in common stocks and seeks to invest in companies that appear to offer superior opportunities for growth of capital. The Master Growth Fund may invest up to 25% of its assets in common stocks and other securities of issuers domiciled outside the United States. The Master Growth Fund may hold a portion of its assets in cash or cash equivalents. The Fund’s investment adviser is MML Investment Advisers, LLC (MML Advisers).
How did the Fund perform during the 12 months ended December 31, 2022?
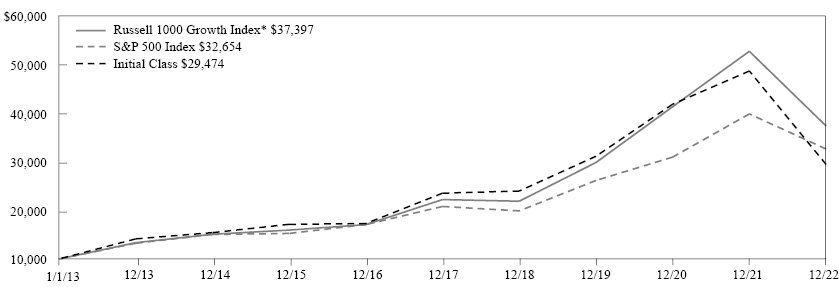
The Fund returned -30.29%, significantly underperforming the -18.11% return of the S&P 500® Index (the “benchmark”), which measures the performance of 500 widely held stocks in the U.S. equity market. The Fund also underperformed the -29.14% return of the Russell 1000® Growth Index, which measures the performance of the large-cap growth segment of U.S. equity securities. It includes the Russell 1000 Index companies with higher price-to-book ratios and higher forecasted growth values.
For a discussion on the economic and market environment during the 12-month period ended December 31, 2022, please see the Economic and Market Review, beginning on page 3.
Capital Research’s discussion of factors that contributed to the Fund’s performance
U.S. equities had its worst year since 2008 during the one-year period ended December 31, 2022, as persistently high inflation and aggressive rate hikes stoked recessionary fears. In 2022, the benchmark entered its first bear market since 2020. Energy was the top S&P 500 sector for the second straight year, climbing 66% for the one-year period ended December 31, 2022. Crude oil prices spiked in March 2022 after Russia’s invasion of Ukraine upended global oil flows.
Growth stocks had the sharpest declines during the reporting period, including several technology giants that had been market leaders over the last decade. Despite consecutive quarters of negative gross domestic product (GDP) growth in the first half of 2022, a strong labor market helped inflation to persist throughout the reporting period.
With respect to the Fund’s performance, stock selection within the materials sector was the top contributor to relative returns. The Fund’s position in energy industry firm Halliburton buoyed results, as its stock outpaced the broader industry. On the downside, Fund holdings within the communication services sector weighed on results. From a Fund holdings perspective, Tesla was the top individual detractor from returns for the reporting period.
Capital Research’s outlook
In Fund management’s view, the overall uncertain economic environment and challenges of inflation are very real concerns. Fund management believes the Fund may be well positioned for the road ahead as they continue to focus on capital appreciation and selecting companies best suited for what Fund management expects to be a challenging economic environment in 2023. Fund management remains confident their time-tested investment approach, based on thorough research and robust debate with an eye on valuation, has the potential to continue to deliver favorable outcomes for investors over the long term.
14
MML American Funds Growth Fund – Portfolio Manager Report (Unaudited) (Continued) |
MML American Funds Growth Fund |
|
Equity Funds |
100.1% |
Total Long-Term Investments |
100.1% |
Other Assets & Liabilities |
(0.1)% |
Net Assets |
100.0% |
15
MML American Funds Growth Fund – Portfolio Manager Report (Unaudited) (Continued) |
GROWTH OF $10,000 INVESTMENT - SERVICE CLASS I

The graph above illustrates the Fund’s historical performance for the past 10 fiscal years or since inception (for Funds lacking 10-year records) in comparison to its benchmark index, as well as one or more additional indexes, if applicable.
Average Annual Total Returns (for the periods ended 12/31/2022) |
||||
|
Inception Date |
1 Year |
5 Years |
10 Years |
Service Class I |
08/15/2008 |
-30.29% |
10.66% |
13.16% |
S&P 500 Index* |
-18.11% |
9.42% |
12.56% |
|
Russell 1000 Growth Index |
-29.14% |
10.96% |
14.10% |
|
* Benchmark
Generally accepted accounting principles require adjustments to be made to the net assets of the Fund at period end for financial reporting purposes only, and as such, the total return based on the unadjusted net asset value per share may differ from the total return reported in the financial highlights.
Performance results in the graph and table reflect the percentage change in net asset value, including reinvestment of dividends and capital gains distributions. Investors should note that the Fund is a professionally managed mutual fund, while the index or indexes shown above are unmanaged, cannot be purchased directly, and, with the exception of any peer group index, do not incur expenses.
Performance data quoted in the graph and table represents past performance; past performance is not predictive of future results. The investment return and principal value of shares of the Fund fluctuate, so your shares, when sold, may be worth more or less than their original cost. Current performance of the Fund may be lower or higher than the performance quoted. The performance shown does not reflect the deduction of taxes, if any, that a shareholder would pay on Fund distributions or the redemption of Fund shares. Performance data current to the most recent month end may be obtained by calling 1-888-309-3539.
Investors should read the Fund’s prospectus with regard to the Fund’s investment objectives, risks, and charges and expenses in conjunction with these financial statements. The Fund’s return reflects changes in the net asset value per share without the deduction of any product charges (e.g., cost of insurance, mortality and expense risk charges, administrative fees, and CDSL). The inclusion of these charges would have reduced the performance shown here.
16
MML American Funds Core Allocation Fund – Portfolio Manager Report (Unaudited) |
What is the investment approach of MML American Funds Core Allocation Fund, and who is the Fund’s investment adviser?
The Fund seeks to achieve as high a total return over time as is considered consistent with prudent investment risk, preservation of capital, and recognition of the Fund’s stated asset allocation. The Fund is a “fund of funds” that seeks to achieve its investment objective by principally investing in a combination of series of the American Funds Insurance Series (the “American Underlying Funds”), managed by Capital Research and Management Company (Capital Research), using a flexible asset allocation approach. The Fund’s investment adviser invests the Fund’s assets in a combination of U.S. domestic and international American Underlying Funds. As of the date of this report, it is expected that the American Underlying Funds will include Class 1 shares of the American Funds Insurance Series - The Bond Fund of America, the American Funds Insurance Series - Washington Mutual Investors Fund, the American Funds Insurance Series - Growth-Income Fund, and the American Funds Insurance Series - International Fund. The Fund’s investment adviser allocates the Fund’s assets among a variety of different asset classes through investing in American Underlying Funds in response to changing market, economic, and investment conditions. The Fund’s investment adviser is MML Investment Advisers, LLC (MML Advisers).
How did the Fund perform during the 12 months ended December 31, 2022?
The Fund returned -13.70%, outperforming the -18.11% return of the S&P 500® Index (the “benchmark”), which measures the performance of 500 widely held stocks in the U.S. equity market. The Fund outperformed the -16.00% return of the MSCI All Country World Index (ACWI) ex USA, which measures the performance of the large- and mid-cap segments of the particular regions, excluding U.S. equity securities, including developed and emerging markets. The Fund underperformed the -13.01% return of the Bloomberg U.S. Aggregate Bond Index, which measures the performance of investment grade, U.S. dollar-denominated, fixed-rate taxable bond market securities, including Treasuries, government-related and corporate securities, mortgage-backed securities (MBS) (agency fixed-rate and hybrid ARM pass-throughs), asset-backed securities (ABS), and commercial mortgage-backed securities (CMBS). Finally, the Fund’s -13.70% return outperformed the -15.93% return of the Custom MML Core Allocation Index, which comprises the benchmark (55%), the Bloomberg U.S. Aggregate Bond Index (35%), and the MSCI ACWI ex USA (10%).
For a discussion on the economic and market environment during the 12-month period ended December 31, 2022, please see the Economic and Market Review, beginning on page 3.
Capital Research’s discussion of factors that contributed to the Fund’s performance
The following paragraphs discuss the results of each of the Fund’s underlying portfolio components. Because the Fund invests in both stock- and bond-based portfolios, its overall performance may vary considerably from the broad market indexes listed above, which each measures the performance of a specific group of securities. These component-specific discussions focus on results and positioning versus each component’s main comparative index, not how the Fund as a whole performed or was positioned versus those indexes.
The American Funds Insurance Series – The Bond Fund of America (the “Bond Fund”) outperformed the Bloomberg U.S. Aggregate Bond Index (the “Index”) for the one-year period ended December 31, 2022, as U.S. fixed income markets fell across the board. During the reporting period, the largest contributions to relative results came from duration positioning and agency MBS. The Bond Fund’s lower-than-benchmark duration helped reduce interest rate sensitivity as rates moved higher and bond prices fell over the period. A lower position in MBS also helped, relative to the benchmark, as spreads widened materially. On the downside, yield curve positioning and a modest position in emerging markets and high-yield bonds detracted from results. Derivatives are securities that derive their value from the performance of one or more other investments and take the form of a contract between two or more parties. Derivatives can be used for hedging, speculation, or both. During the reporting period, the Bond Fund used derivatives as tools for implementing the portfolio’s duration, curve, and credit. Collectively, the use of derivatives detracted from the Bond Fund’s results.
The American Funds Insurance Series – Washington Mutual Investors Fund (the “Income and Growth Fund”) significantly outperformed the benchmark for the one-year period ended December 31, 2022, as U.S. equities had their worst year since 2008. Income and Growth Fund holdings in the consumer discretionary and information technology sectors were additive to relative returns. Among individual securities, the Income and Growth Fund’s higher-than-benchmark position in health care insurer
17
MML American Funds Core Allocation Fund – Portfolio Manager Report (Unaudited) (Continued) |
UnitedHealth Group was a top contributor, as the stock outpaced the broader market. On the downside, security selections within the financial and real estate sectors were top detractors. A lower-than-benchmark position in ExxonMobil weighed on relative returns, as that Fund holding stock outpaced the market overall.
The American Funds Insurance Series – Growth-Income Fund (the “Growth-Income Fund”) outperformed the benchmark for the one-year period ended December 31, 2022, in an environment where persistently high inflation and aggressive rate hikes stoked recessionary fears. During the reporting period, the Growth-Income Fund’s investments in the information technology and industrial sectors were top contributors to relative returns. An out-of-benchmark position in energy company Canadian Natural Resources was a top individual contributor, as that Fund holding outpaced the market overall. On the downside, security selections within the communications and financial sectors dragged on returns. Netflix was the Growth-Income Fund’s top individual detractor, owing to a larger-than-benchmark position and returns that lagged the market.
The American Funds Insurance Series – International Fund (the “International Fund”) underperformed the MSCI ACWI ex USA (the “Index”) for the one-year period ended December 31, 2022, as global stocks fell sharply – pressured by rising interest rates, slowing economic growth, and inflationary pressures not seen since the 1980s. Stock selection within the information technology sector dragged on returns. With respect to specific International Fund holdings, a larger-than-Index position in South Korean chipmaker SK Hynix was among the top individual detractors. Turning to the positive, stock selection within the energy sector boosted relative returns. Specifically, the International Fund’s higher-than-benchmark position in Petroleo Brasileiro, a state-owned Brazilian multinational petroleum provider, was a top contributor, as the stock significantly outpaced the broader market.
Investment adviser outlook
Despite the stock market sell-off in 2022, MML Advisers views the stock markets as extended and valuations high relative to market history. In MML Advisers’ view, while the prospect of positive economic and corporate earnings growth seems to support a bull case, MML Advisers believes that more clarity on the slowing of economic growth, persistency of inflation, labor costs, China’s COVID-19 policy, and the impact of monetary policy tightening is needed for the allocation to stocks to increase. Against this backdrop, MML Advisers believes that diversification across global assets for investors for the Fund could be a sensible approach for what, in MML Advisers’ view, could be a bumpy economic ride.
18
MML American Funds Core Allocation Fund – Portfolio Manager Report (Unaudited) (Continued) |
MML American Funds Core Allocation Fund |
|
Equity Funds |
64.9% |
Fixed Income Funds |
35.2% |
Total Long-Term Investments |
100.1% |
Other Assets & Liabilities |
(0.1)% |
Net Assets |
100.0% |
19
MML American Funds Core Allocation Fund – Portfolio Manager Report (Unaudited) (Continued) |
GROWTH OF $10,000 INVESTMENT - SERVICE CLASS I
The graph above illustrates the Fund’s historical performance for the past 10 fiscal years or since inception (for Funds lacking 10-year records) in comparison to its benchmark index, as well as one or more additional indexes, if applicable.
Average Annual Total Returns (for the periods ended 12/31/2022) |
||||
|
Inception Date |
1 Year |
5 Years |
10 Years |
Service Class I |
08/15/2008 |
-13.70% |
4.05% |
6.80% |
S&P 500 Index* |
-18.11% |
9.42% |
12.56% |
|
Bloomberg U.S. Aggregate Bond Index |
-13.01% |
0.02% |
1.06% |
|
MSCI ACWI ex USA |
-16.00% |
0.88% |
3.80% |
|
Custom MML Core Allocation Index |
-15.93% |
5.68% |
7.85% |
|
* Benchmark
Generally accepted accounting principles require adjustments to be made to the net assets of the Fund at period end for financial reporting purposes only, and as such, the total return based on the unadjusted net asset value per share may differ from the total return reported in the financial highlights.
Performance results in the graph and table reflect the percentage change in net asset value, including reinvestment of dividends and capital gains distributions. Investors should note that the Fund is a professionally managed mutual fund, while the index or indexes shown above are unmanaged, cannot be purchased directly, and, with the exception of any peer group index, do not incur expenses.
Performance data quoted in the graph and table represents past performance; past performance is not predictive of future results. The investment return and principal value of shares of the Fund fluctuate, so your shares, when sold, may be worth more or less than their original cost. Current performance of the Fund may be lower or higher than the performance quoted. The performance shown does not reflect the deduction of taxes, if any, that a shareholder would pay on Fund distributions or the redemption of Fund shares. Performance data current to the most recent month end may be obtained by calling 1-888-309-3539.
Investors should read the Fund’s prospectus with regard to the Fund’s investment objectives, risks, and charges and expenses in conjunction with these financial statements. The Fund’s return reflects changes in the net asset value per share without the deduction of any product charges (e.g., cost of insurance, mortality and expense risk charges, administrative fees, and CDSL). The inclusion of these charges would have reduced the performance shown here.
20
MML Blue Chip Growth Fund – Portfolio Manager Report (Unaudited) |
What is the investment approach of MML Blue Chip Growth Fund, and who is the Fund’s subadviser?
The Fund seeks long-term capital growth. Income is a secondary objective. Under normal circumstances, the Fund invests at least 80% of net assets (plus the amount of any borrowings for investment purposes) in the common stocks of large- and medium-sized blue chip growth companies. The Fund’s subadviser currently defines blue chip growth companies to mean firms that, in its view, are well-established in their industries and have the potential for above-average earnings growth. The Fund is non-diversified, which means that it may hold larger positions in a smaller number of issuers than a diversified fund. The Fund’s subadviser is T. Rowe Price Associates, Inc. (T. Rowe Price).
How did the Fund perform during the 12 months ended December 31, 2022?
The Fund’s Initial Class shares returned -39.50%, significantly underperforming the -29.14% return of the Russell 1000® Growth Index (the “benchmark”), which measures the performance of the large-cap growth segment of U.S. equity securities. It includes the Russell 1000 Index companies with higher price-to-book ratios and higher forecasted growth values. In addition, the Fund significantly underperformed the -18.11% return of the S&P 500® Index, which measures the performance of 500 widely held stocks in the U.S. equity market.
For a discussion on the economic and market environment during the 12-month period ended December 31, 2022, please see the Economic and Market Overview, beginning on page 3.
Subadviser discussion of factors that contributed to the Fund’s performance
Overall, for the one-year period ended December 31, 2022, stock selection and sector allocation detracted from the Fund’s relative performance. The communication services, consumer discretionary, and information technology sectors were the key drivers of the Fund’s underperformance, while the health care and financial sectors were the largest contributors.
Communication services was the largest relative underperformer, due to the Fund’s overweight allocation to the sector, relative to the benchmark, and stock selection within the sector throughout the period. For example, during the period, shares of Fund holding Meta sold off sharply, due in part to headwinds from Apple iOS privacy changes and a significant drop in advertising demand, with macro headwinds putting downward pressure on advertiser budgets. The consumer discretionary sector also detracted from the Fund’s performance on a relative basis due to unfavorable stock choices such Fund holding Carvana, a used car retailer. During the period, shares of this Fund holding traded lower, amid a challenging backdrop that included supply constraints, affordability concerns for consumers (in an environment of rising used car prices and higher financing rates), and concerns around the company’s liquidity runway. Fund holdings in the information technology sector further hampered the Fund’s relative results.
In contrast, health care contributed the most to the Fund’s relative performance during the period, due to beneficial security selection within, and an overweight allocation to, the sector. Shares of Fund holding UnitedHealth Group held up relatively well due to better-than-expected cost trends, as utilization returned to normal and stronger-than-expected onboarding of value-based care patients within Optum (which delivers care aided by technology and data). UnitedHealth Group also benefited from innate defensive characteristics that provided additional support as markets continued to skid lower. The financial sector also bolstered the Fund’s relative returns during the period, driven by favorable security selection and the Fund’s overweight allocation to the sector.
Subadviser outlook
Heading into 2023, in Fund management’s view, capital markets appeared to have priced in a significant global economic slowdown. In Fund management’s view, the key question is whether this deceleration will end in a “soft landing” – with slower, but still positive, growth – or in a full-fledged recession that drags down earnings. T. Rowe Price believes that much depends on the U.S. Federal Reserve and the world’s other major central banks, as they continue efforts to bring inflation under control by hiking interest rates and draining liquidity from the markets. Nevertheless, Fund management’s view is that geopolitical risks could remain potential triggers for downside volatility in 2023. Structural factors, such as bank capital requirements that constrain market liquidity, could magnify price movements, both up and down. Fund management’s view is that although there are good reasons for caution in 2023, excessive pessimism and volatility could create value for agile investors.
21
MML Blue Chip Growth Fund – Portfolio Manager Report (Unaudited) (Continued) |
MML Blue Chip Growth Fund |
|
Microsoft Corp. |
13.3% |
Apple, Inc. |
9.9% |
Amazon.com, Inc. |
6.8% |
Alphabet, Inc. Class C |
6.8% |
UnitedHealth Group, Inc. |
5.2% |
Visa, Inc. Class A |
3.8% |
Mastercard, Inc. Class A |
3.2% |
NVIDIA Corp. |
2.8% |
Eli Lilly & Co. |
2.5% |
ServiceNow, Inc. |
2.4% |
56.7% |
|
MML Blue Chip Growth Fund |
|
Technology |
39.6% |
Communications |
21.1% |
Consumer, Non-cyclical |
18.5% |
Financial |
11.3% |
Consumer, Cyclical |
6.7% |
Basic Materials |
1.3% |
Industrial |
1.0% |
Corporate Debt |
0.2% |
Total Long-Term Investments |
99.7% |
Short-Term Investments and Other Assets and Liabilities |
0.3% |
Net Assets |
100.0% |
22
MML Blue Chip Growth Fund – Portfolio Manager Report (Unaudited) (Continued) |
GROWTH OF $10,000 INVESTMENT - INITIAL CLASS
The graph above illustrates a representative class of the Fund’s historical performance for the past 10 fiscal years or since inception (for Funds lacking 10-year records) in comparison to its benchmark index, as well as one or more additional indexes, if applicable. The performance of other share classes will be greater than or less than the class depicted above.
Average Annual Total Returns (for the periods ended 12/31/2022) |
||||
|
Inception Date |
1 Year |
5 Years |
10 Years |
Initial Class |
05/01/2006 |
-39.50% |
4.59% |
11.41% |
Service Class |
08/15/2008 |
-39.65% |
4.34% |
11.14% |
Russell 1000 Growth Index* |
-29.14% |
10.96% |
14.10% |
|
S&P 500 Index |
-18.11% |
9.42% |
12.56% |
|
* Benchmark
Generally accepted accounting principles require adjustments to be made to the net assets of the Fund at period end for financial reporting purposes only, and as such, the total return based on the unadjusted net asset value per share may differ from the total return reported in the financial highlights.
Performance results in the graph and table reflect the percentage change in net asset value, including reinvestment of dividends and capital gains distributions. Investors should note that the Fund is a professionally managed mutual fund, while the index or indexes shown above are unmanaged, cannot be purchased directly, and, with the exception of any peer group index, do not incur expenses.
Performance data quoted in the graph and table represents past performance; past performance is not predictive of future results. The investment return and principal value of shares of the Fund fluctuate, so your shares, when sold, may be worth more or less than their original cost. Current performance of the Fund may be lower or higher than the performance quoted. The performance shown does not reflect the deduction of taxes, if any, that a shareholder would pay on Fund distributions or the redemption of Fund shares. Performance data current to the most recent month end may be obtained by calling 1-888-309-3539.
Investors should read the Fund’s prospectus with regard to the Fund’s investment objectives, risks, and charges and expenses in conjunction with these financial statements. The Fund’s return reflects changes in the net asset value per share without the deduction of any product charges (e.g., cost of insurance, mortality and expense risk charges, administrative fees, and CDSL). The inclusion of these charges would have reduced the performance shown here.
23
MML Equity Income Fund – Portfolio Manager Report (Unaudited) |
What is the investment approach of MML Equity Income Fund, and who is the Fund’s subadviser?
The Fund seeks dividend income and long-term capital growth by investing primarily in common stocks, with an emphasis on large-capitalization companies that have a strong track record of paying dividends or that the Fund’s subadviser believes to be undervalued. Under normal circumstances, the Fund invests at least 80% of its net assets (plus the amount of any borrowings for investment purposes) in common stocks. The Fund’s subadviser is T. Rowe Price Associates, Inc. (T. Rowe Price).
How did the Fund perform during the 12 months ended December 31, 2022?
The Fund’s Initial Class shares returned -3.57%, outperforming the -7.54% return of the Russell 1000® Value Index (the “benchmark”), which measures the performance of the large-cap value segment of U.S. equity securities. It includes the Russell 1000 Index companies with lower price-to-book ratios and lower expected growth values.
For a discussion on the economic and market environment during the 12-month period ended December 31, 2022, please see the Economic and Market Review, beginning on page 3.
Subadviser discussion of factors that contributed to the Fund’s performance
For the one-year period ended December 31, 2022, favorable security selection and sector allocation drove relative the Fund’s outperformance relative to the benchmark. During the period, the financial, health care, and consumer discretionary sectors were significant relative contributors, while the energy, industrial, and business services sectors were notable detractors.
The financial sector was the primary relative contributor for the period, due to strong stock selection. Fund holding American International Group outperformed the benchmark over the period. Its shares benefited from a strong property and casualty pricing cycle that allowed the company to focus on pushing price, in addition to improved underwriting. Fund holdings in the health care sector also aided relative performance during this time. Shares of pharmaceutical company AbbVie outperformed the health care sector over the period. Shares advanced in April 2022 after the Food and Drug Administration approved RINVOQ and SKYRIZI® for use. T. Rowe Price believes that this may help balance sales deficits from Humira’s patent loss in 2023. The consumer discretionary sector also contributed to relative returns during the period due to positive stock choices, coupled with an underweight allocation to the sector. Shares of Fund holding Las Vegas Sands initially lagged, as China’s increased lockdowns throughout the fiscal year delayed the reopening of the company’s Macau venue. However, Las Vegas Sands’ shares benefited during the third and fourth quarters of 2022, due to a strong recovery in its Singapore operations, which helped offset some of the costs associated with Macau. Additionally, during the fourth quarter of the fiscal year, shares surged following news of Las Vegas Sands and other gaming companies signing 10-year contracts with the Macau government, renewing their casino licenses for the next decade.
On the downside, weak stock selection in the energy sector detracted from the Fund’s relative performance during the period. One Fund holding that detracted over the period was TC Energy. Its shares were lifted early in the year as global natural gas prices dramatically rose following Russia’s invasion of Ukraine. In the third quarter of 2022, however, the company came under pressure, as capital markets risk and a higher interest rate environment weighed on performance. In early December, shares were again pressured, as the company’s Keystone pipeline was shut down following the report of a leak of 14,000 barrels. Finally, Fund holdings in the industrial and business services sectors also hindered the Fund’s relative performance during the period.
Subadviser outlook
In T. Rowe Price’s view, the range of outcomes in the equity market remains abnormally wide as we head into 2023. Fund management expects continued volatility in the markets, as investors react to new metrics as they are reported. Amid such uncertainty, Fund management believes there is risk in being too anchored to a particular macroeconomic outlook. In Fund management’s view, the balance of economic data suggests a recession could be imminent, although such an event is broadly anticipated, making the eventual recession arguably the “most consensus” one in history. T. Rowe Price believes that the severity of the recession will depend on the degree to which the Federal Reserve (the “Fed”) targets the labor market, which remained tight as of the end of the fiscal period, even as economic data weakened. Should the Fed “declare victory” at an inflation level above its stated target, the equity market could rally, in Fund management’s opinion. Conversely, Fund management’s view is that if the Fed’s aim is to disrupt the labor market, the equity market may move lower. In such an uncertain environment, T. Rowe Price believes it is important for the Fund to selectively lean into weakness and trim on strength. Fund management also expects to seek to maintain balance in the Fund’s portfolio, which, in Fund management’s view, could help make the Fund’s performance less dependent on a particular macroeconomic outcome and offer the potential for the Fund to outperform in a variety of markets.
24
MML Equity Income Fund – Portfolio Manager Report (Unaudited) (Continued) |
MML Equity Income Fund |
|
Wells Fargo & Co. |
3.1% |
The Southern Co. |
3.0% |
General Electric Co. |
3.0% |
American International Group, Inc. |
2.5% |
TotalEnergies SE |
2.4% |
Elevance Health, Inc. |
2.4% |
QUALCOMM, Inc. |
2.1% |
Sempra Energy |
2.1% |
Chubb Ltd. |
2.0% |
Johnson & Johnson |
2.0% |
|
24.6% |
MML Equity Income Fund |
|
Financial |
25.1% |
Consumer, Non-cyclical |
23.9% |
Industrial |
10.2% |
Energy |
8.6% |
Utilities |
8.4% |
Consumer, Cyclical |
6.7% |
Technology |
6.3% |
Communications |
5.5% |
Basic Materials |
4.3% |
Total Long-Term Investments |
99.0% |
Short-Term Investments and Other Assets and Liabilities |
1.0% |
Net Assets |
100.0% |
25
MML Equity Income Fund – Portfolio Manager Report (Unaudited) (Continued) |
GROWTH OF $10,000 INVESTMENT - INITIAL CLASS

The graph above illustrates a representative class of the Fund’s historical performance for the past 10 fiscal years or since inception (for Funds lacking 10-year records) in comparison to its benchmark index, as well as one or more additional indexes, if applicable. The performance of other share classes will be greater than or less than the class depicted above.
Average Annual Total Returns (for the periods ended 12/31/2022) |
||||
|
Inception Date |
1 Year |
5 Years |
10 Years |
Initial Class |
05/01/2006 |
-3.57% |
7.06% |
9.71% |
Service Class |
08/15/2008 |
-3.82% |
6.79% |
9.43% |
Russell 1000 Value Index |
-7.54% |
6.67% |
10.29% |
|
Generally accepted accounting principles require adjustments to be made to the net assets of the Fund at period end for financial reporting purposes only, and as such, the total return based on the unadjusted net asset value per share may differ from the total return reported in the financial highlights.
Performance results in the graph and table reflect the percentage change in net asset value, including reinvestment of dividends and capital gains distributions. Investors should note that the Fund is a professionally managed mutual fund, while the index or indexes shown above are unmanaged, cannot be purchased directly, and, with the exception of any peer group index, do not incur expenses.
Performance data quoted in the graph and table represents past performance; past performance is not predictive of future results. The investment return and principal value of shares of the Fund fluctuate, so your shares, when sold, may be worth more or less than their original cost. Current performance of the Fund may be lower or higher than the performance quoted. The performance shown does not reflect the deduction of taxes, if any, that a shareholder would pay on Fund distributions or the redemption of Fund shares. Performance data current to the most recent month end may be obtained by calling 1-888-309-3539.
Investors should read the Fund’s prospectus with regard to the Fund’s investment objectives, risks, and charges and expenses in conjunction with these financial statements. The Fund’s return reflects changes in the net asset value per share without the deduction of any product charges (e.g., cost of insurance, mortality and expense risk charges, administrative fees, and CDSL). The inclusion of these charges would have reduced the performance shown here.
26
MML Equity Index Fund – Portfolio Manager Report (Unaudited) |
What is the investment approach of MML Equity Index Fund, and who is the Fund’s subadviser?
The Fund’s investment objective is to provide investment results that correspond to the price and yield performance of publicly traded common stocks in the aggregate as represented by the S&P 500® Index* (the “Index”). Under normal circumstances, the Fund invests at least 80% (and, typically, substantially all) of its net assets (plus the amount of any borrowings for investment purposes) in the equity securities of companies included within the Index. The Fund’s subadviser is Northern Trust Investments, Inc. (NTI).
How did the Fund perform during the 12 months ended December 31, 2022?
The Fund’s Class I shares returned -18.50%, underperforming the -18.11% return of the Index, which measures the performance of 500 widely held stocks in the U.S. equity market.
For a discussion on the economic and market environment during the 12-month period ended December 31, 2022, please see the Economic and Market Overview, beginning on page 3.
Subadviser discussion of factors that contributed to the Fund’s performance
Generally, the Fund’s underperformance versus the Index was mainly attributable to the impact of fees and expenses necessary for the management and operation of the Fund. The Index is not subject to fees or expenses and it is not possible to invest directly in the Index.
For the one-year period ended December 31, 2022, energy and utilities were the strongest-performing sectors within the Index, returning 65.72% and 1.54%, respectively. The communication services and consumer discretionary sectors exhibited the worst performance across sectors, returning -40.40% and -37.03%, respectively.
In the first quarter of 2022, global equities were dominated by headlines surrounding high inflation and geopolitical unrest, which led to declines across developed and emerging markets. Continued high inflation, compounded by Russia’s invasion of Ukraine, led to a pullback in investor risk appetite. Headwinds for global financial markets continued in the second quarter, with negative returns in most major asset classes outside of cash. Elevated inflationary pressures led to increased investor expectations for monetary policy tightening throughout the quarter, which in turn heightened investor concerns on the economic growth outlook. Despite seeing double-digit gains by mid-August, U.S. equity markets ended with a loss for the third quarter, as investor hopes of a dovish Federal Reserve (the “Fed”) pivot evaporated following hawkish Fed leader rhetoric and more durable core inflation. Interest rates increased sharply in August and September, including a late-September rise stemming from U.K. financial stability concerns. Global markets finished the fourth quarter higher relative to the prior quarters, with investor sentiment buoyed by easing inflationary pressures. However, most major asset classes finished calendar-year 2022 with double-digit losses. Late in the calendar year, declining inflation levels allowed the Fed and European Central Bank to slow the pace of interest rate increases, but at fiscal year-end, a significant amount of uncertainty remained surrounding the future of global interest rates and the duration of restrictive monetary policy.
Derivatives are securities that derive their value from the performance of one or more other investments and take the form of a contract between two or more parties. Derivatives can be used for hedging, speculation, or both. The Fund generally uses equity futures to equitize/gain market exposure for relatively small amounts of cash in the Fund in order to minimize the uninvested cash balances and reduce the impact of any cash drag. There was no impact on the Fund’s performance due to the use of derivatives during the reporting period.
Subadviser outlook
Looking beyond the end of the fiscal period, Fund Management believes 2023 will likely be a turbulent year as inflation and monetary policy fears pivot to a weak global economy, but also to lower inflation and central bank pauses interest rate increases. Fund Management believes pockets of economic durability should limit a U.S. earnings slowdown in the upcoming fiscal year, with potential for sentiment-level upside.
|
* |
The “S&P 500 Index” is a product of S&P Dow Jones Indices LLC or its affiliates (“SPDJI”), and has been licensed for use by MassMutual. S&P®, S&P 500®, US 500, The 500, iBoxx®, iTraxx® and CDX® are trademarks of S&P Global, Inc. or its affiliates (“S&P”); Dow Jones® is a registered trademark of Dow Jones Trademark Holdings LLC (“Dow Jones”); and these trademarks have been licensed for use by SPDJI and sublicensed for certain purposes by MassMutual. The Fund is not sponsored, endorsed, sold or promoted by SPDJI, Dow Jones, S&P, or their respective affiliates, and none of such parties make any representation regarding the advisability of investing in such product(s) nor do they have any liability for any errors, omissions, or interruptions of the S&P 500 Index. |
27
MML Equity Index Fund – Portfolio Manager Report (Unaudited) (Continued) |
MML Equity Index Fund |
|
Apple, Inc. |
6.0% |
Microsoft Corp. |
5.5% |
Amazon.com, Inc. |
2.3% |
Berkshire Hathaway, Inc. Class B |
1.7% |
Alphabet, Inc. Class A |
1.6% |
UnitedHealth Group, Inc. |
1.5% |
Alphabet, Inc. Class C |
1.4% |
Johnson & Johnson |
1.4% |
Exxon Mobil Corp. |
1.4% |
JP Morgan Chase & Co. |
1.2% |
|
24.0% |
MML Equity Index Fund |
|
Consumer, Non-cyclical |
23.2% |
Technology |
21.5% |
Financial |
15.5% |
Communications |
10.7% |
Consumer, Cyclical |
9.0% |
Industrial |
8.4% |
Energy |
5.4% |
Utilities |
3.1% |
Basic Materials |
2.2% |
Total Long-Term Investments |
99.0% |
Short-Term Investments and Other Assets and Liabilities |
1.0% |
Net Assets |
100.0% |
28
MML Equity Index Fund – Portfolio Manager Report (Unaudited) (Continued) |
GROWTH OF $10,000 INVESTMENT - CLASS I
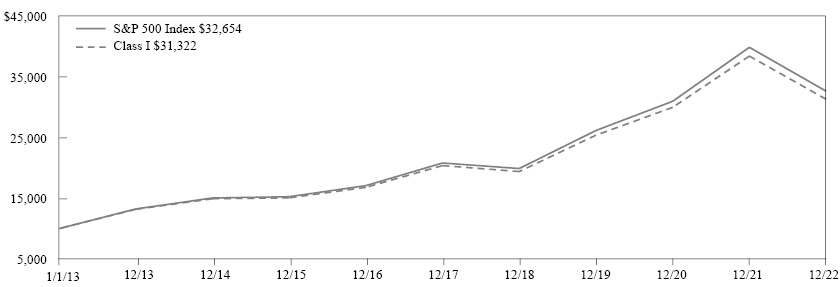
The graph above illustrates a representative class of the Fund’s historical performance for the past 10 fiscal years or since inception (for Funds lacking 10-year records) in comparison to its benchmark index, as well as one or more additional indexes, if applicable. The performance of other share classes will be greater than or less than the class depicted above.
Average Annual Total Returns (for the periods ended 12/31/2022) |
||||
|
Inception Date |
1 Year |
5 Years |
10 Years |
Class I |
05/01/1997 |
-18.50% |
8.97% |
12.09% |
Class II |
05/01/2000 |
-18.35% |
9.14% |
12.26% |
Class III |
05/01/2000 |
-18.23% |
9.30% |
12.42% |
Service Class I |
08/15/2008 |
-18.69% |
8.70% |
11.81% |
S&P 500 Index |
-18.11% |
9.42% |
12.56% |
|
Generally accepted accounting principles require adjustments to be made to the net assets of the Fund at period end for financial reporting purposes only, and as such, the total return based on the unadjusted net asset value per share may differ from the total return reported in the financial highlights.
Performance results in the graph and table reflect the percentage change in net asset value, including reinvestment of dividends and capital gains distributions. Investors should note that the Fund is a professionally managed mutual fund, while the index or indexes shown above are unmanaged, cannot be purchased directly, and, with the exception of any peer group index, do not incur expenses.
Performance data quoted in the graph and table represents past performance; past performance is not predictive of future results. The investment return and principal value of shares of the Fund fluctuate, so your shares, when sold, may be worth more or less than their original cost. Current performance of the Fund may be lower or higher than the performance quoted. The performance shown does not reflect the deduction of taxes, if any, that a shareholder would pay on Fund distributions or the redemption of Fund shares. Performance data current to the most recent month end may be obtained by calling 1-888-309-3539.
Investors should read the Fund’s prospectus with regard to the Fund’s investment objectives, risks, and charges and expenses in conjunction with these financial statements. The Fund’s return reflects changes in the net asset value per share without the deduction of any product charges (e.g., cost of insurance, mortality and expense risk charges, administrative fees, and CDSL). The inclusion of these charges would have reduced the performance shown here.
29
MML Focused Equity Fund – Portfolio Manager Report (Unaudited) |
What is the investment approach of MML Focused Equity Fund, and who is the Fund’s subadviser?
The Fund seeks growth of capital over the long-term by investing primarily in equity securities of U.S. companies that the Fund’s subadviser believes are financially sound, valued conservatively by the market, and have improving prospects. Under normal circumstances, the Fund invests at least 80% of its net assets (plus the amount of any borrowings for investment purposes) in equity securities. The Fund’s subadviser is Wellington Management Company LLP (Wellington Management).
How did the Fund perform during the 12 months ended December 31, 2022?
The Fund’s Class II shares returned -4.69%, significantly outperforming the -19.13% return of the Russell 1000® Index (the “benchmark”), which measures the performance of the large-cap segment of U.S. equity securities. It is a subset of the Russell 3000® Index and includes approximately 1000 of the largest securities based on a combination of their market cap and current index membership.
For a discussion on the economic and market environment during the 12-month period ended December 31, 2022, please see the Economic and Market Overview, beginning on page 3.
Subadviser discussion of factors that contributed to the Fund’s performance
For the one-year period ended December 31, 2022, strong stock selection drove the Fund’s relative results, particularly within the consumer discretionary, industrial, and financial sectors. This was partially offset by weak stock choices within the health care and materials sectors. Sector allocation, a residual of the Fund’s bottom-up stock selection process, also contributed to relative performance throughout the one-year period. Lack of exposure to communication services, an underweight allocation to information technology, relative to the benchmark, and an overweight allocation, relative to the benchmark, to consumer staples contributed the most. This was partially offset by a lack of exposure to the energy sector and an overweight allocation to the consumer discretionary sector.
With respect to specific Fund holdings, top relative contributors for the period included Northrop Grumman (industrials) and TJX Companies (consumer discretionary). Shares of U.S.-based aerospace and defense company Northrop Grumman rose on strength in the industry, as the conflict in Ukraine led to increased domestic military spending throughout the one-year period. Like its peers, as of the end of the fiscal period, growth was moderating for Northrop Grumman, as the B-21 and F-35 programs plateaued, and the U.S. government was shifting from unmanned aerospace platforms to space platforms, which Fund management expects to take time to play out. Shares of TJX Companies rose over the period due to solid demand, combined with good buying opportunities, as traditional retailers continued to experience inventory challenges. TJX Companies’ management remained focused on future profitability and their long-term goal to be a $60 billion revenue company.
Fund holdings that were among the top relative detractors for the period were Ecolab (materials) and Baxter International (health care). Not owning benchmark constituent ExxonMobil (energy) also proved beneficial for the Fund during the reporting period. Shares of U.S.-based chemical company Ecolab fell when growth stocks traded down during the reporting period after a strong run in 2021. The company grappled with inflation and the impact of supply chain disruptions – logistics and labor costs were also an issue for Ecolab during the course of the period. Baxter International underperformed in 2022 primarily because of continued inflationary pressures due to higher raw material costs, overhead costs, and difficulty securing critical components – specifically chips, due to ongoing chip shortages.
Subadviser outlook
Fund management observed that equity and bond markets both fell precipitously in 2022 over fears around rising interest rates and inflation. The Federal Reserve (the “Fed”) initially held that the early signs of inflation were probably temporary and isolated. However, in Fund management’s view, the eventual realization that inflation was not simply going away forced the Fed (and other central banks) to react late. Significant interest rate bumps chipped away at the foundation of the post-Great Financial Crisis bull market.
At fiscal year-end, in Fund management’s view, the Fund’s principal risk centered on whether the Fed can deftly manage a rate hike journey in 2023 without causing a recession. As of December 31, 2022, the Fund held its largest overweight allocations to the consumer staples and health care sectors, and it was most underweight in the information technology sector.
30
MML Focused Equity Fund – Portfolio Manager Report (Unaudited) (Continued) |
MML Focused Equity Fund |
|
The TJX Cos., Inc. |
6.0% |
NIKE, Inc. Class B |
5.5% |
Honeywell International, Inc. |
5.2% |
UnitedHealth Group, Inc. |
5.1% |
Visa, Inc. Class A |
4.6% |
PepsiCo, Inc. |
4.6% |
Chubb Ltd. |
4.6% |
Linde PLC |
4.4% |
Marsh & McLennan Cos., Inc. |
4.4% |
Danaher Corp. |
4.4% |
48.8% |
|
MML Focused Equity Fund |
|
Consumer, Non-cyclical |
36.4% |
Financial |
18.7% |
Consumer, Cyclical |
15.4% |
Industrial |
12.9% |
Basic Materials |
8.1% |
Technology |
6.3% |
Total Long-Term Investments |
97.8% |
Short-Term Investments and Other Assets and Liabilities |
2.2% |
Net Assets |
100.0% |
31
MML Focused Equity Fund – Portfolio Manager Report (Unaudited) (Continued) |
GROWTH OF $10,000 INVESTMENT - CLASS II
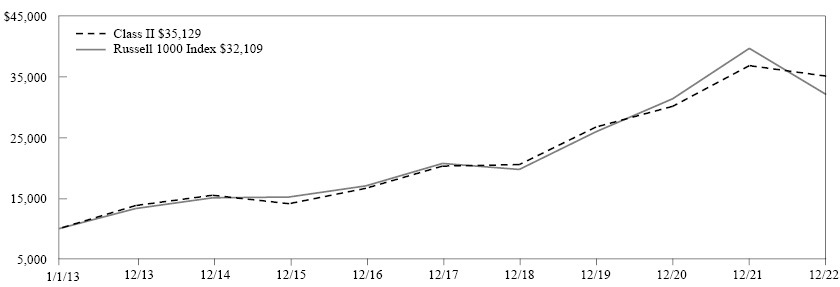
The graph above illustrates a representative class of the Fund’s historical performance for the past 10 fiscal years or since inception (for Funds lacking 10-year records) in comparison to its benchmark index, as well as one or more additional indexes, if applicable. The performance of other share classes will be greater than or less than the class depicted above.
Average Annual Total Returns (for the periods ended 12/31/2022) |
||||
|
Inception Date |
1 Year |
5 Years |
10 Years |
Class II |
12/08/2011 |
-4.69% |
11.59% |
13.39% |
Service Class I |
05/01/2012 |
-5.02% |
11.28% |
13.09% |
Russell 1000 Index |
-19.13% |
9.13% |
12.37% |
|
Generally accepted accounting principles require adjustments to be made to the net assets of the Fund at period end for financial reporting purposes only, and as such, the total return based on the unadjusted net asset value per share may differ from the total return reported in the financial highlights.
Performance results in the graph and table reflect the percentage change in net asset value, including reinvestment of dividends and capital gains distributions. Investors should note that the Fund is a professionally managed mutual fund, while the index or indexes shown above are unmanaged, cannot be purchased directly, and, with the exception of any peer group index, do not incur expenses.
Performance data quoted in the graph and table represents past performance; past performance is not predictive of future results. The investment return and principal value of shares of the Fund fluctuate, so your shares, when sold, may be worth more or less than their original cost. Current performance of the Fund may be lower or higher than the performance quoted. The performance shown does not reflect the deduction of taxes, if any, that a shareholder would pay on Fund distributions or the redemption of Fund shares. Performance data current to the most recent month end may be obtained by calling 1-888-309-3539.
Investors should read the Fund’s prospectus with regard to the Fund’s investment objectives, risks, and charges and expenses in conjunction with these financial statements. The Fund’s return reflects changes in the net asset value per share without the deduction of any product charges (e.g., cost of insurance, mortality and expense risk charges, administrative fees, and CDSL). The inclusion of these charges would have reduced the performance shown here.
32
MML Foreign Fund – Portfolio Manager Report (Unaudited) |
What is the investment approach of MML Foreign Fund, and who is the Fund’s subadviser?
The Fund seeks long-term total return by investing primarily in common stocks of companies listed on foreign securities exchanges. Under normal circumstances, the Fund invests at least 80% of its net assets (plus the amount of any borrowings for investment purposes) in investments of issuers located outside of the U.S., including those in emerging markets. Under normal market conditions, the Fund invests in equity securities of foreign companies representing at least three countries other than the United States. Although the Fund may invest in companies of any size as measured by assets, sales, or market capitalization, the Fund will tend to focus on larger, more seasoned or established companies. The Fund’s subadviser is Thompson, Siegel & Walmsley LLC (TSW).
How did the Fund perform during the 12 months ended December 31, 2022?
The Fund’s Initial Class shares returned -14.58%, underperforming the -14.45% return of the MSCI EAFE Index (the “benchmark”), which measures the performance of the large- and mid-cap segments of developed markets, excluding the U.S. and Canada equity securities.
For a discussion on the economic and market environment during the 12-month period ended December 31, 2022, please see the Economic and Market Overview, beginning on page 3.
Subadviser discussion of factors that contributed to the Fund’s performance
For the one-year period ended December 31, 2022, on a regional basis, a combination of unfavorable positioning and stock selection within the United Kingdom (“UK”) detracted most from the Fund’s relative returns. The UK was the benchmark’s top-performing region for the year, helped by energy representing the largest sector component. The Fund’s underweight exposure to the select companies in the rallying region and sector, relative to the benchmark, detracted from relative returns. Fund holding Persimmon Plc also weighed on returns. The UK homebuilder sold off after the UK housing secretary announced that developers would be responsible for an estimated £4 billion of cladding remediation; investor concerns over the UK economy also detracted from Persimmon’s returns during the period.
From a sector perspective, consumer discretionary weighed most on relative returns during the period. While the Fund’s underweight allocation to one of the market’s worst-performing sectors was additive, stock selection within the sector hampered results. Shares of Japanese conglomerate Sony Group Corporation detracted most after reporting mixed results over the course of the year. The company’s gaming segment faced higher costs following the Bungie studio acquisition as well as the continued supply shortage of PS5 consoles. However, Sony reported strong results across its other business segments.
Conversely, Europe contributed most to the Fund’s relative results during the period. Stock selection there was on full display, as an array of positions from various industries helped to drive the Fund’s performance. Most notable was Irish financial services company AIB Group PLC, which benefited from a relatively strong local economy and a rising interest rate environment during the one-year period. AIB nearly doubled consensus profit-before-tax expectations in the first half of the year due to an improved net interest margin and a €300 million credit write-back.
From a sector perspective, Fund holdings in the industrial sector contributed most to relative returns during the period. The contribution effects were spread among multiple positions from various industry groups – including aviation, defense, machinery, and conglomerate holdings. French aerospace company Dassault Aviation SA was the top performer among the Fund’s holdings for the fiscal period after the company announced a large military jet order by the Indonesian government in the first quarter of 2022. Shares of the company were further boosted following Russia’s invasion of Ukraine early in the fiscal period, as investors anticipated a rise in European defense spending.
33
MML Foreign Fund – Portfolio Manager Report (Unaudited) |
Subadviser outlook
Global stock markets mounted a recovery in the final months of 2022, but in TSW’s view, obvious catalysts for further broad-based gains are notably absent as 2023 begins. Fund management believes that central banks may continue to press the case against inflation, the pace of economic expansion could be underwhelming, and nervous caution will be the watchword for consumers and investors. However, TSW believes that, after a few turbulent prior years, global stock valuations appeared reasonable as of the end of the fiscal period. For instance, the MSCI All-Country World ex US Index, a broad measure of developed and emerging market stocks, returned less than 1% per year over the past five years in U.S. dollar terms, suggesting that prices for international stocks reflect low expectations. In Fund management’s view, this could be a good environment for a patient, value-focused investment style, and that returns for active investors over the next five years could be better than recent experience. In TSW’s opinion, TSW’s emphasis on stocks exhibiting attractive value and fundamentally improving operations is well-suited to challenging market conditions like those that TSW expects to exist in the coming fiscal period.
34
MML Foreign Fund – Portfolio Manager Report (Unaudited) (Continued) |
MML Foreign Fund |
|
Novartis AG Registered |
1.9% |
Unilever PLC |
1.9% |
Sanofi |
1.8% |
TotalEnergies SE |
1.8% |
Anheuser-Busch InBev SA |
1.8% |
Siemens AG Registered |
1.7% |
Sony Group Corp. |
1.7% |
Roche Holding AG |
1.7% |
SAP SE |
1.6% |
Nestle SA Registered |
1.6% |
|
17.5% |
MML Foreign Fund |
|
Consumer, Non-cyclical |
24.7% |
Financial |
20.4% |
Industrial |
13.6% |
Technology |
10.6% |
Consumer, Cyclical |
10.2% |
Basic Materials |
6.8% |
Energy |
6.2% |
Communications |
3.9% |
Utilities |
2.8% |
Total Long-Term Investments |
99.2% |
Short-Term Investments and Other Assets and Liabilities |
0.8% |
Net Assets |
100.0% |
35
MML Foreign Fund – Portfolio Manager Report (Unaudited) (Continued) |
GROWTH OF $10,000 INVESTMENT - INITIAL CLASS
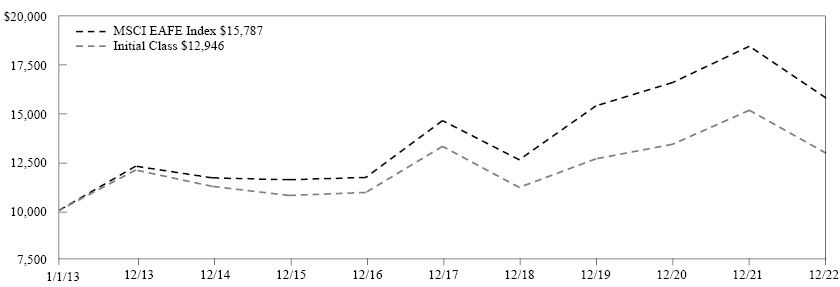
The graph above illustrates a representative class of the Fund’s historical performance for the past 10 fiscal years or since inception (for Funds lacking 10-year records) in comparison to its benchmark index, as well as one or more additional indexes, if applicable. The performance of other share classes will be greater than or less than the class depicted above.
Average Annual Total Returns (for the periods ended 12/31/2022) |
||||
|
Inception Date |
1 Year |
5 Years |
10 Years |
Initial Class |
05/01/2006 |
-14.58% |
-0.54% |
2.62% |
Service Class |
08/15/2008 |
-14.87% |
-0.79% |
2.36% |
MSCI EAFE Index |
-14.45% |
1.54% |
4.67% |
|
Generally accepted accounting principles require adjustments to be made to the net assets of the Fund at period end for financial reporting purposes only, and as such, the total return based on the unadjusted net asset value per share may differ from the total return reported in the financial highlights.
Performance results in the graph and table reflect the percentage change in net asset value, including reinvestment of dividends and capital gains distributions. Investors should note that the Fund is a professionally managed mutual fund, while the index or indexes shown above are unmanaged, cannot be purchased directly, and, with the exception of any peer group index, do not incur expenses.
Performance data quoted in the graph and table represents past performance; past performance is not predictive of future results. The investment return and principal value of shares of the Fund fluctuate, so your shares, when sold, may be worth more or less than their original cost. Current performance of the Fund may be lower or higher than the performance quoted. The performance shown does not reflect the deduction of taxes, if any, that a shareholder would pay on Fund distributions or the redemption of Fund shares. Performance data current to the most recent month end may be obtained by calling 1-888-309-3539.
Investors should read the Fund’s prospectus with regard to the Fund’s investment objectives, risks, and charges and expenses in conjunction with these financial statements. The Fund’s return reflects changes in the net asset value per share without the deduction of any product charges (e.g., cost of insurance, mortality and expense risk charges, administrative fees, and CDSL). The inclusion of these charges would have reduced the performance shown here.
36
MML Fundamental Equity Fund – Portfolio Manager Report (Unaudited) |
What is the investment approach of MML Fundamental Equity Fund, and who is the Fund’s subadviser?
The Fund seeks a high total return by investing primarily in common stocks of U.S. companies of different capitalization ranges. The Fund’s subadviser currently focuses on “large capitalization” issuers, which are considered to be companies with market capitalizations at the time of purchase within the market capitalization range of companies included within the Russell 1000® Index, although it may purchase stocks of companies with any market capitalization. Under normal circumstances, the Fund invests at least 80% of its net assets (plus the amount of any borrowings for investment purposes) in equity securities. The Fund’s subadviser is Invesco Advisers, Inc. (Invesco Advisers).
How did the Fund perform during the 12 months ended December 31, 2022?
The Fund’s Class II shares returned -20.24%, underperforming the -18.11% return of the S&P 500® Index (the “benchmark”), which measures the performance of 500 widely held stocks in the U.S. equity market.
For a discussion on the economic and market environment during the 12-month period ended December 31, 2022, please see the Economic and Market Overview, beginning on page 3.
Subadviser discussion of factors that contributed to the Fund’s performance
For the one-year period ended December 31, 2022, stock selection within the information technology, financial, and consumer staples sectors was the primary driver of the Fund’s underperformance. This was partially offset by strong stock selection in the communication services sector, a moderate underweight to the consumer discretionary sector, and a moderate overweight to the industrial sector.
Fund holdings that were top detractors from relative performance during the fiscal period included Advanced Micro Devices, Airbnb, and Qualcomm. Advanced Micro Devices, a semiconductor company, saw weakened demand for the company’s consumer central processing unit (CPU) and graphics processing unit (GPU) businesses due to global macroeconomic headwinds. Airbnb, which operates an online marketplace focused on short-term home stays, underperformed, as the stock suffered in an environment that featured a combined sell-off of higher-growth, technology, and travel-related stocks. With respect to travel-related stocks, in Fund management’s view, fears of a weakening economy, in tandem with higher gasoline prices, hurt investor sentiment. Qualcomm – a provider of semiconductors, software, and services related to wireless technology – underperformed, as semi-conductor stocks, and technology stocks more broadly, fell out of favor with investors. The company was also affected by COVID-related headwinds in China, which caused weakness in the handset market that was important to Qualcomm’s growth plans.
Fund holdings that were top contributors to the Fund’s relative performance included two pharmaceuticals companies – Eli Lilly and AstraZeneca – and auto parts retailer, O’Reilly. Eli Lilly reported favorable data for its obesity drug, tirzepatide, and it also received Food and Drug Administration approval to use the drug for type 2 diabetes in adults. During the reporting period, pharmaceutical companies were generally viewed as defensive stocks, which investors favored during the equity sell-off. AstraZeneca reported solid earnings results and modestly raised its dividend during the fiscal period. O’Reilly reported solid earnings and did a significant stock buyback program that was well received during the fiscal period. The company’s business model was also considered relatively defensive, as car repairs are non-discretionary, and many consumers opted to pay for maintenance in lieu of buying a new vehicle in 2022’s generally uncertain economic environment.
Subadviser outlook
In the view of Fund management, as of the end of the fiscal year, the key questions going forward are for how long interest rates must be kept in restrictive territory, and whether the economy can avoid a recession. Fund management believes that the federal funds rate – the Federal Reserve’s overnight bank lending rate – will stay elevated for longer than the market would like, but that a significant recession is unlikely. Nonetheless, as of the close of the fiscal year, Invesco Advisers expected sluggish gross domestic product growth and pressure on corporate profits to last for a year or more. Fund management expects to continue to maintain its discipline around valuation, focusing on companies with competitive advantages and skilled management teams that are out-executing their peers.
37
MML Fundamental Equity Fund – Portfolio Manager Report (Unaudited) (Continued) |
MML Fundamental Equity Fund |
|
Microsoft Corp. |
5.8% |
Apple, Inc. |
4.9% |
JP Morgan Chase & Co. |
3.6% |
Exxon Mobil Corp. |
3.1% |
Prologis, Inc. |
2.8% |
United Parcel Service, Inc. Class B |
2.7% |
Netflix, Inc. |
2.6% |
UnitedHealth Group, Inc. |
2.4% |
VMware, Inc. Class A |
2.2% |
Equitable Holdings, Inc. |
2.1% |
32.2% |
|
MML Fundamental Equity Fund |
|
Technology |
22.2% |
Consumer, Non-cyclical |
20.9% |
Financial |
19.7% |
Industrial |
12.8% |
Communications |
10.0% |
Energy |
5.1% |
Consumer, Cyclical |
4.4% |
Utilities |
2.9% |
Basic Materials |
1.3% |
Mutual Funds |
1.1% |
Total Long-Term Investments |
100.4% |
Short-Term Investments and Other Assets and Liabilities |
(0.4)% |
Net Assets |
100.0% |
38
MML Fundamental Equity Fund – Portfolio Manager Report (Unaudited) (Continued) |
GROWTH OF $10,000 INVESTMENT - CLASS II
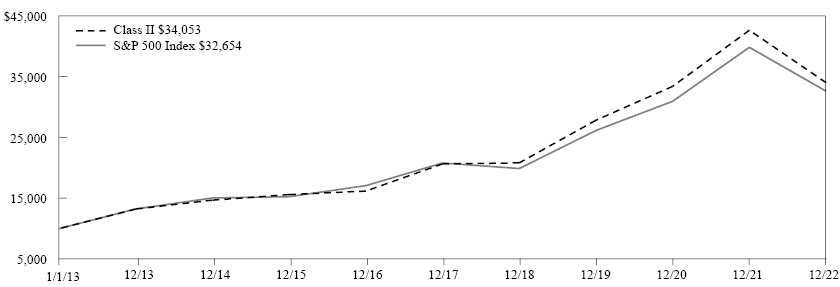
The graph above illustrates a representative class of the Fund’s historical performance for the past 10 fiscal years or since inception (for Funds lacking 10-year records) in comparison to its benchmark index, as well as one or more additional indexes, if applicable. The performance of other share classes will be greater than or less than the class depicted above.
Average Annual Total Returns (for the periods ended 12/31/2022) |
||||
|
Inception Date |
1 Year |
5 Years |
10 Years |
Class II |
12/08/2011 |
-20.24% |
10.50% |
13.04% |
Service Class I |
05/01/2012 |
-20.44% |
10.22% |
12.75% |
S&P 500 Index |
-18.11% |
9.42% |
12.56% |
|
Generally accepted accounting principles require adjustments to be made to the net assets of the Fund at period end for financial reporting purposes only, and as such, the total return based on the unadjusted net asset value per share may differ from the total return reported in the financial highlights.
Performance results in the graph and table reflect the percentage change in net asset value, including reinvestment of dividends and capital gains distributions. Investors should note that the Fund is a professionally managed mutual fund, while the index or indexes shown above are unmanaged, cannot be purchased directly, and, with the exception of any peer group index, do not incur expenses.
Performance data quoted in the graph and table represents past performance; past performance is not predictive of future results. The investment return and principal value of shares of the Fund fluctuate, so your shares, when sold, may be worth more or less than their original cost. Current performance of the Fund may be lower or higher than the performance quoted. The performance shown does not reflect the deduction of taxes, if any, that a shareholder would pay on Fund distributions or the redemption of Fund shares. Performance data current to the most recent month end may be obtained by calling 1-888-309-3539.
Investors should read the Fund’s prospectus with regard to the Fund’s investment objectives, risks, and charges and expenses in conjunction with these financial statements. The Fund’s return reflects changes in the net asset value per share without the deduction of any product charges (e.g., cost of insurance, mortality and expense risk charges, administrative fees, and CDSL). The inclusion of these charges would have reduced the performance shown here.
39
MML Fundamental Value Fund – Portfolio Manager Report (Unaudited) |
What is the investment approach of MML Fundamental Value Fund, and who is the Fund’s subadviser?
The Fund seeks long-term total return by investing primarily in equity securities of issuers that the Fund’s subadviser believes are undervalued. Under normal circumstances, the Fund invests at least 80% of its net assets (plus the amount of any borrowings for investment purposes) in equity securities. Although the Fund may invest in companies of any size, the Fund will tend to focus on companies with large market capitalizations (which the subadviser believes are generally above $1 billion). The Fund’s subadviser is Boston Partners Global Investors, Inc. (Boston Partners).
How did the Fund perform during the 12 months ended December 31, 2022?
The Fund’s Class II shares returned -4.86%, outperforming the -7.54% return of the Russell 1000® Value Index (the “benchmark”), which measures the performance of the large-cap value segment of U.S. equity securities. It includes the Russell 1000 Index companies with lower price-to-book ratios and lower expected growth values.
For a discussion on the economic and market environment during the 12-month period ended December 31, 2022, please see the Economic and Market Overview, beginning on page 3.
Subadviser discussion of factors that contributed to the Fund’s performance
For the one-year period ended December 31, 2022, stock selection and sector allocation both contributed to the Fund’s relative performance. The Fund experienced positive stock selection in the health care, financial, industrial, and consumer discretionary sectors during the fiscal period. In pharmaceuticals and health care, health insurers Cigna and UnitedHealthcare outperformed due to strong earnings and guidance as well as better-than-expected rate increases for government-sponsored insurance. In the financial sector, Fund holding Charles Schwab added value, as rising interest rates resulted in higher net interest income and the company announced a $15 billion share repurchase program. Within the industrial sector, aerospace and defense companies General Dynamics and Howmet outperformed after Russia’s invasion of the Ukraine, and expectations of increased defense budgets globally supported the sector. In consumer discretionary, AutoZone continued to gain market share with commercial customers, resulting in better-than-expected sales and earnings for this Fund holding during the fiscal period. During 2022, the company repurchased about 10% of its outstanding shares. Finally, sector allocation contributed to the Fund’s relative returns due to an overweight allocation to energy and health care, and underweight allocations to real estate and communication services.
Fund holdings within the technology, consumer staples, and communication services sectors detracted during the reporting period. In technology, semiconductor stocks Qualcomm and Micron lagged, as many investors were concerned about future demand in a potentially difficult 2023 economic environment. In consumer staples, consumer goods provider Procter & Gamble detracted, as the company experienced a cost/pricing squeeze during the Fund’s holding period; Fund management consequently eliminated Procter & Gamble from the Fund’s portfolio. Not owning low-growth, defensive food companies such as Archer Daniels-Midland and General Mills also hampered the Fund’s relative performance. In communication services, Alphabet and Meta Platforms underperformed, as online marketing spend slowed relative to expectations. From a sector allocation perspective, the Fund’s overweight allocation to the technology sector and its underweight allocation to utilities and consumer staples reduced relative returns during the fiscal year.
During the reporting period, Fund management increased the Fund’s exposure to the financial and energy sectors and reduced its positions in technology and communication services. In the financial sector, Fund management added to existing holdings, including JP Morgan and Bank of America, as Fund management believed that rising interest rates could help net interest margins and investment income. Within energy, Fund management added to its holdings oil services firm Halliburton, which was achieving strong pricing gains over the course of the fiscal period because of the lack of labor availability for services in the oil patch. In communication services, Fund management sold its position in Meta. The company had looked attractively priced on a historical basis, but Fund management’s expectation of acceleration in online ad revenue late in 2022 failed to materialize.
Subadviser outlook
Fund management will continue to focus on finding investments that have not only attractive valuation characteristics and solid business fundamentals, but also improving business momentum and catalysts that Fund management believes could drive stock prices higher. Fund management’s emphasis on bottom-up security selection and sound fundamental analysis historically has led to alpha generation over time. With rising interest rates and an aggressive Federal Reserve determined to fight inflation, as of the end of the fiscal period, Fund management was increasingly concerned about the path of the economy in 2023. Fund management believes that declining inflation expectations are the key for a reversal in sentiment and potential multiple expansion.
40
MML Fundamental Value Fund – Portfolio Manager Report (Unaudited) (Continued) |
MML Fundamental Value Fund |
|
Johnson & Johnson |
3.8% |
JP Morgan Chase & Co. |
3.7% |
Berkshire Hathaway, Inc. Class B |
3.5% |
Bristol-Myers Squibb Co. |
2.7% |
Sanofi ADR |
2.6% |
The Charles Schwab Corp. |
2.5% |
ConocoPhillips |
2.4% |
AutoZone, Inc. |
2.4% |
Cigna Corp. |
2.4% |
CVS Health Corp. |
2.3% |
28.3% |
|
MML Fundamental Value Fund |
|
Consumer, Non-cyclical |
28.8% |
Financial |
18.7% |
Industrial |
12.4% |
Energy |
12.2% |
Technology |
9.7% |
Communications |
6.3% |
Consumer, Cyclical |
4.1% |
Basic Materials |
3.5% |
Utilities |
2.1% |
Mutual Funds |
0.0% |
Total Long-Term Investments |
97.8% |
Short-Term Investments and Other Assets and Liabilities |
2.2% |
Net Assets |
100.0% |
41
MML Fundamental Value Fund – Portfolio Manager Report (Unaudited) (Continued) |
GROWTH OF $10,000 INVESTMENT - CLASS II
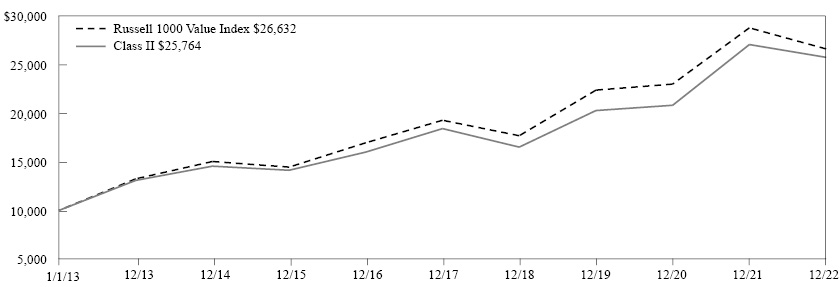
The graph above illustrates a representative class of the Fund’s historical performance for the past 10 fiscal years or since inception (for Funds lacking 10-year records) in comparison to its benchmark index, as well as one or more additional indexes, if applicable. The performance of other share classes will be greater than or less than the class depicted above.
Average Annual Total Returns (for the periods ended 12/31/2022) |
||||
|
Inception Date |
1 Year |
5 Years |
10 Years |
Class II |
08/10/2010 |
-4.86% |
6.93% |
9.93% |
Service Class I |
05/01/2012 |
-5.03% |
6.67% |
9.66% |
Russell 1000 Value Index |
-7.54% |
6.67% |
10.29% |
|
Generally accepted accounting principles require adjustments to be made to the net assets of the Fund at period end for financial reporting purposes only, and as such, the total return based on the unadjusted net asset value per share may differ from the total return reported in the financial highlights.
Performance results in the graph and table reflect the percentage change in net asset value, including reinvestment of dividends and capital gains distributions. Investors should note that the Fund is a professionally managed mutual fund, while the index or indexes shown above are unmanaged, cannot be purchased directly, and, with the exception of any peer group index, do not incur expenses.
Performance data quoted in the graph and table represents past performance; past performance is not predictive of future results. The investment return and principal value of shares of the Fund fluctuate, so your shares, when sold, may be worth more or less than their original cost. Current performance of the Fund may be lower or higher than the performance quoted. The performance shown does not reflect the deduction of taxes, if any, that a shareholder would pay on Fund distributions or the redemption of Fund shares. Performance data current to the most recent month end may be obtained by calling 1-888-309-3539.
Investors should read the Fund’s prospectus with regard to the Fund’s investment objectives, risks, and charges and expenses in conjunction with these financial statements. The Fund’s return reflects changes in the net asset value per share without the deduction of any product charges (e.g., cost of insurance, mortality and expense risk charges, administrative fees, and CDSL). The inclusion of these charges would have reduced the performance shown here.
42
MML Global Fund – Portfolio Manager Report (Unaudited) |
What is the investment approach of MML Global Fund, and who is the Fund’s subadviser?
The Fund seeks long-term capital appreciation by investing primarily in the equity securities of U.S. and foreign companies, including companies in developed and emerging markets. The Fund’s subadviser normally invests the Fund’s assets across different industries, sectors, countries, and regions, but the Fund’s subadviser may invest a significant percentage of the Fund’s assets in issuers in a single industry, sector, country, or region. The Fund’s subadviser is Massachusetts Financial Services Company (MFS).
How did the Fund perform during the 12 months ended December 31, 2022?
The Fund’s Class I shares returned -17.78%, outperforming the -18.14% return of the MSCI World Index (the “benchmark”), which measures the performance of the large- and mid-cap segments of world equity securities.
For a discussion on the economic and market environment during the 12-month period ended December 31, 2022, please see the Economic and Market Overview, beginning on page 3.
Subadviser discussion of factors that contributed to the Fund’s performance
Security selection and an underweight allocation, relative to the benchmark, to both the information technology and consumer discretionary sectors contributed to the Fund’s relative performance for the one-year period ended December 31, 2022. Within the information technology sector, not owning shares of personal electronics maker Apple, software giant Microsoft, and computer graphics processor maker NVIDIA aided the Fund’s relative results. Within the consumer discretionary sector, not owning shares of internet retailer Amazon.com and electric vehicle manufacturer Tesla also strengthened the Fund’s relative results. Elsewhere, not owning shares of social networking service provider Meta Platforms contributed to the Fund’s relative performance. Additionally, overweight allocations to railway operator Canadian Pacific Railway, diversified technology and manufacturing company Honeywell International, and medical devices maker Boston Scientific aided the Fund’s relative returns. The Fund’s underweight position in shares of technology company Alphabet further benefited the Fund’s relative performance.
On the downside, not holding any stocks within the strong-performing energy sector detracted from the Fund’s relative performance for the reporting period. Within the sector, not owning shares of integrated energy companies ExxonMobil and Chevron also hurt the Fund’s relative returns. Stock selection in the health care sector weakened relative results as well. However, there were no individual stocks within this sector, either in the Fund’s portfolio or in the benchmark, that were among the Fund’s largest relative detractors during the fiscal period. Fund holdings in other sectors that dampened relative performance for the fiscal period included overweight positions in cable and broadband companies Liberty Broadband and Comcast, consulting and information technology services provider Accenture, diversified entertainment company Walt Disney, electrical distribution equipment manufacturer Schneider Electric (France), global banking and payments technology provider Fidelity National Information Services, paint and specialty chemicals manufacturer Akzo Nobel (Netherlands), and machinery and industrial products manufacturer Kubota (Japan).
Subadviser outlook
In Fund management’s view, after a year of sharp swings in monetary policy and in the pricing of financial assets, 2023 started off in an environment of continued uncertainty. Fund management believes that central banks are starting to tame inflation; however, in Fund management’s view, there is perhaps a greater risk of policy error as the U.S. and global economies enter the next phase of monetary and fiscal policy moves, with large and continuous changes to interest rates, potentially followed by moderation as inflation starts to fall, offsetting the risk of recession.
After a decade of abundant liquidity, Fund management believes that the new period of quantitative tightening remains largely untested. In their view, the longer-term implications of the new monetary and fiscal regime are still not fully understood. Fund management expects that the volatility in currency markets, in tandem with concerns over military action in Europe (and threatened in Asia), potentially set the stage for volatility in the markets to remain high.
43
MML Global Fund – Portfolio Manager Report (Unaudited) (Continued) |
MML Global Fund |
|
Visa, Inc. Class A |
3.1% |
Thermo Fisher Scientific, Inc. |
3.0% |
Schneider Electric SE |
2.9% |
Roche Holding AG |
2.6% |
LVMH Moet Hennessy Louis Vuitton SE |
2.5% |
Honeywell International, Inc. |
2.4% |
Accenture PLC Class A |
2.3% |
Nestle SA Registered |
2.3% |
Medtronic PLC |
2.3% |
Comcast Corp. Class A |
2.3% |
25.7% |
|
MML Global Fund |
|
Consumer, Non-cyclical |
34.1% |
Industrial |
17.8% |
Financial |
15.1% |
Technology |
10.1% |
Communications |
7.5% |
Consumer, Cyclical |
7.3% |
Basic Materials |
7.3% |
Mutual Funds |
2.1% |
Total Long-Term Investments |
101.3% |
Short-Term Investments and Other Assets and Liabilities |
(1.3)% |
Net Assets |
100.0% |
44
MML Global Fund – Portfolio Manager Report (Unaudited) (Continued) |
GROWTH OF $10,000 INVESTMENT - CLASS I
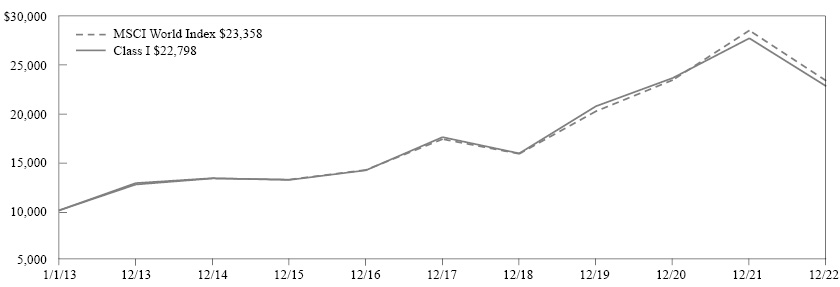
The graph above illustrates a representative class of the Fund’s historical performance for the past 10 fiscal years or since inception (for Funds lacking 10-year records) in comparison to its benchmark index, as well as one or more additional indexes, if applicable. The performance of other share classes will be greater than or less than the class depicted above.
Average Annual Total Returns (for the periods ended 12/31/2022) |
||||
|
Inception Date |
1 Year |
5 Years |
10 Years |
Class I |
05/01/2006 |
-17.78% |
5.38% |
8.59% |
Class II |
05/01/2006 |
-17.71% |
5.39% |
8.63% |
Service Class I |
08/15/2008 |
-18.00% |
5.11% |
8.33% |
MSCI World Index |
-18.14% |
6.14% |
8.85% |
|
Generally accepted accounting principles require adjustments to be made to the net assets of the Fund at period end for financial reporting purposes only, and as such, the total return based on the unadjusted net asset value per share may differ from the total return reported in the financial highlights.
Performance results in the graph and table reflect the percentage change in net asset value, including reinvestment of dividends and capital gains distributions. Investors should note that the Fund is a professionally managed mutual fund, while the index or indexes shown above are unmanaged, cannot be purchased directly, and, with the exception of any peer group index, do not incur expenses.
Performance data quoted in the graph and table represents past performance; past performance is not predictive of future results. The investment return and principal value of shares of the Fund fluctuate, so your shares, when sold, may be worth more or less than their original cost. Current performance of the Fund may be lower or higher than the performance quoted. The performance shown does not reflect the deduction of taxes, if any, that a shareholder would pay on Fund distributions or the redemption of Fund shares. Performance data current to the most recent month end may be obtained by calling 1-888-309-3539.
Investors should read the Fund’s prospectus with regard to the Fund’s investment objectives, risks, and charges and expenses in conjunction with these financial statements. The Fund’s return reflects changes in the net asset value per share without the deduction of any product charges (e.g., cost of insurance, mortality and expense risk charges, administrative fees, and CDSL). The inclusion of these charges would have reduced the performance shown here.
45
MML Income & Growth Fund – Portfolio Manager Report (Unaudited) |
What is the investment approach of MML Income & Growth Fund, and who is the Fund’s subadviser?
The Fund seeks long-term total return and current income by investing primarily in equity securities of issuers that the Fund’s subadviser believes are undervalued. Although the Fund may invest in companies of any size, the Fund will tend to focus on companies with large market capitalizations (which the Fund’s subadviser believes are generally above $2 billion). The Fund’s subadviser is Barrow, Hanley, Mewhinney & Strauss, LLC (Barrow Hanley).
How did the Fund perform during the 12 months ended December 31, 2022?
The Fund’s Initial Class shares returned -0.31%, significantly outperforming the -7.54% return of the Russell 1000® Value Index (the “benchmark”), which measures the performance of the large-cap value segment of U.S. equity securities. It includes the Russell 1000 Index companies with lower price-to-book ratios and lower expected growth values.
For a discussion on the economic and market environment during the 12-month period ended December 31, 2022, please see the Economic and Market Review, beginning on page 3.
Subadviser discussion of factors that contributed to the Fund’s performance
For the one-year period ended December 31, 2022, the Fund’s relative performance was strong across the board, as 10 out of 11 sectors contributed positively. Strong stock selection in health care, information technology, and real estate, coupled with the Fund’s underweight allocation to information technology and real estate, added to relative performance. Conversely, consumer discretionary weighed modestly on the Fund’s relative performance, as headwinds from the Fund’s overweight allocation to the sector slightly outpaced positive stock selection.
The Fund benefited from holdings such as energy producer Hess Corporation, where firm commodity prices and increasing production volumes from their asset in Guyana helped propel shares and relative performance higher. During the fiscal period, the industry remained disciplined in adding more supply to the market, which in turn allowed for continued strong cash generation to fund share repurchases and dividend increases. Turning to other Fund holdings, pharmaceutical firm Merck & Co. reported strong results in their pharmaceutical and vaccine franchises during the fiscal year. Throughout the fiscal year, their animal health franchise also posted solid results, and collectively, cash generation was strong and continued to support attractive investments and returns to shareholders via dividends and share repurchases. Other top contributors to the Fund’s relative performance included multinational energy company Phillips 66, health insurer Cigna Corporation, and John Deere – a manufacturer of agricultural machinery, heavy equipment, forestry machinery, diesel engines, drivetrains used in heavy equipment, and lawn care equipment.
On the downside, Stanley Black & Decker, an industrial and tools business, pressured the Fund’s relative performance, as cost headwinds combined with slowing customer demand led company management to lower earnings guidance for this Fund holding. International Flavors & Fragrances, a global supplier of flavors and fragrances, weighed on the Fund’s relative performance, as inventory destocking, combined with volume headwinds, offset favorable pricing and pushed shares lower. Other Fund holdings that were top detractors during the fiscal period included Advance Auto Parts, financial services company Northern Trust, and cable television provider Altice USA, which Fund management eliminated from the Fund’s portfolio in the fourth quarter of 2022.
Subadviser outlook
Fund management believes that the reversal of the value sector’s fortunes over the last 18-24 months appears likely to persist for years to come, as value runs have historically lasted approximately 7 years on average. Despite the sector’s recent success, valuations for value stocks remain, in Fund management’s view, relatively cheap at a 16% discount to market and a 34% discount relative to growth. Historically, forward five-year returns for value at these levels of discount have been meaningfully positive relative to both the market and growth stocks.
In Fund management’s view, the normalization of higher interest rates, in response to inflation (which Fund management believes may remain higher than preferred by central banks), continues to further bolster confidence in Fund management’s view, as of the end of the fiscal period, that value is well-positioned moving into 2023.
46
MML Income & Growth Fund – Portfolio Manager Report (Unaudited) (Continued) |
MML Income & Growth Fund |
|
Merck & Co., Inc. |
4.0% |
Philip Morris International, Inc. |
3.4% |
Phillips 66 |
3.2% |
Air Products & Chemicals, Inc. |
3.1% |
UnitedHealth Group, Inc. |
3.1% |
Hess Corp. |
3.0% |
Raytheon Technologies Corp. |
2.8% |
Cigna Corp. |
2.6% |
Chubb Ltd. |
2.6% |
The Allstate Corp. |
2.5% |
30.3% |
|
MML Income & Growth Fund |
|
Consumer, Non-cyclical |
28.7% |
Financial |
19.7% |
Industrial |
11.8% |
Energy |
10.2% |
Basic Materials |
8.1% |
Technology |
7.0% |
Consumer, Cyclical |
6.1% |
Utilities |
5.0% |
Communications |
2.6% |
Total Long-Term Investments |
99.2% |
Short-Term Investments and Other Assets and Liabilities |
0.8% |
Net Assets |
100.0% |
47
MML Income & Growth Fund – Portfolio Manager Report (Unaudited) (Continued) |
GROWTH OF $10,000 INVESTMENT - INITIAL CLASS
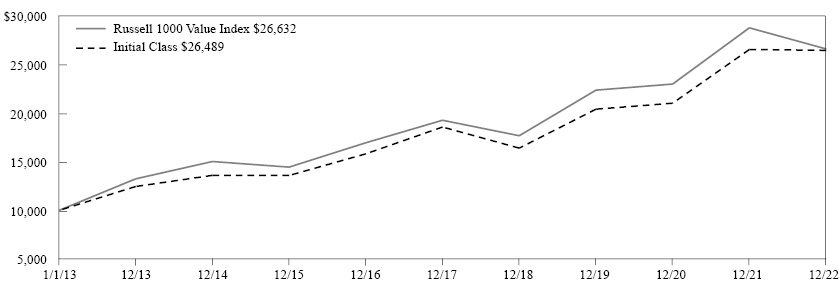
The graph above illustrates a representative class of the Fund’s historical performance for the past 10 fiscal years or since inception (for Funds lacking 10-year records) in comparison to its benchmark index, as well as one or more additional indexes, if applicable. The performance of other share classes will be greater than or less than the class depicted above.
Average Annual Total Returns (for the periods ended 12/31/2022) |
||||
|
Inception Date |
1 Year |
5 Years |
10 Years |
Initial Class |
05/01/2006 |
-0.31% |
7.34% |
10.23% |
Service Class |
08/15/2008 |
-0.59% |
7.06% |
9.95% |
Russell 1000 Value Index |
-7.54% |
6.67% |
10.29% |
|
Generally accepted accounting principles require adjustments to be made to the net assets of the Fund at period end for financial reporting purposes only, and as such, the total return based on the unadjusted net asset value per share may differ from the total return reported in the financial highlights.
Performance results in the graph and table reflect the percentage change in net asset value, including reinvestment of dividends and capital gains distributions. Investors should note that the Fund is a professionally managed mutual fund, while the index or indexes shown above are unmanaged, cannot be purchased directly, and, with the exception of any peer group index, do not incur expenses.
Performance data quoted in the graph and table represents past performance; past performance is not predictive of future results. The investment return and principal value of shares of the Fund fluctuate, so your shares, when sold, may be worth more or less than their original cost. Current performance of the Fund may be lower or higher than the performance quoted. The performance shown does not reflect the deduction of taxes, if any, that a shareholder would pay on Fund distributions or the redemption of Fund shares. Performance data current to the most recent month end may be obtained by calling 1-888-309-3539.
Investors should read the Fund’s prospectus with regard to the Fund’s investment objectives, risks, and charges and expenses in conjunction with these financial statements. The Fund’s return reflects changes in the net asset value per share without the deduction of any product charges (e.g., cost of insurance, mortality and expense risk charges, administrative fees, and CDSL). The inclusion of these charges would have reduced the performance shown here.
48
MML International Equity Fund – Portfolio Manager Report (Unaudited) |
What is the investment approach of MML International Equity Fund, and who are the Fund’s subadvisers?
The Fund seeks long-term capital growth by investing, under normal circumstances, at least 80% of its net assets (plus the amount of any borrowings for investment purposes) in equity securities of foreign companies, including companies located in Europe, Latin America, and Asia. The Fund may invest up to 25% of its total assets in equity securities of issuers in emerging markets. Equity securities may include common stocks, preferred stocks, securities convertible into common or preferred stocks, depositary receipts, rights, and warrants of issuers of any size. The Fund’s two subadvisers are Harris Associates L.P. (Harris), which managed approximately 34% of the Fund’s portfolio; and Massachusetts Financial Services Company (MFS), which managed approximately 66% of the Fund’s portfolio, as of December 31, 2022.
How did the Fund perform during the 12 months ended December 31, 2022?
The Fund’s Class II shares returned -15.10%, underperforming the -14.45% return of the MSCI EAFE Index (the “benchmark”), which measures the performance of the large- and mid-cap segments of developed markets, excluding the U.S. and Canada equity securities. The Fund underperformed the -14.29% return of the MSCI World Index ex USA, which measures the performance of the large- and mid-cap segments of world, excluding U.S. equity securities.
For a discussion on the economic and market environment during the 12-month period ended December 31, 2022, please see the Economic and Market Overview, beginning on page 3.
Subadviser discussion of factors that contributed to the Fund’s performance
For the Harris component of the Fund, Fund management’s bottom-up approach in selecting stocks results in country and sector allocations as a component of the stock selection process. For the one-year period ended December 31, 2022, with respect to country performance relative to the benchmark, country weightings detracted from results, while stock selection contributed. Relative sector performance was negatively impacted by sector weightings, while stock selection contributed to the Fund’s overall results. From a geographic perspective, the Fund component’s exposure to South Korea detracted the most from the Fund’s relative performance – as both underlying holdings lost value during the period – followed by the U.K., where nine of 13 underlying holdings lost value during the period. Mexico and South Korea were the largest negative absolute detractors to the Fund’s performance for the fiscal year. Stock selection in China and Japan contributed positively to the Fund’s relative performance for the fiscal year. Stock selection in India and Denmark were the largest absolute contributors to the Fund’s performance, as a result of the underlying holding in each country gaining value. From a sector perspective, stock selection in financials and a lack of exposure to the energy sector detracted most from the Fund’s relative performance for the fiscal year. In the Fund’s investment in the financial sector, eight of 12 underlying holdings negatively impacted the Fund’s performance. The Fund’s investments in the technology and communication services sector delivered the largest negative returns from a sector perspective and detracted from the Fund’s performance. The industrials and materials sectors generated the best relative performance for 2022, both due to a lower-than-benchmark weighting and positive stock selection. Within the industrial sector, four of the sector’s 15 underlying holdings gained value, led by Sandvik. In materials, five of six underlying holdings gained value, led by Glencore. Derivatives are securities that derive their value from the performance of one or more other investments and take the form of a contract between two or more parties. Derivatives can be used for hedging, speculation, or both. As of year end, currency hedges contributed slightly to the Fund component’s performance for the year.
For the MFS segment of the Fund, stock selection in the health care sector weighed on relative performance. Within the sector, not owning strong-performing biopharmaceutical company AstraZeneca (United Kingdom) and an overweight allocation, relative to the benchmark, to imaging products and medical-related equipment manufacturer HOYA (Japan) hurt the Fund’s relative results. The Fund component’s underweight allocation to the energy sector also held back relative performance. There, not owning global energy and petrochemicals company Shell (United Kingdom) and integrated energy and petroleum company Total (France) weakened the Fund’s relative results. Security selection and an overweight position in the industrial sector further dampened the Fund’s relative returns, led by overweight allocations to electrical distribution equipment manufacturer Schneider Electric (France), machinery and industrial products manufacturer Kubota (Japan), and air conditioning system manufacturer Daikin Industries (Japan). Fund component holdings that weakened the Fund’s relative returns included semiconductor manufacturer Taiwan Semiconductor Manufacturing (Taiwan), which is not a benchmark constituent, and an overweight position in consulting services provider Capgemini (France). Not owning shares of mining giant BHP Billiton (Australia) also hampered
49
MML International Equity Fund – Portfolio Manager Report (Unaudited) (Continued) |
the Fund’s results. Stock selection in the financial sector contributed to the Fund’s relative performance, led by the Fund component’s overweight positions in insurance company AIA Group (Hong Kong), stock exchange Deutsche Boerse (Germany), investment management and banking firm UBS (Switzerland), and insurance provider Zurich Insurance Group (Switzerland). Stock selection in both the consumer discretionary and information technology sectors also supported the Fund’s relative returns. Within the consumer discretionary sector, the Fund component’s overweight position in food catering company Compass Group (United Kingdom) aided relative returns. Within the information technology sector, not owning shares of lithography systems manufacturer for the semiconductor industry ASML (Netherlands) strengthened the Fund’s relative performance. Elsewhere, the Fund component’s overweight allocations to cosmetic products manufacturer Beiersdorf (Germany), pharmaceutical company Novo Nordisk (Denmark), and oil and gas company Galp Energia (Portugal) further bolstered relative returns. During the reporting period, the Fund component’s relative currency exposure, resulting primarily from differences between the Fund component’s and the benchmark’s exposures to holdings of securities denominated in foreign currencies, contributed to the Fund’s relative performance.
Subadviser outlook
While Harris recognizes the challenges facing investors with the current state of financial markets, Harris believes that the lower and more widely dispersed valuations in the market at fiscal year-end allowed Fund management to redeploy capital into increasingly attractive investments. As of the end of the fiscal period, Fund management was optimistic that these decisions have the potential to sow the seeds of future outperformance. Harris remains focused on building a high-conviction Fund portfolio of undervalued businesses that Fund management believes could provide both a margin of safety and the potential for attractive risk-adjusted returns over the long term.
In MFS’s view, after a year of sharp swings in monetary policy and in the pricing of financial assets, MFS observes that 2023 started off in an environment of continued uncertainty. Fund management believes that central banks are starting to tame inflation; however, in Fund management’s view, there is perhaps a greater risk of policy error as the U.S. and global economies enter the next phase of monetary and fiscal policy moves, with large and continuous changes to interest rates, potentially followed by moderation as inflation starts to fall, offsetting the risk of recession. After a decade of abundant liquidity, MFS believes that the new period of quantitative tightening remains largely untested. In their view, the longer-term implications of the new monetary and fiscal regime are still not fully understood. Fund management expects that the volatility in currency markets, in tandem with concerns over military action in Europe (and threatened in Asia), potentially set the stage for volatility in the markets to remain high.
50
MML International Equity Fund – Portfolio Manager Report (Unaudited) (Continued) |
MML International Equity Fund |
|
Nestle SA Registered |
2.5% |
Roche Holding AG |
2.2% |
Schneider Electric SE |
2.0% |
SAP SE |
2.0% |
Intesa Sanpaolo SpA |
1.9% |
Air Liquide SA |
1.8% |
Capgemini SE |
1.7% |
Bayer AG Registered |
1.7% |
Novo Nordisk A/S Class B |
1.7% |
LVMH Moet Hennessy Louis Vuitton SE |
1.7% |
19.2% |
|
MML International Equity Fund |
|
Consumer, Non-cyclical |
28.9% |
Financial |
18.4% |
Consumer, Cyclical |
15.6% |
Industrial |
15.0% |
Technology |
7.5% |
Communications |
5.1% |
Basic Materials |
5.0% |
Energy |
1.8% |
Utilities |
0.9% |
Total Long-Term Investments |
98.2% |
Short-Term Investments and Other Assets and Liabilities |
1.8% |
Net Assets |
100.0% |
51
MML International Equity Fund – Portfolio Manager Report (Unaudited) (Continued) |
GROWTH OF $10,000 INVESTMENT - CLASS II
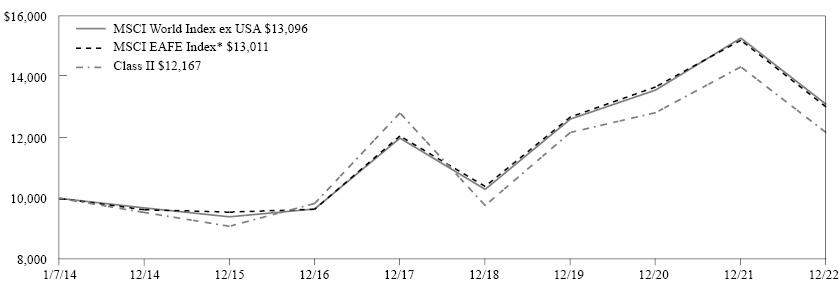
The graph above illustrates a representative class of the Fund’s historical performance for the past 10 fiscal years or since inception (for Funds lacking 10-year records) in comparison to its benchmark index, as well as one or more additional indexes, if applicable. The performance of other share classes will be greater than or less than the class depicted above.
Average Annual Total Returns (for the periods ended 12/31/2022) |
|||||
|
Inception Date |
1 Year |
5 Years |
Since Inception |
Since Inception |
Class II |
01/07/2014 |
-15.10% |
-1.03% |
2.21% |
|
Service Class I |
05/01/2014 |
-15.35% |
-1.30% |
1.69% |
|
MSCI EAFE Index* |
-14.45% |
1.54% |
2.97% |
2.69% |
|
MSCI World Index ex USA |
-14.29% |
1.79% |
3.05% |
2.74% |
|
* Benchmark
Generally accepted accounting principles require adjustments to be made to the net assets of the Fund at period end for financial reporting purposes only, and as such, the total return based on the unadjusted net asset value per share may differ from the total return reported in the financial highlights.
Performance results in the graph and table reflect the percentage change in net asset value, including reinvestment of dividends and capital gains distributions. Investors should note that the Fund is a professionally managed mutual fund, while the index or indexes shown above are unmanaged, cannot be purchased directly, and, with the exception of any peer group index, do not incur expenses.
Performance data quoted in the graph and table represents past performance; past performance is not predictive of future results. The investment return and principal value of shares of the Fund fluctuate, so your shares, when sold, may be worth more or less than their original cost. Current performance of the Fund may be lower or higher than the performance quoted. The performance shown does not reflect the deduction of taxes, if any, that a shareholder would pay on Fund distributions or the redemption of Fund shares. Performance data current to the most recent month end may be obtained by calling 1-888-309-3539.
Investors should read the Fund’s prospectus with regard to the Fund’s investment objectives, risks, and charges and expenses in conjunction with these financial statements. The Fund’s return reflects changes in the net asset value per share without the deduction of any product charges (e.g., cost of insurance, mortality and expense risk charges, administrative fees, and CDSL). The inclusion of these charges would have reduced the performance shown here.
52
MML Large Cap Growth Fund – Portfolio Manager Report (Unaudited) |
What is the investment approach of MML Large Cap Growth Fund, and who is the Fund’s subadviser?
The Fund seeks long-term capital appreciation by investing primarily in large-capitalization companies that the Fund’s subadviser believes offer the potential for long-term growth. Under normal circumstances, the Fund invests at least 80% of its net assets (plus the amount of any borrowings for investment purposes) in the common stocks of companies whose market capitalizations at the time of purchase are within the market capitalization range of companies included in the Russell 1000® Growth Index. The Fund is non-diversified, which means that it may hold larger positions in a smaller number of issuers than a diversified fund. The Fund’s subadviser is Loomis, Sayles & Company, L.P. (Loomis Sayles).
How did the Fund perform during the 12 months ended December 31, 2022?
The Fund’s Initial Class shares returned -27.55%, outperforming the -29.14% return of the Russell 1000 Growth Index (the “benchmark”), which measures the performance of the large-cap growth segment of U.S. equity securities. It includes the Russell 1000 Index companies with higher price-to-book ratios and higher forecasted growth values.
For a discussion on the economic and market environment during the 12-month period ended December 31, 2022, please see the Economic and Market Review, beginning on page 3.
Subadviser discussion of factors that contributed to the Fund’s performance
For the one-year period ended December 31, 2022, stock selection in the communication services, health care, industrial, consumer staples, consumer discretionary, and financial sectors – as well as the Fund’s allocations to the health care, consumer discretionary, industrial, information technology, and financial sectors – contributed to relative returns. Stock selection in the information technology sector, as well as the Fund’s allocations to the communication services and consumer staples sectors, detracted from relative performance.
With respect to specific Fund holdings, Vertex Pharmaceuticals and Monster Beverage were the top contributors. As of the end of the fiscal period, Vertex Pharmaceuticals (“Vertex”) was a leader in creating therapies for patients suffering from cystic fibrosis (CF). Vertex reported financial results during the period that reflected the continued penetration of TRIKAFTA®, its latest and most efficacious CF therapy. Fund management trimmed the Fund’s position in Vertex during the reporting period following the strong performance. As of the end of the fiscal period, Monster Beverage was a leading marketer and distributor of energy drinks in the U.S. and internationally. The company reported strong sales growth during the period, but faced pressure on profitability due to materials cost inflation, increased logistics costs, and can shortages. In the U.S., the company returned to share gains and market share leadership at fiscal year-end, despite increasing pricing by 6% in September 2022. Outside of the U.S., Monster continued to take market share and demonstrated impressive sales growth during the fiscal year. Fund management trimmed the Fund’s position in Monster Beverage during the reporting period following strong price performance.
Fund holdings that hampered performance the most during the reporting period were Meta Platforms and Nvidia. Meta Platforms operates online social networking platforms that allow people to connect, share, and interact with friends and communities. Over the past year, Meta faced headwinds arising from privacy restrictions imposed by Apple, the continued impact of macro weakness on advertising spending, and elevated investments, including a transition to a new product format – short-form video – where monetization was lower. Fund management took advantage of near-term market weakness to add to the Fund’s position in Meta on multiple occasions during the fiscal year. Nvidia is a world leader in graphic processing units (GPUs), which enable computers to produce and utilize highly realistic 3D graphic imagery. Nvidia shares were under pressure throughout 2022, given the weak market backdrop, despite reported financial results that were generally better than consensus expectations – and included multiple quarterly revenue records in the company’s gaming, data center, and professional visualization segments. However, for the last two quarters of 2022, the company experienced lower demand for its gaming cards, which reflected global demand for PCs returning to pre-pandemic levels after a period of excess, and the impact of macroeconomic weakness and COVID-19 restrictions on consumer spending in China. In late August, Nvidia also reported that the U.S. government restricted its ability to sell its leading AI chips to China over concerns that the technology could be leveraged by the Chinese military. The company moved quickly to redesign and ship its A800 chip, which provides Chinese companies with a viable alternative that does not violate U.S. government restrictions.
53
MML Large Cap Growth Fund – Portfolio Manager Report (Unaudited) (Continued) |
Subadviser outlook
The Fund’s investment process is characterized by bottom-up, fundamental research and a long-term investment time horizon. The nature of Fund management’s process is designed to lead to a lower turnover portfolio, where sector positioning is the result of stock selection. At year end, the Fund was overweight in the communication services, health care, industrial, and financial sectors – and underweight in the information technology, consumer staples, and consumer discretionary sectors. The Fund did not have exposure to stocks in the energy, real estate, materials, or utilities sectors. Fund management remains committed to its long-term investment approach to invest in those few high-quality businesses with sustainable competitive advantages and profitable growth when they trade at a significant discount to intrinsic value.
54
MML Large Cap Growth Fund – Portfolio Manager Report (Unaudited) (Continued) |
MML Large Cap Growth Fund |
|
Visa, Inc. Class A |
6.7% |
The Boeing Co. |
6.4% |
Meta Platforms, Inc. Class A |
5.0% |
Microsoft Corp. |
5.0% |
Oracle Corp. |
4.8% |
NVIDIA Corp. |
4.7% |
Amazon.com, Inc. |
4.2% |
Monster Beverage Corp. |
4.1% |
Netflix, Inc. |
4.0% |
Autodesk, Inc. |
3.6% |
48.5% |
|
MML Large Cap Growth Fund |
|
Communications |
26.9% |
Technology |
23.8% |
Consumer, Non-cyclical |
23.1% |
Industrial |
9.3% |
Financial |
8.4% |
Consumer, Cyclical |
8.1% |
Total Long-Term Investments |
99.6% |
Short-Term Investments and Other Assets and Liabilities |
0.4% |
Net Assets |
100.0% |
55
MML Large Cap Growth Fund – Portfolio Manager Report (Unaudited) (Continued) |
GROWTH OF $10,000 INVESTMENT - INITIAL CLASS
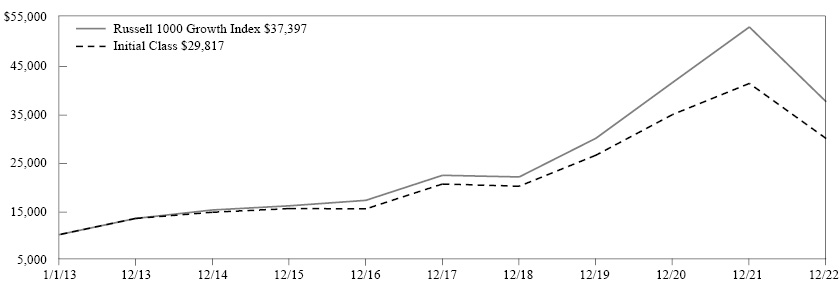
The graph above illustrates a representative class of the Fund’s historical performance for the past 10 fiscal years or since inception (for Funds lacking 10-year records) in comparison to its benchmark index, as well as one or more additional indexes, if applicable. The performance of other share classes will be greater than or less than the class depicted above.
Average Annual Total Returns (for the periods ended 12/31/2022) |
||||
|
Inception Date |
1 Year |
5 Years |
10 Years |
Initial Class |
05/01/2006 |
-27.55% |
7.84% |
11.54% |
Service Class |
08/15/2008 |
-27.73% |
7.59% |
11.27% |
Russell 1000 Growth Index |
-29.14% |
10.96% |
14.10% |
|
Generally accepted accounting principles require adjustments to be made to the net assets of the Fund at period end for financial reporting purposes only, and as such, the total return based on the unadjusted net asset value per share may differ from the total return reported in the financial highlights.
Performance results in the graph and table reflect the percentage change in net asset value, including reinvestment of dividends and capital gains distributions. Investors should note that the Fund is a professionally managed mutual fund, while the index or indexes shown above are unmanaged, cannot be purchased directly, and, with the exception of any peer group index, do not incur expenses.
Performance data quoted in the graph and table represents past performance; past performance is not predictive of future results. The investment return and principal value of shares of the Fund fluctuate, so your shares, when sold, may be worth more or less than their original cost. Current performance of the Fund may be lower or higher than the performance quoted. The performance shown does not reflect the deduction of taxes, if any, that a shareholder would pay on Fund distributions or the redemption of Fund shares. Performance data current to the most recent month end may be obtained by calling 1-888-309-3539.
Investors should read the Fund’s prospectus with regard to the Fund’s investment objectives, risks, and charges and expenses in conjunction with these financial statements. The Fund’s return reflects changes in the net asset value per share without the deduction of any product charges (e.g., cost of insurance, mortality and expense risk charges, administrative fees, and CDSL). The inclusion of these charges would have reduced the performance shown here.
56
MML Managed Volatility Fund – Portfolio Manager Report (Unaudited) |
What is the investment approach of MML Managed Volatility Fund and who is the Fund’s subadviser?
The Fund seeks to capture the majority of the returns associated with equity market investments, while exposing investors to less risk than other equity investments. Under normal circumstances, the Fund invests in a broadly diversified portfolio of common stocks, while also selling index call options and purchasing index put options. The Fund’s stock portfolio will have approximately 500 stocks, and seeks to duplicate the investment composition and return of the S&P 500® Index* (the “Index”) by holding each stock included in the Index in approximately the same proportion as each stock’s relative weighting in the Index. The Fund’s subadviser is Gateway Investment Advisers, LLC (Gateway).
How did the Fund perform during the 12 months ended December 31, 2022?
The Fund’s Initial Class shares returned -12.05%, significantly outperforming the -18.11% return of the Index, which measures the performance of 500 widely held stocks in the U.S. equity market. The Index is the Fund’s benchmark. The Fund also outperformed the -13.01% return of the Bloomberg U.S. Aggregate Bond Index, which measures the performance of investment grade, U.S. dollar-denominated, fixed-rate taxable bond market securities, including Treasuries, government-related and corporate securities, mortgage-backed securities (MBS) (agency fixed-rate and hybrid ARM pass-throughs), asset-backed securities (ABS), and commercial mortgage-backed securities (CMBS).
For a discussion on the economic and market environment during the 12-month period ended December 31, 2022, please see the Economic and Market Overview, beginning on page 3.
Subadviser discussion of factors that contributed to the Fund’s performance
Derivatives are securities that derive their value from the performance of one or more other investments and take the form of a contract between two or more parties. Derivatives can be used for hedging, speculation, or both.
The Fund began 2022 with full index put option coverage. As the equity market began its decline early in the year and implied volatility climbed, the Fund’s investment team began to identify opportunities to monetize higher volatility being priced into index put contracts, preserve index put gains in the event of a sudden and sharp market recovery, and to help position the Fund for attractive outcomes in a wider range of market scenarios. Fund management made these adjustments while keeping the Fund’s market exposure relatively consistent with its historical risk profile.
During the first quarter of 2022, the investment team reduced the Fund’s put coverage to an intra-quarter low range of 65% to 80% before incrementally adding index put options and restoring full put coverage by the quarter-end. During the second quarter, active adjustments were aimed at preserving index put gains in the event of a sudden and sharp market recovery, while maintaining the Fund’s typical risk profile. Put coverage reached an intra-quarter low range of 65% to 80%, a range that was maintained from mid-May through the end of the second quarter. In the third quarter, Fund management executed adjustments to put coverage in an effort to position the Fund for attractive outcomes in a wide range of market scenarios, while keeping the Fund’s market exposure relatively consistent. Put coverage reached an intra-quarter high range of 80% to 95% before adjustments in September brought coverage into a range of 65% to 80%, a level maintained through the end of the third quarter. During the final quarter of 2022, the investment team increased the Fund’s put coverage to a range of 80% to 95% on October 31 and restored full put coverage on November 8, which was maintained through December 31. Fund management executed the increases in put coverage in tandem with an adjustment to existing index put positions. These changes improved the loss mitigation potential of the index put portfolio, while lowering the overall potential annualized cost of puts. Index put option contracts were traded in advance of their expirations, while keeping weighted-average time to expiration relatively extended.
|
* |
The “S&P 500 Index” is a product of S&P Dow Jones Indices LLC or its affiliates (“SPDJI”), and has been licensed for use by MassMutual. S&P®, S&P 500®, US 500, The 500, iBoxx®, iTraxx® and CDX® are trademarks of S&P Global, Inc. or its affiliates (“S&P”); Dow Jones® is a registered trademark of Dow Jones Trademark Holdings LLC (“Dow Jones”); and these trademarks have been licensed for use by SPDJI and sublicensed for certain purposes by MassMutual. The Fund is not sponsored, endorsed, sold or promoted by SPDJI, Dow Jones, S&P, or their respective affiliates, and none of such parties make any representation regarding the advisability of investing in such product(s) nor do they have any liability for any errors, omissions, or interruptions of the S&P 500 Index. |
57
MML Managed Volatility Fund – Portfolio Manager Report (Unaudited) (Continued) |
The Fund maintained a portfolio of written index call options on the full value of its equity holdings over the course of the year, while making active adjustments to positions in response to deteriorating market conditions and opportunistically taking advantage of the higher implied volatility that was priced into longer-dated contracts to enhance cash flow potential. The term structure of volatility pricing was highly dynamic over the year and the investment team generally extended weighted-average time to expiration when term structure was steep and shortened when term structure was inverted or flat.
Subadviser outlook
Based on Gateway’s historic experience in the market, in Gateway’s view, the equity market has delivered well-above-average returns after drawdowns exceeding 20%. On the other hand, Gateway believes that investors who worry that stocks will have difficulty delivering enough near-term earnings growth to justify still-lofty valuations can justify their concerns in more ways than one. In particular, in Gateway’s view, as of the end of the fiscal period, supply chains and labor markets had yet to reach full repair and recent data as of the end of the fiscal period has shown that Americans were spending down their COVID savings. Consequently, Fund management believes that consumer balance sheets could deteriorate in short order, putting a damper on consumer demand and diminishing a key driver of economic growth.
Fund management notes that elevated equity market volatility and higher short-term interest rates increase index call option premiums like those written by the Fund. In Fund management’s view, higher index call option premiums could potentially improve the net cash flow generated by the Fund’s two-part option strategy. If current levels of volatility and interest rates persist, or move higher, Fund management believes that the Fund’s net cash flow may continue to be an attractive source of lower-risk participation in a potential equity market recovery, while possibly providing downside protection if there are additional losses between the end of the 2022 fiscal year and the ultimate recovery of the equity market.
58
MML Managed Volatility Fund – Portfolio Manager Report (Unaudited) (Continued) |
MML Managed Volatility Fund |
|
Apple, Inc. |
6.0% |
Microsoft Corp. |
5.5% |
Amazon.com, Inc. |
2.3% |
Berkshire Hathaway, Inc. Class B |
1.7% |
Alphabet, Inc. Class A |
1.6% |
UnitedHealth Group, Inc. |
1.5% |
Alphabet, Inc. Class C |
1.4% |
Johnson & Johnson |
1.4% |
Exxon Mobil Corp. |
1.4% |
JP Morgan Chase & Co. |
1.2% |
24.0% |
|
MML Managed Volatility Fund |
|
Consumer, Non-cyclical |
23.1% |
Technology |
21.4% |
Financial |
15.4% |
Communications |
10.7% |
Consumer, Cyclical |
8.9% |
Industrial |
8.3% |
Energy |
5.4% |
Utilities |
3.1% |
Basic Materials |
2.1% |
Purchased Options |
1.0% |
Total Long-Term Investments |
99.4% |
Short-Term Investments and Other Assets and Liabilities |
0.6% |
Net Assets |
100.0% |
59
MML Managed Volatility Fund – Portfolio Manager Report (Unaudited) (Continued) |
GROWTH OF $10,000 INVESTMENT - INITIAL CLASS
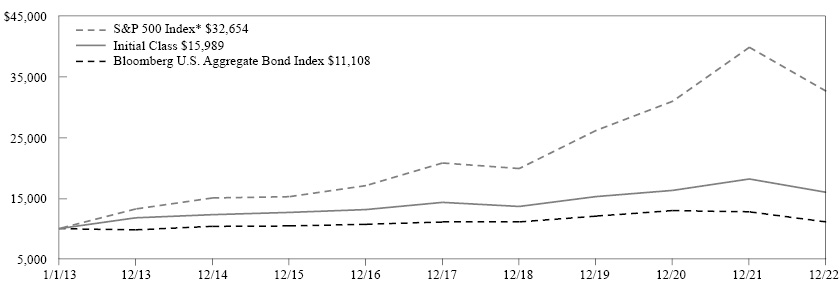
The graph above illustrates a representative class of the Fund’s historical performance for the past 10 fiscal years or since inception (for Funds lacking 10-year records) in comparison to its benchmark index, as well as one or more additional indexes, if applicable. The performance of other share classes will be greater than or less than the class depicted above.
Average Annual Total Returns (for the periods ended 12/31/2022) |
||||
|
Inception Date |
1 Year |
5 Years |
10 Years |
Initial Class |
05/01/2000 |
-12.05% |
2.22% |
4.81% |
Service Class |
08/15/2008 |
-12.27% |
1.97% |
4.54% |
S&P 500 Index* |
-18.11% |
9.42% |
12.56% |
|
Bloomberg U.S. Aggregate Bond Index |
-13.01% |
0.02% |
1.06% |
|
* Benchmark
Generally accepted accounting principles require adjustments to be made to the net assets of the Fund at period end for financial reporting purposes only, and as such, the total return based on the unadjusted net asset value per share may differ from the total return reported in the financial highlights.
Performance results in the graph and table reflect the percentage change in net asset value, including reinvestment of dividends and capital gains distributions. Investors should note that the Fund is a professionally managed mutual fund, while the index or indexes shown above are unmanaged, cannot be purchased directly, and, with the exception of any peer group index, do not incur expenses.
Performance data quoted in the graph and table represents past performance; past performance is not predictive of future results. The investment return and principal value of shares of the Fund fluctuate, so your shares, when sold, may be worth more or less than their original cost. Current performance of the Fund may be lower or higher than the performance quoted. The performance shown does not reflect the deduction of taxes, if any, that a shareholder would pay on Fund distributions or the redemption of Fund shares. Performance data current to the most recent month end may be obtained by calling 1-888-309-3539.
Investors should read the Fund’s prospectus with regard to the Fund’s investment objectives, risks, and charges and expenses in conjunction with these financial statements. The Fund’s return reflects changes in the net asset value per share without the deduction of any product charges (e.g., cost of insurance, mortality and expense risk charges, administrative fees, and CDSL). The inclusion of these charges would have reduced the performance shown here.
60
MML Mid Cap Growth Fund – Portfolio Manager Report (Unaudited) |
What is the investment approach of MML Mid Cap Growth Fund, and who are the Fund’s subadvisers?
The Fund seeks long-term capital appreciation by investing primarily in equity securities of mid-capitalization companies that the Fund’s subadvisers believe offer the potential for above-average earnings growth. Under normal circumstances, the Fund invests at least 80% of its net assets (plus the amount of any borrowings for investment purposes) in a broadly diversified portfolio of common stocks of mid-cap companies whose earnings the Fund’s subadvisers expect to grow at a faster rate than the average company. The Fund’s two subadvisers are T. Rowe Price Associates, Inc. (T. Rowe Price), which managed approximately 78% of the Fund’s portfolio; and Wellington Management Company LLP (Wellington Management), which managed approximately 22% of the Fund’s portfolio, as of December 31, 2022. In addition, T. Rowe Price Investment Management serves as a sub-subadviser for the portion of the portfolio subadvised by T. Rowe Price.
How did the Fund perform during the 12 months ended December 31, 2022?
The Fund’s Initial Class shares returned -25.11%, outperforming the -26.72% return of the Russell Midcap® Growth Index (the “benchmark”), which measures the performance of the mid-cap growth segment of the U.S. equity universe. It includes Russell Midcap Index companies with higher price-to-book ratios and higher forecasted growth values. The Fund’s Initial Class shares -25.11% return significantly underperformed the -13.06% return of the S&P MidCap 400® Index, which measures the performance of mid-sized U.S. companies, reflecting the distinctive risk and return characteristics of this market segment. It comprises stocks in the middle capitalization range, covering approximately 7% of the of U.S. equity market.
For a discussion on the economic and market environment during the 12-month period ended December 31, 2022, please see the Economic and Market Overview, beginning on page 3.
Subadviser discussion of factors that contributed to the Fund’s performance
For the year ended December 31, 2022, within the T. Rowe Price component of the Fund, broadly speaking, stock selection and sector allocation contributed to the Fund component’s relative results. At the sector level, information technology, health care, and communication services aided relative returns, while the energy and financial sectors detracted from the Fund’s relative performance. The information technology sector was a significant contributor to the Fund’s relative performance, due to stock selection and an underweight position, relative to the benchmark. Shares of Fund component holding KLA Corporation, a capital equipment company that provides control systems for the semiconductor industry, held up better than industry peers over the fiscal period. In health care, security selection had a positive impact on relative results, driven by Hologic, a medical technology company focused on women’s health that makes screening, detection, and treatment products. Communication services also aided the Fund’s relative returns, owing to an underweight allocation to the sector, coupled with favorable stock choices. In contrast, an underweight allocation to the energy sector detracted from the Fund’s relative performance. The financial sector also detracted, due to adverse security choices, although this was partially offset by an overweight allocation to the sector.
With respect to the Wellington Management Fund component, Fund component holdings that were top individual contributors to relative performance during the period included Gartner (information technology) and BWX Technologies (industrials). Gartner, an IT research and advisory services company, saw its share price increase after the company reported second-quarter 2022 earnings that beat expectations, driven by double-digit growth in contract value, revenue, and adjusted earnings-per-share. The share price of BWX Technologies – a nuclear components and fuel provider for the commercial nuclear power industry – rose over the fiscal period, as defense companies and weapon manufacturers benefited from increases in government defense budgets in the aftermath of Russia’s invasion of Ukraine. Fund component holdings that detracted most from relative returns during the reporting period included Omnicell (health care) and Align Technology (health care). The share price of Omnicell, a medication management software provider, fell sharply after the company released second-quarter results that missed expectations due to delivery delays. Align Technology is a leader in the clear and removable teeth aligner market with their Invisalign System. Their share price declined after management missed consensus estimates amid lower visibility.
61
MML Mid Cap Growth Fund – Portfolio Manager Report (Unaudited) (Continued) |
Subadviser outlook
Based on T. Rowe Price’s historic experience in the market, T. Rowe Price believes that prospects for U.S. equities will continue to be murky as we head into 2023, with the continued challenging economic backdrop. While Fund management notes that they are unsure if the market will fall to new lows in the upcoming fiscal year, they believe that much depends on the Federal Reserve (the “Fed”) and the world’s other major central banks as they continue efforts to bring inflation under control by hiking interest rates and draining liquidity from the markets. While T. Rowe Price, based on its historic experience in the market, has observed that Fed escalation cycles generally result in market underperformance, especially when inflation is running high, their view is that investors should not assume that a deep downturn is inevitable. Regardless of the environment, T. Rowe Price’s focus remains on owning quality companies with durable growth prospects and prudent balance sheets.
Wellington Management believes the volatile market environment has created more potential opportunities for active management to generate excess return. Near term, Fund management expects an increasingly challenging macroeconomic backdrop, given the Fed’s resolve to tame inflation at the cost of lower growth. However, the resilience of the labor market and early signs of supply chain bottlenecks easing give Wellington Management some confidence in the growth outlook beyond the immediate future. Fund management is increasingly focused on identifying higher-quality businesses that, in their opinion, could be more resilient during a down cycle, while having the potential to outperform as the environment stabilizes and turns more favorable.
62
MML Mid Cap Growth Fund – Portfolio Manager Report (Unaudited) (Continued) |
MML Mid Cap Growth Fund |
|
Agilent Technologies, Inc. |
3.5% |
Hologic, Inc. |
2.4% |
Microchip Technology, Inc. |
2.2% |
Hilton Worldwide Holdings, Inc. |
2.1% |
Textron, Inc. |
1.8% |
Teleflex, Inc. |
1.8% |
Ingersoll Rand, Inc. |
1.8% |
Burlington Stores, Inc. |
1.6% |
KLA Corp. |
1.6% |
Gartner, Inc. |
1.5% |
20.3% |
|
MML Mid Cap Growth Fund |
|
Consumer, Non-cyclical |
29.9% |
Industrial |
18.9% |
Technology |
18.5% |
Consumer, Cyclical |
14.8% |
Financial |
5.9% |
Communications |
5.1% |
Energy |
3.5% |
Basic Materials |
0.5% |
Mutual Funds |
0.1% |
Total Long-Term Investments |
97.2% |
Short-Term Investments and Other Assets and Liabilities |
2.8% |
Net Assets |
100.0% |
63
MML Mid Cap Growth Fund – Portfolio Manager Report (Unaudited) (Continued) |
GROWTH OF $10,000 INVESTMENT - INITIAL CLASS
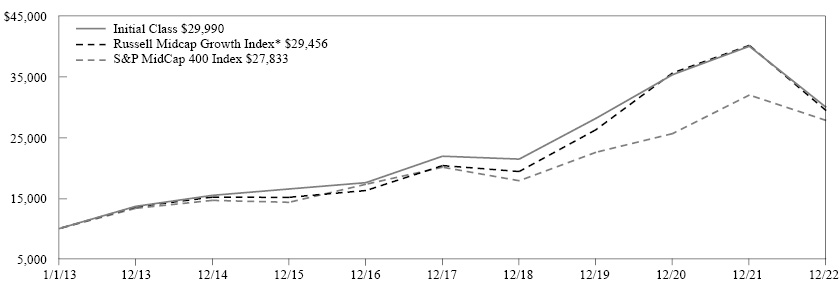
The graph above illustrates a representative class of the Fund’s historical performance for the past 10 fiscal years or since inception (for Funds lacking 10-year records) in comparison to its benchmark index, as well as one or more additional indexes, if applicable. The performance of other share classes will be greater than or less than the class depicted above.
Average Annual Total Returns (for the periods ended 12/31/2022) |
||||
|
Inception Date |
1 Year |
5 Years |
10 Years |
Initial Class |
05/01/2006 |
-25.11% |
6.46% |
11.61% |
Service Class |
08/15/2008 |
-25.31% |
6.20% |
11.34% |
Russell Midcap Growth Index* |
-26.72% |
7.64% |
11.41% |
|
S&P MidCap 400 Index |
-13.06% |
6.71% |
10.78% |
|
* Benchmark
Generally accepted accounting principles require adjustments to be made to the net assets of the Fund at period end for financial reporting purposes only, and as such, the total return based on the unadjusted net asset value per share may differ from the total return reported in the financial highlights.
Performance results in the graph and table reflect the percentage change in net asset value, including reinvestment of dividends and capital gains distributions. Investors should note that the Fund is a professionally managed mutual fund, while the index or indexes shown above are unmanaged, cannot be purchased directly, and, with the exception of any peer group index, do not incur expenses.
Performance data quoted in the graph and table represents past performance; past performance is not predictive of future results. The investment return and principal value of shares of the Fund fluctuate, so your shares, when sold, may be worth more or less than their original cost. Current performance of the Fund may be lower or higher than the performance quoted. The performance shown does not reflect the deduction of taxes, if any, that a shareholder would pay on Fund distributions or the redemption of Fund shares. Performance data current to the most recent month end may be obtained by calling 1-888-309-3539.
Investors should read the Fund’s prospectus with regard to the Fund’s investment objectives, risks, and charges and expenses in conjunction with these financial statements. The Fund’s return reflects changes in the net asset value per share without the deduction of any product charges (e.g., cost of insurance, mortality and expense risk charges, administrative fees, and CDSL). The inclusion of these charges would have reduced the performance shown here.
64
MML Mid Cap Value Fund – Portfolio Manager Report (Unaudited) |
What is the investment approach of MML Mid Cap Value Fund, and who is the Fund’s subadviser?
The Fund seeks long-term capital growth. Income is a secondary objective. The Fund invests primarily in equity securities of mid-capitalization companies that the Fund’s subadviser believes offer prospects for long-term capital growth. Under normal circumstances, the Fund invests at least 80% of its net assets (plus the amount of any borrowings for investment purposes) in equity securities of medium-size companies. The Fund’s subadviser is American Century Investment Management, Inc. (American Century).
How did the Fund perform during the 12 months ended December 31, 2022?
The Fund’s Initial Class shares returned -1.33%, significantly outperforming the -12.03% return of Russell Midcap® Value Index (the “benchmark”), which measures the performance of the mid-cap value segment of the U.S. equity universe. It includes Russell Midcap Index companies with lower price-to-book ratios and lower forecasted growth values.
For a discussion on the economic and market environment during the 12-month period ended December 31, 2022, please see the Economic and Market Overview, beginning on page 3.
Subadviser discussion of factors that contributed to the Fund’s performance
For the one-year period ended December 31, 2022, stock choices in the health care sector positively impacted the Fund’s performance, relative to the benchmark, particularly in the health care providers and services industry. Stock selection in the information technology sector, and within the IT services industry in particular, also benefited the Fund’s performance. In contrast, security selection in the energy sector detracted from the Fund’s relative results. A lack of exposure to Occidental Petroleum and other names from the oil, gas, and consumable fuels industry also hindered the Fund’s performance.
Fund holdings that were key contributors to performance during the reporting period included Reinsurance Group of America and Devon Energy. Global life and health reinsurance company Reinsurance Group of America reported better-than-expected quarterly earnings throughout the fiscal period, with strong core business performance. The company also reported better-than-expected COVID-19-related losses throughout the fiscal period. Shares of oil and gas exploration and production company Devon Energy outperformed, as commodity prices continued to rise amid a fundamentally tight market and geopolitical tensions. This boosted Devon’s free cash flow generation and helped the company make large dividend payments, buy back stock, and pay down debt.
Fund holdings that were key detractors included Advance Auto Parts and T. Rowe Price Group. Advance Auto Parts, an automotive replacement parts retailer, underperformed after announcing weaker-than-expected quarterly earnings and a reduced cash flow outlook for fiscal year 2023. These results were impacted by higher-than-expected inventory needs to serve its commercial automotive repair customers. Following outperformance in the third quarter of 2021, shares of asset management firm T. Rowe Price Group declined on lower equity markets. The company also reported continued outflows in assets under management in December.
Derivatives are securities that derive their value from the performance of one or more other investments and take the form of a contract between two or more parties. Derivatives can be used for hedging, speculation, or both. During the reporting period, the Fund used currency forwards to hedge non-U.S. exposure. There was not a material impact on performance as a result of the Fund’s use of derivatives.
Subadviser outlook
The Fund seeks to invest in companies where Fund management believes the valuation does not reflect the quality and normal earnings power of the company. American Century’s process is generally based on individual security selection, but broad themes emerged during the reporting period. Their research led Fund management to several health care stocks that they believed to offer compelling risk/reward profiles. Due to Fund management’s belief in the potentially attractive valuations in consumer staples, as of fiscal year-end, the Fund held select companies in consumer staples that Fund management believes are trading at a discount to their intrinsic value. As of December 31, 2022, the Fund had an underweight allocation to consumer discretionary because of the difficulty of finding higher-quality companies with durable business models. The Fund also held an underweight allocation to information technology, largely due to valuations that Fund management viewed as stretched.
As we enter 2023, Fund management notes that we continue to face challenging macroeconomic and geopolitical conditions. In the event of a recession, Fund management believes that companies with low debt and steady revenues may be better positioned to grow and maintain their competitive edge, despite any economic headwinds.
65
MML Mid Cap Value Fund – Portfolio Manager Report (Unaudited) (Continued) |
MML Mid Cap Value Fund |
|
Zimmer Biomet Holdings, Inc. |
3.0% |
Northern Trust Corp. |
2.7% |
The Bank of New York Mellon Corp. |
2.6% |
Edison International |
2.2% |
The Allstate Corp. |
2.1% |
Spire, Inc. |
2.0% |
Koninklijke Ahold Delhaize NV |
1.9% |
Oshkosh Corp. |
1.9% |
Conagra Brands, Inc. |
1.8% |
Truist Financial Corp. |
1.7% |
21.9% |
|
MML Mid Cap Value Fund |
|
Financial |
28.0% |
Consumer, Non-cyclical |
21.1% |
Industrial |
15.1% |
Consumer, Cyclical |
10.4% |
Utilities |
8.9% |
Communications |
4.3% |
Energy |
4.1% |
Technology |
3.4% |
Basic Materials |
2.1% |
Mutual Funds |
1.2% |
Total Long-Term Investments |
98.6% |
Short-Term Investments and Other Assets and Liabilities |
1.4% |
Net Assets |
100.0% |
66
MML Mid Cap Value Fund – Portfolio Manager Report (Unaudited) (Continued) |
GROWTH OF $10,000 INVESTMENT - INITIAL CLASS
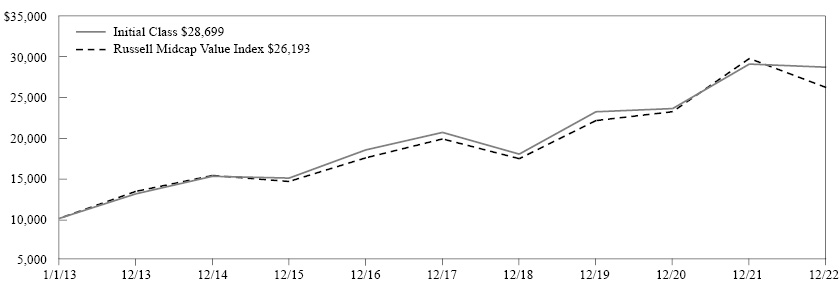
The graph above illustrates a representative class of the Fund’s historical performance for the past 10 fiscal years or since inception (for Funds lacking 10-year records) in comparison to its benchmark index, as well as one or more additional indexes, if applicable. The performance of other share classes will be greater than or less than the class depicted above.
Average Annual Total Returns (for the periods ended 12/31/2022) |
||||
|
Inception Date |
1 Year |
5 Years |
10 Years |
Initial Class |
05/01/2006 |
-1.33% |
6.81% |
11.12% |
Service Class |
08/15/2008 |
-1.56% |
6.54% |
10.84% |
Russell Midcap Value Index |
-12.03% |
5.72% |
10.11% |
|
Generally accepted accounting principles require adjustments to be made to the net assets of the Fund at period end for financial reporting purposes only, and as such, the total return based on the unadjusted net asset value per share may differ from the total return reported in the financial highlights.
Performance results in the graph and table reflect the percentage change in net asset value, including reinvestment of dividends and capital gains distributions. Investors should note that the Fund is a professionally managed mutual fund, while the index or indexes shown above are unmanaged, cannot be purchased directly, and, with the exception of any peer group index, do not incur expenses.
Performance data quoted in the graph and table represents past performance; past performance is not predictive of future results. The investment return and principal value of shares of the Fund fluctuate, so your shares, when sold, may be worth more or less than their original cost. Current performance of the Fund may be lower or higher than the performance quoted. The performance shown does not reflect the deduction of taxes, if any, that a shareholder would pay on Fund distributions or the redemption of Fund shares. Performance data current to the most recent month end may be obtained by calling 1-888-309-3539.
Investors should read the Fund’s prospectus with regard to the Fund’s investment objectives, risks, and charges and expenses in conjunction with these financial statements. The Fund’s return reflects changes in the net asset value per share without the deduction of any product charges (e.g., cost of insurance, mortality and expense risk charges, administrative fees, and CDSL). The inclusion of these charges would have reduced the performance shown here.
67
MML Small Cap Growth Equity Fund – Portfolio Manager Report (Unaudited) |
What is the investment approach of MML Small Cap Growth Equity Fund, and who is the Fund’s subadviser?
The Fund seeks long-term capital appreciation by investing primarily in equity securities of smaller companies that the Fund’s subadviser believes offer potential for long-term growth. Under normal circumstances, the Fund invests at least 80% of its net assets (plus the amount of any borrowings for investment purposes) in the equity securities of companies whose market capitalizations at the time of purchase are within the market capitalization range of companies included in the Russell 2000® Index or the S&P SmallCap 600 Index. The Fund’s subadviser is Wellington Management Company LLP (Wellington Management).
How did the Fund perform during the 12 months ended December 31, 2022?
The Fund’s Initial Class shares returned -23.15%, outperforming the -26.36% return of the Russell 2000 Growth Index (the “benchmark”), which measures the performance of the small- to mid-cap growth segment of the U.S. equity universe. It includes Russell 2000 Index companies with higher price-to-book ratios and higher forecasted growth values. The Fund’s Initial Class shares -23.15% return underperformed the -20.44% return of the Russell 2000 Index, which measures the performance of the small-cap segment of the U.S. equity universe. It is a subset of the Russell 3000® Index and includes approximately 2000 of the smallest securities based on a combination of their market cap and current index membership.
For a discussion on the economic and market environment during the 12-month period ended December 31, 2022, please see the Economic and Market Overview, beginning on page 3.
Subadviser discussion of factors that contributed to the Fund’s performance
Security selection was the primary driver of the Fund’s relative outperformance for the one-year period ended December 31, 2022. Selection was strongest within the health care, industrial, and information technology sectors – while weaker selection within communication services and utilities detracted from results. Sector allocation, a residual of the Fund’s bottom-up stock selection process, contributed to relative performance, led by the Fund’s underweight allocations, relative to the benchmark, to the health care, information technology, and consumer discretionary sectors. This was partially offset by underweight allocations to the energy and utilities sectors.
Fund holdings that were top relative contributors to the Fund’s performance during the period included First Solar (energy) and Viper Energy Partners (energy). First Solar, a manufacturer of solar panels, was both the top relative and absolute contributor to the Fund’s performance. Shares of the company climbed higher during the period after the company experienced strong tailwinds following the signing of the Inflation Reduction Act, which includes a significant investment in climate and energy policy. Fund management eliminated the position during the period. Shares of Viper Energy Partners – which owns, acquires, and exploits oil and natural gas properties – traded higher after the company reported earnings above expectations, driven by an increase in oil-equivalent production volumes and higher realizations of commodity prices.
Fund holdings that were among the top relative detractors for the period included Rapid7 (information technology) and Omnicell (health care). Rapid7 was both the top relative and absolute detractor. Rapid7 shares fell during the period after the cybersecurity solutions provider reported earnings results below expectations and sold off along with the software sector more broadly. Shares of Omnicell, a multinational health care technology company, fell during the period, as the company delivered disappointing third-quarter results and lowered its fiscal-year guidance. Demand for the company’s point-of-care products was delayed, impacted by labor challenges and deferred bookings.
68
MML Small Cap Growth Equity Fund – Portfolio Manager Report (Unaudited) (Continued) |
Subadviser outlook
Fund management notes that, in their view, 2022 was categorized by market volatility unlike anything experienced in the last several years, if not decades. A land-based war in Ukraine, aggressive Federal Reserve (the “Fed”) tightening, and an inflation report in excess of 9% are just a few examples of the conditions causing volatility. While, in Fund management’s view, investors seemed braced for a recession at fiscal year-end, Fund management believes that, as of the end of the fiscal year, the timing and magnitude of any recession are still unknown. In Fund management’s view, the large market swings experienced in 2022 are a result of market participants weighing the impacts of persistent inflation, recession, and the Fed’s reaction function. Given this uncertainty, at fiscal year-end, Fund management planned to remain disciplined within the Fund’s upside/downside valuation framework, balancing exposures to emerging and re-emerging growth companies. At the same time, they were positioning the Fund to be able to recover strongly when the market turns positive.
At the end of 2022, the Fund held its largest overweight allocations to the industrials and health care sectors and its greatest underweight allocations to the information technology, utilities, and materials sectors. As compared to 2021, Fund management believes that the most notable shifts in the Fund’s positioning included increasing the Fund’s allocations to health care and consumer staples and decreasing its exposure to information technology.
69
MML Small Cap Growth Equity Fund – Portfolio Manager Report (Unaudited) (Continued) |
MML Small Cap Growth Equity Fund |
|
Fluor Corp. |
2.0% |
Viper Energy Partners LP |
1.6% |
Chord Energy Corp. |
1.6% |
Cabot Corp. |
1.5% |
Ameris Bancorp |
1.4% |
Calix, Inc. |
1.4% |
Haemonetics Corp. |
1.4% |
Sitio Royalties Corp. |
1.3% |
Applied Industrial Technologies, Inc. |
1.3% |
Wingstop, Inc. |
1.3% |
14.8% |
|
MML Small Cap Growth Equity Fund |
|
Consumer, Non-cyclical |
26.3% |
Financial |
16.8% |
Industrial |
16.0% |
Consumer, Cyclical |
13.4% |
Technology |
10.0% |
Energy |
6.7% |
Communications |
4.6% |
Basic Materials |
2.6% |
Utilities |
2.2% |
Mutual Funds |
1.5% |
Total Long-Term Investments |
100.1% |
Short-Term Investments and Other Assets and Liabilities |
(0.1)% |
Net Assets |
100.0% |
70
MML Small Cap Growth Equity Fund – Portfolio Manager Report (Unaudited) (Continued) |
GROWTH OF $10,000 INVESTMENT - INITIAL CLASS
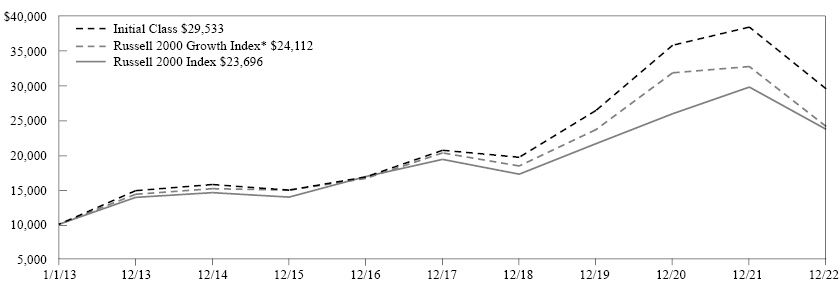
The graph above illustrates a representative class of the Fund’s historical performance for the past 10 fiscal years or since inception (for Funds lacking 10-year records) in comparison to its benchmark index, as well as one or more additional indexes, if applicable. The performance of other share classes will be greater than or less than the class depicted above.
Average Annual Total Returns (for the periods ended 12/31/2022) |
||||
|
Inception Date |
1 Year |
5 Years |
10 Years |
Initial Class |
05/03/1999 |
-23.15% |
7.40% |
11.44% |
Service Class |
08/15/2008 |
-23.35% |
7.13% |
11.16% |
Russell 2000 Growth Index* |
-26.36% |
3.51% |
9.20% |
|
Russell 2000 Index |
-20.44% |
4.13% |
9.01% |
|
* Benchmark
Generally accepted accounting principles require adjustments to be made to the net assets of the Fund at period end for financial reporting purposes only, and as such, the total return based on the unadjusted net asset value per share may differ from the total return reported in the financial highlights.
Performance results in the graph and table reflect the percentage change in net asset value, including reinvestment of dividends and capital gains distributions. Investors should note that the Fund is a professionally managed mutual fund, while the index or indexes shown above are unmanaged, cannot be purchased directly, and, with the exception of any peer group index, do not incur expenses.
Performance data quoted in the graph and table represents past performance; past performance is not predictive of future results. The investment return and principal value of shares of the Fund fluctuate, so your shares, when sold, may be worth more or less than their original cost. Current performance of the Fund may be lower or higher than the performance quoted. The performance shown does not reflect the deduction of taxes, if any, that a shareholder would pay on Fund distributions or the redemption of Fund shares. Performance data current to the most recent month end may be obtained by calling 1-888-309-3539.
Investors should read the Fund’s prospectus with regard to the Fund’s investment objectives, risks, and charges and expenses in conjunction with these financial statements. The Fund’s return reflects changes in the net asset value per share without the deduction of any product charges (e.g., cost of insurance, mortality and expense risk charges, administrative fees, and CDSL). The inclusion of these charges would have reduced the performance shown here.
71
MML Small Company Value Fund – Portfolio Manager Report (Unaudited) |
What is the investment approach of MML Small Company Value Fund, and who is the Fund’s subadviser?
The Fund seeks long-term capital appreciation by investing primarily in equity securities that the Fund’s subadviser believes are undervalued. Under normal circumstances, the Fund invests at least 80% of its net assets (plus the amount of any borrowings for investment purposes) in the securities of companies whose market capitalizations at the time of purchase are within the market capitalization range of companies included in the Russell 2000® Index or the S&P SmallCap 600 Index. The Fund’s subadviser is American Century Investment Management, Inc. (American Century).
How did the Fund perform during the 12 months ended December 31, 2022?
The Fund’s Class II shares returned -14.78%, underperforming the -14.48% return of the Russell 2000 Value Index (the “benchmark”), which measures the performance of the small-cap value segment of the U.S. equity universe. It includes those Russell 2000 Index companies with lower price-to-book ratios and lower forecasted growth values. The Fund outperformed the -20.44% return of the Russell 2000 Index, which measures the performance of the small-cap segment of the U.S. equity universe. It is a subset of the Russell 3000® Index and includes approximately 2000 of the smallest securities based on a combination of their market cap and current index membership.
For a discussion on the economic and market environment during the 12-month period ended December 31, 2022, please see the Economic and Market Overview, beginning on page 3.
Subadviser discussion of factors that contributed to the Fund’s performance
For the one-year period ended December 31, 2022, the benchmark’s worst-performing sectors were communication services and health care. The Fund held underweight allocations to both sectors, relative to the benchmark, which added to the Fund’s relative returns. The best-performing sectors in the benchmark were the energy and utilities sectors. The Fund’s underweight positions in both sectors was detrimental to the Fund’s full-year results.
Hampering the Fund’s performance for the year were its allocations to, and selection decisions within, the energy sector. An overweight allocation to the information technology sector also detracted for the fiscal period, as did stock selections in the consumer staples sector. In the energy sector, the Fund’s large underweight allocation to the oil, gas, and consumable fuels industry was a leading source of underperformance for the fiscal period, but a lack of exposure to two strong-performing exploration and production companies, Antero Resources and Ovintiv, also detracted. In consumer staples, the Fund’s relatively large position in Spectrum Brands Holdings, which is not in the benchmark, was the main detractor for the fiscal period. This household goods company lagged during most of the period as general concern that the government would block the planned sale of its hardware and home improvement business weighed on the stock until late in the year.
On the positive side, the Fund primarily benefited from stock selection within, and its allocation to, the health care sector during the fiscal period. Fund holdings within, and its allocation to, the real estate sector also proved beneficial to the Fund’s returns for the fiscal period, while Fund holdings in the industrial and financial sectors also contributed. In health care, the Fund’s lack of exposure to the biotechnology industry was the primary driver of the contribution to the Fund’s performance, but in the health care providers and services industry, Fund holdings Patterson Cos. and Apria proved beneficial. In the real estate sector, an underweight to the equity real estate investment trust (REIT) industry was the primary driver of the contribution to the Fund’s performance, while a position in Getty Realty, a REIT that specializes in commercial real estate, also drove results. In the industrial sector, two Fund holdings in the building products industry, Cornerstone Building Brands and Colombian glassmaker Tecnoglass, which is not in the benchmark, were the main contributors to the Fund’s performance. In the financial sector, the decision to avoid exposure to the mortgage REITs industry was also advantageous.
Derivatives are securities that derive their value from the performance of one or more other investments and take the form of a contract between two or more parties. Derivatives can be used for hedging, speculation, or both. During 2022, the Fund bought foreign exchange forward hedge contracts to offset the inherent currency risk of holding foreign securities. There was no material effect on performance from the use of these derivatives.
72
MML Small Company Value Fund – Portfolio Manager Report (Unaudited) (Continued) |
Subadviser outlook
The Fund generally seeks to invest in companies where American Century believes the valuation does not reflect the quality and normal earnings power of the company. American Century’s process is based on individual security selection, but broad themes have emerged. As of December 31, 2022, the Fund’s largest overweight was in the information technology sector, driven by Fund management’s conviction in a number of unique and attractively valued opportunities. The Fund’s largest underweight was in the health care sector, on Fund management’s belief that valuations in the space were not presenting attractive risk/reward opportunities. A significant portion of the underweight in the health care sector was driven by the Fund’s lack of exposure to the biotechnology industry, which saw a material reweighting higher with the rebalancing of the benchmark at the end of the second quarter of 2022.
73
MML Small Company Value Fund – Portfolio Manager Report (Unaudited) (Continued) |
MML Small Company Value Fund |
|
Coherent Corp. |
2.6% |
Spectrum Brands Holdings, Inc. |
2.3% |
Old National Bancorp |
2.3% |
Graphic Packaging Holding Co. |
2.3% |
Teradata Corp. |
2.3% |
EVERTEC, Inc. |
2.1% |
Skyline Champion Corp. |
2.1% |
Tapestry, Inc. |
2.0% |
F.N.B. Corp. |
2.0% |
Avnet, Inc. |
2.0% |
22.0% |
|
MML Small Company Value Fund |
|
Financial |
33.4% |
Industrial |
19.3% |
Consumer, Cyclical |
18.0% |
Consumer, Non-cyclical |
14.3% |
Technology |
7.1% |
Energy |
2.7% |
Communications |
1.8% |
Basic Materials |
1.6% |
Utilities |
1.5% |
Mutual Funds |
0.1% |
Total Long-Term Investments |
99.8% |
Short-Term Investments and Other Assets and Liabilities |
0.2% |
Net Assets |
100.0% |
74
MML Small Company Value Fund – Portfolio Manager Report (Unaudited) (Continued) |
GROWTH OF $10,000 INVESTMENT - CLASS II
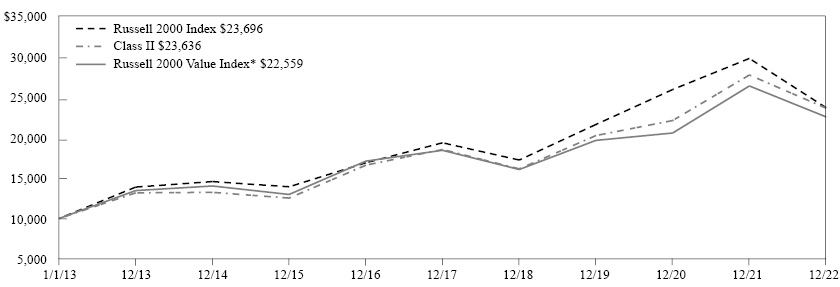
The graph above illustrates a representative class of the Fund’s historical performance for the past 10 fiscal years or since inception (for Funds lacking 10-year records) in comparison to its benchmark index, as well as one or more additional indexes, if applicable. The performance of other share classes will be greater than or less than the class depicted above.
Average Annual Total Returns (for the periods ended 12/31/2022) |
||||
|
Inception Date |
1 Year |
5 Years |
10 Years |
Class II |
02/27/2009 |
-14.78% |
4.99% |
8.98% |
Service Class I |
02/27/2009 |
-15.06% |
4.71% |
8.70% |
Russell 2000 Value Index* |
-14.48% |
4.13% |
8.48% |
|
Russell 2000 Index |
-20.44% |
4.13% |
9.01% |
|
* Benchmark
Generally accepted accounting principles require adjustments to be made to the net assets of the Fund at period end for financial reporting purposes only, and as such, the total return based on the unadjusted net asset value per share may differ from the total return reported in the financial highlights.
Performance results in the graph and table reflect the percentage change in net asset value, including reinvestment of dividends and capital gains distributions. Investors should note that the Fund is a professionally managed mutual fund, while the index or indexes shown above are unmanaged, cannot be purchased directly, and, with the exception of any peer group index, do not incur expenses.
Performance data quoted in the graph and table represents past performance; past performance is not predictive of future results. The investment return and principal value of shares of the Fund fluctuate, so your shares, when sold, may be worth more or less than their original cost. Current performance of the Fund may be lower or higher than the performance quoted. The performance shown does not reflect the deduction of taxes, if any, that a shareholder would pay on Fund distributions or the redemption of Fund shares. Performance data current to the most recent month end may be obtained by calling 1-888-309-3539.
Investors should read the Fund’s prospectus with regard to the Fund’s investment objectives, risks, and charges and expenses in conjunction with these financial statements. The Fund’s return reflects changes in the net asset value per share without the deduction of any product charges (e.g., cost of insurance, mortality and expense risk charges, administrative fees, and CDSL). The inclusion of these charges would have reduced the performance shown here.
75
MML Small/Mid Cap Value Fund – Portfolio Manager Report (Unaudited) |
What is the investment approach of MML Small/Mid Cap Value Fund, and who is the Fund’s subadviser?
The Fund seeks long-term total return by investing primarily in securities that the Fund’s subadviser believes to be undervalued. Under normal circumstances, the Fund invests at least 80% of its net assets (plus the amount of any borrowings for investment purposes) in securities of small- and mid-cap companies. The Fund’s subadviser is AllianceBernstein L.P. (AllianceBernstein).
How did the Fund perform during the 12 months ended December 31, 2022?
The Fund’s Initial Class Shares returned -15.69%, underperforming the -13.08% return of the Russell 2500TM Value Index (the “benchmark), which measures the performance of the small- to mid-cap value segment of the U.S. equity universe. It includes Russell 2500 Index companies with lower price-to-book and lower forecasted growth values.
For a discussion on the economic and market environment during the 12-month period ended December 31, 2022, please see the Economic and Market Overview, beginning on page 3.
Subadviser discussion of factors that contributed to the Fund’s performance
For the one-year period ended December 31, 2022, both security and sector selection detracted from the Fund’s relative performance. Security selection within the consumer staples sector detracted from, whereas stock selection in the technology sector contributed to, the Fund’s performance. An underweight allocation, relative to the benchmark, to the energy sector hampered the Fund’s returns, while an underweight allocation to the real estate sector contributed.
With respect to specific Fund holdings, Hain Celestial (an American food company whose main focus is natural foods and botanically based personal care products) detracted from the Fund’s performance, after reporting disappointing fiscal third- and fourth-quarter results. In 2022, the company faced challenges as a result of cost inflation, supply-chain headwinds, and weakness in European consumer spending. Contract research organization Syneos Health also detracted from the Fund’s performance after reporting disappointing third-quarter 2022 results and lowering its estimates for 2023. The company’s forward guidance was predicated on weak bookings due to reduced spending by its large and mid-size pharmaceutical customers for contracted research services. Tire manufacturer Goodyear Tire & Rubber Company declined due to investor concerns about the company’s ability to raise prices to offset cost inflation, detracting from the Fund’s performance. The company beat estimates for the first two quarters of 2022, but missed third-quarter 2022 estimates and gave a disappointing fourth-quarter outlook.
Certain Fund holdings contributed to the Fund’s performance during the year. These included HF Sinclair, an oil refiner and manufacturer of lubricants, which benefited from a sharp increase in refining margins driven by turmoil in the energy markets after the Russian invasion of Ukraine. The company’s shares were additionally rewarded for the successful closing of the acquisition of The Sinclair Companies by HollyFrontier, a subsidiary of HF Sinclair. Acadia Healthcare, a behavioral health care provider, contributed to the Fund’s performance after reporting strong second-quarter 2022 earnings. Coterra Energy, a domestic energy exploration and production company, also helped to drive the Fund’s full-year results. The company benefited from the broad outperformance of the energy industry during the first half of 2022.
Subadviser outlook
Based on Fund management’s historic experience, Fund management believes that the past three years have been among the most volatile in recent memory. The market has grappled with shocks ranging from a global pandemic to the return of inflation. Certain of investors’ long-standing assumptions have come into question – with globalization seeming to reverse, energy and supply chain security driving company and countries’ spending, and a new era of structurally higher interest rates likely. While Fund management expects volatility to persist, they believe it could be reduced relative to the past few years. In their view, equity performance in the fourth quarter of 2022 seems to support this, as markets cheered improved inflationary data. While Fund management expects further shocks in 2023, their belief is that these market moves could suggest investors have begun to adjust to this new “normal.”
76
MML Small/Mid Cap Value Fund – Portfolio Manager Report (Unaudited) (Continued) |
MML Small/Mid Cap Value Fund |
|
Berry Global Group, Inc. |
1.9% |
First Citizens BancShares, Inc. Class A |
1.7% |
IDACORP, Inc. |
1.7% |
Comerica, Inc. |
1.6% |
Integra LifeSciences Holdings Corp. |
1.6% |
Zions Bancorp NA |
1.5% |
Tapestry, Inc. |
1.5% |
Envista Holdings Corp. |
1.5% |
First Hawaiian, Inc. |
1.5% |
PulteGroup, Inc. |
1.5% |
16.0% |
|
MML Small/Mid Cap Value Fund |
|
Financial |
29.8% |
Industrial |
21.0% |
Consumer, Cyclical |
16.0% |
Consumer, Non-cyclical |
12.8% |
Technology |
6.6% |
Basic Materials |
5.1% |
Energy |
3.5% |
Utilities |
2.5% |
Communications |
2.1% |
Total Long-Term Investments |
99.4% |
Short-Term Investments and Other Assets and Liabilities |
0.6% |
Net Assets |
100.0% |
77
MML Small/Mid Cap Value Fund – Portfolio Manager Report (Unaudited) (Continued) |
GROWTH OF $10,000 INVESTMENT - INITIAL CLASS
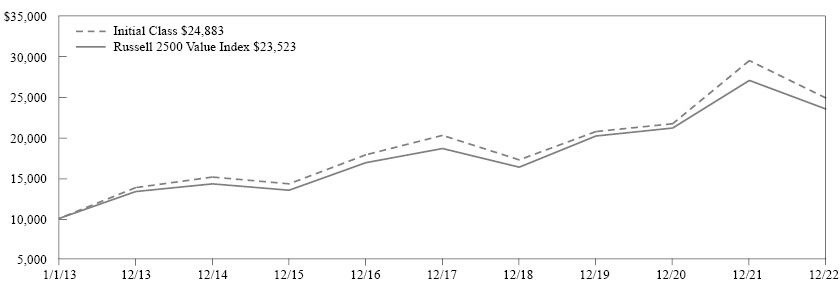
The graph above illustrates a representative class of the Fund’s historical performance for the past 10 fiscal years or since inception (for Funds lacking 10-year records) in comparison to its benchmark index, as well as one or more additional indexes, if applicable. The performance of other share classes will be greater than or less than the class depicted above.
Average Annual Total Returns (for the periods ended 12/31/2022) |
||||
|
Inception Date |
1 Year |
5 Years |
10 Years |
Initial Class |
05/01/2006 |
-15.69% |
4.18% |
9.54% |
Service Class |
08/15/2008 |
-15.89% |
3.92% |
9.27% |
Russell 2500 Value Index |
-13.08% |
4.75% |
8.93% |
|
Generally accepted accounting principles require adjustments to be made to the net assets of the Fund at period end for financial reporting purposes only, and as such, the total return based on the unadjusted net asset value per share may differ from the total return reported in the financial highlights.
Performance results in the graph and table reflect the percentage change in net asset value, including reinvestment of dividends and capital gains distributions. Investors should note that the Fund is a professionally managed mutual fund, while the index or indexes shown above are unmanaged, cannot be purchased directly, and, with the exception of any peer group index, do not incur expenses.
Performance data quoted in the graph and table represents past performance; past performance is not predictive of future results. The investment return and principal value of shares of the Fund fluctuate, so your shares, when sold, may be worth more or less than their original cost. Current performance of the Fund may be lower or higher than the performance quoted. The performance shown does not reflect the deduction of taxes, if any, that a shareholder would pay on Fund distributions or the redemption of Fund shares. Performance data current to the most recent month end may be obtained by calling 1-888-309-3539.
Investors should read the Fund’s prospectus with regard to the Fund’s investment objectives, risks, and charges and expenses in conjunction with these financial statements. The Fund’s return reflects changes in the net asset value per share without the deduction of any product charges (e.g., cost of insurance, mortality and expense risk charges, administrative fees, and CDSL). The inclusion of these charges would have reduced the performance shown here.
78
MML Sustainable Equity Fund – Portfolio Manager Report (Unaudited) |
What is the investment approach of MML Sustainable Equity Fund, formerly known as MML Growth & Income Fund, and who is the Fund’s subadviser?
The Fund seeks capital appreciation and income by investing, under normal circumstances, at least 80% of its net assets (plus the amount of any borrowings for investment purposes) in sustainable equity securities. Equity securities may include common stock, preferred stock, securities convertible into common or preferred stock, rights, and warrants. The Fund’s subadviser currently considers sustainable securities to be those to which the subadviser’s proprietary model assigns an ESG score that is in the top three quartiles of the environmental, social, and governance (“ESG”) scores the model assigns to all of the securities in the Fund’s benchmark, the S&P 500® Index. The Fund’s subadviser is American Century Investment Management, Inc. (American Century). Effective April 29, 2022, American Century replaced Massachusetts Financial Services Company (MFS) as subadviser of the Fund.
How did the Fund perform during the 12 months ended December 31, 2022?
The Fund’s Initial Class shares returned -17.01%, outperforming the -18.11% return of the S&P 500® Index (the “benchmark”), which measures the performance of 500 widely held stocks in the U.S. equity market.
For a discussion on the economic and market environment during the 12-month period ended December 31, 2022, please see the Economic and Market Overview, beginning on page 3.
Subadviser discussion of factors that contributed to the Fund’s performance
For the period of the fiscal year during which MFS served as subadviser of the Fund (January 1, 2022 - April 28, 2022), security selection in both the information technology and communication services sectors contributed to the Fund’s relative performance. Within information technology, not owning shares of both computer graphics processor maker NVIDIA and digital payment technology developer PayPal proved positive for the Fund. In addition, Fund holding Amdocs (a billing software company), which is not a benchmark constituent, supported the Fund’s relative results. Within the communication services sector, not owning shares of social networking service provider Meta Platforms also aided the Fund’s relative returns. Fund holdings in other sectors that bolstered relative performance included oil and gas company ConocoPhillips, biotechnology company Vertex Pharmaceuticals, engineered solutions provider for the aerospace and transportation industries Howmet Aerospace, pharmaceutical company Merck, and retailer Target. Additionally, not owning streaming services provider Netflix further helped relative returns. Detracting from the Fund’s performance relative to the benchmark was security selection in the financial sector. There, not owning shares of insurance and investment firm Berkshire Hathaway – as well as overweight positions in securities exchange services provider NASDAQ and global financial services firm JPMorgan Chase – held back relative returns. The Fund’s underweight position in the strong-performing energy sector also hindered the Fund’s relative results, as did not owning shares of integrated energy companies ExxonMobil and Chevron. Fund holdings in other sectors that hampered relative performance included Irish clinical research provider ICON (not a benchmark constituent) and overweight positions in technology company Alphabet, building controls and systems supplier Johnson Controls International, and software company Adobe Systems. Additionally, not owning shares of health insurance and Medicare/Medicaid provider UnitedHealth Group further hurt the Fund’s relative returns.
For the period of the fiscal year during which American Century served as subadviser of the Fund (April 29, 2022 - December 31, 2022), the Fund’s largest overweight sectors relative to the benchmark were information technology, industrial, and health care. Fund holdings in the energy sector led the Fund’s outperformance of the benchmark. Oil field services company Schlumberger reported strong results across all divisions and geographies during the fiscal period, with higher revenues, earnings, and stronger margins than expected. ConocoPhillips reported solid earnings and increased its 2022 capital return guidance during the fiscal period. The Fund’s lack of exposure to Meta Platforms benefited results, as Facebook’s parent company was hurt more by both Apple iOS platform changes and TikTok competition than other digital advertising platforms over the course of the fiscal period. Managed care companies, including Cigna, benefited from what, in Fund management’s view, many investors perceived to be their defensive profile, meaning the company is believed to be relatively insulated from both rising prices and recession risk. Utility company NextEra Energy outperformed during the fiscal period, given a favorable outlook for its renewable energy development business, further strengthened by the passage of the Inflation Reduction Act of 2022.
79
MML Sustainable Equity Fund – Portfolio Manager Report (Unaudited) (Continued) |
Fund holdings in the real estate sector detracted during the reporting period, led by warehouse real estate investment trust Prologis, which suffered on announcements from Amazon and FedEx that they were reducing excess capacity (which hampered the industry overall). Rising interest rates and a strong dollar also weighed on sector performance during the fiscal period. Other significant detractors included not owning oil giant ExxonMobil, which outperformed during the fiscal period due to rising oil prices. Packaging company Ball lagged after reporting disappointing revenue and earnings during the fiscal period, with slowing customer demand leading to weaker volume growth expectations and a decision to reduce production capacity. Medical device maker Edwards Lifesciences underperformed during the fiscal period, as the recovery in transcatheter aortic valve replacement (TAVR) procedures was slower than expected. Derivatives are securities that derive their value from the performance of one or more other investments and take the form of a contract between two or more parties. Derivatives can be used for hedging, speculation, or both. The Fund’s use of derivatives had no material impact on performance during the reporting period.
Subadviser outlook
In American Century’s view, as we enter 2023, war, inflation, and recession risk all seem to suggest difficult, volatile conditions ahead. Fund management believes that markets will continue to deal with the contrasting risks of rising inflation and interest rates, even as the global economy faces a potential recession. Nevertheless, American Century continues to believe that well-run businesses in strong positions with respect to their competition and sustainability practices could offer a viable way to navigate such challenging market conditions.
80
MML Sustainable Equity Fund – Portfolio Manager Report (Unaudited) (Continued) |
MML Sustainable Equity Fund |
|
Microsoft Corp. |
7.3% |
Apple, Inc. |
4.1% |
Alphabet, Inc. Class A |
3.8% |
ConocoPhillips |
2.5% |
Schlumberger NV |
2.5% |
NextEra Energy, Inc. |
2.2% |
Amazon.com, Inc. |
2.1% |
UnitedHealth Group, Inc. |
2.1% |
Prologis, Inc. |
2.1% |
Cisco Systems, Inc. |
2.0% |
30.7% |
|
MML Sustainable Equity Fund |
|
Consumer, Non-cyclical |
22.5% |
Technology |
19.8% |
Financial |
16.1% |
Communications |
11.7% |
Industrial |
11.1% |
Consumer, Cyclical |
8.2% |
Energy |
5.0% |
Basic Materials |
2.6% |
Utilities |
2.2% |
Mutual Funds |
0.6% |
Total Long-Term Investments |
99.8% |
Short-Term Investments and Other Assets and Liabilities |
0.2% |
Net Assets |
100.0% |
81
MML Sustainable Equity Fund – Portfolio Manager Report (Unaudited) (Continued) |
GROWTH OF $10,000 INVESTMENT - INITIAL CLASS
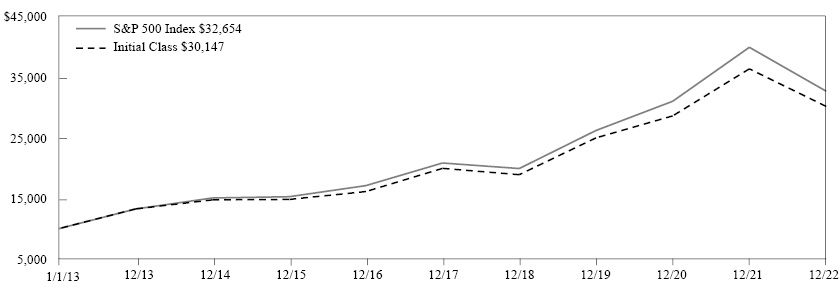
The graph above illustrates a representative class of the Fund’s historical performance for the past 10 fiscal years or since inception (for Funds lacking 10-year records) in comparison to its benchmark index, as well as one or more additional indexes, if applicable. The performance of other share classes will be greater than or less than the class depicted above.
Average Annual Total Returns (for the periods ended 12/31/2022) |
||||
|
Inception Date |
1 Year |
5 Years |
10 Years |
Initial Class |
05/01/2006 |
-17.01% |
8.64% |
11.67% |
Service Class |
08/15/2008 |
-17.20% |
8.37% |
11.39% |
S&P 500 Index |
-18.11% |
9.42% |
12.56% |
|
Generally accepted accounting principles require adjustments to be made to the net assets of the Fund at period end for financial reporting purposes only, and as such, the total return based on the unadjusted net asset value per share may differ from the total return reported in the financial highlights.
Performance results in the graph and table reflect the percentage change in net asset value, including reinvestment of dividends and capital gains distributions. Investors should note that the Fund is a professionally managed mutual fund, while the index or indexes shown above are unmanaged, cannot be purchased directly, and, with the exception of any peer group index, do not incur expenses.
Performance data quoted in the graph and table represents past performance; past performance is not predictive of future results. The investment return and principal value of shares of the Fund fluctuate, so your shares, when sold, may be worth more or less than their original cost. Current performance of the Fund may be lower or higher than the performance quoted. The performance shown does not reflect the deduction of taxes, if any, that a shareholder would pay on Fund distributions or the redemption of Fund shares. Performance data current to the most recent month end may be obtained by calling 1-888-309-3539.
Investors should read the Fund’s prospectus with regard to the Fund’s investment objectives, risks, and charges and expenses in conjunction with these financial statements. The Fund’s return reflects changes in the net asset value per share without the deduction of any product charges (e.g., cost of insurance, mortality and expense risk charges, administrative fees, and CDSL). The inclusion of these charges would have reduced the performance shown here.
82
MML Total Return Bond Fund – Portfolio Manager Report (Unaudited) |
What is the investment approach of MML Total Return Bond Fund, and who is the Fund’s subadviser?
The Fund seeks maximum total return, consistent with preservation of capital and prudent investment management, by investing, under normal circumstances, at least 80% of its net assets (plus the amount of any borrowings for investment purposes) in a diversified portfolio of investment grade fixed income securities (rated Baa3 or higher by Moody’s, BBB- or higher by Standard & Poor’s, BBB- or higher by Fitch, or A-2 by S&P, P-2 by Moody’s, or F-2 by Fitch for short-term debt obligations, or, if unrated, determined by the Fund’s subadviser to be of comparable quality). The Fund’s subadviser is Metropolitan West Asset Management, LLC (MetWest).
How did the Fund perform during the 12 months ended December 31, 2022?
The Fund’s Class II shares returned -14.70%, underperforming the -13.01% return of the Bloomberg U.S. Aggregate Bond Index (the “benchmark”), which measures the performance of investment grade, U.S. dollar-denominated, fixed-rate taxable bond market securities, including Treasuries, government-related and corporate securities, mortgage-backed securities (MBS) (agency fixed-rate and hybrid ARM pass-throughs), asset-backed securities (ABS), and commercial mortgage-backed securities (CMBS).
For a discussion on the economic and market environment during the 12-month period ended December 31, 2022, please see the Economic and Market Overview, beginning on page 3.
Subadviser discussion of factors that contributed to the Fund’s performance
For the one-year period ended December 31, 2022, pricing weakness was felt across many asset classes, with broad stock and bond measures dropping more than 15%, a first for the record books and a nemesis to the investment concept of diversification. Although, in Fund management’s view, late to take action to combat inflation, the Federal Reserve (the “Fed”) initiated its aggressive tightening measures in March – to eventually implement four consecutive 0.75% increases to the federal funds rate (the Fed’s overnight bank lending rate), followed by an additional 0.50% increase in December, bringing the target range to 4.25% to 4.50% by the end of 2022.
Amid this surge in rates and resultant volatility, credit markets lagged in 2022, as spreads widened in both the investment-grade and high-yield markets. Even more affected than the corporate market, agency MBS spreads reached levels similar to where they were in 2008, and delivered an 11.8% loss for 2022. (“Agency” refers to debt issued by U.S. federal government agencies or government-sponsored entities for financing purposes.) Similarly, non-agency MBS spreads reflected weaker economic expectations than those priced by credit markets, resulting in deeply negative year-to-date returns (though better than the agency MBS market segment). Elsewhere, commercial real estate remained vulnerable during the fiscal period, as the work-from-home dynamic continued to weigh on office properties, adding to stress in brick-and-mortar retailers and translating to lagging results. ABS had a modest annual loss of 4.3% with delinquencies and write-offs picking up, especially among the highest-risk borrowers.
For the year ended December 31, 2022, although the Fund began the year positioned defensively, its duration position was extended in a disciplined fashion alongside the rise in Treasury yields to end the period longer than the Index, modestly weighing on returns with further headwinds resulting from the curve-steepening bias (overweight to 2- and 5-year maturities) as shorter maturities led the climb higher. (Duration is a measure of a bond fund’s sensitivity to interest rates. The longer the duration, the greater the price impact on the bond or portfolio when interest rates rise or fall. The yield curve is a graphical representation of bond yields with very short maturities to the longest available, with the curve indicating whether short-term rates are higher or lower than long-term rates.)
Within corporate credit, additions made to the Fund’s portfolio during the year benefited returns in periods when the sector rallied (particularly in the first quarter and the month of November), though the Fund’s allocation to high yield detracted. A further drag came from the Fund’s overweight to communications, which was one of the worst-performing sectors, while issue selection among banking and non-cyclicals also hampered the Fund’s performance. The Fund’s allocation to securitized products also held back relative results, notably the overweight allocation to agency MBS which, indicative of market volatility in 2022, posted both the worst and best months of excess return during 2022. Elsewhere, non-agency MBS issues underperformed amid
83
MML Total Return Bond Fund – Portfolio Manager Report (Unaudited) (Continued) |
overall financial market stress, with a notable bifurcation between higher-quality issues (on which the Fund primarily focuses) that traded more frequently and less liquid issues, with the Fund’s CMBS and ABS issues having a more muted effect on performance.
Subadviser outlook
Fund management believes that the path toward economic stability will be challenging, as uncertainty over the trajectory of monetary policy, inflation, and geopolitical tensions renders the market susceptible to continued volatility. Their view is that the effects of higher rates and tighter financial conditions will continue to be felt into 2023, with a recession the potential outcome. As such, Fund management’s approach is to remain disciplined and opportunistic. Specific to the inflation picture in the U.S., Fund management believes that prices appear to have peaked, with expectations for potential further deceleration as economic activity slows. As a corollary to that, Fund management anticipates that the yield curve will steepen significantly in 2023, with the two-year rate potentially dropping quickly to reflect an easing Fed.
84
MML Total Return Bond Fund – Portfolio Manager Report (Unaudited) (Continued) |
MML Total Return Bond Fund |
|
U.S. Government Agency Obligations and Instrumentalities* |
36.6% |
Corporate Debt |
28.8% |
U.S. Treasury Obligations |
27.6% |
Non-U.S. Government Agency Obligations |
17.8% |
Mutual Funds |
9.5% |
Bank Loans |
2.1% |
Sovereign Debt Obligations |
1.0% |
Municipal Obligations |
1.0% |
Common Stock |
0.1% |
Rights |
0.0% |
Total Long-Term Investments |
124.5% |
Short-Term Investments and Other Assets and Liabilities |
(24.5)% |
Net Assets |
100.0% |
|
* |
May contain securities that are issued by a U.S. Government Agency, but are unsecured and are not guaranteed by a U.S. Government Agency. |
85
MML Total Return Bond Fund – Portfolio Manager Report (Unaudited) (Continued) |
GROWTH OF $10,000 INVESTMENT - CLASS II
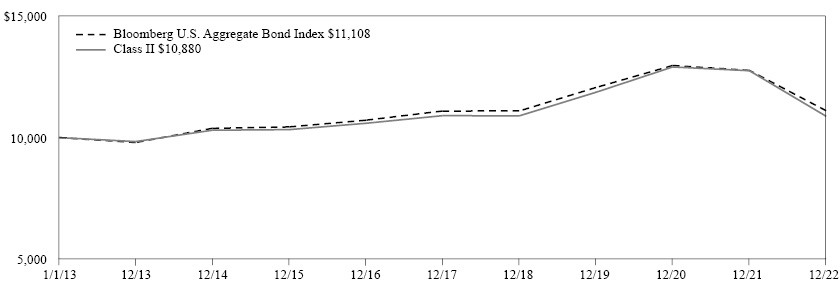
The graph above illustrates a representative class of the Fund’s historical performance for the past 10 fiscal years or since inception (for Funds lacking 10-year records) in comparison to its benchmark index, as well as one or more additional indexes, if applicable. The performance of other share classes will be greater than or less than the class depicted above.
Average Annual Total Returns (for the periods ended 12/31/2022) |
||||
|
Inception Date |
1 Year |
5 Years |
10 Years |
Class II |
08/10/2010 |
-14.70% |
-0.04% |
0.85% |
Service Class I |
05/01/2012 |
-14.90% |
-0.29% |
0.59% |
Bloomberg U.S. Aggregate Bond Index |
-13.01% |
0.02% |
1.06% |
|
Generally accepted accounting principles require adjustments to be made to the net assets of the Fund at period end for financial reporting purposes only, and as such, the total return based on the unadjusted net asset value per share may differ from the total return reported in the financial highlights.
Performance results in the graph and table reflect the percentage change in net asset value, including reinvestment of dividends and capital gains distributions. Investors should note that the Fund is a professionally managed mutual fund, while the index or indexes shown above are unmanaged, cannot be purchased directly, and, with the exception of any peer group index, do not incur expenses.
Performance data quoted in the graph and table represents past performance; past performance is not predictive of future results. The investment return and principal value of shares of the Fund fluctuate, so your shares, when sold, may be worth more or less than their original cost. Current performance of the Fund may be lower or higher than the performance quoted. The performance shown does not reflect the deduction of taxes, if any, that a shareholder would pay on Fund distributions or the redemption of Fund shares. Performance data current to the most recent month end may be obtained by calling 1-888-309-3539.
Investors should read the Fund’s prospectus with regard to the Fund’s investment objectives, risks, and charges and expenses in conjunction with these financial statements. The Fund’s return reflects changes in the net asset value per share without the deduction of any product charges (e.g., cost of insurance, mortality and expense risk charges, administrative fees, and CDSL). The inclusion of these charges would have reduced the performance shown here.
86
December 31, 2022 |
Number of |
Value |
|||||||
Equity Funds — 41.1% |
||||||||
MML Blue Chip Growth Fund, Initial Class (a) |
1,067,531 | $ | 11,422,585 | |||||
MML Equity Income Fund, Initial Class (a) |
1,186,880 | 11,987,484 | ||||||
MML Focused Equity Fund, Class II (a) |
2,222,340 | 16,089,739 | ||||||
MML Foreign Fund, Initial Class (a) |
676,484 | 5,628,347 | ||||||
MML Fundamental Equity Fund, Class II (a) |
1,165,726 | 9,745,468 | ||||||
MML Fundamental Value Fund, Class II (a) |
878,664 | 10,060,706 | ||||||
MML Global Fund, Class I (a) |
2,044,358 | 8,177,431 | ||||||
MML Income & Growth Fund, Initial Class (a) |
856,039 | 9,262,344 | ||||||
MML International Equity Fund, Class II (a) |
1,385,526 | 12,164,916 | ||||||
MML Large Cap Growth Fund, Initial Class (a) |
694,036 | 6,808,492 | ||||||
MML Mid Cap Growth Fund, Initial Class (a) |
780,189 | 6,857,857 | ||||||
MML Mid Cap Value Fund, Initial Class (a) |
707,124 | 6,484,328 | ||||||
MML Small Cap Growth Equity Fund, Initial Class (a) |
67,168 | 565,744 | ||||||
MML Small Company Value Fund, Class II (a) |
433,302 | 3,219,434 | ||||||
MML Small/Mid Cap Value Fund, Initial Class (a) |
184,343 | 1,636,961 | ||||||
MML Strategic Emerging Markets Fund, Class II (a) |
666,962 | 3,221,425 | ||||||
| 123,333,261 | ||||||||
Fixed Income Funds — 59.0% |
||||||||
Invesco V.I. Global Strategic Income Fund, Series I (b) |
1,861,880 | 7,335,807 | ||||||
MML Dynamic Bond Fund, Class II (a) |
4,165,924 | 34,660,484 | ||||||
MML High Yield Fund, Class II (a) |
127,538 | 1,040,706 | ||||||
MML Inflation-Protected and Income Fund, Initial Class (a) |
946,561 | 8,206,684 | ||||||
MML Managed Bond Fund, Initial Class (a) |
5,967,671 | 63,253,785 | ||||||
MML Short-Duration Bond Fund, Class II (a) |
1,711,400 | 14,803,611 | ||||||
MML Total Return Bond Fund, Class II (a) |
5,134,656 | 45,082,280 | ||||||
Number of |
Value |
|||||||
PIMCO Variable Insurance Trust - Long-Term U.S. Government Portfolio, Institutional Shares |
346,135 | $ | 2,710,238 | |||||
| 177,093,595 | ||||||||
TOTAL MUTUAL FUNDS (Cost $361,291,980) |
300,426,856 | |||||||
TOTAL LONG-TERM INVESTMENTS (Cost $361,291,980) |
300,426,856 | |||||||
TOTAL INVESTMENTS — 100.1% (Cost $361,291,980) (c) |
300,426,856 | |||||||
Other Assets/(Liabilities) — (0.1)% |
(280,460 | ) | ||||||
NET ASSETS — 100.0% |
$ | 300,146,396 | ||||||
Notes to Portfolio of Investments
Percentages are stated as a percent of net assets.
|
(a) |
Affiliated issuer. See Note 7 for a summary of transactions in the investments of affiliated issuers. |
|
(b) |
Non-income producing security. |
|
(c) |
See Note 6 for aggregate cost for federal tax purposes. |
The accompanying notes are an integral part of the financial statements.
87
December 31, 2022 |
Number of |
Value |
|||||||
MUTUAL FUNDS — 100.1% |
||||||||
Equity Funds — 49.4% |
||||||||
MML Blue Chip Growth Fund, Initial Class (a) |
1,317,511 | $ | 14,097,366 | |||||
MML Equity Income Fund, Initial Class (a) |
1,578,806 | 15,945,942 | ||||||
MML Focused Equity Fund, Class II (a) |
4,019,862 | 29,103,799 | ||||||
MML Foreign Fund, Initial Class (a) |
909,811 | 7,569,631 | ||||||
MML Fundamental Equity Fund, Class II (a) |
1,578,084 | 13,192,785 | ||||||
MML Fundamental Value Fund, Class II (a) |
1,105,674 | 12,659,964 | ||||||
MML Global Fund, Class I (a) |
2,908,124 | 11,632,497 | ||||||
MML Income & Growth Fund, Initial Class (a) |
1,139,061 | 12,324,637 | ||||||
MML International Equity Fund, Class II (a) |
2,045,705 | 17,961,286 | ||||||
MML Large Cap Growth Fund, Initial Class (a) |
980,960 | 9,623,220 | ||||||
MML Mid Cap Growth Fund, Initial Class (a) |
982,369 | 8,635,027 | ||||||
MML Mid Cap Value Fund, Initial Class (a) |
1,042,752 | 9,562,032 | ||||||
MML Small Cap Growth Equity Fund, Initial Class (a) |
108,452 | 913,466 | ||||||
MML Small Company Value Fund, Class II (a) |
520,322 | 3,865,995 | ||||||
MML Small/Mid Cap Value Fund, Initial Class (a) |
252,606 | 2,243,142 | ||||||
MML Strategic Emerging Markets Fund, Class II (a) |
557,656 | 2,693,477 | ||||||
| 172,024,266 | ||||||||
Fixed Income Funds — 50.7% |
||||||||
Invesco V.I. Global Strategic Income Fund, Series I (b) |
1,952,960 | 7,694,663 | ||||||
MML Dynamic Bond Fund, Class II (a) |
4,259,157 | 35,436,184 | ||||||
MML High Yield Fund, Class II (a) |
269,029 | 2,195,275 | ||||||
MML Inflation-Protected and Income Fund, Initial Class (a) |
1,069,704 | 9,274,330 | ||||||
MML Managed Bond Fund, Initial Class (a) |
5,792,419 | 61,396,213 | ||||||
MML Short-Duration Bond Fund, Class II (a) |
1,667,075 | 14,420,202 | ||||||
MML Total Return Bond Fund, Class II (a) |
4,946,874 | 43,433,557 | ||||||
Number of |
Value |
|||||||
PIMCO Variable Insurance Trust - Long-Term U.S. Government Portfolio, Institutional Shares |
372,761 | $ | 2,918,717 | |||||
| 176,769,141 | ||||||||
TOTAL MUTUAL FUNDS (Cost $411,918,830) |
348,793,407 | |||||||
TOTAL LONG-TERM INVESTMENTS (Cost $411,918,830) |
348,793,407 | |||||||
TOTAL INVESTMENTS — 100.1% (Cost $411,918,830) (c) |
348,793,407 | |||||||
Other Assets/(Liabilities) — (0.1)% |
(329,667 | ) | ||||||
NET ASSETS — 100.0% |
$ | 348,463,740 | ||||||
Notes to Portfolio of Investments
Percentages are stated as a percent of net assets.
|
(a) |
Affiliated issuer. See Note 7 for a summary of transactions in the investments of affiliated issuers. |
|
(b) |
Non-income producing security. |
|
(c) |
See Note 6 for aggregate cost for federal tax purposes. |
The accompanying notes are an integral part of the financial statements.
88
December 31, 2022 |
Number of |
Value |
|||||||
MUTUAL FUNDS — 100.1% |
||||||||
Equity Funds — 61.2% |
||||||||
MML Blue Chip Growth Fund, Initial Class (a) |
6,200,702 | $ | 66,347,513 | |||||
MML Equity Income Fund, Initial Class (a) |
7,015,116 | 70,852,667 | ||||||
MML Focused Equity Fund, Class II (a) |
17,159,891 | 124,237,613 | ||||||
MML Foreign Fund, Initial Class (a) |
3,904,380 | 32,484,438 | ||||||
MML Fundamental Equity Fund, Class II (a) |
7,266,060 | 60,744,264 | ||||||
MML Fundamental Value Fund, Class II (a) |
5,271,671 | 60,360,627 | ||||||
MML Global Fund, Class I (a) |
9,841,926 | 39,367,706 | ||||||
MML Income & Growth Fund, Initial Class (a) |
5,314,711 | 57,505,173 | ||||||
MML International Equity Fund, Class II (a) |
9,638,094 | 84,622,465 | ||||||
MML Large Cap Growth Fund, Initial Class (a) |
4,171,788 | 40,925,245 | ||||||
MML Mid Cap Growth Fund, Initial Class (a) |
4,262,469 | 37,467,105 | ||||||
MML Mid Cap Value Fund, Initial Class (a) |
4,511,979 | 41,374,848 | ||||||
MML Small Cap Growth Equity Fund, Initial Class (a) |
773,130 | 6,511,907 | ||||||
MML Small Company Value Fund, Class II (a) |
2,615,687 | 19,434,557 | ||||||
MML Small/Mid Cap Value Fund, Initial Class (a) |
1,247,905 | 11,081,400 | ||||||
MML Strategic Emerging Markets Fund, Class II (a) |
3,240,026 | 15,649,324 | ||||||
| 768,966,852 | ||||||||
Fixed Income Funds — 38.9% |
||||||||
Invesco V.I. Global Strategic Income Fund, Series I (b) |
3,307,326 | 13,030,864 | ||||||
MML Dynamic Bond Fund, Class II (a) |
11,860,035 | 98,675,491 | ||||||
MML High Yield Fund, Class II (a) |
966,473 | 7,886,418 | ||||||
MML Inflation-Protected and Income Fund, Initial Class (a) |
3,056,844 | 26,502,838 | ||||||
MML Managed Bond Fund, Initial Class (a) |
16,641,243 | 176,387,341 | ||||||
MML Short-Duration Bond Fund, Class II (a) |
5,143,123 | 44,488,012 | ||||||
MML Total Return Bond Fund, Class II (a) |
12,838,962 | 112,726,084 | ||||||
Number of |
Value |
|||||||
PIMCO Variable Insurance Trust - Long-Term U.S. Government Portfolio, Institutional Shares |
1,171,534 | $ | 9,173,112 | |||||
| 488,870,160 | ||||||||
TOTAL MUTUAL FUNDS (Cost $1,499,076,426) |
1,257,837,012 | |||||||
TOTAL LONG-TERM INVESTMENTS (Cost $1,499,076,426) |
1,257,837,012 | |||||||
TOTAL INVESTMENTS — 100.1% (Cost $1,499,076,426) (c) |
1,257,837,012 | |||||||
Other Assets/(Liabilities) — (0.1)% |
(1,020,213 | ) | ||||||
NET ASSETS — 100.0% |
$ | 1,256,816,799 | ||||||
Notes to Portfolio of Investments
Percentages are stated as a percent of net assets.
|
(a) |
Affiliated issuer. See Note 7 for a summary of transactions in the investments of affiliated issuers. |
|
(b) |
Non-income producing security. |
|
(c) |
See Note 6 for aggregate cost for federal tax purposes. |
The accompanying notes are an integral part of the financial statements.
89
December 31, 2022 |
Number of |
Value |
|||||||
MUTUAL FUNDS — 100.1% |
||||||||
Equity Funds — 75.5% |
||||||||
MML Blue Chip Growth Fund, Initial Class (a) |
5,642,930 | $ | 60,379,356 | |||||
MML Equity Income Fund, Initial Class (a) |
6,238,775 | 63,011,625 | ||||||
MML Focused Equity Fund, Class II (a) |
13,906,506 | 100,683,103 | ||||||
MML Foreign Fund, Initial Class (a) |
3,484,014 | 28,986,996 | ||||||
MML Fundamental Equity Fund, Class II (a) |
6,586,714 | 55,064,926 | ||||||
MML Fundamental Value Fund, Class II (a) |
4,673,823 | 53,515,272 | ||||||
MML Global Fund, Class I (a) |
9,597,161 | 38,388,646 | ||||||
MML Income & Growth Fund, Initial Class (a) |
4,889,842 | 52,908,087 | ||||||
MML International Equity Fund, Class II (a) |
8,835,677 | 77,577,248 | ||||||
MML Large Cap Growth Fund, Initial Class (a) |
4,336,179 | 42,537,918 | ||||||
MML Mid Cap Growth Fund, Initial Class (a) |
3,887,032 | 34,167,009 | ||||||
MML Mid Cap Value Fund, Initial Class (a) |
3,943,977 | 36,166,270 | ||||||
MML Small Cap Growth Equity Fund, Initial Class (a) |
961,885 | 8,101,752 | ||||||
MML Small Company Value Fund, Class II (a) |
2,819,963 | 20,952,325 | ||||||
MML Small/Mid Cap Value Fund, Initial Class (a) |
1,029,426 | 9,141,303 | ||||||
MML Strategic Emerging Markets Fund, Class II (a) |
2,805,412 | 13,550,140 | ||||||
| 695,131,976 | ||||||||
Fixed Income Funds — 24.6% |
||||||||
Invesco V.I. Global Strategic Income Fund, Series I (b) |
2,715,969 | 10,700,917 | ||||||
MML Dynamic Bond Fund, Class II (a) |
5,737,700 | 47,737,662 | ||||||
MML High Yield Fund, Class II (a) |
457,046 | 3,729,492 | ||||||
MML Inflation-Protected and Income Fund, Initial Class (a) |
1,532,767 | 13,289,094 | ||||||
MML Managed Bond Fund, Initial Class (a) |
6,596,526 | 69,919,276 | ||||||
MML Short-Duration Bond Fund, Class II (a) |
2,612,970 | 22,602,190 | ||||||
MML Total Return Bond Fund, Class II (a) |
6,057,697 | 53,186,583 | ||||||
Number of |
Value |
|||||||
PIMCO Variable Insurance Trust - Long-Term U.S. Government Portfolio, Institutional Shares |
692,270 | $ | 5,420,474 | |||||
| 226,585,688 | ||||||||
TOTAL MUTUAL FUNDS (Cost $1,104,818,948) |
921,717,664 | |||||||
TOTAL LONG-TERM INVESTMENTS (Cost $1,104,818,948) |
921,717,664 | |||||||
TOTAL INVESTMENTS — 100.1% (Cost $1,104,818,948) (c) |
921,717,664 | |||||||
Other Assets/(Liabilities) — (0.1)% |
(644,793 | ) | ||||||
NET ASSETS — 100.0% |
$ | 921,072,871 | ||||||
Notes to Portfolio of Investments
Percentages are stated as a percent of net assets.
|
(a) |
Affiliated issuer. See Note 7 for a summary of transactions in the investments of affiliated issuers. |
|
(b) |
Non-income producing security. |
|
(c) |
See Note 6 for aggregate cost for federal tax purposes. |
The accompanying notes are an integral part of the financial statements.
90
December 31, 2022 |
Number of |
Value |
|||||||
MUTUAL FUNDS — 100.1% |
||||||||
Equity Funds — 89.5% |
||||||||
MML Blue Chip Growth Fund, Initial Class (a) |
944,715 | $ | 10,108,455 | |||||
MML Equity Income Fund, Initial Class (a) |
968,413 | 9,780,968 | ||||||
MML Focused Equity Fund, Class II (a) |
2,480,687 | 17,960,172 | ||||||
MML Foreign Fund, Initial Class (a) |
536,116 | 4,460,486 | ||||||
MML Fundamental Equity Fund, Class II (a) |
935,629 | 7,821,861 | ||||||
MML Fundamental Value Fund, Class II (a) |
758,942 | 8,689,889 | ||||||
MML Global Fund, Class I (a) |
434,245 | 1,736,980 | ||||||
MML Income & Growth Fund, Initial Class (a) |
804,303 | 8,702,560 | ||||||
MML International Equity Fund, Class II (a) |
1,428,641 | 12,543,464 | ||||||
MML Large Cap Growth Fund, Initial Class (a) |
760,891 | 7,464,343 | ||||||
MML Mid Cap Growth Fund, Initial Class (a) |
793,918 | 6,978,537 | ||||||
MML Mid Cap Value Fund, Initial Class (a) |
648,306 | 5,944,970 | ||||||
MML Small Cap Growth Equity Fund, Initial Class (a) |
185,139 | 1,559,387 | ||||||
MML Small Company Value Fund, Class II (a) |
433,134 | 3,218,185 | ||||||
MML Small/Mid Cap Value Fund, Initial Class (a) |
156,582 | 1,390,449 | ||||||
MML Strategic Emerging Markets Fund, Class II (a) |
396,131 | 1,913,313 | ||||||
| 110,274,019 | ||||||||
Fixed Income Funds — 10.6% |
||||||||
Invesco V.I. Global Strategic Income Fund, Series I (b) |
253,965 | 1,000,623 | ||||||
MML Dynamic Bond Fund, Class II (a) |
281,458 | 2,341,727 | ||||||
MML High Yield Fund, Class II (a) |
66,353 | 541,438 | ||||||
MML Inflation-Protected and Income Fund, Initial Class (a) |
27,644 | 239,677 | ||||||
MML Managed Bond Fund, Initial Class (a) |
401,082 | 4,251,237 | ||||||
MML Short-Duration Bond Fund, Class II (a) |
245,715 | 2,125,436 | ||||||
MML Total Return Bond Fund, Class II (a) |
225,877 | 1,983,197 | ||||||
Number of |
Value |
|||||||
PIMCO Variable Insurance Trust - Long-Term U.S. Government Portfolio, Institutional Shares |
79,877 | $ | 625,438 | |||||
| 13,108,773 | ||||||||
TOTAL MUTUAL FUNDS (Cost $148,913,193) |
123,382,792 | |||||||
TOTAL LONG-TERM INVESTMENTS (Cost $148,913,193) |
123,382,792 | |||||||
TOTAL INVESTMENTS — 100.1% (Cost $148,913,193) (c) |
123,382,792 | |||||||
Other Assets/(Liabilities) — (0.1)% |
(134,629 | ) | ||||||
NET ASSETS — 100.0% |
$ | 123,248,163 | ||||||
Notes to Portfolio of Investments
Percentages are stated as a percent of net assets.
|
(a) |
Affiliated issuer. See Note 7 for a summary of transactions in the investments of affiliated issuers. |
|
(b) |
Non-income producing security. |
|
(c) |
See Note 6 for aggregate cost for federal tax purposes. |
The accompanying notes are an integral part of the financial statements.
91
December 31, 2022 |
Number of |
Value |
|||||||
MUTUAL FUNDS — 100.1% |
||||||||
Equity Funds — 100.1% |
||||||||
American Funds Insurance Series Growth Fund, Class 1 |
2,563,111 | $ | 195,539,750 | |||||
TOTAL MUTUAL FUNDS (Cost $215,888,742) |
195,539,750 | |||||||
TOTAL INVESTMENTS — 100.1% (Cost $215,888,742) (a) |
195,539,750 | |||||||
Other Assets/(Liabilities) — (0.1)% |
(256,637 | ) | ||||||
NET ASSETS — 100.0% |
$ | 195,283,113 | ||||||
Notes to Portfolio of Investments
Percentages are stated as a percent of net assets.
|
(a) |
See Note 6 for aggregate cost for federal tax purposes. |
The accompanying notes are an integral part of the financial statements.
92
MML American Funds Core Allocation Fund – Portfolio of Investments |
December 31, 2022 |
Number of |
Value |
|||||||
MUTUAL FUNDS — 100.1% |
||||||||
Equity Funds — 64.9% |
||||||||
American Funds Insurance Series® Growth-Income Fund, Class 1 |
3,693,149 | $ | 185,432,997 | |||||
American Funds Insurance Series® International Fund, Class 1 |
5,537,439 | 84,778,188 | ||||||
American Funds Insurance Series® Washington Mutual Investors Fund, Class 1 |
14,767,990 | 187,405,789 | ||||||
| 457,616,974 | ||||||||
Fixed Income Funds — 35.2% |
||||||||
American Funds Insurance Series® The Bond Fund Of America, Class 1 |
26,357,841 | 248,027,285 | ||||||
TOTAL MUTUAL FUNDS (Cost $765,035,663) |
705,644,259 | |||||||
TOTAL LONG-TERM INVESTMENTS (Cost $765,035,663) |
705,644,259 | |||||||
TOTAL INVESTMENTS — 100.1% (Cost $765,035,663) (a) |
705,644,259 | |||||||
Other Assets/(Liabilities) — (0.1)% |
(776,263 | ) | ||||||
NET ASSETS — 100.0% |
$ | 704,867,996 | ||||||
Notes to Portfolio of Investments
Percentages are stated as a percent of net assets.
|
(a) |
See Note 6 for aggregate cost for federal tax purposes. |
The accompanying notes are an integral part of the financial statements.
93
December 31, 2022 |
Number of |
Value |
|||||||
EQUITIES — 99.5% |
||||||||
COMMON STOCK — 99.3% |
||||||||
Basic Materials — 1.3% |
||||||||
Chemicals — 1.3% |
||||||||
Linde PLC |
7,349 | $ | 2,397,097 | |||||
The Sherwin-Williams Co. |
9,363 | 2,222,121 | ||||||
| 4,619,218 | ||||||||
| 4,619,218 | ||||||||
Communications — 21.1% |
||||||||
Internet — 19.7% |
||||||||
Alphabet, Inc. Class A (a) |
41,817 | 3,689,514 | ||||||
Alphabet, Inc. Class C (a) |
276,187 | 24,506,073 | ||||||
Amazon.com, Inc. (a) |
292,904 | 24,603,936 | ||||||
Booking Holdings, Inc. (a) |
1,375 | 2,771,010 | ||||||
DoorDash, Inc., Class A (a) |
14,866 | 725,758 | ||||||
Meta Platforms, Inc. Class A (a) |
50,654 | 6,095,702 | ||||||
Netflix, Inc. (a) |
13,263 | 3,910,994 | ||||||
Sea Ltd. ADR (a) |
29,902 | 1,555,801 | ||||||
Shopify, Inc. Class A (a) |
44,848 | 1,556,674 | ||||||
Tencent Holdings Ltd. |
36,800 | 1,564,081 | ||||||
| 70,979,543 | ||||||||
Media — 0.3% |
||||||||
The Walt Disney Co. (a) |
13,499 | 1,172,793 | ||||||
Telecommunications — 1.1% |
||||||||
T-Mobile US, Inc. (a) |
27,655 | 3,871,700 | ||||||
| 76,024,036 | ||||||||
Consumer, Cyclical — 6.7% |
||||||||
Apparel — 1.0% |
||||||||
NIKE, Inc. Class B |
29,323 | 3,431,084 | ||||||
Auto Manufacturers — 1.2% |
||||||||
Tesla, Inc. (a) |
35,030 | 4,314,996 | ||||||
Retail — 4.5% |
||||||||
Chipotle Mexican Grill, Inc. (a) |
2,554 | 3,543,649 | ||||||
Dollar General Corp. |
17,853 | 4,396,301 | ||||||
Lululemon Athletica, Inc. (a) |
8,144 | 2,609,175 | ||||||
Ross Stores, Inc. |
42,165 | 4,894,092 | ||||||
The TJX Cos., Inc. |
10,617 | 845,113 | ||||||
| 16,288,330 | ||||||||
| 24,034,410 | ||||||||
Consumer, Non-cyclical — 18.5% |
||||||||
Commercial Services — 2.1% |
||||||||
Adyen NV ADR (a) |
72,659 | 1,002,694 | ||||||
Affirm Holdings, Inc. (a) (b) |
18,873 | 182,502 | ||||||
Ant International Co. Ltd., Class C (Acquired 6/07/18, Cost $775,038) (a) (c) (d) (e) |
203,348 | 412,796 | ||||||
Block, Inc. (a) |
21,051 | 1,322,845 | ||||||
Number of |
Value |
|||||||
Cintas Corp. |
1,846 | $ | 833,691 | |||||
PayPal Holdings, Inc. (a) |
11,209 | 798,305 | ||||||
S&P Global, Inc. |
7,836 | 2,624,590 | ||||||
TransUnion |
7,889 | 447,701 | ||||||
| 7,625,124 | ||||||||
Health Care – Products — 5.8% |
||||||||
Align Technology, Inc. (a) |
2,101 | 443,101 | ||||||
Danaher Corp. |
22,908 | 6,080,241 | ||||||
Intuitive Surgical, Inc. (a) |
25,020 | 6,639,057 | ||||||
Stryker Corp. |
12,185 | 2,979,111 | ||||||
Teleflex, Inc. |
2,756 | 687,980 | ||||||
Thermo Fisher Scientific, Inc. |
7,547 | 4,156,058 | ||||||
| 20,985,548 | ||||||||
Health Care – Services — 7.0% |
||||||||
Elevance Health, Inc. |
4,873 | 2,499,703 | ||||||
Humana, Inc. |
8,052 | 4,124,154 | ||||||
UnitedHealth Group, Inc. |
34,987 | 18,549,407 | ||||||
| 25,173,264 | ||||||||
Pharmaceuticals — 3.6% |
||||||||
AstraZeneca PLC Sponsored ADR |
21,926 | 1,486,583 | ||||||
Eli Lilly & Co. |
24,653 | 9,019,053 | ||||||
Zoetis, Inc. |
16,373 | 2,399,463 | ||||||
| 12,905,099 | ||||||||
| 66,689,035 | ||||||||
Financial — 11.3% |
||||||||
Banks — 1.3% |
||||||||
The Goldman Sachs Group, Inc. |
13,666 | 4,692,631 | ||||||
Diversified Financial Services — 8.0% |
||||||||
The Charles Schwab Corp. |
41,294 | 3,438,139 | ||||||
Mastercard, Inc. Class A |
32,893 | 11,437,883 | ||||||
Visa, Inc. Class A |
66,607 | 13,838,270 | ||||||
| 28,714,292 | ||||||||
Insurance — 2.0% |
||||||||
Chubb Ltd. |
19,646 | 4,333,907 | ||||||
Marsh & McLennan Cos., Inc. |
16,410 | 2,715,527 | ||||||
| 7,049,434 | ||||||||
| 40,456,357 | ||||||||
Industrial — 1.0% |
||||||||
Electronics — 0.2% |
||||||||
TE Connectivity Ltd. |
6,733 | 772,948 | ||||||
Miscellaneous - Manufacturing — 0.4% |
||||||||
General Electric Co. |
17,208 | 1,441,858 | ||||||
Transportation — 0.4% |
||||||||
Old Dominion Freight Line, Inc. |
5,088 | 1,443,873 | ||||||
| 3,658,679 | ||||||||
The accompanying notes are an integral part of the financial statements.
94
MML Blue Chip Growth Fund – Portfolio of Investments (Continued) |
Number of |
Value |
|||||||
Technology — 39.4% |
||||||||
Computers — 10.1% |
||||||||
Apple, Inc. |
273,409 | $ | 35,524,032 | |||||
Crowdstrike Holdings, Inc. Class A (a) |
4,872 | 512,973 | ||||||
Fortinet, Inc. (a) |
8,833 | 431,845 | ||||||
| 36,468,850 | ||||||||
Semiconductors — 7.3% |
||||||||
Advanced Micro Devices, Inc. (a) |
49,243 | 3,189,469 | ||||||
ASML Holding NV |
9,542 | 5,213,749 | ||||||
Lam Research Corp. |
1,422 | 597,667 | ||||||
Marvell Technology, Inc. |
33,509 | 1,241,173 | ||||||
Monolithic Power Systems, Inc. |
5,858 | 2,071,447 | ||||||
NVIDIA Corp. |
68,674 | 10,036,017 | ||||||
Taiwan Semiconductor Manufacturing Co. Ltd. Sponsored ADR |
16,223 | 1,208,451 | ||||||
Texas Instruments, Inc. |
15,871 | 2,622,207 | ||||||
| 26,180,180 | ||||||||
Software — 22.0% |
||||||||
Atlassian Corp. Class A (a) |
11,838 | 1,523,314 | ||||||
Bill.com Holdings, Inc. (a) |
13,740 | 1,497,110 | ||||||
Canva, Inc. (Acquired 8/16/21, Cost $582,930) (a) (c) (d) (e) |
342 | 188,716 | ||||||
Confluent, Inc. Class A (a) |
18,846 | 419,135 | ||||||
Datadog, Inc. Class A (a) |
8,854 | 650,769 | ||||||
Gusto, Inc. (Acquired 10/04/21, Cost $193,055) (a) (c) (d) (e) |
6,706 | 126,274 | ||||||
Intuit, Inc. |
16,243 | 6,322,100 | ||||||
Microsoft Corp. |
200,061 | 47,978,628 | ||||||
MongoDB, Inc. (a) |
8,401 | 1,653,653 | ||||||
MSCI, Inc. |
1,430 | 665,193 | ||||||
Paycom Software, Inc. (a) |
1,360 | 422,021 | ||||||
Roper Technologies, Inc. |
7,185 | 3,104,567 | ||||||
ServiceNow, Inc. (a) |
21,947 | 8,521,362 | ||||||
Snowflake, Inc. Class A (a) |
5,596 | 803,250 | ||||||
Synopsys, Inc. (a) |
13,954 | 4,455,373 | ||||||
Veeva Systems, Inc. Class A (a) |
6,023 | 971,992 | ||||||
| 79,303,457 | ||||||||
| 141,952,487 | ||||||||
TOTAL COMMON STOCK (Cost $326,886,889) |
357,434,222 | |||||||
PREFERRED STOCK — 0.2% |
||||||||
Technology — 0.2% |
||||||||
Software — 0.2% |
||||||||
Canva, Inc., Series A (Acquired 11/04/21 - 12/17/21, Cost $37,502) (a) (c) (d) (e) |
22 | 12,140 | ||||||
Number of |
Value |
|||||||
Canva, Inc., Series A-3 (Acquired 12/17/21, Cost $3,408) (a) (c) (d) (e) |
2 | $ | 1,104 | |||||
Databricks, Inc., Series G (Acquired 2/01/21, Cost $172,224) (a) (c) (d) (e) |
2,913 | 174,780 | ||||||
Databricks, Inc., Series H (Acquired 8/31/21, Cost $542,974) (a) (c) (d) (e) |
7,389 | 443,340 | ||||||
Gusto, Inc., Series E (Acquired 7/13/21, Cost $254,865) (a) (c) (d) (e) |
8,385 | 157,890 | ||||||
| 789,254 | ||||||||
TOTAL PREFERRED STOCK (Cost $1,010,974) |
789,254 | |||||||
TOTAL EQUITIES (Cost $327,897,863) |
358,223,476 | |||||||
Principal |
||||||||
BONDS & NOTES — 0.2% |
||||||||
CORPORATE DEBT — 0.2% |
||||||||
Retail — 0.2% |
||||||||
Carvana Co. |
||||||||
10.250% 5/01/30 (f) |
$ | 1,040,000 | 488,679 | |||||
TOTAL CORPORATE DEBT (Cost $1,040,000) |
488,679 | |||||||
TOTAL BONDS & NOTES (Cost $1,040,000) |
488,679 | |||||||
TOTAL LONG-TERM INVESTMENTS (Cost $328,937,863) |
358,712,155 | |||||||
Number of |
||||||||
SHORT-TERM INVESTMENTS — 0.9% |
||||||||
Mutual Fund — 0.0% |
||||||||
T. Rowe Price Government Reserve Investment Fund |
101 | 101 | ||||||
The accompanying notes are an integral part of the financial statements.
95
MML Blue Chip Growth Fund – Portfolio of Investments (Continued) |
Principal |
Value |
|||||||
Repurchase Agreement — 0.9% |
||||||||
Fixed Income Clearing Corp., Repurchase Agreement, dated 12/30/22, 1.280%, due 1/03/23 (g) |
$ | 3,329,992 | $ | 3,329,992 | ||||
TOTAL SHORT-TERM INVESTMENTS (Cost $3,330,093) |
3,330,093 | |||||||
TOTAL INVESTMENTS — 100.6% (Cost $332,267,956) (h) |
362,042,248 | |||||||
Other Assets/(Liabilities) — (0.6)% |
(2,124,199 | ) | ||||||
NET ASSETS — 100.0% |
$ | 359,918,049 | ||||||
Abbreviation Legend
|
ADR |
American Depositary Receipt |
Notes to Portfolio of Investments
Percentages are stated as a percent of net assets.
|
(a) |
Non-income producing security. |
|
(b) |
Denotes all or a portion of security on loan. The total value of securities on loan as of December 31, 2022, was $180,487 or 0.05% of net assets. The Fund received $184,312 of non-cash collateral (U.S. Treasury and/or Agency obligations) related to securities lending activity. This amount is not reflected on either the Portfolio of Investments or the Statement of Assets and Liabilities. (Note 2). |
|
(c) |
Investment is valued using significant unobservable inputs. |
|
(d) |
Restricted security. Certain securities are restricted as to resale. At December 31, 2022, these securities amounted to a value of $1,517,040 or 0.42% of net assets. The Fund generally bears the costs, if any, associated with the disposition of restricted securities. |
|
(e) |
This security is fair valued in good faith in accordance with procedures approved by the Board of Trustees. At December 31, 2022, these securities amounted to a value of $1,517,040 or 0.42% of net assets. |
|
(f) |
Security is exempt from registration under Regulation S or Rule 144A of the Securities Act of 1933. These securities are considered restricted and may be resold in transactions exempt from registration. At December 31, 2022, the aggregate market value of these securities amounted to $488,679 or 0.14% of net assets. |
|
(g) |
Maturity value of $3,330,465. Collateralized by U.S. Government Agency obligations with a rate of 0.000%, maturity date of 6/29/23, and an aggregate market value, including accrued interest, of $3,396,644. |
|
(h) |
See Note 6 for aggregate cost for federal tax purposes. |
The accompanying notes are an integral part of the financial statements.
96
December 31, 2022 |
Number of |
Value |
|||||||
EQUITIES — 99.0% |
||||||||
COMMON STOCK — 97.1% |
||||||||
Basic Materials — 4.3% |
||||||||
Chemicals — 2.9% |
||||||||
CF Industries Holdings, Inc. |
82,524 | $ | 7,031,045 | |||||
DuPont de Nemours, Inc. |
3,976 | 272,873 | ||||||
International Flavors & Fragrances, Inc. |
24,963 | 2,617,121 | ||||||
RPM International, Inc. |
12,266 | 1,195,321 | ||||||
| 11,116,360 | ||||||||
Forest Products & Paper — 1.4% |
||||||||
International Paper Co. |
158,167 | 5,477,323 | ||||||
| 16,593,683 | ||||||||
Communications — 5.5% |
||||||||
Internet — 0.5% |
||||||||
Meta Platforms, Inc. Class A (a) |
15,900 | 1,913,406 | ||||||
Media — 3.8% |
||||||||
Comcast Corp. Class A |
105,891 | 3,703,008 | ||||||
Fox Corp. Class B |
7,877 | 224,101 | ||||||
News Corp. Class A |
328,669 | 5,981,776 | ||||||
Paramount Global Class B |
16,200 | 273,456 | ||||||
The Walt Disney Co. (a) |
48,069 | 4,176,235 | ||||||
Warner Bros Discovery, Inc. (a) |
18,076 | 171,360 | ||||||
| 14,529,936 | ||||||||
Telecommunications — 1.2% |
||||||||
AT&T, Inc. |
33,955 | 625,112 | ||||||
Cisco Systems, Inc. |
31,468 | 1,499,135 | ||||||
Verizon Communications, Inc. |
61,374 | 2,418,136 | ||||||
| 4,542,383 | ||||||||
| 20,985,725 | ||||||||
Consumer, Cyclical — 6.1% |
||||||||
Airlines — 0.5% |
||||||||
Southwest Airlines Co. (a) |
52,504 | 1,767,810 | ||||||
Auto Manufacturers — 1.4% |
||||||||
Cummins, Inc. |
4,100 | 993,389 | ||||||
PACCAR, Inc. |
5,390 | 533,448 | ||||||
Volkswagen AG ADR |
305,568 | 3,782,932 | ||||||
| 5,309,769 | ||||||||
Lodging — 1.0% |
||||||||
Las Vegas Sands Corp. (a) |
80,040 | 3,847,523 | ||||||
Retail — 2.6% |
||||||||
Best Buy Co., Inc. |
20,000 | 1,604,200 | ||||||
Kohl’s Corp. |
67,611 | 1,707,178 | ||||||
The TJX Cos., Inc. |
39,694 | 3,159,642 | ||||||
Walmart, Inc. |
24,808 | 3,517,526 | ||||||
| 9,988,546 | ||||||||
Number of |
Value |
|||||||
Toys, Games & Hobbies — 0.6% |
||||||||
Mattel, Inc. (a) |
137,977 | $ | 2,461,510 | |||||
| 23,375,158 | ||||||||
Consumer, Non-cyclical — 23.5% |
||||||||
Agriculture — 1.7% |
||||||||
Philip Morris International, Inc. |
65,779 | 6,657,493 | ||||||
Beverages — 0.2% |
||||||||
Constellation Brands, Inc. Class A |
2,900 | 672,075 | ||||||
Biotechnology — 0.3% |
||||||||
Biogen, Inc. (a) |
4,200 | 1,163,064 | ||||||
Food — 2.6% |
||||||||
Conagra Brands, Inc. |
159,584 | 6,175,901 | ||||||
Mondelez International, Inc. Class A |
8,600 | 573,190 | ||||||
Tyson Foods, Inc. Class A |
53,081 | 3,304,292 | ||||||
| 10,053,383 | ||||||||
Health Care – Products — 2.0% |
||||||||
Medtronic PLC |
43,483 | 3,379,499 | ||||||
Zimmer Biomet Holdings, Inc. |
34,064 | 4,343,160 | ||||||
| 7,722,659 | ||||||||
Health Care – Services — 3.0% |
||||||||
Centene Corp. (a) |
30,649 | 2,513,525 | ||||||
Elevance Health, Inc. |
17,596 | 9,026,220 | ||||||
| 11,539,745 | ||||||||
Household Products & Wares — 1.6% |
||||||||
Kimberly-Clark Corp. |
43,782 | 5,943,406 | ||||||
Pharmaceuticals — 12.1% |
||||||||
AbbVie, Inc. |
35,547 | 5,744,751 | ||||||
AstraZeneca PLC Sponsored ADR |
34,313 | 2,326,421 | ||||||
Becton Dickinson and Co. |
24,782 | 6,302,063 | ||||||
Cardinal Health, Inc. |
28,437 | 2,185,952 | ||||||
Cigna Corp. |
13,866 | 4,594,360 | ||||||
CVS Health Corp. |
44,866 | 4,181,062 | ||||||
Johnson & Johnson |
43,014 | 7,598,423 | ||||||
Merck & Co., Inc. |
34,169 | 3,791,051 | ||||||
Pfizer, Inc. |
101,565 | 5,204,191 | ||||||
Sanofi |
25,813 | 2,497,682 | ||||||
Sanofi ADR |
25,686 | 1,243,973 | ||||||
Viatris, Inc. |
71,200 | 792,456 | ||||||
| 46,462,385 | ||||||||
| 90,214,210 | ||||||||
Energy — 8.6% |
||||||||
Oil & Gas — 7.1% |
||||||||
Chevron Corp. |
6,486 | 1,164,172 | ||||||
EOG Resources, Inc. |
33,561 | 4,346,821 | ||||||
Exxon Mobil Corp. |
55,026 | 6,069,368 | ||||||
Hess Corp. |
23,800 | 3,375,316 | ||||||
TotalEnergies SE |
150,646 | 9,402,593 | ||||||
The accompanying notes are an integral part of the financial statements.
97
MML Equity Income Fund – Portfolio of Investments (Continued) |
Number of |
Value |
|||||||
TotalEnergies SE Sponsored ADR |
45,765 | $ | 2,841,091 | |||||
| 27,199,361 | ||||||||
Pipelines — 1.5% |
||||||||
Enbridge, Inc. |
24,800 | 969,680 | ||||||
Targa Resources Corp. |
3,026 | 222,411 | ||||||
TC Energy Corp. |
108,420 | 4,321,621 | ||||||
The Williams Cos., Inc. |
8,400 | 276,360 | ||||||
| 5,790,072 | ||||||||
| 32,989,433 | ||||||||
Financial — 25.1% |
||||||||
Banks — 10.4% |
||||||||
Bank of America Corp. |
62,861 | 2,081,956 | ||||||
Citigroup, Inc. |
44,440 | 2,010,021 | ||||||
Fifth Third Bancorp |
117,337 | 3,849,827 | ||||||
The Goldman Sachs Group, Inc. |
13,469 | 4,624,985 | ||||||
Huntington Bancshares, Inc. |
362,020 | 5,104,482 | ||||||
JP Morgan Chase & Co. |
20,997 | 2,815,698 | ||||||
Morgan Stanley |
33,511 | 2,849,105 | ||||||
The PNC Financial Services Group, Inc. |
4,230 | 668,086 | ||||||
State Street Corp. |
29,633 | 2,298,632 | ||||||
US Bancorp |
39,600 | 1,726,956 | ||||||
Wells Fargo & Co. |
284,940 | 11,765,173 | ||||||
| 39,794,921 | ||||||||
Diversified Financial Services — 0.9% |
||||||||
Apollo Global Management, Inc. |
12,400 | 790,996 | ||||||
The Charles Schwab Corp. |
24,155 | 2,011,145 | ||||||
Franklin Resources, Inc. |
13,702 | 361,459 | ||||||
Raymond James Financial, Inc. |
2,937 | 313,819 | ||||||
| 3,477,419 | ||||||||
Insurance — 9.6% |
||||||||
American International Group, Inc. |
150,897 | 9,542,726 | ||||||
Chubb Ltd. |
34,879 | 7,694,307 | ||||||
Equitable Holdings, Inc. |
215,830 | 6,194,321 | ||||||
The Hartford Financial Services Group, Inc. |
48,869 | 3,705,736 | ||||||
Loews Corp. |
66,326 | 3,868,796 | ||||||
MetLife, Inc. |
83,834 | 6,067,067 | ||||||
| 37,072,953 | ||||||||
Private Equity — 0.2% |
||||||||
The Carlyle Group, Inc. |
22,000 | 656,480 | ||||||
Real Estate Investment Trusts (REITS) — 4.0% |
||||||||
Equity Residential |
90,008 | 5,310,472 | ||||||
Rayonier, Inc. |
94,964 | 3,130,013 | ||||||
Vornado Realty Trust |
13,024 | 271,029 | ||||||
Welltower, Inc. |
8,101 | 531,021 | ||||||
Number of |
Value |
|||||||
Weyerhaeuser Co. |
193,443 | $ | 5,996,733 | |||||
| 15,239,268 | ||||||||
| 96,241,041 | ||||||||
Industrial — 10.2% |
||||||||
Aerospace & Defense — 2.5% |
||||||||
The Boeing Co. (a) |
18,047 | 3,437,773 | ||||||
L3 Harris Technologies, Inc. |
28,941 | 6,025,806 | ||||||
| 9,463,579 | ||||||||
Electronics — 0.3% |
||||||||
TE Connectivity Ltd. |
9,177 | 1,053,519 | ||||||
Environmental Controls — 0.6% |
||||||||
Stericycle, Inc. (a) |
46,466 | 2,318,189 | ||||||
Hand & Machine Tools — 0.6% |
||||||||
Stanley Black & Decker, Inc. |
31,800 | 2,388,816 | ||||||
Machinery – Diversified — 0.1% |
||||||||
Flowserve Corp. |
12,573 | 385,740 | ||||||
Miscellaneous - Manufacturing — 4.2% |
||||||||
3M Co. |
5,087 | 610,033 | ||||||
General Electric Co. |
136,732 | 11,456,774 | ||||||
Siemens AG Sponsored ADR |
58,204 | 4,003,853 | ||||||
| 16,070,660 | ||||||||
Transportation — 1.9% |
||||||||
United Parcel Service, Inc. Class B |
43,308 | 7,528,663 | ||||||
| 39,209,166 | ||||||||
Technology — 6.3% |
||||||||
Computers — 0.2% |
||||||||
Accenture PLC Class A |
2,100 | 560,364 | ||||||
Semiconductors — 4.0% |
||||||||
Applied Materials, Inc. |
29,517 | 2,874,366 | ||||||
NXP Semiconductor NV |
2,104 | 332,495 | ||||||
QUALCOMM, Inc. |
72,215 | 7,939,317 | ||||||
Samsung Electronics Co. Ltd. |
5,352 | 236,013 | ||||||
Texas Instruments, Inc. |
23,915 | 3,951,236 | ||||||
| 15,333,427 | ||||||||
Software — 2.1% |
||||||||
Fiserv, Inc. (a) |
31,494 | 3,183,098 | ||||||
Microsoft Corp. |
20,230 | 4,851,559 | ||||||
| 8,034,657 | ||||||||
| 23,928,448 | ||||||||
Utilities — 7.5% |
||||||||
Electric — 7.0% |
||||||||
Ameren Corp. |
29,836 | 2,653,017 | ||||||
Dominion Energy, Inc. |
74,950 | 4,595,934 | ||||||
PG&E Corp. (a) |
21,700 | 352,842 | ||||||
Sempra Energy |
51,061 | 7,890,967 | ||||||
The accompanying notes are an integral part of the financial statements.
98
MML Equity Income Fund – Portfolio of Investments (Continued) |
Number of |
Value |
|||||||
The Southern Co. |
160,966 | $ | 11,494,582 | |||||
| 26,987,342 | ||||||||
Gas — 0.5% |
||||||||
NiSource, Inc. |
68,819 | 1,887,017 | ||||||
| 28,874,359 | ||||||||
TOTAL COMMON STOCK (Cost $300,323,498) |
372,411,223 | |||||||
PREFERRED STOCK — 1.9% |
||||||||
Consumer, Cyclical — 0.6% |
||||||||
Auto Manufacturers — 0.6% |
||||||||
Dr Ing hc F Porsche AG (a) |
25,043 | 2,540,768 | ||||||
Consumer, Non-cyclical — 0.4% |
||||||||
Pharmaceuticals — 0.4% |
||||||||
Becton Dickinson and Co. Convertible 6.000% |
29,674 | 1,486,074 | ||||||
Utilities — 0.9% |
||||||||
Electric — 0.6% |
||||||||
NextEra Energy, Inc. Convertible 5.279% |
26,869 | 1,362,258 | ||||||
NextEra Energy, Inc. Convertible 6.926% |
15,955 | 800,782 | ||||||
| 2,163,040 | ||||||||
Gas — 0.3% |
||||||||
NiSource, Inc. 7.750% |
11,665 | 1,204,528 | ||||||
| 3,367,568 | ||||||||
TOTAL PREFERRED STOCK (Cost $7,130,633) |
7,394,410 | |||||||
TOTAL EQUITIES (Cost $307,454,131) |
379,805,633 | |||||||
TOTAL LONG-TERM INVESTMENTS (Cost $307,454,131) |
379,805,633 | |||||||
SHORT-TERM INVESTMENTS — 0.8% |
||||||||
Mutual Fund — 0.0% |
||||||||
T. Rowe Price Government Reserve Investment Fund |
1,093 | 1,093 | ||||||
Principal |
Value |
|||||||
Repurchase Agreement — 0.8% |
||||||||
Fixed Income Clearing Corp., Repurchase Agreement, dated 12/30/22, 1.280%, due 1/03/23 (b) |
$ | 3,113,926 | $ | 3,113,926 | ||||
TOTAL SHORT-TERM INVESTMENTS (Cost $3,115,019) |
3,115,019 | |||||||
TOTAL INVESTMENTS — 99.8% (Cost $310,569,150) (c) |
382,920,652 | |||||||
Other Assets/(Liabilities) — 0.2% |
868,413 | |||||||
NET ASSETS — 100.0% |
$ | 383,789,065 | ||||||
Abbreviation Legend
|
ADR |
American Depositary Receipt |
Notes to Portfolio of Investments
Percentages are stated as a percent of net assets.
|
(a) |
Non-income producing security. |
|
(b) |
Maturity value of $3,114,369. Collateralized by U.S. Government Agency obligations with a rate of 0.000%, maturity date of 6/29/23, and an aggregate market value, including accrued interest, of $3,176,213. |
|
(c) |
See Note 6 for aggregate cost for federal tax purposes. |
The accompanying notes are an integral part of the financial statements.
99
December 31, 2022 |
Number of |
Value |
|||||||
EQUITIES — 99.0% |
||||||||
COMMON STOCK — 99.0% |
||||||||
Basic Materials — 2.2% |
||||||||
Chemicals — 1.7% |
||||||||
Air Products & Chemicals, Inc. |
3,737 | $ | 1,151,968 | |||||
Albemarle Corp. |
1,973 | 427,865 | ||||||
Celanese Corp. |
1,679 | 171,661 | ||||||
CF Industries Holdings, Inc. |
3,357 | 286,016 | ||||||
Dow, Inc. |
11,911 | 600,195 | ||||||
DuPont de Nemours, Inc. |
8,438 | 579,100 | ||||||
Eastman Chemical Co. |
2,068 | 168,418 | ||||||
Ecolab, Inc. |
4,177 | 608,004 | ||||||
FMC Corp. |
2,122 | 264,826 | ||||||
International Flavors & Fragrances, Inc. |
4,295 | 450,288 | ||||||
Linde PLC |
8,368 | 2,729,474 | ||||||
LyondellBasell Industries NV Class A |
4,285 | 355,783 | ||||||
The Mosaic Co. |
5,816 | 255,148 | ||||||
PPG Industries, Inc. |
3,959 | 497,805 | ||||||
The Sherwin-Williams Co. |
3,974 | 943,149 | ||||||
| 9,489,700 | ||||||||
Forest Products & Paper — 0.0% |
||||||||
International Paper Co. |
6,094 | 211,035 | ||||||
Iron & Steel — 0.2% |
||||||||
Nucor Corp. |
4,346 | 572,846 | ||||||
Steel Dynamics, Inc. |
2,820 | 275,514 | ||||||
| 848,360 | ||||||||
Mining — 0.3% |
||||||||
Freeport-McMoRan, Inc. |
24,093 | 915,534 | ||||||
Newmont Corp. |
13,372 | 631,159 | ||||||
| 1,546,693 | ||||||||
| 12,095,788 | ||||||||
Communications — 10.7% |
||||||||
Advertising — 0.1% |
||||||||
The Interpublic Group of Cos., Inc. |
6,585 | 219,346 | ||||||
Omnicom Group, Inc. |
3,450 | 281,417 | ||||||
| 500,763 | ||||||||
Internet — 7.2% |
||||||||
Alphabet, Inc. Class A (a) |
101,020 | 8,912,995 | ||||||
Alphabet, Inc. Class C (a) |
89,598 | 7,950,030 | ||||||
Amazon.com, Inc. (a) |
150,172 | 12,614,448 | ||||||
Booking Holdings, Inc. (a) |
657 | 1,324,039 | ||||||
CDW Corp. |
2,279 | 406,984 | ||||||
eBay, Inc. |
9,255 | 383,805 | ||||||
Etsy, Inc. (a) |
2,133 | 255,491 | ||||||
Expedia Group, Inc. (a) |
2,561 | 224,344 | ||||||
F5, Inc. (a) |
1,003 | 143,940 | ||||||
Number of |
Value |
|||||||
Gen Digital, Inc. |
9,975 | $ | 213,764 | |||||
Match Group, Inc. (a) |
4,767 | 197,783 | ||||||
Meta Platforms, Inc. Class A (a) |
38,060 | 4,580,140 | ||||||
Netflix, Inc. (a) |
7,535 | 2,221,921 | ||||||
VeriSign, Inc. (a) |
1,572 | 322,952 | ||||||
| 39,752,636 | ||||||||
Media — 1.3% |
||||||||
Charter Communications, Inc. Class A (a) |
1,824 | 618,518 | ||||||
Comcast Corp. Class A |
73,044 | 2,554,349 | ||||||
DISH Network Corp. Class A (a) |
4,266 | 59,895 | ||||||
FactSet Research Systems, Inc. |
640 | 256,774 | ||||||
Fox Corp. Class A |
5,113 | 155,282 | ||||||
Fox Corp. Class B |
2,426 | 69,020 | ||||||
News Corp. Class A |
6,527 | 118,791 | ||||||
News Corp. Class B |
1,969 | 36,308 | ||||||
Paramount Global Class B |
8,503 | 143,531 | ||||||
The Walt Disney Co. (a) |
30,863 | 2,681,377 | ||||||
Warner Bros Discovery, Inc. (a) |
37,214 | 352,789 | ||||||
| 7,046,634 | ||||||||
Telecommunications — 2.1% |
||||||||
Arista Networks, Inc. (a) |
4,153 | 503,967 | ||||||
AT&T, Inc. |
120,678 | 2,221,682 | ||||||
Cisco Systems, Inc. |
69,507 | 3,311,313 | ||||||
Corning, Inc. |
12,816 | 409,343 | ||||||
Juniper Networks, Inc. |
5,435 | 173,703 | ||||||
Lumen Technologies, Inc. |
16,039 | 83,724 | ||||||
Motorola Solutions, Inc. |
2,812 | 724,680 | ||||||
T-Mobile US, Inc. (a) |
10,142 | 1,419,880 | ||||||
Verizon Communications, Inc. |
71,103 | 2,801,458 | ||||||
| 11,649,750 | ||||||||
| 58,949,783 | ||||||||
Consumer, Cyclical — 9.0% |
||||||||
Airlines — 0.2% |
||||||||
Alaska Air Group, Inc. (a) |
2,171 | 93,223 | ||||||
American Airlines Group, Inc. (a) |
10,932 | 139,055 | ||||||
Delta Air Lines, Inc. (a) |
10,789 | 354,526 | ||||||
Southwest Airlines Co. (a) |
9,987 | 336,262 | ||||||
United Airlines Holdings, Inc. (a) |
5,498 | 207,275 | ||||||
| 1,130,341 | ||||||||
Apparel — 0.5% |
||||||||
NIKE, Inc. Class B |
21,286 | 2,490,675 | ||||||
Ralph Lauren Corp. |
739 | 78,090 | ||||||
Tapestry, Inc. |
4,239 | 161,421 | ||||||
VF Corp. |
5,553 | 153,318 | ||||||
| 2,883,504 | ||||||||
The accompanying notes are an integral part of the financial statements.
100
MML Equity Index Fund – Portfolio of Investments (Continued) |
Number of |
Value |
|||||||
Auto Manufacturers — 1.5% |
||||||||
Cummins, Inc. |
2,375 | $ | 575,439 | |||||
Ford Motor Co. |
66,535 | 773,802 | ||||||
General Motors Co. |
24,093 | 810,488 | ||||||
PACCAR, Inc. |
5,858 | 579,766 | ||||||
Tesla, Inc. (a) |
45,421 | 5,594,959 | ||||||
| 8,334,454 | ||||||||
Auto Parts & Equipment — 0.1% |
||||||||
Aptiv PLC (a) |
4,564 | 425,045 | ||||||
BorgWarner, Inc. |
3,987 | 160,477 | ||||||
| 585,522 | ||||||||
Distribution & Wholesale — 0.3% |
||||||||
Copart, Inc. (a) |
7,208 | 438,895 | ||||||
Fastenal Co. |
9,682 | 458,152 | ||||||
LKQ Corp. |
4,390 | 234,470 | ||||||
Pool Corp. |
667 | 201,654 | ||||||
W.W. Grainger, Inc. |
763 | 424,419 | ||||||
| 1,757,590 | ||||||||
Entertainment — 0.1% |
||||||||
Caesars Entertainment, Inc. (a) |
3,612 | 150,259 | ||||||
Live Nation Entertainment, Inc. (a) |
2,393 | 166,888 | ||||||
| 317,147 | ||||||||
Home Builders — 0.3% |
||||||||
D.R. Horton, Inc. |
5,328 | 474,938 | ||||||
Lennar Corp. Class A |
4,295 | 388,698 | ||||||
NVR, Inc. (a) |
52 | 239,854 | ||||||
PulteGroup, Inc. |
3,896 | 177,385 | ||||||
| 1,280,875 | ||||||||
Home Furnishing — 0.0% |
||||||||
Whirlpool Corp. |
916 | 129,577 | ||||||
Housewares — 0.0% |
||||||||
Newell Brands, Inc. |
6,453 | 84,405 | ||||||
Leisure Time — 0.1% |
||||||||
Carnival Corp. (a) |
16,628 | 134,021 | ||||||
Norwegian Cruise Line Holdings Ltd. (a) |
7,099 | 86,892 | ||||||
Royal Caribbean Cruises Ltd. (a) |
3,695 | 182,644 | ||||||
| 403,557 | ||||||||
Lodging — 0.4% |
||||||||
Hilton Worldwide Holdings, Inc. |
4,620 | 583,783 | ||||||
Las Vegas Sands Corp. (a) |
5,536 | 266,116 | ||||||
Marriott International, Inc. Class A |
4,566 | 679,832 | ||||||
MGM Resorts International |
5,495 | 184,247 | ||||||
Wynn Resorts Ltd. (a) |
1,744 | 143,828 | ||||||
| 1,857,806 | ||||||||
Retail — 5.5% |
||||||||
Advance Auto Parts, Inc. |
1,021 | 150,118 | ||||||
Number of |
Value |
|||||||
AutoZone, Inc. (a) |
322 | $ | 794,110 | |||||
Bath & Body Works, Inc. |
3,845 | 162,028 | ||||||
Best Buy Co., Inc. |
3,375 | 270,709 | ||||||
CarMax, Inc. (a) |
2,681 | 163,246 | ||||||
Chipotle Mexican Grill, Inc. (a) |
468 | 649,345 | ||||||
Costco Wholesale Corp. |
7,492 | 3,420,098 | ||||||
Darden Restaurants, Inc. |
2,064 | 285,513 | ||||||
Dollar General Corp. |
3,824 | 941,660 | ||||||
Dollar Tree, Inc. (a) |
3,556 | 502,961 | ||||||
Domino’s Pizza, Inc. |
604 | 209,226 | ||||||
Genuine Parts Co. |
2,382 | 413,301 | ||||||
The Home Depot, Inc. |
17,315 | 5,469,116 | ||||||
Lowe’s Cos., Inc. |
10,511 | 2,094,212 | ||||||
McDonald’s Corp. |
12,395 | 3,266,454 | ||||||
O’Reilly Automotive, Inc. (a) |
1,061 | 895,516 | ||||||
Ross Stores, Inc. |
5,895 | 684,233 | ||||||
Starbucks Corp. |
19,440 | 1,928,448 | ||||||
Target Corp. |
7,812 | 1,164,301 | ||||||
The TJX Cos., Inc. |
19,739 | 1,571,224 | ||||||
Tractor Supply Co. |
1,870 | 420,694 | ||||||
Ulta Beauty, Inc. (a) |
873 | 409,498 | ||||||
Walgreens Boots Alliance, Inc. |
12,084 | 451,458 | ||||||
Walmart, Inc. |
23,893 | 3,387,788 | ||||||
Yum! Brands, Inc. |
4,793 | 613,887 | ||||||
| 30,319,144 | ||||||||
Toys, Games & Hobbies — 0.0% |
||||||||
Hasbro, Inc. |
2,181 | 133,063 | ||||||
| 49,216,985 | ||||||||
Consumer, Non-cyclical — 23.2% |
||||||||
Agriculture — 0.9% |
||||||||
Altria Group, Inc. |
30,339 | 1,386,796 | ||||||
Archer-Daniels-Midland Co. |
9,317 | 865,083 | ||||||
Philip Morris International, Inc. |
26,245 | 2,656,257 | ||||||
| 4,908,136 | ||||||||
Beverages — 1.9% |
||||||||
Brown-Forman Corp. Class B |
3,080 | 202,294 | ||||||
The Coca-Cola Co. |
65,875 | 4,190,309 | ||||||
Constellation Brands, Inc. Class A |
2,755 | 638,471 | ||||||
Keurig Dr Pepper, Inc. |
14,313 | 510,402 | ||||||
Molson Coors Beverage Co. Class B |
3,169 | 163,267 | ||||||
Monster Beverage Corp. (a) |
6,480 | 657,914 | ||||||
PepsiCo, Inc. |
23,318 | 4,212,630 | ||||||
| 10,575,287 | ||||||||
Biotechnology — 1.8% |
||||||||
Amgen, Inc. |
9,013 | 2,367,174 | ||||||
Bio-Rad Laboratories, Inc. Class A (a) |
361 | 151,797 | ||||||
Biogen, Inc. (a) |
2,445 | 677,070 | ||||||
Corteva, Inc. |
12,107 | 711,650 | ||||||
The accompanying notes are an integral part of the financial statements.
101
MML Equity Index Fund – Portfolio of Investments (Continued) |
Number of |
Value |
|||||||
Gilead Sciences, Inc. |
21,242 | $ | 1,823,626 | |||||
Illumina, Inc. (a) |
2,647 | 535,223 | ||||||
Incyte Corp. (a) |
3,110 | 249,795 | ||||||
Moderna, Inc. (a) |
5,600 | 1,005,872 | ||||||
Regeneron Pharmaceuticals, Inc. (a) |
1,806 | 1,303,011 | ||||||
Vertex Pharmaceuticals, Inc. (a) |
4,321 | 1,247,818 | ||||||
| 10,073,036 | ||||||||
Commercial Services — 1.8% |
||||||||
Automatic Data Processing, Inc. |
7,001 | 1,672,259 | ||||||
Cintas Corp. |
1,449 | 654,397 | ||||||
CoStar Group, Inc. (a) |
6,904 | 533,541 | ||||||
Equifax, Inc. |
2,062 | 400,770 | ||||||
FleetCor Technologies, Inc. (a) |
1,264 | 232,172 | ||||||
Gartner, Inc. (a) |
1,333 | 448,075 | ||||||
Global Payments, Inc. |
4,572 | 454,091 | ||||||
MarketAxess Holdings, Inc. |
634 | 176,816 | ||||||
Moody’s Corp. |
2,659 | 740,851 | ||||||
PayPal Holdings, Inc. (a) |
19,317 | 1,375,757 | ||||||
Quanta Services, Inc. |
2,410 | 343,425 | ||||||
Robert Half International, Inc. |
1,846 | 136,290 | ||||||
Rollins, Inc. |
3,900 | 142,506 | ||||||
S&P Global, Inc. |
5,640 | 1,889,062 | ||||||
United Rentals, Inc. (a) |
1,179 | 419,040 | ||||||
Verisk Analytics, Inc. |
2,644 | 466,454 | ||||||
| 10,085,506 | ||||||||
Cosmetics & Personal Care — 1.5% |
||||||||
Colgate-Palmolive Co. |
14,054 | 1,107,315 | ||||||
The Estee Lauder Cos., Inc. Class A |
3,905 | 968,869 | ||||||
The Procter & Gamble Co. |
40,104 | 6,078,162 | ||||||
| 8,154,346 | ||||||||
Food — 1.3% |
||||||||
Campbell Soup Co. |
3,392 | 192,496 | ||||||
Conagra Brands, Inc. |
8,087 | 312,967 | ||||||
General Mills, Inc. |
10,037 | 841,602 | ||||||
The Hershey Co. |
2,475 | 573,136 | ||||||
Hormel Foods Corp. |
4,875 | 222,056 | ||||||
The J.M. Smucker Co. |
1,795 | 284,436 | ||||||
Kellogg Co. |
4,298 | 306,189 | ||||||
The Kraft Heinz Co. |
13,418 | 546,247 | ||||||
The Kroger Co. |
10,970 | 489,043 | ||||||
Lamb Weston Holdings, Inc. |
2,421 | 216,340 | ||||||
McCormick & Co., Inc. |
4,220 | 349,796 | ||||||
Mondelez International, Inc. Class A |
23,092 | 1,539,082 | ||||||
Sysco Corp. |
8,584 | 656,247 | ||||||
Tyson Foods, Inc. Class A |
4,878 | 303,655 | ||||||
| 6,833,292 | ||||||||
Health Care – Products — 3.8% |
||||||||
Abbott Laboratories |
29,504 | 3,239,244 | ||||||
Number of |
Value |
|||||||
Align Technology, Inc. (a) |
1,224 | $ | 258,141 | |||||
Baxter International, Inc. |
8,484 | 432,429 | ||||||
Bio-Techne Corp. |
2,644 | 219,135 | ||||||
Boston Scientific Corp. (a) |
24,121 | 1,116,079 | ||||||
The Cooper Cos., Inc. |
831 | 274,787 | ||||||
Danaher Corp. |
11,091 | 2,943,773 | ||||||
Dentsply Sirona, Inc. |
3,627 | 115,484 | ||||||
Edwards Lifesciences Corp. (a) |
10,444 | 779,227 | ||||||
Hologic, Inc. (a) |
4,206 | 314,651 | ||||||
IDEXX Laboratories, Inc. (a) |
1,403 | 572,368 | ||||||
Intuitive Surgical, Inc. (a) |
5,983 | 1,587,589 | ||||||
Medtronic PLC |
22,519 | 1,750,177 | ||||||
PerkinElmer, Inc. |
2,126 | 298,108 | ||||||
ResMed, Inc. |
2,467 | 513,457 | ||||||
Steris PLC |
1,685 | 311,202 | ||||||
Stryker Corp. |
5,673 | 1,386,992 | ||||||
Teleflex, Inc. |
790 | 197,208 | ||||||
Thermo Fisher Scientific, Inc. |
6,638 | 3,655,480 | ||||||
Waters Corp. (a) |
1,009 | 345,663 | ||||||
West Pharmaceutical Services, Inc. |
1,247 | 293,481 | ||||||
Zimmer Biomet Holdings, Inc. |
3,535 | 450,712 | ||||||
| 21,055,387 | ||||||||
Health Care – Services — 2.8% |
||||||||
Catalent, Inc. (a) |
3,019 | 135,885 | ||||||
Centene Corp. (a) |
9,629 | 789,674 | ||||||
Charles River Laboratories International, Inc. (a) |
857 | 186,740 | ||||||
DaVita, Inc. (a) |
938 | 70,041 | ||||||
Elevance Health, Inc. |
4,043 | 2,073,938 | ||||||
HCA Healthcare, Inc. |
3,588 | 860,977 | ||||||
Humana, Inc. |
2,132 | 1,091,989 | ||||||
IQVIA Holdings, Inc. (a) |
3,142 | 643,764 | ||||||
Laboratory Corp. of America Holdings |
1,523 | 358,636 | ||||||
Molina Healthcare, Inc. (a) |
979 | 323,285 | ||||||
Quest Diagnostics, Inc. |
1,965 | 307,405 | ||||||
UnitedHealth Group, Inc. |
15,811 | 8,382,676 | ||||||
Universal Health Services, Inc. Class B |
1,107 | 155,965 | ||||||
| 15,380,975 | ||||||||
Household Products & Wares — 0.3% |
||||||||
Avery Dennison Corp. |
1,369 | 247,789 | ||||||
Church & Dwight Co., Inc. |
4,092 | 329,856 | ||||||
The Clorox Co. |
2,075 | 291,185 | ||||||
Kimberly-Clark Corp. |
5,688 | 772,146 | ||||||
| 1,640,976 | ||||||||
Pharmaceuticals — 7.1% |
||||||||
AbbVie, Inc. |
29,930 | 4,836,987 | ||||||
AmerisourceBergen Corp. |
2,728 | 452,057 | ||||||
The accompanying notes are an integral part of the financial statements.
102
MML Equity Index Fund – Portfolio of Investments (Continued) |
Number of |
Value |
|||||||
Becton Dickinson and Co. |
4,805 | $ | 1,221,912 | |||||
Bristol-Myers Squibb Co. |
35,975 | 2,588,401 | ||||||
Cardinal Health, Inc. |
4,463 | 343,071 | ||||||
Cigna Corp. |
5,178 | 1,715,679 | ||||||
CVS Health Corp. |
22,249 | 2,073,384 | ||||||
DexCom, Inc. (a) |
6,536 | 740,137 | ||||||
Eli Lilly & Co. |
13,347 | 4,882,866 | ||||||
Henry Schein, Inc. (a) |
2,293 | 183,142 | ||||||
Johnson & Johnson |
44,243 | 7,815,526 | ||||||
McKesson Corp. |
2,396 | 898,788 | ||||||
Merck & Co., Inc. |
42,910 | 4,760,864 | ||||||
Organon & Co. |
4,284 | 119,652 | ||||||
Pfizer, Inc. |
94,999 | 4,867,749 | ||||||
Viatris, Inc. |
20,426 | 227,341 | ||||||
Zoetis, Inc. |
7,887 | 1,155,840 | ||||||
| 38,883,396 | ||||||||
| 127,590,337 | ||||||||
Energy — 5.4% |
||||||||
Energy – Alternate Sources — 0.2% |
||||||||
Enphase Energy, Inc. (a) |
2,282 | 604,639 | ||||||
First Solar, Inc. (a) |
1,689 | 252,995 | ||||||
SolarEdge Technologies, Inc. (a) |
937 | 265,424 | ||||||
| 1,123,058 | ||||||||
Oil & Gas — 4.4% |
||||||||
APA Corp. |
5,501 | 256,787 | ||||||
Chevron Corp. |
30,108 | 5,404,085 | ||||||
ConocoPhillips |
21,100 | 2,489,800 | ||||||
Coterra Energy, Inc. |
13,403 | 329,312 | ||||||
Devon Energy Corp. |
11,032 | 678,578 | ||||||
Diamondback Energy, Inc. |
2,995 | 409,656 | ||||||
EOG Resources, Inc. |
9,958 | 1,289,760 | ||||||
EQT Corp. |
6,233 | 210,862 | ||||||
Exxon Mobil Corp. |
69,692 | 7,687,028 | ||||||
Hess Corp. |
4,695 | 665,845 | ||||||
Marathon Oil Corp. |
10,796 | 292,248 | ||||||
Marathon Petroleum Corp. |
7,948 | 925,068 | ||||||
Occidental Petroleum Corp. |
12,329 | 776,604 | ||||||
Phillips 66 |
8,010 | 833,681 | ||||||
Pioneer Natural Resources Co. |
4,021 | 918,356 | ||||||
Valero Energy Corp. |
6,540 | 829,664 | ||||||
| 23,997,334 | ||||||||
Oil & Gas Services — 0.4% |
||||||||
Baker Hughes Co. |
17,046 | 503,368 | ||||||
Halliburton Co. |
15,280 | 601,268 | ||||||
Schlumberger NV |
24,039 | 1,285,125 | ||||||
| 2,389,761 | ||||||||
Pipelines — 0.4% |
||||||||
Kinder Morgan, Inc. |
33,399 | 603,854 | ||||||
Number of |
Value |
|||||||
ONEOK, Inc. |
7,528 | $ | 494,590 | |||||
Targa Resources Corp. |
3,817 | 280,549 | ||||||
The Williams Cos., Inc. |
20,530 | 675,437 | ||||||
| 2,054,430 | ||||||||
| 29,564,583 | ||||||||
Financial — 15.5% |
||||||||
Banks — 4.7% |
||||||||
Bank of America Corp. |
118,139 | 3,912,764 | ||||||
The Bank of New York Mellon Corp. |
12,388 | 563,902 | ||||||
Citigroup, Inc. |
32,628 | 1,475,764 | ||||||
Citizens Financial Group, Inc. |
8,349 | 328,700 | ||||||
Comerica, Inc. |
2,204 | 147,337 | ||||||
Fifth Third Bancorp |
11,560 | 379,284 | ||||||
First Republic Bank |
3,078 | 375,177 | ||||||
The Goldman Sachs Group, Inc. |
5,725 | 1,965,850 | ||||||
Huntington Bancshares, Inc. |
24,297 | 342,588 | ||||||
JP Morgan Chase & Co. |
49,637 | 6,656,322 | ||||||
KeyCorp. |
15,711 | 273,686 | ||||||
M&T Bank Corp. |
2,959 | 429,233 | ||||||
Morgan Stanley |
22,326 | 1,898,156 | ||||||
Northern Trust Corp. |
3,510 | 310,600 | ||||||
The PNC Financial Services Group, Inc. |
6,838 | 1,079,994 | ||||||
Regions Financial Corp. |
15,742 | 339,398 | ||||||
Signature Bank |
1,060 | 122,133 | ||||||
State Street Corp. |
6,193 | 480,391 | ||||||
SVB Financial Group (a) |
995 | 228,989 | ||||||
Truist Financial Corp. |
22,345 | 961,505 | ||||||
US Bancorp |
22,779 | 993,392 | ||||||
Wells Fargo & Co. |
64,511 | 2,663,659 | ||||||
Zions Bancorp NA |
2,535 | 124,621 | ||||||
| 26,053,445 | ||||||||
Diversified Financial Services — 3.9% |
||||||||
American Express Co. |
10,105 | 1,493,014 | ||||||
Ameriprise Financial, Inc. |
1,793 | 558,286 | ||||||
BlackRock, Inc. |
2,540 | 1,799,920 | ||||||
Capital One Financial Corp. |
6,466 | 601,079 | ||||||
Cboe Global Markets, Inc. |
1,787 | 224,215 | ||||||
The Charles Schwab Corp. |
25,726 | 2,141,947 | ||||||
CME Group, Inc. |
6,056 | 1,018,377 | ||||||
Discover Financial Services |
4,602 | 450,214 | ||||||
Franklin Resources, Inc. |
4,783 | 126,176 | ||||||
Intercontinental Exchange, Inc. |
9,409 | 965,269 | ||||||
Invesco Ltd. |
7,657 | 137,749 | ||||||
Mastercard, Inc. Class A |
14,375 | 4,998,619 | ||||||
Nasdaq, Inc. |
5,712 | 350,431 | ||||||
Raymond James Financial, Inc. |
3,273 | 349,720 | ||||||
Synchrony Financial |
7,686 | 252,562 | ||||||
The accompanying notes are an integral part of the financial statements.
103
MML Equity Index Fund – Portfolio of Investments (Continued) |
Number of |
Value |
|||||||
T. Rowe Price Group, Inc. |
3,802 | $ | 414,646 | |||||
Visa, Inc. Class A |
27,670 | 5,748,719 | ||||||
| 21,630,943 | ||||||||
Insurance — 4.2% |
||||||||
Aflac, Inc. |
9,690 | 697,099 | ||||||
The Allstate Corp. |
4,482 | 607,759 | ||||||
American International Group, Inc. |
12,604 | 797,077 | ||||||
Aon PLC Class A |
3,507 | 1,052,591 | ||||||
Arch Capital Group Ltd. (a) |
6,219 | 390,429 | ||||||
Arthur J Gallagher & Co. |
3,544 | 668,186 | ||||||
Assurant, Inc. |
896 | 112,054 | ||||||
Berkshire Hathaway, Inc. Class B (a) |
30,487 | 9,417,434 | ||||||
Brown & Brown, Inc. |
3,950 | 225,031 | ||||||
Chubb Ltd. |
7,036 | 1,552,142 | ||||||
Cincinnati Financial Corp. |
2,682 | 274,610 | ||||||
Everest Re Group Ltd. |
664 | 219,963 | ||||||
Globe Life, Inc. |
1,527 | 184,080 | ||||||
The Hartford Financial Services Group, Inc. |
5,444 | 412,818 | ||||||
Lincoln National Corp. |
2,609 | 80,148 | ||||||
Loews Corp. |
3,365 | 196,280 | ||||||
Marsh & McLennan Cos., Inc. |
8,408 | 1,391,356 | ||||||
MetLife, Inc. |
11,156 | 807,360 | ||||||
Principal Financial Group, Inc. |
3,905 | 327,708 | ||||||
The Progressive Corp. |
9,855 | 1,278,292 | ||||||
Prudential Financial, Inc. |
6,266 | 623,216 | ||||||
The Travelers Cos., Inc. |
3,998 | 749,585 | ||||||
W.R. Berkley Corp. |
3,442 | 249,786 | ||||||
Willis Towers Watson PLC |
1,853 | 453,207 | ||||||
| 22,768,211 | ||||||||
Real Estate — 0.1% |
||||||||
CBRE Group, Inc. Class A (a) |
5,410 | 416,354 | ||||||
Real Estate Investment Trusts (REITS) — 2.6% |
||||||||
Alexandria Real Estate Equities, Inc. |
2,501 | 364,321 | ||||||
American Tower Corp. |
7,892 | 1,671,999 | ||||||
AvalonBay Communities, Inc. |
2,355 | 380,380 | ||||||
Boston Properties, Inc. |
2,402 | 162,327 | ||||||
Camden Property Trust |
1,794 | 200,713 | ||||||
Crown Castle, Inc. |
7,295 | 989,494 | ||||||
Digital Realty Trust, Inc. |
4,842 | 485,507 | ||||||
Equinix, Inc. |
1,568 | 1,027,087 | ||||||
Equity Residential |
5,702 | 336,418 | ||||||
Essex Property Trust, Inc. |
1,097 | 232,476 | ||||||
Extra Space Storage, Inc. |
2,256 | 332,038 | ||||||
Federal Realty Investment Trust |
1,226 | 123,875 | ||||||
Healthpeak Properties, Inc. |
9,087 | 227,811 | ||||||
Host Hotels & Resorts, Inc. |
12,043 | 193,290 | ||||||
Invitation Homes, Inc. |
9,767 | 289,494 | ||||||
Number of |
Value |
|||||||
Iron Mountain, Inc. |
4,897 | $ | 244,115 | |||||
Kimco Realty Corp. |
10,415 | 220,590 | ||||||
Mid-America Apartment Communities, Inc. |
1,946 | 305,502 | ||||||
Prologis, Inc. |
15,641 | 1,763,210 | ||||||
Public Storage |
2,662 | 745,866 | ||||||
Realty Income Corp. |
10,640 | 674,895 | ||||||
Regency Centers Corp. |
2,593 | 162,062 | ||||||
SBA Communications Corp. |
1,818 | 509,604 | ||||||
Simon Property Group, Inc. |
5,515 | 647,902 | ||||||
UDR, Inc. |
5,143 | 199,188 | ||||||
Ventas, Inc. |
6,734 | 303,367 | ||||||
VICI Properties, Inc. |
16,224 | 525,658 | ||||||
Vornado Realty Trust |
2,765 | 57,540 | ||||||
Welltower, Inc. |
8,023 | 525,908 | ||||||
Weyerhaeuser Co. |
12,471 | 386,601 | ||||||
| 14,289,238 | ||||||||
| 85,158,191 | ||||||||
Industrial — 8.4% |
||||||||
Aerospace & Defense — 1.8% |
||||||||
The Boeing Co. (a) |
9,488 | 1,807,369 | ||||||
General Dynamics Corp. |
3,789 | 940,089 | ||||||
Howmet Aerospace, Inc. |
6,228 | 245,445 | ||||||
L3 Harris Technologies, Inc. |
3,224 | 671,269 | ||||||
Lockheed Martin Corp. |
3,950 | 1,921,636 | ||||||
Northrop Grumman Corp. |
2,450 | 1,336,745 | ||||||
Raytheon Technologies Corp. |
24,876 | 2,510,486 | ||||||
TransDigm Group, Inc. |
868 | 546,536 | ||||||
| 9,979,575 | ||||||||
Building Materials — 0.4% |
||||||||
Carrier Global Corp. |
14,179 | 584,884 | ||||||
Johnson Controls International PLC |
11,605 | 742,720 | ||||||
Martin Marietta Materials, Inc. |
1,051 | 355,206 | ||||||
Masco Corp. |
3,799 | 177,299 | ||||||
Mohawk Industries, Inc. (a) |
903 | 92,305 | ||||||
Vulcan Materials Co. |
2,239 | 392,071 | ||||||
| 2,344,485 | ||||||||
Electrical Components & Equipment — 0.3% |
||||||||
AMETEK, Inc. |
3,868 | 540,437 | ||||||
Emerson Electric Co. |
9,962 | 956,950 | ||||||
Generac Holdings, Inc. (a) |
1,075 | 108,209 | ||||||
| 1,605,596 | ||||||||
Electronics — 1.2% |
||||||||
Agilent Technologies, Inc. |
5,033 | 753,188 | ||||||
Allegion PLC |
1,480 | 155,785 | ||||||
Amphenol Corp. Class A |
10,021 | 762,999 | ||||||
Fortive Corp. |
5,993 | 385,050 | ||||||
Garmin Ltd. |
2,595 | 239,493 | ||||||
The accompanying notes are an integral part of the financial statements.
104
MML Equity Index Fund – Portfolio of Investments (Continued) |
Number of |
Value |
|||||||
Honeywell International, Inc. |
11,351 | $ | 2,432,519 | |||||
Keysight Technologies, Inc. (a) |
3,031 | 518,513 | ||||||
Mettler-Toledo International, Inc. (a) |
379 | 547,826 | ||||||
TE Connectivity Ltd. |
5,388 | 618,542 | ||||||
Trimble, Inc. (a) |
4,171 | 210,886 | ||||||
| 6,624,801 | ||||||||
Engineering & Construction — 0.1% |
||||||||
Jacobs Solutions, Inc. |
2,150 | 258,151 | ||||||
Environmental Controls — 0.3% |
||||||||
Pentair PLC |
2,769 | 124,550 | ||||||
Republic Services, Inc. |
3,460 | 446,305 | ||||||
Waste Management, Inc. |
6,337 | 994,149 | ||||||
| 1,565,004 | ||||||||
Hand & Machine Tools — 0.1% |
||||||||
Snap-on, Inc. |
897 | 204,955 | ||||||
Stanley Black & Decker, Inc. |
2,490 | 187,049 | ||||||
| 392,004 | ||||||||
Machinery – Construction & Mining — 0.4% |
||||||||
Caterpillar, Inc. |
8,813 | 2,111,242 | ||||||
Machinery – Diversified — 0.9% |
||||||||
Deere & Co. |
4,652 | 1,994,591 | ||||||
Dover Corp. |
2,418 | 327,421 | ||||||
IDEX Corp. |
1,272 | 290,436 | ||||||
Ingersoll Rand, Inc. |
6,793 | 354,934 | ||||||
Nordson Corp. |
911 | 216,563 | ||||||
Otis Worldwide Corp. |
7,081 | 554,513 | ||||||
Rockwell Automation, Inc. |
1,945 | 500,974 | ||||||
Westinghouse Air Brake Technologies Corp. |
3,064 | 305,818 | ||||||
Xylem, Inc. |
3,036 | 335,691 | ||||||
| 4,880,941 | ||||||||
Miscellaneous - Manufacturing — 1.2% |
||||||||
3M Co. |
9,327 | 1,118,494 | ||||||
A.O. Smith Corp. |
2,164 | 123,867 | ||||||
Eaton Corp. PLC |
6,711 | 1,053,292 | ||||||
General Electric Co. |
18,474 | 1,547,937 | ||||||
Illinois Tool Works, Inc. |
4,747 | 1,045,764 | ||||||
Parker-Hannifin Corp. |
2,163 | 629,433 | ||||||
Teledyne Technologies, Inc. (a) |
790 | 315,929 | ||||||
Textron, Inc. |
3,563 | 252,260 | ||||||
Trane Technologies PLC |
3,904 | 656,223 | ||||||
| 6,743,199 | ||||||||
Packaging & Containers — 0.2% |
||||||||
Amcor PLC |
25,313 | 301,478 | ||||||
Ball Corp. |
5,295 | 270,786 | ||||||
Packaging Corp. of America |
1,579 | 201,970 | ||||||
Sealed Air Corp. |
2,446 | 122,006 | ||||||
Number of |
Value |
|||||||
WestRock Co. |
4,279 | $ | 150,450 | |||||
| 1,046,690 | ||||||||
Shipbuilding — 0.0% |
||||||||
Huntington Ingalls Industries, Inc. |
673 | 155,248 | ||||||
Transportation — 1.5% |
||||||||
C.H. Robinson Worldwide, Inc. |
1,989 | 182,113 | ||||||
CSX Corp. |
35,635 | 1,103,972 | ||||||
Expeditors International of Washington, Inc. |
2,674 | 277,882 | ||||||
FedEx Corp. |
4,027 | 697,476 | ||||||
J.B. Hunt Transport Services, Inc. |
1,399 | 243,930 | ||||||
Norfolk Southern Corp. |
3,920 | 965,967 | ||||||
Old Dominion Freight Line, Inc. |
1,544 | 438,156 | ||||||
Union Pacific Corp. |
10,411 | 2,155,806 | ||||||
United Parcel Service, Inc. Class B |
12,330 | 2,143,447 | ||||||
| 8,208,749 | ||||||||
| 45,915,685 | ||||||||
Technology — 21.5% |
||||||||
Computers — 7.5% |
||||||||
Accenture PLC Class A |
10,657 | 2,843,714 | ||||||
Apple, Inc. |
252,993 | 32,871,380 | ||||||
Cognizant Technology Solutions Corp. Class A |
8,723 | 498,868 | ||||||
DXC Technology Co. (a) |
3,872 | 102,608 | ||||||
EPAM Systems, Inc. (a) |
966 | 316,597 | ||||||
Fortinet, Inc. (a) |
11,026 | 539,061 | ||||||
Hewlett Packard Enterprise Co. |
21,880 | 349,205 | ||||||
HP, Inc. |
14,996 | 402,943 | ||||||
International Business Machines Corp. |
15,309 | 2,156,885 | ||||||
Leidos Holdings, Inc. |
2,300 | 241,937 | ||||||
NetApp, Inc. |
3,702 | 222,342 | ||||||
Seagate Technology Holdings PLC |
3,290 | 173,087 | ||||||
Western Digital Corp. (a) |
5,275 | 166,426 | ||||||
| 40,885,053 | ||||||||
Office & Business Equipment — 0.1% |
||||||||
Zebra Technologies Corp. Class A (a) |
872 | 223,590 | ||||||
Semiconductors — 4.8% |
||||||||
Advanced Micro Devices, Inc. (a) |
27,197 | 1,761,550 | ||||||
Analog Devices, Inc. |
8,703 | 1,427,553 | ||||||
Applied Materials, Inc. |
14,570 | 1,418,826 | ||||||
Broadcom, Inc. |
6,855 | 3,832,836 | ||||||
Intel Corp. |
69,888 | 1,847,140 | ||||||
KLA Corp. |
2,389 | 900,725 | ||||||
Lam Research Corp. |
2,308 | 970,052 | ||||||
Microchip Technology, Inc. |
9,308 | 653,887 | ||||||
Micron Technology, Inc. |
18,411 | 920,182 | ||||||
Monolithic Power Systems, Inc. |
749 | 264,854 | ||||||
NVIDIA Corp. |
42,133 | 6,157,317 | ||||||
The accompanying notes are an integral part of the financial statements.
105
MML Equity Index Fund – Portfolio of Investments (Continued) |
Number of |
Value |
|||||||
NXP Semiconductor NV |
4,370 | $ | 690,591 | |||||
ON Semiconductor Corp. (a) |
7,299 | 455,239 | ||||||
Qorvo, Inc. (a) |
1,738 | 157,532 | ||||||
QUALCOMM, Inc. |
18,920 | 2,080,065 | ||||||
Skyworks Solutions, Inc. |
2,703 | 246,324 | ||||||
Teradyne, Inc. |
2,641 | 230,691 | ||||||
Texas Instruments, Inc. |
15,394 | 2,543,397 | ||||||
| 26,558,761 | ||||||||
Software — 9.1% |
||||||||
Activision Blizzard, Inc. |
11,994 | 918,141 | ||||||
Adobe, Inc. (a) |
7,885 | 2,653,539 | ||||||
Akamai Technologies, Inc. (a) |
2,678 | 225,755 | ||||||
ANSYS, Inc. (a) |
1,467 | 354,412 | ||||||
Autodesk, Inc. (a) |
3,661 | 684,131 | ||||||
Broadridge Financial Solutions, Inc. |
1,975 | 264,907 | ||||||
Cadence Design Systems, Inc. (a) |
4,614 | 741,193 | ||||||
Ceridian HCM Holding, Inc. (a) |
2,578 | 165,379 | ||||||
Electronic Arts, Inc. |
4,450 | 543,701 | ||||||
Fidelity National Information Services, Inc. |
10,069 | 683,182 | ||||||
Fiserv, Inc. (a) |
10,775 | 1,089,029 | ||||||
Intuit, Inc. |
4,777 | 1,859,304 | ||||||
Jack Henry & Associates, Inc. |
1,228 | 215,588 | ||||||
Microsoft Corp. |
126,118 | 30,245,619 | ||||||
MSCI, Inc. |
1,356 | 630,770 | ||||||
Oracle Corp. |
26,023 | 2,127,120 | ||||||
Paychex, Inc. |
5,397 | 623,677 | ||||||
Paycom Software, Inc. (a) |
819 | 254,144 | ||||||
PTC, Inc. (a) |
1,781 | 213,791 | ||||||
Roper Technologies, Inc. |
1,786 | 771,713 | ||||||
Salesforce, Inc. (a) |
16,932 | 2,245,014 | ||||||
ServiceNow, Inc. (a) |
3,403 | 1,321,283 | ||||||
Synopsys, Inc. (a) |
2,577 | 822,810 | ||||||
Take-Two Interactive Software, Inc. (a) |
2,640 | 274,903 | ||||||
Tyler Technologies, Inc. (a) |
700 | 225,687 | ||||||
| 50,154,792 | ||||||||
| 117,822,196 | ||||||||
Utilities — 3.1% |
||||||||
Electric — 2.9% |
||||||||
The AES Corp. |
11,253 | 323,636 | ||||||
Alliant Energy Corp. |
4,228 | 233,428 | ||||||
Ameren Corp. |
4,354 | 387,158 | ||||||
American Electric Power Co., Inc. |
8,656 | 821,887 | ||||||
CenterPoint Energy, Inc. |
10,606 | 318,074 | ||||||
CMS Energy Corp. |
4,889 | 309,620 | ||||||
Consolidated Edison, Inc. |
5,974 | 569,382 | ||||||
Number of |
Value |
|||||||
Constellation Energy Corp. |
5,507 | $ | 474,759 | |||||
Dominion Energy, Inc. |
14,026 | 860,074 | ||||||
DTE Energy Co. |
3,264 | 383,618 | ||||||
Duke Energy Corp. |
12,973 | 1,336,089 | ||||||
Edison International |
6,425 | 408,759 | ||||||
Entergy Corp. |
3,427 | 385,538 | ||||||
Evergy, Inc. |
3,865 | 243,225 | ||||||
Eversource Energy |
5,837 | 489,374 | ||||||
Exelon Corp. |
16,708 | 722,287 | ||||||
FirstEnergy Corp. |
9,145 | 383,541 | ||||||
NextEra Energy, Inc. |
33,640 | 2,812,304 | ||||||
NRG Energy, Inc. |
3,961 | 126,039 | ||||||
PG&E Corp. (a) |
27,124 | 441,036 | ||||||
Pinnacle West Capital Corp. |
1,904 | 144,780 | ||||||
PPL Corp. |
12,402 | 362,386 | ||||||
Public Service Enterprise Group, Inc. |
8,405 | 514,974 | ||||||
Sempra Energy |
5,296 | 818,444 | ||||||
The Southern Co. |
18,445 | 1,317,158 | ||||||
WEC Energy Group, Inc. |
5,316 | 498,428 | ||||||
Xcel Energy, Inc. |
9,217 | 646,204 | ||||||
| 16,332,202 | ||||||||
Gas — 0.1% |
||||||||
Atmos Energy Corp. |
2,357 | 264,149 | ||||||
NiSource, Inc. |
6,836 | 187,443 | ||||||
| 451,592 | ||||||||
Water — 0.1% |
||||||||
American Water Works Co., Inc. |
3,063 | 466,862 | ||||||
| 17,250,656 | ||||||||
TOTAL COMMON STOCK (Cost $330,074,961) |
543,564,204 | |||||||
TOTAL EQUITIES (Cost $330,074,961) |
543,564,204 | |||||||
TOTAL LONG-TERM INVESTMENTS (Cost $330,074,961) |
543,564,204 | |||||||
The accompanying notes are an integral part of the financial statements.
106
MML Equity Index Fund – Portfolio of Investments (Continued) |
Principal |
Value |
|
SHORT-TERM INVESTMENTS — 0.9% |
||
Repurchase Agreement — 0.8% |
||
Fixed Income Clearing Corp., Repurchase Agreement, dated 12/30/22, 1.280%, due 1/03/23 (b) |
$ 4,469,396 |
$ 4,469,396 |
U.S. Treasury Bill — 0.1% |
||
U.S. Treasury Bill |
||
4.618% 5/11/23 (c) (d) |
860,000 |
846,116 |
TOTAL SHORT-TERM INVESTMENTS (Cost $5,315,546) |
5,315,512 |
|
TOTAL INVESTMENTS — 99.9% (Cost $335,390,507) (e) |
548,879,716 |
|
Other Assets/(Liabilities) — 0.1% |
380,307 |
|
NET ASSETS — 100.0% |
$ 549,260,023 |
|
Notes to Portfolio of Investments
Percentages are stated as a percent of net assets.
|
(a) |
Non-income producing security. |
|
(b) |
Maturity value of $4,470,032. Collateralized by U.S. Government Agency obligations with a rate of 0.000%, maturity date of 6/29/23, and an aggregate market value, including accrued interest, of $4,558,790. |
|
(c) |
The rate shown represents yield-to-maturity. |
|
(d) |
All or a portion of this security is pledged/held as collateral for open derivatives. (Note 2). |
|
(e) |
See Note 6 for aggregate cost for federal tax purposes. |
Futures contracts
|
Expiration |
Number of |
Notional |
Value/ Net |
||||||||||||
Long |
||||||||||||||||
S&P 500 E Mini Index |
3/17/23 | 30 | $ | 5,988,823 | $ | (197,323 | ) | |||||||||
The accompanying notes are an integral part of the financial statements.
107
December 31, 2022 |
Number of |
Value |
|||||||
EQUITIES — 97.8% |
||||||||
COMMON STOCK — 97.8% |
||||||||
Basic Materials — 8.1% |
||||||||
Chemicals — 8.1% |
||||||||
Ecolab, Inc. |
80,006 | $ | 11,645,673 | |||||
Linde PLC |
41,977 | 13,692,058 | ||||||
| 25,337,731 | ||||||||
| 25,337,731 | ||||||||
Consumer, Cyclical — 15.4% |
||||||||
Apparel — 5.6% |
||||||||
NIKE, Inc. Class B |
147,301 | 17,235,690 | ||||||
Retail — 9.8% |
||||||||
McDonald’s Corp. |
44,577 | 11,747,377 | ||||||
The TJX Cos., Inc. |
235,597 | 18,753,521 | ||||||
| 30,500,898 | ||||||||
| 47,736,588 | ||||||||
Consumer, Non-cyclical — 36.4% |
||||||||
Beverages — 6.6% |
||||||||
The Coca-Cola Co. |
97,399 | 6,195,551 | ||||||
PepsiCo, Inc. |
79,143 | 14,297,974 | ||||||
| 20,493,525 | ||||||||
Cosmetics & Personal Care — 8.5% |
||||||||
Colgate-Palmolive Co. |
172,003 | 13,552,116 | ||||||
The Procter & Gamble Co. |
84,787 | 12,850,318 | ||||||
| 26,402,434 | ||||||||
Health Care – Products — 12.9% |
||||||||
Baxter International, Inc. |
116,782 | 5,952,378 | ||||||
Danaher Corp. |
51,081 | 13,557,919 | ||||||
Medtronic PLC |
98,780 | 7,677,182 | ||||||
Stryker Corp. |
53,028 | 12,964,816 | ||||||
| 40,152,295 | ||||||||
Health Care – Services — 5.1% |
||||||||
UnitedHealth Group, Inc. |
29,710 | 15,751,648 | ||||||
Pharmaceuticals — 3.3% |
||||||||
Johnson & Johnson |
58,704 | 10,370,061 | ||||||
| 113,169,963 | ||||||||
Financial — 18.7% |
||||||||
Diversified Financial Services — 7.6% |
||||||||
American Express Co. |
63,144 | 9,329,526 | ||||||
Visa, Inc. Class A |
68,882 | 14,310,924 | ||||||
| 23,640,450 | ||||||||
Insurance — 9.0% |
||||||||
Chubb Ltd. |
64,786 | 14,291,792 | ||||||
Marsh & McLennan Cos., Inc. |
82,340 | 13,625,623 | ||||||
| 27,917,415 | ||||||||
Number of |
Value |
|||||||
Real Estate Investment Trusts (REITS) — 2.1% |
||||||||
American Tower Corp. |
30,508 | $ | 6,463,425 | |||||
| 58,021,290 | ||||||||
Industrial — 12.9% |
||||||||
Aerospace & Defense — 5.1% |
||||||||
Lockheed Martin Corp. |
7,136 | 3,471,593 | ||||||
Northrop Grumman Corp. |
22,642 | 12,353,701 | ||||||
| 15,825,294 | ||||||||
Electronics — 5.1% |
||||||||
Honeywell International, Inc. |
75,092 | 16,092,216 | ||||||
Transportation — 2.7% |
||||||||
Union Pacific Corp. |
40,226 | 8,329,598 | ||||||
| 40,247,108 | ||||||||
Technology — 6.3% |
||||||||
Computers — 3.2% |
||||||||
Accenture PLC Class A |
37,172 | 9,918,977 | ||||||
Software — 3.1% |
||||||||
Microsoft Corp. |
40,198 | 9,640,284 | ||||||
| 19,559,261 | ||||||||
TOTAL COMMON STOCK (Cost $270,304,621) |
304,071,941 | |||||||
TOTAL EQUITIES (Cost $270,304,621) |
304,071,941 | |||||||
TOTAL LONG-TERM INVESTMENTS (Cost $270,304,621) |
304,071,941 | |||||||
Principal |
||||||||
SHORT-TERM INVESTMENTS — 2.2% |
||||||||
Repurchase Agreement — 2.2% |
||||||||
Fixed Income Clearing Corp., Repurchase Agreement, dated 12/30/22, 1.280%, due 1/03/23 (a) |
$ | 6,841,559 | 6,841,559 | |||||
TOTAL SHORT-TERM INVESTMENTS (Cost $6,841,559) |
6,841,559 | |||||||
TOTAL INVESTMENTS — 100.0% (Cost $277,146,180) (b) |
310,913,500 | |||||||
Other Assets/(Liabilities) — (0.0)% |
(68,514 | ) | ||||||
NET ASSETS — 100.0% |
$ | 310,844,986 | ||||||
The accompanying notes are an integral part of the financial statements.
108
MML Focused Equity Fund – Portfolio of Investments (Continued) |
Notes to Portfolio of Investments
Percentages are stated as a percent of net assets.
|
(a) |
Maturity value of $6,842,532. Collateralized by U.S. Government Agency obligations with a rate of 0.000%, maturity date of 6/29/23, and an aggregate market value, including accrued interest, of $6,978,446. |
|
(b) |
See Note 6 for aggregate cost for federal tax purposes. |
Country weightings, as a percentage of net assets, is as follows:
United States |
83.1 | % | ||
Ireland |
10.1 | % | ||
Switzerland |
4.6 | % | ||
Total Long-Term Investments |
97.8 | % | ||
Short-Term Investments and Other Assets and Liabilities |
2.2 | % | ||
Net Assets |
100.0 | % |
The accompanying notes are an integral part of the financial statements.
109
December 31, 2022 |
Number of |
Value |
|||||||
EQUITIES — 98.5% |
||||||||
COMMON STOCK — 98.5% |
||||||||
Australia — 3.8% |
||||||||
BHP Group Ltd. Sponsored ADR |
10,700 | $ | 663,935 | |||||
BHP Group Ltd. |
22,900 | 709,012 | ||||||
Macquarie Group Ltd. |
16,700 | 1,895,872 | ||||||
Santos Ltd. |
417,300 | 2,046,216 | ||||||
Westpac Banking Corp. |
46,700 | 734,498 | ||||||
Woodside Energy Group Ltd. (a) |
36,504 | 883,218 | ||||||
| 6,932,751 | ||||||||
Belgium — 3.4% |
||||||||
Anheuser-Busch InBev SA |
53,800 | 3,234,358 | ||||||
Groupe Bruxelles Lambert SA |
14,900 | 1,193,531 | ||||||
KBC Group NV |
29,800 | 1,913,377 | ||||||
| 6,341,266 | ||||||||
Canada — 0.7% |
||||||||
TFI International, Inc. (a) |
12,200 | 1,221,892 | ||||||
Cayman Islands — 2.5% |
||||||||
CK Asset Holdings Ltd. |
294,500 | 1,813,179 | ||||||
CK Hutchison Holdings Ltd. |
481,600 | 2,891,205 | ||||||
| 4,704,384 | ||||||||
Finland — 1.2% |
||||||||
Nokia OYJ |
497,000 | 2,309,259 | ||||||
France — 11.2% |
||||||||
Amundi SA (b) |
21,400 | 1,215,961 | ||||||
Capgemini SE |
14,300 | 2,398,308 | ||||||
Cie de Saint-Gobain |
20,000 | 981,876 | ||||||
Dassault Aviation SA |
5,400 | 916,212 | ||||||
Engie SA |
158,700 | 2,273,225 | ||||||
Rexel SA |
38,100 | 755,028 | ||||||
Sanofi |
34,100 | 3,299,537 | ||||||
Societe Generale SA |
51,200 | 1,284,615 | ||||||
Sodexo SA |
9,400 | 899,231 | ||||||
TotalEnergies SE |
52,200 | 3,258,071 | ||||||
Ubisoft Entertainment SA (c) |
19,500 | 553,507 | ||||||
Veolia Environnement SA |
114,012 | 2,929,026 | ||||||
| 20,764,597 | ||||||||
Germany — 11.7% |
||||||||
Allianz SE Registered |
8,800 | 1,892,231 | ||||||
BASF SE |
47,300 | 2,348,171 | ||||||
Bayer AG Registered |
10,700 | 552,467 | ||||||
Deutsche Boerse AG |
9,400 | 1,621,883 | ||||||
Deutsche Post AG Registered |
48,900 | 1,840,686 | ||||||
HeidelbergCement AG |
43,100 | 2,458,136 | ||||||
Infineon Technologies AG |
65,900 | 2,007,161 | ||||||
SAP SE |
29,500 | 3,044,382 | ||||||
Siemens AG Registered |
22,700 | 3,150,593 | ||||||
Number of |
Value |
|||||||
Siemens Energy AG (c) |
87,700 | $ | 1,650,083 | |||||
Talanx AG (c) |
20,700 | 982,028 | ||||||
| 21,547,821 | ||||||||
Ireland — 4.3% |
||||||||
AIB Group PLC (a) |
510,500 | 1,967,809 | ||||||
DCC PLC |
31,000 | 1,530,357 | ||||||
Linde PLC |
6,200 | 2,022,316 | ||||||
Smurfit Kappa Group PLC |
65,900 | 2,441,619 | ||||||
| 7,962,101 | ||||||||
Israel — 1.0% |
||||||||
Check Point Software Technologies Ltd. (c) |
14,300 | 1,804,088 | ||||||
Italy — 0.3% |
||||||||
Prysmian SpA |
16,100 | 596,008 | ||||||
Japan — 18.5% |
||||||||
Astellas Pharma, Inc. |
133,700 | 2,028,375 | ||||||
Denka Co. Ltd. |
38,500 | 879,148 | ||||||
FANUC Corp. |
12,200 | 1,820,751 | ||||||
Fujitsu Ltd. |
12,300 | 1,628,865 | ||||||
Hitachi Ltd. |
46,600 | 2,345,138 | ||||||
Kirin Holdings Co. Ltd. (a) |
93,300 | 1,429,381 | ||||||
Kyocera Corp. |
40,000 | 1,996,173 | ||||||
Nintendo Co. Ltd. |
54,000 | 2,261,283 | ||||||
Olympus Corp. |
49,800 | 880,250 | ||||||
ORIX Corp. |
134,200 | 2,163,950 | ||||||
Rakuten Group, Inc. (a) (c) |
269,600 | 1,223,645 | ||||||
SBI Holdings, Inc. |
86,000 | 1,648,844 | ||||||
Sega Sammy Holdings, Inc. |
52,800 | 794,915 | ||||||
Seven & i Holdings Co. Ltd. |
66,800 | 2,857,595 | ||||||
Sony Group Corp. |
40,500 | 3,088,364 | ||||||
Square Enix Holdings Co. Ltd. |
17,000 | 789,296 | ||||||
Sumitomo Mitsui Financial Group, Inc. |
60,200 | 2,425,715 | ||||||
Toshiba Corp. |
40,500 | 1,419,637 | ||||||
Toyota Industries Corp. |
45,500 | 2,480,700 | ||||||
| 34,162,025 | ||||||||
Luxembourg — 0.9% |
||||||||
ArcelorMittal SA |
60,200 | 1,573,984 | ||||||
Netherlands — 6.1% |
||||||||
AerCap Holdings NV (c) |
37,600 | 2,192,832 | ||||||
ASML Holding NV |
4,000 | 2,165,212 | ||||||
CNH Industrial NV |
116,200 | 1,866,190 | ||||||
EXOR NV (c) |
10,400 | 759,169 | ||||||
Heineken Holding NV |
28,300 | 2,179,083 | ||||||
Koninklijke Philips NV |
35,779 | 537,015 | ||||||
NXP Semiconductor NV |
10,300 | 1,627,709 | ||||||
| 11,327,210 | ||||||||
The accompanying notes are an integral part of the financial statements.
110
MML Foreign Fund – Portfolio of Investments (Continued) |
Number of |
Value |
|||||||
Norway — 0.8% |
||||||||
Aker BP ASA |
43,673 | $ | 1,361,335 | |||||
DNB Bank ASA |
7,300 | 144,526 | ||||||
Mowi ASA |
1,600 | 27,318 | ||||||
| 1,533,179 | ||||||||
Republic of Korea — 1.5% |
||||||||
Samsung Electronics Co. Ltd. |
63,400 | 2,795,819 | ||||||
Singapore — 1.4% |
||||||||
DBS Group Holdings, Ltd. |
105,000 | 2,658,223 | ||||||
Sweden — 2.3% |
||||||||
Essity AB Class B |
49,700 | 1,304,523 | ||||||
Husqvarna AB Class B |
44,900 | 316,361 | ||||||
Investor AB Class B |
37,800 | 685,589 | ||||||
Skandinaviska Enskilda Banken AB Class A |
32,900 | 378,621 | ||||||
Volvo AB Class B |
84,298 | 1,526,355 | ||||||
| 4,211,449 | ||||||||
Switzerland — 9.6% |
||||||||
ABB Ltd. Registered |
84,000 | 2,558,453 | ||||||
Alcon, Inc. |
8,300 | 570,081 | ||||||
Cie Financiere Richemont SA Registered |
16,600 | 2,148,134 | ||||||
Julius Baer Group Ltd. |
4,900 | 284,817 | ||||||
Nestle SA Registered |
26,200 | 3,025,720 | ||||||
Novartis AG Registered |
39,700 | 3,596,078 | ||||||
Roche Holding AG |
9,800 | 3,079,766 | ||||||
UBS Group AG Registered |
129,400 | 2,411,962 | ||||||
| 17,675,011 | ||||||||
United Kingdom — 17.3% |
||||||||
Ashtead Group PLC |
35,200 | 2,010,860 | ||||||
Aviva PLC |
135,876 | 724,239 | ||||||
Barratt Developments PLC |
135,100 | 648,734 | ||||||
BP PLC |
394,800 | 2,295,854 | ||||||
Bunzl PLC |
39,900 | 1,331,755 | ||||||
Burberry Group PLC |
24,300 | 593,771 | ||||||
Entain PLC |
40,700 | 652,571 | ||||||
Glencore PLC |
295,400 | 1,975,273 | ||||||
GSK PLC |
107,900 | 1,876,360 | ||||||
Imperial Brands PLC |
15,400 | 384,763 | ||||||
Inchcape PLC |
101,900 | 1,005,793 | ||||||
Informa PLC |
215,300 | 1,614,173 | ||||||
Kingfisher PLC |
179,400 | 513,429 | ||||||
Legal & General Group PLC |
384,200 | 1,160,340 | ||||||
Liberty Global PLC Class C (c) |
38,900 | 755,827 | ||||||
Lloyds Banking Group PLC |
4,554,600 | 2,501,081 | ||||||
Melrose Industries PLC |
645,190 | 1,048,895 | ||||||
Persimmon PLC |
61,100 | 901,906 | ||||||
Reckitt Benckiser Group PLC |
35,700 | 2,483,614 | ||||||
Number of |
Value |
|||||||
Smith & Nephew PLC |
144,800 | $ | 1,934,494 | |||||
Tesco PLC |
778,205 | 2,109,920 | ||||||
Unilever PLC |
68,000 | 3,430,531 | ||||||
| 31,954,183 | ||||||||
TOTAL COMMON STOCK (Cost $188,948,208) |
182,075,250 | |||||||
TOTAL EQUITIES (Cost $188,948,208) |
182,075,250 | |||||||
MUTUAL FUNDS — 0.7% |
||||||||
United States — 0.7% |
||||||||
State Street Navigator Securities Lending Government Money Market Portfolio (d) |
1,268,198 | 1,268,198 | ||||||
TOTAL MUTUAL FUNDS (Cost $1,268,198) |
1,268,198 | |||||||
TOTAL LONG-TERM INVESTMENTS (Cost $190,216,406) |
183,343,448 | |||||||
Principal |
||||||||
SHORT-TERM INVESTMENTS — 1.1% |
||||||||
Repurchase Agreement — 1.1% |
||||||||
Fixed Income Clearing Corp., Repurchase Agreement, dated 12/30/22, 1.280%, due 1/03/23 (e) |
$ | 2,062,706 | 2,062,706 | |||||
TOTAL SHORT-TERM INVESTMENTS (Cost $2,062,706) |
2,062,706 | |||||||
TOTAL INVESTMENTS — 100.3% (Cost $192,279,112) (f) |
185,406,154 | |||||||
Other Assets/(Liabilities) — (0.3)% |
(598,529 | ) | ||||||
NET ASSETS — 100.0% |
$ | 184,807,625 | ||||||
Abbreviation Legend
|
ADR |
American Depositary Receipt |
The accompanying notes are an integral part of the financial statements.
111
MML Foreign Fund – Portfolio of Investments (Continued) |
Notes to Portfolio of Investments
Percentages are stated as a percent of net assets.
|
(a) |
Denotes all or a portion of security on loan. The total value of securities on loan as of December 31, 2022, was $6,286,056 or 3.40% of net assets. The Fund received $5,352,067 of non-cash collateral (U.S. Treasury and/or Agency obligations) related to securities lending activity. This amount is not reflected on either the Portfolio of Investments or the Statement of Assets and Liabilities. (Note 2). |
|
(b) |
Security is exempt from registration under Regulation S or Rule 144A of the Securities Act of 1933. These securities are considered restricted and may be resold in transactions exempt from registration. At December 31, 2022, the aggregate market value of these securities amounted to $1,215,961 or 0.66% of net assets. |
|
(c) |
Non-income producing security. |
|
(d) |
Represents investment of security lending cash collateral. (Note 2). |
|
(e) |
Maturity value of $2,063,000. Collateralized by U.S. Government Agency obligations with a rate of 0.000%, maturity date of 6/29/23, and an aggregate market value, including accrued interest, of $2,104,057. |
|
(f) |
See Note 6 for aggregate cost for federal tax purposes. |
Sector weightings, as a percentage of net assets, is as follows:
Consumer, Non-cyclical |
24.7 | % | ||
Financial |
20.4 | % | ||
Industrial |
13.6 | % | ||
Technology |
10.6 | % | ||
Consumer, Cyclical |
10.2 | % | ||
Basic Materials |
6.8 | % | ||
Energy |
6.2 | % | ||
Communications |
3.9 | % | ||
Utilities |
2.8 | % | ||
Total Long-Term Investments |
99.2 | % | ||
Short-Term Investments and Other Assets and Liabilities |
0.8 | % | ||
Net Assets |
100.0 | % |
The accompanying notes are an integral part of the financial statements.
112
MML Fundamental Equity Fund – Portfolio of Investments |
December 31, 2022 |
Number of |
Value |
|||||||
COMMON STOCK — 99.3% |
||||||||
Basic Materials — 1.3% |
||||||||
Chemicals — 1.3% |
||||||||
DuPont de Nemours, Inc. |
6,325 | $ | 434,085 | |||||
Valvoline, Inc. |
51,272 | 1,674,031 | ||||||
| 2,108,116 | ||||||||
Communications — 10.0% |
||||||||
Advertising — 1.0% |
||||||||
The Interpublic Group of Cos., Inc. |
48,925 | 1,629,692 | ||||||
Internet — 6.9% |
||||||||
Airbnb, Inc. Class A (a) |
19,561 | 1,672,465 | ||||||
Alphabet, Inc. Class A (a) |
31,111 | 2,744,924 | ||||||
Meta Platforms, Inc. Class A (a) |
22,711 | 2,733,042 | ||||||
Netflix, Inc. (a) |
14,867 | 4,383,981 | ||||||
| 11,534,412 | ||||||||
Telecommunications — 2.1% |
||||||||
Motorola Solutions, Inc. |
5,075 | 1,307,878 | ||||||
T-Mobile US, Inc. (a) |
7,842 | 1,097,880 | ||||||
Verizon Communications, Inc. |
28,193 | 1,110,804 | ||||||
| 3,516,562 | ||||||||
| 16,680,666 | ||||||||
Consumer, Cyclical — 4.4% |
||||||||
Auto Manufacturers — 1.1% |
||||||||
General Motors Co. |
53,780 | 1,809,159 | ||||||
Auto Parts & Equipment — 0.2% |
||||||||
Mobileye Global, Inc. Class A (a) |
12,067 | 423,069 | ||||||
Retail — 3.1% |
||||||||
Dollar General Corp. |
4,161 | 1,024,646 | ||||||
O’Reilly Automotive, Inc. (a) |
2,838 | 2,395,357 | ||||||
Starbucks Corp. |
17,943 | 1,779,946 | ||||||
| 5,199,949 | ||||||||
| 7,432,177 | ||||||||
Consumer, Non-cyclical — 20.9% |
||||||||
Agriculture — 1.1% |
||||||||
British American Tobacco PLC Sponsored ADR (b) |
44,540 | 1,780,709 | ||||||
Beverages — 5.0% |
||||||||
The Coca-Cola Co. |
45,409 | 2,888,466 | ||||||
Constellation Brands, Inc. Class A |
13,494 | 3,127,235 | ||||||
PepsiCo, Inc. |
13,083 | 2,363,575 | ||||||
| 8,379,276 | ||||||||
Biotechnology — 1.9% |
||||||||
Gilead Sciences, Inc. |
23,401 | 2,008,976 | ||||||
Seagen, Inc. (a) |
8,827 | 1,134,358 | ||||||
| 3,143,334 | ||||||||
Number of |
Value |
|||||||
Commercial Services — 0.6% |
||||||||
Equifax, Inc. |
4,780 | $ | 929,041 | |||||
Cosmetics & Personal Care — 0.5% |
||||||||
Coty, Inc. Class A (a) |
102,800 | 879,968 | ||||||
Food — 0.5% |
||||||||
Sysco Corp. |
11,734 | 897,064 | ||||||
Health Care – Products — 0.9% |
||||||||
Zimmer Biomet Holdings, Inc. |
12,103 | 1,543,132 | ||||||
Health Care – Services — 5.4% |
||||||||
HCA Healthcare, Inc. |
14,033 | 3,367,359 | ||||||
Tenet Healthcare Corp. (a) |
31,807 | 1,551,863 | ||||||
UnitedHealth Group, Inc. |
7,694 | 4,079,205 | ||||||
| 8,998,427 | ||||||||
Pharmaceuticals — 5.0% |
||||||||
AstraZeneca PLC Sponsored ADR |
48,385 | 3,280,503 | ||||||
Bristol-Myers Squibb Co. |
21,029 | 1,513,037 | ||||||
CVS Health Corp. |
24,371 | 2,271,133 | ||||||
Eli Lilly & Co. |
3,528 | 1,290,684 | ||||||
| 8,355,357 | ||||||||
| 34,906,308 | ||||||||
Energy — 5.1% |
||||||||
Oil & Gas — 4.2% |
||||||||
APA Corp. |
39,443 | 1,841,199 | ||||||
Exxon Mobil Corp. |
46,975 | 5,181,343 | ||||||
| 7,022,542 | ||||||||
Pipelines — 0.9% |
||||||||
Cheniere Energy, Inc. |
4,704 | 705,412 | ||||||
Magellan Midstream Partners LP (c) |
16,239 | 815,360 | ||||||
| 1,520,772 | ||||||||
| 8,543,314 | ||||||||
Financial — 19.7% |
||||||||
Banks — 4.4% |
||||||||
First Citizens BancShares, Inc. Class A |
1,857 | 1,408,275 | ||||||
JP Morgan Chase & Co. |
44,723 | 5,997,354 | ||||||
| 7,405,629 | ||||||||
Diversified Financial Services — 8.7% |
||||||||
American Express Co. |
19,233 | 2,841,676 | ||||||
The Charles Schwab Corp. |
33,012 | 2,748,579 | ||||||
Intercontinental Exchange, Inc. |
18,579 | 1,906,019 | ||||||
Mastercard, Inc. Class A |
9,833 | 3,419,229 | ||||||
Rocket Cos., Inc. Class A |
97,958 | 685,706 | ||||||
Visa, Inc. Class A |
14,072 | 2,923,599 | ||||||
| 14,524,808 | ||||||||
Insurance — 3.8% |
||||||||
The Allstate Corp. |
21,917 | 2,971,945 | ||||||
The accompanying notes are an integral part of the financial statements.
113
MML Fundamental Equity Fund – Portfolio of Investments (Continued) |
Number of |
Value |
|||||||
Equitable Holdings, Inc. |
119,907 | $ | 3,441,331 | |||||
| 6,413,276 | ||||||||
Real Estate Investment Trusts (REITS) — 2.8% |
||||||||
Prologis, Inc. |
41,336 | 4,659,807 | ||||||
| 33,003,520 | ||||||||
Industrial — 12.8% |
||||||||
Aerospace & Defense — 1.8% |
||||||||
Lockheed Martin Corp. |
2,760 | 1,342,713 | ||||||
Raytheon Technologies Corp. |
16,547 | 1,669,923 | ||||||
| 3,012,636 | ||||||||
Building Materials — 1.5% |
||||||||
Vulcan Materials Co. |
13,792 | 2,415,117 | ||||||
Electronics — 1.6% |
||||||||
Honeywell International, Inc. |
12,261 | 2,627,532 | ||||||
Environmental Controls — 0.7% |
||||||||
Waste Connections, Inc. |
8,949 | 1,186,279 | ||||||
Machinery – Diversified — 3.5% |
||||||||
Deere & Co. |
6,919 | 2,966,591 | ||||||
Otis Worldwide Corp. |
37,439 | 2,931,848 | ||||||
| 5,898,439 | ||||||||
Transportation — 3.7% |
||||||||
Union Pacific Corp. |
8,824 | 1,827,185 | ||||||
United Parcel Service, Inc. Class B |
25,495 | 4,432,051 | ||||||
| 6,259,236 | ||||||||
| 21,399,239 | ||||||||
Technology — 22.2% |
||||||||
Computers — 5.8% |
||||||||
Amdocs Ltd. |
12,661 | 1,150,885 | ||||||
Apple, Inc. |
63,460 | 8,245,358 | ||||||
Crowdstrike Holdings, Inc. Class A (a) |
3,268 | 344,087 | ||||||
| 9,740,330 | ||||||||
Semiconductors — 4.0% |
||||||||
Advanced Micro Devices, Inc. (a) |
28,403 | 1,839,662 | ||||||
Applied Materials, Inc. |
21,008 | 2,045,759 | ||||||
Monolithic Power Systems, Inc. |
1,094 | 386,850 | ||||||
QUALCOMM, Inc. |
22,068 | 2,426,156 | ||||||
| 6,698,427 | ||||||||
Software — 12.4% |
||||||||
Electronic Arts, Inc. |
6,630 | 810,053 | ||||||
Fiserv, Inc. (a) |
23,801 | 2,405,567 | ||||||
Manhattan Associates, Inc. (a) |
4,554 | 552,856 | ||||||
Microsoft Corp. |
40,312 | 9,667,624 | ||||||
ServiceNow, Inc. (a) |
2,613 | 1,014,550 | ||||||
Synopsys, Inc. (a) |
4,742 | 1,514,073 | ||||||
Tyler Technologies, Inc. (a) |
3,454 | 1,113,604 | ||||||
Number of |
Value |
|||||||
VMware, Inc. Class A (a) |
29,962 | $ | 3,678,135 | |||||
| 20,756,462 | ||||||||
| 37,195,219 | ||||||||
Utilities — 2.9% |
||||||||
Electric — 2.9% |
||||||||
FirstEnergy Corp. |
70,252 | 2,946,369 | ||||||
The Southern Co. |
26,663 | 1,904,005 | ||||||
| 4,850,374 | ||||||||
TOTAL COMMON STOCK (Cost $163,938,314) |
166,118,933 | |||||||
TOTAL EQUITIES (Cost $163,938,314) |
166,118,933 | |||||||
MUTUAL FUNDS — 1.1% |
||||||||
Diversified Financial Services — 1.1% |
||||||||
State Street Navigator Securities Lending Government Money Market Portfolio (d) |
1,772,758 | 1,772,758 | ||||||
TOTAL MUTUAL FUNDS (Cost $1,772,758) |
1,772,758 | |||||||
TOTAL LONG-TERM INVESTMENTS (Cost $165,711,072) |
167,891,691 | |||||||
Principal |
||||||||
SHORT-TERM INVESTMENTS — 0.8% |
||||||||
Repurchase Agreement — 0.8% |
||||||||
Fixed Income Clearing Corp., Repurchase Agreement, dated 12/30/22, 1.280%, due 1/03/23 (e) |
$ | 1,284,747 | 1,284,747 | |||||
TOTAL SHORT-TERM INVESTMENTS (Cost $1,284,747) |
1,284,747 | |||||||
TOTAL INVESTMENTS — 101.2% (Cost $166,995,819) (f) |
169,176,438 | |||||||
Other Assets/(Liabilities) — (1.2)% |
(1,963,808 | ) | ||||||
NET ASSETS — 100.0% |
$ | 167,212,630 | ||||||
Abbreviation Legend
|
ADR |
American Depositary Receipt |
The accompanying notes are an integral part of the financial statements.
114
MML Fundamental Equity Fund – Portfolio of Investments (Continued) |
Notes to Portfolio of Investments
Percentages are stated as a percent of net assets.
|
(a) |
Non-income producing security. |
|
(b) |
Denotes all or a portion of security on loan. The total value of securities on loan as of December 31, 2022, was $1,728,655 or 1.03% of net assets. (Note 2). |
|
(c) |
Security is a Master Limited Partnership. |
|
(d) |
Represents investment of security lending cash collateral. (Note 2). |
|
(e) |
Maturity value of $1,284,930. Collateralized by U.S. Government Agency obligations with a rate of 0.000%, maturity date of 6/29/23, and an aggregate market value, including accrued interest, of $1,310,468. |
|
(f) |
See Note 6 for aggregate cost for federal tax purposes. |
The accompanying notes are an integral part of the financial statements.
115
December 31, 2022 |
Number of |
Value |
|||||||
EQUITIES — 97.8% |
||||||||
COMMON STOCK — 97.8% |
||||||||
Basic Materials — 3.5% |
||||||||
Chemicals — 3.5% |
||||||||
Axalta Coating Systems Ltd. (a) |
59,562 | $ | 1,517,044 | |||||
DuPont de Nemours, Inc. |
43,038 | 2,953,698 | ||||||
Olin Corp. |
25,506 | 1,350,288 | ||||||
| 5,821,030 | ||||||||
Communications — 6.3% |
||||||||
Internet — 2.8% |
||||||||
Alphabet, Inc. Class A (a) |
42,431 | 3,743,687 | ||||||
Booking Holdings, Inc. (a) |
507 | 1,021,747 | ||||||
| 4,765,434 | ||||||||
Telecommunications — 3.5% |
||||||||
Cisco Systems, Inc. |
71,584 | 3,410,262 | ||||||
T-Mobile US, Inc. (a) |
16,913 | 2,367,820 | ||||||
| 5,778,082 | ||||||||
| 10,543,516 | ||||||||
Consumer, Cyclical — 4.1% |
||||||||
Distribution & Wholesale — 0.9% |
||||||||
LKQ Corp. |
28,484 | 1,521,330 | ||||||
Home Furnishing — 0.9% |
||||||||
Sony Group Corp. Sponsored ADR |
19,187 | 1,463,584 | ||||||
Retail — 2.3% |
||||||||
AutoZone, Inc. (a) |
1,603 | 3,953,287 | ||||||
| 6,938,201 | ||||||||
Consumer, Non-cyclical — 28.8% |
||||||||
Beverages — 2.7% |
||||||||
Coca-Cola Europacific Partners PLC |
26,371 | 1,458,844 | ||||||
Keurig Dr Pepper, Inc. |
87,414 | 3,117,183 | ||||||
| 4,576,027 | ||||||||
Commercial Services — 2.5% |
||||||||
FleetCor Technologies, Inc. (a) |
7,385 | 1,356,477 | ||||||
Global Payments, Inc. |
8,191 | 813,530 | ||||||
United Rentals, Inc. (a) |
5,467 | 1,943,081 | ||||||
| 4,113,088 | ||||||||
Food — 0.9% |
||||||||
US Foods Holding Corp. (a) |
43,375 | 1,475,617 | ||||||
Health Care – Products — 1.0% |
||||||||
Avantor, Inc. (a) |
56,034 | 1,181,757 | ||||||
Envista Holdings Corp. (a) |
15,173 | 510,875 | ||||||
| 1,692,632 | ||||||||
Health Care – Services — 4.8% |
||||||||
Centene Corp. (a) |
38,600 | 3,165,586 | ||||||
ICON PLC (a) |
7,564 | 1,469,307 | ||||||
Number of |
Value |
|||||||
UnitedHealth Group, Inc. |
6,353 | $ | 3,368,234 | |||||
| 8,003,127 | ||||||||
Pharmaceuticals — 16.9% |
||||||||
AbbVie, Inc. |
14,608 | 2,360,799 | ||||||
AmerisourceBergen Corp. |
13,449 | 2,228,634 | ||||||
Bristol-Myers Squibb Co. |
62,606 | 4,504,502 | ||||||
Cigna Corp. |
11,919 | 3,949,241 | ||||||
CVS Health Corp. |
41,343 | 3,852,754 | ||||||
Johnson & Johnson |
36,471 | 6,442,602 | ||||||
McKesson Corp. |
1,975 | 740,862 | ||||||
Sanofi ADR |
88,614 | 4,291,576 | ||||||
| 28,370,970 | ||||||||
| 48,231,461 | ||||||||
Energy — 12.2% |
||||||||
Oil & Gas — 10.1% |
||||||||
Canadian Natural Resources Ltd. |
41,021 | 2,277,896 | ||||||
Cenovus Energy, Inc. (b) |
120,033 | 2,329,841 | ||||||
ConocoPhillips |
34,450 | 4,065,100 | ||||||
Devon Energy Corp. |
29,772 | 1,831,276 | ||||||
EOG Resources, Inc. |
9,141 | 1,183,942 | ||||||
Marathon Petroleum Corp. |
26,297 | 3,060,708 | ||||||
Pioneer Natural Resources Co. |
9,326 | 2,129,965 | ||||||
| 16,878,728 | ||||||||
Oil & Gas Services — 2.1% |
||||||||
Halliburton Co. |
19,112 | 752,057 | ||||||
Schlumberger NV |
52,304 | 2,796,172 | ||||||
| 3,548,229 | ||||||||
| 20,426,957 | ||||||||
Financial — 18.7% |
||||||||
Banks — 9.6% |
||||||||
Bank of America Corp. |
78,189 | 2,589,620 | ||||||
The Goldman Sachs Group, Inc. |
7,047 | 2,419,799 | ||||||
JP Morgan Chase & Co. |
45,988 | 6,166,991 | ||||||
Truist Financial Corp. |
30,992 | 1,333,586 | ||||||
Wells Fargo & Co. |
84,008 | 3,468,690 | ||||||
| 15,978,686 | ||||||||
Diversified Financial Services — 3.4% |
||||||||
Capital One Financial Corp. |
6,837 | 635,568 | ||||||
The Charles Schwab Corp. |
49,517 | 4,122,785 | ||||||
Intercontinental Exchange, Inc. |
9,816 | 1,007,023 | ||||||
| 5,765,376 | ||||||||
Insurance — 5.7% |
||||||||
The Allstate Corp. |
5,790 | 785,124 | ||||||
Berkshire Hathaway, Inc. Class B (a) |
19,186 | 5,926,555 | ||||||
Chubb Ltd. |
9,111 | 2,009,887 | ||||||
The accompanying notes are an integral part of the financial statements.
116
MML Fundamental Value Fund – Portfolio of Investments (Continued) |
Number of |
Value |
|||||||
Everest Re Group Ltd. |
2,585 | $ | 856,333 | |||||
| 9,577,899 | ||||||||
| 31,321,961 | ||||||||
Industrial — 12.4% |
||||||||
Aerospace & Defense — 2.4% |
||||||||
General Dynamics Corp. |
7,035 | 1,745,454 | ||||||
Howmet Aerospace, Inc. |
55,481 | 2,186,506 | ||||||
| 3,931,960 | ||||||||
Building Materials — 2.5% |
||||||||
CRH PLC Sponsored ADR (b) |
41,406 | 1,647,545 | ||||||
Masco Corp. |
27,976 | 1,305,640 | ||||||
Mohawk Industries, Inc. (a) |
11,794 | 1,205,582 | ||||||
| 4,158,767 | ||||||||
Electronics — 1.2% |
||||||||
Allegion PLC |
8,831 | 929,551 | ||||||
Fortive Corp. |
15,732 | 1,010,781 | ||||||
| 1,940,332 | ||||||||
Machinery – Construction & Mining — 0.9% |
||||||||
Caterpillar, Inc. |
6,561 | 1,571,753 | ||||||
Machinery – Diversified — 3.3% |
||||||||
Deere & Co. |
5,514 | 2,364,183 | ||||||
Dover Corp. |
6,113 | 827,761 | ||||||
Otis Worldwide Corp. |
16,558 | 1,296,657 | ||||||
Westinghouse Air Brake Technologies Corp. |
10,836 | 1,081,541 | ||||||
| 5,570,142 | ||||||||
Miscellaneous - Manufacturing — 1.0% |
||||||||
Eaton Corp. PLC |
11,026 | 1,730,531 | ||||||
Transportation — 1.1% |
||||||||
Union Pacific Corp. |
8,971 | 1,857,625 | ||||||
| 20,761,110 | ||||||||
Technology — 9.7% |
||||||||
Computers — 1.7% |
||||||||
Cognizant Technology Solutions Corp. Class A |
24,457 | 1,398,696 | ||||||
Leidos Holdings, Inc. |
13,859 | 1,457,828 | ||||||
| 2,856,524 | ||||||||
Semiconductors — 6.1% |
||||||||
Advanced Micro Devices, Inc. (a) |
15,820 | 1,024,661 | ||||||
Applied Materials, Inc. |
17,320 | 1,686,622 | ||||||
Lam Research Corp. |
1,924 | 808,657 | ||||||
Microchip Technology, Inc. |
21,539 | 1,513,115 | ||||||
Number of |
Value |
|||||||
Micron Technology, Inc. |
26,968 | $ | 1,347,861 | |||||
NXP Semiconductor NV |
3,766 | 595,141 | ||||||
Qorvo, Inc. (a) |
5,508 | 499,245 | ||||||
QUALCOMM, Inc. |
24,171 | 2,657,360 | ||||||
| 10,132,662 | ||||||||
Software — 1.9% |
||||||||
Activision Blizzard, Inc. |
13,720 | 1,050,266 | ||||||
Fidelity National Information Services, Inc. |
12,219 | 829,059 | ||||||
SS&C Technologies Holdings, Inc |
25,983 | 1,352,675 | ||||||
| 3,232,000 | ||||||||
| 16,221,186 | ||||||||
Utilities — 2.1% |
||||||||
Electric — 2.1% |
||||||||
CenterPoint Energy, Inc. |
56,529 | 1,695,305 | ||||||
FirstEnergy Corp. |
43,139 | 1,809,249 | ||||||
| 3,504,554 | ||||||||
| 3,504,554 | ||||||||
TOTAL COMMON STOCK (Cost $135,292,968) |
163,769,976 | |||||||
TOTAL EQUITIES (Cost $135,292,968) |
163,769,976 | |||||||
MUTUAL FUNDS — 0.0% |
||||||||
Diversified Financial Services — 0.0% |
||||||||
State Street Navigator Securities Lending Government Money Market Portfolio (c) |
38,835 | 38,835 | ||||||
TOTAL MUTUAL FUNDS (Cost $38,835) |
38,835 | |||||||
TOTAL LONG-TERM INVESTMENTS (Cost $135,331,803) |
163,808,811 | |||||||
The accompanying notes are an integral part of the financial statements.
117
MML Fundamental Value Fund – Portfolio of Investments (Continued) |
Principal |
Value |
|||||||
SHORT-TERM INVESTMENTS — 2.2% |
||||||||
Repurchase Agreement — 2.2% |
||||||||
Fixed Income Clearing Corp., Repurchase Agreement, dated 12/30/22, 1.280%, due 1/03/23 (d) |
$ | 3,618,144 | $ | 3,618,144 | ||||
TOTAL SHORT-TERM INVESTMENTS (Cost $3,618,144) |
3,618,144 | |||||||
TOTAL INVESTMENTS — 100.0% (Cost $138,949,947) (e) |
167,426,955 | |||||||
Other Assets/(Liabilities) — (0.0)% |
(13,450 | ) | ||||||
NET ASSETS — 100.0% |
$ | 167,413,505 | ||||||
Abbreviation Legend
|
ADR |
American Depositary Receipt |
Notes to Portfolio of Investments
Percentages are stated as a percent of net assets.
|
(a) |
Non-income producing security. |
|
(b) |
Denotes all or a portion of security on loan. The total value of securities on loan as of December 31, 2022, was $3,929,694 or 2.35% of net assets. The Fund received $3,992,297 of non-cash collateral (U.S. Treasury and/or Agency obligations) related to securities lending activity. This amount is not reflected on either the Portfolio of Investments or the Statement of Assets and Liabilities. (Note 2). |
|
(c) |
Represents investment of security lending cash collateral. (Note 2). |
|
(d) |
Maturity value of $3,618,659. Collateralized by U.S. Government Agency obligations with a rate of 0.000%, maturity date of 6/29/23, and an aggregate market value, including accrued interest, of $3,690,552. |
|
(e) |
See Note 6 for aggregate cost for federal tax purposes. |
The accompanying notes are an integral part of the financial statements.
118
December 31, 2022 |
Number of |
Value |
|||||||
EQUITIES — 99.1% |
||||||||
COMMON STOCK — 99.1% |
||||||||
Austria — 0.4% |
||||||||
Erste Group Bank AG |
17,304 | $ | 551,783 | |||||
Canada — 3.8% |
||||||||
Canadian National Railway Co. |
20,452 | 2,431,334 | ||||||
Canadian Pacific Railway Ltd. (a) |
38,040 | 2,837,403 | ||||||
| 5,268,737 | ||||||||
Denmark — 0.5% |
||||||||
Carlsberg A/S Class B |
5,558 | 735,749 | ||||||
France — 11.4% |
||||||||
Air Liquide SA |
8,750 | 1,244,594 | ||||||
Danone SA |
40,259 | 2,121,001 | ||||||
EssilorLuxottica SA |
3,386 | 616,577 | ||||||
Hermes International |
388 | 598,738 | ||||||
Legrand SA |
20,114 | 1,619,528 | ||||||
LVMH Moet Hennessy Louis Vuitton SE |
4,720 | 3,428,820 | ||||||
Pernod Ricard SA |
10,590 | 2,081,566 | ||||||
Schneider Electric SE |
29,004 | 4,079,106 | ||||||
| 15,789,930 | ||||||||
Germany — 4.0% |
||||||||
Bayer AG Registered |
28,581 | 1,475,708 | ||||||
Brenntag SE |
9,032 | 577,468 | ||||||
Deutsche Boerse AG |
4,415 | 761,768 | ||||||
Merck KGaA |
10,832 | 2,097,727 | ||||||
MTU Aero Engines AG |
3,060 | 662,307 | ||||||
| 5,574,978 | ||||||||
Ireland — 10.7% |
||||||||
Accenture PLC Class A |
12,178 | 3,249,578 | ||||||
Aon PLC Class A |
6,711 | 2,014,240 | ||||||
Linde PLC (b) |
9,635 | 3,150,366 | ||||||
Linde PLC |
1,894 | 617,785 | ||||||
Medtronic PLC |
41,234 | 3,204,706 | ||||||
Willis Towers Watson PLC |
10,268 | 2,511,347 | ||||||
| 14,748,022 | ||||||||
Israel — 1.0% |
||||||||
Check Point Software Technologies Ltd. (b) |
10,894 | 1,374,387 | ||||||
Japan — 1.6% |
||||||||
Hoya Corp. |
5,600 | 541,829 | ||||||
Kubota Corp. |
91,300 | 1,257,688 | ||||||
Olympus Corp. |
25,300 | 447,195 | ||||||
| 2,246,712 | ||||||||
Mexico — 0.3% |
||||||||
Grupo Financiero Banorte SAB de CV Class O |
54,584 | 392,829 | ||||||
Number of |
Value |
|||||||
Netherlands — 2.3% |
||||||||
Akzo Nobel NV |
16,217 | $ | 1,082,096 | |||||
Heineken NV |
22,245 | 2,089,952 | ||||||
| 3,172,048 | ||||||||
Republic of Korea — 0.9% |
||||||||
Samsung Electronics Co. Ltd. |
28,793 | 1,269,716 | ||||||
Spain — 0.7% |
||||||||
Aena SME SA (b) (c) |
8,228 | 1,036,239 | ||||||
Sweden — 1.6% |
||||||||
Essity AB Class B |
81,977 | 2,151,728 | ||||||
Switzerland — 9.1% |
||||||||
Adecco Group AG Registered |
9,605 | 315,855 | ||||||
Cie Financiere Richemont SA Registered |
18,213 | 2,356,865 | ||||||
Julius Baer Group Ltd. |
10,390 | 603,929 | ||||||
Nestle SA Registered |
27,977 | 3,230,938 | ||||||
Roche Holding AG |
11,351 | 3,567,186 | ||||||
Sonova Holding AG Registered |
2,607 | 620,302 | ||||||
UBS Group AG Registered |
101,005 | 1,882,691 | ||||||
| 12,577,766 | ||||||||
United Kingdom — 7.2% |
||||||||
Aptiv PLC (b) |
5,533 | 515,288 | ||||||
Burberry Group PLC |
42,327 | 1,034,261 | ||||||
Compass Group PLC |
33,928 | 783,973 | ||||||
Diageo PLC |
65,810 | 2,906,123 | ||||||
London Stock Exchange Group PLC |
9,487 | 818,577 | ||||||
Reckitt Benckiser Group PLC |
26,899 | 1,871,337 | ||||||
Rolls-Royce Holdings PLC (b) |
580,979 | 650,459 | ||||||
Whitbread PLC |
16,988 | 528,482 | ||||||
WPP PLC |
90,105 | 894,549 | ||||||
| 10,003,049 | ||||||||
United States — 43.6% |
||||||||
3M Co. |
11,646 | 1,396,588 | ||||||
Abbott Laboratories |
19,559 | 2,147,383 | ||||||
Alphabet, Inc. Class A (b) |
20,145 | 1,777,393 | ||||||
American Express Co. |
11,666 | 1,723,651 | ||||||
Amphenol Corp. Class A |
12,940 | 985,252 | ||||||
Boston Scientific Corp. (b) |
52,967 | 2,450,783 | ||||||
Carrier Global Corp. |
8,851 | 365,104 | ||||||
The Charles Schwab Corp. |
32,019 | 2,665,902 | ||||||
Cognizant Technology Solutions Corp. Class A |
22,247 | 1,272,306 | ||||||
Colgate-Palmolive Co. |
10,769 | 848,489 | ||||||
Comcast Corp. Class A |
91,003 | 3,182,375 | ||||||
The Cooper Cos., Inc. |
3,837 | 1,268,781 | ||||||
eBay, Inc. |
23,583 | 977,987 | ||||||
Equifax, Inc. |
8,379 | 1,628,542 | ||||||
The accompanying notes are an integral part of the financial statements.
119
MML Global Fund – Portfolio of Investments (Continued) |
Number of |
Value |
|||||||
Fidelity National Information Services, Inc. |
23,179 | $ | 1,572,695 | |||||
Fiserv, Inc. (b) |
19,854 | 2,006,644 | ||||||
The Goldman Sachs Group, Inc. |
7,789 | 2,674,587 | ||||||
Honeywell International, Inc. |
15,213 | 3,260,146 | ||||||
International Flavors & Fragrances, Inc. |
18,277 | 1,916,161 | ||||||
Liberty Broadband Corp. Class C (b) |
20,449 | 1,559,645 | ||||||
Marriott International, Inc. Class A |
5,378 | 800,730 | ||||||
Microchip Technology, Inc. |
10,575 | 742,894 | ||||||
Omnicom Group, Inc. |
4,992 | 407,197 | ||||||
Oracle Corp. |
30,721 | 2,511,135 | ||||||
Otis Worldwide Corp. |
10,246 | 802,364 | ||||||
PayPal Holdings, Inc. (b) |
7,236 | 515,348 | ||||||
PPG Industries, Inc. |
12,077 | 1,518,562 | ||||||
Stryker Corp. |
10,541 | 2,577,169 | ||||||
Thermo Fisher Scientific, Inc. |
7,608 | 4,189,650 | ||||||
Union Pacific Corp. |
6,147 | 1,272,859 | ||||||
United Parcel Service, Inc. Class B |
8,225 | 1,429,834 | ||||||
Visa, Inc. Class A |
20,455 | 4,249,731 | ||||||
The Walt Disney Co. (b) |
18,560 | 1,612,493 | ||||||
Waters Corp. (b) |
3,792 | 1,299,063 | ||||||
Zimmer Biomet Holdings, Inc. |
5,708 | 727,770 | ||||||
| 60,337,213 | ||||||||
TOTAL COMMON STOCK (Cost $122,891,531) |
137,230,886 | |||||||
TOTAL EQUITIES (Cost $122,891,531) |
137,230,886 | |||||||
MUTUAL FUNDS — 2.1% |
||||||||
United States — 2.1% |
||||||||
State Street Navigator Securities Lending Government Money Market Portfolio (d) |
2,871,499 | 2,871,499 | ||||||
TOTAL MUTUAL FUNDS (Cost $2,871,499) |
2,871,499 | |||||||
WARRANTS — 0.1% |
||||||||
Switzerland — 0.1% |
||||||||
Cie Financiere Richemont SA, Expires 11/22/23, Strike 67.00 (b) |
105,484 | 87,842 | ||||||
TOTAL WARRANTS (Cost $0) |
87,842 | |||||||
TOTAL LONG-TERM INVESTMENTS (Cost $125,763,030) |
140,190,227 | |||||||
Principal |
Value |
|
SHORT-TERM INVESTMENTS — 0.4% |
||
Repurchase Agreement — 0.4% |
||
Fixed Income Clearing Corp., Repurchase Agreement, dated 12/30/22, 1.280%, due 1/03/23 (e) |
$ 570,957 |
$ 570,957 |
TOTAL SHORT-TERM INVESTMENTS (Cost $570,957) |
570,957 |
|
TOTAL INVESTMENTS — 101.7% (Cost $126,333,987) (f) |
140,761,184 |
|
Other Assets/(Liabilities) — (1.7)% |
(2,299,267) |
|
NET ASSETS — 100.0% |
$ 138,461,917 |
|
Notes to Portfolio of Investments
Percentages are stated as a percent of net assets.
|
(a) |
Denotes all or a portion of security on loan. The total value of securities on loan as of December 31, 2022, was $2,808,985 or 2.03% of net assets. |
|
(b) |
Non-income producing security. |
|
(c) |
Security is exempt from registration under Regulation S or Rule 144A of the Securities Act of 1933. These securities are considered restricted and may be resold in transactions exempt from registration. At December 31, 2022, the aggregate market value of these securities amounted to $1,036,239 or 0.75% of net assets. |
|
(d) |
Represents investment of security lending cash collateral. (Note 2). |
|
(e) |
Maturity value of $571,038. Collateralized by U.S. Government Agency obligations with a rate of 0.000%, maturity date of 6/29/23, and an aggregate market value, including accrued interest, of $582,441. |
|
(f) |
See Note 6 for aggregate cost for federal tax purposes. |
Sector weightings, as a percentage of net assets, is as follows:
Consumer, Non-cyclical |
34.1 | % | ||
Industrial |
17.8 | % | ||
Financial |
15.1 | % | ||
Technology |
10.1 | % | ||
Communications |
7.5 | % | ||
Consumer, Cyclical |
7.3 | % | ||
Basic Materials |
7.3 | % | ||
Mutual Funds |
2.1 | % | ||
Total Long-Term Investments |
101.3 | % | ||
Short-Term Investments and Other Assets and Liabilities |
(1.3 | )% | ||
Net Assets |
100.0 | % |
The accompanying notes are an integral part of the financial statements.
120
December 31, 2022 |
Number of |
Value |
|||||||
EQUITIES — 99.2% |
||||||||
COMMON STOCK — 99.2% |
||||||||
Basic Materials — 8.1% |
||||||||
Chemicals — 8.1% |
||||||||
Air Products & Chemicals, Inc. |
21,983 | $ | 6,776,479 | |||||
Axalta Coating Systems Ltd. (a) |
65,627 | 1,671,520 | ||||||
DuPont de Nemours, Inc. |
56,759 | 3,895,370 | ||||||
Element Solutions, Inc. |
75,420 | 1,371,890 | ||||||
International Flavors & Fragrances, Inc. |
37,958 | 3,979,517 | ||||||
| 17,694,776 | ||||||||
Communications — 2.6% |
||||||||
Media — 1.7% |
||||||||
Comcast Corp. Class A |
104,772 | 3,663,877 | ||||||
Telecommunications — 0.9% |
||||||||
T-Mobile US, Inc. (a) |
13,736 | 1,923,040 | ||||||
| 5,586,917 | ||||||||
Consumer, Cyclical — 6.1% |
||||||||
Auto Parts & Equipment — 0.5% |
||||||||
Aptiv PLC (a) |
11,691 | 1,088,783 | ||||||
Entertainment — 1.0% |
||||||||
Marriott Vacations Worldwide Corp. |
6,259 | 842,399 | ||||||
SeaWorld Entertainment, Inc. (a) |
25,212 | 1,349,094 | ||||||
| 2,191,493 | ||||||||
Food Services — 0.9% |
||||||||
Aramark |
45,500 | 1,880,970 | ||||||
Lodging — 1.4% |
||||||||
Las Vegas Sands Corp. (a) |
44,360 | 2,132,385 | ||||||
MGM Resorts International |
28,382 | 951,649 | ||||||
| 3,084,034 | ||||||||
Retail — 2.3% |
||||||||
Advance Auto Parts, Inc. |
17,332 | 2,548,324 | ||||||
Dollar General Corp. |
7,781 | 1,916,071 | ||||||
Lithia Motors, Inc. |
2,673 | 547,270 | ||||||
| 5,011,665 | ||||||||
| 13,256,945 | ||||||||
Consumer, Non-cyclical — 28.7% |
||||||||
Agriculture — 3.4% |
||||||||
Philip Morris International, Inc. |
73,946 | 7,484,075 | ||||||
Beverages — 2.5% |
||||||||
Coca-Cola Europacific Partners PLC |
63,635 | 3,520,288 | ||||||
Molson Coors Beverage Co. Class B |
36,761 | 1,893,927 | ||||||
| 5,414,215 | ||||||||
Biotechnology — 0.4% |
||||||||
Corteva, Inc. |
13,767 | 809,224 | ||||||
Number of |
Value |
|||||||
Cosmetics & Personal Care — 1.0% |
||||||||
The Procter & Gamble Co. |
14,428 | $ | 2,186,708 | |||||
Health Care – Products — 3.3% |
||||||||
Envista Holdings Corp. (a) |
30,376 | 1,022,760 | ||||||
Hologic, Inc. (a) |
17,703 | 1,324,362 | ||||||
LivaNova PLC (a) |
16,945 | 941,125 | ||||||
Medtronic PLC |
49,599 | 3,854,834 | ||||||
| 7,143,081 | ||||||||
Health Care – Services — 5.7% |
||||||||
Elevance Health, Inc. |
4,646 | 2,383,259 | ||||||
Humana, Inc. |
6,498 | 3,328,210 | ||||||
UnitedHealth Group, Inc. |
12,530 | 6,643,155 | ||||||
| 12,354,624 | ||||||||
Pharmaceuticals — 12.4% |
||||||||
Becton Dickinson and Co. |
9,647 | 2,453,232 | ||||||
Cigna Corp. |
17,147 | 5,681,487 | ||||||
CVS Health Corp. |
57,149 | 5,325,715 | ||||||
Johnson & Johnson |
10,521 | 1,858,535 | ||||||
Merck & Co., Inc. |
79,033 | 8,768,711 | ||||||
Perrigo Co. PLC |
82,173 | 2,801,278 | ||||||
| 26,888,958 | ||||||||
| 62,280,885 | ||||||||
Energy — 10.2% |
||||||||
Oil & Gas — 7.9% |
||||||||
Hess Corp. |
46,525 | 6,598,176 | ||||||
Phillips 66 |
67,328 | 7,007,498 | ||||||
Pioneer Natural Resources Co. |
9,413 | 2,149,835 | ||||||
Valero Energy Corp. |
11,567 | 1,467,390 | ||||||
| 17,222,899 | ||||||||
Oil & Gas Services — 0.9% |
||||||||
Halliburton Co. |
47,497 | 1,869,007 | ||||||
Pipelines — 1.4% |
||||||||
Enbridge, Inc. |
77,734 | 3,039,399 | ||||||
| 22,131,305 | ||||||||
Financial — 19.7% |
||||||||
Banks — 7.9% |
||||||||
JP Morgan Chase & Co. |
28,242 | 3,787,252 | ||||||
M&T Bank Corp. |
11,358 | 1,647,592 | ||||||
Northern Trust Corp. |
36,592 | 3,238,026 | ||||||
US Bancorp |
80,122 | 3,494,120 | ||||||
Wells Fargo & Co. |
119,337 | 4,927,425 | ||||||
| 17,094,415 | ||||||||
Diversified Financial Services — 0.9% |
||||||||
AerCap Holdings NV (a) |
18,026 | 1,051,276 | ||||||
American Express Co. |
6,314 | 932,894 | ||||||
| 1,984,170 | ||||||||
The accompanying notes are an integral part of the financial statements.
121
MML Income & Growth Fund – Portfolio of Investments (Continued) |
Number of |
Value |
|||||||
Insurance — 8.1% |
||||||||
The Allstate Corp. |
40,363 | $ | 5,473,223 | |||||
American International Group, Inc. |
29,333 | 1,855,019 | ||||||
Axis Capital Holdings Ltd. |
20,263 | 1,097,646 | ||||||
Berkshire Hathaway, Inc. Class B (a) |
5,601 | 1,730,149 | ||||||
Chubb Ltd. |
25,573 | 5,641,404 | ||||||
Willis Towers Watson PLC |
7,711 | 1,885,956 | ||||||
| 17,683,397 | ||||||||
Real Estate — 0.4% |
||||||||
The Howard Hughes Corp. (a) |
11,576 | 884,638 | ||||||
Real Estate Investment Trusts (REITS) — 2.4% |
||||||||
Corporate Office Properties Trust |
104,963 | 2,722,740 | ||||||
VICI Properties, Inc. |
75,305 | 2,439,882 | ||||||
| 5,162,622 | ||||||||
| 42,809,242 | ||||||||
Industrial — 11.8% |
||||||||
Aerospace & Defense — 4.1% |
||||||||
General Dynamics Corp. |
11,821 | 2,932,908 | ||||||
Raytheon Technologies Corp. |
60,818 | 6,137,753 | ||||||
| 9,070,661 | ||||||||
Building Materials — 0.9% |
||||||||
MDU Resources Group, Inc. |
63,693 | 1,932,446 | ||||||
Engineering & Construction — 0.9% |
||||||||
AECOM |
22,535 | 1,913,897 | ||||||
Hand & Machine Tools — 1.5% |
||||||||
Stanley Black & Decker, Inc. |
42,638 | 3,202,967 | ||||||
Machinery – Construction & Mining — 1.7% |
||||||||
BWX Technologies, Inc. |
29,148 | 1,692,916 | ||||||
Vertiv Holdings Co. |
143,135 | 1,955,224 | ||||||
| 3,648,140 | ||||||||
Machinery – Diversified — 1.9% |
||||||||
Deere & Co. |
9,523 | 4,083,081 | ||||||
Transportation — 0.8% |
||||||||
J.B. Hunt Transport Services, Inc. |
10,428 | 1,818,226 | ||||||
| 25,669,418 | ||||||||
Technology — 7.0% |
||||||||
Computers — 1.0% |
||||||||
CACI International, Inc. Class A (a) |
5,293 | 1,591,023 | ||||||
Cognizant Technology Solutions Corp. Class A |
12,330 | 705,153 | ||||||
| 2,296,176 | ||||||||
Semiconductors — 2.0% |
||||||||
Broadcom, Inc. |
3,438 | 1,922,289 | ||||||
Microchip Technology, Inc. |
17,039 | 1,196,990 | ||||||
QUALCOMM, Inc. |
10,949 | 1,203,733 | ||||||
| 4,323,012 | ||||||||
Number of |
Value |
|||||||
Software — 4.0% |
||||||||
Electronic Arts, Inc. |
13,746 | $ | 1,679,486 | |||||
Fidelity National Information Services, Inc. |
23,093 | 1,566,860 | ||||||
Oracle Corp. |
66,673 | 5,449,851 | ||||||
| 8,696,197 | ||||||||
| 15,315,385 | ||||||||
Utilities — 5.0% |
||||||||
Electric — 5.0% |
||||||||
CenterPoint Energy, Inc. |
52,497 | 1,574,385 | ||||||
Entergy Corp. |
37,009 | 4,163,512 | ||||||
Exelon Corp. |
33,898 | 1,465,411 | ||||||
Pinnacle West Capital Corp. |
48,488 | 3,687,027 | ||||||
| 10,890,335 | ||||||||
| 10,890,335 | ||||||||
TOTAL COMMON STOCK (Cost $177,148,319) |
215,635,208 | |||||||
TOTAL EQUITIES (Cost $177,148,319) |
215,635,208 | |||||||
TOTAL LONG-TERM INVESTMENTS (Cost $177,148,319) |
215,635,208 | |||||||
Principal |
||||||||
SHORT-TERM INVESTMENTS — 0.7% |
||||||||
Repurchase Agreement — 0.7% |
||||||||
Fixed Income Clearing Corp., Repurchase Agreement, dated 12/30/22, 1.280%, due 1/03/23 (b) |
$ | 1,489,257 | 1,489,257 | |||||
TOTAL SHORT-TERM INVESTMENTS (Cost $1,489,257) |
1,489,257 | |||||||
TOTAL INVESTMENTS — 99.9% (Cost $178,637,576) (c) |
217,124,465 | |||||||
Other Assets/(Liabilities) — 0.1% |
206,725 | |||||||
NET ASSETS — 100.0% |
$ | 217,331,190 | ||||||
The accompanying notes are an integral part of the financial statements.
122
MML Income & Growth Fund – Portfolio of Investments (Continued) |
Notes to Portfolio of Investments
Percentages are stated as a percent of net assets.
|
(a) |
Non-income producing security. |
|
(b) |
Maturity value of $1,489,469. Collateralized by U.S. Government Agency obligations with rates ranging from 0.000% - 3.000%, maturity dates ranging from 6/29/23 - 6/30/24, and an aggregate market value, including accrued interest, of $1,519,106. |
|
(c) |
See Note 6 for aggregate cost for federal tax purposes. |
The accompanying notes are an integral part of the financial statements.
123
December 31, 2022 |
Number of |
Value |
|||||||
EQUITIES — 98.2% |
||||||||
COMMON STOCK — 97.7% |
||||||||
Australia — 0.3% |
||||||||
Orica Ltd. |
53,586 | $ | 547,568 | |||||
Belgium — 1.1% |
||||||||
Anheuser-Busch InBev SA |
21,400 | 1,286,529 | ||||||
KBC Group NV |
15,487 | 994,378 | ||||||
| 2,280,907 | ||||||||
Canada — 3.4% |
||||||||
Canadian National Railway Co. |
18,800 | 2,234,944 | ||||||
Intact Financial Corp. |
7,723 | 1,111,736 | ||||||
Open Text Corp. |
40,600 | 1,203,008 | ||||||
Restaurant Brands International, Inc. |
4,500 | 291,015 | ||||||
Suncor Energy, Inc. |
30,349 | 962,695 | ||||||
The Toronto-Dominion Bank |
22,571 | 1,461,447 | ||||||
| 7,264,845 | ||||||||
Cayman Islands — 2.1% |
||||||||
Alibaba Group Holding Ltd. (a) |
133,440 | 1,473,333 | ||||||
NetEase, Inc. |
63,700 | 928,526 | ||||||
Tencent Holdings Ltd. |
33,700 | 1,432,324 | ||||||
Vipshop Holdings Ltd. ADR (a) |
51,164 | 697,877 | ||||||
| 4,532,060 | ||||||||
Denmark — 2.7% |
||||||||
Carlsberg A/S Class B |
9,558 | 1,265,254 | ||||||
DSV A/S |
5,180 | 821,580 | ||||||
Novo Nordisk A/S Class B |
26,815 | 3,630,750 | ||||||
| 5,717,584 | ||||||||
France — 17.9% |
||||||||
Accor SA (a) |
55,900 | 1,388,862 | ||||||
Air Liquide SA |
27,315 | 3,885,266 | ||||||
BNP Paribas SA |
44,776 | 2,548,083 | ||||||
Capgemini SE |
22,089 | 3,704,631 | ||||||
Cie de Saint-Gobain |
25,520 | 1,252,873 | ||||||
Cie Generale des Etablissements Michelin SCA |
34,564 | 961,118 | ||||||
Danone SA |
14,600 | 769,185 | ||||||
Dassault Systemes SE |
21,936 | 791,167 | ||||||
Edenred |
11,200 | 609,438 | ||||||
Engie SA |
138,389 | 1,982,290 | ||||||
EssilorLuxottica SA |
13,318 | 2,425,156 | ||||||
Kering SA |
2,225 | 1,138,716 | ||||||
L’Oreal SA |
3,117 | 1,118,201 | ||||||
Legrand SA |
15,789 | 1,271,290 | ||||||
LVMH Moet Hennessy Louis Vuitton SE |
4,988 | 3,623,507 | ||||||
Pernod Ricard SA |
13,094 | 2,573,751 | ||||||
Publicis Groupe SA |
18,051 | 1,146,254 | ||||||
Number of |
Value |
|||||||
Schneider Electric SE |
31,019 | $ | 4,362,495 | |||||
Valeo |
57,786 | 1,030,023 | ||||||
Worldline SA (a) (b) |
36,500 | 1,424,243 | ||||||
| 38,006,549 | ||||||||
Germany — 15.8% |
||||||||
adidas AG |
12,110 | 1,653,138 | ||||||
Allianz SE Registered |
9,100 | 1,956,738 | ||||||
Bayer AG Registered |
71,604 | 3,697,092 | ||||||
Bayerische Motoren Werke AG |
20,900 | 1,865,433 | ||||||
Beiersdorf AG |
23,207 | 2,663,041 | ||||||
Continental AG |
30,620 | 1,829,420 | ||||||
Daimler Truck Holding AG (a) |
47,449 | 1,470,125 | ||||||
Deutsche Boerse AG |
15,838 | 2,732,701 | ||||||
Fresenius Medical Care AG & Co. KGaA |
24,800 | 811,162 | ||||||
Fresenius SE & Co. KGaA |
59,700 | 1,679,652 | ||||||
Henkel AG & Co. KGaA |
16,100 | 1,038,364 | ||||||
Mercedes-Benz Group AG |
31,898 | 2,093,259 | ||||||
Merck KGaA |
15,047 | 2,914,005 | ||||||
MTU Aero Engines AG |
4,178 | 904,288 | ||||||
SAP SE |
40,275 | 4,156,356 | ||||||
Siemens AG Registered |
11,140 | 1,546,150 | ||||||
thyssenkrupp AG (a) |
115,674 | 705,847 | ||||||
| 33,716,771 | ||||||||
Hong Kong — 1.7% |
||||||||
AIA Group Ltd. |
321,000 | 3,536,458 | ||||||
India — 0.5% |
||||||||
Axis Bank Ltd. |
29,482 | 331,781 | ||||||
HDFC Bank Ltd. ADR |
11,690 | 799,713 | ||||||
| 1,131,494 | ||||||||
Ireland — 2.2% |
||||||||
Linde PLC (a) |
6,159 | 2,013,815 | ||||||
Ryanair Holdings PLC Sponsored ADR (a) |
36,929 | 2,760,812 | ||||||
| 4,774,627 | ||||||||
Israel — 0.9% |
||||||||
Check Point Software Technologies Ltd. (a) |
15,613 | 1,969,736 | ||||||
Italy — 2.7% |
||||||||
Eni SpA |
116,873 | 1,669,442 | ||||||
Intesa Sanpaolo SpA |
1,784,487 | 3,981,171 | ||||||
| 5,650,613 | ||||||||
Japan — 9.9% |
||||||||
Daikin Industries Ltd. |
13,700 | 2,107,465 | ||||||
Denso Corp. |
26,300 | 1,289,268 | ||||||
Fujitsu Ltd. |
3,900 | 516,469 | ||||||
Hitachi Ltd. |
60,900 | 3,064,783 | ||||||
Hoya Corp. |
17,100 | 1,654,514 | ||||||
The accompanying notes are an integral part of the financial statements.
124
MML International Equity Fund – Portfolio of Investments (Continued) |
Number of |
Value |
|||||||
Koito Manufacturing Co. Ltd. |
47,600 | $ | 709,039 | |||||
Komatsu Ltd. |
31,800 | 689,906 | ||||||
Kose Corp. (c) |
10,800 | 1,173,291 | ||||||
Kubota Corp. |
70,800 | 975,294 | ||||||
Kyocera Corp. |
32,700 | 1,631,872 | ||||||
Olympus Corp. |
94,600 | 1,672,121 | ||||||
Shin-Etsu Chemical Co. Ltd. |
6,400 | 779,747 | ||||||
SMC Corp. |
3,400 | 1,438,981 | ||||||
Sony Group Corp. |
24,200 | 1,845,393 | ||||||
Terumo Corp. |
52,700 | 1,490,295 | ||||||
| 21,038,438 | ||||||||
Mexico — 0.1% |
||||||||
Grupo Televisa SAB Sponsored ADR |
41,100 | 187,416 | ||||||
Netherlands — 4.9% |
||||||||
Akzo Nobel NV |
6,835 | 456,072 | ||||||
CNH Industrial NV |
105,253 | 1,690,380 | ||||||
EXOR NV (a) |
20,075 | 1,465,414 | ||||||
ING Groep NV |
156,394 | 1,908,071 | ||||||
Koninklijke Philips NV |
33,444 | 501,969 | ||||||
Prosus NV (a) |
27,523 | 1,889,604 | ||||||
QIAGEN NV (a) |
28,939 | 1,456,457 | ||||||
Randstad NV |
17,940 | 1,095,539 | ||||||
| 10,463,506 | ||||||||
Portugal — 0.6% |
||||||||
Galp Energia SGPS SA |
88,012 | 1,190,930 | ||||||
Republic of Korea — 0.6% |
||||||||
NAVER Corp. |
9,490 | 1,347,853 | ||||||
Singapore — 0.9% |
||||||||
DBS Group Holdings, Ltd. |
78,800 | 1,994,933 | ||||||
Spain — 0.9% |
||||||||
Amadeus IT Group SA (a) |
38,501 | 1,985,498 | ||||||
Sweden — 1.1% |
||||||||
Sandvik AB |
14,900 | 269,023 | ||||||
SKF AB Class B |
69,800 | 1,068,163 | ||||||
Volvo AB Class B |
52,170 | 944,624 | ||||||
| 2,281,810 | ||||||||
Switzerland — 13.2% |
||||||||
Cie Financiere Richemont SA Registered |
25,252 | 3,267,751 | ||||||
Credit Suisse Group AG Registered (a) |
242,809 | 729,511 | ||||||
Holcim AG (a) |
27,459 | 1,415,983 | ||||||
Julius Baer Group Ltd. (a) |
19,747 | 1,147,814 | ||||||
Nestle SA Registered |
45,163 | 5,215,671 | ||||||
Novartis AG Registered |
34,489 | 3,124,059 | ||||||
Roche Holding AG |
14,997 | 4,712,985 | ||||||
Schindler Holding AG |
2,360 | 443,134 | ||||||
Sika AG Registered |
5,217 | 1,258,807 | ||||||
Number of |
Value |
|||||||
Sonova Holding AG Registered |
2,717 | $ | 646,475 | |||||
The Swatch Group AG |
2,330 | 661,477 | ||||||
UBS Group AG Registered |
163,555 | 3,048,597 | ||||||
Zurich Insurance Group AG |
4,919 | 2,350,669 | ||||||
| 28,022,933 | ||||||||
Taiwan — 0.8% |
||||||||
Taiwan Semiconductor Manufacturing Co. Ltd. Sponsored ADR |
23,473 | 1,748,504 | ||||||
United Kingdom — 12.9% |
||||||||
Ashtead Group PLC |
12,700 | 725,509 | ||||||
Compass Group PLC |
140,568 | 3,248,098 | ||||||
Diageo PLC |
52,420 | 2,314,830 | ||||||
Experian PLC |
68,647 | 2,336,989 | ||||||
Glencore PLC |
181,844 | 1,215,950 | ||||||
Informa PLC |
93,400 | 700,250 | ||||||
Liberty Global PLC Class A (a) |
49,000 | 927,570 | ||||||
Lloyds Banking Group PLC |
3,716,884 | 2,041,063 | ||||||
London Stock Exchange Group PLC |
13,682 | 1,180,538 | ||||||
Prudential PLC |
197,298 | 2,669,962 | ||||||
Reckitt Benckiser Group PLC |
23,496 | 1,634,594 | ||||||
RELX PLC |
83,363 | 2,309,637 | ||||||
Rio Tinto PLC |
21,734 | 1,524,992 | ||||||
Rolls-Royce Holdings PLC (a) |
838,855 | 939,174 | ||||||
Schroders PLC |
236,417 | 1,242,767 | ||||||
Smiths Group PLC |
17,800 | 343,174 | ||||||
Tesco PLC |
439,320 | 1,191,113 | ||||||
WPP PLC |
101,092 | 1,003,626 | ||||||
| 27,549,836 | ||||||||
United States — 0.5% |
||||||||
Yum China Holdings, Inc. |
20,452 | 1,117,702 | ||||||
TOTAL COMMON STOCK (Cost $233,017,914) |
208,058,571 | |||||||
PREFERRED STOCK — 0.5% |
||||||||
Republic of Korea — 0.5% |
||||||||
Samsung Electronics Co. Ltd. 1.760% |
24,000 | 965,709 | ||||||
TOTAL PREFERRED STOCK (Cost $1,328,232) |
965,709 | |||||||
TOTAL EQUITIES (Cost $234,346,146) |
209,024,280 | |||||||
TOTAL LONG-TERM INVESTMENTS (Cost $234,346,146) |
209,024,280 | |||||||
The accompanying notes are an integral part of the financial statements.
125
MML International Equity Fund – Portfolio of Investments (Continued) |
Principal |
Value |
|||||||
SHORT-TERM INVESTMENTS — 1.6% |
||||||||
Repurchase Agreement — 1.6% |
||||||||
Fixed Income Clearing Corp., Repurchase Agreement, dated 12/30/22, 1.280%, due 1/03/23 (d) |
$ | 3,482,055 | $ | 3,482,055 | ||||
TOTAL SHORT-TERM INVESTMENTS (Cost $3,482,055) |
3,482,055 | |||||||
TOTAL INVESTMENTS — 99.8% (Cost $237,828,201) (e) |
212,506,335 | |||||||
Other Assets/(Liabilities) — 0.2% |
406,427 | |||||||
NET ASSETS — 100.0% |
$ | 212,912,762 | ||||||
Abbreviation Legend
|
ADR |
American Depositary Receipt |
Notes to Portfolio of Investments
Percentages are stated as a percent of net assets.
|
(a) |
Non-income producing security. |
|
(b) |
Security is exempt from registration under Regulation S or Rule 144A of the Securities Act of 1933. These securities are considered restricted and may be resold in transactions exempt from registration. At December 31, 2022, the aggregate market value of these securities amounted to $1,424,243 or 0.67% of net assets. |
|
(c) |
Denotes all or a portion of security on loan. The total value of securities on loan as of December 31, 2022, was $1,139,360 or 0.54% of net assets. The Fund received $1,197,608 of non-cash collateral (U.S. Treasury and/or Agency obligations) related to securities lending activity. This amount is not reflected on either the Portfolio of Investments or the Statement of Assets and Liabilities. (Note 2). |
|
(d) |
Maturity value of $3,482,551. Collateralized by U.S. Government Agency obligations with rates ranging from 0.000% - 2.875%, maturity dates ranging from 6/29/23 - 5/15/28, and an aggregate market value, including accrued interest, of $3,551,832. |
|
(e) |
See Note 6 for aggregate cost for federal tax purposes. |
Sector weightings, as a percentage of net assets, is as follows:
Consumer, Non-cyclical |
28.9 | % | ||
Financial |
18.4 | % | ||
Consumer, Cyclical |
15.6 | % | ||
Industrial |
15.0 | % | ||
Technology |
7.5 | % | ||
Communications |
5.1 | % | ||
Basic Materials |
5.0 | % | ||
Energy |
1.8 | % | ||
Utilities |
0.9 | % | ||
Total Long-Term Investments |
98.2 | % | ||
Short-Term Investments and Other Assets and Liabilities |
1.8 | % | ||
Net Assets |
100.0 | % |
The accompanying notes are an integral part of the financial statements.
126
December 31, 2022 |
Number of |
Value |
|||||||
EQUITIES — 99.6% |
||||||||
COMMON STOCK — 99.6% |
||||||||
Communications — 26.9% |
||||||||
Internet — 22.0% |
||||||||
Alibaba Group Holding Ltd. Sponsored ADR (a) |
24,037 | $ | 2,117,419 | |||||
Alphabet, Inc. Class A (a) |
52,400 | 4,623,252 | ||||||
Alphabet, Inc. Class C (a) |
48,819 | 4,331,710 | ||||||
Amazon.com, Inc. (a) |
74,460 | 6,254,640 | ||||||
Meta Platforms, Inc. Class A (a) |
62,451 | 7,515,354 | ||||||
Netflix, Inc. (a) |
20,540 | 6,056,835 | ||||||
Shopify, Inc. Class A (a) |
61,379 | 2,130,465 | ||||||
| 33,029,675 | ||||||||
Media — 4.9% |
||||||||
FactSet Research Systems, Inc. |
7,674 | 3,078,885 | ||||||
The Walt Disney Co. (a) |
49,836 | 4,329,752 | ||||||
| 7,408,637 | ||||||||
| 40,438,312 | ||||||||
Consumer, Cyclical — 8.1% |
||||||||
Auto Manufacturers — 2.8% |
||||||||
Tesla, Inc. (a) |
34,252 | 4,219,161 | ||||||
Retail — 5.3% |
||||||||
Starbucks Corp. |
40,831 | 4,050,435 | ||||||
Yum China Holdings, Inc. |
23,583 | 1,288,811 | ||||||
Yum! Brands, Inc. |
20,017 | 2,563,778 | ||||||
| 7,903,024 | ||||||||
| 12,122,185 | ||||||||
Consumer, Non-cyclical — 23.1% |
||||||||
Beverages — 4.1% |
||||||||
Monster Beverage Corp. (a) |
60,490 | 6,141,550 | ||||||
Biotechnology — 7.8% |
||||||||
Illumina, Inc. (a) |
13,849 | 2,800,268 | ||||||
Regeneron Pharmaceuticals, Inc. (a) |
5,726 | 4,131,251 | ||||||
Vertex Pharmaceuticals, Inc. (a) |
16,764 | 4,841,108 | ||||||
| 11,772,627 | ||||||||
Commercial Services — 2.7% |
||||||||
Block, Inc. (a) |
30,896 | 1,941,505 | ||||||
PayPal Holdings, Inc. (a) |
30,405 | 2,165,444 | ||||||
| 4,106,949 | ||||||||
Health Care – Products — 1.6% |
||||||||
Intuitive Surgical, Inc. (a) |
8,891 | 2,359,227 | ||||||
Pharmaceuticals — 6.9% |
||||||||
Novartis AG Sponsored ADR |
47,176 | 4,279,807 | ||||||
Novo Nordisk A/S Sponsored ADR |
21,742 | 2,942,562 | ||||||
Number of |
Value |
|||||||
Roche Holding AG Sponsored ADR |
79,126 | $ | 3,097,783 | |||||
| 10,320,152 | ||||||||
| 34,700,505 | ||||||||
Financial — 8.4% |
||||||||
Diversified Financial Services — 8.4% |
||||||||
SEI Investments Co. |
43,558 | 2,539,431 | ||||||
Visa, Inc. Class A |
48,479 | 10,071,997 | ||||||
| 12,611,428 | ||||||||
| 12,611,428 | ||||||||
Industrial — 9.3% |
||||||||
Aerospace & Defense — 6.4% |
||||||||
The Boeing Co. (a) |
50,117 | 9,546,787 | ||||||
Machinery – Diversified — 1.0% |
||||||||
Deere & Co. |
3,612 | 1,548,681 | ||||||
Transportation — 1.9% |
||||||||
Expeditors International of Washington, Inc. |
27,093 | 2,815,505 | ||||||
| 13,910,973 | ||||||||
Technology — 23.8% |
||||||||
Semiconductors — 6.7% |
||||||||
NVIDIA Corp. |
47,842 | 6,991,630 | ||||||
QUALCOMM, Inc. |
28,192 | 3,099,428 | ||||||
| 10,091,058 | ||||||||
Software — 17.1% |
||||||||
Autodesk, Inc. (a) |
29,170 | 5,450,998 | ||||||
Microsoft Corp. |
31,134 | 7,466,556 | ||||||
Oracle Corp. |
87,993 | 7,192,548 | ||||||
Salesforce, Inc. (a) |
29,286 | 3,883,031 | ||||||
Workday, Inc. Class A (a) |
10,264 | 1,717,475 | ||||||
| 25,710,608 | ||||||||
| 35,801,666 | ||||||||
TOTAL COMMON STOCK (Cost $154,463,908) |
149,585,069 | |||||||
TOTAL EQUITIES (Cost $154,463,908) |
149,585,069 | |||||||
TOTAL LONG-TERM INVESTMENTS (Cost $154,463,908) |
149,585,069 | |||||||
The accompanying notes are an integral part of the financial statements.
127
MML Large Cap Growth Fund – Portfolio of Investments (Continued) |
Principal |
Value |
|||||||
SHORT-TERM INVESTMENTS — 0.6% |
||||||||
Repurchase Agreement — 0.6% |
||||||||
Fixed Income Clearing Corp., Repurchase Agreement, dated 12/30/22, 1.280%, due 1/03/23 (b) |
$ | 866,700 | $ | 866,700 | ||||
TOTAL SHORT-TERM INVESTMENTS (Cost $866,700) |
866,700 | |||||||
TOTAL INVESTMENTS — 100.2% (Cost $155,330,608) (c) |
150,451,769 | |||||||
Other Assets/(Liabilities) — (0.2)% |
(265,537 | ) | ||||||
NET ASSETS — 100.0% |
$ | 150,186,232 | ||||||
Abbreviation Legend
|
ADR |
American Depositary Receipt |
Notes to Portfolio of Investments
Percentages are stated as a percent of net assets.
|
(a) |
Non-income producing security. |
|
(b) |
Maturity value of $866,823. Collateralized by U.S. Government Agency obligations with a rate of 0.000%, maturity date of 6/29/23, and an aggregate market value, including accrued interest, of $884,067. |
|
(c) |
See Note 6 for aggregate cost for federal tax purposes. |
The accompanying notes are an integral part of the financial statements.
128
December 31, 2022 |
Number of |
Value |
|||||||
EQUITIES — 98.4% |
||||||||
COMMON STOCK — 98.4% |
||||||||
Basic Materials — 2.1% |
||||||||
Chemicals — 1.7% |
||||||||
Air Products & Chemicals, Inc. (a) |
685 | $ | 211,159 | |||||
Albemarle Corp. (a) |
369 | 80,021 | ||||||
Celanese Corp. (a) |
307 | 31,388 | ||||||
CF Industries Holdings, Inc. (a) |
627 | 53,420 | ||||||
Dow, Inc. (a) |
2,175 | 109,598 | ||||||
DuPont de Nemours, Inc. (a) |
1,606 | 110,220 | ||||||
Eastman Chemical Co. (a) |
327 | 26,631 | ||||||
Ecolab, Inc. (a) |
799 | 116,303 | ||||||
FMC Corp. (a) |
385 | 48,048 | ||||||
International Flavors & Fragrances, Inc. (a) |
794 | 83,243 | ||||||
Linde PLC (a) |
1,555 | 507,210 | ||||||
LyondellBasell Industries NV Class A (a) |
781 | 64,846 | ||||||
The Mosaic Co. (a) |
1,085 | 47,599 | ||||||
PPG Industries, Inc. (a) |
760 | 95,562 | ||||||
The Sherwin-Williams Co. (a) |
731 | 173,488 | ||||||
| 1,758,736 | ||||||||
Forest Products & Paper — 0.0% |
||||||||
International Paper Co. (a) |
1,124 | 38,924 | ||||||
Iron & Steel — 0.1% |
||||||||
Nucor Corp. (a) |
835 | 110,061 | ||||||
Mining — 0.3% |
||||||||
Freeport-McMoRan, Inc. (a) |
4,489 | 170,582 | ||||||
Newmont Corp. (a) |
2,448 | 115,546 | ||||||
| 286,128 | ||||||||
| 2,193,849 | ||||||||
Communications — 10.7% |
||||||||
Advertising — 0.1% |
||||||||
The Interpublic Group of Cos., Inc. (a) |
1,250 | 41,638 | ||||||
Omnicom Group, Inc. (a) |
632 | 51,552 | ||||||
| 93,190 | ||||||||
Internet — 7.2% |
||||||||
Alphabet, Inc. Class A (a) (b) |
18,725 | 1,652,107 | ||||||
Alphabet, Inc. Class C (a) (b) |
16,698 | 1,481,614 | ||||||
Amazon.com, Inc. (a) (b) |
27,892 | 2,342,928 | ||||||
Booking Holdings, Inc. (a) (b) |
122 | 245,864 | ||||||
CDW Corp. (a) |
445 | 79,468 | ||||||
eBay, Inc. (a) |
1,792 | 74,314 | ||||||
Etsy, Inc. (a) (b) |
397 | 47,553 | ||||||
Expedia Group, Inc. (a) (b) |
474 | 41,522 | ||||||
F5, Inc. (a) (b) |
177 | 25,401 | ||||||
Gen Digital, Inc. (a) |
1,956 | 41,917 | ||||||
Number of |
Value |
|||||||
Match Group, Inc. (a) (b) |
854 | $ | 35,432 | |||||
Meta Platforms, Inc. Class A (a) (b) |
7,072 | 851,045 | ||||||
Netflix, Inc. (a) (b) |
1,387 | 408,999 | ||||||
VeriSign, Inc. (a) (b) |
277 | 56,907 | ||||||
| 7,385,071 | ||||||||
Media — 1.3% |
||||||||
Charter Communications, Inc. Class A (a) (b) |
337 | 114,277 | ||||||
Comcast Corp. Class A (a) |
13,680 | 478,390 | ||||||
DISH Network Corp. Class A (a) (b) |
884 | 12,411 | ||||||
FactSet Research Systems, Inc. (a) |
117 | 46,941 | ||||||
Fox Corp. Class A (a) |
576 | 17,493 | ||||||
Fox Corp. Class B (a) |
837 | 23,813 | ||||||
News Corp. Class A (a) |
837 | 15,233 | ||||||
News Corp. Class B (a) |
716 | 13,203 | ||||||
Paramount Global Class B (a) |
1,595 | 26,924 | ||||||
The Walt Disney Co. (a) (b) |
5,668 | 492,436 | ||||||
Warner Bros Discovery, Inc. (a) (b) |
6,976 | 66,132 | ||||||
| 1,307,253 | ||||||||
Telecommunications — 2.1% |
||||||||
Arista Networks, Inc. (a) (b) |
772 | 93,682 | ||||||
AT&T, Inc. (a) |
22,183 | 408,389 | ||||||
Cisco Systems, Inc. (a) |
12,927 | 615,842 | ||||||
Corning, Inc. (a) |
2,489 | 79,499 | ||||||
Juniper Networks, Inc. (a) |
1,049 | 33,526 | ||||||
Lumen Technologies, Inc. (a) |
3,054 | 15,942 | ||||||
Motorola Solutions, Inc. (a) |
513 | 132,205 | ||||||
T-Mobile US, Inc. (a) (b) |
1,906 | 266,840 | ||||||
Verizon Communications, Inc. (a) |
13,067 | 514,840 | ||||||
| 2,160,765 | ||||||||
| 10,946,279 | ||||||||
Consumer, Cyclical — 8.9% |
||||||||
Airlines — 0.2% |
||||||||
Alaska Air Group, Inc. (a) (b) |
399 | 17,133 | ||||||
American Airlines Group, Inc. (a) (b) |
2,059 | 26,190 | ||||||
Delta Air Lines, Inc. (a) (b) |
2,045 | 67,199 | ||||||
Southwest Airlines Co. (a) (b) |
1,855 | 62,458 | ||||||
United Airlines Holdings, Inc. (a) (b) |
999 | 37,662 | ||||||
| 210,642 | ||||||||
Apparel — 0.5% |
||||||||
NIKE, Inc. Class B (a) |
3,924 | 459,147 | ||||||
Ralph Lauren Corp. (a) |
120 | 12,680 | ||||||
Tapestry, Inc. (a) |
845 | 32,178 | ||||||
VF Corp. (a) |
995 | 27,472 | ||||||
| 531,477 | ||||||||
Auto Manufacturers — 1.5% |
||||||||
Cummins, Inc. (a) |
444 | 107,577 | ||||||
The accompanying notes are an integral part of the financial statements.
129
MML Managed Volatility Fund – Portfolio of Investments (Continued) |
Number of |
Value |
|||||||
Ford Motor Co. (a) |
12,468 | $ | 145,003 | |||||
General Motors Co. (a) |
4,456 | 149,900 | ||||||
PACCAR, Inc. (a) |
1,033 | 102,236 | ||||||
Tesla, Inc. (a) (b) |
8,439 | 1,039,516 | ||||||
| 1,544,232 | ||||||||
Auto Parts & Equipment — 0.1% |
||||||||
Aptiv PLC (a) (b) |
865 | 80,558 | ||||||
BorgWarner, Inc. (a) |
693 | 27,893 | ||||||
| 108,451 | ||||||||
Distribution & Wholesale — 0.3% |
||||||||
Copart, Inc. (a) (b) |
1,320 | 80,375 | ||||||
Fastenal Co. (a) |
1,825 | 86,359 | ||||||
LKQ Corp. (a) |
804 | 42,942 | ||||||
Pool Corp. (a) |
122 | 36,884 | ||||||
W.W. Grainger, Inc. (a) |
145 | 80,656 | ||||||
| 327,216 | ||||||||
Entertainment — 0.1% |
||||||||
Caesars Entertainment, Inc. (a) (b) |
688 | 28,621 | ||||||
Live Nation Entertainment, Inc. (a) (b) |
465 | 32,429 | ||||||
| 61,050 | ||||||||
Home Builders — 0.2% |
||||||||
D.R. Horton, Inc. (a) |
963 | 85,842 | ||||||
Lennar Corp. Class A (a) |
816 | 73,848 | ||||||
NVR, Inc. (a) (b) |
10 | 46,126 | ||||||
PulteGroup, Inc. (a) |
696 | 31,689 | ||||||
| 237,505 | ||||||||
Home Furnishing — 0.0% |
||||||||
Whirlpool Corp. (a) |
154 | 21,785 | ||||||
Housewares — 0.0% |
||||||||
Newell Brands, Inc. (a) |
1,080 | 14,126 | ||||||
Leisure Time — 0.1% |
||||||||
Carnival Corp. (a) (b) |
3,073 | 24,769 | ||||||
Norwegian Cruise Line Holdings Ltd. (a) (b) |
1,239 | 15,165 | ||||||
Royal Caribbean Cruises Ltd. (a) (b) |
724 | 35,787 | ||||||
| 75,721 | ||||||||
Lodging — 0.4% |
||||||||
Hilton Worldwide Holdings, Inc. (a) |
809 | 102,225 | ||||||
Las Vegas Sands Corp. (a) (b) |
1,035 | 49,752 | ||||||
Marriott International, Inc. Class A (a) |
868 | 129,237 | ||||||
MGM Resorts International (a) |
1,068 | 35,810 | ||||||
Wynn Resorts Ltd. (a) (b) |
313 | 25,813 | ||||||
| 342,837 | ||||||||
Retail — 5.5% |
||||||||
Advance Auto Parts, Inc. (a) |
186 | 27,347 | ||||||
AutoZone, Inc. (a) (b) |
60 | 147,971 | ||||||
Bath & Body Works, Inc. (a) |
701 | 29,540 | ||||||
Number of |
Value |
|||||||
Best Buy Co., Inc. (a) |
634 | $ | 50,853 | |||||
CarMax, Inc. (a) (b) |
465 | 28,314 | ||||||
Chipotle Mexican Grill, Inc. (a) (b) |
88 | 122,099 | ||||||
Costco Wholesale Corp. (a) |
1,378 | 629,057 | ||||||
Darden Restaurants, Inc. (a) |
387 | 53,534 | ||||||
Dollar General Corp. (a) |
717 | 176,561 | ||||||
Dollar Tree, Inc. (a) (b) |
666 | 94,199 | ||||||
Domino’s Pizza, Inc. (a) |
115 | 39,836 | ||||||
Genuine Parts Co. (a) |
410 | 71,139 | ||||||
The Home Depot, Inc. (a) |
3,207 | 1,012,963 | ||||||
Lowe’s Cos., Inc. (a) |
1,944 | 387,322 | ||||||
McDonald’s Corp. (a) |
2,292 | 604,011 | ||||||
O’Reilly Automotive, Inc. (a) (b) |
201 | 169,650 | ||||||
Ross Stores, Inc. (a) |
1,114 | 129,302 | ||||||
Starbucks Corp. (a) |
3,564 | 353,549 | ||||||
Target Corp. (a) |
1,466 | 218,493 | ||||||
The TJX Cos., Inc. (a) |
3,622 | 288,311 | ||||||
Tractor Supply Co. (a) |
349 | 78,514 | ||||||
Ulta Beauty, Inc. (a) (b) |
167 | 78,335 | ||||||
Walgreens Boots Alliance, Inc. (a) |
2,335 | 87,236 | ||||||
Walmart, Inc. (a) |
4,447 | 630,540 | ||||||
Yum! Brands, Inc. (a) |
920 | 117,834 | ||||||
| 5,626,510 | ||||||||
Toys, Games & Hobbies — 0.0% |
||||||||
Hasbro, Inc. (a) |
432 | 26,356 | ||||||
| 9,127,908 | ||||||||
Consumer, Non-cyclical — 23.1% |
||||||||
Agriculture — 0.9% |
||||||||
Altria Group, Inc. (a) |
5,663 | 258,856 | ||||||
Archer-Daniels-Midland Co. (a) |
1,770 | 164,344 | ||||||
Philip Morris International, Inc. (a) |
4,813 | 487,124 | ||||||
| 910,324 | ||||||||
Beverages — 1.9% |
||||||||
Brown-Forman Corp. Class B (a) |
604 | 39,671 | ||||||
The Coca-Cola Co. (a) |
12,241 | 778,650 | ||||||
Constellation Brands, Inc. Class A (a) |
498 | 115,411 | ||||||
Keurig Dr Pepper, Inc. (a) |
2,676 | 95,426 | ||||||
Molson Coors Beverage Co. Class B (a) |
613 | 31,582 | ||||||
Monster Beverage Corp. (a) (b) |
1,183 | 120,110 | ||||||
PepsiCo, Inc. (a) |
4,308 | 778,283 | ||||||
| 1,959,133 | ||||||||
Biotechnology — 1.8% |
||||||||
Amgen, Inc. (a) |
1,665 | 437,296 | ||||||
Bio-Rad Laboratories, Inc. Class A (a) (b) |
72 | 30,275 | ||||||
Biogen, Inc. (a) (b) |
459 | 127,106 | ||||||
Corteva, Inc. (a) |
2,261 | 132,902 | ||||||
The accompanying notes are an integral part of the financial statements.
130
MML Managed Volatility Fund – Portfolio of Investments (Continued) |
Number of |
Value |
|||||||
Gilead Sciences, Inc. (a) |
3,962 | $ | 340,138 | |||||
Illumina, Inc. (a) (b) |
485 | 98,067 | ||||||
Incyte Corp. (a) (b) |
544 | 43,694 | ||||||
Moderna, Inc. (a) (b) |
1,040 | 186,805 | ||||||
Regeneron Pharmaceuticals, Inc. (a) (b) |
339 | 244,585 | ||||||
Vertex Pharmaceuticals, Inc. (a) (b) |
812 | 234,489 | ||||||
| 1,875,357 | ||||||||
Commercial Services — 1.8% |
||||||||
Automatic Data Processing, Inc. (a) |
1,315 | 314,101 | ||||||
Cintas Corp. (a) |
267 | 120,582 | ||||||
CoStar Group, Inc. (a) (b) |
1,253 | 96,832 | ||||||
Equifax, Inc. (a) |
371 | 72,108 | ||||||
FleetCor Technologies, Inc. (a) (b) |
236 | 43,348 | ||||||
Gartner, Inc. (a) (b) |
248 | 83,363 | ||||||
Global Payments, Inc. (a) |
844 | 83,826 | ||||||
MarketAxess Holdings, Inc. (a) |
123 | 34,303 | ||||||
Moody’s Corp. (a) |
501 | 139,589 | ||||||
PayPal Holdings, Inc. (a) (b) |
3,596 | 256,107 | ||||||
Quanta Services, Inc. (a) |
460 | 65,550 | ||||||
Robert Half International, Inc. (a) |
357 | 26,357 | ||||||
Rollins, Inc. (a) |
750 | 27,405 | ||||||
S&P Global, Inc. (a) |
1,050 | 351,687 | ||||||
United Rentals, Inc. (a) (b) |
218 | 77,482 | ||||||
Verisk Analytics, Inc. (a) |
517 | 91,209 | ||||||
| 1,883,849 | ||||||||
Cosmetics & Personal Care — 1.5% |
||||||||
Colgate-Palmolive Co. (a) |
2,614 | 205,957 | ||||||
The Estee Lauder Cos., Inc. Class A (a) |
717 | 177,895 | ||||||
The Procter & Gamble Co. (a) |
7,460 | 1,130,638 | ||||||
| 1,514,490 | ||||||||
Food — 1.3% |
||||||||
Campbell Soup Co. (a) |
671 | 38,079 | ||||||
Conagra Brands, Inc. (a) |
1,475 | 57,083 | ||||||
General Mills, Inc. (a) |
1,791 | 150,175 | ||||||
The Hershey Co. (a) |
457 | 105,828 | ||||||
Hormel Foods Corp. (a) |
937 | 42,680 | ||||||
The J.M. Smucker Co. (a) |
332 | 52,609 | ||||||
Kellogg Co. (a) |
852 | 60,697 | ||||||
The Kraft Heinz Co. (a) |
2,533 | 103,118 | ||||||
The Kroger Co. (a) |
2,109 | 94,019 | ||||||
Lamb Weston Holdings, Inc. (a) |
473 | 42,267 | ||||||
McCormick & Co., Inc. (a) |
805 | 66,727 | ||||||
Mondelez International, Inc. Class A (a) |
4,309 | 287,195 | ||||||
Sysco Corp. (a) |
1,542 | 117,886 | ||||||
Number of |
Value |
|||||||
Tyson Foods, Inc. Class A (a) |
897 | $ | 55,838 | |||||
| 1,274,201 | ||||||||
Health Care – Products — 3.8% |
||||||||
Abbott Laboratories (a) |
5,456 | 599,014 | ||||||
Align Technology, Inc. (a) (b) |
226 | 47,663 | ||||||
Baxter International, Inc. (a) |
1,605 | 81,807 | ||||||
Bio-Techne Corp. (a) |
520 | 43,098 | ||||||
Boston Scientific Corp. (a) (b) |
4,388 | 203,033 | ||||||
The Cooper Cos., Inc. (a) |
154 | 50,923 | ||||||
Danaher Corp. (a) |
2,067 | 548,623 | ||||||
Dentsply Sirona, Inc. (a) |
744 | 23,689 | ||||||
Edwards Lifesciences Corp. (a) (b) |
1,948 | 145,340 | ||||||
Hologic, Inc. (a) (b) |
755 | 56,482 | ||||||
IDEXX Laboratories, Inc. (a) (b) |
268 | 109,333 | ||||||
Intuitive Surgical, Inc. (a) (b) |
1,126 | 298,784 | ||||||
Medtronic PLC (a) |
4,194 | 325,958 | ||||||
PerkinElmer, Inc. (a) |
384 | 53,844 | ||||||
ResMed, Inc. (a) |
459 | 95,532 | ||||||
Steris PLC (a) |
311 | 57,439 | ||||||
Stryker Corp. (a) |
1,038 | 253,781 | ||||||
Teleflex, Inc. (a) |
159 | 39,691 | ||||||
Thermo Fisher Scientific, Inc. (a) |
1,237 | 681,203 | ||||||
Waters Corp. (a) (b) |
193 | 66,118 | ||||||
West Pharmaceutical Services, Inc. (a) |
224 | 52,718 | ||||||
Zimmer Biomet Holdings, Inc. (a) |
652 | 83,130 | ||||||
| 3,917,203 | ||||||||
Health Care – Services — 2.8% |
||||||||
Catalent, Inc. (a) (b) |
554 | 24,936 | ||||||
Centene Corp. (a) (b) |
1,801 | 147,700 | ||||||
Charles River Laboratories International, Inc. (a) (b) |
154 | 33,557 | ||||||
DaVita, Inc. (a) (b) |
189 | 14,113 | ||||||
Elevance Health, Inc. (a) |
743 | 381,137 | ||||||
HCA Healthcare, Inc. (a) |
667 | 160,053 | ||||||
Humana, Inc. (a) |
400 | 204,876 | ||||||
IQVIA Holdings, Inc. (a) (b) |
571 | 116,992 | ||||||
Laboratory Corp. of America Holdings (a) |
286 | 67,347 | ||||||
Molina Healthcare, Inc. (a) (b) |
182 | 60,100 | ||||||
Quest Diagnostics, Inc. (a) |
364 | 56,944 | ||||||
UnitedHealth Group, Inc. (a) |
2,935 | 1,556,078 | ||||||
Universal Health Services, Inc. Class B (a) |
225 | 31,700 | ||||||
| 2,855,533 | ||||||||
Household Products & Wares — 0.3% |
||||||||
Avery Dennison Corp. (a) |
274 | 49,594 | ||||||
Church & Dwight Co., Inc. (a) |
736 | 59,329 | ||||||
The Clorox Co. (a) |
380 | 53,326 | ||||||
The accompanying notes are an integral part of the financial statements.
131
MML Managed Volatility Fund – Portfolio of Investments (Continued) |
Number of |
Value |
|||||||
Kimberly-Clark Corp. (a) |
1,091 | $ | 148,103 | |||||
| 310,352 | ||||||||
Pharmaceuticals — 7.0% |
||||||||
AbbVie, Inc. (a) |
5,560 | 898,552 | ||||||
AmerisourceBergen Corp. (a) |
501 | 83,021 | ||||||
Becton Dickinson and Co. (a) |
898 | 228,361 | ||||||
Bristol-Myers Squibb Co. (a) |
6,649 | 478,395 | ||||||
Cardinal Health, Inc. (a) |
846 | 65,032 | ||||||
Cigna Corp. (a) |
964 | 319,412 | ||||||
CVS Health Corp. (a) |
4,083 | 380,495 | ||||||
DexCom, Inc. (a) (b) |
1,237 | 140,078 | ||||||
Eli Lilly & Co. (a) |
2,478 | 906,551 | ||||||
Henry Schein, Inc. (a) (b) |
411 | 32,826 | ||||||
Johnson & Johnson (a) |
8,223 | 1,452,593 | ||||||
McKesson Corp. (a) |
457 | 171,430 | ||||||
Merck & Co., Inc. (a) |
7,908 | 877,393 | ||||||
Organon & Co. (a) |
877 | 24,495 | ||||||
Pfizer, Inc. (a) |
17,649 | 904,335 | ||||||
Viatris, Inc. (a) |
4,019 | 44,731 | ||||||
Zoetis, Inc. (a) |
1,475 | 216,161 | ||||||
| 7,223,861 | ||||||||
| 23,724,303 | ||||||||
Energy — 5.4% |
||||||||
Energy – Alternate Sources — 0.2% |
||||||||
Enphase Energy, Inc. (a) (b) |
422 | 111,813 | ||||||
First Solar, Inc. (a) (b) |
308 | 46,136 | ||||||
SolarEdge Technologies, Inc. (a) (b) |
178 | 50,422 | ||||||
| 208,371 | ||||||||
Oil & Gas — 4.4% |
||||||||
APA Corp. (a) |
1,038 | 48,454 | ||||||
Chevron Corp. (a) |
5,583 | 1,002,093 | ||||||
ConocoPhillips (a) |
3,956 | 466,808 | ||||||
Coterra Energy, Inc. (a) |
2,511 | 61,695 | ||||||
Devon Energy Corp. (a) |
2,058 | 126,587 | ||||||
Diamondback Energy, Inc. (a) |
552 | 75,502 | ||||||
EOG Resources, Inc. (a) |
1,812 | 234,690 | ||||||
EQT Corp. (a) |
1,130 | 38,228 | ||||||
Exxon Mobil Corp. (a) |
12,916 | 1,424,635 | ||||||
Hess Corp. (a) |
874 | 123,951 | ||||||
Marathon Oil Corp. (a) |
2,095 | 56,712 | ||||||
Marathon Petroleum Corp. (a) |
1,454 | 169,231 | ||||||
Occidental Petroleum Corp. (a) |
2,270 | 142,987 | ||||||
Phillips 66 (a) |
1,514 | 157,577 | ||||||
Pioneer Natural Resources Co. (a) |
761 | 173,805 | ||||||
Valero Energy Corp. (a) |
1,201 | 152,359 | ||||||
| 4,455,314 | ||||||||
Number of |
Value |
|||||||
Oil & Gas Services — 0.4% |
||||||||
Baker Hughes Co. (a) |
3,093 | $ | 91,336 | |||||
Halliburton Co. (a) |
2,831 | 111,400 | ||||||
Schlumberger NV (a) |
4,470 | 238,966 | ||||||
| 441,702 | ||||||||
Pipelines — 0.4% |
||||||||
Kinder Morgan, Inc. (a) |
6,260 | 113,181 | ||||||
ONEOK, Inc. (a) |
1,351 | 88,761 | ||||||
Targa Resources Corp. (a) |
686 | 50,421 | ||||||
The Williams Cos., Inc. (a) |
3,927 | 129,198 | ||||||
| 381,561 | ||||||||
| 5,486,948 | ||||||||
Financial — 15.4% |
||||||||
Banks — 4.7% |
||||||||
Bank of America Corp. (a) |
21,823 | 722,778 | ||||||
The Bank of New York Mellon Corp. (a) |
2,303 | 104,833 | ||||||
Citigroup, Inc. (a) |
6,117 | 276,672 | ||||||
Citizens Financial Group, Inc. (a) |
1,470 | 57,874 | ||||||
Comerica, Inc. (a) |
420 | 28,077 | ||||||
Fifth Third Bancorp (a) |
2,107 | 69,131 | ||||||
First Republic Bank (a) |
586 | 71,427 | ||||||
The Goldman Sachs Group, Inc. (a) |
1,078 | 370,164 | ||||||
Huntington Bancshares, Inc. (a) |
4,405 | 62,110 | ||||||
JP Morgan Chase & Co. (a) |
9,229 | 1,237,609 | ||||||
KeyCorp. (a) |
2,789 | 48,584 | ||||||
M&T Bank Corp. (a) |
572 | 82,974 | ||||||
Morgan Stanley (a) |
4,156 | 353,343 | ||||||
Northern Trust Corp. (a) |
660 | 58,403 | ||||||
The PNC Financial Services Group, Inc. (a) |
1,292 | 204,058 | ||||||
Regions Financial Corp. (a) |
2,764 | 59,592 | ||||||
Signature Bank (a) |
210 | 24,196 | ||||||
State Street Corp. (a) |
1,152 | 89,361 | ||||||
SVB Financial Group (a) (b) |
197 | 45,338 | ||||||
Truist Financial Corp. (a) |
4,164 | 179,177 | ||||||
US Bancorp (a) |
4,181 | 182,333 | ||||||
Wells Fargo & Co. (a) |
12,000 | 495,480 | ||||||
Zions Bancorp NA (a) |
473 | 23,253 | ||||||
| 4,846,767 | ||||||||
Diversified Financial Services — 3.9% |
||||||||
American Express Co. (a) |
1,865 | 275,554 | ||||||
Ameriprise Financial, Inc. (a) |
334 | 103,998 | ||||||
BlackRock, Inc. (a) |
466 | 330,222 | ||||||
Capital One Financial Corp. (a) |
1,176 | 109,321 | ||||||
Cboe Global Markets, Inc. (a) |
326 | 40,903 | ||||||
The Charles Schwab Corp. (a) |
4,761 | 396,401 | ||||||
CME Group, Inc. (a) |
1,137 | 191,198 | ||||||
The accompanying notes are an integral part of the financial statements.
132
MML Managed Volatility Fund – Portfolio of Investments (Continued) |
Number of |
Value |
|||||||
Discover Financial Services (a) |
818 | $ | 80,025 | |||||
Franklin Resources, Inc. (a) |
962 | 25,377 | ||||||
Intercontinental Exchange, Inc. (a) |
1,761 | 180,661 | ||||||
Invesco Ltd. (a) |
1,194 | 21,480 | ||||||
Mastercard, Inc. Class A (a) |
2,663 | 926,005 | ||||||
Nasdaq, Inc. (a) |
1,089 | 66,810 | ||||||
Raymond James Financial, Inc. (a) |
602 | 64,324 | ||||||
Synchrony Financial (a) |
1,598 | 52,510 | ||||||
T. Rowe Price Group, Inc. (a) |
684 | 74,597 | ||||||
Visa, Inc. Class A (a) |
5,138 | 1,067,471 | ||||||
| 4,006,857 | ||||||||
Insurance — 4.1% |
||||||||
Aflac, Inc. (a) |
1,789 | 128,701 | ||||||
The Allstate Corp. (a) |
819 | 111,056 | ||||||
American International Group, Inc. (a) |
2,301 | 145,515 | ||||||
Aon PLC Class A (a) |
665 | 199,593 | ||||||
Arch Capital Group Ltd. (a) (b) |
1,080 | 67,802 | ||||||
Arthur J Gallagher & Co. (a) |
659 | 124,248 | ||||||
Assurant, Inc. (a) |
169 | 21,135 | ||||||
Berkshire Hathaway, Inc. Class B (a) (b) |
5,667 | 1,750,536 | ||||||
Brown & Brown, Inc. (a) |
719 | 40,961 | ||||||
Chubb Ltd. (a) |
1,330 | 293,398 | ||||||
Cincinnati Financial Corp. (a) |
499 | 51,093 | ||||||
Everest Re Group Ltd. (a) |
118 | 39,090 | ||||||
Globe Life, Inc. (a) |
227 | 27,365 | ||||||
The Hartford Financial Services Group, Inc. (a) |
1,007 | 76,361 | ||||||
Lincoln National Corp. (a) |
464 | 14,254 | ||||||
Loews Corp. (a) |
650 | 37,915 | ||||||
Marsh & McLennan Cos., Inc. (a) |
1,576 | 260,796 | ||||||
MetLife, Inc. (a) |
2,115 | 153,063 | ||||||
Principal Financial Group, Inc. (a) |
717 | 60,171 | ||||||
The Progressive Corp. (a) |
1,851 | 240,093 | ||||||
Prudential Financial, Inc. (a) |
1,183 | 117,661 | ||||||
The Travelers Cos., Inc. (a) |
746 | 139,868 | ||||||
W.R. Berkley Corp. (a) |
603 | 43,760 | ||||||
Willis Towers Watson PLC (a) |
357 | 87,315 | ||||||
| 4,231,750 | ||||||||
Real Estate — 0.1% |
||||||||
CBRE Group, Inc. Class A (a) (b) |
1,043 | 80,269 | ||||||
Real Estate Investment Trusts (REITS) — 2.6% |
||||||||
Alexandria Real Estate Equities, Inc. (a) |
456 | 66,426 | ||||||
American Tower Corp. (a) |
1,470 | 311,434 | ||||||
AvalonBay Communities, Inc. (a) |
426 | 68,808 | ||||||
Boston Properties, Inc. (a) |
462 | 31,222 | ||||||
Camden Property Trust (a) |
340 | 38,039 | ||||||
Number of |
Value |
|||||||
Crown Castle, Inc. (a) |
1,382 | $ | 187,454 | |||||
Digital Realty Trust, Inc. (a) |
869 | 87,135 | ||||||
Equinix, Inc. (a) |
286 | 187,339 | ||||||
Equity Residential (a) |
1,045 | 61,655 | ||||||
Essex Property Trust, Inc. (a) |
201 | 42,596 | ||||||
Extra Space Storage, Inc. (a) |
399 | 58,725 | ||||||
Federal Realty Investment Trust (a) |
250 | 25,260 | ||||||
Healthpeak Properties, Inc. (a) |
1,659 | 41,591 | ||||||
Host Hotels & Resorts, Inc. (a) |
2,321 | 37,252 | ||||||
Invitation Homes, Inc. (a) |
1,889 | 55,990 | ||||||
Iron Mountain, Inc. (a) |
951 | 47,407 | ||||||
Kimco Realty Corp. (a) |
1,802 | 38,166 | ||||||
Mid-America Apartment Communities, Inc. (a) |
358 | 56,202 | ||||||
Prologis, Inc. (a) |
2,913 | 328,382 | ||||||
Public Storage (a) |
504 | 141,216 | ||||||
Realty Income Corp. (a) |
1,962 | 124,450 | ||||||
Regency Centers Corp. (a) |
437 | 27,312 | ||||||
SBA Communications Corp. (a) |
345 | 96,707 | ||||||
Simon Property Group, Inc. (a) |
1,021 | 119,947 | ||||||
UDR, Inc. (a) |
872 | 33,773 | ||||||
Ventas, Inc. (a) |
1,322 | 59,556 | ||||||
VICI Properties, Inc. (a) |
3,032 | 98,237 | ||||||
Vornado Realty Trust (a) |
587 | 12,215 | ||||||
Welltower, Inc. (a) |
1,494 | 97,932 | ||||||
Weyerhaeuser Co. (a) |
2,289 | 70,959 | ||||||
| 2,653,387 | ||||||||
| 15,819,030 | ||||||||
Industrial — 8.3% |
||||||||
Aerospace & Defense — 1.8% |
||||||||
The Boeing Co. (a) (b) |
1,764 | 336,024 | ||||||
General Dynamics Corp. (a) |
707 | 175,414 | ||||||
Howmet Aerospace, Inc. (a) |
1,237 | 48,750 | ||||||
L3 Harris Technologies, Inc. (a) |
612 | 127,425 | ||||||
Lockheed Martin Corp. (a) |
732 | 356,111 | ||||||
Northrop Grumman Corp. (a) |
459 | 250,435 | ||||||
Raytheon Technologies Corp. (a) |
4,572 | 461,406 | ||||||
TransDigm Group, Inc. (a) |
160 | 100,744 | ||||||
| 1,856,309 | ||||||||
Building Materials — 0.4% |
||||||||
Carrier Global Corp. (a) |
2,645 | 109,106 | ||||||
Johnson Controls International PLC (a) |
2,126 | 136,064 | ||||||
Martin Marietta Materials, Inc. (a) |
191 | 64,552 | ||||||
Masco Corp. (a) |
717 | 33,462 | ||||||
Mohawk Industries, Inc. (a) (b) |
180 | 18,400 | ||||||
Vulcan Materials Co. (a) |
405 | 70,920 | ||||||
| 432,504 | ||||||||
The accompanying notes are an integral part of the financial statements.
133
MML Managed Volatility Fund – Portfolio of Investments (Continued) |
Number of |
Value |
|||||||
Electrical Components & Equipment — 0.3% |
||||||||
AMETEK, Inc. (a) |
706 | $ | 98,642 | |||||
Emerson Electric Co. (a) |
1,825 | 175,310 | ||||||
Generac Holdings, Inc. (a) (b) |
209 | 21,038 | ||||||
| 294,990 | ||||||||
Electronics — 1.2% |
||||||||
Agilent Technologies, Inc. (a) |
913 | 136,631 | ||||||
Allegion PLC (a) |
250 | 26,315 | ||||||
Amphenol Corp. Class A (a) |
1,782 | 135,682 | ||||||
Fortive Corp. (a) |
1,101 | 70,739 | ||||||
Garmin Ltd. (a) |
508 | 46,883 | ||||||
Honeywell International, Inc. (a) |
2,119 | 454,102 | ||||||
Keysight Technologies, Inc. (a) (b) |
579 | 99,050 | ||||||
Mettler-Toledo International, Inc. (a) (b) |
72 | 104,072 | ||||||
TE Connectivity Ltd. (a) |
988 | 113,422 | ||||||
Trimble, Inc. (a) (b) |
824 | 41,661 | ||||||
| 1,228,557 | ||||||||
Engineering & Construction — 0.0% |
||||||||
Jacobs Solutions, Inc. (a) |
397 | 47,668 | ||||||
Environmental Controls — 0.3% |
||||||||
Pentair PLC (a) |
468 | 21,051 | ||||||
Republic Services, Inc. (a) |
649 | 83,715 | ||||||
Waste Management, Inc. (a) |
1,197 | 187,785 | ||||||
| 292,551 | ||||||||
Hand & Machine Tools — 0.1% |
||||||||
Snap-on, Inc. (a) |
182 | 41,585 | ||||||
Stanley Black & Decker, Inc. (a) |
489 | 36,734 | ||||||
| 78,319 | ||||||||
Machinery – Construction & Mining — 0.4% |
||||||||
Caterpillar, Inc. (a) |
1,643 | 393,597 | ||||||
Machinery – Diversified — 0.9% |
||||||||
Deere & Co. (a) |
863 | 370,020 | ||||||
Dover Corp. (a) |
450 | 60,935 | ||||||
IDEX Corp. (a) |
245 | 55,941 | ||||||
Ingersoll Rand, Inc. (a) |
1,282 | 66,984 | ||||||
Nordson Corp. (a) |
149 | 35,420 | ||||||
Otis Worldwide Corp. (a) |
1,304 | 102,116 | ||||||
Rockwell Automation, Inc. (a) |
367 | 94,528 | ||||||
Westinghouse Air Brake Technologies Corp. (a) |
557 | 55,594 | ||||||
Xylem, Inc. (a) |
596 | 65,900 | ||||||
| 907,438 | ||||||||
Miscellaneous - Manufacturing — 1.2% |
||||||||
3M Co. (a) |
1,685 | 202,065 | ||||||
A.O. Smith Corp. (a) |
389 | 22,266 | ||||||
Eaton Corp. PLC (a) |
1,247 | 195,717 | ||||||
Number of |
Value |
|||||||
General Electric Co. (a) |
3,457 | $ | 289,662 | |||||
Illinois Tool Works, Inc. (a) |
881 | 194,084 | ||||||
Parker-Hannifin Corp. (a) |
404 | 117,564 | ||||||
Teledyne Technologies, Inc. (a) (b) |
142 | 56,787 | ||||||
Textron, Inc. (a) |
576 | 40,781 | ||||||
Trane Technologies PLC (a) |
720 | 121,025 | ||||||
| 1,239,951 | ||||||||
Packaging & Containers — 0.2% |
||||||||
Amcor PLC (a) |
4,630 | 55,143 | ||||||
Ball Corp. (a) |
984 | 50,322 | ||||||
Packaging Corp. of America (a) |
320 | 40,931 | ||||||
Sealed Air Corp. (a) |
401 | 20,002 | ||||||
WestRock Co. (a) |
853 | 29,992 | ||||||
| 196,390 | ||||||||
Shipbuilding — 0.0% |
||||||||
Huntington Ingalls Industries, Inc. (a) |
127 | 29,296 | ||||||
Transportation — 1.5% |
||||||||
C.H. Robinson Worldwide, Inc. (a) |
352 | 32,229 | ||||||
CSX Corp. (a) |
6,536 | 202,485 | ||||||
Expeditors International of Washington, Inc. (a) |
520 | 54,038 | ||||||
FedEx Corp. (a) |
751 | 130,073 | ||||||
J.B. Hunt Transport Services, Inc. (a) |
267 | 46,554 | ||||||
Norfolk Southern Corp. (a) |
738 | 181,858 | ||||||
Old Dominion Freight Line, Inc. (a) |
293 | 83,148 | ||||||
Union Pacific Corp. (a) |
1,922 | 397,989 | ||||||
United Parcel Service, Inc. Class B (a) |
2,311 | 401,744 | ||||||
| 1,530,118 | ||||||||
| 8,527,688 | ||||||||
Technology — 21.4% |
||||||||
Computers — 7.4% |
||||||||
Accenture PLC Class A (a) |
1,967 | 524,874 | ||||||
Apple, Inc. (a) |
46,995 | 6,106,060 | ||||||
Cognizant Technology Solutions Corp. Class A (a) |
1,622 | 92,762 | ||||||
DXC Technology Co. (a) (b) |
704 | 18,656 | ||||||
EPAM Systems, Inc. (a) (b) |
181 | 59,321 | ||||||
Fortinet, Inc. (a) (b) |
2,098 | 102,571 | ||||||
Hewlett Packard Enterprise Co. (a) |
3,930 | 62,723 | ||||||
HP, Inc. (a) |
2,895 | 77,789 | ||||||
International Business Machines Corp. (a) |
2,859 | 402,805 | ||||||
Leidos Holdings, Inc. (a) |
415 | 43,654 | ||||||
NetApp, Inc. (a) |
671 | 40,300 | ||||||
Seagate Technology Holdings PLC (a) |
604 | 31,777 | ||||||
Western Digital Corp. (a) (b) |
1,035 | 32,654 | ||||||
| 7,595,946 | ||||||||
The accompanying notes are an integral part of the financial statements.
134
MML Managed Volatility Fund – Portfolio of Investments (Continued) |
Number of |
Value |
|||||||
Office & Business Equipment — 0.1% |
||||||||
Zebra Technologies Corp. Class A (a) (b) |
161 | $ | 41,282 | |||||
Semiconductors — 4.8% |
||||||||
Advanced Micro Devices, Inc. (a) (b) |
5,023 | 325,340 | ||||||
Analog Devices, Inc. (a) |
1,643 | 269,501 | ||||||
Applied Materials, Inc. (a) |
2,747 | 267,503 | ||||||
Broadcom, Inc. (a) |
1,270 | 710,095 | ||||||
Intel Corp. (a) |
12,994 | 343,431 | ||||||
KLA Corp. (a) |
448 | 168,910 | ||||||
Lam Research Corp. (a) |
424 | 178,207 | ||||||
Microchip Technology, Inc. (a) |
1,731 | 121,603 | ||||||
Micron Technology, Inc. (a) |
3,426 | 171,232 | ||||||
Monolithic Power Systems, Inc. (a) |
138 | 48,798 | ||||||
NVIDIA Corp. (a) |
7,823 | 1,143,253 | ||||||
NXP Semiconductor NV (a) |
826 | 130,533 | ||||||
ON Semiconductor Corp. (a) (b) |
1,363 | 85,010 | ||||||
Qorvo, Inc. (a) (b) |
321 | 29,095 | ||||||
QUALCOMM, Inc. (a) |
3,504 | 385,230 | ||||||
Skyworks Solutions, Inc. (a) |
529 | 48,208 | ||||||
Teradyne, Inc. (a) |
494 | 43,151 | ||||||
Texas Instruments, Inc. (a) |
2,846 | 470,216 | ||||||
| 4,939,316 | ||||||||
Software — 9.1% |
||||||||
Activision Blizzard, Inc. (a) |
2,258 | 172,850 | ||||||
Adobe, Inc. (a) (b) |
1,460 | 491,334 | ||||||
Akamai Technologies, Inc. (a) (b) |
486 | 40,970 | ||||||
ANSYS, Inc. (a) (b) |
268 | 64,746 | ||||||
Autodesk, Inc. (a) (b) |
684 | 127,819 | ||||||
Broadridge Financial Solutions, Inc. (a) |
358 | 48,018 | ||||||
Cadence Design Systems, Inc. (a) (b) |
844 | 135,580 | ||||||
Ceridian HCM Holding, Inc. (a) (b) |
474 | 30,407 | ||||||
Electronic Arts, Inc. (a) |
840 | 102,631 | ||||||
Fidelity National Information Services, Inc. (a) |
1,861 | 126,269 | ||||||
Fiserv, Inc. (a) (b) |
2,018 | 203,959 | ||||||
Intuit, Inc. (a) |
876 | 340,957 | ||||||
Jack Henry & Associates, Inc. (a) |
242 | 42,485 | ||||||
Microsoft Corp. (a) |
23,431 | 5,619,222 | ||||||
MSCI, Inc. (a) |
258 | 120,014 | ||||||
Oracle Corp. (a) |
4,827 | 394,559 | ||||||
Paychex, Inc. (a) |
1,029 | 118,911 | ||||||
Paycom Software, Inc. (a) (b) |
155 | 48,098 | ||||||
PTC, Inc. (a) (b) |
318 | 38,173 | ||||||
Roper Technologies, Inc. (a) |
340 | 146,911 | ||||||
Salesforce, Inc. (a) (b) |
3,149 | 417,526 | ||||||
ServiceNow, Inc. (a) (b) |
638 | 247,716 | ||||||
Synopsys, Inc. (a) (b) |
482 | 153,898 | ||||||
Number of |
Value |
|||||||
Take-Two Interactive Software, Inc. (a) (b) |
492 | $ | 51,232 | |||||
Tyler Technologies, Inc. (a) (b) |
124 | 39,979 | ||||||
| 9,324,264 | ||||||||
| 21,900,808 | ||||||||
Utilities — 3.1% |
||||||||
Electric — 2.9% |
||||||||
The AES Corp. (a) |
2,022 | 58,153 | ||||||
Alliant Energy Corp. (a) |
726 | 40,082 | ||||||
Ameren Corp. (a) |
892 | 79,317 | ||||||
American Electric Power Co., Inc. (a) |
1,567 | 148,787 | ||||||
CenterPoint Energy, Inc. (a) |
1,884 | 56,501 | ||||||
CMS Energy Corp. (a) |
919 | 58,200 | ||||||
Consolidated Edison, Inc. (a) |
1,113 | 106,080 | ||||||
Constellation Energy Corp. (a) |
1,043 | 89,917 | ||||||
Dominion Energy, Inc. (a) |
2,561 | 157,040 | ||||||
DTE Energy Co. (a) |
631 | 74,161 | ||||||
Duke Energy Corp. (a) |
2,430 | 250,266 | ||||||
Edison International (a) |
1,131 | 71,954 | ||||||
Entergy Corp. (a) |
614 | 69,075 | ||||||
Evergy, Inc. (a) |
739 | 46,505 | ||||||
Eversource Energy (a) |
1,123 | 94,152 | ||||||
Exelon Corp. (a) |
3,190 | 137,904 | ||||||
FirstEnergy Corp. (a) |
1,728 | 72,472 | ||||||
NextEra Energy, Inc. (a) |
6,217 | 519,741 | ||||||
NRG Energy, Inc. (a) |
802 | 25,520 | ||||||
PG&E Corp. (a) (b) |
5,055 | 82,194 | ||||||
Pinnacle West Capital Corp. (a) |
364 | 27,679 | ||||||
PPL Corp. (a) |
2,219 | 64,839 | ||||||
Public Service Enterprise Group, Inc. (a) |
1,575 | 96,500 | ||||||
Sempra Energy (a) |
994 | 153,613 | ||||||
The Southern Co. (a) |
3,468 | 247,650 | ||||||
WEC Energy Group, Inc. (a) |
1,010 | 94,698 | ||||||
Xcel Energy, Inc. (a) |
1,797 | 125,988 | ||||||
| 3,048,988 | ||||||||
Gas — 0.1% |
||||||||
Atmos Energy Corp. (a) |
483 | 54,130 | ||||||
NiSource, Inc. (a) |
1,069 | 29,312 | ||||||
| 83,442 | ||||||||
Water — 0.1% |
||||||||
American Water Works Co., Inc. (a) |
568 | 86,575 | ||||||
| 3,219,005 | ||||||||
TOTAL COMMON STOCK (Cost $68,813,539) |
100,945,818 | |||||||
TOTAL EQUITIES (Cost $68,813,539) |
100,945,818 | |||||||
The accompanying notes are an integral part of the financial statements.
135
MML Managed Volatility Fund – Portfolio of Investments (Continued) |
Principal |
Value |
|||||||
BONDS & NOTES — 0.0% |
||||||||
CORPORATE DEBT — 0.0% |
||||||||
Forest Products & Paper — 0.0% |
||||||||
Sino Forest Corp. 5.000% 8/01/49 (a) (c) (d) |
$ | 359,000 | $ | — | ||||
TOTAL CORPORATE DEBT (Cost $0) |
— | |||||||
TOTAL BONDS & NOTES (Cost $0) |
— | |||||||
TOTAL PURCHASED OPTIONS (#) — 1.0% (Cost $1,522,386) |
1,045,424 | |||||||
Number of |
||||||||
RIGHTS — 0.0% |
||||||||
Consumer, Non-cyclical — 0.0% |
||||||||
Health Care – Products — 0.0% |
||||||||
Abiomed, Inc., CVR (a) (b) (c) (d) |
136 | — | ||||||
TOTAL RIGHTS (Cost $139) |
— | |||||||
TOTAL LONG-TERM INVESTMENTS (Cost $70,336,064) |
101,991,242 | |||||||
Principal |
Value |
|||||||
SHORT-TERM INVESTMENTS — 2.7% |
||||||||
Repurchase Agreement — 2.7% |
||||||||
Fixed Income Clearing Corp., Repurchase Agreement, dated 12/30/22, 1.280%, due 1/03/23 (e) |
$ | 2,717,809 | $ | 2,717,809 | ||||
TOTAL SHORT-TERM INVESTMENTS (Cost $2,717,809) |
2,717,809 | |||||||
TOTAL INVESTMENTS — 102.1% (Cost $73,053,873) (f) |
104,709,051 | |||||||
Other Assets/(Liabilities) — (2.1)% |
(2,120,827 | ) | ||||||
NET ASSETS — 100.0% |
$ | 102,588,224 | ||||||
Abbreviation Legend
|
CVR |
Contingent Value Rights |
Notes to Portfolio of Investments
Percentages are stated as a percent of net assets.
|
(a) |
All or a portion of this security is pledged/held as collateral for open derivatives. (Note 2). |
|
(b) |
Non-income producing security. |
|
(c) |
This security is fair valued in good faith in accordance with procedures approved by the Board of Trustees. At December 31, 2022, these securities amounted to a value of $0 or 0.00% of net assets. |
|
(d) |
Investment is valued using significant unobservable inputs. |
|
(e) |
Maturity value of $2,718,196. Collateralized by U.S. Government Agency obligations with a rate of 0.000%, maturity date of 6/29/23, and an aggregate market value, including accrued interest, of $2,772,188. |
|
(f) |
See Note 6 for aggregate cost for federal tax purposes. |
(#) Exchange-Traded Options Purchased
Description |
Expiration |
Exercise |
No. of |
Notional |
Value |
Premiums |
Unrealized |
|||||||||||||||||||||||||
Put |
||||||||||||||||||||||||||||||||
S&P 500 Index |
2/17/23 | 3,425.00 | 39 | USD | 13,357,500 | $ | 68,640 | $ | 195,878 | $ | (127,238 | ) | ||||||||||||||||||||
S&P 500 Index |
2/17/23 | 3,500.00 | 39 | USD | 13,650,000 | 93,483 | 195,020 | (101,537 | ) | |||||||||||||||||||||||
S&P 500 Index |
3/17/23 | 3,400.00 | 34 | USD | 11,560,000 | 112,200 | 266,305 | (154,105 | ) | |||||||||||||||||||||||
S&P 500 Index |
3/17/23 | 3,425.00 | 37 | USD | 12,672,500 | 138,454 | 290,725 | (152,271 | ) | |||||||||||||||||||||||
S&P 500 Index |
3/17/23 | 3,500.00 | 40 | USD | 14,000,000 | 185,560 | 222,780 | (37,220 | ) | |||||||||||||||||||||||
S&P 500 Index |
3/17/23 | 3,550.00 | 34 | USD | 12,070,000 | 190,740 | 171,050 | 19,690 | ||||||||||||||||||||||||
S&P 500 Index |
3/17/23 | 3,575.00 | 39 | USD | 13,942,500 | 256,347 | 180,628 | 75,719 | ||||||||||||||||||||||||
| $ | 1,045,424 | $ | 1,522,386 | $ | (476,962 | ) | ||||||||||||||||||||||||||
The accompanying notes are an integral part of the financial statements.
136
MML Managed Volatility Fund – Portfolio of Investments (Continued) |
Exchange-Traded Options Written
Description |
Expiration |
Exercise |
No. of |
Notional |
Value |
Premiums |
Unrealized |
|||||||||||||||||||||||||
Call |
||||||||||||||||||||||||||||||||
S&P 500 Index |
1/20/23 | 3,850.00 | 29 | USD | 11,165,000 | $ | (214,165 | ) | $ | (213,683 | ) | $ | (482 | ) | ||||||||||||||||||
S&P 500 Index |
1/20/23 | 4,075.00 | 30 | USD | 12,225,000 | (18,000 | ) | (337,350 | ) | 319,350 | ||||||||||||||||||||||
S&P 500 Index |
1/20/23 | 4,100.00 | 29 | USD | 11,890,000 | (12,760 | ) | (349,175 | ) | 336,415 | ||||||||||||||||||||||
S&P 500 Index |
1/31/23 | 3,925.00 | 29 | USD | 11,382,500 | (137,866 | ) | (172,623 | ) | 34,757 | ||||||||||||||||||||||
S&P 500 Index |
2/17/23 | 3,825.00 | 29 | USD | 11,092,500 | (388,600 | ) | (388,527 | ) | (73 | ) | |||||||||||||||||||||
S&P 500 Index |
2/17/23 | 3,900.00 | 29 | USD | 11,310,000 | (234,436 | ) | (357,667 | ) | 123,231 | ||||||||||||||||||||||
S&P 500 Index |
2/17/23 | 3,950.00 | 29 | USD | 11,455,000 | (190,124 | ) | (359,963 | ) | 169,839 | ||||||||||||||||||||||
S&P 500 Index |
2/17/23 | 3,975.00 | 29 | USD | 11,527,500 | (157,789 | ) | (526,055 | ) | 368,266 | ||||||||||||||||||||||
S&P 500 Index |
3/17/23 | 3,900.00 | 29 | USD | 11,310,000 | (387,005 | ) | (352,422 | ) | (34,583 | ) | |||||||||||||||||||||
| $ | (1,740,745 | ) | $ | (3,057,465 | ) | $ | 1,316,720 | |||||||||||||||||||||||||
Currency Legend
|
USD |
U.S. Dollar |
The accompanying notes are an integral part of the financial statements.
137
December 31, 2022 |
Number of |
Value |
|||||||
EQUITIES — 97.1% |
||||||||
COMMON STOCK — 96.6% |
||||||||
Basic Materials — 0.5% |
||||||||
Chemicals — 0.5% |
||||||||
RPM International, Inc. |
17,500 | $ | 1,705,375 | |||||
Communications — 5.1% |
||||||||
Advertising — 0.9% |
||||||||
The Trade Desk, Inc. Class A (a) |
58,200 | 2,609,106 | ||||||
Internet — 3.2% |
||||||||
CDW Corp. |
19,121 | 3,414,628 | ||||||
Etsy, Inc. (a) |
20,115 | 2,409,375 | ||||||
Match Group, Inc. (a) |
42,752 | 1,773,780 | ||||||
Palo Alto Networks, Inc. (a) |
10,978 | 1,531,870 | ||||||
Spotify Technology SA (a) |
11,600 | 915,820 | ||||||
| 10,045,473 | ||||||||
Media — 0.8% |
||||||||
Liberty Media Corp-Liberty Formula One Class C (a) |
41,700 | 2,492,826 | ||||||
Telecommunications — 0.2% |
||||||||
Corning, Inc. |
21,700 | 693,098 | ||||||
| 15,840,503 | ||||||||
Consumer, Cyclical — 14.8% |
||||||||
Airlines — 0.9% |
||||||||
Southwest Airlines Co. (a) |
78,600 | 2,646,462 | ||||||
Apparel — 0.1% |
||||||||
On Holding AG, Class A (a) (b) |
13,300 | 228,228 | ||||||
Auto Manufacturers — 0.1% |
||||||||
Rivian Automotive, Inc. Class A (a) |
19,498 | 359,348 | ||||||
Auto Parts & Equipment — 0.0% |
||||||||
Mobileye Global, Inc. Class A (a) |
4,416 | 154,825 | ||||||
Entertainment — 0.4% |
||||||||
Vail Resorts, Inc. |
4,800 | 1,144,080 | ||||||
Lodging — 3.1% |
||||||||
Hilton Worldwide Holdings, Inc. |
51,403 | 6,495,283 | ||||||
MGM Resorts International |
92,583 | 3,104,308 | ||||||
| 9,599,591 | ||||||||
Retail — 10.2% |
||||||||
Bath & Body Works, Inc. |
34,800 | 1,466,472 | ||||||
Burlington Stores, Inc. (a) |
24,100 | 4,886,516 | ||||||
Casey’s General Stores, Inc. |
11,000 | 2,467,850 | ||||||
Chipotle Mexican Grill, Inc. (a) |
850 | 1,179,367 | ||||||
Dollar General Corp. |
12,800 | 3,152,000 | ||||||
Dollar Tree, Inc. (a) |
17,629 | 2,493,446 | ||||||
Domino’s Pizza, Inc. |
6,600 | 2,286,240 | ||||||
Five Below, Inc. (a) |
9,800 | 1,733,326 | ||||||
Freshpet, Inc. (a) (b) |
45,250 | 2,387,843 | ||||||
Number of |
Value |
|||||||
Lululemon Athletica, Inc. (a) |
9,701 | $ | 3,108,006 | |||||
O’Reilly Automotive, Inc. (a) |
2,700 | 2,278,881 | ||||||
Ross Stores, Inc. |
11,300 | 1,311,591 | ||||||
Wingstop, Inc. |
15,986 | 2,199,993 | ||||||
Yum! Brands, Inc. |
6,500 | 832,520 | ||||||
| 31,784,051 | ||||||||
| 45,916,585 | ||||||||
Consumer, Non-cyclical — 29.7% |
||||||||
Beverages — 0.3% |
||||||||
The Boston Beer Co., Inc. Class A (a) |
3,294 | 1,085,439 | ||||||
Biotechnology — 4.4% |
||||||||
Alnylam Pharmaceuticals, Inc. (a) |
13,900 | 3,303,335 | ||||||
Apellis Pharmaceuticals, Inc. (a) |
8,782 | 454,117 | ||||||
Argenx SE ADR (a) |
3,123 | 1,183,086 | ||||||
CRISPR Therapeutics AG (a) (b) |
8,428 | 342,598 | ||||||
Horizon Therapeutics PLC (a) |
17,700 | 2,014,260 | ||||||
Illumina, Inc. (a) |
6,222 | 1,258,089 | ||||||
Ionis Pharmaceuticals, Inc. (a) |
37,100 | 1,401,267 | ||||||
Karuna Therapeutics, Inc. (a) |
2,166 | 425,619 | ||||||
Seagen, Inc. (a) |
25,419 | 3,266,596 | ||||||
| 13,648,967 | ||||||||
Commercial Services — 8.7% |
||||||||
Bright Horizons Family Solutions, Inc. (a) |
14,900 | 940,190 | ||||||
CoStar Group, Inc. (a) |
32,154 | 2,484,861 | ||||||
Equifax, Inc. |
17,300 | 3,362,428 | ||||||
FleetCor Technologies, Inc. (a) |
15,200 | 2,791,936 | ||||||
Gartner, Inc. (a) |
13,707 | 4,607,471 | ||||||
MarketAxess Holdings, Inc. |
8,800 | 2,454,232 | ||||||
Paylocity Holding Corp. (a) |
7,500 | 1,456,950 | ||||||
Shift4 Payments, Inc. Class A (a) |
33,565 | 1,877,290 | ||||||
TransUnion |
62,860 | 3,567,305 | ||||||
United Rentals, Inc. (a) |
3,500 | 1,243,970 | ||||||
Verisk Analytics, Inc. |
12,200 | 2,152,324 | ||||||
| 26,938,957 | ||||||||
Food — 0.4% |
||||||||
TreeHouse Foods, Inc. (a) |
24,307 | 1,200,280 | ||||||
Health Care – Products — 11.2% |
||||||||
Alcon, Inc. |
27,300 | 1,871,415 | ||||||
Align Technology, Inc. (a) |
7,984 | 1,683,826 | ||||||
Avantor, Inc. (a) |
157,500 | 3,321,675 | ||||||
Bruker Corp. |
59,900 | 4,094,165 | ||||||
The Cooper Cos., Inc. |
10,500 | 3,472,035 | ||||||
Dentsply Sirona, Inc. |
22,000 | 700,480 | ||||||
Exact Sciences Corp. (a) |
12,500 | 618,875 | ||||||
Hologic, Inc. (a) |
100,500 | 7,518,405 | ||||||
ICU Medical, Inc. (a) |
7,400 | 1,165,352 | ||||||
Omnicell, Inc. (a) |
30,224 | 1,523,894 | ||||||
The accompanying notes are an integral part of the financial statements.
138
MML Mid Cap Growth Fund – Portfolio of Investments (Continued) |
Number of |
Value |
|||||||
Quidelortho Corp. (a) |
17,333 | $ | 1,484,918 | |||||
Teleflex, Inc. |
22,640 | 5,651,623 | ||||||
West Pharmaceutical Services, Inc. |
7,035 | 1,655,687 | ||||||
| 34,762,350 | ||||||||
Health Care – Services — 3.2% |
||||||||
Acadia Healthcare Co., Inc. (a) |
35,300 | 2,905,896 | ||||||
agilon health, Inc. (a) (b) |
8,756 | 141,322 | ||||||
Catalent, Inc. (a) |
45,708 | 2,057,317 | ||||||
ICON PLC (a) |
16,928 | 3,288,264 | ||||||
Molina Healthcare, Inc. (a) |
4,500 | 1,485,990 | ||||||
| 9,878,789 | ||||||||
Household Products & Wares — 1.3% |
||||||||
Avery Dennison Corp. |
16,600 | 3,004,600 | ||||||
Reynolds Consumer Products, Inc. |
34,600 | 1,037,308 | ||||||
| 4,041,908 | ||||||||
Pharmaceuticals — 0.2% |
||||||||
Ascendis Pharma A/S ADR (a) |
5,100 | 622,863 | ||||||
| 92,179,553 | ||||||||
Energy — 3.5% |
||||||||
Energy – Alternate Sources — 0.2% |
||||||||
Shoals Technologies Group, Inc. Class A (a) |
21,600 | 532,872 | ||||||
Oil & Gas — 2.3% |
||||||||
Coterra Energy, Inc. |
39,400 | 968,058 | ||||||
Devon Energy Corp. |
13,262 | 815,746 | ||||||
Pioneer Natural Resources Co. |
12,315 | 2,812,623 | ||||||
Venture Global LNG, Inc., Series B (Acquired 3/08/18, Cost $63,420) (a) (c) (d) (e) |
21 | 310,700 | ||||||
Venture Global LNG, Inc., Series C (Acquired 10/16/17-3/08/18, Cost $530,257) (a) (c) (d) (e) |
144 | 2,130,515 | ||||||
| 7,037,642 | ||||||||
Pipelines — 1.0% |
||||||||
Cheniere Energy, Inc. |
20,987 | 3,147,210 | ||||||
| 10,717,724 | ||||||||
Financial — 5.8% |
||||||||
Diversified Financial Services — 2.7% |
||||||||
Cboe Global Markets, Inc. |
6,200 | 777,914 | ||||||
Hamilton Lane, Inc. Class A |
47,338 | 3,023,951 | ||||||
Intercontinental Exchange, Inc. |
17,300 | 1,774,807 | ||||||
Raymond James Financial, Inc. |
8,600 | 918,910 | ||||||
Tradeweb Markets, Inc. Class A |
31,600 | 2,051,788 | ||||||
| 8,547,370 | ||||||||
Insurance — 1.5% |
||||||||
Assurant, Inc. |
19,500 | 2,438,670 | ||||||
Axis Capital Holdings Ltd. |
31,100 | 1,684,687 | ||||||
Number of |
Value |
|||||||
Kemper Corp. |
10,200 | $ | 501,840 | |||||
| 4,625,197 | ||||||||
Private Equity — 1.6% |
||||||||
Ares Management Corp. Class A |
32,743 | 2,240,931 | ||||||
KKR & Co., Inc. |
56,900 | 2,641,298 | ||||||
| 4,882,229 | ||||||||
| 18,054,796 | ||||||||
Industrial — 18.8% |
||||||||
Aerospace & Defense — 0.8% |
||||||||
Hexcel Corp. |
41,738 | 2,456,281 | ||||||
Building Materials — 0.8% |
||||||||
Martin Marietta Materials, Inc. |
7,660 | 2,588,850 | ||||||
Electrical Components & Equipment — 0.1% |
||||||||
Littelfuse, Inc. |
1,900 | 418,380 | ||||||
Electronics — 6.9% |
||||||||
Agilent Technologies, Inc. |
73,591 | 11,012,893 | ||||||
Amphenol Corp. Class A |
23,800 | 1,812,132 | ||||||
Fortive Corp. |
52,200 | 3,353,850 | ||||||
Keysight Technologies, Inc. (a) |
22,500 | 3,849,075 | ||||||
National Instruments Corp. |
34,800 | 1,284,120 | ||||||
| 21,312,070 | ||||||||
Environmental Controls — 0.3% |
||||||||
Waste Connections, Inc. |
7,100 | 941,176 | ||||||
Machinery – Construction & Mining — 1.3% |
||||||||
BWX Technologies, Inc. |
71,071 | 4,127,804 | ||||||
Machinery – Diversified — 3.7% |
||||||||
Cognex Corp. |
21,900 | 1,031,709 | ||||||
Enovis Corp. (a) |
25,978 | 1,390,343 | ||||||
Esab Corp. |
27,783 | 1,303,578 | ||||||
IDEX Corp. |
8,800 | 2,009,304 | ||||||
Ingersoll Rand, Inc. |
106,500 | 5,564,625 | ||||||
| 11,299,559 | ||||||||
Miscellaneous - Manufacturing — 1.9% |
||||||||
Textron, Inc. |
80,800 | 5,720,640 | ||||||
Packaging & Containers — 1.8% |
||||||||
Ball Corp. |
65,347 | 3,341,846 | ||||||
Sealed Air Corp. |
46,400 | 2,314,432 | ||||||
| 5,656,278 | ||||||||
Transportation — 1.2% |
||||||||
J.B. Hunt Transport Services, Inc. |
21,700 | 3,783,612 | ||||||
| 58,304,650 | ||||||||
Technology — 18.4% |
||||||||
Computers — 1.9% |
||||||||
Crowdstrike Holdings, Inc. Class A (a) |
16,310 | 1,717,280 | ||||||
Fortinet, Inc. (a) |
69,700 | 3,407,633 | ||||||
The accompanying notes are an integral part of the financial statements.
139
MML Mid Cap Growth Fund – Portfolio of Investments (Continued) |
Number of |
Value |
|||||||
Leidos Holdings, Inc. |
6,400 | $ | 673,216 | |||||
| 5,798,129 | ||||||||
Semiconductors — 6.6% |
||||||||
KLA Corp. |
12,862 | 4,849,360 | ||||||
Lattice Semiconductor Corp. (a) |
21,100 | 1,368,968 | ||||||
Marvell Technology, Inc. |
108,007 | 4,000,579 | ||||||
Microchip Technology, Inc. |
97,800 | 6,870,450 | ||||||
NXP Semiconductor NV |
2,200 | 347,666 | ||||||
ON Semiconductor Corp. (a) |
26,763 | 1,669,208 | ||||||
Synaptics, Inc. (a) |
14,684 | 1,397,330 | ||||||
| 20,503,561 | ||||||||
Software — 9.9% |
||||||||
Atlassian Corp. Class A (a) |
7,100 | 913,628 | ||||||
Bill.com Holdings, Inc. (a) |
6,600 | 719,136 | ||||||
Black Knight, Inc. (a) |
33,452 | 2,065,661 | ||||||
Broadridge Financial Solutions, Inc. |
9,700 | 1,301,061 | ||||||
CCC Intelligent Solutions Holdings, Inc. (a) |
129,372 | 1,125,537 | ||||||
Ceridian HCM Holding, Inc. (a) |
51,127 | 3,279,797 | ||||||
Clear Secure Inc. Class A (b) |
14,693 | 403,029 | ||||||
Confluent, Inc. Class A (a) |
8,900 | 197,936 | ||||||
Doximity, Inc. Class A (a) (b) |
17,400 | 583,944 | ||||||
Electronic Arts, Inc. |
24,518 | 2,995,609 | ||||||
Fair Isaac Corp. (a) |
4,000 | 2,394,320 | ||||||
HashiCorp, Inc. Class A (a) (b) |
4,500 | 123,030 | ||||||
MongoDB, Inc. (a) |
11,075 | 2,180,003 | ||||||
PTC, Inc. (a) |
15,200 | 1,824,608 | ||||||
Roper Technologies, Inc. |
5,700 | 2,462,913 | ||||||
Synopsys, Inc. (a) |
9,382 | 2,995,579 | ||||||
Veeva Systems, Inc. Class A (a) |
17,627 | 2,844,645 | ||||||
ZoomInfo Technologies, Inc. (a) |
79,192 | 2,384,472 | ||||||
| 30,794,908 | ||||||||
| 57,096,598 | ||||||||
TOTAL COMMON STOCK (Cost $266,741,497) |
299,815,784 | |||||||
PREFERRED STOCK — 0.5% |
||||||||
Consumer, Cyclical — 0.0% |
||||||||
Auto Manufacturers — 0.0% |
||||||||
Nuro, Inc., Series D (Acquired 10/29/21, Cost $159,220) (a) (c) (d) (e) |
7,638 | 106,015 | ||||||
Consumer, Non-cyclical — 0.2% |
||||||||
Commercial Services — 0.1% |
||||||||
Redwood Materials, Inc., Series C (Acquired 5/28/21, Cost $200,090) (a) (c) (d) (e) |
4,221 | 329,238 | ||||||
Number of |
Value |
|||||||
Health Care – Services — 0.1% |
||||||||
Caris Life Sciences, Inc., Series D (Acquired 5/11/21, Cost $271,366) (a) (c) (d) (e) |
33,502 | $ | 220,443 | |||||
| 549,681 | ||||||||
Financial — 0.1% |
||||||||
Investment Companies — 0.1% |
||||||||
Maplebear, Inc.,Series E (Acquired 11/19/21 - 12/01/21, Cost $528,790) (a) (c) (d) (e) |
4,398 | 213,215 | ||||||
Maplebear, Inc., Series I (Acquired 2/26/21, Cost $95,750) (a) (c) (d) (e) |
766 | 37,136 | ||||||
| 250,351 | ||||||||
Industrial — 0.1% |
||||||||
Electrical Components & Equipment — 0.1% |
||||||||
Sila Nanotechnologies, Inc., Series F (Acquired 1/07/21, Cost $407,982) (a) (c) (d) (e) |
9,885 | 308,115 | ||||||
Technology — 0.1% |
||||||||
Software — 0.1% |
||||||||
Databricks, Inc., Series H (Acquired 8/31/21, Cost $186,503) (a) (c) (d) (e) |
2,522 | 151,320 | ||||||
TOTAL PREFERRED STOCK (Cost $1,848,525) |
1,365,482 | |||||||
TOTAL EQUITIES (Cost $268,590,022) |
301,181,266 | |||||||
MUTUAL FUNDS — 0.1% |
||||||||
Diversified Financial Services — 0.1% |
||||||||
State Street Navigator Securities Lending Government Money Market Portfolio (f) |
429,146 | 429,146 | ||||||
TOTAL MUTUAL FUNDS (Cost $429,146) |
429,146 | |||||||
TOTAL LONG-TERM INVESTMENTS (Cost $269,019,168) |
301,610,412 | |||||||
The accompanying notes are an integral part of the financial statements.
140
MML Mid Cap Growth Fund – Portfolio of Investments (Continued) |
Number of |
Value |
|||||||
SHORT-TERM INVESTMENTS — 3.0% |
||||||||
Mutual Fund — 0.0% |
||||||||
T. Rowe Price Treasury Reserve Fund |
103 | $ | 103 | |||||
Principal |
||||||||
Repurchase Agreement — 3.0% |
||||||||
Fixed Income Clearing Corp., Repurchase Agreement, dated 12/30/22, 1.280%, due 1/03/23 (g) |
$ | 9,174,518 | 9,174,518 | |||||
TOTAL SHORT-TERM INVESTMENTS (Cost $9,174,621) |
9,174,621 | |||||||
TOTAL INVESTMENTS — 100.2% (Cost $278,193,789) (h) |
310,785,033 | |||||||
Other Assets/(Liabilities) — (0.2)% |
(470,395 | ) | ||||||
NET ASSETS — 100.0% |
$ | 310,314,638 | ||||||
Abbreviation Legend
|
ADR |
American Depositary Receipt |
Notes to Portfolio of Investments
Percentages are stated as a percent of net assets.
|
(a) |
Non-income producing security. |
|
(b) |
Denotes all or a portion of security on loan. The total value of securities on loan as of December 31, 2022, was $3,433,932 or 1.11% of net assets. The Fund received $3,090,147 of non-cash collateral (U.S. Treasury and/or Agency obligations) related to securities lending activity. This amount is not reflected on either the Portfolio of Investments or the Statement of Assets and Liabilities. (Note 2). |
|
(c) |
Investment is valued using significant unobservable inputs. |
|
(d) |
Restricted security. Certain securities are restricted as to resale. At December 31, 2022, these securities amounted to a value of $3,806,697 or 1.23% of net assets. The Fund generally bears the costs, if any, associated with the disposition of restricted securities. |
|
(e) |
This security is fair valued in good faith in accordance with procedures approved by the Board of Trustees. At December 31, 2022, these securities amounted to a value of $3,806,697 or 1.23% of net assets. |
|
(f) |
Represents investment of security lending cash collateral. (Note 2). |
|
(g) |
Maturity value of $9,175,823. Collateralized by U.S. Government Agency obligations with a rate of 0.000%, maturity date of 6/29/23, and an aggregate market value, including accrued interest, of $9,358,041. |
|
(h) |
See Note 6 for aggregate cost for federal tax purposes. |
The accompanying notes are an integral part of the financial statements.
141
December 31, 2022 |
Number of |
Value |
|||||||
EQUITIES — 97.4% |
||||||||
COMMON STOCK — 96.4% |
||||||||
Basic Materials — 2.1% |
||||||||
Chemicals — 2.0% |
||||||||
Akzo Nobel NV |
47,654 | $ | 3,179,762 | |||||
Axalta Coating Systems Ltd. (a) |
109,455 | 2,787,819 | ||||||
| 5,967,581 | ||||||||
Forest Products & Paper — 0.1% |
||||||||
Mondi PLC |
20,523 | 348,552 | ||||||
| 6,316,133 | ||||||||
Communications — 4.3% |
||||||||
Advertising — 0.9% |
||||||||
Omnicom Group, Inc. |
30,673 | 2,501,996 | ||||||
Internet — 1.1% |
||||||||
F5, Inc. (a) |
22,962 | 3,295,277 | ||||||
Media — 1.1% |
||||||||
Fox Corp. Class B |
118,651 | 3,375,621 | ||||||
Telecommunications — 1.2% |
||||||||
Corning, Inc. |
35,411 | 1,131,027 | ||||||
Juniper Networks, Inc. |
75,835 | 2,423,687 | ||||||
| 3,554,714 | ||||||||
| 12,727,608 | ||||||||
Consumer, Cyclical — 10.4% |
||||||||
Airlines — 1.7% |
||||||||
Southwest Airlines Co. (a) |
147,827 | 4,977,335 | ||||||
Auto Manufacturers — 0.6% |
||||||||
Cummins, Inc. |
6,940 | 1,681,493 | ||||||
Auto Parts & Equipment — 2.5% |
||||||||
Aptiv PLC (a) |
13,710 | 1,276,812 | ||||||
BorgWarner, Inc. |
113,356 | 4,562,579 | ||||||
Cie Generale des Etablissements Michelin SCA |
60,906 | 1,693,607 | ||||||
| 7,532,998 | ||||||||
Food Services — 0.9% |
||||||||
Sodexo SA |
28,944 | 2,768,865 | ||||||
Retail — 4.7% |
||||||||
Advance Auto Parts, Inc. |
24,987 | 3,673,839 | ||||||
Beacon Roofing Supply, Inc. (a) |
30,523 | 1,611,309 | ||||||
Dollar Tree, Inc. (a) |
33,390 | 4,722,682 | ||||||
MSC Industrial Direct Co., Inc. Class A |
50,046 | 4,088,758 | ||||||
| 14,096,588 | ||||||||
| 31,057,279 | ||||||||
Consumer, Non-cyclical — 20.1% |
||||||||
Food — 4.8% |
||||||||
Conagra Brands, Inc. |
141,159 | 5,462,853 | ||||||
Number of |
Value |
|||||||
The J.M. Smucker Co. |
19,824 | $ | 3,141,311 | |||||
Koninklijke Ahold Delhaize NV |
194,993 | 5,602,906 | ||||||
| 14,207,070 | ||||||||
Health Care – Products — 5.2% |
||||||||
Baxter International, Inc. |
29,396 | 1,498,314 | ||||||
Dentsply Sirona, Inc. |
64,153 | 2,042,631 | ||||||
Envista Holdings Corp. (a) |
41,497 | 1,397,204 | ||||||
Hologic, Inc. (a) |
20,296 | 1,518,344 | ||||||
Zimmer Biomet Holdings, Inc. |
70,846 | 9,032,865 | ||||||
| 15,489,358 | ||||||||
Health Care – Services — 4.1% |
||||||||
HCA Healthcare, Inc. |
3,407 | 817,544 | ||||||
Laboratory Corp. of America Holdings |
14,010 | 3,299,075 | ||||||
Quest Diagnostics, Inc. |
23,747 | 3,714,981 | ||||||
Universal Health Services, Inc. Class B |
32,131 | 4,526,936 | ||||||
| 12,358,536 | ||||||||
Household Products & Wares — 1.5% |
||||||||
Kimberly-Clark Corp. |
32,396 | 4,397,757 | ||||||
Pharmaceuticals — 4.5% |
||||||||
AmerisourceBergen Corp. |
22,862 | 3,788,462 | ||||||
Becton Dickinson and Co. |
5,057 | 1,285,995 | ||||||
Cardinal Health, Inc. |
18,365 | 1,411,718 | ||||||
Embecta Corp. |
82,512 | 2,086,729 | ||||||
Henry Schein, Inc. (a) |
60,490 | 4,831,336 | ||||||
| 13,404,240 | ||||||||
| 59,856,961 | ||||||||
Energy — 4.1% |
||||||||
Oil & Gas — 1.9% |
||||||||
Devon Energy Corp. |
17,223 | 1,059,387 | ||||||
Diamondback Energy, Inc. |
14,274 | 1,952,398 | ||||||
EQT Corp. |
43,943 | 1,486,592 | ||||||
Phillips 66 |
10,856 | 1,129,892 | ||||||
| 5,628,269 | ||||||||
Oil & Gas Services — 1.0% |
||||||||
Baker Hughes Co. |
98,471 | 2,907,849 | ||||||
Pipelines — 1.2% |
||||||||
Enterprise Products Partners LP (b) |
152,754 | 3,684,426 | ||||||
| 12,220,544 | ||||||||
Financial — 28.0% |
||||||||
Banks — 11.3% |
||||||||
The Bank of New York Mellon Corp. |
167,596 | 7,628,970 | ||||||
First Hawaiian, Inc. |
176,576 | 4,598,039 | ||||||
Northern Trust Corp. |
92,402 | 8,176,653 | ||||||
Prosperity Bancshares, Inc. |
53,796 | 3,909,893 | ||||||
Truist Financial Corp. |
117,457 | 5,054,175 | ||||||
US Bancorp |
71,425 | 3,114,844 | ||||||
The accompanying notes are an integral part of the financial statements.
142
MML Mid Cap Value Fund – Portfolio of Investments (Continued) |
Number of |
Value |
|||||||
Westamerica Bancorp. |
22,158 | $ | 1,307,544 | |||||
| 33,790,118 | ||||||||
Diversified Financial Services — 1.9% |
||||||||
Ameriprise Financial, Inc. |
3,703 | 1,153,003 | ||||||
T. Rowe Price Group, Inc. |
40,482 | 4,414,967 | ||||||
| 5,567,970 | ||||||||
Insurance — 6.0% |
||||||||
Aflac, Inc. |
27,562 | 1,982,810 | ||||||
The Allstate Corp. |
46,963 | 6,368,183 | ||||||
Chubb Ltd. |
3,694 | 814,896 | ||||||
The Hanover Insurance Group, Inc. |
17,592 | 2,377,207 | ||||||
Reinsurance Group of America, Inc. |
24,079 | 3,421,385 | ||||||
Willis Towers Watson PLC |
11,308 | 2,765,711 | ||||||
| 17,730,192 | ||||||||
Real Estate Investment Trusts (REITS) — 8.4% |
||||||||
Equinix, Inc. |
5,456 | 3,573,844 | ||||||
Essex Property Trust, Inc. |
14,941 | 3,166,297 | ||||||
Healthpeak Properties, Inc. |
173,509 | 4,349,871 | ||||||
Public Storage |
9,039 | 2,532,637 | ||||||
Realty Income Corp. |
65,998 | 4,186,253 | ||||||
Regency Centers Corp. |
59,935 | 3,745,937 | ||||||
VICI Properties, Inc. |
26,432 | 856,397 | ||||||
Weyerhaeuser Co. |
26,908 | 834,148 | ||||||
WP Carey, Inc. |
21,446 | 1,676,005 | ||||||
| 24,921,389 | ||||||||
Savings & Loans — 0.4% |
||||||||
Capitol Federal Financial, Inc. |
136,550 | 1,181,157 | ||||||
| 83,190,826 | ||||||||
Industrial — 15.1% |
||||||||
Building Materials — 1.0% |
||||||||
Cie de Saint-Gobain |
63,671 | 3,125,850 | ||||||
Electrical Components & Equipment — 2.2% |
||||||||
Emerson Electric Co. |
44,857 | 4,308,964 | ||||||
Legrand SA |
29,643 | 2,386,778 | ||||||
| 6,695,742 | ||||||||
Electronics — 2.6% |
||||||||
Atkore, Inc. (a) |
11,529 | 1,307,619 | ||||||
nVent Electric PLC |
89,113 | 3,428,177 | ||||||
TE Connectivity Ltd. |
27,466 | 3,153,097 | ||||||
| 7,888,893 | ||||||||
Engineering & Construction — 1.1% |
||||||||
Vinci SA |
31,720 | 3,168,035 | ||||||
Environmental Controls — 0.5% |
||||||||
Republic Services, Inc. |
10,441 | 1,346,784 | ||||||
Machinery – Construction & Mining — 1.9% |
||||||||
Oshkosh Corp. |
62,772 | 5,535,863 | ||||||
Number of |
Value |
|||||||
Machinery – Diversified — 0.8% |
||||||||
IMI PLC |
144,106 | $ | 2,243,107 | |||||
Packaging & Containers — 3.1% |
||||||||
Amcor PLC |
234,929 | 2,798,004 | ||||||
Packaging Corp. of America |
36,826 | 4,710,414 | ||||||
Sonoco Products Co. |
27,535 | 1,671,650 | ||||||
| 9,180,068 | ||||||||
Shipbuilding — 1.2% |
||||||||
Huntington Ingalls Industries, Inc. |
15,981 | 3,686,497 | ||||||
Transportation — 0.7% |
||||||||
Heartland Express, Inc. |
138,412 | 2,123,240 | ||||||
| 44,994,079 | ||||||||
Technology — 3.4% |
||||||||
Computers — 1.9% |
||||||||
Amdocs Ltd. |
36,266 | 3,296,580 | ||||||
HP, Inc. |
92,128 | 2,475,479 | ||||||
| 5,772,059 | ||||||||
Semiconductors — 1.0% |
||||||||
Applied Materials, Inc. |
13,740 | 1,338,001 | ||||||
Teradyne, Inc. |
16,927 | 1,478,574 | ||||||
| 2,816,575 | ||||||||
Software — 0.5% |
||||||||
Electronic Arts, Inc. |
12,746 | 1,557,306 | ||||||
| 10,145,940 | ||||||||
Utilities — 8.9% |
||||||||
Electric — 6.6% |
||||||||
Duke Energy Corp. |
31,510 | 3,245,215 | ||||||
Edison International |
100,609 | 6,400,744 | ||||||
Evergy, Inc. |
22,369 | 1,407,681 | ||||||
Eversource Energy |
17,481 | 1,465,607 | ||||||
NorthWestern Corp. |
80,711 | 4,789,391 | ||||||
Pinnacle West Capital Corp. |
31,943 | 2,428,946 | ||||||
| 19,737,584 | ||||||||
Gas — 2.3% |
||||||||
Atmos Energy Corp. |
6,859 | 768,688 | ||||||
Spire, Inc. |
85,629 | 5,896,413 | ||||||
| 6,665,101 | ||||||||
| 26,402,685 | ||||||||
TOTAL COMMON STOCK (Cost $286,616,350) |
286,912,055 | |||||||
The accompanying notes are an integral part of the financial statements.
143
MML Mid Cap Value Fund – Portfolio of Investments (Continued) |
Number of |
Value |
|||||||
PREFERRED STOCK — 1.0% |
||||||||
Consumer, Non-cyclical — 1.0% |
||||||||
Household Products & Wares — 1.0% |
||||||||
Henkel AG & Co. KGaA 2.84% |
43,547 | $ | 3,031,478 | |||||
TOTAL PREFERRED STOCK (Cost $2,834,154) |
3,031,478 | |||||||
TOTAL EQUITIES (Cost $289,450,504) |
289,943,533 | |||||||
MUTUAL FUNDS — 1.2% |
||||||||
Diversified Financial Services — 1.2% |
||||||||
iShares Russell Mid-Cap V alue ETF (c) |
33,239 | 3,501,396 | ||||||
TOTAL MUTUAL FUNDS (Cost $3,280,439) |
3,501,396 | |||||||
TOTAL LONG-TERM INVESTMENTS (Cost $292,730,943) |
293,444,929 | |||||||
Principal |
Value |
|||||||
SHORT-TERM INVESTMENTS — 1.0% |
||||||||
Repurchase Agreement — 1.0% |
||||||||
Fixed Income Clearing Corp., Repurchase Agreement, dated 12/30/22, 1.280%, due 1/03/23 (d) |
$ | 2,953,179 | $ | 2,953,179 | ||||
TOTAL SHORT-TERM INVESTMENTS (Cost $2,953,179) |
2,953,179 | |||||||
TOTAL INVESTMENTS — 99.6% (Cost $295,684,122) (e) |
296,398,108 | |||||||
Other Assets/(Liabilities) — 0.4% |
1,211,130 | |||||||
NET ASSETS — 100.0% |
$ | 297,609,238 | ||||||
Abbreviation Legend
|
ETF |
Exchange-Traded Fund |
Notes to Portfolio of Investments
Percentages are stated as a percent of net assets.
|
(a) |
Non-income producing security. |
|
(b) |
Security is a Master Limited Partnership. |
|
(c) |
Denotes all or a portion of security on loan. The total value of securities on loan as of December 31, 2022, was $1,085,418 or 0.36% of net assets. The Fund received $1,109,860 of non-cash collateral (U.S. Treasury and/or Agency obligations) related to securities lending activity. This amount is not reflected on either the Portfolio of Investments or the Statement of Assets and Liabilities. (Note 2). |
|
(d) |
Maturity value of $2,953,599. Collateralized by U.S. Government Agency obligations with a rate of 0.000%, maturity date of 6/29/23, and an aggregate market value, including accrued interest, of $3,012,258. |
|
(e) |
See Note 6 for aggregate cost for federal tax purposes. |
Forward contracts
Counterparty |
Settlement |
Currency Purchased |
Currency Sold |
Unrealized |
||||||||||||||||||||
Bank of America N.A. |
3/31/23 | USD | 2,589,687 | GBP | 2,124,218 | $ | 16,139 | |||||||||||||||||
Bank of America N.A. |
3/31/23 | GBP | 259,988 | USD | 314,764 | 219 | ||||||||||||||||||
JP Morgan Chase Bank N.A. |
3/31/23 | USD | 21,482,889 | EUR | 20,065,201 | (124,009 | ) | |||||||||||||||||
UBS AG |
3/31/23 | NOK | 1,691,923 | USD | 172,393 | 966 | ||||||||||||||||||
UBS AG |
3/31/23 | USD | 171,491 | NOK | 1,691,923 | (1,868 | ) | |||||||||||||||||
| $ | (108,553 | ) | ||||||||||||||||||||||
Currency Legend
|
EUR |
Euro |
|
GBP |
British Pound |
|
NOK |
Norwegian Krone |
|
USD |
U.S. Dollar |
The accompanying notes are an integral part of the financial statements.
144
December 31, 2022 |
Number of |
Value |
|||||||
EQUITIES — 98.6% |
||||||||
COMMON STOCK — 98.6% |
||||||||
Basic Materials — 2.6% |
||||||||
Chemicals — 2.6% |
||||||||
Cabot Corp. |
30,368 | $ | 2,029,797 | |||||
Livent Corp. (a) |
39,062 | 776,162 | ||||||
Methanex Corp. |
19,218 | 727,594 | ||||||
| 3,533,553 | ||||||||
| 3,533,553 | ||||||||
Communications — 4.6% |
||||||||
Internet — 2.2% |
||||||||
Cargurus, Inc. (a) |
45,141 | 632,425 | ||||||
Criteo SA Sponsored ADR (a) |
21,965 | 572,408 | ||||||
Perficient, Inc. (a) |
14,437 | 1,008,136 | ||||||
Ziff Davis, Inc. (a) |
10,512 | 831,499 | ||||||
| 3,044,468 | ||||||||
Media — 0.6% |
||||||||
The New York Times Co. Class A |
24,102 | 782,351 | ||||||
Telecommunications — 1.8% |
||||||||
Calix, Inc. (a) |
27,894 | 1,908,787 | ||||||
Viavi Solutions, Inc. (a) |
63,922 | 671,820 | ||||||
| 2,580,607 | ||||||||
| 6,407,426 | ||||||||
Consumer, Cyclical — 13.4% |
||||||||
Apparel — 2.3% |
||||||||
Carter’s, Inc. (b) |
6,844 | 510,631 | ||||||
Crocs, Inc. (a) |
11,950 | 1,295,738 | ||||||
Deckers Outdoor Corp. (a) |
1,756 | 700,925 | ||||||
Steven Madden Ltd. |
22,951 | 733,514 | ||||||
| 3,240,808 | ||||||||
Auto Parts & Equipment — 0.5% |
||||||||
Visteon Corp. (a) |
5,090 | 665,925 | ||||||
Distribution & Wholesale — 0.7% |
||||||||
WESCO International, Inc. (a) |
7,883 | 986,952 | ||||||
Entertainment — 0.3% |
||||||||
Cinemark Holdings, Inc. (a) |
43,500 | 376,710 | ||||||
Food Services — 0.6% |
||||||||
Sovos Brands, Inc. (a) |
59,623 | 856,783 | ||||||
Home Builders — 2.0% |
||||||||
Century Communities, Inc. |
16,821 | 841,218 | ||||||
Skyline Champion Corp. (a) |
29,795 | 1,534,740 | ||||||
Thor Industries, Inc. (b) |
5,040 | 380,470 | ||||||
| 2,756,428 | ||||||||
Leisure Time — 1.0% |
||||||||
Acushnet Holdings Corp. |
15,835 | 672,354 | ||||||
Number of |
Value |
|||||||
YETI Holdings, Inc. (a) |
19,300 | $ | 797,283 | |||||
| 1,469,637 | ||||||||
Lodging — 0.6% |
||||||||
Boyd Gaming Corp. |
14,459 | 788,449 | ||||||
Retail — 5.4% |
||||||||
Denny’s Corp. (a) |
44,115 | 406,299 | ||||||
Freshpet, Inc. (a) (b) |
2,471 | 130,395 | ||||||
Nu Skin Enterprises, Inc. Class A |
18,481 | 779,159 | ||||||
Patrick Industries, Inc. |
15,759 | 954,995 | ||||||
Rush Enterprises, Inc. Class A |
28,811 | 1,506,239 | ||||||
Texas Roadhouse, Inc. |
12,979 | 1,180,440 | ||||||
Victoria’s Secret & Co. (a) |
20,611 | 737,462 | ||||||
Wingstop, Inc. |
12,961 | 1,783,693 | ||||||
| 7,478,682 | ||||||||
| 18,620,374 | ||||||||
Consumer, Non-cyclical — 26.3% |
||||||||
Beverages — 0.7% |
||||||||
Celsius Holdings, Inc. (a) |
9,776 | 1,017,095 | ||||||
Biotechnology — 9.1% |
||||||||
Adicet Bio, Inc. (a) |
11,533 | 103,105 | ||||||
Akero Therapeutics, Inc. (a) |
8,576 | 469,965 | ||||||
Amicus Therapeutics, Inc. (a) |
63,164 | 771,232 | ||||||
Apellis Pharmaceuticals, Inc. (a) |
11,043 | 571,034 | ||||||
Blueprint Medicines Corp. (a) |
7,814 | 342,331 | ||||||
Celldex Therapeutics, Inc. (a) |
7,753 | 345,551 | ||||||
Crinetics Pharmaceuticals, Inc. (a) |
38,499 | 704,532 | ||||||
Cytokinetics, Inc. (a) |
24,371 | 1,116,679 | ||||||
Halozyme Therapeutics, Inc. (a) |
5,593 | 318,242 | ||||||
Immatics NV (a) |
62,867 | 547,572 | ||||||
Immunocore Holdings PLC ADR (a) |
6,124 | 349,497 | ||||||
Intellia Therapeutics, Inc. (a) |
9,285 | 323,954 | ||||||
Intra-Cellular Therapies, Inc. (a) |
10,844 | 573,864 | ||||||
Karuna Therapeutics, Inc. (a) |
2,771 | 544,501 | ||||||
Kymera Therapeutics, Inc. (a) |
19,747 | 492,885 | ||||||
Myriad Genetics, Inc. (a) |
36,531 | 530,065 | ||||||
Prothena Corp. PLC (a) |
6,169 | 371,682 | ||||||
PTC Therapeutics, Inc. (a) |
12,389 | 472,888 | ||||||
Relay Therapeutics, Inc. (a) |
22,948 | 342,843 | ||||||
Revolution Medicines, Inc. (a) |
31,835 | 758,310 | ||||||
Rocket Pharmaceuticals, Inc. (a) |
32,791 | 641,720 | ||||||
Sage Therapeutics, Inc. (a) |
5,734 | 218,695 | ||||||
Syndax Pharmaceuticals, Inc. (a) |
34,481 | 877,541 | ||||||
Veracyte, Inc. (a) |
24,427 | 579,653 | ||||||
Zentalis Pharmaceuticals, Inc. (a) |
16,746 | 337,264 | ||||||
| 12,705,605 | ||||||||
Commercial Services — 3.8% |
||||||||
Cross Country Healthcare, Inc. (a) |
30,826 | 819,047 | ||||||
The accompanying notes are an integral part of the financial statements.
145
MML Small Cap Growth Equity Fund – Portfolio of Investments (Continued) |
Number of |
Value |
|||||||
H&R Block, Inc. |
18,612 | $ | 679,524 | |||||
HealthEquity, Inc. (a) |
9,776 | 602,593 | ||||||
Herc Holdings, Inc. |
6,258 | 823,365 | ||||||
TriNet Group, Inc. (a) |
22,484 | 1,524,415 | ||||||
WillScot Mobile Mini Holdings Corp. (a) |
19,268 | 870,335 | ||||||
| 5,319,279 | ||||||||
Cosmetics & Personal Care — 1.2% |
||||||||
elf Beauty, Inc. (a) |
30,221 | 1,671,221 | ||||||
Food — 0.4% |
||||||||
The Simply Good Foods Co. (a) |
14,649 | 557,102 | ||||||
Health Care – Products — 6.6% |
||||||||
Glaukos Corp. (a) |
25,802 | 1,127,032 | ||||||
Globus Medical, Inc. Class A (a) |
21,742 | 1,614,778 | ||||||
Haemonetics Corp. (a) |
24,198 | 1,903,173 | ||||||
ICU Medical, Inc. (a) |
4,598 | 724,093 | ||||||
Inari Medical, Inc. (a) |
12,039 | 765,199 | ||||||
Inspire Medical Systems, Inc. (a) |
6,739 | 1,697,419 | ||||||
Omnicell, Inc. (a) |
11,822 | 596,065 | ||||||
Shockwave Medical, Inc. (a) |
3,266 | 671,522 | ||||||
| 9,099,281 | ||||||||
Health Care – Services — 2.1% |
||||||||
Acadia Healthcare Co., Inc. (a) |
20,761 | 1,709,046 | ||||||
Amedisys, Inc. (a) |
7,771 | 649,189 | ||||||
Surgery Partners, Inc. (a) |
21,142 | 589,016 | ||||||
| 2,947,251 | ||||||||
Pharmaceuticals — 2.4% |
||||||||
Aclaris Therapeutics, Inc. (a) |
49,644 | 781,893 | ||||||
Ascendis Pharma A/S ADR (a) |
1,582 | 193,210 | ||||||
BellRing Brands, Inc. (a) |
31,573 | 809,532 | ||||||
Merus NV (a) |
13,142 | 203,307 | ||||||
Owens & Minor, Inc. |
29,545 | 577,014 | ||||||
Revance Therapeutics, Inc. (a) |
10,629 | 196,211 | ||||||
Vaxcyte, Inc. (a) |
8,610 | 412,849 | ||||||
Verona Pharma PLC ADR (a) (b) |
6,300 | 164,619 | ||||||
| 3,338,635 | ||||||||
| 36,655,469 | ||||||||
Energy — 6.7% |
||||||||
Energy – Alternate Sources — 0.4% |
||||||||
Maxeon Solar Technologies Ltd. (a) (b) |
14,577 | 234,107 | ||||||
Shoals Technologies Group, Inc. Class A (a) |
14,700 | 362,649 | ||||||
| 596,756 | ||||||||
Oil & Gas — 6.0% |
||||||||
Chord Energy Corp. |
16,085 | 2,200,589 | ||||||
Magnolia Oil & Gas Corp. Class A |
31,988 | 750,119 | ||||||
Sitio Royalties Corp. Class A |
64,171 | 1,851,329 | ||||||
Number of |
Value |
|||||||
SM Energy Co. |
35,581 | $ | 1,239,286 | |||||
Viper Energy Partners LP (c) |
71,598 | 2,276,100 | ||||||
| 8,317,423 | ||||||||
Oil & Gas Services — 0.3% |
||||||||
Aris Water Solution, Inc. Class A |
24,323 | 350,494 | ||||||
| 9,264,673 | ||||||||
Financial — 16.8% |
||||||||
Banks — 5.6% |
||||||||
Ameris Bancorp |
42,519 | 2,004,346 | ||||||
Atlantic Union Bankshares Corp. |
19,982 | 702,167 | ||||||
Cadence Bank |
63,935 | 1,576,637 | ||||||
First Interstate BancSystem, Inc. Class A |
23,668 | 914,768 | ||||||
National Bank Holdings Corp. Class A |
21,591 | 908,333 | ||||||
Seacoast Banking Corp. of Florida |
29,653 | 924,877 | ||||||
Synovus Financial Corp. |
21,027 | 789,564 | ||||||
| 7,820,692 | ||||||||
Diversified Financial Services — 3.4% |
||||||||
Air Lease Corp. |
26,114 | 1,003,300 | ||||||
Hannon Armstrong Sustainable Infrastructure Capital, Inc. (b) |
47,366 | 1,372,667 | ||||||
PJT Partners, Inc. Class A |
9,901 | 729,605 | ||||||
PRA Group, Inc. (a) |
25,286 | 854,161 | ||||||
StepStone Group, Inc. Class A |
28,531 | 718,410 | ||||||
| 4,678,143 | ||||||||
Insurance — 2.4% |
||||||||
Assured Guaranty Ltd. |
17,471 | 1,087,744 | ||||||
Kemper Corp. |
16,029 | 788,627 | ||||||
MGIC Investment Corp. |
57,759 | 750,867 | ||||||
Selective Insurance Group, Inc. |
8,557 | 758,236 | ||||||
| 3,385,474 | ||||||||
Real Estate — 0.5% |
||||||||
McGrath RentCorp |
6,547 | 646,451 | ||||||
Real Estate Investment Trusts (REITS) — 4.9% |
||||||||
Centerspace |
9,442 | 553,962 | ||||||
Douglas Emmett, Inc. |
37,192 | 583,171 | ||||||
Essential Properties Realty Trust, Inc. |
35,536 | 834,030 | ||||||
National Storage Affiliates Trust |
17,179 | 620,505 | ||||||
Phillips Edison & Co., Inc. |
54,234 | 1,726,811 | ||||||
PotlatchDeltic Corp. |
20,071 | 882,923 | ||||||
Ryman Hospitality Properties, Inc. |
11,728 | 959,116 | ||||||
Xenia Hotels & Resorts, Inc. |
50,934 | 671,310 | ||||||
| 6,831,828 | ||||||||
| 23,362,588 | ||||||||
Industrial — 16.0% |
||||||||
Aerospace & Defense — 1.8% |
||||||||
Curtiss-Wright Corp. |
5,436 | 907,758 | ||||||
The accompanying notes are an integral part of the financial statements.
146
MML Small Cap Growth Equity Fund – Portfolio of Investments (Continued) |
Number of |
Value |
|||||||
Leonardo DRS, Inc. (a) |
12,100 | $ | 154,638 | |||||
Mercury Systems, Inc. (a) |
14,728 | 658,931 | ||||||
Spirit AeroSystems Holdings, Inc. Class A |
26,086 | 772,145 | ||||||
| 2,493,472 | ||||||||
Building Materials — 1.0% |
||||||||
The AZEK Co., Inc (a) |
38,168 | 775,574 | ||||||
Louisiana-Pacific Corp. |
10,816 | 640,307 | ||||||
| 1,415,881 | ||||||||
Electrical Components & Equipment — 1.3% |
||||||||
Acuity Brands, Inc. |
6,269 | 1,038,209 | ||||||
Novanta, Inc. (a) |
5,907 | 802,584 | ||||||
| 1,840,793 | ||||||||
Engineering & Construction — 2.6% |
||||||||
Comfort Systems USA, Inc. |
7,968 | 916,958 | ||||||
Fluor Corp. (a) |
79,188 | 2,744,656 | ||||||
| 3,661,614 | ||||||||
Environmental Controls — 1.0% |
||||||||
Casella Waste Systems, Inc. Class A (a) |
9,258 | 734,252 | ||||||
Clean Harbors, Inc. (a) |
5,170 | 590,000 | ||||||
| 1,324,252 | ||||||||
Hand & Machine Tools — 1.0% |
||||||||
Kennametal, Inc. |
31,290 | 752,838 | ||||||
Regal Rexnord Corp. |
4,745 | 569,305 | ||||||
| 1,322,143 | ||||||||
Machinery – Diversified — 4.7% |
||||||||
Albany International Corp. Class A |
6,818 | 672,187 | ||||||
Applied Industrial Technologies, Inc. |
14,636 | 1,844,575 | ||||||
Cactus, Inc. Class A |
21,283 | 1,069,684 | ||||||
Enovis Corp. (a) |
6,439 | 344,615 | ||||||
Flowserve Corp. |
25,824 | 792,280 | ||||||
The Middleby Corp. (a) |
4,518 | 604,960 | ||||||
Zurn Elkay Water Solutions Corp. |
56,380 | 1,192,437 | ||||||
| 6,520,738 | ||||||||
Metal Fabricate & Hardware — 0.5% |
||||||||
Helios Technologies, Inc. |
13,626 | 741,799 | ||||||
Packaging & Containers — 0.8% |
||||||||
Graphic Packaging Holding Co. |
49,101 | 1,092,497 | ||||||
Transportation — 0.7% |
||||||||
Kirby Corp. (a) |
13,503 | 868,918 | ||||||
RXO, Inc. (a) |
9,500 | 163,400 | ||||||
| 1,032,318 | ||||||||
Trucking & Leasing — 0.6% |
||||||||
GATX Corp. |
8,229 | 875,072 | ||||||
| 22,320,579 | ||||||||
Number of |
Value |
|||||||
Technology — 10.0% |
||||||||
Computers — 1.2% |
||||||||
Exlservice Holdings, Inc. (a) |
7,047 | $ | 1,193,973 | |||||
Rapid7, Inc. (a) |
14,266 | 484,759 | ||||||
| 1,678,732 | ||||||||
Semiconductors — 3.4% |
||||||||
Cirrus Logic, Inc. (a) |
10,381 | 773,177 | ||||||
FormFactor, Inc. (a) |
22,430 | 498,619 | ||||||
Lattice Semiconductor Corp. (a) |
11,724 | 760,653 | ||||||
MKS Instruments, Inc. |
4,825 | 408,822 | ||||||
Power Integrations, Inc. |
12,257 | 879,072 | ||||||
Synaptics, Inc. (a) |
8,990 | 855,489 | ||||||
Tower Semiconductor Ltd. (a) |
13,972 | 603,590 | ||||||
| 4,779,422 | ||||||||
Software — 5.4% |
||||||||
DoubleVerify Holdings, Inc. (a) |
23,130 | 507,935 | ||||||
Five9, Inc. (a) |
10,527 | 714,362 | ||||||
Jamf Holding Corp. (a) |
79,667 | 1,696,907 | ||||||
Manhattan Associates, Inc. (a) |
6,702 | 813,623 | ||||||
New Relic, Inc. (a) |
12,770 | 720,867 | ||||||
PowerSchool Holdings, Inc. Class A (a) |
41,276 | 952,650 | ||||||
RingCentral, Inc. Class A (a) |
22,561 | 798,659 | ||||||
Verra Mobility Corp. (a) |
94,612 | 1,308,484 | ||||||
| 7,513,487 | ||||||||
| 13,971,641 | ||||||||
Utilities — 2.2% |
||||||||
Electric — 1.7% |
||||||||
Ameresco, Inc. Class A (a) |
11,071 | 632,597 | ||||||
Atlantica Sustainable Infrastructure PLC |
28,316 | 733,384 | ||||||
Portland General Electric Co. (b) |
20,627 | 1,010,723 | ||||||
| 2,376,704 | ||||||||
Gas — 0.5% |
||||||||
ONE Gas, Inc. |
9,661 | 731,531 | ||||||
| 3,108,235 | ||||||||
TOTAL COMMON STOCK (Cost $136,330,797) |
137,244,538 | |||||||
TOTAL EQUITIES (Cost $136,330,797) |
137,244,538 | |||||||
MUTUAL FUNDS — 1.5% |
||||||||
Diversified Financial Services — 1.5% |
||||||||
iShares Russell 2000 ETF (b) |
4,278 | 745,912 | ||||||
iShares Russell 2000 Growth ETF |
958 | 205,510 | ||||||
The accompanying notes are an integral part of the financial statements.
147
MML Small Cap Growth Equity Fund – Portfolio of Investments (Continued) |
Number of |
Value |
|||||||
State Street Navigator Securities Lending Government Money Market Portfolio (d) |
1,157,685 | $ | 1,157,685 | |||||
TOTAL MUTUAL FUNDS (Cost $2,141,638) |
2,109,107 | |||||||
TOTAL LONG-TERM INVESTMENTS (Cost $138,472,435) |
139,353,645 | |||||||
Principal |
||||||||
SHORT-TERM INVESTMENTS — 0.9% |
||||||||
Repurchase Agreement — 0.9% |
||||||||
Fixed Income Clearing Corp., Repurchase Agreement, dated 12/30/22, 1.280%, due 1/03/23 (e) |
$ | 1,258,740 | 1,258,740 | |||||
TOTAL SHORT-TERM INVESTMENTS (Cost $1,258,740) |
1,258,740 | |||||||
TOTAL INVESTMENTS — 101.0% (Cost $139,731,175) (f) |
140,612,385 | |||||||
Other Assets/(Liabilities) — (1.0)% |
(1,347,657 | ) | ||||||
NET ASSETS — 100.0% |
$ | 139,264,728 | ||||||
Abbreviation Legend
|
ADR |
American Depositary Receipt |
|
ETF |
Exchange Traded Fund |
Notes to Portfolio of Investments
Percentages are stated as a percent of net assets.
|
(a) |
Non-income producing security. |
|
(b) |
Denotes all or a portion of security on loan. The total value of securities on loan as of December 31, 2022, was $4,464,346 or 3.21% of net assets. The Fund received $3,409,520 of non-cash collateral (U.S. Treasury and/or Agency obligations) related to securities lending activity. This amount is not reflected on either the Portfolio of Investments or the Statement of Assets and Liabilities. (Note 2). |
|
(c) |
Security is a Master Limited Partnership. |
|
(d) |
Represents investment of security lending cash collateral. (Note 2). |
|
(e) |
Maturity value of $1,258,919. Collateralized by U.S. Government Agency obligations with a rate of 0.000%, maturity date of 6/29/23, and an aggregate market value, including accrued interest, of $1,283,989. |
|
(f) |
See Note 6 for aggregate cost for federal tax purposes. |
The accompanying notes are an integral part of the financial statements.
148
December 31, 2022 |
Number of |
Value |
|||||||
EQUITIES — 99.7% |
||||||||
COMMON STOCK — 99.7% |
||||||||
Basic Materials — 1.6% |
||||||||
Chemicals — 1.6% |
||||||||
Element Solutions, Inc. |
18,491 | $ | 336,351 | |||||
Minerals Technologies, Inc. |
14,152 | 859,310 | ||||||
| 1,195,661 | ||||||||
Communications — 1.8% |
||||||||
Advertising — 0.7% |
||||||||
Entravision Communications Corp. Class A |
112,318 | 539,126 | ||||||
Internet — 0.2% |
||||||||
Solo Brands, Inc. Class A (a) |
37,305 | 138,775 | ||||||
Media — 0.9% |
||||||||
Cable One, Inc. |
807 | 574,471 | ||||||
Townsquare Media, Inc. Class A (a) |
12,543 | 90,937 | ||||||
| 665,408 | ||||||||
| 1,343,309 | ||||||||
Consumer, Cyclical — 18.0% |
||||||||
Apparel — 2.0% |
||||||||
Tapestry, Inc. |
40,530 | 1,543,382 | ||||||
Distribution & Wholesale — 1.6% |
||||||||
A-Mark Precious Metals, Inc. |
18,599 | 645,944 | ||||||
KAR Auction Services, Inc. (a) |
42,525 | 554,951 | ||||||
| 1,200,895 | ||||||||
Entertainment — 1.0% |
||||||||
Accel Entertainment, Inc. (a) |
58,416 | 449,803 | ||||||
Penn Entertainment, Inc. (a) |
10,583 | 314,315 | ||||||
| 764,118 | ||||||||
Home Builders — 2.1% |
||||||||
Skyline Champion Corp. (a) |
30,496 | 1,570,849 | ||||||
Home Furnishing — 0.2% |
||||||||
Vizio Holding Corp. Class A (a) |
22,978 | 170,267 | ||||||
Leisure Time — 3.0% |
||||||||
Brunswick Corp. |
20,612 | 1,485,713 | ||||||
Malibu Boats, Inc. Class A (a) |
14,390 | 766,987 | ||||||
| 2,252,700 | ||||||||
Lodging — 0.5% |
||||||||
Boyd Gaming Corp. |
6,428 | 350,519 | ||||||
Retail — 7.6% |
||||||||
Beacon Roofing Supply, Inc. (a) |
28,237 | 1,490,631 | ||||||
Dave & Buster’s Entertainment, Inc. (a) |
22,507 | 797,648 | ||||||
GMS, Inc. (a) |
19,820 | 987,036 | ||||||
MarineMax, Inc. (a) |
22,708 | 708,944 | ||||||
OneWater Marine, Inc. Class A (a) |
20,731 | 592,907 | ||||||
Number of |
Value |
|||||||
Penske Automotive Group, Inc. |
6,542 | $ | 751,872 | |||||
Red Robin Gourmet Burgers, Inc. (a) (b) |
22,707 | 126,705 | ||||||
RH (a) (b) |
1,147 | 306,467 | ||||||
| 5,762,210 | ||||||||
| 13,614,940 | ||||||||
Consumer, Non-cyclical — 14.3% |
||||||||
Commercial Services — 8.2% |
||||||||
AMN Healthcare Services, Inc. (a) |
1,293 | 132,946 | ||||||
Barrett Business Services, Inc. |
4,367 | 407,354 | ||||||
The Brink’s Co. |
24,709 | 1,327,120 | ||||||
Deluxe Corp. |
33,368 | 566,589 | ||||||
Euronet Worldwide, Inc. (a) |
4,913 | 463,689 | ||||||
EVERTEC, Inc. |
50,142 | 1,623,598 | ||||||
Korn Ferry |
23,603 | 1,194,784 | ||||||
Loomis AB |
16,925 | 463,623 | ||||||
| 6,179,703 | ||||||||
Cosmetics & Personal Care — 1.7% |
||||||||
Edgewell Personal Care Co. |
34,525 | 1,330,593 | ||||||
Health Care – Products — 0.2% |
||||||||
Zimvie, Inc. (a) |
13,329 | 124,493 | ||||||
Household Products & Wares — 2.3% |
||||||||
Spectrum Brands Holdings, Inc. |
29,031 | 1,768,569 | ||||||
Pharmaceuticals — 1.9% |
||||||||
Embecta Corp. |
18,883 | 477,551 | ||||||
Patterson Cos., Inc. |
33,207 | 930,792 | ||||||
| 1,408,343 | ||||||||
| 10,811,701 | ||||||||
Energy — 2.7% |
||||||||
Energy – Alternate Sources — 0.9% |
||||||||
Enviva, Inc. (b) |
12,936 | 685,220 | ||||||
Oil & Gas — 0.3% |
||||||||
Earthstone Energy, Inc. Class A (a) |
18,362 | 261,291 | ||||||
Oil & Gas Services — 1.5% |
||||||||
ChampionX Corp. |
37,763 | 1,094,749 | ||||||
NCS Multistage Holdings, Inc. (a) |
402 | 10,050 | ||||||
| 1,104,799 | ||||||||
| 2,051,310 | ||||||||
Financial — 33.4% |
||||||||
Banks — 21.6% |
||||||||
Ameris Bancorp |
18,801 | 886,279 | ||||||
BankUnited, Inc. |
23,960 | 813,921 | ||||||
ConnectOne Bancorp, Inc. |
15,582 | 377,240 | ||||||
F.N.B. Corp. |
117,027 | 1,527,202 | ||||||
First BanCorp |
111,789 | 1,421,956 | ||||||
First Interstate BancSystem, Inc. Class A |
13,859 | 535,650 | ||||||
The accompanying notes are an integral part of the financial statements.
149
MML Small Company Value Fund – Portfolio of Investments (Continued) |
Number of |
Value |
|||||||
First Merchants Corp. |
8,938 | $ | 367,441 | |||||
First Mid Bancshares, Inc. |
4,357 | 139,773 | ||||||
Home BancShares, Inc. |
55,106 | 1,255,866 | ||||||
Independent Bank Group, Inc. |
13,038 | 783,323 | ||||||
Old National Bancorp |
96,581 | 1,736,526 | ||||||
Origin Bancorp, Inc. |
10,179 | 373,569 | ||||||
PacWest Bancorp |
12,043 | 276,387 | ||||||
Premier Financial Corp. |
10,545 | 284,399 | ||||||
QCR Holdings, Inc. |
5,777 | 286,770 | ||||||
SouthState Corp. |
19,303 | 1,473,977 | ||||||
Towne Bank |
11,989 | 369,741 | ||||||
UMB Financial Corp. |
17,578 | 1,468,115 | ||||||
Valley National Bancorp |
109,850 | 1,242,404 | ||||||
Veritex Holdings, Inc. |
26,306 | 738,673 | ||||||
| 16,359,212 | ||||||||
Diversified Financial Services — 0.1% |
||||||||
Enact Holdings, Inc. |
4,366 | 105,308 | ||||||
Insurance — 2.2% |
||||||||
Axis Capital Holdings Ltd. |
21,796 | 1,180,689 | ||||||
ProAssurance Corp. |
5,893 | 102,951 | ||||||
Selective Insurance Group, Inc. |
4,497 | 398,479 | ||||||
| 1,682,119 | ||||||||
Investment Companies — 1.7% |
||||||||
Compass Diversified Holdings (b) |
69,372 | 1,264,651 | ||||||
Private Equity — 0.3% |
||||||||
Patria Investments Ltd. Class A |
16,897 | 235,375 | ||||||
Real Estate Investment Trusts (REITS) — 5.6% |
||||||||
CareTrust REIT, Inc. |
21,218 | 394,231 | ||||||
Easterly Government Properties, Inc. |
18,389 | 262,411 | ||||||
Four Corners Property Trust, Inc. |
25,402 | 658,674 | ||||||
Getty Realty Corp. |
6,403 | 216,742 | ||||||
Highwoods Properties, Inc. |
19,295 | 539,874 | ||||||
Kite Realty Group Trust |
26,926 | 566,792 | ||||||
National Health Investors, Inc. |
8,470 | 442,303 | ||||||
NETSTREIT Corp. |
10,395 | 190,540 | ||||||
Physicians Realty Trust |
32,747 | 473,849 | ||||||
Summit Hotel Properties, Inc. |
41,057 | 296,432 | ||||||
UMH Properties, Inc. |
11,811 | 190,157 | ||||||
| 4,232,005 | ||||||||
Savings & Loans — 1.9% |
||||||||
Pacific Premier Bancorp, Inc. |
32,652 | 1,030,497 | ||||||
Provident Financial Services, Inc. |
17,857 | 381,426 | ||||||
| 1,411,923 | ||||||||
| 25,290,593 | ||||||||
Industrial — 19.3% |
||||||||
Aerospace & Defense — 0.2% |
||||||||
Leonardo DRS, Inc. (a) (b) |
13,696 | 175,035 | ||||||
Number of |
Value |
|||||||
Building Materials — 2.1% |
||||||||
Hayward Holdings, Inc. (a) (b) |
42,546 | $ | 399,932 | |||||
Mohawk Industries, Inc. (a) |
4,534 | 463,465 | ||||||
Tecnoglass, Inc. |
24,415 | 751,250 | ||||||
| 1,614,647 | ||||||||
Electrical Components & Equipment — 0.7% |
||||||||
Belden, Inc. |
6,186 | 444,773 | ||||||
Graham Corp. |
6,111 | 58,788 | ||||||
| 503,561 | ||||||||
Electronics — 6.0% |
||||||||
Advanced Energy Industries, Inc. |
2,611 | 223,972 | ||||||
Avnet, Inc. |
36,023 | 1,497,836 | ||||||
Coherent Corp. (a) |
55,578 | 1,950,788 | ||||||
Vontier Corp. |
44,525 | 860,668 | ||||||
| 4,533,264 | ||||||||
Engineering & Construction — 0.6% |
||||||||
Dycom Industries, Inc. (a) |
4,628 | 433,181 | ||||||
Environmental Controls — 0.2% |
||||||||
CECO Environmental Corp. (a) |
14,296 | 166,977 | ||||||
Charah Solutions, Inc. (a) (b) |
2,879 | 15,545 | ||||||
| 182,522 | ||||||||
Hand & Machine Tools — 0.2% |
||||||||
Luxfer Holdings PLC |
10,932 | 149,987 | ||||||
Machinery – Diversified — 3.5% |
||||||||
DXP Enterprises, Inc. (a) |
13,306 | 366,580 | ||||||
Enovis Corp. (a) |
15,620 | 835,983 | ||||||
Esab Corp. |
10,440 | 489,845 | ||||||
Gates Industrial Corp. PLC (a) |
82,366 | 939,796 | ||||||
| 2,632,204 | ||||||||
Metal Fabricate & Hardware — 2.4% |
||||||||
Hillman Solutions Corp. (a) |
64,665 | 466,235 | ||||||
The Timken Co. |
19,474 | 1,376,227 | ||||||
| 1,842,462 | ||||||||
Miscellaneous - Manufacturing — 0.1% |
||||||||
DIRTT Environmental Solutions (a) (b) |
64,423 | 34,144 | ||||||
Packaging & Containers — 3.3% |
||||||||
Graphic Packaging Holding Co. |
77,004 | 1,713,339 | ||||||
Karat Packaging, Inc. |
5,817 | 83,590 | ||||||
Pactiv Evergreen, Inc. |
63,561 | 722,053 | ||||||
| 2,518,982 | ||||||||
| 14,619,989 | ||||||||
Technology — 7.1% |
||||||||
Semiconductors — 2.9% |
||||||||
Cohu, Inc. (a) |
15,953 | 511,294 | ||||||
Kulicke & Soffa Industries, Inc. |
29,546 | 1,307,706 | ||||||
The accompanying notes are an integral part of the financial statements.
150
MML Small Company Value Fund – Portfolio of Investments (Continued) |
Number of |
Value |
|||||||
MKS Instruments, Inc. |
4,217 | $ | 357,306 | |||||
| 2,176,306 | ||||||||
Software — 4.2% |
||||||||
Digital Turbine, Inc. (a) |
25,245 | 384,734 | ||||||
Donnelley Financial Solutions, Inc. (a) |
21,637 | 836,270 | ||||||
IBEX Holdings Ltd. (a) |
10,628 | 264,106 | ||||||
Teradata Corp. (a) |
50,846 | 1,711,476 | ||||||
| 3,196,586 | ||||||||
| 5,372,892 | ||||||||
Utilities — 1.5% |
||||||||
Electric — 0.7% |
||||||||
ALLETE, Inc. |
5,201 | 335,516 | ||||||
PNM Resources, Inc. |
3,156 | 153,981 | ||||||
| 489,497 | ||||||||
Gas — 0.8% |
||||||||
Northwest Natural Holding Co. |
3,416 | 162,567 | ||||||
Southwest Gas Holdings, Inc. |
7,713 | 477,281 | ||||||
| 639,848 | ||||||||
| 1,129,345 | ||||||||
TOTAL COMMON STOCK (Cost $87,363,242) |
75,429,740 | |||||||
TOTAL EQUITIES (Cost $87,363,242) |
75,429,740 | |||||||
MUTUAL FUNDS — 0.1% |
||||||||
Diversified Financial Services — 0.1% |
||||||||
State Street Navigator Securities Lending Government Money Market Portfolio (c) |
115,944 | 115,944 | ||||||
TOTAL MUTUAL FUNDS (Cost $115,944) |
115,944 | |||||||
TOTAL LONG-TERM INVESTMENTS (Cost $87,479,186) |
75,545,684 | |||||||
Principal |
Value |
|||||||
SHORT-TERM INVESTMENTS — 0.7% |
||||||||
Repurchase Agreement — 0.7% |
||||||||
Fixed Income Clearing Corp., Repurchase Agreement, dated 12/30/22, 1.280%, due 1/03/23 (d) |
$ | 499,850 | $ | 499,850 | ||||
TOTAL SHORT-TERM INVESTMENTS (Cost $499,850) |
499,850 | |||||||
TOTAL INVESTMENTS — 100.5% (Cost $87,979,036) (e) |
76,045,534 | |||||||
Other Assets/(Liabilities) — (0.5)% |
(373,604 | ) | ||||||
NET ASSETS — 100.0% |
$ | 75,671,930 | ||||||
Notes to Portfolio of Investments
Percentages are stated as a percent of net assets.
|
(a) |
Non-income producing security. |
|
(b) |
Denotes all or a portion of security on loan. The total value of securities on loan as of December 31, 2022, was $2,731,691 or 3.61% of net assets. The Fund received $2,721,161 of non-cash collateral (U.S. Treasury and/or Agency obligations) related to securities lending activity. This amount is not reflected on either the Portfolio of Investments or the Statement of Assets and Liabilities. (Note 2). |
|
(c) |
Represents investment of security lending cash collateral. (Note 2). |
|
(d) |
Maturity value of $499,921. Collateralized by U.S. Government Agency obligations with a rate of 0.000%, maturity date of 6/29/23, and an aggregate market value, including accrued interest, of $509,941. |
|
(e) |
See Note 6 for aggregate cost for federal tax purposes. |
The accompanying notes are an integral part of the financial statements.
151
MML Small Company Value Fund – Portfolio of Investments (Continued) |
Forward contracts
Counterparty |
Settlement |
Currency Purchased |
Currency Sold |
Unrealized |
||||||||||||||||||||
UBS AG |
3/31/23 | SEK | 106,458 | USD | 10,270 | $ | (17 | ) | ||||||||||||||||
UBS AG |
3/31/23 | USD | 413,553 | SEK | 4,272,716 | 2,052 | ||||||||||||||||||
| $ | 2,035 | |||||||||||||||||||||||
Currency Legend
|
SEK |
Swedish Krona |
|
USD |
U.S. Dollar |
The accompanying notes are an integral part of the financial statements.
152
December 31, 2022 |
Number of |
Value |
|||||||
EQUITIES — 99.4% |
||||||||
COMMON STOCK — 99.4% |
||||||||
Basic Materials — 5.1% |
||||||||
Chemicals — 2.0% |
||||||||
Huntsman Corp. |
65,270 | $ | 1,793,620 | |||||
Innospec, Inc. |
8,333 | 857,132 | ||||||
| 2,650,752 | ||||||||
Iron & Steel — 2.1% |
||||||||
ATI, Inc. (a) |
57,663 | 1,721,817 | ||||||
Reliance Steel & Aluminum Co. |
5,355 | 1,084,066 | ||||||
| 2,805,883 | ||||||||
Mining — 1.0% |
||||||||
Cameco Corp. |
60,710 | 1,376,296 | ||||||
| 6,832,931 | ||||||||
Communications — 2.1% |
||||||||
Internet — 2.1% |
||||||||
Criteo SA Sponsored ADR (a) |
56,141 | 1,463,034 | ||||||
Gen Digital, Inc. |
62,383 | 1,336,868 | ||||||
| 2,799,902 | ||||||||
| 2,799,902 | ||||||||
Consumer, Cyclical — 16.0% |
||||||||
Airlines — 1.1% |
||||||||
Alaska Air Group, Inc. (a) |
35,680 | 1,532,099 | ||||||
Apparel — 3.7% |
||||||||
Carter’s, Inc. |
14,410 | 1,075,130 | ||||||
Ralph Lauren Corp. |
17,740 | 1,874,586 | ||||||
Tapestry, Inc. |
53,500 | 2,037,280 | ||||||
| 4,986,996 | ||||||||
Auto Parts & Equipment — 1.7% |
||||||||
Dana, Inc. |
65,036 | 983,995 | ||||||
The Goodyear Tire & Rubber Co. (a) |
127,597 | 1,295,109 | ||||||
| 2,279,104 | ||||||||
Home Builders — 3.3% |
||||||||
KB Home |
39,737 | 1,265,624 | ||||||
PulteGroup, Inc. |
43,810 | 1,994,669 | ||||||
Taylor Morrison Home Corp. (a) |
35,754 | 1,085,134 | ||||||
| 4,345,427 | ||||||||
Lodging — 1.2% |
||||||||
Hilton Grand Vacations, Inc. (a) |
41,003 | 1,580,256 | ||||||
Retail — 5.0% |
||||||||
Bath & Body Works, Inc. |
31,447 | 1,325,176 | ||||||
Dine Brands Global, Inc. |
21,011 | 1,357,310 | ||||||
Papa John’s International, Inc. |
17,632 | 1,451,290 | ||||||
Sally Beauty Holdings, Inc. (a) |
94,240 | 1,179,885 | ||||||
Number of |
Value |
|||||||
Williams-Sonoma, Inc. |
11,141 | $ | 1,280,324 | |||||
| 6,593,985 | ||||||||
| 21,317,867 | ||||||||
Consumer, Non-cyclical — 12.8% |
||||||||
Commercial Services — 4.2% |
||||||||
ADT, Inc. |
174,041 | 1,578,552 | ||||||
Herc Holdings, Inc. |
14,680 | 1,931,447 | ||||||
Korn Ferry |
17,330 | 877,245 | ||||||
Robert Half International, Inc. |
17,039 | 1,257,989 | ||||||
| 5,645,233 | ||||||||
Food — 2.4% |
||||||||
The Hain Celestial Group, Inc. (a) |
72,768 | 1,177,386 | ||||||
Nomad Foods Ltd. (a) |
115,348 | 1,988,600 | ||||||
| 3,165,986 | ||||||||
Health Care – Products — 3.1% |
||||||||
Envista Holdings Corp. (a) |
60,290 | 2,029,964 | ||||||
Integra LifeSciences Holdings Corp. (a) |
36,999 | 2,074,534 | ||||||
| 4,104,498 | ||||||||
Health Care – Services — 3.1% |
||||||||
Acadia Healthcare Co., Inc. (a) |
22,432 | 1,846,602 | ||||||
Pediatrix Medical Group, Inc. (a) |
82,910 | 1,232,043 | ||||||
Syneos Health, Inc. (a) |
26,940 | 988,159 | ||||||
| 4,066,804 | ||||||||
| 16,982,521 | ||||||||
Energy — 3.5% |
||||||||
Oil & Gas — 3.5% |
||||||||
Helmerich & Payne, Inc. |
30,850 | 1,529,235 | ||||||
HF Sinclair Corp. |
27,365 | 1,419,970 | ||||||
Magnolia Oil & Gas Corp. Class A |
72,210 | 1,693,324 | ||||||
| 4,642,529 | ||||||||
| 4,642,529 | ||||||||
Financial — 29.8% |
||||||||
Banks — 13.6% |
||||||||
BankUnited, Inc. |
35,839 | 1,217,451 | ||||||
Comerica, Inc. |
31,218 | 2,086,923 | ||||||
First BanCorp |
136,400 | 1,735,008 | ||||||
First Citizens BancShares, Inc. Class A |
3,013 | 2,284,939 | ||||||
First Hawaiian, Inc. |
77,083 | 2,007,241 | ||||||
Synovus Financial Corp. |
46,744 | 1,755,237 | ||||||
Texas Capital Bancshares, Inc. (a) |
29,194 | 1,760,690 | ||||||
Webster Financial Corp. |
25,019 | 1,184,400 | ||||||
Wintrust Financial Corp. |
23,426 | 1,979,966 | ||||||
Zions Bancorp NA |
41,808 | 2,055,281 | ||||||
| 18,067,136 | ||||||||
The accompanying notes are an integral part of the financial statements.
153
MML Small/Mid Cap Value Fund – Portfolio of Investments (Continued) |
Number of |
Value |
|||||||
Diversified Financial Services — 3.3% |
||||||||
Cboe Global Markets, Inc. |
10,370 | $ | 1,301,124 | |||||
Moelis & Co. Class A |
33,606 | 1,289,462 | ||||||
Stifel Financial Corp. |
31,390 | 1,832,234 | ||||||
| 4,422,820 | ||||||||
Insurance — 6.7% |
||||||||
American Financial Group, Inc. |
10,648 | 1,461,757 | ||||||
Everest Re Group Ltd. |
4,510 | 1,494,028 | ||||||
The Hanover Insurance Group, Inc. |
11,958 | 1,615,885 | ||||||
Kemper Corp. |
26,680 | 1,312,656 | ||||||
Reinsurance Group of America, Inc. |
10,990 | 1,561,569 | ||||||
Selective Insurance Group, Inc. |
16,267 | 1,441,419 | ||||||
| 8,887,314 | ||||||||
Real Estate Investment Trusts (REITS) — 6.2% |
||||||||
Broadstone Net Lease, Inc. |
72,058 | 1,168,060 | ||||||
Camden Property Trust |
14,108 | 1,578,403 | ||||||
Cousins Properties, Inc. |
36,928 | 933,909 | ||||||
CubeSmart |
42,354 | 1,704,749 | ||||||
Physicians Realty Trust |
106,994 | 1,548,203 | ||||||
STAG Industrial, Inc. |
39,258 | 1,268,426 | ||||||
| 8,201,750 | ||||||||
| 39,579,020 | ||||||||
Industrial — 21.0% |
||||||||
Aerospace & Defense — 1.4% |
||||||||
Spirit AeroSystems Holdings, Inc. Class A |
62,450 | 1,848,520 | ||||||
Building Materials — 1.1% |
||||||||
Masonite International Corp. (a) |
18,421 | 1,484,917 | ||||||
Electrical Components & Equipment — 0.9% |
||||||||
Belden, Inc. |
16,424 | 1,180,886 | ||||||
Electronics — 2.1% |
||||||||
Avnet, Inc. |
35,115 | 1,460,082 | ||||||
Sensata Technologies Holding PLC |
32,700 | 1,320,426 | ||||||
| 2,780,508 | ||||||||
Engineering & Construction — 4.8% |
||||||||
AECOM |
21,350 | 1,813,256 | ||||||
Arcosa, Inc. |
30,196 | 1,640,851 | ||||||
Dycom Industries, Inc. (a) |
17,537 | 1,641,463 | ||||||
Fluor Corp. (a) |
38,840 | 1,346,194 | ||||||
| 6,441,764 | ||||||||
Hand & Machine Tools — 1.4% |
||||||||
Regal Rexnord Corp. |
16,002 | 1,919,920 | ||||||
Machinery – Construction & Mining — 2.4% |
||||||||
Oshkosh Corp. |
13,701 | 1,208,291 | ||||||
Vertiv Holdings Co. |
144,366 | 1,972,040 | ||||||
| 3,180,331 | ||||||||
Number of |
Value |
|||||||
Metal Fabricate & Hardware — 1.1% |
||||||||
The Timken Co. |
20,893 | $ | 1,476,508 | |||||
Packaging & Containers — 1.9% |
||||||||
Berry Global Group, Inc. |
41,620 | 2,515,096 | ||||||
Transportation — 3.9% |
||||||||
Knight-Swift Transportation Holdings, Inc. |
37,263 | 1,952,954 | ||||||
RXO, Inc. (a) |
12,115 | 208,378 | ||||||
Star Bulk Carriers Corp. |
62,804 | 1,207,721 | ||||||
XPO, Inc. (a) |
52,830 | 1,758,710 | ||||||
| 5,127,763 | ||||||||
| 27,956,213 | ||||||||
Technology — 6.6% |
||||||||
Computers — 1.8% |
||||||||
Genpact Ltd. |
29,920 | 1,385,894 | ||||||
Lumentum Holdings, Inc. (a) |
19,640 | 1,024,619 | ||||||
| 2,410,513 | ||||||||
Semiconductors — 2.4% |
||||||||
Kulicke & Soffa Industries, Inc. |
25,512 | 1,129,161 | ||||||
ON Semiconductor Corp. (a) |
10,580 | 659,874 | ||||||
Synaptics, Inc. (a) |
14,879 | 1,415,886 | ||||||
| 3,204,921 | ||||||||
Software — 2.4% |
||||||||
ACI Worldwide, Inc. (a) |
65,982 | 1,517,586 | ||||||
CommVault Systems, Inc. (a) |
26,746 | 1,680,719 | ||||||
| 3,198,305 | ||||||||
| 8,813,739 | ||||||||
Utilities — 2.5% |
||||||||
Electric — 1.7% |
||||||||
IDACORP, Inc. |
20,995 | 2,264,311 | ||||||
Gas — 0.8% |
||||||||
Southwest Gas Holdings, Inc. |
17,150 | 1,061,242 | ||||||
| 3,325,553 | ||||||||
TOTAL COMMON STOCK (Cost $134,142,770) |
132,250,275 | |||||||
TOTAL EQUITIES (Cost $134,142,770) |
132,250,275 | |||||||
TOTAL LONG-TERM INVESTMENTS (Cost $134,142,770) |
132,250,275 | |||||||
The accompanying notes are an integral part of the financial statements.
154
MML Small/Mid Cap Value Fund – Portfolio of Investments (Continued) |
Principal |
Value |
|||||||
SHORT-TERM INVESTMENTS — 0.7% |
||||||||
Repurchase Agreement — 0.7% |
||||||||
Fixed Income Clearing Corp., Repurchase Agreement, dated 12/30/22, 1.280%, due 1/03/23 (b) |
$ | 898,102 | $ | 898,102 | ||||
TOTAL SHORT-TERM INVESTMENTS (Cost $898,102) |
898,102 | |||||||
TOTAL INVESTMENTS — 100.1% (Cost $135,040,872) (c) |
133,148,377 | |||||||
Other Assets/(Liabilities) — (0.1)% |
(116,157 | ) | ||||||
NET ASSETS — 100.0% |
$ | 133,032,220 | ||||||
Abbreviation Legend
|
ADR |
American Depositary Receipt |
Notes to Portfolio of Investments
Percentages are stated as a percent of net assets.
|
(a) |
Non-income producing security. |
|
(b) |
Maturity value of $898,229. Collateralized by U.S. Government Agency obligations with a rate of 0.000%, maturity date of 6/29/23, and an aggregate market value, including accrued interest, of $916,116. |
|
(c) |
See Note 6 for aggregate cost for federal tax purposes. |
The accompanying notes are an integral part of the financial statements.
155
MML Sustainable Equity Fund – Portfolio of Investments |
December 31, 2022 |
Number of |
Value |
|||||||
COMMON STOCK — 99.2% |
||||||||
Basic Materials — 2.6% |
||||||||
Chemicals — 2.6% |
||||||||
Air Products & Chemicals, Inc. |
2,899 | $ | 893,646 | |||||
Ecolab, Inc. |
3,973 | 578,310 | ||||||
Linde PLC |
5,784 | 1,886,625 | ||||||
| 3,358,581 | ||||||||
| 3,358,581 | ||||||||
Communications — 11.7% |
||||||||
Internet — 7.8% |
||||||||
Airbnb, Inc. Class A (a) |
3,291 | 281,381 | ||||||
Alphabet, Inc. Class A (a) |
55,677 | 4,912,382 | ||||||
Amazon.com, Inc. (a) |
33,116 | 2,781,744 | ||||||
Booking Holdings, Inc. (a) |
301 | 606,599 | ||||||
CDW Corp. |
7,240 | 1,292,919 | ||||||
Uber Technologies, Inc. (a) |
10,625 | 262,756 | ||||||
| 10,137,781 | ||||||||
Media — 0.9% |
||||||||
Liberty Media Corp-Liberty Formula One Class C (a) |
5,203 | 311,035 | ||||||
The Walt Disney Co. (a) |
10,312 | 895,907 | ||||||
| 1,206,942 | ||||||||
Telecommunications — 3.0% |
||||||||
Cisco Systems, Inc. |
53,884 | 2,567,034 | ||||||
Verizon Communications, Inc. |
34,689 | 1,366,747 | ||||||
| 3,933,781 | ||||||||
| 15,278,504 | ||||||||
Consumer, Cyclical — 8.2% |
||||||||
Apparel — 1.2% |
||||||||
Deckers Outdoor Corp. (a) |
1,613 | 643,845 | ||||||
NIKE, Inc. Class B |
7,535 | 881,671 | ||||||
| 1,525,516 | ||||||||
Auto Manufacturers — 1.7% |
||||||||
Cummins, Inc. |
4,848 | 1,174,622 | ||||||
Tesla, Inc. (a) |
8,091 | 996,649 | ||||||
| 2,171,271 | ||||||||
Auto Parts & Equipment — 0.7% |
||||||||
Aptiv PLC (a) |
10,548 | 982,335 | ||||||
Retail — 4.6% |
||||||||
Chipotle Mexican Grill, Inc. (a) |
218 | 302,473 | ||||||
Costco Wholesale Corp. |
1,820 | 830,830 | ||||||
The Home Depot, Inc. |
7,644 | 2,414,434 | ||||||
Target Corp. |
3,581 | 533,712 | ||||||
The TJX Cos., Inc. |
17,933 | 1,427,467 | ||||||
Number of |
Value |
|||||||
Tractor Supply Co. |
2,376 | $ | 534,528 | |||||
| 6,043,444 | ||||||||
| 10,722,566 | ||||||||
Consumer, Non-cyclical — 22.5% |
||||||||
Agriculture — 0.1% |
||||||||
Vital Farms, Inc. (a) |
5,603 | 83,597 | ||||||
Beverages — 1.8% |
||||||||
PepsiCo, Inc. |
13,293 | 2,401,513 | ||||||
Biotechnology — 1.2% |
||||||||
Amgen, Inc. |
3,427 | 900,067 | ||||||
Vertex Pharmaceuticals, Inc. (a) |
2,456 | 709,244 | ||||||
| 1,609,311 | ||||||||
Commercial Services — 0.6% |
||||||||
S&P Global, Inc. |
2,380 | 797,157 | ||||||
Cosmetics & Personal Care — 2.1% |
||||||||
Colgate-Palmolive Co. |
7,973 | 628,193 | ||||||
The Estee Lauder Cos., Inc. Class A |
1,496 | 371,172 | ||||||
The Procter & Gamble Co. |
11,091 | 1,680,952 | ||||||
| 2,680,317 | ||||||||
Food — 2.8% |
||||||||
The Kroger Co. |
20,688 | 922,271 | ||||||
Mondelez International, Inc. Class A |
18,466 | 1,230,759 | ||||||
Sysco Corp. |
20,130 | 1,538,939 | ||||||
| 3,691,969 | ||||||||
Health Care – Products — 2.3% |
||||||||
Edwards Lifesciences Corp. (a) |
13,812 | 1,030,513 | ||||||
Medtronic PLC |
2,426 | 188,549 | ||||||
ResMed, Inc. |
1,386 | 288,468 | ||||||
Thermo Fisher Scientific, Inc. |
2,617 | 1,441,156 | ||||||
| 2,948,686 | ||||||||
Health Care – Services — 2.7% |
||||||||
Humana, Inc. |
1,537 | 787,236 | ||||||
UnitedHealth Group, Inc. |
5,189 | 2,751,104 | ||||||
| 3,538,340 | ||||||||
Pharmaceuticals — 8.9% |
||||||||
AbbVie, Inc. |
10,997 | 1,777,225 | ||||||
Bristol-Myers Squibb Co. |
26,015 | 1,871,779 | ||||||
Cigna Corp. |
7,286 | 2,414,143 | ||||||
CVS Health Corp. |
15,703 | 1,463,363 | ||||||
Eli Lilly & Co. |
1,586 | 580,222 | ||||||
Merck & Co., Inc. |
13,010 | 1,443,460 | ||||||
Novo Nordisk A/S Class B |
7,871 | 1,065,733 | ||||||
Zoetis, Inc. |
6,891 | 1,009,876 | ||||||
| 11,625,801 | ||||||||
| 29,376,691 | ||||||||
The accompanying notes are an integral part of the financial statements.
156
MML Sustainable Equity Fund – Portfolio of Investments (Continued) |
Number of |
Value |
|||||||
Energy — 5.0% |
||||||||
Oil & Gas — 2.5% |
||||||||
ConocoPhillips |
28,025 | $ | 3,306,950 | |||||
Oil & Gas Services — 2.5% |
||||||||
Schlumberger NV |
60,291 | 3,223,157 | ||||||
| 6,530,107 | ||||||||
Financial — 16.1% |
||||||||
Banks — 4.9% |
||||||||
Bank of America Corp. |
13,370 | 442,815 | ||||||
JP Morgan Chase & Co. |
15,483 | 2,076,270 | ||||||
Morgan Stanley |
24,968 | 2,122,779 | ||||||
Regions Financial Corp. |
84,021 | 1,811,493 | ||||||
| 6,453,357 | ||||||||
Diversified Financial Services — 6.1% |
||||||||
American Express Co. |
4,831 | 713,780 | ||||||
Ameriprise Financial, Inc. |
3,372 | 1,049,940 | ||||||
BlackRock, Inc. |
1,891 | 1,340,020 | ||||||
Intercontinental Exchange, Inc. |
6,983 | 716,386 | ||||||
Mastercard, Inc. Class A |
4,762 | 1,655,890 | ||||||
Visa, Inc. Class A |
11,728 | 2,436,609 | ||||||
| 7,912,625 | ||||||||
Insurance — 2.4% |
||||||||
Marsh & McLennan Cos., Inc. |
6,922 | 1,145,452 | ||||||
Prudential Financial, Inc. |
10,172 | 1,011,707 | ||||||
The Travelers Cos., Inc. |
5,542 | 1,039,070 | ||||||
| 3,196,229 | ||||||||
Real Estate Investment Trusts (REITS) — 2.7% |
||||||||
Prologis, Inc. |
24,094 | 2,716,117 | ||||||
SBA Communications Corp. |
2,676 | 750,109 | ||||||
| 3,466,226 | ||||||||
| 21,028,437 | ||||||||
Industrial — 11.1% |
||||||||
Aerospace & Defense — 1.4% |
||||||||
Lockheed Martin Corp. |
3,624 | 1,763,040 | ||||||
Building Materials — 1.8% |
||||||||
Johnson Controls International PLC |
25,410 | 1,626,240 | ||||||
Masco Corp. |
13,704 | 639,566 | ||||||
| 2,265,806 | ||||||||
Electrical Components & Equipment — 0.1% |
||||||||
Generac Holdings, Inc. (a) |
1,732 | 174,343 | ||||||
Electronics — 3.2% |
||||||||
Agilent Technologies, Inc. |
10,228 | 1,530,620 | ||||||
Honeywell International, Inc. |
6,300 | 1,350,090 | ||||||
Keysight Technologies, Inc. (a) |
7,664 | 1,311,081 | ||||||
| 4,191,791 | ||||||||
Number of |
Value |
|||||||
Machinery – Diversified — 1.2% |
||||||||
Cognex Corp. |
5,734 | $ | 270,129 | |||||
Deere & Co. |
1,453 | 622,988 | ||||||
Xylem, Inc. |
6,480 | 716,493 | ||||||
| 1,609,610 | ||||||||
Miscellaneous - Manufacturing — 1.2% |
||||||||
Eaton Corp. PLC |
6,846 | 1,074,480 | ||||||
Parker-Hannifin Corp. |
1,686 | 490,626 | ||||||
| 1,565,106 | ||||||||
Packaging & Containers — 0.5% |
||||||||
Ball Corp. |
13,269 | 678,576 | ||||||
Transportation — 1.7% |
||||||||
Norfolk Southern Corp. |
3,437 | 846,946 | ||||||
Union Pacific Corp. |
2,202 | 455,968 | ||||||
United Parcel Service, Inc. Class B |
5,336 | 927,610 | ||||||
| 2,230,524 | ||||||||
| 14,478,796 | ||||||||
Technology — 19.8% |
||||||||
Computers — 5.2% |
||||||||
Accenture PLC Class A |
5,429 | 1,448,674 | ||||||
Apple, Inc. |
41,318 | 5,368,448 | ||||||
| 6,817,122 | ||||||||
Semiconductors — 5.1% |
||||||||
Advanced Micro Devices, Inc. (a) |
13,116 | 849,523 | ||||||
Analog Devices, Inc. |
9,194 | 1,508,092 | ||||||
Applied Materials, Inc. |
14,144 | 1,377,343 | ||||||
ASML Holding NV |
1,557 | 842,809 | ||||||
Globalfoundries, Inc. (a) |
5,725 | 308,520 | ||||||
NVIDIA Corp. |
12,338 | 1,803,075 | ||||||
| 6,689,362 | ||||||||
Software — 9.5% |
||||||||
Adobe, Inc. (a) |
983 | 330,809 | ||||||
Cadence Design Systems, Inc. (a) |
3,768 | 605,292 | ||||||
Electronic Arts, Inc. |
4,735 | 578,522 | ||||||
Microsoft Corp. |
39,827 | 9,551,311 | ||||||
Salesforce, Inc. (a) |
5,447 | 722,218 | ||||||
ServiceNow, Inc. (a) |
793 | 307,898 | ||||||
Workday, Inc. Class A (a) |
1,671 | 279,608 | ||||||
| 12,375,658 | ||||||||
| 25,882,142 | ||||||||
The accompanying notes are an integral part of the financial statements.
157
MML Sustainable Equity Fund – Portfolio of Investments (Continued) |
Number of |
Value |
|||||||
Utilities — 2.2% |
||||||||
Electric — 2.2% |
||||||||
NextEra Energy, Inc. |
33,926 | $ | 2,836,214 | |||||
TOTAL COMMON STOCK (Cost $114,691,310) |
129,492,038 | |||||||
TOTAL EQUITIES (Cost $114,691,310) |
129,492,038 | |||||||
MUTUAL FUNDS — 0.6% |
||||||||
Diversified Financial Services — 0.6% |
||||||||
SPDR S&P 500 ETF Trust |
2,163 | 827,196 | ||||||
| 827,196 | ||||||||
TOTAL MUTUAL FUNDS (Cost $822,117) |
827,196 | |||||||
TOTAL LONG-TERM INVESTMENTS (Cost $115,513,427) |
130,319,234 | |||||||
Principal |
Value |
|||||||
SHORT-TERM INVESTMENTS — 0.2% |
||||||||
Repurchase Agreement — 0.2% |
||||||||
Fixed Income Clearing Corp., Repurchase Agreement, dated 12/30/22, 1.280%, due 1/03/23 (b) |
$ | 214,419 | $ | 214,419 | ||||
TOTAL SHORT-TERM INVESTMENTS (Cost $214,419) |
214,419 | |||||||
TOTAL INVESTMENTS — 100.0% (Cost $115,727,846) (c) |
130,533,653 | |||||||
Other Assets/(Liabilities) — 0.0% |
4,432 | |||||||
NET ASSETS — 100.0% |
$ | 130,538,085 | ||||||
Notes to Portfolio of Investments
Percentages are stated as a percent of net assets.
|
(a) |
Non-income producing security. |
|
(b) |
Maturity value of $214,450. Collateralized by U.S. Government Agency obligations with a rate of 0.000%, maturity date of 6/29/23, and an aggregate market value, including accrued interest, of $218,770. |
|
(c) |
See Note 6 for aggregate cost for federal tax purposes. |
Forward contracts
Counterparty |
Settlement |
Currency Purchased |
Currency Sold |
Unrealized |
||||||||||||||||||||
JP Morgan Chase Bank N.A. |
3/31/23 | EUR | 92,244 | USD | 98,660 | $ | 672 | |||||||||||||||||
JP Morgan Chase Bank N.A. |
3/31/23 | USD | 821,825 | EUR | 767,601 | (4,754 | ) | |||||||||||||||||
| $ | (4,082 | ) | ||||||||||||||||||||||
Currency Legend
|
EUR |
Euro |
|
USD |
U.S. Dollar |
The accompanying notes are an integral part of the financial statements.
158
December 31, 2022 |
Number of |
Value |
|||||||
EQUITIES — 0.1% |
||||||||
COMMON STOCK — 0.1% |
||||||||
Communications — 0.1% |
||||||||
Telecommunications — 0.1% |
||||||||
Intelsat Emergence SA (a) |
7,210 | $ | 162,225 | |||||
TOTAL COMMON STOCK (Cost $676,994) |
162,225 | |||||||
TOTAL EQUITIES (Cost $676,994) |
162,225 | |||||||
Principal |
||||||||
BONDS & NOTES — 114.9% |
||||||||
BANK LOANS — 2.1% |
||||||||
Aerospace & Defense — 0.0% |
||||||||
TransDigm, Inc. |
||||||||
2020 Term Loan E, 3 mo. USD LIBOR + 2.250% |
||||||||
6.980% VRN 5/30/25 |
$ | 48,625 | 48,052 | |||||
2020 Term Loan F, 3 mo. USD LIBOR + 2.250% |
||||||||
6.980% VRN 12/09/25 |
14,739 | 14,541 | ||||||
| 62,593 | ||||||||
Airlines — 0.0% |
||||||||
American Airlines, Inc., 2021 Term Loan, 3 mo. USD LIBOR + 4.750% |
||||||||
8.993% VRN 4/20/28 |
19,910 | 19,801 | ||||||
United Airlines, Inc., 2021 Term Loan B, 3 mo. USD LIBOR + 3.750% |
||||||||
8.108% VRN 4/21/28 |
22,425 | 22,102 | ||||||
| 41,903 | ||||||||
Auto Parts & Equipment — 0.1% |
||||||||
Clarios Global LP, 2021 USD Term Loan B, 1 mo. USD LIBOR + 3.250% |
||||||||
7.634% VRN 4/30/26 |
194,908 | 190,605 | ||||||
Beverages — 0.0% |
||||||||
Naked Juice LLC, Term Loan, 3 mo. USD SOFR + 3.250% |
||||||||
7.930% VRN 1/24/29 |
141,377 | 126,100 | ||||||
Chemicals — 0.0% |
||||||||
Zep, Inc., 2017 1st Lien Term Loan, 3 mo. USD LIBOR + 4.000% |
||||||||
8.580% VRN 8/12/24 |
91,842 | 79,076 | ||||||
Principal |
Value |
|||||||
Commercial Services — 0.1% |
||||||||
Amentum Government Services Holdings LLC, Term Loan B, 3 mo. USD LIBOR + 4.000% |
||||||||
8.380% - 8.384% VRN 1/29/27 |
$ | 29,285 | $ | 28,577 | ||||
Element Materials Technology Group US Holdings, Inc. |
||||||||
2022 USD Delayed Draw Term Loan, |
||||||||
0.000% 7/06/29 (b) (c) |
9,469 | 9,232 | ||||||
2022 USD Term Loan, |
||||||||
0.000% 7/06/29 (b) |
20,517 | 20,004 | ||||||
Pre-Paid Legal Services, Inc., 2021 Term Loan, 1 mo. USD LIBOR + 3.750% |
||||||||
8.134% VRN 12/15/28 |
43,912 | 42,172 | ||||||
Prime Security Services Borrower LLC, 2021 Term Loan, 3 mo. USD LIBOR + 2.750% |
||||||||
7.517% VRN 9/23/26 |
46,946 | 46,482 | ||||||
Safe Fleet Holdings LLC, 2022 Term Loan, 1 mo. USD SOFR CME + 3.750% |
||||||||
8.173% VRN 2/23/29 |
13,085 | 12,619 | ||||||
Spin Holdco, Inc., 2021 Term Loan, 3 mo. USD LIBOR + 4.000% |
||||||||
7.144% VRN 3/04/28 |
112,839 | 94,756 | ||||||
Trans Union LLC |
||||||||
2019 Term Loan B5, 1 mo. USD LIBOR + 1.750% |
||||||||
6.134% VRN 11/16/26 |
67,474 | 66,450 | ||||||
2021 Term Loan B6, 1 mo. USD LIBOR + 2.250% |
||||||||
6.634% VRN 12/01/28 |
27,601 | 27,294 | ||||||
TruGreen Ltd. Partnership, 2020 Term Loan, 1 mo. USD LIBOR + 4.000% |
||||||||
8.384% VRN 11/02/27 |
24,159 | 21,396 | ||||||
| 368,982 | ||||||||
Computers — 0.0% |
||||||||
Peraton Corp., Term Loan B, 1 mo. USD LIBOR + 3.750% |
||||||||
8.134% VRN 2/01/28 |
29,749 | 28,999 | ||||||
Cosmetics & Personal Care — 0.0% |
||||||||
Sunshine Luxembourg VII SARL, 2021 Term Loan B3, 3 mo. USD LIBOR + 3.750% |
||||||||
8.480% VRN 10/01/26 |
48,643 | 46,508 | ||||||
The accompanying notes are an integral part of the financial statements.
159
MML Total Return Bond Fund – Portfolio of Investments (Continued) |
Principal |
Value |
|||||||
Diversified Financial Services — 0.1% |
||||||||
Deerfield Dakota Holding LLC, 2020 USD Term Loan B, 1 mo. USD SOFR CME + 3.750% |
||||||||
8.073% VRN 4/09/27 |
$ | 58,862 | $ | 54,871 | ||||
Setanta Aircraft Leasing Designated Activity Co., Term Loan B, 3 mo. USD LIBOR + 2.000% |
||||||||
6.730% VRN 11/05/28 |
175,000 | 173,862 | ||||||
| 228,733 | ||||||||
Electronics — 0.0% |
||||||||
II-VI, Inc., 2022 Term Loan B, 3 mo. USD LIBOR + 2.750% |
||||||||
7.134% VRN 7/02/29 |
91,100 | 89,938 | ||||||
Ingram Micro, Inc., 2021 Term Loan B, 3 mo. USD LIBOR + 3.500% |
||||||||
8.230% VRN 6/30/28 |
54,069 | 53,123 | ||||||
| 143,061 | ||||||||
Entertainment — 0.1% |
||||||||
Crown Finance US, Inc., 2022 DIP Term Loan, 3 mo. USD SOFR CME + 10.000% |
||||||||
14.399% - 14.417% VRN 9/07/23 (b) |
90,423 | 88,587 | ||||||
Formula One Holdings Ltd., Term Loan B, |
||||||||
0.000% 1/15/30 (b) |
5,655 | 5,648 | ||||||
Penn National Gaming, Inc., 2022 Term Loan B, 1 mo. USD SOFR CME + 2.750% |
||||||||
7.173% VRN 5/03/29 |
22,404 | 22,146 | ||||||
Scientific Games International, Inc., 2022 USD Term Loan, 1 mo. USD SOFR CME + 3.000% |
||||||||
7.417% VRN 4/14/29 |
45,370 | 44,641 | ||||||
| 161,022 | ||||||||
Food — 0.0% |
||||||||
Hostess Brands LLC, 2019 Term Loan, 1 mo. USD LIBOR + 2.250%, 3 mo. USD LIBOR + 2.250% |
||||||||
6.660% - 6.665% VRN 8/03/25 |
114,746 | 114,267 | ||||||
Health Care – Products — 0.1% |
||||||||
Avantor Funding, Inc., 2021 Term Loan B5, 1 mo. USD LIBOR + 2.250% |
||||||||
6.634% VRN 11/08/27 |
106,630 | 105,978 | ||||||
Bausch & Lomb, Inc., Term Loan, 3 mo. USD SOFR CME + 3.250% |
||||||||
7.842% VRN 5/10/27 (b) |
34,286 | 32,550 | ||||||
Principal |
Value |
|||||||
Medline Borrower LP, USD Term Loan B, 1 mo. USD LIBOR + 3.250% |
||||||||
7.634% VRN 10/23/28 |
$ | 248,125 | $ | 235,466 | ||||
| 373,994 | ||||||||
Home Furnishing — 0.0% |
||||||||
AI Aqua Merger Sub, Inc. |
||||||||
2022 Delayed Draw Term loan, 1 mo. USD SOFR + 4.000%, 3 mo. USD SOFR CME + 3.750% |
||||||||
0.500% VRN 7/31/28 (c) |
6,171 | 5,800 | ||||||
2022 Term Loan B, 3 mo. USD SOFR CME + 3.750% |
||||||||
7.844% VRN 7/31/28 |
35,481 | 33,352 | ||||||
| 39,152 | ||||||||
Insurance — 0.2% |
||||||||
Acrisure LLC, 2020 Term Loan B, 1 mo. USD LIBOR + 3.500% |
||||||||
7.884% VRN 2/15/27 |
98,982 | 92,672 | ||||||
AmWINS Group, Inc., 2021 Term Loan B, 1 mo. USD LIBOR + 2.250% |
||||||||
6.634% VRN 2/19/28 |
491,698 | 482,327 | ||||||
Asurion LLC |
||||||||
2020 Term Loan B8, 1 mo. USD LIBOR + 3.250% |
||||||||
7.634% VRN 12/23/26 |
57,438 | 51,084 | ||||||
2021 Second Lien Term Loan B4, 1 mo. USD LIBOR + 5.250% |
||||||||
9.634% VRN 1/20/29 |
15,118 | 11,684 | ||||||
| 637,767 | ||||||||
Internet — 0.1% |
||||||||
Arches Buyer, Inc., 2021 Term Loan B, 1 mo. USD LIBOR + 3.250% |
||||||||
7.634% VRN 12/06/27 |
25,174 | 23,234 | ||||||
NortonLifeLock, Inc., 2022 Term Loan B, 1 mo. USD SOFR CME + 2.000% |
||||||||
6.423% VRN 9/12/29 |
250,000 | 245,365 | ||||||
Proofpoint, Inc., 1st Lien Term Loan, 3 mo. USD LIBOR + 3.250% |
||||||||
7.985% VRN 8/31/28 |
4,987 | 4,785 | ||||||
| 273,384 | ||||||||
Lodging — 0.1% |
||||||||
Caesars Resort Collection LLC, 2020 Term Loan B1, 1 mo. USD LIBOR + 3.500% |
||||||||
7.884% VRN 7/21/25 |
145,571 | 145,075 | ||||||
The accompanying notes are an integral part of the financial statements.
160
MML Total Return Bond Fund – Portfolio of Investments (Continued) |
Principal |
Value |
|||||||
Fertitta Entertainment LLC, 2022 Term Loan B, 1 mo. USD SOFR + 4.000% |
||||||||
8.323% VRN 1/27/29 |
$ | 124,063 | $ | 117,720 | ||||
| 262,795 | ||||||||
Media — 0.1% |
||||||||
Diamond Sports Group LLC, 2022 2nd Lien Term Loan, 6 mo. USD SOFR CME + 3.50% |
||||||||
8.314% VRN 8/24/26 |
63,860 | 7,663 | ||||||
DirecTV Financing LLC, Term Loan, 1 mo. USD LIBOR + 5.000% |
||||||||
9.384% VRN 8/02/27 |
150,875 | 146,569 | ||||||
Virgin Media Bristol LLC, USD Term Loan N, 1 mo. USD LIBOR + 2.500% |
||||||||
6.818% VRN 1/31/28 |
275,000 | 269,992 | ||||||
| 424,224 | ||||||||
Metal Fabricate & Hardware — 0.0% |
||||||||
AZZ, Inc., Term Loan B, 1 mo. USD SOFR CME + 4.250% |
||||||||
8.673% VRN 5/13/29 |
9,697 | 9,685 | ||||||
Packaging & Containers — 0.1% |
||||||||
Berry Global, Inc., 2021 Term Loan Z, 1 mo. USD LIBOR + 1.750% |
||||||||
6.024% VRN 7/01/26 |
148,820 | 147,467 | ||||||
Pharmaceuticals — 0.4% |
||||||||
Elanco Animal Health, Inc., Term Loan B, 1 mo. USD LIBOR + 1.750% |
||||||||
6.119% VRN 8/01/27 |
168,987 | 161,989 | ||||||
Gainwell Acquisition Corp., Term Loan B, 3 mo. USD LIBOR + 4.000% |
||||||||
8.730% VRN 10/01/27 |
98,990 | 92,679 | ||||||
Grifols Worldwide Operations USA, Inc., USD 2019 Term Loan B, 1 mo. USD LIBOR + 2.000% |
||||||||
6.384% VRN 11/15/27 |
280,004 | 270,322 | ||||||
Horizon Therapeutics USA, Inc., 2021 Term Loan B2, 1 mo. USD LIBOR + 1.750% |
||||||||
6.188% VRN 3/15/28 |
120,386 | 120,235 | ||||||
Jazz Financing Lux SARL, USD Term Loan, 1 mo. USD LIBOR + 3.500% |
||||||||
7.884% VRN 5/05/28 |
140,088 | 138,664 | ||||||
Organon & Co., USD Term Loan, 3 mo. USD LIBOR + 3.000% |
||||||||
7.750% VRN 6/02/28 |
277,429 | 274,309 | ||||||
| 1,058,198 | ||||||||
Principal |
Value |
|||||||
Retail — 0.2% |
||||||||
KFC Holding Co., 2021 Term Loan B, 1 mo. USD LIBOR + 1.750% |
||||||||
6.089% VRN 3/15/28 |
$ | 39,417 | $ | 38,875 | ||||
Michaels Cos., Inc., 2021 Term Loan B, 3 mo. USD LIBOR + 4.250% |
||||||||
8.980% VRN 4/15/28 |
236,400 | 203,436 | ||||||
Whatabrands LLC, 2021 Term Loan B, 1 mo. USD LIBOR + 3.250% |
||||||||
7.634% VRN 8/03/28 |
222,750 | 215,001 | ||||||
| 457,312 | ||||||||
Semiconductors — 0.0% |
||||||||
Entegris, Inc., 2022 Term Loan B, 3 mo. USD SOFR + 3.000% |
||||||||
7.580% VRN 7/06/29 |
60,000 | 59,775 | ||||||
Software — 0.2% |
||||||||
Athenahealth, Inc. |
||||||||
2022 Delayed Draw Term Loan, 1 mo. USD SOFR CME + 3.500% |
||||||||
3.500% VRN 2/15/29 (b) (c) |
38,894 | 35,018 | ||||||
2022 Term Loan B, 1 mo. USD SOFR CME + 3.500% |
||||||||
7.821% VRN 2/15/29 |
228,325 | 205,575 | ||||||
CDK Global, Inc., 2022 USD Term Loan B, 3 mo. USD SOFR CME + 4.500% |
||||||||
9.080% VRN 7/06/29 |
138,833 | 137,412 | ||||||
Mitnick Corporate Purchaser, Inc., Term Loan, 3 mo. USD SOFR CME + 4.750% |
||||||||
8.944% VRN 5/02/29 |
14,464 | 13,515 | ||||||
Open Text Corp., 2022 Term Loan B, |
||||||||
0.000% 11/16/29 (b) |
19,536 | 19,062 | ||||||
RealPage, Inc., 1st Lien Term Loan, 1 mo. USD LIBOR + 3.000% |
||||||||
7.384% VRN 4/24/28 |
14,427 | 13,691 | ||||||
Sophia, L.P., 2021 Term Loan B, 3 mo. USD LIBOR + 3.500% |
||||||||
8.230% VRN 10/07/27 |
21,438 | 20,648 | ||||||
| 444,921 | ||||||||
Telecommunications — 0.2% |
||||||||
Level 3 Financing, Inc., 2019 Term Loan B, 1 mo. USD LIBOR + 1.750% |
||||||||
6.134% VRN 3/01/27 |
464,973 | 444,631 | ||||||
Zayo Group Holdings, Inc., 2022 USD Incremental Term Loan B, 1 mo. USD SOFR CME + 4.250% |
||||||||
8.573% VRN 3/09/27 |
113,118 | 93,410 | ||||||
| 538,041 | ||||||||
The accompanying notes are an integral part of the financial statements.
161
MML Total Return Bond Fund – Portfolio of Investments (Continued) |
Principal |
Value |
|||||||
Transportation — 0.0% |
||||||||
Genesee & Wyoming, Inc., Term Loan, 3 mo. USD LIBOR + 2.000% |
||||||||
6.730% VRN 12/30/26 |
$ | 28,157 | $ | 27,974 | ||||
TOTAL BANK LOANS (Cost $6,566,610) |
6,346,538 | |||||||
CORPORATE DEBT — 28.8% |
||||||||
Aerospace & Defense — 0.2% |
||||||||
The Boeing Co. |
||||||||
1.167% 2/04/23 |
660,000 | 657,465 | ||||||
Agriculture — 0.8% |
||||||||
BAT Capital Corp. |
||||||||
4.390% 8/15/37 |
400,000 | 312,385 | ||||||
4.540% 8/15/47 |
1,050,000 | 747,047 | ||||||
5.650% 3/16/52 |
215,000 | 178,457 | ||||||
Imperial Brands Finance PLC |
||||||||
3.125% 7/26/24 (d) |
320,000 | 306,043 | ||||||
3.500% 7/26/26 (d) |
225,000 | 207,036 | ||||||
Imperial Tobacco Finance PLC |
||||||||
4.250% 7/21/25 (d) |
415,000 | 396,757 | ||||||
Reynolds American, Inc. |
||||||||
5.850% 8/15/45 |
315,000 | 269,837 | ||||||
| 2,417,562 | ||||||||
Banks — 11.7% |
||||||||
Bank of America Corp. |
||||||||
SOFR + .910% 1.658% VRN 3/11/27 |
755,000 | 668,216 | ||||||
SOFR + 1.370% 1.922% VRN 10/24/31 |
110,000 | 84,137 | ||||||
SOFR + 1.060% 2.087% VRN 6/14/29 |
1,000,000 | 843,235 | ||||||
SOFR + 1.220% 2.299% VRN 7/21/32 |
240,000 | 185,500 | ||||||
SOFR + 1.210% 2.572% VRN 10/20/32 |
515,000 | 404,812 | ||||||
SOFR + 2.150% 2.592% VRN 4/29/31 |
140,000 | 114,356 | ||||||
SOFR + 1.320% 2.687% VRN 4/22/32 |
120,000 | 96,360 | ||||||
SOFR + 1.330% 2.972% VRN 2/04/33 |
200,000 | 161,748 | ||||||
3 mo. USD LIBOR + .810% 3.366% VRN 1/23/26 |
415,000 | 396,621 | ||||||
3 mo. USD LIBOR + 1.040% 3.419% VRN 12/20/28 |
470,000 | 425,634 | ||||||
3 mo. USD LIBOR + 1.070% 3.970% VRN 3/05/29 |
485,000 | 448,285 | ||||||
Principal |
Value |
|||||||
Bank of New York Mellon Corp. SOFR + 2.074% |
||||||||
5.834% VRN 10/25/33 |
$ | 290,000 | $ | 301,633 | ||||
Citigroup, Inc. |
||||||||
SOFR + .669% 0.981% VRN 5/01/25 |
85,000 | 79,560 | ||||||
SOFR + .770% 1.462% VRN 6/09/27 |
985,000 | 855,435 | ||||||
SOFR + .694% 2.014% VRN 1/25/26 |
335,000 | 310,677 | ||||||
SOFR + 1.167% 2.561% VRN 5/01/32 |
580,000 | 459,395 | ||||||
SOFR + 2.107% 2.572% VRN 6/03/31 |
255,000 | 206,854 | ||||||
SOFR + 1.422% 2.976% VRN 11/05/30 |
150,000 | 126,468 | ||||||
SOFR + 1.351% 3.057% VRN 1/25/33 |
640,000 | 519,230 | ||||||
SOFR + 1.280% 3.070% VRN 2/24/28 |
190,000 | 171,533 | ||||||
Credit Suisse Group AG |
||||||||
SOFR + .980% 1.305% VRN 2/02/27 (d) |
495,000 | 395,348 | ||||||
SOFR + 1.730% 3.091% VRN 5/14/32 (d) (e) |
825,000 | 572,541 | ||||||
3 mo. USD LIBOR + 1.410% 3.869% VRN 1/12/29 (d) |
65,000 | 52,185 | ||||||
SOFR + 3.920% 6.537% VRN 8/12/33 (d) |
1,955,000 | 1,720,627 | ||||||
SOFR + 5.020% 9.016% VRN 11/15/33 (d) |
300,000 | 308,069 | ||||||
DNB Bank ASA 1 year CMT + .680% |
||||||||
1.605% VRN 3/30/28 (d) |
635,000 | 537,984 | ||||||
The Goldman Sachs Group, Inc. |
||||||||
SOFR + .486% 0.925% VRN 10/21/24 |
530,000 | 508,928 | ||||||
1.217% 12/06/23 |
1,030,000 | 994,216 | ||||||
SOFR + .798% 1.431% VRN 3/09/27 |
500,000 | 438,464 | ||||||
SOFR + .818% 1.542% VRN 9/10/27 |
1,450,000 | 1,252,436 | ||||||
SOFR + .913% 1.948% VRN 10/21/27 |
125,000 | 109,444 | ||||||
SOFR + 1.090% 1.992% VRN 1/27/32 |
140,000 | 106,806 | ||||||
SOFR + 1.248% 2.383% VRN 7/21/32 |
415,000 | 323,093 | ||||||
SOFR + 1.264% 2.650% VRN 10/21/32 |
200,000 | 158,457 | ||||||
3.200% 2/23/23 |
145,000 | 144,636 | ||||||
3 mo. USD LIBOR + 1.201% 3.272% VRN 9/29/25 |
325,000 | 313,325 | ||||||
The accompanying notes are an integral part of the financial statements.
162
MML Total Return Bond Fund – Portfolio of Investments (Continued) |
Principal |
Value |
|||||||
HSBC Holdings PLC |
||||||||
SOFR + 1.732% 2.013% VRN 9/22/28 |
$ | 1,585,000 | $ | 1,326,909 | ||||
SOFR + 1.285% 2.206% VRN 8/17/29 |
610,000 | 495,216 | ||||||
SOFR + 1.187% 2.804% VRN 5/24/32 |
605,000 | 468,278 | ||||||
3 mo. USD LIBOR + 1.211% 3.803% VRN 3/11/25 |
110,000 | 106,968 | ||||||
JP Morgan Chase & Co. |
||||||||
SOFR + .580% 0.697% VRN 3/16/24 |
165,000 | 163,270 | ||||||
3 mo. TSFR + .580% 0.969% VRN 6/23/25 |
1,060,000 | 988,072 | ||||||
SOFR + .885% 1.578% VRN 4/22/27 |
500,000 | 440,064 | ||||||
SOFR + 1.015% 2.069% VRN 6/01/29 |
250,000 | 209,184 | ||||||
SOFR + 1.180% 2.545% VRN 11/08/32 |
375,000 | 297,441 | ||||||
SOFR + 1.250% 2.580% VRN 4/22/32 |
605,000 | 486,430 | ||||||
SOFR + 1.510% 2.739% VRN 10/15/30 |
230,000 | 193,403 | ||||||
SOFR + 1.170% 2.947% VRN 2/24/28 |
1,145,000 | 1,038,122 | ||||||
3 mo. USD LIBOR + 1.245% 3.960% VRN 1/29/27 |
185,000 | 176,537 | ||||||
Lloyds Banking Group PLC |
||||||||
1 year CMT + .850% 1.627% VRN 5/11/27 |
515,000 | 446,283 | ||||||
3 mo. USD LIBOR + 1.205% 3.574% VRN 11/07/28 |
720,000 | 649,445 | ||||||
1 year CMT + 3.500% 3.870% VRN 7/09/25 |
220,000 | 213,017 | ||||||
1 year CMT + 2.300% 4.976% VRN 8/11/33 |
225,000 | 207,206 | ||||||
Macquarie Group Ltd. |
||||||||
SOFR + 1.532% 2.871% VRN 1/14/33 (d) |
1,045,000 | 804,480 | ||||||
SOFR + 2.405% 4.442% VRN 6/21/33 (d) |
240,000 | 209,002 | ||||||
Morgan Stanley |
||||||||
SOFR + .509% 0.791% VRN 1/22/25 |
285,000 | 269,499 | ||||||
SOFR + .560% 1.164% VRN 10/21/25 |
1,300,000 | 1,194,880 | ||||||
SOFR + .879% 1.593% VRN 5/04/27 |
505,000 | 443,526 | ||||||
SOFR + 1.020% 1.928% VRN 4/28/32 |
235,000 | 177,911 | ||||||
SOFR + 1.178% 2.239% VRN 7/21/32 |
160,000 | 122,732 | ||||||
Principal |
Value |
|||||||
SOFR + 1.360% 2.484% VRN 9/16/36 |
$ | 495,000 | $ | 360,157 | ||||
SOFR + 1.200% 2.511% VRN 10/20/32 |
355,000 | 277,737 | ||||||
SOFR + 1.290% 2.943% VRN 1/21/33 |
225,000 | 182,654 | ||||||
Natwest Group PLC 3 mo. USD LIBOR + 1.762% |
||||||||
4.269% VRN 3/22/25 |
775,000 | 758,104 | ||||||
PNC Financial Services Group, Inc. SOFR + 2.140% |
||||||||
6.037% VRN 10/28/33 |
285,000 | 297,713 | ||||||
Santander UK Group Holdings PLC |
||||||||
SOFR + .787% 1.089% VRN 3/15/25 |
540,000 | 504,694 | ||||||
1 year CMT + 1.250% 1.532% VRN 8/21/26 |
710,000 | 625,965 | ||||||
SOFR + .989% 1.673% VRN 6/14/27 |
120,000 | 102,171 | ||||||
SOFR + 1.220% 2.469% VRN 1/11/28 |
200,000 | 171,022 | ||||||
3 mo. USD LIBOR + 1.080% 3.373% VRN 1/05/24 |
445,000 | 445,000 | ||||||
Santander UK PLC |
||||||||
5.000% 11/07/23 (d) |
435,000 | 433,667 | ||||||
UBS Group AG Registered 1 year CMT + 1.550% |
||||||||
4.488% VRN 5/12/26 (d) |
200,000 | 195,620 | ||||||
US Bancorp SOFR + 2.090% |
||||||||
5.850% VRN 10/21/33 |
290,000 | 302,081 | ||||||
Wells Fargo & Co. |
||||||||
SOFR + 2.100% 2.393% VRN 6/02/28 |
1,400,000 | 1,237,507 | ||||||
3 mo. TSFR + 1.432% 2.879% VRN 10/30/30 |
490,000 | 417,726 | ||||||
SOFR + 1.500% 3.350% VRN 3/02/33 |
1,285,000 | 1,086,293 | ||||||
SOFR + 1.510% 3.526% VRN 3/24/28 |
655,000 | 607,331 | ||||||
SOFR + 2.100% 4.897% VRN 7/25/33 |
280,000 | 265,124 | ||||||
SOFR + 4.502% 5.013% VRN 4/04/51 |
150,000 | 133,063 | ||||||
| 34,327,752 | ||||||||
Beverages — 0.2% |
||||||||
Bacardi Ltd. |
||||||||
4.450% 5/15/25 (d) |
700,000 | 679,727 | ||||||
Chemicals — 0.1% |
||||||||
International Flavors & Fragrances, Inc. |
||||||||
5.000% 9/26/48 |
380,000 | 324,814 | ||||||
The accompanying notes are an integral part of the financial statements.
163
MML Total Return Bond Fund – Portfolio of Investments (Continued) |
Principal |
Value |
|||||||
SK Invictus Intermediate II Sarl |
||||||||
5.000% 10/30/29 (d) |
$ | 32,000 | $ | 26,240 | ||||
| 351,054 | ||||||||
Commercial Services — 0.3% |
||||||||
Global Payments, Inc. |
||||||||
5.400% 8/15/32 |
225,000 | 215,087 | ||||||
5.950% 8/15/52 |
126,000 | 113,885 | ||||||
Rent-A-Center, Inc. |
||||||||
6.375% 2/15/29 (d) (e) |
35,000 | 28,313 | ||||||
S&P Global, Inc. |
||||||||
4.750% 8/01/28 (d) |
385,000 | 381,106 | ||||||
WASH Multifamily Acquisition, Inc. |
||||||||
5.750% 4/15/26 (d) |
35,000 | 32,987 | ||||||
| 771,378 | ||||||||
Computers — 0.0% |
||||||||
NCR Corp. |
||||||||
5.250% 10/01/30 (d) |
35,000 | 28,875 | ||||||
Diversified Financial Services — 1.4% |
||||||||
AerCap Ireland Capital DAC / AerCap Global Aviation Trust |
||||||||
3.300% 1/30/32 |
615,000 | 482,573 | ||||||
3.500% 1/15/25 |
1,000,000 | 952,681 | ||||||
Air Lease Corp. |
||||||||
5.850% 12/15/27 |
355,000 | 354,840 | ||||||
American Express Co. |
||||||||
2.550% 3/04/27 |
385,000 | 350,599 | ||||||
Avolon Holdings Funding Ltd. |
||||||||
2.528% 11/18/27 (d) |
389,000 | 311,418 | ||||||
2.875% 2/15/25 (d) |
335,000 | 309,316 | ||||||
3.950% 7/01/24 (d) |
130,000 | 124,536 | ||||||
Capital One Financial Corp. SOFR + 1.790% |
||||||||
3.273% VRN 3/01/30 |
535,000 | 458,382 | ||||||
ORIX Corp. |
||||||||
5.200% 9/13/32 (e) |
305,000 | 298,291 | ||||||
Park Aerospace Holdings Ltd. |
||||||||
4.500% 3/15/23 (d) |
320,000 | 319,211 | ||||||
5.500% 2/15/24 (d) |
82,000 | 80,955 | ||||||
| 4,042,802 | ||||||||
Electric — 1.3% |
||||||||
Duke Energy Carolinas LLC |
||||||||
4.000% 9/30/42 |
1,000,000 | 832,688 | ||||||
Florida Power & Light Co. |
||||||||
3.990% 3/01/49 |
495,000 | 418,103 | ||||||
Jersey Central Power & Light Co. |
||||||||
4.700% 4/01/24 (d) |
800,000 | 789,025 | ||||||
6.400% 5/15/36 |
425,000 | 421,669 | ||||||
Principal |
Value |
|||||||
MidAmerican Energy Co. |
||||||||
4.800% 9/15/43 |
$ | 1,400,000 | $ | 1,312,992 | ||||
Southwestern Electric Power Co. |
||||||||
3.250% 11/01/51 |
170,000 | 112,674 | ||||||
| 3,887,151 | ||||||||
Engineering & Construction — 0.1% |
||||||||
Artera Services LLC |
||||||||
9.033% 12/04/25 (d) (e) |
95,000 | 79,144 | ||||||
Heathrow Funding Ltd. |
||||||||
1.875% 3/14/34 EUR (d) (f) |
380,000 | 293,127 | ||||||
| 372,271 | ||||||||
Entertainment — 0.6% |
||||||||
Caesars Entertainment, Inc. |
||||||||
4.625% 10/15/29 (d) (e) |
75,000 | 61,036 | ||||||
8.125% 7/01/27 (d) (e) |
100,000 | 98,255 | ||||||
Warnermedia Holdings, Inc. |
||||||||
4.279% 3/15/32 (d) |
190,000 | 156,725 | ||||||
5.050% 3/15/42 (d) |
905,000 | 695,782 | ||||||
5.141% 3/15/52 (d) |
910,000 | 664,770 | ||||||
| 1,676,568 | ||||||||
Environmental Controls — 0.1% |
||||||||
Waste Pro USA, Inc. |
||||||||
5.500% 2/15/26 (d) |
175,000 | 154,543 | ||||||
Food — 0.8% |
||||||||
JBS USA LUX SA/JBS USA Food Co./JBS USA Finance, Inc. |
||||||||
4.375% 2/02/52 (d) |
135,000 | 95,153 | ||||||
5.750% 4/01/33 (d) |
400,000 | 381,512 | ||||||
6.500% 12/01/52 (d) |
415,000 | 394,900 | ||||||
Kraft Heinz Foods Co. |
||||||||
4.875% 10/01/49 |
202,000 | 175,898 | ||||||
5.000% 6/04/42 |
360,000 | 327,916 | ||||||
Pilgrim’s Pride Corp. |
||||||||
3.500% 3/01/32 (d) |
360,000 | 281,700 | ||||||
5.875% 9/30/27 (d) |
30,000 | 29,099 | ||||||
Post Holdings, Inc. |
||||||||
5.750% 3/01/27 (d) |
150,000 | 145,062 | ||||||
Smithfield Foods, Inc. |
||||||||
2.625% 9/13/31 (d) |
635,000 | 455,680 | ||||||
| 2,286,920 | ||||||||
Health Care – Products — 0.2% |
||||||||
PerkinElmer, Inc. |
||||||||
2.250% 9/15/31 |
800,000 | 629,084 | ||||||
Health Care – Services — 1.6% |
||||||||
Centene Corp. |
||||||||
2.450% 7/15/28 |
488,000 | 411,492 | ||||||
3.000% 10/15/30 |
453,000 | 371,346 | ||||||
4.250% 12/15/27 |
230,000 | 215,918 | ||||||
The accompanying notes are an integral part of the financial statements.
164
MML Total Return Bond Fund – Portfolio of Investments (Continued) |
Principal |
Value |
|||||||
CommonSpirit Health |
||||||||
2.782% 10/01/30 |
$ | 495,000 | $ | 409,332 | ||||
3.910% 10/01/50 |
75,000 | 55,925 | ||||||
Fresenius Medical Care US Finance III, Inc. |
||||||||
1.875% 12/01/26 (d) |
340,000 | 288,709 | ||||||
HCA, Inc. |
||||||||
2.375% 7/15/31 |
90,000 | 70,296 | ||||||
3.625% 3/15/32 (d) |
255,000 | 216,521 | ||||||
4.125% 6/15/29 |
345,000 | 315,737 | ||||||
4.625% 3/15/52 (d) |
147,000 | 115,224 | ||||||
5.000% 3/15/24 |
287,000 | 285,446 | ||||||
5.250% 6/15/49 |
775,000 | 663,689 | ||||||
5.500% 6/15/47 |
470,000 | 418,972 | ||||||
Molina Healthcare, Inc. |
||||||||
3.875% 11/15/30 (d) |
90,000 | 76,270 | ||||||
3.875% 5/15/32 (d) |
190,000 | 157,783 | ||||||
4.375% 6/15/28 (d) |
300,000 | 273,777 | ||||||
Universal Health Services, Inc. |
||||||||
1.650% 9/01/26 |
385,000 | 331,078 | ||||||
| 4,677,515 | ||||||||
Household Products & Wares — 0.0% |
||||||||
Central Garden & Pet Co. |
||||||||
5.125% 2/01/28 |
123,000 | 114,424 | ||||||
Insurance — 0.9% |
||||||||
Alliant Holdings Intermediate LLC/Alliant Holdings Co-Issuer |
||||||||
6.750% 10/15/27 (d) |
35,000 | 31,460 | ||||||
Aon Corp. / Aon Global Holdings PLC |
||||||||
3.900% 2/28/52 |
190,000 | 146,204 | ||||||
AssuredPartners, Inc. |
||||||||
5.625% 1/15/29 (d) |
30,000 | 24,691 | ||||||
Athene Global Funding |
||||||||
1.985% 8/19/28 (d) |
555,000 | 447,395 | ||||||
3.205% 3/08/27 (d) |
135,000 | 120,468 | ||||||
SOFR + .700% 4.899% FRN 5/24/24 (d) |
505,000 | 496,196 | ||||||
Farmers Exchange Capital 3 mo. USD LIBOR + 3.454% |
||||||||
5.454% VRN 10/15/54 (d) |
970,000 | 888,278 | ||||||
Teachers Insurance & Annuity Association of America |
||||||||
3.300% 5/15/50 (d) |
225,000 | 156,777 | ||||||
4.270% 5/15/47 (d) |
130,000 | 107,047 | ||||||
Willis North America, Inc. |
||||||||
2.950% 9/15/29 |
290,000 | 244,481 | ||||||
| 2,662,997 | ||||||||
Principal |
Value |
|||||||
Internet — 0.1% |
||||||||
Netflix, Inc. |
||||||||
4.625% 5/15/29 EUR (f) |
$ | 150,000 | $ | 157,128 | ||||
Tencent Holdings Ltd. |
||||||||
3.680% 4/22/41 (d) |
335,000 | 247,772 | ||||||
| 404,900 | ||||||||
Machinery – Diversified — 0.0% |
||||||||
OT Merger Corp. |
||||||||
7.875% 10/15/29 (d) |
45,000 | 23,850 | ||||||
Media — 0.9% |
||||||||
Cable One, Inc. |
||||||||
4.000% 11/15/30 (d) (e) |
75,000 | 58,854 | ||||||
Charter Communications Operating LLC/Charter Communications Operating Capital |
||||||||
3.750% 2/15/28 |
92,000 | 83,138 | ||||||
4.800% 3/01/50 |
330,000 | 240,227 | ||||||
4.908% 7/23/25 |
205,000 | 201,084 | ||||||
5.250% 4/01/53 |
265,000 | 205,896 | ||||||
5.375% 5/01/47 |
95,000 | 74,916 | ||||||
5.750% 4/01/48 |
280,000 | 230,827 | ||||||
Cox Communications, Inc. |
||||||||
2.600% 6/15/31 (d) |
385,000 | 307,607 | ||||||
CSC Holdings LLC |
||||||||
6.500% 2/01/29 (d) |
513,000 | 419,377 | ||||||
7.500% 4/01/28 (d) |
32,000 | 21,680 | ||||||
Diamond Sports Group LLC / Diamond Sports Finance Co. |
||||||||
5.375% 8/15/26 (d) |
665,000 | 78,138 | ||||||
Time Warner Cable, Inc. |
||||||||
5.500% 9/01/41 |
535,000 | 445,550 | ||||||
5.875% 11/15/40 |
170,000 | 148,849 | ||||||
| 2,516,143 | ||||||||
Oil & Gas — 0.5% |
||||||||
KazMunay Gas National Co. |
||||||||
4.750% 4/19/27 (d) |
200,000 | 184,200 | ||||||
Pertamina Persero PT |
||||||||
3.100% 8/27/30 (d) |
200,000 | 171,928 | ||||||
Petroleos Mexicanos |
||||||||
5.950% 1/28/31 |
50,000 | 37,838 | ||||||
6.625% 6/15/35 (e) |
900,000 | 653,310 | ||||||
7.690% 1/23/50 |
115,000 | 79,582 | ||||||
Saudi Arabian Oil Co. |
||||||||
1.625% 11/24/25 (d) |
200,000 | 182,163 | ||||||
Shell International Finance BV |
||||||||
3.750% 9/12/46 |
25,000 | 19,858 | ||||||
Transocean Guardian Ltd. |
||||||||
5.875% 1/15/24 (d) |
82,505 | 80,566 | ||||||
The accompanying notes are an integral part of the financial statements.
165
MML Total Return Bond Fund – Portfolio of Investments (Continued) |
Principal |
Value |
|||||||
Transocean Poseidon Ltd. |
||||||||
6.875% 2/01/27 (d) |
$ | 85,750 | $ | 83,445 | ||||
| 1,492,890 | ||||||||
Oil & Gas Services — 0.1% |
||||||||
Transocean Proteus Ltd. |
||||||||
6.250% 12/01/24 (d) |
113,200 | 111,510 | ||||||
USA Compression Partners LP/USA Compression Finance Corp. |
||||||||
6.875% 4/01/26 |
30,000 | 28,779 | ||||||
| 140,289 | ||||||||
Packaging & Containers — 0.6% |
||||||||
Amcor Finance USA, Inc. |
||||||||
3.625% 4/28/26 |
650,000 | 615,703 | ||||||
Ardagh Packaging Finance PLC / Ardagh Holdings USA, Inc. |
||||||||
5.250% 8/15/27 (d) |
190,000 | 142,119 | ||||||
5.250% 8/15/27 (d) (e) |
100,000 | 74,800 | ||||||
Berry Global, Inc. |
||||||||
1.570% 1/15/26 |
410,000 | 365,627 | ||||||
4.875% 7/15/26 (d) |
330,000 | 317,251 | ||||||
Mauser Packaging Solutions Holding Co. |
||||||||
5.500% 4/15/24 (d) |
30,000 | 29,167 | ||||||
Trivium Packaging Finance BV |
||||||||
5.500% 8/15/26 (d) |
320,000 | 293,276 | ||||||
| 1,837,943 | ||||||||
Pharmaceuticals — 1.1% |
||||||||
AbbVie, Inc. |
||||||||
4.450% 5/14/46 |
400,000 | 345,951 | ||||||
Bayer US Finance II LLC |
||||||||
4.375% 12/15/28 (d) |
893,000 | 841,867 | ||||||
4.625% 6/25/38 (d) |
795,000 | 692,826 | ||||||
4.875% 6/25/48 (d) |
210,000 | 182,484 | ||||||
Cigna Corp. |
||||||||
3.400% 3/15/51 |
250,000 | 178,468 | ||||||
CVS Health Corp. |
||||||||
5.050% 3/25/48 |
1,090,000 | 983,280 | ||||||
| 3,224,876 | ||||||||
Pipelines — 1.1% |
||||||||
Energy Transfer LP |
||||||||
4.950% 6/15/28 |
125,000 | 121,085 | ||||||
5.000% 5/15/50 |
380,000 | 305,685 | ||||||
5.150% 3/15/45 |
400,000 | 333,717 | ||||||
5.350% 5/15/45 |
50,000 | 42,616 | ||||||
5.400% 10/01/47 |
394,000 | 333,071 | ||||||
5.500% 6/01/27 |
254,000 | 252,570 | ||||||
Galaxy Pipeline Assets Bidco Ltd. |
||||||||
2.160% 3/31/34 (d) |
369,864 | 314,241 | ||||||
Principal |
Value |
|||||||
Plains All American Pipeline LP/PAA Finance Corp. |
||||||||
3.800% 9/15/30 |
$ | 300,000 | $ | 261,452 | ||||
Rockies Express Pipeline LLC |
||||||||
4.800% 5/15/30 (d) |
250,000 | 219,989 | ||||||
4.950% 7/15/29 (d) |
200,000 | 179,470 | ||||||
Ruby Pipeline LLC |
||||||||
8.000% 4/01/49 (d) |
431,818 | 468,523 | ||||||
TransMontaigne Partners LP/TLP Finance Corp. |
||||||||
6.125% 2/15/26 |
181,000 | 155,660 | ||||||
Venture Global Calcasieu Pass LLC |
||||||||
3.875% 8/15/29 (d) |
365,000 | 319,375 | ||||||
| 3,307,454 | ||||||||
Real Estate — 0.0% |
||||||||
Vonovia SE |
||||||||
1.500% 6/14/41 EUR (d) (f) |
100,000 | 59,303 | ||||||
Real Estate Investment Trusts (REITS) — 1.3% |
||||||||
CapLand Ascendas REIT |
||||||||
0.750% 6/23/28 EUR (d) (f) |
185,000 | 153,997 | ||||||
CubeSmart LP |
||||||||
2.500% 2/15/32 |
385,000 | 295,378 | ||||||
Extra Space Storage LP |
||||||||
2.350% 3/15/32 |
175,000 | 132,902 | ||||||
GLP Capital LP/GLP Financing II, Inc. |
||||||||
4.000% 1/15/30 |
45,000 | 39,412 | ||||||
5.250% 6/01/25 |
205,000 | 201,367 | ||||||
5.300% 1/15/29 |
310,000 | 293,319 | ||||||
5.375% 4/15/26 |
735,000 | 721,276 | ||||||
Healthcare Realty Holdings LP |
||||||||
2.000% 3/15/31 (e) |
215,000 | 162,976 | ||||||
2.050% 3/15/31 |
27,000 | 19,802 | ||||||
2.400% 3/15/30 |
195,000 | 152,609 | ||||||
3.100% 2/15/30 |
190,000 | 159,132 | ||||||
Hudson Pacific Properties LP |
||||||||
3.250% 1/15/30 |
95,000 | 72,202 | ||||||
5.950% 2/15/28 (e) |
270,000 | 252,458 | ||||||
Invitation Homes Operating Partnership LP |
||||||||
2.000% 8/15/31 |
155,000 | 114,941 | ||||||
Physicians Realty LP |
||||||||
2.625% 11/01/31 |
190,000 | 148,813 | ||||||
VICI Properties LP |
||||||||
3.750% 2/15/27 (d) |
20,000 | 18,155 | ||||||
3.875% 2/15/29 (d) |
185,000 | 162,900 | ||||||
4.500% 9/01/26 (d) |
100,000 | 94,192 | ||||||
4.500% 1/15/28 (d) |
50,000 | 45,881 | ||||||
4.625% 6/15/25 (d) |
25,000 | 23,969 | ||||||
5.125% 5/15/32 |
350,000 | 324,083 | ||||||
The accompanying notes are an integral part of the financial statements.
166
MML Total Return Bond Fund – Portfolio of Investments (Continued) |
Principal |
Value |
|||||||
5.625% 5/15/52 |
$ | 164,000 | $ | 145,069 | ||||
5.750% 2/01/27 (d) |
120,000 | 116,969 | ||||||
| 3,851,802 | ||||||||
Retail — 0.1% |
||||||||
Fertitta Entertainment LLC/Fertitta Entertainment Finance Co., Inc. |
||||||||
6.750% 1/15/30 (d) (e) |
35,000 | 28,231 | ||||||
The Michaels Cos., Inc. |
||||||||
5.250% 5/01/28 (d) |
170,000 | 136,770 | ||||||
| 165,001 | ||||||||
Savings & Loans — 0.3% |
||||||||
Nationwide Building Society |
||||||||
SOFR + 1.290% 2.972% VRN 2/16/28 (d) |
340,000 | 299,280 | ||||||
3 mo. USD LIBOR + 1.064% 3.766% VRN 3/08/24 (d) |
525,000 | 522,147 | ||||||
3 mo. USD LIBOR + 1.392% 4.363% VRN 8/01/24 (d) |
190,000 | 187,544 | ||||||
| 1,008,971 | ||||||||
Semiconductors — 0.2% |
||||||||
Broadcom, Inc. |
||||||||
2.600% 2/15/33 (d) |
386,000 | 290,939 | ||||||
3.419% 4/15/33 (d) |
208,000 | 167,321 | ||||||
| 458,260 | ||||||||
Software — 0.4% |
||||||||
Open Text Corp. |
||||||||
6.900% 12/01/27 (d) |
50,000 | 50,000 | ||||||
Oracle Corp. |
||||||||
2.800% 4/01/27 |
140,000 | 127,801 | ||||||
2.875% 3/25/31 |
195,000 | 162,248 | ||||||
3.950% 3/25/51 |
753,000 | 539,885 | ||||||
6.900% 11/09/52 |
285,000 | 307,608 | ||||||
| 1,187,542 | ||||||||
Telecommunications — 1.8% |
||||||||
AT&T, Inc. |
||||||||
3.800% 12/01/57 |
482,000 | 335,193 | ||||||
4.750% 5/15/46 |
710,000 | 604,168 | ||||||
5.250% 3/01/37 |
270,000 | 262,106 | ||||||
Intelsat Jackson Holdings S.A. |
||||||||
6.500% 3/15/30 (d) |
417,000 | 372,794 | ||||||
Intelsat Jackson Holdings S.A., Escrow |
||||||||
8.500% 10/15/24 (d) (h) (i) (j) |
171,000 | — | ||||||
9.750% 7/15/25 (d) (h) (i) (j) |
585,000 | — | ||||||
Level 3 Financing, Inc. |
||||||||
3.875% 11/15/29 (d) |
460,000 | 363,002 | ||||||
Principal |
Value |
|||||||
Sprint Spectrum Co. LLC/Sprint Spectrum Co. II LLC/Sprint Spectrum Co. III LLC |
||||||||
4.738% 3/20/25 (d) |
$ | 793,125 | $ | 784,085 | ||||
T-Mobile USA, Inc. |
||||||||
2.550% 2/15/31 |
900,000 | 737,926 | ||||||
3.750% 4/15/27 |
375,000 | 353,690 | ||||||
3.875% 4/15/30 |
345,000 | 313,333 | ||||||
4.375% 4/15/40 |
115,000 | 98,681 | ||||||
Verizon Communications, Inc. |
||||||||
2.550% 3/21/31 |
330,000 | 271,842 | ||||||
Vodafone Group PLC |
||||||||
4.875% 6/19/49 |
452,000 | 381,026 | ||||||
5.250% 5/30/48 |
600,000 | 531,648 | ||||||
| 5,409,494 | ||||||||
TOTAL CORPORATE DEBT (Cost $96,851,746) |
84,826,806 | |||||||
MUNICIPAL OBLIGATIONS — 1.0% |
||||||||
California State University, Revenue Bond |
||||||||
2.274% 11/01/34 |
180,000 | 134,557 | ||||||
2.374% 11/01/35 |
20,000 | 14,794 | ||||||
City of New York NY, General Obligation |
||||||||
5.206% 10/01/31 |
750,000 | 758,293 | ||||||
Jersey City Municipal Utilities Authority, Revenue Bond |
||||||||
5.470% 5/15/27 |
635,000 | 643,194 | ||||||
New York City Transitional Finance Authority Future Tax Secured Revenue, Revenue Bond |
||||||||
2.450% 11/01/34 |
560,000 | 418,567 | ||||||
New York State Dormitory Authority, Revenue Bond |
||||||||
5.289% 3/15/33 |
750,000 | 757,373 | ||||||
University of California, Revenue Bond |
||||||||
2.247% 5/15/34 |
290,000 | 217,205 | ||||||
| 2,943,983 | ||||||||
TOTAL MUNICIPAL OBLIGATIONS (Cost $3,572,919) |
2,943,983 | |||||||
The accompanying notes are an integral part of the financial statements.
167
MML Total Return Bond Fund – Portfolio of Investments (Continued) |
Principal |
Value |
|||||||
NON-U.S. GOVERNMENT AGENCY OBLIGATIONS — 17.8% |
||||||||
Commercial Mortgage-Backed Securities — 3.1% |
||||||||
BAMLL Commercial Mortgage Securities Trust, Series 2018-PARK, Class A, |
||||||||
4.091% VRN 8/10/38 (d) (k) |
$ | 620,000 | $ | 560,683 | ||||
BX Commercial Mortgage Trust |
||||||||
Series 2019-XL, Class A, 1 mo. TSFR + 1.034% 5.370% FRN 10/15/36 (d) |
1,185,438 | 1,169,170 | ||||||
Series 2022-CSMO, Class A, 1 mo. TSFR + 2.115% 6.450% FRN 6/15/27 (d) |
692,000 | 686,813 | ||||||
BX Trust |
||||||||
Series 2019-OC11, Class A, 3.202% 12/09/41 (d) |
180,000 | 151,503 | ||||||
Series 2022-VAMF, Class C, 1 mo. TSFR + 1.580% 5.916% FRN 1/15/39 (d) |
443,000 | 419,763 | ||||||
BXSC Commercial Mortgage Trust, Series 2022-WSS, Class D, 1 mo. TSFR + 3.188% |
||||||||
7.524% FRN 3/15/35 (d) |
894,000 | 851,570 | ||||||
CALI Mortgage Trust, Series 2019-101C, Class A |
||||||||
3.957% 3/10/39 (d) |
415,000 | 359,235 | ||||||
CPT Mortgage Trust, Series 2019-CPT, Class A |
||||||||
2.865% 11/13/39 (d) |
355,000 | 284,682 | ||||||
DC Office Trust, Series 2019-MTC, Class A |
||||||||
2.965% 9/15/45 (d) |
375,000 | 308,263 | ||||||
GS Mortgage Securities Corp. II, Series 2021-ARDN, Class A, 1 mo. USD LIBOR + 1.250% |
||||||||
5.568% FRN 11/15/36 (d) |
1,570,000 | 1,515,849 | ||||||
Hudson Yards Mortgage Trust |
||||||||
Series 2019-55HY, Class A, 2.943% VRN 12/10/41 (d) (k) |
375,000 | 316,182 | ||||||
Series 2019-30HY, Class A, 3.228% 7/10/39 (d) |
385,000 | 330,966 | ||||||
JP Morgan Chase Commercial Mortgage Securities Trust, Series 2019-OSB, Class A |
||||||||
3.397% 6/05/39 (d) |
385,000 | 336,273 | ||||||
MKT Mortgage Trust, Series 2020-525M, Class A |
||||||||
2.694% 2/12/40 (d) |
255,000 | 200,740 | ||||||
One Bryant Park Trust, Series 2019-OBP, Class A |
||||||||
2.516% 9/15/54 (d) |
490,000 | 402,789 | ||||||
Principal |
Value |
|||||||
RBS Commercial Funding, Inc. Trust, Series 2013-GSP, Class A, |
||||||||
3.834% VRN 1/15/32 (d) (k) |
$ | 670,000 | $ | 638,629 | ||||
SFAVE Commercial Mortgage Securities Trust, Series 2015-5AVE, Class A1, |
||||||||
3.872% VRN 1/05/43 (d) (k) |
655,000 | 459,570 | ||||||
Wells Fargo Commercial Mortgage Trust, Series 2019-JWDR, Class E, |
||||||||
3.860% VRN 9/15/31 (d) (k) |
281,000 | 236,950 | ||||||
| 9,229,630 | ||||||||
Home Equity Asset-Backed Securities — 0.7% |
||||||||
Aegis Asset-Backed Securities Trust Mortgage Pass-Through Certificates, Series 2005-4, Class M2, 1 mo. USD LIBOR + .705% |
||||||||
5.094% FRN 10/25/35 |
760,069 | 704,453 | ||||||
Citigroup Mortgage Loan Trust, Series 2006-HE2, Class M1, 1 mo. USD LIBOR + .435% |
||||||||
4.824% FRN 8/25/36 |
389,928 | 386,564 | ||||||
Morgan Stanley Capital, Inc. Trust, Series 2006-HE1, Class A4, 1 mo. USD LIBOR + .580% |
||||||||
4.969% FRN 1/25/36 |
904,987 | 871,798 | ||||||
| 1,962,815 | ||||||||
Other Asset-Backed Securities — 5.0% |
||||||||
Aimco CLO Ltd. |
||||||||
Series 2020-11A, Class AR, 3 mo. USD LIBOR + 1.130% 5.209% FRN 10/17/34 (d) |
750,000 | 730,057 | ||||||
Series 2015-AA, Class BR2, 3 mo. USD LIBOR + 1.600% 5.679% FRN 10/17/34 (d) |
1,100,000 | 1,055,359 | ||||||
Allegro CLO XII Ltd., Series 2020-1A, Class A1, 3 mo. USD LIBOR + 1.250% |
||||||||
5.528% FRN 1/21/32 (d) |
850,000 | 836,522 | ||||||
Cedar Funding XIV CLO Ltd., Series 2021-14A, Class A, 3 mo. USD LIBOR + 1.100% |
||||||||
5.179% FRN 7/15/33 (d) |
800,000 | 781,601 | ||||||
Dryden Senior Loan Fund, Series 2013-26A, Class AR, 3 mo. USD LIBOR + .900% |
||||||||
4.979% FRN 4/15/29 (d) |
878,261 | 868,314 | ||||||
Eaton Vance CLO Ltd., Series 2020-1A, Class AR, 3 mo. USD LIBOR + 1.170% |
||||||||
5.249% FRN 10/15/34 (d) |
990,000 | 967,301 | ||||||
The accompanying notes are an integral part of the financial statements.
168
MML Total Return Bond Fund – Portfolio of Investments (Continued) |
Principal |
Value |
|||||||
Flatiron CLO Ltd., Series 2021-1A, Class B, 3 mo. USD LIBOR + 1.600% |
||||||||
5.827% FRN 7/19/34 (d) |
$ | 850,000 | $ | 811,726 | ||||
GSAMP Trust, Series 2005-HE5, Class M3, 1 mo. USD LIBOR + .690% |
||||||||
5.079% FRN 11/25/35 |
432,282 | 418,786 | ||||||
HPS Loan Management Ltd., Series 2021-16A, Class A1, 3 mo. USD LIBOR + 1.140% |
||||||||
5.465% FRN 1/23/35 (d) |
1,000,000 | 971,823 | ||||||
LCM LP, Series 21A, Class AR, 3 mo. USD LIBOR + .880% |
||||||||
5.123% FRN 4/20/28 (d) |
174,550 | 173,514 | ||||||
Long Beach Mortgage Loan Trust, 1 mo. USD LIBOR + .220% |
||||||||
4.609% FRN 10/25/36 |
6,035,755 | 1,851,984 | ||||||
Magnetite Ltd., Series 2012-7A, Class A1R2, 3 mo. USD LIBOR + .800% |
||||||||
4.879% FRN 1/15/28 (d) |
912,416 | 900,769 | ||||||
MF1 Ltd., Series 2021-FL7, Class AS, 1 mo. USD LIBOR + 1.450% |
||||||||
5.789% FRN 10/16/36 (d) |
850,000 | 801,298 | ||||||
Progress Residential Trust |
||||||||
Series 2020-SFR3, Class F, 2.796% 10/17/27 (d) |
360,000 | 313,364 | ||||||
Series 2021-SFR2, Class F, 3.395% 4/19/38 (d) |
1,150,000 | 976,205 | ||||||
Series 2021-SFR10, Class F, 4.608% 12/17/38 (d) |
478,889 | 385,715 | ||||||
Rockford Tower CLO Ltd., Series 2021-1A, Class A1, 3 mo. USD LIBOR + 1.170% |
||||||||
5.413% FRN 7/20/34 (d) |
850,000 | 827,895 | ||||||
Saxon Asset Securities Trust, Series 2007-2, Class A2C, 1 mo. USD LIBOR + .240% |
||||||||
4.629% FRN 5/25/47 |
1,556,056 | 1,103,124 | ||||||
| 14,775,357 | ||||||||
Student Loans Asset-Backed Securities — 2.6% |
||||||||
Access Group, Inc., Series 2015-1, Class A, 1 mo. USD LIBOR + .700% |
||||||||
5.089% FRN 7/25/56 (d) |
324,474 | 309,752 | ||||||
Collegiate Funding Services Education Loan Trust, Series 2005-A, Class A4, 3 mo. USD LIBOR + .200% |
||||||||
4.924% FRN 3/28/35 |
1,067,801 | 1,015,917 | ||||||
Principal |
Value |
|||||||
Nelnet Student Loan Trust, Series 2015-1A, Class A, 1 mo. USD LIBOR + .590% |
||||||||
4.979% FRN 4/25/46 (d) |
$ | 619,774 | $ | 604,828 | ||||
SLM Student Loan Trust |
||||||||
Series 2007-7, Class A4, 3 mo. USD LIBOR + .330% 4.688% FRN 1/25/22 |
565,777 | 549,583 | ||||||
Series 2012-7, Class A3, 1 mo. USD LIBOR + .650% 5.039% FRN 5/26/26 |
615,452 | 590,280 | ||||||
Series 2012-2, Class A, 1 mo. USD LIBOR + .700% 5.089% FRN 1/25/29 |
716,124 | 681,616 | ||||||
Series 2012-1, Class A3, 1 mo. USD LIBOR + .950% 5.339% FRN 9/25/28 |
599,136 | 579,738 | ||||||
Series 2008-6, Class A4, 3 mo. USD LIBOR + 1.100% 5.458% FRN 7/25/23 |
869,350 | 842,845 | ||||||
Series 2008-9, Class A, 3 mo. USD LIBOR + 1.500% 5.858% FRN 4/25/23 |
621,655 | 611,497 | ||||||
Series 2008-5, Class B, 3 mo. USD LIBOR + 1.850% 6.208% FRN 7/25/73 |
700,000 | 663,150 | ||||||
Series 2008-9, Class B, 3 mo. USD LIBOR + 2.250% 6.608% FRN 10/25/83 |
1,430,000 | 1,340,960 | ||||||
| 7,790,166 | ||||||||
Whole Loan Collateral Collateralized Mortgage Obligations — 6.4% |
||||||||
American Home Mortgage Investment Trust, Series 2005-1, Class 6A, 6 mo. USD LIBOR + 2.000% |
||||||||
7.162% FRN 6/25/45 |
311,133 | 294,940 | ||||||
Angel Oak Mortgage Trust |
||||||||
Series 2021-7, Class A1, 1.978% VRN 10/25/66 (d) (k) |
227,991 | 186,629 | ||||||
Series 2022-6,Class A1, 4.300% STEP 7/25/67 (d) |
879,882 | 841,990 | ||||||
Chase Mortgage Finance Trust, Series 2007-A1, Class 11A4, |
||||||||
3.393% VRN 3/25/37 (k) |
218,219 | 186,821 | ||||||
Citigroup Mortgage Loan Trust, Series 2005-11, Class A2A, 1 year CMT + 2.400% |
||||||||
5.410% FRN 10/25/35 |
174,674 | 168,082 | ||||||
COLT Mortgage Loan Trust, Series 2021-6, Class A1, |
||||||||
1.907% VRN 12/25/66 (d) (k) |
782,317 | 664,484 | ||||||
The accompanying notes are an integral part of the financial statements.
169
MML Total Return Bond Fund – Portfolio of Investments (Continued) |
Principal |
Value |
|||||||
Countrywide Alternative Loan Trust |
||||||||
Series 2006-OA6, Class 1A2, 1 mo. USD LIBOR + .420% 4.809% FRN 7/25/46 |
$ | 847,457 | $ | 742,030 | ||||
Series 2005-31, Class 2A1, 1 mo. USD LIBOR + .600% 4.989% FRN 8/25/35 |
846,805 | 746,832 | ||||||
Credit Suisse Mortgage Trust, Series 2018-RPL9, Class A, |
||||||||
3.850% VRN 9/25/57 (d) (k) |
806,316 | 742,165 | ||||||
Deephaven Residential Mortgage Trust, Series 2021-4, Class A1, |
||||||||
1.931% VRN 11/25/66 (d) (k) |
1,502,785 | 1,280,383 | ||||||
Deutsche Alt-A Securities, Inc. Mortgage Loan Trust, Series 2005-1, Class 1A3, 1 mo. USD LIBOR + .500% |
||||||||
4.889% FRN 2/25/35 |
1,372,025 | 1,279,379 | ||||||
First Horizon Mortgage Pass-Through Trust, Series 2005-AR5, Class 2A1, |
||||||||
4.310% VRN 11/25/35 (k) |
203,807 | 161,144 | ||||||
GS Mortgage-Backed Securities Trust |
||||||||
Series 2022-PJ6 , Class A4, 3.000% VRN 1/25/53 (d) (k) |
1,980,332 | 1,658,985 | ||||||
Series 2018-RPL1, Class A1A, 3.750% 10/25/57 (d) |
665,668 | 628,712 | ||||||
HarborView Mortgage Loan Trust, Series 2006-10, Class 1A1A, 1 mo. USD LIBOR + .200% |
||||||||
4.539% FRN 11/19/36 |
1,593,885 | 1,249,793 | ||||||
Impac CMB Trust, Series 2005-1, Class 1A1, 1 mo. USD LIBOR + .520% |
||||||||
4.909% FRN 4/25/35 |
439,373 | 400,585 | ||||||
IndyMac Index Mortgage Loan Trust |
||||||||
Series 2005-AR19, Class A1, 3.038% VRN 10/25/35 (k) |
653,777 | 488,101 | ||||||
Series 2006-AR27, Class 1A3, 1 mo. USD LIBOR + .540% 4.929% FRN 10/25/36 |
1,253,839 | 547,660 | ||||||
JP Morgan Mortgage Trust, Series 2021-13, Class A3, |
||||||||
2.500% VRN 4/25/52 (d) (k) |
1,719,002 | 1,385,274 | ||||||
MASTR Adjustable Rate Mortgages Trust, Series 2007-1, Class I2A3, 12 mo. MTA + .740% |
||||||||
2.788% FRN 1/25/47 |
967,517 | 932,077 | ||||||
Nomura Asset Acceptance Corp. Alternative Loan Trust, Series 2005-AR1, Class M1, 1 mo. USD LIBOR + 1.070% |
||||||||
5.459% FRN 2/25/35 |
573,134 | 553,497 | ||||||
Principal |
Value |
|||||||
Opteum Mortgage Acceptance Corp., Series 2005-4 , Class M2, 1 mo. USD LIBOR + .750% |
||||||||
5.139% FRN 11/25/35 |
$ | 1,450,000 | $ | 1,345,931 | ||||
Washington Mutual Mortgage Pass-Through Certificates Trust |
||||||||
Series 2005-AR15, Class A1A1, 1 mo. USD LIBOR + .520% 4.909% FRN 11/25/45 |
1,637,782 | 1,402,516 | ||||||
Series 2005-AR13, Class A1A1, 1 mo. USD LIBOR + .580% 4.969% FRN 10/25/45 |
327,577 | 294,185 | ||||||
Series 2005-AR2, Class 2A21, 1 mo. USD LIBOR + .660% 5.049% FRN 1/25/45 |
265,252 | 250,581 | ||||||
Series 2006-1 Class 3A2, 5.750% 2/25/36 |
444,515 | 379,555 | ||||||
| 18,812,331 | ||||||||
TOTAL NON-U.S. GOVERNMENT AGENCY OBLIGATIONS (Cost $56,121,107) |
52,570,299 | |||||||
SOVEREIGN DEBT OBLIGATIONS — 1.0% |
||||||||
Abu Dhabi Government International Bond |
||||||||
2.500% 9/30/29 (d) |
200,000 | 179,238 | ||||||
Brazilian Government International Bond |
||||||||
2.875% 6/06/25 |
200,000 | 188,783 | ||||||
3.875% 6/12/30 (e) |
200,000 | 173,597 | ||||||
Chile Government International Bond |
||||||||
2.550% 1/27/32 (e) |
224,000 | 183,293 | ||||||
Colombia Government International Bond |
||||||||
4.500% 1/28/26 |
200,000 | 187,970 | ||||||
Dominican Republic International Bond |
||||||||
4.500% 1/30/30 |
200,000 | 170,176 | ||||||
Hungary Government International Bond |
||||||||
2.125% 9/22/31 |
200,000 | 148,132 | ||||||
Mexico Government International Bond |
||||||||
3.750% 1/11/28 |
300,000 | 283,041 | ||||||
Oman Government International Bond |
||||||||
5.625% 1/17/28 (d) |
200,000 | 197,212 | ||||||
Panama Government International Bond |
||||||||
2.252% 9/29/32 |
200,000 | 148,107 | ||||||
3.160% 1/23/30 |
200,000 | 171,991 | ||||||
The accompanying notes are an integral part of the financial statements.
170
MML Total Return Bond Fund – Portfolio of Investments (Continued) |
Principal |
Value |
|||||||
Peruvian Government International Bond |
||||||||
2.844% 6/20/30 (e) |
$ | 80,000 | $ | 67,484 | ||||
4.125% 8/25/27 |
200,000 | 191,307 | ||||||
Qatar Government International Bond |
||||||||
4.500% 4/23/28 (d) |
200,000 | 201,088 | ||||||
Republic of Poland Government International Bond |
||||||||
5.750% 11/16/32 |
17,000 | 18,090 | ||||||
Republic of South Africa Government International Bond |
||||||||
5.875% 4/20/32 |
250,000 | 225,000 | ||||||
Republic of Turkey International Bond |
||||||||
3.250% 3/23/23 (e) |
200,000 | 199,629 | ||||||
Romanian Government International Bond |
||||||||
3.000% 2/14/31 (d) |
110,000 | 86,431 | ||||||
| 3,020,569 | ||||||||
TOTAL SOVEREIGN DEBT OBLIGATIONS (Cost $3,517,958) |
3,020,569 | |||||||
U.S. GOVERNMENT AGENCY OBLIGATIONS AND INSTRUMENTALITIES (l) — 36.6% |
||||||||
Collateralized Mortgage Obligations — 0.8% |
||||||||
Federal Home Loan Mortgage Corp. |
||||||||
Series 4818, Class CA, 3.000% 4/15/48 |
148,881 | 134,734 | ||||||
Series 4639, Class HZ, 3.250% STEP 4/15/53 |
1,613,572 | 1,287,609 | ||||||
Series 4846, Class PA, 4.000% 6/15/47 |
64,612 | 63,607 | ||||||
Federal National Mortgage Association Series 2018-57, Class QA 3.500% 5/25/46 |
87,803 | 85,827 | ||||||
Federal National Mortgage Association REMICS |
||||||||
Series 2018-43, Class CT, 3.000% 6/25/48 |
266,237 | 237,128 | ||||||
Series 2018-55, Class PA, 3.500% 1/25/47 |
81,939 | 79,374 | ||||||
Government National Mortgage Association |
||||||||
Series 2018-124, Class NW, 3.500% 9/20/48 |
259,665 | 242,127 | ||||||
Series 2019-15, Class GT, 3.500% 2/20/49 |
163,500 | 152,539 | ||||||
| 2,282,945 | ||||||||
Principal |
Value |
|||||||
Pass-Through Securities — 35.5% |
||||||||
Federal Home Loan Mortgage Corp. |
||||||||
Pool #QE0312 2.000% 4/01/52 |
$ | 1,203,497 | $ | 985,179 | ||||
Pool #SD8194 2.500% 2/01/52 |
1,626,302 | 1,384,025 | ||||||
Pool #SD8205 2.500% 4/01/52 |
1,754,014 | 1,492,163 | ||||||
Pool #SD8212 2.500% 5/01/52 |
1,693,501 | 1,440,684 | ||||||
Pool #G18592 3.000% 3/01/31 |
168,239 | 160,899 | ||||||
Pool #G18627 3.000% 1/01/32 |
539,216 | 514,677 | ||||||
Pool #G08710 3.000% 6/01/46 |
99,266 | 89,657 | ||||||
Pool #ZM1779 3.000% 9/01/46 |
505,104 | 455,779 | ||||||
Pool #G08726 3.000% 10/01/46 |
741,685 | 668,961 | ||||||
Pool #G08732 3.000% 11/01/46 |
272,101 | 245,421 | ||||||
Pool #G08741 3.000% 1/01/47 |
747,321 | 674,045 | ||||||
Pool #G07848 3.500% 4/01/44 |
1,214,412 | 1,140,487 | ||||||
Pool #G60023 3.500% 4/01/45 |
1,131,956 | 1,063,404 | ||||||
Pool #G08711 3.500% 6/01/46 |
325,798 | 304,336 | ||||||
Pool #G08716 3.500% 8/01/46 |
458,496 | 428,007 | ||||||
Pool #G67700 3.500% 8/01/46 |
552,200 | 517,205 | ||||||
Pool #G08722 3.500% 9/01/46 |
81,231 | 75,829 | ||||||
Pool #G08742 3.500% 1/01/47 |
371,525 | 346,122 | ||||||
Pool #G08757 3.500% 4/01/47 |
95,487 | 88,898 | ||||||
Pool #G67703 3.500% 4/01/47 |
797,320 | 746,542 | ||||||
Pool #G67706 3.500% 12/01/47 |
723,765 | 676,993 | ||||||
Pool #ZA5103 3.500% 12/01/47 |
3,633 | 3,373 | ||||||
Pool #G67707 3.500% 1/01/48 |
2,013,446 | 1,887,106 | ||||||
Pool #G08800 3.500% 2/01/48 |
33,304 | 30,923 | ||||||
Pool #G67708 3.500% 3/01/48 |
177,067 | 165,182 | ||||||
Pool #G67710 3.500% 3/01/48 |
926,593 | 863,818 | ||||||
Pool #G08816 3.500% 6/01/48 |
266,882 | 247,467 | ||||||
Pool #G61556 3.500% 8/01/48 |
475,785 | 443,849 | ||||||
Pool #G60344 4.000% 12/01/45 |
593,916 | 576,067 | ||||||
Pool #G67711 4.000% 3/01/48 |
649,351 | 627,401 | ||||||
Pool #G67713 4.000% 6/01/48 |
2,693 | 2,596 | ||||||
Pool #G08843 4.500% 10/01/48 |
125,270 | 122,928 | ||||||
Pool #G08833 5.000% 7/01/48 |
89,232 | 89,609 | ||||||
Pool #G08844 5.000% 10/01/48 |
76,372 | 76,694 | ||||||
Federal National Mortgage Association |
||||||||
Pool #MA4152 2.000% 10/01/40 |
809,446 | 692,964 | ||||||
Pool #MA4176 2.000% 11/01/40 |
1,573,880 | 1,339,524 | ||||||
Pool #MA4333 2.000% 5/01/41 |
191,655 | 162,638 | ||||||
Pool #BQ6913 2.000% 12/01/51 |
2,298,784 | 1,884,652 | ||||||
Pool #MA4492 2.000% 12/01/51 |
1,762,625 | 1,445,083 | ||||||
Pool #BQ7006 2.000% 1/01/52 |
3,571,548 | 2,928,123 | ||||||
Pool #FS1598 2.000% 4/01/52 |
1,642,107 | 1,344,224 | ||||||
Pool #BL6060 2.455% 4/01/40 |
570,000 | 403,013 | ||||||
Pool #MA4512 2.500% 1/01/52 |
1,732,445 | 1,475,709 | ||||||
Pool #MA4548 2.500% 2/01/52 |
1,653,172 | 1,406,893 | ||||||
Pool #MA4563 2.500% 3/01/52 |
1,688,368 | 1,436,845 | ||||||
The accompanying notes are an integral part of the financial statements.
171
MML Total Return Bond Fund – Portfolio of Investments (Continued) |
Principal |
Value |
|||||||
Pool #MA1607 3.000% 10/01/33 |
$ | 289,347 | $ | 272,937 | ||||
Pool #MA3811 3.000% 10/01/49 |
209,932 | 183,593 | ||||||
Pool #BV8477 3.000% 5/01/52 |
612,480 | 539,583 | ||||||
Pool #AB4262 3.500% 1/01/32 |
257,051 | 246,643 | ||||||
Pool #MA1512 3.500% 7/01/33 |
125,156 | 120,088 | ||||||
Pool #MA1148 3.500% 8/01/42 |
701,021 | 658,288 | ||||||
Pool #CA0996 3.500% 1/01/48 |
129,631 | 120,817 | ||||||
Pool #MA3305 3.500% 3/01/48 |
25,558 | 23,693 | ||||||
Pool #BL1132 3.730% 1/01/29 |
920,000 | 874,640 | ||||||
Pool #MA1146 4.000% 8/01/42 |
288,254 | 277,405 | ||||||
Pool #AS9830 4.000% 6/01/47 |
128,297 | 123,204 | ||||||
Pool #MA3027 4.000% 6/01/47 |
193,746 | 186,056 | ||||||
Pool #AS9972 4.000% 7/01/47 |
124,653 | 119,705 | ||||||
Pool #931504 4.500% 7/01/39 |
40,735 | 40,403 | ||||||
Pool #CA1710 4.500% 5/01/48 |
443,757 | 435,467 | ||||||
Pool #CA1711 4.500% 5/01/48 |
146,181 | 143,450 | ||||||
Pool #CA2208 4.500% 8/01/48 |
251,376 | 246,522 | ||||||
Pool #AD6374 5.000% 5/01/40 |
8,628 | 8,743 | ||||||
Pool #AI2733 5.000% 5/01/41 |
84,291 | 85,498 | ||||||
Pool #977014 5.500% 5/01/38 |
9,234 | 9,543 | ||||||
Pool #985524 5.500% 6/01/38 |
13,032 | 13,486 | ||||||
Pool #988578 5.500% 8/01/38 |
103,053 | 106,686 | ||||||
Pool #995482 5.500% 1/01/39 |
57,760 | 59,704 | ||||||
Government National Mortgage Association II |
||||||||
Pool #MA4126 3.000% 12/20/46 |
593,473 | 538,422 | ||||||
Pool #MA4718 3.000% 9/20/47 |
64,433 | 58,396 | ||||||
Pool #MA4836 3.000% 11/20/47 |
225,929 | 204,760 | ||||||
Pool #MA6209 3.000% 10/20/49 |
187,905 | 164,192 | ||||||
Pool #MA3521 3.500% 3/20/46 |
231,572 | 217,636 | ||||||
Pool #MA3597 3.500% 4/20/46 |
71,884 | 67,468 | ||||||
Pool #MA3663 3.500% 5/20/46 |
105,523 | 98,942 | ||||||
Pool #MA3937 3.500% 9/20/46 |
86,552 | 81,154 | ||||||
Pool #MA4127 3.500% 12/20/46 |
316,155 | 296,140 | ||||||
Pool #MA4262 3.500% 2/20/47 |
320,248 | 299,975 | ||||||
Pool #MA4382 3.500% 4/20/47 |
82,055 | 76,758 | ||||||
Pool #MA4719 3.500% 9/20/47 |
101,251 | 94,652 | ||||||
Pool #MA4837 3.500% 11/20/47 |
209,644 | 195,980 | ||||||
Pool #MA4900 3.500% 12/20/47 |
755,393 | 706,156 | ||||||
Pool #MA4653 4.000% 8/20/47 |
39,876 | 38,365 | ||||||
Pool #MA4838 4.000% 11/20/47 |
166,932 | 160,452 | ||||||
Pool #MA4901 4.000% 12/20/47 |
72,744 | 69,920 | ||||||
Pool #MA5078 4.000% 3/20/48 |
249,863 | 239,852 | ||||||
Pool #MA5466 4.000% 9/20/48 |
277,120 | 265,671 | ||||||
Pool #MA5399 4.500% 8/20/48 |
506,794 | 498,196 | ||||||
Pool #MA3666 5.000% 5/20/46 |
83,615 | 84,747 | ||||||
Pool #MA4199 5.000% 1/20/47 |
84,294 | 85,293 | ||||||
Pool #MA4454 5.000% 5/20/47 |
136,100 | 138,253 | ||||||
Pool #MA4722 5.000% 9/20/47 |
150,089 | 152,324 | ||||||
Principal |
Value |
|||||||
Government National Mortgage Association II TBA 2.500% 1/23/53 (g) |
$ | 5,225,000 | $ | 4,535,137 | ||||
Uniform Mortgage Backed Securities TBA |
||||||||
2.000% 1/12/53 (g) |
14,450,000 | 11,817,391 | ||||||
2.500% 12/25/51 (g) |
11,950,000 | 10,153,766 | ||||||
3.000% 2/25/52 (g) |
6,950,000 | 6,118,715 | ||||||
3.500% 2/25/49 (g) |
275,000 | 250,529 | ||||||
4.000% 1/12/53 (g) |
3,650,000 | 3,432,141 | ||||||
4.500% 1/12/53 (g) |
10,550,000 | 10,182,398 | ||||||
5.000% 1/12/53 (g) |
15,450,000 | 15,249,632 | ||||||
| 104,625,561 | ||||||||
Whole Loans — 0.3% |
||||||||
Connecticut Avenue Securities Trust Series 2022-R03, Class 1M2, 30 day SOFR + 3.500% |
||||||||
7.428% FRN 3/25/42 (d) |
1,000,000 | 1,012,289 | ||||||
TOTAL U.S. GOVERNMENT AGENCY OBLIGATIONS AND INSTRUMENTALITIES (Cost $112,973,211) |
107,920,795 | |||||||
U.S. TREASURY OBLIGATIONS — 27.6% |
||||||||
U.S. Treasury Bonds & Notes — 27.6% |
||||||||
U.S. Treasury Bond |
||||||||
2.000% 11/15/41 |
16,757,000 | 12,059,423 | ||||||
2.375% 2/15/42 |
6,330,000 | 4,867,948 | ||||||
4.000% 11/15/52 |
8,560,000 | 8,656,300 | ||||||
U.S. Treasury Inflation Index |
||||||||
0.625% 7/15/32 |
408,169 | 374,261 | ||||||
U.S. Treasury Note |
||||||||
3.875% 12/31/27 (g) |
16,725,000 | 16,659,957 | ||||||
3.875% 11/30/27 (e) |
12,080,000 | 12,031,746 | ||||||
4.000% 12/15/25 |
3,675,000 | 3,655,615 | ||||||
4.125% 10/31/27 |
540,000 | 542,768 | ||||||
4.125% 11/15/32 |
4,085,000 | 4,179,696 | ||||||
4.250% 12/31/24 |
1,365,000 | 1,361,081 | ||||||
4.500% 11/30/24 (e) |
17,070,000 | 17,080,288 | ||||||
| 81,469,083 | ||||||||
TOTAL U.S. TREASURY OBLIGATIONS (Cost $85,582,288) |
81,469,083 | |||||||
TOTAL BONDS & NOTES (Cost $365,185,839) |
339,098,073 | |||||||
The accompanying notes are an integral part of the financial statements.
172
MML Total Return Bond Fund – Portfolio of Investments (Continued) |
Number of |
Value |
|
RIGHTS — 0.0% |
||
Communications — 0.0% |
||
Telecommunications — 0.0% |
||
Intelsat Jackson Holdings S.A. (a) (h) (j) |
755 |
$ — |
Intelsat Jackson Holdings S.A. (a) (h) (j) |
755 |
— |
— |
||
TOTAL RIGHTS (Cost $0) |
— |
|
MUTUAL FUNDS — 9.5% |
||
Diversified Financial Services — 9.5% |
||
State Street Navigator Securities Lending Government Money Market Portfolio (m) |
27,895,588 |
27,895,588 |
TOTAL MUTUAL FUNDS (Cost $27,895,588) |
27,895,588 |
|
TOTAL LONG-TERM INVESTMENTS (Cost $393,758,421) |
367,155,886 |
|
Principal |
||
SHORT-TERM INVESTMENTS — 11.3% |
||
Repurchase Agreement — 10.8% |
||
Fixed Income Clearing Corp., Repurchase Agreement, dated 12/30/22, 1.280%, due 1/03/23 (n) |
$ 31,835,830 |
31,835,830 |
U.S. Treasury Bill — 0.5% |
||
U.S. Treasury Bill |
||
3.791% 3/16/23 (o) |
1,395,000 |
1,383,431 |
TOTAL SHORT-TERM INVESTMENTS (Cost $33,220,306) |
33,219,261 |
|
TOTAL INVESTMENTS — 135.8% (Cost $426,978,727) (p) |
400,375,147 |
|
Less Unfunded Loan Commitments — (0.0)% |
(31,291) |
|
NET INVESTMENTS — 135.8% (Cost $426,947,436) |
400,343,856 |
|
Other Assets/(Liabilities) — (35.8)% |
(105,598,459) |
|
NET ASSETS — 100.0% |
$ 294,745,397 |
|
Abbreviation Legend
|
CLO |
Collateralized Loan Obligation |
|
DIP |
Debtor In Possession |
|
FRN |
Floating Rate Note |
|
REMICS |
Real Estate Mortgage Investment Conduits |
|
STEP |
Step Up Bond |
|
TBA |
To Be Announced |
|
VRN |
Variable Rate Note |
Notes to Portfolio of Investments
Percentages are stated as a percent of net assets.
|
(a) |
Non-income producing security. |
|
(b) |
All or a portion of the security represents unsettled loan commitments at December 31, 2022 where the rate will be determined at time of settlement. |
|
(c) |
Unfunded or partially unfunded loan commitments. |
|
(d) |
Security is exempt from registration under Regulation S or Rule 144A of the Securities Act of 1933. These securities are considered restricted and may be resold in transactions exempt from registration. At December 31, 2022, the aggregate market value of these securities amounted to $57,172,662 or 19.40% of net assets. |
|
(e) |
Denotes all or a portion of security on loan. The total value of securities on loan as of December 31, 2022, was $27,909,940 or 9.47% of net assets. The Fund received $582,914 of non-cash collateral (U.S. Treasury and/or Agency obligations) related to securities lending activity. This amount is not reflected on either the Portfolio of Investments or the Statement of Assets and Liabilities. (Note 2). |
|
(f) |
The principal amount of the security is in foreign currency. The market value is in U.S. dollars. |
|
(g) |
A portion of this security is purchased on a when-issued, delayed-delivery or forward commitment basis. (Note 2). |
|
(h) |
Investment is valued using significant unobservable inputs. |
|
(i) |
Security is currently in default due to bankruptcy or failure to make payment of principal or interest of the issuer. Income is not being accrued. At December 31, 2022, these securities amounted to a value of $0 or 0.00% of net assets. |
|
(j) |
This security is fair valued in good faith in accordance with procedures approved by the Board of Trustees. At December 31, 2022, these securities amounted to a value of $0 or 0.00% of net assets. |
|
(k) |
Certain variable rate securities are not based on a published reference rate and spread but are determined by the issuer or agent and are based on current market conditions. These securities do not indicate a reference rate and spread in their description above. The rates shown are the current interest rates at December 31, 2022. |
|
(l) |
May contain securities that are issued by a U.S. Government Agency, but are unsecured and are not guaranteed by a U.S. Government Agency. |
|
(m) |
Represents investment of security lending cash collateral. (Note 2). |
|
(n) |
Maturity value of $31,840,358. Collateralized by U.S. Government Agency obligations with a rate of 0.000%, maturity date of 6/29/23, and an aggregate market value, including accrued interest, of $32,472,574. |
|
(o) |
The rate shown represents yield-to-maturity. |
|
(p) |
See Note 6 for aggregate cost for federal tax purposes. |
The accompanying notes are an integral part of the financial statements.
173
MML Total Return Bond Fund – Portfolio of Investments (Continued) |
Forward contracts
Counterparty |
Settlement |
Currency Purchased |
Currency Sold |
Unrealized |
||||||||||||||||||||
Bank of America N.A.* |
1/13/23 | USD | 638,524 | EUR | 643,000 | $ | (50,207 | ) | ||||||||||||||||
Futures contracts
|
Expiration |
Number of |
Notional |
Value/ Net |
||||||||||||
Long |
||||||||||||||||
U.S. Treasury Ultra Bond |
3/22/23 | 1 | $ | 145,445 | $ | (11,132 | ) | |||||||||
U.S. Treasury Note 2 Year |
3/31/23 | 280 | 57,370,000 | 51,875 | ||||||||||||
U.S. Treasury Note 5 Year |
3/31/23 | 3 | 324,006 | (216 | ) | |||||||||||
|
$ | 40,527 | ||||||||||||||
Short |
||||||||||||||||
Euro-BOBL |
3/08/23 | 2 | $ | (255,128 | ) | $ | 7,319 | |||||||||
Euro-Bund |
3/08/23 | 2 | (301,521 | ) | 16,931 | |||||||||||
U.S. Treasury Ultra 10 Year |
3/22/23 | 5 | (592,844 | ) | 1,438 | |||||||||||
|
$ | 25,688 | ||||||||||||||
Centrally Cleared Interest Rate Swaps
Paid by the Fund |
Received by the Fund |
||||||||||||||||||||||||||||||||
Rate/ Reference |
Frequency |
Rate/ Reference |
Frequency |
Termination |
Notional |
Value |
Upfront |
Unrealized |
|||||||||||||||||||||||||
12 Month USD SOFR |
Annually | Fixed 1.950% |
Annually | 6/10/24 | USD | 19,270,000 | $ | (750,848 | ) | $ | — | $ | (750,848 | ) | |||||||||||||||||||
3-Month USD LIBOR BBA |
Quarterly | Fixed 1.073% |
Semi-Annually | 7/24/25 | USD | 3,875,000 | (231,818 | ) | — | (231,818 | ) | ||||||||||||||||||||||
3-Month USD LIBOR BBA |
Quarterly | Fixed 1.034% |
Semi-Annually | 7/24/25 | USD | 5,725,000 | (346,613 | ) | — | (346,613 | ) | ||||||||||||||||||||||
3-Month USD LIBOR BBA |
Quarterly | Fixed 1.026% |
Semi-Annually | 7/24/25 | USD | 7,750,000 | (470,357 | ) | — | (470,357 | ) | ||||||||||||||||||||||
3-Month USD LIBOR BBA |
Quarterly | Fixed 1.390% |
Semi-Annually | 9/28/25 | USD | 15,085,000 | (763,622 | ) | — | (763,622 | ) | ||||||||||||||||||||||
Fixed 1.808% |
Semi-Annually | 3-Month USD LIBOR BBA |
Quarterly | 7/24/53 | USD | 325,000 | 96,766 | — | 96,766 | ||||||||||||||||||||||||
Fixed 1.785% |
Semi-Annually | 3-Month USD LIBOR BBA |
Quarterly | 7/24/53 | USD | 475,000 | 143,384 | — | 143,384 | ||||||||||||||||||||||||
Fixed 1.773% |
Semi-Annually | 3-Month USD LIBOR BBA |
Quarterly | 7/24/53 | USD | 650,000 | 197,698 | — | 197,698 | ||||||||||||||||||||||||
Fixed 1.870% |
Semi-Annually | 3-Month USD LIBOR BBA |
Quarterly | 9/28/53 | USD | 1,285,000 | 360,640 | — | 360,640 | ||||||||||||||||||||||||
| $ | (1,764,770 | ) | $ | — | $ | (1,764,770 | ) | ||||||||||||||||||||||||||
* Contracts are subject to a master netting agreement or similar agreement.
Currency Legend
|
EUR |
Euro |
|
USD |
U.S. Dollar |
The accompanying notes are an integral part of the financial statements.
174
[THIS PAGE INTENTIONALLY LEFT BLANK]
Statements of Assets and Liabilities |
MML |
MML |
|||||||
Assets: |
||||||||
Investments, at value - unaffiliated issuers (Note 2) (a) |
$ | 10,046,045 | $ | 10,613,380 | ||||
Investments, at value - affiliated issuers (Notes 2 & 7) (b) |
290,380,811 | 338,180,027 | ||||||
Repurchase agreements, at value (Note 2) (c) |
— | — | ||||||
Total investments (d) |
300,426,856 | 348,793,407 | ||||||
Cash |
— | — | ||||||
Foreign currency, at value (e) |
— | — | ||||||
Receivables from: |
||||||||
Investments sold |
||||||||
Regular delivery |
106,454 | 28,813 | ||||||
Fund shares sold |
6,839 | 9,406 | ||||||
Dividends |
7,776 | 8,374 | ||||||
Foreign tax reclaims |
— | — | ||||||
Total assets |
300,547,925 | 348,840,000 | ||||||
Liabilities: |
||||||||
Payables for: |
||||||||
Investments purchased |
||||||||
Regular delivery |
7,776 | 8,374 | ||||||
Fund shares repurchased |
110,042 | 34,462 | ||||||
Trustees’ fees and expenses (Note 3) |
39,721 | 47,989 | ||||||
Affiliates (Note 3): |
||||||||
Administration fees |
— | — | ||||||
Investment advisory fees |
25,986 | 30,067 | ||||||
Service fees |
148,557 | 169,157 | ||||||
Accrued expense and other liabilities |
69,447 | 86,211 | ||||||
Total liabilities |
401,529 | 376,260 | ||||||
Net assets |
$ | 300,146,396 | $ | 348,463,740 | ||||
Net assets consist of: |
||||||||
Paid-in capital |
$ | 342,649,688 | $ | 385,138,744 | ||||
Accumulated earnings (loss) |
(42,503,292 | ) | (36,675,004 | ) | ||||
Net assets |
$ | 300,146,396 | $ | 348,463,740 | ||||
(a) |
Cost of investments - unaffiliated issuers: |
$ | 11,553,331 | $ | 12,299,042 | |||||||
(b) |
Cost of investments - affiliated issuers: |
$ | 349,738,649 | $ | 399,619,788 | |||||||
(c) |
Cost of repurchase agreements: |
$ | — | $ | — | |||||||
(d) |
Securities on loan with market value of: |
$ | — | $ | — | |||||||
(e) |
Cost of foreign currency: |
$ | — | $ | — | |||||||
The accompanying notes are an integral part of the financial statements.
176
MML |
MML |
MML |
MML |
MML |
MML |
MML |
|||||||||||||||||||||
| $ | 22,203,976 | $ | 16,121,391 | $ | 1,626,061 | $ | 195,539,750 | $ | 705,644,259 | $ | 358,712,256 | $ | 379,806,726 | ||||||||||||||
| 1,235,633,036 | 905,596,273 | 121,756,731 | — | — | — | — | |||||||||||||||||||||
| — | — | — | — | — | 3,329,992 | 3,113,926 | |||||||||||||||||||||
| 1,257,837,012 | 921,717,664 | 123,382,792 | 195,539,750 | 705,644,259 | 362,042,248 | 382,920,652 | |||||||||||||||||||||
| — | — | — | — | — | 34 | 40,503 | |||||||||||||||||||||
| — | — | — | — | — | — | 3,208 | |||||||||||||||||||||
| 642,498 | 341,367 | — | 6,756 | 125,021 | — | — | |||||||||||||||||||||
| 5,044 | 152,826 | 50,678 | 17,440 | 751 | 101,714 | 84,119 | |||||||||||||||||||||
| 26,317 | 15,551 | 1,794 | — | — | 81,016 | 1,275,951 | |||||||||||||||||||||
| — | — | — | — | — | — | 142,394 | |||||||||||||||||||||
| 1,258,510,871 | 922,227,408 | 123,435,264 | 195,563,946 | 705,770,031 | 362,225,012 | 384,466,827 | |||||||||||||||||||||
| 26,317 | 15,551 | 38,731 | — | — | 1,700,766 | — | |||||||||||||||||||||
| 633,920 | 484,417 | 12,406 | 22,029 | 118,217 | 111,577 | 208,412 | |||||||||||||||||||||
| 178,850 | 139,370 | 12,043 | 14,501 | 75,320 | 41,506 | 54,212 | |||||||||||||||||||||
| — | — | — | 42,786 | 152,476 | — | — | |||||||||||||||||||||
| 109,003 | 79,480 | 10,664 | 25,672 | 52,000 | 237,755 | 248,450 | |||||||||||||||||||||
| 663,590 | 364,775 | 44,097 | 126,509 | 444,969 | 76,238 | 49,230 | |||||||||||||||||||||
| 82,392 | 70,944 | 69,160 | 49,336 | 59,053 | 139,121 | 117,458 | |||||||||||||||||||||
| 1,694,072 | 1,154,537 | 187,101 | 280,833 | 902,035 | 2,306,963 | 677,762 | |||||||||||||||||||||
| $ | 1,256,816,799 | $ | 921,072,871 | $ | 123,248,163 | $ | 195,283,113 | $ | 704,867,996 | $ | 359,918,049 | $ | 383,789,065 | ||||||||||||||
| $ | 1,387,669,451 | $ | 983,561,276 | $ | 136,868,759 | $ | 178,480,388 | $ | 679,192,195 | $ | 336,356,389 | $ | 276,292,136 | ||||||||||||||
| (130,852,652 | ) | (62,488,405 | ) | (13,620,596 | ) | 16,802,725 | 25,675,801 | 23,561,660 | 107,496,929 | ||||||||||||||||||
| $ | 1,256,816,799 | $ | 921,072,871 | $ | 123,248,163 | $ | 195,283,113 | $ | 704,867,996 | $ | 359,918,049 | $ | 383,789,065 | ||||||||||||||
| $ | 24,777,654 | $ | 18,425,716 | $ | 1,827,494 | $ | 215,888,742 | $ | 765,035,663 | $ | 328,937,964 | $ | 307,455,224 | ||||||||||||||
| $ | 1,474,298,772 | $ | 1,086,393,232 | $ | 147,085,699 | $ | — | $ | — | $ | — | $ | — | ||||||||||||||
| $ | — | $ | — | $ | — | $ | — | $ | — | $ | 3,329,992 | $ | 3,113,926 | ||||||||||||||
| $ | — | $ | — | $ | — | $ | — | $ | — | $ | 180,487 | $ | — | ||||||||||||||
| $ | — | $ | — | $ | — | $ | — | $ | — | $ | — | $ | 3,207 |
The accompanying notes are an integral part of the financial statements.
177
MML Series Investment Fund – Financial Statements (Continued) |
Statements of Assets and Liabilities |
MML |
MML |
|||||||
Initial Class shares: |
||||||||
Net assets |
$ | 67,319,837 | $ | 80,987,483 | ||||
Shares outstanding (a) |
8,359,803 | 9,800,266 | ||||||
Net asset value, and redemption price per share |
$ | 8.05 | $ | 8.26 | ||||
Service Class shares: |
||||||||
Net assets |
$ | 232,826,559 | $ | 267,476,257 | ||||
Shares outstanding (a) |
29,285,125 | 32,726,634 | ||||||
Net asset value, offering price and redemption price per share |
$ | 7.95 | $ | 8.17 | ||||
Service Class I shares: |
||||||||
Net assets |
$ | — | $ | — | ||||
Shares outstanding (a) |
— | — | ||||||
Net asset value, offering price and redemption price per share |
$ | — | $ | — | ||||
|
(a) |
Authorized unlimited number of shares with no par value. |
The accompanying notes are an integral part of the financial statements.
178
MML |
MML |
MML |
MML |
MML |
MML |
MML |
|||||||||||||||||||||
| $ | 212,502,311 | $ | 337,614,833 | $ | 54,728,901 | $ | — | $ | — | $ | 243,725,737 | $ | 305,369,852 | ||||||||||||||
| 24,743,165 | 45,765,315 | 6,622,355 | — | — | 22,768,987 | 30,236,943 | |||||||||||||||||||||
| $ | 8.59 | $ | 7.38 | $ | 8.26 | $ | — | $ | — | $ | 10.70 | $ | 10.10 | ||||||||||||||
| $ | 1,044,314,488 | $ | 583,458,038 | $ | 68,519,262 | $ | — | $ | — | $ | 116,192,312 | $ | 78,419,213 | ||||||||||||||
| 123,317,424 | 79,961,488 | 8,474,983 | — | — | 11,780,619 | 7,904,429 | |||||||||||||||||||||
| $ | 8.47 | $ | 7.30 | $ | 8.08 | $ | — | $ | — | $ | 9.86 | $ | 9.92 | ||||||||||||||
| $ | — | $ | — | $ | — | $ | 195,283,113 | $ | 704,867,996 | $ | — | $ | — | ||||||||||||||
| — | — | — | 16,070,995 | 67,918,903 | — | — | |||||||||||||||||||||
| $ | — | $ | — | $ | — | $ | 12.15 | $ | 10.38 | $ | — | $ | — | ||||||||||||||
The accompanying notes are an integral part of the financial statements.
179
MML Series Investment Fund – Financial Statements (Continued) |
Statements of Assets and Liabilities |
MML |
MML |
|||||||
Assets: |
||||||||
Investments, at value (Note 2) (a) |
$ | 544,410,320 | $ | 304,071,941 | ||||
Repurchase agreements, at value (Note 2) (b) |
4,469,396 | 6,841,559 | ||||||
Total investments (c) |
548,879,716 | 310,913,500 | ||||||
Cash |
100,675 | 245 | ||||||
Foreign currency, at value (d) |
— | — | ||||||
Receivables from: |
||||||||
Investments sold |
||||||||
Regular delivery |
— | — | ||||||
Fund shares sold |
219,392 | 5,275 | ||||||
Interest and dividends |
477,951 | 390,161 | ||||||
Foreign tax reclaims |
— | — | ||||||
Total assets |
549,677,734 | 311,309,181 | ||||||
Liabilities: |
||||||||
Payables for: |
||||||||
Investments purchased |
||||||||
Regular delivery |
— | — | ||||||
Fund shares repurchased |
70,476 | 112,285 | ||||||
Cash collateral held for securities on loan (Note 2) |
— | — | ||||||
Trustees’ fees and expenses (Note 3) |
73,403 | 14,041 | ||||||
Variation margin on open derivative instruments (Note 2) |
16,096 | — | ||||||
Affiliates (Note 3): |
||||||||
Administration fees |
46,680 | 39,941 | ||||||
Investment advisory fees |
46,641 | 180,995 | ||||||
Service fees |
22,885 | 13,703 | ||||||
Due to custodian |
— | — | ||||||
Accrued expense and other liabilities |
141,530 | 103,230 | ||||||
Total liabilities |
417,711 | 464,195 | ||||||
Net assets |
$ | 549,260,023 | $ | 310,844,986 | ||||
Net assets consist of: |
||||||||
Paid-in capital |
$ | 274,434,283 | $ | 248,701,874 | ||||
Accumulated earnings (loss) |
274,825,740 | 62,143,112 | ||||||
Net assets |
$ | 549,260,023 | $ | 310,844,986 | ||||
(a) |
Cost of investments: |
$ | 330,921,111 | $ | 270,304,621 | |||||||
(b) |
Cost of repurchase agreements: |
$ | 4,469,396 | $ | 6,841,559 | |||||||
(c) |
Securities on loan with market value of: |
$ | — | $ | — | |||||||
(d) |
Cost of foreign currency: |
$ | — | $ | — | |||||||
The accompanying notes are an integral part of the financial statements.
180
MML |
MML |
MML |
MML |
MML |
MML |
MML |
|||||||||||||||||||||
| $ | 183,343,448 | $ | 167,891,691 | $ | 163,808,811 | $ | 140,190,227 | $ | 215,635,208 | $ | 209,024,280 | $ | 149,585,069 | ||||||||||||||
| 2,062,706 | 1,284,747 | 3,618,144 | 570,957 | 1,489,257 | 3,482,055 | 866,700 | |||||||||||||||||||||
| 185,406,154 | 169,176,438 | 167,426,955 | 140,761,184 | 217,124,465 | 212,506,335 | 150,451,769 | |||||||||||||||||||||
| 113 | 11,478 | 7,894 | 44 | 65 | — | 24 | |||||||||||||||||||||
| 9,241 | 285 | 58,341 | — | — | 98,134 | — | |||||||||||||||||||||
| 781 | — | 128,333 | — | — | 120,048 | 426,904 | |||||||||||||||||||||
| 1,398 | 2,249 | 2,862 | 20,489 | 7,804 | 3,893 | 11,569 | |||||||||||||||||||||
| 75,002 | 94,711 | 85,956 | 97,466 | 512,224 | 34,831 | 23,126 | |||||||||||||||||||||
| 1,076,220 | 5,484 | 37,358 | 771,443 | — | 942,456 | 184,166 | |||||||||||||||||||||
| 186,568,909 | 169,290,645 | 167,747,699 | 141,650,626 | 217,644,558 | 213,705,697 | 151,097,558 | |||||||||||||||||||||
| 85,746 | — | — | — | — | 313,254 | 605,797 | |||||||||||||||||||||
| 86,276 | 54,198 | 62,170 | 52,804 | 52,588 | 81,987 | 88,371 | |||||||||||||||||||||
| 1,268,198 | 1,772,758 | 38,835 | 2,871,499 | — | — | — | |||||||||||||||||||||
| 37,673 | 15,434 | 19,530 | 22,304 | 25,768 | 13,045 | 16,403 | |||||||||||||||||||||
| — | — | — | — | — | — | — | |||||||||||||||||||||
| — | 21,950 | 21,598 | 17,970 | — | 27,352 | — | |||||||||||||||||||||
| 136,208 | 87,796 | 86,394 | 71,878 | 120,668 | 142,391 | 85,814 | |||||||||||||||||||||
| 4,549 | 12,369 | 13,491 | 11,472 | 17,529 | 4,664 | 11,431 | |||||||||||||||||||||
| — | — | — | — | — | 207 | — | |||||||||||||||||||||
| 142,634 | 113,510 | 92,176 | 140,782 | 96,815 | 210,035 | 103,510 | |||||||||||||||||||||
| 1,761,284 | 2,078,015 | 334,194 | 3,188,709 | 313,368 | 792,935 | 911,326 | |||||||||||||||||||||
| $ | 184,807,625 | $ | 167,212,630 | $ | 167,413,505 | $ | 138,461,917 | $ | 217,331,190 | $ | 212,912,762 | $ | 150,186,232 | ||||||||||||||
| $ | 192,062,550 | $ | 165,057,113 | $ | 128,243,169 | $ | 116,207,461 | $ | 154,684,185 | $ | 245,129,808 | $ | 143,051,473 | ||||||||||||||
| (7,254,925 | ) | 2,155,517 | 39,170,336 | 22,254,456 | 62,647,005 | (32,217,046 | ) | 7,134,759 | |||||||||||||||||||
| $ | 184,807,625 | $ | 167,212,630 | $ | 167,413,505 | $ | 138,461,917 | $ | 217,331,190 | $ | 212,912,762 | $ | 150,186,232 | ||||||||||||||
| $ | 190,216,406 | $ | 165,711,072 | $ | 135,331,803 | $ | 125,763,030 | $ | 177,148,319 | $ | 234,346,146 | $ | 154,463,908 | ||||||||||||||
| $ | 2,062,706 | $ | 1,284,747 | $ | 3,618,144 | $ | 570,957 | $ | 1,489,257 | $ | 3,482,055 | $ | 866,700 | ||||||||||||||
| $ | 6,286,056 | $ | 1,728,655 | $ | 3,929,694 | $ | 2,808,985 | $ | — | $ | 1,139,360 | $ | — | ||||||||||||||
| $ | 9,224 | $ | 304 | $ | 57,809 | $ | — | $ | — | $ | 98,128 | $ | — |
The accompanying notes are an integral part of the financial statements.
181
MML Series Investment Fund – Financial Statements (Continued) |
Statements of Assets and Liabilities |
MML |
MML |
|||||||
Initial Class shares: |
||||||||
Net assets |
$ | — | $ | — | ||||
Shares outstanding (a) |
— | — | ||||||
Net asset value, and redemption price per share |
$ | — | $ | — | ||||
Class I shares: |
||||||||
Net assets |
$ | 47,937,903 | $ | — | ||||
Shares outstanding (a) |
1,793,161 | — | ||||||
Net asset value, offering price and redemption price per share |
$ | 26.73 | $ | — | ||||
Class II shares: |
||||||||
Net assets |
$ | 191,941,260 | $ | 288,336,121 | ||||
Shares outstanding (a) |
7,191,845 | 39,852,470 | ||||||
Net asset value, offering price and redemption price per share |
$ | 26.69 | $ | 7.24 | ||||
Class III shares: |
||||||||
Net assets |
$ | 274,717,042 | $ | — | ||||
Shares outstanding (a) |
10,316,561 | — | ||||||
Net asset value, offering price and redemption price per share |
$ | 26.63 | $ | — | ||||
Service Class shares: |
||||||||
Net assets |
$ | — | $ | — | ||||
Shares outstanding (a) |
— | — | ||||||
Net asset value, offering price and redemption price per share |
$ | — | $ | — | ||||
Service Class I shares: |
||||||||
Net assets |
$ | 34,663,818 | $ | 22,508,865 | ||||
Shares outstanding (a) |
1,367,306 | 3,256,098 | ||||||
Net asset value, offering price and redemption price per share |
$ | 25.35 | $ | 6.91 | ||||
|
(a) |
Authorized unlimited number of shares with no par value. |
The accompanying notes are an integral part of the financial statements.
182
MML |
MML |
MML |
MML |
MML |
MML |
MML |
|||||||||||||||||||||
| $ | 175,988,401 | $ | — | $ | — | $ | — | $ | 188,904,023 | $ | — | $ | 132,218,427 | ||||||||||||||
| 21,165,001 | — | — | — | 17,457,019 | — | 13,476,906 | |||||||||||||||||||||
| $ | 8.32 | $ | — | $ | — | $ | — | $ | 10.82 | $ | — | $ | 9.81 | ||||||||||||||
| $ | — | $ | — | $ | — | $ | 103,424,054 | $ | — | $ | — | $ | — | ||||||||||||||
| — | — | — | 25,850,118 | — | — | — | |||||||||||||||||||||
| $ | — | $ | — | $ | — | $ | 4.00 | $ | — | $ | — | $ | — | ||||||||||||||
| $ | — | $ | 147,521,788 | $ | 145,398,065 | $ | 15,306,826 | $ | — | $ | 204,861,450 | $ | — | ||||||||||||||
| — | 17,645,215 | 12,699,395 | 3,546,927 | — | 23,345,732 | — | |||||||||||||||||||||
| $ | — | $ | 8.36 | $ | 11.45 | $ | 4.32 | $ | — | $ | 8.78 | $ | — | ||||||||||||||
| $ | — | $ | — | $ | — | $ | — | $ | — | $ | — | $ | — | ||||||||||||||
| — | — | — | — | — | — | — | |||||||||||||||||||||
| $ | — | $ | — | $ | — | $ | — | $ | — | $ | — | $ | — | ||||||||||||||
| $ | 8,819,224 | $ | — | $ | — | $ | — | $ | 28,427,167 | $ | — | $ | 17,967,805 | ||||||||||||||
| 1,066,920 | — | — | — | 2,678,446 | — | 1,937,924 | |||||||||||||||||||||
| $ | 8.27 | $ | — | $ | — | $ | — | $ | 10.61 | $ | — | $ | 9.27 | ||||||||||||||
| $ | — | $ | 19,690,842 | $ | 22,015,440 | $ | 19,731,037 | $ | — | $ | 8,051,312 | $ | — | ||||||||||||||
| — | 2,481,933 | 1,984,212 | 5,206,517 | — | 927,322 | — | |||||||||||||||||||||
| $ | — | $ | 7.93 | $ | 11.10 | $ | 3.79 | $ | — | $ | 8.68 | $ | — | ||||||||||||||
The accompanying notes are an integral part of the financial statements.
183
MML Series Investment Fund – Financial Statements (Continued) |
Statements of Assets and Liabilities |
MML |
MML |
|||||||
Assets: |
||||||||
Investments, at value (Note 2) (a) |
$ | 101,991,242 | $ | 301,610,515 | ||||
Repurchase agreements, at value (Note 2) (b) |
2,717,809 | 9,174,518 | ||||||
Total investments (c) |
104,709,051 | 310,785,033 | ||||||
Cash |
— | 355 | ||||||
Foreign currency, at value (d) |
28,092 | — | ||||||
Receivables from: |
||||||||
Investments sold |
||||||||
Regular delivery |
— | 395,637 | ||||||
Delayed delivery |
— | — | ||||||
Cash collateral pledged for open derivatives (Note 2) |
— | — | ||||||
Open forward contracts (Note 2) |
— | — | ||||||
Fund shares sold |
1,787 | 5,509 | ||||||
Interest and dividends |
87,595 | 88,817 | ||||||
Foreign tax reclaims |
— | 1,781 | ||||||
Premiums for options written |
525,045 | — | ||||||
Total assets |
105,351,570 | 311,277,132 | ||||||
Liabilities: |
||||||||
Payables for: |
||||||||
Investments purchased |
||||||||
Regular delivery |
— | — | ||||||
Delayed delivery |
— | — | ||||||
Written options outstanding, at value (Note 2) (e) |
1,740,745 | — | ||||||
Open forward contracts (Note 2) |
— | — | ||||||
Fund shares repurchased |
48,322 | 100,311 | ||||||
Cash collateral held for securities on loan (Note 2) |
— | 429,146 | ||||||
Trustees’ fees and expenses (Note 3) |
27,529 | 45,483 | ||||||
Variation margin on open derivative instruments (Note 2) |
— | — | ||||||
Affiliates (Note 3): |
||||||||
Administration fees |
— | — | ||||||
Investment advisory fees |
66,471 | 208,514 | ||||||
Service fees |
12,486 | 51,670 | ||||||
Due to custodian |
524,503 | — | ||||||
Accrued expense and other liabilities |
343,290 | 127,370 | ||||||
Total liabilities |
2,763,346 | 962,494 | ||||||
Net assets |
$ | 102,588,224 | $ | 310,314,638 | ||||
Net assets consist of: |
||||||||
Paid-in capital |
$ | 54,103,932 | $ | 283,468,576 | ||||
Accumulated earnings (loss) |
48,484,292 | 26,846,062 | ||||||
Net assets |
$ | 102,588,224 | $ | 310,314,638 | ||||
(a) |
Cost of investments: |
$ | 70,336,064 | $ | 269,019,271 | |||||||
(b) |
Cost of repurchase agreements: |
$ | 2,717,809 | $ | 9,174,518 | |||||||
(c) |
Securities on loan with market value of: |
$ | — | $ | 3,433,932 | |||||||
(d) |
Cost of foreign currency: |
$ | 28,943 | $ | — | |||||||
(e) |
Premiums on written options: |
$ | 3,057,465 | $ | — | |||||||
The accompanying notes are an integral part of the financial statements.
184
MML |
MML Small |
MML Small |
MML |
MML |
MML |
||||||||||||||||||
| $ | 293,444,929 | $ | 139,353,645 | $ | 75,545,684 | $ | 132,250,275 | $ | 130,319,234 | $ | 368,508,026 | ||||||||||||
| 2,953,179 | 1,258,740 | 499,850 | 898,102 | 214,419 | 31,835,830 | ||||||||||||||||||
| 296,398,108 | 140,612,385 | 76,045,534 | 133,148,377 | 130,533,653 | 400,343,856 | ||||||||||||||||||
| 163 | 33 | 21 | 15 | 8 | 2,282 | ||||||||||||||||||
| 306 | 10 | 38 | — | 75 | 4 | ||||||||||||||||||
| 1,178,850 | 86,581 | 192,889 | 47,668 | 157,599 | 553,543 | ||||||||||||||||||
| — | — | — | — | — | 3,723,888 | ||||||||||||||||||
| — | — | — | — | — | 2,423,847 | ||||||||||||||||||
| 17,324 | — | 2,052 | — | 672 | — | ||||||||||||||||||
| 10,704 | 2,694 | 5,802 | 909 | 338 | 13,468 | ||||||||||||||||||
| 682,617 | 127,153 | 89,991 | 147,738 | 103,130 | 1,695,196 | ||||||||||||||||||
| 25,401 | — | — | — | 3,669 | 967 | ||||||||||||||||||
| — | — | — | — | — | — | ||||||||||||||||||
| 298,313,473 | 140,828,856 | 76,336,327 | 133,344,707 | 130,799,144 | 408,757,051 | ||||||||||||||||||
| 27,954 | 86,803 | 333,670 | 38,834 | — | 2,868,278 | ||||||||||||||||||
| — | — | — | — | — | 82,598,346 | ||||||||||||||||||
| — | — | — | — | — | — | ||||||||||||||||||
| 125,877 | — | 17 | — | 4,754 | 50,207 | ||||||||||||||||||
| 119,509 | 41,683 | 41,443 | 52,795 | 65,916 | 125,539 | ||||||||||||||||||
| — | 1,157,685 | 115,944 | — | — | 27,895,588 | ||||||||||||||||||
| 48,929 | 28,987 | 10,062 | 23,753 | 18,476 | 34,041 | ||||||||||||||||||
| — | — | — | — | — | 42,222 | ||||||||||||||||||
| — | — | 9,845 | — | — | 37,720 | ||||||||||||||||||
| 215,366 | 126,357 | 52,508 | 85,986 | 56,882 | 100,589 | ||||||||||||||||||
| 31,399 | 14,773 | 15,691 | 14,767 | 29,649 | 23,821 | ||||||||||||||||||
| — | — | — | — | — | — | ||||||||||||||||||
| 135,201 | 107,840 | 85,217 | 96,352 | 85,382 | 235,303 | ||||||||||||||||||
| 704,235 | 1,564,128 | 664,397 | 312,487 | 261,059 | 114,011,654 | ||||||||||||||||||
| $ | 297,609,238 | $ | 139,264,728 | $ | 75,671,930 | $ | 133,032,220 | $ | 130,538,085 | $ | 294,745,397 | ||||||||||||
| $ | 250,044,482 | $ | 152,847,580 | $ | 87,389,881 | $ | 117,835,458 | $ | 73,344,514 | $ | 348,840,859 | ||||||||||||
| 47,564,756 | (13,582,852 | ) | (11,717,951 | ) | 15,196,762 | 57,193,571 | (54,095,462 | ) | |||||||||||||||
| $ | 297,609,238 | $ | 139,264,728 | $ | 75,671,930 | $ | 133,032,220 | $ | 130,538,085 | $ | 294,745,397 | ||||||||||||
| $ | 292,730,943 | $ | 138,472,435 | $ | 87,479,186 | $ | 134,142,770 | $ | 115,513,427 | $ | 395,111,606 | ||||||||||||
| $ | 2,953,179 | $ | 1,258,740 | $ | 499,850 | $ | 898,102 | $ | 214,419 | $ | 31,835,830 | ||||||||||||
| $ | 1,085,418 | $ | 4,464,346 | $ | 2,731,691 | $ | — | $ | — | $ | 27,909,940 | ||||||||||||
| $ | 306 | $ | 11 | $ | 38 | $ | — | $ | 75 | $ | (2 | ) | |||||||||||
| $ | — | $ | — | $ | — | $ | — | $ | — | $ | — |
The accompanying notes are an integral part of the financial statements.
185
MML Series Investment Fund – Financial Statements (Continued) |
Statements of Assets and Liabilities |
MML |
MML |
|||||||
Initial Class shares: |
||||||||
Net assets |
$ | 83,308,349 | $ | 229,302,680 | ||||
Shares outstanding (a) |
6,251,137 | 26,091,378 | ||||||
Net asset value, and redemption price per share |
$ | 13.33 | $ | 8.79 | ||||
Class II shares: |
||||||||
Net assets |
$ | — | $ | — | ||||
Shares outstanding (a) |
— | — | ||||||
Net asset value, offering price and redemption price per share |
$ | — | $ | — | ||||
Service Class shares: |
||||||||
Net assets |
$ | 19,279,875 | $ | 81,011,958 | ||||
Shares outstanding (a) |
1,457,991 | 10,285,123 | ||||||
Net asset value, offering price and redemption price per share |
$ | 13.22 | $ | 7.88 | ||||
Service Class I shares: |
||||||||
Net assets |
$ | — | $ | — | ||||
Shares outstanding (a) |
— | — | ||||||
Net asset value, offering price and redemption price per share |
$ | — | $ | — | ||||
|
(a) |
Authorized unlimited number of shares with no par value. |
The accompanying notes are an integral part of the financial statements.
186
MML |
MML Small |
MML Small |
MML |
MML |
MML |
||||||||||||||||||
| $ | 247,315,650 | $ | 116,614,712 | $ | — | $ | 109,597,822 | $ | 83,958,326 | $ | — | ||||||||||||
| 26,974,101 | 13,845,092 | — | 12,345,957 | 4,866,572 | — | ||||||||||||||||||
| $ | 9.17 | $ | 8.42 | $ | — | $ | 8.88 | $ | 17.25 | $ | — | ||||||||||||
| $ | — | $ | — | $ | 51,032,336 | $ | — | $ | — | $ | 256,759,965 | ||||||||||||
| — | — | 6,871,750 | — | — | 29,246,482 | ||||||||||||||||||
| $ | — | $ | — | $ | 7.43 | $ | — | $ | — | $ | 8.78 | ||||||||||||
| $ | 50,293,588 | $ | 22,650,016 | $ | — | $ | 23,434,398 | $ | 46,579,759 | $ | — | ||||||||||||
| 5,645,744 | 3,133,678 | — | 2,690,411 | 2,734,807 | — | ||||||||||||||||||
| $ | 8.91 | $ | 7.23 | $ | — | $ | 8.71 | $ | 17.03 | $ | — | ||||||||||||
| $ | — | $ | — | $ | 24,639,594 | $ | — | $ | — | $ | 37,985,432 | ||||||||||||
| — | — | 3,632,380 | — | — | 4,387,397 | ||||||||||||||||||
| $ | — | $ | — | $ | 6.78 | $ | — | $ | — | $ | 8.66 | ||||||||||||
The accompanying notes are an integral part of the financial statements.
187
MML Series Investment Fund – Financial Statements (Continued) |
|
Statements of Operations |
MML |
MML |
|||||||
Investment income (Note 2): |
||||||||
Dividends - unaffiliated issuers (a) |
$ | 11,253 | $ | 12,119 | ||||
Dividends - affiliated issuers (Note 7) |
6,893,359 | 7,440,149 | ||||||
Interest |
— | — | ||||||
Securities lending net income |
— | — | ||||||
Total investment income |
6,904,612 | 7,452,268 | ||||||
Expenses (Note 3): |
||||||||
Investment advisory fees |
337,205 | 392,568 | ||||||
Custody fees |
13,715 | 13,707 | ||||||
Audit and tax fees |
37,421 | 37,583 | ||||||
Legal fees |
11,467 | 13,436 | ||||||
Proxy fees |
1,340 | 1,340 | ||||||
Shareholder reporting fees |
25,163 | 43,393 | ||||||
Trustees’ fees |
17,788 | 20,717 | ||||||
| 444,099 | 522,744 | |||||||
Administration fees: |
||||||||
Service Class I |
— | — | ||||||
Distribution and Service fees: |
||||||||
Service Class |
657,444 | 756,171 | ||||||
Service Class I |
— | — | ||||||
Total expenses |
1,101,543 | 1,278,915 | ||||||
Expenses waived (Note 3): |
||||||||
Service Class I fees reimbursed by adviser |
— | — | ||||||
Advisory fees waived |
— | — | ||||||
Net expenses: |
1,101,543 | 1,278,915 | ||||||
Net investment income (loss) |
5,803,069 | 6,173,353 | ||||||
Realized and unrealized gain (loss): |
||||||||
Net realized gain (loss) on: |
||||||||
Investment transactions - unaffiliated issuers |
(448,797 | ) | (118,441 | ) | ||||
Investment transactions - affiliated issuers (Note 7) |
(3,983,841 | ) | (5,255,295 | ) | ||||
Foreign currency transactions |
— | — | ||||||
Realized gain distributions - unaffiliated issuers |
— | — | ||||||
Realized gain distributions - affiliated issuers (Note 7) |
27,249,277 | 36,090,157 | ||||||
Net realized gain (loss) |
22,816,639 | 30,716,421 | ||||||
Net change in unrealized appreciation (depreciation) on: |
||||||||
Investment transactions - unaffiliated issuers |
(936,187 | ) | (1,190,157 | ) | ||||
Investment transactions - affiliated issuers (Note 7) |
(85,630,119 | ) | (103,814,985 | ) | ||||
Translation of assets and liabilities in foreign currencies |
— | — | ||||||
Net change in unrealized appreciation (depreciation) |
(86,566,306 | ) | (105,005,142 | ) | ||||
Net realized gain (loss) and change in unrealized appreciation (depreciation) |
(63,749,667 | ) | (74,288,721 | ) | ||||
Net increase (decrease) in net assets resulting from operations |
$ | (57,946,598 | ) | $ | (68,115,368 | ) | ||
(a) |
Net of foreign withholding tax of: |
$ | — | $ | — | |||||||
The accompanying notes are an integral part of the financial statements.
188
MML |
MML |
MML |
MML |
MML |
MML |
MML |
|||||||||||||||||||||
| $ | 38,089 | $ | 22,507 | $ | 2,597 | $ | 1,314,418 | $ | 17,402,002 | $ | 2,190,499 | $ | 11,036,529 | ||||||||||||||
| 24,816,986 | 14,764,548 | 1,661,264 | — | — | — | — | |||||||||||||||||||||
| — | — | — | — | — | 75,746 | 9,946 | |||||||||||||||||||||
| — | — | — | — | — | 21,794 | 18,430 | |||||||||||||||||||||
| 24,855,075 | 14,787,055 | 1,663,861 | 1,314,418 | 17,402,002 | 2,288,039 | 11,064,905 | |||||||||||||||||||||
| 1,425,784 | 1,006,629 | 138,813 | 338,928 | 1,544,948 | 3,355,543 | 3,097,271 | |||||||||||||||||||||
| 13,678 | 13,741 | 13,706 | 3,426 | 5,127 | 50,844 | 41,924 | |||||||||||||||||||||
| 40,632 | 39,336 | 36,859 | 37,047 | 38,591 | 44,352 | 43,373 | |||||||||||||||||||||
| 48,637 | 34,261 | 4,770 | 7,392 | 33,300 | 14,912 | 12,920 | |||||||||||||||||||||
| 1,340 | 1,340 | 1,340 | 1,340 | 1,340 | 1,340 | 1,340 | |||||||||||||||||||||
| 50,961 | 32,179 | 23,080 | 27,215 | 25,874 | 48,751 | 48,649 | |||||||||||||||||||||
| 75,698 | 52,753 | 7,279 | 11,750 | 40,642 | 23,951 | 21,296 | |||||||||||||||||||||
| 1,656,730 | 1,180,239 | 225,847 | 427,098 | 1,689,822 | 3,539,693 | 3,266,773 | |||||||||||||||||||||
| — | — | — | 564,881 | 1,944,552 | — | — | |||||||||||||||||||||
| 2,974,013 | 1,590,244 | 197,472 | — | — | 361,228 | 206,435 | |||||||||||||||||||||
| — | — | — | 564,881 | 1,944,552 | — | — | |||||||||||||||||||||
| 4,630,743 | 2,770,483 | 423,319 | 1,556,860 | 5,578,926 | 3,900,921 | 3,473,208 | |||||||||||||||||||||
| — | — | — | — | (805,249 | ) | — | — | ||||||||||||||||||||
| — | — | — | — | — | — | (123,891 | ) | ||||||||||||||||||||
| 4,630,743 | 2,770,483 | 423,319 | 1,556,860 | 4,773,677 | 3,900,921 | 3,349,317 | |||||||||||||||||||||
| 20,224,332 | 12,016,572 | 1,240,542 | (242,442 | ) | 12,628,325 | (1,612,882 | ) | 7,715,588 | |||||||||||||||||||
| (799,837 | ) | (156,590 | ) | 307,492 | 5,490,626 | (1,460,711 | ) | (5,650,629 | ) | 28,283,120 | |||||||||||||||||
| (21,541,061 | ) | (10,882,387 | ) | (5,121,311 | ) | — | — | — | — | ||||||||||||||||||
| — | — | — | — | — | (17 | ) | (14,733 | ) | |||||||||||||||||||
| — | — | — | 32,021,494 | 85,294,546 | — | — | |||||||||||||||||||||
| 156,274,690 | 139,169,585 | 20,675,007 | — | — | — | — | |||||||||||||||||||||
| 133,933,792 | 128,130,608 | 15,861,188 | 37,512,120 | 83,833,835 | (5,650,646 | ) | 28,268,387 | ||||||||||||||||||||
| (1,235,419 | ) | (1,508,689 | ) | (1,032,607 | ) | (124,668,569 | ) | (221,250,683 | ) | (239,808,771 | ) | (51,554,014 | ) | ||||||||||||||
| (407,487,762 | ) | (320,634,453 | ) | (42,583,434 | ) | — | — | — | — | ||||||||||||||||||
| — | — | — | — | — | — | 1,718 | |||||||||||||||||||||
| (408,723,181 | ) | (322,143,142 | ) | (43,616,041 | ) | (124,668,569 | ) | (221,250,683 | ) | (239,808,771 | ) | (51,552,296 | ) | ||||||||||||||
| (274,789,389 | ) | (194,012,534 | ) | (27,754,853 | ) | (87,156,449 | ) | (137,416,848 | ) | (245,459,417 | ) | (23,283,909 | ) | ||||||||||||||
| $ | (254,565,057 | ) | $ | (181,995,962 | ) | $ | (26,514,311 | ) | $ | (87,398,891 | ) | $ | (124,788,523 | ) | $ | (247,072,299 | ) | $ | (15,568,321 | ) | |||||||
| $ | — | $ | — | $ | — | $ | — | $ | — | $ | 14,935 | $ | 316,416 |
The accompanying notes are an integral part of the financial statements.
189
MML Series Investment Fund – Financial Statements (Continued) |
Statements of Operations |
MML |
MML |
|||||||
Investment income (Note 2): |
||||||||
Dividends (a) |
$ | 10,272,777 | $ | 5,562,891 | ||||
Interest |
25,569 | 21,628 | ||||||
Securities lending net income |
540 | — | ||||||
Total investment income |
10,298,886 | 5,584,519 | ||||||
Expenses (Note 3): |
||||||||
Investment advisory fees |
614,313 | 2,206,142 | ||||||
Custody fees |
48,530 | 24,975 | ||||||
Audit and tax fees |
44,763 | 43,101 | ||||||
Legal fees |
20,536 | 10,642 | ||||||
Proxy fees |
1,340 | 1,340 | ||||||
Shareholder reporting fees |
56,755 | 25,137 | ||||||
Trustees’ fees |
33,443 | 16,471 | ||||||
| 819,680 | 2,327,808 | |||||||
Administration fees: |
||||||||
Class I |
160,907 | — | ||||||
Class II |
366,573 | 456,834 | ||||||
Service Class I |
125,309 | 32,201 | ||||||
Distribution and Service fees: |
||||||||
Service Class |
— | — | ||||||
Service Class I |
104,424 | 53,669 | ||||||
Total expenses |
1,576,893 | 2,870,512 | ||||||
Expenses waived (Note 3): |
||||||||
Advisory fees waived |
— | — | ||||||
Net expenses: |
1,576,893 | 2,870,512 | ||||||
Net investment income (loss) |
8,721,993 | 2,714,007 | ||||||
Realized and unrealized gain (loss): |
||||||||
Net realized gain (loss) on: |
||||||||
Investment transactions |
58,157,289 | 26,460,015 | ||||||
Futures contracts |
(779,738 | ) | — | |||||
Foreign currency transactions |
— | 4,541 | ||||||
Forward contracts |
— | — | ||||||
Net realized gain (loss) |
57,377,551 | 26,464,556 | ||||||
Net change in unrealized appreciation (depreciation) on: |
||||||||
Investment transactions |
(207,317,547 | ) | (47,671,903 | ) | ||||
Futures contracts |
(255,686 | ) | — | |||||
Translation of assets and liabilities in foreign currencies |
— | — | ||||||
Forward contracts |
— | — | ||||||
Net change in unrealized appreciation (depreciation) |
(207,573,233 | ) | (47,671,903 | ) | ||||
Net realized gain (loss) and change in unrealized appreciation (depreciation) |
(150,195,682 | ) | (21,207,347 | ) | ||||
Net increase (decrease) in net assets resulting from operations |
$ | (141,473,689 | ) | $ | (18,493,340 | ) | ||
(a) |
Net of foreign withholding tax of: |
$ | 2,452 | $ | — | |||||||
* |
Net of net increase (decrease) in accrued foreign capital gains tax of: |
$ | — | $ | — | |||||||
The accompanying notes are an integral part of the financial statements.
190
MML |
MML |
MML |
MML |
MML |
MML |
MML |
|||||||||||||||||||||
| $ | 6,518,990 | $ | 3,058,085 | $ | 3,548,326 | $ | 2,443,027 | $ | 5,282,297 | $ | 5,134,951 | $ | 1,056,246 | ||||||||||||||
| 8,993 | 6,293 | 14,474 | 3,892 | 9,361 | 10,526 | 3,891 | |||||||||||||||||||||
| 35,621 | 2,914 | 7,130 | 5,687 | 2,644 | 25,417 | — | |||||||||||||||||||||
| 6,563,604 | 3,067,292 | 3,569,930 | 2,452,606 | 5,294,302 | 5,170,894 | 1,060,137 | |||||||||||||||||||||
| 1,696,528 | 1,178,637 | 1,066,646 | 894,994 | 1,503,211 | 1,747,848 | 1,133,234 | |||||||||||||||||||||
| 79,883 | 32,611 | 35,089 | 67,496 | 30,756 | 156,974 | 37,209 | |||||||||||||||||||||
| 47,857 | 42,809 | 42,742 | 47,833 | 43,597 | 61,773 | 42,742 | |||||||||||||||||||||
| 6,319 | 6,513 | 5,746 | 4,403 | 7,165 | 7,257 | 15,430 | |||||||||||||||||||||
| 1,340 | 1,340 | 1,340 | 1,340 | 1,340 | 1,340 | 1,340 | |||||||||||||||||||||
| 27,078 | 31,931 | 33,176 | 12,090 | 21,648 | 49,370 | 24,451 | |||||||||||||||||||||
| 10,534 | 10,109 | 9,161 | 9,574 | 11,996 | 10,940 | 8,851 | |||||||||||||||||||||
| 1,869,539 | 1,303,950 | 1,193,900 | 1,037,730 | 1,619,713 | 2,035,502 | 1,263,257 | |||||||||||||||||||||
| — | — | — | 173,714 | — | — | — | |||||||||||||||||||||
| — | 262,538 | 233,871 | 24,584 | — | 316,638 | — | |||||||||||||||||||||
| — | 32,121 | 32,790 | 25,451 | — | 11,141 | — | |||||||||||||||||||||
| 17,476 | — | — | — | 73,178 | — | 50,718 | |||||||||||||||||||||
| — | 53,535 | 54,651 | 42,419 | — | 18,569 | — | |||||||||||||||||||||
| 1,887,015 | 1,652,144 | 1,515,212 | 1,303,898 | 1,692,891 | 2,381,850 | 1,313,975 | |||||||||||||||||||||
| (27,226 | ) | — | (35,555 | ) | — | — | (218,520 | ) | — | ||||||||||||||||||
| 1,859,789 | 1,652,144 | 1,479,657 | 1,303,898 | 1,692,891 | 2,163,330 | 1,313,975 | |||||||||||||||||||||
| 4,703,815 | 1,415,148 | 2,090,273 | 1,148,708 | 3,601,411 | 3,007,564 | (253,838 | ) | ||||||||||||||||||||
| (2,127,971 | ) | (1,403,621 | ) | 10,056,920 | 7,488,922 | 21,918,879 | (3,706,272 | ) | 13,353,466 | ||||||||||||||||||
| — | — | — | — | — | — | — | |||||||||||||||||||||
| 25,921 | 612 | (830 | ) | (15,349 | ) | (374 | ) | (69,259 | ) | — | |||||||||||||||||
| — | — | — | — | — | 85,140 | — | |||||||||||||||||||||
| (2,102,050 | ) | (1,403,009 | ) | 10,056,090 | 7,473,573 | 21,918,505 | (3,690,391 | ) | 13,353,466 | ||||||||||||||||||
| (37,058,980 | ) | (48,524,255 | ) | (21,651,878 | ) | (41,115,579 | ) | (27,270,987 | ) | (38,424,717 | )* | (74,280,494 | ) | ||||||||||||||
| — | — | — | — | — | — | — | |||||||||||||||||||||
| (36,994 | ) | 75 | (822 | ) | (21,436 | ) | — | (32,869 | ) | — | |||||||||||||||||
| — | — | — | — | — | 15,249 | — | |||||||||||||||||||||
| (37,095,974 | ) | (48,524,180 | ) | (21,652,700 | ) | (41,137,015 | ) | (27,270,987 | ) | (38,442,337 | ) | (74,280,494 | ) | ||||||||||||||
| (39,198,024 | ) | (49,927,189 | ) | (11,596,610 | ) | (33,663,442 | ) | (5,352,482 | ) | (42,132,728 | ) | (60,927,028 | ) | ||||||||||||||
| $ | (34,494,209 | ) | $ | (48,512,041 | ) | $ | (9,506,337 | ) | $ | (32,514,734 | ) | $ | (1,751,071 | ) | $ | (39,125,164 | ) | $ | (61,180,866 | ) | |||||||
| $ | 620,966 | $ | 8,088 | $ | 66,711 | $ | 175,722 | $ | 32,007 | $ | 650,962 | $ | 56,801 | ||||||||||||||
| $ | — | $ | — | $ | — | $ | — | $ | — | $ | 8,230 | $ | — |
The accompanying notes are an integral part of the financial statements.
191
MML Series Investment Fund – Financial Statements (Continued) |
Statements of Operations |
MML |
MML |
|||||||
Investment income (Note 2): |
||||||||
Dividends (a) |
$ | 1,843,378 | $ | 2,014,459 | ||||
Interest |
11,857 | 44,143 | ||||||
Securities lending net income |
25 | 12,938 | ||||||
Total investment income |
1,855,260 | 2,071,540 | ||||||
Expenses (Note 3): |
||||||||
Investment advisory fees |
879,144 | 2,693,102 | ||||||
Custody fees |
288,709 | 72,057 | ||||||
Audit and tax fees |
42,591 | 44,058 | ||||||
Legal fees |
3,672 | 11,086 | ||||||
Proxy fees |
1,340 | 1,340 | ||||||
Shareholder reporting fees |
48,576 | 17,418 | ||||||
Trustees’ fees |
6,192 | 18,872 | ||||||
| 1,270,224 | 2,857,933 | |||||||
Administration fees: |
||||||||
Class II |
— | — | ||||||
Service Class I |
— | — | ||||||
Distribution and Service fees: |
||||||||
Service Class |
55,378 | 226,059 | ||||||
Service Class I |
— | — | ||||||
Total expenses |
1,325,602 | 3,083,992 | ||||||
Expenses waived (Note 3): |
||||||||
Advisory fees waived |
— | — | ||||||
Net expenses: |
1,325,602 | 3,083,992 | ||||||
Net investment income (loss) |
529,658 | (1,012,452 | ) | |||||
Realized and unrealized gain (loss): |
||||||||
Net realized gain (loss) on: |
||||||||
Investment transactions |
10,345,266 | (2,768,523 | ) | |||||
Futures contracts |
— | — | ||||||
Written options |
7,500,317 | — | ||||||
Swap agreements |
— | — | ||||||
Foreign currency transactions |
— | 980 | ||||||
Forward contracts |
— | — | ||||||
Net realized gain (loss) |
17,845,583 | (2,767,543 | ) | |||||
Net change in unrealized appreciation (depreciation) on: |
||||||||
Investment transactions |
(36,140,245 | ) | (110,908,210 | ) | ||||
Futures contracts |
— | — | ||||||
Written options |
1,543,945 | — | ||||||
Swap agreements |
— | — | ||||||
Translation of assets and liabilities in foreign currencies |
(1,978 | ) | 30 | |||||
Forward contracts |
— | — | ||||||
Net change in unrealized appreciation (depreciation) |
(34,598,278 | ) | (110,908,180 | ) | ||||
Net realized gain (loss) and change in unrealized appreciation (depreciation) |
(16,752,695 | ) | (113,675,723 | ) | ||||
Net increase (decrease) in net assets resulting from operations |
$ | (16,223,037 | ) | $ | (114,688,175 | ) | ||
(a) |
Net of foreign withholding tax of: |
$ | 436 | $ | 2,024 | |||||||
The accompanying notes are an integral part of the financial statements.
192
MML |
MML Small |
MML Small |
MML |
MML |
MML |
||||||||||||||||||
| $ | 8,374,142 | $ | 1,599,040 | $ | 1,500,041 | $ | 2,797,862 | $ | 2,129,700 | $ | — | ||||||||||||
| 20,159 | 8,990 | — | 2,543 | 807 | 9,774,201 | ||||||||||||||||||
| 14,551 | 19,959 | 14,893 | 8,835 | 407 | 70,556 | ||||||||||||||||||
| 8,408,852 | 1,627,989 | 1,514,934 | 2,809,240 | 2,130,914 | 9,844,757 | ||||||||||||||||||
| 2,659,759 | 1,634,381 | 672,473 | 1,114,253 | 719,934 | 1,309,584 | ||||||||||||||||||
| 61,243 | 50,328 | 37,282 | 46,617 | 27,441 | 159,252 | ||||||||||||||||||
| 45,528 | 45,661 | 43,202 | 42,696 | 42,664 | 47,590 | ||||||||||||||||||
| 9,682 | 5,017 | 2,735 | 4,765 | 4,693 | 21,127 | ||||||||||||||||||
| 1,340 | 1,340 | 1,340 | 1,340 | 1,340 | 1,340 | ||||||||||||||||||
| 44,886 | 33,708 | 17,528 | 20,932 | 23,542 | 33,165 | ||||||||||||||||||
| 16,557 | 8,285 | 4,363 | 7,825 | 7,448 | 17,027 | ||||||||||||||||||
| 2,838,995 | 1,778,720 | 778,923 | 1,238,428 | 827,062 | 1,589,085 | ||||||||||||||||||
| — | — | 85,729 | — | — | 428,370 | ||||||||||||||||||
| — | — | 40,360 | — | — | 62,724 | ||||||||||||||||||
| 130,544 | 64,523 | — | 63,724 | 127,888 | — | ||||||||||||||||||
| — | — | 67,267 | — | — | 104,541 | ||||||||||||||||||
| 2,969,539 | 1,843,243 | 972,279 | 1,302,152 | 954,950 | 2,184,720 | ||||||||||||||||||
| — | (47,146 | ) | (126,089 | ) | — | — | — | ||||||||||||||||
| 2,969,539 | 1,796,097 | 846,190 | 1,302,152 | 954,950 | 2,184,720 | ||||||||||||||||||
| 5,439,313 | (168,108 | ) | 668,744 | 1,507,088 | 1,175,964 | 7,660,037 | |||||||||||||||||
| 44,957,289 | (13,537,519 | ) | (272,480 | ) | 16,595,080 | 41,307,469 | (29,267,267 | ) | |||||||||||||||
| — | — | — | — | — | (718,873 | ) | |||||||||||||||||
| — | — | — | — | — | (915,378 | ) | |||||||||||||||||
| — | — | — | — | — | (66,283 | ) | |||||||||||||||||
| (15,719 | ) | (6 | ) | (384 | ) | (7 | ) | (8,968 | ) | (389 | ) | ||||||||||||
| 1,595,863 | — | 85,942 | — | 7,080 | 77,022 | ||||||||||||||||||
| 46,537,433 | (13,537,525 | ) | (186,922 | ) | 16,595,073 | 41,305,581 | (30,891,168 | ) | |||||||||||||||
| (57,252,300 | ) | (31,389,864 | ) | (14,778,235 | ) | (45,354,143 | ) | (71,554,207 | ) | (30,921,793 | ) | ||||||||||||
| — | — | — | — | — | 63,233 | ||||||||||||||||||
| — | — | — | — | — | (32,982 | ) | |||||||||||||||||
| — | — | — | — | — | (1,499,141 | ) | |||||||||||||||||
| (1,044 | ) | (1 | ) | — | — | (196 | ) | 238 | |||||||||||||||
| 145,696 | — | 7,840 | — | (4,082 | ) | (85,870 | ) | ||||||||||||||||
| (57,107,648 | ) | (31,389,865 | ) | (14,770,395 | ) | (45,354,143 | ) | (71,558,485 | ) | (32,476,315 | ) | ||||||||||||
| (10,570,215 | ) | (44,927,390 | ) | (14,957,317 | ) | (28,759,070 | ) | (30,252,904 | ) | (63,367,483 | ) | ||||||||||||
| $ | (5,130,902 | ) | $ | (45,095,498 | ) | $ | (14,288,573 | ) | $ | (27,251,982 | ) | $ | (29,076,940 | ) | $ | (55,707,446 | ) | ||||||
| $ | 102,281 | $ | 1,876 | $ | 8,162 | $ | 5,865 | $ | 5,841 | $ | — |
The accompanying notes are an integral part of the financial statements.
193
MML Series Investment Fund – Financial Statements (Continued) |
|
MML |
||||||||
Year |
Year |
|||||||
Increase (Decrease) in Net Assets: |
||||||||
Operations: |
||||||||
Net investment income (loss) |
$ | 5,803,069 | $ | 7,496,513 | ||||
Net realized gain (loss) |
22,816,639 | 35,667,069 | ||||||
Net change in unrealized appreciation (depreciation) |
(86,566,306 | ) | (9,587,387 | ) | ||||
Net increase (decrease) in net assets resulting from operations |
(57,946,598 | ) | 33,576,195 | |||||
Distributions to shareholders (Note 2): |
||||||||
Initial Class |
(8,975,230 | ) | (3,732,707 | ) | ||||
Service Class |
(31,027,776 | ) | (12,357,121 | ) | ||||
Total distributions |
(40,003,006 | ) | (16,089,828 | ) | ||||
Net fund share transactions (Note 5): |
||||||||
Initial Class |
2,703,199 | (14,286,613 | ) | |||||
Service Class |
(5,350,800 | ) | (37,286,727 | ) | ||||
Increase (decrease) in net assets from fund share transactions |
(2,647,601 | ) | (51,573,340 | ) | ||||
Total increase (decrease) in net assets |
(100,597,205 | ) | (34,086,973 | ) | ||||
Net assets |
||||||||
Beginning of year |
400,743,601 | 434,830,574 | ||||||
End of year |
$ | 300,146,396 | $ | 400,743,601 | ||||
The accompanying notes are an integral part of the financial statements.
194
MML |
MML |
MML |
|||||||||||||||||||||
Year |
Year |
Year |
Year |
Year |
Year |
||||||||||||||||||
| $ | 6,173,353 | $ | 8,075,213 | $ | 20,224,332 | $ | 25,466,940 | $ | 12,016,572 | $ | 14,700,478 | ||||||||||||
| 30,716,421 | 35,066,448 | 133,933,792 | 150,529,735 | 128,130,608 | 125,516,658 | ||||||||||||||||||
| (105,005,142 | ) | 1,576,575 | (408,723,181 | ) | 28,058,278 | (322,143,142 | ) | 21,135,066 | |||||||||||||||
| (68,115,368 | ) | 44,718,236 | (254,565,057 | ) | 204,054,953 | (181,995,962 | ) | 161,352,202 | |||||||||||||||
| (9,558,838 | ) | (4,524,699 | ) | (28,772,658 | ) | (14,369,142 | ) | (50,395,945 | ) | (26,000,345 | ) | ||||||||||||
| (31,581,134 | ) | (14,700,679 | ) | (142,123,211 | ) | (72,819,090 | ) | (85,620,554 | ) | (43,218,278 | ) | ||||||||||||
| (41,139,972 | ) | (19,225,378 | ) | (170,895,869 | ) | (87,188,232 | ) | (136,016,499 | ) | (69,218,623 | ) | ||||||||||||
| (861,345 | ) | (8,921,595 | ) | (2,065,935 | ) | (37,230,262 | ) | 10,986,345 | (46,904,892 | ) | |||||||||||||
| (11,197,946 | ) | (29,861,152 | ) | (61,863,610 | ) | (212,270,785 | ) | 20,768,693 | (83,342,821 | ) | |||||||||||||
| (12,059,291 | ) | (38,782,747 | ) | (63,929,545 | ) | (249,501,047 | ) | 31,755,038 | (130,247,713 | ) | |||||||||||||
| (121,314,631 | ) | (13,289,889 | ) | (489,390,471 | ) | (132,634,326 | ) | (286,257,423 | ) | (38,114,134 | ) | ||||||||||||
| 469,778,371 | 483,068,260 | 1,746,207,270 | 1,878,841,596 | 1,207,330,294 | 1,245,444,428 | ||||||||||||||||||
| $ | 348,463,740 | $ | 469,778,371 | $ | 1,256,816,799 | $ | 1,746,207,270 | $ | 921,072,871 | $ | 1,207,330,294 | ||||||||||||
The accompanying notes are an integral part of the financial statements.
195
MML Series Investment Fund – Financial Statements (Continued) |
Statements of Changes in Net Assets |
MML |
||||||||
Year |
Year |
|||||||
Increase (Decrease) in Net Assets: |
||||||||
Operations: |
||||||||
Net investment income (loss) |
$ | 1,240,542 | $ | 1,508,753 | ||||
Net realized gain (loss) |
15,861,188 | 21,347,657 | ||||||
Net change in unrealized appreciation (depreciation) |
(43,616,041 | ) | 2,729,646 | |||||
Net increase (decrease) in net assets resulting from operations |
(26,514,311 | ) | 25,586,056 | |||||
Distributions to shareholders (Note 2): |
||||||||
Initial Class |
(9,483,401 | ) | (3,793,658 | ) | ||||
Service Class |
(12,710,846 | ) | (4,972,518 | ) | ||||
Service Class I |
— | — | ||||||
Total distributions |
(22,194,247 | ) | (8,766,176 | ) | ||||
Net fund share transactions (Note 5): |
||||||||
Initial Class |
2,283,538 | (560,281 | ) | |||||
Service Class |
1,452,454 | (8,314,247 | ) | |||||
Service Class I |
— | — | ||||||
Increase (decrease) in net assets from fund share transactions |
3,735,992 | (8,874,528 | ) | |||||
Total increase (decrease) in net assets |
(44,972,566 | ) | 7,945,352 | |||||
Net assets |
||||||||
Beginning of year |
168,220,729 | 160,275,377 | ||||||
End of year |
$ | 123,248,163 | $ | 168,220,729 | ||||
The accompanying notes are an integral part of the financial statements.
196
MML |
MML |
MML |
|||||||||||||||||||||
Year |
Year |
Year |
Year |
Year |
Year |
||||||||||||||||||
| $ | (242,442 | ) | $ | (597,776 | ) | $ | 12,628,325 | $ | 9,493,175 | $ | (1,612,882 | ) | $ | (3,040,652 | ) | ||||||||
| 37,512,120 | 51,652,024 | 83,833,835 | 58,363,875 | (5,650,646 | ) | 86,430,345 | |||||||||||||||||
| (124,668,569 | ) | 3,023,836 | (221,250,683 | ) | 46,359,412 | (239,808,771 | ) | (1,392,292 | ) | ||||||||||||||
| (87,398,891 | ) | 54,078,084 | (124,788,523 | ) | 114,216,462 | (247,072,299 | ) | 81,997,401 | |||||||||||||||
| — | — | — | — | (55,459,115 | ) | (38,541,114 | ) | ||||||||||||||||
| — | — | — | — | (27,920,807 | ) | (20,907,454 | ) | ||||||||||||||||
| (51,059,340 | ) | (15,195,901 | ) | (67,869,394 | ) | (35,113,927 | ) | — | — | ||||||||||||||
| (51,059,340 | ) | (15,195,901 | ) | (67,869,394 | ) | (35,113,927 | ) | (83,379,922 | ) | (59,448,568 | ) | ||||||||||||
| — | — | — | — | 41,587,663 | 59,227,612 | ||||||||||||||||||
| — | — | — | — | 20,094,813 | 13,680,075 | ||||||||||||||||||
| 41,237,142 | (3,842,156 | ) | (36,261,954 | ) | (89,042,196 | ) | — | — | |||||||||||||||
| 41,237,142 | (3,842,156 | ) | (36,261,954 | ) | (89,042,196 | ) | 61,682,476 | 72,907,687 | |||||||||||||||
| (97,221,089 | ) | 35,040,027 | (228,919,871 | ) | (9,939,661 | ) | (268,769,745 | ) | 95,456,520 | ||||||||||||||
| 292,504,202 | 257,464,175 | 933,787,867 | 943,727,528 | 628,687,794 | 533,231,274 | ||||||||||||||||||
| $ | 195,283,113 | $ | 292,504,202 | $ | 704,867,996 | $ | 933,787,867 | $ | 359,918,049 | $ | 628,687,794 | ||||||||||||
The accompanying notes are an integral part of the financial statements.
197
MML Series Investment Fund – Financial Statements (Continued) |
Statements of Changes in Net Assets |
MML |
||||||||
Year |
Year |
|||||||
Increase (Decrease) in Net Assets: |
||||||||
Operations: |
||||||||
Net investment income (loss) |
$ | 7,715,588 | $ | 6,922,226 | ||||
Net realized gain (loss) |
28,268,387 | 55,884,175 | ||||||
Net change in unrealized appreciation (depreciation) |
(51,552,296 | ) | 40,615,994 | |||||
Net increase (decrease) in net assets resulting from operations |
(15,568,321 | ) | 103,422,395 | |||||
Distributions to shareholders (Note 2): |
||||||||
Initial Class |
(49,760,616 | ) | (14,539,543 | ) | ||||
Class I |
— | — | ||||||
Class II |
— | — | ||||||
Class III |
— | — | ||||||
Service Class |
(12,697,215 | ) | (3,561,313 | ) | ||||
Service Class I |
— | — | ||||||
Total distributions |
(62,457,831 | ) | (18,100,856 | ) | ||||
Net fund share transactions (Note 5): |
||||||||
Initial Class |
(1,565,016 | ) | (65,572,871 | ) | ||||
Class I |
— | — | ||||||
Class II |
— | — | ||||||
Class III |
— | — | ||||||
Service Class |
5,792,656 | (10,213,562 | ) | |||||
Service Class I |
— | — | ||||||
Increase (decrease) in net assets from fund share transactions |
4,227,640 | (75,786,433 | ) | |||||
Total increase (decrease) in net assets |
(73,798,512 | ) | 9,535,106 | |||||
Net assets |
||||||||
Beginning of year |
457,587,577 | 448,052,471 | ||||||
End of year |
$ | 383,789,065 | $ | 457,587,577 | ||||
The accompanying notes are an integral part of the financial statements.
198
MML |
MML |
MML |
|||||||||||||||||||||
Year |
Year |
Year |
Year |
Year |
Year |
||||||||||||||||||
| $ | 8,721,993 | $ | 8,119,505 | $ | 2,714,007 | $ | 2,701,349 | $ | 4,703,815 | $ | 5,309,115 | ||||||||||||
| 57,377,551 | 40,603,509 | 26,464,556 | 25,021,393 | (2,102,050 | ) | 21,502,193 | |||||||||||||||||
| (207,573,233 | ) | 129,047,822 | (47,671,903 | ) | 34,345,792 | (37,095,974 | ) | 7,132,915 | |||||||||||||||
| (141,473,689 | ) | 177,770,836 | (18,493,340 | ) | 62,068,534 | (34,494,209 | ) | 33,944,223 | |||||||||||||||
| — | — | — | — | (20,270,857 | ) | (6,407,754 | ) | ||||||||||||||||
| (3,711,268 | ) | (3,410,079 | ) | — | — | — | — | ||||||||||||||||
| (18,442,567 | ) | (15,589,702 | ) | (25,919,591 | ) | (19,232,937 | ) | — | — | ||||||||||||||
| (22,468,499 | ) | (19,307,250 | ) | — | — | — | — | ||||||||||||||||
| — | — | — | — | (715,390 | ) | (192,117 | ) | ||||||||||||||||
| (2,927,966 | ) | (2,915,856 | ) | (1,868,194 | ) | (1,434,203 | ) | — | — | ||||||||||||||
| (47,550,300 | ) | (41,222,887 | ) | (27,787,785 | ) | (20,667,140 | ) | (20,986,247 | ) | (6,599,871 | ) | ||||||||||||
| — | — | — | — | (7,814,796 | ) | (55,471,468 | ) | ||||||||||||||||
| (1,966,789 | ) | (8,078,776 | ) | — | — | — | — | ||||||||||||||||
| (32,829,602 | ) | 8,726,265 | (6,640,290 | ) | 22,304,981 | — | — | ||||||||||||||||
| 1,376,083 | (11,761,933 | ) | — | — | — | — | |||||||||||||||||
| — | — | — | — | 2,492,522 | (1,091,260 | ) | |||||||||||||||||
| (5,584,275 | ) | (986,690 | ) | 2,501,399 | 502,795 | — | — | ||||||||||||||||
| (39,004,583 | ) | (12,101,134 | ) | (4,138,891 | ) | 22,807,776 | (5,322,274 | ) | (56,562,728 | ) | |||||||||||||
| (228,028,572 | ) | 124,446,815 | (50,420,016 | ) | 64,209,170 | (60,802,730 | ) | (29,218,376 | ) | ||||||||||||||
| 777,288,595 | 652,841,780 | 361,265,002 | 297,055,832 | 245,610,355 | 274,828,731 | ||||||||||||||||||
| $ | 549,260,023 | $ | 777,288,595 | $ | 310,844,986 | $ | 361,265,002 | $ | 184,807,625 | $ | 245,610,355 | ||||||||||||
The accompanying notes are an integral part of the financial statements.
199
MML Series Investment Fund – Financial Statements (Continued) |
Statements of Changes in Net Assets |
MML |
||||||||
Year |
Year |
|||||||
Increase (Decrease) in Net Assets: |
||||||||
Operations: |
||||||||
Net investment income (loss) |
$ | 1,415,148 | $ | 1,533,777 | ||||
Net realized gain (loss) |
(1,403,009 | ) | 31,117,236 | |||||
Net change in unrealized appreciation (depreciation) |
(48,524,180 | ) | 16,358,111 | |||||
Net increase (decrease) in net assets resulting from operations |
(48,512,041 | ) | 49,009,124 | |||||
Distributions to shareholders (Note 2): |
||||||||
Initial Class |
— | — | ||||||
Class I |
— | — | ||||||
Class II |
(28,431,654 | ) | (17,289,403 | ) | ||||
Service Class |
— | — | ||||||
Service Class I |
(3,707,938 | ) | (2,011,177 | ) | ||||
Total distributions |
(32,139,592 | ) | (19,300,580 | ) | ||||
Net fund share transactions (Note 5): |
||||||||
Initial Class |
— | — | ||||||
Class I |
— | — | ||||||
Class II |
(1,351,311 | ) | 32,759,203 | |||||
Service Class |
— | — | ||||||
Service Class I |
3,475,606 | 1,845,344 | ||||||
Increase (decrease) in net assets from fund share transactions |
2,124,295 | 34,604,547 | ||||||
Total increase (decrease) in net assets |
(78,527,338 | ) | 64,313,091 | |||||
Net assets |
||||||||
Beginning of year |
245,739,968 | 181,426,877 | ||||||
End of year |
$ | 167,212,630 | $ | 245,739,968 | ||||
The accompanying notes are an integral part of the financial statements.
200
MML |
MML |
MML |
|||||||||||||||||||||
Year |
Year |
Year |
Year |
Year |
Year |
||||||||||||||||||
| $ | 2,090,273 | $ | 1,716,263 | $ | 1,148,708 | $ | 2,184,911 | $ | 3,601,411 | $ | 3,388,012 | ||||||||||||
| 10,056,090 | 34,080,303 | 7,473,573 | 95,994,538 | 21,918,505 | 35,764,471 | ||||||||||||||||||
| (21,652,700 | ) | 17,472,558 | (41,137,015 | ) | (36,075,447 | ) | (27,270,987 | ) | 23,692,628 | ||||||||||||||
| (9,506,337 | ) | 53,269,124 | (32,514,734 | ) | 62,104,002 | (1,751,071 | ) | 62,845,111 | |||||||||||||||
| — | — | — | — | (25,068,815 | ) | (3,966,776 | ) | ||||||||||||||||
| — | — | (76,389,044 | ) | (33,942,130 | ) | — | — | ||||||||||||||||
| (29,059,619 | ) | (2,957,707 | ) | (10,377,503 | ) | (1,862,521 | ) | — | — | ||||||||||||||
| — | — | — | — | (3,665,694 | ) | (483,810 | ) | ||||||||||||||||
| (4,135,015 | ) | (312,511 | ) | (10,607,643 | ) | (1,901,117 | ) | — | — | ||||||||||||||
| (33,194,634 | ) | (3,270,218 | ) | (97,374,190 | ) | (37,705,768 | ) | (28,734,509 | ) | (4,450,586 | ) | ||||||||||||
| — | — | — | — | (6,306,407 | ) | (71,827,735 | ) | ||||||||||||||||
| — | — | 53,840,699 | (231,901,017 | ) | — | — | |||||||||||||||||
| 9,294,514 | (50,990,501 | ) | 9,172,796 | 293,903 | — | — | |||||||||||||||||
| — | — | — | — | 831,870 | (1,714,716 | ) | |||||||||||||||||
| 5,272,119 | 1,630,567 | 13,946,261 | 392,623 | — | — | ||||||||||||||||||
| 14,566,633 | (49,359,934 | ) | 76,959,756 | (231,214,491 | ) | (5,474,537 | ) | (73,542,451 | ) | ||||||||||||||
| (28,134,338 | ) | 638,972 | (52,929,168 | ) | (206,816,257 | ) | (35,960,117 | ) | (15,147,926 | ) | |||||||||||||
| 195,547,843 | 194,908,871 | 191,391,085 | 398,207,342 | 253,291,307 | 268,439,233 | ||||||||||||||||||
| $ | 167,413,505 | $ | 195,547,843 | $ | 138,461,917 | $ | 191,391,085 | $ | 217,331,190 | $ | 253,291,307 | ||||||||||||
The accompanying notes are an integral part of the financial statements.
201
MML Series Investment Fund – Financial Statements (Continued) |
Statements of Changes in Net Assets |
MML |
||||||||
Year |
Year |
|||||||
Increase (Decrease) in Net Assets: |
||||||||
Operations: |
||||||||
Net investment income (loss) |
$ | 3,007,564 | $ | 2,387,824 | ||||
Net realized gain (loss) |
(3,690,391 | ) | 23,518,210 | |||||
Net change in unrealized appreciation (depreciation) |
(38,442,337 | ) | (8,031,257 | ) | ||||
Net increase (decrease) in net assets resulting from operations |
(39,125,164 | ) | 17,874,777 | |||||
Distributions to shareholders (Note 2): |
||||||||
Initial Class |
— | — | ||||||
Class II |
(13,471,151 | ) | (1,043,525 | ) | ||||
Service Class |
— | — | ||||||
Service Class I |
(444,434 | ) | (39,246 | ) | ||||
Total distributions |
(13,915,585 | ) | (1,082,771 | ) | ||||
Net fund share transactions (Note 5): |
||||||||
Initial Class |
— | — | ||||||
Class II |
7,179,354 | 73,322,159 | ||||||
Service Class |
— | — | ||||||
Service Class I |
1,284,491 | 659,784 | ||||||
Increase (decrease) in net assets from fund share transactions |
8,463,845 | 73,981,943 | ||||||
Total increase (decrease) in net assets |
(44,576,904 | ) | 90,773,949 | |||||
Net assets |
||||||||
Beginning of year |
257,489,666 | 166,715,717 | ||||||
End of year |
$ | 212,912,762 | $ | 257,489,666 | ||||
The accompanying notes are an integral part of the financial statements.
202
MML |
MML |
MML |
|||||||||||||||||||||
Year |
Year |
Year |
Year |
Year |
Year |
||||||||||||||||||
| $ | (253,838 | ) | $ | (225,060 | ) | $ | 529,658 | $ | 490,544 | $ | (1,012,452 | ) | $ | (2,249,274 | ) | ||||||||
| 13,353,466 | 16,564,832 | 17,845,583 | 705,802 | (2,767,543 | ) | 105,809,675 | |||||||||||||||||
| (74,280,494 | ) | 8,293,487 | (34,598,278 | ) | 14,245,211 | (110,908,180 | ) | (37,213,167 | ) | ||||||||||||||
| (61,180,866 | ) | 24,633,259 | (16,223,037 | ) | 15,441,557 | (114,688,175 | ) | 66,347,234 | |||||||||||||||
| (15,005,574 | ) | (15,351,370 | ) | (447,699 | ) | (1,116,050 | ) | (74,365,442 | ) | (73,246,023 | ) | ||||||||||||
| — | — | — | — | — | — | ||||||||||||||||||
| (2,077,210 | ) | (2,540,115 | ) | (42,368 | ) | (189,127 | ) | (28,240,386 | ) | (25,312,531 | ) | ||||||||||||
| — | — | — | — | — | — | ||||||||||||||||||
| (17,082,784 | ) | (17,891,485 | ) | (490,067 | ) | (1,305,177 | ) | (102,605,828 | ) | (98,558,554 | ) | ||||||||||||
| 4,335,168 | 71,237,108 | (17,752,962 | ) | (13,533,508 | ) | 44,977,349 | (69,578,065 | ) | |||||||||||||||
| — | — | — | — | — | — | ||||||||||||||||||
| 1,284,214 | 2,162,036 | (3,573,554 | ) | (3,570,364 | ) | 20,711,304 | 11,071,866 | ||||||||||||||||
| — | — | — | — | — | — | ||||||||||||||||||
| 5,619,382 | 73,399,144 | (21,326,516 | ) | (17,103,872 | ) | 65,688,653 | (58,506,199 | ) | |||||||||||||||
| (72,644,268 | ) | 80,140,918 | (38,039,620 | ) | (2,967,492 | ) | (151,605,350 | ) | (90,717,519 | ) | |||||||||||||
| 222,830,500 | 142,689,582 | 140,627,844 | 143,595,336 | 461,919,988 | 552,637,507 | ||||||||||||||||||
| $ | 150,186,232 | $ | 222,830,500 | $ | 102,588,224 | $ | 140,627,844 | $ | 310,314,638 | $ | 461,919,988 | ||||||||||||
The accompanying notes are an integral part of the financial statements.
203
MML Series Investment Fund – Financial Statements (Continued) |
Statements of Changes in Net Assets |
MML |
||||||||
Year |
Year |
|||||||
Increase (Decrease) in Net Assets: |
||||||||
Operations: |
||||||||
Net investment income (loss) |
$ | 5,439,313 | $ | 5,276,758 | ||||
Net realized gain (loss) |
46,537,433 | 77,904,945 | ||||||
Net change in unrealized appreciation (depreciation) |
(57,107,648 | ) | (391,209 | ) | ||||
Net increase (decrease) in net assets resulting from operations |
(5,130,902 | ) | 82,790,494 | |||||
Distributions to shareholders (Note 2): |
||||||||
Initial Class |
(67,203,690 | ) | (11,485,165 | ) | ||||
Class II |
— | — | ||||||
Service Class |
(13,746,334 | ) | (1,976,411 | ) | ||||
Service Class I |
— | — | ||||||
Total distributions |
(80,950,024 | ) | (13,461,576 | ) | ||||
Net fund share transactions (Note 5): |
||||||||
Initial Class |
23,326,054 | (113,301,697 | ) | |||||
Class II |
— | — | ||||||
Service Class |
9,275,833 | (4,821,534 | ) | |||||
Service Class I |
— | — | ||||||
Increase (decrease) in net assets from fund share transactions |
32,601,887 | (118,123,231 | ) | |||||
Total increase (decrease) in net assets |
(53,479,039 | ) | (48,794,313 | ) | ||||
Net assets |
||||||||
Beginning of year |
351,088,277 | 399,882,590 | ||||||
End of year |
$ | 297,609,238 | $ | 351,088,277 | ||||
The accompanying notes are an integral part of the financial statements.
204
MML |
MML |
MML |
|||||||||||||||||||||
Year |
Year |
Year |
Year |
Year |
Year |
||||||||||||||||||
| $ | (168,108 | ) | $ | (1,119,827 | ) | $ | 668,744 | $ | 85,713 | $ | 1,507,088 | $ | 1,843,580 | ||||||||||
| (13,537,525 | ) | 47,033,355 | (186,922 | ) | 44,257,606 | 16,595,073 | 45,551,764 | ||||||||||||||||
| (31,389,865 | ) | (30,870,726 | ) | (14,770,395 | ) | (22,532,215 | ) | (45,354,143 | ) | 12,198,307 | |||||||||||||
| (45,095,498 | ) | 15,042,802 | (14,288,573 | ) | 21,811,104 | (27,251,982 | ) | 59,593,651 | |||||||||||||||
| (37,544,747 | ) | (26,449,940 | ) | — | — | (34,744,483 | ) | (1,587,906 | ) | ||||||||||||||
| — | — | (29,347,300 | ) | (4,232,677 | ) | — | — | ||||||||||||||||
| (8,085,294 | ) | (5,524,203 | ) | — | — | (7,306,202 | ) | (239,776 | ) | ||||||||||||||
| — | — | (14,620,372 | ) | (1,927,989 | ) | — | — | ||||||||||||||||
| (45,630,041 | ) | (31,974,143 | ) | (43,967,672 | ) | (6,160,666 | ) | (42,050,685 | ) | (1,827,682 | ) | ||||||||||||
| 25,950,139 | (677,490 | ) | — | — | 17,587,150 | (65,105,278 | ) | ||||||||||||||||
| — | — | 22,435,432 | (9,461,658 | ) | — | — | |||||||||||||||||
| 5,594,133 | 4,842,905 | — | — | 5,516,780 | 123,121 | ||||||||||||||||||
| — | — | 12,922,931 | (41,589 | ) | — | — | |||||||||||||||||
| 31,544,272 | 4,165,415 | 35,358,363 | (9,503,247 | ) | 23,103,930 | (64,982,157 | ) | ||||||||||||||||
| (59,181,267 | ) | (12,765,926 | ) | (22,897,882 | ) | 6,147,191 | (46,198,737 | ) | (7,216,188 | ) | |||||||||||||
| 198,445,995 | 211,211,921 | 98,569,812 | 92,422,621 | 179,230,957 | 186,447,145 | ||||||||||||||||||
| $ | 139,264,728 | $ | 198,445,995 | $ | 75,671,930 | $ | 98,569,812 | $ | 133,032,220 | $ | 179,230,957 | ||||||||||||
The accompanying notes are an integral part of the financial statements.
205
MML Series Investment Fund – Financial Statements (Continued) |
Statements of Changes in Net Assets |
MML |
||||||||
Year |
Year |
|||||||
Increase (Decrease) in Net Assets: |
||||||||
Operations: |
||||||||
Net investment income (loss) |
$ | 1,175,964 | $ | 1,071,998 | ||||
Net realized gain (loss) |
41,305,581 | 20,522,856 | ||||||
Net change in unrealized appreciation (depreciation) |
(71,558,485 | ) | 18,106,179 | |||||
Net increase (decrease) in net assets resulting from operations |
(29,076,940 | ) | 39,701,033 | |||||
Distributions to shareholders (Note 2): |
||||||||
Initial Class |
(14,150,556 | ) | (6,904,294 | ) | ||||
Class II |
— | — | ||||||
Service Class |
(7,831,922 | ) | (3,555,773 | ) | ||||
Service Class I |
— | — | ||||||
Total distributions |
(21,982,478 | ) | (10,460,067 | ) | ||||
Net fund share transactions (Note 5): |
||||||||
Initial Class |
3,883,839 | (12,363,850 | ) | |||||
Class II |
— | — | ||||||
Service Class |
3,853,145 | 1,624,422 | ||||||
Service Class I |
— | — | ||||||
Increase (decrease) in net assets from fund share transactions |
7,736,984 | (10,739,428 | ) | |||||
Total increase (decrease) in net assets |
(43,322,434 | ) | 18,501,538 | |||||
Net assets |
||||||||
Beginning of year |
173,860,519 | 155,358,981 | ||||||
End of year |
$ | 130,538,085 | $ | 173,860,519 | ||||
The accompanying notes are an integral part of the financial statements.
206
MML |
|||||||
Year |
Year |
||||||
| $ | 7,660,037 | $ | 3,996,645 | ||||
| (30,891,168 | ) | (754,915 | ) | ||||
| (32,476,315 | ) | (8,443,618 | ) | ||||
| (55,707,446 | ) | (5,201,888 | ) | ||||
| — | — | ||||||
| (4,566,764 | ) | (21,382,221 | ) | ||||
| — | — | ||||||
| (553,904 | ) | (3,001,071 | ) | ||||
| (5,120,668 | ) | (24,383,292 | ) | ||||
| — | — | ||||||
| (44,721,041 | ) | 92,426,887 | |||||
| — | — | ||||||
| (4,749,361 | ) | 2,945,102 | |||||
| (49,470,402 | ) | 95,371,989 | |||||
| (110,298,516 | ) | 65,786,809 | |||||
| 405,043,913 | 339,257,104 | ||||||
| $ | 294,745,397 | $ | 405,043,913 | ||||
The accompanying notes are an integral part of the financial statements.
207
MML Series Investment Fund – Financial Statements (Continued) |
Financial Highlights (For a share outstanding throughout each period) |
MML Conservative Allocation Fund
Income (loss) from investment |
Less distributions to shareholders |
Ratios / Supplemental Data |
||||||||||
Net |
Net |
Net |
Total |
From net |
From net |
Total |
Net |
Total |
Net |
Ratio of |
Net |
|
Initial Class |
||||||||||||
12/31/22 |
$ 10.77 |
$ 0.18 |
$ (1.72) |
$ (1.54) |
$ (0.38) |
$ (0.80) |
$ (1.18) |
$ 8.05 |
(14.74%) |
$ 67,320 |
0.13% |
1.94% |
12/31/21 |
10.34 |
0.22 |
0.66 |
0.88 |
(0.13) |
(0.32) |
(0.45) |
10.77 |
8.60% |
86,161 |
0.12% |
2.05% |
12/31/20 |
9.95 |
0.09 |
0.86 |
0.95 |
(0.27) |
(0.29) |
(0.56) |
10.34 |
9.93% |
96,649 |
0.12% |
0.95% |
12/31/19 |
9.23 |
0.25 |
1.13 |
1.38 |
(0.28) |
(0.38) |
(0.66) |
9.95 |
15.20% |
95,290 |
0.13% |
2.55% |
12/31/18 |
10.01 |
0.22 |
(0.55) |
(0.33) |
(0.25) |
(0.20) |
(0.45) |
9.23 |
(3.50%) |
90,797 |
0.12% |
2.22% |
Service Class |
||||||||||||
12/31/22 |
$ 10.64 |
$ 0.15 |
$ (1.69) |
$ (1.54) |
$ (0.35) |
$ (0.80) |
$ (1.15) |
$ 7.95 |
(14.91%) |
$ 232,827 |
0.38% |
1.66% |
12/31/21 |
10.22 |
0.19 |
0.65 |
0.84 |
(0.10) |
(0.32) |
(0.42) |
10.64 |
8.33% |
314,582 |
0.37% |
1.75% |
12/31/20 |
9.84 |
0.07 |
0.85 |
0.92 |
(0.25) |
(0.29) |
(0.54) |
10.22 |
9.67% |
338,181 |
0.37% |
0.72% |
12/31/19 |
9.13 |
0.22 |
1.12 |
1.34 |
(0.25) |
(0.38) |
(0.63) |
9.84 |
14.93% |
312,658 |
0.38% |
2.31% |
12/31/18 |
9.90 |
0.19 |
(0.53) |
(0.34) |
(0.23) |
(0.20) |
(0.43) |
9.13 |
(3.70%) |
306,230 |
0.37% |
1.94% |
Year ended December 31 |
|||||
2022 |
2021 |
2020 |
2019 |
2018 |
|
Portfolio turnover ratex |
21% |
28% |
43% |
29% |
18% |
|
c |
Per share amount calculated on the average shares method. |
|
m |
Total return does not reflect expenses that apply at the separate account level or to related insurance products. Inclusion of these charges would reduce the total return figures for all periods shown. |
|
w |
Expenses of the underlying funds are not included in the Fund’s expense ratio. The Fund indirectly bears its proportionate share of the expenses of any underlying fund. |
|
x |
Amount does not include the portfolio activity of any underlying fund. |
The accompanying notes are an integral part of the financial statements.
208
MML Series Investment Fund – Financial Statements (Continued) |
Financial Highlights (For a share outstanding throughout each period) |
MML Balanced Allocation Fund
Income (loss) from investment |
Less distributions to shareholders |
Ratios / Supplemental Data |
||||||||||
Net |
Net |
Net |
Total |
From net |
From net |
Total |
Net |
Total |
Net |
Ratio of |
Net |
|
Initial Class |
||||||||||||
12/31/22 |
$ 10.88 |
$ 0.16 |
$ (1.72) |
$ (1.56) |
$ (0.36) |
$ (0.70) |
$ (1.06) |
$ 8.26 |
(14.73%) |
$ 80,987 |
0.13% |
1.76% |
12/31/21 |
10.32 |
0.20 |
0.82 |
1.02 |
(0.14) |
(0.32) |
(0.46) |
10.88 |
9.98% |
106,757 |
0.12% |
1.88% |
12/31/20 |
9.89 |
0.09 |
0.94 |
1.03 |
(0.26) |
(0.34) |
(0.60) |
10.32 |
10.93% |
109,924 |
0.12% |
0.97% |
12/31/19 |
9.12 |
0.23 |
1.27 |
1.50 |
(0.26) |
(0.47) |
(0.73) |
9.89 |
16.75% |
125,465 |
0.12% |
2.32% |
12/31/18 |
10.16 |
0.20 |
(0.61) |
(0.41) |
(0.24) |
(0.39) |
(0.63) |
9.12 |
(4.47%) |
116,177 |
0.12% |
2.00% |
Service Class |
||||||||||||
12/31/22 |
$ 10.77 |
$ 0.14 |
$ (1.71) |
$ (1.57) |
$ (0.33) |
$ (0.70) |
$ (1.03) |
$ 8.17 |
(14.97%) |
$ 267,476 |
0.38% |
1.52% |
12/31/21 |
10.22 |
0.17 |
0.81 |
0.98 |
(0.11) |
(0.32) |
(0.43) |
10.77 |
9.70% |
363,021 |
0.37% |
1.62% |
12/31/20 |
9.80 |
0.07 |
0.92 |
0.99 |
(0.23) |
(0.34) |
(0.57) |
10.22 |
10.65% |
373,144 |
0.37% |
0.72% |
12/31/19 |
9.03 |
0.20 |
1.27 |
1.47 |
(0.23) |
(0.47) |
(0.70) |
9.80 |
16.61% |
408,868 |
0.37% |
2.07% |
12/31/18 |
10.07 |
0.17 |
(0.61) |
(0.44) |
(0.21) |
(0.39) |
(0.60) |
9.03 |
(4.76%) |
391,230 |
0.37% |
1.76% |
Year ended December 31 |
|||||
2022 |
2021 |
2020 |
2019 |
2018 |
|
Portfolio turnover ratex |
16% |
25% |
22% |
28% |
17% |
|
c |
Per share amount calculated on the average shares method. |
|
m |
Total return does not reflect expenses that apply at the separate account level or to related insurance products. Inclusion of these charges would reduce the total return figures for all periods shown. |
|
w |
Expenses of the underlying funds are not included in the Fund’s expense ratio. The Fund indirectly bears its proportionate share of the expenses of any underlying fund. |
|
x |
Amount does not include the portfolio activity of any underlying fund. |
The accompanying notes are an integral part of the financial statements.
209
MML Series Investment Fund – Financial Statements (Continued) |
Financial Highlights (For a share outstanding throughout each period) |
MML Moderate Allocation Fund
Income (loss) from investment |
Less distributions to shareholders |
Ratios / Supplemental Data |
||||||||||
Net |
Net |
Net |
Total |
From net |
From net |
Total |
Net |
Total |
Net |
Ratio of |
Net |
|
Initial Class |
||||||||||||
12/31/22 |
$ 11.54 |
$ 0.16 |
$ (1.84) |
$ (1.68) |
$ (0.34) |
$ (0.93) |
$ (1.27) |
$ 8.59 |
(14.97%) |
$ 212,502 |
0.12% |
1.64% |
12/31/21 |
10.84 |
0.18 |
1.11 |
1.29 |
(0.16) |
(0.43) |
(0.59) |
11.54 |
11.99% |
284,654 |
0.11% |
1.60% |
12/31/20 |
10.53 |
0.10 |
0.95 |
1.05 |
(0.26) |
(0.48) |
(0.74) |
10.84 |
10.54% |
303,037 |
0.11% |
1.04% |
12/31/19 |
9.71 |
0.21 |
1.54 |
1.75 |
(0.28) |
(0.65) |
(0.93) |
10.53 |
18.58% |
378,044 |
0.12% |
2.05% |
12/31/18 |
11.00 |
0.19 |
(0.73) |
(0.54) |
(0.24) |
(0.51) |
(0.75) |
9.71 |
(5.48%) |
349,719 |
0.11% |
1.79% |
Service Class |
||||||||||||
12/31/22 |
$ 11.38 |
$ 0.13 |
$ (1.80) |
$ (1.67) |
$ (0.31) |
$ (0.93) |
$ (1.24) |
$ 8.47 |
(15.12%) |
$ 1,044,314 |
0.37% |
1.37% |
12/31/21 |
10.70 |
0.15 |
1.09 |
1.24 |
(0.13) |
(0.43) |
(0.56) |
11.38 |
11.67% |
1,461,553 |
0.36% |
1.36% |
12/31/20 |
10.41 |
0.08 |
0.92 |
1.00 |
(0.23) |
(0.48) |
(0.71) |
10.70 |
10.16% |
1,575,805 |
0.36% |
0.76% |
12/31/19 |
9.60 |
0.18 |
1.53 |
1.71 |
(0.25) |
(0.65) |
(0.90) |
10.41 |
18.36% |
1,751,648 |
0.37% |
1.78% |
12/31/18 |
10.88 |
0.16 |
(0.72) |
(0.56) |
(0.21) |
(0.51) |
(0.72) |
9.60 |
(5.70%) |
1,690,215 |
0.36% |
1.54% |
Year ended December 31 |
|||||
2022 |
2021 |
2020 |
2019 |
2018 |
|
Portfolio turnover ratex |
15% |
21% |
19% |
28% |
15% |
|
c |
Per share amount calculated on the average shares method. |
|
m |
Total return does not reflect expenses that apply at the separate account level or to related insurance products. Inclusion of these charges would reduce the total return figures for all periods shown. |
|
w |
Expenses of the underlying funds are not included in the Fund’s expense ratio. The Fund indirectly bears its proportionate share of the expenses of any underlying fund. |
|
x |
Amount does not include the portfolio activity of any underlying fund. |
The accompanying notes are an integral part of the financial statements.
210
MML Series Investment Fund – Financial Statements (Continued) |
Financial Highlights (For a share outstanding throughout each period) |
MML Growth Allocation Fund
Income (loss) from investment |
Less distributions to shareholders |
Ratios / Supplemental Data |
||||||||||
Net |
Net |
Net |
Total |
From net |
From net |
Total |
Net |
Total |
Net |
Ratio of |
Net |
|
Initial Class |
||||||||||||
12/31/22 |
$ 10.11 |
$ 0.11 |
$ (1.61) |
$ (1.50) |
$ (0.24) |
$ (0.99) |
$ (1.23) |
$ 7.38 |
(15.30%) |
$ 337,615 |
0.12% |
1.35% |
12/31/21 |
9.38 |
0.14 |
1.19 |
1.33 |
(0.16) |
(0.44) |
(0.60) |
10.11 |
14.33% |
443,650 |
0.12% |
1.36% |
12/31/20 |
9.04 |
0.09 |
0.98 |
1.07 |
(0.18) |
(0.55) |
(0.73) |
9.38 |
12.76% |
456,817 |
0.11% |
1.07% |
12/31/19 |
8.35 |
0.15 |
1.55 |
1.70 |
(0.22) |
(0.79) |
(1.01) |
9.04 |
21.21% |
573,104 |
0.12% |
1.64% |
12/31/18 |
9.75 |
0.14 |
(0.73) |
(0.59) |
(0.18) |
(0.63) |
(0.81) |
8.35 |
(6.90%) |
536,767 |
0.11% |
1.47% |
Service Class |
||||||||||||
12/31/22 |
$ 10.00 |
$ 0.09 |
$ (1.59) |
$ (1.50) |
$ (0.21) |
$ (0.99) |
$ (1.20) |
$ 7.30 |
(15.45%) |
$ 583,458 |
0.37% |
1.10% |
12/31/21 |
9.29 |
0.11 |
1.17 |
1.28 |
(0.13) |
(0.44) |
(0.57) |
10.00 |
13.93% |
763,680 |
0.37% |
1.10% |
12/31/20 |
8.96 |
0.07 |
0.97 |
1.04 |
(0.16) |
(0.55) |
(0.71) |
9.29 |
12.47% |
788,627 |
0.36% |
0.82% |
12/31/19 |
8.28 |
0.12 |
1.54 |
1.66 |
(0.19) |
(0.79) |
(0.98) |
8.96 |
20.93% |
978,390 |
0.37% |
1.40% |
12/31/18 |
9.67 |
0.12 |
(0.73) |
(0.61) |
(0.15) |
(0.63) |
(0.78) |
8.28 |
(7.10%) |
915,318 |
0.36% |
1.22% |
Year ended December 31 |
|||||
2022 |
2021 |
2020 |
2019 |
2018 |
|
Portfolio turnover ratex |
15% |
27% |
18% |
29% |
17% |
|
c |
Per share amount calculated on the average shares method. |
|
m |
Total return does not reflect expenses that apply at the separate account level or to related insurance products. Inclusion of these charges would reduce the total return figures for all periods shown. |
|
w |
Expenses of the underlying funds are not included in the Fund’s expense ratio. The Fund indirectly bears its proportionate share of the expenses of any underlying fund. |
|
x |
Amount does not include the portfolio activity of any underlying fund. |
The accompanying notes are an integral part of the financial statements.
211
MML Series Investment Fund – Financial Statements (Continued) |
Financial Highlights (For a share outstanding throughout each period) |
MML Aggressive Allocation Fund
Income (loss) from investment |
Less distributions to shareholders |
Ratios / Supplemental Data |
||||||||||
Net |
Net |
Net |
Total |
From net |
From net |
Total |
Net |
Total |
Net |
Ratio of |
Net |
|
Initial Class |
||||||||||||
12/31/22 |
$ 11.70 |
$ 0.10 |
$ (1.90) |
$ (1.80) |
$ (0.21) |
$ (1.43) |
$ (1.64) |
$ 8.26 |
(15.90%) |
$ 54,729 |
0.16% |
1.02% |
12/31/21 |
10.58 |
0.12 |
1.63 |
1.75 |
(0.15) |
(0.48) |
(0.63) |
11.70 |
16.65% |
73,193 |
0.14% |
1.05% |
12/31/20 |
10.16 |
0.10 |
1.15 |
1.25 |
(0.16) |
(0.67) |
(0.83) |
10.58 |
13.35% |
66,655 |
0.15% |
1.08% |
12/31/19 |
9.20 |
0.12 |
1.99 |
2.11 |
(0.21) |
(0.94) |
(1.15) |
10.16 |
23.93% |
67,730 |
0.15% |
1.24% |
12/31/18 |
10.68 |
0.12 |
(0.90) |
(0.78) |
(0.15) |
(0.55) |
(0.70) |
9.20 |
(8.12%) |
56,195 |
0.15% |
1.10% |
Service Class |
||||||||||||
12/31/22 |
$ 11.48 |
$ 0.07 |
$ (1.86) |
$ (1.79) |
$ (0.18) |
$ (1.43) |
$ (1.61) |
$ 8.08 |
(16.13%) |
$ 68,519 |
0.41% |
0.79% |
12/31/21 |
10.39 |
0.09 |
1.60 |
1.69 |
(0.12) |
(0.48) |
(0.60) |
11.48 |
16.40% |
95,028 |
0.39% |
0.78% |
12/31/20 |
9.99 |
0.07 |
1.13 |
1.20 |
(0.13) |
(0.67) |
(0.80) |
10.39 |
13.08% |
93,621 |
0.40% |
0.80% |
12/31/19 |
9.06 |
0.09 |
1.96 |
2.05 |
(0.18) |
(0.94) |
(1.12) |
9.99 |
23.65% |
95,667 |
0.40% |
0.95% |
12/31/18 |
10.54 |
0.09 |
(0.90) |
(0.81) |
(0.12) |
(0.55) |
(0.67) |
9.06 |
(8.44%) |
83,212 |
0.40% |
0.87% |
Year ended December 31 |
|||||
2022 |
2021 |
2020 |
2019 |
2018 |
|
Portfolio turnover ratex |
23% |
37% |
17% |
32% |
19% |
|
c |
Per share amount calculated on the average shares method. |
|
m |
Total return does not reflect expenses that apply at the separate account level or to related insurance products. Inclusion of these charges would reduce the total return figures for all periods shown. |
|
w |
Expenses of the underlying funds are not included in the Fund’s expense ratio. The Fund indirectly bears its proportionate share of the expenses of any underlying fund. |
|
x |
Amount does not include the portfolio activity of any underlying fund. |
The accompanying notes are an integral part of the financial statements.
212
MML Series Investment Fund – Financial Statements (Continued) |
Financial Highlights (For a share outstanding throughout each period) |
MML American Funds Growth Fund
Income (loss) from investment |
Less distributions to shareholders |
Ratios / Supplemental Data |
|||||||||||
Net |
Net |
Net |
Total |
From net |
From net |
Total |
Net |
Total |
Net |
Ratio of |
Ratio of |
Net |
|
Service Class I |
|||||||||||||
12/31/22 |
$ 22.52 |
$ (0.02) |
$ (6.38) |
$ (6.40) |
$ (0.08) |
$ (3.89) |
$ (3.97) |
$ 12.15 |
(30.29%) |
$ 195,283 |
0.69% |
N/A |
(0.11%) |
12/31/21 |
19.56 |
(0.05) |
4.20 |
4.15 |
— |
(1.19) |
(1.19) |
22.52 |
21.48% |
292,504 |
0.68% |
N/A |
(0.21%) |
12/31/20 |
14.33 |
(0.02) |
7.11 |
7.09 |
(0.12) |
(1.74) |
(1.86) |
19.56 |
51.49% |
257,464 |
0.68% |
N/A |
(0.12%) |
12/31/19 |
12.70 |
0.04 |
3.53 |
3.57 |
(0.05) |
(1.89) |
(1.94) |
14.33 |
30.33% |
197,036 |
0.69% |
0.69%l |
0.31% |
12/31/18 |
14.37 |
0.00d |
0.15 |
0.15 |
(0.04) |
(1.78) |
(1.82) |
12.70 |
(0.73%) |
162,360 |
0.69% |
0.69%l |
0.01% |
Year ended December 31 |
|||||
2022 |
2021 |
2020 |
2019 |
2018 |
|
Portfolio turnover ratex |
10% |
13% |
8% |
12% |
12% |
|
c |
Per share amount calculated on the average shares method. |
|
d |
Amount is less than $0.005 per share. |
|
j |
Computed after giving effect to an agreement by MML Advisers to waive certain fees and expenses of the Fund. |
|
l |
Expenses incurred during the period fell under the expense cap. |
|
m |
Total return does not reflect expenses that apply at the separate account level or to related insurance products. Inclusion of these charges would reduce the total return figures for all periods shown. |
|
u |
Expenses of the Master Fund are not included in the Fund’s expense ratio. The Fund indirectly bears its proportionate share of the expenses of the Master Fund. |
|
x |
Amount does not include the portfolio activity of the Master Fund. |
The accompanying notes are an integral part of the financial statements.
213
MML Series Investment Fund – Financial Statements (Continued) |
Financial Highlights (For a share outstanding throughout each period) |
MML American Funds Core Allocation Fund
Income (loss) from investment |
Less distributions to shareholders |
Ratios / Supplemental Data |
|||||||||||
Net |
Net |
Net |
Total |
From net |
From net |
Total |
Net |
Total |
Net |
Ratio of |
Ratio of |
Net |
|
Service Class I |
|||||||||||||
12/31/22 |
$ 13.22 |
$ 0.19 |
$ (1.98) |
$ (1.79) |
$ (0.26) |
$ (0.79) |
$ (1.05) |
$ 10.38 |
(13.70%) |
$ 704,868 |
0.72% |
0.61% |
1.62% |
12/31/21 |
12.16 |
0.13 |
1.42 |
1.55 |
(0.17) |
(0.32) |
(0.49) |
13.22 |
12.85% |
933,788 |
0.71% |
0.65% |
1.00% |
12/31/20 |
11.72 |
0.12 |
1.15 |
1.27 |
(0.20) |
(0.63) |
(0.83) |
12.16 |
11.39% |
943,728 |
0.71% |
N/A |
1.08% |
12/31/19 |
10.98 |
0.18 |
1.72 |
1.90 |
(0.29) |
(0.87) |
(1.16) |
11.72 |
18.12% |
1,001,411 |
0.71% |
N/A |
1.52% |
12/31/18 |
12.60 |
0.17 |
(0.69) |
(0.52) |
(0.22) |
(0.88) |
(1.10) |
10.98 |
(4.84%) |
956,051 |
0.71% |
N/A |
1.41% |
Year ended December 31 |
|||||
2022 |
2021 |
2020 |
2019 |
2018 |
|
Portfolio turnover ratex |
19% |
11% |
14% |
16% |
15% |
|
c |
Per share amount calculated on the average shares method. |
|
j |
Computed after giving effect to an agreement by MML Advisers to waive certain fees and expenses of the Fund. |
|
m |
Total return does not reflect expenses that apply at the separate account level or to related insurance products. Inclusion of these charges would reduce the total return figures for all periods shown. |
|
w |
Expenses of the underlying funds are not included in the Fund’s expense ratio. The Fund indirectly bears its proportionate share of the expenses of any underlying fund. |
|
x |
Amount does not include the portfolio activity of any underlying fund. |
The accompanying notes are an integral part of the financial statements.
214
MML Series Investment Fund – Financial Statements (Continued) |
Financial Highlights (For a share outstanding throughout each period) |
MML Blue Chip Growth Fund
Income (loss) from investment |
Less distributions to shareholders |
Ratios / Supplemental Data |
||||||||||
Net |
Net |
Net |
Total |
From net |
From net |
Total |
Net |
Total |
Net |
Ratio of |
Net |
|
Initial Class |
||||||||||||
12/31/22 |
$ 21.62 |
$ (0.04) |
$ (8.02) |
$ (8.06) |
$ — |
$ (2.86) |
$ (2.86) |
$ 10.70 |
(39.50%) |
$ 243,726 |
0.78% |
(0.28%) |
12/31/21 |
20.51 |
(0.10) |
3.48 |
3.38 |
— |
(2.27) |
(2.27) |
21.62 |
16.34% |
425,249 |
0.77% |
(0.44%) |
12/31/20 |
16.49 |
(0.06) |
5.68 |
5.62 |
— |
(1.60) |
(1.60) |
20.51 |
34.40% |
351,504 |
0.78% |
(0.35%) |
12/31/19 |
14.60 |
(0.02) |
4.16 |
4.14 |
— |
(2.25) |
(2.25) |
16.49 |
29.84% |
304,381 |
0.79% |
(0.09%) |
12/31/18 |
17.41 |
(0.00)d |
0.86 |
0.86 |
— |
(3.67) |
(3.67) |
14.60 |
1.88% |
254,050 |
0.79% |
(0.02%) |
Service Class |
||||||||||||
12/31/22 |
$ 20.28 |
$ (0.07) |
$ (7.49) |
$ (7.56) |
$ — |
$ (2.86) |
$ (2.86) |
$ 9.86 |
(39.65%) |
$ 116,192 |
1.03% |
(0.53%) |
12/31/21 |
19.40 |
(0.14) |
3.29 |
3.15 |
— |
(2.27) |
(2.27) |
20.28 |
16.08% |
203,439 |
1.02% |
(0.69%) |
12/31/20 |
15.71 |
(0.10) |
5.39 |
5.29 |
— |
(1.60) |
(1.60) |
19.40 |
34.00% |
181,728 |
1.03% |
(0.60%) |
12/31/19 |
14.03 |
(0.05) |
3.98 |
3.93 |
— |
(2.25) |
(2.25) |
15.71 |
29.56% |
137,293 |
1.04% |
(0.35%) |
12/31/18 |
16.88 |
(0.05) |
0.87 |
0.82 |
— |
(3.67) |
(3.67) |
14.03 |
1.68% |
99,468 |
1.04% |
(0.26%) |
Year ended December 31 |
|||||
2022 |
2021 |
2020 |
2019 |
2018 |
|
Portfolio turnover rate |
24% |
41% |
26% |
33% |
28% |
|
c |
Per share amount calculated on the average shares method. |
|
d |
Amount is less than $0.005 per share. |
|
m |
Total return does not reflect expenses that apply at the separate account level or to related insurance products. Inclusion of these charges would reduce the total return figures for all periods shown. |
The accompanying notes are an integral part of the financial statements.
215
MML Series Investment Fund – Financial Statements (Continued) |
Financial Highlights (For a share outstanding throughout each period) |
MML Equity Income Fund
Income (loss) from investment |
Less distributions to shareholders |
Ratios / Supplemental Data |
|||||||||||
Net |
Net |
Net |
Total |
From net |
From net |
Total |
Net |
Total |
Net |
Ratio of |
Ratio of |
Net |
|
Initial Class |
|||||||||||||
12/31/22 |
$ 12.38 |
$ 0.22 |
$ (0.64) |
$ (0.42) |
$ (0.21) |
$ (1.65) |
$ (1.86) |
$ 10.10 |
(3.57%) |
$ 305,370 |
0.79% |
0.76% |
1.92% |
12/31/21 |
10.28 |
0.18 |
2.43 |
2.61 |
(0.27) |
(0.24) |
(0.51) |
12.38 |
25.58% |
368,999 |
0.78% |
0.75% |
1.57% |
12/31/20 |
11.18 |
0.22 |
(0.22) |
0.00d |
(0.23) |
(0.67) |
(0.90) |
10.28 |
1.34% |
365,382 |
0.79% |
0.76% |
2.32% |
12/31/19 |
10.04 |
0.24 |
2.25 |
2.49 |
(0.27) |
(1.08) |
(1.35) |
11.18 |
26.45% |
396,909 |
0.78% |
0.75% |
2.22% |
12/31/18 |
12.50 |
0.26 |
(1.23) |
(0.97) |
(0.24) |
(1.25) |
(1.49) |
10.04 |
(9.36%) |
358,947 |
0.79% |
0.76% |
2.17% |
Service Class |
|||||||||||||
12/31/22 |
$ 12.19 |
$ 0.19 |
$ (0.63) |
$ (0.44) |
$ (0.18) |
$ (1.65) |
$ (1.83) |
$ 9.92 |
(3.82%) |
$ 78,419 |
1.04% |
1.01% |
1.67% |
12/31/21 |
10.14 |
0.15 |
2.39 |
2.54 |
(0.25) |
(0.24) |
(0.49) |
12.19 |
25.18% |
88,588 |
1.03% |
1.00% |
1.32% |
12/31/20 |
11.03 |
0.19 |
(0.20) |
(0.01) |
(0.21) |
(0.67) |
(0.88) |
10.14 |
1.17% |
82,671 |
1.04% |
1.01% |
2.06% |
12/31/19 |
9.92 |
0.21 |
2.22 |
2.43 |
(0.24) |
(1.08) |
(1.32) |
11.03 |
26.12% |
86,749 |
1.03% |
1.00% |
1.98% |
12/31/18 |
12.37 |
0.23 |
(1.22) |
(0.99) |
(0.21) |
(1.25) |
(1.46) |
9.92 |
(9.60%) |
75,335 |
1.04% |
1.01% |
1.92% |
Year ended December 31 |
|||||
2022 |
2021 |
2020 |
2019 |
2018 |
|
Portfolio turnover rate |
15% |
21% |
32% |
18% |
19% |
|
c |
Per share amount calculated on the average shares method. |
|
d |
Amount is less than $0.005 per share. |
|
j |
Computed after giving effect to an agreement by MML Advisers to waive certain fees and expenses of the Fund. |
|
m |
Total return does not reflect expenses that apply at the separate account level or to related insurance products. Inclusion of these charges would reduce the total return figures for all periods shown. |
The accompanying notes are an integral part of the financial statements.
216
MML Series Investment Fund – Financial Statements (Continued) |
Financial Highlights (For a share outstanding throughout each period) |
MML Equity Index Fund
Income (loss) from investment |
Less distributions to shareholders |
Ratios / Supplemental Data |
||||||||||
Net |
Net |
Net |
Total |
From net |
From net |
Total |
Net |
Total |
Net |
Ratio of |
Net |
|
Class I |
||||||||||||
12/31/22 |
$ 35.26 |
$ 0.35 |
$ (6.73) |
$ (6.38) |
$ (0.31) |
$ (1.84) |
$ (2.15) |
$ 26.73 |
(18.50%) |
$ 47,938 |
0.43% |
1.18% |
12/31/21 |
29.07 |
0.31 |
7.77 |
8.08 |
(0.43) |
(1.46) |
(1.89) |
35.26 |
28.19% |
65,271 |
0.42% |
0.96% |
12/31/20 |
32.46 |
0.42 |
4.71 |
5.13 |
(0.55) |
(7.97) |
(8.52) |
29.07 |
18.06% |
61,002 |
0.43% |
1.43% |
12/31/19 |
28.09 |
0.48 |
7.71 |
8.19 |
(0.90) |
(2.92) |
(3.82) |
32.46 |
30.86% |
57,944 |
0.44% |
1.51% |
12/31/18 |
31.01 |
0.49 |
(1.76) |
(1.27) |
(0.50) |
(1.15) |
(1.65) |
28.09 |
(4.80%) |
51,998 |
0.43% |
1.57% |
Class II |
||||||||||||
12/31/22 |
$ 35.22 |
$ 0.39 |
$ (6.70) |
$ (6.31) |
$ (0.38) |
$ (1.84) |
$ (2.22) |
$ 26.69 |
(18.35%) |
$ 191,941 |
0.28% |
1.32% |
12/31/21 |
29.04 |
0.36 |
7.76 |
8.12 |
(0.48) |
(1.46) |
(1.94) |
35.22 |
28.37% |
299,922 |
0.27% |
1.11% |
12/31/20 |
32.45 |
0.46 |
4.71 |
5.17 |
(0.61) |
(7.97) |
(8.58) |
29.04 |
18.21% |
239,890 |
0.28% |
1.58% |
12/31/19 |
28.10 |
0.52 |
7.72 |
8.24 |
(0.97) |
(2.92) |
(3.89) |
32.45 |
31.06% |
209,951 |
0.29% |
1.66% |
12/31/18 |
31.01 |
0.54 |
(1.75) |
(1.21) |
(0.55) |
(1.15) |
(1.70) |
28.10 |
(4.63%) |
159,638 |
0.28% |
1.72% |
Class III |
||||||||||||
12/31/22 |
$ 35.15 |
$ 0.44 |
$ (6.70) |
$ (6.26) |
$ (0.42) |
$ (1.84) |
$ (2.26) |
$ 26.63 |
(18.23%) |
$ 274,717 |
0.13% |
1.48% |
12/31/21 |
28.98 |
0.41 |
7.74 |
8.15 |
(0.52) |
(1.46) |
(1.98) |
35.15 |
28.54% |
359,612 |
0.12% |
1.26% |
12/31/20 |
32.39 |
0.50 |
4.71 |
5.21 |
(0.65) |
(7.97) |
(8.62) |
28.98 |
18.41% |
307,589 |
0.13% |
1.72% |
12/31/19 |
28.05 |
0.57 |
7.70 |
8.27 |
(1.01) |
(2.92) |
(3.93) |
32.39 |
31.27% |
268,217 |
0.14% |
1.82% |
12/31/18 |
30.97 |
0.59 |
(1.75) |
(1.16) |
(0.60) |
(1.16) |
(1.76) |
28.05 |
(4.52%) |
391,891 |
0.13% |
1.87% |
Service Class I |
||||||||||||
12/31/22 |
$ 33.55 |
$ 0.26 |
$ (6.39) |
$ (6.13) |
$ (0.23) |
$ (1.84) |
$ (2.07) |
$ 25.35 |
(18.69%) |
$ 34,664 |
0.68% |
0.92% |
12/31/21 |
27.76 |
0.22 |
7.40 |
7.62 |
(0.37) |
(1.46) |
(1.83) |
33.55 |
27.86% |
52,483 |
0.67% |
0.71% |
12/31/20 |
31.35 |
0.33 |
4.52 |
4.85 |
(0.47) |
(7.97) |
(8.44) |
27.76 |
17.74% |
44,361 |
0.68% |
1.18% |
12/31/19 |
27.24 |
0.38 |
7.48 |
7.86 |
(0.83) |
(2.92) |
(3.75) |
31.35 |
30.56% |
45,967 |
0.69% |
1.26% |
12/31/18 |
30.13 |
0.40 |
(1.70) |
(1.30) |
(0.43) |
(1.16) |
(1.59) |
27.24 |
(5.04%) |
40,822 |
0.68% |
1.32% |
Year ended December 31 |
|||||
2022 |
2021 |
2020 |
2019 |
2018 |
|
Portfolio turnover rate |
2% |
3% |
5% |
5% |
3% |
|
c |
Per share amount calculated on the average shares method. |
|
m |
Total return does not reflect expenses that apply at the separate account level or to related insurance products. Inclusion of these charges would reduce the total return figures for all periods shown. |
The accompanying notes are an integral part of the financial statements.
217
MML Series Investment Fund – Financial Statements (Continued) |
Financial Highlights (For a share outstanding throughout each period) |
MML Focused Equity Fund
Income (loss) from investment |
Less distributions to shareholders |
Ratios / Supplemental Data |
|||||||||||
Net |
Net |
Net |
Total |
From net |
From net |
Total |
Net |
Total |
Net |
Ratio of |
Ratio of |
Net |
|
Class II |
|||||||||||||
12/31/22 |
$ 8.30 |
$ 0.06 |
$ (0.45) |
$ (0.39) |
$ (0.07) |
$ (0.60) |
$ (0.67) |
$ 7.24 |
(4.69%) |
$ 288,336 |
0.86% |
N/A |
0.85% |
12/31/21 |
7.25 |
0.07 |
1.51 |
1.58 |
(0.08) |
(0.45) |
(0.53) |
8.30 |
22.25% |
338,277 |
0.87% |
N/A |
0.89% |
12/31/20 |
6.77 |
0.07 |
0.76 |
0.83 |
(0.05) |
(0.30) |
(0.35) |
7.25 |
12.76% |
277,370 |
0.87% |
N/A |
1.10% |
12/31/19 |
5.33 |
0.07 |
1.53 |
1.60 |
(0.02) |
(0.14) |
(0.16) |
6.77 |
30.15% |
297,347 |
0.89% |
0.88% |
1.11% |
12/31/18 |
12.69 |
0.11 |
0.66 |
0.77 |
(0.37) |
(7.76) |
(8.13) |
5.33 |
1.18% |
48,276 |
0.95% |
0.87% |
1.25% |
Service Class I |
|||||||||||||
12/31/22 |
$ 7.96 |
$ 0.04 |
$ (0.44) |
$ (0.40) |
$ (0.05) |
$ (0.60) |
$ (0.65) |
$ 6.91 |
(5.02%) |
$ 22,509 |
1.12% |
N/A |
0.60% |
12/31/21 |
6.98 |
0.05 |
1.45 |
1.50 |
(0.07) |
(0.45) |
(0.52) |
7.96 |
21.88% |
22,988 |
1.12% |
N/A |
0.64% |
12/31/20 |
6.53 |
0.05 |
0.74 |
0.79 |
(0.04) |
(0.30) |
(0.34) |
6.98 |
12.54% |
19,686 |
1.12% |
N/A |
0.85% |
12/31/19 |
5.15 |
0.05 |
1.47 |
1.52 |
(0.00)d |
(0.14) |
(0.14) |
6.53 |
29.73% |
18,439 |
1.15% |
1.13% |
0.90% |
12/31/18 |
12.52 |
0.09 |
0.66 |
0.75 |
(0.36) |
(7.76) |
(8.12) |
5.15 |
0.99% |
10,980 |
1.20% |
1.12% |
1.01% |
Year ended December 31 |
|||||
2022 |
2021 |
2020 |
2019 |
2018 |
|
Portfolio turnover rate |
24% |
34% |
36% |
36% |
64% |
|
c |
Per share amount calculated on the average shares method. |
|
d |
Amount is less than $0.005 per share. |
|
j |
Computed after giving effect to an agreement by MML Advisers to waive certain fees and expenses of the Fund. |
|
m |
Total return does not reflect expenses that apply at the separate account level or to related insurance products. Inclusion of these charges would reduce the total return figures for all periods shown. |
The accompanying notes are an integral part of the financial statements.
218
MML Series Investment Fund – Financial Statements (Continued) |
Financial Highlights (For a share outstanding throughout each period) |
MML Foreign Fund
Income (loss) from investment |
Less distributions to shareholders |
Ratios / Supplemental Data |
|||||||||||
Net |
Net |
Net |
Total |
From net |
From net |
Total |
Net |
Total |
Net |
Ratio of |
Ratio of |
Net |
|
Initial Class |
|||||||||||||
12/31/22 |
$ 11.04 |
$ 0.22 |
$ (1.88) |
$ (1.66) |
$ (0.37) |
$ (0.69) |
$ (1.06) |
$ 8.32 |
(14.58%) |
$ 175,988 |
0.95% |
0.93% |
2.40% |
12/31/21 |
10.02 |
0.22 |
1.09 |
1.31 |
(0.29) |
— |
(0.29) |
11.04 |
13.04% |
237,547 |
0.94% |
0.92% |
1.99% |
12/31/20 |
10.10 |
0.14 |
0.37 |
0.51 |
(0.27) |
(0.32) |
(0.59) |
10.02 |
5.93% |
266,506 |
0.92% |
0.88% |
1.61% |
12/31/19 |
9.25 |
0.26 |
0.92 |
1.18 |
(0.18) |
(0.15) |
(0.33) |
10.10 |
13.17% |
307,367 |
0.94% |
0.89% |
2.69% |
12/31/18 |
11.25 |
0.20 |
(1.95) |
(1.75) |
(0.25) |
— |
(0.25) |
9.25 |
(15.90%) |
294,037 |
0.98% |
0.97% |
1.81% |
Service Class |
|||||||||||||
12/31/22 |
$ 10.98 |
$ 0.19 |
$ (1.87) |
$ (1.68) |
$ (0.34) |
$ (0.69) |
$ (1.03) |
$ 8.27 |
(14.87%) |
$ 8,819 |
1.20% |
1.19% |
2.06% |
12/31/21 |
9.95 |
0.19 |
1.10 |
1.29 |
(0.26) |
— |
(0.26) |
10.98 |
12.95% |
8,063 |
1.19% |
1.17% |
1.72% |
12/31/20 |
10.04 |
0.12 |
0.36 |
0.48 |
(0.25) |
(0.32) |
(0.57) |
9.95 |
5.57% |
8,323 |
1.17% |
1.13% |
1.36% |
12/31/19 |
9.20 |
0.24 |
0.90 |
1.14 |
(0.15) |
(0.15) |
(0.30) |
10.04 |
12.78% |
9,820 |
1.19% |
1.14% |
2.44% |
12/31/18 |
11.18 |
0.17 |
(1.93) |
(1.76) |
(0.22) |
— |
(0.22) |
9.20 |
(16.03%) |
9,324 |
1.23% |
1.22% |
1.57% |
Year ended December 31 |
|||||
2022 |
2021 |
2020 |
2019 |
2018 |
|
Portfolio turnover rate |
10% |
16% |
106% |
43% |
18% |
|
c |
Per share amount calculated on the average shares method. |
|
j |
Computed after giving effect to an agreement by MML Advisers to waive certain fees and expenses of the Fund. |
|
m |
Total return does not reflect expenses that apply at the separate account level or to related insurance products. Inclusion of these charges would reduce the total return figures for all periods shown. |
The accompanying notes are an integral part of the financial statements.
219
MML Series Investment Fund – Financial Statements (Continued) |
Financial Highlights (For a share outstanding throughout each period) |
MML Fundamental Equity Fund
Income (loss) from investment |
Less distributions to shareholders |
Ratios / Supplemental Data |
|||||||||||
Net |
Net |
Net |
Total |
From net |
From net |
Total |
Net |
Total |
Net |
Ratio of |
Ratio of |
Net |
|
Class II |
|||||||||||||
12/31/22 |
$ 12.55 |
$ 0.07 |
$ (2.50) |
$ (2.43) |
$ (0.06) |
$ (1.70) |
$ (1.76) |
$ 8.36 |
(20.24%) |
$ 147,522 |
0.81% |
N/A |
0.75% |
12/31/21 |
10.73 |
0.09 |
2.81 |
2.90 |
(0.06) |
(1.02) |
(1.08) |
12.55 |
27.67% |
220,586 |
0.81% |
N/A |
0.77% |
12/31/20 |
10.02 |
0.07 |
1.85 |
1.92 |
(0.00)d |
(1.21) |
(1.21) |
10.73 |
20.02% |
161,496 |
0.82% |
0.82%k |
0.73% |
12/31/19 |
9.37 |
0.01 |
2.92 |
2.93 |
(0.06) |
(2.22) |
(2.28) |
10.02 |
33.74% |
101,937 |
0.87% |
0.87%l |
0.09% |
12/31/18 |
12.94 |
0.06 |
0.66 |
0.72 |
(0.15) |
(4.14) |
(4.29) |
9.37 |
0.80% |
90,145 |
0.83% |
0.83%l |
0.50% |
Service Class I |
|||||||||||||
12/31/22 |
$ 12.01 |
$ 0.05 |
$ (2.39) |
$ (2.34) |
$ (0.04) |
$ (1.70) |
$ (1.74) |
$ 7.93 |
(20.44%) |
$ 19,691 |
1.06% |
N/A |
0.50% |
12/31/21 |
10.31 |
0.06 |
2.70 |
2.76 |
(0.04) |
(1.02) |
(1.06) |
12.01 |
27.38% |
25,154 |
1.06% |
N/A |
0.52% |
12/31/20 |
9.70 |
0.05 |
1.77 |
1.82 |
— |
(1.21) |
(1.21) |
10.31 |
19.59% |
19,931 |
1.08% |
1.07% |
0.48% |
12/31/19 |
9.15 |
(0.02) |
2.84 |
2.82 |
(0.05) |
(2.22) |
(2.27) |
9.70 |
33.33% |
15,457 |
1.12% |
1.12%l |
(0.16%) |
12/31/18 |
12.74 |
0.03 |
0.67 |
0.70 |
(0.15) |
(4.14) |
(4.29) |
9.15 |
0.66% |
10,401 |
1.08% |
1.08%l |
0.27% |
Year ended December 31 |
|||||
2022 |
2021 |
2020 |
2019 |
2018 |
|
Portfolio turnover rate |
56% |
56% |
113% |
129% |
61% |
|
c |
Per share amount calculated on the average shares method. |
|
d |
Amount is less than $0.005 per share. |
|
j |
Computed after giving effect to an agreement by MML Advisers to waive certain fees and expenses of the Fund. |
|
k |
Amount waived had no impact on the ratio of expenses to average daily net assets. |
|
l |
Expenses incurred during the period fell under the expense cap. |
|
m |
Total return does not reflect expenses that apply at the separate account level or to related insurance products. Inclusion of these charges would reduce the total return figures for all periods shown. |
The accompanying notes are an integral part of the financial statements.
220
MML Series Investment Fund – Financial Statements (Continued) |
Financial Highlights (For a share outstanding throughout each period) |
MML Fundamental Value Fund
Income (loss) from investment |
Less distributions to shareholders |
Ratios / Supplemental Data |
|||||||||||
Net |
Net |
Net |
Total |
From net |
From net |
Total |
Net |
Total |
Net |
Ratio of |
Ratio of |
Net |
|
Class II |
|||||||||||||
12/31/22 |
$ 14.86 |
$ 0.16 |
$ (0.88) |
$ (0.72) |
$ (0.14) |
$ (2.55) |
$ (2.69) |
$ 11.45 |
(4.86%) |
$ 145,398 |
0.82% |
0.80% |
1.21% |
12/31/21 |
11.62 |
0.12 |
3.36 |
3.48 |
(0.24) |
— |
(0.24) |
14.86 |
30.02% |
173,486 |
0.83% |
0.81% |
0.87% |
12/31/20 |
13.09 |
0.19 |
(0.08)aa |
0.11 |
(0.15) |
(1.43) |
(1.58) |
11.62 |
2.67% |
178,953 |
0.80% |
0.78% |
1.71% |
12/31/19 |
12.38 |
0.18 |
2.40 |
2.58 |
(0.27) |
(1.60) |
(1.87) |
13.09 |
22.79% |
193,994 |
0.81% |
0.79% |
1.35% |
12/31/18 |
15.42 |
0.26 |
(1.63) |
(1.37) |
(0.25) |
(1.42) |
(1.67) |
12.38 |
(10.34%) |
168,520 |
0.80% |
0.78% |
1.76% |
Service Class I |
|||||||||||||
12/31/22 |
$ 14.49 |
$ 0.12 |
$ (0.84) |
$ (0.72) |
$ (0.12) |
$ (2.55) |
$ (2.67) |
$ 11.10 |
(5.03%) |
$ 22,015 |
1.07% |
1.05% |
0.96% |
12/31/21 |
11.35 |
0.08 |
3.28 |
3.36 |
(0.22) |
— |
(0.22) |
14.49 |
29.68% |
22,062 |
1.08% |
1.06% |
0.61% |
12/31/20 |
12.83 |
0.16 |
(0.09)aa |
0.07 |
(0.12) |
(1.43) |
(1.55) |
11.35 |
2.37% |
15,956 |
1.05% |
1.03% |
1.47% |
12/31/19 |
12.17 |
0.14 |
2.36 |
2.50 |
(0.24) |
(1.60) |
(1.84) |
12.83 |
22.49% |
16,173 |
1.06% |
1.04% |
1.10% |
12/31/18 |
15.20 |
0.22 |
(1.60) |
(1.38) |
(0.23) |
(1.42) |
(1.65) |
12.17 |
(10.56%) |
13,283 |
1.05% |
1.03% |
1.53% |
Year ended December 31 |
|||||
2022 |
2021 |
2020 |
2019 |
2018 |
|
Portfolio turnover rate |
31% |
42% |
86% |
131% |
28% |
|
c |
Per share amount calculated on the average shares method. |
|
j |
Computed after giving effect to an agreement by MML Advisers to waive certain fees and expenses of the Fund. |
|
m |
Total return does not reflect expenses that apply at the separate account level or to related insurance products. Inclusion of these charges would reduce the total return figures for all periods shown. |
|
aa |
The amount shown for a share outstanding does not correspond with the aggregate net realized and unrealized gain (loss) for the period due to the timing of purchases and redemptions of Fund shares in relation to the fluctuating market values of the Fund. |
The accompanying notes are an integral part of the financial statements.
221
MML Series Investment Fund – Financial Statements (Continued) |
Financial Highlights (For a share outstanding throughout each period) |
MML Global Fund
Income (loss) from investment |
Less distributions to shareholders |
Ratios / Supplemental Data |
||||||||||
Net |
Net |
Net |
Total |
From net |
From net |
Total |
Net |
Total |
Net |
Ratio of |
Net |
|
Class I |
||||||||||||
12/31/22 |
$ 14.85 |
$ 0.06 |
$ (2.61) |
$ (2.55) |
$ (0.19) |
$ (8.11) |
$ (8.30) |
$ 4.00 |
(17.78%) |
$ 103,424 |
0.85% |
0.80% |
12/31/21 |
13.96 |
0.09 |
2.30 |
2.39 |
(0.14) |
(1.36) |
(1.50) |
14.85 |
17.32% |
151,785 |
0.80% |
0.61% |
12/31/20 |
12.86 |
0.11 |
1.61 |
1.72 |
(0.14) |
(0.48) |
(0.62) |
13.96 |
14.02% |
361,660 |
0.80% |
0.88% |
12/31/19 |
10.25 |
0.15 |
2.94 |
3.09 |
(0.08) |
(0.40) |
(0.48) |
12.86 |
30.59% |
411,174 |
0.79% |
1.23% |
12/31/18 |
13.04 |
0.15 |
(1.16) |
(1.01) |
(0.15) |
(1.63) |
(1.78) |
10.25 |
(9.53%) |
179,973 |
0.83% |
1.21% |
Class II |
||||||||||||
12/31/22 |
$ 15.27 |
$ 0.06 |
$ (2.68) |
$ (2.62) |
$ (0.22) |
$ (8.11) |
$ (8.33) |
$ 4.32 |
(17.71%) |
$ 15,307 |
0.85% |
0.81% |
12/31/21 |
14.31 |
0.09 |
2.37 |
2.46 |
(0.14) |
(1.36) |
(1.50) |
15.27 |
17.42% |
20,021 |
0.80% |
0.57% |
12/31/20 |
13.17 |
0.11 |
1.64 |
1.75 |
(0.13) |
(0.48) |
(0.61) |
14.31 |
13.96% |
18,461 |
0.80% |
0.86% |
12/31/19 |
10.48 |
0.16 |
3.00 |
3.16 |
(0.07) |
(0.40) |
(0.47) |
13.17 |
30.58% |
17,896 |
0.79% |
1.31% |
12/31/18 |
13.30 |
0.15 |
(1.19) |
(1.04) |
(0.15) |
(1.63) |
(1.78) |
10.48 |
(9.57%) |
14,950 |
0.83% |
1.21% |
Service Class I |
||||||||||||
12/31/22 |
$ 14.62 |
$ 0.04 |
$ (2.58) |
$ (2.54) |
$ (0.18) |
$ (8.11) |
$ (8.29) |
$ 3.79 |
(18.00%) |
$ 19,731 |
1.10% |
0.54% |
12/31/21 |
13.76 |
0.05 |
2.28 |
2.33 |
(0.11) |
(1.36) |
(1.47) |
14.62 |
17.16% |
19,585 |
1.05% |
0.32% |
12/31/20 |
12.69 |
0.07 |
1.59 |
1.66 |
(0.11) |
(0.48) |
(0.59) |
13.76 |
13.70% |
18,086 |
1.05% |
0.60% |
12/31/19 |
10.11 |
0.13 |
2.89 |
3.02 |
(0.04) |
(0.40) |
(0.44) |
12.69 |
30.28% |
17,108 |
1.04% |
1.06% |
12/31/18 |
12.90 |
0.12 |
(1.16) |
(1.04) |
(0.12) |
(1.63) |
(1.75) |
10.11 |
(9.84%) |
13,989 |
1.08% |
0.97% |
Year ended December 31 |
|||||
2022 |
2021 |
2020 |
2019 |
2018 |
|
Portfolio turnover rate |
14% |
9% |
13% |
16% |
15% |
|
c |
Per share amount calculated on the average shares method. |
|
m |
Total return does not reflect expenses that apply at the separate account level or to related insurance products. Inclusion of these charges would reduce the total return figures for all periods shown. |
The accompanying notes are an integral part of the financial statements.
222
MML Series Investment Fund – Financial Statements (Continued) |
Financial Highlights (For a share outstanding throughout each period) |
MML Income & Growth Fund
Income (loss) from investment |
Less distributions to shareholders |
Ratios / Supplemental Data |
||||||||||
Net |
Net |
Net |
Total |
From net |
From net |
Total |
Net |
Total |
Net |
Ratio of |
Net |
|
Initial Class |
||||||||||||
12/31/22 |
$ 12.41 |
$ 0.18 |
$ (0.25) |
$ (0.07) |
$ (0.18) |
$ (1.34) |
$ (1.52) |
$ 10.82 |
(0.31%) |
$ 188,904 |
0.70% |
1.59% |
12/31/21 |
10.00 |
0.15 |
2.47 |
2.62 |
(0.21) |
— |
(0.21) |
12.41 |
26.27% |
221,734 |
0.69% |
1.29% |
12/31/20 |
9.94 |
0.15 |
0.12aa |
0.27 |
(0.18) |
(0.03) |
(0.21) |
10.00 |
3.03% |
241,441 |
0.70% |
1.75% |
12/31/19 |
8.49 |
0.19 |
1.82 |
2.01 |
(0.19) |
(0.37) |
(0.56) |
9.94 |
24.43% |
274,290 |
0.69% |
2.00% |
12/31/18 |
12.72 |
0.21 |
(1.25) |
(1.04) |
(0.22) |
(2.97) |
(3.19) |
8.49 |
(11.68%) |
240,456 |
0.70% |
1.86% |
Service Class |
||||||||||||
12/31/22 |
$ 12.20 |
$ 0.15 |
$ (0.25) |
$ (0.10) |
$ (0.15) |
$ (1.34) |
$ (1.49) |
$ 10.61 |
(0.59%) |
$ 28,427 |
0.95% |
1.35% |
12/31/21 |
9.84 |
0.12 |
2.43 |
2.55 |
(0.19) |
— |
(0.19) |
12.20 |
25.94% |
31,557 |
0.94% |
1.07% |
12/31/20 |
9.78 |
0.13 |
0.11aa |
0.24 |
(0.15) |
(0.03) |
(0.18) |
9.84 |
2.79% |
26,998 |
0.95% |
1.50% |
12/31/19 |
8.36 |
0.16 |
1.80 |
1.96 |
(0.17) |
(0.37) |
(0.54) |
9.78 |
24.14% |
29,436 |
0.94% |
1.75% |
12/31/18 |
12.58 |
0.18 |
(1.23) |
(1.05) |
(0.20) |
(2.97) |
(3.17) |
8.36 |
(11.94%) |
24,440 |
0.95% |
1.62% |
Year ended December 31 |
|||||
2022 |
2021 |
2020 |
2019 |
2018 |
|
Portfolio turnover rate |
21% |
28% |
49% |
43% |
30% |
|
c |
Per share amount calculated on the average shares method. |
|
m |
Total return does not reflect expenses that apply at the separate account level or to related insurance products. Inclusion of these charges would reduce the total return figures for all periods shown. |
|
aa |
The amount shown for a share outstanding does not correspond with the aggregate net realized and unrealized gain (loss) for the period due to the timing of purchases and redemptions of Fund shares in relation to the fluctuating market values of the Fund. |
The accompanying notes are an integral part of the financial statements.
223
MML Series Investment Fund – Financial Statements (Continued) |
Financial Highlights (For a share outstanding throughout each period) |
MML International Equity Fund
Income (loss) from investment |
Less distributions to shareholders |
Ratios / Supplemental Data |
|||||||||||
Net |
Net |
Net |
Total |
From net |
From net |
Total |
Net |
Total |
Net |
Ratio of |
Ratio of |
Net |
|
Class II |
|||||||||||||
12/31/22 |
$ 11.08 |
$ 0.13 |
$ (1.83) |
$ (1.70) |
$ (0.11) |
$ (0.49) |
$ (0.60) |
$ 8.78 |
(15.10%) |
$ 204,861 |
1.08% |
0.98% |
1.39% |
12/31/21 |
9.98 |
0.14 |
1.03 |
1.17 |
(0.07) |
— |
(0.07) |
11.08 |
11.77% |
249,038 |
1.05% |
0.97% |
1.32% |
12/31/20 |
10.10 |
0.03 |
0.38 |
0.41 |
(0.28) |
(0.25) |
(0.53) |
9.98 |
5.37% |
159,694 |
1.07% |
1.00% |
0.39% |
12/31/19 |
8.91 |
0.29 |
1.74 |
2.03 |
(0.19) |
(0.65) |
(0.84) |
10.10 |
24.63% |
178,397 |
1.05% |
1.00% |
3.02% |
12/31/18 |
11.97 |
0.21 |
(3.02) |
(2.81) |
(0.17) |
(0.08) |
(0.25) |
8.91 |
(23.79%) |
154,540 |
1.12% |
1.00% |
1.91% |
Service Class I |
|||||||||||||
12/31/22 |
$ 10.96 |
$ 0.10 |
$ (1.81) |
$ (1.71) |
$ (0.08) |
$ (0.49) |
$ (0.57) |
$ 8.68 |
(15.35%) |
$ 8,051 |
1.33% |
1.23% |
1.12% |
12/31/21 |
9.88 |
0.12 |
1.02 |
1.14 |
(0.06) |
— |
(0.06) |
10.96 |
11.49% |
8,452 |
1.29% |
1.22% |
1.09% |
12/31/20 |
10.01 |
0.01 |
0.37 |
0.38 |
(0.26) |
(0.25) |
(0.51) |
9.88 |
5.07% |
7,021 |
1.32% |
1.25% |
0.10% |
12/31/19 |
8.84 |
0.26 |
1.73 |
1.99 |
(0.17) |
(0.65) |
(0.82) |
10.01 |
24.35% |
6,821 |
1.30% |
1.25% |
2.70% |
12/31/18 |
11.90 |
0.18 |
(2.99) |
(2.81) |
(0.17) |
(0.08) |
(0.25) |
8.84 |
(23.98%) |
4,767 |
1.37% |
1.25% |
1.64% |
Year ended December 31 |
|||||
2022 |
2021 |
2020 |
2019 |
2018 |
|
Portfolio turnover rate |
19% |
75% |
49% |
37% |
43% |
|
c |
Per share amount calculated on the average shares method. |
|
j |
Computed after giving effect to an agreement by MML Advisers to waive certain fees and expenses of the Fund. |
|
m |
Total return does not reflect expenses that apply at the separate account level or to related insurance products. Inclusion of these charges would reduce the total return figures for all periods shown. |
The accompanying notes are an integral part of the financial statements.
224
MML Series Investment Fund – Financial Statements (Continued) |
Financial Highlights (For a share outstanding throughout each period) |
MML Large Cap Growth Fund
Income (loss) from investment |
Less distributions to shareholders |
Ratios / Supplemental Data |
||||||||||
Net |
Net |
Net |
Total |
From net |
From net |
Total |
Net |
Total |
Net |
Ratio of |
Net |
|
Initial Class |
||||||||||||
12/31/22 |
$ 15.04 |
$ (0.01) |
$ (4.04) |
$ (4.05) |
$ — |
$ (1.18) |
$ (1.18) |
$ 9.81 |
(27.55%) |
$ 132,218 |
0.72% |
(0.12%) |
12/31/21 |
13.98 |
(0.01) |
2.59 |
2.58 |
(0.01) |
(1.51) |
(1.52) |
15.04 |
18.41% |
196,928 |
0.70% |
(0.10%) |
12/31/20 |
11.09 |
0.01 |
3.49 |
3.50 |
(0.04) |
(0.57) |
(0.61) |
13.98 |
31.78% |
120,464 |
0.72% |
0.10% |
12/31/19 |
9.68 |
0.05 |
2.89 |
2.94 |
(0.07) |
(1.46) |
(1.53) |
11.09 |
31.99% |
95,272 |
0.74% |
0.45% |
12/31/18 |
10.69 |
0.06 |
(0.19) |
(0.13) |
(0.07) |
(0.81) |
(0.88) |
9.68 |
(2.26%) |
83,211 |
0.72% |
0.56% |
Service Class |
||||||||||||
12/31/22 |
$ 14.33 |
$ (0.04) |
$ (3.84) |
$ (3.88) |
$ — |
$ (1.18) |
$ (1.18) |
$ 9.27 |
(27.73%) |
$ 17,968 |
0.98% |
(0.37%) |
12/31/21 |
13.41 |
(0.05) |
2.48 |
2.43 |
— |
(1.51) |
(1.51) |
14.33 |
18.08% |
25,902 |
0.95% |
(0.33%) |
12/31/20 |
10.66 |
(0.02)bb |
3.36 |
3.34 |
(0.02) |
(0.57) |
(0.59) |
13.41 |
31.53% |
22,226 |
0.97% |
(0.15%) |
12/31/19 |
9.36 |
0.02 |
2.79 |
2.81 |
(0.05) |
(1.46) |
(1.51) |
10.66 |
31.66% |
16,394 |
0.99% |
0.19% |
12/31/18 |
10.37 |
0.03 |
(0.17) |
(0.14) |
(0.06) |
(0.81) |
(0.87) |
9.36 |
(2.46%) |
10,591 |
0.97% |
0.30% |
Year ended December 31 |
|||||
2022 |
2021 |
2020 |
2019 |
2018 |
|
Portfolio turnover rate |
25% |
21% |
32% |
11% |
16% |
|
c |
Per share amount calculated on the average shares method. |
|
m |
Total return does not reflect expenses that apply at the separate account level or to related insurance products. Inclusion of these charges would reduce the total return figures for all periods shown. |
|
bb |
The amount shown for a share outstanding does not correspond with the aggregate net investment income (loss) as shown on the Statement of Operations for the period due to the timing of class-specific expenses. See Note 3 for each fund’s expense structure. |
The accompanying notes are an integral part of the financial statements.
225
MML Series Investment Fund – Financial Statements (Continued) |
Financial Highlights (For a share outstanding throughout each period) |
MML Managed Volatility Fund
Income (loss) from investment |
Less distributions to |
Ratios / Supplemental Data |
|||||||||
Net |
Net |
Net |
Total |
From net |
Total |
Net |
Total |
Net |
Ratio of |
Net |
|
Initial Class |
|||||||||||
12/31/22 |
$ 15.23 |
$ 0.07 |
$ (1.90) |
$ (1.83) |
$ (0.07) |
$ (0.07) |
$ 13.33 |
(12.05%) |
$ 83,308 |
1.08% |
0.50% |
12/31/21 |
13.78 |
0.06 |
1.53 |
1.59 |
(0.14) |
(0.14) |
15.23 |
11.54% |
114,646 |
0.99% |
0.39% |
12/31/20 |
13.10 |
0.10 |
0.76 |
0.86 |
(0.18) |
(0.18) |
13.78 |
6.68% |
116,694 |
1.06% |
0.78% |
12/31/19 |
11.90 |
0.13 |
1.28 |
1.41 |
(0.21) |
(0.21) |
13.10 |
11.90% |
124,549 |
0.97% |
1.05% |
12/31/18 |
12.63 |
0.12 |
(0.69) |
(0.57) |
(0.16) |
(0.16) |
11.90 |
(4.69%) |
121,635 |
0.96% |
0.99% |
Service Class |
|||||||||||
12/31/22 |
$ 15.10 |
$ 0.03 |
$ (1.88) |
$ (1.85) |
$ (0.03) |
$ (0.03) |
$ 13.22 |
(12.27%) |
$ 19,280 |
1.34% |
0.25% |
12/31/21 |
13.67 |
0.02 |
1.52 |
1.54 |
(0.11) |
(0.11) |
15.10 |
11.26% |
25,982 |
1.24% |
0.14% |
12/31/20 |
12.99 |
0.07 |
0.76 |
0.83 |
(0.15) |
(0.15) |
13.67 |
6.42% |
26,901 |
1.31% |
0.53% |
12/31/19 |
11.80 |
0.10 |
1.26 |
1.36 |
(0.17) |
(0.17) |
12.99 |
11.62% |
30,588 |
1.22% |
0.81% |
12/31/18 |
12.53 |
0.09 |
(0.70) |
(0.61) |
(0.12) |
(0.12) |
11.80 |
(4.93%) |
28,963 |
1.21% |
0.74% |
Year ended December 31 |
|||||
2022 |
2021 |
2020 |
2019 |
2018 |
|
Portfolio turnover rate |
8% |
5% |
20% |
2% |
5% |
|
c |
Per share amount calculated on the average shares method. |
|
m |
Total return does not reflect expenses that apply at the separate account level or to related insurance products. Inclusion of these charges would reduce the total return figures for all periods shown. |
The accompanying notes are an integral part of the financial statements.
226
MML Series Investment Fund – Financial Statements (Continued) |
Financial Highlights (For a share outstanding throughout each period) |
MML Mid Cap Growth Fund
Income (loss) from investment |
Less distributions to shareholders |
Ratios / Supplemental Data |
||||||||||
Net |
Net |
Net |
Total |
From net |
From net |
Total |
Net |
Total |
Net |
Ratio of |
Net |
|
Initial Class |
||||||||||||
12/31/22 |
$ 16.52 |
$ (0.03) |
$ (3.89) |
$ (3.92) |
$ — |
$ (3.81) |
$ (3.81) |
$ 8.79 |
(25.11%) |
$ 229,303 |
0.82% |
(0.23%) |
12/31/21 |
18.10 |
(0.07) |
2.48 |
2.41 |
— |
(3.99) |
(3.99) |
16.52 |
13.21% |
343,781 |
0.80% |
(0.38%) |
12/31/20 |
15.88 |
(0.03) |
3.83 |
3.80 |
(0.01) |
(1.57) |
(1.58) |
18.10 |
25.57% |
434,830 |
0.81% |
(0.19%) |
12/31/19 |
13.94 |
0.02 |
4.17 |
4.19 |
(0.00)d |
(2.25) |
(2.25) |
15.88 |
31.30% |
407,351 |
0.81% |
0.12% |
12/31/18 |
16.19 |
0.01 |
(0.07) |
(0.06) |
— |
(2.19) |
(2.19) |
13.94 |
(2.17%) |
328,715 |
0.81% |
0.07% |
Service Class |
||||||||||||
12/31/22 |
$ 15.34 |
$ (0.05) |
$ (3.60) |
$ (3.65) |
$ — |
$ (3.81) |
$ (3.81) |
$ 7.88 |
(25.31%) |
$ 81,012 |
1.07% |
(0.47%) |
12/31/21 |
17.09 |
(0.11) |
2.35 |
2.24 |
— |
(3.99) |
(3.99) |
15.34 |
12.99% |
118,139 |
1.05% |
(0.63%) |
12/31/20 |
15.10 |
(0.06) |
3.62 |
3.56 |
— |
(1.57) |
(1.57) |
17.09 |
25.25% |
117,808 |
1.06% |
(0.44%) |
12/31/19 |
13.37 |
(0.02) |
4.00 |
3.98 |
— |
(2.25) |
(2.25) |
15.10 |
31.01% |
108,793 |
1.06% |
(0.13%) |
12/31/18 |
15.65 |
(0.03) |
(0.06) |
(0.09) |
— |
(2.19) |
(2.19) |
13.37 |
(2.45%) |
88,952 |
1.06% |
(0.18%) |
Year ended December 31 |
|||||
2022 |
2021 |
2020 |
2019 |
2018 |
|
Portfolio turnover rate |
32% |
33% |
66% |
28% |
26% |
|
c |
Per share amount calculated on the average shares method. |
|
d |
Amount is less than $0.005 per share. |
|
m |
Total return does not reflect expenses that apply at the separate account level or to related insurance products. Inclusion of these charges would reduce the total return figures for all periods shown. |
The accompanying notes are an integral part of the financial statements.
227
MML Series Investment Fund – Financial Statements (Continued) |
Financial Highlights (For a share outstanding throughout each period) |
MML Mid Cap Value Fund
Income (loss) from investment |
Less distributions to shareholders |
Ratios / Supplemental Data |
||||||||||
Net |
Net |
Net |
Total |
From net |
From net |
Total |
Net |
Total |
Net |
Ratio of |
Net |
|
Initial Class |
||||||||||||
12/31/22 |
$ 12.58 |
$ 0.19 |
$ (0.38) |
$ (0.19) |
$ (0.26) |
$ (2.96) |
$ (3.22) |
$ 9.17 |
(1.33%) |
$ 247,316 |
0.90% |
1.76% |
12/31/21 |
10.59 |
0.17 |
2.28 |
2.45 |
(0.18) |
(0.28) |
(0.46) |
12.58 |
23.31% |
295,384 |
0.88% |
1.39% |
12/31/20 |
10.60 |
0.15 |
0.01 |
0.16 |
(0.17) |
— |
(0.17) |
10.59 |
1.71% |
348,614 |
0.89% |
1.62% |
12/31/19 |
9.35 |
0.17 |
2.37 |
2.54 |
(0.18) |
(1.11) |
(1.29) |
10.60 |
29.13% |
389,141 |
0.88% |
1.65% |
12/31/18 |
12.14 |
0.15 |
(1.48) |
(1.33) |
(0.19) |
(1.27) |
(1.46) |
9.35 |
(12.99%) |
343,432 |
0.88% |
1.30% |
Service Class |
||||||||||||
12/31/22 |
$ 12.31 |
$ 0.16 |
$ (0.37) |
$ (0.21) |
$ (0.23) |
$ (2.96) |
$ (3.19) |
$ 8.91 |
(1.56%) |
$ 50,294 |
1.15% |
1.52% |
12/31/21 |
10.38 |
0.14 |
2.22 |
2.36 |
(0.15) |
(0.28) |
(0.43) |
12.31 |
22.95% |
55,704 |
1.13% |
1.16% |
12/31/20 |
10.39 |
0.13 |
0.00d |
0.13 |
(0.14) |
— |
(0.14) |
10.38 |
1.48% |
51,269 |
1.14% |
1.37% |
12/31/19 |
9.18 |
0.14 |
2.33 |
2.47 |
(0.15) |
(1.11) |
(1.26) |
10.39 |
28.90% |
53,223 |
1.13% |
1.40% |
12/31/18 |
11.96 |
0.12 |
(1.47) |
(1.35) |
(0.16) |
(1.27) |
(1.43) |
9.18 |
(13.31%) |
43,275 |
1.13% |
1.06% |
Year ended December 31 |
|||||
2022 |
2021 |
2020 |
2019 |
2018 |
|
Portfolio turnover rate |
70% |
46% |
74% |
39% |
59% |
|
c |
Per share amount calculated on the average shares method. |
|
d |
Amount is less than $0.005 per share. |
|
m |
Total return does not reflect expenses that apply at the separate account level or to related insurance products. Inclusion of these charges would reduce the total return figures for all periods shown. |
The accompanying notes are an integral part of the financial statements.
228
MML Series Investment Fund – Financial Statements (Continued) |
Financial Highlights (For a share outstanding throughout each period) |
MML Small Cap Growth Equity Fund
Income (loss) from investment |
Less distributions |
Ratios / Supplemental Data |
||||||||||
Net |
Net |
Net |
Total |
From net |
Total |
Net |
Total |
Net |
Ratio of |
Ratio of |
Net |
|
Initial Class |
||||||||||||
12/31/22 |
$ 15.26 |
$ (0.01) |
$ (3.26) |
$ (3.27) |
$ (3.57) |
$ (3.57) |
$ 8.42 |
(23.15%) |
$ 116,615 |
1.13% |
1.10% |
(0.07%) |
12/31/21 |
16.86 |
(0.09) |
1.31 |
1.22 |
(2.82) |
(2.82) |
15.26 |
7.31% |
165,781 |
1.10% |
1.07% |
(0.50%) |
12/31/20 |
14.13 |
(0.04) |
4.55 |
4.51 |
(1.78) |
(1.78) |
16.86 |
35.62% |
180,047 |
1.11% |
1.08% |
(0.27%) |
12/31/19 |
12.82 |
(0.01) |
4.11 |
4.10 |
(2.79) |
(2.79) |
14.13 |
34.32% |
170,426 |
1.11% |
1.09% |
(0.06%) |
12/31/18 |
14.98 |
(0.03) |
(0.32) |
(0.35) |
(1.81) |
(1.81) |
12.82 |
(4.87%) |
151,854 |
1.09% |
1.07% |
(0.17%) |
Service Class |
||||||||||||
12/31/22 |
$ 13.73 |
$ (0.03) |
$ (2.90) |
$ (2.93) |
$ (3.57) |
$ (3.57) |
$ 7.23 |
(23.35%) |
$ 22,650 |
1.38% |
1.35% |
(0.32%) |
12/31/21 |
15.48 |
(0.11) |
1.18 |
1.07 |
(2.82) |
(2.82) |
13.73 |
7.04% |
32,665 |
1.35% |
1.32% |
(0.75%) |
12/31/20 |
13.14 |
(0.06) |
4.18 |
4.12 |
(1.78) |
(1.78) |
15.48 |
35.29% |
31,165 |
1.36% |
1.33% |
(0.52%) |
12/31/19 |
12.11 |
(0.04) |
3.86 |
3.82 |
(2.79) |
(2.79) |
13.14 |
33.99% |
26,026 |
1.36% |
1.34% |
(0.30%) |
12/31/18 |
14.27 |
(0.06) |
(0.29) |
(0.35) |
(1.81) |
(1.81) |
12.11 |
(5.11%) |
19,281 |
1.34% |
1.32% |
(0.39%) |
Year ended December 31 |
|||||
2022 |
2021 |
2020 |
2019 |
2018 |
|
Portfolio turnover rate |
68% |
73% |
79% |
63% |
76% |
|
c |
Per share amount calculated on the average shares method. |
|
j |
Computed after giving effect to an agreement by MML Advisers to waive certain fees and expenses of the Fund. |
|
m |
Total return does not reflect expenses that apply at the separate account level or to related insurance products. Inclusion of these charges would reduce the total return figures for all periods shown. |
The accompanying notes are an integral part of the financial statements.
229
MML Series Investment Fund – Financial Statements (Continued) |
Financial Highlights (For a share outstanding throughout each period) |
MML Small Company Value Fund
Income (loss) from investment |
Less distributions to shareholders |
Ratios / Supplemental Data |
|||||||||||
Net |
Net |
Net |
Total |
From net |
From net |
Total |
Net |
Total |
Net |
Ratio of |
Ratio of |
Net |
|
Class II |
|||||||||||||
12/31/22 |
$ 17.91 |
$ 0.10 |
$ (2.20) |
$ (2.10) |
$ (0.03) |
$ (8.35) |
$ (8.38) |
$ 7.43 |
(14.78%) |
$ 51,032 |
1.08% |
0.93% |
0.87% |
12/31/21 |
15.25 |
0.03 |
3.77 |
3.80 |
(0.06) |
(1.08) |
(1.14) |
17.91 |
25.47% |
67,627 |
1.05% |
0.98% |
0.16% |
12/31/20 |
14.75 |
0.04 |
1.15 |
1.19 |
(0.03) |
(0.66) |
(0.69) |
15.25 |
9.16% |
65,955 |
1.06% |
1.01% |
0.33% |
12/31/19 |
13.86 |
0.04 |
3.20 |
3.24 |
(0.04) |
(2.31) |
(2.35) |
14.75 |
25.54% |
74,855 |
1.06% |
1.01% |
0.25% |
12/31/18 |
16.90 |
0.05 |
(2.01) |
(1.96) |
(0.06) |
(1.02) |
(1.08) |
13.86 |
(12.94%) |
66,976 |
1.02% |
0.97% |
0.30% |
Service Class I |
|||||||||||||
12/31/22 |
$ 17.15 |
$ 0.07 |
$ (2.09) |
$ (2.02) |
$ — |
$ (8.35) |
$ (8.35) |
$ 6.78 |
(15.06%) |
$ 24,640 |
1.33% |
1.18% |
0.63% |
12/31/21 |
14.66 |
(0.01)bb |
3.61 |
3.60 |
(0.03) |
(1.08) |
(1.11) |
17.15 |
25.12% |
30,943 |
1.30% |
1.23% |
(0.08%) |
12/31/20 |
14.21 |
0.01 |
1.11 |
1.12 |
(0.01) |
(0.66) |
(0.67) |
14.66 |
8.92% |
26,467 |
1.31% |
1.26% |
0.07% |
12/31/19 |
13.43 |
0.00d |
3.10 |
3.10 |
(0.01) |
(2.31) |
(2.32) |
14.21 |
25.26% |
25,636 |
1.31% |
1.26% |
0.01% |
12/31/18 |
16.43 |
0.01 |
(1.96) |
(1.95) |
(0.03) |
(1.02) |
(1.05) |
13.43 |
(13.19%) |
19,861 |
1.27% |
1.22% |
0.06% |
Year ended December 31 |
|||||
2022 |
2021 |
2020 |
2019 |
2018 |
|
Portfolio turnover rate |
42% |
127% |
29% |
24% |
22% |
|
c |
Per share amount calculated on the average shares method. |
|
d |
Amount is less than $0.005 per share. |
|
j |
Computed after giving effect to an agreement by MML Advisers to waive certain fees and expenses of the Fund. |
|
m |
Total return does not reflect expenses that apply at the separate account level or to related insurance products. Inclusion of these charges would reduce the total return figures for all periods shown. |
|
bb |
The amount shown for a share outstanding does not correspond with the aggregate net investment income (loss) as shown on the Statement of Operations for the period due to the timing of class-specific expenses. See Note 3 for each fund’s expense structure. |
The accompanying notes are an integral part of the financial statements.
230
MML Series Investment Fund – Financial Statements (Continued) |
Financial Highlights (For a share outstanding throughout each period) |
MML Small/Mid Cap Value Fund
Income (loss) from investment |
Less distributions to shareholders |
Ratios / Supplemental Data |
||||||||||
Net |
Net |
Net |
Total |
From net |
From net |
Total |
Net |
Total |
Net |
Ratio of |
Net |
|
Initial Class |
||||||||||||
12/31/22 |
$ 14.72 |
$ 0.12 |
$ (2.23) |
$ (2.11) |
$ (0.16) |
$ (3.57) |
$ (3.73) |
$ 8.88 |
(15.69%) |
$ 109,598 |
0.83% |
1.06% |
12/31/21 |
10.94 |
0.13 |
3.79 |
3.92 |
(0.14) |
— |
(0.14) |
14.72 |
35.94% |
149,280 |
0.81% |
0.99% |
12/31/20 |
11.06 |
0.09 |
0.30 |
0.39 |
(0.10) |
(0.41) |
(0.51) |
10.94 |
4.65% |
164,145 |
0.81% |
0.98% |
12/31/19 |
10.61 |
0.12 |
1.83 |
1.95 |
(0.07) |
(1.43) |
(1.50) |
11.06 |
20.39% |
179,503 |
0.81% |
1.04% |
12/31/18 |
13.99 |
0.09 |
(1.87) |
(1.78) |
(0.07) |
(1.53) |
(1.60) |
10.61 |
(15.00%) |
163,607 |
0.80% |
0.63% |
Service Class |
||||||||||||
12/31/22 |
$ 14.51 |
$ 0.09 |
$ (2.19) |
$ (2.10) |
$ (0.13) |
$ (3.57) |
$ (3.70) |
$ 8.71 |
(15.89%) |
$ 23,434 |
1.08% |
0.81% |
12/31/21 |
10.79 |
0.10 |
3.74 |
3.84 |
(0.12) |
— |
(0.12) |
14.51 |
35.64% |
29,951 |
1.06% |
0.77% |
12/31/20 |
10.92 |
0.07 |
0.28 |
0.35 |
(0.07) |
(0.41) |
(0.48) |
10.79 |
4.32% |
22,302 |
1.06% |
0.73% |
12/31/19 |
10.50 |
0.09 |
1.80 |
1.89 |
(0.04) |
(1.43) |
(1.47) |
10.92 |
19.98% |
23,295 |
1.06% |
0.80% |
12/31/18 |
13.85 |
0.05 |
(1.83) |
(1.78) |
(0.04) |
(1.53) |
(1.57) |
10.50 |
(15.12%) |
19,189 |
1.05% |
0.39% |
Year ended December 31 |
|||||
2022 |
2021 |
2020 |
2019 |
2018 |
|
Portfolio turnover rate |
42% |
50% |
60% |
35% |
38% |
|
c |
Per share amount calculated on the average shares method. |
|
m |
Total return does not reflect expenses that apply at the separate account level or to related insurance products. Inclusion of these charges would reduce the total return figures for all periods shown. |
The accompanying notes are an integral part of the financial statements.
231
MML Series Investment Fund – Financial Statements (Continued) |
Financial Highlights (For a share outstanding throughout each period) |
MML Sustainable Equity Fund
Income (loss) from investment |
Less distributions to shareholders |
Ratios / Supplemental Data |
||||||||||
Net |
Net |
Net |
Total |
From net |
From net |
Total |
Net |
Total |
Net |
Ratio of |
Net |
|
Initial Class |
||||||||||||
12/31/22 |
$ 24.54 |
$ 0.18 |
$ (4.18) |
$ (4.00) |
$ (0.20) |
$ (3.09) |
$ (3.29) |
$ 17.25 |
(17.01%) |
$ 83,958 |
0.57% |
0.90% |
12/31/21 |
20.53 |
0.17 |
5.35 |
5.52 |
(0.20) |
(1.31) |
(1.51) |
24.54 |
27.14% |
112,894 |
0.56% |
0.74% |
12/31/20 |
19.43 |
0.19 |
2.50 |
2.69 |
(0.18) |
(1.41) |
(1.59) |
20.53 |
14.51% |
105,573 |
0.57% |
1.03% |
12/31/19 |
16.35 |
0.19 |
4.86 |
5.05 |
(0.19) |
(1.78) |
(1.97) |
19.43 |
32.10% |
106,949 |
0.57% |
1.02% |
12/31/18 |
17.39 |
0.19 |
(1.07) |
(0.88) |
(0.16) |
— |
(0.16) |
16.35 |
(5.20%) |
92,893 |
0.56% |
1.07% |
Service Class |
||||||||||||
12/31/22 |
$ 24.26 |
$ 0.13 |
$ (4.12) |
$ (3.99) |
$ (0.15) |
$ (3.09) |
$ (3.24) |
$ 17.03 |
(17.20%) |
$ 46,580 |
0.82% |
0.66% |
12/31/21 |
20.33 |
0.10 |
5.29 |
5.39 |
(0.15) |
(1.31) |
(1.46) |
24.26 |
26.78% |
60,966 |
0.81% |
0.44% |
12/31/20 |
19.26 |
0.14 |
2.47 |
2.61 |
(0.13) |
(1.41) |
(1.54) |
20.33 |
14.24% |
49,786 |
0.82% |
0.78% |
12/31/19 |
16.22 |
0.14 |
4.83 |
4.97 |
(0.15) |
(1.78) |
(1.93) |
19.26 |
31.82% |
46,002 |
0.82% |
0.77% |
12/31/18 |
17.27 |
0.15 |
(1.08) |
(0.93) |
(0.12) |
— |
(0.12) |
16.22 |
(5.46%) |
33,821 |
0.81% |
0.83% |
Year ended December 31 |
|||||
2022 |
2021 |
2020 |
2019 |
2018 |
|
Portfolio turnover rate |
81% |
12% |
17% |
16% |
15% |
|
c |
Per share amount calculated on the average shares method. |
|
m |
Total return does not reflect expenses that apply at the separate account level or to related insurance products. Inclusion of these charges would reduce the total return figures for all periods shown. |
The accompanying notes are an integral part of the financial statements.
232
MML Series Investment Fund – Financial Statements (Continued) |
Financial Highlights (For a share outstanding throughout each period) |
MML Total Return Bond Fund
Income (loss) from investment |
Less distributions to shareholders |
Ratios / Supplemental Data |
|||||||||||
Net |
Net |
Net |
Total |
From net |
From net |
Total |
Net |
Total |
Net |
Ratio of |
Ratio of |
Net |
|
Class II |
|||||||||||||
12/31/22 |
$ 10.47 |
$ 0.22 |
$ (1.75) |
$ (1.53) |
$ (0.16) |
$ — |
$ (0.16) |
$ 8.78 |
(14.70%) |
$ 256,760 |
0.64% |
N/A |
2.37% |
12/31/21 |
11.28 |
0.12 |
(0.25) |
(0.13) |
(0.20) |
(0.48) |
(0.68) |
10.47 |
(1.19%) |
354,653 |
0.61% |
N/A |
1.12% |
12/31/20 |
10.74 |
0.20 |
0.74 |
0.94 |
(0.35) |
(0.05) |
(0.40) |
11.28 |
8.79% |
288,005 |
0.62% |
0.61% |
1.77% |
12/31/19 |
10.16 |
0.26 |
0.65 |
0.91 |
(0.33) |
— |
(0.33) |
10.74 |
8.91% |
342,002 |
0.61% |
0.60% |
2.48% |
12/31/18 |
10.36 |
0.25 |
(0.26) |
(0.01) |
(0.19) |
— |
(0.19) |
10.16 |
(0.07%) |
353,571 |
0.60% |
0.60%l |
2.51% |
Service Class I |
|||||||||||||
12/31/22 |
$ 10.32 |
$ 0.20 |
$ (1.73) |
$ (1.53) |
$ (0.13) |
$ — |
$ (0.13) |
$ 8.66 |
(14.90%) |
$ 37,985 |
0.89% |
N/A |
2.13% |
12/31/21 |
11.14 |
0.09 |
(0.25) |
(0.16) |
(0.18) |
(0.48) |
(0.66) |
10.32 |
(1.51%) |
50,391 |
0.86% |
N/A |
0.87% |
12/31/20 |
10.62 |
0.16 |
0.75 |
0.91 |
(0.34) |
(0.05) |
(0.39) |
11.14 |
8.60% |
51,252 |
0.87% |
0.86% |
1.47% |
12/31/19 |
10.06 |
0.23 |
0.64 |
0.87 |
(0.31) |
— |
(0.31) |
10.62 |
8.65% |
34,011 |
0.86% |
0.85% |
2.21% |
12/31/18 |
10.27 |
0.23 |
(0.27) |
(0.04) |
(0.17) |
— |
(0.17) |
10.06 |
(0.35%) |
25,533 |
0.85% |
0.85%l |
2.28% |
Year ended December 31 |
|||||
2022 |
2021 |
2020 |
2019 |
2018 |
|
Portfolio turnover rate |
417% |
441% |
328% |
219% |
250% |
|
c |
Per share amount calculated on the average shares method. |
|
j |
Computed after giving effect to an agreement by MML Advisers to waive certain fees and expenses of the Fund. |
|
l |
Expenses incurred during the period fell under the expense cap. |
|
m |
Total return does not reflect expenses that apply at the separate account level or to related insurance products. Inclusion of these charges would reduce the total return figures for all periods shown. |
The accompanying notes are an integral part of the financial statements.
233
1. The Funds
MML Series Investment Fund (the “Trust”) is registered under the Investment Company Act of 1940, as amended (the “1940 Act”), as an open-end management investment company. The Trust is organized under the laws of the Commonwealth of Massachusetts as a Massachusetts business trust pursuant to an Agreement and Declaration of Trust dated December 19, 1984, as restated May 14, 1993, and further amended and restated as of December 15, 2011, as it may be further amended from time to time. The Trust consists of the following series (each individually referred to as a “Fund” or collectively as the “Funds”):
MML Conservative Allocation Fund (“Conservative Allocation Fund”)
MML Balanced Allocation Fund (“Balanced Allocation Fund”)
MML Moderate Allocation Fund (“Moderate Allocation Fund”)
MML Growth Allocation Fund (“Growth Allocation Fund”)
MML Aggressive Allocation Fund (“Aggressive Allocation Fund”)
MML American Funds Growth Fund (“MML American Funds Growth Fund”)
MML American Funds Core Allocation Fund (“MML American Funds Core Allocation Fund”)
MML Blue Chip Growth Fund (“Blue Chip Growth Fund”)
MML Equity Income Fund (“Equity Income Fund”)
MML Equity Index Fund (“Equity Index Fund”)
MML Focused Equity Fund (“Focused Equity Fund”)
MML Foreign Fund (“Foreign Fund”)
MML Fundamental Equity Fund (“Fundamental Equity Fund”)
MML Fundamental Value Fund (“Fundamental Value Fund”)
MML Global Fund (“Global Fund”)
MML Income & Growth Fund (“Income & Growth Fund”)
MML International Equity Fund (“International Equity Fund”)
MML Large Cap Growth Fund (“Large Cap Growth Fund”)
MML Managed Volatility Fund (“Managed Volatility Fund”)
MML Mid Cap Growth Fund (“Mid Cap Growth Fund”)
MML Mid Cap Value Fund (“Mid Cap Value Fund”)
MML Small Cap Growth Equity Fund (“Small Cap Growth Equity Fund”)
MML Small Company Value Fund (“Small Company Value Fund”)
MML Small/Mid Cap Value Fund (“Small/Mid Cap Value Fund”)
MML Sustainable Equity Fund (“Sustainable Equity Fund”)
MML Total Return Bond Fund (“Total Return Bond Fund”)
The Trust makes shares of the Funds available for the investment of assets of various separate investment accounts established by Massachusetts Mutual Life Insurance Company (“MassMutual”) and by life insurance companies which are subsidiaries of MassMutual. Shares of the Trust are not offered to the general public. MassMutual, MML Bay State Life Insurance Company, C.M. Life Insurance Company, and the Allocation Funds (as defined below), which are “funds of funds” series of the Trust, are the record owners of all of the outstanding shares of the Funds.
Each share class of a Fund represents an interest in the same portfolio of assets. The principal difference among the classes is the level of service and administration fees, and shareholder and distribution service expenses borne by the classes. Because each class will have different fees and expenses, performance and share prices will vary between the classes. The classes of shares are offered to different types of investors, as outlined in the Funds’ Prospectuses.
The Conservative Allocation Fund, Balanced Allocation Fund, Moderate Allocation Fund, Growth Allocation Fund, and Aggressive Allocation Fund (the “Allocation Funds”) invest their investable assets in shares of series of the Trust and MML Series Investment Fund II advised by MML Investment Advisers, LLC (“MML Advisers”) and non-affiliated mutual funds (together, the “MML Underlying Funds”). The financial statements included herein are those of the Funds. The financial statements of the applicable MML Underlying Funds that are not Funds of the Trust are presented separately and can be obtained from the Securities and Exchange Commission’s (“SEC”) EDGAR database on its website at http://www.sec.gov or by calling MML Advisers at 1-888-309-3539.
234
Notes to Financial Statements (Continued) |
MML American Funds Growth Fund (the “Feeder Fund”) invests all of its assets in Class 1 shares of the Growth Fund, a series of the American Funds Insurance Series (the “Master Fund”). The Master Fund is an open-end investment company and organized as a Massachusetts business trust. The Feeder Fund has an investment objective that is consistent with the Master Fund. The Master Fund intends to comply with the requirements under Subchapter M of the Internal Revenue Code of 1986, as amended (the “Code”), applicable to mutual funds and intends to distribute substantially all of its taxable income and capital gains to shareholders, which includes the Feeder Fund, to qualify as a regulated investment company. The performance of the Feeder Fund is directly affected by the performance of the Master Fund. The financial statements of the Master Fund, including the Summary Investment Portfolio, are provided separately and should be read in conjunction with the Feeder Fund’s financial statements. As of December 31, 2022, the MML American Funds Growth Fund owned 0.63% of the Master Fund. The MML American Funds Core Allocation Fund invests all of its investable assets in shares of various series of American Funds Insurance Series, which are managed by Capital Research and Management Company (together, the “American Underlying Funds” and collectively with the MML Underlying Funds, the “Underlying Funds”). The SEC file number for the American Funds Insurance Series is 811-03857. Additional information related to the Master Fund’s and American Underlying Funds’ financial reports can be located on the SEC’s EDGAR database on its website at http://www.sec.gov.
2. Significant Accounting Policies
The following is a summary of significant accounting policies followed consistently by each Fund in the preparation of the financial statements in conformity with accounting principles generally accepted in the United States of America (“generally accepted accounting principles”). The preparation of the financial statements in accordance with generally accepted accounting principles requires management to make estimates and assumptions that affect the reported amounts and disclosures in the financial statements. Actual results could differ from those estimates.
Each Fund is an investment company and accordingly follows the investment company accounting and reporting guidance of the Financial Accounting Standards Board (“FASB”) Accounting Standards Codification Topic 946, Financial Services – Investment Companies.
Investment Valuation
The net asset value of each Fund’s shares is determined once daily as of the close of regular trading on the New York Stock Exchange (“NYSE”), on each day the NYSE is open for trading (a “business day”). The NYSE normally closes at 4:00 p.m. Eastern Time, but may close earlier on some days. If the NYSE is scheduled to close early, the business day will be considered to end as of the time of the NYSE’s scheduled close. A Fund will not treat an intraday disruption in NYSE trading or other event that causes an unscheduled closing of the NYSE as a close of business of the NYSE for these purposes; instead, MML Advisers will determine the fair value of a Fund’s securities in accordance with MML Advisers’ fair valuation policy and procedures. On holidays and other days when the NYSE is closed, each Fund’s net asset value generally is not calculated and the Funds do not anticipate accepting buy or sell orders. However, the value of each Fund’s assets may still be affected on such days to the extent that a Fund or an Underlying Fund or the Master Fund holds foreign securities that trade on days that foreign securities markets are open.
The net asset value of each of the Allocation Funds, Feeder Fund, and MML American Funds Core Allocation Fund is based upon the net asset value(s) of the Master Fund or Underlying Funds, as applicable. Shares of the Master Fund and Underlying Funds are valued at their closing net asset values as reported on each business day.
The Prospectuses and Statements of Additional Information (“SAIs”) for the Underlying Funds and the Master Fund, as applicable, explain the valuation methods for the Underlying Funds and the Master Fund, including the circumstances under which the Underlying Funds or the Master Fund, may use fair value pricing and the effects of doing so. Such Prospectuses and SAIs are available on the SEC’s EDGAR database on its website at http://www.sec.gov.
Equity securities and derivative contracts that are actively traded on a national securities exchange or contract market are valued on the basis of information furnished by a pricing service, which provides the last reported sale price, or, in the case of futures contracts, the settlement price, for securities or derivatives listed on the exchange or contract market or the official closing price on the NASDAQ National Market System (“NASDAQ System”), or in the case of over-the-counter (“OTC”) securities for which
235
Notes to Financial Statements (Continued) |
an official closing price is unavailable or not reported on the NASDAQ System, the last reported bid price. Portfolio securities traded on more than one national securities exchange are valued at the last price at the close of the exchange representing the principal market for such securities. Debt securities are valued on the basis of valuations furnished by a pricing service, which generally determines valuations taking into account factors such as institutional-size trading in similar securities, yield, quality, coupon rate, maturity, type of issue, trading characteristics, and other market data. Shares of other open-end mutual funds are valued at their closing net asset values as reported on each business day.
Investments for which market quotations are readily available are marked to market daily based on those quotations. Market quotations may be provided by third-party vendors or market makers, and may be determined on the basis of a variety of factors, such as broker quotations, financial modeling, and other market data, such as market indexes and yield curves, counterparty information, and foreign exchange rates. U.S. Government and agency securities may be valued on the basis of market quotations or using a model that may incorporate market observable data such as reported sales of similar securities, broker quotes, yields, bids, offers, quoted market prices, and reference data. The fair values of OTC derivative contracts, including forward, swap, and option contracts related to interest rates, foreign currencies, credit standing of reference entities, equity prices, or commodity prices, may be based on market quotations or may be modeled using a series of techniques, including simulation models, depending on the contract and the terms of the transaction. The fair values of asset-backed securities and mortgage-backed securities are estimated based on models that consider the estimated cash flows of each debt tranche of the issuer, established benchmark yield, and estimated tranche-specific spread to the benchmark yield based on the unique attributes of the tranche, including, but not limited to, prepayment speed assumptions and attributes of the collateral.
The Board of Trustees (“Trustees”) have designated MML Advisers as the Funds’ “valuation designee,” responsible for determining the fair value, in good faith, of securities and other instruments held by the Funds for which market quotations are not readily available or for which such market quotations or values are considered by MML Advisers or a subadviser to be unreliable (including, for example, certain foreign securities, thinly-traded securities, certain restricted securities, certain initial public offerings, or securities whose values may have been affected by a significant event). It is possible that a significant amount of a Fund’s assets will be subject to fair valuation in accordance with MML Advisers’ fair valuation policy and procedures. The fair value determined for an investment by MML Advisers may differ from recent market prices for the investment and may be significantly different from the value realized upon the sale of such investment.
The Funds and certain Underlying Funds or the Master Fund may invest in securities that are traded principally in foreign markets and that trade on weekends and other days when the Funds do not price their shares. As a result, the values of the Funds’ portfolio securities may change on days when the prices of the Funds’ shares are not calculated. The prices of the Funds’ shares will reflect any such changes when the prices of the Funds’ shares are next calculated, which is the next business day. The Funds may use fair value pricing more frequently for securities primarily traded in foreign markets because, among other things, most foreign markets close well before the Funds value their securities. The earlier close of these foreign markets gives rise to the possibility that significant events, including broad market moves, may have occurred in the interim. The Funds’ investments may be priced based on fair values provided by a third-party vendor, based on certain factors and methodologies applied by such vendor, in the event that there is movement in the U.S. market, between the close of the foreign market and the time the Funds calculate their net asset values. All assets and liabilities expressed in foreign currencies are converted into U.S. dollars at the mean between the buying and selling rates of such currencies against the U.S. dollar at the end of each business day.
Investments in equity or debt issued by privately held companies or funds (“Private Company” or collectively, the “Private Companies”) and any other investments fair valued using significant unobservable inputs may be fair valued using one or a combination of, but not limited to, the following inputs:
Market approach: (i) recent market transactions, including subsequent rounds of financing, in the underlying investment or comparable issuers; (ii) recapitalizations and other transactions across the capital structure; and (iii) market multiples of comparable issuers.
Income approach: (i) future cash flows discounted to present value and adjusted as appropriate for liquidity, credit, and/or market risks; (ii) quoted prices for similar investments or assets in active markets; and (iii) other risk factors, such as interest rates, yield curves, volatilities, prepayment speeds, loss severities, credit risks, recovery rates, liquidation amounts, and/or default rates.
236
Notes to Financial Statements (Continued) |
Cost approach: (i) audited or unaudited financial statements, investor communications, and financial or operational metrics issued by the Private Company; (ii) changes in the valuation of relevant indexes or publicly traded companies comparable to the Private Company; (iii) relevant news and other public sources; and (iv) known secondary market transactions in the Private Company’s interests and merger or acquisition activity in companies comparable to the Private Company.
Investments in series of preferred stock issued by Private Companies are typically valued utilizing the Market approach in determining the enterprise value of the company. Such investments often contain rights and preferences that differ from other series of preferred and common stock of the same issuer. Valuation techniques such as the current value method (“CVM”), an option pricing model (“OPM”), a probability weighted expected return model (“PWERM”), or a hybrid of those techniques are used in allocating enterprise value of the company, as deemed appropriate under the circumstances. The CVM allocates value among the various parts of a company’s capital structure assuming that the value of convertible preferred stock is represented by the most favorable claim the preferred stockholders have on the enterprise value as of the valuation date. The use of OPM and PWERM techniques involve a determination of the exit scenarios of the investment in order to appropriately allocate the enterprise value of the company among the various parts of its capital structure.
The Private Companies are not subject to the public company disclosure, timing, and reporting standards as other investments held by a Fund. Typically, the most recently available information for a Private Company is as of a date that is earlier than the date a Fund is calculating its net asset value. This factor may result in a difference between the value of the investment and the price a Fund could receive upon the sale of the investment.
Fair value is defined as the price that would be received to sell an asset or paid to transfer a liability in an orderly transaction between market participants at the measurement date. A three-tier hierarchy is utilized to maximize the use of observable market data inputs and minimize the use of unobservable inputs and to establish classification of fair value measurements for disclosure purposes. Inputs refer broadly to the assumptions that market participants would use in pricing the asset or liability, including assumptions about risk, for example, the risk inherent in a particular valuation technique used to measure fair value (such as a pricing model) and/or the risk inherent in the inputs to the valuation technique. Inputs may be observable or unobservable. Observable inputs are inputs that reflect the assumptions market participants would use in pricing the asset or liability and are developed based on market data obtained from sources independent of the reporting entity. Unobservable inputs are inputs that reflect the reporting entity’s own assumptions about the assumptions market participants would use in pricing the asset or liability and are developed based on the best information available in the circumstances. The three-tier hierarchy of inputs is summarized in the three broad Levels listed below. The inputs or methodology used for valuing investments are not necessarily an indication of the risk associated with investing in those investments and the determination of the significance of a particular input to the fair value measurement in its entirety requires judgment and consideration of factors specific to each security.
Level 1 – quoted prices (unadjusted) in active markets for identical investments that the Funds can access at the measurement date
Level 2 – other significant observable inputs (including quoted prices for similar investments, interest rates, prepayment speeds, credit risk, etc.)
Level 3 – significant unobservable inputs, to the extent observable inputs are not available (including the Funds’ own assumptions in determining the fair value of investments)
The availability of observable inputs can vary from security to security and is affected by a wide variety of factors, including, for example, the type of security, whether the security is new and not yet established in the marketplace, the liquidity of markets, and other characteristics particular to the security. To the extent that valuation is based on models or inputs that are less observable or unobservable in the market, the determination of fair value requires more judgment. Accordingly, the degree of judgment exercised in determining fair value is greatest for instruments categorized in Level 3.
Changes in valuation techniques may result in transfers in or out of an investment’s assigned Level within the hierarchy. In addition, in periods of market dislocation, the observability of prices and inputs may be reduced for many instruments. This condition, as well as changes related to liquidity of investments, could cause a security to be reclassified between Levels.
237
Notes to Financial Statements (Continued) |
In certain cases, the inputs used to measure fair value may fall into different Levels of the fair value hierarchy. In such cases, for disclosure purposes, the Level in the fair value hierarchy within which the fair value measurement falls is determined based on the lowest Level input that is significant to the overall fair value measurement.
The Allocation Funds, Feeder Fund, and MML American Funds Core Allocation Fund characterized all investments at Level 1, as of December 31, 2022. The Focused Equity Fund, Fundamental Equity Fund, Fundamental Value Fund, Income & Growth Fund, Large Cap Growth Fund, Small Cap Growth Equity Fund, and Small/Mid Cap Value Fund characterized all long-term investments at Level 1, and all short-term investments at Level 2, as of December 31,2022. For each Fund noted in the preceding sentences, the level classification by major category of investments is the same as the category presentation in the Portfolio of Investments.
The following is the aggregate value by input level, as of December 31, 2022, for the remaining Funds’ investments:
Level 1 |
Level 2 |
Level 3 |
Total |
|||||||||||||
Blue Chip Growth Fund |
||||||||||||||||
Asset Investments |
||||||||||||||||
Common Stock |
$ | 354,139,661 | $ | 2,566,775 | * | $ | 727,786 | ** | $ | 357,434,222 | ||||||
Preferred Stock |
— | — | 789,254 | ** | 789,254 | |||||||||||
Corporate Debt |
— | 488,679 | — | 488,679 | ||||||||||||
Short-Term Investments |
101 | 3,329,992 | — | 3,330,093 | ||||||||||||
Total Investments |
$ | 354,139,762 | $ | 6,385,446 | $ | 1,517,040 | $ | 362,042,248 | ||||||||
Equity Income Fund |
||||||||||||||||
Asset Investments |
||||||||||||||||
Common Stock |
$ | 360,274,935 | $ | 12,136,288 | * | $ | — | $ | 372,411,223 | |||||||
Preferred Stock |
4,853,642 | 2,540,768 | — | 7,394,410 | ||||||||||||
Short-Term Investments |
1,093 | 3,113,926 | — | 3,115,019 | ||||||||||||
Total Investments |
$ | 365,129,670 | $ | 17,790,982 | $ | — | $ | 382,920,652 | ||||||||
Equity Index Fund |
||||||||||||||||
Asset Investments |
||||||||||||||||
Common Stock |
$ | 543,564,204 | $ | — | $ | — | $ | 543,564,204 | ||||||||
Short-Term Investments |
— | 5,315,512 | — | 5,315,512 | ||||||||||||
Total Investments |
$ | 543,564,204 | $ | 5,315,512 | $ | — | $ | 548,879,716 | ||||||||
Liability Derivatives |
||||||||||||||||
Futures Contracts |
$ | (197,323 | ) | $ | — | $ | — | $ | (197,323 | ) | ||||||
Foreign Fund |
||||||||||||||||
Asset Investments |
||||||||||||||||
Common Stock* |
||||||||||||||||
Australia |
$ | 663,935 | $ | 6,268,816 | $ | — | $ | 6,932,751 | ||||||||
Belgium |
— | 6,341,266 | — | 6,341,266 | ||||||||||||
Canada |
1,221,892 | — | — | 1,221,892 | ||||||||||||
Cayman Islands |
— | 4,704,384 | — | 4,704,384 | ||||||||||||
Finland |
— | 2,309,259 | — | 2,309,259 | ||||||||||||
France |
— | 20,764,597 | — | 20,764,597 | ||||||||||||
Germany |
— | 21,547,821 | — | 21,547,821 | ||||||||||||
Ireland |
2,022,316 | 5,939,785 | — | 7,962,101 | ||||||||||||
Israel |
1,804,088 | — | — | 1,804,088 | ||||||||||||
Italy |
— | 596,008 | — | 596,008 | ||||||||||||
Japan |
— | 34,162,025 | — | 34,162,025 | ||||||||||||
Luxembourg |
— | 1,573,984 | — | 1,573,984 | ||||||||||||
238
Notes to Financial Statements (Continued) |
Level 1 |
Level 2 |
Level 3 |
Total |
|||||||||||||
Foreign Fund (Continued) |
||||||||||||||||
Asset Investments (Continued) |
||||||||||||||||
Common Stock* (Continued) |
||||||||||||||||
Netherlands |
$ | 3,820,541 | $ | 7,506,669 | $ | — | $ | 11,327,210 | ||||||||
Norway |
— | 1,533,179 | — | 1,533,179 | ||||||||||||
Republic of Korea |
— | 2,795,819 | — | 2,795,819 | ||||||||||||
Singapore |
— | 2,658,223 | — | 2,658,223 | ||||||||||||
Sweden |
— | 4,211,449 | — | 4,211,449 | ||||||||||||
Switzerland |
— | 17,675,011 | — | 17,675,011 | ||||||||||||
United Kingdom |
755,827 | 31,198,356 | — | 31,954,183 | ||||||||||||
Mutual Funds |
1,268,198 | — | — | 1,268,198 | ||||||||||||
Short-Term Investments |
— | 2,062,706 | — | 2,062,706 | ||||||||||||
Total Investments |
$ | 11,556,797 | $ | 173,849,357 | $ | — | $ | 185,406,154 | ||||||||
Global Fund |
||||||||||||||||
Asset Investments |
||||||||||||||||
Common Stock* |
||||||||||||||||
Austria |
$ | — | $ | 551,783 | $ | — | $ | 551,783 | ||||||||
Canada |
5,268,737 | — | — | 5,268,737 | ||||||||||||
Denmark |
— | 735,749 | — | 735,749 | ||||||||||||
France |
— | 15,789,930 | — | 15,789,930 | ||||||||||||
Germany |
— | 5,574,978 | — | 5,574,978 | ||||||||||||
Ireland |
11,597,656 | 3,150,366 | — | 14,748,022 | ||||||||||||
Israel |
1,374,387 | — | — | 1,374,387 | ||||||||||||
Japan |
— | 2,246,712 | — | 2,246,712 | ||||||||||||
Mexico |
392,829 | — | — | 392,829 | ||||||||||||
Netherlands |
— | 3,172,048 | — | 3,172,048 | ||||||||||||
Republic of Korea |
— | 1,269,716 | — | 1,269,716 | ||||||||||||
Spain |
— | 1,036,239 | — | 1,036,239 | ||||||||||||
Sweden |
— | 2,151,728 | — | 2,151,728 | ||||||||||||
Switzerland |
— | 12,577,766 | — | 12,577,766 | ||||||||||||
United Kingdom |
515,288 | 9,487,761 | — | 10,003,049 | ||||||||||||
United States |
60,337,213 | — | — | 60,337,213 | ||||||||||||
Mutual Funds |
2,871,499 | — | — | 2,871,499 | ||||||||||||
Warrants |
87,842 | — | — | 87,842 | ||||||||||||
Short-Term Investments |
— | 570,957 | — | 570,957 | ||||||||||||
Total Investments |
$ | 82,445,451 | $ | 58,315,733 | $ | — | $ | 140,761,184 | ||||||||
International Equity Fund |
||||||||||||||||
Asset Investments |
||||||||||||||||
Common Stock* |
||||||||||||||||
Australia |
$ | — | $ | 547,568 | $ | — | $ | 547,568 | ||||||||
Belgium |
— | 2,280,907 | — | 2,280,907 | ||||||||||||
Canada |
7,264,845 | — | — | 7,264,845 | ||||||||||||
Cayman Islands |
697,877 | 3,834,183 | — | 4,532,060 | ||||||||||||
Denmark |
— | 5,717,584 | — | 5,717,584 | ||||||||||||
France |
— | 38,006,549 | — | 38,006,549 | ||||||||||||
Germany |
— | 33,716,771 | — | 33,716,771 | ||||||||||||
Hong Kong |
— | 3,536,458 | — | 3,536,458 | ||||||||||||
India |
799,713 | 331,781 | — | 1,131,494 | ||||||||||||
Ireland |
2,760,812 | 2,013,815 | — | 4,774,627 | ||||||||||||
Israel |
1,969,736 | — | — | 1,969,736 | ||||||||||||
Italy |
— | 5,650,613 | — | 5,650,613 | ||||||||||||
239
Notes to Financial Statements (Continued) |
Level 1 |
Level 2 |
Level 3 |
Total |
|||||||||||||
International Equity Fund (Continued) |
||||||||||||||||
Asset Investments (Continued) |
||||||||||||||||
Common Stock* (Continued) |
||||||||||||||||
Japan |
$ | — | $ | 21,038,438 | $ | — | $ | 21,038,438 | ||||||||
Mexico |
187,416 | — | — | 187,416 | ||||||||||||
Netherlands |
— | 10,463,506 | — | 10,463,506 | ||||||||||||
Portugal |
— | 1,190,930 | — | 1,190,930 | ||||||||||||
Republic of Korea |
— | 1,347,853 | — | 1,347,853 | ||||||||||||
Singapore |
— | 1,994,933 | — | 1,994,933 | ||||||||||||
Spain |
— | 1,985,498 | — | 1,985,498 | ||||||||||||
Sweden |
— | 2,281,810 | — | 2,281,810 | ||||||||||||
Switzerland |
— | 28,022,933 | — | 28,022,933 | ||||||||||||
Taiwan |
1,748,504 | — | — | 1,748,504 | ||||||||||||
United Kingdom |
927,570 | 26,622,266 | — | 27,549,836 | ||||||||||||
United States |
1,117,702 | — | — | 1,117,702 | ||||||||||||
Preferred Stock* |
||||||||||||||||
Republic of Korea |
— | 965,709 | — | 965,709 | ||||||||||||
Short-Term Investments |
— | 3,482,055 | — | 3,482,055 | ||||||||||||
Total Investments |
$ | 17,474,175 | $ | 195,032,160 | $ | — | $ | 212,506,335 | ||||||||
Managed Volatility Fund |
||||||||||||||||
Asset Investments |
||||||||||||||||
Common Stock |
$ | 100,945,818 | $ | — | $ | — | $ | 100,945,818 | ||||||||
Corporate Debt |
— | — | — | +,** | — | |||||||||||
Purchased Options |
1,045,424 | — | — | 1,045,424 | ||||||||||||
Rights |
— | — | — | +,** | — | |||||||||||
Short-Term Investments |
— | 2,717,809 | — | 2,717,809 | ||||||||||||
Total Investments |
$ | 101,991,242 | $ | 2,717,809 | $ | — | $ | 104,709,051 | ||||||||
Liability Derivatives |
||||||||||||||||
Written Options |
$ | (1,740,745 | ) | $ | — | $ | — | $ | (1,740,745 | ) | ||||||
Mid Cap Growth Fund |
||||||||||||||||
Asset Investments |
||||||||||||||||
Common Stock |
$ | 297,374,569 | $ | — | $ | 2,441,215 | $ | 299,815,784 | ||||||||
Preferred Stock |
— | — | 1,365,482 | 1,365,482 | ||||||||||||
Mutual Funds |
429,146 | — | — | 429,146 | ||||||||||||
Short-Term Investments |
103 | 9,174,518 | — | 9,174,621 | ||||||||||||
Total Investments |
$ | 297,803,818 | $ | 9,174,518 | $ | 3,806,697 | $ | 310,785,033 | ||||||||
Mid Cap Value Fund |
||||||||||||||||
Asset Investments |
||||||||||||||||
Common Stock |
$ | 262,394,593 | $ | 24,517,462 | * | $ | — | $ | 286,912,055 | |||||||
Preferred Stock |
— | 3,031,478 | * | — | 3,031,478 | |||||||||||
Mutual Funds |
3,501,396 | — | — | 3,501,396 | ||||||||||||
Short-Term Investments |
— | 2,953,179 | — | 2,953,179 | ||||||||||||
Total Investments |
$ | 265,895,989 | $ | 30,502,119 | $ | — | $ | 296,398,108 | ||||||||
Asset Derivatives |
||||||||||||||||
Forward Contracts |
$ | — | $ | 17,324 | $ | — | $ | 17,324 | ||||||||
Liability Derivatives |
||||||||||||||||
Forward Contracts |
$ | — | $ | (125,877 | ) | $ | — | $ | (125,877 | ) | ||||||
240
Notes to Financial Statements (Continued) |
Level 1 |
Level 2 |
Level 3 |
Total |
|||||||||||||
Small Company Value Fund |
||||||||||||||||
Asset Investments |
||||||||||||||||
Common Stock |
$ | 74,966,117 | $ | 463,623 | * | $ | — | $ | 75,429,740 | |||||||
Mutual Funds |
115,944 | — | — | 115,944 | ||||||||||||
Short-Term Investments |
— | 499,850 | — | 499,850 | ||||||||||||
Total Investments |
$ | 75,082,061 | $ | 963,473 | $ | — | $ | 76,045,534 | ||||||||
Asset Derivatives |
||||||||||||||||
Forward Contracts |
$ | — | $ | 2,052 | $ | — | $ | 2,052 | ||||||||
Liability Derivatives |
||||||||||||||||
Forward Contracts |
$ | — | $ | (17 | ) | $ | — | $ | (17 | ) | ||||||
Sustainable Equity Fund |
||||||||||||||||
Asset Investments |
||||||||||||||||
Common Stock |
$ | 127,583,496 | $ | 1,908,542 | * | $ | — | $ | 129,492,038 | |||||||
Mutual Funds |
827,196 | — | — | 827,196 | ||||||||||||
Short-Term Investments |
— | 214,419 | — | 214,419 | ||||||||||||
Total Investments |
$ | 128,410,692 | $ | 2,122,961 | $ | — | $ | 130,533,653 | ||||||||
Asset Derivatives |
||||||||||||||||
Forward Contracts |
$ | — | $ | 672 | $ | — | $ | 672 | ||||||||
Liability Derivatives |
||||||||||||||||
Forward Contracts |
$ | — | $ | (4,754 | ) | $ | — | $ | (4,754 | ) | ||||||
Total Return Bond Fund |
||||||||||||||||
Asset Investments |
||||||||||||||||
Common Stock |
$ | 162,225 | $ | — | $ | — | $ | 162,225 | ||||||||
Bank Loans (Less Unfunded Loan Commitments) |
— | 6,317,374 | — | 6,317,374 | ||||||||||||
Corporate Debt |
— | 84,826,806 | — | +,** | 84,826,806 | |||||||||||
Municipal Obligations |
— | 2,943,983 | — | 2,943,983 | ||||||||||||
Non-U.S. Government Agency Obligations |
— | 52,570,299 | — | 52,570,299 | ||||||||||||
Sovereign Debt Obligations |
— | 3,020,569 | — | 3,020,569 | ||||||||||||
U.S. Government Agency Obligations and Instrumentalities |
— | 107,920,795 | — | 107,920,795 | ||||||||||||
U.S. Treasury Obligations |
— | 81,469,083 | — | 81,469,083 | ||||||||||||
Rights |
— | — | — | +,** | — | |||||||||||
Mutual Funds |
27,895,588 | — | — | 27,895,588 | ||||||||||||
Short-Term Investments |
— | 33,219,261 | — | 33,219,261 | ||||||||||||
Unfunded Loan Commitments*** |
— | (2,127 | ) | — | (2,127 | ) | ||||||||||
Total Investments |
$ | 28,057,813 | $ | 372,286,043 | $ | — | $ | 400,343,856 | ||||||||
Asset Derivatives |
||||||||||||||||
Futures Contracts |
$ | 77,563 | $ | — | $ | — | $ | 77,563 | ||||||||
Swap Agreements |
— | 798,488 | — | 798,488 | ||||||||||||
Total |
$ | 77,563 | $ | 798,488 | $ | — | $ | 876,051 | ||||||||
Liability Derivatives |
||||||||||||||||
Forward Contracts |
$ | — | $ | (50,207 | ) | $ | — | $ | (50,207 | ) | ||||||
Futures Contracts |
(11,348 | ) | — | — | (11,348 | ) | ||||||||||
Swap Agreements |
— | (2,563,258 | ) | — | (2,563,258 | ) | ||||||||||
Total |
$ | (11,348 | ) | $ | (2,613,465 | ) | $ | — | $ | (2,624,813 | ) | |||||
|
* |
Includes foreign equity securities whose values were adjusted to reflect market trading of comparable securities or other correlated instruments after the close of trading in their respective foreign markets, as applicable. |
|
** |
Level 3 investments at December 31, 2022 in relation to net assets were not significant. |
|
*** |
Unfunded loan commitments are valued at the unrealized appreciation/(depreciation) on the commitment. |
|
+ |
Represents a security at $0 value as of December 31, 2022. |
241
Notes to Financial Statements (Continued) |
For certain Fund(s) the Statement of Assets and Liabilities shows receivables from investments sold on a delayed delivery basis and cash collateral pledged for open derivatives, as well as, any applicable liabilities for investments purchased on a delayed delivery basis, amounts due to custodian, and cash collateral held for securities on loan. These amounts approximate fair value and would be categorized at Level 2 for each applicable Fund as of December 31, 2022.
The Funds had no Level 3 transfers during the year ended December 31, 2022.
Following is a reconciliation of investments for which significant unobservable inputs (Level 3) were used in determining value:
Asset Valuation Inputs |
||||||||||||||||||||||||||||||||||||||||
Investments in Securities |
||||||||||||||||||||||||||||||||||||||||
Balance |
Accrued |
Realized Gain |
Change in |
Purchases |
(Sales) |
Transfers into |
Transfers |
Balance |
Net Change |
|||||||||||||||||||||||||||||||
Mid Cap Growth Fund |
||||||||||||||||||||||||||||||||||||||||
Common Stock |
$ | 981,778 | $ | — | $ | — | $ | 1,459,437 | $ | — | $ | — | $ | — | $ | — | $ | 2,441,215 | $ | 1,459,437 | ||||||||||||||||||||
Preferred Stock |
1,975,351 | — | (963 | ) | (475,311 | ) | — | (133,595 | ) | — | — | 1,365,482 | (456,472 | ) | ||||||||||||||||||||||||||
| $ | 2,957,129 | $ | — | $ | (963 | ) | $ | 984,126 | $ | — | $ | (133,595 | ) | $ | — | $ | — | $ | 3,806,697 | $ | 1,002,965 | |||||||||||||||||||
The Mid Cap Growth Fund may fair value certain of its Level 3 investments using acquisition cost, although the transaction may not have occurred during the current reporting period. These investments are generally privately held investments, but may include defaulted securities and new debt issuances. There may not be a secondary market for such investments, and/or there are a limited number of investors. The determination to fair value such investments at cost is based upon factors consistent with the principles of fair value measurement that are reasonably available to the Valuation Committee. Valuations are reviewed by members of the Valuation Committee utilizing available market information to determine if the carrying value of these investments should be adjusted. Such market data may include, but is not limited to, observations of the trading multiples of public companies considered comparable to the private companies being valued, financial or operational information released by the company, and/or news or corporate events that affect the investment, also referred to as enterprise value (EV) to earnings before interest, taxes, depreciation, and amortization (EBITDA) ratios. Valuations may be adjusted to account for company-specific issues, the lack of liquidity inherent in a nonpublic investment, and the fact that comparable public companies are not identical to the investments being fair valued by the Mid Cap Growth Fund. All market variables are assessed on a regular frequency and calibrated as necessary.
Security Description |
Fair Value |
Valuation |
Unobservable |
Range of Unobservable |
Weighted |
|||||||||||||||
Mid Cap Growth Fund |
||||||||||||||||||||
Common Stock |
$ | 2,441,215 | Market approach |
EV / EBITDA |
10.1 x - 14.0x | 12.1x | ||||||||||||||
Preferred Stock |
$ | 1,365,482 | Market approach |
Transaction price |
$ | 8.10 - $125.00 | $ | 58.39 | ||||||||||||
EV / Sales |
5.3x - 6.2x | 5.76x | ||||||||||||||||||
EV/ GMV |
0.29x - 0.41x | 0.33x | ||||||||||||||||||
EV/ EBITDA |
4.3x | — | ||||||||||||||||||
Total |
$ | 3,806,697 | ||||||||||||||||||
|
(a) |
A significant change in unobservable input would have resulted in a correlated significant change to value. |
242
Notes to Financial Statements (Continued) |
Abbreviation Legend
EV/ GMV - financial ratio of comparable public companies’ enterprise value to gross market value; measures the value of a comparable company in terms of its gross profit for a given year
EV/ Sales - financial ratio of comparable public companies’ enterprise value to sales; measures the value of a comparable company in terms of its sales for a given year
EV/ EBITDA - financial ratio of comparable public companies’ enterprise value to earnings; measures the value of a comparable company in terms of its expected earnings for a given year
Derivative Instruments
Derivatives are financial instruments whose values are based on the values of one or more underlying indicators, such as a security, asset, currency, interest rate, or index. Derivative transactions can create investment leverage and may be highly volatile. Losses from derivatives can be substantially greater than the derivatives’ original cost and can sometimes be unlimited. A Fund may not be able to close out a derivative transaction at a favorable time or price.
At December 31, 2022, and during the year then ended, the Fund(s) had the following derivatives and transactions in derivatives, grouped into the indicated risk categories:
Equity |
Foreign |
Interest/ |
Total |
|||||||||||||
Equity Index Fund |
||||||||||||||||
Liability Derivatives |
||||||||||||||||
Futures Contracts^^ |
$ | (197,323 | ) | $ | — | $ | — | $ | (197,323 | ) | ||||||
Realized Gain (Loss)# |
||||||||||||||||
Futures Contracts |
$ | (779,738 | ) | $ | — | $ | — | $ | (779,738 | ) | ||||||
Change in Appreciation (Depreciation)## |
||||||||||||||||
Futures Contracts |
$ | (255,686 | ) | $ | — | $ | — | $ | (255,686 | ) | ||||||
International Equity Fund |
||||||||||||||||
Realized Gain (Loss)# |
||||||||||||||||
Forward Contracts |
$ | — | $ | 85,140 | $ | — | $ | 85,140 | ||||||||
Change in Appreciation (Depreciation)## |
||||||||||||||||
Forward Contracts |
$ | — | $ | 15,249 | $ | — | $ | 15,249 | ||||||||
Managed Volatility Fund |
||||||||||||||||
Asset Derivatives |
||||||||||||||||
Purchased Options*,^^^ |
$ | 1,045,424 | $ | — | $ | — | $ | 1,045,424 | ||||||||
Liability Derivatives |
||||||||||||||||
Written Options^,^^^ |
$ | (1,740,745 | ) | $ | — | $ | — | $ | (1,740,745 | ) | ||||||
Realized Gain (Loss)# |
||||||||||||||||
Purchased Options |
$ | (43,821 | ) | $ | — | $ | — | $ | (43,821 | ) | ||||||
Written Options |
7,500,317 | — | — | 7,500,317 | ||||||||||||
Total Realized Gain (Loss) |
$ | 7,456,496 | $ | — | $ | — | $ | 7,456,496 | ||||||||
Change in Appreciation (Depreciation)## |
||||||||||||||||
Purchased Options |
$ | 91,904 | $ | — | $ | — | $ | 91,904 | ||||||||
Written Options |
1,543,945 | — | — | 1,543,945 | ||||||||||||
Total Change in Appreciation (Depreciation) |
$ | 1,635,849 | $ | — | $ | — | $ | 1,635,849 | ||||||||
243
Notes to Financial Statements (Continued) |
Equity |
Foreign |
Interest/ |
Total |
|||||||||||||
Mid Cap Value Fund |
||||||||||||||||
Asset Derivatives |
||||||||||||||||
Forward Contracts*,^^^ |
$ | — | $ | 17,324 | $ | — | $ | 17,324 | ||||||||
Liability Derivatives |
||||||||||||||||
Forward Contracts^,^^^ |
$ | — | $ | (125,877 | ) | $ | — | $ | (125,877 | ) | ||||||
Realized Gain (Loss)# |
||||||||||||||||
Forward Contracts |
$ | — | $ | 1,595,863 | $ | — | $ | 1,595,863 | ||||||||
Change in Appreciation (Depreciation)## |
||||||||||||||||
Forward Contracts |
$ | — | $ | 145,696 | $ | — | $ | 145,696 | ||||||||
Small Company Value Fund |
||||||||||||||||
Asset Derivatives |
||||||||||||||||
Forward Contracts*,^^^ |
$ | — | $ | 2,052 | $ | — | $ | 2,052 | ||||||||
Liability Derivatives |
||||||||||||||||
Forward Contracts^,^^^ |
$ | — | $ | (17 | ) | $ | — | $ | (17 | ) | ||||||
Realized Gain (Loss)# |
||||||||||||||||
Forward Contracts |
$ | — | $ | 85,942 | $ | — | $ | 85,942 | ||||||||
Change in Appreciation (Depreciation)## |
||||||||||||||||
Forward Contracts |
$ | — | $ | 7,840 | $ | — | $ | 7,840 | ||||||||
Sustainable Equity Fund |
||||||||||||||||
Asset Derivatives |
||||||||||||||||
Forward Contracts*,^^^ |
$ | — | $ | 672 | $ | — | $ | 672 | ||||||||
Liability Derivatives |
||||||||||||||||
Forward Contracts^,^^^ |
$ | — | $ | (4,754 | ) | $ | — | $ | (4,754 | ) | ||||||
Realized Gain (Loss)# |
||||||||||||||||
Forward Contracts |
$ | — | $ | 7,080 | $ | — | $ | 7,080 | ||||||||
Change in Appreciation (Depreciation)## |
||||||||||||||||
Forward Contracts |
$ | — | $ | (4,082 | ) | $ | — | $ | (4,082 | ) | ||||||
Total Return Bond Fund |
||||||||||||||||
Asset Derivatives |
||||||||||||||||
Futures Contracts^^ |
$ | — | $ | — | $ | 77,563 | $ | 77,563 | ||||||||
Swap Agreements^^,^^^ |
— | — | 798,488 | 798,488 | ||||||||||||
Total Value |
$ | — | $ | — | $ | 876,051 | $ | 876,051 | ||||||||
Liability Derivatives |
||||||||||||||||
Forward Contracts^ |
$ | — | $ | (50,207 | ) | $ | — | $ | (50,207 | ) | ||||||
Futures Contracts^^ |
— | — | (11,348 | ) | (11,348 | ) | ||||||||||
Swap Agreements^^,^^^ |
— | — | (2,563,258 | ) | (2,563,258 | ) | ||||||||||
Total Value |
$ | — | $ | (50,207 | ) | $ | (2,574,606 | ) | $ | (2,624,813 | ) | |||||
Realized Gain (Loss)# |
||||||||||||||||
Purchased Options |
$ | — | $ | — | $ | (99,807 | ) | $ | (99,807 | ) | ||||||
Forward Contracts |
— | 77,022 | — | 77,022 | ||||||||||||
Futures Contracts |
— | — | (718,873 | ) | (718,873 | ) | ||||||||||
Swap Agreements |
— | — | (66,283 | ) | (66,283 | ) | ||||||||||
Written Options |
— | — | (915,378 | ) | (915,378 | ) | ||||||||||
Total Realized Gain (Loss) |
$ | — | $ | 77,022 | $ | (1,800,341 | ) | $ | (1,723,319 | ) | ||||||
244
Notes to Financial Statements (Continued) |
Equity |
Foreign |
Interest/ |
Total |
|||||||||||||
Total Return Bond Fund (Continued) |
||||||||||||||||
Change in Appreciation (Depreciation)## |
||||||||||||||||
Purchased Options |
$ | — | $ | — | $ | 50,256 | $ | 50,256 | ||||||||
Forward Contracts |
— | (85,870 | ) | — | (85,870 | ) | ||||||||||
Futures Contracts |
— | — | 63,233 | 63,233 | ||||||||||||
Swap Agreements |
— | — | (1,499,141 | ) | (1,499,141 | ) | ||||||||||
Written Options |
— | — | (32,982 | ) | (32,982 | ) | ||||||||||
Total Change in Appreciation (Depreciation) |
$ | — | $ | (85,870 | ) | $ | (1,418,634 | ) | $ | (1,504,504 | ) | |||||
|
* |
Statements of Assets and Liabilities location: Investments, at value, or Receivables from: open forward contracts, as applicable. |
|
^ |
Statements of Assets and Liabilities location: Payables for: open forward contracts, or written options outstanding, at value, as applicable. |
|
^^ |
Cumulative appreciation/(depreciation) on futures contracts and centrally cleared swaps is reported in “Futures Contracts” and “Swap Agreements” in each applicable Fund’s Portfolio of Investments. Only current day’s variation margin, if any, is reported within the Statements of Assets and Liabilities. |
|
^^^ |
Represents centrally cleared swaps, exchange-traded purchased and written options, or forward contracts, which are not subject to a master netting agreement or similar agreement. |
|
# |
Statements of Operations location: Amounts are included in net realized gain (loss) on: investment transactions, forward contracts, futures contracts, swap agreements, or written options, as applicable. |
|
## |
Statements of Operations location: Amounts are included in net change in unrealized appreciation/(depreciation) on: investment transactions, forward contracts, futures contracts, swap agreements, or written options, as applicable. |
For the year ended December 31, 2022, the average number of contracts, notional amounts, or shares/units for each derivative type was as follows:
Average Number of Contracts, Notional Amounts, or Shares/Units † |
||||||||||||||||||||||||||||
Fund Name |
Futures |
Forward |
Swap |
Purchased |
Purchased |
Written |
Written |
|||||||||||||||||||||
Equity Index Fund |
20 | $ | — | $ | — | — | $ | — | — | $ | — | |||||||||||||||||
International Equity Fund |
— | 1,302,714 | — | — | — | — | — | |||||||||||||||||||||
Managed Volatility Fund |
— | — | — | 225 | — | 277 | — | |||||||||||||||||||||
Mid Cap Value Fund |
— | 25,374,459 | — | — | — | — | — | |||||||||||||||||||||
Small Company Value Fund |
— | 677,169 | — | — | — | — | — | |||||||||||||||||||||
Sustainable Equity Fund |
— | 1,157,646 | — | — | — | — | — | |||||||||||||||||||||
Total Return Bond Fund |
154 | 993,577 | 52,128,333 | 213 | 1,350,000 | 573 | 19,270,000 | |||||||||||||||||||||
|
† |
Amount(s) disclosed represent average number of contracts for futures contracts, notional amounts for forward contracts, swap agreements, purchased swaptions and written swaptions, or shares/units outstanding for purchased options and written options, based on absolute values, which is indicative of volume of this derivative type, for the months that the Fund held such derivatives during the year ended December 31, 2022. |
The Portfolio of Investments included in a Fund’s financial statements shows the assets or liabilities of the Fund associated with individual derivatives transactions. The terms of many of those transactions contemplate that derivatives receivables and payables between the same two parties may be netted and that the parties will collateralize certain obligations. The following tables provide an illustration of the possible effect of netting provisions and of collateral (delivered or received) on a Fund’s derivatives exposure as of December 31, 2022. Netting arrangements vary among different counterparties, and the actual disposition of derivatives receivables and payables, and of collateral, in a bankruptcy or insolvency can be complicated and difficult to predict.
245
Notes to Financial Statements (Continued) |
The following table presents derivative liabilities by counterparty net of amounts available for offset under an master netting agreement (“MNA”) or similar agreement and net of the related collateral pledged by the Fund(s) as of December 31, 2022.
Counterparty |
Derivative |
Financial |
Collateral |
Net Amount* |
||||||||||||
Total Return Bond Fund |
||||||||||||||||
Bank of America N.A. |
$ | (50,207 | ) | $ | — | $ | — | $ | (50,207 | ) | ||||||
|
* |
Represents the net amount payable to the counterparty in the event of default. |
|
** |
The amount presented here may be less than the total amount of collateral received/pledged as the net amount of derivative assets and liabilities for a counterparty cannot be less than $0. |
|
† |
The amount presented here may be less than the total amount shown in the Statements of Assets and Liabilities as some derivatives held by the counterparty are not covered within an MNA or similar agreement. |
Such agreements typically permit a single net payment in the event of default, including the bankruptcy or insolvency of the counterparty. The Fund(s) and counterparties may not be permitted to sell, re-pledge, or use the collateral they receive. In the event that cash collateral is restricted for use, the balance will be reflected as restricted cash within the Statement of Assets and Liabilities.
Further details regarding the derivatives and other investments held by the Fund(s) during the year ended December 31, 2022, are discussed below.
Foreign Currency Exchange Transactions
A Fund may enter into foreign currency exchange transactions for hedging purposes in order to protect against uncertainty in the level of future foreign currency exchange rates, or for other, non-hedging purposes.
A Fund may enter into foreign currency exchange transactions, including foreign currency forward contracts. These contracts call for the Fund to deliver in the future an amount of one currency in return for an amount of another currency, at an exchange rate determined at the time the contract is entered into. Forward contracts are private contractual arrangements and a Fund is subject to the risk that its counterparty will not, or will not be able to, perform its obligations. This type of arrangement may require the Fund to post margin. A Fund may enter into foreign currency exchange transactions in order to hedge against changes in the values of the assets or liabilities denominated in one or more foreign currencies, or otherwise to increase or reduce a Fund’s exposure to various foreign currencies. The use of foreign currency exchange transactions may create investment leverage.
Whenever a Fund enters into a foreign currency exchange transaction, it is subject to the risk that the value of the transaction will move in a direction unfavorable to it. When the Fund uses the transactions for hedging purposes, it is likely that the Fund will have an asset or liability that will offset any loss (or gain) on the transactions, at least in part. If a Fund enters into foreign currency exchange transactions other than for hedging purposes (for example, seeking to profit from an anticipated change in the values of currencies by creating directional exposures in the portfolio with respect to one or more currencies), it will generally be subject to the same risks, but is less likely to have assets or liabilities that will offset any losses on the transactions. There can be no assurance that a Fund will be able to terminate any foreign currency exchange transaction prior to its maturity in order to limit its loss on the transaction.
Forward foreign currency contracts are marked to market daily and the change in their value is recorded by the Funds as an unrealized gain or loss. Forward foreign currency contracts are valued at the settlement price established through dealers or other market sources on the day which they are traded. When a forward foreign currency contract is extinguished, through delivery or offset by entering into another forward foreign currency contract, the Funds record a realized gain or loss equal to the difference between the value of the contract at the time it was opened and the value of the contract at the time it was extinguished or offset.
246
Notes to Financial Statements (Continued) |
The notional or contractual amounts of these instruments do not necessarily represent the amounts potentially subject to risk. The measurement of the risk associated with these instruments is meaningful only when all related and offsetting transactions and counterparty risks are considered.
A Fund’s current exposure to a counterparty is the unrealized appreciation/(depreciation) on the contract.
Futures Contracts
A Fund may seek to manage a variety of different risks, such as interest rate risk, equity price risk, and currency risk, through the use of futures contracts and related options.
Futures Contracts. A Fund may use interest rate futures contracts to adjust the interest rate sensitivity (duration) of its portfolio or the credit exposure of the portfolio. Interest rate futures contracts obligate the long or short holder to take or make delivery of a specified quantity of a financial instrument, such as a specific fixed income security, during a specified future period at a specified price. A Fund may use index futures contracts to hedge against broad market risks to its portfolio or to gain broad market exposure when it holds uninvested cash or as an inexpensive substitute for cash investments directly in securities or other assets, including commodities and precious metals. Securities index futures contracts are contracts to buy or sell units of a securities index at a specified future date at a price agreed upon when the contract is made and are settled in cash. Positions in futures contracts may be closed out only on an exchange or board of trade which provides a market for such futures. Because futures contracts are exchange-traded, they typically have minimal exposure to counterparty risk.
Parties to a futures contract are not required to post the entire notional amount of the contract, but rather a small percentage of that amount (by way of margin), both at the time they enter into futures transactions, and then on a daily basis if their positions decline in value; as a result, futures contracts are highly leveraged. Such payments are known as variation margin and are recorded by the Funds as unrealized gains or losses. Because futures markets are highly leveraged, they can be extremely volatile, and there can be no assurance that the pricing of a futures contract will correlate precisely with the pricing of the asset or index underlying it or the asset or liability of the Fund that is the subject of the hedge. It may not always be possible for a Fund to enter into a closing transaction with respect to a futures contract it has entered into, at a favorable time or price. When a Fund enters into a futures transaction, it is subject to the risk that the value of the futures contract will move in a direction unfavorable to it. When a Fund uses futures contracts for hedging purposes, it is likely that the Fund will have an asset or liability that will offset any loss (or gain) on the transactions, at least in part.
Options on Futures Contracts. If a Fund buys an option on a futures contract, it will have the right to assume a futures contract at a particular price during the course of the option. Its potential loss should generally be limited to the amount of the premium paid and any transaction costs. If a Fund sells an option on a futures contract, it is subject generally to the same risks as if it had entered into a futures contract underlying the option itself.
When a futures contract is closed, the Fund records a realized gain or loss equal to the difference between the value of the contract at the time it was opened and the value at the time it was closed. Futures contracts are valued at the settlement price established each day by the board of trade or exchange on which they are traded. For information regarding the accounting treatment of options, see “Options, Rights, and Warrants” below.
Swap Agreements
Swap agreements are typically two-party contracts entered into primarily by institutional investors. In a standard “swap” transaction, two parties agree to exchange the returns (or differentials in rates of return) earned or realized on particular predetermined investments or instruments or rates, which may be adjusted for an interest factor. The gross returns to be exchanged or “swapped” between the parties are generally calculated with respect to a “notional amount,” (i.e., the return on or increase in value of a particular dollar amount invested at a particular interest rate or in a “basket” of securities representing a particular index).
247
Notes to Financial Statements (Continued) |
Interest Rate Swaps. When a Fund enters into an interest rate swap, it typically agrees to make payments to its counterparty based on a specified long- or short-term interest rate, and will receive payments from its counterparty based on another interest rate. Other forms of interest rate swap agreements include, among others, interest rate caps, under which, in return for a specified payment stream, one party agrees to make payments to the other to the extent that interest rates exceed a specified rate, or “cap”; interest rate floors, under which, in return for a specified payment stream, one party agrees to make payments to the other to the extent that interest rates fall below a specified rate, or “floor”; and interest rate collars, under which a party sells a cap and purchases a floor or vice versa in an attempt to protect itself against interest rate movements exceeding given minimum or maximum levels. A Fund may enter into an interest rate swap in order, for example, to hedge against the effect of interest rate changes on the value of specific securities in its portfolio, or to adjust the interest rate sensitivity (duration) or the credit exposure of its portfolio overall, or otherwise as a substitute for a direct investment in debt securities.
Whenever a Fund enters into a swap agreement, it takes on counterparty risk — the risk that its counterparty will be unable or unwilling to meet its obligations under the swap agreement. The Fund also takes the risk that the market will move against its position in the swap agreement. In the case of an interest rate swap, the value of the swap may increase or decrease depending on changes in interest rates. When the Fund enters into any type of swap for hedging purposes, it is likely that the Fund will have an asset or liability that will offset any loss (or gain) on the swap, at least in part. Swap agreements may be non-transferable or otherwise highly illiquid, and a Fund may not be able to terminate or transfer a swap agreement at any particular time or at an acceptable price.
Swaptions. A Fund may also enter into options on swap agreements (“swaptions”). A swaption is a contract that gives a counterparty the right (but not the obligation) to enter into a new swap agreement or to shorten, extend, cancel, or otherwise modify an existing swap agreement, at some designated future time on specified terms. A Fund may write (sell) and purchase put and call swaptions. Depending on the terms of the particular option agreement, a Fund will generally incur a greater degree of risk when it writes a swaption than it will incur when it purchases a swaption. When a Fund purchases a swaption, it risks losing only the amount of the premium it has paid should it decide to let the option expire unexercised. However, when a Fund writes a swaption, upon exercise of the option the Fund will become obligated according to the terms of the underlying agreement. A Fund may enter into swaptions for the same purposes as swaps. For information regarding the accounting treatment of options, see “Options, Rights, and Warrants” below.
Centrally Cleared Swaps. Certain clearinghouses currently offer clearing for limited types of derivatives transactions, principally certain interest rate swaps, certain index swaps, and credit derivatives. In a cleared derivative transaction, a Fund typically enters into the transaction with a financial institution counterparty, and performance of the transaction is effectively guaranteed by a central clearinghouse, thereby reducing or eliminating the Fund’s exposure to the credit risk of its original counterparty. The Fund will be required to post amounts (“initial margin”) with the clearinghouse or at the instruction of the clearinghouse. The initial margin required by a clearinghouse may be greater than the initial margin the Fund would be required to post in an uncleared transaction. If cash is deposited as the initial margin, it is shown as collateral on a Fund’s Statement of Assets and Liabilities. Swap agreements are marked-to-market daily and subsequent payments (“variation margin”) are made or received by a Fund depending on whether unrealized gains or losses are incurred. These amounts are reflected as receivables or payables on a Fund’s Statement of Assets and Liabilities (“Variation margin on open derivative instruments”) and as a component of net change in unrealized appreciation/(depreciation) on a Fund’s Statement of Operations. Only a limited number of transaction types are currently eligible for clearing.
During the term of a swap transaction, changes in the value of the swap are recognized as unrealized gains or losses by marking to market to reflect the market value of the swap. When the swap is terminated, a Fund will record a realized gain or loss equal to the difference, if any, between the proceeds from (or cost of) the closing transaction and a Fund’s basis in the agreement. Upfront swap premium payments paid or received by a Fund, if any, are recorded within the value of the open swap agreement on the Fund’s Statement of Assets and Liabilities and represent payments paid or received upon entering into the swap agreement to compensate for differences between stated terms of the swap agreement and prevailing market conditions (credit spreads, currency exchange rates, and other relevant factors). These upfront payments are recorded as realized gain or loss on the Fund’s Statement of Operations upon termination or maturity of the swap agreement.
248
Notes to Financial Statements (Continued) |
During the term of a swap transaction, the periodic net payments can be made for a set period of time or may be triggered by a predetermined credit event. The net periodic payments may be based on a fixed or variable interest rate, the change in market value of a specified security, basket of securities or index, or the return generated by a security. These periodic payments received or made by the Funds are recorded in the accompanying Statements of Operations as realized gains and losses, respectively.
A Fund’s current exposure to a counterparty is the fair value of the transaction.
Options, Rights, and Warrants
A Fund may purchase and sell put and call options on portfolio securities or an index of securities to enhance investment performance or to protect against changes in market prices. A Fund that invests in debt securities may also purchase and sell put and call options to adjust the interest rate sensitivity of its portfolio or the credit exposure of the portfolio.
Call Options. A call option gives the holder the right to purchase, and obligates the writer to sell, a security at the strike price at any time before the expiration date in the case of an American-style option or only on the expiration date in the case of a European-style option.
Put Options. A put option gives the holder the right to sell, and obligates the writer to buy, a security at the exercise price.
Writing put and call options. A Fund may write call options on a security it owns, in a “directional” strategy hoping to realize a greater current return through the receipt of premiums. In return for the option premium, the Fund takes the risk that it will have to forego any increase in the value of the security over the strike price. When a Fund has written a call option on a security it does not own, its exposure on such an option is theoretically unlimited. A Fund may enter into closing purchase transactions in order to realize a profit or limit a loss on a previously written call option or, in the case of a call option on a security it owns, to free itself to sell the underlying security or to write another call on the security, or protect a security from being called in an unexpected market rise. Any profits from a closing purchase transaction in the case of a call option on a security a Fund owns may be offset by a decline in the value of the underlying security. Conversely, because increases in the market price of a call option will generally reflect increases in the market price of the underlying security, any loss resulting from a closing purchase transaction relating to a call option on a security a Fund owns is likely to be offset in whole or in part by unrealized appreciation of the underlying security owned by the Fund. A Fund may not be able to close out a call option that it has previously written. A Fund may write put options in order to enhance its current return by taking a long directional position as to a security or index of securities. By writing a put option, the Fund assumes the risk that it may be required to purchase the underlying security for an exercise price higher than its then current market value, resulting in a potential capital loss unless the security later appreciates in value. A Fund may terminate a put option that it has written before it expires by entering into a closing purchase transaction. Any loss from this transaction may be partially or entirely offset by the premium received on the terminated option. A Fund may not be able to close out a put option that it has previously written.
When a Fund writes a call or put option, an amount equal to the premium received is recorded as a liability. Premiums received from writing options which expire are treated as realized gains. Premiums received from writing options which are exercised or closed are added to the proceeds or offset against the amount paid on the underlying investment to determine the realized gain or loss.
Purchasing put and call options. A Fund may purchase put options to protect portfolio holdings against a decline in market value of a security or securities held by it. A Fund may also purchase a put option hoping to profit from an anticipated decline in the value of the underlying security. If the Fund holds the security underlying the option, the option premium and any transaction costs will reduce any profit the Fund might have realized had it sold the underlying security instead of buying the put option. A Fund may purchase call options to hedge against an increase in the price of securities that the Fund wants ultimately to buy. A Fund may also purchase a call option as a long directional investment hoping to profit from an anticipated increase in the value of the underlying security. In order for a call option to be profitable, the market price of the underlying security must rise sufficiently above the exercise price to cover the premium and transaction costs. These costs will reduce any profit the Fund might have realized had it bought the underlying security at the time it purchased the call option.
249
Notes to Financial Statements (Continued) |
When a Fund purchases an option, it runs the risk that it will lose its entire investment in the option in a relatively short period of time, unless the Fund exercises the option or enters into a closing sale transaction before the option’s expiration. If the price of the underlying security does not rise (in the case of a call) or fall (in the case of a put) to an extent sufficient to cover the option premium and transaction costs, the Fund will lose part or all of its investment in the option. This contrasts with an investment by a Fund in the underlying security, since the Fund will not realize a loss if the security’s price does not change. Premiums paid for purchasing options that expire are treated as realized losses.
Exchange Traded Options. Exchange traded options purchased or sold by a Fund may be traded on a securities or options exchange or market. Such options typically have minimal exposure to counterparty risk. However, an exchange or market may at times find it necessary to impose restrictions on particular types of options transactions, such as opening transactions. If an underlying security ceases to meet qualifications imposed by the market or the Options Clearing Corporation, new series of options on that security will no longer be opened to replace expiring series, and opening transactions in existing series may be prohibited. Exchange traded options are valued at the last sale price, or if no sales are reported, the last bid price.
OTC Options. OTC options purchased or sold by a Fund are not traded on securities or options exchanges or backed by clearinghouses. Rather, they are entered into directly between a Fund and the counterparty to the option. In the case of an OTC option purchased by the Fund, the value of the option to the Fund will depend on the willingness and ability of the option writer to perform its obligations to the Fund. In addition, OTC options may not be transferable and there may be little or no secondary market for them, so they may be considered illiquid. It may not be possible to enter into closing transactions with respect to OTC options or otherwise to terminate such options, and as a result a Fund may be required to remain obligated on an unfavorable OTC option until its expiration. OTC options are valued using prices supplied by a primary pricing source, selected pursuant to procedures approved by the Trustees.
Rights and Warrants. A Fund may purchase or hold warrants or rights in order to gain exposure to the underlying security without owning the security, including, for example, cases where the Fund hopes to lock in the price today of a security it may wish to purchase in the future. Warrants generally give the holder the right, but not the obligation, to buy a security at a stated price. In order for a warrant to be profitable, the market price of the underlying security must rise sufficiently above the exercise price to cover any premium and transaction costs. Rights may similarly confer on the holder the right to purchase or acquire securities, including through participation in a so-called rights offering. Bonds may be issued with warrants or other rights attached to purchase or acquire equity or other debt securities, typically of the bond issuer. The market prices of bonds with warrants or rights attached to purchase equity securities or bonds may, to some degree, reflect changes in the values of the underlying securities.
When a Fund purchases or otherwise acquires warrants or other rights, it runs the risk that it will lose its entire investment in the warrants or rights, unless the Fund exercises the warrant or right, acquires the underlying securities, or enters into a closing transaction before expiration. If the price of the underlying security does not rise to an extent sufficient to cover any premium and transaction costs, the Fund will lose part or all of its investment. Any premiums or purchase price paid for warrants or other rights that expire are treated as realized losses. Warrants and similar rights differ from options in that they are typically written by the issuer of the security underlying the warrant or right. Although some warrants and rights may be non-transferable, others may be traded over-the-counter or on an exchange.
Inflation-Linked Securities
Inflation-linked securities are typically fixed income securities whose principal values are periodically adjusted according to a measure of inflation. If the index measuring inflation falls, the principal value of an inflation-linked security will be adjusted downward, and consequently the interest payable on the security (calculated with respect to a smaller principal amount) will be reduced. Repayment of the original principal of the security upon maturity (as adjusted for inflation) is guaranteed in the case of U.S. Treasury inflation-linked securities. For securities that do not provide a similar guarantee, the adjusted principal value of the security repaid at maturity may be less than the original principal.
Alternatively, the interest rates payable on certain inflation-linked securities may be adjusted according to a measure of inflation. As a result, the principal values of such securities do not adjust according to the rate of inflation, although the interest payable on such securities may decline during times of falling inflation.
250
Notes to Financial Statements (Continued) |
The values of inflation-linked securities are expected to change in response to changes in real interest rates. Real interest rates are tied to the relationship between nominal interest rates and the rate of inflation. If nominal interest rates increase at a faster rate than inflation, real interest rates may rise, leading to a decrease in value of inflation-linked securities. Inflation-linked securities may cause a potential cash flow mismatch to investors, because an increase in the principal amount of an inflation-linked security will be treated as interest income currently subject to tax at ordinary income rates even though investors will not receive repayment of principal until maturity. If a Fund invests in such securities, it will be required to distribute such interest income in order to qualify for treatment as a regulated investment company and eliminate the Fund-level tax, without a corresponding receipt of cash, and therefore may be required to dispose of portfolio securities at a time when it may not be advantageous to do so in order to make such distributions.
Bank Loans
A Fund may invest in bank loans including, for example, corporate loans, loan participations, direct debt, bank debt, and bridge debt. A Fund may invest in a loan by lending money to a borrower directly as part of a syndicate of lenders. In a syndicated loan, the agent that originated and structured the loan typically administers and enforces the loan on behalf of the syndicate. Failure by the agent to fulfill its obligations may delay or adversely affect receipt of payment by a Fund. A Fund may also invest in loans through novations, assignments, and participation interests. In a novation, a Fund typically assumes all of the rights of a lending institution in a loan, including the right to receive payments of principal and interest and other amounts directly from the borrower and to enforce its rights as a lender directly against the borrower. When a Fund takes an assignment of a loan, the Fund acquires some or all of the interest of another lender (or assignee) in the loan. In such cases, the Fund may be required generally to rely upon the assignor to demand payment and enforce rights under the loan. If a Fund acquires a participation in the loan, the Fund purchases an indirect interest in a loan held by a third party and the Fund typically will have a contractual relationship only with the third party loan investor, not with the borrower. As a result, a Fund may have the right to receive payments of principal, interest, and any fees to which it is entitled only from the loan investor selling the participation and only upon receipt by such loan investor of such payments from the borrower. In such cases, a Fund assumes the credit risk of both the borrower and the loan investor selling the participation, and the Fund may be unable to realize some or all of the value of its interest in the loan in the event of the insolvency of the third party.
Changes in the financial condition of the borrower or economic conditions or other circumstances may reduce the capacity of the borrower to make principal and interest payments on such instruments and may lead to defaults. The value of any collateral securing a bank loan may decline after the Fund invests, and there is a risk that the value of the collateral may not be sufficient to cover the amount owed to the Fund.
The Total Return Bond Fund entered into certain loan agreements which are unfunded. The Total Return Bond Fund is obligated to fund these commitments at the borrower’s discretion. These commitments are disclosed in the Total Return Bond Fund’s Portfolio of Investments. At December 31, 2022, the Total Return Bond Fund had sufficient cash and/or securities to cover these commitments.
Repurchase Agreements
Each Fund may enter into repurchase agreements with certain banks and broker-dealers whereby a Fund acquires a security for cash and obtains a simultaneous commitment from the seller to repurchase the security at an agreed upon price and date. A Fund, through its custodian, takes possession of the securities collateralizing the repurchase agreement in a segregated account. Repurchase agreements must be fully collateralized at all times, but involve some risk to a Fund if the other party should default on its obligation and the Fund is delayed or prevented from recovering the collateral, or if the Fund is required to return collateral to a borrower at a time when it may realize a loss on the investment of that collateral.
When-Issued, Delayed-Delivery, Forward Commitment, and To-Be-Announced Transactions
A Fund may enter into when-issued, delayed-delivery, forward commitment, or to-be-announced (“TBA”) transactions (collectively, the “Forward Transactions”) in order to lock in the purchase price of the underlying security, or in order to adjust the interest rate exposure of the Fund’s existing portfolio. In Forward Transactions, a Fund commits to purchase or sell particular securities, with payment and delivery to take place at a future date. In the case of TBA purchase commitments, the unit price and
251
Notes to Financial Statements (Continued) |
the estimated principal amount are established when the Fund enters into a commitment, with the actual principal amount being within a specified range of the estimate. Although a Fund does not typically pay for the securities in these types of transactions until they are delivered, it immediately assumes the risks of ownership, including the risk of price fluctuation. As a result, each of these types of transactions may create investment leverage in a Fund’s portfolio and increase the volatility of the Fund. If a Fund’s counterparty fails to deliver a security purchased in a Forward Transaction, there may be a loss, and the Fund may have missed an opportunity to make an alternative investment.
These securities are valued on the basis of valuations furnished by a pricing service, selected pursuant to procedures approved by the Trustees, which determines valuations taking into account appropriate factors such as institutional-size trading in similar groups of securities, yield, quality, coupon rate, maturity, type of issue, trading characteristics, and other market data. Securities for which no market quotation is available are valued at fair value in accordance with procedures approved by the Trustees. The Funds record on a daily basis the unrealized appreciation/(depreciation) based upon changes in the values of these securities. When a Forward Transaction is closed, the Funds record a realized gain or loss equal to the difference between the value of the transaction at the time it was opened and the value of the transaction at the time it was closed.
Dollar Roll Transactions
A Fund may enter into dollar roll transactions, in which the Fund sells mortgage-backed securities for delivery in the current month and simultaneously contracts to purchase substantially similar securities on a specified future date from the same party. A Fund may invest in dollar rolls in order to benefit from anticipated changes in pricing for the mortgage-backed securities during the term of the transaction, or for the purpose of creating investment leverage. In a dollar roll, the securities that are to be purchased will be of the same type as the securities sold, but will be supported by different pools of mortgages.
Dollar rolls involve the risk that the Fund’s counterparty will be unable to deliver the mortgage-backed securities underlying the dollar roll at the fixed time. If the counterparty files for bankruptcy or becomes insolvent, a Fund’s use of the transaction proceeds may be restricted pending a determination by the counterparty or its representative, whether to enforce the Fund’s obligation to repurchase the securities. A Fund can incur a loss on a dollar roll transaction (either because its counterparty fails to perform or because the value of the mortgages subject to the transaction declines) and on the investments made by the Fund with the proceeds of the dollar roll transaction.
A Fund accounts for a dollar roll transaction as a purchase and sale whereby the difference in the sales price and purchase price of the security sold is recorded as a realized gain (loss). If certain criteria are met, these dollar roll transactions may be considered financing transactions, whereby the difference in the sales price and the future purchase price is recorded as an adjustment to interest income. Dollar roll transactions generally have the effect of creating leverage in a Fund’s portfolio.
Securities Lending
Each Fund, other than the Allocation Funds, Feeder Fund, and MML American Funds Core Allocation Fund, may lend its securities; however, lending cannot exceed 33% of the total assets of the Fund taken at current value. The Funds’ securities lending activities are governed by a Securities Lending Agency Agreement (“Lending Agreement”) between each Fund and the lending agent (“Agent”). The Lending Agreement authorizes the Agent to lend portfolio securities held by a Fund to approved borrowers (each, a “Borrower”).
Each Fund expects that in connection with any securities on loan, the loan will be secured continuously by collateral consisting of cash (U.S. currency) and/or securities (U.S. Treasury and Agency obligations) adjusted daily to have value at least equal to the current market value of the securities loaned. The market value of the loaned securities is determined at the close of business of a Fund and any additional collateral is delivered to the Fund the next business day. The Funds bear the risk of loss with respect to the investment of cash collateral. As with other extensions of credit, the Funds may bear the risk of delay in recovery of the loaned securities or even loss of rights in the collateral should the Borrower of the securities fail financially. Pursuant to the Lending Agreement, the Agent has provided indemnification to the Funds in the event of default by a Borrower with respect to a loan. The Funds receive compensation for lending their securities in the form of a securities loan fee paid by the Borrower,
252
Notes to Financial Statements (Continued) |
as well as a share of the income earned on investment of the cash collateral received for the loaned securities. At December 31, 2022, the Funds’ collateral was equal to or greater than 100% of the market value of securities on loan and all of the Funds’ cash collateral was invested in the State Street Navigator Securities Lending Government Money Market Portfolio.
Subject to the terms of the Lending Agreement and the agreement between the Agent and the applicable Borrower (“Borrowing Agreement”), security loans can be terminated by the Agent, the Fund, or the Borrower and the related securities must be returned within the earlier of the customary settlement period for such securities or the period of time specified in the Borrowing Agreement.
The Funds employ the Agent to implement their securities lending program and the Agent receives a fee from the Funds for its services. In addition, the Funds may be required to pay a rebate to the Borrower. Accordingly, a Fund’s compensation for lending its securities is reduced by any such fees or rebate paid to the Agent or Borrower, respectively. Income received by the Funds in securities lending transactions during the year ended December 31, 2022, is reflected as securities lending income on the Statement of Operations.
Accounting for Investment Transactions
Investment transactions are accounted for on the trade date. Realized gains and losses on sales of investments and unrealized appreciation and depreciation of investments are computed by the specific identification cost method. Proceeds received from litigation, if any, are included in realized gains on investment transactions for any investments that are no longer held in the portfolio and as a reduction in cost for investments that continue to be held in the portfolio. Interest income, adjusted for amortization of discounts and premiums on debt securities, is earned from the settlement date and is recorded on the accrual basis. Dividend income, realized capital gain distributions, and distributions including realized gain distributions are recorded on the ex-dividend date. Non-cash dividends received in the form of stock are recorded as dividend income at market value. Withholding taxes on foreign interest, dividends, and capital gains have been provided for in accordance with the applicable country’s tax rules and rates. Foreign dividend income is recorded on the ex-dividend date or as soon as practicable after the Fund determines the existence of a dividend declaration after exercising reasonable due diligence. Distributions received on securities that represent a return of capital or capital gains are recorded as a reduction of cost of investments and/or as a realized gain.
Foreign Currency Translation
The books and records of the Funds are maintained in U.S. dollars. The market values of foreign currencies, foreign securities, and other assets and liabilities denominated in foreign currencies are translated into U.S. dollars at the mean of the buying and selling rates of such currencies against the U.S. dollar at the end of each business day. Purchases and sales of foreign securities and income and expense items are translated at the rates of exchange prevailing on the respective dates of such transactions. The Funds do not isolate that portion of the results of operations arising from changes in the exchange rates from that portion arising from changes in the market prices of securities. Net realized foreign currency gains and losses resulting from changes in exchange rates include foreign currency gains and losses between trade date and settlement date on investment securities transactions, foreign currency transactions, and the difference between the amounts of dividends or interest recorded on the books of the Funds and the amount actually received.
Allocation of Operating Activity
In maintaining the records for the Funds, the income and expense accounts are allocated daily to each class of shares. Investment income and loss, and unrealized and realized gains or losses are prorated among the classes of shares based on the relative net assets of each. Expenses are allocated to each class of shares depending on the nature of the expenditures. Administration and service fees, if any, which are directly attributable to a class of shares, are charged to that class’s operations. Expenses of a Fund not directly attributable to the operations of any specific class of shares of the Fund are prorated among the classes to which the expense relates based on relative net assets or another alternative method.
253
Notes to Financial Statements (Continued) |
In addition, each of the Allocation Fund, Feeder Fund, and MML American Funds Core Allocation Fund will also incur certain fees and expenses indirectly as a shareholder in the Underlying Funds or the Master Fund. Because the Underlying Funds have varied expense and fee levels, and the Allocation Funds and MML American Funds Core Allocation Fund may own different proportions of Underlying Funds at different times, the amount of fees and expenses indirectly incurred by each of the Allocation Funds and MML American Funds Core Allocation Fund will vary.
Foreign Securities
The Global Fund invests a significant amount of its assets in foreign securities and each of the Foreign Fund and International Equity Fund invests substantially all of its assets in foreign securities. The other Funds, except for the Allocation Funds, Feeder Fund, and MML American Funds Core Allocation Fund, may also invest in foreign securities. In addition, certain Underlying Funds or the Master Fund may invest in foreign securities. Foreign securities, including American Depositary Receipts, are subject to additional risks compared to securities of U.S. issuers, including international trade, currency, political, regulatory, public health, and diplomatic risks. In addition, fluctuations in currency exchange rates may favorably or unfavorably affect the values of foreign securities and the price of a Fund’s shares. Emerging markets securities are subject to greater risks than securities issued in developed foreign markets, including less liquidity, less stringent investor protection and disclosure standards, less reliable settlement practices, greater price volatility, higher relative rates of inflation, greater political, economic, and social instability, greater custody and operational risks, greater risk of new or inconsistent government treatment of or restrictions on issuers and instruments, and greater volatility in currency exchange rates, and are more susceptible to environmental problems.
Federal Income Tax
It is each Fund’s intent to continue to comply with the provisions of Subchapter M of the Code, applicable to a regulated investment company. Under such provisions, the Funds would not be subject to federal income taxes on their ordinary income and net realized capital gains to the extent they are distributed or deemed to have been distributed to their shareholders. Therefore, the Funds have not made any provision for federal income tax.
Dividends and Distributions to Shareholders
Dividends from net investment income and distributions of any net realized capital gains of each Fund are declared and paid annually and at other times as may be required to satisfy tax or regulatory requirements.
Distributions to shareholders are recorded on the ex-dividend date. Income and capital gain distributions are determined in accordance with income tax regulations, which may differ from generally accepted accounting principles. As a result, net investment income and net realized capital gains on investment transactions for a reporting period may differ significantly from distributions during such period.
|
3. |
Advisory Fees and Other Transactions |
Investment Advisory Fees and Investment Subadvisers
MML Advisers, a wholly-owned subsidiary of MassMutual, serves as investment adviser to each Fund. Under the investment advisory agreements between MML Advisers and the Trust on behalf of each Fund, MML Advisers is responsible for providing investment management services for each Fund. In return for these services, MML Advisers receives advisory fees, based upon each Fund’s average daily net assets, computed and accrued daily and payable monthly, at the annual rates shown in the following table.
MML Advisers has also entered into investment subadvisory agreements for certain Funds with the unaffiliated investment subadviser(s) shown in the following table. MML Advisers pays a subadvisory fee to each of these subadvisers based upon the aggregate net assets under management which include (1) the average daily net assets of the specified Fund which it manages, and, if applicable, (2) the average daily net assets of other Funds or accounts of MML Advisers or its affiliates for which the subadviser provides subadvisory services.
254
Notes to Financial Statements (Continued) |
The applicable Funds’ subadvisory fees are paid monthly by MML Advisers out of the advisory fees.
Fund |
Investment Advisory Fee |
Investment Subadviser(s) |
Conservative Allocation Fund |
0.10% |
N/A |
Balanced Allocation Fund |
0.10% |
N/A |
Moderate Allocation Fund |
0.10% |
N/A |
Growth Allocation Fund |
0.10% |
N/A |
Aggressive Allocation Fund |
0.10% |
N/A |
MML American Funds Growth Fund |
0.15% on the first $500 million; and 0.125% on any excess over $500 million |
N/A |
MML American Funds Core Allocation Fund |
0.20% on the first $750 million; and 0.175% on any excess over $750 million |
N/A |
Blue Chip Growth Fund |
0.75% on the first $400 million; and 0.70% on any excess over $400 million |
T. Rowe Price Associates, Inc. |
Equity Income Fund |
0.75% on the first $500 million; and 0.70% on any excess over $500 million |
T. Rowe Price Associates, Inc. |
Equity Index Fund |
0.10% on the first $500 million; and 0.08% on any excess over $500 million |
Northern Trust Investments, Inc. |
Focused Equity Fund |
0.70% on the first $250 million; and 0.60% on any excess over $250 million |
Wellington Management Company LLP |
Foreign Fund |
0.86% on the first $500 million; and 0.82% on any excess over $500 million |
Thompson, Siegel & Walmsley LLC |
Fundamental Equity Fund |
0.60% on the first $250 million; and 0.58% on any excess over $250 million |
Invesco Advisers, Inc. |
Fundamental Value Fund |
0.60% on the first $500 million; and 0.575% on any excess over $500 million |
Boston Partners Global Investors, Inc. |
Global Fund |
0.60% on the first $500 million; and 0.55% on any excess over $500 million |
Massachusetts Financial Services Company |
Income & Growth Fund |
0.65% on the first $500 million; and 0.60% on any excess over $500 million |
Barrow, Hanley, Mewhinney & Strauss, LLC |
International Equity Fund |
0.80% on the first $250 million; and 0.75% on any excess over $250 million |
Harris Associates L.P.; and Massachusetts Financial Services Company |
Large Cap Growth Fund |
0.65% on the first $500 million; and 0.60% on any excess over $500 million |
Loomis, Sayles & Company, L.P. |
Managed Volatility Fund |
0.75% on the first $500 million; and 0.70% on any excess over $500 million |
Gateway Investment Advisers, LLC |
Mid Cap Growth Fund* |
0.77% on the first $500 million; and 0.75% on any excess over $500 million |
T. Rowe Price Associates, Inc.; and Wellington Management Company LLP |
Mid Cap Value Fund |
0.84% on the first $500 million; and 0.80% on any excess over $500 million |
American Century Investment Management, Inc. |
Small Cap Growth Equity Fund |
1.04% on the first $200 million; and 1.00% on any excess over $200 million |
Wellington Management Company LLP |
Small Company Value Fund |
0.80% on the first $150 million; and 0.70% on any excess over $150 million |
American Century Investment Management, Inc. |
Small/Mid Cap Value Fund |
0.75% on the first $500 million; and 0.70% on any excess over $500 million |
AllianceBernstein L.P. |
Sustainable Equity Fund** |
0.50% on the first $500 million; and 0.475% on any excess over $500 million |
American Century Investment Management, Inc. |
Total Return Bond Fund |
0.40% on the first $500 million; and 0.38% on any excess over $500 million |
Metropolitan West Asset Management, LLC |
|
* |
Effective March 7, 2022, T. Rowe Price Investment Management, Inc. was added as a sub-subadviser to the portion of the Fund subadvised by T. Rowe Price Associates, Inc. |
|
** |
Effective April 29, 2022, American Century Investment Management, Inc. replaced Massachusetts Financial Services Company as subadviser of the Fund. |
255
Notes to Financial Statements (Continued) |
Administration Fees
For the Funds noted below, under a separate Administrative and Shareholder Services Agreement between the Trust and MML Advisers, on behalf of each Fund, MML Advisers is obligated to provide administrative and shareholder services and bear some of the Fund specific administrative expenses. In return for these services, MML Advisers receives an administrative services fee, based upon the average daily net assets of the applicable class of shares of the Funds, at the following annual rates:
Class I |
Class II |
Class III |
Service |
|
MML American Funds Growth Fund |
N/A |
N/A |
N/A |
0.25% |
MML American Funds Core Allocation Fund |
N/A |
N/A |
N/A |
0.25% |
Equity Index Fund |
0.30% |
0.15% |
None |
0.30% |
Focused Equity Fund |
N/A |
0.15% |
N/A |
0.15% |
Fundamental Equity Fund |
N/A |
0.15% |
N/A |
0.15% |
Fundamental Value Fund |
N/A |
0.15% |
N/A |
0.15% |
Global Fund |
0.15% |
0.15% |
N/A |
0.15% |
International Equity Fund |
N/A |
0.15% |
N/A |
0.15% |
Small Company Value Fund |
N/A |
0.15% |
N/A |
0.15% |
Total Return Bond Fund |
N/A |
0.15% |
N/A |
0.15% |
Distribution and Service Fees
MML Distributors, LLC (the “Distributor”) acts as distributor to the Funds. Pursuant to a Distribution and Services Plan adopted by the Funds pursuant to Rule 12b-1 under the 1940 Act, Service Class shares and Service Class I shares of the Funds pay an annual fee of 0.25% of the average daily net asset value of Service Class shares and Service Class I shares. This fee, or a portion thereof, is paid to: (i) the Distributor for services provided and expenses incurred by it in connection with the distribution of Service Class shares or Service Class I shares, as applicable, of each Fund; and/or (ii) MassMutual for services provided and expenses incurred by it for purposes of maintaining or providing personal services to Service Class and Service Class I shareholders. The Distributor is a wholly-owned subsidiary of MassMutual.
Expense Caps and Waivers
MML Advisers has agreed to cap the fees and expenses of the Fund noted below (other than extraordinary legal and other expenses, interest expense, expenses related to borrowings, securities lending, leverage, taxes, and brokerage, short sale dividend and loan expense, or other non-recurring or unusual expenses such as organizational expenses and shareholder meeting expenses, as applicable) based upon the average daily net assets of the applicable class of shares of the Fund, as follows:
Service |
|
MML American Funds Core Allocation Fund* |
1.01% |
|
* |
Expense cap in effect through April 30, 2023. |
MML Advisers has agreed to waive 0.10% of the investment advisory fee of the International Equity Fund through April 30, 2023.
MML Advisers has agreed to waive 0.15% of the investment advisory fee of the Small Company Value Fund through April 30, 2023.
256
Notes to Financial Statements (Continued) |
MML Advisers has agreed to voluntarily waive 0.03% of the investment advisory fee of the Equity Income Fund. MML Advisers may amend or discontinue this waiver at any time without advance notice.
Effective May 1, 2022, MML Advisers has agreed to waive 0.01% of the investment advisory fee of the Foreign Fund through April 30, 2023. Prior to May 1, 2022, MML Advisers had agreed to waive 0.02% of the investment advisory fee of the Foreign Fund.
MML Advisers has agreed to waive 0.02% of the investment advisory fee of the Fundamental Value Fund through April 30, 2023.
MML Advisers has agreed to waive 0.03% of the investment advisory fee of the Small Cap Growth Equity Fund through April 30, 2023.
Expense caps and waiver amounts are reflected as a reduction of expenses on the Statements of Operations.
Rebated Brokerage Commissions
The Funds listed below have entered into agreements with certain brokers whereby the brokers will rebate to the Funds, in cash, a portion of brokerage commissions. Rebated brokerage commissions are amounts earned by the Funds and are included with realized gain or loss on investment transactions presented in the Statements of Operations. For the year ended December 31, 2022, brokerage commissions rebated under these agreements were as follows:
Rebated |
|
Focused Equity Fund |
$ 220 |
Foreign Fund |
4,466 |
Fundamental Equity Fund |
1,901 |
Income & Growth Fund |
158 |
Large Cap Growth Fund |
2,016 |
Managed Volatility Fund |
277 |
Mid Cap Growth Fund |
516 |
Small Cap Growth Equity Fund |
2,879 |
Small/Mid Cap Value Fund |
456 |
Deferred Compensation
Trustees of the Funds who are not officers or employees of MassMutual may elect to defer receipt of their annual fees in accordance with terms of a Non-Qualified Deferred Compensation Plan. Amounts deferred shall accrue interest or earnings and shall be recorded on the Funds’ books as other liabilities. Deferred compensation is included within Trustees’ fees and expenses in the Statements of Assets and Liabilities.
Other
Certain officers and trustees of the Funds may also be employees of MassMutual. The compensation of a trustee who is not an employee of MassMutual is borne by the Funds.
257
Notes to Financial Statements (Continued) |
|
4. |
Purchases and Sales of Investments |
Cost of purchases and proceeds from sales of investment securities (excluding short-term investments) and in Underlying Funds or the Master Fund for the year ended December 31, 2022, were as follows:
Purchases |
Sales |
|||||||||||||||
Long-Term U.S. |
Other Long-Term |
Long-Term U.S. |
Other Long-Term |
|||||||||||||
Conservative Allocation Fund |
$ | — | $ | 71,931,312 | $ | — | $ | 81,562,177 | ||||||||
Balanced Allocation Fund |
— | 62,719,669 | — | 73,687,984 | ||||||||||||
Moderate Allocation Fund |
— | 219,365,610 | — | 278,006,993 | ||||||||||||
Growth Allocation Fund |
— | 200,114,237 | — | 153,331,333 | ||||||||||||
Aggressive Allocation Fund |
— | 35,075,283 | — | 31,605,281 | ||||||||||||
MML American Funds Growth Fund |
— | 43,757,858 | — | 21,867,838 | ||||||||||||
MML American Funds Core Allocation Fund |
— | 150,989,644 | — | 157,398,691 | ||||||||||||
Blue Chip Growth Fund |
— | 111,584,570 | — | 134,005,927 | ||||||||||||
Equity Income Fund |
— | 61,762,091 | — | 113,812,007 | ||||||||||||
Equity Index Fund |
— | 11,858,455 | — | 94,154,969 | ||||||||||||
Focused Equity Fund |
— | 77,440,805 | — | 110,393,147 | ||||||||||||
Foreign Fund |
— | 20,601,777 | — | 42,801,793 | ||||||||||||
Fundamental Equity Fund |
— | 110,890,538 | — | 140,750,258 | ||||||||||||
Fundamental Value Fund |
— | 54,185,670 | — | 71,538,035 | ||||||||||||
Global Fund |
— | 20,930,092 | — | 40,246,997 | ||||||||||||
Income & Growth Fund |
— | 48,587,269 | — | 79,260,056 | ||||||||||||
International Equity Fund |
— | 41,540,249 | — | 44,210,950 | ||||||||||||
Large Cap Growth Fund |
— | 41,129,586 | — | 48,827,059 | ||||||||||||
Managed Volatility Fund |
— | 9,106,953 | — | 20,534,798 | ||||||||||||
Mid Cap Growth Fund |
— | 106,761,424 | — | 142,706,382 | ||||||||||||
Mid Cap Value Fund |
— | 217,785,169 | — | 257,126,738 | ||||||||||||
Small Cap Growth Equity Fund |
— | 105,374,432 | — | 116,012,165 | ||||||||||||
Small Company Value Fund |
— | 35,000,191 | — | 42,239,857 | ||||||||||||
Small/Mid Cap Value Fund |
— | 62,424,366 | — | 80,251,932 | ||||||||||||
Sustainable Equity Fund |
— | 117,114,969 | — | 130,174,189 | ||||||||||||
Total Return Bond Fund |
1,496,569,537 | 70,162,993 | 1,556,760,006 | 61,236,806 | ||||||||||||
The Funds may purchase from, or sell securities to, other affiliated Funds under procedures adopted by the Trustees. These procedures have been designed to ensure that cross trades conducted by the Funds comply with Rule 17a-7 under the 1940 Act. The cross trades disclosed in the table below are included within the respective purchases and sales amounts shown in the table above, as applicable.
Purchases |
Sales |
Realized |
||||||||||
Blue Chip Growth Fund |
$ | 1,346,788 | $ | — | $ | — | ||||||
Focused Equity Fund |
— | 3,241,418 | 917,187 | |||||||||
Fundamental Equity Fund |
— | 75,112 | (21,560 | ) | ||||||||
Global Fund |
— | 194,335 | 90,942 | |||||||||
International Equity Fund |
— | 47,496 | (2,833 | ) | ||||||||
Mid Cap Growth Fund |
152,322 | 367,481 | (328,822 | ) | ||||||||
Mid Cap Value Fund |
402,465 | — | — | |||||||||
Small Cap Growth Equity Fund |
44,675 | 112,855 | (120,209 | ) | ||||||||
258
Notes to Financial Statements (Continued) |
|
5. |
Capital Share Transactions |
Changes in shares outstanding for each Fund were as follows:
Year Ended December 31, 2022 |
Year Ended December 31, 2021 |
|||||||||||||||
Shares |
Amount |
Shares |
Amount |
|||||||||||||
Conservative Allocation Fund Initial Class |
||||||||||||||||
Sold |
712,948 | $ | 6,781,512 | 1,317,401 | $ | 14,142,765 | ||||||||||
Issued as reinvestment of dividends |
1,071,030 | 8,975,230 | 350,160 | 3,732,707 | ||||||||||||
Redeemed |
(1,421,697 | ) | (13,053,543 | ) | (3,017,345 | ) | (32,162,085 | ) | ||||||||
Net increase (decrease) |
362,281 | $ | 2,703,199 | (1,349,784 | ) | $ | (14,286,613 | ) | ||||||||
Conservative Allocation Fund Service Class |
||||||||||||||||
Sold |
2,610,694 | $ | 23,706,695 | 3,213,504 | $ | 33,738,624 | ||||||||||
Issued as reinvestment of dividends |
3,747,316 | 31,027,776 | 1,172,402 | 12,357,121 | ||||||||||||
Redeemed |
(6,625,342 | ) | (60,085,271 | ) | (7,919,464 | ) | (83,382,472 | ) | ||||||||
Net increase (decrease) |
(267,332 | ) | $ | (5,350,800 | ) | (3,533,558 | ) | $ | (37,286,727 | ) | ||||||
Balanced Allocation Fund Initial Class |
||||||||||||||||
Sold |
398,445 | $ | 3,869,330 | 877,652 | $ | 9,456,200 | ||||||||||
Issued as reinvestment of dividends |
1,114,084 | 9,558,838 | 421,294 | 4,524,699 | ||||||||||||
Redeemed |
(1,522,833 | ) | (14,289,513 | ) | (2,135,654 | ) | (22,902,494 | ) | ||||||||
Net increase (decrease) |
(10,304 | ) | $ | (861,345 | ) | (836,708 | ) | $ | (8,921,595 | ) | ||||||
Balanced Allocation Fund Service Class |
||||||||||||||||
Sold |
1,316,290 | $ | 11,937,916 | 1,625,967 | $ | 17,295,303 | ||||||||||
Issued as reinvestment of dividends |
3,719,804 | 31,581,134 | 1,381,643 | 14,700,679 | ||||||||||||
Redeemed |
(6,023,865 | ) | (54,716,996 | ) | (5,807,202 | ) | (61,857,134 | ) | ||||||||
Net increase (decrease) |
(987,771 | ) | $ | (11,197,946 | ) | (2,799,592 | ) | $ | (29,861,152 | ) | ||||||
Moderate Allocation Fund Initial Class |
||||||||||||||||
Sold |
516,919 | $ | 5,156,639 | 862,377 | $ | 9,880,653 | ||||||||||
Issued as reinvestment of dividends |
3,225,634 | 28,772,658 | 1,267,120 | 14,369,142 | ||||||||||||
Redeemed |
(3,676,201 | ) | (35,995,232 | ) | (5,411,452 | ) | (61,480,057 | ) | ||||||||
Net increase (decrease) |
66,352 | $ | (2,065,935 | ) | (3,281,955 | ) | $ | (37,230,262 | ) | |||||||
Moderate Allocation Fund Service Class |
||||||||||||||||
Sold |
1,892,199 | $ | 17,807,573 | 1,516,893 | $ | 17,134,928 | ||||||||||
Issued as reinvestment of dividends |
16,150,365 | 142,123,211 | 6,501,705 | 72,819,090 | ||||||||||||
Redeemed |
(23,108,309 | ) | (221,794,394 | ) | (26,871,869 | ) | (302,224,803 | ) | ||||||||
Net increase (decrease) |
(5,065,745 | ) | $ | (61,863,610 | ) | (18,853,271 | ) | $ | (212,270,785 | ) | ||||||
Growth Allocation Fund Initial Class |
||||||||||||||||
Sold |
813,310 | $ | 7,011,968 | 1,318,991 | $ | 13,173,938 | ||||||||||
Issued as reinvestment of dividends |
6,579,105 | 50,395,945 | 2,628,953 | 26,000,345 | ||||||||||||
Redeemed |
(5,528,355 | ) | (46,421,568 | ) | (8,729,559 | ) | (86,079,175 | ) | ||||||||
Net increase (decrease) |
1,864,060 | $ | 10,986,345 | (4,781,615 | ) | $ | (46,904,892 | ) | ||||||||
Growth Allocation Fund Service Class |
||||||||||||||||
Sold |
2,190,880 | $ | 18,633,725 | 1,363,263 | $ | 13,444,521 | ||||||||||
Issued as reinvestment of dividends |
11,280,705 | 85,620,554 | 4,410,028 | 43,218,278 | ||||||||||||
Redeemed |
(9,861,333 | ) | (83,485,586 | ) | (14,314,207 | ) | (140,005,620 | ) | ||||||||
Net increase (decrease) |
3,610,252 | $ | 20,768,693 | (8,540,916 | ) | $ | (83,342,821 | ) | ||||||||
259
Notes to Financial Statements (Continued) |
Year Ended December 31, 2022 |
Year Ended December 31, 2021 |
|||||||||||||||
Shares |
Amount |
Shares |
Amount |
|||||||||||||
Aggressive Allocation Fund Initial Class |
||||||||||||||||
Sold |
533,923 | $ | 5,297,398 | 522,864 | $ | 6,030,795 | ||||||||||
Issued as reinvestment of dividends |
1,102,721 | 9,483,401 | 332,777 | 3,793,658 | ||||||||||||
Redeemed |
(1,271,467 | ) | (12,497,261 | ) | (899,303 | ) | (10,384,734 | ) | ||||||||
Net increase (decrease) |
365,177 | $ | 2,283,538 | (43,662 | ) | $ | (560,281 | ) | ||||||||
Aggressive Allocation Fund Service Class |
||||||||||||||||
Sold |
296,837 | $ | 2,983,943 | 561,991 | $ | 6,286,103 | ||||||||||
Issued as reinvestment of dividends |
1,509,602 | 12,710,846 | 444,372 | 4,972,518 | ||||||||||||
Redeemed |
(1,611,786 | ) | (14,242,335 | ) | (1,734,728 | ) | (19,572,868 | ) | ||||||||
Net increase (decrease) |
194,653 | $ | 1,452,454 | (728,365 | ) | $ | (8,314,247 | ) | ||||||||
MML American Funds Growth Fund Service Class I |
||||||||||||||||
Sold |
1,287,566 | $ | 20,950,319 | 1,421,642 | $ | 30,291,273 | ||||||||||
Issued as reinvestment of dividends |
3,762,663 | 51,059,340 | 705,801 | 15,195,901 | ||||||||||||
Redeemed |
(1,970,351 | ) | (30,772,517 | ) | (2,302,374 | ) | (49,329,330 | ) | ||||||||
Net increase (decrease) |
3,079,878 | $ | 41,237,142 | (174,931 | ) | $ | (3,842,156 | ) | ||||||||
MML American Funds Core Allocation Fund Service Class I |
||||||||||||||||
Sold |
2,071,437 | $ | 23,646,520 | 1,930,223 | $ | 24,669,541 | ||||||||||
Issued as reinvestment of dividends |
6,402,773 | 67,869,394 | 2,724,122 | 35,113,927 | ||||||||||||
Redeemed |
(11,188,243 | ) | (127,777,868 | ) | (11,603,125 | ) | (148,825,664 | ) | ||||||||
Net increase (decrease) |
(2,714,033 | ) | $ | (36,261,954 | ) | (6,948,780 | ) | $ | (89,042,196 | ) | ||||||
Blue Chip Growth Fund Initial Class |
||||||||||||||||
Sold |
1,761,469 | $ | 29,252,111 | 3,597,688 | $ | 81,865,367 | ||||||||||
Issued as reinvestment of dividends |
4,315,884 | 55,459,115 | 1,759,868 | 38,541,114 | ||||||||||||
Redeemed |
(2,977,143 | ) | (43,123,563 | ) | (2,825,029 | ) | (61,178,869 | ) | ||||||||
Net increase (decrease) |
3,100,210 | $ | 41,587,663 | 2,532,527 | $ | 59,227,612 | ||||||||||
Blue Chip Growth Fund Service Class |
||||||||||||||||
Sold |
679,047 | $ | 9,136,135 | 631,588 | $ | 12,914,196 | ||||||||||
Issued as reinvestment of dividends |
2,356,186 | 27,920,807 | 1,016,899 | 20,907,454 | ||||||||||||
Redeemed |
(1,287,273 | ) | (16,962,129 | ) | (981,051 | ) | (20,141,575 | ) | ||||||||
Net increase (decrease) |
1,747,960 | $ | 20,094,813 | 667,436 | $ | 13,680,075 | ||||||||||
Equity Income Fund Initial Class |
||||||||||||||||
Sold |
575,126 | $ | 6,199,048 | 2,692,533 | $ | 32,621,441 | ||||||||||
Issued as reinvestment of dividends |
4,859,435 | 49,760,616 | 1,222,838 | 14,539,543 | ||||||||||||
Redeemed |
(5,013,975 | ) | (57,524,680 | ) | (9,632,127 | ) | (112,733,855 | ) | ||||||||
Net increase (decrease) |
420,586 | $ | (1,565,016 | ) | (5,716,756 | ) | $ | (65,572,871 | ) | |||||||
Equity Income Fund Service Class |
||||||||||||||||
Sold |
664,460 | $ | 7,275,321 | 389,998 | $ | 4,508,653 | ||||||||||
Issued as reinvestment of dividends |
1,260,895 | 12,697,215 | 304,126 | 3,561,313 | ||||||||||||
Redeemed |
(1,290,248 | ) | (14,179,880 | ) | (1,580,650 | ) | (18,283,528 | ) | ||||||||
Net increase (decrease) |
635,107 | $ | 5,792,656 | (886,526 | ) | $ | (10,213,562 | ) | ||||||||
Equity Index Fund Class I |
||||||||||||||||
Sold |
67,838 | $ | 2,009,083 | 152,663 | $ | 4,732,504 | ||||||||||
Issued as reinvestment of dividends |
129,312 | 3,711,268 | 102,868 | 3,410,078 | ||||||||||||
Redeemed |
(255,205 | ) | (7,687,140 | ) | (502,825 | ) | (16,221,358 | ) | ||||||||
Net increase (decrease) |
(58,055 | ) | $ | (1,966,789 | ) | (247,294 | ) | $ | (8,078,776 | ) | ||||||
260
Notes to Financial Statements (Continued) |
Year Ended December 31, 2022 |
Year Ended December 31, 2021 |
|||||||||||||||
Shares |
Amount |
Shares |
Amount |
|||||||||||||
Equity Index Fund Class II |
||||||||||||||||
Sold |
361,953 | $ | 10,753,475 | 374,280 | $ | 12,166,442 | ||||||||||
Issued as reinvestment of dividends |
643,944 | 18,442,567 | 470,988 | 15,589,702 | ||||||||||||
Redeemed |
(2,328,957 | ) | (62,025,644 | ) | (590,486 | ) | (19,029,879 | ) | ||||||||
Net increase (decrease) |
(1,323,060 | ) | $ | (32,829,602 | ) | 254,782 | $ | 8,726,265 | ||||||||
Equity Index Fund Class III |
||||||||||||||||
Sold |
79,074 | $ | 2,295,509 | 37,959 | $ | 1,237,022 | ||||||||||
Issued as reinvestment of dividends |
786,712 | 22,468,499 | 584,714 | 19,307,250 | ||||||||||||
Redeemed |
(779,272 | ) | (23,387,925 | ) | (1,007,733 | ) | (32,306,205 | ) | ||||||||
Net increase (decrease) |
86,514 | $ | 1,376,083 | (385,060 | ) | $ | (11,761,933 | ) | ||||||||
Equity Index Fund Service Class I |
||||||||||||||||
Sold |
261,908 | $ | 7,527,695 | 266,450 | $ | 8,421,480 | ||||||||||
Issued as reinvestment of dividends |
107,488 | 2,927,966 | 92,362 | 2,915,856 | ||||||||||||
Redeemed |
(566,330 | ) | (16,039,936 | ) | (392,561 | ) | (12,324,026 | ) | ||||||||
Net increase (decrease) |
(196,934 | ) | $ | (5,584,275 | ) | (33,749 | ) | $ | (986,690 | ) | ||||||
Focused Equity Fund Class II |
||||||||||||||||
Sold |
2,132,132 | $ | 16,808,418 | 6,913,546 | $ | 55,330,646 | ||||||||||
Issued as reinvestment of dividends |
3,625,118 | 25,919,591 | 2,459,455 | 19,232,937 | ||||||||||||
Redeemed |
(6,667,073 | ) | (49,368,299 | ) | (6,847,984 | ) | (52,258,602 | ) | ||||||||
Net increase (decrease) |
(909,823 | ) | $ | (6,640,290 | ) | 2,525,017 | $ | 22,304,981 | ||||||||
Focused Equity Fund Service Class I |
||||||||||||||||
Sold |
638,087 | $ | 4,483,571 | 294,885 | $ | 2,200,618 | ||||||||||
Issued as reinvestment of dividends |
273,128 | 1,868,194 | 190,972 | 1,434,203 | ||||||||||||
Redeemed |
(542,986 | ) | (3,850,366 | ) | (417,907 | ) | (3,132,026 | ) | ||||||||
Net increase (decrease) |
368,229 | $ | 2,501,399 | 67,950 | $ | 502,795 | ||||||||||
Foreign Fund Initial Class |
||||||||||||||||
Sold |
994,709 | $ | 7,649,467 | 698,911 | $ | 7,592,093 | ||||||||||
Issued as reinvestment of dividends |
2,553,005 | 20,270,857 | 584,116 | 6,407,754 | ||||||||||||
Redeemed |
(3,890,562 | ) | (35,735,120 | ) | (6,384,869 | ) | (69,471,315 | ) | ||||||||
Net increase (decrease) |
(342,848 | ) | $ | (7,814,796 | ) | (5,101,842 | ) | $ | (55,471,468 | ) | ||||||
Foreign Fund Service Class |
||||||||||||||||
Sold |
339,397 | $ | 2,669,508 | 34,152 | $ | 369,219 | ||||||||||
Issued as reinvestment of dividends |
90,556 | 715,390 | 17,609 | 192,117 | ||||||||||||
Redeemed |
(97,613 | ) | (892,376 | ) | (153,281 | ) | (1,652,596 | ) | ||||||||
Net increase (decrease) |
332,340 | $ | 2,492,522 | (101,520 | ) | $ | (1,091,260 | ) | ||||||||
Fundamental Equity Fund Class II |
||||||||||||||||
Sold |
176,778 | $ | 1,830,209 | 4,573,320 | $ | 57,115,425 | ||||||||||
Issued as reinvestment of dividends |
3,187,405 | 28,431,654 | 1,459,021 | 17,289,403 | ||||||||||||
Redeemed |
(3,297,033 | ) | (31,613,174 | ) | (3,512,142 | ) | (41,645,625 | ) | ||||||||
Net increase (decrease) |
67,150 | $ | (1,351,311 | ) | 2,520,199 | $ | 32,759,203 | |||||||||
Fundamental Equity Fund Service Class I |
||||||||||||||||
Sold |
318,929 | $ | 3,103,406 | 264,135 | $ | 3,035,868 | ||||||||||
Issued as reinvestment of dividends |
437,773 | 3,707,938 | 177,196 | 2,011,177 | ||||||||||||
Redeemed |
(368,627 | ) | (3,335,738 | ) | (280,442 | ) | (3,201,701 | ) | ||||||||
Net increase (decrease) |
388,075 | $ | 3,475,606 | 160,889 | $ | 1,845,344 | ||||||||||
261
Notes to Financial Statements (Continued) |
Year Ended December 31, 2022 |
Year Ended December 31, 2021 |
|||||||||||||||
Shares |
Amount |
Shares |
Amount |
|||||||||||||
Fundamental Value Fund Class II |
||||||||||||||||
Sold |
116,688 | $ | 1,571,780 | 130,603 | $ | 1,785,480 | ||||||||||
Issued as reinvestment of dividends |
2,535,743 | 29,059,619 | 208,878 | 2,957,707 | ||||||||||||
Redeemed |
(1,630,095 | ) | (21,336,885 | ) | (4,068,912 | ) | (55,733,688 | ) | ||||||||
Net increase (decrease) |
1,022,336 | $ | 9,294,514 | (3,729,431 | ) | $ | (50,990,501 | ) | ||||||||
Fundamental Value Fund Service Class I |
||||||||||||||||
Sold |
471,750 | $ | 6,072,484 | 343,977 | $ | 4,659,686 | ||||||||||
Issued as reinvestment of dividends |
371,854 | 4,135,015 | 22,597 | 312,511 | ||||||||||||
Redeemed |
(381,607 | ) | (4,935,380 | ) | (250,312 | ) | (3,341,630 | ) | ||||||||
Net increase (decrease) |
461,997 | $ | 5,272,119 | 116,262 | $ | 1,630,567 | ||||||||||
Global Fund Class I |
||||||||||||||||
Sold |
1,401,530 | $ | 15,971,596 | 814,729 | $ | 12,513,054 | ||||||||||
Issued as reinvestment of dividends |
18,908,179 | 76,389,044 | 2,324,803 | 33,942,130 | ||||||||||||
Redeemed |
(4,678,239 | ) | (38,519,941 | ) | (18,836,865 | ) | (278,356,201 | ) | ||||||||
Net increase (decrease) |
15,631,470 | $ | 53,840,699 | (15,697,333 | ) | $ | (231,901,017 | ) | ||||||||
Global Fund Class II |
||||||||||||||||
Sold |
103,583 | $ | 686,323 | 36,326 | $ | 558,440 | ||||||||||
Issued as reinvestment of dividends |
2,380,161 | 10,377,503 | 124,085 | 1,862,521 | ||||||||||||
Redeemed |
(248,234 | ) | (1,891,030 | ) | (139,227 | ) | (2,127,058 | ) | ||||||||
Net increase (decrease) |
2,235,510 | $ | 9,172,796 | 21,184 | $ | 293,903 | ||||||||||
Global Fund Service Class I |
||||||||||||||||
Sold |
1,405,747 | $ | 5,564,461 | 115,794 | $ | 1,716,730 | ||||||||||
Issued as reinvestment of dividends |
2,769,620 | 10,607,643 | 132,206 | 1,901,117 | ||||||||||||
Redeemed |
(308,834 | ) | (2,225,843 | ) | (222,281 | ) | (3,225,224 | ) | ||||||||
Net increase (decrease) |
3,866,533 | $ | 13,946,261 | 25,719 | $ | 392,623 | ||||||||||
Income & Growth Fund Initial Class |
||||||||||||||||
Sold |
304,044 | $ | 3,552,002 | 285,316 | $ | 3,304,306 | ||||||||||
Issued as reinvestment of dividends |
2,371,695 | 25,068,815 | 331,393 | 3,966,776 | ||||||||||||
Redeemed |
(3,087,397 | ) | (34,927,224 | ) | (6,897,198 | ) | (79,098,817 | ) | ||||||||
Net increase (decrease) |
(411,658 | ) | $ | (6,306,407 | ) | (6,280,489 | ) | $ | (71,827,735 | ) | ||||||
Income & Growth Fund Service Class |
||||||||||||||||
Sold |
225,340 | $ | 2,505,294 | 175,639 | $ | 2,029,727 | ||||||||||
Issued as reinvestment of dividends |
353,150 | 3,665,694 | 41,070 | 483,810 | ||||||||||||
Redeemed |
(487,071 | ) | (5,339,118 | ) | (374,578 | ) | (4,228,253 | ) | ||||||||
Net increase (decrease) |
91,419 | $ | 831,870 | (157,869 | ) | $ | (1,714,716 | ) | ||||||||
International Equity Fund Class II |
||||||||||||||||
Sold |
1,706,116 | $ | 16,160,334 | 9,069,663 | $ | 101,495,259 | ||||||||||
Issued as reinvestment of dividends |
1,601,802 | 13,471,151 | 95,386 | 1,043,524 | ||||||||||||
Redeemed |
(2,448,090 | ) | (22,452,131 | ) | (2,682,521 | ) | (29,216,624 | ) | ||||||||
Net increase (decrease) |
859,828 | $ | 7,179,354 | 6,482,528 | $ | 73,322,159 | ||||||||||
International Equity Fund Service Class I |
||||||||||||||||
Sold |
241,508 | $ | 2,072,305 | 171,454 | $ | 1,857,514 | ||||||||||
Issued as reinvestment of dividends |
53,353 | 444,434 | 3,620 | 39,246 | ||||||||||||
Redeemed |
(138,751 | ) | (1,232,248 | ) | (114,321 | ) | (1,236,976 | ) | ||||||||
Net increase (decrease) |
156,110 | $ | 1,284,491 | 60,753 | $ | 659,784 | ||||||||||
Large Cap Growth Fund Initial Class |
||||||||||||||||
Sold |
814,657 | $ | 10,514,304 | 5,215,773 | $ | 82,059,146 | ||||||||||
Issued as reinvestment of dividends |
1,410,298 | 15,005,574 | 1,018,671 | 15,351,370 | ||||||||||||
Redeemed |
(1,840,290 | ) | (21,184,710 | ) | (1,757,405 | ) | (26,173,408 | ) | ||||||||
Net increase (decrease) |
384,665 | $ | 4,335,168 | 4,477,039 | $ | 71,237,108 | ||||||||||
262
Notes to Financial Statements (Continued) |
Year Ended December 31, 2022 |
Year Ended December 31, 2021 |
|||||||||||||||
Shares |
Amount |
Shares |
Amount |
|||||||||||||
Large Cap Growth Fund Service Class |
||||||||||||||||
Sold |
154,958 | $ | 1,696,088 | 219,583 | $ | 3,134,867 | ||||||||||
Issued as reinvestment of dividends |
206,482 | 2,077,210 | 176,765 | 2,540,115 | ||||||||||||
Redeemed |
(230,780 | ) | (2,489,084 | ) | (246,696 | ) | (3,512,946 | ) | ||||||||
Net increase (decrease) |
130,660 | $ | 1,284,214 | 149,652 | $ | 2,162,036 | ||||||||||
Managed Volatility Fund Initial Class |
||||||||||||||||
Sold |
165,548 | $ | 2,277,869 | 456,777 | $ | 6,665,778 | ||||||||||
Issued as reinvestment of dividends |
32,402 | 447,699 | 74,816 | 1,116,050 | ||||||||||||
Redeemed |
(1,475,682 | ) | (20,478,530 | ) | (1,469,731 | ) | (21,315,336 | ) | ||||||||
Net increase (decrease) |
(1,277,732 | ) | $ | (17,752,962 | ) | (938,138 | ) | $ | (13,533,508 | ) | ||||||
Managed Volatility Fund Service Class |
||||||||||||||||
Sold |
110,763 | $ | 1,535,299 | 76,169 | $ | 1,111,406 | ||||||||||
Issued as reinvestment of dividends |
3,088 | 42,368 | 12,773 | 189,127 | ||||||||||||
Redeemed |
(376,285 | ) | (5,151,221 | ) | (336,632 | ) | (4,870,897 | ) | ||||||||
Net increase (decrease) |
(262,434 | ) | $ | (3,573,554 | ) | (247,690 | ) | $ | (3,570,364 | ) | ||||||
Mid Cap Growth Fund Initial Class |
||||||||||||||||
Sold |
687,798 | $ | 8,871,440 | 376,598 | $ | 6,871,013 | ||||||||||
Issued as reinvestment of dividends |
7,945,026 | 74,365,442 | 4,417,734 | 73,246,023 | ||||||||||||
Redeemed |
(3,346,499 | ) | (38,259,533 | ) | (8,013,135 | ) | (149,695,101 | ) | ||||||||
Net increase (decrease) |
5,286,325 | $ | 44,977,349 | (3,218,803 | ) | $ | (69,578,065 | ) | ||||||||
Mid Cap Growth Fund Service Class |
||||||||||||||||
Sold |
450,404 | $ | 4,923,070 | 261,708 | $ | 4,464,715 | ||||||||||
Issued as reinvestment of dividends |
3,361,951 | 28,240,386 | 1,643,671 | 25,312,531 | ||||||||||||
Redeemed |
(1,229,487 | ) | (12,452,152 | ) | (1,095,218 | ) | (18,705,380 | ) | ||||||||
Net increase (decrease) |
2,582,868 | $ | 20,711,304 | 810,161 | $ | 11,071,866 | ||||||||||
Mid Cap Value Fund Initial Class |
||||||||||||||||
Sold |
377,540 | $ | 3,953,594 | 516,336 | $ | 6,216,110 | ||||||||||
Issued as reinvestment of dividends |
7,368,826 | 67,203,690 | 951,546 | 11,485,165 | ||||||||||||
Redeemed |
(4,248,707 | ) | (47,831,230 | ) | (10,898,765 | ) | (131,002,972 | ) | ||||||||
Net increase (decrease) |
3,497,659 | $ | 23,326,054 | (9,430,883 | ) | $ | (113,301,697 | ) | ||||||||
Mid Cap Value Fund Service Class |
||||||||||||||||
Sold |
499,436 | $ | 5,432,802 | 207,527 | $ | 2,459,200 | ||||||||||
Issued as reinvestment of dividends |
1,549,756 | 13,746,334 | 167,209 | 1,976,411 | ||||||||||||
Redeemed |
(927,277 | ) | (9,903,303 | ) | (790,210 | ) | (9,257,145 | ) | ||||||||
Net increase (decrease) |
1,121,915 | $ | 9,275,833 | (415,474 | ) | $ | (4,821,534 | ) | ||||||||
Small Cap Growth Equity Fund Initial Class |
||||||||||||||||
Sold |
792,070 | $ | 9,036,817 | 752,478 | $ | 12,451,857 | ||||||||||
Issued as reinvestment of dividends |
4,120,186 | 37,544,747 | 1,745,045 | 26,449,940 | ||||||||||||
Redeemed |
(1,931,582 | ) | (20,631,425 | ) | (2,310,590 | ) | (39,579,287 | ) | ||||||||
Net increase (decrease) |
2,980,674 | $ | 25,950,139 | 186,933 | $ | (677,490 | ) | |||||||||
Small Cap Growth Equity Fund Service Class |
||||||||||||||||
Sold |
179,706 | $ | 1,819,497 | 274,287 | $ | 4,200,610 | ||||||||||
Issued as reinvestment of dividends |
1,033,055 | 8,085,294 | 404,553 | 5,524,203 | ||||||||||||
Redeemed |
(457,312 | ) | (4,310,658 | ) | (314,080 | ) | (4,881,908 | ) | ||||||||
Net increase (decrease) |
755,449 | $ | 5,594,133 | 364,760 | $ | 4,842,905 | ||||||||||
Small Company Value Fund Class II |
||||||||||||||||
Sold |
52,446 | $ | 692,652 | 49,542 | $ | 857,690 | ||||||||||
Issued as reinvestment of dividends |
3,691,484 | 29,347,300 | 252,697 | 4,232,677 | ||||||||||||
Redeemed |
(648,843 | ) | (7,604,520 | ) | (851,408 | ) | (14,552,025 | ) | ||||||||
Net increase (decrease) |
3,095,087 | $ | 22,435,432 | (549,169 | ) | $ | (9,461,658 | ) | ||||||||
263
Notes to Financial Statements (Continued) |
Year Ended December 31, 2022 |
Year Ended December 31, 2021 |
|||||||||||||||
Shares |
Amount |
Shares |
Amount |
|||||||||||||
Small Company Value Fund Service Class I |
||||||||||||||||
Sold |
164,878 | $ | 1,859,929 | 220,846 | $ | 3,680,415 | ||||||||||
Issued as reinvestment of dividends |
2,011,055 | 14,620,372 | 120,049 | 1,927,989 | ||||||||||||
Redeemed |
(347,702 | ) | (3,557,370 | ) | (342,502 | ) | (5,649,993 | ) | ||||||||
Net increase (decrease) |
1,828,231 | $ | 12,922,931 | (1,607 | ) | $ | (41,589 | ) | ||||||||
Small/Mid Cap Value Fund Initial Class |
||||||||||||||||
Sold |
244,627 | $ | 2,824,697 | 251,132 | $ | 3,419,445 | ||||||||||
Issued as reinvestment of dividends |
3,696,222 | 34,744,483 | 113,828 | 1,587,906 | ||||||||||||
Redeemed |
(1,738,794 | ) | (19,982,030 | ) | (5,230,139 | ) | (70,112,629 | ) | ||||||||
Net increase (decrease) |
2,202,055 | $ | 17,587,150 | (4,865,179 | ) | $ | (65,105,278 | ) | ||||||||
Small/Mid Cap Value Fund Service Class |
||||||||||||||||
Sold |
155,334 | $ | 1,750,896 | 487,440 | $ | 6,596,608 | ||||||||||
Issued as reinvestment of dividends |
791,571 | 7,306,202 | 17,413 | 239,776 | ||||||||||||
Redeemed |
(320,209 | ) | (3,540,318 | ) | (507,167 | ) | (6,713,263 | ) | ||||||||
Net increase (decrease) |
626,696 | $ | 5,516,780 | (2,314 | ) | $ | 123,121 | |||||||||
Sustainable Equity Fund Initial Class |
||||||||||||||||
Sold |
75,488 | $ | 1,533,865 | 66,627 | $ | 1,538,558 | ||||||||||
Issued as reinvestment of dividends |
776,650 | 14,150,556 | 291,690 | 6,904,294 | ||||||||||||
Redeemed |
(586,856 | ) | (11,800,582 | ) | (899,707 | ) | (20,806,702 | ) | ||||||||
Net increase (decrease) |
265,282 | $ | 3,883,839 | (541,390 | ) | $ | (12,363,850 | ) | ||||||||
Sustainable Equity Fund Service Class |
||||||||||||||||
Sold |
104,841 | $ | 2,127,109 | 245,830 | $ | 5,684,791 | ||||||||||
Issued as reinvestment of dividends |
435,107 | 7,831,922 | 151,762 | 3,555,773 | ||||||||||||
Redeemed |
(317,920 | ) | (6,105,886 | ) | (334,157 | ) | (7,616,142 | ) | ||||||||
Net increase (decrease) |
222,028 | $ | 3,853,145 | 63,435 | $ | 1,624,422 | ||||||||||
Total Return Bond Fund Class II |
||||||||||||||||
Sold |
2,328,641 | $ | 21,378,689 | 12,039,126 | $ | 133,221,787 | ||||||||||
Issued as reinvestment of dividends |
501,842 | 4,566,764 | 2,030,600 | 21,382,221 | ||||||||||||
Redeemed |
(7,472,850 | ) | (70,666,494 | ) | (5,702,540 | ) | (62,177,121 | ) | ||||||||
Net increase (decrease) |
(4,642,367 | ) | $ | (44,721,041 | ) | 8,367,186 | $ | 92,426,887 | ||||||||
Total Return Bond Fund Service Class I |
||||||||||||||||
Sold |
387,364 | $ | 3,536,579 | 900,135 | $ | 9,677,022 | ||||||||||
Issued as reinvestment of dividends |
61,613 | 553,904 | 288,842 | 3,001,071 | ||||||||||||
Redeemed |
(946,691 | ) | (8,839,844 | ) | (905,850 | ) | (9,732,991 | ) | ||||||||
Net increase (decrease) |
(497,714 | ) | $ | (4,749,361 | ) | 283,127 | $ | 2,945,102 | ||||||||
|
6. |
Federal Income Tax Information |
At December 31, 2022, the aggregate cost of investments and the unrealized appreciation/(depreciation) in the value of all investments owned by the Fund(s), as computed on a federal income tax basis, were as follows:
Federal |
Tax Basis |
Tax Basis |
Net Unrealized |
|||||||||||||
Conservative Allocation Fund |
$ | 372,941,627 | $ | 2,644,794 | $ | (75,159,565 | ) | $ | (72,514,771 | ) | ||||||
Balanced Allocation Fund |
422,809,943 | 3,809,100 | (77,825,636 | ) | (74,016,536 | ) | ||||||||||
Moderate Allocation Fund |
1,544,323,808 | 15,843,307 | (302,330,103 | ) | (286,486,796 | ) | ||||||||||
Growth Allocation Fund |
1,128,698,369 | 11,818,742 | (218,799,447 | ) | (206,980,705 | ) | ||||||||||
Aggressive Allocation Fund |
155,336,083 | 1,416,962 | (33,370,253 | ) | (31,953,291 | ) | ||||||||||
264
Notes to Financial Statements (Continued) |
Federal |
Tax Basis |
Tax Basis |
Net Unrealized |
|||||||||||||
MML American Funds Growth Fund |
$ | 215,992,644 | $ | — | $ | (20,452,894 | ) | $ | (20,452,894 | ) | ||||||
MML American Funds Core Allocation Fund |
781,858,590 | 4,819,434 | (81,033,765 | ) | (76,214,331 | ) | ||||||||||
Blue Chip Growth Fund |
332,881,017 | 79,037,625 | (49,876,394 | ) | 29,161,231 | |||||||||||
Equity Income Fund |
311,666,670 | 83,755,214 | (12,501,232 | ) | 71,253,982 | |||||||||||
Equity Index Fund |
338,731,585 | 234,694,416 | (24,743,608 | ) | 209,950,808 | |||||||||||
Focused Equity Fund |
277,703,165 | 45,004,819 | (11,794,483 | ) | 33,210,336 | |||||||||||
Foreign Fund |
192,694,867 | 17,902,662 | (25,191,375 | ) | (7,288,713 | ) | ||||||||||
Fundamental Equity Fund |
167,599,090 | 14,286,063 | (12,708,715 | ) | 1,577,348 | |||||||||||
Fundamental Value Fund |
140,159,108 | 33,327,616 | (6,059,769 | ) | 27,267,847 | |||||||||||
Global Fund |
127,721,574 | 22,724,994 | (9,685,384 | ) | 13,039,610 | |||||||||||
Income & Growth Fund |
179,928,305 | 46,294,921 | (9,098,761 | ) | 37,196,160 | |||||||||||
International Equity Fund |
243,977,299 | 9,569,488 | (41,040,452 | ) | (31,470,964 | ) | ||||||||||
Large Cap Growth Fund |
156,255,474 | 17,483,295 | (23,287,000 | ) | (5,803,705 | ) | ||||||||||
Managed Volatility Fund |
76,474,989 | 34,162,676 | (4,612,745 | ) | 29,549,931 | |||||||||||
Mid Cap Growth Fund |
281,736,424 | 57,667,484 | (28,618,875 | ) | 29,048,609 | |||||||||||
Mid Cap Value Fund |
298,197,449 | 13,512,648 | (15,420,746 | ) | (1,908,098 | ) | ||||||||||
Small Cap Growth Equity Fund |
141,630,302 | 14,731,436 | (15,749,353 | ) | (1,017,917 | ) | ||||||||||
Small Company Value Fund |
88,668,454 | 2,094,877 | (14,715,762 | ) | (12,620,885 | ) | ||||||||||
Small/Mid Cap Value Fund |
135,857,790 | 12,534,150 | (15,243,563 | ) | (2,709,413 | ) | ||||||||||
Sustainable Equity Fund |
115,846,395 | 24,671,652 | (9,988,801 | ) | 14,682,851 | |||||||||||
Total Return Bond Fund |
428,158,119 | 944,354 | (30,507,379 | ) | (29,563,025 | ) | ||||||||||
Net capital loss carryforwards may be applied against any net realized taxable gains in succeeding years, subject to the carryforward period limitations, where applicable. Capital losses may be carried forward indefinitely, and retain the character of the original loss.
At December 31, 2022, the following Fund(s) had accumulated capital loss carryforwards:
Short Term |
Long Term |
|||||||
Blue Chip Growth Fund |
$ | 5,559,994 | $ | — | ||||
Foreign Fund |
— | 2,354,641 | ||||||
Fundamental Equity Fund |
815,741 | — | ||||||
International Equity Fund |
2,720,330 | 908,524 | ||||||
Mid Cap Growth Fund |
2,158,528 | — | ||||||
Small Cap Growth Equity Fund |
12,536,602 | — | ||||||
Total Return Bond Fund |
18,733,842 | 13,571,910 | ||||||
Generally accepted accounting principles in the United States of America require that only distributions in excess of tax basis earnings and profits be reported in the financial statements as a return of capital.
265
Notes to Financial Statements (Continued) |
The tax character of distributions (including capital gain dividends, if any, designated pursuant to Section 852 of the Code) paid during the year ended December 31, 2022, was as follows:
Ordinary |
Long Term |
|||||||
Conservative Allocation Fund |
$ | 12,473,039 | $ | 27,529,967 | ||||
Balanced Allocation Fund |
13,376,800 | 27,763,172 | ||||||
Moderate Allocation Fund |
43,264,795 | 127,631,074 | ||||||
Growth Allocation Fund |
25,329,990 | 110,686,509 | ||||||
Aggressive Allocation Fund |
2,644,343 | 19,549,904 | ||||||
MML American Funds Growth Fund |
975,318 | 50,084,022 | ||||||
MML American Funds Core Allocation Fund |
16,557,069 | 51,312,325 | ||||||
Blue Chip Growth Fund |
493,775 | 82,886,147 | ||||||
Equity Income Fund |
12,258,083 | 50,199,748 | ||||||
Equity Index Fund |
8,843,632 | 38,706,668 | ||||||
Focused Equity Fund |
2,937,276 | 24,850,509 | ||||||
Foreign Fund |
7,317,041 | 13,669,206 | ||||||
Fundamental Equity Fund |
6,781,663 | 25,357,929 | ||||||
Fundamental Value Fund |
5,802,738 | 27,391,896 | ||||||
Global Fund |
2,471,607 | 94,902,583 | ||||||
Income & Growth Fund |
4,675,502 | 24,059,007 | ||||||
International Equity Fund |
3,912,311 | 10,003,274 | ||||||
Large Cap Growth Fund |
422,374 | 16,660,410 | ||||||
Managed Volatility Fund |
490,067 | — | ||||||
Mid Cap Growth Fund |
13,544,916 | 89,060,912 | ||||||
Mid Cap Value Fund |
30,217,508 | 50,732,516 | ||||||
Small Cap Growth Equity Fund |
12,651,099 | 32,978,942 | ||||||
Small Company Value Fund |
3,960,778 | 40,006,894 | ||||||
Small/Mid Cap Value Fund |
22,601,913 | 19,448,772 | ||||||
Sustainable Equity Fund |
2,294,061 | 19,688,417 | ||||||
Total Return Bond Fund |
5,120,668 | — | ||||||
The tax character of distributions (including capital gain dividends, if any, designated pursuant to Section 852 of the Code) paid during the year ended December 31, 2021, was as follows:
Ordinary |
Long Term |
|||||||
Conservative Allocation Fund |
$ | 4,127,931 | $ | 11,961,897 | ||||
Balanced Allocation Fund |
5,188,953 | 14,036,425 | ||||||
Moderate Allocation Fund |
21,088,797 | 66,099,435 | ||||||
Growth Allocation Fund |
17,313,032 | 51,905,591 | ||||||
Aggressive Allocation Fund |
1,924,724 | 6,841,452 | ||||||
MML American Funds Growth Fund |
— | 15,195,901 | ||||||
MML American Funds Core Allocation Fund |
12,434,688 | 22,679,239 | ||||||
Blue Chip Growth Fund |
— | 59,448,568 | ||||||
Equity Income Fund |
10,129,058 | 7,971,798 | ||||||
Equity Index Fund |
10,561,732 | 30,661,155 | ||||||
Focused Equity Fund |
5,363,033 | 15,304,107 | ||||||
Foreign Fund |
6,599,871 | — | ||||||
Fundamental Equity Fund |
4,811,850 | 14,488,730 | ||||||
Fundamental Value Fund |
3,270,218 | — | ||||||
266
Notes to Financial Statements (Continued) |
Ordinary |
Long Term |
|||||||
Global Fund |
$ | 3,475,898 | $ | 34,229,870 | ||||
Income & Growth Fund |
4,450,586 | — | ||||||
International Equity Fund |
1,082,771 | — | ||||||
Large Cap Growth Fund |
1,300,212 | 16,591,273 | ||||||
Managed Volatility Fund |
1,305,177 | — | ||||||
Mid Cap Growth Fund |
12,553,859 | 86,004,695 | ||||||
Mid Cap Value Fund |
5,099,259 | 8,362,317 | ||||||
Small Cap Growth Equity Fund |
14,675,515 | 17,298,628 | ||||||
Small Company Value Fund |
465,390 | 5,695,276 | ||||||
Small/Mid Cap Value Fund |
1,827,682 | — | ||||||
Sustainable Equity Fund |
1,289,287 | 9,170,780 | ||||||
Total Return Bond Fund |
20,704,098 | 3,679,194 | ||||||
The following Fund(s) have elected to pass through the foreign tax credit for the year ended December 31, 2022:
Amount |
||||
Conservative Allocation Fund |
$ | 61,740 | ||
Balanced Allocation Fund |
84,315 | |||
Moderate Allocation Fund |
385,551 | |||
Growth Allocation Fund |
338,254 | |||
Aggressive Allocation Fund |
49,958 | |||
MML American Funds Core Allocation Fund |
314,806 | |||
Foreign Fund |
434,081 | |||
Global Fund |
132,763 | |||
International Equity Fund |
551,617 | |||
Capital accounts within the financial statements are periodically adjusted for permanent differences between book and tax accounting. These adjustments have no impact on net assets or the results of operations. Temporary book and tax accounting differences will reverse in subsequent periods. At December 31, 2022, temporary book and tax accounting differences were primarily attributable to the deferral of wash sale losses, deferred Trustee compensation, and other temporary basis adjustments.
At December 31, 2022, the components of distributable earnings on a tax basis were as follows:
Undistributed |
Undistributed |
Other |
Unrealized |
Total |
||||||||||||||||
Conservative Allocation Fund |
$ | 5,799,329 | $ | 24,250,457 | $ | (38,307 | ) | $ | (72,514,771 | ) | $ | (42,503,292 | ) | |||||||
Balanced Allocation Fund |
9,929,018 | 27,458,866 | (46,352 | ) | (74,016,536 | ) | (36,675,004 | ) | ||||||||||||
Moderate Allocation Fund |
36,599,979 | 119,207,061 | (172,896 | ) | (286,486,796 | ) | (130,852,652 | ) | ||||||||||||
Growth Allocation Fund |
25,707,982 | 118,919,501 | (135,183 | ) | (206,980,705 | ) | (62,488,405 | ) | ||||||||||||
Aggressive Allocation Fund |
3,429,277 | 14,914,883 | (11,465 | ) | (31,953,291 | ) | (13,620,596 | ) | ||||||||||||
MML American Funds Growth Fund |
3,193,498 | 34,075,672 | (13,551 | ) | (20,452,894 | ) | 16,802,725 | |||||||||||||
MML American Funds Core Allocation Fund |
25,844,362 | 76,117,843 | (72,073 | ) | (76,214,331 | ) | 25,675,801 | |||||||||||||
Blue Chip Growth Fund |
— | (5,559,994 | ) | (39,577 | ) | 29,161,231 | 23,561,660 | |||||||||||||
Equity Income Fund |
8,767,448 | 27,527,643 | (52,501 | ) | 71,254,339 | 107,496,929 | ||||||||||||||
Equity Index Fund |
8,761,461 | 56,184,148 | (70,677 | ) | 209,950,808 | 274,825,740 | ||||||||||||||
Focused Equity Fund |
2,726,455 | 26,219,015 | (12,693 | ) | 33,210,335 | 62,143,112 | ||||||||||||||
267
Notes to Financial Statements (Continued) |
Undistributed |
Undistributed |
Other |
Unrealized |
Total |
||||||||||||||||
Foreign Fund |
$ | 2,457,681 | $ | (2,354,641 | ) | $ | (36,862 | ) | $ | (7,321,103 | ) | $ | (7,254,925 | ) | ||||||
Fundamental Equity Fund |
1,408,447 | (815,741 | ) | (14,608 | ) | 1,577,419 | 2,155,517 | |||||||||||||
Fundamental Value Fund |
2,087,654 | 9,832,932 | (18,799 | ) | 27,268,549 | 39,170,336 | ||||||||||||||
Global Fund |
1,132,292 | 8,107,306 | (21,691 | ) | 13,036,549 | 22,254,456 | ||||||||||||||
Income & Growth Fund |
4,486,082 | 20,989,576 | (24,813 | ) | 37,196,160 | 62,647,005 | ||||||||||||||
International Equity Fund |
2,947,263 | (3,628,854 | ) | (12,167 | ) | (31,523,288 | ) | (32,217,046 | ) | |||||||||||
Large Cap Growth Fund |
— | 12,954,129 | (15,665 | ) | (5,803,705 | ) | 7,134,759 | |||||||||||||
Managed Volatility Fund |
3,212,375 | 15,749,021 | (27,035 | ) | 29,549,931 | 48,484,292 | ||||||||||||||
Mid Cap Growth Fund |
— | (2,158,528 | ) | (44,019 | ) | 29,048,609 | 26,846,062 | |||||||||||||
Mid Cap Value Fund |
10,566,992 | 38,954,024 | (47,622 | ) | (1,908,638 | ) | 47,564,756 | |||||||||||||
Small Cap Growth Equity Fund |
— | (12,536,602 | ) | (28,332 | ) | (1,017,918 | ) | (13,582,852 | ) | |||||||||||
Small Company Value Fund |
772,380 | 140,269 | (9,715 | ) | (12,620,885 | ) | (11,717,951 | ) | ||||||||||||
Small/Mid Cap Value Fund |
2,790,644 | 15,138,668 | (23,137 | ) | (2,709,413 | ) | 15,196,762 | |||||||||||||
Sustainable Equity Fund |
1,170,763 | 41,357,834 | (17,877 | ) | 14,682,851 | 57,193,571 | ||||||||||||||
Total Return Bond Fund |
7,805,951 | (32,305,752 | ) | (32,670 | ) | (29,562,991 | ) | (54,095,462 | ) | |||||||||||
During the year ended December 31, 2022, the following amounts were reclassified due to permanent differences between book and tax accounting:
Paid-in Capital |
Accumulated |
Undistributed |
||||||||||
Conservative Allocation Fund |
$ | — | $ | 50 | $ | (50 | ) | |||||
Balanced Allocation Fund |
— | (3,760,222 | ) | 3,760,222 | ||||||||
Moderate Allocation Fund |
— | (16,392,488 | ) | 16,392,488 | ||||||||
Growth Allocation Fund |
— | (13,705,866 | ) | 13,705,866 | ||||||||
Aggressive Allocation Fund |
— | (2,189,561 | ) | 2,189,561 | ||||||||
MML American Funds Growth Fund |
— | (3,436,437 | ) | 3,436,437 | ||||||||
MML American Funds Core Allocation Fund |
— | (13,221,902 | ) | 13,221,902 | ||||||||
Blue Chip Growth Fund |
(1,615,893 | ) | 48 | 1,615,845 | ||||||||
Equity Income Fund |
— | 63,882 | (63,882 | ) | ||||||||
Equity Index Fund |
— | 103,389 | (103,389 | ) | ||||||||
Focused Equity Fund |
— | (4,518 | ) | 4,518 | ||||||||
Foreign Fund |
— | (305,465 | ) | 305,465 | ||||||||
Fundamental Equity Fund |
(201 | ) | 349,071 | (348,870 | ) | |||||||
Fundamental Value Fund |
— | 1,832 | (1,832 | ) | ||||||||
Global Fund |
— | 15,355 | (15,355 | ) | ||||||||
Income & Growth Fund |
— | 106,285 | (106,285 | ) | ||||||||
International Equity Fund |
— | 10,910 | (10,910 | ) | ||||||||
Large Cap Growth Fund |
(255,423 | ) | — | 255,423 | ||||||||
Managed Volatility Fund |
— | 20,503 | (20,503 | ) | ||||||||
Mid Cap Growth Fund |
(1,015,375 | ) | (962 | ) | 1,016,337 | |||||||
Mid Cap Value Fund |
— | (1,580,144 | ) | 1,580,144 | ||||||||
Small Cap Growth Equity Fund |
(63,235 | ) | (18,107 | ) | 81,342 | |||||||
Small Company Value Fund |
(11 | ) | (71,007 | ) | 71,018 | |||||||
Small/Mid Cap Value Fund |
13,259 | 95,801 | (109,060 | ) | ||||||||
Sustainable Equity Fund |
(29 | ) | (925,089 | ) | 925,118 | |||||||
Total Return Bond Fund |
— | (349,855 | ) | 349,855 | ||||||||
268
Notes to Financial Statements (Continued) |
The Funds did not have any unrecognized tax benefits at December 31, 2022, nor were there any increases or decreases in unrecognized tax benefits for the year then ended. The Funds recognize interest and penalties, if any, related to unrecognized tax benefits as an income tax expense in the Statements of Operations. During the year ended December 31, 2022, the Funds did not incur any such interest or penalties. The Funds are subject to examination by U.S. federal and state tax authorities for returns filed for the prior three fiscal years. Foreign taxes are provided for based on the Funds’ understanding of the tax rules and rates that exist in the foreign markets in which they invest.
|
7. |
Investment in Affiliated Issuers |
A summary of the Funds’ transactions in the securities of affiliated issuers during the year ended December 31, 2022, was as follows:
Beginning |
Purchases |
Sales |
Change in |
Net |
Value as of |
Number of |
Dividend |
Realized |
||||||||||||||||||||||||||||
Conservative Allocation Fund |
|
|||||||||||||||||||||||||||||||||||
MML Blue Chip Growth Fund, Initial Class |
$ | 18,878,130 | $ | 5,311,344 | $ | (2,357,976 | ) | $ | (10,222,435 | ) | $ | (186,478 | ) | $ | 11,422,585 | 1,067,531 | $ | — | $ | 2,628,974 | ||||||||||||||||
MML Dynamic Bond Fund, Class II |
46,152,132 | 3,729,983 | (7,530,451 | ) | (6,789,602 | ) | (901,578 | ) | 34,660,484 | 4,165,924 | 1,472,279 | — | ||||||||||||||||||||||||
MML Equity Income Fund, Initial Class |
13,865,662 | 2,538,685 | (1,988,657 | ) | (2,719,888 | ) | 291,682 | 11,987,484 | 1,186,880 | 221,224 | 1,726,502 | |||||||||||||||||||||||||
MML Equity Index Fund, Class III |
323,786 | — | (306,837 | ) | (73,671 | ) | 56,722 | — | — | — | — | |||||||||||||||||||||||||
MML Focused Equity Fund, Class II |
23,344,555 | 3,810,463 | (8,115,727 | ) | (4,173,738 | ) | 1,224,186 | 16,089,739 | 2,222,340 | 148,379 | 1,358,215 | |||||||||||||||||||||||||
MML Foreign Fund, Initial Class |
7,767,047 | 1,143,310 | (1,504,411 | ) | (1,730,442 | ) | (47,157 | ) | 5,628,347 | 676,484 | 231,742 | 431,693 | ||||||||||||||||||||||||
MML Fundamental Equity Fund, Class II |
14,509,139 | 2,501,840 | (2,533,417 | ) | (4,920,155 | ) | 188,061 | 9,745,468 | 1,165,726 | 65,485 | 1,813,911 | |||||||||||||||||||||||||
MML Fundamental Value Fund, Class II |
11,875,092 | 2,513,915 | (1,759,508 | ) | (2,648,945 | ) | 80,152 | 10,060,706 | 878,664 | 105,731 | 1,897,673 | |||||||||||||||||||||||||
MML Global Fund, Class I |
7,284,169 | 10,982,046 | (3,082,468 | ) | (5,139,754 | ) | (1,866,562 | ) | 8,177,431 | 2,044,358 | 130,779 | 5,717,299 | ||||||||||||||||||||||||
MML High Yield Fund, Class II |
3,198,901 | 328,083 | (1,993,585 | ) | (318,210 | ) | (174,483 | ) | 1,040,706 | 127,538 | 164,368 | — | ||||||||||||||||||||||||
MML Income & Growth Fund, Initial Class |
11,443,113 | 1,792,480 | (2,595,029 | ) | (1,828,135 | ) | 449,915 | 9,262,344 | 856,039 | 150,962 | 1,149,191 | |||||||||||||||||||||||||
MML Inflation-Protected and Income Fund, Initial Class |
15,378,186 | 1,804,967 | (6,120,361 | ) | (2,278,421 | ) | (577,687 | ) | 8,206,684 | 946,561 | 298,323 | 838,797 | ||||||||||||||||||||||||
MML International Equity Fund, Class II |
14,566,592 | 2,563,473 | (1,872,902 | ) | (3,148,078 | ) | 55,831 | 12,164,916 | 1,385,526 | 146,985 | 669,354 | |||||||||||||||||||||||||
MML Large Cap Growth Fund, Initial Class |
10,689,895 | 1,200,386 | (1,449,137 | ) | (3,675,500 | ) | 42,848 | 6,808,492 | 694,036 | 1 | 776,046 | |||||||||||||||||||||||||
MML Managed Bond Fund, Initial Class |
84,781,807 | 6,942,782 | (13,255,875 | ) | (14,540,030 | ) | (674,899 | ) | 63,253,785 | 5,967,671 | 2,177,864 | 728,752 | ||||||||||||||||||||||||
MML Mid Cap Growth Fund, Initial Class |
9,792,436 | 3,178,900 | (1,428,048 | ) | (4,670,261 | ) | (15,170 | ) | 6,857,857 | 780,189 | — | 2,218,484 | ||||||||||||||||||||||||
MML Mid Cap Value Fund, Initial Class |
7,344,208 | 2,076,957 | (1,084,171 | ) | (2,174,970 | ) | 322,304 | 6,484,328 | 707,124 | 141,573 | 1,611,453 | |||||||||||||||||||||||||
MML Short-Duration Bond Fund, Class II |
20,222,310 | 1,553,397 | (4,899,572 | ) | (1,682,795 | ) | (389,729 | ) | 14,803,611 | 1,711,400 | 532,150 | — | ||||||||||||||||||||||||
MML Small Cap Growth Equity Fund, Initial Class |
1,016,603 | 294,549 | (330,208 | ) | (370,180 | ) | (45,020 | ) | 565,744 | 67,168 | — | 196,103 | ||||||||||||||||||||||||
MML Small Company Value Fund, Class II |
4,263,155 | 2,033,859 | (621,824 | ) | (2,196,286 | ) | (259,470 | ) | 3,219,434 | 433,302 | 6,619 | 1,841,289 | ||||||||||||||||||||||||
MML Small/Mid Cap Value Fund, Initial Class |
2,213,947 | 619,657 | (342,443 | ) | (917,099 | ) | 62,899 | 1,636,961 | 184,343 | 22,745 | 494,751 | |||||||||||||||||||||||||
MML Strategic Emerging Markets Fund, Class II |
3,715,182 | 2,450,953 | (602,683 | ) | (1,775,998 | ) | (566,029 | ) | 3,221,425 | 666,962 | 113,503 | 1,150,790 | ||||||||||||||||||||||||
MML Total Return Bond Fund, Class II |
55,603,249 | 9,497,389 | (11,328,653 | ) | (7,635,526 | ) | (1,054,179 | ) | 45,082,280 | 5,134,656 | 762,647 | — | ||||||||||||||||||||||||
| $ | 388,229,296 | $ | 68,869,418 | $ | (77,103,943 | ) | $ | (85,630,119 | ) | $ | (3,983,841 | ) | $ | 290,380,811 | $ | 6,893,359 | $ | 27,249,277 | ||||||||||||||||||
269
Notes to Financial Statements (Continued) |
Beginning |
Purchases |
Sales |
Change in |
Net |
Value as of |
Number of |
Dividend |
Realized |
||||||||||||||||||||||||||||
Balanced Allocation Fund |
||||||||||||||||||||||||||||||||||||
MML Blue Chip Growth Fund, Initial Class |
$ | 26,815,070 | $ | 3,549,913 | $ | (2,757,517 | ) | $ | (13,249,167 | ) | $ | (260,933 | ) | $ | 14,097,366 | 1,317,511 | $ | — | $ | 3,267,203 | ||||||||||||||||
MML Dynamic Bond Fund, Class II |
47,473,621 | 2,143,287 | (6,293,761 | ) | (7,220,945 | ) | (666,018 | ) | 35,436,184 | 4,259,157 | 1,504,969 | — | ||||||||||||||||||||||||
MML Equity Income Fund, Initial Class |
18,695,294 | 2,837,397 | (2,319,739 | ) | (3,412,199 | ) | 145,189 | 15,945,942 | 1,578,806 | 295,449 | 2,305,762 | |||||||||||||||||||||||||
MML Equity Index Fund, Class III |
588,392 | — | (557,592 | ) | (125,638 | ) | 94,838 | — | — | — | — | |||||||||||||||||||||||||
MML Focused Equity Fund, Class II |
30,754,605 | 7,114,843 | (4,703,044 | ) | (4,812,498 | ) | 749,893 | 29,103,799 | 4,019,862 | 259,330 | 2,373,812 | |||||||||||||||||||||||||
MML Foreign Fund, Initial Class |
10,706,884 | 1,075,626 | (1,748,529 | ) | (2,217,567 | ) | (246,783 | ) | 7,569,631 | 909,811 | 314,756 | 586,331 | ||||||||||||||||||||||||
MML Fundamental Equity Fund, Class II |
19,761,204 | 2,767,484 | (2,905,074 | ) | (6,727,236 | ) | 296,407 | 13,192,785 | 1,578,084 | 88,199 | 2,443,120 | |||||||||||||||||||||||||
MML Fundamental Value Fund, Class II |
15,252,771 | 2,747,963 | (2,061,745 | ) | (3,013,490 | ) | (265,535 | ) | 12,659,964 | 1,105,674 | 133,880 | 2,402,884 | ||||||||||||||||||||||||
MML Global Fund, Class I |
14,083,881 | 11,955,429 | (3,573,768 | ) | (8,767,790 | ) | (2,065,255 | ) | 11,632,497 | 2,908,124 | 188,344 | 8,233,880 | ||||||||||||||||||||||||
MML High Yield Fund, Class II |
3,437,409 | 219,427 | (912,022 | ) | (501,929 | ) | (47,610 | ) | 2,195,275 | 269,029 | 178,807 | — | ||||||||||||||||||||||||
MML Income & Growth Fund, Initial Class |
15,201,327 | 1,888,410 | (2,933,345 | ) | (2,191,149 | ) | 359,394 | 12,324,637 | 1,139,061 | 198,203 | 1,508,817 | |||||||||||||||||||||||||
MML Inflation-Protected and Income Fund, Initial Class |
15,731,738 | 1,220,155 | (4,771,386 | ) | (2,931,330 | ) | 25,153 | 9,274,330 | 1,069,704 | 273,600 | 769,281 | |||||||||||||||||||||||||
MML International Equity Fund, Class II |
22,956,392 | 1,910,861 | (2,196,430 | ) | (4,764,385 | ) | 54,848 | 17,961,286 | 2,045,705 | 216,242 | 984,742 | |||||||||||||||||||||||||
MML Large Cap Growth Fund, Initial Class |
15,224,548 | 1,270,190 | (1,690,167 | ) | (5,348,377 | ) | 167,026 | 9,623,220 | 980,960 | — | 1,097,456 | |||||||||||||||||||||||||
MML Managed Bond Fund, Initial Class |
85,697,030 | 3,948,487 | (13,074,788 | ) | (14,059,495 | ) | (1,115,021 | ) | 61,396,213 | 5,792,419 | 2,120,388 | 709,519 | ||||||||||||||||||||||||
MML Mid Cap Growth Fund, Initial Class |
12,915,451 | 3,436,113 | (1,666,152 | ) | (5,605,300 | ) | (445,085 | ) | 8,635,027 | 982,369 | — | 2,814,288 | ||||||||||||||||||||||||
MML Mid Cap Value Fund, Initial Class |
10,856,755 | 2,713,543 | (1,264,927 | ) | (2,841,616 | ) | 98,277 | 9,562,032 | 1,042,752 | 208,760 | 2,376,187 | |||||||||||||||||||||||||
MML Short-Duration Bond Fund, Class II |
21,086,825 | 807,930 | (5,342,032 | ) | (1,640,201 | ) | (492,320 | ) | 14,420,202 | 1,667,075 | 519,823 | — | ||||||||||||||||||||||||
MML Small Cap Growth Equity Fund, Initial Class |
1,618,629 | 352,750 | (389,065 | ) | (604,207 | ) | (64,641 | ) | 913,466 | 108,452 | — | 313,182 | ||||||||||||||||||||||||
MML Small Company Value Fund, Class II |
5,263,639 | 2,313,275 | (721,703 | ) | (2,745,094 | ) | (244,122 | ) | 3,865,995 | 520,322 | 8,022 | 2,231,891 | ||||||||||||||||||||||||
MML Small/Mid Cap Value Fund, Initial Class |
3,072,382 | 752,214 | (401,225 | ) | (1,229,568 | ) | 49,339 | 2,243,142 | 252,606 | 31,267 | 680,148 | |||||||||||||||||||||||||
MML Strategic Emerging Markets Fund, Class II |
4,495,858 | 1,160,088 | (701,592 | ) | (1,778,010 | ) | (482,867 | ) | 2,693,477 | 557,656 | 97,807 | 991,654 | ||||||||||||||||||||||||
MML Total Return Bond Fund, Class II |
56,561,333 | 3,597,819 | (7,798,332 | ) | (8,027,794 | ) | (899,469 | ) | 43,433,557 | 4,946,874 | 802,303 | — | ||||||||||||||||||||||||
| $ | 458,251,038 | $ | 59,783,204 | $ | (70,783,935 | ) | $ | (103,814,985 | ) | $ | (5,255,295 | ) | $ | 338,180,027 | $ | 7,440,149 | $ | 36,090,157 | ||||||||||||||||||
270
Notes to Financial Statements (Continued) |
Beginning |
Purchases |
Sales |
Change in |
Net |
Value as of |
Number of |
Dividend |
Realized |
||||||||||||||||||||||||||||
Moderate Allocation Fund |
||||||||||||||||||||||||||||||||||||
MML Blue Chip Growth Fund, Initial Class |
$ | 119,078,373 | $ | 23,650,122 | $ | (13,656,358 | ) | $ | (60,228,971 | ) | $ | (2,495,653 | ) | $ | 66,347,513 | 6,200,702 | $ | — | $ | 15,500,023 | ||||||||||||||||
MML Dynamic Bond Fund, Class II |
136,034,260 | 4,436,613 | (19,554,878 | ) | (20,284,691 | ) | (1,955,813 | ) | 98,675,491 | 11,860,035 | 4,238,379 | — | ||||||||||||||||||||||||
MML Equity Income Fund, Initial Class |
85,186,498 | 11,783,736 | (11,507,877 | ) | (14,521,222 | ) | (88,468 | ) | 70,852,667 | 7,015,116 | 1,324,829 | 10,339,347 | ||||||||||||||||||||||||
MML Equity Index Fund, Class III |
2,570,749 | — | (2,436,178 | ) | (549,851 | ) | 415,280 | — | — | — | — | |||||||||||||||||||||||||
MML Focused Equity Fund, Class II |
150,519,148 | 13,866,870 | (21,261,297 | ) | (22,444,503 | ) | 3,557,395 | 124,237,613 | 17,159,891 | 1,106,812 | 10,131,371 | |||||||||||||||||||||||||
MML Foreign Fund, Initial Class |
48,011,592 | 4,004,341 | (8,746,818 | ) | (10,575,892 | ) | (208,785 | ) | 32,484,438 | 3,904,380 | 1,372,240 | 2,556,228 | ||||||||||||||||||||||||
MML Fundamental Equity Fund, Class II |
91,989,309 | 11,712,769 | (13,451,414 | ) | (29,551,086 | ) | 44,686 | 60,744,264 | 7,266,060 | 404,270 | 11,198,230 | |||||||||||||||||||||||||
MML Fundamental Value Fund, Class II |
73,990,776 | 12,284,564 | (10,202,997 | ) | (14,724,025 | ) | (987,691 | ) | 60,360,627 | 5,271,671 | 642,445 | 11,530,615 | ||||||||||||||||||||||||
MML Global Fund, Class I |
68,406,406 | 30,084,477 | (17,948,368 | ) | (32,792,551 | ) | (8,382,258 | ) | 39,367,706 | 9,841,926 | 662,996 | 28,984,377 | ||||||||||||||||||||||||
MML High Yield Fund, Class II |
12,424,398 | 776,464 | (3,173,394 | ) | (1,787,257 | ) | (353,793 | ) | 7,886,418 | 966,473 | 764,202 | — | ||||||||||||||||||||||||
MML Income & Growth Fund, Initial Class |
70,525,048 | 7,877,241 | (12,571,714 | ) | (9,886,551 | ) | 1,561,149 | 57,505,173 | 5,314,711 | 905,332 | 6,891,809 | |||||||||||||||||||||||||
MML Inflation-Protected and Income Fund, Initial Class |
42,813,623 | 3,269,670 | (11,477,355 | ) | (7,984,564 | ) | (118,536 | ) | 26,502,838 | 3,056,844 | 844,875 | 2,375,538 | ||||||||||||||||||||||||
MML International Equity Fund, Class II |
106,431,468 | 11,074,042 | (10,814,263 | ) | (21,498,572 | ) | (570,210 | ) | 84,622,465 | 9,638,094 | 1,024,942 | 4,667,482 | ||||||||||||||||||||||||
MML Large Cap Growth Fund, Initial Class |
66,912,533 | 4,821,877 | (8,387,390 | ) | (23,467,893 | ) | 1,046,118 | 40,925,245 | 4,171,788 | — | 4,732,009 | |||||||||||||||||||||||||
MML Managed Bond Fund, Initial Class |
245,507,034 | 8,542,208 | (34,434,792 | ) | (40,520,731 | ) | (2,706,378 | ) | 176,387,341 | 16,641,243 | 6,148,446 | 2,057,379 | ||||||||||||||||||||||||
MML Mid Cap Growth Fund, Initial Class |
59,752,007 | 12,977,869 | (8,283,138 | ) | (24,074,230 | ) | (2,905,403 | ) | 37,467,105 | 4,262,469 | — | 12,374,547 | ||||||||||||||||||||||||
MML Mid Cap Value Fund, Initial Class |
48,295,182 | 11,359,111 | (6,294,749 | ) | (12,128,800 | ) | 144,104 | 41,374,848 | 4,511,979 | 912,144 | 10,382,408 | |||||||||||||||||||||||||
MML Short-Duration Bond Fund, Class II |
60,746,848 | 1,803,831 | (11,764,637 | ) | (5,145,600 | ) | (1,152,430 | ) | 44,488,012 | 5,143,123 | 1,714,981 | — | ||||||||||||||||||||||||
MML Small Cap Growth Equity Fund, Initial Class |
10,801,917 | 2,192,302 | (1,938,299 | ) | (4,030,385 | ) | (513,628 | ) | 6,511,907 | 773,130 | — | 2,172,438 | ||||||||||||||||||||||||
MML Small Company Value Fund, Class II |
26,754,460 | 11,343,235 | (3,580,284 | ) | (13,993,246 | ) | (1,089,608 | ) | 19,434,557 | 2,615,687 | 40,501 | 11,265,972 | ||||||||||||||||||||||||
MML Small/Mid Cap Value Fund, Initial Class |
15,358,966 | 3,549,714 | (1,980,025 | ) | (5,851,261 | ) | 4,006 | 11,081,400 | 1,247,905 | 155,124 | 3,374,295 | |||||||||||||||||||||||||
MML Strategic Emerging Markets Fund, Class II |
22,136,448 | 9,339,671 | (3,497,954 | ) | (10,679,236 | ) | (1,649,605 | ) | 15,649,324 | 3,240,026 | 566,195 | 5,740,622 | ||||||||||||||||||||||||
MML Total Return Bond Fund, Class II |
163,083,343 | 9,746,147 | (36,201,222 | ) | (20,766,644 | ) | (3,135,540 | ) | 112,726,084 | 12,838,962 | 1,988,273 | — | ||||||||||||||||||||||||
| $ | 1,727,330,386 | $ | 210,496,874 | $ | (273,165,401 | ) | $ | (407,487,762 | ) | $ | (21,541,061 | ) | $ | 1,235,633,036 | $ | 24,816,986 | $ | 156,274,690 | ||||||||||||||||||
271
Notes to Financial Statements (Continued) |
Beginning |
Purchases |
Sales |
Change in |
Net |
Value as of |
Number of |
Dividend |
Realized |
||||||||||||||||||||||||||||
Growth Allocation Fund |
||||||||||||||||||||||||||||||||||||
MML Blue Chip Growth Fund, Initial Class |
$ | 101,175,724 | $ | 21,261,535 | $ | (7,785,807 | ) | $ | (52,940,883 | ) | $ | (1,331,213 | ) | $ | 60,379,356 | 5,642,930 | $ | — | $ | 13,704,359 | ||||||||||||||||
MML Dynamic Bond Fund, Class II |
61,776,329 | 2,457,721 | (6,185,161 | ) | (9,708,744 | ) | (602,483 | ) | 47,737,662 | 5,737,700 | 2,000,619 | — | ||||||||||||||||||||||||
MML Equity Income Fund, Initial Class |
71,688,995 | 10,644,961 | (6,660,302 | ) | (12,112,198 | ) | (549,831 | ) | 63,011,625 | 6,238,775 | 1,153,987 | 9,006,048 | ||||||||||||||||||||||||
MML Equity Index Fund, Class III |
2,421,041 | — | (2,294,307 | ) | (519,159 | ) | 392,425 | — | — | — | — | |||||||||||||||||||||||||
MML Focused Equity Fund, Class II |
113,058,200 | 14,412,399 | (12,248,400 | ) | (16,580,032 | ) | 2,040,936 | 100,683,103 | 13,906,506 | 875,303 | 8,012,213 | |||||||||||||||||||||||||
MML Foreign Fund, Initial Class |
39,542,796 | 3,825,164 | (5,259,901 | ) | (8,984,876 | ) | (136,187 | ) | 28,986,996 | 3,484,014 | 1,196,256 | 2,228,404 | ||||||||||||||||||||||||
MML Fundamental Equity Fund, Class II |
80,360,265 | 11,080,010 | (9,941,011 | ) | (27,217,183 | ) | 782,845 | 55,064,926 | 6,586,714 | 368,104 | 10,196,457 | |||||||||||||||||||||||||
MML Fundamental Value Fund, Class II |
61,906,708 | 10,958,532 | (5,823,729 | ) | (13,182,509 | ) | (343,730 | ) | 53,515,272 | 4,673,823 | 556,312 | 9,984,700 | ||||||||||||||||||||||||
MML Global Fund, Class I |
53,002,880 | 33,418,809 | (10,997,967 | ) | (32,161,974 | ) | (4,873,102 | ) | 38,388,646 | 9,597,161 | 625,233 | 27,333,457 | ||||||||||||||||||||||||
MML High Yield Fund, Class II |
4,657,790 | 334,719 | (433,352 | ) | (807,064 | ) | (22,601 | ) | 3,729,492 | 457,046 | 300,840 | — | ||||||||||||||||||||||||
MML Income & Growth Fund, Initial Class |
60,362,634 | 7,336,485 | (7,491,366 | ) | (7,500,431 | ) | 200,765 | 52,908,087 | 4,889,842 | 804,223 | 6,122,128 | |||||||||||||||||||||||||
MML Inflation-Protected and Income Fund, Initial Class |
20,725,646 | 1,614,773 | (5,299,659 | ) | (3,885,735 | ) | 134,069 | 13,289,094 | 1,532,767 | 387,772 | 1,090,298 | |||||||||||||||||||||||||
MML International Equity Fund, Class II |
90,146,881 | 11,819,914 | (6,002,654 | ) | (17,242,918 | ) | (1,143,975 | ) | 77,577,248 | 8,835,677 | 894,447 | 4,073,225 | ||||||||||||||||||||||||
MML Large Cap Growth Fund, Initial Class |
56,371,209 | 12,107,966 | (4,814,875 | ) | (21,661,003 | ) | 534,621 | 42,537,918 | 4,336,179 | — | 4,760,607 | |||||||||||||||||||||||||
MML Managed Bond Fund, Initial Class |
112,318,571 | 4,025,441 | (27,989,649 | ) | (17,412,853 | ) | (1,022,234 | ) | 69,919,276 | 6,596,526 | 2,402,157 | 803,804 | ||||||||||||||||||||||||
MML Mid Cap Growth Fund, Initial Class |
50,540,072 | 11,926,390 | (4,805,598 | ) | (21,934,028 | ) | (1,559,827 | ) | 34,167,009 | 3,887,032 | — | 10,975,367 | ||||||||||||||||||||||||
MML Mid Cap Value Fund, Initial Class |
40,109,326 | 9,956,960 | (3,645,511 | ) | (10,224,679 | ) | (29,826 | ) | 36,166,270 | 3,943,977 | 782,610 | 8,907,989 | ||||||||||||||||||||||||
MML Short-Duration Bond Fund, Class II |
28,358,715 | 1,005,406 | (3,798,866 | ) | (2,631,356 | ) | (331,709 | ) | 22,602,190 | 2,612,970 | 798,570 | — | ||||||||||||||||||||||||
MML Small Cap Growth Equity Fund, Initial Class |
11,808,558 | 2,652,216 | (1,124,604 | ) | (4,793,548 | ) | (440,870 | ) | 8,101,752 | 961,885 | — | 2,570,027 | ||||||||||||||||||||||||
MML Small Company Value Fund, Class II |
26,739,054 | 11,999,510 | (2,081,636 | ) | (15,186,811 | ) | (517,792 | ) | 20,952,325 | 2,819,963 | 42,438 | 11,804,988 | ||||||||||||||||||||||||
MML Small/Mid Cap Value Fund, Initial Class |
12,052,462 | 2,941,162 | (1,154,792 | ) | (4,619,299 | ) | (78,230 | ) | 9,141,303 | 1,029,426 | 125,560 | 2,731,213 | ||||||||||||||||||||||||
MML Strategic Emerging Markets Fund, Class II |
18,206,002 | 7,499,211 | (2,074,691 | ) | (9,137,173 | ) | (943,209 | ) | 13,550,140 | 2,805,412 | 479,764 | 4,864,301 | ||||||||||||||||||||||||
MML Total Return Bond Fund, Class II |
75,444,836 | 1,520,812 | (12,547,839 | ) | (10,189,997 | ) | (1,041,229 | ) | 53,186,583 | 6,057,697 | 970,353 | — | ||||||||||||||||||||||||
| $ | 1,192,774,694 | $ | 194,800,096 | $ | (150,461,677 | ) | $ | (320,634,453 | ) | $ | (10,882,387 | ) | $ | 905,596,273 | $ | 14,764,548 | $ | 139,169,585 | ||||||||||||||||||
272
Notes to Financial Statements (Continued) |
Beginning |
Purchases |
Sales |
Change in |
Net |
Value as of |
Number of |
Dividend |
Realized |
||||||||||||||||||||||||||||
Aggressive Allocation Fund |
||||||||||||||||||||||||||||||||||||
MML Blue Chip Growth Fund, Initial Class |
$ | 17,179,439 | $ | 4,240,645 | $ | (1,949,699 | ) | $ | (8,871,161 | ) | $ | (490,769 | ) | $ | 10,108,455 | 944,715 | $ | — | $ | 2,387,962 | ||||||||||||||||
MML Dynamic Bond Fund, Class II |
3,208,185 | 207,325 | (539,395 | ) | (467,994 | ) | (66,394 | ) | 2,341,727 | 281,458 | 103,153 | — | ||||||||||||||||||||||||
MML Equity Income Fund, Initial Class |
11,529,611 | 1,942,396 | (1,636,730 | ) | (1,924,788 | ) | (129,521 | ) | 9,780,968 | 968,413 | 186,057 | 1,452,043 | ||||||||||||||||||||||||
MML Equity Index Fund, Class III |
348,718 | — | (330,464 | ) | (72,123 | ) | 53,869 | — | — | — | — | |||||||||||||||||||||||||
MML Focused Equity Fund, Class II |
20,203,154 | 3,188,946 | (2,773,257 | ) | (3,121,749 | ) | 463,078 | 17,960,172 | 2,480,687 | 159,679 | 1,461,641 | |||||||||||||||||||||||||
MML Foreign Fund, Initial Class |
6,387,202 | 800,328 | (1,222,398 | ) | (1,411,932 | ) | (92,714 | ) | 4,460,486 | 536,116 | 194,064 | 361,506 | ||||||||||||||||||||||||
MML Fundamental Equity Fund, Class II |
12,811,706 | 2,006,208 | (2,764,937 | ) | (4,131,229 | ) | (99,887 | ) | 7,821,861 | 935,629 | 58,796 | 1,628,660 | ||||||||||||||||||||||||
MML Fundamental Value Fund, Class II |
10,392,476 | 2,042,807 | (1,456,336 | ) | (2,083,416 | ) | (205,642 | ) | 8,689,889 | 758,942 | 93,865 | 1,684,686 | ||||||||||||||||||||||||
MML Global Fund, Class I |
3,841,463 | 2,887,804 | (2,487,091 | ) | (230,725 | ) | (2,274,471 | ) | 1,736,980 | 434,245 | 39,585 | 1,730,552 | ||||||||||||||||||||||||
MML High Yield Fund, Class II |
644,392 | 50,910 | (35,731 | ) | (115,621 | ) | (2,512 | ) | 541,438 | 66,353 | 43,387 | — | ||||||||||||||||||||||||
MML Income & Growth Fund, Initial Class |
10,036,146 | 1,408,622 | (1,507,466 | ) | (1,105,809 | ) | (128,933 | ) | 8,702,560 | 804,303 | 134,313 | 1,022,456 | ||||||||||||||||||||||||
MML Inflation-Protected and Income Fund, Initial Class |
924,296 | 62,398 | (653,337 | ) | (35,990 | ) | (57,690 | ) | 239,677 | 27,644 | 8,296 | 23,325 | ||||||||||||||||||||||||
MML International Equity Fund, Class II |
14,964,880 | 2,213,387 | (1,561,852 | ) | (2,773,864 | ) | (299,087 | ) | 12,543,464 | 1,428,641 | 141,838 | 645,919 | ||||||||||||||||||||||||
MML Large Cap Growth Fund, Initial Class |
9,864,502 | 2,581,585 | (1,195,096 | ) | (3,845,776 | ) | 59,128 | 7,464,343 | 760,891 | — | 862,676 | |||||||||||||||||||||||||
MML Managed Bond Fund, Initial Class |
7,994,965 | 388,231 | (2,948,882 | ) | (1,000,525 | ) | (182,552 | ) | 4,251,237 | 401,082 | 151,755 | 50,780 | ||||||||||||||||||||||||
MML Mid Cap Growth Fund, Initial Class |
8,384,819 | 4,389,447 | (1,174,025 | ) | (4,058,753 | ) | (562,951 | ) | 6,978,537 | 793,918 | — | 2,302,982 | ||||||||||||||||||||||||
MML Mid Cap Value Fund, Initial Class |
6,773,808 | 1,812,079 | (891,629 | ) | (1,682,372 | ) | (66,916 | ) | 5,944,970 | 648,306 | 132,882 | 1,512,514 | ||||||||||||||||||||||||
MML Short-Duration Bond Fund, Class II |
2,517,949 | 122,997 | (245,633 | ) | (244,212 | ) | (25,665 | ) | 2,125,436 | 245,715 | 75,804 | — | ||||||||||||||||||||||||
MML Small Cap Growth Equity Fund, Initial Class |
2,303,388 | 560,530 | (272,706 | ) | (923,156 | ) | (108,669 | ) | 1,559,387 | 185,139 | — | 509,611 | ||||||||||||||||||||||||
MML Small Company Value Fund, Class II |
4,246,531 | 1,979,671 | (509,978 | ) | (2,257,092 | ) | (240,947 | ) | 3,218,185 | 433,134 | 6,749 | 1,877,515 | ||||||||||||||||||||||||
MML Small/Mid Cap Value Fund, Initial Class |
1,913,833 | 507,256 | (282,396 | ) | (678,190 | ) | (70,054 | ) | 1,390,449 | 156,582 | 19,974 | 434,477 | ||||||||||||||||||||||||
MML Strategic Emerging Markets Fund, Class II |
3,136,291 | 892,849 | (492,324 | ) | (1,300,926 | ) | (322,577 | ) | 1,913,313 | 396,131 | 71,576 | 725,702 | ||||||||||||||||||||||||
MML Total Return Bond Fund, Class II |
3,999,052 | 165,462 | (1,665,851 | ) | (246,031 | ) | (269,435 | ) | 1,983,197 | 225,877 | 39,491 | — | ||||||||||||||||||||||||
| $ | 163,606,806 | $ | 34,451,883 | $ | (28,597,213 | ) | $ | (42,583,434 | ) | $ | (5,121,311 | ) | $ | 121,756,731 | $ | 1,661,264 | $ | 20,675,007 | ||||||||||||||||||
|
8. |
Indemnifications |
Under the Funds’ organizational documents, current and former Trustees and Officers are provided with specified rights to indemnification against liabilities arising in connection with the performance of their duties to the Funds, and shareholders are indemnified against personal liability for obligations of the Funds. In the normal course of business, the Funds may also enter into contracts that provide general indemnifications. The Funds’ maximum exposure under these arrangements is unknown as this would be dependent on future claims that may be made against the Funds. The risk of material loss from such claims is considered remote.
273
Notes to Financial Statements (Continued) |
|
9. |
New Accounting Pronouncements |
In June 2022, FASB issued Accounting Standards Update 2022-03 — Fair Value Measurement (Topic 820) — Fair Value Measurement of Equity Securities Subject to Contractual Sale Restrictions (“ASU 2022-03”). ASU 2022-03 clarifies the guidance in Topic 820 to indicate that a contractual sale restriction should not be considered in the fair value of an equity security subject to such a restriction, and requires entities with investments in equity securities subject to contractual sale restrictions to disclose certain qualitative and quantitative information about such securities. ASU 2022-03 is effective for fiscal years, and interim periods within those fiscal years, beginning after December 15, 2023, and allows for early adoption. ASU 2022-03 will only be applicable to an equity security in which the contractual arrangement that restricts its sale is executed or modified on or after the adoption date. Management is currently evaluating the impact of applying this update.
|
10. |
Coronavirus (COVID-19) Pandemic |
The global pandemic outbreak of the novel coronavirus known as COVID-19 and efforts to contain its spread have produced, and will likely continue to produce, substantial market volatility, severe market dislocations and liquidity constraints in many markets, exchange trading suspensions and closures, higher default rates, and global business disruption, and they may result in future significant adverse effects, such as declines in global financial markets and a substantial economic downturn or recession throughout the world. Such factors may have a significant adverse effect on a Fund’s performance and have the potential to impair the ability of a Fund’s investment adviser, subadviser, or other service providers to serve the Fund and could lead to disruptions that negatively impact the Fund.
|
11. |
Russia-Ukraine War |
In February 2022, Russia commenced a large-scale military attack on Ukraine. The outbreak of hostilities between the two countries could result in more widespread conflict and could have a severe adverse effect on the regional and the global financial markets and economies. One or more of the Funds hold positions in securities or other instruments that are economically tied to Russia. Investments in Russia are subject to political, economic, legal, market, and currency risks, as well as the risks related to the economic sanctions on Russia, Russian individuals, and Russian corporate and banking entities imposed by the United States and/or other countries. Such sanctions — which affect companies in many sectors, including energy, financial services, and defense, among others — could adversely affect the global energy and financial markets and, thus, could affect the value of a Fund’s investments, even beyond any direct exposure the Fund may have to Russian issuers or the adjoining geographic regions. Such sanctions may also result in a decline in the value and liquidity of Russian securities and a weakening of the ruble, and will impair a Fund’s ability to buy, sell, receive, or deliver Russian securities. In addition, certain transactions have been or may be prohibited and/or existing investments have or may become illiquid (e.g., because transacting in certain existing investments is prohibited), which could cause a Fund to sell other portfolio holdings at a disadvantageous time or price in order to meet shareholder redemptions.
274
To the Board of Trustees of MML Series Investment Fund and Shareholders of MML Conservative Allocation Fund, MML Balanced Allocation Fund, MML Moderate Allocation Fund, MML Growth Allocation Fund, MML Aggressive Allocation Fund, MML American Funds Growth Fund, MML American Funds Core Allocation Fund, MML Blue Chip Growth Fund, MML Equity Income Fund, MML Equity Index Fund, MML Focused Equity Fund, MML Foreign Fund, MML Fundamental Equity Fund, MML Fundamental Value Fund, MML Global Fund, MML Income & Growth Fund, MML International Equity Fund, MML Large Cap Growth Fund, MML Managed Volatility Fund, MML Mid Cap Growth Fund, MML Mid Cap Value Fund, MML Small Cap Growth Equity Fund, MML Small Company Value Fund, MML Small/Mid Cap Value Fund, MML Sustainable Equity Fund (formerly known as “MML Growth & Income Fund”), and MML Total Return Bond Fund (collectively, the “Funds”):
Opinion on the Financial Statements and Financial Highlights
We have audited the accompanying statements of assets and liabilities of the Funds of MML Series Investment Fund, including the portfolios of investments, as of December 31, 2022, the related statements of operations for the year then ended, the statements of changes in net assets for each of the two years in the period then ended, the financial highlights for each of the five years in the period then ended, and the related notes. In our opinion, the financial statements and financial highlights present fairly, in all material respects, the financial position of each of the Funds as of December 31, 2022, and the results of their operations for the year then ended, the changes in their net assets for each of the two years in the period then ended, and the financial highlights for each of the five years in the period then ended, in conformity with accounting principles generally accepted in the United States of America.
Basis for Opinion
These financial statements and financial highlights are the responsibility of the Funds’ management. Our responsibility is to express an opinion on the Funds’ financial statements and financial highlights based on our audits. We are a public accounting firm registered with the Public Company Accounting Oversight Board (United States) (PCAOB) and are required to be independent with respect to the Funds in accordance with the U.S. federal securities laws and the applicable rules and regulations of the Securities and Exchange Commission and the PCAOB.
We conducted our audits in accordance with the standards of the PCAOB. Those standards require that we plan and perform the audit to obtain reasonable assurance about whether the financial statements and financial highlights are free of material misstatement, whether due to error or fraud. The Funds are not required to have, nor were we engaged to perform, an audit of their internal control over financial reporting. As part of our audits we are required to obtain an understanding of internal control over financial reporting but not for the purpose of expressing an opinion on the effectiveness of the Funds’ internal control over financial reporting. Accordingly, we express no such opinion.
Our audits included performing procedures to assess the risks of material misstatement of the financial statements and financial highlights, whether due to error or fraud, and performing procedures that respond to those risks. Such procedures included examining, on a test basis, evidence regarding the amounts and disclosures in the financial statements and financial highlights. Our audits also included evaluating the accounting principles used and significant estimates made by management, as well as evaluating the overall presentation of the financial statements and financial highlights. Our procedures included confirmation of securities owned as of December 31, 2022, by correspondence with the custodian, transfer agents, brokers, and agent banks; when replies were not received from brokers or agent banks, we performed other auditing procedures. We believe that our audits provide a reasonable basis for our opinion.
/s/ Deloitte & Touche LLP
Boston, Massachusetts
February 22, 2023
We have served as the auditor of one or more MassMutual investment companies since 1995.
275
The following table lists the Trust’s Trustees and Principal Officers; their address and year of birth; their position with the Trust; the length of time holding that position with the Trust; their principal occupation(s) during at least the past five years; the number of portfolios in the fund complex they oversee; and other directorships they hold in companies subject to registration or reporting requirements of the Securities Exchange Act of 1934 (generally called “public companies”) or in registered investment companies. The Trust’s Statements of Additional Information include additional information about the Trust’s Trustees and are available, without charge, upon request by calling 1-888-309-3539 or by writing MML Series Investment Fund, c/o Massachusetts Mutual Life Insurance Company, 1295 State Street, Springfield, Massachusetts 01111-0001, Attention: Investment Management Solutions.
Independent Trustees
Name, Address*, |
Position(s) |
Term of |
Principal Occupation(s) |
Number of |
Other Directorships |
Allan W. Blair Year of birth: 1948 |
Trustee |
Since 2003 |
Retired. |
110 |
Trustee (since 2003), MassMutual Select Funds (open-end investment company); Trustee (since 2012), MassMutual Premier Funds (open-end investment company); Trustee (since 2021), MassMutual Advantage Funds (open-end investment company); Trustee (since 2012), MML Series Investment Fund II (open-end investment company). |
Nabil N. El-Hage Year of birth: 1958 |
Trustee |
Since 2012 |
Founder and CEO (since 2018), AEE International LLC (a Puerto Rico LLC); Founder and sole member (2016-2018), PR Academy of Executive Education LLC (a Puerto Rico LLC). |
110 |
Trustee (since 2012), MassMutual Select Funds (open-end investment company); Trustee (since 2003), Chairman (2006-2012), MassMutual Premier Funds (open-end investment company); Trustee (since 2021), MassMutual Advantage Funds (open-end investment company); Trustee (since 2005), Chairman (2006-2012), MML Series Investment Fund II (open-end investment company). |
Maria D. Furman Year of birth: 1954 |
Trustee |
Since 2012 |
Retired. |
110 |
Trustee (since 2012), MassMutual Select Funds (open-end investment company); Trustee (since 2004), MassMutual Premier Funds (open-end investment company); Trustee (since 2021), MassMutual Advantage Funds (open-end investment company); Trustee (since 2005), MML Series Investment Fund II (open-end investment company). |
276
Trustees and Principal Officers (Unaudited) (Continued) |
Name, Address*, |
Position(s) |
Term of |
Principal Occupation(s) |
Number of |
Other Directorships |
R. Bradford Malt Year of birth: 1954 |
Trustee |
Since 2022 |
Chairman (2004-2019), Management Committee (1993-2019), Partner (1987-2019), Associate (1979-1987), Ropes & Gray LLP (counsel to the Trust and MassMutual). |
110 |
Trustee (since 2022), MassMutual Select Funds (open-end investment company); Trustee (since 2022), MassMutual Premier Funds (open-end investment company); Trustee (since 2022), MassMutual Advantage Funds (open-end investment company); Trustee (since 2022), MML Series Investment Fund II (open-end investment company). |
C. Ann Merrifield Year of birth: 1951 |
Trustee |
Since 2012 |
Retired. |
110 |
Director (since 2020), Lead Director (2020-2022), Chairperson (since 2020) of the Nominating and Governance Committee, Member (since 2020) and Chairperson (2020-2022) of the Compensation Committee, and Member (2020-2022) of the Audit Committee, Lyra Therapeutics (a clinical-stage specialty pharmaceutical company); Director (since 2014), Chairperson (since 2017), Lead Director (2015-2017), Member (since 2014) and Chairperson (since 2015) of the Nominating and Governance Committee, Member (since 2019) of the Compensation Committee, and Member (2014-2019) of the Audit Committee, InVivo Therapeutics (research and clinical-stage biomaterials and biotechnology company); Trustee (since 2012), MassMutual Select Funds (open-end investment company); Trustee (since 2004), MassMutual Premier Funds (open-end investment company); Trustee (since 2021), MassMutual Advantage Funds (open-end investment company); Trustee (since 2005), MML Series Investment Fund II (open-end investment company). |
Cynthia R. Plouché Year of birth: 1957 |
Trustee |
Since |
Retired; Assessor (2014-2018), Moraine Township (property assessment). |
110 |
Trustee (since 2014), Northern Trust Funds (open-end investment companies); Trustee (since 2022), MassMutual Select Funds (open-end investment company); Trustee (since 2022), MassMutual Premier Funds (open-end investment company); Trustee (since 2022), MassMutual Advantage Funds (open-end investment company); Trustee (since 2022), MML Series Investment Fund II (open-end investment company). |
Jason J. Price Year of birth: 1973 |
Trustee |
Since 2022 |
Co-Founder and Chairman of the Board (2017-2021), NXTHVN (arts organization). |
110 |
Trustee (since 2022), MassMutual Select Funds (open-end investment company); Trustee (since 2022), MassMutual Premier Funds (open-end investment company); Trustee (since 2022), MassMutual Advantage Funds (open-end investment company); Trustee (since 2022), MML Series Investment Fund II (open-end investment company). |
277
Trustees and Principal Officers (Unaudited) (Continued) |
Name, Address*, |
Position(s) |
Term of |
Principal Occupation(s) |
Number of |
Other Directorships |
Susan B. Sweeney Year of birth: 1952 |
Chairperson
Trustee |
Since 2022
Since 2009 |
Retired. |
112^ |
Trustee (since 2012), Barings Corporate Investors (closed-end investment company); Trustee (since 2012), Barings Participation Investors (closed-end investment company); Chairperson (since 2022), Trustee (since 2009), MassMutual Select Funds (open-end investment company); Chairperson (since 2022), Trustee (since 2012), MassMutual Premier Funds (open-end investment company); Chairperson (since 2022), Trustee (since 2021), MassMutual Advantage Funds (open-end investment company); Chairperson (since 2022), Trustee (since 2012), MML Series Investment Fund II (open-end investment company). |
Interested Trustees
Name, Address*, |
Position(s) |
Term of |
Principal Occupation(s) |
Number of |
Other Directorships |
Michael R. Fanning^^ Year of birth: 1963 |
Trustee |
Since 2021 |
Head of MassMutual U.S. (since 2016), Executive Vice President (2016-2018), Member of MassMutual’s Executive Leadership Team (since 2008), MassMutual. |
110 |
Director (since 2016), MML Advisers; Trustee (since 2021), MassMutual Select Funds (open-end investment company); Trustee (since 2021), MassMutual Premier Funds (open-end investment company); Trustee (since 2021), MassMutual Advantage Funds (open-end investment company); Trustee (since 2021), MML Series Investment Fund II (open-end investment company). |
Clifford M, Noreen^^^ Year of birth: 1957 |
Trustee |
Since 2021 |
Head of Global Investment Strategy (since 2019), Deputy Chief Investment Officer and Managing Director (2016-2018), MassMutual; President (2008-2016), Vice Chairman (2007-2008), Member of the Board of Managers (2006-2016), Managing Director (2000-2016), Barings LLC. |
112^ |
Chairman (since 2009), Trustee (since 2005), President (2005-2009), CI Subsidiary Trust and PI Subsidiary Trust; Chairman and Trustee (since 2009), President (2005-2009), Vice President (1993-2005), Barings Corporate Investors (closed-end investment company); Chairman and Trustee (since 2009), President (2005-2009), Vice President (1993-2005), Barings Participation Investors (closed-end investment company); Trustee (since 2021), MassMutual Select Funds (open-end investment company); Trustee (since 2021), MassMutual Premier Funds (open-end investment company); Trustee (since 2021), MassMutual Advantage Funds (open-end investment company); Trustee (since 2021), MML Series Investment Fund II (open-end investment company). |
278
Trustees and Principal Officers (Unaudited) (Continued) |
Principal Officers
Name, Address*, |
Position(s) |
Term of |
Principal Occupation(s) |
Number of |
Andrea Anastasio |
Vice President |
Since |
Vice President (since 2021), MML Advisers; Head of Investment Management Solutions (since 2021), MassMutual; Head of Investment Strategy and Research, North America (2019-2021), Head of Investment Product Management (2016- 2019), State Street Global Advisors; Vice President (since 2021), MassMutual Select Funds (open-end investment company); Vice President (since 2021), MassMutual Premier Funds (open-end investment company); Vice President (since 2021), MassMutual Advantage Funds (open-end investment company); Vice President (since 2021), MML Series Investment Fund II (open-end investment company). |
110 |
Andrew M. Goldberg Year of birth: 1966 |
Vice President, Secretary, and Chief Legal Officer
Assistant Secretary |
Since 2008
2001- 2008 |
Lead Counsel, Investment Adviser & Mutual Funds (since 2018), Assistant Vice President and Counsel (2004-2018), MassMutual; Secretary (since 2015), Assistant Secretary (2013-2015), MML Advisers; Vice President, Secretary, and Chief Legal Officer (since 2008), Assistant Secretary (2001-2008), MassMutual Select Funds (open-end investment company); Vice President, Secretary, (formerly known as “Clerk”), and Chief Legal Officer (since 2008), Assistant Clerk (2004-2008), MassMutual Premier Funds (open-end investment company); Vice President, Secretary, and Chief Legal Officer (since 2021), MassMutual Advantage Funds (open-end investment company); Vice President, Secretary, (formerly known as “Clerk”), and Chief Legal Officer (since 2008), Assistant Clerk (2005-2008), MML Series Investment Fund II (open-end investment company). |
110 |
Renee Hitchcock Year of birth: 1970 |
Chief Financial Officer and Treasurer
Assistant Treasurer |
Since 2016
2007- 2016 |
Head of Mutual Fund Administration (since 2018), Assistant Vice President (2015-2018), MassMutual; Chief Financial Officer and Treasurer (since 2016), Assistant Treasurer (2007-2016), MassMutual Select Funds (open-end investment company); Chief Financial Officer and Treasurer (since 2016), Assistant Treasurer (2007-2016), MassMutual Premier Funds (open-end investment company); Chief Financial Officer and Treasurer (since 2021), MassMutual Advantage Funds (open-end investment company); Chief Financial Officer and Treasurer (since 2016), Assistant Treasurer (2007-2016), MML Series Investment Fund II (open-end investment company). |
110 |
Paul LaPiana Year of birth: 1969 |
President |
Since 2021 |
President (since 2021), MML Advisers; Head of MassMutual U.S. Product (since 2019), Head of Field Management (2016-2019), MassMutual; President (since 2021), MassMutual Select Funds (open-end investment company); President (since 2021), MassMutual Premier Funds (open-end investment company); President (since 2021), MassMutual Advantage Funds (open-end investment company); President (since 2021), MML Series Investment Fund II (open-end investment company). |
110 |
Jill Nareau Robert Year of birth: 1972 |
Vice President and Assistant Secretary
Assistant Secretary |
Since 2017
2008- 2017 |
Lead Counsel, Investment Adviser & Mutual Funds (since 2018), Assistant Vice President and Counsel (2009-2018), MassMutual; Assistant Secretary (since 2015), MML Advisers; Vice President and Assistant Secretary (since 2017), Assistant Secretary (2008-2017), MassMutual Select Funds (open-end investment company); Vice President and Assistant Secretary (since 2017), Assistant Secretary (formerly known as “Assistant Clerk”) (2008-2017), MassMutual Premier Funds (open-end investment company); Vice President and Assistant Secretary (since 2021), MassMutual Advantage Funds (open-end investment company);Vice President and Assistant Secretary (since 2017), Assistant Secretary (formerly known as “Assistant Clerk”) (2008-2017), MML Series Investment Fund II (open-end investment company). |
110 |
279
Trustees and Principal Officers (Unaudited) (Continued) |
Name, Address*, |
Position(s) |
Term of |
Principal Occupation(s) |
Number of |
Douglas Steele Year of birth: 1975 |
Vice President |
Since 2016 |
Head of Product Management (since 2021), Vice President (since 2017), Head of Manager Research (2021), Head of Investment Management (2017-2021), Head of Investment Due Diligence (2016-2017), MML Advisers; Head of Product Management (since 2021), Head of Manager Research (2021), Head of Investment Management (2017-2021), Assistant Vice President (2013-2017), MassMutual; Vice President (since 2016), MassMutual Select Funds (open-end investment company); Vice President (since 2016), MassMutual Premier Funds (open-end investment company); Vice President (since 2021), MassMutual Advantage Funds (open-end investment company); Vice President (since 2016), MML Series Investment Fund II (open-end investment company). |
110 |
Philip S. Wellman Year of birth: 1964 |
Vice President and Chief Compliance Officer |
Since 2007 |
Vice President and Chief Compliance Officer (since 2013), MML Advisers; Head of Mutual Funds & RIA Compliance (since 2018), Vice President, Associate General Counsel, and Chief Compliance Officer (Mutual Funds) (2014-2018), MassMutual; Vice President and Chief Compliance Officer (since 2007), MassMutual Select Funds (open-end investment company); Vice President and Chief Compliance Officer (since 2007), MassMutual Premier Funds (open-end investment company); Vice President and Chief Compliance Officer (since 2021), MassMutual Advantage Funds (open-end investment company); Vice President and Chief Compliance Officer (since 2007), MML Series Investment Fund II (open-end investment company). |
110 |
|
* |
The address of each Trustee and Principal Officer is the same as that for the Trust; 1295 State Street, Springfield, Massachusetts 01111-0001. |
|
** |
Each Trustee of the Trust serves until the next meeting of shareholders called for the purpose of electing Trustees and until the election and qualification of his or her successor or until he or she dies, resigns, or is removed. Notwithstanding the foregoing, unless the Trustees determine that it is desirable and in the best interest of the Trust that an exception to the retirement policy of the Trust be made, a Trustee shall retire and cease to serve as a Trustee upon the conclusion of the calendar year in which such Trustee attains the age of seventy-five years, however, an interested Trustee of the Trust shall no longer serve as a Trustee if or when they are no longer an employee of MassMutual or an affiliate. |
|
|
The Chairperson is elected to hold such office for a term of three years or until their successor is elected and qualified to carry out the duties and responsibilities of their office, or until he or she retires, dies, resigns, is removed, or becomes disqualified, and any such Chairperson may not serve more than two consecutive terms. The Chairperson shall hold office at the pleasure of the Trustees. |
|
^ |
Barings Participation Investors and Barings Corporate Investors are deemed to be a part of the Fund Complex, because they are managed by Barings LLC, an affiliate of MML Advisers. |
|
^^ |
Mr. Fanning is an “Interested Person,” as that term is defined in the 1940 Act, as an employee of MassMutual. |
|
^^^ |
Mr. Noreen is an “Interested Person,” as that term is defined in the 1940 Act, as an employee of MassMutual. |
|
# |
The President, Treasurer, and Secretary and such other officers as the Trustees may in their discretion from time to time elect are elected to hold such office until their successor is elected and qualified to carry out the duties and responsibilities of their office, or until he or she dies, resigns, is removed, or becomes disqualified. Each officer shall hold office at the pleasure of the Trustees. |
280
For corporate shareholders, a portion of the ordinary dividends paid during the Fund(s)’ year ended December 31, 2022, qualified for the dividends received deduction, as follows:
Dividends |
||||
Conservative Allocation Fund |
12.13 | % | ||
Balanced Allocation Fund |
15.29 | % | ||
Moderate Allocation Fund |
22.39 | % | ||
Growth Allocation Fund |
30.73 | % | ||
Aggressive Allocation Fund |
47.34 | % | ||
MML American Funds Growth Fund |
100 | % | ||
MML American Funds Core Allocation Fund |
41.06 | % | ||
Blue Chip Growth Fund |
100 | % | ||
Equity Income Fund |
71.30 | % | ||
Equity Index Fund |
100 | % | ||
Focused Equity Fund |
100 | % | ||
Fundamental Equity Fund |
36.38 | % | ||
Fundamental Value Fund |
49.46 | % | ||
Global Fund |
69.34 | % | ||
Income & Growth Fund |
94.12 | % | ||
International Equity Fund |
0.05 | % | ||
Large Cap Growth Fund |
100 | % | ||
Managed Volatility Fund |
100 | % | ||
Mid Cap Growth Fund |
14.42 | % | ||
Mid Cap Value Fund |
22.44 | % | ||
Small Cap Growth Equity Fund |
6.56 | % | ||
Small Company Value Fund |
22.19 | % | ||
Small/Mid Cap Value Fund |
12.83 | % | ||
Sustainable Equity Fund |
69.18 | % | ||
For the year ended December 31, 2022, the following Fund(s) earned the following foreign sources of income:
Amount |
||||
Conservative Allocation Fund |
$ | 367,506 | ||
Balanced Allocation Fund |
539,695 | |||
Moderate Allocation Fund |
2,430,757 | |||
Growth Allocation Fund |
2,170,585 | |||
Aggressive Allocation Fund |
321,271 | |||
MML American Funds Core Allocation Fund |
1,380,386 | |||
Foreign Fund |
5,089,261 | |||
Global Fund |
903,356 | |||
International Equity Fund |
3,941,747 | |||
The Fund(s) intend to pass through the maximum amount allowable as Section 163(j) Interest Dividends as defined in the Treasury Regulations §1.163(j)-1(b).
281
A description of the policies and procedures that each Fund’s investment adviser and subadvisers use to vote proxies relating to the Fund’s portfolio securities is available, without charge, upon request, by calling 1-888-309-3539, and on the SEC’s EDGAR database on its website at http://www.sec.gov.
Information regarding how the Funds voted proxies relating to portfolio securities during the most recent 12-month period ended June 30 is available, without charge, upon request, on the MassMutual website at https://www.massmutual.com/funds and on the SEC’s EDGAR database on its website at http://www.sec.gov.
The Funds file their complete schedule of portfolio holdings with the SEC for the first and third quarters of each fiscal year as an exhibit to their reports on Form N-PORT. The Funds’ Forms N-PORT are available on the SEC’s EDGAR database on its website at http://www.sec.gov. In addition, the Funds make the complete schedule of portfolio holdings from their filings on Form N-PORT available to shareholders at https://www.massmutual.com/funds.
Trustees’ Approval of Investment Advisory Contracts
At their meeting in December 2022, the Trustees, including the Trustees who are not “interested persons” (as such term is defined in the 1940 Act) of the Trust, MML Advisers, or the subadvisers (the “Independent Trustees”), reviewed and approved a proposal to make changes to the existing subadvisory agreement with Harris Associates L.P. (“Harris”) for the International Equity Fund in order to exclude all cash from the assets of the International Equity Fund on which Harris is paid. In arriving at their decision, the Trustees discussed the fees payable to Harris by MML Advisers under the amended subadvisory agreement and the effect of such fees on the profitability to MML Advisers. The Trustees concluded that they were satisfied that MML Advisers’ projected level of profitability due to the amended subadvisory agreement is not excessive and the subadvisory fee amount under the amended subadvisory agreement is fair and reasonable. In their deliberations, the Trustees were advised by independent counsel.
Prior to the vote being taken to approve the amendment to the subadvisory agreement discussed above, the Independent Trustees met separately in executive session to discuss the appropriateness of such contract. The Independent Trustees weighed the foregoing matters in light of the advice given to them by their independent legal counsel as to the law applicable to the review of investment advisory contracts. In arriving at a decision, the Trustees, including the Independent Trustees, did not identify any single matter as all-important or controlling. The foregoing summary does not detail all of the matters considered.
The amended subadvisory agreement became effective on January 1, 2023.
Also at their meeting in December 2022, the Trustees, including the Independent Trustees, reviewed and approved a new subadvisory agreement with Thompson, Siegel & Walmsley LLC (“TSW”) for the Foreign Fund (the “New Subadvisory Agreement”) due to an expected change in control of TSW which would cause the prior subadvisory agreement with TSW to terminate. The Trustees considered, among other things, that the New Subadvisory Agreement would not result in any changes in the fees payable by the Fund or MML Advisers and that the services provided by TSW as well as the personnel providing such services would remain unchanged. The Trustees concluded that the New Subadvisory Agreement is in the best interests of the Fund and its shareholders. In their deliberations, the Trustees were advised by independent counsel.
Prior to the votes being taken to approve the New Subadvisory Agreement discussed above, the Independent Trustees met separately in executive session to discuss the appropriateness of such contract. The Independent Trustees weighed the foregoing matters in light of the advice given to them by their independent legal counsel as to the law applicable to the review of investment advisory contracts. In arriving at a decision, the Trustees, including the Independent Trustees, did not identify any single matter as all-important or controlling. The foregoing summary does not detail all of the matters considered.
The New Subadvisory Agreement became effective on January 23, 2023.
282
Other Information (Unaudited) (Continued) |
Submission of Matters to a Vote of Security Holders
A Special Meeting of Shareholders of the Trust was held on May 25, 2022 and on the adjournment dates of June 9, 2022, July 28, 2022, August 18, 2022, and August 19, 2022. The Notice of Meeting of Shareholders, and a Proxy Statement and voting instruction card, were first mailed, or otherwise made available, on or about April 8, 2022 to shareholders of record as of February 25, 2022. The results of the vote on the matters submitted to shareholders at the Special Meeting are as follows:
Proposal 1: |
To elect Allan W. Blair, Nabil N. El-Hage, Michael R. Fanning, Maria D. Furman, R. Bradford Malt, C. Ann Merrifield, Clifford M. Noreen, Cynthia R. Plouché, Jason J. Price, and Susan B. Sweeney as Trustees of each Trust of which the Funds are series for an indefinite term of office.* |
This matter was approved by the Trust’s shareholders on June 9, 2022. The results of the votes were as follows:
|
Shares Voted |
Shares For |
% of Shares |
Withhold |
% of Shares |
|||||||||||||||
Allan W. Blair |
836,355,491.101 | 819,239,879.174 | 97.063% | 17,115,611.927 | 2.027% | |||||||||||||||
Nabil N. El-Hage |
836,355,491.101 | 820,023,997.857 | 97.156% | 16,331,493.244 | 1.934% | |||||||||||||||
Michael R. Fanning |
836,355,491.101 | 820,349,272.325 | 97.194% | 16,006,218.776 | 1.896% | |||||||||||||||
Maria D. Furman |
836,355,491.101 | 818,355,990.457 | 96.958% | 17,999,500.644 | 2.132% | |||||||||||||||
R. Bradford Malt |
836,355,491.101 | 819,735,779.473 | 97.122% | 16,619,711.628 | 1.969% | |||||||||||||||
C. Ann Merrifield |
836,355,491.101 | 818,406,703.737 | 96.964% | 17,948,787.364 | 2.126% | |||||||||||||||
Clifford M. Noreen |
836,355,491.101 | 820,407,214.709 | 97.201% | 15,948,276.392 | 1.889% | |||||||||||||||
Cynthia R. Plouché |
836,355,491.101 | 818,750,862.042 | 97.005% | 17,604,629.059 | 2.085% | |||||||||||||||
Jason J. Price |
836,355,491.101 | 820,393,954.933 | 97.200% | 15,961,536.168 | 1.891% | |||||||||||||||
Susan B. Sweeney |
836,355,491.101 | 818,772,013.146 | 97.008% | 17,583,477.955 | 2.083% | |||||||||||||||
|
* |
Denotes Trust-wide proposal and voting results. |
Proposal 2: |
To liquidate the MML American Funds International Fund and distribute the liquidation proceeds to an affiliated money market fund. |
This matter was approved by the Fund’s shareholders on August 19, 2022. The results of the votes were as follows:
|
Shares Voted |
Shares For |
% of Shares |
Against |
% of Shares |
Abstain |
% of Shares |
|||||||||||||||||||||
MML American Funds International Fund |
5,690,970.412 | 5,402,760.563 | 94.843% | 116,011.577 | 2.037% | 172,198.272 | 3.022% | |||||||||||||||||||||
283
Other Information (Unaudited) (Continued) |
Proposal 3: |
To change the status of certain Funds from diversified funds to non-diversified funds. |
This matter was approved by the following Fund’s shareholders on June 9, 2022. The results of the votes were as follows:
|
Shares Voted |
Shares For |
% of Shares |
Against |
% of Shares |
Abstain |
% of Shares |
|||||||||||||||||||||
Blue Chip Growth Fund |
29,066,255.075 | 27,557,765.389 | 94.087% | 1,099,245.855 | 3.753% | 409,243.831 | 1.397% | |||||||||||||||||||||
This matter was approved by the following Fund’s shareholders on August 19, 2022. The results of the votes were as follows:
|
Shares Voted |
Shares For |
% of Shares |
Against |
% of Shares |
Abstain |
% of Shares |
|||||||||||||||||||||
Large Cap Growth Fund |
14,637,642.964 | 13,730,519.545 | 93.787% | 427,700.868 | 2.921% | 479,422.551 | 3.274% | |||||||||||||||||||||
284
Other Information (Unaudited) (Continued) |
Fund Expenses December 31, 2022
Expense Examples:
The following information is in regards to expenses for the six months ended December 31, 2022:
As a shareholder of the Funds, you incur ongoing costs, including investment advisory fees, distribution and/or service (12b-1) fees, and other Fund expenses. These examples are intended to help you understand your ongoing costs (in dollars) of investing in the Funds and to compare these costs with the ongoing costs of investing in other mutual funds. These examples are based on an investment of $1,000 invested for the six months ended December 31, 2022.
Actual Expenses:
The first four columns of the table below provide information about actual account values and actual expenses. You may use this information, together with the amount you invested, to estimate the expenses that you paid over the period. Simply divide your account value by $1,000 (for example, an $8,600 account value divided by $1,000 = 8.6), then multiply the result by the number under the heading entitled “Operating Expenses Incurred” to estimate the expenses you paid on your account during this period.
Hypothetical Example for Comparison Purposes:
The last two columns of the table below provide information about hypothetical account values and hypothetical expenses based on the Fund’s actual expense ratio and an assumed rate of return of 5% per year before expenses, which is not the Fund’s actual return. The hypothetical account values and expenses may not be used to estimate the actual ending account balance or expenses you paid for the period. You may use this information to compare the ongoing costs of investing in the Fund and other funds. To do so, compare this 5% hypothetical example with the 5% hypothetical examples that appear in the shareholder reports of the other funds.
Please note that the expenses shown in the table are meant to highlight your ongoing costs only and do not reflect any transactional costs. Therefore, the last two columns of the table are useful in comparing ongoing costs only, and will not help you determine the relative total costs of owning different funds. In addition, if these transactional costs were included, your costs would have been higher.
Beginning |
Annualized |
Ending |
Operating |
Ending Value |
Operating |
|
Conservative Allocation Fund |
||||||
Initial Class |
$1,000 |
0.14% |
$997.00 |
$0.70 |
$1,024.50 |
$0.71 |
Service Class |
1,000 |
0.39% |
996.00 |
1.96 |
1,023.20 |
1.99 |
Balanced Allocation Fund |
|
|||||
Initial Class |
1,000 |
0.14% |
1,004.10 |
0.71 |
1,024.50 |
0.71 |
Service Class |
1,000 |
0.39% |
1,003.10 |
1.97 |
1,023.20 |
1.99 |
Moderate Allocation Fund |
||||||
Initial Class |
1,000 |
0.12% |
1,012.60 |
0.61 |
1,024.60 |
0.61 |
Service Class |
1,000 |
0.37% |
1,011.40 |
1.88 |
1,023.30 |
1.89 |
Growth Allocation Fund |
||||||
Initial Class |
1,000 |
0.12% |
1,021.90 |
0.61 |
1,024.60 |
0.61 |
Service Class |
1,000 |
0.37% |
1,021.20 |
1.88 |
1,023.30 |
1.89 |
Aggressive Allocation Fund |
||||||
Initial Class |
1,000 |
0.18% |
1,031.40 |
0.92 |
1,024.30 |
0.92 |
Service Class |
1,000 |
0.43% |
1,029.80 |
2.20 |
1,023.00 |
2.19 |
285
Other Information (Unaudited) (Continued) |
Beginning |
Annualized |
Ending |
Operating |
Ending Value |
Operating |
|
MML American Funds Growth Fund |
||||||
Service Class I** |
$1,000 |
1.04% |
$996.70 |
$5.23 |
$1,020.00 |
$5.30 |
MML American Funds Core Allocation Fund |
||||||
Service Class I |
1,000 |
0.61% |
1,015.90 |
3.10 |
1,022.10 |
3.11 |
Blue Chip Growth Fund |
||||||
Initial Class |
1,000 |
0.79% |
934.30 |
3.85 |
1,021.20 |
4.02 |
Service Class |
1,000 |
1.04% |
932.90 |
5.07 |
1,020.00 |
5.30 |
Equity Income Fund |
||||||
Initial Class |
1,000 |
0.77% |
1,053.70 |
3.99 |
1,021.30 |
3.92 |
Service Class |
1,000 |
1.02% |
1,052.50 |
5.28 |
1,020.10 |
5.19 |
Equity Index Fund |
||||||
Class I |
1,000 |
0.43% |
1,020.50 |
2.19 |
1,023.00 |
2.19 |
Class II |
1,000 |
0.28% |
1,021.60 |
1.43 |
1,023.80 |
1.43 |
Class III |
1,000 |
0.13% |
1,022.20 |
0.66 |
1,024.60 |
0.66 |
Service Class I |
1,000 |
0.68% |
1,019.10 |
3.46 |
1,021.80 |
3.47 |
Focused Equity Fund |
||||||
Class II |
1,000 |
0.87% |
1,069.00 |
4.54 |
1,020.80 |
4.43 |
Service Class I |
1,000 |
1.12% |
1,066.40 |
5.83 |
1,019.60 |
5.70 |
Foreign Fund |
||||||
Initial Class |
1,000 |
0.94% |
1,051.30 |
4.86 |
1,020.50 |
4.79 |
Service Class |
1,000 |
1.20% |
1,049.10 |
6.20 |
1,019.20 |
6.11 |
Fundamental Equity Fund |
||||||
Class II |
1,000 |
0.83% |
1,020.40 |
4.23 |
1,021.00 |
4.23 |
Service Class I |
1,000 |
1.08% |
1,018.70 |
5.50 |
1,019.80 |
5.50 |
Fundamental Value Fund |
||||||
Class II |
1,000 |
0.80% |
1,067.80 |
4.17 |
1,021.20 |
4.08 |
Service Class I |
1,000 |
1.05% |
1,066.80 |
5.47 |
1,019.90 |
5.35 |
Global Fund |
||||||
Class I |
1,000 |
0.84% |
1,041.80 |
4.32 |
1,021.00 |
4.28 |
Class II |
1,000 |
0.84% |
1,043.60 |
4.33 |
1,021.00 |
4.28 |
Service Class I |
1,000 |
1.09% |
1,041.60 |
5.61 |
1,019.70 |
5.55 |
Income & Growth Fund |
||||||
Initial Class |
1,000 |
0.71% |
1,083.30 |
3.73 |
1,021.60 |
3.62 |
Service Class |
1,000 |
0.96% |
1,080.90 |
5.04 |
1,020.40 |
4.89 |
International Equity Fund |
||||||
Class II |
1,000 |
1.02% |
1,053.40 |
5.28 |
1,020.10 |
5.19 |
Service Class I |
1,000 |
1.27% |
1,051.90 |
6.57 |
1,018.80 |
6.46 |
Large Cap Growth Fund |
||||||
Initial Class |
1,000 |
0.76% |
1,016.50 |
3.86 |
1,021.40 |
3.87 |
Service Class |
1,000 |
1.01% |
1,015.30 |
5.13 |
1,020.10 |
5.14 |
Managed Volatility Fund |
||||||
Initial Class |
1,000 |
1.18% |
1,003.20 |
5.96 |
1,019.30 |
6.01 |
Service Class |
1,000 |
1.43% |
1,002.00 |
7.22 |
1,018.00 |
7.27 |
Mid Cap Growth Fund |
||||||
Initial Class |
1,000 |
0.82% |
1,038.70 |
4.21 |
1,021.10 |
4.18 |
Service Class |
1,000 |
1.07% |
1,037.80 |
5.50 |
1,019.80 |
5.45 |
Mid Cap Value Fund |
||||||
Initial Class |
1,000 |
0.91% |
1,072.80 |
4.75 |
1,020.60 |
4.63 |
Service Class |
1,000 |
1.16% |
1,071.40 |
6.06 |
1,019.40 |
5.90 |
286
Other Information (Unaudited) (Continued) |
Beginning |
Annualized |
Ending |
Operating |
Ending Value |
Operating |
|
Small Cap Growth Equity Fund |
||||||
Initial Class |
$1,000 |
1.13% |
$1,041.00 |
$5.81 |
$1,019.50 |
$5.75 |
Service Class |
1,000 |
1.38% |
1,039.70 |
7.09 |
1,018.20 |
7.02 |
Small Company Value Fund |
||||||
Class II |
1,000 |
0.95% |
1,021.60 |
4.84 |
1,020.40 |
4.84 |
Service Class I |
1,000 |
1.20% |
1,019.40 |
6.11 |
1,019.20 |
6.11 |
Small/Mid Cap Value Fund |
||||||
Initial Class |
1,000 |
0.86% |
1,050.80 |
4.45 |
1,020.90 |
4.38 |
Service Class |
1,000 |
1.11% |
1,049.30 |
5.73 |
1,019.60 |
5.65 |
Sustainable Equity Fund |
||||||
Initial Class |
1,000 |
0.59% |
1,042.20 |
3.04 |
1,022.20 |
3.01 |
Service Class |
1,000 |
0.84% |
1,040.80 |
4.32 |
1,021.00 |
4.28 |
Total Return Bond Fund |
||||||
Class II |
1,000 |
0.65% |
963.40 |
3.22 |
1,021.90 |
3.31 |
Service Class I |
1,000 |
0.90% |
962.90 |
4.45 |
1,020.70 |
4.58 |
|
* |
Expenses are calculated using the annualized expense ratio for the six months ended December 31, 2022, multiplied by the average account value over the period, multiplied by 184 days in the period, divided by 365 days in the year, unless stated otherwise. The annualized expense ratio does not reflect expenses deducted under the variable life insurance or variable annuity contract through which the Funds are invested in. Inclusion of these expenses would increase the annualized expense ratios shown. |
|
** |
The annualized expense ratio reflects the expenses of both the Feeder Fund and the Master Fund in which it invests. |
287
Underwriter:
MML Distributors, LLC
1295 State Street
Springfield, Massachusetts 01111-0001

© 2023 Massachusetts Mutual Life Insurance Company (MassMutual®), Springfield, MA 01111-0001. All rights reserved. www.MassMutual.com. Investment Adviser: MML Investment Advisers, LLC |
MM202403-304048 |
|
American Funds
Annual report |
 |

Investing
in global
companies for
the long term
American Funds Insurance Series, by Capital Group, is the underlying investment vehicle for many variable annuities and insurance products. For over 90 years, Capital Group has invested with a long-term focus based on thorough research and attention to risk.
Investing for short periods makes losses more likely. For current information and month-end results, visit capitalgroup.com/afis. For information about your insurance contract and month-end results, go to the website of the company that issued your contract.
Investing outside the United States involves risks, such as currency fluctuations, periods of illiquidity and price volatility, as more fully described in the prospectus. These risks may be heightened in connection with investments in developing countries. Investing in small-capitalization stocks can involve greater risk than is customarily associated with investing in stocks of larger, more established companies. The return of principal for bond funds and for funds with significant underlying bond holdings is not guaranteed. Fund shares are subject to the same interest rate, inflation and credit risks associated with the underlying bond holdings. High-yield bonds are subject to greater fluctuations in value and risk of loss of income and principal than investment-grade bonds. Bond ratings, which typically range from AAA/Aaa (highest) to D (lowest), are assigned by credit rating agencies such as Standard & Poor’s, Moody’s and/or Fitch as an indication of an issuer’s creditworthiness. The use of derivatives involves a variety of risks, which may be different from, or greater than, the risks associated with investing in traditional cash securities, such as stocks and bonds. Hedge instruments, including exchange-traded futures contracts and exchange-traded put options, may not provide an effective hedge of the underlying securities because changes in the prices of such instruments may not track those of the securities they are intended to hedge. In addition, the managed risk strategy may not effectively protect the funds from market declines and will limit the funds’ participation in market gains. The use of the managed risk strategy could cause the funds’ returns to lag those of the underlying funds in certain market conditions. Refer to the funds’ prospectuses and the Risk Factors section of this report for more information on these and other risks associated with investing in the funds.
Investments are not FDIC-insured, nor are they deposits of or guaranteed by a bank or any other entity, so they may lose value.
Contents
| 1 | Letter to investors |
| 4 | Fund reviews |
| Investment portfolios | |
| 46 | Global Growth Fund |
| 51 | Global Small Capitalization Fund |
| 58 | Growth Fund |
| 65 | International Fund |
| 70 | New World Fund® |
| 84 | Washington Mutual Investors Fund |
| 89 | Capital World Growth and Income Fund® |
| 97 | Growth-Income Fund |
| 103 | International Growth and Income Fund |
| 109 | Capital Income Builder® |
| 127 | Asset Allocation Fund |
| 160 | American Funds® Global Balanced Fund |
| 176 | The Bond Fund of America® |
| 206 | Capital World Bond Fund® |
| 226 | American High-Income Trust® |
| 245 | American Funds Mortgage Fund® |
| 252 | Ultra-Short Bond Fund |
| 254 | U.S. Government Securities Fund® |
| 263 | Managed Risk Growth Fund |
| 265 | Managed Risk International Fund |
| 267 | Managed Risk Washington Mutual Investors Fund |
| 269 | Managed Risk Growth-Income Fund |
| 271 | Managed Risk Asset Allocation Fund |
| 273 | Financial statements |
Fellow investors:
It is our pleasure to present the annual report for American Funds Insurance Series® for the year ended December 31, 2022.
Regarding the investment environment, global stocks fell sharply, pressured by rising interest rates, slowing economic growth and inflationary pressures not seen since the 1980s. Several key benchmark indexes fell into bear market territory at times and all but one sector declined in the MSCI All Country World Index1. Communication services, consumer discretionary and information technology stocks suffered the biggest losses. Meanwhile, energy stocks surged amid higher oil and gas prices. Late in the year, signs that inflation may have peaked in the U.S., Europe and elsewhere sparked a rally that erased some of the losses.
U.S. equities had their worst year since 2008 as the S&P 500 Index2 fell 18.11%. Growth stocks had the sharpest declines, including several tech giants that had been market leaders over the last decade. On the upside, energy was the top S&P 500 sector for the second straight year, climbing 66%. Crude oil prices spiked in March after Russia’s invasion of Ukraine upended global oil flows. Despite consecutive quarters of negative gross domestic product growth in the first half, a strong labor market helped inflation to persist.
European stocks declined as record-high inflation, rising interest rates and the Ukraine invasion combined to hammer the eurozone economy. Gross domestic product growth in the 19-member eurozone decelerated throughout the year, falling to 0.3% in the third quarter from 0.6% in the first quarter. Political turmoil also weighed on markets amid contentious leadership changes in Italy and the United Kingdom. Despite a strong fourth-quarter rally in European stocks, the MSCI Europe Index3 finished the full year down by 15.06%.
Emerging markets stocks tumbled, undercut by China’s economic slowdown, interest rate hikes and the growing strength of the U.S. dollar. Rising inflation in developing countries that spurred monetary tightening, as well as rolling lockdowns in China to suppress COVID-19, also weighed on equity prices. Overall, the MSCI Emerging Markets Index4 slid 20.09%.
Bonds fell in the face of rising inflation, and the Federal Reserve hiked its policy rate 425 basis points over seven policy meetings in an attempt to tame it. The Bloomberg U.S. Treasury Index5 lost 12.46% in one of the worst bond market
Past results are not predictive of results in future periods.
All market returns referenced in this report are unmanaged and, therefore, have no expenses. Investors cannot invest directly in an index. Country returns are based on MSCI indexes, which reflect reinvestment of distributions and dividends net of withholding taxes. Source: MSCI.
| 1 | Source: MSCI. MSCI ACWI is a free float-adjusted market capitalization-weighted index that is designed to measure equity market results in the global developed and emerging markets, consisting of more than 40 developed and emerging market country indexes. Results reflect dividends net of withholding taxes. |
| 2 | Source: S&P Dow Jones Indices LLC. S&P 500 Index is a market capitalization-weighted index based on the results of approximately 500 widely held common stocks. |
| 3 | Source: MSCI. MSCI Europe Index is a free float-adjusted market capitalization-weighted index that is designed to measure results of more than 10 developed equity markets in Europe. Results reflect dividends net of withholding taxes. |
| 4 | Source: MSCI. MSCI Emerging Markets Index is a free float-adjusted market capitalization weighted index that is designed to measure equity market results in the global emerging markets, consisting of more than 20 emerging market country indexes. Results reflect dividends net of withholding taxes. |
| 5 | Source: Bloomberg Index Services Ltd. Bloomberg U.S. Treasury Index measures the performance of public obligations of the U.S. Treasury. |
| American Funds Insurance Series | 1 |
declines in history. The Federal Reserve and European Central Bank, among others, aggressively raised interest rates in an attempt to bring inflation back to a target of roughly 2%, down from 7% to 10% in many economies. U.S. Treasury yields rose across the curve, which ended the year inverted as shorter dated bonds sold off sharply. The 10-year Treasury yield rose 237 basis points to 3.88%. In this environment, investment-grade (BBB/ Baa and above) corporate bonds saw the worst returns. The Bloomberg U.S. Corporate Investment Grade Index6 was down 15.76%, and spreads widened by 38 basis points. Elsewhere, the Bloomberg U.S. Corporate High Yield 2% Issuer Capped Index7 fell by 11.18%, while the Bloomberg Municipal Bond Index8 declined 8.53%.
In foreign exchange markets a strong U.S. dollar grew stronger for much of the year, particularly as the Fed raised rates at a faster pace than some other central banks, though there was some reversal of its strength in the last two months of the year. The dollar posted gains of 6.6% and 14.6% against the euro and the yen, respectively.
Looking ahead
Big questions remain about how the U.S. economy will do in 2023. It is possible that the delayed impact of higher rates will keep growth slow, or even cause a mild recession. However, we have confidence in the long-term trajectory of the economy, and the stock market has likely digested much of the potential bad news already, given the decline this year. Investors have reason for hope, as we’ve already taken a measure of pain, in both stocks and bonds. Inflation may persist above the levels we’ve been used to the past decade, but is likely to gently decline over the coming year from the 6.5% mark, published in January 2023. That would be good news on its own, and would also lighten the upward pressure we’ve seen on interest rates this past year. The global negative impact of COVID-19 has already persisted longer than anyone predicted back in early 2020, but should also decline with time, particularly as China has decided to end lockdowns. That will eventually help economic growth.
Thus, as 2023 progresses we may see, out of many fears, a reason for optimism. The ongoing war in Ukraine remains a wild card, and we hope it does not spill over into a larger conflict. That may be the biggest risk to a mildly positive outlook for stocks. There can still be bumps in the road, but with our world-class research, we will continue to focus on finding those companies with the best fundamentals and the best risk-versus-return tradeoffs. We believe that we will find plenty of attractive securities for the long term in this environment. In the event of periods of volatility, we remain committed to our process, and will look for opportunities at that time as well.
Our time-tested process is based on extensive research, a long-term framework and close attention to valuation, and has resulted in superior outcomes for investors over time. As always, we thank you for your continued support of our efforts and we look forward to reporting to you again in six months.
Sincerely,

Donald D. O’Neal
Co-President

Alan N. Berro
Co-President
February 13, 2023
Past results are not predictive of results in future periods.
| 6 | Source: Bloomberg Index Services Ltd. Bloomberg U.S. Corporate Investment Grade Index represents the universe of investment-grade, publicly issued U.S. corporate and specified foreign debentures and secured notes that meet the specified maturity, liquidity and quality requirements. |
| 7 | Source: Bloomberg Index Services Ltd. Bloomberg U.S. Corporate High Yield 2% Issuer Capped Index covers the universe of fixed-rate, non-investment-grade debt. The index limits the maximum exposure of any one issuer to 2%. |
| 8 | Source: Bloomberg Index Services Ltd. Bloomberg Municipal Bond Index is a market-value-weighted index designed to represent the long-term investment-grade tax-exempt bond market. |
| 2 | American Funds Insurance Series |
About the series
Unless otherwise indicated, American Funds Insurance Series investment results are for Class 1 shares (Class P1 shares for managed risk funds). Class 1A shares began operations on January 6, 2017. Class 2 shares began operations on April 30, 1997. Class 3 shares began operations on January 16, 2004. Class 4 shares began operations on December 14, 2012. Results encompassing periods prior to those dates assume a hypothetical investment in Class 1 shares and include the deduction of additional annual expenses (0.25% for Class 1A shares, 0.25% for Class 2 shares, 0.18% for Class 3 shares and 0.50% for Class 4 shares).
The variable annuities and life insurance contracts that use the series’ funds contain certain fees and expenses not reflected in this report. Investment results assume all distributions are reinvested and reflect applicable fees and expenses. When applicable, results reflect fee waivers and/or expense reimbursements, without which they would have been lower. Visit capitalgroup.com/afis for more information.
The investment adviser is currently waiving a portion of its management fee for Global Growth Fund, Global Small Capitalization Fund, New World Fund, Washington Mutual Investors Fund, Capital World Growth and Income Fund, International Growth and Income Fund, Capital Income Builder, American Funds Global Balanced Fund, The Bond Fund of America, Capital World Bond Fund, American High-Income Trust, American Funds Mortgage Fund and U.S. Government Securities Fund. The waivers will be in effect through at least May 1, 2023. The waivers may only be modified or terminated with the approval of the series’ board. Applicable fund results shown reflect the waivers, without which results would have been lower. Refer to the Financial Highlights tables in this report for details.
For the managed risk funds, the investment adviser is currently waiving a portion of its management fee equal to 0.05% of each fund’s net assets. In addition, the investment adviser is currently reimbursing a portion of other expenses for Managed Risk International Fund. The waivers and reimbursement will be in effect through at least May 1, 2023, unless modified or terminated by the series’ board. After that time, the investment adviser may elect to extend, modify or terminate the reimbursement. The waivers may only be modified or terminated with the approval of the series’ board. Applicable fund results shown reflect the waivers and reimbursement, without which results would have been lower. Refer to the Financial Highlights tables in this report for details.
The Managed Risk Growth Fund pursues its objective by investing in shares of American Funds Insurance Series® — Growth Fund and American Funds Insurance Series® — The Bond Fund of America. The Managed Risk International Fund pursues its objective by investing in shares of American Funds Insurance Series® — International Fund and American Funds Insurance Series® — The Bond Fund of America. The Managed Risk Washington Mutual Investors Fund pursues its objective by investing in shares of American Funds Insurance Series® — Washington Mutual Investors Fund and American Funds Insurance Series® — U.S. Government Securities Fund. The Managed Risk Growth-Income Fund pursues its objective by investing in shares of American Funds Insurance Series® — Growth-Income Fund and American Funds Insurance Series® — The Bond Fund of America. The Managed Risk Asset Allocation Fund pursues its objective by investing in shares of American Funds Insurance Series® — Asset Allocation Fund. The funds seek to manage portfolio volatility and provide downside protection, primarily through the use of exchange-traded futures. The benefit of the funds’ managed risk strategy should be most apparent during periods of high volatility and in down markets. In steady or rising markets, the funds’ results can be expected to lag those of the underlying fund.
Funds are listed in the report as follows: equity, balanced, fixed income and managed risk.
| American Funds Insurance Series | 3 |
Global Growth Fund
Fund results shown are for past periods and are not predictive of results for future periods. Current and future results may be lower or higher than those shown. Prices and returns will vary, so investors may lose money. Investing for short periods makes losses more likely. For current information and month-end results, visit capitalgroup.com/afis. For information about your insurance contract and month-end results, go to the website of the company that issued your contract.
Global Growth Fund declined 24.54% for the 12 months ended December 31, 2022, compared with a decrease of 18.36% in its benchmark index, MSCI ACWI (All Country World Index),1 a free float-adjusted market capitalization-weighted index that is designed to measure equity market results in the global developed and emerging markets, consisting of more than 40 developed and emerging market country indexes.
Global stocks fell sharply, pressured by rising interest rates, slowing economic growth and inflationary pressures not seen since the 1980s. The war in Ukraine also weighed on investors throughout the year. Several key benchmark indexes fell into bear market territory at times and all but one sector declined in the MSCI ACWI. Within that index, communication services, consumer discretionary and information technology stocks suffered the biggest losses. Meanwhile, energy stocks surged amid higher oil and gas prices. Late in the year, signs that inflation may have peaked in the U.S., Europe and elsewhere sparked a rally that erased some of the losses.
Within the fund, stock selection in the consumer discretionary sector was the top contributor to relative returns. A larger-than-index position in health care firm Cigna was among the top individual contributors to the fund, with returns that outpaced the broader market. On the downside, stock selections within the information technology sector weighed on results. Netherlands-based payments firm Adyen was among the top individual detractors, with returns that lagged the broader market in a weak sector overall.
On a geographic basis, stocks of companies domiciled in Hong Kong and France were among the top contributors to results, while stocks of companies based in the United States and the Netherlands were among the top detractors.
The fund’s portfolio managers are optimistic they will continue to find good companies globally that offer high-quality products and services, and whose values are not yet fully reflected in their share prices.
| 4 | American Funds Insurance Series |
Global Growth Fund (continued)
How a hypothetical $10,000 investment has grown
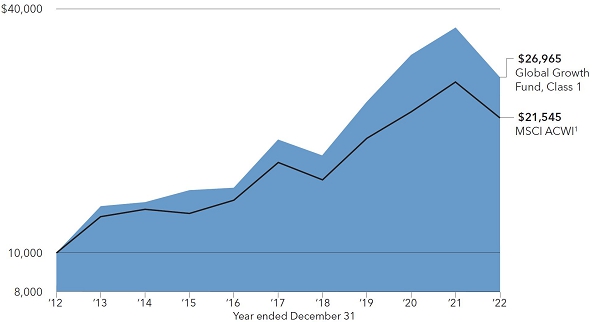
Total returns based on a $1,000 investment
For periods ended December 31, 20222
| 1 year | 5 years | 10 years | Lifetime (since April 30, 1997) |
Gross expense ratio |
Net expense ratio | |||||||||||||||||||
| Class 1 | –24.54 | % | 7.33 | % | 10.43 | % | 9.57 | % | 0.52 | % | 0.41 | % | ||||||||||||
| Class 1A | –24.73 | 7.07 | 10.16 | 9.30 | 0.77 | 0.66 | ||||||||||||||||||
| Class 2 | –24.74 | 7.06 | 10.15 | 9.30 | 0.77 | 0.66 | ||||||||||||||||||
| Class 4 | –24.92 | 6.80 | 9.92 | 9.04 | 1.02 | 0.91 | ||||||||||||||||||
Investment results assume all distributions are reinvested and reflect applicable fees and expenses. The investment adviser is currently waiving a portion of its management fee. This waiver will be in effect through at least May 1, 2023. The waiver may only be modified or terminated with the approval of the fund’s board. Net expense ratios reflect the waiver, without which they would have been higher. When applicable, investment results reflect fee waivers and/or expense reimbursements, without which results would have been lower. Visit capitalgroup.com/afis for more information. Expense ratios are as of the fund’s prospectus dated May 1, 2023 (unaudited). Refer to the Financial Highlights table in this report for details.
Past results are not predictive of results in future periods.
Any market index shown is unmanaged and, therefore, has no expenses. Investors cannot invest directly in an index.
| 1 | Source: MSCI. The MSCI index results reflect dividends net of withholding taxes and reinvestment of distributions. |
| 2 | Periods greater than one year are annualized. |
| Where the fund’s assets were invested as of December 31, 2022 | Percent of net assets |
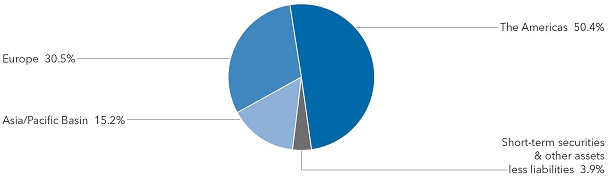
| American Funds Insurance Series | 5 |
Global Small Capitalization Fund
Fund results shown are for past periods and are not predictive of results for future periods. Current and future results may be lower or higher than those shown. Prices and returns will vary, so investors may lose money. Investing for short periods makes losses more likely. For current information and month-end results, visit capitalgroup.com/afis. For information about your insurance contract and month-end results, go to the website of the company that issued your contract.
Global Small Capitalization Fund declined 29.37% for the 12 months ended December 31, 2022. Its benchmark, the MSCI All Country World Small Cap Index,1 a free float-adjusted market capitalization-weighted index designed to measure equity market results of smaller capitalization companies in both developed and emerging markets, declined 18.67%.
Global stocks fell sharply, pressured by rising interest rates, slowing economic growth and inflationary pressures not seen since the 1980s. The war in Ukraine also weighed on investors throughout the year. Several key benchmark indexes fell into bear market territory at times and all but one sector declined in the MSCI All Country World Index. Within that index, communication services, consumer discretionary and information technology stocks suffered the biggest losses. Meanwhile, energy stocks surged amid higher oil and gas prices. Late in the year, signs that inflation may have peaked in the U.S., Europe and elsewhere sparked a rally that erased some of the losses.
Regarding the fund, stock selection within the health care sector was a positive contributor to relative returns. A larger-than-index investment in medical technology firm Haemonetics was among the fund’s top individual contributors over the period. On the downside, stock selection within the information technology sector weighed on returns. Within individual securities, India-based cloud platform provider Tanla Platforms was a top detractor, as its stock lagged the broader market.
Geographically, investments in companies domiciled in Hong Kong and Korea were overall additive to returns, while investments in those domiciled in China and the United States were detractors, overall.
In a turbulent year for markets across the board, the fund’s results for the past 12 months have been disappointing. However, with analysts’ full-time return to the road after COVID-19-related pauses, fund managers remain confident in the primary research capabilities underpinning investment decisions, and optimistic for the outlook ahead. While cognizant of the possibility of recession in the short term, managers remain committed to investing in companies with long-term potential.
| 6 | American Funds Insurance Series |
Global Small Capitalization Fund (continued)
How a hypothetical $10,000 investment has grown
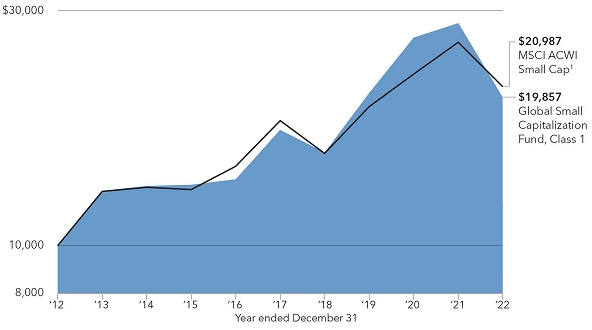
Total returns based on a $1,000 investment
For periods ended December 31, 20222
| 1 year | 5 years | 10 years | Lifetime (since April 30, 1998) |
Gross expense ratio |
Net expense ratio | |||||||||||||||||||
| Class 1 | –29.37 | % | 3.05 | % | 7.10 | % | 8.39 | % | 0.70 | % | 0.66 | % | ||||||||||||
| Class 1A | –29.54 | 2.80 | 6.84 | 8.13 | 0.95 | 0.91 | ||||||||||||||||||
| Class 2 | –29.55 | 2.79 | 6.84 | 8.13 | 0.95 | 0.91 | ||||||||||||||||||
| Class 4 | –29.69 | 2.54 | 6.58 | 7.86 | 1.20 | 1.16 | ||||||||||||||||||
Investment results assume all distributions are reinvested and reflect applicable fees and expenses. The investment adviser is currently waiving a portion of its management fee. This waiver will be in effect through at least May 1, 2023. The waiver may only be modified or terminated with the approval of the fund’s board. Net expense ratios reflect the waiver, without which they would have been higher. When applicable, investment results reflect fee waivers and/or expense reimbursements, without which results would have been lower. Visit capitalgroup.com/afis for more information. Expense ratios are restated to reflect current fees and are as of the fund’s prospectus dated May 1, 2023 (unaudited). Refer to the Financial Highlights table in this report for details.
Past results are not predictive of results in future periods.
Any market index shown is unmanaged and, therefore, has no expenses. Investors cannot invest directly in an index.
| 1 | Source: MSCI. The MSCI index results reflect dividends net of withholding taxes and reinvestment of distributions. |
| 2 | Periods greater than one year are annualized. |
| Where the fund’s assets were invested as of December 31, 2022 | Percent of net assets |
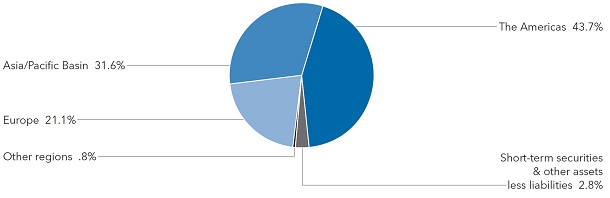
| American Funds Insurance Series | 7 |
Growth Fund
Fund results shown are for past periods and are not predictive of results for future periods. Current and future results may be lower or higher than those shown. Prices and returns will vary, so investors may lose money. Investing for short periods makes losses more likely. For current information and month-end results, visit capitalgroup.com/afis. For information about your insurance contract and month-end results, go to the website of the company that issued your contract.
Growth Fund declined 29.75% for the 12 months ended December 31, 2022, compared with a decrease of 18.11% in its benchmark index, S&P 500 Index,1 a market capitalization-weighted index based on the results of approximately 500 widely held common stocks.
U.S. equities had their worst year since 2008, as persistently high inflation and aggressive rate hikes stoked recession fears. S&P 500 Index entered its first bear market since 2020. Energy was the top S&P 500 sector for the second straight year, climbing 66%. Crude oil prices spiked in March after Russia’s invasion of Ukraine upended global oil flows. Growth stocks had the sharpest declines, including several tech giants that had been market leaders over the last decade. Despite consecutive quarters of negative gross domestic product growth in the first half, a strong labor market helped inflation to persist.
Regarding the fund, stock selection within the materials sector was the top contributor to relative returns. A position in energy industry firm Halliburton buoyed results as its stock outpaced the broader industry. On the downside, investments within the communication services sector weighed on results. A position in Tesla was the top individual detractor to returns.
The overall uncertain economic environment and challenges of inflation are very real concerns. The fund’s managers believe it is well-positioned for the road ahead and continue to focus on capital appreciation and selecting companies best suited for this challenging economic environment. Portfolio managers remain confident their time-tested investment approach, based on thorough research and robust debate with an eye on valuation, can continue to deliver superior outcomes for investors over the long-term.
| 8 | American Funds Insurance Series |
Growth Fund (continued)
How a hypothetical $10,000 investment has grown
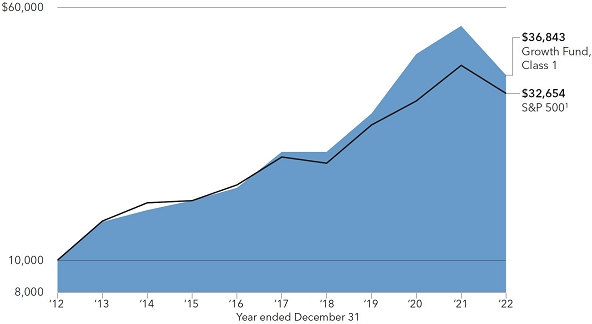
Total returns based on a $1,000 investment
For periods ended December 31, 20222
| 1 year | 5 years | 10 years | Lifetime (since February 8, 1984) |
Expense ratio | ||||||||||||||||
| Class 1 | –29.75 | % | 11.42 | % | 13.93 | % | 12.65 | % | 0.34 | % | ||||||||||
| Class 1A | –29.93 | 11.14 | 13.65 | 12.37 | 0.59 | |||||||||||||||
| Class 2 | –29.94 | 11.14 | 13.64 | 12.37 | 0.59 | |||||||||||||||
| Class 3 | –29.89 | 11.22 | 13.72 | 12.45 | 0.52 | |||||||||||||||
| Class 4 | –30.11 | 10.86 | 13.38 | 12.09 | 0.84 | |||||||||||||||
Investment results assume all distributions are reinvested and reflect applicable fees and expenses. When applicable, investment results reflect fee waivers and/or expense reimbursements, without which results would have been lower. Visit capitalgroup.com/afis for more information. Expense ratios are as of the fund’s prospectus dated May 1, 2023 (unaudited). Refer to the Financial Highlights table in this report for details.
Past results are not predictive of results in future periods.
Any market index shown is unmanaged and, therefore, has no expenses. Investors cannot invest directly in an index.
| 1 | Source: S&P Dow Jones Indices LLC. |
| 2 | Periods greater than one year are annualized. |
| Where the fund’s assets were invested as of December 31, 2022 | Percent of net assets |
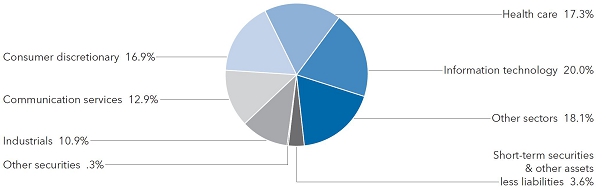
| American Funds Insurance Series | 9 |
International Fund
Fund results shown are for past periods and are not predictive of results for future periods. Current and future results may be lower or higher than those shown. Prices and returns will vary, so investors may lose money. Investing for short periods makes losses more likely. For current information and month-end results, visit capitalgroup.com/afis. For information about your insurance contract and month-end results, go to the website of the company that issued your contract.
International Fund declined 20.57% for the 12 months ended December 31, 2022. Its benchmark index, MSCI ACWI (All Country World Index) ex USA,1 a free float-adjusted market capitalization-weighted index that is designed to measure equity market results in the global developed and emerging markets (consisting of more than 40 developed and emerging market country indexes, excluding the U.S.), fell 16.00%.
Global stocks fell sharply, pressured by rising interest rates, slowing economic growth and inflationary pressures not seen since the 1980s. The war in Ukraine also weighed on investors throughout the year. Several key benchmark indexes fell into bear market territory at times and all but one sector declined in the MSCI All Country World Index. Within that index, communication services, consumer discretionary and information technology stocks suffered the biggest losses. Meanwhile, energy stocks surged amid higher oil and gas prices. Late in the year, signs that inflation may have peaked in the U.S., Europe and elsewhere sparked a rally that erased some of the losses.
Within the portfolio, stock selection within the energy sector boosted relative returns. Within individual securities, a higher-than-index position in Petroleo Brasileiro was a top contributor as the stock significantly outpaced the market overall. On the downside, stock selection within the information technology sector dragged on returns. A larger-than-index position in South Korean chipmaker SK Hynix was among the top individual detractors.
Looking ahead, the market continues to focus on global inflation levels as a key determinant for interest-rate and asset-price movement. There are signs that the worst of the inflation surge, due in part to rising oil prices and supply-chain issues during the COVID-19 pandemic, seems to be behind us. However, there is still uncertainty about how wage increases – as seen in many developed markets – could impact the continuation of high inflation. As a result of tighter monetary conditions, economies around the world are seeing growth moderate. Meanwhile, contributors to a turbulent macro environment in 2022, such as the war in Ukraine and U.S.-China tensions, have not subsided. In this uncertain environment, the fund’s managers endeavor to maintain a portfolio with a healthy balance of well-managed companies across sectors.
| 10 | American Funds Insurance Series |
International Fund (continued)
How a hypothetical $10,000 investment has grown
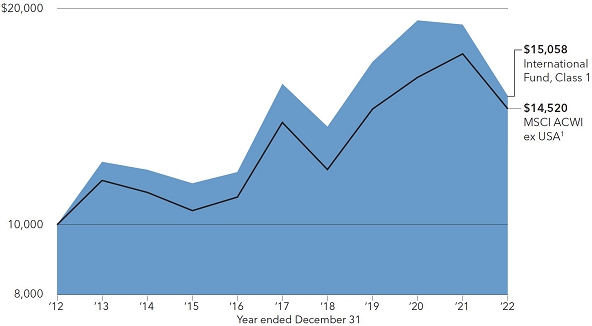
Total returns based on a $1,000 investment
For periods ended December 31, 20222
| 1 year | 5 years | 10 years | Lifetime (since May 1, 1990) |
Expense ratio | ||||||||||||||||
| Class 1 | –20.57 | % | –0.78 | % | 4.18 | % | 7.07 | % | 0.53 | % | ||||||||||
| Class 1A | –20.80 | –1.03 | 3.92 | 6.80 | 0.78 | |||||||||||||||
| Class 2 | –20.79 | –1.03 | 3.92 | 6.80 | 0.78 | |||||||||||||||
| Class 3 | –20.76 | –0.97 | 3.98 | 6.87 | 0.71 | |||||||||||||||
| Class 4 | –21.02 | –1.29 | 3.67 | 6.54 | 1.03 | |||||||||||||||
Investment results assume all distributions are reinvested and reflect applicable fees and expenses. When applicable, investment results reflect fee waivers and/or expense reimbursements, without which results would have been lower. Visit capitalgroup.com/afis for more information. Expense ratios are restated to reflect current fees and are as of the fund’s prospectus dated May 1, 2023 (unaudited). Refer to the Financial Highlights table in this report for details.
Past results are not predictive of results in future periods.
Any market index shown is unmanaged and, therefore, has no expenses. Investors cannot invest directly in an index.
| 1 | Source: MSCI. The MSCI index result reflects dividends net of withholding taxes and reinvestment of distributions. |
| 2 | Periods greater than one year are annualized. |
| Where the fund’s assets were invested as of December 31, 2022 | Percent of net assets |
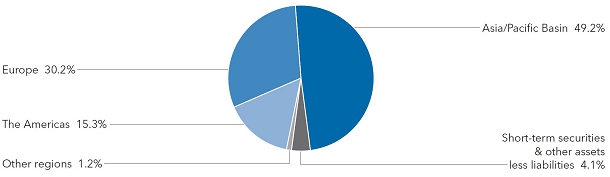
| American Funds Insurance Series | 11 |
New World Fund®
Fund results shown are for past periods and are not predictive of results for future periods. Current and future results may be lower or higher than those shown. Prices and returns will vary, so investors may lose money. Investing for short periods makes losses more likely. For current information and month-end results, visit capitalgroup.com/afis. For information about your insurance contract and month-end results, go to the website of the company that issued your contract.
New World Fund was down 21.86% for the 12 months ended December 31, 2022. Its benchmark index, MSCI ACWI (All Country World Index),1 a free float-adjusted market capitalization-weighted index that is designed to measure equity market results in the global developed and emerging markets (consisting of more than 40 developed and emerging market country indexes), declined 18.36%. The MSCI Emerging Markets (EM) Index,1 a free float-adjusted market capitalization-weighted index that is designed to measure equity market results in the global emerging markets (consisting of more than 20 emerging market country indexes), fell by 20.09%.
Global stocks fell sharply, pressured by rising interest rates, slowing economic growth and inflationary pressures not seen since the 1980s. The war in Ukraine also weighed on investors throughout the year. Several key benchmark indexes fell into bear market territory at times and all but one sector declined in the MSCI All Country World Index. Within that index, communication services, consumer discretionary and information technology stocks suffered the biggest losses. Meanwhile, energy stocks surged amid higher oil and gas prices. Late in the year, signs that inflation may have peaked in the U.S., Europe and elsewhere sparked a rally that erased some of the losses.
Emerging markets stocks tumbled, undercut by China’s economic slowdown, the Federal Reserve’s aggressive interest rate hikes and the growing strength of the U.S. dollar. Rising inflation in developing countries that spurred monetary tightening, as well as rolling lockdowns in China to suppress COVID-19, also weighed on equity prices. However, a few countries, including Brazil, were able to separate from the group by benefiting from some stronger fundamentals.
Within the portfolio, a higher-than-benchmark position in the materials sector was beneficial to the fund’s relative returns. Brazilian mining company Vale was a top individual contributor, as its stock saw returns that outpaced the broader market. Indian energy company Reliance Industries was also a relative contributor. On the downside, stock selection within the health care sector dragged on relative returns. Among individual securities, a larger-than-benchmark position in Singapore-based Sea Ltd. was a top detractor to results.
The investment environment has become much more challenging over the last year, with a wide range of uncertainties affecting equity prices – including global shifts in monetary policy, elevated geopolitical tensions and the potential for widespread recession. The portfolio managers believe the fund’s flexibility in seeking investments in both the developed world and emerging markets will provide significant opportunities in these periods of volatility. They remain confident that on-the-ground research, a cornerstone of their investment process, will provide highly differentiated investment insights leading to potentially superior outcomes over the long term.
| 12 | American Funds Insurance Series |
New World Fund® (continued)
How a hypothetical $10,000 investment has grown
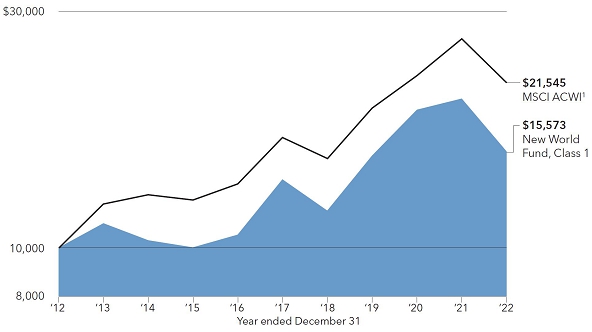
Total returns based on a $1,000 investment
For periods ended December 31, 20222
| 1 year | 5 years | 10 years | Lifetime (since June 17, 1999) |
Gross expense ratio |
Net expense ratio | |||||||||||||||||||
| Class 1 | –21.86 | % | 2.58 | % | 4.53 | % | 7.45 | % | 0.64 | % | 0.57 | % | ||||||||||||
| Class 1A | –22.09 | 2.32 | 4.27 | 7.18 | 0.89 | 0.82 | ||||||||||||||||||
| Class 2 | –22.10 | 2.32 | 4.27 | 7.18 | 0.89 | 0.82 | ||||||||||||||||||
| Class 4 | –22.25 | 2.07 | 4.02 | 6.92 | 1.14 | 1.07 | ||||||||||||||||||
Investment results assume all distributions are reinvested and reflect applicable fees and expenses. The investment adviser is currently waiving a portion of its management fee. This waiver will be in effect through at least May 1, 2023. The waiver may only be modified or terminated with the approval of the fund’s board. Net expense ratios reflect the waiver, without which they would have been higher. When applicable, investment results reflect fee waivers and/or expense reimbursements, without which results would have been lower. Visit capitalgroup.com/afis for more information. Expense ratios are restated to reflect current fees and are as of the fund’s prospectus dated May 1, 2023 (unaudited). Refer to the Financial Highlights table in this report for details.
Past results are not predictive of results in future periods.
Any market index shown is unmanaged and, therefore, has no expenses. Investors cannot invest directly in an index.
| 1 | Source: MSCI. The MSCI index result reflects dividends net of withholding taxes and reinvestment of distributions. |
| 2 | Periods greater than one year are annualized. |
| Where the fund’s assets were invested as of December 31, 2022 | Percent of net assets |
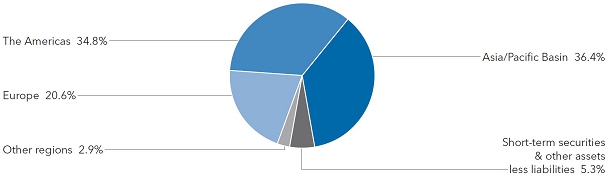
| American Funds Insurance Series | 13 |
Washington Mutual Investors Fund
Fund results shown are for past periods and are not predictive of results for future periods. Current and future results may be lower or higher than those shown. Prices and returns will vary, so investors may lose money. Investing for short periods makes losses more likely. For current information and month-end results, visit capitalgroup.com/afis. For information about your insurance contract and month-end results, go to the website of the company that issued your contract.
Washington Mutual Investors Fund declined 8.28% for the 12 months ended December 31, 2022. Its benchmark index, S&P 500 Index,1 a market capitalization-weighted index based on the results of approximately 500 widely held common stocks, fell by 18.11%.
U.S. equities had their worst year since 2008, as persistently high inflation and aggressive rate hikes stoked recession fears. S&P 500 Index entered its first bear market since 2020. Energy was the top S&P 500 sector for the second straight year, climbing 66%. Crude oil prices spiked in March after Russia’s invasion of Ukraine upended global oil flows. Growth stocks had the sharpest declines, including several tech giants that had been market leaders over the last decade. Despite consecutive quarters of negative gross domestic product growth in the first half, a strong labor market helped inflation to persist.
Regarding the fund, stock selections in the consumer discretionary and information technology sectors were additive to relative returns. Among individual securities, a higher-than-benchmark position in Unitedhealth Group was a top contributor, as the stock outpaced the broader market. On the downside, security selections within the financials and real estate sectors were top detractors. A lower-than-index position in Exxon Mobil weighed on relative returns as the stock outpaced the market overall.
Looking ahead, the fund’s portfolio managers are keeping a close watch on monetary policy, inflation, and other global issues, along with the resulting implications for the U.S. economy. Portfolio managers continue to favor well-managed, high-quality companies that are capable of paying dividends in myriad economic environments. We remain optimistic that this focus, supported by our global research, will help us to identify attractive long-term investment opportunities.
| 14 | American Funds Insurance Series |
Washington Mutual Investors Fund (continued)
How a hypothetical $10,000 investment has grown
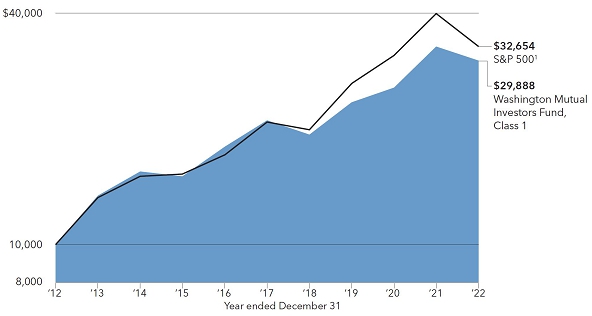
Total returns based on a $1,000 investment
For periods ended December 31, 20222
| 1 year | 5 years | 10 years | Lifetime (since July 5,2001) |
Gross expense ratio |
Net expense ratio | |||||||||||||||||||
| Class 1 | –8.28 | % | 7.37 | % | 11.57 | % | 6.97 | % | 0.40 | % | 0.25 | % | ||||||||||||
| Class 1A | –8.45 | 7.11 | 11.30 | 6.71 | 0.65 | 0.50 | ||||||||||||||||||
| Class 2 | –8.45 | 7.11 | 11.30 | 6.70 | 0.65 | 0.50 | ||||||||||||||||||
| Class 4 | –8.69 | 6.84 | 11.08 | 6.47 | 0.90 | 0.75 | ||||||||||||||||||
Investment results assume all distributions are reinvested and reflect applicable fees and expenses. The investment adviser is currently waiving a portion of its management fee. This waiver will be in effect through at least May 1, 2023. The waiver may only be modified or terminated with the approval of the fund’s board. Net expense ratios reflect the waiver, without which they would have been higher. When applicable, investment results reflect fee waivers and/or expense reimbursements, without which results would have been lower. Visit capitalgroup.com/afis for more information. Expense ratios are restated to reflect current fees and are as of the fund’s prospectus dated May 1, 2023 (unaudited). Refer to the Financial Highlights table in this report for details.
Past results are not predictive of results in future periods.
Any market index shown is unmanaged and, therefore, has no expenses. Investors cannot invest directly in an index.
| 1 | Source: S&P Dow Jones Indices LLC. |
| 2 | Periods greater than one year are annualized. |
| Where the fund’s assets were invested as of December 31, 2022 | Percent of net assets |
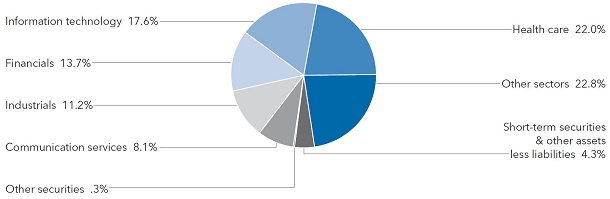
| American Funds Insurance Series | 15 |
Capital World Growth and Income Fund®
Fund results shown are for past periods and are not predictive of results for future periods. Current and future results may be lower or higher than those shown. Prices and returns will vary, so investors may lose money. Investing for short periods makes losses more likely. For current information and month-end results, visit capitalgroup.com/afis. For information about your insurance contract and month-end results, go to the website of the company that issued your contract.
Capital World Growth and Income Fund declined 17.13% for the 12 months ended December 31, 2022, compared with a decline of 18.36% in its benchmark index, MSCI ACWI (All Country World Index),1 a free float-adjusted market capitalization-weighted index that is designed to measure equity market results in the global developed and emerging markets, consisting of more than 40 developed and emerging market country indexes.
Global stocks fell sharply, pressured by rising interest rates, slowing economic growth and inflationary pressures not seen since the 1980s. The war in Ukraine also weighed on investors throughout the year. Several key benchmark indexes fell into bear market territory at times and all but one sector declined in the MSCI All Country World Index. Within that index, communication services, consumer discretionary and information technology stocks suffered the biggest losses. Meanwhile, energy stocks surged amid higher oil and gas prices. Late in the year, signs that inflation may have peaked in the U.S., Europe and elsewhere sparked a rally that erased some of the losses.
Within the portfolio, a higher-than-index position and stock selection within the materials sector was a top contributor to relative returns. Results were also buoyed by holdings in Vale, a Brazil-based mining company, which saw returns over the period that outpaced the broader market. On the downside, stock selection within the communication services and financials sectors were among the top detractors to returns. A position in Sberbank Russia weighed on returns as the stock saw sharp declines due to Russia’s invasion of Ukraine and related consequences.
On a geographical basis, stocks domiciled in the United States and Brazil contributed the most to relative returns, while holdings in Japan and Russia dragged.
Looking ahead, the market continues to focus on global inflation levels as a key determinant for interest-rate and asset-price movement. There are signs that the worst of the inflation surge, due in part to rising oil prices and supply-chain issues during the COVID-19 pandemic, seems to be behind us. However, there is still uncertainty about how wage increases – as seen in many developed markets – could impact the continuation of high inflation. As a result of tighter monetary conditions, economies around the world are seeing growth moderate. Meanwhile, contributors to a turbulent macro environment in 2022, such as the war in Ukraine and U.S.-China tensions, have not subsided. Against this uncertainty, the fund’s managers remain committed to finding companies that can grow regardless of macro environment and investing in those that have shown a strong tendency to pay a dividend through difficult economic conditions.
| 16 | American Funds Insurance Series |
Capital World Growth and Income Fund® (continued)
How a hypothetical $10,000 investment has grown
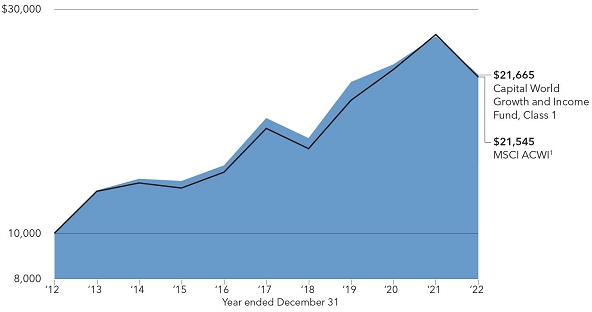
Total returns based on a $1,000 investment
For periods ended December 31, 20222
| 1 year | 5 years | 10 years | Lifetime (since May 1, 2006) |
Gross expense ratio |
Net expense ratio | |||||||||||||||||||
| Class 1 | –17.13 | % | 4.36 | % | 8.04 | % | 6.40 | % | 0.53 | % | 0.42 | % | ||||||||||||
| Class 1A | –17.29 | 4.10 | 7.79 | 6.15 | 0.78 | 0.67 | ||||||||||||||||||
| Class 2 | –17.33 | 4.10 | 7.77 | 6.14 | 0.78 | 0.67 | ||||||||||||||||||
| Class 4 | –17.57 | 3.83 | 7.53 | 5.89 | 1.03 | 0.92 | ||||||||||||||||||
Investment results assume all distributions are reinvested and reflect applicable fees and expenses. The investment adviser is currently waiving a portion of its management fee. This waiver will be in effect through at least May 1, 2023. The waiver may only be modified or terminated with the approval of the fund’s board. Net expense ratios reflect the waiver, without which they would have been higher. When applicable, investment results reflect fee waivers and/or expense reimbursements, without which results would have been lower. Visit capitalgroup.com/afis for more information. Expense ratios are restated to reflect current fees and are as of the fund’s prospectus dated May 1, 2023 (unaudited). Refer to the Financial Highlights table in this report for details.
Past results are not predictive of results in future periods.
Any market index shown is unmanaged and, therefore, has no expenses. Investors cannot invest directly in an index.
| 1 | Source: MSCI. The MSCI index results reflect dividends net of withholding taxes and reinvestment of distributions. |
| 2 | Periods greater than one year are annualized. |
| Where the fund’s assets were invested as of December 31, 2022 | Percent of net assets |
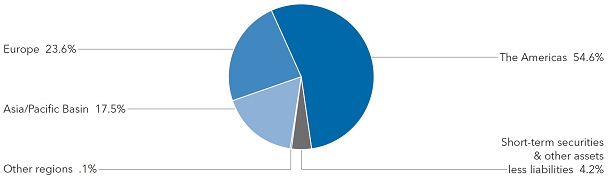
| American Funds Insurance Series | 17 |
Growth-Income Fund
Fund results shown are for past periods and are not predictive of results for future periods. Current and future results may be lower or higher than those shown. Prices and returns will vary, so investors may lose money. Investing for short periods makes losses more likely. For current information and month-end results, visit capitalgroup.com/afis. For information about your insurance contract and month-end results, go to the website of the company that issued your contract.
Growth-Income Fund fell 16.28% for the 12 months ended December 31, 2022, compared with a decline of 18.11% in its benchmark index, S&P 500 Index,1 a market capitalization-weighted index based on the results of approximately 500 widely held common stocks.
U.S. equities had their worst year since 2008, as persistently high inflation and aggressive rate hikes stoked recession fears. The S&P 500 entered its first bear market since 2020. Energy was the top S&P 500 sector for the second straight year, climbing 66%. Crude oil prices spiked in March after Russia’s invasion of Ukraine upended global oil flows. Growth stocks had the sharpest declines, including several tech giants that had been market leaders over the last decade. Despite consecutive quarters of negative gross domestic product growth in the first half, a strong labor market helped inflation to persist.
Regarding the fund, investments within the information technology and industrials sectors were top contributors to the fund’s relative returns. An out-of-benchmark position in energy company Canadian Natural Resources was a top individual contributor, as the stock outpaced the market overall. On the downside, security selections within the communications and financials sectors dragged on portfolio returns. Netflix was the fund’s top individual detractor owing to a larger-than-benchmark position and returns that lagged the market overall.
Looking ahead, uncertainty in the macroeconomic outlook and in the trajectory of inflation and interest rates will likely continue. Stock valuations have started to come down to reflect investor concerns, although corporate earnings outlooks may not have bottomed. The fund’s portfolio managers will take advantage of volatility to build positions in companies and stocks in which they see long term value. The current environment should provide opportunities for finding investments with attractive risk-adjusted return potential.
| 18 | American Funds Insurance Series |
Growth-Income Fund (continued)
How a hypothetical $10,000 investment has grown
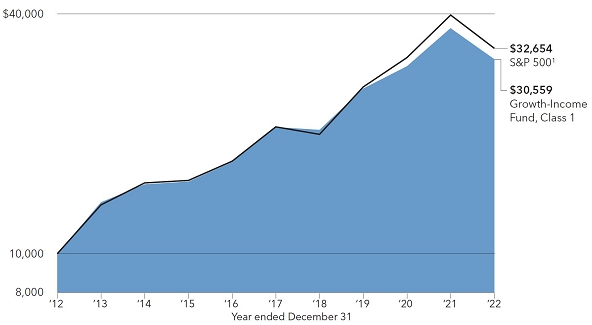
Total returns based on a $1,000 investment
For periods ended December 31, 20222
| 1 year | 5 years | 10 years | Lifetime (since February 8, 1984) |
Expense ratio | ||||||||||||||||
| Class 1 | –16.28 | % | 8.09 | % | 11.82 | % | 11.01 | % | 0.28 | % | ||||||||||
| Class 1A | –16.48 | 7.83 | 11.55 | 10.74 | 0.53 | |||||||||||||||
| Class 2 | –16.50 | 7.83 | 11.54 | 10.74 | 0.53 | |||||||||||||||
| Class 3 | –16.43 | 7.91 | 11.62 | 10.82 | 0.46 | |||||||||||||||
| Class 4 | –16.70 | 7.56 | 11.28 | 10.47 | 0.78 | |||||||||||||||
Investment results assume all distributions are reinvested and reflect applicable fees and expenses. When applicable, investment results reflect fee waivers and/or expense reimbursements, without which results would have been lower. Visit capitalgroup.com/afis for more information. Expense ratios are as of the fund’s prospectus dated May 1, 2023 (unaudited). Refer to the Financial Highlights table in this report for details.
Past results are not predictive of results in future periods.
Any market index shown is unmanaged and, therefore, has no expenses. Investors cannot invest directly in an index.
| 1 | Source: S&P Dow Jones Indices LLC. |
| 2 | Periods greater than one year are annualized. |
| Where the fund’s assets were invested as of December 31, 2022 | Percent of net assets |
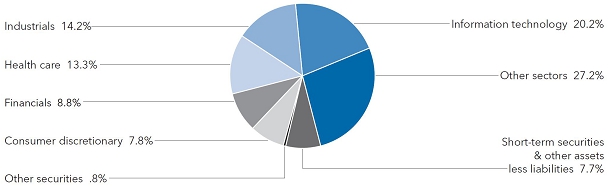
| American Funds Insurance Series | 19 |
International Growth and Income Fund
Fund results shown are for past periods and are not predictive of results for future periods. Current and future results may be lower or higher than those shown. Prices and returns will vary, so investors may lose money. Investing for short periods makes losses more likely. For current information and month-end results, visit capitalgroup.com/afis. For information about your insurance contract and month-end results, go to the website of the company that issued your contract.
International Growth and Income Fund fell 15.00% for the 12 months ended December 31, 2022, compared with a decline of 16.00% in its benchmark index, MSCI ACWI (All Country World Index) ex USA,1 a free float-adjusted market capitalization-weighted index that is designed to measure equity market results in the global developed and emerging markets (consisting of more than 40 developed and emerging market country indexes excluding the U.S.).
Global stocks fell sharply, pressured by rising interest rates, slowing economic growth and inflationary pressures not seen since the 1980s. The war in Ukraine also weighed on investors throughout the year. Several key benchmark indexes fell into bear market territory at times and all but one sector declined in the MSCI All Country World Index. Within that index, communication services, consumer discretionary and information technology stocks suffered the biggest losses. Meanwhile, energy stocks surged amid higher oil and gas prices. Late in the year, signs that inflation may have peaked in the U.S., Europe and elsewhere sparked a rally that erased some of the losses.
Regarding the fund, stock selections within the consumer discretionary and consumer staples sectors were additive to relative results. Within individual securities, British American Tobacco was a top contributor owing to returns that outpaced the broader market. On the downside, security selections within the financials and energy sectors detracted from returns. Positions in Russian firms Sberbank and Gazprom were among the top individual detractors as their stocks saw declines due to the Russian invasion of Ukraine and related consequences.
The new year looks to continue current macroeconomic uncertainty and trends stemming from shifting monetary policies and geopolitical tensions around the world. In this environment, valuations remain depressed, particularly outside the United States. The fund’s managers continue to focus on businesses they believe will provide good value over the long-term, as guided by the fundamental, global research that underpins investment decisions.
| 20 | American Funds Insurance Series |
International Growth and Income Fund (continued)
How a hypothetical $10,000 investment has grown
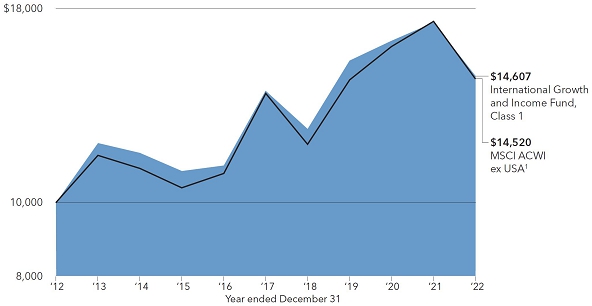
Total returns based on a $1,000 investment
For periods ended December 31, 20222
| 1 year | 5 years | 10 years | Lifetime (since November 18, 2008) |
Expense ratio | ||||||||||||||||
| Class 1 | –15.00 | % | 0.88 | % | 3.86 | % | 6.91 | % | 0.55 | % | ||||||||||
| Class 1A | –15.31 | 0.61 | 3.60 | 6.64 | 0.80 | |||||||||||||||
| Class 2 | –15.25 | 0.62 | 3.60 | 6.64 | 0.80 | |||||||||||||||
| Class 4 | –15.52 | 0.35 | 3.37 | 6.40 | 1.05 | |||||||||||||||
Investment results assume all distributions are reinvested and reflect applicable fees and expenses. The investment adviser is currently waiving a portion of its management fee. This waiver will be in effect through at least May 1, 2023. The waiver may only be modified or terminated with the approval of the fund’s board. When applicable, investment results reflect fee waivers and/or expense reimbursements, without which results would have been lower. Visit capitalgroup.com/afis for more information. Expense ratios are restated to reflect current fees and are as of the fund’s prospectus dated May 1, 2023 (unaudited). Refer to the Financial Highlights table in this report for details.
Past results are not predictive of results in future periods.
Any market index shown is unmanaged and, therefore, has no expenses. Investors cannot invest directly in an index.
| 1 | Source: MSCI. The MSCI index result reflects dividends net of withholding taxes and reinvestment of distributions. |
| 2 | Periods greater than one year are annualized. |
| Where the fund’s assets were invested as of December 31, 2022 | Percent of net assets |
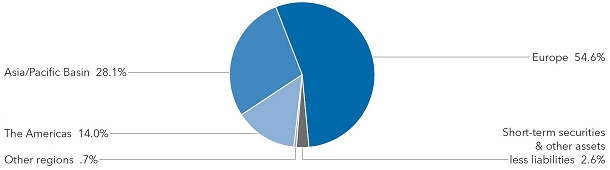
| American Funds Insurance Series | 21 |
Capital Income Builder®
Fund results shown are for past periods and are not predictive of results for future periods. Current and future results may be lower or higher than those shown. Prices and returns will vary, so investors may lose money. Investing for short periods makes losses more likely. For current information and month-end results, visit capitalgroup.com/afis. For information about your insurance contract and month-end results, go to the website of the company that issued your contract.
Capital Income Builder, which invests in a mix of stocks and bonds, declined 6.90% for the 12 months ended December 31, 2022. During the same period, the index blend of 70%/30% MSCI ACWI (All Country World Index)/Bloomberg U.S. Aggregate Index1 fell 16.59%. MSCI ACWI,2 a free float-adjusted market capitalization-weighted index that is designed to measure equity market results in the global developed and emerging markets (consisting of more than 40 developed and emerging market country indexes), fell 18.36%. The Bloomberg U.S. Aggregate Index,3 which represents the U.S. investment-grade (rated BBB/Baa and above) fixed-rate bond market, fell 13.01%.
Global stocks fell sharply, pressured by rising interest rates, slowing economic growth and inflationary pressures not seen since the 1980s. The war in Ukraine also weighed on investors throughout the year. Several key benchmark indexes fell into bear market territory at times and all but one sector declined in the MSCI All Country World Index. Within that index, communication services, consumer discretionary and information technology stocks suffered the biggest losses. Meanwhile, energy stocks surged amid higher oil and gas prices. Late in the year, signs that inflation may have peaked in the U.S., Europe and elsewhere sparked a rally that erased some of the losses.
U.S. fixed income markets fell across the board. The Federal Reserve raised the federal funds rate by 425 basis points from near zero to counter the highest inflation since the 1980s. U.S. Treasury yields rose across the curve, which ended the year inverted as shorter dated bonds sold off sharply.
The overall portfolio has protected the absolute downside for investors. In the equity portfolio, stock selection in consumer staples was a top contributor to relative returns. Investment in aerospace, within the industrials sector, was also additive, as was a position in the energy sector. On the downside, stock selection within financials detracted from returns. Overall, dividend-paying companies have done better than the broader market.
The fund’s fixed income portfolio outpaced its benchmark and was additive to relative returns overall. Duration positioning within the portfolio was a primary driver of returns, while curve positioning and security selection detracted.
The fund’s portfolio managers are cautious given the impact of a potential U.S. recession on earnings and dividends, but also aware that markets tend to bottom three to six months ahead of a recession and are therefore ready to revisit early cyclical investment ideas. With the strength of the U.S. dollar reversing, we believe the fund’s exposure to global markets is well-positioned. The fund also remains well-positioned to use its geographic flexibility to pursue dividend-paying investment opportunities around the world. Fund managers remain loyal to the fund’s objective and optimistic about the companies with growing dividends that were selected for this portfolio through fundamental, bottom-up security selection.
| 22 | American Funds Insurance Series |
Capital Income Builder® (continued)
How a hypothetical $10,000 investment has grown
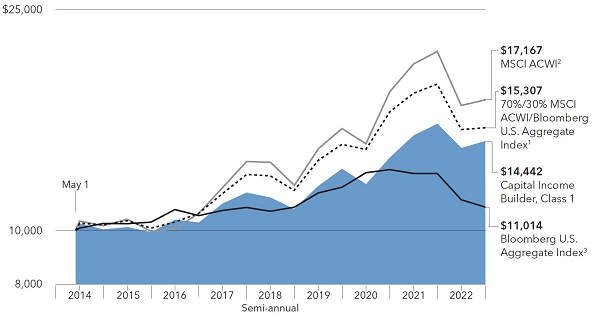
Total returns based on a $1,000 investment
For periods ended December 31, 20224
| 1 year | 5 years | Lifetime (since May 1, 2014) |
Gross expense ratio |
Net expense ratio | ||||||||||||||||
| Class 1 | –6.90 | % | 4.35 | % | 4.33 | % | 0.41 | % | 0.27 | % | ||||||||||
| Class 1A | –7.06 | 4.10 | 4.08 | 0.66 | 0.52 | |||||||||||||||
| Class 2 | –7.13 | 4.09 | 4.14 | 0.66 | 0.52 | |||||||||||||||
| Class 4 | –7.37 | 3.83 | 3.81 | 0.91 | 0.77 | |||||||||||||||
Investment results assume all distributions are reinvested and reflect applicable fees and expenses. The investment adviser is currently waiving a portion of its management fee. This waiver will be in effect through at least May 1, 2023. The waiver may only be modified or terminated with the approval of the fund’s board. Net expense ratios reflect the waiver, without which they would have been higher. When applicable, investment results reflect fee waivers and/or expense reimbursements, without which results would have been lower. Visit capitalgroup.com/afis for more information. Expense ratios are restated to reflect current fees and are as of the fund’s prospectus dated May 1, 2023 (unaudited). Refer to the Financial Highlights table in this report for details.
Past results are not predictive of results in future periods.
Any market index shown is unmanaged and, therefore, has no expenses. Investors cannot invest directly in an index.
| 1 | Data sources: MSCI and Bloomberg Index Services Ltd. 70%/30% MSCI ACWI/Bloomberg U.S. Aggregate Index blends the MSCI ACWI (All Country World Index) with the Bloomberg U.S. Aggregate Index by weighting their total returns at 70% and 30%, respectively. Its result assumes the blend is rebalanced monthly. |
| 2 | Source: MSCI. The MSCI index result reflects dividends net of withholding taxes and reinvestment of distributions. |
| 3 | Source: Bloomberg Index Services Ltd. |
| 4 | Periods greater than one year are annualized. |
| Where the fund’s assets were invested as of December 31, 2022 | Percent of net assets |
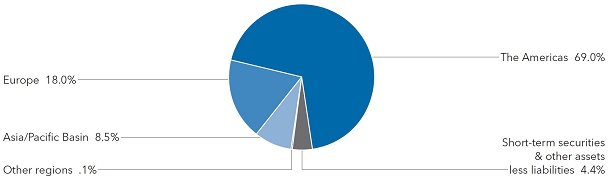
| American Funds Insurance Series | 23 |
Asset Allocation Fund
Fund results shown are for past periods and are not predictive of results for future periods. Current and future results may be lower or higher than those shown. Prices and returns will vary, so investors may lose money. Investing for short periods makes losses more likely. For current information and month-end results, visit capitalgroup.com/afis. For information about your insurance contract and month-end results, go to the website of the company that issued your contract.
Asset Allocation Fund, which is a mix of stocks and bonds, fell 13.19% for the 12 months ended December 31, 2022. During the same period, the index blend of 60%/40% S&P 500 Index/Bloomberg U.S. Aggregate Index1 declined 15.79%. S&P 500 Index,2 a market capitalization-weighted index based on the results of approximately 500 widely held common stocks, was down 18.11%, while the Bloomberg U.S. Aggregate Index,3 which represents the U.S. investment-grade (rated BBB/Baa and above) fixed-rate bond market, fell by 13.01%.
U.S. equities had their worst year since 2008, as persistently high inflation and aggressive rate hikes stoked recession fears. The S&P 500 entered its first bear market since 2020. Energy was the top S&P 500 sector for the second straight year, climbing 66%. Crude oil prices spiked in March after Russia’s invasion of Ukraine upended global oil flows. Growth stocks had the sharpest declines, including several tech giants that had been market leaders over the last decade. Despite consecutive quarters of negative gross domestic product growth in the first half, a strong labor market helped inflation to persist.
U.S. fixed income markets fell across the board. The Federal Reserve raised the federal funds rate by 425 basis points from near zero to counter the highest inflation since the 1980s. U.S. Treasury yields rose across the curve, and ended the year inverted as shorter dated bonds sold off sharply.
In the equity portfolio, investment selection within the consumer discretionary sector was the top contributor to relative returns on a sector basis. Results were buoyed by an off-benchmark holding in food services company Aramark and a higher-than-index position in Philip Morris, which saw returns that significantly outpaced the market overall. On the downside, stock selections within the energy and financials sectors weighed on relative returns. Within energy, Exxon Mobil – which the fund did not hold – weighed on relative results as its stock outpaced the broader market. A higher-than-benchmark holding in Charter Communications was among the top individual detractors, as returns lagged the broader market.
The fund’s fixed income investments were additive to relative returns overall. Duration positioning within Treasuries and mortgage-backed securities (MBS) contributed positively to results. Sector and security selections detracted. An out-of-benchmark position within U.S. Treasury Inflation-Protected Securities (TIPS) also weighed on returns.
In the wake of market selloffs and rotations like the one seen in 2022, opportunities often abound for the long-term investor. Fund managers note that many sound companies with outstanding long-term prospects are trading at attractive valuations because the market is focused on the short term. Managers are focused on differentiating between companies whose fundamental outlook has changed versus those facing more transient issues, and where valuations are attractive. In addition, their portfolios are balanced across a broad array of cyclical and market exposures.
| 24 | American Funds Insurance Series |
Asset Allocation Fund (continued)
How a hypothetical $10,000 investment has grown
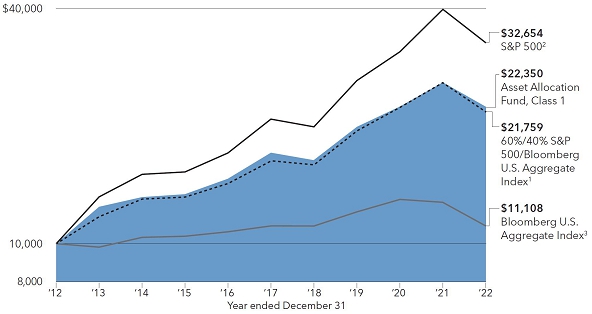
Total returns based on a $1,000 investment
For periods ended December 31, 20224
| 1 year | 5 years | 10 years | Lifetime (since August 1,1989) |
Expense ratio | ||||||||||||||||
| Class 1 | –13.19 | % | 5.59 | % | 8.37 | % | 8.22 | % | 0.30 | % | ||||||||||
| Class 1A | –13.43 | 5.32 | 8.11 | 7.95 | 0.55 | |||||||||||||||
| Class 2 | –13.41 | 5.33 | 8.10 | 7.95 | 0.55 | |||||||||||||||
| Class 3 | –13.37 | 5.40 | 8.18 | 8.03 | 0.48 | |||||||||||||||
| Class 4 | –13.66 | 5.06 | 7.87 | 7.69 | 0.80 | |||||||||||||||
Investment results assume all distributions are reinvested and reflect applicable fees and expenses. When applicable, investment results reflect fee waivers and/or expense reimbursements, without which results would have been lower. Visit capitalgroup.com/afis for more information. Expense ratios are as of the fund’s prospectus dated May 1, 2023 (unaudited). Refer to the Financial Highlights table in this report for details.
Past results are not predictive of results in future periods.
Any market index shown is unmanaged and, therefore, has no expenses. Investors cannot invest directly in an index.
| 1 | Data sources: Bloomberg Index Services Ltd. and S&P Dow Jones Indices LLC. 60%/40% S&P 500 Index/Bloomberg U.S. Aggregate Index blends the S&P 500 with the Bloomberg U.S. Aggregate Index by weighting their total returns at 60% and 40%, respectively. Its result assumes the blend is rebalanced monthly. |
| 2 | Source: S&P Dow Jones Indices LLC. |
| 3 | Source: Bloomberg Index Services Ltd. |
| 4 | Periods greater than one year are annualized. |
| Where the fund’s assets were invested as of December 31, 2022 | Percent of net assets |
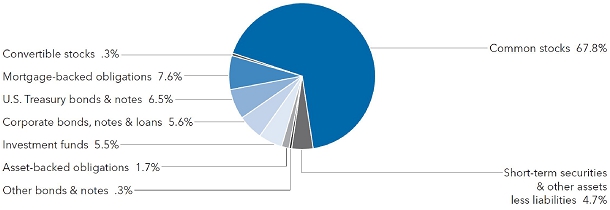
| American Funds Insurance Series | 25 |
American Funds® Global Balanced Fund
Fund results shown are for past periods and are not predictive of results for future periods. Current and future results may be lower or higher than those shown. Prices and returns will vary, so investors may lose money. Investing for short periods makes losses more likely. For current information and month-end results, visit capitalgroup.com/afis. For information about your insurance contract and month-end results, go to the website of the company that issued your contract.
American Funds Global Balanced Fund declined 14.33% for the 12 months ended December 31, 2022. Over the same period, the fund’s index blend of 60%/40% MSCI ACWI (All Country World Index)/Bloomberg Global Aggregate Index1 fell 17.33%. MSCI ACWI,2 a free float-adjusted market capitalization-weighted index that is designed to measure equity market results in the global developed and emerging markets (consisting of more than 40 developed and emerging market country indexes), was down 18.36%, while the Bloomberg Global Aggregate Index,3 a measure of global investment-grade bonds (rated BBB/Baa and above), declined 16.25%.
Global stocks fell sharply, pressured by rising interest rates, slowing economic growth and inflationary pressures not seen since the 1980s. The war in Ukraine also weighed on investors throughout the year. Several key benchmark indexes fell into bear market territory at times and all but one sector declined in the MSCI ACWI. Within that index, communication services, consumer discretionary and information technology stocks suffered the biggest losses. Meanwhile, energy stocks surged amid higher oil and gas prices. Late in the year, signs that inflation may have peaked in the U.S., Europe and elsewhere sparked a rally that erased some of the losses. Bonds fell in the face of rising inflation, and the Federal Reserve hiked its policy rate 425 basis points over seven policy meetings in an attempt to tame it. The Bloomberg U.S. Treasury Index4 lost 12.46% in one of the worst bond market declines in history. The Federal Reserve and European Central Bank, among others, aggressively raised interest rates in an attempt to bring inflation back to a target of roughly 2%, down from 7% to 10% in many economies.
The fund declined overall but outpaced its primary benchmark index. Within the equity portfolio, stock selection in the communication services sector was a top contributor to relative results. A lower-than-benchmark position in Amazon was additive to portfolio relative returns as the stock lagged the market overall. On the downside, stock selection within the materials sector weighed on returns. A higher-than-benchmark holding in Home Depot was a top detractor among individual stocks. The fund’s fixed income investments detracted from relative results. A small exposure to Russian bonds weighed on relative returns, while overall sector selection was positive, owing mostly to holdings in euro-denominated assets.
Investors face an ongoing combination of risks in the year ahead, with likely weak economic growth, high inflation and geopolitical risk continuing. Among stock sectors, fund managers believe sectors such as U.S. utilities and health care may provide attractive investment opportunities as renewable energy incentives and demographic changes are expected to aid growth. They are also closely watching the U.S. dollar, whose strength has weighed on non-U.S. holdings in the portfolio and is expected to remain strong into 2023. The fund’s fixed income portfolio remains cautiously positioned in the current inflationary environment, but managers are confident in the long-term opportunities in bond markets that are now delivering meaningful income for the first time in years. As always, they continue to focus on core principals of global research, individual security selection and bottom-up fundamental analysis to underpin investment decisions.
| 26 | American Funds Insurance Series |
American Funds® Global Balanced Fund (continued)
How a hypothetical $10,000 investment has grown
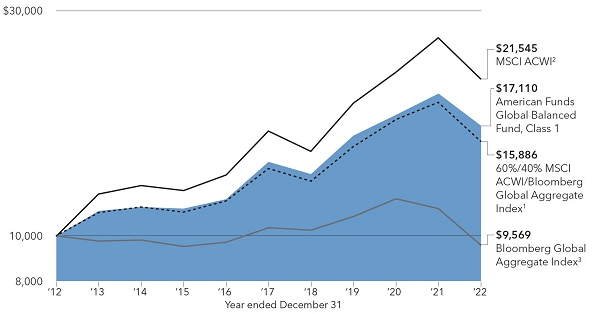
Total returns based on a $1,000 investment
For periods ended December 31, 20225
| 1 year | 5 years | 10 years | Lifetime (since May 2, 2011) |
Gross expense ratio |
Net expense ratio | |||||||||||||||||||
| Class 1 | –14.33 | % | 3.65 | % | 5.52 | % | 5.23 | % | 0.51 | % | 0.50 | % | ||||||||||||
| Class 1A | –14.56 | 3.41 | 5.28 | 4.99 | 0.76 | 0.75 | ||||||||||||||||||
| Class 2 | –14.56 | 3.40 | 5.25 | 4.97 | 0.76 | 0.75 | ||||||||||||||||||
| Class 4 | –14.73 | 3.13 | 5.12 | 4.81 | 1.01 | 1.00 | ||||||||||||||||||
Investment results assume all distributions are reinvested and reflect applicable fees and expenses. The investment adviser is currently waiving a portion of its management fee. This waiver will be in effect through at least May 1, 2023. The waiver may only be modified or terminated with the approval of the fund’s board. Net expense ratios reflect the waiver, without which they would have been higher. When applicable, investment results reflect fee waivers and/or expense reimbursements, without which results would have been lower. Visit capitalgroup.com/afis for more information. Expense ratios are restated to reflect current fees and are as of the fund’s prospectus dated May 1, 2023 (unaudited). Refer to the Financial Highlights table in this report for details.
Past results are not predictive of results in future periods.
Any market index shown is unmanaged and, therefore, has no expenses. Investors cannot invest directly in an index.
| 1 | Data sources: MSCI and Bloomberg Index Services Ltd. The 60%/40% MSCI ACWI/Bloomberg Global Aggregate Index blends the MSCI ACWI (All Country World Index) with the Bloomberg Global Aggregate Index by weighting their cumulative total returns at 60% and 40%, respectively. Its result assumes the blend is rebalanced monthly. |
| 2 | Source: MSCI. The MSCI index results reflect dividends net of withholding taxes and reinvestment of distributions. |
| 3 | Source: Bloomberg Index Services Ltd. |
| 4 | Source: Bloomberg Index Services Ltd. The Bloomberg U.S. Treasury Index measures the performance of public obligations of the U.S. Treasury. |
| 5 | Periods greater than one year are annualized. |
| Where the fund’s assets were invested as of December 31, 2022 | Percent of net assets |
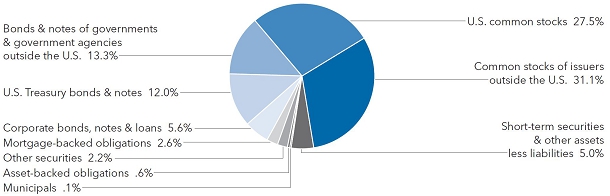
| American Funds Insurance Series | 27 |
The Bond Fund of America®
Fund results shown are for past periods and are not predictive of results for future periods. Current and future results may be lower or higher than those shown. Prices and returns will vary, so investors may lose money. Investing for short periods makes losses more likely. For current information and month-end results, visit capitalgroup.com/afis. For information about your insurance contract and month-end results, go to the website of the company that issued your contract.
The Bond Fund of America declined 12.26% for the 12 months ended December 31, 2022. The fund’s benchmark, Bloomberg U.S. Aggregate Index,1 which represents the U.S. investment-grade (rated BBB/Baa and above) fixed-rate bond market, was down 13.01%.
U.S. fixed income markets fell across the board. The U.S. Federal Reserve raised the federal funds rate by 425 basis points from near zero to counter the highest inflation since the 1980s. U.S. Treasury yields rose across the curve, which ended the year inverted as shorter dated bonds sold off sharply. The 10-year Treasury yield soared 237 basis points to 3.88%. The Bloomberg U.S. Corporate Investment Grade Index2 returned –15.76%, and spreads widened by 38 basis points. Elsewhere, the Bloomberg U.S. Corporate High Yield 2% Issuer Capped Index3 returned –11.18%, while the Bloomberg Municipal Bond Index4 returned –8.53%.
Over the period, the largest contributions to relative results came from duration positioning and agency mortgage-backed securities (MBS). The fund’s lower-than-benchmark duration helped reduce interest rate sensitivity as rates moved higher and bond prices fell over the period. A lower position in MBS also helped, relative to the benchmark, as spreads widened materially. On the downside, yield curve positioning and a modest position in emerging markets and high-yield bonds detracted from results.
The market and economic environments in 2023 look very different than last year. Inflation appears to have peaked and is on the decline, the Fed has guided to a peak federal funds rate of around 5% to be reached in the first half of 2023, and the market is gearing for an economic slowdown or recession. In response, yields have moved higher and spreads on risky assets have moved wider, making valuations more attractive for fixed income investors.
The fund’s managers have a conservative outlook on the economy and believe that while valuations are more attractive, they do not fully compensate investors for the risk of a deeper economic downturn in the coming year. Managers have added duration, corporate bonds and structured products like agency mortgage-backed securities to effectively eliminate lower-than-benchmark positions but have not moved significantly higher than the benchmark. Interest rate positioning is concentrated in intermediate securities around five-year maturities, which managers believe will benefit the portfolio if inflation and the economy continue to slow and the Fed ends the rate-hike cycle in the first half of 2023.
As the year progresses and managers gain more confidence on either the direction of the economy or valuations, they expect to take more meaningful positions relative to the benchmark. As always, research-driven security selection is expected to be an important driver of future investment results.
| 28 | American Funds Insurance Series |
The Bond Fund of America® (continued)
How a hypothetical $10,000 investment has grown
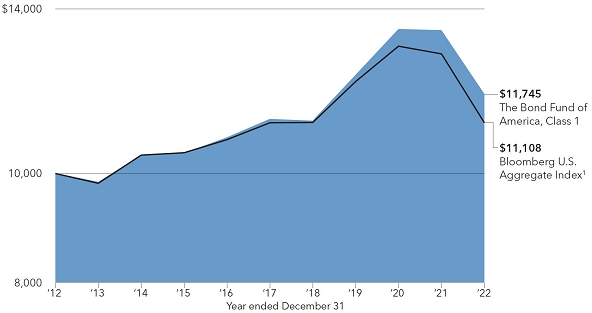
Total returns based on a $1,000 investment
For periods ended December 31, 20225
| 1 year | 5 years | 10 years | Lifetime (since January 2, 1996) |
Gross expense ratio |
Net expense ratio | |||||||||||||||||||
| Class 1 | –12.26 | % | 1.02 | % | 1.62 | % | 4.04 | % | 0.38 | % | 0.21 | % | ||||||||||||
| Class 1A | –12.49 | 0.78 | 1.37 | 3.79 | 0.63 | 0.46 | ||||||||||||||||||
| Class 2 | –12.58 | 0.76 | 1.36 | 3.78 | 0.63 | 0.46 | ||||||||||||||||||
| Class 4 | –12.75 | 0.51 | 1.12 | 3.53 | 0.88 | 0.71 | ||||||||||||||||||
Investment results assume all distributions are reinvested and reflect applicable fees and expenses. The investment adviser is currently waiving a portion of its management fee. This waiver will be in effect through at least May 1, 2023. The waiver may only be modified or terminated with the approval of the fund’s board. Net expense ratios reflect the waiver, without which they would have been higher. When applicable, investment results reflect fee waivers and/or expense reimbursements, without which results would have been lower. Visit capitalgroup.com/afis for more information. Expense ratios are as of the fund’s prospectus dated May 1, 2023 (unaudited). Refer to the Financial Highlights table in this report for details.
Past results are not predictive of results in future periods.
Any market index shown is unmanaged and, therefore, has no expenses. Investors cannot invest directly in an index.
| 1 | Source: Bloomberg Index Services Ltd. |
| 2 | Source: Bloomberg Index Services Ltd. Bloomberg U.S. Corporate Investment Grade Index represents the universe of investment-grade, publicly issued U.S. corporate and specified foreign debentures and secured notes that meet the specified maturity, liquidity and quality requirements. |
| 3 | Source: Bloomberg Index Services Ltd. Bloomberg U.S. Corporate High Yield 2% Issuer Capped Index covers the universe of fixed-rate, non-investment-grade debt. The index limits the maximum exposure of any one issuer to 2%. |
| 4 | Source: Bloomberg Index Services Ltd. Bloomberg Municipal Bond Index is a market-value-weighted index designed to represent the long-term investment-grade tax-exempt bond market. |
| 5 | Periods greater than one year are annualized. |
| Where the fund’s assets were invested as of December 31, 2022 | Percent of net assets |
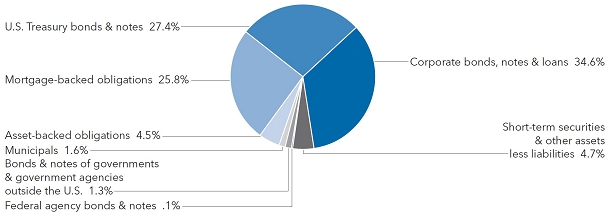
| American Funds Insurance Series | 29 |
Capital World Bond Fund®
Fund results shown are for past periods and are not predictive of results for future periods. Current and future results may be lower or higher than those shown. Prices and returns will vary, so investors may lose money. Investing for short periods makes losses more likely. For current information and month-end results, visit capitalgroup.com/afis. For information about your insurance contract and month-end results, go to the website of the company that issued your contract.
Capital World Bond Fund declined 17.43% for the 12 months ended December 31, 2022. The fund’s benchmark, the Bloomberg Global Aggregate Index,1 which measures global investment-grade bonds (rated BBB/Baa and above), was down 16.25%.
Bonds plummeted in the face of soaring inflation, which rose in part due to energy price shocks resulting from Russia’s invasion of Ukraine. The Bloomberg U.S. Treasury Index2 lost 12.46% in one of the worst bond market declines in history. The Federal Reserve and European Central Bank, among others, aggressively raised interest rates in an attempt to bring consumer price increases back to a target of roughly 2%, down from 7% to 10% in many economies.
Over the period, the largest contributions to the fund’s relative results were due to currency and sector selection, with a modest boost from curve positioning. Unhedged holdings in the euro and Japanese yen were additive. On the downside, duration positioning as well as currency hedging in forward contracts detracted. Weak absolute returns in part reflect the strength of the U.S. dollar, spurred by the Fed’s aggressive rate hikes and their effect on global bond markets.
Looking ahead, the fund’s managers believe the Fed’s hiking cycle is close to a peak and see the 50-60 basis points of further hikes priced into forward curves as realistic. The managers’ outlook for bonds is therefore good, with the U.S. dollar likely in a peaking phase as inflation momentum turns around. They expect inflation to fall this year as growth is likely to be relatively sluggish in both the U.S. and Europe.
| 30 | American Funds Insurance Series |
Capital World Bond Fund® (continued)
How a hypothetical $10,000 investment has grown
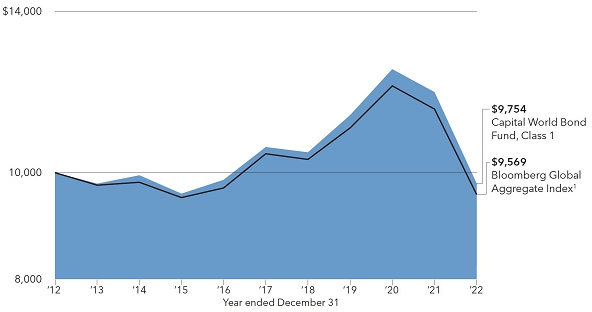
Total returns based on a $1,000 investment
For periods ended December 31, 20223
| 1 year | 5 years | 10 years | Lifetime (since October 4, 2006) |
Expense ratio | ||||||||||||||||
| Class 1 | –17.43 | % | –1.53 | % | –0.25 | % | 2.40 | % | 0.47 | % | ||||||||||
| Class 1A | –17.69 | –1.76 | –0.48 | 2.16 | 0.72 | |||||||||||||||
| Class 24 | –17.70 | –1.77 | –0.50 | 2.14 | 0.72 | |||||||||||||||
| Class 4 | –17.84 | –2.01 | –0.70 | 1.92 | 0.97 | |||||||||||||||
Investment results assume all distributions are reinvested and reflect applicable fees and expenses. The investment adviser is currently waiving a portion of its management fee. This waiver will be in effect through at least May 1, 2023. The waiver may only be modified or terminated with the approval of the fund’s board. When applicable, investment results reflect fee waivers and/or expense reimbursements, without which results would have been lower. Visit capitalgroup.com/afis for more information. Expense ratios are restated to reflect current fees and are as of the fund’s prospectus dated May 1, 2023 (unaudited). Refer to the Financial Highlights table in this report for details.
Past results are not predictive of results in future periods.
Any market index shown is unmanaged and, therefore, has no expenses. Investors cannot invest directly in an index.
| 1 | Source: Bloomberg Index Services Ltd. |
| 2 | Source: Bloomberg Index Services Ltd. Bloomberg U.S. Treasury Index measures the performance of public obligations of the U.S. Treasury. |
| 3 | Periods greater than one year are annualized. |
| 4 | Capital World Bond Fund Class 2 shares were first sold on November 6, 2006. Results prior to that date are hypothetical based on Class 1 share results adjusted for estimated additional annual expenses of 0.25%. |
| Where the fund’s assets were invested as of December 31, 2022 | Percent of net assets |
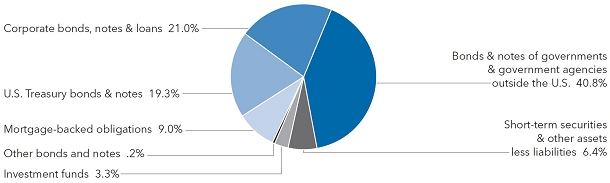
| American Funds Insurance Series | 31 |
American High-Income Trust®
Fund results shown are for past periods and are not predictive of results for future periods. Current and future results may be lower or higher than those shown. Prices and returns will vary, so investors may lose money. Investing for short periods makes losses more likely. For current information and month-end results, visit capitalgroup.com/afis. For information about your insurance contract and month-end results, go to the website of the company that issued your contract.
American High-Income Trust fell 9.01% for the 12 months ended December 31, 2022. In comparison, the fund’s benchmark, the Bloomberg U.S. Corporate High Yield 2% Issuer Capped Index,1 which measures fixed-rate non-investment-grade bonds (rated BB/Ba and below) and limits the exposure of an issuer to 2%, was down 11.18%.
U.S. fixed income markets fell across the board. The Federal Reserve raised the federal funds rate by 425 basis points from near zero to counter the highest inflation since the 1980s. U.S. Treasury yields rose across the curve, and ended the year inverted as shorter dated bonds sold off sharply. The 10-year Treasury yield soared 237 basis points to 3.88%. Investment-grade (BBB/Baa and above) corporate bonds saw the worst returns. The Bloomberg U.S. Corporate Investment Grade Index2 returned –15.76%, and spreads widened by 38 basis points. Elsewhere, the Bloomberg Municipal Bond Index3 returned –8.53%.
At a high level, security selection was most additive to the fund’s relative returns over the period. In particular, investments within the energy and non-cyclical consumer staples sectors contributed to relative results. On the downside, security selection and a lower-than-benchmark position within the cyclical consumer goods sector detracted from relative results.
With high-yield bond yields close to their long-term average, markets now reflect the higher inflation that emerged over the last year. The adverse consequences of tighter global monetary policy may lead to somewhat higher default rates in the next several years, which could in turn lead to a further rise in yields. The substantial yield increases across fixed income markets provides a more attractive forward return outlook, and although yields may continue to adjust to higher levels, much of the required adjustment may have already occurred. The fund’s managers continue to seek attractive opportunities within the high yield market that appropriately compensate for the underlying investment risks.
| 32 | American Funds Insurance Series |
American High-Income Trust® (continued)
How a hypothetical $10,000 investment has grown
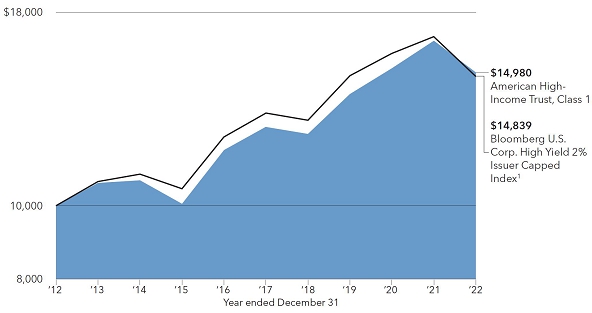
Total returns based on a $1,000 investment
For periods ended December 31, 20224
| 1 year | 5 years | 10 years | Lifetime (since February 8,1984) |
Gross expense ratio |
Net expense ratio | |||||||||||||||||||
| Class 1 | –9.01 | % | 3.40 | % | 4.12 | % | 8.16 | % | 0.44 | % | 0.30 | % | ||||||||||||
| Class 1A | –9.29 | 3.14 | 3.87 | 7.89 | 0.69 | 0.55 | ||||||||||||||||||
| Class 2 | –9.26 | 3.14 | 3.86 | 7.89 | 0.69 | 0.55 | ||||||||||||||||||
| Class 3 | –9.25 | 3.21 | 3.93 | 7.97 | 0.62 | 0.48 | ||||||||||||||||||
| Class 4 | –9.53 | 2.88 | 3.64 | 7.63 | 0.94 | 0.80 | ||||||||||||||||||
Investment results assume all distributions are reinvested and reflect applicable fees and expenses. The investment adviser is currently waiving a portion of its management fee. This waiver will be in effect through at least May 1, 2023. The waiver may only be modified or terminated with the approval of the fund’s board. Net expense ratios reflect the waiver, without which they would have been higher. When applicable, investment results reflect fee waivers and/or expense reimbursements, without which results would have been lower. Visit capitalgroup.com/afis for more information. Expense ratios are restated to reflect current fees and are as of the fund’s prospectus dated May 1, 2023 (unaudited). Refer to the Financial Highlights table in this report for details.
Past results are not predictive of results in future periods.
Any market index shown is unmanaged and, therefore, has no expenses. Investors cannot invest directly in an index.
| 1 | Source: Bloomberg Index Services Ltd. |
| 2 | Source: Bloomberg Index Services Ltd. Bloomberg U.S. Corporate Investment Grade Index represents the universe of investment-grade, publicly issued U.S. corporate and specified foreign debentures and secured notes that meet the specified maturity, liquidity and quality requirements. |
| 3 | Source: Bloomberg Index Services Ltd. Bloomberg Municipal Bond Index is a market-value-weighted index designed to represent the long-term investment-grade tax-exempt bond market. |
| 4 | Periods greater than one year are annualized. |
| Where the fund’s assets were invested as of December 31, 2022 | Percent of net assets |
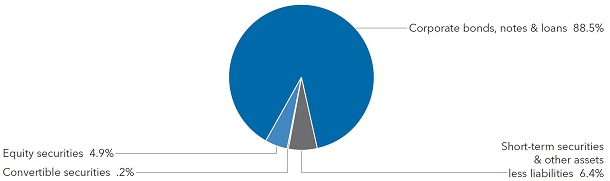
| American Funds Insurance Series | 33 |
American Funds Mortgage Fund®
Fund results shown are for past periods and are not predictive of results for future periods. Current and future results may be lower or higher than those shown. Prices and returns will vary, so investors may lose money. Investing for short periods makes losses more likely. For current information and month-end results, visit capitalgroup.com/afis. For information about your insurance contract and month-end results, go to the website of the company that issued your contract.
American Funds Mortgage Fund fell 9.76% for the 12 months ended December 31, 2022. Its benchmark index, Bloomberg U.S. Mortgage-Backed Securities Index,1 which covers the mortgage-backed pass-through securities of Ginnie Mae, Fannie Mae and Freddie Mac, was down 11.81%.
U.S. fixed income markets fell across the board. The Federal Reserve raised the federal funds rate by 425 basis points from near zero to counter the highest inflation since the 1980s. U.S. Treasury yields rose across the curve, which ended the year inverted as shorter dated bonds sold off sharply. The 10-year Treasury yield soared 237 basis points to 3.88%. Investment-grade (BBB/Baa and above) corporate bonds saw the worst returns. The Bloomberg U.S. Corporate Investment Grade Index2 returned –15.76%, and spreads widened by 38 basis points. Elsewhere, the Bloomberg U.S. Corporate High Yield 2% Issuer Capped Index3 returned –11.18%, while the Bloomberg Municipal Bond Index4 returned –8.53%.
The fund declined but outpaced its benchmark index. At a high level, duration and curve positioning were most additive to relative returns over the period. In particular, the fund benefitted from lower-than-benchmark duration positioning within securitized mortgage-backed security pass-throughs. On the downside, sector selection weighed on results overall, particularly in an out-of-benchmark position within Treasuries.
The fund’s focus remains on meeting its core objectives of providing current income and preserving invested capital. Managers are mindful of the fund’s correlation to equity and its use as a building block in investor portfolios. They are cautious about weakening economic activity as the Fed continues to raise interest rates. The fund is positioned with the view that inflation may remain elevated and that a contraction in growth is likely sometime in the next year.
| 34 | American Funds Insurance Series |
American Funds Mortgage Fund® (continued)
How a hypothetical $10,000 investment has grown
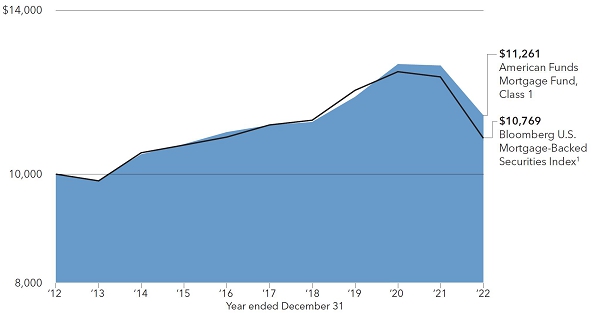
Total returns based on a $1,000 investment
For periods ended December 31, 20225
| 1 year | 5 years | Lifetime 10 years |
Gross (since May 2, 2011) |
Net expense ratio |
expense ratio | |||||||||||||||||||
| Class 1 | –9.76 | % | 0.38 | % | 1.19 | % | 1.65 | % | 0.40 | % | 0.30 | % | ||||||||||||
| Class 1A | –10.03 | 0.14 | 0.95 | 1.40 | 0.65 | 0.55 | ||||||||||||||||||
| Class 2 | –9.94 | 0.14 | 0.94 | 1.40 | 0.65 | 0.55 | ||||||||||||||||||
| Class 4 | –10.16 | –0.11 | 0.75 | 1.20 | 0.90 | 0.80 | ||||||||||||||||||
Investment results assume all distributions are reinvested and reflect applicable fees and expenses. The investment adviser is currently waiving a portion of its management fee. This waiver will be in effect through at least May 1, 2023. The waiver may only be modified or terminated with the approval of the fund’s board. Net expense ratios reflect the waiver, without which they would have been higher. When applicable, investment results reflect fee waivers and/or expense reimbursements, without which results would have been lower. Visit capitalgroup.com/afis for more information. Expense ratios are restated to reflect current fees and are as of the fund’s prospectus dated May 1, 2023 (unaudited). Refer to the Financial Highlights table in this report for details.
Past results are not predictive of results in future periods.
Any market index shown is unmanaged and, therefore, has no expenses. Investors cannot invest directly in an index.
| 1 | Source: Bloomberg Index Services Ltd. |
| 2 | Source: Bloomberg Index Services Ltd. Bloomberg U.S. Corporate Investment Grade Index represents the universe of investment-grade, publicly issued U.S. corporate and specified foreign debentures and secured notes that meet the specified maturity, liquidity and quality requirements. |
| 3 | Source: Bloomberg Index Services Ltd. Bloomberg U.S. Corporate High Yield 2% Issuer Capped Index covers the universe of fixed-rate, non-investment-grade debt. The index limits the maximum exposure of any one issuer to 2%. |
| 4 | Source: Bloomberg Index Services Ltd. Bloomberg Municipal Bond Index is a market-value-weighted index designed to represent the long-term investment-grade tax-exempt bond market. |
| 5 | Periods greater than one year are annualized. |
| Where the fund’s assets were invested as of December 31, 2022 | Percent of net assets |
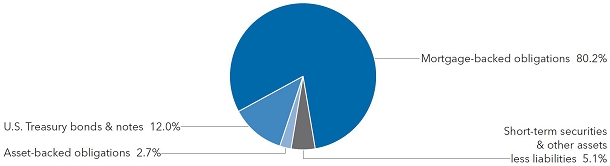
| American Funds Insurance Series | 35 |
Ultra-Short Bond Fund
Fund results shown are for past periods and are not predictive of results for future periods. Current and future results may be lower or higher than those shown. Prices and returns will vary, so investors may lose money. Investing for short periods makes losses more likely. For current information and month-end results, visit capitalgroup.com/afis. For information about your insurance contract and month-end results, go to the website of the company that issued your contract.
Ultra-Short Bond Fund rose 1.42% for the 12 months ended December 31, 2022, compared with a 0.69% rise in the Bloomberg Short-Term Government/Corporate Index,1 which consists of investment-grade (rated BBB/ Baa and above), fixed-rate, publicly placed, dollar-denominated and non-convertible securities with remaining maturity from one up to (but not including) 12 months within either the government or corporate sector.
With a focus on capital preservation and liquidity, the fund continues to invest in a conservative manner, typically investing in both shorter duration and higher quality securities relative to the index. In the current rising interest rate environment, this approach positioned the fund to capture interest rate hikes relatively quickly. With the U.S. Federal Reserve raising its benchmark rate seven times and by a total of 425 basis points in 2022, the fund’s shorter duration compared with the index resulted in a more positive 12-month return.
Short-term interest rates are currently near a 15-year high and, with the current inflation outlook, the Federal Reserve may choose to increase them again. However, uncertainty on when the Fed may pause hikes or reverse course continues to drive the market.
| 36 | American Funds Insurance Series |
Ultra-Short Bond Fund (continued)
Total returns based on a $1,000 investment
For periods ended December 31, 20222
| 1 year | 5 years | 10 years | Lifetime (since February 8, 1984) |
Expense ratio | ||||||||||||||||
| Class 1 | 1.42 | % | 0.97 | % | 0.49 | % | 3.17 | % | 0.30 | % | ||||||||||
| Class 1A | 1.32 | 0.97 | 0.39 | 2.95 | 0.55 | |||||||||||||||
| Class 2 | 1.17 | 0.72 | 0.24 | 2.91 | 0.55 | |||||||||||||||
| Class 3 | 1.19 | 0.80 | 0.31 | 2.98 | 0.48 | |||||||||||||||
| Class 4 | 0.83 | 0.47 | 0.06 | 2.67 | 0.80 | |||||||||||||||
Investment results assume all distributions are reinvested and reflect applicable fees and expenses. When applicable, investment results reflect fee waivers and/or expense reimbursements, without which results would have been lower. Visit capitalgroup.com/afis for more information. Expense ratios are restated to reflect current fees and are as of the fund’s prospectus dated May 1, 2023 (unaudited). Refer to the Financial Highlights table in this report for details.
Past results are not predictive of results in future periods.
Any market index shown is unmanaged and, therefore, has no expenses. Investors cannot invest directly in an index.
| 1 | Source: Bloomberg Index Services Ltd. |
| 2 | Periods greater than one year are annualized. |
| Where the fund’s assets were invested as of December 31, 2022 | Percent of net assets | |||
| Commercial paper | 76.5 | % | ||
| Federal agency bills & notes | 21.5 | |||
| Other assets less liabilities | 2.0 | |||
| Total | 100.0 | % | ||
| American Funds Insurance Series | 37 |
U.S. Government Securities Fund®
Fund results shown are for past periods and are not predictive of results for future periods. Current and future results may be lower or higher than those shown. Prices and returns will vary, so investors may lose money. Investing for short periods makes losses more likely. For current information and month-end results, visit capitalgroup.com/afis. For information about your insurance contract and month-end results, go to the website of the company that issued your contract.
U.S. Government Securities Fund declined 10.75% for the 12 months ended December 31, 2022. Its benchmark, the Bloomberg U.S. Government/Mortgage-Backed Securities Index,1 which covers obligations issued by the U.S. Treasury and U.S. government agencies, was down 12.12%.
U.S. fixed income markets fell across the board. The Federal Reserve raised the federal funds rate by 425 basis points from near zero to counter the highest inflation since the 1980s. U.S. Treasury yields rose across the curve, which ended the year inverted as shorter dated bonds sold off sharply. The 10-year Treasury yield soared 237 basis points to 3.88%.
Over the period, the fund outpaced its benchmark. Top contributors to relative returns were duration and curve positioning. Duration positioning particularly within agency mortgage-backed securities (MBS) was additive. On the downside, sector and security selection weighed modestly on returns relative to the benchmark. The fund utilized interest rate derivatives to more efficiently execute the portfolio’s interest rate positioning based on how managers expected yields to move. These had mixed impacts on results, but ultimately helped to express managers’ convictions more efficiently.
The Fed has provided enormous support to the markets, particularly over the last two years. It is difficult to imagine unwinding that support without disruptions to financial markets and the economy. The fund’s present high weighting to Treasury Inflation-Protected Securities (TIPS) is intended to provide additional return if the market underestimates future inflation. It remains to be seen just how far the Fed will go to tame inflation, but the fund’s managers intend to use all the tools at their disposal to navigate these volatile markets as they seek to protect and grow shareholder assets over time.
| 38 | American Funds Insurance Series |
U.S. Government Securities Fund® (continued)
How a hypothetical $10,000 investment has grown
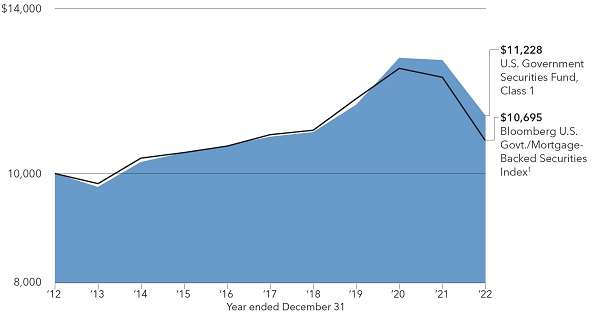
Total returns based on a $1,000 investment
For periods ended December 31, 20222
| 1 year | 5 years | 10 years | Lifetime (since December 2, 1985) |
Gross expense ratio |
Net expense ratio | |||||||||||||||||||
| Class 1 | –10.75 | % | 0.85 | % | 1.17 | % | 5.17 | % | 0.34 | % | 0.24 | % | ||||||||||||
| Class 1A | –10.93 | 0.61 | 0.93 | 4.92 | 0.59 | 0.49 | ||||||||||||||||||
| Class 2 | –10.95 | 0.61 | 0.92 | 4.91 | 0.59 | 0.49 | ||||||||||||||||||
| Class 3 | –10.90 | 0.67 | 0.99 | 4.99 | 0.52 | 0.42 | ||||||||||||||||||
| Class 4 | –11.19 | 0.37 | 0.70 | 4.66 | 0.84 | 0.74 | ||||||||||||||||||
Investment results assume all distributions are reinvested and reflect applicable fees and expenses. The investment adviser is currently waiving a portion of its management fee. This waiver will be in effect through at least May 1, 2023. The waiver may only be modified or terminated with the approval of the fund’s board. Net expense ratios reflect the waiver, without which they would have been higher. When applicable, investment results reflect fee waivers and/or expense reimbursements, without which results would have been lower. Visit capitalgroup.com/afis for more information. Expense ratios are restated to reflect current fees and are as of the fund’s prospectus dated May 1, 2023 (unaudited). Refer to the Financial Highlights table in this report for details.
Past results are not predictive of results in future periods.
Any market index shown is unmanaged and, therefore, has no expenses. Investors cannot invest directly in an index.
| 1 | Source: Bloomberg Index Services Ltd. |
| 2 | Periods greater than one year are annualized. |
| Where the fund’s assets were invested as of December 31, 2022 | Percent of net assets |
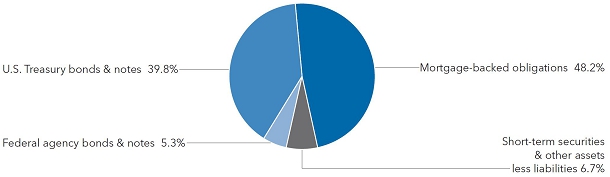
| American Funds Insurance Series | 39 |
Managed Risk Growth Fund
Fund results shown are for past periods and are not predictive of results for future periods. Current and future results may be lower or higher than those shown. Prices and returns will vary, so investors may lose money. Investing for short periods makes losses more likely. For current information and month-end results, visit capitalgroup.com/afis. For information about your insurance contract and month-end results, go to the website of the company that issued your contract.
The fund declined 24.62% for the 12 months ended December 31, 2022. S&P 500 Managed Risk Index – Moderate Aggressive1 was down 13.52%. S&P 500 Index,2 a market capitalization-weighted index based on the results of approximately 500 widely held common stocks, fell 18.11%.
The fund pursues its objective by investing in shares of American Funds Insurance Series®– Growth Fund and American Funds Insurance Series® – The Bond Fund of America while seeking to manage portfolio volatility and provide downside protection, primarily through the use of exchange-traded options and futures contracts. The benefit of the fund’s managed risk strategy should be most apparent during periods of high volatility and in down markets. In steady or rising markets, the fund’s results can be expected to lag those of the underlying fund.
The underlying Growth Fund’s investment within the materials sector was the top contributor to relative returns. Security selections within the consumer discretionary and communication services sectors detracted. The return of the underlying The Bond Fund of America was additive to relative results against its primary benchmark, the Bloomberg U.S. Aggregate Index.3 The managed risk strategy was additive to returns overall. Within the strategy, the equity future overlay was positive while the Treasury future and option overlays detracted.
How a hypothetical $10,000 investment has grown

Total returns based on a $1,000 investment
For periods ended December 31, 20224
| 1 year | 5 years | Lifetime (since May 1, 2013) |
Gross expense ratio |
Net expense ratio | ||||||||||||||||
| Class P1 | –24.62 | % | 6.61 | % | 8.10 | % | 0.74 | % | 0.69 | % | ||||||||||
| Class P2 | –24.88 | 6.31 | 7.80 | 0.99 | 0.94 | |||||||||||||||
The investment adviser is currently waiving a portion of its management fee. This waiver will be in effect through at least May 1, 2023. The waiver may only be modified or terminated with the approval of the fund’s board. Net expense ratios shown reflect the waiver, without which they would have been higher. When applicable, investment results reflect fee waivers and/or expense reimbursements, without which results would have been lower. Visit capitalgroup.com/afis for more information. Expense ratios are as of the fund’s prospectus dated May 1, 2023 (unaudited).
Past results are not predictive of results in future periods.
Any market index shown is unmanaged and, therefore, has no expenses. Investors cannot invest directly in an index.
| 1 | Source: S&P Dow Jones Indices LLC. Standard & Poor’s Managed Risk Index Series is designed to simulate a dynamic protective portfolio that allocates between the underlying equity index and cash, based on realized volatilities of the underlying equity and bond indexes, while maintaining a fixed allocation to the underlying bond index. |
| 2 | Source: S&P Dow Jones Indices LLC. |
| 3 | Source: Bloomberg Index Services Ltd. Bloomberg U.S. Aggregate Index represents the U.S. investment-grade (rated BBB/Baa and above) fixed-rate bond market. |
| 4 | Periods greater than one year are annualized. |
Milliman Financial Risk Management LLC serves as the subadviser with respect to the management of the fund’s managed risk strategy.
| 40 | American Funds Insurance Series |
Managed Risk International Fund
Fund results shown are for past periods and are not predictive of results for future periods. Current and future results may be lower or higher than those shown. Prices and returns will vary, so investors may lose money. Investing for short periods makes losses more likely. For current information and month-end results, visit capitalgroup.com/afis. For information about your insurance contract and month-end results, go to the website of the company that issued your contract.
The fund declined 15.27% for the 12 months ended December 31, 2022, compared to S&P EPAC Ex. Korea LargeMidCap Managed Risk Index – Moderate Aggressive,1 which was down 12.42%. MSCI ACWI (All Country World Index) ex USA,2 a free float-adjusted market capitalization-weighted index that is designed to measure equity market results in the global developed and emerging markets (consisting of more than 40 developed and emerging market country indexes, excluding the U.S.), fell 16.00%.
The fund pursues its objective by investing in shares of American Funds Insurance Series®– International Fund and American Funds Insurance Series®– The Bond Fund of America while seeking to manage portfolio volatility and provide downside protection, primarily through the use of exchange-traded options and futures contracts. The benefit of the fund’s managed risk strategy should be most apparent during periods of high volatility and in down markets. In steady or rising markets, the fund’s results can be expected to lag those of the underlying fund.
The underlying International Fund’s investment within the energy sector was the top contributor to relative returns. On the downside, stock selections within the financials and information technology sectors detracted from relative results. The managed risk strategy was additive to results overall. Within the strategy, the equity future overlay was positive while the Treasury future and option overlays detracted.
How a hypothetical $10,000 investment has grown
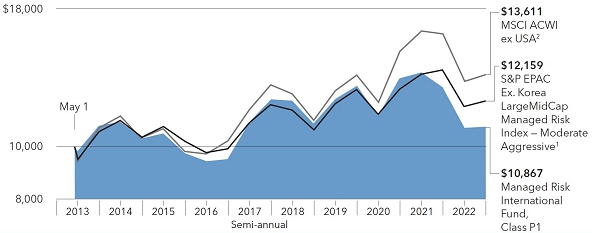
Total returns based on a $1,000 investment
For periods ended December 31, 20223
| 1 year | 5 years | Lifetime (since May 1, 2013) |
Gross expense ratio |
Net expense ratio | ||||||||||||||||
| Class P1 | –15.27 | % | –2.31 | % | 0.86 | % | 0.93 | % | 0.86 | % | ||||||||||
| Class P2 | –15.54 | –2.60 | 0.51 | 1.18 | 1.11 | |||||||||||||||
The investment adviser is currently waiving a portion of its management fee. In addition, the investment adviser is currently reimbursing a portion of other expenses. This waiver and reimbursement will be in effect through at least May 1, 2023. The adviser may elect at its discretion to extend, modify or terminate the reimbursement at that time. The waiver may only be modified or terminated with the approval of the fund’s board. Net expense ratios shown reflect the waiver and reimbursement, without which they would have been higher. When applicable, investment results reflect fee waivers and/or expense reimbursements, without which results would have been lower. Visit capitalgroup.com/afis for more information. Expense ratios are as of the fund’s prospectus dated May 1, 2023 (unaudited).
Past results are not predictive of results in future periods.
Any market index shown is unmanaged and, therefore, has no expenses. Investors cannot invest directly in an index.
| 1 | Source: S&P Dow Jones Indices LLC. Standard & Poor’s Managed Risk Index Series is designed to simulate a dynamic protective portfolio that allocates between the underlying equity index and cash, based on realized volatilities of the underlying equity and bond indexes, while maintaining a fixed allocation to the underlying bond index. |
| 2 | Source: MSCI. The MSCI index result reflects reinvestment of distributions and dividends net of withholding taxes. |
| 3 | Periods greater than one year are annualized. |
Milliman Financial Risk Management LLC serves as the subadviser with respect to the management of the fund’s managed risk strategy.
| American Funds Insurance Series | 41 |
Managed Risk Washington Mutual Investors Fund
Fund results shown are for past periods and are not predictive of results for future periods. Current and future results may be lower or higher than those shown. Prices and returns will vary, so investors may lose money. Investing for short periods makes losses more likely. For current information and month-end results, visit capitalgroup.com/afis. For information about your insurance contract and month-end results, go to the website of the company that issued your contract.
The fund declined 8.92% for the 12 months ended December 31, 2022. S&P 500 Managed Risk Index – Moderate1 fell 13.13%. S&P 500 Index,2 a market capitalization-weighted index based on the results of approximately 500 widely held common stocks, was down 18.11%.
The fund pursues its objective by investing in shares of American Funds Insurance Series®– Washington Mutual Investors Fund and American Funds Insurance Series®– U.S. Government Securities Fund while seeking to manage portfolio volatility and provide downside protection, primarily through the use of exchange-traded options and futures contracts. The benefit of the fund’s managed risk strategy should be most apparent during periods of high volatility and in down markets. In steady or rising markets, the fund’s results can be expected to lag those of the underlying fund.
The underlying Washington Mutual Investors Fund’s security selection within the consumer discretionary sector was the top contributor to relative returns. Investments in the information technology sector were also additive. The top detractors to relative returns on a sector basis were security selections within financials and real estate. The managed risk strategy detracted overall. Within the strategy, the equity future overlay was additive while the Treasury future and option overlays detracted.
How a hypothetical $10,000 investment has grown
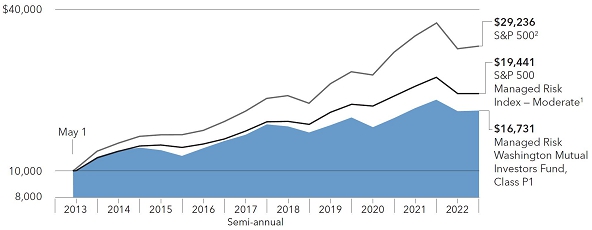
Total returns based on a $1,000 investment
For periods ended December 31, 20223
| 1 year | 5 years | Lifetime (since May 1, 2013) |
Gross expense ratio |
Net expense ratio | ||||||||||||||||
| Class P1 | –8.92 | % | 2.39 | % | 5.47 | % | 0.67 | % | 0.62 | % | ||||||||||
| Class P2 | –9.16 | 2.08 | 5.12 | 0.93 | 0.88 | |||||||||||||||
The investment adviser is currently waiving a portion of its management fee. This waiver will be in effect through at least May 1, 2023. The waiver may only be modified or terminated with the approval of the fund’s board. Net expense ratios shown reflect the waiver, without which they would have been higher. When applicable, investment results reflect fee waivers and/or expense reimbursements, without which results would have been lower. Visit capitalgroup.com/afis for more information. Expense ratios are as of the fund’s prospectus dated May 1, 2023 (unaudited).
Past results are not predictive of results in future periods.
Any market index shown is unmanaged and, therefore, has no expenses. Investors cannot invest directly in an index.
| 1 | Source: S&P Dow Jones Indices LLC. Standard & Poor’s Managed Risk Index Series is designed to simulate a dynamic protective portfolio that allocates between the underlying equity index and cash, based on realized volatilities of the underlying equity and bond indexes, while maintaining a fixed allocation to the underlying bond index. |
| 2 | Source: S&P Dow Jones Indices LLC. |
| 3 | Periods greater than one year are annualized. |
Milliman Financial Risk Management LLC serves as the subadviser with respect to the management of the fund’s managed risk strategy.
| 42 | American Funds Insurance Series |
Managed Risk Growth-Income Fund
Fund results shown are for past periods and are not predictive of results for future periods. Current and future results may be lower or higher than those shown. Prices and returns will vary, so investors may lose money. Investing for short periods makes losses more likely. For current information and month-end results, visit capitalgroup.com/afis. For information about your insurance contract and month-end results, go to the website of the company that issued your contract.
The fund declined 16.74% for the 12 months ended December 31, 2022, compared to the S&P 500 Managed Risk Index – Moderate,1 which declined 13.13%. S&P 500 Index,2 a market capitalization-weighted index based on the results of approximately 500 widely held common stocks, was down 18.11%.
The fund pursues its objective by investing in shares of American Funds Insurance Series®– Growth-Income Fund and American Funds Insurance Series®– The Bond Fund of America while seeking to manage portfolio volatility and provide downside protection, primarily through the use of exchange-traded options and futures contracts. The benefit of the fund’s managed risk strategy should be most apparent during periods of high volatility and in down markets. In steady or rising markets, the fund’s results can be expected to lag those of the underlying fund.
The underlying Growth-Income Fund’s investment within the information technology sector was the top contributor to relative returns. A higher-than-benchmark investment within the industrials sector was also additive to results. On the downside, security selections within the financials and communication services sectors weighed on relative results. The managed risk strategy detracted overall. Within the strategy, the equity future overlay was positive while the Treasury future and option overlays detracted.
How a hypothetical $10,000 investment has grown
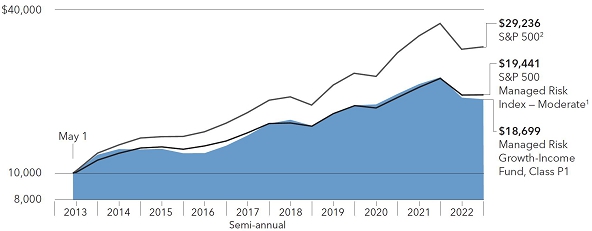
Total returns based on a $1,000 investment
For periods ended December 31, 20223
| 1 year | 5 years | Lifetime (since May 1, 2013) |
Gross expense ratio |
Net expense ratio | ||||||||||||||||
| Class P1 | –16.74 | % | 4.32 | % | 6.69 | % | 0.67 | % | 0.62 | % | ||||||||||
| Class P2 | –16.93 | 4.06 | 6.39 | 0.92 | 0.87 | |||||||||||||||
The investment adviser is currently waiving a portion of its management fee. This waiver will be in effect through at least May 1, 2023. The waiver may only be modified or terminated with the approval of the fund’s board. Net expense ratios shown reflect the waiver, without which they would have been higher. When applicable, investment results reflect fee waivers and/or expense reimbursements, without which results would have been lower. Visit capitalgroup.com/afis for more information. Expense ratios are as of the fund’s prospectus dated May 1, 2023 (unaudited).
Past results are not predictive of results in future periods.
Any market index shown is unmanaged and, therefore, has no expenses. Investors cannot invest directly in an index.
| 1 | Source: S&P Dow Jones Indices LLC. Standard & Poor’s Managed Risk Index Series is designed to simulate a dynamic protective portfolio that allocates between the underlying equity index and cash, based on realized volatilities of the underlying equity and bond indexes, while maintaining a fixed allocation to the underlying bond index. |
| 2 | Source: S&P Dow Jones Indices LLC. |
| 3 | Periods greater than one year are annualized. |
Milliman Financial Risk Management LLC serves as the subadviser with respect to the management of the fund’s managed risk strategy.
| American Funds Insurance Series | 43 |
Managed Risk Asset Allocation Fund
Fund results shown are for past periods and are not predictive of results for future periods. Current and future results may be lower or higher than those shown. Prices and returns will vary, so investors may lose money. Investing for short periods makes losses more likely. For current information and month-end results, visit capitalgroup.com/afis. For information about your insurance contract and month-end results, go to the website of the company that issued your contract.
The fund was down 13.75% for the 12 months ended December 31, 2022. S&P 500 Managed Risk Index — Moderate Conservative1 fell 12.94%. S&P 500 Index,2 a market capitalization-weighted index based on the results of approximately 500 widely held common stocks, declined 18.11%.
The fund pursues its objective by investing in shares of American Funds Insurance Series®– Asset Allocation Fund while seeking to manage portfolio volatility and provide downside protection, primarily through the use of exchange-traded options and futures contracts. The benefit of the fund’s managed risk strategy should be most apparent during periods of high volatility and in down markets. In steady or rising markets, the fund’s results can be expected to lag those of the underlying fund.
The underlying Asset Allocation Fund’s investment selections within the consumer discretionary and health care sectors were top contributors to relative results on a sector basis. Stock selections within financials and energy detracted from relative returns on a sector basis, although the energy sector was up on an absolute basis. The managed risk strategy detracted from returns overall. Within the strategy, the equity future overlay was positive while the Treasury future and option overlays detracted.
| 44 | American Funds Insurance Series |
Managed Risk Asset Allocation Fund (continued)
How a hypothetical $10,000 investment has grown
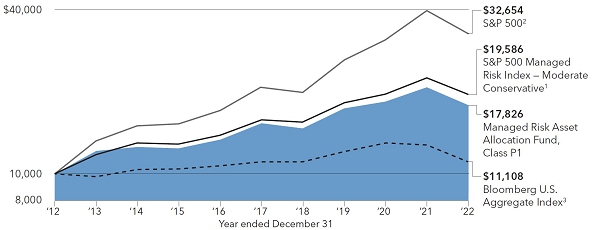
Total returns based on a $1,000 investment
For periods ended December 31, 20224
| 1 year | 5 years | 10 years | Lifetime (since September 28, 2012) |
Gross expense ratio |
Net expense ratio | |||||||||||||||||||
| Class P1 | –13.75 | % | 3.09 | % | 5.95 | % | 5.92 | % | 0.70 | % | 0.65 | % | ||||||||||||
| Class P2 | –13.97 | 2.83 | 5.69 | 5.66 | 0.95 | 0.90 | ||||||||||||||||||
The investment adviser is currently waiving a portion of its management fee. This waiver will be in effect through at least May 1, 2023. The waiver may only be modified or terminated with the approval of the fund’s board. Net expense ratios shown reflect the waiver, without which they would have been higher. When applicable, investment results reflect fee waivers and/or expense reimbursements, without which results would have been lower. Visit capitalgroup.com/afis for more information. Expense ratios are as of the fund’s prospectus dated May 1, 2023 (unaudited).
Past results are not predictive of results in future periods.
Any market index shown is unmanaged and, therefore, has no expenses. Investors cannot invest directly in an index.
| 1 | Source: S&P Dow Jones Indices LLC. Standard & Poor’s Managed Risk Index Series is designed to simulate a dynamic protective portfolio that allocates between the underlying equity index and cash, based on realized volatilities of the underlying equity and bond indexes, while maintaining a fixed allocation to the underlying bond index. |
| 2 | Source: S&P Dow Jones Indices LLC. |
| 3 | Source: Bloomberg Index Services Ltd. Bloomberg U.S. Aggregate Index represents the U.S. investment-grade (rated BBB/Baa and above) fixed-rate bond market. |
| 4 | Periods greater than one year are annualized. |
Milliman Financial Risk Management LLC serves as the subadviser with respect to the management of the fund’s managed risk strategy.
| American Funds Insurance Series | 45 |
Global Growth Fund
Investment portfolio December 31, 2022
| Common stocks 94.49% | Shares | Value (000) |
||||||
| Information technology 22.59% | ||||||||
| Microsoft Corp. | 1,807,800 | $ | 433,547 | |||||
| ASML Holding NV | 458,318 | 248,089 | ||||||
| ASML Holding NV (New York registered) (ADR) | 227,600 | 124,361 | ||||||
| Taiwan Semiconductor Manufacturing Company, Ltd. | 15,615,000 | 227,583 | ||||||
| Taiwan Semiconductor Manufacturing Company, Ltd. (ADR) | 140,000 | 10,429 | ||||||
| Applied Materials, Inc. | 875,000 | 85,208 | ||||||
| Broadcom, Inc. | 125,300 | 70,059 | ||||||
| Fiserv, Inc.1 | 497,600 | 50,292 | ||||||
| Adyen NV1 | 34,330 | 47,506 | ||||||
| Samsung Electronics Co., Ltd. | 785,100 | 34,621 | ||||||
| Apple, Inc. | 242,400 | 31,495 | ||||||
| Hexagon AB, Class B | 2,920,500 | 30,700 | ||||||
| MongoDB, Inc., Class A1 | 139,000 | 27,361 | ||||||
| Keyence Corp. | 69,400 | 27,170 | ||||||
| NVIDIA Corp. | 167,500 | 24,478 | ||||||
| Mastercard, Inc., Class A | 53,300 | 18,534 | ||||||
| EPAM Systems, Inc.1 | 50,700 | 16,616 | ||||||
| Visa, Inc., Class A | 70,197 | 14,584 | ||||||
| Capgemini SE | 85,000 | 14,256 | ||||||
| Network International Holdings PLC1 | 3,731,800 | 13,366 | ||||||
| DocuSign, Inc.1 | 180,000 | 9,976 | ||||||
| Shopify, Inc., Class A, subordinate voting shares1 | 195,000 | 6,768 | ||||||
| 1,566,999 | ||||||||
| Health care 21.87% | ||||||||
| Novo Nordisk A/S, Class B | 1,706,930 | 231,118 | ||||||
| UnitedHealth Group, Inc. | 335,800 | 178,034 | ||||||
| DexCom, Inc.1 | 1,012,000 | 114,599 | ||||||
| ResMed, Inc. | 509,000 | 105,938 | ||||||
| AstraZeneca PLC | 748,300 | 101,556 | ||||||
| Pfizer, Inc. | 1,884,219 | 96,547 | ||||||
| Cigna Corp. | 259,119 | 85,857 | ||||||
| Merck & Co., Inc. | 620,000 | 68,789 | ||||||
| Regeneron Pharmaceuticals, Inc.1 | 95,036 | 68,568 | ||||||
| Eli Lilly and Company | 158,300 | 57,912 | ||||||
| EssilorLuxottica | 266,943 | 48,609 | ||||||
| Gilead Sciences, Inc. | 457,317 | 39,261 | ||||||
| Mettler-Toledo International, Inc.1 | 25,400 | 36,714 | ||||||
| NovoCure, Ltd.1 | 340,000 | 24,939 | ||||||
| Alnylam Pharmaceuticals, Inc.1 | 104,200 | 24,763 | ||||||
| CVS Health Corp. | 243,600 | 22,701 | ||||||
| Danaher Corp. | 82,100 | 21,791 | ||||||
| Bayer AG | 363,860 | 18,787 | ||||||
| Seagen, Inc.1 | 127,200 | 16,346 | ||||||
| Novartis AG | 165,600 | 15,000 | ||||||
| Zoetis, Inc., Class A | 98,300 | 14,406 | ||||||
| Eurofins Scientific SE, non-registered shares | 182,400 | 13,135 | ||||||
| Sanofi | 135,000 | 13,063 | ||||||
| Vertex Pharmaceuticals, Inc.1 | 43,700 | 12,620 | ||||||
| Olympus Corp. | 665,800 | 11,769 | ||||||
| Centene Corp.1 | 143,500 | 11,768 | ||||||
| Genus PLC | 270,000 | 9,731 | ||||||
| Thermo Fisher Scientific, Inc. | 17,472 | 9,622 | ||||||
| Siemens Healthineers AG | 178,000 | 8,905 | ||||||
| Bachem Holding AG | 101,500 | 8,853 | ||||||
| Virbac SA | 36,000 | 8,825 | ||||||
| Catalent, Inc.1 | 166,200 | 7,481 | ||||||
| Rede D’Or Sao Luiz SA | 1,073,663 | 6,015 | ||||||
| 46 | American Funds Insurance Series |
Global Growth Fund (continued)
| Common stocks (continued) | Shares | Value (000) |
||||||
| Health care (continued) | ||||||||
| Organon & Co. | 62,000 | $ | 1,732 | |||||
| Viatris, Inc. | 110,678 | 1,232 | ||||||
| EUROAPI1 | 5,869 | 87 | ||||||
| 1,517,073 | ||||||||
| Consumer discretionary 13.94% | ||||||||
| Chipotle Mexican Grill, Inc.1 | 141,600 | 196,468 | ||||||
| LVMH Moët Hennessy-Louis Vuitton SE | 236,818 | 172,035 | ||||||
| Floor & Decor Holdings, Inc., Class A1 | 914,698 | 63,690 | ||||||
| MGM China Holdings, Ltd.1 | 54,589,200 | 60,155 | ||||||
| Renault SA1 | 1,688,781 | 56,267 | ||||||
| Prosus NV, Class N | 760,993 | 52,246 | ||||||
| Amazon.com, Inc.1 | 524,248 | 44,037 | ||||||
| NIKE, Inc., Class B | 352,600 | 41,258 | ||||||
| Cie. Financière Richemont SA, Class A | 291,500 | 37,722 | ||||||
| Wynn Macau, Ltd.1 | 21,430,000 | 23,884 | ||||||
| Coupang, Inc., Class A1 | 1,445,604 | 21,265 | ||||||
| YUM! Brands, Inc. | 166,000 | 21,261 | ||||||
| Booking Holdings, Inc.1 | 9,900 | 19,951 | ||||||
| Domino’s Pizza Enterprises, Ltd. | 430,000 | 19,367 | ||||||
| MercadoLibre, Inc.1 | 22,250 | 18,829 | ||||||
| Home Depot, Inc. | 59,500 | 18,794 | ||||||
| Melco Resorts & Entertainment, Ltd. (ADR)1 | 1,559,600 | 17,935 | ||||||
| IDP Education, Ltd. | 871,300 | 16,102 | ||||||
| Evolution AB | 140,000 | 13,673 | ||||||
| Dollar Tree Stores, Inc.1 | 95,000 | 13,437 | ||||||
| Moncler SpA | 217,370 | 11,571 | ||||||
| Entain PLC | 665,250 | 10,666 | ||||||
| Target Corp. | 60,500 | 9,017 | ||||||
| Tesla, Inc.1 | 60,000 | 7,391 | ||||||
| 967,021 | ||||||||
| Financials 8.92% | ||||||||
| AIA Group, Ltd. | 10,109,600 | 111,378 | ||||||
| Tradeweb Markets, Inc., Class A | 1,634,960 | 106,158 | ||||||
| AXA SA | 1,692,893 | 47,182 | ||||||
| Kotak Mahindra Bank, Ltd. | 1,696,000 | 37,316 | ||||||
| Aon PLC, Class A | 101,000 | 30,314 | ||||||
| Prudential PLC | 2,203,282 | 29,816 | ||||||
| HDFC Bank, Ltd. | 1,464,450 | 28,828 | ||||||
| Citigroup, Inc. | 569,715 | 25,768 | ||||||
| Ping An Insurance (Group) Company of China, Ltd., Class H | 3,855,500 | 25,447 | ||||||
| Société Générale | 1,011,450 | 25,378 | ||||||
| Blackstone, Inc., nonvoting shares | 312,000 | 23,147 | ||||||
| China Merchants Bank Co., Ltd., Class H | 3,867,000 | 21,436 | ||||||
| Zurich Insurance Group AG | 42,200 | 20,166 | ||||||
| Banco Santander, SA | 5,334,500 | 15,976 | ||||||
| Wells Fargo & Company | 377,200 | 15,575 | ||||||
| London Stock Exchange Group PLC | 165,000 | 14,237 | ||||||
| AU Small Finance Bank, Ltd. | 1,416,725 | 11,157 | ||||||
| Bank of America Corp. | 320,200 | 10,605 | ||||||
| HDFC Life Insurance Company, Ltd. | 1,406,500 | 9,600 | ||||||
| Tokio Marine Holdings, Inc. | 368,300 | 7,884 | ||||||
| Jackson Financial, Inc., Class A | 44,327 | 1,542 | ||||||
| Moscow Exchange MICEX-RTS PJSC1,2 | 12,640,000 | — | 3 | |||||
| 618,910 | ||||||||
| Consumer staples 8.57% | ||||||||
| British American Tobacco PLC | 3,329,455 | 132,095 | ||||||
| Philip Morris International, Inc. | 1,086,204 | 109,935 | ||||||
| Altria Group, Inc. | 1,523,500 | 69,639 | ||||||
| Kweichow Moutai Co., Ltd., Class A | 278,166 | 68,834 | ||||||
| American Funds Insurance Series | 47 |
Global Growth Fund (continued)
| Common stocks (continued) | Shares | Value (000) |
||||||
| Consumer staples (continued) | ||||||||
| Keurig Dr Pepper, Inc. | 1,624,000 | $ | 57,912 | |||||
| Nestlé SA | 460,353 | 53,164 | ||||||
| Monster Beverage Corp.1 | 336,502 | 34,165 | ||||||
| Costco Wholesale Corp. | 39,170 | 17,881 | ||||||
| Carrefour SA, non-registered shares | 1,055,594 | 17,662 | ||||||
| Pernod Ricard SA | 73,000 | 14,349 | ||||||
| Simply Good Foods Co.1 | 263,800 | 10,032 | ||||||
| Bunge, Ltd. | 85,000 | 8,481 | ||||||
| 594,149 | ||||||||
| Industrials 7.54% | ||||||||
| Carrier Global Corp. | 1,366,400 | 56,364 | ||||||
| Caterpillar, Inc. | 231,600 | 55,482 | ||||||
| Boeing Company1 | 239,000 | 45,527 | ||||||
| MTU Aero Engines AG | 167,000 | 36,146 | ||||||
| Alliance Global Group, Inc. | 156,400,700 | 33,466 | ||||||
| Airbus SE, non-registered shares | 245,400 | 29,179 | ||||||
| DSV A/S | 171,230 | 27,158 | ||||||
| NIBE Industrier AB, Class B | 2,328,700 | 21,776 | ||||||
| Techtronic Industries Co., Ltd. | 1,883,000 | 20,967 | ||||||
| CSX Corp. | 635,000 | 19,672 | ||||||
| Safran SA | 156,300 | 19,532 | ||||||
| GT Capital Holdings, Inc. | 2,454,611 | 19,234 | ||||||
| Rentokil Initial PLC | 2,380,000 | 14,628 | ||||||
| Kone OYJ, Class B | 273,500 | 14,166 | ||||||
| Canadian Pacific Railway, Ltd. (CAD denominated) | 183,000 | 13,644 | ||||||
| ASSA ABLOY AB, Class B | 611,000 | 13,146 | ||||||
| L3Harris Technologies, Inc. | 62,600 | 13,034 | ||||||
| Recruit Holdings Co., Ltd. | 374,200 | 11,901 | ||||||
| Daikin Industries, Ltd. | 74,600 | 11,476 | ||||||
| Rheinmetall AG | 52,200 | 10,397 | ||||||
| BayCurrent Consulting, Inc. | 321,000 | 10,037 | ||||||
| SMC Corp. | 22,500 | 9,523 | ||||||
| Suzhou Maxwell Technologies Co., Ltd., Class A | 156,970 | 9,302 | ||||||
| Nidec Corp. | 143,000 | 7,447 | ||||||
| 523,204 | ||||||||
| Energy 4.84% | ||||||||
| TotalEnergies SE | 1,210,900 | 75,578 | ||||||
| Canadian Natural Resources, Ltd. (CAD denominated) | 1,281,064 | 71,140 | ||||||
| Cenovus Energy, Inc. (CAD denominated) | 3,151,200 | 61,139 | ||||||
| Reliance Industries, Ltd. | 1,601,273 | 49,121 | ||||||
| Tourmaline Oil Corp. | 430,700 | 21,732 | ||||||
| Equinor ASA | 592,000 | 21,234 | ||||||
| Aker BP ASA | 599,979 | 18,702 | ||||||
| Halliburton Company | 235,128 | 9,252 | ||||||
| Gaztransport & Technigaz SA | 75,000 | 8,013 | ||||||
| Gazprom PJSC2 | 8,346,000 | — | 3 | |||||
| LUKOIL Oil Co. PJSC2 | 246,300 | — | 3 | |||||
| 335,911 | ||||||||
| Materials 3.25% | ||||||||
| Sherwin-Williams Company | 385,500 | 91,491 | ||||||
| Linde PLC | 169,940 | 55,431 | ||||||
| Vale SA, ordinary nominative shares | 1,577,389 | 26,554 | ||||||
| First Quantum Minerals, Ltd. | 706,200 | 14,755 | ||||||
| Shin-Etsu Chemical Co., Ltd. | 113,500 | 13,828 | ||||||
| Corteva, Inc. | 201,300 | 11,832 | ||||||
| Koninklijke DSM NV | 93,100 | 11,414 | ||||||
| 225,305 | ||||||||
| 48 | American Funds Insurance Series |
Global Growth Fund (continued)
| Common stocks (continued) | Shares | Value (000) |
||||||
| Communication services 2.68% | ||||||||
| Alphabet, Inc., Class A1 | 1,236,600 | $ | 109,105 | |||||
| Meta Platforms, Inc., Class A1 | 190,923 | 22,976 | ||||||
| Publicis Groupe SA | 273,000 | 17,336 | ||||||
| Sea, Ltd., Class A (ADR)1 | 273,336 | 14,222 | ||||||
| Tencent Holdings, Ltd. | 297,100 | 12,627 | ||||||
| Bharti Airtel, Ltd. | 945,000 | 9,186 | ||||||
| 185,452 | ||||||||
| Real estate 0.18% | ||||||||
| Goodman Logistics (HK), Ltd. REIT | 1,027,500 | 12,072 | ||||||
| Utilities 0.11% | ||||||||
| Brookfield Infrastructure Partners, LP | 247,500 | 7,666 | ||||||
| Total common stocks (cost: $4,798,092,000) | 6,553,762 | |||||||
| Preferred securities 1.66% | ||||||||
| Health care 1.36% | ||||||||
| Sartorius AG, nonvoting non-registered preferred shares | 239,000 | 94,514 | ||||||
| Information technology 0.30% | ||||||||
| Samsung Electronics Co., Ltd., nonvoting preferred shares | 512,300 | 20,614 | ||||||
| Total preferred securities (cost: $27,546,000) | 115,128 | |||||||
| Short-term securities 4.03% | ||||||||
| Money market investments 2.37% | ||||||||
| Capital Group Central Cash Fund 4.31%4,5 | 1,645,519 | 164,535 | ||||||
| Weighted average yield at acquisition |
Principal amount (000) |
|||||||||||
| Commercial paper 1.66% | ||||||||||||
| KfW 1/27/20236 | 3.890 | % | USD | 65,000 | 64,782 | |||||||
| Toronto-Dominion Bank 1/27/20236 | 4.130 | 50,000 | 49,833 | |||||||||
| 114,615 | ||||||||||||
| Total short-term securities (cost: $279,166,000) | 279,150 | |||||||||||
| Total investment securities 100.18% (cost: $5,104,804,000) | 6,948,040 | |||||||||||
| Other assets less liabilities (0.18)% | (12,386 | ) | ||||||||||
| Net assets 100.00% | $ | 6,935,654 | ||||||||||
| American Funds Insurance Series | 49 |
Global Growth Fund (continued)
Investments in affiliates5
| Value of affiliates at 1/1/2022 (000) |
Additions (000) |
Reductions (000) |
Net realized loss (000) |
Net unrealized depreciation (000) |
Value of affiliates at 12/31/2022 (000) |
Dividend income (000) |
||||||||||||||||||||||
| Short-term securities 2.37% | ||||||||||||||||||||||||||||
| Money market investments 2.37% | ||||||||||||||||||||||||||||
| Capital Group Central Cash Fund 4.31%4 | $ | 376,714 | $ | 1,480,091 | $ | 1,692,180 | $ | (71 | ) | $ | (19 | ) | $ | 164,535 | $ | 9,353 | ||||||||||||
| Money market investments purchased with collateral from securities on loan 0.00% | ||||||||||||||||||||||||||||
| Capital Group Central Cash Fund 4.31%4 | 1,808 | 1,8087 | — | — | 8 | |||||||||||||||||||||||
| Total 2.37% | $ | (71 | ) | $ | (19 | ) | $ | 164,535 | $ | 9,353 | ||||||||||||||||||
| 1 | Security did not produce income during the last 12 months. |
| 2 | Value determined using significant unobservable inputs. |
| 3 | Amount less than one thousand. |
| 4 | Rate represents the seven-day yield at 12/31/2022. |
| 5 | Part of the same “group of investment companies” as the fund as defined under the Investment Company Act of 1940, as amended. |
| 6 | Acquired in a transaction exempt from registration under Rule 144A or, for commercial paper, Section 4(a)(2) of the Securities Act of 1933. May be resold in the U.S. in transactions exempt from registration, normally to qualified institutional buyers. The total value of all such securities was $114,615,000, which represented 1.65% of the net assets of the fund. |
| 7 | Represents net activity. Refer to Note 5 for more information on securities lending. |
| 8 | Dividend income is included with securities lending income in the fund’s statement of operations and is not shown in this table. |
Key to abbreviations
ADR = American Depositary Receipts
CAD = Canadian dollars
REIT = Real Estate Investment Trust
USD = U.S. dollars
Refer to the notes to financial statements.
| 50 | American Funds Insurance Series |
Global Small Capitalization Fund
Investment portfolio December 31, 2022
| Common stocks 96.00% | Shares | Value (000) |
||||||
| Industrials 20.67% | ||||||||
| International Container Terminal Services, Inc. | 11,690,490 | $ | 42,075 | |||||
| Visional, Inc.1 | 504,850 | 33,522 | ||||||
| Stericycle, Inc.1 | 571,050 | 28,490 | ||||||
| Japan Airport Terminal Co., Ltd.1 | 559,900 | 27,843 | ||||||
| IMCD NV | 177,337 | 25,330 | ||||||
| Fasadgruppen Group AB | 2,370,503 | 23,995 | ||||||
| Trelleborg AB, Class B | 982,292 | 22,727 | ||||||
| Boyd Group Services, Inc. | 146,809 | 22,678 | ||||||
| Cleanaway Waste Management, Ltd. | 12,501,414 | 22,274 | ||||||
| Interpump Group SpA | 454,700 | 20,598 | ||||||
| Saia, Inc.1 | 80,994 | 16,983 | ||||||
| CG Power and Industrial Solutions, Ltd.1 | 4,880,108 | 15,908 | ||||||
| Instalco AB | 4,098,065 | 15,622 | ||||||
| Montrose Environmental Group, Inc.1 | 348,186 | 15,456 | ||||||
| Alfen NV1 | 162,431 | 14,668 | ||||||
| Dürr AG | 426,625 | 14,396 | ||||||
| ALS, Ltd. | 1,639,100 | 13,632 | ||||||
| Cargotec OYJ, Class B, non-registered shares | 300,450 | 13,341 | ||||||
| Wizz Air Holdings PLC1 | 522,941 | 11,979 | ||||||
| Daiseki Co., Ltd. | 313,600 | 10,798 | ||||||
| AirTAC International Group | 355,062 | 10,747 | ||||||
| Woodward, Inc. | 105,000 | 10,144 | ||||||
| Rumo SA | 2,802,100 | 9,877 | ||||||
| Japan Elevator Service Holdings Co., Ltd. | 787,656 | 9,866 | ||||||
| The AZEK Co., Inc., Class A1 | 482,390 | 9,802 | ||||||
| Comfort Systems USA, Inc. | 84,100 | 9,678 | ||||||
| Centre Testing International Group Co., Ltd. | 2,684,839 | 8,615 | ||||||
| Melrose Industries PLC | 5,266,169 | 8,561 | ||||||
| DL E&C Co., Ltd. | 287,442 | 7,732 | ||||||
| Guangzhou Baiyun International Airport Co., Ltd., Class A1 | 3,524,879 | 7,613 | ||||||
| Engcon AB, Class B1,2 | 1,070,647 | 6,833 | ||||||
| Carel Industries SpA | 252,900 | 6,357 | ||||||
| Burckhardt Compression Holding AG | 9,963 | 5,929 | ||||||
| Kajaria Ceramics, Ltd. | 422,763 | 5,916 | ||||||
| Hensoldt AG | 248,197 | 5,873 | ||||||
| Diploma PLC | 161,300 | 5,420 | ||||||
| SIS, Ltd.1 | 1,128,949 | 5,353 | ||||||
| GVS SpA1,2 | 1,192,262 | 5,159 | ||||||
| Reliance Worldwide Corp., Ltd. | 2,548,379 | 5,127 | ||||||
| Addtech AB, Class B | 353,050 | 5,054 | ||||||
| KEI Industries, Ltd. | 267,444 | 4,724 | ||||||
| First Advantage Corp.1 | 361,017 | 4,693 | ||||||
| Vicor Corp.1 | 85,683 | 4,605 | ||||||
| Harsha Engineers International, Ltd.1 | 970,777 | 4,488 | ||||||
| ICF International, Inc. | 43,592 | 4,318 | ||||||
| Sulzer AG | 54,789 | 4,278 | ||||||
| Controladora Vuela Compañía de Aviación, SAB de CV, Class A (ADR), ordinary participation certificates1 | 460,200 | 3,847 | ||||||
| LIXIL Corp. | 196,500 | 2,995 | ||||||
| Trex Co., Inc.1 | 59,516 | 2,519 | ||||||
| Aalberts NV, non-registered shares | 64,502 | 2,508 | ||||||
| Dätwyler Holding, Inc., non-registered shares | 12,348 | 2,466 | ||||||
| Antares Vision SpA1 | 281,100 | 2,418 | ||||||
| Chart Industries, Inc.1 | 16,174 | 1,864 | ||||||
| Matson, Inc. | 8,674 | 542 | ||||||
| 608,236 | ||||||||
| Information technology 18.70% | ||||||||
| Wolfspeed, Inc.1 | 790,681 | 54,589 | ||||||
| eMemory Technology, Inc. | 910,430 | 39,481 | ||||||
| Net One Systems Co., Ltd. | 1,201,156 | 31,223 | ||||||
| Nordic Semiconductor ASA1 | 1,677,583 | 28,098 | ||||||
| American Funds Insurance Series | 51 |
Global Small Capitalization Fund (continued)
| Common stocks (continued) | Shares | Value (000) |
||||||
| Information technology (continued) | ||||||||
| Confluent, Inc., Class A1 | 1,096,085 | $ | 24,377 | |||||
| PAR Technology Corp.1,2 | 837,615 | 21,837 | ||||||
| SUMCO Corp. | 1,466,300 | 19,620 | ||||||
| ALTEN SA, non-registered shares | 142,299 | 17,869 | ||||||
| Kingdee International Software Group Co., Ltd.1 | 7,337,224 | 15,619 | ||||||
| Extreme Networks, Inc.1 | 828,378 | 15,168 | ||||||
| BE Semiconductor Industries NV | 235,536 | 14,308 | ||||||
| Smartsheet, Inc., Class A1 | 346,627 | 13,643 | ||||||
| Euronet Worldwide, Inc.1 | 144,187 | 13,608 | ||||||
| Ceridian HCM Holding, Inc.1 | 211,500 | 13,568 | ||||||
| Silicon Laboratories, Inc.1 | 95,000 | 12,889 | ||||||
| Tanla Platforms, Ltd. | 1,477,291 | 12,708 | ||||||
| MACOM Technology Solutions Holdings, Inc.1 | 190,000 | 11,966 | ||||||
| Keywords Studios PLC | 344,606 | 11,355 | ||||||
| Alphawave IP Group PLC1,2 | 8,897,291 | 10,900 | ||||||
| SHIFT, Inc.1 | 59,200 | 10,521 | ||||||
| SINBON Electronics Co., Ltd. | 1,142,550 | 10,218 | ||||||
| OVH Groupe SAS1,2 | 591,394 | 10,169 | ||||||
| Qorvo, Inc.1 | 110,518 | 10,017 | ||||||
| Pegasystems, Inc. | 288,141 | 9,866 | ||||||
| GitLab, Inc., Class A1,2 | 213,816 | 9,716 | ||||||
| SimCorp AS | 139,192 | 9,512 | ||||||
| CCC Intelligent Solutions Holdings, Inc.1 | 1,033,074 | 8,988 | ||||||
| Aspen Technology, Inc.1 | 36,561 | 7,510 | ||||||
| Credo Technology Group Holding, Ltd.1 | 555,400 | 7,392 | ||||||
| INFICON Holding AG | 7,397 | 6,462 | ||||||
| Cognex Corp. | 116,600 | 5,493 | ||||||
| Bentley Systems, Inc., Class B | 142,373 | 5,262 | ||||||
| Unity Software, Inc.1,2 | 183,231 | 5,239 | ||||||
| Kingboard Laminates Holdings, Ltd. | 4,498,000 | 4,945 | ||||||
| AvidXchange Holdings, Inc.1 | 489,768 | 4,868 | ||||||
| Topicus.com, Inc., subordinate voting shares1 | 87,540 | 4,596 | ||||||
| MongoDB, Inc., Class A1 | 23,300 | 4,586 | ||||||
| Truecaller AB, Class B1,2 | 1,289,744 | 4,044 | ||||||
| Linklogis, Inc., Class B1,2 | 6,753,115 | 3,482 | ||||||
| Softcat PLC | 222,430 | 3,192 | ||||||
| Globant SA1 | 17,730 | 2,981 | ||||||
| Rapid7, Inc.1 | 71,250 | 2,421 | ||||||
| Kingboard Holdings, Ltd. | 710,000 | 2,261 | ||||||
| TELUS International (Cda), Inc., subordinate voting shares1,2 | 102,669 | 2,032 | ||||||
| GlobalWafers Co., Ltd. | 145,000 | 2,014 | ||||||
| LEM Holding SA | 990 | 1,922 | ||||||
| Cvent Holding Corp.1 | 344,800 | 1,862 | ||||||
| HashiCorp, Inc., Class A1 | 54,600 | 1,493 | ||||||
| Bechtle AG, non-registered shares | 40,616 | 1,437 | ||||||
| Marqeta, Inc., Class A1 | 212,881 | 1,301 | ||||||
| Semtech Corp.1 | 32,200 | 924 | ||||||
| Yotpo, Ltd.1,3,4 | 678,736 | 842 | ||||||
| 550,394 | ||||||||
| Consumer discretionary 17.91% | ||||||||
| Melco Resorts & Entertainment, Ltd. (ADR)1 | 3,600,384 | 41,404 | ||||||
| Skechers USA, Inc., Class A1 | 700,000 | 29,365 | ||||||
| Five Below, Inc.1 | 165,181 | 29,216 | ||||||
| Thor Industries, Inc. | 370,472 | 27,967 | ||||||
| Mattel, Inc.1 | 1,400,000 | 24,976 | ||||||
| Wyndham Hotels & Resorts, Inc. | 332,330 | 23,698 | ||||||
| Entain PLC | 1,424,930 | 22,847 | ||||||
| YETI Holdings, Inc.1 | 547,131 | 22,602 | ||||||
| NEXTAGE Co., Ltd. | 1,036,500 | 19,999 | ||||||
| Domino’s Pizza Enterprises, Ltd.2 | 443,338 | 19,968 | ||||||
| Light & Wonder, Inc.1 | 299,658 | 17,560 | ||||||
| 52 | American Funds Insurance Series |
Global Small Capitalization Fund (continued)
| Common stocks (continued) | Shares | Value (000) |
||||||
| Consumer discretionary (continued) | ||||||||
| Asbury Automotive Group, Inc.1 | 97,426 | $ | 17,464 | |||||
| Inchcape PLC | 1,719,150 | 16,969 | ||||||
| Evolution AB | 172,264 | 16,824 | ||||||
| DraftKings, Inc., Class A1,2 | 1,400,364 | 15,950 | ||||||
| Lands’ End, Inc.1,5 | 2,100,000 | 15,939 | ||||||
| Helen of Troy, Ltd.1 | 141,542 | 15,698 | ||||||
| TopBuild Corp.1 | 82,261 | 12,873 | ||||||
| WH Smith PLC | 701,756 | 12,524 | ||||||
| Kindred Group PLC (SDR) | 1,164,011 | 12,150 | ||||||
| Shoei Co., Ltd. | 281,700 | 11,006 | ||||||
| Tongcheng Travel Holdings, Ltd.1 | 4,538,400 | 10,922 | ||||||
| Golden Entertainment, Inc.1 | 256,800 | 9,604 | ||||||
| Chervon Holdings, Ltd.2 | 1,635,700 | 9,023 | ||||||
| Musti Group OYJ | 495,800 | 8,297 | ||||||
| MRF, Ltd. | 7,160 | 7,650 | ||||||
| Tube Investments of India, Ltd. | 204,200 | 6,852 | ||||||
| Melco International Development, Ltd.1 | 6,130,000 | 6,655 | ||||||
| Compagnie Plastic Omnium SA | 337,633 | 4,898 | ||||||
| Zhongsheng Group Holdings, Ltd. | 938,500 | 4,784 | ||||||
| Everi Holdings, Inc.1 | 330,000 | 4,736 | ||||||
| Leslie’s, Inc.1 | 353,358 | 4,315 | ||||||
| On Holding AG, Class A1 | 238,410 | 4,091 | ||||||
| Elior Group SA1,2 | 1,153,174 | 4,066 | ||||||
| Persimmon PLC | 255,136 | 3,766 | ||||||
| Haichang Ocean Park Holdings, Ltd.1 | 17,691,000 | 3,617 | ||||||
| IDP Education, Ltd. | 150,966 | 2,790 | ||||||
| Arco Platform, Ltd., Class A1,2 | 158,600 | 2,141 | ||||||
| DESCENTE, Ltd. | 81,425 | 2,003 | ||||||
| 527,209 | ||||||||
| Health care 17.06% | ||||||||
| Insulet Corp.1 | 322,368 | 94,901 | ||||||
| Haemonetics Corp.1 | 960,147 | 75,516 | ||||||
| Globus Medical, Inc., Class A1 | 464,688 | 34,512 | ||||||
| Oak Street Health, Inc.1 | 1,542,490 | 33,179 | ||||||
| Integra LifeSciences Holdings Corp.1 | 527,958 | 29,603 | ||||||
| Max Healthcare Institute, Ltd.1 | 4,669,887 | 24,816 | ||||||
| CONMED Corp. | 200,920 | 17,810 | ||||||
| CanSino Biologics, Inc., Class H | 1,864,200 | 15,948 | ||||||
| Vaxcyte, Inc.1 | 274,959 | 13,184 | ||||||
| Ocumension Therapeutics1 | 9,650,966 | 12,105 | ||||||
| Hapvida Participações e Investimentos SA1 | 12,352,106 | 11,885 | ||||||
| Bachem Holding AG | 135,555 | 11,823 | ||||||
| Angelalign Technology, Inc. | 640,800 | 10,100 | ||||||
| ICON PLC1 | 46,061 | 8,947 | ||||||
| Shandong Pharmaceutical Glass Co., Ltd., Class A | 2,180,508 | 8,890 | ||||||
| CompuGroup Medical SE & Co. KGaA | 228,815 | 8,808 | ||||||
| Ambu AS, Class B, non-registered shares1 | 683,462 | 8,672 | ||||||
| Penumbra, Inc.1 | 36,200 | 8,053 | ||||||
| Netcare, Ltd. | 8,818,088 | 7,527 | ||||||
| iRhythm Technologies, Inc.1 | 79,700 | 7,466 | ||||||
| Denali Therapeutics, Inc.1 | 257,903 | 7,172 | ||||||
| Encompass Health Corp. | 117,866 | 7,050 | ||||||
| New Horizon Health, Ltd.1 | 3,007,844 | 6,730 | ||||||
| Medmix AG | 324,953 | 6,200 | ||||||
| Health Catalyst, Inc.1 | 568,785 | 6,046 | ||||||
| Hypera SA, ordinary nominative shares | 582,885 | 4,990 | ||||||
| Amplifon SpA | 141,536 | 4,228 | ||||||
| The Ensign Group, Inc. | 39,450 | 3,732 | ||||||
| Masimo Corp.1 | 23,687 | 3,505 | ||||||
| Amvis Holdings, Inc. | 122,400 | 3,113 | ||||||
| Nordhealth AS, Class A1,2 | 1,279,999 | 2,916 | ||||||
| American Funds Insurance Series | 53 |
Global Small Capitalization Fund (continued)
| Common stocks (continued) | Shares | Value (000) |
||||||
| Health care (continued) | ||||||||
| Gland Pharma, Ltd.1 | 90,000 | $ | 1,715 | |||||
| Beam Therapeutics, Inc.1 | 22,757 | 890 | ||||||
| DiaSorin Italia SpA | 292 | 41 | ||||||
| 502,073 | ||||||||
| Financials 8.75% | ||||||||
| Star Health & Allied Insurance Co., Ltd.1 | 6,037,336 | 41,333 | ||||||
| Cholamandalam Investment and Finance Co., Ltd. | 3,684,053 | 32,078 | ||||||
| Eurobank Ergasias Services and Holdings SA1 | 17,966,239 | 20,281 | ||||||
| Independent Bank Group, Inc. | 280,449 | 16,849 | ||||||
| Stifel Financial Corp. | 271,050 | 15,821 | ||||||
| Glacier Bancorp, Inc. | 286,088 | 14,139 | ||||||
| Fukuoka Financial Group, Inc. | 572,200 | 13,049 | ||||||
| IIFL Finance, Ltd. | 2,116,842 | 12,316 | ||||||
| IIFL Wealth Management, Ltd. | 513,500 | 11,028 | ||||||
| Janus Henderson Group PLC | 440,000 | 10,349 | ||||||
| Bridgepoint Group PLC | 3,459,845 | 8,017 | ||||||
| Remgro, Ltd. | 965,035 | 7,551 | ||||||
| Five-Star Business Finance, Ltd.1 | 993,023 | 7,268 | ||||||
| Patria Investments, Ltd., Class A | 508,200 | 7,079 | ||||||
| Aptus Value Housing Finance India, Ltd. | 1,816,424 | 6,657 | ||||||
| SiriusPoint, Ltd.1 | 1,100,000 | 6,490 | ||||||
| Aavas Financiers, Ltd.1 | 272,734 | 6,072 | ||||||
| Eastern Bankshares, Inc. | 278,164 | 4,798 | ||||||
| AU Small Finance Bank, Ltd. | 483,716 | 3,809 | ||||||
| SouthState Corp. | 46,350 | 3,539 | ||||||
| Allfunds Group PLC | 470,000 | 3,284 | ||||||
| East West Bancorp, Inc. | 49,700 | 3,275 | ||||||
| Capitec Bank Holdings, Ltd. | 15,161 | 1,658 | ||||||
| PT Bank Raya Indonesia Tbk1 | 23,860,996 | 619 | ||||||
| 257,359 | ||||||||
| Materials 3.56% | ||||||||
| JSR Corp. | 1,140,088 | 22,469 | ||||||
| LANXESS AG | 441,240 | 17,807 | ||||||
| OZ Minerals, Ltd. | 648,901 | 12,142 | ||||||
| Navin Fluorine International, Ltd. | 175,000 | 8,586 | ||||||
| PI Industries, Ltd. | 188,382 | 7,772 | ||||||
| Zeon Corp. | 768,700 | 7,730 | ||||||
| Vidrala, SA, non-registered shares | 64,918 | 5,581 | ||||||
| MMG, Ltd.1 | 14,608,000 | 3,728 | ||||||
| Materion Corp. | 41,809 | 3,659 | ||||||
| Toyo Gosei Co., Ltd.2 | 63,400 | 3,485 | ||||||
| Recticel SA/NV | 175,000 | 2,921 | ||||||
| Mayr-Melnhof Karton AG, non-registered shares | 17,479 | 2,824 | ||||||
| Livent Corp.1 | 130,000 | 2,583 | ||||||
| Perimeter Solutions SA1,2 | 221,167 | 2,021 | ||||||
| Huhtamäki OYJ | 42,500 | 1,455 | ||||||
| Covestro AG, non-registered shares | 2,600 | 102 | ||||||
| 104,865 | ||||||||
| Real estate 2.53% | ||||||||
| Altus Group, Ltd. | 551,189 | 21,999 | ||||||
| Embassy Office Parks REIT | 4,939,400 | 20,043 | ||||||
| Macrotech Developers, Ltd.1 | 582,697 | 7,685 | ||||||
| JHSF Participações SA | 5,823,950 | 5,537 | ||||||
| Mindspace Business Parks REIT | 1,250,000 | 5,054 | ||||||
| ESR-Logos REIT | 15,133,928 | 4,166 | ||||||
| 54 | American Funds Insurance Series |
Global Small Capitalization Fund (continued)
| Common stocks (continued) | Shares | Value (000) |
||||||
| Real estate (continued) | ||||||||
| Fibra Uno Administración, SA de CV REIT | 3,400,000 | $ | 4,006 | |||||
| Corp. Inmobiliaria Vesta, SAB de CV | 1,606,000 | 3,833 | ||||||
| Ayala Land, Inc. | 3,718,100 | 2,069 | ||||||
| 74,392 | ||||||||
| Energy 1.89% | ||||||||
| Venture Global LNG, Inc., Series C1,3,4 | 2,760 | 25,418 | ||||||
| Subsea 7 SA | 1,050,980 | 12,088 | ||||||
| DT Midstream, Inc. | 166,383 | 9,194 | ||||||
| Weatherford International1 | 82,600 | 4,206 | ||||||
| Worley, Ltd. | 350,000 | 3,577 | ||||||
| Aegis Logistics, Ltd. | 199,283 | 838 | ||||||
| Helmerich & Payne, Inc. | 7,700 | 382 | ||||||
| 55,703 | ||||||||
| Communication services 1.77% | ||||||||
| JCDecaux SE1 | 976,059 | 18,563 | ||||||
| Lions Gate Entertainment Corp., Class B1 | 3,059,785 | 16,614 | ||||||
| Rightmove PLC | 816,439 | 5,055 | ||||||
| Bandwidth, Inc., Class A1 | 206,800 | 4,746 | ||||||
| VTEX, Class A1 | 993,126 | 3,724 | ||||||
| Trustpilot Group PLC1 | 2,966,832 | 3,473 | ||||||
| 52,175 | ||||||||
| Utilities 1.62% | ||||||||
| ACEN Corp. | 143,954,250 | 19,747 | ||||||
| ENN Energy Holdings, Ltd. | 1,205,597 | 16,819 | ||||||
| Brookfield Infrastructure Corp., Class A, subordinate voting shares | 157,667 | 6,133 | ||||||
| Neoenergia SA | 1,442,015 | 4,220 | ||||||
| SembCorp Industries, Ltd. | 282,600 | 712 | ||||||
| 47,631 | ||||||||
| Consumer staples 1.54% | ||||||||
| Grocery Outlet Holding Corp.1 | 621,782 | 18,150 | ||||||
| Shop Apotheke Europe NV, non-registered shares1 | 169,500 | 8,003 | ||||||
| Monde Nissin Corp. | 39,914,950 | 7,960 | ||||||
| Scandinavian Tobacco Group A/S | 305,111 | 5,352 | ||||||
| AAK AB | 223,527 | 3,819 | ||||||
| Hilton Food Group PLC | 250,077 | 1,688 | ||||||
| Zur Rose Group AG1,2 | 9,250 | 257 | ||||||
| 45,229 | ||||||||
| Total common stocks (cost: $2,451,546,000) | 2,825,266 | |||||||
| Preferred securities 0.87% | ||||||||
| Information technology 0.62% | ||||||||
| SmartHR, Inc., Series D, preferred shares1,3,4 | 3,006 | 10,752 | ||||||
| Yotpo, Ltd., Series F, preferred shares1,3,4 | 2,158,609 | 2,677 | ||||||
| Yotpo, Ltd., Series B, preferred shares1,3,4 | 287,894 | 357 | ||||||
| Yotpo, Ltd., Series C, preferred shares1,3,4 | 274,070 | 340 | ||||||
| Yotpo, Ltd., Series A-1, preferred shares1,3,4 | 183,819 | 228 | ||||||
| Yotpo, Ltd., Series A, preferred shares1,3,4 | 89,605 | 111 | ||||||
| Yotpo, Ltd., Series C-1, preferred shares1,3,4 | 75,980 | 94 | ||||||
| Yotpo, Ltd., Series D, preferred shares1,3,4 | 42,368 | 52 | ||||||
| Yotpo, Ltd., Series B-1, preferred shares1,3,4 | 33,838 | 42 | ||||||
| Outreach Corp., Series G, preferred shares1,3,4 | 154,354 | 3,603 | ||||||
| 18,256 | ||||||||
| American Funds Insurance Series | 55 |
Global Small Capitalization Fund (continued)
| Preferred securities (continued) | Shares | Value (000) |
||||||
| Industrials 0.24% | ||||||||
| Azul SA (ADR), preferred nominative shares1,2 | 1,128,836 | $ | 6,897 | |||||
| Azul SA, preferred nominative shares1 | 109,500 | 229 | ||||||
| 7,126 | ||||||||
| Health care 0.01% | ||||||||
| PACT Pharma, Inc., Series C, 8.00% noncumulative preferred shares1,3,4 | 2,931,405 | 196 | ||||||
| Total preferred securities (cost: $45,236,000) | 25,578 | |||||||
| Rights & warrants 0.34% | ||||||||
| Information technology 0.34% | ||||||||
| OPT Machine Vision Tech Co., Ltd., Class A, warrants, expire 2/3/20231,6 | 526,700 | 10,007 | ||||||
| Total rights & warrants (cost: $18,773,000) | 10,007 | |||||||
| Short-term securities 5.05% | ||||||||
| Money market investments 3.25% | ||||||||
| Capital Group Central Cash Fund 4.31%5,7 | 958,183 | 95,809 | ||||||
| Money market investments purchased with collateral from securities on loan 1.80% | ||||||||
| Capital Group Central Cash Fund 4.31%5,7,8 | 232,377 | 23,235 | ||||||
| Goldman Sachs Financial Square Government Fund, Institutional Shares 4.15%7,8 | 18,552,259 | 18,553 | ||||||
| Invesco Short-Term Investments Trust – Government & Agency Portfolio, Institutional Class 4.22%7,8 | 10,793,666 | 10,794 | ||||||
| State Street Institutional U.S. Government Money Market Fund, Institutional Class 4.09%7,8 | 271,134 | 271 | ||||||
| 52,853 | ||||||||
| Total short-term securities (cost: $148,644,000) | 148,662 | |||||||
| Total investment securities 102.26% (cost: $2,664,199,000) | 3,009,513 | |||||||
| Other assets less liabilities (2.26)% | (66,610 | ) | ||||||
| Net assets 100.00% | $ | 2,942,903 | ||||||
Investments in affiliates5
| Value of affiliates at 1/1/2022 (000) |
Additions (000) |
Reductions (000) |
Net realized loss (000) |
Net unrealized depreciation (000) |
Value of affiliates at 12/31/2022 (000) |
Dividend income (000) |
||||||||||||||||||||||
| Common stocks 0.54% | ||||||||||||||||||||||||||||
| Consumer discretionary 0.54% | ||||||||||||||||||||||||||||
| Lands’ End, Inc.1 | $ | 41,223 | $ | — | $ | — | $ | — | $ | (25,284 | ) | $ | 15,939 | $ | — | |||||||||||||
| Short-term securities 4.04% | ||||||||||||||||||||||||||||
| Money market investments 3.25% | ||||||||||||||||||||||||||||
| Capital Group Central Cash Fund 4.31%7 | 203,087 | 779,439 | 886,686 | (30 | ) | (1 | ) | 95,809 | 3,871 | |||||||||||||||||||
| Money market investments purchased with collateral from securities on loan 0.79% | ||||||||||||||||||||||||||||
| Capital Group Central Cash Fund 4.31%7,8 | 32,260 | 9,0259 | 23,235 | — | 10 | |||||||||||||||||||||||
| Total short-term securities | 119,044 | |||||||||||||||||||||||||||
| Total 4.58% | $ | (30 | ) | $ | (25,285 | ) | $ | 134,983 | $ | 3,871 | ||||||||||||||||||
| 56 | American Funds Insurance Series |
Global Small Capitalization Fund (continued)
Restricted securities4
| Acquisition date |
Cost (000) |
Value (000) |
Percent of net assets |
|||||||||||
| Venture Global LNG, Inc., Series C1,3 | 5/1/2015 | $ | 8,280 | $ | 25,418 | .86 | % | |||||||
| SmartHR, Inc., Series D, preferred shares1,3 | 5/28/2021 | 14,344 | 10,752 | .37 | ||||||||||
| Yotpo, Ltd., Series F, preferred shares1,3 | 2/25/2021 | 4,748 | 2,677 | .09 | ||||||||||
| Yotpo, Ltd.1,3 | 3/16/2021 | 1,418 | 842 | .03 | ||||||||||
| Yotpo, Ltd., Series B, preferred shares1,3 | 3/16/2021 | 602 | 357 | .01 | ||||||||||
| Yotpo, Ltd., Series C, preferred shares1,3 | 3/16/2021 | 573 | 340 | .01 | ||||||||||
| Yotpo, Ltd., Series A-1, preferred shares1,3 | 3/16/2021 | 384 | 228 | .01 | ||||||||||
| Yotpo, Ltd., Series A, preferred shares1,3 | 3/16/2021 | 187 | 111 | .01 | ||||||||||
| Yotpo, Ltd., Series C-1, preferred shares1,3 | 3/16/2021 | 159 | 94 | .00 | ||||||||||
| Yotpo, Ltd., Series D, preferred shares1,3 | 3/16/2021 | 89 | 52 | .00 | ||||||||||
| Yotpo, Ltd., Series B-1, preferred shares1,3 | 3/16/2021 | 71 | 42 | .00 | ||||||||||
| Outreach Corp., Series G, preferred shares1,3 | 5/27/2021 | 4,517 | 3,603 | .12 | ||||||||||
| PACT Pharma, Inc., Series C, 8.00% noncumulative preferred shares1,3 | 2/7/2020 | 6,000 | 196 | .01 | ||||||||||
| Total | $ | 41,372 | $ | 44,712 | 1.52 | % | ||||||||
| 1 | Security did not produce income during the last 12 months. |
| 2 | All or a portion of this security was on loan. The total value of all such securities was $59,781,000, which represented 2.03% of the net assets of the fund. Refer to Note 5 for more information on securities lending. |
| 3 | Value determined using significant unobservable inputs. |
| 4 | Restricted security, other than Rule 144A securities or commercial paper issued pursuant to Section 4(a)(2) of the Securities Act of 1933. The total value of all such restricted securities was $44,712,000, which represented 1.52% of the net assets of the fund. |
| 5 | Affiliate of the fund or part of the same “group of investment companies” as the fund, as defined under the Investment Company Act of 1940, as amended. |
| 6 | Acquired in a transaction exempt from registration under Rule 144A or, for commercial paper, Section 4(a)(2) of the Securities Act of 1933. May be resold in the U.S. in transactions exempt from registration, normally to qualified institutional buyers. The total value of all such securities was $10,007,000, which represented .34% of the net assets of the fund. |
| 7 | Rate represents the seven-day yield at 12/31/2022. |
| 8 | Security purchased with cash collateral from securities on loan. Refer to Note 5 for more information on securities lending. |
| 9 | Represents net activity. Refer to Note 5 for more information on securities lending. |
| 10 | Dividend income is included with securities lending income in the fund’s statement of operations and is not shown in this table. |
Key to abbreviations
ADR = American Depositary Receipts
REIT = Real Estate Investment Trust
SDR = Swedish Depositary Receipts
Refer to the notes to financial statements.
| American Funds Insurance Series | 57 |
Growth Fund
Investment portfolio December 31, 2022
| Common stocks 96.12% | Shares | Value (000) |
||||||
| Information technology 20.03% | ||||||||
| Microsoft Corp. | 6,282,998 | $ | 1,506,789 | |||||
| Broadcom, Inc. | 1,265,075 | 707,341 | ||||||
| ASML Holding NV | 736,108 | 398,458 | ||||||
| ASML Holding NV (New York registered) (ADR) | 189,937 | 103,781 | ||||||
| Visa, Inc., Class A | 1,198,388 | 248,977 | ||||||
| Apple, Inc. | 1,694,416 | 220,156 | ||||||
| Mastercard, Inc., Class A | 566,983 | 197,157 | ||||||
| Fiserv, Inc.1 | 1,615,000 | 163,228 | ||||||
| Synopsys, Inc.1 | 467,600 | 149,300 | ||||||
| Motorola Solutions, Inc. | 510,100 | 131,458 | ||||||
| Shopify, Inc., Class A, subordinate voting shares1 | 3,665,992 | 127,247 | ||||||
| Applied Materials, Inc. | 1,199,328 | 116,791 | ||||||
| Wolfspeed, Inc.1 | 1,655,641 | 114,305 | ||||||
| RingCentral, Inc., Class A1 | 3,132,381 | 110,886 | ||||||
| ServiceNow, Inc.1 | 269,875 | 104,784 | ||||||
| Salesforce, Inc.1 | 787,000 | 104,348 | ||||||
| Micron Technology, Inc. | 2,048,078 | 102,363 | ||||||
| NVIDIA Corp. | 665,500 | 97,256 | ||||||
| Taiwan Semiconductor Manufacturing Company, Ltd. | 5,456,000 | 79,519 | ||||||
| Taiwan Semiconductor Manufacturing Company, Ltd. (ADR) | 209,700 | 15,621 | ||||||
| Cloudflare, Inc., Class A1 | 1,858,800 | 84,036 | ||||||
| Amadeus IT Group SA, Class A, non-registered shares1 | 1,612,361 | 83,150 | ||||||
| Genpact, Ltd. | 1,524,231 | 70,602 | ||||||
| Keyence Corp. | 165,500 | 64,794 | ||||||
| Fidelity National Information Services, Inc. | 884,718 | 60,028 | ||||||
| Toast, Inc., Class A1 | 3,143,518 | 56,678 | ||||||
| CDW Corp. | 311,859 | 55,692 | ||||||
| MongoDB, Inc., Class A1 | 279,700 | 55,056 | ||||||
| SAP SE | 477,361 | 49,263 | ||||||
| Constellation Software, Inc. | 31,255 | 48,798 | ||||||
| GoDaddy, Inc., Class A1 | 645,081 | 48,265 | ||||||
| Samsung Electronics Co., Ltd. | 1,085,000 | 47,846 | ||||||
| Unity Software, Inc.1,2 | 1,660,000 | 47,459 | ||||||
| Ceridian HCM Holding, Inc.1 | 712,011 | 45,676 | ||||||
| Trimble, Inc.1 | 840,920 | 42,517 | ||||||
| Concentrix Corp. | 305,551 | 40,687 | ||||||
| Block, Inc., Class A1 | 635,970 | 39,964 | ||||||
| DocuSign, Inc.1 | 718,524 | 39,821 | ||||||
| Bill.com Holdings, Inc.1 | 358,729 | 39,087 | ||||||
| MicroStrategy, Inc., Class A1 | 236,458 | 33,475 | ||||||
| NetApp, Inc. | 527,540 | 31,684 | ||||||
| Silicon Laboratories, Inc.1 | 231,815 | 31,450 | ||||||
| MKS Instruments, Inc. | 360,705 | 30,563 | ||||||
| Intel Corp. | 1,136,000 | 30,025 | ||||||
| Smartsheet, Inc., Class A1 | 729,700 | 28,721 | ||||||
| Adobe, Inc.1 | 69,034 | 23,232 | ||||||
| VeriSign, Inc.1 | 110,053 | 22,609 | ||||||
| Ciena Corp.1 | 416,000 | 21,208 | ||||||
| Nuvei Corp., subordinate voting shares1 | 806,616 | 20,499 | ||||||
| Intuit, Inc. | 52,500 | 20,434 | ||||||
| TE Connectivity, Ltd. | 156,600 | 17,978 | ||||||
| Alteryx, Inc., Class A1 | 286,092 | 14,496 | ||||||
| Enphase Energy, Inc.1 | 45,303 | 12,004 | ||||||
| TELUS International (Cda), Inc., subordinate voting shares1 | 533,800 | 10,564 | ||||||
| Globant SA1 | 57,138 | 9,608 | ||||||
| Kulicke and Soffa Industries, Inc. | 151,860 | 6,721 | ||||||
| Stripe, Inc., Class B1,3,4 | 168,598 | 4,704 | ||||||
| 6,189,159 | ||||||||
| 58 | American Funds Insurance Series |
Growth Fund (continued)
| Common stocks (continued) | Shares | Value (000) |
||||||
| Health care 17.31% | ||||||||
| Regeneron Pharmaceuticals, Inc.1 | 1,123,014 | $ | 810,243 | |||||
| UnitedHealth Group, Inc. | 1,508,620 | 799,840 | ||||||
| Intuitive Surgical, Inc.1 | 2,058,000 | 546,090 | ||||||
| Alnylam Pharmaceuticals, Inc.1 | 2,075,046 | 493,135 | ||||||
| Centene Corp.1 | 3,895,936 | 319,506 | ||||||
| Thermo Fisher Scientific, Inc. | 532,200 | 293,077 | ||||||
| Vertex Pharmaceuticals, Inc.1 | 879,601 | 254,011 | ||||||
| Seagen, Inc.1 | 1,746,784 | 224,479 | ||||||
| Moderna, Inc.1 | 1,200,000 | 215,544 | ||||||
| NovoCure, Ltd.1 | 2,388,098 | 175,167 | ||||||
| Eli Lilly and Company | 463,663 | 169,627 | ||||||
| Pfizer, Inc. | 1,675,000 | 85,827 | ||||||
| CVS Health Corp. | 909,400 | 84,747 | ||||||
| Horizon Therapeutics PLC1 | 689,825 | 78,502 | ||||||
| AstraZeneca PLC | 550,784 | 74,750 | ||||||
| Edwards Lifesciences Corp.1 | 906,411 | 67,627 | ||||||
| Danaher Corp. | 216,235 | 57,393 | ||||||
| Molina Healthcare, Inc.1 | 145,723 | 48,121 | ||||||
| Abbott Laboratories | 426,712 | 46,849 | ||||||
| Verily Life Sciences, LLC1,3,4 | 300,178 | 45,222 | ||||||
| Zimmer Biomet Holdings, Inc. | 353,900 | 45,122 | ||||||
| Ascendis Pharma A/S (ADR)1 | 364,721 | 44,543 | ||||||
| Zoetis, Inc., Class A | 297,320 | 43,572 | ||||||
| Mettler-Toledo International, Inc.1 | 26,000 | 37,582 | ||||||
| Humana, Inc. | 65,982 | 33,795 | ||||||
| Align Technology, Inc.1 | 160,000 | 33,744 | ||||||
| Karuna Therapeutics, Inc.1 | 170,239 | 33,452 | ||||||
| Guardant Health, Inc.1 | 1,166,810 | 31,737 | ||||||
| Novo Nordisk A/S, Class B | 225,077 | 30,475 | ||||||
| Catalent, Inc.1 | 409,100 | 18,414 | ||||||
| Oak Street Health, Inc.1 | 806,352 | 17,345 | ||||||
| Exact Sciences Corp.1 | 341,000 | 16,883 | ||||||
| DexCom, Inc.1 | 148,800 | 16,850 | ||||||
| Pacific Biosciences of California, Inc.1 | 1,613,190 | 13,196 | ||||||
| CRISPR Therapeutics AG1 | 262,678 | 10,678 | ||||||
| Galapagos NV1 | 231,294 | 10,259 | ||||||
| R1 RCM, Inc.1 | 912,865 | 9,996 | ||||||
| Ultragenyx Pharmaceutical, Inc.1 | 161,278 | 7,472 | ||||||
| Fate Therapeutics, Inc.1 | 233,700 | 2,358 | ||||||
| Biohaven, Ltd.1 | 65,550 | 910 | ||||||
| Sana Biotechnology, Inc.1,2 | 179,600 | 710 | ||||||
| 5,348,850 | ||||||||
| Consumer discretionary 16.94% | ||||||||
| Tesla, Inc.1 | 10,830,000 | 1,334,039 | ||||||
| D.R. Horton, Inc. | 5,494,844 | 489,810 | ||||||
| Amazon.com, Inc.1 | 4,125,222 | 346,519 | ||||||
| Home Depot, Inc. | 1,031,000 | 325,652 | ||||||
| Dollar Tree Stores, Inc.1 | 1,965,915 | 278,059 | ||||||
| Las Vegas Sands Corp.1 | 5,500,000 | 264,385 | ||||||
| LVMH Moët Hennessy-Louis Vuitton SE | 313,000 | 227,377 | ||||||
| Chipotle Mexican Grill, Inc.1 | 120,100 | 166,637 | ||||||
| Dollar General Corp. | 657,120 | 161,816 | ||||||
| Target Corp. | 1,030,200 | 153,541 | ||||||
| Hermès International | 94,901 | 146,446 | ||||||
| Burlington Stores, Inc.1 | 664,250 | 134,683 | ||||||
| Royal Caribbean Cruises, Ltd.1 | 2,282,305 | 112,814 | ||||||
| Aramark | 2,454,864 | 101,484 | ||||||
| DoorDash, Inc., Class A1 | 2,000,000 | 97,640 | ||||||
| Etsy, Inc.1 | 770,678 | 92,312 | ||||||
| Airbnb, Inc., Class A1 | 1,044,500 | 89,305 | ||||||
| NVR, Inc.1 | 18,380 | 84,779 | ||||||
| American Funds Insurance Series | 59 |
Growth Fund (continued)
| Common stocks (continued) | Shares | Value (000) |
||||||
| Consumer discretionary (continued) | ||||||||
| NIKE, Inc., Class B | 543,416 | $ | 63,585 | |||||
| Norwegian Cruise Line Holdings, Ltd.1,2 | 5,159,551 | 63,153 | ||||||
| Darden Restaurants, Inc. | 387,870 | 53,654 | ||||||
| O’Reilly Automotive, Inc.1 | 63,500 | 53,596 | ||||||
| Booking Holdings, Inc.1 | 25,450 | 51,289 | ||||||
| Salvatore Ferragamo SpA | 2,174,477 | 38,488 | ||||||
| Toll Brothers, Inc. | 744,683 | 37,175 | ||||||
| YUM! Brands, Inc. | 275,700 | 35,312 | ||||||
| Floor & Decor Holdings, Inc., Class A1 | 420,000 | 29,245 | ||||||
| Polaris, Inc. | 280,000 | 28,280 | ||||||
| adidas AG | 200,959 | 27,433 | ||||||
| Caesars Entertainment, Inc.1 | 653,214 | 27,174 | ||||||
| Adient PLC1 | 722,000 | 25,046 | ||||||
| VF Corp. | 872,859 | 24,100 | ||||||
| General Motors Company | 660,000 | 22,202 | ||||||
| LGI Homes, Inc.1 | 181,100 | 16,770 | ||||||
| YETI Holdings, Inc.1 | 405,000 | 16,730 | ||||||
| Hilton Worldwide Holdings, Inc. | 100,828 | 12,741 | ||||||
| 5,233,271 | ||||||||
| Communication services 12.87% | ||||||||
| Meta Platforms, Inc., Class A1 | 9,903,206 | 1,191,752 | ||||||
| Netflix, Inc.1 | 3,896,520 | 1,149,006 | ||||||
| Alphabet, Inc., Class C1 | 5,949,690 | 527,916 | ||||||
| Alphabet, Inc., Class A1 | 2,232,320 | 196,958 | ||||||
| Charter Communications, Inc., Class A1 | 469,410 | 159,177 | ||||||
| Verizon Communications, Inc. | 3,720,000 | 146,568 | ||||||
| Take-Two Interactive Software, Inc.1 | 1,177,716 | 122,635 | ||||||
| Snap, Inc., Class A, nonvoting shares1 | 11,280,711 | 100,962 | ||||||
| Frontier Communications Parent, Inc.1 | 3,168,010 | 80,721 | ||||||
| T-Mobile US, Inc.1 | 543,849 | 76,139 | ||||||
| Comcast Corp., Class A | 1,822,263 | 63,724 | ||||||
| Pinterest, Inc., Class A1 | 1,752,664 | 42,555 | ||||||
| Electronic Arts, Inc. | 304,581 | 37,214 | ||||||
| Iridium Communications, Inc.1 | 604,439 | 31,068 | ||||||
| Tencent Holdings, Ltd. | 605,000 | 25,714 | ||||||
| ZoomInfo Technologies, Inc.1 | 785,400 | 23,648 | ||||||
| 3,975,757 | ||||||||
| Industrials 10.90% | ||||||||
| Uber Technologies, Inc.1 | 14,666,767 | 362,709 | ||||||
| TransDigm Group, Inc. | 562,400 | 354,115 | ||||||
| Carrier Global Corp. | 7,599,761 | 313,490 | ||||||
| Jacobs Solutions, Inc. | 2,554,200 | 306,683 | ||||||
| Delta Air Lines, Inc.1 | 7,215,000 | 237,085 | ||||||
| United Rentals, Inc.1 | 462,000 | 164,204 | ||||||
| Caterpillar, Inc. | 676,300 | 162,014 | ||||||
| Waste Connections, Inc. | 1,101,159 | 145,970 | ||||||
| MTU Aero Engines AG | 541,769 | 117,261 | ||||||
| General Electric Co. | 1,368,072 | 114,631 | ||||||
| Airbus SE, non-registered shares | 955,893 | 113,658 | ||||||
| Ryanair Holdings PLC (ADR)1 | 1,500,325 | 112,164 | ||||||
| Ryanair Holdings PLC1 | 96,554 | 1,264 | ||||||
| Robert Half International, Inc. | 1,323,800 | 97,736 | ||||||
| Old Dominion Freight Line, Inc. | 329,800 | 93,591 | ||||||
| Boeing Company1 | 395,000 | 75,243 | ||||||
| United Airlines Holdings, Inc.1 | 1,695,914 | 63,936 | ||||||
| Middleby Corp.1 | 449,500 | 60,188 | ||||||
| Axon Enterprise, Inc.1 | 347,957 | 57,736 | ||||||
| Equifax, Inc. | 290,691 | 56,499 | ||||||
| Northrop Grumman Corp. | 98,700 | 53,852 | ||||||
| Dun & Bradstreet Holdings, Inc. | 3,869,573 | 47,441 | ||||||
| 60 | American Funds Insurance Series |
Growth Fund (continued)
| Common stocks (continued) | Shares | Value (000) |
||||||
| Industrials (continued) | ||||||||
| Canadian Pacific Railway, Ltd. | 496,000 | $ | 36,997 | |||||
| AMETEK, Inc. | 253,600 | 35,433 | ||||||
| Rockwell Automation | 129,246 | 33,290 | ||||||
| HEICO Corp. | 195,000 | 29,960 | ||||||
| Advanced Drainage Systems, Inc. | 350,426 | 28,724 | ||||||
| ITT, Inc. | 343,000 | 27,817 | ||||||
| Armstrong World Industries, Inc. | 374,203 | 25,666 | ||||||
| Safran SA | 185,870 | 23,227 | ||||||
| Saia, Inc.1 | 75,433 | 15,817 | ||||||
| 3,368,401 | ||||||||
| Energy 5.92% | ||||||||
| Halliburton Company | 12,143,661 | 477,853 | ||||||
| Canadian Natural Resources, Ltd. (CAD denominated) | 6,655,000 | 369,564 | ||||||
| Schlumberger, Ltd. | 2,340,000 | 125,096 | ||||||
| Cenovus Energy, Inc. (CAD denominated) | 6,081,800 | 117,998 | ||||||
| Permian Resources Corp., Class A | 11,260,000 | 105,844 | ||||||
| Tourmaline Oil Corp. | 1,838,700 | 92,777 | ||||||
| TotalEnergies SE | 1,469,000 | 91,688 | ||||||
| EQT Corp. | 2,268,000 | 76,726 | ||||||
| Pioneer Natural Resources Company | 328,000 | 74,912 | ||||||
| EOG Resources, Inc. | 466,699 | 60,447 | ||||||
| ConocoPhillips | 472,041 | 55,701 | ||||||
| MEG Energy Corp.1 | 3,810,000 | 53,042 | ||||||
| Hess Corp. | 354,000 | 50,204 | ||||||
| Coterra Energy, Inc. | 1,275,197 | 31,332 | ||||||
| Range Resources Corp. | 907,000 | 22,693 | ||||||
| Suncor Energy, Inc. | 540,794 | 17,154 | ||||||
| Equitrans Midstream Corp. | 936,942 | 6,278 | ||||||
| 1,829,309 | ||||||||
| Financials 5.82% | ||||||||
| Bank of America Corp. | 14,780,700 | 489,537 | ||||||
| Capital One Financial Corp. | 1,399,000 | 130,051 | ||||||
| First Republic Bank | 943,211 | 114,968 | ||||||
| KKR & Co., Inc. | 2,409,043 | 111,828 | ||||||
| Apollo Asset Management, Inc. | 1,557,942 | 99,381 | ||||||
| T. Rowe Price Group, Inc. | 642,000 | 70,017 | ||||||
| MSCI, Inc. | 146,390 | 68,096 | ||||||
| Marsh & McLennan Companies, Inc. | 403,461 | 66,765 | ||||||
| Western Alliance Bancorporation | 1,071,775 | 63,835 | ||||||
| Wells Fargo & Company | 1,511,200 | 62,397 | ||||||
| Blackstone, Inc., nonvoting shares | 738,000 | 54,752 | ||||||
| Signature Bank | 446,233 | 51,415 | ||||||
| S&P Global, Inc. | 141,000 | 47,227 | ||||||
| Aon PLC, Class A | 155,700 | 46,732 | ||||||
| JPMorgan Chase & Co. | 313,702 | 42,067 | ||||||
| Morgan Stanley | 426,474 | 36,259 | ||||||
| Progressive Corp. | 265,951 | 34,496 | ||||||
| Blue Owl Capital, Inc., Class A | 2,891,712 | 30,652 | ||||||
| Arch Capital Group, Ltd.1 | 458,700 | 28,797 | ||||||
| Goldman Sachs Group, Inc. | 74,300 | 25,513 | ||||||
| Tradeweb Markets, Inc., Class A | 390,000 | 25,323 | ||||||
| Ares Management Corp., Class A | 310,500 | 21,251 | ||||||
| SVB Financial Group1 | 87,300 | 20,091 | ||||||
| Ryan Specialty Holdings, Inc., Class A1 | 455,200 | 18,895 | ||||||
| Brookfield Corp., Class A | 585,103 | 18,407 | ||||||
| Trupanion, Inc.1,2 | 287,655 | 13,672 | ||||||
| Brookfield Asset Management, Ltd., Class A | 146,275 | 4,194 | ||||||
| 1,796,618 | ||||||||
| American Funds Insurance Series | 61 |
Growth Fund (continued)
| Common stocks (continued) | Shares | Value (000) |
||||||
| Materials 3.15% | ||||||||
| Silgan Holdings, Inc. | 2,858,000 | $ | 148,159 | |||||
| Wheaton Precious Metals Corp. | 3,674,000 | 143,580 | ||||||
| Linde PLC | 373,860 | 121,946 | ||||||
| Grupo México, SAB de CV, Series B | 25,356,800 | 89,018 | ||||||
| Barrick Gold Corp. | 4,058,000 | 69,716 | ||||||
| CF Industries Holdings, Inc. | 743,000 | 63,304 | ||||||
| ATI, Inc.1 | 2,070,860 | 61,836 | ||||||
| Royal Gold, Inc. | 517,000 | 58,276 | ||||||
| Franco-Nevada Corp. | 390,000 | 53,163 | ||||||
| Nutrien, Ltd. (CAD denominated) | 665,949 | 48,618 | ||||||
| Steel Dynamics, Inc. | 394,900 | 38,582 | ||||||
| Albemarle Corp. | 144,809 | 31,403 | ||||||
| Mosaic Co. | 678,459 | 29,764 | ||||||
| Summit Materials, Inc., Class A | 570,855 | 16,206 | ||||||
| 973,571 | ||||||||
| Consumer staples 2.28% | ||||||||
| Costco Wholesale Corp. | 253,000 | 115,494 | ||||||
| British American Tobacco PLC | 2,768,763 | 109,850 | ||||||
| Performance Food Group Co.1 | 1,743,000 | 101,774 | ||||||
| Constellation Brands, Inc., Class A | 334,017 | 77,408 | ||||||
| Archer Daniels Midland Company | 784,800 | 72,869 | ||||||
| Altria Group, Inc. | 1,440,000 | 65,822 | ||||||
| Monster Beverage Corp.1 | 577,600 | 58,644 | ||||||
| Estée Lauder Companies, Inc., Class A | 211,111 | 52,379 | ||||||
| Molson Coors Beverage Company, Class B, restricted voting shares | 608,423 | 31,346 | ||||||
| Philip Morris International, Inc. | 201,113 | 20,355 | ||||||
| 705,941 | ||||||||
| Utilities 0.79% | ||||||||
| PG&E Corp.1 | 9,227,065 | 150,032 | ||||||
| AES Corp. | 1,085,884 | 31,230 | ||||||
| CenterPoint Energy, Inc. | 953,746 | 28,603 | ||||||
| Constellation Energy Corp. | 242,227 | 20,882 | ||||||
| Edison International | 199,191 | 12,673 | ||||||
| 243,420 | ||||||||
| Real estate 0.11% | ||||||||
| Equinix, Inc. REIT | 51,784 | 33,920 | ||||||
| Total common stocks (cost: $20,777,099,000) | 29,698,217 | |||||||
| Preferred securities 0.19% | ||||||||
| Information technology 0.16% | ||||||||
| PsiQuantum Corp., Series D, preferred shares1,3,4 | 906,761 | 24,501 | ||||||
| Samsung Electronics Co., Ltd., nonvoting preferred shares | 531,000 | 21,366 | ||||||
| Tipalti Solutions, Ltd., Series F, preferred shares1,3,4 | 406,310 | 2,385 | ||||||
| Stripe, Inc., Series H, 6.00% noncumulative preferred shares1,3,4 | 52,656 | 1,469 | ||||||
| 49,721 | ||||||||
| Industrials 0.03% | ||||||||
| ABL Space Systems Co., Series B2, preferred shares1,3,4 | 153,713 | 5,775 | ||||||
| Einride AB, Series C, preferred shares1,3,4 | 77,647 | 2,640 | ||||||
| 8,415 | ||||||||
| Total preferred securities (cost: $68,091,000) | 58,136 | |||||||
| 62 | American Funds Insurance Series |
Growth Fund (continued)
| Convertible stocks 0.03% | Shares | Value (000) |
||||||
| Financials 0.03% | ||||||||
| KKR & Co., Inc., Series C, convertible preferred shares, 6.00% 9/15/2023 | 125,800 | $ | 7,202 | |||||
| Total convertible stocks (cost: $7,758,000) | 7,202 | |||||||
| Convertible bonds & notes 0.02% | Principal amount (000) |
|||||||
| Consumer staples 0.01% | ||||||||
| JUUL Labs, Inc., convertible notes, 7.00% PIK 2/3/20253,4,5 | USD | 46,459 | 4,646 | |||||
| Industrials 0.01% | ||||||||
| Einride AB, convertible notes, 7.00% 2/1/20233,4 | 2,500 | 2,500 | ||||||
| Total convertible bonds & notes (cost: $46,042,000) | 7,146 | |||||||
| Bonds, notes & other debt instruments 0.05% | ||||||||
| Corporate bonds, notes & loans 0.05% | ||||||||
| Consumer discretionary 0.05% | ||||||||
| Royal Caribbean Cruises, Ltd. 5.50% 4/1/20286 | 19,060 | 15,245 | ||||||
| Total bonds, notes & other debt instruments (cost: $14,159,000) | 15,245 | |||||||
| Short-term securities 3.86% | Shares | |||||||
| Money market investments 3.70% | ||||||||
| Capital Group Central Cash Fund 4.31%7,8 | 11,426,693 | 1,142,555 | ||||||
| Money market investments purchased with collateral from securities on loan 0.16% | ||||||||
| Capital Group Central Cash Fund 4.31%7,8,9 | 244,125 | 24,410 | ||||||
| Goldman Sachs Financial Square Government Fund, Institutional Shares 4.15%7,9 | 13,667,057 | 13,667 | ||||||
| Invesco Short-Term Investments Trust – Government & Agency Portfolio, Institutional Class 4.22%7,9 | 12,203,079 | 12,203 | ||||||
| 50,280 | ||||||||
| Total short-term securities (cost: $1,192,617,000) | 1,192,835 | |||||||
| Total investment securities 100.27% (cost: $22,105,766,000) | 30,978,781 | |||||||
| Other assets less liabilities (0.27)% | (82,433 | ) | ||||||
| Net assets 100.00% | $ | 30,896,348 | ||||||
Investments in affiliates8
| Value of affiliates at 1/1/2022 (000) |
Additions (000) |
Reductions (000) |
Net realized loss (000) |
Net unrealized appreciation (000) |
Value of affiliates at 12/31/2022 (000) |
Dividend income (000) |
||||||||||||||||||||||
| Short-term securities 3.78% | ||||||||||||||||||||||||||||
| Money market investments 3.70% | ||||||||||||||||||||||||||||
| Capital Group Central Cash Fund 4.31%7 | $ | 1,610,187 | $ | 4,675,615 | $ | 5,142,944 | $ | (325 | ) | $ | 22 | $ | 1,142,555 | $ | 22,361 | |||||||||||||
| Money market investments purchased with collateral from securities on loan 0.08% | ||||||||||||||||||||||||||||
| Capital Group Central Cash Fund 4.31%7,9 | 20,304 | 4,106 | 10 | 24,410 | — | 11 | ||||||||||||||||||||||
| Total 3.78% | $ | (325 | ) | $ | 22 | $ | 1,166,965 | $ | 22,361 | |||||||||||||||||||
| American Funds Insurance Series | 63 |
Growth Fund (continued)
Restricted securities4
| Percent | ||||||||||||||
| Acquisition | Cost | Value | of net | |||||||||||
| date(s) | (000) | (000) | assets | |||||||||||
| Verily Life Sciences, LLC1,3 | 12/21/2018 | $ | 37,000 | $ | 45,222 | .14 | % | |||||||
| PsiQuantum Corp., Series D, preferred shares1,3 | 5/28/2021 | 23,781 | 24,501 | .08 | ||||||||||
| Stripe, Inc., Class B1,3 | 5/6/2021 | 6,766 | 4,704 | .02 | ||||||||||
| Stripe, Inc., Series H, 6.00% noncumulative preferred shares1,3 | 3/15/2021 | 2,113 | 1,469 | .00 | ||||||||||
| ABL Space Systems Co., Series B2, preferred shares1,3 | 10/22/2021 | 10,452 | 5,775 | .02 | ||||||||||
| Einride AB, Series C, preferred shares1,3 | 11/23/2022 | 2,640 | 2,640 | .01 | ||||||||||
| Einride AB, convertible notes, 7.00% 2/1/20233 | 1/7/2022 | 2,500 | 2,500 | .01 | ||||||||||
| JUUL Labs, Inc., convertible notes, 7.00% PIK 2/3/20253,5 | 2/3/2020-11/3/2022 | 43,542 | 4,646 | .01 | ||||||||||
| Tipalti Solutions, Ltd., Series F, preferred shares1,3 | 12/1/2021 | 6,956 | 2,385 | .01 | ||||||||||
| Total | $ | 135,750 | $ | 93,842 | .30 | % | ||||||||
| 1 | Security did not produce income during the last 12 months. |
| 2 | All or a portion of this security was on loan. The total value of all such securities was $54,504,000, which represented .18% of the net assets of the fund. Refer to Note 5 for more information on securities lending. |
| 3 | Value determined using significant unobservable inputs. |
| 4 | Restricted security, other than Rule 144A securities or commercial paper issued pursuant to Section 4(a)(2) of the Securities Act of 1933. The total value of all such restricted securities was $93,842,000, which represented .30% of the net assets of the fund. |
| 5 | Payment in kind; the issuer has the option of paying additional securities in lieu of cash. Payment methods and rates are as of the most recent payment when available. |
| 6 | Acquired in a transaction exempt from registration under Rule 144A or, for commercial paper, Section 4(a)(2) of the Securities Act of 1933. May be resold in the U.S. in transactions exempt from registration, normally to qualified institutional buyers. The total value of all such securities was $15,245,000, which represented .05% of the net assets of the fund. |
| 7 | Rate represents the seven-day yield at 12/31/2022. |
| 8 | Part of the same “group of investment companies” as the fund as defined under the Investment Company Act of 1940, as amended. |
| 9 | Security purchased with cash collateral from securities on loan. Refer to Note 5 for more information on securities lending. |
| 10 | Represents net activity. Refer to Note 5 for more information on securities lending. |
| 11 | Dividend income is included with securities lending income in the fund’s statement of operations and is not shown in this table. |
Key to abbreviations
ADR = American Depositary Receipts
CAD = Canadian dollars
PIK = Payment In Kind
REIT = Real Estate Investment Trust
USD = U.S. dollars
Refer to the notes to financial statements.
| 64 | American Funds Insurance Series |
International Fund
Investment portfolio December 31, 2022
| Common stocks 94.99% | Shares | Value (000) |
||||||
| Industrials 16.64% | ||||||||
| Recruit Holdings Co., Ltd. | 7,310,189 | $ | 232,492 | |||||
| Airbus SE, non-registered shares | 1,657,958 | 197,135 | ||||||
| Safran SA | 718,500 | 89,786 | ||||||
| Melrose Industries PLC | 36,613,980 | 59,524 | ||||||
| Siemens AG | 418,132 | 58,034 | ||||||
| MTU Aero Engines AG | 229,720 | 49,721 | ||||||
| Ashtead Group PLC | 645,000 | 36,847 | ||||||
| DSV A/S | 230,223 | 36,515 | ||||||
| NIBE Industrier AB, Class B | 3,878,804 | 36,271 | ||||||
| Thales SA | 271,438 | 34,700 | ||||||
| Techtronic Industries Co., Ltd. | 2,724,000 | 30,332 | ||||||
| Legrand SA | 358,100 | 28,833 | ||||||
| International Container Terminal Services, Inc. | 7,953,240 | 28,625 | ||||||
| Shenzhen Inovance Technology Co., Ltd., Class A | 2,350,967 | 23,513 | ||||||
| ZTO Express (Cayman), Inc., Class A (ADR) | 685,354 | 18,415 | ||||||
| Diploma PLC | 540,545 | 18,165 | ||||||
| Rumo SA | 5,039,366 | 17,763 | ||||||
| Grab Holdings, Ltd., Class A1 | 5,356,295 | 17,247 | ||||||
| Brenntag SE | 259,299 | 16,578 | ||||||
| CCR SA, ordinary nominative shares | 5,580,000 | 11,435 | ||||||
| SMC Corp. | 26,900 | 11,385 | ||||||
| Airports of Thailand PCL, foreign registered shares1 | 5,078,900 | 11,000 | ||||||
| Kingspan Group PLC | 153,796 | 8,281 | ||||||
| Larsen & Toubro, Ltd. | 327,351 | 8,232 | ||||||
| Bureau Veritas SA | 292,900 | 7,709 | ||||||
| AB Volvo, Class B | 396,824 | 7,185 | ||||||
| LIXIL Corp. | 441,700 | 6,731 | ||||||
| Fluidra, SA, non-registered shares | 432,985 | 6,715 | ||||||
| BAE Systems PLC | 617,024 | 6,377 | ||||||
| Zhejiang Sanhua Intelligent Controls Co., Ltd., Class A | 846,334 | 2,578 | ||||||
| 1,118,124 | ||||||||
| Information technology 13.74% | ||||||||
| SK hynix, Inc. | 3,255,725 | 195,968 | ||||||
| Shopify, Inc., Class A, subordinate voting shares1 | 4,215,370 | 146,315 | ||||||
| ASML Holding NV | 210,218 | 113,792 | ||||||
| Taiwan Semiconductor Manufacturing Company, Ltd. | 6,501,000 | 94,750 | ||||||
| Nice, Ltd. (ADR)1 | 432,150 | 83,102 | ||||||
| Fujitsu, Ltd. | 437,900 | 57,990 | ||||||
| Lasertec Corp. | 320,511 | 53,238 | ||||||
| Samsung Electronics Co., Ltd. | 631,500 | 27,848 | ||||||
| NXP Semiconductors NV | 173,200 | 27,371 | ||||||
| Disco Corp. | 65,800 | 18,915 | ||||||
| Atlassian Corp., Class A1 | 107,001 | 13,769 | ||||||
| OBIC Co., Ltd. | 83,700 | 12,374 | ||||||
| Constellation Software, Inc. | 7,730 | 12,069 | ||||||
| TELUS International (Cda), Inc., subordinate voting shares1 | 526,752 | 10,424 | ||||||
| Suse SA1,2 | 576,586 | 10,410 | ||||||
| Kingdee International Software Group Co., Ltd.1 | 4,786,000 | 10,188 | ||||||
| Dassault Systemes SE | 277,000 | 9,991 | ||||||
| ASM International NV | 25,152 | 6,368 | ||||||
| Infosys, Ltd. | 329,392 | 5,967 | ||||||
| Tata Consultancy Services, Ltd. | 113,863 | 4,483 | ||||||
| Canva, Inc.1,3,4 | 4,819 | 4,282 | ||||||
| PagSeguro Digital, Ltd., Class A1 | 426,548 | 3,728 | ||||||
| 923,342 | ||||||||
| Health care 12.52% | ||||||||
| Daiichi Sankyo Company, Ltd. | 9,749,808 | 312,457 | ||||||
| Novo Nordisk A/S, Class B | 1,255,260 | 169,962 | ||||||
| Olympus Corp. | 5,808,100 | 102,662 | ||||||
| Bayer AG | 841,261 | 43,436 | ||||||
| American Funds Insurance Series | 65 |
International Fund (continued)
| Common stocks (continued) | Shares | Value (000) |
||||||
| Health care (continued) | ||||||||
| Siemens Healthineers AG | 833,668 | $ | 41,705 | |||||
| Grifols, SA, Class A, non-registered shares1 | 2,789,283 | 32,345 | ||||||
| Grifols, SA, Class B (ADR)1 | 793,690 | 6,747 | ||||||
| WuXi Biologics (Cayman), Inc.1 | 2,504,066 | 19,224 | ||||||
| HOYA Corp. | 198,300 | 19,187 | ||||||
| M3, Inc. | 644,835 | 17,566 | ||||||
| EssilorLuxottica | 80,200 | 14,604 | ||||||
| Insulet Corp.1 | 46,653 | 13,734 | ||||||
| Takeda Pharmaceutical Company, Ltd. | 361,300 | 11,285 | ||||||
| Hapvida Participações e Investimentos SA1 | 8,863,653 | 8,528 | ||||||
| Ambu AS, Class B, non-registered shares1 | 662,880 | 8,411 | ||||||
| Eurofins Scientific SE, non-registered shares | 98,473 | 7,091 | ||||||
| WuXi AppTec Co., Ltd., Class A | 288,960 | 3,345 | ||||||
| WuXi AppTec Co., Ltd., Class H | 312,000 | 3,297 | ||||||
| bioMérieux SA | 58,300 | 6,131 | ||||||
| 841,717 | ||||||||
| Materials 10.64% | ||||||||
| First Quantum Minerals, Ltd. | 10,951,800 | 228,823 | ||||||
| Fortescue Metals Group, Ltd. | 12,796,750 | 178,403 | ||||||
| Vale SA (ADR), ordinary nominative shares | 6,886,607 | 116,865 | ||||||
| Vale SA, ordinary nominative shares | 770,681 | 12,974 | ||||||
| Shin-Etsu Chemical Co., Ltd. | 563,500 | 68,654 | ||||||
| JSR Corp. | 1,681,700 | 33,144 | ||||||
| Ivanhoe Mines, Ltd., Class A1 | 3,403,051 | 26,893 | ||||||
| Wacker Chemie AG | 147,773 | 18,887 | ||||||
| Linde PLC | 35,287 | 11,510 | ||||||
| Koninklijke DSM NV | 93,550 | 11,469 | ||||||
| BASF SE | 136,760 | 6,789 | ||||||
| Yunnan Energy New Material Co., Ltd., Class A | 19,136 | 362 | ||||||
| 714,773 | ||||||||
| Energy 10.48% | ||||||||
| Reliance Industries, Ltd. | 9,393,560 | 288,158 | ||||||
| Canadian Natural Resources, Ltd. (CAD denominated) | 1,562,283 | 86,756 | ||||||
| Neste OYJ | 1,756,952 | 81,150 | ||||||
| Woodside Energy Group, Ltd. | 3,071,566 | 74,317 | ||||||
| Petróleo Brasileiro SA (Petrobras) (ADR), ordinary nominative shares | 6,724,576 | 71,617 | ||||||
| TotalEnergies SE | 1,147,298 | 71,609 | ||||||
| Shell PLC (GBP denominated) | 573,839 | 16,307 | ||||||
| Cenovus Energy, Inc. (CAD denominated) | 725,880 | 14,084 | ||||||
| 703,998 | ||||||||
| Consumer discretionary 9.06% | ||||||||
| MercadoLibre, Inc.1 | 128,451 | 108,700 | ||||||
| Evolution AB | 960,556 | 93,812 | ||||||
| Sony Group Corp. | 920,500 | 70,194 | ||||||
| Galaxy Entertainment Group, Ltd. | 9,204,000 | 60,944 | ||||||
| LVMH Moët Hennessy-Louis Vuitton SE | 72,682 | 52,799 | ||||||
| Flutter Entertainment PLC1 | 313,163 | 42,911 | ||||||
| Ferrari NV (EUR denominated) | 177,292 | 37,933 | ||||||
| Kering SA | 70,951 | 36,312 | ||||||
| Maruti Suzuki India, Ltd. | 303,300 | 30,675 | ||||||
| Entain PLC | 1,832,094 | 29,375 | ||||||
| Coupang, Inc., Class A1 | 1,304,214 | 19,185 | ||||||
| Mercedes-Benz Group AG | 136,786 | 8,976 | ||||||
| InterContinental Hotels Group PLC | 155,468 | 8,949 | ||||||
| Aptiv PLC1 | 84,000 | 7,823 | ||||||
| 608,588 | ||||||||
| 66 | American Funds Insurance Series |
International Fund (continued)
| Common stocks (continued) | Shares | Value (000) |
||||||
| Financials 9.05% | ||||||||
| Kotak Mahindra Bank, Ltd. | 7,207,964 | $ | 158,591 | |||||
| AIA Group, Ltd. | 12,210,576 | 134,524 | ||||||
| Aegon NV | 12,263,736 | 62,212 | ||||||
| HDFC Bank, Ltd. | 2,216,455 | 43,632 | ||||||
| HDFC Bank, Ltd. (ADR) | 207,750 | 14,212 | ||||||
| Nu Holdings, Ltd., Class A1 | 8,115,368 | 33,030 | ||||||
| Bajaj Finance, Ltd. | 396,342 | 31,369 | ||||||
| ING Groep NV | 2,331,678 | 28,447 | ||||||
| Axis Bank, Ltd. | 1,917,190 | 21,549 | ||||||
| FinecoBank SpA | 1,211,135 | 20,184 | ||||||
| Futu Holdings, Ltd. (ADR)1 | 375,890 | 15,280 | ||||||
| China Merchants Bank Co., Ltd., Class A | 2,726,800 | 14,621 | ||||||
| B3 SA-Brasil, Bolsa, Balcao | 4,413,000 | 11,041 | ||||||
| Allfunds Group PLC | 1,266,915 | 8,853 | ||||||
| Bajaj Finserv, Ltd. | 325,950 | 6,074 | ||||||
| XP, Inc., Class A1 | 292,000 | 4,479 | ||||||
| 608,098 | ||||||||
| Communication services 6.20% | ||||||||
| Sea, Ltd., Class A (ADR)1 | 3,557,478 | 185,096 | ||||||
| Bharti Airtel, Ltd. | 12,732,125 | 123,766 | ||||||
| Bharti Airtel, Ltd., interim shares | 836,308 | 4,373 | ||||||
| Universal Music Group NV | 1,717,633 | 41,462 | ||||||
| Informa PLC | 3,630,108 | 27,216 | ||||||
| Ubisoft Entertainment SA1 | 518,403 | 14,715 | ||||||
| Singapore Telecommunications, Ltd. | 5,800,500 | 11,136 | ||||||
| Vivendi SE | 907,392 | 8,683 | ||||||
| Yandex NV, Class A1,3 | 313,000 | — | 5 | |||||
| 416,447 | ||||||||
| Consumer staples 4.31% | ||||||||
| Kweichow Moutai Co., Ltd., Class A | 224,223 | 55,485 | ||||||
| Danone SA | 878,392 | 46,277 | ||||||
| Seven & i Holdings Co., Ltd. | 984,200 | 42,102 | ||||||
| Treasury Wine Estates, Ltd. | 4,139,490 | 38,250 | ||||||
| British American Tobacco PLC | 911,000 | 36,144 | ||||||
| Kobe Bussan Co., Ltd. | 754,900 | 21,791 | ||||||
| CP ALL PCL, foreign registered shares | 9,053,300 | 17,849 | ||||||
| Nestlé SA | 78,463 | 9,061 | ||||||
| Dabur India, Ltd. | 933,875 | 6,324 | ||||||
| Shiseido Company, Ltd. | 122,000 | 6,012 | ||||||
| Essity Aktiebolag, Class B | 211,237 | 5,544 | ||||||
| Pernod Ricard SA | 22,974 | 4,516 | ||||||
| Diageo PLC | 13,194 | 583 | ||||||
| 289,938 | ||||||||
| Utilities 1.77% | ||||||||
| ENN Energy Holdings, Ltd. | 8,532,700 | 119,038 | ||||||
| Real estate 0.58% | ||||||||
| ESR Group, Ltd. | 14,852,600 | 31,175 | ||||||
| Ayala Land, Inc. | 14,181,500 | 7,891 | ||||||
| 39,066 | ||||||||
| Total common stocks (cost: $5,702,657,000) | 6,383,129 | |||||||
| Preferred securities 0.79% | ||||||||
| Health care 0.29% | ||||||||
| Grifols, SA, Class B, nonvoting non-registered preferred shares1 | 2,274,930 | 19,221 | ||||||
| American Funds Insurance Series | 67 |
International Fund (continued)
| Preferred securities (continued) | Shares | Value (000) |
||||||
| Energy 0.20% | ||||||||
| Petróleo Brasileiro SA (Petrobras), preferred nominative shares | 2,980,131 | $ | 13,829 | |||||
| Financials 0.16% | ||||||||
| Itaú Unibanco Holding SA, preferred nominative shares | 2,246,000 | 10,635 | ||||||
| Consumer discretionary 0.13% | ||||||||
| Dr. Ing. h.c. F. Porsche AG, nonvoting non-registered preferred shares1 | 88,248 | 8,953 | ||||||
| Information technology 0.01% | ||||||||
| Canva, Inc., Series A, noncumulative preferred shares1,3,4 | 422 | 375 | ||||||
| Canva, Inc., Series A-3, noncumulative preferred shares1,3,4 | 18 | 16 | ||||||
| Canva, Inc., Series A-4, noncumulative preferred shares1,3,4 | 1 | 1 | ||||||
| 392 | ||||||||
| Total preferred securities (cost: $78,028,000) | 53,030 | |||||||
| Rights & warrants 0.13% | ||||||||
| Health care 0.13% | ||||||||
| WuXi AppTec Co., Ltd., Class A, warrants, expire 11/21/20231,6 | 729,706 | 8,446 | ||||||
| Total rights & warrants (cost: $8,772,000) | 8,446 | |||||||
| Short-term securities 4.57% | ||||||||
| Money market investments 4.55% | ||||||||
| Capital Group Central Cash Fund 4.31%7,8 | 3,060,530 | 306,023 | ||||||
| Money market investments purchased with collateral from securities on loan 0.02% | ||||||||
| Goldman Sachs Financial Square Government Fund, Institutional Shares 4.15%7,9 | 603,851 | 604 | ||||||
| Capital Group Central Cash Fund 4.31%7,8,9 | 4,223 | 422 | ||||||
| Invesco Short-Term Investments Trust – Government & Agency Portfolio, Institutional Class 4.22%7,9 | 420,189 | 420 | ||||||
| 1,446 | ||||||||
| Total short-term securities (cost: $307,420,000) | 307,469 | |||||||
| Total investment securities 100.48% (cost: $6,096,877,000) | 6,752,074 | |||||||
| Other assets less liabilities (0.48)% | (32,493 | ) | ||||||
| Net assets 100.00% | $ | 6,719,581 | ||||||
| 68 | American Funds Insurance Series |
International Fund (continued)
Investments in affiliates8
| Value of affiliates at 1/1/2022 (000) |
Additions (000) |
Reductions (000) |
Net realized loss (000) |
Net unrealized depreciation (000) |
Value of affiliates at 12/31/2022 (000) |
Dividend income (000) |
||||||||||||||||||||||
| Short-term securities 4.56% | ||||||||||||||||||||||||||||
| Money market investments 4.55% | ||||||||||||||||||||||||||||
| Capital Group Central Cash Fund 4.31%7 | $ | 977,398 | $ | 1,494,158 | $ | 2,165,364 | $ | (112 | ) | $ | (57 | ) | $ | 306,023 | $ | 9,392 | ||||||||||||
| Money market investments purchased with collateral from securities on loan 0.01% | ||||||||||||||||||||||||||||
| Capital Group Central Cash Fund 4.31%7,9 | 34,059 | 33,637 | 10 | 422 | — | 11 | ||||||||||||||||||||||
| Total 4.56% | $ | (112 | ) | $ | (57 | ) | $ | 306,445 | $ | 9,392 | ||||||||||||||||||
Restricted securities4
| Percent | ||||||||||||||
| Acquisition | Cost | Value | of net | |||||||||||
| date(s) | (000) | (000) | assets | |||||||||||
| Canva, Inc.1,3 | 8/26/2021-11/4/2021 | $ | 8,215 | $ | 4,282 | .06 | % | |||||||
| Canva, Inc., Series A, noncumulative preferred shares1,3 | 11/4/2021 | 719 | 375 | .01 | ||||||||||
| Canva, Inc., Series A-3, noncumulative preferred shares1,3 | 11/4/2021 | 31 | 16 | .00 | ||||||||||
| Canva, Inc., Series A-4, noncumulative preferred shares1,3 | 11/4/2021 | 2 | 1 | .00 | ||||||||||
| Total | $ | 8,967 | $ | 4,674 | .07 | % | ||||||||
| 1 | Security did not produce income during the last 12 months. |
| 2 | All or a portion of this security was on loan. The total value of all such securities was $1,530,000, which represented .02% of the net assets of the fund. Refer to Note 5 for more information on securities lending. |
| 3 | Value determined using significant unobservable inputs. |
| 4 | Restricted security, other than Rule 144A securities or commercial paper issued pursuant to Section 4(a)(2) of the Securities Act of 1933. The total value of all such restricted securities was $4,674,000, which represented .07% of the net assets of the fund. |
| 5 | Amount less than one thousand. |
| 6 | Acquired in a transaction exempt from registration under Rule 144A or, for commercial paper, Section 4(a)(2) of the Securities Act of 1933. May be resold in the U.S. in transactions exempt from registration, normally to qualified institutional buyers. The total value of all such securities was $8,446,000, which represented .13% of the net assets of the fund. |
| 7 | Rate represents the seven-day yield at 12/31/2022. |
| 8 | Part of the same “group of investment companies” as the fund as defined under the Investment Company Act of 1940, as amended. |
| 9 | Security purchased with cash collateral from securities on loan. Refer to Note 5 for more information on securities lending. |
| 10 | Represents net activity. Refer to Note 5 for more information on securities lending. |
| 11 | Dividend income is included with securities lending income in the fund’s statement of operations and is not shown in this table. |
Key to abbreviations
ADR = American Depositary Receipts
CAD = Canadian dollars
EUR = Euros
GBP = British pounds
Refer to the notes to financial statements.
| American Funds Insurance Series | 69 |
New World Fund
Investment portfolio December 31, 2022
| Common stocks 90.37% | Shares | Value (000) |
||||||
| Information technology 14.17% | ||||||||
| Microsoft Corp. | 343,380 | $ | 82,348 | |||||
| Taiwan Semiconductor Manufacturing Company, Ltd. | 3,763,000 | 54,844 | ||||||
| Broadcom, Inc. | 50,719 | 28,359 | ||||||
| ASML Holding NV | 52,210 | 28,261 | ||||||
| Micron Technology, Inc. | 505,143 | 25,247 | ||||||
| Wolfspeed, Inc.1 | 312,105 | 21,548 | ||||||
| Mastercard, Inc., Class A | 47,073 | 16,369 | ||||||
| Apple, Inc. | 114,398 | 14,864 | ||||||
| Tata Consultancy Services, Ltd. | 274,095 | 10,793 | ||||||
| Visa, Inc., Class A | 50,545 | 10,501 | ||||||
| Keyence Corp. | 23,700 | 9,279 | ||||||
| Infosys, Ltd. (ADR) | 342,942 | 6,176 | ||||||
| Infosys, Ltd. | 131,247 | 2,378 | ||||||
| SAP SE | 70,089 | 7,233 | ||||||
| Silergy Corp. | 459,376 | 6,514 | ||||||
| Synopsys, Inc.1 | 20,004 | 6,387 | ||||||
| TELUS International (Cda), Inc., subordinate voting shares1 | 321,870 | 6,370 | ||||||
| Samsung Electronics Co., Ltd. | 143,145 | 6,312 | ||||||
| NVIDIA Corp. | 42,638 | 6,231 | ||||||
| EPAM Systems, Inc.1 | 18,611 | 6,100 | ||||||
| PagSeguro Digital, Ltd., Class A1 | 674,012 | 5,891 | ||||||
| Edenred SA | 100,382 | 5,462 | ||||||
| Accenture PLC, Class A | 20,142 | 5,375 | ||||||
| Network International Holdings PLC1 | 1,472,831 | 5,275 | ||||||
| Nokia Corp. | 1,113,649 | 5,174 | ||||||
| Tokyo Electron, Ltd. | 15,700 | 4,664 | ||||||
| Nice, Ltd. (ADR)1 | 23,806 | 4,578 | ||||||
| Kingdee International Software Group Co., Ltd.1 | 2,128,000 | 4,530 | ||||||
| Lasertec Corp. | 27,100 | 4,501 | ||||||
| Amadeus IT Group SA, Class A, non-registered shares1 | 70,704 | 3,646 | ||||||
| Applied Materials, Inc. | 36,011 | 3,507 | ||||||
| MediaTek, Inc. | 142,000 | 2,884 | ||||||
| ASM International NV | 10,858 | 2,749 | ||||||
| SK hynix, Inc. | 41,006 | 2,468 | ||||||
| Trimble, Inc.1 | 41,404 | 2,093 | ||||||
| Logitech International SA | 31,053 | 1,927 | ||||||
| Euronet Worldwide, Inc.1 | 19,369 | 1,828 | ||||||
| KLA Corp. | 4,743 | 1,788 | ||||||
| Coforge, Ltd. | 33,028 | 1,544 | ||||||
| Cognizant Technology Solutions Corp., Class A | 25,905 | 1,482 | ||||||
| Globant SA1 | 8,094 | 1,361 | ||||||
| Hamamatsu Photonics KK | 25,400 | 1,222 | ||||||
| Hundsun Technologies, Inc., Class A | 198,090 | 1,153 | ||||||
| Atlassian Corp., Class A1 | 8,731 | 1,124 | ||||||
| VeriSign, Inc.1 | 4,446 | 913 | ||||||
| MKS Instruments, Inc. | 8,486 | 719 | ||||||
| StoneCo, Ltd., Class A1 | 67,249 | 635 | ||||||
| Autodesk, Inc.1 | 3,359 | 628 | ||||||
| Disco Corp. | 2,100 | 604 | ||||||
| Advanced Micro Devices, Inc.1 | 8,455 | 548 | ||||||
| Canva, Inc.1,2,3 | 385 | 342 | ||||||
| Intel Corp. | 3,575 | 95 | ||||||
| 436,824 | ||||||||
| Financials 13.94% | ||||||||
| Kotak Mahindra Bank, Ltd. | 2,819,943 | 62,045 | ||||||
| AIA Group, Ltd. | 4,251,600 | 46,840 | ||||||
| Ping An Insurance (Group) Company of China, Ltd., Class H | 4,499,844 | 29,700 | ||||||
| HDFC Bank, Ltd. | 1,423,436 | 28,021 | ||||||
| B3 SA-Brasil, Bolsa, Balcao | 10,338,358 | 25,867 | ||||||
| Capitec Bank Holdings, Ltd. | 206,384 | 22,575 | ||||||
| Bajaj Finance, Ltd. | 215,621 | 17,066 | ||||||
| 70 | American Funds Insurance Series |
New World Fund (continued)
| Common stocks (continued) | Shares | Value (000) |
||||||
| Financials (continued) | ||||||||
| ICICI Bank, Ltd. | 967,310 | $ | 10,368 | |||||
| ICICI Bank, Ltd. (ADR) | 290,583 | 6,361 | ||||||
| AU Small Finance Bank, Ltd. | 1,923,084 | 15,145 | ||||||
| Bank Central Asia Tbk PT | 20,947,600 | 11,484 | ||||||
| UniCredit SpA | 750,471 | 10,672 | ||||||
| Industrial and Commercial Bank of China, Ltd., Class H | 20,423,000 | 10,519 | ||||||
| Nu Holdings, Ltd., Class A1 | 2,383,890 | 9,702 | ||||||
| Bank Mandiri (Persero) Tbk PT | 15,218,600 | 9,671 | ||||||
| XP, Inc., Class A1 | 602,058 | 9,236 | ||||||
| China Merchants Bank Co., Ltd., Class H | 1,461,000 | 8,099 | ||||||
| Discovery, Ltd.1 | 1,031,032 | 7,486 | ||||||
| Banco Bilbao Vizcaya Argentaria, SA | 1,202,030 | 7,259 | ||||||
| Bank Rakyat Indonesia (Persero) Tbk PT | 19,736,600 | 6,257 | ||||||
| Eurobank Ergasias Services and Holdings SA1 | 5,321,431 | 6,007 | ||||||
| Bank of Baroda | 2,476,327 | 5,528 | ||||||
| Moody’s Corp. | 17,666 | 4,922 | ||||||
| United Overseas Bank, Ltd. | 191,900 | 4,401 | ||||||
| Canara Bank | 1,094,165 | 4,386 | ||||||
| Erste Group Bank AG | 135,838 | 4,332 | ||||||
| East Money Information Co., Ltd., Class A | 1,416,356 | 3,955 | ||||||
| Alpha Services and Holdings SA1 | 3,535,444 | 3,772 | ||||||
| Hong Kong Exchanges and Clearing, Ltd. | 76,500 | 3,306 | ||||||
| Bajaj Finserv, Ltd. | 176,756 | 3,294 | ||||||
| Standard Bank Group, Ltd. | 330,214 | 3,261 | ||||||
| Aon PLC, Class A | 10,455 | 3,138 | ||||||
| DBS Group Holdings, Ltd. | 122,873 | 3,111 | ||||||
| Grupo Financiero Banorte, SAB de CV, Series O | 393,905 | 2,828 | ||||||
| China Pacific Insurance (Group) Co., Ltd., Class H | 1,158,294 | 2,558 | ||||||
| Postal Savings Bank of China Co., Ltd., Class H | 3,919,000 | 2,421 | ||||||
| Bank of Ningbo Co., Ltd., Class A | 498,700 | 2,329 | ||||||
| S&P Global, Inc. | 6,883 | 2,305 | ||||||
| National Bank of Greece SA1 | 482,747 | 1,931 | ||||||
| Piramal Enterprises, Ltd. | 169,260 | 1,690 | ||||||
| Banco Santander México, SA, Institución de Banca Múltiple, Grupo Financiero Santander México, Class B | 1,294,654 | 1,515 | ||||||
| Lufax Holding, Ltd. (ADR) | 751,404 | 1,458 | ||||||
| China Construction Bank Corp., Class H | 2,110,000 | 1,322 | ||||||
| TISCO Financial Group PCL, foreign registered shares | 343,800 | 983 | ||||||
| Fairfax Financial Holdings, Ltd., subordinate voting shares | 1,008 | 597 | ||||||
| HDFC Life Insurance Company, Ltd. | 23,813 | 162 | ||||||
| Moscow Exchange MICEX-RTS PJSC1,2 | 438,203 | — | 4 | |||||
| Sberbank of Russia PJSC1,2 | 2,662,164 | — | 4 | |||||
| 429,885 | ||||||||
| Health care 13.14% | ||||||||
| Novo Nordisk A/S, Class B | 469,272 | 63,539 | ||||||
| Thermo Fisher Scientific, Inc. | 72,737 | 40,056 | ||||||
| Eli Lilly and Company | 98,730 | 36,119 | ||||||
| AstraZeneca PLC | 199,832 | 27,120 | ||||||
| Max Healthcare Institute, Ltd.1 | 4,642,420 | 24,670 | ||||||
| PerkinElmer, Inc. | 129,804 | 18,201 | ||||||
| Abbott Laboratories | 165,381 | 18,157 | ||||||
| BeiGene, Ltd. (ADR)1 | 65,681 | 14,446 | ||||||
| BeiGene, Ltd.1 | 44,100 | 753 | ||||||
| Jiangsu Hengrui Medicine Co., Ltd., Class A | 2,545,088 | 14,110 | ||||||
| EssilorLuxottica | 72,078 | 13,125 | ||||||
| Danaher Corp. | 48,758 | 12,941 | ||||||
| Rede D’Or Sao Luiz SA | 1,633,717 | 9,153 | ||||||
| Hypera SA, ordinary nominative shares | 1,024,373 | 8,770 | ||||||
| Pfizer, Inc. | 167,880 | 8,602 | ||||||
| Laurus Labs, Ltd. | 1,901,101 | 8,597 | ||||||
| WuXi Biologics (Cayman), Inc.1 | 1,102,600 | 8,465 | ||||||
| American Funds Insurance Series | 71 |
New World Fund (continued)
| Common stocks (continued) | Shares | Value (000) |
||||||
| Health care (continued) | ||||||||
| CSL, Ltd. | 41,156 | $ | 8,025 | |||||
| Olympus Corp. | 386,100 | 6,825 | ||||||
| Carl Zeiss Meditec AG, non-registered shares | 52,892 | 6,676 | ||||||
| CanSino Biologics, Inc., Class H | 673,696 | 5,763 | ||||||
| WuXi AppTec Co., Ltd., Class H | 268,500 | 2,837 | ||||||
| WuXi AppTec Co., Ltd., Class A | 203,359 | 2,354 | ||||||
| Siemens Healthineers AG | 100,533 | 5,029 | ||||||
| Hapvida Participações e Investimentos SA1 | 4,948,421 | 4,761 | ||||||
| Zoetis, Inc., Class A | 31,997 | 4,689 | ||||||
| Innovent Biologics, Inc.1 | 1,062,373 | 4,561 | ||||||
| Straumann Holding AG | 28,092 | 3,181 | ||||||
| Legend Biotech Corp. (ADR)1 | 63,359 | 3,163 | ||||||
| Hutchmed China, Ltd.1,5 | 786,002 | 2,418 | ||||||
| Shionogi & Co., Ltd. | 46,400 | 2,308 | ||||||
| Teva Pharmaceutical Industries, Ltd. (ADR)1 | 238,996 | 2,180 | ||||||
| Mettler-Toledo International, Inc.1 | 1,435 | 2,074 | ||||||
| OdontoPrev SA, ordinary nominative shares | 1,000,547 | 1,711 | ||||||
| Align Technology, Inc.1 | 7,299 | 1,539 | ||||||
| Asahi Intecc Co., Ltd. | 91,600 | 1,510 | ||||||
| Genus PLC | 40,970 | 1,477 | ||||||
| Angelalign Technology, Inc. | 85,000 | 1,340 | ||||||
| Medtronic PLC | 16,413 | 1,276 | ||||||
| Merck KGaA | 5,502 | 1,066 | ||||||
| Bayer AG | 16,010 | 827 | ||||||
| Zai Lab, Ltd. (ADR)1 | 16,060 | 493 | ||||||
| Shandong Pharmaceutical Glass Co., Ltd., Class A | 66,700 | 272 | ||||||
| 405,179 | ||||||||
| Industrials 10.83% | ||||||||
| Airbus SE, non-registered shares | 370,290 | 44,028 | ||||||
| General Electric Co. | 229,310 | 19,214 | ||||||
| Larsen & Toubro, Ltd. | 722,885 | 18,180 | ||||||
| Safran SA | 141,435 | 17,674 | ||||||
| IMCD NV | 113,074 | 16,151 | ||||||
| DSV A/S | 97,381 | 15,445 | ||||||
| Shenzhen Inovance Technology Co., Ltd., Class A | 1,435,674 | 14,359 | ||||||
| Copa Holdings, SA, Class A1 | 172,274 | 14,328 | ||||||
| Carrier Global Corp. | 342,044 | 14,109 | ||||||
| International Container Terminal Services, Inc. | 3,660,200 | 13,173 | ||||||
| Grab Holdings, Ltd., Class A1 | 3,941,298 | 12,691 | ||||||
| Rumo SA | 3,544,401 | 12,493 | ||||||
| Caterpillar, Inc. | 38,431 | 9,207 | ||||||
| ZTO Express (Cayman), Inc., Class A (ADR) | 294,858 | 7,923 | ||||||
| Daikin Industries, Ltd. | 45,200 | 6,953 | ||||||
| Mitsui & Co., Ltd. | 239,100 | 6,952 | ||||||
| InPost SA1 | 768,099 | 6,492 | ||||||
| TransDigm Group, Inc. | 9,831 | 6,190 | ||||||
| Zhejiang Sanhua Intelligent Controls Co., Ltd., Class A | 2,015,524 | 6,140 | ||||||
| Suzhou Maxwell Technologies Co., Ltd., Class A | 89,800 | 5,321 | ||||||
| Thales SA | 39,462 | 5,045 | ||||||
| Interpump Group SpA | 109,354 | 4,954 | ||||||
| Boeing Company1 | 25,403 | 4,839 | ||||||
| Raytheon Technologies Corp. | 39,064 | 3,942 | ||||||
| Contemporary Amperex Technology Co., Ltd., Class A | 67,547 | 3,825 | ||||||
| Wizz Air Holdings PLC1 | 153,309 | 3,512 | ||||||
| Siemens AG | 24,155 | 3,353 | ||||||
| Centre Testing International Group Co., Ltd. | 953,496 | 3,059 | ||||||
| SMC Corp. | 7,000 | 2,963 | ||||||
| BAE Systems PLC | 273,358 | 2,825 | ||||||
| Spirax-Sarco Engineering PLC | 21,156 | 2,718 | ||||||
| Epiroc AB, Class B | 153,337 | 2,472 | ||||||
| Bharat Electronics, Ltd. | 1,997,357 | 2,412 | ||||||
| 72 | American Funds Insurance Series |
New World Fund (continued)
| Common stocks (continued) | Shares | Value (000) |
||||||
| Industrials (continued) | ||||||||
| Legrand SA | 28,999 | $ | 2,335 | |||||
| Bureau Veritas SA | 85,112 | 2,240 | ||||||
| ABB, Ltd. | 71,165 | 2,168 | ||||||
| AirTAC International Group | 70,000 | 2,119 | ||||||
| Techtronic Industries Co., Ltd. | 180,500 | 2,010 | ||||||
| Grupo Aeroportuario del Pacífico, SAB de CV, Class B | 138,094 | 1,978 | ||||||
| Hitachi, Ltd. | 32,800 | 1,651 | ||||||
| Atlas Copco AB, Class B | 128,644 | 1,374 | ||||||
| Nidec Corp. | 25,100 | 1,307 | ||||||
| Haitian International Holdings, Ltd. | 485,000 | 1,297 | ||||||
| Experian PLC | 27,683 | 942 | ||||||
| CCR SA, ordinary nominative shares | 343,384 | 704 | ||||||
| Vicor Corp.1 | 8,616 | 463 | ||||||
| Hefei Meyer Optoelectronic Technology, Inc., Class A | 126,100 | 434 | ||||||
| 333,964 | ||||||||
| Consumer discretionary 10.70% | ||||||||
| LVMH Moët Hennessy-Louis Vuitton SE | 58,437 | 42,451 | ||||||
| MercadoLibre, Inc.1 | 33,916 | 28,701 | ||||||
| Midea Group Co., Ltd., Class A | 3,015,168 | 22,397 | ||||||
| Hermès International | 13,597 | 20,982 | ||||||
| Evolution AB | 195,296 | 19,073 | ||||||
| Li Ning Co., Ltd. | 2,222,001 | 19,068 | ||||||
| Galaxy Entertainment Group, Ltd. | 2,661,000 | 17,620 | ||||||
| General Motors Company | 464,326 | 15,620 | ||||||
| H World Group, Ltd. (ADR) | 205,118 | 8,701 | ||||||
| H World Group, Ltd. | 611,320 | 2,631 | ||||||
| YUM! Brands, Inc. | 70,324 | 9,007 | ||||||
| Trip.com Group, Ltd. (ADR)1 | 243,784 | 8,386 | ||||||
| Zhongsheng Group Holdings, Ltd. | 1,519,000 | 7,743 | ||||||
| Kering SA | 13,551 | 6,935 | ||||||
| NIKE, Inc., Class B | 56,533 | 6,615 | ||||||
| Jumbo SA | 367,791 | 6,278 | ||||||
| Astra International Tbk PT | 16,312,800 | 5,943 | ||||||
| IDP Education, Ltd. | 294,204 | 5,437 | ||||||
| Industria de Diseño Textil, SA | 198,585 | 5,288 | ||||||
| Marriott International, Inc., Class A | 35,444 | 5,277 | ||||||
| JD.com, Inc., Class A | 181,431 | 5,100 | ||||||
| Titan Co., Ltd. | 153,168 | 4,794 | ||||||
| Tesla, Inc.1 | 36,323 | 4,474 | ||||||
| adidas AG | 32,573 | 4,447 | ||||||
| Prosus NV, Class N | 63,003 | 4,325 | ||||||
| Alibaba Group Holding, Ltd.1 | 377,472 | 4,168 | ||||||
| Americanas SA, ordinary nominative shares | 1,839,202 | 3,362 | ||||||
| Lear Corp. | 22,412 | 2,779 | ||||||
| Airbnb, Inc., Class A1 | 32,220 | 2,755 | ||||||
| Melco Resorts & Entertainment, Ltd. (ADR)1 | 237,753 | 2,734 | ||||||
| Maruti Suzuki India, Ltd. | 24,671 | 2,495 | ||||||
| Aptiv PLC1 | 23,648 | 2,202 | ||||||
| Booking Holdings, Inc.1 | 1,083 | 2,183 | ||||||
| InterContinental Hotels Group PLC | 37,749 | 2,173 | ||||||
| JD Health International, Inc.1 | 233,200 | 2,133 | ||||||
| Naspers, Ltd., Class N | 10,720 | 1,767 | ||||||
| Stellantis NV | 121,859 | 1,726 | ||||||
| Inchcape PLC | 158,322 | 1,563 | ||||||
| Shangri-La Asia, Ltd.1 | 1,882,000 | 1,542 | ||||||
| Magazine Luiza SA1 | 2,856,097 | 1,482 | ||||||
| Levi Strauss & Co., Class A | 89,390 | 1,387 | ||||||
| Sands China, Ltd.1 | 367,200 | 1,216 | ||||||
| Renault SA1 | 31,040 | 1,034 | ||||||
| FSN E-Commerce Ventures, Ltd. | 499,594 | 932 | ||||||
| Flutter Entertainment PLC1 | 6,201 | 850 | ||||||
| American Funds Insurance Series | 73 |
New World Fund (continued)
| Common stocks (continued) | Shares | Value (000) |
||||||
| Consumer discretionary (continued) | ||||||||
| Cie. Financière Richemont SA, Class A | 6,488 | $ | 840 | |||||
| Gree Electric Appliances, Inc. of Zhuhai, Class A | 132,946 | 617 | ||||||
| Jiumaojiu International Holdings, Ltd. | 196,000 | 517 | ||||||
| Cyrela Brazil Realty SA, ordinary nominative shares | 115,141 | 285 | ||||||
| Ozon Holdings PLC (ADR)1,2 | 209,599 | — | 4 | |||||
| 330,035 | ||||||||
| Materials 7.96% | ||||||||
| Vale SA (ADR), ordinary nominative shares | 1,657,863 | 28,134 | ||||||
| Vale SA, ordinary nominative shares | 1,563,228 | 26,316 | ||||||
| First Quantum Minerals, Ltd. | 1,427,502 | 29,826 | ||||||
| Freeport-McMoRan, Inc. | 632,561 | 24,037 | ||||||
| Asian Paints, Ltd. | 524,675 | 19,588 | ||||||
| Albemarle Corp. | 72,979 | 15,826 | ||||||
| Linde PLC | 43,780 | 14,280 | ||||||
| Sika AG | 54,150 | 13,066 | ||||||
| Pidilite Industries, Ltd. | 359,013 | 11,037 | ||||||
| Barrick Gold Corp. | 348,685 | 5,990 | ||||||
| Shin-Etsu Chemical Co., Ltd. | 46,300 | 5,641 | ||||||
| LANXESS AG | 133,996 | 5,408 | ||||||
| Sociedad Química y Minera de Chile SA, Class B (ADR) | 59,883 | 4,781 | ||||||
| Wacker Chemie AG | 33,237 | 4,248 | ||||||
| Gerdau SA (ADR) | 743,704 | 4,120 | ||||||
| Givaudan SA | 1,316 | 4,012 | ||||||
| Loma Negra Compania Industrial Argentina SA (ADR) | 505,941 | 3,466 | ||||||
| Fresnillo PLC | 299,094 | 3,247 | ||||||
| Jindal Steel & Power, Ltd. | 427,648 | 2,989 | ||||||
| Shandong Sinocera Functional Material Co., Ltd., Class A | 551,700 | 2,189 | ||||||
| Wheaton Precious Metals Corp. | 52,459 | 2,050 | ||||||
| OCI NV | 50,734 | 1,810 | ||||||
| Amcor PLC (CDI) | 142,086 | 1,703 | ||||||
| Arkema SA | 18,241 | 1,645 | ||||||
| CCL Industries, Inc., Class B, nonvoting shares | 34,789 | 1,486 | ||||||
| Umicore SA | 37,150 | 1,371 | ||||||
| Koninklijke DSM NV | 11,145 | 1,366 | ||||||
| Grupo México, SAB de CV, Series B | 372,626 | 1,308 | ||||||
| Corteva, Inc. | 19,893 | 1,169 | ||||||
| Glencore PLC | 166,729 | 1,115 | ||||||
| Yunnan Energy New Material Co., Ltd., Class A | 53,564 | 1,012 | ||||||
| BASF SE | 13,092 | 650 | ||||||
| Navin Fluorine International, Ltd. | 7,411 | 364 | ||||||
| Polymetal International PLC1 | 76,572 | 228 | ||||||
| Alrosa PJSC1,2 | 1,123,215 | — | 4 | |||||
| 245,478 | ||||||||
| Consumer staples 6.23% | ||||||||
| Kweichow Moutai Co., Ltd., Class A | 119,607 | 29,597 | ||||||
| ITC, Ltd. | 4,065,758 | 16,297 | ||||||
| Bunge, Ltd. | 149,915 | 14,957 | ||||||
| Anheuser-Busch InBev SA/NV | 179,767 | 10,807 | ||||||
| Nestlé SA | 92,198 | 10,648 | ||||||
| Constellation Brands, Inc., Class A | 41,910 | 9,713 | ||||||
| Philip Morris International, Inc. | 89,011 | 9,009 | ||||||
| Varun Beverages, Ltd. | 520,713 | 8,291 | ||||||
| Ajinomoto Co., Inc. | 270,999 | 8,263 | ||||||
| Monster Beverage Corp.1 | 79,331 | 8,054 | ||||||
| Carlsberg A/S, Class B | 47,845 | 6,334 | ||||||
| Kimberly-Clark de México, SAB de CV, Class A, ordinary participation certificates | 3,616,697 | 6,138 | ||||||
| Pernod Ricard SA | 31,035 | 6,100 | ||||||
| Raia Drogasil SA, ordinary nominative shares | 1,191,066 | 5,351 | ||||||
| Avenue Supermarts, Ltd.1 | 96,957 | 4,752 | ||||||
| Japan Tobacco, Inc. | 232,900 | 4,709 | ||||||
| 74 | American Funds Insurance Series |
New World Fund (continued)
| Common stocks (continued) | Shares | Value (000) |
||||||
| Consumer staples (continued) | ||||||||
| Arca Continental, SAB de CV | 559,188 | $ | 4,541 | |||||
| Dabur India, Ltd. | 536,320 | 3,632 | ||||||
| Uni-Charm Corp. | 86,000 | 3,298 | ||||||
| Mondelez International, Inc. | 48,376 | 3,224 | ||||||
| British American Tobacco PLC | 57,762 | 2,292 | ||||||
| L’Oréal SA, non-registered shares | 6,141 | 2,203 | ||||||
| Foshan Haitian Flavouring and Food Co., Ltd., Class A | 189,896 | 2,174 | ||||||
| Proya Cosmetics Co., Ltd., Class A | 83,620 | 2,015 | ||||||
| Danone SA | 34,906 | 1,839 | ||||||
| United Spirits, Ltd.1 | 150,135 | 1,593 | ||||||
| Essity Aktiebolag, Class B | 59,261 | 1,555 | ||||||
| Monde Nissin Corp. | 7,788,000 | 1,553 | ||||||
| Wuliangye Yibin Co., Ltd., Class A | 51,771 | 1,340 | ||||||
| Reckitt Benckiser Group PLC | 18,928 | 1,317 | ||||||
| Diageo PLC | 9,646 | 426 | ||||||
| X5 Retail Group NV (GDR)1,2 | 88,147 | — | 4 | |||||
| 192,022 | ||||||||
| Communication services 5.12% | ||||||||
| Sea, Ltd., Class A (ADR)1 | 440,837 | 22,937 | ||||||
| Alphabet, Inc., Class C1 | 170,931 | 15,167 | ||||||
| Alphabet, Inc., Class A1 | 70,628 | 6,231 | ||||||
| Bharti Airtel, Ltd. | 1,936,137 | 18,821 | ||||||
| Bharti Airtel, Ltd., interim shares | 80,154 | 419 | ||||||
| Tencent Holdings, Ltd. | 398,700 | 16,946 | ||||||
| MTN Group, Ltd. | 1,937,113 | 14,510 | ||||||
| América Móvil, SAB de CV, Series L (ADR) | 579,878 | 10,554 | ||||||
| Netflix, Inc.1 | 32,399 | 9,554 | ||||||
| Meta Platforms, Inc., Class A1 | 66,844 | 8,044 | ||||||
| Telefónica, SA, non-registered shares | 2,013,890 | 7,294 | ||||||
| NetEase, Inc. | 215,200 | 3,137 | ||||||
| NetEase, Inc. (ADR) | 26,801 | 1,946 | ||||||
| Vodafone Group PLC | 4,478,968 | 4,540 | ||||||
| Indus Towers, Ltd. | 1,704,995 | 3,916 | ||||||
| Activision Blizzard, Inc. | 51,137 | 3,914 | ||||||
| Singapore Telecommunications, Ltd. | 1,920,800 | 3,688 | ||||||
| JCDecaux SE1 | 88,804 | 1,689 | ||||||
| Telefônica Brasil SA, ordinary nominative shares | 222,879 | 1,619 | ||||||
| TIM SA | 649,389 | 1,525 | ||||||
| Informa PLC | 166,372 | 1,247 | ||||||
| Sitios Latinoamerica, SAB de CV, Class B11 | 531,908 | 255 | ||||||
| Yandex NV, Class A1,2 | 378,730 | — | 4 | |||||
| 157,953 | ||||||||
| Energy 4.96% | ||||||||
| Reliance Industries, Ltd. | 1,922,257 | 58,967 | ||||||
| TotalEnergies SE | 429,775 | 26,824 | ||||||
| Baker Hughes Co., Class A | 400,704 | 11,833 | ||||||
| New Fortress Energy, Inc., Class A | 199,711 | 8,472 | ||||||
| BP PLC | 1,438,591 | 8,366 | ||||||
| Exxon Mobil Corp. | 66,625 | 7,349 | ||||||
| Hess Corp. | 42,526 | 6,031 | ||||||
| Cheniere Energy, Inc. | 33,338 | 4,999 | ||||||
| Aker BP ASA | 160,241 | 4,995 | ||||||
| Chevron Corp. | 24,508 | 4,399 | ||||||
| Petróleo Brasileiro SA (Petrobras) (ADR), ordinary nominative shares | 240,586 | 2,562 | ||||||
| Shell PLC (GBP denominated) | 88,634 | 2,519 | ||||||
| INPEX Corp. | 229,000 | 2,444 | ||||||
| TechnipFMC PLC1 | 171,689 | 2,093 | ||||||
| American Funds Insurance Series | 75 |
New World Fund (continued)
| Common stocks (continued) | Shares | Value (000) |
||||||
| Energy (continued) | ||||||||
| Galp Energia, SGPS, SA, Class B | 76,673 | $ | 1,037 | |||||
| Gazprom PJSC2 | 945,858 | — | 4 | |||||
| Rosneft Oil Co. PJSC2 | 588,661 | — | 4 | |||||
| 152,890 | ||||||||
| Utilities 1.73% | ||||||||
| ENN Energy Holdings, Ltd. | 1,596,100 | 22,267 | ||||||
| AES Corp. | 494,900 | 14,233 | ||||||
| Engie SA | 433,528 | 6,210 | ||||||
| Enel SpA | 717,325 | 3,858 | ||||||
| Power Grid Corporation of India, Ltd. | 1,407,075 | 3,622 | ||||||
| China Resources Gas Group, Ltd. | 848,600 | 3,161 | ||||||
| China Gas Holdings, Ltd. | 67,400 | 97 | ||||||
| 53,448 | ||||||||
| Real estate 1.59% | ||||||||
| Macrotech Developers, Ltd.1 | 1,294,321 | 17,070 | ||||||
| American Tower Corp. REIT | 36,333 | 7,698 | ||||||
| ESR Group, Ltd. | 2,725,200 | 5,720 | ||||||
| CK Asset Holdings, Ltd. | 920,500 | 5,667 | ||||||
| BR Malls Participações SA, ordinary nominative shares | 3,350,637 | 5,267 | ||||||
| China Resources Mixc Lifestyle Services, Ltd. | 550,000 | 2,794 | ||||||
| CTP NV | 192,994 | 2,273 | ||||||
| Embassy Office Parks REIT | 367,228 | 1,490 | ||||||
| China Overseas Land & Investment, Ltd. | 222,115 | 586 | ||||||
| Country Garden Services Holdings Co., Ltd. | 180,000 | 446 | ||||||
| Ayala Land, Inc. | 198,600 | 110 | ||||||
| 49,121 | ||||||||
| Total common stocks (cost: $2,233,829,000) | 2,786,799 | |||||||
| Preferred securities 1.05% | ||||||||
| Consumer discretionary 0.38% | ||||||||
| Dr. Ing. h.c. F. Porsche AG, nonvoting non-registered preferred shares1 | 43,971 | 4,461 | ||||||
| Getir BV, Series D, preferred shares1,2,3 | 7,768 | 3,736 | ||||||
| Porsche Automobil Holding SE, nonvoting preferred shares | 60,985 | 3,346 | ||||||
| 11,543 | ||||||||
| Materials 0.28% | ||||||||
| Gerdau SA, preferred nominative shares | 1,533,179 | 8,529 | ||||||
| Real estate 0.17% | ||||||||
| QuintoAndar, Ltd., Series E, preferred shares1,2,3 | 32,657 | 4,267 | ||||||
| QuintoAndar, Ltd., Series E-1, preferred shares1,2,3 | 8,400 | 1,098 | ||||||
| 5,365 | ||||||||
| Financials 0.13% | ||||||||
| Itaú Unibanco Holding SA, preferred nominative shares | 339,548 | 1,608 | ||||||
| Itaú Unibanco Holding SA (ADR), preferred nominative shares | 151,962 | 716 | ||||||
| Banco Bradesco SA, preferred nominative shares | 619,768 | 1,778 | ||||||
| 4,102 | ||||||||
| Energy 0.06% | ||||||||
| Petróleo Brasileiro SA (Petrobras) (ADR), preferred nominative shares | 129,613 | 1,204 | ||||||
| Petróleo Brasileiro SA (Petrobras), preferred nominative shares | 156,248 | 725 | ||||||
| 1,929 | ||||||||
| Health care 0.02% | ||||||||
| Grifols, SA, Class B, nonvoting non-registered preferred shares1 | 71,554 | 605 | ||||||
| 76 | American Funds Insurance Series |
New World Fund (continued)
| Preferred securities (continued) | Shares | Value (000) |
||||||
| Industrials 0.01% | ||||||||
| GOL Linhas Aéreas Inteligentes SA, preferred nominative shares1 | 169,406 | $ | 235 | |||||
| Information technology 0.00% | ||||||||
| Canva, Inc., Series A, noncumulative preferred shares1,2,3 | 34 | 30 | ||||||
| Canva, Inc., Series A-3, noncumulative preferred shares1,2,3 | 1 | 1 | ||||||
| 31 | ||||||||
| Total preferred securities (cost: $30,813,000) | 32,339 | |||||||
| Rights & warrants 0.00% | ||||||||
| Materials 0.00% | ||||||||
| Shandong Sinocera Functional Material Co., Ltd., Class A, warrants, expire 10/30/20231,6 | 43,474 | 172 | ||||||
| Consumer discretionary 0.00% | ||||||||
| Compagnie Financière Richemont SA, Class A, warrants, expire 11/22/20231 | 37,386 | 31 | ||||||
| Total rights & warrants (cost: $183,000) | 203 | |||||||
| Bonds, notes & other debt instruments 3.26% | Principal amount (000) |
|||||||
| Bonds & notes of governments & government agencies outside the U.S. 2.66% | ||||||||
| Abu Dhabi (Emirate of) 2.50% 9/30/20296 | USD | 1,000 | 899 | |||||
| Abu Dhabi (Emirate of) 1.70% 3/2/20316 | 885 | 732 | ||||||
| Angola (Republic of) 8.25% 5/9/2028 | 500 | 457 | ||||||
| Angola (Republic of) 8.00% 11/26/20296 | 1,100 | 968 | ||||||
| Angola (Republic of) 8.75% 4/14/20326 | 280 | 243 | ||||||
| Argentine Republic 1.00% 7/9/2029 | 32 | 9 | ||||||
| Argentine Republic 0.50% 7/9/2030 (0.75% on 7/9/2023)7 | 5,341 | 1,454 | ||||||
| Argentine Republic 1.50% 7/9/2035 (3.625% on 7/9/2023)7 | 2,217 | 568 | ||||||
| Argentine Republic 3.875% 1/9/2038 (4.25% on 7/9/2023)7 | 1,318 | 420 | ||||||
| Argentine Republic 3.50% 7/9/2041 (4.875% on 7/9/2029)7 | 5,279 | 1,502 | ||||||
| Armenia (Republic of) 7.15% 3/26/2025 | 290 | 294 | ||||||
| Bahrain (Kingdom of) 6.75% 9/20/20296 | 200 | 200 | ||||||
| Brazil (Federative Republic of) 10.00% 1/1/2027 | BRL | 19,869 | 3,461 | |||||
| Brazil (Federative Republic of) 6.00% 5/15/20278 | 16,377 | 3,109 | ||||||
| Chile (Republic of) 3.10% 5/7/2041 | USD | 375 | 271 | |||||
| Chile (Republic of) 4.34% 3/7/2042 | 645 | 547 | ||||||
| China (People’s Republic of), Series INBK, 2.89% 11/18/2031 | CNY | 36,200 | 5,205 | |||||
| China (People’s Republic of), Series INBK, 3.72% 4/12/2051 | 34,650 | 5,410 | ||||||
| Colombia (Republic of) 4.50% 1/28/2026 | USD | 280 | 264 | |||||
| Colombia (Republic of) 3.25% 4/22/2032 | 700 | 511 | ||||||
| Colombia (Republic of) 8.00% 4/20/2033 | 200 | 201 | ||||||
| Colombia (Republic of) 7.375% 9/18/2037 | 1,090 | 1,025 | ||||||
| Colombia (Republic of) 5.625% 2/26/2044 | 520 | 384 | ||||||
| Colombia (Republic of) 5.20% 5/15/2049 | 755 | 517 | ||||||
| Colombia (Republic of) 4.125% 5/15/2051 | 350 | 211 | ||||||
| Cote d’Ivoire (Republic of) 4.875% 1/30/2032 | EUR | 150 | 127 | |||||
| Dominican Republic 6.875% 1/29/2026 | USD | 370 | 374 | |||||
| Dominican Republic 8.625% 4/20/20276 | 575 | 600 | ||||||
| Dominican Republic 5.50% 2/22/20296 | 275 | 254 | ||||||
| Dominican Republic 11.375% 7/6/2029 | DOP | 12,800 | 221 | |||||
| Dominican Republic 6.00% 2/22/20336 | USD | 150 | 136 | |||||
| Dominican Republic 7.45% 4/30/20446 | 1,125 | 1,053 | ||||||
| Dominican Republic 7.45% 4/30/2044 | 1,000 | 936 | ||||||
| Dominican Republic 5.875% 1/30/20606 | 280 | 206 | ||||||
| Egypt (Arab Republic of) 5.875% 2/16/20316 | 365 | 255 | ||||||
| American Funds Insurance Series | 77 |
New World Fund (continued)
| Bonds, notes & other debt instruments (continued) | Principal amount (000) |
Value (000) |
||||||
| Bonds & notes of governments & government agencies outside the U.S. (continued) | ||||||||
| Egypt (Arab Republic of) 6.375% 4/11/2031 | EUR | 550 | $ | 411 | ||||
| Egypt (Arab Republic of) 7.625% 5/29/20326 | USD | 900 | 669 | |||||
| Egypt (Arab Republic of) 7.625% 5/29/2032 | 275 | 204 | ||||||
| Egypt (Arab Republic of) 8.50% 1/31/2047 | 800 | 536 | ||||||
| Egypt (Arab Republic of) 8.875% 5/29/2050 | 850 | 578 | ||||||
| Egypt (Arab Republic of) 8.75% 9/30/2051 | 755 | 510 | ||||||
| Egypt (Arab Republic of) 8.15% 11/20/20596 | 500 | 329 | ||||||
| Ethiopia (Federal Democratic Republic of) 6.625% 12/11/2024 | 880 | 553 | ||||||
| Export-Import Bank of India 3.25% 1/15/2030 | 1,180 | 1,025 | ||||||
| Gabonese Republic 6.95% 6/16/2025 | 540 | 513 | ||||||
| Gabonese Republic 7.00% 11/24/2031 | 300 | 247 | ||||||
| Ghana (Republic of) 6.375% 2/11/2027 | 485 | 188 | ||||||
| Ghana (Republic of) 7.875% 3/26/2027 | 200 | 79 | ||||||
| Ghana (Republic of) 7.75% 4/7/20296 | 1,125 | 423 | ||||||
| Ghana (Republic of) 7.625% 5/16/2029 | 460 | 174 | ||||||
| Ghana (Republic of) 8.125% 3/26/2032 | 2,130 | 782 | ||||||
| Honduras (Republic of) 6.25% 1/19/2027 | 1,365 | 1,208 | ||||||
| Honduras (Republic of) 5.625% 6/24/2030 | 678 | 547 | ||||||
| Honduras (Republic of) 5.625% 6/24/20306 | 281 | 227 | ||||||
| Indonesia (Republic of) 6.625% 2/17/2037 | 500 | 568 | ||||||
| Indonesia (Republic of) 5.25% 1/17/2042 | 840 | 828 | ||||||
| Iraq (Republic of) 6.752% 3/9/2023 | 960 | 950 | ||||||
| Jordan (Hashemite Kingdom of) 5.75% 1/31/20276 | 800 | 773 | ||||||
| Kazakhstan (Republic of) 6.50% 7/21/20456 | 800 | 836 | ||||||
| Kenya (Republic of) 6.875% 6/24/2024 | 200 | 185 | ||||||
| Kenya (Republic of) 8.25% 2/28/20486 | 1,800 | 1,402 | ||||||
| Mongolia (State of) 8.75% 3/9/2024 | 370 | 359 | ||||||
| Mongolia (State of) 4.45% 7/7/2031 | 300 | 234 | ||||||
| Mozambique (Republic of) 5.00% 9/15/2031 (9.00% on 9/15/2023)7 | 880 | 678 | ||||||
| Oman (Sultanate of) 4.875% 2/1/20256 | 565 | 556 | ||||||
| Oman (Sultanate of) 5.375% 3/8/2027 | 750 | 736 | ||||||
| Oman (Sultanate of) 6.25% 1/25/20316 | 600 | 606 | ||||||
| Pakistan (Islamic Republic of) 8.25% 9/30/20256 | 410 | 199 | ||||||
| Pakistan (Islamic Republic of) 6.00% 4/8/20266 | 380 | 153 | ||||||
| Pakistan (Islamic Republic of) 6.875% 12/5/20276 | 1,050 | 416 | ||||||
| Pakistan (Islamic Republic of) 7.875% 3/31/2036 | 200 | 72 | ||||||
| Pakistan (Islamic Republic of) 8.875% 4/8/2051 | 850 | 300 | ||||||
| Panama (Republic of) 3.75% 4/17/20266 | 678 | 639 | ||||||
| Panama (Republic of) 4.50% 5/15/2047 | 1,155 | 892 | ||||||
| Panama (Republic of) 4.50% 4/16/2050 | 200 | 152 | ||||||
| Panama (Republic of) 4.30% 4/29/2053 | 400 | 290 | ||||||
| Panama (Republic of) 4.50% 1/19/2063 | 200 | 142 | ||||||
| Paraguay (Republic of) 4.70% 3/27/20276 | 400 | 395 | ||||||
| Paraguay (Republic of) 4.95% 4/28/2031 | 320 | 310 | ||||||
| Peru (Republic of) 3.00% 1/15/2034 | 425 | 336 | ||||||
| Peru (Republic of) 6.55% 3/14/2037 | 1,070 | 1,131 | ||||||
| Peru (Republic of) 3.55% 3/10/2051 | 370 | 265 | ||||||
| Peru (Republic of) 2.78% 12/1/2060 | 365 | 214 | ||||||
| PETRONAS Capital, Ltd. 4.55% 4/21/20506 | 400 | 359 | ||||||
| Philippines (Republic of) 1.648% 6/10/2031 | 580 | 465 | ||||||
| Philippines (Republic of) 6.375% 10/23/2034 | 820 | 911 | ||||||
| Philippines (Republic of) 3.95% 1/20/2040 | 700 | 595 | ||||||
| Philippines (Republic of) 3.70% 3/1/2041 | 505 | 414 | ||||||
| Philippines (Republic of) 2.95% 5/5/2045 | 790 | 572 | ||||||
| PT Indonesia Asahan Aluminium Tbk 6.757% 11/15/2048 | 200 | 188 | ||||||
| Qatar (State of) 4.50% 4/23/20286 | 2,000 | 2,016 | ||||||
| Qatar (State of) 4.50% 4/23/2028 | 600 | 605 | ||||||
| Romania 2.00% 1/28/2032 | EUR | 1,375 | 987 | |||||
| Romania 2.00% 4/14/2033 | 300 | 207 | ||||||
| Romania 5.125% 6/15/20486 | USD | 500 | 399 | |||||
| Russian Federation 4.25% 6/23/20279 | 1,000 | 430 | ||||||
| 78 | American Funds Insurance Series |
New World Fund (continued)
| Bonds, notes & other debt instruments (continued) | Principal amount (000) |
Value (000) |
||||||
| Bonds & notes of governments & government agencies outside the U.S. (continued) | ||||||||
| Russian Federation 4.375% 3/21/20296,9 | USD | 800 | $ | 328 | ||||
| Russian Federation 5.10% 3/28/20359 | 1,600 | 656 | ||||||
| Russian Federation 5.25% 6/23/20479 | 1,200 | 492 | ||||||
| Senegal (Republic of) 4.75% 3/13/2028 | EUR | 950 | 880 | |||||
| South Africa (Republic of) 5.875% 6/22/2030 | USD | 1,200 | 1,120 | |||||
| South Africa (Republic of) 5.875% 4/20/2032 | 400 | 362 | ||||||
| Sri Lanka (Democratic Socialist Republic of) 6.125% 6/3/20259 | 450 | 147 | ||||||
| Sri Lanka (Democratic Socialist Republic of) 6.85% 11/3/20259 | 1,904 | 614 | ||||||
| Sri Lanka (Democratic Socialist Republic of) 6.825% 7/18/20269 | 1,270 | 407 | ||||||
| Sri Lanka (Democratic Socialist Republic of) 7.55% 3/28/20309 | 471 | 150 | ||||||
| Tunisia (Republic of) 6.75% 10/31/2023 | EUR | 465 | 420 | |||||
| Tunisia (Republic of) 6.75% 10/31/2023 | 310 | 280 | ||||||
| Tunisia (Republic of) 5.625% 2/17/2024 | 500 | 422 | ||||||
| Tunisia (Republic of) 5.75% 1/30/2025 | USD | 625 | 435 | |||||
| Turkey (Republic of) 11.875% 1/15/2030 | 800 | 954 | ||||||
| Turkey (Republic of) 5.875% 6/26/2031 | 1,170 | 963 | ||||||
| Turkey (Republic of) 4.875% 4/16/2043 | 400 | 261 | ||||||
| Turkey (Republic of) 5.75% 5/11/2047 | 2,005 | 1,373 | ||||||
| Ukraine 8.994% 2/1/20269 | 600 | 134 | ||||||
| Ukraine 7.75% 9/1/20299 | 2,328 | 503 | ||||||
| Ukraine 9.75% 11/1/20309 | 900 | 187 | ||||||
| Ukraine 7.375% 9/25/20349 | 2,180 | 416 | ||||||
| United Mexican States 4.50% 4/22/2029 | 300 | 287 | ||||||
| United Mexican States 4.75% 4/27/2032 | 870 | 817 | ||||||
| United Mexican States 4.75% 3/8/2044 | 1,090 | 884 | ||||||
| United Mexican States 3.75% 4/19/2071 | 200 | 125 | ||||||
| United Mexican States, Series M, 7.50% 6/3/2027 | MXN | 20,360 | 986 | |||||
| United Mexican States, Series M, 7.75% 5/29/2031 | 43,000 | 2,044 | ||||||
| Venezuela (Bolivarian Republic of) 9.00% 5/7/20239 | USD | 1,383 | 121 | |||||
| Venezuela (Bolivarian Republic of) 8.25% 10/13/20249 | 299 | 26 | ||||||
| Venezuela (Bolivarian Republic of) 7.65% 4/21/20259 | 129 | 11 | ||||||
| Venezuela (Bolivarian Republic of) 11.75% 10/21/20269 | 64 | 6 | ||||||
| Venezuela (Bolivarian Republic of) 9.25% 9/15/20279 | 170 | 16 | ||||||
| Venezuela (Bolivarian Republic of) 9.25% 5/7/20289 | 319 | 29 | ||||||
| Venezuela (Bolivarian Republic of) 7.00% 12/1/20189 | 64 | 5 | ||||||
| Venezuela (Bolivarian Republic of) 7.75% 10/13/20199 | 1,149 | 92 | ||||||
| Venezuela (Bolivarian Republic of) 6.00% 12/9/20209 | 950 | 67 | ||||||
| Venezuela (Bolivarian Republic of) 11.95% 8/5/20319 | 106 | 10 | ||||||
| Venezuela (Bolivarian Republic of) 12.75% 8/23/20229 | 85 | 7 | ||||||
| Venezuela (Bolivarian Republic of) 7.00% 3/31/20389 | 107 | 10 | ||||||
| 82,039 | ||||||||
| Corporate bonds, notes & loans 0.51% | ||||||||
| Energy 0.17% | ||||||||
| Oleoducto Central SA 4.00% 7/14/20276 | 255 | 225 | ||||||
| Oleoducto Central SA 4.00% 7/14/2027 | 200 | 177 | ||||||
| Petrobras Global Finance Co. 6.85% 6/5/2115 | 314 | 266 | ||||||
| Petróleos Mexicanos 6.875% 8/4/2026 | 800 | 757 | ||||||
| Petróleos Mexicanos 6.49% 1/23/2027 | 1,670 | 1,525 | ||||||
| Petróleos Mexicanos 8.75% 6/2/2029 | 1,105 | 1,038 | ||||||
| Petróleos Mexicanos 6.70% 2/16/2032 | 622 | 490 | ||||||
| Petrorio Luxembourg SARL 6.125% 6/9/2026 | 200 | 191 | ||||||
| PTT Exploration and Production PCL 2.993% 1/15/2030 | 200 | 174 | ||||||
| Sinopec Group Overseas Development (2018), Ltd. 3.10% 1/8/20516 | 630 | 420 | ||||||
| 5,263 | ||||||||
| American Funds Insurance Series | 79 |
New World Fund (continued)
| Bonds, notes & other debt instruments (continued) | Principal amount (000) |
Value (000) |
||||||
| Corporate bonds, notes & loans (continued) | ||||||||
| Financials 0.09% | ||||||||
| Bangkok Bank PCL 3.733% 9/25/2034 (5-year UST Yield Curve Rate T Note Constant Maturity + 1.90% on 9/25/2029)7 | USD | 800 | $ | 670 | ||||
| CMB International Leasing Management, Ltd. 2.75% 8/12/2030 | 895 | 687 | ||||||
| HDFC Bank, Ltd. 3.70% junior subordinated perpetual bonds (5-Year UST Yield Curve Rate T Note Constant Maturity + 2.925% on 2/25/2027)6,7 | 600 | 516 | ||||||
| Power Financial Corp., Ltd. 6.15% 12/6/2028 | 432 | 439 | ||||||
| Power Financial Corp., Ltd. 4.50% 6/18/2029 | 273 | 253 | ||||||
| Power Financial Corp., Ltd. 3.35% 5/16/2031 | 310 | 258 | ||||||
| 2,823 | ||||||||
| Consumer discretionary 0.07% | ||||||||
| Alibaba Group Holding, Ltd. 4.20% 12/6/2047 | 600 | 461 | ||||||
| Alibaba Group Holding, Ltd. 3.15% 2/9/2051 | 410 | 256 | ||||||
| Arcos Dorados BV 6.125% 5/27/2029 | 450 | 437 | ||||||
| Meituan Dianping 3.05% 10/28/20306 | 800 | 618 | ||||||
| MercadoLibre, Inc. 3.125% 1/14/2031 | 400 | 310 | ||||||
| Sands China, Ltd. 4.875% 6/18/2030 | 220 | 193 | ||||||
| 2,275 | ||||||||
| Materials 0.05% | ||||||||
| Braskem Idesa SAPI 7.45% 11/15/2029 | 775 | 613 | ||||||
| Braskem Idesa SAPI 7.45% 11/15/20296 | 300 | 237 | ||||||
| GC Treasury Center Co., Ltd. 4.40% 3/30/20326 | 230 | 204 | ||||||
| Sasol Financing USA, LLC 5.875% 3/27/2024 | 500 | 491 | ||||||
| 1,545 | ||||||||
| Utilities 0.04% | ||||||||
| AES Panama Generation Holdings SRL 4.375% 5/31/20306 | 280 | 244 | ||||||
| Empresas Publicas de Medellin ESP 4.25% 7/18/20296 | 412 | 328 | ||||||
| Enfragen Energia Sur SA 5.375% 12/30/2030 | 969 | 679 | ||||||
| 1,251 | ||||||||
| Communication services 0.04% | ||||||||
| Axiata SPV5 Labuan, Ltd. 3.064% 8/19/2050 | 357 | 238 | ||||||
| PLDT, Inc. 2.50% 1/23/2031 | 210 | 165 | ||||||
| Tencent Holdings, Ltd. 3.975% 4/11/2029 | 400 | 369 | ||||||
| Tencent Holdings, Ltd. 3.24% 6/3/20506 | 580 | 368 | ||||||
| 1,140 | ||||||||
| Consumer staples 0.02% | ||||||||
| Marfrig Global Foods SA 3.95% 1/29/2031 | 320 | 246 | ||||||
| NBM US Holdings, Inc. 6.625% 8/6/20293 | 420 | 407 | ||||||
| 653 | ||||||||
| Industrials 0.02% | ||||||||
| Mexico City Airport Trust 4.25% 10/31/2026 | 475 | 454 | ||||||
| Health care 0.01% | ||||||||
| Rede D’Or Finance SARL 4.50% 1/22/2030 | 480 | 414 | ||||||
| Total corporate bonds, notes & loans | 15,818 | |||||||
| U.S. Treasury bonds & notes 0.09% | ||||||||
| U.S. Treasury 0.09% | ||||||||
| U.S. Treasury (3-month U.S. Treasury Bill Yield - 0.015%) 4.383% 1/31/202410,11 | 2,730 | 2,729 | ||||||
| Total bonds, notes & other debt instruments (cost: $123,585,000) | 100,586 | |||||||
| 80 | American Funds Insurance Series |
New World Fund (continued)
| Value | ||||||||
| Short-term securities 5.44% | Shares | (000) | ||||||
| Money market investments 5.43% | ||||||||
| Capital Group Central Cash Fund 4.31%12,13 | 1,673,444 | $ | 167,328 | |||||
| Money market investments purchased with collateral from securities on loan 0.01% | ||||||||
| Goldman Sachs Financial Square Government Fund, Institutional Shares 4.15%12,14 | 149,334 | 150 | ||||||
| Capital Group Central Cash Fund 4.31%12,13,14 | 862 | 86 | ||||||
| Invesco Short-Term Investments Trust – Government & Agency Portfolio, Institutional Class 4.22%12,14 | 58,955 | 59 | ||||||
| 295 | ||||||||
| Total short-term securities (cost: $167,602,000) | 167,623 | |||||||
| Total investment securities 100.12% (cost: $2,556,012,000) | 3,087,550 | |||||||
| Other assets less liabilities (0.12)% | (3,766 | ) | ||||||
| Net assets 100.00% | $ | 3,083,784 | ||||||
Futures contracts
| Contracts | Type | Number of contracts |
Expiration | Notional amount (000) |
Value and unrealized (depreciation) appreciation at 12/31/2022 (000) |
||||||||||
| 2 Year Euro-Schatz Futures | Long | 40 | March 2023 | USD | 4,514 | $ | (18 | ) | |||||||
| 5 Year U.S. Treasury Note Futures | Short | 14 | March 2023 | (1,511 | ) | 3 | |||||||||
| 10 Year Euro-Bund Futures | Short | 18 | March 2023 | (2,561 | ) | 126 | |||||||||
| 10 Year Ultra U.S. Treasury Note Futures | Short | 43 | March 2023 | (5,086 | ) | 30 | |||||||||
| 30 Year Ultra U.S. Treasury Bond Futures | Long | 53 | March 2023 | 7,118 | (48 | ) | |||||||||
| $ | 93 | ||||||||||||||
Forward currency contracts
| Unrealized | ||||||||||||||
| (depreciation) | ||||||||||||||
| Contract amount | appreciation | |||||||||||||
| Currency purchased (000) |
Currency sold (000) |
Counterparty | Settlement date |
at 12/31/2022 (000) |
||||||||||
| USD | 77 | EUR | 73 | Goldman Sachs | 1/11/2023 | $ | (1 | ) | ||||||
| USD | 1,484 | EUR | 1,409 | Goldman Sachs | 1/12/2023 | (25 | ) | |||||||
| EUR | 8 | USD | 9 | Barclays Bank PLC | 1/13/2023 | — | 4 | |||||||
| USD | 1,683 | EUR | 1,593 | JPMorgan Chase | 1/13/2023 | (24 | ) | |||||||
| $ | (50 | ) | ||||||||||||
| American Funds Insurance Series | 81 |
New World Fund (continued)
Swap contracts
Credit default swaps
Centrally cleared credit default swaps on credit indices — buy protection
| Upfront | Unrealized | |||||||||||||||||||||
| Notional | Value at | premium | appreciation | |||||||||||||||||||
| Reference | Financing | Payment | Expiration | amount | 12/31/2022 | paid | at 12/31/2022 | |||||||||||||||
| index | rate paid | frequency | date | (000) | (000) | (000) | (000) | |||||||||||||||
| CDX.EM.38 | 1.00% | Quarterly | 12/20/2027 | USD 2,230 | $ 131 | $ 129 | $ 2 | |||||||||||||||
Investments in affiliates13
| Value of affiliates at 1/1/2022 (000) |
Additions (000) |
Reductions (000) |
Net realized loss (000) |
Net unrealized appreciation (000) |
Value of affiliates at 12/31/2022 (000) |
Dividend income (000) |
||||||||||||||||||||||
| Short-term securities 5.43% | ||||||||||||||||||||||||||||
| Money market investments 5.43% | ||||||||||||||||||||||||||||
| Capital Group Central Cash Fund 4.31%12 | $ | 216,764 | $ | 756,276 | $ | 805,673 | $ | (44 | ) | $ | 5 | $ | 167,328 | $ | 4,331 | |||||||||||||
| Money market investments purchased with collateral from securities on loan 0.00% | ||||||||||||||||||||||||||||
| Capital Group Central Cash Fund 4.31%12,14 | 4,255 | 4,169 | 15 | 86 | — | 16 | ||||||||||||||||||||||
| Total 5.43% | $ | (44 | ) | $ | 5 | $ | 167,414 | $ | 4,331 | |||||||||||||||||||
Restricted securities3
| Percent | ||||||||||||||
| Acquisition | Cost | Value | of net | |||||||||||
| date(s) | (000) | (000) | assets | |||||||||||
| QuintoAndar, Ltd., Series E, preferred shares1,2 | 5/26/2021 | $ | 5,258 | $ | 4,267 | .14 | % | |||||||
| QuintoAndar, Ltd., Series E-1, preferred shares1,2 | 12/20/2021 | 1,716 | 1,098 | .04 | ||||||||||
| Getir BV, Series D, preferred shares1,2 | 5/27/2021 | 3,500 | 3,736 | .12 | ||||||||||
| NBM US Holdings, Inc. 6.625% 8/6/2029 | 7/8/2022 | 404 | 407 | .01 | ||||||||||
| Canva, Inc.1,2 | 8/26/2021-11/4/2021 | 656 | 342 | .01 | ||||||||||
| Canva, Inc., Series A, noncumulative preferred shares1,2 | 11/4/2021 | 58 | 30 | .00 | ||||||||||
| Canva, Inc., Series A-3, noncumulative preferred shares1,2 | 11/4/2021 | 2 | 1 | .00 | ||||||||||
| Total | $ | 11,594 | $ | 9,881 | .32 | % | ||||||||
| 82 | American Funds Insurance Series |
New World Fund (continued)
| 1 | Security did not produce income during the last 12 months. |
| 2 | Value determined using significant unobservable inputs. |
| 3 | Restricted security, other than Rule 144A securities or commercial paper issued pursuant to Section 4(a)(2) of the Securities Act of 1933. The total value of all such restricted securities was $9,881,000, which represented .32% of the net assets of the fund. |
| 4 | Amount less than one thousand. |
| 5 | All or a portion of this security was on loan. The total value of all such securities was $311,000, which represented .01% of the net assets of the fund. Refer to Note 5 for more information on securities lending. |
| 6 | Acquired in a transaction exempt from registration under Rule 144A or, for commercial paper, Section 4(a)(2) of the Securities Act of 1933. May be resold in the U.S. in transactions exempt from registration, normally to qualified institutional buyers. The total value of all such securities was $19,603,000, which represented .64% of the net assets of the fund. |
| 7 | Step bond; coupon rate may change at a later date. |
| 8 | Index-linked bond whose principal amount moves with a government price index. |
| 9 | Scheduled interest and/or principal payment was not received. |
| 10 | All or a portion of this security was pledged as collateral. The total value of pledged collateral was $297,000, which represented .01% of the net assets of the fund. |
| 11 | Coupon rate may change periodically. Reference rate and spread are as of the most recent information available. Some coupon rates are determined by the issuer or agent based on current market conditions; therefore, the reference rate and spread are not available. |
| 12 | Rate represents the seven-day yield at 12/31/2022. |
| 13 | Part of the same “group of investment companies” as the fund as defined under the Investment Company Act of 1940, as amended. |
| 14 | Security purchased with cash collateral from securities on loan. Refer to Note 5 for more information on securities lending. |
| 15 | Represents net activity. Refer to Note 5 for more information on securities lending. |
| 16 | Dividend income is included with securities lending income in the fund’s statement of operations and is not shown in this table. |
Key to abbreviations
ADR = American Depositary Receipts
BRL = Brazilian reais
CDI = CREST Depository Interest
CNY = Chinese yuan
DOP = Dominican pesos
EUR = Euros
GBP = British pounds
GDR = Global Depositary Receipts
MXN = Mexican pesos
REIT = Real Estate Investment Trust
USD = U.S. dollars
Refer to the notes to financial statements.
| American Funds Insurance Series | 83 |
Washington Mutual Investors Fund
Investment portfolio December 31, 2022
| Common stocks 95.35% | Shares | Value (000) |
||||||
| Health care 21.99% | ||||||||
| UnitedHealth Group, Inc. | 706,573 | $ | 374,611 | |||||
| Pfizer, Inc. | 5,089,889 | 260,806 | ||||||
| CVS Health Corp. | 2,030,283 | 189,202 | ||||||
| Eli Lilly and Company | 436,276 | 159,607 | ||||||
| Johnson & Johnson | 897,185 | 158,488 | ||||||
| AbbVie, Inc. | 926,694 | 149,763 | ||||||
| AstraZeneca PLC (ADR) | 1,747,998 | 118,514 | ||||||
| Humana, Inc. | 211,641 | 108,400 | ||||||
| Gilead Sciences, Inc. | 1,234,157 | 105,952 | ||||||
| Abbott Laboratories | 676,709 | 74,296 | ||||||
| Cigna Corp. | 197,196 | 65,339 | ||||||
| Elevance Health, Inc. | 118,687 | 60,883 | ||||||
| Danaher Corp. | 228,637 | 60,685 | ||||||
| Bristol-Myers Squibb Company | 577,839 | 41,576 | ||||||
| Novo Nordisk A/S, Class B (ADR) | 214,095 | 28,976 | ||||||
| Zimmer Biomet Holdings, Inc. | 179,120 | 22,838 | ||||||
| Thermo Fisher Scientific, Inc. | 38,181 | 21,026 | ||||||
| Regeneron Pharmaceuticals, Inc.1 | 25,933 | 18,710 | ||||||
| Zoetis, Inc., Class A | 100,063 | 14,664 | ||||||
| Roche Holding AG (ADR) | 322,207 | 12,614 | ||||||
| Molina Healthcare, Inc.1 | 37,656 | 12,435 | ||||||
| Edwards Lifesciences Corp.1 | 85,300 | 6,364 | ||||||
| Baxter International, Inc. | 114,187 | 5,820 | ||||||
| ResMed, Inc. | 24,754 | 5,152 | ||||||
| 2,076,721 | ||||||||
| Information technology 17.56% | ||||||||
| Broadcom, Inc. | 919,032 | 513,857 | ||||||
| Microsoft Corp. | 1,830,263 | 438,934 | ||||||
| Apple, Inc. | 765,754 | 99,494 | ||||||
| ASML Holding NV (New York registered) (ADR) | 157,302 | 85,950 | ||||||
| Intel Corp. | 2,778,330 | 73,431 | ||||||
| Visa, Inc., Class A | 290,482 | 60,351 | ||||||
| Fidelity National Information Services, Inc. | 587,989 | 39,895 | ||||||
| Motorola Solutions, Inc. | 149,004 | 38,400 | ||||||
| Mastercard, Inc., Class A | 110,216 | 38,325 | ||||||
| SAP SE (ADR) | 370,066 | 38,187 | ||||||
| KLA Corp. | 90,564 | 34,145 | ||||||
| Applied Materials, Inc. | 344,981 | 33,594 | ||||||
| Paychex, Inc. | 238,707 | 27,585 | ||||||
| TE Connectivity, Ltd. | 233,588 | 26,816 | ||||||
| Automatic Data Processing, Inc. | 91,188 | 21,781 | ||||||
| Texas Instruments, Inc. | 119,302 | 19,711 | ||||||
| NetApp, Inc. | 285,109 | 17,124 | ||||||
| Synopsys, Inc.1 | 47,178 | 15,064 | ||||||
| Oracle Corp. | 116,989 | 9,563 | ||||||
| QUALCOMM, Inc. | 85,889 | 9,443 | ||||||
| EPAM Systems, Inc.1 | 21,637 | 7,091 | ||||||
| Analog Devices, Inc. | 28,186 | 4,623 | ||||||
| Micron Technology, Inc. | 74,256 | 3,711 | ||||||
| Ciena Corp.1 | 17,550 | 895 | ||||||
| 1,657,970 | ||||||||
| Financials 13.67% | ||||||||
| Marsh & McLennan Companies, Inc. | 1,329,999 | 220,088 | ||||||
| JPMorgan Chase & Co. | 1,231,233 | 165,108 | ||||||
| BlackRock, Inc. | 152,050 | 107,747 | ||||||
| Chubb, Ltd. | 450,474 | 99,375 | ||||||
| CME Group, Inc., Class A | 530,969 | 89,288 | ||||||
| Wells Fargo & Company | 1,821,863 | 75,225 | ||||||
| Bank of America Corp. | 1,370,945 | 45,406 | ||||||
| Citizens Financial Group, Inc. | 1,109,159 | 43,668 | ||||||
| 84 | American Funds Insurance Series |
Washington Mutual Investors Fund (continued)
| Common stocks (continued) | Shares | Value (000) |
||||||
| Financials (continued) | ||||||||
| Discover Financial Services | 414,920 | $ | 40,592 | |||||
| Intercontinental Exchange, Inc. | 394,483 | 40,470 | ||||||
| Morgan Stanley | 458,540 | 38,985 | ||||||
| S&P Global, Inc. | 111,373 | 37,303 | ||||||
| Capital One Financial Corp. | 348,076 | 32,357 | ||||||
| Blackstone, Inc., nonvoting shares | 403,946 | 29,969 | ||||||
| Apollo Asset Management, Inc. | 443,289 | 28,277 | ||||||
| Nasdaq, Inc. | 458,289 | 28,116 | ||||||
| KKR & Co., Inc. | 601,229 | 27,909 | ||||||
| Goldman Sachs Group, Inc. | 78,842 | 27,073 | ||||||
| Aon PLC, Class A | 75,142 | 22,553 | ||||||
| PNC Financial Services Group, Inc. | 130,342 | 20,586 | ||||||
| Toronto-Dominion Bank2 | 236,859 | 15,339 | ||||||
| KeyCorp | 770,460 | 13,422 | ||||||
| Canadian Imperial Bank of Commerce | 314,940 | 12,739 | ||||||
| Arthur J. Gallagher & Co. | 56,249 | 10,605 | ||||||
| Moody’s Corp. | 26,105 | 7,273 | ||||||
| Fifth Third Bancorp | 192,883 | 6,329 | ||||||
| Charles Schwab Corp. | 38,738 | 3,225 | ||||||
| Progressive Corp. | 14,654 | 1,901 | ||||||
| 1,290,928 | ||||||||
| Industrials 11.24% | ||||||||
| Northrop Grumman Corp. | 340,603 | 185,836 | ||||||
| Lockheed Martin Corp. | 220,356 | 107,201 | ||||||
| Raytheon Technologies Corp. | 991,865 | 100,099 | ||||||
| Caterpillar, Inc. | 415,519 | 99,542 | ||||||
| Norfolk Southern Corp. | 312,913 | 77,108 | ||||||
| CSX Corp. | 2,421,254 | 75,011 | ||||||
| L3Harris Technologies, Inc. | 323,116 | 67,276 | ||||||
| Honeywell International, Inc. | 292,363 | 62,653 | ||||||
| Boeing Company1 | 256,666 | 48,892 | ||||||
| Waste Connections, Inc. | 206,205 | 27,335 | ||||||
| Equifax, Inc. | 124,702 | 24,237 | ||||||
| ABB, Ltd. (ADR) | 753,846 | 22,962 | ||||||
| United Parcel Service, Inc., Class B | 123,077 | 21,396 | ||||||
| Robert Half International, Inc. | 278,467 | 20,559 | ||||||
| Union Pacific Corp. | 99,249 | 20,552 | ||||||
| Rockwell Automation | 59,498 | 15,325 | ||||||
| Carrier Global Corp. | 317,975 | 13,117 | ||||||
| Huntington Ingalls Industries, Inc. | 47,307 | 10,913 | ||||||
| PACCAR, Inc. | 108,835 | 10,771 | ||||||
| Republic Services, Inc. | 78,273 | 10,096 | ||||||
| Johnson Controls International PLC | 152,323 | 9,749 | ||||||
| BAE Systems PLC (ADR)2 | 212,361 | 8,950 | ||||||
| HEICO Corp. | 56,216 | 8,637 | ||||||
| Air Lease Corp., Class A | 157,245 | 6,041 | ||||||
| RELX PLC (ADR) | 186,041 | 5,157 | ||||||
| Waste Management, Inc. | 11,150 | 1,749 | ||||||
| 1,061,164 | ||||||||
| Consumer discretionary 8.11% | ||||||||
| Home Depot, Inc. | 574,803 | 181,557 | ||||||
| YUM! Brands, Inc. | 682,736 | 87,445 | ||||||
| Target Corp. | 566,187 | 84,385 | ||||||
| General Motors Company | 1,894,289 | 63,724 | ||||||
| Darden Restaurants, Inc. | 417,284 | 57,723 | ||||||
| Lennar Corp., Class A | 515,314 | 46,636 | ||||||
| Wynn Resorts, Ltd.1 | 470,851 | 38,831 | ||||||
| NIKE, Inc., Class B | 321,417 | 37,609 | ||||||
| TJX Companies, Inc. | 469,822 | 37,398 | ||||||
| Dollar General Corp. | 115,057 | 28,333 | ||||||
| American Funds Insurance Series | 85 |
Washington Mutual Investors Fund (continued)
| Common stocks (continued) | Shares | Value (000) |
||||||
| Consumer discretionary (continued) | ||||||||
| D.R. Horton, Inc. | 283,590 | $ | 25,279 | |||||
| Starbucks Corp. | 247,055 | 24,508 | ||||||
| Chipotle Mexican Grill, Inc.1 | 9,251 | 12,836 | ||||||
| VF Corp. | 440,631 | 12,166 | ||||||
| Aptiv PLC1 | 104,868 | 9,766 | ||||||
| McDonald’s Corp. | 21,948 | 5,784 | ||||||
| Royal Caribbean Cruises, Ltd.1 | 110,264 | 5,450 | ||||||
| Polaris, Inc. | 52,835 | 5,336 | ||||||
| Amazon.com, Inc.1 | 17,265 | 1,450 | ||||||
| 766,216 | ||||||||
| Consumer staples 6.76% | ||||||||
| Archer Daniels Midland Company | 1,568,943 | 145,676 | ||||||
| Philip Morris International, Inc. | 1,242,650 | 125,769 | ||||||
| Keurig Dr Pepper, Inc. | 1,386,913 | 49,457 | ||||||
| Kraft Heinz Company | 1,133,294 | 46,136 | ||||||
| Procter & Gamble Company | 266,724 | 40,425 | ||||||
| Reckitt Benckiser Group PLC (ADR)2 | 2,494,590 | 35,149 | ||||||
| Nestlé SA (ADR) | 289,515 | 33,393 | ||||||
| General Mills, Inc. | 345,460 | 28,967 | ||||||
| Hormel Foods Corp. | 592,388 | 26,983 | ||||||
| Mondelez International, Inc. | 372,276 | 24,812 | ||||||
| Costco Wholesale Corp. | 50,498 | 23,052 | ||||||
| Church & Dwight Co., Inc. | 148,770 | 11,992 | ||||||
| Walgreens Boots Alliance, Inc. | 316,943 | 11,841 | ||||||
| Unilever PLC (ADR) | 182,723 | 9,200 | ||||||
| British American Tobacco PLC (ADR) | 222,076 | 8,879 | ||||||
| Kimberly-Clark Corp. | 55,351 | 7,514 | ||||||
| Danone (ADR) | 694,054 | 7,298 | ||||||
| Conagra Brands, Inc. | 57,435 | 2,223 | ||||||
| 638,766 | ||||||||
| Energy 5.90% | ||||||||
| Pioneer Natural Resources Company | 558,497 | 127,555 | ||||||
| Chevron Corp. | 509,098 | 91,378 | ||||||
| ConocoPhillips | 757,878 | 89,430 | ||||||
| Baker Hughes Co., Class A | 2,518,351 | 74,367 | ||||||
| Exxon Mobil Corp. | 576,453 | 63,583 | ||||||
| EOG Resources, Inc. | 297,609 | 38,546 | ||||||
| Canadian Natural Resources, Ltd. | 665,647 | 36,963 | ||||||
| TC Energy Corp. | 678,590 | 27,049 | ||||||
| Enbridge, Inc. | 208,235 | 8,142 | ||||||
| 557,013 | ||||||||
| Communication services 3.97% | ||||||||
| Comcast Corp., Class A | 6,323,705 | 221,140 | ||||||
| Alphabet, Inc., Class C1 | 732,176 | 64,966 | ||||||
| Alphabet, Inc., Class A1 | 442,820 | 39,070 | ||||||
| Meta Platforms, Inc., Class A1 | 262,927 | 31,641 | ||||||
| Activision Blizzard, Inc. | 138,758 | 10,622 | ||||||
| Electronic Arts, Inc. | 36,898 | 4,508 | ||||||
| Deutsche Telekom AG (ADR) | 142,813 | 2,853 | ||||||
| 374,800 | ||||||||
| Utilities 2.63% | ||||||||
| Constellation Energy Corp. | 810,638 | 69,885 | ||||||
| Sempra Energy | 407,271 | 62,940 | ||||||
| Entergy Corp. | 349,992 | 39,374 | ||||||
| CMS Energy Corp. | 446,368 | 28,268 | ||||||
| Public Service Enterprise Group, Inc. | 235,300 | 14,417 | ||||||
| NextEra Energy, Inc. | 142,120 | 11,881 | ||||||
| 86 | American Funds Insurance Series |
Washington Mutual Investors Fund (continued)
| Common stocks (continued) | Shares | Value (000) |
||||||
| Utilities (continued) | ||||||||
| Xcel Energy, Inc. | 110,238 | $ | 7,729 | |||||
| Dominion Energy, Inc. | 123,750 | 7,588 | ||||||
| Evergy, Inc. | 95,960 | 6,039 | ||||||
| 248,121 | ||||||||
| Materials 2.24% | ||||||||
| Linde PLC | 198,540 | 64,760 | ||||||
| Rio Tinto PLC (ADR) | 501,584 | 35,713 | ||||||
| Corteva, Inc. | 497,904 | 29,267 | ||||||
| Air Products and Chemicals, Inc. | 64,476 | 19,875 | ||||||
| LyondellBasell Industries NV | 219,873 | 18,256 | ||||||
| Nucor Corp. | 125,314 | 16,518 | ||||||
| Huntsman Corp. | 442,172 | 12,151 | ||||||
| Albemarle Corp. | 55,023 | 11,932 | ||||||
| H.B. Fuller Co. | 49,263 | 3,528 | ||||||
| 212,000 | ||||||||
| Real estate 1.28% | ||||||||
| Extra Space Storage, Inc. REIT | 363,771 | 53,540 | ||||||
| American Tower Corp. REIT | 109,250 | 23,146 | ||||||
| Equinix, Inc. REIT | 27,909 | 18,281 | ||||||
| Digital Realty Trust, Inc. REIT | 174,296 | 17,477 | ||||||
| Regency Centers Corp. REIT | 115,400 | 7,212 | ||||||
| Welltower, Inc. REIT | 15,517 | 1,017 | ||||||
| 120,673 | ||||||||
| Total common stocks (cost: $7,295,957,000) | 9,004,372 | |||||||
| Convertible stocks 0.35% | ||||||||
| Health care 0.20% | ||||||||
| Becton, Dickinson and Company, Series B, convertible preferred shares, 6.00% 6/1/2023 | 197,800 | 9,906 | ||||||
| Danaher Corp., Series B, cumulative convertible preferred shares, 5.00% 4/15/20232 | 6,821 | 9,253 | ||||||
| 19,159 | ||||||||
| Utilities 0.08% | ||||||||
| NextEra Energy, Inc., noncumulative convertible preferred units, 6.926% 9/1/2025 | 90,700 | 4,552 | ||||||
| American Electric Power Company, Inc., convertible preferred units, 6.125% 8/15/2023 | 56,400 | 2,909 | ||||||
| 7,461 | ||||||||
| Financials 0.07% | ||||||||
| KKR & Co., Inc., Series C, convertible preferred shares, 6.00% 9/15/2023 | 113,300 | 6,487 | ||||||
| Total convertible stocks (cost: $33,103,000) | 33,107 | |||||||
| Short-term securities 4.19% | ||||||||
| Money market investments 4.07% | ||||||||
| Capital Group Central Cash Fund 4.31%3,4 | 3,847,079 | 384,669 | ||||||
| American Funds Insurance Series | 87 |
Washington Mutual Investors Fund (continued)
| Short-term securities (continued) | Shares | Value (000) |
||||||
| Money market investments purchased with collateral from securities on loan 0.12% | ||||||||
| Capital Group Central Cash Fund 4.31%3,4,5 | 63,391 | $ | 6,338 | |||||
| State Street Institutional U.S. Government Money Market Fund, Institutional Class 4.09%3,5 | 2,494,000 | 2,494 | ||||||
| Goldman Sachs Financial Square Government Fund, Institutional Shares 4.15%3,5 | 1,460,582 | 1,461 | ||||||
| Invesco Short-Term Investments Trust – Government & Agency Portfolio, Institutional Class 4.22%3,5 | 1,324,956 | 1,325 | ||||||
| 11,618 | ||||||||
| Total short-term securities (cost: $396,237,000) | 396,287 | |||||||
| Total investment securities 99.89% (cost: $7,725,297,000) | 9,433,766 | |||||||
| Other assets less liabilities 0.11% | 9,934 | |||||||
| Net assets 100.00% | $ | 9,443,700 | ||||||
Investments in affiliates4
| Value of affiliates at 1/1/2022 (000) |
Additions (000) |
Reductions (000) |
Net realized loss (000) |
Net unrealized appreciation (000) |
Value of affiliates at 12/31/2022 (000) |
Dividend income (000) |
||||||||||||||||||||||
| Short-term securities 4.14% | ||||||||||||||||||||||||||||
| Money market investments 4.07% | ||||||||||||||||||||||||||||
| Capital Group Central Cash Fund 4.31%3 | $ | 321,870 | $ | 1,392,905 | $ | 1,330,045 | $ | (71 | ) | $ | 10 | $ | 384,669 | $ | 6,762 | |||||||||||||
| Money market investments purchased with collateral from securities on loan 0.07% | ||||||||||||||||||||||||||||
| Capital Group Central Cash Fund 4.31%3,5 | 9,273 | 2,9356 | 6,338 | — | 7 | |||||||||||||||||||||||
| Total 4.14% | $ | (71 | ) | $ | 10 | $ | 391,007 | $ | 6,762 | |||||||||||||||||||
| 1 | Security did not produce income during the last 12 months. |
| 2 | All or a portion of this security was on loan. The total value of all such securities was $12,432,000, which represented .13% of the net assets of the fund. Refer to Note 5 for more information on securities lending. |
| 3 | Rate represents the seven-day yield at 12/31/2022. |
| 4 | Part of the same “group of investment companies” as the fund as defined under the Investment Company Act of 1940, as amended. |
| 5 | Security purchased with cash collateral from securities on loan. Refer to Note 5 for more information on securities lending. |
| 6 | Represents net activity. Refer to Note 5 for more information on securities lending. |
| 7 | Dividend income is included with securities lending income in the fund’s statement of operations and is not shown in this table. |
Key to abbreviations
ADR = American Depositary Receipts
REIT = Real Estate Investment Trust
Refer to the notes to financial statements.
| 88 | American Funds Insurance Series |
Capital World Growth and Income Fund
Investment portfolio December 31, 2022
| Common stocks 95.23% | Shares | Value (000) |
||||||
| Information technology 15.74% | ||||||||
| Broadcom, Inc. | 91,368 | $ | 51,087 | |||||
| Microsoft Corp. | 200,685 | 48,128 | ||||||
| Taiwan Semiconductor Manufacturing Company, Ltd. | 2,403,800 | 35,035 | ||||||
| ASML Holding NV | 48,522 | 26,265 | ||||||
| Apple, Inc. | 111,767 | 14,522 | ||||||
| EPAM Systems, Inc.1 | 37,912 | 12,425 | ||||||
| Tokyo Electron, Ltd. | 35,800 | 10,635 | ||||||
| Capgemini SE | 47,477 | 7,963 | ||||||
| Micron Technology, Inc. | 141,746 | 7,085 | ||||||
| Accenture PLC, Class A | 24,538 | 6,548 | ||||||
| Mastercard, Inc., Class A | 15,969 | 5,553 | ||||||
| Logitech International SA | 65,146 | 4,043 | ||||||
| NVIDIA Corp. | 25,359 | 3,706 | ||||||
| Delta Electronics, Inc. | 337,000 | 3,139 | ||||||
| Keyence Corp. | 7,600 | 2,975 | ||||||
| Hexagon AB, Class B | 260,158 | 2,735 | ||||||
| Ceridian HCM Holding, Inc.1 | 38,252 | 2,454 | ||||||
| Shopify, Inc., Class A, subordinate voting shares1 | 69,098 | 2,398 | ||||||
| OBIC Co., Ltd. | 16,200 | 2,395 | ||||||
| Applied Materials, Inc. | 23,343 | 2,273 | ||||||
| Synopsys, Inc.1 | 6,800 | 2,171 | ||||||
| MediaTek, Inc. | 93,000 | 1,889 | ||||||
| Worldline SA, non-registered shares1 | 44,297 | 1,729 | ||||||
| TE Connectivity, Ltd. | 13,147 | 1,509 | ||||||
| Lasertec Corp. | 8,872 | 1,474 | ||||||
| Fujitsu, Ltd. | 11,000 | 1,457 | ||||||
| SK hynix, Inc. | 22,772 | 1,371 | ||||||
| ServiceNow, Inc.1 | 3,191 | 1,239 | ||||||
| Oracle Corp. | 15,041 | 1,229 | ||||||
| Disco Corp. | 3,900 | 1,121 | ||||||
| GlobalWafers Co., Ltd. | 71,000 | 986 | ||||||
| Snowflake, Inc., Class A1 | 5,882 | 844 | ||||||
| Zscaler, Inc.1 | 7,066 | 791 | ||||||
| Infosys, Ltd. | 41,700 | 755 | ||||||
| Nomura Research Institute, Ltd. | 28,600 | 680 | ||||||
| SS&C Technologies Holdings, Inc. | 10,174 | 530 | ||||||
| PagSeguro Digital, Ltd., Class A1 | 22,705 | 198 | ||||||
| Wolfspeed, Inc.1 | 1,813 | 125 | ||||||
| Fidelity National Information Services, Inc. | 1,708 | 116 | ||||||
| 271,578 | ||||||||
| Health care 15.17% | ||||||||
| UnitedHealth Group, Inc. | 74,724 | 39,617 | ||||||
| Abbott Laboratories | 241,728 | 26,539 | ||||||
| Eli Lilly and Company | 58,184 | 21,286 | ||||||
| Gilead Sciences, Inc. | 178,860 | 15,355 | ||||||
| AstraZeneca PLC | 104,122 | 14,131 | ||||||
| Pfizer, Inc. | 261,843 | 13,417 | ||||||
| Novo Nordisk A/S, Class B | 84,097 | 11,387 | ||||||
| Thermo Fisher Scientific, Inc. | 20,658 | 11,376 | ||||||
| Daiichi Sankyo Company, Ltd. | 344,500 | 11,040 | ||||||
| Centene Corp.1 | 118,976 | 9,757 | ||||||
| Novartis AG | 96,113 | 8,706 | ||||||
| Siemens Healthineers AG | 144,724 | 7,240 | ||||||
| Stryker Corp. | 28,725 | 7,023 | ||||||
| AbbVie, Inc. | 34,990 | 5,655 | ||||||
| Amgen, Inc. | 18,534 | 4,868 | ||||||
| Takeda Pharmaceutical Company, Ltd. | 146,400 | 4,573 | ||||||
| CVS Health Corp. | 47,511 | 4,428 | ||||||
| Olympus Corp. | 213,300 | 3,770 | ||||||
| Medtronic PLC | 42,451 | 3,299 | ||||||
| Vertex Pharmaceuticals, Inc.1 | 10,220 | 2,951 | ||||||
| American Funds Insurance Series | 89 |
Capital World Growth and Income Fund (continued)
| Common stocks (continued) | Shares | Value (000) |
||||||
| Health care (continued) | ||||||||
| ResMed, Inc. | 13,349 | $ | 2,778 | |||||
| Shionogi & Co., Ltd. | 52,400 | 2,607 | ||||||
| Insulet Corp.1 | 8,552 | 2,518 | ||||||
| PerkinElmer, Inc. | 17,633 | 2,472 | ||||||
| Carl Zeiss Meditec AG, non-registered shares | 19,475 | 2,458 | ||||||
| Bayer AG | 46,783 | 2,416 | ||||||
| EssilorLuxottica | 12,616 | 2,297 | ||||||
| DexCom, Inc.1 | 19,845 | 2,247 | ||||||
| Cigna Corp. | 6,618 | 2,193 | ||||||
| Intuitive Surgical, Inc.1 | 7,213 | 1,914 | ||||||
| Zoetis, Inc., Class A | 11,180 | 1,638 | ||||||
| CSL, Ltd. | 8,133 | 1,586 | ||||||
| Alcon, Inc. | 21,412 | 1,471 | ||||||
| Rede D’Or Sao Luiz SA | 255,608 | 1,432 | ||||||
| BioNTech SE (ADR) | 8,468 | 1,272 | ||||||
| Guardant Health, Inc.1 | 32,188 | 876 | ||||||
| Eurofins Scientific SE, non-registered shares | 12,151 | 875 | ||||||
| Penumbra, Inc.1 | 3,640 | 810 | ||||||
| Catalent, Inc.1 | 13,075 | 588 | ||||||
| Molina Healthcare, Inc.1 | 1,089 | 360 | ||||||
| Agilon Health, Inc.1 | 19,961 | 322 | ||||||
| HOYA Corp. | 1,300 | 126 | ||||||
| EUROAPI1 | 2,830 | 42 | ||||||
| 261,716 | ||||||||
| Financials 12.95% | ||||||||
| Zurich Insurance Group AG | 40,892 | 19,541 | ||||||
| AIA Group, Ltd. | 1,331,999 | 14,675 | ||||||
| Kotak Mahindra Bank, Ltd. | 641,387 | 14,112 | ||||||
| Toronto-Dominion Bank (CAD denominated) | 196,293 | 12,710 | ||||||
| JPMorgan Chase & Co. | 73,488 | 9,855 | ||||||
| HDFC Bank, Ltd. | 379,442 | 7,470 | ||||||
| HDFC Bank, Ltd. (ADR) | 14,868 | 1,017 | ||||||
| B3 SA-Brasil, Bolsa, Balcao | 3,320,838 | 8,309 | ||||||
| DNB Bank ASA | 401,356 | 7,946 | ||||||
| Ping An Insurance (Group) Company of China, Ltd., Class H | 1,071,500 | 7,072 | ||||||
| Ping An Insurance (Group) Company of China, Ltd., Class A | 23,000 | 156 | ||||||
| Nasdaq, Inc. | 110,650 | 6,788 | ||||||
| PNC Financial Services Group, Inc. | 39,710 | 6,272 | ||||||
| Wells Fargo & Company | 142,901 | 5,900 | ||||||
| Morgan Stanley | 64,543 | 5,487 | ||||||
| Chubb, Ltd. | 23,142 | 5,105 | ||||||
| ING Groep NV | 395,598 | 4,827 | ||||||
| American International Group, Inc. | 75,453 | 4,772 | ||||||
| Aon PLC, Class A | 15,659 | 4,700 | ||||||
| HDFC Life Insurance Company, Ltd. | 681,398 | 4,651 | ||||||
| CME Group, Inc., Class A | 27,577 | 4,637 | ||||||
| Discover Financial Services | 44,649 | 4,368 | ||||||
| DBS Group Holdings, Ltd. | 167,200 | 4,233 | ||||||
| Blackstone, Inc., nonvoting shares | 54,273 | 4,027 | ||||||
| Intercontinental Exchange, Inc. | 35,038 | 3,595 | ||||||
| KBC Groep NV | 54,921 | 3,526 | ||||||
| S&P Global, Inc. | 8,773 | 2,938 | ||||||
| Citigroup, Inc. | 60,832 | 2,751 | ||||||
| FinecoBank SpA | 153,752 | 2,562 | ||||||
| Israel Discount Bank Ltd., Class A | 471,720 | 2,479 | ||||||
| Fairfax Financial Holdings, Ltd., subordinate voting shares | 4,135 | 2,449 | ||||||
| AXA SA | 80,016 | 2,230 | ||||||
| BNP Paribas SA | 35,889 | 2,042 | ||||||
| ICICI Bank, Ltd. | 188,346 | 2,019 | ||||||
| Apollo Asset Management, Inc. | 31,437 | 2,005 | ||||||
| Banco Santander, SA | 631,521 | 1,891 | ||||||
| 90 | American Funds Insurance Series |
Capital World Growth and Income Fund (continued)
| Common stocks (continued) | Shares | Value (000) |
||||||
| Financials (continued) | ||||||||
| National Bank of Canada | 26,966 | $ | 1,817 | |||||
| Arthur J. Gallagher & Co. | 9,509 | 1,793 | ||||||
| Fifth Third Bancorp | 48,163 | 1,580 | ||||||
| Goldman Sachs Group, Inc. | 4,548 | 1,562 | ||||||
| Power Corporation of Canada, subordinate voting shares2 | 63,342 | 1,490 | ||||||
| Blue Owl Capital, Inc., Class A | 136,448 | 1,446 | ||||||
| Macquarie Group, Ltd. | 12,033 | 1,366 | ||||||
| XP, Inc., Class A1 | 86,047 | 1,320 | ||||||
| Postal Savings Bank of China Co., Ltd., Class H | 2,121,000 | 1,310 | ||||||
| United Overseas Bank, Ltd. | 54,800 | 1,257 | ||||||
| Marsh & McLennan Companies, Inc. | 7,341 | 1,215 | ||||||
| Bajaj Finance, Ltd. | 15,022 | 1,189 | ||||||
| China Merchants Bank Co., Ltd., Class H | 130,403 | 723 | ||||||
| China Merchants Bank Co., Ltd., Class A | 86,187 | 462 | ||||||
| Axis Bank, Ltd. | 100,962 | 1,135 | ||||||
| Hong Kong Exchanges and Clearing, Ltd. | 25,200 | 1,089 | ||||||
| Tryg A/S | 45,292 | 1,074 | ||||||
| East Money Information Co., Ltd., Class A | 379,800 | 1,061 | ||||||
| Aegon NV | 196,376 | 996 | ||||||
| Lufax Holding, Ltd. (ADR) | 180,760 | 351 | ||||||
| Sberbank of Russia PJSC1,3 | 3,196,952 | — | 4 | |||||
| 223,353 | ||||||||
| Industrials 12.59% | ||||||||
| Airbus SE, non-registered shares | 165,602 | 19,690 | ||||||
| General Electric Co. | 226,107 | 18,945 | ||||||
| BAE Systems PLC | 1,376,080 | 14,222 | ||||||
| Raytheon Technologies Corp. | 121,846 | 12,297 | ||||||
| Carrier Global Corp. | 262,272 | 10,819 | ||||||
| Recruit Holdings Co., Ltd. | 317,150 | 10,087 | ||||||
| Safran SA | 80,040 | 10,002 | ||||||
| Lockheed Martin Corp. | 20,070 | 9,764 | ||||||
| Deere & Company | 21,851 | 9,369 | ||||||
| Siemens AG | 59,301 | 8,230 | ||||||
| Caterpillar, Inc. | 31,794 | 7,617 | ||||||
| Boeing Company1 | 39,550 | 7,534 | ||||||
| CSX Corp. | 174,517 | 5,406 | ||||||
| L3Harris Technologies, Inc. | 25,925 | 5,398 | ||||||
| Mitsui & Co., Ltd. | 152,400 | 4,431 | ||||||
| LIXIL Corp. | 288,000 | 4,389 | ||||||
| Melrose Industries PLC | 2,436,274 | 3,961 | ||||||
| RELX PLC | 119,741 | 3,318 | ||||||
| RELX PLC (ADR) | 15,132 | 419 | ||||||
| TransDigm Group, Inc. | 5,844 | 3,680 | ||||||
| Bureau Veritas SA | 137,541 | 3,620 | ||||||
| Johnson Controls International PLC | 55,085 | 3,525 | ||||||
| Daikin Industries, Ltd. | 19,600 | 3,015 | ||||||
| Brenntag SE | 39,862 | 2,549 | ||||||
| Compagnie de Saint-Gobain SA, non-registered shares | 51,704 | 2,538 | ||||||
| Canadian Pacific Railway, Ltd. | 31,797 | 2,372 | ||||||
| Legrand SA | 28,600 | 2,303 | ||||||
| Bunzl PLC | 68,998 | 2,303 | ||||||
| ASSA ABLOY AB, Class B | 104,956 | 2,258 | ||||||
| Northrop Grumman Corp. | 3,877 | 2,115 | ||||||
| Schneider Electric SE | 13,179 | 1,853 | ||||||
| Thales SA | 14,244 | 1,821 | ||||||
| Waste Connections, Inc. | 13,211 | 1,751 | ||||||
| BayCurrent Consulting, Inc. | 54,200 | 1,695 | ||||||
| Rockwell Automation | 6,529 | 1,682 | ||||||
| VINCI SA | 15,814 | 1,579 | ||||||
| Rentokil Initial PLC | 256,104 | 1,574 | ||||||
| Nidec Corp. | 22,100 | 1,151 | ||||||
| American Funds Insurance Series | 91 |
Capital World Growth and Income Fund (continued)
| Common stocks (continued) | Shares | Value (000) |
||||||
| Industrials (continued) | ||||||||
| SMC Corp. | 2,700 | $ | 1,143 | |||||
| AB Volvo, Class B | 62,128 | 1,125 | ||||||
| MTU Aero Engines AG | 5,108 | 1,106 | ||||||
| Atlas Copco AB, Class B | 89,617 | 957 | ||||||
| Adecco Group AG | 28,154 | 926 | ||||||
| ManpowerGroup, Inc. | 11,115 | 925 | ||||||
| Larsen & Toubro, Ltd. | 35,295 | 888 | ||||||
| International Consolidated Airlines Group SA (CDI)1,2 | 287,033 | 427 | ||||||
| Honeywell International, Inc. | 1,401 | 300 | ||||||
| Deutsche Post AG | 3,901 | 147 | ||||||
| 217,226 | ||||||||
| Consumer discretionary 9.00% | ||||||||
| LVMH Moët Hennessy-Louis Vuitton SE | 40,590 | 29,488 | ||||||
| Home Depot, Inc. | 63,297 | 19,993 | ||||||
| General Motors Company | 304,882 | 10,256 | ||||||
| Amazon.com, Inc.1 | 98,471 | 8,272 | ||||||
| Booking Holdings, Inc.1 | 3,555 | 7,164 | ||||||
| Flutter Entertainment PLC1 | 45,621 | 6,251 | ||||||
| Restaurant Brands International, Inc. | 44,121 | 2,853 | ||||||
| Restaurant Brands International, Inc. (CAD denominated) | 43,454 | 2,811 | ||||||
| Cie. Financière Richemont SA, Class A | 40,890 | 5,291 | ||||||
| Sony Group Corp. | 66,800 | 5,094 | ||||||
| Dollar Tree Stores, Inc.1 | 33,180 | 4,693 | ||||||
| Marriott International, Inc., Class A | 29,974 | 4,463 | ||||||
| Lennar Corp., Class A | 39,345 | 3,561 | ||||||
| Target Corp. | 22,747 | 3,390 | ||||||
| Industria de Diseño Textil, SA | 117,969 | 3,141 | ||||||
| Sands China, Ltd.1 | 935,200 | 3,098 | ||||||
| Shimano, Inc. | 19,200 | 3,059 | ||||||
| Chipotle Mexican Grill, Inc.1 | 2,122 | 2,944 | ||||||
| Evolution AB | 25,292 | 2,470 | ||||||
| Rivian Automotive, Inc., Class A1 | 126,108 | 2,324 | ||||||
| NIKE, Inc., Class B | 19,311 | 2,260 | ||||||
| Pan Pacific International Holdings Corp. | 119,900 | 2,226 | ||||||
| YUM! Brands, Inc. | 16,678 | 2,136 | ||||||
| Astra International Tbk PT | 5,716,600 | 2,083 | ||||||
| InterContinental Hotels Group PLC | 34,581 | 1,991 | ||||||
| Darden Restaurants, Inc. | 14,208 | 1,965 | ||||||
| Stellantis NV | 128,257 | 1,818 | ||||||
| JD.com, Inc., Class A | 52,947 | 1,488 | ||||||
| Tesla, Inc.1 | 12,036 | 1,483 | ||||||
| Midea Group Co., Ltd., Class A | 194,700 | 1,446 | ||||||
| Li Ning Co., Ltd. | 163,000 | 1,399 | ||||||
| Kindred Group PLC (SDR) | 127,475 | 1,331 | ||||||
| Wynn Macau, Ltd.1 | 826,400 | 921 | ||||||
| Royal Caribbean Cruises, Ltd.1 | 17,446 | 862 | ||||||
| Aristocrat Leisure, Ltd. | 39,792 | 822 | ||||||
| Entain PLC | 17,337 | 278 | ||||||
| Hermès International | 105 | 162 | ||||||
| 155,287 | ||||||||
| Consumer staples 7.57% | ||||||||
| Philip Morris International, Inc. | 309,980 | 31,373 | ||||||
| Nestlé SA | 110,820 | 12,798 | ||||||
| Keurig Dr Pepper, Inc. | 316,125 | 11,273 | ||||||
| British American Tobacco PLC | 243,321 | 9,654 | ||||||
| Kroger Co. | 171,853 | 7,661 | ||||||
| Kweichow Moutai Co., Ltd., Class A | 28,600 | 7,077 | ||||||
| Ocado Group PLC1 | 898,794 | 6,764 | ||||||
| Imperial Brands PLC | 257,311 | 6,429 | ||||||
| Seven & i Holdings Co., Ltd. | 137,500 | 5,882 | ||||||
| 92 | American Funds Insurance Series |
Capital World Growth and Income Fund (continued)
| Common stocks (continued) | Shares | Value (000) |
||||||
| Consumer staples (continued) | ||||||||
| Bunge, Ltd. | 52,225 | $ | 5,210 | |||||
| Ajinomoto Co., Inc. | 131,100 | 3,997 | ||||||
| Danone SA | 68,733 | 3,621 | ||||||
| Arca Continental, SAB de CV | 432,054 | 3,509 | ||||||
| Treasury Wine Estates, Ltd. | 365,056 | 3,373 | ||||||
| Varun Beverages, Ltd. | 177,457 | 2,825 | ||||||
| Altria Group, Inc. | 56,773 | 2,595 | ||||||
| ITC, Ltd. | 565,239 | 2,266 | ||||||
| Constellation Brands, Inc., Class A | 9,208 | 2,134 | ||||||
| Inner Mongolia Yili Industrial Group Co., Ltd., Class A | 307,600 | 1,368 | ||||||
| Essity Aktiebolag, Class B | 31,422 | 825 | ||||||
| 130,634 | ||||||||
| Materials 7.02% | ||||||||
| Vale SA, ordinary nominative shares | 1,606,974 | 27,052 | ||||||
| Vale SA (ADR), ordinary nominative shares | 880,043 | 14,934 | ||||||
| Fortescue Metals Group, Ltd. | 1,251,957 | 17,454 | ||||||
| Rio Tinto PLC | 167,527 | 11,755 | ||||||
| Freeport-McMoRan, Inc. | 262,321 | 9,968 | ||||||
| Linde PLC | 21,113 | 6,887 | ||||||
| Shin-Etsu Chemical Co., Ltd. | 39,100 | 4,764 | ||||||
| BHP Group, Ltd. (CDI) | 116,082 | 3,579 | ||||||
| Air Products and Chemicals, Inc. | 8,996 | 2,773 | ||||||
| Albemarle Corp. | 11,198 | 2,428 | ||||||
| CRH PLC | 60,032 | 2,377 | ||||||
| Air Liquide SA, bonus shares1 | 8,561 | 1,218 | ||||||
| Air Liquide SA, non-registered shares | 7,503 | 1,067 | ||||||
| Barrick Gold Corp. (CAD denominated) | 121,716 | 2,086 | ||||||
| Dow, Inc. | 40,669 | 2,049 | ||||||
| Akzo Nobel NV | 29,669 | 1,980 | ||||||
| Glencore PLC | 279,444 | 1,869 | ||||||
| Amcor PLC (CDI) | 147,168 | 1,764 | ||||||
| Evonik Industries AG | 82,596 | 1,586 | ||||||
| First Quantum Minerals, Ltd. | 70,833 | 1,480 | ||||||
| HeidelbergCement AG | 25,414 | 1,449 | ||||||
| Lynas Rare Earths, Ltd.1 | 121,178 | 643 | ||||||
| 121,162 | ||||||||
| Energy 6.30% | ||||||||
| Canadian Natural Resources, Ltd. (CAD denominated)2 | 429,516 | 23,852 | ||||||
| Baker Hughes Co., Class A | 428,998 | 12,668 | ||||||
| TotalEnergies SE | 178,299 | 11,129 | ||||||
| EOG Resources, Inc. | 74,135 | 9,602 | ||||||
| Tourmaline Oil Corp. | 123,757 | 6,244 | ||||||
| BP PLC | 932,803 | 5,424 | ||||||
| Reliance Industries, Ltd. | 147,765 | 4,533 | ||||||
| Cameco Corp. (CAD denominated) | 147,245 | 3,337 | ||||||
| Cameco Corp. | 46,300 | 1,050 | ||||||
| Shell PLC (GBP denominated) | 149,201 | 4,240 | ||||||
| Cenovus Energy, Inc. (CAD denominated) | 206,756 | 4,011 | ||||||
| Woodside Energy Group, Ltd. | 119,566 | 2,893 | ||||||
| Woodside Energy Group, Ltd. (CDI) | 37,610 | 908 | ||||||
| ConocoPhillips | 29,431 | 3,473 | ||||||
| Aker BP ASA | 101,330 | 3,159 | ||||||
| TC Energy Corp. (CAD denominated) | 76,353 | 3,044 | ||||||
| Suncor Energy, Inc. | 84,173 | 2,670 | ||||||
| Var Energi ASA | 735,288 | 2,537 | ||||||
| Exxon Mobil Corp. | 18,586 | 2,050 | ||||||
| Halliburton Company | 44,744 | 1,761 | ||||||
| Gazprom PJSC3 | 2,248,304 | — | 4 | |||||
| 108,585 | ||||||||
| American Funds Insurance Series | 93 |
Capital World Growth and Income Fund (continued)
| Common stocks (continued) | Shares | Value (000) |
||||||
| Communication services 4.97% | ||||||||
| Alphabet, Inc., Class C1 | 185,056 | $ | 16,420 | |||||
| Alphabet, Inc., Class A1 | 90,146 | 7,954 | ||||||
| Netflix, Inc.1 | 30,480 | 8,988 | ||||||
| Comcast Corp., Class A | 225,329 | 7,880 | ||||||
| SoftBank Corp. | 536,785 | 6,069 | ||||||
| NetEase, Inc. | 348,000 | 5,073 | ||||||
| Publicis Groupe SA | 78,301 | 4,972 | ||||||
| Meta Platforms, Inc., Class A1 | 38,469 | 4,629 | ||||||
| Sea, Ltd., Class A (ADR)1 | 85,765 | 4,462 | ||||||
| Universal Music Group NV | 148,872 | 3,594 | ||||||
| Bharti Airtel, Ltd. | 357,140 | 3,472 | ||||||
| Bharti Airtel, Ltd., interim shares | 13,994 | 73 | ||||||
| Deutsche Telekom AG1 | 161,959 | 3,230 | ||||||
| Singapore Telecommunications, Ltd. | 1,510,800 | 2,901 | ||||||
| Omnicom Group, Inc. | 21,678 | 1,768 | ||||||
| Nippon Telegraph and Telephone Corp. | 53,400 | 1,524 | ||||||
| Tencent Holdings, Ltd. | 34,300 | 1,458 | ||||||
| Take-Two Interactive Software, Inc.1 | 12,130 | 1,263 | ||||||
| Yandex NV, Class A1,3 | 151,598 | — | 4 | |||||
| 85,730 | ||||||||
| Utilities 2.91% | ||||||||
| DTE Energy Company | 51,844 | 6,093 | ||||||
| Iberdrola, SA, non-registered shares | 502,226 | 5,875 | ||||||
| PG&E Corp.1 | 322,958 | 5,251 | ||||||
| NextEra Energy, Inc. | 55,877 | 4,671 | ||||||
| E.ON SE | 439,329 | 4,385 | ||||||
| China Resources Gas Group, Ltd. | 1,106,532 | 4,121 | ||||||
| Engie SA | 236,678 | 3,390 | ||||||
| Engie SA, bonus shares | 41,586 | 596 | ||||||
| Edison International | 52,162 | 3,318 | ||||||
| Enel SpA | 583,497 | 3,138 | ||||||
| Exelon Corp. | 59,727 | 2,582 | ||||||
| Power Grid Corporation of India, Ltd. | 862,367 | 2,220 | ||||||
| AES Corp. | 47,865 | 1,377 | ||||||
| Endesa, SA | 67,522 | 1,274 | ||||||
| Constellation Energy Corp. | 12,539 | 1,081 | ||||||
| Public Service Enterprise Group, Inc. | 14,569 | 893 | ||||||
| 50,265 | ||||||||
| Real estate 1.01% | ||||||||
| Crown Castle, Inc. REIT | 39,469 | 5,353 | ||||||
| Longfor Group Holdings, Ltd. | 866,238 | 2,655 | ||||||
| American Tower Corp. REIT | 12,107 | 2,565 | ||||||
| China Resources Mixc Lifestyle Services, Ltd. | 358,800 | 1,823 | ||||||
| W. P. Carey, Inc. REIT | 22,705 | 1,774 | ||||||
| Americold Realty Trust, Inc. REIT | 62,231 | 1,762 | ||||||
| Sun Hung Kai Properties, Ltd. | 70,500 | 965 | ||||||
| Iron Mountain, Inc. REIT | 11,618 | 579 | ||||||
| 17,476 | ||||||||
| Total common stocks (cost: $1,368,680,000) | 1,643,012 | |||||||
| Preferred securities 0.16% | ||||||||
| Consumer discretionary 0.12% | ||||||||
| Dr. Ing. h.c. F. Porsche AG, nonvoting non-registered preferred shares1 | 19,788 | 2,007 | ||||||
| 94 | American Funds Insurance Series |
Capital World Growth and Income Fund (continued)
| Preferred securities (continued) | Shares | Value (000) |
||||||||||
| Health care 0.03% | ||||||||||||
| Grifols, SA, Class B, nonvoting non-registered preferred shares1 | 59,790 | $ | 505 | |||||||||
| Financials 0.01% | ||||||||||||
| Fannie Mae, Series S, 8.25% noncumulative preferred shares1 | 58,870 | 138 | ||||||||||
| Federal Home Loan Mortgage Corp., Series Z, 8.375% noncumulative preferred shares1 | 61,516 | 125 | ||||||||||
| 263 | ||||||||||||
| Total preferred securities (cost: $3,231,000) | 2,775 | |||||||||||
| Convertible bonds & notes 0.05% | Principal amount (000) |
|||||||||||
| Communication services 0.05% | ||||||||||||
| Sea, Ltd., convertible notes, 2.375% 12/1/2025 | USD | 952 | 940 | |||||||||
| Total convertible bonds & notes (cost: $2,437,000) | 940 | |||||||||||
| Bonds, notes & other debt instruments 0.35% | ||||||||||||
| Corporate bonds, notes & loans 0.29% | ||||||||||||
| Health care 0.15% | ||||||||||||
| Teva Pharmaceutical Finance Co. BV 6.00% 4/15/2024 | 1,600 | 1,572 | ||||||||||
| Teva Pharmaceutical Finance Co. BV 3.15% 10/1/2026 | 1,100 | 964 | ||||||||||
| 2,536 | ||||||||||||
| Consumer discretionary 0.07% | ||||||||||||
| Royal Caribbean Cruises, Ltd. 11.50% 6/1/20255 | 647 | 695 | ||||||||||
| Royal Caribbean Cruises, Ltd. 5.50% 4/1/20285 | 390 | 312 | ||||||||||
| Royal Caribbean Cruises, Ltd. 8.25% 1/15/20295 | 151 | 152 | ||||||||||
| Royal Caribbean Cruises, Ltd. 9.25% 1/15/20295 | 125 | 129 | ||||||||||
| 1,288 | ||||||||||||
| Energy 0.04% | ||||||||||||
| TransCanada PipeLines, Ltd. 5.10% 3/15/2049 | 800 | 729 | ||||||||||
| Financials 0.03% | ||||||||||||
| Lloyds Banking Group PLC 3.369% 12/14/20466 | 709 | 462 | ||||||||||
| Total corporate bonds, notes & loans | 5,015 | |||||||||||
| Bonds & notes of governments & government agencies outside the U.S. 0.06% | ||||||||||||
| United Mexican States, Series M, 8.00% 12/7/2023 | MXN | 20,000 | 1,001 | |||||||||
| Total bonds, notes & other debt instruments (cost: $6,581,000) | 6,016 | |||||||||||
| Short-term securities 4.42% | Weighted average yield at acquisition |
|||||||||||
| Commercial paper 4.04% | ||||||||||||
| DBS Bank, Ltd. 1/5/20235 | 3.640 | % | USD | 37,100 | 37,073 | |||||||
| DNB Bank ASA 3/2/20235 | 4.273 | 33,000 | 32,755 | |||||||||
| 69,828 | ||||||||||||
| American Funds Insurance Series | 95 |
Capital World Growth and Income Fund (continued)
| Short-term securities (continued) | Shares | Value (000) |
||||||
| Money market investments purchased with collateral from securities on loan 0.34% | ||||||||
| Invesco Short-Term Investments Trust – Government & Agency Portfolio,Institutional Class 4.22%7,8 | 2,893,689 | $ | 2,894 | |||||
| Goldman Sachs Financial Square Government Fund, Institutional Shares 4.15%7,8 | 2,827,563 | 2,827 | ||||||
| Capital Group Central Cash Fund 4.31%7,8,9 | 1,112 | 111 | ||||||
| 5,832 | ||||||||
| Money market investments 0.04% | ||||||||
| Capital Group Central Cash Fund 4.31%7,9 | 6,929 | 693 | ||||||
| Total short-term securities (cost: $76,365,000) | 76,353 | |||||||
| Total investment securities 100.21% (cost: $1,457,294,000) | 1,729,096 | |||||||
| Other assets less liabilities (0.21)% | (3,698 | ) | ||||||
| Net assets 100.00% | $ | 1,725,398 | ||||||
Investments in affiliates9
| Value of affiliates at 1/1/2022 (000) |
Additions (000) |
Reductions (000) |
Net realized gain (000) |
Net unrealized depreciation (000) |
Value of affiliates at 12/31/2022 (000) |
Dividend income (000) |
||||||||||||||||||||||
| Short-term securities 0.05% | ||||||||||||||||||||||||||||
| Money market investments purchased with collateral from securities on loan 0.01% | ||||||||||||||||||||||||||||
| Capital Group Central Cash Fund 4.31%7,8 | $ | 293 | $ | $ | 182 | 10 | $ | $ | $ | 111 | $ | — | 11 | |||||||||||||||
| Money market investments 0.04% | ||||||||||||||||||||||||||||
| Capital Group Central Cash Fund 4.31%7 | 12,989 | 493,820 | 506,123 | 8 | (1 | ) | 693 | 1,469 | ||||||||||||||||||||
| Total 0.05% | $ | 8 | $ | (1 | ) | $ | 804 | $ | 1,469 | |||||||||||||||||||
| 1 | Security did not produce income during the last 12 months. |
| 2 | All or a portion of this security was on loan. The total value of all such securities was $6,155,000, which represented .36% of the net assets of the fund. Refer to Note 5 for more information on securities lending. |
| 3 | Value determined using significant unobservable inputs. |
| 4 | Amount less than one thousand. |
| 5 | Acquired in a transaction exempt from registration under Rule 144A or, for commercial paper, Section 4(a)(2) of the Securities Act of 1933. May be resold in the U.S. in transactions exempt from registration, normally to qualified institutional buyers. The total value of all such securities was $71,116,000, which represented 4.12% of the net assets of the fund. |
| 6 | Step bond; coupon rate may change at a later date. |
| 7 | Rate represents the seven-day yield at 12/31/2022. |
| 8 | Security purchased with cash collateral from securities on loan. Refer to Note 5 for more information on securities lending. |
| 9 | Part of the same “group of investment companies” as the fund as defined under the Investment Company Act of 1940, as amended. |
| 10 | Represents net activity. Refer to Note 5 for more information on securities lending. |
| 11 | Dividend income is included with securities lending income in the fund’s statement of operations and is not shown in this table. |
Key to abbreviations
ADR = American Depositary Receipts
CAD = Canadian dollars
CDI = CREST Depository Interest
GBP = British pounds
MXN = Mexican pesos
REIT = Real Estate Investment Trust
SDR = Swedish Depositary Receipts
USD = U.S. dollars
Refer to the notes to financial statements.
| 96 | American Funds Insurance Series |
Growth-Income Fund
Investment portfolio December 31, 2022
| Common stocks 91.48% | Shares | Value (000) |
||||||
| Information technology 20.19% | ||||||||
| Microsoft Corp. | 7,759,381 | $ | 1,860,855 | |||||
| Broadcom, Inc. | 2,430,747 | 1,359,104 | ||||||
| Mastercard, Inc., Class A | 1,487,948 | 517,404 | ||||||
| Apple, Inc. | 2,169,231 | 281,848 | ||||||
| Visa, Inc., Class A | 1,346,541 | 279,757 | ||||||
| ASML Holding NV | 215,068 | 116,417 | ||||||
| ASML Holding NV (New York registered) (ADR) | 137,293 | 75,017 | ||||||
| Taiwan Semiconductor Manufacturing Company, Ltd. | 12,123,000 | 176,689 | ||||||
| Automatic Data Processing, Inc. | 718,796 | 171,692 | ||||||
| Fidelity National Information Services, Inc. | 2,472,310 | 167,746 | ||||||
| Accenture PLC, Class A | 625,335 | 166,864 | ||||||
| Applied Materials, Inc. | 1,686,100 | 164,192 | ||||||
| Concentrix Corp. | 904,367 | 120,426 | ||||||
| Micron Technology, Inc. | 2,363,454 | 118,125 | ||||||
| ServiceNow, Inc.1 | 294,412 | 114,311 | ||||||
| GoDaddy, Inc., Class A1 | 1,402,444 | 104,931 | ||||||
| Global Payments, Inc. | 973,628 | 96,701 | ||||||
| FleetCor Technologies, Inc.1 | 420,507 | 77,239 | ||||||
| Analog Devices, Inc. | 398,402 | 65,350 | ||||||
| QUALCOMM, Inc. | 564,911 | 62,106 | ||||||
| Fiserv, Inc.1 | 536,700 | 54,244 | ||||||
| Texas Instruments, Inc. | 309,811 | 51,187 | ||||||
| Adobe, Inc.1 | 143,116 | 48,163 | ||||||
| TELUS International (Cda), Inc., subordinate voting shares1 | 2,302,991 | 45,576 | ||||||
| KLA Corp. | 116,000 | 43,736 | ||||||
| MKS Instruments, Inc. | 481,000 | 40,755 | ||||||
| Cognizant Technology Solutions Corp., Class A | 682,850 | 39,052 | ||||||
| NVIDIA Corp. | 239,765 | 35,039 | ||||||
| Snowflake, Inc., Class A1 | 225,042 | 32,303 | ||||||
| Datadog, Inc., Class A1 | 365,800 | 26,886 | ||||||
| Intel Corp. | 1,000,000 | 26,430 | ||||||
| Ceridian HCM Holding, Inc.1 | 350,352 | 22,475 | ||||||
| Trimble, Inc.1 | 443,800 | 22,439 | ||||||
| Lam Research Corp. | 50,039 | 21,031 | ||||||
| Dye & Durham, Ltd.2 | 1,322,100 | 16,023 | ||||||
| Paychex, Inc. | 127,131 | 14,691 | ||||||
| VeriSign, Inc.1 | 61,000 | 12,532 | ||||||
| Atlassian Corp., Class A1 | 52,744 | 6,787 | ||||||
| Euronet Worldwide, Inc.1 | 27,800 | 2,624 | ||||||
| 6,658,747 | ||||||||
| Industrials 14.17% | ||||||||
| Raytheon Technologies Corp. | 7,634,279 | 770,451 | ||||||
| General Electric Co. | 6,238,229 | 522,701 | ||||||
| Northrop Grumman Corp. | 633,267 | 345,517 | ||||||
| TFI International, Inc. | 2,669,105 | 267,551 | ||||||
| Carrier Global Corp. | 5,549,584 | 228,920 | ||||||
| TransDigm Group, Inc. | 340,571 | 214,441 | ||||||
| Woodward, Inc. | 2,204,500 | 212,977 | ||||||
| General Dynamics Corp. | 848,975 | 210,639 | ||||||
| Airbus SE, non-registered shares | 1,617,590 | 192,335 | ||||||
| Waste Connections, Inc. | 1,425,463 | 188,959 | ||||||
| L3Harris Technologies, Inc. | 840,290 | 174,957 | ||||||
| Old Dominion Freight Line, Inc. | 525,000 | 148,985 | ||||||
| BWX Technologies, Inc. | 2,159,505 | 125,424 | ||||||
| Norfolk Southern Corp. | 482,759 | 118,962 | ||||||
| United Rentals, Inc.1 | 296,000 | 105,204 | ||||||
| ITT, Inc. | 1,244,379 | 100,919 | ||||||
| Waste Management, Inc. | 625,300 | 98,097 | ||||||
| Equifax, Inc. | 490,008 | 95,238 | ||||||
| Air Lease Corp., Class A | 2,097,300 | 80,578 | ||||||
| Honeywell International, Inc. | 364,682 | 78,151 | ||||||
| American Funds Insurance Series | 97 |
Growth-Income Fund (continued)
| Common stocks (continued) | Shares | Value (000) |
||||||
| Industrials (continued) | ||||||||
| Fortive Corp. | 1,085,000 | $ | 69,711 | |||||
| United Airlines Holdings, Inc.1 | 1,810,598 | 68,260 | ||||||
| Safran SA | 539,713 | 67,444 | ||||||
| Lockheed Martin Corp. | 110,000 | 53,514 | ||||||
| GFL Environmental, Inc., subordinate voting shares | 1,600,000 | 46,768 | ||||||
| CSX Corp. | 1,171,873 | 36,305 | ||||||
| Otis Worldwide Corp. | 268,100 | 20,995 | ||||||
| Fastenal Co. | 379,747 | 17,970 | ||||||
| Boeing Company1 | 62,500 | 11,906 | ||||||
| 4,673,879 | ||||||||
| Health care 13.30% | ||||||||
| UnitedHealth Group, Inc. | 2,035,435 | 1,079,147 | ||||||
| Abbott Laboratories | 6,014,324 | 660,313 | ||||||
| AbbVie, Inc. | 3,742,689 | 604,856 | ||||||
| Novo Nordisk A/S, Class B | 2,431,449 | 329,218 | ||||||
| Humana, Inc. | 487,426 | 249,655 | ||||||
| AstraZeneca PLC | 1,209,323 | 164,124 | ||||||
| AstraZeneca PLC (ADR) | 721,200 | 48,897 | ||||||
| Elevance Health, Inc. | 366,614 | 188,062 | ||||||
| Thermo Fisher Scientific, Inc. | 265,602 | 146,264 | ||||||
| Bristol-Myers Squibb Company | 1,994,278 | 143,488 | ||||||
| Eli Lilly and Company | 360,974 | 132,059 | ||||||
| Pfizer, Inc. | 2,180,169 | 111,712 | ||||||
| PerkinElmer, Inc. | 769,600 | 107,913 | ||||||
| Seagen, Inc.1 | 654,515 | 84,112 | ||||||
| Horizon Therapeutics PLC1 | 421,815 | 48,002 | ||||||
| Zoetis, Inc., Class A | 305,121 | 44,715 | ||||||
| Tandem Diabetes Care, Inc.1 | 910,186 | 40,913 | ||||||
| Stryker Corp. | 148,897 | 36,404 | ||||||
| Medtronic PLC | 413,597 | 32,145 | ||||||
| Roche Holding AG, nonvoting non-registered shares | 85,502 | 26,870 | ||||||
| Penumbra, Inc.1 | 117,381 | 26,113 | ||||||
| Edwards Lifesciences Corp.1 | 317,059 | 23,656 | ||||||
| Zimmer Biomet Holdings, Inc. | 171,174 | 21,825 | ||||||
| Takeda Pharmaceutical Company, Ltd. | 464,600 | 14,511 | ||||||
| NovoCure, Ltd.1 | 193,600 | 14,200 | ||||||
| Vir Biotechnology, Inc.1 | 258,400 | 6,540 | ||||||
| 4,385,714 | ||||||||
| Financials 8.78% | ||||||||
| JPMorgan Chase & Co. | 3,394,830 | 455,247 | ||||||
| Chubb, Ltd. | 1,451,726 | 320,251 | ||||||
| Marsh & McLennan Companies, Inc. | 1,709,201 | 282,839 | ||||||
| Arthur J. Gallagher & Co. | 1,189,650 | 224,297 | ||||||
| Nasdaq, Inc. | 2,761,260 | 169,403 | ||||||
| BlackRock, Inc. | 202,957 | 143,821 | ||||||
| Morgan Stanley | 1,592,297 | 135,377 | ||||||
| Aon PLC, Class A | 442,013 | 132,666 | ||||||
| B3 SA-Brasil, Bolsa, Balcao | 39,829,500 | 99,654 | ||||||
| Berkshire Hathaway, Inc., Class B1 | 285,000 | 88,037 | ||||||
| State Street Corp. | 1,077,260 | 83,563 | ||||||
| Webster Financial Corp. | 1,701,139 | 80,532 | ||||||
| American International Group, Inc. | 1,272,230 | 80,456 | ||||||
| Signature Bank | 669,947 | 77,191 | ||||||
| S&P Global, Inc. | 228,138 | 76,413 | ||||||
| Moody’s Corp. | 216,306 | 60,267 | ||||||
| Power Corporation of Canada, subordinate voting shares2 | 2,293,100 | 53,940 | ||||||
| Wells Fargo & Company | 1,298,041 | 53,596 | ||||||
| Blue Owl Capital, Inc., Class A | 4,749,165 | 50,341 | ||||||
| MSCI, Inc. | 98,300 | 45,726 | ||||||
| TPG, Inc., Class A | 1,347,552 | 37,502 | ||||||
| 98 | American Funds Insurance Series |
Growth-Income Fund (continued)
| Common stocks (continued) | Shares | Value (000) |
||||||
| Financials (continued) | ||||||||
| LPL Financial Holdings, Inc. | 169,900 | $ | 36,727 | |||||
| Western Alliance Bancorporation | 486,936 | 29,002 | ||||||
| Citizens Financial Group, Inc. | 728,750 | 28,691 | ||||||
| Bank of America Corp. | 791,332 | 26,209 | ||||||
| PNC Financial Services Group, Inc. | 152,679 | 24,114 | ||||||
| CME Group, Inc., Class A | 5,500 | 925 | ||||||
| 2,896,787 | ||||||||
| Consumer discretionary 7.82% | ||||||||
| Amazon.com, Inc.1 | 5,804,151 | 487,549 | ||||||
| General Motors Company | 8,736,000 | 293,879 | ||||||
| Dollar Tree Stores, Inc.1 | 1,279,006 | 180,903 | ||||||
| Home Depot, Inc. | 551,165 | 174,091 | ||||||
| Hilton Worldwide Holdings, Inc. | 1,177,320 | 148,766 | ||||||
| Royal Caribbean Cruises, Ltd.1 | 2,958,586 | 146,243 | ||||||
| Wyndham Hotels & Resorts, Inc. | 1,842,940 | 131,420 | ||||||
| D.R. Horton, Inc. | 1,325,599 | 118,164 | ||||||
| Chipotle Mexican Grill, Inc.1 | 70,670 | 98,054 | ||||||
| Burlington Stores, Inc.1 | 399,428 | 80,988 | ||||||
| InterContinental Hotels Group PLC | 1,396,700 | 80,392 | ||||||
| Starbucks Corp. | 767,500 | 76,136 | ||||||
| NIKE, Inc., Class B | 629,740 | 73,686 | ||||||
| Dollar General Corp. | 291,102 | 71,684 | ||||||
| Lear Corp. | 569,068 | 70,576 | ||||||
| Kering SA | 101,695 | 52,046 | ||||||
| Aptiv PLC1 | 447,289 | 41,656 | ||||||
| Darden Restaurants, Inc. | 296,000 | 40,946 | ||||||
| CarMax, Inc.1 | 650,000 | 39,578 | ||||||
| Churchill Downs, Inc. | 185,426 | 39,205 | ||||||
| Airbnb, Inc., Class A1 | 350,000 | 29,925 | ||||||
| Norwegian Cruise Line Holdings, Ltd.1 | 2,177,187 | 26,649 | ||||||
| YUM! Brands, Inc. | 196,630 | 25,184 | ||||||
| NVR, Inc.1 | 5,298 | 24,437 | ||||||
| Rivian Automotive, Inc., Class A1 | 1,071,576 | 19,749 | ||||||
| McDonald’s Corp. | 25,000 | 6,588 | ||||||
| 2,578,494 | ||||||||
| Communication services 7.52% | ||||||||
| Alphabet, Inc., Class C1 | 5,068,984 | 449,771 | ||||||
| Alphabet, Inc., Class A1 | 4,841,135 | 427,133 | ||||||
| Netflix, Inc.1 | 1,812,523 | 534,477 | ||||||
| Comcast Corp., Class A | 11,970,266 | 418,600 | ||||||
| Meta Platforms, Inc., Class A1 | 3,113,843 | 374,720 | ||||||
| Charter Communications, Inc., Class A1 | 378,097 | 128,213 | ||||||
| Electronic Arts, Inc. | 843,700 | 103,083 | ||||||
| T-Mobile US, Inc.1 | 181,772 | 25,448 | ||||||
| Take-Two Interactive Software, Inc.1 | 178,984 | 18,638 | ||||||
| 2,480,083 | ||||||||
| Consumer staples 5.80% | ||||||||
| Philip Morris International, Inc. | 6,790,089 | 687,225 | ||||||
| British American Tobacco PLC | 9,433,859 | 374,286 | ||||||
| Keurig Dr Pepper, Inc. | 6,469,367 | 230,698 | ||||||
| General Mills, Inc. | 1,378,800 | 115,612 | ||||||
| Mondelez International, Inc. | 1,506,161 | 100,386 | ||||||
| Molson Coors Beverage Company, Class B, restricted voting shares | 1,620,313 | 83,478 | ||||||
| Anheuser-Busch InBev SA/NV | 1,339,531 | 80,530 | ||||||
| Archer Daniels Midland Company | 670,100 | 62,219 | ||||||
| Constellation Brands, Inc., Class A | 237,807 | 55,112 | ||||||
| Bunge, Ltd. | 538,852 | 53,761 | ||||||
| American Funds Insurance Series | 99 |
Growth-Income Fund (continued)
| Common stocks (continued) | Shares | Value (000) |
||||||
| Consumer staples (continued) | ||||||||
| Procter & Gamble Company | 180,677 | $ | 27,383 | |||||
| Kraft Heinz Company | 567,200 | 23,091 | ||||||
| Monster Beverage Corp.1 | 178,560 | 18,129 | ||||||
| 1,911,910 | ||||||||
| Energy 4.78% | ||||||||
| Chevron Corp. | 2,053,300 | 368,547 | ||||||
| ConocoPhillips | 2,749,013 | 324,383 | ||||||
| Canadian Natural Resources, Ltd. (CAD denominated) | 4,947,114 | 274,722 | ||||||
| Baker Hughes Co., Class A | 7,353,936 | 217,162 | ||||||
| EOG Resources, Inc. | 620,310 | 80,343 | ||||||
| TC Energy Corp. (CAD denominated)2 | 1,849,358 | 73,728 | ||||||
| Exxon Mobil Corp. | 660,220 | 72,822 | ||||||
| Equitrans Midstream Corp. | 10,215,807 | 68,446 | ||||||
| Suncor Energy, Inc. | 1,451,133 | 46,031 | ||||||
| Cheniere Energy, Inc. | 238,735 | 35,801 | ||||||
| Diamondback Energy, Inc. | 117,500 | 16,072 | ||||||
| 1,578,057 | ||||||||
| Utilities 4.04% | ||||||||
| PG&E Corp.1 | 25,776,996 | 419,134 | ||||||
| Edison International | 2,689,330 | 171,095 | ||||||
| Entergy Corp. | 1,304,500 | 146,756 | ||||||
| Constellation Energy Corp. | 1,414,838 | 121,973 | ||||||
| Sempra Energy | 690,000 | 106,633 | ||||||
| CenterPoint Energy, Inc. | 2,840,104 | 85,175 | ||||||
| AES Corp. | 2,803,707 | 80,635 | ||||||
| Enel SpA | 12,931,498 | 69,549 | ||||||
| NextEra Energy, Inc. | 585,000 | 48,906 | ||||||
| DTE Energy Company | 401,000 | 47,129 | ||||||
| CMS Energy Corp. | 551,001 | 34,895 | ||||||
| 1,331,880 | ||||||||
| Materials 3.24% | ||||||||
| Linde PLC | 1,122,332 | 366,082 | ||||||
| Vale SA (ADR), ordinary nominative shares | 5,459,475 | 92,647 | ||||||
| Vale SA, ordinary nominative shares | 3,404,848 | 57,318 | ||||||
| LyondellBasell Industries NV | 1,735,980 | 144,138 | ||||||
| Albemarle Corp. | 540,457 | 117,204 | ||||||
| Freeport-McMoRan, Inc. | 2,382,960 | 90,553 | ||||||
| Corteva, Inc. | 1,405,942 | 82,641 | ||||||
| ATI, Inc.1 | 1,769,447 | 52,836 | ||||||
| Barrick Gold Corp. | 2,373,000 | 40,768 | ||||||
| Sherwin-Williams Company | 101,038 | 23,979 | ||||||
| 1,068,166 | ||||||||
| Real estate 1.84% | ||||||||
| VICI Properties, Inc. REIT | 9,124,903 | 295,647 | ||||||
| Equinix, Inc. REIT | 298,158 | 195,302 | ||||||
| Crown Castle, Inc. REIT | 864,782 | 117,299 | ||||||
| 608,248 | ||||||||
| Total common stocks (cost: $19,921,309,000) | 30,171,965 | |||||||
| Convertible stocks 0.83% | ||||||||
| Health care 0.51% | ||||||||
| Danaher Corp., Series B, cumulative convertible preferred shares, 5.00% 4/15/20232 | 123,957 | 168,154 | ||||||
| 100 | American Funds Insurance Series |
Growth-Income Fund (continued)
| Convertible stocks (continued) | Shares | Value (000) |
||||||
| Consumer discretionary 0.14% | ||||||||
| Aptiv PLC, Series A, convertible preferred shares, 5.50% 6/15/2023 | 420,075 | $ | 45,082 | |||||
| Utilities 0.09% | ||||||||
| NextEra Energy, Inc., noncumulative convertible preferred units, 6.926% 9/1/2025 | 617,200 | 30,977 | ||||||
| Financials 0.09% | ||||||||
| KKR & Co., Inc., Series C, convertible preferred shares, 6.00% 9/15/2023 | 527,700 | 30,211 | ||||||
| Total convertible stocks (cost: $288,316,000) | 274,424 | |||||||
| Bonds, notes & other debt instruments 0.02% | Principal amount (000) |
|||||||
| Corporate bonds, notes & loans 0.02% | ||||||||
| Industrials 0.02% | ||||||||
| Boeing Company 4.875% 5/1/2025 | USD | 4,706 | 4,674 | |||||
| Consumer discretionary 0.00% | ||||||||
| General Motors Financial Co. 4.30% 7/13/2025 | 160 | 155 | ||||||
| General Motors Financial Co. 5.25% 3/1/2026 | 827 | 815 | ||||||
| 970 | ||||||||
| Energy 0.00% | ||||||||
| Weatherford International, Ltd. 11.00% 12/1/20243 | 265 | 272 | ||||||
| Total corporate bonds, notes & loans | 5,916 | |||||||
| Total bonds, notes & other debt instruments (cost: $5,868,000) | 5,916 | |||||||
| Short-term securities 8.45% | Shares | |||||||
| Money market investments 7.77% | ||||||||
| Capital Group Central Cash Fund 4.31%4,5 | 25,654,468 | 2,565,190 | ||||||
| Money market investments purchased with collateral from securities on loan 0.68% | ||||||||
| Invesco Short-Term Investments Trust – Government & Agency Portfolio, Institutional Class 4.22%4,6 | 92,462,113 | 92,462 | ||||||
| Goldman Sachs Financial Square Government Fund, Institutional Shares 4.15%4,6 | 91,131,298 | 91,131 | ||||||
| Capital Group Central Cash Fund 4.31%4,5,6 | 402,344 | 40,231 | ||||||
| 223,824 | ||||||||
| Total short-term securities (cost: $2,788,688,000) | 2,789,014 | |||||||
| Total investment securities 100.78% (cost: $23,004,181,000) | 33,241,319 | |||||||
| Other assets less liabilities (0.78)% | (258,352 | ) | ||||||
| Net assets 100.00% | $ | 32,982,967 | ||||||
| American Funds Insurance Series | 101 |
Growth-Income Fund (continued)
Investments in affiliates5
| Value of affiliates at 1/1/2022 (000) |
Additions (000) |
Reductions (000) |
Net realized loss (000) |
Net unrealized appreciation (000) |
Value of affiliates at 12/31/2022 (000) |
Dividend income (000) |
||||||||||||||||||||||
| Short-term securities 7.89% | ||||||||||||||||||||||||||||
| Money market investments 7.77% | ||||||||||||||||||||||||||||
| Capital Group Central Cash Fund 4.31%4 | $ | 1,220,761 | $ | 5,840,874 | $ | 4,496,259 | $ | (316 | ) | $ | 130 | $ | 2,565,190 | $ | 40,278 | |||||||||||||
| Money market investments purchased with collateral from securities on loan 0.12% | ||||||||||||||||||||||||||||
| Capital Group Central Cash Fund 4.31%4,6 | 39,148 | 1,083 | 7 | 40,231 | — | 8 | ||||||||||||||||||||||
| Total 7.89% | $ | (316 | ) | $ | 130 | $ | 2,605,421 | $ | 40,278 | |||||||||||||||||||
| 1 | Security did not produce income during the last 12 months. |
| 2 | All or a portion of this security was on loan. The total value of all such securities was $240,456,000, which represented .73% of the net assets of the fund. Refer to Note 5 for more information on securities lending. |
| 3 | Acquired in a transaction exempt from registration under Rule 144A or, for commercial paper, Section 4(a)(2) of the Securities Act of 1933. May be resold in the U.S. in transactions exempt from registration, normally to qualified institutional buyers. The total value of all such securities was $272,000, which represented less than .01% of the net assets of the fund. |
| 4 | Rate represents the seven-day yield at 12/31/2022. |
| 5 | Part of the same “group of investment companies” as the fund as defined under the Investment Company Act of 1940, as amended. |
| 6 | Security purchased with cash collateral from securities on loan. Refer to Note 5 for more information on securities lending. |
| 7 | Represents net activity. Refer to Note 5 for more information on securities lending. |
| 8 | Dividend income is included with securities lending income in the fund’s statement of operations and is not shown in this table. |
Key to abbreviations
ADR = American Depositary Receipts
CAD = Canadian dollars
REIT = Real Estate Investment Trust
USD = U.S. dollars
Refer to the notes to financial statements.
| 102 | American Funds Insurance Series |
International Growth and Income Fund
Investment portfolio December 31, 2022
| Common stocks 96.75% | Shares | Value (000) |
||||||
| Financials 16.53% | ||||||||
| AIA Group, Ltd. | 408,000 | $ | 4,495 | |||||
| Ping An Insurance (Group) Company of China, Ltd., Class H | 643,000 | 4,244 | ||||||
| AXA SA | 114,432 | 3,189 | ||||||
| Zurich Insurance Group AG | 5,399 | 2,580 | ||||||
| HDFC Bank, Ltd. | 118,266 | 2,328 | ||||||
| Tokio Marine Holdings, Inc. | 105,200 | 2,252 | ||||||
| UniCredit SpA | 132,526 | 1,885 | ||||||
| Toronto-Dominion Bank (CAD denominated) | 28,953 | 1,875 | ||||||
| Société Générale | 70,627 | 1,772 | ||||||
| DNB Bank ASA | 78,454 | 1,553 | ||||||
| Euronext NV | 20,312 | 1,506 | ||||||
| Banco Bilbao Vizcaya Argentaria, SA | 216,058 | 1,305 | ||||||
| Aon PLC, Class A | 4,301 | 1,291 | ||||||
| Hana Financial Group, Inc. | 37,354 | 1,250 | ||||||
| London Stock Exchange Group PLC | 12,717 | 1,097 | ||||||
| Hang Seng Bank, Ltd. | 66,200 | 1,096 | ||||||
| B3 SA-Brasil, Bolsa, Balcao | 407,901 | 1,021 | ||||||
| UBS Group AG | 54,178 | 1,010 | ||||||
| Industrial and Commercial Bank of China, Ltd., Class H | 1,959,040 | 1,009 | ||||||
| Banco Santander, SA | 307,795 | 922 | ||||||
| Resona Holdings, Inc. | 167,200 | 918 | ||||||
| XP, Inc., Class A1 | 53,223 | 816 | ||||||
| Prudential PLC | 55,866 | 756 | ||||||
| Erste Group Bank AG | 22,556 | 719 | ||||||
| DBS Group Holdings, Ltd. | 26,695 | 676 | ||||||
| Bank Leumi Le-Israel BM | 77,681 | 648 | ||||||
| Discovery, Ltd.1 | 88,847 | 645 | ||||||
| Tryg A/S | 25,561 | 606 | ||||||
| ABN AMRO Bank NV | 42,512 | 587 | ||||||
| HDFC Life Insurance Company, Ltd. | 82,955 | 566 | ||||||
| China Merchants Bank Co., Ltd., Class H | 98,500 | 546 | ||||||
| Kotak Mahindra Bank, Ltd. | 23,335 | 513 | ||||||
| Israel Discount Bank Ltd., Class A | 87,914 | 462 | ||||||
| Banca Generali SpA | 13,051 | 449 | ||||||
| ICICI Bank, Ltd. (ADR) | 18,198 | 398 | ||||||
| Islandsbanki hf. | 466,167 | 394 | ||||||
| Skandinaviska Enskilda Banken AB, Class A | 32,490 | 374 | ||||||
| Brookfield Corp., Class A (CAD denominated) | 10,905 | 343 | ||||||
| Grupo Financiero Banorte, SAB de CV, Series O | 41,185 | 296 | ||||||
| ICICI Securities, Ltd. | 45,682 | 275 | ||||||
| Postal Savings Bank of China Co., Ltd., Class H | 437,000 | 270 | ||||||
| ING Groep NV | 21,878 | 267 | ||||||
| EQT AB | 11,659 | 248 | ||||||
| United Overseas Bank, Ltd. | 5,400 | 124 | ||||||
| AU Small Finance Bank, Ltd. | 12,289 | 97 | ||||||
| Brookfield Asset Management, Ltd., Class A (CAD denominated)1 | 2,726 | 78 | ||||||
| Moscow Exchange MICEX-RTS PJSC1,2 | 346,177 | — | 3 | |||||
| Sberbank of Russia PJSC1,2 | 476,388 | — | 3 | |||||
| 49,751 | ||||||||
| Industrials 11.96% | ||||||||
| Airbus SE, non-registered shares | 51,245 | 6,093 | ||||||
| BAE Systems PLC | 413,069 | 4,269 | ||||||
| Alliance Global Group, Inc. | 7,895,900 | 1,689 | ||||||
| ABB, Ltd. | 50,534 | 1,539 | ||||||
| Rheinmetall AG | 7,314 | 1,457 | ||||||
| SMC Corp. | 3,100 | 1,312 | ||||||
| Daikin Industries, Ltd. | 8,400 | 1,292 | ||||||
| RELX PLC | 46,516 | 1,289 | ||||||
| Brenntag SE | 19,924 | 1,274 | ||||||
| Bunzl PLC | 34,974 | 1,167 | ||||||
| CCR SA, ordinary nominative shares | 565,458 | 1,159 | ||||||
| American Funds Insurance Series | 103 |
International Growth and Income Fund (continued)
| Common stocks (continued) | Shares | Value (000) |
||||||
| Industrials (continued) | ||||||||
| Ryanair Holdings PLC (ADR)1 | 13,626 | $ | 1,019 | |||||
| Safran SA | 7,664 | 958 | ||||||
| InPost SA1 | 109,547 | 926 | ||||||
| Cathay Pacific Airways, Ltd.1,4 | 787,000 | 856 | ||||||
| LIXIL Corp. | 50,900 | 776 | ||||||
| Mitsui & Co., Ltd. | 25,200 | 733 | ||||||
| Waste Connections, Inc. (CAD denominated) | 5,192 | 688 | ||||||
| Experian PLC | 17,789 | 606 | ||||||
| TFI International, Inc. (CAD denominated) | 5,936 | 594 | ||||||
| Techtronic Industries Co., Ltd. | 50,500 | 562 | ||||||
| Caterpillar, Inc. | 2,260 | 541 | ||||||
| BELIMO Holding AG | 1,112 | 531 | ||||||
| Epiroc AB, Class A | 19,779 | 362 | ||||||
| Epiroc AB, Class B | 10,197 | 164 | ||||||
| Canadian Pacific Railway, Ltd. (CAD denominated) | 6,837 | 510 | ||||||
| Interpump Group SpA | 9,158 | 415 | ||||||
| Deutsche Post AG | 9,640 | 363 | ||||||
| Siemens AG | 2,589 | 359 | ||||||
| Nidec Corp. | 6,900 | 359 | ||||||
| DSV A/S | 2,161 | 343 | ||||||
| Japan Airlines Co., Ltd.1 | 16,500 | 338 | ||||||
| Adecco Group AG | 10,191 | 335 | ||||||
| Kone OYJ, Class B | 5,245 | 272 | ||||||
| ASSA ABLOY AB, Class B | 11,710 | 252 | ||||||
| Wizz Air Holdings PLC1 | 9,714 | 222 | ||||||
| SITC International Holdings Co., Ltd. | 79,659 | 176 | ||||||
| Hitachi, Ltd. | 2,400 | 121 | ||||||
| Polycab India, Ltd. | 2,077 | 64 | ||||||
| Husqvarna AB, Class B | 1,503 | 11 | ||||||
| 35,996 | ||||||||
| Consumer discretionary 11.78% | ||||||||
| Evolution AB | 44,081 | 4,305 | ||||||
| LVMH Moët Hennessy-Louis Vuitton SE | 5,830 | 4,235 | ||||||
| MGM China Holdings, Ltd.1 | 2,330,000 | 2,568 | ||||||
| Renault SA1 | 75,272 | 2,508 | ||||||
| Sands China, Ltd.1 | 568,372 | 1,883 | ||||||
| Restaurant Brands International, Inc. (CAD denominated) | 26,120 | 1,689 | ||||||
| InterContinental Hotels Group PLC | 25,528 | 1,469 | ||||||
| Wynn Macau, Ltd.1 | 1,317,200 | 1,468 | ||||||
| Prosus NV, Class N | 19,085 | 1,310 | ||||||
| Midea Group Co., Ltd., Class A | 170,800 | 1,269 | ||||||
| Galaxy Entertainment Group, Ltd. | 184,000 | 1,218 | ||||||
| Sodexo SA | 11,689 | 1,118 | ||||||
| adidas AG | 8,004 | 1,093 | ||||||
| Li Ning Co., Ltd. | 122,500 | 1,051 | ||||||
| B&M European Value Retail SA | 203,086 | 1,012 | ||||||
| Nitori Holdings Co., Ltd. | 6,200 | 804 | ||||||
| Industria de Diseño Textil, SA | 29,903 | 796 | ||||||
| Paltac Corp. | 21,900 | 767 | ||||||
| Valeo SA, non-registered shares | 40,170 | 716 | ||||||
| Stellantis NV | 43,832 | 621 | ||||||
| OPAP SA | 41,296 | 585 | ||||||
| Entain PLC | 33,218 | 533 | ||||||
| Coupang, Inc., Class A1 | 32,030 | 471 | ||||||
| D’Ieteren Group | 2,035 | 392 | ||||||
| Americanas SA, ordinary nominative shares | 149,913 | 274 | ||||||
| Games Workshop Group PLC | 2,532 | 262 | ||||||
| IDP Education, Ltd. | 13,164 | 243 | ||||||
| JD.com, Inc., Class A | 7,174 | 202 | ||||||
| Pan Pacific International Holdings Corp. | 9,000 | 167 | ||||||
| Kering SA | 287 | 147 | ||||||
| 104 | American Funds Insurance Series |
International Growth and Income Fund (continued)
| Common stocks (continued) | Shares | Value (000) |
||||||
| Consumer discretionary (continued) | ||||||||
| Balkrishna Industries, Ltd. | 4,894 | $ | 126 | |||||
| Dixon Technologies (India), Ltd. | 1,902 | 90 | ||||||
| MercadoLibre, Inc.1 | 88 | 75 | ||||||
| 35,467 | ||||||||
| Consumer staples 11.46% | ||||||||
| British American Tobacco PLC | 196,339 | 7,790 | ||||||
| Philip Morris International, Inc. | 65,119 | 6,591 | ||||||
| Nestlé SA | 26,069 | 3,011 | ||||||
| Anheuser-Busch InBev SA/NV | 40,759 | 2,450 | ||||||
| Carlsberg A/S, Class B | 18,056 | 2,390 | ||||||
| Kweichow Moutai Co., Ltd., Class A | 9,490 | 2,348 | ||||||
| Pernod Ricard SA | 6,241 | 1,227 | ||||||
| Japan Tobacco, Inc. | 58,100 | 1,175 | ||||||
| Asahi Group Holdings, Ltd. | 33,300 | 1,037 | ||||||
| Foshan Haitian Flavouring and Food Co., Ltd., Class A | 77,954 | 892 | ||||||
| Arca Continental, SAB de CV | 108,287 | 879 | ||||||
| Carrefour SA, non-registered shares | 47,224 | 790 | ||||||
| KT&G Corp. | 9,986 | 722 | ||||||
| Varun Beverages, Ltd. | 43,375 | 691 | ||||||
| Ocado Group PLC1 | 80,608 | 607 | ||||||
| Imperial Brands PLC | 20,722 | 518 | ||||||
| L’Oréal SA, non-registered shares | 1,190 | 427 | ||||||
| Reckitt Benckiser Group PLC | 5,140 | 357 | ||||||
| Haleon PLC1 | 60,392 | 241 | ||||||
| Danone SA | 4,351 | 229 | ||||||
| Avenue Supermarts, Ltd.1 | 2,324 | 114 | ||||||
| 34,486 | ||||||||
| Information technology 10.82% | ||||||||
| Taiwan Semiconductor Manufacturing Company, Ltd. | 517,000 | 7,535 | ||||||
| ASML Holding NV | 10,887 | 5,893 | ||||||
| Edenred SA | 50,178 | 2,730 | ||||||
| Tokyo Electron, Ltd. | 8,300 | 2,466 | ||||||
| Samsung Electronics Co., Ltd. | 41,896 | 1,848 | ||||||
| MediaTek, Inc. | 87,000 | 1,767 | ||||||
| Broadcom, Inc. | 2,678 | 1,497 | ||||||
| SAP SE | 13,056 | 1,347 | ||||||
| Keyence Corp. | 2,700 | 1,057 | ||||||
| Kingdee International Software Group Co., Ltd.1 | 444,000 | 945 | ||||||
| Logitech International SA | 14,465 | 898 | ||||||
| Nokia Corp. | 184,789 | 859 | ||||||
| TDK Corp. | 25,500 | 828 | ||||||
| Capgemini SE | 4,791 | 804 | ||||||
| ASM International NV | 2,074 | 525 | ||||||
| Vanguard International Semiconductor Corp. | 186,000 | 468 | ||||||
| Halma PLC | 12,131 | 290 | ||||||
| Amadeus IT Group SA, Class A, non-registered shares1 | 4,613 | 238 | ||||||
| Nice, Ltd. (ADR)1 | 888 | 171 | ||||||
| Fujitsu, Ltd. | 1,000 | 132 | ||||||
| eMemory Technology, Inc. | 3,000 | 130 | ||||||
| Nomura Research Institute, Ltd. | 5,300 | 126 | ||||||
| 32,554 | ||||||||
| Health care 10.34% | ||||||||
| AstraZeneca PLC | 77,983 | 10,584 | ||||||
| Novo Nordisk A/S, Class B | 49,782 | 6,740 | ||||||
| Sanofi | 28,623 | 2,770 | ||||||
| EssilorLuxottica | 10,095 | 1,838 | ||||||
| Siemens Healthineers AG | 34,852 | 1,744 | ||||||
| Bayer AG | 32,378 | 1,672 | ||||||
| GSK PLC | 49,438 | 860 | ||||||
| American Funds Insurance Series | 105 |
International Growth and Income Fund (continued)
| Common stocks (continued) | Shares | Value (000) |
||||||
| Health care (continued) | ||||||||
| Genus PLC | 21,154 | $ | 762 | |||||
| Grifols, SA, Class B (ADR)1 | 88,384 | 751 | ||||||
| EUROAPI1 | 39,510 | 586 | ||||||
| Shionogi & Co., Ltd. | 9,600 | 478 | ||||||
| Lonza Group AG | 927 | 456 | ||||||
| Roche Holding AG, nonvoting non-registered shares | 1,328 | 417 | ||||||
| Novartis AG | 4,476 | 405 | ||||||
| BeiGene, Ltd. (ADR)1 | 1,387 | 305 | ||||||
| Hypera SA, ordinary nominative shares | 30,419 | 260 | ||||||
| Innovent Biologics, Inc.1 | 48,500 | 208 | ||||||
| CanSino Biologics, Inc., Class H4 | 22,800 | 195 | ||||||
| HOYA Corp. | 1,000 | 97 | ||||||
| 31,128 | ||||||||
| Energy 7.77% | ||||||||
| TotalEnergies SE | 89,101 | 5,561 | ||||||
| BP PLC | 643,014 | 3,739 | ||||||
| TechnipFMC PLC1 | 186,903 | 2,279 | ||||||
| Equinor ASA | 57,576 | 2,065 | ||||||
| TC Energy Corp. (CAD denominated) | 42,686 | 1,702 | ||||||
| Schlumberger, Ltd. | 30,187 | 1,614 | ||||||
| Canadian Natural Resources, Ltd. (CAD denominated)4 | 25,703 | 1,427 | ||||||
| Aker BP ASA | 43,949 | 1,370 | ||||||
| Cameco Corp. (CAD denominated) | 52,625 | 1,193 | ||||||
| Reliance Industries, Ltd. | 18,972 | 582 | ||||||
| Gaztransport & Technigaz SA | 4,690 | 501 | ||||||
| Tourmaline Oil Corp. | 9,772 | 493 | ||||||
| Woodside Energy Group, Ltd. | 18,414 | 446 | ||||||
| INPEX Corp. | 31,500 | 336 | ||||||
| Var Energi ASA | 20,924 | 72 | ||||||
| Sovcomflot PAO1,2 | 356,717 | — | 3 | |||||
| Gazprom PJSC2 | 671,150 | — | 3 | |||||
| LUKOIL Oil Co. PJSC2 | 9,706 | — | 3 | |||||
| 23,380 | ||||||||
| Materials 5.76% | ||||||||
| Vale SA, ordinary nominative shares | 198,640 | 3,344 | ||||||
| Vale SA (ADR), ordinary nominative shares | 80,910 | 1,373 | ||||||
| Linde PLC | 7,570 | 2,469 | ||||||
| Glencore PLC | 306,363 | 2,049 | ||||||
| Barrick Gold Corp. | 94,562 | 1,625 | ||||||
| Barrick Gold Corp. (CAD denominated) | 13,543 | 232 | ||||||
| UPM-Kymmene OYJ | 23,659 | 887 | ||||||
| Rio Tinto PLC | 10,464 | 734 | ||||||
| Asahi Kasei Corp. | 99,900 | 710 | ||||||
| Air Liquide SA, non-registered shares | 4,908 | 698 | ||||||
| Fresnillo PLC | 58,201 | 632 | ||||||
| Koninklijke DSM NV | 5,120 | 628 | ||||||
| Sociedad Química y Minera de Chile SA, Class B (ADR) | 7,688 | 614 | ||||||
| Fortescue Metals Group, Ltd. | 42,173 | 588 | ||||||
| Sika AG | 1,500 | 362 | ||||||
| Shin-Etsu Chemical Co., Ltd. | 1,900 | 231 | ||||||
| Givaudan SA | 52 | 158 | ||||||
| Alrosa PJSC1,2 | 53,607 | — | 3 | |||||
| 17,334 | ||||||||
| Communication services 5.66% | ||||||||
| Koninklijke KPN NV | 752,688 | 2,329 | ||||||
| Nippon Telegraph and Telephone Corp. | 81,600 | 2,329 | ||||||
| Tencent Holdings, Ltd. | 50,600 | 2,151 | ||||||
| Telefónica, SA, non-registered shares | 402,982 | 1,459 | ||||||
| Publicis Groupe SA | 22,225 | 1,411 | ||||||
| 106 | American Funds Insurance Series |
International Growth and Income Fund (continued)
| Common stocks (continued) | Shares | Value (000) |
||||||
| Communication services (continued) | ||||||||
| Sea, Ltd., Class A (ADR)1 | 21,542 | $ | 1,121 | |||||
| BT Group PLC | 635,302 | 863 | ||||||
| SoftBank Corp. | 76,200 | 862 | ||||||
| Vodafone Group PLC | 839,939 | 851 | ||||||
| América Móvil, SAB de CV, Series L (ADR) | 41,487 | 755 | ||||||
| Singapore Telecommunications, Ltd. | 319,600 | 614 | ||||||
| Deutsche Telekom AG1 | 29,435 | 587 | ||||||
| Indus Towers, Ltd. | 246,737 | 567 | ||||||
| Viaplay Group AB, Class B1 | 20,606 | 393 | ||||||
| MTN Group, Ltd. | 44,802 | 336 | ||||||
| Universal Music Group NV | 9,460 | 228 | ||||||
| NetEase, Inc. | 10,800 | 157 | ||||||
| Sitios Latinoamerica, SAB de CV, Class B11 | 40,380 | 19 | ||||||
| Yandex NV, Class A1,2 | 5,000 | — | 3 | |||||
| 17,032 | ||||||||
| Utilities 3.07% | ||||||||
| Engie SA | 190,787 | 2,733 | ||||||
| Enel SpA | 397,417 | 2,137 | ||||||
| ENN Energy Holdings, Ltd. | 118,100 | 1,648 | ||||||
| Brookfield Infrastructure Partners, LP | 36,875 | 1,142 | ||||||
| National Grid PLC | 43,151 | 518 | ||||||
| Iberdrola, SA, non-registered shares | 37,788 | 442 | ||||||
| China Resources Gas Group, Ltd. | 106,200 | 396 | ||||||
| Veolia Environnement | 9,023 | 232 | ||||||
| 9,248 | ||||||||
| Real estate 1.60% | ||||||||
| CK Asset Holdings, Ltd. | 327,000 | 2,014 | ||||||
| Longfor Group Holdings, Ltd. | 351,500 | 1,077 | ||||||
| Link REIT | 108,007 | 793 | ||||||
| Unibail-Rodamco-Westfield REIT, non-registered shares1 | 10,561 | 551 | ||||||
| Embassy Office Parks REIT | 94,895 | 385 | ||||||
| 4,820 | ||||||||
| Total common stocks (cost: $287,727,000) | 291,196 | |||||||
| Preferred securities 0.63% | ||||||||
| Materials 0.40% | ||||||||
| Gerdau SA, preferred nominative shares | 216,930 | 1,207 | ||||||
| Consumer discretionary 0.14% | ||||||||
| Volkswagen AG, nonvoting preferred shares | 3,468 | 432 | ||||||
| Information technology 0.09% | ||||||||
| Samsung Electronics Co., Ltd., nonvoting preferred shares | 6,483 | 261 | ||||||
| Total preferred securities (cost: $2,271,000) | 1,900 | |||||||
| Short-term securities 2.11% | ||||||||
| Money market investments 1.82% | ||||||||
| Capital Group Central Cash Fund 4.31%5,6 | 54,926 | 5,492 | ||||||
| American Funds Insurance Series | 107 |
International Growth and Income Fund (continued)
| Short-term securities (continued) | Shares | Value (000) |
||||||
| Money market investments purchased with collateral from securities on loan 0.29% | ||||||||
| Invesco Short-Term Investments Trust – Government & Agency Portfolio, Institutional Class 4.22%5,7 | 851,683 | $ | 852 | |||||
| Goldman Sachs Financial Square Government Fund, Institutional Shares 4.15%5,7 | 14,166 | 14 | ||||||
| 866 | ||||||||
| Total short-term securities (cost: $6,355,000) | 6,358 | |||||||
| Total investment securities 99.49% (cost: $296,353,000) | 299,454 | |||||||
| Other assets less liabilities 0.51% | 1,543 | |||||||
| Net assets 100.00% | $ | 300,997 | ||||||
Forward currency contracts
| Contract amount | Unrealized appreciation | |||||||||||
| Currency purchased (000) |
Currency sold (000) |
Counterparty | Settlement date |
at 12/31/2022 (000) | ||||||||
| USD | 612 | GBP | 502 | UBS AG | 1/12/2023 | $5 | ||||||
Investments in affiliates6
| Value of affiliate at 1/1/2022 (000) |
Additions (000) |
Reductions (000) |
Net realized loss (000) |
Net unrealized depreciation (000) |
Value of affiliate at 12/31/2022 (000) |
Dividend income (000) |
||||||||||||||||||||||
| Short-term securities 1.82% | ||||||||||||||||||||||||||||
| Money market investments 1.82% | ||||||||||||||||||||||||||||
| Capital Group Central Cash Fund 4.31%5 | $ | 21,699 | $ | 75,477 | $ | 91,678 | $ | (4 | ) | $ | (2 | ) | $ | 5,492 | $ | 302 | ||||||||||||
| 1 | Security did not produce income during the last 12 months. |
| 2 | Value determined using significant unobservable inputs. |
| 3 | Amount less than one thousand. |
| 4 | All or a portion of this security was on loan. The total value of all such securities was $1,435,000, which represented .48% of the net assets of the fund. Refer to Note 5 for more information on securities lending. |
| 5 | Rate represents the seven-day yield at 12/31/2022. |
| 6 | Part of the same “group of investment companies” as the fund as defined under the Investment Company Act of 1940, as amended. |
| 7 | Security purchased with cash collateral from securities on loan. Refer to Note 5 for more information on securities lending. |
Key to abbreviations
ADR = American Depositary Receipts
CAD = Canadian dollars
GBP = British pounds
REIT = Real Estate Investment Trust
USD = U.S. dollars
Refer to the notes to financial statements.
| 108 | American Funds Insurance Series |
Capital Income Builder
Investment portfolio December 31, 2022
| Common stocks 74.46% | Shares | Value (000) |
||||||
| Financials 13.77% | ||||||||
| Zurich Insurance Group AG | 39,942 | $ | 19,087 | |||||
| Toronto-Dominion Bank (CAD denominated) | 162,719 | 10,536 | ||||||
| JPMorgan Chase & Co. | 68,717 | 9,215 | ||||||
| PNC Financial Services Group, Inc. | 49,137 | 7,761 | ||||||
| Münchener Rückversicherungs-Gesellschaft AG | 23,791 | 7,736 | ||||||
| CME Group, Inc., Class A | 45,573 | 7,664 | ||||||
| DBS Group Holdings, Ltd. | 300,006 | 7,595 | ||||||
| Morgan Stanley | 88,772 | 7,547 | ||||||
| DNB Bank ASA | 301,733 | 5,974 | ||||||
| Power Corporation of Canada, subordinate voting shares | 201,698 | 4,745 | ||||||
| BlackRock, Inc. | 6,520 | 4,620 | ||||||
| B3 SA-Brasil, Bolsa, Balcao | 1,360,408 | 3,404 | ||||||
| Tryg A/S | 138,292 | 3,280 | ||||||
| Ping An Insurance (Group) Company of China, Ltd., Class H | 447,500 | 2,954 | ||||||
| Ping An Insurance (Group) Company of China, Ltd., Class A | 34,457 | 233 | ||||||
| Webster Financial Corp. | 61,978 | 2,934 | ||||||
| AIA Group, Ltd. | 253,600 | 2,794 | ||||||
| American International Group, Inc. | 43,993 | 2,782 | ||||||
| Principal Financial Group, Inc. | 31,762 | 2,665 | ||||||
| Blackstone, Inc., nonvoting shares | 33,399 | 2,478 | ||||||
| KBC Groep NV | 33,615 | 2,158 | ||||||
| United Overseas Bank, Ltd. | 89,200 | 2,046 | ||||||
| State Street Corp. | 26,015 | 2,018 | ||||||
| Kaspi.kz JSC1 | 21,756 | 1,555 | ||||||
| Kaspi.kz JSC (GDR) | 5,969 | 426 | ||||||
| East West Bancorp, Inc. | 29,501 | 1,944 | ||||||
| ING Groep NV | 157,320 | 1,919 | ||||||
| Wells Fargo & Company | 45,898 | 1,895 | ||||||
| China Pacific Insurance (Group) Co., Ltd., Class H | 794,150 | 1,754 | ||||||
| National Bank of Canada | 24,069 | 1,622 | ||||||
| Travelers Companies, Inc. | 8,641 | 1,620 | ||||||
| Swedbank AB, Class A | 88,691 | 1,507 | ||||||
| Citizens Financial Group, Inc. | 36,461 | 1,436 | ||||||
| KeyCorp | 75,308 | 1,312 | ||||||
| China Merchants Bank Co., Ltd., Class A | 131,100 | 703 | ||||||
| China Merchants Bank Co., Ltd., Class H | 94,500 | 524 | ||||||
| IIFL Wealth Management, Ltd. | 55,104 | 1,183 | ||||||
| Franklin Resources, Inc. | 42,738 | 1,127 | ||||||
| OneMain Holdings, Inc. | 33,517 | 1,116 | ||||||
| EFG International AG | 113,913 | 1,086 | ||||||
| BNP Paribas SA | 17,927 | 1,020 | ||||||
| Great-West Lifeco, Inc. | 43,284 | 1,001 | ||||||
| Truist Financial Corp. | 23,131 | 995 | ||||||
| Corebridge Financial, Inc. | 44,617 | 895 | ||||||
| Hang Seng Bank, Ltd. | 52,200 | 864 | ||||||
| Euronext NV | 11,304 | 838 | ||||||
| Hong Kong Exchanges and Clearing, Ltd. | 18,300 | 791 | ||||||
| Bank Central Asia Tbk PT | 1,423,700 | 781 | ||||||
| TPG, Inc., Class A | 26,918 | 749 | ||||||
| Citigroup, Inc. | 16,200 | 733 | ||||||
| Patria Investments, Ltd., Class A | 47,813 | 666 | ||||||
| Banco Santander, SA | 201,758 | 604 | ||||||
| Vontobel Holding AG | 7,885 | 524 | ||||||
| Macquarie Group, Ltd. | 4,045 | 459 | ||||||
| Hana Financial Group, Inc. | 10,680 | 357 | ||||||
| Cullen/Frost Bankers, Inc. | 1,968 | 263 | ||||||
| UniCredit SpA | 12,643 | 180 | ||||||
| SouthState Corp. | 2,204 | 168 | ||||||
| Moscow Exchange MICEX-RTS PJSC2,3 | 875,002 | — | 4 | |||||
| Sberbank of Russia PJSC2,3 | 204,176 | — | 4 | |||||
| 156,843 | ||||||||
| American Funds Insurance Series | 109 |
Capital Income Builder (continued)
| Common stocks (continued) | Shares | Value (000) |
||||||
| Consumer staples 10.07% | ||||||||
| Philip Morris International, Inc. | 259,908 | $ | 26,305 | |||||
| British American Tobacco PLC | 471,482 | 18,706 | ||||||
| General Mills, Inc. | 102,770 | 8,617 | ||||||
| Altria Group, Inc. | 188,250 | 8,605 | ||||||
| PepsiCo, Inc. | 47,154 | 8,519 | ||||||
| Nestlé SA | 70,531 | 8,145 | ||||||
| Kimberly-Clark Corp. | 39,311 | 5,337 | ||||||
| Imperial Brands PLC | 207,379 | 5,181 | ||||||
| ITC, Ltd. | 1,060,348 | 4,250 | ||||||
| Unilever PLC (GBP denominated) | 57,668 | 2,909 | ||||||
| Carlsberg A/S, Class B | 19,656 | 2,602 | ||||||
| Keurig Dr Pepper, Inc. | 72,760 | 2,595 | ||||||
| Danone SA | 48,454 | 2,553 | ||||||
| Anheuser-Busch InBev SA/NV | 37,592 | 2,260 | ||||||
| Kraft Heinz Company | 32,392 | 1,319 | ||||||
| Seven & i Holdings Co., Ltd. | 29,600 | 1,266 | ||||||
| Procter & Gamble Company | 7,687 | 1,165 | ||||||
| Mondelez International, Inc. | 14,725 | 981 | ||||||
| Vector Group, Ltd. | 69,487 | 824 | ||||||
| Essity Aktiebolag, Class B | 23,218 | 610 | ||||||
| Viscofan, SA, non-registered shares | 9,124 | 589 | ||||||
| Reckitt Benckiser Group PLC | 7,982 | 555 | ||||||
| Scandinavian Tobacco Group A/S | 21,667 | 380 | ||||||
| Kimberly-Clark de México, SAB de CV, Class A, ordinary participation certificates | 136,106 | 231 | ||||||
| Coca-Cola HBC AG (CDI) | 7,021 | 168 | ||||||
| 114,672 | ||||||||
| Health care 9.47% | ||||||||
| AbbVie, Inc. | 173,251 | 27,999 | ||||||
| Amgen, Inc. | 53,879 | 14,151 | ||||||
| Gilead Sciences, Inc. | 153,232 | 13,155 | ||||||
| AstraZeneca PLC | 60,447 | 8,204 | ||||||
| Abbott Laboratories | 66,565 | 7,308 | ||||||
| Medtronic PLC | 82,068 | 6,378 | ||||||
| Novartis AG | 65,737 | 5,955 | ||||||
| Bristol-Myers Squibb Company | 74,164 | 5,336 | ||||||
| Pfizer, Inc. | 89,394 | 4,581 | ||||||
| UnitedHealth Group, Inc. | 6,954 | 3,687 | ||||||
| Roche Holding AG, nonvoting non-registered shares | 10,419 | 3,274 | ||||||
| Takeda Pharmaceutical Company, Ltd. | 87,100 | 2,720 | ||||||
| Royalty Pharma PLC, Class A | 42,309 | 1,672 | ||||||
| Merck & Co., Inc. | 7,825 | 868 | ||||||
| EBOS Group, Ltd. | 30,676 | 850 | ||||||
| CVS Health Corp. | 7,431 | 692 | ||||||
| Bayer AG | 12,641 | 653 | ||||||
| GSK PLC | 17,925 | 312 | ||||||
| Koninklijke Philips NV (EUR denominated) | 4,898 | 74 | ||||||
| Organon & Co. | 662 | 18 | ||||||
| 107,887 | ||||||||
| Industrials 7.34% | ||||||||
| Raytheon Technologies Corp. | 239,595 | 24,180 | ||||||
| Lockheed Martin Corp. | 11,445 | 5,568 | ||||||
| BAE Systems PLC | 526,461 | 5,441 | ||||||
| Honeywell International, Inc. | 24,790 | 5,312 | ||||||
| Siemens AG | 36,680 | 5,091 | ||||||
| RELX PLC | 131,761 | 3,650 | ||||||
| RELX PLC (ADR) | 8,177 | 227 | ||||||
| Kone OYJ, Class B | 71,780 | 3,718 | ||||||
| L3Harris Technologies, Inc. | 16,708 | 3,479 | ||||||
| Deutsche Post AG | 64,678 | 2,435 | ||||||
| VINCI SA | 24,215 | 2,418 | ||||||
| 110 | American Funds Insurance Series |
Capital Income Builder (continued)
| Common stocks (continued) | Shares | Value (000) |
||||||
| Industrials (continued) | ||||||||
| Singapore Technologies Engineering, Ltd. | 898,600 | $ | 2,249 | |||||
| Trinity Industries, Inc. | 72,684 | 2,149 | ||||||
| BOC Aviation, Ltd. | 194,500 | 1,617 | ||||||
| Illinois Tool Works, Inc. | 7,243 | 1,596 | ||||||
| ITOCHU Corp. | 44,400 | 1,388 | ||||||
| SGS SA | 589 | 1,364 | ||||||
| Compañia de Distribución Integral Logista Holdings, SA, non-registered shares | 45,292 | 1,144 | ||||||
| Trelleborg AB, Class B | 47,577 | 1,101 | ||||||
| Grupo Aeroportuario del Pacífico, SAB de CV, Class B | 74,506 | 1,067 | ||||||
| AB Volvo, Class B | 58,146 | 1,053 | ||||||
| Norfolk Southern Corp. | 3,965 | 977 | ||||||
| LIXIL Corp. | 54,600 | 832 | ||||||
| Ventia Services Group Pty, Ltd. | 490,862 | 796 | ||||||
| United Parcel Service, Inc., Class B | 4,455 | 774 | ||||||
| Union Pacific Corp. | 3,606 | 747 | ||||||
| Marubeni Corp. | 56,900 | 650 | ||||||
| General Dynamics Corp. | 2,526 | 627 | ||||||
| Waste Management, Inc. | 3,955 | 620 | ||||||
| Carrier Global Corp. | 13,015 | 537 | ||||||
| Airbus SE, non-registered shares | 3,671 | 436 | ||||||
| Sulzer AG | 4,695 | 367 | ||||||
| 83,610 | ||||||||
| Information technology 6.92% | ||||||||
| Broadcom, Inc. | 65,566 | 36,661 | ||||||
| Microsoft Corp. | 63,062 | 15,124 | ||||||
| Taiwan Semiconductor Manufacturing Company, Ltd. | 583,800 | 8,509 | ||||||
| Paychex, Inc. | 17,290 | 1,998 | ||||||
| Texas Instruments, Inc. | 11,533 | 1,905 | ||||||
| KLA Corp. | 4,878 | 1,839 | ||||||
| Vanguard International Semiconductor Corp. | 618,700 | 1,558 | ||||||
| Automatic Data Processing, Inc. | 6,477 | 1,547 | ||||||
| QUALCOMM, Inc. | 11,372 | 1,250 | ||||||
| Western Union Company | 83,565 | 1,151 | ||||||
| Tokyo Electron, Ltd. | 3,500 | 1,040 | ||||||
| SAP SE | 10,071 | 1,039 | ||||||
| Analog Devices, Inc. | 5,930 | 973 | ||||||
| NetApp, Inc. | 14,882 | 894 | ||||||
| GlobalWafers Co., Ltd. | 46,938 | 652 | ||||||
| Fidelity National Information Services, Inc. | 9,497 | 644 | ||||||
| Intel Corp. | 18,944 | 501 | ||||||
| MediaTek, Inc. | 24,000 | 487 | ||||||
| Tripod Technology Corp. | 152,000 | 465 | ||||||
| SINBON Electronics Co., Ltd. | 42,446 | 380 | ||||||
| BE Semiconductor Industries NV | 3,388 | 206 | ||||||
| 78,823 | ||||||||
| Utilities 6.24% | ||||||||
| Dominion Energy, Inc. | 102,936 | 6,312 | ||||||
| Iberdrola, SA, non-registered shares | 496,459 | 5,807 | ||||||
| DTE Energy Company | 49,064 | 5,766 | ||||||
| National Grid PLC | 476,775 | 5,727 | ||||||
| Engie SA | 335,814 | 4,810 | ||||||
| Engie SA, bonus shares | 36,900 | 529 | ||||||
| Power Grid Corporation of India, Ltd. | 2,007,912 | 5,169 | ||||||
| E.ON SE | 486,449 | 4,855 | ||||||
| The Southern Co. | 62,100 | 4,434 | ||||||
| Edison International | 60,608 | 3,856 | ||||||
| Duke Energy Corp. | 32,752 | 3,373 | ||||||
| AES Corp. | 108,568 | 3,122 | ||||||
| Entergy Corp. | 26,522 | 2,984 | ||||||
| Exelon Corp. | 49,566 | 2,143 | ||||||
| American Funds Insurance Series | 111 |
Capital Income Builder (continued)
| Common stocks (continued) | Shares | Value (000) |
||||||
| Utilities (continued) | ||||||||
| Public Service Enterprise Group, Inc. | 28,665 | $ | 1,756 | |||||
| SSE PLC | 77,332 | 1,595 | ||||||
| CenterPoint Energy, Inc. | 51,179 | 1,535 | ||||||
| Sempra Energy | 9,762 | 1,509 | ||||||
| ENN Energy Holdings, Ltd. | 93,600 | 1,306 | ||||||
| Enel SpA | 240,213 | 1,292 | ||||||
| NextEra Energy, Inc. | 13,466 | 1,126 | ||||||
| Evergy, Inc. | 15,369 | 967 | ||||||
| Power Assets Holdings, Ltd. | 106,500 | 583 | ||||||
| CMS Energy Corp. | 3,992 | 253 | ||||||
| American Electric Power Company, Inc. | 1,512 | 144 | ||||||
| SembCorp Industries, Ltd. | 44,800 | 113 | ||||||
| 71,066 | ||||||||
| Energy 6.00% | ||||||||
| Canadian Natural Resources, Ltd. (CAD denominated)5 | 195,057 | 10,832 | ||||||
| Chevron Corp. | 47,686 | 8,559 | ||||||
| TC Energy Corp. (CAD denominated) | 181,889 | 7,252 | ||||||
| TC Energy Corp. | 16,085 | 641 | ||||||
| Exxon Mobil Corp. | 69,719 | 7,690 | ||||||
| TotalEnergies SE | 90,216 | 5,631 | ||||||
| BP PLC | 806,006 | 4,687 | ||||||
| EOG Resources, Inc. | 34,736 | 4,499 | ||||||
| Shell PLC (GBP denominated) | 115,306 | 3,277 | ||||||
| Shell PLC (ADR) | 8,467 | 482 | ||||||
| Woodside Energy Group, Ltd. | 86,228 | 2,086 | ||||||
| Woodside Energy Group, Ltd. (CDI) | 23,081 | 557 | ||||||
| ConocoPhillips | 20,510 | 2,420 | ||||||
| Pioneer Natural Resources Company | 10,296 | 2,352 | ||||||
| Schlumberger, Ltd. | 36,843 | 1,970 | ||||||
| Enbridge, Inc. (CAD denominated) | 40,329 | 1,576 | ||||||
| Baker Hughes Co., Class A | 52,596 | 1,553 | ||||||
| Equitrans Midstream Corp. | 213,059 | 1,427 | ||||||
| DT Midstream, Inc. | 13,716 | 758 | ||||||
| Galp Energia, SGPS, SA, Class B | 11,022 | 149 | ||||||
| Gazprom PJSC2 | 880,428 | — | 4 | |||||
| 68,398 | ||||||||
| Real estate 5.99% | ||||||||
| VICI Properties, Inc. REIT | 586,804 | 19,012 | ||||||
| Crown Castle, Inc. REIT | 113,151 | 15,348 | ||||||
| Equinix, Inc. REIT | 10,699 | 7,008 | ||||||
| Gaming and Leisure Properties, Inc. REIT | 93,929 | 4,893 | ||||||
| Federal Realty Investment Trust REIT | 28,164 | 2,846 | ||||||
| Link REIT | 372,507 | 2,735 | ||||||
| American Tower Corp. REIT | 9,879 | 2,093 | ||||||
| CK Asset Holdings, Ltd. | 318,000 | 1,958 | ||||||
| Boston Properties, Inc. REIT | 22,486 | 1,520 | ||||||
| Charter Hall Group REIT | 146,326 | 1,192 | ||||||
| Longfor Group Holdings, Ltd. | 353,000 | 1,082 | ||||||
| POWERGRID Infrastructure Investment Trust | 681,036 | 1,047 | ||||||
| Embassy Office Parks REIT | 245,585 | 996 | ||||||
| Mindspace Business Parks REIT | 214,689 | 868 | ||||||
| Extra Space Storage, Inc. REIT | 5,810 | 855 | ||||||
| Americold Realty Trust, Inc. REIT | 30,182 | 854 | ||||||
| Sun Hung Kai Properties, Ltd. | 61,255 | 838 | ||||||
| CTP NV | 68,103 | 802 | ||||||
| Digital Realty Trust, Inc. REIT | 6,950 | 697 | ||||||
| 112 | American Funds Insurance Series |
Capital Income Builder (continued)
| Common stocks (continued) | Shares | Value (000) |
||||||
| Real estate (continued) | ||||||||
| Kimco Realty Corp. REIT | 31,388 | $ | 665 | |||||
| Prologis, Inc. REIT | 4,763 | 537 | ||||||
| CubeSmart REIT | 8,847 | 356 | ||||||
| 68,202 | ||||||||
| Materials 2.91% | ||||||||
| Vale SA (ADR), ordinary nominative shares | 349,433 | 5,930 | ||||||
| Vale SA, ordinary nominative shares | 225,247 | 3,792 | ||||||
| Rio Tinto PLC | 79,626 | 5,587 | ||||||
| Air Products and Chemicals, Inc. | 9,631 | 2,969 | ||||||
| Linde PLC | 8,936 | 2,915 | ||||||
| BHP Group, Ltd. (CDI) | 82,385 | 2,540 | ||||||
| International Flavors & Fragrances, Inc. | 21,588 | 2,263 | ||||||
| LyondellBasell Industries NV | 18,557 | 1,541 | ||||||
| Evonik Industries AG | 54,480 | 1,046 | ||||||
| Sociedad Química y Minera de Chile SA, Class B (ADR) | 12,475 | 996 | ||||||
| BASF SE | 16,131 | 801 | ||||||
| UPM-Kymmene OYJ | 19,684 | 738 | ||||||
| Asahi Kasei Corp. | 96,900 | 688 | ||||||
| Fortescue Metals Group, Ltd. | 28,457 | 397 | ||||||
| Nexa Resources SA5 | 51,286 | 309 | ||||||
| WestRock Co. | 7,448 | 262 | ||||||
| Shin-Etsu Chemical Co., Ltd. | 1,900 | 231 | ||||||
| Smurfit Kappa Group PLC | 4,754 | 176 | ||||||
| 33,181 | ||||||||
| Consumer discretionary 2.90% | ||||||||
| Starbucks Corp. | 41,213 | 4,088 | ||||||
| Home Depot, Inc. | 12,852 | 4,059 | ||||||
| Industria de Diseño Textil, SA | 149,994 | 3,994 | ||||||
| Midea Group Co., Ltd., Class A | 513,775 | 3,816 | ||||||
| McDonald’s Corp. | 11,404 | 3,005 | ||||||
| Kering SA | 5,640 | 2,887 | ||||||
| Restaurant Brands International, Inc. | 38,245 | 2,473 | ||||||
| LVMH Moët Hennessy-Louis Vuitton SE | 2,860 | 2,078 | ||||||
| YUM! Brands, Inc. | 10,281 | 1,317 | ||||||
| Galaxy Entertainment Group, Ltd. | 196,000 | 1,298 | ||||||
| Cie. Financière Richemont SA, Class A | 7,967 | 1,031 | ||||||
| Darden Restaurants, Inc. | 7,101 | 982 | ||||||
| Mercedes-Benz Group AG | 8,466 | 556 | ||||||
| OPAP SA | 27,844 | 395 | ||||||
| Pearson PLC | 26,653 | 302 | ||||||
| Inchcape PLC | 26,460 | 261 | ||||||
| Kindred Group PLC (SDR) | 24,452 | 255 | ||||||
| VF Corp. | 4,833 | 134 | ||||||
| Thule Group AB | 4,224 | 88 | ||||||
| 33,019 | ||||||||
| Communication services 2.85% | ||||||||
| Comcast Corp., Class A | 222,680 | 7,787 | ||||||
| Verizon Communications, Inc. | 113,150 | 4,458 | ||||||
| SoftBank Corp. | 380,300 | 4,300 | ||||||
| Singapore Telecommunications, Ltd. | 1,528,600 | 2,935 | ||||||
| Koninklijke KPN NV | 918,661 | 2,842 | ||||||
| BCE, Inc. | 54,651 | 2,401 | ||||||
| Nippon Telegraph and Telephone Corp. | 75,100 | 2,143 | ||||||
| HKT Trust and HKT, Ltd., units | 1,127,240 | 1,378 | ||||||
| Warner Music Group Corp., Class A | 33,470 | 1,172 | ||||||
| Omnicom Group, Inc. | 10,871 | 887 | ||||||
| WPP PLC | 81,366 | 808 | ||||||
| American Funds Insurance Series | 113 |
Capital Income Builder (continued)
| Common stocks (continued) | Shares | Value (000) |
||||||
| Communication services (continued) | ||||||||
| Indus Towers, Ltd. | 211,665 | $ | 486 | |||||
| América Móvil, SAB de CV, Series L (ADR) | 24,725 | 450 | ||||||
| ProSiebenSat.1 Media SE | 40,927 | 366 | ||||||
| 32,413 | ||||||||
| Total common stocks (cost: $704,847,000) | 848,114 | |||||||
| Preferred securities 0.05% | ||||||||
| Information technology 0.05% | ||||||||
| Samsung Electronics Co., Ltd., nonvoting preferred shares | 13,546 | 545 | ||||||
| Total preferred securities (cost: $456,000) | 545 | |||||||
| Rights & warrants 0.00% | ||||||||
| Consumer discretionary 0.00% | ||||||||
| Compagnie Financière Richemont SA, Class A, warrants, expire 11/22/20233 | 7,130 | 6 | ||||||
| Total rights & warrants (cost: $0) | 6 | |||||||
| Convertible stocks 0.44% | ||||||||
| Utilities 0.28% | ||||||||
| NextEra Energy, Inc., noncumulative convertible preferred units, 6.926% 9/1/2025 | 35,900 | 1,802 | ||||||
| AES Corp., convertible preferred units, 6.875% 2/15/2024 | 8,659 | 883 | ||||||
| American Electric Power Company, Inc., convertible preferred units, 6.125% 8/15/2023 | 9,704 | 501 | ||||||
| 3,186 | ||||||||
| Health care 0.10% | ||||||||
| Danaher Corp., Series B, cumulative convertible preferred shares, 5.00% 4/15/20235 | 841 | 1,141 | ||||||
| Consumer discretionary 0.06% | ||||||||
| Aptiv PLC, Series A, convertible preferred shares, 5.50% 6/15/2023 | 6,448 | 692 | ||||||
| Total convertible stocks (cost: $4,623,000) | 5,019 | |||||||
| Investment funds 2.46% | ||||||||
| Capital Group Central Corporate Bond Fund6 | 3,442,868 | 28,059 | ||||||
| Total investment funds (cost: $33,742,000) | 28,059 | |||||||
| Bonds, notes & other debt instruments 18.22% | Principal amount (000) |
|||||||
| U.S. Treasury bonds & notes 9.44% | ||||||||
| U.S. Treasury 7.06% | ||||||||
| U.S. Treasury 0.125% 1/31/2023 | USD | 2,200 | 2,193 | |||||
| U.S. Treasury 0.375% 10/31/2023 | 875 | 844 | ||||||
| U.S. Treasury 0.125% 12/15/2023 | 8,410 | 8,057 | ||||||
| U.S. Treasury 2.50% 4/30/2024 | 2,224 | 2,161 | ||||||
| U.S. Treasury 3.25% 8/31/2024 | 554 | 542 | ||||||
| U.S. Treasury 0.625% 10/15/2024 | 11,050 | 10,322 | ||||||
| U.S. Treasury 0.75% 11/15/2024 | 3,525 | 3,291 | ||||||
| U.S. Treasury 4.50% 11/30/2024 | 3,677 | 3,678 | ||||||
| U.S. Treasury 4.00% 12/15/2025 | 4,257 | 4,230 | ||||||
| U.S. Treasury 0.75% 3/31/2026 | 1 | 1 | ||||||
| U.S. Treasury 0.75% 4/30/2026 | 1,093 | 977 | ||||||
| U.S. Treasury 0.75% 5/31/2026 | 3,850 | 3,435 | ||||||
| 114 | American Funds Insurance Series |
Capital Income Builder (continued)
| Bonds, notes & other debt instruments (continued) | Principal amount (000) |
Value (000) |
||||||
| U.S. Treasury bonds & notes (continued) | ||||||||
| U.S. Treasury (continued) | ||||||||
| U.S. Treasury 1.875% 6/30/2026 | USD | 6,300 | $ | 5,845 | ||||
| U.S. Treasury 1.125% 10/31/2026 | 995 | 890 | ||||||
| U.S. Treasury 2.00% 11/15/20267 | 2,800 | 2,589 | ||||||
| U.S. Treasury 0.50% 4/30/2027 | 2,900 | 2,498 | ||||||
| U.S. Treasury 6.125% 11/15/2027 | 950 | 1,037 | ||||||
| U.S. Treasury 3.875% 11/30/2027 | 15,438 | 15,354 | ||||||
| U.S. Treasury 1.25% 3/31/2028 | 1,350 | 1,174 | ||||||
| U.S. Treasury 3.875% 11/30/2029 | 1,360 | 1,351 | ||||||
| U.S. Treasury 6.25% 5/15/2030 | 890 | 1,016 | ||||||
| U.S. Treasury 4.125% 11/15/2032 | 1,610 | 1,642 | ||||||
| U.S. Treasury 1.125% 5/15/20407 | 2,400 | 1,506 | ||||||
| U.S. Treasury 2.00% 11/15/2041 | 300 | 215 | ||||||
| U.S. Treasury 4.00% 11/15/2042 | 806 | 790 | ||||||
| U.S. Treasury 2.375% 5/15/2051 | 197 | 142 | ||||||
| U.S. Treasury 3.00% 8/15/20527 | 5,411 | 4,486 | ||||||
| U.S. Treasury 4.00% 11/15/2052 | 115 | 116 | ||||||
| 80,382 | ||||||||
| U.S. Treasury inflation-protected securities 2.38% | ||||||||
| U.S. Treasury Inflation-Protected Security 0.125% 1/15/20238 | 2,610 | 2,605 | ||||||
| U.S. Treasury Inflation-Protected Security 0.625% 4/15/20238 | 3,400 | 3,367 | ||||||
| U.S. Treasury Inflation-Protected Security 0.375% 7/15/20238 | 1,818 | 1,797 | ||||||
| U.S. Treasury Inflation-Protected Security 0.625% 1/15/20248 | 1,220 | 1,195 | ||||||
| U.S. Treasury Inflation-Protected Security 0.50% 4/15/20248 | 1,581 | 1,539 | ||||||
| U.S. Treasury Inflation-Protected Security 0.125% 7/15/20248 | 1,887 | 1,828 | ||||||
| U.S. Treasury Inflation-Protected Security 0.125% 10/15/20248 | 2,752 | 2,652 | ||||||
| U.S. Treasury Inflation-Protected Security 0.25% 1/15/20258 | 539 | 518 | ||||||
| U.S. Treasury Inflation-Protected Security 0.125% 4/15/20258 | 1,269 | 1,210 | ||||||
| U.S. Treasury Inflation-Protected Security 0.375% 7/15/20258 | 377 | 362 | ||||||
| U.S. Treasury Inflation-Protected Security 0.125% 10/15/20258 | 230 | 218 | ||||||
| U.S. Treasury Inflation-Protected Security 0.125% 4/15/20268 | 2,388 | 2,245 | ||||||
| U.S. Treasury Inflation-Protected Security 1.625% 10/15/20278 | 2,253 | 2,250 | ||||||
| U.S. Treasury Inflation-Protected Security 0.50% 1/15/20288 | 242 | 227 | ||||||
| U.S. Treasury Inflation-Protected Security 0.125% 1/15/20308 | 2,143 | 1,925 | ||||||
| U.S. Treasury Inflation-Protected Security 0.125% 1/15/20318 | 1,831 | 1,625 | ||||||
| U.S. Treasury Inflation-Protected Security 0.125% 7/15/20318 | 139 | 123 | ||||||
| U.S. Treasury Inflation-Protected Security 1.00% 2/15/20498 | 201 | 169 | ||||||
| U.S. Treasury Inflation-Protected Security 0.125% 2/15/20517,8 | 2,031 | 1,311 | ||||||
| 27,166 | ||||||||
| Total U.S. Treasury bonds & notes | 107,548 | |||||||
| Mortgage-backed obligations 6.13% | ||||||||
| Federal agency mortgage-backed obligations 5.40% | ||||||||
| Fannie Mae Pool #695412 5.00% 6/1/20339 | — | 4 | — | 4 | ||||
| Fannie Mae Pool #AD3566 5.00% 10/1/20359 | 2 | 2 | ||||||
| Fannie Mae Pool #931768 5.00% 8/1/20399 | 1 | 1 | ||||||
| Fannie Mae Pool #AC0794 5.00% 10/1/20399 | 5 | 5 | ||||||
| Fannie Mae Pool #932606 5.00% 2/1/20409 | 2 | 2 | ||||||
| Fannie Mae Pool #AE0311 3.50% 8/1/20409 | 9 | 8 | ||||||
| Fannie Mae Pool #AE1248 5.00% 6/1/20419 | 8 | 8 | ||||||
| Fannie Mae Pool #AJ1873 4.00% 10/1/20419 | 7 | 6 | ||||||
| Fannie Mae Pool #AE1274 5.00% 10/1/20419 | 7 | 7 | ||||||
| Fannie Mae Pool #AE1277 5.00% 11/1/20419 | 5 | 5 | ||||||
| Fannie Mae Pool #AE1283 5.00% 12/1/20419 | 2 | 2 | ||||||
| Fannie Mae Pool #AE1290 5.00% 2/1/20429 | 4 | 4 | ||||||
| Fannie Mae Pool #AT0300 3.50% 3/1/20439 | 1 | 1 | ||||||
| Fannie Mae Pool #AT3954 3.50% 4/1/20439 | 2 | 2 | ||||||
| Fannie Mae Pool #AY1829 3.50% 12/1/20449 | 2 | 2 | ||||||
| Fannie Mae Pool #FM9416 3.50% 7/1/20459 | 150 | 138 | ||||||
| Fannie Mae Pool #BH3122 4.00% 6/1/20479 | 1 | 1 | ||||||
| American Funds Insurance Series | 115 |
Capital Income Builder (continued)
| Bonds, notes & other debt instruments (continued) | Principal amount (000) |
Value (000) |
||||||
| Mortgage-backed obligations (continued) | ||||||||
| Federal agency mortgage-backed obligations (continued) | ||||||||
| Fannie Mae Pool #BJ5015 4.00% 12/1/20479 | USD | 39 | $ | 37 | ||||
| Fannie Mae Pool #BK5232 4.00% 5/1/20489 | 20 | 19 | ||||||
| Fannie Mae Pool #BK6840 4.00% 6/1/20489 | 27 | 25 | ||||||
| Fannie Mae Pool #BK9743 4.00% 8/1/20489 | 8 | 8 | ||||||
| Fannie Mae Pool #BK9761 4.50% 8/1/20489 | 5 | 5 | ||||||
| Fannie Mae Pool #FM3280 3.50% 5/1/20499 | 38 | 35 | ||||||
| Fannie Mae Pool #CA5540 3.00% 4/1/20509 | 3,219 | 2,861 | ||||||
| Fannie Mae Pool #CA6309 3.00% 7/1/20509 | 376 | 337 | ||||||
| Fannie Mae Pool #CB2787 3.50% 12/1/20519 | 23 | 21 | ||||||
| Fannie Mae Pool #BV0790 3.50% 1/1/20529 | 97 | 88 | ||||||
| Fannie Mae Pool #FS0647 3.00% 2/1/20529 | 1,017 | 907 | ||||||
| Fannie Mae Pool #CB3236 3.00% 3/1/20529 | 424 | 373 | ||||||
| Fannie Mae Pool #FS3275 3.00% 4/1/20529 | 787 | 691 | ||||||
| Fannie Mae Pool #MA4600 3.50% 5/1/20529 | 1,452 | 1,321 | ||||||
| Fannie Mae Pool #BT8370 3.50% 6/1/20529 | 291 | 265 | ||||||
| Fannie Mae Pool #MA4732 4.00% 9/1/20529 | 353 | 332 | ||||||
| Fannie Mae Pool #MA4782 3.50% 10/1/20529 | 880 | 800 | ||||||
| Fannie Mae Pool #MA4877 6.50% 12/1/20529 | 103 | 106 | ||||||
| Fannie Mae Pool #MA4902 3.50% 1/1/20539 | 53 | 48 | ||||||
| Fannie Mae Pool #MA4866 4.00% 1/1/20539 | 828 | 777 | ||||||
| Fannie Mae Pool #MA4868 5.00% 1/1/20539 | 30 | 30 | ||||||
| Fannie Mae Pool #MA4895 6.50% 1/1/20539 | 118 | 121 | ||||||
| Fannie Mae Pool #BF0142 5.50% 8/1/20569 | 391 | 404 | ||||||
| Fannie Mae Pool #BF0342 5.50% 1/1/20599 | 266 | 272 | ||||||
| Fannie Mae Pool #BM6737 4.50% 11/1/20599 | 704 | 691 | ||||||
| Fannie Mae Pool #BF0497 3.00% 7/1/20609 | 458 | 401 | ||||||
| Freddie Mac Pool #Q15874 4.00% 2/1/20439 | 1 | 1 | ||||||
| Freddie Mac Pool #G67711 4.00% 3/1/20489 | 234 | 225 | ||||||
| Freddie Mac Pool #Q55971 4.00% 5/1/20489 | 20 | 19 | ||||||
| Freddie Mac Pool #Q56175 4.00% 5/1/20489 | 19 | 18 | ||||||
| Freddie Mac Pool #Q55970 4.00% 5/1/20489 | 10 | 9 | ||||||
| Freddie Mac Pool #Q56599 4.00% 6/1/20489 | 28 | 27 | ||||||
| Freddie Mac Pool #Q57242 4.50% 7/1/20489 | 13 | 13 | ||||||
| Freddie Mac Pool #Q58411 4.50% 9/1/20489 | 51 | 51 | ||||||
| Freddie Mac Pool #Q58436 4.50% 9/1/20489 | 28 | 27 | ||||||
| Freddie Mac Pool #Q58378 4.50% 9/1/20489 | 20 | 20 | ||||||
| Freddie Mac Pool #ZT1704 4.50% 1/1/20499 | 1,234 | 1,218 | ||||||
| Freddie Mac Pool #QD2877 3.00% 12/1/20519 | 130 | 114 | ||||||
| Freddie Mac Pool #SD1374 3.00% 3/1/20529 | 430 | 378 | ||||||
| Freddie Mac Pool #SD1937 3.00% 3/1/20529 | 243 | 214 | ||||||
| Freddie Mac Pool #QE4383 4.00% 6/1/20529 | 340 | 319 | ||||||
| Freddie Mac Pool #RA7556 4.50% 6/1/20529 | 936 | 903 | ||||||
| Freddie Mac Pool #SD8242 3.00% 9/1/20529 | 605 | 531 | ||||||
| Freddie Mac Pool #SD1584 4.50% 9/1/20529 | 206 | 202 | ||||||
| Freddie Mac Pool #QF1730 4.00% 10/1/20529 | 838 | 787 | ||||||
| Freddie Mac Pool #SD8256 4.00% 10/1/20529 | 100 | 94 | ||||||
| Freddie Mac Pool #SD8264 3.50% 11/1/20529 | 200 | 182 | ||||||
| Freddie Mac Pool #SD8275 4.50% 12/1/20529 | 1,959 | 1,887 | ||||||
| Freddie Mac Pool #SD8281 6.50% 12/1/20529 | 406 | 416 | ||||||
| Freddie Mac Pool #SD8285 3.50% 1/1/20539 | 14 | 13 | ||||||
| Freddie Mac Pool #SD8286 4.00% 1/1/20539 | 200 | 188 | ||||||
| Freddie Mac Pool #SD8288 5.00% 1/1/20539 | 35 | 35 | ||||||
| Freddie Mac Pool #SD8282 6.50% 1/1/20539 | 457 | 468 | ||||||
| Freddie Mac Seasoned Credit Risk Transfer Trust, Series 2017-1, Class HA, 3.00% 1/25/20569,10 | 115 | 108 | ||||||
| Freddie Mac Seasoned Credit Risk Transfer Trust, Series 2017-2, Class MA, 3.00% 8/25/20569 | 235 | 219 | ||||||
| Freddie Mac Seasoned Credit Risk Transfer Trust, Series 2017-2, Class HA, 3.00% 8/25/20569,10 | 233 | 218 | ||||||
| Freddie Mac Seasoned Credit Risk Transfer Trust, Series 2017-4, Class HT, 3.25% 6/25/20579,10 | 97 | 88 | ||||||
| 116 | American Funds Insurance Series |
Capital Income Builder (continued)
| Bonds, notes & other debt instruments (continued) | Principal amount (000) |
Value (000) |
||||||
| Mortgage-backed obligations (continued) | ||||||||
| Federal agency mortgage-backed obligations (continued) | ||||||||
| Freddie Mac Seasoned Credit Risk Transfer Trust, Series 2017-4, Class MT, 3.50% 6/25/20579 | USD80 | $ | 73 | |||||
| Freddie Mac Seasoned Credit Risk Transfer Trust, Series 2018-3, Class MA, 3.50% 8/25/20579 | 20 | 19 | ||||||
| Freddie Mac Seasoned Credit Risk Transfer Trust, Series 2019-1, Class MT, 3.50% 7/25/20589 | 1,001 | 905 | ||||||
| Freddie Mac Seasoned Credit Risk Transfer Trust, Series 2019-1, Class MA, 3.50% 7/25/20589 | 408 | 386 | ||||||
| Freddie Mac Seasoned Credit Risk Transfer Trust, Series 2019-2, Class MA, 3.50% 8/25/20589 | 629 | 594 | ||||||
| Freddie Mac Seasoned Credit Risk Transfer Trust, Series 2019-3, Class MA, 3.50% 10/25/20589 | 18 | 17 | ||||||
| Freddie Mac Seasoned Credit Risk Transfer Trust, Series 2019-3, Class MT, 3.50% 10/25/20589 | 10 | 9 | ||||||
| Freddie Mac Seasoned Loan Structured Transaction Trust, Series 2018-2, Class A1, 3.50% 11/25/20289 | 922 | 881 | ||||||
| Freddie Mac Seasoned Loan Structured Transaction Trust, Series 2019-2, Class A1C, 2.75% 9/25/20299 | 1,293 | 1,191 | ||||||
| Government National Mortgage Assn. 4.00% 1/1/20539,11 | 3,400 | 3,218 | ||||||
| Government National Mortgage Assn. 4.50% 1/1/20539,11 | 60 | 58 | ||||||
| Government National Mortgage Assn. 5.00% 2/1/20539,11 | 8,731 | 8,652 | ||||||
| Government National Mortgage Assn. 5.50% 2/1/20539,11 | 1,017 | 1,022 | ||||||
| Government National Mortgage Assn. Pool #MA5764 4.50% 2/20/20499 | 454 | 441 | ||||||
| Government National Mortgage Assn. Pool #MA8426 4.00% 11/20/20529 | 2,927 | 2,773 | ||||||
| Government National Mortgage Assn. Pool #MA8427 4.50% 11/20/20529 | 1,054 | 1,024 | ||||||
| Government National Mortgage Assn. Pool #MA8488 4.00% 12/20/20529 | 54 | 52 | ||||||
| Government National Mortgage Assn. Pool #MA8489 4.50% 12/20/20529 | 300 | 291 | ||||||
| Government National Mortgage Assn. Pool #694836 5.682% 9/20/20599 | — | 4 | — | 4 | ||||
| Government National Mortgage Assn. Pool #765152 4.14% 7/20/20619 | — | 4 | — | 4 | ||||
| Government National Mortgage Assn. Pool #766525 4.70% 11/20/20629 | — | 4 | — | 4 | ||||
| Government National Mortgage Assn. Pool #AA7554 6.64% 7/20/20649 | 1 | 1 | ||||||
| Government National Mortgage Assn. Pool #725893 5.20% 9/20/20649 | — | 4 | — | 4 | ||||
| Uniform Mortgage-Backed Security 2.50% 1/1/20389,11 | 1,708 | 1,563 | ||||||
| Uniform Mortgage-Backed Security 2.00% 1/1/20539,11 | 60 | 49 | ||||||
| Uniform Mortgage-Backed Security 2.50% 1/1/20539,11 | 140 | 119 | ||||||
| Uniform Mortgage-Backed Security 4.00% 1/1/20539,11 | 340 | 319 | ||||||
| Uniform Mortgage-Backed Security 4.50% 1/1/20539,11 | 340 | 327 | ||||||
| Uniform Mortgage-Backed Security 5.00% 1/1/20539,11 | 1,250 | 1,232 | ||||||
| Uniform Mortgage-Backed Security 5.50% 1/1/20539,11 | 13,500 | 13,538 | ||||||
| Uniform Mortgage-Backed Security 6.50% 1/1/20539,11 | 1,836 | 1,880 | ||||||
| Uniform Mortgage-Backed Security 4.00% 2/1/20539,11 | 172 | 161 | ||||||
| Uniform Mortgage-Backed Security 5.50% 2/1/20539,11 | 80 | 80 | ||||||
| Uniform Mortgage-Backed Security 6.00% 2/1/20539,11 | 470 | 477 | ||||||
| 61,513 | ||||||||
| Collateralized mortgage-backed obligations (privately originated) 0.42% | ||||||||
| Arroyo Mortgage Trust, Series 2021-1R, Class A1, 1.175% 10/25/20481,9,10 | 141 | 112 | ||||||
| BINOM Securitization Trust, Series 2022-RPL1, Class A1, 3.00% 2/25/20611,9,10 | 84 | 75 | ||||||
| BRAVO Residential Funding Trust, Series 2022-RPL1, Class A1, 2.75% 9/25/20611,9 | 90 | 78 | ||||||
| Cascade Funding Mortgage Trust, Series 2020-HB4, Class A, 0.946% 12/26/20301,9,10 | 71 | 69 | ||||||
| Cascade Funding Mortgage Trust, Series 2021-HB7, Class A, 1.151% 10/27/20311,9,10 | 136 | 129 | ||||||
| Cascade Funding Mortgage Trust, Series 2021-HB6, Class A, 0.898% 6/25/20361,9,10 | 104 | 99 | ||||||
| CIM Trust, Series 2022-R2, Class A1, 3.75% 12/25/20611,9,10 | 185 | 175 | ||||||
| Citigroup Mortgage Loan Trust, Series 2020-EXP1, Class A1A, 1.804% 5/25/20601,9,10 | 10 | 10 | ||||||
| Connecticut Avenue Securities Trust, Series 2021-R01, Class 1M1, (30-day Average USD-SOFR + 0.75%) 4.678% 10/25/20411,9,10 | 4 | 4 | ||||||
| Finance of America Structured Securities Trust, Series 2019-JR3, Class A, 2.00% 9/25/20691,9 | 59 | 61 | ||||||
| Finance of America Structured Securities Trust, Series 2019-JR4, Class A, 2.00% 11/25/20691,9 | 67 | 66 | ||||||
| American Funds Insurance Series | 117 |
Capital Income Builder (continued)
| Bonds, notes & other debt instruments (continued) | Principal amount (000) |
Value (000) |
||||||
| Mortgage-backed obligations (continued) | ||||||||
| Collateralized mortgage-backed obligations (privately originated) (continued) | ||||||||
| Flagstar Mortgage Trust, Series 2021-10INV, Class A3, 2.50% 10/25/20511,9,10 | USD | 117 | $ | 95 | ||||
| Freddie Mac Structured Agency Credit Risk Debt Notes, Series 2015-DNA3, Class M3, (1-month USD-LIBOR + 4.70%) 9.089% 4/25/20289,10 | 252 | 261 | ||||||
| Freddie Mac Structured Agency Credit Risk Debt Notes, Series 2022-DNA3, Class M1A, (30-day Average USD-SOFR + 2.00%) 5.928% 4/25/20421,9,10 | 109 | 109 | ||||||
| Freddie Mac Structured Agency Credit Risk Debt Notes, Series 2022-DNA4, Class M1A, (30-day Average USD-SOFR + 2.20%) 6.128% 5/25/20421,9,10 | 19 | 19 | ||||||
| Freddie Mac Structured Agency Credit Risk Debt Notes, Series 2022-DNA6, Class M1A, (30-day Average USD-SOFR + 2.15%) 6.078% 9/25/20421,9,10 | 34 | 34 | ||||||
| Freddie Mac Structured Agency Credit Risk Debt Notes, Series 2022-DNA6, Class M1B, (30-day Average USD-SOFR + 3.70%) 7.628% 9/25/20421,9,10 | 64 | 65 | ||||||
| Freddie Mac Structured Agency Credit Risk Debt Notes, Series 2020-DNA1, Class M2, (1-month USD-LIBOR + 1.70%) 6.089% 1/25/20501,9,10 | 188 | 187 | ||||||
| Freddie Mac Structured Agency Credit Risk Debt Notes, Series 2020-DNA2, Class M2, (1-month USD-LIBOR + 1.85%) 6.239% 2/25/20501,9,10 | 408 | 407 | ||||||
| Freddie Mac Structured Agency Credit Risk Debt Notes, Series 2020-DNA3, Class B1, (1-month USD-LIBOR + 5.10%) 9.489% 6/27/20501,9,10 | 108 | 112 | ||||||
| Freddie Mac Structured Agency Credit Risk Debt Notes, Series 2020-DNA4, Class B1, (1-month USD-LIBOR + 6.00%) 10.389% 8/25/20501,9,10 | 540 | 575 | ||||||
| Home Partners of America Trust, Series 2022-1, Class A, 3.93% 4/17/20391,9 | 196 | 184 | ||||||
| Legacy Mortgage Asset Trust, Series 2022-GS1, Class A1, 4.00% 2/25/2061 (7.00% on 4/25/2025)1,9,12 | 200 | 185 | ||||||
| Legacy Mortgage Asset Trust, Series 2021-GS2, Class A1, 1.75% 4/25/20611,9,10 | 78 | 71 | ||||||
| Legacy Mortgage Asset Trust, Series 2021-GS5, Class A1, 2.25% 7/25/2067 (5.25% on 11/25/2024)1,9,12 | 132 | 119 | ||||||
| Mello Warehouse Securitization Trust, Series 2021-3, Class A, (1-month USD-LIBOR + 0.85%) 5.239% 11/25/20551,9,10 | 202 | 195 | ||||||
| NewRez Warehouse Securitization Trust, Series 2021-1, Class A, (1-month USD-LIBOR + 0.75%) 5.139% 5/25/20551,9,10 | 281 | 277 | ||||||
| Progress Residential Trust, Series 2022-SFR3, Class A, 3.20% 4/17/20391,9 | 100 | 91 | ||||||
| Reverse Mortgage Investment Trust, Series 2021-HB1, Class A, 1.259% 11/25/20311,9,10 | 66 | 62 | ||||||
| Towd Point Mortgage Trust, Series 2016-5, Class A1, 2.50% 10/25/20561,9,10 | 20 | 19 | ||||||
| Towd Point Mortgage Trust, Series 2017-3, Class A1, 2.75% 7/25/20571,9,10 | 20 | 19 | ||||||
| Towd Point Mortgage Trust, Series 2017-6, Class A1, 2.75% 10/25/20571,9,10 | 40 | 39 | ||||||
| Towd Point Mortgage Trust, Series 2018-2, Class A1, 3.25% 3/25/20581,9,10 | 49 | 47 | ||||||
| Towd Point Mortgage Trust, Series 2018-5, Class A1A, 3.25% 7/25/20581,9,10 | 24 | 23 | ||||||
| Towd Point Mortgage Trust, Series 2020-4, Class A1, 1.75% 10/25/20601,9 | 472 | 420 | ||||||
| Treehouse Park Improvement Association No.1 - Anleihen 9.75% 12/1/20331,2 | 100 | 89 | ||||||
| Tricon Residential Trust, Series 2021-SFR1, Class A, 1.943% 7/17/20381,9 | 196 | 170 | ||||||
| 4,752 | ||||||||
| Commercial mortgage-backed securities 0.31% | ||||||||
| BOCA Commercial Mortgage Trust, Series 2022-BOCA, Class A, (1-month USD CME Term SOFR + 1.77%) 6.105% 5/15/20391,9,10 | 110 | 108 | ||||||
| BPR Trust, Series 2022-OANA, Class A, (1-month USD CME Term SOFR + 1.898%) 6.234% 4/15/20371,9,10 | 329 | 322 | ||||||
| BX Trust, Series 2022-CSMO, Class A, (1-month USD CME Term SOFR + 2.115%) 6.45% 6/15/20271,9,10 | 332 | 330 | ||||||
| BX Trust, Series 2021-VOLT, Class A, (1-month USD-LIBOR + 0.70%) 5.018% 9/15/20361,9,10 | 548 | 529 | ||||||
| BX Trust, Series 2021-ARIA, Class A, (1-month USD-LIBOR + 0.899%) 5.217% 10/15/20361,9,10 | 266 | 253 | ||||||
| BX Trust, Series 2021-ARIA Class C, (1-month USD-LIBOR + 1.646%) 5.964% 10/15/20361,9,10 | 100 | 93 | ||||||
| BX Trust, Series 2022-IND, Class A, (1-month USD CME Term SOFR + 1.491%) 5.827% 4/15/20371,9,10 | 155 | 152 | ||||||
| BX Trust, Series 2021-SOAR, Class A, (1-month USD-LIBOR + 0.67%) 4.988% 6/15/20381,9,10 | 173 | 167 | ||||||
| 118 | American Funds Insurance Series |
Capital Income Builder (continued)
| Bonds, notes & other debt instruments (continued) | Principal amount (000) |
Value (000) |
||||||
| Mortgage-backed obligations (continued) | ||||||||
| Commercial mortgage-backed securities (continued) | ||||||||
| BX Trust, Series 2021-SOAR, Class D, (1-month USD-LIBOR + 1.40%) 5.718% 6/15/20381,9,10 | USD | 99 | $ | 94 | ||||
| BX Trust, Series 2021-ACNT, Class C, (1-month USD-LIBOR + 1.50%) 5.818% 11/15/20381,9,10 | 100 | 95 | ||||||
| BX Trust, Series 2022-PSB, Class A, (1-month USD CME Term SOFR + 2.451%) 6.787% 8/15/20391,9,10 | 99 | 99 | ||||||
| Extended Stay America Trust, Series 2021-ESH, Class A, (1-month USD-LIBOR + 1.08%) 5.398% 7/15/20381,9,10 | 98 | 95 | ||||||
| Great Wolf Trust, Series 2019-WOLF, Class A, (1-month USD-LIBOR + 1.034%) 5.352% 12/15/20361,9,10 | 24 | 23 | ||||||
| GS Mortgage Securities Trust, Series 2018-HULA, Class A, 5.238% 7/15/20251,9,10 | 229 | 223 | ||||||
| Hawaii Hotel Trust, Series 2019-MAUI, Class A, (1-month USD-LIBOR + 1.15%) 5.468% 5/17/20381,9,10 | 300 | 292 | ||||||
| JPMorgan Chase Commercial Mortgage Securities Trust, Series 2022-OPO, Class C, 3.565% 1/5/20391,9,10 | 100 | 78 | ||||||
| La Quinta Mortgage Trust, Series 2022-LAQ, Class A, (1-month USD CME Term SOFR + 1.724%) 6.059% 3/15/20391,9,10 | 50 | 49 | ||||||
| LUXE Commercial Mortgage Trust, Series 2021-TRIP, Class A, (1-month USD-LIBOR + 1.05%) 5.368% 10/15/20381,9,10 | 62 | 59 | ||||||
| Multifamily Connecticut Avenue Securities, Series 2019-1, Class M10, (1-month USD-LIBOR + 3.25%) 7.639% 10/15/20491,9,10 | 141 | 133 | ||||||
| SREIT Trust, Series 2021-MFP, Class A, (1-month USD-LIBOR + 0.731%) 5.049% 11/15/20381,9,10 | 361 | 348 | ||||||
| 3,542 | ||||||||
| Total mortgage-backed obligations | 69,807 | |||||||
| Corporate bonds, notes & loans 1.72% | ||||||||
| Health care 0.28% | ||||||||
| AbbVie, Inc. 3.20% 11/21/2029 | 25 | 23 | ||||||
| AbbVie, Inc. 4.25% 11/21/2049 | 39 | 33 | ||||||
| Amgen, Inc. 4.05% 8/18/2029 | 145 | 136 | ||||||
| Amgen, Inc. 4.20% 3/1/2033 | 133 | 123 | ||||||
| Amgen, Inc. 4.20% 2/22/2052 | 19 | 15 | ||||||
| Amgen, Inc. 4.875% 3/1/2053 | 45 | 40 | ||||||
| AstraZeneca PLC 3.375% 11/16/2025 | 200 | 193 | ||||||
| AstraZeneca PLC 3.00% 5/28/2051 | 11 | 8 | ||||||
| Centene Corp. 4.625% 12/15/2029 | 530 | 486 | ||||||
| Centene Corp. 3.375% 2/15/2030 | 179 | 152 | ||||||
| Centene Corp. 2.625% 8/1/2031 | 40 | 31 | ||||||
| Gilead Sciences, Inc. 1.65% 10/1/2030 | 8 | 6 | ||||||
| HCA, Inc. 2.375% 7/15/2031 | 18 | 14 | ||||||
| Humana, Inc. 3.70% 3/23/2029 | 12 | 11 | ||||||
| Merck & Co., Inc. 1.70% 6/10/2027 | 118 | 105 | ||||||
| Merck & Co., Inc. 3.40% 3/7/2029 | 110 | 103 | ||||||
| Regeneron Pharmaceuticals, Inc. 1.75% 9/15/2030 | 8 | 6 | ||||||
| Regeneron Pharmaceuticals, Inc. 2.80% 9/15/2050 | 2 | 1 | ||||||
| Shire PLC 3.20% 9/23/2026 | 270 | 254 | ||||||
| Teva Pharmaceutical Finance Co. BV 6.00% 4/15/2024 | 700 | 687 | ||||||
| Teva Pharmaceutical Finance Co. BV 3.15% 10/1/2026 | 650 | 570 | ||||||
| Teva Pharmaceutical Finance Co. BV 4.10% 10/1/2046 | 300 | 184 | ||||||
| Zoetis, Inc. 5.60% 11/16/2032 | 25 | 26 | ||||||
| 3,207 | ||||||||
| Energy 0.27% | ||||||||
| Apache Corp. 4.25% 1/15/2030 | 385 | 341 | ||||||
| Baker Hughes Holdings, LLC 2.061% 12/15/2026 | 8 | 7 | ||||||
| BP Capital Markets America, Inc. 3.633% 4/6/2030 | 360 | 331 | ||||||
| Cenovus Energy, Inc. 5.40% 6/15/2047 | 73 | 66 | ||||||
| EQT Corp. 5.00% 1/15/2029 | 35 | 33 | ||||||
| EQT Corp. 3.625% 5/15/20311 | 20 | 17 | ||||||
| American Funds Insurance Series | 119 |
Capital Income Builder (continued)
| Bonds, notes & other debt instruments (continued) | Principal amount (000) |
Value (000) |
||||||
| Corporate bonds, notes & loans (continued) | ||||||||
| Energy (continued) | ||||||||
| Equinor ASA 2.375% 5/22/2030 | USD | 365 | $ | 311 | ||||
| Exxon Mobil Corp. 2.995% 8/16/2039 | 200 | 154 | ||||||
| Exxon Mobil Corp. 3.452% 4/15/2051 | 25 | 19 | ||||||
| Kinder Morgan, Inc. 5.45% 8/1/2052 | 11 | 10 | ||||||
| MPLX, LP 4.95% 9/1/2032 | 20 | 19 | ||||||
| MPLX, LP 4.95% 3/14/2052 | 20 | 16 | ||||||
| New Fortress Energy, Inc. 6.50% 9/30/20261 | 80 | 75 | ||||||
| NGL Energy Operating, LLC 7.50% 2/1/20261 | 80 | 71 | ||||||
| ONEOK, Inc. 3.10% 3/15/2030 | 42 | 35 | ||||||
| ONEOK, Inc. 7.15% 1/15/2051 | 97 | 99 | ||||||
| Pemex Project Funding Master Trust, Series 13, 6.625% 6/15/2035 | 150 | 109 | ||||||
| Petróleos Mexicanos 6.50% 1/23/2029 | 20 | 17 | ||||||
| Petróleos Mexicanos 8.75% 6/2/2029 | 177 | 166 | ||||||
| Sabine Pass Liquefaction, LLC 4.50% 5/15/2030 | 142 | 132 | ||||||
| Shell International Finance BV 2.00% 11/7/2024 | 420 | 400 | ||||||
| TransCanada Corp. 5.875% 8/15/2076 (3-month USD-LIBOR + 4.64% on 8/15/2026)12 | 540 | 515 | ||||||
| TransCanada PipeLines, Ltd. 5.10% 3/15/2049 | 150 | 137 | ||||||
| Williams Companies, Inc. 5.30% 8/15/2052 | 40 | 36 | ||||||
| 3,116 | ||||||||
| Communication services 0.24% | ||||||||
| América Móvil, SAB de CV, 8.46% 12/18/2036 | MXN | 1,300 | 58 | |||||
| AT&T, Inc. 3.50% 6/1/2041 | USD | 75 | 56 | |||||
| CCO Holdings, LLC 4.25% 2/1/20311 | 360 | 290 | ||||||
| CCO Holdings, LLC 4.75% 2/1/20321 | 25 | 20 | ||||||
| CCO Holdings, LLC 4.25% 1/15/20341 | 175 | 130 | ||||||
| Charter Communications Operating, LLC 3.70% 4/1/2051 | 25 | 15 | ||||||
| Meta Platforms, Inc. 3.85% 8/15/2032 | 160 | 141 | ||||||
| Meta Platforms, Inc. 4.45% 8/15/2052 | 95 | 76 | ||||||
| Netflix, Inc. 4.875% 4/15/2028 | 150 | 145 | ||||||
| SBA Tower Trust 1.631% 11/15/20261 | 253 | 215 | ||||||
| Sprint Corp. 6.875% 11/15/2028 | 325 | 338 | ||||||
| Sprint Corp. 8.75% 3/15/2032 | 90 | 107 | ||||||
| T-Mobile US, Inc. 3.875% 4/15/2030 | 625 | 568 | ||||||
| T-Mobile US, Inc. 2.55% 2/15/2031 | 253 | 207 | ||||||
| Verizon Communications, Inc. 1.75% 1/20/2031 | 142 | 111 | ||||||
| Walt Disney Company 4.625% 3/23/2040 | 120 | 113 | ||||||
| WarnerMedia Holdings, Inc. 4.279% 3/15/20321 | 56 | 46 | ||||||
| WarnerMedia Holdings, Inc. 5.05% 3/15/20421 | 47 | 36 | ||||||
| WarnerMedia Holdings, Inc. 5.141% 3/15/20521 | 88 | 64 | ||||||
| 2,736 | ||||||||
| Utilities 0.23% | ||||||||
| AEP Transmission Co., LLC 3.80% 6/15/2049 | 45 | 35 | ||||||
| Duke Energy Florida, LLC 5.95% 11/15/2052 | 25 | 27 | ||||||
| Edison International 4.125% 3/15/2028 | 132 | 123 | ||||||
| Edison International 6.95% 11/15/2029 | 25 | 26 | ||||||
| FirstEnergy Corp. 2.65% 3/1/2030 | 493 | 403 | ||||||
| FirstEnergy Corp. 2.25% 9/1/2030 | 107 | 85 | ||||||
| ITC Holdings Corp. 3.35% 11/15/2027 | 25 | 23 | ||||||
| Pacific Gas and Electric Co. 3.25% 2/16/2024 | 1,025 | 1,001 | ||||||
| Pacific Gas and Electric Co. 2.95% 3/1/2026 | 97 | 89 | ||||||
| Pacific Gas and Electric Co. 3.75% 7/1/2028 | 105 | 93 | ||||||
| Pacific Gas and Electric Co. 4.65% 8/1/2028 | 284 | 262 | ||||||
| Pacific Gas and Electric Co. 2.50% 2/1/2031 | 375 | 292 | ||||||
| Southern California Edison Co., Series C, 3.60% 2/1/2045 | 206 | 149 | ||||||
| Union Electric Co. 3.90% 4/1/2052 | 25 | 20 | ||||||
| WEC Energy Group, Inc. 5.15% 10/1/2027 | 25 | 25 | ||||||
| 2,653 | ||||||||
| 120 | American Funds Insurance Series |
Capital Income Builder (continued)
| Bonds, notes & other debt instruments (continued) | Principal amount (000) |
Value (000) |
||||||
| Corporate bonds, notes & loans (continued) | ||||||||
| Financials 0.20% | ||||||||
| AerCap Ireland Capital DAC 3.30% 1/30/2032 | USD | 150 | $ | 118 | ||||
| American Express Co. 4.42% 8/3/2033 (USD-SOFR + 1.76% on 8/3/2032)12 | 82 | 78 | ||||||
| Bank of America Corp. 4.948% 7/22/2028 (USD-SOFR + 2.04% on 7/22/2027)12 | 40 | 39 | ||||||
| Bank of America Corp. 1.922% 10/24/2031 (USD-SOFR + 1.37% on 10/24/2030)12 | 231 | 177 | ||||||
| Bank of America Corp. 5.015% 7/22/2033 (USD-SOFR + 2.16% on 7/22/2032)12 | 84 | 80 | ||||||
| Charles Schwab Corp. 2.45% 3/3/2027 | 25 | 23 | ||||||
| Citigroup, Inc. 3.057% 1/25/2033 (USD-SOFR + 1.351% on 1/25/2032)12 | 35 | 28 | ||||||
| CME Group, Inc. 2.65% 3/15/2032 | 50 | 42 | ||||||
| Corebridge Financial, Inc. 3.85% 4/5/20291 | 180 | 164 | ||||||
| Corebridge Financial, Inc. 3.90% 4/5/20321 | 32 | 28 | ||||||
| Corebridge Financial, Inc. 4.35% 4/5/20421 | 7 | 6 | ||||||
| Corebridge Financial, Inc. 4.40% 4/5/20521 | 49 | 39 | ||||||
| Credit Suisse Group AG 9.016% 11/15/2033 (USD-SOFR + 5.02% on 11/15/2032)1,12 | 250 | 257 | ||||||
| Danske Bank AS 4.298% 4/1/2028 (1-year UST Yield Curve Rate T Note Constant Maturity + 1.75% on 4/1/2027)1,12 | 200 | 184 | ||||||
| Discover Financial Services 6.70% 11/29/2032 | 25 | 25 | ||||||
| Goldman Sachs Group, Inc. 2.65% 10/21/2032 (USD-SOFR + 1.264% on 10/21/2031)12 | 75 | 59 | ||||||
| Goldman Sachs Group, Inc. 3.102% 2/24/2033 (USD-SOFR + 1.41% on 2/24/2032)12 | 40 | 33 | ||||||
| Intercontinental Exchange, Inc. 4.60% 3/15/2033 | 18 | 17 | ||||||
| Intercontinental Exchange, Inc. 4.95% 6/15/2052 | 16 | 15 | ||||||
| JPMorgan Chase & Co. 5.546% 12/15/2025 (USD-SOFR + 1.07% on 12/15/2024)12 | 100 | 100 | ||||||
| JPMorgan Chase & Co. 4.851% 7/25/2028 (USD-SOFR + 1.99% on 7/25/2027)12 | 40 | 39 | ||||||
| JPMorgan Chase & Co. 1.953% 2/4/2032 (USD-SOFR + 1.065% on 2/4/2031)12 | 227 | 174 | ||||||
| JPMorgan Chase & Co. 2.963% 1/25/2033 (USD-SOFR + 1.26% on 1/25/2032)12 | 17 | 14 | ||||||
| JPMorgan Chase & Co. 4.912% 7/25/2033 (USD-SOFR + 2.08% on 7/25/2032)12 | 25 | 24 | ||||||
| Morgan Stanley 4.889% 7/20/2033 (USD-SOFR + 2.077% on 7/20/2032)12 | 20 | 19 | ||||||
| Navient Corp. 5.00% 3/15/2027 | 150 | 132 | ||||||
| New York Life Global Funding 3.00% 1/10/20281 | 150 | 138 | ||||||
| SVB Financial Group 4.70% junior subordinated perpetual bonds (5-year UST Yield Curve Rate T Note Constant Maturity + 3.064% on 11/15/2031)12 | 38 | 24 | ||||||
| Wells Fargo & Company 4.808% 7/25/2028 (USD-SOFR + 1.98% on 7/25/2027)12 | 45 | 44 | ||||||
| Wells Fargo & Company 3.35% 3/2/2033 (USD-SOFR + 1.50% on 3/2/2032)12 | 105 | 89 | ||||||
| Wells Fargo & Company 4.897% 7/25/2033 (USD-SOFR + 4.897% on 7/25/2032)12 | 35 | 33 | ||||||
| 2,242 | ||||||||
| Consumer discretionary 0.19% | ||||||||
| Bayerische Motoren Werke AG 3.45% 4/1/20271 | 25 | 23 | ||||||
| Bayerische Motoren Werke AG 4.15% 4/9/20301 | 290 | 276 | ||||||
| Bayerische Motoren Werke AG 3.70% 4/1/20321 | 25 | 22 | ||||||
| Daimler Trucks Finance North America, LLC 1.125% 12/14/20231 | 495 | 476 | ||||||
| Daimler Trucks Finance North America, LLC 1.625% 12/13/20241 | 175 | 162 | ||||||
| Daimler Trucks Finance North America, LLC 2.375% 12/14/20281 | 150 | 126 | ||||||
| Daimler Trucks Finance North America, LLC 2.50% 12/14/20311 | 150 | 117 | ||||||
| Ford Motor Co. 2.30% 2/10/2025 | 200 | 183 | ||||||
| Ford Motor Credit Company, LLC 5.125% 6/16/2025 | 200 | 193 | ||||||
| Grand Canyon University 4.125% 10/1/2024 | 200 | 188 | ||||||
| McDonald’s Corp. 4.60% 9/9/2032 | 15 | 15 | ||||||
| McDonald’s Corp. 5.15% 9/9/2052 | 10 | 10 | ||||||
| Royal Caribbean Cruises, Ltd. 11.50% 6/1/20251 | 160 | 172 | ||||||
| Toyota Motor Credit Corp. 5.40% 11/10/2025 | 228 | 232 | ||||||
| 2,195 | ||||||||
| Industrials 0.10% | ||||||||
| Ashtead Capital, Inc. 5.50% 8/11/20321 | 200 | 192 | ||||||
| Boeing Company 4.508% 5/1/2023 | 270 | 270 | ||||||
| Boeing Company 2.75% 2/1/2026 | 91 | 84 | ||||||
| Boeing Company 3.625% 2/1/2031 | 280 | 246 | ||||||
| Boeing Company 5.805% 5/1/2050 | 95 | 89 | ||||||
| American Funds Insurance Series | 121 |
Capital Income Builder (continued)
| Bonds, notes & other debt instruments (continued) | Principal amount (000) |
Value (000) |
||||||
| Corporate bonds, notes & loans (continued) | ||||||||
| Industrials (continued) | ||||||||
| Canadian Pacific Railway, Ltd. 2.45% 12/2/2031 | USD | 78 | $ | 65 | ||||
| Canadian Pacific Railway, Ltd. 3.10% 12/2/2051 | 102 | 69 | ||||||
| CSX Corp. 4.75% 11/15/2048 | 50 | 45 | ||||||
| CSX Corp. 4.50% 11/15/2052 | 35 | 31 | ||||||
| Lockheed Martin Corp. 5.10% 11/15/2027 | 19 | 19 | ||||||
| Masco Corp. 3.125% 2/15/2051 | 10 | 6 | ||||||
| Union Pacific Corp. 2.80% 2/14/2032 | 17 | 15 | ||||||
| Union Pacific Corp. 3.50% 2/14/2053 | 20 | 15 | ||||||
| 1,146 | ||||||||
| Consumer staples 0.09% | ||||||||
| 7-Eleven, Inc. 0.80% 2/10/20241 | 50 | 48 | ||||||
| 7-Eleven, Inc. 1.30% 2/10/20281 | 30 | 25 | ||||||
| 7-Eleven, Inc. 1.80% 2/10/20311 | 207 | 159 | ||||||
| Altria Group, Inc. 3.875% 9/16/2046 | 22 | 15 | ||||||
| Altria Group, Inc. 3.70% 2/4/2051 | 28 | 18 | ||||||
| Anheuser-Busch InBev NV 4.50% 6/1/2050 | 20 | 18 | ||||||
| British American Tobacco PLC 4.70% 4/2/2027 | 105 | 101 | ||||||
| British American Tobacco PLC 4.448% 3/16/2028 | 150 | 139 | ||||||
| British American Tobacco PLC 4.54% 8/15/2047 | 82 | 58 | ||||||
| British American Tobacco PLC 4.758% 9/6/2049 | 121 | 88 | ||||||
| Kraft Heinz Company 3.00% 6/1/2026 | 93 | 87 | ||||||
| Kraft Heinz Company 4.875% 10/1/2049 | 170 | 148 | ||||||
| Kraft Heinz Company 5.50% 6/1/2050 | 75 | 72 | ||||||
| Philip Morris International, Inc. 5.125% 11/17/2027 | 43 | 43 | ||||||
| Philip Morris International, Inc. 5.625% 11/17/2029 | 23 | 23 | ||||||
| Philip Morris International, Inc. 5.75% 11/17/2032 | 16 | 16 | ||||||
| 1,058 | ||||||||
| Information technology 0.07% | ||||||||
| Apple, Inc. 3.35% 8/8/2032 | 20 | 18 | ||||||
| Apple, Inc. 3.95% 8/8/2052 | 20 | 17 | ||||||
| Broadcom, Inc. 4.00% 4/15/20291 | 3 | 3 | ||||||
| Broadcom, Inc. 4.15% 4/15/20321 | 11 | 10 | ||||||
| Broadcom, Inc. 3.137% 11/15/20351 | 2 | 1 | ||||||
| Broadcom, Inc. 3.75% 2/15/20511 | 91 | 63 | ||||||
| Lenovo Group, Ltd. 5.875% 4/24/2025 | 400 | 390 | ||||||
| Oracle Corp. 2.875% 3/25/2031 | 64 | 53 | ||||||
| Oracle Corp. 3.60% 4/1/2050 | 150 | 102 | ||||||
| ServiceNow, Inc. 1.40% 9/1/2030 | 130 | 100 | ||||||
| 757 | ||||||||
| Materials 0.03% | ||||||||
| Celanese US Holdings, LLC 6.379% 7/15/2032 | 10 | 9 | ||||||
| Dow Chemical Co. 3.60% 11/15/2050 | 75 | 54 | ||||||
| International Flavors & Fragrances, Inc. 1.832% 10/15/20271 | 100 | 84 | ||||||
| International Flavors & Fragrances, Inc. 3.468% 12/1/20501 | 10 | 7 | ||||||
| LYB International Finance III, LLC 3.625% 4/1/2051 | 102 | 69 | ||||||
| Nutrien, Ltd. 5.90% 11/7/2024 | 84 | 85 | ||||||
| South32 Treasury, Ltd. 4.35% 4/14/20321 | 10 | 9 | ||||||
| 317 | ||||||||
| Real estate 0.02% | ||||||||
| American Tower Corp. 4.05% 3/15/2032 | 11 | 10 | ||||||
| Equinix, Inc. 1.55% 3/15/2028 | 25 | 21 | ||||||
| Equinix, Inc. 3.20% 11/18/2029 | 144 | 125 | ||||||
| Equinix, Inc. 2.50% 5/15/2031 | 47 | 38 | ||||||
| 194 | ||||||||
| Total corporate bonds, notes & loans | 19,621 | |||||||
| 122 | American Funds Insurance Series |
Capital Income Builder (continued)
| Bonds, notes & other debt instruments (continued) | Principal amount (000) |
Value (000) |
||||||
| Asset-backed obligations 0.84% | ||||||||
| Affirm Asset Securitization Trust, Series 2022-X1, Class A, 1.75% 2/15/20271,9 | USD | 96 | $ | 93 | ||||
| American Express Credit Account Master Trust, Series 2022-3, Class A, 3.75% 8/16/20279 | 100 | 98 | ||||||
| American Homes 4 Rent, Series 2014-SFR2, Class A, 3.786% 10/17/20361,9 | 86 | 83 | ||||||
| American Homes 4 Rent, Series 2015-SFR2, Class A, 3.732% 10/17/20521,9 | 87 | 83 | ||||||
| American Homes 4 Rent, Series 2015-SFR2, Class B, 4.295% 10/17/20521,9 | 100 | 95 | ||||||
| AmeriCredit Automobile Receivables Trust, Series 2022-2, Class A2B, (30-day Average USD-SOFR + 1.15%) 4.958% 12/18/20259,10 | 132 | 132 | ||||||
| Avis Budget Rental Car Funding (AESOP), LLC, Series 2020-2, Class A, 2.02% 2/20/20271,9 | 197 | 179 | ||||||
| Avis Budget Rental Car Funding (AESOP), LLC, Series 2020-2A, Class B, 2.96% 2/20/20271,9 | 100 | 90 | ||||||
| Bankers Healthcare Group Securitization Trust, Series 2022-A, Class A, 1.71% 2/20/20351,9 | 69 | 64 | ||||||
| CarMax Auto Owner Trust, Series 2022-3, Class A2B, (30-day Average USD-SOFR + 0.77%) 4.577% 9/15/20259,10 | 103 | 103 | ||||||
| CF Hippolyta, LLC, Series 2020-1, Class A1, 1.69% 7/15/20601,9 | 354 | 317 | ||||||
| CF Hippolyta, LLC, Series 2020-1, Class A2, 1.99% 7/15/20601,9 | 89 | 73 | ||||||
| CF Hippolyta, LLC, Series 2020-1, Class B1, 2.28% 7/15/20601,9 | 91 | 79 | ||||||
| CF Hippolyta, LLC, Series 2020-1, Class B2, 2.60% 7/15/20601,9 | 91 | 72 | ||||||
| CF Hippolyta, LLC, Series 2021-1, Class A1, 1.53% 3/15/20611,9 | 319 | 276 | ||||||
| CF Hippolyta, LLC, Series 2022-1, Class A1, 5.97% 8/15/20621,9 | 493 | 483 | ||||||
| Exeter Automobile Receivables Trust, Series 2022-3A, Class A2, 3.45% 8/15/20249 | 36 | 36 | ||||||
| Exeter Automobile Receivables Trust, Series 2022-4A, Class A2, 3.99% 8/15/20249 | 44 | 44 | ||||||
| FirstKey Homes Trust, Series 2022-SFR2, Class A, 4.145% 5/17/20391,9 | 131 | 123 | ||||||
| Ford Credit Auto Owner Trust, Series 2022-B, Class A2B, (30-day Average USD-SOFR + 0.60%) 4.407% 2/15/20259,10 | 70 | 70 | ||||||
| Freedom Financial, Series 2022-1FP, Class A, 0.94% 3/19/20291,9 | 7 | 7 | ||||||
| GCI Funding I, LLC, Series 2020-1, Class A, 2.82% 10/18/20451,9 | 506 | 447 | ||||||
| GCI Funding I, LLC, Series 2021-1, Class A, 2.38% 6/18/20461,9 | 85 | 72 | ||||||
| Global SC Finance V SRL, Series 2019-1A, Class B, 4.81% 9/17/20391,9 | 133 | 125 | ||||||
| GM Financial Automobile Leasing Trust, Series 2022-3, Class A2B, (30-day Average USD-SOFR + 0.71%) 4.536% 10/21/20249,10 | 76 | 76 | ||||||
| GM Financial Consumer Automobile Receivables Trust, Series 2022-3, Class A2B, (30-day Average USD-SOFR + 0.60%) 4.408% 9/16/20259,10 | 78 | 78 | ||||||
| GM Financial Revolving Receivables Trust, Series 2022-1, Class A, 5.91% 10/11/20351,9 | 184 | 188 | ||||||
| Hertz Vehicle Financing III, LLC, Series 2021-1A, Class A, 1.21% 12/26/20251,9 | 247 | 228 | ||||||
| Hertz Vehicle Financing III, LLC, Series 2021-1A, Class B, 1.56% 12/26/20251,9 | 100 | 92 | ||||||
| Hertz Vehicle Financing III, LLC, Series 2021-2A, Class A, 1.68% 12/27/20271,9 | 268 | 234 | ||||||
| Hertz Vehicle Financing III, LLC, Series 2021-2A, Class B, 2.12% 12/27/20271,9 | 100 | 86 | ||||||
| Hertz Vehicle Financing III, LLC, Series 2021-2A, Class C, 2.52% 12/27/20271,9 | 100 | 83 | ||||||
| Hyundai Auto Receivables Trust, Series 2022-B, Class A2B, (30-day Average USD-SOFR + 0.58%) 4.387% 5/15/20259,10 | 100 | 100 | ||||||
| Navient Student Loan Trust, Series 2021-A, Class A, 0.84% 5/15/20691,9 | 46 | 40 | ||||||
| Navient Student Loan Trust, Series 2021-C, Class A, 1.06% 10/15/20691,9 | 143 | 122 | ||||||
| Nelnet Student Loan Trust, Series 2021-A, Class APT1, 1.36% 4/20/20621,9 | 211 | 187 | ||||||
| Nelnet Student Loan Trust, Series 2021-B, Class AFX, 1.42% 4/20/20621,9 | 423 | 376 | ||||||
| Nelnet Student Loan Trust, Series 2021-C, Class AFL, (1-month USD-LIBOR + 0.74%) 5.093% 4/20/20621,9,10 | 218 | 212 | ||||||
| New Economy Assets Phase 1 Issuer, LLC, Series 2021-1, Class A1, 1.91% 10/20/20611,9 | 935 | 792 | ||||||
| Nissan Auto Lease Trust, Series 2021-A, Class A3, 0.52% 8/15/20249 | 199 | 194 | ||||||
| Nissan Auto Lease Trust, Series 2022-A, Class A2B, (30-day Average USD-SOFR + 0.68%) 4.487% 8/15/20249,10 | 236 | 236 | ||||||
| OnDeck Asset Securitization Trust, LLC, Series 2021-1A, Class A, 1.59% 5/17/20271,9 | 100 | 92 | ||||||
| Oportun Funding, LLC, Series 2021-B, Class A, 1.47% 5/8/20311,9 | 100 | 87 | ||||||
| PFS Financing Corp., Series 2022-D, Class A, 4.27% 8/16/20271,9 | 100 | 98 | ||||||
| Santander Drive Auto Receivables Trust, Series 2022-4, Class A2, 4.05% 7/15/20259 | 158 | 158 | ||||||
| Santander Drive Auto Receivables Trust, Series 2022-7, Class A2, 5.81% 1/15/20269 | 577 | 578 | ||||||
| SMB Private Education Loan Trust, Series 2021-A, Class APT2, 1.07% 1/15/20531,9 | 73 | 62 | ||||||
| American Funds Insurance Series | 123 |
Capital Income Builder (continued)
| Bonds, notes & other debt instruments (continued) | Principal amount (000) |
Value (000) |
||||||
| Asset-backed obligations (continued) | ||||||||
| Stonepeak Infrastructure Partners, Series 2021-1A, Class AA, 2.301% 2/28/20331,9 | USD | 211 | $ | 188 | ||||
| Toyota Auto Loan Extended Note Trust, Series 2021-1, Class A, 1.07% 2/27/20341,9,10 | 335 | 297 | ||||||
| Toyota Auto Receivables Owner Trust, Series 2022-C, Class A2B, (1-month USD-SOFR + 0.57%) 4.377% 8/15/20259,10 | 27 | 27 | ||||||
| Verizon Master Trust, Series 2022-3, Class A, 3.01% 5/20/2027 (3.76% on 11/20/2023)9,12 | 160 | 157 | ||||||
| Verizon Master Trust, Series 2022-7, Class A1A, 5.23% 11/22/2027 (5.98% on 11/20/2024)9,12 | 451 | 454 | ||||||
| Volkswagen Auto Lease Trust, Series 2022-A, Class A2, 3.02% 10/21/20249 | 102 | 100 | ||||||
| Westlake Automobile Receivables Trust, Series 2022-2A, Class A2A, 3.36% 8/15/20251,9 | 492 | 487 | ||||||
| Westlake Automobile Receivables Trust, Series 2022-3, Class C, 5.49% 7/15/20261,9 | 80 | 79 | ||||||
| Westlake Automobile Receivables Trust, Series 2022-3, Class B, 5.99% 12/15/20271,9 | 100 | 100 | ||||||
| 9,532 | ||||||||
| Bonds & notes of governments & government agencies outside the U.S. 0.07% | ||||||||
| Peru (Republic of) 2.783% 1/23/2031 | 190 | 158 | ||||||
| Portuguese Republic 5.125% 10/15/2024 | 18 | 18 | ||||||
| Qatar (State of) 4.50% 4/23/2028 | 200 | 201 | ||||||
| Saudi Arabia (Kingdom of) 3.625% 3/4/2028 | 200 | 191 | ||||||
| United Mexican States 3.25% 4/16/2030 | 200 | 175 | ||||||
| 743 | ||||||||
| Municipals 0.02% | ||||||||
| California 0.00% | ||||||||
| Golden State Tobacco Securitization Corp., Enhanced Tobacco Settlement Asset-Backed Bonds, Series 2021-B, 2.746% 6/1/2034 | 15 | 12 | ||||||
| Illinois 0.02% | ||||||||
| G.O. Bonds, Pension Funding, Series 2003, 5.10% 6/1/2033 | 225 | 216 | ||||||
| Total municipals | 228 | |||||||
| Total bonds, notes & other debt instruments (cost: $218,921,000) | 207,479 | |||||||
| Short-term securities 7.36% | Shares | |||||||
| Money market investments 6.84% | ||||||||
| Capital Group Central Cash Fund 4.31%6,13 | 779,601 | 77,952 | ||||||
| Money market investments purchased with collateral from securities on loan 0.52% | ||||||||
| Goldman Sachs Financial Square Government Fund, Institutional Shares 4.15%13,14 | 2,241,328 | 2,241 | ||||||
| Invesco Short-Term Investments Trust – Government & Agency Portfolio, Institutional Class 4.22%13,14 | 1,944,356 | 1,945 | ||||||
| Capital Group Central Cash Fund 4.31%6,13,14 | 17,119 | 1,712 | ||||||
| 5,898 | ||||||||
| Total short-term securities (cost: $83,839,000) | 83,850 | |||||||
| Total investment securities 102.99% (cost: $1,046,428,000) | 1,173,072 | |||||||
| Other assets less liabilities (2.99)% | (34,006 | ) | ||||||
| Net assets 100.00% | $ | 1,139,066 | ||||||
| 124 | American Funds Insurance Series |
Capital Income Builder (continued)
Futures contracts
| Contracts | Type | Number of contracts |
Expiration | Notional amount (000) |
Value and unrealized appreciation (depreciation) at 12/31/2022 (000) |
|||||||||||
| 2 Year U.S. Treasury Note Futures | Long | 203 | March 2023 | USD | 41,631 | $ | 49 | |||||||||
| 5 Year U.S. Treasury Note Futures | Long | 357 | March 2023 | 38,531 | (52 | ) | ||||||||||
| 10 Year Ultra U.S. Treasury Note Futures | Long | 7 | March 2023 | 828 | (12 | ) | ||||||||||
| 10 Year U.S. Treasury Note Futures | Short | 14 | March 2023 | (1,572 | ) | 11 | ||||||||||
| 20 Year U.S. Treasury Bond Futures | Long | 9 | March 2023 | 1,128 | (13 | ) | ||||||||||
| 30 Year Ultra U.S. Treasury Bond Futures | Long | 61 | March 2023 | 8,193 | (62 | ) | ||||||||||
| $ | (79 | ) | ||||||||||||||
Swap contracts
Interest rate swaps
Centrally cleared interest rate swaps
| Receive | Pay | Upfront | Unrealized (depreciation) | ||||||||||||||||||||||||
| Rate | Payment frequency |
Rate | Payment frequency |
Expiration date |
Notional amount (000) |
Value at 12/31/2022 (000) |
premium paid (000) |
appreciation at 12/31/2022 (000) | |||||||||||||||||||
| 3.52647% | Annual | U.S. EFFR | Annual | 6/16/2024 | USD5,215 | $ | (90 | ) | $ | — | $ | (90 | ) | ||||||||||||||
| 3.5291% | Annual | U.S. EFFR | Annual | 6/16/2024 | 5,635 | (98 | ) | — | (98 | ) | |||||||||||||||||
| 3.497% | Annual | U.S. EFFR | Annual | 6/16/2024 | 5,600 | (99 | ) | — | (99 | ) | |||||||||||||||||
| 3.4585% | Annual | U.S. EFFR | Annual | 6/17/2024 | 898 | (17 | ) | — | (17 | ) | |||||||||||||||||
| 3.4325% | Annual | U.S. EFFR | Annual | 6/17/2024 | 4,100 | (76 | ) | — | (76 | ) | |||||||||||||||||
| 3-month USD-LIBOR | Quarterly | 0.5935% | Semi-annual | 5/18/2030 | 7,200 | 1,512 | — | 1,512 | |||||||||||||||||||
| 3-month USD-LIBOR | Quarterly | 0.807% | Semi-annual | 5/18/2050 | 805 | 388 | — | 388 | |||||||||||||||||||
| $ | 1,520 | $ | — | $ | 1,520 | ||||||||||||||||||||||
Credit default swaps
Centrally cleared credit default swaps on credit indices — sell protection
| Financing rate received |
Payment frequency |
Reference index |
Expiration date |
Notional amount (000) |
15
|
Value at 12/31/2022 (000) |
16
|
Upfront premium paid (000) |
Unrealized depreciation at 12/31/2022 (000) |
|||||||||||||
| 5.00% | Quarterly | CDX.NA.HY.38 | 6/20/2027 | USD6,138 | $ | 127 | $ | 174 | $ | (47 | ) | |||||||||||
| American Funds Insurance Series | 125 |
Capital Income Builder (continued)
Investments in affiliates6
| Value of affiliates at 1/1/2022 (000) |
Additions (000) |
Reductions (000) |
Net realized loss (000) |
Net unrealized (depreciation) appreciation (000) |
Value of affiliates at 12/31/2022 (000) |
Dividend income (000) |
||||||||||||||||||||||||||
| Investment funds 2.46% | ||||||||||||||||||||||||||||||||
| Capital Group Central Corporate Bond Fund | $ | 30,304 | $ | 6,708 | $ | 3,076 | $ | (677 | ) | $(5,200 | ) | $28,059 | $ 900 | |||||||||||||||||||
| Short-term securities 6.99% | ||||||||||||||||||||||||||||||||
| Money market investments 6.84% | ||||||||||||||||||||||||||||||||
| Capital Group Central Cash Fund 4.31%13 | 42,892 | 254,586 | 219,519 | (14 | ) | 7 | 77,952 | 1,714 | ||||||||||||||||||||||||
| Money market investments purchased with collateral from securities on loan 0.15% | ||||||||||||||||||||||||||||||||
| Capital Group Central Cash Fund 4.31%13,14 | 1,954 | 242 | 17 | 1,712 | — | 18 | ||||||||||||||||||||||||||
| Total short-term securities | 79,664 | |||||||||||||||||||||||||||||||
| Total 9.45% | $ | (691 | ) | $(5,193 | ) | $107,723 | $ 2,614 | |||||||||||||||||||||||||
| 1 | Acquired in a transaction exempt from registration under Rule 144A or, for commercial paper, Section 4(a)(2) of the Securities Act of 1933. May be resold in the U.S. in transactions exempt from registration, normally to qualified institutional buyers. The total value of all such securities was $20,234,000, which represented 1.78% of the net assets of the fund. |
| 2 | Value determined using significant unobservable inputs. |
| 3 | Security did not produce income during the last 12 months. |
| 4 | Amount less than one thousand. |
| 5 | All or a portion of this security was on loan. The total value of all such securities was $6,251,000, which represented .55% of the net assets of the fund. Refer to Note 5 for more information on securities lending. |
| 6 | Part of the same “group of investment companies” as the fund as defined under the Investment Company Act of 1940, as amended. |
| 7 | All or a portion of this security was pledged as collateral. The total value of pledged collateral was $1,982,000, which represented .17% of the net assets of the fund. |
| 8 | Index-linked bond whose principal amount moves with a government price index. |
| 9 | Principal payments may be made periodically. Therefore, the effective maturity date may be earlier than the stated maturity date. |
| 10 | Coupon rate may change periodically. Reference rate and spread are as of the most recent information available. Some coupon rates are determined by the issuer or agent based on current market conditions; therefore, the reference rate and spread are not available. |
| 11 | Purchased on a TBA basis. |
| 12 | Step bond; coupon rate may change at a later date. |
| 13 | Rate represents the seven-day yield at 12/31/2022. |
| 14 | Security purchased with cash collateral from securities on loan. Refer to Note 5 for more information on securities lending. |
| 15 | The maximum potential amount the fund may pay as a protection seller should a credit event occur. |
| 16 | The prices and resulting values for credit default swap indices serve as an indicator of the current status of the payment/performance risk. As the value of a sell protection credit default swap increases or decreases, when compared to the notional amount of the swap, the payment/performance risk may decrease or increase, respectively. |
| 17 | Represents net activity. Refer to Note 5 for more information on securities lending. |
| 18 | Dividend income is included with securities lending income in the fund’s statement of operations and is not shown in this table. |
Key to abbreviations
ADR = American Depositary Receipts
Assn. = Association
CAD = Canadian dollars
CDI = CREST Depository Interest
CME = CME Group
DAC = Designated Activity Company
EFFR = Effective Federal Funds Rate
EUR = Euros
G.O. = General Obligation
GBP = British pounds
GDR = Global Depositary Receipts
LIBOR = London Interbank Offered Rate
MXN = Mexican pesos
REIT = Real Estate Investment Trust
SDR = Swedish Depositary Receipts
SOFR = Secured Overnight Financing Rate
TBA = To be announced
USD = U.S. dollars
Refer to the notes to financial statements.
| 126 | American Funds Insurance Series |
Asset Allocation Fund
Investment portfolio December 31, 2022
| Common stocks 67.78% | Shares | Value (000) |
||||||
| Health care 13.40% | ||||||||
| UnitedHealth Group, Inc. | 929,300 | $ | 492,696 | |||||
| Johnson & Johnson | 2,030,000 | 358,600 | ||||||
| Pfizer, Inc. | 5,493,542 | 281,489 | ||||||
| Humana, Inc. | 500,000 | 256,095 | ||||||
| Gilead Sciences, Inc. | 2,665,000 | 228,790 | ||||||
| Cigna Corp. | 650,000 | 215,371 | ||||||
| AbbVie, Inc. | 1,221,978 | 197,484 | ||||||
| Abbott Laboratories | 1,600,000 | 175,664 | ||||||
| Eli Lilly and Company | 400,469 | 146,508 | ||||||
| Vertex Pharmaceuticals, Inc.1 | 505,500 | 145,978 | ||||||
| CVS Health Corp. | 1,453,100 | 135,414 | ||||||
| Regeneron Pharmaceuticals, Inc.1 | 187,220 | 135,077 | ||||||
| Centene Corp.1 | 1,235,513 | 101,324 | ||||||
| Bristol-Myers Squibb Company | 1,374,818 | 98,918 | ||||||
| AstraZeneca PLC | 461,000 | 62,565 | ||||||
| AstraZeneca PLC (ADR) | 249,881 | 16,942 | ||||||
| Thermo Fisher Scientific, Inc. | 116,000 | 63,880 | ||||||
| Alnylam Pharmaceuticals, Inc.1 | 261,834 | 62,225 | ||||||
| Novo Nordisk A/S, Class B | 246,400 | 33,363 | ||||||
| AbCellera Biologics, Inc.1,2 | 2,871,293 | 29,086 | ||||||
| Seagen, Inc.1 | 170,500 | 21,911 | ||||||
| Rotech Healthcare, Inc.1,3,4 | 184,138 | 19,703 | ||||||
| Elevance Health, Inc. | 37,542 | 19,258 | ||||||
| Zoetis, Inc., Class A | 95,618 | 14,013 | ||||||
| Karuna Therapeutics, Inc.1 | 57,100 | 11,220 | ||||||
| 3,323,574 | ||||||||
| Consumer discretionary 9.59% | ||||||||
| Aramark | 11,375,152 | 470,249 | ||||||
| Home Depot, Inc. | 1,206,200 | 380,990 | ||||||
| General Motors Company | 6,575,000 | 221,183 | ||||||
| Booking Holdings, Inc.1 | 87,604 | 176,546 | ||||||
| Lennar Corp., Class A | 1,357,800 | 122,881 | ||||||
| Dollar General Corp. | 493,075 | 121,420 | ||||||
| LVMH Moët Hennessy-Louis Vuitton SE | 165,700 | 120,372 | ||||||
| Amazon.com, Inc.1 | 1,340,400 | 112,594 | ||||||
| Target Corp. | 750,000 | 111,780 | ||||||
| Etsy, Inc.1 | 840,578 | 100,684 | ||||||
| Entain PLC | 6,000,000 | 96,202 | ||||||
| Burlington Stores, Inc.1 | 431,484 | 87,488 | ||||||
| D.R. Horton, Inc. | 870,000 | 77,552 | ||||||
| Royal Caribbean Cruises, Ltd.1 | 1,014,324 | 50,138 | ||||||
| YUM! Brands, Inc. | 277,000 | 35,478 | ||||||
| Dollar Tree Stores, Inc.1 | 185,000 | 26,166 | ||||||
| YETI Holdings, Inc.1 | 495,471 | 20,468 | ||||||
| Darden Restaurants, Inc. | 142,000 | 19,643 | ||||||
| Chipotle Mexican Grill, Inc.1 | 9,709 | 13,471 | ||||||
| Li Auto, Inc., Class A (ADR)1,2 | 350,694 | 7,154 | ||||||
| Xpeng, Inc., Class A (ADR)1,2 | 703,800 | 6,996 | ||||||
| 2,379,455 | ||||||||
| Financials 9.21% | ||||||||
| Aon PLC, Class A | 807,600 | 242,393 | ||||||
| Chubb, Ltd. | 800,000 | 176,480 | ||||||
| Apollo Asset Management, Inc. | 2,630,627 | 167,808 | ||||||
| Synchrony Financial | 4,100,000 | 134,726 | ||||||
| JPMorgan Chase & Co. | 973,100 | 130,493 | ||||||
| First Republic Bank | 1,000,000 | 121,890 | ||||||
| Bank of America Corp. | 3,000,000 | 99,360 | ||||||
| Arthur J. Gallagher & Co. | 476,724 | 89,881 | ||||||
| Capital One Financial Corp. | 850,000 | 79,016 | ||||||
| Blue Owl Capital, Inc., Class A2 | 7,085,161 | 75,103 | ||||||
| American Funds Insurance Series | 127 |
Asset Allocation Fund (continued)
| Common stocks (continued) | Shares | Value (000) |
||||||
| Financials (continued) | ||||||||
| Goldman Sachs Group, Inc. | 213,000 | $ | 73,140 | |||||
| Ares Management Corp., Class A | 1,015,403 | 69,494 | ||||||
| KKR & Co., Inc. | 1,497,000 | 69,491 | ||||||
| Nasdaq, Inc. | 1,098,300 | 67,381 | ||||||
| Charles Schwab Corp. | 801,126 | 66,702 | ||||||
| CME Group, Inc., Class A | 380,200 | 63,934 | ||||||
| Discover Financial Services | 600,000 | 58,698 | ||||||
| Toronto-Dominion Bank (CAD denominated)2 | 885,700 | 57,348 | ||||||
| SLM Corp. | 3,345,000 | 55,527 | ||||||
| Intercontinental Exchange, Inc. | 538,487 | 55,243 | ||||||
| Blackstone, Inc., nonvoting shares | 737,500 | 54,715 | ||||||
| S&P Global, Inc. | 118,700 | 39,757 | ||||||
| Brookfield Corp., Class A | 1,260,000 | 39,640 | ||||||
| The Bank of N.T. Butterfield & Son, Ltd. | 1,120,585 | 33,405 | ||||||
| Morgan Stanley | 339,372 | 28,853 | ||||||
| Antin Infrastructure Partners SA | 1,243,300 | 27,033 | ||||||
| EQT AB | 1,250,263 | 26,646 | ||||||
| Wells Fargo & Company | 570,000 | 23,535 | ||||||
| Progressive Corp. | 105,000 | 13,620 | ||||||
| Bridgepoint Group PLC | 5,809,554 | 13,461 | ||||||
| OneMain Holdings, Inc. | 300,000 | 9,993 | ||||||
| Brookfield Asset Management, Ltd., Class A | 315,000 | 9,031 | ||||||
| Islandsbanki hf. | 9,555,235 | 8,073 | ||||||
| Jonah Energy Parent, LLC3 | 32,117 | 1,899 | ||||||
| Sberbank of Russia PJSC1,3 | 8,880,000 | — | 5 | |||||
| 2,283,769 | ||||||||
| Information technology 8.88% | ||||||||
| Microsoft Corp. | 3,355,454 | 804,705 | ||||||
| Broadcom, Inc. | 1,249,134 | 698,428 | ||||||
| ASML Holding NV (New York registered) (ADR) | 316,764 | 173,080 | ||||||
| MKS Instruments, Inc. | 1,600,000 | 135,568 | ||||||
| Taiwan Semiconductor Manufacturing Company, Ltd. (ADR) | 1,275,000 | 94,975 | ||||||
| Mastercard, Inc., Class A | 195,977 | 68,147 | ||||||
| NVIDIA Corp. | 332,696 | 48,620 | ||||||
| MediaTek, Inc. | 1,463,000 | 29,717 | ||||||
| Oracle Corp. | 321,820 | 26,306 | ||||||
| Paychex, Inc. | 205,595 | 23,759 | ||||||
| GoDaddy, Inc., Class A1 | 281,000 | 21,024 | ||||||
| Apple, Inc. | 150,000 | 19,490 | ||||||
| KLA Corp. | 49,000 | 18,474 | ||||||
| MicroStrategy, Inc., Class A1 | 96,100 | 13,605 | ||||||
| Applied Materials, Inc. | 135,000 | 13,146 | ||||||
| Snowflake, Inc., Class A1 | 85,810 | 12,317 | ||||||
| 2,201,361 | ||||||||
| Consumer staples 6.59% | ||||||||
| Philip Morris International, Inc. | 9,438,592 | 955,280 | ||||||
| Nestlé SA | 1,954,200 | 225,682 | ||||||
| Archer Daniels Midland Company | 1,880,000 | 174,558 | ||||||
| British American Tobacco PLC (ADR) | 2,634,146 | 105,313 | ||||||
| British American Tobacco PLC | 1,080,000 | 42,849 | ||||||
| Altria Group, Inc. | 1,570,000 | 71,764 | ||||||
| Avenue Supermarts, Ltd.1 | 970,539 | 47,566 | ||||||
| Costco Wholesale Corp. | 26,000 | 11,869 | ||||||
| 1,634,881 | ||||||||
| Industrials 6.22% | ||||||||
| Northrop Grumman Corp. | 933,553 | 509,356 | ||||||
| Lockheed Martin Corp. | 474,900 | 231,034 | ||||||
| L3Harris Technologies, Inc. | 1,094,000 | 227,782 | ||||||
| Boeing Company1 | 1,039,506 | 198,015 | ||||||
| 128 | American Funds Insurance Series |
Asset Allocation Fund (continued)
| Common stocks (continued) | Shares | Value (000) |
||||||
| Industrials (continued) | ||||||||
| Caterpillar, Inc. | 618,000 | $ | 148,048 | |||||
| CSX Corp. | 2,628,369 | 81,427 | ||||||
| Raytheon Technologies Corp. | 395,000 | 39,863 | ||||||
| General Electric Co. | 288,000 | 24,132 | ||||||
| Huntington Ingalls Industries, Inc. | 100,000 | 23,068 | ||||||
| AMETEK, Inc. | 140,000 | 19,561 | ||||||
| Chart Industries, Inc.1 | 130,200 | 15,003 | ||||||
| Copart, Inc.1 | 232,000 | 14,126 | ||||||
| Storskogen Group AB, Class B | 16,853,587 | 12,088 | ||||||
| 1,543,503 | ||||||||
| Communication services 4.72% | ||||||||
| Alphabet, Inc., Class C1 | 2,992,500 | 265,525 | ||||||
| Alphabet, Inc., Class A1 | 1,269,460 | 112,004 | ||||||
| Charter Communications, Inc., Class A1 | 821,000 | 278,401 | ||||||
| Meta Platforms, Inc., Class A1 | 1,777,348 | 213,886 | ||||||
| Netflix, Inc.1 | 384,527 | 113,390 | ||||||
| Comcast Corp., Class A | 2,874,400 | 100,518 | ||||||
| ZoomInfo Technologies, Inc.1 | 1,747,900 | 52,629 | ||||||
| Activision Blizzard, Inc. | 400,000 | 30,620 | ||||||
| Electronic Arts, Inc. | 35,000 | 4,276 | ||||||
| 1,171,249 | ||||||||
| Energy 4.12% | ||||||||
| Canadian Natural Resources, Ltd. (CAD denominated)2 | 7,515,800 | 417,366 | ||||||
| Pioneer Natural Resources Company | 752,000 | 171,749 | ||||||
| ConocoPhillips | 1,252,000 | 147,736 | ||||||
| Cenovus Energy, Inc. (CAD denominated) | 7,500,000 | 145,513 | ||||||
| Hess Corp. | 400,000 | 56,728 | ||||||
| Chevron Corp. | 270,000 | 48,462 | ||||||
| TC Energy Corp. | 631,700 | 25,180 | ||||||
| Equitrans Midstream Corp. | 718,490 | 4,814 | ||||||
| Diamond Offshore Drilling, Inc.1 | 266,381 | 2,770 | ||||||
| Altera Infrastructure, LP1,3 | 6,273 | 497 | ||||||
| Constellation Oil Services Holding SA, Class B-11,3 | 480,336 | 53 | ||||||
| McDermott International, Ltd.1 | 30,762 | 10 | ||||||
| Bighorn Permian Resources, LLC3 | 4,392 | — | 5 | |||||
| 1,020,878 | ||||||||
| Materials 3.45% | ||||||||
| Corteva, Inc. | 4,365,508 | 256,605 | ||||||
| Mosaic Co. | 1,940,000 | 85,108 | ||||||
| Linde PLC | 256,541 | 83,678 | ||||||
| Royal Gold, Inc. | 700,000 | 78,904 | ||||||
| Wheaton Precious Metals Corp. | 1,785,000 | 69,758 | ||||||
| Nucor Corp. | 500,000 | 65,905 | ||||||
| Franco-Nevada Corp. | 347,089 | 47,313 | ||||||
| First Quantum Minerals, Ltd. | 2,100,000 | 43,877 | ||||||
| ATI, Inc.1 | 1,350,000 | 40,311 | ||||||
| Vale SA, ordinary nominative shares | 1,750,000 | 29,460 | ||||||
| Nutrien, Ltd. (CAD denominated) | 400,272 | 29,222 | ||||||
| Lundin Mining Corp.2 | 4,320,000 | 26,513 | ||||||
| 856,654 | ||||||||
| Real estate 0.96% | ||||||||
| VICI Properties, Inc. REIT | 2,769,449 | 89,730 | ||||||
| Gaming and Leisure Properties, Inc. REIT | 1,593,566 | 83,009 | ||||||
| Equinix, Inc. REIT | 63,445 | 41,559 | ||||||
| Crown Castle, Inc. REIT | 166,000 | 22,516 | ||||||
| 236,814 | ||||||||
| American Funds Insurance Series | 129 |
Asset Allocation Fund (continued)
| Common stocks (continued) | Shares | Value (000) |
||||||
| Utilities 0.64% | ||||||||
| CenterPoint Energy, Inc. | 1,717,846 | $ | 51,518 | |||||
| Exelon Corp. | 779,231 | 33,686 | ||||||
| AES Corp. | 983,067 | 28,273 | ||||||
| Sempra Energy | 132,039 | 20,405 | ||||||
| FirstEnergy Corp. | 307,000 | 12,876 | ||||||
| Constellation Energy Corp. | 138,666 | 11,955 | ||||||
| 158,713 | ||||||||
| Total common stocks (cost: $11,870,390,000) | 16,810,851 | |||||||
| Preferred securities 0.00% | ||||||||
| Industrials 0.00% | ||||||||
| ACR III LSC Holdings, LLC, Series B, preferred shares1,3,6 | 450 | 189 | ||||||
| Total preferred securities (cost: $466,000) | 189 | |||||||
| Rights & warrants 0.00% | ||||||||
| Energy 0.00% | ||||||||
| Constellation Oil Services Holding SA, Class D, warrants, expire 6/10/20711,3 | 4 | — | 5 | |||||
| Total rights & warrants (cost: $0) | — | 5 | ||||||
| Convertible stocks 0.26% | ||||||||
| Health care 0.26% | ||||||||
| Carbon Health Technologies, Inc., convertible preferred shares, 1.00% 7/9/20243,4 | 50,000 | 63,388 | ||||||
| Total convertible stocks (cost: $50,000,000) | 63,388 | |||||||
| Investment funds 5.51% | ||||||||
| Capital Group Central Corporate Bond Fund7 | 167,745,028 | 1,367,122 | ||||||
| Total investment funds (cost: $1,676,023,000) | 1,367,122 | |||||||
| Bonds, notes & other debt instruments 21.72% | Principal amount (000) |
|||||||
| Mortgage-backed obligations 7.58% | ||||||||
| Federal agency mortgage-backed obligations 7.02% | ||||||||
| Fannie Mae Pool #AD7072 4.00% 6/1/20258 | USD | 2 | 2 | |||||
| Fannie Mae Pool #AE2321 4.00% 8/1/20258 | 1 | 1 | ||||||
| Fannie Mae Pool #AE3069 4.00% 9/1/20258 | 1 | 1 | ||||||
| Fannie Mae Pool #AH0829 4.00% 1/1/20268 | 1 | 1 | ||||||
| Fannie Mae Pool #AH6431 4.00% 2/1/20268 | 168 | 165 | ||||||
| Fannie Mae Pool #AH5618 4.00% 2/1/20268 | 2 | 1 | ||||||
| Fannie Mae Pool #890329 4.00% 4/1/20268 | 27 | 26 | ||||||
| Fannie Mae Pool #MA1109 4.00% 5/1/20278 | 2 | 2 | ||||||
| Fannie Mae Pool #MA3653 3.00% 3/1/20298 | 13 | 12 | ||||||
| Fannie Mae Pool #AL8347 4.00% 3/1/20298 | 185 | 181 | ||||||
| Fannie Mae Pool #254767 5.50% 6/1/20338 | 208 | 214 | ||||||
| Fannie Mae Pool #555956 5.50% 12/1/20338 | 131 | 135 | ||||||
| Fannie Mae Pool #BN1085 4.00% 1/1/20348 | 411 | 403 | ||||||
| Fannie Mae Pool #BN3172 4.00% 1/1/20348 | 162 | 158 | ||||||
| Fannie Mae Pool #929185 5.50% 1/1/20368 | 383 | 396 | ||||||
| Fannie Mae Pool #893641 6.00% 9/1/20368 | 776 | 811 | ||||||
| Fannie Mae Pool #893688 6.00% 10/1/20368 | 164 | 171 | ||||||
| Fannie Mae Pool #AS8554 3.00% 12/1/20368 | 5,967 | 5,542 | ||||||
| Fannie Mae Pool #907239 6.00% 12/1/20368 | 54 | 56 | ||||||
| Fannie Mae Pool #928031 6.00% 1/1/20378 | 63 | 65 | ||||||
| Fannie Mae Pool #888292 6.00% 3/1/20378 | 547 | 571 | ||||||
| Fannie Mae Pool #AD0249 5.50% 4/1/20378 | 111 | 114 | ||||||
| 130 | American Funds Insurance Series |
Asset Allocation Fund (continued)
| Bonds, notes & other debt instruments (continued) | Principal amount (000) |
Value (000) |
||||||
| Mortgage-backed obligations (continued) | ||||||||
| Federal agency mortgage-backed obligations (continued) | ||||||||
| Fannie Mae Pool #190379 5.50% 5/1/20378 | USD | 55 | $ | 57 | ||||
| Fannie Mae Pool #924952 6.00% 8/1/20378 | 865 | 903 | ||||||
| Fannie Mae Pool #888637 6.00% 9/1/20378 | 10 | 10 | ||||||
| Fannie Mae Pool #995674 6.00% 5/1/20388 | 310 | 324 | ||||||
| Fannie Mae Pool #AD0119 6.00% 7/1/20388 | 938 | 984 | ||||||
| Fannie Mae Pool #995224 6.00% 9/1/20388 | 8 | 8 | ||||||
| Fannie Mae Pool #AE0021 6.00% 10/1/20388 | 286 | 298 | ||||||
| Fannie Mae Pool #AL7164 6.00% 10/1/20388 | 196 | 201 | ||||||
| Fannie Mae Pool #889983 6.00% 10/1/20388 | 18 | 19 | ||||||
| Fannie Mae Pool #AD0095 6.00% 11/1/20388 | 689 | 717 | ||||||
| Fannie Mae Pool #AB0538 6.00% 11/1/20388 | 110 | 114 | ||||||
| Fannie Mae Pool #995391 6.00% 11/1/20388 | 14 | 15 | ||||||
| Fannie Mae Pool #AD0833 6.00% 1/1/20398 | — | 5 | — | 5 | ||||
| Fannie Mae Pool #AL0309 6.00% 1/1/20408 | 62 | 65 | ||||||
| Fannie Mae Pool #AL0013 6.00% 4/1/20408 | 182 | 190 | ||||||
| Fannie Mae Pool #AL7228 6.00% 4/1/20418 | 242 | 248 | ||||||
| Fannie Mae Pool #AB4536 6.00% 6/1/20418 | 413 | 428 | ||||||
| Fannie Mae Pool #MA4387 2.00% 7/1/20418 | 7,655 | 6,462 | ||||||
| Fannie Mae Pool #MA4501 2.00% 12/1/20418 | 8,791 | 7,421 | ||||||
| Fannie Mae Pool #FS0305 1.50% 1/1/20428 | 22,809 | 18,688 | ||||||
| Fannie Mae Pool #MA4520 2.00% 1/1/20428 | 14,931 | 12,603 | ||||||
| Fannie Mae Pool #AP2131 3.50% 8/1/20428 | 3,155 | 2,956 | ||||||
| Fannie Mae Pool #AU8813 4.00% 11/1/20438 | 2,218 | 2,169 | ||||||
| Fannie Mae Pool #AU9348 4.00% 11/1/20438 | 1,262 | 1,234 | ||||||
| Fannie Mae Pool #AU9350 4.00% 11/1/20438 | 1,052 | 1,015 | ||||||
| Fannie Mae Pool #AL8773 3.50% 2/1/20458 | 5,278 | 4,945 | ||||||
| Fannie Mae Pool #FM9416 3.50% 7/1/20458 | 8,847 | 8,192 | ||||||
| Fannie Mae Pool #AL8354 3.50% 10/1/20458 | 1,320 | 1,231 | ||||||
| Fannie Mae Pool #AL8522 3.50% 5/1/20468 | 2,806 | 2,610 | ||||||
| Fannie Mae Pool #BC7611 4.00% 5/1/20468 | 113 | 109 | ||||||
| Fannie Mae Pool #AS8310 3.00% 11/1/20468 | 373 | 335 | ||||||
| Fannie Mae Pool #BD9307 4.00% 11/1/20468 | 1,322 | 1,263 | ||||||
| Fannie Mae Pool #BD9699 3.50% 12/1/20468 | 1,482 | 1,375 | ||||||
| Fannie Mae Pool #BE1290 3.50% 2/1/20478 | 2,160 | 2,005 | ||||||
| Fannie Mae Pool #BM1179 3.00% 4/1/20478 | 470 | 421 | ||||||
| Fannie Mae Pool #256975 7.00% 10/1/20478 | 2 | 2 | ||||||
| Fannie Mae Pool #CA0770 3.50% 11/1/20478 | 1,522 | 1,415 | ||||||
| Fannie Mae Pool #257036 7.00% 11/1/20478 | 6 | 7 | ||||||
| Fannie Mae Pool #MA3211 4.00% 12/1/20478 | 2,648 | 2,535 | ||||||
| Fannie Mae Pool #MA3277 4.00% 2/1/20488 | 11 | 10 | ||||||
| Fannie Mae Pool #BK5255 4.00% 5/1/20488 | 11 | 11 | ||||||
| Fannie Mae Pool #FM3278 3.50% 11/1/20488 | 16,898 | 15,676 | ||||||
| Fannie Mae Pool #FM3280 3.50% 5/1/20498 | 2,314 | 2,144 | ||||||
| Fannie Mae Pool #CA4756 3.00% 12/1/20498 | 1,745 | 1,556 | ||||||
| Fannie Mae Pool #CA5659 2.50% 5/1/20508 | 2,353 | 1,999 | ||||||
| Fannie Mae Pool #CA5968 2.50% 6/1/20508 | 5,666 | 4,869 | ||||||
| Fannie Mae Pool #CA6593 2.50% 8/1/20508 | 12,778 | 11,002 | ||||||
| Fannie Mae Pool #CA7599 2.50% 11/1/20508 | 1,607 | 1,386 | ||||||
| Fannie Mae Pool #FM4897 3.00% 11/1/20508 | 14,598 | 13,142 | ||||||
| Fannie Mae Pool #CA8828 2.50% 2/1/20518 | 4,022 | 3,458 | ||||||
| Fannie Mae Pool #CA9291 2.50% 2/1/20518 | 52 | 44 | ||||||
| Fannie Mae Pool #CA9390 2.50% 3/1/20518 | 666 | 565 | ||||||
| Fannie Mae Pool #CB0290 2.00% 4/1/20518 | 4,822 | 3,945 | ||||||
| Fannie Mae Pool #FM7741 2.50% 5/1/20518 | 816 | 693 | ||||||
| Fannie Mae Pool #FM8453 3.00% 8/1/20518 | 4,876 | 4,347 | ||||||
| Fannie Mae Pool #FM8436 2.50% 9/1/20518 | 45 | 39 | ||||||
| Fannie Mae Pool #CB1810 3.00% 10/1/20518 | 165 | 145 | ||||||
| Fannie Mae Pool #BU0616 2.50% 11/1/20518 | 49 | 42 | ||||||
| Fannie Mae Pool #CB2078 3.00% 11/1/20518 | 9,882 | 8,696 | ||||||
| Fannie Mae Pool #CB2286 2.50% 12/1/20518 | 17,352 | 14,835 | ||||||
| Fannie Mae Pool #CB2402 2.50% 12/1/20518 | 10,959 | 9,290 | ||||||
| American Funds Insurance Series | 131 |
Asset Allocation Fund (continued)
| Bonds, notes & other debt instruments (continued) | Principal amount (000) |
Value (000) |
||||||
| Mortgage-backed obligations (continued) | ||||||||
| Federal agency mortgage-backed obligations (continued) | ||||||||
| Fannie Mae Pool #CB2375 2.50% 12/1/20518 | USD | 7,995 | $ | 6,825 | ||||
| Fannie Mae Pool #BU8372 2.50% 12/1/20518 | 955 | 812 | ||||||
| Fannie Mae Pool #CB2323 2.50% 12/1/20518 | 947 | 805 | ||||||
| Fannie Mae Pool #CB2312 2.50% 12/1/20518 | 366 | 311 | ||||||
| Fannie Mae Pool #CB2319 2.50% 12/1/20518 | 196 | 168 | ||||||
| Fannie Mae Pool #BT9510 2.50% 12/1/20518 | 94 | 81 | ||||||
| Fannie Mae Pool #BT9483 2.50% 12/1/20518 | 95 | 81 | ||||||
| Fannie Mae Pool #CB2372 2.50% 12/1/20518 | 93 | 80 | ||||||
| Fannie Mae Pool #FS0235 2.50% 1/1/20528 | 12,638 | 10,713 | ||||||
| Fannie Mae Pool #FS0182 3.00% 1/1/20528 | 13,050 | 11,488 | ||||||
| Fannie Mae Pool #FS0303 3.00% 1/1/20528 | 978 | 859 | ||||||
| Fannie Mae Pool #CB3666 2.50% 2/1/20528 | 24,794 | 21,026 | ||||||
| Fannie Mae Pool #FS0546 2.50% 2/1/20528 | 11,820 | 10,020 | ||||||
| Fannie Mae Pool #BV4367 2.50% 2/1/20528 | 818 | 695 | ||||||
| Fannie Mae Pool #FS0613 2.50% 2/1/20528 | 736 | 625 | ||||||
| Fannie Mae Pool #BV9531 2.50% 2/1/20528 | 721 | 612 | ||||||
| Fannie Mae Pool #BU8226 2.50% 2/1/20528 | 612 | 520 | ||||||
| Fannie Mae Pool #BV4259 2.50% 2/1/20528 | 596 | 507 | ||||||
| Fannie Mae Pool #BV3216 2.50% 2/1/20528 | 487 | 413 | ||||||
| Fannie Mae Pool #BU7298 2.50% 2/1/20528 | 361 | 306 | ||||||
| Fannie Mae Pool #BV0307 2.50% 2/1/20528 | 75 | 63 | ||||||
| Fannie Mae Pool #BV3495 2.50% 2/1/20528 | 64 | 55 | ||||||
| Fannie Mae Pool #FS0647 3.00% 2/1/20528 | 67,926 | 60,633 | ||||||
| Fannie Mae Pool #CB2896 3.00% 2/1/20528 | 7,625 | 6,703 | ||||||
| Fannie Mae Pool #CB5013 2.50% 3/1/20528 | 3,992 | 3,392 | ||||||
| Fannie Mae Pool #BV6631 2.50% 3/1/20528 | 921 | 782 | ||||||
| Fannie Mae Pool #BV8086 2.50% 3/1/20528 | 596 | 508 | ||||||
| Fannie Mae Pool #BT8111 2.50% 3/1/20528 | 593 | 503 | ||||||
| Fannie Mae Pool #BV4173 2.50% 3/1/20528 | 525 | 446 | ||||||
| Fannie Mae Pool #BU8885 2.50% 3/1/20528 | 507 | 431 | ||||||
| Fannie Mae Pool #FS0831 3.00% 3/1/20528 | 16,034 | 14,095 | ||||||
| Fannie Mae Pool #CB3170 3.00% 3/1/20528 | 7,000 | 6,156 | ||||||
| Fannie Mae Pool #CB3410 3.00% 3/1/20528 | 158 | 139 | ||||||
| Fannie Mae Pool #MA4578 2.50% 4/1/20528 | 31,872 | 27,036 | ||||||
| Fannie Mae Pool #BV5332 2.50% 4/1/20528 | 966 | 820 | ||||||
| Fannie Mae Pool #BV4656 2.50% 4/1/20528 | 873 | 741 | ||||||
| Fannie Mae Pool #BV2996 2.50% 4/1/20528 | 814 | 691 | ||||||
| Fannie Mae Pool #CB3351 2.50% 4/1/20528 | 739 | 628 | ||||||
| Fannie Mae Pool #BV4182 2.50% 4/1/20528 | 730 | 620 | ||||||
| Fannie Mae Pool #FS1922 2.50% 4/1/20528 | 716 | 608 | ||||||
| Fannie Mae Pool #BV8569 2.50% 4/1/20528 | 683 | 580 | ||||||
| Fannie Mae Pool #BV7698 2.50% 4/1/20528 | 620 | 526 | ||||||
| Fannie Mae Pool #BV7717 2.50% 4/1/20528 | 593 | 504 | ||||||
| Fannie Mae Pool #BU8933 3.00% 4/1/20528 | 1,825 | 1,604 | ||||||
| Fannie Mae Pool #CB3364 3.00% 4/1/20528 | 457 | 402 | ||||||
| Fannie Mae Pool #BU8825 2.50% 5/1/20528 | 1,018 | 864 | ||||||
| Fannie Mae Pool #BW2204 2.50% 5/1/20528 | 885 | 752 | ||||||
| Fannie Mae Pool #BV9818 2.50% 5/1/20528 | 790 | 672 | ||||||
| Fannie Mae Pool #BW0160 2.50% 5/1/20528 | 665 | 565 | ||||||
| Fannie Mae Pool #MA4598 2.50% 5/1/20528 | 162 | 137 | ||||||
| Fannie Mae Pool #BV9644 2.50% 5/1/20528 | 89 | 76 | ||||||
| Fannie Mae Pool #FS1877 3.00% 5/1/20528 | 5,704 | 5,012 | ||||||
| Fannie Mae Pool #BV7238 3.00% 5/1/20528 | 1,886 | 1,658 | ||||||
| Fannie Mae Pool #CB3495 3.00% 5/1/20528 | 1,867 | 1,640 | ||||||
| Fannie Mae Pool #BT7819 3.00% 5/1/20528 | 138 | 121 | ||||||
| Fannie Mae Pool #BW1436 4.50% 5/1/20528 | 3,137 | 3,023 | ||||||
| Fannie Mae Pool #MA4624 3.00% 6/1/20528 | 1,431 | 1,257 | ||||||
| Fannie Mae Pool #BW2935 3.00% 6/1/20528 | 747 | 657 | ||||||
| Fannie Mae Pool #BW1449 3.00% 6/1/20528 | 400 | 352 | ||||||
| Fannie Mae Pool #BV9701 3.00% 6/1/20528 | 114 | 100 | ||||||
| Fannie Mae Pool #BW5663 4.50% 6/1/20528 | 2,906 | 2,800 | ||||||
| 132 | American Funds Insurance Series |
Asset Allocation Fund (continued)
| Bonds, notes & other debt instruments (continued) | Principal amount (000) |
Value (000) |
||||||
| Mortgage-backed obligations (continued) | ||||||||
| Federal agency mortgage-backed obligations (continued) | ||||||||
| Fannie Mae Pool #CB4534 4.50% 6/1/20528 | USD | 2,080 | $ | 2,004 | ||||
| Fannie Mae Pool #FS2239 2.50% 7/1/20528 | 10,586 | 8,987 | ||||||
| Fannie Mae Pool #MA4652 2.50% 7/1/20528 | 7,000 | 5,940 | ||||||
| Fannie Mae Pool #BV7868 2.50% 7/1/20528 | 996 | 845 | ||||||
| Fannie Mae Pool #BV2584 2.50% 7/1/20528 | 602 | 510 | ||||||
| Fannie Mae Pool #BW5528 2.50% 7/1/20528 | 525 | 445 | ||||||
| Fannie Mae Pool #BW6043 2.50% 7/1/20528 | 62 | 53 | ||||||
| Fannie Mae Pool #BW5579 3.50% 7/1/20528 | 2,000 | 1,819 | ||||||
| Fannie Mae Pool #CB4159 4.00% 7/1/20528 | 1,519 | 1,427 | ||||||
| Fannie Mae Pool #FS2555 4.50% 7/1/20528 | 125 | 120 | ||||||
| Fannie Mae Pool #MA4743 2.50% 8/1/20528 | 6,986 | 5,925 | ||||||
| Fannie Mae Pool #BW7293 3.50% 8/1/20528 | 3,000 | 2,729 | ||||||
| Fannie Mae Pool #CB4363 3.50% 8/1/20528 | 960 | 874 | ||||||
| Fannie Mae Pool #BV7903 3.50% 8/1/20528 | 200 | 182 | ||||||
| Fannie Mae Pool #BV8024 4.00% 8/1/20528 | 1,924 | 1,807 | ||||||
| Fannie Mae Pool #BW7302 4.00% 8/1/20528 | 289 | 272 | ||||||
| Fannie Mae Pool #BW4199 4.50% 8/1/20528 | 2,996 | 2,887 | ||||||
| Fannie Mae Pool #BW3035 4.50% 8/1/20528 | 2,532 | 2,440 | ||||||
| Fannie Mae Pool #BW5789 4.50% 8/1/20528 | 999 | 963 | ||||||
| Fannie Mae Pool #BW6395 4.50% 8/1/20528 | 999 | 962 | ||||||
| Fannie Mae Pool #BW7349 3.00% 9/1/20528 | 1,886 | 1,658 | ||||||
| Fannie Mae Pool #BW7780 3.00% 9/1/20528 | 219 | 192 | ||||||
| Fannie Mae Pool #MA4732 4.00% 9/1/20528 | 56,336 | 52,898 | ||||||
| Fannie Mae Pool #BW7326 4.00% 9/1/20528 | 1,648 | 1,547 | ||||||
| Fannie Mae Pool #BW9348 4.00% 9/1/20528 | 1,429 | 1,342 | ||||||
| Fannie Mae Pool #BW8103 4.00% 9/1/20528 | 1,353 | 1,271 | ||||||
| Fannie Mae Pool #MA4733 4.50% 9/1/20528 | 12,197 | 11,752 | ||||||
| Fannie Mae Pool #BV0957 4.50% 9/1/20528 | 3,075 | 2,962 | ||||||
| Fannie Mae Pool #BW1192 4.50% 9/1/20528 | 2,185 | 2,105 | ||||||
| Fannie Mae Pool #BW1201 5.00% 9/1/20528 | 2,361 | 2,331 | ||||||
| Fannie Mae Pool #MA4824 2.50% 10/1/20528 | 94 | 80 | ||||||
| Fannie Mae Pool #MA4782 3.50% 10/1/20528 | 3,000 | 2,729 | ||||||
| Fannie Mae Pool #BW8980 4.00% 10/1/20528 | 5,340 | 5,014 | ||||||
| Fannie Mae Pool #BW1210 4.00% 10/1/20528 | 4,034 | 3,788 | ||||||
| Fannie Mae Pool #BW7356 4.00% 10/1/20528 | 3,356 | 3,151 | ||||||
| Fannie Mae Pool #BX0509 4.00% 10/1/20528 | 1,444 | 1,356 | ||||||
| Fannie Mae Pool #MA4784 4.50% 10/1/20528 | 14,120 | 13,605 | ||||||
| Fannie Mae Pool #CB4959 4.50% 10/1/20528 | 9,275 | 8,936 | ||||||
| Fannie Mae Pool #BV0961 4.50% 10/1/20528 | 3,995 | 3,849 | ||||||
| Fannie Mae Pool #BW8981 4.50% 10/1/20528 | 2,309 | 2,224 | ||||||
| Fannie Mae Pool #BX0097 4.50% 10/1/20528 | 998 | 962 | ||||||
| Fannie Mae Pool #MA4785 5.00% 10/1/20528 | 3,500 | 3,455 | ||||||
| Fannie Mae Pool #MA4887 2.50% 11/1/20528 | 1,448 | 1,228 | ||||||
| Fannie Mae Pool #MA4854 2.50% 11/1/20528 | 902 | 765 | ||||||
| Fannie Mae Pool #BW1309 2.50% 11/1/20528 | 813 | 690 | ||||||
| Fannie Mae Pool #MA4885 3.00% 11/1/20528 | 801 | 704 | ||||||
| Fannie Mae Pool #FS3279 3.50% 11/1/20528 | 9,999 | 9,099 | ||||||
| Fannie Mae Pool #MA4803 3.50% 11/1/20528 | 1,000 | 910 | ||||||
| Fannie Mae Pool #MA4804 4.00% 11/1/20528 | 6,621 | 6,217 | ||||||
| Fannie Mae Pool #BW1310 4.00% 11/1/20528 | 1,509 | 1,417 | ||||||
| Fannie Mae Pool #BX3075 4.50% 11/1/20528 | 2,973 | 2,865 | ||||||
| Fannie Mae Pool #MA4911 3.00% 12/1/20528 | 650 | 571 | ||||||
| Fannie Mae Pool #MA4838 3.50% 12/1/20528 | 4,500 | 4,093 | ||||||
| Fannie Mae Pool #MA4839 4.00% 12/1/20528 | 4,000 | 3,756 | ||||||
| Fannie Mae Pool #MA4841 5.00% 12/1/20528 | 6,256 | 6,175 | ||||||
| Fannie Mae Pool #MA4877 6.50% 12/1/20528 | 1,000 | 1,026 | ||||||
| Fannie Mae Pool #MA4868 5.00% 1/1/20538 | 7,999 | 7,896 | ||||||
| Fannie Mae Pool #BX4609 5.00% 1/1/20538 | 1,277 | 1,261 | ||||||
| Fannie Mae Pool #MA4869 5.50% 1/1/20538 | 100 | 100 | ||||||
| Fannie Mae Pool #MA4895 6.50% 1/1/20538 | 7,427 | 7,618 | ||||||
| Fannie Mae Pool #BM6736 4.50% 11/1/20598 | 11,696 | 11,413 | ||||||
| American Funds Insurance Series | 133 |
Asset Allocation Fund (continued)
| Bonds, notes & other debt instruments (continued) | Principal amount (000) |
Value (000) |
||||||
| Mortgage-backed obligations (continued) | ||||||||
| Federal agency mortgage-backed obligations (continued) | ||||||||
| Fannie Mae Pool #BF0497 3.00% 7/1/20608 | USD | 4,130 | $ | 3,619 | ||||
| Fannie Mae, Series 2002-W3, Class A5, 7.50% 11/25/20418 | 24 | 26 | ||||||
| Fannie Mae, Series 2001-T10, Class A1, 7.00% 12/25/20418 | 84 | 86 | ||||||
| Fannie Mae, Series 2014-M1, Class A2, Multi Family, 3.298% 7/25/20238,9 | 1,660 | 1,644 | ||||||
| Fannie Mae, Series 2014-M2, Class A2, Multi Family, 3.513% 12/25/20238,9 | 1,909 | 1,877 | ||||||
| Fannie Mae, Series 2014-M3, Class A2, Multi Family, 3.501% 1/25/20248,9 | 1,338 | 1,314 | ||||||
| Fannie Mae, Series 2014-M9, Class A2, Multi Family, 3.103% 7/25/20248,9 | 3,273 | 3,169 | ||||||
| Fannie Mae, Series 2017-M3, Class A2, Multi Family, 2.471% 12/25/20268,9 | 7,323 | 6,758 | ||||||
| Fannie Mae, Series 2017-M7, Class A2, Multi Family, 2.961% 2/25/20278,9 | 2,602 | 2,446 | ||||||
| Fannie Mae, Series 2006-43, Class JO, principal only, 0% 6/25/20368 | 39 | 32 | ||||||
| Freddie Mac Pool #C91912 3.00% 2/1/20378 | 11,022 | 10,254 | ||||||
| Freddie Mac Pool #G03978 5.00% 3/1/20388 | 420 | 429 | ||||||
| Freddie Mac Pool #G04553 6.50% 9/1/20388 | 48 | 51 | ||||||
| Freddie Mac Pool #G08347 4.50% 6/1/20398 | 67 | 67 | ||||||
| Freddie Mac Pool #C03518 5.00% 9/1/20408 | 572 | 580 | ||||||
| Freddie Mac Pool #Q05807 4.00% 1/1/20428 | 1,648 | 1,586 | ||||||
| Freddie Mac Pool #Q23185 4.00% 11/1/20438 | 1,303 | 1,275 | ||||||
| Freddie Mac Pool #Q23190 4.00% 11/1/20438 | 758 | 732 | ||||||
| Freddie Mac Pool #760014 2.74% 8/1/20458,9 | 179 | 173 | ||||||
| Freddie Mac Pool #Q37988 4.00% 12/1/20458 | 5,730 | 5,510 | ||||||
| Freddie Mac Pool #G60344 4.00% 12/1/20458 | 4,930 | 4,740 | ||||||
| Freddie Mac Pool #Z40130 3.00% 1/1/20468 | 4,452 | 4,029 | ||||||
| Freddie Mac Pool #Q41090 4.50% 6/1/20468 | 204 | 200 | ||||||
| Freddie Mac Pool #Q41909 4.50% 7/1/20468 | 242 | 238 | ||||||
| Freddie Mac Pool #760015 2.561% 1/1/20478,9 | 444 | 420 | ||||||
| Freddie Mac Pool #Q46021 3.50% 2/1/20478 | 1,150 | 1,068 | ||||||
| Freddie Mac Pool #SI2002 4.00% 3/1/20488 | 2,336 | 2,234 | ||||||
| Freddie Mac Pool #SD8106 2.00% 11/1/20508 | 33,078 | 27,081 | ||||||
| Freddie Mac Pool #SD7528 2.00% 11/1/20508 | 17,984 | 14,872 | ||||||
| Freddie Mac Pool #QC2344 2.50% 4/1/20518 | 966 | 821 | ||||||
| Freddie Mac Pool #RA5288 2.00% 5/1/20518 | 30,665 | 25,100 | ||||||
| Freddie Mac Pool #SD8151 2.50% 6/1/20518 | 330 | 281 | ||||||
| Freddie Mac Pool #RA5782 2.50% 9/1/20518 | 10,333 | 8,855 | ||||||
| Freddie Mac Pool #SD7545 2.50% 9/1/20518 | 7,074 | 6,091 | ||||||
| Freddie Mac Pool #RA5759 2.50% 9/1/20518 | 2,039 | 1,728 | ||||||
| Freddie Mac Pool #QC7910 2.50% 9/1/20518 | 931 | 795 | ||||||
| Freddie Mac Pool #QC6921 2.50% 9/1/20518 | 911 | 774 | ||||||
| Freddie Mac Pool #RA5971 3.00% 9/1/20518 | 6,901 | 6,123 | ||||||
| Freddie Mac Pool #QC6456 3.00% 9/1/20518 | 701 | 616 | ||||||
| Freddie Mac Pool #RA6107 2.50% 10/1/20518 | 5,385 | 4,568 | ||||||
| Freddie Mac Pool #QC8778 2.50% 10/1/20518 | 462 | 392 | ||||||
| Freddie Mac Pool #QC9156 2.50% 10/1/20518 | 327 | 278 | ||||||
| Freddie Mac Pool #QC7814 2.50% 10/1/20518 | 27 | 23 | ||||||
| Freddie Mac Pool #RA6231 2.50% 11/1/20518 | 1,993 | 1,690 | ||||||
| Freddie Mac Pool #QC9944 2.50% 11/1/20518 | 1,474 | 1,251 | ||||||
| Freddie Mac Pool #QD1746 2.50% 11/1/20518 | 933 | 792 | ||||||
| Freddie Mac Pool #QC9788 2.50% 11/1/20518 | 930 | 790 | ||||||
| Freddie Mac Pool #QD1523 2.50% 11/1/20518 | 218 | 185 | ||||||
| Freddie Mac Pool #RA6483 2.50% 12/1/20518 | 6,952 | 5,934 | ||||||
| Freddie Mac Pool #RA7081 2.50% 12/1/20518 | 2,698 | 2,288 | ||||||
| Freddie Mac Pool #QD3362 2.50% 12/1/20518 | 854 | 725 | ||||||
| Freddie Mac Pool #RA6433 2.50% 12/1/20518 | 43 | 37 | ||||||
| Freddie Mac Pool #RA6485 3.00% 12/1/20518 | 1,935 | 1,701 | ||||||
| Freddie Mac Pool #RA6428 3.00% 12/1/20518 | 420 | 369 | ||||||
| Freddie Mac Pool #SD0853 2.50% 1/1/20528 | 5,650 | 4,790 | ||||||
| Freddie Mac Pool #SD7552 2.50% 1/1/20528 | 2,429 | 2,077 | ||||||
| Freddie Mac Pool #SD0854 2.50% 1/1/20528 | 1,987 | 1,688 | ||||||
| Freddie Mac Pool #RA6615 2.50% 1/1/20528 | 600 | 510 | ||||||
| Freddie Mac Pool #QD5254 2.50% 1/1/20528 | 597 | 507 | ||||||
| Freddie Mac Pool #SD8194 2.50% 2/1/20528 | 642 | 545 | ||||||
| Freddie Mac Pool #QD9066 2.50% 2/1/20528 | 501 | 426 | ||||||
| 134 | American Funds Insurance Series |
Asset Allocation Fund (continued)
| Bonds, notes & other debt instruments (continued) | Principal amount (000) |
Value (000) |
||||||
| Mortgage-backed obligations (continued) | ||||||||
| Federal agency mortgage-backed obligations (continued) | ||||||||
| Freddie Mac Pool #QD6379 2.50% 2/1/20528 | USD | 97 | $ | 83 | ||||
| Freddie Mac Pool #QD6971 2.50% 2/1/20528 | 63 | 54 | ||||||
| Freddie Mac Pool #QD7312 2.50% 2/1/20528 | 32 | 27 | ||||||
| Freddie Mac Pool #RA6806 3.00% 2/1/20528 | 2,000 | 1,758 | ||||||
| Freddie Mac Pool #QD6948 3.00% 2/1/20528 | 1,906 | 1,676 | ||||||
| Freddie Mac Pool #RA6608 3.00% 2/1/20528 | 954 | 838 | ||||||
| Freddie Mac Pool #QD7089 3.50% 2/1/20528 | 1,195 | 1,089 | ||||||
| Freddie Mac Pool #QD8976 2.50% 3/1/20528 | 952 | 809 | ||||||
| Freddie Mac Pool #QE0957 2.50% 3/1/20528 | 875 | 743 | ||||||
| Freddie Mac Pool #RA6959 2.50% 3/1/20528 | 766 | 651 | ||||||
| Freddie Mac Pool #QE0615 2.50% 3/1/20528 | 606 | 515 | ||||||
| Freddie Mac Pool #SD8200 2.50% 3/1/20528 | 437 | 371 | ||||||
| Freddie Mac Pool #QD8152 2.50% 3/1/20528 | 367 | 312 | ||||||
| Freddie Mac Pool #QD8673 3.00% 3/1/20528 | 1,542 | 1,356 | ||||||
| Freddie Mac Pool #RA6992 3.00% 3/1/20528 | 1,097 | 964 | ||||||
| Freddie Mac Pool #SD8205 2.50% 4/1/20528 | 6,581 | 5,582 | ||||||
| Freddie Mac Pool #QD9911 2.50% 4/1/20528 | 2,676 | 2,269 | ||||||
| Freddie Mac Pool #QE0800 2.50% 4/1/20528 | 2,628 | 2,231 | ||||||
| Freddie Mac Pool #QE0170 2.50% 4/1/20528 | 1,711 | 1,451 | ||||||
| Freddie Mac Pool #QE3079 2.50% 4/1/20528 | 932 | 792 | ||||||
| Freddie Mac Pool #QD9907 2.50% 4/1/20528 | 850 | 722 | ||||||
| Freddie Mac Pool #QE0407 2.50% 4/1/20528 | 769 | 653 | ||||||
| Freddie Mac Pool #QE5290 2.50% 4/1/20528 | 740 | 628 | ||||||
| Freddie Mac Pool #QE0025 2.50% 4/1/20528 | 549 | 466 | ||||||
| Freddie Mac Pool #QE0799 2.50% 4/1/20528 | 123 | 105 | ||||||
| Freddie Mac Pool #SD7554 2.50% 4/1/20528 | 94 | 80 | ||||||
| Freddie Mac Pool #QE2101 2.50% 4/1/20528 | 45 | 38 | ||||||
| Freddie Mac Pool #SD8206 3.00% 4/1/20528 | 800 | 703 | ||||||
| Freddie Mac Pool #RA7063 3.50% 4/1/20528 | 22,000 | 20,028 | ||||||
| Freddie Mac Pool #QE2352 2.50% 5/1/20528 | 40 | 34 | ||||||
| Freddie Mac Pool #QE1793 3.00% 5/1/20528 | 1,910 | 1,679 | ||||||
| Freddie Mac Pool #QE3080 3.00% 5/1/20528 | 400 | 351 | ||||||
| Freddie Mac Pool #RA7386 3.50% 5/1/20528 | 7,332 | 6,669 | ||||||
| Freddie Mac Pool #SD8220 3.00% 6/1/20528 | 4,451 | 3,913 | ||||||
| Freddie Mac Pool #QE4383 4.00% 6/1/20528 | 2,336 | 2,193 | ||||||
| Freddie Mac Pool #QE6097 2.50% 7/1/20528 | 83 | 71 | ||||||
| Freddie Mac Pool #QE5714 3.50% 7/1/20528 | 4,000 | 3,639 | ||||||
| Freddie Mac Pool #QE6274 3.50% 7/1/20528 | 4,000 | 3,638 | ||||||
| Freddie Mac Pool #SD8226 3.50% 7/1/20528 | 2,667 | 2,426 | ||||||
| Freddie Mac Pool #QE5983 3.50% 7/1/20528 | 2,000 | 1,819 | ||||||
| Freddie Mac Pool #QE7680 4.50% 7/1/20528 | 2,533 | 2,441 | ||||||
| Freddie Mac Pool #RA7747 2.50% 8/1/20528 | 2,681 | 2,273 | ||||||
| Freddie Mac Pool #QE8026 2.50% 8/1/20528 | 1,675 | 1,421 | ||||||
| Freddie Mac Pool #SD8234 2.50% 8/1/20528 | 32 | 27 | ||||||
| Freddie Mac Pool #RA7749 3.50% 8/1/20528 | 13,390 | 12,181 | ||||||
| Freddie Mac Pool #QE9057 4.00% 8/1/20528 | 1,231 | 1,156 | ||||||
| Freddie Mac Pool #QE7157 4.00% 8/1/20528 | 224 | 210 | ||||||
| Freddie Mac Pool #SD1576 5.00% 8/1/20528 | 3,206 | 3,165 | ||||||
| Freddie Mac Pool #SD8262 2.50% 9/1/20528 | 9,650 | 8,185 | ||||||
| Freddie Mac Pool #QF0923 2.50% 9/1/20528 | 597 | 506 | ||||||
| Freddie Mac Pool #SD8242 3.00% 9/1/20528 | 17,971 | 15,797 | ||||||
| Freddie Mac Pool #SD8243 3.50% 9/1/20528 | 4,039 | 3,675 | ||||||
| Freddie Mac Pool #SD8244 4.00% 9/1/20528 | 4,000 | 3,756 | ||||||
| Freddie Mac Pool #QE9625 4.00% 9/1/20528 | 1,586 | 1,489 | ||||||
| Freddie Mac Pool #QF0152 4.50% 9/1/20528 | 1,531 | 1,475 | ||||||
| Freddie Mac Pool #SD8246 5.00% 9/1/20528 | 79,771 | 78,743 | ||||||
| Freddie Mac Pool #RA7938 5.00% 9/1/20528 | 1,321 | 1,304 | ||||||
| Freddie Mac Pool #QF1751 2.50% 10/1/20528 | 946 | 803 | ||||||
| Freddie Mac Pool #SD8271 2.50% 10/1/20528 | 579 | 491 | ||||||
| Freddie Mac Pool #QF1464 4.00% 10/1/20528 | 1,521 | 1,429 | ||||||
| Freddie Mac Pool #QF1489 4.00% 10/1/20528 | 1,281 | 1,203 | ||||||
| American Funds Insurance Series | 135 |
Asset Allocation Fund (continued)
| Bonds, notes & other debt instruments (continued) | Principal amount (000) |
Value (000) |
||||||
| Mortgage-backed obligations (continued) | ||||||||
| Federal agency mortgage-backed obligations (continued) | ||||||||
| Freddie Mac Pool #SD8256 4.00% 10/1/20528 | USD | 1,000 | $ | 939 | ||||
| Freddie Mac Pool #QF1925 4.00% 10/1/20528 | 1,000 | 939 | ||||||
| Freddie Mac Pool #SD8257 4.50% 10/1/20528 | 53,823 | 51,858 | ||||||
| Freddie Mac Pool #QF3304 5.00% 10/1/20528 | 3,694 | 3,646 | ||||||
| Freddie Mac Pool #SD8291 2.50% 11/1/20528 | 855 | 725 | ||||||
| Freddie Mac Pool #SD8283 2.50% 11/1/20528 | 634 | 538 | ||||||
| Freddie Mac Pool #SD8273 3.50% 11/1/20528 | 4,000 | 3,639 | ||||||
| Freddie Mac Pool #SD8264 3.50% 11/1/20528 | 4,000 | 3,639 | ||||||
| Freddie Mac Pool #QF3364 4.00% 11/1/20528 | 2,477 | 2,326 | ||||||
| Freddie Mac Pool #SD8265 4.00% 11/1/20528 | 251 | 235 | ||||||
| Freddie Mac Pool #SD8266 4.50% 11/1/20528 | 4 | 3 | ||||||
| Freddie Mac Pool #SD8275 4.50% 12/1/20528 | 1,295 | 1,248 | ||||||
| Freddie Mac Pool #SD8276 5.00% 12/1/20528 | 6,999 | 6,909 | ||||||
| Freddie Mac Pool #SD8281 6.50% 12/1/20528 | 14,617 | 14,994 | ||||||
| Freddie Mac Pool #SD8284 3.00% 1/1/20538 | 11,360 | 9,985 | ||||||
| Freddie Mac Pool #SD8285 3.50% 1/1/20538 | 5,499 | 5,003 | ||||||
| Freddie Mac Pool #SD8286 4.00% 1/1/20538 | 336 | 315 | ||||||
| Freddie Mac Pool #SD8288 5.00% 1/1/20538 | 3,778 | 3,729 | ||||||
| Freddie Mac Pool #SD8282 6.50% 1/1/20538 | 706 | 724 | ||||||
| Freddie Mac, Series T041, Class 3A, 4.402% 7/25/20328,9 | 187 | 179 | ||||||
| Freddie Mac, Series K733, Class A2, Multi Family, 3.75% 8/25/20258,9 | 9,778 | 9,538 | ||||||
| Freddie Mac, Series K734, Class A2, Multi Family, 3.208% 2/25/20268 | 7,370 | 7,077 | ||||||
| Freddie Mac, Series K076, Class A2, Multi Family, 3.90% 4/25/20288 | 3,237 | 3,158 | ||||||
| Freddie Mac, Series K143, Class A2, Multi Family, 2.35% 6/25/20328 | 19,961 | 16,758 | ||||||
| Freddie Mac Seasoned Credit Risk Transfer Trust, Series 2017-1, Class HA, 3.00% 1/25/20568,9 | 2,646 | 2,476 | ||||||
| Freddie Mac Seasoned Credit Risk Transfer Trust, Series 2017-3, Class HA, 3.25% 7/25/20568,9 | 1,149 | 1,082 | ||||||
| Freddie Mac Seasoned Credit Risk Transfer Trust, Series 2017-2, Class MA, 3.00% 8/25/20568 | 5,121 | 4,758 | ||||||
| Freddie Mac Seasoned Credit Risk Transfer Trust, Series 2017-2, Class HA, 3.00% 8/25/20568,9 | 5,074 | 4,744 | ||||||
| Freddie Mac Seasoned Credit Risk Transfer Trust, Series 2017-4, Class HT, 3.25% 6/25/20578,9 | 911 | 831 | ||||||
| Freddie Mac Seasoned Credit Risk Transfer Trust, Series 2017-4, Class MT, 3.50% 6/25/20578 | 755 | 684 | ||||||
| Freddie Mac Seasoned Credit Risk Transfer Trust, Series 2018-3, Class MA, 3.50% 8/25/20578 | 1,823 | 1,730 | ||||||
| Freddie Mac Seasoned Credit Risk Transfer Trust, Series 2018-2, Class MT, 3.50% 11/25/20578 | 1,942 | 1,757 | ||||||
| Freddie Mac Seasoned Credit Risk Transfer Trust, Series 2019-2, Class MA, 3.50% 8/25/20588 | 9,501 | 8,965 | ||||||
| Freddie Mac Seasoned Credit Risk Transfer Trust, Series 2019-4, Class MA, 3.00% 2/25/20598 | 5,448 | 5,052 | ||||||
| Freddie Mac Seasoned Loan Structured Transaction Trust, Series 2018-2, Class A1, 3.50% 11/25/20288 | 2,154 | 2,056 | ||||||
| Freddie Mac Seasoned Loan Structured Transaction Trust, Series 2019-1, Class A1, 3.50% 5/25/20298 | 4,272 | 4,072 | ||||||
| Freddie Mac Seasoned Loan Structured Transaction Trust, Series 2019-1, Class A2, 3.50% 5/25/20298 | 2,455 | 2,255 | ||||||
| Freddie Mac Seasoned Loan Structured Transaction Trust, Series 2019-3, Class A1C, 2.75% 11/25/20298 | 2,682 | 2,465 | ||||||
| Government National Mortgage Assn. 2.00% 1/1/20538,10 | 68,784 | 57,662 | ||||||
| Government National Mortgage Assn. 2.50% 1/1/20538,10 | 5,866 | 5,085 | ||||||
| Government National Mortgage Assn. 3.00% 1/1/20538,10 | 83,663 | 74,514 | ||||||
| Government National Mortgage Assn. 3.50% 1/1/20538,10 | 16,502 | 15,165 | ||||||
| Government National Mortgage Assn. 4.00% 1/1/20538,10 | 3,200 | 3,029 | ||||||
| Government National Mortgage Assn. 4.50% 1/1/20538,10 | 33,456 | 32,460 | ||||||
| Government National Mortgage Assn. Pool #BD7245 4.00% 1/20/20488 | 437 | 417 | ||||||
| Government National Mortgage Assn. Pool #MA5652 4.50% 12/20/20488 | 342 | 332 | ||||||
| Government National Mortgage Assn. Pool #MA6602 4.50% 4/20/20508 | 204 | 200 | ||||||
| 136 | American Funds Insurance Series |
Asset Allocation Fund (continued)
| Bonds, notes & other debt instruments (continued) | Principal amount (000) |
Value (000) |
||||||
| Mortgage-backed obligations (continued) | ||||||||
| Federal agency mortgage-backed obligations (continued) | ||||||||
| Government National Mortgage Assn. Pool #MA7259 4.50% 3/20/20518 | USD | 1,762 | $ | 1,734 | ||||
| Government National Mortgage Assn. Pool #MA7316 4.50% 4/20/20518 | 490 | 482 | ||||||
| Government National Mortgage Assn. Pool #MA8346 4.00% 10/20/20528 | 1,260 | 1,193 | ||||||
| Government National Mortgage Assn. Pool #MA8426 4.00% 11/20/20528 | 10,566 | 10,009 | ||||||
| Government National Mortgage Assn. Pool #MA8488 4.00% 12/20/20528 | 1,000 | 947 | ||||||
| Uniform Mortgage-Backed Security 1.50% 1/1/20388,10 | 25,420 | 22,012 | ||||||
| Uniform Mortgage-Backed Security 2.50% 1/1/20388,10 | 638 | 584 | ||||||
| Uniform Mortgage-Backed Security 2.00% 1/1/20538,10 | 108,193 | 88,062 | ||||||
| Uniform Mortgage-Backed Security 4.00% 1/1/20538,10 | 7,100 | 6,660 | ||||||
| Uniform Mortgage-Backed Security 4.50% 1/1/20538,10 | 9,560 | 9,203 | ||||||
| Uniform Mortgage-Backed Security 5.00% 1/1/20538,10 | 4,884 | 4,813 | ||||||
| Uniform Mortgage-Backed Security 5.50% 1/1/20538,10 | 60,890 | 61,059 | ||||||
| Uniform Mortgage-Backed Security 6.00% 1/1/20538,10 | 12,770 | 12,962 | ||||||
| Uniform Mortgage-Backed Security 4.00% 2/1/20538,10 | 15,948 | 14,963 | ||||||
| Uniform Mortgage-Backed Security 5.00% 2/1/20538,10 | 35,408 | 34,891 | ||||||
| Uniform Mortgage-Backed Security 5.50% 2/1/20538,10 | 16,800 | 16,838 | ||||||
| Uniform Mortgage-Backed Security 6.00% 2/1/20538,10 | 36,230 | 36,745 | ||||||
| 1,739,465 | ||||||||
| Commercial mortgage-backed securities 0.44% | ||||||||
| Bank Commercial Mortgage Trust, Series 2020-BN26, Class A4, 2.403% 3/15/20638 | 2,909 | 2,435 | ||||||
| Bank Commercial Mortgage Trust, Series 2022-BNK40, Class A4, 3.394% 3/15/20648,9 | 2,550 | 2,246 | ||||||
| Barclays Commercial Mortgage Securities, LLC, Series 2017-DELC, Class A, 5.293% 8/15/20366,8,9 | 2,000 | 1,966 | ||||||
| Benchmark Mortgage Trust, Series 2018-B2, Class A4, 3.615% 2/15/20518 | 1,000 | 927 | ||||||
| Benchmark Mortgage Trust, Series 2020-B17, Class A5, 2.289% 3/15/20538 | 2,960 | 2,466 | ||||||
| BX Trust, Series 2021-SDMF, Class A, (1-month USD-LIBOR + 0.589%) 4.907% 9/15/20346,8,9 | 5,954 | 5,711 | ||||||
| BX Trust, Series 2021-VOLT, Class A, (1-month USD-LIBOR + 0.70%) 5.018% 9/15/20366,8,9 | 4,505 | 4,346 | ||||||
| BX Trust, Series 2021-ARIA, Class A, (1-month USD-LIBOR + 0.899%) 5.217% 10/15/20366,8,9 | 7,968 | 7,593 | ||||||
| BX Trust, Series 2021-ARIA, Class B, (1-month USD-LIBOR + 1.297%) 5.615% 10/15/20366,8,9 | 5,968 | 5,613 | ||||||
| BX Trust, Series 2021-SOAR, Class A, (1-month USD-LIBOR + 0.67%) 4.988% 6/15/20386,8,9 | 7,481 | 7,216 | ||||||
| BX Trust, Series 2021-SOAR, Class B, (1-month USD-LIBOR + 0.87%) 5.188% 6/15/20386,8,9 | 1,351 | 1,290 | ||||||
| BX Trust, Series 2021-SOAR, Class C, (1-month USD-LIBOR + 1.10%) 5.418% 6/15/20386,8,9 | 1,220 | 1,156 | ||||||
| BX Trust, Series 2021-ACNT, Class A, (1-month USD-LIBOR + 0.85%) 5.168% 11/15/20386,8,9 | 5,254 | 5,063 | ||||||
| Citigroup Commercial Mortgage Trust, Series 2015-GC29, Class AAB, 2.984% 4/10/20488 | 470 | 459 | ||||||
| Commercial Mortgage Trust, Series 2015-PC1, Class A5, 3.902% 7/10/20508 | 4,735 | 4,540 | ||||||
| CSAIL Commercial Mortgage Trust, Series 2015-C4, Class ASB, 3.617% 11/15/20488 | 780 | 758 | ||||||
| Extended Stay America Trust, Series 2021-ESH, Class A, (1-month USD-LIBOR + 1.08%) 5.398% 7/15/20386,8,9 | 1,537 | 1,495 | ||||||
| Extended Stay America Trust, Series 2021-ESH, Class B, (1-month USD-LIBOR + 1.38%) 5.698% 7/15/20386,8,9 | 1,403 | 1,351 | ||||||
| Extended Stay America Trust, Series 2021-ESH, Class C, (1-month USD-LIBOR + 1.70%) 6.018% 7/15/20386,8,9 | 1,465 | 1,410 | ||||||
| Grace Mortgage Trust, Series 2020-GRCE, Class A, 2.347% 12/10/20406,8 | 3,795 | 2,918 | ||||||
| GS Mortgage Securities Trust, Series 2020-GC47, Class A5, 2.377% 5/12/20538 | 2,489 | 2,059 | ||||||
| JPMorgan Chase Commercial Mortgage Securities Trust, Series 2022-OPO, Class A, 3.024% 1/5/20396,8 | 1,964 | 1,682 | ||||||
| JPMorgan Chase Commercial Mortgage Securities Trust, Series 2022-OPO, Class C, 3.377% 1/5/20396,8 | 868 | 708 | ||||||
| JPMorgan Chase Commercial Mortgage Securities Trust, Series 2022-OPO, Class C, 3.565% 1/5/20396,8,9 | 523 | 407 | ||||||
| American Funds Insurance Series | 137 |
Asset Allocation Fund (continued)
| Bonds, notes & other debt instruments (continued) | Principal amount (000) |
Value (000) |
||||||
| Mortgage-backed obligations (continued) | ||||||||
| Commercial mortgage-backed securities (continued) | ||||||||
| JPMorgan Chase Commercial Mortgage Securities Trust, Series 2021-410T, Class A, 2.287% 3/5/20426,8 | USD | 1,431 | $ | 1,171 | ||||
| LUXE Commercial Mortgage Trust, Series 2021-TRIP, Class A, (1-month USD-LIBOR + 1.05%) 5.368% 10/15/20386,8,9 | 1,236 | 1,184 | ||||||
| LUXE Commercial Mortgage Trust, Series 2021-TRIP, Class B, (1-month USD-LIBOR + 1.40%) 5.718% 10/15/20386,8,9 | 1,904 | 1,803 | ||||||
| Manhattan West Mortgage Trust, Series 2020-1MW, Class A, 2.13% 9/10/20396,8 | 13,772 | 11,780 | ||||||
| MHC Commercial Mortgage Trust, CMO, Series 2021-MHC, Class A, (1-month USD-LIBOR + 0.801%) 5.119% 4/15/20266,8,9 | 3,950 | 3,837 | ||||||
| Morgan Stanley Bank of America Merrill Lynch Trust, Series 2015-C27, Class ASB, 3.557% 12/15/20478 | 556 | 541 | ||||||
| Morgan Stanley Bank of America Merrill Lynch Trust, Series 2015-C22, Class ASB, 3.04% 4/15/20488 | 467 | 454 | ||||||
| SLG Office Trust, Series 2021-OVA, Class A, 2.585% 7/15/20416,8 | 2,194 | 1,756 | ||||||
| SREIT Trust, Series 2021-MFP, Class A, (1-month USD-LIBOR + 0.731%) 5.049% 11/15/20386,8,9 | 4,808 | 4,631 | ||||||
| StorageMart Commercial Mortgage Trust, Series 2022-MINI, Class A, (1-month USD CME Term SOFR + 1.00%) 5.336% 1/15/20396,8,9 | 10,709 | 10,352 | ||||||
| WMRK Commercial Mortgage Trust, Series 2022-WMRK, Class A, (1-month USD CME Term SOFR + 2.789%) 7.125% 11/15/20276,8,9 | 6,379 | 6,373 | ||||||
| 109,697 | ||||||||
| Collateralized mortgage-backed obligations (privately originated) 0.12% | ||||||||
| Arroyo Mortgage Trust, Series 2021-1R, Class A1, 1.175% 10/25/20486,8,9 | 1,101 | 870 | ||||||
| Bellemeade Re, Ltd., Series 2019-3A, Class M1B, (1-month USD-LIBOR + 1.60%) 5.989% 7/25/20296,8,9 | 496 | 496 | ||||||
| Cascade Funding Mortgage Trust, Series 2018-RM2, Class A, 4.00% 10/25/20686,8,9 | 1,181 | 1,140 | ||||||
| Connecticut Avenue Securities Trust, Series 2021-R01, Class 1M1, (30-day Average USD-SOFR + 0.75%) 4.678% 10/25/20416,8,9 | 192 | 190 | ||||||
| Credit Suisse Mortgage Trust, Series 2020-NET, Class A, 2.257% 8/15/20376,8 | 4,096 | 3,664 | ||||||
| Credit Suisse Mortgage Trust, Series 2017-RPL3, Class A1, 2.00% 1/25/20606,8,9 | 2,081 | 1,788 | ||||||
| CS First Boston Mortgage Securities Corp., Series 2004-5, Class IVA1, 6.00% 9/25/20348 | 148 | 141 | ||||||
| Finance of America Structured Securities Trust, Series 2019-JR1, Class A, 2.00% 3/25/20696,8 | 2,051 | 2,196 | ||||||
| Finance of America Structured Securities Trust, Series 2019-JR2, Class A1, 2.00% 6/25/20696,8 | 6,250 | 6,425 | ||||||
| Freddie Mac Structured Agency Credit Risk Debt Notes, Series 2015-DNA1, Class M3, (1-month USD-LIBOR + 3.30%) 7.689% 10/25/20278,9 | 235 | 237 | ||||||
| Freddie Mac Structured Agency Credit Risk Debt Notes, Series 2022-DNA6, Class M1A, (30-day Average USD-SOFR + 2.15%) 6.078% 9/25/20426,8,9 | 996 | 998 | ||||||
| Home Partners of America Trust, Series 2021-2, Class A, 1.901% 12/17/20266,8 | 4,304 | 3,724 | ||||||
| Legacy Mortgage Asset Trust, Series 2019-GS7, Class A1, 6.25% 11/25/20596,8,9 | 1,042 | 1,042 | ||||||
| MASTR Alternative Loan Trust, Series 2004-2, Class 2A1, 6.00% 2/25/20348 | 314 | 300 | ||||||
| Mello Warehouse Securitization Trust, Series 2021-3, Class A, (1-month USD-LIBOR + 0.85%) 5.239% 11/25/20556,8,9 | 4,040 | 3,909 | ||||||
| Onslow Bay Financial Mortgage Loan Trust, Series 2022-J1, Class A2, 2.50% 2/25/20526,8,9 | 2,784 | 2,248 | ||||||
| RMF Proprietary Issuance Trust, Series 2019-1, Class A, 2.75% 10/25/20636,8,9 | 355 | 328 | ||||||
| 29,696 | ||||||||
| Total mortgage-backed obligations | 1,878,858 | |||||||
| U.S. Treasury bonds & notes 6.52% | ||||||||
| U.S. Treasury 4.53% | ||||||||
| U.S. Treasury 0.125% 2/28/2023 | 44,825 | 44,537 | ||||||
| U.S. Treasury 2.50% 5/15/2024 | 700 | 679 | ||||||
| U.S. Treasury 2.50% 5/31/2024 | 100,000 | 97,016 | ||||||
| U.S. Treasury 3.25% 8/31/2024 | 22,613 | 22,143 | ||||||
| U.S. Treasury 1.50% 9/30/2024 | 907 | 862 | ||||||
| U.S. Treasury 4.50% 11/30/2024 | 760 | 760 | ||||||
| 138 | American Funds Insurance Series |
Asset Allocation Fund (continued)
| Bonds, notes & other debt instruments (continued) | Principal amount (000) |
Value (000) |
||||||
| U.S. Treasury bonds & notes (continued) | ||||||||
| U.S. Treasury (continued) | ||||||||
| U.S. Treasury 1.00% 12/15/2024 | USD | 10,725 | $ | 10,038 | ||||
| U.S. Treasury 3.00% 7/15/2025 | 3,165 | 3,066 | ||||||
| U.S. Treasury 4.00% 12/15/2025 | 32,029 | 31,829 | ||||||
| U.S. Treasury 0.375% 1/31/2026 | 45,000 | 40,052 | ||||||
| U.S. Treasury 0.50% 2/28/2026 | 42,515 | 37,903 | ||||||
| U.S. Treasury 1.625% 5/15/2026 | 1,500 | 1,381 | ||||||
| U.S. Treasury 1.50% 8/15/2026 | 500 | 456 | ||||||
| U.S. Treasury 0.75% 8/31/2026 | 52 | 46 | ||||||
| U.S. Treasury 0.875% 9/30/2026 | 565 | 502 | ||||||
| U.S. Treasury 1.125% 10/31/2026 | 471 | 421 | ||||||
| U.S. Treasury 1.125% 2/28/2027 | 762 | 678 | ||||||
| U.S. Treasury 2.375% 5/15/2027 | 880 | 820 | ||||||
| U.S. Treasury 2.625% 5/31/2027 | 96,250 | 90,738 | ||||||
| U.S. Treasury 0.50% 6/30/2027 | 36,300 | 31,057 | ||||||
| U.S. Treasury 4.125% 9/30/2027 | 90,000 | 90,345 | ||||||
| U.S. Treasury 3.875% 11/30/2027 | 39,923 | 39,707 | ||||||
| U.S. Treasury 0.625% 12/31/2027 | 7,109 | 6,025 | ||||||
| U.S. Treasury 2.875% 5/15/2028 | 5,217 | 4,926 | ||||||
| U.S. Treasury 1.25% 9/30/2028 | 3,142 | 2,699 | ||||||
| U.S. Treasury 1.50% 11/30/2028 | 50,000 | 43,417 | ||||||
| U.S. Treasury 1.375% 12/31/2028 | 10,900 | 9,398 | ||||||
| U.S. Treasury 2.875% 4/30/2029 | 50,000 | 46,843 | ||||||
| U.S. Treasury 3.875% 11/30/2029 | 1,662 | 1,651 | ||||||
| U.S. Treasury 1.50% 2/15/2030 | 36,651 | 31,236 | ||||||
| U.S. Treasury 0.625% 5/15/2030 | 20,225 | 16,012 | ||||||
| U.S. Treasury 2.875% 5/15/2032 | 50,000 | 46,102 | ||||||
| U.S. Treasury 4.125% 11/15/2032 | 96,356 | 98,276 | ||||||
| U.S. Treasury 1.125% 5/15/2040 | 62,775 | 39,393 | ||||||
| U.S. Treasury 1.375% 11/15/2040 | 52,695 | 34,328 | ||||||
| U.S. Treasury 1.75% 8/15/2041 | 47,854 | 32,834 | ||||||
| U.S. Treasury 2.00% 11/15/2041 | 1,181 | 846 | ||||||
| U.S. Treasury 4.00% 11/15/2042 | 21,751 | 21,312 | ||||||
| U.S. Treasury 2.50% 2/15/2046 | 3,755 | 2,822 | ||||||
| U.S. Treasury 3.00% 5/15/2047 | 9,355 | 7,690 | ||||||
| U.S. Treasury 3.00% 2/15/2048 | 336 | 277 | ||||||
| U.S. Treasury 2.00% 2/15/2050 | 13,825 | 9,184 | ||||||
| U.S. Treasury 1.375% 8/15/2050 | 12,500 | 6,993 | ||||||
| U.S. Treasury 2.375% 5/15/2051 | 4,757 | 3,430 | ||||||
| U.S. Treasury 2.00% 8/15/2051 | 1,356 | 893 | ||||||
| U.S. Treasury 2.25% 2/15/205211 | 72,025 | 50,351 | ||||||
| U.S. Treasury 3.00% 8/15/205211 | 73,627 | 61,049 | ||||||
| 1,123,023 | ||||||||
| U.S. Treasury inflation-protected securities 1.99% | ||||||||
| U.S. Treasury Inflation-Protected Security 0.50% 4/15/202412 | 22,067 | 21,475 | ||||||
| U.S. Treasury Inflation-Protected Security 0.125% 7/15/202412 | 76,769 | 74,363 | ||||||
| U.S. Treasury Inflation-Protected Security 0.125% 10/15/202412 | 98,718 | 95,142 | ||||||
| U.S. Treasury Inflation-Protected Security 0.25% 1/15/202512 | 25,161 | 24,151 | ||||||
| U.S. Treasury Inflation-Protected Security 0.375% 7/15/202512 | 4,649 | 4,467 | ||||||
| U.S. Treasury Inflation-Protected Security 0.125% 10/15/202512 | 3,905 | 3,711 | ||||||
| U.S. Treasury Inflation-Protected Security 0.125% 4/15/202612 | 43,574 | 40,962 | ||||||
| U.S. Treasury Inflation-Protected Security 0.125% 10/15/202612 | 15,266 | 14,319 | ||||||
| U.S. Treasury Inflation-Protected Security 1.625% 10/15/202712 | 50,295 | 50,231 | ||||||
| U.S. Treasury Inflation-Protected Security 0.75% 7/15/202812 | 20,774 | 19,790 | ||||||
| U.S. Treasury Inflation-Protected Security 0.875% 1/15/202912 | 23,419 | 22,309 | ||||||
| American Funds Insurance Series | 139 |
Asset Allocation Fund (continued)
| Bonds, notes & other debt instruments (continued) | Principal amount (000) |
Value (000) |
||||||
| U.S. Treasury bonds & notes (continued) | ||||||||
| U.S. Treasury inflation-protected securities (continued) | ||||||||
| U.S. Treasury Inflation-Protected Security 0.125% 1/15/203112 | USD | 27,071 | $ | 24,019 | ||||
| U.S. Treasury Inflation-Protected Security 0.125% 1/15/203212 | 60,545 | 52,974 | ||||||
| U.S. Treasury Inflation-Protected Security 1.00% 2/15/204912 | 55,158 | 46,174 | ||||||
| 494,087 | ||||||||
| Total U.S. Treasury bonds & notes | 1,617,110 | |||||||
| Corporate bonds, notes & loans 5.63% | ||||||||
| Financials 1.27% | ||||||||
| ACE INA Holdings, Inc. 3.35% 5/3/2026 | 880 | 843 | ||||||
| ACE INA Holdings, Inc. 4.35% 11/3/2045 | 400 | 348 | ||||||
| Advisor Group Holdings, LLC 6.25% 3/1/20286 | 4,470 | 4,115 | ||||||
| AerCap Ireland Capital DAC 2.45% 10/29/2026 | 5,457 | 4,779 | ||||||
| AerCap Ireland Capital DAC 3.00% 10/29/2028 | 4,501 | 3,779 | ||||||
| AerCap Ireland Capital DAC 3.30% 1/30/2032 | 2,838 | 2,226 | ||||||
| AerCap Ireland Capital DAC 3.85% 10/29/2041 | 1,970 | 1,400 | ||||||
| AG Merger Sub II, Inc. 10.75% 8/1/20276 | 2,420 | 2,453 | ||||||
| AG TTMT Escrow Issuer, LLC 8.625% 9/30/20276 | 1,072 | 1,083 | ||||||
| AIB Group PLC 7.583% 10/14/2026 (USD-SOFR + 3.456% on 10/14/2025)6,13 | 7,750 | 7,899 | ||||||
| Alliant Holdings Intermediate, LLC 4.25% 10/15/20276 | 2,100 | 1,884 | ||||||
| Alliant Holdings Intermediate, LLC 5.875% 11/1/20296 | 2,295 | 1,890 | ||||||
| Ally Financial, Inc. 8.00% 11/1/2031 | 3,000 | 3,127 | ||||||
| American International Group, Inc. 2.50% 6/30/2025 | 10,533 | 9,926 | ||||||
| AmWINS Group, Inc. 4.875% 6/30/20296 | 1,348 | 1,145 | ||||||
| Aretec Escrow Issuer, Inc. 7.50% 4/1/20296 | 1,250 | 1,034 | ||||||
| Banco Santander, SA 5.147% 8/18/2025 | 2,400 | 2,376 | ||||||
| Bangkok Bank PCL 3.733% 9/25/2034 (5-year UST Yield Curve Rate T Note Constant Maturity + 1.90% on 9/25/2029)13 | 2,428 | 2,034 | ||||||
| Bank of America Corp. 3.55% 3/5/2024 (3-month USD-LIBOR + 0.78% on 3/5/2023)13 | 6,000 | 5,978 | ||||||
| Bank of America Corp. 1.197% 10/24/2026 (USD-SOFR + 1.01% on 10/24/2025)13 | 2,500 | 2,225 | ||||||
| Bank of America Corp. 1.734% 7/22/2027 (USD-SOFR + 0.96% on 7/22/2026)13 | 1,565 | 1,373 | ||||||
| Bank of America Corp. 3.419% 12/20/2028 (3-month USD-LIBOR + 1.04% on 12/20/2027)13 | 2,345 | 2,127 | ||||||
| Bank of America Corp. 1.922% 10/24/2031 (USD-SOFR + 1.37% on 10/24/2030)13 | 1,000 | 766 | ||||||
| Bank of Nova Scotia 1.625% 5/1/2023 | 5,000 | 4,948 | ||||||
| Berkshire Hathaway, Inc. 2.75% 3/15/2023 | 1,615 | 1,608 | ||||||
| Berkshire Hathaway, Inc. 3.125% 3/15/2026 | 500 | 480 | ||||||
| Blackstone Private Credit Fund 7.05% 9/29/20256 | 2,510 | 2,493 | ||||||
| BNP Paribas SA 2.159% 9/15/2029 (USD-SOFR + 1.218% on 9/15/2028)6,13 | 2,400 | 1,961 | ||||||
| Castlelake Aviation Finance DAC 5.00% 4/15/20276 | 3,370 | 2,937 | ||||||
| Citigroup, Inc. 5.61% 9/29/2026 (USD-SOFR + 1.546% on 12/29/2025)13 | 8,000 | 8,043 | ||||||
| Citigroup, Inc. 2.976% 11/5/2030 (USD-SOFR + 1.422% on 11/5/2029)13 | 3,254 | 2,743 | ||||||
| CME Group, Inc. 3.75% 6/15/2028 | 3,425 | 3,297 | ||||||
| Coinbase Global, Inc. 3.375% 10/1/20286 | 2,625 | 1,391 | ||||||
| Coinbase Global, Inc. 3.625% 10/1/20316 | 2,875 | 1,388 | ||||||
| Compass Diversified Holdings 5.25% 4/15/20296 | 820 | 703 | ||||||
| Compass Diversified Holdings 5.00% 1/15/20326 | 715 | 569 | ||||||
| Corebridge Financial, Inc. 3.50% 4/4/20256 | 642 | 616 | ||||||
| Corebridge Financial, Inc. 3.65% 4/5/20276 | 914 | 853 | ||||||
| Corebridge Financial, Inc. 3.85% 4/5/20296 | 621 | 567 | ||||||
| Corebridge Financial, Inc. 3.90% 4/5/20326 | 351 | 307 | ||||||
| Corebridge Financial, Inc. 4.35% 4/5/20426 | 203 | 167 | ||||||
| Corebridge Financial, Inc. 4.40% 4/5/20526 | 489 | 390 | ||||||
| Crédit Agricole SA 4.375% 3/17/20256 | 850 | 822 | ||||||
| Credit Suisse Group AG 3.80% 6/9/2023 | 1,875 | 1,826 | ||||||
| Credit Suisse Group AG 4.207% 6/12/2024 (3-month USD-LIBOR + 1.24% on 6/12/2023)6,13 | 4,500 | 4,388 | ||||||
| Credit Suisse Group AG 3.625% 9/9/2024 | 1,500 | 1,400 | ||||||
| Credit Suisse Group AG 2.593% 9/11/2025 (USD-SOFR + 1.56% on 9/11/2024)6,13 | 1,568 | 1,387 | ||||||
| Credit Suisse Group AG 2.193% 6/5/2026 (USD-SOFR + 2.044% on 6/5/2025)6,13 | 1,250 | 1,069 | ||||||
| 140 | American Funds Insurance Series |
Asset Allocation Fund (continued)
| Bonds, notes & other debt instruments (continued) | Principal amount (000) |
Value (000) |
||||||
| Corporate bonds, notes & loans (continued) | ||||||||
| Financials (continued) | ||||||||
| Credit Suisse Group AG 3.869% 1/12/2029 (3-month USD-LIBOR + 1.41% on 1/12/2028)6,13 | USD | 800 | $ | 642 | ||||
| Danske Bank AS 3.773% 3/28/2025 (1-year UST Yield Curve Rate T Note Constant Maturity + 1.45% on 3/28/2024)6,13 | 6,000 | 5,817 | ||||||
| Deutsche Bank AG 2.129% 11/24/2026 (USD-SOFR + 1.87% on 11/24/2025)13 | 2,212 | 1,954 | ||||||
| Deutsche Bank AG 2.311% 11/16/2027 (USD-SOFR + 1.219% on 11/16/2026)13 | 2,788 | 2,367 | ||||||
| Deutsche Bank AG 2.552% 1/7/2028 (USD-SOFR + 1.318% on 1/7/2027)13 | 5,000 | 4,257 | ||||||
| Digital Currency Group, Inc., Term Loan, (3-month USD-LIBOR + 7.00%) 8.00% 11/30/20263,9,14 | 709 | 616 | ||||||
| Digital Currency Group, Inc., Term Loan, 8.75% 11/30/20263,14 | 945 | 758 | ||||||
| DNB Bank ASA 5.896% 10/9/2026 (USD-SOFR + 1.95% on 10/9/2025)6,13 | 7,750 | 7,758 | ||||||
| FS Energy and Power Fund 7.50% 8/15/20236 | 1,995 | 2,001 | ||||||
| Goldman Sachs Group, Inc. 1.948% 10/21/2027 (USD-SOFR + 0.913% on 10/21/2026)13 | 2,198 | 1,925 | ||||||
| Goldman Sachs Group, Inc. 2.64% 2/24/2028 (USD-SOFR + 1.114% on 2/24/2027)13 | 4,000 | 3,567 | ||||||
| Goldman Sachs Group, Inc. 3.814% 4/23/2029 (3-month USD-LIBOR + 1.158% on 4/23/2028)13 | 390 | 357 | ||||||
| Goldman Sachs Group, Inc. 2.615% 4/22/2032 (USD-SOFR + 1.281% on 4/22/2031)13 | 2,323 | 1,858 | ||||||
| Goldman Sachs Group, Inc. 3.21% 4/22/2042 (USD-SOFR + 1.513% on 4/22/2041)13 | 2,000 | 1,448 | ||||||
| Groupe BPCE SA 2.75% 1/11/20236 | 600 | 600 | ||||||
| Groupe BPCE SA 5.70% 10/22/20236 | 2,250 | 2,234 | ||||||
| Groupe BPCE SA 5.15% 7/21/20246 | 3,710 | 3,634 | ||||||
| Groupe BPCE SA 1.00% 1/20/20266 | 3,000 | 2,633 | ||||||
| Hightower Holding, LLC 6.75% 4/15/20296 | 870 | 731 | ||||||
| HSBC Holdings PLC 4.25% 3/14/2024 | 3,000 | 2,948 | ||||||
| HSBC Holdings PLC 2.633% 11/7/2025 (3-month USD-LIBOR + 1.14% on 11/7/2024)13 | 625 | 587 | ||||||
| HSBC Holdings PLC 2.099% 6/4/2026 (USD-SOFR + 1.929% on 6/4/2025)13 | 3,000 | 2,733 | ||||||
| HSBC Holdings PLC 3.973% 5/22/2030 (3-month USD-LIBOR + 1.61% on 5/22/2029)13 | 1,500 | 1,316 | ||||||
| Intercontinental Exchange, Inc. 2.65% 9/15/2040 | 7,425 | 5,166 | ||||||
| Intesa Sanpaolo SpA 3.375% 1/12/20236 | 750 | 750 | ||||||
| Intesa Sanpaolo SpA 5.017% 6/26/20246 | 1,730 | 1,664 | ||||||
| Intesa Sanpaolo SpA 3.25% 9/23/20246 | 750 | 712 | ||||||
| Intesa Sanpaolo SpA 3.875% 7/14/20276 | 300 | 268 | ||||||
| Intesa Sanpaolo SpA 8.248% 11/21/2033 (1-year UST Yield Curve Rate T Note Constant Maturity + 4.40% on 11/21/2032)6,13 | 4,600 | 4,680 | ||||||
| JPMorgan Chase & Co. 3.559% 4/23/2024 (3-month USD-LIBOR + 0.73% on 4/23/2023)13 | 4,725 | 4,694 | ||||||
| JPMorgan Chase & Co. 4.08% 4/26/2026 (USD-SOFR + 1.32% on 4/26/2025)13 | 6,000 | 5,831 | ||||||
| JPMorgan Chase & Co. 4.323% 4/26/2028 (USD-SOFR + 1.56% on 4/26/2027)13 | 4,000 | 3,826 | ||||||
| JPMorgan Chase & Co. 4.851% 7/25/2028 (USD-SOFR + 1.99% on 7/25/2027)13 | 3,740 | 3,652 | ||||||
| JPMorgan Chase & Co. 4.586% 4/26/2033 (USD-SOFR + 1.80% on 4/26/2032)13 | 299 | 278 | ||||||
| JPMorgan Chase & Co. 4.912% 7/25/2033 (USD-SOFR + 2.08% on 7/25/2032)13 | 3,982 | 3,803 | ||||||
| Kasikornbank PCL HK 3.343% 10/2/2031 (5-year UST Yield Curve Rate T Note Constant Maturity + 1.70% on 10/2/2026)13 | 1,222 | 1,077 | ||||||
| Lloyds Banking Group PLC 4.05% 8/16/2023 | 2,000 | 1,987 | ||||||
| Lloyds Banking Group PLC 1.627% 5/11/2027 (1-year UST Yield Curve Rate T Note Constant Maturity + 0.85% on 5/11/2026)13 | 800 | 693 | ||||||
| LPL Holdings, Inc. 4.625% 11/15/20276 | 2,700 | 2,527 | ||||||
| LPL Holdings, Inc. 4.375% 5/15/20316 | 1,805 | 1,537 | ||||||
| Marsh & McLennan Companies, Inc. 3.875% 3/15/2024 | 820 | 809 | ||||||
| Marsh & McLennan Companies, Inc. 4.375% 3/15/2029 | 1,705 | 1,651 | ||||||
| Marsh & McLennan Companies, Inc. 4.90% 3/15/2049 | 719 | 665 | ||||||
| Marsh & McLennan Companies, Inc. 2.90% 12/15/2051 | 920 | 594 | ||||||
| MGIC Investment Corp. 5.25% 8/15/2028 | 1,175 | 1,085 | ||||||
| Morgan Stanley 3.737% 4/24/2024 (3-month USD-LIBOR + 0.847% on 4/24/2023)13 | 300 | 298 | ||||||
| Morgan Stanley 4.679% 7/17/2026 (USD-SOFR + 1.669% on 7/17/2025)13 | 2,450 | 2,410 | ||||||
| American Funds Insurance Series | 141 |
Asset Allocation Fund (continued)
| Bonds, notes & other debt instruments (continued) | Principal amount (000) |
Value (000) |
||||||
| Corporate bonds, notes & loans (continued) | ||||||||
| Financials (continued) | ||||||||
| Morgan Stanley 3.125% 7/27/2026 | USD | 325 | $ | 304 | ||||
| MSCI, Inc. 3.625% 11/1/20316 | 2,225 | 1,843 | ||||||
| National Australia Bank, Ltd. 1.887% 1/12/20276 | 5,000 | 4,450 | ||||||
| Navient Corp. 5.50% 1/25/2023 | 1,594 | 1,594 | ||||||
| Navient Corp. 6.125% 3/25/2024 | 8,030 | 7,879 | ||||||
| Navient Corp. 5.875% 10/25/2024 | 1,005 | 974 | ||||||
| Navient Corp. 6.75% 6/15/2026 | 300 | 285 | ||||||
| Navient Corp. 5.50% 3/15/2029 | 5,980 | 4,888 | ||||||
| New York Life Global Funding 2.35% 7/14/20266 | 590 | 544 | ||||||
| Northwestern Mutual Global Funding 1.75% 1/11/20276 | 2,500 | 2,211 | ||||||
| OneMain Finance Corp. 3.875% 9/15/2028 | 756 | 602 | ||||||
| Owl Rock Capital Corp. 4.00% 3/30/2025 | 102 | 96 | ||||||
| Owl Rock Capital Corp. 3.75% 7/22/2025 | 2,874 | 2,658 | ||||||
| Owl Rock Capital Corp. 3.40% 7/15/2026 | 1,290 | 1,128 | ||||||
| Owl Rock Capital Corp. II 4.625% 11/26/20246 | 2,305 | 2,194 | ||||||
| Owl Rock Capital Corp. III 3.125% 4/13/2027 | 2,520 | 2,078 | ||||||
| Owl Rock Core Income Corp. 4.70% 2/8/2027 | 2,500 | 2,258 | ||||||
| Oxford Finance, LLC 6.375% 2/1/20276 | 1,125 | 1,049 | ||||||
| PNC Financial Services Group, Inc. 3.90% 4/29/2024 | 2,000 | 1,977 | ||||||
| Power Financial Corp., Ltd. 5.25% 8/10/2028 | 383 | 373 | ||||||
| Power Financial Corp., Ltd. 6.15% 12/6/2028 | 350 | 356 | ||||||
| Power Financial Corp., Ltd. 4.50% 6/18/2029 | 554 | 513 | ||||||
| Power Financial Corp., Ltd. 3.95% 4/23/2030 | 1,213 | 1,067 | ||||||
| Prudential Financial, Inc. 4.35% 2/25/2050 | 2,205 | 1,879 | ||||||
| Prudential Financial, Inc. 3.70% 3/13/2051 | 755 | 580 | ||||||
| Quicken Loans, LLC 3.625% 3/1/20296 | 1,505 | 1,195 | ||||||
| Rabobank Nederland 4.375% 8/4/2025 | 4,500 | 4,397 | ||||||
| Rocket Mortgage, LLC 2.875% 10/15/20266 | 2,110 | 1,812 | ||||||
| Royal Bank of Canada 1.15% 6/10/2025 | 4,711 | 4,316 | ||||||
| Ryan Specialty Group, LLC 4.375% 2/1/20306 | 270 | 234 | ||||||
| Springleaf Finance Corp. 6.125% 3/15/2024 | 2,550 | 2,472 | ||||||
| Starwood Property Trust, Inc. 5.50% 11/1/20236 | 1,160 | 1,152 | ||||||
| Starwood Property Trust, Inc. 4.375% 1/15/20276 | 1,540 | 1,350 | ||||||
| Swiss Re Finance (Luxembourg) SA 5.00% 4/2/2049 (5-year UST Yield Curve Rate T Note Constant Maturity + 3.582% on 4/2/2029)6,13 |
2,800 | 2,591 | ||||||
| Toronto-Dominion Bank 2.65% 6/12/2024 | 625 | 605 | ||||||
| Toronto-Dominion Bank 0.75% 9/11/2025 | 5,375 | 4,803 | ||||||
| Toronto-Dominion Bank 1.25% 9/10/2026 | 2,425 | 2,124 | ||||||
| Toronto-Dominion Bank 1.95% 1/12/2027 | 2,500 | 2,231 | ||||||
| Toronto-Dominion Bank 2.45% 1/12/2032 | 1,500 | 1,219 | ||||||
| Travelers Companies, Inc. 4.00% 5/30/2047 | 860 | 699 | ||||||
| U.S. Bancorp 2.375% 7/22/2026 | 4,000 | 3,696 | ||||||
| UBS Group AG 4.125% 9/24/20256 | 2,750 | 2,677 | ||||||
| UniCredit SpA 4.625% 4/12/20276 | 625 | 586 | ||||||
| Wells Fargo & Company 2.164% 2/11/2026 (3-month USD-LIBOR + 0.75% on 2/11/2025)13 | 8,000 | 7,464 | ||||||
| Wells Fargo & Company 3.526% 3/24/2028 (USD-SOFR + 1.51% on 3/24/2027)13 | 4,337 | 4,024 | ||||||
| Westpac Banking Corp. 2.75% 1/11/2023 | 1,750 | 1,749 | ||||||
| Westpac Banking Corp. 2.894% 2/4/2030 (5-year UST Yield Curve Rate T Note Constant Maturity + 1.35% on 2/4/2025)13 | 3,000 | 2,753 | ||||||
| Westpac Banking Corp. 2.668% 11/15/2035 (5-year UST Yield Curve Rate T Note Constant Maturity + 1.75% on 11/15/2030)13 | 3,325 | 2,478 | ||||||
| Westpac Banking Corp. 2.963% 11/16/2040 | 1,500 | 996 | ||||||
| 315,964 | ||||||||
| Energy 0.62% | ||||||||
| Altera Infrastructure, LP 8.50% 7/15/20233,6,15 | 3,550 | 663 | ||||||
| Antero Midstream Partners, LP 5.375% 6/15/20296 | 2,170 | 1,987 | ||||||
| Antero Resources Corp. 7.625% 2/1/20296 | 955 | 962 | ||||||
| Ascent Resources Utica Holdings, LLC 7.00% 11/1/20266 | 2,000 | 1,943 | ||||||
| 142 | American Funds Insurance Series |
Asset Allocation Fund (continued)
| Bonds, notes & other debt instruments (continued) | Principal amount (000) |
Value (000) |
||||||
| Corporate bonds, notes & loans (continued) | ||||||||
| Energy (continued) | ||||||||
| Ascent Resources Utica Holdings, LLC 5.875% 6/30/20296 | USD | 1,270 | $ | 1,134 | ||||
| Bonanza Creek Energy, Inc. 5.00% 10/15/20266 | 480 | 439 | ||||||
| BP Capital Markets America, Inc. 2.772% 11/10/2050 | 681 | 438 | ||||||
| Canadian Natural Resources, Ltd. 2.05% 7/15/2025 | 961 | 895 | ||||||
| Canadian Natural Resources, Ltd. 4.95% 6/1/2047 | 1,559 | 1,360 | ||||||
| Cheniere Energy, Inc. 4.625% 10/15/2028 | 4,645 | 4,207 | ||||||
| Chesapeake Energy Corp. 4.875% 4/15/202215 | 7,225 | 163 | ||||||
| Chesapeake Energy Corp. 5.50% 2/1/20266 | 685 | 662 | ||||||
| Chesapeake Energy Corp. 5.875% 2/1/20296 | 2,240 | 2,126 | ||||||
| CNX Midstream Partners, LP 4.75% 4/15/20306 | 1,055 | 867 | ||||||
| CNX Resources Corp. 7.25% 3/14/20276 | 1,725 | 1,715 | ||||||
| CNX Resources Corp. 6.00% 1/15/20296 | 2,675 | 2,465 | ||||||
| CNX Resources Corp. 7.375% 1/15/20316 | 553 | 531 | ||||||
| Comstock Resources, Inc. 5.875% 1/15/20306 | 450 | 387 | ||||||
| Constellation Oil Services Holding SA 13.50% 6/30/20253,6 | 1,120 | 1,120 | ||||||
| Constellation Oil Services Holding SA 4.00% PIK 12/31/202616 | 434 | 257 | ||||||
| Crestwood Midstream Partners, LP 8.00% 4/1/20296 | 4,265 | 4,250 | ||||||
| Diamond Foreign Asset Co. 9.00% Cash 4/22/20276,9,16 | 204 | 194 | ||||||
| Diamond Foreign Asset Co. 9.00% Cash 4/22/202716 | 185 | 176 | ||||||
| DT Midstream, Inc. 4.375% 6/15/20316 | 1,680 | 1,412 | ||||||
| Enbridge Energy Partners, LP, Series B, 7.50% 4/15/2038 | 300 | 331 | ||||||
| Enbridge, Inc. 4.00% 10/1/2023 | 278 | 276 | ||||||
| Enbridge, Inc. 2.50% 1/15/2025 | 300 | 284 | ||||||
| Enbridge, Inc. 3.70% 7/15/2027 | 62 | 58 | ||||||
| Energy Transfer Operating, LP 5.00% 5/15/2050 | 1,869 | 1,502 | ||||||
| Energy Transfer Partners, LP 4.50% 4/15/2024 | 1,210 | 1,193 | ||||||
| Energy Transfer Partners, LP 4.75% 1/15/2026 | 2,494 | 2,432 | ||||||
| Enterprise Products Operating, LLC 4.90% 5/15/2046 | 500 | 437 | ||||||
| EQM Midstream Partners, LP 4.125% 12/1/2026 | 686 | 612 | ||||||
| EQM Midstream Partners, LP 6.50% 7/1/20276 | 1,690 | 1,618 | ||||||
| EQM Midstream Partners, LP 5.50% 7/15/2028 | 3,088 | 2,767 | ||||||
| EQM Midstream Partners, LP 7.50% 6/1/20306 | 642 | 619 | ||||||
| EQM Midstream Partners, LP 4.75% 1/15/20316 | 1,635 | 1,340 | ||||||
| EQT Corp. 5.00% 1/15/2029 | 340 | 320 | ||||||
| EQT Corp. 7.25% 2/1/203013 | 1,110 | 1,153 | ||||||
| EQT Corp. 3.625% 5/15/20316 | 400 | 340 | ||||||
| Equinor ASA 3.00% 4/6/2027 | 4,000 | 3,739 | ||||||
| Equinor ASA 3.625% 9/10/2028 | 3,685 | 3,494 | ||||||
| Exxon Mobil Corp. 2.019% 8/16/2024 | 643 | 615 | ||||||
| Exxon Mobil Corp. 2.44% 8/16/2029 | 1,963 | 1,719 | ||||||
| Exxon Mobil Corp. 3.452% 4/15/2051 | 1,000 | 758 | ||||||
| Genesis Energy, LP 6.50% 10/1/2025 | 4,280 | 4,097 | ||||||
| Genesis Energy, LP 6.25% 5/15/2026 | 1,805 | 1,654 | ||||||
| Genesis Energy, LP 8.00% 1/15/2027 | 4,612 | 4,362 | ||||||
| Genesis Energy, LP 7.75% 2/1/2028 | 470 | 433 | ||||||
| Halliburton Company 3.80% 11/15/2025 | 6 | 6 | ||||||
| Harvest Midstream I, LP 7.50% 9/1/20286 | 850 | 813 | ||||||
| Hess Midstream Operations, LP 4.25% 2/15/20306 | 960 | 822 | ||||||
| Hess Midstream Operations, LP 5.50% 10/15/20306 | 400 | 366 | ||||||
| Hess Midstream Partners, LP 5.125% 6/15/20286 | 2,155 | 1,997 | ||||||
| Hilcorp Energy I, LP 6.00% 4/15/20306 | 350 | 312 | ||||||
| Hilcorp Energy I, LP 6.00% 2/1/20316 | 460 | 398 | ||||||
| Holly Energy Partners, LP / Holly Energy Finance Corp. 6.375% 4/15/20276 | 545 | 536 | ||||||
| Kinder Morgan, Inc. 5.45% 8/1/2052 | 1,238 | 1,118 | ||||||
| Marathon Oil Corp. 4.40% 7/15/2027 | 1,005 | 961 | ||||||
| MPLX, LP 4.125% 3/1/2027 | 500 | 473 | ||||||
| MPLX, LP 2.65% 8/15/2030 | 4,273 | 3,472 | ||||||
| MPLX, LP 4.50% 4/15/2038 | 750 | 635 | ||||||
| MPLX, LP 4.70% 4/15/2048 | 1,101 | 874 | ||||||
| New Fortress Energy, Inc. 6.75% 9/15/20256 | 1,065 | 1,010 | ||||||
| New Fortress Energy, Inc. 6.50% 9/30/20266 | 2,435 | 2,266 | ||||||
| American Funds Insurance Series | 143 |
Asset Allocation Fund (continued)
| Bonds, notes & other debt instruments (continued) | Principal amount (000) |
Value (000) |
||||||
| Corporate bonds, notes & loans (continued) | ||||||||
| Energy (continued) | ||||||||
| NGL Energy Operating, LLC 7.50% 2/1/20266 | USD | 14,165 | $ | 12,637 | ||||
| NGL Energy Partners, LP 6.125% 3/1/2025 | 3,422 | 2,794 | ||||||
| Oasis Petroleum, Inc. 6.375% 6/1/20266 | 1,945 | 1,897 | ||||||
| ONEOK, Inc. 5.85% 1/15/2026 | 347 | 352 | ||||||
| Parkland Corp. 4.625% 5/1/20306 | 1,035 | 858 | ||||||
| Petróleos Mexicanos 6.875% 10/16/2025 | 3,755 | 3,682 | ||||||
| Petróleos Mexicanos 5.35% 2/12/2028 | 1,870 | 1,578 | ||||||
| Petróleos Mexicanos 6.75% 9/21/2047 | 1,996 | 1,278 | ||||||
| Pioneer Natural Resources Company 2.15% 1/15/2031 | 1,669 | 1,323 | ||||||
| Plains All American Pipeline, LP 3.80% 9/15/2030 | 113 | 98 | ||||||
| Range Resources Corp. 8.25% 1/15/2029 | 1,040 | 1,073 | ||||||
| Range Resources Corp. 4.75% 2/15/20306 | 1,670 | 1,474 | ||||||
| Rockies Express Pipeline, LLC 4.95% 7/15/20296 | 2,689 | 2,421 | ||||||
| Southwestern Energy Co. 7.75% 10/1/2027 | 2,450 | 2,501 | ||||||
| Southwestern Energy Co. 8.375% 9/15/2028 | 395 | 408 | ||||||
| Southwestern Energy Co. 5.375% 2/1/2029 | 1,355 | 1,258 | ||||||
| Southwestern Energy Co. 5.375% 3/15/2030 | 1,945 | 1,778 | ||||||
| Southwestern Energy Co. 4.75% 2/1/2032 | 960 | 822 | ||||||
| Statoil ASA 3.25% 11/10/2024 | 2,850 | 2,780 | ||||||
| Statoil ASA 4.25% 11/23/2041 | 2,000 | 1,769 | ||||||
| Sunoco, LP 4.50% 5/15/2029 | 1,050 | 920 | ||||||
| Sunoco, LP 4.50% 4/30/2030 | 1,255 | 1,091 | ||||||
| Targa Resources Partners, LP 5.50% 3/1/2030 | 2,260 | 2,130 | ||||||
| Total SE 2.986% 6/29/2041 | 88 | 66 | ||||||
| TransCanada PipeLines, Ltd. 4.25% 5/15/2028 | 1,090 | 1,034 | ||||||
| TransCanada PipeLines, Ltd. 4.10% 4/15/2030 | 598 | 549 | ||||||
| TransCanada PipeLines, Ltd. 4.75% 5/15/2038 | 2,000 | 1,790 | ||||||
| TransCanada PipeLines, Ltd. 4.875% 5/15/2048 | 700 | 615 | ||||||
| Valero Energy Corp. 4.00% 4/1/2029 | 4,000 | 3,773 | ||||||
| Venture Global Calcasieu Pass, LLC 4.125% 8/15/20316 | 840 | 717 | ||||||
| Weatherford International, Ltd. 11.00% 12/1/20246 | 497 | 509 | ||||||
| Weatherford International, Ltd. 6.50% 9/15/20286 | 2,380 | 2,337 | ||||||
| Weatherford International, Ltd. 8.625% 4/30/20306 | 7,690 | 7,398 | ||||||
| Western Gas Partners, LP 4.50% 3/1/2028 | 3,018 | 2,785 | ||||||
| Western Midstream Operating, LP 4.30% 2/1/203013 | 1,125 | 985 | ||||||
| Williams Companies, Inc. 3.50% 11/15/2030 | 1,094 | 959 | ||||||
| 153,004 | ||||||||
| Health care 0.60% | ||||||||
| AbbVie, Inc. 3.80% 3/15/2025 | 206 | 201 | ||||||
| AbbVie, Inc. 2.95% 11/21/2026 | 1,445 | 1,346 | ||||||
| AdaptHealth, LLC 5.125% 3/1/20306 | 830 | 708 | ||||||
| AmerisourceBergen Corp. 0.737% 3/15/2023 | 1,291 | 1,280 | ||||||
| Amgen, Inc. 4.40% 2/22/2062 | 1,697 | 1,352 | ||||||
| Anthem, Inc. 2.375% 1/15/2025 | 818 | 777 | ||||||
| AstraZeneca Finance, LLC 1.20% 5/28/2026 | 3,786 | 3,375 | ||||||
| AstraZeneca Finance, LLC 1.75% 5/28/2028 | 1,871 | 1,609 | ||||||
| AstraZeneca Finance, LLC 2.25% 5/28/2031 | 742 | 619 | ||||||
| AstraZeneca PLC 3.375% 11/16/2025 | 1,140 | 1,101 | ||||||
| Bausch Health Companies, Inc. 5.00% 1/30/20286 | 1,735 | 836 | ||||||
| Bausch Health Companies, Inc. 4.875% 6/1/20286 | 7,450 | 4,753 | ||||||
| Bausch Health Companies, Inc. 5.00% 2/15/20296 | 1,000 | 481 | ||||||
| Baxter International, Inc. 1.322% 11/29/2024 | 7,109 | 6,623 | ||||||
| Baxter International, Inc. 1.915% 2/1/2027 | 4,739 | 4,208 | ||||||
| Baxter International, Inc. 2.272% 12/1/2028 | 3,180 | 2,718 | ||||||
| Bayer US Finance II, LLC 3.875% 12/15/20236 | 1,685 | 1,661 | ||||||
| Becton, Dickinson and Company 3.363% 6/6/2024 | 198 | 194 | ||||||
| Boston Scientific Corp. 3.45% 3/1/2024 | 313 | 307 | ||||||
| Centene Corp. 4.25% 12/15/2027 | 565 | 531 | ||||||
| Centene Corp. 2.45% 7/15/2028 | 1,325 | 1,121 | ||||||
| 144 | American Funds Insurance Series |
Asset Allocation Fund (continued)
| Bonds, notes & other debt instruments (continued) | Principal amount (000) |
Value (000) |
||||||
| Corporate bonds, notes & loans (continued) | ||||||||
| Health care (continued) | ||||||||
| Centene Corp. 4.625% 12/15/2029 | USD | 1,265 | $ | 1,159 | ||||
| Cigna Corp. 3.75% 7/15/2023 | 245 | 243 | ||||||
| Community Health Systems, Inc. 5.625% 3/15/20276 | 1,960 | 1,684 | ||||||
| Community Health Systems, Inc. 5.25% 5/15/20306 | 3,675 | 2,778 | ||||||
| Eli Lilly and Company 3.375% 3/15/2029 | 1,353 | 1,269 | ||||||
| GlaxoSmithKline PLC 3.625% 5/15/2025 | 2,825 | 2,761 | ||||||
| HCA, Inc. 3.375% 3/15/20296 | 804 | 708 | ||||||
| HCA, Inc. 3.50% 9/1/2030 | 4,050 | 3,503 | ||||||
| HCA, Inc. 3.625% 3/15/20326 | 1,000 | 849 | ||||||
| HCA, Inc. 4.375% 3/15/20426 | 1,500 | 1,201 | ||||||
| HCA, Inc. 4.625% 3/15/20526 | 1,450 | 1,135 | ||||||
| Jazz Securities DAC 4.375% 1/15/20296 | 1,975 | 1,764 | ||||||
| Merck & Co., Inc. 1.90% 12/10/2028 | 600 | 516 | ||||||
| Merck & Co., Inc. 2.75% 12/10/2051 | 1,103 | 742 | ||||||
| Molina Healthcare, Inc. 4.375% 6/15/20286 | 440 | 402 | ||||||
| Molina Healthcare, Inc. 3.875% 11/15/20306 | 2,899 | 2,461 | ||||||
| Molina Healthcare, Inc. 3.875% 5/15/20326 | 3,855 | 3,207 | ||||||
| Novant Health, Inc. 3.168% 11/1/2051 | 3,750 | 2,608 | ||||||
| Novartis Capital Corp. 1.75% 2/14/2025 | 1,250 | 1,179 | ||||||
| Novartis Capital Corp. 2.00% 2/14/2027 | 2,386 | 2,174 | ||||||
| Owens & Minor, Inc. 4.375% 12/15/2024 | 5,615 | 5,436 | ||||||
| Owens & Minor, Inc. 4.50% 3/31/20296 | 4,175 | 3,334 | ||||||
| Par Pharmaceutical, Inc. 7.50% 4/1/20276 | 7,303 | 5,566 | ||||||
| Pfizer, Inc. 2.95% 3/15/2024 | 219 | 214 | ||||||
| Shire PLC 2.875% 9/23/2023 | 1,365 | 1,342 | ||||||
| Summa Health 3.511% 11/15/2051 | 1,655 | 1,123 | ||||||
| Tenet Healthcare Corp. 4.875% 1/1/20266 | 11,225 | 10,638 | ||||||
| Tenet Healthcare Corp. 4.25% 6/1/20296 | 2,060 | 1,788 | ||||||
| Tenet Healthcare Corp. 4.375% 1/15/20306 | 1,925 | 1,670 | ||||||
| Teva Pharmaceutical Finance Co. BV 6.00% 4/15/2024 | 7,016 | 6,891 | ||||||
| Teva Pharmaceutical Finance Co. BV 7.125% 1/31/2025 | 935 | 931 | ||||||
| Teva Pharmaceutical Finance Co. BV 3.15% 10/1/2026 | 17,790 | 15,594 | ||||||
| Teva Pharmaceutical Finance Co. BV 5.125% 5/9/2029 | 7,495 | 6,684 | ||||||
| Teva Pharmaceutical Finance Co. BV 4.10% 10/1/2046 | 3,550 | 2,178 | ||||||
| UnitedHealth Group, Inc. 1.15% 5/15/2026 | 2,610 | 2,334 | ||||||
| UnitedHealth Group, Inc. 5.30% 2/15/2030 | 2,500 | 2,582 | ||||||
| UnitedHealth Group, Inc. 2.00% 5/15/2030 | 974 | 806 | ||||||
| UnitedHealth Group, Inc. 4.20% 5/15/2032 | 767 | 730 | ||||||
| UnitedHealth Group, Inc. 3.05% 5/15/2041 | 3,875 | 2,928 | ||||||
| UnitedHealth Group, Inc. 3.25% 5/15/2051 | 2,504 | 1,804 | ||||||
| UnitedHealth Group, Inc. 4.75% 5/15/2052 | 1,250 | 1,161 | ||||||
| Valeant Pharmaceuticals International, Inc. 5.50% 11/1/20256 | 6,275 | 5,344 | ||||||
| 149,222 | ||||||||
| Consumer discretionary 0.59% | ||||||||
| Allied Universal Holdco, LLC 4.625% 6/1/20286 | 1,660 | 1,374 | ||||||
| Amazon.com, Inc. 2.70% 6/3/2060 | 2,765 | 1,679 | ||||||
| American Honda Finance Corp. 3.50% 2/15/2028 | 750 | 702 | ||||||
| Asbury Automotive Group, Inc. 4.625% 11/15/20296 | 2,115 | 1,785 | ||||||
| Atlas LuxCo 4 SARL 4.625% 6/1/20286 | 1,065 | 865 | ||||||
| Bayerische Motoren Werke AG 2.25% 9/15/20236 | 300 | 294 | ||||||
| Caesars Entertainment, Inc. 6.25% 7/1/20256 | 2,815 | 2,741 | ||||||
| Carnival Corp. 4.00% 8/1/20286 | 3,875 | 3,167 | ||||||
| Daimler Trucks Finance North America, LLC 3.50% 4/7/20256 | 2,000 | 1,920 | ||||||
| Daimler Trucks Finance North America, LLC 2.00% 12/14/20266 | 2,400 | 2,118 | ||||||
| Daimler Trucks Finance North America, LLC 3.65% 4/7/20276 | 450 | 421 | ||||||
| Daimler Trucks Finance North America, LLC 2.375% 12/14/20286 | 1,350 | 1,137 | ||||||
| Fertitta Entertainment, Inc. 4.625% 1/15/20296 | 3,580 | 3,034 | ||||||
| Fertitta Entertainment, Inc. 6.75% 1/15/20306 | 1,790 | 1,447 | ||||||
| First Student Bidco, Inc. 4.00% 7/31/20296 | 1,300 | 1,077 | ||||||
| American Funds Insurance Series | 145 |
Asset Allocation Fund (continued)
| Bonds, notes & other debt instruments (continued) | Principal amount (000) |
Value (000) |
||||||
| Corporate bonds, notes & loans (continued) | ||||||||
| Consumer discretionary (continued) | ||||||||
| Ford Motor Credit Company, LLC 5.125% 6/16/2025 | USD | 3,855 | $ | 3,714 | ||||
| Ford Motor Credit Company, LLC 4.542% 8/1/2026 | 2,455 | 2,266 | ||||||
| Ford Motor Credit Company, LLC 2.70% 8/10/2026 | 2,110 | 1,835 | ||||||
| General Motors Financial Co. 2.35% 2/26/2027 | 783 | 685 | ||||||
| Hanesbrands, Inc. 4.875% 5/15/20266 | 2,700 | 2,417 | ||||||
| Hilton Grand Vacations Borrower 5.00% 6/1/20296 | 3,580 | 3,083 | ||||||
| Hilton Worldwide Holdings, Inc. 4.00% 5/1/20316 | 1,885 | 1,581 | ||||||
| Home Depot, Inc. 1.50% 9/15/2028 | 3,000 | 2,556 | ||||||
| Home Depot, Inc. 3.90% 12/6/2028 | 825 | 796 | ||||||
| Home Depot, Inc. 2.95% 6/15/2029 | 4,000 | 3,627 | ||||||
| Home Depot, Inc. 1.875% 9/15/2031 | 3,000 | 2,405 | ||||||
| Home Depot, Inc. 4.25% 4/1/2046 | 2,000 | 1,742 | ||||||
| Home Depot, Inc. 4.50% 12/6/2048 | 428 | 391 | ||||||
| Hyundai Capital America 1.00% 9/17/20246 | 3,025 | 2,797 | ||||||
| Hyundai Capital America 1.50% 6/15/20266 | 850 | 737 | ||||||
| Hyundai Capital America 1.65% 9/17/20266 | 3,075 | 2,707 | ||||||
| Hyundai Capital America 2.375% 10/15/20276 | 2,579 | 2,210 | ||||||
| Hyundai Capital America 2.10% 9/15/20286 | 3,075 | 2,529 | ||||||
| International Game Technology PLC 6.50% 2/15/20256 | 1,880 | 1,895 | ||||||
| International Game Technology PLC 5.25% 1/15/20296 | 6,490 | 6,059 | ||||||
| KB Home 7.25% 7/15/2030 | 1,295 | 1,260 | ||||||
| Kontoor Brands, Inc. 4.125% 11/15/20296 | 910 | 745 | ||||||
| Lindblad Expeditions, LLC 6.75% 2/15/20276 | 775 | 704 | ||||||
| Lithia Motors, Inc. 3.875% 6/1/20296 | 2,900 | 2,388 | ||||||
| Lithia Motors, Inc. 4.375% 1/15/20316 | 1,025 | 836 | ||||||
| Marriott International, Inc. 2.75% 10/15/2033 | 2,500 | 1,914 | ||||||
| McDonald’s Corp. 4.60% 9/9/2032 | 1,275 | 1,251 | ||||||
| Melco International Development, Ltd. 5.75% 7/21/20286 | 1,710 | 1,433 | ||||||
| Mercedes-Benz Finance North America, LLC 5.375% 11/26/20256 | 1,500 | 1,510 | ||||||
| Mercedes-Benz Finance North America, LLC 5.25% 11/29/20276 | 2,875 | 2,895 | ||||||
| NCL Corp., Ltd. 5.875% 2/15/20276 | 2,450 | 2,125 | ||||||
| NCL Corp., Ltd. 7.75% 2/15/20296 | 1,375 | 1,037 | ||||||
| Neiman Marcus Group, LLC 7.125% 4/1/20266 | 1,345 | 1,263 | ||||||
| Party City Holdings, Inc. (6-month USD-LIBOR + 5.00%) 8.061% 7/15/20256,9 | 780 | 213 | ||||||
| Party City Holdings, Inc. 8.75% 2/15/20266 | 3,440 | 998 | ||||||
| Penske Automotive Group, Inc. 3.75% 6/15/2029 | 1,375 | 1,118 | ||||||
| Premier Entertainment Sub, LLC 5.625% 9/1/20296 | 1,690 | 1,248 | ||||||
| Premier Entertainment Sub, LLC 5.875% 9/1/20316 | 1,690 | 1,198 | ||||||
| Real Hero Merger Sub 2, Inc. 6.25% 2/1/20296 | 715 | 491 | ||||||
| Royal Caribbean Cruises, Ltd. 11.50% 6/1/20256 | 2,423 | 2,604 | ||||||
| Royal Caribbean Cruises, Ltd. 4.25% 7/1/20266 | 3,120 | 2,526 | ||||||
| Royal Caribbean Cruises, Ltd. 5.375% 7/15/20276 | 3,520 | 2,855 | ||||||
| Royal Caribbean Cruises, Ltd. 8.25% 1/15/20296 | 1,408 | 1,417 | ||||||
| Sally Holdings, LLC 5.625% 12/1/2025 | 2,705 | 2,610 | ||||||
| Sands China, Ltd. 5.625% 8/8/2025 | 1,302 | 1,247 | ||||||
| Sands China, Ltd. 2.80% 3/8/202713 | 2,075 | 1,780 | ||||||
| Scientific Games Corp. 7.00% 5/15/20286 | 750 | 717 | ||||||
| Scientific Games Corp. 7.25% 11/15/20296 | 2,240 | 2,154 | ||||||
| Sonic Automotive, Inc. 4.625% 11/15/20296 | 3,035 | 2,434 | ||||||
| Sonic Automotive, Inc. 4.875% 11/15/20316 | 1,325 | 1,043 | ||||||
| Stellantis Finance US, Inc. 1.711% 1/29/20276 | 2,200 | 1,891 | ||||||
| Stellantis Finance US, Inc. 5.625% 1/12/20286 | 2,500 | 2,480 | ||||||
| Stellantis Finance US, Inc. 2.691% 9/15/20316 | 2,150 | 1,646 | ||||||
| Stellantis Finance US, Inc. 6.375% 9/12/20326 | 2,000 | 1,980 | ||||||
| Tempur Sealy International, Inc. 4.00% 4/15/20296 | 850 | 715 | ||||||
| The Gap, Inc. 3.625% 10/1/20296 | 486 | 343 | ||||||
| The Gap, Inc. 3.875% 10/1/20316 | 323 | 226 | ||||||
| Toyota Motor Credit Corp. 0.80% 1/9/2026 | 429 | 383 | ||||||
| Toyota Motor Credit Corp. 1.90% 1/13/2027 | 2,500 | 2,234 | ||||||
| Travel + Leisure Co. 4.50% 12/1/20296 | 2,100 | 1,714 | ||||||
| Volkswagen Group of America Finance, LLC 4.25% 11/13/20236 | 3,770 | 3,734 | ||||||
| 146 | American Funds Insurance Series |
Asset Allocation Fund (continued)
| Bonds, notes & other debt instruments (continued) | Principal amount (000) |
Value (000) |
||||||
| Corporate bonds, notes & loans (continued) | ||||||||
| Consumer discretionary (continued) | ||||||||
| Volkswagen Group of America Finance, LLC 4.625% 11/13/20256 | USD | 3,845 | $ | 3,786 | ||||
| Volkswagen Group of America Finance, LLC 3.20% 9/26/20266 | 3,201 | 2,972 | ||||||
| Wheel Pros, Inc. 6.50% 5/15/20296 | 1,750 | 621 | ||||||
| Wyndham Destinations, Inc. 4.625% 3/1/20306 | 1,300 | 1,080 | ||||||
| Wyndham Worldwide Corp. 4.375% 8/15/20286 | 2,255 | 2,027 | ||||||
| Wynn Las Vegas, LLC 4.25% 5/30/20236 | 2,193 | 2,165 | ||||||
| 145,804 | ||||||||
| Communication services 0.53% | ||||||||
| Alphabet, Inc. 1.998% 8/15/2026 | 3,000 | 2,762 | ||||||
| Alphabet, Inc. 1.90% 8/15/2040 | 1,375 | 918 | ||||||
| Alphabet, Inc. 2.25% 8/15/2060 | 1,265 | 719 | ||||||
| AT&T, Inc. 3.50% 9/15/2053 | 5,140 | 3,492 | ||||||
| CCO Holdings, LLC 4.75% 3/1/20306 | 2,500 | 2,162 | ||||||
| CCO Holdings, LLC 4.50% 8/15/20306 | 3,500 | 2,899 | ||||||
| CCO Holdings, LLC 4.25% 2/1/20316 | 3,875 | 3,117 | ||||||
| CCO Holdings, LLC 4.75% 2/1/20326 | 2,150 | 1,747 | ||||||
| CCO Holdings, LLC 4.50% 5/1/2032 | 2,710 | 2,162 | ||||||
| Charter Communications Operating, LLC 4.908% 7/23/2025 | 500 | 491 | ||||||
| Charter Communications Operating, LLC 3.70% 4/1/2051 | 2,000 | 1,223 | ||||||
| Charter Communications Operating, LLC 3.90% 6/1/2052 | 3,000 | 1,895 | ||||||
| Comcast Corp. 2.35% 1/15/2027 | 4,000 | 3,640 | ||||||
| Comcast Corp. 3.20% 7/15/2036 | 375 | 305 | ||||||
| Comcast Corp. 2.80% 1/15/2051 | 791 | 503 | ||||||
| Comcast Corp. 2.887% 11/1/2051 | 2,571 | 1,663 | ||||||
| CSC Holdings, LLC 3.375% 2/15/20316 | 1,875 | 1,226 | ||||||
| DIRECTV Financing, LLC 5.875% 8/15/20276 | 3,655 | 3,277 | ||||||
| DISH Network Corp. 11.75% 11/15/20276 | 3,700 | 3,815 | ||||||
| Embarq Corp. 7.995% 6/1/2036 | 6,465 | 3,020 | ||||||
| Fox Corp. 4.03% 1/25/2024 | 1,120 | 1,107 | ||||||
| Frontier Communications Corp. 5.875% 10/15/20276 | 2,225 | 2,071 | ||||||
| Frontier Communications Corp. 5.00% 5/1/20286 | 5,550 | 4,851 | ||||||
| Frontier Communications Corp. 6.75% 5/1/20296 | 4,400 | 3,646 | ||||||
| Frontier Communications Holdings, LLC 5.875% 11/1/2029 | 1,850 | 1,434 | ||||||
| Frontier Communications Holdings, LLC 6.00% 1/15/20306 | 1,900 | 1,495 | ||||||
| Frontier Communications Holdings, LLC 8.75% 5/15/20306 | 1,100 | 1,121 | ||||||
| Gray Escrow II, Inc. 5.375% 11/15/20316 | 900 | 650 | ||||||
| iHeartCommunications, Inc. 5.25% 8/15/20276 | 3,093 | 2,625 | ||||||
| Intelsat Jackson Holding Co. 6.50% 3/15/20306 | 2,891 | 2,592 | ||||||
| Ligado Networks, LLC 15.50% PIK 11/1/20236,16 | 4,712 | 1,537 | ||||||
| Live Nation Entertainment, Inc. 3.75% 1/15/20286 | 1,350 | 1,154 | ||||||
| Midas OpCo Holdings, LLC 5.625% 8/15/20296 | 3,205 | 2,649 | ||||||
| Netflix, Inc. 4.875% 4/15/2028 | 1,250 | 1,210 | ||||||
| Netflix, Inc. 5.875% 11/15/2028 | 2,175 | 2,210 | ||||||
| Netflix, Inc. 6.375% 5/15/2029 | 50 | 52 | ||||||
| Netflix, Inc. 5.375% 11/15/20296 | 25 | 24 | ||||||
| News Corp. 3.875% 5/15/20296 | 875 | 760 | ||||||
| News Corp. 5.125% 2/15/20326 | 550 | 501 | ||||||
| Nexstar Broadcasting, Inc. 4.75% 11/1/20286 | 3,175 | 2,751 | ||||||
| SBA Tower Trust 1.631% 11/15/20266 | 8,707 | 7,408 | ||||||
| Scripps Escrow II, Inc. 3.875% 1/15/20296 | 2,325 | 1,869 | ||||||
| Sinclair Television Group, Inc. 4.125% 12/1/20306 | 1,175 | 882 | ||||||
| Sirius XM Radio, Inc. 4.00% 7/15/20286 | 3,575 | 3,118 | ||||||
| Sirius XM Radio, Inc. 4.125% 7/1/20306 | 950 | 786 | ||||||
| Sirius XM Radio, Inc. 3.875% 9/1/20316 | 1,975 | 1,545 | ||||||
| Sprint Corp. 6.875% 11/15/2028 | 2,525 | 2,627 | ||||||
| Take-Two Interactive Software, Inc. 3.30% 3/28/2024 | 3,175 | 3,102 | ||||||
| Take-Two Interactive Software, Inc. 4.00% 4/14/2032 | 2,438 | 2,165 | ||||||
| T-Mobile US, Inc. 1.50% 2/15/2026 | 500 | 448 | ||||||
| T-Mobile US, Inc. 2.05% 2/15/2028 | 325 | 280 | ||||||
| American Funds Insurance Series | 147 |
Asset Allocation Fund (continued)
| Bonds, notes & other debt instruments (continued) | Principal amount (000) |
Value (000) |
||||||
| Corporate bonds, notes & loans (continued) | ||||||||
| Communication services (continued) | ||||||||
| Univision Communications, Inc. 6.625% 6/1/20276 | USD | 5,800 | $ | 5,608 | ||||
| Univision Communications, Inc. 4.50% 5/1/20296 | 3,475 | 2,913 | ||||||
| Univision Communications, Inc. 7.375% 6/30/20306 | 225 | 215 | ||||||
| Verizon Communications, Inc. 2.875% 11/20/2050 | 2,453 | 1,548 | ||||||
| Virgin Media O2 4.25% 1/31/20316 | 4,525 | 3,673 | ||||||
| Virgin Media Secured Finance PLC 4.50% 8/15/20306 | 2,115 | 1,771 | ||||||
| VMED O2 UK Financing I PLC 4.75% 7/15/20316 | 225 | 183 | ||||||
| Vodafone Group PLC 5.25% 5/30/2048 | 500 | 443 | ||||||
| Vodafone Group PLC 4.25% 9/17/2050 | 4,350 | 3,337 | ||||||
| WarnerMedia Holdings, Inc. 3.638% 3/15/20256 | 3,807 | 3,623 | ||||||
| WarnerMedia Holdings, Inc. 3.755% 3/15/20276 | 1,018 | 918 | ||||||
| WarnerMedia Holdings, Inc. 4.054% 3/15/20296 | 1,435 | 1,244 | ||||||
| WarnerMedia Holdings, Inc. 4.279% 3/15/20326 | 2,903 | 2,399 | ||||||
| WarnerMedia Holdings, Inc. 5.05% 3/15/20426 | 2,500 | 1,922 | ||||||
| WarnerMedia Holdings, Inc. 5.141% 3/15/20526 | 1,500 | 1,096 | ||||||
| Ziggo Bond Co. BV 5.125% 2/28/20306 | 1,775 | 1,436 | ||||||
| Ziggo Bond Finance BV 4.875% 1/15/20306 | 725 | 608 | ||||||
| 132,643 | ||||||||
| Industrials 0.53% | ||||||||
| AAdvantage Loyalty IP, Ltd. 5.50% 4/20/20266 | 1,005 | 968 | ||||||
| Allison Transmission Holdings, Inc. 3.75% 1/30/20316 | 3,445 | 2,838 | ||||||
| Avis Budget Car Rental, LLC 5.75% 7/15/20276 | 1,025 | 929 | ||||||
| Avis Budget Group, Inc. 5.375% 3/1/20296 | 2,450 | 2,099 | ||||||
| Avolon Holdings Funding, Ltd. 3.95% 7/1/20246 | 1,587 | 1,520 | ||||||
| Avolon Holdings Funding, Ltd. 4.25% 4/15/20266 | 1,126 | 1,022 | ||||||
| Avolon Holdings Funding, Ltd. 4.375% 5/1/20266 | 1,975 | 1,802 | ||||||
| Boeing Company 4.875% 5/1/2025 | 1,555 | 1,545 | ||||||
| Boeing Company 3.10% 5/1/2026 | 251 | 236 | ||||||
| Boeing Company 3.25% 2/1/2028 | 4,000 | 3,639 | ||||||
| Boeing Company 5.15% 5/1/2030 | 1,100 | 1,076 | ||||||
| Boeing Company 3.60% 5/1/2034 | 6,250 | 5,016 | ||||||
| Boeing Company 5.805% 5/1/2050 | 4,000 | 3,729 | ||||||
| Bombardier, Inc. 7.125% 6/15/20266 | 4,100 | 3,985 | ||||||
| Bombardier, Inc. 7.875% 4/15/20276 | 8,070 | 7,844 | ||||||
| Bombardier, Inc. 6.00% 2/15/20286 | 1,010 | 935 | ||||||
| BWX Technologies, Inc. 4.125% 4/15/20296 | 1,025 | 899 | ||||||
| Canadian Pacific Railway, Ltd. 1.75% 12/2/2026 | 1,385 | 1,236 | ||||||
| Canadian Pacific Railway, Ltd. 2.45% 12/2/2031 | 1,738 | 1,444 | ||||||
| Canadian Pacific Railway, Ltd. 3.10% 12/2/2051 | 829 | 561 | ||||||
| Chart Industries, Inc. 7.50% 1/1/20306 | 1,347 | 1,356 | ||||||
| Clarivate Science Holdings Corp. 3.875% 7/1/20286 | 590 | 512 | ||||||
| Clarivate Science Holdings Corp. 4.875% 7/1/20296 | 520 | 443 | ||||||
| CoreLogic, Inc. 4.50% 5/1/20286 | 6,075 | 4,669 | ||||||
| Covanta Holding Corp. 4.875% 12/1/20296 | 1,035 | 849 | ||||||
| CSX Corp. 4.25% 3/15/2029 | 1,062 | 1,024 | ||||||
| CSX Corp. 2.50% 5/15/2051 | 1,125 | 688 | ||||||
| Honeywell International, Inc. 2.30% 8/15/2024 | 2,640 | 2,536 | ||||||
| Honeywell International, Inc. 1.35% 6/1/2025 | 5,947 | 5,503 | ||||||
| Honeywell International, Inc. 2.70% 8/15/2029 | 1,470 | 1,310 | ||||||
| Icahn Enterprises Finance Corp. 4.75% 9/15/2024 | 2,090 | 2,009 | ||||||
| Icahn Enterprises, LP 5.25% 5/15/2027 | 1,185 | 1,088 | ||||||
| Icahn Enterprises, LP 4.375% 2/1/2029 | 1,525 | 1,292 | ||||||
| L3Harris Technologies, Inc. 1.80% 1/15/2031 | 2,625 | 2,021 | ||||||
| Lockheed Martin Corp. 5.10% 11/15/2027 | 951 | 974 | ||||||
| Lockheed Martin Corp. 5.25% 1/15/2033 | 1,742 | 1,802 | ||||||
| Lockheed Martin Corp. 5.70% 11/15/2054 | 1,849 | 1,949 | ||||||
| LSC Communications, Inc. 8.75% 10/15/20233,6,15 | 4,063 | 12 | ||||||
| Masco Corp. 1.50% 2/15/2028 | 774 | 642 | ||||||
| Masco Corp. 2.00% 2/15/2031 | 497 | 384 | ||||||
| 148 | American Funds Insurance Series |
Asset Allocation Fund (continued)
| Bonds, notes & other debt instruments (continued) | Principal amount (000) |
Value (000) |
||||||
| Corporate bonds, notes & loans (continued) | ||||||||
| Industrials (continued) | ||||||||
| Masco Corp. 3.125% 2/15/2051 | USD | 230 | $ | 144 | ||||
| MasTec, Inc. 4.50% 8/15/20286 | 1,425 | 1,279 | ||||||
| Mileage Plus Holdings, LLC 6.50% 6/20/20276 | 1,980 | 1,973 | ||||||
| Norfolk Southern Corp. 3.05% 5/15/2050 | 2,746 | 1,852 | ||||||
| Northrop Grumman Corp. 2.93% 1/15/2025 | 1,820 | 1,747 | ||||||
| Northrop Grumman Corp. 3.25% 1/15/2028 | 3,495 | 3,229 | ||||||
| Otis Worldwide Corp. 2.293% 4/5/2027 | 2,135 | 1,914 | ||||||
| Roller Bearing Company of America, Inc. 4.375% 10/15/20296 | 195 | 169 | ||||||
| Rolls-Royce PLC 5.75% 10/15/20276 | 1,940 | 1,851 | ||||||
| Siemens AG 1.20% 3/11/20266 | 3,887 | 3,468 | ||||||
| Siemens AG 1.70% 3/11/20286 | 3,700 | 3,167 | ||||||
| SkyMiles IP, Ltd. 4.75% 10/20/20286 | 2,950 | 2,777 | ||||||
| Spirit AeroSystems, Inc. 9.375% 11/30/20296 | 507 | 534 | ||||||
| The Brink’s Co. 4.625% 10/15/20276 | 2,385 | 2,186 | ||||||
| TransDigm, Inc. 6.25% 3/15/20266 | 3,476 | 3,436 | ||||||
| TransDigm, Inc. 5.50% 11/15/2027 | 2,200 | 2,070 | ||||||
| Triumph Group, Inc. 8.875% 6/1/20246 | 2,295 | 2,339 | ||||||
| Triumph Group, Inc. 6.25% 9/15/20246 | 4,775 | 4,534 | ||||||
| Triumph Group, Inc. 7.75% 8/15/2025 | 3,950 | 3,366 | ||||||
| Union Pacific Corp. 2.40% 2/5/2030 | 2,414 | 2,071 | ||||||
| Union Pacific Corp. 2.95% 3/10/2052 | 1,000 | 681 | ||||||
| Union Pacific Corp. 3.839% 3/20/2060 | 546 | 425 | ||||||
| Union Pacific Corp. 3.799% 4/6/2071 | 545 | 405 | ||||||
| United Airlines, Inc. 4.375% 4/15/20266 | 975 | 905 | ||||||
| United Airlines, Inc. 4.625% 4/15/20296 | 2,225 | 1,941 | ||||||
| United Rentals, Inc. 3.875% 2/15/2031 | 2,050 | 1,723 | ||||||
| United Technologies Corp. 3.65% 8/16/2023 | 52 | 52 | ||||||
| United Technologies Corp. 3.95% 8/16/2025 | 3,155 | 3,085 | ||||||
| United Technologies Corp. 4.125% 11/16/2028 | 1,075 | 1,031 | ||||||
| Vertical U.S. Newco, Inc. 5.25% 7/15/20276 | 2,000 | 1,779 | ||||||
| 130,519 | ||||||||
| Materials 0.40% | ||||||||
| Alcoa Nederland Holding BV 4.125% 3/31/20296 | 1,175 | 1,044 | ||||||
| Allegheny Technologies, Inc. 4.875% 10/1/2029 | 710 | 628 | ||||||
| Allegheny Technologies, Inc. 5.125% 10/1/2031 | 1,110 | 983 | ||||||
| Anglo American Capital PLC 2.25% 3/17/20286 | 484 | 408 | ||||||
| Anglo American Capital PLC 2.625% 9/10/20306 | 2,500 | 2,037 | ||||||
| Anglo American Capital PLC 3.95% 9/10/20506 | 1,281 | 942 | ||||||
| Arconic Rolled Products Corp. 6.125% 2/15/20286 | 750 | 705 | ||||||
| Avient Corp. 7.125% 8/1/20306 | 855 | 837 | ||||||
| Ball Corp. 6.875% 3/15/2028 | 1,415 | 1,455 | ||||||
| Ball Corp. 3.125% 9/15/2031 | 3,520 | 2,832 | ||||||
| CAN-PACK SA 3.875% 11/15/20296 | 935 | 738 | ||||||
| Celanese US Holdings, LLC 6.165% 7/15/2027 | 3,500 | 3,458 | ||||||
| Chevron Phillips Chemical Co., LLC 3.30% 5/1/20236 | 595 | 591 | ||||||
| Cleveland-Cliffs, Inc. 5.875% 6/1/2027 | 9,000 | 8,613 | ||||||
| Cleveland-Cliffs, Inc. 4.625% 3/1/20296 | 1,825 | 1,622 | ||||||
| Cleveland-Cliffs, Inc. 4.875% 3/1/20316 | 1,351 | 1,195 | ||||||
| CVR Partners, LP 6.125% 6/15/20286 | 745 | 669 | ||||||
| Dow Chemical Co. 3.60% 11/15/2050 | 1,328 | 955 | ||||||
| First Quantum Minerals, Ltd. 6.50% 3/1/20246 | 2,204 | 2,159 | ||||||
| First Quantum Minerals, Ltd. 7.50% 4/1/20256 | 11,350 | 11,071 | ||||||
| First Quantum Minerals, Ltd. 6.875% 3/1/20266 | 3,625 | 3,438 | ||||||
| First Quantum Minerals, Ltd. 6.875% 10/15/20276 | 4,240 | 3,987 | ||||||
| FXI Holdings, Inc. 7.875% 11/1/20246 | 2,321 | 1,933 | ||||||
| FXI Holdings, Inc. 12.25% 11/15/20266 | 4,492 | 3,726 | ||||||
| Glencore Funding, LLC 4.125% 3/12/20246 | 945 | 930 | ||||||
| International Flavors & Fragrances, Inc. 1.832% 10/15/20276 | 5,400 | 4,541 | ||||||
| Kaiser Aluminum Corp. 4.625% 3/1/20286 | 2,495 | 2,181 | ||||||
| American Funds Insurance Series | 149 |
Asset Allocation Fund (continued)
| Bonds, notes & other debt instruments (continued) | Principal amount (000) |
Value (000) |
||||||
| Corporate bonds, notes & loans (continued) | ||||||||
| Materials (continued) | ||||||||
| LSB Industries, Inc. 6.25% 10/15/20286 | USD | 860 | $ | 788 | ||||
| LYB International Finance III, LLC 2.25% 10/1/2030 | 1,198 | 953 | ||||||
| LYB International Finance III, LLC 3.625% 4/1/2051 | 2,537 | 1,708 | ||||||
| LYB International Finance III, LLC 3.80% 10/1/2060 | 1,186 | 774 | ||||||
| Methanex Corp. 5.125% 10/15/2027 | 6,300 | 5,854 | ||||||
| Mineral Resources, Ltd. 8.50% 5/1/20306 | 1,525 | 1,548 | ||||||
| Mosaic Co. 4.05% 11/15/2027 | 1,050 | 991 | ||||||
| Nova Chemicals Corp. 4.25% 5/15/20296 | 1,875 | 1,536 | ||||||
| Novelis Corp. 3.875% 8/15/20316 | 1,115 | 912 | ||||||
| Praxair, Inc. 1.10% 8/10/2030 | 2,938 | 2,258 | ||||||
| SCIH Salt Holdings, Inc. 4.875% 5/1/20286 | 3,485 | 2,997 | ||||||
| SCIH Salt Holdings, Inc. 6.625% 5/1/20296 | 1,230 | 992 | ||||||
| Sherwin-Williams Company 3.125% 6/1/2024 | 275 | 267 | ||||||
| Sherwin-Williams Company 3.80% 8/15/2049 | 5,208 | 3,891 | ||||||
| South32 Treasury, Ltd. 4.35% 4/14/20326 | 1,527 | 1,311 | ||||||
| SPCM SA 3.375% 3/15/20306 | 600 | 484 | ||||||
| Venator Finance SARL 9.50% 7/1/20256 | 1,825 | 1,323 | ||||||
| Venator Finance SARL 5.75% 7/15/20256 | 5,845 | 2,005 | ||||||
| Warrior Met Coal, Inc. 7.875% 12/1/20286 | 3,400 | 3,356 | ||||||
| Westlake Chemical Corp. 4.375% 11/15/2047 | 500 | 378 | ||||||
| 98,004 | ||||||||
| Utilities 0.31% | ||||||||
| Ameren Corp. 2.50% 9/15/2024 | 969 | 927 | ||||||
| Calpine Corp. 3.75% 3/1/20316 | 1,975 | 1,593 | ||||||
| Commonwealth Edison Co. 4.35% 11/15/2045 | 1,085 | 931 | ||||||
| Commonwealth Edison Co. 3.85% 3/15/2052 | 2,600 | 2,083 | ||||||
| Dominion Resources, Inc., junior subordinated, 3.071% 8/15/202413 | 920 | 887 | ||||||
| Duke Energy Carolinas, LLC 3.95% 11/15/2028 | 1,250 | 1,202 | ||||||
| Duke Energy Corp. 4.50% 8/15/2032 | 2,000 | 1,879 | ||||||
| Duke Energy Corp. 3.50% 6/15/2051 | 2,000 | 1,398 | ||||||
| Duke Energy Florida, LLC 3.20% 1/15/2027 | 1,445 | 1,366 | ||||||
| Duke Energy Indiana, Inc. 3.25% 10/1/2049 | 1,225 | 856 | ||||||
| Duke Energy Progress, LLC 3.70% 10/15/2046 | 457 | 348 | ||||||
| Duke Energy Progress, LLC 2.50% 8/15/2050 | 202 | 122 | ||||||
| Duke Energy Progress, LLC 2.90% 8/15/2051 | 91 | 60 | ||||||
| Edison International 3.55% 11/15/2024 | 2,200 | 2,125 | ||||||
| EDP Finance BV 3.625% 7/15/20246 | 4,100 | 3,959 | ||||||
| Electricité de France SA 4.75% 10/13/20356 | 1,250 | 1,057 | ||||||
| Electricité de France SA 4.875% 9/21/20386 | 2,750 | 2,246 | ||||||
| Electricité de France SA 5.60% 1/27/2040 | 525 | 481 | ||||||
| Emera US Finance, LP 3.55% 6/15/2026 | 320 | 300 | ||||||
| Enersis Américas SA 4.00% 10/25/2026 | 245 | 233 | ||||||
| Entergy Corp. 2.80% 6/15/2030 | 3,325 | 2,816 | ||||||
| Eversource Energy 3.80% 12/1/2023 | 2,730 | 2,700 | ||||||
| FirstEnergy Corp. 3.40% 3/1/2050 | 2,250 | 1,489 | ||||||
| FirstEnergy Transmission, LLC 2.866% 9/15/20286 | 675 | 590 | ||||||
| NRG Energy, Inc. 3.625% 2/15/20316 | 1,875 | 1,429 | ||||||
| Pacific Gas and Electric Co. 2.10% 8/1/2027 | 125 | 107 | ||||||
| Pacific Gas and Electric Co. 2.50% 2/1/2031 | 2,941 | 2,289 | ||||||
| Pacific Gas and Electric Co. 3.30% 8/1/2040 | 100 | 68 | ||||||
| Pacific Gas and Electric Co. 3.50% 8/1/2050 | 1,250 | 781 | ||||||
| PacifiCorp, First Mortgage Bonds, 4.125% 1/15/2049 | 4,000 | 3,293 | ||||||
| PG&E Corp. 5.00% 7/1/2028 | 3,750 | 3,429 | ||||||
| PG&E Corp. 5.25% 7/1/2030 | 3,400 | 3,099 | ||||||
| Public Service Electric and Gas Co. 3.60% 12/1/2047 | 548 | 419 | ||||||
| Public Service Electric and Gas Co. 3.15% 1/1/2050 | 2,451 | 1,727 | ||||||
| Southern California Edison Co. 2.85% 8/1/2029 | 4,450 | 3,877 | ||||||
| Southern California Edison Co. 6.00% 1/15/2034 | 2,500 | 2,620 | ||||||
| Southern California Edison Co. 5.75% 4/1/2035 | 675 | 675 | ||||||
| 150 | American Funds Insurance Series |
Asset Allocation Fund (continued)
| Bonds, notes & other debt instruments (continued) | Principal amount (000) |
Value (000) |
||||||
| Corporate bonds, notes & loans (continued) | ||||||||
| Utilities (continued) | ||||||||
| Southern California Edison Co. 5.35% 7/15/2035 | USD | 3,000 | $ | 2,915 | ||||
| Southern California Edison Co. 4.00% 4/1/2047 | 264 | 208 | ||||||
| Talen Energy Corp. 7.25% 5/15/20276 | 8,334 | 8,664 | ||||||
| Talen Energy Corp., Term Loan B, (3-month USD-LIBOR + 3.75%) 7.821% 7/8/20269,14 | 2,815 | 2,861 | ||||||
| Talen Energy Supply, LLC 7.625% 6/1/20286 | 1,180 | 1,232 | ||||||
| Venture Global Calcasieu Pass, LLC 3.875% 8/15/20296 | 1,030 | 903 | ||||||
| Virginia Electric and Power Co. 2.40% 3/30/2032 | 2,575 | 2,088 | ||||||
| Xcel Energy, Inc. 2.60% 12/1/2029 | 1,950 | 1,669 | ||||||
| 76,001 | ||||||||
| Real estate 0.28% | ||||||||
| Alexandria Real Estate Equities, Inc. 3.80% 4/15/2026 | 315 | 305 | ||||||
| Alexandria Real Estate Equities, Inc. 3.95% 1/15/2028 | 1,220 | 1,148 | ||||||
| Alexandria Real Estate Equities, Inc. 2.75% 12/15/2029 | 1,940 | 1,654 | ||||||
| Alexandria Real Estate Equities, Inc. 3.375% 8/15/2031 | 1,320 | 1,155 | ||||||
| Alexandria Real Estate Equities, Inc. 1.875% 2/1/2033 | 4,095 | 3,056 | ||||||
| Alexandria Real Estate Equities, Inc. 4.85% 4/15/2049 | 410 | 349 | ||||||
| American Tower Corp. 1.45% 9/15/2026 | 2,369 | 2,070 | ||||||
| American Tower Corp. 3.55% 7/15/2027 | 1,425 | 1,322 | ||||||
| American Tower Corp. 3.60% 1/15/2028 | 1,000 | 921 | ||||||
| American Tower Corp. 1.50% 1/31/2028 | 2,500 | 2,073 | ||||||
| American Tower Corp. 2.30% 9/15/2031 | 1,500 | 1,170 | ||||||
| American Tower Corp. 2.95% 1/15/2051 | 2,000 | 1,247 | ||||||
| Anywhere Real Estate Group, LLC 5.75% 1/15/20296 | 2,260 | 1,712 | ||||||
| Essex Portfolio, LP 3.875% 5/1/2024 | 1,000 | 980 | ||||||
| Essex Portfolio, LP 3.50% 4/1/2025 | 6,825 | 6,587 | ||||||
| Extra Space Storage, Inc. 2.35% 3/15/2032 | 1,385 | 1,051 | ||||||
| GLP Capital, LP 3.35% 9/1/2024 | 1,263 | 1,212 | ||||||
| Hospitality Properties Trust 4.35% 10/1/2024 | 560 | 510 | ||||||
| Host Hotels & Resorts, LP 4.50% 2/1/2026 | 355 | 341 | ||||||
| Howard Hughes Corp. 5.375% 8/1/20286 | 1,450 | 1,309 | ||||||
| Howard Hughes Corp. 4.125% 2/1/20296 | 1,860 | 1,560 | ||||||
| Howard Hughes Corp. 4.375% 2/1/20316 | 2,690 | 2,180 | ||||||
| Invitation Homes Operating Partnership, LP 2.00% 8/15/2031 | 2,401 | 1,780 | ||||||
| Iron Mountain, Inc. 5.25% 7/15/20306 | 3,785 | 3,298 | ||||||
| Iron Mountain, Inc. 4.50% 2/15/20316 | 2,650 | 2,184 | ||||||
| Kennedy-Wilson Holdings, Inc. 4.75% 3/1/2029 | 2,645 | 2,100 | ||||||
| Kennedy-Wilson Holdings, Inc. 4.75% 2/1/2030 | 1,940 | 1,482 | ||||||
| Kennedy-Wilson Holdings, Inc. 5.00% 3/1/2031 | 2,260 | 1,704 | ||||||
| Ladder Capital Finance Holdings LLLP 4.25% 2/1/20276 | 3,757 | 3,163 | ||||||
| Park Intermediate Holdings, LLC 4.875% 5/15/20296 | 2,280 | 1,933 | ||||||
| Public Storage 1.85% 5/1/2028 | 2,490 | 2,140 | ||||||
| Public Storage 1.95% 11/9/2028 | 2,027 | 1,733 | ||||||
| Public Storage 2.30% 5/1/2031 | 719 | 585 | ||||||
| RHP Hotel Properties, LP 4.50% 2/15/20296 | 1,300 | 1,123 | ||||||
| RLJ Lodging Trust, LP 4.00% 9/15/20296 | 1,240 | 1,007 | ||||||
| Scentre Group 3.50% 2/12/20256 | 3,075 | 2,945 | ||||||
| Scentre Group 3.25% 10/28/20256 | 1,000 | 939 | ||||||
| Scentre Group 3.75% 3/23/20276 | 2,430 | 2,241 | ||||||
| Sun Communities Operating, LP 2.30% 11/1/2028 | 1,845 | 1,540 | ||||||
| Sun Communities Operating, LP 2.70% 7/15/2031 | 876 | 694 | ||||||
| UDR, Inc. 2.95% 9/1/2026 | 760 | 699 | ||||||
| VICI Properties, LP 3.875% 2/15/20296 | 1,367 | 1,200 | ||||||
| VICI Properties, LP 4.625% 12/1/20296 | 532 | 485 | ||||||
| VICI Properties, LP 4.125% 8/15/20306 | 971 | 851 | ||||||
| 69,738 | ||||||||
| American Funds Insurance Series | 151 |
Asset Allocation Fund (continued)
| Bonds, notes & other debt instruments (continued) | Principal amount (000) |
Value (000) |
||||||
| Corporate bonds, notes & loans (continued) | ||||||||
| Information technology 0.27% | ||||||||
| Adobe, Inc. 1.90% 2/1/2025 | USD | 366 | $ | 346 | ||||
| Almonde, Inc., Term Loan B, (3-month USD-LIBOR + 3.50%) 6.871% 6/13/20249,14 | 225 | 200 | ||||||
| Almonde, Inc., Term Loan, (3-month USD-LIBOR + 7.25%) 10.621% 6/13/20259,14 | 4,150 | 3,121 | ||||||
| Analog Devices, Inc. 1.70% 10/1/2028 | 1,286 | 1,092 | ||||||
| Analog Devices, Inc. 2.10% 10/1/2031 | 1,212 | 982 | ||||||
| Analog Devices, Inc. 2.80% 10/1/2041 | 2,961 | 2,179 | ||||||
| Analog Devices, Inc. 2.95% 10/1/2051 | 1,955 | 1,327 | ||||||
| Apple, Inc. 3.00% 2/9/2024 | 625 | 613 | ||||||
| Apple, Inc. 3.35% 2/9/2027 | 40 | 38 | ||||||
| Apple, Inc. 1.20% 2/8/2028 | 5,000 | 4,245 | ||||||
| Apple, Inc. 3.95% 8/8/2052 | 3,500 | 2,994 | ||||||
| Block, Inc. 3.50% 6/1/2031 | 2,325 | 1,858 | ||||||
| Booz Allen Hamilton, Inc. 4.00% 7/1/20296 | 1,000 | 882 | ||||||
| Broadcom, Inc. 1.95% 2/15/20286 | 1,407 | 1,191 | ||||||
| Broadcom, Inc. 2.60% 2/15/20336 | 2,524 | 1,901 | ||||||
| Broadcom, Inc. 3.469% 4/15/20346 | 1,771 | 1,418 | ||||||
| CommScope Finance, LLC 6.00% 3/1/20266 | 1,600 | 1,480 | ||||||
| Diebold Nixdorf, Inc. 9.375% 7/15/20256 | 10,434 | 7,462 | ||||||
| Diebold Nixdorf, Inc., units, 8.50% PIK or 8.50% Cash 10/15/20263,6,16 | 6,909 | 4,162 | ||||||
| Diebold Nixdorf, Inc., Term Loan, (USD-SOFR + 5.25%) 6.75% 7/15/20253,9,14 | 4,731 | 3,186 | ||||||
| Fidelity National Information Services, Inc. 3.10% 3/1/2041 | 302 | 209 | ||||||
| Finastra, Ltd., Term Loan B, (3-month EUR-EURIBOR + 3.00%) 4.00% 6/13/20249,14 | EUR | 1,343 | 1,243 | |||||
| Fiserv, Inc. 3.50% 7/1/2029 | USD | 471 | 425 | |||||
| Fiserv, Inc. 2.65% 6/1/2030 | 3,605 | 3,039 | ||||||
| Gartner, Inc. 4.50% 7/1/20286 | 650 | 607 | ||||||
| Intuit, Inc. 0.95% 7/15/2025 | 1,530 | 1,394 | ||||||
| Intuit, Inc. 1.35% 7/15/2027 | 1,395 | 1,209 | ||||||
| Intuit, Inc. 1.65% 7/15/2030 | 1,845 | 1,484 | ||||||
| Mastercard, Inc. 2.00% 11/18/2031 | 3,874 | 3,120 | ||||||
| Microsoft Corp. 2.921% 3/17/2052 | 4,814 | 3,431 | ||||||
| NCR Corp. 5.125% 4/15/20296 | 1,650 | 1,383 | ||||||
| PayPal Holdings, Inc. 2.65% 10/1/2026 | 662 | 612 | ||||||
| PayPal Holdings, Inc. 2.30% 6/1/2030 | 616 | 507 | ||||||
| Sabre GLBL, Inc. 7.375% 9/1/20256 | 946 | 911 | ||||||
| Sabre GLBL, Inc. 11.25% 12/15/20276 | 1,157 | 1,192 | ||||||
| Sabre Holdings Corp. 9.25% 4/15/20256 | 3,122 | 3,115 | ||||||
| Synaptics, Inc. 4.00% 6/15/20296 | 875 | 738 | ||||||
| Unisys Corp. 6.875% 11/1/20276 | 725 | 558 | ||||||
| VeriSign, Inc. 2.70% 6/15/2031 | 625 | 511 | ||||||
| Veritas US, Inc. 7.50% 9/1/20256 | 835 | 577 | ||||||
| Viavi Solutions, Inc. 3.75% 10/1/20296 | 725 | 611 | ||||||
| 67,553 | ||||||||
| Consumer staples 0.23% | ||||||||
| 7-Eleven, Inc. 0.80% 2/10/20246 | 1,700 | 1,618 | ||||||
| 7-Eleven, Inc. 0.95% 2/10/20266 | 825 | 723 | ||||||
| 7-Eleven, Inc. 1.30% 2/10/20286 | 2,500 | 2,076 | ||||||
| Albertsons Companies, Inc. 3.50% 3/15/20296 | 1,230 | 1,035 | ||||||
| Altria Group, Inc. 3.40% 2/4/2041 | 1,500 | 1,000 | ||||||
| Altria Group, Inc. 3.70% 2/4/2051 | 1,395 | 879 | ||||||
| Anheuser-Busch InBev NV 4.00% 4/13/2028 | 845 | 806 | ||||||
| Anheuser-Busch InBev NV 4.35% 6/1/2040 | 2,500 | 2,208 | ||||||
| Anheuser-Busch InBev NV 4.60% 4/15/2048 | 1,500 | 1,311 | ||||||
| British American Tobacco PLC 3.222% 8/15/2024 | 2,826 | 2,723 | ||||||
| British American Tobacco PLC 3.215% 9/6/2026 | 3,323 | 3,070 | ||||||
| British American Tobacco PLC 4.54% 8/15/2047 | 940 | 668 | ||||||
| Central Garden & Pet Co. 4.125% 4/30/20316 | 1,395 | 1,157 | ||||||
| Coca-Cola Company 1.00% 3/15/2028 | 940 | 787 | ||||||
| Conagra Brands, Inc. 1.375% 11/1/2027 | 4,615 | 3,852 | ||||||
| Constellation Brands, Inc. 3.60% 2/15/2028 | 625 | 580 | ||||||
| 152 | American Funds Insurance Series |
Asset Allocation Fund (continued)
| Bonds, notes & other debt instruments (continued) | Principal amount (000) |
Value (000) |
||||||
| Corporate bonds, notes & loans (continued) | ||||||||
| Consumer staples (continued) | ||||||||
| Constellation Brands, Inc. 2.25% 8/1/2031 | USD | 1,487 | $ | 1,185 | ||||
| Coty, Inc. 4.75% 1/15/20296 | 1,680 | 1,523 | ||||||
| Imperial Tobacco Finance PLC 6.125% 7/27/20276 | 845 | 842 | ||||||
| Kronos Acquisition Holdings, Inc. 5.00% 12/31/20266 | 2,990 | 2,590 | ||||||
| Lamb Weston Holdings, Inc. 4.125% 1/31/20306 | 2,210 | 1,955 | ||||||
| PepsiCo, Inc. 2.625% 10/21/2041 | 5,000 | 3,721 | ||||||
| PepsiCo, Inc. 3.625% 3/19/2050 | 777 | 639 | ||||||
| PepsiCo, Inc. 2.75% 10/21/2051 | 1,723 | 1,200 | ||||||
| Philip Morris International, Inc. 2.875% 5/1/2024 | 788 | 765 | ||||||
| Philip Morris International, Inc. 3.25% 11/10/2024 | 2,000 | 1,936 | ||||||
| Philip Morris International, Inc. 0.875% 5/1/2026 | 2,990 | 2,630 | ||||||
| Philip Morris International, Inc. 5.125% 11/17/2027 | 3,073 | 3,101 | ||||||
| Philip Morris International, Inc. 3.375% 8/15/2029 | 788 | 711 | ||||||
| Philip Morris International, Inc. 5.625% 11/17/2029 | 1,482 | 1,507 | ||||||
| Philip Morris International, Inc. 1.75% 11/1/2030 | 2,956 | 2,322 | ||||||
| Philip Morris International, Inc. 5.75% 11/17/2032 | 938 | 959 | ||||||
| Post Holdings, Inc. 4.625% 4/15/20306 | 2,886 | 2,496 | ||||||
| Prestige Brands International, Inc. 3.75% 4/1/20316 | 1,115 | 921 | ||||||
| Reynolds American, Inc. 5.85% 8/15/2045 | 2,030 | 1,737 | ||||||
| Simmons Foods, Inc. 4.625% 3/1/20296 | 560 | 457 | ||||||
| 57,690 | ||||||||
| Total corporate bonds, notes & loans | 1,396,142 | |||||||
| Asset-backed obligations 1.68% | ||||||||
| Affirm Asset Securitization Trust, Series 2021-Z2, Class A, 1.17% 11/16/20266,8 | 1,050 | 1,005 | ||||||
| Allegro CLO, Ltd., Series 2016-1A, Class AR2, (3-month USD-LIBOR + 0.95%) 5.029% 1/15/20306,8,9 | 2,205 | 2,182 | ||||||
| Allegro CLO, Ltd., Series 2017-1A, Class AR, (3-month USD-LIBOR + 0.95%) 5.029% 10/16/20306,8,9 | 1,639 | 1,612 | ||||||
| American Express Credit Account Master Trust, Series 2018-9, Class A, (1-month USD-LIBOR + 0.38%) 4.698% 4/15/20268,9 | 9,000 | 8,995 | ||||||
| Ares CLO, Ltd., Series 2017-42A, Class AR, (3-month USD-LIBOR + 0.92%) 5.245% 1/22/20286,8,9 | 2,566 | 2,538 | ||||||
| Avis Budget Rental Car Funding (AESOP), LLC, Series 2017-2A, Class A, 2.97% 3/20/20246,8 | 960 | 957 | ||||||
| Avis Budget Rental Car Funding (AESOP), LLC, Series 2018-1A, Class A, 3.70% 9/20/20246,8 | 1,114 | 1,103 | ||||||
| Avis Budget Rental Car Funding (AESOP), LLC, Series 2018-2A, Class A, 4.00% 3/20/20256,8 | 3,100 | 3,049 | ||||||
| Avis Budget Rental Car Funding (AESOP), LLC, Series 2020-2, Class A, 2.02% 2/20/20276,8 | 539 | 489 | ||||||
| Avis Budget Rental Car Funding (AESOP), LLC, Series 2020-2A, Class B, 2.96% 2/20/20276,8 | 138 | 124 | ||||||
| Avis Budget Rental Car Funding (AESOP), LLC, Series 2021-1A, Class A, 1.38% 8/20/20276,8 | 11,617 | 10,133 | ||||||
| BA Credit Card Trust, Series 2022-A2, Class A2, 5.00% 4/17/20288 | 6,633 | 6,706 | ||||||
| Ballyrock CLO, Ltd., Series 2019-2A, Class A1AR, (3-month USD-LIBOR + 1.00%) 5.675% 11/20/20306,8,9 | 3,660 | 3,614 | ||||||
| Bankers Healthcare Group Securitization Trust, Series 2021-A, Class A, 1.42% 11/17/20336,8 | 531 | 494 | ||||||
| Castlelake Aircraft Securitization Trust, Series 2021-1, Class A, 2.868% 5/11/20376,8 | 4,807 | 4,092 | ||||||
| Castlelake Aircraft Securitization Trust, Series 2017-1R, Class A, 2.741% 8/15/20416,8 | 665 | 582 | ||||||
| Cent CLO, Ltd., Series 2014-21A, Class AR, (3-month USD-LIBOR + 0.97%) 5.328% 7/27/20306,8,9 | 5,164 | 5,089 | ||||||
| CF Hippolyta, LLC, Series 2020-1, Class A1, 1.69% 7/15/20606,8 | 5,191 | 4,639 | ||||||
| CF Hippolyta, LLC, Series 2020-1, Class A2, 1.99% 7/15/20606,8 | 1,746 | 1,444 | ||||||
| CF Hippolyta, LLC, Series 2021-1, Class A1, 1.53% 3/15/20616,8 | 6,093 | 5,277 | ||||||
| Citibank Credit Card Issuance Trust, Series 2017-A5, Class A5, (1-month USD-LIBOR + 0.62%) 4.981% 4/22/20268,9 | 4,960 | 4,963 | ||||||
| American Funds Insurance Series | 153 |
Asset Allocation Fund (continued)
| Bonds, notes & other debt instruments (continued) | Principal amount (000) |
Value (000) |
||||||
| Asset-backed obligations (continued) | ||||||||
| CLI Funding VI, LLC, Series 2020-2A, Class A, 2.03% 9/15/20456,8 | USD | 1,446 | $ | 1,245 | ||||
| CLI Funding VI, LLC, Series 2020-1A, Class A, 2.08% 9/18/20456,8 | 5,382 | 4,669 | ||||||
| CLI Funding VI, LLC, Series 2020-3A, Class A, 2.07% 10/18/20456,8 | 1,170 | 1,017 | ||||||
| CLI Funding VIII, LLC, Series 2021-1A, Class A, 1.64% 2/18/20466,8 | 1,607 | 1,373 | ||||||
| Discover Card Execution Note Trust, Series 2018-A6, Class A6, (1-month USD-LIBOR + 0.39%) 4.708% 3/15/20268,9 | 11,400 | 11,397 | ||||||
| Drive Auto Receivables Trust, Series 2020-1, Class C, 2.36% 3/16/20268 | 256 | 256 | ||||||
| DriveTime Auto Owner Trust, Series 2022-3, Class A, 6.05% 10/15/20266,8 | 6,318 | 6,335 | ||||||
| Dryden Senior Loan Fund, CLO, Series 2017-47A, Class A1R, (3-month USD-LIBOR + 0.98%) 5.059% 4/15/20286,8,9 | 5,181 | 5,131 | ||||||
| EDvestinU Private Education Loan, LLC, Series 2021-A, Class A, 1.80% 11/25/20456,8 | 351 | 297 | ||||||
| Enterprise Fleet Financing, LLC, Series 2022-1, Class A2, 3.03% 1/20/20286,8 | 6,513 | 6,341 | ||||||
| Enterprise Fleet Financing, LLC, Series 2022-3, Class A2, 4.38% 7/20/20296,8 | 3,263 | 3,192 | ||||||
| Enterprise Fleet Financing, LLC, Series 2022-4, Class A2, 5.76% 10/22/20296,8 | 5,092 | 5,109 | ||||||
| Exeter Automobile Receivables Trust, Series 2022-6, Class A2, 5.73% 11/17/20258 | 1,100 | 1,101 | ||||||
| FirstKey Homes Trust, Series 2020-SFR2, Class A, 1.266% 10/19/20376,8 | 5,999 | 5,320 | ||||||
| Flagship Credit Auto Trust, Series 2022-4, Class A2, 6.15% 9/15/20266,8 | 3,272 | 3,292 | ||||||
| Ford Credit Auto Owner Trust, Series 2018-2, Class A, 3.47% 1/15/20306,8 | 4,825 | 4,760 | ||||||
| Ford Credit Auto Owner Trust, Series 2018-1, Class A, 3.52% 7/15/20306,8 | 6,000 | 5,885 | ||||||
| Ford Credit Auto Owner Trust, Series 2018-1, Class A, 3.19% 7/15/20316,8 | 9,605 | 9,181 | ||||||
| Ford Credit Auto Owner Trust, Series 2020-1, Class A, 2.04% 8/15/20316,8 | 8,861 | 8,318 | ||||||
| GCI Funding I, LLC, Series 2020-1, Class A, 2.82% 10/18/20456,8 | 685 | 604 | ||||||
| GCI Funding I, LLC, Series 2020-1, Class B, 3.81% 10/18/20456,8 | 275 | 245 | ||||||
| Global SC Finance V SRL, Series 2019-1A, Class B, 4.81% 9/17/20396,8 | 2,443 | 2,294 | ||||||
| Global SC Finance V SRL, Series 2020-1A, Class A, 2.17% 10/17/20406,8 | 10,273 | 9,116 | ||||||
| Global SC Finance VII SRL, Series 2020-2A, Class A, 2.26% 11/19/20406,8 | 12,830 | 11,408 | ||||||
| Global SC Finance VII SRL, Series 2021-1A, Class A, 1.86% 4/17/20416,8 | 4,021 | 3,468 | ||||||
| Global SC Finance VII SRL, Series 2021-2A, Class A, 1.95% 8/17/20416,8 | 5,992 | 5,201 | ||||||
| Global SC Finance VII SRL, Series 2021-2A, Class B, 2.49% 8/17/20416,8 | 474 | 402 | ||||||
| Hertz Vehicle Financing III, LLC, Series 2021-A, Class B, 3.65% 6/30/20233,6,8 | 5,930 | 5,689 | ||||||
| Hertz Vehicle Financing III, LLC, Series 2021-1A, Class A, 1.21% 12/26/20256,8 | 8,452 | 7,816 | ||||||
| Hertz Vehicle Financing III, LLC, Series 2021-1A, Class B, 1.56% 12/26/20256,8 | 634 | 581 | ||||||
| Hertz Vehicle Financing III, LLC, Series 2021-1A, Class C, 2.05% 12/26/20256,8 | 405 | 365 | ||||||
| Hertz Vehicle Financing III, LLC, Series 2022-4A, Class A, 3.73% 9/25/20266,8 | 8,390 | 8,026 | ||||||
| Hertz Vehicle Financing III, LLC, Series 2021-2A, Class A, 1.68% 12/27/20276,8 | 5,565 | 4,853 | ||||||
| Hertz Vehicle Financing III, LLC, Series 2021-2A, Class B, 2.12% 12/27/20276,8 | 685 | 588 | ||||||
| Hertz Vehicle Financing III, LLC, Series 2021-2A, Class C, 2.52% 12/27/20276,8 | 429 | 355 | ||||||
| Hertz Vehicle Financing III, LLC, Series 2022-2A, Class A, 2.33% 6/26/20286,8 | 4,900 | 4,305 | ||||||
| Hertz Vehicle Financing III, LLC, Series 2022-5A, Class A, 3.89% 9/25/20286,8 | 8,750 | 8,096 | ||||||
| Longfellow Place CLO, Ltd., Series 2013-1A, Class AR3, (3-month USD-LIBOR + 1.00%) 5.079% 4/15/20296,8,9 | 1,090 | 1,087 | ||||||
| Madison Park Funding, Ltd., CLO, Series 2015-17A, Class AR2, (3-month USD-LIBOR + 1.00%) 5.278% 7/21/20306,8,9 | 5,497 | 5,411 | ||||||
| Marathon CLO, Ltd., Series 2017-9A, Class A1AR, (3-month USD-LIBOR + 1.15%) 5.229% 4/15/20296,8,9 | 2,311 | 2,288 | ||||||
| Mercury Financial Credit Card Master Trust, Series 2021-1A, Class A, 1.54% 3/20/20266,8 | 4,700 | 4,486 | ||||||
| Mission Lane Credit Card Master Trust, Series 2021-A, Class A, 1.59% 9/15/20266,8 | 1,900 | 1,840 | ||||||
| Mission Lane Credit Card Master Trust, Series 2022-A, Class A, 6.92% 9/15/20276,8 | 2,531 | 2,473 | ||||||
| Navient Student Loan Trust, Series 2021-C, Class A, 1.06% 10/15/20696,8 | 5,085 | 4,327 | ||||||
| Navient Student Loan Trust, Series 2021-G, Class A, 1.58% 4/15/20706,8 | 5,969 | 5,062 | ||||||
| Navigator Aircraft ABS, Ltd., Series 2021-1, Class A, 2.771% 11/15/20466,8 | 6,343 | 5,341 | ||||||
| Nelnet Student Loan Trust, Series 2021-C, Class AFX, 1.32% 4/20/20626,8 | 10,468 | 9,303 | ||||||
| Nelnet Student Loan Trust, Series 2021-A, Class APT1, 1.36% 4/20/20626,8 | 5,889 | 5,217 | ||||||
| Nelnet Student Loan Trust, Series 2021-B, Class AFX, 1.42% 4/20/20626,8 | 10,010 | 8,901 | ||||||
| New Economy Assets Phase 1 Issuer, LLC, Series 2021-1, Class A1, 1.91% 10/20/20616,8 | 23,051 | 19,520 | ||||||
| Newark BSL CLO 2, Ltd., Series 2017-1A, Class A1R, (3-month USD-LIBOR + 0.97%) 5.328% 7/25/20306,8,9 | 1,752 | 1,733 | ||||||
| Palmer Square Loan Funding, CLO, Series 2020-4, Class A1, (3-month USD-LIBOR + 1.00%) 5.757% 11/25/20286,8,9 | 1,415 | 1,405 | ||||||
| 154 | American Funds Insurance Series |
Asset Allocation Fund (continued)
| Bonds, notes & other debt instruments (continued) | Principal amount (000) |
Value (000) |
||||||
| Asset-backed obligations (continued) | ||||||||
| Palmer Square Loan Funding, CLO, Series 2021-1, Class A1, (3-month USD-LIBOR + 0.90%) 5.143% 4/20/20296,8,9 | USD | 437 | $ | 433 | ||||
| Palmer Square Loan Funding, CLO, Series 2021-4A, Class A1, (3-month USD-LIBOR + 0.80%) 4.879% 10/15/20296,8,9 | 8,431 | 8,324 | ||||||
| Palmer Square Loan Funding, CLO, Series 2021-4A, Class A2, (3-month USD-LIBOR + 1.40%) 5.479% 10/15/20296,8,9 | 5,378 | 5,207 | ||||||
| Palmer Square Loan Funding, CLO, Series 2022-5, Class A1, (3-month USD CME Term SOFR + 1.56%) 4.084% 1/15/20316,8,9 | 5,871 | 5,838 | ||||||
| PG&E Wildfire Recovery Funding, LLC, Series 2022-A, Class A2, 4.263% 6/1/20368 | 2,725 | 2,534 | ||||||
| PPM CLO, Ltd., Series 2022-6, Class A, (3-month USD CME Term SOFR + 2.45%) 2.45% 1/20/20316,8,9 | 9,947 | 9,947 | ||||||
| Race Point CLO, Ltd., Series 2015-9A, Class A1A2, (3-month USD-LIBOR + 0.94%) 5.019% 10/15/20306,8,9 | 4,634 | 4,571 | ||||||
| Santander Drive Auto Receivables Trust, Series 2022-5, Class A2, 3.98% 1/15/20258 | 4,359 | 4,337 | ||||||
| Santander Drive Auto Receivables Trust, Series 2020-1, Class C, 4.11% 12/15/20258 | 646 | 643 | ||||||
| Santander Drive Auto Receivables Trust, Series 2022-7, Class A2, 5.81% 1/15/20268 | 1,987 | 1,991 | ||||||
| Santander Drive Auto Receivables Trust, Series 2022-5, Class A3, 4.11% 8/17/20268 | 4,101 | 4,027 | ||||||
| SMB Private Education Loan Trust, Series 2021-A, Class A2A2, (1-month USD-LIBOR + 0.73%) 5.048% 1/15/20536,8,9 | 6,531 | 6,256 | ||||||
| SOLRR Aircraft Aviation Holding, Ltd., Series 2021-1, Class A, 2.636% 10/15/20466,8 | 3,451 | 2,775 | ||||||
| SPRITE, Ltd., Series 2021-1, Class A, 3.75% 11/15/20466,8 | 4,820 | 4,182 | ||||||
| Stellar Jay Ireland DAC, Series 2021-1, Class A, 3.967% 10/15/20416,8 | 4,782 | 4,039 | ||||||
| Stonepeak Infrastructure Partners, Series 2021-1A, Class AA, 2.301% 2/28/20336,8 | 2,480 | 2,209 | ||||||
| Stonepeak Infrastructure Partners, Series 2021-1A, Class A, 2.675% 2/28/20336,8 | 2,048 | 1,770 | ||||||
| Stratus Static CLO, Ltd., Series 2022-3, Class A, (3-month USD CME Term SOFR + 2.15%) 6.678% 10/20/20316,8,9 | 7,500 | 7,500 | ||||||
| SuttonPark Structured Settlements, Series 2021-1, Class A, 1.95% 9/15/20756,8 | 3,286 | 2,989 | ||||||
| TAL Advantage V, LLC, Series 2020-1A, Class A, 2.05% 9/20/20456,8 | 1,820 | 1,599 | ||||||
| Textainer Marine Containers, Ltd., Series 2020-2A, Class A, 2.10% 9/20/20456,8 | 801 | 699 | ||||||
| Textainer Marine Containers, Ltd., Series 2021-1A, Class A, 1.68% 2/20/20466,8 | 924 | 778 | ||||||
| Textainer Marine Containers, Ltd., Series 2021-2A, Class A, 2.23% 4/20/20466,8 | 2,661 | 2,267 | ||||||
| Toyota Auto Loan Extended Note Trust, Series 2019-1, Class A, 2.56% 11/25/20316,8 | 3,250 | 3,134 | ||||||
| Toyota Auto Loan Extended Note Trust, Series 2020-1, Class A, 1.35% 5/25/20336,8 | 889 | 814 | ||||||
| Toyota Auto Loan Extended Note Trust, Series 2021-1, Class A, 1.07% 2/27/20346,8,9 | 7,257 | 6,439 | ||||||
| Triton Container Finance VIII, LLC, Series 2020-1, Class A, 2.11% 9/20/20456,8 | 10,345 | 8,870 | ||||||
| Triton Container Finance VIII, LLC, Series 2021-1, Class A, 1.86% 3/20/20466,8 | 1,823 | 1,523 | ||||||
| Westlake Automobile Receivables Trust, Series 2022-3, Class A2, 5.24% 7/15/20256,8 | 6,521 | 6,506 | ||||||
| 417,313 | ||||||||
| Bonds & notes of governments & government agencies outside the U.S. 0.17% | ||||||||
| CPPIB Capital, Inc. 2.75% 11/2/20276 | 6,600 | 6,096 | ||||||
| European Investment Bank 0.75% 10/26/2026 | 6,194 | 5,433 | ||||||
| OMERS Finance Trust 3.50% 4/19/20326 | 4,315 | 3,905 | ||||||
| OMERS Finance Trust 4.00% 4/19/20526 | 4,315 | 3,459 | ||||||
| Panama (Republic of) 3.298% 1/19/2033 | 4,365 | 3,545 | ||||||
| Panama (Republic of) 4.50% 1/19/2063 | 1,035 | 733 | ||||||
| Peru (Republic of) 1.862% 12/1/2032 | 2,525 | 1,848 | ||||||
| Peru (Republic of) 2.78% 12/1/2060 | 3,775 | 2,214 | ||||||
| Qatar (State of) 3.375% 3/14/20246 | 2,315 | 2,271 | ||||||
| Qatar (State of) 4.00% 3/14/20296 | 745 | 733 | ||||||
| Qatar (State of) 4.817% 3/14/20496 | 750 | 731 | ||||||
| Swedish Export Credit Corp. 3.625% 9/3/2024 | 5,089 | 4,993 | ||||||
| United Mexican States 2.659% 5/24/2031 | 2,703 | 2,187 | ||||||
| United Mexican States 4.875% 5/19/2033 | 1,790 | 1,647 | ||||||
| United Mexican States 3.771% 5/24/2061 | 1,528 | 971 | ||||||
| 40,766 | ||||||||
| American Funds Insurance Series | 155 |
Asset Allocation Fund (continued)
| Bonds, notes & other debt instruments (continued) | Principal amount (000) |
Value (000) |
||||||
| Municipals 0.14% | ||||||||
| California 0.02% | ||||||||
| Golden State Tobacco Securitization Corp., Enhanced Tobacco Settlement Asset-Backed Bonds, Series 2021-A-1, 2.158% 6/1/2026 | USD | 1,200 | $ | 1,079 | ||||
| Golden State Tobacco Securitization Corp., Enhanced Tobacco Settlement Asset-Backed Bonds, Series 2021-A-1, 2.332% 6/1/2027 | 1,660 | 1,454 | ||||||
| Golden State Tobacco Securitization Corp., Enhanced Tobacco Settlement Asset-Backed Bonds, Series 2021-B, 2.746% 6/1/2034 | 495 | 398 | ||||||
| Golden State Tobacco Securitization Corp., Enhanced Tobacco Settlement Asset-Backed Bonds, Series 2021-B, 3.293% 6/1/2042 | 1,170 | 869 | ||||||
| Golden State Tobacco Securitization Corp., Enhanced Tobacco Settlement Asset-Backed Bonds, Series 2021-B, 3.00% 6/1/2046 | 2,470 | 2,288 | ||||||
| 6,088 | ||||||||
| Connecticut 0.00% | ||||||||
| Housing Fin. Auth., Housing Mortgage Fin. Program Bonds, Series 2014-A-1, 4.00% 11/15/2044 | 5 | 5 | ||||||
| Housing Fin. Auth., Housing Mortgage Fin. Program Bonds, Series 2014-C-1, 4.00% 11/15/2044 | 10 | 10 | ||||||
| 15 | ||||||||
| Florida 0.04% | ||||||||
| Board of Administration Fin. Corp., Rev. Bonds, Series 2020-A, 1.705% 7/1/2027 | 5,335 | 4,649 | ||||||
| Board of Administration Fin. Corp., Rev. Bonds, Series 2020-A, 2.154% 7/1/2030 | 5,365 | 4,399 | ||||||
| 9,048 | ||||||||
| Guam 0.00% | ||||||||
| A.B. Won Pat International Airport Auth., General Rev. Bonds, Series 2021-A, 3.839% 10/1/2036 | 240 | 196 | ||||||
| A.B. Won Pat International Airport Auth., General Rev. Bonds, Series 2021-A, 4.46% 10/1/2043 | 315 | 246 | ||||||
| 442 | ||||||||
| Illinois 0.01% | ||||||||
| G.O. Bonds, Pension Funding, Series 2003, Assured Guaranty Municipal insured, 5.10% 6/1/2033 | 4,125 | 3,952 | ||||||
| Maryland 0.00% | ||||||||
| Community Dev. Administration, Dept. of Housing and Community Dev., Residential Rev. Ref. Bonds, Series 2014-E, 2.857% 9/1/2040 | 10 | 10 | ||||||
| Minnesota 0.00% | ||||||||
| Housing Fin. Agcy., Residential Housing Fin. Bonds, Series 2014-A, 4.00% 7/1/2038 | 30 | 30 | ||||||
| New York 0.03% | ||||||||
| Dormitory Auth., Taxable State Personal Income Tax Rev. Bonds (General Purpose), Series 2021-C, 1.187% 3/15/2026 (escrowed to maturity) | 2,865 | 2,556 | ||||||
| Dormitory Auth., Taxable State Personal Income Tax Rev. Bonds (General Purpose), Series 2021-C, 1.748% 3/15/2028 | 4,745 | 4,036 | ||||||
| 6,592 | ||||||||
| Ohio 0.02% | ||||||||
| Cleveland-Cuyahoga Port Auth., Federal Lease Rev. Bonds (VA Cleveland Health Care Center Project), Series 2021, 4.425% 5/1/2031 | 5,110 | 4,314 | ||||||
| South Carolina 0.00% | ||||||||
| Housing Fin. Auth., Mortgage Rev. Ref. Bonds, Series 2014, AMT, 4.00% 7/1/2041 | 10 | 10 | ||||||
| 156 | American Funds Insurance Series |
Asset Allocation Fund (continued)
| Bonds, notes & other debt instruments (continued) | Principal amount (000) |
Value (000) |
||||||
| Municipals (continued) | ||||||||
| South Dakota 0.00% | ||||||||
| Housing Dev. Auth., Homeownership Mortgage Bonds, Series 2014-F, 4.00% 5/1/2034 | USD | 5 | $ | 5 | ||||
| Tennessee 0.00% | ||||||||
| Housing Dev. Agcy., Residential Fin. Program Bonds, Series 2013-2-A, AMT, 4.00% 7/1/2043 | 5 | 5 | ||||||
| Wisconsin 0.02% | ||||||||
| Public Fin. Auth., Federal Lease Rev. Bonds (Fort Sam Acquisition Fncg.), Series 2022, 4.95% 3/1/2034 | 5,865 | 5,213 | ||||||
| Total municipals | 35,724 | |||||||
| Total bonds, notes & other debt instruments (cost: $5,829,150,000) | 5,385,913 | |||||||
| Short-term securities 6.82% | Shares | |||||||
| Money market investments 6.61% | ||||||||
| Capital Group Central Cash Fund 4.31%7,17 | 16,398,802 | 1,639,716 | ||||||
| Money market investments purchased with collateral from securities on loan 0.21% | ||||||||
| Goldman Sachs Financial Square Government Fund, Institutional Shares 4.15%17,18 | 20,644,758 | 20,645 | ||||||
| Invesco Short-Term Investments Trust – Government & Agency Portfolio, Institutional Class 4.22%17,18 | 17,940,546 | 17,940 | ||||||
| Capital Group Central Cash Fund 4.31%7,17,18 | 126,229 | 12,622 | ||||||
| 51,207 | ||||||||
| Total short-term securities (cost: $1,690,721,000) | 1,690,923 | |||||||
| Total investment securities 102.09% (cost: $21,116,750,000) | 25,318,386 | |||||||
| Other assets less liabilities (2.09)% | (517,812 | ) | ||||||
| Net assets 100.00% | $ | 24,800,574 | ||||||
Futures contracts
| Contracts | Type | Number of contracts |
Expiration | Notional amount (000) |
Value and unrealized appreciation (depreciation) at 12/31/2022 (000) |
||||||||||
| 2 Year U.S. Treasury Note Futures | Long | 543 | March 2023 | USD111,357 | $ | 139 | |||||||||
| 5 Year U.S. Treasury Note Futures | Long | 2,120 | March 2023 | 228,811 | (257 | ) | |||||||||
| 10 Year U.S. Treasury Note Futures | Long | 1,324 | March 2023 | 148,681 | (1,571 | ) | |||||||||
| 10 Year Ultra U.S. Treasury Note Futures | Short | 3,101 | March 2023 | (366,790 | ) | 2,180 | |||||||||
| 20 Year U.S. Treasury Bond Futures | Long | 960 | March 2023 | 120,330 | (1,534 | ) | |||||||||
| 30 Year Ultra U.S. Treasury Bond Futures | Long | 53 | March 2023 | 7,119 | (123 | ) | |||||||||
| $ | (1,166 | ) | |||||||||||||
| American Funds Insurance Series | 157 |
Asset Allocation Fund (continued)
Swap contracts
Credit default swaps
Centrally cleared credit default swaps on credit indices — buy protection
| Reference index |
Financing rate paid |
Payment frequency |
Expiration date |
Notional amount (000) |
Value at 12/31/2022 (000) |
Upfront premium received (000) |
Unrealized depreciation at 12/31/2022 (000) |
|||||||||||||
| CDX.NA.IG.39 | 1.00% | Quarterly | 12/20/2027 | USD238,057 | $(1,903 | ) | $(280 | ) | $(1,623 | ) | ||||||||||
Investments in affiliates7
| Value of affiliates at 1/1/2022 (000) |
Additions (000) |
Reductions (000) |
Net realized loss (000) |
Net unrealized appreciation (depreciation) (000) |
Value of affiliates at 12/31/2022 (000) |
Dividend income (000) |
||||||||||||||||||||||
| Common stocks 0.00% | ||||||||||||||||||||||||||||
| Health care 0.00% | ||||||||||||||||||||||||||||
| NuCana PLC (ADR)19 | $ | 7,086 | $ | — | $ | 2,674 | $ | (14,288 | ) | $ | 9,876 | $ | — | $ | — | |||||||||||||
| Investment funds 5.51% | ||||||||||||||||||||||||||||
| Capital Group Central Corporate Bond Fund | 1,617,261 | 83,203 | 40,000 | (10,186 | ) | (283,156 | ) | 1,367,122 | 43,890 | |||||||||||||||||||
| Short-term securities 6.66% | ||||||||||||||||||||||||||||
| Money market investments 6.61% | ||||||||||||||||||||||||||||
| Capital Group Central Cash Fund 4.31%17 | 1,417,334 | 4,300,144 | 4,077,429 | (250 | ) | (83 | ) | 1,639,716 | 36,585 | |||||||||||||||||||
| Money market investments purchased with collateral from securities on loan 0.05% | ||||||||||||||||||||||||||||
| Capital Group Central Cash Fund 4.31%17,18 | 8,492 | 4,130 | 20 | 12,622 | — | 21 | ||||||||||||||||||||||
| Total short-term securities | 1,652,338 | |||||||||||||||||||||||||||
| Total 12.17% | $ | (24,724 | ) | $ | (273,363 | ) | $ | 3,019,460 | $ | 80,475 | ||||||||||||||||||
Restricted securities4
| Acquisition date |
Cost (000) |
Value (000) |
Percent of net assets |
|||||||||||
| Carbon Health Technologies, Inc., convertible preferred shares, 1.00% 7/9/2024 3 | 7/9/2021 | $ | 50,000 | $ | 63,388 | .26 | % | |||||||
| Rotech Healthcare, Inc.1,3 | 8/22/2014 | 6,949 | 19,703 | .08 | ||||||||||
| Total | $ | 56,949 | $ | 83,091 | .34 | % | ||||||||
| 158 | American Funds Insurance Series |
Asset Allocation Fund (continued)
| 1 | Security did not produce income during the last 12 months. |
| 2 | All or a portion of this security was on loan. The total value of all such securities was $67,688,000, which represented .27% of the net assets of the fund. Refer to Note 5 for more information on securities lending. |
| 3 | Value determined using significant unobservable inputs. |
| 4 | Restricted security, other than Rule 144A securities or commercial paper issued pursuant to Section 4(a)(2) of the Securities Act of 1933. The total value of all such restricted securities was $83,091,000, which represented .33% of the net assets of the fund. |
| 5 | Amount less than one thousand. |
| 6 | Acquired in a transaction exempt from registration under Rule 144A or, for commercial paper, Section 4(a)(2) of the Securities Act of 1933. May be resold in the U.S. in transactions exempt from registration, normally to qualified institutional buyers. The total value of all such securities was $1,155,580,000, which represented 4.66% of the net assets of the fund. |
| 7 | Affiliate of the fund or part of the same “group of investment companies” as the fund, as defined under the Investment Company Act of 1940, as amended. |
| 8 | Principal payments may be made periodically. Therefore, the effective maturity date may be earlier than the stated maturity date. |
| 9 | Coupon rate may change periodically. Reference rate and spread are as of the most recent information available. Some coupon rates are determined by the issuer or agent based on current market conditions; therefore, the reference rate and spread are not available. |
| 10 | Purchased on a TBA basis. |
| 11 | All or a portion of this security was pledged as collateral. The total value of pledged collateral was $8,779,000, which represented .04% of the net assets of the fund. |
| 12 | Index-linked bond whose principal amount moves with a government price index. |
| 13 | Step bond; coupon rate may change at a later date. |
| 14 | Loan participations and assignments; may be subject to legal or contractual restrictions on resale. The total value of all such loans was $8,799,000, which represented .04% of the net assets of the fund. |
| 15 | Scheduled interest and/or principal payment was not received. |
| 16 | Payment in kind; the issuer has the option of paying additional securities in lieu of cash. Payment methods and rates are as of the most recent payment when available. |
| 17 | Rate represents the seven-day yield at 12/31/2022. |
| 18 | Security purchased with cash collateral from securities on loan. Refer to Note 5 for more information on securities lending. |
| 19 | Affiliated issuer during the reporting period but no longer held at 12/31/2022. |
| 20 | Represents net activity. Refer to Note 5 for more information on securities lending. |
| 21 | Dividend income is included with securities lending income in the fund’s statement of operations and is not shown in this table. |
Key to abbreviations
ADR = American Depositary Receipts
Agcy. = Agency
AMT = Alternative Minimum Tax
Assn. = Association
Auth. = Authority
CAD = Canadian dollars
CLO = Collateralized Loan Obligations
CME = CME Group
CMO = Collateralized Mortgage Obligations
DAC = Designated Activity Company
Dept. = Department
Dev. = Development
EUR = Euros
EURIBOR = Euro Interbank Offered Rate
Fin. = Finance
Fncg. = Financing
G.O. = General Obligation
LIBOR = London Interbank Offered Rate
PIK = Payment In Kind
Ref. = Refunding
REIT = Real Estate Investment Trust
Rev. = Revenue
SOFR = Secured Overnight Financing Rate
TBA = To be announced
USD = U.S. dollars
Refer to the notes to financial statements.
| American Funds Insurance Series | 159 |
American Funds Global Balanced Fund
(formerly Global Balanced Fund)
Investment portfolio December 31, 2022
| Common stocks 58.58% | Shares | Value (000) |
||||||
| Financials 10.64% | ||||||||
| Zurich Insurance Group AG | 10,777 | $ | 5,150 | |||||
| B3 SA-Brasil, Bolsa, Balcao | 2,047,634 | 5,123 | ||||||
| HDFC Bank, Ltd. (ADR) | 25,988 | 1,778 | ||||||
| HDFC Bank, Ltd. | 79,465 | 1,564 | ||||||
| DNB Bank ASA | 156,181 | 3,092 | ||||||
| AIA Group, Ltd. | 195,894 | 2,158 | ||||||
| Toronto-Dominion Bank (CAD denominated) | 32,954 | 2,134 | ||||||
| PNC Financial Services Group, Inc. | 11,839 | 1,870 | ||||||
| Kotak Mahindra Bank, Ltd. | 78,279 | 1,722 | ||||||
| DBS Group Holdings, Ltd. | 55,100 | 1,395 | ||||||
| Citigroup, Inc. | 30,627 | 1,385 | ||||||
| BlackRock, Inc. | 1,886 | 1,337 | ||||||
| ING Groep NV | 98,239 | 1,199 | ||||||
| United Overseas Bank, Ltd. | 47,600 | 1,092 | ||||||
| BNP Paribas SA | 12,920 | 735 | ||||||
| Nasdaq, Inc. | 11,966 | 734 | ||||||
| JPMorgan Chase & Co. | 5,371 | 720 | ||||||
| KBC Groep NV | 11,130 | 715 | ||||||
| Münchener Rückversicherungs-Gesellschaft AG | 1,931 | 628 | ||||||
| Aegon NV | 122,629 | 622 | ||||||
| Bank Central Asia Tbk PT | 1,108,100 | 608 | ||||||
| Tryg A/S | 24,243 | 575 | ||||||
| Banco Santander, SA | 176,586 | 529 | ||||||
| Ping An Insurance (Group) Company of China, Ltd., Class H | 66,500 | 439 | ||||||
| Ping An Insurance (Group) Company of China, Ltd., Class A | 11,400 | 77 | ||||||
| FinecoBank SpA | 26,543 | 442 | ||||||
| Great-West Lifeco, Inc. | 17,334 | 401 | ||||||
| CME Group, Inc., Class A | 2,292 | 385 | ||||||
| Fairfax Financial Holdings, Ltd., subordinate voting shares | 506 | 300 | ||||||
| Allfunds Group PLC | 18,078 | 126 | ||||||
| Lufax Holding, Ltd. (ADR) | 47,602 | 92 | ||||||
| 39,127 | ||||||||
| Industrials 8.37% | ||||||||
| Raytheon Technologies Corp. | 71,227 | 7,188 | ||||||
| General Electric Co. | 39,535 | 3,313 | ||||||
| BAE Systems PLC | 264,063 | 2,729 | ||||||
| Thales SA | 20,022 | 2,560 | ||||||
| General Dynamics Corp. | 8,468 | 2,101 | ||||||
| Carrier Global Corp. | 49,012 | 2,022 | ||||||
| L3Harris Technologies, Inc. | 9,073 | 1,889 | ||||||
| Siemens AG | 13,373 | 1,856 | ||||||
| Honeywell International, Inc. | 6,585 | 1,411 | ||||||
| RELX PLC | 46,732 | 1,295 | ||||||
| CSX Corp. | 38,467 | 1,192 | ||||||
| LIXIL Corp. | 54,500 | 831 | ||||||
| Deutsche Post AG | 17,657 | 665 | ||||||
| Safran SA | 4,525 | 565 | ||||||
| Trelleborg AB, Class B | 11,334 | 262 | ||||||
| Brenntag SE | 3,756 | 240 | ||||||
| Melrose Industries PLC | 141,781 | 230 | ||||||
| Airbus SE, non-registered shares | 1,805 | 215 | ||||||
| NIBE Industrier AB, Class B | 21,550 | 201 | ||||||
| 30,765 | ||||||||
| Health care 7.78% | ||||||||
| Abbott Laboratories | 57,298 | 6,291 | ||||||
| Gilead Sciences, Inc. | 30,992 | 2,661 | ||||||
| Novartis AG | 28,897 | 2,617 | ||||||
| Siemens Healthineers AG | 51,525 | 2,578 | ||||||
| UnitedHealth Group, Inc. | 4,540 | 2,407 | ||||||
| 160 | American Funds Insurance Series |
American Funds Global Balanced Fund (continued)
(formerly Global Balanced Fund)
| Common stocks (continued) | Shares | Value (000) |
||||||
| Health care (continued) | ||||||||
| Thermo Fisher Scientific, Inc. | 3,354 | $ | 1,847 | |||||
| AstraZeneca PLC | 12,615 | 1,712 | ||||||
| Merck KGaA | 8,165 | 1,581 | ||||||
| AbbVie, Inc. | 8,136 | 1,315 | ||||||
| Stryker Corp. | 3,999 | 978 | ||||||
| Amgen, Inc. | 3,365 | 884 | ||||||
| Medtronic PLC | 11,261 | 875 | ||||||
| Eurofins Scientific SE, non-registered shares | 11,316 | 815 | ||||||
| BioMarin Pharmaceutical, Inc.1 | 6,615 | 685 | ||||||
| Humana, Inc. | 1,166 | 597 | ||||||
| Bayer AG | 10,117 | 522 | ||||||
| Takeda Pharmaceutical Company, Ltd. | 8,400 | 262 | ||||||
| 28,627 | ||||||||
| Information technology 6.47% | ||||||||
| Broadcom, Inc. | 16,303 | 9,115 | ||||||
| Microsoft Corp. | 31,123 | 7,464 | ||||||
| Micron Technology, Inc. | 44,625 | 2,230 | ||||||
| Taiwan Semiconductor Manufacturing Company, Ltd. | 97,000 | 1,414 | ||||||
| GlobalWafers Co., Ltd. | 86,000 | 1,195 | ||||||
| ServiceNow, Inc.1 | 2,184 | 848 | ||||||
| Accenture PLC, Class A | 3,024 | 807 | ||||||
| Apple, Inc. | 3,194 | 415 | ||||||
| Applied Materials, Inc. | 2,383 | 232 | ||||||
| Texas Instruments, Inc. | 380 | 63 | ||||||
| 23,783 | ||||||||
| Consumer staples 5.34% | ||||||||
| Nestlé SA | 35,802 | 4,135 | ||||||
| Philip Morris International, Inc. | 36,010 | 3,645 | ||||||
| ITC, Ltd. | 833,272 | 3,340 | ||||||
| Imperial Brands PLC | 95,936 | 2,397 | ||||||
| Seven & i Holdings Co., Ltd. | 39,200 | 1,677 | ||||||
| Pernod Ricard SA | 5,580 | 1,097 | ||||||
| British American Tobacco PLC | 27,475 | 1,090 | ||||||
| Heineken NV | 7,506 | 705 | ||||||
| Altria Group, Inc. | 14,317 | 654 | ||||||
| Inner Mongolia Yili Industrial Group Co., Ltd., Class A | 104,700 | 465 | ||||||
| Treasury Wine Estates, Ltd. | 27,708 | 256 | ||||||
| Kweichow Moutai Co., Ltd., Class A | 721 | 178 | ||||||
| 19,639 | ||||||||
| Utilities 4.80% | ||||||||
| DTE Energy Company | 29,637 | 3,483 | ||||||
| Power Grid Corporation of India, Ltd. | 1,007,658 | 2,594 | ||||||
| NextEra Energy, Inc. | 28,214 | 2,359 | ||||||
| Duke Energy Corp. | 16,849 | 1,735 | ||||||
| E.ON SE | 157,688 | 1,574 | ||||||
| Entergy Corp. | 10,025 | 1,128 | ||||||
| Iberdrola, SA, non-registered shares | 77,458 | 906 | ||||||
| ENN Energy Holdings, Ltd. | 64,000 | 893 | ||||||
| Dominion Energy, Inc. | 14,276 | 875 | ||||||
| National Grid PLC | 65,238 | 784 | ||||||
| Enel SpA | 122,240 | 657 | ||||||
| SembCorp Industries, Ltd. | 187,100 | 471 | ||||||
| Public Service Enterprise Group, Inc. | 3,391 | 208 | ||||||
| 17,667 | ||||||||
| American Funds Insurance Series | 161 |
American Funds Global Balanced Fund (continued)
(formerly Global Balanced Fund)
| Common stocks (continued) | Shares | Value (000) |
||||||
| Materials 4.33% | ||||||||
| Freeport-McMoRan, Inc. | 87,143 | $ | 3,311 | |||||
| Linde PLC | 6,504 | 2,122 | ||||||
| BHP Group, Ltd. (CDI) | 62,248 | 1,919 | ||||||
| Evonik Industries AG | 96,394 | 1,851 | ||||||
| Fortescue Metals Group, Ltd. | 126,401 | 1,762 | ||||||
| Rio Tinto PLC | 20,187 | 1,417 | ||||||
| Shin-Etsu Chemical Co., Ltd. | 11,000 | 1,340 | ||||||
| Vale SA (ADR), ordinary nominative shares | 64,102 | 1,088 | ||||||
| UPM-Kymmene OYJ | 15,079 | 565 | ||||||
| International Flavors & Fragrances, Inc. | 2,739 | 287 | ||||||
| Air Liquide SA, non-registered shares | 1,874 | 267 | ||||||
| 15,929 | ||||||||
| Energy 4.02% | ||||||||
| Canadian Natural Resources, Ltd. (CAD denominated) | 125,963 | 6,995 | ||||||
| Neste OYJ | 40,724 | 1,881 | ||||||
| Shell PLC (GBP denominated) | 54,477 | 1,548 | ||||||
| Chevron Corp. | 8,045 | 1,444 | ||||||
| BP PLC | 184,567 | 1,073 | ||||||
| DT Midstream, Inc. | 10,284 | 568 | ||||||
| Baker Hughes Co., Class A | 17,643 | 521 | ||||||
| TC Energy Corp. (CAD denominated) | 12,080 | 482 | ||||||
| Woodside Energy Group, Ltd. (CDI) | 10,942 | 264 | ||||||
| 14,776 | ||||||||
| Communication services 3.14% | ||||||||
| Alphabet, Inc., Class A1 | 19,243 | 1,698 | ||||||
| Alphabet, Inc., Class C1 | 7,907 | 701 | ||||||
| Netflix, Inc.1 | 8,029 | 2,368 | ||||||
| Singapore Telecommunications, Ltd. | 782,600 | 1,502 | ||||||
| Comcast Corp., Class A | 30,643 | 1,072 | ||||||
| BCE, Inc. | 22,635 | 995 | ||||||
| Omnicom Group, Inc. | 10,624 | 867 | ||||||
| Universal Music Group NV | 31,035 | 749 | ||||||
| SoftBank Corp. | 54,400 | 615 | ||||||
| Meta Platforms, Inc., Class A1 | 4,089 | 492 | ||||||
| Electronic Arts, Inc. | 4,021 | 491 | ||||||
| 11,550 | ||||||||
| Consumer discretionary 2.27% | ||||||||
| LVMH Moët Hennessy-Louis Vuitton SE | 2,423 | 1,760 | ||||||
| Cie. Financière Richemont SA, Class A | 8,551 | 1,107 | ||||||
| Ferrari NV | 3,990 | 855 | ||||||
| Ferrari NV (EUR denominated) | 1,039 | 222 | ||||||
| General Motors Company | 27,725 | 933 | ||||||
| Tesla, Inc.1 | 7,350 | 905 | ||||||
| InterContinental Hotels Group PLC | 12,297 | 708 | ||||||
| Starbucks Corp. | 4,596 | 456 | ||||||
| Royal Caribbean Cruises, Ltd.1 | 8,302 | 410 | ||||||
| Astra International Tbk PT | 1,050,300 | 383 | ||||||
| Aptiv PLC1 | 2,518 | 234 | ||||||
| D.R. Horton, Inc. | 2,232 | 199 | ||||||
| Airbnb, Inc., Class A1 | 1,851 | 158 | ||||||
| JD.com, Inc., Class A | 1,200 | 34 | ||||||
| 8,364 | ||||||||
| 162 | American Funds Insurance Series |
American Funds Global Balanced Fund (continued)
(formerly Global Balanced Fund)
| Common stocks (continued) | Shares | Value (000) |
||||||
| Real estate 1.42% | ||||||||
| Embassy Office Parks REIT | 342,621 | $ | 1,390 | |||||
| Equinix, Inc. REIT | 2,059 | 1,349 | ||||||
| CTP NV | 104,148 | 1,226 | ||||||
| Digital Realty Trust, Inc. REIT | 4,683 | 470 | ||||||
| Crown Castle, Inc. REIT | 3,025 | 410 | ||||||
| Americold Realty Trust, Inc. REIT | 12,798 | 362 | ||||||
| 5,207 | ||||||||
| Total common stocks (cost: $194,190,000) | 215,434 | |||||||
| Preferred securities 0.40% | ||||||||
| Financials 0.25% | ||||||||
| Fannie Mae, Series S, 8.25% noncumulative preferred shares1 | 223,000 | 522 | ||||||
| Federal Home Loan Mortgage Corp., Series Z, 8.375% noncumulative preferred shares1 | 192,000 | 389 | ||||||
| 911 | ||||||||
| Consumer discretionary 0.15% | ||||||||
| Dr. Ing. h.c. F. Porsche AG, nonvoting non-registered preferred shares1 | 5,497 | 558 | ||||||
| Total preferred securities (cost: $1,986,000) | 1,469 | |||||||
| Convertible stocks 0.34% | ||||||||
| Utilities 0.23% | ||||||||
| NextEra Energy, Inc., noncumulative convertible preferred units, 6.926% 9/1/2025 | 16,500 | 828 | ||||||
| Health care 0.11% | ||||||||
| Danaher Corp., Series B, cumulative convertible preferred shares, 5.00% 4/15/2023 | 300 | 407 | ||||||
| Total convertible stocks (cost: $1,214,000) | 1,235 | |||||||
| Investment funds 1.50% | ||||||||
| Capital Group Central Corporate Bond Fund2 | 678,772 | 5,532 | ||||||
| Total investment funds (cost: $5,481,000) | 5,532 | |||||||
| Bonds, notes & other debt instruments 34.19% | Principal amount (000) |
|||||||
| Bonds & notes of governments & government agencies outside the U.S. 13.26% | ||||||||
| Abu Dhabi (Emirate of) 0.75% 9/2/20233 | USD | 275 | 267 | |||||
| Agricultural Development Bank of China 3.75% 1/25/2029 | CNY | 550 | 83 | |||||
| Asian Development Bank 1.125% 6/10/2025 | GBP | 100 | 112 | |||||
| Australia (Commonwealth of), Series 152, 2.75% 11/21/2028 | AUD | 310 | 200 | |||||
| Australia (Commonwealth of), Series 157, 1.50% 6/21/2031 | 1,055 | 591 | ||||||
| Australia (Commonwealth of), Series 163, 1.00% 11/21/2031 | 150 | 79 | ||||||
| Australia (Commonwealth of), Series 166, 3.00% 11/21/2033 | 2,250 | 1,388 | ||||||
| Austria (Republic of) 0% 2/20/2031 | EUR | 660 | 553 | |||||
| Brazil (Federative Republic of) 10.00% 1/1/2023 | BRL | 600 | 108 | |||||
| Brazil (Federative Republic of) 0% 1/1/2024 | 1,700 | 284 | ||||||
| Brazil (Federative Republic of) 10.00% 1/1/2025 | 900 | 163 | ||||||
| Canada 0.75% 10/1/2024 | CAD | 1,125 | 785 | |||||
| Canada 2.25% 6/1/2025 | 1,400 | 998 | ||||||
| Canada 0.25% 3/1/2026 | 570 | 378 | ||||||
| Canada 3.50% 3/1/2028 | 1,009 | 749 | ||||||
| Chile (Republic of) 4.70% 9/1/2030 | CLP | 245,000 | 279 | |||||
| American Funds Insurance Series | 163 |
American Funds Global Balanced Fund (continued)
(formerly Global Balanced Fund)
| Bonds, notes & other debt instruments (continued) | Principal amount (000) |
Value (000) |
||||||
| Bonds & notes of governments & government agencies outside the U.S. (continued) | ||||||||
| China (People’s Republic of), Series 1910, 3.86% 7/22/2049 | CNY | 2,110 | $ | 336 | ||||
| China (People’s Republic of), Series INBK, 3.39% 3/16/2050 | 1,600 | 235 | ||||||
| China (People’s Republic of), Series INBK, 3.81% 9/14/2050 | 10,290 | 1,626 | ||||||
| China Development Bank Corp., Series 2008, 2.89% 6/22/2025 | 3,240 | 470 | ||||||
| China Development Bank Corp., Series 2004, 3.43% 1/14/2027 | 1,060 | 156 | ||||||
| China Development Bank Corp., Series 2009, 3.39% 7/10/2027 | 8,580 | 1,258 | ||||||
| China Development Bank Corp., Series 1805, 4.88% 2/9/2028 | 2,040 | 322 | ||||||
| Colombia (Republic of), Series B, 5.75% 11/3/2027 | COP | 2,331,300 | 365 | |||||
| Colombia (Republic of), Series B, 7.00% 3/26/2031 | 5,308,700 | 776 | ||||||
| European Investment Bank 0.375% 9/15/2027 | EUR | 110 | 105 | |||||
| European Investment Bank 0.25% 1/20/2032 | 860 | 717 | ||||||
| European Union 0% 7/6/2026 | 100 | 97 | ||||||
| European Union 0.25% 10/22/2026 | 50 | 48 | ||||||
| French Republic O.A.T. 0.75% 2/25/2028 | 640 | 618 | ||||||
| French Republic O.A.T. 0% 11/25/2030 | 1,320 | 1,128 | ||||||
| French Republic O.A.T. 0% 5/25/2032 | 650 | 527 | ||||||
| French Republic O.A.T. 2.00% 11/25/2032 | 610 | 596 | ||||||
| French Republic O.A.T. 3.25% 5/25/2045 | 160 | 171 | ||||||
| Germany (Federal Republic of) 0% 4/16/2027 | 950 | 915 | ||||||
| Germany (Federal Republic of) 0% 8/15/2031 | 2,600 | 2,258 | ||||||
| Germany (Federal Republic of) 0% 2/15/2032 | 540 | 463 | ||||||
| Germany (Federal Republic of) 1.70% 8/15/2032 | 1,129 | 1,127 | ||||||
| Germany (Federal Republic of) 1.00% 5/15/2038 | 640 | 548 | ||||||
| Germany (Federal Republic of) 0% 8/15/2050 | 200 | 112 | ||||||
| Germany (Federal Republic of) 0% 8/15/2052 | 260 | 139 | ||||||
| Greece (Hellenic Republic of) 3.45% 4/2/2024 | 110 | 118 | ||||||
| Greece (Hellenic Republic of) 3.375% 2/15/2025 | 300 | 321 | ||||||
| Greece (Hellenic Republic of) 1.75% 6/18/2032 | 790 | 668 | ||||||
| India (Republic of) 5.15% 11/9/2025 | INR | 8,000 | 92 | |||||
| Indonesia (Republic of), Series 78, 8.25% 5/15/2029 | IDR | 1,833,000 | 127 | |||||
| Indonesia (Republic of), Series 87, 6.50% 2/15/2031 | 1,253,000 | 78 | ||||||
| Israel (State of) 2.875% 1/29/2024 | EUR | 200 | 213 | |||||
| Israel (State of) 1.50% 1/18/2027 | 100 | 100 | ||||||
| Italy (Republic of) 1.35% 4/1/2030 | 660 | 581 | ||||||
| Italy (Republic of) 2.50% 12/1/2032 | 650 | 583 | ||||||
| Japan, Series 17, 0.10% 9/10/20234 | JPY | 10,900 | 84 | |||||
| Japan, Series 18, 0.10% 3/10/20244 | 21,660 | 169 | ||||||
| Japan, Series 19, 0.10% 9/10/20244 | 31,620 | 247 | ||||||
| Japan, Series 150, 0.005% 12/20/2026 | 84,950 | 644 | ||||||
| Japan, Series 22, 0.10% 3/10/20274 | 26,454 | 211 | ||||||
| Japan, Series 346, 0.10% 3/20/2027 | 134,150 | 1,018 | ||||||
| Japan, Series 363, 0.10% 6/20/2031 | 56,000 | 412 | ||||||
| Japan, Series 365, 0.10% 12/20/2031 | 317,600 | 2,340 | ||||||
| Japan, Series 152, 1.20% 3/20/2035 | 264,400 | 2,109 | ||||||
| Japan, Series 179, 0.50% 12/20/2041 | 71,600 | 476 | ||||||
| Japan, Series 42, 1.70% 3/20/2044 | 50,150 | 408 | ||||||
| Japan, Series 37, 0.60% 6/20/2050 | 26,950 | 162 | ||||||
| Japan, Series 74, 1.00% 3/20/2052 | 178,400 | 1,178 | ||||||
| Japan, Series 76, 1.40% 9/20/2052 | 80,350 | 586 | ||||||
| KfW 1.125% 7/4/2025 | GBP | 95 | 106 | |||||
| Malaysia (Federation of), Series 0119, 3.906% 7/15/2026 | MYR | 1,380 | 315 | |||||
| Malaysia (Federation of), Series 0219, 3.885% 8/15/2029 | 620 | 140 | ||||||
| Malaysia (Federation of), Series 0519, 3.757% 5/22/2040 | 270 | 57 | ||||||
| Morocco (Kingdom of) 3.50% 6/19/2024 | EUR | 100 | 107 | |||||
| Morocco (Kingdom of) 1.50% 11/27/2031 | 100 | 79 | ||||||
| Netherlands (Kingdom of the) 5.50% 1/15/2028 | 100 | 121 | ||||||
| Nova Scotia (Province of) 3.15% 12/1/2051 | CAD | 170 | 101 | |||||
| Peru (Republic of) 2.392% 1/23/2026 | USD | 90 | 83 | |||||
| Philippines (Republic of) 0.001% 4/12/2024 | JPY | 100,000 | 753 | |||||
| 164 | American Funds Insurance Series |
American Funds Global Balanced Fund (continued)
(formerly Global Balanced Fund)
| Bonds, notes & other debt instruments (continued) | Principal amount (000) |
Value (000) |
||||||
| Bonds & notes of governments & government agencies outside the U.S. (continued) | ||||||||
| Philippines (Republic of) 0.25% 4/28/2025 | EUR | 100 | $ | 99 | ||||
| Philippines (Republic of) 1.648% 6/10/2031 | USD | 200 | 160 | |||||
| Poland (Republic of), Series 1029, 2.75% 10/25/2029 | PLN | 410 | 74 | |||||
| Portuguese Republic 0.475% 10/18/2030 | EUR | 230 | 199 | |||||
| Romania 2.125% 3/7/2028 | 130 | 117 | ||||||
| Romania 3.624% 5/26/2030 | 392 | 344 | ||||||
| Romania 2.00% 1/28/2032 | 100 | 72 | ||||||
| Romania 2.00% 4/14/2033 | 200 | 138 | ||||||
| Romania 3.375% 2/8/2038 | 80 | 58 | ||||||
| Romania 4.625% 4/3/2049 | 39 | 30 | ||||||
| Romania 3.375% 1/28/2050 | 73 | 45 | ||||||
| Russian Federation 7.00% 8/16/20235,6 | RUB | 16,600 | 77 | |||||
| Russian Federation 2.875% 12/4/20255 | EUR | 200 | 90 | |||||
| Russian Federation 4.25% 6/23/20275 | USD | 200 | 86 | |||||
| Russian Federation 4.375% 3/21/20295 | 200 | 82 | ||||||
| Russian Federation 6.90% 5/23/20295 | RUB | 28,250 | 123 | |||||
| Russian Federation 7.65% 4/10/20305 | 38,320 | 166 | ||||||
| Russian Federation 5.90% 3/12/20315 | 5,620 | 24 | ||||||
| Russian Federation 6.90% 7/23/20315 | 18,200 | 79 | ||||||
| Russian Federation 8.50% 9/17/20315 | 5,530 | 24 | ||||||
| Russian Federation 7.70% 3/23/20335 | 23,030 | 100 | ||||||
| Russian Federation 7.25% 5/10/20345 | 8,140 | 35 | ||||||
| Serbia (Republic of) 3.125% 5/15/2027 | EUR | 385 | 356 | |||||
| Serbia (Republic of) 2.05% 9/23/2036 | 185 | 112 | ||||||
| South Africa (Republic of), Series R-2030, 8.00% 1/31/2030 | ZAR | 3,000 | 157 | |||||
| Spain (Kingdom of) 0% 1/31/2027 | EUR | 335 | 317 | |||||
| Spain (Kingdom of) 0.80% 7/30/2027 | 490 | 474 | ||||||
| Spain (Kingdom of) 0.50% 10/31/2031 | 395 | 329 | ||||||
| Spain (Kingdom of) 0.70% 4/30/2032 | 830 | 693 | ||||||
| Tunisia (Republic of) 6.75% 10/31/2023 | 260 | 235 | ||||||
| Tunisia (Republic of) 6.75% 10/31/2023 | 150 | 135 | ||||||
| Ukraine 6.876% 5/21/20313,5 | USD | 250 | 48 | |||||
| Ukraine 6.876% 5/21/20315 | 200 | 38 | ||||||
| United Kingdom 2.75% 9/7/2024 | GBP | 50 | 60 | |||||
| United Kingdom 1.25% 7/22/2027 | 410 | 447 | ||||||
| United Kingdom 0.375% 10/22/2030 | 490 | 463 | ||||||
| United Kingdom 0.25% 7/31/2031 | 160 | 145 | ||||||
| United Kingdom 1.00% 1/31/2032 | 1,490 | 1,427 | ||||||
| United Kingdom 4.25% 6/7/2032 | 1,165 | 1,474 | ||||||
| United Kingdom 3.25% 1/22/2044 | 174 | 187 | ||||||
| United Kingdom 1.25% 7/31/2051 | 413 | 270 | ||||||
| United Mexican States, Series M, 5.75% 3/5/2026 | MXN | 18,200 | 846 | |||||
| United Mexican States, Series M, 7.50% 6/3/2027 | 1,950 | 94 | ||||||
| United Mexican States, Series M, 7.75% 5/29/2031 | 5,000 | 238 | ||||||
| United Mexican States, Series M, 8.00% 11/7/2047 | 5,120 | 235 | ||||||
| United Mexican States, Series M, 8.00% 7/31/2053 | 18,880 | 864 | ||||||
|
|
48,783 | |||||||
| U.S. Treasury bonds & notes 12.04% | ||||||||
| U.S. Treasury 11.52% | ||||||||
| U.S. Treasury 2.50% 3/31/2023 | USD | 1,182 | 1,177 | |||||
| U.S. Treasury 2.75% 4/30/2023 | 1,485 | 1,477 | ||||||
| U.S. Treasury 1.50% 2/29/2024 | 5,058 | 4,876 | ||||||
| U.S. Treasury 2.50% 4/30/2024 | 995 | 967 | ||||||
| U.S. Treasury 3.25% 8/31/2024 | 706 | 691 | ||||||
| U.S. Treasury 1.50% 10/31/2024 | 1,300 | 1,232 | ||||||
| U.S. Treasury 1.00% 12/15/2024 | 620 | 580 | ||||||
| U.S. Treasury 1.75% 3/15/2025 | 98 | 93 | ||||||
| U.S. Treasury 3.00% 7/15/2025 | 1,016 | 984 | ||||||
| American Funds Insurance Series | 165 |
American Funds Global Balanced Fund (continued)
(formerly Global Balanced Fund)
| Bonds, notes & other debt instruments (continued) | Principal amount (000) |
Value (000) |
||||||
| U.S. Treasury bonds & notes (continued) | ||||||||
| U.S. Treasury (continued) | ||||||||
| U.S. Treasury 3.125% 8/15/2025 | USD | 18 | $ | 17 | ||||
| U.S. Treasury 0.25% 8/31/2025 | 833 | 749 | ||||||
| U.S. Treasury 4.50% 11/15/2025 | 178 | 179 | ||||||
| U.S. Treasury 0.375% 11/30/2025 | 50 | 45 | ||||||
| U.S. Treasury 0.50% 2/28/2026 | 500 | 446 | ||||||
| U.S. Treasury 0.75% 3/31/2026 | 2,075 | 1,861 | ||||||
| U.S. Treasury 0.875% 6/30/2026 | 74 | 66 | ||||||
| U.S. Treasury 2.25% 2/15/2027 | 298 | 277 | ||||||
| U.S. Treasury 1.875% 2/28/2027 | 6,696 | 6,133 | ||||||
| U.S. Treasury 2.50% 3/31/2027 | 1,025 | 962 | ||||||
| U.S. Treasury 2.75% 4/30/2027 | 6,460 | 6,125 | ||||||
| U.S. Treasury 2.75% 7/31/2027 | 46 | 43 | ||||||
| U.S. Treasury 3.125% 8/31/2027 | 2,160 | 2,078 | ||||||
| U.S. Treasury 4.125% 9/30/2027 | 268 | 269 | ||||||
| U.S. Treasury 4.125% 10/31/2027 | 357 | 358 | ||||||
| U.S. Treasury 2.875% 5/15/2028 | 1,275 | 1,204 | ||||||
| U.S. Treasury 2.875% 8/15/2028 | 557 | 525 | ||||||
| U.S. Treasury 0.625% 5/15/2030 | 823 | 652 | ||||||
| U.S. Treasury 0.625% 8/15/2030 | 650 | 512 | ||||||
| U.S. Treasury 1.625% 5/15/2031 | 375 | 316 | ||||||
| U.S. Treasury 1.25% 8/15/2031 | 395 | 321 | ||||||
| U.S. Treasury 1.375% 11/15/2031 | 834 | 680 | ||||||
| U.S. Treasury 1.875% 2/15/2032 | 779 | 661 | ||||||
| U.S. Treasury 2.875% 5/15/2032 | 640 | 590 | ||||||
| U.S. Treasury 2.75% 8/15/2032 | 1,279 | 1,164 | ||||||
| U.S. Treasury 4.125% 11/15/2032 | 195 | 199 | ||||||
| U.S. Treasury 1.875% 2/15/20417 | 920 | 652 | ||||||
| U.S. Treasury 2.25% 5/15/20417 | 525 | 395 | ||||||
| U.S. Treasury 2.875% 11/15/2046 | 400 | 322 | ||||||
| U.S. Treasury 1.25% 5/15/2050 | 140 | 76 | ||||||
| U.S. Treasury 2.375% 5/15/2051 | 490 | 353 | ||||||
| U.S. Treasury 2.00% 8/15/2051 | 560 | 369 | ||||||
| U.S. Treasury 1.875% 11/15/20517 | 686 | 437 | ||||||
| U.S. Treasury 2.25% 2/15/20527 | 765 | 535 | ||||||
| U.S. Treasury 2.875% 5/15/2052 | 273 | 220 | ||||||
| U.S. Treasury 3.00% 8/15/2052 | 510 | 423 | ||||||
| U.S. Treasury 4.00% 11/15/2052 | 70 | 70 | ||||||
| 42,361 | ||||||||
| U.S. Treasury inflation-protected securities 0.52% | ||||||||
| U.S. Treasury Inflation-Protected Security 0.125% 7/15/20244 | 829 | 803 | ||||||
| U.S. Treasury Inflation-Protected Security 0.125% 10/15/20244 | 575 | 555 | ||||||
| U.S. Treasury Inflation-Protected Security 0.375% 7/15/20274 | 367 | 346 | ||||||
| U.S. Treasury Inflation-Protected Security 1.00% 2/15/20494 | 249 | 208 | ||||||
| 1,912 | ||||||||
| Total U.S. Treasury bonds & notes | 44,273 | |||||||
| Corporate bonds, notes & loans 5.64% | ||||||||
| Financials 1.80% | ||||||||
| ACE INA Holdings, Inc. 3.35% 5/3/2026 | 10 | 10 | ||||||
| ACE INA Holdings, Inc. 4.35% 11/3/2045 | 20 | 17 | ||||||
| AIA Group, Ltd. 0.88% 9/9/2033 (5-year EUR Annual Swap + 1.10% on 9/9/2028)8 | EUR | 200 | 167 | |||||
| AIB Group PLC 7.583% 10/14/2026 (USD-SOFR + 3.456% on 10/14/2025)3,8 | USD | 200 | 204 | |||||
| Allianz SE 4.75% perpetual bonds (3-month EUR-EURIBOR + 3.60% on 10/24/2023)8 | EUR | 100 | 106 | |||||
| Banco de Sabadell, SA 2.625% 3/24/2026 (5-year EUR Mid-Swap + 2.20% on 3/24/2025)8 | 100 | 101 | ||||||
| Bank of America Corp. 0.976% 4/22/2025 (USD-SOFR + 0.69% on 4/22/2024)8 | USD | 200 | 188 | |||||
| Bank of America Corp. 1.319% 6/19/2026 (USD-SOFR + 1.15% on 6/19/2025)8 | 500 | 451 | ||||||
| Bank of America Corp. 1.734% 7/22/2027 (USD-SOFR + 0.96% on 7/22/2026)8 | 160 | 140 | ||||||
| 166 | American Funds Insurance Series |
American Funds Global Balanced Fund (continued)
(formerly Global Balanced Fund)
| Bonds, notes & other debt instruments (continued) | Principal amount (000) |
Value (000) |
||||||
| Corporate bonds, notes & loans (continued) | ||||||||
| Financials (continued) | ||||||||
| Bank of America Corp. 3.419% 12/20/2028 (3-month USD-LIBOR + 1.04% on 12/20/2027)8 | USD | 236 | $ | 214 | ||||
| Bank of America Corp. 2.496% 2/13/2031 (3-month USD-LIBOR + 0.99% on 2/13/2030)8 | 20 | 16 | ||||||
| Barclays Bank PLC 5.304% 8/9/2026 (1-year UST Yield Curve Rate T Note Constant Maturity + 2.30% on 8/9/2025)8 | 475 | 472 | ||||||
| Citigroup, Inc. 0.981% 5/1/2025 (USD-SOFR + 0.669% on 5/1/2024)8 | 103 | 96 | ||||||
| Citigroup, Inc. 3.106% 4/8/2026 (USD-SOFR + 2.842% on 3/8/2026)8 | 175 | 166 | ||||||
| Citigroup, Inc. 1.462% 6/9/2027 (USD-SOFR + 0.67% on 6/9/2026)8 | 310 | 269 | ||||||
| Citigroup, Inc. 3.07% 2/24/2028 (USD-SOFR + 1.28% on 2/24/2027)8 | 110 | 99 | ||||||
| Citigroup, Inc. 4.91% 5/24/2033 (USD-SOFR + 2.086% on 5/24/2032)8 | 29 | 27 | ||||||
| Commonwealth Bank of Australia 2.688% 3/11/20313 | 225 | 174 | ||||||
| Corebridge Financial, Inc. 3.90% 4/5/20323 | 59 | 52 | ||||||
| Deutsche Bank AG 2.311% 11/16/2027 (USD-SOFR + 1.219% on 11/16/2026)8 | 160 | 136 | ||||||
| Deutsche Bank AG 4.00% 6/24/2032 (3-month EUR-EURIBOR + 3.30% on 6/24/2027)8 | EUR | 100 | 95 | |||||
| Goldman Sachs Group, Inc. 1.00% 3/18/20339 | 210 | 162 | ||||||
| Goldman Sachs Group, Inc. 4.017% 10/31/2038 (3-month USD-LIBOR + 1.373% on 10/31/2037)8 | USD | 78 | 64 | |||||
| Groupe BPCE SA 5.70% 10/22/20233 | 200 | 199 | ||||||
| Groupe BPCE SA 1.00% 4/1/2025 | EUR | 100 | 101 | |||||
| HSBC Holdings PLC 4.292% 9/12/2026 (3-month USD-LIBOR + 1.348% on 9/12/2025)8 | USD | 200 | 191 | |||||
| JPMorgan Chase & Co. 1.578% 4/22/2027 (USD-SOFR + 0.885% on 4/22/2026)8 | 186 | 164 | ||||||
| JPMorgan Chase & Co. 4.493% 3/24/2031 (USD-SOFR + 3.79% on 3/24/2030)8 | 160 | 150 | ||||||
| Morgan Stanley 3.125% 7/27/2026 | 110 | 103 | ||||||
| Morgan Stanley 0.985% 12/10/2026 (USD-SOFR + 0.72% on 12/10/2025)8 | 200 | 175 | ||||||
| Morgan Stanley 1.593% 5/4/2027 (USD-SOFR + 0.879% on 5/4/2026)8 | 126 | 111 | ||||||
| Morgan Stanley 2.699% 1/22/2031 (USD-SOFR + 1.143% on 1/22/2030)8 | 72 | 60 | ||||||
| Morgan Stanley 2.95% 5/7/2032 (3-month EUR-EURIBOR + 1.245% on 5/7/2031)8 | EUR | 510 | 485 | |||||
| New York Life Insurance Company 3.75% 5/15/20503 | USD | 23 | 18 | |||||
| Nordea Bank AB 3.60% 6/6/20253 | 200 | 193 | ||||||
| Royal Bank of Canada 1.20% 4/27/2026 | 175 | 156 | ||||||
| UBS Group AG 4.49% 8/5/2025 (1-year UST Yield Curve Rate T Note Constant Maturity + 1.60% on 8/5/2024)3,8 | 450 | 442 | ||||||
| Wells Fargo & Company 3.526% 3/24/2028 (USD-SOFR + 1.51% on 3/24/2027)8 | 210 | 195 | ||||||
| Wells Fargo & Company 2.393% 6/2/2028 (USD-SOFR + 2.10% on 6/2/2027)8 | 400 | 354 | ||||||
| Wells Fargo & Company 4.611% 4/25/2053 (USD-SOFR + 2.13% on 4/25/2052)8 | 100 | 85 | ||||||
| 6,608 | ||||||||
| Utilities 0.89% | ||||||||
| Alabama Power Co. 3.00% 3/15/2052 | 250 | 166 | ||||||
| CMS Energy Corp. 3.00% 5/15/2026 | 150 | 140 | ||||||
| Consumers Energy Co. 3.60% 8/15/2032 | 250 | 228 | ||||||
| Duke Energy Carolinas, LLC 3.05% 3/15/2023 | 280 | 279 | ||||||
| Duke Energy Progress, LLC 3.70% 9/1/2028 | 75 | 71 | ||||||
| E.ON SE 1.625% 3/29/2031 | EUR | 240 | 216 | |||||
| Edison International 4.125% 3/15/2028 | USD | 160 | 149 | |||||
| Enel Finance International SA 1.875% 7/12/20283 | 200 | 159 | ||||||
| Enersis Américas SA 4.00% 10/25/2026 | 35 | 33 | ||||||
| Entergy Louisiana, LLC 4.75% 9/15/2052 | 100 | 90 | ||||||
| Exelon Corp. 3.40% 4/15/2026 | 150 | 143 | ||||||
| FirstEnergy Corp. 3.50% 4/1/20283 | 35 | 32 | ||||||
| Florida Power & Light Company 2.875% 12/4/2051 | 120 | 81 | ||||||
| Interstate Power and Light Co. 2.30% 6/1/2030 | 50 | 41 | ||||||
| NextEra Energy Capital Holdings, Inc. 2.75% 11/1/2029 | 232 | 201 | ||||||
| Niagara Mohawk Power Corp. 3.508% 10/1/20243 | 85 | 82 | ||||||
| Pacific Gas and Electric Co. 2.95% 3/1/2026 | 25 | 23 | ||||||
| Pacific Gas and Electric Co. 2.10% 8/1/2027 | 100 | 86 | ||||||
| American Funds Insurance Series | 167 |
American Funds Global Balanced Fund (continued)
(formerly Global Balanced Fund)
| Bonds, notes & other debt instruments (continued) | Principal amount (000) |
Value (000) |
||||||
| Corporate bonds, notes & loans (continued) | ||||||||
| Utilities (continued) | ||||||||
| Pacific Gas and Electric Co. 3.00% 6/15/2028 | USD | 140 | $ | 121 | ||||
| Pacific Gas and Electric Co. 4.65% 8/1/2028 | 114 | 105 | ||||||
| Pacific Gas and Electric Co. 4.55% 7/1/2030 | 31 | 28 | ||||||
| Pacific Gas and Electric Co. 2.50% 2/1/2031 | 600 | 467 | ||||||
| Pacific Gas and Electric Co. 3.25% 6/1/2031 | 50 | 41 | ||||||
| Pacific Gas and Electric Co. 3.50% 8/1/2050 | 137 | 86 | ||||||
| Xcel Energy, Inc. 3.35% 12/1/2026 | 216 | 203 | ||||||
| 3,271 | ||||||||
| Consumer discretionary 0.62% | ||||||||
| Amazon.com, Inc. 2.80% 8/22/2024 | 45 | 44 | ||||||
| Bayerische Motoren Werke AG 3.90% 4/9/20253 | 70 | 69 | ||||||
| Bayerische Motoren Werke AG 4.15% 4/9/20303 | 70 | 67 | ||||||
| Daimler Trucks Finance North America, LLC 3.65% 4/7/20273 | 150 | 140 | ||||||
| General Motors Financial Co. 2.40% 4/10/2028 | 150 | 126 | ||||||
| Hyundai Capital America 1.50% 6/15/20263 | 250 | 217 | ||||||
| Hyundai Capital America 2.375% 10/15/20273 | 109 | 93 | ||||||
| Hyundai Capital Services, Inc. 3.75% 3/5/20233 | 250 | 249 | ||||||
| Royal Caribbean Cruises, Ltd. 11.50% 6/1/20253 | 222 | 239 | ||||||
| Royal Caribbean Cruises, Ltd. 5.50% 4/1/20283 | 185 | 148 | ||||||
| Royal Caribbean Cruises, Ltd. 8.25% 1/15/20293 | 70 | 70 | ||||||
| Royal Caribbean Cruises, Ltd. 9.25% 1/15/20293 | 59 | 61 | ||||||
| Stellantis Finance US, Inc. 5.625% 1/12/20283 | 400 | 397 | ||||||
| Stellantis Finance US, Inc. 2.691% 9/15/20313 | 200 | 153 | ||||||
| Toyota Motor Credit Corp. 3.375% 4/1/2030 | 33 | 30 | ||||||
| Volkswagen International Finance NV 4.375% junior subordinated perpetual bonds (9-year EUR Mid-Swap + 3.36% on 3/28/2031)8 | EUR | 200 | 175 | |||||
| 2,278 | ||||||||
| Health care 0.45% | ||||||||
| Aetna, Inc. 2.80% 6/15/2023 | USD | 10 | 10 | |||||
| Amgen, Inc. 1.90% 2/21/2025 | 40 | 37 | ||||||
| Amgen, Inc. 2.20% 2/21/2027 | 30 | 27 | ||||||
| Amgen, Inc. 4.20% 3/1/2033 | 280 | 260 | ||||||
| AstraZeneca Finance, LLC 2.25% 5/28/2031 | 69 | 57 | ||||||
| AstraZeneca PLC 3.50% 8/17/2023 | 150 | 149 | ||||||
| Becton, Dickinson and Company 3.734% 12/15/2024 | 10 | 10 | ||||||
| Becton, Dickinson and Company 3.70% 6/6/2027 | 43 | 41 | ||||||
| Becton, Dickinson and Company 2.823% 5/20/2030 | 28 | 24 | ||||||
| Becton, Dickinson and Company 4.298% 8/22/2032 | 320 | 300 | ||||||
| Cigna Corp. 4.125% 11/15/2025 | 80 | 78 | ||||||
| EMD Finance, LLC 3.25% 3/19/20253 | 250 | 240 | ||||||
| Stryker Corp. 0.75% 3/1/2029 | EUR | 210 | 188 | |||||
| Takeda Pharmaceutical Company, Ltd. 2.25% 11/21/2026 | 100 | 102 | ||||||
| UnitedHealth Group, Inc. 4.00% 5/15/2029 | USD | 135 | 129 | |||||
| 1,652 | ||||||||
| Communication services 0.42% | ||||||||
| AT&T, Inc. 2.75% 6/1/2031 | 375 | 312 | ||||||
| AT&T, Inc. 2.55% 12/1/2033 | 64 | 49 | ||||||
| Comcast Corp. 0% 9/14/2026 | EUR | 100 | 94 | |||||
| Deutsche Telekom International Finance BV 9.25% 6/1/2032 | USD | 45 | 56 | |||||
| Netflix, Inc. 3.875% 11/15/20299 | EUR | 200 | 201 | |||||
| Orange SA 9.00% 3/1/20318 | USD | 65 | 80 | |||||
| T-Mobile US, Inc. 2.05% 2/15/2028 | 200 | 172 | ||||||
| Verizon Communications, Inc. 0.375% 3/22/2029 | EUR | 140 | 121 | |||||
| 168 | American Funds Insurance Series |
American Funds Global Balanced Fund (continued)
(formerly Global Balanced Fund)
| Bonds, notes & other debt instruments (continued) | Principal amount (000) |
Value (000) |
||||||
| Corporate bonds, notes & loans (continued) | ||||||||
| Communication services (continued) | ||||||||
| Verizon Communications, Inc. 2.55% 3/21/2031 | USD | 325 | $ | 268 | ||||
| Verizon Communications, Inc. 0.75% 3/22/2032 | EUR | 100 | 80 | |||||
| WarnerMedia Holdings, Inc. 5.05% 3/15/20423 | USD | 168 | 129 | |||||
| 1,562 | ||||||||
| Information technology 0.38% | ||||||||
| Apple, Inc. 3.35% 8/8/2032 | 580 | 528 | ||||||
| Broadcom, Inc. 4.00% 4/15/20293 | 21 | 19 | ||||||
| Broadcom, Inc. 4.15% 11/15/2030 | 70 | 63 | ||||||
| Broadcom, Inc. 3.419% 4/15/20333 | 53 | 43 | ||||||
| Broadcom, Inc. 3.137% 11/15/20353 | 15 | 11 | ||||||
| Lenovo Group, Ltd. 5.875% 4/24/2025 | 269 | 262 | ||||||
| Mastercard, Inc. 2.00% 11/18/2031 | 102 | 82 | ||||||
| Microsoft Corp. 2.40% 8/8/2026 | 187 | 175 | ||||||
| Oracle Corp. 2.65% 7/15/2026 | 216 | 199 | ||||||
| 1,382 | ||||||||
| Industrials 0.32% | ||||||||
| Boeing Company 4.508% 5/1/2023 | 400 | 399 | ||||||
| Canadian Pacific Railway, Ltd. 3.10% 12/2/2051 | 164 | 111 | ||||||
| Carrier Global Corp. 2.242% 2/15/2025 | 6 | 6 | ||||||
| Carrier Global Corp. 2.493% 2/15/2027 | 7 | 6 | ||||||
| CSX Corp. 3.80% 4/15/2050 | 6 | 5 | ||||||
| CSX Corp. 2.50% 5/15/2051 | 75 | 46 | ||||||
| Lima Metro Line 2 Finance, Ltd. 5.875% 7/5/20343 | 95 | 92 | ||||||
| MISC Capital Two (Labuan), Ltd. 3.75% 4/6/20273 | 200 | 181 | ||||||
| Singapore Airlines, Ltd. 3.375% 1/19/2029 | 200 | 181 | ||||||
| United Technologies Corp. 4.125% 11/16/2028 | 170 | 163 | ||||||
| 1,190 | ||||||||
| Consumer staples 0.26% | ||||||||
| Altria Group, Inc. 2.20% 6/15/2027 | EUR | 270 | 260 | |||||
| Anheuser-Busch InBev NV 4.00% 4/13/2028 | USD | 100 | 95 | |||||
| Anheuser-Busch InBev NV 4.75% 1/23/2029 | 220 | 218 | ||||||
| British American Tobacco PLC 3.215% 9/6/2026 | 62 | 57 | ||||||
| British American Tobacco PLC 4.70% 4/2/2027 | 67 | 64 | ||||||
| British American Tobacco PLC 3.557% 8/15/2027 | 105 | 96 | ||||||
| British American Tobacco PLC 3.462% 9/6/2029 | 75 | 65 | ||||||
| Philip Morris International, Inc. 5.75% 11/17/2032 | 110 | 113 | ||||||
| 968 | ||||||||
| Energy 0.24% | ||||||||
| Canadian Natural Resources, Ltd. 2.95% 7/15/2030 | 161 | 136 | ||||||
| Halliburton Company 3.80% 11/15/2025 | 2 | 2 | ||||||
| Kinder Morgan, Inc. 4.30% 6/1/2025 | 165 | 162 | ||||||
| Petróleos Mexicanos 6.75% 9/21/2047 | 107 | 69 | ||||||
| Qatar Petroleum 3.125% 7/12/20413 | 270 | 208 | ||||||
| Statoil ASA 3.70% 3/1/2024 | 50 | 49 | ||||||
| TransCanada Corp. 5.875% 8/15/2076 (3-month USD-LIBOR + 4.64% on 8/15/2026)8 | 288 | 275 | ||||||
| 901 | ||||||||
| Real estate 0.14% | ||||||||
| American Tower Corp. 0.875% 5/21/2029 | EUR | 250 | 214 | |||||
| Equinix, Inc. 2.15% 7/15/2030 | USD | 176 | 140 | |||||
| Essex Portfolio, LP 3.50% 4/1/2025 | 120 | 116 | ||||||
| Essex Portfolio, LP 3.375% 4/15/2026 | 40 | 38 | ||||||
| 508 | ||||||||
| American Funds Insurance Series | 169 |
American Funds Global Balanced Fund (continued)
(formerly Global Balanced Fund)
| Bonds, notes & other debt instruments (continued) | Principal amount (000) |
Value (000) |
||||||
| Corporate bonds, notes & loans (continued) | ||||||||
| Materials 0.12% | ||||||||
| Celanese US Holdings, LLC 5.337% 1/19/2029 | EUR | 300 | $ | 305 | ||||
| Celanese US Holdings, LLC 6.379% 7/15/2032 | USD | 50 | 48 | |||||
| Vale Overseas, Ltd. 3.75% 7/8/2030 | 94 | 82 | ||||||
| 435 | ||||||||
| Total corporate bonds, notes & loans | 20,755 | |||||||
| Mortgage-backed obligations 2.58% | ||||||||
| Federal agency mortgage-backed obligations 1.56% | ||||||||
| Fannie Mae Pool #FM7100 3.50% 6/1/205010 | 350 | 324 | ||||||
| Fannie Mae Pool #CB2402 2.50% 12/1/205110 | 315 | 267 | ||||||
| Fannie Mae Pool #BV9612 2.50% 4/1/205210 | 271 | 230 | ||||||
| Fannie Mae Pool #FS2555 4.50% 7/1/205210 | 148 | 143 | ||||||
| Fannie Mae Pool #MA4732 4.00% 9/1/205210 | 471 | 442 | ||||||
| Fannie Mae Pool #BW3812 4.50% 9/1/205210 | 120 | 116 | ||||||
| Fannie Mae Pool #MA4784 4.50% 10/1/205210 | 135 | 130 | ||||||
| Fannie Mae Pool #BW7796 5.00% 10/1/205210 | 840 | 829 | ||||||
| Fannie Mae Pool #BW1299 4.00% 11/1/205210 | 57 | 53 | ||||||
| Fannie Mae Pool #BW1385 4.00% 12/1/205210 | 290 | 272 | ||||||
| Freddie Mac Pool #ZJ9038 5.00% 6/1/202310 | — | 11 | — | 11 | ||||
| Freddie Mac Pool #QE8253 4.50% 8/1/205210 | 200 | 193 | ||||||
| Freddie Mac Pool #SD8256 4.00% 10/1/205210 | 100 | 94 | ||||||
| Freddie Mac Pool #SD8257 4.50% 10/1/205210 | 513 | 494 | ||||||
| Freddie Mac Pool #QF2182 4.50% 10/1/205210 | 84 | 81 | ||||||
| Freddie Mac Pool #QF3955 4.00% 12/1/205210 | 238 | 224 | ||||||
| Freddie Mac Pool #SD8275 4.50% 12/1/205210 | 75 | 72 | ||||||
| Freddie Mac, Series K153, Class A2, Multi Family, 3.82% 1/25/203310 | 580 | 546 | ||||||
| Government National Mortgage Assn. 3.50% 1/1/205310,12 | 1,350 | 1,241 | ||||||
| 5,751 | ||||||||
| Other mortgage-backed securities 1.02% | ||||||||
| Nordea Kredit 0.50% 10/1/204010 | DKK | 1,615 | 181 | |||||
| Nykredit Realkredit AS, Series 01E, 1.50% 10/1/203710 | 502 | 62 | ||||||
| Nykredit Realkredit AS, Series 01E, 0.50% 10/1/204010 | 7,234 | 809 | ||||||
| Nykredit Realkredit AS, Series 01E, 1.50% 10/1/204010 | 1,281 | 158 | ||||||
| Nykredit Realkredit AS, Series 01E, 0.50% 10/1/204310 | 20,442 | 2,228 | ||||||
| Nykredit Realkredit AS, Series 01E, 0.50% 10/1/205010 | 1,365 | 136 | ||||||
| Nykredit Realkredit AS, Series CCE, 1.00% 10/1/205010 | 590 | 63 | ||||||
| Nykredit Realkredit AS, Series 01E, 1.00% 10/1/205310 | 862 | 90 | ||||||
| Realkredit Danmark AS 1.00% 10/1/205310 | 194 | 20 | ||||||
| 3,747 | ||||||||
| Total mortgage-backed obligations | 9,498 | |||||||
| Asset-backed obligations 0.63% | ||||||||
| AmeriCredit Automobile Receivables Trust, Series 2022-2, Class A2B, (30-day Average USD-SOFR + 1.15%) 4.958% 12/18/202510,13 | USD | 203 | 203 | |||||
| CarMax Auto Owner Trust, Series 2022-3, Class A2B, (30-day Average USD-SOFR + 0.77%) 4.577% 9/15/202510,13 | 128 | 128 | ||||||
| Exeter Automobile Receivables Trust, Series 2022-3A, Class A2, 3.45% 8/15/202410 | 56 | 56 | ||||||
| Exeter Automobile Receivables Trust, Series 2022-4A, Class A2, 3.99% 8/15/202410 | 66 | 66 | ||||||
| Ford Credit Auto Owner Trust, Series 2022-B, Class A2B, (30-day Average USD-SOFR + 0.60%) 4.407% 2/15/202510,13 | 111 | 111 | ||||||
| GM Financial Automobile Leasing Trust, Series 2022-3, Class A2B, (30-day Average USD-SOFR + 0.71%) 4.536% 10/21/202410,13 | 110 | 110 | ||||||
| GM Financial Consumer Automobile Receivables Trust, Series 2022-3, Class A2B, (30-day Average USD-SOFR + 0.60%) 4.408% 9/16/202510,13 | 121 | 121 | ||||||
| Hyundai Auto Receivables Trust, Series 2022-B, Class A2B, (30-day Average USD-SOFR + 0.58%) 4.387% 5/15/202510,13 | 120 | 120 | ||||||
| 170 | American Funds Insurance Series |
American Funds Global Balanced Fund (continued)
(formerly Global Balanced Fund)
| Bonds, notes & other debt instruments (continued) | Principal amount (000) |
Value (000) |
||||||
| Asset-backed obligations (continued) | ||||||||
| Nissan Auto Lease Trust, Series 2021-A, Class A3, 0.52% 8/15/202410 | USD | 302 | $ | 295 | ||||
| Nissan Auto Lease Trust, Series 2022-A, Class A2B, (30-day Average USD-SOFR + 0.68%) 4.487% 8/15/202410,13 | 283 | 283 | ||||||
| Santander Drive Auto Receivables Trust, Series 2022-4, Class A2, 4.05% 7/15/202510 | 193 | 193 | ||||||
| Toyota Auto Receivables Owner Trust, Series 2022-C, Class A2B, (1-month USD-SOFR + 0.57%) 4.377% 8/15/202510,13 | 40 | 40 | ||||||
| Verizon Master Trust, Series 2022-3, Class A, 3.01% 5/20/2027 (3.76% on 11/20/2023)8,10 | 250 | 245 | ||||||
| Volkswagen Auto Lease Trust, Series 2022-A, Class A2, 3.02% 10/21/202410 | 155 | 153 | ||||||
| Westlake Automobile Receivables Trust, Series 2022-2A, Class A2A, 3.36% 8/15/20253,10 | 181 | 180 | ||||||
| 2,304 | ||||||||
| Municipals 0.04% | ||||||||
| Ohio 0.02% | ||||||||
| Turnpike and Infrastructure Commission, Turnpike Rev. Ref. Bonds (Infrastructure Projects), Series 2020-A, 3.216% 2/15/2048 | 100 | 72 | ||||||
| Texas 0.02% | ||||||||
| Grand Parkway Transportation Corp., Grand Parkway System Toll Rev. Ref. Bonds, Series 2020-B, 3.236% 10/1/2052 | 80 | 57 | ||||||
| Total municipals | 129 | |||||||
| Total bonds, notes & other debt instruments (cost: $141,023,000) | 125,742 | |||||||
| Short-term securities 4.34% | Weighted average yield at acquisition |
|||||||||||
| Commercial paper 3.27% | ||||||||||||
| British Columbia (Province of) 1/23/2023 | 3.996 | % | 2,560 | 2,553 | ||||||||
| KfW 1/27/20233 | 3.890 | 4,500 | 4,485 | |||||||||
| Toronto-Dominion Bank 1/27/20233 | 4.132 | 5,000 | 4,983 | |||||||||
| 12,021 | ||||||||||||
| Shares | ||||||||||||
| Money market investments 1.07% | ||||||||||||
| Capital Group Central Cash Fund 4.31%2,14 | 39,285 | 3,928 | ||||||||||
| Total short-term securities (cost: $15,953,000) | 15,949 | |||||||||||
| Total investment securities 99.35% (cost: $359,847,000) | 365,361 | |||||||||||
| Other assets less liabilities 0.65% | 2,399 | |||||||||||
| Net assets 100.00% | $ | 367,760 | ||||||||||
| American Funds Insurance Series | 171 |
American Funds Global Balanced Fund (continued)
(formerly Global Balanced Fund)
Futures contracts
| Contracts | Type | Number of contracts |
Expiration | Notional amount (000) |
Value and unrealized appreciation (depreciation) at 12/31/2022 (000) |
||||||||||
| 2 Year U.S. Treasury Note Futures | Long | 5 | March 2023 | USD1,025 | $ | 1 | |||||||||
| 5 Year Euro-Bobl Futures | Long | 49 | March 2023 | 6,071 | (205 | ) | |||||||||
| 5 Year U.S. Treasury Note Futures | Long | 95 | March 2023 | 10,253 | (8 | ) | |||||||||
| 10 Year Euro-Bund Futures | Long | 14 | March 2023 | 1,992 | (128 | ) | |||||||||
| 10 Year Italy Government Bond Futures | Short | 1 | March 2023 | (116 | ) | 9 | |||||||||
| 10 Year Japanese Government Bond Futures | Short | 1 | March 2023 | (1,108 | ) | 23 | |||||||||
| 10 Year Australian Treasury Bond Futures | Long | 4 | March 2023 | 315 | (19 | ) | |||||||||
| 10 Year Ultra U.S. Treasury Note Futures | Long | 6 | March 2023 | 710 | (6 | ) | |||||||||
| 10 Year U.S. Treasury Note Futures | Short | 6 | March 2023 | (674 | ) | 4 | |||||||||
| 10 Year UK Gilt Futures | Short | 2 | March 2023 | (241 | ) | 15 | |||||||||
| 20 Year U.S. Treasury Bond Futures | Long | 4 | March 2023 | 501 | (11 | ) | |||||||||
| 30 Year Euro-Buxl Futures | Long | 2 | March 2023 | 290 | (54 | ) | |||||||||
| 30 Year Ultra U.S. Treasury Bond Futures | Short | 6 | March 2023 | (806 | ) | 6 | |||||||||
| $ | (373 | ) | |||||||||||||
Forward currency contracts
| Contract amount | Unrealized appreciation (depreciation) |
||||||||||||||
| Currency purchased (000) |
Currency sold (000) |
Counterparty | Settlement date |
at 12/31/2022 (000) |
|||||||||||
| KRW | 1,761,900 | USD | 1,337 | Citibank | 1/9/2023 | $ | 63 | ||||||||
| USD | 687 | KRW | 894,770 | Bank of America | 1/9/2023 | (23 | ) | ||||||||
| EUR | 2,560 | DKK | 19,040 | Standard Chartered Bank | 1/10/2023 | (1 | ) | ||||||||
| USD | 203 | NZD | 320 | HSBC Bank | 1/10/2023 | (1 | ) | ||||||||
| SEK | 1,270 | USD | 122 | UBS AG | 1/10/2023 | (1 | ) | ||||||||
| USD | 511 | MYR | 2,250 | JPMorgan Chase | 1/10/2023 | (3 | ) | ||||||||
| USD | 640 | AUD | 950 | HSBC Bank | 1/10/2023 | (7 | ) | ||||||||
| USD | 445 | MXN | 8,853 | Goldman Sachs | 1/10/2023 | (8 | ) | ||||||||
| EUR | 4,105 | USD | 4,324 | Goldman Sachs | 1/12/2023 | 74 | |||||||||
| CAD | 1,450 | USD | 1,063 | HSBC Bank | 1/12/2023 | 8 | |||||||||
| USD | 74 | CAD | 100 | HSBC Bank | 1/12/2023 | — | 11 | ||||||||
| NZD | 470 | USD | 299 | Morgan Stanley | 1/12/2023 | (1 | ) | ||||||||
| USD | 1,585 | EUR | 1,500 | BNP Paribas | 1/12/2023 | (21 | ) | ||||||||
| JPY | 169,239 | USD | 1,256 | Bank of America | 1/13/2023 | 35 | |||||||||
| JPY | 89,090 | USD | 656 | Bank of America | 1/13/2023 | 24 | |||||||||
| USD | 278 | COP | 1,337,640 | Citibank | 1/13/2023 | 3 | |||||||||
| USD | 563 | CAD | 760 | Standard Chartered Bank | 1/13/2023 | 2 | |||||||||
| USD | 98 | GBP | 80 | Morgan Stanley | 1/13/2023 | 1 | |||||||||
| GBP | 240 | USD | 292 | Bank of New York Mellon | 1/13/2023 | (2 | ) | ||||||||
| USD | 303 | MXN | 6,020 | UBS AG | 1/13/2023 | (5 | ) | ||||||||
| JPY | 466,020 | USD | 3,428 | Standard Chartered Bank | 1/20/2023 | 133 | |||||||||
| JPY | 81,321 | AUD | 890 | HSBC Bank | 1/20/2023 | 15 | |||||||||
| JPY | 51,480 | USD | 380 | Standard Chartered Bank | 1/20/2023 | 14 | |||||||||
| USD | 112 | CLP | 100,000 | Bank of America | 1/23/2023 | (6 | ) | ||||||||
| USD | 564 | BRL | 3,025 | Citibank | 1/23/2023 | (7 | ) | ||||||||
| JPY | 118,440 | USD | 821 | Standard Chartered Bank | 1/27/2023 | 85 | |||||||||
| JPY | 172,080 | USD | 1,271 | BNP Paribas | 1/27/2023 | 46 | |||||||||
| JPY | 45,290 | USD | 313 | UBS AG | 1/27/2023 | 33 | |||||||||
| JPY | 78,800 | USD | 585 | Goldman Sachs | 1/27/2023 | 18 | |||||||||
| PLN | 4,260 | USD | 922 | Citibank | 2/2/2023 | 47 | |||||||||
| 172 | American Funds Insurance Series |
American Funds Global Balanced Fund (continued)
(formerly Global Balanced Fund)
Forward currency contracts (continued)
| Contract amount | Unrealized appreciation |
||||||||||||||
| Currency purchased (000) |
Currency sold (000) |
Counterparty | Settlement date |
(depreciation) at 12/31/2022 (000) |
|||||||||||
| USD | 245 | PLN | 1,150 | UBS AG | 2/2/2023 | $ | (17 | ) | |||||||
| USD | 420 | PLN | 1,940 | Citibank | 2/2/2023 | (21 | ) | ||||||||
| PLN | 1,940 | USD | 468 | BNP Paribas | 2/2/2023 | (26 | ) | ||||||||
| KRW | 405,540 | USD | 307 | Standard Chartered Bank | 2/28/2023 | 16 | |||||||||
| CNH | 8,530 | USD | 1,218 | Standard Chartered Bank | 3/6/2023 | 22 | |||||||||
| JPY | 76,110 | USD | 565 | BNP Paribas | 3/6/2023 | 20 | |||||||||
| EUR | 720 | USD | 757 | Bank of America | 3/6/2023 | 17 | |||||||||
| KRW | 347,180 | USD | 267 | HSBC Bank | 3/6/2023 | 10 | |||||||||
| $ | 536 | ||||||||||||||
Swap contracts
Interest rate swaps
Centrally cleared interest rate swaps
| Receive | Pay | Notional | Value at | Upfront premium |
Unrealized (depreciation) appreciation |
|||||||||||||||||||||
| Rate | Payment frequency |
Rate | Payment frequency |
Expiration date |
amount (000) |
12/31/2022 (000) |
paid (000) |
at 12/31/2022 (000) |
||||||||||||||||||
| 1.2475% | Semi-annual | 3-month NZD-BBR-FRA | Quarterly | 8/20/2023 | NZD | 375 | $ | (6 | ) | $ | — | $ | (6 | ) | ||||||||||||
| 1.234974% | Semi-annual | 3-month NZD-BBR-FRA | Quarterly | 8/20/2023 | 3,197 | (51 | ) | — | (51 | ) | ||||||||||||||||
| 1.2375% | Semi-annual | 3-month NZD-BBR-FRA | Quarterly | 8/26/2023 | 1,178 | (20 | ) | — | (20 | ) | ||||||||||||||||
| 1.264% | Semi-annual | 3-month NZD-BBR-FRA | Quarterly | 8/27/2023 | 2,945 | (48 | ) | — | (48 | ) | ||||||||||||||||
| 1.26% | Semi-annual | 3-month NZD-BBR-FRA | Quarterly | 8/30/2023 | 486 | (8 | ) | — | (8 | ) | ||||||||||||||||
| 1.28% | Semi-annual | 3-month NZD-BBR-FRA | Quarterly | 8/31/2023 | 486 | (8 | ) | — | (8 | ) | ||||||||||||||||
| 1.30% | Semi-annual | 3-month NZD-BBR-FRA | Quarterly | 9/3/2023 | 533 | (9 | ) | — | (9 | ) | ||||||||||||||||
| 1.4975% | Semi-annual | 3-month NZD-BBR-FRA | Quarterly | 9/21/2023 | 1,001 | (17 | ) | — | (17 | ) | ||||||||||||||||
| 1.445% | Semi-annual | 3-month NZD-BBR-FRA | Quarterly | 9/28/2023 | 1,000 | (18 | ) | — | (18 | ) | ||||||||||||||||
| 1.4475% | Semi-annual | 3-month NZD-BBR-FRA | Quarterly | 9/29/2023 | 1,019 | (19 | ) | — | (19 | ) | ||||||||||||||||
| 1.4475% | Semi-annual | 3-month NZD-BBR-FRA | Quarterly | 9/30/2023 | 1,023 | (19 | ) | — | (19 | ) | ||||||||||||||||
| 1.5125% | Semi-annual | 3-month NZD-BBR-FRA | Quarterly | 10/14/2023 | 904 | (17 | ) | — | (17 | ) | ||||||||||||||||
| 1.53% | Semi-annual | 3-month NZD-BBR-FRA | Quarterly | 10/14/2023 | 1,031 | (20 | ) | — | (20 | ) | ||||||||||||||||
| 1.5625% | Semi-annual | 3-month NZD-BBR-FRA | Quarterly | 10/15/2023 | 1,029 | (19 | ) | — | (19 | ) | ||||||||||||||||
| 1.59% | Semi-annual | 3-month NZD-BBR-FRA | Quarterly | 10/18/2023 | 1,029 | (19 | ) | — | (19 | ) | ||||||||||||||||
| 1.62% | Semi-annual | 3-month NZD-BBR-FRA | Quarterly | 10/19/2023 | 1,144 | (21 | ) | — | (21 | ) | ||||||||||||||||
| 3.7697% | Semi-annual | 3-month NZD-BBR-FRA | Quarterly | 11/6/2023 | 5,500 | (47 | ) | — | (47 | ) | ||||||||||||||||
| 2.24% | Semi-annual | 3-month NZD-BBR-FRA | Quarterly | 11/8/2023 | 1,463 | (24 | ) | — | (24 | ) | ||||||||||||||||
| 2.2525% | Semi-annual | 3-month NZD-BBR-FRA | Quarterly | 11/8/2023 | 1,463 | (24 | ) | — | (24 | ) | ||||||||||||||||
| 2.20% | Semi-annual | 3-month NZD-BBR-FRA | Quarterly | 11/9/2023 | 123 | (2 | ) | — | (2 | ) | ||||||||||||||||
| 2.495% | Annual | SONIA | Annual | 5/5/2024 | GBP | 3,050 | (77 | ) | — | (77 | ) | |||||||||||||||
| 2.42% | Annual | SONIA | Annual | 5/5/2024 | 6,100 | (160 | ) | — | (160 | ) | ||||||||||||||||
| 2.9588% | Annual | SONIA | Annual | 6/9/2024 | 4,180 | (84 | ) | — | (84 | ) | ||||||||||||||||
| SONIA | Annual | 5.6325% | Annual | 9/25/2024 | 7,720 | (88 | ) | — | (88 | ) | ||||||||||||||||
| 6.59% | 28-day | 28-day MXN-TIIE | 28-day | 6/25/2026 | MXN | 2,000 | (7 | ) | — | (7 | ) | |||||||||||||||
| 6.585% | 28-day | 28-day MXN-TIIE | 28-day | 6/25/2026 | 2,600 | (10 | ) | — | (10 | ) | ||||||||||||||||
| 6.64% | 28-day | 28-day MXN-TIIE | 28-day | 6/25/2026 | 3,200 | (12 | ) | — | (12 | ) | ||||||||||||||||
| 6.6175% | 28-day | 28-day MXN-TIIE | 28-day | 6/25/2026 | 8,600 | (31 | ) | — | (31 | ) | ||||||||||||||||
| 6.633% | 28-day | 28-day MXN-TIIE | 28-day | 6/25/2026 | 8,900 | (32 | ) | — | (32 | ) | ||||||||||||||||
| 6.58% | 28-day | 28-day MXN-TIIE | 28-day | 6/25/2026 | 11,300 | (42 | ) | — | (42 | ) | ||||||||||||||||
| 7.59% | 28-day | 28-day MXN-TIIE | 28-day | 10/29/2026 | 2,500 | (6 | ) | — | (6 | ) | ||||||||||||||||
| 7.62% | 28-day | 28-day MXN-TIIE | 28-day | 10/29/2026 | 3,701 | (8 | ) | — | (8 | ) | ||||||||||||||||
| 7.66% | 28-day | 28-day MXN-TIIE | 28-day | 10/29/2026 | 6,100 | (13 | ) | — | (13 | ) | ||||||||||||||||
| American Funds Insurance Series | 173 |
American Funds Global Balanced Fund (continued)
(formerly Global Balanced Fund)
Swap contracts (continued)
Interest rate swaps (continued)
Centrally cleared interest rate swaps (continued)
| Receive | Pay | Notional | Value at | Upfront premium |
Unrealized (depreciation) appreciation |
|||||||||||||||||||||
| Rate | Payment frequency |
Rate | Payment frequency |
Expiration date |
amount (000) |
12/31/2022 (000) |
paid (000) |
at 12/31/2022 (000) |
||||||||||||||||||
| 7.64% | 28-day | 28-day MXN-TIIE | 28-day | 10/29/2026 | MXN | 6,000 | $ | (13 | ) | $ | — | $ | (13 | ) | ||||||||||||
| 7.52% | 28-day | 28-day MXN-TIIE | 28-day | 10/30/2026 | 7,639 | (18 | ) | — | (18 | ) | ||||||||||||||||
| 9.07% | 28-day | 28-day MXN-TIIE | 28-day | 4/28/2027 | 20,400 | 8 | — | 8 | ||||||||||||||||||
| $ | (1,009 | ) | $ | — | $ | (1,009 | ) | |||||||||||||||||||
Credit default swaps
Centrally cleared credit default swaps on credit indices — sell protection
| Financing rate received |
Payment frequency |
Reference index |
Expiration date |
Notional amount (000) |
15 | Value at 12/31/2022 (000) |
16 | Upfront premium paid (000) |
Unrealized appreciation at 12/31/2022 (000) |
|||||||||||||||||
| 1.00% | Quarterly | CDX.NA.IG.39 | 12/20/2027 | USD | 2,580 | $ | 20 | $ | 13 | $ | 7 | |||||||||||||||
Investments in affiliates2
| Value of affiliates at 1/1/2022 (000) |
Additions (000) |
Reductions (000) |
Net realized gain (000) |
Net unrealized appreciation (000) |
Value of affiliates at 12/31/2022 (000) |
Dividend income (000) |
||||||||||||||||||||||
| Investment funds 1.50% | ||||||||||||||||||||||||||||
| Capital Group Central Corporate Bond Fund | $ | — | $ | 5,481 | $ | — | $ | — | $ | 51 | $ | 5,532 | $ | 50 | ||||||||||||||
| Short-term securities 1.07% | ||||||||||||||||||||||||||||
| Money market investments 1.07% | ||||||||||||||||||||||||||||
| Capital Group Central Cash Fund 4.31%14 | 1,127 | 144,034 | 141,236 | 3 | — | 3,928 | 343 | |||||||||||||||||||||
| Total 2.57% | $ | 3 | $ | 51 | $ | 9,460 | $ | 393 | ||||||||||||||||||||
Restricted securities9
| Acquisition date(s) |
Cost (000) |
Value (000) |
Percent of net assets |
|||||||||||||
| Netflix, Inc. 3.875% 11/15/2029 | 7/11/20222-7/12/2022 | $ | 191 | $ | 201 | .06 | % | |||||||||
| Goldman Sachs Group, Inc. 1.00% 3/18/2033 | 5/19/2021 | 251 | 162 | .04 | ||||||||||||
| Total | $ | 442 | $ | 363 | .10 | % | ||||||||||
| 174 | American Funds Insurance Series |
American Funds Global Balanced Fund (continued)
(formerly Global Balanced Fund)
| 1 | Security did not produce income during the last 12 months. |
| 2 | Part of the same “group of investment companies” as the fund as defined under the Investment Company Act of 1940, as amended. |
| 3 | Acquired in a transaction exempt from registration under Rule 144A or, for commercial paper, Section 4(a)(2) of the Securities Act of 1933. May be resold in the U.S. in transactions exempt from registration, normally to qualified institutional buyers. The total value of all such securities was $14,344,000, which represented 3.90% of the net assets of the fund. |
| 4 | Index-linked bond whose principal amount moves with a government price index. |
| 5 | Scheduled interest and/or principal payment was not received. |
| 6 | Value determined using significant unobservable inputs. |
| 7 | All or a portion of this security was pledged as collateral. The total value of pledged collateral was $758,000, which represented .21% of the net assets of the fund. |
| 8 | Step bond; coupon rate may change at a later date. |
| 9 | Restricted security, other than Rule 144A securities or commercial paper issued pursuant to Section 4(a)(2) of the Securities Act of 1933. The total value of all such restricted securities was $363,000, which represented .10% of the net assets of the fund. |
| 10 | Principal payments may be made periodically. Therefore, the effective maturity date may be earlier than the stated maturity date. |
| 11 | Amount less than one thousand. |
| 12 | Purchased on a TBA basis. |
| 13 | Coupon rate may change periodically. Reference rate and spread are as of the most recent information available. Some coupon rates are determined by the issuer or agent based on current market conditions; therefore, the reference rate and spread are not available. |
| 14 | Rate represents the seven-day yield at 12/31/2022. |
| 15 | The maximum potential amount the fund may pay as a protection seller should a credit event occur. |
| 16 | The prices and resulting values for credit default swap indices serve as an indicator of the current status of the payment/performance risk. As the value of a sell protection credit default swap increases or decreases, when compared to the notional amount of the swap, the payment/performance risk may decrease or increase, respectively. |
Key to abbreviations
ADR = American Depositary Receipts
Assn. = Association
AUD = Australian dollars
BBR = Bank Base Rate
BRL = Brazilian reais
CAD = Canadian dollars
CDI = CREST Depository Interest
CLP = Chilean pesos
CNH = Chinese yuan renminbi
CNY = Chinese yuan
COP = Colombian pesos
DKK = Danish kroner
EUR = Euros
EURIBOR = Euro Interbank Offered Rate
FRA = Forward Rate Agreement
GBP = British pounds
IDR = Indonesian rupiah
INR = Indian rupees
JPY = Japanese yen
KRW = South Korean won
LIBOR = London Interbank Offered Rate
MXN = Mexican pesos
MYR = Malaysian ringgits
NZD = New Zealand dollars
PLN = Polish zloty
Ref. = Refunding
REIT = Real Estate Investment Trust
Rev. = Revenue
RUB = Russian rubles
SEK = Swedish kronor
SOFR = Secured Overnight Financing Rate
SONIA = Sterling Overnight Interbank Average Rate
TBA = To be announced
TIIE = Equilibrium Interbank Interest Rate
USD = U.S. dollars
ZAR = South African rand
Refer to the notes to financial statements.
| American Funds Insurance Series | 175 |
The Bond Fund of America
Investment portfolio December 31, 2022
| Bonds, notes & other debt instruments 95.37% | Principal amount (000) |
Value (000) |
||||||
| Corporate bonds, notes & loans 34.59% | ||||||||
| Financials 9.65% | ||||||||
| ACE INA Holdings, Inc. 3.35% 5/3/2026 | USD | 2,025 | $ | 1,941 | ||||
| ACE INA Holdings, Inc. 4.35% 11/3/2045 | 2,220 | 1,933 | ||||||
| AerCap Ireland Capital DAC 1.65% 10/29/2024 | 5,996 | 5,535 | ||||||
| AerCap Ireland Capital DAC 6.50% 7/15/2025 | 1,798 | 1,824 | ||||||
| AerCap Ireland Capital DAC 1.75% 1/30/2026 | 2,841 | 2,503 | ||||||
| AerCap Ireland Capital DAC 2.45% 10/29/2026 | 10,289 | 9,010 | ||||||
| AerCap Ireland Capital DAC 3.00% 10/29/2028 | 10,345 | 8,686 | ||||||
| AerCap Ireland Capital DAC 3.30% 1/30/2032 | 11,338 | 8,891 | ||||||
| AerCap Ireland Capital DAC 3.40% 10/29/2033 | 5,120 | 3,896 | ||||||
| AerCap Ireland Capital DAC 3.85% 10/29/2041 | 1,254 | 891 | ||||||
| AerCap Ireland Capital, Ltd. / AerCap Global Aviation Trust 1.15% 10/29/2023 | 3,130 | 3,013 | ||||||
| Ally Financial, Inc. 5.125% 9/30/2024 | 1,500 | 1,486 | ||||||
| Ally Financial, Inc. 8.00% 11/1/2031 | 8,075 | 8,418 | ||||||
| American Express Co. 4.42% 8/3/2033 (USD-SOFR + 1.76% on 8/3/2032)1 | 4,501 | 4,265 | ||||||
| Arthur J. Gallagher & Co. 3.50% 5/20/2051 | 1,073 | 754 | ||||||
| Banco Santander, SA 5.147% 8/18/2025 | 4,000 | 3,960 | ||||||
| Banco Santander, SA 1.722% 9/14/2027 (1-year UST Yield Curve Rate T Note Constant Maturity + 0.90% on 9/14/2026)1 | 1,400 | 1,198 | ||||||
| Bank of America Corp. 1.53% 12/6/2025 (USD-SOFR + 0.65% on 12/6/2024)1 | 1,970 | 1,818 | ||||||
| Bank of America Corp. 1.658% 3/11/2027 (USD-SOFR + 0.91% on 3/11/2026)1 | 981 | 869 | ||||||
| Bank of America Corp. 1.734% 7/22/2027 (USD-SOFR + 0.96% on 7/22/2026)1 | 7,989 | 7,009 | ||||||
| Bank of America Corp. 4.376% 4/27/2028 (USD-SOFR + 1.58% on 4/27/2027)1 | 2,635 | 2,524 | ||||||
| Bank of America Corp. 4.948% 7/22/2028 (USD-SOFR + 2.04% on 7/22/2027)1 | 11,107 | 10,866 | ||||||
| Bank of America Corp. 6.204% 11/10/2028 (USD-SOFR + 1.99% on 11/10/2027)1 | 1,502 | 1,553 | ||||||
| Bank of America Corp. 3.419% 12/20/2028 (3-month USD-LIBOR + 1.04% on 12/20/2027)1 | 10,129 | 9,189 | ||||||
| Bank of America Corp. 2.087% 6/14/2029 (USD-SOFR + 1.06% on 6/14/2028)1 | 2,773 | 2,338 | ||||||
| Bank of America Corp. 1.922% 10/24/2031 (USD-SOFR + 1.37% on 10/24/2030)1 | 21,177 | 16,224 | ||||||
| Bank of America Corp. 2.687% 4/22/2032 (USD-SOFR + 1.32% on 4/22/2031)1 | 8,343 | 6,698 | ||||||
| Bank of America Corp. 2.299% 7/21/2032 (USD-SOFR + 1.22% on 7/21/2031)1 | 36,155 | 27,930 | ||||||
| Bank of America Corp. 2.572% 10/20/2032 (USD-SOFR + 1.21% on 10/20/2031)1 | 2,613 | 2,053 | ||||||
| Bank of America Corp. 2.972% 2/4/2033 (USD-SOFR + 1.33% on 2/4/2032)1 | 4,089 | 3,305 | ||||||
| Bank of America Corp. 4.571% 4/27/2033 (USD-SOFR + 1.83% on 4/27/2032)1 | 10,180 | 9,340 | ||||||
| Bank of America Corp. 5.015% 7/22/2033 (USD-SOFR + 2.16% on 7/22/2032)1 | 7,947 | 7,568 | ||||||
| Bank of Ireland Group PLC 6.253% 9/16/2026 (1-year UST Yield Curve Rate T Note Constant Maturity + 2.65% on 9/16/2025)1,2 | 4,850 | 4,814 | ||||||
| Barclays Bank PLC 5.304% 8/9/2026 (1-year UST Yield Curve Rate T Note Constant Maturity + 2.30% on 8/9/2025)1 | 4,525 | 4,496 | ||||||
| BNP Paribas SA 1.323% 1/13/2027 (USD-SOFR + 1.004% on 1/13/2026)1,2 | 7,581 | 6,634 | ||||||
| BNP Paribas SA 2.591% 1/20/2028 (USD-SOFR + 1.228% on 1/20/2027)1,2 | 13,134 | 11,569 | ||||||
| BNP Paribas SA 2.159% 9/15/2029 (USD-SOFR + 1.218% on 9/15/2028)1,2 | 3,594 | 2,936 | ||||||
| BNP Paribas SA 2.871% 4/19/2032 (USD-SOFR + 1.387% on 4/19/2031)1,2 | 4,177 | 3,276 | ||||||
| Canadian Imperial Bank of Commerce (CIBC) 3.60% 4/7/2032 | 1,303 | 1,152 | ||||||
| Capital One Financial Corp. 1.343% 12/6/2024 (USD-SOFR + 0.69% on 12/6/2023)1 | 4,525 | 4,334 | ||||||
| Capital One Financial Corp. 4.985% 7/24/2026 (USD-SOFR + 2.16% on 7/24/2025)1 | 2,430 | 2,382 | ||||||
| Capital One Financial Corp. 4.927% 5/10/2028 (USD-SOFR + 2.057% on 5/10/2027)1 | 4,650 | 4,509 | ||||||
| China Ping An Insurance Overseas (Holdings), Ltd. 2.85% 8/12/2031 | 1,126 | 880 | ||||||
| CIT Group, Inc. 3.929% 6/19/2024 (USD-SOFR + 3.827% on 6/19/2023)1 | 5,410 | 5,364 | ||||||
| Citigroup, Inc. 4.60% 3/9/2026 | 1,800 | 1,770 | ||||||
| Citigroup, Inc. 1.462% 6/9/2027 (USD-SOFR + 0.67% on 6/9/2026)1 | 8,740 | 7,591 | ||||||
| Citigroup, Inc. 3.07% 2/24/2028 (USD-SOFR + 1.28% on 2/24/2027)1 | 5,520 | 4,984 | ||||||
| Citigroup, Inc. 4.658% 5/24/2028 (USD-SOFR + 1.887% on 5/24/2027)1 | 3,386 | 3,282 | ||||||
| Citigroup, Inc. 3.057% 1/25/2033 (USD-SOFR + 1.351% on 1/25/2032)1 | 1,030 | 834 | ||||||
| Citigroup, Inc. 3.785% 3/17/2033 (USD-SOFR + 1.939% on 3/17/2032)1 | 5,350 | 4,590 | ||||||
| Citigroup, Inc. 4.91% 5/24/2033 (USD-SOFR + 2.086% on 5/24/2032)1 | 1,718 | 1,614 | ||||||
| Citigroup, Inc. 6.27% 11/17/2033 (USD-SOFR + 2.338% on 11/17/2032)1 | 2,781 | 2,878 | ||||||
| Corebridge Financial, Inc. 3.50% 4/4/20252 | 1,439 | 1,381 | ||||||
| Corebridge Financial, Inc. 3.65% 4/5/20272 | 4,493 | 4,195 | ||||||
| Corebridge Financial, Inc. 3.85% 4/5/20292 | 5,794 | 5,289 | ||||||
| Corebridge Financial, Inc. 3.90% 4/5/20322 | 5,959 | 5,221 | ||||||
| Corebridge Financial, Inc. 4.35% 4/5/20422 | 361 | 298 | ||||||
| 176 | American Funds Insurance Series |
The Bond Fund of America (continued)
| Bonds, notes & other debt instruments (continued) | Principal amount (000) |
Value (000) |
||||||
| Corporate bonds, notes & loans (continued) | ||||||||
| Financials (continued) | ||||||||
| Corebridge Financial, Inc. 4.40% 4/5/20522 | USD | 1,352 | $ | 1,078 | ||||
| Crédit Agricole SA 1.907% 6/16/2026 (USD-SOFR + 1.676% on 6/16/2025)1,2 | 4,450 | 4,060 | ||||||
| Crédit Agricole SA 1.247% 1/26/2027 (USD-SOFR + 0.892% on 1/26/2026)1,2 | 2,450 | 2,145 | ||||||
| Credit Suisse Group AG 3.80% 6/9/2023 | 15,327 | 14,927 | ||||||
| Credit Suisse Group AG 2.593% 9/11/2025 (USD-SOFR + 1.56% on 9/11/2024)1,2 | 850 | 752 | ||||||
| Credit Suisse Group AG 2.193% 6/5/2026 (USD-SOFR + 2.044% on 6/5/2025)1,2 | 7,609 | 6,505 | ||||||
| Credit Suisse Group AG 1.305% 2/2/2027 (USD-SOFR + 0.98% on 2/2/2026)1,2 | 11,200 | 8,973 | ||||||
| Credit Suisse Group AG 6.442% 8/11/2028 (USD-SOFR + 3.70% on 8/11/2027)1,2 | 1,265 | 1,154 | ||||||
| Credit Suisse Group AG 4.194% 4/1/2031 (USD-SOFR + 3.73% on 4/1/2030)1,2 | 5,476 | 4,262 | ||||||
| Credit Suisse Group AG 3.091% 5/14/2032 (USD-SOFR + 1.73% on 5/14/2031)1,2 | 7,369 | 5,106 | ||||||
| Credit Suisse Group AG 6.537% 8/12/2033 (USD-SOFR + 3.92% on 8/12/2032)1,2 | 576 | 507 | ||||||
| Credit Suisse Group AG 9.016% 11/15/2033 (USD-SOFR + 5.02% on 11/15/2032)1,2 | 6,658 | 6,835 | ||||||
| Danske Bank AS 1.549% 9/10/2027 (1-year UST Yield Curve Rate T Note Constant Maturity + 0.73% on 9/10/2026)1,2 | 2,990 | 2,565 | ||||||
| Danske Bank AS 4.298% 4/1/2028 (1-year UST Yield Curve Rate T Note Constant Maturity + 1.75% on 4/1/2027)1,2 | 2,975 | 2,740 | ||||||
| Deutsche Bank AG 3.95% 2/27/2023 | 6,350 | 6,328 | ||||||
| Deutsche Bank AG 0.898% 5/28/2024 | 2,500 | 2,339 | ||||||
| Deutsche Bank AG 3.70% 5/30/2024 | 5,150 | 5,007 | ||||||
| Deutsche Bank AG 2.222% 9/18/2024 (USD-SOFR + 2.159% on 9/18/2023)1 | 10,475 | 10,120 | ||||||
| Deutsche Bank AG 3.961% 11/26/2025 (USD-SOFR + 2.581% on 11/26/2024)1 | 3,673 | 3,512 | ||||||
| Deutsche Bank AG 4.10% 1/13/2026 | 7,305 | 7,029 | ||||||
| Deutsche Bank AG 4.10% 1/13/2026 | 857 | 824 | ||||||
| Deutsche Bank AG 2.129% 11/24/2026 (USD-SOFR + 1.87% on 11/24/2025)1 | 41,608 | 36,749 | ||||||
| Deutsche Bank AG 2.311% 11/16/2027 (USD-SOFR + 1.219% on 11/16/2026)1 | 4,315 | 3,664 | ||||||
| Deutsche Bank AG 2.552% 1/7/2028 (USD-SOFR + 1.318% on 1/7/2027)1 | 7,258 | 6,179 | ||||||
| Deutsche Bank AG 3.547% 9/18/2031 (USD-SOFR + 3.043% on 9/18/2030)1 | 2,900 | 2,331 | ||||||
| Discover Financial Services 6.70% 11/29/2032 | 1,475 | 1,504 | ||||||
| DNB Bank ASA 1.535% 5/25/2027 (5-year UST Yield Curve Rate T Note Constant Maturity + 0.72% on 5/25/2026)1,2 | 1,200 | 1,045 | ||||||
| GE Capital Funding, LLC 4.55% 5/15/2032 | 973 | 927 | ||||||
| Goldman Sachs Group, Inc. 1.431% 3/9/2027 (USD-SOFR + 0.795% on 3/9/2026)1 | 3,030 | 2,660 | ||||||
| Goldman Sachs Group, Inc. 1.542% 9/10/2027 (USD-SOFR + 0.818% on 9/10/2026)1 | 13,275 | 11,468 | ||||||
| Goldman Sachs Group, Inc. 1.948% 10/21/2027 (USD-SOFR + 0.913% on 10/21/2026)1 | 13,961 | 12,226 | ||||||
| Goldman Sachs Group, Inc. 2.64% 2/24/2028 (USD-SOFR + 1.114% on 2/24/2027)1 | 1,758 | 1,568 | ||||||
| Goldman Sachs Group, Inc. 3.615% 3/15/2028 (USD-SOFR + 1.846% on 3/15/2027)1 | 7,403 | 6,907 | ||||||
| Goldman Sachs Group, Inc. 4.482% 8/23/2028 (USD-SOFR + 1.725% on 8/23/2027)1 | 1,534 | 1,473 | ||||||
| Goldman Sachs Group, Inc. 3.814% 4/23/2029 (3-month USD-LIBOR + 1.158% on 4/23/2028)1 | 9,600 | 8,786 | ||||||
| Goldman Sachs Group, Inc. 3.102% 2/24/2033 (USD-SOFR + 1.41% on 2/24/2032)1 | 10,422 | 8,490 | ||||||
| Goldman Sachs Group, Inc. 2.908% 7/21/2042 (USD-SOFR + 1.40% on 7/21/2041)1 | 3,160 | 2,161 | ||||||
| Goldman Sachs Group, Inc. 5.30% junior subordinated perpetual bonds (3-month USD-LIBOR + 3.834% on 11/10/2026)1 | 1,750 | 1,665 | ||||||
| Groupe BPCE SA 2.75% 1/11/20232 | 6,875 | 6,871 | ||||||
| Groupe BPCE SA 5.70% 10/22/20232 | 28,166 | 27,963 | ||||||
| Groupe BPCE SA 5.15% 7/21/20242 | 5,481 | 5,369 | ||||||
| Groupe BPCE SA 1.625% 1/14/20252 | 2,980 | 2,776 | ||||||
| Groupe BPCE SA 1.652% 10/6/2026 (USD-SOFR + 1.52% on 10/6/2025)1,2 | 6,350 | 5,649 | ||||||
| Groupe BPCE SA 5.748% 7/19/2033 (USD-SOFR + 2.865% on 7/19/2032)1,2 | 6,195 | 5,908 | ||||||
| HSBC Holdings PLC 2.251% 11/22/2027 (USD-SOFR + 1.10% on 11/22/2026)1 | 5,270 | 4,571 | ||||||
| HSBC Holdings PLC 4.583% 6/19/2029 (3-month USD-LIBOR + 1.535% on 6/19/2028)1 | 6,410 | 5,913 | ||||||
| HSBC Holdings PLC 2.206% 8/17/2029 (USD-SOFR + 1.285% on 8/17/2028)1 | 5,917 | 4,786 | ||||||
| HSBC Holdings PLC 2.804% 5/24/2032 (USD-SOFR + 1.187% on 5/24/2031)1 | 5,250 | 4,074 | ||||||
| HSBC Holdings PLC 5.402% 8/11/2033 (USD-SOFR + 2.87% on 8/11/2032)1 | 3,595 | 3,339 | ||||||
| Huarong Finance 2017 Co., Ltd. 4.75% 4/27/2027 | 669 | 585 | ||||||
| Huarong Finance 2017 Co., Ltd. 4.25% 11/7/2027 | 6,335 | 5,422 | ||||||
| Huarong Finance 2019 Co., Ltd. (3-month USD-LIBOR + 1.125%) 5.824% 2/24/20233 | 2,750 | 2,741 | ||||||
| Huarong Finance 2019 Co., Ltd. (3-month USD-LIBOR + 1.25%) 6.007% 2/24/20253 | 397 | 374 | ||||||
| Huarong Finance II Co., Ltd. 5.50% 1/16/2025 | 6,669 | 6,328 | ||||||
| American Funds Insurance Series | 177 |
The Bond Fund of America (continued)
| Bonds, notes & other debt instruments (continued) | Principal amount (000) |
Value (000) |
||||||
| Corporate bonds, notes & loans (continued) | ||||||||
| Financials (continued) | ||||||||
| Huarong Finance II Co., Ltd. 5.00% 11/19/2025 | USD | 480 | $ | 444 | ||||
| Huarong Finance II Co., Ltd. 4.625% 6/3/2026 | 200 | 177 | ||||||
| Huarong Finance II Co., Ltd. 4.875% 11/22/2026 | 2,106 | 1,886 | ||||||
| Intercontinental Exchange, Inc. 4.35% 6/15/2029 | 8,710 | 8,433 | ||||||
| Intercontinental Exchange, Inc. 4.60% 3/15/2033 | 4,601 | 4,408 | ||||||
| Intercontinental Exchange, Inc. 4.95% 6/15/2052 | 5,327 | 4,963 | ||||||
| Intesa Sanpaolo SpA 3.375% 1/12/20232 | 10,035 | 10,030 | ||||||
| Intesa Sanpaolo SpA 5.017% 6/26/20242 | 68,143 | 65,545 | ||||||
| Intesa Sanpaolo SpA 3.25% 9/23/20242 | 770 | 731 | ||||||
| Intesa Sanpaolo SpA 5.71% 1/15/20262 | 15,400 | 14,816 | ||||||
| Intesa Sanpaolo SpA 3.875% 7/14/20272 | 6,250 | 5,581 | ||||||
| Intesa Sanpaolo SpA 3.875% 1/12/20282 | 1,986 | 1,753 | ||||||
| Iron Mountain Information Management Services, Inc. 5.00% 7/15/20322 | 2,060 | 1,714 | ||||||
| JPMorgan Chase & Co. 0.969% 6/23/2025 (USD-SOFR + 0.58% on 6/23/2024)1 | 5,870 | 5,475 | ||||||
| JPMorgan Chase & Co. 1.561% 12/10/2025 (USD-SOFR + 0.605% on 12/10/2024)1 | 11,105 | 10,289 | ||||||
| JPMorgan Chase & Co. 4.08% 4/26/2026 (USD-SOFR + 1.32% on 4/26/2025)1 | 3,620 | 3,518 | ||||||
| JPMorgan Chase & Co. 1.578% 4/22/2027 (USD-SOFR + 0.885% on 4/22/2026)1 | 1,832 | 1,612 | ||||||
| JPMorgan Chase & Co. 1.47% 9/22/2027 (USD-SOFR + 0.765% on 9/22/2026)1 | 5,965 | 5,172 | ||||||
| JPMorgan Chase & Co. 2.947% 2/24/2028 (USD-SOFR + 1.17% on 2/24/2027)1 | 4,350 | 3,941 | ||||||
| JPMorgan Chase & Co. 4.323% 4/26/2028 (USD-SOFR + 1.56% on 4/26/2027)1 | 12,080 | 11,555 | ||||||
| JPMorgan Chase & Co. 4.851% 7/25/2028 (USD-SOFR + 1.99% on 7/25/2027)1 | 8,465 | 8,265 | ||||||
| JPMorgan Chase & Co. 3.509% 1/23/2029 (3-month USD-LIBOR + 0.945% on 1/23/2028)1 | 9,600 | 8,729 | ||||||
| JPMorgan Chase & Co. 2.069% 6/1/2029 (USD-SOFR + 1.015% on 6/1/2028)1 | 2,453 | 2,053 | ||||||
| JPMorgan Chase & Co. 4.203% 7/23/2029 (3-month USD-LIBOR + 1.26% on 7/23/2028)1 | 11,980 | 11,186 | ||||||
| JPMorgan Chase & Co. 2.522% 4/22/2031 (USD-SOFR + 2.04% on 4/22/2030)1 | 1,766 | 1,449 | ||||||
| JPMorgan Chase & Co. 2.58% 4/22/2032 (USD-SOFR + 1.25% on 4/22/2031)1 | 4,802 | 3,858 | ||||||
| JPMorgan Chase & Co. 2.545% 11/8/2032 (USD-SOFR + 1.18% on 11/8/2031)1 | 5,313 | 4,213 | ||||||
| JPMorgan Chase & Co. 2.963% 1/25/2033 (USD-SOFR + 1.26% on 1/25/2032)1 | 553 | 452 | ||||||
| JPMorgan Chase & Co. 4.586% 4/26/2033 (USD-SOFR + 1.80% on 4/26/2032)1 | 1,907 | 1,771 | ||||||
| JPMorgan Chase & Co. 4.912% 7/25/2033 (USD-SOFR + 2.08% on 7/25/2032)1 | 5,475 | 5,229 | ||||||
| Kasikornbank PCL HK 3.343% 10/2/2031 (5-year UST Yield Curve Rate T Note Constant Maturity + 1.70% on 10/2/2026)1 | 2,415 | 2,128 | ||||||
| Keb Hana Bank 3.25% 3/30/20272 | 1,315 | 1,227 | ||||||
| Lloyds Banking Group PLC 2.438% 2/5/2026 (1-year UST Yield Curve Rate T Note Constant Maturity + 1.00% on 2/5/2025)1 | 2,675 | 2,493 | ||||||
| Marsh & McLennan Companies, Inc. 2.375% 12/15/2031 | 367 | 297 | ||||||
| Marsh & McLennan Companies, Inc. 2.90% 12/15/2051 | 505 | 326 | ||||||
| MetLife Capital Trust IV, junior subordinated, 7.875% 12/15/2067 (3-month USD-LIBOR + 3.96% on 12/1/2037)1,2 | 1,405 | 1,521 | ||||||
| MetLife, Inc. 3.60% 11/13/2025 | 3,490 | 3,395 | ||||||
| MetLife, Inc. 5.00% 7/15/2052 | 165 | 158 | ||||||
| Mitsubishi UFJ Financial Group, Inc. 0.962% 10/11/2025 (1-year UST Yield Curve Rate T Note Constant Maturity + 0.45% on 10/11/2024)1 | 2,960 | 2,724 | ||||||
| Mitsubishi UFJ Financial Group, Inc. 1.538% 7/20/2027 (1-year UST Yield Curve Rate T Note Constant Maturity + 0.75% on 7/20/2026)1 | 6,200 | 5,383 | ||||||
| Mitsubishi UFJ Financial Group, Inc. 1.64% 10/13/2027 (1-year UST Yield Curve Rate T Note Constant Maturity + 0.67% on 10/13/2026)1 | 2,225 | 1,930 | ||||||
| Mitsubishi UFJ Financial Group, Inc. 2.341% 1/19/2028 (1-year UST Yield Curve Rate T Note Constant Maturity + 0.83% on 1/19/2027)1 | 2,970 | 2,618 | ||||||
| Mitsubishi UFJ Financial Group, Inc. 4.08% 4/19/2028 (1-year UST Yield Curve Rate T Note Constant Maturity + 1.30% on 4/19/2027)1 | 2,945 | 2,781 | ||||||
| Mitsubishi UFJ Financial Group, Inc. 5.133% 7/20/2033 (1-year UST Yield Curve Rate T Note Constant Maturity + 2.125% on 7/20/2032)1 | 1,197 | 1,146 | ||||||
| Mizuho Financial Group, Inc. 1.554% 7/9/2027 (1-year UST Yield Curve Rate T Note Constant Maturity + 0.75% on 7/9/2026)1 | 4,615 | 4,026 | ||||||
| Mizuho Financial Group, Inc. 5.669% 9/13/2033 (1-year UST Yield Curve Rate T Note Constant Maturity + 2.40% on 9/13/2032)1 | 2,390 | 2,379 | ||||||
| Morgan Stanley 0.791% 1/22/2025 (USD-SOFR + 0.509% on 1/22/2024)1 | 3,065 | 2,901 | ||||||
| Morgan Stanley 2.72% 7/22/2025 (USD-SOFR + 1.152% on 7/22/2024)1 | 2,300 | 2,200 | ||||||
| 178 | American Funds Insurance Series |
The Bond Fund of America (continued)
| Bonds, notes & other debt instruments (continued) | Principal amount (000) |
Value (000) |
||||||
| Corporate bonds, notes & loans (continued) | ||||||||
| Financials (continued) | ||||||||
| Morgan Stanley 1.512% 7/20/2027 (USD-SOFR + 0.858% on 7/20/2026)1 | USD | 10,488 | $ | 9,114 | ||||
| Morgan Stanley 4.21% 4/20/2028 (USD-SOFR + 1.61% on 4/20/2027)1 | 3,671 | 3,497 | ||||||
| Morgan Stanley 6.296% 10/18/2028 (USD-SOFR + 2.44% on 10/18/2027)1 | 2,007 | 2,075 | ||||||
| Morgan Stanley 2.239% 7/21/2032 (USD-SOFR + 1.178% on 7/21/2031)1 | 26,412 | 20,326 | ||||||
| Morgan Stanley 2.511% 10/20/2032 (USD-SOFR + 1.20% on 10/20/2031)1 | 2,813 | 2,209 | ||||||
| Morgan Stanley 2.943% 1/21/2033 (USD-SOFR + 1.29% on 1/21/2032)1 | 6,616 | 5,369 | ||||||
| Morgan Stanley 4.889% 7/20/2033 (USD-SOFR + 2.077% on 7/20/2032)1 | 3,375 | 3,181 | ||||||
| Morgan Stanley 6.342% 10/18/2033 (USD-SOFR + 2.565% on 10/18/2032)1 | 3,810 | 4,004 | ||||||
| Morgan Stanley 5.297% 4/20/2037 (USD-SOFR + 2.62% on 4/20/2032)1 | 2,286 | 2,096 | ||||||
| MSCI, Inc. 3.25% 8/15/20332 | 2,750 | 2,128 | ||||||
| Navient Corp. 6.75% 6/25/2025 | 425 | 409 | ||||||
| OneMain Holdings, Inc. 7.125% 3/15/2026 | 250 | 238 | ||||||
| Rede D’Or Finance SARL 4.50% 1/22/20302 | 1,572 | 1,355 | ||||||
| Santander Holdings USA, Inc. 3.50% 6/7/2024 | 8,325 | 8,092 | ||||||
| Santander Holdings USA, Inc. 2.49% 1/6/20281 | 3,625 | 3,115 | ||||||
| State Street Corp. 4.164% 8/4/2033 (USD-SOFR + 1.726% on 8/4/2032)1 | 1,640 | 1,520 | ||||||
| Sumitomo Mitsui Banking Corp. 2.174% 1/14/2027 | 1,100 | 977 | ||||||
| SVB Financial Group 4.70% junior subordinated perpetual bonds (5-year UST Yield Curve Rate T Note Constant Maturity + 3.064% on 11/15/2031)1 | 1,530 | 971 | ||||||
| Synchrony Financial 4.375% 3/19/2024 | 3,640 | 3,576 | ||||||
| Toronto-Dominion Bank 1.95% 1/12/2027 | 1,060 | 946 | ||||||
| Travelers Companies, Inc. 2.55% 4/27/2050 | 768 | 478 | ||||||
| U.S. Bancorp 4.548% 7/22/2028 (USD-SOFR + 1.66% on 7/27/2027)1 | 2,440 | 2,387 | ||||||
| UBS Group AG 1.494% 8/10/2027 (1-year UST Yield Curve Rate T Note Constant Maturity + 0.85% on 8/10/2026)1,2 | 4,000 | 3,446 | ||||||
| UniCredit SpA 4.625% 4/12/20272 | 1,395 | 1,307 | ||||||
| UniCredit SpA 5.861% 6/19/2032 (5-year USD-ICE Swap + 3.703% on 6/19/2027)1,2 | 16,130 | 14,182 | ||||||
| Vigorous Champion International, Ltd. 4.25% 5/28/2029 | 462 | 415 | ||||||
| Wells Fargo & Company 2.406% 10/30/2025 (3-month USD-LIBOR + 0.825% on 10/30/2024)1 | 20,480 | 19,382 | ||||||
| Wells Fargo & Company 3.908% 4/25/2026 (USD-SOFR + 1.32% on 4/25/2025)1 | 3,524 | 3,428 | ||||||
| Wells Fargo & Company 3.526% 3/24/2028 (USD-SOFR + 1.51% on 3/24/2027)1 | 9,236 | 8,569 | ||||||
| Wells Fargo & Company 4.808% 7/25/2028 (USD-SOFR + 1.98% on 7/25/2027)1 | 7,450 | 7,289 | ||||||
| Wells Fargo & Company 3.35% 3/2/2033 (USD-SOFR + 1.50% on 3/2/2032)1 | 7,665 | 6,478 | ||||||
| Wells Fargo & Company 4.897% 7/25/2033 (USD-SOFR + 4.897% on 7/25/2032)1 | 3,675 | 3,500 | ||||||
| Wells Fargo & Company 4.611% 4/25/2053 (USD-SOFR + 2.13% on 4/25/2052)1 | 20,666 | 17,607 | ||||||
| Willis North America, Inc. 4.65% 6/15/2027 | 1,290 | 1,248 | ||||||
| 986,796 | ||||||||
| Utilities 4.42% | ||||||||
| AEP Texas, Inc. 3.45% 5/15/2051 | 1,475 | 1,048 | ||||||
| Alabama Power Co. 3.00% 3/15/2052 | 3,697 | 2,458 | ||||||
| Alfa Desarrollo SpA 4.55% 9/27/20512 | 1,001 | 763 | ||||||
| Ameren Corp. 4.50% 3/15/2049 | 2,875 | 2,634 | ||||||
| Baltimore Gas & Electric 4.55% 6/1/2052 | 525 | 467 | ||||||
| Berkshire Hathaway Energy Company 4.50% 2/1/2045 | 5,895 | 5,161 | ||||||
| Comisión Federal de Electricidad 4.688% 5/15/20292 | 3,655 | 3,249 | ||||||
| Comisión Federal de Electricidad 3.875% 7/26/20332 | 1,340 | 1,019 | ||||||
| Connecticut Light and Power Co. 2.05% 7/1/2031 | 1,775 | 1,430 | ||||||
| Consumers Energy Co. 4.05% 5/15/2048 | 1,413 | 1,173 | ||||||
| Consumers Energy Co. 3.75% 2/15/2050 | 5,625 | 4,416 | ||||||
| Consumers Energy Co. 3.10% 8/15/2050 | 4,123 | 2,883 | ||||||
| Consumers Energy Co. 3.50% 8/1/2051 | 235 | 178 | ||||||
| Duke Energy Corp. 3.75% 4/15/2024 | 3,826 | 3,760 | ||||||
| Duke Energy Corp. 4.50% 8/15/2032 | 7,811 | 7,340 | ||||||
| Duke Energy Corp. 3.50% 6/15/2051 | 1,139 | 796 | ||||||
| Duke Energy Florida, LLC 3.40% 10/1/2046 | 5,669 | 4,098 | ||||||
| Duke Energy Florida, LLC 3.00% 12/15/2051 | 711 | 480 | ||||||
| Duke Energy Florida, LLC 5.95% 11/15/2052 | 575 | 616 | ||||||
| American Funds Insurance Series | 179 |
The Bond Fund of America (continued)
| Bonds, notes & other debt instruments (continued) | Principal amount (000) |
Value (000) |
||||||
| Corporate bonds, notes & loans (continued) | ||||||||
| Utilities (continued) | ||||||||
| Duke Energy Progress, LLC 3.70% 9/1/2028 | USD | 3,750 | $ | 3,530 | ||||
| Duke Energy Progress, LLC 2.00% 8/15/2031 | 1,775 | 1,407 | ||||||
| Duke Energy Progress, LLC 2.50% 8/15/2050 | 644 | 389 | ||||||
| Edison International 3.55% 11/15/2024 | 6,850 | 6,618 | ||||||
| Edison International 4.95% 4/15/2025 | 175 | 172 | ||||||
| Edison International 5.75% 6/15/2027 | 3,181 | 3,196 | ||||||
| Edison International 4.125% 3/15/2028 | 3,644 | 3,387 | ||||||
| Edison International 6.95% 11/15/2029 | 2,525 | 2,643 | ||||||
| Electricité de France SA 2.625% junior subordinated perpetual bonds (5-year EUR Mid-Swap + 2.86% on 6/1/2028)1 | EUR | 2,800 | 2,346 | |||||
| Emera US Finance, LP 0.833% 6/15/2024 | USD | 600 | 560 | |||||
| Emera US Finance, LP 2.639% 6/15/2031 | 4,400 | 3,456 | ||||||
| Enel Società per Azioni 8.75% 9/24/2073 (USD Semi Annual 30/360 (vs. 3-month USD-LIBOR) + 5.88% on 9/24/2023)1,2 | 1,000 | 1,003 | ||||||
| ENN Clean Energy International Investment, Ltd. 3.375% 5/12/20262 | 1,310 | 1,143 | ||||||
| Entergy Louisiana, LLC 4.20% 9/1/2048 | 6,325 | 5,207 | ||||||
| Entergy Louisiana, LLC 4.75% 9/15/2052 | 1,525 | 1,377 | ||||||
| Eversource Energy 3.80% 12/1/2023 | 5,000 | 4,945 | ||||||
| FirstEnergy Corp. 1.60% 1/15/2026 | 20,066 | 17,774 | ||||||
| FirstEnergy Corp. 3.50% 4/1/20282 | 2,400 | 2,191 | ||||||
| FirstEnergy Corp. 4.10% 5/15/20282 | 425 | 401 | ||||||
| FirstEnergy Corp. 2.65% 3/1/2030 | 12,524 | 10,234 | ||||||
| FirstEnergy Corp. 2.25% 9/1/2030 | 13,707 | 10,904 | ||||||
| FirstEnergy Corp., Series B, 4.40% 7/15/2027 (4.15% on 1/15/2023)1 | 12,178 | 11,355 | ||||||
| FirstEnergy Transmission, LLC 2.866% 9/15/20282 | 4,000 | 3,498 | ||||||
| Florida Power & Light Company 2.45% 2/3/2032 | 4,890 | 4,087 | ||||||
| Florida Power & Light Company 2.875% 12/4/2051 | 9,334 | 6,305 | ||||||
| Georgia Power Co. 3.70% 1/30/2050 | 275 | 206 | ||||||
| Interchile SA 4.50% 6/30/20562 | 465 | 385 | ||||||
| Israel Electric Corp., Ltd. 4.25% 8/14/20282 | 10,190 | 9,649 | ||||||
| Israel Electric Corp., Ltd. 3.75% 2/22/20322 | 340 | 299 | ||||||
| ITC Holdings Corp. 3.35% 11/15/2027 | 1,118 | 1,031 | ||||||
| Jersey Central Power & Light Co. 2.75% 3/1/20322 | 525 | 425 | ||||||
| Mississippi Power Co. 4.25% 3/15/2042 | 5,020 | 4,093 | ||||||
| Monongahela Power Co. 3.55% 5/15/20272 | 1,700 | 1,600 | ||||||
| NextEra Energy Capital Holdings, Inc. 1.875% 1/15/2027 | 2,772 | 2,457 | ||||||
| Northern States Power Co. 4.50% 6/1/2052 | 3,328 | 3,035 | ||||||
| Oncor Electric Delivery Company, LLC 4.15% 6/1/20322 | 1,035 | 980 | ||||||
| Oncor Electric Delivery Company, LLC 4.55% 9/15/20322 | 975 | 958 | ||||||
| Pacific Gas and Electric Co. 3.25% 6/15/2023 | 5,615 | 5,554 | ||||||
| Pacific Gas and Electric Co. 3.40% 8/15/2024 | 2,000 | 1,920 | ||||||
| Pacific Gas and Electric Co. 3.15% 1/1/2026 | 27,543 | 25,623 | ||||||
| Pacific Gas and Electric Co. 2.95% 3/1/2026 | 10,850 | 9,956 | ||||||
| Pacific Gas and Electric Co. 3.30% 3/15/2027 | 5,850 | 5,212 | ||||||
| Pacific Gas and Electric Co. 3.30% 12/1/2027 | 12,289 | 10,865 | ||||||
| Pacific Gas and Electric Co. 3.75% 7/1/2028 | 13,075 | 11,621 | ||||||
| Pacific Gas and Electric Co. 4.65% 8/1/2028 | 7,900 | 7,278 | ||||||
| Pacific Gas and Electric Co. 4.55% 7/1/2030 | 35,299 | 32,078 | ||||||
| Pacific Gas and Electric Co. 2.50% 2/1/2031 | 19,695 | 15,326 | ||||||
| Pacific Gas and Electric Co. 3.25% 6/1/2031 | 1,300 | 1,060 | ||||||
| Pacific Gas and Electric Co. 3.30% 8/1/2040 | 8,898 | 6,055 | ||||||
| Pacific Gas and Electric Co. 3.75% 8/15/2042 | 9,466 | 6,383 | ||||||
| Pacific Gas and Electric Co. 4.75% 2/15/2044 | 336 | 258 | ||||||
| Pacific Gas and Electric Co. 3.50% 8/1/2050 | 6,836 | 4,272 | ||||||
| Public Service Electric and Gas Co. 3.20% 5/15/2029 | 6,000 | 5,456 | ||||||
| Public Service Electric and Gas Co. 1.90% 8/15/2031 | 775 | 618 | ||||||
| Public Service Electric and Gas Co. 3.10% 3/15/2032 | 7,500 | 6,577 | ||||||
| Puget Energy, Inc. 3.65% 5/15/2025 | 300 | 286 | ||||||
| Southern California Edison Co. 4.20% 3/1/2029 | 11,000 | 10,485 | ||||||
| Southern California Edison Co. 2.85% 8/1/2029 | 8,200 | 7,144 | ||||||
| Southern California Edison Co. 2.50% 6/1/2031 | 5,149 | 4,256 | ||||||
| 180 | American Funds Insurance Series |
The Bond Fund of America (continued)
| Bonds, notes & other debt instruments (continued) | Principal amount (000) |
Value (000) |
||||||
| Corporate bonds, notes & loans (continued) | ||||||||
| Utilities (continued) | ||||||||
| Southern California Edison Co. 5.95% 11/1/2032 | USD | 1,100 | $ | 1,166 | ||||
| Southern California Edison Co. 5.75% 4/1/2035 | 4,549 | 4,546 | ||||||
| Southern California Edison Co. 5.35% 7/15/2035 | 6,450 | 6,267 | ||||||
| Southern California Edison Co. 5.625% 2/1/2036 | 7,051 | 6,888 | ||||||
| Southern California Edison Co. 5.55% 1/15/2037 | 3,844 | 3,774 | ||||||
| Southern California Edison Co. 5.95% 2/1/2038 | 5,121 | 5,188 | ||||||
| Southern California Edison Co. 4.00% 4/1/2047 | 9,402 | 7,391 | ||||||
| Southern California Edison Co. 4.125% 3/1/2048 | 5,765 | 4,628 | ||||||
| Southern California Edison Co. 4.875% 3/1/2049 | 555 | 491 | ||||||
| Southern California Edison Co. 3.65% 2/1/2050 | 8,086 | 5,943 | ||||||
| Southern California Edison Co., Series C, 3.60% 2/1/2045 | 2,717 | 1,960 | ||||||
| Southwestern Electric Power Co. 1.65% 3/15/2026 | 3,550 | 3,179 | ||||||
| Southwestern Electric Power Co. 3.25% 11/1/2051 | 2,270 | 1,502 | ||||||
| Union Electric Co. 2.15% 3/15/2032 | 3,175 | 2,518 | ||||||
| Virginia Electric and Power Co. 2.30% 11/15/2031 | 2,425 | 1,958 | ||||||
| Virginia Electric and Power Co. 2.40% 3/30/2032 | 5,345 | 4,333 | ||||||
| WEC Energy Group, Inc. 2.20% 12/15/2028 | 1,575 | 1,336 | ||||||
| Wisconsin Electric Power Co. 2.85% 12/1/2051 | 375 | 241 | ||||||
| Wisconsin Power and Light Co. 1.95% 9/16/2031 | 525 | 413 | ||||||
| Wisconsin Power and Light Co. 3.65% 4/1/2050 | 1,075 | 793 | ||||||
| Xcel Energy, Inc. 3.30% 6/1/2025 | 5,650 | 5,428 | ||||||
| Xcel Energy, Inc. 1.75% 3/15/2027 | 5,660 | 4,966 | ||||||
| Xcel Energy, Inc. 2.60% 12/1/2029 | 2,925 | 2,504 | ||||||
| Xcel Energy, Inc. 2.35% 11/15/2031 | 9,059 | 7,263 | ||||||
| Xcel Energy, Inc. 4.60% 6/1/2032 | 11,675 | 11,185 | ||||||
| 451,359 | ||||||||
| Consumer discretionary 4.21% | ||||||||
| Allied Universal Holdco, LLC 4.625% 6/1/20282 | 335 | 277 | ||||||
| Amazon.com, Inc. 3.30% 4/13/2027 | 1,760 | 1,673 | ||||||
| Amazon.com, Inc. 1.65% 5/12/2028 | 3,860 | 3,321 | ||||||
| Amazon.com, Inc. 3.45% 4/13/2029 | 1,305 | 1,222 | ||||||
| Amazon.com, Inc. 3.60% 4/13/2032 | 6,830 | 6,271 | ||||||
| Amazon.com, Inc. 2.875% 5/12/2041 | 650 | 488 | ||||||
| Amazon.com, Inc. 3.10% 5/12/2051 | 9,380 | 6,727 | ||||||
| Amazon.com, Inc. 3.95% 4/13/2052 | 1,635 | 1,362 | ||||||
| Amazon.com, Inc. 3.25% 5/12/2061 | 4,100 | 2,828 | ||||||
| Amazon.com, Inc. 4.10% 4/13/2062 | 470 | 391 | ||||||
| Atlas LuxCo 4 SARL 4.625% 6/1/20282 | 255 | 207 | ||||||
| Bath & Body Works, Inc. 6.875% 11/1/2035 | 740 | 659 | ||||||
| Bayerische Motoren Werke AG 1.25% 8/12/20262 | 100 | 88 | ||||||
| Bayerische Motoren Werke AG 3.45% 4/1/20272 | 1,075 | 1,016 | ||||||
| Bayerische Motoren Werke AG 1.95% 8/12/20312 | 620 | 486 | ||||||
| Bayerische Motoren Werke AG 3.70% 4/1/20322 | 1,350 | 1,210 | ||||||
| Daimler Trucks Finance North America, LLC 1.125% 12/14/20232 | 3,015 | 2,898 | ||||||
| Daimler Trucks Finance North America, LLC 1.625% 12/13/20242 | 4,950 | 4,597 | ||||||
| Daimler Trucks Finance North America, LLC 3.50% 4/7/20252 | 1,750 | 1,680 | ||||||
| Daimler Trucks Finance North America, LLC 3.65% 4/7/20272 | 4,140 | 3,875 | ||||||
| Daimler Trucks Finance North America, LLC 2.375% 12/14/20282 | 3,975 | 3,348 | ||||||
| Daimler Trucks Finance North America, LLC 2.50% 12/14/20312 | 9,625 | 7,486 | ||||||
| DaimlerChrysler North America Holding Corp. 3.35% 2/22/20232 | 2,000 | 1,993 | ||||||
| DaimlerChrysler North America Holding Corp. 1.75% 3/10/20232 | 8,000 | 7,953 | ||||||
| Ford Motor Co. 2.90% 2/10/2029 | 1,065 | 852 | ||||||
| Ford Motor Credit Company, LLC 5.125% 6/16/2025 | 3,870 | 3,729 | ||||||
| Ford Motor Credit Company, LLC 4.271% 1/9/2027 | 18,542 | 16,803 | ||||||
| Ford Motor Credit Company, LLC 4.125% 8/17/2027 | 39,080 | 35,066 | ||||||
| Ford Motor Credit Company, LLC 3.815% 11/2/2027 | 3,790 | 3,337 | ||||||
| Ford Motor Credit Company, LLC 7.35% 11/4/2027 | 6,289 | 6,460 | ||||||
| Ford Motor Credit Company, LLC 5.113% 5/3/2029 | 4,205 | 3,817 | ||||||
| General Motors Company 4.35% 4/9/2025 | 11,358 | 11,059 | ||||||
| American Funds Insurance Series | 181 |
The Bond Fund of America (continued)
| Bonds, notes & other debt instruments (continued) | Principal amount (000) |
Value (000) |
||||||
| Corporate bonds, notes & loans (continued) | ||||||||
| Consumer discretionary (continued) | ||||||||
| General Motors Company 6.125% 10/1/2025 | USD | 23,743 | $ | 24,188 | ||||
| General Motors Company 5.40% 10/15/2029 | 781 | 747 | ||||||
| General Motors Company 5.40% 4/1/2048 | 7,200 | 5,915 | ||||||
| General Motors Financial Co. 3.25% 1/5/2023 | 964 | 964 | ||||||
| General Motors Financial Co. 1.05% 3/8/2024 | 4,200 | 3,990 | ||||||
| General Motors Financial Co. 1.50% 6/10/2026 | 6,712 | 5,837 | ||||||
| General Motors Financial Co. 2.35% 2/26/2027 | 9,771 | 8,547 | ||||||
| General Motors Financial Co. 2.40% 4/10/2028 | 13,909 | 11,722 | ||||||
| General Motors Financial Co. 2.40% 10/15/2028 | 464 | 386 | ||||||
| General Motors Financial Co. 3.60% 6/21/2030 | 465 | 392 | ||||||
| General Motors Financial Co. 2.35% 1/8/2031 | 6,075 | 4,594 | ||||||
| General Motors Financial Co. 2.70% 6/10/2031 | 5,495 | 4,223 | ||||||
| Grand Canyon University 4.125% 10/1/2024 | 4,190 | 3,941 | ||||||
| Home Depot, Inc. 2.95% 6/15/2029 | 6,081 | 5,515 | ||||||
| Home Depot, Inc. 4.50% 12/6/2048 | 1,915 | 1,747 | ||||||
| Hyundai Capital America 2.375% 2/10/20232 | 9,977 | 9,955 | ||||||
| Hyundai Capital America 1.25% 9/18/20232 | 3,150 | 3,054 | ||||||
| Hyundai Capital America 0.875% 6/14/20242 | 380 | 355 | ||||||
| Hyundai Capital America 3.40% 6/20/20242 | 8,180 | 7,899 | ||||||
| Hyundai Capital America 1.00% 9/17/20242 | 2,750 | 2,543 | ||||||
| Hyundai Capital America 2.65% 2/10/20252 | 12,372 | 11,645 | ||||||
| Hyundai Capital America 1.80% 10/15/20252 | 13,274 | 11,952 | ||||||
| Hyundai Capital America 1.30% 1/8/20262 | 6,000 | 5,254 | ||||||
| Hyundai Capital America 1.50% 6/15/20262 | 7,475 | 6,485 | ||||||
| Hyundai Capital America 1.65% 9/17/20262 | 7,275 | 6,403 | ||||||
| Hyundai Capital America 3.00% 2/10/20272 | 9,000 | 8,090 | ||||||
| Hyundai Capital America 2.375% 10/15/20272 | 7,543 | 6,465 | ||||||
| Hyundai Capital America 1.80% 1/10/20282 | 5,965 | 4,901 | ||||||
| Hyundai Capital America 2.00% 6/15/20282 | 5,775 | 4,714 | ||||||
| Hyundai Capital America 2.10% 9/15/20282 | 3,010 | 2,476 | ||||||
| Hyundai Capital Services, Inc. 1.25% 2/8/20262 | 3,695 | 3,213 | ||||||
| KIA Corp. 2.375% 2/14/20252 | 1,580 | 1,467 | ||||||
| Marriott International, Inc. 5.75% 5/1/2025 | 330 | 333 | ||||||
| Marriott International, Inc. 3.125% 6/15/2026 | 410 | 384 | ||||||
| Marriott International, Inc. 5.00% 10/15/2027 | 4,470 | 4,418 | ||||||
| Marriott International, Inc. 2.75% 10/15/2033 | 2,226 | 1,705 | ||||||
| McDonald’s Corp. 2.125% 3/1/2030 | 2,482 | 2,082 | ||||||
| McDonald’s Corp. 4.60% 9/9/2032 | 1,765 | 1,731 | ||||||
| McDonald’s Corp. 4.45% 3/1/2047 | 3,535 | 3,082 | ||||||
| McDonald’s Corp. 3.625% 9/1/2049 | 2,938 | 2,224 | ||||||
| McDonald’s Corp. 5.15% 9/9/2052 | 730 | 704 | ||||||
| Meituan Dianping 3.05% 10/28/20302 | 3,200 | 2,471 | ||||||
| Nissan Motor Co., Ltd. 3.043% 9/15/20232 | 240 | 235 | ||||||
| Nissan Motor Co., Ltd. 3.522% 9/17/20252 | 800 | 744 | ||||||
| Nissan Motor Co., Ltd. 2.00% 3/9/20262 | 12,000 | 10,333 | ||||||
| Nissan Motor Co., Ltd. 2.75% 3/9/20282 | 11,200 | 9,089 | ||||||
| Nissan Motor Co., Ltd. 4.81% 9/17/20302 | 16,083 | 13,685 | ||||||
| Sands China, Ltd. 2.80% 3/8/20271 | 2,368 | 2,031 | ||||||
| Starbucks Corp. 3.75% 12/1/2047 | 3,785 | 2,891 | ||||||
| Stellantis Finance US, Inc. 1.711% 1/29/20272 | 6,921 | 5,948 | ||||||
| Stellantis Finance US, Inc. 5.625% 1/12/20282 | 825 | 818 | ||||||
| Stellantis Finance US, Inc. 2.691% 9/15/20312 | 6,554 | 5,016 | ||||||
| Stellantis Finance US, Inc. 6.375% 9/12/20322 | 12,065 | 11,946 | ||||||
| Toyota Motor Credit Corp. 3.375% 4/1/2030 | 4,954 | 4,505 | ||||||
| Volkswagen Group of America Finance, LLC 4.25% 11/13/20232 | 15,000 | 14,858 | ||||||
| Volkswagen Group of America Finance, LLC 2.85% 9/26/20242 | 546 | 523 | ||||||
| Volkswagen Group of America Finance, LLC 3.35% 5/13/20252 | 2,636 | 2,520 | ||||||
| 182 | American Funds Insurance Series |
The Bond Fund of America (continued)
| Bonds, notes & other debt instruments (continued) | Principal amount (000) |
Value (000) |
||||||
| Corporate bonds, notes & loans (continued) | ||||||||
| Consumer discretionary (continued) | ||||||||
| Volkswagen Group of America Finance, LLC 1.625% 11/24/20272 | USD | 2,550 | $ | 2,139 | ||||
| Wyndham Destinations, Inc. 6.625% 7/31/20262 | 675 | 662 | ||||||
| Wynn Resorts Finance, LLC 5.125% 10/1/20292 | 410 | 352 | ||||||
| 430,187 | ||||||||
| Health care 3.84% | ||||||||
| AbbVie, Inc. 3.20% 11/21/2029 | 8,482 | 7,666 | ||||||
| AbbVie, Inc. 4.25% 11/21/2049 | 8 | 7 | ||||||
| Amgen, Inc. 3.00% 2/22/2029 | 325 | 288 | ||||||
| Amgen, Inc. 4.05% 8/18/2029 | 8,400 | 7,869 | ||||||
| Amgen, Inc. 2.45% 2/21/2030 | 5,131 | 4,329 | ||||||
| Amgen, Inc. 4.20% 3/1/2033 | 9,522 | 8,839 | ||||||
| Amgen, Inc. 4.875% 3/1/2053 | 4,975 | 4,440 | ||||||
| Amgen, Inc. 4.40% 2/22/2062 | 196 | 156 | ||||||
| Anthem, Inc. 2.375% 1/15/2025 | 1,534 | 1,457 | ||||||
| Anthem, Inc. 4.10% 5/15/2032 | 8,711 | 8,128 | ||||||
| Anthem, Inc. 4.55% 5/15/2052 | 1,721 | 1,504 | ||||||
| AstraZeneca Finance, LLC 1.75% 5/28/2028 | 1,429 | 1,229 | ||||||
| AstraZeneca Finance, LLC 2.25% 5/28/2031 | 2,087 | 1,741 | ||||||
| AstraZeneca PLC 4.00% 1/17/2029 | 5,920 | 5,694 | ||||||
| Bausch Health Companies, Inc. 4.875% 6/1/20282 | 830 | 529 | ||||||
| Baxter International, Inc. 2.539% 2/1/2032 | 3,906 | 3,113 | ||||||
| Bayer US Finance II, LLC 4.25% 12/15/20252 | 17,570 | 17,043 | ||||||
| Becton, Dickinson and Company 4.298% 8/22/2032 | 545 | 512 | ||||||
| Centene Corp. 4.25% 12/15/2027 | 14,860 | 13,969 | ||||||
| Centene Corp. 2.45% 7/15/2028 | 12,410 | 10,499 | ||||||
| Centene Corp. 4.625% 12/15/2029 | 14,945 | 13,691 | ||||||
| Centene Corp. 3.375% 2/15/2030 | 15,718 | 13,323 | ||||||
| Centene Corp. 2.50% 3/1/2031 | 8,550 | 6,707 | ||||||
| Centene Corp. 2.625% 8/1/2031 | 2,510 | 1,977 | ||||||
| Danaher Corp. 2.80% 12/10/2051 | 1,090 | 725 | ||||||
| Eli Lilly and Company 3.375% 3/15/2029 | 1,255 | 1,177 | ||||||
| GE Healthcare Holding, LLC 5.65% 11/15/20272 | 4,895 | 4,961 | ||||||
| GE Healthcare Holding, LLC 5.857% 3/15/20302 | 1,145 | 1,175 | ||||||
| GE Healthcare Holding, LLC 5.905% 11/22/20322 | 8,640 | 8,980 | ||||||
| GE Healthcare Holding, LLC 6.377% 11/22/20522 | 375 | 401 | ||||||
| Gilead Sciences, Inc. 1.65% 10/1/2030 | 1,570 | 1,249 | ||||||
| HCA, Inc. 3.125% 3/15/20272 | 755 | 688 | ||||||
| HCA, Inc. 2.375% 7/15/2031 | 2,318 | 1,810 | ||||||
| HCA, Inc. 3.625% 3/15/20322 | 5,000 | 4,244 | ||||||
| HCA, Inc. 4.625% 3/15/20522 | 390 | 305 | ||||||
| Johnson & Johnson 0.95% 9/1/2027 | 12,753 | 11,001 | ||||||
| Johnson & Johnson 2.10% 9/1/2040 | 825 | 571 | ||||||
| Johnson & Johnson 2.25% 9/1/2050 | 1,933 | 1,205 | ||||||
| Laboratory Corporation of America Holdings 1.55% 6/1/2026 | 1,058 | 938 | ||||||
| Laboratory Corporation of America Holdings 4.70% 2/1/2045 | 4,160 | 3,584 | ||||||
| Merck & Co., Inc. 1.70% 6/10/2027 | 3,093 | 2,747 | ||||||
| Merck & Co., Inc. 2.75% 12/10/2051 | 808 | 544 | ||||||
| Regeneron Pharmaceuticals, Inc. 1.75% 9/15/2030 | 1,918 | 1,486 | ||||||
| Roche Holdings, Inc. 1.93% 12/13/20282 | 7,845 | 6,720 | ||||||
| Roche Holdings, Inc. 2.076% 12/13/20312 | 12,562 | 10,254 | ||||||
| Roche Holdings, Inc. 2.607% 12/13/20512 | 645 | 421 | ||||||
| Shire PLC 3.20% 9/23/2026 | 13,588 | 12,762 | ||||||
| Teva Pharmaceutical Finance Co. BV 7.125% 1/31/2025 | 45,000 | 44,821 | ||||||
| Teva Pharmaceutical Finance Co. BV 3.15% 10/1/2026 | 68,853 | 60,352 | ||||||
| Teva Pharmaceutical Finance Co. BV 6.75% 3/1/2028 | 26,824 | 26,215 | ||||||
| Teva Pharmaceutical Finance Co. BV 4.10% 10/1/2046 | 46,666 | 28,634 | ||||||
| UnitedHealth Group, Inc. 3.75% 7/15/2025 | 5,410 | 5,294 | ||||||
| UnitedHealth Group, Inc. 3.70% 5/15/2027 | 1,184 | 1,147 | ||||||
| UnitedHealth Group, Inc. 4.00% 5/15/2029 | 2,231 | 2,136 | ||||||
| American Funds Insurance Series | 183 |
The Bond Fund of America (continued)
| Bonds, notes & other debt instruments (continued) | Principal amount (000) |
Value (000) |
||||||
| Corporate bonds, notes & loans (continued) | ||||||||
| Health care (continued) | ||||||||
| UnitedHealth Group, Inc. 2.00% 5/15/2030 | USD | 855 | $ | 707 | ||||
| UnitedHealth Group, Inc. 4.20% 5/15/2032 | 3,169 | 3,018 | ||||||
| UnitedHealth Group, Inc. 3.05% 5/15/2041 | 1,300 | 982 | ||||||
| UnitedHealth Group, Inc. 4.25% 6/15/2048 | 960 | 834 | ||||||
| UnitedHealth Group, Inc. 3.25% 5/15/2051 | 927 | 668 | ||||||
| UnitedHealth Group, Inc. 4.75% 5/15/2052 | 1,400 | 1,300 | ||||||
| UnitedHealth Group, Inc. 4.95% 5/15/2062 | 294 | 277 | ||||||
| UnitedHealth Group, Inc. 6.05% 2/15/2063 | 230 | 251 | ||||||
| Zoetis, Inc. 5.60% 11/16/2032 | 2,850 | 2,964 | ||||||
| 392,258 | ||||||||
| Communication services 3.31% | ||||||||
| AT&T, Inc. 1.70% 3/25/2026 | 19,000 | 17,145 | ||||||
| AT&T, Inc. 1.65% 2/1/2028 | 4,700 | 3,977 | ||||||
| AT&T, Inc. 4.30% 2/15/2030 | 15,940 | 15,047 | ||||||
| AT&T, Inc. 2.55% 12/1/2033 | 15,003 | 11,574 | ||||||
| AT&T, Inc. 3.50% 9/15/2053 | 19,935 | 13,545 | ||||||
| CCO Holdings, LLC 4.75% 2/1/20322 | 1,265 | 1,028 | ||||||
| CCO Holdings, LLC 4.25% 1/15/20342 | 3,875 | 2,867 | ||||||
| CCO Holdings, LLC and CCO Holdings Capital Corp. 5.125% 5/1/20272 | 4,800 | 4,484 | ||||||
| CCO Holdings, LLC and CCO Holdings Capital Corp. 2.25% 1/15/2029 | 1,351 | 1,090 | ||||||
| CCO Holdings, LLC and CCO Holdings Capital Corp. 2.80% 4/1/2031 | 8,212 | 6,412 | ||||||
| CCO Holdings, LLC and CCO Holdings Capital Corp. 4.40% 4/1/2033 | 2,642 | 2,268 | ||||||
| CCO Holdings, LLC and CCO Holdings Capital Corp. 5.75% 4/1/2048 | 5,000 | 4,114 | ||||||
| CCO Holdings, LLC and CCO Holdings Capital Corp. 5.25% 4/1/2053 | 1,240 | 962 | ||||||
| CenturyLink, Inc. 4.00% 2/15/20272 | 10,381 | 8,821 | ||||||
| Comcast Corp. 3.15% 2/15/2028 | 7,200 | 6,660 | ||||||
| Comcast Corp. 4.00% 3/1/2048 | 5,000 | 4,033 | ||||||
| Meta Platforms, Inc. 4.45% 8/15/2052 | 3,775 | 3,019 | ||||||
| Netflix, Inc. 4.875% 4/15/2028 | 23,259 | 22,511 | ||||||
| Netflix, Inc. 5.875% 11/15/2028 | 29,196 | 29,664 | ||||||
| Netflix, Inc. 6.375% 5/15/2029 | 5,078 | 5,235 | ||||||
| Netflix, Inc. 5.375% 11/15/20292 | 15,350 | 14,917 | ||||||
| Netflix, Inc. 4.875% 6/15/20302 | 18,215 | 17,018 | ||||||
| News Corp. 5.125% 2/15/20322 | 1,300 | 1,185 | ||||||
| SBA Tower Trust 1.631% 11/15/20262 | 6,741 | 5,735 | ||||||
| Sirius XM Radio, Inc. 4.00% 7/15/20282 | 675 | 589 | ||||||
| Sprint Corp. 7.625% 2/15/2025 | 6,665 | 6,895 | ||||||
| Tencent Holdings, Ltd. 2.39% 6/3/20302 | 10,000 | 8,153 | ||||||
| T-Mobile US, Inc. 3.50% 4/15/2025 | 3,275 | 3,152 | ||||||
| T-Mobile US, Inc. 2.25% 2/15/2026 | 2,388 | 2,177 | ||||||
| T-Mobile US, Inc. 2.625% 4/15/2026 | 9,691 | 8,899 | ||||||
| T-Mobile US, Inc. 3.75% 4/15/2027 | 5,000 | 4,717 | ||||||
| T-Mobile US, Inc. 2.625% 2/15/2029 | 3,117 | 2,643 | ||||||
| T-Mobile US, Inc. 2.40% 3/15/2029 | 1,224 | 1,035 | ||||||
| T-Mobile US, Inc. 3.875% 4/15/2030 | 4,500 | 4,087 | ||||||
| T-Mobile US, Inc. 2.875% 2/15/2031 | 17,956 | 14,862 | ||||||
| T-Mobile US, Inc. 3.00% 2/15/2041 | 2,100 | 1,490 | ||||||
| T-Mobile US, Inc. 3.40% 10/15/2052 | 12,280 | 8,307 | ||||||
| Verizon Communications, Inc. 4.329% 9/21/2028 | 1,539 | 1,483 | ||||||
| Verizon Communications, Inc. 1.75% 1/20/2031 | 15,450 | 12,023 | ||||||
| Verizon Communications, Inc. 2.55% 3/21/2031 | 7,535 | 6,215 | ||||||
| Verizon Communications, Inc. 2.355% 3/15/2032 | 2,815 | 2,239 | ||||||
| Verizon Communications, Inc. 3.40% 3/22/2041 | 2,050 | 1,549 | ||||||
| Verizon Communications, Inc. 2.875% 11/20/2050 | 3,000 | 1,894 | ||||||
| Verizon Communications, Inc. 3.55% 3/22/2051 | 1,975 | 1,416 | ||||||
| Verizon Communications, Inc. 3.875% 3/1/2052 | 3,155 | 2,408 | ||||||
| Vodafone Group PLC 4.25% 9/17/2050 | 3,050 | 2,340 | ||||||
| WarnerMedia Holdings, Inc. 3.428% 3/15/20242 | 6,552 | 6,364 | ||||||
| WarnerMedia Holdings, Inc. 3.638% 3/15/20252 | 3,056 | 2,909 | ||||||
| 184 | American Funds Insurance Series |
The Bond Fund of America (continued)
| Bonds, notes & other debt instruments (continued) | Principal amount (000) |
Value (000) |
||||||
| Corporate bonds, notes & loans (continued) | ||||||||
| Communication services (continued) | ||||||||
| WarnerMedia Holdings, Inc. 3.755% 3/15/20272 | USD | 9,501 | $ | 8,569 | ||||
| WarnerMedia Holdings, Inc. 4.054% 3/15/20292 | 1,316 | 1,141 | ||||||
| WarnerMedia Holdings, Inc. 4.279% 3/15/20322 | 4,932 | 4,075 | ||||||
| WarnerMedia Holdings, Inc. 5.05% 3/15/20422 | 3,147 | 2,419 | ||||||
| WarnerMedia Holdings, Inc. 5.141% 3/15/20522 | 10,630 | 7,769 | ||||||
| WarnerMedia Holdings, Inc. 5.391% 3/15/20622 | 2,802 | 2,057 | ||||||
| ZipRecruiter, Inc. 5.00% 1/15/20302 | 1,500 | 1,239 | ||||||
| 338,426 | ||||||||
| Industrials 3.13% | ||||||||
| ADT Security Corp. 4.125% 8/1/20292 | 510 | 434 | ||||||
| Air Lease Corp. 0.80% 8/18/2024 | 3,175 | 2,926 | ||||||
| Air Lease Corp. 2.875% 1/15/2026 | 10,172 | 9,423 | ||||||
| Air Lease Corp. 2.20% 1/15/2027 | 4,341 | 3,789 | ||||||
| Air Lease Corp. 2.10% 9/1/2028 | 2,450 | 2,000 | ||||||
| Avolon Holdings Funding, Ltd. 3.95% 7/1/20242 | 12,514 | 11,987 | ||||||
| Avolon Holdings Funding, Ltd. 2.125% 2/21/20262 | 8,333 | 7,181 | ||||||
| Avolon Holdings Funding, Ltd. 4.25% 4/15/20262 | 3,302 | 2,997 | ||||||
| Avolon Holdings Funding, Ltd. 3.25% 2/15/20272 | 8,000 | 6,857 | ||||||
| Avolon Holdings Funding, Ltd. 2.528% 11/18/20272 | 2,142 | 1,715 | ||||||
| BNSF Funding Trust I, junior subordinated, 6.613% 12/15/2055 (3-month USD-LIBOR + 2.35% on 1/15/2026)1 | 1,680 | 1,590 | ||||||
| Boeing Company 4.508% 5/1/2023 | 11,358 | 11,338 | ||||||
| Boeing Company 1.95% 2/1/2024 | 5,646 | 5,441 | ||||||
| Boeing Company 2.80% 3/1/2024 | 500 | 485 | ||||||
| Boeing Company 4.875% 5/1/2025 | 32,512 | 32,292 | ||||||
| Boeing Company 2.75% 2/1/2026 | 18,384 | 17,057 | ||||||
| Boeing Company 2.196% 2/4/2026 | 18,411 | 16,748 | ||||||
| Boeing Company 3.10% 5/1/2026 | 649 | 611 | ||||||
| Boeing Company 2.70% 2/1/2027 | 6,473 | 5,852 | ||||||
| Boeing Company 5.04% 5/1/2027 | 14,350 | 14,215 | ||||||
| Boeing Company 3.25% 2/1/2028 | 11,379 | 10,353 | ||||||
| Boeing Company 3.25% 3/1/2028 | 1,925 | 1,724 | ||||||
| Boeing Company 5.15% 5/1/2030 | 42,874 | 41,935 | ||||||
| Boeing Company 3.625% 2/1/2031 | 1,602 | 1,408 | ||||||
| Boeing Company 3.90% 5/1/2049 | 1,411 | 997 | ||||||
| Boeing Company 5.805% 5/1/2050 | 4,122 | 3,843 | ||||||
| Canadian Pacific Railway, Ltd. 1.75% 12/2/2026 | 1,982 | 1,769 | ||||||
| Canadian Pacific Railway, Ltd. 2.45% 12/2/2031 | 3,131 | 2,602 | ||||||
| Canadian Pacific Railway, Ltd. 3.00% 12/2/2041 | 1,677 | 1,271 | ||||||
| Canadian Pacific Railway, Ltd. 3.10% 12/2/2051 | 3,111 | 2,106 | ||||||
| Carrier Global Corp. 3.377% 4/5/2040 | 15,000 | 11,443 | ||||||
| CSX Corp. 4.10% 11/15/2032 | 8,010 | 7,534 | ||||||
| CSX Corp. 4.50% 11/15/2052 | 6,670 | 5,828 | ||||||
| Dun & Bradstreet Corp. 5.00% 12/15/20292 | 2,798 | 2,398 | ||||||
| Eaton Corp. 4.15% 3/15/2033 | 1,518 | 1,416 | ||||||
| Eaton Corp. 4.70% 8/23/2052 | 535 | 487 | ||||||
| General Dynamics Corp. 3.625% 4/1/2030 | 675 | 629 | ||||||
| Mexico City Airport Trust 5.50% 10/31/2046 | 1,959 | 1,512 | ||||||
| Mexico City Airport Trust 5.50% 7/31/2047 | 5,909 | 4,564 | ||||||
| Mexico City Airport Trust 5.50% 7/31/20472 | 1,132 | 874 | ||||||
| MISC Capital Two (Labuan), Ltd. 3.75% 4/6/20272 | 2,690 | 2,441 | ||||||
| Norfolk Southern Corp. 4.55% 6/1/2053 | 1,188 | 1,039 | ||||||
| Northrop Grumman Corp. 3.25% 1/15/2028 | 10,845 | 10,021 | ||||||
| Raytheon Technologies Corp. 1.90% 9/1/2031 | 3,087 | 2,431 | ||||||
| Raytheon Technologies Corp. 2.375% 3/15/2032 | 1,321 | 1,073 | ||||||
| Raytheon Technologies Corp. 2.82% 9/1/2051 | 665 | 434 | ||||||
| Raytheon Technologies Corp. 3.03% 3/15/2052 | 1,190 | 812 | ||||||
| Republic Services, Inc. 2.375% 3/15/2033 | 1,635 | 1,309 | ||||||
| Spirit AeroSystems, Inc. 9.375% 11/30/20292 | 503 | 530 | ||||||
| American Funds Insurance Series | 185 |
The Bond Fund of America (continued)
| Bonds, notes & other debt instruments (continued) | Principal amount (000) |
Value (000) |
||||||
| Corporate bonds, notes & loans (continued) | ||||||||
| Industrials (continued) | ||||||||
| Summit Digitel Infrastructure Private, Ltd. 2.875% 8/12/20312 | USD | 2,550 | $ | 1,962 | ||||
| Triton Container International, Ltd. 1.15% 6/7/20242 | 1,609 | 1,489 | ||||||
| Triton Container International, Ltd. 3.15% 6/15/20312 | 2,482 | 1,934 | ||||||
| Union Pacific Corp. 2.15% 2/5/2027 | 2,213 | 2,002 | ||||||
| Union Pacific Corp. 2.40% 2/5/2030 | 4,454 | 3,820 | ||||||
| Union Pacific Corp. 2.375% 5/20/2031 | 3,938 | 3,326 | ||||||
| Union Pacific Corp. 2.80% 2/14/2032 | 6,734 | 5,832 | ||||||
| Union Pacific Corp. 3.375% 2/14/2042 | 530 | 424 | ||||||
| Union Pacific Corp. 3.25% 2/5/2050 | 7,000 | 5,078 | ||||||
| Union Pacific Corp. 2.95% 3/10/2052 | 1,405 | 957 | ||||||
| United Rentals, Inc. 5.50% 5/15/2027 | 2,500 | 2,472 | ||||||
| United Technologies Corp. 3.125% 5/4/2027 | 4,551 | 4,245 | ||||||
| United Technologies Corp. 4.125% 11/16/2028 | 4,974 | 4,771 | ||||||
| Waste Management, Inc. 4.15% 4/15/2032 | 2,155 | 2,057 | ||||||
| 320,090 | ||||||||
| Energy 2.54% | ||||||||
| Antero Resources Corp. 5.375% 3/1/20302 | 280 | 260 | ||||||
| Apache Corp. 4.625% 11/15/2025 | 645 | 624 | ||||||
| Apache Corp. 4.25% 1/15/2030 | 2,465 | 2,186 | ||||||
| Apache Corp. 5.35% 7/1/2049 | 800 | 648 | ||||||
| Baker Hughes Holdings, LLC 2.061% 12/15/2026 | 1,136 | 1,020 | ||||||
| Canadian Natural Resources, Ltd. 2.05% 7/15/2025 | 754 | 702 | ||||||
| Canadian Natural Resources, Ltd. 3.85% 6/1/2027 | 1,151 | 1,086 | ||||||
| Cenovus Energy, Inc. 5.375% 7/15/2025 | 2,763 | 2,756 | ||||||
| Cenovus Energy, Inc. 4.25% 4/15/2027 | 13,613 | 13,032 | ||||||
| Cenovus Energy, Inc. 2.65% 1/15/2032 | 2,969 | 2,378 | ||||||
| Cenovus Energy, Inc. 5.25% 6/15/2037 | 770 | 704 | ||||||
| Cenovus Energy, Inc. 5.40% 6/15/2047 | 14,816 | 13,323 | ||||||
| Cheniere Energy Partners, LP 3.25% 1/31/2032 | 937 | 746 | ||||||
| Chevron Corp. 2.954% 5/16/2026 | 3,365 | 3,196 | ||||||
| Chevron Corp. 3.078% 5/11/2050 | 692 | 500 | ||||||
| Devon Energy Corp. 4.50% 1/15/2030 | 5,197 | 4,850 | ||||||
| DT Midstream, Inc. 4.125% 6/15/20292 | 555 | 478 | ||||||
| Ecopetrol SA 5.875% 5/28/2045 | 452 | 316 | ||||||
| Enbridge, Inc. 4.00% 10/1/2023 | 1,500 | 1,488 | ||||||
| Energy Transfer Partners, LP 6.25% junior subordinated perpetual bonds (3-month USD-LIBOR + 4.028% on 2/15/2023)1 | 7,850 | 6,682 | ||||||
| Energy Transfer Partners, LP 6.625% junior subordinated perpetual bonds (3-month USD-LIBOR + 4.155% on 2/15/2049)1 | 500 | 373 | ||||||
| EQT Corp. 5.70% 4/1/2028 | 1,223 | 1,218 | ||||||
| EQT Corp. 7.25% 2/1/20301 | 7,500 | 7,791 | ||||||
| Equinor ASA 3.625% 9/10/2028 | 4,928 | 4,673 | ||||||
| Equinor ASA 3.125% 4/6/2030 | 20,000 | 18,004 | ||||||
| Equinor ASA 3.25% 11/18/2049 | 5,687 | 4,159 | ||||||
| Exxon Mobil Corp. 3.043% 3/1/2026 | 4,625 | 4,417 | ||||||
| Exxon Mobil Corp. 2.61% 10/15/2030 | 1,040 | 911 | ||||||
| Occidental Petroleum Corp. 8.875% 7/15/2030 | 630 | 712 | ||||||
| Odebrecht Drilling Norbe 7.35% PIK 12/1/20262,4 | 40 | 22 | ||||||
| Odebrecht Drilling Norbe 0% perpetual bonds2 | 1,150 | 3 | ||||||
| Oleoducto Central SA 4.00% 7/14/20272 | 1,715 | 1,516 | ||||||
| Oleoducto Central SA 4.00% 7/14/2027 | 350 | 309 | ||||||
| Petróleos Mexicanos 3.50% 1/30/2023 | 1,500 | 1,496 | ||||||
| Petróleos Mexicanos 6.875% 10/16/2025 | 5,000 | 4,903 | ||||||
| Petróleos Mexicanos 6.875% 8/4/2026 | 24,876 | 23,550 | ||||||
| Petróleos Mexicanos 6.49% 1/23/2027 | 20,653 | 18,867 | ||||||
| Petróleos Mexicanos 6.50% 3/13/2027 | 31,829 | 29,102 | ||||||
| Petróleos Mexicanos 6.50% 1/23/2029 | 3,139 | 2,694 | ||||||
| Petróleos Mexicanos 8.75% 6/2/2029 | 5,805 | 5,451 | ||||||
| Petróleos Mexicanos 6.70% 2/16/2032 | 14,854 | 11,693 | ||||||
| 186 | American Funds Insurance Series |
The Bond Fund of America (continued)
| Bonds, notes & other debt instruments (continued) | Principal amount (000) |
Value (000) |
||||||
| Corporate bonds, notes & loans (continued) | ||||||||
| Energy (continued) | ||||||||
| Qatar Petroleum 2.25% 7/12/20312 | USD | 22,020 | $ | 18,281 | ||||
| Qatar Petroleum 3.125% 7/12/20412 | 7,310 | 5,644 | ||||||
| Qatar Petroleum 3.30% 7/12/20512 | 2,185 | 1,619 | ||||||
| SA Global Sukuk, Ltd. 1.602% 6/17/20262 | 7,645 | 6,842 | ||||||
| Sabine Pass Liquefaction, LLC 5.75% 5/15/2024 | 5,148 | 5,152 | ||||||
| Shell International Finance BV 3.875% 11/13/2028 | 9,410 | 9,081 | ||||||
| Shell International Finance BV 2.75% 4/6/2030 | 1,186 | 1,043 | ||||||
| Southwestern Energy Co. 5.95% 1/23/20251 | 495 | 487 | ||||||
| Total Capital Canada, Ltd. 2.75% 7/15/2023 | 2,140 | 2,113 | ||||||
| Total Capital International 3.455% 2/19/2029 | 885 | 822 | ||||||
| TransCanada PipeLines, Ltd. 4.10% 4/15/2030 | 1,578 | 1,449 | ||||||
| Western Midstream Operating, LP 3.35% 2/1/20251 | 2,782 | 2,637 | ||||||
| Western Midstream Operating, LP 4.30% 2/1/20301 | 2,202 | 1,927 | ||||||
| Western Midstream Operating, LP 5.50% 2/1/20501 | 3,079 | 2,542 | ||||||
| Williams Partners, LP 4.50% 11/15/2023 | 500 | 497 | ||||||
| Williams Partners, LP 4.30% 3/4/2024 | 595 | 588 | ||||||
| 259,563 | ||||||||
| Consumer staples 1.83% | ||||||||
| 7-Eleven, Inc. 1.80% 2/10/20312 | 4,676 | 3,582 | ||||||
| 7-Eleven, Inc. 2.80% 2/10/20512 | 5,000 | 3,082 | ||||||
| Altria Group, Inc. 4.40% 2/14/2026 | 4,585 | 4,494 | ||||||
| Altria Group, Inc. 4.50% 5/2/2043 | 1,585 | 1,196 | ||||||
| Altria Group, Inc. 5.95% 2/14/2049 | 8,434 | 7,539 | ||||||
| Anheuser-Busch InBev NV 4.75% 1/23/2029 | 7,500 | 7,419 | ||||||
| Anheuser-Busch InBev NV 5.55% 1/23/2049 | 5,000 | 4,971 | ||||||
| Anheuser-Busch InBev NV 4.50% 6/1/2050 | 1,355 | 1,192 | ||||||
| British American Tobacco International Finance PLC 3.95% 6/15/20252 | 16,879 | 16,226 | ||||||
| British American Tobacco International Finance PLC 1.668% 3/25/2026 | 4,070 | 3,611 | ||||||
| British American Tobacco PLC 3.557% 8/15/2027 | 9,561 | 8,750 | ||||||
| British American Tobacco PLC 4.448% 3/16/2028 | 3,065 | 2,844 | ||||||
| British American Tobacco PLC 2.259% 3/25/2028 | 4,348 | 3,616 | ||||||
| British American Tobacco PLC 4.742% 3/16/2032 | 2,675 | 2,381 | ||||||
| British American Tobacco PLC 4.39% 8/15/2037 | 1,500 | 1,171 | ||||||
| British American Tobacco PLC 4.54% 8/15/2047 | 13,490 | 9,582 | ||||||
| British American Tobacco PLC 4.758% 9/6/2049 | 21,450 | 15,620 | ||||||
| British American Tobacco PLC 5.65% 3/16/2052 | 430 | 356 | ||||||
| Conagra Brands, Inc. 5.30% 11/1/2038 | 436 | 412 | ||||||
| Conagra Brands, Inc. 5.40% 11/1/2048 | 57 | 53 | ||||||
| Constellation Brands, Inc. 3.50% 5/9/2027 | 7,500 | 7,035 | ||||||
| Constellation Brands, Inc. 4.35% 5/9/2027 | 890 | 868 | ||||||
| Constellation Brands, Inc. 2.875% 5/1/2030 | 620 | 529 | ||||||
| Constellation Brands, Inc. 2.25% 8/1/2031 | 1,487 | 1,185 | ||||||
| Constellation Brands, Inc. 4.75% 5/9/2032 | 2,284 | 2,205 | ||||||
| Imperial Tobacco Finance PLC 6.125% 7/27/20272 | 1,810 | 1,804 | ||||||
| JBS USA Lux SA 2.50% 1/15/20272 | 3,880 | 3,399 | ||||||
| JBS USA Lux SA 3.00% 2/2/20292 | 2,709 | 2,248 | ||||||
| JBS USA Lux SA 5.50% 1/15/20302 | 435 | 415 | ||||||
| JBS USA Lux SA 3.625% 1/15/20322 | 1,430 | 1,160 | ||||||
| JBS USA Lux SA 3.00% 5/15/20322 | 3,430 | 2,635 | ||||||
| JBS USA Lux SA 5.75% 4/1/20332 | 7,368 | 7,046 | ||||||
| Kraft Heinz Company 5.50% 6/1/2050 | 2,725 | 2,619 | ||||||
| PepsiCo, Inc. 1.95% 10/21/2031 | 6,979 | 5,658 | ||||||
| Philip Morris International, Inc. 5.00% 11/17/2025 | 6,555 | 6,592 | ||||||
| Philip Morris International, Inc. 5.125% 11/17/2027 | 4,898 | 4,942 | ||||||
| Philip Morris International, Inc. 5.625% 11/17/2029 | 4,309 | 4,382 | ||||||
| Philip Morris International, Inc. 5.75% 11/17/2032 | 6,327 | 6,470 | ||||||
| Philip Morris International, Inc. 4.125% 3/4/2043 | 4,117 | 3,270 | ||||||
| Philip Morris International, Inc. 4.875% 11/15/2043 | 5,433 | 4,774 | ||||||
| PT Indofood CBP Sukses Makmur Tbk 3.398% 6/9/2031 | 3,110 | 2,590 | ||||||
| American Funds Insurance Series | 187 |
The Bond Fund of America (continued)
| Bonds, notes & other debt instruments (continued) | Principal amount (000) |
Value (000) |
||||||
| Corporate bonds, notes & loans (continued) | ||||||||
| Consumer staples (continued) | ||||||||
| PT Indofood CBP Sukses Makmur Tbk 4.745% 6/9/2051 | USD | 685 | $ | 507 | ||||
| Reynolds American, Inc. 4.45% 6/12/2025 | 14,570 | 14,267 | ||||||
| Reynolds American, Inc. 5.85% 8/15/2045 | 1,688 | 1,445 | ||||||
| Wal-Mart Stores, Inc. 4.15% 9/9/2032 | 570 | 557 | ||||||
| Wal-Mart Stores, Inc. 4.50% 9/9/2052 | 480 | 460 | ||||||
| 187,159 | ||||||||
| Information technology 0.82% | ||||||||
| Analog Devices, Inc. 2.80% 10/1/2041 | 521 | 383 | ||||||
| Apple, Inc. 2.70% 8/5/2051 | 7,080 | 4,701 | ||||||
| Apple, Inc. 3.95% 8/8/2052 | 1,805 | 1,544 | ||||||
| Block, Inc. 2.75% 6/1/2026 | 1,975 | 1,767 | ||||||
| Block, Inc. 3.50% 6/1/2031 | 825 | 659 | ||||||
| Broadcom Corp. 3.875% 1/15/2027 | 7,027 | 6,657 | ||||||
| Broadcom, Inc. 4.00% 4/15/20292 | 1,470 | 1,338 | ||||||
| Broadcom, Inc. 4.15% 4/15/20322 | 2,270 | 1,999 | ||||||
| Broadcom, Inc. 3.469% 4/15/20342 | 33,872 | 27,121 | ||||||
| Broadcom, Inc. 3.137% 11/15/20352 | 2,149 | 1,587 | ||||||
| Broadcom, Inc. 3.187% 11/15/20362 | 4,803 | 3,465 | ||||||
| Broadcom, Inc. 4.926% 5/15/20372 | 4,049 | 3,547 | ||||||
| Global Payments, Inc. 2.90% 11/15/2031 | 1,005 | 795 | ||||||
| Oracle Corp. 1.65% 3/25/2026 | 4,867 | 4,363 | ||||||
| Oracle Corp. 2.30% 3/25/2028 | 6,875 | 5,967 | ||||||
| Oracle Corp. 2.875% 3/25/2031 | 3,345 | 2,782 | ||||||
| Oracle Corp. 3.95% 3/25/2051 | 4,869 | 3,490 | ||||||
| PayPal Holdings, Inc. 5.05% 6/1/2052 | 3,775 | 3,439 | ||||||
| salesforce.com, inc. 1.95% 7/15/2031 | 3,775 | 3,019 | ||||||
| salesforce.com, inc. 2.70% 7/15/2041 | 875 | 628 | ||||||
| salesforce.com, inc. 2.90% 7/15/2051 | 5,140 | 3,393 | ||||||
| salesforce.com, inc. 3.05% 7/15/2061 | 265 | 170 | ||||||
| VeriSign, Inc. 2.70% 6/15/2031 | 1,494 | 1,220 | ||||||
| 84,034 | ||||||||
| Real estate 0.70% | ||||||||
| American Tower Corp. 1.45% 9/15/2026 | 657 | 574 | ||||||
| American Tower Corp. 3.65% 3/15/2027 | 2,291 | 2,143 | ||||||
| Corporacion Inmobiliaria Vesta, SAB de CV, 3.625% 5/13/20312 | 395 | 318 | ||||||
| Corporate Office Properties, LP 2.00% 1/15/2029 | 1,139 | 876 | ||||||
| Corporate Office Properties, LP 2.75% 4/15/2031 | 1,547 | 1,161 | ||||||
| Corporate Office Properties, LP 2.90% 12/1/2033 | 564 | 402 | ||||||
| Equinix, Inc. 2.90% 11/18/2026 | 3,287 | 3,009 | ||||||
| Equinix, Inc. 3.20% 11/18/2029 | 3,846 | 3,356 | ||||||
| Equinix, Inc. 2.50% 5/15/2031 | 7,760 | 6,254 | ||||||
| Equinix, Inc. 3.90% 4/15/2032 | 1,155 | 1,029 | ||||||
| Equinix, Inc. 3.40% 2/15/2052 | 1,201 | 823 | ||||||
| Extra Space Storage, Inc. 2.35% 3/15/2032 | 698 | 530 | ||||||
| FibraSOMA 4.375% 7/22/20312 | 1,475 | 1,105 | ||||||
| Hospitality Properties Trust 4.50% 3/15/2025 | 855 | 739 | ||||||
| Hospitality Properties Trust 3.95% 1/15/2028 | 1,710 | 1,217 | ||||||
| Howard Hughes Corp. 4.375% 2/1/20312 | 675 | 547 | ||||||
| Invitation Homes Operating Partnership, LP 2.30% 11/15/2028 | 767 | 636 | ||||||
| Invitation Homes Operating Partnership, LP 2.00% 8/15/2031 | 2,048 | 1,518 | ||||||
| Invitation Homes Operating Partnership, LP 2.70% 1/15/2034 | 660 | 483 | ||||||
| Iron Mountain, Inc. 4.875% 9/15/20272 | 1,605 | 1,479 | ||||||
| Iron Mountain, Inc. 5.25% 3/15/20282 | 3,500 | 3,226 | ||||||
| Iron Mountain, Inc. 5.25% 7/15/20302 | 675 | 588 | ||||||
| Omega Healthcare Investors, Inc. 4.375% 8/1/2023 | 186 | 185 | ||||||
| Piedmont Operating Partnership, LP 4.45% 3/15/2024 | 1,000 | 983 | ||||||
| Public Storage 1.95% 11/9/2028 | 993 | 849 | ||||||
| Public Storage 2.30% 5/1/2031 | 3,195 | 2,601 | ||||||
| 188 | American Funds Insurance Series |
The Bond Fund of America (continued)
| Bonds, notes & other debt instruments (continued) | Principal amount (000) |
Value (000) |
||||||
| Corporate bonds, notes & loans (continued) | ||||||||
| Real estate (continued) | ||||||||
| Scentre Group 3.50% 2/12/20252 | USD | 4,565 | $ | 4,372 | ||||
| Sun Communities Operating, LP 2.30% 11/1/2028 | 1,026 | 856 | ||||||
| Sun Communities Operating, LP 2.70% 7/15/2031 | 3,877 | 3,070 | ||||||
| VICI Properties, LP 4.375% 5/15/2025 | 670 | 652 | ||||||
| VICI Properties, LP 4.75% 2/15/2028 | 6,844 | 6,505 | ||||||
| VICI Properties, LP 4.95% 2/15/2030 | 5,515 | 5,257 | ||||||
| VICI Properties, LP 4.125% 8/15/20302 | 425 | 373 | ||||||
| VICI Properties, LP 5.125% 5/15/2032 | 11,766 | 10,917 | ||||||
| VICI Properties, LP 5.625% 5/15/2052 | 2,695 | 2,388 | ||||||
| 71,021 | ||||||||
| Materials 0.13% | ||||||||
| Air Products and Chemicals, Inc. 2.70% 5/15/2040 | 2,911 | 2,178 | ||||||
| Celanese US Holdings, LLC 6.05% 3/15/2025 | 195 | 194 | ||||||
| Celanese US Holdings, LLC 6.165% 7/15/2027 | 2,875 | 2,840 | ||||||
| Celanese US Holdings, LLC 6.33% 7/15/2029 | 775 | 755 | ||||||
| Celanese US Holdings, LLC 6.379% 7/15/2032 | 2,055 | 1,960 | ||||||
| Glencore Funding, LLC 2.625% 9/23/20312 | 790 | 631 | ||||||
| Glencore Funding, LLC 3.375% 9/23/20512 | 370 | 242 | ||||||
| International Flavors & Fragrances, Inc. 2.30% 11/1/20302 | 3,536 | 2,813 | ||||||
| Methanex Corp. 5.125% 10/15/2027 | 510 | 474 | ||||||
| Nova Chemicals Corp. 4.25% 5/15/20292 | 425 | 348 | ||||||
| South32 Treasury, Ltd. 4.35% 4/14/20322 | 1,384 | 1,188 | ||||||
| 13,623 | ||||||||
| Municipals 0.01% | ||||||||
| Aeropuerto International de Tocume SA 4.00% 8/11/20412 | 730 | 603 | ||||||
| Aeropuerto International de Tocume SA 5.125% 8/11/20612 | 565 | 464 | ||||||
| 1,067 | ||||||||
| Total corporate bonds, notes & loans | 3,535,583 | |||||||
| U.S. Treasury bonds & notes 27.43% | ||||||||
| U.S. Treasury 14.76% | ||||||||
| U.S. Treasury 0.125% 5/31/2023 | 39,035 | 38,325 | ||||||
| U.S. Treasury 2.25% 12/31/2023 | 24,768 | 24,174 | ||||||
| U.S. Treasury 1.50% 2/29/2024 | 9,807 | 9,455 | ||||||
| U.S. Treasury 2.50% 4/30/2024 | 22,390 | 21,755 | ||||||
| U.S. Treasury 0.375% 9/15/2024 | 15,740 | 14,672 | ||||||
| U.S. Treasury 4.50% 11/30/2024 | 38,095 | 38,103 | ||||||
| U.S. Treasury 3.00% 7/15/2025 | 97,643 | 94,593 | ||||||
| U.S. Treasury 4.00% 12/15/2025 | 67,475 | 67,053 | ||||||
| U.S. Treasury 0.375% 12/31/2025 | 44,080 | 39,409 | ||||||
| U.S. Treasury 0.375% 1/31/2026 | 40,000 | 35,602 | ||||||
| U.S. Treasury 0.75% 5/31/2026 | 20,625 | 18,401 | ||||||
| U.S. Treasury 0.75% 8/31/2026 | 26,766 | 23,705 | ||||||
| U.S. Treasury 1.375% 8/31/2026 | 45,000 | 40,809 | ||||||
| U.S. Treasury 0.50% 4/30/2027 | 45,625 | 39,295 | ||||||
| U.S. Treasury 2.75% 4/30/2027 | 11,500 | 10,903 | ||||||
| U.S. Treasury 2.25% 11/15/20275 | 105,830 | 97,546 | ||||||
| U.S. Treasury 6.125% 11/15/2027 | 24,000 | 26,188 | ||||||
| U.S. Treasury 3.875% 11/30/2027 | 46,272 | 46,021 | ||||||
| U.S. Treasury 1.25% 5/31/2028 | 21,480 | 18,605 | ||||||
| U.S. Treasury 3.875% 11/30/2029 | 149 | 148 | ||||||
| U.S. Treasury 3.875% 12/31/2029 | 5,750 | 5,710 | ||||||
| U.S. Treasury 1.625% 5/15/2031 | 1,630 | 1,372 | ||||||
| U.S. Treasury 4.125% 11/15/2032 | 15,000 | 15,299 | ||||||
| U.S. Treasury 4.25% 5/15/2039 | 106,700 | 110,123 | ||||||
| U.S. Treasury 1.125% 5/15/2040 | 124,213 | 77,947 | ||||||
| U.S. Treasury 1.375% 11/15/2040 | 40,000 | 26,058 | ||||||
| U.S. Treasury 1.875% 2/15/2041 | 46,900 | 33,221 | ||||||
| American Funds Insurance Series | 189 |
The Bond Fund of America (continued)
| Bonds, notes & other debt instruments (continued) | Principal amount (000) |
Value (000) |
||||||
| U.S. Treasury bonds & notes (continued) | ||||||||
| U.S. Treasury (continued) | ||||||||
| U.S. Treasury 2.00% 11/15/2041 | USD | 247 | $ | 177 | ||||
| U.S. Treasury 2.375% 2/15/2042 | 3,271 | 2,500 | ||||||
| U.S. Treasury 4.00% 11/15/2042 | 766 | 751 | ||||||
| U.S. Treasury 3.00% 2/15/2049 | 123,340 | 102,162 | ||||||
| U.S. Treasury 1.25% 5/15/2050 | 21,285 | 11,514 | ||||||
| U.S. Treasury 2.00% 8/15/2051 | 1,587 | 1,044 | ||||||
| U.S. Treasury 1.875% 11/15/2051 | 4,670 | 2,974 | ||||||
| U.S. Treasury 3.00% 8/15/20525 | 493,436 | 409,137 | ||||||
| U.S. Treasury 4.00% 11/15/2052 | 3,800 | 3,820 | ||||||
| 1,508,571 | ||||||||
| U.S. Treasury inflation-protected securities 12.67% | ||||||||
| U.S. Treasury Inflation-Protected Security 0.125% 1/15/20236 | 206,245 | 205,862 | ||||||
| U.S. Treasury Inflation-Protected Security 0.625% 4/15/20236 | 85,927 | 85,102 | ||||||
| U.S. Treasury Inflation-Protected Security 0.375% 7/15/20236 | 6,574 | 6,498 | ||||||
| U.S. Treasury Inflation-Protected Security 0.625% 1/15/20246 | 255,440 | 250,190 | ||||||
| U.S. Treasury Inflation-Protected Security 0.50% 4/15/20246 | 29,208 | 28,425 | ||||||
| U.S. Treasury Inflation-Protected Security 0.125% 7/15/20246 | 250,395 | 242,546 | ||||||
| U.S. Treasury Inflation-Protected Security 0.125% 10/15/20246 | 57,910 | 55,812 | ||||||
| U.S. Treasury Inflation-Protected Security 0.25% 1/15/20256 | 26,921 | 25,840 | ||||||
| U.S. Treasury Inflation-Protected Security 0.125% 4/15/20256 | 28,626 | 27,283 | ||||||
| U.S. Treasury Inflation-Protected Security 0.375% 7/15/20256 | 71,002 | 68,225 | ||||||
| U.S. Treasury Inflation-Protected Security 0.625% 1/15/20266 | 3,300 | 3,168 | ||||||
| U.S. Treasury Inflation-Protected Security 0.125% 10/15/20266 | 13,368 | 12,538 | ||||||
| U.S. Treasury Inflation-Protected Security 0.125% 4/15/20276 | 66,635 | 62,091 | ||||||
| U.S. Treasury Inflation-Protected Security 0.375% 7/15/20276 | 85,852 | 80,941 | ||||||
| U.S. Treasury Inflation-Protected Security 1.625% 10/15/20276 | 21,184 | 21,157 | ||||||
| U.S. Treasury Inflation-Protected Security 0.50% 1/15/20285,6 | 90,600 | 85,240 | ||||||
| U.S. Treasury Inflation-Protected Security 0.125% 1/15/20316 | 20,209 | 17,930 | ||||||
| U.S. Treasury Inflation-Protected Security 0.125% 7/15/20316 | 13,385 | 11,811 | ||||||
| U.S. Treasury Inflation-Protected Security 0.125% 2/15/20516 | 6,118 | 3,947 | ||||||
| 1,294,606 | ||||||||
| Total U.S. Treasury bonds & notes | 2,803,177 | |||||||
| Mortgage-backed obligations 25.81% | ||||||||
| Federal agency mortgage-backed obligations 23.23% | ||||||||
| Fannie Mae Pool #254764 5.50% 6/1/20237 | — | 8 | — | 8 | ||||
| Fannie Mae Pool #AB1068 4.50% 5/1/20257 | 37 | 37 | ||||||
| Fannie Mae Pool #256133 4.50% 1/1/20267 | 32 | 31 | ||||||
| Fannie Mae Pool #AR3058 3.00% 1/1/20287 | 75 | 72 | ||||||
| Fannie Mae Pool #AS8018 3.00% 9/1/20317 | 44 | 42 | ||||||
| Fannie Mae Pool #BM4741 3.00% 4/1/20327 | 28 | 27 | ||||||
| Fannie Mae Pool #913966 6.00% 2/1/20377 | 34 | 36 | ||||||
| Fannie Mae Pool #945680 6.00% 9/1/20377 | 426 | 444 | ||||||
| Fannie Mae Pool #924866 2.765% 10/1/20373,7 | 419 | 410 | ||||||
| Fannie Mae Pool #988588 5.50% 8/1/20387 | 185 | 192 | ||||||
| Fannie Mae Pool #889982 5.50% 11/1/20387 | 919 | 953 | ||||||
| Fannie Mae Pool #AB1297 5.00% 8/1/20407 | 191 | 194 | ||||||
| Fannie Mae Pool #AH8144 5.00% 4/1/20417 | 805 | 810 | ||||||
| Fannie Mae Pool #AH9479 5.00% 4/1/20417 | 754 | 764 | ||||||
| Fannie Mae Pool #AI1862 5.00% 5/1/20417 | 952 | 963 | ||||||
| Fannie Mae Pool #AI3510 5.00% 6/1/20417 | 524 | 530 | ||||||
| Fannie Mae Pool #AJ0704 5.00% 9/1/20417 | 444 | 452 | ||||||
| Fannie Mae Pool #AJ5391 5.00% 11/1/20417 | 321 | 325 | ||||||
| Fannie Mae Pool #MA4501 2.00% 12/1/20417 | 9,994 | 8,437 | ||||||
| Fannie Mae Pool #MA4540 2.00% 2/1/20427 | 2,628 | 2,218 | ||||||
| Fannie Mae Pool #AZ3904 4.00% 5/1/20457 | 42 | 40 | ||||||
| Fannie Mae Pool #FM9416 3.50% 7/1/20457 | 2,819 | 2,610 | ||||||
| Fannie Mae Pool #AL8522 3.50% 5/1/20467 | 896 | 833 | ||||||
| Fannie Mae Pool #BD1968 4.00% 7/1/20467 | 792 | 757 | ||||||
| 190 | American Funds Insurance Series |
The Bond Fund of America (continued)
| Bonds, notes & other debt instruments (continued) | Principal amount (000) |
Value (000) |
||||||
| Mortgage-backed obligations (continued) | ||||||||
| Federal agency mortgage-backed obligations (continued) | ||||||||
| Fannie Mae Pool #BD5477 4.00% 7/1/20467 | USD | 137 | $ | 132 | ||||
| Fannie Mae Pool #BE0592 4.00% 11/1/20467 | 313 | 295 | ||||||
| Fannie Mae Pool #MA3058 4.00% 7/1/20477 | 42 | 40 | ||||||
| Fannie Mae Pool #CA0770 3.50% 11/1/20477 | 4,696 | 4,364 | ||||||
| Fannie Mae Pool #CA0706 4.00% 11/1/20477 | 91 | 87 | ||||||
| Fannie Mae Pool #BM4413 4.50% 12/1/20477 | 2,854 | 2,812 | ||||||
| Fannie Mae Pool #CA1189 3.50% 2/1/20487 | 1,384 | 1,285 | ||||||
| Fannie Mae Pool #BJ5749 4.00% 5/1/20487 | 16 | 16 | ||||||
| Fannie Mae Pool #BF0293 3.00% 7/1/20487 | 6,893 | 6,129 | ||||||
| Fannie Mae Pool #BF0318 3.50% 8/1/20487 | 5,642 | 5,198 | ||||||
| Fannie Mae Pool #FM4891 3.50% 10/1/20487 | 20,838 | 19,368 | ||||||
| Fannie Mae Pool #BM4676 4.00% 10/1/20487 | 13 | 12 | ||||||
| Fannie Mae Pool #FM3280 3.50% 5/1/20497 | 738 | 684 | ||||||
| Fannie Mae Pool #CA3807 3.00% 7/1/20497 | 1,416 | 1,267 | ||||||
| Fannie Mae Pool #CA3806 3.00% 7/1/20497 | 913 | 818 | ||||||
| Fannie Mae Pool #FM1262 4.00% 7/1/20497 | 22,731 | 21,695 | ||||||
| Fannie Mae Pool #FM0007 3.50% 9/1/20497 | 15,691 | 14,461 | ||||||
| Fannie Mae Pool #FM1589 3.50% 9/1/20497 | 4,398 | 4,048 | ||||||
| Fannie Mae Pool #FM1954 3.50% 11/1/20497 | 6,796 | 6,252 | ||||||
| Fannie Mae Pool #CA5968 2.50% 6/1/20507 | 6,170 | 5,302 | ||||||
| Fannie Mae Pool #FM5507 3.00% 7/1/20507 | 18,556 | 16,591 | ||||||
| Fannie Mae Pool #CA6309 3.00% 7/1/20507 | 6,665 | 5,981 | ||||||
| Fannie Mae Pool #BP6715 2.00% 9/1/20507 | 1 | 1 | ||||||
| Fannie Mae Pool #CA7028 2.50% 9/1/20507 | 1,108 | 957 | ||||||
| Fannie Mae Pool #BQ3005 2.50% 10/1/20507 | 1,935 | 1,646 | ||||||
| Fannie Mae Pool #CA7257 2.50% 10/1/20507 | 314 | 270 | ||||||
| Fannie Mae Pool #CA7599 2.50% 11/1/20507 | 7,463 | 6,437 | ||||||
| Fannie Mae Pool #FM4897 3.00% 11/1/20507 | 18,989 | 17,095 | ||||||
| Fannie Mae Pool #MA4208 2.00% 12/1/20507 | 12,762 | 10,450 | ||||||
| Fannie Mae Pool #CA8828 2.50% 2/1/20517 | 6,306 | 5,420 | ||||||
| Fannie Mae Pool #CB0290 2.00% 4/1/20517 | 21,666 | 17,724 | ||||||
| Fannie Mae Pool #MA4305 2.00% 4/1/20517 | 33 | 27 | ||||||
| Fannie Mae Pool #BR1035 2.00% 5/1/20517 | 20 | 16 | ||||||
| Fannie Mae Pool #FM7510 3.00% 6/1/20517 | 242 | 213 | ||||||
| Fannie Mae Pool #FM7900 2.50% 7/1/20517 | 533 | 457 | ||||||
| Fannie Mae Pool #FM8442 2.50% 8/1/20517 | 9,106 | 7,723 | ||||||
| Fannie Mae Pool #CB1527 2.50% 9/1/20517 | 1,264 | 1,074 | ||||||
| Fannie Mae Pool #FS0965 2.00% 11/1/20517 | 156 | 128 | ||||||
| Fannie Mae Pool #CB2402 2.50% 12/1/20517 | 4,932 | 4,181 | ||||||
| Fannie Mae Pool #FM9846 2.50% 12/1/20517 | 569 | 483 | ||||||
| Fannie Mae Pool #CB2787 3.50% 12/1/20517 | 27 | 25 | ||||||
| Fannie Mae Pool #FS2776 2.50% 1/1/20527 | 3,264 | 2,769 | ||||||
| Fannie Mae Pool #CB2765 2.00% 2/1/20527 | 6,870 | 5,649 | ||||||
| Fannie Mae Pool #FS0647 3.00% 2/1/20527 | 41,218 | 36,792 | ||||||
| Fannie Mae Pool #CB3744 2.50% 3/1/20527 | 1,000 | 848 | ||||||
| Fannie Mae Pool #CB3170 3.00% 3/1/20527 | 392 | 345 | ||||||
| Fannie Mae Pool #BV7773 2.50% 4/1/20527 | 9,356 | 7,942 | ||||||
| Fannie Mae Pool #BV5370 2.50% 4/1/20527 | 8,486 | 7,196 | ||||||
| Fannie Mae Pool #BV2994 2.50% 4/1/20527 | 3,401 | 2,887 | ||||||
| Fannie Mae Pool #MA4578 2.50% 4/1/20527 | 780 | 662 | ||||||
| Fannie Mae Pool #BV7521 2.50% 5/1/20527 | 1,000 | 848 | ||||||
| Fannie Mae Pool #CB3495 3.00% 5/1/20527 | 1,174 | 1,031 | ||||||
| Fannie Mae Pool #MA4599 3.00% 5/1/20527 | 500 | 439 | ||||||
| Fannie Mae Pool #BV9975 2.50% 6/1/20527 | 3,301 | 2,802 | ||||||
| Fannie Mae Pool #BV2452 3.00% 6/1/20527 | 739 | 649 | ||||||
| Fannie Mae Pool #CB4159 4.00% 7/1/20527 | 1,689 | 1,586 | ||||||
| Fannie Mae Pool #BW1001 4.50% 7/1/20527 | 675 | 651 | ||||||
| Fannie Mae Pool #BV2562 4.50% 7/1/20527 | 522 | 503 | ||||||
| Fannie Mae Pool #MA4699 3.50% 8/1/20527 | 900 | 819 | ||||||
| Fannie Mae Pool #MA4700 4.00% 8/1/20527 | 2,823 | 2,651 | ||||||
| Fannie Mae Pool #BV8024 4.00% 8/1/20527 | 2,138 | 2,008 | ||||||
| American Funds Insurance Series | 191 |
The Bond Fund of America (continued)
| Bonds, notes & other debt instruments (continued) | Principal amount (000) |
Value (000) |
||||||
| Mortgage-backed obligations (continued) | ||||||||
| Federal agency mortgage-backed obligations (continued) | ||||||||
| Fannie Mae Pool #BW9409 4.50% 8/1/20527 | USD | 1,998 | $ | 1,925 | ||||
| Fannie Mae Pool #BW5751 4.50% 8/1/20527 | 1,983 | 1,910 | ||||||
| Fannie Mae Pool #BW2284 4.50% 8/1/20527 | 1,944 | 1,873 | ||||||
| Fannie Mae Pool #BW6191 4.50% 8/1/20527 | 999 | 965 | ||||||
| Fannie Mae Pool #BW7611 4.50% 8/1/20527 | 974 | 938 | ||||||
| Fannie Mae Pool #BW8077 4.50% 8/1/20527 | 90 | 86 | ||||||
| Fannie Mae Pool #MA4732 4.00% 9/1/20527 | 9,060 | 8,508 | ||||||
| Fannie Mae Pool #BW7326 4.00% 9/1/20527 | 1,831 | 1,720 | ||||||
| Fannie Mae Pool #BW9348 4.00% 9/1/20527 | 1,588 | 1,491 | ||||||
| Fannie Mae Pool #BW8103 4.00% 9/1/20527 | 1,504 | 1,412 | ||||||
| Fannie Mae Pool #BV0952 4.50% 9/1/20527 | 4,153 | 4,001 | ||||||
| Fannie Mae Pool #BW3812 4.50% 9/1/20527 | 3,994 | 3,848 | ||||||
| Fannie Mae Pool #BW9386 4.50% 9/1/20527 | 2,996 | 2,888 | ||||||
| Fannie Mae Pool #BV0957 4.50% 9/1/20527 | 2,996 | 2,887 | ||||||
| Fannie Mae Pool #BW8692 4.50% 9/1/20527 | 999 | 963 | ||||||
| Fannie Mae Pool #BW9180 4.50% 9/1/20527 | 420 | 405 | ||||||
| Fannie Mae Pool #BW8497 4.50% 9/1/20527 | 65 | 63 | ||||||
| Fannie Mae Pool #BW7702 4.50% 9/1/20527 | 42 | 40 | ||||||
| Fannie Mae Pool #MA4761 5.00% 9/1/20527 | 36,426 | 35,956 | ||||||
| Fannie Mae Pool #BW1295 3.50% 10/1/20527 | 574 | 522 | ||||||
| Fannie Mae Pool #BW8980 4.00% 10/1/20527 | 5,933 | 5,571 | ||||||
| Fannie Mae Pool #BW1210 4.00% 10/1/20527 | 4,482 | 4,208 | ||||||
| Fannie Mae Pool #BW7356 4.00% 10/1/20527 | 3,728 | 3,500 | ||||||
| Fannie Mae Pool #BX0509 4.00% 10/1/20527 | 1,604 | 1,506 | ||||||
| Fannie Mae Pool #CB4794 4.50% 10/1/20527 | 15,949 | 15,370 | ||||||
| Fannie Mae Pool #MA4784 4.50% 10/1/20527 | 10,684 | 10,294 | ||||||
| Fannie Mae Pool #BW8745 4.50% 10/1/20527 | 4,974 | 4,792 | ||||||
| Fannie Mae Pool #BX0097 4.50% 10/1/20527 | 2,995 | 2,885 | ||||||
| Fannie Mae Pool #BW7795 4.50% 10/1/20527 | 496 | 478 | ||||||
| Fannie Mae Pool #BW8592 4.50% 10/1/20527 | 149 | 143 | ||||||
| Fannie Mae Pool #MA4820 6.50% 10/1/20527 | 294 | 303 | ||||||
| Fannie Mae Pool #MA4854 2.50% 11/1/20527 | 902 | 765 | ||||||
| Fannie Mae Pool #MA4803 3.50% 11/1/20527 | 7,069 | 6,431 | ||||||
| Fannie Mae Pool #MA4804 4.00% 11/1/20527 | 9,106 | 8,550 | ||||||
| Fannie Mae Pool #BW1310 4.00% 11/1/20527 | 1,677 | 1,574 | ||||||
| Fannie Mae Pool #BX1042 4.50% 11/1/20527 | 548 | 528 | ||||||
| Fannie Mae Pool #BX1516 4.50% 11/1/20527 | 542 | 523 | ||||||
| Fannie Mae Pool #BX1035 4.50% 11/1/20527 | 308 | 297 | ||||||
| Fannie Mae Pool #BX3075 4.50% 11/1/20527 | 291 | 280 | ||||||
| Fannie Mae Pool #BX2558 4.50% 11/1/20527 | 62 | 60 | ||||||
| Fannie Mae Pool #MA4805 4.50% 11/1/20527 | 36 | 35 | ||||||
| Fannie Mae Pool #BW1380 4.50% 12/1/20527 | 13,486 | 12,993 | ||||||
| Fannie Mae Pool #MA4840 4.50% 12/1/20527 | 4,721 | 4,549 | ||||||
| Fannie Mae Pool #MA4841 5.00% 12/1/20527 | 4,013 | 3,961 | ||||||
| Fannie Mae Pool #MA4877 6.50% 12/1/20527 | 58,203 | 59,707 | ||||||
| Fannie Mae Pool #BX4022 6.50% 12/1/20527 | 200 | 205 | ||||||
| Fannie Mae Pool #MA4868 5.00% 1/1/20537 | 8,583 | 8,472 | ||||||
| Fannie Mae Pool #MA4895 6.50% 1/1/20537 | 4,225 | 4,335 | ||||||
| Fannie Mae Pool #BF0145 3.50% 3/1/20577 | 11,899 | 10,887 | ||||||
| Fannie Mae Pool #BF0264 3.50% 5/1/20587 | 9,059 | 8,322 | ||||||
| Fannie Mae Pool #BF0332 3.00% 1/1/20597 | 19,463 | 17,158 | ||||||
| Fannie Mae Pool #BF0497 3.00% 7/1/20607 | 22,447 | 19,666 | ||||||
| Fannie Mae Pool #BF0585 4.50% 12/1/20617 | 1,326 | 1,293 | ||||||
| Fannie Mae, Series 2001-4, Class GA, 9.00% 4/17/20253,7 | — | 8 | — | 8 | ||||
| Fannie Mae, Series 2001-50, Class BA, 7.00% 10/25/20417 | 7 | 7 | ||||||
| Fannie Mae, Series 2002-W3, Class A5, 7.50% 11/25/20417 | 17 | 19 | ||||||
| Fannie Mae, Series 2002-W1, Class 2A, 4.915% 2/25/20423,7 | 21 | 21 | ||||||
| Freddie Mac Pool #ZS8507 3.00% 11/1/20287 | 113 | 108 | ||||||
| Freddie Mac Pool #ZK7590 3.00% 1/1/20297 | 2,445 | 2,346 | ||||||
| Freddie Mac Pool #A15120 5.50% 10/1/20337 | 51 | 52 | ||||||
| Freddie Mac Pool #QN1073 3.00% 12/1/20347 | 46 | 44 | ||||||
| 192 | American Funds Insurance Series |
The Bond Fund of America (continued)
| Bonds, notes & other debt instruments (continued) | Principal amount (000) |
Value (000) |
||||||
| Mortgage-backed obligations (continued) | ||||||||
| Federal agency mortgage-backed obligations (continued) | ||||||||
| Freddie Mac Pool #G05196 5.50% 10/1/20387 | USD | 50 | $ | 52 | ||||
| Freddie Mac Pool #G05267 5.50% 12/1/20387 | 37 | 39 | ||||||
| Freddie Mac Pool #G06020 5.50% 12/1/20397 | 72 | 75 | ||||||
| Freddie Mac Pool #G05860 5.50% 2/1/20407 | 265 | 275 | ||||||
| Freddie Mac Pool #A93948 4.50% 9/1/20407 | 157 | 156 | ||||||
| Freddie Mac Pool #G06868 4.50% 4/1/20417 | 177 | 176 | ||||||
| Freddie Mac Pool #G06841 5.50% 6/1/20417 | 422 | 439 | ||||||
| Freddie Mac Pool #RB5138 2.00% 12/1/20417 | 2,632 | 2,222 | ||||||
| Freddie Mac Pool #RB5145 2.00% 2/1/20427 | 2,569 | 2,169 | ||||||
| Freddie Mac Pool #RB5148 2.00% 3/1/20427 | 5,501 | 4,643 | ||||||
| Freddie Mac Pool #Z40130 3.00% 1/1/20467 | 20,778 | 18,802 | ||||||
| Freddie Mac Pool #ZT2100 3.00% 4/1/20477 | 109 | 98 | ||||||
| Freddie Mac Pool #G08789 4.00% 11/1/20477 | 628 | 603 | ||||||
| Freddie Mac Pool #G61733 3.00% 12/1/20477 | 5,178 | 4,642 | ||||||
| Freddie Mac Pool #G67709 3.50% 3/1/20487 | 13,489 | 12,616 | ||||||
| Freddie Mac Pool #G61628 3.50% 9/1/20487 | 330 | 307 | ||||||
| Freddie Mac Pool #Q58494 4.00% 9/1/20487 | 1,273 | 1,217 | ||||||
| Freddie Mac Pool #ZN4842 3.50% 4/1/20497 | 751 | 693 | ||||||
| Freddie Mac Pool #RA1369 3.50% 9/1/20497 | 1,997 | 1,840 | ||||||
| Freddie Mac Pool #SD7508 3.50% 10/1/20497 | 10,988 | 10,187 | ||||||
| Freddie Mac Pool #QA4673 3.00% 11/1/20497 | 29,606 | 26,538 | ||||||
| Freddie Mac Pool #SD8090 2.00% 9/1/20507 | 1,362 | 1,115 | ||||||
| Freddie Mac Pool #SD8106 2.00% 11/1/20507 | 2,836 | 2,321 | ||||||
| Freddie Mac Pool #SD8128 2.00% 2/1/20517 | 115 | 94 | ||||||
| Freddie Mac Pool #SD8134 2.00% 3/1/20517 | 191 | 156 | ||||||
| Freddie Mac Pool #RA5288 2.00% 5/1/20517 | 2,916 | 2,387 | ||||||
| Freddie Mac Pool #SD1852 2.50% 6/1/20517 | 13,776 | 11,687 | ||||||
| Freddie Mac Pool #QC2817 2.50% 6/1/20517 | 2,789 | 2,389 | ||||||
| Freddie Mac Pool #QC7173 2.50% 9/1/20517 | 3,203 | 2,723 | ||||||
| Freddie Mac Pool #QD1746 2.50% 11/1/20517 | 3,044 | 2,585 | ||||||
| Freddie Mac Pool #SD1385 2.50% 11/1/20517 | 1,671 | 1,434 | ||||||
| Freddie Mac Pool #RA6485 3.00% 12/1/20517 | 35,637 | 31,327 | ||||||
| Freddie Mac Pool #SD7552 2.50% 1/1/20527 | 11,001 | 9,407 | ||||||
| Freddie Mac Pool #QD5725 2.50% 1/1/20527 | 2,995 | 2,544 | ||||||
| Freddie Mac Pool #QD4799 2.50% 1/1/20527 | 1,000 | 848 | ||||||
| Freddie Mac Pool #RA6608 3.00% 2/1/20527 | 888 | 780 | ||||||
| Freddie Mac Pool #QD7089 3.50% 2/1/20527 | 867 | 790 | ||||||
| Freddie Mac Pool #QE0327 2.50% 4/1/20527 | 1,000 | 849 | ||||||
| Freddie Mac Pool #QE2020 2.50% 5/1/20527 | 7,000 | 5,941 | ||||||
| Freddie Mac Pool #SD8219 2.50% 6/1/20527 | 73,484 | 62,311 | ||||||
| Freddie Mac Pool #SD8220 3.00% 6/1/20527 | 3,363 | 2,957 | ||||||
| Freddie Mac Pool #QE4855 3.50% 6/1/20527 | 68 | 62 | ||||||
| Freddie Mac Pool #QE4084 6.50% 6/1/20527 | 333 | 345 | ||||||
| Freddie Mac Pool #SD8234 2.50% 8/1/20527 | 5,524 | 4,684 | ||||||
| Freddie Mac Pool #SD8237 4.00% 8/1/20527 | 2,186 | 2,053 | ||||||
| Freddie Mac Pool #QE9057 4.00% 8/1/20527 | 1,368 | 1,285 | ||||||
| Freddie Mac Pool #QE8065 4.50% 8/1/20527 | 4,104 | 3,954 | ||||||
| Freddie Mac Pool #QE7539 4.50% 8/1/20527 | 2,160 | 2,083 | ||||||
| Freddie Mac Pool #QE8253 4.50% 8/1/20527 | 1,712 | 1,649 | ||||||
| Freddie Mac Pool #QE6903 4.50% 8/1/20527 | 248 | 239 | ||||||
| Freddie Mac Pool #QE7702 4.50% 8/1/20527 | 35 | 34 | ||||||
| Freddie Mac Pool #SD8242 3.00% 9/1/20527 | 73 | 64 | ||||||
| Freddie Mac Pool #QE9625 4.00% 9/1/20527 | 1,763 | 1,655 | ||||||
| Freddie Mac Pool #SD8244 4.00% 9/1/20527 | 1,457 | 1,368 | ||||||
| Freddie Mac Pool #QE9919 4.50% 9/1/20527 | 23,534 | 22,676 | ||||||
| Freddie Mac Pool #QF0313 4.50% 9/1/20527 | 9,988 | 9,636 | ||||||
| Freddie Mac Pool #QF0660 4.50% 9/1/20527 | 2,996 | 2,889 | ||||||
| Freddie Mac Pool #QE9813 4.50% 9/1/20527 | 406 | 392 | ||||||
| Freddie Mac Pool #QF0820 4.50% 9/1/20527 | 366 | 353 | ||||||
| Freddie Mac Pool #RA7930 4.50% 9/1/20527 | 306 | 295 | ||||||
| Freddie Mac Pool #QF1205 4.50% 9/1/20527 | 298 | 287 | ||||||
| American Funds Insurance Series | 193 |
The Bond Fund of America (continued)
| Bonds, notes & other debt instruments (continued) | Principal amount (000) |
Value (000) |
||||||
| Mortgage-backed obligations (continued) | ||||||||
| Federal agency mortgage-backed obligations (continued) | ||||||||
| Freddie Mac Pool #QF0311 5.00% 9/1/20527 | USD | 17,998 | $ | 17,766 | ||||
| Freddie Mac Pool #QF2029 3.00% 10/1/20527 | 696 | 612 | ||||||
| Freddie Mac Pool #QF1464 4.00% 10/1/20527 | 1,691 | 1,588 | ||||||
| Freddie Mac Pool #QF2379 4.50% 10/1/20527 | 4,994 | 4,816 | ||||||
| Freddie Mac Pool #QF1254 4.50% 10/1/20527 | 3,226 | 3,108 | ||||||
| Freddie Mac Pool #QF1849 4.50% 10/1/20527 | 2,140 | 2,062 | ||||||
| Freddie Mac Pool #QF2136 4.50% 10/1/20527 | 1,908 | 1,838 | ||||||
| Freddie Mac Pool #QF0819 4.50% 10/1/20527 | 863 | 833 | ||||||
| Freddie Mac Pool #QF2380 4.50% 10/1/20527 | 632 | 611 | ||||||
| Freddie Mac Pool #QF2845 4.50% 10/1/20527 | 537 | 518 | ||||||
| Freddie Mac Pool #QF2182 4.50% 10/1/20527 | 303 | 292 | ||||||
| Freddie Mac Pool #QF0866 4.50% 10/1/20527 | 126 | 121 | ||||||
| Freddie Mac Pool #SD8263 3.00% 11/1/20527 | 14,713 | 12,932 | ||||||
| Freddie Mac Pool #SD8264 3.50% 11/1/20527 | 4,331 | 3,940 | ||||||
| Freddie Mac Pool #QF3144 3.50% 11/1/20527 | 673 | 614 | ||||||
| Freddie Mac Pool #SD1896 4.00% 11/1/20527 | 20,313 | 19,355 | ||||||
| Freddie Mac Pool #SD1894 4.00% 11/1/20527 | 7,177 | 6,853 | ||||||
| Freddie Mac Pool #QF3364 4.00% 11/1/20527 | 2,753 | 2,585 | ||||||
| Freddie Mac Pool #QF2936 4.50% 11/1/20527 | 2,907 | 2,801 | ||||||
| Freddie Mac Pool #QF2846 4.50% 11/1/20527 | 998 | 961 | ||||||
| Freddie Mac Pool #QF3276 5.50% 11/1/20527 | 703 | 707 | ||||||
| Freddie Mac Pool #QF2862 6.50% 11/1/20527 | 100 | 103 | ||||||
| Freddie Mac Pool #SD8280 6.50% 11/1/20527 | 53 | 54 | ||||||
| Freddie Mac Pool #QF3956 4.50% 12/1/20527 | 18,992 | 18,299 | ||||||
| Freddie Mac Pool #SD8275 4.50% 12/1/20527 | 2,480 | 2,390 | ||||||
| Freddie Mac Pool #SD8276 5.00% 12/1/20527 | 32,354 | 31,937 | ||||||
| Freddie Mac Pool #QF4754 5.00% 12/1/20527 | 3,000 | 2,961 | ||||||
| Freddie Mac Pool #QF4185 6.50% 12/1/20527 | 668 | 685 | ||||||
| Freddie Mac Pool #SD8284 3.00% 1/1/20537 | 4,597 | 4,040 | ||||||
| Freddie Mac Pool #SD8288 5.00% 1/1/20537 | 1,671 | 1,649 | ||||||
| Freddie Mac Pool #SD8282 6.50% 1/1/20537 | 59,134 | 60,661 | ||||||
| Freddie Mac, Series 3061, Class PN, 5.50% 11/15/20357 | 58 | 58 | ||||||
| Freddie Mac, Series 3318, Class JT, 5.50% 5/15/20377 | 125 | 126 | ||||||
| Freddie Mac, Series 3146, Class PO, principal only, 0% 4/15/20367 | 121 | 100 | ||||||
| Freddie Mac, Series 3156, Class PO, principal only, 0% 5/15/20367 | 118 | 99 | ||||||
| Freddie Mac Seasoned Credit Risk Transfer Trust, Series 2018-3, Class MA, 3.50% 8/25/20577 | 8,360 | 7,937 | ||||||
| Freddie Mac Seasoned Credit Risk Transfer Trust, Series 2019-2, Class MA, 3.50% 8/25/20587 | 1,930 | 1,821 | ||||||
| Freddie Mac Seasoned Loan Structured Transaction Trust, Series 2022-1, Class A1, 3.50% 5/25/20327 | 10,720 | 10,343 | ||||||
| Government National Mortgage Assn. 2.00% 1/1/20537,9 | 14,785 | 12,394 | ||||||
| Government National Mortgage Assn. 3.00% 1/1/20537,9 | 9,533 | 8,491 | ||||||
| Government National Mortgage Assn. 3.50% 1/1/20537,9 | 33,185 | 30,495 | ||||||
| Government National Mortgage Assn. 4.00% 1/1/20537,9 | 33,300 | 31,515 | ||||||
| Government National Mortgage Assn. 5.00% 1/1/20537,9 | 75,701 | 75,023 | ||||||
| Government National Mortgage Assn. 5.50% 1/1/20537,9 | 4,775 | 4,803 | ||||||
| Government National Mortgage Assn. 5.50% 2/1/20537,9 | 51,027 | 51,288 | ||||||
| Government National Mortgage Assn. Pool #MA5817 4.00% 3/20/20497 | 12,379 | 11,844 | ||||||
| Government National Mortgage Assn. Pool #MA6042 5.00% 7/20/20497 | 35 | 35 | ||||||
| Government National Mortgage Assn. Pool #MA6221 4.50% 10/20/20497 | 5,200 | 5,081 | ||||||
| Government National Mortgage Assn. Pool #MA6600 3.50% 4/20/20507 | 11,395 | 10,581 | ||||||
| Government National Mortgage Assn. Pool #MA8346 4.00% 10/20/20527 | 10,072 | 9,541 | ||||||
| Government National Mortgage Assn. Pool #MA8426 4.00% 11/20/20527 | 18,573 | 17,594 | ||||||
| Government National Mortgage Assn. Pool #MA8427 4.50% 11/20/20527 | 62,302 | 60,506 | ||||||
| Government National Mortgage Assn. Pool #MA8489 4.50% 12/20/20527 | 485 | 471 | ||||||
| Uniform Mortgage-Backed Security 2.50% 1/1/20387,9 | 7,545 | 6,905 | ||||||
| Uniform Mortgage-Backed Security 2.00% 1/1/20537,9 | 210,537 | 171,362 | ||||||
| Uniform Mortgage-Backed Security 2.50% 1/1/20537,9 | 62,762 | 53,158 | ||||||
| Uniform Mortgage-Backed Security 3.00% 1/1/20537,9 | 11,245 | 9,871 | ||||||
| Uniform Mortgage-Backed Security 4.00% 1/1/20537,9 | 2,735 | 2,565 | ||||||
| 194 | American Funds Insurance Series |
The Bond Fund of America (continued)
| Bonds, notes & other debt instruments (continued) | Principal amount (000) |
Value (000) |
||||||
| Mortgage-backed obligations (continued) | ||||||||
| Federal agency mortgage-backed obligations (continued) | ||||||||
| Uniform Mortgage-Backed Security 4.50% 1/1/20537,9 | USD | 5,931 | $ | 5,709 | ||||
| Uniform Mortgage-Backed Security 5.00% 1/1/20537,9 | 42,025 | 41,417 | ||||||
| Uniform Mortgage-Backed Security 5.50% 1/1/20537,9 | 212,640 | 213,231 | ||||||
| Uniform Mortgage-Backed Security 6.00% 1/1/20537,9 | 10,275 | 10,430 | ||||||
| Uniform Mortgage-Backed Security 3.50% 2/1/20537,9 | 10,960 | 9,965 | ||||||
| Uniform Mortgage-Backed Security 4.00% 2/1/20537,9 | 76,136 | 71,431 | ||||||
| Uniform Mortgage-Backed Security 5.00% 2/1/20537,9 | 13,100 | 12,908 | ||||||
| Uniform Mortgage-Backed Security 6.00% 2/1/20537,9 | 112,000 | 113,591 | ||||||
| Uniform Mortgage-Backed Security 6.50% 2/1/20537,9 | 215,026 | 219,946 | ||||||
| 2,374,821 | ||||||||
| Commercial mortgage-backed securities 1.51% | ||||||||
| Bank Commercial Mortgage Trust, Series 2019-BN16, Class A4, 4.005% 2/15/20527 | 770 | 722 | ||||||
| Bank Commercial Mortgage Trust, Series 2019-BN17, Class A4, 3.714% 4/15/20527 | 100 | 92 | ||||||
| Bank Commercial Mortgage Trust, Series 2018-BN10, Class A5, 3.688% 2/15/20617 | 205 | 191 | ||||||
| Bank Commercial Mortgage Trust, Series 2018-BN10, Class A4, 3.428% 2/17/20617 | 127 | 117 | ||||||
| Bank Commercial Mortgage Trust, Series 2018-BN12, Class A4, 4.255% 5/15/20613,7 | 2,444 | 2,335 | ||||||
| Bank Commercial Mortgage Trust, Series 2019-BN19, Class A3, 3.183% 8/15/20617 | 1,018 | 900 | ||||||
| Bank Commercial Mortgage Trust, Series 2020-BN26, Class A4, 2.403% 3/15/20637 | 295 | 247 | ||||||
| Benchmark Mortgage Trust, Series 2018-B8, Class A5, 4.232% 1/15/20527 | 2,541 | 2,427 | ||||||
| Benchmark Mortgage Trust, Series 2018-B7, Class A4, 4.51% 5/15/20533,7 | 781 | 757 | ||||||
| BOCA Commercial Mortgage Trust, Series 2022-BOCA, Class A, (1-month USD CME Term SOFR + 1.77%) 6.105% 5/15/20392,3,7 | 8,575 | 8,420 | ||||||
| BPR Trust, Series 2022-OANA, Class A, (1-month USD CME Term SOFR + 1.898%) 6.234% 4/15/20372,3,7 | 3,822 | 3,739 | ||||||
| BX Trust, Series 2022-CSMO, Class A, (1-month USD CME Term SOFR + 2.115%) 6.45% 6/15/20272,3,7 | 8,476 | 8,431 | ||||||
| BX Trust, Series 2021-VOLT, Class A, (1-month USD-LIBOR + 0.70%) 5.018% 9/15/20362,3,7 | 14,727 | 14,207 | ||||||
| BX Trust, Series 2021-VOLT, Class B, (1-month USD-LIBOR + 0.95%) 5.268% 9/15/20362,3,7 | 570 | 539 | ||||||
| BX Trust, Series 2021-ARIA, Class A, (1-month USD-LIBOR + 0.899%) 5.217% 10/15/20362,3,7 | 5,292 | 5,043 | ||||||
| BX Trust, Series 2021-ARIA, Class B, (1-month USD-LIBOR + 1.297%) 5.615% 10/15/20362,3,7 | 995 | 936 | ||||||
| BX Trust, Series 2021-ARIA Class C, (1-month USD-LIBOR + 1.646%) 5.964% 10/15/20362,3,7 | 996 | 931 | ||||||
| BX Trust, Series 2021-RISE, Class A, (1-month USD-LIBOR + 0.74%) 5.065% 11/15/20362,3,7 | 12,622 | 12,131 | ||||||
| BX Trust, Series 2022-IND, Class A, (1-month USD CME Term SOFR + 1.491%) 5.827% 4/15/20372,3,7 | 5,441 | 5,335 | ||||||
| BX Trust, Series 2021-SOAR, Class A, (1-month USD-LIBOR + 0.67%) 4.988% 6/15/20382,3,7 | 3,741 | 3,608 | ||||||
| BX Trust, Series 2021-SOAR, Class B, (1-month USD-LIBOR + 0.87%) 5.188% 6/15/20382,3,7 | 433 | 413 | ||||||
| BX Trust, Series 2021-SOAR, Class C, (1-month USD-LIBOR + 1.10%) 5.418% 6/15/20382,3,7 | 293 | 278 | ||||||
| BX Trust, Series 2021-SOAR, Class D, (1-month USD-LIBOR + 1.40%) 5.718% 6/15/20382,3,7 | 740 | 699 | ||||||
| BX Trust, Series 2021-ACNT, Class A, (1-month USD-LIBOR + 0.85%) 5.168% 11/15/20382,3,7 | 9,979 | 9,616 | ||||||
| BX Trust, Series 2021-ACNT, Class B, (1-month USD-LIBOR + 1.25%) 5.568% 11/15/20382,3,7 | 339 | 325 | ||||||
| BX Trust, Series 2021-ACNT, Class C, (1-month USD-LIBOR + 1.50%) 5.818% 11/15/20382,3,7 | 100 | 95 | ||||||
| BX Trust, Series 2021-ACNT, Class D, (1-month USD-LIBOR + 1.85%) 6.168% 11/15/20382,3,7 | 151 | 143 | ||||||
| BX Trust, Series 2022-GPA, Class A, (1-month USD CME Term SOFR + 2.165%) 6.501% 10/15/20392,3,7 | 3,198 | 3,185 | ||||||
| American Funds Insurance Series | 195 |
The Bond Fund of America (continued)
| Bonds, notes & other debt instruments (continued) | Principal amount (000) |
Value (000) |
||||||
| Mortgage-backed obligations (continued) | ||||||||
| Commercial mortgage-backed securities (continued) | ||||||||
| Citigroup Commercial Mortgage Trust, Series 2016-GC36, Class A5, 3.616% 2/10/20497 | USD | 610 | $ | 574 | ||||
| Commercial Mortgage Trust, Series 2014-LC15, Class AM, 4.198% 4/10/20477 | 350 | 339 | ||||||
| CSAIL Commercial Mortgage Trust, Series 2015-C2, Class A3, 3.231% 6/15/20577 | 1,137 | 1,080 | ||||||
| Deutsche Bank Commercial Mortgage Trust, Series 2016-C1, Class AM, 3.539% 5/10/20497 | 200 | 182 | ||||||
| Extended Stay America Trust, Series 2021-ESH, Class A, (1-month USD-LIBOR + 1.08%) 5.398% 7/15/20382,3,7 | 2,811 | 2,735 | ||||||
| Extended Stay America Trust, Series 2021-ESH, Class B, (1-month USD-LIBOR + 1.38%) 5.698% 7/15/20382,3,7 | 641 | 618 | ||||||
| Extended Stay America Trust, Series 2021-ESH, Class C, (1-month USD-LIBOR + 1.70%) 6.018% 7/15/20382,3,7 | 875 | 841 | ||||||
| Extended Stay America Trust, Series 2021-ESH, Class D, (1-month USD-LIBOR + 2.25%) 6.568% 7/15/20382,3,7 | 670 | 643 | ||||||
| Fontainebleau Miami Beach Trust, CMO, Series 2019-FBLU, Class A, 3.144% 12/10/20362,7 | 304 | 284 | ||||||
| Grace Mortgage Trust, Series 2020-GRCE, Class A, 2.347% 12/10/20402,7 | 1,897 | 1,458 | ||||||
| Great Wolf Trust, Series 2019-WOLF, Class A, (1-month USD-LIBOR + 1.034%) 5.352% 12/15/20362,3,7 | 3,894 | 3,786 | ||||||
| GS Mortgage Securities Trust, Series 2022-SHIP, Class A, (1-month USD CME Term SOFR + 0.731%) 5.067% 8/15/20242,3,7 | 1,317 | 1,300 | ||||||
| GS Mortgage Securities Trust, Series 2017-GS7, Class A4, 3.43% 8/10/20507 | 400 | 369 | ||||||
| GS Mortgage Securities Trust, Series 2019-GC38, Class A4, 3.968% 2/10/20527 | 100 | 93 | ||||||
| GS Mortgage Securities Trust, Series 2020-GC47, Class A5, 2.377% 5/12/20537 | 1,536 | 1,271 | ||||||
| ILPT Commercial Mortgage Trust, Series 2022-LPF2, Class A, (1-month USD CME Term SOFR + 2.245%) 6.581% 10/15/20392,3,7 | 3,391 | 3,398 | ||||||
| JPMBB Commercial Mortgage Securities Trust, Series 2014-C18, Class A5, 4.079% 2/15/20477 | 3,280 | 3,206 | ||||||
| JPMDB Commercial Mortgage Securities Trust, Series 2017-C5, Class A5, 3.694% 3/15/20507 | 640 | 599 | ||||||
| JPMDB Commercial Mortgage Securities Trust, Series 2017-C7, Class A5, 3.409% 10/15/20507 | 240 | 221 | ||||||
| JPMorgan Chase Commercial Mortgage Securities Trust, Series 2022-OPO, Class A, 3.024% 1/5/20392,7 | 7,867 | 6,739 | ||||||
| JPMorgan Chase Commercial Mortgage Securities Trust, Series 2016-JP4, Class A4, 3.648% 12/15/20493,7 | 2,040 | 1,906 | ||||||
| La Quinta Mortgage Trust, Series 2022-LAQ, Class A, (1-month USD CME Term SOFR + 1.724%) 6.059% 3/15/20392,3,7 | 848 | 831 | ||||||
| LUXE Commercial Mortgage Trust, Series 2021-TRIP, Class A, (1-month USD-LIBOR + 1.05%) 5.368% 10/15/20382,3,7 | 1,576 | 1,510 | ||||||
| MHC Commercial Mortgage Trust, CMO, Series 2021-MHC, Class A, (1-month USD-LIBOR + 0.801%) 5.119% 4/15/20262,3,7 | 154 | 150 | ||||||
| Morgan Stanley Bank of America Merrill Lynch Trust, Series 2014-C17, Class A5, 3.741% 8/15/20477 | 5,446 | 5,277 | ||||||
| Morgan Stanley Bank of America Merrill Lynch Trust, Series 2015-C22, Class A-4, 3.306% 4/15/20487 | 410 | 389 | ||||||
| Morgan Stanley Bank of America Merrill Lynch Trust, Series 2016-C32, Class A-4, 3.72% 12/15/20497 | 245 | 230 | ||||||
| Morgan Stanley Capital I Trust, Series 2015-UBS8, Class AS, 4.114% 12/15/20487 | 730 | 670 | ||||||
| SLG Office Trust, Series 2021-OVA, Class A, 2.585% 7/15/20412,7 | 4,065 | 3,253 | ||||||
| SREIT Trust, Series 2021-FLWR, Class A, (1-month USD-LIBOR + 0.577%) 4.894% 7/15/20362,3,7 | 9,351 | 8,989 | ||||||
| SREIT Trust, Series 2021-FLWR, Class B, (1-month USD-LIBOR + 0.926%) 5.244% 7/15/20362,3,7 | 1,000 | 954 | ||||||
| SREIT Trust, Series 2021-MFP, Class A, (1-month USD-LIBOR + 0.731%) 5.049% 11/15/20382,3,7 | 8,739 | 8,418 | ||||||
| SREIT Trust, Series 2021-MFP, Class B, (1-month USD-LIBOR + 1.079%) 5.398% 11/15/20382,3,7 | 263 | 251 | ||||||
| SREIT Trust, Series 2021-MFP, Class C, (1-month USD-LIBOR + 1.329%) 5.647% 11/15/20382,3,7 | 141 | 134 | ||||||
| 196 | American Funds Insurance Series |
The Bond Fund of America (continued)
| Bonds, notes & other debt instruments (continued) | Principal amount (000) |
Value (000) |
||||||
| Mortgage-backed obligations (continued) | ||||||||
| Commercial mortgage-backed securities (continued) | ||||||||
| Wells Fargo Commercial Mortgage Trust, Series 2015-SG1, Class A-4, 3.789% 9/15/20487 | USD | 2,373 | $ | 2,267 | ||||
| Wells Fargo Commercial Mortgage Trust, Series 2016-C37, Class A5, 3.794% 12/15/20497 | 2,550 | 2,406 | ||||||
| Wells Fargo Commercial Mortgage Trust, Series 2019-C54, Class A4, 3.146% 12/15/20527 | 1,019 | 892 | ||||||
| Wells Fargo Commercial Mortgage Trust, Series 2017-RC1, Class A4, 3.631% 1/15/20607 | 205 | 192 | ||||||
| 154,317 | ||||||||
| Collateralized mortgage-backed obligations (privately originated) 1.07% | ||||||||
| Arroyo Mortgage Trust, Series 2021-1R, Class A1, 1.175% 10/25/20482,3,7 | 2,864 | 2,263 | ||||||
| Arroyo Mortgage Trust, Series 2020-1, Class A1A, 1.662% 3/25/20552,7 | 131 | 119 | ||||||
| Arroyo Mortgage Trust, Series 2022-1, Class A1A, 2.495% 12/25/2056 (3.495% on 2/25/2026)1,2,7 | 6,000 | 5,521 | ||||||
| Bellemeade Re, Ltd., Series 2019-3A, Class M1B, (1-month USD-LIBOR + 1.60%) 5.989% 7/25/20292,3,7 | 414 | 414 | ||||||
| BRAVO Residential Funding Trust, Series 2020-RPL2, Class A1, 2.00% 5/25/20592,3,7 | 923 | 830 | ||||||
| BRAVO Residential Funding Trust, Series 2020-RPL1, Class A1, 2.50% 5/26/20592,3,7 | 586 | 556 | ||||||
| BRAVO Residential Funding Trust, Series 2022-RPL1, Class A1, 2.75% 9/25/20612,7 | 4,867 | 4,221 | ||||||
| Cascade Funding Mortgage Trust, Series 2020-HB4, Class A, 0.946% 12/26/20302,3,7 | 425 | 413 | ||||||
| Cascade Funding Mortgage Trust, Series 2021-HB7, Class A, 1.151% 10/27/20312,3,7 | 3,032 | 2,858 | ||||||
| Cascade Funding Mortgage Trust, Series 2021-HB6, Class A, 0.898% 6/25/20362,3,7 | 1,700 | 1,616 | ||||||
| CIM Trust, Series 2022-R2, Class A1, 3.75% 12/25/20612,3,7 | 6,893 | 6,513 | ||||||
| Citigroup Mortgage Loan Trust, Series 2020-EXP1, Class A1A, 1.804% 5/25/20602,3,7 | 204 | 186 | ||||||
| COLT Mortgage Loan Trust, Series 2021-5, Class A1, 1.726% 11/26/20662,3,7 | 1,660 | 1,406 | ||||||
| Connecticut Avenue Securities Trust, Series 2022-R06, Class 1M1, (30-day Average USD-SOFR + 2.75%) 6.678% 5/25/20422,3,7 | 326 | 330 | ||||||
| Credit Suisse Mortgage Trust, Series 2020-NET, Class A, 2.257% 8/15/20372,7 | 1,575 | 1,409 | ||||||
| Credit Suisse Mortgage Trust, Series 2017-RPL3, Class A1, 2.00% 1/25/20602,3,7 | 1,611 | 1,384 | ||||||
| Finance of America Structured Securities Trust, Series 2019-JR1, Class A, 2.00% 3/25/20692,7 | 2,051 | 2,196 | ||||||
| Finance of America Structured Securities Trust, Series 2019-JR2, Class A1, 2.00% 6/25/20692,7 | 2,604 | 2,677 | ||||||
| Flagstar Mortgage Trust, Series 2021-5INV, Class A2, 2.50% 7/25/20512,3,7 | 2,073 | 1,674 | ||||||
| Flagstar Mortgage Trust, Series 2021-6INV, Class A4, 2.50% 8/25/20512,3,7 | 1,937 | 1,562 | ||||||
| Flagstar Mortgage Trust, Series 2021-8INV, Class A3, 2.50% 9/25/20512,3,7 | 2,038 | 1,646 | ||||||
| Flagstar Mortgage Trust, Series 2021-10INV, Class A3, 2.50% 10/25/20512,3,7 | 3,206 | 2,589 | ||||||
| Flagstar Mortgage Trust, Series 2021-11INV, Class A4, 2.50% 11/25/20512,3,7 | 2,222 | 1,794 | ||||||
| Freddie Mac Structured Agency Credit Risk Debt Notes, Series 2015-DNA3, Class M3, (1-month USD-LIBOR + 4.70%) 9.089% 4/25/20283,7 | 1,497 | 1,548 | ||||||
| Freddie Mac Structured Agency Credit Risk Debt Notes, Series 2022-DNA3, Class M1A, (30-day Average USD-SOFR + 2.00%) 5.928% 4/25/20422,3,7 | 1,537 | 1,531 | ||||||
| Freddie Mac Structured Agency Credit Risk Debt Notes, Series 2022-DNA4, Class M1A, (30-day Average USD-SOFR + 2.20%) 6.128% 5/25/20422,3,7 | 73 | 73 | ||||||
| Freddie Mac Structured Agency Credit Risk Debt Notes, Series 2022-DNA5, Class M1A, (30-day Average USD-SOFR + 2.95%) 6.878% 6/25/20422,3,7 | 278 | 281 | ||||||
| Freddie Mac Structured Agency Credit Risk Debt Notes, Series 2022-DNA6, Class M1A, (30-day Average USD-SOFR + 2.15%) 6.078% 9/25/20422,3,7 | 611 | 612 | ||||||
| Freddie Mac Structured Agency Credit Risk Debt Notes, Series 2022-DNA6, Class M1B, (30-day Average USD-SOFR + 3.70%) 7.628% 9/25/20422,3,7 | 1,519 | 1,552 | ||||||
| Freddie Mac Structured Agency Credit Risk Debt Notes, Series 2020-DNA2, Class M2, (1-month USD-LIBOR + 1.85%) 6.239% 2/25/20502,3,7 | 3,005 | 3,000 | ||||||
| Freddie Mac Structured Agency Credit Risk Debt Notes, Series 2020-DNA4, Class B1, (1-month USD-LIBOR + 6.00%) 10.389% 8/25/20502,3,7 | 949 | 1,011 | ||||||
| GCAT Trust, Series 2021-NQM6, Class A1, 1.855% 8/25/20662,3,7 | 3,494 | 2,935 | ||||||
| Home Partners of America Trust, Series 2021-2, Class A, 1.901% 12/17/20262,7 | 5,380 | 4,654 | ||||||
| Hundred Acre Wood Trust, Series 2021-INV1, Class A3, 2.50% 7/25/20512,3,7 | 882 | 712 | ||||||
| Legacy Mortgage Asset Trust, Series 2022-GS1, Class A1, 4.00% 2/25/2061 (7.00% on 4/25/2025)1,2,7 | 3,534 | 3,273 | ||||||
| American Funds Insurance Series | 197 |
The Bond Fund of America (continued)
| Bonds, notes & other debt instruments (continued) | Principal amount (000) |
Value (000) |
||||||
| Mortgage-backed obligations (continued) | ||||||||
| Collateralized mortgage-backed obligations (privately originated) (continued) | ||||||||
| Legacy Mortgage Asset Trust, Series 2021-GS2, Class A1, 1.75% 4/25/20612,3,7 | USD | 858 | $ | 780 | ||||
| Legacy Mortgage Asset Trust, Series 2021-GS5, Class A1, 2.25% 7/25/2067 (5.25% on 11/25/2024)1,2,7 | 2,644 | 2,380 | ||||||
| Mello Warehouse Securitization Trust, Series 2021-3, Class A, (1-month USD-LIBOR + 0.85%) 5.239% 11/25/20552,3,7 | 16,160 | 15,635 | ||||||
| MFRA Trust, Series 2021-RPL1, Class A1, 1.131% 7/25/20602,3,7 | 3,088 | 2,720 | ||||||
| PRKCM Trust, Series 2021-AFC2, Class A1, 2.071% 11/25/20562,3,7 | 3,558 | 2,965 | ||||||
| Progress Residential Trust, Series 2022-SFR3, Class A, 3.20% 4/17/20392,7 | 1,132 | 1,028 | ||||||
| Reverse Mortgage Investment Trust, Series 2021-HB1, Class A, 1.259% 11/25/20312,3,7 | 3,346 | 3,155 | ||||||
| Towd Point Mortgage Trust, Series 2020-4, Class A1, 1.75% 10/25/20602,7 | 10,737 | 9,539 | ||||||
| Treehouse Park Improvement Association No.1 - Anleihen 9.75% 12/1/20332,10 | 1,680 | 1,486 | ||||||
| Tricon Residential Trust, Series 2021-SFR1, Class A, 1.943% 7/17/20382,7 | 5,033 | 4,381 | ||||||
| 109,428 | ||||||||
| Total mortgage-backed obligations | 2,638,566 | |||||||
| Asset-backed obligations 4.52% | ||||||||
| Affirm Asset Securitization Trust, Series 2021-B, Class A, 1.03% 8/17/20262,7 | 701 | 665 | ||||||
| Affirm Asset Securitization Trust, Series 2021-Z2, Class A, 1.17% 11/16/20262,7 | 672 | 643 | ||||||
| Affirm Asset Securitization Trust, Series 2022-X1, Class A, 1.75% 2/15/20272,7 | 765 | 744 | ||||||
| AGL CLO, Ltd., Series 2022-18A, Class A1, (3-month USD CME Term SOFR + 1.32%) 5.308% 4/21/20312,3,7 | — | 8 | — | 8 | ||||
| American Credit Acceptance Receivables Trust, Series 2020-3, Class C, 1.85% 6/15/20262,7 | 1,178 | 1,169 | ||||||
| American Credit Acceptance Receivables Trust, Series 2020-3, Class D, 2.40% 6/15/20262,7 | 2,500 | 2,429 | ||||||
| American Credit Acceptance Receivables Trust, Series 2022-3, Class B, 4.55% 10/13/20262,7 | 360 | 353 | ||||||
| American Credit Acceptance Receivables Trust, Series 2021-1, Class C, 0.83% 3/15/20272,7 | 1,055 | 1,038 | ||||||
| American Credit Acceptance Receivables Trust, Series 2021-1, Class D, 1.14% 3/15/20272,7 | 806 | 760 | ||||||
| American Homes 4 Rent, Series 2014-SFR2, Class A, 3.786% 10/17/20362,7 | 1,136 | 1,097 | ||||||
| American Homes 4 Rent, Series 2015-SFR2, Class A, 3.732% 10/17/20522,7 | 2,781 | 2,631 | ||||||
| American Homes 4 Rent, Series 2015-SFR2, Class B, 4.295% 10/17/20522,7 | 396 | 376 | ||||||
| AmeriCredit Automobile Receivables Trust, Series 2021-2, Class B, 0.69% 1/19/20277 | 997 | 935 | ||||||
| AmeriCredit Automobile Receivables Trust, Series 2021-2, Class C, 1.01% 1/19/20277 | 1,109 | 1,009 | ||||||
| AmeriCredit Automobile Receivables Trust, Series 2021-2, Class D, 1.29% 6/18/20277 | 2,613 | 2,319 | ||||||
| Avis Budget Rental Car Funding (AESOP), LLC, Series 2018-2A, Class A, 4.00% 3/20/20252,7 | 2,755 | 2,710 | ||||||
| Avis Budget Rental Car Funding (AESOP), LLC, Series 2019-2A, Class A, 3.35% 9/22/20252,7 | 2,210 | 2,137 | ||||||
| Avis Budget Rental Car Funding (AESOP), LLC, Series 2020-1A, Class A, 2.33% 8/20/20262,7 | 7,689 | 7,124 | ||||||
| Avis Budget Rental Car Funding (AESOP), LLC, Series 2020-2, Class A, 2.02% 2/20/20272,7 | 2,427 | 2,203 | ||||||
| Avis Budget Rental Car Funding (AESOP), LLC, Series 2020-2A, Class B, 2.96% 2/20/20272,7 | 623 | 560 | ||||||
| Avis Budget Rental Car Funding (AESOP), LLC, Series 2020-2A, Class C, 4.25% 2/20/20272,7 | 1,279 | 1,144 | ||||||
| Avis Budget Rental Car Funding (AESOP), LLC, Series 2021-1A, Class A, 1.38% 8/20/20272,7 | 3,445 | 3,005 | ||||||
| Avis Budget Rental Car Funding (AESOP), LLC, Series 2021-1A, Class B, 1.63% 8/20/20272,7 | 531 | 449 | ||||||
| Avis Budget Rental Car Funding (AESOP), LLC, Series 2021-1A, Class C, 2.13% 8/20/20272,7 | 193 | 161 | ||||||
| Ballyrock CLO, Ltd., Series 2019-2A, Class A1AR, (3-month USD-LIBOR + 1.00%) 5.675% 11/20/20302,3,7 | 575 | 568 | ||||||
| 198 | American Funds Insurance Series |
The Bond Fund of America (continued)
| Bonds, notes & other debt instruments (continued) | Principal amount (000) |
Value (000) |
||||||
| Asset-backed obligations (continued) | ||||||||
| Bankers Healthcare Group Securitization Trust, Series 2021-B, Class A, 0.90% 10/17/20342,7 | USD | 180 | $ | 170 | ||||
| Bankers Healthcare Group Securitization Trust, Series 2021-B, Class B, 1.67% 10/17/20342,7 | 269 | 227 | ||||||
| Blackbird Capital II Aircraft Lease, Ltd. / Blackbird Capital II Aircraft Lease US, LLC, Series 2021-1, Class A, 2.443% 7/15/20462,7 | 3,951 | 3,250 | ||||||
| Blackbird Capital II Aircraft Lease, Ltd. / Blackbird Capital II Aircraft Lease US, LLC, Series 2021-1, Class B, 3.446% 7/15/20462,7 | 497 | 375 | ||||||
| CarMax Auto Owner Trust, Series 2019-2, Class C, 3.16% 2/18/20257 | 400 | 396 | ||||||
| CarMax Auto Owner Trust, Series 2021-1, Class C, 0.94% 12/15/20267 | 210 | 190 | ||||||
| CarMax Auto Owner Trust, Series 2021-1, Class D, 1.28% 7/15/20277 | 206 | 184 | ||||||
| Carvana Auto Receivables Trust, Series 2021-N4, Class C, 1.72% 9/11/20287 | 538 | 514 | ||||||
| Castlelake Aircraft Securitization Trust, Series 2021-1, Class A, 2.868% 5/11/20372,7 | 15,953 | 13,578 | ||||||
| Castlelake Aircraft Securitization Trust, Series 2021-1, Class C, 3.464% 5/11/20372,7 | 6,185 | 5,238 | ||||||
| Castlelake Aircraft Securitization Trust, Series 2021-1, Class C, 6.171% 5/11/20372,7 | 671 | 544 | ||||||
| Castlelake Aircraft Securitization Trust, Series 2017-1R, Class A, 2.741% 8/15/20412,7 | 802 | 702 | ||||||
| CF Hippolyta, LLC, Series 2020-1, Class A1, 1.69% 7/15/20602,7 | 18,679 | 16,693 | ||||||
| CF Hippolyta, LLC, Series 2020-1, Class A2, 1.99% 7/15/20602,7 | 1,950 | 1,613 | ||||||
| CF Hippolyta, LLC, Series 2020-1, Class B1, 2.28% 7/15/20602,7 | 3,395 | 2,969 | ||||||
| CF Hippolyta, LLC, Series 2020-1, Class B2, 2.60% 7/15/20602,7 | 368 | 291 | ||||||
| CF Hippolyta, LLC, Series 2021-1, Class A1, 1.53% 3/15/20612,7 | 6,053 | 5,242 | ||||||
| CF Hippolyta, LLC, Series 2021-1, Class B1, 1.98% 3/15/20612,7 | 1,917 | 1,602 | ||||||
| CF Hippolyta, LLC, Series 2022-1, Class A1, 5.97% 8/15/20622,7 | 15,132 | 14,821 | ||||||
| CF Hippolyta, LLC, Series 2022-1, Class A2, 6.11% 8/15/20622,7 | 6,637 | 6,257 | ||||||
| CLI Funding VI, LLC, Series 2020-2A, Class A, 2.03% 9/15/20452,7 | 2,298 | 1,978 | ||||||
| CLI Funding VI, LLC, Series 2020-3A, Class A, 2.07% 10/18/20452,7 | 4,800 | 4,174 | ||||||
| CLI Funding VIII, LLC, Series 2021-1A, Class A, 2.38% 2/18/20462,7 | 436 | 363 | ||||||
| CPS Auto Receivables Trust, Series 2019-B, Class D, 3.69% 3/17/20252,7 | 249 | 248 | ||||||
| CPS Auto Receivables Trust, Series 2019-C, Class D, 3.17% 6/16/20252,7 | 405 | 404 | ||||||
| CPS Auto Receivables Trust, Series 2022-B, Class A, 2.88% 6/15/20262,7 | 1,883 | 1,849 | ||||||
| CPS Auto Receivables Trust, Series 2021-A, Class C, 0.83% 9/15/20262,7 | 514 | 507 | ||||||
| CPS Auto Receivables Trust, Series 2021-A, Class D, 1.16% 12/15/20262,7 | 590 | 559 | ||||||
| CPS Auto Receivables Trust, Series 2022-B, Class B, 3.88% 8/15/20282,7 | 2,111 | 2,033 | ||||||
| CPS Auto Receivables Trust, Series 2022-B, Class C, 4.33% 8/15/20282,7 | 2,797 | 2,658 | ||||||
| Drive Auto Receivables Trust, Series 2021-1, Class B, 0.65% 7/15/20257 | 86 | 86 | ||||||
| Drive Auto Receivables Trust, Series 2019-3, Class D, 3.18% 10/15/20267 | 3,890 | 3,844 | ||||||
| Drive Auto Receivables Trust, Series 2021-1, Class C, 1.02% 6/15/20277 | 5,369 | 5,249 | ||||||
| Drive Auto Receivables Trust, Series 2021-1, Class D, 1.45% 1/16/20297 | 4,053 | 3,800 | ||||||
| DriveTime Auto Owner Trust, Series 2019-2A, Class D, 3.48% 2/18/20252,7 | 2,320 | 2,309 | ||||||
| DriveTime Auto Owner Trust, Series 2019-3, Class D, 2.96% 4/15/20252,7 | 1,473 | 1,454 | ||||||
| DriveTime Auto Owner Trust, Series 2020-3A, Class C, 1.47% 6/15/20262,7 | 817 | 791 | ||||||
| DriveTime Auto Owner Trust, Series 2021-1A, Class C, 0.84% 10/15/20262,7 | 825 | 792 | ||||||
| DriveTime Auto Owner Trust, Series 2021-1A, Class D, 1.16% 11/16/20262,7 | 449 | 414 | ||||||
| DriveTime Auto Owner Trust, Series 2021-2A, Class B, 0.81% 1/15/20272,7 | 1,179 | 1,156 | ||||||
| DriveTime Auto Owner Trust, Series 2021-2A, Class C, 1.10% 2/16/20272,7 | 1,231 | 1,170 | ||||||
| DriveTime Auto Owner Trust, Series 2021-2A, Class D, 1.50% 2/16/20272,7 | 832 | 764 | ||||||
| EDvestinU Private Education Loan, LLC, Series 2021-A, Class A, 1.80% 11/25/20452,7 | 428 | 362 | ||||||
| Enterprise Fleet Financing, LLC, Series 2022-3, Class A3, 4.29% 7/20/20292,7 | 897 | 851 | ||||||
| Enterprise Fleet Financing, LLC, Series 2022-3, Class A2, 4.38% 7/20/20292,7 | 1,380 | 1,350 | ||||||
| Exeter Automobile Receivables Trust, Series 2019-2A, Class D, 3.71% 3/17/20252,7 | 3,251 | 3,218 | ||||||
| Exeter Automobile Receivables Trust, Series 2020-3A, Class C, 1.32% 7/15/20257 | 401 | 397 | ||||||
| Exeter Automobile Receivables Trust, Series 2019-3A, Class D, 3.11% 8/15/20252,7 | 3,405 | 3,352 | ||||||
| Exeter Automobile Receivables Trust, Series 2021-2, Class B, 0.57% 9/15/20257 | 721 | 716 | ||||||
| Exeter Automobile Receivables Trust, Series 2022-2A, Class A3, 2.80% 11/17/20257 | 1,162 | 1,150 | ||||||
| Exeter Automobile Receivables Trust, Series 2022-6, Class A2, 5.73% 11/17/20257 | 587 | 588 | ||||||
| Exeter Automobile Receivables Trust, Series 2020-1A, Class D, 2.73% 12/15/20252,7 | 893 | 875 | ||||||
| Exeter Automobile Receivables Trust, Series 2021-2, Class C, 0.98% 6/15/20267 | 1,807 | 1,737 | ||||||
| Exeter Automobile Receivables Trust, Series 2020-3A, Class D, 1.73% 7/15/20267 | 1,012 | 975 | ||||||
| Exeter Automobile Receivables Trust, Series 2022-2A, Class B, 3.65% 10/15/20267 | 3,047 | 2,976 | ||||||
| Exeter Automobile Receivables Trust, Series 2022-4A, Class B, 4.57% 1/15/20277 | 568 | 558 | ||||||
| Exeter Automobile Receivables Trust, Series 2021-2, Class D, 1.40% 4/15/20277 | 2,612 | 2,388 | ||||||
| American Funds Insurance Series | 199 |
The Bond Fund of America (continued)
| Bonds, notes & other debt instruments (continued) | Principal amount (000) |
Value (000) |
||||||
| Asset-backed obligations (continued) | ||||||||
| Exeter Automobile Receivables Trust, Series 2022-2A, Class D, 4.56% 7/17/20287 | USD | 1,201 | $ | 1,127 | ||||
| FirstKey Homes Trust, Series 2020-SFR2, Class A, 1.266% 10/19/20372,7 | 17,959 | 15,928 | ||||||
| FirstKey Homes Trust, Series 2021-SFR3, Class A, 2.135% 12/17/20382,7 | 1,380 | 1,195 | ||||||
| FirstKey Homes Trust, Series 2022-SFR2, Class A, 4.145% 5/17/20392,7 | 1,733 | 1,628 | ||||||
| Ford Credit Auto Owner Trust, Series 2018-2, Class A, 3.47% 1/15/20302,7 | 17,675 | 17,438 | ||||||
| Ford Credit Auto Owner Trust, Series 2018-1, Class A, 3.19% 7/15/20312,7 | 30,070 | 28,744 | ||||||
| GCI Funding I, LLC, Series 2020-1, Class A, 2.82% 10/18/20452,7 | 2,069 | 1,827 | ||||||
| GCI Funding I, LLC, Series 2021-1, Class A, 2.38% 6/18/20462,7 | 1,421 | 1,210 | ||||||
| GCI Funding I, LLC, Series 2021-1, Class B, 3.04% 6/18/20462,7 | 158 | 134 | ||||||
| Global SC Finance VII SRL, Series 2020-2A, Class A, 2.26% 11/19/20402,7 | 2,868 | 2,550 | ||||||
| Global SC Finance VII SRL, Series 2021-1A, Class A, 1.86% 4/17/20412,7 | 9,797 | 8,450 | ||||||
| Global SC Finance VII SRL, Series 2021-2A, Class A, 1.95% 8/17/20412,7 | 2,739 | 2,378 | ||||||
| Global SC Finance VII SRL, Series 2021-2A, Class B, 2.49% 8/17/20412,7 | 214 | 181 | ||||||
| GM Financial Automobile Leasing Trust, Series 2020-2, Class C, 2.56% 7/22/20247 | 301 | 300 | ||||||
| GM Financial Automobile Leasing Trust, Series 2020-2, Class D, 3.21% 12/20/20247 | 425 | 424 | ||||||
| GM Financial Revolving Receivables Trust, Series 2022-1, Class A, 5.91% 10/11/20352,7 | 2,703 | 2,756 | ||||||
| Hertz Vehicle Financing III, LLC, Series 2021-A, Class B, 3.65% 6/30/20232,7,10 | 8,590 | 8,241 | ||||||
| Hertz Vehicle Financing III, LLC, Series 2021-1A, Class A, 1.21% 12/26/20252,7 | 12,703 | 11,748 | ||||||
| Hertz Vehicle Financing III, LLC, Series 2021-1A, Class B, 1.56% 12/26/20252,7 | 1,171 | 1,074 | ||||||
| Hertz Vehicle Financing III, LLC, Series 2021-1A, Class C, 2.05% 12/26/20252,7 | 810 | 731 | ||||||
| Hertz Vehicle Financing III, LLC, Series 2021-2A, Class A, 1.68% 12/27/20272,7 | 17,770 | 15,498 | ||||||
| Hertz Vehicle Financing III, LLC, Series 2021-2A, Class B, 2.12% 12/27/20272,7 | 1,264 | 1,085 | ||||||
| Hertz Vehicle Financing III, LLC, Series 2021-2A, Class C, 2.52% 12/27/20272,7 | 859 | 710 | ||||||
| LAD Auto Receivables Trust, Series 2021-1A, Class A, 1.30% 8/17/20262,7 | 866 | 842 | ||||||
| LAD Auto Receivables Trust, Series 2021-1A, Class B, 1.94% 11/16/20262,7 | 304 | 285 | ||||||
| LAD Auto Receivables Trust, Series 2022-1, Class A, 5.21% 6/15/20272,7 | 1,207 | 1,188 | ||||||
| LAD Auto Receivables Trust, Series 2022-1, Class B, 5.87% 9/15/20272,7 | 438 | 426 | ||||||
| LAD Auto Receivables Trust, Series 2022-1, Class C, 6.85% 4/15/20302,7 | 623 | 596 | ||||||
| Madison Park Funding, Ltd., CLO, Series 2015-17A, Class AR2, (3-month USD-LIBOR + 1.00%) 5.278% 7/21/20302,3,7 | 892 | 878 | ||||||
| Marathon CLO, Ltd., Series 2017-9A, Class A1AR, (3-month USD-LIBOR + 1.15%) 5.229% 4/15/20292,3,7 | 574 | 568 | ||||||
| Mission Lane Credit Card Master Trust, Series 2021-A, Class A, 1.59% 9/15/20262,7 | 1,242 | 1,203 | ||||||
| Mission Lane Credit Card Master Trust, Series 2021-A, Class B, 2.24% 9/15/20262,7 | 230 | 223 | ||||||
| Mission Lane Credit Card Master Trust, Series 2022-B, Class A1, 8.25% 1/15/20287,10,11 | 1,006 | 1,006 | ||||||
| Mission Lane Credit Card Master Trust, Series 2022-B, Class A2, 8.73% 1/15/20287,10,11 | 150 | 150 | ||||||
| Navient Student Loan Trust, Series 2021-C, Class A, 1.06% 10/15/20692,7 | 4,052 | 3,449 | ||||||
| Navient Student Loan Trust, Series 2021-EA, Class A, 0.97% 12/16/20692,7 | 2,516 | 2,110 | ||||||
| Navient Student Loan Trust, Series 2021-G, Class A, 1.58% 4/15/20702,7 | 895 | 759 | ||||||
| Navigator Aircraft ABS, Ltd., Series 2021-1, Class A, 2.771% 11/15/20462,7 | 4,396 | 3,702 | ||||||
| Nelnet Student Loan Trust, Series 2021-C, Class AFX, 1.32% 4/20/20622,7 | 314 | 279 | ||||||
| Nelnet Student Loan Trust, Series 2021-A, Class APT1, 1.36% 4/20/20622,7 | 5,377 | 4,762 | ||||||
| Nelnet Student Loan Trust, Series 2021-B, Class AFX, 1.42% 4/20/20622,7 | 12,315 | 10,951 | ||||||
| Nelnet Student Loan Trust, Series 2021-C, Class AFL, (1-month USD-LIBOR + 0.74%) 5.093% 4/20/20622,3,7 | 4,035 | 3,918 | ||||||
| New Economy Assets Phase 1 Issuer, LLC, Series 2021-1, Class A1, 1.91% 10/20/20612,7 | 50,765 | 42,988 | ||||||
| Newark BSL CLO 2, Ltd., Series 2017-1A, Class A1R, (3-month USD-LIBOR + 0.97%) 5.328% 7/25/20302,3,7 | 273 | 270 | ||||||
| Oportun Funding, LLC, Series 2021-A, Class A, 1.21% 3/8/20282,7 | 240 | 224 | ||||||
| Palmer Square Loan Funding, CLO, Series 2021-1, Class A1, (3-month USD-LIBOR + 0.90%) 5.143% 4/20/20292,3,7 | 256 | 253 | ||||||
| PFS Financing Corp., Series 2021-B, Class A, 0.775% 8/17/20262,7 | 7,884 | 7,276 | ||||||
| PFS Financing Corp., Series 2022-D, Class A, 4.27% 8/16/20272,7 | 1,721 | 1,681 | ||||||
| Prestige Auto Receivables Trust, Series 2019-1A, Class C, 2.70% 10/15/20242,7 | 804 | 802 | ||||||
| Prestige Auto Receivables Trust, Series 2019-1A, Class D, 3.01% 8/15/20252,7 | 1,355 | 1,341 | ||||||
| Prodigy Finance DAC, Series 2021-1A, Class A, (1-month USD-LIBOR + 1.25%) 5.639% 7/25/20512,3,7 | 577 | 558 | ||||||
| 200 | American Funds Insurance Series |
The Bond Fund of America (continued)
| Bonds, notes & other debt instruments (continued) | Principal amount (000) |
Value (000) |
||||||
| Asset-backed obligations (continued) | ||||||||
| Santander Drive Auto Receivables Trust, Series 2019-2, Class D, 3.22% 7/15/20257 | USD | 1,584 | $ | 1,574 | ||||
| Santander Drive Auto Receivables Trust, Series 2021-2, Class B, 0.59% 9/15/20257 | 523 | 521 | ||||||
| Santander Drive Auto Receivables Trust, Series 2020-3, Class C, 1.12% 1/15/20267 | 1,480 | 1,467 | ||||||
| Santander Drive Auto Receivables Trust, Series 2021-2, Class C, 0.90% 6/15/20267 | 2,812 | 2,736 | ||||||
| Santander Drive Auto Receivables Trust, Series 2020-3, Class D, 1.64% 11/16/20267 | 2,211 | 2,120 | ||||||
| Santander Drive Auto Receivables Trust, Series 2022-5, Class B, 4.43% 3/15/20277 | 917 | 892 | ||||||
| Santander Drive Auto Receivables Trust, Series 2021-2, Class D, 1.35% 7/15/20277 | 1,802 | 1,686 | ||||||
| Santander Drive Auto Receivables Trust, Series 2021-3, Class C, 0.95% 9/15/20277 | 1,677 | 1,613 | ||||||
| Santander Drive Auto Receivables Trust, Series 2021-3, Class D, 1.33% 9/15/20277 | 2,236 | 2,073 | ||||||
| Santander Drive Auto Receivables Trust, Series 2022-5, Class C, 4.74% 10/15/20287 | 856 | 828 | ||||||
| SLAM, Ltd., Series 2021-1, Class A, 2.434% 6/15/20462,7 | 2,641 | 2,190 | ||||||
| SLAM, Ltd., Series 2021-1, Class B, 3.422% 6/15/20462,7 | 487 | 397 | ||||||
| SOLRR Aircraft Aviation Holding, Ltd., Series 2021-1, Class A, 2.636% 10/15/20462,7 | 2,392 | 1,923 | ||||||
| SPRITE, Ltd., Series 2021-1, Class A, 3.75% 11/15/20462,7 | 3,233 | 2,805 | ||||||
| Stellar Jay Ireland DAC, Series 2021-1, Class A, 3.967% 10/15/20412,7 | 451 | 381 | ||||||
| Stonepeak Infrastructure Partners, Series 2021-1A, Class AA, 2.301% 2/28/20332,7 | 1,243 | 1,108 | ||||||
| Stonepeak Infrastructure Partners, Series 2021-1A, Class A, 2.675% 2/28/20332,7 | 1,441 | 1,245 | ||||||
| SuttonPark Structured Settlements, Series 2021-1, Class A, 1.95% 9/15/20752,7 | 2,300 | 2,092 | ||||||
| TAL Advantage V, LLC, Series 2020-1A, Class A, 2.05% 9/20/20452,7 | 2,971 | 2,610 | ||||||
| Textainer Marine Containers, Ltd., Series 2020-1A, Class A, 2.73% 8/21/20452,7 | 1,252 | 1,135 | ||||||
| Textainer Marine Containers, Ltd., Series 2020-2A, Class A, 2.10% 9/20/20452,7 | 2,223 | 1,939 | ||||||
| Textainer Marine Containers, Ltd., Series 2021-1A, Class A, 1.68% 2/20/20462,7 | 6,190 | 5,211 | ||||||
| Textainer Marine Containers, Ltd., Series 2021-1A, Class B, 2.52% 2/20/20462,7 | 346 | 288 | ||||||
| Textainer Marine Containers, Ltd., Series 2021-2A, Class A, 2.23% 4/20/20462,7 | 5,200 | 4,431 | ||||||
| TIF Funding II, LLC, Series 2020-1A, Class A, 2.09% 8/20/20452,7 | 4,358 | 3,747 | ||||||
| TIF Funding II, LLC, Series 2021-1A, Class B, 2.54% 2/20/20462,7 | 130 | 107 | ||||||
| Toyota Auto Loan Extended Note Trust, Series 2019-1, Class A, 2.56% 11/25/20312,7 | 6,000 | 5,785 | ||||||
| Triton Container Finance VIII, LLC, Series 2020-1, Class A, 2.11% 9/20/20452,7 | 10,418 | 8,932 | ||||||
| Triton Container Finance VIII, LLC, Series 2021-1, Class A, 1.86% 3/20/20462,7 | 3,563 | 2,978 | ||||||
| Triton Container Finance VIII, LLC, Series 2021-1A, Class B, 2.58% 3/20/20462,7 | 346 | 285 | ||||||
| Westlake Automobile Receivables Trust, Series 2020-3A, Class C, 1.24% 11/17/20252,7 | 1,557 | 1,518 | ||||||
| Westlake Automobile Receivables Trust, Series 2020-3A, Class D, 1.65% 2/17/20262,7 | 3,023 | 2,866 | ||||||
| Westlake Automobile Receivables Trust, Series 2021-2, Class B, 0.62% 7/15/20262,7 | 1,690 | 1,632 | ||||||
| Westlake Automobile Receivables Trust, Series 2021-2, Class C, 0.89% 7/15/20262,7 | 2,181 | 2,050 | ||||||
| Westlake Automobile Receivables Trust, Series 2021-2, Class D, 1.23% 12/15/20262,7 | 1,446 | 1,318 | ||||||
| 461,708 | ||||||||
| Municipals 1.62% | ||||||||
| California 0.03% | ||||||||
| G.O. Bonds, Series 2009, 7.50% 4/1/2034 | 2,100 | 2,541 | ||||||
| Golden State Tobacco Securitization Corp., Enhanced Tobacco Settlement Asset-Backed Bonds, Series 2021-B, 2.746% 6/1/2034 | 650 | 523 | ||||||
| 3,064 | ||||||||
| Illinois 1.47% | ||||||||
| City of Chicago, Board of Education, Unlimited Tax G.O. Bonds (Dedicated Rev.), Series 2010-C, 6.319% 11/1/2029 | 65 | 61 | ||||||
| City of Chicago, Board of Education, Unlimited Tax G.O. Bonds (Dedicated Rev.), Series 2009-E, 6.138% 12/1/2039 | 30,835 | 26,399 | ||||||
| City of Chicago, Board of Education, Unlimited Tax G.O. Bonds (Dedicated Rev.), Series 2010-D, 6.519% 12/1/2040 | 8,945 | 7,689 | ||||||
| City of Chicago, Board of Education, Unlimited Tax G.O. Bonds (Qualified School Construction Bonds), Series 2009-G, 1.75% 12/15/2025 | 2,500 | 2,155 | ||||||
| G.O. Bonds, Series 2013-B, 4.31% 4/1/2023 | 2,125 | 2,122 | ||||||
| G.O. Bonds, Pension Funding, Series 2003, 4.95% 6/1/2023 | 6,228 | 6,231 | ||||||
| G.O. Bonds, Pension Funding, Series 2003, 5.10% 6/1/2033 | 107,000 | 102,807 | ||||||
| G.O. Bonds, Taxable Build America Bonds, Series 2010-2, 5.95% 3/1/2023 | 3,210 | 3,215 | ||||||
| 150,679 | ||||||||
| American Funds Insurance Series | 201 |
The Bond Fund of America (continued)
| Bonds, notes & other debt instruments (continued) | Principal amount (000) |
Value (000) |
||||||
| Municipals (continued) | ||||||||
| New York 0.05% | ||||||||
| Dormitory Auth., Taxable State Personal Income Tax Rev. Bonds (General Purpose), Series 2021-C, 2.202% 3/15/2034 | USD | 6,390 | $ | 4,881 | ||||
| Texas 0.03% | ||||||||
| Grand Parkway Transportation Corp., Grand Parkway System Toll Rev. Ref. Bonds, Series 2020-B, 3.236% 10/1/2052 | 4,075 | 2,899 | ||||||
| Wisconsin 0.04% | ||||||||
| Public Fin. Auth., Federal Lease Rev. Bonds (Fort Sam Acquisition Fncg.), Series 2022, 4.95% 3/1/2034 | 4,580 | 4,071 | ||||||
| Total municipals | 165,594 | |||||||
| Bonds & notes of governments & government agencies outside the U.S. 1.29% | ||||||||
| Chile (Republic of) 3.50% 1/31/2034 | 600 | 513 | ||||||
| Chile (Republic of) 3.10% 5/7/2041 | 2,340 | 1,689 | ||||||
| Chile (Republic of) 4.34% 3/7/2042 | 1,320 | 1,120 | ||||||
| Chile (Republic of) 4.00% 1/31/2052 | 580 | 450 | ||||||
| Colombia (Republic of) 4.125% 5/15/2051 | 3,120 | 1,878 | ||||||
| Colombia (Republic of), Series B, 5.75% 11/3/2027 | COP | 24,813,800 | 3,883 | |||||
| Dominican Republic 5.95% 1/25/20272 | USD | 8,100 | 7,954 | |||||
| Indonesia (Republic of) 4.65% 9/20/2032 | 2,690 | 2,638 | ||||||
| Indonesia (Republic of) 3.35% 3/12/2071 | 1,660 | 1,109 | ||||||
| Indonesia (Republic of), Series 91, 6.375% 4/15/2032 | IDR | 31,265,000 | 1,936 | |||||
| Israel (State of) 1.00% 3/31/2030 | ILS | 11,800 | 2,799 | |||||
| Israel (State of) 3.375% 1/15/2050 | USD | 4,750 | 3,670 | |||||
| Israel (State of) 3.875% 7/3/2050 | 4,775 | 4,036 | ||||||
| Malaysia (Federation of), Series 0219, 3.885% 8/15/2029 | MYR | 5,290 | 1,193 | |||||
| Panama (Republic of) 3.362% 6/30/2031 | USD | 15,625 | 12,695 | |||||
| Panama (Republic of) 3.87% 7/23/2060 | 7,500 | 4,863 | ||||||
| Panama (Republic of) 4.50% 1/19/2063 | 395 | 280 | ||||||
| Paraguay (Republic of) 5.00% 4/15/2026 | 1,250 | 1,248 | ||||||
| Peru (Republic of) 6.35% 8/12/2028 | PEN | 5,840 | 1,463 | |||||
| Peru (Republic of) 5.94% 2/12/2029 | 6,005 | 1,450 | ||||||
| Peru (Republic of) 2.783% 1/23/2031 | USD | 2,155 | 1,788 | |||||
| Peru (Republic of) 6.15% 8/12/2032 | PEN | 12,950 | 2,998 | |||||
| Peru (Republic of) 3.60% 1/15/2072 | USD | 7,640 | 4,999 | |||||
| Philippines (Republic of) 3.229% 3/29/2027 | 475 | 457 | ||||||
| Philippines (Republic of) 3.20% 7/6/2046 | 4,900 | 3,598 | ||||||
| Philippines (Republic of) 4.20% 3/29/2047 | 272 | 234 | ||||||
| Poland (Republic of) 5.75% 11/16/2032 | 555 | 593 | ||||||
| Portuguese Republic 5.125% 10/15/2024 | 24,775 | 24,868 | ||||||
| PT Indonesia Asahan Aluminium Tbk 5.71% 11/15/20232 | 1,020 | 1,023 | ||||||
| PT Indonesia Asahan Aluminium Tbk 4.75% 5/15/20252 | 1,270 | 1,251 | ||||||
| PT Indonesia Asahan Aluminium Tbk 5.45% 5/15/20302 | 340 | 324 | ||||||
| PT Indonesia Asahan Aluminium Tbk 5.80% 5/15/20502 | 1,150 | 966 | ||||||
| Qatar (State of) 4.50% 4/23/20282 | 5,100 | 5,141 | ||||||
| Qatar (State of) 5.103% 4/23/20482 | 3,400 | 3,425 | ||||||
| Romania 3.75% 2/7/2034 | EUR | 5,625 | 4,515 | |||||
| Saudi Arabia (Kingdom of) 3.628% 4/20/20272 | USD | 5,000 | 4,846 | |||||
| Saudi Arabia (Kingdom of) 3.625% 3/4/20282 | 11,435 | 10,939 | ||||||
| United Mexican States 4.875% 5/19/2033 | 2,175 | 2,001 | ||||||
| United Mexican States 3.50% 2/12/2034 | 1,030 | 827 | ||||||
| United Mexican States 4.40% 2/12/2052 | 440 | 325 | ||||||
| 131,985 | ||||||||
| 202 | American Funds Insurance Series |
The Bond Fund of America (continued)
| Bonds, notes & other debt instruments (continued) | Principal amount (000) |
Value (000) |
||||||
| Federal agency bonds & notes 0.11% | ||||||||
| Fannie Mae 2.125% 4/24/2026 | USD | 11,910 | $ | 11,160 | ||||
| Total bonds, notes & other debt instruments (cost: $10,540,248,000) | 9,747,773 | |||||||
| Short-term securities 13.95% | Shares | |||||||
| Money market investments 13.95% | ||||||||
| Capital Group Central Cash Fund 4.31%12,13 | 14,258,627 | 1,425,720 | ||||||
| Total short-term securities (cost: $1,425,522,000) | 1,425,720 | |||||||
| Total investment securities 109.32% (cost: $11,965,770,000) | 11,173,493 | |||||||
| Other assets less liabilities (9.32)% | (952,411 | ) | ||||||
| Net assets 100.00% | $ | 10,221,082 | ||||||
Futures contracts
| Contracts | Type | Number of contracts |
Expiration | Notional amount (000) |
Value and unrealized appreciation (depreciation) at 12/31/2022 (000) |
||||||||||
| 3 Month SOFR Futures | Short | 658 | June 2023 | USD(156,415 | ) | $ | 2,698 | ||||||||
| 2 Year U.S. Treasury Note Futures | Short | 2,055 | March 2023 | (421,436 | ) | 1,029 | |||||||||
| 5 Year Euro-Bobl Futures | Long | 1 | March 2023 | 124 | (4 | ) | |||||||||
| 5 Year U.S. Treasury Note Futures | Long | 16,226 | March 2023 | 1,751,267 | (2,467 | ) | |||||||||
| 10 Year U.S. Treasury Note Futures | Long | 2,294 | March 2023 | 257,609 | (1,391 | ) | |||||||||
| 10 Year Ultra U.S. Treasury Note Futures | Short | 1,388 | March 2023 | (164,174 | ) | 2,514 | |||||||||
| 20 Year U.S. Treasury Bond Futures | Long | 999 | March 2023 | 125,218 | (2,035 | ) | |||||||||
| 30 Year Ultra U.S. Treasury Bond Futures | Long | 1,708 | March 2023 | 229,406 | (7,297 | ) | |||||||||
| $ | (6,953 | ) | |||||||||||||
Forward currency contracts
| Contract amount | Unrealized appreciation (depreciation) | |||||||||||
| Currency purchased (000) |
Currency sold (000) |
Counterparty | Settlement date |
at 12/31/2022 (000) | ||||||||
| USD | 1,965 | IDR | 30,407,000 | Citibank | 1/9/2023 | $ | 11 | |||||
| USD | 3,158 | ILS | 10,725 | HSBC Bank | 1/11/2023 | 106 | ||||||
| USD | 1,173 | MYR | 5,150 | HSBC Bank | 1/11/2023 | (4) | ||||||
| USD | 1,248 | EUR | 1,180 | Morgan Stanley | 1/11/2023 | (16) | ||||||
| USD | 4,761 | COP | 22,893,650 | Citibank | 1/13/2023 | 52 | ||||||
| USD | 5,947 | EUR | 5,628 | JPMorgan Chase | 1/13/2023 | (84) | ||||||
| USD | 613 | EUR | 582 | JPMorgan Chase | 1/20/2023 | (11) | ||||||
| USD | 5,952 | PEN | 22,885 | Citibank | 1/23/2023 | (59) | ||||||
| JPY | 3,460,300 | USD | 24,759 | Morgan Stanley | 2/17/2023 | 1,783 | ||||||
| JPY | 3,432,900 | USD | 25,173 | Morgan Stanley | 2/17/2023 | 1,158 | ||||||
| JPY | 3,448,400 | USD | 25,841 | Morgan Stanley | 3/17/2023 | 711 | ||||||
| $ | 3,647 | |||||||||||
| American Funds Insurance Series | 203 |
The Bond Fund of America (continued)
Swap contracts
Interest rate swaps
Centrally cleared interest rate swaps
| Receive | Pay | Notional | Value at | Upfront premium |
Unrealized appreciation (depreciation) |
|||||||||||||||||||
| Rate | Payment frequency | Rate | Payment frequency | Expiration date | amount (000) |
12/31/2022 (000) |
paid (000) | at 12/31/2022 (000) |
||||||||||||||||
| SOFR | Annual | 0.471% | Annual | 10/26/2023 | USD87,775 | $ | 3,103 | $— | $ | 3,103 | ||||||||||||||
| 0.45801% | Annual | SOFR | Annual | 10/26/2023 | 85,775 | (3,041 | ) | — | (3,041 | ) | ||||||||||||||
| 3.497% | Annual | U.S. EFFR | Annual | 6/16/2024 | 27,000 | (479 | ) | — | (479 | ) | ||||||||||||||
| 3.52647% | Annual | U.S. EFFR | Annual | 6/16/2024 | 72,532 | (1,257 | ) | — | (1,257 | ) | ||||||||||||||
| 3.5291% | Annual | U.S. EFFR | Annual | 6/16/2024 | 78,378 | (1,355 | ) | — | (1,355 | ) | ||||||||||||||
| 3.4585% | Annual | U.S. EFFR | Annual | 6/17/2024 | 4,154 | (76 | ) | — | (76 | ) | ||||||||||||||
| 3.4325% | Annual | U.S. EFFR | Annual | 6/17/2024 | 19,800 | (369 | ) | — | (369 | ) | ||||||||||||||
| 4.5645% | Annual | U.S. EFFR | Annual | 10/19/2024 | 19,200 | (5 | ) | — | (5 | ) | ||||||||||||||
| 4.533% | Annual | U.S. EFFR | Annual | 10/20/2024 | 23,900 | (20 | ) | — | (20 | ) | ||||||||||||||
| 4.56% | Annual | U.S. EFFR | Annual | 10/27/2024 | 24,000 | (4 | ) | — | (4 | ) | ||||||||||||||
| 4.5245% | Annual | U.S. EFFR | Annual | 10/27/2024 | 28,800 | (23 | ) | — | (23 | ) | ||||||||||||||
| 3-month USD-LIBOR | Quarterly | 1.972% | Semi-annual | 4/26/2051 | 23,200 | 6,475 | — | 6,475 | ||||||||||||||||
| 3-month USD-LIBOR | Quarterly | 1.9855% | Semi-annual | 4/26/2051 | 8,580 | 2,374 | — | 2,374 | ||||||||||||||||
| 3-month USD-LIBOR | Quarterly | 1.9778% | Semi-annual | 4/28/2051 | 13,500 | 3,753 | — | 3,753 | ||||||||||||||||
| $ | 9,076 | $— | $ | 9,076 | ||||||||||||||||||||
Credit default swaps
Centrally cleared credit default swaps on credit indices — buy protection
| Reference index |
Financing rate paid |
Payment frequency |
Expiration date |
Notional amount (000) |
Value at 12/31/2022 (000) | Upfront premium (received) paid (000) |
Unrealized depreciation at 12/31/2022 (000) |
|||||||||||||||||
| CDX.NA.IG.39 | 1.00% | Quarterly | 12/20/2027 | USD74,676 | $ | (597 | ) | $ | (310 | ) | $ | (287 | ) | |||||||||||
| CDX.NA.HY.39 | 5.00% | Quarterly | 12/20/2027 | 153,455 | (945 | ) | 5,777 | (6,722 | ) | |||||||||||||||
| $ | (1,542 | ) | $ | 5,467 | $ | (7,009 | ) | |||||||||||||||||
Investments in affiliates13
| Value of affiliate at 1/1/2022 (000) |
Additions (000) |
Reductions (000) |
Net realized loss (000) |
Net unrealized appreciation (000) |
Value of affiliate at 12/31/2022 (000) |
Dividend income (000) | ||||||||
| Short-term securities 13.95% | ||||||||||||||
| Money market investments 13.95% | ||||||||||||||
| Capital Group Central Cash Fund 4.31%12 | $1,311,257 | $4,011,285 | $3,896,680 | $(218) | $ 76 | $1,425,720 | $34,880 |
| 204 | American Funds Insurance Series |
The Bond Fund of America (continued)
Restricted securities11
| Acquisition date |
Cost (000) |
Value (000) |
Percent of net assets |
||||||||||||
| Mission Lane Credit Card Master Trust, Series 2022-B, Class A1, 8.25% 1/15/20287,10 | 12/6/2022 | $ | 1,006 | $ | 1,006 | .01 | % | ||||||||
| Mission Lane Credit Card Master Trust, Series 2022-B, Class A2, 8.73% 1/15/20287,10 | 12/6/2022 | 150 | 150 | .00 | |||||||||||
| Total | $ | 1,156 | $ | 1,156 | .01 | % | |||||||||
| 1 | Step bond; coupon rate may change at a later date. |
| 2 | Acquired in a transaction exempt from registration under Rule 144A or, for commercial paper, Section 4(a)(2) of the Securities Act of 1933. May be resold in the U.S. in transactions exempt from registration, normally to qualified institutional buyers. The total value of all such securities was $1,530,868,000, which represented 14.98% of the net assets of the fund. |
| 3 | Coupon rate may change periodically. Reference rate and spread are as of the most recent information available. Some coupon rates are determined by the issuer or agent based on current market conditions; therefore, the reference rate and spread are not available. |
| 4 | Payment in kind; the issuer has the option of paying additional securities in lieu of cash. Payment methods and rates are as of the most recent payment when available. |
| 5 | All or a portion of this security was pledged as collateral. The total value of pledged collateral was $58,239,000, which represented .57% of the net assets of the fund. |
| 6 | Index-linked bond whose principal amount moves with a government price index. |
| 7 | Principal payments may be made periodically. Therefore, the effective maturity date may be earlier than the stated maturity date. |
| 8 | Amount less than one thousand. |
| 9 | Purchased on a TBA basis. |
| 10 | Value determined using significant unobservable inputs. |
| 11 | Restricted security, other than Rule 144A securities or commercial paper issued pursuant to Section 4(a)(2) of the Securities Act of 1933. The total value of all such restricted securities was $1,156,000, which represented .01% of the net assets of the fund. |
| 12 | Rate represents the seven-day yield at 12/31/2022. |
| 13 | Part of the same “group of investment companies” as the fund as defined under the Investment Company Act of 1940, as amended. |
Key to abbreviations
Assn. = Association
Auth. = Authority
CLO = Collateralized Loan Obligations
CME = CME Group
CMO = Collateralized Mortgage Obligations
COP = Colombian pesos
DAC = Designated Activity Company
EFFR = Effective Federal Funds Rate
EUR = Euros
Fin. = Finance
Fncg. = Financing
G.O. = General Obligation
ICE = Intercontinental Exchange, Inc.
IDR = Indonesian rupiah
ILS = Israeli shekels
JPY = Japanese yen
LIBOR = London Interbank Offered Rate
MYR = Malaysian ringgits
PEN = Peruvian nuevos soles
PIK = Payment In Kind
Ref. = Refunding
Rev. = Revenue
SOFR = Secured Overnight Financing Rate
TBA = To be announced
USD = U.S. dollars
Refer to the notes to financial statements.
| American Funds Insurance Series | 205 |
Capital World Bond Fund
Investment portfolio December 31, 2022
| Bonds, notes & other debt instruments 90.28% | Principal amount (000) |
Value (000) |
||||||
| Euros 19.79% | ||||||||
| AIA Group, Ltd. 0.88% 9/9/2033 (5-year EUR Annual Swap + 1.10% on 9/9/2028)1 | EUR | 2,800 | $ | 2,333 | ||||
| Allianz SE 4.75% perpetual bonds (3-month EUR-EURIBOR + 3.60% on 10/24/2023)1 | 4,200 | 4,471 | ||||||
| Altria Group, Inc. 1.00% 2/15/2023 | 1,020 | 1,089 | ||||||
| Altria Group, Inc. 2.20% 6/15/2027 | 2,900 | 2,795 | ||||||
| Altria Group, Inc. 3.125% 6/15/2031 | 800 | 711 | ||||||
| American Honda Finance Corp. 1.95% 10/18/2024 | 560 | 584 | ||||||
| American Tower Corp. 0.45% 1/15/2027 | 2,525 | 2,321 | ||||||
| American Tower Corp. 0.875% 5/21/2029 | 1,470 | 1,257 | ||||||
| AT&T, Inc. 1.60% 5/19/2028 | 2,350 | 2,237 | ||||||
| Austria (Republic of) 0% 2/20/2031 | 6,900 | 5,785 | ||||||
| Banco de Sabadell, SA 2.625% 3/24/2026 (5-year EUR Mid-Swap + 2.20% on 3/24/2025)1 | 500 | 504 | ||||||
| Bank of America Corp. 3.648% 3/31/2029 (3-month EUR-EURIBOR + 3.67% on 3/31/2028)1,2 | 5,000 | 5,177 | ||||||
| CaixaBank, SA 2.25% 4/17/2030 (5-year EUR Annual (vs. 6-month EUR-EURIBOR) + 1.68% on 4/17/2025)1 | 2,400 | 2,345 | ||||||
| Celanese US Holdings, LLC 4.777% 7/19/2026 | 235 | 240 | ||||||
| Deutsche Bank AG 4.00% 6/24/2032 (3-month EUR-EURIBOR + 3.30% on 6/24/2027)1 | 700 | 665 | ||||||
| Deutsche Telekom International Finance BV 7.50% 1/24/2033 | 200 | 273 | ||||||
| Dow Chemical Co. 0.50% 3/15/2027 | 1,110 | 1,035 | ||||||
| E.ON SE 1.625% 3/29/2031 | 810 | 731 | ||||||
| Egypt (Arab Republic of) 5.625% 4/16/2030 | 300 | 224 | ||||||
| Equinor ASA 1.375% 5/22/2032 | 2,550 | 2,267 | ||||||
| European Investment Bank 0.25% 1/20/2032 | 4,900 | 4,085 | ||||||
| European Investment Bank 1.50% 6/15/2032 | 1,000 | 932 | ||||||
| European Union 0% 7/6/2026 | 1,600 | 1,545 | ||||||
| European Union 0.25% 10/22/2026 | 610 | 591 | ||||||
| European Union 0% 7/4/2031 | 705 | 584 | ||||||
| European Union 0% 7/4/2035 | 220 | 159 | ||||||
| European Union 0.20% 6/4/2036 | 1,500 | 1,080 | ||||||
| Finland (Republic of) 1.50% 9/15/2032 | 3,380 | 3,154 | ||||||
| French Republic O.A.T. 0.75% 2/25/2028 | 4,500 | 4,347 | ||||||
| French Republic O.A.T. 0% 11/25/2030 | 19,550 | 16,712 | ||||||
| French Republic O.A.T. 0% 5/25/2032 | 2,120 | 1,718 | ||||||
| French Republic O.A.T. 2.00% 11/25/2032 | 4,260 | 4,162 | ||||||
| French Republic O.A.T. 0.50% 5/25/2040 | 2,080 | 1,414 | ||||||
| French Republic O.A.T. 0.75% 5/25/2052 | 5,930 | 3,416 | ||||||
| Germany (Federal Republic of) 0% 4/11/2025 | 2,100 | 2,124 | ||||||
| Germany (Federal Republic of) 0% 10/9/2026 | 6,060 | 5,908 | ||||||
| Germany (Federal Republic of) 0% 4/16/2027 | 32,700 | 31,482 | ||||||
| Germany (Federal Republic of) 1.30% 10/15/2027 | 3,580 | 3,626 | ||||||
| Germany (Federal Republic of) 0% 2/15/2030 | 13,340 | 12,029 | ||||||
| Germany (Federal Republic of) 0% 8/15/2030 | 15,050 | 13,413 | ||||||
| Germany (Federal Republic of) 0% 8/15/2031 | 12,600 | 10,944 | ||||||
| Germany (Federal Republic of) 1.70% 8/15/2032 | 10,906 | 10,887 | ||||||
| Germany (Federal Republic of) 1.00% 5/15/2038 | 6,040 | 5,175 | ||||||
| Germany (Federal Republic of) 0% 8/15/2050 | 1,200 | 673 | ||||||
| Germany (Federal Republic of) 0% 8/15/2052 | 2,650 | 1,421 | ||||||
| Goldman Sachs Group, Inc. 3.375% 3/27/20252 | 5,000 | 5,327 | ||||||
| Goldman Sachs Group, Inc. 1.00% 3/18/20332 | 2,705 | 2,091 | ||||||
| Greece (Hellenic Republic of) 3.375% 2/15/2025 | 5,825 | 6,236 | ||||||
| Greece (Hellenic Republic of) 1.75% 6/18/2032 | 5,970 | 5,047 | ||||||
| Groupe BPCE SA 4.625% 7/18/2023 | 1,200 | 1,296 | ||||||
| Groupe BPCE SA 1.00% 4/1/2025 | 2,900 | 2,925 | ||||||
| Intesa Sanpaolo SpA 6.625% 9/13/2023 | 510 | 557 | ||||||
| Israel (State of) 2.875% 1/29/2024 | 1,180 | 1,258 | ||||||
| Italy (Republic of) 1.85% 7/1/2025 | 17,700 | 18,218 | ||||||
| Italy (Republic of) 1.35% 4/1/2030 | 7 | 6 | ||||||
| Italy (Republic of) 2.50% 12/1/2032 | 9,610 | 8,613 | ||||||
| JPMorgan Chase & Co. 0.389% 2/24/2028 (3-month EUR-EURIBOR + 0.65% on 2/24/2027)1,2 | 3,208 | 2,944 | ||||||
| 206 | American Funds Insurance Series |
Capital World Bond Fund (continued)
| Bonds, notes & other debt instruments (continued) | Principal amount (000) |
Value (000) |
||||||
| Euros (continued) | ||||||||
| KfW 0.125% 6/30/2025 | EUR | 590 | $ | 590 | ||||
| Lloyds Banking Group PLC 1.75% 9/7/2028 (5-year EUR-EURIBOR + 1.30% on 9/7/2023)1 | 2,400 | 2,472 | ||||||
| Morgan Stanley 2.103% 5/8/2026 (3-month EUR-EURIBOR + 0.904% on 5/8/2025)1 | 580 | 592 | ||||||
| Morgan Stanley 2.95% 5/7/2032 (3-month EUR-EURIBOR + 1.245% on 5/7/2031)1 | 1,535 | 1,460 | ||||||
| Morocco (Kingdom of) 3.50% 6/19/2024 | 1,400 | 1,492 | ||||||
| Morocco (Kingdom of) 1.50% 11/27/2031 | 3,300 | 2,617 | ||||||
| Philippines (Republic of) 0.25% 4/28/2025 | 875 | 870 | ||||||
| Portuguese Republic 0.475% 10/18/2030 | 1,610 | 1,395 | ||||||
| Quebec (Province of) 0.25% 5/5/2031 | 920 | 764 | ||||||
| Quebec (Province of) 0.50% 1/25/2032 | 1,155 | 957 | ||||||
| Romania 2.125% 3/7/2028 | 1,440 | 1,291 | ||||||
| Romania 1.75% 7/13/2030 | 2,560 | 1,913 | ||||||
| Romania 2.00% 1/28/2032 | 1,605 | 1,153 | ||||||
| Romania 3.75% 2/7/2034 | 530 | 425 | ||||||
| Russian Federation 2.875% 12/4/20253 | 3,000 | 1,349 | ||||||
| Russian Federation 2.875% 12/4/20253 | 1,500 | 674 | ||||||
| Serbia (Republic of) 3.125% 5/15/2027 | 847 | 783 | ||||||
| Serbia (Republic of) 1.50% 6/26/2029 | 3,353 | 2,584 | ||||||
| Spain (Kingdom of) 0% 1/31/2027 | 2,325 | 2,198 | ||||||
| Spain (Kingdom of) 0.80% 7/30/2027 | 8,970 | 8,674 | ||||||
| Spain (Kingdom of) 1.45% 4/30/2029 | 1,890 | 1,824 | ||||||
| Spain (Kingdom of) 1.25% 10/31/2030 | 1,295 | 1,191 | ||||||
| Spain (Kingdom of) 0.50% 10/31/2031 | 4,645 | 3,873 | ||||||
| Spain (Kingdom of) 0.70% 4/30/2032 | 4,785 | 3,993 | ||||||
| Spain (Kingdom of) 1.90% 10/31/2052 | 1,010 | 695 | ||||||
| State Grid Overseas Investment, Ltd. 1.375% 5/2/2025 | 441 | 442 | ||||||
| State Grid Overseas Investment, Ltd. 2.125% 5/2/2030 | 200 | 177 | ||||||
| Stryker Corp. 0.25% 12/3/2024 | 480 | 483 | ||||||
| Stryker Corp. 0.75% 3/1/2029 | 980 | 877 | ||||||
| Stryker Corp. 1.00% 12/3/2031 | 450 | 376 | ||||||
| TOTAL SA 1.75% junior subordinated perpetual bonds (5-year EUR-EURIBOR + 1.765% on 4/4/2024)1 | 2,000 | 2,025 | ||||||
| Toyota Motor Credit Corp. 0.125% 11/5/2027 | 1,850 | 1,684 | ||||||
| Tunisia (Republic of) 6.75% 10/31/2023 | 5,109 | 4,612 | ||||||
| Tunisia (Republic of) 6.75% 10/31/2023 | 1,295 | 1,169 | ||||||
| Ukraine 6.75% 6/20/2028 | 3,119 | 619 | ||||||
| Ukraine 6.75% 6/20/2028 | 1,225 | 243 | ||||||
| Ukraine 4.375% 1/27/2032 | 2,705 | 476 | ||||||
| Volkswagen International Finance NV 4.375% junior subordinated perpetual bonds (9-year EUR Mid-Swap + 3.36% on 3/28/2031)1 | 1,300 | 1,140 | ||||||
| 293,295 | ||||||||
| Japanese yen 7.50% | ||||||||
| Japan, Series 18, 0.10% 3/10/20244 | JPY | 1,064,481 | 8,293 | |||||
| Japan, Series 19, 0.10% 9/10/20244 | 463,865 | 3,628 | ||||||
| Japan, Series 346, 0.10% 3/20/2027 | 777,900 | 5,905 | ||||||
| Japan, Series 356, 0.10% 9/20/2029 | 1,720,800 | 12,847 | ||||||
| Japan, Series 116, 2.20% 3/20/2030 | 576,100 | 4,933 | ||||||
| Japan, Series 26, 0.005% 3/10/20314 | 527,493 | 4,178 | ||||||
| Japan, Series 362, 0.10% 3/20/2031 | 737,200 | 5,435 | ||||||
| Japan, Series 365, 0.10% 12/20/2031 | 520,150 | 3,832 | ||||||
| Japan, Series 145, 1.70% 6/20/2033 | 742,700 | 6,290 | ||||||
| Japan, Series 152, 1.20% 3/20/2035 | 987,100 | 7,875 | ||||||
| Japan, Series 21, 2.30% 12/20/2035 | 720,000 | 6,451 | ||||||
| Japan, Series 162, 0.60% 9/20/2037 | 1,617,000 | 11,642 | ||||||
| Japan, Series 179, 0.50% 12/20/2041 | 196,950 | 1,309 | ||||||
| Japan, Series 37, 0.60% 6/20/2050 | 694,500 | 4,183 | ||||||
| Japan, Series 70, 0.70% 3/20/2051 | 276,100 | 1,694 | ||||||
| Japan, Series 73, 0.70% 12/20/2051 | 1,568,700 | 9,576 | ||||||
| American Funds Insurance Series | 207 |
Capital World Bond Fund (continued)
| Bonds, notes & other debt instruments (continued) | Principal amount (000) |
Value (000) |
||||||
| Japanese yen (continued) | ||||||||
| Japan, Series 74, 1.00% 3/20/2052 | JPY | 626,900 | $ | 4,140 | ||||
| Japan, Series 76, 1.40% 9/20/2052 | 296,450 | 2,162 | ||||||
| Philippines (Republic of) 0.001% 4/12/2024 | 900,000 | 6,778 | ||||||
| 111,151 | ||||||||
| British pounds 4.17% | ||||||||
| American Honda Finance Corp. 0.75% 11/25/2026 | GBP | 1,420 | 1,470 | |||||
| Asian Development Bank 1.125% 6/10/2025 | 1,240 | 1,393 | ||||||
| KfW 1.125% 7/4/2025 | 1,165 | 1,305 | ||||||
| Lloyds Banking Group PLC 7.625% 4/22/2025 | 655 | 835 | ||||||
| Quebec (Province of) 2.25% 9/15/2026 | 1,870 | 2,083 | ||||||
| United Kingdom 0.125% 1/30/2026 | 425 | 463 | ||||||
| United Kingdom 1.25% 7/22/2027 | 3,060 | 3,335 | ||||||
| United Kingdom 4.25% 12/7/2027 | 5,910 | 7,336 | ||||||
| United Kingdom 4.75% 12/7/2030 | 8,230 | 10,732 | ||||||
| United Kingdom 0.25% 7/31/2031 | 11,850 | 10,738 | ||||||
| United Kingdom 1.00% 1/31/2032 | 10,970 | 10,504 | ||||||
| United Kingdom 4.25% 6/7/2032 | 3,010 | 3,809 | ||||||
| United Kingdom 0.625% 7/31/2035 | 210 | 171 | ||||||
| United Kingdom 0.875% 1/31/2046 | 4,916 | 3,151 | ||||||
| United Kingdom 1.25% 7/31/2051 | 6,635 | 4,338 | ||||||
| United Kingdom 1.125% 10/22/2073 | 225 | 119 | ||||||
| 61,782 | ||||||||
| Chinese yuan renminbi 2.84% | ||||||||
| China (People’s Republic of), Series INBK, 2.75% 2/17/2032 | CNY | 25,660 | 3,646 | |||||
| China (People’s Republic of), Series 1910, 3.86% 7/22/2049 | 103,240 | 16,440 | ||||||
| China (People’s Republic of), Series INBK, 3.39% 3/16/2050 | 26,230 | 3,854 | ||||||
| China (People’s Republic of), Series INBK, 3.81% 9/14/2050 | 51,550 | 8,146 | ||||||
| China (People’s Republic of), Series INBK, 3.53% 10/18/2051 | 45,510 | 6,877 | ||||||
| China Development Bank Corp., Series 1814, 4.15% 10/26/2025 | 20,900 | 3,133 | ||||||
| 42,096 | ||||||||
| Canadian dollars 2.31% | ||||||||
| Canada 0.75% 10/1/2024 | CAD | 14,570 | 10,169 | |||||
| Canada 0.25% 3/1/2026 | 5,800 | 3,847 | ||||||
| Canada 3.50% 3/1/2028 | 24,018 | 17,831 | ||||||
| Canada 2.75% 12/1/2048 | 3,500 | 2,337 | ||||||
| 34,184 | ||||||||
| Mexican pesos 2.13% | ||||||||
| Petróleos Mexicanos 7.19% 9/12/2024 | MXN | 42,534 | 2,024 | |||||
| United Mexican States 4.50% 12/4/20254 | 16,544 | 845 | ||||||
| United Mexican States, Series M, 5.75% 3/5/2026 | 44,700 | 2,078 | ||||||
| United Mexican States, Series M, 7.50% 6/3/2027 | 251,720 | 12,188 | ||||||
| United Mexican States, Series M20, 8.50% 5/31/2029 | 140,400 | 7,013 | ||||||
| United Mexican States, Series M30, 8.50% 11/18/2038 | 21,100 | 1,025 | ||||||
| United Mexican States, Series M, 8.00% 11/7/2047 | 7,830 | 359 | ||||||
| United Mexican States, Series M, 8.00% 7/31/2053 | 133,170 | 6,095 | ||||||
| 31,627 | ||||||||
| Australian dollars 1.63% | ||||||||
| Australia (Commonwealth of), Series 163, 1.00% 11/21/2031 | AUD | 5,789 | 3,061 | |||||
| Australia (Commonwealth of), Series 166, 3.00% 11/21/2033 | 12,355 | 7,622 | ||||||
| Australia (Commonwealth of), Series 167, 3.75% 5/21/2034 | 20,520 | 13,529 | ||||||
| 24,212 | ||||||||
| 208 | American Funds Insurance Series |
Capital World Bond Fund (continued)
| Bonds, notes & other debt instruments (continued) | Principal amount (000) |
Value (000) |
||||||
| Danish kroner 1.62% | ||||||||
| Nordea Kredit 0.50% 10/1/20405 | DKK | 17,477 | $ | 1,955 | ||||
| Nykredit Realkredit AS, Series 01E, 0.50% 10/1/20405 | 90,967 | 10,167 | ||||||
| Nykredit Realkredit AS, Series 01E, 0.50% 10/1/20435 | 106,007 | 11,555 | ||||||
| Realkredit Danmark AS 1.00% 10/1/20535 | 2,712 | 285 | ||||||
| 23,962 | ||||||||
| South Korean won 0.52% | ||||||||
| South Korea (Republic of), Series 2503, 1.50% 3/10/2025 | KRW | 5,183,670 | 3,908 | |||||
| South Korea (Republic of), Series 2712, 2.375% 12/10/2027 | 5,158,930 | 3,821 | ||||||
| 7,729 | ||||||||
| Colombian pesos 0.48% | ||||||||
| Colombia (Republic of), Series B, 7.00% 3/26/2031 | COP | 31,310,800 | 4,575 | |||||
| Colombia (Republic of), Series B, 7.25% 10/26/2050 | 21,884,200 | 2,569 | ||||||
| 7,144 | ||||||||
| Chilean pesos 0.41% | ||||||||
| Chile (Republic of) 4.00% 3/1/2023 | CLP | 2,300,000 | 2,681 | |||||
| Chile (Republic of) 1.50% 3/1/20264 | 808,331 | 933 | ||||||
| Chile (Republic of) 5.00% 10/1/2028 | 955,000 | 1,089 | ||||||
| Chile (Republic of) 4.70% 9/1/2030 | 1,205,000 | 1,371 | ||||||
| 6,074 | ||||||||
| Indonesian rupiah 0.37% | ||||||||
| Indonesia (Republic of), Series 84, 7.25% 2/15/2026 | IDR | 22,733,000 | 1,495 | |||||
| Indonesia (Republic of), Series 95, 6.375% 8/15/2028 | 3,136,000 | 200 | ||||||
| Indonesia (Republic of), Series 78, 8.25% 5/15/2029 | 23,729,000 | 1,643 | ||||||
| Indonesia (Republic of), Series 82, 7.00% 9/15/2030 | 2,930,000 | 190 | ||||||
| Indonesia (Republic of), Series 68, 8.375% 3/15/2034 | 27,353,000 | 1,926 | ||||||
| 5,454 | ||||||||
| Russian rubles 0.23% | ||||||||
| Russian Federation 7.00% 8/16/20233,6 | RUB | 430,300 | 1,984 | |||||
| Russian Federation 7.65% 4/10/20303 | 316,110 | 1,371 | ||||||
| 3,355 | ||||||||
| Brazilian reais 0.21% | ||||||||
| Brazil (Federative Republic of) 6.00% 8/15/20244 | BRL | 13,461 | 2,531 | |||||
| Brazil (Federative Republic of) 10.00% 1/1/2025 | 3,300 | 598 | ||||||
| 3,129 | ||||||||
| South African rand 0.20% | ||||||||
| South Africa (Republic of), Series R-2030, 8.00% 1/31/2030 | ZAR | 30,120 | 1,581 | |||||
| South Africa (Republic of), Series R-2048, 8.75% 2/28/2048 | 30,850 | 1,420 | ||||||
| 3,001 | ||||||||
| Dominican pesos 0.15% | ||||||||
| Dominican Republic 8.90% 2/15/2023 | DOP | 128,000 | 2,271 | |||||
| Malaysian ringgits 0.15% | ||||||||
| Malaysia (Federation of), Series 0519, 3.757% 5/22/2040 | MYR | 10,588 | 2,222 | |||||
| Ukrainian hryvnia 0.11% | ||||||||
| Ukraine 15.97% 4/19/20236 | UAH | 78,370 | 1,592 | |||||
| Indian rupees 0.08% | ||||||||
| India (Republic of) 5.15% 11/9/2025 | INR | 96,010 | 1,102 | |||||
| American Funds Insurance Series | 209 |
Capital World Bond Fund (continued)
| Bonds, notes & other debt instruments (continued) | Principal amount (000) |
Value (000) |
||||||
| Romanian leu 0.07% | ||||||||
| Romania 4.75% 2/24/2025 | RON | 5,000 | $ | 1,038 | ||||
| Polish zloty 0.06% | ||||||||
| Poland (Republic of), Series 1029, 2.75% 10/25/2029 | PLN | 4,900 | 879 | |||||
| Norwegian kroner 0.04% | ||||||||
| Norway (Kingdom of) 2.125% 5/18/2032 | NOK | 6,615 | 619 | |||||
| U.S. dollars 45.21% | ||||||||
| 1375209 BC, Ltd. 9.00% 1/30/20287 | USD | 60 | 59 | |||||
| 7-Eleven, Inc. 0.95% 2/10/20267 | 520 | 456 | ||||||
| 7-Eleven, Inc. 1.30% 2/10/20287 | 2,180 | 1,810 | ||||||
| 7-Eleven, Inc. 1.80% 2/10/20317 | 2,015 | 1,544 | ||||||
| ACE INA Holdings, Inc. 3.35% 5/3/2026 | 195 | 187 | ||||||
| ACE INA Holdings, Inc. 4.35% 11/3/2045 | 425 | 370 | ||||||
| Advisor Group Holdings, LLC 6.25% 3/1/20287 | 295 | 272 | ||||||
| AerCap Ireland Capital DAC 2.45% 10/29/2026 | 2,102 | 1,841 | ||||||
| Aeropuerto International de Tocume SA 5.125% 8/11/20617 | 660 | 542 | ||||||
| Aetna, Inc. 2.80% 6/15/2023 | 340 | 336 | ||||||
| AG Merger Sub II, Inc. 10.75% 8/1/20277 | 256 | 260 | ||||||
| AG TTMT Escrow Issuer, LLC 8.625% 9/30/20277 | 103 | 104 | ||||||
| AIB Group PLC 7.583% 10/14/2026 (USD-SOFR + 3.456% on 10/14/2025)1,7 | 1,225 | 1,249 | ||||||
| Alabama Power Co. 3.00% 3/15/2052 | 980 | 651 | ||||||
| Albertsons Companies, Inc. 4.625% 1/15/20277 | 125 | 116 | ||||||
| Albertsons Companies, Inc. 3.50% 3/15/20297 | 340 | 286 | ||||||
| Alcoa Nederland Holding BV 4.125% 3/31/20297 | 75 | 67 | ||||||
| Allegheny Technologies, Inc. 4.875% 10/1/2029 | 25 | 22 | ||||||
| Allegheny Technologies, Inc. 5.125% 10/1/2031 | 45 | 40 | ||||||
| Alliant Holdings Intermediate, LLC 6.75% 10/15/20277 | 280 | 252 | ||||||
| Alliant Holdings Intermediate, LLC 5.875% 11/1/20297 | 90 | 74 | ||||||
| Allied Universal Holdco, LLC 9.75% 7/15/20277 | 175 | 153 | ||||||
| Allied Universal Holdco, LLC 6.00% 6/1/20297 | 300 | 218 | ||||||
| Almonde, Inc., Term Loan, (3-month USD-LIBOR + 7.25%) 10.621% 6/13/20258,9 | 570 | 429 | ||||||
| Altera Infrastructure, LP 8.50% 7/15/20233,6,7 | 555 | 104 | ||||||
| Amazon.com, Inc. 1.50% 6/3/2030 | 2,040 | 1,644 | ||||||
| American Electric Power Company, Inc. 1.00% 11/1/2025 | 250 | 224 | ||||||
| American Express Co. 3.375% 5/3/2024 | 4,202 | 4,119 | ||||||
| Amgen, Inc. 2.20% 2/21/2027 | 445 | 400 | ||||||
| AmWINS Group, Inc. 4.875% 6/30/20297 | 220 | 187 | ||||||
| Anglo American Capital PLC 3.95% 9/10/20507 | 521 | 383 | ||||||
| Angola (Republic of) 9.50% 11/12/2025 | 3,580 | 3,693 | ||||||
| Anywhere Real Estate Group, LLC 5.75% 1/15/20297 | 200 | 152 | ||||||
| Anywhere Real Estate Group, LLC 5.25% 4/15/20307 | 130 | 95 | ||||||
| Apple, Inc. 3.35% 8/8/2032 | 1,600 | 1,457 | ||||||
| Ardagh Group SA 6.50% Cash 6/30/20277,10 | 210 | 146 | ||||||
| Aretec Escrow Issuer, Inc. 7.50% 4/1/20297 | 180 | 149 | ||||||
| Argentine Republic 0.50% 7/9/2030 (0.75% on 7/9/2023)1 | 1,921 | 523 | ||||||
| Argentine Republic 1.50% 7/9/2035 (3.625% on 7/9/2023)1 | 3,025 | 775 | ||||||
| Asbury Automotive Group, Inc. 5.00% 2/15/20327 | 55 | 45 | ||||||
| Ascensus, Inc., Term Loan, (3-month USD-LIBOR + 6.50%) 10.25% 8/2/20298,9 | 120 | 106 | ||||||
| Ascent Resources Utica Holdings, LLC 8.25% 12/31/20287 | 160 | 157 | ||||||
| Ascent Resources Utica Holdings, LLC 5.875% 6/30/20297 | 55 | 49 | ||||||
| AssuredPartners, Inc. 7.00% 8/15/20257 | 120 | 116 | ||||||
| AssuredPartners, Inc. 5.625% 1/15/20297 | 365 | 301 | ||||||
| AstraZeneca PLC 3.50% 8/17/2023 | 2,700 | 2,678 | ||||||
| AT&T, Inc. 3.50% 9/15/2053 | 2,070 | 1,406 | ||||||
| Atkore, Inc. 4.25% 6/1/20317 | 25 | 21 | ||||||
| Atlantic Aviation FBO, Inc., Term Loan, (3-month USD-LIBOR + 2.75%) 7.134% 9/22/20288,9 | 149 | 147 | ||||||
| 210 | American Funds Insurance Series |
Capital World Bond Fund (continued)
| Bonds, notes & other debt instruments (continued) | Principal amount (000) |
Value (000) |
||||||
| U.S. dollars (continued) | ||||||||
| Atlantic Aviation FBO, Inc., Term Loan, (3-month USD-LIBOR + 5.75%) 10.134% 9/21/20298,9 | USD | 213 | $ | 207 | ||||
| Avantor Funding, Inc. 4.625% 7/15/20287 | 160 | 146 | ||||||
| Avantor Funding, Inc. 3.875% 11/1/20297 | 90 | 76 | ||||||
| B&G Foods, Inc. 5.25% 4/1/2025 | 65 | 57 | ||||||
| B&G Foods, Inc. 5.25% 9/15/2027 | 220 | 169 | ||||||
| Ball Corp. 6.875% 3/15/2028 | 108 | 111 | ||||||
| Bank of America Corp. 2.456% 10/22/2025 (3-month USD-LIBOR + 0.87% on 10/22/2024)1 | 847 | 801 | ||||||
| Bank of America Corp. 1.53% 12/6/2025 (USD-SOFR + 0.65% on 12/6/2024)1 | 6,260 | 5,778 | ||||||
| Bank of America Corp. 1.734% 7/22/2027 (USD-SOFR + 0.96% on 7/22/2026)1 | 3,745 | 3,286 | ||||||
| Bank of America Corp. 2.299% 7/21/2032 (USD-SOFR + 1.22% on 7/21/2031)1 | 4,780 | 3,693 | ||||||
| Bank of Nova Scotia 2.45% 2/2/2032 | 2,100 | 1,695 | ||||||
| Barclays Bank PLC 5.304% 8/9/2026 (1-year UST Yield Curve Rate T Note Constant Maturity + 2.30% on 8/9/2025)1 | 2,350 | 2,335 | ||||||
| Barclays Bank PLC 5.501% 8/9/2028 (1-year UST Yield Curve Rate T Note Constant Maturity + 2.65% on 8/5/2027)1 | 1,290 | 1,252 | ||||||
| Bath & Body Works, Inc. 6.625% 10/1/20307 | 120 | 113 | ||||||
| Bath & Body Works, Inc. 6.875% 11/1/2035 | 75 | 67 | ||||||
| Bausch Health Americas, Inc. 9.25% 4/1/20267 | 80 | 56 | ||||||
| Bausch Health Companies, Inc. 5.75% 8/15/20277 | 140 | 96 | ||||||
| Bausch Health Companies, Inc. 14.00% 10/15/20307 | 160 | 96 | ||||||
| Bausch Health Companies, Inc. 5.25% 2/15/20317 | 160 | 78 | ||||||
| Bayer AG 3.375% 10/8/20247 | 840 | 812 | ||||||
| Bayer US Finance II, LLC 4.25% 12/15/20257 | 203 | 197 | ||||||
| Bayerische Motoren Werke AG 3.90% 4/9/20257 | 900 | 881 | ||||||
| Bayerische Motoren Werke AG 4.15% 4/9/20307 | 900 | 857 | ||||||
| Beasley Mezzanine Holdings, LLC 8.625% 2/1/20267 | 30 | 18 | ||||||
| Becton, Dickinson and Company 4.298% 8/22/2032 | 320 | 300 | ||||||
| Berkshire Hathaway Energy Company 2.85% 5/15/2051 | 300 | 198 | ||||||
| BIP-V Chinook Holdco, LLC 5.50% 6/15/20317 | 400 | 350 | ||||||
| Blue Racer Midstream, LLC 7.625% 12/15/20257 | 65 | 65 | ||||||
| BMC Software, Inc. 9.125% 3/1/20267 | 160 | 151 | ||||||
| BMC Software, Inc., Term Loan, (3-month USD-LIBOR + 5.50%) 6.128% 3/31/20268,9 | 25 | 23 | ||||||
| BNP Paribas SA 2.159% 9/15/2029 (USD-SOFR + 1.218% on 9/15/2028)1,7 | 700 | 572 | ||||||
| BNP Paribas SA 2.871% 4/19/2032 (USD-SOFR + 1.387% on 4/19/2031)1,7 | 1,275 | 1,000 | ||||||
| Boeing Company 5.15% 5/1/2030 | 2,855 | 2,792 | ||||||
| Boeing Company 3.625% 2/1/2031 | 1,127 | 990 | ||||||
| Bombardier, Inc. 7.125% 6/15/20267 | 60 | 58 | ||||||
| Bombardier, Inc. 6.00% 2/15/20287 | 65 | 60 | ||||||
| Bombardier, Inc. 7.45% 5/1/20347 | 125 | 126 | ||||||
| Booz Allen Hamilton, Inc. 3.875% 9/1/20287 | 43 | 38 | ||||||
| Booz Allen Hamilton, Inc. 4.00% 7/1/20297 | 132 | 116 | ||||||
| Boyd Gaming Corp. 4.75% 12/1/2027 | 120 | 112 | ||||||
| Boyd Gaming Corp. 4.75% 6/15/20317 | 45 | 39 | ||||||
| Boyne USA, Inc. 4.75% 5/15/20297 | 107 | 95 | ||||||
| Braskem Netherlands Finance BV 4.50% 1/31/20307 | 745 | 635 | ||||||
| British American Tobacco PLC 2.789% 9/6/2024 | 1,150 | 1,101 | ||||||
| British American Tobacco PLC 3.215% 9/6/2026 | 955 | 882 | ||||||
| British American Tobacco PLC 3.557% 8/15/2027 | 1,545 | 1,414 | ||||||
| British American Tobacco PLC 3.462% 9/6/2029 | 1,150 | 991 | ||||||
| Broadcom, Inc. 4.00% 4/15/20297 | 250 | 228 | ||||||
| Broadcom, Inc. 3.419% 4/15/20337 | 698 | 562 | ||||||
| Broadcom, Inc. 3.469% 4/15/20347 | 48 | 38 | ||||||
| Broadcom, Inc. 3.137% 11/15/20357 | 185 | 137 | ||||||
| Broadcom, Inc. 3.75% 2/15/20517 | 926 | 643 | ||||||
| BroadStreet Partners, Inc. 5.875% 4/15/20297 | 160 | 136 | ||||||
| BWX Technologies, Inc. 4.125% 4/15/20297 | 195 | 171 | ||||||
| Caesars Entertainment, Inc. 6.25% 7/1/20257 | 35 | 34 | ||||||
| Caesars Entertainment, Inc. 4.625% 10/15/20297 | 15 | 12 | ||||||
| Caesars Resort Collection, LLC 5.75% 7/1/20257 | 165 | 162 | ||||||
| California Resources Corp. 7.125% 2/1/20267 | 100 | 96 | ||||||
| American Funds Insurance Series | 211 |
Capital World Bond Fund (continued)
| Bonds, notes & other debt instruments (continued) | Principal amount (000) |
Value (000) |
||||||
| U.S. dollars (continued) | ||||||||
| Callon Petroleum Co. 7.50% 6/15/20307 | USD | 30 | $ | 27 | ||||
| Canadian Pacific Railway, Ltd. 2.45% 12/2/2031 | 798 | 663 | ||||||
| Canadian Pacific Railway, Ltd. 3.10% 12/2/2051 | 1,378 | 933 | ||||||
| CAN-PACK SA 3.875% 11/15/20297 | 90 | 71 | ||||||
| Carnival Corp. 6.00% 5/1/20297 | 100 | 67 | ||||||
| CCO Holdings, LLC 4.75% 3/1/20307 | 135 | 117 | ||||||
| CCO Holdings, LLC 4.50% 8/15/20307 | 255 | 211 | ||||||
| CCO Holdings, LLC 4.25% 2/1/20317 | 155 | 125 | ||||||
| CCO Holdings, LLC 4.50% 6/1/20337 | 162 | 125 | ||||||
| CCO Holdings, LLC 4.25% 1/15/20347 | 70 | 52 | ||||||
| CCO Holdings, LLC and CCO Holdings Capital Corp. 5.125% 5/1/20277 | 125 | 117 | ||||||
| CCO Holdings, LLC and CCO Holdings Capital Corp. 3.75% 2/15/2028 | 2,650 | 2,394 | ||||||
| CDI Escrow Issuer, Inc. 5.75% 4/1/20307 | 70 | 63 | ||||||
| CDK Global, Inc. 7.25% 6/15/20297 | 55 | 54 | ||||||
| Cedar Fair, LP 5.50% 5/1/20257 | 120 | 119 | ||||||
| Centene Corp. 2.45% 7/15/2028 | 40 | 34 | ||||||
| Centene Corp. 4.625% 12/15/2029 | 325 | 298 | ||||||
| Centene Corp. 2.50% 3/1/2031 | 155 | 122 | ||||||
| Central Garden & Pet Co. 4.125% 10/15/2030 | 74 | 61 | ||||||
| Central Garden & Pet Co. 4.125% 4/30/20317 | 110 | 91 | ||||||
| Charles River Laboratories International, Inc. 4.25% 5/1/20287 | 35 | 32 | ||||||
| Charles River Laboratories International, Inc. 4.00% 3/15/20317 | 70 | 61 | ||||||
| Cheniere Energy Partners, LP 4.50% 10/1/2029 | 160 | 144 | ||||||
| Cheniere Energy Partners, LP 4.00% 3/1/2031 | 75 | 64 | ||||||
| Cheniere Energy Partners, LP 3.25% 1/31/2032 | 56 | 45 | ||||||
| Chesapeake Energy Corp. 4.875% 4/15/20223 | 915 | 21 | ||||||
| Chesapeake Energy Corp. 5.875% 2/1/20297 | 130 | 123 | ||||||
| Chesapeake Energy Corp. 6.75% 4/15/20297 | 30 | 29 | ||||||
| Ciena Corp. 4.00% 1/31/20307 | 80 | 71 | ||||||
| Cigna Corp. 2.375% 3/15/2031 | 375 | 308 | ||||||
| Clarivate Science Holdings Corp. 3.875% 7/1/20287 | 45 | 39 | ||||||
| Clarivate Science Holdings Corp. 4.875% 7/1/20297 | 55 | 47 | ||||||
| Cleveland-Cliffs, Inc. 4.875% 3/1/20317 | 130 | 115 | ||||||
| CMS Energy Corp. 3.875% 3/1/2024 | 100 | 98 | ||||||
| CMS Energy Corp. 3.00% 5/15/2026 | 1,200 | 1,118 | ||||||
| CNX Resources Corp. 7.25% 3/14/20277 | 240 | 239 | ||||||
| Coinbase Global, Inc. 3.375% 10/1/20287 | 55 | 29 | ||||||
| Coinbase Global, Inc. 3.625% 10/1/20317 | 85 | 41 | ||||||
| Colombia (Republic of) 3.875% 4/25/2027 | 350 | 311 | ||||||
| Commonwealth Bank of Australia 2.688% 3/11/20317 | 4,650 | 3,593 | ||||||
| Compass Diversified Holdings 5.25% 4/15/20297 | 307 | 263 | ||||||
| Compass Diversified Holdings 5.00% 1/15/20327 | 65 | 52 | ||||||
| Comstock Resources, Inc. 6.75% 3/1/20297 | 110 | 99 | ||||||
| Comstock Resources, Inc. 5.875% 1/15/20307 | 65 | 56 | ||||||
| Constellation Oil Services Holding SA 4.00% PIK 12/31/202610 | 1,097 | 649 | ||||||
| Constellium SE 3.75% 4/15/20297 | 125 | 102 | ||||||
| Consumers Energy Co. 3.375% 8/15/2023 | 345 | 342 | ||||||
| Consumers Energy Co. 3.60% 8/15/2032 | 1,600 | 1,462 | ||||||
| Corebridge Financial, Inc. 3.90% 4/5/20327 | 748 | 655 | ||||||
| CoreLogic, Inc. 4.50% 5/1/20287 | 364 | 280 | ||||||
| CoreLogic, Inc., Term Loan, (3-month USD-LIBOR + 6.50%) 10.938% 6/4/20298,9 | 65 | 47 | ||||||
| Corporate Office Properties, LP 2.75% 4/15/2031 | 1,212 | 910 | ||||||
| Covanta Holding Corp. 4.875% 12/1/20297 | 25 | 21 | ||||||
| Crédit Agricole SA 4.375% 3/17/20257 | 1,100 | 1,064 | ||||||
| Crédit Agricole SA 1.907% 6/16/2026 (USD-SOFR + 1.676% on 6/16/2025)1,7 | 2,675 | 2,441 | ||||||
| Credit Suisse Group AG 3.091% 5/14/2032 (USD-SOFR + 1.73% on 5/14/2031)1,7 | 1,000 | 693 | ||||||
| Crestwood Midstream Partners, LP 6.00% 2/1/20297 | 85 | 78 | ||||||
| Crestwood Midstream Partners, LP 8.00% 4/1/20297 | 100 | 100 | ||||||
| Crown Castle International Corp. 2.50% 7/15/2031 | 767 | 620 | ||||||
| CSX Corp. 3.80% 4/15/2050 | 75 | 59 | ||||||
| CVR Partners, LP 6.125% 6/15/20287 | 100 | 90 | ||||||
| Daimler Trucks Finance North America, LLC 3.65% 4/7/20277 | 725 | 679 | ||||||
| 212 | American Funds Insurance Series |
Capital World Bond Fund (continued)
| Bonds, notes & other debt instruments (continued) | Principal amount (000) |
Value (000) |
||||||
| U.S. dollars (continued) | ||||||||
| Danske Bank AS 3.875% 9/12/20237 | USD | 1,675 | $ | 1,654 | ||||
| Darling Ingredients, Inc. 6.00% 6/15/20307 | 245 | 240 | ||||||
| DaVita, Inc. 4.625% 6/1/20307 | 65 | 52 | ||||||
| Deluxe Corp. 8.00% 6/1/20297 | 20 | 16 | ||||||
| Deutsche Bank AG 2.129% 11/24/2026 (USD-SOFR + 1.87% on 11/24/2025)1 | 850 | 751 | ||||||
| Deutsche Bank AG 2.311% 11/16/2027 (USD-SOFR + 1.219% on 11/16/2026)1 | 1,160 | 985 | ||||||
| Deutsche Telekom International Finance BV 9.25% 6/1/2032 | 930 | 1,166 | ||||||
| Development Bank of Mongolia, LLC 7.25% 10/23/2023 | 1,980 | 1,777 | ||||||
| Diamond Foreign Asset Co. 9.00% Cash 4/22/20277,9,10 | 25 | 24 | ||||||
| Diamond Foreign Asset Co. 9.00% Cash 4/22/202710 | 22 | 21 | ||||||
| Diamond Sports Group, LLC 6.625% 8/15/20277 | 310 | 3 | ||||||
| Diebold Nixdorf, Inc. 9.375% 7/15/20257 | 309 | 221 | ||||||
| Diebold Nixdorf, Inc., Term Loan, (USD-SOFR + 5.25%) 6.75% 7/15/20256,8,9 | 93 | 63 | ||||||
| Digital Currency Group, Inc., Term Loan, (3-month USD-LIBOR + 7.00%) 8.00% 11/30/20266,8,9 | 17 | 15 | ||||||
| Digital Currency Group, Inc., Term Loan, 8.75% 11/30/20266,8 | 22 | 18 | ||||||
| DIRECTV Financing, LLC 5.875% 8/15/20277 | 110 | 99 | ||||||
| DIRECTV Financing, LLC, Term Loan, (3-month USD-LIBOR + 5.00%) 9.384% 8/2/20278,9 | 102 | 99 | ||||||
| Discovery Communications, Inc. 3.625% 5/15/2030 | 468 | 387 | ||||||
| DISH DBS Corp. 5.25% 12/1/20267 | 15 | 13 | ||||||
| DISH Network Corp. 11.75% 11/15/20277 | 260 | 268 | ||||||
| Dominican Republic 5.50% 1/27/20257 | 1,375 | 1,366 | ||||||
| Dominican Republic 8.625% 4/20/20277 | 225 | 235 | ||||||
| Dominican Republic 5.50% 2/22/20297 | 350 | 323 | ||||||
| Dominican Republic 6.40% 6/5/20497 | 813 | 660 | ||||||
| Duke Energy Progress, LLC 2.00% 8/15/2031 | 2,360 | 1,871 | ||||||
| Dun & Bradstreet Corp. 5.00% 12/15/20297 | 197 | 169 | ||||||
| Edison International 4.125% 3/15/2028 | 2,390 | 2,222 | ||||||
| Edison International 5.00% junior subordinated perpetual bonds (5-year UST Yield Curve Rate T Note Constant Maturity + 3.901% on 3/15/2049)1 | 100 | 84 | ||||||
| Electricité de France SA 4.875% 9/21/20387 | 795 | 649 | ||||||
| Empresas Publicas de Medellin ESP 4.25% 7/18/20297 | 1,030 | 819 | ||||||
| Enbridge, Inc. 4.00% 10/1/2023 | 600 | 595 | ||||||
| Endo Luxembourg Finance Co. I SARL / Endo U.S., Inc. 6.125% 4/1/20297 | 205 | 156 | ||||||
| Enel Finance International SA 1.375% 7/12/20267 | 1,248 | 1,077 | ||||||
| Enel Finance International SA 1.875% 7/12/20287 | 1,227 | 977 | ||||||
| Entegris Escrow Corp. 4.75% 4/15/20297 | 45 | 41 | ||||||
| Entergy Corp. 0.90% 9/15/2025 | 750 | 669 | ||||||
| Entergy Louisiana, LLC 4.75% 9/15/2052 | 1,275 | 1,151 | ||||||
| EQM Midstream Partners, LP 6.50% 7/1/20277 | 225 | 215 | ||||||
| EQM Midstream Partners, LP 7.50% 6/1/20307 | 45 | 43 | ||||||
| EQM Midstream Partners, LP 6.50% 7/15/2048 | 40 | 30 | ||||||
| EQT Corp. 7.25% 2/1/20301 | 40 | 42 | ||||||
| Equinix, Inc. 1.80% 7/15/2027 | 1,145 | 982 | ||||||
| Equinix, Inc. 2.15% 7/15/2030 | 3,216 | 2,566 | ||||||
| Ethiopia (Federal Democratic Republic of) 6.625% 12/11/2024 | 3,910 | 2,457 | ||||||
| Fair Isaac Corp. 4.00% 6/15/20287 | 120 | 109 | ||||||
| Fannie Mae Pool #MA2754 3.00% 9/1/20265 | 59 | 57 | ||||||
| Fannie Mae Pool #AO4151 3.50% 6/1/20425 | 108 | 101 | ||||||
| Fannie Mae Pool #AP7888 3.50% 10/1/20425 | 338 | 316 | ||||||
| Fannie Mae Pool #AQ0770 3.50% 11/1/20425 | 131 | 123 | ||||||
| Fannie Mae Pool #FM8399 2.50% 8/1/20515 | 889 | 759 | ||||||
| Fannie Mae Pool #BT9589 2.50% 8/1/20515 | 34 | 29 | ||||||
| Fannie Mae Pool #CB1552 2.50% 9/1/20515 | 998 | 848 | ||||||
| Fannie Mae Pool #BQ7435 2.50% 9/1/20515 | 97 | 83 | ||||||
| Fannie Mae Pool #MA4414 2.50% 9/1/20515 | 33 | 28 | ||||||
| Fannie Mae Pool #FS0031 2.50% 10/1/20515 | 336 | 284 | ||||||
| Fannie Mae Pool #BT3056 2.50% 11/1/20515 | 721 | 613 | ||||||
| Fannie Mae Pool #CB2402 2.50% 12/1/20515 | 3,207 | 2,718 | ||||||
| Fannie Mae Pool #BU3413 2.50% 12/1/20515 | 807 | 685 | ||||||
| Fannie Mae Pool #BU3058 2.50% 12/1/20515 | 268 | 227 | ||||||
| American Funds Insurance Series | 213 |
Capital World Bond Fund (continued)
| Bonds, notes & other debt instruments (continued) | Principal amount (000) |
Value (000) |
||||||
| U.S. dollars (continued) | ||||||||
| Fannie Mae Pool #BV2930 2.50% 1/1/20525 | USD | 998 | $ | 846 | ||||
| Fannie Mae Pool #BU8226 2.50% 2/1/20525 | 1,260 | 1,070 | ||||||
| Fannie Mae Pool #BU1339 2.50% 2/1/20525 | 275 | 234 | ||||||
| Fannie Mae Pool #BV0307 2.50% 2/1/20525 | 273 | 232 | ||||||
| Fannie Mae Pool #BQ7473 2.50% 2/1/20525 | 158 | 134 | ||||||
| Fannie Mae Pool #CB2866 2.50% 2/1/20525 | 95 | 81 | ||||||
| Fannie Mae Pool #BV2189 2.50% 2/1/20525 | 62 | 53 | ||||||
| Fannie Mae Pool #CB2876 2.50% 2/1/20525 | 31 | 27 | ||||||
| Fannie Mae Pool #CB2809 2.50% 2/1/20525 | 32 | 27 | ||||||
| Fannie Mae Pool #BV3694 2.50% 2/1/20525 | 32 | 27 | ||||||
| Fannie Mae Pool #FS0647 3.00% 2/1/20525 | 2,865 | 2,557 | ||||||
| Fannie Mae Pool #BV4040 2.50% 3/1/20525 | 1,645 | 1,398 | ||||||
| Fannie Mae Pool #BV7520 2.50% 3/1/20525 | 864 | 734 | ||||||
| Fannie Mae Pool #BV8086 2.50% 3/1/20525 | 809 | 690 | ||||||
| Fannie Mae Pool #BU6885 2.50% 3/1/20525 | 808 | 686 | ||||||
| Fannie Mae Pool #BV5642 2.50% 3/1/20525 | 94 | 80 | ||||||
| Fannie Mae Pool #MA4578 2.50% 4/1/20525 | 4,881 | 4,140 | ||||||
| Fannie Mae Pool #BV5332 2.50% 4/1/20525 | 1,929 | 1,638 | ||||||
| Fannie Mae Pool #BQ7478 2.50% 4/1/20525 | 1,222 | 1,038 | ||||||
| Fannie Mae Pool #CB3350 2.50% 4/1/20525 | 1,011 | 859 | ||||||
| Fannie Mae Pool #BU8802 2.50% 4/1/20525 | 998 | 848 | ||||||
| Fannie Mae Pool #BU8916 2.50% 4/1/20525 | 785 | 666 | ||||||
| Fannie Mae Pool #BU6901 2.50% 4/1/20525 | 91 | 77 | ||||||
| Fannie Mae Pool #MA4600 3.50% 5/1/20525 | 2,782 | 2,531 | ||||||
| Fannie Mae Pool #BV8959 2.50% 6/1/20525 | 127 | 108 | ||||||
| Fannie Mae Pool #FS2239 2.50% 7/1/20525 | 6,973 | 5,920 | ||||||
| Fannie Mae Pool #FS2555 4.50% 7/1/20525 | 1,105 | 1,065 | ||||||
| Fannie Mae Pool #BW6395 4.50% 8/1/20525 | 999 | 963 | ||||||
| Fannie Mae Pool #BW5789 4.50% 8/1/20525 | 371 | 357 | ||||||
| Fannie Mae Pool #BW1201 5.00% 9/1/20525 | 2,820 | 2,783 | ||||||
| Fannie Mae Pool #MA4761 5.00% 9/1/20525 | 524 | 517 | ||||||
| Fannie Mae Pool #MA4784 4.50% 10/1/20525 | 2,209 | 2,128 | ||||||
| Fannie Mae Pool #MA4785 5.00% 10/1/20525 | 1,300 | 1,283 | ||||||
| Fannie Mae Pool #MA4804 4.00% 11/1/20525 | 854 | 802 | ||||||
| Fannie Mae Pool #MA4839 4.00% 12/1/20525 | 442 | 415 | ||||||
| Fannie Mae Pool #MA4841 5.00% 12/1/20525 | 3,000 | 2,961 | ||||||
| Fannie Mae Pool #MA4866 4.00% 1/1/20535 | 238 | 223 | ||||||
| Fannie Mae Pool #MA4868 5.00% 1/1/20535 | 1,000 | 987 | ||||||
| Fertitta Entertainment, Inc. 4.625% 1/15/20297 | 25 | 21 | ||||||
| Fertitta Entertainment, Inc. 6.75% 1/15/20307 | 25 | 20 | ||||||
| First Quantum Minerals, Ltd. 6.875% 3/1/20267 | 325 | 308 | ||||||
| First Quantum Minerals, Ltd. 6.875% 10/15/20277 | 240 | 226 | ||||||
| First Student Bidco, Inc. 4.00% 7/31/20297 | 85 | 70 | ||||||
| FirstEnergy Corp., Series B, 4.40% 7/15/2027 (4.15% on 1/15/2023)1 | 1,800 | 1,678 | ||||||
| FirstEnergy Transmission, LLC 2.866% 9/15/20287 | 2,325 | 2,033 | ||||||
| Florida Power & Light Company 2.875% 12/4/2051 | 1,465 | 990 | ||||||
| Ford Motor Co. 3.25% 2/12/2032 | 20 | 15 | ||||||
| Ford Motor Credit Company, LLC 3.81% 1/9/2024 | 290 | 282 | ||||||
| Ford Motor Credit Company, LLC 2.90% 2/16/2028 | 200 | 165 | ||||||
| Ford Motor Credit Company, LLC 4.00% 11/13/2030 | 125 | 103 | ||||||
| Freddie Mac Pool #ZS8588 3.00% 11/1/20305 | 47 | 45 | ||||||
| Freddie Mac, Series K153, Class A2, Multi Family, 3.82% 1/25/20335 | 3,975 | 3,742 | ||||||
| Freddie Mac Pool #QC7173 2.50% 9/1/20515 | 132 | 112 | ||||||
| Freddie Mac Pool #QC9156 2.50% 10/1/20515 | 866 | 736 | ||||||
| Freddie Mac Pool #QD1523 2.50% 11/1/20515 | 757 | 643 | ||||||
| Freddie Mac Pool #QD2521 2.50% 12/1/20515 | 67 | 57 | ||||||
| Freddie Mac Pool #SD0853 2.50% 1/1/20525 | 885 | 750 | ||||||
| Freddie Mac Pool #QD9066 2.50% 2/1/20525 | 210 | 179 | ||||||
| Freddie Mac Pool #QD7063 2.50% 2/1/20525 | 95 | 81 | ||||||
| Freddie Mac Pool #QD9879 2.50% 3/1/20525 | 730 | 619 | ||||||
| Freddie Mac Pool #QD9460 2.50% 3/1/20525 | 663 | 562 | ||||||
| Freddie Mac Pool #RA6959 2.50% 3/1/20525 | 27 | 23 | ||||||
| 214 | American Funds Insurance Series |
Capital World Bond Fund (continued)
| Bonds, notes & other debt instruments (continued) | Principal amount (000) |
Value (000) |
||||||
| U.S. dollars (continued) | ||||||||
| Freddie Mac Pool #QD9200 2.50% 4/1/20525 | USD | 919 | $ | 780 | ||||
| Freddie Mac Pool #QE0323 2.50% 4/1/20525 | 900 | 765 | ||||||
| Freddie Mac Pool #QE2310 2.50% 4/1/20525 | 840 | 713 | ||||||
| Freddie Mac Pool #QE4383 4.00% 6/1/20525 | 3,563 | 3,345 | ||||||
| Freddie Mac Pool #QE6084 5.00% 7/1/20525 | 1,276 | 1,260 | ||||||
| Freddie Mac Pool #QE8063 4.00% 8/1/20525 | 300 | 282 | ||||||
| Freddie Mac Pool #QE8065 4.50% 8/1/20525 | 3,700 | 3,565 | ||||||
| Freddie Mac Pool #QF0152 4.50% 9/1/20525 | 500 | 482 | ||||||
| Freddie Mac Pool #QF1489 4.00% 10/1/20525 | 1,000 | 939 | ||||||
| Freddie Mac Pool #SD8256 4.00% 10/1/20525 | 400 | 376 | ||||||
| Freddie Mac Pool #SD8257 4.50% 10/1/20525 | 8,419 | 8,111 | ||||||
| Freddie Mac Pool #QF0866 4.50% 10/1/20525 | 2,226 | 2,151 | ||||||
| Freddie Mac Pool #QF1486 4.50% 10/1/20525 | 400 | 385 | ||||||
| Freddie Mac Pool #QF3304 5.00% 10/1/20525 | 800 | 790 | ||||||
| Freddie Mac Pool #SD8264 3.50% 11/1/20525 | 4,668 | 4,246 | ||||||
| Freddie Mac Pool #QF3985 4.00% 11/1/20525 | 308 | 290 | ||||||
| Freddie Mac Pool #SD8275 4.50% 12/1/20525 | 598 | 576 | ||||||
| Freddie Mac Pool #SD8276 5.00% 12/1/20525 | 4,753 | 4,692 | ||||||
| Freddie Mac Pool #SD8288 5.00% 1/1/20535 | 507 | 501 | ||||||
| Frontier Communications Corp. 5.875% 10/15/20277 | 100 | 93 | ||||||
| Frontier Communications Corp. 5.00% 5/1/20287 | 65 | 57 | ||||||
| Frontier Communications Holdings, LLC 5.875% 11/1/2029 | 250 | 194 | ||||||
| FS Energy and Power Fund 7.50% 8/15/20237 | 150 | 150 | ||||||
| FXI Holdings, Inc. 12.25% 11/15/20267 | 497 | 412 | ||||||
| Gartner, Inc. 3.75% 10/1/20307 | 70 | 60 | ||||||
| General Motors Financial Co. 1.05% 3/8/2024 | 725 | 689 | ||||||
| Genesis Energy, LP 8.00% 1/15/2027 | 125 | 118 | ||||||
| Georgia (Republic of) 2.75% 4/22/20267 | 400 | 363 | ||||||
| GoDaddy Operating Co. 3.50% 3/1/20297 | 80 | 67 | ||||||
| Goldman Sachs Group, Inc. 1.542% 9/10/2027 (USD-SOFR + 0.818% on 9/10/2026)1 | 1,080 | 933 | ||||||
| Goldman Sachs Group, Inc. 2.383% 7/21/2032 (USD-SOFR + 1.248% on 7/21/2031)1 | 726 | 565 | ||||||
| Government National Mortgage Assn. 3.50% 1/1/20535,11 | 7,440 | 6,837 | ||||||
| Gray Escrow II, Inc. 5.375% 11/15/20317 | 30 | 22 | ||||||
| Group 1 Automotive, Inc. 4.00% 8/15/20287 | 145 | 123 | ||||||
| Groupe BPCE SA 5.15% 7/21/20247 | 1,800 | 1,763 | ||||||
| Grupo Energia Bogota SA ESP 4.875% 5/15/20307 | 660 | 593 | ||||||
| Hanesbrands, Inc. 4.625% 5/15/20247 | 120 | 116 | ||||||
| Hanesbrands, Inc. 4.875% 5/15/20267 | 100 | 90 | ||||||
| Harsco Corp. 5.75% 7/31/20277 | 200 | 158 | ||||||
| Harvest Midstream I, LP 7.50% 9/1/20287 | 25 | 24 | ||||||
| HCA, Inc. 5.625% 9/1/2028 | 120 | 120 | ||||||
| HealthEquity, Inc. 4.50% 10/1/20297 | 30 | 26 | ||||||
| Hess Midstream Operations, LP 5.50% 10/15/20307 | 34 | 31 | ||||||
| Hightower Holding, LLC 6.75% 4/15/20297 | 235 | 198 | ||||||
| Hilcorp Energy I, LP 6.00% 4/15/20307 | 105 | 94 | ||||||
| Hilcorp Energy I, LP 6.00% 2/1/20317 | 115 | 100 | ||||||
| Hilton Worldwide Holdings, Inc. 4.875% 1/15/2030 | 25 | 23 | ||||||
| Hilton Worldwide Holdings, Inc. 4.00% 5/1/20317 | 155 | 130 | ||||||
| Honduras (Republic of) 6.25% 1/19/2027 | 2,083 | 1,843 | ||||||
| Honduras (Republic of) 5.625% 6/24/2030 | 958 | 773 | ||||||
| Howard Hughes Corp. 5.375% 8/1/20287 | 275 | 248 | ||||||
| Howard Hughes Corp. 4.125% 2/1/20297 | 195 | 164 | ||||||
| Howard Hughes Corp. 4.375% 2/1/20317 | 120 | 97 | ||||||
| Howard Midstream Energy Partners, LLC 6.75% 1/15/20277 | 60 | 58 | ||||||
| HSBC Holdings PLC 2.633% 11/7/2025 (3-month USD-LIBOR + 1.14% on 11/7/2024)1 | 305 | 287 | ||||||
| HSBC Holdings PLC 4.292% 9/12/2026 (3-month USD-LIBOR + 1.348% on 9/12/2025)1 | 4,172 | 3,995 | ||||||
| HSBC Holdings PLC 2.871% 11/22/2032 (USD-SOFR + 1.41% on 11/22/2031)1 | 921 | 706 | ||||||
| Huarong Finance 2019 Co., Ltd. (3-month USD-LIBOR + 1.125%) 5.824% 2/24/20239 | 3,326 | 3,316 | ||||||
| Huarong Finance 2019 Co., Ltd. (3-month USD-LIBOR + 1.25%) 6.007% 2/24/20259 | 363 | 342 | ||||||
| Huarong Finance II Co., Ltd. 5.50% 1/16/2025 | 880 | 835 | ||||||
| American Funds Insurance Series | 215 |
Capital World Bond Fund (continued)
| Bonds, notes & other debt instruments (continued) | Principal amount (000) |
Value (000) |
||||||
| U.S. dollars (continued) | ||||||||
| Huarong Finance II Co., Ltd. 5.00% 11/19/2025 | USD | 1,007 | $ | 931 | ||||
| HUB International, Ltd. 7.00% 5/1/20267 | 315 | 309 | ||||||
| Hyundai Capital America 0.875% 6/14/20247 | 1,200 | 1,120 | ||||||
| Hyundai Capital America 1.50% 6/15/20267 | 2,375 | 2,061 | ||||||
| Hyundai Capital America 1.65% 9/17/20267 | 269 | 237 | ||||||
| Hyundai Capital America 2.00% 6/15/20287 | 600 | 490 | ||||||
| Hyundai Capital Services, Inc. 3.75% 3/5/20237 | 2,450 | 2,442 | ||||||
| iHeartCommunications, Inc. 5.25% 8/15/20277 | 80 | 68 | ||||||
| Ingles Markets, Inc. 4.00% 6/15/20317 | 140 | 118 | ||||||
| Intesa Sanpaolo SpA 5.017% 6/26/20247 | 3,270 | 3,145 | ||||||
| Intesa Sanpaolo SpA 7.00% 11/21/20257 | 225 | 230 | ||||||
| Iraq (Republic of) 6.752% 3/9/20237 | 545 | 539 | ||||||
| Iron Mountain Information Management Services, Inc. 5.00% 7/15/20327 | 55 | 46 | ||||||
| Iron Mountain, Inc. 5.25% 7/15/20307 | 235 | 205 | ||||||
| Israel (State of) 3.375% 1/15/2050 | 1,470 | 1,136 | ||||||
| Israel (State of) 3.875% 7/3/2050 | 795 | 672 | ||||||
| Jacobs Entertainment, Inc. 6.75% 2/15/20297 | 25 | 23 | ||||||
| JPMorgan Chase & Co. 4.912% 7/25/2033 (USD-SOFR + 2.08% on 7/25/2032)1 | 45 | 43 | ||||||
| Kantar Group, LLC, Term Loan B2, (3-month USD-LIBOR + 4.50%) 9.23% 12/4/20268,9 | 64 | 60 | ||||||
| KB Home 6.875% 6/15/2027 | 50 | 50 | ||||||
| Keb Hana Bank 3.25% 3/30/20277 | 1,370 | 1,278 | ||||||
| Kennedy-Wilson Holdings, Inc. 4.75% 3/1/2029 | 110 | 87 | ||||||
| Kennedy-Wilson Holdings, Inc. 4.75% 2/1/2030 | 245 | 187 | ||||||
| Kinetik Holdings, LP 5.875% 6/15/20307 | 50 | 47 | ||||||
| Kronos Acquisition Holdings, Inc. 5.00% 12/31/20267 | 85 | 74 | ||||||
| Kronos Acquisition Holdings, Inc. 7.00% 12/31/20277 | 140 | 115 | ||||||
| LABL Escrow Issuer, LLC 10.50% 7/15/20277 | 45 | 42 | ||||||
| Lamar Media Corp. 3.75% 2/15/2028 | 135 | 121 | ||||||
| Lamar Media Corp. 3.625% 1/15/2031 | 160 | 132 | ||||||
| Lamb Weston Holdings, Inc. 4.125% 1/31/20307 | 200 | 177 | ||||||
| Lamb Weston Holdings, Inc. 4.375% 1/31/20327 | 60 | 53 | ||||||
| Las Vegas Sands Corp. 3.20% 8/8/2024 | 25 | 24 | ||||||
| LCM Investments Holdings II, LLC 4.875% 5/1/20297 | 110 | 88 | ||||||
| Level 3 Financing, Inc. 3.75% 7/15/20297 | 210 | 151 | ||||||
| Levi Strauss & Co. 3.50% 3/1/20317 | 115 | 91 | ||||||
| Ligado Networks, LLC 15.50% PIK 11/1/20237,10 | 124 | 40 | ||||||
| Lindblad Expeditions, LLC 6.75% 2/15/20277 | 5 | 5 | ||||||
| Lithia Motors, Inc. 4.625% 12/15/20277 | 120 | 108 | ||||||
| Live Nation Entertainment, Inc. 4.75% 10/15/20277 | 130 | 116 | ||||||
| Lloyds Banking Group PLC 1.627% 5/11/2027 (1-year UST Yield Curve Rate T Note Constant Maturity + 0.85% on 5/11/2026)1 | 7,000 | 6,067 | ||||||
| LPL Holdings, Inc. 4.625% 11/15/20277 | 485 | 454 | ||||||
| LPL Holdings, Inc. 4.00% 3/15/20297 | 25 | 22 | ||||||
| LSB Industries, Inc. 6.25% 10/15/20287 | 126 | 115 | ||||||
| LSC Communications, Inc. 8.75% 10/15/20233,6,7 | 431 | 1 | ||||||
| Mallinckrodt PLC 10.00% 4/15/20257 | 440 | 379 | ||||||
| Marriott International, Inc. 2.75% 10/15/2033 | 5 | 4 | ||||||
| Mastercard, Inc. 2.00% 11/18/2031 | 600 | 483 | ||||||
| Match Group, Inc. 5.625% 2/15/20297 | 130 | 121 | ||||||
| Meituan Dianping 2.125% 10/28/2025 | 1,730 | 1,532 | ||||||
| Meituan Dianping 3.05% 10/28/20307 | 3,095 | 2,390 | ||||||
| Methanex Corp. 5.125% 10/15/2027 | 55 | 51 | ||||||
| Methanex Corp. 5.25% 12/15/2029 | 170 | 151 | ||||||
| Mexico City Airport Trust 5.50% 7/31/2047 | 432 | 334 | ||||||
| MGM Resorts International 5.50% 4/15/2027 | 90 | 84 | ||||||
| Midas OpCo Holdings, LLC 5.625% 8/15/20297 | 145 | 120 | ||||||
| Mileage Plus Holdings, LLC 6.50% 6/20/20277 | 63 | 63 | ||||||
| Mineral Resources, Ltd. 8.00% 11/1/20277 | 155 | 159 | ||||||
| Mineral Resources, Ltd. 8.50% 5/1/20307 | 25 | 25 | ||||||
| MISC Capital Two (Labuan), Ltd. 3.75% 4/6/20277 | 3,236 | 2,937 | ||||||
| Mohegan Gaming & Entertainment 8.00% 2/1/20267 | 105 | 98 | ||||||
| 216 | American Funds Insurance Series |
Capital World Bond Fund (continued)
| Bonds, notes & other debt instruments (continued) | Principal amount (000) |
Value (000) |
||||||
| U.S. dollars (continued) | ||||||||
| Molina Healthcare, Inc. 4.375% 6/15/20287 | USD | 80 | $ | 73 | ||||
| Molina Healthcare, Inc. 3.875% 11/15/20307 | 75 | 64 | ||||||
| MoneyGram International, Inc. 5.375% 8/1/20267 | 50 | 51 | ||||||
| Morgan Stanley 1.593% 5/4/2027 (USD-SOFR + 0.879% on 5/4/2026)1 | 2,164 | 1,901 | ||||||
| Morgan Stanley 1.928% 4/28/2032 (USD-SOFR + 1.02% on 4/28/2031)1 | 1,396 | 1,057 | ||||||
| Mozart Debt Merger Sub, Inc. 5.25% 10/1/20297 | 155 | 123 | ||||||
| MSCI, Inc. 3.875% 2/15/20317 | 215 | 179 | ||||||
| MSCI, Inc. 3.625% 11/1/20317 | 350 | 290 | ||||||
| Murphy Oil Corp. 5.625% 5/1/2027 | 15 | 15 | ||||||
| Murphy Oil USA, Inc. 4.75% 9/15/2029 | 48 | 44 | ||||||
| Nabors Industries, Inc. 7.375% 5/15/20277 | 55 | 53 | ||||||
| National Financial Partners Corp. 6.875% 8/15/20287 | 105 | 87 | ||||||
| Nationstar Mortgage Holdings, Inc. 5.125% 12/15/20307 | 135 | 104 | ||||||
| Navient Corp. 5.00% 3/15/2027 | 45 | 39 | ||||||
| Navient Corp. 4.875% 3/15/2028 | 145 | 119 | ||||||
| NCL Corp., Ltd. 5.875% 2/15/20277 | 80 | 69 | ||||||
| NCR Corp. 5.25% 10/1/20307 | 15 | 12 | ||||||
| Neiman Marcus Group, LLC 7.125% 4/1/20267 | 85 | 80 | ||||||
| Netflix, Inc. 4.875% 4/15/2028 | 45 | 44 | ||||||
| Netflix, Inc. 4.875% 6/15/20307 | 225 | 210 | ||||||
| New Fortress Energy, Inc. 6.75% 9/15/20257 | 50 | 47 | ||||||
| New Fortress Energy, Inc. 6.50% 9/30/20267 | 255 | 237 | ||||||
| New York Life Global Funding 1.20% 8/7/20307 | 2,725 | 2,094 | ||||||
| Newell Rubbermaid, Inc. 4.70% 4/1/2026 | 80 | 75 | ||||||
| Nexstar Broadcasting, Inc. 4.75% 11/1/20287 | 255 | 221 | ||||||
| Nexstar Escrow Corp. 5.625% 7/15/20277 | 115 | 106 | ||||||
| NGL Energy Operating, LLC 7.50% 2/1/20267 | 215 | 192 | ||||||
| NGL Energy Partners, LP 7.50% 11/1/2023 | 200 | 195 | ||||||
| Niagara Mohawk Power Corp. 3.508% 10/1/20247 | 180 | 173 | ||||||
| Northern Oil and Gas, Inc. 8.125% 3/1/20287 | 335 | 322 | ||||||
| NorthRiver Midstream Finance, LP 5.625% 2/15/20267 | 105 | 100 | ||||||
| NortonLifeLock, Inc. 7.125% 9/30/20307 | 160 | 157 | ||||||
| Nova Chemicals Corp. 5.25% 6/1/20277 | 20 | 18 | ||||||
| Novelis Corp. 4.75% 1/30/20307 | 80 | 71 | ||||||
| Novelis Corp. 3.875% 8/15/20317 | 20 | 16 | ||||||
| NuStar Logistics, LP 5.625% 4/28/2027 | 80 | 75 | ||||||
| Oasis Petroleum, Inc. 6.375% 6/1/20267 | 35 | 34 | ||||||
| Occidental Petroleum Corp. 6.375% 9/1/2028 | 194 | 196 | ||||||
| Occidental Petroleum Corp. 8.875% 7/15/2030 | 25 | 28 | ||||||
| Occidental Petroleum Corp. 6.625% 9/1/2030 | 125 | 129 | ||||||
| Occidental Petroleum Corp. 6.125% 1/1/2031 | 65 | 66 | ||||||
| Occidental Petroleum Corp. 6.45% 9/15/2036 | 18 | 18 | ||||||
| Occidental Petroleum Corp. 6.60% 3/15/2046 | 15 | 15 | ||||||
| State of Ohio, Turnpike and Infrastructure Commission, Turnpike Rev. Ref. Bonds (Infrastructure Projects), Series 2020-A, 3.216% 2/15/2048 | 1,410 | 1,008 | ||||||
| Oleoducto Central SA 4.00% 7/14/20277 | 2,535 | 2,241 | ||||||
| Oleoducto Central SA 4.00% 7/14/2027 | 630 | 557 | ||||||
| Open Text Corp. 3.875% 2/15/20287 | 25 | 22 | ||||||
| Open Text Corp., Term Loan B, (3-month USD-LIBOR + 3.50%) 3.50% 11/16/20298,9 | 155 | 151 | ||||||
| Option Care Health, Inc. 4.375% 10/31/20297 | 25 | 22 | ||||||
| Oracle Corp. 2.65% 7/15/2026 | 2,327 | 2,142 | ||||||
| Oracle Corp. 3.25% 11/15/2027 | 1,880 | 1,730 | ||||||
| Oracle Corp. 3.60% 4/1/2050 | 980 | 664 | ||||||
| Oracle Corp. 3.95% 3/25/2051 | 22 | 16 | ||||||
| Orange SA 9.00% 3/1/20311 | 2,434 | 2,985 | ||||||
| Oxford Finance, LLC 6.375% 2/1/20277 | 30 | 28 | ||||||
| Pacific Gas and Electric Co. 4.65% 8/1/2028 | 542 | 499 | ||||||
| Pacific Gas and Electric Co. 3.30% 8/1/2040 | 6,850 | 4,661 | ||||||
| Panama (Republic of) 3.75% 4/17/20267 | 465 | 439 | ||||||
| Panther BF Aggregator 2, LP 6.25% 5/15/20267 | 44 | 43 | ||||||
| Panther BF Aggregator 2, LP 8.50% 5/15/20277 | 85 | 83 | ||||||
| Park Intermediate Holdings, LLC 4.875% 5/15/20297 | 65 | 55 | ||||||
| American Funds Insurance Series | 217 |
Capital World Bond Fund (continued)
| Bonds, notes & other debt instruments (continued) | Principal amount (000) |
Value (000) |
||||||
| U.S. dollars (continued) | ||||||||
| Party City Holdings, Inc. 8.75% 2/15/20267 | USD | 5 | $ | 1 | ||||
| Performance Food Group, Inc. 5.50% 10/15/20277 | 11 | 10 | ||||||
| Peru (Republic of) 2.392% 1/23/2026 | 500 | 461 | ||||||
| Petrobras Global Finance Co. 6.75% 6/3/2050 | 29 | 25 | ||||||
| Petrobras Global Finance Co. 5.50% 6/10/2051 | 21 | 16 | ||||||
| Petróleos Mexicanos 4.625% 9/21/2023 | 714 | 704 | ||||||
| Petróleos Mexicanos 6.875% 10/16/2025 | 660 | 647 | ||||||
| Petróleos Mexicanos 6.875% 8/4/2026 | 865 | 819 | ||||||
| Petróleos Mexicanos 6.49% 1/23/2027 | 406 | 371 | ||||||
| Petróleos Mexicanos 6.50% 3/13/2027 | 1,493 | 1,365 | ||||||
| Petróleos Mexicanos 6.84% 1/23/2030 | 681 | 564 | ||||||
| Petróleos Mexicanos 6.70% 2/16/2032 | 779 | 613 | ||||||
| Petróleos Mexicanos 6.75% 9/21/2047 | 346 | 222 | ||||||
| Petróleos Mexicanos 7.69% 1/23/2050 | 55 | 38 | ||||||
| Petróleos Mexicanos 6.95% 1/28/2060 | 201 | 128 | ||||||
| PG&E Corp. 5.00% 7/1/2028 | 145 | 133 | ||||||
| PG&E Corp. 5.25% 7/1/2030 | 175 | 160 | ||||||
| PGT Innovations, Inc. 4.375% 10/1/20297 | 5 | 4 | ||||||
| Philip Morris International, Inc. 5.125% 11/17/2027 | 315 | 318 | ||||||
| Philip Morris International, Inc. 5.625% 11/17/2029 | 420 | 427 | ||||||
| Philip Morris International, Inc. 2.10% 5/1/2030 | 634 | 514 | ||||||
| Philip Morris International, Inc. 5.75% 11/17/2032 | 1,554 | 1,589 | ||||||
| Picard Midco, Inc. 6.50% 3/31/20297 | 235 | 198 | ||||||
| Post Holdings, Inc. 5.625% 1/15/20287 | 85 | 80 | ||||||
| Post Holdings, Inc. 5.50% 12/15/20297 | 80 | 73 | ||||||
| Post Holdings, Inc. 4.625% 4/15/20307 | 444 | 384 | ||||||
| Procter & Gamble Company 3.00% 3/25/2030 | 338 | 310 | ||||||
| PT Indonesia Asahan Aluminium Tbk 5.71% 11/15/2023 | 960 | 963 | ||||||
| PT Indonesia Asahan Aluminium Tbk 5.45% 5/15/20307 | 500 | 477 | ||||||
| Qatar Petroleum 3.125% 7/12/20417 | 2,895 | 2,235 | ||||||
| Radiology Partners, Inc. 9.25% 2/1/20287 | 245 | 138 | ||||||
| Radiology Partners, Inc., Term Loan, (3-month USD-LIBOR + 4.25%) 8.639% 7/9/20258,9 | 10 | 8 | ||||||
| Range Resources Corp. 4.75% 2/15/20307 | 145 | 128 | ||||||
| Raptor Acquisition Corp. 4.875% 11/1/20267 | 180 | 160 | ||||||
| Real Hero Merger Sub 2, Inc. 6.25% 2/1/20297 | 25 | 17 | ||||||
| RLJ Lodging Trust, LP 4.00% 9/15/20297 | 25 | 20 | ||||||
| Roller Bearing Company of America, Inc. 4.375% 10/15/20297 | 20 | 17 | ||||||
| Royal Caribbean Cruises, Ltd. 11.50% 6/1/20257 | 57 | 61 | ||||||
| Royal Caribbean Cruises, Ltd. 5.375% 7/15/20277 | 40 | 32 | ||||||
| Royal Caribbean Cruises, Ltd. 9.25% 1/15/20297 | 160 | 165 | ||||||
| RP Escrow Issuer, LLC 5.25% 12/15/20257 | 190 | 145 | ||||||
| Russian Federation 4.25% 6/23/20273 | 1,400 | 602 | ||||||
| Ryan Specialty Group, LLC 4.375% 2/1/20307 | 45 | 39 | ||||||
| Sabre GLBL, Inc. 11.25% 12/15/20277 | 75 | 77 | ||||||
| Sally Holdings, LLC 5.625% 12/1/2025 | 48 | 46 | ||||||
| Santander Holdings USA, Inc. 3.244% 10/5/2026 | 3,750 | 3,485 | ||||||
| Scentre Group 3.50% 2/12/20257 | 210 | 201 | ||||||
| Scentre Group 3.75% 3/23/20277 | 110 | 101 | ||||||
| Scientific Games Corp. 7.00% 5/15/20287 | 20 | 19 | ||||||
| Scientific Games Holdings, LP 6.625% 3/1/20307 | 46 | 39 | ||||||
| SCIH Salt Holdings, Inc. 4.875% 5/1/20287 | 115 | 99 | ||||||
| Scotts Miracle-Gro Co. 4.50% 10/15/2029 | 140 | 114 | ||||||
| Scotts Miracle-Gro Co. 4.375% 2/1/2032 | 55 | 42 | ||||||
| Sealed Air Corp. 5.00% 4/15/20297 | 40 | 38 | ||||||
| ServiceNow, Inc. 1.40% 9/1/2030 | 1,830 | 1,404 | ||||||
| Silgan Holdings, Inc. 4.125% 2/1/2028 | 80 | 74 | ||||||
| Simmons Foods, Inc. 4.625% 3/1/20297 | 160 | 130 | ||||||
| Singapore Airlines, Ltd. 3.375% 1/19/2029 | 3,710 | 3,353 | ||||||
| Sirius XM Radio, Inc. 4.00% 7/15/20287 | 195 | 170 | ||||||
| Sirius XM Radio, Inc. 3.875% 9/1/20317 | 170 | 133 | ||||||
| SkyMiles IP, Ltd. 4.75% 10/20/20287 | 25 | 24 | ||||||
| 218 | American Funds Insurance Series |
Capital World Bond Fund (continued)
| Bonds, notes & other debt instruments (continued) | Principal amount (000) |
Value (000) |
||||||
| U.S. dollars (continued) | ||||||||
| SM Energy Co. 5.625% 6/1/2025 | USD | 55 | $ | 53 | ||||
| SM Energy Co. 6.50% 7/15/2028 | 45 | 43 | ||||||
| Sonic Automotive, Inc. 4.625% 11/15/20297 | 45 | 36 | ||||||
| Sonic Automotive, Inc. 4.875% 11/15/20317 | 20 | 16 | ||||||
| Southern California Edison Co. 2.85% 8/1/2029 | 200 | 174 | ||||||
| Southwestern Energy Co. 5.95% 1/23/20251 | 110 | 108 | ||||||
| Southwestern Energy Co. 7.75% 10/1/2027 | 20 | 20 | ||||||
| Southwestern Energy Co. 8.375% 9/15/2028 | 30 | 31 | ||||||
| Southwestern Energy Co. 5.375% 3/15/2030 | 135 | 123 | ||||||
| Southwestern Energy Co. 4.75% 2/1/2032 | 105 | 90 | ||||||
| Spirit AeroSystems, Inc. 9.375% 11/30/20297 | 17 | 18 | ||||||
| Sprint Corp. 7.625% 3/1/2026 | 130 | 137 | ||||||
| Sri Lanka (Democratic Socialist Republic of) 5.75% 4/18/20233 | 2,890 | 917 | ||||||
| Stellantis Finance US, Inc. 1.711% 1/29/20277 | 1,500 | 1,289 | ||||||
| Stellantis Finance US, Inc. 5.625% 1/12/20287 | 2,560 | 2,539 | ||||||
| Stellantis Finance US, Inc. 2.691% 9/15/20317 | 453 | 347 | ||||||
| Stericycle, Inc. 3.875% 1/15/20297 | 110 | 96 | ||||||
| Studio City Finance, Ltd. 6.00% 7/15/20257 | 200 | 174 | ||||||
| Sunoco, LP 4.50% 5/15/2029 | 290 | 254 | ||||||
| Sunoco, LP 4.50% 4/30/2030 | 35 | 30 | ||||||
| Surgery Center Holdings 10.00% 4/15/20277 | 103 | 105 | ||||||
| SVB Financial Group 4.70% junior subordinated perpetual bonds (5-year UST Yield Curve Rate T Note Constant Maturity + 3.064% on 11/15/2031)1 | 12 | 8 | ||||||
| Swiss Re Finance (Luxembourg) SA 5.00% 4/2/2049 (5-year UST Yield Curve Rate T Note Constant Maturity + 3.582% on 4/2/2029)1,7 | 800 | 740 | ||||||
| Talen Energy Corp. 7.25% 5/15/20277 | 205 | 213 | ||||||
| Tencent Holdings, Ltd. 3.24% 6/3/20507 | 3,450 | 2,188 | ||||||
| Tenet Healthcare Corp. 4.875% 1/1/20267 | 245 | 232 | ||||||
| Tenet Healthcare Corp. 6.125% 10/1/20287 | 25 | 22 | ||||||
| Teva Pharmaceutical Finance Co. BV 6.00% 4/15/2024 | 4,600 | 4,518 | ||||||
| Teva Pharmaceutical Finance Co. BV 7.125% 1/31/2025 | 3,710 | 3,695 | ||||||
| Teva Pharmaceutical Finance Co. BV 3.15% 10/1/2026 | 110 | 96 | ||||||
| State of Texas, Grand Parkway Transportation Corp., Grand Parkway System Toll Rev. Ref. Bonds, Series 2020-B, 3.236% 10/1/2052 | 1,780 | 1,266 | ||||||
| Thermo Fisher Scientific, Inc. 4.80% 11/21/2027 | 630 | 633 | ||||||
| Tibco Software, Inc., Term Loan A, (3-month USD CME Term SOFR + 4.50%) 9.18% 9/29/20288,9 | 245 | 218 | ||||||
| T-Mobile US, Inc. 2.40% 3/15/2029 | 1,079 | 913 | ||||||
| Toyota Motor Credit Corp. 3.375% 4/1/2030 | 453 | 412 | ||||||
| TransDigm, Inc. 6.25% 3/15/20267 | 65 | 64 | ||||||
| TransDigm, Inc. 5.50% 11/15/2027 | 35 | 33 | ||||||
| TransDigm, Inc. 4.875% 5/1/2029 | 80 | 70 | ||||||
| Transocean Guardian, Ltd. 5.875% 1/15/20247 | 10 | 10 | ||||||
| Transocean Poseidon, Ltd. 6.875% 2/1/20277 | 66 | 64 | ||||||
| Treehouse Park Improvement Association No.1 - Anleihen 9.75% 12/1/20336,7 | 100 | 88 | ||||||
| Triumph Group, Inc. 6.25% 9/15/20247 | 35 | 33 | ||||||
| U.S. Treasury 0.125% 1/31/2023 | 12,320 | 12,282 | ||||||
| U.S. Treasury 2.625% 2/28/2023 | 6,900 | 6,882 | ||||||
| U.S. Treasury 1.875% 8/31/2024 | 4,515 | 4,320 | ||||||
| U.S. Treasury 3.25% 8/31/2024 | 1,065 | 1,043 | ||||||
| U.S. Treasury 0.25% 8/31/2025 | 20,534 | 18,475 | ||||||
| U.S. Treasury 2.875% 11/30/2025 | 5,400 | 5,198 | ||||||
| U.S. Treasury 4.00% 12/15/2025 | 1,992 | 1,980 | ||||||
| U.S. Treasury 0.375% 1/31/2026 | 14,610 | 13,004 | ||||||
| U.S. Treasury 0.75% 8/31/2026 | 4,361 | 3,862 | ||||||
| U.S. Treasury 0.875% 9/30/2026 | 11,098 | 9,858 | ||||||
| U.S. Treasury 1.125% 10/31/2026 | 1,698 | 1,519 | ||||||
| U.S. Treasury 2.50% 3/31/2027 | 9,560 | 8,975 | ||||||
| U.S. Treasury 3.875% 11/30/2027 | 105,639 | 105,067 | ||||||
| U.S. Treasury 1.625% 8/15/2029 | 10,760 | 9,336 | ||||||
| U.S. Treasury 1.375% 11/15/203112 | 25,783 | 20,999 | ||||||
| American Funds Insurance Series | 219 |
Capital World Bond Fund (continued)
| Bonds, notes & other debt instruments (continued) | Principal amount (000) |
Value (000) |
||||||
| U.S. dollars (continued) | ||||||||
| U.S. Treasury 1.875% 2/15/2032 | USD | 2,000 | $ | 1,696 | ||||
| U.S. Treasury 4.125% 11/15/2032 | 1,169 | 1,192 | ||||||
| U.S. Treasury 1.125% 5/15/2040 | 9,170 | 5,754 | ||||||
| U.S. Treasury 1.875% 2/15/204112 | 18,740 | 13,274 | ||||||
| U.S. Treasury 1.75% 8/15/2041 | 6,050 | 4,151 | ||||||
| U.S. Treasury 2.375% 2/15/2042 | 2,872 | 2,195 | ||||||
| U.S. Treasury 3.00% 8/15/2048 | 5,045 | 4,164 | ||||||
| U.S. Treasury 2.00% 8/15/2051 | 5,755 | 3,788 | ||||||
| U.S. Treasury 3.00% 8/15/205212 | 29,749 | 24,666 | ||||||
| U.S. Treasury Inflation-Protected Security 0.125% 2/15/20514 | 3,239 | 2,089 | ||||||
| UBS Group AG 1.008% 7/30/2024 (5-year UST Yield Curve Rate T Note Constant Maturity + 0.83% on 7/30/2023)1,7 | 1,950 | 1,897 | ||||||
| UBS Group AG 4.49% 8/5/2025 (1-year UST Yield Curve Rate T Note Constant Maturity + 1.60% on 8/5/2024)1,7 | 2,265 | 2,228 | ||||||
| UKG, Inc., Term Loan, (3-month USD-LIBOR + 5.25%) 8.998% 5/3/20278,9 | 75 | 69 | ||||||
| Ukraine 7.75% 9/1/20243 | 6,210 | 1,544 | ||||||
| Ukraine 7.75% 9/1/20263 | 1,570 | 338 | ||||||
| Ukraine 6.876% 5/21/20313 | 1,269 | 244 | ||||||
| Uniform Mortgage-Backed Security 5.00% 1/1/20535,11 | 2,100 | 2,070 | ||||||
| Uniform Mortgage-Backed Security 5.50% 1/1/20535,11 | 10,300 | 10,329 | ||||||
| Unisys Corp. 6.875% 11/1/20277 | 35 | 27 | ||||||
| United Natural Foods, Inc. 6.75% 10/15/20287 | 235 | 226 | ||||||
| United Rentals, Inc. 4.875% 1/15/2028 | 30 | 29 | ||||||
| United Rentals, Inc. 6.00% 12/15/20297 | 315 | 314 | ||||||
| Univision Communications, Inc. 4.50% 5/1/20297 | 240 | 201 | ||||||
| Univision Communications, Inc. 7.375% 6/30/20307 | 145 | 139 | ||||||
| US Foods, Inc. 4.625% 6/1/20307 | 35 | 31 | ||||||
| Vail Resorts, Inc. 6.25% 5/15/20257 | 120 | 120 | ||||||
| Valeant Pharmaceuticals International, Inc. 5.50% 11/1/20257 | 75 | 64 | ||||||
| Valvoline, Inc. 3.625% 6/15/20317 | 85 | 70 | ||||||
| Venator Finance SARL 9.50% 7/1/20257 | 185 | 134 | ||||||
| Venator Finance SARL 5.75% 7/15/20257 | 140 | 48 | ||||||
| Venture Global Calcasieu Pass, LLC 3.875% 8/15/20297 | 35 | 31 | ||||||
| Venture Global Calcasieu Pass, LLC 4.125% 8/15/20317 | 125 | 107 | ||||||
| Venture Global Calcasieu Pass, LLC 3.875% 11/1/20337 | 65 | 53 | ||||||
| Verizon Communications, Inc. 3.15% 3/22/2030 | 575 | 508 | ||||||
| Verizon Communications, Inc. 2.55% 3/21/2031 | 2,100 | 1,732 | ||||||
| VICI Properties, LP 4.375% 5/15/2025 | 1,563 | 1,520 | ||||||
| VICI Properties, LP 4.625% 12/1/20297 | 15 | 14 | ||||||
| VICI Properties, LP 4.125% 8/15/20307 | 420 | 368 | ||||||
| VZ Secured Financing BV 5.00% 1/15/20327 | 200 | 163 | ||||||
| W. R. Grace Holdings, LLC 5.625% 8/15/20297 | 20 | 16 | ||||||
| Warner Music Group 3.75% 12/1/20297 | 125 | 108 | ||||||
| Warner Music Group 3.875% 7/15/20307 | 135 | 117 | ||||||
| Warner Music Group 3.00% 2/15/20317 | 80 | 64 | ||||||
| WarnerMedia Holdings, Inc. 4.279% 3/15/20327 | 917 | 758 | ||||||
| WarnerMedia Holdings, Inc. 5.05% 3/15/20427 | 1,928 | 1,482 | ||||||
| Warrior Met Coal, Inc. 7.875% 12/1/20287 | 140 | 138 | ||||||
| WASH Multifamily Acquisition, Inc. 5.75% 4/15/20267 | 320 | 302 | ||||||
| WEA Finance, LLC 3.75% 9/17/20247 | 535 | 506 | ||||||
| Weatherford International, Ltd. 11.00% 12/1/20247 | 5 | 5 | ||||||
| Weatherford International, Ltd. 6.50% 9/15/20287 | 65 | 64 | ||||||
| Weatherford International, Ltd. 8.625% 4/30/20307 | 65 | 63 | ||||||
| Wells Fargo & Company 3.526% 3/24/2028 (USD-SOFR + 1.51% on 3/24/2027)1 | 5,788 | 5,370 | ||||||
| Wells Fargo & Company 4.611% 4/25/2053 (USD-SOFR + 2.13% on 4/25/2052)1 | 1,600 | 1,363 | ||||||
| WESCO Distribution, Inc. 7.125% 6/15/20257 | 180 | 183 | ||||||
| WESCO Distribution, Inc. 7.25% 6/15/20287 | 245 | 249 | ||||||
| Western Global Airlines, LLC 10.375% 8/15/20257 | 15 | 11 | ||||||
| Western Midstream Operating, LP 3.35% 2/1/20251 | 85 | 81 | ||||||
| Western Midstream Operating, LP 4.75% 8/15/2028 | 65 | 59 | ||||||
| Western Midstream Operating, LP 5.50% 2/1/20501 | 25 | 21 | ||||||
| 220 | American Funds Insurance Series |
Capital World Bond Fund (continued)
| Bonds, notes & other debt instruments (continued) | Principal amount (000) |
Value (000) |
||||||
| U.S. dollars (continued) | ||||||||
| Westpac Banking Corp. 2.894% 2/4/2030 (5-year UST Yield Curve Rate T Note Constant Maturity + 1.35% on 2/4/2025)1 | USD | 1,250 | $ | 1,147 | ||||
| WeWork Companies, LLC 5.00% 7/10/20257 | 50 | 17 | ||||||
| Wyndham Destinations, Inc. 6.625% 7/31/20267 | 65 | 64 | ||||||
| Wynn Las Vegas, LLC 4.25% 5/30/20237 | 38 | 38 | ||||||
| Wynn Resorts Finance, LLC 7.75% 4/15/20257 | 180 | 179 | ||||||
| Yahoo Holdings, Inc., Term Loan B, (1-month USD-LIBOR + 5.50%) 9.884% 9/1/20278,9 | 110 | 100 | ||||||
| Ziggo Bond Co. BV 5.125% 2/28/20307 | 200 | 162 | ||||||
| Ziggo Bond Finance BV 4.875% 1/15/20307 | 300 | 252 | ||||||
| 669,959 | ||||||||
| Total bonds, notes & other debt instruments (cost: $1,515,444,000) | 1,337,877 | |||||||
| Investment funds 3.29% | Shares | |||||||
| U.S. dollars 3.29% | ||||||||
| Capital Group Central Corporate Bond Fund13 | 5,972,524 | 48,676 | ||||||
| Total investment funds (cost: $47,079,000) | 48,676 | |||||||
| Preferred securities 0.00% | ||||||||
| U.S. dollars 0.00% | ||||||||
| ACR III LSC Holdings, LLC, Series B, preferred shares6,7,14 | 48 | 20 | ||||||
| Total preferred securities (cost: $49,000) | 20 | |||||||
| Common stocks 0.01% | ||||||||
| U.S. dollars 0.01% | ||||||||
| Constellation Oil Services Holding SA, Class B-16,14 | 1,214,969 | 134 | ||||||
| Bighorn Permian Resources, LLC6 | 531 | — | 15 | |||||
| Total common stocks (cost: $0) | 134 | |||||||
| Short-term securities 6.79% | Weighted average yield at acquisition |
Principal amount (000) |
||||||||||
| Commercial paper 6.78% | ||||||||||||
| DNB Bank ASA 3/2/20237 | 4.273 | % | USD | 35,000 | 34,740 | |||||||
| NRW.Bank 2/6/20237 | 4.192 | 31,100 | 30,957 | |||||||||
| Oesterreich Kontrollbank 2/21/2023 | 4.245 | 35,000 | 34,773 | |||||||||
| 100,470 | ||||||||||||
| Shares | ||||||||||||
| Money market investments 0.01% | ||||||||||||
| Capital Group Central Cash Fund 4.31%13,16 | 1,674 | 167 | ||||||||||
| Total short-term securities (cost: $100,664,000) | 100,637 | |||||||||||
| Total investment securities 100.37% (cost: $1,663,236,000) | 1,487,344 | |||||||||||
| Other assets less liabilities (0.37)% | (5,450 | ) | ||||||||||
| Net assets 100.00% | $ | 1,481,894 | ||||||||||
| American Funds Insurance Series | 221 |
Capital World Bond Fund (continued)
Futures contracts
| Contracts | Type | Number of contracts |
Expiration | Notional amount (000) |
Value and unrealized (depreciation) appreciation at 12/31/2022 (000) |
|||||||||||
| 2 Year Euro-Schatz Futures | Long | 60 | March 2023 | USD | 6,771 | $ | (87 | ) | ||||||||
| 2 Year U.S. Treasury Note Futures | Long | 130 | March 2023 | 26,660 | 31 | |||||||||||
| 5 Year Euro-Bobl Futures | Long | 236 | March 2023 | 29,242 | (987 | ) | ||||||||||
| 5 Year U.S. Treasury Note Futures | Long | 1,196 | March 2023 | 129,084 | (139 | ) | ||||||||||
| 10 Year Euro-Bund Futures | Long | 95 | March 2023 | 13,518 | (880 | ) | ||||||||||
| 10 Year Italy Government Bond Futures | Long | 71 | March 2023 | 8,278 | (663 | ) | ||||||||||
| 10 Year Japanese Government Bond Futures | Long | 9 | March 2023 | 9,975 | (41 | ) | ||||||||||
| 10 Year U.S. Treasury Note Futures | Long | 328 | March 2023 | 36,833 | (201 | ) | ||||||||||
| 10 Year Ultra U.S. Treasury Note Futures | Short | 175 | March 2023 | (20,699 | ) | 123 | ||||||||||
| 10 Year UK Gilt Futures | Short | 44 | March 2023 | (5,314 | ) | 335 | ||||||||||
| 20 Year U.S. Treasury Bond Futures | Long | 65 | March 2023 | 8,147 | (131 | ) | ||||||||||
| 30 Year Euro-Buxl Futures | Long | 57 | March 2023 | 8,252 | (1,530 | ) | ||||||||||
| 30 Year Ultra U.S. Treasury Bond Futures | Short | 170 | March 2023 | (22,833 | ) | 183 | ||||||||||
| $ | (3,987 | ) | ||||||||||||||
Forward currency contracts
| Contract amount | Unrealized appreciation (depreciation) |
||||||||||||||
| Currency purchased (000) |
Currency sold (000) |
Counterparty | Settlement date |
at 12/31/2022 (000) |
|||||||||||
| KRW | 8,431,290 | USD | 6,478 | Bank of America | 1/9/2023 | $ | 219 | ||||||||
| HUF | 1,284,310 | EUR | 3,067 | UBS AG | 1/10/2023 | 145 | |||||||||
| PLN | 20,540 | EUR | 4,330 | HSBC Bank | 1/10/2023 | 45 | |||||||||
| DKK | 17,400 | USD | 2,465 | UBS AG | 1/10/2023 | 42 | |||||||||
| PLN | 3,330 | USD | 739 | UBS AG | 1/10/2023 | 20 | |||||||||
| SEK | 23,400 | USD | 2,256 | UBS AG | 1/10/2023 | (12 | ) | ||||||||
| USD | 6,519 | AUD | 9,680 | HSBC Bank | 1/10/2023 | (75 | ) | ||||||||
| USD | 2,058 | HUF | 818,090 | UBS AG | 1/10/2023 | (127 | ) | ||||||||
| EUR | 6,800 | USD | 7,143 | Bank of America | 1/11/2023 | 142 | |||||||||
| CNH | 154,697 | USD | 22,271 | Citibank | 1/11/2023 | 105 | |||||||||
| USD | 1,405 | EUR | 1,320 | Bank of America | 1/11/2023 | (9 | ) | ||||||||
| USD | 2,019 | EUR | 1,900 | Bank of America | 1/11/2023 | (17 | ) | ||||||||
| SEK | 22,100 | USD | 2,141 | Bank of America | 1/11/2023 | (22 | ) | ||||||||
| NZD | 1,070 | USD | 682 | Morgan Stanley | 1/12/2023 | (2 | ) | ||||||||
| JPY | 2,083,770 | USD | 15,470 | Bank of America | 1/13/2023 | 438 | |||||||||
| CNH | 146,490 | USD | 21,104 | JPMorgan Chase | 1/13/2023 | 89 | |||||||||
| USD | 4,476 | GBP | 3,660 | Morgan Stanley | 1/13/2023 | 50 | |||||||||
| PLN | 18,110 | EUR | 3,807 | UBS AG | 1/13/2023 | 50 | |||||||||
| CHF | 2,790 | USD | 2,985 | UBS AG | 1/13/2023 | 37 | |||||||||
| USD | 3,682 | CAD | 4,970 | Standard Chartered Bank | 1/13/2023 | 11 | |||||||||
| EUR | 9,477 | DKK | 70,470 | BNP Paribas | 1/13/2023 | (1 | ) | ||||||||
| USD | 807 | NOK | 7,930 | UBS AG | 1/13/2023 | (3 | ) | ||||||||
| USD | 19,831 | MXN | 394,043 | UBS AG | 1/13/2023 | (336 | ) | ||||||||
| EUR | 6,752 | PLN | 31,970 | HSBC Bank | 1/17/2023 | (48 | ) | ||||||||
| JPY | 6,231,228 | USD | 45,941 | Standard Chartered Bank | 1/20/2023 | 1,678 | |||||||||
| JPY | 3,696,640 | USD | 27,194 | Standard Chartered Bank | 1/20/2023 | 1,056 | |||||||||
| USD | 5,044 | HUF | 1,807,090 | Bank of America | 1/20/2023 | 232 | |||||||||
| JPY | 573,812 | AUD | 6,280 | HSBC Bank | 1/20/2023 | 105 | |||||||||
| CAD | 16,753 | USD | 12,310 | Bank of America | 1/20/2023 | 64 | |||||||||
| CZK | 124,020 | USD | 5,572 | Goldman Sachs | 1/20/2023 | (92 | ) | ||||||||
| USD | 14,203 | DKK | 100,190 | Bank of America | 1/20/2023 | (244 | ) | ||||||||
| 222 | American Funds Insurance Series |
Capital World Bond Fund (continued)
Forward currency contracts (continued)
| Contract amount | Unrealized appreciation |
||||||||||||||
| Currency purchased (000) |
Currency sold (000) |
Counterparty | Settlement date |
(depreciation) at 12/31/2022 (000) |
|||||||||||
| USD | 5,215 | CZK | 124,020 | Morgan Stanley | 1/20/2023 | $ | (266 | ) | |||||||
| HUF | 1,807,090 | USD | 5,519 | Bank of America | 1/20/2023 | (706 | ) | ||||||||
| EUR | 23,500 | USD | 24,897 | Bank of America | 1/23/2023 | 303 | |||||||||
| USD | 2,087 | COP | 10,038,860 | Morgan Stanley | 1/23/2023 | 26 | |||||||||
| CZK | 47,290 | EUR | 1,935 | UBS AG | 1/23/2023 | 14 | |||||||||
| COP | 3,594,590 | USD | 753 | Bank of America | 1/23/2023 | (15 | ) | ||||||||
| USD | 10,027 | EUR | 9,480 | BNP Paribas | 1/23/2023 | (139 | ) | ||||||||
| THB | 84,660 | USD | 2,468 | Standard Chartered Bank | 1/26/2023 | (8 | ) | ||||||||
| JPY | 833,790 | USD | 5,779 | Standard Chartered Bank | 1/27/2023 | 599 | |||||||||
| JPY | 1,210,240 | USD | 8,936 | BNP Paribas | 1/27/2023 | 322 | |||||||||
| JPY | 419,350 | USD | 2,897 | UBS AG | 1/27/2023 | 310 | |||||||||
| JPY | 559,100 | USD | 4,149 | Goldman Sachs | 1/27/2023 | 128 | |||||||||
| PLN | 24,520 | USD | 5,913 | BNP Paribas | 2/2/2023 | (333 | ) | ||||||||
| KRW | 2,855,970 | USD | 2,161 | Standard Chartered Bank | 2/28/2023 | 110 | |||||||||
| EUR | 14,020 | USD | 14,746 | Bank of America | 3/6/2023 | 330 | |||||||||
| CNH | 64,940 | USD | 9,270 | Standard Chartered Bank | 3/6/2023 | 162 | |||||||||
| JPY | 417,300 | USD | 3,097 | BNP Paribas | 3/6/2023 | 111 | |||||||||
| KRW | 2,388,130 | USD | 1,834 | HSBC Bank | 3/6/2023 | 65 | |||||||||
| $ | 4,553 | ||||||||||||||
Swap contracts
Interest rate swaps
Centrally cleared interest rate swaps
| Receive | Pay | Notional | Value at | Upfront premium |
Unrealized depreciation |
|||||||||||||||||||
| Rate | Payment frequency |
Rate | Payment frequency |
Expiration date |
amount (000) |
12/31/2022 (000) |
paid (000) |
at 12/31/2022 (000) |
||||||||||||||||
| 1.2475% | Semi-annual | 3-month NZD-BBR-FRA | Quarterly | 8/20/2023 | NZD | 4,428 | $ | (70 | ) | $ | — | $ | (70 | ) | ||||||||||
| 1.234974% | Semi-annual | 3-month NZD-BBR-FRA | Quarterly | 8/20/2023 | 37,736 | (600 | ) | — | (600 | ) | ||||||||||||||
| 1.2375% | Semi-annual | 3-month NZD-BBR-FRA | Quarterly | 8/26/2023 | 13,908 | (231 | ) | — | (231 | ) | ||||||||||||||
| 1.264% | Semi-annual | 3-month NZD-BBR-FRA | Quarterly | 8/27/2023 | 34,764 | (572 | ) | — | (572 | ) | ||||||||||||||
| 1.26% | Semi-annual | 3-month NZD-BBR-FRA | Quarterly | 8/30/2023 | 5,734 | (95 | ) | — | (95 | ) | ||||||||||||||
| 1.28% | Semi-annual | 3-month NZD-BBR-FRA | Quarterly | 8/31/2023 | 5,734 | (95 | ) | — | (95 | ) | ||||||||||||||
| 1.30% | Semi-annual | 3-month NZD-BBR-FRA | Quarterly | 9/3/2023 | 6,295 | (106 | ) | — | (106 | ) | ||||||||||||||
| 1.4975% | Semi-annual | 3-month NZD-BBR-FRA | Quarterly | 9/21/2023 | 11,830 | (206 | ) | — | (206 | ) | ||||||||||||||
| 1.445% | Semi-annual | 3-month NZD-BBR-FRA | Quarterly | 9/28/2023 | 11,817 | (215 | ) | — | (215 | ) | ||||||||||||||
| 1.4475% | Semi-annual | 3-month NZD-BBR-FRA | Quarterly | 9/29/2023 | 12,043 | (220 | ) | — | (220 | ) | ||||||||||||||
| 1.4475% | Semi-annual | 3-month NZD-BBR-FRA | Quarterly | 9/30/2023 | 12,093 | (221 | ) | — | (221 | ) | ||||||||||||||
| 1.5125% | Semi-annual | 3-month NZD-BBR-FRA | Quarterly | 10/14/2023 | 10,675 | (203 | ) | — | (203 | ) | ||||||||||||||
| 1.53% | Semi-annual | 3-month NZD-BBR-FRA | Quarterly | 10/14/2023 | 12,176 | (230 | ) | — | (230 | ) | ||||||||||||||
| 1.5625% | Semi-annual | 3-month NZD-BBR-FRA | Quarterly | 10/15/2023 | 12,163 | (228 | ) | — | (228 | ) | ||||||||||||||
| 1.59% | Semi-annual | 3-month NZD-BBR-FRA | Quarterly | 10/18/2023 | 12,163 | (228 | ) | — | (228 | ) | ||||||||||||||
| 1.62% | Semi-annual | 3-month NZD-BBR-FRA | Quarterly | 10/19/2023 | 13,521 | (252 | ) | — | (252 | ) | ||||||||||||||
| 2.2525% | Semi-annual | 3-month NZD-BBR-FRA | Quarterly | 11/8/2023 | 17,111 | (283 | ) | — | (283 | ) | ||||||||||||||
| 2.24% | Semi-annual | 3-month NZD-BBR-FRA | Quarterly | 11/8/2023 | 17,111 | (284 | ) | — | (284 | ) | ||||||||||||||
| 2.20% | Semi-annual | 3-month NZD-BBR-FRA | Quarterly | 11/9/2023 | 1,440 | (24 | ) | — | (24 | ) | ||||||||||||||
| 2.495% | Annual | SONIA | Annual | 5/5/2024 | GBP | 7,210 | (183 | ) | — | (183 | ) | |||||||||||||
| 2.42% | Annual | SONIA | Annual | 5/5/2024 | 42,400 | (1,114 | ) | — | (1,114 | ) | ||||||||||||||
| 2.363% | Annual | SONIA | Annual | 5/11/2024 | 40,870 | (1,101 | ) | — | (1,101 | ) | ||||||||||||||
| 2.628% | Annual | SONIA | Annual | 7/28/2024 | 40,530 | (1,386 | ) | — | (1,386 | ) | ||||||||||||||
| SONIA | Annual | 5.6325% | Annual | 9/25/2024 | 41,140 | (468 | ) | — | (468 | ) | ||||||||||||||
| 6.255% | 28-day | 28-day MXN-TIIE | 28-day | 5/22/2026 | MXN | 47,800 | (198 | ) | — | (198 | ) | |||||||||||||
| American Funds Insurance Series | 223 |
Capital World Bond Fund (continued)
Swap contracts (continued)
Interest rate swaps (continued)
Centrally cleared interest rate swaps (continued)
| Receive | Pay | Notional | Value at | Upfront premium |
Unrealized depreciation |
|||||||||||||||||||
| Rate | Payment frequency |
Rate | Payment frequency |
Expiration date |
amount (000) |
12/31/2022 (000) |
paid (000) |
at 12/31/2022 (000) |
||||||||||||||||
| 6.19% | 28-day | 28-day MXN-TIIE | 28-day | 5/22/2026 | MXN | 48,400 | $ | (205 | ) | $ | — | $ | (205 | ) | ||||||||||
| 6.16% | 28-day | 28-day MXN-TIIE | 28-day | 6/9/2026 | 58,800 | (253 | ) | — | 15 | (253 | ) | |||||||||||||
| 6.5375% | 28-day | 28-day MXN-TIIE | 28-day | 6/17/2026 | 14,000 | (52 | ) | — | (52 | ) | ||||||||||||||
| 6.50% | 28-day | 28-day MXN-TIIE | 28-day | 6/17/2026 | 13,900 | (53 | ) | — | (53 | ) | ||||||||||||||
| 6.47% | 28-day | 28-day MXN-TIIE | 28-day | 6/17/2026 | 14,200 | (55 | ) | — | (55 | ) | ||||||||||||||
| 6.55% | 28-day | 28-day MXN-TIIE | 28-day | 6/17/2026 | 43,000 | (160 | ) | — | 15 | (160 | ) | |||||||||||||
| 6.55% | 28-day | 28-day MXN-TIIE | 28-day | 6/18/2026 | 14,100 | (53 | ) | — | (53 | ) | ||||||||||||||
| 6.50% | 28-day | 28-day MXN-TIIE | 28-day | 6/18/2026 | 27,800 | (106 | ) | — | (106 | ) | ||||||||||||||
| 6.64% | 28-day | 28-day MXN-TIIE | 28-day | 6/25/2026 | 62,600 | (226 | ) | — | (226 | ) | ||||||||||||||
| 6.633% | 28-day | 28-day MXN-TIIE | 28-day | 6/25/2026 | 172,500 | (623 | ) | — | (623 | ) | ||||||||||||||
| 7.59% | 28-day | 28-day MXN-TIIE | 28-day | 10/29/2026 | 28,900 | (64 | ) | — | (64 | ) | ||||||||||||||
| 7.62% | 28-day | 28-day MXN-TIIE | 28-day | 10/29/2026 | 43,375 | (94 | ) | — | (94 | ) | ||||||||||||||
| 7.52% | 28-day | 28-day MXN-TIIE | 28-day | 10/30/2026 | 89,445 | (209 | ) | — | (209 | ) | ||||||||||||||
| $ | (10,966 | ) | $ | — | 15 | $ | (10,966 | ) | ||||||||||||||||
Credit default swaps
Centrally cleared credit default swaps on credit indices — buy protection
| Reference index |
Financing rate paid |
Payment frequency |
Expiration date |
Notional amount (000) |
Value at 12/31/2022 (000) |
Upfront premium paid (000) |
Unrealized depreciation at 12/31/2022 (000) |
||||||||||||||||
| CDX.EM.38 | 1.00% | Quarterly | 12/20/2027 | USD5,650 | $ | 331 | $ | 350 | $ | (19 | ) | ||||||||||||
| Centrally cleared credit default swaps on credit indices — sell protection | |||||||||||||||||||||||
| Financing rate received |
Payment frequency |
Reference index |
Expiration date |
Notional amount (000) |
17
|
Value at 12/31/2022 (000) |
18
|
Upfront premium (received) paid (000) |
Unrealized appreciation at 12/31/2022 (000) |
||||||||||||||
| 5.00% | Quarterly | CDX.NA.HY.39 | 12/20/2027 | USD19,138 | $ | 118 | $ | (134 | ) | $ | 252 | ||||||||||||
| 1.00% | Quarterly | CDX.NA.IG.39 | 12/20/2027 | 97,747 | 781 | 547 | 234 | ||||||||||||||||
| $ | 899 | $ | 413 | $ | 486 | ||||||||||||||||||
Investments in affiliates13
| Value of affiliates at 1/1/2022 (000) |
Additions (000) |
Reductions (000) |
Net realized gain (000) |
Net unrealized appreciation (depreciation) (000) |
Value of affiliates at 12/31/2022 (000) |
Dividend income (000) |
||||||||||||||||||||||||||||
| Investment funds 3.29% | ||||||||||||||||||||||||||||||||||
| Capital Group Central Corporate Bond Fund | $ | — | $ | 47,078 | $ | — | $ | — | $ | 1,598 | $ | 48,676 | $ | 306 | ||||||||||||||||||||
| Short-term securities 0.01% | ||||||||||||||||||||||||||||||||||
| Money market investments 0.01% | ||||||||||||||||||||||||||||||||||
| Capital Group Central Cash Fund 4.31%16 | 144,080 | 923,691 | 1,067,610 | 17 | (11 | ) | 167 | 2,751 | ||||||||||||||||||||||||||
| Total 3.30% | $ | 17 | $ | 1,587 | $ | 48,843 | $ | 3,057 | ||||||||||||||||||||||||||
| 224 | American Funds Insurance Series |
Capital World Bond Fund (continued)
Restricted securities2
| Acquisition date |
Cost (000) |
Value (000) |
Percent of net assets |
|||||||||||
| Goldman Sachs Group, Inc. 3.375% 3/27/2025 | 5/19/2020 | $ | 5,689 | $ | 5,327 | .36 | % | |||||||
| Goldman Sachs Group, Inc. 1.00% 3/18/2033 | 5/19/2021 | 3,239 | 2,091 | .14 | ||||||||||
| Bank of America Corp. 3.648% 3/31/2029 (3-month EUR-EURIBOR + 3.67% on 3/31/2028)1 | 5/19/2020 | 6,045 | 5,177 | .35 | ||||||||||
| JPMorgan Chase & Co. 0.389% 2/24/2028 (3-month EUR-EURIBOR + 0.65% on 2/24/2027)1 | 5/19/2020 | 3,381 | 2,944 | .20 | ||||||||||
| Total | $ | 18,354 | $ | 15,539 | 1.05 | % | ||||||||
| 1 | Step bond; coupon rate may change at a later date. |
| 2 | Restricted security, other than Rule 144A securities or commercial paper issued pursuant to Section 4(a)(2) of the Securities Act of 1933. The total value of all such restricted securities was $15,539,000, which represented 1.05% of the net assets of the fund. |
| 3 | Scheduled interest and/or principal payment was not received. |
| 4 | Index-linked bond whose principal amount moves with a government price index. |
| 5 | Principal payments may be made periodically. Therefore, the effective maturity date may be earlier than the stated maturity date. |
| 6 | Value determined using significant unobservable inputs. |
| 7 | Acquired in a transaction exempt from registration under Rule 144A or, for commercial paper, Section 4(a)(2) of the Securities Act of 1933. May be resold in the U.S. in transactions exempt from registration, normally to qualified institutional buyers. The total value of all such securities was $166,829,000, which represented 11.26% of the net assets of the fund. |
| 8 | Loan participations and assignments; may be subject to legal or contractual restrictions on resale. The total value of all such loans was $1,760,000, which represented .12% of the net assets of the fund. |
| 9 | Coupon rate may change periodically. Reference rate and spread are as of the most recent information available. Some coupon rates are determined by the issuer or agent based on current market conditions; therefore, the reference rate and spread are not available. |
| 10 | Payment in kind; the issuer has the option of paying additional securities in lieu of cash. Payment methods and rates are as of the most recent payment when available. |
| 11 | Purchased on a TBA basis. |
| 12 | All or a portion of this security was pledged as collateral. The total value of pledged collateral was $12,515,000, which represented .84% of the net assets of the fund. |
| 13 | Part of the same “group of investment companies” as the fund as defined under the Investment Company Act of 1940, as amended. |
| 14 | Security did not produce income during the last 12 months. |
| 15 | Amount less than one thousand. |
| 16 | Rate represents the seven-day yield at 12/31/2022. |
| 17 | The maximum potential amount the fund may pay as a protection seller should a credit event occur. |
| 18 | The prices and resulting values for credit default swap indices serve as an indicator of the current status of the payment/performance risk. As the value of a sell protection credit default swap increases or decreases, when compared to the notional amount of the swap, the payment/performance risk may decrease or increase, respectively. |
Key to abbreviations
Assn. = Association
AUD = Australian dollars
BBR = Bank Base Rate
BRL = Brazilian reais
CAD = Canadian dollars
CHF = Swiss francs
CLP = Chilean pesos
CME = CME Group
CNH = Chinese yuan renminbi
CNY = Chinese yuan
COP = Colombian pesos
CZK = Czech korunas
DAC = Designated Activity Company
DKK = Danish kroner
DOP = Dominican pesos
EUR = Euros
EURIBOR = Euro Interbank Offered Rate
FRA = Forward Rate Agreement
GBP = British pounds
HUF = Hungarian forints
IDR = Indonesian rupiah
INR = Indian rupees
JPY = Japanese yen
KRW = South Korean won
LIBOR = London Interbank Offered Rate
MXN = Mexican pesos
MYR = Malaysian ringgits
NOK = Norwegian kroner
NZD = New Zealand dollars
PIK = Payment In Kind
PLN = Polish zloty
Ref. = Refunding
Rev. = Revenue
RON = Romanian leu
RUB = Russian rubles
SEK = Swedish kronor
SOFR = Secured Overnight Financing Rate
SONIA = Sterling Overnight Interbank Average Rate
TBA = To be announced
THB = Thai baht
TIIE = Equilibrium Interbank Interest Rate
UAH = Ukrainian hryvnia
USD = U.S. dollars
ZAR = South African rand
Refer to the notes to financial statements.
| American Funds Insurance Series | 225 |
American High-Income Trust
Investment portfolio December 31, 2022
| Bonds, notes & other debt instruments 88.59% | Principal amount (000) |
Value (000) |
||||||
| Corporate bonds, notes & loans 88.51% | ||||||||
| Energy 14.19% | ||||||||
| Aethon United BR, LP / Aethon United Finance Corp. 8.25% 2/15/20261 | USD | 295 | $ | 293 | ||||
| Altera Infrastructure, LP 8.50% 7/15/20231,2,3 | 2,009 | 375 | ||||||
| Antero Midstream Partners, LP 5.375% 6/15/20291 | 570 | 522 | ||||||
| Antero Resources Corp. 7.625% 2/1/20291 | 244 | 246 | ||||||
| Antero Resources Corp. 5.375% 3/1/20301 | 230 | 214 | ||||||
| Apache Corp. 6.00% 1/15/2037 | 165 | 153 | ||||||
| Apache Corp. 5.10% 9/1/2040 | 695 | 578 | ||||||
| Apache Corp. 4.75% 4/15/2043 | 265 | 200 | ||||||
| Ascent Resources - Utica, LLC, Term Loan, (3-month USD-LIBOR + 9.00%) 10.00% 11/1/20251,4,5 | 228 | 242 | ||||||
| Ascent Resources Utica Holdings, LLC 7.00% 11/1/20261 | 2,040 | 1,982 | ||||||
| Ascent Resources Utica Holdings, LLC 9.00% 11/1/20271 | 170 | 210 | ||||||
| Ascent Resources Utica Holdings, LLC 8.25% 12/31/20281 | 271 | 266 | ||||||
| Ascent Resources Utica Holdings, LLC 5.875% 6/30/20291 | 1,245 | 1,112 | ||||||
| BIP-V Chinook Holdco, LLC 5.50% 6/15/20311 | 1,610 | 1,409 | ||||||
| Blue Racer Midstream, LLC 7.625% 12/15/20251 | 496 | 493 | ||||||
| Bonanza Creek Energy, Inc. 5.00% 10/15/20261 | 905 | 829 | ||||||
| California Resources Corp. 7.125% 2/1/20261 | 390 | 375 | ||||||
| Callon Petroleum Co. 7.50% 6/15/20301 | 515 | 472 | ||||||
| Centennial Resource Production, LLC 6.875% 4/1/20271 | 440 | 416 | ||||||
| Cheniere Energy Partners, LP 4.50% 10/1/2029 | 938 | 846 | ||||||
| Cheniere Energy Partners, LP 4.00% 3/1/2031 | 413 | 352 | ||||||
| Cheniere Energy Partners, LP 3.25% 1/31/2032 | 615 | 490 | ||||||
| Cheniere Energy, Inc. 4.625% 10/15/2028 | 3,831 | 3,470 | ||||||
| Chesapeake Energy Corp. 4.875% 4/15/20222 | 4,300 | 97 | ||||||
| Chesapeake Energy Corp. 5.50% 2/1/20261 | 1,000 | 966 | ||||||
| Chesapeake Energy Corp. 5.875% 2/1/20291 | 1,670 | 1,585 | ||||||
| Chesapeake Energy Corp. 6.75% 4/15/20291 | 380 | 371 | ||||||
| CNX Midstream Partners, LP 4.75% 4/15/20301 | 280 | 230 | ||||||
| CNX Resources Corp. 7.25% 3/14/20271 | 1,168 | 1,161 | ||||||
| CNX Resources Corp. 6.00% 1/15/20291 | 1,669 | 1,538 | ||||||
| CNX Resources Corp. 7.375% 1/15/20311 | 856 | 822 | ||||||
| Comstock Resources, Inc. 6.75% 3/1/20291 | 910 | 823 | ||||||
| Comstock Resources, Inc. 5.875% 1/15/20301 | 770 | 663 | ||||||
| Constellation Oil Services Holding SA 4.00% PIK 12/31/20266 | 3,114 | 1,843 | ||||||
| Continental Resources, Inc. 5.75% 1/15/20311 | 365 | 341 | ||||||
| Crestwood Midstream Partners, LP 5.75% 4/1/2025 | 250 | 244 | ||||||
| Crestwood Midstream Partners, LP 5.625% 5/1/20271 | 290 | 270 | ||||||
| Crestwood Midstream Partners, LP 6.00% 2/1/20291 | 575 | 528 | ||||||
| Crestwood Midstream Partners, LP 8.00% 4/1/20291 | 1,675 | 1,669 | ||||||
| Devon Energy Corp. 5.875% 6/15/2028 | 202 | 205 | ||||||
| Devon Energy Corp. 4.50% 1/15/2030 | 493 | 460 | ||||||
| Diamond Foreign Asset Co. 9.00% Cash 4/22/20271,5,6 | 68 | 65 | ||||||
| Diamond Foreign Asset Co. 9.00% Cash 4/22/20276 | 62 | 58 | ||||||
| DT Midstream, Inc. 4.125% 6/15/20291 | 1,503 | 1,294 | ||||||
| DT Midstream, Inc. 4.375% 6/15/20311 | 832 | 699 | ||||||
| Energean Israel Finance, Ltd. 4.50% 3/30/20241 | 945 | 914 | ||||||
| Energean Israel Finance, Ltd. 4.875% 3/30/20261 | 1,080 | 1,002 | ||||||
| Energean Israel Finance, Ltd. 5.875% 3/30/20311 | 80 | 70 | ||||||
| Energean PLC 6.50% 4/30/20271 | 380 | 354 | ||||||
| EnLink Midstream Partners, LLC 5.625% 1/15/20281 | 445 | 425 | ||||||
| EQM Midstream Partners, LP 4.125% 12/1/2026 | 127 | 113 | ||||||
| EQM Midstream Partners, LP 7.50% 6/1/20271 | 405 | 397 | ||||||
| EQM Midstream Partners, LP 6.50% 7/1/20271 | 2,345 | 2,245 | ||||||
| EQM Midstream Partners, LP 5.50% 7/15/2028 | 881 | 789 | ||||||
| EQM Midstream Partners, LP 4.50% 1/15/20291 | 835 | 703 | ||||||
| EQM Midstream Partners, LP 7.50% 6/1/20301 | 1,078 | 1,040 | ||||||
| EQM Midstream Partners, LP 4.75% 1/15/20311 | 1,645 | 1,348 | ||||||
| EQM Midstream Partners, LP 6.50% 7/15/2048 | 910 | 684 | ||||||
| EQT Corp. 6.125% 2/1/20257 | 250 | 251 | ||||||
| EQT Corp. 5.00% 1/15/2029 | 290 | 273 | ||||||
| 226 | American Funds Insurance Series |
American High-Income Trust (continued)
| Bonds, notes & other debt instruments (continued) | Principal amount (000) |
Value (000) |
||||||
| Corporate bonds, notes & loans (continued) | ||||||||
| Energy (continued) | ||||||||
| EQT Corp. 7.25% 2/1/20307 | USD | 300 | $ | 312 | ||||
| EQT Corp. 3.625% 5/15/20311 | 500 | 424 | ||||||
| Genesis Energy, LP 5.625% 6/15/2024 | 120 | 116 | ||||||
| Genesis Energy, LP 6.50% 10/1/2025 | 1,886 | 1,805 | ||||||
| Genesis Energy, LP 6.25% 5/15/2026 | 320 | 293 | ||||||
| Genesis Energy, LP 8.00% 1/15/2027 | 2,825 | 2,672 | ||||||
| Genesis Energy, LP 7.75% 2/1/2028 | 87 | 80 | ||||||
| Harbour Energy PLC 5.50% 10/15/20261 | 1,545 | 1,387 | ||||||
| Harvest Midstream I, LP 7.50% 9/1/20281 | 1,947 | 1,863 | ||||||
| Hess Midstream Operations, LP 4.25% 2/15/20301 | 1,300 | 1,113 | ||||||
| Hess Midstream Operations, LP 5.50% 10/15/20301 | 630 | 577 | ||||||
| Hess Midstream Partners, LP 5.125% 6/15/20281 | 851 | 788 | ||||||
| Hilcorp Energy I, LP 6.25% 11/1/20281 | 145 | 132 | ||||||
| Hilcorp Energy I, LP 5.75% 2/1/20291 | 985 | 878 | ||||||
| Hilcorp Energy I, LP 6.00% 4/15/20301 | 922 | 821 | ||||||
| Hilcorp Energy I, LP 6.00% 2/1/20311 | 728 | 631 | ||||||
| Hilcorp Energy I, LP 6.25% 4/15/20321 | 835 | 722 | ||||||
| Holly Energy Partners, LP / Holly Energy Finance Corp. 6.375% 4/15/20271 | 220 | 216 | ||||||
| Holly Energy Partners, LP / Holly Energy Finance Corp. 5.00% 2/1/20281 | 260 | 237 | ||||||
| Howard Midstream Energy Partners, LLC 6.75% 1/15/20271 | 460 | 442 | ||||||
| Independence Energy Finance, LLC 7.25% 5/1/20261 | 500 | 472 | ||||||
| Kinetik Holdings, LP 5.875% 6/15/20301 | 500 | 470 | ||||||
| Murphy Oil Corp. 5.75% 8/15/2025 | 139 | 137 | ||||||
| Murphy Oil Corp. 5.625% 5/1/2027 | 135 | 131 | ||||||
| Murphy Oil Corp. 6.375% 7/15/2028 | 415 | 400 | ||||||
| Murphy Oil USA, Inc. 4.75% 9/15/2029 | 820 | 752 | ||||||
| Murphy Oil USA, Inc. 3.75% 2/15/20311 | 1,065 | 878 | ||||||
| Nabors Industries, Inc. 7.375% 5/15/20271 | 1,540 | 1,494 | ||||||
| Nabors Industries, Ltd. 7.25% 1/15/20261 | 320 | 302 | ||||||
| Neptune Energy Group Holdings, Ltd. 6.625% 5/15/20251 | 1,250 | 1,216 | ||||||
| New Fortress Energy, Inc. 6.75% 9/15/20251 | 1,625 | 1,541 | ||||||
| New Fortress Energy, Inc. 6.50% 9/30/20261 | 4,175 | 3,885 | ||||||
| NGL Energy Operating, LLC 7.50% 2/1/20261 | 8,670 | 7,735 | ||||||
| NGL Energy Partners, LP 6.125% 3/1/2025 | 2,054 | 1,677 | ||||||
| NGL Energy Partners, LP 7.50% 4/15/2026 | 650 | 498 | ||||||
| Northern Oil and Gas, Inc. 8.125% 3/1/20281 | 1,805 | 1,735 | ||||||
| NorthRiver Midstream Finance, LP 5.625% 2/15/20261 | 625 | 593 | ||||||
| NuStar Logistics, LP 6.00% 6/1/2026 | 286 | 276 | ||||||
| Oasis Petroleum, Inc. 6.375% 6/1/20261 | 995 | 970 | ||||||
| Occidental Petroleum Corp. 5.875% 9/1/2025 | 710 | 709 | ||||||
| Occidental Petroleum Corp. 6.375% 9/1/2028 | 225 | 227 | ||||||
| Occidental Petroleum Corp. 8.875% 7/15/2030 | 650 | 735 | ||||||
| Occidental Petroleum Corp. 6.625% 9/1/2030 | 990 | 1,025 | ||||||
| Occidental Petroleum Corp. 6.125% 1/1/2031 | 640 | 647 | ||||||
| Occidental Petroleum Corp. 6.45% 9/15/2036 | 125 | 128 | ||||||
| Occidental Petroleum Corp. 6.60% 3/15/2046 | 605 | 624 | ||||||
| Occidental Petroleum Corp. 4.20% 3/15/2048 | 165 | 127 | ||||||
| Parkland Corp. 4.625% 5/1/20301 | 835 | 692 | ||||||
| Patterson-UTI Energy, Inc. 5.15% 11/15/2029 | 80 | 72 | ||||||
| PDC Energy, Inc. 5.75% 5/15/2026 | 600 | 574 | ||||||
| Petrobras Global Finance Co. 6.75% 6/3/2050 | 288 | 252 | ||||||
| Petrobras Global Finance Co. 5.50% 6/10/2051 | 202 | 155 | ||||||
| Petróleos Mexicanos 6.875% 10/16/2025 | 350 | 343 | ||||||
| Petróleos Mexicanos 8.75% 6/2/2029 | 732 | 687 | ||||||
| Petrorio Luxembourg SARL 6.125% 6/9/20261 | 320 | 305 | ||||||
| Range Resources Corp. 4.875% 5/15/2025 | 362 | 344 | ||||||
| Range Resources Corp. 8.25% 1/15/2029 | 900 | 929 | ||||||
| Range Resources Corp. 4.75% 2/15/20301 | 970 | 856 | ||||||
| Rockies Express Pipeline, LLC 4.95% 7/15/20291 | 550 | 495 | ||||||
| Sabine Pass Liquefaction, LLC 4.50% 5/15/2030 | 371 | 345 | ||||||
| Sanchez Energy Corp. 7.25% 2/15/20231,2 | 739 | 12 | ||||||
| American Funds Insurance Series | 227 |
American High-Income Trust (continued)
| Bonds, notes & other debt instruments (continued) | Principal amount (000) |
Value (000) |
||||||
| Corporate bonds, notes & loans (continued) | ||||||||
| Energy (continued) | ||||||||
| SM Energy Co. 5.625% 6/1/2025 | USD | 430 | $ | 413 | ||||
| Southwestern Energy Co. 5.95% 1/23/20257 | 215 | 212 | ||||||
| Southwestern Energy Co. 7.75% 10/1/2027 | 272 | 278 | ||||||
| Southwestern Energy Co. 8.375% 9/15/2028 | 565 | 584 | ||||||
| Southwestern Energy Co. 5.375% 2/1/2029 | 340 | 316 | ||||||
| Southwestern Energy Co. 5.375% 3/15/2030 | 2,470 | 2,257 | ||||||
| Southwestern Energy Co. 4.75% 2/1/2032 | 1,225 | 1,049 | ||||||
| Suburban Propane Partners, LP / Suburban Energy Finance Corp. 5.00% 6/1/20311 | 335 | 285 | ||||||
| Sunoco, LP 6.00% 4/15/2027 | 547 | 540 | ||||||
| Sunoco, LP 5.875% 3/15/2028 | 290 | 275 | ||||||
| Sunoco, LP 4.50% 5/15/2029 | 1,735 | 1,520 | ||||||
| Sunoco, LP 4.50% 4/30/2030 | 1,680 | 1,461 | ||||||
| Tallgrass Energy Partners, LP 7.50% 10/1/20251 | 85 | 86 | ||||||
| Targa Resources Partners, LP 6.50% 7/15/2027 | 133 | 134 | ||||||
| Targa Resources Partners, LP 6.875% 1/15/2029 | 915 | 924 | ||||||
| Targa Resources Partners, LP 5.50% 3/1/2030 | 802 | 756 | ||||||
| Targa Resources Partners, LP 4.875% 2/1/2031 | 695 | 629 | ||||||
| Transocean Guardian, Ltd. 5.875% 1/15/20241 | 92 | 90 | ||||||
| Transocean Poseidon, Ltd. 6.875% 2/1/20271 | 337 | 328 | ||||||
| Transocean, Inc. 6.125% 8/1/20251 | 178 | 174 | ||||||
| Transocean, Inc. 7.25% 11/1/20251 | 500 | 443 | ||||||
| Transocean, Inc. 11.50% 1/30/20271 | 95 | 95 | ||||||
| Transocean, Inc. 6.80% 3/15/2038 | 300 | 190 | ||||||
| USA Compression Partners, LP 6.875% 4/1/2026 | 669 | 643 | ||||||
| USA Compression Partners, LP 6.875% 9/1/2027 | 247 | 231 | ||||||
| Venture Global Calcasieu Pass, LLC 4.125% 8/15/20311 | 2,795 | 2,386 | ||||||
| Venture Global Calcasieu Pass, LLC 3.875% 11/1/20331 | 650 | 532 | ||||||
| Weatherford International, Ltd. 11.00% 12/1/20241 | 185 | 189 | ||||||
| Weatherford International, Ltd. 6.50% 9/15/20281 | 2,130 | 2,091 | ||||||
| Weatherford International, Ltd. 8.625% 4/30/20301 | 3,485 | 3,353 | ||||||
| Western Gas Partners, LP 4.50% 3/1/2028 | 979 | 904 | ||||||
| Western Midstream Operating, LP 3.35% 2/1/20257 | 369 | 350 | ||||||
| Western Midstream Operating, LP 4.75% 8/15/2028 | 160 | 146 | ||||||
| Western Midstream Operating, LP 4.30% 2/1/20307 | 480 | 420 | ||||||
| Western Midstream Operating, LP 5.50% 2/1/20507 | 770 | 636 | ||||||
| 117,959 | ||||||||
| Consumer discretionary 12.43% | ||||||||
| Adient Global Holdings, Ltd. 4.875% 8/15/20261 | 525 | 490 | ||||||
| Affinity Gaming 6.875% 12/15/20271 | 1,040 | 883 | ||||||
| Allied Universal Holdco, LLC 6.625% 7/15/20261 | 508 | 466 | ||||||
| Allied Universal Holdco, LLC 9.75% 7/15/20271 | 716 | 624 | ||||||
| Allied Universal Holdco, LLC 4.625% 6/1/20281 | 490 | 406 | ||||||
| Allied Universal Holdco, LLC 6.00% 6/1/20291 | 2,790 | 2,029 | ||||||
| Asbury Automotive Group, Inc. 4.50% 3/1/2028 | 250 | 220 | ||||||
| Asbury Automotive Group, Inc. 4.625% 11/15/20291 | 1,545 | 1,304 | ||||||
| Asbury Automotive Group, Inc. 5.00% 2/15/20321 | 1,070 | 882 | ||||||
| Atlas LuxCo 4 SARL 4.625% 6/1/20281 | 280 | 227 | ||||||
| AutoNation, Inc. 2.40% 8/1/2031 | 610 | 440 | ||||||
| Bath & Body Works, Inc. 6.625% 10/1/20301 | 540 | 508 | ||||||
| Bath & Body Works, Inc. 6.875% 11/1/2035 | 1,316 | 1,172 | ||||||
| Bath & Body Works, Inc. 6.75% 7/1/2036 | 655 | 577 | ||||||
| Beazer Homes USA, Inc. 5.875% 10/15/2027 | 540 | 473 | ||||||
| Boyd Gaming Corp. 4.75% 12/1/2027 | 441 | 411 | ||||||
| Boyd Gaming Corp. 4.75% 6/15/20311 | 345 | 301 | ||||||
| Boyne USA, Inc. 4.75% 5/15/20291 | 570 | 505 | ||||||
| Caesars Entertainment, Inc. 6.25% 7/1/20251 | 1,085 | 1,056 | ||||||
| Caesars Entertainment, Inc. 8.125% 7/1/20271 | 665 | 655 | ||||||
| Caesars Entertainment, Inc. 4.625% 10/15/20291 | 560 | 457 | ||||||
| Caesars Resort Collection, LLC 5.75% 7/1/20251 | 345 | 338 | ||||||
| 228 | American Funds Insurance Series |
American High-Income Trust (continued)
| Bonds, notes & other debt instruments (continued) | Principal amount (000) |
Value (000) |
||||||
| Corporate bonds, notes & loans (continued) | ||||||||
| Consumer discretionary (continued) | ||||||||
| Carnival Corp. 10.50% 2/1/20261 | USD | 1,405 | $ | 1,414 | ||||
| Carnival Corp. 4.00% 8/1/20281 | 3,000 | 2,452 | ||||||
| Carnival Corp. 6.00% 5/1/20291 | 655 | 438 | ||||||
| Carnival Corp. 10.50% 6/1/20301 | 100 | 81 | ||||||
| CDI Escrow Issuer, Inc. 5.75% 4/1/20301 | 615 | 552 | ||||||
| CEC Entertainment, Inc. 6.75% 5/1/20261 | 320 | 298 | ||||||
| Dana, Inc. 4.25% 9/1/2030 | 200 | 161 | ||||||
| Dana, Inc. 4.50% 2/15/2032 | 375 | 300 | ||||||
| Empire Communities Corp. 7.00% 12/15/20251 | 475 | 430 | ||||||
| Empire Resorts, Inc. 7.75% 11/1/20261 | 470 | 378 | ||||||
| Everi Holdings, Inc. 5.00% 7/15/20291 | 95 | 82 | ||||||
| Fertitta Entertainment, Inc. 4.625% 1/15/20291 | 1,260 | 1,068 | ||||||
| Fertitta Entertainment, Inc. 6.75% 1/15/20301 | 4,090 | 3,307 | ||||||
| First Student Bidco, Inc. 4.00% 7/31/20291 | 2,135 | 1,769 | ||||||
| Ford Motor Co. 5.291% 12/8/2046 | 70 | 54 | ||||||
| Ford Motor Credit Company, LLC 5.125% 6/16/2025 | 2,215 | 2,134 | ||||||
| Ford Motor Credit Company, LLC 3.375% 11/13/2025 | 465 | 421 | ||||||
| Ford Motor Credit Company, LLC 4.542% 8/1/2026 | 1,460 | 1,348 | ||||||
| Ford Motor Credit Company, LLC 2.70% 8/10/2026 | 350 | 304 | ||||||
| Ford Motor Credit Company, LLC 4.271% 1/9/2027 | 525 | 476 | ||||||
| Ford Motor Credit Company, LLC 4.95% 5/28/2027 | 370 | 346 | ||||||
| Ford Motor Credit Company, LLC 4.125% 8/17/2027 | 835 | 749 | ||||||
| Ford Motor Credit Company, LLC 3.815% 11/2/2027 | 880 | 775 | ||||||
| Ford Motor Credit Company, LLC 2.90% 2/16/2028 | 300 | 248 | ||||||
| Ford Motor Credit Company, LLC 5.113% 5/3/2029 | 200 | 182 | ||||||
| Ford Motor Credit Company, LLC 4.00% 11/13/2030 | 570 | 469 | ||||||
| Group 1 Automotive, Inc. 4.00% 8/15/20281 | 615 | 522 | ||||||
| Hanesbrands, Inc. 4.625% 5/15/20241 | 1,945 | 1,887 | ||||||
| Hanesbrands, Inc. 4.875% 5/15/20261 | 1,624 | 1,454 | ||||||
| Hilton Grand Vacations Borrower 5.00% 6/1/20291 | 591 | 509 | ||||||
| Hilton Worldwide Holdings, Inc. 3.75% 5/1/20291 | 200 | 173 | ||||||
| Hilton Worldwide Holdings, Inc. 4.875% 1/15/2030 | 408 | 370 | ||||||
| Hilton Worldwide Holdings, Inc. 4.00% 5/1/20311 | 1,520 | 1,275 | ||||||
| International Game Technology PLC 6.50% 2/15/20251 | 911 | 918 | ||||||
| International Game Technology PLC 4.125% 4/15/20261 | 915 | 855 | ||||||
| International Game Technology PLC 5.25% 1/15/20291 | 4,120 | 3,846 | ||||||
| Jacobs Entertainment, Inc. 6.75% 2/15/20291 | 505 | 456 | ||||||
| KB Home 6.875% 6/15/2027 | 330 | 333 | ||||||
| KB Home 7.25% 7/15/2030 | 330 | 321 | ||||||
| Kontoor Brands, Inc. 4.125% 11/15/20291 | 370 | 303 | ||||||
| Las Vegas Sands Corp. 3.20% 8/8/2024 | 400 | 378 | ||||||
| LCM Investments Holdings II, LLC 4.875% 5/1/20291 | 2,565 | 2,057 | ||||||
| Levi Strauss & Co. 3.50% 3/1/20311 | 430 | 342 | ||||||
| Lindblad Expeditions, LLC 6.75% 2/15/20271 | 205 | 186 | ||||||
| Lithia Motors, Inc. 4.625% 12/15/20271 | 270 | 244 | ||||||
| Lithia Motors, Inc. 3.875% 6/1/20291 | 1,165 | 959 | ||||||
| Lithia Motors, Inc. 4.375% 1/15/20311 | 830 | 677 | ||||||
| LSF9 Atlantis Holdings, LLC / Victra Finance Corp. 7.75% 2/15/20261 | 335 | 297 | ||||||
| M.D.C. Holdings, Inc. 6.00% 1/15/2043 | 573 | 468 | ||||||
| Marriott International, Inc. 3.50% 10/15/2032 | 470 | 392 | ||||||
| Marriott International, Inc. 2.75% 10/15/2033 | 430 | 329 | ||||||
| Marriott Ownership Resorts, Inc. 4.50% 6/15/20291 | 370 | 307 | ||||||
| Mattel, Inc. 3.75% 4/1/20291 | 490 | 431 | ||||||
| Melco International Development, Ltd. 4.875% 6/6/20251 | 440 | 405 | ||||||
| Melco International Development, Ltd. 5.75% 7/21/20281 | 595 | 498 | ||||||
| Melco International Development, Ltd. 5.375% 12/4/20291 | 1,221 | 982 | ||||||
| Melco Resorts Finance, Ltd. 5.25% 4/26/20261 | 300 | 264 | ||||||
| Merlin Entertainment 5.75% 6/15/20261 | 492 | 461 | ||||||
| MGM Resorts International 6.00% 3/15/2023 | 281 | 281 | ||||||
| MGM Resorts International 5.50% 4/15/2027 | 401 | 374 | ||||||
| Mohegan Gaming & Entertainment 8.00% 2/1/20261 | 370 | 347 | ||||||
| American Funds Insurance Series | 229 |
American High-Income Trust (continued)
| Bonds, notes & other debt instruments (continued) | Principal amount (000) |
Value (000) |
||||||
| Corporate bonds, notes & loans (continued) | ||||||||
| Consumer discretionary (continued) | ||||||||
| Motel 6 Operating, LP, Term Loan B, (1-month USD-LIBOR + 5.00%) 9.318% 9/9/20264,5 | USD | 512 | $ | 506 | ||||
| NCL Corp., Ltd. 3.625% 12/15/20241 | 300 | 257 | ||||||
| NCL Corp., Ltd. 5.875% 3/15/20261 | 405 | 319 | ||||||
| NCL Corp., Ltd. 5.875% 2/15/20271 | 1,510 | 1,310 | ||||||
| NCL Corp., Ltd. 7.75% 2/15/20291 | 360 | 271 | ||||||
| Neiman Marcus Group, LLC 7.125% 4/1/20261 | 1,650 | 1,549 | ||||||
| Panther BF Aggregator 2, LP 6.25% 5/15/20261 | 140 | 137 | ||||||
| Panther BF Aggregator 2, LP 8.50% 5/15/20271 | 455 | 445 | ||||||
| Party City Holdings, Inc. (6-month USD-LIBOR + 5.00%) 8.061% 7/15/20251,5 | 240 | 65 | ||||||
| Party City Holdings, Inc. 8.75% 2/15/20261 | 7,577 | 2,197 | ||||||
| Party City Holdings, Inc. 6.625% 8/1/20261 | 500 | 13 | ||||||
| Penske Automotive Group, Inc. 3.75% 6/15/2029 | 670 | 545 | ||||||
| PetSmart, Inc. 4.75% 2/15/20281 | 710 | 644 | ||||||
| PetSmart, Inc. 7.75% 2/15/20291 | 1,190 | 1,120 | ||||||
| Premier Entertainment Sub, LLC 5.625% 9/1/20291 | 1,065 | 787 | ||||||
| Premier Entertainment Sub, LLC 5.875% 9/1/20311 | 375 | 266 | ||||||
| QVC, Inc. 4.85% 4/1/2024 | 75 | 70 | ||||||
| QVC, Inc. 4.375% 9/1/2028 | 121 | 73 | ||||||
| Raptor Acquisition Corp. 4.875% 11/1/20261 | 550 | 489 | ||||||
| Real Hero Merger Sub 2, Inc. 6.25% 2/1/20291 | 480 | 330 | ||||||
| Royal Caribbean Cruises, Ltd. 11.50% 6/1/20251 | 2,371 | 2,548 | ||||||
| Royal Caribbean Cruises, Ltd. 4.25% 7/1/20261 | 1,820 | 1,473 | ||||||
| Royal Caribbean Cruises, Ltd. 5.50% 8/31/20261 | 715 | 602 | ||||||
| Royal Caribbean Cruises, Ltd. 5.375% 7/15/20271 | 1,365 | 1,107 | ||||||
| Royal Caribbean Cruises, Ltd. 3.70% 3/15/2028 | 1,370 | 1,009 | ||||||
| Royal Caribbean Cruises, Ltd. 5.50% 4/1/20281 | 710 | 568 | ||||||
| Royal Caribbean Cruises, Ltd. 8.25% 1/15/20291 | 1,775 | 1,786 | ||||||
| Royal Caribbean Cruises, Ltd. 9.25% 1/15/20291 | 1,010 | 1,039 | ||||||
| Sally Holdings, LLC 5.625% 12/1/2025 | 1,030 | 994 | ||||||
| Sands China, Ltd. 5.625% 8/8/2025 | 275 | 263 | ||||||
| Sands China, Ltd. 5.90% 8/8/2028 | 200 | 188 | ||||||
| Sands China, Ltd. 4.875% 6/18/2030 | 550 | 484 | ||||||
| Sands China, Ltd. 3.75% 8/8/20317 | 560 | 441 | ||||||
| Scientific Games Corp. 8.625% 7/1/20251 | 1,215 | 1,242 | ||||||
| Scientific Games Corp. 7.00% 5/15/20281 | 985 | 941 | ||||||
| Scientific Games Corp. 7.25% 11/15/20291 | 960 | 923 | ||||||
| Scientific Games Holdings, LP 6.625% 3/1/20301 | 845 | 715 | ||||||
| Sonic Automotive, Inc. 4.625% 11/15/20291 | 1,565 | 1,255 | ||||||
| Sonic Automotive, Inc. 4.875% 11/15/20311 | 2,180 | 1,717 | ||||||
| Studio City Finance, Ltd. 6.00% 7/15/20251 | 690 | 599 | ||||||
| Studio City Finance, Ltd. 5.00% 1/15/20291 | 550 | 407 | ||||||
| Tempur Sealy International, Inc. 4.00% 4/15/20291 | 435 | 366 | ||||||
| The Gap, Inc. 3.625% 10/1/20291 | 170 | 120 | ||||||
| The Gap, Inc. 3.875% 10/1/20311 | 108 | 76 | ||||||
| The Home Co., Inc. 7.25% 10/15/20251 | 660 | 568 | ||||||
| Travel + Leisure Co. 6.00% 4/1/2027 | 205 | 195 | ||||||
| Travel + Leisure Co. 4.50% 12/1/20291 | 1,155 | 943 | ||||||
| Universal Entertainment Corp. 8.50% 12/11/20241 | 2,945 | 2,751 | ||||||
| Vail Resorts, Inc. 6.25% 5/15/20251 | 315 | 316 | ||||||
| VICI Properties, LP 4.25% 12/1/20261 | 462 | 432 | ||||||
| VICI Properties, LP / VICI Note Co., Inc. 5.625% 5/1/20241 | 447 | 443 | ||||||
| WASH Multifamily Acquisition, Inc. 5.75% 4/15/20261 | 1,245 | 1,175 | ||||||
| Wheel Pros, Inc. 6.50% 5/15/20291 | 1,280 | 454 | ||||||
| Wheel Pros, Inc., Term Loan, (3-month USD-LIBOR + 4.50%) 8.825% 5/11/20284,5 | 948 | 647 | ||||||
| Wyndham Destinations, Inc. 6.625% 7/31/20261 | 695 | 681 | ||||||
| Wyndham Destinations, Inc. 4.625% 3/1/20301 | 400 | 332 | ||||||
| Wyndham Worldwide Corp. 4.375% 8/15/20281 | 765 | 688 | ||||||
| Wynn Las Vegas, LLC 4.25% 5/30/20231 | 861 | 850 | ||||||
| Wynn Macau, Ltd. 5.625% 8/26/20281 | 900 | 771 | ||||||
| 230 | American Funds Insurance Series |
American High-Income Trust (continued)
| Bonds, notes & other debt instruments (continued) | Principal amount (000) |
Value (000) |
||||||
| Corporate bonds, notes & loans (continued) | ||||||||
| Consumer discretionary (continued) | ||||||||
| Wynn Resorts Finance, LLC 7.75% 4/15/20251 | USD | 494 | $ | 492 | ||||
| Wynn Resorts Finance, LLC 5.125% 10/1/20291 | 482 | 414 | ||||||
| Yahoo Holdings, Inc., Term Loan B, (1-month USD-LIBOR + 5.50%) 9.884% 9/1/20274,5 | 465 | 421 | ||||||
| 103,390 | ||||||||
| Communication services 10.50% | ||||||||
| Altice France Holding SA 10.50% 5/15/20271 | 1,650 | 1,262 | ||||||
| Altice France SA 5.125% 7/15/20291 | 1,677 | 1,260 | ||||||
| Brightstar Escrow Corp. 9.75% 10/15/20251 | 140 | 129 | ||||||
| Cablevision Systems Corp. 5.375% 2/1/20281 | 457 | 369 | ||||||
| CCO Holdings, LLC 5.00% 2/1/20281 | 586 | 533 | ||||||
| CCO Holdings, LLC 6.375% 9/1/20291 | 300 | 283 | ||||||
| CCO Holdings, LLC 4.75% 3/1/20301 | 3,437 | 2,972 | ||||||
| CCO Holdings, LLC 4.50% 8/15/20301 | 3,029 | 2,509 | ||||||
| CCO Holdings, LLC 4.25% 2/1/20311 | 3,065 | 2,465 | ||||||
| CCO Holdings, LLC 4.75% 2/1/20321 | 1,225 | 996 | ||||||
| CCO Holdings, LLC 4.50% 5/1/2032 | 1,024 | 817 | ||||||
| CCO Holdings, LLC 4.50% 6/1/20331 | 1,330 | 1,023 | ||||||
| CCO Holdings, LLC 4.25% 1/15/20341 | 2,040 | 1,510 | ||||||
| CCO Holdings, LLC and CCO Holdings Capital Corp. 5.50% 5/1/20261 | 102 | 99 | ||||||
| CCO Holdings, LLC and CCO Holdings Capital Corp. 5.375% 6/1/20291 | 360 | 326 | ||||||
| CCO Holdings, LLC and CCO Holdings Capital Corp. 2.80% 4/1/2031 | 140 | 109 | ||||||
| Centerfield Media Parent, Inc. 6.625% 8/1/20261 | 960 | 616 | ||||||
| Cinemark USA, Inc. 5.875% 3/15/20261 | 278 | 232 | ||||||
| Clear Channel Worldwide Holdings, Inc. 7.75% 4/15/20281 | 570 | 417 | ||||||
| Clear Channel Worldwide Holdings, Inc. 7.50% 6/1/20291 | 315 | 232 | ||||||
| Cogent Communications Group, Inc. 3.50% 5/1/20261 | 450 | 409 | ||||||
| Connect Finco SARL 6.75% 10/1/20261 | 725 | 673 | ||||||
| Consolidated Communications, Inc. 5.00% 10/1/20281 | 225 | 166 | ||||||
| CSC Holdings, LLC 6.50% 2/1/20291 | 600 | 492 | ||||||
| CSC Holdings, LLC 3.375% 2/15/20311 | 700 | 458 | ||||||
| Diamond Sports Group, LLC 5.375% 8/15/20261 | 503 | 60 | ||||||
| Diamond Sports Group, LLC 6.625% 8/15/20271 | 1,056 | 12 | ||||||
| DIRECTV Financing, LLC 5.875% 8/15/20271 | 3,010 | 2,699 | ||||||
| DIRECTV Financing, LLC, Term Loan, (3-month USD-LIBOR + 5.00%) 9.384% 8/2/20274,5 | 1,655 | 1,613 | ||||||
| DISH Network Corp. 11.75% 11/15/20271 | 3,950 | 4,073 | ||||||
| Embarq Corp. 7.995% 6/1/2036 | 2,867 | 1,339 | ||||||
| Epicor Software Corp., Term Loan, (3-month USD-LIBOR + 7.75%) 12.134% 7/31/20284,5 | 365 | 361 | ||||||
| Frontier Communications Corp. 5.875% 10/15/20271 | 1,455 | 1,354 | ||||||
| Frontier Communications Corp. 5.00% 5/1/20281 | 3,780 | 3,304 | ||||||
| Frontier Communications Corp. 6.75% 5/1/20291 | 1,990 | 1,649 | ||||||
| Frontier Communications Holdings, LLC 5.875% 11/1/2029 | 1,390 | 1,077 | ||||||
| Frontier Communications Holdings, LLC 6.00% 1/15/20301 | 750 | 590 | ||||||
| Frontier Communications Holdings, LLC 8.75% 5/15/20301 | 970 | 988 | ||||||
| Gray Escrow II, Inc. 5.375% 11/15/20311 | 925 | 668 | ||||||
| Gray Television, Inc. 5.875% 7/15/20261 | 203 | 181 | ||||||
| Gray Television, Inc. 7.00% 5/15/20271 | 1,018 | 904 | ||||||
| Gray Television, Inc. 4.75% 10/15/20301 | 397 | 288 | ||||||
| iHeartCommunications, Inc. 5.25% 8/15/20271 | 1,995 | 1,693 | ||||||
| iHeartCommunications, Inc. 4.75% 1/15/20281 | 250 | 204 | ||||||
| Iliad Holding SAS 6.50% 10/15/20261 | 630 | 585 | ||||||
| Kantar Group, LLC, Term Loan B2, (3-month USD-LIBOR + 4.50%) 9.23% 12/4/20264,5 | 385 | 357 | ||||||
| Lamar Media Corp. 3.75% 2/15/2028 | 61 | 55 | ||||||
| Lamar Media Corp. 4.875% 1/15/2029 | 300 | 277 | ||||||
| Lamar Media Corp. 4.00% 2/15/2030 | 260 | 228 | ||||||
| Level 3 Financing, Inc. 3.75% 7/15/20291 | 855 | 616 | ||||||
| American Funds Insurance Series | 231 |
American High-Income Trust (continued)
| Bonds, notes & other debt instruments (continued) | Principal amount (000) |
Value (000) |
||||||
| Corporate bonds, notes & loans (continued) | ||||||||
| Communication services (continued) | ||||||||
| Ligado Networks, LLC 15.50% PIK 11/1/20231,6 | USD | 2,149 | $ | 701 | ||||
| Live Nation Entertainment, Inc. 4.75% 10/15/20271 | 250 | 223 | ||||||
| Live Nation Entertainment, Inc. 3.75% 1/15/20281 | 425 | 363 | ||||||
| Match Group, Inc. 4.625% 6/1/20281 | 308 | 275 | ||||||
| Match Group, Inc. 5.625% 2/15/20291 | 300 | 280 | ||||||
| McGraw-Hill Education, Inc. 5.75% 8/1/20281 | 520 | 438 | ||||||
| Midas OpCo Holdings, LLC 5.625% 8/15/20291 | 3,110 | 2,570 | ||||||
| Netflix, Inc. 4.875% 4/15/2028 | 310 | 300 | ||||||
| News Corp. 3.875% 5/15/20291 | 1,620 | 1,408 | ||||||
| News Corp. 5.125% 2/15/20321 | 1,760 | 1,604 | ||||||
| Nexstar Broadcasting, Inc. 4.75% 11/1/20281 | 2,910 | 2,522 | ||||||
| Nexstar Escrow Corp. 5.625% 7/15/20271 | 324 | 298 | ||||||
| Scripps Escrow II, Inc. 3.875% 1/15/20291 | 750 | 603 | ||||||
| Sinclair Television Group, Inc. 4.125% 12/1/20301 | 710 | 533 | ||||||
| Sirius XM Radio, Inc. 3.125% 9/1/20261 | 1,600 | 1,423 | ||||||
| Sirius XM Radio, Inc. 4.00% 7/15/20281 | 2,385 | 2,080 | ||||||
| Sirius XM Radio, Inc. 4.125% 7/1/20301 | 445 | 368 | ||||||
| Sirius XM Radio, Inc. 3.875% 9/1/20311 | 2,590 | 2,026 | ||||||
| Sprint Corp. 7.625% 3/1/2026 | 480 | 506 | ||||||
| Sprint Corp. 6.875% 11/15/2028 | 1,656 | 1,723 | ||||||
| Sprint Corp. 8.75% 3/15/2032 | 1,751 | 2,088 | ||||||
| TEGNA, Inc. 5.00% 9/15/2029 | 366 | 348 | ||||||
| T-Mobile US, Inc. 3.375% 4/15/2029 | 860 | 759 | ||||||
| Univision Communications, Inc. 5.125% 2/15/20251 | 3,195 | 3,049 | ||||||
| Univision Communications, Inc. 6.625% 6/1/20271 | 3,050 | 2,949 | ||||||
| Univision Communications, Inc. 4.50% 5/1/20291 | 4,500 | 3,772 | ||||||
| Univision Communications, Inc. 7.375% 6/30/20301 | 935 | 895 | ||||||
| Univision Communications, Inc., Term Loan, (3-month USD CME Term SOFR + 4.25%) 8.83% 6/24/20294,5 | 69 | 69 | ||||||
| UPC Broadband Finco BV 4.875% 7/15/20311 | 430 | 359 | ||||||
| Virgin Media O2 4.25% 1/31/20311 | 1,975 | 1,603 | ||||||
| Virgin Media Secured Finance PLC 4.50% 8/15/20301 | 990 | 829 | ||||||
| VZ Secured Financing BV 5.00% 1/15/20321 | 1,060 | 863 | ||||||
| Warner Music Group 3.75% 12/1/20291 | 1,645 | 1,417 | ||||||
| Warner Music Group 3.875% 7/15/20301 | 780 | 673 | ||||||
| Warner Music Group 3.00% 2/15/20311 | 225 | 180 | ||||||
| WarnerMedia Holdings, Inc. 4.279% 3/15/20321 | 298 | 246 | ||||||
| Ziggo Bond Co. BV 5.125% 2/28/20301 | 419 | 339 | ||||||
| Ziggo Bond Finance BV 4.875% 1/15/20301 | 1,350 | 1,132 | ||||||
| 87,346 | ||||||||
| Materials 9.94% | ||||||||
| Alcoa Nederland Holding BV 5.50% 12/15/20271 | 510 | 492 | ||||||
| Alcoa Nederland Holding BV 4.125% 3/31/20291 | 430 | 382 | ||||||
| Allegheny Technologies, Inc. 5.875% 12/1/2027 | 180 | 172 | ||||||
| Allegheny Technologies, Inc. 4.875% 10/1/2029 | 1,575 | 1,394 | ||||||
| Allegheny Technologies, Inc. 5.125% 10/1/2031 | 1,170 | 1,036 | ||||||
| ArcelorMittal 7.00% 10/15/2039 | 488 | 497 | ||||||
| ArcelorMittal 6.75% 3/1/2041 | 755 | 731 | ||||||
| Arconic Corp. 6.00% 5/15/20251 | 360 | 355 | ||||||
| Arconic Rolled Products Corp. 6.125% 2/15/20281 | 200 | 188 | ||||||
| Ardagh Group SA 6.50% Cash 6/30/20271,6 | 422 | 294 | ||||||
| Ardagh Metal Packaging Finance USA, LLC 6.00% 6/15/20271 | 750 | 735 | ||||||
| Ardagh Metal Packaging Finance USA, LLC 3.25% 9/1/20281 | 500 | 425 | ||||||
| Ardagh Metal Packaging Finance USA, LLC 4.00% 9/1/20291 | 550 | 437 | ||||||
| Ardagh Packaging Finance 4.125% 8/15/20261 | 900 | 782 | ||||||
| Avient Corp. 7.125% 8/1/20301 | 335 | 328 | ||||||
| Axalta Coating Systems, LLC 4.75% 6/15/20271 | 460 | 426 | ||||||
| Ball Corp. 6.875% 3/15/2028 | 1,065 | 1,095 | ||||||
| Ball Corp. 2.875% 8/15/2030 | 160 | 128 | ||||||
| 232 | American Funds Insurance Series |
American High-Income Trust (continued)
| Bonds, notes & other debt instruments (continued) | Principal amount (000) |
Value (000) |
||||||
| Corporate bonds, notes & loans (continued) | ||||||||
| Materials (continued) | ||||||||
| Ball Corp. 3.125% 9/15/2031 | USD | 1,660 | $ | 1,335 | ||||
| BWAY Parent Co., Inc. 5.50% 4/15/20241 | 1,464 | 1,427 | ||||||
| BWAY Parent Co., Inc. 7.25% 4/15/20251 | 625 | 579 | ||||||
| BWAY Parent Co., Inc., Term Loan, | ||||||||
| (3-month USD-LIBOR + 3.25%) 7.37% 4/3/20244,5 | 255 | 250 | ||||||
| CAN-PACK SA 3.875% 11/15/20291 | 1,300 | 1,026 | ||||||
| Cleveland-Cliffs, Inc. 6.75% 3/15/20261 | 262 | 263 | ||||||
| Cleveland-Cliffs, Inc. 7.00% 3/15/2027 | 297 | 281 | ||||||
| Cleveland-Cliffs, Inc. 5.875% 6/1/2027 | 3,243 | 3,104 | ||||||
| Cleveland-Cliffs, Inc. 4.625% 3/1/20291 | 1,981 | 1,761 | ||||||
| Cleveland-Cliffs, Inc. 4.875% 3/1/20311 | 2,875 | 2,543 | ||||||
| Crown Holdings, Inc. 5.25% 4/1/20301 | 240 | 227 | ||||||
| CVR Partners, LP 6.125% 6/15/20281 | 1,125 | 1,011 | ||||||
| Element Solutions, Inc. 3.875% 9/1/20281 | 410 | 349 | ||||||
| First Quantum Minerals, Ltd. 7.50% 4/1/20251 | 3,893 | 3,797 | ||||||
| First Quantum Minerals, Ltd. 6.875% 3/1/20261 | 2,926 | 2,775 | ||||||
| First Quantum Minerals, Ltd. 6.875% 10/15/20271 | 7,610 | 7,156 | ||||||
| Freeport-McMoRan, Inc. 4.25% 3/1/2030 | 437 | 398 | ||||||
| Freeport-McMoRan, Inc. 5.45% 3/15/2043 | 411 | 372 | ||||||
| FXI Holdings, Inc. 7.875% 11/1/20241 | 6,248 | 5,204 | ||||||
| FXI Holdings, Inc. 12.25% 11/15/20261 | 7,432 | 6,165 | ||||||
| GPC Merger Sub, Inc. 7.125% 8/15/20281 | 334 | 279 | ||||||
| Graphic Packaging International, LLC 3.75% 2/1/20301 | 790 | 673 | ||||||
| Hexion, Inc., Term Loan, (3-month USD CME Term SOFR + 4.50%) 8.934% 3/15/20294,5 | 454 | 391 | ||||||
| Kaiser Aluminum Corp. 4.625% 3/1/20281 | 638 | 558 | ||||||
| LABL, Inc. 5.875% 11/1/20281 | 730 | 637 | ||||||
| LABL, Inc. 8.25% 11/1/20291 | 490 | 391 | ||||||
| LSB Industries, Inc. 6.25% 10/15/20281 | 1,620 | 1,484 | ||||||
| Methanex Corp. 5.125% 10/15/2027 | 3,870 | 3,596 | ||||||
| Methanex Corp. 5.25% 12/15/2029 | 1,217 | 1,082 | ||||||
| Methanex Corp. 5.65% 12/1/2044 | 465 | 355 | ||||||
| Mineral Resources, Ltd. 8.00% 11/1/20271 | 1,292 | 1,323 | ||||||
| Mineral Resources, Ltd. 8.50% 5/1/20301 | 1,270 | 1,289 | ||||||
| Neon Holdings, Inc. 10.125% 4/1/20261 | 595 | 508 | ||||||
| Nova Chemicals Corp. 4.875% 6/1/20241 | 760 | 737 | ||||||
| Nova Chemicals Corp. 5.25% 6/1/20271 | 2,036 | 1,834 | ||||||
| Nova Chemicals Corp. 4.25% 5/15/20291 | 2,330 | 1,908 | ||||||
| Novelis Corp. 3.25% 11/15/20261 | 825 | 741 | ||||||
| Novelis Corp. 4.75% 1/30/20301 | 563 | 500 | ||||||
| Novelis Corp. 3.875% 8/15/20311 | 1,122 | 918 | ||||||
| Olin Corp. 5.625% 8/1/2029 | 200 | 190 | ||||||
| Olin Corp. 5.00% 2/1/2030 | 180 | 165 | ||||||
| Owens-Illinois, Inc. 5.875% 8/15/20231 | 191 | 190 | ||||||
| Owens-Illinois, Inc. 6.375% 8/15/20251 | 265 | 260 | ||||||
| SCIH Salt Holdings, Inc. 4.875% 5/1/20281 | 2,185 | 1,879 | ||||||
| SCIH Salt Holdings, Inc. 6.625% 5/1/20291 | 1,225 | 988 | ||||||
| Scotts Miracle-Gro Co. 4.50% 10/15/2029 | 379 | 308 | ||||||
| Scotts Miracle-Gro Co. 4.375% 2/1/2032 | 455 | 344 | ||||||
| Sealed Air Corp. 4.00% 12/1/20271 | 316 | 287 | ||||||
| Sealed Air Corp. 5.00% 4/15/20291 | 690 | 650 | ||||||
| Silgan Holdings, Inc. 4.125% 2/1/2028 | 377 | 350 | ||||||
| SPCM SA 3.375% 3/15/20301 | 400 | 323 | ||||||
| Summit Materials, LLC 6.50% 3/15/20271 | 360 | 353 | ||||||
| Summit Materials, LLC 5.25% 1/15/20291 | 755 | 704 | ||||||
| Trivium Packaging BV 5.50% 8/15/20261 | 330 | 303 | ||||||
| Trivium Packaging BV 8.50% 8/15/20271 | 703 | 646 | ||||||
| Tronox, Ltd. 4.625% 3/15/20291 | 730 | 608 | ||||||
| Valvoline, Inc. 4.25% 2/15/20301 | 353 | 343 | ||||||
| Valvoline, Inc. 3.625% 6/15/20311 | 410 | 337 | ||||||
| Venator Finance SARL 9.50% 7/1/20251 | 1,538 | 1,115 | ||||||
| American Funds Insurance Series | 233 |
American High-Income Trust (continued)
| Bonds, notes & other debt instruments (continued) | Principal amount (000) |
Value (000) |
||||||
| Corporate bonds, notes & loans (continued) | ||||||||
| Materials (continued) | ||||||||
| Venator Finance SARL 5.75% 7/15/20251 | USD | 3,501 | $ | 1,201 | ||||
| W. R. Grace Holdings, LLC 5.625% 8/15/20291 | 440 | 356 | ||||||
| Warrior Met Coal, Inc. 7.875% 12/1/20281 | 1,680 | 1,658 | ||||||
| 82,682 | ||||||||
| Health care 9.93% | ||||||||
| 1375209 BC, Ltd. 9.00% 1/30/20281 | 720 | 705 | ||||||
| AdaptHealth, LLC 5.125% 3/1/20301 | 625 | 533 | ||||||
| Avantor Funding, Inc. 4.625% 7/15/20281 | 2,380 | 2,167 | ||||||
| Avantor Funding, Inc. 3.875% 11/1/20291 | 500 | 420 | ||||||
| Bausch Health Americas, Inc. 9.25% 4/1/20261 | 1,789 | 1,255 | ||||||
| Bausch Health Americas, Inc. 8.50% 1/31/20271 | 252 | 132 | ||||||
| Bausch Health Companies, Inc. 9.00% 12/15/20251 | 1,591 | 1,258 | ||||||
| Bausch Health Companies, Inc. 6.125% 2/1/20271 | 245 | 169 | ||||||
| Bausch Health Companies, Inc. 5.75% 8/15/20271 | 865 | 590 | ||||||
| Bausch Health Companies, Inc. 7.00% 1/15/20281 | 413 | 200 | ||||||
| Bausch Health Companies, Inc. 5.00% 1/30/20281 | 1,357 | 653 | ||||||
| Bausch Health Companies, Inc. 4.875% 6/1/20281 | 3,390 | 2,163 | ||||||
| Bausch Health Companies, Inc. 5.00% 2/15/20291 | 310 | 149 | ||||||
| Bausch Health Companies, Inc. 7.25% 5/30/20291 | 340 | 165 | ||||||
| Bausch Health Companies, Inc. 5.25% 1/30/20301 | 1,712 | 824 | ||||||
| Bausch Health Companies, Inc. 14.00% 10/15/20301 | 550 | 329 | ||||||
| Bausch Health Companies, Inc. 5.25% 2/15/20311 | 3,762 | 1,828 | ||||||
| Catalent Pharma Solutions, Inc. 5.00% 7/15/20271 | 290 | 270 | ||||||
| Catalent Pharma Solutions, Inc. 3.125% 2/15/20291 | 285 | 227 | ||||||
| Catalent Pharma Solutions, Inc. 3.50% 4/1/20301 | 1,310 | 1,036 | ||||||
| Centene Corp. 4.25% 12/15/2027 | 344 | 323 | ||||||
| Centene Corp. 2.45% 7/15/2028 | 2,255 | 1,908 | ||||||
| Centene Corp. 4.625% 12/15/2029 | 2,035 | 1,864 | ||||||
| Centene Corp. 3.375% 2/15/2030 | 422 | 358 | ||||||
| Centene Corp. 3.00% 10/15/2030 | 720 | 592 | ||||||
| Centene Corp. 2.50% 3/1/2031 | 1,245 | 977 | ||||||
| Centene Corp. 2.625% 8/1/2031 | 400 | 315 | ||||||
| Charles River Laboratories International, Inc. 4.25% 5/1/20281 | 561 | 518 | ||||||
| Charles River Laboratories International, Inc. 3.75% 3/15/20291 | 680 | 602 | ||||||
| Charles River Laboratories International, Inc. 4.00% 3/15/20311 | 400 | 347 | ||||||
| Community Health Systems, Inc. 8.00% 3/15/20261 | 580 | 529 | ||||||
| Community Health Systems, Inc. 5.625% 3/15/20271 | 1,645 | 1,414 | ||||||
| Community Health Systems, Inc. 6.00% 1/15/20291 | 348 | 292 | ||||||
| Community Health Systems, Inc. 6.875% 4/15/20291 | 240 | 124 | ||||||
| Community Health Systems, Inc. 5.25% 5/15/20301 | 1,370 | 1,035 | ||||||
| Community Health Systems, Inc. 4.75% 2/15/20311 | 100 | 73 | ||||||
| DaVita, Inc. 4.625% 6/1/20301 | 850 | 686 | ||||||
| Encompass Health Corp. 4.50% 2/1/2028 | 496 | 451 | ||||||
| Encompass Health Corp. 4.75% 2/1/2030 | 285 | 251 | ||||||
| Endo DAC 6.00% 6/30/20281,2 | 2,313 | 127 | ||||||
| Endo DAC / Endo Finance, LLC / Endo Finco 9.50% 7/31/20271,2 | 311 | 44 | ||||||
| Endo International PLC 5.875% 10/15/20241 | 520 | 413 | ||||||
| Endo Luxembourg Finance Co. I SARL / Endo U.S., Inc. 6.125% 4/1/20291 | 660 | 502 | ||||||
| Grifols Escrow Issuer SA 4.75% 10/15/20281 | 630 | 545 | ||||||
| HCA, Inc. 5.625% 9/1/2028 | 1,300 | 1,295 | ||||||
| HCA, Inc. 5.875% 2/1/2029 | 255 | 255 | ||||||
| HCA, Inc. 3.50% 9/1/2030 | 1,215 | 1,051 | ||||||
| HCA, Inc. 4.625% 3/15/20521 | 233 | 182 | ||||||
| HCA, Inc. 7.50% 11/15/2095 | 250 | 269 | ||||||
| HealthEquity, Inc. 4.50% 10/1/20291 | 600 | 525 | ||||||
| IMS Health Holdings, Inc. 5.00% 10/15/20261 | 823 | 788 | ||||||
| Jazz Securities DAC 4.375% 1/15/20291 | 461 | 412 | ||||||
| Mallinckrodt PLC 10.00% 4/15/20251 | 939 | 808 | ||||||
| Minerva Merger Sub, Inc. 6.50% 2/15/20301 | 640 | 473 | ||||||
| 234 | American Funds Insurance Series |
American High-Income Trust (continued)
| Bonds, notes & other debt instruments (continued) | Principal amount (000) |
Value (000) |
||||||
| Corporate bonds, notes & loans (continued) | ||||||||
| Health care (continued) | ||||||||
| Molina Healthcare, Inc. 4.375% 6/15/20281 | USD | 1,055 | $ | 965 | ||||
| Molina Healthcare, Inc. 3.875% 11/15/20301 | 2,309 | 1,960 | ||||||
| Molina Healthcare, Inc. 3.875% 5/15/20321 | 2,275 | 1,893 | ||||||
| Mozart Debt Merger Sub, Inc. 3.875% 4/1/20291 | 220 | 178 | ||||||
| Mozart Debt Merger Sub, Inc. 5.25% 10/1/20291 | 1,425 | 1,134 | ||||||
| Option Care Health, Inc. 4.375% 10/31/20291 | 290 | 254 | ||||||
| Organon Finance 1, LLC 4.125% 4/30/20281 | 535 | 475 | ||||||
| Owens & Minor, Inc. 4.375% 12/15/2024 | 1,185 | 1,147 | ||||||
| Owens & Minor, Inc. 4.50% 3/31/20291 | 1,145 | 914 | ||||||
| Owens & Minor, Inc. 6.625% 4/1/20301 | 675 | 581 | ||||||
| Par Pharmaceutical, Inc. 7.50% 4/1/20271 | 4,665 | 3,555 | ||||||
| Radiology Partners, Inc. 9.25% 2/1/20281 | 1,873 | 1,054 | ||||||
| Radiology Partners, Inc., Term Loan, (3-month USD-LIBOR + 4.25%) 8.639% 7/9/20254,5 | 95 | 80 | ||||||
| RP Escrow Issuer, LLC 5.25% 12/15/20251 | 1,175 | 899 | ||||||
| Select Medical Holdings Corp. 6.25% 8/15/20261 | 554 | 528 | ||||||
| Surgery Center Holdings 10.00% 4/15/20271 | 244 | 249 | ||||||
| Syneos Health, Inc. 3.625% 1/15/20291 | 530 | 423 | ||||||
| Team Health Holdings, Inc. 6.375% 2/1/20251 | 704 | 407 | ||||||
| Team Health Holdings, Inc., Term Loan B, (3-month USD CME Term SOFR + 5.25%) 9.573% 3/2/20274,5 | 276 | 209 | ||||||
| Tenet Healthcare Corp. 4.625% 7/15/2024 | 130 | 127 | ||||||
| Tenet Healthcare Corp. 4.875% 1/1/20261 | 5,600 | 5,307 | ||||||
| Tenet Healthcare Corp. 6.25% 2/1/20271 | 500 | 481 | ||||||
| Tenet Healthcare Corp. 5.125% 11/1/20271 | 265 | 247 | ||||||
| Tenet Healthcare Corp. 4.625% 6/15/20281 | 890 | 798 | ||||||
| Tenet Healthcare Corp. 6.125% 10/1/20281 | 740 | 664 | ||||||
| Tenet Healthcare Corp. 4.25% 6/1/20291 | 990 | 859 | ||||||
| Tenet Healthcare Corp. 4.375% 1/15/20301 | 1,340 | 1,162 | ||||||
| Tenet Healthcare Corp. 6.875% 11/15/2031 | 100 | 90 | ||||||
| Teva Pharmaceutical Finance Co. BV 6.00% 4/15/2024 | 3,379 | 3,319 | ||||||
| Teva Pharmaceutical Finance Co. BV 7.125% 1/31/2025 | 1,984 | 1,976 | ||||||
| Teva Pharmaceutical Finance Co. BV 3.15% 10/1/2026 | 3,314 | 2,905 | ||||||
| Teva Pharmaceutical Finance Co. BV 4.75% 5/9/2027 | 570 | 516 | ||||||
| Teva Pharmaceutical Finance Co. BV 6.75% 3/1/2028 | 1,888 | 1,845 | ||||||
| Teva Pharmaceutical Finance Co. BV 5.125% 5/9/2029 | 6,865 | 6,123 | ||||||
| Teva Pharmaceutical Finance Co. BV 4.10% 10/1/2046 | 412 | 253 | ||||||
| Valeant Pharmaceuticals International, Inc. 5.50% 11/1/20251 | 4,190 | 3,568 | ||||||
| 82,566 | ||||||||
| Industrials 8.97% | ||||||||
| AAdvantage Loyalty IP, Ltd. 5.50% 4/20/20261 | 990 | 954 | ||||||
| ADT Security Corp. 4.125% 8/1/20291 | 200 | 170 | ||||||
| Allison Transmission Holdings, Inc. 3.75% 1/30/20311 | 1,235 | 1,017 | ||||||
| Ashtead Capital, Inc. 5.50% 8/11/20321 | 600 | 576 | ||||||
| Atkore, Inc. 4.25% 6/1/20311 | 385 | 331 | ||||||
| Atlantic Aviation FBO, Inc., Term Loan, (3-month USD-LIBOR + 5.75%) 10.134% 9/21/20294,5 | 2,899 | 2,813 | ||||||
| ATS Automation Tooling Systems, Inc. 4.125% 12/15/20281 | 275 | 238 | ||||||
| Avis Budget Car Rental, LLC 5.75% 7/15/20271 | 885 | 802 | ||||||
| Avis Budget Group, Inc. 5.375% 3/1/20291 | 1,215 | 1,041 | ||||||
| Avolon Holdings Funding, Ltd. 5.25% 5/15/20241 | 660 | 647 | ||||||
| Avolon Holdings Funding, Ltd. 2.528% 11/18/20271 | 2,098 | 1,680 | ||||||
| BlueLinx Holdings, Inc. 6.00% 11/15/20291 | 500 | 416 | ||||||
| Bohai Financial Investment Holding Co., Ltd. 4.50% 3/15/20231 | 132 | 132 | ||||||
| Bombardier, Inc. 7.50% 3/15/20251 | 593 | 588 | ||||||
| Bombardier, Inc. 7.125% 6/15/20261 | 3,395 | 3,300 | ||||||
| Bombardier, Inc. 7.875% 4/15/20271 | 3,978 | 3,867 | ||||||
| Bombardier, Inc. 6.00% 2/15/20281 | 1,335 | 1,236 | ||||||
| Bombardier, Inc. 7.45% 5/1/20341 | 450 | 452 | ||||||
| American Funds Insurance Series | 235 |
American High-Income Trust (continued)
| Bonds, notes & other debt instruments (continued) | Principal amount (000) |
Value (000) |
||||||
| Corporate bonds, notes & loans (continued) | ||||||||
| Industrials (continued) | ||||||||
| Builders FirstSource, Inc. 4.25% 2/1/20321 | USD | 735 | $ | 597 | ||||
| BWX Technologies, Inc. 4.125% 6/30/20281 | 515 | 464 | ||||||
| BWX Technologies, Inc. 4.125% 4/15/20291 | 1,005 | 881 | ||||||
| Chart Industries, Inc. 7.50% 1/1/20301 | 523 | 526 | ||||||
| Clarivate Science Holdings Corp. 3.875% 7/1/20281 | 1,595 | 1,384 | ||||||
| Clarivate Science Holdings Corp. 4.875% 7/1/20291 | 1,265 | 1,077 | ||||||
| Clean Harbors, Inc. 4.875% 7/15/20271 | 766 | 727 | ||||||
| CoreLogic, Inc. 4.50% 5/1/20281 | 4,279 | 3,288 | ||||||
| CoreLogic, Inc., Term Loan, (3-month USD-LIBOR + 6.50%) 10.938% 6/4/20294,5 | 660 | 480 | ||||||
| Covanta Holding Corp. 4.875% 12/1/20291 | 1,295 | 1,063 | ||||||
| Covanta Holding Corp. 5.00% 9/1/2030 | 1,590 | 1,287 | ||||||
| Dun & Bradstreet Corp. 5.00% 12/15/20291 | 1,585 | 1,358 | ||||||
| Garda World Security Corp. 6.00% 6/1/20291 | 150 | 122 | ||||||
| GFL Environmental, Inc. 3.50% 9/1/20281 | 765 | 673 | ||||||
| Harsco Corp. 5.75% 7/31/20271 | 700 | 554 | ||||||
| Herc Holdings, Inc. 5.50% 7/15/20271 | 200 | 187 | ||||||
| Howmet Aerospace, Inc. 5.95% 2/1/2037 | 150 | 146 | ||||||
| Icahn Enterprises Finance Corp. 4.75% 9/15/2024 | 1,080 | 1,038 | ||||||
| Icahn Enterprises, LP 5.25% 5/15/2027 | 277 | 254 | ||||||
| Icahn Enterprises, LP 4.375% 2/1/2029 | 675 | 572 | ||||||
| JELD-WEN Holding, Inc. 4.875% 12/15/20271 | 543 | 410 | ||||||
| LABL Escrow Issuer, LLC 6.75% 7/15/20261 | 450 | 425 | ||||||
| LABL Escrow Issuer, LLC 10.50% 7/15/20271 | 1,310 | 1,221 | ||||||
| LSC Communications, Inc. 8.75% 10/15/20231,2,3 | 8,933 | 27 | ||||||
| LSC Communications, Inc., Term Loan B, (3-month USD-LIBOR + 4.50%) 7.75% 9/30/20222,3,4,5 | 301 | 1 | ||||||
| Masonite International Corp. 3.50% 2/15/20301 | 530 | 429 | ||||||
| MasTec, Inc. 4.50% 8/15/20281 | 460 | 413 | ||||||
| Mileage Plus Holdings, LLC 6.50% 6/20/20271 | 3,543 | 3,530 | ||||||
| Mueller Water Products, Inc. 4.00% 6/15/20291 | 275 | 242 | ||||||
| Park River Holdings, Inc. 5.625% 2/1/20291 | 775 | 517 | ||||||
| PGT Innovations, Inc. 4.375% 10/1/20291 | 1,125 | 943 | ||||||
| Pitney Bowes, Inc. 6.875% 3/15/20271 | 600 | 514 | ||||||
| PM General Purchaser, LLC 9.50% 10/1/20281 | 2,428 | 1,855 | ||||||
| Prime Security Services Borrower, LLC 3.375% 8/31/20271 | 475 | 411 | ||||||
| Prime Security Services Borrower, LLC 6.25% 1/15/20281 | 627 | 572 | ||||||
| R.R. Donnelley & Sons Co. 6.125% 11/1/20261 | 375 | 351 | ||||||
| Roller Bearing Company of America, Inc. 4.375% 10/15/20291 | 170 | 147 | ||||||
| Rolls-Royce PLC 5.75% 10/15/20271 | 720 | 687 | ||||||
| Sensata Technologies, Inc. 3.75% 2/15/20311 | 500 | 412 | ||||||
| SkyMiles IP, Ltd. 4.75% 10/20/20281 | 1,975 | 1,859 | ||||||
| Spirit AeroSystems, Inc. 4.60% 6/15/2028 | 1,410 | 1,141 | ||||||
| Spirit AeroSystems, Inc. 9.375% 11/30/20291 | 980 | 1,033 | ||||||
| SRS Distribution, Inc. 4.625% 7/1/20281 | 480 | 426 | ||||||
| Stericycle, Inc. 5.375% 7/15/20241 | 1,135 | 1,120 | ||||||
| Stericycle, Inc. 3.875% 1/15/20291 | 940 | 821 | ||||||
| The Brink’s Co. 4.625% 10/15/20271 | 719 | 659 | ||||||
| The Hertz Corp. 5.00% 12/1/20291 | 380 | 289 | ||||||
| Titan International, Inc. 7.00% 4/30/2028 | 750 | 709 | ||||||
| TransDigm, Inc. 6.25% 3/15/20261 | 1,638 | 1,619 | ||||||
| TransDigm, Inc. 6.875% 5/15/2026 | 460 | 450 | ||||||
| TransDigm, Inc. 6.375% 6/15/2026 | 240 | 234 | ||||||
| TransDigm, Inc. 5.50% 11/15/2027 | 855 | 805 | ||||||
| TransDigm, Inc. 4.625% 1/15/2029 | 155 | 137 | ||||||
| TransDigm, Inc. 4.875% 5/1/2029 | 220 | 192 | ||||||
| Triumph Group, Inc. 8.875% 6/1/20241 | 633 | 645 | ||||||
| Triumph Group, Inc. 6.25% 9/15/20241 | 4,812 | 4,569 | ||||||
| Triumph Group, Inc. 7.75% 8/15/2025 | 1,260 | 1,074 | ||||||
| Uber Technologies, Inc. 8.00% 11/1/20261 | 498 | 501 | ||||||
| United Airlines, Inc. 4.375% 4/15/20261 | 285 | 265 | ||||||
| United Airlines, Inc. 4.625% 4/15/20291 | 505 | 441 | ||||||
| 236 | American Funds Insurance Series |
American High-Income Trust (continued)
| Bonds, notes & other debt instruments (continued) | Principal amount (000) |
Value (000) |
||||||
| Corporate bonds, notes & loans (continued) | ||||||||
| Industrials (continued) | ||||||||
| United Rentals, Inc. 4.875% 1/15/2028 | USD | 680 | $ | 646 | ||||
| United Rentals, Inc. 6.00% 12/15/20291 | 910 | 906 | ||||||
| United Rentals, Inc. 3.875% 2/15/2031 | 525 | 441 | ||||||
| United Rentals, Inc. 3.75% 1/15/2032 | 450 | 368 | ||||||
| Vertical U.S. Newco, Inc. 5.25% 7/15/20271 | 1,495 | 1,330 | ||||||
| WESCO Distribution, Inc. 7.125% 6/15/20251 | 675 | 685 | ||||||
| WESCO Distribution, Inc. 7.25% 6/15/20281 | 825 | 837 | ||||||
| Western Global Airlines, LLC 10.375% 8/15/20251 | 475 | 357 | ||||||
| 74,604 | ||||||||
| Financials 7.26% | ||||||||
| Advisor Group Holdings, LLC 6.25% 3/1/20281 | 2,191 | 2,017 | ||||||
| AG Merger Sub II, Inc. 10.75% 8/1/20271 | 3,800 | 3,852 | ||||||
| AG TTMT Escrow Issuer, LLC 8.625% 9/30/20271 | 1,058 | 1,069 | ||||||
| Alliant Holdings Intermediate, LLC 4.25% 10/15/20271 | 890 | 798 | ||||||
| Alliant Holdings Intermediate, LLC 6.75% 10/15/20271 | 1,741 | 1,569 | ||||||
| Alliant Holdings Intermediate, LLC 5.875% 11/1/20291 | 1,560 | 1,285 | ||||||
| AmWINS Group, Inc. 4.875% 6/30/20291 | 1,260 | 1,070 | ||||||
| Aretec Escrow Issuer, Inc. 7.50% 4/1/20291 | 2,875 | 2,379 | ||||||
| Ascensus, Inc., Term Loan, (3-month USD-LIBOR + 6.50%) 10.25% 8/2/20294,5 | 1,245 | 1,096 | ||||||
| AssuredPartners, Inc. 8.00% 5/15/20271 | 437 | 419 | ||||||
| AssuredPartners, Inc. 5.625% 1/15/20291 | 365 | 301 | ||||||
| Blackstone Private Credit Fund 7.05% 9/29/20251 | 640 | 636 | ||||||
| BroadStreet Partners, Inc. 5.875% 4/15/20291 | 575 | 490 | ||||||
| Castlelake Aviation Finance DAC 5.00% 4/15/20271 | 1,115 | 972 | ||||||
| Coinbase Global, Inc. 3.375% 10/1/20281 | 1,320 | 699 | ||||||
| Coinbase Global, Inc. 3.625% 10/1/20311 | 1,090 | 526 | ||||||
| Compass Diversified Holdings 5.25% 4/15/20291 | 4,150 | 3,557 | ||||||
| Compass Diversified Holdings 5.00% 1/15/20321 | 1,230 | 979 | ||||||
| Credit Acceptance Corp. 5.125% 12/31/20241 | 275 | 259 | ||||||
| Digital Currency Group, Inc., Term Loan, (3-month USD-LIBOR + 7.00%) 8.00% 11/30/20263,4,5 | 823 | 715 | ||||||
| Digital Currency Group, Inc., Term Loan, 8.75% 11/30/20263,4 | 1,097 | 879 | ||||||
| FS Energy and Power Fund 7.50% 8/15/20231 | 2,784 | 2,793 | ||||||
| Hightower Holding, LLC 6.75% 4/15/20291 | 905 | 761 | ||||||
| HUB International, Ltd. 7.00% 5/1/20261 | 2,080 | 2,040 | ||||||
| HUB International, Ltd. 5.625% 12/1/20291 | 240 | 210 | ||||||
| Iron Mountain Information Management Services, Inc. 5.00% 7/15/20321 | 725 | 603 | ||||||
| JPMorgan Chase & Co. 2.956% 5/13/2031 (USD-SOFR + 2.515% on 5/13/2030)7 | 160 | 132 | ||||||
| JPMorgan Chase & Co. 4.912% 7/25/2033 (USD-SOFR + 2.08% on 7/25/2032)7 | 490 | 468 | ||||||
| LPL Holdings, Inc. 4.625% 11/15/20271 | 1,592 | 1,490 | ||||||
| LPL Holdings, Inc. 4.00% 3/15/20291 | 1,900 | 1,656 | ||||||
| LPL Holdings, Inc. 4.375% 5/15/20311 | 1,135 | 967 | ||||||
| MGIC Investment Corp. 5.25% 8/15/2028 | 525 | 485 | ||||||
| MSCI, Inc. 4.00% 11/15/20291 | 900 | 785 | ||||||
| MSCI, Inc. 3.625% 9/1/20301 | 66 | 55 | ||||||
| MSCI, Inc. 3.875% 2/15/20311 | 1,450 | 1,208 | ||||||
| MSCI, Inc. 3.625% 11/1/20311 | 2,055 | 1,702 | ||||||
| MSCI, Inc. 3.25% 8/15/20331 | 945 | 731 | ||||||
| National Financial Partners Corp. 6.875% 8/15/20281 | 739 | 611 | ||||||
| Navient Corp. 5.50% 1/25/2023 | 684 | 684 | ||||||
| Navient Corp. 6.125% 3/25/2024 | 1,047 | 1,027 | ||||||
| Navient Corp. 5.875% 10/25/2024 | 1,405 | 1,362 | ||||||
| Navient Corp. 6.75% 6/25/2025 | 550 | 529 | ||||||
| Navient Corp. 6.75% 6/15/2026 | 640 | 608 | ||||||
| Navient Corp. 5.00% 3/15/2027 | 2,883 | 2,529 | ||||||
| Navient Corp. 4.875% 3/15/2028 | 320 | 264 | ||||||
| Navient Corp. 5.50% 3/15/2029 | 2,280 | 1,864 | ||||||
| Navient Corp. 5.625% 8/1/2033 | 1,478 | 1,056 | ||||||
| OneMain Finance Corp. 3.875% 9/15/2028 | 206 | 164 | ||||||
| American Funds Insurance Series | 237 |
American High-Income Trust (continued)
| Bonds, notes & other debt instruments (continued) | Principal amount (000) |
Value (000) |
||||||
| Corporate bonds, notes & loans (continued) | ||||||||
| Financials (continued) | ||||||||
| OneMain Holdings, Inc. 7.125% 3/15/2026 | USD | 1,335 | $ | 1,272 | ||||
| Owl Rock Capital Corp. 3.75% 7/22/2025 | 600 | 555 | ||||||
| Owl Rock Capital Corp. 3.40% 7/15/2026 | 290 | 254 | ||||||
| Owl Rock Capital Corp. II 4.625% 11/26/20241 | 450 | 428 | ||||||
| Owl Rock Capital Corp. III 3.125% 4/13/2027 | 600 | 495 | ||||||
| Owl Rock Core Income Corp. 4.70% 2/8/2027 | 800 | 722 | ||||||
| Oxford Finance, LLC 6.375% 2/1/20271 | 1,893 | 1,764 | ||||||
| Quicken Loans, LLC 3.625% 3/1/20291 | 455 | 361 | ||||||
| Rocket Mortgage, LLC 2.875% 10/15/20261 | 520 | 447 | ||||||
| Ryan Specialty Group, LLC 4.375% 2/1/20301 | 615 | 533 | ||||||
| Springleaf Finance Corp. 6.125% 3/15/2024 | 367 | 356 | ||||||
| Springleaf Finance Corp. 6.625% 1/15/2028 | 340 | 314 | ||||||
| Starwood Property Trust, Inc. 4.375% 1/15/20271 | 570 | 500 | ||||||
| 60,352 | ||||||||
| Information technology 4.50% | ||||||||
| Almonde, Inc., Term Loan B, (3-month USD-LIBOR + 3.50%) 6.871% 6/13/20244,5 | 270 | 239 | ||||||
| Almonde, Inc., Term Loan, (3-month USD-LIBOR + 7.25%) 10.621% 6/13/20254,5 | 3,899 | 2,932 | ||||||
| Black Knight, Inc. 3.625% 9/1/20281 | 410 | 357 | ||||||
| Block, Inc. 2.75% 6/1/2026 | 1,455 | 1,302 | ||||||
| Block, Inc. 3.50% 6/1/2031 | 1,570 | 1,255 | ||||||
| BMC Software, Inc. 7.125% 10/2/20251 | 180 | 175 | ||||||
| BMC Software, Inc. 9.125% 3/1/20261 | 240 | 227 | ||||||
| BMC Software, Inc., Term Loan, (3-month USD-LIBOR + 5.50%) 6.128% 3/31/20264,5 | 1,170 | 1,080 | ||||||
| Booz Allen Hamilton, Inc. 3.875% 9/1/20281 | 450 | 399 | ||||||
| Booz Allen Hamilton, Inc. 4.00% 7/1/20291 | 580 | 511 | ||||||
| CDK Global, Inc. 7.25% 6/15/20291 | 1,460 | 1,430 | ||||||
| Ciena Corp. 4.00% 1/31/20301 | 440 | 388 | ||||||
| CommScope Finance, LLC 6.00% 3/1/20261 | 430 | 398 | ||||||
| CommScope Finance, LLC 8.25% 3/1/20271 | 360 | 280 | ||||||
| CommScope Technologies, LLC 6.00% 6/15/20251 | 380 | 347 | ||||||
| CommScope Technologies, LLC 5.00% 3/15/20271 | 220 | 150 | ||||||
| Condor Merger Sub, Inc. 7.375% 2/15/20301 | 400 | 322 | ||||||
| Diebold Nixdorf, Inc. 9.375% 7/15/20251 | 7,523 | 5,380 | ||||||
| Diebold Nixdorf, Inc., units, 8.50% PIK or 8.50% Cash 10/15/20261,3,6 | 1,324 | 797 | ||||||
| Diebold Nixdorf, Inc., Term Loan, (USD-SOFR + 5.25%) 6.75% 7/15/20253,4,5 | 2,084 | 1,404 | ||||||
| Elastic NV 4.125% 7/15/20291 | 350 | 283 | ||||||
| Entegris Escrow Corp. 4.75% 4/15/20291 | 790 | 722 | ||||||
| Fair Isaac Corp. 4.00% 6/15/20281 | 1,195 | 1,087 | ||||||
| Finastra, Ltd., Term Loan B, (3-month EUR-EURIBOR + 3.00%) 4.00% 6/13/20244,5 | EUR | 846 | 783 | |||||
| Gartner, Inc. 4.50% 7/1/20281 | USD | 2,098 | 1,960 | |||||
| Gartner, Inc. 3.625% 6/15/20291 | 154 | 135 | ||||||
| Gartner, Inc. 3.75% 10/1/20301 | 1,001 | 864 | ||||||
| GoDaddy Operating Co. 5.25% 12/1/20271 | 390 | 370 | ||||||
| GoDaddy Operating Co. 3.50% 3/1/20291 | 210 | 176 | ||||||
| Imola Merger Corp. 4.75% 5/15/20291 | 300 | 261 | ||||||
| MicroStrategy, Inc. 6.125% 6/15/20281 | 325 | 233 | ||||||
| MoneyGram International, Inc. 5.375% 8/1/20261 | 875 | 888 | ||||||
| NCR Corp. 5.125% 4/15/20291 | 1,759 | 1,474 | ||||||
| NortonLifeLock, Inc. 7.125% 9/30/20301 | 255 | 251 | ||||||
| Open Text Corp., Term Loan B, (3-month USD-LIBOR + 3.50%) 3.50% 11/16/20294,5 | 355 | 347 | ||||||
| Rocket Software, Inc. 6.50% 2/15/20291 | 455 | 359 | ||||||
| Sabre GLBL, Inc. 7.375% 9/1/20251 | 133 | 128 | ||||||
| Sabre GLBL, Inc. 11.25% 12/15/20271 | 877 | 904 | ||||||
| Sabre Holdings Corp. 9.25% 4/15/20251 | 1,152 | 1,149 | ||||||
| Synaptics, Inc. 4.00% 6/15/20291 | 375 | 316 | ||||||
| Tibco Software, Inc., Term Loan A, (3-month USD CME Term SOFR + 4.50%) 9.18% 9/29/20284,5 | 1,255 | 1,117 | ||||||
| UKG, Inc., Term Loan B, (3-month USD-LIBOR + 3.25%) 6.998% 5/4/20264,5 | 465 | 443 | ||||||
| UKG, Inc., Term Loan, (3-month USD-LIBOR + 5.25%) 8.998% 5/3/20274,5 | 1,970 | 1,820 | ||||||
| 238 | American Funds Insurance Series |
American High-Income Trust (continued)
| Bonds, notes & other debt instruments (continued) | Principal amount (000) |
Value (000) |
||||||
| Corporate bonds, notes & loans (continued) | ||||||||
| Information technology (continued) | ||||||||
| Unisys Corp. 6.875% 11/1/20271 | USD | 1,385 | $ | 1,065 | ||||
| VeriSign, Inc. 5.25% 4/1/2025 | 132 | 132 | ||||||
| Veritas US, Inc. 7.50% 9/1/20251 | 285 | 197 | ||||||
| Viavi Solutions, Inc. 3.75% 10/1/20291 | 230 | 194 | ||||||
| Xerox Corp. 5.50% 8/15/20281 | 435 | 349 | ||||||
| 37,380 | ||||||||
| Consumer staples 4.14% | ||||||||
| Albertsons Companies, Inc. 4.625% 1/15/20271 | 1,060 | 987 | ||||||
| Albertsons Companies, Inc. 5.875% 2/15/20281 | 190 | 181 | ||||||
| Albertsons Companies, Inc. 3.50% 3/15/20291 | 3,468 | 2,917 | ||||||
| Albertsons Companies, Inc. 4.875% 2/15/20301 | 615 | 550 | ||||||
| B&G Foods, Inc. 5.25% 4/1/2025 | 1,377 | 1,210 | ||||||
| B&G Foods, Inc. 5.25% 9/15/2027 | 2,093 | 1,608 | ||||||
| Central Garden & Pet Co. 4.125% 10/15/2030 | 600 | 494 | ||||||
| Central Garden & Pet Co. 4.125% 4/30/20311 | 1,005 | 833 | ||||||
| Coty, Inc. 5.00% 4/15/20261 | 700 | 665 | ||||||
| Coty, Inc. 6.50% 4/15/20261 | 460 | 442 | ||||||
| Coty, Inc. 4.75% 1/15/20291 | 1,260 | 1,142 | ||||||
| Darling Ingredients, Inc. 5.25% 4/15/20271 | 329 | 317 | ||||||
| Darling Ingredients, Inc. 6.00% 6/15/20301 | 1,205 | 1,180 | ||||||
| Edgewell Personal Care Co. 5.50% 6/1/20281 | 275 | 258 | ||||||
| Energizer Holdings, Inc. 4.375% 3/31/20291 | 545 | 463 | ||||||
| Ingles Markets, Inc. 4.00% 6/15/20311 | 345 | 291 | ||||||
| Kraft Heinz Company 3.875% 5/15/2027 | 275 | 263 | ||||||
| Kraft Heinz Company 4.375% 6/1/2046 | 306 | 250 | ||||||
| Kronos Acquisition Holdings, Inc. 5.00% 12/31/20261 | 1,953 | 1,692 | ||||||
| Kronos Acquisition Holdings, Inc. 7.00% 12/31/20271 | 3,040 | 2,504 | ||||||
| Lamb Weston Holdings, Inc. 4.125% 1/31/20301 | 2,615 | 2,313 | ||||||
| Lamb Weston Holdings, Inc. 4.375% 1/31/20321 | 715 | 626 | ||||||
| Nestle Skin Health SA, Term Loan B3, (3-month USD-LIBOR + 3.75%) 8.48% 10/1/20264,5 | 784 | 753 | ||||||
| Performance Food Group, Inc. 5.50% 10/15/20271 | 705 | 666 | ||||||
| Performance Food Group, Inc. 4.25% 8/1/20291 | 483 | 419 | ||||||
| Post Holdings, Inc. 5.625% 1/15/20281 | 1,199 | 1,130 | ||||||
| Post Holdings, Inc. 5.50% 12/15/20291 | 811 | 736 | ||||||
| Post Holdings, Inc. 4.625% 4/15/20301 | 3,355 | 2,901 | ||||||
| Post Holdings, Inc. 4.50% 9/15/20311 | 1,350 | 1,137 | ||||||
| Prestige Brands International, Inc. 5.125% 1/15/20281 | 103 | 97 | ||||||
| Prestige Brands International, Inc. 3.75% 4/1/20311 | 1,275 | 1,053 | ||||||
| Simmons Foods, Inc. 4.625% 3/1/20291 | 993 | 810 | ||||||
| TreeHouse Foods, Inc. 4.00% 9/1/2028 | 1,415 | 1,205 | ||||||
| United Natural Foods, Inc. 6.75% 10/15/20281 | 2,030 | 1,954 | ||||||
| US Foods, Inc. 4.625% 6/1/20301 | 460 | 406 | ||||||
| 34,453 | ||||||||
| Real estate 3.45% | ||||||||
| Anywhere Real Estate Group, LLC 5.75% 1/15/20291 | 2,213 | 1,677 | ||||||
| Anywhere Real Estate Group, LLC 5.25% 4/15/20301 | 957 | 699 | ||||||
| Brookfield Property REIT, Inc. 5.75% 5/15/20261 | 1,304 | 1,193 | ||||||
| Brookfield Property REIT, Inc. 4.50% 4/1/20271 | 194 | 162 | ||||||
| Forestar Group, Inc. 3.85% 5/15/20261 | 465 | 408 | ||||||
| Forestar Group, Inc. 5.00% 3/1/20281 | 92 | 79 | ||||||
| Hospitality Properties Trust 4.35% 10/1/2024 | 145 | 132 | ||||||
| Howard Hughes Corp. 5.375% 8/1/20281 | 1,447 | 1,306 | ||||||
| Howard Hughes Corp. 4.125% 2/1/20291 | 2,043 | 1,714 | ||||||
| Howard Hughes Corp. 4.375% 2/1/20311 | 2,258 | 1,830 | ||||||
| Iron Mountain, Inc. 4.875% 9/15/20271 | 1,616 | 1,489 | ||||||
| Iron Mountain, Inc. 5.25% 3/15/20281 | 1,214 | 1,119 | ||||||
| Iron Mountain, Inc. 5.00% 7/15/20281 | 367 | 330 | ||||||
| American Funds Insurance Series | 239 |
American High-Income Trust (continued)
| Bonds, notes & other debt instruments (continued) | Principal amount (000) |
Value (000) |
||||||
| Corporate bonds, notes & loans (continued) | ||||||||
| Real estate (continued) | ||||||||
| Iron Mountain, Inc. 5.25% 7/15/20301 | USD | 2,880 | $ | 2,509 | ||||
| Iron Mountain, Inc. 4.50% 2/15/20311 | 950 | 783 | ||||||
| Kennedy-Wilson Holdings, Inc. 4.75% 3/1/2029 | 2,505 | 1,989 | ||||||
| Kennedy-Wilson Holdings, Inc. 4.75% 2/1/2030 | 2,545 | 1,944 | ||||||
| Kennedy-Wilson Holdings, Inc. 5.00% 3/1/2031 | 2,050 | 1,546 | ||||||
| Ladder Capital Finance Holdings LLLP 5.25% 10/1/20251 | 740 | 697 | ||||||
| Ladder Capital Finance Holdings LLLP 4.25% 2/1/20271 | 1,429 | 1,203 | ||||||
| Ladder Capital Finance Holdings LLLP 4.75% 6/15/20291 | 100 | 81 | ||||||
| Medical Properties Trust, Inc. 5.00% 10/15/2027 | 638 | 538 | ||||||
| Medical Properties Trust, Inc. 3.50% 3/15/2031 | 239 | 164 | ||||||
| Park Intermediate Holdings, LLC 4.875% 5/15/20291 | 820 | 695 | ||||||
| RHP Hotel Properties, LP 4.50% 2/15/20291 | 535 | 462 | ||||||
| RLJ Lodging Trust, LP 4.00% 9/15/20291 | 800 | 650 | ||||||
| VICI Properties, LP 3.50% 2/15/20251 | 261 | 247 | ||||||
| VICI Properties, LP 4.625% 6/15/20251 | 620 | 595 | ||||||
| VICI Properties, LP 3.875% 2/15/20291 | 1,111 | 975 | ||||||
| VICI Properties, LP 4.625% 12/1/20291 | 184 | 168 | ||||||
| VICI Properties, LP 4.125% 8/15/20301 | 330 | 289 | ||||||
| WeWork Companies, LLC 5.00% 7/10/20251 | 2,985 | 992 | ||||||
| 28,665 | ||||||||
| Utilities 3.20% | ||||||||
| AmeriGas Partners, LP 5.875% 8/20/2026 | 80 | 76 | ||||||
| AmeriGas Partners, LP 5.75% 5/20/2027 | 324 | 302 | ||||||
| Calpine Corp. 4.50% 2/15/20281 | 150 | 134 | ||||||
| Calpine Corp. 5.125% 3/15/20281 | 518 | 463 | ||||||
| Calpine Corp. 3.75% 3/1/20311 | 500 | 403 | ||||||
| DPL, Inc. 4.125% 7/1/2025 | 555 | 522 | ||||||
| Emera, Inc. 6.75% 6/15/2076 (3-month USD-LIBOR + 5.44% on 6/15/2026)7 | 1,155 | 1,113 | ||||||
| FirstEnergy Corp. 2.65% 3/1/2030 | 624 | 510 | ||||||
| FirstEnergy Corp. 2.25% 9/1/2030 | 980 | 780 | ||||||
| FirstEnergy Corp. 7.375% 11/15/2031 | 337 | 380 | ||||||
| FirstEnergy Corp. 3.40% 3/1/2050 | 510 | 337 | ||||||
| FirstEnergy Corp., Series C, 5.35% 7/15/20477 | 475 | 425 | ||||||
| FirstEnergy Transmission, LLC 2.866% 9/15/20281 | 265 | 232 | ||||||
| FirstEnergy Transmission, LLC 4.55% 4/1/20491 | 100 | 81 | ||||||
| NextEra Energy Partners, LP 4.25% 7/15/20241 | 122 | 118 | ||||||
| NRG Energy, Inc. 3.625% 2/15/20311 | 845 | 644 | ||||||
| Pacific Gas and Electric Co. 5.45% 6/15/2027 | 335 | 331 | ||||||
| Pacific Gas and Electric Co. 2.10% 8/1/2027 | 116 | 99 | ||||||
| Pacific Gas and Electric Co. 3.30% 12/1/2027 | 124 | 110 | ||||||
| Pacific Gas and Electric Co. 3.75% 7/1/2028 | 10 | 9 | ||||||
| Pacific Gas and Electric Co. 4.55% 7/1/2030 | 213 | 194 | ||||||
| Pacific Gas and Electric Co. 2.50% 2/1/2031 | 393 | 306 | ||||||
| Pacific Gas and Electric Co. 3.25% 6/1/2031 | 107 | 87 | ||||||
| Pacific Gas and Electric Co. 3.30% 8/1/2040 | 280 | 190 | ||||||
| Pacific Gas and Electric Co. 3.50% 8/1/2050 | 1,000 | 625 | ||||||
| PG&E Corp. 5.00% 7/1/2028 | 3,150 | 2,881 | ||||||
| PG&E Corp. 5.25% 7/1/2030 | 3,040 | 2,771 | ||||||
| Talen Energy Corp. 10.50% 1/15/20261,2 | 2,987 | 1,434 | ||||||
| Talen Energy Corp. 7.25% 5/15/20271 | 5,189 | 5,395 | ||||||
| Talen Energy Corp. 6.625% 1/15/20281 | 130 | 133 | ||||||
| Talen Energy Corp., Term Loan, (3-month USD CME Term SOFR + 4.75%) 9.008% 11/13/20234,5 | 3,085 | 3,116 | ||||||
| Talen Energy Corp., Term Loan B, (3-month USD-LIBOR + 3.75%) 7.821% 7/8/20264,5 | 500 | 508 | ||||||
| Talen Energy Supply, LLC 7.625% 6/1/20281 | 489 | 511 | ||||||
| 240 | American Funds Insurance Series |
American High-Income Trust (continued)
| Bonds, notes & other debt instruments (continued) | Principal amount (000) |
Value (000) |
||||||
| Corporate bonds, notes & loans (continued) | ||||||||
| Utilities (continued) | ||||||||
| Targa Resources Partners, LP 4.00% 1/15/2032 | USD | 190 | $ | 160 | ||||
| Venture Global Calcasieu Pass, LLC 3.875% 8/15/20291 | 1,190 | 1,043 | ||||||
| Vistra Operations Co., LLC 3.55% 7/15/20241 | 231 | 222 | ||||||
| 26,645 | ||||||||
| Total corporate bonds, notes & loans | 736,042 | |||||||
| Mortgage-backed obligations 0.08% | ||||||||
| Collateralized mortgage-backed obligations 0.08% | ||||||||
| Treehouse Park Improvement Association No.1 - Anleihen 9.75% 12/1/20331,3 | 712 | 630 | ||||||
| Total bonds, notes & other debt instruments (cost: $842,910,000) | 736,672 | |||||||
| Convertible bonds & notes 0.06% | ||||||||
| Communication services 0.05% | ||||||||
| DISH DBS Corp., convertible notes, 3.375% 8/15/2026 | 635 | 399 | ||||||
| Energy 0.01% | ||||||||
| Mesquite Energy, Inc., convertible notes, 13.14% Cash 7/15/20231,3,6 | 79 | 79 | ||||||
| Total convertible bonds & notes (cost: $720,000) | 478 | |||||||
| Convertible stocks 0.11% | Shares | |||||||
| Utilities 0.06% | ||||||||
| PG&E Corp., convertible preferred units, 5.50% 8/16/2023 | 3,350 | 483 | ||||||
| Financials 0.05% | ||||||||
| 2020 Cash Mandatory Exchangeable Trust, convertible preferred shares, 5.25% 6/1/20231 | 411 | 472 | ||||||
| Total convertible stocks (cost: $657,000) | 955 | |||||||
| Common stocks 4.45% | ||||||||
| Health care 2.60% | ||||||||
| Rotech Healthcare, Inc.3,8,9 | 201,793 | 21,591 | ||||||
| Energy 1.15% | ||||||||
| Chesapeake Energy Corp. | 29,829 | 2,815 | ||||||
| Weatherford International8 | 33,659 | 1,714 | ||||||
| Ascent Resources - Utica, LLC, Class A3,8,9 | 6,297,894 | 1,260 | ||||||
| Denbury, Inc.8 | 13,380 | 1,164 | ||||||
| Diamond Offshore Drilling, Inc.8 | 110,972 | 1,154 | ||||||
| California Resources Corp. | 17,202 | 748 | ||||||
| Constellation Oil Services Holding SA, Class B-13,8 | 3,449,949 | 380 | ||||||
| Altera Infrastructure, LP3,8 | 3,550 | 282 | ||||||
| McDermott International, Ltd.8 | 82,509 | 26 | ||||||
| Mesquite Energy, Inc.3,8 | 3,558 | 21 | ||||||
| Bighorn Permian Resources, LLC3 | 2,894 | — | 10 | |||||
| 9,564 | ||||||||
| Financials 0.32% | ||||||||
| Jonah Energy Parent, LLC3 | 38,716 | 2,289 | ||||||
| Navient Corp. | 20,000 | 329 | ||||||
| 2,618 | ||||||||
| American Funds Insurance Series | 241 |
American High-Income Trust (continued)
| Common stocks (continued) | Shares | Value (000) |
||||||
| Consumer discretionary 0.29% | ||||||||
| NMG Parent, LLC8 | 9,965 | $ | 1,520 | |||||
| MYT Holding Co., Class B3,8 | 608,846 | 913 | ||||||
| 2,433 | ||||||||
| Information technology 0.05% | ||||||||
| MoneyGram International, Inc.8 | 41,400 | 451 | ||||||
| Communication services 0.04% | ||||||||
| Intelsat SA3,8 | 8,164 | 196 | ||||||
| iHeartMedia, Inc., Class A8 | 22,639 | 139 | ||||||
| 335 | ||||||||
| Total common stocks (cost: $13,251,000) | 36,992 | |||||||
| Preferred securities 0.32% | ||||||||
| Consumer discretionary 0.27% | ||||||||
| MYT Holdings, LLC, Series A, 10.00% preferred shares3,8 | 2,095,904 | 2,201 | ||||||
| Industrials 0.05% | ||||||||
| ACR III LSC Holdings, LLC, Series B, preferred shares1,3,8 | 1,022 | 428 | ||||||
| Total preferred securities (cost: $2,933,000) | 2,629 | |||||||
| Rights & warrants 0.10% | ||||||||
| Consumer discretionary 0.10% | ||||||||
| NMG Parent, LLC, warrants, expire 9/24/20278 | 27,111 | 826 | ||||||
| Communication services 0.00% | ||||||||
| Intelsat Jackson Holdings SA (CVR), Series A3,8 | 855 | 6 | ||||||
| Intelsat Jackson Holdings SA (CVR), Series B3,8 | 855 | 6 | ||||||
| 12 | ||||||||
| Total rights & warrants (cost: $173,000) | 838 | |||||||
| Short-term securities 4.64% | ||||||||
| Money market investments 4.64% | ||||||||
| Capital Group Central Cash Fund 4.31%11,12 | 385,690 | 38,565 | ||||||
| Total short-term securities (cost: $38,557,000) | 38,565 | |||||||
| Total investment securities 98.27% (cost: $899,201,000) | 817,129 | |||||||
| Other assets less liabilities 1.73% | 14,425 | |||||||
| Net assets 100.00% | $ | 831,554 |
| 242 | American Funds Insurance Series |
American High-Income Trust (continued)
Futures contracts
| Contracts | Type | Number of contracts |
Expiration | Notional amount (000) |
Value and unrealized (depreciation) appreciation at 12/31/2022 (000) |
||||||||||
| 5 Year U.S. Treasury Note Futures | Long | 63 | March 2023 | USD | 6,799 | $ | (98 | ) | |||||||
| 10 Year U.S. Treasury Note Futures | Short | 14 | March 2023 | (1,572 | ) | 10 | |||||||||
| 30 Year Ultra U.S. Treasury Bond Futures | Short | 1 | March 2023 | (134 | ) | — | 10 | ||||||||
| $ | (88 | ) | |||||||||||||
Swap contracts
Credit default swaps
Centrally cleared credit default swaps on credit indices — buy protection
| Reference index |
Financing rate paid |
Payment frequency |
Expiration date |
Notional amount (000) |
Value at 12/31/2022 (000) |
Upfront premium paid (000) |
Unrealized depreciation at 12/31/2022 (000) |
|||||||||||||||||
| CDX.NA.HY.39 | 5.00% | Quarterly | 12/20/2027 | USD | 8,050 | $ | (50 | ) | $ | 104 | $ | (154 | ) | |||||||||||
Investments in affiliates12
| Value of affiliate at 1/1/2022 (000) |
Additions (000) |
Reductions (000) |
Net realized loss (000) |
Net unrealized appreciation (000) |
Value of affiliate at 12/31/2022 (000) |
Dividend income (000) |
||||||||||||||||||||||
| Short-term securities 4.64% | ||||||||||||||||||||||||||||
| Money market investments 4.64% | ||||||||||||||||||||||||||||
| Capital Group Central Cash Fund 4.31%11 | $ | 17,238 | $ | 219,950 | $ | 198,620 | $ | (7 | ) | $ | 4 | $ | 38,565 | $ | 610 | |||||||||||||
Restricted securities9
| Acquisition date |
Cost (000) |
Value (000) |
Percent of net assets |
||||||||||||
| Rotech Healthcare, Inc.3,8 | 9/26/2013 | $ | 4,331 | $ | 21,591 | 2.60 | % | ||||||||
| Ascent Resources - Utica, LLC, Class A3,8 | 11/15/2016 | 302 | 1,260 | .15 | |||||||||||
| Total | $ | 4,633 | $ | 22,851 | 2.75 | % | |||||||||
| American Funds Insurance Series | 243 |
American High-Income Trust (continued)
| 1 | Acquired in a transaction exempt from registration under Rule 144A or, for commercial paper, Section 4(a)(2) of the Securities Act of 1933. May be resold in the U.S. in transactions exempt from registration, normally to qualified institutional buyers. The total value of all such securities was $544,764,000, which represented 65.51% of the net assets of the fund. |
| 2 | Scheduled interest and/or principal payment was not received. |
| 3 | Value determined using significant unobservable inputs. |
| 4 | Loan participations and assignments; may be subject to legal or contractual restrictions on resale. The total value of all such loans was $25,672,000, which represented 3.09% of the net assets of the fund. |
| 5 | Coupon rate may change periodically. Reference rate and spread are as of the most recent information available. Some coupon rates are determined by the issuer or agent based on current market conditions; therefore, the reference rate and spread are not available. |
| 6 | Payment in kind; the issuer has the option of paying additional securities in lieu of cash. Payment methods and rates are as of the most recent payment when available. |
| 7 | Step bond; coupon rate may change at a later date. |
| 8 | Security did not produce income during the last 12 months. |
| 9 | Restricted security, other than Rule 144A securities or commercial paper issued pursuant to Section 4(a)(2) of the Securities Act of 1933. The total value of all such restricted securities was $22,851,000, which represented 2.75% of the net assets of the fund. |
| 10 | Amount less than one thousand. |
| 11 | Rate represents the seven-day yield at 12/31/2022. |
| 12 | Part of the same “group of investment companies” as the fund as defined under the Investment Company Act of 1940, as amended. |
Key to abbreviations
CME = CME Group
CVR = Contingent Value Rights
DAC = Designated Activity Company
EUR = Euros
EURIBOR = Euro Interbank Offered Rate
LIBOR = London Interbank Offered Rate
PIK = Payment In Kind
REIT = Real Estate Investment Trust
SOFR = Secured Overnight Financing Rate
USD = U.S. dollars
Refer to the notes to financial statements.
| 244 | American Funds Insurance Series |
American Funds Mortgage Fund
Investment portfolio December 31, 2022
| Bonds, notes & other debt instruments 94.91% | Principal amount (000) |
Value (000) |
||||||
| Mortgage-backed obligations 80.19% | ||||||||
| Federal agency mortgage-backed obligations 77.35% | ||||||||
| Fannie Mae Pool #695412 5.00% 6/1/20331 | USD | — | 2 | $ | — | 2 | ||
| Fannie Mae Pool #AD3566 5.00% 10/1/20351 | 2 | 2 | ||||||
| Fannie Mae Pool #256583 5.00% 12/1/20361 | 32 | 32 | ||||||
| Fannie Mae Pool #931768 5.00% 8/1/20391 | 1 | 1 | ||||||
| Fannie Mae Pool #AC0794 5.00% 10/1/20391 | 5 | 5 | ||||||
| Fannie Mae Pool #932606 5.00% 2/1/20401 | 2 | 2 | ||||||
| Fannie Mae Pool #AE1248 5.00% 6/1/20411 | 8 | 8 | ||||||
| Fannie Mae Pool #MA4387 2.00% 7/1/20411 | 19 | 16 | ||||||
| Fannie Mae Pool #AJ1873 4.00% 10/1/20411 | 7 | 6 | ||||||
| Fannie Mae Pool #AE1274 5.00% 10/1/20411 | 7 | 7 | ||||||
| Fannie Mae Pool #AE1277 5.00% 11/1/20411 | 5 | 5 | ||||||
| Fannie Mae Pool #MA4501 2.00% 12/1/20411 | 370 | 312 | ||||||
| Fannie Mae Pool #AE1283 5.00% 12/1/20411 | 2 | 2 | ||||||
| Fannie Mae Pool #MA4540 2.00% 2/1/20421 | 530 | 447 | ||||||
| Fannie Mae Pool #AE1290 5.00% 2/1/20421 | 4 | 4 | ||||||
| Fannie Mae Pool #MA4570 2.00% 3/1/20421 | 120 | 102 | ||||||
| Fannie Mae Pool #AT0300 3.50% 3/1/20431 | 1 | 1 | ||||||
| Fannie Mae Pool #AT3954 3.50% 4/1/20431 | 2 | 2 | ||||||
| Fannie Mae Pool #AY1829 3.50% 12/1/20441 | 2 | 2 | ||||||
| Fannie Mae Pool #FM9416 3.50% 7/1/20451 | 374 | 346 | ||||||
| Fannie Mae Pool #BH3122 4.00% 6/1/20471 | 1 | 1 | ||||||
| Fannie Mae Pool #BJ5015 4.00% 12/1/20471 | 39 | 37 | ||||||
| Fannie Mae Pool #BK5232 4.00% 5/1/20481 | 20 | 19 | ||||||
| Fannie Mae Pool #BK6840 4.00% 6/1/20481 | 27 | 25 | ||||||
| Fannie Mae Pool #BK9743 4.00% 8/1/20481 | 8 | 8 | ||||||
| Fannie Mae Pool #BK9761 4.50% 8/1/20481 | 5 | 5 | ||||||
| Fannie Mae Pool #FM3280 3.50% 5/1/20491 | 98 | 91 | ||||||
| Fannie Mae Pool #CA5496 3.00% 4/1/20501,3 | 1,215 | 1,089 | ||||||
| Fannie Mae Pool #CA5968 2.50% 6/1/20501 | 54 | 46 | ||||||
| Fannie Mae Pool #CA6593 2.50% 8/1/20501 | 560 | 482 | ||||||
| Fannie Mae Pool #CA7257 2.50% 10/1/20501 | 126 | 109 | ||||||
| Fannie Mae Pool #BQ3005 2.50% 10/1/20501 | 82 | 70 | ||||||
| Fannie Mae Pool #MA4208 2.00% 12/1/20501 | 13 | 10 | ||||||
| Fannie Mae Pool #CA8955 2.50% 2/1/20511 | 66 | 57 | ||||||
| Fannie Mae Pool #CB0290 2.00% 4/1/20511 | 116 | 95 | ||||||
| Fannie Mae Pool #MA4305 2.00% 4/1/20511 | 1 | 1 | ||||||
| Fannie Mae Pool #CB0041 3.00% 4/1/20511 | 211 | 188 | ||||||
| Fannie Mae Pool #FM7687 3.00% 6/1/20511 | 278 | 247 | ||||||
| Fannie Mae Pool #FM7900 2.50% 7/1/20511 | 28 | 24 | ||||||
| Fannie Mae Pool #CB1527 2.50% 9/1/20511 | 450 | 382 | ||||||
| Fannie Mae Pool #FS0965 2.00% 11/1/20511 | 3 | 2 | ||||||
| Fannie Mae Pool #FM9492 2.50% 11/1/20511 | 464 | 397 | ||||||
| Fannie Mae Pool #FM9694 2.50% 11/1/20511 | 230 | 197 | ||||||
| Fannie Mae Pool #CB2286 2.50% 12/1/20511 | 764 | 653 | ||||||
| Fannie Mae Pool #BU3058 2.50% 12/1/20511 | 295 | 251 | ||||||
| Fannie Mae Pool #FM9804 2.50% 12/1/20511 | 247 | 212 | ||||||
| Fannie Mae Pool #FM9976 3.00% 12/1/20511 | 100 | 89 | ||||||
| Fannie Mae Pool #CB2544 3.00% 1/1/20521 | 280 | 248 | ||||||
| Fannie Mae Pool #BV3870 2.50% 2/1/20521 | 405 | 344 | ||||||
| Fannie Mae Pool #FS0523 2.50% 2/1/20521 | 380 | 325 | ||||||
| Fannie Mae Pool #BV8569 2.50% 4/1/20521 | 1,274 | 1,081 | ||||||
| Fannie Mae Pool #MA4578 2.50% 4/1/20521 | 204 | 173 | ||||||
| Fannie Mae Pool #CB4274 2.50% 7/1/20521 | 179 | 152 | ||||||
| Fannie Mae Pool #BW0004 3.50% 7/1/20521 | 300 | 273 | ||||||
| Fannie Mae Pool #CB4159 4.00% 7/1/20521 | 22 | 20 | ||||||
| Fannie Mae Pool #MA4700 4.00% 8/1/20521 | 1,967 | 1,847 | ||||||
| Fannie Mae Pool #BV8024 4.00% 8/1/20521 | 28 | 26 | ||||||
| Fannie Mae Pool #BW7326 4.00% 9/1/20521 | 24 | 22 | ||||||
| Fannie Mae Pool #BW9348 4.00% 9/1/20521 | 21 | 20 | ||||||
| Fannie Mae Pool #BW8103 4.00% 9/1/20521 | 20 | 18 | ||||||
| Fannie Mae Pool #BW9823 4.50% 9/1/20521 | 45 | 44 | ||||||
| American Funds Insurance Series | 245 |
American Funds Mortgage Fund (continued)
| Bonds, notes & other debt instruments (continued) | Principal amount (000) |
Value (000) |
||||||
| Mortgage-backed obligations (continued) | ||||||||
| Federal agency mortgage-backed obligations (continued) | ||||||||
| Fannie Mae Pool #CB5208 5.00% 9/1/20521 | USD | 599 | $ | 591 | ||||
| Fannie Mae Pool #BW8980 4.00% 10/1/20521 | 77 | 72 | ||||||
| Fannie Mae Pool #BW1210 4.00% 10/1/20521 | 58 | 54 | ||||||
| Fannie Mae Pool #BW7356 4.00% 10/1/20521 | 48 | 45 | ||||||
| Fannie Mae Pool #BX0509 4.00% 10/1/20521 | 21 | 20 | ||||||
| Fannie Mae Pool #BW7795 4.50% 10/1/20521 | 477 | 460 | ||||||
| Fannie Mae Pool #MA4784 4.50% 10/1/20521 | 4 | 4 | ||||||
| Fannie Mae Pool #BW7121 5.00% 10/1/20521 | 577 | 570 | ||||||
| Fannie Mae Pool #CB5380 5.00% 10/1/20521 | 203 | 200 | ||||||
| Fannie Mae Pool #MA4803 3.50% 11/1/20521 | 38 | 34 | ||||||
| Fannie Mae Pool #MA4804 4.00% 11/1/20521 | 575 | 540 | ||||||
| Fannie Mae Pool #BW1310 4.00% 11/1/20521 | 22 | 21 | ||||||
| Fannie Mae Pool #BX1516 4.50% 11/1/20521 | 469 | 452 | ||||||
| Fannie Mae Pool #MA4841 5.00% 12/1/20521 | 1,000 | 987 | ||||||
| Fannie Mae Pool #MA4866 4.00% 1/1/20531 | 68 | 64 | ||||||
| Fannie Mae Pool #MA4868 5.00% 1/1/20531 | 495 | 489 | ||||||
| Fannie Mae Pool #BF0379 3.50% 4/1/20591 | 146 | 134 | ||||||
| Fannie Mae Pool #BF0481 3.50% 6/1/20601 | 173 | 159 | ||||||
| Fannie Mae Pool #BF0497 3.00% 7/1/20601 | 53 | 46 | ||||||
| Fannie Mae Pool #BF0585 4.50% 12/1/20611 | 56 | 54 | ||||||
| Freddie Mac Pool #ZA1922 5.00% 2/1/20261 | 1 | 1 | ||||||
| Freddie Mac Pool #ZS8950 5.00% 10/1/20291 | 2 | 2 | ||||||
| Freddie Mac Pool #A18781 5.00% 3/1/20341 | 623 | 637 | ||||||
| Freddie Mac Pool #RB5138 2.00% 12/1/20411 | 102 | 86 | ||||||
| Freddie Mac Pool #RB5145 2.00% 2/1/20421 | 94 | 79 | ||||||
| Freddie Mac Pool #RB5148 2.00% 3/1/20421 | 597 | 504 | ||||||
| Freddie Mac Pool #Q15874 4.00% 2/1/20431 | 1 | 1 | ||||||
| Freddie Mac Pool #760012 3.113% 4/1/20451,4 | 39 | 38 | ||||||
| Freddie Mac Pool #760013 3.208% 4/1/20451,4 | 23 | 22 | ||||||
| Freddie Mac Pool #760014 2.74% 8/1/20451,4 | 335 | 324 | ||||||
| Freddie Mac Pool #760015 2.561% 1/1/20471,4 | 63 | 60 | ||||||
| Freddie Mac Pool #Q47615 3.50% 4/1/20471 | 18 | 17 | ||||||
| Freddie Mac Pool #Q52069 3.50% 11/1/20471 | 28 | 26 | ||||||
| Freddie Mac Pool #Q55971 4.00% 5/1/20481 | 20 | 19 | ||||||
| Freddie Mac Pool #Q56175 4.00% 5/1/20481 | 19 | 18 | ||||||
| Freddie Mac Pool #Q55970 4.00% 5/1/20481 | 10 | 9 | ||||||
| Freddie Mac Pool #Q56599 4.00% 6/1/20481 | 28 | 27 | ||||||
| Freddie Mac Pool #Q58411 4.50% 9/1/20481 | 51 | 51 | ||||||
| Freddie Mac Pool #Q58436 4.50% 9/1/20481 | 28 | 27 | ||||||
| Freddie Mac Pool #Q58378 4.50% 9/1/20481 | 20 | 20 | ||||||
| Freddie Mac Pool #RA1339 3.00% 9/1/20491,3 | 1,531 | 1,360 | ||||||
| Freddie Mac Pool #QA2748 3.50% 9/1/20491 | 19 | 18 | ||||||
| Freddie Mac Pool #SD7512 3.00% 2/1/20501 | 160 | 143 | ||||||
| Freddie Mac Pool #SD8106 2.00% 11/1/20501 | 597 | 488 | ||||||
| Freddie Mac Pool #SD8128 2.00% 2/1/20511 | 2 | 2 | ||||||
| Freddie Mac Pool #SD8134 2.00% 3/1/20511 | 3 | 3 | ||||||
| Freddie Mac Pool #RA5288 2.00% 5/1/20511 | 327 | 268 | ||||||
| Freddie Mac Pool #RA6406 2.00% 11/1/20511 | 80 | 65 | ||||||
| Freddie Mac Pool #SD7548 2.50% 11/1/20511 | 1,100 | 947 | ||||||
| Freddie Mac Pool #SD1385 2.50% 11/1/20511 | 68 | 58 | ||||||
| Freddie Mac Pool #SD7552 2.50% 1/1/20521 | 396 | 338 | ||||||
| Freddie Mac Pool #RA6598 3.50% 1/1/20521 | 196 | 179 | ||||||
| Freddie Mac Pool #SD7550 3.00% 2/1/20521 | 404 | 361 | ||||||
| Freddie Mac Pool #SD0873 3.50% 2/1/20521,3 | 1,203 | 1,113 | ||||||
| Freddie Mac Pool #QD7089 3.50% 2/1/20521 | 9 | 9 | ||||||
| Freddie Mac Pool #SD1450 2.50% 3/1/20521 | 3,355 | 2,879 | ||||||
| Freddie Mac Pool #SD7553 3.00% 3/1/20521 | 325 | 289 | ||||||
| Freddie Mac Pool #QE6097 2.50% 7/1/20521 | 197 | 168 | ||||||
| Freddie Mac Pool #SD8237 4.00% 8/1/20521 | 1,523 | 1,430 | ||||||
| Freddie Mac Pool #QE9057 4.00% 8/1/20521 | 18 | 17 | ||||||
| Freddie Mac Pool #SD8238 4.50% 8/1/20521 | 10 | 10 | ||||||
| 246 | American Funds Insurance Series |
American Funds Mortgage Fund (continued)
| Bonds, notes & other debt instruments (continued) | Principal amount (000) |
Value (000) |
||||||
| Mortgage-backed obligations (continued) | ||||||||
| Federal agency mortgage-backed obligations (continued) | ||||||||
| Freddie Mac Pool #SD8244 4.00% 9/1/20521 | USD | 651 | $ | 612 | ||||
| Freddie Mac Pool #QE9625 4.00% 9/1/20521 | 23 | 21 | ||||||
| Freddie Mac Pool #RA7938 5.00% 9/1/20521 | 715 | 706 | ||||||
| Freddie Mac Pool #QF1464 4.00% 10/1/20521 | 22 | 21 | ||||||
| Freddie Mac Pool #SD8257 4.50% 10/1/20521 | 14 | 13 | ||||||
| Freddie Mac Pool #SD8264 3.50% 11/1/20521 | 1,232 | 1,121 | ||||||
| Freddie Mac Pool #SD8273 3.50% 11/1/20521 | 124 | 112 | ||||||
| Freddie Mac Pool #QF3364 4.00% 11/1/20521 | 35 | 33 | ||||||
| Freddie Mac Pool #SD1895 4.50% 11/1/20521 | 407 | 400 | ||||||
| Freddie Mac Pool #SD8280 6.50% 11/1/20521 | 920 | 944 | ||||||
| Freddie Mac Pool #SD8275 4.50% 12/1/20521 | 1,793 | 1,728 | ||||||
| Freddie Mac Pool #SD8276 5.00% 12/1/20521 | 55 | 54 | ||||||
| Freddie Mac Pool #SD8286 4.00% 1/1/20531 | 210 | 197 | ||||||
| Freddie Mac Pool #SD8288 5.00% 1/1/20531 | 132 | 130 | ||||||
| Freddie Mac Pool #SD8282 6.50% 1/1/20531 | 200 | 205 | ||||||
| Freddie Mac, Series K152, Class A2, Multi Family, 3.80% 10/25/20321,4 | 207 | 196 | ||||||
| Freddie Mac, Series K152, Class A2, Multi Family, 3.78% 11/25/20321 | 1,767 | 1,671 | ||||||
| Freddie Mac Seasoned Credit Risk Transfer Trust, Series 2017-1, Class HA, 3.00% 1/25/20561,4 | 134 | 126 | ||||||
| Freddie Mac Seasoned Credit Risk Transfer Trust, Series 2017-3, Class HT, 3.25% 7/25/20561 | 101 | 91 | ||||||
| Freddie Mac Seasoned Credit Risk Transfer Trust, Series 2017-2, Class MA, 3.00% 8/25/20561 | 209 | 194 | ||||||
| Freddie Mac Seasoned Credit Risk Transfer Trust, Series 2017-2, Class HA, 3.00% 8/25/20561,4 | 155 | 145 | ||||||
| Freddie Mac Seasoned Credit Risk Transfer Trust, Series 2018-1, Class HT, 3.00% 5/25/20571 | 112 | 98 | ||||||
| Freddie Mac Seasoned Credit Risk Transfer Trust, Series 2018-3, Class MA, 3.50% 8/25/20571 | 147 | 140 | ||||||
| Freddie Mac Seasoned Credit Risk Transfer Trust, Series 2019-2, Class MT, 3.50% 8/26/20581 | 31 | 28 | ||||||
| Freddie Mac Seasoned Credit Risk Transfer Trust, Series 2019-3, Class MT, 3.50% 10/25/20581 | 18 | 17 | ||||||
| Freddie Mac Seasoned Loan Structured Transaction Trust, Series 2018-1, Class A1, 3.50% 6/25/20281 | 306 | 293 | ||||||
| Freddie Mac Seasoned Loan Structured Transaction Trust, Series 2018-2, Class A1, 3.50% 11/25/20281 | 14 | 13 | ||||||
| Freddie Mac Seasoned Loan Structured Transaction Trust, Series 2022-1, Class A1, 3.50% 5/25/20321 | 469 | 453 | ||||||
| Government National Mortgage Assn. 2.00% 1/1/20531,5 | 174 | 146 | ||||||
| Government National Mortgage Assn. 2.50% 1/1/20531,5 | 207 | 180 | ||||||
| Government National Mortgage Assn. 3.00% 1/1/20531,5 | 388 | 346 | ||||||
| Government National Mortgage Assn. 3.50% 1/1/20531,5 | 178 | 163 | ||||||
| Government National Mortgage Assn. 5.00% 1/1/20531,5 | 7,330 | 7,264 | ||||||
| Government National Mortgage Assn. 5.50% 1/1/20531,5 | 1,198 | 1,205 | ||||||
| Government National Mortgage Assn. Pool #AH5894 3.75% 5/20/20341 | 693 | 678 | ||||||
| Government National Mortgage Assn. Pool #AD0028 3.75% 7/20/20381 | 510 | 488 | ||||||
| Government National Mortgage Assn. Pool #004410 4.00% 4/20/20391 | 54 | 52 | ||||||
| Government National Mortgage Assn. Pool #AH5897 3.75% 7/20/20391 | 526 | 502 | ||||||
| Government National Mortgage Assn. Pool #783690 6.00% 9/20/20391 | 81 | 86 | ||||||
| Government National Mortgage Assn. Pool #004823 4.00% 10/20/20401 | 83 | 79 | ||||||
| Government National Mortgage Assn. Pool #005104 5.00% 6/20/20411 | 169 | 170 | ||||||
| Government National Mortgage Assn. Pool #005142 4.50% 8/20/20411 | 12 | 12 | ||||||
| Government National Mortgage Assn. Pool #005165 6.50% 8/20/20411 | 83 | 84 | ||||||
| Government National Mortgage Assn. Pool #AA5326 3.50% 5/20/20421 | 131 | 119 | ||||||
| Government National Mortgage Assn. Pool #MA0366 3.50% 6/20/20421 | 198 | 182 | ||||||
| Government National Mortgage Assn. Pool #AD4360 3.50% 7/20/20431 | 90 | 84 | ||||||
| Government National Mortgage Assn. Pool #AH5884 4.25% 7/20/20441 | 1,034 | 997 | ||||||
| Government National Mortgage Assn. Pool #MA8347 4.50% 10/20/20521 | 800 | 777 | ||||||
| Government National Mortgage Assn. Pool #MA8426 4.00% 11/20/20521 | 140 | 133 | ||||||
| Government National Mortgage Assn. Pool #MA8427 4.50% 11/20/20521 | 1,852 | 1,798 | ||||||
| American Funds Insurance Series | 247 |
American Funds Mortgage Fund (continued)
| Bonds, notes & other debt instruments (continued) | Principal amount (000) |
Value (000) |
||||||
| Mortgage-backed obligations (continued) | ||||||||
| Federal agency mortgage-backed obligations (continued) | ||||||||
| Government National Mortgage Assn. Pool #MA8489 4.50% 12/20/20521 | USD | 100 | $ | 97 | ||||
| Government National Mortgage Assn. Pool #AN1825 4.619% 6/20/20651 | 195 | 192 | ||||||
| Government National Mortgage Assn. Pool #AO0461 4.628% 8/20/20651 | 65 | 64 | ||||||
| Government National Mortgage Assn. Pool #AO0409 4.617% 12/20/20651 | 128 | 126 | ||||||
| Government National Mortgage Assn. Pool #AO0385 4.498% 1/20/20661 | 519 | 510 | ||||||
| Government National Mortgage Assn. Pool #725897 5.20% 1/20/20661 | 1 | 1 | ||||||
| Uniform Mortgage-Backed Security 4.00% 1/1/20381,5 | 125 | 122 | ||||||
| Uniform Mortgage-Backed Security 2.00% 1/1/20531,5 | 1,191 | 969 | ||||||
| Uniform Mortgage-Backed Security 4.50% 1/1/20531,5 | 1,882 | 1,812 | ||||||
| Uniform Mortgage-Backed Security 5.50% 1/1/20531,5 | 4,837 | 4,851 | ||||||
| Uniform Mortgage-Backed Security 6.00% 1/1/20531,5 | 1,958 | 1,988 | ||||||
| Uniform Mortgage-Backed Security 6.50% 1/1/20531,5 | 3,690 | 3,780 | ||||||
| Uniform Mortgage-Backed Security 4.00% 2/1/20531,5 | 130 | 122 | ||||||
| Uniform Mortgage-Backed Security 6.00% 2/1/20531,5 | 1,132 | 1,148 | ||||||
| 68,880 | ||||||||
| Collateralized mortgage-backed obligations (privately originated) 1.79% | ||||||||
| Cascade Funding Mortgage Trust, Series 2020-HB4, Class A, 0.946% 12/26/20301,4,6 | 74 | 72 | ||||||
| Cascade Funding Mortgage Trust, Series 2021-HB7, Class A, 1.151% 10/27/20311,4,6 | 95 | 89 | ||||||
| Cascade Funding Mortgage Trust, Series 2021-HB6, Class A, 0.898% 6/25/20361,4,6 | 306 | 291 | ||||||
| CIM Trust, Series 2022-R2, Class A1, 3.75% 12/25/20611,4,6 | 181 | 171 | ||||||
| COLT Mortgage Loan Trust, Series 2021-5, Class A1, 1.726% 11/26/20661,4,6 | 87 | 74 | ||||||
| Credit Suisse Mortgage Trust, Series 2017-RPL3, Class A1, 2.00% 1/25/20601,4,6 | 159 | 137 | ||||||
| GCAT Trust, Series 2021-NQM6, Class A1, 1.855% 8/25/20661,4,6 | 28 | 24 | ||||||
| GS Mortgage-Backed Securities Trust, Series 2022-PJ5, Class A4, 2.50% 10/25/20521,4,6 | 212 | 171 | ||||||
| Mello Warehouse Securitization Trust, Series 2021-3, Class A, (1-month USD-LIBOR + 0.85%) 5.239% 11/25/20551,4,6 | 175 | 169 | ||||||
| Mill City Mortgage Trust, Series 15-1, Class M2, 3.616% 6/25/20561,4,6 | 38 | 37 | ||||||
| Onslow Bay Financial Mortgage Loan Trust, Series 2022-J1, Class A2, 2.50% 2/25/20521,4,6 | 138 | 111 | ||||||
| Reverse Mortgage Investment Trust, Series 2021-HB1, Class A, 1.259% 11/25/20311,4,6 | 95 | 89 | ||||||
| Towd Point Mortgage Trust, Series 2015-4, Class M2, 3.75% 4/25/20551,4,6 | 100 | 97 | ||||||
| Towd Point Mortgage Trust, Series 2015-4, Class M1, 3.75% 4/25/20551,4,6 | 10 | 10 | ||||||
| Towd Point Mortgage Trust, Series 2016-5, Class A1, 2.50% 10/25/20561,4,6 | 41 | 41 | ||||||
| Towd Point Mortgage Trust, Series 2017-5, Class A1, 4.989% 2/25/20571,4,6 | 10 | 10 | ||||||
| 1,593 | ||||||||
| Commercial mortgage-backed securities 1.05% | ||||||||
| BOCA Commercial Mortgage Trust, Series 2022-BOCA, Class A, (1-month USD CME Term SOFR + 1.77%) 6.105% 5/15/20391,4,6 | 100 | 98 | ||||||
| BX Trust, Series 2022-CSMO, Class A, (1-month USD CME Term SOFR + 2.115%) 6.45% 6/15/20271,4,6 | 100 | 99 | ||||||
| BX Trust, Series 2021-ARIA, Class A, (1-month USD-LIBOR + 0.899%) 5.217% 10/15/20361,4,6 | 606 | 578 | ||||||
| LUXE Commercial Mortgage Trust, Series 2021-TRIP, Class A, (1-month USD-LIBOR + 1.05%) 5.368% 10/15/20381,4,6 | 164 | 158 | ||||||
| 933 | ||||||||
| Total mortgage-backed obligations | 71,406 | |||||||
| U.S. Treasury bonds & notes 12.04% | ||||||||
| U.S. Treasury inflation-protected securities 10.83% | ||||||||
| U.S. Treasury Inflation-Protected Security 0.125% 1/15/20237 | 714 | 713 | ||||||
| U.S. Treasury Inflation-Protected Security 0.625% 4/15/20237 | 355 | 352 | ||||||
| U.S. Treasury Inflation-Protected Security 0.375% 7/15/20237 | 522 | 516 | ||||||
| U.S. Treasury Inflation-Protected Security 0.625% 1/15/20243,7 | 3,621 | 3,546 | ||||||
| U.S. Treasury Inflation-Protected Security 0.50% 4/15/20247 | 2,024 | 1,970 | ||||||
| U.S. Treasury Inflation-Protected Security 0.125% 7/15/20247 | 658 | 637 | ||||||
| U.S. Treasury Inflation-Protected Security 0.125% 10/15/20247 | 107 | 104 | ||||||
| 248 | American Funds Insurance Series |
American Funds Mortgage Fund (continued)
| Bonds, notes & other debt instruments (continued) | Principal amount (000) |
Value (000) |
||||||
| U.S. Treasury bonds & notes (continued) | ||||||||
| U.S. Treasury inflation-protected securities (continued) | ||||||||
| U.S. Treasury Inflation-Protected Security 0.125% 10/15/20267 | USD | 65 | $ | 61 | ||||
| U.S. Treasury Inflation-Protected Security 0.125% 1/15/20317 | 1,202 | 1,067 | ||||||
| U.S. Treasury Inflation-Protected Security 0.75% 2/15/20427 | 426 | 357 | ||||||
| U.S. Treasury Inflation-Protected Security 1.00% 2/15/20497 | 385 | 322 | ||||||
| 9,645 | ||||||||
| U.S. Treasury 1.21% | ||||||||
| U.S. Treasury 0.875% 1/31/2024 | 10 | 9 | ||||||
| U.S. Treasury 1.25% 8/15/2031 | 443 | 360 | ||||||
| U.S. Treasury 1.875% 2/15/2032 | 10 | 8 | ||||||
| U.S. Treasury 1.875% 2/15/20413 | 690 | 489 | ||||||
| U.S. Treasury 2.375% 2/15/2042 | 150 | 115 | ||||||
| U.S. Treasury 3.25% 5/15/2042 | 60 | 53 | ||||||
| U.S. Treasury 1.875% 11/15/2051 | 65 | 41 | ||||||
| 1,075 | ||||||||
| Total U.S. Treasury bonds & notes | 10,720 | |||||||
| Asset-backed obligations 2.68% | ||||||||
| Ballyrock CLO, Ltd., Series 2019-2A, Class A1AR, (3-month USD-LIBOR + 1.00%) 5.675% 11/20/20301,4,6 | 250 | 247 | ||||||
| Bankers Healthcare Group Securitization Trust, Series 2021-A, Class A, 1.42% 11/17/20331,6 | 54 | 50 | ||||||
| Bankers Healthcare Group Securitization Trust, Series 2021-B, Class A, 0.90% 10/17/20341,6 | 54 | 51 | ||||||
| Capital One Multi-Asset Execution Trust, Series 2022-A3, Class A, 4.95% 10/15/20271 | 540 | 545 | ||||||
| CF Hippolyta, LLC, Series 2020-1, Class A1, 1.69% 7/15/20601,6 | 286 | 256 | ||||||
| CPS Auto Receivables Trust, Series 2022-B, Class A, 2.88% 6/15/20261,6 | 67 | 66 | ||||||
| Hertz Vehicle Financing III, LLC, Series 2021-1A, Class A, 1.21% 12/26/20251,6 | 86 | 79 | ||||||
| Navient Student Loan Trust, Series 2021-A, Class A, 0.84% 5/15/20691,6 | 116 | 101 | ||||||
| Navient Student Loan Trust, Series 2021-C, Class A, 1.06% 10/15/20691,6 | 215 | 183 | ||||||
| Nelnet Student Loan Trust, Series 2021-A, Class APT1, 1.36% 4/20/20621,6 | 193 | 171 | ||||||
| Nelnet Student Loan Trust, Series 2021-C, Class AFL, (1-month USD-LIBOR + 0.74%) 5.093% 4/20/20621,4,6 | 160 | 155 | ||||||
| New Economy Assets Phase 1 Issuer, LLC, Series 2021-1, Class A1, 1.91% 10/20/20611,6 | 530 | 449 | ||||||
| Santander Drive Auto Receivables Trust, Series 2022-6, Class A2, 4.37% 5/15/20251 | 35 | 35 | ||||||
| 2,388 | ||||||||
| Total bonds, notes & other debt instruments (cost: $87,116,000) | 84,514 | |||||||
| Short-term securities 25.67% | Weighted average yield at acquisition |
|||||||||||
| Commercial paper 14.04% | ||||||||||||
| Chariot Funding, LLC 1/27/20236 | 4.150 | % | 2,000 | 1,993 | ||||||||
| Citigroup Global Markets, Inc. 2/21/20236 | 4.580 | 2,000 | 1,987 | |||||||||
| Henkel of America, Inc. 2/1/20236 | 4.300 | 2,000 | 1,992 | |||||||||
| Honeywell International, Inc. 2/1/20236 | 4.100 | 2,000 | 1,992 | |||||||||
| Johnson & Johnson 1/30/20236 | 4.190 | 1,000 | 996 | |||||||||
| Procter & Gamble Co. 2/9/20236 | 4.300 | 500 | 498 | |||||||||
| Procter & Gamble Co. 2/10/20236 | 4.250 | 1,500 | 1,492 | |||||||||
| Roche Holdings, Inc. 1/3/20236 | 4.230 | 1,050 | 1,050 | |||||||||
| Starbird Funding Corp. 1/3/20236 | 4.300 | 500 | 500 | |||||||||
| 12,500 | ||||||||||||
| American Funds Insurance Series | 249 |
American Funds Mortgage Fund (continued)
| Short-term securities (continued) | Weighted average yield at acquisition |
Principal amount (000) |
Value (000) |
|||||||||
| Federal agency bills & notes 11.63% | ||||||||||||
| Federal Farm Credit Banks 1/12/2023 | 3.880 | % | USD | 4,500 | $ | 4,495 | ||||||
| Federal Home Loan Bank 1/11/2023 | 4.120 | 1,500 | 1,498 | |||||||||
| Federal Home Loan Bank 2/28/2023 | 4.350 | 1,500 | 1,490 | |||||||||
| Federal Home Loan Bank 3/3/2023 | 4.370 | 1,000 | 993 | |||||||||
| Federal Home Loan Bank 3/22/2023 | 4.440 | 1,000 | 990 | |||||||||
| Federal Home Loan Bank 3/24/2023 | 4.462 | 900 | 891 | |||||||||
| 10,357 | ||||||||||||
| Total short-term securities (cost: $22,859,000) | 22,857 | |||||||||||
| Total investment securities 120.58% (cost: $109,975,000) | 107,371 | |||||||||||
| Other assets less liabilities (20.58)% | (18,328 | ) | ||||||||||
| Net assets 100.00% | $ | 89,043 | ||||||||||
Futures contracts
| Contracts | Type | Number of contracts |
Expiration | Notional amount (000) |
Value and unrealized appreciation (depreciation) at 12/31/2022 (000) |
||||||||||
| 3 Month SOFR Futures | Short | 12 | June 2023 | USD | (2,853 | ) | $ | 49 | |||||||
| 2 Year U.S. Treasury Note Futures | Short | 5 | March 2023 | (1,025 | ) | (1 | ) | ||||||||
| 5 Year U.S. Treasury Note Futures | Long | 144 | March 2023 | 15,542 | (19 | ) | |||||||||
| 10 Year Ultra U.S. Treasury Note Futures | Long | 47 | March 2023 | 5,559 | (60 | ) | |||||||||
| 10 Year U.S. Treasury Note Futures | Long | 5 | March 2023 | 562 | (3 | ) | |||||||||
| 20 Year U.S. Treasury Bond Futures | Long | 18 | March 2023 | 2,256 | (28 | ) | |||||||||
| 30 Year Ultra U.S. Treasury Bond Futures | Long | 12 | March 2023 | 1,612 | (13 | ) | |||||||||
| $ | (75 | ) | |||||||||||||
Swap contracts
Interest rate swaps
Centrally cleared interest rate swaps
| Receive | Pay | Upfront | Unrealized | |||||||||||||||||||||||||
| Rate | Payment frequency |
Rate | Payment frequency |
Expiration date |
Notional amount (000 |
) | Value at 12/31/2022 (000) |
premium paid (000) |
appreciation at 12/31/2022 (000) |
|||||||||||||||||||
| 3-month USD-LIBOR | Quarterly | 0.81% | Semi-annual | 7/28/2045 | USD | 1,800 | $ | 795 | $ | 5 | $ | 790 | ||||||||||||||||
| 1 | Principal payments may be made periodically. Therefore, the effective maturity date may be earlier than the stated maturity date. |
| 2 | Amount less than one thousand. |
| 3 | All or a portion of this security was pledged as collateral. The total value of pledged collateral was $692,000, which represented .78% of the net assets of the fund. |
| 4 | Coupon rate may change periodically. Reference rate and spread are as of the most recent information available. Some coupon rates are determined by the issuer or agent based on current market conditions; therefore, the reference rate and spread are not available. |
| 5 | Purchased on a TBA basis. |
| 6 | Acquired in a transaction exempt from registration under Rule 144A or, for commercial paper, Section 4(a)(2) of the Securities Act of 1933. May be resold in the U.S. in transactions exempt from registration, normally to qualified institutional buyers. The total value of all such securities was $16,834,000, which represented 18.91% of the net assets of the fund. |
| 7 | Index-linked bond whose principal amount moves with a government price index. |
| 250 | American Funds Insurance Series |
American Funds Mortgage Fund (continued)
Key to abbreviations
Assn. = Association
CLO = Collateralized Loan Obligations
CME = CME Group
LIBOR = London Interbank Offered Rate
SOFR = Secured Overnight Financing Rate
TBA = To be announced
USD = U.S. dollars
Refer to the notes to financial statements.
| American Funds Insurance Series | 251 |
Ultra-Short Bond Fund
Investment portfolio December 31, 2022
| Short-term securities 97.99% | Weighted average yield at acquisition |
Principal amount (000) |
Value (000) |
|||||||||
| Commercial paper 76.48% | ||||||||||||
| British Columbia (Province of) 3/6/2023 | 4.470 | % | USD | 7,400 | $ | 7,339 | ||||||
| CAFCO, LLC 2/3/20231 | 4.300 | 1,250 | 1,245 | |||||||||
| Caisse des Dépôts et Consignations 3/9/2023 | 4.490 | 12,000 | 11,899 | |||||||||
| Canadian Imperial Holdings, Inc. 1/9/2023 | 4.080 | 10,000 | 9,988 | |||||||||
| Chariot Funding, LLC 1/23/20231 | 4.400 | 5,000 | 4,985 | |||||||||
| CHARTA, LLC 1/17/20231 | 4.330 | 10,000 | 9,978 | |||||||||
| DBS Bank, Ltd. 3/14/20231 | 4.548 | 10,000 | 9,906 | |||||||||
| DNB Bank ASA 3/13/20231 | 4.535 | 13,000 | 12,885 | |||||||||
| Export Development Canada 2/6/2023 | 4.300 | 11,810 | 11,756 | |||||||||
| Fairway Finance Company, LLC 1/18/20231 | 4.250 | 4,000 | 3,991 | |||||||||
| Gotham Funding Corp. 1/10/20231 | 4.200 | 3,000 | 2,996 | |||||||||
| Gotham Funding Corp. 3/28/20231 | 4.600 | 10,000 | 9,883 | |||||||||
| Johnson & Johnson 2/27/20231 | 4.330 | 8,700 | 8,637 | |||||||||
| Johnson & Johnson 3/6/20231 | 4.430 | 5,000 | 4,959 | |||||||||
| KfW 2/15/20231 | 4.380 | 12,000 | 11,932 | |||||||||
| Komatsu Finance America, Inc. 1/13/20231 | 4.330 | 5,000 | 4,992 | |||||||||
| Komatsu Finance America, Inc. 1/18/20231 | 4.200 | 4,000 | 3,991 | |||||||||
| Liberty Street Funding, LLC 1/18/20231 | 4.400 | 10,850 | 10,825 | |||||||||
| Linde, Inc. 1/5/2023 | 4.010 | 13,000 | 12,991 | |||||||||
| LMA-Americas, LLC 1/27/20231 | 4.300 | 10,000 | 9,966 | |||||||||
| L’Oréal USA, Inc. 1/26/20231 | 4.240 | 10,000 | 9,967 | |||||||||
| LVMH Moët Hennessy Louis Vuitton, Inc. 2/6/20231 | 4.400 | 10,000 | 9,953 | |||||||||
| Manhattan Asset Funding Company, LLC 3/24/20231 | 4.650 | 9,700 | 9,596 | |||||||||
| Mizuho Bank, Ltd. 1/31/20231 | 4.405 | 12,000 | 11,954 | |||||||||
| Nestlé Finance International, Ltd. 1/19/20231 | 4.280 | 6,000 | 5,986 | |||||||||
| NRW.Bank 3/8/20231 | 4.450 | 8,250 | 8,181 | |||||||||
| Oesterreichische Kontrollbank 2/15/2023 | 4.390 | 13,000 | 12,926 | |||||||||
| Procter & Gamble Co. 2/10/20231 | 4.250 | 13,050 | 12,984 | |||||||||
| Québec (Province of) 2/1/20231 | 4.230 | 10,000 | 9,960 | |||||||||
| Siemens Capital Co., LLC 1/18/20231 | 4.080 | 8,000 | 7,982 | |||||||||
| Stadshypotek AB Handelsbanken, Inc. 1/18/20231 | 4.150 | 6,500 | 6,485 | |||||||||
| Starbird Funding Corp. 1/3/20231 | 4.300 | 11,000 | 10,995 | |||||||||
| Sumitomo Mitsui Trust Bank, Ltd. 2/3/20231 | 4.300 | 9,000 | 8,962 | |||||||||
| Sumitomo Mitsui Trust Bank, Ltd. 2/7/20231 | 4.600 | 6,000 | 5,972 | |||||||||
| Toronto-Dominion Bank 1/20/20231 | 4.300 | 10,000 | 9,975 | |||||||||
| TotalEnergies Capital Canada, Ltd. 1/3/20231 | 4.280 | 13,000 | 12,994 | |||||||||
| Toyota Credit de Puerto Rico Corp. 1/17/2023 | 4.340 | 3,550 | 3,542 | |||||||||
| Toyota Industries Commercial Finance, Inc. 1/23/20231 | 4.120 | 1,100 | 1,097 | |||||||||
| Toyota Industries Commercial Finance, Inc. 3/6/20231 | 4.450 | 6,000 | 5,951 | |||||||||
| 330,606 | ||||||||||||
| Federal agency bills & notes 21.51% | ||||||||||||
| Federal Home Loan Bank 2/1/2023 | 4.130 | 15,000 | 14,951 | |||||||||
| Federal Home Loan Bank 2/15/2023 | 4.300 | 4,800 | 4,775 | |||||||||
| Federal Home Loan Bank 2/17/2023 | 4.314 | 36,317 | 36,123 | |||||||||
| Federal Home Loan Bank 2/22/2023 | 4.357 | 23,290 | 23,149 | |||||||||
| Federal Home Loan Bank 3/3/2023 | 4.370 | 5,300 | 5,262 | |||||||||
| Federal Home Loan Bank 3/22/2023 | 4.440 | 6,000 | 5,942 | |||||||||
| Federal Home Loan Bank 3/24/2023 | 4.462 | 2,800 | 2,771 | |||||||||
| 92,973 | ||||||||||||
| Total short-term securities (cost: $423,636,000) | 423,579 | |||||||||||
| Total investment securities 97.99% (cost: $423,636,000) | 423,579 | |||||||||||
| Other assets less liabilities 2.01% | 8,682 | |||||||||||
| Net assets 100.00% | $ | 432,261 | ||||||||||
| 252 | American Funds Insurance Series |
Ultra-Short Bond Fund (continued)
| 1 | Acquired in a transaction exempt from registration under Rule 144A or, for commercial paper, Section 4(a)(2) of the Securities Act of 1933. May be resold in the U.S. in transactions exempt from registration, normally to qualified institutional buyers. The total value of all such securities was $260,165,000, which represented 60.19% of the net assets of the fund. |
Key to abbreviations
USD = U.S. dollars
Refer to the notes to financial statements.
| American Funds Insurance Series | 253 |
U.S. Government Securities Fund
Investment portfolio December 31, 2022
| Bonds, notes & other debt instruments 93.28% | Principal amount (000) |
Value (000) |
||||||
| Mortgage-backed obligations 48.21% | ||||||||
| Federal agency mortgage-backed obligations 48.21% | ||||||||
| Fannie Mae Pool #406607 6.50% 8/1/20241 | USD | 10 | $ | 11 | ||||
| Fannie Mae Pool #735070 6.50% 10/1/20241 | 1 | 1 | ||||||
| Fannie Mae Pool #745316 6.50% 2/1/20261 | 56 | 58 | ||||||
| Fannie Mae Pool #AL9870 6.50% 2/1/20281 | 45 | 46 | ||||||
| Fannie Mae Pool #695412 5.00% 6/1/20331 | 1 | 1 | ||||||
| Fannie Mae Pool #AD3566 5.00% 10/1/20351 | 6 | 6 | ||||||
| Fannie Mae Pool #MA2588 4.00% 4/1/20361 | 666 | 642 | ||||||
| Fannie Mae Pool #MA2746 4.00% 9/1/20361 | 1,376 | 1,326 | ||||||
| Fannie Mae Pool #940890 6.50% 6/1/20371 | — | 2 | — | 2 | ||||
| Fannie Mae Pool #256828 7.00% 7/1/20371 | 3 | 3 | ||||||
| Fannie Mae Pool #256860 6.50% 8/1/20371 | 11 | 11 | ||||||
| Fannie Mae Pool #888698 7.00% 10/1/20371 | 13 | 14 | ||||||
| Fannie Mae Pool #970343 6.00% 2/1/20381 | 14 | 14 | ||||||
| Fannie Mae Pool #931768 5.00% 8/1/20391 | 5 | 6 | ||||||
| Fannie Mae Pool #AC0794 5.00% 10/1/20391 | 20 | 20 | ||||||
| Fannie Mae Pool #932606 5.00% 2/1/20401 | 9 | 9 | ||||||
| Fannie Mae Pool #AI1862 5.00% 5/1/20411 | 372 | 376 | ||||||
| Fannie Mae Pool #AI3510 5.00% 6/1/20411 | 205 | 207 | ||||||
| Fannie Mae Pool #AE1248 5.00% 6/1/20411 | 33 | 33 | ||||||
| Fannie Mae Pool #AJ0704 5.00% 9/1/20411 | 174 | 176 | ||||||
| Fannie Mae Pool #AJ1873 4.00% 10/1/20411 | 26 | 25 | ||||||
| Fannie Mae Pool #AJ5391 5.00% 11/1/20411 | 125 | 127 | ||||||
| Fannie Mae Pool #AE1277 5.00% 11/1/20411 | 18 | 18 | ||||||
| Fannie Mae Pool #MA4501 2.00% 12/1/20411 | 2,961 | 2,500 | ||||||
| Fannie Mae Pool #AE1283 5.00% 12/1/20411 | 10 | 10 | ||||||
| Fannie Mae Pool #MA4540 2.00% 2/1/20421 | 1,366 | 1,153 | ||||||
| Fannie Mae Pool #AE1290 5.00% 2/1/20421 | 18 | 18 | ||||||
| Fannie Mae Pool #MA4570 2.00% 3/1/20421 | 884 | 746 | ||||||
| Fannie Mae Pool #AT0300 3.50% 3/1/20431 | 5 | 5 | ||||||
| Fannie Mae Pool #AT3954 3.50% 4/1/20431 | 8 | 7 | ||||||
| Fannie Mae Pool #AT7161 3.50% 6/1/20431 | 41 | 39 | ||||||
| Fannie Mae Pool #AY1829 3.50% 12/1/20441 | 8 | 7 | ||||||
| Fannie Mae Pool #BE5017 3.50% 2/1/20451 | 63 | 59 | ||||||
| Fannie Mae Pool #FM9416 3.50% 7/1/20451 | 4,487 | 4,155 | ||||||
| Fannie Mae Pool #BE8740 3.50% 5/1/20471 | 57 | 53 | ||||||
| Fannie Mae Pool #BE8742 3.50% 5/1/20471 | 17 | 15 | ||||||
| Fannie Mae Pool #BH2846 3.50% 5/1/20471 | 8 | 7 | ||||||
| Fannie Mae Pool #BH2848 3.50% 5/1/20471 | 7 | 6 | ||||||
| Fannie Mae Pool #BH2847 3.50% 5/1/20471 | 5 | 5 | ||||||
| Fannie Mae Pool #BH3122 4.00% 6/1/20471 | 5 | 5 | ||||||
| Fannie Mae Pool #BJ5015 4.00% 12/1/20471 | 154 | 148 | ||||||
| Fannie Mae Pool #BM3788 3.50% 3/1/20481 | 3,243 | 3,018 | ||||||
| Fannie Mae Pool #BJ4901 3.50% 3/1/20481 | 43 | 40 | ||||||
| Fannie Mae Pool #BK5232 4.00% 5/1/20481 | 79 | 75 | ||||||
| Fannie Mae Pool #BK6840 4.00% 6/1/20481 | 106 | 102 | ||||||
| Fannie Mae Pool #BK9743 4.00% 8/1/20481 | 31 | 30 | ||||||
| Fannie Mae Pool #BK9761 4.50% 8/1/20481 | 20 | 20 | ||||||
| Fannie Mae Pool #FM3280 3.50% 5/1/20491 | 1,170 | 1,084 | ||||||
| Fannie Mae Pool #FM1062 3.50% 6/1/20491 | 436 | 408 | ||||||
| Fannie Mae Pool #BJ8411 3.50% 8/1/20491 | 113 | 105 | ||||||
| Fannie Mae Pool #CA4151 3.50% 9/1/20491 | 582 | 545 | ||||||
| Fannie Mae Pool #FM1443 3.50% 9/1/20491 | 326 | 304 | ||||||
| Fannie Mae Pool #FM2179 3.00% 1/1/20501 | 3,675 | 3,277 | ||||||
| Fannie Mae Pool #CA6593 2.50% 8/1/20501 | 926 | 798 | ||||||
| Fannie Mae Pool #BQ3005 2.50% 10/1/20501 | 604 | 514 | ||||||
| Fannie Mae Pool #CA7257 2.50% 10/1/20501 | 195 | 168 | ||||||
| Fannie Mae Pool #MA4208 2.00% 12/1/20501 | 228 | 187 | ||||||
| Fannie Mae Pool #CB0290 2.00% 4/1/20511 | 926 | 757 | ||||||
| Fannie Mae Pool #MA4305 2.00% 4/1/20511 | 11 | 9 | ||||||
| Fannie Mae Pool #BR1035 2.00% 5/1/20511 | 6 | 5 | ||||||
| Fannie Mae Pool #FM7687 3.00% 6/1/20511 | 5,752 | 5,108 | ||||||
| 254 | American Funds Insurance Series |
U.S. Government Securities Fund (continued)
| Bonds, notes & other debt instruments (continued) | Principal amount (000) |
Value (000) |
||||||
| Mortgage-backed obligations (continued) | ||||||||
| Federal agency mortgage-backed obligations (continued) | ||||||||
| Fannie Mae Pool #FM7900 2.50% 7/1/20511 | USD | 195 | $ | 167 | ||||
| Fannie Mae Pool #CB1527 2.50% 9/1/20511 | 702 | 596 | ||||||
| Fannie Mae Pool #FS0965 2.00% 11/1/20511 | 51 | 41 | ||||||
| Fannie Mae Pool #BU3058 2.50% 12/1/20511 | 1,512 | 1,284 | ||||||
| Fannie Mae Pool #CB2286 2.50% 12/1/20511 | 1,266 | 1,082 | ||||||
| Fannie Mae Pool #FM9976 3.00% 12/1/20511 | 845 | 755 | ||||||
| Fannie Mae Pool #CB2544 3.00% 1/1/20521 | 2,361 | 2,088 | ||||||
| Fannie Mae Pool #FS0523 2.50% 2/1/20521 | 199 | 171 | ||||||
| Fannie Mae Pool #FS0647 3.00% 2/1/20521 | 3,881 | 3,465 | ||||||
| Fannie Mae Pool #CB3495 3.00% 5/1/20521 | 5,807 | 5,103 | ||||||
| Fannie Mae Pool #MA4600 3.50% 5/1/20521 | 17,861 | 16,244 | ||||||
| Fannie Mae Pool #CB3897 3.50% 6/1/20521 | 17,000 | 15,465 | ||||||
| Fannie Mae Pool #CB3774 4.00% 6/1/20521 | 3,250 | 3,052 | ||||||
| Fannie Mae Pool #FS2159 5.00% 6/1/20521 | 64 | 63 | ||||||
| Fannie Mae Pool #BV2558 5.00% 6/1/20521 | 62 | 61 | ||||||
| Fannie Mae Pool #CB4159 4.00% 7/1/20521 | 234 | 220 | ||||||
| Fannie Mae Pool #MA4700 4.00% 8/1/20521 | 6,346 | 5,959 | ||||||
| Fannie Mae Pool #BV8024 4.00% 8/1/20521 | 296 | 278 | ||||||
| Fannie Mae Pool #BW9411 5.00% 8/1/20521 | 926 | 914 | ||||||
| Fannie Mae Pool #FS2489 5.00% 8/1/20521 | 60 | 59 | ||||||
| Fannie Mae Pool #MA4732 4.00% 9/1/20521 | 2,012 | 1,890 | ||||||
| Fannie Mae Pool #BW7326 4.00% 9/1/20521 | 254 | 238 | ||||||
| Fannie Mae Pool #BW9348 4.00% 9/1/20521 | 219 | 206 | ||||||
| Fannie Mae Pool #BW8103 4.00% 9/1/20521 | 208 | 195 | ||||||
| Fannie Mae Pool #BW1192 4.50% 9/1/20521 | 1,848 | 1,780 | ||||||
| Fannie Mae Pool #BW6231 4.50% 9/1/20521 | 223 | 215 | ||||||
| Fannie Mae Pool #BW1201 5.00% 9/1/20521 | 4,200 | 4,146 | ||||||
| Fannie Mae Pool #BV0954 5.00% 9/1/20521 | 1,797 | 1,774 | ||||||
| Fannie Mae Pool #BW8088 5.00% 9/1/20521 | 327 | 323 | ||||||
| Fannie Mae Pool #BW8980 4.00% 10/1/20521 | 821 | 771 | ||||||
| Fannie Mae Pool #BW1210 4.00% 10/1/20521 | 620 | 582 | ||||||
| Fannie Mae Pool #BW7356 4.00% 10/1/20521 | 516 | 484 | ||||||
| Fannie Mae Pool #BX0509 4.00% 10/1/20521 | 222 | 209 | ||||||
| Fannie Mae Pool #MA4784 4.50% 10/1/20521 | 5,035 | 4,851 | ||||||
| Fannie Mae Pool #BW9458 4.50% 10/1/20521 | 999 | 965 | ||||||
| Fannie Mae Pool #BX0097 4.50% 10/1/20521 | 998 | 962 | ||||||
| Fannie Mae Pool #BW8981 4.50% 10/1/20521 | 995 | 958 | ||||||
| Fannie Mae Pool #BW8996 4.50% 10/1/20521 | 994 | 958 | ||||||
| Fannie Mae Pool #CB4959 4.50% 10/1/20521 | 993 | 956 | ||||||
| Fannie Mae Pool #BX0902 5.00% 10/1/20521 | 916 | 904 | ||||||
| Fannie Mae Pool #CB5380 5.00% 10/1/20521 | 478 | 472 | ||||||
| Fannie Mae Pool #BX0892 5.00% 10/1/20521 | 102 | 101 | ||||||
| Fannie Mae Pool #MA4820 6.50% 10/1/20521 | 300 | 308 | ||||||
| Fannie Mae Pool #MA4803 3.50% 11/1/20521 | 612 | 557 | ||||||
| Fannie Mae Pool #MA4804 4.00% 11/1/20521 | 2,492 | 2,340 | ||||||
| Fannie Mae Pool #BW1310 4.00% 11/1/20521 | 232 | 218 | ||||||
| Fannie Mae Pool #BX1766 5.00% 11/1/20521 | 1,900 | 1,875 | ||||||
| Fannie Mae Pool #MA4806 5.00% 11/1/20521 | 1,313 | 1,296 | ||||||
| Fannie Mae Pool #BX1761 5.00% 11/1/20521 | 921 | 909 | ||||||
| Fannie Mae Pool #BX1274 5.50% 11/1/20521 | 165 | 166 | ||||||
| Fannie Mae Pool #MA4852 6.50% 11/1/20521 | 244 | 251 | ||||||
| Fannie Mae Pool #MA4840 4.50% 12/1/20521 | 995 | 959 | ||||||
| Fannie Mae Pool #BX1072 5.00% 12/1/20521 | 1,943 | 1,918 | ||||||
| Fannie Mae Pool #BX4020 5.00% 12/1/20521 | 29 | 29 | ||||||
| Fannie Mae Pool #MA4877 6.50% 12/1/20521 | 39,345 | 40,362 | ||||||
| Fannie Mae Pool #BX1071 6.50% 12/1/20521 | 82 | 85 | ||||||
| Fannie Mae Pool #MA4868 5.00% 1/1/20531 | 1,457 | 1,438 | ||||||
| Fannie Mae Pool #MA4894 6.00% 1/1/20531 | 2,000 | 2,032 | ||||||
| Fannie Mae Pool #MA4895 6.50% 1/1/20531 | 8,828 | 9,056 | ||||||
| Fannie Mae Pool #BF0497 3.00% 7/1/20601 | 1,429 | 1,252 | ||||||
| Fannie Mae Pool #BF0585 4.50% 12/1/20611 | 459 | 448 | ||||||
| American Funds Insurance Series | 255 |
U.S. Government Securities Fund (continued)
| Bonds, notes & other debt instruments (continued) | Principal amount (000) |
Value (000) |
||||||
| Mortgage-backed obligations (continued) | ||||||||
| Federal agency mortgage-backed obligations (continued) | ||||||||
| Fannie Mae, Series 2001-4, Class GA, 9.00% 4/17/20251,3 | USD | — | 2 | $ | — | 2 | ||
| Fannie Mae, Series 2001-4, Class NA, 9.00% 10/25/20251,3 | — | 2 | — | 2 | ||||
| Fannie Mae, Series 2014-M1, Class A2, Multi Family, 3.298% 7/25/20231,3 | 186 | 185 | ||||||
| Fannie Mae, Series 2014-M3, Class A2, Multi Family, 3.501% 1/25/20241,3 | 368 | 361 | ||||||
| Freddie Mac Pool #ZA2024 6.50% 9/1/20271 | 2 | 2 | ||||||
| Freddie Mac Pool #1H1354 4.336% 11/1/20361,3 | 53 | 54 | ||||||
| Freddie Mac Pool #C03518 5.00% 9/1/20401 | 279 | 283 | ||||||
| Freddie Mac Pool #G06459 5.00% 5/1/20411 | 660 | 669 | ||||||
| Freddie Mac Pool #RB5138 2.00% 12/1/20411 | 794 | 670 | ||||||
| Freddie Mac Pool #RB5145 2.00% 2/1/20421 | 772 | 651 | ||||||
| Freddie Mac Pool #RB5148 2.00% 3/1/20421 | 1,823 | 1,538 | ||||||
| Freddie Mac Pool #Q15874 4.00% 2/1/20431 | 3 | 3 | ||||||
| Freddie Mac Pool #Q17696 3.50% 4/1/20431 | 30 | 28 | ||||||
| Freddie Mac Pool #Q19133 3.50% 6/1/20431 | 31 | 29 | ||||||
| Freddie Mac Pool #Q23190 4.00% 11/1/20431 | 145 | 140 | ||||||
| Freddie Mac Pool #Q28558 3.50% 9/1/20441 | 208 | 194 | ||||||
| Freddie Mac Pool #760014 2.74% 8/1/20451,3 | 268 | 259 | ||||||
| Freddie Mac Pool #Q47615 3.50% 4/1/20471 | 50 | 46 | ||||||
| Freddie Mac Pool #Q52069 3.50% 11/1/20471 | 78 | 72 | ||||||
| Freddie Mac Pool #Q54701 3.50% 3/1/20481 | 57 | 53 | ||||||
| Freddie Mac Pool #Q54709 3.50% 3/1/20481 | 56 | 52 | ||||||
| Freddie Mac Pool #Q54700 3.50% 3/1/20481 | 40 | 38 | ||||||
| Freddie Mac Pool #Q54781 3.50% 3/1/20481 | 35 | 33 | ||||||
| Freddie Mac Pool #Q54782 3.50% 3/1/20481 | 34 | 32 | ||||||
| Freddie Mac Pool #Q54699 3.50% 3/1/20481 | 22 | 20 | ||||||
| Freddie Mac Pool #Q54831 3.50% 3/1/20481 | 17 | 16 | ||||||
| Freddie Mac Pool #Q54698 3.50% 3/1/20481 | 14 | 14 | ||||||
| Freddie Mac Pool #G67711 4.00% 3/1/20481 | 1,407 | 1,351 | ||||||
| Freddie Mac Pool #Q55971 4.00% 5/1/20481 | 78 | 75 | ||||||
| Freddie Mac Pool #Q56175 4.00% 5/1/20481 | 74 | 71 | ||||||
| Freddie Mac Pool #Q56590 3.50% 6/1/20481 | 27 | 25 | ||||||
| Freddie Mac Pool #Q56589 3.50% 6/1/20481 | 17 | 16 | ||||||
| Freddie Mac Pool #Q56599 4.00% 6/1/20481 | 114 | 109 | ||||||
| Freddie Mac Pool #Q58411 4.50% 9/1/20481 | 204 | 202 | ||||||
| Freddie Mac Pool #Q58436 4.50% 9/1/20481 | 110 | 109 | ||||||
| Freddie Mac Pool #Q58378 4.50% 9/1/20481 | 80 | 79 | ||||||
| Freddie Mac Pool #ZT0522 4.50% 9/1/20481 | 21 | 21 | ||||||
| Freddie Mac Pool #QA0284 3.50% 6/1/20491 | 194 | 180 | ||||||
| Freddie Mac Pool #QA2748 3.50% 9/1/20491 | 51 | 48 | ||||||
| Freddie Mac Pool #RA1463 3.50% 10/1/20491 | 393 | 368 | ||||||
| Freddie Mac Pool #RA1580 3.50% 10/1/20491 | 204 | 191 | ||||||
| Freddie Mac Pool #SD8106 2.00% 11/1/20501 | 2,906 | 2,379 | ||||||
| Freddie Mac Pool #SD8128 2.00% 2/1/20511 | 37 | 30 | ||||||
| Freddie Mac Pool #SD8134 2.00% 3/1/20511 | 62 | 51 | ||||||
| Freddie Mac Pool #RA5288 2.00% 5/1/20511 | 2,959 | 2,422 | ||||||
| Freddie Mac Pool #SD0726 2.50% 10/1/20511 | 14,344 | 12,316 | ||||||
| Freddie Mac Pool #RA6406 2.00% 11/1/20511 | 488 | 400 | ||||||
| Freddie Mac Pool #SD1385 2.50% 11/1/20511 | 531 | 456 | ||||||
| Freddie Mac Pool #SD7552 2.50% 1/1/20521 | 333 | 285 | ||||||
| Freddie Mac Pool #SD7550 3.00% 2/1/20521 | 3,397 | 3,035 | ||||||
| Freddie Mac Pool #SD0873 3.50% 2/1/20521 | 14,059 | 13,011 | ||||||
| Freddie Mac Pool #QD7089 3.50% 2/1/20521 | 216 | 197 | ||||||
| Freddie Mac Pool #SD7553 3.00% 3/1/20521 | 308 | 274 | ||||||
| Freddie Mac Pool #8D0226 2.521% 5/1/20521,3 | 513 | 462 | ||||||
| Freddie Mac Pool #QE6097 2.50% 7/1/20521 | 635 | 539 | ||||||
| Freddie Mac Pool #SD8237 4.00% 8/1/20521 | 4,913 | 4,613 | ||||||
| Freddie Mac Pool #QE9057 4.00% 8/1/20521 | 189 | 178 | ||||||
| Freddie Mac Pool #QE6926 5.00% 8/1/20521 | 862 | 851 | ||||||
| Freddie Mac Pool #QE8282 5.00% 8/1/20521 | 817 | 806 | ||||||
| Freddie Mac Pool #QE8695 5.00% 8/1/20521 | 59 | 58 | ||||||
| Freddie Mac Pool #QE7647 5.00% 8/1/20521 | 58 | 57 | ||||||
| 256 | American Funds Insurance Series |
U.S. Government Securities Fund (continued)
| Bonds, notes & other debt instruments (continued) | Principal amount (000) |
Value (000) |
||||||
| Mortgage-backed obligations (continued) | ||||||||
| Federal agency mortgage-backed obligations (continued) | ||||||||
| Freddie Mac Pool #SD1496 5.00% 8/1/20521 | USD | 54 | $ | 54 | ||||
| Freddie Mac Pool #SD8244 4.00% 9/1/20521 | 3,275 | 3,076 | ||||||
| Freddie Mac Pool #QE9625 4.00% 9/1/20521 | 244 | 229 | ||||||
| Freddie Mac Pool #QF0671 4.50% 9/1/20521 | 503 | 485 | ||||||
| Freddie Mac Pool #RA7938 5.00% 9/1/20521 | 11,870 | 11,717 | ||||||
| Freddie Mac Pool #QF0311 5.00% 9/1/20521 | 1,324 | 1,307 | ||||||
| Freddie Mac Pool #QF0151 5.00% 9/1/20521 | 799 | 789 | ||||||
| Freddie Mac Pool #SD8246 5.00% 9/1/20521 | 225 | 222 | ||||||
| Freddie Mac Pool #QF0706 5.00% 9/1/20521 | 64 | 64 | ||||||
| Freddie Mac Pool #QF1464 4.00% 10/1/20521 | 234 | 220 | ||||||
| Freddie Mac Pool #QF2136 4.50% 10/1/20521 | 999 | 962 | ||||||
| Freddie Mac Pool #QF1431 4.50% 10/1/20521 | 999 | 962 | ||||||
| Freddie Mac Pool #QF1765 4.50% 10/1/20521 | 995 | 958 | ||||||
| Freddie Mac Pool #SD8257 4.50% 10/1/20521 | 743 | 716 | ||||||
| Freddie Mac Pool #QF1305 5.00% 10/1/20521 | 74 | 73 | ||||||
| Freddie Mac Pool #SD1710 5.00% 10/1/20521 | 26 | 26 | ||||||
| Freddie Mac Pool #QF3364 4.00% 11/1/20521 | 381 | 358 | ||||||
| Freddie Mac Pool #QF2445 4.50% 11/1/20521 | 4,769 | 4,595 | ||||||
| Freddie Mac Pool #SD1895 4.50% 11/1/20521 | 1,272 | 1,249 | ||||||
| Freddie Mac Pool #QF2560 4.50% 11/1/20521 | 999 | 965 | ||||||
| Freddie Mac Pool #QF2846 4.50% 11/1/20521 | 998 | 961 | ||||||
| Freddie Mac Pool #QF2936 4.50% 11/1/20521 | 969 | 934 | ||||||
| Freddie Mac Pool #QF2976 5.00% 11/1/20521 | 81 | 80 | ||||||
| Freddie Mac Pool #SD8275 4.50% 12/1/20521 | 36,151 | 34,831 | ||||||
| Freddie Mac Pool #SD8276 5.00% 12/1/20521 | 1,866 | 1,842 | ||||||
| Freddie Mac Pool #SD8281 6.50% 12/1/20521 | 2,000 | 2,052 | ||||||
| Freddie Mac Pool #SD8285 3.50% 1/1/20531 | 346 | 314 | ||||||
| Freddie Mac Pool #SD8286 4.00% 1/1/20531 | 199 | 187 | ||||||
| Freddie Mac Pool #SD8288 5.00% 1/1/20531 | 7,348 | 7,253 | ||||||
| Freddie Mac Pool #SD8282 6.50% 1/1/20531 | 10,431 | 10,701 | ||||||
| Freddie Mac, Series 1567, Class A, (1-month USD-LIBOR + 0.40%) 2.547% 8/15/20231,3 | 1 | 1 | ||||||
| Freddie Mac, Series K029, Class A2, Multi Family, 3.32% 2/25/20231 | 134 | 133 | ||||||
| Freddie Mac, Series K035, Class A2, Multi Family, 3.458% 8/25/20231,3 | 2,526 | 2,502 | ||||||
| Freddie Mac, Series K040, Class A2, Multi Family, 3.241% 9/25/20241 | 1,363 | 1,328 | ||||||
| Freddie Mac Seasoned Credit Risk Transfer Trust, Series 2017-1, Class HA, 3.00% 1/25/20561,3 | 4,525 | 4,234 | ||||||
| Freddie Mac Seasoned Credit Risk Transfer Trust, Series 2017-3, Class MT, 3.00% 7/25/20561 | 822 | 724 | ||||||
| Freddie Mac Seasoned Credit Risk Transfer Trust, Series 2017-3, Class HT, 3.25% 7/25/20561 | 333 | 300 | ||||||
| Freddie Mac Seasoned Credit Risk Transfer Trust, Series 2017-2, Class MA, 3.00% 8/25/20561 | 4,525 | 4,204 | ||||||
| Freddie Mac Seasoned Credit Risk Transfer Trust, Series 2017-2, Class HA, 3.00% 8/25/20561,3 | 4,135 | 3,866 | ||||||
| Freddie Mac Seasoned Credit Risk Transfer Trust, Series 2018-1, Class HT, 3.00% 5/25/20571 | 910 | 800 | ||||||
| Freddie Mac Seasoned Credit Risk Transfer Trust, Series 2017-4, Class HT, 3.25% 6/25/20571,3 | 1,311 | 1,197 | ||||||
| Freddie Mac Seasoned Credit Risk Transfer Trust, Series 2018-3, Class MA, 3.50% 8/25/20571 | 509 | 484 | ||||||
| Freddie Mac Seasoned Credit Risk Transfer Trust, Series 2018-2, Class MT, 3.50% 11/25/20571 | 4,148 | 3,753 | ||||||
| Freddie Mac Seasoned Credit Risk Transfer Trust, Series 2018-2, Class MA, 3.50% 11/26/20571 | 252 | 239 | ||||||
| Freddie Mac Seasoned Credit Risk Transfer Trust, Series 2019-1, Class MT, 3.50% 7/25/20581 | 763 | 689 | ||||||
| Freddie Mac Seasoned Credit Risk Transfer Trust, Series 2019-1, Class MA, 3.50% 7/25/20581 | 587 | 556 | ||||||
| Freddie Mac Seasoned Credit Risk Transfer Trust, Series 2019-2, Class MA, 3.50% 8/25/20581 | 2,148 | 2,027 | ||||||
| American Funds Insurance Series | 257 |
U.S. Government Securities Fund (continued)
| Bonds, notes & other debt instruments (continued) | Principal amount (000) |
Value (000) |
||||||
| Mortgage-backed obligations (continued) | ||||||||
| Federal agency mortgage-backed obligations (continued) | ||||||||
| Freddie Mac Seasoned Credit Risk Transfer Trust, Series 2019-2, Class MT, 3.50% 8/26/20581 | USD | 731 | $ | 661 | ||||
| Freddie Mac Seasoned Credit Risk Transfer Trust, Series 2019-3, Class MT, 3.50% 10/25/20581 | 396 | 358 | ||||||
| Freddie Mac Seasoned Credit Risk Transfer Trust, Series 2019-4, Class MA, 3.00% 2/25/20591 | 1,819 | 1,687 | ||||||
| Freddie Mac Seasoned Loan Structured Transaction Trust, Series 2018-1, Class A1, 3.50% 6/25/20281 | 4,262 | 4,070 | ||||||
| Freddie Mac Seasoned Loan Structured Transaction Trust, Series 2018-2, Class A1, 3.50% 11/25/20281 | 18,482 | 17,646 | ||||||
| Freddie Mac Seasoned Loan Structured Transaction Trust, Series 2019-3, Class A1C, 2.75% 11/25/20291 | 4,786 | 4,398 | ||||||
| Freddie Mac Seasoned Loan Structured Transaction Trust, Series 2020-1, Class A1D, 2.00% 7/25/20301 | 1,377 | 1,231 | ||||||
| Freddie Mac Seasoned Loan Structured Transaction Trust, Series 2020-1, Class A2D, 2.00% 7/25/20301 | 435 | 356 | ||||||
| Freddie Mac Seasoned Loan Structured Transaction Trust, Series 2022-1, Class A1, 3.50% 5/25/20321 | 4,668 | 4,503 | ||||||
| Government National Mortgage Assn. 2.00% 1/1/20531,4 | 1,395 | 1,169 | ||||||
| Government National Mortgage Assn. 2.50% 1/1/20531,4 | 2,486 | 2,155 | ||||||
| Government National Mortgage Assn. 3.00% 1/1/20531,4 | 1,755 | 1,563 | ||||||
| Government National Mortgage Assn. 3.50% 1/1/20531,4 | 2,260 | 2,077 | ||||||
| Government National Mortgage Assn. 5.00% 1/1/20531,4 | 6,848 | 6,787 | ||||||
| Government National Mortgage Assn. 5.50% 1/1/20531,4 | 14,351 | 14,436 | ||||||
| Government National Mortgage Assn. Pool #782365 6.00% 7/15/20381 | 84 | 89 | ||||||
| Government National Mortgage Assn. Pool #700778 5.50% 10/15/20381 | 21 | 21 | ||||||
| Government National Mortgage Assn. Pool #004269 6.50% 10/20/20381 | 164 | 176 | ||||||
| Government National Mortgage Assn. Pool #698668 5.50% 11/15/20381 | 28 | 29 | ||||||
| Government National Mortgage Assn. Pool #698406 5.00% 7/15/20391 | 186 | 190 | ||||||
| Government National Mortgage Assn. Pool #783690 6.00% 9/20/20391 | 81 | 86 | ||||||
| Government National Mortgage Assn. Pool #783689 5.50% 2/20/20401 | 2,598 | 2,758 | ||||||
| Government National Mortgage Assn. Pool #783688 5.00% 6/20/20411 | 870 | 894 | ||||||
| Government National Mortgage Assn. Pool #783687 4.50% 12/20/20411 | 570 | 562 | ||||||
| Government National Mortgage Assn. Pool #MA0533 3.00% 11/20/20421 | 19 | 17 | ||||||
| Government National Mortgage Assn. Pool #MA8347 4.50% 10/20/20521 | 675 | 656 | ||||||
| Government National Mortgage Assn. Pool #MA8426 4.00% 11/20/20521 | 28,092 | 26,611 | ||||||
| Government National Mortgage Assn. Pool #MA8427 4.50% 11/20/20521 | 32,820 | 31,874 | ||||||
| Government National Mortgage Assn. Pool #MA8488 4.00% 12/20/20521 | 3,100 | 2,936 | ||||||
| Government National Mortgage Assn. Pool #MA8489 4.50% 12/20/20521 | 13,100 | 12,722 | ||||||
| Uniform Mortgage-Backed Security 2.00% 1/1/20381,4 | 1,115 | 992 | ||||||
| Uniform Mortgage-Backed Security 2.50% 1/1/20381,4 | 2,275 | 2,082 | ||||||
| Uniform Mortgage-Backed Security 4.00% 1/1/20381,4 | 920 | 897 | ||||||
| Uniform Mortgage-Backed Security 2.00% 1/1/20531,4 | 14,849 | 12,086 | ||||||
| Uniform Mortgage-Backed Security 4.50% 1/1/20531,4 | 4,574 | 4,402 | ||||||
| Uniform Mortgage-Backed Security 5.50% 1/1/20531,4 | 53,779 | 53,928 | ||||||
| Uniform Mortgage-Backed Security 6.00% 1/1/20531,4 | 29,742 | 30,190 | ||||||
| Uniform Mortgage-Backed Security 6.50% 1/1/20531,4 | 81,263 | 83,237 | ||||||
| Uniform Mortgage-Backed Security 4.00% 2/1/20531,4 | 1,392 | 1,306 | ||||||
| Uniform Mortgage-Backed Security 5.50% 2/1/20531,4 | 31,200 | 31,271 | ||||||
| Uniform Mortgage-Backed Security 6.00% 2/1/20531,4 | 19,158 | 19,430 | ||||||
| 723,593 | ||||||||
| U.S. Treasury bonds & notes 39.79% | ||||||||
| U.S. Treasury inflation-protected securities 26.16% | ||||||||
| U.S. Treasury Inflation-Protected Security 0.125% 1/15/20235 | 21,974 | 21,933 | ||||||
| U.S. Treasury Inflation-Protected Security 0.625% 4/15/20235 | 31,116 | 30,816 | ||||||
| U.S. Treasury Inflation-Protected Security 0.375% 7/15/20235 | 21,857 | 21,606 | ||||||
| U.S. Treasury Inflation-Protected Security 0.625% 1/15/20245 | 55,898 | 54,749 | ||||||
| U.S. Treasury Inflation-Protected Security 0.50% 4/15/20245 | 14,570 | 14,179 | ||||||
| U.S. Treasury Inflation-Protected Security 0.125% 7/15/20245 | 56,967 | 55,181 | ||||||
| U.S. Treasury Inflation-Protected Security 0.125% 10/15/20245 | 26,585 | 25,622 | ||||||
| 258 | American Funds Insurance Series |
U.S. Government Securities Fund (continued)
| Bonds, notes & other debt instruments (continued) | Principal amount (000) |
Value (000) |
||||||
| U.S. Treasury bonds & notes (continued) | ||||||||
| U.S. Treasury inflation-protected securities (continued) | ||||||||
| U.S. Treasury Inflation-Protected Security 0.125% 4/15/20255 | USD | 8,421 | $ | 8,026 | ||||
| U.S. Treasury Inflation-Protected Security 0.375% 7/15/20255 | 57,803 | 55,543 | ||||||
| U.S. Treasury Inflation-Protected Security 0.125% 10/15/20255 | 7,805 | 7,419 | ||||||
| U.S. Treasury Inflation-Protected Security 0.625% 1/15/20265 | 3,380 | 3,245 | ||||||
| U.S. Treasury Inflation-Protected Security 0.125% 4/15/20265 | 5,750 | 5,406 | ||||||
| U.S. Treasury Inflation-Protected Security 0.125% 10/15/20265 | 34,217 | 32,092 | ||||||
| U.S. Treasury Inflation-Protected Security 0.125% 4/15/20275 | 7,315 | 6,817 | ||||||
| U.S. Treasury Inflation-Protected Security 1.625% 10/15/20275 | 12,137 | 12,122 | ||||||
| U.S. Treasury Inflation-Protected Security 0.125% 7/15/20305 | 7,293 | 6,528 | ||||||
| U.S. Treasury Inflation-Protected Security 0.125% 1/15/20315 | 6,877 | 6,102 | ||||||
| U.S. Treasury Inflation-Protected Security 0.125% 7/15/20315 | 1,001 | 883 | ||||||
| U.S. Treasury Inflation-Protected Security 0.125% 1/15/20325 | 4,412 | 3,860 | ||||||
| U.S. Treasury Inflation-Protected Security 2.125% 2/15/20415 | 422 | 446 | ||||||
| U.S. Treasury Inflation-Protected Security 0.75% 2/15/20425 | 8,558 | 7,171 | ||||||
| U.S. Treasury Inflation-Protected Security 0.625% 2/15/20435 | 4,523 | 3,648 | ||||||
| U.S. Treasury Inflation-Protected Security 1.00% 2/15/20495 | 4,914 | 4,114 | ||||||
| U.S. Treasury Inflation-Protected Security 0.25% 2/15/20505 | 337 | 227 | ||||||
| U.S. Treasury Inflation-Protected Security 0.125% 2/15/20515 | 6,032 | 3,891 | ||||||
| U.S. Treasury Inflation-Protected Security 0.125% 2/15/20525 | 1,459 | 943 | ||||||
| 392,569 | ||||||||
| U.S. Treasury 13.63% | ||||||||
| U.S. Treasury 0.50% 11/30/2023 | 12,069 | 11,611 | ||||||
| U.S. Treasury 2.125% 11/30/2023 | — | 2 | — | 2 | ||||
| U.S. Treasury 0.125% 12/15/2023 | 1,934 | 1,853 | ||||||
| U.S. Treasury 2.25% 12/31/2023 | 1,332 | 1,300 | ||||||
| U.S. Treasury 2.50% 1/31/2024 | 26,000 | 25,395 | ||||||
| U.S. Treasury 1.50% 2/29/2024 | 369 | 356 | ||||||
| U.S. Treasury 3.00% 7/31/2024 | 3,685 | 3,594 | ||||||
| U.S. Treasury 2.75% 5/15/2025 | 7,459 | 7,193 | ||||||
| U.S. Treasury 3.125% 8/15/2025 | 390 | 379 | ||||||
| U.S. Treasury 3.50% 9/15/2025 | 28,000 | 27,447 | ||||||
| U.S. Treasury 4.00% 12/15/2025 | 5,694 | 5,659 | ||||||
| U.S. Treasury 2.625% 7/31/2029 | 19,809 | 18,245 | ||||||
| U.S. Treasury 3.125% 8/31/2029 | 22,521 | 21,382 | ||||||
| U.S. Treasury 3.875% 12/31/2029 | 2,905 | 2,885 | ||||||
| U.S. Treasury 2.75% 8/15/2032 | 7,500 | 6,828 | ||||||
| U.S. Treasury 1.125% 5/15/2040 | 7,000 | 4,393 | ||||||
| U.S. Treasury 2.50% 2/15/2045 | 4,850 | 3,668 | ||||||
| U.S. Treasury 2.50% 2/15/2046 | 3,900 | 2,931 | ||||||
| U.S. Treasury 2.50% 5/15/2046 | 5,400 | 4,049 | ||||||
| U.S. Treasury 2.875% 11/15/2046 | 2,700 | 2,174 | ||||||
| U.S. Treasury 2.875% 5/15/2049 | 6,300 | 5,095 | ||||||
| U.S. Treasury 2.25% 8/15/2049 | 1,635 | 1,157 | ||||||
| U.S. Treasury 1.25% 5/15/20506 | 19,460 | 10,527 | ||||||
| U.S. Treasury 1.375% 8/15/2050 | 4,330 | 2,423 | ||||||
| U.S. Treasury 1.625% 11/15/20506 | 26,165 | 15,671 | ||||||
| U.S. Treasury 1.875% 2/15/20516 | 6,672 | 4,264 | ||||||
| U.S. Treasury 2.00% 8/15/2051 | 5,546 | 3,650 | ||||||
| U.S. Treasury 1.875% 11/15/2051 | 3,164 | 2,015 | ||||||
| U.S. Treasury 2.875% 5/15/2052 | 350 | 282 | ||||||
| U.S. Treasury 3.00% 8/15/2052 | 7,025 | 5,825 | ||||||
| U.S. Treasury 4.00% 11/15/2052 | 2,290 | 2,302 | ||||||
| 204,553 | ||||||||
| Total U.S. Treasury bonds & notes | 597,122 | |||||||
| American Funds Insurance Series | 259 |
U.S. Government Securities Fund (continued)
| Bonds, notes & other debt instruments (continued) | Principal amount (000) |
Value (000) |
||||||
| Federal agency bonds & notes 5.28% | ||||||||
| Export-Import Bank of the United States-Guaranteed, Ethiopian Leasing 2012, LLC 2.646% 5/12/2026 |
USD | 308 | $ | 296 | ||||
| Fannie Mae 7.125% 1/15/2030 | 2,000 | 2,353 | ||||||
| Federal Home Loan Bank 3.25% 11/16/2028 | 6,500 | 6,250 | ||||||
| Federal Home Loan Bank 5.50% 7/15/2036 | 300 | 328 | ||||||
| Private Export Funding Corp. 3.55% 1/15/2024 | 3,190 | 3,143 | ||||||
| Private Export Funding Corp. 1.40% 7/15/2028 | 3,000 | 2,536 | ||||||
| Tennessee Valley Authority 0.75% 5/15/2025 | 3,700 | 3,390 | ||||||
| Tennessee Valley Authority 2.875% 2/1/2027 | 5,000 | 4,742 | ||||||
| Tennessee Valley Authority 4.65% 6/15/2035 | 1,780 | 1,764 | ||||||
| Tennessee Valley Authority 5.88% 4/1/2036 | 875 | 971 | ||||||
| Tennessee Valley Authority, Series A, 4.625% 9/15/2060 | 250 | 232 | ||||||
| TVA Southaven 3.846% 8/15/2033 | 887 | 820 | ||||||
| U.S. Agency for International Development, Israel (State of), Class 1A, 5.50% 9/18/2023 | 1,250 | 1,255 | ||||||
| U.S. Agency for International Development, Jordan (Kingdom of) 3.00% 6/30/2025 | 14,779 | 14,231 | ||||||
| U.S. Agency for International Development, Morocco (Kingdom of) 7.55% 7/15/2026 | 1,909 | 2,000 | ||||||
| U.S. Department of Housing and Urban Development, Series 2015-A-9, 2.80% 8/1/2023 | 1,500 | 1,481 | ||||||
| U.S. Department of Housing and Urban Development, Series 2015-A-10, 2.85% 8/1/2024 | 2,250 | 2,190 | ||||||
| U.S. Department of Housing and Urban Development, Series 2015-A-11, 2.95% 8/1/2025 | 2,640 | 2,532 | ||||||
| U.S. Department of Housing and Urban Development, Series 2015-A-12, 3.10% 8/1/2026 | 2,625 | 2,497 | ||||||
| U.S. Department of Housing and Urban Development, Series 2015-A-13, 3.15% 8/1/2027 | 11,482 | 10,812 | ||||||
| U.S. Department of Housing and Urban Development, Series 2015-A-14, 3.25% 8/1/2028 | 3,856 | 3,598 | ||||||
| U.S. Department of Housing and Urban Development, Series 2015-A-15, 3.35% 8/1/2029 | 2,650 | 2,450 | ||||||
| U.S. Department of Housing and Urban Development, Series 2015-A-16, 3.50% 8/1/2030 | 2,482 | 2,361 | ||||||
| U.S. Department of Housing and Urban Development, Series 2015-A-17, 3.55% 8/1/2031 | 2,475 | 2,350 | ||||||
| U.S. Department of Housing and Urban Development, Series 2015-A-18, 3.60% 8/1/2032 | 2,377 | 2,159 | ||||||
| U.S. Department of Housing and Urban Development, Series 2015-A-19, 3.65% 8/1/2033 | 2,059 | 1,866 | ||||||
| U.S. Department of Housing and Urban Development, Series 2015-A-20, 3.70% 8/1/2034 | 651 | 589 | ||||||
| 79,196 | ||||||||
| Total bonds, notes & other debt instruments (cost: $1,480,306,000) | 1,399,911 | |||||||
| Short-term securities 21.20% | Weighted average yield at acquisition |
|||||||||||
| Commercial paper 13.42% | ||||||||||||
| CAFCO, LLC 2/3/20237 | 4.300 | % | 8,750 | 8,713 | ||||||||
| Chariot Funding, LLC 1/3/20237 | 3.880 | 10,000 | 9,995 | |||||||||
| Chariot Funding, LLC 1/27/20237 | 4.150 | 8,000 | 7,973 | |||||||||
| Chariot Funding, LLC 2/10/20237 | 4.657 | 15,000 | 14,923 | |||||||||
| CHARTA, LLC 1/11/20237 | 3.900 | 5,680 | 5,672 | |||||||||
| Citigroup Global Markets, Inc. 2/21/20237 | 4.580 | 6,000 | 5,959 | |||||||||
| Coca-Cola Co. 2/21/20237 | 4.200 | 15,000 | 14,903 | |||||||||
| Honeywell International, Inc. 2/1/20237 | 4.100 | 3,000 | 2,988 | |||||||||
| Honeywell International, Inc. 2/21/20237 | 4.310 | 15,300 | 15,201 | |||||||||
| Honeywell International, Inc. 2/27/20237 | 4.300 | 6,050 | 6,006 | |||||||||
| 260 | American Funds Insurance Series |
U.S. Government Securities Fund (continued)
| Short-term securities (continued) | Weighted average yield at acquisition |
Principal amount (000) |
Value (000) |
|||||||||
| Commercial paper (continued) | ||||||||||||
| Johnson & Johnson 1/30/20237 | 4.190 | % | USD9,000 | $ | 8,967 | |||||||
| Johnson & Johnson 2/13/20237 | 4.220 | 10,000 | 9,946 | |||||||||
| Linde, Inc. 2/6/2023 | 4.340 | 15,000 | 14,932 | |||||||||
| Paccar Financial Corp. 1/6/2023 | 4.110 | 20,000 | 19,983 | |||||||||
| Procter & Gamble Co. 2/9/20237 | 4.300 | 14,500 | 14,428 | |||||||||
| Procter & Gamble Co. 2/10/20237 | 4.250 | 18,500 | 18,406 | |||||||||
| Roche Holdings, Inc. 1/3/20237 | 4.230 | 13,950 | 13,944 | |||||||||
| Starbird Funding Corp. 1/3/20237 | 4.300 | 8,500 | 8,496 | |||||||||
| 201,435 | ||||||||||||
| Federal agency bills & notes 6.19% | ||||||||||||
| Federal Farm Credit Banks 1/12/2023 | 3.880 | 5,500 | 5,494 | |||||||||
| Federal Home Loan Bank 1/3/2023 | 3.900 | 850 | 850 | |||||||||
| Federal Home Loan Bank 1/11/2023 | 4.005 | 20,700 | 20,680 | |||||||||
| Federal Home Loan Bank 2/8/2023 | 4.161 | 25,000 | 24,896 | |||||||||
| Federal Home Loan Bank 2/10/2023 | 4.215 | 6,750 | 6,720 | |||||||||
| Federal Home Loan Bank 2/22/2023 | 4.320 | 4,400 | 4,373 | |||||||||
| Federal Home Loan Bank 2/24/2023 | 4.297 | 10,000 | 9,936 | |||||||||
| Federal Home Loan Bank 3/3/2023 | 4.370 | 20,000 | 19,856 | |||||||||
| 92,805 | ||||||||||||
| U.S. Treasury bills 1.59% | ||||||||||||
| U.S. Treasury 11/2/2023 | 4.527 | 24,780 | 23,854 | |||||||||
| Total short-term securities (cost: $318,108,000) | 318,094 | |||||||||||
| Total investment securities 114.48% (cost: $1,798,414,000) | 1,718,005 | |||||||||||
| Other assets less liabilities (14.48)% | (217,283 | ) | ||||||||||
| Net assets 100.00% | $ | 1,500,722 | ||||||||||
Futures contracts
| Value and | |||||||||||||||
| unrealized | |||||||||||||||
| appreciation | |||||||||||||||
| Notional | (depreciation) | ||||||||||||||
| Number of | amount | at 12/31/2022 | |||||||||||||
| Contracts | Type | contracts | Expiration | (000) | (000) | ||||||||||
| 3 Month SOFR Futures | Short | 270 | June 2023 | USD (64,183 | ) | $ | 920 | ||||||||
| 90 Day Eurodollar Futures | Long | 1,495 | September 2023 | 354,782 | (15,731 | ) | |||||||||
| 90 Day Eurodollar Futures | Short | 923 | December 2023 | (219,697 | ) | 8,805 | |||||||||
| 90 Day Eurodollar Futures | Short | 885 | December 2024 | (213,285 | ) | 4,539 | |||||||||
| 2 Year U.S. Treasury Note Futures | Short | 298 | March 2023 | (61,113 | ) | 148 | |||||||||
| 5 Year U.S. Treasury Note Futures | Long | 3,872 | March 2023 | 417,904 | (536 | ) | |||||||||
| 10 Year U.S. Treasury Note Futures | Long | 603 | March 2023 | 67,715 | (373 | ) | |||||||||
| 10 Year Ultra U.S. Treasury Note Futures | Long | 164 | March 2023 | 19,398 | (294 | ) | |||||||||
| 20 Year U.S. Treasury Bond Futures | Long | 447 | March 2023 | 56,029 | (765 | ) | |||||||||
| 30 Year Ultra U.S. Treasury Bond Futures | Short | 35 | March 2023 | (4,701 | ) | 111 | |||||||||
| $ | (3,176 | ) | |||||||||||||
| American Funds Insurance Series | 261 |
U.S. Government Securities Fund (continued)
Swap contracts
Interest rate swaps
Centrally cleared interest rate swaps
| Unrealized | ||||||||||||||||||||||||||
| Upfront | appreciation | |||||||||||||||||||||||||
| Receive | Pay | Notional | Value at | premium | (depreciation) | |||||||||||||||||||||
| Payment | Payment | Expiration | amount | 12/31/2022 | paid | at 12/31/2022 | ||||||||||||||||||||
| Rate | frequency | Rate | frequency | date | (000) | (000) | (000) | (000) | ||||||||||||||||||
| SOFR | Annual | 0.471% | Annual | 10/26/2023 | USD 30,500 | $ | 1,078 | $ | — | $ | 1,078 | |||||||||||||||
| 0.45801% | Annual | SOFR | Annual | 10/26/2023 | 30,500 | (1,081 | ) | — | (1,081 | ) | ||||||||||||||||
| 0.241% | Annual | U.S. EFFR | Annual | 3/1/2024 | 119,400 | (6,219 | ) | — | (6,219 | ) | ||||||||||||||||
| U.S. EFFR | Annual | 0.11% | Annual | 5/18/2024 | 97,600 | 4,372 | — | 4,372 | ||||||||||||||||||
| 3.497% | Annual | U.S. EFFR | Annual | 6/16/2024 | 24,000 | (426 | ) | — | (426 | ) | ||||||||||||||||
| 3.4585% | Annual | U.S. EFFR | Annual | 6/17/2024 | 3,697 | (68 | ) | — | (68 | ) | ||||||||||||||||
| 3.4325% | Annual | U.S. EFFR | Annual | 6/17/2024 | 17,700 | (330 | ) | — | (330 | ) | ||||||||||||||||
| 4.345% | Annual | U.S. EFFR | Annual | 9/29/2024 | 19,000 | (85 | ) | — | (85 | ) | ||||||||||||||||
| 4.197% | Annual | U.S. EFFR | Annual | 9/30/2024 | 19,000 | (131 | ) | — | (131 | ) | ||||||||||||||||
| 4.1735% | Annual | U.S. EFFR | Annual | 9/30/2024 | 19,400 | (142 | ) | — | (142 | ) | ||||||||||||||||
| 4.15% | Annual | U.S. EFFR | Annual | 10/6/2024 | 19,300 | (146 | ) | — | (146 | ) | ||||||||||||||||
| 4.5645% | Annual | U.S. EFFR | Annual | 10/19/2024 | 7,100 | (2 | ) | — | (2 | ) | ||||||||||||||||
| 4.533% | Annual | U.S. EFFR | Annual | 10/20/2024 | 8,800 | (7 | ) | — | (7 | ) | ||||||||||||||||
| 4.56% | Annual | U.S. EFFR | Annual | 10/27/2024 | 8,900 | (2 | ) | — | (2 | ) | ||||||||||||||||
| 4.5245% | Annual | U.S. EFFR | Annual | 10/27/2024 | 10,600 | (8 | ) | — | (8 | ) | ||||||||||||||||
| U.S. EFFR | Annual | 0.1275% | Annual | 6/25/2025 | 20,100 | 1,938 | — | 1,938 | ||||||||||||||||||
| U.S. EFFR | Annual | 0.126% | Annual | 6/25/2025 | 20,100 | 1,938 | — | 1,938 | ||||||||||||||||||
| U.S. EFFR | Annual | 0.106% | Annual | 6/30/2025 | 22,492 | 2,187 | — | 2,187 | ||||||||||||||||||
| 3-month USD-LIBOR | Quarterly | 1.867% | Semi-annual | 7/11/2025 | 49,400 | 3,060 | — | 3,060 | ||||||||||||||||||
| 2.925% | Semi-annual | 3-month USD-LIBOR | Quarterly | 2/1/2028 | 12,800 | (616 | ) | — | (616 | ) | ||||||||||||||||
| 2.92% | Semi-annual | 3-month USD-LIBOR | Quarterly | 2/2/2028 | 12,200 | (590 | ) | — | (590 | ) | ||||||||||||||||
| U.S. EFFR | Annual | 0.5385% | Annual | 3/26/2030 | 49,000 | 9,477 | — | 9,477 | ||||||||||||||||||
| 0.913% | Semi-annual | 3-month USD-LIBOR | Quarterly | 6/9/2030 | 31,000 | (5,918 | ) | — | (5,918 | ) | ||||||||||||||||
| U.S. EFFR | Annual | 0.666% | Annual | 11/19/2030 | 15,500 | 3,075 | — | 3,075 | ||||||||||||||||||
| 3-month USD-LIBOR | Quarterly | 2.963% | Semi-annual | 2/1/2038 | 9,800 | 486 | — | 486 | ||||||||||||||||||
| 3-month USD-LIBOR | Quarterly | 2.986% | Semi-annual | 2/1/2038 | 7,800 | 375 | — | 375 | ||||||||||||||||||
| 0.833% | Semi-annual | 3-month USD-LIBOR | Quarterly | 4/3/2040 | 15,800 | (5,952 | ) | — | (5,952 | ) | ||||||||||||||||
| 3-month USD-LIBOR | Quarterly | 0.811% | Semi-annual | 7/27/2050 | 5,110 | 2,464 | — | 2,464 | ||||||||||||||||||
| SOFR | Annual | 2.85282% | Annual | 12/6/2052 | 540 | 38 | — | 38 | ||||||||||||||||||
| SOFR | Annual | 2.93542% | Annual | 12/6/2052 | 550 | 31 | — | 31 | ||||||||||||||||||
| $ | 8,796 | $ | — | $ | 8,796 | |||||||||||||||||||||
| 1 | Principal payments may be made periodically. Therefore, the effective maturity date may be earlier than the stated maturity date. |
| 2 | Amount less than one thousand. |
| 3 | Coupon rate may change periodically. Reference rate and spread are as of the most recent information available. Some coupon rates are determined by the issuer or agent based on current market conditions; therefore, the reference rate and spread are not available. For short-term securities, the date of the next scheduled coupon rate change is considered to be the maturity date. |
| 4 | Purchased on a TBA basis. |
| 5 | Index-linked bond whose principal amount moves with a government price index. |
| 6 | All or a portion of this security was pledged as collateral. The total value of pledged collateral was $10,807,000, which represented .72% of the net assets of the fund. |
| 7 | Acquired in a transaction exempt from registration under Rule 144A or, for commercial paper, Section 4(a)(2) of the Securities Act of 1933. May be resold in the U.S. in transactions exempt from registration, normally to qualified institutional buyers. The total value of all such securities was $166,520,000, which represented 11.10% of the net assets of the fund. |
Key to abbreviations
Assn. = Association
EFFR = Effective Federal Funds Rate
LIBOR = London Interbank Offered Rate
SOFR = Secured Overnight Financing Rate
TBA = To be announced
USD = U.S. dollars
Refer to the notes to financial statements.
| 262 | American Funds Insurance Series |
Managed Risk Growth Fund
Investment portfolio December 31, 2022
| Growth funds 85.30% | Shares | Value (000) |
||||||
| American Funds Insurance Series – Growth Fund, Class 1 | 5,078,871 | $ | 387,467 | |||||
| Total growth funds (cost: $439,303,000) | 387,467 | |||||||
| Fixed income funds 7.53% | ||||||||
| American Funds Insurance Series – The Bond Fund of America, Class 1 | 3,634,107 | 34,197 | ||||||
| Total fixed income funds (cost: $35,683,000) | 34,197 | |||||||
| Short-term securities 2.48% | ||||||||
| State Street Institutional U.S. Government Money Market Fund, Premier Class 4.12%1 | 11,266,894 | 11,267 | ||||||
| Total short-term securities (cost: $11,267,000) | 11,267 | |||||||
| Options purchased 0.04% | ||||||||
| Options purchased* | 205 | |||||||
| Total options purchased (cost: $1,216,000) | 205 | |||||||
| Total investment securities 95.35% (cost: $487,469,000) | 433,136 | |||||||
| Other assets less liabilities 4.65% | 21,106 | |||||||
| Net assets 100.00% | $ | 454,242 | ||||||
*Options purchased
Put
| Description | Number of contracts |
Notional amount (000) |
Exercise price |
Expiration date |
Value at 12/31/2022 (000) |
|||||||||||
| S&P 500 Index | 35 | USD | 13,438 | USD | 2,600.00 | 3/17/2023 | $ | 13 | ||||||||
| S&P 500 Index | 70 | 26,877 | 2,700.00 | 3/17/2023 | 29 | |||||||||||
| S&P 500 Index | 175 | 67,191 | 2,800.00 | 3/17/2023 | 87 | |||||||||||
| S&P 500 Index | 5 | 1,920 | 2,850.00 | 3/17/2023 | 2 | |||||||||||
| S&P 500 Index | 110 | 42,234 | 2,900.00 | 3/17/2023 | 74 | |||||||||||
| $ | 205 | |||||||||||||||
| American Funds Insurance Series | 263 |
Managed Risk Growth Fund (continued)
Futures contracts
| Contracts | Type | Number of contracts |
Expiration | Notional amount (000) |
Value and unrealized (depreciation) appreciation at 12/31/2022 (000) |
||||||||||
| 5 Year U.S. Treasury Note Futures | Long | 283 | March 2023 | USD | 30,544 | $ | (47 | ) | |||||||
| Nikkei 225 Index Contracts | Short | 3 | March 2023 | (590 | ) | 45 | |||||||||
| Japanese Yen Currency Contracts | Short | 7 | March 2023 | (674 | ) | (31 | ) | ||||||||
| FTSE 100 Index Contracts | Short | 19 | March 2023 | (1,716 | ) | (1 | ) | ||||||||
| British Pound Currency Contracts | Short | 24 | March 2023 | (1,812 | ) | 47 | |||||||||
| Mini MSCI Emerging Market Index Contracts | Short | 57 | March 2023 | (2,734 | ) | 42 | |||||||||
| Russell 2000 Mini Index Contracts | Short | 66 | March 2023 | (5,844 | ) | 156 | |||||||||
| Euro Stoxx 50 Index Contracts | Short | 314 | March 2023 | (12,714 | ) | 544 | |||||||||
| Euro Currency Contracts | Short | 101 | March 2023 | (13,577 | ) | (30 | ) | ||||||||
| S&P Mid 400 E-mini Index Contracts | Short | 92 | March 2023 | (22,472 | ) | 455 | |||||||||
| S&P 500 E-mini Index Contracts | Short | 1,194 | March 2023 | (230,502 | ) | 6,305 | |||||||||
| $ | 7,485 | ||||||||||||||
Investments in affiliates2
| Value of affiliates at 1/1/2022 (000) |
Additions (000) |
Reductions (000) |
Net realized loss (000) |
Net unrealized (depreciation) appreciation (000) |
Value of affiliates at 12/31/2022 (000) |
Dividend income (000) |
Capital gain distributions received (000) |
|||||||||||||||||||||||||
| Growth funds 85.30% | ||||||||||||||||||||||||||||||||
| American Funds Insurance Series – Growth Fund, Class 1 | $ | 504,914 | $ | 458,729 | $ | 366,785 | $ | (17,443 | ) | $ | (191,948 | ) | $ | 387,467 | $ | 2,476 | $ | 60,090 | ||||||||||||||
| Fixed income funds 7.53% | ||||||||||||||||||||||||||||||||
| American Funds Insurance Series – The Bond Fund of America, Class 1 | 59,236 | 70,113 | 86,469 | (9,458 | ) | 775 | 34,197 | 1,344 | 443 | |||||||||||||||||||||||
| Total 92.83% | $ | (26,901 | ) | $ | (191,173 | ) | $ | 421,664 | $ | 3,820 | $ | 60,533 | ||||||||||||||||||||
| 1 | Rate represents the seven-day yield at 12/31/2022. |
| 2 | Part of the same “group of investment companies” as the fund as defined under the Investment Company Act of 1940, as amended. |
Key to abbreviation
USD = U.S. dollars
Refer to the notes to financial statements.
| 264 | American Funds Insurance Series |
Managed Risk International Fund
Investment portfolio December 31, 2022
| Growth funds 84.51% | Shares | Value (000) |
||||||
| American Funds Insurance Series – International Fund, Class 1 | 6,952,007 | $ | 106,435 | |||||
| Total growth funds (cost: $119,403,000) | 106,435 | |||||||
| Fixed income funds 9.95% | ||||||||
| American Funds Insurance Series – The Bond Fund of America, Class 1 | 1,331,210 | 12,527 | ||||||
| Total fixed income funds (cost: $13,253,000) | 12,527 | |||||||
| Short-term securities 2.09% | ||||||||
| State Street Institutional U.S. Government Money Market Fund, Premier Class 4.12%1 | 2,635,506 | 2,636 | ||||||
| Total short-term securities (cost: $2,636,000) | 2,636 | |||||||
| Options purchased 0.14% | ||||||||
| Options purchased* | 169 | |||||||
| Total options purchased (cost: $399,000) | 169 | |||||||
| Total investment securities 96.69% (cost: $135,691,000) | 121,767 | |||||||
| Other assets less liabilities 3.31% | 4,167 | |||||||
| Net assets 100.00% | $ | 125,934 | ||||||
*Options purchased
Put
| Description | Number of contracts |
Notional amount (000) |
Exercise price |
Expiration date |
Value at 12/31/2022 (000) |
||||||||||||
| iShares MSCI EAFE ETF | 50 | USD | 328 | USD | 47.00 | 3/17/2023 | $ | — | 2 | ||||||||
| iShares MSCI EAFE ETF | 1,700 | 11,159 | 48.00 | 3/17/2023 | 13 | ||||||||||||
| iShares MSCI EAFE ETF | 450 | 2,954 | 55.00 | 3/17/2023 | 11 | ||||||||||||
| iShares MSCI EAFE ETF | 1,375 | 9,025 | 43.00 | 6/16/2023 | 34 | ||||||||||||
| iShares MSCI EAFE ETF | 350 | 2,297 | 45.00 | 6/16/2023 | 15 | ||||||||||||
| iShares MSCI EAFE ETF | 200 | 1,313 | 46.00 | 6/16/2023 | 9 | ||||||||||||
| iShares MSCI EAFE ETF | 1,700 | 11,159 | 50.00 | 6/16/2023 | 87 | ||||||||||||
| $ | 169 | ||||||||||||||||
Futures contracts
| Contracts | Type | Number of contracts |
Expiration | Notional amount (000) |
Value and unrealized (depreciation) appreciation at 12/31/2022 (000) |
||||||||||
| 5 Year U.S. Treasury Note Futures | Long | 75 | March 2023 | USD | 8,095 | $ | (13 | ) | |||||||
| S&P 500 E-mini Index Contracts | Short | 66 | March 2023 | (12,742 | ) | 351 | |||||||||
| Mini MSCI Emerging Market Index Contracts | Short | 394 | March 2023 | (18,900 | ) | 245 | |||||||||
| MSCI EAFE Index Contracts | Short | 279 | March 2023 | (27,194 | ) | 428 | |||||||||
| $ | 1,011 | ||||||||||||||
| American Funds Insurance Series | 265 |
Managed Risk International Fund (continued)
Investments in affiliates3
| Value of affiliates at 1/1/2022 (000) |
Additions (000) |
Reductions (000) |
Net realized loss (000) |
Net unrealized depreciation (000) |
Value of affiliates at 12/31/2022 (000) |
Dividend income (000) |
Capital gain distributions received (000) |
|||||||||||||||||||||||||
| Growth funds 84.51% | ||||||||||||||||||||||||||||||||
| American Funds Insurance Series – International Fund, Class 1 | $ | 136,987 | $ | 107,662 | $ | 92,768 | $ | (7,315 | ) | $ | (38,131 | ) | $ | 106,435 | $ | 2,273 | $ | 16,110 | ||||||||||||||
| Fixed income funds 9.95% | ||||||||||||||||||||||||||||||||
| American Funds Insurance Series – The Bond Fund of America, Class 1 | 16,071 | 14,150 | 15,224 | (2,409 | ) | (61 | ) | 12,527 | 427 | 160 | ||||||||||||||||||||||
| Total 94.46% | $ | (9,724 | ) | $ | (38,192 | ) | $ | 118,962 | $ | 2,700 | $ | 16,270 | ||||||||||||||||||||
| 1 | Rate represents the seven-day yield at 12/31/2022. |
| 2 | Amount less than one thousand. |
| 3 | Part of the same “group of investment companies” as the fund as defined under the Investment Company Act of 1940, as amended. |
Key to abbreviation
USD = U.S. dollars
Refer to the notes to financial statements.
| 266 | American Funds Insurance Series |
Managed Risk Washington Mutual Investors Fund
Investment portfolio December 31, 2022
| Growth-and-income funds 84.89% | Shares | Value (000) |
||||||
| American Funds Insurance Series – Washington Mutual Investors Fund, Class 1 | 21,639,334 | $ | 274,603 | |||||
| Total growth-and-income funds (cost: $299,529,000) | 274,603 | |||||||
| Fixed income funds 9.99% | ||||||||
| American Funds Insurance Series – U.S. Government Securities Fund, Class 1 | 3,235,124 | 32,319 | ||||||
| Total fixed income funds (cost: $34,728,000) | 32,319 | |||||||
| Short-term securities 2.32% | ||||||||
| State Street Institutional U.S. Government Money Market Fund, Premier Class 4.12%1 | 7,500,680 | 7,501 | ||||||
| Total short-term securities (cost: $7,501,000) | 7,501 | |||||||
| Options purchased 0.09% | ||||||||
| Options purchased* | 274 | |||||||
| Total options purchased (cost: $1,254,000) | 274 | |||||||
| Total investment securities 97.29% (cost: $343,012,000) | 314,697 | |||||||
| Other assets less liabilities 2.71% | 8,775 | |||||||
| Net assets 100.00% | $ | 323,472 | ||||||
*Options purchased
Put
| Description | Number of contracts |
Notional amount (000) |
Exercise price |
Expiration date |
Value at 12/31/2022 (000) |
||||||||||||
| S&P 500 Index | 15 | USD | 5,759 | USD | 2,500.00 | 3/17/2023 | $ | 4 | |||||||||
| S&P 500 Index | 15 | 5,759 | 2,600.00 | 3/17/2023 | 6 | ||||||||||||
| S&P 500 Index | 80 | 30,716 | 2,700.00 | 3/17/2023 | 33 | ||||||||||||
| S&P 500 Index | 130 | 49,913 | 2,800.00 | 3/17/2023 | 65 | ||||||||||||
| S&P 500 Index | 45 | 17,278 | 2,850.00 | 3/17/2023 | 24 | ||||||||||||
| S&P 500 Index | 105 | 40,315 | 2,900.00 | 3/17/2023 | 70 | ||||||||||||
| S&P 500 Index | 30 | 11,519 | 2,825.00 | 6/16/2023 | 72 | ||||||||||||
| $ | 274 | ||||||||||||||||
Futures contracts
| Contracts | Type | Number of contracts |
Expiration | Notional amount (000) |
Value and unrealized (depreciation) appreciation at 12/31/2022 (000) |
||||||||||
| 5 Year U.S. Treasury Note Futures | Long | 146 | March 2023 | USD | 15,758 | $ | (81 | ) | |||||||
| Russell 2000 Mini Index Contracts | Short | 1 | March 2023 | (89 | ) | 3 | |||||||||
| S&P Mid 400 E-mini Index Contracts | Short | 7 | March 2023 | (1,710 | ) | 31 | |||||||||
| Euro Stoxx 50 Index Contracts | Short | 47 | March 2023 | (1,903 | ) | 70 | |||||||||
| Euro Currency Contracts | Short | 15 | March 2023 | (2,016 | ) | (5 | ) | ||||||||
| FTSE 100 Index Contracts | Short | 31 | March 2023 | (2,799 | ) | (5 | ) | ||||||||
| American Funds Insurance Series | 267 |
Managed Risk Washington Mutual Investors Fund (continued)
Futures contracts (continued)
| Contracts | Type | Number of contracts |
Expiration | Notional amount (000) |
Value and unrealized (depreciation) appreciation at 12/31/2022 (000) |
||||||||||
| British Pound Currency Contracts | Short | 38 | March 2023 | USD | (2,870 | ) | $ | 68 | |||||||
| S&P 500 E-mini Index Contracts | Short | 563 | March 2023 | (108,687 | ) | 2,521 | |||||||||
| $ | 2,602 | ||||||||||||||
Investments in affiliates2
| Value of affiliates at 1/1/2022 (000) |
Additions (000) |
Reductions (000) |
Net realized gain (loss) (000) |
Net unrealized (depreciation) appreciation (000) |
Value of affiliates at 12/31/2022 (000) |
Dividend income (000) |
Capital gain distributions received (000) |
|||||||||||||||||||||||||
| Growth-and-income funds 84.89% | ||||||||||||||||||||||||||||||||
| American Funds Insurance Series – Washington Mutual Investors Fund, Class 1 | $ | 315,947 | $ | 235,449 | $ | 186,345 | $ | 38,519 | $ | (128,967 | ) | $ | 274,603 | $ | 5,946 | $ | 61,850 | |||||||||||||||
| Fixed income funds 9.99% | ||||||||||||||||||||||||||||||||
| American Funds Insurance Series – U.S. Government Securities Fund, Class 1 | 37,066 | 33,763 | 33,365 | (5,847 | ) | 702 | 32,319 | 1,347 | — | |||||||||||||||||||||||
| Total 94.88% | $ | 32,672 | $ | (128,265 | ) | $ | 306,922 | $ | 7,293 | $ | 61,850 | |||||||||||||||||||||
| 1 | Rate represents the seven-day yield at 12/31/2022. |
| 2 | Part of the same “group of investment companies” as the fund as defined under the Investment Company Act of 1940, as amended. |
Key to abbreviation
USD = U.S. dollars
Refer to the notes to financial statements.
| 268 | American Funds Insurance Series |
Managed Risk Growth-Income Fund
Investment portfolio December 31, 2022
| Growth-and-income funds 79.84% | Shares | Value (000) |
||||||
| American Funds Insurance Series – Growth-Income Fund, Class 1 | 33,417,153 | $ | 1,677,875 | |||||
| Total growth-and-income funds (cost: $1,757,211,000) | 1,677,875 | |||||||
| Fixed income funds 14.97% | ||||||||
| American Funds Insurance Series – The Bond Fund of America, Class 1 | 33,434,013 | 314,614 | ||||||
| Total fixed income funds (cost: $348,317,000) | 314,614 | |||||||
| Short-term securities 2.25% | ||||||||
| State Street Institutional U.S. Government Money Market Fund, Premier Class 4.12%1 | 47,304,896 | 47,305 | ||||||
| Total short-term securities (cost: $47,305,000) | 47,305 | |||||||
| Options purchased 0.12% | ||||||||
| Options purchased* | 2,485 | |||||||
| Total options purchased (cost: $13,461,000) | 2,485 | |||||||
| Total investment securities 97.18% (cost: $2,166,294,000) | 2,042,279 | |||||||
| Other assets less liabilities 2.82% | 59,165 | |||||||
| Net assets 100.00% | $ | 2,101,444 | ||||||
*Options purchased
Put
| Description | Number of contracts |
Notional amount (000) |
Exercise price |
Expiration date |
Value at 12/31/2022 (000) |
||||||||||||
| S&P 500 Index | 420 | USD | 161,259 | USD | 2,700.00 | 3/17/2023 | $ | 172 | |||||||||
| S&P 500 Index | 1,500 | 575,925 | 2,800.00 | 3/17/2023 | 750 | ||||||||||||
| S&P 500 Index | 1,575 | 604,721 | 2,850.00 | 3/17/2023 | 838 | ||||||||||||
| S&P 500 Index | 1,080 | 414,666 | 2,900.00 | 3/17/2023 | 725 | ||||||||||||
| $ | 2,485 | ||||||||||||||||
Futures contracts
| Contracts | Type | Number of contracts |
Expiration | Notional amount (000) |
Value and unrealized (depreciation) appreciation at 12/31/2022 (000) |
||||||||||
| 5 Year U.S. Treasury Note Futures | Long | 1,001 | March 2023 | USD | 108,038 | $ | (177 | ) | |||||||
| Nikkei 225 Index Contracts | Short | 1 | March 2023 | (197 | ) | 3 | |||||||||
| Japanese Yen Currency Contracts | Short | 3 | March 2023 | (289 | ) | (4 | ) | ||||||||
| Russell 2000 Mini Index Contracts | Short | 52 | March 2023 | (4,604 | ) | 100 | |||||||||
| Mini MSCI Emerging Market Index Contracts | Short | 230 | March 2023 | (11,033 | ) | 137 | |||||||||
| FTSE 100 Index Contracts | Short | 189 | March 2023 | (17,066 | ) | (33 | ) | ||||||||
| British Pound Currency Contracts | Short | 235 | March 2023 | (17,748 | ) | 433 | |||||||||
| Euro Stoxx 50 Index Contracts | Short | 579 | March 2023 | (23,445 | ) | 892 | |||||||||
| Euro Currency Contracts | Short | 187 | March 2023 | (25,138 | ) | (70 | ) | ||||||||
| American Funds Insurance Series | 269 |
Managed Risk Growth-Income Fund (continued)
Futures contracts (continued)
| Contracts | Type | Number of contracts |
Expiration | Notional amount (000) |
Value and unrealized (depreciation) appreciation at 12/31/2022 (000) |
||||||||||
| S&P Mid 400 E-mini Index Contracts | Short | 210 | March 2023 | USD(51,295 | ) | $ | 773 | ||||||||
| S&P 500 E-mini Index Contracts | Short | 3,266 | March 2023 | (630,501 | ) | 14,597 | |||||||||
| $ | 16,651 | ||||||||||||||
Investments in affiliates2
| Value of affiliates at 1/1/2022 (000) |
Additions (000) |
Reductions (000) |
Net realized gain (loss) (000) |
Net unrealized depreciation (000) |
Value of affiliates at 12/31/2022 (000) |
Dividend income (000) |
Capital gain distributions received (000) |
|||||||||||||||||||||||||
| Growth-and-income funds 79.84% | ||||||||||||||||||||||||||||||||
| American Funds Insurance Series –Growth-Income Fund, Class 1 | $ | 2,125,192 | $ | 1,251,540 | $ | 1,173,057 | $ | 198,223 | $ | (724,023 | ) | $ | 1,677,875 | $ | 26,763 | $ | 175,737 | |||||||||||||||
| Fixed income funds 14.97% | ||||||||||||||||||||||||||||||||
| American Funds Insurance Series –The Bond Fund of America, Class 1 | 398,789 | 234,510 | 257,964 | (41,426 | ) | (19,295 | ) | 314,614 | 10,505 | 3,897 | ||||||||||||||||||||||
| Total 94.81% | $ | 156,797 | $ | (743,318 | ) | $ | 1,992,489 | $ | 37,268 | $ | 179,634 | |||||||||||||||||||||
| 1 | Rate represents the seven-day yield at 12/31/2022. |
| 2 | Part of the same “group of investment companies” as the fund as defined under the Investment Company Act of 1940, as amended. |
Key to abbreviation
USD = U.S. dollars
Refer to the notes to financial statements.
| 270 | American Funds Insurance Series |
Managed Risk Asset Allocation Fund
Investment portfolio December 31, 2022
| Asset allocation funds 95.19% | Shares | Value (000) |
||||||
| American Funds Insurance Series – Asset Allocation Fund, Class 1 | 93,886,027 | $ | 2,084,270 | |||||
| Total asset allocation funds (cost: $2,174,894,000) | 2,084,270 | |||||||
| Short-term securities 3.19% | ||||||||
| State Street Institutional U.S. Government Money Market Fund, Premier Class 4.12%1 | 69,776,962 | 69,777 | ||||||
| Total short-term securities (cost: $69,777,000) | 69,777 | |||||||
| Options purchased 0.02% | ||||||||
| Options purchased* | 383 | |||||||
| Total options purchased (cost: $1,887,000) | 383 | |||||||
| Total investment securities 98.40% (cost: $2,246,558,000) | 2,154,430 | |||||||
| Other assets less liabilities 1.60% | 35,042 | |||||||
| Net assets 100.00% | $ | 2,189,472 | ||||||
*Options purchased
Put
| Description | Number of contracts |
Notional amount (000) |
Exercise price |
Expiration date |
Value at 12/31/2022 (000) |
||||||||||||
| S&P 500 Index | 410 | USD | 157,419 | USD | 2,850.00 | 3/17/2023 | $ | 218 | |||||||||
| S&P 500 Index | 245 | 94,068 | 2,900.00 | 3/17/2023 | 165 | ||||||||||||
| $ | 383 | ||||||||||||||||
| Futures contracts | |||||
| Contracts | Type | Number of contracts |
Expiration | Notional amount (000) |
Value and unrealized (depreciation) appreciation at 12/31/2022 (000) |
||||||||||
| 5 Year U.S. Treasury Note Futures | Long | 1,028 | March 2023 | USD110,952 | $ | (162 | ) | ||||||||
| Mini MSCI Emerging Market Index Contracts | Short | 166 | March 2023 | (7,963 | ) | 100 | |||||||||
| FTSE 100 Index Contracts | Short | 89 | March 2023 | (8,036 | ) | (18 | ) | ||||||||
| Russell 2000 Mini Index Contracts | Short | 93 | March 2023 | (8,235 | ) | 157 | |||||||||
| British Pound Currency Contracts | Short | 110 | March 2023 | (8,308 | ) | 196 | |||||||||
| Euro Stoxx 50 Index Contracts | Short | 399 | March 2023 | (16,156 | ) | 623 | |||||||||
| Euro Currency Contracts | Short | 124 | March 2023 | (16,669 | ) | (47 | ) | ||||||||
| S&P Mid 400 E-mini Index Contracts | Short | 183 | March 2023 | (44,700 | ) | 548 | |||||||||
| S&P 500 E-mini Index Contracts | Short | 2,599 | March 2023 | (501,737 | ) | 12,185 | |||||||||
| $ | 13,582 | ||||||||||||||
| American Funds Insurance Series | 271 |
Managed Risk Asset Allocation Fund (continued)
Investments in affiliates2
| Value of affiliate at 1/1/2022 (000) |
Additions (000) |
Reductions (000) |
Net realized gain (000) |
Net unrealized depreciation (000) |
Value of affiliate at 12/31/2022 (000) |
Dividend income (000) |
Capital gain distributions received (000) |
|||||||||||||||||||||||||
| Asset allocation funds 95.19% | ||||||||||||||||||||||||||||||||
| American Funds Insurance Series –Asset Allocation Fund, Class 1 | $ | 2,678,055 | $ | 1,104,342 | $ | 1,086,607 | $ | 55,156 | $ | (666,676 | ) | $ | 2,084,270 | $ | 46,591 | $ | 231,217 | |||||||||||||||
| 1 | Rate represents the seven-day yield at 12/31/2022. |
| 2 | Part of the same “group of investment companies” as the fund as defined under the Investment Company Act of 1940, as amended. |
Key to abbreviation
USD = U.S. dollars
Refer to the notes to financial statements.
| 272 | American Funds Insurance Series |
| Financial statements | |
| Statements of assets and liabilities at December 31, 2022 |
(dollars in thousands) |
| Global Growth Fund |
Global Small Capitalization Fund |
Growth Fund |
International Fund |
New World Fund |
||||||||||||||||
| Assets: | ||||||||||||||||||||
| Investment securities, at value: | ||||||||||||||||||||
| Unaffiliated issuers | $ | 6,783,505 | $ | 2,874,530 | $ | 29,811,816 | $ | 6,445,629 | $ | 2,920,136 | ||||||||||
| Affiliated issuers | 164,535 | 134,983 | 1,166,965 | 306,445 | 167,414 | |||||||||||||||
| Cash | 695 | 32 | 1,221 | 1,055 | 671 | |||||||||||||||
| Cash collateral received for securities on loan | — | 5,872 | 5,587 | 161 | 32 | |||||||||||||||
| Cash collateral pledged for futures contracts | — | — | — | — | 161 | |||||||||||||||
| Cash collateral pledged for swap contracts | — | — | — | — | — | |||||||||||||||
| Cash denominated in currencies other than U.S. dollars | 6,010 | 86 | 1,197 | 1,640 | 929 | |||||||||||||||
| Unrealized appreciation on open forward currency contracts | — | — | — | — | — | * | ||||||||||||||
| Unrealized appreciation on unfunded commitments | — | — | — | — | — | |||||||||||||||
| Receivables for: | ||||||||||||||||||||
| Sales of investments | 9,427 | 47 | 4,581 | 1,634 | 4,534 | |||||||||||||||
| Sales of fund’s shares | 1,203 | 347 | 53,171 | 1,486 | 1,478 | |||||||||||||||
| Dividends and interest | 5,076 | 2,430 | 18,226 | 14,915 | 5,113 | |||||||||||||||
| Variation margin on futures contracts | — | — | — | — | 27 | |||||||||||||||
| Variation margin on centrally cleared swap contracts | — | — | — | — | — | * | ||||||||||||||
| Securities lending income | 7 | 270 | 48 | 17 | 42 | |||||||||||||||
| Currency translations | 961 | — | — | 47 | 90 | |||||||||||||||
| Other | — | — | * | — | * | — | — | |||||||||||||
| 6,971,419 | 3,018,597 | 31,062,812 | 6,773,029 | 3,100,627 | ||||||||||||||||
| Liabilities: | ||||||||||||||||||||
| Collateral for securities on loan | — | 58,725 | 55,867 | 1,607 | 327 | |||||||||||||||
| Unrealized depreciation on open forward currency contracts | — | — | — | — | 50 | |||||||||||||||
| Unrealized depreciation on unfunded commitments | — | — | — | — | — | |||||||||||||||
| Payables for: | ||||||||||||||||||||
| Purchases of investments | 3,893 | 1,234 | 69,568 | 2,056 | 2,377 | |||||||||||||||
| Repurchases of fund’s shares | 23,378 | 5,067 | 24,857 | 18,617 | 2,624 | |||||||||||||||
| Investment advisory services | 2,202 | 1,519 | 8,498 | 2,792 | 1,351 | |||||||||||||||
| Insurance administrative fees | 361 | 162 | 1,629 | 235 | 448 | |||||||||||||||
| Services provided by related parties | 1,005 | 515 | 4,478 | 946 | 393 | |||||||||||||||
| Trustees’ deferred compensation | 85 | 56 | 478 | 174 | 41 | |||||||||||||||
| Variation margin on futures contracts | — | — | — | — | 41 | |||||||||||||||
| Variation margin on centrally cleared swap contracts | — | — | — | — | — | * | ||||||||||||||
| Non-U.S. taxes | 4,611 | 8,270 | 886 | 26,641 | 8,988 | |||||||||||||||
| Other | 230 | 146 | 203 | 380 | 203 | |||||||||||||||
| 35,765 | 75,694 | 166,464 | 53,448 | 16,843 | ||||||||||||||||
| Net assets at December 31, 2022 | $ | 6,935,654 | $ | 2,942,903 | $ | 30,896,348 | $ | 6,719,581 | $ | 3,083,784 | ||||||||||
| Net assets consist of: | ||||||||||||||||||||
| Capital paid in on shares of beneficial interest | $ | 4,528,931 | $ | 2,581,405 | $ | 20,120,055 | $ | 6,463,732 | $ | 2,578,375 | ||||||||||
| Total distributable earnings (accumulated loss) | 2,406,723 | 361,498 | 10,776,293 | 255,849 | 505,409 | |||||||||||||||
| Net assets at December 31, 2022 | $ | 6,935,654 | $ | 2,942,903 | $ | 30,896,348 | $ | 6,719,581 | $ | 3,083,784 | ||||||||||
| Investment securities on loan, at value | $ | — | $ | 59,781 | $ | 54,504 | $ | 1,530 | $ | 311 | ||||||||||
| Investment securities, at cost | ||||||||||||||||||||
| Unaffiliated issuers | 4,940,295 | 2,530,368 | 20,939,019 | 5,790,481 | 2,388,619 | |||||||||||||||
| Affiliated issuers | 164,509 | 133,831 | 1,166,747 | 306,396 | 167,393 | |||||||||||||||
| Cash denominated in currencies other than U.S. dollars, at cost | 6,096 | 85 | 1,195 | 1,614 | 939 | |||||||||||||||
Refer to the end of the statements of assets and liabilities for footnotes.
Refer to the notes to financial statements.
| American Funds Insurance Series | 273 |
| Financial statements (continued) | |
| Statements of assets and liabilities at December 31, 2022 (continued) |
(dollars in thousands) |
| Washington Mutual Investors Fund |
Capital World Growth and Income Fund |
Growth- Income Fund |
International Growth and Income Fund |
Capital Income Builder |
||||||||||||||||
| Assets: | ||||||||||||||||||||
| Investment securities, at value: | ||||||||||||||||||||
| Unaffiliated issuers | $ | 9,042,759 | $ | 1,728,292 | $ | 30,635,898 | $ | 293,962 | $ | 1,065,349 | ||||||||||
| Affiliated issuers | 391,007 | 804 | 2,605,421 | 5,492 | 107,723 | |||||||||||||||
| Cash | 2,877 | 739 | 2,141 | 75 | 826 | |||||||||||||||
| Cash collateral received for securities on loan | 1,290 | 648 | 24,869 | 96 | 655 | |||||||||||||||
| Cash collateral pledged for futures contracts | — | — | — | — | — | |||||||||||||||
| Cash collateral pledged for swap contracts | — | — | — | — | — | |||||||||||||||
| Cash denominated in currencies other than U.S. dollars | — | 1,728 | 844 | 556 | 753 | |||||||||||||||
| Unrealized appreciation on open forward currency contracts | — | — | — | 5 | — | |||||||||||||||
| Unrealized appreciation on unfunded commitments | — | — | — | — | — | |||||||||||||||
| Receivables for: | ||||||||||||||||||||
| Sales of investments | 19,678 | 4,368 | 3,486 | 1,304 | 17,973 | |||||||||||||||
| Sales of fund’s shares | 1,698 | 332 | 11,206 | 54 | 475 | |||||||||||||||
| Dividends and interest | 11,258 | 1,617 | 53,240 | 1,606 | 3,711 | |||||||||||||||
| Variation margin on futures contracts | — | — | — | — | 2 | |||||||||||||||
| Variation margin on centrally cleared swap contracts | — | — | — | — | 22 | |||||||||||||||
| Securities lending income | 7 | 5 | 71 | 3 | 4 | |||||||||||||||
| Currency translations | 3 | 252 | — | 75 | 101 | |||||||||||||||
| Other | — | — | — | — | — | |||||||||||||||
| 9,470,577 | 1,738,785 | 33,337,176 | 303,228 | 1,197,594 | ||||||||||||||||
| Liabilities: | ||||||||||||||||||||
| Collateral for securities on loan | 12,908 | 6,480 | 248,693 | 962 | 6,553 | |||||||||||||||
| Unrealized depreciation on open forward currency contracts | — | — | — | — | — | |||||||||||||||
| Unrealized depreciation on unfunded commitments | — | — | — | — | — | |||||||||||||||
| Payables for: | ||||||||||||||||||||
| Purchases of investments | 2,823 | 1,089 | 28,952 | 197 | 49,380 | |||||||||||||||
| Repurchases of fund’s shares | 7,197 | 4,367 | 62,689 | 744 | 1,446 | |||||||||||||||
| Investment advisory services | 1,903 | 544 | 7,284 | 121 | 211 | |||||||||||||||
| Insurance administrative fees | 706 | 118 | 1,021 | 74 | 328 | |||||||||||||||
| Services provided by related parties | 1,072 | 299 | 3,696 | 69 | 143 | |||||||||||||||
| Trustees’ deferred compensation | 99 | 25 | 530 | 14 | 7 | |||||||||||||||
| Variation margin on futures contracts | — | — | — | — | 95 | |||||||||||||||
| Variation margin on centrally cleared swap contracts | — | — | — | — | 25 | |||||||||||||||
| Non-U.S. taxes | 159 | 410 | 1,143 | 35 | 320 | |||||||||||||||
| Other | 10 | 55 | 201 | 15 | 20 | |||||||||||||||
| 26,877 | 13,387 | 354,209 | 2,231 | 58,528 | ||||||||||||||||
| Net assets at December 31, 2022 | $ | 9,443,700 | $ | 1,725,398 | $ | 32,982,967 | $ | 300,997 | $ | 1,139,066 | ||||||||||
| Net assets consist of: | ||||||||||||||||||||
| Capital paid in on shares of beneficial interest | $ | 7,625,116 | $ | 1,532,409 | $ | 20,816,349 | $ | 322,284 | $ | 1,032,534 | ||||||||||
| Total distributable earnings (accumulated loss) | 1,818,584 | 192,989 | 12,166,618 | (21,287 | ) | 106,532 | ||||||||||||||
| Net assets at December 31, 2022 | $ | 9,443,700 | $ | 1,725,398 | $ | 32,982,967 | $ | 300,997 | $ | 1,139,066 | ||||||||||
| Investment securities on loan, at value | $ | 12,432 | $ | 6,155 | $ | 240,456 | $ | 1,435 | $ | 6,251 | ||||||||||
| Investment securities, at cost | ||||||||||||||||||||
| Unaffiliated issuers | 7,334,340 | 1,456,490 | 20,399,086 | 290,864 | 933,032 | |||||||||||||||
| Affiliated issuers | 390,957 | 804 | 2,605,095 | 5,489 | 113,396 | |||||||||||||||
| Cash denominated in currencies other than U.S. dollars, at cost | — | 1,754 | 847 | 564 | 763 | |||||||||||||||
Refer to the end of the statements of assets and liabilities for footnotes.
Refer to the notes to financial statements.
| 274 | American Funds Insurance Series |
| Financial statements (continued) | |
| Statements of assets and liabilities at December 31, 2022 (continued) |
(dollars in thousands) |
| Asset Allocation Fund |
American Funds Global Balanced Fund† |
The Bond Fund of America |
Capital World Bond Fund |
American High-Income Trust |
||||||||||||||||
| Assets: | ||||||||||||||||||||
| Investment securities, at value: | ||||||||||||||||||||
| Unaffiliated issuers | $ | 22,298,926 | $ | 355,901 | $ | 9,747,773 | $ | 1,438,501 | $ | 778,564 | ||||||||||
| Affiliated issuers | 3,019,460 | 9,460 | 1,425,720 | 48,843 | 38,565 | |||||||||||||||
| Cash | 4,463 | 142 | 3,761 | 431 | 1,024 | |||||||||||||||
| Cash collateral received for securities on loan | 5,690 | — | — | — | — | |||||||||||||||
| Cash collateral pledged for futures contracts | — | — | — | — | 99 | |||||||||||||||
| Cash collateral pledged for swap contracts | — | — | — | — | 517 | |||||||||||||||
| Cash denominated in currencies other than U.S. dollars | 592 | 86 | — | * | 732 | 5 | ||||||||||||||
| Unrealized appreciation on open forward currency contracts | — | 686 | 3,821 | 7,008 | — | |||||||||||||||
| Unrealized appreciation on unfunded commitments | — | — | — | 12 | 572 | |||||||||||||||
| Receivables for: | ||||||||||||||||||||
| Sales of investments | 139,321 | 2,041 | 780,689 | 21 | 1,605 | |||||||||||||||
| Sales of fund’s shares | 1,899 | 327 | 10,460 | 165 | 585 | |||||||||||||||
| Dividends and interest | 74,681 | 1,624 | 71,420 | 10,334 | 13,187 | |||||||||||||||
| Variation margin on futures contracts | 194 | 29 | 494 | 326 | 2 | |||||||||||||||
| Variation margin on centrally cleared swap contracts | 11 | 16 | 345 | 149 | 3 | |||||||||||||||
| Securities lending income | 88 | — | — | — | — | |||||||||||||||
| Currency translations | 79 | 18 | 70 | 429 | — | |||||||||||||||
| Other | — | — | — | — | 3 | |||||||||||||||
| 25,545,404 | 370,330 | 12,044,553 | 1,506,951 | 834,731 | ||||||||||||||||
| Liabilities: | ||||||||||||||||||||
| Collateral for securities on loan | 56,897 | — | — | — | — | |||||||||||||||
| Unrealized depreciation on open forward currency contracts | — | 150 | 174 | 2,455 | — | |||||||||||||||
| Unrealized depreciation on unfunded commitments | 9 | — | — | 1 | 3 | |||||||||||||||
| Payables for: | ||||||||||||||||||||
| Purchases of investments | 647,278 | 1,470 | 1,812,910 | 19,999 | 2,546 | |||||||||||||||
| Repurchases of fund’s shares | 24,374 | 477 | 4,453 | 677 | 164 | |||||||||||||||
| Investment advisory services | 5,696 | 137 | 1,428 | 550 | 190 | |||||||||||||||
| Insurance administrative fees | 3,321 | 69 | 614 | 33 | 49 | |||||||||||||||
| Services provided by related parties | 2,697 | 66 | 1,048 | 217 | 153 | |||||||||||||||
| Trustees’ deferred compensation | 304 | 4 | 124 | 26 | 32 | |||||||||||||||
| Variation margin on futures contracts | 630 | 55 | 2,321 | 722 | 6 | |||||||||||||||
| Variation margin on centrally cleared swap contracts | 13 | 23 | 394 | 222 | 2 | |||||||||||||||
| Non-U.S. taxes | 3,511 | 100 | 5 | 51 | — | |||||||||||||||
| Other | 100 | 19 | — | * | 104 | 32 | ||||||||||||||
| 744,830 | 2,570 | 1,823,471 | 25,057 | 3,177 | ||||||||||||||||
| Net assets at December 31, 2022 | $ | 24,800,574 | $ | 367,760 | $ | 10,221,082 | $ | 1,481,894 | $ | 831,554 | ||||||||||
| Net assets consist of: | ||||||||||||||||||||
| Capital paid in on shares of beneficial interest | $ | 19,598,942 | $ | 316,997 | $ | 11,855,514 | $ | 1,808,688 | $ | 1,203,258 | ||||||||||
| Total distributable earnings (accumulated loss) | 5,201,632 | 50,763 | (1,634,432 | ) | (326,794 | ) | (371,704 | ) | ||||||||||||
| Net assets at December 31, 2022 | $ | 24,800,574 | $ | 367,760 | $ | 10,221,082 | $ | 1,481,894 | $ | 831,554 | ||||||||||
| Investment securities on loan, at value | $ | 67,688 | $ | — | $ | — | $ | — | $ | — | ||||||||||
| Investment securities, at cost | ||||||||||||||||||||
| Unaffiliated issuers | 17,788,591 | 350,438 | 10,540,249 | 1,615,990 | 860,644 | |||||||||||||||
| Affiliated issuers | 3,328,159 | 9,409 | 1,425,521 | 47,246 | 38,557 | |||||||||||||||
| Cash denominated in currencies other than U.S. dollars, at cost | 594 | 86 | — | * | 728 | 5 | ||||||||||||||
Refer to the end of the statements of assets and liabilities for footnotes.
Refer to the notes to financial statements.
| American Funds Insurance Series | 275 |
| Financial statements (continued) | |
| Statements of assets and liabilities at December 31, 2022 (continued) |
(dollars in thousands) |
| American Funds Mortgage Fund |
Ultra-Short Bond Fund |
U.S. Government Securities Fund |
Managed Risk Growth Fund |
Managed Risk International Fund |
||||||||||||||||
| Assets: | ||||||||||||||||||||
| Investment securities, at value: | ||||||||||||||||||||
| Unaffiliated issuers | $ | 107,371 | $ | 423,579 | $ | 1,718,005 | $ | 11,472 | $ | 2,805 | ||||||||||
| Affiliated issuers | — | — | — | 421,664 | 118,962 | |||||||||||||||
| Cash | 2,692 | 9,083 | 40,936 | — | — | |||||||||||||||
| Cash collateral received for securities on loan | — | — | — | — | — | |||||||||||||||
| Cash collateral pledged for futures contracts | — | — | — | 15,705 | 2,698 | |||||||||||||||
| Cash collateral pledged for swap contracts | — | — | — | — | — | |||||||||||||||
| Cash denominated in currencies other than U.S. dollars | — | — | — | — | — | |||||||||||||||
| Unrealized appreciation on open forward currency contracts | — | — | — | — | — | |||||||||||||||
| Unrealized appreciation on unfunded commitments | — | — | — | — | — | |||||||||||||||
| Receivables for: | ||||||||||||||||||||
| Sales of investments | 9,780 | — | 134,003 | 6,691 | 1,022 | |||||||||||||||
| Sales of fund’s shares | 42 | 322 | 2,930 | 237 | 18 | |||||||||||||||
| Dividends and interest | 261 | 29 | 5,528 | 57 | 13 | |||||||||||||||
| Variation margin on futures contracts | 2 | — | 185 | 1,011 | 602 | |||||||||||||||
| Variation margin on centrally cleared swap contracts | 5 | — | 385 | — | — | |||||||||||||||
| Securities lending income | — | — | — | — | — | |||||||||||||||
| Currency translations | — | — | — | — | — | |||||||||||||||
| Other | 1 | — | — | — | — | |||||||||||||||
| 120,154 | 433,013 | 1,901,972 | 456,837 | 126,120 | ||||||||||||||||
| Liabilities: | ||||||||||||||||||||
| Collateral for securities on loan | — | — | — | — | — | |||||||||||||||
| Unrealized depreciation on open forward currency contracts | — | — | — | — | — | |||||||||||||||
| Unrealized depreciation on unfunded commitments | — | — | — | — | — | |||||||||||||||
| Payables for: | ||||||||||||||||||||
| Purchases of investments | 31,002 | — | 398,190 | 2,108 | 19 | |||||||||||||||
| Repurchases of fund’s shares | 22 | 504 | 1,200 | 4 | 43 | |||||||||||||||
| Investment advisory services | 13 | 95 | 226 | 39 | 11 | |||||||||||||||
| Insurance administrative fees | 25 | 50 | 119 | 287 | 80 | |||||||||||||||
| Services provided by related parties | 21 | 92 | 310 | 93 | 26 | |||||||||||||||
| Trustees’ deferred compensation | 3 | 11 | 44 | 3 | 1 | |||||||||||||||
| Variation margin on futures contracts | 25 | — | 744 | 61 | 6 | |||||||||||||||
| Variation margin on centrally cleared swap contracts | — | * | — | 415 | — | — | ||||||||||||||
| Non-U.S. taxes | — | — | — | — | — | |||||||||||||||
| Other | — | * | — | 2 | — | — | ||||||||||||||
| 31,111 | 752 | 401,250 | 2,595 | 186 | ||||||||||||||||
| Net assets at December 31, 2022 | $ | 89,043 | $ | 432,261 | $ | 1,500,722 | $ | 454,242 | $ | 125,934 | ||||||||||
| Net assets consist of: | ||||||||||||||||||||
| Capital paid in on shares of beneficial interest | $ | 99,881 | $ | 429,623 | $ | 1,743,160 | $ | 471,757 | $ | 148,875 | ||||||||||
| Total distributable earnings (accumulated loss) | (10,838 | ) | 2,638 | (242,438 | ) | (17,515 | ) | (22,941 | ) | |||||||||||
| Net assets at December 31, 2022 | $ | 89,043 | $ | 432,261 | $ | 1,500,722 | $ | 454,242 | $ | 125,934 | ||||||||||
| Investment securities on loan, at value | $ | — | $ | — | $ | — | $ | — | $ | — | ||||||||||
| Investment securities, at cost | ||||||||||||||||||||
| Unaffiliated issuers | 109,975 | 423,636 | 1,798,414 | 12,483 | 3,035 | |||||||||||||||
| Affiliated issuers | — | — | — | 474,986 | 132,656 | |||||||||||||||
| Cash denominated in currencies other than U.S. dollars, at cost | — | — | — | — | — | |||||||||||||||
Refer to the end of the statements of assets and liabilities for footnotes.
Refer to the notes to financial statements.
| 276 | American Funds Insurance Series |
| Financial statements (continued) | |
| Statements of assets and liabilities at December 31, 2022 (continued) |
(dollars in thousands) |
| Managed Risk Washington Mutual Investors Fund |
Managed Risk Growth- Income Fund |
Managed Risk Asset Allocation Fund |
||||||||||
| Assets: | ||||||||||||
| Investment securities, at value: | ||||||||||||
| Unaffiliated issuers | $ | 7,775 | $ | 49,790 | $ | 70,160 | ||||||
| Affiliated issuers | 306,922 | 1,992,489 | 2,084,270 | |||||||||
| Cash | — | — | — | |||||||||
| Cash collateral received for securities on loan | — | — | — | |||||||||
| Cash collateral pledged for futures contracts | 6,746 | 43,741 | 34,859 | |||||||||
| Cash collateral pledged for swap contracts | — | — | — | |||||||||
| Cash denominated in currencies other than U.S. dollars | — | — | — | |||||||||
| Unrealized appreciation on open forward currency contracts | — | — | — | |||||||||
| Unrealized appreciation on unfunded commitments | — | — | — | |||||||||
| Receivables for: | ||||||||||||
| Sales of investments | 2,029 | 13,902 | 1,056 | |||||||||
| Sales of fund’s shares | 72 | 11,603 | 104 | |||||||||
| Dividends and interest | 36 | 229 | 280 | |||||||||
| Variation margin on futures contracts | 363 | 2,759 | 2,144 | |||||||||
| Variation margin on centrally cleared swap contracts | — | — | — | |||||||||
| Securities lending income | — | — | — | |||||||||
| Currency translations | — | — | — | |||||||||
| Other | — | — | — | |||||||||
| 323,943 | 2,114,513 | 2,192,873 | ||||||||||
| Liabilities: | ||||||||||||
| Collateral for securities on loan | — | — | — | |||||||||
| Unrealized depreciation on open forward currency contracts | — | — | — | |||||||||
| Unrealized depreciation on unfunded commitments | — | — | — | |||||||||
| Payables for: | ||||||||||||
| Purchases of investments | 63 | 10,953 | — | |||||||||
| Repurchases of fund’s shares | 92 | 420 | 1,215 | |||||||||
| Investment advisory services | 28 | 179 | 188 | |||||||||
| Insurance administrative fees | 201 | 1,304 | 1,381 | |||||||||
| Services provided by related parties | 67 | 56 | 465 | |||||||||
| Trustees’ deferred compensation | 3 | 14 | 29 | |||||||||
| Variation margin on futures contracts | 17 | 143 | 123 | |||||||||
| Variation margin on centrally cleared swap contracts | — | — | — | |||||||||
| Non-U.S. taxes | — | — | — | |||||||||
| Other | — | — | — | |||||||||
| 471 | 13,069 | 3,401 | ||||||||||
| Net assets at December 31, 2022 | $ | 323,472 | $ | 2,101,444 | $ | 2,189,472 | ||||||
| Net assets consist of: | ||||||||||||
| Capital paid in on shares of beneficial interest | $ | 321,451 | $ | 1,965,919 | $ | 2,033,928 | ||||||
| Total distributable earnings (accumulated loss) | 2,021 | 135,525 | 155,544 | |||||||||
| Net assets at December 31, 2022 | $ | 323,472 | $ | 2,101,444 | $ | 2,189,472 | ||||||
| Investment securities on loan, at value | $ | — | $ | — | $ | — | ||||||
| Investment securities, at cost | ||||||||||||
| Unaffiliated issuers | 8,755 | 60,766 | 71,664 | |||||||||
| Affiliated issuers | 334,257 | 2,105,528 | 2,174,894 | |||||||||
| Cash denominated in currencies other than U.S. dollars, at cost | — | — | — | |||||||||
Refer to the end of the statements of assets and liabilities for footnotes.
Refer to the notes to financial statements.
| American Funds Insurance Series | 277 |
Financial statements (continued)
| Statements of assets and liabilities at December 31, 2022 (continued) |
(dollars and shares in thousands, except per-share amounts) |
| Global Growth Fund |
Global Small Capitalization Fund |
Growth Fund |
International Fund |
New World Fund |
||||||||||||||||||
| Shares of beneficial interest issued and outstanding (no stated par value) — unlimited shares authorized |
||||||||||||||||||||||
| Class 1: | Net assets | $ | 3,104,085 | $ | 915,430 | $ | 13,660,417 | $ | 3,157,234 | $ | 1,610,310 | |||||||||||
| Shares outstanding | 102,854 | 56,436 | 179,057 | 206,282 | 72,225 | |||||||||||||||||
| Net asset value per share | $ | 30.18 | $ | 16.22 | $ | 76.29 | $ | 15.31 | $ | 22.30 | ||||||||||||
| Class 1A: | Net assets | $ | 14,317 | $ | 4,256 | $ | 187,432 | $ | 10,423 | $ | 8,868 | |||||||||||
| Shares outstanding | 477 | 266 | 2,479 | 685 | 399 | |||||||||||||||||
| Net asset value per share | $ | 30.04 | $ | 16.00 | $ | 75.61 | $ | 15.23 | $ | 22.19 | ||||||||||||
| Class 2: | Net assets | $ | 3,233,725 | $ | 1,762,209 | $ | 14,451,475 | $ | 3,163,979 | $ | 763,546 | |||||||||||
| Shares outstanding | 108,539 | 115,167 | 191,651 | 207,745 | 34,672 | |||||||||||||||||
| Net asset value per share | $ | 29.79 | $ | 15.30 | $ | 75.41 | $ | 15.23 | $ | 22.02 | ||||||||||||
| Class 3: | Net assets | $ | 187,905 | $ | 15,480 | |||||||||||||||||
| Shares outstanding | Not applicable | Not applicable | 2,438 | 1,008 | Not applicable | |||||||||||||||||
| Net asset value per share | $ | 77.09 | $ | 15.35 | ||||||||||||||||||
| Class 4: | Net assets | $ | 583,527 | $ | 261,008 | $ | 2,409,119 | $ | 372,465 | $ | 701,060 | |||||||||||
| Shares outstanding | 19,774 | 17,087 | 32,713 | 24,843 | 32,104 | |||||||||||||||||
| Net asset value per share | $ | 29.51 | $ | 15.28 | $ | 73.64 | $ | 14.99 | $ | 21.84 | ||||||||||||
| Washington Mutual Investors Fund |
Capital World Growth and Income Fund |
Growth- Income Fund |
International Growth and Income Fund |
Capital Income Builder |
||||||||||||||||||
| Shares of beneficial interest issued and outstanding (no stated par value) — unlimited shares authorized |
||||||||||||||||||||||
| Class 1: | Net assets | $ | 5,506,834 | $ | 548,491 | $ | 19,692,010 | $ | 13,396 | $ | 586,560 | |||||||||||
| Shares outstanding | 433,800 | 46,994 | 392,155 | 1,499 | 53,377 | |||||||||||||||||
| Net asset value per share | $ | 12.69 | $ | 11.67 | $ | 50.21 | $ | 8.94 | $ | 10.99 | ||||||||||||
| Class 1A: | Net assets | $ | 64,036 | $ | 5,749 | $ | 28,316 | $ | 4,894 | $ | 9,764 | |||||||||||
| Shares outstanding | 5,079 | 496 | 567 | 562 | 890 | |||||||||||||||||
| Net asset value per share | $ | 12.61 | $ | 11.61 | $ | 49.93 | $ | 8.70 | $ | 10.98 | ||||||||||||
| Class 2: | Net assets | $ | 2,775,107 | $ | 982,987 | $ | 11,507,731 | $ | 162,036 | $ | 13,016 | |||||||||||
| Shares outstanding | 222,723 | 84,464 | 232,660 | 18,628 | 1,185 | |||||||||||||||||
| Net asset value per share | $ | 12.46 | $ | 11.64 | $ | 49.46 | $ | 8.70 | $ | 10.98 | ||||||||||||
| Class 3: | Net assets | $ | 124,729 | |||||||||||||||||||
| Shares outstanding | Not applicable | Not applicable | 2,478 | Not applicable | Not applicable | |||||||||||||||||
| Net asset value per share | $ | 50.33 | ||||||||||||||||||||
| Class 4: | Net assets | $ | 1,097,723 | $ | 188,171 | $ | 1,630,181 | $ | 120,671 | $ | 529,726 | |||||||||||
| Shares outstanding | 88,991 | 16,576 | 33,460 | 14,090 | 48,314 | |||||||||||||||||
| Net asset value per share | $ | 12.34 | $ | 11.35 | $ | 48.72 | $ | 8.56 | $ | 10.96 | ||||||||||||
Refer to the end of the statements of assets and liabilities for footnotes.
Refer to the notes to financial statements.
| 278 | American Funds Insurance Series |
Financial statements (continued)
| Statements of assets and liabilities at December 31, 2022 (continued) |
(dollars and shares in thousands, except per-share amounts) |
| Asset Allocation Fund |
American Funds Global Balanced Fund† |
The Bond Fund of America |
Capital World Bond Fund |
American High-Income Trust |
||||||||||||||||||
| Shares of beneficial interest issued and outstanding (no stated par value) — unlimited shares authorized |
||||||||||||||||||||||
| Class 1: | Net assets | $ | 15,137,832 | $ | 96,407 | $ | 6,369,876 | $ | 663,191 | $ | 223,824 | |||||||||||
| Shares outstanding | 681,900 | 7,682 | 676,909 | 69,436 | 26,230 | |||||||||||||||||
| Net asset value per share | $ | 22.20 | $ | 12.55 | $ | 9.41 | $ | 9.55 | $ | 8.53 | ||||||||||||
| Class 1A: | Net assets | $ | 26,595 | $ | 2,555 | $ | 220,548 | $ | 1,344 | $ | 1,263 | |||||||||||
| Shares outstanding | 1,203 | 204 | 23,592 | 141 | 148 | |||||||||||||||||
| Net asset value per share | $ | 22.10 | $ | 12.49 | $ | 9.35 | $ | 9.50 | $ | 8.51 | ||||||||||||
| Class 2: | Net assets | $ | 4,227,802 | $ | 157,808 | $ | 2,843,749 | $ | 764,813 | $ | 521,241 | |||||||||||
| Shares outstanding | 192,995 | 12,632 | 306,636 | 80,914 | 62,452 | |||||||||||||||||
| Net asset value per share | $ | 21.91 | $ | 12.49 | $ | 9.27 | $ | 9.45 | $ | 8.35 | ||||||||||||
| Class 3: | Net assets | $ | 28,209 | $ | 8,471 | |||||||||||||||||
| Shares outstanding | 1,269 | Not applicable | Not applicable | Not applicable | 987 | |||||||||||||||||
| Net asset value per share | $ | 22.23 | $ | 8.58 | ||||||||||||||||||
| Class 4: | Net assets | $ | 5,380,136 | $ | 110,990 | $ | 786,909 | $ | 52,546 | $ | 76,755 | |||||||||||
| Shares outstanding | 247,415 | 9,009 | 85,213 | 5,633 | 8,291 | |||||||||||||||||
| Net asset value per share | $ | 21.75 | $ | 12.32 | $ | 9.23 | $ | 9.33 | $ | 9.26 | ||||||||||||
| American Funds Mortgage Fund |
Ultra-Short Bond Fund |
U.S. Government Securities Fund |
Managed Risk Growth Fund |
Managed Risk International Fund |
||||||||||||||||||
| Shares of beneficial interest issued and outstanding (no stated par value) — unlimited shares authorized |
||||||||||||||||||||||
| Class 1: | Net assets | $ | 993 | $ | 50,347 | $ | 241,681 | |||||||||||||||
| Shares outstanding | 105 | 4,436 | 24,189 | Not applicable | Not applicable | |||||||||||||||||
| Net asset value per share | $ | 9.45 | $ | 11.35 | $ | 9.99 | ||||||||||||||||
| Class 1A: | Net assets | $ | 1,656 | $ | 10 | $ | 3,952 | |||||||||||||||
| Shares outstanding | 177 | 1 | 397 | Not applicable | Not applicable | |||||||||||||||||
| Net asset value per share | $ | 9.34 | $ | 11.35 | $ | 9.96 | ||||||||||||||||
| Class 2: | Net assets | $ | 46,324 | $ | 297,253 | $ | 1,058,577 | |||||||||||||||
| Shares outstanding | 4,951 | 27,031 | 107,285 | Not applicable | Not applicable | |||||||||||||||||
| Net asset value per share | $ | 9.36 | $ | 11.00 | $ | 9.87 | ||||||||||||||||
| Class 3: | Net assets | $ | 4,328 | $ | 6,507 | |||||||||||||||||
| Shares outstanding | Not applicable | 389 | 649 | Not applicable | Not applicable | |||||||||||||||||
| Net asset value per share | $ | 11.14 | $ | 10.02 | ||||||||||||||||||
| Class 4: | Net assets | $ | 40,070 | $ | 80,323 | $ | 190,005 | |||||||||||||||
| Shares outstanding | 4,334 | 7,267 | 19,274 | Not applicable | Not applicable | |||||||||||||||||
| Net asset value per share | $ | 9.25 | $ | 11.05 | $ | 9.86 | ||||||||||||||||
| Class P1: | Net assets | $ | 9,249 | $ | 1,762 | |||||||||||||||||
| Shares outstanding | Not applicable | Not applicable | Not applicable | 813 | 205 | |||||||||||||||||
| Net asset value per share | $ | 11.37 | $ | 8.61 | ||||||||||||||||||
| Class P2: | Net assets | $ | 444,993 | $ | 124,172 | |||||||||||||||||
| Shares outstanding | Not applicable | Not applicable | Not applicable | 39,434 | 14,470 | |||||||||||||||||
| Net asset value per share | $ | 11.28 | $ | 8.58 | ||||||||||||||||||
Refer to the end of the statements of assets and liabilities for footnotes.
Refer to the notes to financial statements.
| American Funds Insurance Series | 279 |
Financial statements (continued)
| Statements of assets and liabilities at December 31, 2022 (continued) |
(dollars and shares in thousands, except per-share amounts) |
| Managed Risk Washington Mutual Investors Fund |
Managed Risk Growth- Income Fund |
Managed Risk Asset Allocation Fund |
||||||||||||
| Shares of beneficial interest issued and outstanding (no stated par value) — unlimited shares authorized |
||||||||||||||
| Class P1: | Net assets | $ | 2,748 | $ | 1,833,437 | $ | 7,152 | |||||||
| Shares outstanding | 244 | 146,536 | 575 | |||||||||||
| Net asset value per share | $ | 11.24 | $ | 12.51 | $ | 12.43 | ||||||||
| Class P2: | Net assets | $ | 320,724 | $ | 268,007 | $ | 2,182,320 | |||||||
| Shares outstanding | 28,686 | 21,540 | 180,515 | |||||||||||
| Net asset value per share | $ | 11.18 | $ | 12.44 | $ | 12.09 | ||||||||
| * | Amount less than one thousand. |
| † | Formerly Global Balanced Fund. |
Refer to the notes to financial statements.
| 280 | American Funds Insurance Series |
| Financial statements (continued) | |
| Statements of operations for the year ended December 31, 2022 |
(dollars in thousands) |
| Global Growth Fund |
Global Small Capitalization Fund |
Growth Fund |
International Fund |
New World Fund |
||||||||||||||||
| Investment income: | ||||||||||||||||||||
| Income (net of non-U.S. taxes1): | ||||||||||||||||||||
| Dividends: | ||||||||||||||||||||
| Unaffiliated issuers | $ | 99,453 | $ | 23,688 | $ | 315,299 | $ | 164,844 | $ | 57,252 | ||||||||||
| Affiliated issuers | 9,353 | 3,871 | 22,361 | 9,392 | 4,331 | |||||||||||||||
| 108,806 | 27,559 | 337,660 | 174,236 | 61,583 | ||||||||||||||||
| Interest from unaffiliated issuers | 53 | 25 | 1,956 | 2 | 7,384 | |||||||||||||||
| European Union withholding tax reclaims | 782 | 264 | 818 | 5,544 | 358 | |||||||||||||||
| Interest from European Union withholding tax reclaims | 71 | 3 | 22 | 920 | 14 | |||||||||||||||
| Securities lending income (net of fees) | 178 | 2,281 | 1,158 | 1,331 | 338 | |||||||||||||||
| 109,890 | 30,132 | 341,614 | 182,033 | 69,677 | ||||||||||||||||
| Fees and expenses1: | ||||||||||||||||||||
| Investment advisory services | 36,131 | 21,657 | 109,146 | 35,444 | 21,012 | |||||||||||||||
| Distribution services | 10,254 | 5,525 | 48,823 | 9,585 | 3,999 | |||||||||||||||
| Insurance administrative services | 1,537 | 699 | 6,939 | 1,008 | 1,923 | |||||||||||||||
| Transfer agent services | 1 | — | 2 | 6 | 1 | 1 | ||||||||||||||
| Administrative services | 2,236 | 973 | 10,468 | 2,191 | 1,018 | |||||||||||||||
| Accounting and administrative services | — | — | — | — | — | |||||||||||||||
| Reports to shareholders | 77 | 41 | 299 | 90 | 34 | |||||||||||||||
| Registration statement and prospectus | 27 | 14 | 136 | 54 | 14 | |||||||||||||||
| Trustees’ compensation | 10 | 5 | 45 | 10 | 5 | |||||||||||||||
| Auditing and legal | 79 | 92 | 105 | 90 | 109 | |||||||||||||||
| Custodian | 868 | 430 | 384 | 1,246 | 758 | |||||||||||||||
| Other | 8 | 51 | 24 | 8 | 51 | |||||||||||||||
| Total fees and expenses before waivers/reimbursement | 51,228 | 29,487 | 176,375 | 49,727 | 28,924 | |||||||||||||||
| Less waivers/reimbursement of fees and expenses: | ||||||||||||||||||||
| Investment advisory services waivers | 5,162 | 1,011 | 1 | — | 3,759 | |||||||||||||||
| Miscellaneous fee reimbursement | — | — | — | — | — | |||||||||||||||
| Total waivers/reimbursement of fees and expenses | 5,162 | 1,011 | 1 | — | 3,759 | |||||||||||||||
| Total fees and expenses after waivers/reimbursement | 46,066 | 28,476 | 176,374 | 49,727 | 25,165 | |||||||||||||||
| Net investment income | 63,824 | 1,656 | 165,240 | 132,306 | 44,512 | |||||||||||||||
| Net realized gain (loss) and unrealized depreciation: | ||||||||||||||||||||
| Net realized gain (loss)1 on: | ||||||||||||||||||||
| Investments in: | ||||||||||||||||||||
| Unaffiliated issuers | 555,056 | 25,932 | 1,853,746 | (374,601 | ) | (3,895 | ) | |||||||||||||
| Affiliated issuers | (71 | ) | (30 | ) | (325 | ) | (112 | ) | (44 | ) | ||||||||||
| Futures contracts | — | — | — | — | 100 | |||||||||||||||
| Forward currency contracts | — | — | — | — | 379 | |||||||||||||||
| Swap contracts | — | — | — | — | (2 | ) | ||||||||||||||
| Currency transactions | (1,864 | ) | 50 | 654 | (3,241 | ) | 72 | |||||||||||||
| Capital gain distributions received from affiliated issuers | — | — | — | — | — | |||||||||||||||
| 553,121 | 25,952 | 1,854,075 | (377,954 | ) | (3,390 | ) | ||||||||||||||
| Net unrealized (depreciation) appreciation1 on: | ||||||||||||||||||||
| Investments in: | ||||||||||||||||||||
| Unaffiliated issuers | (2,977,320 | ) | (1,267,074 | ) | (15,238,570 | ) | (1,582,438 | ) | (968,542 | ) | ||||||||||
| Affiliated issuers | (19 | ) | (25,285 | ) | 22 | (57 | ) | 5 | ||||||||||||
| Futures contracts | — | — | — | — | 129 | |||||||||||||||
| Forward currency contracts | — | — | — | — | (30 | ) | ||||||||||||||
| Swap contracts | — | — | — | — | 2 | |||||||||||||||
| Currency translations | 395 | (145 | ) | (48 | ) | (351 | ) | (1,943 | ) | |||||||||||
| (2,976,944 | ) | (1,292,504 | ) | (15,238,596 | ) | (1,582,846 | ) | (970,379 | ) | |||||||||||
| Net realized gain (loss) and unrealized depreciation | (2,423,823 | ) | (1,266,552 | ) | (13,384,521 | ) | (1,960,800 | ) | (973,769 | ) | ||||||||||
| Net (decrease) increase in net assets resulting from operations | $ | (2,359,999 | ) | $ | (1,264,896 | ) | $ | (13,219,281 | ) | $ | (1,828,494 | ) | $ | (929,257 | ) | |||||
Refer to the end of the statements of operations for footnotes.
Refer to the notes to financial statements.
| American Funds Insurance Series | 281 |
| Financial statements (continued) | |
| Statements of operations for the year ended December 31, 2022 (continued) |
(dollars in thousands) |
| Washington Mutual Investors Fund |
Capital World Growth and Income Fund |
Growth- Income Fund |
International Growth and Income Fund |
Capital Income Builder |
||||||||||||||||
| Investment income: | ||||||||||||||||||||
| Income (net of non-U.S. taxes1): | ||||||||||||||||||||
| Dividends: | ||||||||||||||||||||
| Unaffiliated issuers | $ | 229,615 | $ | 49,442 | $ | 601,261 | $ | 11,087 | $ | 32,630 | ||||||||||
| Affiliated issuers | 6,762 | 1,469 | 40,278 | 302 | 2,614 | |||||||||||||||
| 236,377 | 50,911 | 641,539 | 11,389 | 35,244 | ||||||||||||||||
| Interest from unaffiliated issuers | 1 | 480 | 1,322 | — | 4,766 | |||||||||||||||
| European Union withholding tax reclaims | — | — | 3,119 | 995 | 103 | |||||||||||||||
| Interest from European Union withholding tax reclaims | — | — | 292 | 35 | — | |||||||||||||||
| Securities lending income (net of fees) | 293 | 147 | 836 | 29 | 65 | |||||||||||||||
| 236,671 | 51,538 | 647,108 | 12,448 | 40,178 | ||||||||||||||||
| Fees and expenses1: | ||||||||||||||||||||
| Investment advisory services | 37,368 | 9,637 | 89,899 | 1,720 | 4,443 | |||||||||||||||
| Distribution services | 10,015 | 3,172 | 35,861 | 726 | 1,368 | |||||||||||||||
| Insurance administrative services | 2,882 | 499 | 4,286 | 306 | 1,362 | |||||||||||||||
| Transfer agent services | 2 | — | 2 | 6 | — | 2 | — | 2 | ||||||||||||
| Administrative services | 2,969 | 558 | 10,612 | 93 | 337 | |||||||||||||||
| Accounting and administrative services | — | — | — | — | — | |||||||||||||||
| Reports to shareholders | 65 | 23 | 285 | 9 | 10 | |||||||||||||||
| Registration statement and prospectus | 29 | 5 | 109 | 5 | 3 | |||||||||||||||
| Trustees’ compensation | 11 | 2 | 42 | 1 | 1 | |||||||||||||||
| Auditing and legal | 52 | 69 | 102 | 82 | 70 | |||||||||||||||
| Custodian | 275 | 259 | 469 | 20 | 101 | |||||||||||||||
| Other | 5 | 6 | 23 | 22 | 1 | |||||||||||||||
| Total fees and expenses before waivers/reimbursement | 53,673 | 14,230 | 141,694 | 2,984 | 7,696 | |||||||||||||||
| Less waivers/reimbursement of fees and expenses: | ||||||||||||||||||||
| Investment advisory services waivers | 14,561 | 2,866 | — | 295 | 1,989 | |||||||||||||||
| Miscellaneous fee reimbursement | — | — | — | — | — | |||||||||||||||
| Total waivers/reimbursement of fees and expenses | 14,561 | 2,866 | — | 295 | 1,989 | |||||||||||||||
| Total fees and expenses after waivers/reimbursement | 39,112 | 11,364 | 141,694 | 2,689 | 5,707 | |||||||||||||||
| Net investment income | 197,559 | 40,174 | 505,414 | 9,759 | 34,471 | |||||||||||||||
| Net realized gain (loss) and unrealized depreciation: | ||||||||||||||||||||
| Net realized gain (loss)1 on: | ||||||||||||||||||||
| Investments in: | ||||||||||||||||||||
| Unaffiliated issuers | 73,904 | (82,354 | ) | 1,822,012 | (25,009 | ) | (1,384 | ) | ||||||||||||
| Affiliated issuers | (71 | ) | 8 | (316 | ) | (4 | ) | (691 | ) | |||||||||||
| Futures contracts | — | — | — | — | (7,468 | ) | ||||||||||||||
| Forward currency contracts | — | — | — | (54 | ) | 7 | ||||||||||||||
| Swap contracts | — | — | — | — | 1,909 | |||||||||||||||
| Currency transactions | (22 | ) | (382 | ) | (871 | ) | (231 | ) | (125 | ) | ||||||||||
| Capital gain distributions received from affiliated issuers | — | — | — | — | — | |||||||||||||||
| 73,811 | (82,728 | ) | 1,820,825 | (25,298 | ) | (7,752 | ) | |||||||||||||
| Net unrealized (depreciation) appreciation1 on: | ||||||||||||||||||||
| Investments in: | ||||||||||||||||||||
| Unaffiliated issuers | (1,207,072 | ) | (336,626 | ) | (9,143,460 | ) | (40,723 | ) | (104,188 | ) | ||||||||||
| Affiliated issuers | 10 | (1 | ) | 130 | (2 | ) | (5,193 | ) | ||||||||||||
| Futures contracts | — | — | — | — | (311 | ) | ||||||||||||||
| Forward currency contracts | — | — | — | 5 | (2 | ) | ||||||||||||||
| Swap contracts | — | — | — | — | 36 | |||||||||||||||
| Currency translations | (3 | ) | (154 | ) | (173 | ) | 1 | 64 | ||||||||||||
| (1,207,065 | ) | (336,781 | ) | (9,143,503 | ) | (40,719 | ) | (109,594 | ) | |||||||||||
| Net realized gain (loss) and unrealized depreciation | (1,133,254 | ) | (419,509 | ) | (7,322,678 | ) | (66,017 | ) | (117,346 | ) | ||||||||||
| Net (decrease) increase in net assets resulting from operations | $ | (935,695 | ) | $ | (379,335 | ) | $ | (6,817,264 | ) | $ | (56,258 | ) | $ | (82,875 | ) | |||||
Refer to the end of the statements of operations for footnotes.
Refer to the notes to financial statements.
| 282 | American Funds Insurance Series |
| Financial statements (continued) | |
| Statements of operations for the year ended December 31, 2022 (continued) |
(dollars in thousands) |
| Asset Allocation Fund |
American Funds Global Balanced Fund3 |
The Bond Fund of America |
Capital World Bond Fund |
American High-Income Trust |
||||||||||||||||
| Investment income: | ||||||||||||||||||||
| Income (net of non-U.S. taxes1): | ||||||||||||||||||||
| Dividends: | ||||||||||||||||||||
| Unaffiliated issuers | $ | 388,405 | $ | 6,485 | $ | 1 | $ | 65 | $ | 3,225 | ||||||||||
| Affiliated issuers | 80,475 | 393 | 34,880 | 3,057 | 610 | |||||||||||||||
| 468,880 | 6,878 | 34,881 | 3,122 | 3,835 | ||||||||||||||||
| Interest from unaffiliated issuers | 178,663 | 3,237 | 331,418 | 44,637 | 52,726 | |||||||||||||||
| European Union withholding tax reclaims | 23 | — | — | — | — | |||||||||||||||
| Interest from European Union withholding tax reclaims | 9 | — | — | — | — | |||||||||||||||
| Securities lending income (net of fees) | 631 | 7 | — | — | — | |||||||||||||||
| 648,206 | 10,122 | 366,299 | 47,759 | 56,561 | ||||||||||||||||
| Fees and expenses1: | ||||||||||||||||||||
| Investment advisory services | 70,034 | 2,063 | 39,380 | 7,727 | 3,914 | |||||||||||||||
| Distribution services | 25,560 | 721 | 9,930 | 2,251 | 1,656 | |||||||||||||||
| Insurance administrative services | 14,064 | 300 | 2,381 | 146 | 203 | |||||||||||||||
| Transfer agent services | 4 | — | 2 | 2 | — | 2 | — | 2 | ||||||||||||
| Administrative services | 7,927 | 118 | 3,334 | 492 | 271 | |||||||||||||||
| Accounting and administrative services | — | — | — | — | — | |||||||||||||||
| Reports to shareholders | 164 | 6 | 91 | 22 | 17 | |||||||||||||||
| Registration statement and prospectus | 51 | 2 | 216 | 5 | 4 | |||||||||||||||
| Trustees’ compensation | 30 | — | 2 | 12 | 2 | 2 | ||||||||||||||
| Auditing and legal | 83 | 54 | 59 | 51 | 49 | |||||||||||||||
| Custodian | 616 | 69 | 95 | 143 | 18 | |||||||||||||||
| Other | 17 | 4 | 11 | 6 | 18 | |||||||||||||||
| Total fees and expenses before waivers/reimbursement | 118,550 | 3,337 | 55,511 | 10,845 | 6,152 | |||||||||||||||
| Less waivers/reimbursement of fees and expenses: | ||||||||||||||||||||
| Investment advisory services waivers | — | 25 | 21,118 | 611 | 1,428 | |||||||||||||||
| Miscellaneous fee reimbursement | — | — | — | — | — | |||||||||||||||
| Total waivers/reimbursement of fees and expenses | — | 25 | 21,118 | 611 | 1,428 | |||||||||||||||
| Total fees and expenses after waivers/reimbursement | 118,550 | 3,312 | 34,393 | 10,234 | 4,724 | |||||||||||||||
| Net investment income | 529,656 | 6,810 | 331,906 | 37,525 | 51,837 | |||||||||||||||
| Net realized gain (loss) and unrealized depreciation: | ||||||||||||||||||||
| Net realized gain (loss)1 on: | ||||||||||||||||||||
| Investments in: | ||||||||||||||||||||
| Unaffiliated issuers | 867,100 | 41,092 | (720,113 | ) | (161,648 | ) | (27,908 | ) | ||||||||||||
| Affiliated issuers | (24,724 | ) | 3 | (218 | ) | 17 | (7 | ) | ||||||||||||
| Futures contracts | 65,437 | 539 | (136,499 | ) | (7,447 | ) | 1,533 | |||||||||||||
| Forward currency contracts | — | (1,292 | ) | 1,795 | (18,216 | ) | — | |||||||||||||
| Swap contracts | (73 | ) | 142 | 28,243 | (796 | ) | (82 | ) | ||||||||||||
| Currency transactions | 4,210 | (235 | ) | (118 | ) | (3,040 | ) | 21 | ||||||||||||
| Capital gain distributions received from affiliated issuers | — | — | — | — | — | |||||||||||||||
| 911,950 | 40,249 | (826,910 | ) | (191,130 | ) | (26,443 | ) | |||||||||||||
| Net unrealized (depreciation) appreciation1 on: | ||||||||||||||||||||
| Investments in: | ||||||||||||||||||||
| Unaffiliated issuers | (5,229,896 | ) | (113,353 | ) | (1,058,517 | ) | (184,433 | ) | (118,628 | ) | ||||||||||
| Affiliated issuers | (273,363 | ) | 51 | 76 | 1,587 | 4 | ||||||||||||||
| Futures contracts | 13,070 | (454 | ) | (6,976 | ) | (3,811 | ) | 123 | ||||||||||||
| Forward currency contracts | — | 725 | 4,002 | 4,071 | — | |||||||||||||||
| Swap contracts | (1,575 | ) | (763 | ) | 12,978 | (6,561 | ) | (161 | ) | |||||||||||
| Currency translations | 6 | 14 | 48 | 566 | (31 | ) | ||||||||||||||
| (5,491,758 | ) | (113,780 | ) | (1,048,389 | ) | (188,581 | ) | (118,693 | ) | |||||||||||
| Net realized gain (loss) and unrealized depreciation | (4,579,808 | ) | (73,531 | ) | (1,875,299 | ) | (379,711 | ) | (145,136 | ) | ||||||||||
| Net (decrease) increase in net assets resulting from operations | $ | (4,050,152 | ) | $ | (66,721 | ) | $ | (1,543,393 | ) | $ | (342,186 | ) | $ | (93,299 | ) | |||||
Refer to the end of the statements of operations for footnotes.
Refer to the notes to financial statements.
| American Funds Insurance Series | 283 |
| Financial statements (continued) | |
| Statements of operations for the year ended December 31, 2022 (continued) |
(dollars in thousands) |
| American Funds Mortgage Fund |
Ultra-Short Bond Fund |
U.S. Government Securities Fund |
Managed Risk Growth Fund |
Managed Risk International Fund |
||||||||||||||||
| Investment income: | ||||||||||||||||||||
| Income (net of non-U.S. taxes1): | ||||||||||||||||||||
| Dividends: | ||||||||||||||||||||
| Unaffiliated issuers | $ | — | $ | — | $ | — | $ | 265 | $ | 55 | ||||||||||
| Affiliated issuers | — | — | — | 3,820 | 2,700 | |||||||||||||||
| — | — | — | 4,085 | 2,755 | ||||||||||||||||
| Interest from unaffiliated issuers | 2,336 | 7,293 | 52,923 | — | — | |||||||||||||||
| European Union withholding tax reclaims | — | — | — | — | — | |||||||||||||||
| Interest from European Union withholding tax reclaims | — | — | — | — | — | |||||||||||||||
| Securities lending income (net of fees) | — | — | — | — | — | |||||||||||||||
| 2,336 | 7,293 | 52,923 | 4,085 | 2,755 | ||||||||||||||||
| Fees and expenses1: | ||||||||||||||||||||
| Investment advisory services | 350 | 1,110 | 5,345 | 746 | 208 | |||||||||||||||
| Distribution services | 228 | 889 | 3,494 | 1,219 | 342 | |||||||||||||||
| Insurance administrative services | 105 | 173 | 522 | 1,244 | 346 | |||||||||||||||
| Transfer agent services | — | 2 | — | 2 | — | 2 | — | 2 | — | 2 | ||||||||||
| Administrative services | 31 | 121 | 503 | — | — | |||||||||||||||
| Accounting and administrative services | — | — | — | 58 | 49 | |||||||||||||||
| Reports to shareholders | 5 | 7 | 21 | 2 | 1 | |||||||||||||||
| Registration statement and prospectus | 2 | 3 | 7 | 4 | 2 | |||||||||||||||
| Trustees’ compensation | — | 2 | — | 2 | 2 | 1 | — | 2 | ||||||||||||
| Auditing and legal | 44 | 43 | 46 | 16 | 16 | |||||||||||||||
| Custodian | 17 | 1 | 29 | 6 | 7 | |||||||||||||||
| Other | — | 2 | — | 2 | 1 | — | 2 | — | 2 | |||||||||||
| Total fees and expenses before waivers/reimbursement | 782 | 2,347 | 9,970 | 3,296 | 971 | |||||||||||||||
| Less waivers/reimbursement of fees and expenses: | ||||||||||||||||||||
| Investment advisory services waivers | 158 | — | 2,256 | 249 | 69 | |||||||||||||||
| Miscellaneous fee reimbursement | — | — | — | — | 32 | |||||||||||||||
| Total waivers/reimbursement of fees and expenses | 158 | — | 2,256 | 249 | 101 | |||||||||||||||
| Total fees and expenses after waivers/reimbursement | 624 | 2,347 | 7,714 | 3,047 | 870 | |||||||||||||||
| Net investment income | 1,712 | 4,946 | 45,209 | 1,038 | 1,885 | |||||||||||||||
| Net realized gain (loss) and unrealized depreciation: | ||||||||||||||||||||
| Net realized gain (loss)1 on: | ||||||||||||||||||||
| Investments in: | ||||||||||||||||||||
| Unaffiliated issuers | (9,212 | ) | — | 2 | (104,839 | ) | (3,857 | ) | (1,108 | ) | ||||||||||
| Affiliated issuers | — | — | — | (26,901 | ) | (9,724 | ) | |||||||||||||
| Futures contracts | (2,688 | ) | — | (52,928 | ) | 1,884 | 4,007 | |||||||||||||
| Forward currency contracts | — | — | — | — | — | |||||||||||||||
| Swap contracts | 3,147 | — | 20,919 | — | — | |||||||||||||||
| Currency transactions | — | — | — | 127 | 29 | |||||||||||||||
| Capital gain distributions received from affiliated issuers | — | — | — | 60,533 | 16,270 | |||||||||||||||
| (8,753 | ) | — | 2 | (136,848 | ) | 31,786 | 9,474 | |||||||||||||
| Net unrealized (depreciation) appreciation1 on: | ||||||||||||||||||||
| Investments in: | ||||||||||||||||||||
| Unaffiliated issuers | (3,365 | ) | (59 | ) | (99,107 | ) | 399 | 327 | ||||||||||||
| Affiliated issuers | — | — | — | (191,173 | ) | (38,192 | ) | |||||||||||||
| Futures contracts | (79 | ) | — | (3,785 | ) | 8,824 | 1,394 | |||||||||||||
| Forward currency contracts | — | — | — | — | — | |||||||||||||||
| Swap contracts | (1,585 | ) | — | (7,297 | ) | — | — | |||||||||||||
| Currency translations | — | — | — | — | — | |||||||||||||||
| (5,029 | ) | (59 | ) | (110,189 | ) | (181,950 | ) | (36,471 | ) | |||||||||||
| Net realized gain (loss) and unrealized depreciation | (13,782 | ) | (59 | ) | (247,037 | ) | (150,164 | ) | (26,997 | ) | ||||||||||
| Net (decrease) increase in net assets resulting from operations | $ | (12,070 | ) | $ | 4,887 | $ | (201,828 | ) | $ | (149,126 | ) | $ | (25,112 | ) | ||||||
Refer to the end of the statements of operations for footnotes.
Refer to the notes to financial statements.
| 284 | American Funds Insurance Series |
| Financial statements (continued) | |
| Statements of operations for the year ended December 31, 2022 (continued) |
(dollars in thousands) |
| Managed Risk Washington Mutual Investors Fund |
Managed Risk Growth- Income Fund |
Managed Risk Asset Allocation Fund |
||||||||||
| Investment income: | ||||||||||||
| Income (net of non-U.S. taxes1): | ||||||||||||
| Dividends: | ||||||||||||
| Unaffiliated issuers | $ | 158 | $ | 1,054 | $ | 1,230 | ||||||
| Affiliated issuers | 7,293 | 37,268 | 46,591 | |||||||||
| 7,451 | 38,322 | 47,821 | ||||||||||
| Interest from unaffiliated issuers | — | — | — | |||||||||
| European Union withholding tax reclaims | — | — | — | |||||||||
| Interest from European Union withholding tax reclaims | — | — | — | |||||||||
| Securities lending income (net of fees) | — | — | — | |||||||||
| 7,451 | 38,322 | 47,821 | ||||||||||
| Fees and expenses1: | ||||||||||||
| Investment advisory services | 499 | 3,399 | 3,572 | |||||||||
| Distribution services | 824 | 720 | 5,935 | |||||||||
| Insurance administrative services | 830 | 5,665 | 5,953 | |||||||||
| Transfer agent services | — | 2 | — | 2 | — | 2 | ||||||
| Administrative services | — | — | — | |||||||||
| Accounting and administrative services | 53 | 96 | 98 | |||||||||
| Reports to shareholders | 2 | 5 | 6 | |||||||||
| Registration statement and prospectus | 3 | 10 | 13 | |||||||||
| Trustees’ compensation | — | 2 | 2 | 3 | ||||||||
| Auditing and legal | 16 | 18 | 19 | |||||||||
| Custodian | 7 | 7 | 6 | |||||||||
| Other | — | 2 | 1 | 1 | ||||||||
| Total fees and expenses before waivers/reimbursement | 2,234 | 9,923 | 15,606 | |||||||||
| Less waivers/reimbursement of fees and expenses: | ||||||||||||
| Investment advisory services waivers | 166 | 1,135 | 1,192 | |||||||||
| Miscellaneous fee reimbursement | — | — | — | |||||||||
| Total waivers/reimbursement of fees and expenses | 166 | 1,135 | 1,192 | |||||||||
| Total fees and expenses after waivers/reimbursement | 2,068 | 8,788 | 14,414 | |||||||||
| Net investment income | 5,383 | 29,534 | 33,407 | |||||||||
| Net realized gain (loss) and unrealized depreciation: | ||||||||||||
| Net realized gain (loss)1 on: | ||||||||||||
| Investments in: | ||||||||||||
| Unaffiliated issuers | (3,288 | ) | (38,643 | ) | (5,894 | ) | ||||||
| Affiliated issuers | 32,672 | 156,797 | 55,156 | |||||||||
| Futures contracts | (4,543 | ) | (51,822 | ) | (47,767 | ) | ||||||
| Forward currency contracts | — | — | — | |||||||||
| Swap contracts | — | — | — | |||||||||
| Currency transactions | 43 | 322 | 259 | |||||||||
| Capital gain distributions received from affiliated issuers | 61,850 | 179,634 | 231,217 | |||||||||
| 86,734 | 246,288 | 232,971 | ||||||||||
| Net unrealized (depreciation) appreciation1 on: | ||||||||||||
| Investments in: | ||||||||||||
| Unaffiliated issuers | 51 | 7,712 | 396 | |||||||||
| Affiliated issuers | (128,265 | ) | (743,318 | ) | (666,676 | ) | ||||||
| Futures contracts | 2,705 | 17,339 | 13,823 | |||||||||
| Forward currency contracts | — | — | — | |||||||||
| Swap contracts | — | — | — | |||||||||
| Currency translations | — | — | — | |||||||||
| (125,509 | ) | (718,267 | ) | (652,457 | ) | |||||||
| Net realized gain (loss) and unrealized depreciation | (38,775 | ) | (471,979 | ) | (419,486 | ) | ||||||
| Net (decrease) increase in net assets resulting from operations | $ | (33,392 | ) | $ | (442,445 | ) | $ | (386,079 | ) | |||
| 1 | Additional information related to non-U.S. taxes and class-specific fees and expenses is included in the notes to financial statements. |
| 2 | Amount less than one thousand. |
| 3 | Formerly Global Balanced Fund. |
Refer to the notes to financial statements.
| American Funds Insurance Series | 285 |
| Financial statements (continued) | |
| Statements of changes in net assets | (dollars in thousands) |
| Global Growth Fund | Global Small Capitalization Fund |
Growth Fund | ||||||||||||||||||||||
| Year ended December 31, | Year ended December 31, | Year ended December 31, | ||||||||||||||||||||||
| 2022 | 2021 | 2022 | 2021 | 2022 | 2021 | |||||||||||||||||||
| Operations: | ||||||||||||||||||||||||
| Net investment income (loss) | $ | 63,824 | $ | 36,408 | $ | 1,656 | $ | (11,335 | ) | $ | 165,240 | $ | 87,664 | |||||||||||
| Net realized gain (loss) | 553,121 | 846,935 | 25,952 | 1,098,836 | 1,854,075 | 5,061,178 | ||||||||||||||||||
| Net unrealized (depreciation) appreciation | (2,976,944 | ) | 485,952 | (1,292,504 | ) | (710,657 | ) | (15,238,596 | ) | 3,147,345 | ||||||||||||||
| Net (decrease) increase in net assets resulting from operations | (2,359,999 | ) | 1,369,295 | (1,264,896 | ) | 376,844 | (13,219,281 | ) | 8,296,187 | |||||||||||||||
| Distributions paid to shareholders | (892,563 | ) | (486,343 | ) | (1,091,116 | ) | (123,155 | ) | (5,140,514 | ) | (5,437,958 | ) | ||||||||||||
| Net capital share transactions | 597,636 | 466,658 | 721,994 | (989,509 | ) | 3,850,397 | 3,623,473 | |||||||||||||||||
| Total (decrease) increase in net assets | (2,654,926 | ) | 1,349,610 | (1,634,018 | ) | (735,820 | ) | (14,509,398 | ) | 6,481,702 | ||||||||||||||
| Net assets: | ||||||||||||||||||||||||
| Beginning of year | 9,590,580 | 8,240,970 | 4,576,921 | 5,312,741 | 45,405,746 | 38,924,044 | ||||||||||||||||||
| End of year | $ | 6,935,654 | $ | 9,590,580 | $ | 2,942,903 | $ | 4,576,921 | $ | 30,896,348 | $ | 45,405,746 | ||||||||||||
| International Fund | New World Fund | Washington Mutual Investors Fund |
||||||||||||||||||||||
| Year ended December 31, | Year ended December 31, | Year ended December 31, | ||||||||||||||||||||||
| 2022 | 2021 | 2022 | 2021 | 2022 | 2021 | |||||||||||||||||||
| Operations: | ||||||||||||||||||||||||
| Net investment income (loss) | $ | 132,306 | $ | 147,317 | $ | 44,512 | $ | 32,010 | $ | 197,559 | $ | 173,016 | ||||||||||||
| Net realized gain (loss) | (377,954 | ) | 1,273,483 | (3,390 | ) | 318,018 | 73,811 | 2,286,033 | ||||||||||||||||
| Net unrealized (depreciation) appreciation | (1,582,846 | ) | (1,501,184 | ) | (970,379 | ) | (136,128 | ) | (1,207,065 | ) | 81,431 | |||||||||||||
| Net (decrease) increase in net assets resulting from operations | (1,828,494 | ) | (80,384 | ) | (929,257 | ) | 213,900 | (935,695 | ) | 2,540,480 | ||||||||||||||
| Distributions paid to shareholders | (1,146,487 | ) | (249,096 | ) | (357,382 | ) | (185,700 | ) | (2,416,808 | ) | (166,149 | ) | ||||||||||||
| Net capital share transactions | 265,209 | (832,025 | ) | (77,021 | ) | 176,091 | 1,331,066 | (488,260 | ) | |||||||||||||||
| Total (decrease) increase in net assets | (2,709,772 | ) | (1,161,505 | ) | (1,363,660 | ) | 204,291 | (2,021,437 | ) | 1,886,071 | ||||||||||||||
| Net assets: | ||||||||||||||||||||||||
| Beginning of year | 9,429,353 | 10,590,858 | 4,447,444 | 4,243,153 | 11,465,137 | 9,579,066 | ||||||||||||||||||
| End of year | $ | 6,719,581 | $ | 9,429,353 | $ | 3,083,784 | $ | 4,447,444 | $ | 9,443,700 | $ | 11,465,137 | ||||||||||||
Refer to the end of the statements of changes in net assets for footnotes.
Refer to the notes to financial statements.
| 286 | American Funds Insurance Series |
| Financial statements (continued) | |
| Statements of changes in net assets (continued) | (dollars in thousands) |
| Capital World Growth and Income Fund |
Growth-Income Fund | International Growth and Income Fund |
||||||||||||||||||||||
| Year ended December 31, | Year ended December 31, | Year ended December 31, | ||||||||||||||||||||||
| 2022 | 2021 | 2022 | 2021 | 2022 | 2021 | |||||||||||||||||||
| Operations: | ||||||||||||||||||||||||
| Net investment income (loss) | $ | 40,174 | $ | 44,268 | $ | 505,414 | $ | 480,125 | $ | 9,759 | $ | 34,510 | ||||||||||||
| Net realized gain (loss) | (82,728 | ) | 410,057 | 1,820,825 | 3,512,628 | (25,298 | ) | 357,845 | ||||||||||||||||
| Net unrealized (depreciation) appreciation | (336,781 | ) | (139,980 | ) | (9,143,503 | ) | 4,888,658 | (40,719 | ) | (342,815 | ) | |||||||||||||
| Net (decrease) increase in net assets resulting from operations | (379,335 | ) | 314,345 | (6,817,264 | ) | 8,881,411 | (56,258 | ) | 49,540 | |||||||||||||||
| Distributions paid to shareholders | (454,298 | ) | (90,172 | ) | (3,956,410 | ) | (915,114 | ) | (154,047 | ) | (14,532 | ) | ||||||||||||
| Net capital share transactions | 175,376 | (14,968 | ) | 804,156 | (3,505,347 | ) | 132,760 | (1,112,349 | ) | |||||||||||||||
| Total (decrease) increase in net assets | (658,257 | ) | 209,205 | (9,969,518 | ) | 4,460,950 | (77,545 | ) | (1,077,341 | ) | ||||||||||||||
| Net assets: | ||||||||||||||||||||||||
| Beginning of year | 2,383,655 | 2,174,450 | 42,952,485 | 38,491,535 | 378,542 | 1,455,883 | ||||||||||||||||||
| End of year | $ | 1,725,398 | $ | 2,383,655 | $ | 32,982,967 | $ | 42,952,485 | $ | 300,997 | $ | 378,542 | ||||||||||||
| Capital Income Builder | Asset Allocation Fund | American Funds Global Balanced Fund* |
||||||||||||||||||||||
| Year ended December 31, | Year ended December 31, | Year ended December 31, | ||||||||||||||||||||||
| 2022 | 2021 | 2022 | 2021 | 2022 | 2021 | |||||||||||||||||||
| Operations: | ||||||||||||||||||||||||
| Net investment income (loss) | $ | 34,471 | $ | 32,730 | $ | 529,656 | $ | 496,078 | $ | 6,810 | $ | 4,583 | ||||||||||||
| Net realized gain (loss) | (7,752 | ) | 44,998 | 911,950 | 2,982,523 | 40,249 | 24,122 | |||||||||||||||||
| Net unrealized (depreciation) appreciation | (109,594 | ) | 81,302 | (5,491,758 | ) | 990,457 | (113,780 | ) | 17,602 | |||||||||||||||
| Net (decrease) increase in net assets resulting from operations | (82,875 | ) | 159,030 | (4,050,152 | ) | 4,469,058 | (66,721 | ) | 46,307 | |||||||||||||||
| Distributions paid to shareholders | (31,988 | ) | (29,764 | ) | (3,253,724 | ) | (1,541,316 | ) | (2,232 | ) | (29,247 | ) | ||||||||||||
| Net capital share transactions | 109,402 | (81,691 | ) | 1,398,530 | (1,879,473 | ) | (30,663 | ) | (4,816 | ) | ||||||||||||||
| Total (decrease) increase in net assets | (5,461 | ) | 47,575 | (5,905,346 | ) | 1,048,269 | (99,616 | ) | 12,244 | |||||||||||||||
| Net assets: | ||||||||||||||||||||||||
| Beginning of year | 1,144,527 | 1,096,952 | 30,705,920 | 29,657,651 | 467,376 | 455,132 | ||||||||||||||||||
| End of year | $ | 1,139,066 | $ | 1,144,527 | $ | 24,800,574 | $ | 30,705,920 | $ | 367,760 | $ | 467,376 | ||||||||||||
Refer to the end of the statements of changes in net assets for footnotes.
Refer to the notes to financial statements.
| American Funds Insurance Series | 287 |
| Financial statements (continued) | |
| Statements of changes in net assets (continued) | (dollars in thousands) |
| The Bond Fund of America |
Capital World Bond Fund | American High-Income Trust |
||||||||||||||||||||||
| Year ended December 31, | Year ended December 31, | Year ended December 31, | ||||||||||||||||||||||
| 2022 | 2021 | 2022 | 2021 | 2022 | 2021 | |||||||||||||||||||
| Operations: | ||||||||||||||||||||||||
| Net investment income (loss) | $ | 331,906 | $ | 215,953 | $ | 37,525 | $ | 42,586 | $ | 51,837 | $ | 47,176 | ||||||||||||
| Net realized gain (loss) | (826,910 | ) | 129,232 | (191,130 | ) | 16,012 | (26,443 | ) | 7,485 | |||||||||||||||
| Net unrealized (depreciation) appreciation | (1,048,389 | ) | (353,151 | ) | (188,581 | ) | (168,792 | ) | (118,693 | ) | 21,386 | |||||||||||||
| Net (decrease) increase in net assets resulting from operations | (1,543,393 | ) | (7,966 | ) | (342,186 | ) | (110,194 | ) | (93,299 | ) | 76,047 | |||||||||||||
| Distributions paid to shareholders | (462,954 | ) | (687,442 | ) | (30,830 | ) | (91,748 | ) | (67,772 | ) | (43,416 | ) | ||||||||||||
| Net capital share transactions | (959,150 | ) | 2,474,568 | (230,098 | ) | (51,795 | ) | (59,810 | ) | 152,225 | ||||||||||||||
| Total (decrease) increase in net assets | (2,965,497 | ) | 1,779,160 | (603,114 | ) | (253,737 | ) | (220,881 | ) | 184,856 | ||||||||||||||
| Net assets: | ||||||||||||||||||||||||
| Beginning of year | 13,186,579 | 11,407,419 | 2,085,008 | 2,338,745 | 1,052,435 | 867,579 | ||||||||||||||||||
| End of year | $ | 10,221,082 | $ | 13,186,579 | $ | 1,481,894 | $ | 2,085,008 | $ | 831,554 | $ | 1,052,435 | ||||||||||||
| American Funds Mortgage Fund |
Ultra-Short Bond Fund | U.S. Government Securities Fund |
||||||||||||||||||||||
| Year ended December 31, | Year ended December 31, | Year ended December 31, | ||||||||||||||||||||||
| 2022 | 2021 | 2022 | 2021 | 2022 | 2021 | |||||||||||||||||||
| Operations: | ||||||||||||||||||||||||
| Net investment income (loss) | $ | 1,712 | $ | 1,555 | $ | 4,946 | $ | (1,883 | ) | $ | 45,209 | $ | 26,482 | |||||||||||
| Net realized gain (loss) | (8,753 | ) | (90 | ) | — | † | — | † | (136,848 | ) | (5,219 | ) | ||||||||||||
| Net unrealized (depreciation) appreciation | (5,029 | ) | (2,808 | ) | (59 | ) | (4 | ) | (110,189 | ) | (36,820 | ) | ||||||||||||
| Net (decrease) increase in net assets resulting from operations | (12,070 | ) | (1,343 | ) | 4,887 | (1,887 | ) | (201,828 | ) | (15,557 | ) | |||||||||||||
| Distributions paid to shareholders | (1,793 | ) | (13,157 | ) | (2,237 | ) | — | (60,476 | ) | (209,728 | ) | |||||||||||||
| Net capital share transactions | (231,492 | ) | 29,279 | 96,950 | (41,201 | ) | (402,273 | ) | 236,927 | |||||||||||||||
| Total (decrease) increase in net assets | (245,355 | ) | 14,779 | 99,600 | (43,088 | ) | (664,577 | ) | 11,642 | |||||||||||||||
| Net assets: | ||||||||||||||||||||||||
| Beginning of year | 334,398 | 319,619 | 332,661 | 375,749 | 2,165,299 | 2,153,657 | ||||||||||||||||||
| End of year | $ | 89,043 | $ | 334,398 | $ | 432,261 | $ | 332,661 | $ | 1,500,722 | $ | 2,165,299 | ||||||||||||
Refer to the end of the statements of changes in net assets for footnotes.
Refer to the notes to financial statements.
| 288 | American Funds Insurance Series |
| Financial statements (continued) | |
| Statements of changes in net assets (continued) | (dollars in thousands) |
| Managed Risk Growth Fund |
Managed Risk International Fund |
Managed Risk Washington Mutual Investors Fund |
||||||||||||||||||||||
| Year ended December 31, | Year ended December 31, | Year ended December 31, | ||||||||||||||||||||||
| 2022 | 2021 | 2022 | 2021 | 2022 | 2021 | |||||||||||||||||||
| Operations: | ||||||||||||||||||||||||
| Net investment income (loss) | $ | 1,038 | $ | (392 | ) | $ | 1,885 | $ | 2,984 | $ | 5,383 | $ | 3,320 | |||||||||||
| Net realized gain (loss) | 31,786 | 93,312 | 9,474 | 654 | 86,734 | 15,848 | ||||||||||||||||||
| Net unrealized (depreciation) appreciation | (181,950 | ) | (21,491 | ) | (36,471 | ) | (10,287 | ) | (125,509 | ) | 38,411 | |||||||||||||
| Net (decrease) increase in net assets resulting from operations | (149,126 | ) | 71,429 | (25,112 | ) | (6,649 | ) | (33,392 | ) | 57,579 | ||||||||||||||
| Distributions paid to shareholders | (90,246 | ) | (27,384 | ) | (4,275 | ) | (931 | ) | (14,671 | ) | (6,019 | ) | ||||||||||||
| Net capital share transactions | 97,021 | (11,898 | ) | (6,014 | ) | (654 | ) | (1,502 | ) | (34,883 | ) | |||||||||||||
| Total (decrease) increase in net assets | (142,351 | ) | 32,147 | (35,401 | ) | (8,234 | ) | (49,565 | ) | 16,677 | ||||||||||||||
| Net assets: | ||||||||||||||||||||||||
| Beginning of year | 596,593 | 564,446 | 161,335 | 169,569 | 373,037 | 356,360 | ||||||||||||||||||
| End of year | $ | 454,242 | $ | 596,593 | $ | 125,934 | $ | 161,335 | $ | 323,472 | $ | 373,037 | ||||||||||||
| Managed Risk Growth-Income Fund |
Managed Risk Asset Allocation Fund |
|||||||||||||||||||||||
| Year ended December 31, | Year ended December 31, | |||||||||||||||||||||||
| 2022 | 2021 | 2022 | 2021 | |||||||||||||||||||||
| Operations: | ||||||||||||||||||||||||
| Net investment income (loss) | $ | 29,534 | $ | 23,938 | $ | 33,407 | $ | 29,121 | ||||||||||||||||
| Net realized gain (loss) | 246,288 | 49,377 | 232,971 | 133,738 | ||||||||||||||||||||
| Net unrealized (depreciation) appreciation | (718,267 | ) | 292,194 | (652,457 | ) | 169,648 | ||||||||||||||||||
| Net (decrease) increase in net assets resulting from operations | (442,445 | ) | 365,509 | (386,079 | ) | 332,507 | ||||||||||||||||||
| Distributions paid to shareholders | (99,803 | ) | (68,168 | ) | (138,964 | ) | (38,227 | ) | ||||||||||||||||
| Net capital share transactions | (23,880 | ) | (64,385 | ) | (104,505 | ) | (254,031 | ) | ||||||||||||||||
| Total (decrease) increase in net assets | (566,128 | ) | 232,956 | (629,548 | ) | 40,249 | ||||||||||||||||||
| Net assets: | ||||||||||||||||||||||||
| Beginning of year | 2,667,572 | 2,434,616 | 2,819,020 | 2,778,771 | ||||||||||||||||||||
| End of year | $ | 2,101,444 | $ | 2,667,572 | $ | 2,189,472 | $ | 2,819,020 | ||||||||||||||||
| * | Formerly Global Balanced Fund. |
| † | Amount less than one thousand. |
Refer to the notes to financial statements.
| American Funds Insurance Series | 289 |
Notes to financial statements
1. Organization
American Funds Insurance Series (the “series”) is registered under the Investment Company Act of 1940, as amended (the “1940 Act”), as an open-end, diversified management investment company with 34 different funds ("the funds"), including 23 funds in the series covered in this report. The other 11 funds in the series are covered in separate reports. Six funds in the series are covered in the American Funds Insurance Series - Target Date Series report and five funds in the series are covered in the American Funds Insurance Series - Portfolio Series report. The assets of each fund are segregated, with each fund accounted for separately. Capital Research and Management Company (“CRMC”) is the series’ investment adviser. Milliman Financial Risk Management LLC (“Milliman FRM”) is the subadviser for the risk management strategy for eight of the funds (the “managed risk funds”), five of which are covered in this report.
The managed risk funds covered in this report are Managed Risk Growth Fund, Managed Risk International Fund, Managed Risk Washington Mutual Investors Fund, Managed Risk Growth-Income Fund and Managed Risk Asset Allocation Fund. The managed risk funds invest in other funds within the series (the “underlying funds”) and employ Milliman FRM to implement the risk management strategy, which consists of using hedging instruments — primarily exchange-traded options and futures contracts — to attempt to stabilize the volatility of the funds around target volatility levels and reduce the downside exposure of the funds during periods of significant market declines.
Shareholders approved a proposal to reorganize the series from a Massachusetts business trust to a Delaware statutory trust. The series reserved the right to delay implementing the reorganization and has elected to do so.
The investment objective(s) for each fund covered in this report are as follows:
Global Growth Fund — To provide long-term growth of capital.
Global Small Capitalization Fund — To provide long-term growth of capital.
Growth Fund — To provide growth of capital.
International Fund — To provide long-term growth of capital.
New World Fund — To provide long-term capital appreciation.
Washington Mutual Investors Fund — To produce income exceeding the average yield on U.S. stocks generally and to provide an opportunity for growth of principal consistent with sound common stock investing.
Capital World Growth and Income Fund — To provide long-term growth of capital while providing current income.
Growth-Income Fund — To achieve long-term growth of capital and income.
International Growth and Income Fund — To provide long-term growth of capital while providing current income.
Capital Income Builder — The two primary objectives are (1) to provide a level of current income that exceeds the average yield on U.S. stocks generally and (2) to provide a growing stream of income over the years. The secondary objective is to provide growth of capital.
Asset Allocation Fund — To provide high total return (including income and capital gains) consistent with preservation of capital over the long term.
American Funds Global Balanced Fund (formerly Global Balanced Fund) — Seeks the balanced accomplishment of three objectives: long-term growth of capital, conservation of principal and current income.
The Bond Fund of America — To provide as high a level of current income as is consistent with the preservation of capital.
Capital World Bond Fund — To provide, over the long term, a high level of total return consistent with prudent investment management.
American High-Income Trust — The primary objective is to provide a high level of current income. The secondary objective is capital appreciation.
| 290 | American Funds Insurance Series |
American Funds Mortgage Fund — To provide current income and preservation of capital.
Ultra-Short Bond Fund — To provide current income, consistent with the maturity and quality standards applicable to the fund, and preservation of capital and liquidity.
U.S. Government Securities Fund — To provide a high level of current income consistent with prudent investment risk and preservation of capital.
Managed Risk Growth Fund — To provide growth of capital while seeking to manage volatility and provide downside protection.
Managed Risk International Fund — To provide long-term growth of capital while seeking to manage volatility and provide downside protection.
Managed Risk Washington Mutual Investors Fund — To produce income exceeding the average yield on U.S. stocks generally and to provide an opportunity for growth of principal consistent with sound common stock investing, in each case while seeking to manage volatility and provide downside protection.
Managed Risk Growth-Income Fund — To achieve long-term growth of capital and income while seeking to manage volatility and provide downside protection.
Managed Risk Asset Allocation Fund — To provide high total return (including income and capital gains) consistent with preservation of capital over the long term while seeking to manage volatility and provide downside protection.
Each fund in the series, except the managed risk funds, offers either four or five share classes (Classes 1, 1A, 2, 3 or 4); the managed risk funds offer two share classes (Classes P1 and P2). Holders of all share classes of each fund have equal pro rata rights to assets, dividends and liquidation proceeds of each fund held. Each share class of each fund has identical voting rights, except for the exclusive right to vote on matters affecting only its class. Share classes have different fees and expenses (“class-specific fees and expenses”), primarily due to different arrangements for certain distribution expenses. Differences in class-specific fees and expenses will result in differences in net investment income and, therefore, the payment of different per-share dividends by each class of each fund.
2. Significant accounting policies
Each fund is an investment company that applies the accounting and reporting guidance issued in Topic 946 by the U.S. Financial Accounting Standards Board. Each fund’s financial statements have been prepared to comply with U.S. generally accepted accounting principles (“U.S. GAAP”). These principles require the series’ investment adviser to make estimates and assumptions that affect reported amounts and disclosures. Actual results could differ from those estimates. Subsequent events, if any, have been evaluated through the date of issuance in the preparation of the financial statements. The funds follow the significant accounting policies described in this section, as well as the valuation policies described in the next section on valuation.
Cash — Cash may include amounts held in an interest bearing deposit facility.
Security transactions and related investment income — Security transactions are recorded by each fund as of the date the trades are executed with brokers. Realized gains and losses from security transactions are determined based on the specific identified cost of the securities. In the event a security is purchased with a delayed payment date, each fund will segregate liquid assets sufficient to meet their payment obligations. Dividend income is recognized on the ex-dividend date and interest income is recognized on an accrual basis. Market discounts, premiums and original issue discounts on fixed-income securities are amortized daily over the expected life of the security.
Fees and expenses — The fees and expenses of the underlying funds held by the managed risk funds are not included in the fees and expenses reported for each of the managed risk funds; however, they are indirectly reflected in the valuation of each of the underlying funds. These fees are included in the unaudited net effective expense ratios that are provided as additional information in the financial highlights tables.
| American Funds Insurance Series | 291 |
Class allocations — Income, fees and expenses (other than class-specific fees and expenses), realized gains and losses and unrealized appreciation and depreciation are allocated daily among the various share classes of each fund based on their relative net assets. Class-specific fees and expenses, such as distribution expenses, are accrued daily and charged directly to the respective share class of each fund.
Distributions paid to shareholders — Income dividends and capital gain distributions are recorded on each fund’s ex-dividend date.
Currency translation — Assets and liabilities, including investment securities, denominated in currencies other than U.S. dollars are translated into U.S. dollars at the exchange rates supplied by one or more pricing vendors on the valuation date. Purchases and sales of investment securities and income and expenses are translated into U.S. dollars at the exchange rates on the dates of such transactions. The effects of changes in exchange rates on investment securities are included with the net realized gain or loss and net unrealized appreciation or depreciation on investments in the funds’ statements of operations. The realized gain or loss and unrealized appreciation or depreciation resulting from all other transactions denominated in currencies other than U.S. dollars are disclosed separately.
3. Valuation
CRMC, the series’ investment adviser, values the funds’ investments at fair value as defined by U.S. GAAP. The net asset value per share is calculated once daily as of the close of regular trading on the New York Stock Exchange, normally 4 p.m. New York time, each day the New York Stock Exchange is open.
Methods and inputs — The series’ investment adviser uses the following methods and inputs to establish the fair value of each fund’s assets and liabilities. Use of particular methods and inputs may vary over time based on availability and relevance as market and economic conditions evolve.
Equity securities, including depositary receipts, are generally valued at the official closing price of, or the last reported sale price on, the exchange or market on which such securities are traded, as of the close of business on the day the securities are being valued or, lacking any sales, at the last available bid price. Prices for each security are taken from the principal exchange or market on which the security trades. The value of an underlying fund is based on its reported net asset value.
Fixed-income securities, including short-term securities, are generally valued at evaluated prices obtained from third-party pricing vendors. Vendors value such securities based on one or more of the inputs described in the following table. The table provides examples of inputs that are commonly relevant for valuing particular classes of fixed-income securities in which the funds are authorized to invest. However, these classifications are not exclusive and any of the inputs may be used to value any other class of fixed-income security.
| Fixed-income class | Examples of standard inputs |
| All | Benchmark yields, transactions, bids, offers, quotations from dealers and trading systems, new issues, spreads and other relationships observed in the markets among comparable securities; and proprietary pricing models such as yield measures calculated using factors such as cash flows, financial or collateral performance and other reference data (collectively referred to as “standard inputs”) |
| Corporate bonds, notes & loans; convertible securities | Standard inputs and underlying equity of the issuer |
| Bonds & notes of governments & government agencies | Standard inputs and interest rate volatilities |
| Mortgage-backed; asset-backed obligations | Standard inputs and cash flows, prepayment information, default rates, delinquency and loss assumptions, collateral characteristics, credit enhancements and specific deal information |
| Municipal securities | Standard inputs and, for certain distressed securities, cash flows or liquidation values using a net present value calculation based on inputs that include, but are not limited to, financial statements and debt contracts |
| 292 | American Funds Insurance Series |
Securities with both fixed-income and equity characteristics, or equity securities traded principally among fixed-income dealers, are generally valued in the manner described for either equity or fixed-income securities, depending on which method is deemed most appropriate by the series’ investment adviser. The Capital Group Central Corporate Bond Fund (“CCBF”), a fund within the Capital Group Central Fund Series II, and Capital Group Central Cash Fund (“CCF”), a fund within the Capital Group Central Fund Series (collectively the “Central Funds“), are each valued based upon a floating net asset value, which fluctuates with changes in the value of each fund’s portfolio securities. The underlying securities are valued based on the policies and procedures in the Central Funds’ statements of additional information. The State Street Institutional U.S. Government Money Market Fund held by the managed risk funds is managed to maintain a $1.00 net asset value per share. The net asset value of each share class of each managed risk fund is calculated based on the reported net asset values of the underlying funds in which each fund invests.
Exchange-traded options and futures are generally valued at the official closing price for options and official settlement price for futures of the exchange or market on which such instruments are traded, as of the close of business on the day such instruments are being valued. Forward currency contracts are valued based on the spot and forward exchange rates obtained from a third-party pricing vendor. Swaps are generally valued using evaluated prices obtained from third-party pricing vendors who calculate these values based on market inputs that may include the yields of the indices referenced in the instrument and the relevant curve, dealer quotes, default probabilities and recovery rates, other reference data, and terms of the contract.
Securities and other assets for which representative market quotations are not readily available or are considered unreliable by the series’ investment adviser are fair valued as determined in good faith under fair value guidelines adopted by the series’ investment adviser and approved by the board of trustees as further described. The investment adviser follows fair valuation guidelines, consistent with U.S. Securities and Exchange Commission rules and guidance, to consider relevant principles and factors when making fair value determinations. The investment adviser considers relevant indications of value that are reasonably and timely available to it in determining the fair value to be assigned to a particular security, such as the type and cost of the security, contractual or legal restrictions on resale of the security, relevant financial or business developments of the issuer, actively traded similar or related securities, dealer or broker quotes, conversion or exchange rights on the security, related corporate actions, significant events occurring after the close of trading in the security, and changes in overall market conditions. In addition, the closing prices of equity securities and futures that trade in markets outside U.S. time zones may be adjusted to reflect significant events that occur after the close of local trading but before the net asset value of each share class of each fund is determined. Fair valuations of investments that are not actively trading involve judgment and may differ materially from valuations that would have been used had greater market activity occurred.
Processes and structure — The series’ board of trustees has designated the series’ investment adviser to make fair value determinations, subject to board oversight. The investment adviser has established a Joint Fair Valuation Committee (the “Fair Valuation Committee”) to administer, implement and oversee the fair valuation process, and to make fair value decisions. The Fair Valuation Committee regularly reviews its own fair value decisions, as well as decisions made under its standing instructions to the investment adviser’s valuation team. The Fair Valuation Committee reviews changes in fair value measurements from period to period and may, as deemed appropriate, update the fair valuation guidelines to better reflect the results of back testing and address new or evolving issues. The Fair Valuation Committee reports any changes to the fair valuation guidelines to the board of trustees. The series’ board and audit committee also regularly review reports that describe fair value determinations and methods.
The series’ investment adviser has also established a Fixed-Income Pricing Review Group to administer and oversee the fixed-income valuation process, including the use of fixed-income pricing vendors. This group regularly reviews pricing vendor information and market data. Pricing decisions, processes and controls over security valuation are also subject to additional internal reviews facilitated by the investment adviser’s global risk management group.
Classifications — The series’ investment adviser classifies the funds’ assets and liabilities into three levels based on the inputs used to value the assets or liabilities. Level 1 values are based on quoted prices in active markets for identical securities. Level 2 values are based on significant observable market inputs, such as quoted prices for similar securities and quoted prices in inactive markets. Certain securities trading outside the U.S. may transfer between Level 1 and Level 2 due to valuation adjustments resulting from significant market movements following the close of local trading. Level 3 values are based on significant unobservable inputs that reflect the investment adviser’s determination of assumptions that market participants might reasonably use in valuing the securities.
The valuation levels are not necessarily an indication of the risk or liquidity associated with the underlying investment. For example, U.S. government securities are reflected as Level 2 because the inputs used to determine fair value may not always be quoted prices in an active market. The tables on the following pages present the funds’ valuation levels as of December 31, 2022 (dollars in thousands):
| American Funds Insurance Series | 293 |
| Global Growth Fund | ||||||||||||||||
| Investment securities | ||||||||||||||||
| Level 1 | Level 2 | Level 3 | Total | |||||||||||||
| Assets: | ||||||||||||||||
| Common stocks: | ||||||||||||||||
| Information technology | $ | 923,708 | $ | 643,291 | $ | — | $ | 1,566,999 | ||||||||
| Health care | 1,027,635 | 489,438 | — | 1,517,073 | ||||||||||||
| Consumer discretionary | 493,333 | 473,688 | — | 967,021 | ||||||||||||
| Financials | 213,109 | 405,801 | — | * | 618,910 | |||||||||||
| Consumer staples | 308,045 | 286,104 | — | 594,149 | ||||||||||||
| Industrials | 203,723 | 319,481 | — | 523,204 | ||||||||||||
| Energy | 163,263 | 172,648 | — | * | 335,911 | |||||||||||
| Materials | 200,063 | 25,242 | — | 225,305 | ||||||||||||
| Communication services | 146,303 | 39,149 | — | 185,452 | ||||||||||||
| Real estate | — | 12,072 | — | 12,072 | ||||||||||||
| Utilities | 7,666 | — | — | 7,666 | ||||||||||||
| Preferred securities | — | 115,128 | — | 115,128 | ||||||||||||
| Short-term securities | 164,535 | 114,615 | — | 279,150 | ||||||||||||
| Total | $ | 3,851,383 | $ | 3,096,657 | $ | — | * | $ | 6,948,040 | |||||||
| * Amount less than one thousand. | ||||||||||||||||
| Global Small Capitalization Fund | ||||||||||||||||
| Investment securities | ||||||||||||||||
| Level 1 | Level 2 | Level 3 | Total | |||||||||||||
| Assets: | ||||||||||||||||
| Common stocks: | ||||||||||||||||
| Industrials | $ | 145,496 | $ | 462,740 | $ | — | $ | 608,236 | ||||||||
| Information technology | 278,192 | 271,360 | 842 | 550,394 | ||||||||||||
| Consumer discretionary | 319,599 | 207,610 | — | 527,209 | ||||||||||||
| Health care | 368,441 | 133,632 | — | 502,073 | ||||||||||||
| Financials | 82,339 | 175,020 | — | 257,359 | ||||||||||||
| Materials | 8,263 | 96,602 | — | 104,865 | ||||||||||||
| Real estate | 35,375 | 39,017 | — | 74,392 | ||||||||||||
| Energy | 13,782 | 16,503 | 25,418 | 55,703 | ||||||||||||
| Communication services | 25,084 | 27,091 | — | 52,175 | ||||||||||||
| Utilities | 10,353 | 37,278 | — | 47,631 | ||||||||||||
| Consumer staples | 18,150 | 27,079 | — | 45,229 | ||||||||||||
| Preferred securities | 7,126 | — | 18,452 | 25,578 | ||||||||||||
| Rights & warrants | — | 10,007 | — | 10,007 | ||||||||||||
| Short-term securities | 148,662 | — | — | 148,662 | ||||||||||||
| Total | $ | 1,460,862 | $ | 1,503,939 | $ | 44,712 | $ | 3,009,513 | ||||||||
The following table reconciles the valuation of the fund’s Level 3 investment securities and related transactions for the year ended December 31, 2022 (dollars in thousands):
| Beginning value at 1/1/2022 |
Transfers into Level 3* |
Purchases | Sales | Net realized gain |
Unrealized depreciation† |
Transfers out of Level 3* |
Ending value at 12/31/2022 |
||||||||||||||||||
| Investment securities | $ | 44,963 | $ | — | $ | — | $ | — | $ | — | $ | (251) | $ | — | $ | 44,712 | |||||||||
| Net unrealized depreciation during the period on Level 3 investment securities held at December 31, 2022 | $ | (251 | ) | ||||||||||||||||||||||
| * | Transfers into or out of Level 3 are based on the beginning market value of the quarter in which they occurred. These transfers are the result of changes in the availability of pricing sources and/or in the observability of significant inputs used in valuing the securities. |
| † | Net unrealized depreciation is included in the related amounts on investments in the fund’s statement of operations. |
| 294 | American Funds Insurance Series |
Unobservable inputs — Valuation of the fund’s Level 3 securities is based on significant unobservable inputs that reflect the investment adviser’s determination of assumptions that market participants might reasonably use in valuing the securities. The following table provides additional information used by the fund’s investment adviser to fair value the fund’s Level 3 securities (dollars in thousands):
| Value at 12/31/2022 |
Valuation techniques |
Unobservable inputs |
Range (if applicable) |
Weighted average* |
Impact to valuation from an increase in input† | ||||||||
| Common stocks | $26,260 | Market comparable companies | Price/Cash flow multiple | 5.7x | 5.7x | Increase | |||||||
| EV/Sales multiple | 6.2x | 6.2x | Increase | ||||||||||
| DLOM | 16% | 16% | Decrease | ||||||||||
| Discount for lack of certainty | 10% | 10% | Decrease | ||||||||||
| Risk discount | 25% | 25% | Decrease | ||||||||||
| Preferred securities | 18,452 | Transaction price | N/A | N/A | N/A | N/A | |||||||
| Market comparable companies | EV/Sales multiple | 6.2x - 12.9x | 11.0x | Increase | |||||||||
| Risk discount | 25% | 25% | Decrease | ||||||||||
| Net adjustment (decrease) based on movement of market comparables | 44% | 44% | Decrease | ||||||||||
| DLOM | 10% | 10% | Decrease | ||||||||||
| Total | $44,712 | ||||||||||||
| * | Weighted average is by relative fair value. |
| † | This column represents the directional change in fair value of the Level 3 securities that would result in an increase from the corresponding input. Significant increases and decreases in these inputs in isolation could result in significantly higher or lower fair value measurements. |
Key to abbreviations
DLOM = Discount for lack of marketability
EV = Enterprise value
| Growth Fund | ||||||||||||||||
| Investment securities | ||||||||||||||||
| Level 1 | Level 2 | Level 3 | Total | |||||||||||||
| Assets: | ||||||||||||||||
| Common stocks: | ||||||||||||||||
| Information technology | $ | 5,461,425 | $ | 723,030 | $ | 4,704 | $ | 6,189,159 | ||||||||
| Health care | 5,188,144 | 115,484 | 45,222 | 5,348,850 | ||||||||||||
| Consumer discretionary | 4,793,527 | 439,744 | — | 5,233,271 | ||||||||||||
| Communication services | 3,950,043 | 25,714 | — | 3,975,757 | ||||||||||||
| Industrials | 3,112,991 | 255,410 | — | 3,368,401 | ||||||||||||
| Energy | 1,737,621 | 91,688 | — | 1,829,309 | ||||||||||||
| Financials | 1,796,618 | — | — | 1,796,618 | ||||||||||||
| Materials | 973,571 | — | — | 973,571 | ||||||||||||
| Consumer staples | 596,091 | 109,850 | — | 705,941 | ||||||||||||
| Utilities | 243,420 | — | — | 243,420 | ||||||||||||
| Real estate | 33,920 | — | — | 33,920 | ||||||||||||
| Preferred securities | — | 21,366 | 36,770 | 58,136 | ||||||||||||
| Convertible stocks | 7,202 | — | — | 7,202 | ||||||||||||
| Convertible bonds & notes | — | — | 7,146 | 7,146 | ||||||||||||
| Bonds, notes & other debt instruments | — | 15,245 | — | 15,245 | ||||||||||||
| Short-term securities | 1,192,835 | — | — | 1,192,835 | ||||||||||||
| Total | $ | 29,087,408 | $ | 1,797,531 | $ | 93,842 | $ | 30,978,781 | ||||||||
| American Funds Insurance Series | 295 |
| International Fund | ||||||||||||||||
| Investment securities | ||||||||||||||||
| Level 1 | Level 2 | Level 3 | Total | |||||||||||||
| Assets: | ||||||||||||||||
| Common stocks: | ||||||||||||||||
| Industrials | $ | 64,860 | $ | 1,053,264 | $ | — | $ | 1,118,124 | ||||||||
| Information technology | 296,778 | 622,282 | 4,282 | 923,342 | ||||||||||||
| Health care | 29,009 | 812,708 | — | 841,717 | ||||||||||||
| Materials | 397,065 | 317,708 | — | 714,773 | ||||||||||||
| Energy | 172,457 | 531,541 | — | 703,998 | ||||||||||||
| Consumer discretionary | 135,708 | 472,880 | — | 608,588 | ||||||||||||
| Financials | 78,042 | 530,056 | — | 608,098 | ||||||||||||
| Communication services | 185,096 | 231,351 | — | * | 416,447 | |||||||||||
| Consumer staples | — | 289,938 | — | 289,938 | ||||||||||||
| Utilities | — | 119,038 | — | 119,038 | ||||||||||||
| Real estate | — | 39,066 | — | 39,066 | ||||||||||||
| Preferred securities | 24,464 | 28,174 | 392 | 53,030 | ||||||||||||
| Rights & warrants | — | 8,446 | — | 8,446 | ||||||||||||
| Short-term securities | 307,469 | — | — | 307,469 | ||||||||||||
| Total | $ | 1,690,948 | $ | 5,056,452 | $ | 4,674 | $ | 6,752,074 | ||||||||
| * Amount less than one thousand. | ||||||||||||||||
| New World Fund | ||||||||||||||||
| Investment securities | ||||||||||||||||
| Level 1 | Level 2 | Level 3 | Total | |||||||||||||
| Assets: | ||||||||||||||||
| Common stocks: | ||||||||||||||||
| Information technology | $ | 263,065 | $ | 173,417 | $ | 342 | $ | 436,824 | ||||||||
| Financials | 67,929 | 361,956 | — | * | 429,885 | |||||||||||
| Health care | 188,331 | 216,848 | — | 405,179 | ||||||||||||
| Industrials | 108,081 | 225,883 | — | 333,964 | ||||||||||||
| Consumer discretionary | 105,950 | 224,085 | — | * | 330,035 | |||||||||||
| Materials | 162,789 | 82,689 | — | * | 245,478 | |||||||||||
| Consumer staples | 60,987 | 131,035 | — | * | 192,022 | |||||||||||
| Communication services | 81,746 | 76,207 | — | * | 157,953 | |||||||||||
| Energy | 47,738 | 105,152 | — | * | 152,890 | |||||||||||
| Utilities | 14,233 | 39,215 | — | 53,448 | ||||||||||||
| Real estate | 12,965 | 36,156 | — | 49,121 | ||||||||||||
| Preferred securities | 14,795 | 8,412 | 9,132 | 32,339 | ||||||||||||
| Rights & warrants | 31 | 172 | — | 203 | ||||||||||||
| Bonds, notes & other debt instruments | — | 100,586 | — | 100,586 | ||||||||||||
| Short-term securities | 167,623 | — | — | 167,623 | ||||||||||||
| Total | $ | 1,296,263 | $ | 1,781,813 | $ | 9,474 | $ | 3,087,550 | ||||||||
| Other investments† | ||||||||||||||||
| Level 1 | Level 2 | Level 3 | Total | |||||||||||||
| Assets: | ||||||||||||||||
| Unrealized appreciation on futures contracts | $ | 159 | $ | — | $ | — | $ | 159 | ||||||||
| Unrealized appreciation on open forward currency contracts | — | — | * | — | — | * | ||||||||||
| Unrealized appreciation on centrally cleared credit default swaps | — | 2 | — | 2 | ||||||||||||
| Liabilities: | ||||||||||||||||
| Unrealized depreciation on futures contracts | (66 | ) | — | — | (66 | ) | ||||||||||
| Unrealized depreciation on open forward currency contracts | — | (50 | ) | — | (50 | ) | ||||||||||
| Total | $ | 93 | $ | (48 | ) | $ | — | $ | 45 | |||||||
| * | Amount less than one thousand. |
| † | Futures contracts, forward currency contracts and credit default swaps are not included in the fund’s investment portfolio. |
Washington Mutual Investors Fund
As of December 31, 2022, all of the fund’s investment securities were classified as Level 1.
| 296 | American Funds Insurance Series |
| Capital World Growth and Income Fund | ||||||||||||||||
| Investment securities | ||||||||||||||||
| Level 1 | Level 2 | Level 3 | Total | |||||||||||||
| Assets: | ||||||||||||||||
| Common stocks: | ||||||||||||||||
| Information technology | $ | 164,931 | $ | 106,647 | $ | — | $ | 271,578 | ||||||||
| Health care | 186,991 | 74,725 | — | 261,716 | ||||||||||||
| Financials | 110,259 | 113,094 | — | * | 223,353 | |||||||||||
| Industrials | 103,918 | 113,308 | — | 217,226 | ||||||||||||
| Consumer discretionary | 81,430 | 73,857 | — | 155,287 | ||||||||||||
| Consumer staples | 63,755 | 66,879 | — | 130,634 | ||||||||||||
| Materials | 69,657 | 51,505 | — | 121,162 | ||||||||||||
| Energy | 73,762 | 34,823 | — | * | 108,585 | |||||||||||
| Communication services | 53,364 | 32,366 | — | * | 85,730 | |||||||||||
| Utilities | 25,266 | 24,999 | — | 50,265 | ||||||||||||
| Real estate | 12,033 | 5,443 | — | 17,476 | ||||||||||||
| Preferred securities | 263 | 2,512 | — | 2,775 | ||||||||||||
| Convertible bonds & notes | — | 940 | — | 940 | ||||||||||||
| Bonds, notes & other debt instruments | — | 6,016 | — | 6,016 | ||||||||||||
| Short-term securities | 6,525 | 69,828 | — | 76,353 | ||||||||||||
| Total | $ | 952,154 | $ | 776,942 | $ | — | * | $ | 1,729,096 | |||||||
| * Amount less than one thousand. | ||||||||||||||||
| Growth-Income Fund | ||||||||||||||||
| Investment securities | ||||||||||||||||
| Level 1 | Level 2 | Level 3 | Total | |||||||||||||
| Assets: | ||||||||||||||||
| Common stocks: | ||||||||||||||||
| Information technology | $ | 6,365,641 | $ | 293,106 | $ | — | $ | 6,658,747 | ||||||||
| Industrials | 4,414,100 | 259,779 | — | 4,673,879 | ||||||||||||
| Health care | 3,850,991 | 534,723 | — | 4,385,714 | ||||||||||||
| Financials | 2,896,787 | — | — | 2,896,787 | ||||||||||||
| Consumer discretionary | 2,446,056 | 132,438 | — | 2,578,494 | ||||||||||||
| Communication services | 2,480,083 | — | — | 2,480,083 | ||||||||||||
| Consumer staples | 1,457,094 | 454,816 | — | 1,911,910 | ||||||||||||
| Energy | 1,578,057 | — | — | 1,578,057 | ||||||||||||
| Utilities | 1,262,331 | 69,549 | — | 1,331,880 | ||||||||||||
| Materials | 1,068,166 | — | — | 1,068,166 | ||||||||||||
| Real estate | 608,248 | — | — | 608,248 | ||||||||||||
| Convertible stocks | 274,424 | — | — | 274,424 | ||||||||||||
| Bonds, notes & other debt instruments | — | 5,916 | — | 5,916 | ||||||||||||
| Short-term securities | 2,789,014 | — | — | 2,789,014 | ||||||||||||
| Total | $ | 31,490,992 | $ | 1,750,327 | $ | — | $ | 33,241,319 | ||||||||
| American Funds Insurance Series | 297 |
| International Growth and Income Fund | ||||||||||||||||
| Investment securities | ||||||||||||||||
| Level 1 | Level 2 | Level 3 | Total | |||||||||||||
| Assets: | ||||||||||||||||
| Common stocks: | ||||||||||||||||
| Financials | $ | 6,118 | $ | 43,633 | $ | — | * | $ | 49,751 | |||||||
| Industrials | 4,511 | 31,485 | — | 35,996 | ||||||||||||
| Consumer discretionary | 2,509 | 32,958 | — | 35,467 | ||||||||||||
| Consumer staples | 7,470 | 27,016 | — | 34,486 | ||||||||||||
| Information technology | 1,668 | 30,886 | — | 32,554 | ||||||||||||
| Health care | 1,316 | 29,812 | — | 31,128 | ||||||||||||
| Energy | 8,708 | 14,672 | — | * | 23,380 | |||||||||||
| Materials | 9,657 | 7,677 | — | * | 17,334 | |||||||||||
| Communication services | 1,895 | 15,137 | — | * | 17,032 | |||||||||||
| Utilities | 1,142 | 8,106 | — | 9,248 | ||||||||||||
| Real estate | — | 4,820 | — | 4,820 | ||||||||||||
| Preferred securities | 1,207 | 693 | — | 1,900 | ||||||||||||
| Short-term securities | 6,358 | — | — | 6,358 | ||||||||||||
| Total | $ | 52,559 | $ | 246,895 | $ | — | * | $ | 299,454 | |||||||
| Other investments† | ||||||||||||||||
| Level 1 | Level 2 | Level 3 | Total | |||||||||||||
| Assets: | ||||||||||||||||
| Unrealized appreciation on open forward currency contracts | $ | — | $ | 5 | $ | — | $ | 5 | ||||||||
| * | Amount less than one thousand. |
| † | Forward currency contracts are not included in the fund’s investment portfolio. |
| Capital Income Builder | ||||||||||||||||
| Investment securities | ||||||||||||||||
| Level 1 | Level 2 | Level 3 | Total | |||||||||||||
| Assets: | ||||||||||||||||
| Common stocks: | ||||||||||||||||
| Financials | $ | 85,911 | $ | 70,932 | $ — | * | $ | 156,843 | ||||||||
| Consumer staples | 64,498 | 50,174 | — | 114,672 | ||||||||||||
| Health care | 85,845 | 22,042 | — | 107,887 | ||||||||||||
| Industrials | 47,860 | 35,750 | — | 83,610 | ||||||||||||
| Information technology | 64,487 | 14,336 | — | 78,823 | ||||||||||||
| Utilities | 39,280 | 31,786 | — | 71,066 | ||||||||||||
| Energy | 52,011 | 16,387 | — | * | 68,398 | |||||||||||
| Real estate | 56,684 | 11,518 | — | 68,202 | ||||||||||||
| Materials | 20,977 | 12,204 | — | 33,181 | ||||||||||||
| Consumer discretionary | 16,058 | 16,961 | — | 33,019 | ||||||||||||
| Communication services | 17,155 | 15,258 | — | 32,413 | ||||||||||||
| Preferred securities | — | 545 | — | 545 | ||||||||||||
| Rights & warrants | 6 | — | — | 6 | ||||||||||||
| Convertible stocks | 5,019 | — | — | 5,019 | ||||||||||||
| Investment funds | 28,059 | — | — | 28,059 | ||||||||||||
| Bonds, notes & other debt instruments: | ||||||||||||||||
| U.S. Treasury bonds & notes | — | 107,548 | — | 107,548 | ||||||||||||
| Mortgage-backed obligations | — | 69,718 | 89 | 69,807 | ||||||||||||
| Corporate bonds, notes & loans | — | 19,621 | — | 19,621 | ||||||||||||
| Asset-backed obligations | — | 9,532 | — | 9,532 | ||||||||||||
| Bonds & notes of governments & government agencies outside the U.S. | — | 743 | — | 743 | ||||||||||||
| Municipals | — | 228 | — | 228 | ||||||||||||
| Short-term securities | 83,850 | — | — | 83,850 | ||||||||||||
| Total | $ | 667,700 | $ | 505,283 | $ | 89 | $ | 1,173,072 | ||||||||
Refer to the end of the tables for footnotes.
| 298 | American Funds Insurance Series |
| Other investments† | ||||||||||||||||
| Level 1 | Level 2 | Level 3 | Total | |||||||||||||
| Assets: | ||||||||||||||||
| Unrealized appreciation on futures contracts | $ | 60 | $ | — | $ | — | $ | 60 | ||||||||
| Unrealized appreciation on centrally cleared interest rate swaps | — | 1,900 | — | 1,900 | ||||||||||||
| Liabilities: | ||||||||||||||||
| Unrealized depreciation on futures contracts | (139 | ) | — | — | (139 | ) | ||||||||||
| Unrealized depreciation on centrally cleared interest rate swaps | — | (380 | ) | — | (380 | ) | ||||||||||
| Unrealized depreciation on centrally cleared credit default swaps | — | (47 | ) | — | (47 | ) | ||||||||||
| Total | $ | (79 | ) | $ | 1,473 | $ | — | $ | 1,394 | |||||||
| * | Amount less than one thousand. |
| † | Futures contracts, interest rate swaps and credit default swaps are not included in the fund’s investment portfolio. |
Asset Allocation Fund
| Investment securities | ||||||||||||||||
| Level 1 | Level 2 | Level 3 | Total | |||||||||||||
| Assets: | ||||||||||||||||
| Common stocks: | ||||||||||||||||
| Health care | $ | 3,207,943 | $ | 95,928 | $ | 19,703 | $ | 3,323,574 | ||||||||
| Consumer discretionary | 2,162,881 | 216,574 | — | 2,379,455 | ||||||||||||
| Financials | 2,206,657 | 75,213 | 1,899 | 2,283,769 | ||||||||||||
| Information technology | 2,171,644 | 29,717 | — | 2,201,361 | ||||||||||||
| Consumer staples | 1,318,784 | 316,097 | — | 1,634,881 | ||||||||||||
| Industrials | 1,531,415 | 12,088 | — | 1,543,503 | ||||||||||||
| Communication services | 1,171,249 | — | — | 1,171,249 | ||||||||||||
| Energy | 1,020,328 | — | 550 | 1,020,878 | ||||||||||||
| Materials | 856,654 | — | — | 856,654 | ||||||||||||
| Real estate | 236,814 | — | — | 236,814 | ||||||||||||
| Utilities | 158,713 | — | — | 158,713 | ||||||||||||
| Preferred securities | — | — | 189 | 189 | ||||||||||||
| Rights & warrants | — | — | — | * | — | * | ||||||||||
| Convertible stocks | — | — | 63,388 | 63,388 | ||||||||||||
| Investment funds | 1,367,122 | — | — | 1,367,122 | ||||||||||||
| Bonds, notes & other debt instruments: | ||||||||||||||||
| Mortgage-backed obligations | — | 1,878,858 | — | 1,878,858 | ||||||||||||
| U.S. Treasury bonds & notes | — | 1,617,110 | — | 1,617,110 | ||||||||||||
| Corporate bonds, notes & loans | — | 1,385,625 | 10,517 | 1,396,142 | ||||||||||||
| Asset-backed obligations | — | 411,624 | 5,689 | 417,313 | ||||||||||||
| Bonds & notes of governments & government agencies outside the U.S. | — | 40,766 | — | 40,766 | ||||||||||||
| Municipals | — | 35,724 | — | 35,724 | ||||||||||||
| Short-term securities | 1,690,923 | — | — | 1,690,923 | ||||||||||||
| Total | $ | 19,101,127 | $ | 6,115,324 | $ | 101,935 | $ | 25,318,386 | ||||||||
| Other investments† | ||||||||||||||||
| Level 1 | Level 2 | Level 3 | Total | |||||||||||||
| Assets: | ||||||||||||||||
| Unrealized appreciation on futures contracts | $ | 2,319 | $ | — | $ | — | $ | 2,319 | ||||||||
| Liabilities: | ||||||||||||||||
| Unrealized depreciation on futures contracts | (3,485 | ) | — | — | (3,485 | ) | ||||||||||
| Unrealized depreciation on centrally cleared credit default swaps | — | (1,623 | ) | — | (1,623 | ) | ||||||||||
| Total | $ | (1,166 | ) | $ | (1,623 | ) | $ | — | $ | (2,789 | ) | |||||
| * | Amount less than one thousand. |
| † | Futures contracts and credit default swaps are not included in the fund’s investment portfolio. |
| American Funds Insurance Series | 299 |
American Funds Global Balanced Fund
| Investment securities | ||||||||||||||||
| Level 1 | Level 2 | Level 3 | Total | |||||||||||||
| Assets: | ||||||||||||||||
| Common stocks: | ||||||||||||||||
| Financials | $ | 16,259 | $ | 22,868 | $ | — | $ | 39,127 | ||||||||
| Industrials | 19,116 | 11,649 | — | 30,765 | ||||||||||||
| Health care | 18,540 | 10,087 | — | 28,627 | ||||||||||||
| Information technology | 21,174 | 2,609 | — | 23,783 | ||||||||||||
| Consumer staples | 4,299 | 15,340 | — | 19,639 | ||||||||||||
| Utilities | 9,788 | 7,879 | — | 17,667 | ||||||||||||
| Materials | 6,808 | 9,121 | — | 15,929 | ||||||||||||
| Energy | 10,010 | 4,766 | — | 14,776 | ||||||||||||
| Communication services | 8,684 | 2,866 | — | 11,550 | ||||||||||||
| Consumer discretionary | 4,150 | 4,214 | — | 8,364 | ||||||||||||
| Real estate | 2,591 | 2,616 | — | 5,207 | ||||||||||||
| Preferred securities | 911 | 558 | — | 1,469 | ||||||||||||
| Convertible stocks | 1,235 | — | — | 1,235 | ||||||||||||
| Investment funds | 5,532 | — | — | 5,532 | ||||||||||||
| Bonds, notes & other debt instruments: | ||||||||||||||||
| Bonds & notes of governments & government agencies outside the U.S. | — | 48,706 | 77 | 48,783 | ||||||||||||
| U.S. Treasury bonds & notes | — | 44,273 | — | 44,273 | ||||||||||||
| Corporate bonds, notes & loans | — | 20,755 | — | 20,755 | ||||||||||||
| Mortgage-backed obligations | — | 9,498 | — | 9,498 | ||||||||||||
| Asset-backed obligations | — | 2,304 | — | 2,304 | ||||||||||||
| Municipals | — | 129 | — | 129 | ||||||||||||
| Short-term securities | 3,928 | 12,021 | — | 15,949 | ||||||||||||
| Total | $ | 133,025 | $ | 232,259 | $ | 77 | $ | 365,361 | ||||||||
| Other investments* | ||||||||||||||||
| Level 1 | Level 2 | Level 3 | Total | |||||||||||||
| Assets: | ||||||||||||||||
| Unrealized appreciation on futures contracts | $ | 58 | $ | — | $ | — | $ | 58 | ||||||||
| Unrealized appreciation on open forward currency contracts | — | 686 | — | 686 | ||||||||||||
| Unrealized appreciation on centrally cleared interest rate swaps | — | 8 | — | 8 | ||||||||||||
| Unrealized appreciation on centrally cleared credit default swaps | — | 7 | — | 7 | ||||||||||||
| Liabilities: | ||||||||||||||||
| Unrealized depreciation on futures contracts | (431 | ) | — | — | (431 | ) | ||||||||||
| Unrealized depreciation on open forward currency contracts | — | (150 | ) | — | (150 | ) | ||||||||||
| Unrealized depreciation on centrally cleared interest rate swaps | — | (1,017 | ) | — | (1,017 | ) | ||||||||||
| Total | $ | (373 | ) | $ | (466 | ) | $ | — | $ | (839 | ) | |||||
| * | Futures contracts, forward currency contracts, interest rate swaps and credit default swaps are not included in the fund’s investment portfolio. |
The Bond Fund of America
| Investment securities | ||||||||||||||||
| Level 1 | Level 2 | Level 3 | Total | |||||||||||||
| Assets: | ||||||||||||||||
| Bonds, notes & other debt instruments: | ||||||||||||||||
| Corporate bonds, notes & loans | $ | — | $ | 3,535,583 | $ | — | $ | 3,535,583 | ||||||||
| U.S. Treasury bonds & notes | — | 2,803,177 | — | 2,803,177 | ||||||||||||
| Mortgage-backed obligations | — | 2,637,080 | 1,486 | 2,638,566 | ||||||||||||
| Asset-backed obligations | — | 452,311 | 9,397 | 461,708 | ||||||||||||
| Municipals | — | 165,594 | — | 165,594 | ||||||||||||
| Bonds & notes of governments & government agencies | ||||||||||||||||
| outside the U.S. | — | 131,985 | — | 131,985 | ||||||||||||
| Federal agency bonds & notes | — | 11,160 | — | 11,160 | ||||||||||||
| Short-term securities | 1,425,720 | — | — | 1,425,720 | ||||||||||||
| Total | $ | 1,425,720 | $ | 9,736,890 | $ | 10,883 | $ | 11,173,493 | ||||||||
| 300 | American Funds Insurance Series |
| Other investments* | ||||||||||||||||
| Level 1 | Level 2 | Level 3 | Total | |||||||||||||
| Assets: | ||||||||||||||||
| Unrealized appreciation on futures contracts | $ | 6,241 | $ | — | $ | — | $ | 6,241 | ||||||||
| Unrealized appreciation on open forward currency contracts | — | 3,821 | — | 3,821 | ||||||||||||
| Unrealized appreciation on centrally cleared interest rate swaps | — | 15,705 | — | 15,705 | ||||||||||||
| Liabilities: | ||||||||||||||||
| Unrealized depreciation on futures contracts | (13,194 | ) | — | — | (13,194 | ) | ||||||||||
| Unrealized depreciation on open forward currency contracts | — | (174 | ) | — | (174 | ) | ||||||||||
| Unrealized depreciation on centrally cleared interest rate swaps | — | (6,629 | ) | — | (6,629 | ) | ||||||||||
| Unrealized depreciation on centrally cleared credit default swaps | — | (7,009 | ) | — | (7,009 | ) | ||||||||||
| Total | $ | (6,953 | ) | $ | 5,714 | $ | — | $ | (1,239 | ) | ||||||
| * | Futures contracts, forward currency contracts, interest rate swaps and credit default swaps are not included in the fund’s investment portfolio. |
Capital World Bond Fund
| Investment securities | ||||||||||||||||
| Level 1 | Level 2 | Level 3 | Total | |||||||||||||
| Assets: | ||||||||||||||||
| Bonds, notes & other debt instruments: | ||||||||||||||||
| Euros | $ | — | $ | 293,295 | $ | — | $ | 293,295 | ||||||||
| Japanese yen | — | 111,151 | — | 111,151 | ||||||||||||
| British pounds | — | 61,782 | — | 61,782 | ||||||||||||
| Chinese yuan renminbi | — | 42,096 | — | 42,096 | ||||||||||||
| Canadian dollars | — | 34,184 | — | 34,184 | ||||||||||||
| Mexican pesos | — | 31,627 | — | 31,627 | ||||||||||||
| Australian dollars | — | 24,212 | — | 24,212 | ||||||||||||
| Danish kroner | — | 23,962 | — | 23,962 | ||||||||||||
| South Korean won | — | 7,729 | — | 7,729 | ||||||||||||
| Colombian pesos | — | 7,144 | — | 7,144 | ||||||||||||
| Chilean pesos | — | 6,074 | — | 6,074 | ||||||||||||
| Indonesian rupiah | — | 5,454 | — | 5,454 | ||||||||||||
| Russian rubles | — | 1,371 | 1,984 | 3,355 | ||||||||||||
| Brazilian reais | — | 3,129 | — | 3,129 | ||||||||||||
| South African rand | — | 3,001 | — | 3,001 | ||||||||||||
| Dominican pesos | — | 2,271 | — | 2,271 | ||||||||||||
| Malaysian ringgits | — | 2,222 | — | 2,222 | ||||||||||||
| Ukrainian hryvnia | — | — | 1,592 | 1,592 | ||||||||||||
| Indian rupees | — | 1,102 | — | 1,102 | ||||||||||||
| Romanian leu | — | 1,038 | — | 1,038 | ||||||||||||
| Polish zloty | — | 879 | — | 879 | ||||||||||||
| Norwegian kroner | — | 619 | — | 619 | ||||||||||||
| U.S. dollars | — | 669,670 | 289 | 669,959 | ||||||||||||
| Investment funds | 48,676 | — | — | 48,676 | ||||||||||||
| Preferred securities | — | — | 20 | 20 | ||||||||||||
| Common stocks | — | — | 134 | 134 | ||||||||||||
| Short-term securities | 167 | 100,470 | — | 100,637 | ||||||||||||
| Total | $ | 48,843 | $ | 1,434,482 | $ | 4,019 | $ | 1,487,344 | ||||||||
| American Funds Insurance Series | 301 |
| Other investments* | ||||||||||||||||
| Level 1 | Level 2 | Level 3 | Total | |||||||||||||
| Assets: | ||||||||||||||||
| Unrealized appreciation on futures contracts | $ | 672 | $ | — | $ | — | $ | 672 | ||||||||
| Unrealized appreciation on open forward currency contracts | — | 7,008 | — | 7,008 | ||||||||||||
| Unrealized appreciation on centrally cleared credit default swaps | — | 486 | — | 486 | ||||||||||||
| Liabilities: | ||||||||||||||||
| Unrealized depreciation on futures contracts | (4,659 | ) | — | — | (4,659 | ) | ||||||||||
| Unrealized depreciation on open forward currency contracts | — | (2,455 | ) | — | (2,455 | ) | ||||||||||
| Unrealized depreciation on centrally cleared interest rate swaps | — | (10,966 | ) | — | (10,966 | ) | ||||||||||
| Unrealized depreciation on centrally cleared credit default swaps | — | (19 | ) | — | (19 | ) | ||||||||||
| Total | $ | (3,987 | ) | $ | (5,946 | ) | $ | — | $ | (9,933 | ) | |||||
| * | Futures contracts, forward currency contracts, interest rate swaps and credit default swaps are not included in the fund’s investment portfolio. |
American High-Income Trust
| Investment securities | ||||||||||||||||
| Level 1 | Level 2 | Level 3 | Total | |||||||||||||
| Assets: | ||||||||||||||||
| Bonds, notes & other debt instruments: | ||||||||||||||||
| Corporate bonds, notes & loans | $ | — | $ | 731,844 | $ | 4,198 | $ | 736,042 | ||||||||
| Mortgage-backed obligations | — | — | 630 | 630 | ||||||||||||
| Convertible bonds & notes | — | 399 | 79 | 478 | ||||||||||||
| Convertible stocks | 483 | 472 | — | 955 | ||||||||||||
| Common stocks | 8,540 | 1,520 | 26,932 | 36,992 | ||||||||||||
| Preferred securities | — | — | 2,629 | 2,629 | ||||||||||||
| Rights & warrants | — | 826 | 12 | 838 | ||||||||||||
| Short-term securities | 38,565 | — | — | 38,565 | ||||||||||||
| Total | $ | 47,588 | $ | 735,061 | $ | 34,480 | $ | 817,129 | ||||||||
| Other investments1 | ||||||||||||||||
| Level 1 | Level 2 | Level 3 | Total | |||||||||||||
| Assets: | ||||||||||||||||
| Unrealized appreciation on futures contracts | $ | 10 | $ | — | $ | — | $ | 10 | ||||||||
| Liabilities: | ||||||||||||||||
| Unrealized depreciation on futures contracts | (98 | ) | — | — | (98 | ) | ||||||||||
| Unrealized depreciation on centrally cleared credit default swaps | — | (154 | ) | — | (154 | ) | ||||||||||
| Total | $ | (88 | ) | $ | (154 | ) | $ | — | $ | (242 | ) | |||||
| 1 | Futures contracts and credit default swaps are not included in the investment portfolio. |
The following table reconciles the valuation of the fund’s Level 3 investment securities and related transactions for the year ended December 31, 2022 (dollars in thousands):
| Beginning value at 1/1/2022 |
Transfers into Level 32 |
Purchases | Sales | Net realized gain3 |
Unrealized depreciation3 |
Transfers out of Level 32 |
Ending value at 12/31/2022 |
|||||||||||||||||||||||||
| Investment securities | $ | 40,411 | $ | 3,989 | $ | 4,058 | $ | (11,715 | ) | $ | 883 | $ | (3,084 | ) | $ | (62 | ) | $ | 34,480 | |||||||||||||
| Net unrealized depreciation during the period on Level 3 investment securities held at December 31, 2022 | $ | (1,467 | ) | |||||||||||||||||||||||||||||
| 2 | Transfers into or out of Level 3 are based on the beginning market value of the quarter in which they occurred. These transfers are the result of changes in the availability of pricing sources and/or in the observability of significant inputs used in valuing the securities. |
| 3 | Net realized gain and unrealized depreciation are included in the related amounts on investments in the fund’s statement of operations. |
| 302 | American Funds Insurance Series |
Unobservable inputs — Valuation of the fund’s Level 3 securities is based on significant unobservable inputs that reflect the investment adviser’s determination of assumptions that market participants might reasonably use in valuing the securities. The following table provides additional information used by the fund’s investment adviser to fair value the fund’s Level 3 securities (dollars in thousands):
| Value at 12/31/2022 |
Valuation techniques |
Unobservable inputs |
Range (if applicable) |
Weighted average* |
Impact to valuation from an increase in input† | |||||||
| Bonds, notes & other debt instruments | $4,828 | Estimated recovery value | Expected proceeds | N/A | N/A | N/A | ||||||
| EV/EBITDA multiple | 7.5x | 7.5x | Increase | |||||||||
| DLOM | 15% | 15% | Decrease | |||||||||
| Vendor price | N/A | N/A | N/A | |||||||||
| Yield analysis | Yield | 15.7% - 16.0% | 15.8% | Decrease | ||||||||
| Transaction price | N/A | N/A | N/A | |||||||||
| Transaction | Net adjustment (decrease) based on movement of market comparables | |||||||||||
| 10% | 10% | |||||||||||
| Convertible bonds & notes | 79 | Transaction | Transaction price | N/A | N/A | N/A | ||||||
| Common stocks | 26,932 | Estimated recovery value | Expected proceeds | N/A | N/A | N/A | ||||||
| EV/EBITDA multiple | 7.5x | 7.5x | Increase | |||||||||
| DLOM | 15% | 15% | Decrease | |||||||||
| Vendor price | N/A | N/A | N/A | |||||||||
| Risk discount | 90% | 90% | Decrease | |||||||||
| Net adjustment (decrease) based on movement of market comparables | ||||||||||||
| 20% | 20% | Decrease | ||||||||||
| EV/EBITDA multiple | 3.7x | 3.7x | Increase | |||||||||
| Market comparable companies | EV/EBITDA less CapEx multiple | 10.2x | 10.2x | Increase | ||||||||
| DLOM | 17% | 17% | Decrease | |||||||||
| Transaction | Transaction price | N/A | N/A | N/A | ||||||||
| Discount for lack of certainty | 5% | 5% | Decrease | |||||||||
| Indicative market quotation | Broker quote | N/A | N/A | N/A | ||||||||
| Preferred securities | 2,629 | Indicative market quotation | Broker quote | N/A | N/A | N/A | ||||||
| Market comparable companies | EV/EBITDA multiple | 3.5x | 3.5x | Increase | ||||||||
| DLOM | 30% | 30% | Decrease | |||||||||
| Rights & warrants | 12 | Indicative market quotation | Broker quote | N/A | N/A | N/A | ||||||
| Total | $34,480 |
| * | Weighted average is by relative fair value. |
| † | This column represents the directional change in fair value of the Level 3 securities that would result in an increase from the corresponding input. Significant increases and decreases in these inputs in isolation could result in significantly higher or lower fair value measurements. |
Key to abbreviations and symbols
CapEx = Capital expenditures
DLOM = Discount for lack of marketability
EBITDA = Earnings before income taxes, depreciation and amortization
EV = Enterprise value
| American Funds Insurance Series | 303 |
American Funds Mortgage Fund
| Investment securities | ||||||||||||||||
| Level 1 | Level 2 | Level 3 | Total | |||||||||||||
| Assets: | ||||||||||||||||
| Bonds, notes & other debt instruments: | ||||||||||||||||
| Mortgage-backed obligations | $ | — | $ | 71,406 | $ | — | $ | 71,406 | ||||||||
| U.S. Treasury bonds & notes | — | 10,720 | — | 10,720 | ||||||||||||
| Asset-backed obligations | — | 2,388 | — | 2,388 | ||||||||||||
| Short-term securities | — | 22,857 | — | 22,857 | ||||||||||||
| Total | $ | — | $ | 107,371 | $ | — | $ | 107,371 | ||||||||
| Other investments* | ||||||||||||||||
| Level 1 | Level 2 | Level 3 | Total | |||||||||||||
| Assets: | ||||||||||||||||
| Unrealized appreciation on futures contracts | $ | 49 | $ | — | $ | — | $ | 49 | ||||||||
| Unrealized appreciation on centrally cleared interest rate swaps | — | 790 | — | 790 | ||||||||||||
| Liabilities: | ||||||||||||||||
| Unrealized depreciation on futures contracts | (124 | ) | — | — | (124 | ) | ||||||||||
| Total | $ | (75 | ) | $ | 790 | $ | — | $ | 715 | |||||||
| * | Futures contracts and interest rate swaps are not included in the fund’s investment portfolio. |
Ultra-Short Bond Fund
As of December 31, 2022, all of the fund’s investment securities were classified as Level 2.
U.S. Government Securities Fund
| Investment securities | ||||||||||||||||
| Level 1 | Level 2 | Level 3 | Total | |||||||||||||
| Assets: | ||||||||||||||||
| Bonds, notes & other debt instruments: | ||||||||||||||||
| Mortgage-backed obligations | $ | — | $ | 723,593 | $ | — | $ | 723,593 | ||||||||
| U.S. Treasury bonds & notes | — | 597,122 | — | 597,122 | ||||||||||||
| Federal agency bonds & notes | — | 79,196 | — | 79,196 | ||||||||||||
| Short-term securities | — | 318,094 | — | 318,094 | ||||||||||||
| Total | $ | — | $ | 1,718,005 | $ | — | $ | 1,718,005 | ||||||||
| Other investments* | ||||||||||||||||
| Level 1 | Level 2 | Level 3 | Total | |||||||||||||
| Assets: | ||||||||||||||||
| Unrealized appreciation on futures contracts | $ | 14,523 | $ | — | $ | — | $ | 14,523 | ||||||||
| Unrealized appreciation on centrally cleared interest rate swaps | — | 30,519 | — | 30,519 | ||||||||||||
| Liabilities: | ||||||||||||||||
| Unrealized depreciation on futures contracts | (17,699 | ) | — | — | (17,699 | ) | ||||||||||
| Unrealized depreciation on centrally cleared interest rate swaps | — | (21,723 | ) | — | (21,723 | ) | ||||||||||
| Total | $ | (3,176 | ) | $ | 8,796 | $ | — | $ | 5,620 | |||||||
| * | Futures contracts and interest rate swaps are not included in the fund’s investment portfolio. |
Managed Risk Growth Fund
As of December 31, 2022, all of the fund’s investments were classified as Level 1.
Managed Risk International Fund
As of December 31, 2022, all of the fund’s investments were classified as Level 1.
Managed Risk Washington Mutual Investors Fund
As of December 31, 2022, all of the fund’s investments were classified as Level 1.
| 304 | American Funds Insurance Series |
Managed Risk Growth-Income Fund
As of December 31, 2022, all of the fund’s investments were classified as Level 1.
Managed Risk Asset Allocation Fund
As of December 31, 2022, all of the fund’s investments were classified as Level 1.
4. Risk factors
Investing in the funds may involve certain risks including, but not limited to, those described below.
Market conditions — The prices of, and the income generated by, the common stocks, bonds and other securities held by a fund may decline — sometimes rapidly or unpredictably — due to various factors, including events or conditions affecting the general economy or particular industries or companies; overall market changes; local, regional or global political, social or economic instability; governmental, governmental agency or central bank responses to economic conditions; and currency exchange rate, interest rate and commodity price fluctuations. These risks may be heightened in the case of smaller capitalization stocks.
Economies and financial markets throughout the world are highly interconnected. Economic, financial or political events, trading and tariff arrangements, wars, terrorism, cybersecurity events, natural disasters, public health emergencies (such as the spread of infectious disease) and other circumstances in one country or region, including actions taken by governmental or quasi-governmental authorities in response to any of the foregoing, could have impacts on global economies or markets. As a result, whether or not a fund invests in securities of issuers located in or with significant exposure to the countries affected, the value and liquidity of a fund’s investments may be negatively affected by developments in other countries and regions.
Issuer risks — The prices of, and the income generated by, securities held by a fund may decline in response to various factors directly related to the issuers of such securities, including reduced demand for an issuer’s goods or services, poor management performance, major litigation, investigations or other controversies related to the issuer, changes in the issuer’s financial condition or credit rating, changes in government regulations affecting the issuer or its competitive environment and strategic initiatives such as mergers, acquisitions or dispositions and the market response to any such initiatives.
Investing in income-oriented stocks — The value of a fund’s securities and income provided by a fund may be reduced by changes in the dividend policies of, and the capital resources available for dividend payments at, the companies in which the fund invests.
Investing in growth-oriented stocks — Growth-oriented common stocks and other equity-type securities (such as preferred stocks, convertible preferred stocks and convertible bonds) may involve larger price swings and greater potential for loss than other types of investments. These risks may be even greater in the case of smaller capitalization stocks.
Investing in small companies — Investing in smaller companies may pose additional risks. For example, it is often more difficult to value or dispose of small company stocks and more difficult to obtain information about smaller companies than about larger companies. Furthermore, smaller companies often have limited product lines, operating histories, markets and/or financial resources, may be dependent on one or a few key persons for management, and can be more susceptible to losses. Moreover, the prices of their stocks may be more volatile than stocks of larger, more established companies, particularly during times of market turmoil.
Investing outside the U.S. — Securities of issuers domiciled outside the U.S., or with significant operations or revenues outside the U.S., may lose value because of adverse political, social, economic or market developments (including social instability, regional conflicts, terrorism and war) in the countries or regions in which the issuers operate or generate revenue. These securities may also lose value due to changes in foreign currency exchange rates against the U.S. dollar and/or currencies of other countries. Issuers of these securities may be more susceptible to actions of foreign governments, such as nationalization, currency blockage or the imposition of price controls, sanctions, or punitive taxes, each of which could adversely impact the value of these securities. Securities markets in certain countries may be more volatile and/or less liquid than those in the U.S. Investments outside the U.S. may also be subject to different regulatory, legal, accounting, auditing, financial reporting and recordkeeping requirements, and may be more difficult to value, than those in the U.S. In addition, the value of investments outside the U.S. may be reduced by foreign taxes, including foreign withholding taxes on interest and dividends. Further, there may be increased risks of delayed settlement of securities purchased or sold by the fund, which could impact the liquidity of the fund’s portfolio. The risks of investing outside the U.S. may be heightened in connection with investments in emerging markets.
| American Funds Insurance Series | 305 |
Investing in developing countries — Investing in countries with developing economies and/or markets may involve risks in addition to and greater than those generally associated with investing in developed countries. For instance, developing countries tend to have less developed political, economic and legal systems than those in developed countries. Accordingly, the governments of these countries may be less stable and more likely to intervene in the market economy, for example, by imposing capital controls, nationalizing a company or industry, placing restrictions on foreign ownership and on withdrawing sale proceeds of securities from the country, and/or imposing punitive taxes that could adversely affect the prices of securities. Information regarding issuers in developing countries may be limited, incomplete or inaccurate, and such issuers may not be subject to regulatory, accounting, auditing, and financial reporting and recordkeeping standards comparable to those to which issuers in developed countries are subject. A fund’s rights with respect to its investments in developing countries, if any, will generally be governed by local law, which may make it difficult or impossible for the fund to pursue legal remedies or to obtain and enforce judgments in local courts. In addition, the economies of these countries may be dependent on relatively few industries, may have limited access to capital and may be more susceptible to changes in local and global trade conditions and downturns in the world economy. Securities markets in these countries can also be relatively small and have substantially lower trading volumes. As a result, securities issued in these countries may be more volatile and less liquid, and may be more difficult to value, than securities issued in countries with more developed economies and/or markets. Less certainty with respect to security valuations may lead to additional challenges and risks in calculating a fund’s net asset value. Additionally, developing countries are more likely to experience problems with the clearing and settling of trades and the holding of securities by banks, agents and depositories that are less established than those in developed countries.
Investing in emerging markets — Investing in emerging markets may involve risks in addition to and greater than those generally associated with investing in the securities markets of developed countries. For instance, emerging market countries tend to have less developed political, economic and legal systems than those in developed countries. Accordingly, the governments of these countries may be less stable and more likely to intervene in the market economy, for example, by imposing capital controls, nationalizing a company or industry, placing restrictions on foreign ownership and on withdrawing sale proceeds of securities from the country, and/or imposing punitive taxes that could adversely affect the prices of securities. Information regarding issuers in emerging markets may be limited, incomplete or inaccurate, and such issuers may not be subject to regulatory, accounting, auditing, and financial reporting and recordkeeping standards comparable to those to which issuers in more developed markets are subject. A fund’s rights with respect to its investments in emerging markets, if any, will generally be governed by local law, which may make it difficult or impossible for the fund to pursue legal remedies or to obtain and enforce judgments in local courts. In addition, the economies of these countries may be dependent on relatively few industries, may have limited access to capital and may be more susceptible to changes in local and global trade conditions and downturns in the world economy. Securities markets in these countries can also be relatively small and have substantially lower trading volumes. As a result, securities issued in these countries may be more volatile and less liquid, and may be more difficult to value, than securities issued in countries with more developed economies and/or markets. Less certainty with respect to security valuations may lead to additional challenges and risks in calculating a fund’s net asset value. Additionally, emerging markets are more likely to experience problems with the clearing and settling of trades and the holding of securities by banks, agents and depositories that are less established than those in developed countries.
Investing in debt instruments — The prices of, and the income generated by, bonds and other debt securities held by a fund may be affected by factors such as the interest rates, maturities and credit quality of these securities.
Rising interest rates will generally cause the prices of bonds and other debt securities to fall. Also, when interest rates rise, issuers are less likely to refinance existing debt securities, causing the average life of such securities to extend. A general rise in interest rates may cause investors to sell debt securities on a large scale, which could also adversely affect the price and liquidity of debt securities and could also result in increased redemptions from a fund. Falling interest rates may cause an issuer to redeem, call or refinance a debt security before its stated maturity, which may result in a fund failing to recoup the full amount of its initial investment and having to reinvest the proceeds in lower yielding securities. Longer maturity debt securities generally have greater sensitivity to changes in interest rates and may be subject to greater price fluctuations than shorter maturity debt securities.
Bonds and other debt securities are also subject to credit risk, which is the possibility that the credit strength of an issuer or guarantor will weaken or be perceived to be weaker, and/or an issuer of a debt security will fail to make timely payments of principal or interest and the security will go into default. Changes in actual or perceived creditworthiness may occur quickly. A downgrade or default affecting any of a fund’s securities could cause the value of a fund’s shares to decrease. Lower quality debt securities generally have higher rates of interest and may be subject to greater price fluctuations than higher quality debt securities. Credit risk is gauged, in part, by the credit ratings of the debt securities in which a fund invests. However, ratings are only the opinions of the rating agencies issuing them and are not guarantees as to credit quality or an evaluation of market risk. The fund’s investment adviser relies on its own credit analysts to research issuers and issues in assessing credit and default risks.
| 306 | American Funds Insurance Series |
Investing in lower rated debt instruments — Lower rated bonds and other lower rated debt securities generally have higher rates of interest and involve greater risk of default or price declines due to changes in the issuer’s creditworthiness than those of higher quality debt securities. The market prices of these securities may fluctuate more than the prices of higher quality debt securities and may decline significantly in periods of general economic difficulty. These risks may be increased with respect to investments in junk bonds.
Investing in derivatives — The use of derivatives involves a variety of risks, which may be different from, or greater than, the risks associated with investing in traditional securities, such as stocks and bonds. Changes in the value of a derivative may not correlate perfectly with, and may be more sensitive to market events than, the underlying asset, rate or index, and a derivative instrument may cause a fund to lose significantly more than its initial investment. Derivatives may be difficult to value, difficult for a fund to buy or sell at an opportune time or price and difficult, or even impossible, to terminate or otherwise offset. A fund’s use of derivatives may result in losses to the fund, and investing in derivatives may reduce a fund’s returns and increase a fund’s price volatility. A fund’s counterparty to a derivative transaction (including, if applicable, the fund’s clearing broker, the derivatives exchange or the clearinghouse) may be unable or unwilling to honor its financial obligations in respect of the transaction. In certain cases, the fund may be hindered or delayed in exercising remedies against or closing out derivative instruments with a counterparty, which may result in additional losses. Derivatives are also subject to operational risk (such as documentation issues, settlement issues and systems failures) and legal risk (such as insufficient documentation, insufficient capacity or authority of a counterparty, and issues with the legality or enforceability of a contract).
Currency — The prices of, and the income generated by, many debt securities held by a fund may also be affected by changes in relative currency values. If the U.S. dollar appreciates against foreign currencies, the value in U.S. dollars of a fund’s securities denominated in such currencies would generally fall and vice versa.
Investing in mortgage-related and other asset-backed securities — Mortgage-related securities, such as mortgage-backed securities, and other asset-backed securities, include debt obligations that represent interests in pools of mortgages or other income-bearing assets, such as residential mortgage loans, home equity loans, mortgages on commercial buildings, consumer loans and equipment leases. While such securities are subject to the risks associated with investments in debt instruments generally (for example, credit, extension and interest rate risks), they are also subject to other and different risks. Mortgage-backed and other asset-backed securities are subject to changes in the payment patterns of borrowers of the underlying debt, potentially increasing the volatility of the securities and a fund’s net asset value. When interest rates fall, borrowers are more likely to refinance or prepay their debt before its stated maturity. This may result in a fund having to reinvest the proceeds in lower yielding securities, effectively reducing a fund’s income. Conversely, if interest rates rise and borrowers repay their debt more slowly than expected, the time in which the mortgage-backed and other asset-backed securities are paid off could be extended, reducing a fund’s cash available for reinvestment in higher yielding securities. Mortgage-backed securities are also subject to the risk that underlying borrowers will be unable to meet their obligations and the value of property that secures the mortgages may decline in value and be insufficient, upon foreclosure, to repay the associated loans. Investments in asset-backed securities are subject to similar risks.
Investing in future delivery contracts — A fund may enter into contracts, such as to-be-announced contracts and mortgage dollar rolls, that involve a fund selling mortgage-related securities and simultaneously contracting to repurchase similar securities for delivery at a future date at a predetermined price. This can increase a fund’s market exposure, and the market price of the securities that the fund contracts to repurchase could drop below their purchase price. While a fund can preserve and generate capital through the use of such contracts by, for example, realizing the difference between the sale price and the future purchase price, the income generated by the fund may be reduced by engaging in such transactions. In addition, these transactions increase the turnover rate of a fund.
Investing in inflation-linked bonds — The values of inflation-linked bonds generally fluctuate in response to changes in real interest rates — i.e., rates of interest after factoring in inflation. A rise in real interest rates may cause the prices of inflation-linked securities to fall, while a decline in real interest rates may cause the prices to increase. Inflation-linked bonds may experience greater losses than other debt securities with similar durations when real interest rates rise faster than nominal interest rates. There can be no assurance that the value of an inflation-linked security will be directly correlated to changes in interest rates; for example, if interest rates rise for reasons other than inflation, the increase may not be reflected in the security’s inflation measure.
Investing in inflation-linked bonds may also reduce a fund’s distributable income during periods of deflation. If prices for goods and services decline throughout the economy, the principal and income on inflation-linked securities may decline and result in losses to a fund.
| American Funds Insurance Series | 307 |
Investing in securities backed by the U.S. government — Securities backed by the U.S. Treasury or the full faith and credit of the U.S. government are guaranteed only as to the timely payment of interest and principal when held to maturity. Accordingly, the current market values for these securities will fluctuate with changes in interest rates and the credit rating of the U.S. government. Securities issued by U.S. government-sponsored entities and federal agencies and instrumentalities that are not backed by the full faith and credit of the U.S. government are neither issued nor guaranteed by the U.S. government. U.S. government securities are subject to market risk, interest rate risk and credit risk.
Investing in repurchase agreements — Upon entering into a repurchase agreement, a fund purchases a security from a bank or broker-dealer, which simultaneously commits to repurchase the security within a specified time at the fund’s cost with interest. The security purchased by the fund constitutes collateral for the seller’s repurchase obligation. If the party agreeing to repurchase should default, the fund may seek to sell the security it holds as collateral. The fund may incur a loss if the value of the collateral securing the repurchase obligation falls below the repurchase price. The fund may also incur disposition costs and encounter procedural delays in connection with liquidating the collateral.
Interest rate risk — The values and liquidity of the securities held by a fund may be affected by changing interest rates. For example, the values of these securities may decline when interest rates rise and increase when interest rates fall. Longer maturity debt securities generally have greater sensitivity to changes in interest rates and may be subject to greater price fluctuations than shorter maturity debt securities. A fund may invest in variable and floating rate securities. When a fund holds variable or floating rate securities, a decrease in market interest rates will adversely affect the income received from such securities and the net asset value of a fund’s shares. Although the values of such securities are generally less sensitive to interest rate changes than those of other debt securities, the value of variable and floating rate securities may decline if their interest rates do not rise as quickly, or as much, as market interest rates. Conversely, floating rate securities will not generally increase in value if interest rates decline. During periods of extremely low short-term interest rates, a fund may not be able to maintain a positive yield and, in relatively low interest rate environments, there are heightened risks associated with rising interest rates.
Credit and liquidity support — Changes in the credit quality of banks and financial institutions providing credit and liquidity support features with respect to securities held by a fund could cause the values of these securities to decline.
Asset allocation — A fund’s percentage allocation to equity securities, debt securities and money market instruments could cause the fund to underperform relative to relevant benchmarks and other funds with similar investment objectives.
Liquidity risk — Certain fund holdings may be or may become difficult or impossible to sell, particularly during times of market turmoil. Liquidity may be impacted by the lack of an active market for a holding, legal or contractual restrictions on resale, or the reduced number and capacity of market participants to make a market in such holding. Market prices for less liquid or illiquid holdings may be volatile or difficult to determine, and reduced liquidity may have an adverse impact on the market price of such holdings. Additionally, the sale of less liquid or illiquid holdings may involve substantial delays (including delays in settlement) and additional costs and the fund may be unable to sell such holdings when necessary to meet its liquidity needs, or to try to limit losses, or may be forced to sell at a loss.
Management — The investment adviser to the funds actively manages the funds’ investments. Consequently, the funds are subject to the risk that the methods and analyses, including models, tools and data, employed by the investment adviser in this process may be flawed or incorrect and may not produce the desired results. This could cause the funds to lose value or their investment results to lag relevant benchmarks or other funds with similar objectives.
Investing in the managed risk funds may involve additional risks including, but not limited to, those described below.
Fund structure — The managed risk funds invest in underlying funds and incur expenses related to those underlying funds. In addition, investors in the managed risk funds will incur fees to pay for certain expenses related to the operations of the managed risk funds. An investor holding the underlying fund directly would incur lower overall expenses but would not receive the benefit of the managed risk strategy. Additionally, in accordance with an exemption under the Investment Company Act of 1940, as amended, the investment adviser considers only proprietary funds when selecting underlying investment options and allocations. This means that the fund’s investment adviser did not, nor does it expect to, consider any unaffiliated funds as underlying investment options for the fund. This strategy could raise certain conflicts of interest when choosing underlying investments for the fund, including the selection of funds that result in greater compensation to the adviser or funds with relatively lower historical investment results. The investment adviser has policies and procedures designed to mitigate material conflicts of interest that may arise in connection with its management of the fund.
| 308 | American Funds Insurance Series |
Management — The managed risk funds are subject to the risk that the managed risk strategy or the methods employed by the subadviser in implementing the managed risk strategy may not produce the desired results. This could cause the managed risk funds to lose value or their investment results to lag relevant benchmarks or other funds with similar objectives.
Underlying fund risks — Because the managed risk funds’ investments consist of investments in underlying funds, the managed risk funds’ risks are directly related to the risks of the respective underlying fund in which each managed risk fund invests. For this reason, it is important to understand the risks associated with investing both in the managed risk fund and in each of the underlying funds.
Investing in options and futures contracts — In addition to the risks generally associated with investing in derivative instruments, options and futures contracts are subject to the creditworthiness of the clearing organizations, exchanges and, in the case of futures, futures commission merchants with which a fund transacts. While both options and futures contracts are generally liquid instruments, under certain market conditions, options and futures may be deemed to be illiquid. For example, a fund may be temporarily prohibited from closing out its position in an options or futures contract if intraday price change limits or limits on trading volume imposed by the applicable exchange are triggered. If a fund is unable to close out a position on an options or futures contract, the fund would remain subject to the risk of adverse price movements until the fund is able to close out the position in question. The ability of a fund to successfully utilize options and futures contracts may depend in part upon the ability of the fund’s investment adviser or subadviser to accurately forecast interest rates and other economic factors and to assess and predict the impact of such economic factors on the options and futures in which the fund invests. If the investment adviser or subadviser incorrectly forecasts economic developments or incorrectly predicts the impact of such developments on the options and futures in which it invests, a fund could suffer losses. Whereas the risk of loss on a put option purchased by the fund is limited to the initial cost of the option, the amount of a potential loss on a futures contract could greatly exceed the relatively small initial amount invested in entering the futures position.
Hedging — There may be imperfect or even negative correlation between the prices of the options and futures contracts in which a fund invests and the prices of the underlying securities or indexes which the fund seeks to hedge. For example, options and futures contracts may not provide an effective hedge because changes in options and futures contract prices may not track those of the underlying securities or indexes they are intended to hedge. In addition, there are significant differences between the securities market, on the one hand, and the options and futures markets, on the other, that could result in an imperfect correlation between the markets, causing a given hedge not to achieve its objectives. The degree of imperfection of correlation depends on circumstances such as variations in speculative market demand for options and futures, including technical influences in options and futures trading, and differences between the financial instruments being hedged and the instruments underlying the standard contracts available for trading. A decision as to whether, when and how to hedge involves the exercise of skill and judgment, and even a well-conceived hedge may be unsuccessful to some degree because of market behavior or unexpected interest rate trends. In addition, the fund’s investment in exchange-traded options and futures and their resulting costs could limit the fund’s gains in rising markets relative to those of the underlying funds, or to those of unhedged funds in general.
Short positions — The fund may suffer losses from short positions in futures contracts. Losses from short positions in futures contracts occur when the underlying index increases in value. As the underlying index increases in value, the holder of the short position in the corresponding futures contract is required to pay the difference in value of the futures contract resulting from the increase in the index on a daily basis. Losses from a short position in an index futures contract could potentially be very large if the value of the underlying index rises dramatically in a short period of time.
Nondiversification risk — As nondiversified funds, the managed risk funds have the ability to invest a larger percentage of their assets in the securities of a smaller number of issuers than diversified funds. To the extent that a managed risk fund invests a larger percentage of its assets in securities of one or more issuers, poor performance by these securities could have a greater adverse impact on the fund’s investment results.
| American Funds Insurance Series | 309 |
5. Certain investment techniques
Securities lending — Some of the funds have entered into securities lending transactions in which the funds earn income by lending investment securities to brokers, dealers or other institutions. Each transaction involves three parties: the fund, acting as the lender of the securities, a borrower, and a lending agent that acts as an intermediary.
Securities lending transactions are entered into by the fund under the securities lending agreement with the lending agent. The lending agent facilitates the exchange of securities between the lender and the borrower, generally provides protection from borrower default, marks to market the value of collateral daily, secures additional collateral from the borrower if it falls below preset terms, and may reinvest the collateral on behalf of the fund according to agreed parameters. The lending agent has indemnified the fund against losses resulting from borrower default. Although risk is mitigated by the collateral and indemnification, the fund could experience a delay in recovering its securities and a potential loss of income or value if the borrower fails to return the securities, collateral investments decline in value or the lending agent fails to perform.
The borrower is required to post highly liquid assets, such as cash or U.S. government securities, as collateral for the loan in an amount at least equal to the value of the securities loaned. Investments made with cash collateral are recognized as assets in the fund’s investment portfolio. The same amount is recorded as a liability in the fund’s statement of assets and liabilities. While securities are on loan, the fund will continue to receive the equivalent of the interest, dividends or other distributions paid by the issuer, as well as a portion of the interest on the investment of the collateral. Additionally, although the fund does not have the right to vote on securities while they are on loan, the fund has a right to consent on corporate actions and a right to recall loaned securities to vote on proposals affecting them. The borrower is obligated to return the loaned security at the conclusion of the loan or, during the pendency of the loan, on demand from the fund.
The following table presents the value of the securities on loan, the type and value of collateral received and the value of the investment securities purchased, if any, from the cash collateral received by each fund (dollars in thousands):
| Collateral received | ||||||||||||||||
| Value of | Value of | |||||||||||||||
| investment | investment | |||||||||||||||
| securities | U.S. government | securities | ||||||||||||||
| Funds | on loan | Cash | securities | purchased | ||||||||||||
| Global Small Capitalization Fund | $ | 59,781 | $ | 58,725 | $ | 4,519 | $ | 52,853 | ||||||||
| Growth Fund | 54,504 | 55,867 | — | 50,280 | ||||||||||||
| International Fund | 1,530 | 1,607 | — | 1,446 | ||||||||||||
| New World Fund | 311 | 327 | — | 295 | ||||||||||||
| Washington Mutual Investors Fund | 12,432 | 12,908 | — | 11,618 | ||||||||||||
| Capital World Growth and Income Fund | 6,155 | 6,480 | — | 5,832 | ||||||||||||
| Growth-Income Fund | 240,456 | 248,693 | — | 223,824 | ||||||||||||
| International Growth and Income Fund | 1,435 | 962 | 585 | 866 | ||||||||||||
| Capital Income Builder | 6,251 | 6,553 | — | 5,898 | ||||||||||||
| Asset Allocation Fund | 67,688 | 56,897 | 17,890 | 51,207 | ||||||||||||
Investment securities purchased from cash collateral are disclosed in the investment portfolio as short-term securities. Securities received as collateral, if any, are not recognized as fund assets. The contractual maturity of collateral received under the securities lending agreement is classified as overnight and continuous.
Index-linked bonds — Some of the funds have invested in index-linked bonds, which are fixed-income securities whose principal value is periodically adjusted to a government price index. Over the life of an index-linked bond, interest is paid on the adjusted principal value. Increases or decreases in the principal value of index-linked bonds are recorded as interest income in the fund’s statement of operations.
Mortgage dollar rolls — Some of the funds have entered into mortgage dollar roll transactions in which the fund sells a mortgage-backed security to a counterparty and simultaneously enters into an agreement with the same counterparty to buy back a similar security on a specific future date at a predetermined price. Mortgage dollar rolls are accounted for as purchase and sale transactions, which may increase the funds’ portfolio turnover rates.
| 310 | American Funds Insurance Series |
Loan transactions — Some of the funds have entered into loan transactions in which the fund acquires a loan either through an agent, by assignment from another holder, or as a participation interest in another holder’s portion of a loan. The loan is often administered by a financial institution that acts as agent for the holders of the loan, and the fund may be required to receive approval from the agent and/or borrower prior to the sale of the investment. The loan’s interest rate and maturity date may change based on the terms of the loan, including potential early payments of principal.
Short-term securities — The managed risk funds hold shares of State Street Institutional U.S. Government Money Market Fund, a cash management vehicle offered and managed by State Street Bank and Trust Company.
Unfunded commitments — Asset Allocation Fund, Capital World Bond Fund and American High-Income Trust have participated in transactions that involve unfunded commitments, which may obligate each fund to purchase new or additional bonds and/or purchase additional shares of the applicable issuer if certain contingencies are met. As of December 31, 2022, the maximum exposure from these unfunded commitments for Asset Allocation Fund, Capital World Bond Fund and American High-Income Trust was $5,000,000, $150,000 and $4,155,000, respectively, which would represent 0.02%, 0.01% and 0.50%, respectively, of the net assets of each fund should such commitments become due. Unrealized appreciation on these unfunded commitments for Capital World Bond Fund and American High-Income Trust of $12,000 and $572,000, respectively, is disclosed as unrealized appreciation on unfunded commitments in each fund’s statement of assets and liabilities, and unrealized depreciation on these unfunded commitments for Asset Allocation Fund, Capital World Bond Fund and American High-Income Trust of $9,000, $1,000 and $3,000, respectively, is disclosed as unrealized depreciation on unfunded commitments in each fund’s statement of assets and liabilities. Both are included in net unrealized (depreciation) appreciation on investments in unaffiliated issuers in each fund’s statement of operations.
Options contracts — The managed risk funds have entered into options contracts, which give the holder of the option, in return for a premium payment, the right to buy from (in the case of a call) or sell to (in the case of a put) the writer of the option, the security underlying the option (or the cash value of the index underlying the option) at a specified price. As part of their managed risk strategy, the funds will at times purchase put options on equity indexes in standardized contracts traded on foreign or domestic securities exchanges, boards of trade, or similar entities. By purchasing a put option on an equity index, the funds obtain the right (but not the obligation) to sell the cash value of the index underlying the option at a specified exercise price, and in return for this right, the funds pay the current market price, or the option premium, for the option.
The funds may terminate their position in a put option by allowing the option to expire or by exercising the option. If the option is allowed to expire, the funds will lose the entire premium. If the option is exercised, the funds complete the sale of the underlying instrument (or delivers the cash value of the index underlying the option) at the exercise price. The funds may also terminate a put option position by entering into opposing close-out transactions in advance of the option expiration date.
Premiums paid on options purchased, as well as the daily fluctuation in market value, are included in investment securities from unaffiliated issuers in each fund’s statement of assets and liabilities. Realized gains or losses are recorded at the time the option contract is closed or expires. Net realized gains or losses and net unrealized appreciation or depreciation from options contracts are recorded in investments in unaffiliated issuers in each fund’s statement of operations.
Futures contracts — Some of the funds have entered into futures contracts, which provide for the future sale by one party and purchase by another party of a specified amount of a specific financial instrument for a specified price, date, time and place designated at the time the contract is made. Futures contracts are used to strategically manage the fund’s interest rate sensitivity by increasing or decreasing the duration of the fund or a portion of the fund’s portfolio. For the managed risk funds, futures contracts are used to strategically manage portfolio volatility and downside equity risk.
Upon entering into futures contracts, and to maintain the fund’s open positions in futures contracts, the fund is required to deposit with a futures broker, known as a futures commission merchant (“FCM“), in a segregated account in the name of the FCM an amount of cash, U.S. government securities or other liquid securities, known as initial margin. The margin required for a particular futures contract is set by the exchange on which the contract is traded to serve as collateral, and may be significantly modified from time to time by the exchange during the term of the contract.
On a daily basis, each fund pays or receives variation margin based on the increase or decrease in the value of the futures contracts and records variation margin on futures contracts in each fund’s statement of assets and liabilities. Futures contracts may involve a risk of loss in excess of the variation margin shown on each fund’s statement of assets and liabilities. Each fund records realized gains or losses at the time the futures contract is closed or expires. Net realized gains or losses and net unrealized appreciation or depreciation from futures contracts are recorded in each fund’s statement of operations.
| American Funds Insurance Series | 311 |
Forward currency contracts — Some of the funds have entered into forward currency contracts, which represent agreements to exchange currencies on specific future dates at predetermined rates. The series’ investment adviser uses forward currency contracts to manage the fund’s exposure to changes in exchange rates. Upon entering into these contracts, risks may arise from the potential inability of counterparties to meet the terms of their contracts and from possible movements in exchange rates.
On a daily basis, the series’ investment adviser values forward currency contracts based on the applicable exchange rates and records unrealized appreciation or depreciation for open forward currency contracts in each fund’s statement of assets and liabilities. Realized gains or losses are recorded at the time the forward contract is closed or offset by another contract with the same broker for the same settlement date and currency. Closed forward currency contracts that have not reached their settlement date are included in the respective receivables or payables for closed forward currency contracts in each fund’s statement of assets and liabilities. Net realized gains or losses from closed forward currency contracts and net unrealized appreciation or depreciation from open forward currency contracts are recorded in each fund’s statement of operations.
Swap contracts — Some of the funds have entered into swap agreements, which are two-party contracts entered into primarily by institutional investors for a specified time period. In a typical swap transaction, two parties agree to exchange the returns earned or realized from one or more underlying assets or rates of return. Swap agreements can be traded on a swap execution facility (SEF) and cleared through a central clearinghouse (cleared), traded over-the-counter (OTC) and cleared, or traded bilaterally and not cleared. Because clearing interposes a central clearinghouse as the ultimate counterparty to each participant’s swap, and margin is required to be exchanged under the rules of the clearinghouse, central clearing is intended to decrease (but not eliminate) counterparty risk relative to uncleared bilateral swaps. To the extent the funds enter into bilaterally negotiated swap transactions, the funds will enter into swap agreements only with counterparties that meet certain credit standards and subject to agreed collateralized procedures. The term of a swap can be days, months or years and certain swaps may be less liquid than others.
Upon entering into a centrally cleared swap contract, the funds are required to deposit cash, U.S. government securities or other liquid securities, which is known as initial margin. Generally, the initial margin required for a particular swap is set and held as collateral by the clearinghouse on which the contract is cleared. The amount of initial margin required may be significantly modified from time to time by the clearinghouse during the term of the contract.
On a daily basis, interest accruals related to the exchange of future payments are recorded as a receivable and payable in the funds’ statement of assets and liabilities for centrally cleared swaps and as unrealized appreciation or depreciation in the funds’ statement of assets and liabilities for bilateral swaps. For centrally cleared swaps, the fund also pays or receives a variation margin based on the increase or decrease in the value of the swaps, including accrued interest as applicable, and records variation margin in the statement of assets and liabilities. The funds record realized gains and losses on both the net accrued interest and any gain or loss recognized at the time the swap is closed or expires. Net realized gains or losses, as well as any net unrealized appreciation or depreciation, from swaps are recorded in the funds’ statement of operations.
Swap agreements can take different forms. Some of the funds have entered into the following types of swap agreements:
Interest rate swaps — Some of the funds have entered into interest rate swaps, which seek to manage the interest rate sensitivity of the fund by increasing or decreasing the duration of the funds or a portion of the funds’ portfolio. An interest rate swap is an agreement between two parties to exchange or swap payments based on changes in an interest rate or rates. Typically, one interest rate is fixed and the other is variable based on a designated short-term interest rate such as the Secured Overnight Financing Rate (SOFR), prime rate or other benchmark. In other types of interest rate swaps, known as basis swaps, the parties agree to swap variable interest rates based on different designated short-term interest rates. Interest rate swaps generally do not involve the delivery of securities or other principal amounts. Rather, cash payments are exchanged by the parties based on the application of the designated interest rates to a notional amount, which is the predetermined dollar principal of the trade upon which payment obligations are computed. Accordingly, the funds’ current obligation or right under the swap agreement is generally equal to the net amount to be paid or received under the swap agreement based on the relative value of the position held by each party.
| 312 | American Funds Insurance Series |
Credit default swap indices — Some of the funds have entered into centrally cleared credit default swap indices, including CDX and iTraxx indices (collectively referred to as “CDSIs”), in order to assume exposure to a diversified portfolio of credits or to hedge against existing credit risks. A CDSI is based on a portfolio of credit default swaps with similar characteristics, such as credit default swaps on high-yield bonds. In a typical CDSI transaction, one party (the protection buyer) is obligated to pay the other party (the protection seller) a stream of periodic payments over the term of the contract. If a credit event, such as a default or restructuring, occurs with respect to any of the underlying reference obligations, the protection seller must pay the protection buyer the loss on those credits.
The funds may enter into a CDSI transaction as either protection buyer or protection seller. If the funds are protection buyers, they would pay the counterparty a periodic stream of payments over the term of the contract and would not recover any of those payments if no credit events were to occur with respect to any of the underlying reference obligations. However, if a credit event did occur, the funds, as protection buyers, would have the right to deliver the referenced debt obligations or a specified amount of cash, depending on the terms of the applicable agreement, and to receive the par value of such debt obligations from the counterparty protection seller. As protection sellers, the funds would receive fixed payments throughout the term of the contract if no credit events were to occur with respect to any of the underlying reference obligations. If a credit event were to occur, however, the value of any deliverable obligation received by the funds, coupled with the periodic payments previously received by the funds, may be less than the full notional value that the funds, as a protection seller, pays to the counterparty protection buyer, effectively resulting in a loss of value to the funds. Furthermore, as protection sellers, the funds would effectively add leverage to their portfolio because it would have investment exposure to the notional amount of the swap transaction.
The following table presents the average month-end notional amounts of options contracts purchased, futures contracts, forward currency contracts, interest rate swaps and credit default swaps while held for each fund (dollars in thousands):
| Options | Forward | Interest | Credit | ||||||||
| contracts | Futures | currency | rate | default | |||||||
| purchased | contracts | contracts | swaps | swaps | |||||||
| New World Fund | Not applicable | $ 25,541 | $ 4,534 | Not applicable | $ 2,230 | ||||||
| International Growth and Income Fund | Not applicable | Not applicable | 785 | Not applicable | Not applicable | ||||||
| Capital Income Builder | Not applicable | 77,835 | 97 | * | $ 24,014 | 5,645 | |||||
| Asset Allocation Fund | Not applicable | 1,604,889 | Not applicable | Not applicable | 184,454 | ||||||
| Global Balanced Fund | Not applicable | 14,924 | 29,040 | 35,865 | 4,634 | ||||||
| The Bond Fund of America | Not applicable | 3,326,801 | 90,045 | 516,484 | 199,116 | ||||||
| Capital World Bond Fund | Not applicable | 297,755 | 449,743 | 384,936 | 92,966 | ||||||
| American High-Income Trust | Not applicable | 9,021 | Not applicable | Not applicable | 10,272 | ||||||
| American Funds Mortgage Fund | Not applicable | 31,977 | Not applicable | 4,025 | Not applicable | ||||||
| U.S. Government Securities Fund | Not applicable | 2,339,082 | Not applicable | 1,287,321 | Not applicable | ||||||
| Managed Risk Growth Fund | $ 269,349 | 170,792 | Not applicable | Not applicable | Not applicable | ||||||
| Managed Risk International Fund | 63,717 | 11,008 | Not applicable | Not applicable | Not applicable | ||||||
| Managed Risk Washington Mutual Investors Fund | 242,721 | 39,716 | Not applicable | Not applicable | Not applicable | ||||||
| Managed Risk Growth-Income Fund | 2,353,130 | 267,681 | Not applicable | Not applicable | Not applicable | ||||||
| Managed Risk Asset Allocation Fund | 418,987 | 290,562 | Not applicable | Not applicable | Not applicable |
| * | No contracts were held at the end of the reporting period; amount represents the average month-end notional amount of contracts while they were held. |
| American Funds Insurance Series | 313 |
The following tables identify the location and fair value amounts on each fund’s statement of assets and liabilities and/or the effect on each fund’s statement of operations resulting from each fund’s use of options, futures contracts, forward currency contracts, interest rate swaps and/or credit default swaps as of, or for the year ended, December 31, 2022 (dollars in thousands):
New World Fund
| Assets | Liabilities | |||||||||||||
| Contracts | Risk type | Location on statement of assets and liabilities |
Value | Location on statement of assets and liabilities |
Value | |||||||||
| Futures | Interest | Unrealized appreciation1 | $ | 159 | Unrealized depreciation1 | $ | 66 | |||||||
| Forward currency | Currency | Unrealized appreciation on open forward currency contracts | — | 2 | Unrealized depreciation on open forward currency contracts | 50 | ||||||||
| Swap (centrally cleared) | Credit | Unrealized appreciation1 | 2 | Unrealized depreciation1 | — | |||||||||
| $ | 161 | $ | 116 | |||||||||||
| Net realized gain (loss) | Net unrealized appreciation (depreciation) | |||||||||||||
| Contracts | Risk type | Location on statement of operations |
Value | Location on statement of operations |
Value | |||||||||
| Futures | Interest | Net realized gain on futures contracts | $ | 100 | Net unrealized appreciation on futures contracts | $ | 129 | |||||||
| Forward currency | Currency | Net realized gain on forward currency contracts | 379 | Net unrealized depreciation on forward currency contracts | (30 | ) | ||||||||
| Swap | Credit | Net realized loss on swap contracts | (2 | ) | Net unrealized appreciation on swap contracts | 2 | ||||||||
| $ | 477 | $ | 101 | |||||||||||
| International Growth and Income Fund | ||||||||||||||
| Assets | Liabilities | |||||||||||||
| Contracts | Risk type | Location on statement of assets and liabilities |
Value | Location on statement of assets and liabilities |
Value | |||||||||
| Forward currency | Currency | Unrealized appreciation on open forward currency contracts | $ | 5 | Unrealized depreciation on open forward currency contracts | $ | — | |||||||
| Net realized loss | Net unrealized appreciation | |||||||||||||
| Contracts | Risk type | Location on statement of operations |
Value | Location on statement of operations |
Value | |||||||||
| Forward currency | Currency | Net realized loss on forward currency contracts | $ | (54 | ) | Net unrealized appreciation on forward currency contracts | $ | 5 | ||||||
Refer to the end of the tables for footnotes.
| 314 | American Funds Insurance Series |
Capital Income Builder
| Assets | Liabilities | |||||||||||||
| Contracts | Risk type | Location on statement of assets and liabilities |
Value | Location on statement of assets and liabilities |
Value | |||||||||
| Futures | Interest | Unrealized appreciation1 | $ | 60 | Unrealized depreciation1 | $ | 139 | |||||||
| Swap (centrally cleared) | Interest | Unrealized appreciation1 | 1,900 | Unrealized depreciation1 | 380 | |||||||||
| Swap (centrally cleared) | Credit | Unrealized appreciation1 | — | Unrealized depreciation1 | 47 | |||||||||
| $ | 1,960 | $ | 566 | |||||||||||
| Net realized (loss) gain | Net unrealized (depreciation) appreciation | |||||||||||||
| Contracts | Risk type | Location on statement of operations |
Value | Location on statement of operations |
Value | |||||||||
| Futures | Interest | Net realized loss on futures contracts | $ | (7,468 | ) | Net unrealized depreciation on futures contracts | $ | (311 | ) | |||||
| Forward currency | Currency | Net realized gain on forward currency contracts | 7 | Net unrealized depreciation on forward currency contracts | (2 | ) | ||||||||
| Swap | Interest | Net realized gain on swap contracts | 1,864 | Net unrealized appreciation on swap contracts | 69 | |||||||||
| Swap | Credit | Net realized gain on swap contracts | 45 | Net unrealized depreciation on swap contracts | (33 | ) | ||||||||
| $ | (5,552 | ) | $ | (277 | ) | |||||||||
| Asset Allocation Fund | ||||||||||||||
| Assets | Liabilities | |||||||||||||
| Contracts | Risk type | Location on statement of assets and liabilities |
Value | Location on statement of assets and liabilities |
Value | |||||||||
| Futures | Interest | Unrealized appreciation1 | $ | 2,319 | Unrealized depreciation1 | $ | 3,485 | |||||||
| Swap (centrally cleared) | Credit | Unrealized appreciation1 | — | Unrealized depreciation1 | 1,623 | |||||||||
| $ | 2,319 | $ | 5,108 | |||||||||||
| Net realized gain (loss) | Net unrealized appreciation (depreciation) | |||||||||||||
| Contracts | Risk type | Location on statement of operations |
Value | Location on statement of operations |
Value | |||||||||
| Futures | Interest | Net realized gain on futures contracts | $ | 65,437 | Net unrealized appreciation on futures contracts | $ | 13,070 | |||||||
| Swap | Credit | Net realized loss on swap contracts | (73 | ) | Net unrealized depreciation on swap contracts | (1,575 | ) | |||||||
| $ | 65,364 | $ | 11,495 | |||||||||||
Refer to the end of the tables for footnotes.
| American Funds Insurance Series | 315 |
American Funds Global Balanced Fund
| Assets | Liabilities | |||||||||||||
| Contracts | Risk type | Location on statement of assets and liabilities |
Value | Location on statement of assets and liabilities |
Value | |||||||||
| Futures | Interest | Unrealized appreciation1 | $ | 58 | Unrealized depreciation1 | $ | 431 | |||||||
| Forward currency | Currency | Unrealized appreciation on open forward currency contracts | 686 | Unrealized depreciation on open forward currency contracts | 150 | |||||||||
| Swap (centrally cleared) | Interest | Unrealized appreciation1 | 8 | Unrealized depreciation1 | 1,017 | |||||||||
| Swap (centrally cleared) | Credit | Unrealized appreciation1 | 7 | Unrealized depreciation1 | — | |||||||||
| $ | 759 | $ | 1,598 | |||||||||||
| Net realized gain (loss) | Net unrealized (depreciation) appreciation | |||||||||||||
| Contracts | Risk type | Location on statement of operations |
Value | Location on statement of operations |
Value | |||||||||
| Futures | Interest | Net realized gain on futures contracts | $ | 539 | Net unrealized depreciation on futures contracts | $ | (454 | ) | ||||||
| Forward currency | Currency | Net realized loss on forward currency contracts | (1,292 | ) | Net unrealized appreciation on forward currency contracts | 725 | ||||||||
| Swap | Interest | Net realized gain on swap contracts | 94 | Net unrealized depreciation on swap contracts | (772 | ) | ||||||||
| Swap | Credit | Net realized gain on swap contracts | 48 | Net unrealized appreciation on swap contracts | 9 | |||||||||
| $ | (611 | ) | $ | (492 | ) | |||||||||
| The Bond Fund of America | ||||||||||||||
| Assets | Liabilities | |||||||||||||
| Contracts | Risk type | Location on statement of assets and liabilities |
Value | Location on statement of assets and liabilities |
Value | |||||||||
| Futures | Interest | Unrealized appreciation1 | $ | 6,241 | Unrealized depreciation1 | $ | 13,194 | |||||||
| Forward currency | Currency | Unrealized appreciation on open forward currency contracts | 3,821 | Unrealized depreciation on open forward currency contracts | 174 | |||||||||
| Swap (centrally cleared) | Interest | Unrealized appreciation1 | 15,705 | Unrealized depreciation1 | 6,629 | |||||||||
| Swap (centrally cleared) | Credit | Unrealized appreciation1 | — | Unrealized depreciation1 | 7,009 | |||||||||
| $ | 25,767 | $ | 27,006 | |||||||||||
Refer to the end of the tables for footnotes.
| 316 | American Funds Insurance Series |
| Net realized (loss) gain | Net unrealized (depreciation) appreciation | |||||||||||||
| Contracts | Risk type | Location on statement of operations |
Value | Location on statement of operations |
Value | |||||||||
| Futures | Interest | Net realized loss on futures contracts | $ | (136,499 | ) | Net unrealized depreciation on futures contracts | $ | (6,976 | ) | |||||
| Forward currency | Currency | Net realized gain on forward currency contracts | 1,795 | Net unrealized appreciation on forward currency contracts | 4,002 | |||||||||
| Swap | Interest | Net realized gain on swap contracts | 26,807 | Net unrealized appreciation on swap contracts | 20,061 | |||||||||
| Swap | Credit | Net realized gain on swap contracts | 1,436 | Net unrealized depreciation on swap contracts | (7,083 | ) | ||||||||
| $ | (106,461 | ) | $ | 10,004 | ||||||||||
| Capital World Bond Fund | ||||||||||||||
| Assets | Liabilities | |||||||||||||
| Contracts | Risk type | Location on statement of assets and liabilities |
Value | Location on statement of assets and liabilities |
Value | |||||||||
| Futures | Interest | Unrealized appreciation1 | $ | 672 | Unrealized depreciation1 | $ | 4,659 | |||||||
| Forward currency | Currency | Unrealized appreciation on open forward currency contracts | 7,008 | Unrealized depreciation on open forward currency contracts | 2,455 | |||||||||
| Swap (centrally cleared) | Interest | Unrealized appreciation1 | — | Unrealized depreciation1 | 10,966 | |||||||||
| Swap (centrally cleared) | Credit | Unrealized appreciation1 | 486 | Unrealized depreciation1 | 19 | |||||||||
| $ | 8,166 | $ | 18,099 | |||||||||||
| Net realized (loss) gain | Net unrealized (depreciation) appreciation | |||||||||||||
| Contracts | Risk type | Location on statement of operations |
Value | Location on statement of operations |
Value | |||||||||
| Futures | Interest | Net realized loss on futures contracts | $ | (7,447 | ) | Net unrealized depreciation on futures contracts | $ | (3,811 | ) | |||||
| Forward currency | Currency | Net realized loss on forward currency contracts | (18,216 | ) | Net unrealized appreciation on forward currency contracts | 4,071 | ||||||||
| Swap | Interest | Net realized loss on swap contracts | (2,331 | ) | Net unrealized depreciation on swap contracts | (7,110 | ) | |||||||
| Swap | Credit | Net realized gain on swap contracts | 1,535 | Net unrealized appreciation on swap contracts | 549 | |||||||||
| $ | (26,459 | ) | $ | (6,301 | ) | |||||||||
| American High-Income Trust | ||||||||||||||
| Assets | Liabilities | |||||||||||||
| Contracts | Risk type | Location on statement of assets and liabilities |
Value | Location on statement of assets and liabilities |
Value | |||||||||
| Futures | Interest | Unrealized appreciation1 | $ | 10 | Unrealized depreciation1 | $ | 98 | |||||||
| Swap (centrally cleared) | Credit | Unrealized appreciation1 | — | Unrealized depreciation1 | 154 | |||||||||
| $ | 10 | $ | 252 | |||||||||||
Refer to the end of the tables for footnotes.
| American Funds Insurance Series | 317 |
| Net realized gain (loss) | Net unrealized appreciation (depreciation) | |||||||||||||
| Contracts | Risk type | Location on statement of operations |
Value | Location on statement of operations |
Value | |||||||||
| Futures | Interest | Net realized gain on futures contracts | $ | 1,533 | Net unrealized appreciation on futures contracts | $ | 123 | |||||||
| Swap | Credit | Net realized loss on swap contracts | (82 | ) | Net unrealized depreciation on swap contracts | (161 | ) | |||||||
| $ | 1,451 | $ | (38 | ) | ||||||||||
| American Funds Mortgage Fund | ||||||||||||||
| Assets | Liabilities | |||||||||||||
| Contracts | Risk type | Location on statement of assets and liabilities |
Value | Location on statement of assets and liabilities |
Value | |||||||||
| Futures | Interest | Unrealized appreciation1 | $ | 49 | Unrealized depreciation1 | $ | 124 | |||||||
| Swap (centrally cleared) | Interest | Unrealized appreciation1 | 790 | Unrealized depreciation1 | — | |||||||||
| $ | 839 | $ | 124 | |||||||||||
| Net realized (loss) gain | Net unrealized depreciation | |||||||||||||
| Contracts | Risk type | Location on statement of operations |
Value | Location on statement of operations |
Value | |||||||||
| Futures | Interest | Net realized loss on futures contracts | $ | (2,688 | ) | Net unrealized depreciation on futures contracts | $ | (79 | ) | |||||
| Swap | Interest | Net realized gain on swap contracts | 3,147 | Net unrealized depreciation on swap contracts | (1,585 | ) | ||||||||
| $ | 459 | $ | (1,664 | ) | ||||||||||
| U.S. Government Securities Fund | ||||||||||||||
| Assets | Liabilities | |||||||||||||
| Contracts | Risk type | Location on statement of assets and liabilities |
Value | Location on statement of assets and liabilities |
Value | |||||||||
| Futures | Interest | Unrealized appreciation1 | $ | 14,523 | Unrealized depreciation1 | $ | 17,699 | |||||||
| Swap (centrally cleared) | Interest | Unrealized appreciation1 | 30,519 | Unrealized depreciation1 | 21,723 | |||||||||
| $ | 45,042 | $ | 39,422 | |||||||||||
| Net realized (loss) gain | Net unrealized depreciation | |||||||||||||
| Contracts | Risk type | Location on statement of operations |
Value | Location on statement of operations |
Value | |||||||||
| Futures | Interest | Net realized loss on futures contracts | $ | (52,928 | ) | Net unrealized depreciation on futures contracts | $ | (3,785 | ) | |||||
| Swap | Interest | Net realized gain on swap contracts | 20,919 | Net unrealized depreciation on swap contracts | (7,297 | ) | ||||||||
| $ | (32,009 | ) | $ | (11,082 | ) | |||||||||
Refer to the end of the tables for footnotes.
| 318 | American Funds Insurance Series |
Managed Risk Growth Fund
| Assets | Liabilities | |||||||||||||
| Contracts | Risk type | Location on statement of assets and liabilities |
Value | Location on statement of assets and liabilities |
Value | |||||||||
| Options purchased | Equity | Investment securities from unaffiliated issuers3 | $ | 205 | Investment securities from unaffiliated issuers3 | $ | — | |||||||
| Futures | Currency | Unrealized appreciation1 | 47 | Unrealized depreciation1 | 61 | |||||||||
| Futures | Equity | Unrealized appreciation1 | 7,547 | Unrealized depreciation1 | 1 | |||||||||
| Futures | Interest | Unrealized appreciation1 | — | Unrealized depreciation1 | 47 | |||||||||
| $ | 7,799 | $ | 109 | |||||||||||
| Net realized (loss) gain | Net unrealized appreciation | |||||||||||||
| Contracts | Risk type | Location on statement of operations |
Value | Location on statement of operations |
Value | |||||||||
| Options purchased | Equity | Net realized loss on investments in unaffiliated issuers | $ | (3,857 | ) | Net unrealized appreciation on investments in unaffiliated issuers | $ | 399 | ||||||
| Futures | Currency | Net realized gain on futures contracts | 463 | Net unrealized appreciation on futures contracts | 52 | |||||||||
| Futures | Equity | Net realized gain on futures contracts | 12,863 | Net unrealized appreciation on futures contracts | 8,762 | |||||||||
| Futures | Interest | Net realized loss on futures contracts | (11,442 | ) | Net unrealized appreciation on futures contracts | 10 | ||||||||
| $ | (1,973 | ) | $ | 9,223 | ||||||||||
| Managed Risk International Fund | ||||||||||||||
| Assets | Liabilities | |||||||||||||
| Contracts | Risk type | Location on statement of assets and liabilities |
Value | Location on statement of assets and liabilities |
Value | |||||||||
| Options purchased | Equity | Investment securities from unaffiliated issuers3 | $ | 169 | Investment securities from unaffiliated issuers3 | $ | — | |||||||
| Futures | Currency | Unrealized appreciation1 | — | Unrealized depreciation1 | — | |||||||||
| Futures | Equity | Unrealized appreciation1 | 1,024 | Unrealized depreciation1 | — | |||||||||
| Futures | Interest | Unrealized appreciation1 | — | Unrealized depreciation1 | 13 | |||||||||
| $ | 1,193 | $ | 13 | |||||||||||
| Net realized (loss) gain | Net unrealized appreciation | |||||||||||||
| Contracts | Risk type | Location on statement of operations |
Value | Location on statement of operations |
Value | |||||||||
| Options purchased | Equity | Net realized loss on investments in unaffiliated issuers | $ | (1,108 | ) | Net unrealized appreciation on investments in unaffiliated issuers | $ | 327 | ||||||
| Futures | Currency | Net realized gain on futures contracts | — | Net unrealized appreciation on futures contracts | — | |||||||||
| Futures | Equity | Net realized gain on futures contracts | 6,799 | Net unrealized appreciation on futures contracts | 57 | |||||||||
| Futures | Interest | Net realized loss on futures contracts | (2,792 | ) | Net unrealized appreciation on futures contracts | 1,337 | ||||||||
| $ | 2,899 | $ | 1,721 | |||||||||||
Refer to the end of the tables for footnotes.
| American Funds Insurance Series | 319 |
Managed Risk Washington Mutual Investors Fund
| Assets | Liabilities | |||||||||||||
| Contracts | Risk type | Location on statement of assets and liabilities |
Value | Location on statement of assets and liabilities |
Value | |||||||||
| Options purchased | Equity | Investment securities from unaffiliated issuers3 | $ | 274 | Investment securities from unaffiliated issuers3 | $ | — | |||||||
| Futures | Currency | Unrealized appreciation1 | 68 | Unrealized depreciation1 | 5 | |||||||||
| Futures | Equity | Unrealized appreciation1 | 2,625 | Unrealized depreciation1 | 5 | |||||||||
| Futures | Interest | Unrealized appreciation1 | — | Unrealized depreciation1 | 81 | |||||||||
| $ | 2,967 | $ | 91 | |||||||||||
| Net realized (loss) gain | Net unrealized appreciation (depreciation) | |||||||||||||
| Contracts | Risk type | Location on statement of operations |
Value | Location on statement of operations |
Value | |||||||||
| Options purchased | Equity | Net realized loss on investments in unaffiliated issuers | $ | (3,288 | ) | Net unrealized appreciation on investments in unaffiliated issuers | $ | 51 | ||||||
| Futures | Currency | Net realized gain on futures contracts | 270 | Net unrealized appreciation on futures contracts | 68 | |||||||||
| Futures | Equity | Net realized gain on futures contracts | 1,194 | Net unrealized appreciation on futures contracts | 2,690 | |||||||||
| Futures | Interest | Net realized loss on futures contracts | (6,007 | ) | Net unrealized depreciation on futures contracts | (53 | ) | |||||||
| $ | (7,831 | ) | $ | 2,756 | ||||||||||
| Managed Risk Growth-Income Fund | ||||||||||||||
| Assets | Liabilities | |||||||||||||
| Contracts | Risk type | Location on statement of assets and liabilities |
Value | Location on statement of assets and liabilities |
Value | |||||||||
| Options purchased | Equity | Investment securities from unaffiliated issuers3 | $ | 2,485 | Investment securities from unaffiliated issuers3 | $ | — | |||||||
| Futures | Currency | Unrealized appreciation1 | 433 | Unrealized depreciation1 | 74 | |||||||||
| Futures | Equity | Unrealized appreciation1 | 16,502 | Unrealized depreciation1 | 33 | |||||||||
| Futures | Interest | Unrealized appreciation1 | — | Unrealized depreciation1 | 177 | |||||||||
| $ | 19,420 | $ | 284 | |||||||||||
| Net realized (loss) gain | Net unrealized appreciation (depreciation) | |||||||||||||
| Contracts | Risk type | Location on statement of operations |
Value | Location on statement of operations |
Value | |||||||||
| Options purchased | Equity | Net realized loss on investments in unaffiliated issuers | $ | (38,643 | ) | Net unrealized appreciation on investments in unaffiliated issuers | $ | 7,712 | ||||||
| Futures | Currency | Net realized gain on futures contracts | 1,635 | Net unrealized appreciation on futures contracts | 368 | |||||||||
| Futures | Equity | Net realized loss on futures contracts | (12,730 | ) | Net unrealized appreciation on futures contracts | 17,087 | ||||||||
| Futures | Interest | Net realized loss on futures contracts | (40,727 | ) | Net unrealized depreciation on futures contracts | (116 | ) | |||||||
| $ | (90,465 | ) | $ | 25,051 | ||||||||||
Refer to the end of the tables for footnotes.
| 320 | American Funds Insurance Series |
Managed Risk Asset Allocation Fund
| Assets | Liabilities | |||||||||||||
| Contracts | Risk type | Location on statement of assets and liabilities |
Value | Location on statement of assets and liabilities |
Value | |||||||||
| Options purchased | Equity | Investment securities from unaffiliated issuers3 | $ | 383 | Investment securities from unaffiliated issuers3 | $ | — | |||||||
| Futures | Currency | Unrealized appreciation1 | 196 | Unrealized depreciation1 | 47 | |||||||||
| Futures | Equity | Unrealized appreciation1 | 13,613 | Unrealized depreciation1 | 18 | |||||||||
| Futures | Interest | Unrealized appreciation1 | — | Unrealized depreciation1 | 162 | |||||||||
| $ | 14,192 | $ | 227 | |||||||||||
| Net realized (loss) gain | Net unrealized appreciation (depreciation) | |||||||||||||
| Contracts | Risk type | Location on statement of operations |
Value | Location on statement of operations |
Value | |||||||||
| Options purchased | Equity | Net realized loss on investments in unaffiliated issuers | $ | (5,894 | ) | Net unrealized appreciation on investments in unaffiliated issuers | $ | 396 | ||||||
| Futures | Currency | Net realized gain on futures contracts | 1,468 | Net unrealized appreciation on futures contracts | 158 | |||||||||
| Futures | Equity | Net realized loss on futures contracts | (9,987 | ) | Net unrealized appreciation on futures contracts | 13,720 | ||||||||
| Futures | Interest | Net realized loss on futures contracts | (39,248 | ) | Net unrealized depreciation on futures contracts | (55 | ) | |||||||
| $ | (53,661 | ) | $ | 14,219 | ||||||||||
| 1 | Includes cumulative appreciation/depreciation on futures contracts, centrally cleared interest rate swaps and/or centrally cleared credit default swaps as reported in the applicable table following each fund’s investment portfolio. Only current day’s variation margin is reported within each fund’s statement of assets and liabilities. |
| 2 | Amount less than one thousand. |
| 3 | Includes options purchased as reported in each fund’s investment portfolio. |
Collateral — Some funds either receive or pledge highly liquid assets, such as cash or U.S. government securities, as collateral due to securities lending and/or their use of futures contracts, forward currency contracts, interest rate swaps, credit default swaps and/or future delivery contracts. For securities lending, each participating fund receives collateral in exchange for lending investment securities. The lending agent may reinvest collateral from securities lending transactions according to agreed parameters. For futures contracts, centrally cleared interest rate swaps and centrally cleared credit default swaps, the program calls for each participating fund to pledge collateral for initial and variation margin by contract. For forward currency contracts, the program calls for each participating fund to either receive or pledge collateral based on the net gain or loss on unsettled contracts by counterparty. For future delivery contracts, the program calls for each participating fund to either receive or pledge collateral based on the net gain or loss on unsettled contracts by certain counterparties. The purpose of the collateral is to cover potential losses that could occur in the event that either party cannot meet its contractual obligation. Non-cash collateral pledged by each participating fund, if any, is disclosed in each fund’s investment portfolio, and cash collateral pledged by each participating fund, if any, is held in a segregated account with the fund’s custodian, which is reflected as pledged cash collateral in each fund’s statement of assets and liabilities.
Rights of offset — Funds that hold forward currency contracts have enforceable master netting agreements with certain counterparties, where amounts payable by each party to the other in the same currency (with the same settlement date and with the same counter-party) are settled net of each party’s payment obligation. If an early termination date occurs under these agreements following an event of default or termination event, all obligations of each party to its counterparty are settled net through a single payment in a single currency (“close-out netting”). For financial reporting purposes, the funds do not offset financial assets and financial liabilities that are subject to these master netting arrangements in the statements of assets and liabilities.
| American Funds Insurance Series | 321 |
The following tables present each fund’s forward currency contracts by counterparty that are subject to master netting agreements but that are not offset in the funds’ statements of assets and liabilities. The net amount column shows the impact of offsetting on the funds’ statement of assets and liabilities as of December 31, 2022, if close-out netting was exercised (dollars in thousands):
New World Fund
| Gross amounts recognized in the |
Gross amounts not offset in the statement of assets and liabilities and subject to a master netting agreement |
|||||||||||||||||||
| Counterparty | statement of assets and liabilities |
Available to offset |
Non-cash collateral* |
Cash collateral* |
Net amount |
|||||||||||||||
| Assets: | ||||||||||||||||||||
| Barclays Bank PLC | $ | — | † | $ | — | $ | — | $ | — | $ | — | † | ||||||||
| Liabilities: | ||||||||||||||||||||
| Goldman Sachs | $ | 26 | $ | — | $ | — | $ | — | $ | 26 | ||||||||||
| JPMorgan Chase | 24 | — | — | — | 24 | |||||||||||||||
| Total | $ | 50 | $ | — | $ | — | $ | — | $ | 50 | ||||||||||
International Growth and Income Fund
| Gross amounts recognized in the |
Gross amounts not offset in the statement of assets and liabilities and subject to a master netting agreement |
|||||||||||||||||||
| Counterparty | statement of assets and liabilities |
Available to offset |
Non-cash collateral* |
Cash collateral* |
Net amount |
|||||||||||||||
| Assets: | ||||||||||||||||||||
| UBS AG | $ | 5 | $ | — | $ | — | $ | — | $ | 5 | ||||||||||
American Funds Global Balanced Fund
| Gross amounts recognized in the |
Gross amounts not offset in the statement of assets and liabilities and subject to a master netting agreement |
|||||||||||||||||||
| Counterparty | statement of assets and liabilities |
Available to offset |
Non-cash collateral* |
Cash collateral* |
Net amount |
|||||||||||||||
| Assets: | ||||||||||||||||||||
| Bank of America | $ | 76 | $ | (29 | ) | $ | — | $ | (47 | ) | $ | — | ||||||||
| BNP Paribas | 66 | (47 | ) | — | — | 19 | ||||||||||||||
| Citibank | 113 | (28 | ) | — | — | 85 | ||||||||||||||
| Goldman Sachs | 92 | (8 | ) | — | — | 84 | ||||||||||||||
| HSBC Bank | 33 | (8 | ) | — | — | 25 | ||||||||||||||
| Morgan Stanley | 1 | (1 | ) | — | — | — | ||||||||||||||
| Standard Chartered Bank | 272 | (1 | ) | — | — | 271 | ||||||||||||||
| UBS AG | 33 | (23 | ) | — | — | 10 | ||||||||||||||
| Total | $ | 686 | $ | (145 | ) | $ | — | $ | (47 | ) | $ | 494 | ||||||||
| Liabilities: | ||||||||||||||||||||
| Bank of America | $ | 29 | $ | (29 | ) | $ | — | $ | — | $ | — | |||||||||
| Bank of New York Mellon | 2 | — | — | — | 2 | |||||||||||||||
| BNP Paribas | 47 | (47 | ) | — | — | — | ||||||||||||||
| Citibank | 28 | (28 | ) | — | — | — | ||||||||||||||
| Goldman Sachs | 8 | (8 | ) | — | — | — | ||||||||||||||
| HSBC Bank | 8 | (8 | ) | — | — | — | ||||||||||||||
| JPMorgan Chase | 3 | — | — | — | 3 | |||||||||||||||
| Morgan Stanley | 1 | (1 | ) | — | — | — | ||||||||||||||
| Standard Chartered Bank | 1 | (1 | ) | — | — | — | ||||||||||||||
| UBS AG | 23 | (23 | ) | — | — | — | ||||||||||||||
| Total | $ | 150 | $ | (145 | ) | $ | — | $ | — | $ | 5 | |||||||||
Refer to the end of the tables for footnotes.
| 322 | American Funds Insurance Series |
The Bond Fund of America
| Gross amounts recognized in the |
Gross amounts not offset in the statement of assets and liabilities and subject to a master netting agreement |
|||||||||||||||||||
| Counterparty | statement of assets and liabilities |
Available to offset |
Non-cash collateral* |
Cash collateral* |
Net amount |
|||||||||||||||
| Assets: | ||||||||||||||||||||
| Citibank | $ | 63 | $ | (59 | ) | $ | — | $ | — | $ | 4 | |||||||||
| HSBC Bank | 106 | (4 | ) | — | — | 102 | ||||||||||||||
| Morgan Stanley | 3,652 | (16 | ) | — | (2,380 | ) | 1,256 | |||||||||||||
| Total | $ | 3,821 | $ | (79 | ) | $ | — | $ | (2,380 | ) | $ | 1,362 | ||||||||
| Liabilities: | ||||||||||||||||||||
| Citibank | $ | 59 | $ | (59 | ) | $ | — | $ | — | $ | — | |||||||||
| HSBC Bank | 4 | (4 | ) | — | — | — | ||||||||||||||
| JPMorgan Chase | 95 | — | — | — | 95 | |||||||||||||||
| Morgan Stanley | 16 | (16 | ) | — | — | — | ||||||||||||||
| Total | $ | 174 | $ | (79 | ) | $ | — | $ | — | $ | 95 | |||||||||
Capital World Bond Fund
| Gross amounts recognized in the |
Gross amounts not offset in the statement of assets and liabilities and subject to a master netting agreement |
|||||||||||||||||||
| Counterparty | statement of assets and liabilities |
Available to offset |
Non-cash collateral* |
Cash collateral* |
Net amount |
|||||||||||||||
| Assets: | ||||||||||||||||||||
| Bank of America | $ | 1,728 | $ | (1,013 | ) | $ | (59 | ) | $ | — | $ | 656 | ||||||||
| BNP Paribas | 433 | (433 | ) | — | — | — | ||||||||||||||
| Citibank | 105 | — | — | — | 105 | |||||||||||||||
| Goldman Sachs | 128 | (92 | ) | — | — | 36 | ||||||||||||||
| HSBC Bank | 215 | (123 | ) | — | (92 | ) | — | |||||||||||||
| JPMorgan Chase | 89 | — | — | — | 89 | |||||||||||||||
| Morgan Stanley | 76 | (76 | ) | — | — | — | ||||||||||||||
| Standard Chartered Bank | 3,616 | (8 | ) | — | (2,190 | ) | 1,418 | |||||||||||||
| UBS AG | 618 | (478 | ) | — | — | 140 | ||||||||||||||
| Total | $ | 7,008 | $ | (2,223 | ) | $ | (59 | ) | $ | (2,282 | ) | $ | 2,444 | |||||||
| Liabilities: | ||||||||||||||||||||
| Bank of America | $ | 1,013 | $ | (1,013 | ) | $ | — | $ | — | $ | — | |||||||||
| BNP Paribas | 473 | (433 | ) | (40 | ) | — | — | |||||||||||||
| Goldman Sachs | 92 | (92 | ) | — | — | — | ||||||||||||||
| HSBC Bank | 123 | (123 | ) | — | — | — | ||||||||||||||
| Morgan Stanley | 268 | (76 | ) | — | — | 192 | ||||||||||||||
| Standard Chartered Bank | 8 | (8 | ) | — | — | — | ||||||||||||||
| UBS AG | 478 | (478 | ) | — | — | — | ||||||||||||||
| Total | $ | 2,455 | $ | (2,223 | ) | $ | (40 | ) | $ | — | $ | 192 | ||||||||
| * | Collateral is shown on a settlement basis. |
| † | Amount less than one thousand. |
6. Taxation and distributions
Federal income taxation — Each fund complies with the requirements under Subchapter M of the Internal Revenue Code applicable to regulated investment companies and intends to distribute substantially all of its net taxable income and net capital gains each year. The funds are not subject to income taxes to the extent such distributions are made. Therefore, no federal income tax provision is required.
As of and during the year ended December 31, 2022, none of the funds had a liability for any unrecognized tax benefits. Each fund recognizes interest and penalties, if any, related to unrecognized tax benefits as income tax expense in their respective statements of operations. During the year, none of the funds incurred any significant interest or penalties.
| American Funds Insurance Series | 323 |
Each fund’s tax returns are generally not subject to examination by federal, state and, if applicable, non-U.S. tax authorities after the expiration of each jurisdiction’s statute of limitations, which is typically three years after the date of filing but can be extended in certain jurisdictions.
Non-U.S. taxation — Dividend and interest income, if any, are recorded net of non-U.S. taxes paid. The funds may file withholding tax reclaims in certain jurisdictions to recover a portion of amounts previously withheld. As a result of rulings from European courts, the funds filed for additional reclaims related to prior years. These reclaims are recorded when the amount is known and there are no significant uncertainties on collectability. During the year ended December 31, 2022, some of the funds recognized reclaims (net of fees and the effect of realized gain or loss from currency translations) and interest related to European court rulings as follows (dollars in thousands):
| Fund | Reclaims | Fees | Interest | |||||||||
| Global Growth Fund | $ | 782 | $ | 700 | $ | 71 | ||||||
| Global Small Capitalization Fund | 264 | 1 | 3 | |||||||||
| Growth Fund | 818 | 41 | 22 | |||||||||
| International Fund | 5,544 | 1,191 | 920 | |||||||||
| New World Fund | 358 | 110 | 14 | |||||||||
| Growth-Income Fund | 3,119 | 674 | 292 | |||||||||
| International Growth and Income Fund | 995 | 133 | 35 | |||||||||
| Capital Income Builder | 103 | — | — | |||||||||
| Asset Allocation Fund | 23 | 115 | 9 | |||||||||
The reclaims and interest are included in each fund’s statements of operations. Gains realized by the funds on the sale of securities in certain countries, if any, may be subject to non-U.S. taxes. If applicable, the funds record an estimated deferred tax liability based on unrealized gains to provide for potential non-U.S. taxes payable upon the sale of these securities.
Distributions — Distributions determined on a tax basis may differ from net investment income and net realized gains for financial reporting purposes. These differences are due primarily to different treatment for items such as currency gains and losses; short-term capital gains and losses; capital losses related to sales of certain securities within 30 days of purchase; unrealized appreciation of certain investments in securities outside the U.S.; deferred expenses; cost of investments sold; paydowns on fixed-income securities; net capital losses; net operating losses; non-U.S. taxes on capital gains; amortization of premiums and discounts and income on certain investments. The fiscal year in which amounts are distributed may differ from the year in which the net investment income and net realized gains are recorded by the funds for financial reporting purposes. The funds may also designate a portion of the amount paid to redeeming shareholders as a distribution for tax purposes.
Additional tax basis disclosures for each fund as of December 31, 2022, were as follows (dollars in thousands):
| Global Growth Fund |
Global Small Capitalization Fund |
Growth Fund |
International Fund |
New World Fund |
Washington Mutual Investors Fund |
|||||||||||||||||||
| Undistributed ordinary income | $ | 18,515 | $ | 1,947 | $ | 58,974 | $ | 15,623 | $ | 8,333 | $ | 45,061 | ||||||||||||
| Undistributed long-term capital gains | 549,285 | 39,017 | 1,978,732 | — | — | 89,689 | ||||||||||||||||||
| Capital loss carryforward* | — | — | — | (374,845 | ) | — | — | |||||||||||||||||
| Gross unrealized appreciation on investments | 2,375,954 | 670,857 | 11,042,046 | 1,336,912 | 734,224 | 2,118,125 | ||||||||||||||||||
| Gross unrealized depreciation on investments | (532,719 | ) | (341,080 | ) | (2,302,474 | ) | (696,377 | ) | (227,842 | ) | (434,198 | ) | ||||||||||||
| Net unrealized appreciation (depreciation) on investments | 1,843,235 | 329,777 | 8,739,572 | 640,535 | 506,382 | 1,683,927 | ||||||||||||||||||
| Cost of investments | 5,104,805 | 2,679,736 | 22,239,209 | 6,111,539 | 2,581,084 | 7,749,839 | ||||||||||||||||||
| Reclassification from (to) total distributable earnings/accumulated loss to (from) capital paid in on shares of beneficial interest | (2 | ) | 1 | (1 | ) | — | 2,307 | — | ||||||||||||||||
Refer to the end of the tables for footnote.
| 324 | American Funds Insurance Series |
| Capital World Growth and Income Fund |
Growth- Income Fund |
International Growth and Income Fund |
Capital Income Builder |
Asset Allocation Fund |
American Funds Global Balanced Fund |
|||||||||||||||||||
| Undistributed ordinary income | $ | 6,716 | $ | 117,578 | $ | 1,209 | $ | 10,957 | $ | 120,979 | $ | 2,667 | ||||||||||||
| Undistributed long-term capital gains | — | 1,825,597 | — | — | 958,605 | 44,806 | ||||||||||||||||||
| Capital loss carryforward* | (72,176 | ) | — | (23,828 | ) | (28,240 | ) | — | — | |||||||||||||||
| Gross unrealized appreciation on investments | 404,604 | 11,485,057 | 40,113 | 172,719 | 5,621,631 | 32,081 | ||||||||||||||||||
| Gross unrealized depreciation on investments | (145,788 | ) | (1,261,066 | ) | (38,777 | ) | (48,638 | ) | (1,495,405 | ) | (28,506 | ) | ||||||||||||
| Net unrealized appreciation (depreciation) on investments | 258,816 | 10,223,991 | 1,336 | 124,081 | 4,126,226 | 3,575 | ||||||||||||||||||
| Cost of investments | 1,470,280 | 23,017,328 | 298,123 | 1,050,210 | 21,189,651 | 360,934 | ||||||||||||||||||
| Reclassification from (to) total distributable earnings/accumulated loss to (from) capital paid in on shares of beneficial interest | — | 1 | (2 | ) | 1 | — | (5 | ) | ||||||||||||||||
| The Bond Fund of America |
Capital World Bond Fund |
American High-Income Trust |
American Funds Mortgage Fund |
Ultra-Short Bond Fund |
U.S. Government Securities Fund |
|||||||||||||||||||
| Undistributed ordinary income | $ | 58,751 | $ | — | $ | 9,376 | $ | 529 | $ | 2,708 | $ | 8,185 | ||||||||||||
| Capital loss carryforward* | (907,300 | ) | (133,685 | ) | (298,537 | ) | (9,549 | ) | (1 | ) | (177,836 | ) | ||||||||||||
| Gross unrealized appreciation on investments | 59,386 | 15,710 | 31,393 | 1,496 | 27 | 52,241 | ||||||||||||||||||
| Gross unrealized depreciation on investments | (845,293 | ) | (205,368 | ) | (114,413 | ) | (3,313 | ) | (84 | ) | (124,942 | ) | ||||||||||||
| Net unrealized appreciation (depreciation) on investments | (785,907 | ) | (189,658 | ) | (83,020 | ) | (1,817 | ) | (57 | ) | (72,701 | ) | ||||||||||||
| Cost of investments | 11,952,694 | 1,666,306 | 899,803 | 109,898 | 423,636 | 1,796,326 | ||||||||||||||||||
| Reclassification from (to) total distributable earnings/accumulated loss to (from) capital paid in on shares of beneficial interest | — | (18,935 | ) | — | — | — | — | |||||||||||||||||
| Managed Risk Growth Fund |
Managed Risk International Fund |
Managed Risk Washington Mutual Investors Fund |
Managed Risk Growth- Income Fund |
Managed Risk Asset Allocation Fund |
||||||||||||||||||||
| Undistributed ordinary income | $ | 5,720 | $ | 1,966 | $ | 5,613 | $ | 29,224 | $ | 35,270 | ||||||||||||||
| Undistributed long-term capital gains | 105,958 | 8,883 | 41,991 | 263,419 | 248,376 | |||||||||||||||||||
| Capital loss carryforward utilized | — | 12,234 | 23,718 | — | — | |||||||||||||||||||
| Gross unrealized appreciation on investments | 1,057 | 229 | 981 | 10,979 | 1,506 | |||||||||||||||||||
| Gross unrealized depreciation on investments | (130,250 | ) | (34,019 | ) | (46,563 | ) | (168,097 | ) | (129,608 | ) | ||||||||||||||
| Net unrealized appreciation (depreciation) on investments | (129,193 | ) | (33,790 | ) | (45,582 | ) | (157,118 | ) | (128,102 | ) | ||||||||||||||
| Cost of investments | 569,814 | 156,568 | 362,881 | 2,216,048 | 2,296,114 | |||||||||||||||||||
| * | Each fund’s capital loss carryforward will be used to offset any capital gains realized by the fund in future years. Funds with a capital loss carryforward will not make distributions from capital gains while a capital loss carryforward remains. |
| American Funds Insurance Series | 325 |
Distributions paid by each fund were characterized for tax purposes as follows (dollars in thousands):
Global Growth Fund
| Year ended December 31, 2022 | Year ended December 31, 2021 | |||||||||||||||||||||||
| Share class | Ordinary income |
Long-term capital gains |
Total distributions paid |
Ordinary income |
Long-term capital gains |
Total distributions paid |
||||||||||||||||||
| Class 1 | $ | 39,498 | $ | 361,119 | $ | 400,617 | $ | 23,870 | $ | 193,074 | $ | 216,944 | ||||||||||||
| Class 1A | 141 | 1,617 | 1,758 | 55 | 645 | 700 | ||||||||||||||||||
| Class 2 | 32,689 | 386,947 | 419,636 | 15,210 | 221,402 | 236,612 | ||||||||||||||||||
| Class 4 | 4,312 | 66,240 | 70,552 | 1,339 | 30,748 | 32,087 | ||||||||||||||||||
| Total | $ | 76,640 | $ | 815,923 | $ | 892,563 | $ | 40,474 | $ | 445,869 | $ | 486,343 | ||||||||||||
| Global Small Capitalization Fund | ||||||||||||||||||||||||
| Year ended December 31, 2022 | Year ended December 31, 2021 | |||||||||||||||||||||||
| Share class | Ordinary income |
Long-term capital gains |
Total distributions paid |
Ordinary income |
Long-term capital gains |
Total distributions paid |
||||||||||||||||||
| Class 1 | $ | 47,544 | $ | 285,173 | $ | 332,717 | $ | — | $ | 55,655 | $ | 55,655 | ||||||||||||
| Class 1A | 209 | 1,252 | 1,461 | — | 39 | 39 | ||||||||||||||||||
| Class 2 | 94,748 | 568,298 | 663,046 | — | 60,246 | 60,246 | ||||||||||||||||||
| Class 4 | 13,417 | 80,475 | 93,892 | — | 7,215 | 7,215 | ||||||||||||||||||
| Total | $ | 155,918 | $ | 935,198 | $ | 1,091,116 | $ | — | $ | 123,155 | $ | 123,155 | ||||||||||||
| Growth Fund | ||||||||||||||||||||||||
| Year ended December 31, 2022 | Year ended December 31, 2021 | |||||||||||||||||||||||
| Share class | Ordinary income |
Long-term capital gains |
Total distributions paid |
Ordinary income |
Long-term capital gains |
Total distributions paid |
||||||||||||||||||
| Class 1 | $ | 319,915 | $ | 1,912,725 | $ | 2,232,640 | $ | 181,380 | $ | 2,073,422 | $ | 2,254,802 | ||||||||||||
| Class 1A | 3,677 | 23,411 | 27,088 | 701 | 9,031 | 9,732 | ||||||||||||||||||
| Class 2 | 311,929 | 2,152,577 | 2,464,506 | 167,439 | 2,610,409 | 2,777,848 | ||||||||||||||||||
| Class 3 | 4,207 | 28,163 | 32,370 | 2,435 | 35,107 | 37,542 | ||||||||||||||||||
| Class 4 | 43,665 | 340,245 | 383,910 | 17,483 | 340,551 | 358,034 | ||||||||||||||||||
| Total | $ | 683,393 | $ | 4,457,121 | $ | 5,140,514 | $ | 369,438 | $ | 5,068,520 | $ | 5,437,958 | ||||||||||||
| International Fund | ||||||||||||||||||||||||
| Year ended December 31, 2022 | Year ended December 31, 2021 | |||||||||||||||||||||||
| Share class | Ordinary income |
Long-term capital gains |
Total distributions paid |
Ordinary income |
Long-term capital gains |
Total distributions paid |
||||||||||||||||||
| Class 1 | $ | 94,903 | $ | 448,918 | $ | 543,821 | $ | 131,730 | $ | — | $ | 131,730 | ||||||||||||
| Class 1A | 281 | 1,398 | 1,679 | 281 | — | 281 | ||||||||||||||||||
| Class 2 | 86,539 | 450,228 | 536,767 | 105,815 | — | 105,815 | ||||||||||||||||||
| Class 3 | 431 | 2,195 | 2,626 | 545 | — | 545 | ||||||||||||||||||
| Class 4 | 9,244 | 52,350 | 61,594 | 10,725 | — | 10,725 | ||||||||||||||||||
| Total | $ | 191,398 | $ | 955,089 | $ | 1,146,487 | $ | 249,096 | $ | — | $ | 249,096 | ||||||||||||
| 326 | American Funds Insurance Series |
| New World Fund | ||||||||||||||||||||||||
| Year ended December 31, 2022 | Year ended December 31, 2021 | |||||||||||||||||||||||
| Share class | Ordinary income |
Long-term capital gains |
Total distributions paid |
Ordinary income |
Long-term capital gains |
Total distributions paid |
||||||||||||||||||
| Class 1 | $ | 60,201 | $ | 129,123 | $ | 189,324 | $ | 26,785 | $ | 78,257 | $ | 105,042 | ||||||||||||
| Class 1A | 317 | 724 | 1,041 | 77 | 273 | 350 | ||||||||||||||||||
| Class 2 | 26,575 | 61,661 | 88,236 | 9,450 | 36,498 | 45,948 | ||||||||||||||||||
| Class 4 | 22,718 | 56,063 | 78,781 | 5,794 | 28,566 | 34,360 | ||||||||||||||||||
| Total | $ | 109,811 | $ | 247,571 | $ | 357,382 | $ | 42,106 | $ | 143,594 | $ | 185,700 | ||||||||||||
| Washington Mutual Investors Fund | ||||||||||||||||||||||||
| Year ended December 31, 2022 | Year ended December 31, 2021 | |||||||||||||||||||||||
| Share class | Ordinary income |
Long-term capital gains |
Total distributions paid |
Ordinary income |
Long-term capital gains |
Total distributions paid |
||||||||||||||||||
| Class 1 | $ | 351,097 | $ | 1,068,126 | $ | 1,419,223 | $ | 104,666 | $ | — | $ | 104,666 | ||||||||||||
| Class 1A | 3,359 | 10,665 | 14,024 | 2,211 | — | 2,211 | ||||||||||||||||||
| Class 2 | 173,751 | 551,636 | 725,387 | 46,652 | — | 46,652 | ||||||||||||||||||
| Class 4 | 61,406 | 196,768 | 258,174 | 12,620 | — | 12,620 | ||||||||||||||||||
| Total | $ | 589,613 | $ | 1,827,195 | $ | 2,416,808 | $ | 166,149 | $ | — | $ | 166,149 | ||||||||||||
| Capital World Growth and Income Fund | ||||||||||||||||||||||||
| Year ended December 31, 2022 | Year ended December 31, 2021 | |||||||||||||||||||||||
| Share class | Ordinary income |
Long-term capital gains |
Total distributions paid |
Ordinary income |
Long-term capital gains |
Total distributions paid |
||||||||||||||||||
| Class 1 | $ | 32,166 | $ | 109,599 | $ | 141,765 | $ | 14,543 | $ | 16,997 | $ | 31,540 | ||||||||||||
| Class 1A | 337 | 1,188 | 1,525 | 99 | 67 | 166 | ||||||||||||||||||
| Class 2 | 57,060 | 205,827 | 262,887 | 20,948 | 29,988 | 50,936 | ||||||||||||||||||
| Class 4 | 10,246 | 37,875 | 48,121 | 3,094 | 4,436 | 7,530 | ||||||||||||||||||
| Total | $ | 99,809 | $ | 354,489 | $ | 454,298 | $ | 38,684 | $ | 51,488 | $ | 90,172 | ||||||||||||
| Growth-Income Fund | ||||||||||||||||||||||||
| Year ended December 31, 2022 | Year ended December 31, 2021 | |||||||||||||||||||||||
| Share class | Ordinary income |
Long-term capital gains |
Total distributions paid |
Ordinary income |
Long-term capital gains |
Total distributions paid |
||||||||||||||||||
| Class 1 | $ | 597,601 | $ | 1,754,172 | $ | 2,351,773 | $ | 328,564 | $ | 239,575 | $ | 568,139 | ||||||||||||
| Class 1A | 784 | 2,464 | 3,248 | 308 | 185 | 493 | ||||||||||||||||||
| Class 2 | 328,556 | 1,071,265 | 1,399,821 | 164,258 | 145,765 | 310,023 | ||||||||||||||||||
| Class 3 | 3,597 | 11,428 | 15,025 | 1,864 | 1,578 | 3,442 | ||||||||||||||||||
| Class 4 | 41,526 | 145,017 | 186,543 | 16,599 | 16,418 | 33,017 | ||||||||||||||||||
| Total | $ | 972,064 | $ | 2,984,346 | $ | 3,956,410 | $ | 511,593 | $ | 403,521 | $ | 915,114 | ||||||||||||
| International Growth and Income Fund | ||||||||||||||||||||||||
| Year ended December 31, 2022 | Year ended December 31, 2021 | |||||||||||||||||||||||
| Share class | Ordinary income |
Long-term capital gains |
Total distributions paid |
Ordinary income |
Long-term capital gains |
Total distributions paid |
||||||||||||||||||
| Class 1 | $ | 397 | $ | 6,104 | $ | 6,501 | $ | 4,585 | $ | — | $ | 4,585 | ||||||||||||
| Class 1A | 147 | 2,108 | 2,255 | 140 | — | 140 | ||||||||||||||||||
| Class 2 | 4,951 | 81,276 | 86,227 | 6,218 | — | 6,218 | ||||||||||||||||||
| Class 4 | 3,387 | 55,677 | 59,064 | 3,589 | — | 3,589 | ||||||||||||||||||
| Total | $ | 8,882 | $ | 145,165 | $ | 154,047 | $ | 14,532 | $ | — | $ | 14,532 | ||||||||||||
| American Funds Insurance Series | 327 |
| Capital Income Builder | ||||||||||||||||||||||||
| Year ended December 31, 2022 | Year ended December 31, 2021 | |||||||||||||||||||||||
| Share class | Ordinary income |
Long-term capital gains |
Total distributions paid |
Ordinary income |
Long-term capital gains |
Total distributions paid |
||||||||||||||||||
| Class 1 | $ | 17,636 | $ | — | $ | 17,636 | $ | 16,222 | $ | — | $ | 16,222 | ||||||||||||
| Class 1A | 270 | — | 270 | 218 | — | 218 | ||||||||||||||||||
| Class 2 | 354 | — | 354 | 315 | — | 315 | ||||||||||||||||||
| Class 4 | 13,728 | — | 13,728 | 13,009 | — | 13,009 | ||||||||||||||||||
| Total | $ | 31,988 | $ | — | $ | 31,988 | $ | 29,764 | $ | — | $ | 29,764 | ||||||||||||
| Asset Allocation Fund | ||||||||||||||||||||||||
| Year ended December 31, 2022 | Year ended December 31, 2021 | |||||||||||||||||||||||
| Share class | Ordinary income |
Long-term capital gains |
Total distributions paid |
Ordinary income |
Long-term capital gains |
Total distributions paid |
||||||||||||||||||
| Class 1 | $ | 476,426 | $ | 1,525,081 | $ | 2,001,507 | $ | 424,814 | $ | 579,353 | $ | 1,004,167 | ||||||||||||
| Class 1A | 708 | 2,098 | 2,806 | 423 | 457 | 880 | ||||||||||||||||||
| Class 2 | 124,332 | 440,697 | 565,029 | 108,045 | 154,751 | 262,796 | ||||||||||||||||||
| Class 3 | 845 | 2,914 | 3,759 | 717 | 976 | 1,693 | ||||||||||||||||||
| Class 4 | 142,374 | 538,249 | 680,623 | 107,752 | 164,028 | 271,780 | ||||||||||||||||||
| Total | $ | 744,685 | $ | 2,509,039 | $ | 3,253,724 | $ | 641,751 | $ | 899,565 | $ | 1,541,316 | ||||||||||||
| American Funds Global Balanced Fund | ||||||||||||||||||||||||
| Year ended December 31, 2022 | Year ended December 31, 2021 | |||||||||||||||||||||||
| Share class | Ordinary income |
Long-term capital gains |
Total distributions paid |
Ordinary income |
Long-term capital gains |
Total distributions paid |
||||||||||||||||||
| Class 1 | $ | 72 | $ | 498 | $ | 570 | $ | 1,680 | $ | 6,058 | $ | 7,738 | ||||||||||||
| Class 1A | 2 | 13 | 15 | 45 | 189 | 234 | ||||||||||||||||||
| Class 2 | 123 | 850 | 973 | 2,431 | 10,638 | 13,069 | ||||||||||||||||||
| Class 4 | 85 | 589 | 674 | 1,305 | 6,901 | 8,206 | ||||||||||||||||||
| Total | $ | 282 | $ | 1,950 | $ | 2,232 | $ | 5,461 | $ | 23,786 | $ | 29,247 | ||||||||||||
| The Bond Fund of America | ||||||||||||||||||||||||
| Year ended December 31, 2022 | Year ended December 31, 2021 | |||||||||||||||||||||||
| Share class | Ordinary income |
Long-term capital gains |
Total distributions paid |
Ordinary income |
Long-term capital gains |
Total distributions paid |
||||||||||||||||||
| Class 1 | $ | 235,158 | $ | 60,668 | $ | 295,826 | $ | 301,454 | $ | 133,858 | $ | 435,312 | ||||||||||||
| Class 1A | 7,470 | 1,700 | 9,170 | 408 | 193 | 601 | ||||||||||||||||||
| Class 2 | 98,333 | 27,763 | 126,096 | 138,464 | 69,578 | 208,042 | ||||||||||||||||||
| Class 4 | 24,749 | 7,113 | 31,862 | 28,710 | 14,777 | 43,487 | ||||||||||||||||||
| Total | $ | 365,710 | $ | 97,244 | $ | 462,954 | $ | 469,036 | $ | 218,406 | $ | 687,442 | ||||||||||||
| Capital World Bond Fund | ||||||||||||||||||||||||
| Year ended December 31, 2022 | Year ended December 31, 2021 | |||||||||||||||||||||||
| Share class | Ordinary income |
Long-term capital gains |
Total distributions paid |
Ordinary income |
Long-term capital gains |
Total distributions paid |
||||||||||||||||||
| Class 1 | $ | 2,151 | $ | 11,752 | $ | 13,903 | $ | 34,401 | $ | 10,279 | $ | 44,680 | ||||||||||||
| Class 1A | 3 | 20 | 23 | 34 | 7 | 41 | ||||||||||||||||||
| Class 2 | 2,087 | 13,752 | 15,839 | 33,715 | 10,855 | 44,570 | ||||||||||||||||||
| Class 4 | 120 | 945 | 1,065 | 1,845 | 612 | 2,457 | ||||||||||||||||||
| Total | $ | 4,361 | $ | 26,469 | $ | 30,830 | $ | 69,995 | $ | 21,753 | $ | 91,748 | ||||||||||||
| 328 | American Funds Insurance Series |
| American High-Income Trust | ||||||||||||||||||||||||
| Year ended December 31, 2022 | Year ended December 31, 2021 | |||||||||||||||||||||||
| Share class | Ordinary income |
Long-term capital gains |
Total distributions paid |
Ordinary income |
Long-term capital gains |
Total distributions paid |
||||||||||||||||||
| Class 1 | $ | 18,444 | $ | — | $ | 18,444 | $ | 11,054 | $ | — | $ | 11,054 | ||||||||||||
| Class 1A | 100 | — | 100 | 59 | — | 59 | ||||||||||||||||||
| Class 2 | 42,707 | — | 42,707 | 28,636 | — | 28,636 | ||||||||||||||||||
| Class 3 | 694 | — | 694 | 429 | — | 429 | ||||||||||||||||||
| Class 4 | 5,827 | — | 5,827 | 3,238 | — | 3,238 | ||||||||||||||||||
| Total | $ | 67,772 | $ | — | $ | 67,772 | $ | 43,416 | $ | — | $ | 43,416 | ||||||||||||
| American Funds Mortgage Fund | ||||||||||||||||||||||||
| Year ended December 31, 2022 | Year ended December 31, 2021 | |||||||||||||||||||||||
| Share class | Ordinary income |
Long-term capital gains |
Total distributions paid |
Ordinary income |
Long-term capital gains |
Total distributions paid |
||||||||||||||||||
| Class 1 | $ | 15 | $ | — | $ | 15 | $ | 6,294 | $ | 3,087 | $ | 9,381 | ||||||||||||
| Class 1A | 37 | — | 37 | 39 | 18 | 57 | ||||||||||||||||||
| Class 2 | 995 | — | 995 | 1,448 | 784 | 2,232 | ||||||||||||||||||
| Class 4 | 746 | — | 746 | 936 | 551 | 1,487 | ||||||||||||||||||
| Total | $ | 1,793 | $ | — | $ | 1,793 | $ | 8,717 | $ | 4,440 | $ | 13,157 | ||||||||||||
| Ultra-Short Bond Fund | ||||||||||||||||||||||||
| Year ended December 31, 2022 | Year ended December 31, 2021 | |||||||||||||||||||||||
| Share class | Ordinary income |
Long-term capital gains |
Total distributions paid |
Ordinary income |
Long-term capital gains |
Total distributions paid |
||||||||||||||||||
| Class 1 | $ | 348 | $ | — | $ | 348 | $ | — | $ | — | $ | — | ||||||||||||
| Class 1A | — | † | — | — | † | — | — | — | ||||||||||||||||
| Class 2 | 1,570 | — | 1,570 | — | — | — | ||||||||||||||||||
| Class 3 | 26 | — | 26 | — | — | — | ||||||||||||||||||
| Class 4 | 293 | — | 293 | — | — | — | ||||||||||||||||||
| Total | $ | 2,237 | $ | — | $ | 2,237 | $ | — | $ | — | $ | — | ||||||||||||
| U.S. Government Securities Fund | ||||||||||||||||||||||||
| Year ended December 31, 2022 | Year ended December 31, 2021 | |||||||||||||||||||||||
| Share class | Ordinary income |
Long-term capital gains |
Total distributions paid |
Ordinary income |
Long-term capital gains |
Total distributions paid |
||||||||||||||||||
| Class 1 | $ | 10,360 | $ | — | $ | 10,360 | $ | 30,987 | $ | 9,355 | $ | 40,342 | ||||||||||||
| Class 1A | 153 | — | 153 | 389 | 129 | 518 | ||||||||||||||||||
| Class 2 | 42,631 | — | 42,631 | 108,143 | 36,124 | 144,267 | ||||||||||||||||||
| Class 3 | 292 | — | 292 | 714 | 234 | 948 | ||||||||||||||||||
| Class 4 | 7,040 | — | 7,040 | 17,596 | 6,057 | 23,653 | ||||||||||||||||||
| Total | $ | 60,476 | $ | — | $ | 60,476 | $ | 157,829 | $ | 51,899 | $ | 209,728 | ||||||||||||
Refer to the end of the tables for footnote.
| American Funds Insurance Series | 329 |
| Managed Risk Growth Fund | ||||||||||||||||||||||||
| Year ended December 31, 2022 | Year ended December 31, 2021 | |||||||||||||||||||||||
| Share class | Ordinary income |
Long-term capital gains |
Total distributions paid |
Ordinary income |
Long-term capital gains |
Total distributions paid |
||||||||||||||||||
| Class P1 | $ | 162 | $ | 1,634 | $ | 1,796 | $ | 106 | $ | 409 | $ | 515 | ||||||||||||
| Class P2 | 6,629 | 81,821 | 88,450 | 3,159 | 23,710 | 26,869 | ||||||||||||||||||
| Total | $ | 6,791 | $ | 83,455 | $ | 90,246 | $ | 3,265 | $ | 24,119 | $ | 27,384 | ||||||||||||
| Managed Risk International Fund | ||||||||||||||||||||||||
| Year ended December 31, 2022 | Year ended December 31, 2021 | |||||||||||||||||||||||
| Share class | Ordinary income |
Long-term capital gains |
Total distributions paid |
Ordinary income |
Long-term capital gains |
Total distributions paid |
||||||||||||||||||
| Class P1 | $ | 69 | $ | — | $ | 69 | $ | 14 | $ | — | $ | 14 | ||||||||||||
| Class P2 | 4,206 | — | 4,206 | 917 | — | 917 | ||||||||||||||||||
| Total | $ | 4,275 | $ | — | $ | 4,275 | $ | 931 | $ | — | $ | 931 | ||||||||||||
| Managed Risk Washington Mutual Investors Fund | ||||||||||||||||||||||||
| Year ended December 31, 2022 | Year ended December 31, 2021 | |||||||||||||||||||||||
| Share class | Ordinary income |
Long-term capital gains |
Total distributions paid |
Ordinary income |
Long-term capital gains |
Total distributions paid |
||||||||||||||||||
| Class P1 | $ | 127 | $ | — | $ | 127 | $ | 40 | $ | — | $ | 40 | ||||||||||||
| Class P2 | 14,544 | — | 14,544 | 5,979 | — | 5,979 | ||||||||||||||||||
| Total | $ | 14,671 | $ | — | $ | 14,671 | $ | 6,019 | $ | — | $ | 6,019 | ||||||||||||
| Managed Risk Growth-Income Fund | ||||||||||||||||||||||||
| Year ended December 31, 2022 | Year ended December 31, 2021 | |||||||||||||||||||||||
| Share class | Ordinary income |
Long-term capital gains |
Total distributions paid |
Ordinary income |
Long-term capital gains |
Total distributions paid |
||||||||||||||||||
| Class P1 | $ | 43,232 | $ | 44,484 | $ | 87,716 | $ | 30,716 | $ | 29,380 | $ | 60,096 | ||||||||||||
| Class P2 | 5,626 | 6,461 | 12,087 | 3,713 | 4,359 | 8,072 | ||||||||||||||||||
| Total | $ | 48,858 | $ | 50,945 | $ | 99,803 | $ | 34,429 | $ | 33,739 | $ | 68,168 | ||||||||||||
| Managed Risk Asset Allocation Fund | ||||||||||||||||||||||||
| Year ended December 31, 2022 | Year ended December 31, 2021 | |||||||||||||||||||||||
| Share class | Ordinary income |
Long-term capital gains |
Total distributions paid |
Ordinary income |
Long-term capital gains |
Total distributions paid |
||||||||||||||||||
| Class P1 | $ | 176 | $ | 254 | $ | 430 | $ | 114 | $ | — | $ | 114 | ||||||||||||
| Class P2 | 51,616 | 86,918 | 138,534 | 38,113 | — | 38,113 | ||||||||||||||||||
| Total | $ | 51,792 | $ | 87,172 | $ | 138,964 | $ | 38,227 | $ | — | $ | 38,227 | ||||||||||||
| † | Amount less than one thousand. |
7. Fees and transactions
CRMC, the series’ investment adviser, is the parent company of American Funds Distributors®, Inc. (“AFD”), the distributor of the series’ shares, and American Funds Service Company® (“AFS”), the series’ transfer agent. CRMC, AFD and AFS are considered related parties to the series.
| 330 | American Funds Insurance Series |
Investment advisory services — The series has an investment advisory and service agreement with CRMC that provides for monthly fees accrued daily. These fees are based on annual rates that generally decrease as net asset levels increase. CRMC receives investment advisory fees from the underlying funds held by the managed risk funds, which are included in the unaudited net effective expense ratios that are provided as additional information in the financial highlights tables. Subadvisory fees for the managed risk funds are paid by CRMC to Milliman FRM. The managed risk funds are not responsible for paying any subadvisory fees.
The series’ board of trustees approved a revised investment advisory and services agreement effective May 1, 2022. The revised agreement provides investment advisory services fees based on revised annual rates and net asset levels for some of the funds. The following table discloses the annual rates and net asset levels before and after the revised contract became effective:
| Prior to May 1, 2022 | Effective May 1, 2022 | |||||||||||||||||||||||||||||||
| Rates | Net asset levels (in billions) |
Rates | Net asset levels (in billions) |
|||||||||||||||||||||||||||||
| Fund | Beginning with |
Ending with |
Up to | In excess of |
Beginning with |
Ending with |
Up to | In excess of |
||||||||||||||||||||||||
| Global Growth Fund | .690 | % | .445 | % | $ | .6 | $ | 8.0 | .475 | % | .435 | % | $ | 15.0 | $ | 15.0 | ||||||||||||||||
| Global Small Capitalization Fund | .800 | .635 | .6 | 5.0 | .647 | .615 | 15.0 | 15.0 | ||||||||||||||||||||||||
| Growth Fund | .500 | .280 | .6 | 34.0 | .500 | .275 | .6 | 44.0 | ||||||||||||||||||||||||
| International Fund | .690 | .430 | .5 | 21.0 | .478 | .430 | 15.0 | 21.0 | ||||||||||||||||||||||||
| New World Fund | .850 | .580 | .5 | 4.0 | .577 | .510 | 15.0 | 15.0 | ||||||||||||||||||||||||
| Washington Mutual Investors Fund | .500 | .350 | .6 | 10.5 | .374 | .350 | 15.0 | 15.0 | ||||||||||||||||||||||||
| Capital World Growth and Income Fund | .690 | .480 | .6 | 3.0 | .475 | .435 | 15.0 | 15.0 | ||||||||||||||||||||||||
| Growth-Income Fund | .500 | .219 | .6 | 34.0 | .500 | .217 | .6 | 44.0 | ||||||||||||||||||||||||
| International Growth and Income Fund | .690 | .500 | .5 | 1.5 | .478 | .450 | 15.0 | 15.0 | ||||||||||||||||||||||||
| Capital Income Builder | .500 | .410 | .6 | 1.0 | .357 | .330 | 15.0 | 15.0 | ||||||||||||||||||||||||
| Asset Allocation Fund | .500 | .240 | .6 | 21.0 | .500 | .236 | .6 | 34.0 | ||||||||||||||||||||||||
| American Funds Global Balanced Fund | .660 | .510 | .5 | 1.0 | .446 | .420 | 15.0 | 15.0 | ||||||||||||||||||||||||
| The Bond Fund of America | .480 | .320 | .6 | 13.0 | .352 | .320 | 15.0 | 15.0 | ||||||||||||||||||||||||
| Capital World Bond Fund | .570 | .450 | 1.0 | 3.0 | .431 | .360 | 15.0 | 15.0 | ||||||||||||||||||||||||
| American High-Income Trust | .500 | .420 | .6 | 2.0 | .404 | .386 | 15.0 | 15.0 | ||||||||||||||||||||||||
| American Funds Mortgage Fund | .420 | .290 | .6 | 3.0 | .295 | .280 | 15.0 | 15.0 | ||||||||||||||||||||||||
| Ultra-Short Bond Fund | .320 | .270 | 1.0 | 2.0 | .257 | .242 | 15.0 | 15.0 | ||||||||||||||||||||||||
| U.S. Government Securities Fund | .420 | .290 | .6 | 3.0 | .295 | .280 | 15.0 | 15.0 | ||||||||||||||||||||||||
Investment advisory services waivers — CRMC is waiving a portion of its investment advisory services fees for some of the funds. During the year ended December 31, 2022, CRMC waived $1,000 in fees for Growth Fund in advance of the revised investment advisory and service agreement effective May 1, 2022. CRMC also waived a portion of its investment advisory services fees for the following funds based on the rates listed:
| Fund | Waiver rates prior to May 1, 2022 |
Waiver rates effective May 1, 2022 |
||||||
| Global Growth Fund | Not applicable | .11 | % | |||||
| Global Small Capitalization Fund | Not applicable | .05 | ||||||
| New World Fund | .18 | % | .07 | |||||
| Washington Mutual Investors Fund | .16 | .11 | ||||||
| Capital World Growth and Income Fund | .23 | .14 | ||||||
| International Growth and Income Fund | .14 | .01 | ||||||
| Capital Income Builder | .25 | .14 | ||||||
| American Funds Global Balanced Fund | Not applicable | .01 | ||||||
| The Bond Fund of America | .19 | .19 | ||||||
| Capital World Bond Fund | .10 | .10 | ||||||
| American High-Income Trust | .19 | .14 | ||||||
| American Funds Mortgage Fund | .21 | .12 | ||||||
| U.S. Government Securities Fund | .16 | .12 | ||||||
| Managed Risk Growth Fund | .05 | .05 | ||||||
| Managed Risk International Fund | .05 | .05 | ||||||
| Managed Risk Washington Mutual Investors Fund | .05 | .05 | ||||||
| Managed Risk Growth-Income Fund | .05 | .05 | ||||||
| Managed Risk Asset Allocation Fund | .05 | .05 | ||||||
| American Funds Insurance Series | 331 |
The waiver rates for each fund, except Growth Fund, will be in effect through at least May 1, 2023, and may only be modified or terminated with the approval of the series’ board. For the year ended December 31, 2022, total investment advisory services fees waived by CRMC were $58,051,000. CRMC does not intend to recoup these waivers. Investment advisory fees in each fund’s statement of operations are presented gross of any waivers from CRMC.
The range of rates, net asset levels and the current annualized rates of average daily net assets for each fund before and after any investment advisory services waivers, if applicable, are as follows:
| Rates | Net asset level (in billions) |
For the year ended December 31, |
For the year ended December 31, |
|||||||||||||||||||||
| Fund | Beginning with |
Ending with |
Up to | In excess of |
2022, before waiver |
2022, after waiver |
||||||||||||||||||
| Global Growth Fund | .475 | % | .435 | % | $ | 15.0 | $ | 15.0 | .485 | % | .415 | % | ||||||||||||
| Global Small Capitalization Fund | .647 | .615 | 15.0 | 15.0 | .668 | .637 | ||||||||||||||||||
| Growth Fund | .500 | .275 | .6 | 44.0 | .313 | .313 | ||||||||||||||||||
| International Fund | .478 | .430 | 15.0 | 21.0 | .485 | .485 | ||||||||||||||||||
| New World Fund | .577 | .510 | 15.0 | 15.0 | .619 | .509 | ||||||||||||||||||
| Washington Mutual Investors Fund | .374 | .350 | 15.0 | 15.0 | .378 | .230 | ||||||||||||||||||
| Capital World Growth and Income Fund | .475 | .435 | 15.0 | 15.0 | .518 | .364 | ||||||||||||||||||
| Growth-Income Fund | .500 | .217 | .6 | 44.0 | .254 | .254 | ||||||||||||||||||
| International Growth and Income Fund | .478 | .450 | 15.0 | 15.0 | .555 | .460 | ||||||||||||||||||
| Capital Income Builder | .357 | .330 | 15.0 | 15.0 | .395 | .218 | ||||||||||||||||||
| Asset Allocation Fund | .500 | .236 | .6 | 34.0 | .265 | .265 | ||||||||||||||||||
| American Funds Global Balanced Fund | .446 | .420 | 15.0 | 15.0 | .523 | .517 | ||||||||||||||||||
| The Bond Fund of America | .352 | .320 | 15.0 | 15.0 | .354 | .164 | ||||||||||||||||||
| Capital World Bond Fund | .431 | .360 | 15.0 | 15.0 | .471 | .433 | ||||||||||||||||||
| American High-Income Trust | .404 | .386 | 15.0 | 15.0 | .433 | .275 | ||||||||||||||||||
| American Funds Mortgage Fund | .295 | .280 | 15.0 | 15.0 | .346 | .189 | ||||||||||||||||||
| Ultra-Short Bond Fund | .257 | .242 | 15.0 | 15.0 | .275 | .275 | ||||||||||||||||||
| U.S. Government Securities Fund | .295 | .280 | 15.0 | 15.0 | .319 | .184 | ||||||||||||||||||
| Managed Risk Growth Fund | .150 | all | .150 | .100 | ||||||||||||||||||||
| Managed Risk International Fund | .150 | all | .150 | .100 | ||||||||||||||||||||
| Managed Risk Washington Mutual Investors Fund | .150 | all | .150 | .100 | ||||||||||||||||||||
| Managed Risk Growth-Income Fund | .150 | all | .150 | .100 | ||||||||||||||||||||
| Managed Risk Asset Allocation Fund | .150 | all | .150 | .100 | ||||||||||||||||||||
Class-specific fees and expenses — Expenses that are specific to individual share classes are accrued directly to the respective share class. The principal class-specific fees and expenses are further described below:
Distribution services — The series has plans of distribution for all share classes except Class 1. Under the plans, the board of trustees approves certain categories of expenses that are used to finance activities primarily intended to sell fund shares. The plans provide for payments to pay service fees to firms that have entered into agreements with the series. These payments, based on an annualized percentage of average daily net assets, range from 0.18% to 0.50% as noted in the table below. In some cases, the board of trustees has limited the amounts that may be paid to less than the maximum allowed by the plans.
| Share class | Currently approved limits | Plan limits | ||||||
| Class 1A | 0.00 | % | 0.25 | % | ||||
| Class 2 | 0.25 | 0.25 | ||||||
| Class 3 | 0.18 | 0.18 | ||||||
| Class 4 | 0.25 | 0.25 | ||||||
| Class P1 | 0.00 | 0.25 | ||||||
| Class P2 | 0.25 | 0.50 | ||||||
| 332 | American Funds Insurance Series |
Insurance administrative services — The series has an insurance administrative services plan for Class 1A, 4, P1 and P2 shares. Under the plan, these share classes pay 0.25% of each insurance company’s respective average daily net assets in each share class to compensate the insurance companies for services provided to their separate accounts and contractholders for which the shares of the fund are beneficially owned as underlying investments of such contractholders’ annuities. These services include, but are not limited to, maintenance, shareholder communications and transactional services. The insurance companies are not related parties to the series.
Transfer agent services — The series has a shareholder services agreement with AFS under which the funds compensate AFS for providing transfer agent services to all of the funds’ share classes. These services include recordkeeping, shareholder communications and transaction processing. In addition, the managed risk funds reimburse AFS for amounts paid to third parties for performing transfer agent services on behalf of fund shareholders.
Administrative services — The series has an administrative services agreement with CRMC under which each fund compensates CRMC for providing administrative services to all of the funds’ share classes except Class P1 and P2 shares. Administrative services are provided by CRMC and its affiliates to help assist third parties providing non-distribution services to fund shareholders. These services include providing in-depth information on each fund and market developments that impact fund investments. Administrative services also include, but are not limited to, coordinating, monitoring and overseeing third parties that provide services to fund shareholders. The agreement provides each fund, other than the managed risk funds, the ability to charge an administrative services fee at the annual rate of 0.05% of average daily net assets attributable to each share class. Currently each fund, other than the managed-risk funds, pays CRMC an administrative services fee at the annual rate of 0.03% of average daily net assets of each share class for CRMC’s provision of administrative services. For the managed risk funds, CRMC receives administrative services fees at an annual rate of 0.03% of average daily net assets from Class 1 shares of the underlying funds for administrative services provided to the series.
Accounting and administrative services — The managed risk funds have a subadministration agreement with Bank of New York Mellon (“BNY Mellon”) under which the fund compensates BNY Mellon for providing accounting and administrative services to each of the managed risk funds’ share classes. These services include, but are not limited to, fund accounting (including calculation of net asset value), financial reporting and tax services. BNY Mellon is not a related party to the managed risk funds.
Class-specific expenses under the agreements described above were as follows (dollars in thousands):
| Global Growth Fund | ||||||||||||
| Share class | Distribution services |
Insurance administrative services |
Administrative services |
|||||||||
| Class 1 | Not applicable | Not applicable | $1,002 | |||||||||
| Class 1A | $— | $37 | 4 | |||||||||
| Class 2 | 8,754 | Not applicable | 1,050 | |||||||||
| Class 4 | 1,500 | 1,500 | 180 | |||||||||
| Total class-specific expenses | $10,254 | $1,537 | $2,236 | |||||||||
| Global Small Capitalization Fund | ||||||||||||
| Share class | Distribution services |
Insurance administrative services |
Administrative services |
|||||||||
| Class 1 | Not applicable | Not applicable | $308 | |||||||||
| Class 1A | $— | $11 | 1 | |||||||||
| Class 2 | 4,837 | Not applicable | 581 | |||||||||
| Class 4 | 688 | 688 | 83 | |||||||||
| Total class-specific expenses | $5,525 | $699 | $973 | |||||||||
| Growth Fund | ||||||||||||
| Share class | Distribution services |
Insurance administrative services |
Administrative services |
|||||||||
| Class 1 | Not applicable | Not applicable | $4,542 | |||||||||
| Class 1A | $— | $407 | 49 | |||||||||
| Class 2 | 41,888 | Not applicable | 5,026 | |||||||||
| Class 3 | 403 | Not applicable | 67 | |||||||||
| Class 4 | 6,532 | 6,532 | 784 | |||||||||
| Total class-specific expenses | $48,823 | $6,939 | $10,468 | |||||||||
| International Fund | ||||||||||||
| Share class | Distribution services |
Insurance administrative services |
Administrative services |
|||||||||
| Class 1 | Not applicable | Not applicable | $1,036 | |||||||||
| Class 1A | $— | $26 | 3 | |||||||||
| Class 2 | 8,573 | Not applicable | 1,029 | |||||||||
| Class 3 | 30 | Not applicable | 5 | |||||||||
| Class 4 | 982 | 982 | 118 | |||||||||
| Total class-specific expenses | $9,585 | $1,008 | $2,191 | |||||||||
| American Funds Insurance Series | 333 |
| New World Fund | ||||||||||||
| Share class | Distribution services |
Insurance administrative services |
Administrative services |
|||||||||
| Class 1 | Not applicable | Not applicable | $535 | |||||||||
| Class 1A | $— | $25 | 3 | |||||||||
| Class 2 | 2,101 | Not applicable | 252 | |||||||||
| Class 4 | 1,898 | 1,898 | 228 | |||||||||
| Total class-specific expenses | $3,999 | $1,923 | $1,018 | |||||||||
| Washington Mutual Investors Fund | ||||||||||||
| Share class | Distribution services |
Insurance administrative services |
Administrative services |
|||||||||
| Class 1 | Not applicable | Not applicable | $1,738 | |||||||||
| Class 1A | $— | $243 | 29 | |||||||||
| Class 2 | 7,376 | Not applicable | 885 | |||||||||
| Class 4 | 2,639 | 2,639 | 317 | |||||||||
| Total class-specific expenses | $10,015 | $2,882 | $2,969 | |||||||||
| Capital World Growth and Income Fund | ||||||||||||
| Share class | Distribution services |
Insurance administrative services |
Administrative services |
|||||||||
| Class 1 | Not applicable | Not applicable | $175 | |||||||||
| Class 1A | $— | $15 | 2 | |||||||||
| Class 2 | 2,689 | Not applicable | 323 | |||||||||
| Class 4 | 483 | 484 | 58 | |||||||||
| Total class-specific expenses | $3,172 | $499 | $558 | |||||||||
| Growth-Income Fund | ||||||||||||
| Share class | Distribution services |
Insurance administrative services |
Administrative services |
|||||||||
| Class 1 | Not applicable | Not applicable | $6,289 | |||||||||
| Class 1A | $— | $73 | 9 | |||||||||
| Class 2 | 31,403 | Not applicable | 3,768 | |||||||||
| Class 3 | 245 | Not applicable | 41 | |||||||||
| Class 4 | 4,213 | 4,213 | 505 | |||||||||
| Total class-specific expenses | $35,861 | $4,286 | $10,612 | |||||||||
| International Growth and Income Fund | ||||||||||||
| Share class | Distribution services |
Insurance administrative services |
Administrative services |
|||||||||
| Class 1 | Not applicable | Not applicable | $4 | |||||||||
| Class 1A | $— | $12 | 2 | |||||||||
| Class 2 | 432 | Not applicable | 52 | |||||||||
| Class 4 | 294 | 294 | 35 | |||||||||
| Total class-specific expenses | $726 | $306 | $93 | |||||||||
| Capital Income Builder | ||||||||||||
| Share class | Distribution services |
Insurance administrative services |
Administrative services |
|||||||||
| Class 1 | Not applicable | Not applicable | $170 | |||||||||
| Class 1A | $— | $24 | 3 | |||||||||
| Class 2 | 31 | Not applicable | 4 | |||||||||
| Class 4 | 1,337 | 1,338 | 160 | |||||||||
| Total class-specific expenses | $1,368 | $1,362 | $337 | |||||||||
| Asset Allocation Fund | ||||||||||||
| Share class | Distribution services |
Insurance administrative services |
Administrative services |
|||||||||
| Class 1 | Not applicable | Not applicable | $4,850 | |||||||||
| Class 1A | $— | $62 | 8 | |||||||||
| Class 2 | 11,503 | Not applicable | 1,380 | |||||||||
| Class 3 | 55 | Not applicable | 9 | |||||||||
| Class 4 | 14,002 | 14,002 | 1,680 | |||||||||
| Total class-specific expenses | $25,560 | $14,064 | $7,927 | |||||||||
| American Funds Global Balanced Fund | ||||||||||||
| Share class | Distribution services |
Insurance administrative services |
Administrative services |
|||||||||
| Class 1 | Not applicable | Not applicable | $31 | |||||||||
| Class 1A | $— | $7 | 1 | |||||||||
| Class 2 | 428 | Not applicable | 51 | |||||||||
| Class 4 | 293 | 293 | 35 | |||||||||
| Total class-specific expenses | $721 | $300 | $118 | |||||||||
| The Bond Fund of America | ||||||||||||
| Share class | Distribution services |
Insurance administrative services |
Administrative services |
|||||||||
| Class 1 | Not applicable | Not applicable | $2,100 | |||||||||
| Class 1A | $— | $354 | 43 | |||||||||
| Class 2 | 7,903 | Not applicable | 948 | |||||||||
| Class 4 | 2,027 | 2,027 | 243 | |||||||||
| Total class-specific expenses | $9,930 | $2,381 | $3,334 | |||||||||
| Capital World Bond Fund | ||||||||||||
| Share class | Distribution services |
Insurance administrative services |
Administrative services |
|||||||||
| Class 1 | Not applicable | Not applicable | $222 | |||||||||
| Class 1A | $— | $4 | — | * | ||||||||
| Class 2 | 2,109 | Not applicable | 253 | |||||||||
| Class 4 | 142 | 142 | 17 | |||||||||
| Total class-specific expenses | $2,251 | $146 | $492 | |||||||||
Refer to the end of the tables for footnote.
| 334 | American Funds Insurance Series |
| American High-Income Trust | ||||||||||||
| Share class | Distribution services |
Insurance administrative services |
Administrative services |
|||||||||
| Class 1 | Not applicable | Not applicable | $71 | |||||||||
| Class 1A | $— | $3 | — | * | ||||||||
| Class 2 | 1,440 | Not applicable | 173 | |||||||||
| Class 3 | 16 | Not applicable | 3 | |||||||||
| Class 4 | 200 | 200 | 24 | |||||||||
| Total class-specific expenses | $1,656 | $203 | $271 | |||||||||
| American Funds Mortgage Fund | ||||||||||||
| Share class | Distribution services |
Insurance administrative services |
Administrative services |
|||||||||
| Class 1 | Not applicable | Not applicable | $3 | |||||||||
| Class 1A | $— | $4 | 1 | |||||||||
| Class 2 | 127 | Not applicable | 15 | |||||||||
| Class 4 | 101 | 101 | 12 | |||||||||
| Total class-specific expenses | $228 | $105 | $31 | |||||||||
| Ultra-Short Bond Fund | ||||||||||||
| Share class | Distribution services |
Insurance administrative services |
Administrative services |
|||||||||
| Class 1 | Not applicable | Not applicable | $14 | |||||||||
| Class 1A | $— | $— | — | * | ||||||||
| Class 2 | 707 | Not applicable | 85 | |||||||||
| Class 3 | 9 | Not applicable | 1 | |||||||||
| Class 4 | 173 | 173 | 21 | |||||||||
| Total class-specific expenses | $889 | $173 | $121 | |||||||||
| U.S. Government Securities Fund | ||||||||||||
| Share class | Distribution services |
Insurance administrative services |
Administrative services |
|||||||||
| Class 1 | Not applicable | Not applicable | $81 | |||||||||
| Class 1A | $— | $10 | 1 | |||||||||
| Class 2 | 2,967 | Not applicable | 356 | |||||||||
| Class 3 | 15 | Not applicable | 3 | |||||||||
| Class 4 | 512 | 512 | 62 | |||||||||
| Total class-specific expenses | $3,494 | $522 | $503 | |||||||||
| Managed Risk Growth Fund | ||||||||||||
| Share class | Distribution services |
Insurance administrative services |
||||||||||
| Class P1 | Not applicable | $25 | ||||||||||
| Class P2 | $1,219 | 1,219 | ||||||||||
| Total class-specific expenses | $1,219 | $1,244 | ||||||||||
| Managed Risk International Fund | ||||||||||||
| Share class | Distribution services |
Insurance administrative services |
||||||||||
| Class P1 | Not applicable | $4 | ||||||||||
| Class P2 | $342 | 342 | ||||||||||
| Total class-specific expenses | $342 | $346 | ||||||||||
| Managed Risk Washington Mutual Investors Fund | ||||||||||||
| Share class | Distribution services |
Insurance administrative services |
||||||||||
| Class P1 | Not applicable | $6 | ||||||||||
| Class P2 | $824 | 824 | ||||||||||
| Total class-specific expenses | $824 | $830 | ||||||||||
| Managed Risk Growth-Income Fund | ||||||||||||
| Share class | Distribution services |
Insurance administrative services |
||||||||||
| Class P1 | Not applicable | $4,945 | ||||||||||
| Class P2 | $720 | 720 | ||||||||||
| Total class-specific expenses | $720 | $5,665 | ||||||||||
| Managed Risk Asset Allocation Fund | ||||||||||||
| Share class | Distribution services |
Insurance administrative services |
||||||||||
| Class P1 | Not applicable | $18 | ||||||||||
| Class P2 | $5,935 | 5,935 | ||||||||||
| Total class-specific expenses | $5,935 | $5,953 | ||||||||||
| * | Amount less than one thousand. |
| American Funds Insurance Series | 335 |
Miscellaneous fee reimbursements — CRMC reimbursed a portion of miscellaneous fees and expenses for Managed Risk International Fund. These reimbursements may be adjusted or discontinued by CRMC, subject to any restrictions in the series’ prospectus. For the year ended December 31, 2022, total fees and expenses reimbursed by CRMC were $32,000. CRMC does not intend to recoup these reimbursements. Fees and expenses in each fund’s statement of operations are presented gross of any reimbursements from CRMC.
Trustees’ deferred compensation — Trustees who are unaffiliated with CRMC may elect to defer the cash payment of part or all of their compensation. These deferred amounts, which remain as liabilities of the funds, are treated as if invested in one or more of the American Funds. These amounts represent general, unsecured liabilities of the funds and vary according to the total returns of the selected funds. Trustees’ compensation, shown on the accompanying financial statements, reflects current fees (either paid in cash or deferred) and a net decrease in the value of the deferred amounts as follows (dollars in thousands):
| Fund | Current fees | Decrease in value of deferred amounts |
Total trustees’ compensation |
|||||||||
| Global Growth Fund | $ | 21 | $ | (11 | ) | $ | 10 | |||||
| Global Small Capitalization Fund | 10 | (5 | ) | 5 | ||||||||
| Growth Fund | 99 | (54 | ) | 45 | ||||||||
| International Fund | 21 | (11 | ) | 10 | ||||||||
| New World Fund | 10 | (5 | ) | 5 | ||||||||
| Washington Mutual Investors Fund | 27 | (16 | ) | 11 | ||||||||
| Capital World Growth and Income Fund | 5 | (3 | ) | 2 | ||||||||
| Growth-Income Fund | 98 | (56 | ) | 42 | ||||||||
| International Growth and Income Fund | 1 | — | * | 1 | ||||||||
| Capital Income Builder | 3 | (2 | ) | 1 | ||||||||
| Asset Allocation Fund | 73 | (43 | ) | 30 | ||||||||
| American Funds Global Balanced Fund | 1 | (1 | ) | — | * | |||||||
| The Bond Fund of America | 31 | (19 | ) | 12 | ||||||||
| Capital World Bond Fund | 5 | (3 | ) | 2 | ||||||||
| American High-Income Trust | 3 | (1 | ) | 2 | ||||||||
| American Funds Mortgage Fund | — | * | — | * | — | * | ||||||
| Ultra-Short Bond Fund | 1 | (1 | ) | — | * | |||||||
| U.S. Government Securities Fund | 5 | (3 | ) | 2 | ||||||||
| Managed Risk Growth Fund | 2 | (1 | ) | 1 | ||||||||
| Managed Risk International Fund | — | * | — | * | — | * | ||||||
| Managed Risk Washington Mutual Investors Fund | 1 | (1 | ) | — | * | |||||||
| Managed Risk Growth-Income Fund | 6 | (4 | ) | 2 | ||||||||
| Managed Risk Asset Allocation Fund | 7 | (4 | ) | 3 | ||||||||
| * | Amount less than one thousand. |
Affiliated officers and trustees — Officers and certain trustees of the series are or may be considered to be affiliated with CRMC, AFD and AFS. No affiliated officers or trustees received any compensation directly from any fund in the series.
Investments in CCBF and CCF — Some of the funds hold shares of CCBF, a corporate bond fund, and/or CCF, an institutional prime money market fund ,which are both managed by CRMC. CCBF seeks to provide maximum total return consistent with capital preservation and prudent risk management by investing primarily in corporate debt instruments. CCBF is used as an investment vehicle for some of the funds’ corporate bond investments. CCF invests in high-quality, short-term money market instruments. CCF is used as the primary investment vehicle for some of the funds’ short-term investments. Both CCBF and CCF shares are only available for purchase by CRMC, its affiliates, and other funds managed by CRMC or its affiliates, and are not available to the public. CRMC does not receive an investment advisory services fee from either CCBF or CCF.
Security transactions with related funds — The funds may purchase from, or sell securities to, other CRMC-managed funds (or funds managed by certain affiliates of CRMC) under procedures adopted by the fund’s board of trustees. The funds involved in such transactions are considered related by virtue of having a common investment adviser (or affiliated investment advisers), common trustees and/or common officers. When such transactions occur, each transaction is executed at the current market price of the security and no brokerage commissions or fees are paid in accordance with Rule 17a-7 of the 1940 Act.
| 336 | American Funds Insurance Series |
The following table presents purchase and sale transactions between each fund and related funds, and net realized loss or gain from such sales, if any, as of December 31, 2022 (dollars in thousands):
| Fund | Purchases | Sales | Net realized (loss) gain |
|||||||||
| Global Growth Fund | $ | 49,680 | $ | 71,818 | $ | (20,300) | ||||||
| Global Small Capitalization Fund | 57,920 | 34,601 | 1,035 | |||||||||
| Growth Fund | 261,401 | 361,390 | 36,542 | |||||||||
| International Fund | 104,003 | 132,023 | (15,330 | ) | ||||||||
| New World Fund | 32,986 | 51,119 | 1,384 | |||||||||
| Washington Mutual Investors Fund | 78,899 | 86,050 | (13,933 | ) | ||||||||
| Capital World Growth and Income Fund | 29,485 | 42,194 | (1,316 | ) | ||||||||
| Growth-Income Fund | 260,856 | 367,634 | 60,804 | |||||||||
| International Growth and Income Fund | 3,035 | 3,711 | (301 | ) | ||||||||
| Capital Income Builder | 11,219 | 9,127 | 1,159 | |||||||||
| Asset Allocation Fund | 217,739 | 147,808 | (22,154 | ) | ||||||||
| American Funds Global Balanced Fund | 2,864 | 3,686 | (19 | ) | ||||||||
| The Bond Fund of America | 1,289 | 6,983 | (541 | ) | ||||||||
| Capital World Bond Fund | 58 | 14,120 | (947 | ) | ||||||||
| American High-Income Trust | 57 | 29,194 | (1,415 | ) | ||||||||
8. Indemnifications
The series’ organizational documents provide board members and officers with indemnification against certain liabilities or expenses in connection with the performance of their duties to the series. In the normal course of business, the series may also enter into contracts that provide general indemnifications. Each fund’s maximum exposure under these arrangements is unknown since it is dependent on future claims that may be made against the series. The risk of material loss from such claims is considered remote. Insurance policies are also available to the series’ board members and officers.
9. Committed line of credit
Global Small Capitalization Fund, New World Fund and American High-Income Trust participate with other funds managed by CRMC in a $1.5 billion credit facility (the “line of credit”) to be utilized for temporary purposes to fund shareholder redemptions. Each fund has agreed to pay commitment fees on its pro-rata portion of the line of credit, which are reflected in other expenses in each fund’s statement of operations. None of the funds borrowed on this line of credit at any time during the year ended December 31, 2022.
| American Funds Insurance Series | 337 |
10. Capital share transactions
Capital share transactions in each fund were as follows (dollars and shares in thousands):
| Global Growth Fund | ||||||||||||||||||||||||||||||||
| Sales* | Reinvestments of distributions |
Repurchases* | Net increase (decrease) |
|||||||||||||||||||||||||||||
| Share class | Amount | Shares | Amount | Shares | Amount | Shares | Amount | Shares | ||||||||||||||||||||||||
| Year ended December 31, 2022 | ||||||||||||||||||||||||||||||||
| Class 1 | $ | 434,070 | 13,042 | $ | 400,617 | 12,733 | $ | (553,744 | ) | (16,845 | ) | $ | 280,943 | 8,930 | ||||||||||||||||||
| Class 1A | 2,997 | 91 | 1,758 | 56 | (2,085 | ) | (65 | ) | 2,670 | 82 | ||||||||||||||||||||||
| Class 2 | 92,048 | 2,700 | 419,636 | 13,511 | (295,933 | ) | (9,100 | ) | 215,751 | 7,111 | ||||||||||||||||||||||
| Class 4 | 99,092 | 2,978 | 70,552 | 2,294 | (71,372 | ) | (2,195 | ) | 98,272 | 3,077 | ||||||||||||||||||||||
| Total net increase (decrease) | $ | 628,207 | 18,811 | $ | 892,563 | 28,594 | $ | (923,134 | ) | (28,205 | ) | $ | 597,636 | 19,200 | ||||||||||||||||||
| Year ended December 31, 2021 | ||||||||||||||||||||||||||||||||
| Class 1 | $ | 683,154 | 15,421 | $ | 216,944 | 5,062 | $ | (307,264 | ) | (6,960 | ) | $ | 592,834 | 13,523 | ||||||||||||||||||
| Class 1A | 6,731 | 151 | 700 | 17 | (2,591 | ) | (58 | ) | 4,840 | 110 | ||||||||||||||||||||||
| Class 2 | 69,770 | 1,607 | 236,612 | 5,601 | (588,817 | ) | (13,514 | ) | (282,435 | ) | (6,306 | ) | ||||||||||||||||||||
| Class 4 | 167,855 | 3,876 | 32,087 | 766 | (48,523 | ) | (1,127 | ) | 151,419 | 3,515 | ||||||||||||||||||||||
| Total net increase (decrease) | $ | 927,510 | 21,055 | $ | 486,343 | 11,446 | $ | (947,195 | ) | (21,659 | ) | $ | 466,658 | 10,842 | ||||||||||||||||||
| Global Small Capitalization Fund | ||||||||||||||||||||||||||||||||
| Sales* | Reinvestments of distributions |
Repurchases* | Net (decrease) increase |
|||||||||||||||||||||||||||||
| Share class | Amount | Shares | Amount | Shares | Amount | Shares | Amount | Shares | ||||||||||||||||||||||||
| Year ended December 31, 2022 | ||||||||||||||||||||||||||||||||
| Class 1 | $ | 187,481 | 9,235 | $ | 331,498 | 19,030 | $ | (570,697 | ) | (21,774 | ) | $ | (51,718 | ) | 6,491 | |||||||||||||||||
| Class 1A | 989 | 43 | 1,461 | 85 | (276 | ) | (15 | ) | 2,174 | 113 | ||||||||||||||||||||||
| Class 2 | 111,019 | 5,043 | 663,046 | 40,307 | (118,512 | ) | (6,722 | ) | 655,553 | 38,628 | ||||||||||||||||||||||
| Class 4 | 56,480 | 2,653 | 93,892 | 5,707 | (34,387 | ) | (1,715 | ) | 115,985 | 6,645 | ||||||||||||||||||||||
| Total net increase (decrease) | $ | 355,969 | 16,974 | $ | 1,089,897 | 65,129 | $ | (723,872 | ) | (30,226 | ) | $ | 721,994 | 51,877 | ||||||||||||||||||
| Year ended December 31, 2021 | ||||||||||||||||||||||||||||||||
| Class 1 | $ | 216,763 | 6,235 | $ | 55,510 | 1,581 | $ | (1,077,292 | ) | (31,128 | ) | $ | (805,019 | ) | (23,312 | ) | ||||||||||||||||
| Class 1A | 4,095 | 118 | 39 | 1 | (153 | ) | (4 | ) | 3,981 | 115 | ||||||||||||||||||||||
| Class 2 | 59,596 | 1,785 | 60,246 | 1,778 | (374,611 | ) | (11,071 | ) | (254,769 | ) | (7,508 | ) | ||||||||||||||||||||
| Class 4 | 89,704 | 2,662 | 7,215 | 212 | (30,621 | ) | (901 | ) | 66,298 | 1,973 | ||||||||||||||||||||||
| Total net increase (decrease) | $ | 370,158 | 10,800 | $ | 123,010 | 3,572 | $ | (1,482,677 | ) | (43,104 | ) | $ | (989,509 | ) | (28,732 | ) | ||||||||||||||||
Refer to the end of the tables for footnotes.
| 338 | American Funds Insurance Series |
| Growth Fund | ||||||||||||||||||||||||||||||||
| Sales* | Reinvestments of distributions |
Repurchases* | Net increase (decrease) |
|||||||||||||||||||||||||||||
| Share class | Amount | Shares | Amount | Shares | Amount | Shares | Amount | Shares | ||||||||||||||||||||||||
| Year ended December 31, 2022 | ||||||||||||||||||||||||||||||||
| Class 1 | $ | 2,593,666 | 29,149 | $ | 2,228,505 | 26,120 | $ | (3,051,097 | ) | (31,275 | ) | $ | 1,771,074 | 23,994 | ||||||||||||||||||
| Class 1A | 133,124 | 1,387 | 27,088 | 320 | (15,271 | ) | (181 | ) | 144,941 | 1,526 | ||||||||||||||||||||||
| Class 2 | 520,092 | 5,686 | 2,464,507 | 29,214 | (1,621,163 | ) | (17,346 | ) | 1,363,436 | 17,554 | ||||||||||||||||||||||
| Class 3 | 1,224 | 14 | 32,371 | 376 | (28,004 | ) | (296 | ) | 5,591 | 94 | ||||||||||||||||||||||
| Class 4 | 409,323 | 4,647 | 383,909 | 4,657 | (227,877 | ) | (2,558 | ) | 565,355 | 6,746 | ||||||||||||||||||||||
| Total net increase (decrease) | $ | 3,657,429 | 40,883 | $ | 5,136,380 | 60,687 | $ | (4,943,412 | ) | (51,656 | ) | $ | 3,850,397 | 49,914 | ||||||||||||||||||
| Year ended December 31, 2021 | ||||||||||||||||||||||||||||||||
| Class 1 | $ | 2,916,865 | 22,963 | $ | 2,251,516 | 19,653 | $ | (2,207,142 | ) | (17,684 | ) | $ | 2,961,239 | 24,932 | ||||||||||||||||||
| Class 1A | 68,640 | 560 | 9,733 | 86 | (25,312 | ) | (198 | ) | 53,061 | 448 | ||||||||||||||||||||||
| Class 2 | 432,245 | 3,495 | 2,777,848 | 24,558 | (3,289,822 | ) | (26,755 | ) | (79,729 | ) | 1,298 | |||||||||||||||||||||
| Class 3 | 1,972 | 15 | 37,541 | 326 | (37,449 | ) | (298 | ) | 2,064 | 43 | ||||||||||||||||||||||
| Class 4 | 553,762 | 4,582 | 358,034 | 3,232 | (224,958 | ) | (1,864 | ) | 686,838 | 5,950 | ||||||||||||||||||||||
| Total net increase (decrease) | $ | 3,973,484 | 31,615 | $ | 5,434,672 | 47,855 | $ | (5,784,683 | ) | (46,799 | ) | $ | 3,623,473 | 32,671 | ||||||||||||||||||
| International Fund | ||||||||||||||||||||||||||||||||
| Sales* | Reinvestments of distributions |
Repurchases* | Net (decrease) increase |
|||||||||||||||||||||||||||||
| Share class | Amount | Shares | Amount | Shares | Amount | Shares | Amount | Shares | ||||||||||||||||||||||||
| Year ended December 31, 2022 | ||||||||||||||||||||||||||||||||
| Class 1 | $ | 280,536 | 15,960 | $ | 543,821 | 32,473 | $ | (1,015,741 | ) | (51,244 | ) | $ | (191,384 | ) | (2,811 | ) | ||||||||||||||||
| Class 1A | 2,247 | 127 | 1,679 | 101 | (1,009 | ) | (63 | ) | 2,917 | 165 | ||||||||||||||||||||||
| Class 2 | 189,379 | 10,637 | 536,766 | 32,189 | (347,301 | ) | (20,471 | ) | 378,844 | 22,355 | ||||||||||||||||||||||
| Class 3 | 87 | 5 | 2,627 | 156 | (1,366 | ) | (79 | ) | 1,348 | 82 | ||||||||||||||||||||||
| Class 4 | 65,571 | 3,703 | 61,594 | 3,751 | (53,681 | ) | (3,200 | ) | 73,484 | 4,254 | ||||||||||||||||||||||
| Total net increase (decrease) | $ | 537,820 | 30,432 | $ | 1,146,487 | 68,670 | $ | (1,419,098 | ) | (75,057 | ) | $ | 265,209 | 24,045 | ||||||||||||||||||
| Year ended December 31, 2021 | ||||||||||||||||||||||||||||||||
| Class 1 | $ | 366,681 | 15,339 | $ | 131,729 | 5,782 | $ | (1,253,303 | ) | (51,135 | ) | $ | (754,893 | ) | (30,014 | ) | ||||||||||||||||
| Class 1A | 4,570 | 192 | 281 | 13 | (2,479 | ) | (103 | ) | 2,372 | 102 | ||||||||||||||||||||||
| Class 2 | 264,867 | 11,161 | 105,815 | 4,673 | (502,502 | ) | (20,818 | ) | (131,820 | ) | (4,984 | ) | ||||||||||||||||||||
| Class 3 | 125 | 5 | 546 | 24 | (3,534 | ) | (146 | ) | (2,863 | ) | (117 | ) | ||||||||||||||||||||
| Class 4 | 95,888 | 4,069 | 10,725 | 480 | (51,434 | ) | (2,169 | ) | 55,179 | 2,380 | ||||||||||||||||||||||
| Total net increase (decrease) | $ | 732,131 | 30,766 | $ | 249,096 | 10,972 | $ | (1,813,252 | ) | (74,371 | ) | $ | (832,025 | ) | (32,633 | ) | ||||||||||||||||
Refer to the end of the tables for footnotes.
| American Funds Insurance Series | 339 |
| New World Fund | ||||||||||||||||||||||||||||||||
| Sales* | Reinvestments of distributions |
Repurchases* | Net (decrease) increase |
|||||||||||||||||||||||||||||
| Share class | Amount | Shares | Amount | Shares | Amount | Shares | Amount | Shares | ||||||||||||||||||||||||
| Year ended December 31, 2022 | ||||||||||||||||||||||||||||||||
| Class 1 | $ | 91,026 | 3,688 | $ | 189,325 | 7,939 | $ | (434,293 | ) | (16,140 | ) | $ | (153,942 | ) | (4,513 | ) | ||||||||||||||||
| Class 1A | 1,549 | 60 | 1,040 | 44 | (1,769 | ) | (76 | ) | 820 | 28 | ||||||||||||||||||||||
| Class 2 | 72,626 | 2,937 | 88,236 | 3,744 | (163,288 | ) | (6,534 | ) | (2,426 | ) | 147 | |||||||||||||||||||||
| Class 4 | 133,209 | 5,310 | 78,780 | 3,371 | (133,462 | ) | (5,583 | ) | 78,527 | 3,098 | ||||||||||||||||||||||
| Total net increase (decrease) | $ | 298,410 | 11,995 | $ | 357,381 | 15,098 | $ | (732,812 | ) | (28,333 | ) | $ | (77,021 | ) | (1,240 | ) | ||||||||||||||||
| Year ended December 31, 2021 | ||||||||||||||||||||||||||||||||
| Class 1 | $ | 180,001 | 5,517 | $ | 104,795 | 3,183 | $ | (165,865 | ) | (5,053 | ) | $ | 118,931 | 3,647 | ||||||||||||||||||
| Class 1A | 14,137 | 436 | 350 | 11 | (21,114 | ) | (642 | ) | (6,627 | ) | (195 | ) | ||||||||||||||||||||
| Class 2 | 82,347 | 2,547 | 45,947 | 1,410 | (159,868 | ) | (4,915 | ) | (31,574 | ) | (958 | ) | ||||||||||||||||||||
| Class 4 | 135,084 | 4,224 | 34,360 | 1,061 | (74,083 | ) | (2,295 | ) | 95,361 | 2,990 | ||||||||||||||||||||||
| Total net increase (decrease) | $ | 411,569 | 12,724 | $ | 185,452 | 5,665 | $ | (420,930 | ) | (12,905 | ) | $ | 176,091 | 5,484 | ||||||||||||||||||
| Washington Mutual Investors Fund | ||||||||||||||||||||||||||||||||
| Sales* | Reinvestments of distributions |
Repurchases* | Net increase (decrease) |
|||||||||||||||||||||||||||||
| Share class | Amount | Shares | Amount | Shares | Amount | Shares | Amount | Shares | ||||||||||||||||||||||||
| Year ended December 31, 2022 | ||||||||||||||||||||||||||||||||
| Class 1 | $ | 311,628 | 22,333 | $ | 1,412,614 | 106,476 | $ | (1,024,832 | ) | (69,053 | ) | $ | 699,410 | 59,756 | ||||||||||||||||||
| Class 1A | 33,907 | 2,321 | 14,025 | 1,066 | (125,110 | ) | (7,699 | ) | (77,178 | ) | (4,312 | ) | ||||||||||||||||||||
| Class 2 | 48,719 | 3,523 | 725,386 | 55,707 | (414,058 | ) | (28,659 | ) | 360,047 | 30,571 | ||||||||||||||||||||||
| Class 4 | 238,615 | 16,711 | 258,174 | 20,025 | (148,002 | ) | (10,093 | ) | 348,787 | 26,643 | ||||||||||||||||||||||
| Total net increase (decrease) | $ | 632,869 | 44,888 | $ | 2,410,199 | 183,274 | $ | (1,712,002 | ) | (115,504 | ) | $ | 1,331,066 | 112,658 | ||||||||||||||||||
| Year ended December 31, 2021 | ||||||||||||||||||||||||||||||||
| Class 1 | $ | 740,227 | 42,419 | $ | 104,068 | 6,017 | $ | (1,150,862 | ) | (70,448 | ) | $ | (306,567 | ) | (22,012 | ) | ||||||||||||||||
| Class 1A | 128,020 | 7,779 | 2,211 | 129 | (4,020 | ) | (244 | ) | 126,211 | 7,664 | ||||||||||||||||||||||
| Class 2 | 51,950 | 3,263 | 46,652 | 2,739 | (508,810 | ) | (31,581 | ) | (410,208 | ) | (25,579 | ) | ||||||||||||||||||||
| Class 4 | 156,222 | 9,709 | 12,620 | 746 | (66,538 | ) | (4,145 | ) | 102,304 | 6,310 | ||||||||||||||||||||||
| Total net increase (decrease) | $ | 1,076,419 | 63,170 | $ | 165,551 | 9,631 | $ | (1,730,230 | ) | (106,418 | ) | $ | (488,260 | ) | (33,617 | ) | ||||||||||||||||
| Capital World Growth and Income Fund | ||||||||||||||||||||||||||||||||
| Sales* | Reinvestments of distributions |
Repurchases* | Net (decrease) increase |
|||||||||||||||||||||||||||||
| Share class | Amount | Shares | Amount | Shares | Amount | Shares | Amount | Shares | ||||||||||||||||||||||||
| Year ended December 31, 2022 | ||||||||||||||||||||||||||||||||
| Class 1 | $ | 286,528 | 22,239 | $ | 137,343 | 10,946 | $ | (434,782 | ) | (30,278 | ) | $ | (10,911 | ) | 2,907 | |||||||||||||||||
| Class 1A | 1,618 | 116 | 1,525 | 122 | (1,079 | ) | (91 | ) | 2,064 | 147 | ||||||||||||||||||||||
| Class 2 | 15,274 | 1,157 | 262,887 | 21,001 | (144,703 | ) | (10,617 | ) | 133,458 | 11,541 | ||||||||||||||||||||||
| Class 4 | 25,643 | 1,909 | 48,121 | 3,940 | (22,999 | ) | (1,756 | ) | 50,765 | 4,093 | ||||||||||||||||||||||
| Total net increase (decrease) | $ | 329,063 | 25,421 | $ | 449,876 | 36,009 | $ | (603,563 | ) | (42,742 | ) | $ | 175,376 | 18,688 | ||||||||||||||||||
| Year ended December 31, 2021 | ||||||||||||||||||||||||||||||||
| Class 1 | $ | 171,552 | 9,531 | $ | 30,555 | 1,698 | $ | (117,328 | ) | (6,578 | ) | $ | 84,779 | 4,651 | ||||||||||||||||||
| Class 1A | 4,092 | 231 | 166 | 9 | (605 | ) | (34 | ) | 3,653 | 206 | ||||||||||||||||||||||
| Class 2 | 21,440 | 1,205 | 50,935 | 2,838 | (216,241 | ) | (12,206 | ) | (143,866 | ) | (8,163 | ) | ||||||||||||||||||||
| Class 4 | 49,326 | 2,833 | 7,530 | 427 | (16,390 | ) | (939 | ) | 40,466 | 2,321 | ||||||||||||||||||||||
| Total net increase (decrease) | $ | 246,410 | 13,800 | $ | 89,186 | 4,972 | $ | (350,564 | ) | (19,757 | ) | $ | (14,968 | ) | (985 | ) | ||||||||||||||||
Refer to the end of the tables for footnotes.
| 340 | American Funds Insurance Series |
| Growth-Income Fund | ||||||||||||||||||||||||||||||||
| Sales* | Reinvestments of distributions |
Repurchases* | Net increase (decrease) |
|||||||||||||||||||||||||||||
| Share class | Amount | Shares | Amount | Shares | Amount | Shares | Amount | Shares | ||||||||||||||||||||||||
| Year ended December 31, 2022 | ||||||||||||||||||||||||||||||||
| Class 1 | $ | 2,026,623 | 38,323 | $ | 2,348,918 | 43,972 | $ | (3,853,406 | ) | (68,861 | ) | $ | 522,135 | 13,434 | ||||||||||||||||||
| Class 1A | 4,813 | 89 | 3,248 | 61 | (3,333 | ) | (64 | ) | 4,728 | 86 | ||||||||||||||||||||||
| Class 2 | 119,436 | 2,219 | 1,399,821 | 26,589 | (1,455,432 | ) | (26,710 | ) | 63,825 | 2,098 | ||||||||||||||||||||||
| Class 3 | 766 | 15 | 15,025 | 280 | (15,511 | ) | (279 | ) | 280 | 16 | ||||||||||||||||||||||
| Class 4 | 180,173 | 3,342 | 186,543 | 3,596 | (153,528 | ) | (2,879 | ) | 213,188 | 4,059 | ||||||||||||||||||||||
| Total net increase (decrease) | $ | 2,331,811 | 43,988 | $ | 3,953,555 | 74,498 | $ | (5,481,210 | ) | (98,793 | ) | $ | 804,156 | 19,693 | ||||||||||||||||||
| Year ended December 31, 2021 | ||||||||||||||||||||||||||||||||
| Class 1 | $ | 778,306 | 12,603 | $ | 567,351 | 8,928 | $ | (3,472,494 | ) | (56,343 | ) | $ | (2,126,837 | ) | (34,812 | ) | ||||||||||||||||
| Class 1A | 14,065 | 224 | 493 | 8 | (2,433 | ) | (39 | ) | 12,125 | 193 | ||||||||||||||||||||||
| Class 2 | 143,239 | 2,361 | 310,023 | 4,964 | (2,027,406 | ) | (33,135 | ) | (1,574,144 | ) | (25,810 | ) | ||||||||||||||||||||
| Class 3 | 1,007 | 16 | 3,442 | 54 | (23,575 | ) | (379 | ) | (19,126 | ) | (309 | ) | ||||||||||||||||||||
| Class 4 | 302,016 | 4,995 | 33,018 | 536 | (132,399 | ) | (2,191 | ) | 202,635 | 3,340 | ||||||||||||||||||||||
| Total net increase (decrease) | $ | 1,238,633 | 20,199 | $ | 914,327 | 14,490 | $ | (5,658,307 | ) | (92,087 | ) | $ | (3,505,347 | ) | (57,398 | ) | ||||||||||||||||
| International Growth and Income Fund | ||||||||||||||||||||||||||||||||
| Sales* | Reinvestments of distributions |
Repurchases* | Net (decrease) increase |
|||||||||||||||||||||||||||||
| Share class | Amount | Shares | Amount | Shares | Amount | Shares | Amount | Shares | ||||||||||||||||||||||||
| Year ended December 31, 2022 | ||||||||||||||||||||||||||||||||
| Class 1 | $ | 2,793 | 220 | $ | 6,501 | 686 | $ | (16,761 | ) | (946 | ) | $ | (7,467 | ) | (40 | ) | ||||||||||||||||
| Class 1A | 1,041 | 92 | 2,255 | 244 | (921 | ) | (61 | ) | 2,375 | 275 | ||||||||||||||||||||||
| Class 2 | 7,743 | 664 | 86,227 | 9,344 | (24,550 | ) | (2,262 | ) | 69,420 | 7,746 | ||||||||||||||||||||||
| Class 4 | 23,335 | 2,027 | 59,065 | 6,499 | (13,968 | ) | (1,295 | ) | 68,432 | 7,231 | ||||||||||||||||||||||
| Total net increase (decrease) | $ | 34,912 | 3,003 | $ | 154,048 | 16,773 | $ | (56,200 | ) | (4,564 | ) | $ | 132,760 | 15,212 | ||||||||||||||||||
| Year ended December 31, 2021 | ||||||||||||||||||||||||||||||||
| Class 1 | $ | 48,015 | 2,368 | $ | 4,294 | 210 | $ | (1,169,382 | ) | (59,936 | ) | $ | (1,117,073 | ) | (57,358 | ) | ||||||||||||||||
| Class 1A | 2,986 | 152 | 141 | 7 | (561 | ) | (28 | ) | 2,566 | 131 | ||||||||||||||||||||||
| Class 2 | 8,004 | 401 | 6,218 | 322 | (29,755 | ) | (1,507 | ) | (15,533 | ) | (784 | ) | ||||||||||||||||||||
| Class 4 | 27,229 | 1,381 | 3,589 | 188 | (13,127 | ) | (671 | ) | 17,691 | 898 | ||||||||||||||||||||||
| Total net increase (decrease) | $ | 86,234 | 4,302 | $ | 14,242 | 727 | $ | (1,212,825 | ) | (62,142 | ) | $ | (1,112,349 | ) | (57,113 | ) | ||||||||||||||||
Refer to the end of the tables for footnotes.
| American Funds Insurance Series | 341 |
| Capital Income Builder | ||||||||||||||||||||||||||||||||
| Sales* | Reinvestments of distributions |
Repurchases* | Net increase (decrease) |
|||||||||||||||||||||||||||||
| Share class | Amount | Shares | Amount | Shares | Amount | Shares | Amount | Shares | ||||||||||||||||||||||||
| Year ended December 31, 2022 | ||||||||||||||||||||||||||||||||
| Class 1 | $ | 177,351 | 15,800 | $ | 17,636 | 1,573 | $ | (114,944 | ) | (10,289 | ) | $ | 80,043 | 7,084 | ||||||||||||||||||
| Class 1A | 2,218 | 196 | 270 | 24 | (1,259 | ) | (111 | ) | 1,229 | 109 | ||||||||||||||||||||||
| Class 2 | 2,390 | 211 | 355 | 32 | (1,006 | ) | (88 | ) | 1,739 | 155 | ||||||||||||||||||||||
| Class 4 | 94,517 | 8,303 | 13,728 | 1,228 | (81,854 | ) | (7,293 | ) | 26,391 | 2,238 | ||||||||||||||||||||||
| Total net increase (decrease) | $ | 276,476 | 24,510 | $ | 31,989 | 2,857 | $ | (199,063 | ) | (17,781 | ) | $ | 109,402 | 9,586 | ||||||||||||||||||
| Year ended December 31, 2021 | ||||||||||||||||||||||||||||||||
| Class 1 | $ | 107,711 | 9,192 | $ | 16,222 | 1,379 | $ | (252,397 | ) | (21,377 | ) | $ | (128,464 | ) | (10,806 | ) | ||||||||||||||||
| Class 1A | 2,434 | 206 | 218 | 19 | (451 | ) | (39 | ) | 2,201 | 186 | ||||||||||||||||||||||
| Class 2 | 5,007 | 428 | 315 | 27 | (1,572 | ) | (134 | ) | 3,750 | 321 | ||||||||||||||||||||||
| Class 4 | 70,040 | 6,029 | 13,009 | 1,105 | (42,227 | ) | (3,629 | ) | 40,822 | 3,505 | ||||||||||||||||||||||
| Total net increase (decrease) | $ | 185,192 | 15,855 | $ | 29,764 | 2,530 | $ | (296,647 | ) | (25,179 | ) | $ | (81,691 | ) | (6,794 | ) | ||||||||||||||||
| Asset Allocation Fund | ||||||||||||||||||||||||||||||||
| Sales* | Reinvestments of distributions |
Repurchases* | Net increase (decrease) |
|||||||||||||||||||||||||||||
| Share class | Amount | Shares | Amount | Shares | Amount | Shares | Amount | Shares | ||||||||||||||||||||||||
| Year ended December 31, 2022 | ||||||||||||||||||||||||||||||||
| Class 1 | $ | 1,365,105 | 57,634 | $ | 2,001,507 | 85,450 | $ | (2,607,782 | ) | (108,817 | ) | $ | 758,830 | 34,267 | ||||||||||||||||||
| Class 1A | 8,603 | 375 | 2,806 | 121 | (2,839 | ) | (126 | ) | 8,570 | 370 | ||||||||||||||||||||||
| Class 2 | 58,248 | 2,413 | 565,030 | 24,435 | (581,503 | ) | (24,252 | ) | 41,775 | 2,596 | ||||||||||||||||||||||
| Class 3 | 126 | 5 | 3,759 | 160 | (3,377 | ) | (141 | ) | 508 | 24 | ||||||||||||||||||||||
| Class 4 | 332,209 | 13,862 | 680,622 | 29,650 | (423,984 | ) | (17,975 | ) | 588,847 | 25,537 | ||||||||||||||||||||||
| Total net increase (decrease) | $ | 1,764,291 | 74,289 | $ | 3,253,724 | 139,816 | $ | (3,619,485 | ) | (151,311 | ) | $ | 1,398,530 | 62,794 | ||||||||||||||||||
| Year ended December 31, 2021 | ||||||||||||||||||||||||||||||||
| Class 1 | $ | 1,077,099 | 38,077 | $ | 1,004,165 | 35,557 | $ | (4,395,063 | ) | (151,941 | ) | $ | (2,313,799 | ) | (78,307 | ) | ||||||||||||||||
| Class 1A | 8,925 | 315 | 880 | 31 | (1,749 | ) | (63 | ) | 8,056 | 283 | ||||||||||||||||||||||
| Class 2 | 117,974 | 4,243 | 262,797 | 9,420 | (649,009 | ) | (23,286 | ) | (268,238 | ) | (9,623 | ) | ||||||||||||||||||||
| Class 3 | 1,030 | 36 | 1,693 | 60 | (2,340 | ) | (83 | ) | 383 | 13 | ||||||||||||||||||||||
| Class 4 | 687,105 | 24,820 | 271,781 | 9,809 | (264,761 | ) | (9,619 | ) | 694,125 | 25,010 | ||||||||||||||||||||||
| Total net increase (decrease) | $ | 1,892,133 | 67,491 | $ | 1,541,316 | 54,877 | $ | (5,312,922 | ) | (184,992 | ) | $ | (1,879,473 | ) | (62,624 | ) | ||||||||||||||||
Refer to the end of the tables for footnotes.
| 342 | American Funds Insurance Series |
| American Funds Global Balanced Fund | ||||||||||||||||||||||||||||||||
| Sales* | Reinvestments of distributions |
Repurchases* | Net (decrease) increase |
|||||||||||||||||||||||||||||
| Share class | Amount | Shares | Amount | Shares | Amount | Shares | Amount | Shares | ||||||||||||||||||||||||
| Year ended December 31, 2022 | ||||||||||||||||||||||||||||||||
| Class 1 | $ | 37,857 | 3,046 | $ | 570 | 44 | $ | (45,473 | ) | (3,593 | ) | $ | (7,046 | ) | (503 | ) | ||||||||||||||||
| Class 1A | 160 | 12 | 15 | 1 | (857 | ) | (63 | ) | (682 | ) | (50 | ) | ||||||||||||||||||||
| Class 2 | 3,979 | 308 | 974 | 74 | (24,238 | ) | (1,876 | ) | (19,285 | ) | (1,494 | ) | ||||||||||||||||||||
| Class 4 | 9,992 | 779 | 674 | 52 | (14,316 | ) | (1,139 | ) | (3,650 | ) | (308 | ) | ||||||||||||||||||||
| Total net increase (decrease) | $ | 51,988 | 4,145 | $ | 2,233 | 171 | $ | (84,884 | ) | (6,671 | ) | $ | (30,663 | ) | (2,355 | ) | ||||||||||||||||
| Year ended December 31, 2021 | ||||||||||||||||||||||||||||||||
| Class 1 | $ | 9,259 | 623 | $ | 7,739 | 533 | $ | (40,506 | ) | (2,798 | ) | $ | (23,508 | ) | (1,642 | ) | ||||||||||||||||
| Class 1A | 925 | 63 | 233 | 16 | (252 | ) | (17 | ) | 906 | 62 | ||||||||||||||||||||||
| Class 2 | 5,621 | 383 | 13,069 | 902 | (27,137 | ) | (1,828 | ) | (8,447 | ) | (543 | ) | ||||||||||||||||||||
| Class 4 | 28,503 | 1,957 | 8,206 | 572 | (10,476 | ) | (713 | ) | 26,233 | 1,816 | ||||||||||||||||||||||
| Total net increase (decrease) | $ | 44,308 | 3,026 | $ | 29,247 | 2,023 | $ | (78,371 | ) | (5,356 | ) | $ | (4,816 | ) | (307 | ) | ||||||||||||||||
| The Bond Fund of America | ||||||||||||||||||||||||||||||||
| Sales* | Reinvestments of distributions |
Repurchases* | Net (decrease) increase |
|||||||||||||||||||||||||||||
| Share class | Amount | Shares | Amount | Shares | Amount | Shares | Amount | Shares | ||||||||||||||||||||||||
| Year ended December 31, 2022 | ||||||||||||||||||||||||||||||||
| Class 1 | $ | 1,045,629 | 102,870 | $ | 293,730 | 29,996 | $ | (2,254,686 | ) | (218,872 | ) | $ | (915,327 | ) | (86,006 | ) | ||||||||||||||||
| Class 1A | 222,556 | 22,066 | 9,170 | 944 | (5,163 | ) | (515 | ) | 226,563 | 22,495 | ||||||||||||||||||||||
| Class 2 | 49,800 | 5,005 | 126,095 | 13,059 | (487,579 | ) | (48,690 | ) | (311,684 | ) | (30,626 | ) | ||||||||||||||||||||
| Class 4 | 123,107 | 12,517 | 31,861 | 3,314 | (113,670 | ) | (11,505 | ) | 41,298 | 4,326 | ||||||||||||||||||||||
| Total net increase (decrease) | $ | 1,441,092 | 142,458 | $ | 460,856 | 47,313 | $ | (2,861,098 | ) | (279,582 | ) | $ | (959,150 | ) | (89,811 | ) | ||||||||||||||||
| Year ended December 31, 2021 | ||||||||||||||||||||||||||||||||
| Class 1 | $ | 2,441,954 | 212,866 | $ | 432,376 | 38,456 | $ | (737,146 | ) | (64,100 | ) | $ | 2,137,184 | 187,222 | ||||||||||||||||||
| Class 1A | 5,329 | 464 | 601 | 54 | (2,565 | ) | (223 | ) | 3,365 | 295 | ||||||||||||||||||||||
| Class 2 | 204,371 | 17,879 | 208,042 | 18,765 | (302,247 | ) | (26,735 | ) | 110,166 | 9,909 | ||||||||||||||||||||||
| Class 4 | 240,539 | 21,228 | 43,487 | 3,939 | (60,173 | ) | (5,327 | ) | 223,853 | 19,840 | ||||||||||||||||||||||
| Total net increase (decrease) | $ | 2,892,193 | 252,437 | $ | 684,506 | 61,214 | $ | (1,102,131 | ) | (96,385 | ) | $ | 2,474,568 | 217,266 | ||||||||||||||||||
| Capital World Bond Fund | ||||||||||||||||||||||||||||||||
| Sales* | Reinvestments of distributions |
Repurchases* | Net (decrease) increase |
|||||||||||||||||||||||||||||
| Share class | Amount | Shares | Amount | Shares | Amount | Shares | Amount | Shares | ||||||||||||||||||||||||
| Year ended December 31, 2022 | ||||||||||||||||||||||||||||||||
| Class 1 | $ | 63,069 | 6,354 | $ | 13,903 | 1,398 | $ | (234,228 | ) | (22,105 | ) | $ | (157,256 | ) | (14,353 | ) | ||||||||||||||||
| Class 1A | 470 | 46 | 24 | 2 | (371 | ) | (38 | ) | 123 | 10 | ||||||||||||||||||||||
| Class 2 | 32,696 | 3,225 | 15,838 | 1,606 | (121,387 | ) | (11,954 | ) | (72,853 | ) | (7,123 | ) | ||||||||||||||||||||
| Class 4 | 7,078 | 688 | 1,065 | 109 | (8,255 | ) | (838 | ) | (112 | ) | (41 | ) | ||||||||||||||||||||
| Total net increase (decrease) | $ | 103,313 | 10,313 | $ | 30,830 | 3,115 | $ | (364,241 | ) | (34,935 | ) | $ | (230,098 | ) | (21,507 | ) | ||||||||||||||||
| Year ended December 31, 2021 | ||||||||||||||||||||||||||||||||
| Class 1 | $ | 129,119 | 10,361 | $ | 44,414 | 3,661 | $ | (305,638 | ) | (24,399 | ) | $ | (132,105 | ) | (10,377 | ) | ||||||||||||||||
| Class 1A | 1,155 | 95 | 40 | 3 | (261 | ) | (21 | ) | 934 | 77 | ||||||||||||||||||||||
| Class 2 | 83,201 | 6,733 | 44,570 | 3,700 | (58,585 | ) | (4,813 | ) | 69,186 | 5,620 | ||||||||||||||||||||||
| Class 4 | 19,357 | 1,604 | 2,457 | 206 | (11,624 | ) | (951 | ) | 10,190 | 859 | ||||||||||||||||||||||
| Total net increase (decrease) | $ | 232,832 | 18,793 | $ | 91,481 | 7,570 | $ | (376,108 | ) | (30,184 | ) | $ | (51,795 | ) | (3,821 | ) | ||||||||||||||||
Refer to the end of the tables for footnotes.
| American Funds Insurance Series | 343 |
| American High-Income Trust | ||||||||||||||||||||||||||||||||
| Sales* | Reinvestments of distributions |
Repurchases* | Net (decrease) increase |
|||||||||||||||||||||||||||||
| Share class | Amount | Shares | Amount | Shares | Amount | Shares | Amount | Shares | ||||||||||||||||||||||||
| Year ended December 31, 2022 | ||||||||||||||||||||||||||||||||
| Class 1 | $ | 29,406 | 3,042 | $ | 17,917 | 2,062 | $ | (58,971 | ) | (6,116 | ) | $ | (11,648 | ) | (1,012 | ) | ||||||||||||||||
| Class 1A | 362 | 39 | 100 | 11 | (426 | ) | (45 | ) | 36 | 5 | ||||||||||||||||||||||
| Class 2 | 7,171 | 758 | 42,707 | 5,019 | (98,679 | ) | (10,782 | ) | (48,801 | ) | (5,005 | ) | ||||||||||||||||||||
| Class 3 | 432 | 46 | 695 | 79 | (1,385 | ) | (149 | ) | (258 | ) | (24 | ) | ||||||||||||||||||||
| Class 4 | 65,309 | 6,490 | 5,827 | 619 | (70,275 | ) | (6,997 | ) | 861 | 112 | ||||||||||||||||||||||
| Total net increase (decrease) | $ | 102,680 | 10,375 | $ | 67,246 | 7,790 | $ | (229,736 | ) | (24,089 | ) | $ | (59,810 | ) | (5,924 | ) | ||||||||||||||||
| Year ended December 31, 2021 | ||||||||||||||||||||||||||||||||
| Class 1 | $ | 160,559 | 15,547 | $ | 10,757 | 1,060 | $ | (19,514 | ) | (1,906 | ) | $ | 151,802 | 14,701 | ||||||||||||||||||
| Class 1A | 915 | 89 | 59 | 5 | (548 | ) | (53 | ) | 426 | 41 | ||||||||||||||||||||||
| Class 2 | 20,019 | 2,003 | 28,636 | 2,874 | (66,675 | ) | (6,630 | ) | (18,020 | ) | (1,753 | ) | ||||||||||||||||||||
| Class 3 | 908 | 88 | 429 | 42 | (1,328 | ) | (129 | ) | 9 | 1 | ||||||||||||||||||||||
| Class 4 | 143,656 | 13,002 | 3,238 | 295 | (128,886 | ) | (11,648 | ) | 18,008 | 1,649 | ||||||||||||||||||||||
| Total net increase (decrease) | $ | 326,057 | 30,729 | $ | 43,119 | 4,276 | $ | (216,951 | ) | (20,366 | ) | $ | 152,225 | 14,639 | ||||||||||||||||||
| American Funds Mortgage Fund | ||||||||||||||||||||||||||||||||
| Sales* | Reinvestments of distributions |
Repurchases* | Net (decrease) increase |
|||||||||||||||||||||||||||||
| Share class | Amount | Shares | Amount | Shares | Amount | Shares | Amount | Shares | ||||||||||||||||||||||||
| Year ended December 31, 2022 | ||||||||||||||||||||||||||||||||
| Class 1 | $ | 784 | 78 | $ | 15 | 2 | $ | (229,165 | ) | (21,726 | ) | $ | (228,366 | ) | (21,646 | ) | ||||||||||||||||
| Class 1A | 662 | 67 | 37 | 4 | (1,033 | ) | (103 | ) | (334 | ) | (32 | ) | ||||||||||||||||||||
| Class 2 | 3,214 | 326 | 995 | 103 | (9,402 | ) | (951 | ) | (5,193 | ) | (522 | ) | ||||||||||||||||||||
| Class 4 | 10,671 | 1,091 | 746 | 78 | (9,016 | ) | (920 | ) | 2,401 | 249 | ||||||||||||||||||||||
| Total net increase (decrease) | $ | 15,331 | 1,562 | $ | 1,793 | 187 | $ | (248,616 | ) | (23,700 | ) | $ | (231,492 | ) | (21,951 | ) | ||||||||||||||||
| Year ended December 31, 2021 | ||||||||||||||||||||||||||||||||
| Class 1 | $ | 35,679 | 3,267 | $ | 9,382 | 880 | $ | (27,270 | ) | (2,517 | ) | $ | 17,791 | 1,630 | ||||||||||||||||||
| Class 1A | 1,498 | 139 | 57 | 5 | (436 | ) | (40 | ) | 1,119 | 104 | ||||||||||||||||||||||
| Class 2 | 6,415 | 588 | 2,232 | 210 | (5,928 | ) | (547 | ) | 2,719 | 251 | ||||||||||||||||||||||
| Class 4 | 11,056 | 1,029 | 1,486 | 142 | (4,892 | ) | (457 | ) | 7,650 | 714 | ||||||||||||||||||||||
| Total net increase (decrease) | $ | 54,648 | 5,023 | $ | 13,157 | 1,237 | $ | (38,526 | ) | (3,561 | ) | $ | 29,279 | 2,699 | ||||||||||||||||||
Refer to the end of the tables for footnotes.
| 344 | American Funds Insurance Series |
| Ultra-Short Bond Fund | ||||||||||||||||||||||||||||||||
| Sales* | Reinvestments of distributions |
Repurchases* | Net increase (decrease) |
|||||||||||||||||||||||||||||
| Share class | Amount | Shares | Amount | Shares | Amount | Shares | Amount | Shares | ||||||||||||||||||||||||
| Year ended December 31, 2022 | ||||||||||||||||||||||||||||||||
| Class 1 | $ | 33,573 | 2,975 | $ | 348 | 31 | $ | (20,904 | ) | (1,853 | ) | $ | 13,017 | 1,153 | ||||||||||||||||||
| Class 1A | — | — | — | † | — | † | — | — | — | † | — | † | ||||||||||||||||||||
| Class 2 | 117,586 | 10,755 | 1,569 | 143 | (68,709 | ) | (6,275 | ) | 50,446 | 4,623 | ||||||||||||||||||||||
| Class 3 | 735 | 67 | 26 | 2 | (1,082 | ) | (97 | ) | (321 | ) | (28 | ) | ||||||||||||||||||||
| Class 4 | 84,873 | 7,721 | 293 | 27 | (51,358 | ) | (4,671 | ) | 33,808 | 3,077 | ||||||||||||||||||||||
| Total net increase (decrease) | $ | 236,767 | 21,518 | $ | 2,236 | 203 | $ | (142,053 | ) | (12,896 | ) | $ | 96,950 | 8,825 | ||||||||||||||||||
| Year ended December 31, 2021 | ||||||||||||||||||||||||||||||||
| Class 1 | $ | 16,242 | 1,439 | $ | — | — | $ | (22,707 | ) | (2,011 | ) | $ | (6,465 | ) | (572 | ) | ||||||||||||||||
| Class 1A | — | — | — | — | — | — | — | — | ||||||||||||||||||||||||
| Class 2 | 86,233 | 7,864 | — | — | (127,622 | ) | (11,640 | ) | (41,389 | ) | (3,776 | ) | ||||||||||||||||||||
| Class 3 | 1,253 | 113 | — | — | (915 | ) | (83 | ) | 338 | 30 | ||||||||||||||||||||||
| Class 4 | 35,704 | 3,232 | — | — | (29,389 | ) | (2,660 | ) | 6,315 | 572 | ||||||||||||||||||||||
| Total net increase (decrease) | $ | 139,432 | 12,648 | $ | — | — | $ | (180,633 | ) | (16,394 | ) | $ | (41,201 | ) | (3,746 | ) | ||||||||||||||||
| U.S. Government Securities Fund | ||||||||||||||||||||||||||||||||
| Sales* | Reinvestments of distributions |
Repurchases* | Net (decrease) increase |
|||||||||||||||||||||||||||||
| Share class | Amount | Shares | Amount | Shares | Amount | Shares | Amount | Shares | ||||||||||||||||||||||||
| Year ended December 31, 2022 | ||||||||||||||||||||||||||||||||
| Class 1 | $ | 69,422 | 6,446 | $ | 10,134 | 987 | $ | (316,401 | ) | (27,982 | ) | $ | (236,845 | ) | (20,549 | ) | ||||||||||||||||
| Class 1A | 2,902 | 273 | 153 | 15 | (3,237 | ) | (300 | ) | (182 | ) | (12 | ) | ||||||||||||||||||||
| Class 2 | 43,941 | 4,115 | 42,631 | 4,200 | (233,844 | ) | (21,667 | ) | (147,272 | ) | (13,352 | ) | ||||||||||||||||||||
| Class 3 | 308 | 28 | 292 | 28 | (2,508 | ) | (236 | ) | (1,908 | ) | (180 | ) | ||||||||||||||||||||
| Class 4 | 67,334 | 6,331 | 7,040 | 695 | (90,440 | ) | (8,406 | ) | (16,066 | ) | (1,380 | ) | ||||||||||||||||||||
| Total net increase (decrease) | $ | 183,907 | 17,193 | $ | 60,250 | 5,925 | $ | (646,430 | ) | (58,591 | ) | $ | (402,273 | ) | (35,473 | ) | ||||||||||||||||
| Year ended December 31, 2021 | ||||||||||||||||||||||||||||||||
| Class 1 | $ | 213,039 | 17,786 | $ | 38,963 | 3,337 | $ | (115,497 | ) | (9,263 | ) | $ | 136,505 | 11,860 | ||||||||||||||||||
| Class 1A | 4,388 | 354 | 518 | 44 | (3,192 | ) | (265 | ) | 1,714 | 133 | ||||||||||||||||||||||
| Class 2 | 91,122 | 7,303 | 144,267 | 12,514 | (129,818 | ) | (10,810 | ) | 105,571 | 9,007 | ||||||||||||||||||||||
| Class 3 | 1,023 | 86 | 948 | 81 | (1,549 | ) | (126 | ) | 422 | 41 | ||||||||||||||||||||||
| Class 4 | 87,885 | 7,227 | 23,653 | 2,055 | (118,823 | ) | (9,719 | ) | (7,285 | ) | (437 | ) | ||||||||||||||||||||
| Total net increase (decrease) | $ | 397,457 | 32,756 | $ | 208,349 | 18,031 | $ | (368,879 | ) | (30,183 | ) | $ | 236,927 | 20,604 | ||||||||||||||||||
| Managed Risk Growth Fund | ||||||||||||||||||||||||||||||||
| Sales* | Reinvestments of distributions |
Repurchases* | Net increase (decrease) |
|||||||||||||||||||||||||||||
| Share class | Amount | Shares | Amount | Shares | Amount | Shares | Amount | Shares | ||||||||||||||||||||||||
| Year ended December 31, 2022 | ||||||||||||||||||||||||||||||||
| Class P1 | $ | 1,679 | 122 | $ | 1,796 | 147 | $ | (2,034 | ) | (134 | ) | $ | 1,441 | 135 | ||||||||||||||||||
| Class P2 | 37,760 | 2,684 | 88,450 | 7,291 | (30,630 | ) | (2,253 | ) | 95,580 | 7,722 | ||||||||||||||||||||||
| Total net increase (decrease) | $ | 39,439 | 2,806 | $ | 90,246 | 7,438 | $ | (32,664 | ) | (2,387 | ) | $ | 97,021 | 7,857 | ||||||||||||||||||
| Year ended December 31, 2021 | ||||||||||||||||||||||||||||||||
| Class P1 | $ | 3,593 | 199 | $ | 515 | 30 | $ | (3,079 | ) | (172 | ) | $ | 1,029 | 57 | ||||||||||||||||||
| Class P2 | 39,055 | 2,202 | 26,869 | 1,558 | (78,851 | ) | (4,405 | ) | (12,927 | ) | (645 | ) | ||||||||||||||||||||
| Total net increase (decrease) | $ | 42,648 | 2,401 | $ | 27,384 | 1,588 | $ | (81,930 | ) | (4,577 | ) | $ | (11,898 | ) | (588 | ) | ||||||||||||||||
Refer to the end of the tables for footnotes.
| American Funds Insurance Series | 345 |
| Managed Risk International Fund | ||||||||||||||||||||||||||||||||
| Sales* | Reinvestments of distributions |
Repurchases* | Net increase (decrease) |
|||||||||||||||||||||||||||||
| Share class | Amount | Shares | Amount | Shares | Amount | Shares | Amount | Shares | ||||||||||||||||||||||||
| Year ended December 31, 2022 | ||||||||||||||||||||||||||||||||
| Class P1 | $ | 578 | 62 | $ | 69 | 8 | $ | (323 | ) | (37 | ) | $ | 324 | 33 | ||||||||||||||||||
| Class P2 | 5,403 | 564 | 4,206 | 470 | (15,947 | ) | (1,788 | ) | (6,338 | ) | (754 | ) | ||||||||||||||||||||
| Total net increase (decrease) | $ | 5,981 | 626 | $ | 4,275 | 478 | $ | (16,270 | ) | (1,825 | ) | $ | (6,014 | ) | (721 | ) | ||||||||||||||||
| Year ended December 31, 2021 | ||||||||||||||||||||||||||||||||
| Class P1 | $ | 887 | 80 | $ | 14 | 1 | $ | (531 | ) | (48 | ) | $ | 370 | 33 | ||||||||||||||||||
| Class P2 | 12,803 | 1,181 | 917 | 80 | (14,744 | ) | (1,323 | ) | (1,024 | ) | (62 | ) | ||||||||||||||||||||
| Total net increase (decrease) | $ | 13,690 | 1,261 | $ | 931 | 81 | $ | (15,275 | ) | (1,371 | ) | $ | (654 | ) | (29 | ) | ||||||||||||||||
| Managed Risk Washington Mutual Investors Fund | ||||||||||||||||||||||||||||||||
| Sales* | Reinvestments of distributions |
Repurchases* | Net increase (decrease) |
|||||||||||||||||||||||||||||
| Share class | Amount | Shares | Amount | Shares | Amount | Shares | Amount | Shares | ||||||||||||||||||||||||
| Year ended December 31, 2022 | ||||||||||||||||||||||||||||||||
| Class P1 | $ | 1,026 | 86 | $ | 127 | 11 | $ | (498 | ) | (43 | ) | $ | 655 | 54 | ||||||||||||||||||
| Class P2 | 22,662 | 1,947 | 14,544 | 1,281 | (39,363 | ) | (3,307 | ) | (2,157 | ) | (79 | ) | ||||||||||||||||||||
| Total net increase (decrease) | $ | 23,688 | 2,033 | $ | 14,671 | 1,292 | $ | (39,861 | ) | (3,350 | ) | $ | (1,502 | ) | (25 | ) | ||||||||||||||||
| Year ended December 31, 2021 | ||||||||||||||||||||||||||||||||
| Class P1 | $ | 971 | 80 | $ | 40 | 3 | $ | (343 | ) | (29 | ) | $ | 668 | 54 | ||||||||||||||||||
| Class P2 | 9,743 | 800 | 5,979 | 487 | (51,273 | ) | (4,254 | ) | (35,551 | ) | (2,967 | ) | ||||||||||||||||||||
| Total net increase (decrease) | $ | 10,714 | 880 | $ | 6,019 | 490 | $ | (51,616 | ) | (4,283 | ) | $ | (34,883 | ) | (2,913 | ) | ||||||||||||||||
| Managed Risk Growth-Income Fund | ||||||||||||||||||||||||||||||||
| Sales* | Reinvestments of distributions |
Repurchases* | Net decrease | |||||||||||||||||||||||||||||
| Share class | Amount | Shares | Amount | Shares | Amount | Shares | Amount | Shares | ||||||||||||||||||||||||
| Year ended December 31, 2022 | ||||||||||||||||||||||||||||||||
| Class P1 | $ | 49,558 | 3,678 | $ | 87,716 | 6,731 | $ | (157,932 | ) | (11,880 | ) | $ | (20,658 | ) | (1,471 | ) | ||||||||||||||||
| Class P2 | 13,539 | 1,010 | 12,087 | 932 | (28,848 | ) | (2,135 | ) | (3,222 | ) | (193 | ) | ||||||||||||||||||||
| Total net increase (decrease) | $ | 63,097 | 4,688 | $ | 99,803 | 7,663 | $ | (186,780 | ) | (14,015 | ) | $ | (23,880 | ) | (1,664 | ) | ||||||||||||||||
| Year ended December 31, 2021 | ||||||||||||||||||||||||||||||||
| Class P1 | $ | 64,192 | 4,303 | $ | 60,096 | 4,023 | $ | (175,764 | ) | (11,680 | ) | $ | (51,476 | ) | (3,354 | ) | ||||||||||||||||
| Class P2 | 14,838 | 1,008 | 8,072 | 546 | (35,819 | ) | (2,404 | ) | (12,909 | ) | (850 | ) | ||||||||||||||||||||
| Total net increase (decrease) | $ | 79,030 | 5,311 | $ | 68,168 | 4,569 | $ | (211,583 | ) | (14,084 | ) | $ | (64,385 | ) | (4,204 | ) | ||||||||||||||||
Refer to the end of the tables for footnotes.
| 346 | American Funds Insurance Series |
| Managed Risk Asset Allocation Fund | ||||||||||||||||||||||||||||||||
| Sales* | Reinvestments of distributions |
Repurchases* | Net increase (decrease) |
|||||||||||||||||||||||||||||
| Share class | Amount | Shares | Amount | Shares | Amount | Shares | Amount | Shares | ||||||||||||||||||||||||
| Year ended December 31, 2022 | ||||||||||||||||||||||||||||||||
| Class P1 | $ | 1,649 | 120 | $ | 430 | 34 | $ | (675 | ) | (52 | ) | $ | 1,404 | 102 | ||||||||||||||||||
| Class P2 | 38,665 | 2,998 | 138,534 | 11,152 | (283,108 | ) | (22,026 | ) | (105,909 | ) | (7,876 | ) | ||||||||||||||||||||
| Total net increase (decrease) | $ | 40,314 | 3,118 | $ | 138,964 | 11,186 | $ | (283,783 | ) | (22,078 | ) | $ | (104,505 | ) | (7,774 | ) | ||||||||||||||||
| Year ended December 31, 2021 | ||||||||||||||||||||||||||||||||
| Class P1 | $ | 2,097 | 141 | $ | 114 | 8 | $ | (899 | ) | (60 | ) | $ | 1,312 | 89 | ||||||||||||||||||
| Class P2 | 57,616 | 4,016 | 38,113 | 2,632 | (351,072 | ) | (24,507 | ) | (255,343 | ) | (17,859 | ) | ||||||||||||||||||||
| Total net increase (decrease) | $ | 59,713 | 4,157 | $ | 38,227 | 2,640 | $ | (351,971 | ) | (24,567 | ) | $ | (254,031 | ) | (17,770 | ) | ||||||||||||||||
| * | Includes exchanges between share classes of the fund. |
| † | Amount less than one thousand. |
11. Ownership concentration
At December 31, 2022, American Funds Insurance Series - Portfolio Series - Managed Risk Growth and Income Portfolio held 18% and 17% of the outstanding shares of American Funds Insurance Series - Capital World Growth and Income Fund and American Funds Insurance Series - Capital Income Builder, respectively. In addition, American Funds Insurance Series - Portfolio Series - Managed Risk Global Allocation Portfolio held 25% of the outstanding shares of American Funds Insurance Series - American Funds Global Balanced Fund.
12. Investment transactions and other disclosures
The following tables present additional information for each fund for the year ended December 31, 2022 (dollars in thousands):
| Global Growth Fund |
Global Small Capitalization Fund |
Growth Fund |
International Fund |
New World Fund |
Washington Mutual Investors Fund |
|||||||||||||||||||
| Purchases of investment securities* | $ | 2,020,468 | $ | 1,224,731 | $ | 10,017,065 | $ | 2,810,699 | $ | 1,260,720 | $ | 2,833,147 | ||||||||||||
| Sales of investment securities* | 2,146,215 | 1,218,842 | 10,662,318 | 2,867,081 | 1,624,730 | 3,802,409 | ||||||||||||||||||
| Non-U.S. taxes paid on dividend income | 6,202 | 2,117 | 9,817 | 9,312 | 3,655 | 1,964 | ||||||||||||||||||
| Non-U.S. taxes paid on interest income | — | — | — | — | 5 | — | ||||||||||||||||||
| Non-U.S. taxes paid on realized gains | 1,408 | 5,338 | — | 8,023 | 4,440 | — | ||||||||||||||||||
| Non-U.S. taxes provided on unrealized appreciation | 5,103 | 9,184 | — | 25,364 | 8,906 | — | ||||||||||||||||||
| Capital World Growth and Income Fund |
Growth- Income Fund |
International Growth and Income Fund |
Capital Income Builder |
Asset Allocation Fund |
American Funds Global Balanced Fund |
|||||||||||||||||||
| Purchases of investment securities* | $ | 749,437 | $ | 8,339,283 | $ | 142,556 | $ | 1,242,326 | $ | 27,267,262 | $ | 392,565 | ||||||||||||
| Sales of investment securities* | 985,479 | 12,308,349 | 139,199 | 1,167,109 | 28,617,726 | 407,112 | ||||||||||||||||||
| Non-U.S. taxes paid on dividend income | 2,593 | 9,673 | 744 | 1,500 | 9,616 | 372 | ||||||||||||||||||
| Non-U.S. taxes paid on interest income | — | — | — | — | — | 11 | ||||||||||||||||||
| Non-U.S. taxes paid on realized gains | 173 | — | † | 51 | 46 | — | 43 | |||||||||||||||||
| Non-U.S. taxes provided on unrealized appreciation | 568 | — | 58 | 349 | 2,592 | 83 | ||||||||||||||||||
Refer to the end of the tables for footnotes.
| American Funds Insurance Series | 347 |
| The Bond Fund of America |
Capital World Bond Fund |
American High-Income Trust |
American Funds Mortgage Fund |
Ultra-Short Bond Fund |
U.S. Government Securities Fund |
|||||||||||||||||||
| Purchases of investment securities* | $ | 38,975,446 | $ | 1,910,865 | $ | 293,093 | $ | 1,134,922 | $ | — | $ | 9,478,478 | ||||||||||||
| Sales of investment securities* | 37,928,493 | 2,233,596 | 378,913 | 1,243,904 | — | 9,100,700 | ||||||||||||||||||
| Non-U.S. taxes paid on interest income | 22 | 135 | — | — | — | — | ||||||||||||||||||
| Non-U.S. taxes paid on realized gains | — | 333 | — | — | — | — | ||||||||||||||||||
| Non-U.S. taxes provided on unrealized appreciation | — | 117 | — | — | — | — | ||||||||||||||||||
| Managed Risk Growth Fund |
Managed Risk International Fund |
Managed Risk Washington Mutual Investors Fund |
Managed Risk Growth- Income Fund |
Managed Risk Asset Allocation Fund |
||||||||||||||||||||
| Purchases of investment securities* | $ | 528,842 | $ | 121,812 | $ | 269,212 | $ | 1,486,050 | $ | 1,104,342 | ||||||||||||||
| Sales of investment securities* | 453,254 | 107,992 | 219,710 | 1,431,021 | 1,086,607 | |||||||||||||||||||
| * | Excludes short-term securities and U.S. government obligations, if any. |
| † | Amount less than one thousand. |
| 348 | American Funds Insurance Series |
Financial highlights
| (Loss) income from investment operations1 |
Dividends and distributions | |||||||||||||||||||||||||||||||||||||||||||||||||||
| Year ended | Net asset value, beginning of year |
Net investment income |
Net (losses) gains on securities (both realized and unrealized) |
Total from investment operations |
Dividends (from net investment income) |
Distributions (from capital gains) |
Total dividends and distributions |
Net asset value, end of year |
Total return2 | Net assets, end of year (in millions) |
Ratio of expenses to average net assets before waivers3 |
Ratio of expenses to average net assets after waivers2,3 |
Ratio of net income to average net assets2 |
|||||||||||||||||||||||||||||||||||||||
| Global Growth Fund | ||||||||||||||||||||||||||||||||||||||||||||||||||||
| Class 1: | ||||||||||||||||||||||||||||||||||||||||||||||||||||
| 12/31/2022 | $ | 45.46 | $ | .34 | $ | (11.34 | ) | $ | (11.00 | ) | $ | (.31 | ) | $ | (3.97 | ) | $ | (4.28 | ) | $ | 30.18 | (24.54 | )% | $ | 3,104 | .53 | % | .46 | % | 1.01 | % | |||||||||||||||||||||
| 12/31/2021 | 41.16 | .25 | 6.48 | 6.73 | (.26 | ) | (2.17 | ) | (2.43 | ) | 45.46 | 16.72 | 4,270 | .55 | .54 | .56 | ||||||||||||||||||||||||||||||||||||
| 12/31/2020 | 32.57 | .20 | 9.56 | 9.76 | (.21 | ) | (.96 | ) | (1.17 | ) | 41.16 | 30.79 | 3,309 | .56 | .56 | .59 | ||||||||||||||||||||||||||||||||||||
| 12/31/2019 | 25.74 | .32 | 8.60 | 8.92 | (.41 | ) | (1.68 | ) | (2.09 | ) | 32.57 | 35.61 | 2,515 | .56 | .56 | 1.07 | ||||||||||||||||||||||||||||||||||||
| 12/31/2018 | 30.51 | .29 | (2.65 | ) | (2.36 | ) | (.28 | ) | (2.13 | ) | (2.41 | ) | 25.74 | (8.81 | ) | 1,942 | .55 | .55 | .98 | |||||||||||||||||||||||||||||||||
| Class 1A: | ||||||||||||||||||||||||||||||||||||||||||||||||||||
| 12/31/2022 | 45.28 | .26 | (11.31 | ) | (11.05 | ) | (.22 | ) | (3.97 | ) | (4.19 | ) | 30.04 | (24.73 | ) | 14 | .78 | .71 | .78 | |||||||||||||||||||||||||||||||||
| 12/31/2021 | 41.02 | .14 | 6.46 | 6.60 | (.17 | ) | (2.17 | ) | (2.34 | ) | 45.28 | 16.45 | 18 | .80 | .79 | .33 | ||||||||||||||||||||||||||||||||||||
| 12/31/2020 | 32.47 | .12 | 9.52 | 9.64 | (.13 | ) | (.96 | ) | (1.09 | ) | 41.02 | 30.49 | 12 | .81 | .81 | .34 | ||||||||||||||||||||||||||||||||||||
| 12/31/2019 | 25.69 | .25 | 8.55 | 8.80 | (.34 | ) | (1.68 | ) | (2.02 | ) | 32.47 | 35.22 | 8 | .81 | .81 | .83 | ||||||||||||||||||||||||||||||||||||
| 12/31/2018 | 30.46 | .23 | (2.66 | ) | (2.43 | ) | (.21 | ) | (2.13 | ) | (2.34 | ) | 25.69 | (9.02 | ) | 5 | .80 | .80 | .77 | |||||||||||||||||||||||||||||||||
| Class 2: | ||||||||||||||||||||||||||||||||||||||||||||||||||||
| 12/31/2022 | 44.94 | .25 | (11.21 | ) | (10.96 | ) | (.22 | ) | (3.97 | ) | (4.19 | ) | 29.79 | (24.74 | ) | 3,234 | .78 | .71 | .76 | |||||||||||||||||||||||||||||||||
| 12/31/2021 | 40.72 | .13 | 6.41 | 6.54 | (.15 | ) | (2.17 | ) | (2.32 | ) | 44.94 | 16.42 | 4,559 | .80 | .80 | .30 | ||||||||||||||||||||||||||||||||||||
| 12/31/2020 | 32.24 | .12 | 9.44 | 9.56 | (.12 | ) | (.96 | ) | (1.08 | ) | 40.72 | 30.47 | 4,387 | .81 | .81 | .34 | ||||||||||||||||||||||||||||||||||||
| 12/31/2019 | 25.50 | .24 | 8.51 | 8.75 | (.33 | ) | (1.68 | ) | (2.01 | ) | 32.24 | 35.28 | 3,895 | .81 | .81 | .83 | ||||||||||||||||||||||||||||||||||||
| 12/31/2018 | 30.24 | .22 | (2.63 | ) | (2.41 | ) | (.20 | ) | (2.13 | ) | (2.33 | ) | 25.50 | (9.04 | ) | 3,306 | .80 | .80 | .73 | |||||||||||||||||||||||||||||||||
| Class 4: | ||||||||||||||||||||||||||||||||||||||||||||||||||||
| 12/31/2022 | 44.57 | .17 | (11.12 | ) | (10.95 | ) | (.14 | ) | (3.97 | ) | (4.11 | ) | 29.51 | (24.92 | ) | 584 | 1.03 | .96 | .52 | |||||||||||||||||||||||||||||||||
| 12/31/2021 | 40.45 | .03 | 6.35 | 6.38 | (.09 | ) | (2.17 | ) | (2.26 | ) | 44.57 | 16.14 | 744 | 1.05 | 1.04 | .07 | ||||||||||||||||||||||||||||||||||||
| 12/31/2020 | 32.05 | .03 | 9.38 | 9.41 | (.05 | ) | (.96 | ) | (1.01 | ) | 40.45 | 30.17 | 533 | 1.06 | 1.06 | .09 | ||||||||||||||||||||||||||||||||||||
| 12/31/2019 | 25.39 | .17 | 8.45 | 8.62 | (.28 | ) | (1.68 | ) | (1.96 | ) | 32.05 | 34.87 | 382 | 1.06 | 1.06 | .57 | ||||||||||||||||||||||||||||||||||||
| 12/31/2018 | 30.13 | .14 | (2.60 | ) | (2.46 | ) | (.15 | ) | (2.13 | ) | (2.28 | ) | 25.39 | (9.24 | ) | 249 | 1.05 | 1.05 | .47 | |||||||||||||||||||||||||||||||||
Refer to the end of the tables for footnotes.
| American Funds Insurance Series | 349 |
Financial highlights (continued)
| (Loss) income from investment operations1 |
Dividends and distributions | |||||||||||||||||||||||||||||||||||||||||||||||||||
| Year ended | Net asset value, beginning of year |
Net investment income (loss) |
Net (losses) gains on securities (both realized and unrealized) |
Total from investment operations |
Dividends (from net investment income) |
Distributions (from capital gains) |
Total dividends and distributions |
Net asset value, end of year |
Total return2 | Net assets, end of year (in millions) |
Ratio of expenses to average net assets before waivers3 |
Ratio of expenses to average net assets after waivers2,3 |
Ratio of net income (loss) to average net assets2 |
|||||||||||||||||||||||||||||||||||||||
| Global Small Capitalization Fund | ||||||||||||||||||||||||||||||||||||||||||||||||||||
| Class 1: | ||||||||||||||||||||||||||||||||||||||||||||||||||||
| 12/31/2022 | $ | 34.17 | $ | .05 | $ | (9.50 | ) | $ | (9.45 | ) | $ | — | $ | (8.50 | ) | $ | (8.50 | ) | $ | 16.22 | (29.37 | )% | $ | 916 | .72 | % | .69 | % | .24 | % | ||||||||||||||||||||||
| 12/31/2021 | 32.64 | (.02 | ) | 2.32 | 2.30 | — | (.77 | ) | (.77 | ) | 34.17 | 6.98 | 1,707 | .74 | .74 | (.07 | ) | |||||||||||||||||||||||||||||||||||
| 12/31/2020 | 26.80 | (.01 | ) | 7.49 | 7.48 | (.05 | ) | (1.59 | ) | (1.64 | ) | 32.64 | 30.04 | 2,391 | .75 | .75 | (.06 | ) | ||||||||||||||||||||||||||||||||||
| 12/31/2019 | 21.75 | .12 | 6.61 | 6.73 | (.10 | ) | (1.58 | ) | (1.68 | ) | 26.80 | 31.84 | 2,050 | .75 | .75 | .48 | ||||||||||||||||||||||||||||||||||||
| 12/31/2018 | 25.38 | .11 | (2.51 | ) | (2.40 | ) | (.09 | ) | (1.14 | ) | (1.23 | ) | 21.75 | (10.31 | ) | 1,453 | .73 | .73 | .42 | |||||||||||||||||||||||||||||||||
| Class 1A: | ||||||||||||||||||||||||||||||||||||||||||||||||||||
| 12/31/2022 | 33.93 | — | 4 | (9.43 | ) | (9.43 | ) | — | (8.50 | ) | (8.50 | ) | 16.00 | (29.54 | ) | 4 | .97 | .94 | — | 5 | ||||||||||||||||||||||||||||||||
| 12/31/2021 | 32.49 | (.07 | ) | 2.28 | 2.21 | — | (.77 | ) | (.77 | ) | 33.93 | 6.73 | 5 | .99 | .99 | (.21 | ) | |||||||||||||||||||||||||||||||||||
| 12/31/2020 | 26.74 | (.09 | ) | 7.48 | 7.39 | (.05 | ) | (1.59 | ) | (1.64 | ) | 32.49 | 29.72 | 1 | .99 | .99 | (.33 | ) | ||||||||||||||||||||||||||||||||||
| 12/31/2019 | 21.71 | .05 | 6.61 | 6.66 | (.05 | ) | (1.58 | ) | (1.63 | ) | 26.74 | 31.56 | 1 | .99 | .99 | .22 | ||||||||||||||||||||||||||||||||||||
| 12/31/2018 | 25.36 | .05 | (2.52 | ) | (2.47 | ) | (.04 | ) | (1.14 | ) | (1.18 | ) | 21.71 | (10.56 | ) | — | 6 | .98 | .98 | .21 | ||||||||||||||||||||||||||||||||
| Class 2: | ||||||||||||||||||||||||||||||||||||||||||||||||||||
| 12/31/2022 | 32.94 | — | 4 | (9.14 | ) | (9.14 | ) | — | (8.50 | ) | (8.50 | ) | 15.30 | (29.55 | ) | 1,762 | .97 | .94 | — | 5 | ||||||||||||||||||||||||||||||||
| 12/31/2021 | 31.56 | (.10 | ) | 2.25 | 2.15 | — | (.77 | ) | (.77 | ) | 32.94 | 6.74 | 2,521 | .99 | .99 | (.30 | ) | |||||||||||||||||||||||||||||||||||
| 12/31/2020 | 26.02 | (.08 | ) | 7.25 | 7.17 | (.04 | ) | (1.59 | ) | (1.63 | ) | 31.56 | 29.72 | 2,653 | 1.00 | 1.00 | (.31 | ) | ||||||||||||||||||||||||||||||||||
| 12/31/2019 | 21.16 | .05 | 6.43 | 6.48 | (.04 | ) | (1.58 | ) | (1.62 | ) | 26.02 | 31.52 | 2,363 | 1.00 | 1.00 | .22 | ||||||||||||||||||||||||||||||||||||
| 12/31/2018 | 24.72 | .04 | (2.44 | ) | (2.40 | ) | (.02 | ) | (1.14 | ) | (1.16 | ) | 21.16 | (10.55 | ) | 2,056 | .98 | .98 | .17 | |||||||||||||||||||||||||||||||||
| Class 4: | ||||||||||||||||||||||||||||||||||||||||||||||||||||
| 12/31/2022 | 32.96 | (.05 | ) | (9.13 | ) | (9.18 | ) | — | (8.50 | ) | (8.50 | ) | 15.28 | (29.69 | ) | 261 | 1.22 | 1.19 | (.25 | ) | ||||||||||||||||||||||||||||||||
| 12/31/2021 | 31.67 | (.18 | ) | 2.24 | 2.06 | — | (.77 | ) | (.77 | ) | 32.96 | 6.43 | 344 | 1.24 | 1.24 | (.53 | ) | |||||||||||||||||||||||||||||||||||
| 12/31/2020 | 26.16 | (.14 | ) | 7.27 | 7.13 | (.03 | ) | (1.59 | ) | (1.62 | ) | 31.67 | 29.39 | 268 | 1.25 | 1.25 | (.56 | ) | ||||||||||||||||||||||||||||||||||
| 12/31/2019 | 21.28 | (.01 | ) | 6.47 | 6.46 | — | 4 | (1.58 | ) | (1.58 | ) | 26.16 | 31.24 | 206 | 1.25 | 1.25 | (.04 | ) | ||||||||||||||||||||||||||||||||||
| 12/31/2018 | 24.91 | (.02 | ) | (2.46 | ) | (2.48 | ) | (.01 | ) | (1.14 | ) | (1.15 | ) | 21.28 | (10.80 | ) | 146 | 1.24 | 1.24 | (.08 | ) | |||||||||||||||||||||||||||||||
Refer to the end of the tables for footnotes.
| 350 | American Funds Insurance Series |
Financial highlights (continued)
| (Loss) income from investment operations1 |
Dividends and distributions | |||||||||||||||||||||||||||||||||||||||||||||||
| Year ended | Net asset value, beginning of year |
Net investment income (loss) |
Net (losses) gains on securities (both realized and unrealized) |
Total from investment operations |
Dividends (from net investment income) |
Distributions (from capital gains) |
Total dividends and distributions |
Net asset value, end of year |
Total return | Net assets, end of year (in millions) |
Ratio of expenses to average net assets3 |
Ratio of net income (loss) to average net assets |
||||||||||||||||||||||||||||||||||||
| Growth Fund | ||||||||||||||||||||||||||||||||||||||||||||||||
| Class 1: | ||||||||||||||||||||||||||||||||||||||||||||||||
| 12/31/2022 | $ | 127.58 | $ | .58 | $ | (37.03 | ) | $ | (36.45 | ) | $ | (.53 | ) | $ | (14.31 | ) | $ | (14.84 | ) | $ | 76.29 | (29.75 | )% | $ | 13,660 | .35 | % | .64 | % | |||||||||||||||||||
| 12/31/2021 | 120.22 | .46 | 24.29 | 24.75 | (.58 | ) | (16.81 | ) | (17.39 | ) | 127.58 | 22.30 | 19,783 | .34 | .37 | |||||||||||||||||||||||||||||||||
| 12/31/2020 | 81.22 | .43 | 41.28 | 41.71 | (.53 | ) | (2.18 | ) | (2.71 | ) | 120.22 | 52.45 | 15,644 | .35 | .46 | |||||||||||||||||||||||||||||||||
| 12/31/2019 | 69.96 | .83 | 19.63 | 20.46 | (.76 | ) | (8.44 | ) | (9.20 | ) | 81.22 | 31.11 | 10,841 | .35 | 1.09 | |||||||||||||||||||||||||||||||||
| 12/31/2018 | 77.85 | .64 | .25 | .89 | (.54 | ) | (8.24 | ) | (8.78 | ) | 69.96 | (.01 | ) | 8,474 | .34 | .81 | ||||||||||||||||||||||||||||||||
| Class 1A: | ||||||||||||||||||||||||||||||||||||||||||||||||
| 12/31/2022 | 126.70 | .39 | (36.79 | ) | (36.40 | ) | (.38 | ) | (14.31 | ) | (14.69 | ) | 75.61 | (29.93 | ) | 187 | .60 | .45 | ||||||||||||||||||||||||||||||
| 12/31/2021 | 119.59 | .16 | 24.11 | 24.27 | (.35 | ) | (16.81 | ) | (17.16 | ) | 126.70 | 21.97 | 121 | .59 | .13 | |||||||||||||||||||||||||||||||||
| 12/31/2020 | 80.92 | .20 | 41.05 | 41.25 | (.40 | ) | (2.18 | ) | (2.58 | ) | 119.59 | 52.07 | 60 | .60 | .21 | |||||||||||||||||||||||||||||||||
| 12/31/2019 | 69.77 | .65 | 19.55 | 20.20 | (.61 | ) | (8.44 | ) | (9.05 | ) | 80.92 | 30.79 | 18 | .60 | .85 | |||||||||||||||||||||||||||||||||
| 12/31/2018 | 77.74 | .47 | .24 | .71 | (.44 | ) | (8.24 | ) | (8.68 | ) | 69.77 | (.26 | ) | 10 | .59 | .60 | ||||||||||||||||||||||||||||||||
| Class 2: | ||||||||||||||||||||||||||||||||||||||||||||||||
| 12/31/2022 | 126.28 | .35 | (36.62 | ) | (36.27 | ) | (.29 | ) | (14.31 | ) | (14.60 | ) | 75.41 | (29.94 | ) | 14,452 | .60 | .38 | ||||||||||||||||||||||||||||||
| 12/31/2021 | 119.18 | .15 | 24.03 | 24.18 | (.27 | ) | (16.81 | ) | (17.08 | ) | 126.28 | 21.97 | 21,986 | .59 | .12 | |||||||||||||||||||||||||||||||||
| 12/31/2020 | 80.57 | .19 | 40.89 | 41.08 | (.29 | ) | (2.18 | ) | (2.47 | ) | 119.18 | 52.10 | 20,594 | .60 | .21 | |||||||||||||||||||||||||||||||||
| 12/31/2019 | 69.48 | .63 | 19.47 | 20.10 | (.57 | ) | (8.44 | ) | (9.01 | ) | 80.57 | 30.77 | 15,885 | .60 | .83 | |||||||||||||||||||||||||||||||||
| 12/31/2018 | 77.35 | .44 | .27 | .71 | (.34 | ) | (8.24 | ) | (8.58 | ) | 69.48 | (.25 | ) | 13,701 | .59 | .55 | ||||||||||||||||||||||||||||||||
| Class 3: | ||||||||||||||||||||||||||||||||||||||||||||||||
| 12/31/2022 | 128.68 | .42 | (37.35 | ) | (36.93 | ) | (.35 | ) | (14.31 | ) | (14.66 | ) | 77.09 | (29.89 | ) | 188 | .53 | .45 | ||||||||||||||||||||||||||||||
| 12/31/2021 | 121.13 | .24 | 24.47 | 24.71 | (.35 | ) | (16.81 | ) | (17.16 | ) | 128.68 | 22.07 | 302 | .52 | .19 | |||||||||||||||||||||||||||||||||
| 12/31/2020 | 81.84 | .26 | 41.56 | 41.82 | (.35 | ) | (2.18 | ) | (2.53 | ) | 121.13 | 52.20 | 279 | .53 | .28 | |||||||||||||||||||||||||||||||||
| 12/31/2019 | 70.44 | .69 | 19.77 | 20.46 | (.62 | ) | (8.44 | ) | (9.06 | ) | 81.84 | 30.86 | 213 | .53 | .90 | |||||||||||||||||||||||||||||||||
| 12/31/2018 | 78.32 | .50 | .26 | .76 | (.40 | ) | (8.24 | ) | (8.64 | ) | 70.44 | (.18 | ) | 187 | .52 | .62 | ||||||||||||||||||||||||||||||||
| Class 4: | ||||||||||||||||||||||||||||||||||||||||||||||||
| 12/31/2022 | 123.79 | .12 | (35.87 | ) | (35.75 | ) | (.09 | ) | (14.31 | ) | (14.40 | ) | 73.64 | (30.11 | ) | 2,409 | .85 | .14 | ||||||||||||||||||||||||||||||
| 12/31/2021 | 117.24 | (.15 | ) | 23.59 | 23.44 | (.08 | ) | (16.81 | ) | (16.89 | ) | 123.79 | 21.69 | 3,214 | .84 | (.13 | ) | |||||||||||||||||||||||||||||||
| 12/31/2020 | 79.41 | (.04 | ) | 40.24 | 40.20 | (.19 | ) | (2.18 | ) | (2.37 | ) | 117.24 | 51.71 | 2,347 | .85 | (.04 | ) | |||||||||||||||||||||||||||||||
| 12/31/2019 | 68.64 | .44 | 19.19 | 19.63 | (.42 | ) | (8.44 | ) | (8.86 | ) | 79.41 | 30.44 | 1,513 | .85 | .59 | |||||||||||||||||||||||||||||||||
| 12/31/2018 | 76.56 | .24 | .28 | .52 | (.20 | ) | (8.24 | ) | (8.44 | ) | 68.64 | (.50 | ) | 1,076 | .84 | .31 | ||||||||||||||||||||||||||||||||
Refer to the end of the tables for footnotes.
| American Funds Insurance Series | 351 |
Financial highlights (continued)
| (Loss) income from investment operations1 |
Dividends and distributions | |||||||||||||||||||||||||||||||||||||||||||||||
| Year ended | Net asset value, beginning of year |
Net investment income |
Net (losses) gains on securities (both realized and unrealized) |
Total from investment operations |
Dividends (from net investment income) |
Distributions (from capital gains) |
Total dividends and distributions |
Net asset value, end of year |
Total return | Net assets, end of year (in millions) |
Ratio of expenses to average net assets3 |
Ratio of net income to average net assets |
||||||||||||||||||||||||||||||||||||
| International Fund | ||||||||||||||||||||||||||||||||||||||||||||||||
| Class 1: | ||||||||||||||||||||||||||||||||||||||||||||||||
| 12/31/2022 | $ | 22.70 | $ | .34 | $ | (4.79 | ) | $ | (4.45 | ) | $ | (.34 | ) | $ | (2.60 | ) | $ | (2.94 | ) | $ | 15.31 | (20.57 | )% | $ | 3,157 | .54 | % | 1.95 | % | |||||||||||||||||||
| 12/31/2021 | 23.64 | .38 | (.67 | ) | (.29 | ) | (.65 | ) | — | (.65 | ) | 22.70 | (1.23 | ) | 4,747 | .55 | 1.57 | |||||||||||||||||||||||||||||||
| 12/31/2020 | 20.86 | .14 | 2.82 | 2.96 | (.18 | ) | — | (.18 | ) | 23.64 | 14.28 | 5,652 | .55 | .71 | ||||||||||||||||||||||||||||||||||
| 12/31/2019 | 17.66 | .30 | 3.74 | 4.04 | (.34 | ) | (.50 | ) | (.84 | ) | 20.86 | 23.21 | 5,353 | .54 | 1.54 | |||||||||||||||||||||||||||||||||
| 12/31/2018 | 21.71 | .34 | (2.97 | ) | (2.63 | ) | (.40 | ) | (1.02 | ) | (1.42 | ) | 17.66 | (12.94 | ) | 4,811 | .53 | 1.62 | ||||||||||||||||||||||||||||||
| Class 1A: | ||||||||||||||||||||||||||||||||||||||||||||||||
| 12/31/2022 | 22.61 | .30 | (4.78 | ) | (4.48 | ) | (.30 | ) | (2.60 | ) | (2.90 | ) | 15.23 | (20.80 | ) | 10 | .79 | 1.73 | ||||||||||||||||||||||||||||||
| 12/31/2021 | 23.55 | .33 | (.67 | ) | (.34 | ) | (.60 | ) | — | (.60 | ) | 22.61 | (1.47 | ) | 12 | .80 | 1.39 | |||||||||||||||||||||||||||||||
| 12/31/2020 | 20.80 | .08 | 2.81 | 2.89 | (.14 | ) | — | (.14 | ) | 23.55 | 13.96 | 10 | .80 | .43 | ||||||||||||||||||||||||||||||||||
| 12/31/2019 | 17.62 | .25 | 3.72 | 3.97 | (.29 | ) | (.50 | ) | (.79 | ) | 20.80 | 22.90 | 7 | .79 | 1.27 | |||||||||||||||||||||||||||||||||
| 12/31/2018 | 21.67 | .27 | (2.93 | ) | (2.66 | ) | (.37 | ) | (1.02 | ) | (1.39 | ) | 17.62 | (13.11 | ) | 5 | .78 | 1.32 | ||||||||||||||||||||||||||||||
| Class 2: | ||||||||||||||||||||||||||||||||||||||||||||||||
| 12/31/2022 | 22.60 | .29 | (4.76 | ) | (4.47 | ) | (.30 | ) | (2.60 | ) | (2.90 | ) | 15.23 | (20.79 | ) | 3,164 | .79 | 1.71 | ||||||||||||||||||||||||||||||
| 12/31/2021 | 23.54 | .33 | (.68 | ) | (.35 | ) | (.59 | ) | — | (.59 | ) | 22.60 | (1.49 | ) | 4,190 | .80 | 1.35 | |||||||||||||||||||||||||||||||
| 12/31/2020 | 20.78 | .09 | 2.80 | 2.89 | (.13 | ) | — | (.13 | ) | 23.54 | 13.97 | 4,481 | .80 | .46 | ||||||||||||||||||||||||||||||||||
| 12/31/2019 | 17.60 | .25 | 3.72 | 3.97 | (.29 | ) | (.50 | ) | (.79 | ) | 20.78 | 22.88 | 4,311 | .79 | 1.29 | |||||||||||||||||||||||||||||||||
| 12/31/2018 | 21.63 | .29 | (2.95 | ) | (2.66 | ) | (.35 | ) | (1.02 | ) | (1.37 | ) | 17.60 | (13.13 | ) | 3,875 | .78 | 1.40 | ||||||||||||||||||||||||||||||
| Class 3: | ||||||||||||||||||||||||||||||||||||||||||||||||
| 12/31/2022 | 22.76 | .31 | (4.81 | ) | (4.50 | ) | (.31 | ) | (2.60 | ) | (2.91 | ) | 15.35 | (20.76 | ) | 16 | .72 | 1.78 | ||||||||||||||||||||||||||||||
| 12/31/2021 | 23.69 | .34 | (.67 | ) | (.33 | ) | (.60 | ) | — | (.60 | ) | 22.76 | (1.39 | ) | 21 | .73 | 1.41 | |||||||||||||||||||||||||||||||
| 12/31/2020 | 20.92 | .10 | 2.81 | 2.91 | (.14 | ) | — | (.14 | ) | 23.69 | 14.00 | 25 | .73 | .53 | ||||||||||||||||||||||||||||||||||
| 12/31/2019 | 17.70 | .27 | 3.75 | 4.02 | (.30 | ) | (.50 | ) | (.80 | ) | 20.92 | 23.05 | 25 | .72 | 1.37 | |||||||||||||||||||||||||||||||||
| 12/31/2018 | 21.75 | .31 | (2.98 | ) | (2.67 | ) | (.36 | ) | (1.02 | ) | (1.38 | ) | 17.70 | (13.10 | ) | 24 | .71 | 1.48 | ||||||||||||||||||||||||||||||
| Class 4: | ||||||||||||||||||||||||||||||||||||||||||||||||
| 12/31/2022 | 22.31 | .25 | (4.71 | ) | (4.46 | ) | (.26 | ) | (2.60 | ) | (2.86 | ) | 14.99 | (21.02 | ) | 373 | 1.04 | 1.47 | ||||||||||||||||||||||||||||||
| 12/31/2021 | 23.25 | .27 | (.67 | ) | (.40 | ) | (.54 | ) | — | (.54 | ) | 22.31 | (1.71 | ) | 459 | 1.05 | 1.13 | |||||||||||||||||||||||||||||||
| 12/31/2020 | 20.54 | .04 | 2.76 | 2.80 | (.09 | ) | — | (.09 | ) | 23.25 | 13.66 | 423 | 1.05 | .21 | ||||||||||||||||||||||||||||||||||
| 12/31/2019 | 17.40 | .20 | 3.69 | 3.89 | (.25 | ) | (.50 | ) | (.75 | ) | 20.54 | 22.67 | 379 | 1.04 | 1.03 | |||||||||||||||||||||||||||||||||
| 12/31/2018 | 21.42 | .23 | (2.93 | ) | (2.70 | ) | (.30 | ) | (1.02 | ) | (1.32 | ) | 17.40 | (13.41 | ) | 295 | 1.03 | 1.13 | ||||||||||||||||||||||||||||||
Refer to the end of the tables for footnotes.
| 352 | American Funds Insurance Series |
Financial highlights (continued)
| (Loss) income from investment operations1 |
Dividends and distributions | |||||||||||||||||||||||||||||||||||||||||||||||||||
| Year ended | Net asset value, beginning of year |
Net investment income |
Net (losses) gains on securities (both realized and unrealized) |
Total from investment operations |
Dividends (from net investment income) |
Distributions (from capital gains) |
Total dividends and distributions |
Net asset value, end of year |
Total return2 | Net assets, end of year (in millions) |
Ratio of expenses to average net assets before waivers3 |
Ratio of expenses to average net assets after waivers2,3 |
Ratio of net income to average net assets2 |
|||||||||||||||||||||||||||||||||||||||
| New World Fund | ||||||||||||||||||||||||||||||||||||||||||||||||||||
| Class 1: | ||||||||||||||||||||||||||||||||||||||||||||||||||||
| 12/31/2022 | $ | 31.83 | $ | .37 | $ | (7.17 | ) | $ | (6.80 | ) | $ | (.39 | ) | $ | (2.34 | ) | $ | (2.73 | ) | $ | 22.30 | (21.86 | )% | $ | 1,610 | .68 | % | .57 | % | 1.48 | % | |||||||||||||||||||||
| 12/31/2021 | 31.59 | .29 | 1.38 | 1.67 | (.36 | ) | (1.07 | ) | (1.43 | ) | 31.83 | 5.16 | 2,443 | .74 | .56 | .88 | ||||||||||||||||||||||||||||||||||||
| 12/31/2020 | 25.84 | .15 | 5.93 | 6.08 | (.06 | ) | (.27 | ) | (.33 | ) | 31.59 | 23.89 | 2,309 | .76 | .64 | .58 | ||||||||||||||||||||||||||||||||||||
| 12/31/2019 | 20.98 | .28 | 5.79 | 6.07 | (.29 | ) | (.92 | ) | (1.21 | ) | 25.84 | 29.47 | 2,129 | .76 | .76 | 1.18 | ||||||||||||||||||||||||||||||||||||
| 12/31/2018 | 25.30 | .27 | (3.65 | ) | (3.38 | ) | (.27 | ) | (.67 | ) | (.94 | ) | 20.98 | (13.83 | ) | 1,702 | .77 | .77 | 1.11 | |||||||||||||||||||||||||||||||||
| Class 1A: | ||||||||||||||||||||||||||||||||||||||||||||||||||||
| 12/31/2022 | 31.70 | .30 | (7.15 | ) | (6.85 | ) | (.32 | ) | (2.34 | ) | (2.66 | ) | 22.19 | (22.09 | ) | 9 | .93 | .82 | 1.24 | |||||||||||||||||||||||||||||||||
| 12/31/2021 | 31.43 | .17 | 1.41 | 1.58 | (.24 | ) | (1.07 | ) | (1.31 | ) | 31.70 | 4.90 | 12 | .99 | .81 | .54 | ||||||||||||||||||||||||||||||||||||
| 12/31/2020 | 25.74 | .07 | 5.92 | 5.99 | (.03 | ) | (.27 | ) | (.30 | ) | 31.43 | 23.63 | 18 | 1.01 | .87 | .26 | ||||||||||||||||||||||||||||||||||||
| 12/31/2019 | 20.92 | .22 | 5.76 | 5.98 | (.24 | ) | (.92 | ) | (1.16 | ) | 25.74 | 29.11 | 4 | 1.01 | 1.01 | .92 | ||||||||||||||||||||||||||||||||||||
| 12/31/2018 | 25.25 | .21 | (3.64 | ) | (3.43 | ) | (.23 | ) | (.67 | ) | (.90 | ) | 20.92 | (14.02 | ) | 2 | 1.02 | 1.02 | .91 | |||||||||||||||||||||||||||||||||
| Class 2: | ||||||||||||||||||||||||||||||||||||||||||||||||||||
| 12/31/2022 | 31.48 | .30 | (7.10 | ) | (6.80 | ) | (.32 | ) | (2.34 | ) | (2.66 | ) | 22.02 | (22.10 | ) | 764 | .93 | .82 | 1.24 | |||||||||||||||||||||||||||||||||
| 12/31/2021 | 31.25 | .20 | 1.38 | 1.58 | (.28 | ) | (1.07 | ) | (1.35 | ) | 31.48 | 4.92 | 1,086 | .99 | .81 | .63 | ||||||||||||||||||||||||||||||||||||
| 12/31/2020 | 25.59 | .08 | 5.87 | 5.95 | (.02 | ) | (.27 | ) | (.29 | ) | 31.25 | 23.58 | 1,109 | 1.01 | .89 | .34 | ||||||||||||||||||||||||||||||||||||
| 12/31/2019 | 20.79 | .22 | 5.73 | 5.95 | (.23 | ) | (.92 | ) | (1.15 | ) | 25.59 | 29.15 | 981 | 1.01 | 1.01 | .93 | ||||||||||||||||||||||||||||||||||||
| 12/31/2018 | 25.07 | .20 | (3.61 | ) | (3.41 | ) | (.20 | ) | (.67 | ) | (.87 | ) | 20.79 | (14.04 | ) | 843 | 1.02 | 1.02 | .85 | |||||||||||||||||||||||||||||||||
| Class 4: | ||||||||||||||||||||||||||||||||||||||||||||||||||||
| 12/31/2022 | 31.24 | .24 | (7.03 | ) | (6.79 | ) | (.27 | ) | (2.34 | ) | (2.61 | ) | 21.84 | (22.25 | ) | 701 | 1.18 | 1.07 | .99 | |||||||||||||||||||||||||||||||||
| 12/31/2021 | 31.04 | .12 | 1.36 | 1.48 | (.21 | ) | (1.07 | ) | (1.28 | ) | 31.24 | 4.63 | 906 | 1.24 | 1.06 | .38 | ||||||||||||||||||||||||||||||||||||
| 12/31/2020 | 25.47 | .02 | 5.83 | 5.85 | (.01 | ) | (.27 | ) | (.28 | ) | 31.04 | 23.29 | 807 | 1.26 | 1.14 | .08 | ||||||||||||||||||||||||||||||||||||
| 12/31/2019 | 20.71 | .16 | 5.70 | 5.86 | (.18 | ) | (.92 | ) | (1.10 | ) | 25.47 | 28.82 | 646 | 1.26 | 1.26 | .67 | ||||||||||||||||||||||||||||||||||||
| 12/31/2018 | 24.99 | .14 | (3.59 | ) | (3.45 | ) | (.16 | ) | (.67 | ) | (.83 | ) | 20.71 | (14.25 | ) | 464 | 1.27 | 1.27 | .61 | |||||||||||||||||||||||||||||||||
Refer to the end of the tables for footnotes.
| American Funds Insurance Series | 353 |
Financial highlights (continued)
| (Loss) income from investment operations1 |
Dividends and distributions | |||||||||||||||||||||||||||||||||||||||||||||||||||
| Year ended | Net asset value, beginning of year |
Net investment income |
Net (losses) gains on securities (both realized and unrealized) |
Total from investment operations |
Dividends (from net investment income) |
Distributions (from capital gains) |
Total dividends and distributions |
Net asset value, end of year |
Total return2 | Net assets, end of year (in millions) |
Ratio of expenses to average net assets before waivers3 |
Ratio of expenses to average net assets after waivers2,3 |
Ratio of net income to average net assets2 |
|||||||||||||||||||||||||||||||||||||||
| Washington Mutual Investors Fund | ||||||||||||||||||||||||||||||||||||||||||||||||||||
| Class 1: | ||||||||||||||||||||||||||||||||||||||||||||||||||||
| 12/31/2022 | $ | 18.09 | $ | .31 | $ | (1.69 | ) | $ | (1.38 | ) | $ | (.30 | ) | $ | (3.72 | ) | $ | (4.02 | ) | $ | 12.69 | (8.28 | )% | $ | 5,507 | .41 | % | .26 | % | 2.13 | % | |||||||||||||||||||||
| 12/31/2021 | 14.35 | .29 | 3.73 | 4.02 | (.28 | ) | — | (.28 | ) | 18.09 | 28.12 | 6,766 | .42 | .31 | 1.79 | |||||||||||||||||||||||||||||||||||||
| 12/31/2020 | 13.56 | .25 | .95 | 1.20 | (.26 | ) | (.15 | ) | (.41 | ) | 14.35 | 9.04 | 5,684 | .43 | .43 | 2.00 | ||||||||||||||||||||||||||||||||||||
| 12/31/2019 | 12.38 | .30 | 2.25 | 2.55 | (.30 | ) | (1.07 | ) | (1.37 | ) | 13.56 | 21.66 | 5,559 | .42 | .42 | 2.28 | ||||||||||||||||||||||||||||||||||||
| 12/31/2018 | 14.96 | .31 | (1.44 | ) | (1.13 | ) | (.31 | ) | (1.14 | ) | (1.45 | ) | 12.38 | (8.45 | ) | 4,810 | .41 | .41 | 2.13 | |||||||||||||||||||||||||||||||||
| Class 1A: | ||||||||||||||||||||||||||||||||||||||||||||||||||||
| 12/31/2022 | 17.96 | .27 | (1.67 | ) | (1.40 | ) | (.23 | ) | (3.72 | ) | (3.95 | ) | 12.61 | (8.45 | ) | 64 | .66 | .51 | 1.76 | |||||||||||||||||||||||||||||||||
| 12/31/2021 | 14.28 | .27 | 3.67 | 3.94 | (.26 | ) | — | (.26 | ) | 17.96 | 27.70 | 169 | .67 | .53 | 1.62 | |||||||||||||||||||||||||||||||||||||
| 12/31/2020 | 13.51 | .23 | .93 | 1.16 | (.24 | ) | (.15 | ) | (.39 | ) | 14.28 | 8.79 | 25 | .67 | .67 | 1.78 | ||||||||||||||||||||||||||||||||||||
| 12/31/2019 | 12.35 | .26 | 2.24 | 2.50 | (.27 | ) | (1.07 | ) | (1.34 | ) | 13.51 | 21.35 | 9 | .67 | .67 | 2.03 | ||||||||||||||||||||||||||||||||||||
| 12/31/2018 | 14.94 | .26 | (1.42 | ) | (1.16 | ) | (.29 | ) | (1.14 | ) | (1.43 | ) | 12.35 | (8.67 | ) | 3 | .66 | .66 | 1.84 | |||||||||||||||||||||||||||||||||
| Class 2: | ||||||||||||||||||||||||||||||||||||||||||||||||||||
| 12/31/2022 | 17.83 | .26 | (1.65 | ) | (1.39 | ) | (.26 | ) | (3.72 | ) | (3.98 | ) | 12.46 | (8.45 | ) | 2,775 | .66 | .51 | 1.88 | |||||||||||||||||||||||||||||||||
| 12/31/2021 | 14.15 | .25 | 3.67 | 3.92 | (.24 | ) | — | (.24 | ) | 17.83 | 27.78 | 3,426 | .67 | .56 | 1.54 | |||||||||||||||||||||||||||||||||||||
| 12/31/2020 | 13.39 | .22 | .91 | 1.13 | (.22 | ) | (.15 | ) | (.37 | ) | 14.15 | 8.68 | 3,082 | .68 | .68 | 1.75 | ||||||||||||||||||||||||||||||||||||
| 12/31/2019 | 12.24 | .26 | 2.22 | 2.48 | (.26 | ) | (1.07 | ) | (1.33 | ) | 13.39 | 21.38 | 3,093 | .67 | .67 | 2.03 | ||||||||||||||||||||||||||||||||||||
| 12/31/2018 | 14.80 | .27 | (1.42 | ) | (1.15 | ) | (.27 | ) | (1.14 | ) | (1.41 | ) | 12.24 | (8.66 | ) | 2,850 | .66 | .66 | 1.88 | |||||||||||||||||||||||||||||||||
| Class 4: | ||||||||||||||||||||||||||||||||||||||||||||||||||||
| 12/31/2022 | 17.71 | .23 | (1.64 | ) | (1.41 | ) | (.24 | ) | (3.72 | ) | (3.96 | ) | 12.34 | (8.69 | ) | 1,098 | .91 | .77 | 1.64 | |||||||||||||||||||||||||||||||||
| 12/31/2021 | 14.06 | .21 | 3.65 | 3.86 | (.21 | ) | — | (.21 | ) | 17.71 | 27.51 | 1,104 | .92 | .81 | 1.30 | |||||||||||||||||||||||||||||||||||||
| 12/31/2020 | 13.31 | .19 | .91 | 1.10 | (.20 | ) | (.15 | ) | (.35 | ) | 14.06 | 8.47 | 788 | .93 | .93 | 1.51 | ||||||||||||||||||||||||||||||||||||
| 12/31/2019 | 12.19 | .23 | 2.20 | 2.43 | (.24 | ) | (1.07 | ) | (1.31 | ) | 13.31 | 21.03 | 621 | .92 | .92 | 1.78 | ||||||||||||||||||||||||||||||||||||
| 12/31/2018 | 14.77 | .23 | (1.42 | ) | (1.19 | ) | (.25 | ) | (1.14 | ) | (1.39 | ) | 12.19 | (8.92 | ) | 368 | .91 | .91 | 1.62 | |||||||||||||||||||||||||||||||||
Refer to the end of the tables for footnotes.
| 354 | American Funds Insurance Series |
Financial highlights (continued)
| (Loss) income from investment operations1 |
Dividends and distributions | |||||||||||||||||||||||||||||||||||||||||||||||||||
| Year ended | Net asset value, beginning of year |
Net investment income |
Net (losses) gains on securities (both realized and unrealized) |
Total from investment operations |
Dividends (from net investment income) |
Distributions (from capital gains) |
Total dividends and distributions |
Net asset value, end of year |
Total return2 | Net assets, end of year (in millions) |
Ratio of expenses to average net assets before waivers3 |
Ratio of expenses to average net assets after waivers2,3 |
Ratio of net income to average net assets2 |
|||||||||||||||||||||||||||||||||||||||
| Capital World Growth and Income Fund | ||||||||||||||||||||||||||||||||||||||||||||||||||||
| Class 1: | ||||||||||||||||||||||||||||||||||||||||||||||||||||
| 12/31/2022 | $ | 18.42 | $ | .32 | $ | (3.28 | ) | $ | (2.96 | ) | $ | (.34 | ) | $ | (3.45 | ) | $ | (3.79 | ) | $ | 11.67 | (17.13 | )% | $ | 548 | .57 | % | .41 | % | 2.36 | % | |||||||||||||||||||||
| 12/31/2021 | 16.67 | .38 | 2.10 | 2.48 | (.33 | ) | (.40 | ) | (.73 | ) | 18.42 | 15.03 | 812 | .63 | .47 | 2.14 | ||||||||||||||||||||||||||||||||||||
| 12/31/2020 | 15.92 | .22 | 1.14 | 1.36 | (.23 | ) | (.38 | ) | (.61 | ) | 16.67 | 9.03 | 657 | .66 | .66 | 1.49 | ||||||||||||||||||||||||||||||||||||
| 12/31/2019 | 13.02 | .31 | 3.67 | 3.98 | (.32 | ) | (.76 | ) | (1.08 | ) | 15.92 | 31.39 | 625 | .65 | .65 | 2.08 | ||||||||||||||||||||||||||||||||||||
| 12/31/2018 | 15.81 | .29 | (1.62 | ) | (1.33 | ) | (.28 | ) | (1.18 | ) | (1.46 | ) | 13.02 | (9.36 | ) | 492 | .63 | .63 | 1.94 | |||||||||||||||||||||||||||||||||
| Class 1A: | ||||||||||||||||||||||||||||||||||||||||||||||||||||
| 12/31/2022 | 18.34 | .28 | (3.25 | ) | (2.97 | ) | (.31 | ) | (3.45 | ) | (3.76 | ) | 11.61 | (17.29 | ) | 6 | .82 | .66 | 2.13 | |||||||||||||||||||||||||||||||||
| 12/31/2021 | 16.62 | .37 | 2.06 | 2.43 | (.31 | ) | (.40 | ) | (.71 | ) | 18.34 | 14.71 | 7 | .88 | .70 | 2.08 | ||||||||||||||||||||||||||||||||||||
| 12/31/2020 | 15.88 | .18 | 1.13 | 1.31 | (.19 | ) | (.38 | ) | (.57 | ) | 16.62 | 8.78 | 2 | .90 | .90 | 1.23 | ||||||||||||||||||||||||||||||||||||
| 12/31/2019 | 13.00 | .26 | 3.68 | 3.94 | (.30 | ) | (.76 | ) | (1.06 | ) | 15.88 | 31.04 | 2 | .90 | .90 | 1.77 | ||||||||||||||||||||||||||||||||||||
| 12/31/2018 | 15.81 | .26 | (1.63 | ) | (1.37 | ) | (.26 | ) | (1.18 | ) | (1.44 | ) | 13.00 | (9.62 | ) | 1 | .88 | .88 | 1.74 | |||||||||||||||||||||||||||||||||
| Class 2: | ||||||||||||||||||||||||||||||||||||||||||||||||||||
| 12/31/2022 | 18.38 | .28 | (3.26 | ) | (2.98 | ) | (.31 | ) | (3.45 | ) | (3.76 | ) | 11.64 | (17.33 | ) | 983 | .82 | .66 | 2.11 | |||||||||||||||||||||||||||||||||
| 12/31/2021 | 16.63 | .33 | 2.11 | 2.44 | (.29 | ) | (.40 | ) | (.69 | ) | 18.38 | 14.78 | 1,340 | .88 | .73 | 1.85 | ||||||||||||||||||||||||||||||||||||
| 12/31/2020 | 15.89 | .18 | 1.13 | 1.31 | (.19 | ) | (.38 | ) | (.57 | ) | 16.63 | 8.73 | 1,349 | .91 | .91 | 1.23 | ||||||||||||||||||||||||||||||||||||
| 12/31/2019 | 12.99 | .27 | 3.68 | 3.95 | (.29 | ) | (.76 | ) | (1.05 | ) | 15.89 | 31.14 | 1,366 | .90 | .90 | 1.84 | ||||||||||||||||||||||||||||||||||||
| 12/31/2018 | 15.78 | .26 | (1.63 | ) | (1.37 | ) | (.24 | ) | (1.18 | ) | (1.42 | ) | 12.99 | (9.63 | ) | 1,228 | .88 | .88 | 1.70 | |||||||||||||||||||||||||||||||||
| Class 4: | ||||||||||||||||||||||||||||||||||||||||||||||||||||
| 12/31/2022 | 18.04 | .24 | (3.20 | ) | (2.96 | ) | (.28 | ) | (3.45 | ) | (3.73 | ) | 11.35 | (17.57 | ) | 188 | 1.07 | .91 | 1.86 | |||||||||||||||||||||||||||||||||
| 12/31/2021 | 16.35 | .29 | 2.06 | 2.35 | (.26 | ) | (.40 | ) | (.66 | ) | 18.04 | 14.46 | 225 | 1.13 | .97 | 1.65 | ||||||||||||||||||||||||||||||||||||
| 12/31/2020 | 15.63 | .14 | 1.12 | 1.26 | (.16 | ) | (.38 | ) | (.54 | ) | 16.35 | 8.55 | 166 | 1.16 | 1.16 | .97 | ||||||||||||||||||||||||||||||||||||
| 12/31/2019 | 12.81 | .23 | 3.61 | 3.84 | (.26 | ) | (.76 | ) | (1.02 | ) | 15.63 | 30.73 | 145 | 1.15 | 1.15 | 1.56 | ||||||||||||||||||||||||||||||||||||
| 12/31/2018 | 15.60 | .21 | (1.60 | ) | (1.39 | ) | (.22 | ) | (1.18 | ) | (1.40 | ) | 12.81 | (9.89 | ) | 95 | 1.13 | 1.13 | 1.43 | |||||||||||||||||||||||||||||||||
Refer to the end of the tables for footnotes.
| American Funds Insurance Series | 355 |
Financial highlights (continued)
| (Loss) income from investment operations1 |
Dividends and distributions | |||||||||||||||||||||||||||||||||||||||||||||||
| Year ended | Net asset value, beginning of year |
Net investment income |
Net (losses) gains on securities (both realized and unrealized) |
Total from investment operations |
Dividends (from net investment income) |
Distributions (from capital gains) |
Total dividends and distributions |
Net asset value, end of year |
Total return | Net assets, end of year (in millions) |
Ratio of expenses to average net assets3 |
Ratio of net income to average net assets |
||||||||||||||||||||||||||||||||||||
| Growth-Income Fund | ||||||||||||||||||||||||||||||||||||||||||||||||
| Class 1: | ||||||||||||||||||||||||||||||||||||||||||||||||
| 12/31/2022 | $ | 67.35 | $ | .85 | $ | (11.50 | ) | $ | (10.65 | ) | $ | (.83 | ) | $ | (5.66 | ) | $ | (6.49 | ) | $ | 50.21 | (16.28 | )% | $ | 19,692 | .29 | % | 1.54 | % | |||||||||||||||||||
| 12/31/2021 | 55.38 | .79 | 12.64 | 13.43 | (.86 | ) | (.60 | ) | (1.46 | ) | 67.35 | 24.42 | 25,507 | .29 | 1.28 | |||||||||||||||||||||||||||||||||
| 12/31/2020 | 50.71 | .75 | 6.02 | 6.77 | (.80 | ) | (1.30 | ) | (2.10 | ) | 55.38 | 13.81 | 22,903 | .29 | 1.52 | |||||||||||||||||||||||||||||||||
| 12/31/2019 | 45.39 | 1.00 | 10.40 | 11.40 | (.92 | ) | (5.16 | ) | (6.08 | ) | 50.71 | 26.46 | 21,057 | .29 | 2.05 | |||||||||||||||||||||||||||||||||
| 12/31/2018 | 50.22 | .84 | (1.25 | ) | (.41 | ) | (.84 | ) | (3.58 | ) | (4.42 | ) | 45.39 | (1.55 | ) | 16,783 | .28 | 1.65 | ||||||||||||||||||||||||||||||
| Class 1A: | ||||||||||||||||||||||||||||||||||||||||||||||||
| 12/31/2022 | 67.02 | .71 | (11.44 | ) | (10.73 | ) | (.70 | ) | (5.66 | ) | (6.36 | ) | 49.93 | (16.48 | ) | 28 | .54 | 1.30 | ||||||||||||||||||||||||||||||
| 12/31/2021 | 55.16 | .65 | 12.55 | 13.20 | (.74 | ) | (.60 | ) | (1.34 | ) | 67.02 | 24.08 | 32 | .53 | 1.04 | |||||||||||||||||||||||||||||||||
| 12/31/2020 | 50.54 | .63 | 5.99 | 6.62 | (.70 | ) | (1.30 | ) | (2.00 | ) | 55.16 | 13.55 | 16 | .54 | 1.28 | |||||||||||||||||||||||||||||||||
| 12/31/2019 | 45.28 | .89 | 10.36 | 11.25 | (.83 | ) | (5.16 | ) | (5.99 | ) | 50.54 | 26.14 | 11 | .54 | 1.82 | |||||||||||||||||||||||||||||||||
| 12/31/2018 | 50.15 | .72 | (1.25 | ) | (.53 | ) | (.76 | ) | (3.58 | ) | (4.34 | ) | 45.28 | (1.78 | ) | 7 | .53 | 1.43 | ||||||||||||||||||||||||||||||
| Class 2: | ||||||||||||||||||||||||||||||||||||||||||||||||
| 12/31/2022 | 66.44 | .70 | (11.33 | ) | (10.63 | ) | (.69 | ) | (5.66 | ) | (6.35 | ) | 49.46 | (16.50 | ) | 11,508 | .54 | 1.29 | ||||||||||||||||||||||||||||||
| 12/31/2021 | 54.66 | .63 | 12.45 | 13.08 | (.70 | ) | (.60 | ) | (1.30 | ) | 66.44 | 24.10 | 15,319 | .54 | 1.03 | |||||||||||||||||||||||||||||||||
| 12/31/2020 | 50.08 | .62 | 5.93 | 6.55 | (.67 | ) | (1.30 | ) | (1.97 | ) | 54.66 | 13.54 | 14,012 | .54 | 1.27 | |||||||||||||||||||||||||||||||||
| 12/31/2019 | 44.90 | .87 | 10.27 | 11.14 | (.80 | ) | (5.16 | ) | (5.96 | ) | 50.08 | 26.14 | 13,586 | .53 | 1.80 | |||||||||||||||||||||||||||||||||
| 12/31/2018 | 49.71 | .71 | (1.23 | ) | (.52 | ) | (.71 | ) | (3.58 | ) | (4.29 | ) | 44.90 | (1.79 | ) | 12,035 | .53 | 1.40 | ||||||||||||||||||||||||||||||
| Class 3: | ||||||||||||||||||||||||||||||||||||||||||||||||
| 12/31/2022 | 67.48 | .75 | (11.51 | ) | (10.76 | ) | (.73 | ) | (5.66 | ) | (6.39 | ) | 50.33 | (16.43 | ) | 125 | .47 | 1.36 | ||||||||||||||||||||||||||||||
| 12/31/2021 | 55.49 | .68 | 12.65 | 13.33 | (.74 | ) | (.60 | ) | (1.34 | ) | 67.48 | 24.18 | 166 | .47 | 1.10 | |||||||||||||||||||||||||||||||||
| 12/31/2020 | 50.81 | .66 | 6.02 | 6.68 | (.70 | ) | (1.30 | ) | (2.00 | ) | 55.49 | 13.60 | 154 | .47 | 1.34 | |||||||||||||||||||||||||||||||||
| 12/31/2019 | 45.47 | .91 | 10.43 | 11.34 | (.84 | ) | (5.16 | ) | (6.00 | ) | 50.81 | 26.24 | 156 | .46 | 1.87 | |||||||||||||||||||||||||||||||||
| 12/31/2018 | 50.29 | .75 | (1.25 | ) | (.50 | ) | (.74 | ) | (3.58 | ) | (4.32 | ) | 45.47 | (1.72 | ) | 140 | .46 | 1.47 | ||||||||||||||||||||||||||||||
| Class 4: | ||||||||||||||||||||||||||||||||||||||||||||||||
| 12/31/2022 | 65.57 | .56 | (11.18 | ) | (10.62 | ) | (.57 | ) | (5.66 | ) | (6.23 | ) | 48.72 | (16.70 | ) | 1,630 | .79 | 1.05 | ||||||||||||||||||||||||||||||
| 12/31/2021 | 53.99 | .48 | 12.28 | 12.76 | (.58 | ) | (.60 | ) | (1.18 | ) | 65.57 | 23.80 | 1,928 | .79 | .79 | |||||||||||||||||||||||||||||||||
| 12/31/2020 | 49.52 | .49 | 5.85 | 6.34 | (.57 | ) | (1.30 | ) | (1.87 | ) | 53.99 | 13.25 | 1,407 | .79 | 1.02 | |||||||||||||||||||||||||||||||||
| 12/31/2019 | 44.47 | .74 | 10.18 | 10.92 | (.71 | ) | (5.16 | ) | (5.87 | ) | 49.52 | 25.86 | 1,216 | .79 | 1.56 | |||||||||||||||||||||||||||||||||
| 12/31/2018 | 49.31 | .58 | (1.23 | ) | (.65 | ) | (.61 | ) | (3.58 | ) | (4.19 | ) | 44.47 | (2.05 | ) | 899 | .78 | 1.15 | ||||||||||||||||||||||||||||||
Refer to the end of the tables for footnotes.
| 356 | American Funds Insurance Series |
Financial highlights (continued)
| (Loss) income from investment operations1 |
Dividends and distributions | |||||||||||||||||||||||||||||||||||||||||||||||||||
| Year ended | Net asset value, beginning of year |
Net investment income |
Net (losses) gains on securities (both realized and unrealized) |
Total from investment operations |
Dividends (from net investment income) |
Distributions (from capital gains) |
Total dividends and distributions |
Net asset value, end of year |
Total return2 | Net assets, end of year (in millions) |
Ratio of expenses to average net assets before waivers3 |
Ratio of expenses to average net assets after waivers2,3 |
Ratio of net income to average net assets2 |
|||||||||||||||||||||||||||||||||||||||
| International Growth and Income Fund | ||||||||||||||||||||||||||||||||||||||||||||||||||||
| Class 1: | ||||||||||||||||||||||||||||||||||||||||||||||||||||
| 12/31/2022 | $ | 19.62 | $ | .39 | $ | (3.09 | ) | $ | (2.70 | ) | $ | (.28 | ) | $ | (7.70 | ) | $ | (7.98 | ) | $ | 8.94 | (15.00 | )% | $ | 13 | .64 | % | .54 | % | 3.29 | % | |||||||||||||||||||||
| 12/31/2021 | 19.01 | .54 | .53 | 1.07 | (.46 | ) | — | (.46 | ) | 19.62 | 5.64 | 30 | .67 | .67 | 2.70 | |||||||||||||||||||||||||||||||||||||
| 12/31/2020 | 18.18 | .27 | .85 | 1.12 | (.29 | ) | — | (.29 | ) | 19.01 | 6.24 | 1,120 | .68 | .68 | 1.70 | |||||||||||||||||||||||||||||||||||||
| 12/31/2019 | 15.35 | .46 | 3.03 | 3.49 | (.47 | ) | (.19 | ) | (.66 | ) | 18.18 | 23.06 | 1,140 | .66 | .66 | 2.73 | ||||||||||||||||||||||||||||||||||||
| 12/31/2018 | 17.72 | .45 | (2.39 | ) | (1.94 | ) | (.43 | ) | — | (.43 | ) | 15.35 | (11.00 | ) | 1,034 | .65 | .65 | 2.62 | ||||||||||||||||||||||||||||||||||
| Class 1A: | ||||||||||||||||||||||||||||||||||||||||||||||||||||
| 12/31/2022 | 19.39 | .35 | (3.05 | ) | (2.70 | ) | (.29 | ) | (7.70 | ) | (7.99 | ) | 8.70 | (15.31 | ) | 5 | .88 | .79 | 3.15 | |||||||||||||||||||||||||||||||||
| 12/31/2021 | 18.97 | .50 | .52 | 1.02 | (.60 | ) | — | (.60 | ) | 19.39 | 5.39 | 6 | .94 | .92 | 2.50 | |||||||||||||||||||||||||||||||||||||
| 12/31/2020 | 18.15 | .22 | .85 | 1.07 | (.25 | ) | — | (.25 | ) | 18.97 | 5.98 | 3 | .93 | .93 | 1.38 | |||||||||||||||||||||||||||||||||||||
| 12/31/2019 | 15.33 | .41 | 3.04 | 3.45 | (.44 | ) | (.19 | ) | (.63 | ) | 18.15 | 22.76 | 2 | .91 | .91 | 2.41 | ||||||||||||||||||||||||||||||||||||
| 12/31/2018 | 17.70 | .41 | (2.39 | ) | (1.98 | ) | (.39 | ) | — | (.39 | ) | 15.33 | (11.24 | ) | 2 | .90 | .90 | 2.35 | ||||||||||||||||||||||||||||||||||
| Class 2: | ||||||||||||||||||||||||||||||||||||||||||||||||||||
| 12/31/2022 | 19.38 | .36 | (3.05 | ) | (2.69 | ) | (.29 | ) | (7.70 | ) | (7.99 | ) | 8.70 | (15.25 | ) | 162 | .88 | .78 | 3.24 | |||||||||||||||||||||||||||||||||
| 12/31/2021 | 18.95 | .48 | .53 | 1.01 | (.58 | ) | — | (.58 | ) | 19.38 | 5.37 | 211 | .93 | .92 | 2.44 | |||||||||||||||||||||||||||||||||||||
| 12/31/2020 | 18.12 | .23 | .85 | 1.08 | (.25 | ) | — | (.25 | ) | 18.95 | 6.01 | 221 | .93 | .93 | 1.43 | |||||||||||||||||||||||||||||||||||||
| 12/31/2019 | 15.30 | .42 | 3.02 | 3.44 | (.43 | ) | (.19 | ) | (.62 | ) | 18.12 | 22.76 | 257 | .91 | .91 | 2.49 | ||||||||||||||||||||||||||||||||||||
| 12/31/2018 | 17.66 | .41 | (2.38 | ) | (1.97 | ) | (.39 | ) | — | (.39 | ) | 15.30 | (11.23 | ) | 230 | .90 | .90 | 2.38 | ||||||||||||||||||||||||||||||||||
| Class 4: | ||||||||||||||||||||||||||||||||||||||||||||||||||||
| 12/31/2022 | 19.23 | .33 | (3.04 | ) | (2.71 | ) | (.26 | ) | (7.70 | ) | (7.96 | ) | 8.56 | (15.52 | ) | 121 | 1.13 | 1.04 | 3.01 | |||||||||||||||||||||||||||||||||
| 12/31/2021 | 18.82 | .44 | .51 | .95 | (.54 | ) | — | (.54 | ) | 19.23 | 5.09 | 132 | 1.18 | 1.17 | 2.21 | |||||||||||||||||||||||||||||||||||||
| 12/31/2020 | 18.01 | .19 | .83 | 1.02 | (.21 | ) | — | (.21 | ) | 18.82 | 5.73 | 112 | 1.18 | 1.18 | 1.19 | |||||||||||||||||||||||||||||||||||||
| 12/31/2019 | 15.22 | .37 | 3.01 | 3.38 | (.40 | ) | (.19 | ) | (.59 | ) | 18.01 | 22.47 | 101 | 1.16 | 1.16 | 2.18 | ||||||||||||||||||||||||||||||||||||
| 12/31/2018 | 17.58 | .36 | (2.36 | ) | (2.00 | ) | (.36 | ) | — | (.36 | ) | 15.22 | (11.46 | ) | 71 | 1.15 | 1.15 | 2.10 | ||||||||||||||||||||||||||||||||||
Refer to the end of the tables for footnotes.
| American Funds Insurance Series | 357 |
Financial highlights (continued)
| (Loss) income from investment operations1 |
Dividends and distributions | |||||||||||||||||||||||||||||||||||||||||||||||||||
| Year ended | Net asset value, beginning of year |
Net investment income |
Net (losses) gains on securities (both realized and unrealized) |
Total from investment operations |
Dividends (from net investment income) |
Distributions (from capital gains) |
Total dividends and distributions |
Net asset value, end of year |
Total return2 | Net assets, end of year (in millions) |
Ratio of expenses to average net assets before waivers3 |
Ratio of expenses to average net assets after waivers2,3 |
Ratio of net income to average net assets2 |
|||||||||||||||||||||||||||||||||||||||
| Capital Income Builder | ||||||||||||||||||||||||||||||||||||||||||||||||||||
| Class 1: | ||||||||||||||||||||||||||||||||||||||||||||||||||||
| 12/31/2022 | $ | 12.17 | $ | .37 | $ | (1.21 | ) | $ | (.84 | ) | $ | (.34 | ) | $ | — | $ | (.34 | ) | $ | 10.99 | (6.90 | )% | $ | 586 | .44 | % | .26 | % | 3.31 | % | ||||||||||||||||||||||
| 12/31/2021 | 10.87 | .37 | 1.28 | 1.65 | (.35 | ) | — | (.35 | ) | 12.17 | 15.31 | 563 | .53 | .27 | 3.19 | |||||||||||||||||||||||||||||||||||||
| 12/31/2020 | 10.73 | .31 | .15 | .46 | (.32 | ) | — | (.32 | ) | 10.87 | 4.64 | 621 | .53 | .35 | 3.07 | |||||||||||||||||||||||||||||||||||||
| 12/31/2019 | 9.37 | .32 | 1.36 | 1.68 | (.32 | ) | — | (.32 | ) | 10.73 | 18.16 | 533 | .53 | .53 | 3.17 | |||||||||||||||||||||||||||||||||||||
| 12/31/2018 | 10.40 | .31 | (1.00 | ) | (.69 | ) | (.32 | ) | (.02 | ) | (.34 | ) | 9.37 | (6.77 | ) | 317 | .54 | .54 | 3.08 | |||||||||||||||||||||||||||||||||
| Class 1A: | ||||||||||||||||||||||||||||||||||||||||||||||||||||
| 12/31/2022 | 12.15 | .34 | (1.19 | ) | (.85 | ) | (.32 | ) | — | (.32 | ) | 10.98 | (7.06 | ) | 10 | .69 | .52 | 3.06 | ||||||||||||||||||||||||||||||||||
| 12/31/2021 | 10.86 | .34 | 1.27 | 1.61 | (.32 | ) | — | (.32 | ) | 12.15 | 14.95 | 10 | .78 | .52 | 2.94 | |||||||||||||||||||||||||||||||||||||
| 12/31/2020 | 10.72 | .28 | .16 | .44 | (.30 | ) | — | (.30 | ) | 10.86 | 4.38 | 6 | .78 | .60 | 2.81 | |||||||||||||||||||||||||||||||||||||
| 12/31/2019 | 9.36 | .29 | 1.37 | 1.66 | (.30 | ) | — | (.30 | ) | 10.72 | 17.90 | 6 | .78 | .78 | 2.84 | |||||||||||||||||||||||||||||||||||||
| 12/31/2018 | 10.39 | .28 | (.99 | ) | (.71 | ) | (.30 | ) | (.02 | ) | (.32 | ) | 9.36 | (7.01 | ) | 2 | .79 | .79 | 2.82 | |||||||||||||||||||||||||||||||||
| Class 2: | ||||||||||||||||||||||||||||||||||||||||||||||||||||
| 12/31/2022 | 12.16 | .34 | (1.20 | ) | (.86 | ) | (.32 | ) | — | (.32 | ) | 10.98 | (7.13 | ) | 13 | .69 | .51 | 3.06 | ||||||||||||||||||||||||||||||||||
| 12/31/2021 | 10.87 | .34 | 1.27 | 1.61 | (.32 | ) | — | (.32 | ) | 12.16 | 14.94 | 13 | .78 | .52 | 2.93 | |||||||||||||||||||||||||||||||||||||
| 12/31/2020 | 10.72 | .29 | .16 | .45 | (.30 | ) | — | (.30 | ) | 10.87 | 4.48 | 8 | .78 | .60 | 2.83 | |||||||||||||||||||||||||||||||||||||
| 12/31/2019 | 9.36 | .30 | 1.35 | 1.65 | (.29 | ) | — | (.29 | ) | 10.72 | 17.89 | 6 | .78 | .78 | 2.91 | |||||||||||||||||||||||||||||||||||||
| 12/31/2018 | 10.40 | .28 | (1.00 | ) | (.72 | ) | (.30 | ) | (.02 | ) | (.32 | ) | 9.36 | (7.08 | ) | 4 | .79 | .79 | 2.83 | |||||||||||||||||||||||||||||||||
| Class 4: | ||||||||||||||||||||||||||||||||||||||||||||||||||||
| 12/31/2022 | 12.14 | .31 | (1.20 | ) | (.89 | ) | (.29 | ) | — | (.29 | ) | 10.96 | (7.37 | ) | 530 | .94 | .76 | 2.81 | ||||||||||||||||||||||||||||||||||
| 12/31/2021 | 10.85 | .31 | 1.27 | 1.58 | (.29 | ) | — | (.29 | ) | 12.14 | 14.68 | 559 | 1.03 | .77 | 2.69 | |||||||||||||||||||||||||||||||||||||
| 12/31/2020 | 10.71 | .26 | .15 | .41 | (.27 | ) | — | (.27 | ) | 10.85 | 4.11 | 462 | 1.03 | .85 | 2.55 | |||||||||||||||||||||||||||||||||||||
| 12/31/2019 | 9.35 | .27 | 1.36 | 1.63 | (.27 | ) | — | (.27 | ) | 10.71 | 17.62 | 454 | 1.03 | 1.03 | 2.68 | |||||||||||||||||||||||||||||||||||||
| 12/31/2018 | 10.38 | .26 | (1.00 | ) | (.74 | ) | (.27 | ) | (.02 | ) | (.29 | ) | 9.35 | (7.25 | ) | 352 | 1.04 | 1.04 | 2.58 | |||||||||||||||||||||||||||||||||
Refer to the end of the tables for footnotes.
| 358 | American Funds Insurance Series |
Financial highlights (continued)
| (Loss) income from investment operations1 |
Dividends and distributions | |||||||||||||||||||||||||||||||||||||||||||||||
| Year ended | Net asset value, beginning of year |
Net investment income |
Net (losses) gains on securities (both realized and unrealized) |
Total from investment operations |
Dividends (from net investment income) |
Distributions (from capital gains) |
Total dividends and distributions |
Net asset value, end of year |
Total return | Net assets, end of year (in millions) |
Ratio of expenses to average net assets3 |
Ratio of net income to average net assets |
||||||||||||||||||||||||||||||||||||
| Asset Allocation Fund | ||||||||||||||||||||||||||||||||||||||||||||||||
| Class 1: | ||||||||||||||||||||||||||||||||||||||||||||||||
| 12/31/2022 | $ | 29.08 | $ | .52 | $ | (4.24 | ) | $ | (3.72 | ) | $ | (.51 | ) | $ | (2.65 | ) | $ | (3.16 | ) | $ | 22.20 | (13.19)% | $ | 15,138 | .30 | % | 2.15 | % | ||||||||||||||||||||
| 12/31/2021 | 26.50 | .48 | 3.54 | 4.02 | (.50 | ) | (.94 | ) | (1.44 | ) | 29.08 | 15.40 | 18,836 | .30 | 1.71 | |||||||||||||||||||||||||||||||||
| 12/31/2020 | 24.05 | .43 | 2.59 | 3.02 | (.46 | ) | (.11 | ) | (.57 | ) | 26.50 | 12.71 | 19,238 | .30 | 1.80 | |||||||||||||||||||||||||||||||||
| 12/31/2019 | 21.29 | .51 | 3.94 | 4.45 | (.50 | ) | (1.19 | ) | (1.69 | ) | 24.05 | 21.54 | 17,730 | .29 | 2.21 | |||||||||||||||||||||||||||||||||
| 12/31/2018 | 23.71 | .48 | (1.43 | ) | (.95 | ) | (.44 | ) | (1.03 | ) | (1.47 | ) | 21.29 | (4.35 | ) | 14,627 | .28 | 2.04 | ||||||||||||||||||||||||||||||
| Class 1A: | ||||||||||||||||||||||||||||||||||||||||||||||||
| 12/31/2022 | 28.97 | .46 | (4.22 | ) | (3.76 | ) | (.46 | ) | (2.65 | ) | (3.11 | ) | 22.10 | (13.43 | ) | 27 | .55 | 1.95 | ||||||||||||||||||||||||||||||
| 12/31/2021 | 26.42 | .42 | 3.52 | 3.94 | (.45 | ) | (.94 | ) | (1.39 | ) | 28.97 | 15.13 | 24 | .55 | 1.49 | |||||||||||||||||||||||||||||||||
| 12/31/2020 | 23.99 | .37 | 2.58 | 2.95 | (.41 | ) | (.11 | ) | (.52 | ) | 26.42 | 12.43 | 14 | .55 | 1.56 | |||||||||||||||||||||||||||||||||
| 12/31/2019 | 21.26 | .45 | 3.92 | 4.37 | (.45 | ) | (1.19 | ) | (1.64 | ) | 23.99 | 21.19 | 11 | .54 | 1.95 | |||||||||||||||||||||||||||||||||
| 12/31/2018 | 23.69 | .42 | (1.42 | ) | (1.00 | ) | (.40 | ) | (1.03 | ) | (1.43 | ) | 21.26 | (4.58 | ) | 7 | .53 | 1.82 | ||||||||||||||||||||||||||||||
| Class 2: | ||||||||||||||||||||||||||||||||||||||||||||||||
| 12/31/2022 | 28.74 | .46 | (4.19 | ) | (3.73 | ) | (.45 | ) | (2.65 | ) | (3.10 | ) | 21.91 | (13.41 | ) | 4,228 | .55 | 1.90 | ||||||||||||||||||||||||||||||
| 12/31/2021 | 26.21 | .41 | 3.49 | 3.90 | (.43 | ) | (.94 | ) | (1.37 | ) | 28.74 | 15.10 | 5,473 | .55 | 1.46 | |||||||||||||||||||||||||||||||||
| 12/31/2020 | 23.79 | .37 | 2.56 | 2.93 | (.40 | ) | (.11 | ) | (.51 | ) | 26.21 | 12.46 | 5,242 | .55 | 1.55 | |||||||||||||||||||||||||||||||||
| 12/31/2019 | 21.08 | .45 | 3.89 | 4.34 | (.44 | ) | (1.19 | ) | (1.63 | ) | 23.79 | 21.23 | 5,154 | .54 | 1.96 | |||||||||||||||||||||||||||||||||
| 12/31/2018 | 23.49 | .41 | (1.41 | ) | (1.00 | ) | (.38 | ) | (1.03 | ) | (1.41 | ) | 21.08 | (4.60 | ) | 4,668 | .53 | 1.78 | ||||||||||||||||||||||||||||||
| Class 3: | ||||||||||||||||||||||||||||||||||||||||||||||||
| 12/31/2022 | 29.12 | .48 | (4.25 | ) | (3.77 | ) | (.47 | ) | (2.65 | ) | (3.12 | ) | 22.23 | (13.37 | ) | 28 | .48 | 1.97 | ||||||||||||||||||||||||||||||
| 12/31/2021 | 26.53 | .43 | 3.55 | 3.98 | (.45 | ) | (.94 | ) | (1.39 | ) | 29.12 | 15.22 | 36 | .48 | 1.53 | |||||||||||||||||||||||||||||||||
| 12/31/2020 | 24.08 | .39 | 2.59 | 2.98 | (.42 | ) | (.11 | ) | (.53 | ) | 26.53 | 12.50 | 33 | .48 | 1.62 | |||||||||||||||||||||||||||||||||
| 12/31/2019 | 21.32 | .47 | 3.93 | 4.40 | (.45 | ) | (1.19 | ) | (1.64 | ) | 24.08 | 21.30 | 32 | .47 | 2.02 | |||||||||||||||||||||||||||||||||
| 12/31/2018 | 23.73 | .43 | (1.41 | ) | (.98 | ) | (.40 | ) | (1.03 | ) | (1.43 | ) | 21.32 | (4.49 | ) | 29 | .46 | 1.85 | ||||||||||||||||||||||||||||||
| Class 4: | ||||||||||||||||||||||||||||||||||||||||||||||||
| 12/31/2022 | 28.56 | .39 | (4.16 | ) | (3.77 | ) | (.39 | ) | (2.65 | ) | (3.04 | ) | 21.75 | (13.66 | ) | 5,380 | .80 | 1.66 | ||||||||||||||||||||||||||||||
| 12/31/2021 | 26.06 | .34 | 3.47 | 3.81 | (.37 | ) | (.94 | ) | (1.31 | ) | 28.56 | 14.84 | 6,337 | .80 | 1.22 | |||||||||||||||||||||||||||||||||
| 12/31/2020 | 23.67 | .31 | 2.54 | 2.85 | (.35 | ) | (.11 | ) | (.46 | ) | 26.06 | 12.16 | 5,131 | .80 | 1.30 | |||||||||||||||||||||||||||||||||
| 12/31/2019 | 20.99 | .39 | 3.87 | 4.26 | (.39 | ) | (1.19 | ) | (1.58 | ) | 23.67 | 20.92 | 4,493 | .79 | 1.71 | |||||||||||||||||||||||||||||||||
| 12/31/2018 | 23.40 | .35 | (1.40 | ) | (1.05 | ) | (.33 | ) | (1.03 | ) | (1.36 | ) | 20.99 | (4.83 | ) | 3,594 | .78 | 1.54 | ||||||||||||||||||||||||||||||
Refer to the end of the tables for footnotes.
| American Funds Insurance Series | 359 |
Financial highlights (continued)
| (Loss) income from investment operations1 |
Dividends and distributions | |||||||||||||||||||||||||||||||||||||||||||||||||||
| Year ended | Net asset value, beginning of year |
Net investment income |
Net (losses) gains on securities (both realized and unrealized) |
Total from investment operations |
Dividends (from net investment income) |
Distributions (from capital gains) |
Total dividends and distributions |
Net asset value, end of year |
Total return2 | Net assets, end of year (in millions) |
Ratio of expenses to average net assets before waivers3 |
Ratio of expenses to average net assets after waivers2,3 |
Ratio of net income to average net assets2 |
|||||||||||||||||||||||||||||||||||||||
| American Funds Global Balanced Fund | ||||||||||||||||||||||||||||||||||||||||||||||||||||
| Class 1: | ||||||||||||||||||||||||||||||||||||||||||||||||||||
| 12/31/2022 | $ | 14.73 | $ | .26 | $ | (2.37 | ) | $ | (2.11 | ) | $ | — | $ | (.07 | ) | $ | (.07 | ) | $ | 12.55 | (14.33 | )% | $ | 96 | .59 | % | .58 | % | 1.99 | % | ||||||||||||||||||||||
| 12/31/2021 | 14.19 | .18 | 1.37 | 1.55 | (.19 | ) | (.82 | ) | (1.01 | ) | 14.73 | 11.05 | 120 | .73 | .73 | 1.24 | ||||||||||||||||||||||||||||||||||||
| 12/31/2020 | 13.51 | .17 | 1.24 | 1.41 | (.19 | ) | (.54 | ) | (.73 | ) | 14.19 | 10.53 | 139 | .72 | .72 | 1.29 | ||||||||||||||||||||||||||||||||||||
| 12/31/2019 | 11.67 | .24 | 2.17 | 2.41 | (.20 | ) | (.37 | ) | (.57 | ) | 13.51 | 20.79 | 134 | .72 | .72 | 1.88 | ||||||||||||||||||||||||||||||||||||
| 12/31/2018 | 12.75 | .23 | (.96 | ) | (.73 | ) | (.20 | ) | (.15 | ) | (.35 | ) | 11.67 | (5.81 | ) | 110 | .72 | .72 | 1.82 | |||||||||||||||||||||||||||||||||
| Class 1A: | ||||||||||||||||||||||||||||||||||||||||||||||||||||
| 12/31/2022 | 14.70 | .22 | (2.36 | ) | (2.14 | ) | — | (.07 | ) | (.07 | ) | 12.49 | (14.56 | ) | 3 | .84 | .84 | 1.71 | ||||||||||||||||||||||||||||||||||
| 12/31/2021 | 14.16 | .15 | 1.36 | 1.51 | (.15 | ) | (.82 | ) | (.97 | ) | 14.70 | 10.83 | 4 | .98 | .98 | 1.02 | ||||||||||||||||||||||||||||||||||||
| 12/31/2020 | 13.49 | .14 | 1.23 | 1.37 | (.16 | ) | (.54 | ) | (.70 | ) | 14.16 | 10.25 | 3 | .97 | .97 | 1.03 | ||||||||||||||||||||||||||||||||||||
| 12/31/2019 | 11.65 | .21 | 2.17 | 2.38 | (.17 | ) | (.37 | ) | (.54 | ) | 13.49 | 20.54 | 2 | .97 | .97 | 1.63 | ||||||||||||||||||||||||||||||||||||
| 12/31/2018 | 12.74 | .18 | (.94 | ) | (.76 | ) | (.18 | ) | (.15 | ) | (.33 | ) | 11.65 | (6.03 | ) | 2 | .98 | .98 | 1.44 | |||||||||||||||||||||||||||||||||
| Class 2: | ||||||||||||||||||||||||||||||||||||||||||||||||||||
| 12/31/2022 | 14.70 | .22 | (2.36 | ) | (2.14 | ) | — | (.07 | ) | (.07 | ) | 12.49 | (14.56 | ) | 158 | .84 | .83 | 1.73 | ||||||||||||||||||||||||||||||||||
| 12/31/2021 | 14.16 | .15 | 1.36 | 1.51 | (.15 | ) | (.82 | ) | (.97 | ) | 14.70 | 10.79 | 208 | .98 | .98 | 1.01 | ||||||||||||||||||||||||||||||||||||
| 12/31/2020 | 13.48 | .14 | 1.23 | 1.37 | (.15 | ) | (.54 | ) | (.69 | ) | 14.16 | 10.30 | 208 | .97 | .97 | 1.03 | ||||||||||||||||||||||||||||||||||||
| 12/31/2019 | 11.65 | .21 | 2.16 | 2.37 | (.17 | ) | (.37 | ) | (.54 | ) | 13.48 | 20.44 | 207 | .97 | .97 | 1.64 | ||||||||||||||||||||||||||||||||||||
| 12/31/2018 | 12.72 | .20 | (.96 | ) | (.76 | ) | (.16 | ) | (.15 | ) | (.31 | ) | 11.65 | (6.01 | ) | 185 | .97 | .97 | 1.57 | |||||||||||||||||||||||||||||||||
| Class 4: | ||||||||||||||||||||||||||||||||||||||||||||||||||||
| 12/31/2022 | 14.53 | .19 | (2.33 | ) | (2.14 | ) | — | (.07 | ) | (.07 | ) | 12.32 | (14.73 | ) | 111 | 1.09 | 1.08 | 1.49 | ||||||||||||||||||||||||||||||||||
| 12/31/2021 | 14.02 | .11 | 1.34 | 1.45 | (.12 | ) | (.82 | ) | (.94 | ) | 14.53 | 10.46 | 135 | 1.23 | 1.23 | .77 | ||||||||||||||||||||||||||||||||||||
| 12/31/2020 | 13.36 | .10 | 1.22 | 1.32 | (.12 | ) | (.54 | ) | (.66 | ) | 14.02 | 10.00 | 105 | 1.22 | 1.22 | .78 | ||||||||||||||||||||||||||||||||||||
| 12/31/2019 | 11.55 | .18 | 2.14 | 2.32 | (.14 | ) | (.37 | ) | (.51 | ) | 13.36 | 20.21 | 94 | 1.22 | 1.22 | 1.37 | ||||||||||||||||||||||||||||||||||||
| 12/31/2018 | 12.63 | .17 | (.96 | ) | (.79 | ) | (.14 | ) | (.15 | ) | (.29 | ) | 11.55 | (6.31 | ) | 69 | 1.22 | 1.22 | 1.34 | |||||||||||||||||||||||||||||||||
Refer to the end of the tables for footnotes.
| 360 | American Funds Insurance Series |
Financial highlights (continued)
| (Loss) income from investment operations1 |
Dividends and distributions | |||||||||||||||||||||||||||||||||||||||||||||||||||
| Year ended | Net asset value, beginning of year |
Net investment income |
Net (losses) gains on securities (both realized and unrealized) |
Total from investment operations |
Dividends (from net investment income) |
Distributions (from capital gains) |
Total dividends and distributions |
Net asset value, end of year |
Total return2 | Net assets, end of year (in millions) |
Ratio of expenses to average net assets before waivers3 |
Ratio of expenses to average net assets after waivers2,3 |
Ratio of net income to average net assets2 |
|||||||||||||||||||||||||||||||||||||||
| The Bond Fund of America | ||||||||||||||||||||||||||||||||||||||||||||||||||||
| Class 1: | ||||||||||||||||||||||||||||||||||||||||||||||||||||
| 12/31/2022 | $ | 11.21 | $ | .31 | $ | (1.67 | ) | $ | (1.36 | ) | $ | (.32 | ) | $ | (.12 | ) | $ | (.44 | ) | $ | 9.41 | (12.26 | )% | $ | 6,370 | .39 | % | .20 | % | 3.09 | % | |||||||||||||||||||||
| 12/31/2021 | 11.89 | .21 | (.23 | ) | (.02 | ) | (.19 | ) | (.47 | ) | (.66 | ) | 11.21 | (.14 | ) | 8,555 | .39 | .26 | 1.84 | |||||||||||||||||||||||||||||||||
| 12/31/2020 | 11.17 | .23 | .87 | 1.10 | (.27 | ) | (.11 | ) | (.38 | ) | 11.89 | 9.96 | 6,844 | .40 | .40 | 2.00 | ||||||||||||||||||||||||||||||||||||
| 12/31/2019 | 10.47 | .30 | .71 | 1.01 | (.31 | ) | — | (.31 | ) | 11.17 | 9.70 | 6,481 | .39 | .39 | 2.76 | |||||||||||||||||||||||||||||||||||||
| 12/31/2018 | 10.82 | .29 | (.35 | ) | (.06 | ) | (.28 | ) | (.01 | ) | (.29 | ) | 10.47 | (.45 | ) | 5,962 | .38 | .38 | 2.70 | |||||||||||||||||||||||||||||||||
| Class 1A: | ||||||||||||||||||||||||||||||||||||||||||||||||||||
| 12/31/2022 | 11.16 | .31 | (1.69 | ) | (1.38 | ) | (.31 | ) | (.12 | ) | (.43 | ) | 9.35 | (12.49 | ) | 220 | .64 | .45 | 3.15 | |||||||||||||||||||||||||||||||||
| 12/31/2021 | 11.84 | .18 | (.23 | ) | (.05 | ) | (.16 | ) | (.47 | ) | (.63 | ) | 11.16 | (.36 | ) | 12 | .64 | .51 | 1.59 | |||||||||||||||||||||||||||||||||
| 12/31/2020 | 11.13 | .20 | .87 | 1.07 | (.25 | ) | (.11 | ) | (.36 | ) | 11.84 | 9.68 | 9 | .65 | .65 | 1.74 | ||||||||||||||||||||||||||||||||||||
| 12/31/2019 | 10.45 | .27 | .71 | .98 | (.30 | ) | — | (.30 | ) | 11.13 | 9.36 | 7 | .64 | .64 | 2.48 | |||||||||||||||||||||||||||||||||||||
| 12/31/2018 | 10.80 | .26 | (.33 | ) | (.07 | ) | (.27 | ) | (.01 | ) | (.28 | ) | 10.45 | (.60 | ) | 3 | .63 | .63 | 2.50 | |||||||||||||||||||||||||||||||||
| Class 2: | ||||||||||||||||||||||||||||||||||||||||||||||||||||
| 12/31/2022 | 11.06 | .28 | (1.66 | ) | (1.38 | ) | (.29 | ) | (.12 | ) | (.41 | ) | 9.27 | (12.58 | ) | 2,844 | .64 | .45 | 2.84 | |||||||||||||||||||||||||||||||||
| 12/31/2021 | 11.73 | .18 | (.22 | ) | (.04 | ) | (.16 | ) | (.47 | ) | (.63 | ) | 11.06 | (.31 | ) | 3,729 | .64 | .52 | 1.57 | |||||||||||||||||||||||||||||||||
| 12/31/2020 | 11.02 | .20 | .86 | 1.06 | (.24 | ) | (.11 | ) | (.35 | ) | 11.73 | 9.73 | 3,840 | .65 | .65 | 1.75 | ||||||||||||||||||||||||||||||||||||
| 12/31/2019 | 10.34 | .27 | .70 | .97 | (.29 | ) | — | (.29 | ) | 11.02 | 9.36 | 3,561 | .64 | .64 | 2.51 | |||||||||||||||||||||||||||||||||||||
| 12/31/2018 | 10.69 | .26 | (.34 | ) | (.08 | ) | (.26 | ) | (.01 | ) | (.27 | ) | 10.34 | (.71 | ) | 3,524 | .63 | .63 | 2.45 | |||||||||||||||||||||||||||||||||
| Class 4: | ||||||||||||||||||||||||||||||||||||||||||||||||||||
| 12/31/2022 | 11.01 | .26 | (1.65 | ) | (1.39 | ) | (.27 | ) | (.12 | ) | (.39 | ) | 9.23 | (12.75 | ) | 787 | .89 | .70 | 2.61 | |||||||||||||||||||||||||||||||||
| 12/31/2021 | 11.69 | .15 | (.22 | ) | (.07 | ) | (.14 | ) | (.47 | ) | (.61 | ) | 11.01 | (.59 | ) | 891 | .89 | .76 | 1.34 | |||||||||||||||||||||||||||||||||
| 12/31/2020 | 11.00 | .17 | .85 | 1.02 | (.22 | ) | (.11 | ) | (.33 | ) | 11.69 | 9.38 | 714 | .90 | .90 | 1.48 | ||||||||||||||||||||||||||||||||||||
| 12/31/2019 | 10.33 | .24 | .70 | .94 | (.27 | ) | — | (.27 | ) | 11.00 | 9.08 | 502 | .89 | .89 | 2.25 | |||||||||||||||||||||||||||||||||||||
| 12/31/2018 | 10.68 | .23 | (.33 | ) | (.10 | ) | (.24 | ) | (.01 | ) | (.25 | ) | 10.33 | (.89 | ) | 366 | .88 | .88 | 2.22 | |||||||||||||||||||||||||||||||||
Refer to the end of the tables for footnotes.
| American Funds Insurance Series | 361 |
Financial highlights (continued)
| (Loss) income from investment operations1 |
Dividends and distributions | |||||||||||||||||||||||||||||||||||||||||||||||||||
| Year ended | Net asset value, beginning of year |
Net investment income |
Net (losses) gains on securities (both realized and unrealized) |
Total from investment operations |
Dividends (from net investment income) |
Distributions (from capital gains) |
Total dividends and distributions |
Net asset value, end of year |
Total return2 | Net assets, end of year (in millions) |
Ratio of expenses to average net assets before waivers3 |
Ratio of expenses to average net assets after waivers2,3 |
Ratio of net income to average net assets2 |
|||||||||||||||||||||||||||||||||||||||
| Capital World Bond Fund | ||||||||||||||||||||||||||||||||||||||||||||||||||||
| Class 1: | ||||||||||||||||||||||||||||||||||||||||||||||||||||
| 12/31/2022 | $ | 11.79 | $ | .25 | $ | (2.30 | ) | $ | (2.05 | ) | $ | (.03 | ) | $ | (.16 | ) | $ | (.19 | ) | $ | 9.55 | (17.43 | )% | $ | 663 | .51 | % | .48 | % | 2.43 | % | |||||||||||||||||||||
| 12/31/2021 | 12.94 | .25 | (.85 | ) | (.60 | ) | (.24 | ) | (.31 | ) | (.55 | ) | 11.79 | (4.73 | ) | 988 | .60 | .50 | 2.06 | |||||||||||||||||||||||||||||||||
| 12/31/2020 | 12.12 | .26 | .95 | 1.21 | (.18 | ) | (.21 | ) | (.39 | ) | 12.94 | 10.17 | 1,219 | .59 | .52 | 2.08 | ||||||||||||||||||||||||||||||||||||
| 12/31/2019 | 11.42 | .31 | .61 | .92 | (.22 | ) | — | (.22 | ) | 12.12 | 8.08 | 1,077 | .58 | .58 | 2.60 | |||||||||||||||||||||||||||||||||||||
| 12/31/2018 | 11.88 | .30 | (.44 | ) | (.14 | ) | (.28 | ) | (.04 | ) | (.32 | ) | 11.42 | (1.14 | ) | 1,015 | .57 | .57 | 2.56 | |||||||||||||||||||||||||||||||||
| Class 1A: | ||||||||||||||||||||||||||||||||||||||||||||||||||||
| 12/31/2022 | 11.76 | .22 | (2.30 | ) | (2.08 | ) | (.02 | ) | (.16 | ) | (.18 | ) | 9.50 | (17.69 | ) | 1 | .76 | .73 | 2.19 | |||||||||||||||||||||||||||||||||
| 12/31/2021 | 12.91 | .23 | (.85 | ) | (.62 | ) | (.22 | ) | (.31 | ) | (.53 | ) | 11.76 | (4.88 | ) | 1 | .85 | .75 | 1.85 | |||||||||||||||||||||||||||||||||
| 12/31/2020 | 12.10 | .23 | .95 | 1.18 | (.16 | ) | (.21 | ) | (.37 | ) | 12.91 | 9.89 | 1 | .83 | .76 | 1.83 | ||||||||||||||||||||||||||||||||||||
| 12/31/2019 | 11.41 | .28 | .60 | .88 | (.19 | ) | — | (.19 | ) | 12.10 | 7.75 | 1 | .83 | .83 | 2.35 | |||||||||||||||||||||||||||||||||||||
| 12/31/2018 | 11.87 | .27 | (.43 | ) | (.16 | ) | (.26 | ) | (.04 | ) | (.30 | ) | 11.41 | (1.29 | ) | 1 | .82 | .82 | 2.36 | |||||||||||||||||||||||||||||||||
| Class 2: | ||||||||||||||||||||||||||||||||||||||||||||||||||||
| 12/31/2022 | 11.70 | .22 | (2.29 | ) | (2.07 | ) | (.02 | ) | (.16 | ) | (.18 | ) | 9.45 | (17.70 | ) | 765 | .76 | .73 | 2.18 | |||||||||||||||||||||||||||||||||
| 12/31/2021 | 12.84 | .22 | (.84 | ) | (.62 | ) | (.21 | ) | (.31 | ) | (.52 | ) | 11.70 | (4.92 | ) | 1,030 | .85 | .75 | 1.82 | |||||||||||||||||||||||||||||||||
| 12/31/2020 | 12.03 | .22 | .95 | 1.17 | (.15 | ) | (.21 | ) | (.36 | ) | 12.84 | 9.90 | 1,058 | .84 | .77 | 1.83 | ||||||||||||||||||||||||||||||||||||
| 12/31/2019 | 11.34 | .28 | .60 | .88 | (.19 | ) | — | (.19 | ) | 12.03 | 7.77 | 1,002 | .83 | .83 | 2.35 | |||||||||||||||||||||||||||||||||||||
| 12/31/2018 | 11.79 | .27 | (.43 | ) | (.16 | ) | (.25 | ) | (.04 | ) | (.29 | ) | 11.34 | (1.33 | ) | 1,032 | .82 | .82 | 2.32 | |||||||||||||||||||||||||||||||||
| Class 4: | ||||||||||||||||||||||||||||||||||||||||||||||||||||
| 12/31/2022 | 11.57 | .19 | (2.25 | ) | (2.06 | ) | (.02 | ) | (.16 | ) | (.18 | ) | 9.33 | (17.84 | ) | 53 | 1.01 | .98 | 1.94 | |||||||||||||||||||||||||||||||||
| 12/31/2021 | 12.71 | .19 | (.84 | ) | (.65 | ) | (.18 | ) | (.31 | ) | (.49 | ) | 11.57 | (5.18 | ) | 66 | 1.10 | 1.00 | 1.57 | |||||||||||||||||||||||||||||||||
| 12/31/2020 | 11.92 | .19 | .94 | 1.13 | (.13 | ) | (.21 | ) | (.34 | ) | 12.71 | 9.62 | 61 | 1.09 | 1.02 | 1.58 | ||||||||||||||||||||||||||||||||||||
| 12/31/2019 | 11.24 | .24 | .60 | .84 | (.16 | ) | — | (.16 | ) | 11.92 | 7.54 | 49 | 1.08 | 1.08 | 2.09 | |||||||||||||||||||||||||||||||||||||
| 12/31/2018 | 11.70 | .24 | (.43 | ) | (.19 | ) | (.23 | ) | (.04 | ) | (.27 | ) | 11.24 | (1.61 | ) | 40 | 1.07 | 1.07 | 2.09 | |||||||||||||||||||||||||||||||||
Refer to the end of the tables for footnotes.
| 362 | American Funds Insurance Series |
Financial highlights (continued)
| (Loss) income from investment operations1 |
Dividends and distributions | |||||||||||||||||||||||||||||||||||||||||||||||||||
| Year ended | Net asset value, beginning of year |
Net investment income |
Net (losses) gains on securities (both realized and unrealized) |
Total from investment operations |
Dividends (from net investment income) |
Distributions (from capital gains) |
Total dividends and distributions |
Net asset value, end of year |
Total return2 | Net assets, end of year (in millions) |
Ratio of expenses to average net assets before waivers3 |
Ratio of expenses to average net assets after waivers2,3 |
Ratio of net income to average net assets2 |
|||||||||||||||||||||||||||||||||||||||
| American High-Income Trust | ||||||||||||||||||||||||||||||||||||||||||||||||||||
| Class 1: | ||||||||||||||||||||||||||||||||||||||||||||||||||||
| 12/31/2022 | $ | 10.19 | $ | .56 | $ | (1.47 | ) | $ | (.91 | ) | $ | (.75 | ) | $ | — | $ | (.75 | ) | $ | 8.53 | (9.01 | )% | $ | 224 | .47 | % | .32 | % | 5.95 | % | ||||||||||||||||||||||
| 12/31/2021 | 9.80 | .51 | .34 | .85 | (.46 | ) | — | (.46 | ) | 10.19 | 8.74 | 278 | .53 | .37 | 4.95 | |||||||||||||||||||||||||||||||||||||
| 12/31/2020 | 9.87 | .61 | .17 | .78 | (.85 | ) | — | (.85 | ) | 9.80 | 8.21 | 123 | .52 | .52 | 6.46 | |||||||||||||||||||||||||||||||||||||
| 12/31/2019 | 9.34 | .67 | .52 | 1.19 | (.66 | ) | — | (.66 | ) | 9.87 | 12.85 | 525 | .51 | .51 | 6.71 | |||||||||||||||||||||||||||||||||||||
| 12/31/2018 | 10.19 | .64 | (.84 | ) | (.20 | ) | (.65 | ) | — | (.65 | ) | 9.34 | (2.15 | ) | 501 | .50 | .50 | 6.32 | ||||||||||||||||||||||||||||||||||
| Class 1A: | ||||||||||||||||||||||||||||||||||||||||||||||||||||
| 12/31/2022 | 10.16 | .53 | (1.46 | ) | (.93 | ) | (.72 | ) | — | (.72 | ) | 8.51 | (9.29 | ) | 1 | .72 | .57 | 5.70 | ||||||||||||||||||||||||||||||||||
| 12/31/2021 | 9.78 | .49 | .33 | .82 | (.44 | ) | — | (.44 | ) | 10.16 | 8.42 | 1 | .78 | .64 | 4.75 | |||||||||||||||||||||||||||||||||||||
| 12/31/2020 | 9.86 | .56 | .20 | .76 | (.84 | ) | — | (.84 | ) | 9.78 | 7.94 | 1 | .78 | .78 | 5.85 | |||||||||||||||||||||||||||||||||||||
| 12/31/2019 | 9.33 | .65 | .51 | 1.16 | (.63 | ) | — | (.63 | ) | 9.86 | 12.61 | 1 | .75 | .75 | 6.47 | |||||||||||||||||||||||||||||||||||||
| 12/31/2018 | 10.18 | .62 | (.84 | ) | (.22 | ) | (.63 | ) | — | (.63 | ) | 9.33 | (2.35 | ) | 1 | .75 | .75 | 6.11 | ||||||||||||||||||||||||||||||||||
| Class 2: | ||||||||||||||||||||||||||||||||||||||||||||||||||||
| 12/31/2022 | 9.98 | .52 | (1.43 | ) | (.91 | ) | (.72 | ) | — | (.72 | ) | 8.35 | (9.26 | ) | 521 | .72 | .57 | 5.68 | ||||||||||||||||||||||||||||||||||
| 12/31/2021 | 9.61 | .48 | .33 | .81 | (.44 | ) | — | (.44 | ) | 9.98 | 8.42 | 673 | .78 | .65 | 4.80 | |||||||||||||||||||||||||||||||||||||
| 12/31/2020 | 9.70 | .55 | .19 | .74 | (.83 | ) | — | (.83 | ) | 9.61 | 7.94 | 665 | .78 | .78 | 5.88 | |||||||||||||||||||||||||||||||||||||
| 12/31/2019 | 9.19 | .64 | .50 | 1.14 | (.63 | ) | — | (.63 | ) | 9.70 | 12.55 | 667 | .76 | .76 | 6.45 | |||||||||||||||||||||||||||||||||||||
| 12/31/2018 | 10.03 | .61 | (.83 | ) | (.22 | ) | (.62 | ) | — | (.62 | ) | 9.19 | (2.34 | ) | 661 | .75 | .75 | 6.07 | ||||||||||||||||||||||||||||||||||
| Class 3: | ||||||||||||||||||||||||||||||||||||||||||||||||||||
| 12/31/2022 | 10.24 | .54 | (1.47 | ) | (.93 | ) | (.73 | ) | — | (.73 | ) | 8.58 | (9.25 | ) | 9 | .65 | .50 | 5.76 | ||||||||||||||||||||||||||||||||||
| 12/31/2021 | 9.84 | .50 | .34 | .84 | (.44 | ) | — | (.44 | ) | 10.24 | 8.60 | 10 | .71 | .58 | 4.86 | |||||||||||||||||||||||||||||||||||||
| 12/31/2020 | 9.92 | .57 | .19 | .76 | (.84 | ) | — | (.84 | ) | 9.84 | 7.93 | 10 | .71 | .71 | 5.94 | |||||||||||||||||||||||||||||||||||||
| 12/31/2019 | 9.38 | .66 | .52 | 1.18 | (.64 | ) | — | (.64 | ) | 9.92 | 12.70 | 10 | .69 | .69 | 6.52 | |||||||||||||||||||||||||||||||||||||
| 12/31/2018 | 10.23 | .63 | (.85 | ) | (.22 | ) | (.63 | ) | — | (.63 | ) | 9.38 | (2.33 | ) | 10 | .68 | .68 | 6.14 | ||||||||||||||||||||||||||||||||||
| Class 4: | ||||||||||||||||||||||||||||||||||||||||||||||||||||
| 12/31/2022 | 10.99 | .55 | (1.58 | ) | (1.03 | ) | (.70 | ) | — | (.70 | ) | 9.26 | (9.53 | ) | 77 | .97 | .82 | 5.44 | ||||||||||||||||||||||||||||||||||
| 12/31/2021 | 10.54 | .50 | .36 | .86 | (.41 | ) | — | (.41 | ) | 10.99 | 8.18 | 90 | 1.03 | .89 | 4.52 | |||||||||||||||||||||||||||||||||||||
| 12/31/2020 | 10.56 | .57 | .22 | .79 | (.81 | ) | — | (.81 | ) | 10.54 | 7.74 | 69 | 1.03 | 1.03 | 5.58 | |||||||||||||||||||||||||||||||||||||
| 12/31/2019 | 9.96 | .67 | .54 | 1.21 | (.61 | ) | — | (.61 | ) | 10.56 | 12.27 | 63 | 1.01 | 1.01 | 6.21 | |||||||||||||||||||||||||||||||||||||
| 12/31/2018 | 10.82 | .63 | (.90 | ) | (.27 | ) | (.59 | ) | — | (.59 | ) | 9.96 | (2.64 | ) | 31 | 1.00 | 1.00 | 5.83 | ||||||||||||||||||||||||||||||||||
Refer to the end of the tables for footnotes.
| American Funds Insurance Series | 363 |
Financial highlights (continued)
| (Loss) income from investment operations1 |
Dividends and distributions | |||||||||||||||||||||||||||||||||||||||||||||||||||
| Year ended | Net asset value, beginning of year |
Net investment income |
Net (losses) gains on securities (both realized and unrealized) |
Total from investment operations |
Dividends (from net investment income) |
Distributions (from capital gains) |
Total dividends and distributions |
Net asset value, end of year |
Total return2 | Net assets, end of year (in millions) |
Ratio of expenses to average net assets before waivers |
Ratio of expenses to average net assets after waivers2 |
Ratio of net income to average net assets2 |
|||||||||||||||||||||||||||||||||||||||
| American Funds Mortgage Fund | ||||||||||||||||||||||||||||||||||||||||||||||||||||
| Class 1: | ||||||||||||||||||||||||||||||||||||||||||||||||||||
| 12/31/2022 | $ | 10.63 | $ | .07 | $ | (1.10 | ) | $ | (1.03 | ) | $ | (.15 | ) | $ | — | $ | (.15 | ) | $ | 9.45 | (9.76 | )% | $ | 1 | .45 | % | .25 | % | .70 | % | ||||||||||||||||||||||
| 12/31/2021 | 11.11 | .06 | (.09 | ) | (.03 | ) | (.08 | ) | (.37 | ) | (.45 | ) | 10.63 | (.32 | ) | 231 | .49 | .29 | .58 | |||||||||||||||||||||||||||||||||
| 12/31/2020 | 10.56 | .10 | .64 | .74 | (.17 | ) | (.02 | ) | (.19 | ) | 11.11 | 6.98 | 224 | .48 | .36 | .93 | ||||||||||||||||||||||||||||||||||||
| 12/31/2019 | 10.30 | .24 | .30 | .54 | (.28 | ) | — | (.28 | ) | 10.56 | 5.30 | 210 | .47 | .47 | 2.26 | |||||||||||||||||||||||||||||||||||||
| 12/31/2018 | 10.47 | .20 | (.14 | ) | .06 | (.23 | ) | — | (.23 | ) | 10.30 | .58 | 209 | .48 | .48 | 1.97 | ||||||||||||||||||||||||||||||||||||
| Class 1A: | ||||||||||||||||||||||||||||||||||||||||||||||||||||
| 12/31/2022 | 10.59 | .19 | (1.24 | ) | (1.05 | ) | (.20 | ) | — | (.20 | ) | 9.34 | (10.03 | ) | 2 | .69 | .54 | 1.91 | ||||||||||||||||||||||||||||||||||
| 12/31/2021 | 11.08 | .04 | (.10 | ) | (.06 | ) | (.06 | ) | (.37 | ) | (.43 | ) | 10.59 | (.47 | ) | 2 | .74 | .54 | .33 | |||||||||||||||||||||||||||||||||
| 12/31/2020 | 10.55 | .07 | .63 | .70 | (.15 | ) | (.02 | ) | (.17 | ) | 11.08 | 6.63 | 1 | .73 | .59 | .61 | ||||||||||||||||||||||||||||||||||||
| 12/31/2019 | 10.28 | .22 | .30 | .52 | (.25 | ) | — | (.25 | ) | 10.55 | 5.09 | 1 | .71 | .71 | 2.04 | |||||||||||||||||||||||||||||||||||||
| 12/31/2018 | 10.46 | .18 | (.14 | ) | .04 | (.22 | ) | — | (.22 | ) | 10.28 | .36 | 1 | .73 | .73 | 1.77 | ||||||||||||||||||||||||||||||||||||
| Class 2: | ||||||||||||||||||||||||||||||||||||||||||||||||||||
| 12/31/2022 | 10.61 | .18 | (1.23 | ) | (1.05 | ) | (.20 | ) | — | (.20 | ) | 9.36 | (9.94 | ) | 46 | .69 | .54 | 1.87 | ||||||||||||||||||||||||||||||||||
| 12/31/2021 | 11.09 | .04 | (.10 | ) | (.06 | ) | (.05 | ) | (.37 | ) | (.42 | ) | 10.61 | (.57 | ) | 58 | .74 | .54 | .33 | |||||||||||||||||||||||||||||||||
| 12/31/2020 | 10.54 | .08 | .63 | .71 | (.14 | ) | (.02 | ) | (.16 | ) | 11.09 | 6.72 | 58 | .73 | .60 | .68 | ||||||||||||||||||||||||||||||||||||
| 12/31/2019 | 10.28 | .21 | .31 | .52 | (.26 | ) | — | (.26 | ) | 10.54 | 5.04 | 56 | .72 | .72 | 2.01 | |||||||||||||||||||||||||||||||||||||
| 12/31/2018 | 10.45 | .18 | (.15 | ) | .03 | (.20 | ) | — | (.20 | ) | 10.28 | .32 | 57 | .73 | .73 | 1.72 | ||||||||||||||||||||||||||||||||||||
| Class 4: | ||||||||||||||||||||||||||||||||||||||||||||||||||||
| 12/31/2022 | 10.49 | .16 | (1.22 | ) | (1.06 | ) | (.18 | ) | — | (.18 | ) | 9.25 | (10.16 | ) | 40 | .94 | .79 | 1.66 | ||||||||||||||||||||||||||||||||||
| 12/31/2021 | 10.97 | .01 | (.09 | ) | (.08 | ) | (.03 | ) | (.37 | ) | (.40 | ) | 10.49 | (.78 | ) | 43 | .99 | .79 | .08 | |||||||||||||||||||||||||||||||||
| 12/31/2020 | 10.44 | .04 | .63 | .67 | (.12 | ) | (.02 | ) | (.14 | ) | 10.97 | 6.38 | 37 | .98 | .85 | .41 | ||||||||||||||||||||||||||||||||||||
| 12/31/2019 | 10.19 | .18 | .31 | .49 | (.24 | ) | — | (.24 | ) | 10.44 | 4.80 | 28 | .97 | .97 | 1.71 | |||||||||||||||||||||||||||||||||||||
| 12/31/2018 | 10.38 | .15 | (.15 | ) | — | 4 | (.19 | ) | — | (.19 | ) | 10.19 | .07 | 24 | .98 | .98 | 1.49 | |||||||||||||||||||||||||||||||||||
Refer to the end of the tables for footnotes.
| 364 | American Funds Insurance Series |
Financial highlights (continued)
| Income (loss) from investment operations1 |
Dividends and distributions | |||||||||||||||||||||||||||||||||||||||||||||||
| Year ended | Net asset value, beginning of year |
Net investment income (loss) |
Net (losses) gains on securities (both realized and unrealized) |
Total from investment operations |
Dividends (from net investment income) |
Distributions (from capital gains) |
Total dividends end distributions |
Net asset value, end of year |
Total return | Net assets, end of year (in millions) |
Ratio of expenses to average net assets |
Ratio of net income (loss) to average net assets |
||||||||||||||||||||||||||||||||||||
| Ultra-Short Bond Fund | ||||||||||||||||||||||||||||||||||||||||||||||||
| Class 1: | ||||||||||||||||||||||||||||||||||||||||||||||||
| 12/31/2022 | $ | 11.27 | $ | .17 | $ | (.01 | ) | $ | .16 | $ | (.08 | ) | $ | — | $ | (.08 | ) | $ | 11.35 | 1.42 | % | $ | 51 | .32 | % | 1.48 | % | |||||||||||||||||||||
| 12/31/2021 | 11.31 | (.03 | ) | (.01 | ) | (.04 | ) | — | — | — | 11.27 | (.35 | ) | 37 | .37 | (.28 | ) | |||||||||||||||||||||||||||||||
| 12/31/2020 | 11.30 | .02 | .02 | .04 | (.03 | ) | — | (.03 | ) | 11.31 | .34 | 44 | .37 | .16 | ||||||||||||||||||||||||||||||||||
| 12/31/2019 | 11.31 | .22 | — | 4 | .22 | (.23 | ) | — | (.23 | ) | 11.30 | 1.92 | 30 | .36 | 1.92 | |||||||||||||||||||||||||||||||||
| 12/31/2018 | 11.29 | .18 | — | 4 | .18 | (.16 | ) | — | (.16 | ) | 11.31 | 1.58 | 37 | .35 | 1.60 | |||||||||||||||||||||||||||||||||
| Class 1A: | ||||||||||||||||||||||||||||||||||||||||||||||||
| 12/31/2022 | 11.28 | .16 | (.01 | ) | .15 | (.08 | ) | — | (.08 | ) | 11.35 | 1.32 | — | 6 | .31 | 1.40 | ||||||||||||||||||||||||||||||||
| 12/31/2021 | 11.31 | (.03 | ) | — | 4 | (.03 | ) | — | — | — | 11.28 | (.27 | ) | — | 6 | .36 | (.28 | ) | ||||||||||||||||||||||||||||||
| 12/31/2020 | 11.30 | .03 | .01 | .04 | (.03 | ) | — | (.03 | ) | 11.31 | .32 | — | 6 | .35 | .26 | |||||||||||||||||||||||||||||||||
| 12/31/2019 | 11.31 | .22 | — | 4 | .22 | (.23 | ) | — | (.23 | ) | 11.30 | 1.92 | — | 6 | .37 | 1.90 | ||||||||||||||||||||||||||||||||
| 12/31/2018 | 11.29 | .18 | — | 4 | .18 | (.16 | ) | — | (.16 | ) | 11.31 | 1.58 | — | 6 | .35 | 1.60 | ||||||||||||||||||||||||||||||||
| Class 2: | ||||||||||||||||||||||||||||||||||||||||||||||||
| 12/31/2022 | 10.93 | .13 | — | 4 | .13 | (.06 | ) | — | (.06 | ) | 11.00 | 1.17 | 297 | .57 | 1.23 | |||||||||||||||||||||||||||||||||
| 12/31/2021 | 10.99 | (.06 | ) | — | 4 | (.06 | ) | — | — | — | 10.93 | (.55 | ) | 245 | .62 | (.53 | ) | |||||||||||||||||||||||||||||||
| 12/31/2020 | 11.01 | — | 4 | — | 4 | — | 4 | (.02 | ) | — | (.02 | ) | 10.99 | .03 | 288 | .62 | (.05 | ) | ||||||||||||||||||||||||||||||
| 12/31/2019 | 11.03 | .18 | — | 4 | .18 | (.20 | ) | — | (.20 | ) | 11.01 | 1.62 | 230 | .61 | 1.66 | |||||||||||||||||||||||||||||||||
| 12/31/2018 | 11.01 | .15 | — | 4 | .15 | (.13 | ) | — | (.13 | ) | 11.03 | 1.36 | 247 | .60 | 1.34 | |||||||||||||||||||||||||||||||||
| Class 3: | ||||||||||||||||||||||||||||||||||||||||||||||||
| 12/31/2022 | 11.07 | .13 | — | 4 | .13 | (.06 | ) | — | (.06 | ) | 11.14 | 1.19 | 4 | .50 | 1.19 | |||||||||||||||||||||||||||||||||
| 12/31/2021 | 11.12 | (.05 | ) | — | 4 | (.05 | ) | — | — | — | 11.07 | (.45 | ) | 5 | .55 | (.46 | ) | |||||||||||||||||||||||||||||||
| 12/31/2020 | 11.13 | — | 4 | .02 | .02 | (.03 | ) | — | (.03 | ) | 11.12 | .13 | 4 | .55 | .03 | |||||||||||||||||||||||||||||||||
| 12/31/2019 | 11.14 | .20 | — | 4 | .20 | (.21 | ) | — | (.21 | ) | 11.13 | 1.76 | 3 | .54 | 1.74 | |||||||||||||||||||||||||||||||||
| 12/31/2018 | 11.12 | .16 | (.01 | ) | .15 | (.13 | ) | — | (.13 | ) | 11.14 | 1.38 | 4 | .53 | 1.42 | |||||||||||||||||||||||||||||||||
| Class 4: | ||||||||||||||||||||||||||||||||||||||||||||||||
| 12/31/2022 | 11.00 | .12 | (.03 | ) | .09 | (.04 | ) | — | (.04 | ) | 11.05 | .83 | 80 | .82 | 1.05 | |||||||||||||||||||||||||||||||||
| 12/31/2021 | 11.08 | (.09 | ) | .01 | (.08 | ) | — | — | — | 11.00 | (.72 | ) | 46 | .87 | (.79 | ) | ||||||||||||||||||||||||||||||||
| 12/31/2020 | 11.13 | (.04 | ) | .01 | (.03 | ) | (.02 | ) | — | (.02 | ) | 11.08 | (.25 | ) | 40 | .87 | (.35 | ) | ||||||||||||||||||||||||||||||
| 12/31/2019 | 11.15 | .16 | — | 4 | .16 | (.18 | ) | — | (.18 | ) | 11.13 | 1.40 | 22 | .86 | 1.40 | |||||||||||||||||||||||||||||||||
| 12/31/2018 | 11.13 | .12 | .01 | .13 | (.11 | ) | — | (.11 | ) | 11.15 | 1.14 | 18 | .86 | 1.11 | ||||||||||||||||||||||||||||||||||
Refer to the end of the tables for footnotes.
| American Funds Insurance Series | 365 |
Financial highlights (continued)
| (Loss) income from investment operations1 |
Dividends and distributions | |||||||||||||||||||||||||||||||||||||||||||||||||||
| Year ended | Net asset value, beginning of year |
Net investment income |
Net (losses) gains on securities (both realized and unrealized) |
Total from investment operations |
Dividends (from net investment income) |
Distributions (from capital gains) |
Total dividends and distributions |
Net asset value, end of year |
Total return2 | Net assets, end of year (in millions) |
Ratio of expenses to average net assets before waivers |
Ratio of expenses to average net assets after waivers2 |
Ratio of net income to average net assets2 |
|||||||||||||||||||||||||||||||||||||||
| U.S. Government Securities Fund | ||||||||||||||||||||||||||||||||||||||||||||||||||||
| Class 1: | ||||||||||||||||||||||||||||||||||||||||||||||||||||
| 12/31/2022 | $ | 11.67 | $ | .32 | $ | (1.56 | ) | $ | (1.24 | ) | $ | (.44 | ) | $ | — | $ | (.44 | ) | $ | 9.99 | (10.75 | )% | $ | 242 | .36 | % | .22 | % | 2.90 | % | ||||||||||||||||||||||
| 12/31/2021 | 13.04 | .18 | (.26 | ) | (.08 | ) | (.18 | ) | (1.11 | ) | (1.29 | ) | 11.67 | (.44 | ) | 522 | .39 | .29 | 1.50 | |||||||||||||||||||||||||||||||||
| 12/31/2020 | 12.34 | .16 | 1.07 | 1.23 | (.26 | ) | (.27 | ) | (.53 | ) | 13.04 | 10.09 | 429 | .38 | .38 | 1.21 | ||||||||||||||||||||||||||||||||||||
| 12/31/2019 | 11.94 | .25 | .43 | .68 | (.28 | ) | — | (.28 | ) | 12.34 | 5.69 | 1,418 | .37 | .37 | 2.07 | |||||||||||||||||||||||||||||||||||||
| 12/31/2018 | 12.08 | .24 | (.13 | ) | .11 | (.25 | ) | — | (.25 | ) | 11.94 | .91 | 1,445 | .36 | .36 | 2.02 | ||||||||||||||||||||||||||||||||||||
| Class 1A: | ||||||||||||||||||||||||||||||||||||||||||||||||||||
| 12/31/2022 | 11.63 | .29 | (1.55 | ) | (1.26 | ) | (.41 | ) | — | (.41 | ) | 9.96 | (10.93 | ) | 4 | .60 | .47 | 2.70 | ||||||||||||||||||||||||||||||||||
| 12/31/2021 | 13.00 | .16 | (.26 | ) | (.10 | ) | (.16 | ) | (1.11 | ) | (1.27 | ) | 11.63 | (.65 | ) | 5 | .64 | .53 | 1.28 | |||||||||||||||||||||||||||||||||
| 12/31/2020 | 12.32 | .09 | 1.10 | 1.19 | (.24 | ) | (.27 | ) | (.51 | ) | 13.00 | 9.75 | 4 | .64 | .64 | .69 | ||||||||||||||||||||||||||||||||||||
| 12/31/2019 | 11.93 | .22 | .43 | .65 | (.26 | ) | — | (.26 | ) | 12.32 | 5.42 | 2 | .62 | .62 | 1.82 | |||||||||||||||||||||||||||||||||||||
| 12/31/2018 | 12.08 | .22 | (.14 | ) | .08 | (.23 | ) | — | (.23 | ) | 11.93 | .70 | 1 | .61 | .61 | 1.82 | ||||||||||||||||||||||||||||||||||||
| Class 2: | ||||||||||||||||||||||||||||||||||||||||||||||||||||
| 12/31/2022 | 11.53 | .29 | (1.54 | ) | (1.25 | ) | (.41 | ) | — | (.41 | ) | 9.87 | (10.95 | ) | 1,059 | .61 | .47 | 2.69 | ||||||||||||||||||||||||||||||||||
| 12/31/2021 | 12.89 | .15 | (.25 | ) | (.10 | ) | (.15 | ) | (1.11 | ) | (1.26 | ) | 11.53 | (.62 | ) | 1,391 | .64 | .54 | 1.24 | |||||||||||||||||||||||||||||||||
| 12/31/2020 | 12.21 | .09 | 1.10 | 1.19 | (.24 | ) | (.27 | ) | (.51 | ) | 12.89 | 9.80 | 1,439 | .64 | .64 | .73 | ||||||||||||||||||||||||||||||||||||
| 12/31/2019 | 11.82 | .22 | .42 | .64 | (.25 | ) | — | (.25 | ) | 12.21 | 5.31 | 1,343 | .62 | .62 | 1.82 | |||||||||||||||||||||||||||||||||||||
| 12/31/2018 | 11.96 | .21 | (.14 | ) | .07 | (.21 | ) | — | (.21 | ) | 11.82 | .73 | 1,323 | .61 | .61 | 1.77 | ||||||||||||||||||||||||||||||||||||
| Class 3: | ||||||||||||||||||||||||||||||||||||||||||||||||||||
| 12/31/2022 | 11.70 | .30 | (1.57 | ) | (1.27 | ) | (.41 | ) | — | (.41 | ) | 10.02 | (10.90 | ) | 6 | .54 | .40 | 2.76 | ||||||||||||||||||||||||||||||||||
| 12/31/2021 | 13.07 | .16 | (.26 | ) | (.10 | ) | (.16 | ) | (1.11 | ) | (1.27 | ) | 11.70 | (.62 | ) | 9 | .57 | .47 | 1.31 | |||||||||||||||||||||||||||||||||
| 12/31/2020 | 12.37 | .10 | 1.12 | 1.22 | (.25 | ) | (.27 | ) | (.52 | ) | 13.07 | 9.91 | 10 | .57 | .57 | .78 | ||||||||||||||||||||||||||||||||||||
| 12/31/2019 | 11.97 | .23 | .43 | .66 | (.26 | ) | — | (.26 | ) | 12.37 | 5.49 | 9 | .55 | .55 | 1.88 | |||||||||||||||||||||||||||||||||||||
| 12/31/2018 | 12.11 | .22 | (.14 | ) | .08 | (.22 | ) | — | (.22 | ) | 11.97 | .71 | 9 | .54 | .54 | 1.84 | ||||||||||||||||||||||||||||||||||||
| Class 4: | ||||||||||||||||||||||||||||||||||||||||||||||||||||
| 12/31/2022 | 11.52 | .26 | (1.54 | ) | (1.28 | ) | (.38 | ) | — | (.38 | ) | 9.86 | (11.19 | ) | 190 | .85 | .72 | 2.45 | ||||||||||||||||||||||||||||||||||
| 12/31/2021 | 12.88 | .12 | (.25 | ) | (.13 | ) | (.12 | ) | (1.11 | ) | (1.23 | ) | 11.52 | (.88 | ) | 238 | .89 | .79 | .98 | |||||||||||||||||||||||||||||||||
| 12/31/2020 | 12.22 | .05 | 1.10 | 1.15 | (.22 | ) | (.27 | ) | (.49 | ) | 12.88 | 9.48 | 272 | .89 | .89 | .42 | ||||||||||||||||||||||||||||||||||||
| 12/31/2019 | 11.84 | .19 | .42 | .61 | (.23 | ) | — | (.23 | ) | 12.22 | 5.14 | 124 | .87 | .87 | 1.56 | |||||||||||||||||||||||||||||||||||||
| 12/31/2018 | 11.98 | .18 | (.12 | ) | .06 | (.20 | ) | — | (.20 | ) | 11.84 | .50 | 91 | .86 | .86 | 1.53 | ||||||||||||||||||||||||||||||||||||
Refer to the end of the tables for footnotes.
| 366 | American Funds Insurance Series |
Financial highlights (continued)
| (Loss) income from investment operations1 |
Dividends and distributions | Ratio of expenses |
Ratio of expenses |
|||||||||||||||||||||||||||||||||||||||||||||||||||||
| Year ended | Net asset value, beginning of year |
Net investment income (loss) |
Net (losses) gains on securities (both realized and unrealized) |
Total from investment operations |
Dividends (from net investment income) |
Distributions (from capital gains) |
Total dividends and distributions |
Net asset value, end of year |
Total return2 | Net assets, end of year (in millions) |
to average net assets before waivers/ reimburse- ments7 |
to average net assets after waivers/ reimburse- ments2,7 |
Net effective expense ratio2,8,9 |
Ratio of net income to average net assets2 |
||||||||||||||||||||||||||||||||||||||||||
| Managed Risk Growth Fund | ||||||||||||||||||||||||||||||||||||||||||||||||||||||||
| Class P1: | ||||||||||||||||||||||||||||||||||||||||||||||||||||||||
| 12/31/2022 | $ | 18.53 | $ | .06 | $ | (4.46 | ) | $ | (4.40 | ) | $ | (.22 | ) | $ | (2.54 | ) | $ | (2.76 | ) | $ | 11.37 | (24.62 | )% | $ | 9 | .41 | % | .36 | % | .69 | % | .47 | % | |||||||||||||||||||||||
| 12/31/2021 | 17.25 | .04 | 2.16 | 2.20 | (.18 | ) | (.74 | ) | (.92 | ) | 18.53 | 13.08 | 13 | .41 | .36 | .69 | .19 | |||||||||||||||||||||||||||||||||||||||
| 12/31/2020 | 13.78 | .07 | 4.20 | 4.27 | (.12 | ) | (.68 | ) | (.80 | ) | 17.25 | 32.45 | 11 | .42 | .37 | .72 | .49 | |||||||||||||||||||||||||||||||||||||||
| 12/31/2019 | 12.30 | .15 | 2.44 | 2.59 | (.19 | ) | (.92 | ) | (1.11 | ) | 13.78 | 22.01 | 6 | .42 | .37 | .73 | 1.19 | |||||||||||||||||||||||||||||||||||||||
| 12/31/2018 | 13.22 | .11 | (.04 | ) | .07 | (.10 | ) | (.89 | ) | (.99 | ) | 12.30 | (.04 | )10 | 3 | .42 | 10 | .37 | 10 | .71 | 10 | .82 | 10 | |||||||||||||||||||||||||||||||||
| Class P2: | ||||||||||||||||||||||||||||||||||||||||||||||||||||||||
| 12/31/2022 | 18.42 | .03 | (4.45 | ) | (4.42 | ) | (.18 | ) | (2.54 | ) | (2.72 | ) | 11.28 | (24.88 | ) | 445 | .67 | .62 | .95 | .20 | ||||||||||||||||||||||||||||||||||||
| 12/31/2021 | 17.11 | (.01 | ) | 2.16 | 2.15 | (.10 | ) | (.74 | ) | (.84 | ) | 18.42 | 12.89 | 584 | .67 | .62 | .95 | (.07 | ) | |||||||||||||||||||||||||||||||||||||
| 12/31/2020 | 13.71 | .03 | 4.16 | 4.19 | (.11 | ) | (.68 | ) | (.79 | ) | 17.11 | 32.03 | 554 | .67 | .62 | .97 | .20 | |||||||||||||||||||||||||||||||||||||||
| 12/31/2019 | 12.21 | .09 | 2.45 | 2.54 | (.12 | ) | (.92 | ) | (1.04 | ) | 13.71 | 21.74 | 434 | .68 | .63 | .99 | .73 | |||||||||||||||||||||||||||||||||||||||
| 12/31/2018 | 13.14 | .06 | (.04 | ) | .02 | (.06 | ) | (.89 | ) | (.95 | ) | 12.21 | (.37 | ) | 340 | .68 | .63 | .97 | .46 | |||||||||||||||||||||||||||||||||||||
| Managed Risk International Fund | ||||||||||||||||||||||||||||||||||||||||||||||||||||||||
| Class P1: | ||||||||||||||||||||||||||||||||||||||||||||||||||||||||
| 12/31/2022 | $ | 10.55 | $ | .15 | $ | (1.75 | ) | $ | (1.60 | ) | $ | (.34 | ) | $ | — | $ | (.34 | ) | $ | 8.61 | (15.27 | )%10 | $ | 2 | .44 | %10 | .37 | %10 | .87 | %10 | 1.70 | %10 | ||||||||||||||||||||||||
| 12/31/2021 | 11.07 | .24 | (.67 | ) | (.43 | ) | (.09 | ) | — | (.09 | ) | 10.55 | (3.92 | )10 | 2 | .44 | 10 | .36 | 10 | .87 | 10 | 2.12 | 10 | |||||||||||||||||||||||||||||||||
| 12/31/2020 | 11.01 | .08 | .22 | .30 | (.16 | ) | (.08 | ) | (.24 | ) | 11.07 | 3.13 | 10 | 2 | .43 | 10 | .35 | 10 | .86 | 10 | .82 | 10 | ||||||||||||||||||||||||||||||||||
| 12/31/2019 | 9.82 | .17 | 1.54 | 1.71 | (.20 | ) | (.32 | ) | (.52 | ) | 11.01 | 17.91 | 10 | 1 | .41 | 10 | .33 | 10 | .84 | 10 | 1.64 | 10 | ||||||||||||||||||||||||||||||||||
| 12/31/2018 | 11.25 | .32 | (1.44 | ) | (1.12 | ) | (.26 | ) | (.05 | ) | (.31 | ) | 9.82 | (10.11 | )10 | — | 6 | .33 | 10 | .28 | 10 | .77 | 10 | 3.02 | 10 | |||||||||||||||||||||||||||||||
| Class P2: | ||||||||||||||||||||||||||||||||||||||||||||||||||||||||
| 12/31/2022 | 10.48 | .12 | (1.74 | ) | (1.62 | ) | (.28 | ) | — | (.28 | ) | 8.58 | (15.54 | ) | 124 | .70 | .63 | 1.13 | 1.36 | |||||||||||||||||||||||||||||||||||||
| 12/31/2021 | 10.99 | .20 | (.65 | ) | (.45 | ) | (.06 | ) | — | (.06 | ) | 10.48 | (4.13 | ) | 160 | .71 | .63 | 1.14 | 1.79 | |||||||||||||||||||||||||||||||||||||
| 12/31/2020 | 10.92 | .04 | .23 | .27 | (.12 | ) | (.08 | ) | (.20 | ) | 10.99 | 2.80 | 168 | .71 | .63 | 1.14 | .42 | |||||||||||||||||||||||||||||||||||||||
| 12/31/2019 | 9.76 | .13 | 1.55 | 1.68 | (.20 | ) | (.32 | ) | (.52 | ) | 10.92 | 17.64 | 165 | .71 | .63 | 1.14 | 1.21 | |||||||||||||||||||||||||||||||||||||||
| 12/31/2018 | 11.15 | .16 | (1.32 | ) | (1.16 | ) | (.18 | ) | (.05 | ) | (.23 | ) | 9.76 | (10.50 | ) | 151 | .69 | .64 | 1.13 | 1.49 | ||||||||||||||||||||||||||||||||||||
| Managed Risk Washington Mutual Investors Fund | ||||||||||||||||||||||||||||||||||||||||||||||||||||||||
| Class P1: | ||||||||||||||||||||||||||||||||||||||||||||||||||||||||
| 12/31/2022 | $ | 12.95 | $ | .23 | $ | (1.38 | ) | $ | (1.15 | ) | $ | (.56 | ) | $ | — | $ | (.56 | ) | $ | 11.24 | (8.92 | )%10 | $ | 3 | .41 | %10 | .36 | %10 | .75 | %10 | 1.96 | %10 | ||||||||||||||||||||||||
| 12/31/2021 | 11.24 | .16 | 1.79 | 1.95 | (.24 | ) | — | (.24 | ) | 12.95 | 17.46 | 10 | 2 | .41 | 10 | .36 | 10 | .77 | 10 | 1.33 | 10 | |||||||||||||||||||||||||||||||||||
| 12/31/2020 | 12.01 | .18 | (.35 | ) | (.17 | ) | (.26 | ) | (.34 | ) | (.60 | ) | 11.24 | (.93 | )10 | 2 | .40 | 10 | .35 | 10 | .76 | 10 | 1.66 | 10 | ||||||||||||||||||||||||||||||||
| 12/31/2019 | 11.28 | .25 | 1.28 | 1.53 | (.20 | ) | (.60 | ) | (.80 | ) | 12.01 | 14.14 | 10 | 1 | .38 | 10 | .33 | 10 | .74 | 10 | 2.14 | 10 | ||||||||||||||||||||||||||||||||||
| 12/31/2018 | 13.04 | .40 | (1.27 | ) | (.87 | ) | (.45 | ) | (.44 | ) | (.89 | ) | 11.28 | (6.99 | )10 | — | 6 | .33 | 10 | .28 | 10 | .67 | 10 | 3.21 | 10 | |||||||||||||||||||||||||||||||
| Class P2: | ||||||||||||||||||||||||||||||||||||||||||||||||||||||||
| 12/31/2022 | 12.88 | .19 | (1.37 | ) | (1.18 | ) | (.52 | ) | — | (.52 | ) | 11.18 | (9.16 | ) | 321 | .67 | .62 | 1.01 | 1.62 | |||||||||||||||||||||||||||||||||||||
| 12/31/2021 | 11.18 | .11 | 1.79 | 1.90 | (.20 | ) | — | (.20 | ) | 12.88 | 17.11 | 371 | .68 | .62 | 1.03 | .91 | ||||||||||||||||||||||||||||||||||||||||
| 12/31/2020 | 11.91 | .13 | (.33 | ) | (.20 | ) | (.19 | ) | (.34 | ) | (.53 | ) | 11.18 | (1.25 | ) | 355 | .68 | .63 | 1.04 | 1.18 | ||||||||||||||||||||||||||||||||||||
| 12/31/2019 | 11.21 | .18 | 1.31 | 1.49 | (.19 | ) | (.60 | ) | (.79 | ) | 11.91 | 13.88 | 365 | .68 | .63 | 1.04 | 1.62 | |||||||||||||||||||||||||||||||||||||||
| 12/31/2018 | 12.96 | .19 | (1.10 | ) | (.91 | ) | (.40 | ) | (.44 | ) | (.84 | ) | 11.21 | (7.38 | ) | 336 | .68 | .63 | 1.02 | 1.49 | ||||||||||||||||||||||||||||||||||||
Refer to the end of the tables for footnotes.
| American Funds Insurance Series | 367 |
Financial highlights (continued)
| (Loss) income from investment operations1 |
Dividends and distributions | Ratio of expenses |
Ratio of expenses |
|||||||||||||||||||||||||||||||||||||||||||||||||||||
| Year ended | Net asset value, beginning of year |
Net investment income (loss) |
Net (losses) gains on securities (both realized and unrealized) |
Total from investment operations |
Dividends (from net investment income) |
Distributions (from capital gains) |
Total dividends and distributions |
Net asset value, end of year |
Total return2 | Net assets, end of year (in millions) |
to average net assets before waivers/ reimburse- ments7 |
to average net assets after waivers/ reimburse- ments2,7 |
Net effective expense ratio2,8,9 |
Ratio of net income to average net assets2 |
||||||||||||||||||||||||||||||||||||||||||
| Managed Risk Growth-Income Fund | ||||||||||||||||||||||||||||||||||||||||||||||||||||||||
| Class P1: | ||||||||||||||||||||||||||||||||||||||||||||||||||||||||
| 12/31/2022 | $ | 15.73 | $ | .18 | $ | (2.79 | ) | $ | (2.61 | ) | $ | (.30 | ) | $ | (.31 | ) | $ | (.61 | ) | $ | 12.51 | (16.74 | )% | $ | 1,833 | .41 | % | .36 | % | .65 | % | 1.33 | % | |||||||||||||||||||||||
| 12/31/2021 | 14.01 | .14 | 1.99 | 2.13 | (.21 | ) | (.20 | ) | (.41 | ) | 15.73 | 15.32 | 2,328 | .41 | .36 | .66 | .96 | |||||||||||||||||||||||||||||||||||||||
| 12/31/2020 | 13.76 | .17 | 1.08 | 1.25 | (.26 | ) | (.74 | ) | (1.00 | ) | 14.01 | 9.85 | 2,120 | .41 | .36 | .66 | 1.24 | |||||||||||||||||||||||||||||||||||||||
| 12/31/2019 | 11.73 | .22 | 2.01 | 2.23 | (.10 | ) | (.10 | ) | (.20 | ) | 13.76 | 19.14 | 1,987 | .42 | .37 | .67 | 1.71 | |||||||||||||||||||||||||||||||||||||||
| 12/31/2018 | 12.66 | (.02 | ) | (.15 | ) | (.17 | ) | (.19 | ) | (.57 | ) | (.76 | ) | 11.73 | (1.66 | ) | 1,662 | .40 | .35 | .64 | (.20 | ) | ||||||||||||||||||||||||||||||||||
| Class P2: | ||||||||||||||||||||||||||||||||||||||||||||||||||||||||
| 12/31/2022 | 15.64 | .15 | (2.78 | ) | (2.63 | ) | (.26 | ) | (.31 | ) | (.57 | ) | 12.44 | (16.93 | ) | 268 | .66 | .61 | .90 | 1.10 | ||||||||||||||||||||||||||||||||||||
| 12/31/2021 | 13.93 | .10 | 1.98 | 2.08 | (.17 | ) | (.20 | ) | (.37 | ) | 15.64 | 15.05 | 340 | .66 | .61 | .91 | .70 | |||||||||||||||||||||||||||||||||||||||
| 12/31/2020 | 13.69 | .14 | 1.07 | 1.21 | (.23 | ) | (.74 | ) | (.97 | ) | 13.93 | 9.58 | 315 | .66 | .61 | .91 | 1.02 | |||||||||||||||||||||||||||||||||||||||
| 12/31/2019 | 11.67 | .19 | 2.00 | 2.19 | (.07 | ) | (.10 | ) | (.17 | ) | 13.69 | 18.84 | 283 | .67 | .62 | .92 | 1.47 | |||||||||||||||||||||||||||||||||||||||
| 12/31/2018 | 12.58 | .16 | (.36 | ) | (.20 | ) | (.14 | ) | (.57 | ) | (.71 | ) | 11.67 | (1.97 | ) | 230 | .69 | .64 | .93 | 1.25 | ||||||||||||||||||||||||||||||||||||
| Managed Risk Asset Allocation Fund | ||||||||||||||||||||||||||||||||||||||||||||||||||||||||
| Class P1: | ||||||||||||||||||||||||||||||||||||||||||||||||||||||||
| 12/31/2022 | $ | 15.33 | $ | .24 | $ | (2.34 | ) | $ | (2.10 | ) | $ | (.32 | ) | $ | (.48 | ) | $ | (.80 | ) | $ | 12.43 | (13.75 | )% | $ | 7 | .41 | % | .36 | % | .64 | % | 1.80 | % | |||||||||||||||||||||||
| 12/31/2021 | 13.84 | .21 | 1.55 | 1.76 | (.27 | ) | — | (.27 | ) | 15.33 | 12.82 | 7 | .41 | .36 | .66 | 1.43 | ||||||||||||||||||||||||||||||||||||||||
| 12/31/2020 | 13.81 | .25 | .51 | .76 | (.21 | ) | (.52 | ) | (.73 | ) | 13.84 | 6.10 | 5 | .41 | .36 | .66 | 1.91 | |||||||||||||||||||||||||||||||||||||||
| 12/31/2019 | 12.23 | .26 | 1.92 | 2.18 | (.03 | ) | (.57 | ) | (.60 | ) | 13.81 | 18.25 | 2 | .41 | .36 | .65 | 2.01 | |||||||||||||||||||||||||||||||||||||||
| 12/31/2018 | 13.59 | .22 | (.80 | ) | (.58 | ) | (.25 | ) | (.53 | ) | (.78 | ) | 12.23 | (4.63 | ) | 2 | .37 | .32 | .59 | 1.67 | ||||||||||||||||||||||||||||||||||||
| Class P2: | ||||||||||||||||||||||||||||||||||||||||||||||||||||||||
| 12/31/2022 | 14.93 | .18 | (2.25 | ) | (2.07 | ) | (.29 | ) | (.48 | ) | (.77 | ) | 12.09 | (13.97 | ) | 2,182 | .66 | .61 | .89 | 1.40 | ||||||||||||||||||||||||||||||||||||
| 12/31/2021 | 13.45 | .15 | 1.53 | 1.68 | (.20 | ) | — | (.20 | ) | 14.93 | 12.50 | 2,812 | .66 | .61 | .91 | 1.03 | ||||||||||||||||||||||||||||||||||||||||
| 12/31/2020 | 13.46 | .15 | .56 | .71 | (.20 | ) | (.52 | ) | (.72 | ) | 13.45 | 5.88 | 2,773 | .66 | .61 | .91 | 1.15 | |||||||||||||||||||||||||||||||||||||||
| 12/31/2019 | 12.22 | .19 | 1.93 | 2.12 | (.31 | ) | (.57 | ) | (.88 | ) | 13.46 | 17.98 | 2,830 | .66 | .61 | .90 | 1.51 | |||||||||||||||||||||||||||||||||||||||
| 12/31/2018 | 13.55 | .17 | (.79 | ) | (.62 | ) | (.18 | ) | (.53 | ) | (.71 | ) | 12.22 | (4.89 | ) | 2,541 | .62 | .57 | .84 | 1.27 | ||||||||||||||||||||||||||||||||||||
Refer to the end of the tables for footnotes.
| 368 | American Funds Insurance Series |
Financial highlights (continued)
| Portfolio turnover rate for all share classes | Year ended December 31, | |||||||||||||||||||
| excluding mortgage dollar roll transactions11,12 | 2022 | 2021 | 2020 | 2019 | 2018 | |||||||||||||||
| Capital Income Builder | 48 | % | 60 | % | 110 | % | 44 | % | 42 | % | ||||||||||
| Asset Allocation Fund | 42 | 45 | 49 | 47 | 34 | |||||||||||||||
| American Funds Global Balanced Fund | 111 | 36 | 68 | 60 | 30 | |||||||||||||||
| The Bond Fund of America | 77 | 87 | 72 | 146 | 98 | |||||||||||||||
| Capital World Bond Fund | 114 | 64 | 88 | 110 | 78 | |||||||||||||||
| American Funds Mortgage Fund | 56 | 38 | 123 | 84 | 60 | |||||||||||||||
| U.S. Government Securities Fund | 77 | 126 | 112 | 103 | 76 | |||||||||||||||
| Portfolio turnover rate for all share classes | Year ended December 31, | |||||||||||||||||||
| including mortgage dollar roll transactions11,12 | 2022 | 2021 | 2020 | 2019 | 2018 | |||||||||||||||
| Global Growth Fund | 29 | % | 18 | % | 17 | % | 14 | % | 25 | % | ||||||||||
| Global Small Capitalization Fund | 40 | 29 | 38 | 50 | 43 | |||||||||||||||
| Growth Fund | 29 | 25 | 32 | 21 | 35 | |||||||||||||||
| International Fund | 42 | 44 | 40 | 32 | 29 | |||||||||||||||
| New World Fund | 40 | 43 | 70 | 38 | 58 | |||||||||||||||
| Washington Mutual Investors Fund | 30 | 90 | 40 | 37 | 49 | |||||||||||||||
| Capital World Growth and Income Fund | 42 | 85 | 36 | 29 | 49 | |||||||||||||||
| Growth-Income Fund | 25 | 24 | 33 | 27 | 39 | |||||||||||||||
| International Growth and Income Fund | 48 | 41 | 56 | 28 | 38 | |||||||||||||||
| Capital Income Builder | 126 | 93 | 184 | 72 | 98 | |||||||||||||||
| Asset Allocation Fund | 118 | 124 | 145 | 79 | 86 | |||||||||||||||
| American Funds Global Balanced Fund | 126 | 39 | 86 | 74 | 51 | |||||||||||||||
| The Bond Fund of America | 415 | 456 | 461 | 373 | 514 | |||||||||||||||
| Capital World Bond Fund | 188 | 91 | 145 | 159 | 125 | |||||||||||||||
| American High-Income Trust | 34 | 56 | 78 | 58 | 67 | |||||||||||||||
| American Funds Mortgage Fund | 1141 | 975 | 1143 | 350 | 811 | |||||||||||||||
| Ultra-Short Bond Fund | — | 13 | — | 13 | — | 13 | — | 13 | — | 13 | ||||||||||
| U.S. Government Securities Fund | 695 | 433 | 867 | 277 | 446 | |||||||||||||||
| Managed Risk Growth Fund | 97 | 32 | 80 | 10 | 7 | |||||||||||||||
| Managed Risk International Fund | 82 | 24 | 71 | 8 | 8 | |||||||||||||||
| Managed Risk Washington Mutual Investors Fund | 70 | 16 | 101 | 13 | 11 | |||||||||||||||
| Managed Risk Growth-Income Fund | 67 | 13 | 38 | 6 | 14 | |||||||||||||||
| Managed Risk Asset Allocation Fund | 48 | 5 | 30 | 8 | 12 | |||||||||||||||
| 1 | Based on average shares outstanding. |
| 2 | This column reflects the impact of certain waivers/reimbursements from CRMC. During some of the years shown, CRMC waived a portion of investment advisory services fees on some funds, including each of the managed risk funds. In addition, during some of the years shown, CRMC reimbursed a portion of miscellaneous fees and expenses for some of the managed risk funds. |
| 3 | Ratios do not include expenses of any Central Funds. The fund indirectly bears its proportionate share of the expenses of any Central Funds, if applicable. |
| 4 | Amount less than $.01. |
| 5 | Amount less than .01%. |
| 6 | Amount less than $1 million. |
| 7 | This column does not include expenses of the underlying funds in which each fund invests. |
| 8 | This column reflects the net effective expense ratios for each fund and class, which include each class’s expense ratio combined with the weighted average net expense ratio of the underlying funds for the periods presented. Refer to the expense example for further information regarding fees and expenses. |
| 9 | Unaudited. |
| 10 | All or a significant portion of assets in this class consisted of seed capital invested by CRMC and/or its affiliates. Certain fees (including, where applicable, fees for distribution services) are not charged or accrued on these seed capital assets. If such fees were paid by the fund on seed capital assets, fund expenses would have been higher and net income and total return would have been lower. |
| 11 | Refer to Note 5 for further information on mortgage dollar rolls. |
| 12 | Rates do not include the fund’s portfolio activity with respect to any Central Funds, if applicable. |
| 13 | Amount is either less than 1% or there is no turnover. |
Refer to the notes to financial statements.
| American Funds Insurance Series | 369 |
Report of Independent Registered Public Accounting Firm
To the Board of Trustees of American Funds Insurance Series and Shareholders of Global Growth Fund, Global Small Capitalization Fund, Growth Fund, International Fund, New World Fund®, Washington Mutual Investors Fund, Capital World Growth and Income Fund®, Growth-Income Fund, International Growth and Income Fund, Capital Income Builder®, Asset Allocation Fund, American Funds® Global Balanced Fund, The Bond Fund of America®, Capital World Bond Fund®, American High-Income Trust®, American Funds Mortgage Fund®, Ultra-Short Bond Fund, U.S. Government Securities Fund®, Managed Risk Growth Fund, Managed Risk International Fund, Managed Risk Washington Mutual Investors Fund, Managed Risk Growth-Income Fund and Managed Risk Asset Allocation Fund
Opinions on the Financial Statements
We have audited the accompanying statements of assets and liabilities, including the investment portfolios, of Global Growth Fund, Global Small Capitalization Fund, Growth Fund, International Fund, New World Fund®, Washington Mutual Investors Fund, Capital World Growth and Income Fund®, Growth-Income Fund, International Growth and Income Fund, Capital Income Builder®, Asset Allocation Fund, American Funds® Global Balanced Fund (formerly Global Balanced Fund), The Bond Fund of America®, Capital World Bond Fund®, American High Income Trust®, American Funds Mortgage Fund®, Ultra-Short Bond Fund, U.S. Government Securities Fund®, Managed Risk Growth Fund, Managed Risk International Fund, Managed Risk Washington Mutual Investors Fund, Managed Risk Growth-Income Fund and Managed Risk Asset Allocation Fund (twenty-three of the funds constituting American Funds Insurance Series, hereafter collectively referred to as the “Funds”) as of December 31, 2022, the related statements of operations for the year ended December 31, 2022, the statements of changes in net assets for each of the two years in the period ended December 31, 2022, including the related notes, and the financial highlights for each of the five years in the period ended December 31, 2022 (collectively referred to as the “financial statements”). In our opinion, the financial statements present fairly, in all material respects, the financial position of each of the Funds as of December 31, 2022, the results of each of their operations for the year then ended, the changes in each of their net assets for each of the two years in the period ended December 31, 2022 and each of the financial highlights for each of the five years in the period ended December 31, 2022 in conformity with accounting principles generally accepted in the United States of America.
Basis for Opinions
These financial statements are the responsibility of the Funds’ management. Our responsibility is to express an opinion on the Funds’ financial statements based on our audits. We are a public accounting firm registered with the Public Company Accounting Oversight Board (United States) (PCAOB) and are required to be independent with respect to the Funds in accordance with the U.S. federal securities laws and the applicable rules and regulations of the Securities and Exchange Commission and the PCAOB.
We conducted our audits of these financial statements in accordance with the standards of the PCAOB. Those standards require that we plan and perform the audit to obtain reasonable assurance about whether the financial statements are free of material misstatement, whether due to error or fraud.
Our audits included performing procedures to assess the risks of material misstatement of the financial statements, whether due to error or fraud, and performing procedures that respond to those risks. Such procedures included examining, on a test basis, evidence regarding the amounts and disclosures in the financial statements. Our audits also included evaluating the accounting principles used and significant estimates made by management, as well as evaluating the overall presentation of the financial statements. Our procedures included confirmation of securities owned as of December 31, 2022 by correspondence with the custodian, transfer agent and brokers; when replies were not received from brokers, we performed other auditing procedures. We believe that our audits provide a reasonable basis for our opinions.
/s/PricewaterhouseCoopers LLP
Los Angeles, California
February 13, 2023
We have served as the auditor of one or more investment companies in The Capital Group Companies Investment Company Complex since 1934.
| 370 | American Funds Insurance Series |
| Expense example | unaudited |
The funds in American Funds Insurance Series serve as the underlying investment vehicle for various insurance products. As an owner of an insurance contract that invests in one of the funds in the series, you incur two types of costs: (1) transaction costs, such as initial sales charges on purchase payments and contingent deferred sales charges on redemptions (loads), and (2) ongoing costs, including management fees, distribution and service (12b-1) fees, and other expenses. Additional fees are charged by the insurance companies related to the various benefits they provide. This example is intended to help you understand your ongoing costs (in dollars) of investing in the underlying funds so you can compare these costs with the ongoing costs of investing in other mutual funds that serve a similar function in other annuity products. The example is based on an investment of $1,000 invested at the beginning of the period and held for the entire six-month period (July 1, 2022, through December 31, 2022).
Actual expenses:
The first line of each share class in the tables on the following pages provides information about actual account values and actual expenses. You may use the information in this line, together with the amount you invested, to estimate the expenses that you paid over the period. Simply divide your account value by $1,000 (for example, an $8,600 account value divided by $1,000 = 8.6), then multiply the result by the number in the first line under the heading titled “Expenses paid during period” to estimate the expenses you paid on your account during this period.
Hypothetical example for comparison purposes:
The second line of each share class in the tables on the following pages provides information about hypothetical account values and hypothetical expenses based on the actual expense ratio for the share class and an assumed rate of return of 5.00% per year before expenses, which is not the actual return of the share class. The hypothetical account values and expenses may not be used to estimate the actual ending account balance or expenses you paid for the period. You may use this information to compare the ongoing costs of investing in the fund and other funds. To do so, compare this 5.00% hypothetical example with the 5.00% hypothetical examples that appear in the shareholder reports of the other funds.
Notes:
Additional fees are charged by the insurance companies related to the various benefits they provide. You can estimate the impact of these fees by adding the amount of the fees to the total estimated expenses you paid on your account during the period as calculated above. In addition, your ending account value would be lower by the amount of these fees.
Note that the expenses shown in the tables on the following pages are meant to highlight your ongoing costs only and do not reflect any transactional costs. Therefore, the second line of each share class in the tables is useful in comparing ongoing costs only and will not help you determine the relative total costs of owning different funds. In addition, if these transactional costs were included, your costs would have been higher.
| American Funds Insurance Series | 371 |
Expense example (continued)
| Beginning account value 7/1/2022 |
Ending account value 12/31/2022 |
Expenses paid during period1 |
Annualized expense ratio |
|||||||||||||
| Global Growth Fund | ||||||||||||||||
| Class 1 – actual return | $ | 1,000.00 | $ | 1,045.68 | $ | 2.11 | .41 | % | ||||||||
| Class 1 – assumed 5% return | 1,000.00 | 1,023.14 | 2.09 | .41 | ||||||||||||
| Class 1A – actual return | 1,000.00 | 1,044.04 | 3.40 | .66 | ||||||||||||
| Class 1A – assumed 5% return | 1,000.00 | 1,021.88 | 3.36 | .66 | ||||||||||||
| Class 2 – actual return | 1,000.00 | 1,043.99 | 3.40 | .66 | ||||||||||||
| Class 2 – assumed 5% return | 1,000.00 | 1,021.88 | 3.36 | .66 | ||||||||||||
| Class 4 – actual return | 1,000.00 | 1,042.74 | 4.69 | .91 | ||||||||||||
| Class 4 – assumed 5% return | 1,000.00 | 1,020.62 | 4.63 | .91 | ||||||||||||
| Global Small Capitalization Fund | ||||||||||||||||
| Class 1 – actual return | $ | 1,000.00 | $ | 1,038.40 | $ | 3.34 | .65 | % | ||||||||
| Class 1 – assumed 5% return | 1,000.00 | 1,021.93 | 3.31 | .65 | ||||||||||||
| Class 1A – actual return | 1,000.00 | 1,036.94 | 4.62 | .90 | ||||||||||||
| Class 1A – assumed 5% return | 1,000.00 | 1,020.67 | 4.58 | .90 | ||||||||||||
| Class 2 – actual return | 1,000.00 | 1,037.29 | 4.62 | .90 | ||||||||||||
| Class 2 – assumed 5% return | 1,000.00 | 1,020.67 | 4.58 | .90 | ||||||||||||
| Class 4 – actual return | 1,000.00 | 1,035.94 | 5.90 | 1.15 | ||||||||||||
| Class 4 – assumed 5% return | 1,000.00 | 1,019.41 | 5.85 | 1.15 | ||||||||||||
| Growth Fund | ||||||||||||||||
| Class 1 – actual return | $ | 1,000.00 | $ | 1,000.70 | $ | 1.77 | .35 | % | ||||||||
| Class 1 – assumed 5% return | 1,000.00 | 1,023.44 | 1.79 | .35 | ||||||||||||
| Class 1A – actual return | 1,000.00 | 999.41 | 3.02 | .60 | ||||||||||||
| Class 1A – assumed 5% return | 1,000.00 | 1,022.18 | 3.06 | .60 | ||||||||||||
| Class 2 – actual return | 1,000.00 | 999.43 | 3.02 | .60 | ||||||||||||
| Class 2 – assumed 5% return | 1,000.00 | 1,022.18 | 3.06 | .60 | ||||||||||||
| Class 3 – actual return | 1,000.00 | 999.93 | 2.67 | .53 | ||||||||||||
| Class 3 – assumed 5% return | 1,000.00 | 1,022.53 | 2.70 | .53 | ||||||||||||
| Class 4 – actual return | 1,000.00 | 998.12 | 4.28 | .85 | ||||||||||||
| Class 4 – assumed 5% return | 1,000.00 | 1,020.92 | 4.33 | .85 | ||||||||||||
| International Fund | ||||||||||||||||
| Class 1 – actual return | $ | 1,000.00 | $ | 1,025.33 | $ | 2.71 | .53 | % | ||||||||
| Class 1 – assumed 5% return | 1,000.00 | 1,022.53 | 2.70 | .53 | ||||||||||||
| Class 1A – actual return | 1,000.00 | 1,024.07 | 3.98 | .78 | ||||||||||||
| Class 1A – assumed 5% return | 1,000.00 | 1,021.27 | 3.97 | .78 | ||||||||||||
| Class 2 – actual return | 1,000.00 | 1,023.84 | 3.98 | .78 | ||||||||||||
| Class 2 – assumed 5% return | 1,000.00 | 1,021.27 | 3.97 | .78 | ||||||||||||
| Class 3 – actual return | 1,000.00 | 1,024.24 | 3.62 | .71 | ||||||||||||
| Class 3 – assumed 5% return | 1,000.00 | 1,021.63 | 3.62 | .71 | ||||||||||||
| Class 4 – actual return | 1,000.00 | 1,022.83 | 5.25 | 1.03 | ||||||||||||
| Class 4 – assumed 5% return | 1,000.00 | 1,020.01 | 5.24 | 1.03 | ||||||||||||
| New World Fund | ||||||||||||||||
| Class 1 – actual return | $ | 1,000.00 | $ | 1,024.46 | $ | 2.91 | .57 | % | ||||||||
| Class 1 – assumed 5% return | 1,000.00 | 1,022.33 | 2.91 | .57 | ||||||||||||
| Class 1A – actual return | 1,000.00 | 1,022.80 | 4.18 | .82 | ||||||||||||
| Class 1A – assumed 5% return | 1,000.00 | 1,021.07 | 4.18 | .82 | ||||||||||||
| Class 2 – actual return | 1,000.00 | 1,022.92 | 4.18 | .82 | ||||||||||||
| Class 2 – assumed 5% return | 1,000.00 | 1,021.07 | 4.18 | .82 | ||||||||||||
| Class 4 – actual return | 1,000.00 | 1,021.54 | 5.45 | 1.07 | ||||||||||||
| Class 4 – assumed 5% return | 1,000.00 | 1,019.81 | 5.45 | 1.07 | ||||||||||||
Refer to the end of the tables for footnotes.
| 372 | American Funds Insurance Series |
Expense example (continued)
| Beginning account value 7/1/2022 |
Ending account value 12/31/2022 |
Expenses paid during period1 |
Annualized expense ratio |
|||||||||||||
| Washington Mutual Investors Fund | ||||||||||||||||
| Class 1 – actual return | $ | 1,000.00 | $ | 1,052.84 | $ | 1.40 | .27 | % | ||||||||
| Class 1 – assumed 5% return | 1,000.00 | 1,023.84 | 1.38 | .27 | ||||||||||||
| Class 1A – actual return | 1,000.00 | 1,052.10 | 2.69 | .52 | ||||||||||||
| Class 1A – assumed 5% return | 1,000.00 | 1,022.58 | 2.65 | .52 | ||||||||||||
| Class 2 – actual return | 1,000.00 | 1,052.45 | 2.69 | .52 | ||||||||||||
| Class 2 – assumed 5% return | 1,000.00 | 1,022.58 | 2.65 | .52 | ||||||||||||
| Class 4 – actual return | 1,000.00 | 1,051.21 | 3.98 | .77 | ||||||||||||
| Class 4 – assumed 5% return | 1,000.00 | 1,021.32 | 3.92 | .77 | ||||||||||||
| Capital World Growth and Income Fund | ||||||||||||||||
| Class 1 – actual return | $ | 1,000.00 | $ | 1,051.64 | $ | 2.12 | .41 | % | ||||||||
| Class 1 – assumed 5% return | 1,000.00 | 1,023.14 | 2.09 | .41 | ||||||||||||
| Class 1A – actual return | 1,000.00 | 1,050.71 | 3.41 | .66 | ||||||||||||
| Class 1A – assumed 5% return | 1,000.00 | 1,021.88 | 3.36 | .66 | ||||||||||||
| Class 2 – actual return | 1,000.00 | 1,050.34 | 3.41 | .66 | ||||||||||||
| Class 2 – assumed 5% return | 1,000.00 | 1,021.88 | 3.36 | .66 | ||||||||||||
| Class 4 – actual return | 1,000.00 | 1,048.71 | 4.70 | .91 | ||||||||||||
| Class 4 – assumed 5% return | 1,000.00 | 1,020.62 | 4.63 | .91 | ||||||||||||
| Growth-Income Fund | ||||||||||||||||
| Class 1 – actual return | $ | 1,000.00 | $ | 1,042.31 | $ | 1.49 | .29 | % | ||||||||
| Class 1 – assumed 5% return | 1,000.00 | 1,023.74 | 1.48 | .29 | ||||||||||||
| Class 1A – actual return | 1,000.00 | 1,041.04 | 2.78 | .54 | ||||||||||||
| Class 1A – assumed 5% return | 1,000.00 | 1,022.48 | 2.75 | .54 | ||||||||||||
| Class 2 – actual return | 1,000.00 | 1,041.03 | 2.78 | .54 | ||||||||||||
| Class 2 – assumed 5% return | 1,000.00 | 1,022.48 | 2.75 | .54 | ||||||||||||
| Class 3 – actual return | 1,000.00 | 1,041.33 | 2.42 | .47 | ||||||||||||
| Class 3 – assumed 5% return | 1,000.00 | 1,022.84 | 2.40 | .47 | ||||||||||||
| Class 4 – actual return | 1,000.00 | 1,039.68 | 4.06 | .79 | ||||||||||||
| Class 4 – assumed 5% return | 1,000.00 | 1,021.22 | 4.02 | .79 | ||||||||||||
| International Growth and Income Fund | ||||||||||||||||
| Class 1 – actual return | $ | 1,000.00 | $ | 1,049.28 | $ | 3.00 | .58 | % | ||||||||
| Class 1 – assumed 5% return | 1,000.00 | 1,022.28 | 2.96 | .58 | ||||||||||||
| Class 1A – actual return | 1,000.00 | 1,047.38 | 4.28 | .83 | ||||||||||||
| Class 1A – assumed 5% return | 1,000.00 | 1,021.02 | 4.23 | .83 | ||||||||||||
| Class 2 – actual return | 1,000.00 | 1,048.38 | 4.29 | .83 | ||||||||||||
| Class 2 – assumed 5% return | 1,000.00 | 1,021.02 | 4.23 | .83 | ||||||||||||
| Class 4 – actual return | 1,000.00 | 1,046.04 | 5.57 | 1.08 | ||||||||||||
| Class 4 – assumed 5% return | 1,000.00 | 1,019.76 | 5.50 | 1.08 | ||||||||||||
| Capital Income Builder | ||||||||||||||||
| Class 1 – actual return | $ | 1,000.00 | $ | 1,030.31 | $ | 1.38 | .27 | % | ||||||||
| Class 1 – assumed 5% return | 1,000.00 | 1,023.84 | 1.38 | .27 | ||||||||||||
| Class 1A – actual return | 1,000.00 | 1,029.07 | 2.66 | .52 | ||||||||||||
| Class 1A – assumed 5% return | 1,000.00 | 1,022.58 | 2.65 | .52 | ||||||||||||
| Class 2 – actual return | 1,000.00 | 1,028.17 | 2.66 | .52 | ||||||||||||
| Class 2 – assumed 5% return | 1,000.00 | 1,022.58 | 2.65 | .52 | ||||||||||||
| Class 4 – actual return | 1,000.00 | 1,026.94 | 3.93 | .77 | ||||||||||||
| Class 4 – assumed 5% return | 1,000.00 | 1,021.32 | 3.92 | .77 | ||||||||||||
Refer to the end of the tables for footnotes.
| American Funds Insurance Series | 373 |
Expense example (continued)
| Beginning account value 7/1/2022 |
Ending account value 12/31/2022 |
Expenses paid during period1 |
Annualized expense ratio |
|||||||||||||
| Asset Allocation Fund | ||||||||||||||||
| Class 1 – actual return | $ | 1,000.00 | $ | 1,030.72 | $ | 1.54 | .30 | % | ||||||||
| Class 1 – assumed 5% return | 1,000.00 | 1,023.69 | 1.53 | .30 | ||||||||||||
| Class 1A – actual return | 1,000.00 | 1,029.04 | 2.81 | .55 | ||||||||||||
| Class 1A – assumed 5% return | 1,000.00 | 1,022.43 | 2.80 | .55 | ||||||||||||
| Class 2 – actual return | 1,000.00 | 1,029.79 | 2.81 | .55 | ||||||||||||
| Class 2 – assumed 5% return | 1,000.00 | 1,022.43 | 2.80 | .55 | ||||||||||||
| Class 3 – actual return | 1,000.00 | 1,029.98 | 2.46 | .48 | ||||||||||||
| Class 3 – assumed 5% return | 1,000.00 | 1,022.79 | 2.45 | .48 | ||||||||||||
| Class 4 – actual return | 1,000.00 | 1,027.95 | 4.09 | .80 | ||||||||||||
| Class 4 – assumed 5% return | 1,000.00 | 1,021.17 | 4.08 | .80 | ||||||||||||
| American Funds Global Balanced Fund | ||||||||||||||||
| Class 1 – actual return | $ | 1,000.00 | $ | 1,023.65 | $ | 2.65 | .52 | % | ||||||||
| Class 1 – assumed 5% return | 1,000.00 | 1,022.58 | 2.65 | .52 | ||||||||||||
| Class 1A – actual return | 1,000.00 | 1,022.93 | 3.93 | .77 | ||||||||||||
| Class 1A – assumed 5% return | 1,000.00 | 1,021.32 | 3.92 | .77 | ||||||||||||
| Class 2 – actual return | 1,000.00 | 1,022.09 | 3.92 | .77 | ||||||||||||
| Class 2 – assumed 5% return | 1,000.00 | 1,021.32 | 3.92 | .77 | ||||||||||||
| Class 4 – actual return | 1,000.00 | 1,021.56 | 5.20 | 1.02 | ||||||||||||
| Class 4 – assumed 5% return | 1,000.00 | 1,020.06 | 5.19 | 1.02 | ||||||||||||
| The Bond Fund of America | ||||||||||||||||
| Class 1 – actual return | $ | 1,000.00 | $ | 974.47 | $ | 1.00 | .20 | % | ||||||||
| Class 1 – assumed 5% return | 1,000.00 | 1,024.20 | 1.02 | .20 | ||||||||||||
| Class 1A – actual return | 1,000.00 | 973.31 | 2.24 | .45 | ||||||||||||
| Class 1A – assumed 5% return | 1,000.00 | 1,022.94 | 2.29 | .45 | ||||||||||||
| Class 2 – actual return | 1,000.00 | 972.85 | 2.24 | .45 | ||||||||||||
| Class 2 – assumed 5% return | 1,000.00 | 1,022.94 | 2.29 | .45 | ||||||||||||
| Class 4 – actual return | 1,000.00 | 971.88 | 3.48 | .70 | ||||||||||||
| Class 4 – assumed 5% return | 1,000.00 | 1,021.68 | 3.57 | .70 | ||||||||||||
| Capital World Bond Fund | ||||||||||||||||
| Class 1 – actual return | $ | 1,000.00 | $ | 983.53 | $ | 2.40 | .48 | % | ||||||||
| Class 1 – assumed 5% return | 1,000.00 | 1,022.79 | 2.45 | .48 | ||||||||||||
| Class 1A – actual return | 1,000.00 | 982.42 | 3.65 | .73 | ||||||||||||
| Class 1A – assumed 5% return | 1,000.00 | 1,021.53 | 3.72 | .73 | ||||||||||||
| Class 2 – actual return | 1,000.00 | 982.33 | 3.65 | .73 | ||||||||||||
| Class 2 – assumed 5% return | 1,000.00 | 1,021.53 | 3.72 | .73 | ||||||||||||
| Class 4 – actual return | 1,000.00 | 981.07 | 4.89 | .98 | ||||||||||||
| Class 4 – assumed 5% return | 1,000.00 | 1,020.27 | 4.99 | .98 | ||||||||||||
| American High-Income Trust | ||||||||||||||||
| Class 1 – actual return | $ | 1,000.00 | $ | 1,038.86 | $ | 1.59 | .31 | % | ||||||||
| Class 1 – assumed 5% return | 1,000.00 | 1,023.64 | 1.58 | .31 | ||||||||||||
| Class 1A – actual return | 1,000.00 | 1,037.88 | 2.88 | .56 | ||||||||||||
| Class 1A – assumed 5% return | 1,000.00 | 1,022.38 | 2.85 | .56 | ||||||||||||
| Class 2 – actual return | 1,000.00 | 1,037.22 | 2.88 | .56 | ||||||||||||
| Class 2 – assumed 5% return | 1,000.00 | 1,022.38 | 2.85 | .56 | ||||||||||||
| Class 3 – actual return | 1,000.00 | 1,038.14 | 2.52 | .49 | ||||||||||||
| Class 3 – assumed 5% return | 1,000.00 | 1,022.74 | 2.50 | .49 | ||||||||||||
| Class 4 – actual return | 1,000.00 | 1,036.07 | 4.16 | .81 | ||||||||||||
| Class 4 – assumed 5% return | 1,000.00 | 1,021.12 | 4.13 | .81 | ||||||||||||
Refer to the end of the tables for footnotes.
| 374 | American Funds Insurance Series |
Expense example (continued)
| Beginning account value 7/1/2022 |
Ending account value 12/31/2022 |
Expenses paid during period1 |
Annualized expense ratio |
|||||||||||||
| American Funds Mortgage Fund | ||||||||||||||||
| Class 1 – actual return | $ | 1,000.00 | $ | 968.01 | $ | 1.64 | .33 | % | ||||||||
| Class 1 – assumed 5% return | 1,000.00 | 1,023.54 | 1.68 | .33 | ||||||||||||
| Class 1A – actual return | 1,000.00 | 966.87 | 2.88 | .58 | ||||||||||||
| Class 1A – assumed 5% return | 1,000.00 | 1,022.28 | 2.96 | .58 | ||||||||||||
| Class 2 – actual return | 1,000.00 | 967.70 | 2.93 | .59 | ||||||||||||
| Class 2 – assumed 5% return | 1,000.00 | 1,022.23 | 3.01 | .59 | ||||||||||||
| Class 4 – actual return | 1,000.00 | 966.53 | 4.16 | .84 | ||||||||||||
| Class 4 – assumed 5% return | 1,000.00 | 1,020.97 | 4.28 | .84 | ||||||||||||
| Ultra-Short Bond Fund | ||||||||||||||||
| Class 1 – actual return | $ | 1,000.00 | $ | 1,013.26 | $ | 1.57 | .31 | % | ||||||||
| Class 1 – assumed 5% return | 1,000.00 | 1,023.64 | 1.58 | .31 | ||||||||||||
| Class 1A – actual return | 1,000.00 | 1,013.23 | 1.52 | .30 | ||||||||||||
| Class 1A – assumed 5% return | 1,000.00 | 1,023.69 | 1.53 | .30 | ||||||||||||
| Class 2 – actual return | 1,000.00 | 1,012.64 | 2.84 | .56 | ||||||||||||
| Class 2 – assumed 5% return | 1,000.00 | 1,022.38 | 2.85 | .56 | ||||||||||||
| Class 3 – actual return | 1,000.00 | 1,012.86 | 2.49 | .49 | ||||||||||||
| Class 3 – assumed 5% return | 1,000.00 | 1,022.74 | 2.50 | .49 | ||||||||||||
| Class 4 – actual return | 1,000.00 | 1,010.10 | 4.10 | .81 | ||||||||||||
| Class 4 – assumed 5% return | 1,000.00 | 1,021.12 | 4.13 | .81 | ||||||||||||
| U.S. Government Securities Fund | ||||||||||||||||
| Class 1 – actual return | $ | 1,000.00 | $ | 960.56 | $ | 1.09 | .22 | % | ||||||||
| Class 1 – assumed 5% return | 1,000.00 | 1,024.10 | 1.12 | .22 | ||||||||||||
| Class 1A – actual return | 1,000.00 | 959.29 | 2.27 | .46 | ||||||||||||
| Class 1A – assumed 5% return | 1,000.00 | 1,022.89 | 2.35 | .46 | ||||||||||||
| Class 2 – actual return | 1,000.00 | 959.68 | 2.27 | .46 | ||||||||||||
| Class 2 – assumed 5% return | 1,000.00 | 1,022.89 | 2.35 | .46 | ||||||||||||
| Class 3 – actual return | 1,000.00 | 959.92 | 1.93 | .39 | ||||||||||||
| Class 3 – assumed 5% return | 1,000.00 | 1,023.24 | 1.99 | .39 | ||||||||||||
| Class 4 – actual return | 1,000.00 | 958.46 | 3.50 | .71 | ||||||||||||
| Class 4 – assumed 5% return | 1,000.00 | 1,021.63 | 3.62 | .71 | ||||||||||||
Refer to the end of the tables for footnotes.
| American Funds Insurance Series | 375 |
Expense example (continued)
| Beginning account value 7/1/2022 |
Ending account value 12/31/2022 |
Expenses paid during period1,2 |
Annualized expense ratio2 |
Effective expenses paid during period3 |
Effective annualized expense ratio4 |
|||||||||||||||||||
| Managed Risk Growth Fund | ||||||||||||||||||||||||
| Class P1 – actual return | $ | 1,000.00 | $ | 968.78 | $ | 1.84 | .37 | % | $ | 3.42 | .69 | % | ||||||||||||
| Class P1 – assumed 5% return | 1,000.00 | 1,023.34 | 1.89 | .37 | 3.52 | .69 | ||||||||||||||||||
| Class P2 – actual return | 1,000.00 | 967.08 | 3.07 | .62 | 4.71 | .95 | ||||||||||||||||||
| Class P2 – assumed 5% return | 1,000.00 | 1,022.08 | 3.16 | .62 | 4.84 | .95 | ||||||||||||||||||
| Managed Risk International Fund | ||||||||||||||||||||||||
| Class P1 – actual return | $ | 1,000.00 | $ | 1,004.86 | $ | 1.82 | .36 | % | $ | 4.40 | .87 | % | ||||||||||||
| Class P1 – assumed 5% return | 1,000.00 | 1,023.39 | 1.84 | .36 | 4.43 | .87 | ||||||||||||||||||
| Class P2 – actual return | 1,000.00 | 1,003.52 | 3.13 | .62 | 5.71 | 1.13 | ||||||||||||||||||
| Class P2 – assumed 5% return | 1,000.00 | 1,022.08 | 3.16 | .62 | 5.75 | 1.13 | ||||||||||||||||||
| Managed Risk Washington Mutual Investors Fund | ||||||||||||||||||||||||
| Class P1 – actual return | $ | 1,000.00 | $ | 1,005.83 | $ | 1.87 | .37 | % | $ | 3.79 | .75 | % | ||||||||||||
| Class P1 – assumed 5% return | 1,000.00 | 1,023.34 | 1.89 | .37 | 3.82 | .75 | ||||||||||||||||||
| Class P2 – actual return | 1,000.00 | 1,004.38 | 3.18 | .63 | 5.10 | 1.01 | ||||||||||||||||||
| Class P2 – assumed 5% return | 1,000.00 | 1,022.03 | 3.21 | .63 | 5.14 | 1.01 | ||||||||||||||||||
| Managed Risk Growth-Income Fund | ||||||||||||||||||||||||
| Class P1 – actual return | $ | 1,000.00 | $ | 989.69 | $ | 1.81 | .36 | % | $ | 3.26 | .65 | % | ||||||||||||
| Class P1 – assumed 5% return | 1,000.00 | 1,023.39 | 1.84 | .36 | 3.31 | .65 | ||||||||||||||||||
| Class P2 – actual return | 1,000.00 | 989.03 | 3.06 | .61 | 4.51 | .90 | ||||||||||||||||||
| Class P2 – assumed 5% return | 1,000.00 | 1,022.13 | 3.11 | .61 | 4.58 | .90 | ||||||||||||||||||
| Managed Risk Asset Allocation Fund | ||||||||||||||||||||||||
| Class P1 – actual return | $ | 1,000.00 | $ | 1,007.60 | $ | 1.82 | .36 | % | $ | 3.24 | .64 | % | ||||||||||||
| Class P1 – assumed 5% return | 1,000.00 | 1,023.39 | 1.84 | .36 | 3.26 | .64 | ||||||||||||||||||
| Class P2 – actual return | 1,000.00 | 1,006.19 | 3.03 | .60 | 4.50 | .89 | ||||||||||||||||||
| Class P2 – assumed 5% return | 1,000.00 | 1,022.18 | 3.06 | .60 | 4.53 | .89 | ||||||||||||||||||
| 1 | The “expenses paid during period” are equal to the “annualized expense ratio,” multiplied by the average account value over the period, multiplied by the number of days in the period, and divided by 365 (to reflect the one-half year period). |
| 2 | The “expenses paid during period” and “annualized expense ratio” do not include the expenses of the underlying funds in which each fund invests. |
| 3 | The “effective expenses paid during period” are equal to the “effective annualized expense ratio,” multiplied by the average account value over the period, multiplied by the number of days in the period, and divided by 365 (to reflect the period). |
| 4 | The “effective annualized expense ratio” reflects the net annualized expense ratio of the class plus the class’s pro-rata share of the weighted average expense ratio of the underlying funds in which it invests. |
| 376 | American Funds Insurance Series |
| Liquidity Risk Management Program | unaudited |
The series has adopted a liquidity risk management program (the “program”). The series’ board has designated Capital Research and Management Company (“CRMC”) as the administrator of the program. Personnel of CRMC or its affiliates conduct the day-to-day operation of the program pursuant to policies and procedures administered by the Capital Group Liquidity Risk Management Committee.
Under the program, CRMC manages each fund’s liquidity risk, which is the risk that the fund could not meet shareholder redemption requests without significant dilution of remaining shareholders’ interests in the fund. This risk is managed by monitoring the degree of liquidity of each fund’s investments, limiting the amount of each fund’s illiquid investments, and utilizing various risk management tools and facilities available to each fund for meeting shareholder redemptions, among other means. CRMC’s process of determining the degree of liquidity of each fund’s investments is supported by one or more third-party liquidity assessment vendors.
The series’ board reviewed a report prepared by CRMC regarding the operation and effectiveness of the program for the period October 1, 2021, through September 30, 2022. No significant liquidity events impacting any of the funds were noted in the report. In addition, CRMC provided its assessment that the program had been effective in managing each fund’s liquidity risk.
| American Funds Insurance Series | 377 |
This page intentionally left blank.
| 378 | American Funds Insurance Series |
This page intentionally left blank.
| American Funds Insurance Series | 379 |
This page intentionally left blank.
| 380 | American Funds Insurance Series |
This page intentionally left blank.
| American Funds Insurance Series | 381 |
Board of trustees and other officers
Independent trustees1
| Name and year of birth | Year first elected a trustee of the series2 |
Principal occupation(s) during past five years | Number of portfolios in fund complex overseen by trustee |
Other directorships3 held by trustee | ||||
| Francisco G. Cigarroa, MD, 1957 | 2021 | Professor of Surgery, University of Texas Health San Antonio; Trustee, Ford Foundation; Clayton Research Scholar, Clayton Foundation for Biomedical Research | 86 | None | ||||
| James G. Ellis, 1947 | 2010 | Former Dean and Professor of Marketing, Marshall School of Business, University of Southern California | 96 | Advanced Merger Partners; EVe Mobility Acquisition Corp (acquisitions of companies in the electric vehicle market); J. G. Boswell (agricultural production); Mercury General Corporation | ||||
| Nariman Farvardin, 1956 | 2018 | President, Stevens Institute of Technology | 91 | None | ||||
| Jennifer C. Feikin, 1968 | 2022 | Business Advisor; previously held positions at Google, AOL, 20th Century Fox and McKinsey & Company; Trustee, The Nature Conservancy of Utah; former Trustee, The Nature Conservancy of California; former Director, First Descents | 97 | Hertz Global Holdings, Inc. | ||||
| Leslie Stone Heisz, 1961 | 2022 | Former Managing Director, Lazard (retired, 2010); Director, Kaiser Permanente (California public benefit corporation); former Lecturer, UCLA Anderson School of Management | 97 | Edwards Lifesciences; Public Storage | ||||
| Mary Davis Holt, 1950 | 2015–2016; 2017 | Principal, Mary Davis Holt Enterprises, LLC (leadership development consulting); former Partner, Flynn Heath Holt Leadership, LLC (leadership consulting); former COO, Time Life Inc. (1993–2003) | 87 | None | ||||
| Merit E. Janow, 1958 | 2007 | Dean Emerita and Professor of Practice, International Economic Law & International Affairs, Columbia University, School of International and Public Affairs | 93 | Aptiv (autonomous and green vehicle technology); Mastercard Incorporated | ||||
| Margaret Spellings, 1957 Chair of the Board (Independent and Non-Executive) |
2010 | President and CEO, Texas 2036; former President, Margaret Spellings & Company (public policy and strategic consulting); former President, The University of North Carolina; former President, George W. Bush Presidential Center | 91 | None | ||||
| Alexandra Trower, 1964 | 2018 | Former Executive Vice President, Global Communications and Corporate Officer, The Estée Lauder Companies | 86 | None | ||||
| Paul S. Williams, 1959 | 2020 | Former Partner/Managing Director, Major, Lindsey & Africa (executive recruiting firm) | 86 | Air Transport Services Group, Inc. (aircraft leasing and air cargo transportation); Compass Minerals, Inc. (producer of salt and specialty fertilizers); Public Storage, Inc. |
Interested trustees4,5
| Name, year of birth and position with series |
Year first elected a trustee or officer of the series2 |
Principal occupation(s) during past five years and positions held with affiliated entities or the principal underwriter of the series |
Number of portfolios in fund complex overseen by trustee |
Other directorships3 held by trustee | ||||
| Donald D. O’Neal, 1960 Co-President and Trustee |
1998 | Partner — Capital International Investors, Capital Research and Management Company; Partner — Capital International Investors, Capital Bank and Trust Company5 | 35 | None | ||||
| Michael C. Gitlin, 1970 Trustee |
2019 | Partner — Capital Fixed Income Investors, Capital Research and Management Company; Vice Chairman and Director, Capital Research and Management Company; Director, The Capital Group Companies, Inc.5 | 86 | None |
The series statement of additional information includes further details about the series trustees and is available without charge upon request by calling American Funds Service Company at (800) 421-4225 or by visiting the Capital Group website at capitalgroup.com/afis. The address for all trustees and officers of the series is 333 South Hope Street, Los Angeles, CA 90071. Attention: Secretary.
| 382 | American Funds Insurance Series |
Other officers5
| Name, year of birth and position with series |
Year first elected an officer of the series2 |
Principal occupation(s) during past five years and positions held with affiliated entities or the principal underwriter of the series | ||
| Alan N. Berro, 1960 Co-President |
1998 | Partner — Capital World Investors, Capital Research and Management Company; Partner — Capital World Investors, Capital Bank and Trust Company5; Director, The Capital Group Companies, Inc.5 | ||
| Maria Manotok, 1974 Principal Executive Officer | 2012 | Senior Vice President and Senior Counsel — Fund Business Management Group, Capital Research and Management Company; Chair, Senior Vice President, Senior Counsel and Director, Capital International, Inc.5; Senior Vice President, Secretary and Director, Capital Group Companies Global5; Senior Vice President, Secretary and Director, Capital Group International, Inc.5 | ||
| Michael W. Stockton, 1967 Executive Vice President |
2021 | Senior Vice President — Fund Business Management Group, Capital Research and Management Company | ||
| Patrice Collette, 1967 Senior Vice President |
2022 | Partner — Capital World Investors, Capital International, Inc.5 | ||
| Peter Eliot, 1971 Senior Vice President |
2022 | Partner — Capital International Investors, Capital Research and Management Company | ||
| Irfan M. Furniturewala, 1971 Senior Vice President |
2022 | Partner — Capital International Investors, Capital Research and Management Company | ||
| Sung Lee, 1966 Senior Vice President |
2008 | Partner — Capital Research Global Investors, Capital International, Inc.5; Director, The Capital Group Companies, Inc.5 | ||
| Keiko McKibben, 1969 Senior Vice President |
2010 | Partner — Capital Research Global Investors, Capital Research and Management Company | ||
| Carlos A. Schonfeld, 1971 Senior Vice President |
2022 | Partner — Capital International Investors, Capital Research and Management Company; Director, Capital International Limited5 | ||
| Alan J. Wilson, 1961 Senior Vice President |
2022 | Partner — Capital World Investors, Capital Research and Management Company; Director, Capital Research and Management Company | ||
| Steven I. Koszalka, 1964 Secretary |
2003 | Vice President — Fund Business Management Group, Capital Research and Management Company | ||
| Gregory F. Niland, 1971 Treasurer |
2008 | Vice President — Investment Operations, Capital Research and Management Company | ||
| Susan K. Countess, 1966 Assistant Secretary |
2014 | Associate — Fund Business Management Group, Capital Research and Management Company | ||
| Sandra Chuon, 1972 Assistant Treasurer |
2019 | Vice President — Investment Operations, Capital Research and Management Company | ||
| Brian C. Janssen, 1972 Assistant Treasurer |
2015 | Senior Vice President — Investment Operations, Capital Research and Management Company |
| 1 | The term independent trustee refers to a trustee who is not an “interested person” of the series within the meaning of the Investment Company Act of 1940. |
| 2 | Trustees and officers of the series serve until their resignation, removal or retirement. |
| 3 | This includes all directorships/trusteeships (other than those in the American Funds or other funds managed by Capital Research and Management Company or its affiliates) that are held by each trustee as a trustee or director of a public company or a registered investment company. |
| 4 | The term interested trustee refers to a trustee who is an “interested person” within the meaning of the Investment Company Act of 1940, on the basis of their affiliation with the series investment adviser, Capital Research and Management Company, or affiliated entities (including the series principal underwriter). |
| 5 | Company affiliated with Capital Research and Management Company. |
| American Funds Insurance Series | 383 |
Office of the series
333 South Hope Street
Los Angeles, CA 90071-1406
Investment adviser
Capital Research and Management Company
333 South Hope Street
Los Angeles, CA 90071-1406
Investment subadviser
Milliman Financial Risk Management LLC
(Managed Risk Funds only)
71 South Wacker Drive, 31st Floor
Chicago, IL 60606-4637
Custodian of assets
State Street Bank and Trust Company
One Lincoln Street
Boston, MA 02111-2900
Counsel
Morgan, Lewis & Bockius LLP
One Federal Street
Boston, MA 02110-1726
Independent registered public accounting firm
PricewaterhouseCoopers LLP
601 South Figueroa Street
Los Angeles, CA 90017-3874
| 384 | American Funds Insurance Series |
Investors should carefully consider investment objectives, risks, charges and expenses. This and other important information is contained in the series prospectuses and summary prospectuses, which can be obtained from your financial professional and should be read carefully before investing. You may also call American Funds Service Company (AFS) at (800) 421-4225 or visit the Capital Group website at capitalgroup.com/afis.
“American Funds Proxy Voting Procedures and Principles” — which describes how we vote proxies relating to portfolio securities — is available on the Capital Group website or upon request by calling AFS. The series files its proxy voting record with the U.S. Securities and Exchange Commission (SEC) for the 12 months ended June 30 by August 31. The proxy voting record is available free of charge on the SEC website at sec.gov and on the Capital Group website.
American Funds Insurance Series files a complete list of its portfolio holdings with the SEC for the first and third quarters of each fiscal year on Form NPORT-P. This filing is available free of charge on the SEC website and our website.
This report is for the information of American Funds Insurance Series investors, but it also may be used as sales literature when preceded or accompanied by the current prospectuses or summary prospectuses for American Funds Insurance Series and the prospectus for the applicable insurance contract, which give details about charges, expenses, investment objectives and operating policies of the series. If used as sales material after March 31, 2023, this report must be accompanied by a statistical update for the most recently completed calendar quarter.
Fund attribution data was produced using FactSet, a third-party software system, based on daily portfolios. Securities in their initial period of acquisition may not be included in this analysis. The analysis includes equity investments only and excludes forward contracts and fixed income investments, if applicable. It does not account for buy-and-sell transactions that might have occurred intraday. As a result, average portfolio weight percentages are approximate, and the actual average portfolio weight percentages might be higher or lower. Data elements, such as pricing, income, market cap, etc., were provided by FactSet. The indexes provided for attribution are based on FactSet’s methodology. The indexes are broad-based market benchmarks and may not be used by Capital Group® as the sole comparative index for the funds. Capital Group believes the software and information from FactSet to be reliable. However, Capital Group cannot be responsible for inaccuracies, incomplete information or updating of information by FactSet.
Hedge instruments, including exchange-traded futures contracts and exchange-traded put options, may not provide an effective hedge of the underlying securities because changes in the prices of such instruments may not track those of the securities they are intended to hedge. In addition, the managed risk strategy may not effectively protect the funds from market declines and will limit the funds’ participation in market gains. The use of the managed risk strategy could cause the funds’ returns to lag those of the applicable underlying funds in certain rising market conditions.
BLOOMBERG® is a trademark and service mark of Bloomberg Finance L.P. and its affiliates (collectively “Bloomberg”). Bloomberg or Bloomberg’s licensors own all proprietary rights in the Bloomberg Indices. Neither Bloomberg nor Bloomberg’s licensors approves or endorses this material, or guarantees the accuracy or completeness of any information herein, or makes any warranty, express or implied, as to the results to be obtained therefrom and, to the maximum extent allowed by law, neither shall have any liability or responsibility for injury or damages arising in connection therewith.
MSCI has not approved, reviewed or produced this report, makes no express or implied warranties or representations and is not liable whatsoever for any data in the report. You may not redistribute the MSCI data or use it as a basis for other indices or investment products.
The S&P 500 Index is a product of S&P Dow Jones Indices LLC and/or its affiliates and has been licensed for use by Capital Group. Copyright © 2023 S&P Dow Jones Indices LLC, a division of S&P Global, and/or its affiliates. All rights reserved. Redistribution or reproduction in whole or in part is prohibited without written permission of S&P Dow Jones Indices LLC.
American Funds Distributors, Inc., member FINRA.
The Capital Advantage®
Since 1931, Capital Group, home of American Funds, has helped investors pursue long-term investment success. Our consistent approach — in combination with The Capital SystemTM — has resulted in superior outcomes.
Aligned with investor success
We base our decisions on a long-term perspective, which we believe aligns our goals with the interests of our clients. American Funds Insurance Series portfolio managers average 28 years of investment industry experience, including 23 years at our company, reflecting a career commitment to our long-term approach.1
The Capital System
The Capital System combines individual accountability with teamwork. Funds using The Capital System are divided into portions that are managed independently by investment professionals with diverse backgrounds, ages and investment approaches. An extensive global research effort is the backbone of our system.
American Funds Insurance Series’ superior outcomes
American Funds Insurance Series equity funds have beaten their comparable Lipper indexes in 89% of 10-year periods and 100% of 20-year periods.2 Our fixed income funds have helped investors achieve diversification through attention to correlation between bonds and equities.3 We strive to keep management fees competitive. Over the past 20 years, most funds’ fees have been below industry averages.4
| 1 | Portfolio manager experience as of the American Funds Insurance Series prospectus dated May 1, 2022. | |
| 2 | Based on Class 1 share results for rolling calendar-year periods starting the first full calendar year after each fund’s inception through December 31, 2021. Periods covered are the shorter of the fund’s lifetime or since the inception date of the comparable Lipper index or average. The comparable Lipper indexes are: Capital World Funds Index (Global Growth Fund, Capital World Growth and Income Fund), Growth Funds Index (Growth Fund), International Funds Index (International Fund), Emerging Markets Funds Index (New World Fund), Growth & Income Funds Index (Washington Mutual Investors Fund, Growth and Income Fund) and Balanced Funds Index (Asset Allocation Fund). The Lipper Global Small-/Mid-Cap Funds Average was used for Global Small Capitalization Fund. Lipper source: Refinitiv Lipper. There have been periods when the fund has lagged the index. | |
| 3 | Based on Class 1 share results as of December 31, 2021. Three of our five fixed income funds showed a three-year correlation below 0.3. Standard & Poor’s 500 Index was used as an equity market proxy. Correlation based on monthly total returns. Correlation is a statistical measure of how two securities move in relation to each other. A correlation ranges from –1 to 1. A positive correlation close to 1 implies that as one security moves, either up or down, the other security will move in “lockstep,” in the same direction. A negative correlation close to –1 indicates that the securities have moved in the opposite direction. | |
| 4 | Based on management fees for the 20-year period ended December 31, 2021, versus comparable Lipper categories, excluding funds of funds. |
All Capital Group trademarks mentioned are owned by The Capital Group Companies, Inc., an affiliated company or fund. All other company and product names mentioned are the property of their respective companies.

| (b) | Not applicable to this filing. |
Item 2. Code of Ethics.
As of December 31, 2022, the Registrant adopted a Code of Ethics that applies to the Principal Executive Officer, Principal Financial Officer, and other senior financial officers pursuant to the Sarbanes-Oxley Act of 2002. For the year ended December 31, 2022, the Code of Ethics was amended to remove a registrant no longer subject to the Code of Ethics, and the Registrant did not grant any waivers, including implicit waivers, from any provisions of the Code of Ethics. A copy of its Code of Ethics is filed with this Form N-CSR under Item 13(a)(1).
Item 3. Audit Committee Financial Expert.
The Registrant’s Board of Trustees has determined that Nabil N. El-Hage, a member of the Audit Committee, is an audit committee financial expert as defined by the Securities and Exchange Commission (the “SEC”). Mr. El-Hage is “independent” as defined by the SEC for purposes of audit committee financial expert determinations.
Item 4. Principal Accountant Fees and Services.
References below to Deloitte & Touche LLP include its affiliates where applicable.
| (a) | AUDIT FEES: The aggregate fees billed to the Registrant for professional services rendered by its independent auditors, Deloitte & Touche LLP, for the audit of the Registrant’s annual financial statements for the fiscal years ended 2022 and 2021 were $436,164 and $901,027, respectively. |
| (b) | AUDIT RELATED FEES: No such fees were billed to the Registrant by Deloitte & Touche LLP for the fiscal years ended 2022 and 2021. No such fees were billed to the Registrant’s adviser and any entity controlling, controlled by, or under common control with the adviser that provides ongoing services to the Registrant by Deloitte & Touche LLP* for the fiscal years ended 2022 and 2021. |
| (c) | TAX FEES: The aggregate fees billed to the Registrant for professional services rendered by Deloitte & Touche LLP for the review of Form 1120-RIC, Form 8613, excise distribution projections, distribution calculation and reasonable out of pocket expenses for the fiscal years ended 2022 and 2021 were $10,019 and $7,863, respectively. No such fees were billed to the Registrant’s adviser and any entity controlling, controlled by, or under common control with the adviser that provides ongoing services to the Registrant by Deloitte & Touche LLP* for the fiscal years ended 2022 and 2021. |
| (d) | ALL OTHER FEES: No such fees were billed to the Registrant by Deloitte & Touche LLP for the fiscal years ended 2022 and 2021. No such fees were billed to the Registrant’s adviser and any entity controlling, controlled by, or under common control with the adviser that provides ongoing services to the Registrant by Deloitte & Touche LLP* for the fiscal years ended 2022 and 2021. |
| (e) | (1) AUDIT COMMITTEE PRE-APPROVAL POLICY: All services to be performed for the Registrant by Deloitte & Touche LLP must be pre-approved by the audit committee. All services performed during the fiscal years ended 2022 and 2021 were pre-approved by the committee. |
(2) Not applicable.
| (f) | Not applicable. |
| (g) | The aggregate non-audit fees billed by Deloitte & Touche LLP for services rendered to the Registrant, the Registrant’s adviser and any entity controlling, controlled by, or under common control with the adviser that provides ongoing services to the Registrant, for the fiscal years ended 2022 and 2021 were $610,690 and $2,548,097, respectively. |
| (h) | The audit committee considers whether the provision of non-audit services by Deloitte & Touche LLP to the Registrant's adviser and any entity controlling, controlled by, or under common control with the adviser that provides ongoing services to the Registrant that were not pre-approved pursuant to paragraph (c)(7)(ii) of Rule 2-01 of Regulation S-X is compatible with maintaining Deloitte & Touche LLP's independence. |
| (i) | Not applicable. |
| (j) | Not applicable. |
| * | Refers to fees that were required to be approved by the audit committee for services that relate directly to the operations and financial reporting of the Registrant. |
Item 5. Audit Committee of Listed Registrants.
Not applicable to this filing.
Item 6. Investments.
| (a) | Please see portfolio of investments contained in the Report to Stockholders included under Item 1 of this form N-CSR. |
| (b) | Not applicable. |
Item 7. Disclosure of Proxy Voting Policies and Procedures for Closed-End Management Investment Companies.
Not applicable to this filing.
Item 8. Portfolio Managers of Closed-End Management Investment Companies.
Not applicable to this filing.
Item 9. Purchases of Equity Securities by Closed-End Management Investment Company and Affiliated Purchasers.
Not applicable to this filing.
Item 10. Submission of Matters to a Vote of Security Holders.
Not applicable to this filing.
Item 11. Controls and Procedures.
(a) The Registrant’s Principal Executive Officer and Principal Financial Officer have concluded that the Registrant’s disclosure controls and procedures (as defined in Rule 30a-3(c) under the Investment Company Act of 1940, as amended (the “1940 Act”) (17 CFR 270.30a-3(c))) are effective, as of a date within 90 days of the filing date of this Form N-CSR, to provide reasonable assurance that the information required to be disclosed by the Registrant on Form N-CSR is recorded, processed, summarized, and reported within the time periods specified in the SEC’s rules and forms, based on their evaluation of these disclosure controls and procedures required by Rule 30a-3(b) under the 1940 Act (17 CFR 270.30a-3(b)) and Rules 13a-15(b) or 15d-15(b) under the Securities Exchange Act of 1934 (17 CFR 240.13a-15(b) or 240.15d-15(b)).
(b) There were no changes in the Registrant’s internal control over financial reporting (as defined in Rule 30a-3(d) under the 1940 Act (17 CFR 270.30a-3(d))) that occurred during the period covered by this report that has materially affected, or is reasonably likely to materially affect, the Registrant’s internal control over financial reporting.
Item 12. Disclosure of Securities Lending Activities for Closed-End Management Investment Companies
Not applicable to this filing.
Item 13. Exhibits.
(a)(1) Code of Ethics (Item 2) is attached.
(a)(3) Not applicable to this filing.
(a)(4) Not applicable to this filing.
SIGNATURES
Pursuant to the requirements of the Securities Exchange Act of 1934 and the Investment Company Act of 1940, the registrant has duly caused this report to be signed on its behalf by the undersigned, thereunto duly authorized.
| (Registrant) | MML Series Investment Fund | |
| By (Signature and Title) | /s/ Paul LaPiana | |
| Paul LaPiana, President and Principal Executive Officer | ||
| Date | 2/22/2023 |
Pursuant to the requirements of the Securities Exchange Act of 1934 and the Investment Company Act of 1940, this report has been signed below by the following persons on behalf of the registrant and in the capacities and on the dates indicated.
| By (Signature and Title) | /s/ Paul LaPiana | |
| Paul LaPiana, President and Principal Executive Officer | ||
| Date | 2/22/2023 | |
| By (Signature and Title) | /s/ Renee Hitchcock | |
| Renée Hitchcock, Treasurer and Principal Financial Officer | ||
| Date | 2/22/2023 |
MassMutual Select Funds
MassMutual Premier Funds
MassMutual Advantage Funds
MML Series Investment Fund
MML Series Investment Fund II
Section 7 – Corporate Governance
Code of Ethics for Principal Executive and Senior Financial Officers
This Code of Ethics (the “Code”) for Principal Executive and Senior Financial Officers has been adopted by those investment companies identified above (individually, a “Fund” and collectively, the “Funds”) to effectuate compliance with Section 406 under the Sarbanes-Oxley Act of 2002 and the rules adopted to implement Section 406. The Code applies to each Fund’s principal executive officer, principal financial officer, principal accounting officer or controller, or persons performing similar functions (“Covered Officers”). A listing of positions currently within the ambit of Covered Officers for each Fund is attached as Exhibit A.1
| 1. | Purposes of the Code |
This Code sets forth standards and procedures that are reasonably designed to deter wrongdoing and to promote:
| · | honest and ethical conduct, including the ethical handling of actual or apparent conflicts of interest between personal and professional relationships; |
| · | full, fair, accurate, timely, and understandable disclosure in reports and documents that the Funds file with, or submit to, the Securities and Exchange Commission (“SEC”) and in other public communications made by the Funds; |
| · | compliance with applicable governmental laws, rules and regulations; |
| · | the prompt internal reporting of violations of this Code to an appropriate person identified in the Code; and |
| · | accountability for adherence to this Code. |
It is acknowledged that, as a result of each Covered Officer being employed by one of the Funds’ service providers, each Covered Officer will, in the normal course of his or her duties, be involved in establishing policies and implementing decisions that may have different effects on the Funds and the applicable service provider. It is further acknowledged that the participation of the Covered Officers in such activities is inherent in the relationship between each Fund and its service provider and is consistent with the expectations of each Fund’s Board of Trustees with respect to the performance by the Covered Officers of their duties as officers of the Funds.
In general, the principles that govern honest and ethical conduct, including the avoidance of conflicts of interest between personal and professional relationships, reflect, at the minimum, the following: (1) the duty at all times in performing any responsibilities as a financial officer, controller, accountant or principal executive officer of a Fund, to place the interests of the Fund ahead of personal interests; (2) the fundamental standard that Covered Officers should not take inappropriate advantage of their positions; (3) the duty to assure that each Fund’s financial statements and reports to shareholders are prepared honestly and accurately in accordance with applicable rules, regulations and accounting standards; and (4) the duty to conduct the Fund’s business and affairs in an honest and ethical manner. Each Covered Officer should be sensitive to situations that may give rise to actual as well as apparent conflicts of interest.
| 1 | The obligations imposed by this Code on Covered Officers are separate from and in addition to any obligations that may be imposed on such persons as covered persons under the Code of Ethics adopted by the Funds under Rule 17j-1 of the Investment Company Act of 1940, as amended and any other code of conduct applicable to Covered Officers in whatever capacity they serve. This Code does not incorporate by reference any provisions of the Rule 17j-1 Code of Ethics and, accordingly, any violations or waivers granted under the Rule 17j-1 Code of Ethics will not be considered a violation or waiver under this Code. |
1
| 2. | Prohibitions |
The specific provisions and reporting requirements of this Code are concerned primarily with promoting honest and ethical conduct and avoiding conflicts of interest between personal and professional relationships.
No Covered Officer may use information concerning the business and affairs of a Fund (including the investment intentions of a Fund), or use his or her ability to influence such investment intentions, for personal gain to himself or herself, his or her family or friends or any other person or in a manner detrimental to the interests of a Fund or its shareholders.
No Covered Officer may use his or her personal influence or personal relationships to influence the preparation and issuance of financial reports of a Fund whereby the Covered Officer would benefit personally to the detriment of the Fund and its shareholders.
No Covered Officer shall, in connection with carrying out his or her official duties and responsibilities on behalf of a Fund:
| (i) | employ any device, scheme or artifice to defraud a Fund or its shareholders; |
| (ii) | intentionally cause a Fund to make any untrue statement of a material fact or omit to state a material fact necessary in order to make the statements made, in light of the circumstances under which they are made, not misleading in its official documents, regulatory filings, financial statements or communications to the public; |
| (iii) | engage in any act, practice, or course of business which operates or would operate as a fraud or deceit upon any Fund or its shareholders; |
| (iv) | engage in any manipulative practice with respect to any Fund; |
| (v) | intentionally cause a Fund to fail to comply with applicable laws, rules and regulations, including failure to comply with the requirement of full, fair, accurate, understandable and timely disclosure in reports and documents that a Fund files with, or submits to, the SEC and in other public communications made by the Fund; |
| (vi) | intentionally mislead or omit to provide material information to the Fund’s independent auditors or to the Board of Trustees or the officers of the Fund or its investment adviser in connection with Fund related matters; |
| (vii) | fail to notify the Code Administrator (as defined in Section 7 below) promptly if he or she becomes aware of any existing or potential violations of this Code or applicable laws; or |
2
| (viii) | retaliate against others for, or otherwise discourage, the reporting of actual or apparent violations of this Code. |
| 3. | Reports of Conflicts of Interests |
If a Covered Officer becomes aware of an actual or apparent conflict of interest under this Code, he or she must immediately report the matter to the Code Administrator. Upon receipt of such report, the Code Administrator will take prompt steps to determine whether an actual conflict of interest exists or appears to exist, and if so, will take steps (if possible) to resolve the conflict or remedy the appearance thereof. If the Code Administrator determines that no actual or apparent conflict exists, the Code Administrator shall meet with the Covered Officer to advise him or her of such finding and of his or her reason for taking no action. In lieu of determining whether a conflict or appearance of conflict exists, the Code Administrator may in his or her discretion refer the matter to the affected Fund’s Board of Trustees or any committee appointed by the Board to deal with such information.
If the Code Administrator is involved or believed to be involved in the conflict of interest or appearance of conflict of interest, the Covered Officer shall report the matter directly to Massachusetts Mutual Life Insurance Company’s (“MassMutual”) General Counsel or Chief Compliance & Ethics Officer, who shall take the same action as described above with respect to resolving the matter.
| 4. | Waivers |
Any Covered Officer requesting a waiver of any provision of this Code must submit a written request for such waiver to the Code Administrator, setting forth the basis of such request and all necessary facts upon which such request can be evaluated. The Code Administrator shall review such request and make a written determination thereon.
In determining whether to waive any of the provisions of this Code, the Code Administrator shall consider whether the proposed action:
| (i) | is prohibited by this Code; |
| (ii) | is consistent with honest and ethical conduct; and |
| (iii) | will result in a conflict of interest between the Covered Officer’s personal and professional obligations to a Fund. |
In lieu of determining whether to waive any provision of this Code, the Code Administrator may in his or her discretion refer the matter to the affected Fund’s Board of Trustees or any committee appointed by the Board to deal with such information.
| 5. | Reporting Requirements |
| (a) | Each Covered Officer shall, upon becoming subject to this Code, be presented with a copy of this Code by the Code Administrator, and shall certify to the Code Administrator that he or she has received, read, understands and shall adhere to this Code. (See Exhibit B.) |
| (b) | At least annually, all Covered Officers shall be provided with a copy of the current Code by the Code Administrator, and shall certify that they (i) have read and understand the Code and shall adhere to the Code, (ii) have complied with the requirements of the Code, (iii) have disclosed or reported any violations of this Code to the Code Administrator, and (iv) will cooperate fully with any investigation or inquiry as to whether a possible violation of the Code has occurred. (See Exhibit C.) |
3
| (c) | In the event that a Covered Officer ceases to be a Principal Executive or Senior Financial Officer during a given year, to the extent possible, Compliance will obtain from the former Covered Officer a certification that the Covered Officer (i) has read and understands the Code, (ii) has complied with the requirements of the Code during the relevant period, (iii) has disclosed or reported any violations of the Code to the Code Administrator, and (iv) will cooperate fully with any investigation or inquiry as to whether a possible violation of the Code has occurred. (See Exhibit D.) |
| (d) | The Code Administrator shall submit a quarterly report to the Board of Trustees or any committee appointed by the Board to deal with such information, containing (i) a description of any report of a conflict of interest or apparent conflict and the disposition thereof; (ii) a description of any request for a waiver from this Code and the disposition thereof; (iii) any violation of the Code that has been reported or found and the sanction imposed; and (iv) any other significant information arising in connection with the Code, including any proposed amendments. |
| (e) | Each Covered Officer shall notify the Code Administrator promptly if he or she knows of or has a reasonable belief that any violation of this Code has occurred or is likely to occur. Failure to do so is itself a violation of this Code. |
| (f) | Any changes to or waivers of this Code, including “implicit” waivers as defined in applicable SEC rules, will, to the extent required, be disclosed by the Funds as provided by applicable SEC rules.2 |
| 6. | Sanctions |
Any violations of this Code shall be subject to the imposition of such sanctions by the Adviser or the appropriate affiliate of the Adviser, as may be deemed appropriate under the circumstances to achieve the purpose of this Code and may include, without limitation, a letter of censure, suspension from employment or termination of employment, in the sole discretion of the Adviser or the appropriate affiliate of the Adviser, and/or removal as an officer of the Fund, in the sole discretion of the Fund’s Board of Trustees or any committee appointed by the Board to deal with such matters.
| 7. | Administration and Construction |
| (a) | The administration of this Code of Ethics shall be the responsibility of the Code Administrator of this Code, acting under the terms of this Code and the oversight of the Board of Trustees of the Fund or any committee appointed by the Board to deal with such information. |
| (b) | The Code Administrator shall be the Chief Compliance Officer of the Funds or his or her designee. |
| 2 | An "implicit waiver" is the failure to take action within a reasonable period of time regarding a material departure from a provision of this Code that has been made known to the Code Administrator, MassMutual’s General Counsel or Chief Compliance & Ethics Officer, or an executive officer of the Trust. |
4
| (c) | The duties of the Code Administrator will include: |
| (i) | maintaining a current list of the names of all Covered Officers; |
| (ii) | furnishing all Covered Officers a copy of this Code and initially and periodically informing them of their duties and obligations thereunder; |
| (iii) | maintaining or supervising the maintenance of all records required by this Code, including records of waivers granted hereunder; |
| (iv) | issuing interpretations of this Code which appear to the Code Administrator to be consistent with the objectives of this Code and any applicable laws or regulations; |
| (v) | conducting such inspections or investigations as shall reasonably be required to detect and report any violations of this Code, with his or her recommendations to MassMutual’s General Counsel and Chief Compliance & Ethics Officer and to the Board of Trustees of the affected Fund(s) or any committee appointed by them to deal with such information; and |
| (vi) | conducting educational training programs as needed to explain and reinforce the terms of this Code. |
| (d) | In carrying out the duties and responsibilities described under this Code, the Code Administrator may consult with such other persons as the Code Administrator shall deem necessary or desirable, including legal counsel to the Trust, legal counsel to the Trustees who are not “interested persons,” as that term is defined in the Investment Company Act of 1940, as amended (the “Disinterested Trustees”), legal counsel to the Trust’s investment adviser, and the Trust’s Chief Legal Officer. |
| 8. | Required Records |
The Code Administrator shall maintain and cause to be maintained in an easily accessible place the following records for the period required by applicable SEC rules (currently six years following the end of the fiscal year of the Fund in which the applicable event or report occurred):
| (i) | a copy of any Code which has been in effect during the period; |
| (ii) | a copy of each certification pursuant to the Code made by a Covered Officer during the period; |
| (iii) | a copy of each report made by the Code Administrator pursuant to this Code during the period; |
| (iv) | a list of all Covered Officers who are or have been required to make reports pursuant to this Code during the period, plus those person(s) who are or were responsible for reviewing these reports; |
| (v) | a record of any request to waive any requirement of this Code, the decision thereon and the reasons supporting the decision; |
5
| (vi) | a record of any report of any conflict of interest or appearance of a conflict of interest received by the Code Administrator or discovered by the Code Administrator during the period, the decision thereon and the reasons supporting the decision; and |
| (vii) | a record of any violation of any such Code and of any action taken as a result of such violation, during the period. |
| 9. | Amendments and Modifications |
This Code (other than Exhibits A and E and the names of the Funds identified on the first page that have adopted the Code) may not be amended or modified except by a writing that is approved or ratified by a majority vote of the Board of Trustees and the Disinterested Trustees. The Code Administrator must approve any permitted amendments or modifications not requiring Board of Trustees approval or ratification.
| 10. | Confidentiality |
This Code is for the internal use of the Funds. Reports and records prepared or maintained under this Code are considered confidential and shall be maintained and protected accordingly to the extent permitted by applicable laws, rules and regulations. Except as otherwise authorized by law or this Code, such matters shall not be disclosed to anyone other than the Trustees and their counsel, Fund counsel, Fund officers, the Funds’ Chief Legal Officer, the independent auditors of the Funds, and MassMutual or its counsel, except as such disclosure may be required pursuant to applicable judicial or regulatory process. This provision does not preclude Covered Officers or others from reporting such matters to the Securities and Exchange Commission or other regulatory authorities.
6
EXHIBIT A
Positions Covered by this Code of Ethics
The following officers of the Funds:
| · | Principal Executive Officer (President); |
| · | Principal Financial Officer (Chief Financial Officer); |
| · | Comptroller or Principal Accounting Officer; |
| · | Treasurer; |
| · | Assistant Treasurer; and |
| · | Other persons performing similar functions as the Principal Executive Officer, Principal Financial Officer, Comptroller, or Principal Accounting Officer |
7
EXHIBIT B
INITIAL CERTIFICATION
I certify that I have received, read and understand the Funds’ Code of Ethics for Principal Executive and Senior Financial Officers of the Funds (the “Code”) and will adhere to the Code’s requirements.
I also agree to cooperate fully with any investigation or inquiry as to whether a possible violation of the Code has occurred.
_____________________________________________________
Signature (may be electronic)
_____________________________________________________
Date
8
EXHIBIT C
ANNUAL CERTIFICATION
I certify that I have received, read and understand the Funds’ Code of Ethics for Principal Executive and Senior Financial Officers (the “Code”) and will adhere to the Code’s requirements.
I certify that I have complied with the requirements of the Code and have disclosed or reported any violations of the Code to the Code Administrator during the prior year.
I also agree to cooperate fully with any investigation or inquiry as to whether a possible violation of the Code has occurred.
_____________________________________________________
Signature (may be electronic)
_____________________________________________________
Date
9
EXHIBIT D
PARTIAL YEAR CERTIFICATION
I certify that I have received, read and understand the Funds’ Code of Ethics for Principal Executive and Senior Financial Officers (the “Code”).
I certify that I have complied with the requirements of the Code and have disclosed or reported any violations of the Code to the Code Administrator during the current year, up to and including the date on which I ceased to be a Covered Officer.
I also agree to cooperate fully with any investigation or inquiry as to whether a possible violation of the Code has occurred.
_____________________________________________________
Signature (may be electronic)
_____________________________________________________
Date
10
EXHIBIT E
ADOPTION AND AMENDMENT DATES for Code of Ethics for Principal Executive and Senior Financial Officers of the Funds
THE MASSMUTUAL SELECT FUNDS
Adopted November 3, 2003, Amended May 13, 2008, Amended June 30, 2015, Amended January 1, 2016, Amended October 13, 2016, Amended September 20, 2017, Amended June 4, 2019, Amended October 1, 2021, Amended September 27, 2022.
THE MASSMUTUAL PREMIER FUNDS
Adopted December 12, 2003, Amended November 1, 2004, Amended May 21, 2008, Amended June 30, 2015, Amended January 1, 2016, Amended October 13, 2016, Amended September 20, 2017, Amended June 4, 2019, Amended October 1, 2021, Amended September 27, 2022.
THE MML SERIES INVESTMENT FUND
Adopted November 3, 2003, Amended May 13, 2008, Amended June 30, 2015, Amended January 1, 2016, Amended October 13, 2016, Amended September 20, 2017, Amended June 4, 2019, Amended October 1, 2021, Amended September 27, 2022.
THE MML SERIES INVESTMENT FUND II
Adopted April 27, 2005, Amended May 21, 2008, Amended June 30, 2015, Amended January 1, 2016, Amended October 13, 2016, Amended September 20, 2017, Amended June 4, 2019, Amended October 1, 2021, Amended September 27, 2022.
THE MASSMUTUAL ADVANTAGE FUNDS
Adopted September 29, 2021, Amended September 27, 2022.
11
EX-99.CERT
CERTIFICATION PURSUANT TO SECTION 302 OF THE SARBANES-OXLEY ACT OF 2002:
I, Paul LaPiana, certify that:
1. I have reviewed this report on Form N-CSR of MML Series Investment Fund;
2. Based on my knowledge, this report does not contain any untrue statement of a material fact or omit to state a material fact necessary to make the statements made, in light of the circumstances under which such statements were made, not misleading with respect to the period covered by this report;
3. Based on my knowledge, the financial statements, and other financial information included in this report, fairly present in all material respects the financial condition, results of operations, changes in net assets, and cash flows (if the financial statements are required to include a statement of cash flows) of the registrant as of, and for, the periods presented in this report;
4. The registrant's other certifying officer(s) and I are responsible for establishing and maintaining disclosure controls and procedures (as defined in Rule 30a-3(c) under the Investment Company Act of 1940) and internal control over financial reporting (as defined in Rule 30a-3(d) under the Investment Company Act of 1940) for the registrant and have:
a) Designed such disclosure controls and procedures, or caused such disclosure controls and procedures to be designed under our supervision, to ensure that material information relating to the registrant, including its consolidated subsidiaries, is made known to us by others within those entities, particularly during the period in which this report is being prepared;
b) Designed such internal control over financial reporting, or caused such internal control over financial reporting to be designed under our supervision, to provide reasonable assurance regarding the reliability of financial reporting and the preparation of financial statements for external purposes in accordance with generally accepted accounting principles;
c) Evaluated the effectiveness of the registrant’s disclosure controls and procedures and presented in this report our conclusions about the effectiveness of the disclosure controls and procedures, as of a date within 90 days prior to the filing date of this report, based on such evaluation; and
d) Disclosed in this report any change in the registrant’s internal control over financial reporting that occurred during the period covered by this report that has materially affected, or is reasonably likely to materially affect, the registrant’s internal control over financial reporting; and
5. The registrant’s other certifying officer(s) and I have disclosed to the registrant’s auditors and the audit committee of the registrant’s board of directors (or persons performing the equivalent functions):
a) All significant deficiencies and material weaknesses in the design or operation of internal control over financial reporting which are reasonably likely to adversely affect the registrant’s ability to record, process, summarize, and report financial information; and
b) Any fraud, whether or not material, that involves management or other employees who have a significant role in the registrant’s internal control over financial reporting.
| Date: | 2/22/2023 | /s/ Paul LaPiana | ||
|
Paul LaPiana President and Principal Executive Officer |
||||
EX-99.CERT
CERTIFICATION PURSUANT TO SECTION 302 OF THE SARBANES-OXLEY ACT OF 2002:
I, Renee Hitchcock, certify that:
1. I have reviewed this report on Form N-CSR of MML Series Investment Fund;
2. Based on my knowledge, this report does not contain any untrue statement of a material fact or omit to state a material fact necessary to make the statements made, in light of the circumstances under which such statements were made, not misleading with respect to the period covered by this report;
3. Based on my knowledge, the financial statements, and other financial information included in this report, fairly present in all material respects the financial condition, results of operations, changes in net assets, and cash flows (if the financial statements are required to include a statement of cash flows) of the registrant as of, and for, the periods presented in this report;
4. The registrant's other certifying officer(s) and I are responsible for establishing and maintaining disclosure controls and procedures (as defined in Rule 30a-3(c) under the Investment Company Act of 1940) and internal control over financial reporting (as defined in Rule 30a-3(d) under the Investment Company Act of 1940) for the registrant and have:
a) Designed such disclosure controls and procedures, or caused such disclosure controls and procedures to be designed under our supervision, to ensure that material information relating to the registrant, including its consolidated subsidiaries, is made known to us by others within those entities, particularly during the period in which this report is being prepared;
b) Designed such internal control over financial reporting, or caused such internal control over financial reporting to be designed under our supervision, to provide reasonable assurance regarding the reliability of financial reporting and the preparation of financial statements for external purposes in accordance with generally accepted accounting principles;
c) Evaluated the effectiveness of the registrant’s disclosure controls and procedures and presented in this report our conclusions about the effectiveness of the disclosure controls and procedures, as of a date within 90 days prior to the filing date of this report, based on such evaluation; and
d) Disclosed in this report any change in the registrant’s internal control over financial reporting that occurred during the period covered by this report that has materially affected, or is reasonably likely to materially affect, the registrant’s internal control over financial reporting; and
5. The registrant’s other certifying officer(s) and I have disclosed to the registrant’s auditors and the audit committee of the registrant’s board of directors (or persons performing the equivalent functions):
a) All significant deficiencies and material weaknesses in the design or operation of internal control over financial reporting which are reasonably likely to adversely affect the registrant’s ability to record, process, summarize, and report financial information; and
b) Any fraud, whether or not material, that involves management or other employees who have a significant role in the registrant’s internal control over financial reporting.
| Date: | 2/22/2023 | /s/ Renee Hitchcock | ||
| Renée Hitchcock | ||||
| Treasurer and Principal Financial Officer | ||||
EX-99.906.CERT
CERTIFICATION PURSUANT TO SECTION 906 OF THE SARBANES-OXLEY ACT OF 2002
In connection with the Certified Shareholder Report of the MML Series Investment Fund (the “Trust”) on Form N-CSR for the period ending December 31, 2022, as filed with the Securities and Exchange Commission on the date hereof ("the Report"), the undersigned hereby certifies that:
1. The Report fully complies with the requirements of Section 13(a) or 15(d) of the Securities Exchange Act of 1934, and
2. The information contained in the Report fairly presents, in all material respects, the financial condition and results of operations of the Trust.
| Date: | 2/22/2023 | /s/ Paul LaPiana | ||
|
Paul LaPiana President and Principal Executive Officer |
||||
This certification is being furnished to the Commission solely pursuant to Rule 30a-2(b) under the Investment Company Act of 1940, as amended, and 18 U.S.C. § 1350 and is not being filed as part of the Form N-CSR with the Commission.
EX-99.906.CERT
CERTIFICATION PURSUANT TO SECTION 906 OF THE SARBANES-OXLEY ACT OF 2002
In connection with the Certified Shareholder Report of the MML Series Investment Fund (the “Trust”) on Form N-CSR for the period ending December 31, 2022, as filed with the Securities and Exchange Commission on the date hereof ("the Report"), the undersigned hereby certifies that:
1. The Report fully complies with the requirements of Section 13(a) or 15(d) of the Securities Exchange Act of 1934, and
2. The information contained in the Report fairly presents, in all material respects, the financial condition and results of operations of the Trust.
| Date: | 2/22/2023 | /s/ Renee Hitchcock | ||
|
Renée Hitchcock Treasurer and Principal Financial Officer |
||||
This certification is being furnished to the Commission solely pursuant to Rule 30a-2(b) under the Investment Company Act of 1940, as amended, and 18 U.S.C. § 1350 and is not being filed as part of the Form N-CSR with the Commission.
I, Steven I. Koszalka, in my capacity as Secretary of the American Funds Insurance Series (“AFIS”), certify that in compliance with Sections 302 and 906 of the Sarbanes-Oxley Act of 2002, the Principal Executive Officer and Treasurer of AFIS intend to certify to the U.S. Securities and Exchange Commission (“SEC”) with respect to the attached PDFs of the Series (Quarterly, Semi-annual or Annual) report. MML Series Investment Fund may rely on these certifications, which will be made in connection with AFIS’ filings with the SEC on forms N-CSR and N-PORT, which can be found at http://www.sec.gov/cgi-bin/browse-edgar?action=getcompany&CIK=0000729528&owner=include&count=40.
| /s/ Steven I. Koszalka | February 16, 2023 | ||
| Steven I. Koszalka | Date | ||
| Secretary, | |||
| American Funds Insurance Series |