UNITED STATES
SECURITIES AND EXCHANGE COMMISSION
Washington, D.C. 20549
FORM N-CSR
CERTIFIED SHAREHOLDER REPORT OF REGISTERED
MANAGEMENT INVESTMENT COMPANIES
Investment Company Act file number 811-21667
Fidelity Central Investment Portfolios LLC
(Exact name of registrant as specified in charter)
245 Summer St., Boston, Massachusetts 02210
(Address of principal executive offices) (Zip code)
Margaret Carey, Secretary
245 Summer St.
Boston, Massachusetts 02210
(Name and address of agent for service)
Registrant's telephone number, including area code:
617-563-7000
| |
Date of fiscal year end:
| September 30
|
|
|
Date of reporting period:
| September 30, 2023
|
Item 1.
Reports to Stockholders
Fidelity® Emerging Markets Equity Central Fund
Annual Report
September 30, 2023
Contents
To view a fund's proxy voting guidelines and proxy voting record for the 12-month period ended June 30, visit http://www.fidelity.com/proxyvotingresults or visit the Securities and Exchange Commission's (SEC) web site at http://www.sec.gov.
You may also call 1-800-544-8544 to request a free copy of the proxy voting guidelines.
Standard & Poor's, S&P and S&P 500 are registered service marks of The McGraw-Hill Companies, Inc. and have been licensed for use by Fidelity Distributors Corporation.
Other third-party marks appearing herein are the property of their respective owners.
All other marks appearing herein are registered or unregistered trademarks or service marks of FMR LLC or an affiliated company. © 2023 FMR LLC. All rights reserved.
A fund files its complete schedule of portfolio holdings with the SEC for the first and third quarters of each fiscal year on Form N-PORT. Forms N-PORT are available on the SEC's web site at http://www.sec.gov. A fund's Forms N-PORT may be reviewed and copied at the SEC's Public Reference Room in Washington, DC. Information regarding the operation of the SEC's Public Reference Room may be obtained by calling 1-800-SEC-0330.
Average annual total return reflects the change in the value of an investment, assuming reinvestment of distributions from dividend income and capital gains (the profits earned upon the sale of securities that have grown in value, if any) and assuming a constant rate of performance each year. The hypothetical investment and the average annual total returns do not reflect the deduction of taxes that a shareholder would pay on fund distributions or the redemption of fund shares. During periods of reimbursement by Fidelity, a fund's total return will be greater than it would be had the reimbursement not occurred. How a fund did yesterday is no guarantee of how it will do tomorrow.
Average Annual Total Returns
|
|
|
|
|
|
Periods ended September 30, 2023
|
Past 1
year
|
Past 5
years
|
Past 10
years
|
Fidelity® Emerging Markets Equity Central Fund
|
15.11%
|
2.29%
|
3.71%
|
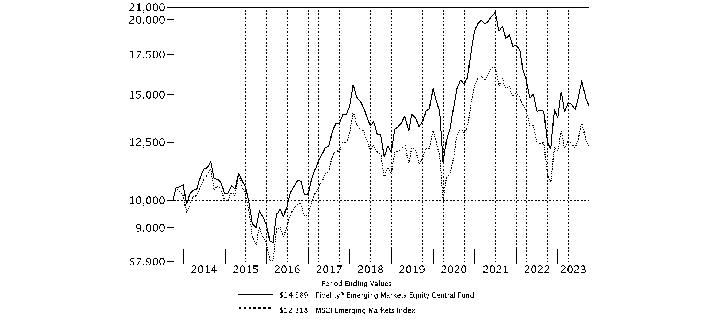
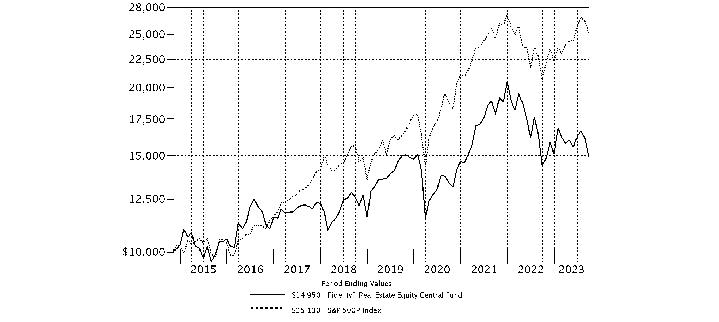
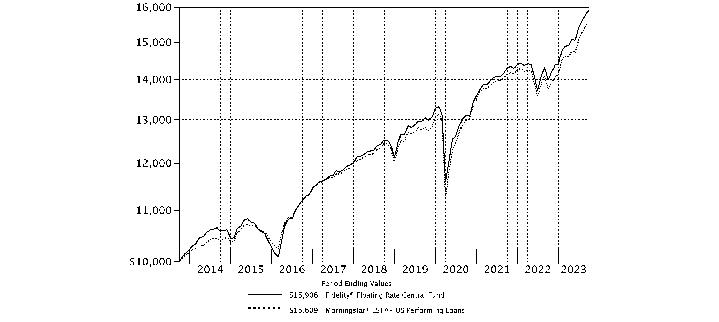
$10,000 Over 10 Years
|
|
|
Let's say hypothetically that $10,000 was invested in Fidelity® Emerging Markets Equity Central Fund on September 30, 2013.
The chart shows how the value of your investment would have changed, and also shows how the MSCI Emerging Markets Index performed over the same period.
|
|
|
Market Recap:
International (non-U.S.) equities gained 20.60% for the 12 months ending September 30, 2023, according to the MSCI ACWI (All Country World Index) ex USA Index, as global economic expansion and a slowing in the pace of inflation in some market provided a favorable backdrop for risk assets through July. After producing a return of -15.68 in 2022, the index's upturn the past 12 months has been largely driven by a narrow set of companies in the information technology and communication services sectors, in part due to excitement for generative artificial intelligence. Following strong gains in June (+4.50%) and July (+4.07%), the year-to-date rally sputtered in August (-4.51%) and September (-3.35%) amid a stalling pattern in disinflationary trends, soaring yields on longer-term U.S. government bonds and weak economic conditions in the eurozone and China. A stronger U.S. dollar also was a headwind for global economies. Still, non-U.S. stocks ended September up 5.50% year to date. For the full 12 months, all regions advanced, with Europe ex U.K. (+31%) leading. Japan (+26%) and the U.K. (+25%) also outperformed, whereas Asia Pacific ex Japan (+11%) lagged by the widest margin. Each of the 11 sectors also advanced, with information technology (+30%), industrials (+29%) and energy (+28%) ahead of the pack. Conversely, real estate (+5%) lagged most, followed by consumer staples (+9%).
Comments from Co-Managers Priyanshu Bakshi, Di Chen and Lewis Chung:
For the fiscal year, the fund gained 15.11%, versus 11.74% for the benchmark, the MSCI Emerging Markets Index. From a regional standpoint, picks in Emerging Asia and an underweight in the Middle East contributed to the fund's performance versus the benchmark. By sector, security selection helped relative performance, led by materials, consumer discretionary, utilities and information technology. The top individual relative contributor was an overweight in Posco Holdings (+164%). This period we lowered our position in Posco Holdings. The second-largest relative contributor was an overweight in Cemex (+88%), which we reduced the past 12 months. An overweight in PDD Holdings (+54%) also contributed. It was among the biggest holdings at period end. In contrast, our picks in Africa, primarily in South Africa, and a non-benchmark allocation to developed markets detracted from the fund's relative result. By sector, the biggest relative detractor was an underweight in information technology, primarily within the technology hardware & equipment industry. An overweight in consumer discretionary also hurt, as did stock selection in consumer staples. The fund's non-benchmark stake in PagSeguro Digital returned -35% and was the largest individual relative detractor. A second notable relative detractor was an overweight in Impala Platinum Holdings (-43%). A non-benchmark stake in Sea returned -21% and notably hurt. Notable changes in positioning include a higher allocation to India and Taiwan. By sector, meaningful changes in positioning include increased exposure to information technology.
Note to shareholders:
On December 27, 2022, Lewis Chung assumed co-management responsibilities for the fund. On July 1, 2023, Guillermo de las Casas came off of the fund.
The views expressed above reflect those of the portfolio manager(s) only through the end of the period as stated on the cover of this report and do not necessarily represent the views of Fidelity or any other person in the Fidelity organization. Any such views are subject to change at any time based upon market or other conditions and Fidelity disclaims any responsibility to update such views. These views may not be relied on as investment advice and, because investment decisions for a Fidelity fund are based on numerous factors, may not be relied on as an indication of trading intent on behalf of any Fidelity fund.
Top Holdings (% of Fund's net assets)
|
|
|
Taiwan Semiconductor Manufacturing Co. Ltd. (Taiwan, Semiconductors & Semiconductor Equipment)
|
7.6
|
|
Samsung Electronics Co. Ltd. (Korea (South), Technology Hardware, Storage & Peripherals)
|
4.9
|
|
Tencent Holdings Ltd. (China, Interactive Media & Services)
|
3.5
|
|
Alibaba Group Holding Ltd. (China, Broadline Retail)
|
2.9
|
|
HDFC Bank Ltd. (India, Banks)
|
2.3
|
|
PDD Holdings, Inc. ADR (China, Broadline Retail)
|
2.0
|
|
Reliance Industries Ltd. (India, Oil, Gas & Consumable Fuels)
|
1.8
|
|
SK Hynix, Inc. (Korea (South), Semiconductors & Semiconductor Equipment)
|
1.5
|
|
Meituan Class B (China, Hotels, Restaurants & Leisure)
|
1.4
|
|
China Construction Bank Corp. (H Shares) (China, Banks)
|
1.4
|
|
|
|
29.3
|
|
|
|
Market Sectors (% of Fund's net assets)
|
|
|
Financials
|
22.2
|
|
Information Technology
|
19.8
|
|
Consumer Discretionary
|
15.0
|
|
Communication Services
|
8.8
|
|
Materials
|
7.9
|
|
Consumer Staples
|
6.2
|
|
Industrials
|
5.7
|
|
Energy
|
4.7
|
|
Health Care
|
3.7
|
|
Utilities
|
3.0
|
|
Real Estate
|
1.6
|
|
|
|
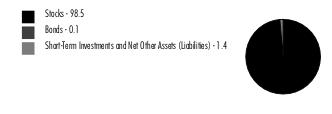
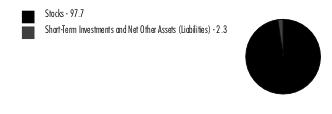
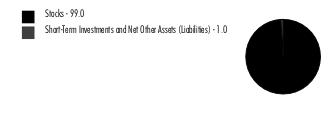
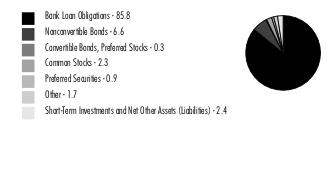
Asset Allocation (% of Fund's net assets)
|
|
|
|
|
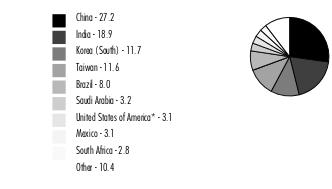
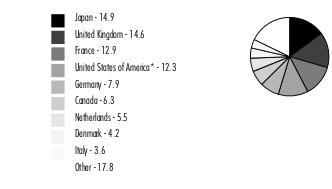
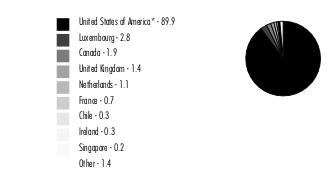
Geographic Diversification (% of Fund's net assets)
|
|
|
* Includes Short-Term investments and Net Other Assets (Liabilities).
Percentages are adjusted for the effect of derivatives, if applicable.
|
|
|
Showing Percentage of Net Assets
Common Stocks - 95.3%
|
|
|
|
Shares
|
Value ($)
|
Brazil - 6.0%
|
|
|
|
Arezzo Industria e Comercio SA
|
|
190,539
|
2,462,407
|
Cury Construtora e Incorporado SA
|
|
322,800
|
1,044,201
|
Cyrela Brazil Realty SA
|
|
185,800
|
749,255
|
Dexco SA
|
|
2,623,228
|
4,018,433
|
ENGIE Brasil Energia SA
|
|
479,100
|
3,948,854
|
Equatorial Energia SA
|
|
957,828
|
6,109,154
|
Hapvida Participacoes e Investimentos SA (a)(b)
|
|
6,314,040
|
5,903,848
|
Hypera SA (a)
|
|
373,780
|
2,761,773
|
Localiza Rent a Car SA
|
|
874,731
|
10,190,737
|
Localiza Rent a Car SA rights 11/10/23 (a)
|
|
6,414
|
20,416
|
LOG Commercial Properties e Participacoes SA
|
|
101,400
|
410,720
|
MercadoLibre, Inc. (a)
|
|
3,394
|
4,303,185
|
Multiplan Empreendimentos Imobiliarios SA (a)
|
|
47,200
|
230,716
|
PagSeguro Digital Ltd. (a)
|
|
1,166,227
|
10,041,214
|
Raia Drogasil SA
|
|
2,606,200
|
14,320,606
|
Rede D'Oregon Sao Luiz SA (b)
|
|
79,800
|
403,402
|
Rumo SA
|
|
2,094,200
|
9,507,444
|
StoneCo Ltd. Class A (a)
|
|
589,011
|
6,284,747
|
Transmissora Alianca de Energia Eletrica SA
|
|
470,100
|
3,232,168
|
Vale SA sponsored ADR
|
|
1,424,915
|
19,093,861
|
XP, Inc. Class A
|
|
921,283
|
21,235,573
|
YDUQS Participacoes SA
|
|
915,848
|
3,620,356
|
TOTAL BRAZIL
|
|
|
129,893,070
|
Canada - 0.6%
|
|
|
|
Barrick Gold Corp.
|
|
963,400
|
14,017,470
|
Chile - 1.0%
|
|
|
|
Antofagasta PLC
|
|
610,450
|
10,643,336
|
Banco de Chile
|
|
113,393,500
|
11,546,703
|
TOTAL CHILE
|
|
|
22,190,039
|
China - 26.8%
|
|
|
|
Advanced Micro-Fabrication Equipment, Inc., China (A Shares)
|
|
146,900
|
3,028,939
|
Akeso, Inc. (a)(b)
|
|
388,892
|
1,787,792
|
Alibaba Group Holding Ltd. (a)
|
|
5,751,228
|
62,355,886
|
Alibaba Group Holding Ltd. sponsored ADR (a)
|
|
45,413
|
3,939,124
|
Angelalign Technology, Inc. (b)(c)
|
|
91,437
|
568,055
|
Asymchem Laboratories Tianjin Co. Ltd. (H Shares) (b)
|
|
23,400
|
329,293
|
Baidu, Inc.:
|
|
|
|
Class A (a)
|
|
219,750
|
3,698,540
|
sponsored ADR (a)
|
|
31,064
|
4,173,448
|
BeiGene Ltd. ADR (a)
|
|
23,400
|
4,208,958
|
Beijing Enlight Media Co. Ltd. (A Shares)
|
|
1,653,899
|
1,948,029
|
Bilibili, Inc. ADR (a)
|
|
123,575
|
1,701,628
|
BYD Co. Ltd. (H Shares)
|
|
548,423
|
16,897,037
|
C&S Paper Co. Ltd. (A Shares)
|
|
2,058,500
|
2,889,766
|
China Communications Services Corp. Ltd. (H Shares)
|
|
7,754,000
|
3,257,671
|
China Construction Bank Corp. (H Shares)
|
|
51,789,000
|
29,113,308
|
China Gas Holdings Ltd.
|
|
3,567,000
|
3,366,147
|
China Jushi Co. Ltd. (A Shares)
|
|
4,641,304
|
8,581,470
|
China Life Insurance Co. Ltd. (H Shares)
|
|
9,809,000
|
15,281,645
|
China Merchants Shekou Industrial Zone Holdings Co. Ltd. (A Shares)
|
|
463,700
|
786,858
|
China Overseas Land and Investment Ltd.
|
|
1,536,960
|
3,187,382
|
China Petroleum & Chemical Corp. (H Shares)
|
|
20,284,000
|
11,086,205
|
China Resources Beer Holdings Co. Ltd.
|
|
1,508,666
|
8,274,501
|
China Resources Land Ltd.
|
|
1,389,000
|
5,534,041
|
China Tower Corp. Ltd. (H Shares) (b)
|
|
13,098,210
|
1,254,466
|
Daqin Railway Co. Ltd. (A Shares)
|
|
8,321,300
|
8,308,194
|
Daqo New Energy Corp. ADR (a)
|
|
19,114
|
578,581
|
ENN Energy Holdings Ltd.
|
|
745,500
|
6,187,947
|
ESR Group Ltd. (b)
|
|
554,600
|
779,037
|
Greentown China Holdings Ltd.
|
|
1,656,500
|
1,719,759
|
Guangdong Investment Ltd.
|
|
4,558,000
|
3,480,656
|
Haier Smart Home Co. Ltd.
|
|
2,795,600
|
8,737,835
|
Haier Smart Home Co. Ltd. (A Shares)
|
|
211,600
|
683,936
|
Haitian International Holdings Ltd.
|
|
1,759,000
|
3,728,717
|
Innovent Biologics, Inc. (a)(b)
|
|
894,351
|
4,368,426
|
JD.com, Inc. Class A
|
|
493,019
|
7,172,852
|
KE Holdings, Inc. ADR
|
|
237,700
|
3,689,104
|
Kingdee International Software Group Co. Ltd. (a)
|
|
414,000
|
509,639
|
Kunlun Energy Co. Ltd.
|
|
5,564,000
|
4,795,970
|
Kweichow Moutai Co. Ltd. (A Shares)
|
|
43,800
|
10,789,083
|
Lenovo Group Ltd.
|
|
6,678,626
|
6,882,500
|
Li Auto, Inc.:
|
|
|
|
ADR (a)
|
|
340,865
|
12,151,837
|
Class A (a)
|
|
57,370
|
1,023,805
|
Li Ning Co. Ltd.
|
|
865,984
|
3,643,769
|
Longfor Properties Co. Ltd. (b)
|
|
272,034
|
489,115
|
Medlive Technology Co. Ltd. (b)
|
|
176,500
|
178,282
|
Meituan Class B (a)(b)
|
|
2,017,998
|
29,212,925
|
NetEase, Inc. ADR
|
|
90,470
|
9,061,475
|
New Oriental Education & Technology Group, Inc. (a)
|
|
126,700
|
749,803
|
New Oriental Education & Technology Group, Inc. sponsored ADR (a)
|
|
187,974
|
11,005,878
|
PDD Holdings, Inc. ADR (a)
|
|
444,045
|
43,547,493
|
Ping An Insurance Group Co. of China Ltd. (H Shares)
|
|
4,838,000
|
27,439,429
|
Proya Cosmetics Co. Ltd. (A Shares)
|
|
578,988
|
8,056,588
|
Shangri-La Asia Ltd. (a)
|
|
932,000
|
637,920
|
Shenzhen Mindray Bio-Medical Electronics Co. Ltd. (A Shares)
|
|
171,703
|
6,344,886
|
Sinopec Engineering Group Co. Ltd. (H Shares)
|
|
5,122,500
|
2,309,097
|
Sinopharm Group Co. Ltd. (H Shares)
|
|
844,109
|
2,446,865
|
Sinotruk Hong Kong Ltd.
|
|
1,686,000
|
3,246,717
|
Sunny Optical Technology Group Co. Ltd.
|
|
179,400
|
1,253,128
|
Tencent Holdings Ltd.
|
|
1,932,062
|
74,894,373
|
Tongdao Liepin Group (a)
|
|
703,363
|
628,728
|
TravelSky Technology Ltd. (H Shares)
|
|
2,337,000
|
4,052,696
|
Trip.com Group Ltd. ADR (a)
|
|
366,572
|
12,819,023
|
Tsingtao Brewery Co. Ltd. (H Shares)
|
|
1,155,800
|
9,460,765
|
Uni-President China Holdings Ltd.
|
|
4,109,400
|
2,886,202
|
WuXi AppTec Co. Ltd. (H Shares) (b)(c)
|
|
342,352
|
4,098,545
|
Wuxi Biologics (Cayman), Inc. (a)(b)
|
|
1,823,932
|
10,600,434
|
Xinyi Solar Holdings Ltd.
|
|
3,461,167
|
2,590,036
|
XPeng, Inc. ADR (a)(c)
|
|
333,999
|
6,132,222
|
Zai Lab Ltd. (a)
|
|
1,139,648
|
2,788,810
|
Zhuzhou CRRC Times Electric Co. Ltd. (H Shares)
|
|
934,500
|
3,233,956
|
ZTO Express, Inc. sponsored ADR
|
|
475,100
|
11,483,167
|
TOTAL CHINA
|
|
|
578,130,394
|
Greece - 0.6%
|
|
|
|
Alpha Bank SA (a)
|
|
5,704,401
|
7,589,986
|
Piraeus Financial Holdings SA (a)
|
|
1,628,583
|
4,838,312
|
TOTAL GREECE
|
|
|
12,428,298
|
Hong Kong - 0.9%
|
|
|
|
ASMPT Ltd.
|
|
470,100
|
4,208,175
|
Huanxi Media Group Ltd. (a)
|
|
9,169,702
|
1,007,023
|
Kerry Properties Ltd.
|
|
652,000
|
1,109,015
|
Prudential PLC
|
|
1,255,348
|
13,494,160
|
TOTAL HONG KONG
|
|
|
19,818,373
|
Hungary - 0.1%
|
|
|
|
Richter Gedeon PLC
|
|
130,548
|
3,159,899
|
India - 18.8%
|
|
|
|
Apollo Hospitals Enterprise Ltd.
|
|
122,306
|
7,567,624
|
Bajaj Auto Ltd.
|
|
116,181
|
7,085,033
|
Bajaj Finance Ltd.
|
|
223,648
|
21,037,618
|
Bharat Electronics Ltd.
|
|
5,198,700
|
8,658,761
|
Bharti Airtel Ltd.
|
|
2,075,706
|
23,158,115
|
Coal India Ltd.
|
|
2,324,400
|
8,263,538
|
Divi's Laboratories Ltd.
|
|
77,760
|
3,525,960
|
Eicher Motors Ltd.
|
|
119,390
|
4,956,119
|
Embassy Office Parks (REIT)
|
|
561,352
|
2,032,252
|
HDFC Bank Ltd. (a)
|
|
2,670,682
|
48,983,767
|
HDFC Standard Life Insurance Co. Ltd. (b)
|
|
2,091,628
|
16,055,924
|
Hindustan Aeronautics Ltd.
|
|
265,200
|
6,158,191
|
ICICI Bank Ltd.
|
|
1,365,600
|
15,646,584
|
Indraprastha Gas Ltd.
|
|
1,000,720
|
5,481,755
|
Infosys Ltd.
|
|
388,565
|
6,678,115
|
Infosys Ltd. sponsored ADR
|
|
1,574,294
|
26,936,170
|
ITC Ltd.
|
|
2,725,187
|
14,585,092
|
JK Cement Ltd.
|
|
334,398
|
12,804,260
|
Larsen & Toubro Ltd.
|
|
425,751
|
15,502,853
|
Ltimindtree Ltd. (b)
|
|
5,600
|
351,360
|
Mahanagar Gas Ltd.
|
|
318,301
|
3,943,927
|
Mahindra & Mahindra Ltd.
|
|
178,328
|
3,337,945
|
MakeMyTrip Ltd. (a)
|
|
112,256
|
4,548,613
|
Mankind Pharma Ltd.
|
|
236,582
|
5,115,140
|
Maruti Suzuki India Ltd.
|
|
49,720
|
6,353,454
|
NTPC Ltd.
|
|
2,950,011
|
8,723,733
|
One97 Communications Ltd. (a)
|
|
646,725
|
6,680,268
|
Petronet LNG Ltd.
|
|
1,116,868
|
3,227,464
|
Power Grid Corp. of India Ltd.
|
|
3,386,841
|
8,147,426
|
Reliance Industries Ltd.
|
|
1,377,097
|
38,890,738
|
Shree Cement Ltd.
|
|
26,427
|
8,104,577
|
Sona Blw Precision Forgings Ltd. (b)
|
|
622,578
|
4,374,204
|
SRF Ltd.
|
|
240,600
|
6,517,801
|
Star Health & Allied Insurance Co. Ltd. (a)
|
|
1,260,200
|
9,120,458
|
Tata Motors Ltd.
|
|
322,726
|
2,449,352
|
Tata Steel Ltd.
|
|
8,624,500
|
13,388,307
|
Torrent Pharmaceuticals Ltd.
|
|
101,833
|
2,365,822
|
Zomato Ltd. (a)
|
|
12,724,254
|
15,553,824
|
TOTAL INDIA
|
|
|
406,312,144
|
Indonesia - 2.7%
|
|
|
|
First Resources Ltd.
|
|
5,740,300
|
6,424,769
|
PT Bank Central Asia Tbk
|
|
36,610,824
|
20,905,242
|
PT Bank Rakyat Indonesia (Persero) Tbk
|
|
65,486,455
|
22,139,549
|
PT Sumber Alfaria Trijaya Tbk
|
|
33,018,600
|
6,323,847
|
PT Telkom Indonesia Persero Tbk
|
|
11,776,300
|
2,854,656
|
TOTAL INDONESIA
|
|
|
58,648,063
|
Korea (South) - 10.9%
|
|
|
|
Coway Co. Ltd.
|
|
110,070
|
3,352,534
|
Delivery Hero AG (a)(b)
|
|
96,151
|
2,761,984
|
Hyundai Motor Co. Ltd.
|
|
19,866
|
2,802,662
|
Jeisys Medical, Inc. (a)
|
|
129,314
|
1,148,944
|
Kakao Corp.
|
|
209,884
|
6,834,125
|
Kakao Pay Corp. (a)
|
|
50,634
|
1,523,154
|
Kia Corp.
|
|
266,682
|
16,014,694
|
LG Chemical Ltd.
|
|
9,900
|
3,616,400
|
LG Corp.
|
|
105,552
|
6,546,215
|
LS Electric Co. Ltd.
|
|
35,511
|
2,452,887
|
NAVER Corp.
|
|
112,777
|
16,822,990
|
NCSOFT Corp.
|
|
4,696
|
770,295
|
POSCO
|
|
32,301
|
12,696,278
|
Samsung Biologics Co. Ltd. (a)(b)
|
|
15,726
|
7,919,999
|
Samsung Electronics Co. Ltd.
|
|
2,086,702
|
105,248,453
|
Samsung SDI Co. Ltd.
|
|
28,359
|
10,692,542
|
SK Hynix, Inc.
|
|
387,328
|
32,717,479
|
TOTAL KOREA (SOUTH)
|
|
|
233,921,635
|
Mauritius - 0.0%
|
|
|
|
Jumo World Holding Ltd. (d)(e)
|
|
161,297
|
285,496
|
Jumo World Ltd. (a)(e)
|
|
161
|
0
|
TOTAL MAURITIUS
|
|
|
285,496
|
Mexico - 3.1%
|
|
|
|
CEMEX S.A.B. de CV sponsored ADR (a)
|
|
2,268,500
|
14,745,250
|
Corporacion Inmobiliaria Vesta S.A.B. de CV
|
|
769,600
|
2,538,764
|
Fibra Uno Administracion SA de CV
|
|
1,077,800
|
1,796,591
|
Grupo Aeroportuario del Pacifico S.A.B. de CV Series B
|
|
466,596
|
7,669,015
|
Grupo Aeroportuario Norte S.A.B. de CV
|
|
320,800
|
3,481,630
|
Grupo Financiero Banorte S.A.B. de CV Series O
|
|
2,970,532
|
24,904,572
|
Wal-Mart de Mexico SA de CV Series V
|
|
2,993,800
|
11,269,160
|
TOTAL MEXICO
|
|
|
66,404,982
|
Netherlands - 0.1%
|
|
|
|
CTP BV (b)
|
|
90,385
|
1,293,876
|
Panama - 0.3%
|
|
|
|
Copa Holdings SA Class A
|
|
76,670
|
6,832,830
|
Peru - 0.5%
|
|
|
|
Credicorp Ltd. (United States)
|
|
76,909
|
9,842,045
|
Philippines - 0.4%
|
|
|
|
Ayala Land, Inc.
|
|
6,376,700
|
3,316,037
|
SM Investments Corp.
|
|
242,000
|
3,604,446
|
SM Prime Holdings, Inc.
|
|
2,124,500
|
1,136,678
|
TOTAL PHILIPPINES
|
|
|
8,057,161
|
Poland - 0.5%
|
|
|
|
CD Projekt RED SA (c)
|
|
138,183
|
3,960,151
|
Dino Polska SA (a)(b)
|
|
82,954
|
6,740,909
|
TOTAL POLAND
|
|
|
10,701,060
|
Romania - 0.1%
|
|
|
|
Societatea de Producere A Energiei Electrice in Hidrocentrale Hidroelectrica SA
|
|
46,900
|
1,196,238
|
Russia - 0.7%
|
|
|
|
Fix Price Group Ltd. GDR (Reg. S) (a)(e)
|
|
365,722
|
135,072
|
Gazprom OAO sponsored ADR (Reg. S) (a)(e)
|
|
782,800
|
178,823
|
LSR Group OJSC (e)
|
|
6,300
|
6,111
|
LUKOIL PJSC sponsored ADR (a)(e)
|
|
176,600
|
49,958
|
Novatek PJSC GDR (Reg. S) (a)(e)
|
|
46,200
|
2,587,200
|
Sberbank of Russia (e)
|
|
794,750
|
4,712
|
Sberbank of Russia sponsored ADR (a)(e)
|
|
1,468,992
|
26,148
|
Severstal PAO GDR (Reg. S) (a)(e)
|
|
433,400
|
10,233
|
TCS Group Holding PLC GDR (a)(e)
|
|
292,174
|
3,506,088
|
X5 Retail Group NV GDR (Reg. S) (a)(e)
|
|
450,200
|
4,538,016
|
Yandex NV Series A (a)(e)
|
|
471,648
|
4,622,150
|
TOTAL RUSSIA
|
|
|
15,664,511
|
Saudi Arabia - 3.2%
|
|
|
|
Al Rajhi Bank
|
|
914,415
|
16,555,021
|
Alinma Bank
|
|
1,454,700
|
12,954,973
|
Bupa Arabia for Cooperative Insurance Co.
|
|
221,850
|
12,303,804
|
Saudi Arabian Oil Co. (b)
|
|
522,500
|
4,876,082
|
The Saudi National Bank
|
|
2,515,993
|
22,003,912
|
TOTAL SAUDI ARABIA
|
|
|
68,693,792
|
Singapore - 1.1%
|
|
|
|
Sea Ltd. ADR (a)
|
|
535,533
|
23,536,675
|
South Africa - 2.8%
|
|
|
|
Capitec Bank Holdings Ltd.
|
|
181,099
|
16,416,486
|
Discovery Ltd.
|
|
1,537,900
|
11,140,866
|
Impala Platinum Holdings Ltd.
|
|
1,869,600
|
9,739,017
|
Naspers Ltd. Class N
|
|
56,717
|
9,063,187
|
Pick 'n Pay Stores Ltd.
|
|
2,331,408
|
4,555,996
|
Shoprite Holdings Ltd.
|
|
717,441
|
9,088,060
|
TOTAL SOUTH AFRICA
|
|
|
60,003,612
|
Taiwan - 11.6%
|
|
|
|
Accton Technology Corp.
|
|
87,000
|
1,335,494
|
Alchip Technologies Ltd.
|
|
149,000
|
12,496,091
|
ASE Technology Holding Co. Ltd.
|
|
313,000
|
1,068,993
|
ASUSTeK Computer, Inc.
|
|
193,000
|
2,197,348
|
BizLink Holding, Inc.
|
|
505,390
|
4,241,190
|
Chailease Holding Co. Ltd.
|
|
3,203,658
|
17,999,070
|
Chroma ATE, Inc.
|
|
371,000
|
3,183,333
|
Delta Electronics, Inc.
|
|
498,000
|
5,018,537
|
E Ink Holdings, Inc.
|
|
73,000
|
407,268
|
eMemory Technology, Inc.
|
|
85,774
|
5,388,137
|
Formosa Plastics Corp.
|
|
2,942,000
|
7,276,779
|
Global Unichip Corp.
|
|
27,828
|
1,185,613
|
Hon Hai Precision Industry Co. Ltd. (Foxconn)
|
|
278,000
|
896,546
|
King Yuan Electronics Co. Ltd.
|
|
1,873,000
|
4,419,462
|
Lite-On Technology Corp.
|
|
446,000
|
1,684,746
|
Taiwan Semiconductor Manufacturing Co. Ltd.
|
|
10,021,763
|
163,505,954
|
Taiwan Semiconductor Manufacturing Co. Ltd. sponsored ADR
|
|
25,300
|
2,198,570
|
Uni-President Enterprises Corp.
|
|
4,055,000
|
8,818,162
|
Unimicron Technology Corp.
|
|
428,559
|
2,313,443
|
Wiwynn Corp.
|
|
73,847
|
3,445,401
|
TOTAL TAIWAN
|
|
|
249,080,137
|
Tanzania - 0.0%
|
|
|
|
Helios Towers PLC (a)
|
|
906,200
|
811,550
|
Thailand - 0.7%
|
|
|
|
Carabao Group PCL (For. Reg.)
|
|
2,652,900
|
5,948,938
|
Land & House PCL (For. Reg.)
|
|
5,415,700
|
1,155,191
|
PTT Global Chemical PCL (For. Reg.)
|
|
7,628,200
|
7,196,907
|
Supalai PCL (For. Reg.)
|
|
1,411,000
|
775,582
|
TOTAL THAILAND
|
|
|
15,076,618
|
United Arab Emirates - 0.1%
|
|
|
|
Emaar Properties PJSC
|
|
663,350
|
1,452,018
|
United States of America - 1.7%
|
|
|
|
FirstCash Holdings, Inc.
|
|
167,272
|
16,790,763
|
Globant SA (a)
|
|
21,184
|
4,191,254
|
Legend Biotech Corp. ADR (a)
|
|
34,226
|
2,298,960
|
Parade Technologies Ltd.
|
|
22,000
|
673,741
|
Tenaris SA sponsored ADR
|
|
177,200
|
5,599,520
|
Titan Cement International Trading SA
|
|
425,630
|
7,748,954
|
TOTAL UNITED STATES OF AMERICA
|
|
|
37,303,192
|
|
TOTAL COMMON STOCKS
(Cost $1,984,860,097)
|
|
|
2,054,755,178
|
|
|
|
|
|
Preferred Stocks - 3.2%
|
|
|
|
Shares
|
Value ($)
|
Convertible Preferred Stocks - 0.5%
|
|
|
|
China - 0.4%
|
|
|
|
ByteDance Ltd. Series E1 (a)(d)(e)
|
|
30,246
|
7,066,978
|
dMed Biopharmaceutical Co. Ltd. Series C (a)(d)(e)
|
|
52,588
|
411,764
|
|
|
|
|
7,478,742
|
India - 0.1%
|
|
|
|
Meesho Series F (a)(d)(e)
|
|
33,863
|
2,641,653
|
TOTAL CONVERTIBLE PREFERRED STOCKS
|
|
|
10,120,395
|
Nonconvertible Preferred Stocks - 2.7%
|
|
|
|
Brazil - 1.9%
|
|
|
|
Companhia de Transmissao de Energia Eletrica Paulista (PN)
|
|
625,300
|
2,910,947
|
Metalurgica Gerdau SA (PN)
|
|
4,773,300
|
10,588,235
|
Petroleo Brasileiro SA - Petrobras:
|
|
|
|
(PN) sponsored ADR (non-vtg.)
|
|
1,036,000
|
14,203,560
|
sponsored ADR
|
|
874,700
|
13,111,753
|
|
|
|
|
40,814,495
|
Korea (South) - 0.8%
|
|
|
|
Hyundai Motor Co. Ltd. Series 2
|
|
93,208
|
7,289,706
|
Samsung Electronics Co. Ltd.
|
|
237,058
|
9,528,235
|
|
|
|
|
16,817,941
|
United States of America - 0.0%
|
|
|
|
Gupshup, Inc. (a)(d)(e)
|
|
44,950
|
561,875
|
TOTAL NONCONVERTIBLE PREFERRED STOCKS
|
|
|
58,194,311
|
|
TOTAL PREFERRED STOCKS
(Cost $52,474,660)
|
|
|
68,314,706
|
|
|
|
|
|
Corporate Bonds - 0.1%
|
|
|
|
Principal
Amount (f)
|
Value ($)
|
Convertible Bonds - 0.1%
|
|
|
|
Brazil - 0.1%
|
|
|
|
Creditas Financial Solutions Ltd. 5% 7/28/27 (d)(e)
|
|
2,066,600
|
2,073,833
|
Nonconvertible Bonds - 0.0%
|
|
|
|
China - 0.0%
|
|
|
|
Ant International Co. Ltd. 3.55% 8/14/24 (d)(e)
|
|
601,592
|
598,584
|
|
TOTAL CORPORATE BONDS
(Cost $2,668,192)
|
|
|
2,672,417
|
|
|
|
|
|
Government Obligations - 0.0%
|
|
|
|
Principal
Amount (f)
|
Value ($)
|
United States of America - 0.0%
|
|
|
|
U.S. Treasury Bills, yield at date of purchase 5.32% 10/19/23
(Cost $109,711)
|
|
110,000
|
109,725
|
|
|
|
|
|
Money Market Funds - 1.6%
|
|
|
|
Shares
|
Value ($)
|
Fidelity Cash Central Fund 5.39% (g)
|
|
22,503,177
|
22,507,677
|
Fidelity Securities Lending Cash Central Fund 5.39% (g)(h)
|
|
10,700,580
|
10,701,650
|
|
TOTAL MONEY MARKET FUNDS
(Cost $33,208,944)
|
|
|
33,209,327
|
|
|
|
|
|
|
TOTAL INVESTMENT IN SECURITIES - 100.2%
(Cost $2,073,321,604)
|
2,159,061,353
|
NET OTHER ASSETS (LIABILITIES) - (0.2)%
|
(3,519,318)
|
NET ASSETS - 100.0%
|
2,155,542,035
|
|
|
|
Legend
(b)
|
Security exempt from registration under Rule 144A of the Securities Act of 1933. These securities may be resold in transactions exempt from registration, normally to qualified institutional buyers. At the end of the period, the value of these securities amounted to $104,347,958 or 4.8% of net assets.
|
(c)
|
Security or a portion of the security is on loan at period end.
|
(d)
|
Restricted securities (including private placements) - Investment in securities not registered under the Securities Act of 1933 (excluding 144A issues). At the end of the period, the value of restricted securities (excluding 144A issues) amounted to $13,640,183 or 0.6% of net assets.
|
(f)
|
Amount is stated in United States dollars unless otherwise noted.
|
(g)
|
Affiliated fund that is generally available only to investment companies and other accounts managed by Fidelity Investments. The rate quoted is the annualized seven-day yield of the fund at period end. A complete unaudited listing of the fund's holdings as of its most recent quarter end is available upon request. In addition, each Fidelity Central Fund's financial statements, which are not covered by the Fund's Report of Independent Registered Public Accounting Firm, are available on the SEC's website or upon request.
|
(h)
|
Investment made with cash collateral received from securities on loan.
|
Additional information on each restricted holding is as follows:
|
Security
|
Acquisition Date
|
Acquisition Cost ($)
|
Ant International Co. Ltd. 3.55% 8/14/24
|
8/14/23
|
601,592
|
|
|
|
|
ByteDance Ltd. Series E1
|
11/18/20
|
3,314,181
|
|
|
|
|
Creditas Financial Solutions Ltd. 5% 7/28/27
|
1/28/22 - 7/28/23
|
2,066,600
|
|
|
|
|
dMed Biopharmaceutical Co. Ltd. Series C
|
12/01/20
|
746,915
|
|
|
|
|
Gupshup, Inc.
|
6/08/21
|
1,027,791
|
|
|
|
|
Jumo World Holding Ltd.
|
9/06/23
|
161,297
|
|
|
|
|
Meesho Series F
|
9/21/21
|
2,596,355
|
|
|
|
|
Affiliated Central Funds
Fiscal year to date information regarding the Fund's investments in Fidelity Central Funds, including the ownership percentage, is presented below.
Affiliate
|
Value,
beginning
of period ($)
|
Purchases ($)
|
Sales
Proceeds ($)
|
Dividend
Income ($)
|
Realized
Gain (loss) ($)
|
Change in
Unrealized
appreciation
(depreciation) ($)
|
Value,
end
of period ($)
|
% ownership,
end
of period
|
Fidelity Cash Central Fund 5.39%
|
23,156,025
|
919,987,198
|
920,635,546
|
1,485,556
|
-
|
-
|
22,507,677
|
0.1%
|
Fidelity Securities Lending Cash Central Fund 5.39%
|
9,615,779
|
449,580,661
|
448,494,790
|
228,127
|
-
|
-
|
10,701,650
|
0.0%
|
Total
|
32,771,804
|
1,369,567,859
|
1,369,130,336
|
1,713,683
|
-
|
-
|
33,209,327
|
|
|
|
|
|
|
|
|
|
|
|
Amounts in the dividend income column in the above table include any capital gain distributions from underlying funds, which are presented in the corresponding line item in the Statement of Operations, if applicable.
Amounts in the dividend income column for Fidelity Securities Lending Cash Central Fund represents the income earned on investing cash collateral, less rebates paid to borrowers and any lending agent fees associated with the loan, plus any premium payments received for lending certain types of securities.
Amounts included in the purchases and sales proceeds columns may include in-kind transactions, if applicable.
Investment Valuation
The following is a summary of the inputs used, as of September 30, 2023, involving the Fund's assets and liabilities carried at fair value. The inputs or methodology used for valuing securities may not be an indication of the risk associated with investing in those securities. For more information on valuation inputs, and their aggregation into the levels used below, please refer to the Investment Valuation section in the accompanying Notes to Financial Statements.
Valuation Inputs at Reporting Date:
|
Description
|
Total ($)
|
Level 1 ($)
|
Level 2 ($)
|
Level 3 ($)
|
Investments in Securities:
|
|
|
|
|
|
|
Equities:
|
|
|
|
|
Communication Services
|
188,805,395
|
71,241,288
|
105,874,979
|
11,689,128
|
Consumer Discretionary
|
329,528,409
|
171,277,017
|
155,609,739
|
2,641,653
|
Consumer Staples
|
135,105,532
|
121,614,282
|
8,818,162
|
4,673,088
|
Energy
|
102,074,841
|
99,258,860
|
-
|
2,815,981
|
Financials
|
473,691,597
|
315,669,681
|
154,199,472
|
3,822,444
|
Health Care
|
80,303,481
|
57,433,530
|
22,458,187
|
411,764
|
Industrials
|
120,434,134
|
107,193,842
|
13,240,292
|
-
|
Information Technology
|
427,375,158
|
52,728,352
|
374,084,931
|
561,875
|
Materials
|
170,787,568
|
137,448,861
|
33,328,474
|
10,233
|
Real Estate
|
33,438,847
|
33,432,736
|
-
|
6,111
|
Utilities
|
61,524,922
|
61,524,922
|
-
|
-
|
|
|
Corporate Bonds
|
2,672,417
|
-
|
-
|
2,672,417
|
|
|
Government Obligations
|
109,725
|
-
|
109,725
|
-
|
|
|
Money Market Funds
|
33,209,327
|
33,209,327
|
-
|
-
|
Total Investments in Securities:
|
2,159,061,353
|
1,262,032,698
|
867,723,961
|
29,304,694
|
The following is a reconciliation of Investments in Securities for which Level 3 inputs were used in determining value:
|
|
Investments in Securities:
|
|
Beginning Balance
|
$
|
13,983,170
|
|
Net Realized Gain (Loss) on Investment Securities
|
|
(969,388)
|
|
Net Unrealized Gain (Loss) on Investment Securities
|
|
15,734,274
|
|
Cost of Purchases
|
|
1,451,755
|
|
Proceeds of Sales
|
|
(895,117)
|
|
Amortization/Accretion
|
|
-
|
|
Transfers into Level 3
|
|
-
|
|
Transfers out of Level 3
|
|
-
|
|
Ending Balance
|
$
|
29,304,694
|
|
The change in unrealized gain (loss) for the period attributable to Level 3 securities held at September 30, 2023
|
$
|
14,825,959
|
|
|
The information used in the above reconciliation represents fiscal year to date activity for any Investments in Securities identified as using Level 3 inputs at either the beginning or the end of the current fiscal period. Cost of purchases and proceeds of sales may include securities received and/or delivered through in-kind transactions, corporate actions or exchanges. Transfers into Level 3 were attributable to a lack of observable market data resulting from decreases in market activity, decreases in liquidity, security restructurings or corporate actions. Transfers out of Level 3 were attributable to observable market data becoming available for those securities. Transfers in or out of Level 3 represent the beginning value of any Security or Instrument where a change in the pricing level occurred from the beginning to the end of the period. Realized and unrealized gains (losses) disclosed in the reconciliation are included in Net Gain (Loss) on the Fund's Statement of Operations.
|
|
Statement of Assets and Liabilities
|
|
|
|
|
September 30, 2023
|
|
|
|
|
|
|
Assets
|
|
|
|
|
Investment in securities, at value (including securities loaned of $10,680,258) - See accompanying schedule:
|
|
|
|
|
Unaffiliated issuers (cost $2,040,112,660)
|
$
|
2,125,852,026
|
|
|
Fidelity Central Funds (cost $33,208,944)
|
|
33,209,327
|
|
|
|
|
|
|
|
|
|
|
|
|
|
|
Total Investment in Securities (cost $2,073,321,604)
|
|
|
$
|
2,159,061,353
|
Foreign currency held at value (cost $9,200,001)
|
|
|
|
5,445,963
|
Receivable for investments sold
|
|
|
|
13,790,878
|
Receivable for fund shares sold
|
|
|
|
3,040
|
Dividends receivable
|
|
|
|
4,701,189
|
Interest receivable
|
|
|
|
22,663
|
Distributions receivable from Fidelity Central Funds
|
|
|
|
124,057
|
Other receivables
|
|
|
|
316,026
|
Total assets
|
|
|
|
2,183,465,169
|
Liabilities
|
|
|
|
|
Payable to custodian bank
|
$
|
15,919
|
|
|
Payable for investments purchased
|
|
6,524,589
|
|
|
Payable for fund shares redeemed
|
|
1,511,166
|
|
|
Deferred taxes
|
|
9,062,674
|
|
|
Other payables and accrued expenses
|
|
107,136
|
|
|
Collateral on securities loaned
|
|
10,701,650
|
|
|
Total Liabilities
|
|
|
|
27,923,134
|
Net Assets
|
|
|
$
|
2,155,542,035
|
Net Assets consist of:
|
|
|
|
|
Paid in capital
|
|
|
$
|
2,276,735,115
|
Total accumulated earnings (loss)
|
|
|
|
(121,193,080)
|
Net Assets
|
|
|
$
|
2,155,542,035
|
Net Asset Value, offering price and redemption price per share ($2,155,542,035 ÷ 11,477,607 shares)
|
|
|
$
|
187.80
|
Statement of Operations
|
|
|
|
|
Year ended
September 30, 2023
|
Investment Income
|
|
|
|
|
Dividends
|
|
|
$
|
61,071,362
|
Non-Cash dividends
|
|
|
|
5,151,599
|
Interest
|
|
|
|
71,619
|
Income from Fidelity Central Funds (including $228,127 from security lending)
|
|
|
|
1,713,683
|
Income before foreign taxes withheld
|
|
|
$
|
68,008,263
|
Less foreign taxes withheld
|
|
|
|
(6,630,820)
|
Total Income
|
|
|
|
61,377,443
|
Expenses
|
|
|
|
|
Custodian fees and expenses
|
$
|
428,392
|
|
|
Independent trustees' fees and expenses
|
|
11,244
|
|
|
Interest
|
|
14,991
|
|
|
Total Expenses
|
|
|
|
454,627
|
Net Investment income (loss)
|
|
|
|
60,922,816
|
Realized and Unrealized Gain (Loss)
|
|
|
|
|
Net realized gain (loss) on:
|
|
|
|
|
Investment Securities:
|
|
|
|
|
Unaffiliated issuers (net of foreign taxes of $2,578,437)
|
|
(106,586,945)
|
|
|
Foreign currency transactions
|
|
(276,770)
|
|
|
Futures contracts
|
|
1,940,837
|
|
|
Total net realized gain (loss)
|
|
|
|
(104,922,878)
|
Change in net unrealized appreciation (depreciation) on:
|
|
|
|
|
Investment Securities:
|
|
|
|
|
Unaffiliated issuers(net of increase in deferred foreign taxes of $5,863,078)
|
|
302,807,605
|
|
|
Assets and liabilities in foreign currencies
|
|
(3,083,960)
|
|
|
Total change in net unrealized appreciation (depreciation)
|
|
|
|
299,723,645
|
Net gain (loss)
|
|
|
|
194,800,767
|
Net increase (decrease) in net assets resulting from operations
|
|
|
$
|
255,723,583
|
Statement of Changes in Net Assets
|
|
|
|
|
Year ended
September 30, 2023
|
|
Year ended
September 30, 2022
|
Increase (Decrease) in Net Assets
|
|
|
|
|
Operations
|
|
|
|
|
Net investment income (loss)
|
$
|
60,922,816
|
$
|
50,153,926
|
Net realized gain (loss)
|
|
(104,922,878)
|
|
(70,415,223)
|
Change in net unrealized appreciation (depreciation)
|
|
299,723,645
|
|
(732,341,671)
|
Net increase (decrease) in net assets resulting from operations
|
|
255,723,583
|
|
(752,602,968)
|
Distributions to shareholders
|
|
(66,650,856)
|
|
(175,351,726)
|
|
|
|
|
|
|
Affiliated share transactions
|
|
|
|
|
Proceeds from sales of shares
|
|
527,724,240
|
|
889,582,434
|
Reinvestment of distributions
|
|
66,650,856
|
|
175,351,726
|
Cost of shares redeemed
|
|
(399,969,764)
|
|
(267,629,838)
|
|
|
|
|
|
|
Net increase (decrease) in net assets resulting from share transactions
|
|
194,405,332
|
|
797,304,322
|
Total increase (decrease) in net assets
|
|
383,478,059
|
|
(130,650,372)
|
|
|
|
|
|
|
Net Assets
|
|
|
|
|
Beginning of period
|
|
1,772,063,976
|
|
1,902,714,348
|
End of period
|
$
|
2,155,542,035
|
$
|
1,772,063,976
|
|
|
|
|
|
|
Other Information
|
|
|
|
|
Shares
|
|
|
|
|
Sold
|
|
2,759,066
|
|
4,216,200
|
Issued in reinvestment of distributions
|
|
350,181
|
|
743,918
|
Redeemed
|
|
(2,152,238)
|
|
(1,290,658)
|
Net increase (decrease)
|
|
957,009
|
|
3,669,460
|
|
|
|
|
|
|
Financial Highlights
Fidelity® Emerging Markets Equity Central Fund
|
|
|
Years ended September 30,
|
|
2023
|
|
2022
|
|
2021
|
|
2020
|
|
2019
|
Selected Per-Share Data
|
|
|
|
|
|
|
|
|
|
|
Net asset value, beginning of period
|
$
|
168.44
|
$
|
277.72
|
$
|
237.14
|
$
|
210.61
|
$
|
220.61
|
Income from Investment Operations
|
|
|
|
|
|
|
|
|
|
|
Net investment income (loss) A,B
|
|
5.48
|
|
5.84
|
|
5.06
|
|
3.85
|
|
7.79 C
|
Net realized and unrealized gain (loss)
|
|
19.98
|
|
(90.17)
|
|
40.55
|
|
28.57
|
|
1.52
|
Total from investment operations
|
|
25.46
|
|
(84.33)
|
|
45.61
|
|
32.42
|
|
9.31
|
Distributions from net investment income
|
|
(6.10)
|
|
(6.45)
|
|
(5.03)
|
|
(5.52)
|
|
(4.54)
|
Distributions from net realized gain
|
|
-
|
|
(18.50)
|
|
-
|
|
(.37)
|
|
(14.76)
|
Total distributions
|
|
(6.10)
|
|
(24.95)
|
|
(5.03)
|
|
(5.89)
|
|
(19.31) D
|
Net asset value, end of period
|
$
|
187.80
|
$
|
168.44
|
$
|
277.72
|
$
|
237.14
|
$
|
210.61
|
Total Return E
|
|
15.11%
|
|
(32.96)%
|
|
19.17%
|
|
15.71%
|
|
5.22%
|
Ratios to Average Net Assets B,F,G
|
|
|
|
|
|
|
|
|
|
|
Expenses before reductions
|
|
.02%
|
|
.02%
|
|
.03%
|
|
.05%
|
|
.06%
|
Expenses net of fee waivers, if any
|
|
.02%
|
|
.02%
|
|
.03%
|
|
.05%
|
|
.06%
|
Expenses net of all reductions
|
|
.02%
|
|
.02%
|
|
.03%
|
|
.05%
|
|
.06%
|
Net investment income (loss)
|
|
2.88%
|
|
2.68%
|
|
1.74%
|
|
1.76%
|
|
3.73% C
|
Supplemental Data
|
|
|
|
|
|
|
|
|
|
|
Net assets, end of period (000 omitted)
|
$
|
2,155,542
|
$
|
1,772,064
|
$
|
1,902,714
|
$
|
1,986,807
|
$
|
1,779,865
|
Portfolio turnover rate H
|
|
50%
|
|
58%
|
|
68%
|
|
50%
|
|
60%
|
ACalculated based on average shares outstanding during the period.
BNet investment income (loss) is affected by the timing of the declaration of dividends by any underlying mutual funds or exchange-traded funds (ETFs). Net investment income (loss) of any mutual funds or ETFs is not included in the Fund's net investment income (loss) ratio.
CNet investment income per share reflects one or more large, non-recurring dividend(s) which amounted to $2.72 per share. Excluding such non-recurring dividend(s), the ratio of net investment income (loss) to average net assets would have been 2.43%.
DTotal distributions per share do not sum due to rounding.
ETotal returns would have been lower if certain expenses had not been reduced during the applicable periods shown.
FFees and expenses of any underlying mutual funds or exchange-traded funds (ETFs) are not included in the Fund's expense ratio. The Fund indirectly bears its proportionate share of these expenses. For additional expense information related to investments in Fidelity Central Funds, please refer to the "Investments in Fidelity Central Funds" note found in the Notes to Financial Statements section of the most recent Annual or Semi-Annual report.
GExpense ratios reflect operating expenses of the class. Expenses before reductions do not reflect amounts reimbursed, waived, or reduced through arrangements with the investment adviser, brokerage services, or other offset arrangements, if applicable, and do not represent the amount paid by the class during periods when reimbursements, waivers or reductions occur.
HAmount does not include the portfolio activity of any underlying mutual funds or exchange-traded funds (ETFs).
For the period ended September 30, 2023
1. Organization.
Fidelity Emerging Markets Equity Central Fund (the Fund) is a fund of Fidelity Central Investment Portfolios LLC (the LLC) and is authorized to issue an unlimited number of shares. Shares of the Fund are only offered to other investment companies and accounts managed by Fidelity Management & Research Company LLC (FMR), or its affiliates (the Investing Funds). The LLC is registered under the Investment Company Act of 1940, as amended (the 1940 Act), as an open-end management investment company organized as a Delaware Limited Liability Company. The Fund's investments in emerging markets can be subject to social, economic, regulatory, and political uncertainties and can be extremely volatile.
2. Investments in Fidelity Central Funds.
Funds may invest in Fidelity Central Funds, which are open-end investment companies generally available only to other investment companies and accounts managed by the investment adviser and its affiliates. The Schedule of Investments lists any Fidelity Central Funds held as an investment as of period end, but does not include the underlying holdings of each Fidelity Central Fund. An investing fund indirectly bears its proportionate share of the expenses of the underlying Fidelity Central Funds.
Based on its investment objective, each Fidelity Central Fund may invest or participate in various investment vehicles or strategies that are similar to those of the investing fund. These strategies are consistent with the investment objectives of the investing fund and may involve certain economic risks which may cause a decline in value of each of the Fidelity Central Funds and thus a decline in the value of the investing fund.
Fidelity Central Fund
|
Investment Manager
|
Investment Objective
|
Investment Practices
|
Expense RatioA
|
Fidelity Money Market Central Funds
|
Fidelity Management & Research Company LLC (FMR)
|
Each fund seeks to obtain a high level of current income consistent with the preservation of capital and liquidity.
|
Short-term Investments
|
Less than .005%
|
A Expenses expressed as a percentage of average net assets and are as of each underlying Central Fund's most recent annual or semi-annual shareholder report.
A complete unaudited list of holdings for each Fidelity Central Fund is available upon request or at the Securities and Exchange Commission website at www.sec.gov. In addition, the financial statements of the Fidelity Central Funds which contain the significant accounting policies (including investment valuation policies) of those funds, and are not covered by the Report of Independent Registered Public Accounting Firm, are available on the Securities and Exchange Commission website or upon request.
3. Significant Accounting Policies.
The Fund is an investment company and applies the accounting and reporting guidance of the Financial Accounting Standards Board (FASB) Accounting Standards Codification Topic 946 Financial Services - Investment Companies. The financial statements have been prepared in conformity with accounting principles generally accepted in the United States of America (GAAP), which require management to make certain estimates and assumptions at the date of the financial statements. Actual results could differ from those estimates. Subsequent events, if any, through the date that the financial statements were issued have been evaluated in the preparation of the financial statements. The Fund's Schedule of Investments lists any underlying mutual funds or exchange-traded funds (ETFs) but does not include the underlying holdings of these funds. The following summarizes the significant accounting policies of the Fund:
Investment Valuation. Investments are valued as of 4:00 p.m. Eastern time on the last calendar day of the period. The Board of Directors (the Board) has designated the Fund's investment adviser as the valuation designee responsible for the fair valuation function and performing fair value determinations as needed. The investment adviser has established a Fair Value Committee (the Committee) to carry out the day-to-day fair valuation responsibilities and has adopted policies and procedures to govern the fair valuation process and the activities of the Committee. In accordance with these fair valuation policies and procedures, which have been approved by the Board, the Fund attempts to obtain prices from one or more third party pricing services or brokers to value its investments. When current market prices, quotations or currency exchange rates are not readily available or reliable, investments will be fair valued in good faith by the Committee, in accordance with the policies and procedures. Factors used in determining fair value vary by investment type and may include market or investment specific events, transaction data, estimated cash flows, and market observations of comparable investments. The frequency that the fair valuation procedures are used cannot be predicted and they may be utilized to a significant extent. The Committee manages the Fund's fair valuation practices and maintains the fair valuation policies and procedures. The Fund's investment adviser reports to the Board information regarding the fair valuation process and related material matters.
The Fund categorizes the inputs to valuation techniques used to value its investments into a disclosure hierarchy consisting of three levels as shown below:
Level 1 - unadjusted quoted prices in active markets for identical investments
Level 2 - other significant observable inputs (including quoted prices for similar investments, interest rates, prepayment speeds, etc.)
Level 3 - unobservable inputs (including the Fund's own assumptions based on the best information available)
Valuation techniques used to value the Fund's investments by major category are as follows:
Equity securities, including restricted securities, for which market quotations are readily available, are valued at the last reported sale price or official closing price as reported by a third party pricing service on the primary market or exchange on which they are traded and are categorized as Level 1 in the hierarchy. In the event there were no sales during the day or closing prices are not available, securities are valued at the last quoted bid price or may be valued using the last available price and are generally categorized as Level 2 in the hierarchy. For foreign equity securities, when market or security specific events arise, comparisons to the valuation of American Depositary Receipts (ADRs), futures contracts, ETFs and certain indexes as well as quoted prices for similar securities may be used and would be categorized as Level 2 in the hierarchy. For equity securities, including restricted securities, where observable inputs are limited, assumptions about market activity and risk are used and these securities may be categorized as Level 3 in the hierarchy.
Debt securities, including restricted securities, are valued based on evaluated prices received from third party pricing services or from brokers who make markets in such securities. Corporate bonds and U.S. government and government agency obligations are valued by pricing services who utilize matrix pricing which considers yield or price of bonds of comparable quality, coupon, maturity and type or by broker-supplied prices. When independent prices are unavailable or unreliable, debt securities may be valued utilizing pricing methodologies which consider similar factors that would be used by third party pricing services. Debt securities are generally categorized as Level 2 in the hierarchy but may be Level 3 depending on the circumstances.
Investments in open-end mutual funds, including the Fidelity Central Funds, are valued at their closing net asset value (NAV) each business day and are categorized as Level 1 in the hierarchy.
The following provides information on Level 3 securities held by the Fund that were valued at period end based on unobservable inputs. These amounts exclude valuations provided by a broker.
Asset Type
|
Fair Value
|
Valuation Technique(s)
|
Unobservable Input
|
Amount or Range/Weighted Average
|
Impact to Valuation from an Increase in InputA
|
Equities
|
$26,632,277
|
Market comparable
|
Enterprise value/Revenue multiple (EV/R)
|
2.8 - 7.5 / 4.1
|
Increase
|
|
|
Market approach
|
Discount rate
|
20.0% - 50.0% / 21.3%
|
Decrease
|
|
|
Indicative market price
|
Discount rate
|
20.0%
|
Decrease
|
|
|
|
Bid price
|
$15.00 - $70.00 / $38.35
|
Increase
|
|
|
Recovery value
|
Recovery value
|
$0.00
|
Increase
|
Corporate Bonds
|
$2,672,417
|
Market comparable
|
Enterprise value/Revenue multiple (EV/R)
|
6.0
|
Increase
|
|
|
Discounted cash flow
|
Discount rate
|
4.2%
|
Decrease
|
A Represents the directional change in the fair value of the Level 3 investments that could have resulted from an increase in the corresponding input as of period end. A decrease to the unobservable input would have had the opposite effect. Significant changes in these inputs may have resulted in a significantly higher or lower fair value measurement at period end.
Changes in valuation techniques may result in transfers in or out of an assigned level within the disclosure hierarchy. The aggregate value of investments by input level as of September 30, 2023, as well as a roll forward of Level 3 investments, is included at the end of the Fund's Schedule of Investments.
Foreign Currency. Certain Funds may use foreign currency contracts to facilitate transactions in foreign-denominated securities. Gains and losses from these transactions may arise from changes in the value of the foreign currency or if the counterparties do not perform under the contracts' terms.
Foreign-denominated assets, including investment securities, and liabilities are translated into U.S. dollars at the exchange rates at period end. Purchases and sales of investment securities, income and dividends received, and expenses denominated in foreign currencies are translated into U.S. dollars at the exchange rate in effect on the transaction date.
The effects of exchange rate fluctuations on investments are included with the net realized and unrealized gain (loss) on investment securities. Other foreign currency transactions resulting in realized and unrealized gain (loss) are disclosed separately.
Investment Transactions and Income. For financial reporting purposes, the Fund's investment holdings and NAV include trades executed through the end of the last business day of the period. The NAV per share for processing shareholder transactions is calculated as of the close of business of the New York Stock Exchange (NYSE), normally 4:00 p.m. Eastern time and includes trades executed through the end of the prior business day. Gains and losses on securities sold are determined on the basis of identified cost and include proceeds received from litigation. Commissions paid to certain brokers with whom the investment adviser, or its affiliates, places trades on behalf of a fund include an amount in addition to trade execution, which may be rebated back to a fund. Any such rebates are included in net realized gain (loss) on investments in the Statement of Operations. Dividend income is recorded on the ex-dividend date, except for certain dividends from foreign securities where the ex-dividend date may have passed, which are recorded as soon as the Fund is informed of the ex-dividend date. Non-cash dividends included in dividend income, if any, are recorded at the fair market value of the securities received. Income and capital gain distributions from Fidelity Central Funds, if any, are recorded on the ex-dividend date. Interest income is accrued as earned and includes coupon interest and amortization of premium and accretion of discount on debt securities as applicable. Investment income is recorded net of foreign taxes withheld where recovery of such taxes is uncertain. Funds may file withholding tax reclaims in certain jurisdictions to recover a portion of amounts previously withheld. Any withholding tax reclaims income is included in the Statement of Operations in foreign taxes withheld. Any receivables for withholding tax reclaims are included in the Statement of Assets and Liabilities in dividends receivable.
Expenses. Expenses directly attributable to a fund are charged to that fund. Expenses attributable to more than one fund are allocated among the respective funds on the basis of relative net assets or other appropriate methods. Expenses included in the accompanying financial statements reflect the expenses of that fund and do not include any expenses associated with any underlying mutual funds or exchange-traded funds. Although not included in a fund's expenses, a fund indirectly bears its proportionate share of these expenses through the net asset value of each underlying mutual fund or exchange-traded fund. Expense estimates are accrued in the period to which they relate and adjustments are made when actual amounts are known.
Income Tax Information and Distributions to Shareholders. Each year, the Fund intends to qualify as a regulated investment company under Subchapter M of the Internal Revenue Code, including distributing substantially all of its taxable income and realized gains. As a result, no provision for U.S. Federal income taxes is required. As of September 30, 2023, the Fund did not have any unrecognized tax benefits in the financial statements; nor is the Fund aware of any tax positions for which it is reasonably possible that the total amounts of unrecognized tax benefits will significantly change in the next twelve months. The Fund files a U.S. federal tax return, in addition to state and local tax returns as required. The Fund's federal income tax returns are subject to examination by the Internal Revenue Service (IRS) for a period of three fiscal years after they are filed. State and local tax returns may be subject to examination for an additional fiscal year depending on the jurisdiction. Foreign taxes are provided for based on the Fund's understanding of the tax rules and rates that exist in the foreign markets in which it invests. The Fund is subject to a tax imposed on capital gains by certain countries in which it invests. An estimated deferred tax liability for net unrealized appreciation on the applicable securities is included in Deferred taxes on the Statement of Assets & Liabilities.
Distributions are declared and recorded on the ex-dividend date. Income and capital gain distributions are determined in accordance with income tax regulations, which may differ from GAAP.
Capital accounts within the financial statements are adjusted for permanent book-tax differences. These adjustments have no impact on net assets or the results of operations. Capital accounts are not adjusted for temporary book-tax differences which will reverse in a subsequent period.
Book-tax differences are primarily due to futures contracts, foreign currency transactions, certain foreign taxes, passive foreign investment companies (PFIC), capital loss carryforwards and losses deferred due to wash sales and excise tax regulations.
As of period end, the cost and unrealized appreciation (depreciation) in securities, and derivatives if applicable, for federal income tax purposes were as follows:
Gross unrealized appreciation
|
$363,496,320
|
Gross unrealized depreciation
|
(307,624,104)
|
Net unrealized appreciation (depreciation)
|
$55,872,216
|
Tax Cost
|
$2,103,189,137
|
The tax-based components of distributable earnings as of period end were as follows:
Undistributed ordinary income
|
$9,526,003
|
Capital loss carryforward
|
$(173,659,907)
|
Net unrealized appreciation (depreciation) on securities and other investments
|
$52,003,499
|
Capital loss carryforwards are only available to offset future capital gains of the Fund to the extent provided by regulations and may be limited. The capital loss carryforward information presented below, including any applicable limitation, is estimated as of fiscal period end and is subject to adjustment.
Short-term
|
$(111,952,107)
|
Long-term
|
(61,707,800)
|
Total capital loss carryforward
|
$(173,659,907)
|
The tax character of distributions paid was as follows:
|
September 30, 2023
|
September 30, 2022
|
Ordinary Income
|
$66,650,856
|
$ 51,459,061
|
Long-term Capital Gains
|
-
|
123,892,665
|
Total
|
$66,650,856
|
$ 175,351,726
|
Restricted Securities (including Private Placements). Funds may invest in securities that are subject to legal or contractual restrictions on resale. These securities generally may be resold in transactions exempt from registration or to the public if the securities are registered. Disposal of these securities may involve time-consuming negotiations and expense, and prompt sale at an acceptable price may be difficult. Information regarding restricted securities held at period end is included at the end of the Schedule of Investments, if applicable.
New Accounting Pronouncement. In June 2022, the Financial Accounting Standards Board (FASB) issued Accounting Standards Update (ASU) 2022-03 Fair Value Measurement (Topic 820): Fair Value Measurement of Equity Securities Subject to Contractual Sale Restrictions. The amendments in this ASU clarify that a contractual restriction on the sale of an equity security is not considered part of the unit of account of the equity security and, therefore, is not considered in measuring fair value. They also clarify that an entity cannot, as a separate unit of account, recognize and measure a contractual sale restriction. They also require additional disclosures for equity securities subject to contractual sale restrictions. ASU 2022-03 will be effective for fiscal years, including interim periods within those fiscal years, beginning after December 15, 2023, and allows for early adoption. ASU 2022-03 will only be applicable to an equity security in which the contractual arrangement that restricts its sale is executed or modified on or after the adoption date. Management is currently evaluating the potential impact of ASU 2022-03 to the financial statements.
4. Derivative Instruments.
Risk Exposures and the Use of Derivative Instruments. The Fund's investment objectives allow for various types of derivative instruments, including futures contracts. Derivatives are investments whose value is primarily derived from underlying assets, indices or reference rates and may be transacted on an exchange or over-the-counter (OTC). Derivatives may involve a future commitment to buy or sell a specified asset based on specified terms, to exchange future cash flows at periodic intervals based on a notional principal amount, or for one party to make one or more payments upon the occurrence of specified events in exchange for periodic payments from the other party.
Derivatives were used to increase returns and to manage exposure to certain risks as defined below. The success of any strategy involving derivatives depends on analysis of numerous economic factors, and if the strategies for investment do not work as intended, the objectives may not be achieved.
Derivatives were used to increase or decrease exposure to the following risk(s):
|
|
Equity Risk
|
Equity risk relates to the fluctuations in the value of financial instruments as a result of changes in market prices (other than those arising from interest rate risk or foreign exchange risk), whether caused by factors specific to an individual investment, its issuer, or all factors affecting all instruments traded in a market or market segment.
|
Funds are also exposed to additional risks from investing in derivatives, such as liquidity risk and counterparty credit risk. Liquidity risk is the risk that a fund will be unable to close out the derivative in the open market in a timely manner. Counterparty credit risk is the risk that the counterparty will not be able to fulfill its obligation to a fund. Counterparty credit risk related to exchange-traded contracts may be mitigated by the protection provided by the exchange on which they trade.
Investing in derivatives may involve greater risks than investing in the underlying assets directly and, to varying degrees, may involve risk of loss in excess of any initial investment and collateral received and amounts recognized in the Statement of Assets and Liabilities. In addition, there may be the risk that the change in value of the derivative contract does not correspond to the change in value of the underlying instrument.
Futures Contracts. A futures contract is an agreement between two parties to buy or sell a specified underlying instrument for a fixed price at a specified future date. Futures contracts were used to manage exposure to the stock market.
Upon entering into a futures contract, a fund is required to deposit either cash or securities (initial margin) with a clearing broker in an amount equal to a certain percentage of the face value of the contract. Futures contracts are marked-to-market daily and subsequent daily payments are made or received by a fund depending on the daily fluctuations in the value of the futures contracts and are recorded as unrealized appreciation or (depreciation). This receivable and/or payable, if any, is included in daily variation margin on futures contracts in the Statement of Assets and Liabilities. Realized gain or (loss) is recorded upon the expiration or closing of a futures contract. The net realized gain (loss) and change in net unrealized appreciation (depreciation) on futures contracts during the period is presented in the Statement of Operations.
Any open futures contracts at period end are presented in the Schedule of Investments under the caption "Futures Contracts". The notional amount at value reflects each contract's exposure to the underlying instrument or index at period end, and is representative of volume of activity during the period unless an average notional amount is presented. Any securities deposited to meet initial margin requirements are identified in the Schedule of Investments. Any cash deposited to meet initial margin requirements is presented as segregated cash with brokers for derivative instruments in the Statement of Assets and Liabilities.
5. Purchases and Sales of Investments.
Purchases and sales of securities, other than short-term securities, U.S. government securities and in-kind transactions, as applicable, are noted in the table below.
|
Purchases ($)
|
Sales ($)
|
Fidelity Emerging Markets Equity Central Fund
|
1,210,680,289
|
1,027,187,980
|
6. Fees and Other Transactions with Affiliates.
Management Fee and Expense Contract. Fidelity Management & Research Company LLC (the investment adviser) provides the Fund with investment management services. The Fund does not pay any fees for these services. Pursuant to the Fund's management contract, the investment adviser receives a monthly management fee that represents a portion of the management fees it receives from the Investing Funds. In addition, under an expense contract, the investment adviser also pays all other expenses of the Fund, excluding custody fees, the compensation of the independent Directors, and certain miscellaneous expenses such as proxy and shareholder meeting expenses.
Brokerage Commissions. A portion of portfolio transactions were placed with brokerage firms which are affiliates of the investment adviser. Brokerage commissions are included in net realized gain (loss) and change in net unrealized appreciation (depreciation) in the Statement of Operations. The commissions paid to these affiliated firms were as follows:
|
Amount
|
Fidelity Emerging Markets Equity Central Fund
|
$8,341
|
Interfund Lending Program. Pursuant to an Exemptive Order issued by the Securities and Exchange Commission (the SEC), the Fund, along with other registered investment companies having management contracts with FMR, or other affiliated entities of FMR, may participate in an interfund lending program. This program provides an alternative credit facility allowing the Fund to borrow from, or lend money to, other participating affiliated funds. At period end, there were no interfund loans outstanding. Activity in this program during the period for which loans were outstanding was as follows:
|
Borrower or Lender
|
Average Loan Balance
|
Weighted Average Interest Rate
|
Interest Expense
|
Fidelity Emerging Markets Equity Central Fund
|
Borrower
|
$ 16,227,143
|
4.75%
|
$14,991
|
Interfund Trades. Funds may purchase from or sell securities to other Fidelity Funds under procedures adopted by the Board. The procedures have been designed to ensure these interfund trades are executed in accordance with Rule 17a-7 of the 1940 Act. Any interfund trades are included within the respective purchases and sales amounts shown in the Purchases and Sales of Investments note. Interfund trades during the period are noted in the table below.
|
Purchases ($)
|
Sales ($)
|
Realized Gain (Loss) ($)
|
Fidelity Emerging Markets Equity Central Fund
|
13,010,722
|
20,486,522
|
(2,387,010)
|
7. Security Lending.
Funds lend portfolio securities from time to time in order to earn additional income. Lending agents are used, including National Financial Services (NFS), an affiliate of the investment adviser. Pursuant to a securities lending agreement, NFS will receive a fee, which is capped at 9.9% of a fund's daily lending revenue, for its services as lending agent. A fund may lend securities to certain qualified borrowers, including NFS. On the settlement date of the loan, a fund receives collateral (in the form of U.S. Treasury obligations, letters of credit and/or cash) against the loaned securities and maintains collateral in an amount not less than 100% of the market value of the loaned securities during the period of the loan. The market value of the loaned securities is determined at the close of business of a fund and any additional required collateral is delivered to a fund on the next business day. A fund or borrower may terminate the loan at any time, and if the borrower defaults on its obligation to return the securities loaned because of insolvency or other reasons, a fund may apply collateral received from the borrower against the obligation. A fund may experience delays and costs in recovering the securities loaned. Any cash collateral received is invested in the Fidelity Securities Lending Cash Central Fund. Any loaned securities are identified as such in the Schedule of Investments, and the value of loaned securities and cash collateral at period end, as applicable, are presented in the Statement of Assets and Liabilities. Security lending income represents the income earned on investing cash collateral, less rebates paid to borrowers and any lending agent fees associated with the loan, plus any premium payments received for lending certain types of securities. Security lending income is presented in the Statement of Operations as a component of income from Fidelity Central Funds. Affiliated security lending activity, if any, was as follows:
|
Total Security Lending Fees Paid to NFS
|
Security Lending Income From Securities Loaned to NFS
|
Value of Securities Loaned to NFS at Period End
|
Fidelity Emerging Markets Equity Central Fund
|
$24,243
|
$210
|
$-
|
8. Other.
A fund's organizational documents provide former and current directors and officers with a limited indemnification against liabilities arising in connection with the performance of their duties to the fund. In the normal course of business, a fund may also enter into contracts that provide general indemnifications. A fund's maximum exposure under these arrangements is unknown as this would be dependent on future claims that may be made against a fund. The risk of material loss from such claims is considered remote.
At the end of the period, mutual funds managed by the investment adviser or its affiliates were the owners of record of all of the outstanding shares of the Fund.
9. Risk and Uncertainties.
Many factors affect a fund's performance. Developments that disrupt global economies and financial markets, such as pandemics, epidemics, outbreaks of infectious diseases, war, terrorism, and environmental disasters, may significantly affect a fund's investment performance. The effects of these developments to a fund will be impacted by the types of securities in which a fund invests, the financial condition, industry, economic sector, and geographic location of an issuer, and a fund's level of investment in the securities of that issuer. Significant concentrations in security types, issuers, industries, sectors, and geographic locations may magnify the factors that affect a fund's performance.
To the Board of Trustees of Fidelity Central Investment Portfolios LLC and the Shareholders of Fidelity Emerging Markets Equity Central Fund:
Opinion on the Financial Statements and Financial Highlights
We have audited the accompanying statement of assets and liabilities of Fidelity Emerging Markets Equity Central Fund (the "Fund"), a fund of Fidelity Central Investment Portfolios LLC, including the schedule of investments, as of September 30, 2023, the related statement of operations for the year then ended, the statement of changes in net assets for each of the two years in the period then ended, the financial highlights for each of the five years in the period then ended, and the related notes. In our opinion, the financial statements and financial highlights present fairly, in all material respects, the financial position of the Fund as of September 30, 2023, and the results of its operations for the year then ended, the changes in its net assets for each of the two years in the period then ended, and the financial highlights for each of the five years in the period then ended in conformity with accounting principles generally accepted in the United States of America.
Basis for Opinion
These financial statements and financial highlights are the responsibility of the Fund's management. Our responsibility is to express an opinion on the Fund's financial statements and financial highlights based on our audits. We are a public accounting firm registered with the Public Company Accounting Oversight Board (United States) (PCAOB) and are required to be independent with respect to the Fund in accordance with the U.S. federal securities laws and the applicable rules and regulations of the Securities and Exchange Commission and the PCAOB.
We conducted our audits in accordance with the standards of the PCAOB. Those standards require that we plan and perform the audit to obtain reasonable assurance about whether the financial statements and financial highlights are free of material misstatement, whether due to error or fraud. The Fund is not required to have, nor were we engaged to perform, an audit of its internal control over financial reporting. As part of our audits, we are required to obtain an understanding of internal control over financial reporting but not for the purpose of expressing an opinion on the effectiveness of the Fund's internal control over financial reporting. Accordingly, we express no such opinion.
Our audits included performing procedures to assess the risks of material misstatement of the financial statements and financial highlights, whether due to error or fraud, and performing procedures that respond to those risks. Such procedures included examining, on a test basis, evidence regarding the amounts and disclosures in the financial statements and financial highlights. Our audits also included evaluating the accounting principles used and significant estimates made by management, as well as evaluating the overall presentation of the financial statements and financial highlights. Our procedures included confirmation of securities owned as of September 30, 2023, by correspondence with the custodian and brokers; when replies were not received from brokers, we performed other auditing procedures. We believe that our audits provide a reasonable basis for our opinion.
/s/ Deloitte & Touche LLP
Boston, Massachusetts
November 10, 2023
We have served as the auditor of one or more of the Fidelity investment companies since 1999.
DIRECTORS AND OFFICERS (TRUSTEES AND OFFICERS)
The Trustees, Members of the Advisory Board (if any), and officers of the Fidelity Central Investment Portfolios LLC and fund, as applicable, are listed below. The Board of Trustees governs the fund and is responsible for protecting the interests of shareholders. The Trustees are experienced executives who meet periodically throughout the year to oversee the fund's activities, review contractual arrangements with companies that provide services to the fund, oversee management of the risks associated with such activities and contractual arrangements, and review the fund's performance. Except for Vijay Advani, each of the Trustees oversees 322 funds. Mr. Advani oversees 215 funds.
The Trustees hold office without limit in time except that (a) any Trustee may resign; (b) any Trustee may be removed by written instrument, signed by at least two-thirds of the number of Trustees prior to such removal; (c) any Trustee who requests to be retired or who has become incapacitated by illness or injury may be retired by written instrument signed by a majority of the other Trustees; and (d) any Trustee may be removed at any special meeting of shareholders by a two-thirds vote of the outstanding voting securities of the trust. Each Trustee who is not an interested person (as defined in the 1940 Act) of the trust and the fund is referred to herein as an Independent Trustee. Each Independent Trustee shall retire not later than the last day of the calendar year in which his or her 75th birthday occurs. The Independent Trustees may waive this mandatory retirement age policy with respect to individual Trustees. Officers and Advisory Board Members hold office without limit in time, except that any officer or Advisory Board Member may resign or may be removed by a vote of a majority of the Trustees at any regular meeting or any special meeting of the Trustees. Except as indicated, each individual has held the office shown or other offices in the same company for the past five years.
The fund's Statement of Additional Information (SAI) includes more information about the Trustees. To request a free copy, call Fidelity at 1-800-544-8544.
Experience, Skills, Attributes, and Qualifications of the Trustees. The Governance and Nominating Committee has adopted a statement of policy that describes the experience, qualifications, attributes, and skills that are necessary and desirable for potential Independent Trustee candidates (Statement of Policy). The Board believes that each Trustee satisfied at the time he or she was initially elected or appointed a Trustee, and continues to satisfy, the standards contemplated by the Statement of Policy. The Governance and Nominating Committee also engages professional search firms to help identify potential Independent Trustee candidates who have the experience, qualifications, attributes, and skills consistent with the Statement of Policy. From time to time, additional criteria based on the composition and skills of the current Independent Trustees, as well as experience or skills that may be appropriate in light of future changes to board composition, business conditions, and regulatory or other developments, have also been considered by the professional search firms and the Governance and Nominating Committee. In addition, the Board takes into account the Trustees' commitment and participation in Board and committee meetings, as well as their leadership of standing and ad hoc committees throughout their tenure.
In determining that a particular Trustee was and continues to be qualified to serve as a Trustee, the Board has considered a variety of criteria, none of which, in isolation, was controlling. The Board believes that, collectively, the Trustees have balanced and diverse experience, qualifications, attributes, and skills, which allow the Board to operate effectively in governing the fund and protecting the interests of shareholders. Information about the specific experience, skills, attributes, and qualifications of each Trustee, which in each case led to the Board's conclusion that the Trustee should serve (or continue to serve) as a trustee of the fund, is provided below.
Board Structure and Oversight Function. Robert A. Lawrence is an interested person and currently serves as Chair. The Trustees have determined that an interested Chair is appropriate and benefits shareholders because an interested Chair has a personal and professional stake in the quality and continuity of services provided to the fund. Independent Trustees exercise their informed business judgment to appoint an individual of their choosing to serve as Chair, regardless of whether the Trustee happens to be independent or a member of management. The Independent Trustees have determined that they can act independently and effectively without having an Independent Trustee serve as Chair and that a key structural component for assuring that they are in a position to do so is for the Independent Trustees to constitute a substantial majority for the Board. The Independent Trustees also regularly meet in executive session. David M. Thomas serves as Lead Independent Trustee and as such (i) acts as a liaison between the Independent Trustees and management with respect to matters important to the Independent Trustees and (ii) with management prepares agendas for Board meetings.
Fidelity® funds are overseen by different Boards of Trustees. The fund's Board oversees Fidelity's high income and certain equity funds, and other Boards oversee Fidelity's alternative investment, investment-grade bond, money market, asset allocation, and other equity funds. The asset allocation funds may invest in Fidelity® funds overseen by the fund's Board. The use of separate Boards, each with its own committee structure, allows the Trustees of each group of Fidelity® funds to focus on the unique issues of the funds they oversee, including common research, investment, and operational issues. On occasion, the separate Boards establish joint committees to address issues of overlapping consequences for the Fidelity® funds overseen by each Board.
The Trustees operate using a system of committees to facilitate the timely and efficient consideration of all matters of importance to the Trustees, the fund, and fund shareholders and to facilitate compliance with legal and regulatory requirements and oversight of the fund's activities and associated risks. The Board, acting through its committees, has charged FMR and its affiliates with (i) identifying events or circumstances the occurrence of which could have demonstrably adverse effects on the fund's business and/or reputation; (ii) implementing processes and controls to lessen the possibility that such events or circumstances occur or to mitigate the effects of such events or circumstances if they do occur; and (iii) creating and maintaining a system designed to evaluate continuously business and market conditions in order to facilitate the identification and implementation processes described in (i) and (ii) above. Because the day-to-day operations and activities of the fund are carried out by or through FMR, its affiliates, and other service providers, the fund's exposure to risks is mitigated but not eliminated by the processes overseen by the Trustees. While each of the Board's committees has responsibility for overseeing different aspects of the fund's activities, oversight is exercised primarily through the Operations, Audit, and Compliance Committees. Appropriate personnel, including but not limited to the fund's Chief Compliance Officer (CCO), FMR's internal auditor, the independent accountants, the fund's Treasurer and portfolio management personnel, make periodic reports to the Board's committees, as appropriate, including an annual review of Fidelity's risk management program for the Fidelity® funds. The responsibilities of each standing committee, including their oversight responsibilities, are described further under "Standing Committees of the Trustees."
Interested Trustees*:
Correspondence intended for a Trustee who is an interested person may be sent to Fidelity Investments, 245 Summer Street, Boston, Massachusetts 02210.
Name, Year of Birth; Principal Occupations and Other Relevant Experience+
Bettina Doulton (1964)
Year of Election or Appointment: 2020
Trustee
Ms. Doulton also serves as Trustee of other Fidelity® funds. Prior to her retirement, Ms. Doulton served in a variety of positions at Fidelity Investments, including as a managing director of research (2006-2007), portfolio manager to certain Fidelity® funds (1993-2005), equity analyst and portfolio assistant (1990-1993), and research assistant (1987-1990). Ms. Doulton currently owns and operates Phi Builders + Architects and Cellardoor Winery. Previously, Ms. Doulton served as a member of the Board of Brown Capital Management, LLC (2014-2018).
Robert A. Lawrence (1952)
Year of Election or Appointment: 2020
Trustee
Chair of the Board of Trustees
Mr. Lawrence also serves as Trustee of other funds. Previously, Mr. Lawrence served as a Trustee and Member of the Advisory Board of certain funds. Prior to his retirement in 2008, Mr. Lawrence served as Vice President of certain Fidelity® funds (2006-2008), Senior Vice President, Head of High Income Division of Fidelity Management & Research Company (investment adviser firm, 2006-2008), and President of Fidelity Strategic Investments (investment adviser firm, 2002-2005).
* Determined to be an "Interested Trustee" by virtue of, among other things, his or her affiliation with the Fidelity Central Investment Portfolios LLC or various entities under common control with FMR.
+ The information includes the Trustee's principal occupation during the last five years and other information relating to the experience, attributes, and skills relevant to the Trustee's qualifications to serve as a Trustee, which led to the conclusion that the Trustee should serve as a Trustee for the fund.
Independent Trustees:
Correspondence intended for an Independent Trustee may be sent to Fidelity Investments, P.O. Box 55235, Boston, Massachusetts 02205-5235.
Name, Year of Birth; Principal Occupations and Other Relevant Experience+
Vijay C. Advani (1960)
Year of Election or Appointment: 2023
Trustee
Mr. Advani also serves as Trustee or Member of the Advisory Board of other funds. Previously, Mr. Advani served as Executive Chairman (2020-2022), Chief Executive Officer (2017-2020) and Chief Operating Officer (2016-2017) of Nuveen (global investment manager). He also served in various capacities at Franklin Resources (global investment manager), including Co-President (2015-2016), Executive Vice President, Global Advisory Services (2008-2015), Head of Global Retail Distribution (2005-2008), Executive Managing Director, International Retail Development (2002-2005), Managing Director, Product Developments, Sales & Marketing, Asia, Eastern Europe and Africa (2000-2002) and President, Templeton Asset Management India (1995-2000). Mr. Advani also served as Senior Investment Officer of International Finance Corporation (private equity and venture capital arm of The World Bank, 1984-1995). Mr. Advani is Chairman Emeritus of the U.S. India Business Council (2018-present), a Director of The Global Impact Investing Network (2019-present), a Director of LOK Capital (Mauritius) (2022-present), a member of the Advisory Council of LOK Capital (2022-present), a Senior Advisor of Neuberger Berman (2021-present), a Senior Advisor of Seviora Holdings Pte. Ltd (Temasek-Singapore) (2021-present), a Director of Seviora Capital (Singapore) (2021-present) and an Advisor of EQUIAM (2021-present). Mr. Advani formerly served as a member of the Board of BowX Acquisition Corp. (special purpose acquisition company, 2020-2021), a member of the Board of Intellecap (advisory arm of The Aavishkaar Group, 2018-2020), a member of the Board of Nuveen Investments, Inc. (2017-2020) and a member of the Board of Docusign (software, 2016-2019).
Thomas P. Bostick (1956)
Year of Election or Appointment: 2021
Trustee
Lieutenant General Bostick also serves as Trustee of other Fidelity® funds. Prior to his retirement, General Bostick (United States Army, Retired) held a variety of positions within the U.S. Army, including Commanding General and Chief of Engineers, U.S. Army Corps of Engineers (2012-2016) and Deputy Chief of Staff and Director of Human Resources, U.S. Army (2009-2012). General Bostick currently serves as a member of the Board and Finance and Governance & Sustainability Committees of CSX Corporation (transportation, 2020-present) and a member of the Board and Corporate Governance and Nominating Committee of Perma-Fix Environmental Services, Inc. (nuclear waste management, 2020-present). General Bostick serves as Chief Executive Officer of Bostick Global Strategies, LLC (consulting, 2016-present), as a member of the Board of HireVue, Inc. (video interview and assessment, 2020-present), as a member of the Board of Allonnia (biotechnology and engineering solutions, 2022-present) and on the Advisory Board of Solugen, Inc. (specialty bio-based chemicals manufacturer, 2022-present). Previously, General Bostick served as a Member of the Advisory Board of certain Fidelity® funds (2021), President, Intrexon Bioengineering (2018-2020) and Chief Operating Officer (2017-2020) and Senior Vice President of the Environment Sector (2016-2017) of Intrexon Corporation (biopharmaceutical company).
Dennis J. Dirks (1948)
Year of Election or Appointment: 2005
Trustee
Mr. Dirks also serves as Trustee of other Fidelity® funds. Prior to his retirement in May 2003, Mr. Dirks served as Chief Operating Officer and as a member of the Board of The Depository Trust & Clearing Corporation (financial markets infrastructure), President, Chief Operating Officer and a member of the Board of The Depository Trust Company (DTC), President and a member of the Board of the National Securities Clearing Corporation (NSCC), Chief Executive Officer and a member of the Board of the Government Securities Clearing Corporation and Chief Executive Officer and a member of the Board of the Mortgage-Backed Securities Clearing Corporation. Mr. Dirks currently serves as a member of the Finance Committee (2016-present) and Board (2017-present) and is Treasurer (2018-present) of the Asolo Repertory Theatre.
Donald F. Donahue (1950)
Year of Election or Appointment: 2018
Trustee
Mr. Donahue also serves as Trustee of other Fidelity® funds. Mr. Donahue serves as President and Chief Executive Officer of Miranda Partners, LLC (risk consulting for the financial services industry, 2012-present). Previously, Mr. Donahue served as Chief Executive Officer (2006-2012), Chief Operating Officer (2003-2006) and Managing Director, Customer Marketing and Development (1999-2003) of The Depository Trust & Clearing Corporation (financial markets infrastructure). Mr. Donahue currently serves as a member (2007-present) and Co-Chairman (2016-present) of the Board of United Way of New York. Mr. Donahue previously served as a member of the Advisory Board of certain Fidelity® funds (2015-2018) and as a member of the Board of The Leadership Academy (previously NYC Leadership Academy) (2012-2022).
Vicki L. Fuller (1957)
Year of Election or Appointment: 2020
Trustee
Ms. Fuller also serves as Trustee of other Fidelity® funds. Previously, Ms. Fuller served as a member of the Advisory Board of certain Fidelity® funds (2018-2020), Chief Investment Officer of the New York State Common Retirement Fund (2012-2018) and held a variety of positions at AllianceBernstein L.P. (global asset management, 1985-2012), including Managing Director (2006-2012) and Senior Vice President and Senior Portfolio Manager (2001-2006). Ms. Fuller currently serves as a member of the Board, Audit Committee and Nominating and Governance Committee of two Blackstone business development companies (2020-present), as a member of the Board of Treliant, LLC (consulting, 2019-present), as a member of the Board of Ariel Alternatives, LLC (private equity, 2022-present) and as a member of the Board and Chair of the Audit Committee of Gusto, Inc. (software, 2021-present). In addition, Ms. Fuller currently serves as a member of the Board of Roosevelt University (2019-present) and as a member of the Executive Board of New York University's Stern School of Business. Ms. Fuller previously served as a member of the Board, Audit Committee and Nominating and Governance Committee of The Williams Companies, Inc. (natural gas infrastructure, 2018-2021).
Patricia L. Kampling (1959)
Year of Election or Appointment: 2020
Trustee
Ms. Kampling also serves as Trustee of other Fidelity® funds. Prior to her retirement, Ms. Kampling served as Chairman of the Board and Chief Executive Officer (2012-2019), President and Chief Operating Officer (2011-2012) and Executive Vice President and Chief Financial Officer (2010-2011) of Alliant Energy Corporation. Ms. Kampling currently serves as a member of the Board, Finance Committee and Governance, Compensation and Nominating Committee of Xcel Energy Inc. (utilities company, 2020-present) and as a member of the Board, Audit, Finance and Risk Committee and Safety, Environmental, Technology and Operations Committee and Chair of the Executive Development and Compensation Committee of American Water Works Company, Inc. (utilities company, 2019-present). In addition, Ms. Kampling currently serves as a member of the Board of the Nature Conservancy, Wisconsin Chapter (2019-present). Previously, Ms. Kampling served as a Member of the Advisory Board of certain Fidelity® funds (2020), a member of the Board, Compensation Committee and Executive Committee and Chair of the Audit Committee of Briggs & Stratton Corporation (manufacturing, 2011-2021), a member of the Board of Interstate Power and Light Company (2012-2019) and Wisconsin Power and Light Company (2012-2019) (each a subsidiary of Alliant Energy Corporation) and as a member of the Board and Workforce Development Committee of the Business Roundtable (2018-2019).
Thomas A. Kennedy (1955)
Year of Election or Appointment: 2021
Trustee
Mr. Kennedy also serves as Trustee of other Fidelity® funds. Previously, Mr. Kennedy served as a Member of the Advisory Board of certain Fidelity® funds (2020) and held a variety of positions at Raytheon Company (aerospace and defense, 1983-2020), including Chairman and Chief Executive Officer (2014-2020) and Executive Vice President and Chief Operating Officer (2013-2014). Mr. Kennedy served as Executive Chairman of the Board of Directors of Raytheon Technologies Corporation (aerospace and defense, 2020-2021). Mr. Kennedy serves as a Director of the Board of Directors of Textron Inc. (aerospace and defense, 2023-present).
Oscar Munoz (1959)
Year of Election or Appointment: 2021
Trustee
Mr. Munoz also serves as Trustee of other Fidelity® funds. Prior to his retirement, Mr. Munoz served as Executive Chairman (2020-2021), Chief Executive Officer (2015-2020), President (2015-2016) and a member of the Board (2010-2021) of United Airlines Holdings, Inc. Mr. Munoz currently serves as a member of the Board of CBRE Group, Inc. (commercial real estate, 2020-present), a member of the Board of Univision Communications, Inc. (Hispanic media, 2020-present), a member of the Board of Archer Aviation Inc. (2021-present), a member of the Defense Business Board of the United States Department of Defense (2021-present) and a member of the Board of Salesforce.com, Inc. (cloud-based software, 2022-present). Previously, Mr. Munoz served as a Member of the Advisory Board of certain Fidelity® funds (2021).
David M. Thomas (1949)
Year of Election or Appointment: 2008
Trustee
Lead Independent Trustee
Mr. Thomas also serves as Trustee of other Fidelity® funds. Previously, Mr. Thomas served as Executive Chairman (2005-2006) and Chairman and Chief Executive Officer (2000-2005) of IMS Health, Inc. (pharmaceutical and healthcare information solutions). Mr. Thomas currently serves as a member of the Board of Fortune Brands Home and Security (home and security products, 2004-present) and as Director (2013-present) and Non-Executive Chairman of the Board (2022-present) of Interpublic Group of Companies, Inc. (marketing communication).
Susan Tomasky (1953)
Year of Election or Appointment: 2020
Trustee
Ms. Tomasky also serves as Trustee of other Fidelity® funds. Prior to her retirement, Ms. Tomasky served in various executive officer positions at American Electric Power Company, Inc. (1998-2011), including most recently as President of AEP Transmission (2007-2011). Ms. Tomasky currently serves as a member of the Board and Sustainability Committee and as Chair of the Audit Committee of Marathon Petroleum Corporation (2018-present) and as a member of the Board, Executive Committee, Corporate Governance Committee and Organization and Compensation Committee and as Lead Director of the Board of Public Service Enterprise Group, Inc. (utilities company, 2012-present) and as a member of the Board of its subsidiary company, Public Service Electric and Gas Co. (2021-present). In addition, Ms. Tomasky currently serves as a member (2009-present) and President (2020-present) of the Board of the Royal Shakespeare Company - America (2009-present), as a member of the Board of the Columbus Association for the Performing Arts (2011-present) and as a member of the Board and Kenyon in the World Committee of Kenyon College (2016-present). Previously, Ms. Tomasky served as a Member of the Advisory Board of certain Fidelity® funds (2020), as a member of the Board of the Columbus Regional Airport Authority (2007-2020), as a member of the Board (2011-2018) and Lead Independent Director (2015-2018) of Andeavor Corporation (previously Tesoro Corporation) (independent oil refiner and marketer) and as a member of the Board of Summit Midstream Partners LP (energy, 2012-2018).
Michael E. Wiley (1950)
Year of Election or Appointment: 2018
Trustee
Mr. Wiley also serves as Trustee of other Fidelity® funds. Previously, Mr. Wiley served as a member of the Advisory Board of certain Fidelity® funds (2018-2020), Chairman, President and CEO of Baker Hughes, Inc. (oilfield services, 2000-2004). Mr. Wiley also previously served as a member of the Board of Andeavor Corporation (independent oil refiner and marketer, 2005-2018), a member of the Board of Andeavor Logistics LP (natural resources logistics, 2015-2018) and a member of the Board of High Point Resources (exploration and production, 2005-2020).
+ The information includes the Trustee's principal occupation during the last five years and other information relating to the experience, attributes, and skills relevant to the Trustee's qualifications to serve as a Trustee, which led to the conclusion that the Trustee should serve as a Trustee for the fund.
Advisory Board Members and Officers:
Correspondence intended for a Member of the Advisory Board (if any) may be sent to Fidelity Investments, P.O. Box 55235, Boston, Massachusetts 02205-5235. Correspondence intended for an officer or Peter S. Lynch may be sent to Fidelity Investments, 245 Summer Street, Boston, Massachusetts 02210.
Name, Year of Birth; Principal Occupation
Peter S. Lynch (1944)
Year of Election or Appointment: 2004
Member of the Advisory Board
Mr. Lynch also serves as a Member of the Advisory Board of other Fidelity® funds. Mr. Lynch is Vice Chairman and a Director of Fidelity Management & Research Company LLC (investment adviser firm). In addition, Mr. Lynch serves as a Trustee of Boston College and as the Chairman of the Inner-City Scholarship Fund. Previously, Mr. Lynch served as Vice Chairman and a Director of FMR Co., Inc. (investment adviser firm) and on the Special Olympics International Board of Directors (1997-2006).
Karen B. Peetz (1955)
Year of Election or Appointment: 2023
Member of the Advisory Board
Ms. Peetz also serves as a Member of the Advisory Board of other funds. Previously, Ms. Peetz served as Chief Administration Officer (2020-2023) of Citigroup Inc. (a diversified financial service company). She also served in various capacities at Bank of New York Mellon Corporation, including President (2013-2016), Vice Chairman, Senior Executive Vice President and Chief Executive Officer of Financial Markets & Treasury Services (2010-2013), Senior Executive Vice President and Chief Executive Officer of Global Corporate Trust (2003-2008), Senior Vice President and Division Manager of Global Payments & Trade Services (2002-2003) and Senior Vice President and Division Manager of Domestic Corporate Trust (1998-2002). Ms. Peetz also served in various capacities at Chase Manhattan Corporation (1982-1998), including Senior Vice President and Manager of Corporate Trust International Business (1996-1998), Managing Director and Manager of Corporate Trust Services (1994-1996) and Managing Director and Group Manager of Financial Institution Sales (1990-1993). Ms. Peetz currently serves as Chair of Amherst Holdings Advisory Council (2018-present), Trustee of Johns Hopkins University (2016-present), Chair of the Carey Business School Advisory Council, Member of the Johns Hopkins Medicine Board and Finance Committee and Chair of the Lyme and Tick Related Disease Institute Advisory Council. Ms. Peetz previously served as a member of the Board of Guardian Life Insurance Company of America (2019-2023), a member of the Board of Trane Technologies (2018-2022), a member of the Board of Wells Fargo Corp. (2017-2019), a member of the Board of SunCoke Energy Inc. (2012-2016), a member of the Board of Private Export Funding Corporation (2010-2016) and as a Trustee of Penn State University (2010-2014) and the United Way of New York City (2008-2010).
Heather Bonner (1977)
Year of Election or Appointment: 2023
Assistant Treasurer
Ms. Bonner also serves as an officer of other funds. Ms. Bonner is a Senior Vice President (2022-present) and is an employee of Fidelity Investments (2022-present). Ms. Bonner serves as Assistant Treasurer of Fidelity CRET Trustee LLC (2022-present). Prior to joining Fidelity, Ms. Bonner served as Managing Director at AQR Capital Management (2013-2022) and was the Treasurer and Principal Financial Officer of the AQR Funds (2013-2022).
Craig S. Brown (1977)
Year of Election or Appointment: 2022
Deputy Treasurer
Mr. Brown also serves as an officer of other funds. Mr. Brown is a Vice President (2015-present) and is an employee of Fidelity Investments. Mr. Brown serves as Assistant Treasurer of FIMM, LLC (2021-present). Previously, Mr. Brown served as Assistant Treasurer of certain Fidelity® funds (2019-2022).
John J. Burke III (1964)
Year of Election or Appointment: 2018
Chief Financial Officer
Mr. Burke also serves as Chief Financial Officer of other funds. Mr. Burke is Head of Fidelity Fund and Investment Operations (2018-present) and is an employee of Fidelity Investments. Mr. Burke serves as President, Executive Vice President, or Director of certain Fidelity entities. Previously Mr. Burke served as head of Asset Management Investment Operations (2012-2018).
Margaret Carey (1973)
Year of Election or Appointment: 2023
Secretary and Chief Legal Officer (CLO)
Ms. Carey also serves as an officer of other funds and as CLO of certain Fidelity entities. Ms. Carey is a Senior Vice President, Deputy General Counsel (2019-present) and is an employee of Fidelity Investments.
William C. Coffey (1969)
Year of Election or Appointment: 2019
Assistant Secretary
Mr. Coffey also serves as Assistant Secretary of other funds. Mr. Coffey is a Senior Vice President, Deputy General Counsel (2010-present) and is an employee of Fidelity Investments. Previously, Mr. Coffey served as Secretary and CLO of certain funds (2018-2019); CLO, Secretary, or Senior Vice President of certain Fidelity entities and Assistant Secretary of certain funds (2009-2018).
Timothy M. Cohen (1969)
Year of Election or Appointment: 2018
Vice President
Mr. Cohen also serves as Vice President of other funds. Mr. Cohen is Co-Head of Equity (2018-present) and is an employee of Fidelity Investments. Mr. Cohen serves a Director of Fidelity Management & Research (Japan) Limited (investment adviser firm, 2016-present). Previously, Mr. Cohen served as Executive Vice President of Fidelity SelectCo, LLC (2019) and Head of Global Equity Research (2016-2018).
Jonathan Davis (1968)
Year of Election or Appointment: 2010
Assistant Treasurer
Mr. Davis also serves as an officer of other funds. Mr. Davis is a Vice President (2006-present) and is an employee of Fidelity Investments. Mr. Davis serves as Assistant Treasurer of certain Fidelity entities.
Laura M. Del Prato (1964)
Year of Election or Appointment: 2018
Assistant Treasurer
Ms. Del Prato also serves as an officer of other funds. Ms. Del Prato is a Senior Vice President (2017-present) and is an employee of Fidelity Investments. Ms. Del Prato serves as Vice President or Assistant Treasurer of certain Fidelity entities. Previously, Ms. Del Prato served as President and Treasurer of The North Carolina Capital Management Trust: Cash Portfolio and Term Portfolio (2018-2020).
Colm A. Hogan (1973)
Year of Election or Appointment: 2020
Assistant Treasurer
Mr. Hogan also serves as an officer of other funds. Mr. Hogan is a Vice President (2016-present) and is an employee of Fidelity Investments. Mr. Hogan serves as Assistant Treasurer of certain Fidelity entities. Previously, Mr. Hogan served as Deputy Treasurer of certain Fidelity® funds (2016-2020) and Assistant Treasurer of certain Fidelity® funds (2016-2018).
Pamela R. Holding (1964)
Year of Election or Appointment: 2018
Vice President
Ms. Holding also serves as Vice President of other funds. Ms. Holding is Co-Head of Equity (2018-present) and is an employee of Fidelity Investments. Previously, Ms. Holding served as Executive Vice President of Fidelity SelectCo, LLC (2019) and as Chief Investment Officer of Fidelity Institutional Asset Management (2013-2018).
Chris Maher (1972)
Year of Election or Appointment: 2020
Deputy Treasurer
Mr. Maher also serves as an officer of other funds. Mr. Maher is a Vice President (2008-present) and is an employee of Fidelity Investments. Mr. Maher serves as Assistant Treasurer of certain Fidelity entities. Previously, Mr. Maher served as Assistant Treasurer of certain funds (2013-2020).
Jason P. Pogorelec (1975)
Year of Election or Appointment: 2020
Chief Compliance Officer
Mr. Pogorelec also serves as Chief Compliance Officer of other funds. Mr. Pogorelec is a Senior Vice President of Asset Management Compliance (2020-present) and is an employee of Fidelity Investments. Mr. Pogorelec serves as Compliance Officer of Fidelity Management & Research Company LLC (investment adviser firm, 2023-present) and Ballyrock Investment Advisors LLC (2023-present). Previously, Mr. Pogorelec served as a Vice President, Associate General Counsel for Fidelity Investments (2010-2020) and Assistant Secretary of certain Fidelity® funds (2015-2020).
Brett Segaloff (1972)
Year of Election or Appointment: 2021
Anti-Money Laundering (AML) Officer
Mr. Segaloff also serves as AML Officer of other funds. Mr. Segaloff is a Vice President (2022-present) and is an employee of Fidelity Investments. Mr. Segaloff serves as Anti Money Laundering Compliance Officer or Anti Money Laundering/Bank Secrecy Act Compliance Officer of certain Fidelity entities.
Stacie M. Smith (1974)
Year of Election or Appointment: 2016
President and Treasurer
Ms. Smith also serves as an officer of other funds. Ms. Smith is a Senior Vice President (2016-present) and is an employee of Fidelity Investments. Ms. Smith serves as Assistant Treasurer of certain Fidelity entities and has served in other fund officer roles.
Jim Wegmann (1979)
Year of Election or Appointment: 2019
Assistant Treasurer
Mr. Wegmann also serves as an officer of other funds. Mr. Wegmann is a Vice President (2016-present) and is an employee of Fidelity Investments. Mr. Wegmann serves as Assistant Treasurer of FIMM, LLC (2021-present). Previously, Mr. Wegmann served as Assistant Treasurer of certain Fidelity® funds (2019-2021).
As a shareholder, you incur two types of costs: (1) transaction costs, which may include sales charges (loads) on purchase payments or redemption proceeds, as applicable and (2) ongoing costs, which generally include management fees, distribution and/or service (12b-1) fees and other Fund expenses. This Example is intended to help you understand your ongoing costs (in dollars) of investing in a fund and to compare these costs with the ongoing costs of investing in other mutual funds.
The Example is based on an investment of $1,000 invested at the beginning of the period and held for the entire period (April 1, 2023 to September 30, 2023).
|
Actual Expenses
The first line of the accompanying table provides information about actual account values and actual expenses. You may use the information in this line, together with the amount you invested, to estimate the expenses that you paid over the period. Simply divide your account value by $1,000.00 (for example, an $8,600 account value divided by $1,000.00 = 8.6), then multiply the result by the number in the first line for a class/Fund under the heading entitled "Expenses Paid During Period" to estimate the expenses you paid on your account during this period. If any fund is a shareholder of any underlying mutual funds or exchange-traded funds (ETFs) (the Underlying Funds), such fund indirectly bears its proportional share of the expenses of the Underlying Funds in addition to the direct expenses incurred presented in the table. These fees and expenses are not included in the annualized expense ratio used to calculate the expense estimate in the table below.
Hypothetical Example for Comparison Purposes
The second line of the accompanying table provides information about hypothetical account values and hypothetical expenses based on the actual expense ratio and an assumed rate of return of 5% per year before expenses, which is not the actual return. The hypothetical account values and expenses may not be used to estimate the actual ending account balance or expenses you paid for the period. You may use this information to compare the ongoing costs of investing in the Fund and other funds. To do so, compare this 5% hypothetical example with the 5% hypothetical examples that appear in the shareholder reports of the other funds. If any fund is a shareholder of any Underlying Funds, such fund indirectly bears its proportional share of the expenses of the Underlying Funds in addition to the direct expenses as presented in the table. These fees and expenses are not included in the annualized expense ratio used to calculate the expense estimate in the table below.
Please note that the expenses shown in the table are meant to highlight your ongoing costs only and do not reflect any transaction costs. Therefore, the second line of the table is useful in comparing ongoing costs only, and will not help you determine the relative total costs of owning different funds. In addition, if these transactional costs were included, your costs would have been higher.
|
|
|
|
|
Annualized Expense Ratio- A
|
|
Beginning Account Value April 1, 2023
|
|
Ending Account Value September 30, 2023
|
|
Expenses Paid During Period- C April 1, 2023 to September 30, 2023
|
|
|
|
|
|
|
|
|
|
|
|
Fidelity® Emerging Markets Equity Central Fund
|
|
|
|
.0228%
|
|
|
|
|
|
|
Actual
|
|
|
|
|
|
$ 1,000
|
|
$ 991.90
|
|
$ .11
|
Hypothetical-B
|
|
|
|
|
|
$ 1,000
|
|
$ 1,024.95
|
|
$ .12
|
|
|
A Annualized expense ratio reflects expenses net of applicable fee waivers.
B 5% return per year before expenses
C Expenses are equal to the annualized expense ratio, multiplied by the average account value over the period, multiplied by 183/ 365 (to reflect the one-half year period). The fees and expenses of any Underlying Funds are not included in each annualized expense ratio.
The dividend and capital gains distributions for the fund(s) are available on Fidelity.com or Institutional.Fidelity.com.
The fund designates $1,633,971 of distributions paid during the fiscal year ended 2023 as qualifying to be taxed as section 163(j) interest dividends.
The fund designates 55.58%, 67.27%, 67.27%, and 67.27% of the dividends distributed in December, March, June, September, respectively during the fiscal year as amounts which may be taken into account as a dividend for the purposes of the maximum rate under section 1(h)(11) of the Internal Revenue Code.
The amounts per share which represent income derived from sources within, and taxes paid to, foreign countries or possessions of the United States are $2.9836 and $0.8666 for the dividend paid December 12, 2022.
The fund will notify shareholders in January 2024 of amounts for use in preparing 2023 income tax returns.
Board Approval of Investment Advisory Contracts and Management Fees
Fidelity Emerging Markets Equity Central Fund
Each year, the Board of Directors, including the Independent Directors (together, the Board), considers the renewal of the fund's management contract with Fidelity Management & Research Company LLC (FMR) and the sub-advisory agreements (together, the Advisory Contracts) for the fund. FMR and the sub-advisers are referred to herein as the Investment Advisers. The Board, assisted by the advice of fund counsel and Independent Directors' counsel, requests and considers a broad range of information relevant to the renewal of the Advisory Contracts throughout the year.
The Board meets regularly and, at each of its meetings, covers an extensive agenda of topics and materials and considers factors that are relevant to its annual consideration of the renewal of the fund's Advisory Contracts, including the services and support provided to the fund and its shareholders. The Board, acting directly and through its Committees (each of which is composed of and chaired by Independent Directors), requests and receives information concerning the annual consideration of the renewal of the fund's Advisory Contracts. The Board also meets as needed to review matters specifically related to the Board's annual consideration of the renewal of the Advisory Contracts. Members of the Board may also meet with trustees of other Fidelity funds through joint ad hoc committees to discuss certain matters relevant to all of the Fidelity funds.
Approval of Stub Period Continuation. At its May 2023 meeting, the Board of Directors voted to continue the fund's management contract with FMR, and the sub-advisory agreements and sub-sub-advisory agreements, in each case, where applicable (together, the Advisory Contracts), without modification, for two months from June 1, 2023 through July 31, 2023. The Board considered that the approval of the fund's Advisory Contracts will not result in any changes in (i) the investment process or strategies employed in the management of the fund's assets; (ii) the fees and expenses paid by shareholders; (iii) the nature, extent or quality of services provided under the fund's Advisory Contracts; or (iv) the day-to-day management of the fund or the persons primarily responsible for such management. The Board also considered that since its last approval of the fund's Advisory Contracts, FMR had provided additional information on the fund in support of the annual contract renewal process, including competitive analyses on total expenses and management fees and in-depth reviews of fund performance and fund profitability information. The Board concluded that the fund's Advisory Contracts are fair and reasonable, and that the fund's Advisory Contracts should be renewed, without modification, through July 31, 2023, with the understanding that the Board would consider the annual renewal for a full one year period in July 2023.
At its July 2023 meeting, the Board unanimously determined to renew the fund's Advisory Contracts. In reaching its determination, the Board considered all factors it believed relevant and reached a determination, with the assistance of fund counsel and Independent Directors' counsel and through the exercise of its business judgment, that the renewal of the Advisory Contracts was in the best interests of the fund and its shareholders and the fact that no fee is payable under the management contract was fair and reasonable in light of all of the surrounding circumstances.
Nature, Extent, and Quality of Services Provided. The Board considered staffing as it relates to the fund, including the backgrounds and experience of investment personnel of the Investment Advisers, and also considered the Investment Advisers' implementation of the fund's investment program. The Independent Directors also had discussions with senior management of Fidelity's investment operations and investment groups. The Board considered the structure of the investment personnel compensation program and whether this structure provides appropriate incentives to act in the best interests of the fund.
Resources Dedicated to Investment Management and Support Services. The Board and the Fund Oversight and Research Committees reviewed the general qualifications and capabilities of Fidelity's investment staff, including its size, education, experience, and resources, as well as Fidelity's approach to recruiting, training, managing, and compensating investment personnel. The Board noted the resources devoted to expansion of Fidelity's global investment organization, and that Fidelity's analysts have extensive resources, tools, and capabilities that allow them to conduct sophisticated quantitative and fundamental analysis, as well as credit analysis of issuers, counterparties, and guarantors. Further, the Board considered that Fidelity's investment professionals have sufficient access to global information and data so as to provide competitive investment results over time, and that those professionals also have access to sophisticated tools that permit them to assess portfolio construction and risk and performance attribution characteristics continuously, as well as to transmit new information and research conclusions rapidly around the world. Additionally, in its deliberations, the Board considered Fidelity's trading, risk management, compliance, and technology and operations capabilities and resources, which are integral parts of the investment management process.
Administrative Services. The Board considered (i) the nature, extent, quality, and cost of advisory and administrative services performed by the Investment Advisers and their affiliates under the Advisory Contracts and under separate agreements covering transfer agency, pricing and bookkeeping, and securities lending services for the fund; (ii) the nature and extent of Fidelity's supervision of third party service providers, principally custodians, subcustodians, and pricing vendors; and (iii) the resources devoted by Fidelity to, and the record of compliance with, the fund's compliance policies and procedures. The Board also reviewed the allocation of fund brokerage, including allocations to brokers affiliated with the Investment Advisers, and the use of "soft" commission dollars to pay for research services. The Board also considered the fund's securities lending activities and any payments made to Fidelity relating to securities lending.
Investment Performance. The Board reviewed the fund's absolute investment performance, as well as the fund's relative investment performance, and considered the fund's underperformance for different time periods ended February 28, 2023. The Board did not consider performance to be a material factor in its decision to renew the fund's Advisory Contracts, as the fund is not publicly offered as a stand-alone investment product. In this regard, the Board noted that the fund is designed to offer a liquid investment option for other investment companies managed by Fidelity and ultimately to enhance the performance of those investment companies.
Based on its review, the Board concluded that the nature, extent, and quality of services provided to the fund under the Advisory Contracts should continue to benefit the shareholders of the fund.
Competitiveness of Management Fee and Total Expense Ratio. The Board considered that while the fund does not pay a management fee, FMR receives fees for providing services to funds that invest in the fund. The Board also noted that FMR bears all expenses of the fund with certain limited exceptions (i.e., custody fees, interest, taxes, fees and expenses of the Independent Directors, proxy and shareholder meeting expenses, and extraordinary expenses). The Board further noted that the fund pays its non-operating expenses, including brokerage commissions and fees and expenses associated with the fund's securities lending program, if applicable. Based on its review, the Board concluded that the management fee received for providing services to the fund and the fund's total expense ratio were reasonable in light of the services that the fund and its shareholders receive and the other factors considered.
Costs of the Services and Profitability. The Board considered the level of Fidelity's profits in respect of all the Fidelity funds, as well as the profitability of the funds that invest in the fund.
A public accounting firm has been engaged annually by the Board as part of the Board's assessment of Fidelity's profitability analysis. The engagement includes the review and assessment of the methodologies used by Fidelity in determining the revenues and expenses attributable to Fidelity's fund business, and completion of agreed-upon procedures in respect of the mathematical accuracy of certain fund profitability information and its conformity to established allocation methodologies. After considering the reports issued under the engagement and information provided by Fidelity, the Board concluded that while other allocation methods may also be reasonable, Fidelity's profitability methodologies are reasonable in all material respects.
The Board also reviewed Fidelity's non-fund businesses and potential indirect benefits such businesses may have received as a result of their association with Fidelity's fund business (i.e., fall-out benefits) as well as cases where Fidelity's affiliates may benefit from the funds' business. The Board considered areas where potential indirect benefits to the Fidelity funds from their relationships with Fidelity may exist. The Board's consideration of these matters was informed by the findings of a joint ad hoc committee created by it and the boards of other Fidelity funds to evaluate potential fall-out benefits.
The Board concluded that the costs of the services provided by and the profits realized by Fidelity in connection with the operation of the fund were not relevant to the renewal of the Advisory Contracts because the fund pays no advisory fees and FMR bears all expenses of the fund with certain exceptions.
Economies of Scale. The Board concluded that because the fund pays no advisory fees and FMR bears all expenses of the fund with certain exceptions, the realization of economies of scale was not a material factor in the Board's decision to renew the fund's Advisory Contract.
Additional Information Requested by the Board. In order to develop fully the factual basis for consideration of the Fidelity funds' advisory contracts, the Board requested and received additional information on certain topics, including: (i) fund flow and performance trends, in particular the underperformance of certain funds and strategies, and Fidelity's long-term strategies for certain funds, including any consideration of fund liquidations or mergers; (ii) the operation of performance fees and competitor use of performance fees; (iii) Fidelity's pricing philosophy compared to competitors; (iv) fund profitability methodology and data; (v) evaluation of competitive fund data and peer group classifications and fee and expense comparisons; (vi) the management fee and expense structures for different funds and classes and information about the differences between various fee and expense structures; (vii) group fee breakpoints and related voluntary fee waivers; and (viii) information regarding other accounts managed by Fidelity and the funds' sub-advisory arrangements.
Conclusion. Based on its evaluation of all of the conclusions noted above, and after considering all factors it believed relevant, the Board, including the Independent Directors, concluded that the advisory and sub-advisory fee arrangements are fair and reasonable in light of all of the surrounding circumstances and that the fund's Advisory Contracts should be renewed through July 31, 2024.
1.876933.114
EMQ-ANN-1123
Fidelity® International Equity Central Fund
Annual Report
September 30, 2023
Contents
To view a fund's proxy voting guidelines and proxy voting record for the 12-month period ended June 30, visit http://www.fidelity.com/proxyvotingresults or visit the Securities and Exchange Commission's (SEC) web site at http://www.sec.gov.
You may also call 1-800-544-8544 to request a free copy of the proxy voting guidelines.
Standard & Poor's, S&P and S&P 500 are registered service marks of The McGraw-Hill Companies, Inc. and have been licensed for use by Fidelity Distributors Corporation.
Other third-party marks appearing herein are the property of their respective owners.
All other marks appearing herein are registered or unregistered trademarks or service marks of FMR LLC or an affiliated company. © 2023 FMR LLC. All rights reserved.
A fund files its complete schedule of portfolio holdings with the SEC for the first and third quarters of each fiscal year on Form N-PORT. Forms N-PORT are available on the SEC's web site at http://www.sec.gov. A fund's Forms N-PORT may be reviewed and copied at the SEC's Public Reference Room in Washington, DC. Information regarding the operation of the SEC's Public Reference Room may be obtained by calling 1-800-SEC-0330.
Average annual total return reflects the change in the value of an investment, assuming reinvestment of distributions from dividend income and capital gains (the profits earned upon the sale of securities that have grown in value, if any) and assuming a constant rate of performance each year. The hypothetical investment and the average annual total returns do not reflect the deduction of taxes that a shareholder would pay on fund distributions or the redemption of fund shares. During periods of reimbursement by Fidelity, a fund's total return will be greater than it would be had the reimbursement not occurred. How a fund did yesterday is no guarantee of how it will do tomorrow.
Average Annual Total Returns
|
|
|
|
|
|
Periods ended September 30, 2023
|
Past 1
year
|
Past 5
years
|
Past 10
years
|
Fidelity® International Equity Central Fund
|
25.78%
|
5.41%
|
5.16%
|
$10,000 Over 10 Years
|
|
|
Let's say hypothetically that $10,000 was invested in Fidelity® International Equity Central Fund on September 30, 2013.
The chart shows how the value of your investment would have changed, and also shows how the MSCI World ex USA Index performed over the same period.
|
|
|
Market Recap:
International (non-U.S.) equities gained 20.60% for the 12 months ending September 30, 2023, according to the MSCI ACWI (All Country World Index) ex USA Index, as global economic expansion and a slowing in the pace of inflation in some market provided a favorable backdrop for risk assets through July. After producing a return of -15.68 in 2022, the index's upturn the past 12 months has been largely driven by a narrow set of companies in the information technology and communication services sectors, in part due to excitement for generative artificial intelligence. Following strong gains in June (+4.50%) and July (+4.07%), the year-to-date rally sputtered in August (-4.51%) and September (-3.35%) amid a stalling pattern in disinflationary trends, soaring yields on longer-term U.S. government bonds and weak economic conditions in the eurozone and China. A stronger U.S. dollar also was a headwind for global economies. Still, non-U.S. stocks ended September up 5.50% year to date. For the full 12 months, all regions advanced, with Europe ex U.K. (+31%) leading. Japan (+26%) and the U.K. (+25%) also outperformed, whereas Asia Pacific ex Japan (+11%) lagged by the widest margin. Each of the 11 sectors also advanced, with information technology (+30%), industrials (+29%) and energy (+28%) ahead of the pack. Conversely, real estate (+5%) lagged most, followed by consumer staples (+9%).
Comments from Co-Managers Adarsh Bala, Christopher Bartoli and Ashley Fernandes:
For the fiscal year, the fund gained 25.78%, versus 24.29% for the benchmark MSCI World ex USA Index. From a regional standpoint, an overweight in Europe ex U.K. and positioning in Canada contributed to the fund's performance versus the benchmark. By sector, the biggest contributor to relative performance was stock selection in energy. Positioning in information technology and communication services also helped. The top individual relative contributor was an overweight in DSV (+59%). DSV was one of our biggest holdings. A second notable relative contributor was an overweight in ASM International (+87%). Another notable relative contributor this period was avoiding CSL, a benchmark component that returned about -11%. In contrast, picks in Europe ex U.K., primarily in France, and stock selection and an underweight in Japan hurt the fund's relative result. By sector, the biggest detractor was security selection in consumer staples. Also hurting were stock picking in financials and real estate. The largest individual relative detractor was an overweight in Diageo (-11%). Diageo was among our biggest holdings. A stake in Teleperformance returned -34% and was the second-largest relative detractor. Teleperformance was not held at period end. Notable changes in positioning include increased exposure to Denmark and a lower allocation to Switzerland.
Note to shareholders:
On October 31, 2022, Christopher Bartoli assumed co-management responsibilities for the fund, succeeding Masaki Nakamura.
The views expressed above reflect those of the portfolio manager(s) only through the end of the period as stated on the cover of this report and do not necessarily represent the views of Fidelity or any other person in the Fidelity organization. Any such views are subject to change at any time based upon market or other conditions and Fidelity disclaims any responsibility to update such views. These views may not be relied on as investment advice and, because investment decisions for a Fidelity fund are based on numerous factors, may not be relied on as an indication of trading intent on behalf of any Fidelity fund.
Top Holdings (% of Fund's net assets)
|
|
|
Novo Nordisk A/S Series B (Denmark, Pharmaceuticals)
|
2.4
|
|
AstraZeneca PLC (United Kingdom) (United Kingdom, Pharmaceuticals)
|
2.4
|
|
LVMH Moet Hennessy Louis Vuitton SE (France, Textiles, Apparel & Luxury Goods)
|
2.2
|
|
ASML Holding NV (Netherlands) (Netherlands, Semiconductors & Semiconductor Equipment)
|
2.2
|
|
Nestle SA (Reg. S) (United States of America, Food Products)
|
1.9
|
|
TotalEnergies SE (France, Oil, Gas & Consumable Fuels)
|
1.7
|
|
RELX PLC (London Stock Exchange) (United Kingdom, Professional Services)
|
1.5
|
|
Sumitomo Mitsui Financial Group, Inc. (Japan, Banks)
|
1.4
|
|
DSV A/S (Denmark, Air Freight & Logistics)
|
1.4
|
|
Diageo PLC (United Kingdom, Beverages)
|
1.3
|
|
|
|
18.4
|
|
|
|
Market Sectors (% of Fund's net assets)
|
|
|
Financials
|
21.7
|
|
Industrials
|
18.1
|
|
Health Care
|
13.1
|
|
Consumer Discretionary
|
10.7
|
|
Information Technology
|
10.3
|
|
Consumer Staples
|
7.4
|
|
Materials
|
6.8
|
|
Energy
|
4.6
|
|
Communication Services
|
2.4
|
|
Real Estate
|
1.4
|
|
Utilities
|
1.2
|
|
|
|
Asset Allocation (% of Fund's net assets)
|
|
|
|
|
Geographic Diversification (% of Fund's net assets)
|
|
|
* Includes Short-Term investments and Net Other Assets (Liabilities).
Percentages are adjusted for the effect of derivatives, if applicable.
|
|
|
Showing Percentage of Net Assets
Common Stocks - 97.7%
|
|
|
|
Shares
|
Value ($)
|
Australia - 2.1%
|
|
|
|
Arena (REIT) unit
|
|
3,190,341
|
6,892,132
|
Commonwealth Bank of Australia
|
|
136,451
|
8,770,485
|
Flutter Entertainment PLC (a)
|
|
37,641
|
6,149,462
|
Glencore PLC
|
|
2,143,900
|
12,208,464
|
Macquarie Group Ltd.
|
|
104,266
|
11,244,254
|
Rio Tinto PLC
|
|
300,900
|
18,894,261
|
Treasury Wine Estates Ltd.
|
|
588,396
|
4,664,553
|
Westpac Banking Corp.
|
|
1,251,903
|
17,023,868
|
Woodside Energy Group Ltd.
|
|
457,413
|
10,635,348
|
TOTAL AUSTRALIA
|
|
|
96,482,827
|
Belgium - 1.0%
|
|
|
|
Azelis Group NV
|
|
326,449
|
6,457,536
|
KBC Group NV
|
|
479,562
|
29,984,981
|
UCB SA
|
|
75,200
|
6,164,833
|
Warehouses de Pauw
|
|
125,597
|
3,112,537
|
TOTAL BELGIUM
|
|
|
45,719,887
|
Canada - 6.3%
|
|
|
|
Africa Oil Corp.
|
|
2,873,959
|
5,776,483
|
Alimentation Couche-Tard, Inc. Class A (multi-vtg.)
|
|
603,100
|
30,628,999
|
Athabasca Oil Corp. (a)(b)
|
|
1,294,102
|
4,144,556
|
Boardwalk (REIT) (b)
|
|
49,400
|
2,429,902
|
Cameco Corp.
|
|
91,355
|
3,624,606
|
Canadian Natural Resources Ltd.
|
|
185,154
|
11,974,178
|
Canadian Pacific Kansas City Ltd.
|
|
376,900
|
28,015,331
|
Chemtrade Logistics Income Fund
|
|
1,515,100
|
9,013,074
|
Constellation Software, Inc.
|
|
23,000
|
47,482,871
|
Constellation Software, Inc. warrants 8/22/28 (a)(c)
|
|
24,200
|
2
|
Emera, Inc. (b)
|
|
69,730
|
2,434,454
|
Fortis, Inc.
|
|
71,490
|
2,715,383
|
Franco-Nevada Corp.
|
|
76,300
|
10,186,254
|
GFL Environmental, Inc.
|
|
151,990
|
4,826,305
|
Imperial Oil Ltd.
|
|
231,631
|
14,267,071
|
Intact Financial Corp.
|
|
95,200
|
13,879,259
|
Ivanhoe Mines Ltd. (a)
|
|
624,000
|
5,347,587
|
Lumine Group, Inc.
|
|
53,706
|
795,557
|
MEG Energy Corp. (a)
|
|
435,913
|
8,482,371
|
Methanex Corp. (b)
|
|
98,100
|
4,420,910
|
Nutrien Ltd.
|
|
142,100
|
8,775,519
|
Onex Corp. (sub. vtg.)
|
|
171,200
|
10,062,136
|
Quebecor, Inc. Class B (sub. vtg.)
|
|
133,200
|
2,854,741
|
Royal Bank of Canada
|
|
352,400
|
30,796,893
|
Shopify, Inc. Class A (a)
|
|
185,610
|
10,128,738
|
Teck Resources Ltd. Class B (sub. vtg.)
|
|
124,600
|
5,362,868
|
TMX Group Ltd.
|
|
821,100
|
17,646,169
|
TOTAL CANADA
|
|
|
296,072,217
|
China - 0.3%
|
|
|
|
Chervon Holdings Ltd.
|
|
269,100
|
805,828
|
NXP Semiconductors NV
|
|
15,500
|
3,098,760
|
Prosus NV
|
|
324,542
|
9,562,965
|
TOTAL CHINA
|
|
|
13,467,553
|
Denmark - 4.2%
|
|
|
|
Carlsberg A/S Series B
|
|
111,200
|
14,051,227
|
DSV A/S
|
|
344,200
|
64,356,513
|
Novo Nordisk A/S Series B
|
|
1,263,800
|
115,070,588
|
Novozymes A/S Series B
|
|
140,400
|
5,666,194
|
TOTAL DENMARK
|
|
|
199,144,522
|
Finland - 1.3%
|
|
|
|
Elisa Corp. (A Shares)
|
|
105,030
|
4,873,676
|
Nordea Bank Abp
|
|
3,201,900
|
35,203,008
|
Sampo Oyj (A Shares)
|
|
433,600
|
18,786,199
|
TOTAL FINLAND
|
|
|
58,862,883
|
France - 12.9%
|
|
|
|
Air Liquide SA
|
|
366,860
|
61,790,810
|
Airbus Group NV
|
|
214,100
|
28,656,960
|
ALTEN
|
|
164,500
|
21,670,136
|
Antin Infrastructure Partners SA
|
|
67,800
|
876,665
|
ARGAN SA
|
|
10,816
|
722,706
|
AXA SA
|
|
408,000
|
12,104,898
|
BNP Paribas SA
|
|
309,800
|
19,699,028
|
Capgemini SA
|
|
238,900
|
41,686,566
|
Dassault Systemes SA
|
|
159,900
|
5,966,771
|
Edenred SA
|
|
643,900
|
40,355,647
|
Engie SA
|
|
298,310
|
4,574,933
|
EssilorLuxottica SA
|
|
235,478
|
41,118,088
|
Hermes International SCA
|
|
7,100
|
12,984,700
|
L'Oreal SA
|
|
140,500
|
58,224,901
|
LVMH Moet Hennessy Louis Vuitton SE
|
|
138,345
|
104,427,049
|
Pernod Ricard SA
|
|
158,800
|
26,501,642
|
Safran SA
|
|
260,400
|
40,807,083
|
TotalEnergies SE
|
|
1,191,133
|
78,316,233
|
Veolia Environnement SA
|
|
125,330
|
3,622,810
|
TOTAL FRANCE
|
|
|
604,107,626
|
Germany - 7.9%
|
|
|
|
Allianz SE
|
|
143,100
|
34,054,399
|
Bayer AG
|
|
108,800
|
5,225,057
|
Deutsche Borse AG
|
|
179,400
|
30,981,802
|
Deutsche Telekom AG
|
|
653,900
|
13,716,734
|
DHL Group
|
|
543,231
|
22,131,844
|
E.ON SE
|
|
253,400
|
3,000,560
|
Evonik Industries AG
|
|
161,000
|
2,949,014
|
Fresenius SE & Co. KGaA
|
|
422,000
|
13,143,859
|
Hannover Reuck SE
|
|
155,300
|
34,135,293
|
Infineon Technologies AG
|
|
772,600
|
25,589,091
|
LEG Immobilien AG (a)
|
|
41,700
|
2,880,666
|
Mercedes-Benz Group AG (Germany)
|
|
260,000
|
18,095,160
|
Merck KGaA
|
|
261,343
|
43,697,618
|
MTU Aero Engines AG
|
|
91,800
|
16,669,291
|
Muenchener Rueckversicherungs-Gesellschaft AG in Muenchen
|
|
2,660
|
1,038,014
|
Rheinmetall AG
|
|
61,528
|
15,865,812
|
RWE AG
|
|
120,440
|
4,475,832
|
SAP SE
|
|
126,159
|
16,330,276
|
Siemens AG
|
|
198,150
|
28,317,369
|
Siemens Healthineers AG (d)
|
|
719,000
|
36,487,812
|
Symrise AG
|
|
36,900
|
3,512,839
|
TOTAL GERMANY
|
|
|
372,298,342
|
Hong Kong - 1.3%
|
|
|
|
AIA Group Ltd.
|
|
3,015,600
|
24,387,601
|
CK Asset Holdings Ltd.
|
|
869,588
|
4,580,607
|
Prudential PLC
|
|
1,742,260
|
18,728,141
|
Sino Land Ltd.
|
|
2,950,509
|
3,326,926
|
Techtronic Industries Co. Ltd.
|
|
1,251,000
|
12,141,056
|
TOTAL HONG KONG
|
|
|
63,164,331
|
Hungary - 0.3%
|
|
|
|
Richter Gedeon PLC
|
|
589,800
|
14,276,039
|
India - 1.0%
|
|
|
|
HCL Technologies Ltd.
|
|
691,000
|
10,275,749
|
HDFC Bank Ltd. (a)
|
|
2,037,400
|
37,368,555
|
TOTAL INDIA
|
|
|
47,644,304
|
Ireland - 1.1%
|
|
|
|
AIB Group PLC
|
|
2,909,400
|
13,103,603
|
Bank of Ireland Group PLC
|
|
1,499,400
|
14,726,886
|
Kingspan Group PLC (Ireland)
|
|
306,700
|
23,009,389
|
TOTAL IRELAND
|
|
|
50,839,878
|
Israel - 0.1%
|
|
|
|
NICE Ltd. sponsored ADR (a)
|
|
16,652
|
2,830,840
|
Wix.com Ltd. (a)
|
|
16,100
|
1,477,980
|
TOTAL ISRAEL
|
|
|
4,308,820
|
Italy - 3.6%
|
|
|
|
Coca-Cola HBC AG
|
|
293,200
|
8,045,422
|
Davide Campari Milano NV
|
|
768,800
|
9,075,066
|
Enel SpA
|
|
646,786
|
3,966,574
|
Ferrari NV (Italy)
|
|
38,800
|
11,473,658
|
FinecoBank SpA
|
|
1,306,000
|
15,899,549
|
GVS SpA (a)(d)
|
|
115,000
|
622,509
|
Industrie de Nora SpA
|
|
116,500
|
2,005,202
|
Intercos SpA
|
|
143,900
|
1,953,455
|
Prada SpA
|
|
1,043,000
|
6,140,034
|
Prysmian SpA
|
|
547,300
|
22,074,846
|
Recordati SpA
|
|
884,700
|
41,819,457
|
UniCredit SpA
|
|
1,919,400
|
45,732,377
|
TOTAL ITALY
|
|
|
168,808,149
|
Japan - 14.9%
|
|
|
|
Advantest Corp.
|
|
78,000
|
2,175,694
|
Ajinomoto Co., Inc.
|
|
168,200
|
6,485,562
|
Bandai Namco Holdings, Inc.
|
|
648,600
|
13,192,838
|
BayCurrent Consulting, Inc.
|
|
258,300
|
8,638,808
|
Capcom Co. Ltd.
|
|
515,050
|
18,559,584
|
Daiichi Sankyo Kabushiki Kaisha
|
|
659,200
|
18,047,132
|
Daiichikosho Co. Ltd.
|
|
141,740
|
2,302,421
|
DENSO Corp.
|
|
638,800
|
10,250,108
|
Dip Corp.
|
|
115,590
|
2,846,435
|
Fast Retailing Co. Ltd.
|
|
50,600
|
11,021,450
|
FUJIFILM Holdings Corp.
|
|
433,000
|
25,049,306
|
Fujitsu Ltd.
|
|
38,000
|
4,469,221
|
Hitachi Ltd.
|
|
617,600
|
38,277,354
|
Hoya Corp.
|
|
326,100
|
33,398,342
|
Itochu Corp.
|
|
667,600
|
24,109,664
|
JTOWER, Inc. (a)
|
|
140,450
|
5,780,029
|
Kansai Electric Power Co., Inc.
|
|
437,880
|
6,062,248
|
Katitas Co. Ltd.
|
|
76,300
|
1,112,028
|
KDDI Corp.
|
|
222,130
|
6,799,506
|
Keyence Corp.
|
|
26,100
|
9,652,456
|
Kobe Bussan Co. Ltd.
|
|
147,700
|
3,465,178
|
LY Corp.
|
|
1,431,690
|
3,971,666
|
Minebea Mitsumi, Inc.
|
|
1,037,700
|
16,907,321
|
Misumi Group, Inc.
|
|
349,700
|
5,467,573
|
Mitsui Fudosan Logistics Park, Inc.
|
|
1,158
|
3,649,746
|
Mizuho Financial Group, Inc.
|
|
1,375,000
|
23,344,689
|
Nomura Real Estate Holdings, Inc.
|
|
175,400
|
4,404,953
|
Nomura Research Institute Ltd.
|
|
120,400
|
3,136,491
|
NSD Co. Ltd.
|
|
55,100
|
1,045,661
|
ORIX Corp.
|
|
500,400
|
9,343,670
|
Persol Holdings Co. Ltd.
|
|
14,586,520
|
23,757,755
|
Relo Group, Inc.
|
|
595,300
|
6,447,357
|
Renesas Electronics Corp. (a)
|
|
889,900
|
13,593,188
|
Seibu Giken Co. Ltd.
|
|
40,000
|
695,931
|
Shin-Etsu Chemical Co. Ltd.
|
|
1,403,700
|
40,771,378
|
SoftBank Group Corp.
|
|
236,176
|
9,949,042
|
Sony Group Corp.
|
|
747,700
|
61,143,604
|
Sumitomo Mitsui Financial Group, Inc. (b)
|
|
1,372,000
|
67,400,936
|
Suzuki Motor Corp.
|
|
473,100
|
19,028,558
|
Terumo Corp.
|
|
392,500
|
10,389,810
|
TIS, Inc.
|
|
403,000
|
8,880,347
|
Tokio Marine Holdings, Inc.
|
|
2,076,300
|
48,074,029
|
Tokyo Electron Ltd.
|
|
253,600
|
34,639,800
|
Toyota Motor Corp.
|
|
1,698,400
|
30,469,854
|
TOTAL JAPAN
|
|
|
698,208,723
|
Korea (South) - 0.0%
|
|
|
|
Doosan Robotics Ltd. (e)
|
|
7,700
|
148,021
|
Hanssak Co. Ltd. (e)
|
|
7,140
|
65,988
|
TOTAL KOREA (SOUTH)
|
|
|
214,009
|
Luxembourg - 0.0%
|
|
|
|
L'Occitane Ltd.
|
|
814,500
|
2,433,843
|
Netherlands - 5.5%
|
|
|
|
Adyen BV (a)(d)
|
|
4,100
|
3,039,880
|
Argenx SE ADR (a)
|
|
24,200
|
11,897,446
|
ASM International NV (Netherlands)
|
|
42,200
|
17,734,840
|
ASML Holding NV (Netherlands)
|
|
171,808
|
101,152,023
|
Heineken NV (Bearer)
|
|
115,500
|
10,182,657
|
IMCD NV
|
|
171,300
|
21,732,831
|
Shell PLC (London)
|
|
1,348,788
|
42,748,786
|
Topicus.Com, Inc. (a)
|
|
26,781
|
1,769,035
|
Universal Music Group NV
|
|
245,240
|
6,399,828
|
Wolters Kluwer NV
|
|
344,973
|
41,815,458
|
TOTAL NETHERLANDS
|
|
|
258,472,784
|
Norway - 0.4%
|
|
|
|
Equinor ASA
|
|
328,641
|
10,770,239
|
Norsk Hydro ASA
|
|
482,000
|
3,016,279
|
Schibsted ASA (B Shares)
|
|
192,890
|
4,024,909
|
TOTAL NORWAY
|
|
|
17,811,427
|
Portugal - 0.1%
|
|
|
|
Galp Energia SGPS SA Class B
|
|
247,082
|
3,667,633
|
Singapore - 0.3%
|
|
|
|
Parkway Life REIT
|
|
891,548
|
2,406,593
|
Sea Ltd. ADR (a)
|
|
107,390
|
4,719,791
|
United Overseas Bank Ltd.
|
|
291,105
|
6,069,124
|
Wing Tai Holdings Ltd.
|
|
2,245,800
|
2,300,015
|
TOTAL SINGAPORE
|
|
|
15,495,523
|
South Africa - 0.2%
|
|
|
|
Anglo American PLC (United Kingdom)
|
|
289,400
|
7,946,811
|
Spain - 1.9%
|
|
|
|
Amadeus IT Holding SA Class A
|
|
354,349
|
21,459,120
|
Banco Santander SA (Spain)
|
|
5,406,700
|
20,589,085
|
CaixaBank SA
|
|
6,850,600
|
27,421,229
|
Cellnex Telecom SA (d)
|
|
285,131
|
9,938,963
|
EDP Renovaveis SA
|
|
142,870
|
2,343,530
|
Iberdrola SA
|
|
868,431
|
9,712,921
|
TOTAL SPAIN
|
|
|
91,464,848
|
Sweden - 2.3%
|
|
|
|
AddTech AB (B Shares)
|
|
1,185,727
|
19,014,088
|
Atlas Copco AB (A Shares)
|
|
2,345,900
|
31,507,030
|
Autoliv, Inc.
|
|
55,600
|
5,364,288
|
Evolution AB (d)
|
|
102,700
|
10,400,143
|
Haypp Group (a)
|
|
353,000
|
1,466,855
|
Hemnet Group AB
|
|
115,810
|
2,044,725
|
Indutrade AB
|
|
964,189
|
17,888,446
|
JM AB (B Shares)
|
|
84,400
|
1,145,619
|
Kry International AB (a)(c)(f)
|
|
527
|
20,064
|
Sandvik AB
|
|
881,500
|
16,219,912
|
Swedish Logistic Property AB (a)
|
|
565,110
|
1,355,161
|
TOTAL SWEDEN
|
|
|
106,426,331
|
Switzerland - 3.5%
|
|
|
|
Compagnie Financiere Richemont SA Series A
|
|
400,410
|
48,763,235
|
DSM-Firmenich AG
|
|
49,500
|
4,193,513
|
Julius Baer Group Ltd.
|
|
429,150
|
27,468,994
|
Partners Group Holding AG
|
|
22,190
|
25,078,445
|
Sika AG
|
|
144,564
|
36,814,190
|
UBS Group AG
|
|
920,860
|
22,826,584
|
TOTAL SWITZERLAND
|
|
|
165,144,961
|
Taiwan - 0.3%
|
|
|
|
Taiwan Semiconductor Manufacturing Co. Ltd.
|
|
859,000
|
14,014,661
|
United Kingdom - 14.6%
|
|
|
|
3i Group PLC
|
|
1,550,657
|
39,220,260
|
Ashtead Group PLC
|
|
195,000
|
11,900,733
|
AstraZeneca PLC (United Kingdom)
|
|
841,100
|
113,451,355
|
B&M European Value Retail SA
|
|
1,380,776
|
9,878,992
|
BAE Systems PLC
|
|
2,015,411
|
24,490,962
|
Beazley PLC
|
|
1,380,272
|
9,321,327
|
Big Yellow Group PLC
|
|
131,400
|
1,504,614
|
British American Tobacco PLC (United Kingdom)
|
|
100,629
|
3,163,975
|
Compass Group PLC
|
|
2,572,722
|
62,624,158
|
Cranswick PLC
|
|
102,418
|
4,438,586
|
Deliveroo PLC Class A (a)(d)
|
|
4,890,700
|
7,136,703
|
Diageo PLC
|
|
1,716,484
|
63,283,543
|
Diploma PLC
|
|
183,468
|
6,724,433
|
Grainger Trust PLC
|
|
427,613
|
1,218,763
|
Halma PLC
|
|
497,200
|
11,759,595
|
Hiscox Ltd.
|
|
1,238,920
|
15,191,643
|
Horizonte Minerals PLC (a)
|
|
1,143,600
|
1,751,109
|
Hotel Chocolat Group Ltd. (a)(b)
|
|
1,302,371
|
2,041,894
|
Indivior PLC (a)
|
|
335,100
|
7,273,540
|
Informa PLC
|
|
593,510
|
5,433,958
|
JD Sports Fashion PLC
|
|
5,621,800
|
10,268,160
|
John Wood Group PLC (a)
|
|
9,358,100
|
17,731,871
|
Lancashire Holdings Ltd.
|
|
1,380,700
|
9,939,093
|
London Stock Exchange Group PLC
|
|
437,670
|
43,865,883
|
National Grid PLC
|
|
785,540
|
9,394,550
|
NatWest Group PLC
|
|
2,458,400
|
7,032,394
|
RELX PLC (London Stock Exchange)
|
|
2,125,515
|
71,714,734
|
Rentokil Initial PLC
|
|
4,149,000
|
30,804,722
|
Rolls-Royce Holdings PLC (a)
|
|
5,403,300
|
14,477,519
|
RS GROUP PLC
|
|
1,996,815
|
17,916,653
|
Sage Group PLC
|
|
2,162,200
|
26,090,811
|
SSE PLC
|
|
274,640
|
5,394,921
|
Supreme PLC
|
|
2,316,800
|
3,505,142
|
Unilever PLC (Netherlands)
|
|
164,940
|
8,175,938
|
WH Smith PLC
|
|
206,900
|
3,392,776
|
WPP PLC
|
|
369,140
|
3,288,785
|
TOTAL UNITED KINGDOM
|
|
|
684,804,095
|
United States of America - 10.0%
|
|
|
|
Airbnb, Inc. Class A (a)
|
|
17,600
|
2,414,896
|
CBRE Group, Inc. (a)
|
|
274,200
|
20,252,412
|
CDW Corp.
|
|
80,400
|
16,221,504
|
Elastic NV (a)
|
|
25,500
|
2,071,620
|
Experian PLC
|
|
832,600
|
27,336,665
|
Ferguson PLC
|
|
170,000
|
28,136,116
|
Fiserv, Inc. (a)
|
|
82,016
|
9,264,527
|
ICON PLC (a)
|
|
147,700
|
36,371,125
|
Linde PLC
|
|
146,712
|
54,628,213
|
Marsh & McLennan Companies, Inc.
|
|
203,900
|
38,802,170
|
Micron Technology, Inc.
|
|
68,300
|
4,646,449
|
Nestle SA (Reg. S)
|
|
771,868
|
87,372,385
|
NextEra Energy, Inc.
|
|
32,880
|
1,883,695
|
Philip Morris International, Inc.
|
|
75,900
|
7,026,822
|
Republic Services, Inc.
|
|
16,220
|
2,311,512
|
Roche Holding AG (participation certificate)
|
|
92,500
|
25,252,603
|
S&P Global, Inc.
|
|
85,366
|
31,193,590
|
Sanofi SA
|
|
250,055
|
26,849,721
|
Schneider Electric SA
|
|
149,150
|
24,578,755
|
Thermo Fisher Scientific, Inc.
|
|
35,700
|
18,070,269
|
Waste Connections, Inc. (United States)
|
|
19,010
|
2,553,043
|
TOTAL UNITED STATES OF AMERICA
|
|
|
467,238,092
|
Zambia - 0.3%
|
|
|
|
First Quantum Minerals Ltd.
|
|
674,700
|
15,940,455
|
|
TOTAL COMMON STOCKS
(Cost $3,958,457,384)
|
|
|
4,584,481,574
|
|
|
|
|
|
Nonconvertible Preferred Stocks - 0.0%
|
|
|
|
Shares
|
Value ($)
|
Sweden - 0.0%
|
|
|
|
Kry International AB Series E (a)(c)(f)
(Cost $1,391,178)
|
|
3,043
|
115,852
|
|
|
|
|
|
Money Market Funds - 3.6%
|
|
|
|
Shares
|
Value ($)
|
Fidelity Cash Central Fund 5.39% (g)
|
|
111,749,018
|
111,771,368
|
Fidelity Securities Lending Cash Central Fund 5.39% (g)(h)
|
|
58,819,286
|
58,825,168
|
|
TOTAL MONEY MARKET FUNDS
(Cost $170,596,534)
|
|
|
170,596,536
|
|
|
|
|
|
|
TOTAL INVESTMENT IN SECURITIES - 101.3%
(Cost $4,130,445,096)
|
4,755,193,962
|
NET OTHER ASSETS (LIABILITIES) - (1.3)%
|
(63,077,045)
|
NET ASSETS - 100.0%
|
4,692,116,917
|
|
|
|
Legend
(b)
|
Security or a portion of the security is on loan at period end.
|
(d)
|
Security exempt from registration under Rule 144A of the Securities Act of 1933. These securities may be resold in transactions exempt from registration, normally to qualified institutional buyers. At the end of the period, the value of these securities amounted to $67,626,010 or 1.4% of net assets.
|
(e)
|
Security or a portion of the security purchased on a delayed delivery or when-issued basis.
|
(f)
|
Restricted securities (including private placements) - Investment in securities not registered under the Securities Act of 1933 (excluding 144A issues). At the end of the period, the value of restricted securities (excluding 144A issues) amounted to $135,916 or 0.0% of net assets.
|
(g)
|
Affiliated fund that is generally available only to investment companies and other accounts managed by Fidelity Investments. The rate quoted is the annualized seven-day yield of the fund at period end. A complete unaudited listing of the fund's holdings as of its most recent quarter end is available upon request. In addition, each Fidelity Central Fund's financial statements, which are not covered by the Fund's Report of Independent Registered Public Accounting Firm, are available on the SEC's website or upon request.
|
(h)
|
Investment made with cash collateral received from securities on loan.
|
Additional information on each restricted holding is as follows:
|
Security
|
Acquisition Date
|
Acquisition Cost ($)
|
Kry International AB
|
5/14/21
|
228,879
|
|
|
|
|
Kry International AB Series E
|
5/14/21
|
1,391,178
|
|
|
|
|
Affiliated Central Funds
Fiscal year to date information regarding the Fund's investments in Fidelity Central Funds, including the ownership percentage, is presented below.
Affiliate
|
Value,
beginning
of period ($)
|
Purchases ($)
|
Sales
Proceeds ($)
|
Dividend
Income ($)
|
Realized
Gain (loss) ($)
|
Change in
Unrealized
appreciation
(depreciation) ($)
|
Value,
end
of period ($)
|
% ownership,
end
of period
|
Fidelity Cash Central Fund 5.39%
|
37,282,189
|
1,840,770,096
|
1,766,280,918
|
3,526,590
|
-
|
1
|
111,771,368
|
0.3%
|
Fidelity Securities Lending Cash Central Fund 5.39%
|
55,235,153
|
663,538,473
|
659,948,458
|
478,270
|
-
|
-
|
58,825,168
|
0.2%
|
Total
|
92,517,342
|
2,504,308,569
|
2,426,229,376
|
4,004,860
|
-
|
1
|
170,596,536
|
|
|
|
|
|
|
|
|
|
|
|
Amounts in the dividend income column in the above table include any capital gain distributions from underlying funds, which are presented in the corresponding line item in the Statement of Operations, if applicable.
Amounts in the dividend income column for Fidelity Securities Lending Cash Central Fund represents the income earned on investing cash collateral, less rebates paid to borrowers and any lending agent fees associated with the loan, plus any premium payments received for lending certain types of securities.
Amounts included in the purchases and sales proceeds columns may include in-kind transactions, if applicable.
Investment Valuation
The following is a summary of the inputs used, as of September 30, 2023, involving the Fund's assets and liabilities carried at fair value. The inputs or methodology used for valuing securities may not be an indication of the risk associated with investing in those securities. For more information on valuation inputs, and their aggregation into the levels used below, please refer to the Investment Valuation section in the accompanying Notes to Financial Statements.
Valuation Inputs at Reporting Date:
|
Description
|
Total ($)
|
Level 1 ($)
|
Level 2 ($)
|
Level 3 ($)
|
Investments in Securities:
|
|
|
|
|
|
|
Equities:
|
|
|
|
|
Communication Services
|
104,658,358
|
60,532,797
|
44,125,561
|
-
|
Consumer Discretionary
|
502,565,355
|
113,986,376
|
388,578,979
|
-
|
Consumer Staples
|
351,215,648
|
125,666,600
|
225,549,048
|
-
|
Energy
|
212,139,375
|
69,668,769
|
142,470,606
|
-
|
Financials
|
1,021,077,262
|
547,860,901
|
473,216,361
|
-
|
Health Care
|
618,004,694
|
270,320,086
|
347,684,608
|
-
|
Industrials
|
847,781,499
|
456,216,183
|
391,565,316
|
-
|
Information Technology
|
485,785,964
|
197,083,755
|
288,566,291
|
135,918
|
Materials
|
313,189,742
|
165,048,900
|
148,140,842
|
-
|
Real Estate
|
68,597,118
|
68,597,118
|
-
|
-
|
Utilities
|
59,582,411
|
22,248,375
|
37,334,036
|
-
|
|
|
Money Market Funds
|
170,596,536
|
170,596,536
|
-
|
-
|
Total Investments in Securities:
|
4,755,193,962
|
2,267,826,396
|
2,487,231,648
|
135,918
|
Statement of Assets and Liabilities
|
|
|
|
|
September 30, 2023
|
|
|
|
|
|
|
Assets
|
|
|
|
|
Investment in securities, at value (including securities loaned of $56,207,539) - See accompanying schedule:
|
|
|
|
|
Unaffiliated issuers (cost $3,959,848,562)
|
$
|
4,584,597,426
|
|
|
Fidelity Central Funds (cost $170,596,534)
|
|
170,596,536
|
|
|
|
|
|
|
|
|
|
|
|
|
|
|
Total Investment in Securities (cost $4,130,445,096)
|
|
|
$
|
4,755,193,962
|
Cash
|
|
|
|
72,092
|
Foreign currency held at value (cost $617,447)
|
|
|
|
615,273
|
Receivable for investments sold
|
|
|
|
15,844,825
|
Receivable for fund shares sold
|
|
|
|
6,930
|
Dividends receivable
|
|
|
|
8,629,610
|
Reclaims receivable
|
|
|
|
12,680,258
|
Interest receivable
|
|
|
|
888
|
Distributions receivable from Fidelity Central Funds
|
|
|
|
346,091
|
Other receivables
|
|
|
|
2,063
|
Total assets
|
|
|
|
4,793,391,992
|
Liabilities
|
|
|
|
|
Payable for investments purchased
|
|
|
|
|
Regular delivery
|
$
|
37,435,781
|
|
|
Delayed delivery
|
|
216,149
|
|
|
Payable for fund shares redeemed
|
|
4,062,906
|
|
|
Other payables and accrued expenses
|
|
735,071
|
|
|
Collateral on securities loaned
|
|
58,825,168
|
|
|
Total Liabilities
|
|
|
|
101,275,075
|
Net Assets
|
|
|
$
|
4,692,116,917
|
Net Assets consist of:
|
|
|
|
|
Paid in capital
|
|
|
$
|
4,195,379,668
|
Total accumulated earnings (loss)
|
|
|
|
496,737,249
|
Net Assets
|
|
|
$
|
4,692,116,917
|
Net Asset Value, offering price and redemption price per share ($4,692,116,917 ÷ 53,067,464 shares)
|
|
|
$
|
88.42
|
Statement of Operations
|
|
|
|
|
Year ended
September 30, 2023
|
Investment Income
|
|
|
|
|
Dividends
|
|
|
$
|
116,941,005
|
Interest
|
|
|
|
57,848
|
Income from Fidelity Central Funds (including $478,270 from security lending)
|
|
|
|
4,004,860
|
Income before foreign taxes withheld
|
|
|
$
|
121,003,713
|
Less foreign taxes withheld
|
|
|
|
(11,673,537)
|
Total Income
|
|
|
|
109,330,176
|
Expenses
|
|
|
|
|
Custodian fees and expenses
|
$
|
233,790
|
|
|
Independent trustees' fees and expenses
|
|
23,798
|
|
|
Total Expenses
|
|
|
|
257,588
|
Net Investment income (loss)
|
|
|
|
109,072,588
|
Realized and Unrealized Gain (Loss)
|
|
|
|
|
Net realized gain (loss) on:
|
|
|
|
|
Investment Securities:
|
|
|
|
|
Unaffiliated issuers (net of foreign taxes of $79,610)
|
|
(7,606,120)
|
|
|
Foreign currency transactions
|
|
194,976
|
|
|
Futures contracts
|
|
(251,302)
|
|
|
Total net realized gain (loss)
|
|
|
|
(7,662,446)
|
Change in net unrealized appreciation (depreciation) on:
|
|
|
|
|
Investment Securities:
|
|
|
|
|
Unaffiliated issuers(net of increase in deferred foreign taxes of $304,885)
|
|
773,680,819
|
|
|
Fidelity Central Funds
|
|
1
|
|
|
Assets and liabilities in foreign currencies
|
|
667,536
|
|
|
Total change in net unrealized appreciation (depreciation)
|
|
|
|
774,348,356
|
Net gain (loss)
|
|
|
|
766,685,910
|
Net increase (decrease) in net assets resulting from operations
|
|
|
$
|
875,758,498
|
Statement of Changes in Net Assets
|
|
|
|
|
Year ended
September 30, 2023
|
|
Year ended
September 30, 2022
|
Increase (Decrease) in Net Assets
|
|
|
|
|
Operations
|
|
|
|
|
Net investment income (loss)
|
$
|
109,072,588
|
$
|
85,100,977
|
Net realized gain (loss)
|
|
(7,662,446)
|
|
(117,143,364)
|
Change in net unrealized appreciation (depreciation)
|
|
774,348,356
|
|
(1,139,915,261)
|
Net increase (decrease) in net assets resulting from operations
|
|
875,758,498
|
|
(1,171,957,648)
|
Distributions to shareholders
|
|
(103,851,743)
|
|
(301,411,089)
|
|
|
|
|
|
|
Affiliated share transactions
|
|
|
|
|
Proceeds from sales of shares
|
|
1,101,921,798
|
|
1,136,288,448
|
Reinvestment of distributions
|
|
103,851,743
|
|
301,411,089
|
Cost of shares redeemed
|
|
(583,628,102)
|
|
(456,223,837)
|
|
|
|
|
|
|
Net increase (decrease) in net assets resulting from share transactions
|
|
622,145,439
|
|
981,475,700
|
Total increase (decrease) in net assets
|
|
1,394,052,194
|
|
(491,893,037)
|
|
|
|
|
|
|
Net Assets
|
|
|
|
|
Beginning of period
|
|
3,298,064,723
|
|
3,789,957,760
|
End of period
|
$
|
4,692,116,917
|
$
|
3,298,064,723
|
|
|
|
|
|
|
Other Information
|
|
|
|
|
Shares
|
|
|
|
|
Sold
|
|
12,617,963
|
|
12,769,516
|
Issued in reinvestment of distributions
|
|
1,145,589
|
|
3,029,094
|
Redeemed
|
|
(6,599,034)
|
|
(5,354,221)
|
Net increase (decrease)
|
|
7,164,518
|
|
10,444,389
|
|
|
|
|
|
|
Financial Highlights
Fidelity® International Equity Central Fund
|
|
|
Years ended September 30,
|
|
2023
|
|
2022
|
|
2021
|
|
2020
|
|
2019
|
Selected Per-Share Data
|
|
|
|
|
|
|
|
|
|
|
Net asset value, beginning of period
|
$
|
71.85
|
$
|
106.88
|
$
|
84.62
|
$
|
77.92
|
$
|
84.55
|
Income from Investment Operations
|
|
|
|
|
|
|
|
|
|
|
Net investment income (loss) A,B
|
|
2.13
|
|
2.07
|
|
1.80
|
|
1.40
|
|
2.23
|
Net realized and unrealized gain (loss)
|
|
16.42
|
|
(28.91)
|
|
22.17
|
|
6.94
|
|
(3.09)
|
Total from investment operations
|
|
18.55
|
|
(26.84)
|
|
23.97
|
|
8.34
|
|
(.86)
|
Distributions from net investment income
|
|
(1.98)
|
|
(2.25)
|
|
(1.71)
|
|
(1.39)
|
|
(2.12)
|
Distributions from net realized gain
|
|
-
|
|
(5.94)
|
|
-
|
|
(.25)
|
|
(3.65)
|
Total distributions
|
|
(1.98)
|
|
(8.19)
|
|
(1.71)
|
|
(1.64)
|
|
(5.77)
|
Net asset value, end of period
|
$
|
88.42
|
$
|
71.85
|
$
|
106.88
|
$
|
84.62
|
$
|
77.92
|
Total Return C
|
|
25.78%
|
|
(27.21)%
|
|
28.42%
|
|
10.91%
|
|
(.21)%
|
Ratios to Average Net Assets B,D,E
|
|
|
|
|
|
|
|
|
|
|
Expenses before reductions
|
|
.01%
|
|
.01%
|
|
.01%
|
|
.01%
|
|
.01%
|
Expenses net of fee waivers, if any
|
|
.01%
|
|
.01%
|
|
.01%
|
|
.01%
|
|
.01%
|
Expenses net of all reductions
|
|
.01%
|
|
.01%
|
|
.01%
|
|
.01%
|
|
.01%
|
Net investment income (loss)
|
|
2.39%
|
|
2.25%
|
|
1.79%
|
|
1.77%
|
|
2.93%
|
Supplemental Data
|
|
|
|
|
|
|
|
|
|
|
Net assets, end of period (000 omitted)
|
$
|
4,692,117
|
$
|
3,298,065
|
$
|
3,789,958
|
$
|
3,020,929
|
$
|
2,432,786
|
Portfolio turnover rate F
|
|
40%
|
|
38%
|
|
52%
|
|
81%
|
|
70%
|
ACalculated based on average shares outstanding during the period.
BNet investment income (loss) is affected by the timing of the declaration of dividends by any underlying mutual funds or exchange-traded funds (ETFs). Net investment income (loss) of any mutual funds or ETFs is not included in the Fund's net investment income (loss) ratio.
CTotal returns would have been lower if certain expenses had not been reduced during the applicable periods shown.
DFees and expenses of any underlying mutual funds or exchange-traded funds (ETFs) are not included in the Fund's expense ratio. The Fund indirectly bears its proportionate share of these expenses. For additional expense information related to investments in Fidelity Central Funds, please refer to the "Investments in Fidelity Central Funds" note found in the Notes to Financial Statements section of the most recent Annual or Semi-Annual report.
EExpense ratios reflect operating expenses of the class. Expenses before reductions do not reflect amounts reimbursed, waived, or reduced through arrangements with the investment adviser, brokerage services, or other offset arrangements, if applicable, and do not represent the amount paid by the class during periods when reimbursements, waivers or reductions occur.
FAmount does not include the portfolio activity of any underlying mutual funds or exchange-traded funds (ETFs).
For the period ended September 30, 2023
1. Organization.
Fidelity International Equity Central Fund (the Fund) is a fund of Fidelity Central Investment Portfolios LLC (the LLC) and is authorized to issue an unlimited number of shares. Shares of the Fund are only offered to other investment companies and accounts managed by Fidelity Management & Research Company LLC (FMR), or its affiliates (the Investing Funds). The LLC is registered under the Investment Company Act of 1940, as amended (the 1940 Act), as an open-end management investment company organized as a Delaware Limited Liability Company.
2. Investments in Fidelity Central Funds.
Funds may invest in Fidelity Central Funds, which are open-end investment companies generally available only to other investment companies and accounts managed by the investment adviser and its affiliates. The Schedule of Investments lists any Fidelity Central Funds held as an investment as of period end, but does not include the underlying holdings of each Fidelity Central Fund. An investing fund indirectly bears its proportionate share of the expenses of the underlying Fidelity Central Funds.
Based on its investment objective, each Fidelity Central Fund may invest or participate in various investment vehicles or strategies that are similar to those of the investing fund. These strategies are consistent with the investment objectives of the investing fund and may involve certain economic risks which may cause a decline in value of each of the Fidelity Central Funds and thus a decline in the value of the investing fund.
Fidelity Central Fund
|
Investment Manager
|
Investment Objective
|
Investment Practices
|
Expense RatioA
|
Fidelity Money Market Central Funds
|
Fidelity Management & Research Company LLC (FMR)
|
Each fund seeks to obtain a high level of current income consistent with the preservation of capital and liquidity.
|
Short-term Investments
|
Less than .005%
|
A Expenses expressed as a percentage of average net assets and are as of each underlying Central Fund's most recent annual or semi-annual shareholder report.
A complete unaudited list of holdings for each Fidelity Central Fund is available upon request or at the Securities and Exchange Commission website at www.sec.gov. In addition, the financial statements of the Fidelity Central Funds which contain the significant accounting policies (including investment valuation policies) of those funds, and are not covered by the Report of Independent Registered Public Accounting Firm, are available on the Securities and Exchange Commission website or upon request.
3. Significant Accounting Policies.
The Fund is an investment company and applies the accounting and reporting guidance of the Financial Accounting Standards Board (FASB) Accounting Standards Codification Topic 946 Financial Services - Investment Companies. The financial statements have been prepared in conformity with accounting principles generally accepted in the United States of America (GAAP), which require management to make certain estimates and assumptions at the date of the financial statements. Actual results could differ from those estimates. Subsequent events, if any, through the date that the financial statements were issued have been evaluated in the preparation of the financial statements. The Fund's Schedule of Investments lists any underlying mutual funds or exchange-traded funds (ETFs) but does not include the underlying holdings of these funds. The following summarizes the significant accounting policies of the Fund:
Investment Valuation. Investments are valued as of 4:00 p.m. Eastern time on the last calendar day of the period. The Board of Directors (the Board) has designated the Fund's investment adviser as the valuation designee responsible for the fair valuation function and performing fair value determinations as needed. The investment adviser has established a Fair Value Committee (the Committee) to carry out the day-to-day fair valuation responsibilities and has adopted policies and procedures to govern the fair valuation process and the activities of the Committee. In accordance with these fair valuation policies and procedures, which have been approved by the Board, the Fund attempts to obtain prices from one or more third party pricing services or brokers to value its investments. When current market prices, quotations or currency exchange rates are not readily available or reliable, investments will be fair valued in good faith by the Committee, in accordance with the policies and procedures. Factors used in determining fair value vary by investment type and may include market or investment specific events, transaction data, estimated cash flows, and market observations of comparable investments. The frequency that the fair valuation procedures are used cannot be predicted and they may be utilized to a significant extent. The Committee manages the Fund's fair valuation practices and maintains the fair valuation policies and procedures. The Fund's investment adviser reports to the Board information regarding the fair valuation process and related material matters.
The Fund categorizes the inputs to valuation techniques used to value its investments into a disclosure hierarchy consisting of three levels as shown below:
Level 1 - unadjusted quoted prices in active markets for identical investments
Level 2 - other significant observable inputs (including quoted prices for similar investments, interest rates, prepayment speeds, etc.)
Level 3 - unobservable inputs (including the Fund's own assumptions based on the best information available)
Valuation techniques used to value the Fund's investments by major category are as follows:
Equity securities, including restricted securities, for which market quotations are readily available, are valued at the last reported sale price or official closing price as reported by a third party pricing service on the primary market or exchange on which they are traded and are categorized as Level 1 in the hierarchy. In the event there were no sales during the day or closing prices are not available, securities are valued at the last quoted bid price or may be valued using the last available price and are generally categorized as Level 2 in the hierarchy. For foreign equity securities, when market or security specific events arise, comparisons to the valuation of American Depositary Receipts (ADRs), futures contracts, ETFs and certain indexes as well as quoted prices for similar securities may be used and would be categorized as Level 2 in the hierarchy. For equity securities, including restricted securities, where observable inputs are limited, assumptions about market activity and risk are used and these securities may be categorized as Level 3 in the hierarchy.
Investments in open-end mutual funds, including the Fidelity Central Funds, are valued at their closing net asset value (NAV) each business day and are categorized as Level 1 in the hierarchy.
Changes in valuation techniques may result in transfers in or out of an assigned level within the disclosure hierarchy. The aggregate value of investments by input level as of September 30, 2023 is included at the end of the Fund's Schedule of Investments.
Foreign Currency. Certain Funds may use foreign currency contracts to facilitate transactions in foreign-denominated securities. Gains and losses from these transactions may arise from changes in the value of the foreign currency or if the counterparties do not perform under the contracts' terms.
Foreign-denominated assets, including investment securities, and liabilities are translated into U.S. dollars at the exchange rates at period end. Purchases and sales of investment securities, income and dividends received, and expenses denominated in foreign currencies are translated into U.S. dollars at the exchange rate in effect on the transaction date.
The effects of exchange rate fluctuations on investments are included with the net realized and unrealized gain (loss) on investment securities. Other foreign currency transactions resulting in realized and unrealized gain (loss) are disclosed separately.
Investment Transactions and Income. For financial reporting purposes, the Fund's investment holdings and NAV include trades executed through the end of the last business day of the period. The NAV per share for processing shareholder transactions is calculated as of the close of business of the New York Stock Exchange (NYSE), normally 4:00 p.m. Eastern time and includes trades executed through the end of the prior business day. Gains and losses on securities sold are determined on the basis of identified cost and include proceeds received from litigation. Commissions paid to certain brokers with whom the investment adviser, or its affiliates, places trades on behalf of a fund include an amount in addition to trade execution, which may be rebated back to a fund. Any such rebates are included in net realized gain (loss) on investments in the Statement of Operations. Dividend income is recorded on the ex-dividend date, except for certain dividends from foreign securities where the ex-dividend date may have passed, which are recorded as soon as the Fund is informed of the ex-dividend date. Non-cash dividends included in dividend income, if any, are recorded at the fair market value of the securities received. Income and capital gain distributions from Fidelity Central Funds, if any, are recorded on the ex-dividend date. Certain distributions received by the Fund represent a return of capital or capital gain. The Fund determines the components of these distributions subsequent to the ex-dividend date, based upon receipt of tax filings or other correspondence relating to the underlying investment. These distributions are recorded as a reduction of cost of investments and/or as a realized gain. Interest income is accrued as earned and includes coupon interest and amortization of premium and accretion of discount on debt securities as applicable. Investment income is recorded net of foreign taxes withheld where recovery of such taxes is uncertain. Funds may file withholding tax reclaims in certain jurisdictions to recover a portion of amounts previously withheld. Any withholding tax reclaims income is included in the Statement of Operations in foreign taxes withheld. Any receivables for withholding tax reclaims are included in the Statement of Assets and Liabilities in reclaims receivable.
Expenses. Expenses directly attributable to a fund are charged to that fund. Expenses attributable to more than one fund are allocated among the respective funds on the basis of relative net assets or other appropriate methods. Expenses included in the accompanying financial statements reflect the expenses of that fund and do not include any expenses associated with any underlying mutual funds or exchange-traded funds. Although not included in a fund's expenses, a fund indirectly bears its proportionate share of these expenses through the net asset value of each underlying mutual fund or exchange-traded fund. Expense estimates are accrued in the period to which they relate and adjustments are made when actual amounts are known.
Income Tax Information and Distributions to Shareholders. Each year, the Fund intends to qualify as a regulated investment company under Subchapter M of the Internal Revenue Code, including distributing substantially all of its taxable income and realized gains. As a result, no provision for U.S. Federal income taxes is required. As of September 30, 2023, the Fund did not have any unrecognized tax benefits in the financial statements; nor is the Fund aware of any tax positions for which it is reasonably possible that the total amounts of unrecognized tax benefits will significantly change in the next twelve months. The Fund files a U.S. federal tax return, in addition to state and local tax returns as required. The Fund's federal income tax returns are subject to examination by the Internal Revenue Service (IRS) for a period of three fiscal years after they are filed. State and local tax returns may be subject to examination for an additional fiscal year depending on the jurisdiction. Foreign taxes are provided for based on the Fund's understanding of the tax rules and rates that exist in the foreign markets in which it invests. The Fund is subject to a tax imposed on capital gains by certain countries in which it invests. An estimated deferred tax liability for net unrealized appreciation on the applicable securities is included in Other payables and accrued expenses on the Statement of Assets & Liabilities.
Distributions are declared and recorded on the ex-dividend date. Income and capital gain distributions are determined in accordance with income tax regulations, which may differ from GAAP.
Capital accounts within the financial statements are adjusted for permanent book-tax differences. These adjustments have no impact on net assets or the results of operations. Capital accounts are not adjusted for temporary book-tax differences which will reverse in a subsequent period.
Book-tax differences are primarily due to futures contracts, foreign currency transactions, certain foreign taxes, passive foreign investment companies (PFIC), capital loss carryforwards and losses deferred due to wash sales and excise tax regulations.
As of period end, the cost and unrealized appreciation (depreciation) in securities, and derivatives if applicable, for federal income tax purposes were as follows:
Gross unrealized appreciation
|
$787,003,720
|
Gross unrealized depreciation
|
(184,311,371)
|
Net unrealized appreciation (depreciation)
|
$602,692,349
|
Tax Cost
|
$4,152,501,613
|
The tax-based components of distributable earnings as of period end were as follows:
Undistributed ordinary income
|
$19,736,655
|
Capital loss carryforward
|
$(124,465,203)
|
Net unrealized appreciation (depreciation) on securities and other investments
|
$602,138,063
|
Capital loss carryforwards are only available to offset future capital gains of the Fund to the extent provided by regulations and may be limited. The capital loss carryforward information presented below, including any applicable limitation, is estimated as of fiscal period end and is subject to adjustment.
Short-term
|
$(124,465,203)
|
Total capital loss carryforward
|
$(124,465,203)
|
The tax character of distributions paid was as follows:
|
September 30, 2023
|
September 30, 2022
|
Ordinary Income
|
$103,851,743
|
$ 146,442,802
|
Long-term Capital Gains
|
-
|
154,968,287
|
Total
|
$103,851,743
|
$ 301,411,089
|
Delayed Delivery Transactions and When-Issued Securities. During the period, certain Funds transacted in securities on a delayed delivery or when-issued basis. Payment and delivery may take place after the customary settlement period for that security. The price of the underlying securities and the date when the securities will be delivered and paid for are fixed at the time the transaction is negotiated. Securities purchased on a delayed delivery or when-issued basis are identified as such in the Schedule of Investments. Compensation for interest forgone in the purchase of a delayed delivery or when-issued debt security may be received. With respect to purchase commitments, each applicable Fund identifies securities as segregated in its records with a value at least equal to the amount of the commitment. Payables and receivables associated with the purchases and sales of delayed delivery securities having the same coupon, settlement date and broker are offset. Delayed delivery or when-issued securities that have been purchased from and sold to different brokers are reflected as both payables and receivables in the Statement of Assets and Liabilities under the caption "Delayed delivery", as applicable. Losses may arise due to changes in the value of the underlying securities or if the counterparty does not perform under the contract's terms, or if the issuer does not issue the securities due to political, economic, or other factors.
Restricted Securities (including Private Placements). Funds may invest in securities that are subject to legal or contractual restrictions on resale. These securities generally may be resold in transactions exempt from registration or to the public if the securities are registered. Disposal of these securities may involve time-consuming negotiations and expense, and prompt sale at an acceptable price may be difficult. Information regarding restricted securities held at period end is included at the end of the Schedule of Investments, if applicable.
4. Derivative Instruments.
Risk Exposures and the Use of Derivative Instruments. The Fund's investment objectives allow for various types of derivative instruments, including futures contracts. Derivatives are investments whose value is primarily derived from underlying assets, indices or reference rates and may be transacted on an exchange or over-the-counter (OTC). Derivatives may involve a future commitment to buy or sell a specified asset based on specified terms, to exchange future cash flows at periodic intervals based on a notional principal amount, or for one party to make one or more payments upon the occurrence of specified events in exchange for periodic payments from the other party.
Derivatives were used to increase returns and to manage exposure to certain risks as defined below. The success of any strategy involving derivatives depends on analysis of numerous economic factors, and if the strategies for investment do not work as intended, the objectives may not be achieved.
Derivatives were used to increase or decrease exposure to the following risk(s):
|
|
Equity Risk
|
Equity risk relates to the fluctuations in the value of financial instruments as a result of changes in market prices (other than those arising from interest rate risk or foreign exchange risk), whether caused by factors specific to an individual investment, its issuer, or all factors affecting all instruments traded in a market or market segment.
|
Funds are also exposed to additional risks from investing in derivatives, such as liquidity risk and counterparty credit risk. Liquidity risk is the risk that a fund will be unable to close out the derivative in the open market in a timely manner. Counterparty credit risk is the risk that the counterparty will not be able to fulfill its obligation to a fund. Counterparty credit risk related to exchange-traded contracts may be mitigated by the protection provided by the exchange on which they trade.
Investing in derivatives may involve greater risks than investing in the underlying assets directly and, to varying degrees, may involve risk of loss in excess of any initial investment and collateral received and amounts recognized in the Statement of Assets and Liabilities. In addition, there may be the risk that the change in value of the derivative contract does not correspond to the change in value of the underlying instrument.
Futures Contracts. A futures contract is an agreement between two parties to buy or sell a specified underlying instrument for a fixed price at a specified future date. Futures contracts were used to manage exposure to the stock market.
Upon entering into a futures contract, a fund is required to deposit either cash or securities (initial margin) with a clearing broker in an amount equal to a certain percentage of the face value of the contract. Futures contracts are marked-to-market daily and subsequent daily payments are made or received by a fund depending on the daily fluctuations in the value of the futures contracts and are recorded as unrealized appreciation or (depreciation). This receivable and/or payable, if any, is included in daily variation margin on futures contracts in the Statement of Assets and Liabilities. Realized gain or (loss) is recorded upon the expiration or closing of a futures contract. The net realized gain (loss) and change in net unrealized appreciation (depreciation) on futures contracts during the period is presented in the Statement of Operations.
Any open futures contracts at period end are presented in the Schedule of Investments under the caption "Futures Contracts". The notional amount at value reflects each contract's exposure to the underlying instrument or index at period end, and is representative of volume of activity during the period unless an average notional amount is presented. Any securities deposited to meet initial margin requirements are identified in the Schedule of Investments. Any cash deposited to meet initial margin requirements is presented as segregated cash with brokers for derivative instruments in the Statement of Assets and Liabilities.
5. Purchases and Sales of Investments.
Purchases and sales of securities, other than short-term securities and in-kind transactions, as applicable, are noted in the table below.
|
Purchases ($)
|
Sales ($)
|
Fidelity International Equity Central Fund
|
2,334,846,649
|
1,761,262,639
|
6. Fees and Other Transactions with Affiliates.
Management Fee and Expense Contract. Fidelity Management & Research Company LLC (the investment adviser) provides the Fund with investment management services. The Fund does not pay any fees for these services. Pursuant to the Fund's management contract, the investment adviser receives a monthly management fee that represents a portion of the management fees it receives from the Investing Funds. In addition, under an expense contract, the investment adviser also pays all other expenses of the Fund, excluding custody fees, the compensation of the independent Directors, and certain miscellaneous expenses such as proxy and shareholder meeting expenses.
Brokerage Commissions. A portion of portfolio transactions were placed with brokerage firms which are affiliates of the investment adviser. Brokerage commissions are included in net realized gain (loss) and change in net unrealized appreciation (depreciation) in the Statement of Operations. The commissions paid to these affiliated firms were as follows:
|
Amount
|
Fidelity International Equity Central Fund
|
$ 4,890
|
Interfund Trades. Funds may purchase from or sell securities to other Fidelity Funds under procedures adopted by the Board. The procedures have been designed to ensure these interfund trades are executed in accordance with Rule 17a-7 of the 1940 Act. Any interfund trades are included within the respective purchases and sales amounts shown in the Purchases and Sales of Investments note. Interfund trades during the period are noted in the table below.
|
Purchases ($)
|
Sales ($)
|
Realized Gain (Loss) ($)
|
Fidelity International Equity Central Fund
|
103,590,377
|
55,994,242
|
(2,531,016)
|
Other. During the period, the investment adviser reimbursed the Fund for certain losses as follows:
|
Amount ($)
|
Fidelity International Equity Central Fund
|
7,457
|
7. Security Lending.
Funds lend portfolio securities from time to time in order to earn additional income. Lending agents are used, including National Financial Services (NFS), an affiliate of the investment adviser. Pursuant to a securities lending agreement, NFS will receive a fee, which is capped at 9.9% of a fund's daily lending revenue, for its services as lending agent. A fund may lend securities to certain qualified borrowers, including NFS. On the settlement date of the loan, a fund receives collateral (in the form of U.S. Treasury obligations, letters of credit and/or cash) against the loaned securities and maintains collateral in an amount not less than 100% of the market value of the loaned securities during the period of the loan. The market value of the loaned securities is determined at the close of business of a fund and any additional required collateral is delivered to a fund on the next business day. A fund or borrower may terminate the loan at any time, and if the borrower defaults on its obligation to return the securities loaned because of insolvency or other reasons, a fund may apply collateral received from the borrower against the obligation. A fund may experience delays and costs in recovering the securities loaned. Any cash collateral received is invested in the Fidelity Securities Lending Cash Central Fund. Any loaned securities are identified as such in the Schedule of Investments, and the value of loaned securities and cash collateral at period end, as applicable, are presented in the Statement of Assets and Liabilities. Security lending income represents the income earned on investing cash collateral, less rebates paid to borrowers and any lending agent fees associated with the loan, plus any premium payments received for lending certain types of securities. Security lending income is presented in the Statement of Operations as a component of income from Fidelity Central Funds. Affiliated security lending activity, if any, was as follows:
|
Total Security Lending Fees Paid to NFS
|
Security Lending Income From Securities Loaned to NFS
|
Value of Securities Loaned to NFS at Period End
|
Fidelity International Equity Central Fund
|
$50,736
|
$-
|
$-
|
8. Other.
A fund's organizational documents provide former and current directors and officers with a limited indemnification against liabilities arising in connection with the performance of their duties to the fund. In the normal course of business, a fund may also enter into contracts that provide general indemnifications. A fund's maximum exposure under these arrangements is unknown as this would be dependent on future claims that may be made against a fund. The risk of material loss from such claims is considered remote.
At the end of the period, mutual funds managed by the investment adviser or its affiliates were the owners of record of all of the outstanding shares of the Fund.
9. Risk and Uncertainties.
Many factors affect a fund's performance. Developments that disrupt global economies and financial markets, such as pandemics, epidemics, outbreaks of infectious diseases, war, terrorism, and environmental disasters, may significantly affect a fund's investment performance. The effects of these developments to a fund will be impacted by the types of securities in which a fund invests, the financial condition, industry, economic sector, and geographic location of an issuer, and a fund's level of investment in the securities of that issuer. Significant concentrations in security types, issuers, industries, sectors, and geographic locations may magnify the factors that affect a fund's performance.
To the Board of Trustees of Fidelity Central Investment Portfolios LLC and the Shareholders of Fidelity International Equity Central Fund:
Opinion on the Financial Statements and Financial Highlights
We have audited the accompanying statement of assets and liabilities of Fidelity International Equity Central Fund (the "Fund"), a fund of Fidelity Central Investment Portfolios LLC, including the schedule of investments, as of September 30, 2023, the related statement of operations for the year then ended, the statement of changes in net assets for each of the two years in the period then ended, the financial highlights for each of the five years in the period then ended, and the related notes. In our opinion, the financial statements and financial highlights present fairly, in all material respects, the financial position of the Fund as of September 30, 2023, and the results of its operations for the year then ended, the changes in its net assets for each of the two years in the period then ended, and the financial highlights for each of the five years in the period then ended in conformity with accounting principles generally accepted in the United States of America.
Basis for Opinion
These financial statements and financial highlights are the responsibility of the Fund's management. Our responsibility is to express an opinion on the Fund's financial statements and financial highlights based on our audits. We are a public accounting firm registered with the Public Company Accounting Oversight Board (United States) (PCAOB) and are required to be independent with respect to the Fund in accordance with the U.S. federal securities laws and the applicable rules and regulations of the Securities and Exchange Commission and the PCAOB.
We conducted our audits in accordance with the standards of the PCAOB. Those standards require that we plan and perform the audit to obtain reasonable assurance about whether the financial statements and financial highlights are free of material misstatement, whether due to error or fraud. The Fund is not required to have, nor were we engaged to perform, an audit of its internal control over financial reporting. As part of our audits, we are required to obtain an understanding of internal control over financial reporting but not for the purpose of expressing an opinion on the effectiveness of the Fund's internal control over financial reporting. Accordingly, we express no such opinion.
Our audits included performing procedures to assess the risks of material misstatement of the financial statements and financial highlights, whether due to error or fraud, and performing procedures that respond to those risks. Such procedures included examining, on a test basis, evidence regarding the amounts and disclosures in the financial statements and financial highlights. Our audits also included evaluating the accounting principles used and significant estimates made by management, as well as evaluating the overall presentation of the financial statements and financial highlights. Our procedures included confirmation of securities owned as of September 30, 2023, by correspondence with the custodian and brokers; when replies were not received from brokers, we performed other auditing procedures. We believe that our audits provide a reasonable basis for our opinion.
/s/ Deloitte & Touche LLP
Boston, Massachusetts
November 13, 2023
We have served as the auditor of one or more of the Fidelity investment companies since 1999.
DIRECTORS AND OFFICERS (TRUSTEES AND OFFICERS)
The Trustees, Members of the Advisory Board (if any), and officers of the Fidelity Central Investment Portfolios LLC and fund, as applicable, are listed below. The Board of Trustees governs the fund and is responsible for protecting the interests of shareholders. The Trustees are experienced executives who meet periodically throughout the year to oversee the fund's activities, review contractual arrangements with companies that provide services to the fund, oversee management of the risks associated with such activities and contractual arrangements, and review the fund's performance. Except for Vijay Advani, each of the Trustees oversees 322 funds. Mr. Advani oversees 215 funds.
The Trustees hold office without limit in time except that (a) any Trustee may resign; (b) any Trustee may be removed by written instrument, signed by at least two-thirds of the number of Trustees prior to such removal; (c) any Trustee who requests to be retired or who has become incapacitated by illness or injury may be retired by written instrument signed by a majority of the other Trustees; and (d) any Trustee may be removed at any special meeting of shareholders by a two-thirds vote of the outstanding voting securities of the trust. Each Trustee who is not an interested person (as defined in the 1940 Act) of the trust and the fund is referred to herein as an Independent Trustee. Each Independent Trustee shall retire not later than the last day of the calendar year in which his or her 75th birthday occurs. The Independent Trustees may waive this mandatory retirement age policy with respect to individual Trustees. Officers and Advisory Board Members hold office without limit in time, except that any officer or Advisory Board Member may resign or may be removed by a vote of a majority of the Trustees at any regular meeting or any special meeting of the Trustees. Except as indicated, each individual has held the office shown or other offices in the same company for the past five years.
The fund's Statement of Additional Information (SAI) includes more information about the Trustees. To request a free copy, call Fidelity at 1-800-544-8544.
Experience, Skills, Attributes, and Qualifications of the Trustees. The Governance and Nominating Committee has adopted a statement of policy that describes the experience, qualifications, attributes, and skills that are necessary and desirable for potential Independent Trustee candidates (Statement of Policy). The Board believes that each Trustee satisfied at the time he or she was initially elected or appointed a Trustee, and continues to satisfy, the standards contemplated by the Statement of Policy. The Governance and Nominating Committee also engages professional search firms to help identify potential Independent Trustee candidates who have the experience, qualifications, attributes, and skills consistent with the Statement of Policy. From time to time, additional criteria based on the composition and skills of the current Independent Trustees, as well as experience or skills that may be appropriate in light of future changes to board composition, business conditions, and regulatory or other developments, have also been considered by the professional search firms and the Governance and Nominating Committee. In addition, the Board takes into account the Trustees' commitment and participation in Board and committee meetings, as well as their leadership of standing and ad hoc committees throughout their tenure.
In determining that a particular Trustee was and continues to be qualified to serve as a Trustee, the Board has considered a variety of criteria, none of which, in isolation, was controlling. The Board believes that, collectively, the Trustees have balanced and diverse experience, qualifications, attributes, and skills, which allow the Board to operate effectively in governing the fund and protecting the interests of shareholders. Information about the specific experience, skills, attributes, and qualifications of each Trustee, which in each case led to the Board's conclusion that the Trustee should serve (or continue to serve) as a trustee of the fund, is provided below.
Board Structure and Oversight Function. Robert A. Lawrence is an interested person and currently serves as Chair. The Trustees have determined that an interested Chair is appropriate and benefits shareholders because an interested Chair has a personal and professional stake in the quality and continuity of services provided to the fund. Independent Trustees exercise their informed business judgment to appoint an individual of their choosing to serve as Chair, regardless of whether the Trustee happens to be independent or a member of management. The Independent Trustees have determined that they can act independently and effectively without having an Independent Trustee serve as Chair and that a key structural component for assuring that they are in a position to do so is for the Independent Trustees to constitute a substantial majority for the Board. The Independent Trustees also regularly meet in executive session. David M. Thomas serves as Lead Independent Trustee and as such (i) acts as a liaison between the Independent Trustees and management with respect to matters important to the Independent Trustees and (ii) with management prepares agendas for Board meetings.
Fidelity® funds are overseen by different Boards of Trustees. The fund's Board oversees Fidelity's high income and certain equity funds, and other Boards oversee Fidelity's alternative investment, investment-grade bond, money market, asset allocation, and other equity funds. The asset allocation funds may invest in Fidelity® funds overseen by the fund's Board. The use of separate Boards, each with its own committee structure, allows the Trustees of each group of Fidelity® funds to focus on the unique issues of the funds they oversee, including common research, investment, and operational issues. On occasion, the separate Boards establish joint committees to address issues of overlapping consequences for the Fidelity® funds overseen by each Board.
The Trustees operate using a system of committees to facilitate the timely and efficient consideration of all matters of importance to the Trustees, the fund, and fund shareholders and to facilitate compliance with legal and regulatory requirements and oversight of the fund's activities and associated risks. The Board, acting through its committees, has charged FMR and its affiliates with (i) identifying events or circumstances the occurrence of which could have demonstrably adverse effects on the fund's business and/or reputation; (ii) implementing processes and controls to lessen the possibility that such events or circumstances occur or to mitigate the effects of such events or circumstances if they do occur; and (iii) creating and maintaining a system designed to evaluate continuously business and market conditions in order to facilitate the identification and implementation processes described in (i) and (ii) above. Because the day-to-day operations and activities of the fund are carried out by or through FMR, its affiliates, and other service providers, the fund's exposure to risks is mitigated but not eliminated by the processes overseen by the Trustees. While each of the Board's committees has responsibility for overseeing different aspects of the fund's activities, oversight is exercised primarily through the Operations, Audit, and Compliance Committees. Appropriate personnel, including but not limited to the fund's Chief Compliance Officer (CCO), FMR's internal auditor, the independent accountants, the fund's Treasurer and portfolio management personnel, make periodic reports to the Board's committees, as appropriate, including an annual review of Fidelity's risk management program for the Fidelity® funds. The responsibilities of each standing committee, including their oversight responsibilities, are described further under "Standing Committees of the Trustees."
Interested Trustees*:
Correspondence intended for a Trustee who is an interested person may be sent to Fidelity Investments, 245 Summer Street, Boston, Massachusetts 02210.
Name, Year of Birth; Principal Occupations and Other Relevant Experience+
Bettina Doulton (1964)
Year of Election or Appointment: 2020
Trustee
Ms. Doulton also serves as Trustee of other Fidelity® funds. Prior to her retirement, Ms. Doulton served in a variety of positions at Fidelity Investments, including as a managing director of research (2006-2007), portfolio manager to certain Fidelity® funds (1993-2005), equity analyst and portfolio assistant (1990-1993), and research assistant (1987-1990). Ms. Doulton currently owns and operates Phi Builders + Architects and Cellardoor Winery. Previously, Ms. Doulton served as a member of the Board of Brown Capital Management, LLC (2014-2018).
Robert A. Lawrence (1952)
Year of Election or Appointment: 2020
Trustee
Chair of the Board of Trustees
Mr. Lawrence also serves as Trustee of other funds. Previously, Mr. Lawrence served as a Trustee and Member of the Advisory Board of certain funds. Prior to his retirement in 2008, Mr. Lawrence served as Vice President of certain Fidelity® funds (2006-2008), Senior Vice President, Head of High Income Division of Fidelity Management & Research Company (investment adviser firm, 2006-2008), and President of Fidelity Strategic Investments (investment adviser firm, 2002-2005).
* Determined to be an "Interested Trustee" by virtue of, among other things, his or her affiliation with the Fidelity Central Investment Portfolios LLC or various entities under common control with FMR.
+ The information includes the Trustee's principal occupation during the last five years and other information relating to the experience, attributes, and skills relevant to the Trustee's qualifications to serve as a Trustee, which led to the conclusion that the Trustee should serve as a Trustee for the fund.
Independent Trustees:
Correspondence intended for an Independent Trustee may be sent to Fidelity Investments, P.O. Box 55235, Boston, Massachusetts 02205-5235.
Name, Year of Birth; Principal Occupations and Other Relevant Experience+
Vijay C. Advani (1960)
Year of Election or Appointment: 2023
Trustee
Mr. Advani also serves as Trustee or Member of the Advisory Board of other funds. Previously, Mr. Advani served as Executive Chairman (2020-2022), Chief Executive Officer (2017-2020) and Chief Operating Officer (2016-2017) of Nuveen (global investment manager). He also served in various capacities at Franklin Resources (global investment manager), including Co-President (2015-2016), Executive Vice President, Global Advisory Services (2008-2015), Head of Global Retail Distribution (2005-2008), Executive Managing Director, International Retail Development (2002-2005), Managing Director, Product Developments, Sales & Marketing, Asia, Eastern Europe and Africa (2000-2002) and President, Templeton Asset Management India (1995-2000). Mr. Advani also served as Senior Investment Officer of International Finance Corporation (private equity and venture capital arm of The World Bank, 1984-1995). Mr. Advani is Chairman Emeritus of the U.S. India Business Council (2018-present), a Director of The Global Impact Investing Network (2019-present), a Director of LOK Capital (Mauritius) (2022-present), a member of the Advisory Council of LOK Capital (2022-present), a Senior Advisor of Neuberger Berman (2021-present), a Senior Advisor of Seviora Holdings Pte. Ltd (Temasek-Singapore) (2021-present), a Director of Seviora Capital (Singapore) (2021-present) and an Advisor of EQUIAM (2021-present). Mr. Advani formerly served as a member of the Board of BowX Acquisition Corp. (special purpose acquisition company, 2020-2021), a member of the Board of Intellecap (advisory arm of The Aavishkaar Group, 2018-2020), a member of the Board of Nuveen Investments, Inc. (2017-2020) and a member of the Board of Docusign (software, 2016-2019).
Thomas P. Bostick (1956)
Year of Election or Appointment: 2021
Trustee
Lieutenant General Bostick also serves as Trustee of other Fidelity® funds. Prior to his retirement, General Bostick (United States Army, Retired) held a variety of positions within the U.S. Army, including Commanding General and Chief of Engineers, U.S. Army Corps of Engineers (2012-2016) and Deputy Chief of Staff and Director of Human Resources, U.S. Army (2009-2012). General Bostick currently serves as a member of the Board and Finance and Governance & Sustainability Committees of CSX Corporation (transportation, 2020-present) and a member of the Board and Corporate Governance and Nominating Committee of Perma-Fix Environmental Services, Inc. (nuclear waste management, 2020-present). General Bostick serves as Chief Executive Officer of Bostick Global Strategies, LLC (consulting, 2016-present), as a member of the Board of HireVue, Inc. (video interview and assessment, 2020-present), as a member of the Board of Allonnia (biotechnology and engineering solutions, 2022-present) and on the Advisory Board of Solugen, Inc. (specialty bio-based chemicals manufacturer, 2022-present). Previously, General Bostick served as a Member of the Advisory Board of certain Fidelity® funds (2021), President, Intrexon Bioengineering (2018-2020) and Chief Operating Officer (2017-2020) and Senior Vice President of the Environment Sector (2016-2017) of Intrexon Corporation (biopharmaceutical company).
Dennis J. Dirks (1948)
Year of Election or Appointment: 2005
Trustee
Mr. Dirks also serves as Trustee of other Fidelity® funds. Prior to his retirement in May 2003, Mr. Dirks served as Chief Operating Officer and as a member of the Board of The Depository Trust & Clearing Corporation (financial markets infrastructure), President, Chief Operating Officer and a member of the Board of The Depository Trust Company (DTC), President and a member of the Board of the National Securities Clearing Corporation (NSCC), Chief Executive Officer and a member of the Board of the Government Securities Clearing Corporation and Chief Executive Officer and a member of the Board of the Mortgage-Backed Securities Clearing Corporation. Mr. Dirks currently serves as a member of the Finance Committee (2016-present) and Board (2017-present) and is Treasurer (2018-present) of the Asolo Repertory Theatre.
Donald F. Donahue (1950)
Year of Election or Appointment: 2018
Trustee
Mr. Donahue also serves as Trustee of other Fidelity® funds. Mr. Donahue serves as President and Chief Executive Officer of Miranda Partners, LLC (risk consulting for the financial services industry, 2012-present). Previously, Mr. Donahue served as Chief Executive Officer (2006-2012), Chief Operating Officer (2003-2006) and Managing Director, Customer Marketing and Development (1999-2003) of The Depository Trust & Clearing Corporation (financial markets infrastructure). Mr. Donahue currently serves as a member (2007-present) and Co-Chairman (2016-present) of the Board of United Way of New York. Mr. Donahue previously served as a member of the Advisory Board of certain Fidelity® funds (2015-2018) and as a member of the Board of The Leadership Academy (previously NYC Leadership Academy) (2012-2022).
Vicki L. Fuller (1957)
Year of Election or Appointment: 2020
Trustee
Ms. Fuller also serves as Trustee of other Fidelity® funds. Previously, Ms. Fuller served as a member of the Advisory Board of certain Fidelity® funds (2018-2020), Chief Investment Officer of the New York State Common Retirement Fund (2012-2018) and held a variety of positions at AllianceBernstein L.P. (global asset management, 1985-2012), including Managing Director (2006-2012) and Senior Vice President and Senior Portfolio Manager (2001-2006). Ms. Fuller currently serves as a member of the Board, Audit Committee and Nominating and Governance Committee of two Blackstone business development companies (2020-present), as a member of the Board of Treliant, LLC (consulting, 2019-present), as a member of the Board of Ariel Alternatives, LLC (private equity, 2022-present) and as a member of the Board and Chair of the Audit Committee of Gusto, Inc. (software, 2021-present). In addition, Ms. Fuller currently serves as a member of the Board of Roosevelt University (2019-present) and as a member of the Executive Board of New York University's Stern School of Business. Ms. Fuller previously served as a member of the Board, Audit Committee and Nominating and Governance Committee of The Williams Companies, Inc. (natural gas infrastructure, 2018-2021).
Patricia L. Kampling (1959)
Year of Election or Appointment: 2020
Trustee
Ms. Kampling also serves as Trustee of other Fidelity® funds. Prior to her retirement, Ms. Kampling served as Chairman of the Board and Chief Executive Officer (2012-2019), President and Chief Operating Officer (2011-2012) and Executive Vice President and Chief Financial Officer (2010-2011) of Alliant Energy Corporation. Ms. Kampling currently serves as a member of the Board, Finance Committee and Governance, Compensation and Nominating Committee of Xcel Energy Inc. (utilities company, 2020-present) and as a member of the Board, Audit, Finance and Risk Committee and Safety, Environmental, Technology and Operations Committee and Chair of the Executive Development and Compensation Committee of American Water Works Company, Inc. (utilities company, 2019-present). In addition, Ms. Kampling currently serves as a member of the Board of the Nature Conservancy, Wisconsin Chapter (2019-present). Previously, Ms. Kampling served as a Member of the Advisory Board of certain Fidelity® funds (2020), a member of the Board, Compensation Committee and Executive Committee and Chair of the Audit Committee of Briggs & Stratton Corporation (manufacturing, 2011-2021), a member of the Board of Interstate Power and Light Company (2012-2019) and Wisconsin Power and Light Company (2012-2019) (each a subsidiary of Alliant Energy Corporation) and as a member of the Board and Workforce Development Committee of the Business Roundtable (2018-2019).
Thomas A. Kennedy (1955)
Year of Election or Appointment: 2021
Trustee
Mr. Kennedy also serves as Trustee of other Fidelity® funds. Previously, Mr. Kennedy served as a Member of the Advisory Board of certain Fidelity® funds (2020) and held a variety of positions at Raytheon Company (aerospace and defense, 1983-2020), including Chairman and Chief Executive Officer (2014-2020) and Executive Vice President and Chief Operating Officer (2013-2014). Mr. Kennedy served as Executive Chairman of the Board of Directors of Raytheon Technologies Corporation (aerospace and defense, 2020-2021). Mr. Kennedy serves as a Director of the Board of Directors of Textron Inc. (aerospace and defense, 2023-present).
Oscar Munoz (1959)
Year of Election or Appointment: 2021
Trustee
Mr. Munoz also serves as Trustee of other Fidelity® funds. Prior to his retirement, Mr. Munoz served as Executive Chairman (2020-2021), Chief Executive Officer (2015-2020), President (2015-2016) and a member of the Board (2010-2021) of United Airlines Holdings, Inc. Mr. Munoz currently serves as a member of the Board of CBRE Group, Inc. (commercial real estate, 2020-present), a member of the Board of Univision Communications, Inc. (Hispanic media, 2020-present), a member of the Board of Archer Aviation Inc. (2021-present), a member of the Defense Business Board of the United States Department of Defense (2021-present) and a member of the Board of Salesforce.com, Inc. (cloud-based software, 2022-present). Previously, Mr. Munoz served as a Member of the Advisory Board of certain Fidelity® funds (2021).
David M. Thomas (1949)
Year of Election or Appointment: 2008
Trustee
Lead Independent Trustee
Mr. Thomas also serves as Trustee of other Fidelity® funds. Previously, Mr. Thomas served as Executive Chairman (2005-2006) and Chairman and Chief Executive Officer (2000-2005) of IMS Health, Inc. (pharmaceutical and healthcare information solutions). Mr. Thomas currently serves as a member of the Board of Fortune Brands Home and Security (home and security products, 2004-present) and as Director (2013-present) and Non-Executive Chairman of the Board (2022-present) of Interpublic Group of Companies, Inc. (marketing communication).
Susan Tomasky (1953)
Year of Election or Appointment: 2020
Trustee
Ms. Tomasky also serves as Trustee of other Fidelity® funds. Prior to her retirement, Ms. Tomasky served in various executive officer positions at American Electric Power Company, Inc. (1998-2011), including most recently as President of AEP Transmission (2007-2011). Ms. Tomasky currently serves as a member of the Board and Sustainability Committee and as Chair of the Audit Committee of Marathon Petroleum Corporation (2018-present) and as a member of the Board, Executive Committee, Corporate Governance Committee and Organization and Compensation Committee and as Lead Director of the Board of Public Service Enterprise Group, Inc. (utilities company, 2012-present) and as a member of the Board of its subsidiary company, Public Service Electric and Gas Co. (2021-present). In addition, Ms. Tomasky currently serves as a member (2009-present) and President (2020-present) of the Board of the Royal Shakespeare Company - America (2009-present), as a member of the Board of the Columbus Association for the Performing Arts (2011-present) and as a member of the Board and Kenyon in the World Committee of Kenyon College (2016-present). Previously, Ms. Tomasky served as a Member of the Advisory Board of certain Fidelity® funds (2020), as a member of the Board of the Columbus Regional Airport Authority (2007-2020), as a member of the Board (2011-2018) and Lead Independent Director (2015-2018) of Andeavor Corporation (previously Tesoro Corporation) (independent oil refiner and marketer) and as a member of the Board of Summit Midstream Partners LP (energy, 2012-2018).
Michael E. Wiley (1950)
Year of Election or Appointment: 2018
Trustee
Mr. Wiley also serves as Trustee of other Fidelity® funds. Previously, Mr. Wiley served as a member of the Advisory Board of certain Fidelity® funds (2018-2020), Chairman, President and CEO of Baker Hughes, Inc. (oilfield services, 2000-2004). Mr. Wiley also previously served as a member of the Board of Andeavor Corporation (independent oil refiner and marketer, 2005-2018), a member of the Board of Andeavor Logistics LP (natural resources logistics, 2015-2018) and a member of the Board of High Point Resources (exploration and production, 2005-2020).
+ The information includes the Trustee's principal occupation during the last five years and other information relating to the experience, attributes, and skills relevant to the Trustee's qualifications to serve as a Trustee, which led to the conclusion that the Trustee should serve as a Trustee for the fund.
Advisory Board Members and Officers:
Correspondence intended for a Member of the Advisory Board (if any) may be sent to Fidelity Investments, P.O. Box 55235, Boston, Massachusetts 02205-5235. Correspondence intended for an officer or Peter S. Lynch may be sent to Fidelity Investments, 245 Summer Street, Boston, Massachusetts 02210.
Name, Year of Birth; Principal Occupation
Peter S. Lynch (1944)
Year of Election or Appointment: 2004
Member of the Advisory Board
Mr. Lynch also serves as a Member of the Advisory Board of other Fidelity® funds. Mr. Lynch is Vice Chairman and a Director of Fidelity Management & Research Company LLC (investment adviser firm). In addition, Mr. Lynch serves as a Trustee of Boston College and as the Chairman of the Inner-City Scholarship Fund. Previously, Mr. Lynch served as Vice Chairman and a Director of FMR Co., Inc. (investment adviser firm) and on the Special Olympics International Board of Directors (1997-2006).
Karen B. Peetz (1955)
Year of Election or Appointment: 2023
Member of the Advisory Board
Ms. Peetz also serves as a Member of the Advisory Board of other funds. Previously, Ms. Peetz served as Chief Administration Officer (2020-2023) of Citigroup Inc. (a diversified financial service company). She also served in various capacities at Bank of New York Mellon Corporation, including President (2013-2016), Vice Chairman, Senior Executive Vice President and Chief Executive Officer of Financial Markets & Treasury Services (2010-2013), Senior Executive Vice President and Chief Executive Officer of Global Corporate Trust (2003-2008), Senior Vice President and Division Manager of Global Payments & Trade Services (2002-2003) and Senior Vice President and Division Manager of Domestic Corporate Trust (1998-2002). Ms. Peetz also served in various capacities at Chase Manhattan Corporation (1982-1998), including Senior Vice President and Manager of Corporate Trust International Business (1996-1998), Managing Director and Manager of Corporate Trust Services (1994-1996) and Managing Director and Group Manager of Financial Institution Sales (1990-1993). Ms. Peetz currently serves as Chair of Amherst Holdings Advisory Council (2018-present), Trustee of Johns Hopkins University (2016-present), Chair of the Carey Business School Advisory Council, Member of the Johns Hopkins Medicine Board and Finance Committee and Chair of the Lyme and Tick Related Disease Institute Advisory Council. Ms. Peetz previously served as a member of the Board of Guardian Life Insurance Company of America (2019-2023), a member of the Board of Trane Technologies (2018-2022), a member of the Board of Wells Fargo Corp. (2017-2019), a member of the Board of SunCoke Energy Inc. (2012-2016), a member of the Board of Private Export Funding Corporation (2010-2016) and as a Trustee of Penn State University (2010-2014) and the United Way of New York City (2008-2010).
Heather Bonner (1977)
Year of Election or Appointment: 2023
Assistant Treasurer
Ms. Bonner also serves as an officer of other funds. Ms. Bonner is a Senior Vice President (2022-present) and is an employee of Fidelity Investments (2022-present). Ms. Bonner serves as Assistant Treasurer of Fidelity CRET Trustee LLC (2022-present). Prior to joining Fidelity, Ms. Bonner served as Managing Director at AQR Capital Management (2013-2022) and was the Treasurer and Principal Financial Officer of the AQR Funds (2013-2022).
Craig S. Brown (1977)
Year of Election or Appointment: 2022
Deputy Treasurer
Mr. Brown also serves as an officer of other funds. Mr. Brown is a Vice President (2015-present) and is an employee of Fidelity Investments. Mr. Brown serves as Assistant Treasurer of FIMM, LLC (2021-present). Previously, Mr. Brown served as Assistant Treasurer of certain Fidelity® funds (2019-2022).
John J. Burke III (1964)
Year of Election or Appointment: 2018
Chief Financial Officer
Mr. Burke also serves as Chief Financial Officer of other funds. Mr. Burke is Head of Fidelity Fund and Investment Operations (2018-present) and is an employee of Fidelity Investments. Mr. Burke serves as President, Executive Vice President, or Director of certain Fidelity entities. Previously Mr. Burke served as head of Asset Management Investment Operations (2012-2018).
Margaret Carey (1973)
Year of Election or Appointment: 2023
Secretary and Chief Legal Officer (CLO)
Ms. Carey also serves as an officer of other funds and as CLO of certain Fidelity entities. Ms. Carey is a Senior Vice President, Deputy General Counsel (2019-present) and is an employee of Fidelity Investments.
William C. Coffey (1969)
Year of Election or Appointment: 2019
Assistant Secretary
Mr. Coffey also serves as Assistant Secretary of other funds. Mr. Coffey is a Senior Vice President, Deputy General Counsel (2010-present) and is an employee of Fidelity Investments. Previously, Mr. Coffey served as Secretary and CLO of certain funds (2018-2019); CLO, Secretary, or Senior Vice President of certain Fidelity entities and Assistant Secretary of certain funds (2009-2018).
Timothy M. Cohen (1969)
Year of Election or Appointment: 2018
Vice President
Mr. Cohen also serves as Vice President of other funds. Mr. Cohen is Co-Head of Equity (2018-present) and is an employee of Fidelity Investments. Mr. Cohen serves a Director of Fidelity Management & Research (Japan) Limited (investment adviser firm, 2016-present). Previously, Mr. Cohen served as Executive Vice President of Fidelity SelectCo, LLC (2019) and Head of Global Equity Research (2016-2018).
Jonathan Davis (1968)
Year of Election or Appointment: 2010
Assistant Treasurer
Mr. Davis also serves as an officer of other funds. Mr. Davis is a Vice President (2006-present) and is an employee of Fidelity Investments. Mr. Davis serves as Assistant Treasurer of certain Fidelity entities.
Laura M. Del Prato (1964)
Year of Election or Appointment: 2018
Assistant Treasurer
Ms. Del Prato also serves as an officer of other funds. Ms. Del Prato is a Senior Vice President (2017-present) and is an employee of Fidelity Investments. Ms. Del Prato serves as Vice President or Assistant Treasurer of certain Fidelity entities. Previously, Ms. Del Prato served as President and Treasurer of The North Carolina Capital Management Trust: Cash Portfolio and Term Portfolio (2018-2020).
Colm A. Hogan (1973)
Year of Election or Appointment: 2020
Assistant Treasurer
Mr. Hogan also serves as an officer of other funds. Mr. Hogan is a Vice President (2016-present) and is an employee of Fidelity Investments. Mr. Hogan serves as Assistant Treasurer of certain Fidelity entities. Previously, Mr. Hogan served as Deputy Treasurer of certain Fidelity® funds (2016-2020) and Assistant Treasurer of certain Fidelity® funds (2016-2018).
Pamela R. Holding (1964)
Year of Election or Appointment: 2018
Vice President
Ms. Holding also serves as Vice President of other funds. Ms. Holding is Co-Head of Equity (2018-present) and is an employee of Fidelity Investments. Previously, Ms. Holding served as Executive Vice President of Fidelity SelectCo, LLC (2019) and as Chief Investment Officer of Fidelity Institutional Asset Management (2013-2018).
Chris Maher (1972)
Year of Election or Appointment: 2020
Deputy Treasurer
Mr. Maher also serves as an officer of other funds. Mr. Maher is a Vice President (2008-present) and is an employee of Fidelity Investments. Mr. Maher serves as Assistant Treasurer of certain Fidelity entities. Previously, Mr. Maher served as Assistant Treasurer of certain funds (2013-2020).
Jason P. Pogorelec (1975)
Year of Election or Appointment: 2020
Chief Compliance Officer
Mr. Pogorelec also serves as Chief Compliance Officer of other funds. Mr. Pogorelec is a Senior Vice President of Asset Management Compliance (2020-present) and is an employee of Fidelity Investments. Mr. Pogorelec serves as Compliance Officer of Fidelity Management & Research Company LLC (investment adviser firm, 2023-present) and Ballyrock Investment Advisors LLC (2023-present). Previously, Mr. Pogorelec served as a Vice President, Associate General Counsel for Fidelity Investments (2010-2020) and Assistant Secretary of certain Fidelity® funds (2015-2020).
Brett Segaloff (1972)
Year of Election or Appointment: 2021
Anti-Money Laundering (AML) Officer
Mr. Segaloff also serves as AML Officer of other funds. Mr. Segaloff is a Vice President (2022-present) and is an employee of Fidelity Investments. Mr. Segaloff serves as Anti Money Laundering Compliance Officer or Anti Money Laundering/Bank Secrecy Act Compliance Officer of certain Fidelity entities.
Stacie M. Smith (1974)
Year of Election or Appointment: 2016
President and Treasurer
Ms. Smith also serves as an officer of other funds. Ms. Smith is a Senior Vice President (2016-present) and is an employee of Fidelity Investments. Ms. Smith serves as Assistant Treasurer of certain Fidelity entities and has served in other fund officer roles.
Jim Wegmann (1979)
Year of Election or Appointment: 2019
Assistant Treasurer
Mr. Wegmann also serves as an officer of other funds. Mr. Wegmann is a Vice President (2016-present) and is an employee of Fidelity Investments. Mr. Wegmann serves as Assistant Treasurer of FIMM, LLC (2021-present). Previously, Mr. Wegmann served as Assistant Treasurer of certain Fidelity® funds (2019-2021).
As a shareholder, you incur two types of costs: (1) transaction costs, which may include sales charges (loads) on purchase payments or redemption proceeds, as applicable and (2) ongoing costs, which generally include management fees, distribution and/or service (12b-1) fees and other Fund expenses. This Example is intended to help you understand your ongoing costs (in dollars) of investing in a fund and to compare these costs with the ongoing costs of investing in other mutual funds.
The Example is based on an investment of $1,000 invested at the beginning of the period and held for the entire period (April 1, 2023 to September 30, 2023).
|
Actual Expenses
The first line of the accompanying table provides information about actual account values and actual expenses. You may use the information in this line, together with the amount you invested, to estimate the expenses that you paid over the period. Simply divide your account value by $1,000.00 (for example, an $8,600 account value divided by $1,000.00 = 8.6), then multiply the result by the number in the first line for a class/Fund under the heading entitled "Expenses Paid During Period" to estimate the expenses you paid on your account during this period. If any fund is a shareholder of any underlying mutual funds or exchange-traded funds (ETFs) (the Underlying Funds), such fund indirectly bears its proportional share of the expenses of the Underlying Funds in addition to the direct expenses incurred presented in the table. These fees and expenses are not included in the annualized expense ratio used to calculate the expense estimate in the table below.
Hypothetical Example for Comparison Purposes
The second line of the accompanying table provides information about hypothetical account values and hypothetical expenses based on the actual expense ratio and an assumed rate of return of 5% per year before expenses, which is not the actual return. The hypothetical account values and expenses may not be used to estimate the actual ending account balance or expenses you paid for the period. You may use this information to compare the ongoing costs of investing in the Fund and other funds. To do so, compare this 5% hypothetical example with the 5% hypothetical examples that appear in the shareholder reports of the other funds. If any fund is a shareholder of any Underlying Funds, such fund indirectly bears its proportional share of the expenses of the Underlying Funds in addition to the direct expenses as presented in the table. These fees and expenses are not included in the annualized expense ratio used to calculate the expense estimate in the table below.
Please note that the expenses shown in the table are meant to highlight your ongoing costs only and do not reflect any transaction costs. Therefore, the second line of the table is useful in comparing ongoing costs only, and will not help you determine the relative total costs of owning different funds. In addition, if these transactional costs were included, your costs would have been higher.
|
|
|
|
|
Annualized Expense Ratio- A
|
|
Beginning Account Value April 1, 2023
|
|
Ending Account Value September 30, 2023
|
|
Expenses Paid During Period- C April 1, 2023 to September 30, 2023
|
|
|
|
|
|
|
|
|
|
|
|
Fidelity® International Equity Central Fund
|
|
|
|
.0063%
|
|
|
|
|
|
|
Actual
|
|
|
|
|
|
$ 1,000
|
|
$ 981.60
|
|
$ .03
|
Hypothetical-B
|
|
|
|
|
|
$ 1,000
|
|
$ 1,025.04
|
|
$ .03
|
|
|
A Annualized expense ratio reflects expenses net of applicable fee waivers.
B 5% return per year before expenses
C Expenses are equal to the annualized expense ratio, multiplied by the average account value over the period, multiplied by 183/ 365 (to reflect the one-half year period). The fees and expenses of any Underlying Funds are not included in each annualized expense ratio.
The dividend and capital gains distributions for the fund(s) are available on Fidelity.com or Institutional.Fidelity.com.
The fund designates $3,665,682 of distributions paid during the fiscal year ended 2023 as qualifying to be taxed as section 163(j) interest dividends.
The fund designates 2% of the dividends distributed during the fiscal year as qualifying for the dividends-received deduction for corporate shareholders.
The fund designates 66.05%, 100%, 100%, and 100% of the dividends distributed in December, March, June and September, respectively during the fiscal year as amounts which may be taken into account as a dividend for the purposes of the maximum rate under section 1(h)(11) of the Internal Revenue Code.
The amounts per share which represent income derived from sources within, and taxes paid to, foreign countries or possessions of the United States are $0.5657 and $0.1817 for the dividend paid December 12, 2022.
The fund will notify shareholders in January 2024 of amounts for use in preparing 2023 income tax returns.
Board Approval of Investment Advisory Contracts and Management Fees
Fidelity International Equity Central Fund
Each year, the Board of Directors, including the Independent Directors (together, the Board), considers the renewal of the fund's management contract with Fidelity Management & Research Company LLC (FMR) and the sub-advisory agreements (together, the Advisory Contracts) for the fund. FMR and the sub-advisers are referred to herein as the Investment Advisers. The Board, assisted by the advice of fund counsel and Independent Directors' counsel, requests and considers a broad range of information relevant to the renewal of the Advisory Contracts throughout the year.
The Board meets regularly and, at each of its meetings, covers an extensive agenda of topics and materials and considers factors that are relevant to its annual consideration of the renewal of the fund's Advisory Contracts, including the services and support provided to the fund and its shareholders. The Board, acting directly and through its Committees (each of which is composed of and chaired by Independent Directors), requests and receives information concerning the annual consideration of the renewal of the fund's Advisory Contracts. The Board also meets as needed to review matters specifically related to the Board's annual consideration of the renewal of the Advisory Contracts. Members of the Board may also meet with trustees of other Fidelity funds through joint ad hoc committees to discuss certain matters relevant to all of the Fidelity funds.
Approval of Stub Period Continuation. At its May 2023 meeting, the Board of Directors voted to continue the fund's management contract with FMR, and the sub-advisory agreements and sub-sub-advisory agreements, in each case, where applicable (together, the Advisory Contracts), without modification, for two months from June 1, 2023 through July 31, 2023. The Board considered that the approval of the fund's Advisory Contracts will not result in any changes in (i) the investment process or strategies employed in the management of the fund's assets; (ii) the fees and expenses paid by shareholders; (iii) the nature, extent or quality of services provided under the fund's Advisory Contracts; or (iv) the day-to-day management of the fund or the persons primarily responsible for such management. The Board also considered that since its last approval of the fund's Advisory Contracts, FMR had provided additional information on the fund in support of the annual contract renewal process, including competitive analyses on total expenses and management fees and in-depth reviews of fund performance and fund profitability information. The Board concluded that the fund's Advisory Contracts are fair and reasonable, and that the fund's Advisory Contracts should be renewed, without modification, through July 31, 2023, with the understanding that the Board would consider the annual renewal for a full one year period in July 2023.
At its July 2023 meeting, the Board unanimously determined to renew the fund's Advisory Contracts. In reaching its determination, the Board considered all factors it believed relevant and reached a determination, with the assistance of fund counsel and Independent Directors' counsel and through the exercise of its business judgment, that the renewal of the Advisory Contracts was in the best interests of the fund and its shareholders and the fact that no fee is payable under the management contract was fair and reasonable in light of all of the surrounding circumstances.
Nature, Extent, and Quality of Services Provided. The Board considered staffing as it relates to the fund, including the backgrounds and experience of investment personnel of the Investment Advisers, and also considered the Investment Advisers' implementation of the fund's investment program. The Independent Directors also had discussions with senior management of Fidelity's investment operations and investment groups. The Board considered the structure of the investment personnel compensation program and whether this structure provides appropriate incentives to act in the best interests of the fund.
Resources Dedicated to Investment Management and Support Services. The Board and the Fund Oversight and Research Committees reviewed the general qualifications and capabilities of Fidelity's investment staff, including its size, education, experience, and resources, as well as Fidelity's approach to recruiting, training, managing, and compensating investment personnel. The Board noted the resources devoted to expansion of Fidelity's global investment organization, and that Fidelity's analysts have extensive resources, tools, and capabilities that allow them to conduct sophisticated quantitative and fundamental analysis, as well as credit analysis of issuers, counterparties, and guarantors. Further, the Board considered that Fidelity's investment professionals have sufficient access to global information and data so as to provide competitive investment results over time, and that those professionals also have access to sophisticated tools that permit them to assess portfolio construction and risk and performance attribution characteristics continuously, as well as to transmit new information and research conclusions rapidly around the world. Additionally, in its deliberations, the Board considered Fidelity's trading, risk management, compliance, and technology and operations capabilities and resources, which are integral parts of the investment management process.
Administrative Services. The Board considered (i) the nature, extent, quality, and cost of advisory and administrative services performed by the Investment Advisers and their affiliates under the Advisory Contracts and under separate agreements covering transfer agency, pricing and bookkeeping, and securities lending services for the fund; (ii) the nature and extent of Fidelity's supervision of third party service providers, principally custodians, subcustodians, and pricing vendors; and (iii) the resources devoted by Fidelity to, and the record of compliance with, the fund's compliance policies and procedures. The Board also reviewed the allocation of fund brokerage, including allocations to brokers affiliated with the Investment Advisers, and the use of "soft" commission dollars to pay for research services. The Board also considered the fund's securities lending activities and any payments made to Fidelity relating to securities lending.
Investment Performance. The Board reviewed the fund's absolute investment performance, as well as the fund's relative investment performance, but did not consider performance to be a material factor in its decision to renew the fund's Advisory Contracts, as the fund is not publicly offered as a stand-alone investment product. In this regard, the Board noted that the fund is designed to offer a liquid investment option for other investment companies managed by Fidelity and ultimately to enhance the performance of those investment companies.
Based on its review, the Board concluded that the nature, extent, and quality of services provided to the fund under the Advisory Contracts should continue to benefit the shareholders of the fund.
Competitiveness of Management Fee and Total Expense Ratio. The Board considered that while the fund does not pay a management fee, FMR receives fees for providing services to funds that invest in the fund. The Board also noted that FMR bears all expenses of the fund with certain limited exceptions (i.e., custody fees, interest, taxes, fees and expenses of the Independent Directors, proxy and shareholder meeting expenses, and extraordinary expenses). The Board further noted that the fund pays its non-operating expenses, including brokerage commissions and fees and expenses associated with the fund's securities lending program, if applicable. Based on its review, the Board concluded that the management fee received for providing services to the fund and the fund's total expense ratio were reasonable in light of the services that the fund and its shareholders receive and the other factors considered.
Costs of the Services and Profitability. The Board considered the level of Fidelity's profits in respect of all the Fidelity funds, as well as the profitability of the funds that invest in the fund.
A public accounting firm has been engaged annually by the Board as part of the Board's assessment of Fidelity's profitability analysis. The engagement includes the review and assessment of the methodologies used by Fidelity in determining the revenues and expenses attributable to Fidelity's fund business, and completion of agreed-upon procedures in respect of the mathematical accuracy of certain fund profitability information and its conformity to established allocation methodologies. After considering the reports issued under the engagement and information provided by Fidelity, the Board concluded that while other allocation methods may also be reasonable, Fidelity's profitability methodologies are reasonable in all material respects.
The Board also reviewed Fidelity's non-fund businesses and potential indirect benefits such businesses may have received as a result of their association with Fidelity's fund business (i.e., fall-out benefits) as well as cases where Fidelity's affiliates may benefit from the funds' business. The Board considered areas where potential indirect benefits to the Fidelity funds from their relationships with Fidelity may exist. The Board's consideration of these matters was informed by the findings of a joint ad hoc committee created by it and the boards of other Fidelity funds to evaluate potential fall-out benefits.
The Board concluded that the costs of the services provided by and the profits realized by Fidelity in connection with the operation of the fund were not relevant to the renewal of the Advisory Contracts because the fund pays no advisory fees and FMR bears all expenses of the fund with certain exceptions.
Economies of Scale. The Board concluded that because the fund pays no advisory fees and FMR bears all expenses of the fund with certain exceptions, the realization of economies of scale was not a material factor in the Board's decision to renew the fund's Advisory Contract.
Additional Information Requested by the Board. In order to develop fully the factual basis for consideration of the Fidelity funds' advisory contracts, the Board requested and received additional information on certain topics, including: (i) fund flow and performance trends, in particular the underperformance of certain funds and strategies, and Fidelity's long-term strategies for certain funds, including any consideration of fund liquidations or mergers; (ii) the operation of performance fees and competitor use of performance fees; (iii) Fidelity's pricing philosophy compared to competitors; (iv) fund profitability methodology and data; (v) evaluation of competitive fund data and peer group classifications and fee and expense comparisons; (vi) the management fee and expense structures for different funds and classes and information about the differences between various fee and expense structures; (vii) group fee breakpoints and related voluntary fee waivers; and (viii) information regarding other accounts managed by Fidelity and the funds' sub-advisory arrangements.
Conclusion. Based on its evaluation of all of the conclusions noted above, and after considering all factors it believed relevant, the Board, including the Independent Directors, concluded that the advisory and sub-advisory fee arrangements are fair and reasonable in light of all of the surrounding circumstances and that the fund's Advisory Contracts should be renewed through July 31, 2024.
1.859208.115
INTCEN-ANN-1123
Fidelity® Real Estate Equity Central Fund
Annual Report
September 30, 2023
Contents
To view a fund's proxy voting guidelines and proxy voting record for the 12-month period ended June 30, visit http://www.fidelity.com/proxyvotingresults or visit the Securities and Exchange Commission's (SEC) web site at http://www.sec.gov.
You may also call 1-800-544-8544 to request a free copy of the proxy voting guidelines.
Standard & Poor's, S&P and S&P 500 are registered service marks of The McGraw-Hill Companies, Inc. and have been licensed for use by Fidelity Distributors Corporation.
Other third-party marks appearing herein are the property of their respective owners.
All other marks appearing herein are registered or unregistered trademarks or service marks of FMR LLC or an affiliated company. © 2023 FMR LLC. All rights reserved.
A fund files its complete schedule of portfolio holdings with the SEC for the first and third quarters of each fiscal year on Form N-PORT. Forms N-PORT are available on the SEC's web site at http://www.sec.gov. A fund's Forms N-PORT may be reviewed and copied at the SEC's Public Reference Room in Washington, DC. Information regarding the operation of the SEC's Public Reference Room may be obtained by calling 1-800-SEC-0330.
Average annual total return reflects the change in the value of an investment, assuming reinvestment of distributions from dividend income and capital gains (the profits earned upon the sale of securities that have grown in value, if any) and assuming a constant rate of performance each year. The hypothetical investment and the average annual total returns do not reflect the deduction of taxes that a shareholder would pay on fund distributions or the redemption of fund shares. During periods of reimbursement by Fidelity, a fund's total return will be greater than it would be had the reimbursement not occurred. How a fund did yesterday is no guarantee of how it will do tomorrow.
Average Annual Total Returns
|
|
|
|
|
|
Periods ended September 30, 2023
|
Past 1
year
|
Past 5
years
|
Life of
Fund A
|
Fidelity® Real Estate Equity Central Fund
|
3.90%
|
3.52%
|
4.62%
|
A From November 3, 2014
$10,000 Over Life of Fund
|
|
|
Let's say hypothetically that $10,000 was invested in Fidelity® Real Estate Equity Central Fund, on November 3, 2014, when the fund started.
The chart shows how the value of your investment would have changed, and also shows how the S&P 500® Index performed over the same period.
|
|
|
Market Recap:
U.S. equities gained 21.62% for the 12 months ending September 30, 2023, according to the S&P 500® index, as global economic expansion and a slowing in the pace of inflation provided a favorable backdrop for higher-risk assets through July. After returning -18.11% in 2022, the index's upturn has been driven by a narrow set of companies in the information technology and communication services sectors, largely due to excitement for generative artificial intelligence. Monetary tightening by the U.S. Federal Reserve continued amid consistent pressure on core inflation, a measure that excludes food and energy. Since March 2022, the Fed has hiked its benchmark interest rate 11 times. The latest bump came in late July, a fourth consecutive raise of a stepped-down 25 basis points. The year-to-date rally sputtered in August amid a stalling pattern in disinflationary trends, soaring yields on longer-term government bonds and concern that the Fed will keep interest rates higher for longer than expected. These factors slowed the advance of richly valued tech stocks and seemed to lower the odds of an economic "soft landing." The S&P 500® closed at its 2023 high on July 31 before returning -6.28% in the final two months of Q3. Still, U.S. stocks ended September up 13.07% year to date. By sector for the full 12 months, tech (+43%) and communications services (+38%) led. In contrast, two defensive, rate-sensitive sectors lagged most: utilities (-7%) and real estate (-1%).
Comments from Portfolio Manager Samuel Wald:
For the fiscal year ending September 30, 2023, the fund gained 3.90%, versus 2.99% for the FTSE NAREIT Equity REITs Linked Index and 21.62% for the broad-based S&P 500® index. Relative to the FTSE NAREIT index, lacking exposure to the strong-performing regional malls category and security selection among specialty REITs detracted. In contrast, security selection among health care REITs contributed the most, followed by favorable picks and an underweight in the lagging diversified industry. The biggest individual relative detractor this period was avoiding Simon Property Group, an index component that gained 28%. A non-index stake in Cyxtera Technologies returned -98% and was the second-largest relative detractor though the stock was no longer held at period end. Outsized exposure to Mid-America Apartment Communities (-14%), one of the fund's largest holdings, also hurt. In contrast, the top individual relative contributor was an overweight in Equinix (+30%), a top-5 holding within the portfolio on September 30. Not owning Realty Income, an index component that returned -10%, was the second-largest relative contributor. Similarly, the decision to avoid Medical Properties Trust, an index component that returned about -49%, proved advantageous as well. Notable changes in positioning include increased exposure to the data center and industrial industries.
The views expressed above reflect those of the portfolio manager(s) only through the end of the period as stated on the cover of this report and do not necessarily represent the views of Fidelity or any other person in the Fidelity organization. Any such views are subject to change at any time based upon market or other conditions and Fidelity disclaims any responsibility to update such views. These views may not be relied on as investment advice and, because investment decisions for a Fidelity fund are based on numerous factors, may not be relied on as an indication of trading intent on behalf of any Fidelity fund.
Top Holdings (% of Fund's net assets)
|
|
|
Prologis (REIT), Inc.
|
13.9
|
|
Equinix, Inc.
|
9.4
|
|
CubeSmart
|
5.7
|
|
Ventas, Inc.
|
5.6
|
|
Mid-America Apartment Communities, Inc.
|
5.1
|
|
Digital Realty Trust, Inc.
|
4.9
|
|
Welltower, Inc.
|
4.6
|
|
Essex Property Trust, Inc.
|
4.5
|
|
Equity Lifestyle Properties, Inc.
|
3.6
|
|
Four Corners Property Trust, Inc.
|
3.4
|
|
|
|
60.7
|
|
|
|
Market Sectors (% of Fund's net assets)
|
|
|
REITs - Warehouse/Industrial
|
20.8
|
|
REITs - Diversified
|
18.9
|
|
REITs - Apartments
|
15.6
|
|
REITs - Health Care
|
10.2
|
|
REITs - Storage
|
8.0
|
|
|
|
Asset Allocation (% of Fund's net assets)
|
|
|
|
|
Showing Percentage of Net Assets
Common Stocks - 99.0%
|
|
|
|
Shares
|
Value ($)
|
Equity Real Estate Investment Trusts (REITs) - 97.6%
|
|
|
|
REITs - Apartments - 15.6%
|
|
|
|
Essex Property Trust, Inc.
|
|
195,919
|
41,552,461
|
Invitation Homes, Inc.
|
|
915,904
|
29,024,998
|
Mid-America Apartment Communities, Inc.
|
|
368,300
|
47,381,795
|
UDR, Inc.
|
|
742,782
|
26,495,034
|
|
|
|
|
144,454,288
|
REITs - Diversified - 18.9%
|
|
|
|
Crown Castle International Corp.
|
|
75,400
|
6,939,062
|
Digital Realty Trust, Inc.
|
|
372,100
|
45,031,542
|
Equinix, Inc.
|
|
119,538
|
86,815,668
|
Lamar Advertising Co. Class A
|
|
218,459
|
18,234,773
|
Outfront Media, Inc.
|
|
572,700
|
5,784,270
|
VICI Properties, Inc.
|
|
433,031
|
12,601,202
|
|
|
|
|
175,406,517
|
REITs - Health Care - 10.2%
|
|
|
|
Ventas, Inc.
|
|
1,247,694
|
52,565,348
|
Welltower, Inc.
|
|
517,966
|
42,431,775
|
|
|
|
|
94,997,123
|
REITs - Health Care Facilities - 1.3%
|
|
|
|
Omega Healthcare Investors, Inc.
|
|
356,400
|
11,818,224
|
REITs - Hotels - 3.3%
|
|
|
|
Ryman Hospitality Properties, Inc.
|
|
368,500
|
30,688,680
|
REITs - Manufactured Homes - 3.6%
|
|
|
|
Equity Lifestyle Properties, Inc. (a)
|
|
519,600
|
33,103,716
|
REITs - Office Property - 2.9%
|
|
|
|
Alexandria Real Estate Equities, Inc.
|
|
264,780
|
26,504,478
|
REITs - Regional Malls - 1.5%
|
|
|
|
Tanger Factory Outlet Centers, Inc.
|
|
599,500
|
13,548,700
|
REITs - Shopping Centers - 5.7%
|
|
|
|
SITE Centers Corp.
|
|
2,245,300
|
27,684,549
|
Urban Edge Properties (a)
|
|
1,646,100
|
25,119,486
|
|
|
|
|
52,804,035
|
REITs - Single Tenant - 5.8%
|
|
|
|
Four Corners Property Trust, Inc.
|
|
1,417,800
|
31,460,982
|
Spirit Realty Capital, Inc.
|
|
663,300
|
22,240,449
|
|
|
|
|
53,701,431
|
REITs - Storage - 8.0%
|
|
|
|
CubeSmart
|
|
1,379,419
|
52,597,246
|
Extra Space Storage, Inc. (a)
|
|
177,100
|
21,531,818
|
|
|
|
|
74,129,064
|
REITs - Warehouse/Industrial - 20.8%
|
|
|
|
Americold Realty Trust
|
|
936,700
|
28,485,047
|
EastGroup Properties, Inc.
|
|
108,000
|
17,985,240
|
Prologis (REIT), Inc.
|
|
1,143,137
|
128,271,402
|
Terreno Realty Corp.
|
|
317,716
|
18,046,269
|
|
|
|
|
192,787,958
|
TOTAL EQUITY REAL ESTATE INVESTMENT TRUSTS (REITS)
|
|
|
903,944,214
|
Real Estate Management & Development - 1.4%
|
|
|
|
Real Estate Services - 1.4%
|
|
|
|
CBRE Group, Inc. (b)
|
|
134,300
|
9,919,398
|
Jones Lang LaSalle, Inc. (b)
|
|
19,200
|
2,710,656
|
|
|
|
|
12,630,054
|
|
TOTAL COMMON STOCKS
(Cost $893,111,707)
|
|
|
916,574,268
|
|
|
|
|
|
Money Market Funds - 4.6%
|
|
|
|
Shares
|
Value ($)
|
Fidelity Cash Central Fund 5.39% (c)
|
|
5,032,536
|
5,033,543
|
Fidelity Securities Lending Cash Central Fund 5.39% (c)(d)
|
|
37,317,918
|
37,321,650
|
|
TOTAL MONEY MARKET FUNDS
(Cost $42,355,193)
|
|
|
42,355,193
|
|
|
|
|
|
|
TOTAL INVESTMENT IN SECURITIES - 103.6%
(Cost $935,466,900)
|
958,929,461
|
NET OTHER ASSETS (LIABILITIES) - (3.6)%
|
(33,027,711)
|
NET ASSETS - 100.0%
|
925,901,750
|
|
|
|
Legend
(a)
|
Security or a portion of the security is on loan at period end.
|
(c)
|
Affiliated fund that is generally available only to investment companies and other accounts managed by Fidelity Investments. The rate quoted is the annualized seven-day yield of the fund at period end. A complete unaudited listing of the fund's holdings as of its most recent quarter end is available upon request. In addition, each Fidelity Central Fund's financial statements, which are not covered by the Fund's Report of Independent Registered Public Accounting Firm, are available on the SEC's website or upon request.
|
(d)
|
Investment made with cash collateral received from securities on loan.
|
Affiliated Central Funds
Fiscal year to date information regarding the Fund's investments in Fidelity Central Funds, including the ownership percentage, is presented below.
Affiliate
|
Value,
beginning
of period ($)
|
Purchases ($)
|
Sales
Proceeds ($)
|
Dividend
Income ($)
|
Realized
Gain (loss) ($)
|
Change in
Unrealized
appreciation
(depreciation) ($)
|
Value,
end
of period ($)
|
% ownership,
end
of period
|
Fidelity Cash Central Fund 5.39%
|
11,883,685
|
366,743,379
|
373,593,521
|
412,171
|
-
|
-
|
5,033,543
|
0.0%
|
Fidelity Securities Lending Cash Central Fund 5.39%
|
21,869,667
|
126,252,853
|
110,800,870
|
184,691
|
-
|
-
|
37,321,650
|
0.1%
|
Total
|
33,753,352
|
492,996,232
|
484,394,391
|
596,862
|
-
|
-
|
42,355,193
|
|
|
|
|
|
|
|
|
|
|
|
Amounts in the dividend income column in the above table include any capital gain distributions from underlying funds, which are presented in the corresponding line item in the Statement of Operations, if applicable.
Amounts in the dividend income column for Fidelity Securities Lending Cash Central Fund represents the income earned on investing cash collateral, less rebates paid to borrowers and any lending agent fees associated with the loan, plus any premium payments received for lending certain types of securities.
Amounts included in the purchases and sales proceeds columns may include in-kind transactions, if applicable.
Investment Valuation
The following is a summary of the inputs used, as of September 30, 2023, involving the Fund's assets and liabilities carried at fair value. The inputs or methodology used for valuing securities may not be an indication of the risk associated with investing in those securities. For more information on valuation inputs, and their aggregation into the levels used below, please refer to the Investment Valuation section in the accompanying Notes to Financial Statements.
Valuation Inputs at Reporting Date:
|
Description
|
Total ($)
|
Level 1 ($)
|
Level 2 ($)
|
Level 3 ($)
|
Investments in Securities:
|
|
|
|
|
|
|
Common Stocks
|
916,574,268
|
916,574,268
|
-
|
-
|
|
|
Money Market Funds
|
42,355,193
|
42,355,193
|
-
|
-
|
Total Investments in Securities:
|
958,929,461
|
958,929,461
|
-
|
-
|
Statement of Assets and Liabilities
|
|
|
|
|
September 30, 2023
|
|
|
|
|
|
|
Assets
|
|
|
|
|
Investment in securities, at value (including securities loaned of $36,605,614) - See accompanying schedule:
|
|
|
|
|
Unaffiliated issuers (cost $893,111,707)
|
$
|
916,574,268
|
|
|
Fidelity Central Funds (cost $42,355,193)
|
|
42,355,193
|
|
|
|
|
|
|
|
|
|
|
|
|
|
|
Total Investment in Securities (cost $935,466,900)
|
|
|
$
|
958,929,461
|
Receivable for fund shares sold
|
|
|
|
30,091,482
|
Dividends receivable
|
|
|
|
4,413,674
|
Distributions receivable from Fidelity Central Funds
|
|
|
|
21,543
|
Total assets
|
|
|
|
993,456,160
|
Liabilities
|
|
|
|
|
Payable to custodian bank
|
$
|
2,400
|
|
|
Payable for investments purchased
|
|
30,085,221
|
|
|
Payable for fund shares redeemed
|
|
138,564
|
|
|
Other payables and accrued expenses
|
|
6,575
|
|
|
Collateral on securities loaned
|
|
37,321,650
|
|
|
Total Liabilities
|
|
|
|
67,554,410
|
Net Assets
|
|
|
$
|
925,901,750
|
Net Assets consist of:
|
|
|
|
|
Paid in capital
|
|
|
$
|
1,000,141,528
|
Total accumulated earnings (loss)
|
|
|
|
(74,239,778)
|
Net Assets
|
|
|
$
|
925,901,750
|
Net Asset Value, offering price and redemption price per share ($925,901,750 ÷ 8,263,547 shares)
|
|
|
$
|
112.05
|
Statement of Operations
|
|
|
|
|
Year ended
September 30, 2023
|
Investment Income
|
|
|
|
|
Dividends
|
|
|
$
|
33,646,486
|
Income from Fidelity Central Funds (including $184,691 from security lending)
|
|
|
|
596,862
|
Total Income
|
|
|
|
34,243,348
|
Expenses
|
|
|
|
|
Custodian fees and expenses
|
$
|
17,770
|
|
|
Independent trustees' fees and expenses
|
|
5,878
|
|
|
Interest
|
|
13,648
|
|
|
Total Expenses
|
|
|
|
37,296
|
Net Investment income (loss)
|
|
|
|
34,206,052
|
Realized and Unrealized Gain (Loss)
|
|
|
|
|
Net realized gain (loss) on:
|
|
|
|
|
Investment Securities:
|
|
|
|
|
Unaffiliated issuers
|
|
(49,876,734)
|
|
|
Total net realized gain (loss)
|
|
|
|
(49,876,734)
|
Change in net unrealized appreciation (depreciation) on investment securities
|
|
|
|
60,896,493
|
Net gain (loss)
|
|
|
|
11,019,759
|
Net increase (decrease) in net assets resulting from operations
|
|
|
$
|
45,225,811
|
Statement of Changes in Net Assets
|
|
|
|
|
Year ended
September 30, 2023
|
|
Year ended
September 30, 2022
|
Increase (Decrease) in Net Assets
|
|
|
|
|
Operations
|
|
|
|
|
Net investment income (loss)
|
$
|
34,206,052
|
$
|
36,019,368
|
Net realized gain (loss)
|
|
(49,876,734)
|
|
37,104,328
|
Change in net unrealized appreciation (depreciation)
|
|
60,896,493
|
|
(330,048,765)
|
Net increase (decrease) in net assets resulting from operations
|
|
45,225,811
|
|
(256,925,069)
|
Distributions to shareholders
|
|
(29,797,466)
|
|
(31,677,620)
|
|
|
|
|
|
|
Affiliated share transactions
|
|
|
|
|
Proceeds from sales of shares
|
|
145,385,181
|
|
388,385,226
|
Reinvestment of distributions
|
|
29,797,466
|
|
31,677,620
|
Cost of shares redeemed
|
|
(238,163,802)
|
|
(790,606,931)
|
|
|
|
|
|
|
Net increase (decrease) in net assets resulting from share transactions
|
|
(62,981,155)
|
|
(370,544,085)
|
Total increase (decrease) in net assets
|
|
(47,552,810)
|
|
(659,146,774)
|
|
|
|
|
|
|
Net Assets
|
|
|
|
|
Beginning of period
|
|
973,454,560
|
|
1,632,601,334
|
End of period
|
$
|
925,901,750
|
$
|
973,454,560
|
|
|
|
|
|
|
Other Information
|
|
|
|
|
Shares
|
|
|
|
|
Sold
|
|
1,212,524
|
|
2,712,126
|
Issued in reinvestment of distributions
|
|
250,288
|
|
225,421
|
Redeemed
|
|
(1,957,115)
|
|
(5,758,378)
|
Net increase (decrease)
|
|
(494,303)
|
|
(2,820,831)
|
|
|
|
|
|
|
Financial Highlights
Fidelity® Real Estate Equity Central Fund
|
|
|
Years ended September 30,
|
|
2023
|
|
2022
|
|
2021
|
|
2020
|
|
2019
|
Selected Per-Share Data
|
|
|
|
|
|
|
|
|
|
|
Net asset value, beginning of period
|
$
|
111.15
|
$
|
141.00
|
$
|
108.09
|
$
|
124.43
|
$
|
109.73
|
Income from Investment Operations
|
|
|
|
|
|
|
|
|
|
|
Net investment income (loss) A,B
|
|
4.22
|
|
3.36
|
|
3.33
|
|
3.43
|
|
3.92
|
Net realized and unrealized gain (loss)
|
|
.29
|
|
(30.20)
|
|
32.42
|
|
(16.47)
|
|
15.85
|
Total from investment operations
|
|
4.51
|
|
(26.84)
|
|
35.75
|
|
(13.04)
|
|
19.77
|
Distributions from net investment income
|
|
(3.61)
|
|
(3.01)
|
|
(2.84)
|
|
(3.30)
|
|
(3.16)
|
Distributions from net realized gain
|
|
-
|
|
-
|
|
-
|
|
-
|
|
(1.91)
|
Total distributions
|
|
(3.61)
|
|
(3.01)
|
|
(2.84)
|
|
(3.30)
|
|
(5.07)
|
Net asset value, end of period
|
$
|
112.05
|
$
|
111.15
|
$
|
141.00
|
$
|
108.09
|
$
|
124.43
|
Total Return C
|
|
3.90%
|
|
(19.44)%
|
|
33.38%
|
|
(10.48)%
|
|
18.98%
|
Ratios to Average Net Assets B,D,E
|
|
|
|
|
|
|
|
|
|
|
Expenses before reductions
|
|
-% F
|
|
-% F
|
|
-% F
|
|
-% F
|
|
.01%
|
Expenses net of fee waivers, if any
|
|
-% F
|
|
-% F
|
|
-% F
|
|
-% F
|
|
.01%
|
Expenses net of all reductions
|
|
-% F
|
|
-% F
|
|
-% F
|
|
-% F
|
|
.01%
|
Net investment income (loss)
|
|
3.53%
|
|
2.36%
|
|
2.54%
|
|
3.05%
|
|
3.44%
|
Supplemental Data
|
|
|
|
|
|
|
|
|
|
|
Net assets, end of period (000 omitted)
|
$
|
925,902
|
$
|
973,455
|
$
|
1,632,601
|
$
|
700,071
|
$
|
453,902
|
Portfolio turnover rate G
|
|
44%
|
|
56%
|
|
28%
|
|
84% H
|
|
37%
|
ACalculated based on average shares outstanding during the period.
BNet investment income (loss) is affected by the timing of the declaration of dividends by any underlying mutual funds or exchange-traded funds (ETFs). Net investment income (loss) of any mutual funds or ETFs is not included in the Fund's net investment income (loss) ratio.
CTotal returns would have been lower if certain expenses had not been reduced during the applicable periods shown.
DFees and expenses of any underlying mutual funds or exchange-traded funds (ETFs) are not included in the Fund's expense ratio. The Fund indirectly bears its proportionate share of these expenses. For additional expense information related to investments in Fidelity Central Funds, please refer to the "Investments in Fidelity Central Funds" note found in the Notes to Financial Statements section of the most recent Annual or Semi-Annual report.
EExpense ratios reflect operating expenses of the class. Expenses before reductions do not reflect amounts reimbursed, waived, or reduced through arrangements with the investment adviser, brokerage services, or other offset arrangements, if applicable, and do not represent the amount paid by the class during periods when reimbursements, waivers or reductions occur.
FAmount represents less than .005%.
GAmount does not include the portfolio activity of any underlying mutual funds or exchange-traded funds (ETFs).
HPortfolio turnover rate excludes securities received or delivered in-kind.
For the period ended September 30, 2023
1. Organization.
Fidelity Real Estate Equity Central Fund (the Fund) is a non-diversified fund of Fidelity Central Investment Portfolios LLC (the LLC) and is authorized to issue an unlimited number of shares. Shares of the Fund are only offered to other investment companies and accounts managed by Fidelity Management & Research Company LLC (FMR), or its affiliates (the Investing Funds). The LLC is registered under the Investment Company Act of 1940, as amended (the 1940 Act), as an open-end management investment company organized as a Delaware Limited Liability Company.
2. Investments in Fidelity Central Funds.
Funds may invest in Fidelity Central Funds, which are open-end investment companies generally available only to other investment companies and accounts managed by the investment adviser and its affiliates. The Schedule of Investments lists any Fidelity Central Funds held as an investment as of period end, but does not include the underlying holdings of each Fidelity Central Fund. An investing fund indirectly bears its proportionate share of the expenses of the underlying Fidelity Central Funds.
Based on its investment objective, each Fidelity Central Fund may invest or participate in various investment vehicles or strategies that are similar to those of the investing fund. These strategies are consistent with the investment objectives of the investing fund and may involve certain economic risks which may cause a decline in value of each of the Fidelity Central Funds and thus a decline in the value of the investing fund.
Fidelity Central Fund
|
Investment Manager
|
Investment Objective
|
Investment Practices
|
Expense RatioA
|
Fidelity Money Market Central Funds
|
Fidelity Management & Research Company LLC (FMR)
|
Each fund seeks to obtain a high level of current income consistent with the preservation of capital and liquidity.
|
Short-term Investments
|
Less than .005%
|
A Expenses expressed as a percentage of average net assets and are as of each underlying Central Fund's most recent annual or semi-annual shareholder report.
A complete unaudited list of holdings for each Fidelity Central Fund is available upon request or at the Securities and Exchange Commission website at www.sec.gov. In addition, the financial statements of the Fidelity Central Funds which contain the significant accounting policies (including investment valuation policies) of those funds, and are not covered by the Report of Independent Registered Public Accounting Firm, are available on the Securities and Exchange Commission website or upon request.
3. Significant Accounting Policies.
The Fund is an investment company and applies the accounting and reporting guidance of the Financial Accounting Standards Board (FASB) Accounting Standards Codification Topic 946 Financial Services - Investment Companies. The financial statements have been prepared in conformity with accounting principles generally accepted in the United States of America (GAAP), which require management to make certain estimates and assumptions at the date of the financial statements. Actual results could differ from those estimates. Subsequent events, if any, through the date that the financial statements were issued have been evaluated in the preparation of the financial statements. The Fund's Schedule of Investments lists any underlying mutual funds or exchange-traded funds (ETFs) but does not include the underlying holdings of these funds. The following summarizes the significant accounting policies of the Fund:
Investment Valuation. Investments are valued as of 4:00 p.m. Eastern time on the last calendar day of the period. The Board of Directors (the Board) has designated the Fund's investment adviser as the valuation designee responsible for the fair valuation function and performing fair value determinations as needed. The investment adviser has established a Fair Value Committee (the Committee) to carry out the day-to-day fair valuation responsibilities and has adopted policies and procedures to govern the fair valuation process and the activities of the Committee. In accordance with these fair valuation policies and procedures, which have been approved by the Board, the Fund attempts to obtain prices from one or more third party pricing services or brokers to value its investments. When current market prices, quotations or currency exchange rates are not readily available or reliable, investments will be fair valued in good faith by the Committee, in accordance with the policies and procedures. Factors used in determining fair value vary by investment type and may include market or investment specific events, transaction data, estimated cash flows, and market observations of comparable investments. The frequency that the fair valuation procedures are used cannot be predicted and they may be utilized to a significant extent. The Committee manages the Fund's fair valuation practices and maintains the fair valuation policies and procedures. The Fund's investment adviser reports to the Board information regarding the fair valuation process and related material matters.
The Fund categorizes the inputs to valuation techniques used to value its investments into a disclosure hierarchy consisting of three levels as shown below:
Level 1 - unadjusted quoted prices in active markets for identical investments
Level 2 - other significant observable inputs (including quoted prices for similar investments, interest rates, prepayment speeds, etc.)
Level 3 - unobservable inputs (including the Fund's own assumptions based on the best information available)
Valuation techniques used to value the Fund's investments by major category are as follows:
Equity securities, including restricted securities, for which market quotations are readily available, are valued at the last reported sale price or official closing price as reported by a third party pricing service on the primary market or exchange on which they are traded and are categorized as Level 1 in the hierarchy. In the event there were no sales during the day or closing prices are not available, securities are valued at the last quoted bid price or may be valued using the last available price and are generally categorized as Level 2 in the hierarchy. For foreign equity securities, when market or security specific events arise, comparisons to the valuation of American Depositary Receipts (ADRs), futures contracts, ETFs and certain indexes as well as quoted prices for similar securities may be used and would be categorized as Level 2 in the hierarchy.
Investments in open-end mutual funds, including the Fidelity Central Funds, are valued at their closing net asset value (NAV) each business day and are categorized as Level 1 in the hierarchy.
Changes in valuation techniques may result in transfers in or out of an assigned level within the disclosure hierarchy. The aggregate value of investments by input level as of September 30, 2023 is included at the end of the Fund's Schedule of Investments.
Investment Transactions and Income. For financial reporting purposes, the Fund's investment holdings and NAV include trades executed through the end of the last business day of the period. The NAV per share for processing shareholder transactions is calculated as of the close of business of the New York Stock Exchange (NYSE), normally 4:00 p.m. Eastern time and
includes trades executed through the end of the prior business day. Gains and losses on securities sold are determined on the basis of identified cost. Commissions paid to certain brokers with
whom the investment adviser, or its affiliates, places trades on behalf of a fund include an amount in addition to trade execution, which may be rebated back to a fund. Any such rebates are included in net realized gain (loss) on investments in the Statement of Operations. Dividend income is recorded on the ex-dividend date, except for certain dividends from foreign securities where the ex-dividend date may have passed, which are recorded as soon as the Fund is informed of the ex-dividend date. Non-cash dividends included in dividend income, if any, are recorded at the fair market value of the securities received. Income and capital gain distributions from Fidelity Central Funds, if any, are recorded on the ex-dividend date. Certain distributions received by the Fund represent a return of capital or capital gain. The Fund determines the components of these distributions subsequent to the ex-dividend date, based upon receipt of tax filings or other correspondence relating to the underlying investment. These distributions are recorded as a reduction of cost of investments and/or as a realized gain.
Expenses. Expenses directly attributable to a fund are charged to that fund. Expenses attributable to more than one fund are allocated among the respective funds on the basis of relative net assets or other appropriate methods. Expenses included in the accompanying financial statements reflect the expenses of that fund and do not include any expenses associated with any underlying mutual funds or exchange-traded funds. Although not included in a fund's expenses, a fund indirectly bears its proportionate share of these expenses through the net asset value of each underlying mutual fund or exchange-traded fund. Expense estimates are accrued in the period to which they relate and adjustments are made when actual amounts are known.
Income Tax Information and Distributions to Shareholders. Each year, the Fund intends to qualify as a regulated investment company under Subchapter M of the Internal Revenue Code, including distributing substantially all of its taxable income and realized gains. As a result, no provision for U.S. Federal income taxes is required. As of September 30, 2023, the Fund did not have any unrecognized tax benefits in the financial statements; nor is the Fund aware of any tax positions for which it is reasonably possible that the total amounts of unrecognized tax benefits will significantly change in the next twelve months. The Fund files a U.S. federal tax return, in addition to state and local tax returns as required. The Fund's federal income tax returns are subject to examination by the Internal Revenue Service (IRS) for a period of three fiscal years after they are filed. State and local tax returns may be subject to examination for an additional fiscal year depending on the jurisdiction.
Distributions are declared and recorded on the ex-dividend date. Income and capital gain distributions are determined in accordance with income tax regulations, which may differ from GAAP.
Capital accounts within the financial statements are adjusted for permanent book-tax differences. These adjustments have no impact on net assets or the results of operations. Capital accounts are not adjusted for temporary book-tax differences which will reverse in a subsequent period.
Book-tax differences are primarily due to capital loss carryforwards and losses deferred due to wash sales.
As of period end, the cost and unrealized appreciation (depreciation) in securities, and derivatives if applicable, for federal income tax purposes were as follows:
Gross unrealized appreciation
|
$88,561,578
|
Gross unrealized depreciation
|
(70,701,893)
|
Net unrealized appreciation (depreciation)
|
$17,859,685
|
Tax Cost
|
$941,069,776
|
The tax-based components of distributable earnings as of period end were as follows:
Undistributed ordinary income
|
$6,372,842
|
Capital loss carryforward
|
$(98,472,305)
|
Net unrealized appreciation (depreciation) on securities and other investments
|
$17,859,685
|
Capital loss carryforwards are only available to offset future capital gains of the Fund to the extent provided by regulations and may be limited. The capital loss carryforward information presented below, including any applicable limitation, is estimated as of fiscal period end and is subject to adjustment.
Short-term
|
$(67,254,687)
|
Long-term
|
(31,217,618)
|
Total capital loss carryforward
|
$(98,472,305)
|
The tax character of distributions paid was as follows:
|
September 30, 2023
|
September 30, 2022
|
Ordinary Income
|
$29,797,466
|
$31,677,620
|
4. Purchases and Sales of Investments.
Purchases and sales of securities, other than short-term securities and in-kind transactions, as applicable, are noted in the table below.
|
Purchases ($)
|
Sales ($)
|
Fidelity Real Estate Equity Central Fund
|
430,667,127
|
484,195,632
|
5. Fees and Other Transactions with Affiliates.
Management Fee and Expense Contract. Fidelity Management & Research Company LLC (the investment adviser) provides the Fund with investment management services. The Fund does not pay any fees for these services. Pursuant to the Fund's management contract, the investment adviser receives a monthly management fee that represents a portion of the management fees it receives from the Investing Funds. In addition, under an expense contract, the investment adviser also pays all other expenses of the Fund, excluding custody fees, the compensation of the independent Directors, and certain miscellaneous expenses such as proxy and shareholder meeting expenses.
Brokerage Commissions. A portion of portfolio transactions were placed with brokerage firms which are affiliates of the investment adviser. Brokerage commissions are included in net realized gain (loss) and change in net unrealized appreciation (depreciation) in the Statement of Operations. The commissions paid to these affiliated firms were as follows:
|
Amount
|
Fidelity Real Estate Equity Central Fund
|
$8,399
|
Interfund Lending Program. Pursuant to an Exemptive Order issued by the Securities and Exchange Commission (the SEC), the Fund, along with other registered investment companies having management contracts with FMR, or other affiliated entities of FMR, may participate in an interfund lending program. This program provides an alternative credit facility allowing the Fund to borrow from, or lend money to, other participating affiliated funds. At period end, there were no interfund loans outstanding. Activity in this program during the period for which loans were outstanding was as follows:
|
Borrower or Lender
|
Average Loan Balance
|
Weighted Average Interest Rate
|
Interest Expense
|
Fidelity Real Estate Equity Central Fund
|
Borrower
|
$ 21,526,400
|
4.57%
|
$13,648
|
Interfund Trades. Funds may purchase from or sell securities to other Fidelity Funds under procedures adopted by the Board. The procedures have been designed to ensure these interfund trades are executed in accordance with Rule 17a-7 of the 1940 Act. Any interfund trades are included within the respective purchases and sales amounts shown in the Purchases and Sales of Investments note. Interfund trades during the period are noted in the table below.
|
Purchases ($)
|
Sales ($)
|
Realized Gain (Loss) ($)
|
Fidelity Real Estate Equity Central Fund
|
32,947,043
|
22,286,129
|
(3,568,725)
|
6. Security Lending.
Funds lend portfolio securities from time to time in order to earn additional income. Lending agents are used, including National Financial Services (NFS), an affiliate of the investment adviser. Pursuant to a securities lending agreement, NFS will receive a fee, which is capped at 9.9% of a fund's daily lending revenue, for its services as lending agent. A fund may lend securities to certain qualified borrowers, including NFS. On the settlement date of the loan, a fund receives collateral (in the form of U.S. Treasury obligations, letters of credit and/or cash) against the loaned securities and maintains collateral in an amount not less than 100% of the market value of the loaned securities during the period of the loan. The market value of the loaned securities is determined at the close of business of a fund and any additional required collateral is delivered to a fund on the next business day. A fund or borrower may terminate the loan at any time, and if the borrower defaults on its obligation to return the securities loaned because of insolvency or other reasons, a fund may apply collateral received from the borrower against the obligation. A fund may experience delays and costs in recovering the securities loaned. Any cash collateral received is invested in the Fidelity Securities Lending Cash Central Fund. Any loaned securities are identified as such in the Schedule of Investments, and the value of loaned securities and cash collateral at period end, as applicable, are presented in the Statement of Assets and Liabilities. Security lending income represents the income earned on investing cash collateral, less rebates paid to borrowers and any lending agent fees associated with the loan, plus any premium payments received for lending certain types of securities. Security lending income is presented in the Statement of Operations as a component of income from Fidelity Central Funds. Affiliated security lending activity, if any, was as follows:
|
Total Security Lending Fees Paid to NFS
|
Security Lending Income From Securities Loaned to NFS
|
Value of Securities Loaned to NFS at Period End
|
Fidelity Real Estate Equity Central Fund
|
$19,920
|
$438
|
$-
|
7. Other.
A fund's organizational documents provide former and current directors and officers with a limited indemnification against liabilities arising in connection with the performance of their duties to the fund. In the normal course of business, a fund may also enter into contracts that provide general indemnifications. A fund's maximum exposure under these arrangements is unknown as this would be dependent on future claims that may be made against a fund. The risk of material loss from such claims is considered remote.
At the end of the period, mutual funds managed by the investment adviser or its affiliates were the owners of record of all of the outstanding shares of the Fund.
8. Risk and Uncertainties.
Many factors affect a fund's performance. Developments that disrupt global economies and financial markets, such as pandemics, epidemics, outbreaks of infectious diseases, war, terrorism, and environmental disasters, may significantly affect a fund's investment performance. The effects of these developments to a fund will be impacted by the types of securities in which a fund invests, the financial condition, industry, economic sector, and geographic location of an issuer, and a fund's level of investment in the securities of that issuer. Significant concentrations in security types, issuers, industries, sectors, and geographic locations may magnify the factors that affect a fund's performance.
To the Board of Trustees of Fidelity Central Investment Portfolios LLC and the Shareholders of Fidelity Real Estate Equity Central Fund:
Opinion on the Financial Statements and Financial Highlights
We have audited the accompanying statement of assets and liabilities of Fidelity Real Estate Equity Central Fund (the "Fund"), a fund of Fidelity Central Investment Portfolios LLC, including the schedule of investments, as of September 30, 2023, the related statement of operations for the year then ended, the statement of changes in net assets for each of the two years in the period then ended, the financial highlights for each of the five years in the period then ended, and the related notes. In our opinion, the financial statements and financial highlights present fairly, in all material respects, the financial position of the Fund as of September 30, 2023, and the results of its operations for the year then ended, the changes in its net assets for each of the two years in the period then ended, and the financial highlights for each of the five years in the period then ended in conformity with accounting principles generally accepted in the United States of America.
Basis for Opinion
These financial statements and financial highlights are the responsibility of the Fund's management. Our responsibility is to express an opinion on the Fund's financial statements and financial highlights based on our audits. We are a public accounting firm registered with the Public Company Accounting Oversight Board (United States) (PCAOB) and are required to be independent with respect to the Fund in accordance with the U.S. federal securities laws and the applicable rules and regulations of the Securities and Exchange Commission and the PCAOB.
We conducted our audits in accordance with the standards of the PCAOB. Those standards require that we plan and perform the audit to obtain reasonable assurance about whether the financial statements and financial highlights are free of material misstatement, whether due to error or fraud. The Fund is not required to have, nor were we engaged to perform, an audit of its internal control over financial reporting. As part of our audits we are required to obtain an understanding of internal control over financial reporting but not for the purpose of expressing an opinion on the effectiveness of the Fund's internal control over financial reporting. Accordingly, we express no such opinion.
Our audits included performing procedures to assess the risks of material misstatement of the financial statements and financial highlights, whether due to error or fraud, and performing procedures that respond to those risks. Such procedures included examining, on a test basis, evidence regarding the amounts and disclosures in the financial statements and financial highlights. Our audits also included evaluating the accounting principles used and significant estimates made by management, as well as evaluating the overall presentation of the financial statements and financial highlights. Our procedures included confirmation of securities owned as of September 30, 2023, by correspondence with the custodian and brokers; when replies were not received from brokers, we performed other auditing procedures. We believe that our audits provide a reasonable basis for our opinion.
/s/ Deloitte & Touche LLP
Boston, Massachusetts
November 10, 2023
We have served as the auditor of one or more of the Fidelity investment companies since 1999.
DIRECTORS AND OFFICERS (TRUSTEES AND OFFICERS)
The Trustees, Members of the Advisory Board (if any), and officers of the Fidelity Central Investment Portfolios LLC and fund, as applicable, are listed below. The Board of Trustees governs the fund and is responsible for protecting the interests of shareholders. The Trustees are experienced executives who meet periodically throughout the year to oversee the fund's activities, review contractual arrangements with companies that provide services to the fund, oversee management of the risks associated with such activities and contractual arrangements, and review the fund's performance. Except for Vijay Advani, each of the Trustees oversees 322 funds. Mr. Advani oversees 215 funds.
The Trustees hold office without limit in time except that (a) any Trustee may resign; (b) any Trustee may be removed by written instrument, signed by at least two-thirds of the number of Trustees prior to such removal; (c) any Trustee who requests to be retired or who has become incapacitated by illness or injury may be retired by written instrument signed by a majority of the other Trustees; and (d) any Trustee may be removed at any special meeting of shareholders by a two-thirds vote of the outstanding voting securities of the trust. Each Trustee who is not an interested person (as defined in the 1940 Act) of the trust and the fund is referred to herein as an Independent Trustee. Each Independent Trustee shall retire not later than the last day of the calendar year in which his or her 75th birthday occurs. The Independent Trustees may waive this mandatory retirement age policy with respect to individual Trustees. Officers and Advisory Board Members hold office without limit in time, except that any officer or Advisory Board Member may resign or may be removed by a vote of a majority of the Trustees at any regular meeting or any special meeting of the Trustees. Except as indicated, each individual has held the office shown or other offices in the same company for the past five years.
The fund's Statement of Additional Information (SAI) includes more information about the Trustees. To request a free copy, call Fidelity at 1-800-544-8544.
Experience, Skills, Attributes, and Qualifications of the Trustees. The Governance and Nominating Committee has adopted a statement of policy that describes the experience, qualifications, attributes, and skills that are necessary and desirable for potential Independent Trustee candidates (Statement of Policy). The Board believes that each Trustee satisfied at the time he or she was initially elected or appointed a Trustee, and continues to satisfy, the standards contemplated by the Statement of Policy. The Governance and Nominating Committee also engages professional search firms to help identify potential Independent Trustee candidates who have the experience, qualifications, attributes, and skills consistent with the Statement of Policy. From time to time, additional criteria based on the composition and skills of the current Independent Trustees, as well as experience or skills that may be appropriate in light of future changes to board composition, business conditions, and regulatory or other developments, have also been considered by the professional search firms and the Governance and Nominating Committee. In addition, the Board takes into account the Trustees' commitment and participation in Board and committee meetings, as well as their leadership of standing and ad hoc committees throughout their tenure.
In determining that a particular Trustee was and continues to be qualified to serve as a Trustee, the Board has considered a variety of criteria, none of which, in isolation, was controlling. The Board believes that, collectively, the Trustees have balanced and diverse experience, qualifications, attributes, and skills, which allow the Board to operate effectively in governing the fund and protecting the interests of shareholders. Information about the specific experience, skills, attributes, and qualifications of each Trustee, which in each case led to the Board's conclusion that the Trustee should serve (or continue to serve) as a trustee of the fund, is provided below.
Board Structure and Oversight Function. Robert A. Lawrence is an interested person and currently serves as Chair. The Trustees have determined that an interested Chair is appropriate and benefits shareholders because an interested Chair has a personal and professional stake in the quality and continuity of services provided to the fund. Independent Trustees exercise their informed business judgment to appoint an individual of their choosing to serve as Chair, regardless of whether the Trustee happens to be independent or a member of management. The Independent Trustees have determined that they can act independently and effectively without having an Independent Trustee serve as Chair and that a key structural component for assuring that they are in a position to do so is for the Independent Trustees to constitute a substantial majority for the Board. The Independent Trustees also regularly meet in executive session. David M. Thomas serves as Lead Independent Trustee and as such (i) acts as a liaison between the Independent Trustees and management with respect to matters important to the Independent Trustees and (ii) with management prepares agendas for Board meetings.
Fidelity® funds are overseen by different Boards of Trustees. The fund's Board oversees Fidelity's high income and certain equity funds, and other Boards oversee Fidelity's alternative investment, investment-grade bond, money market, asset allocation, and other equity funds. The asset allocation funds may invest in Fidelity® funds overseen by the fund's Board. The use of separate Boards, each with its own committee structure, allows the Trustees of each group of Fidelity® funds to focus on the unique issues of the funds they oversee, including common research, investment, and operational issues. On occasion, the separate Boards establish joint committees to address issues of overlapping consequences for the Fidelity® funds overseen by each Board.
The Trustees operate using a system of committees to facilitate the timely and efficient consideration of all matters of importance to the Trustees, the fund, and fund shareholders and to facilitate compliance with legal and regulatory requirements and oversight of the fund's activities and associated risks. The Board, acting through its committees, has charged FMR and its affiliates with (i) identifying events or circumstances the occurrence of which could have demonstrably adverse effects on the fund's business and/or reputation; (ii) implementing processes and controls to lessen the possibility that such events or circumstances occur or to mitigate the effects of such events or circumstances if they do occur; and (iii) creating and maintaining a system designed to evaluate continuously business and market conditions in order to facilitate the identification and implementation processes described in (i) and (ii) above. Because the day-to-day operations and activities of the fund are carried out by or through FMR, its affiliates, and other service providers, the fund's exposure to risks is mitigated but not eliminated by the processes overseen by the Trustees. While each of the Board's committees has responsibility for overseeing different aspects of the fund's activities, oversight is exercised primarily through the Operations, Audit, and Compliance Committees. Appropriate personnel, including but not limited to the fund's Chief Compliance Officer (CCO), FMR's internal auditor, the independent accountants, the fund's Treasurer and portfolio management personnel, make periodic reports to the Board's committees, as appropriate, including an annual review of Fidelity's risk management program for the Fidelity® funds. The responsibilities of each standing committee, including their oversight responsibilities, are described further under "Standing Committees of the Trustees."
Interested Trustees*:
Correspondence intended for a Trustee who is an interested person may be sent to Fidelity Investments, 245 Summer Street, Boston, Massachusetts 02210.
Name, Year of Birth; Principal Occupations and Other Relevant Experience+
Bettina Doulton (1964)
Year of Election or Appointment: 2020
Trustee
Ms. Doulton also serves as Trustee of other Fidelity® funds. Prior to her retirement, Ms. Doulton served in a variety of positions at Fidelity Investments, including as a managing director of research (2006-2007), portfolio manager to certain Fidelity® funds (1993-2005), equity analyst and portfolio assistant (1990-1993), and research assistant (1987-1990). Ms. Doulton currently owns and operates Phi Builders + Architects and Cellardoor Winery. Previously, Ms. Doulton served as a member of the Board of Brown Capital Management, LLC (2014-2018).
Robert A. Lawrence (1952)
Year of Election or Appointment: 2020
Trustee
Chair of the Board of Trustees
Mr. Lawrence also serves as Trustee of other funds. Previously, Mr. Lawrence served as a Trustee and Member of the Advisory Board of certain funds. Prior to his retirement in 2008, Mr. Lawrence served as Vice President of certain Fidelity® funds (2006-2008), Senior Vice President, Head of High Income Division of Fidelity Management & Research Company (investment adviser firm, 2006-2008), and President of Fidelity Strategic Investments (investment adviser firm, 2002-2005).
* Determined to be an "Interested Trustee" by virtue of, among other things, his or her affiliation with the Fidelity Central Investment Portfolios LLC or various entities under common control with FMR.
+ The information includes the Trustee's principal occupation during the last five years and other information relating to the experience, attributes, and skills relevant to the Trustee's qualifications to serve as a Trustee, which led to the conclusion that the Trustee should serve as a Trustee for the fund.
Independent Trustees:
Correspondence intended for an Independent Trustee may be sent to Fidelity Investments, P.O. Box 55235, Boston, Massachusetts 02205-5235.
Name, Year of Birth; Principal Occupations and Other Relevant Experience+
Vijay C. Advani (1960)
Year of Election or Appointment: 2023
Trustee
Mr. Advani also serves as Trustee or Member of the Advisory Board of other funds. Previously, Mr. Advani served as Executive Chairman (2020-2022), Chief Executive Officer (2017-2020) and Chief Operating Officer (2016-2017) of Nuveen (global investment manager). He also served in various capacities at Franklin Resources (global investment manager), including Co-President (2015-2016), Executive Vice President, Global Advisory Services (2008-2015), Head of Global Retail Distribution (2005-2008), Executive Managing Director, International Retail Development (2002-2005), Managing Director, Product Developments, Sales & Marketing, Asia, Eastern Europe and Africa (2000-2002) and President, Templeton Asset Management India (1995-2000). Mr. Advani also served as Senior Investment Officer of International Finance Corporation (private equity and venture capital arm of The World Bank, 1984-1995). Mr. Advani is Chairman Emeritus of the U.S. India Business Council (2018-present), a Director of The Global Impact Investing Network (2019-present), a Director of LOK Capital (Mauritius) (2022-present), a member of the Advisory Council of LOK Capital (2022-present), a Senior Advisor of Neuberger Berman (2021-present), a Senior Advisor of Seviora Holdings Pte. Ltd (Temasek-Singapore) (2021-present), a Director of Seviora Capital (Singapore) (2021-present) and an Advisor of EQUIAM (2021-present). Mr. Advani formerly served as a member of the Board of BowX Acquisition Corp. (special purpose acquisition company, 2020-2021), a member of the Board of Intellecap (advisory arm of The Aavishkaar Group, 2018-2020), a member of the Board of Nuveen Investments, Inc. (2017-2020) and a member of the Board of Docusign (software, 2016-2019).
Thomas P. Bostick (1956)
Year of Election or Appointment: 2021
Trustee
Lieutenant General Bostick also serves as Trustee of other Fidelity® funds. Prior to his retirement, General Bostick (United States Army, Retired) held a variety of positions within the U.S. Army, including Commanding General and Chief of Engineers, U.S. Army Corps of Engineers (2012-2016) and Deputy Chief of Staff and Director of Human Resources, U.S. Army (2009-2012). General Bostick currently serves as a member of the Board and Finance and Governance & Sustainability Committees of CSX Corporation (transportation, 2020-present) and a member of the Board and Corporate Governance and Nominating Committee of Perma-Fix Environmental Services, Inc. (nuclear waste management, 2020-present). General Bostick serves as Chief Executive Officer of Bostick Global Strategies, LLC (consulting, 2016-present), as a member of the Board of HireVue, Inc. (video interview and assessment, 2020-present), as a member of the Board of Allonnia (biotechnology and engineering solutions, 2022-present) and on the Advisory Board of Solugen, Inc. (specialty bio-based chemicals manufacturer, 2022-present). Previously, General Bostick served as a Member of the Advisory Board of certain Fidelity® funds (2021), President, Intrexon Bioengineering (2018-2020) and Chief Operating Officer (2017-2020) and Senior Vice President of the Environment Sector (2016-2017) of Intrexon Corporation (biopharmaceutical company).
Dennis J. Dirks (1948)
Year of Election or Appointment: 2005
Trustee
Mr. Dirks also serves as Trustee of other Fidelity® funds. Prior to his retirement in May 2003, Mr. Dirks served as Chief Operating Officer and as a member of the Board of The Depository Trust & Clearing Corporation (financial markets infrastructure), President, Chief Operating Officer and a member of the Board of The Depository Trust Company (DTC), President and a member of the Board of the National Securities Clearing Corporation (NSCC), Chief Executive Officer and a member of the Board of the Government Securities Clearing Corporation and Chief Executive Officer and a member of the Board of the Mortgage-Backed Securities Clearing Corporation. Mr. Dirks currently serves as a member of the Finance Committee (2016-present) and Board (2017-present) and is Treasurer (2018-present) of the Asolo Repertory Theatre.
Donald F. Donahue (1950)
Year of Election or Appointment: 2018
Trustee
Mr. Donahue also serves as Trustee of other Fidelity® funds. Mr. Donahue serves as President and Chief Executive Officer of Miranda Partners, LLC (risk consulting for the financial services industry, 2012-present). Previously, Mr. Donahue served as Chief Executive Officer (2006-2012), Chief Operating Officer (2003-2006) and Managing Director, Customer Marketing and Development (1999-2003) of The Depository Trust & Clearing Corporation (financial markets infrastructure). Mr. Donahue currently serves as a member (2007-present) and Co-Chairman (2016-present) of the Board of United Way of New York. Mr. Donahue previously served as a member of the Advisory Board of certain Fidelity® funds (2015-2018) and as a member of the Board of The Leadership Academy (previously NYC Leadership Academy) (2012-2022).
Vicki L. Fuller (1957)
Year of Election or Appointment: 2020
Trustee
Ms. Fuller also serves as Trustee of other Fidelity® funds. Previously, Ms. Fuller served as a member of the Advisory Board of certain Fidelity® funds (2018-2020), Chief Investment Officer of the New York State Common Retirement Fund (2012-2018) and held a variety of positions at AllianceBernstein L.P. (global asset management, 1985-2012), including Managing Director (2006-2012) and Senior Vice President and Senior Portfolio Manager (2001-2006). Ms. Fuller currently serves as a member of the Board, Audit Committee and Nominating and Governance Committee of two Blackstone business development companies (2020-present), as a member of the Board of Treliant, LLC (consulting, 2019-present), as a member of the Board of Ariel Alternatives, LLC (private equity, 2022-present) and as a member of the Board and Chair of the Audit Committee of Gusto, Inc. (software, 2021-present). In addition, Ms. Fuller currently serves as a member of the Board of Roosevelt University (2019-present) and as a member of the Executive Board of New York University's Stern School of Business. Ms. Fuller previously served as a member of the Board, Audit Committee and Nominating and Governance Committee of The Williams Companies, Inc. (natural gas infrastructure, 2018-2021).
Patricia L. Kampling (1959)
Year of Election or Appointment: 2020
Trustee
Ms. Kampling also serves as Trustee of other Fidelity® funds. Prior to her retirement, Ms. Kampling served as Chairman of the Board and Chief Executive Officer (2012-2019), President and Chief Operating Officer (2011-2012) and Executive Vice President and Chief Financial Officer (2010-2011) of Alliant Energy Corporation. Ms. Kampling currently serves as a member of the Board, Finance Committee and Governance, Compensation and Nominating Committee of Xcel Energy Inc. (utilities company, 2020-present) and as a member of the Board, Audit, Finance and Risk Committee and Safety, Environmental, Technology and Operations Committee and Chair of the Executive Development and Compensation Committee of American Water Works Company, Inc. (utilities company, 2019-present). In addition, Ms. Kampling currently serves as a member of the Board of the Nature Conservancy, Wisconsin Chapter (2019-present). Previously, Ms. Kampling served as a Member of the Advisory Board of certain Fidelity® funds (2020), a member of the Board, Compensation Committee and Executive Committee and Chair of the Audit Committee of Briggs & Stratton Corporation (manufacturing, 2011-2021), a member of the Board of Interstate Power and Light Company (2012-2019) and Wisconsin Power and Light Company (2012-2019) (each a subsidiary of Alliant Energy Corporation) and as a member of the Board and Workforce Development Committee of the Business Roundtable (2018-2019).
Thomas A. Kennedy (1955)
Year of Election or Appointment: 2021
Trustee
Mr. Kennedy also serves as Trustee of other Fidelity® funds. Previously, Mr. Kennedy served as a Member of the Advisory Board of certain Fidelity® funds (2020) and held a variety of positions at Raytheon Company (aerospace and defense, 1983-2020), including Chairman and Chief Executive Officer (2014-2020) and Executive Vice President and Chief Operating Officer (2013-2014). Mr. Kennedy served as Executive Chairman of the Board of Directors of Raytheon Technologies Corporation (aerospace and defense, 2020-2021). Mr. Kennedy serves as a Director of the Board of Directors of Textron Inc. (aerospace and defense, 2023-present).
Oscar Munoz (1959)
Year of Election or Appointment: 2021
Trustee
Mr. Munoz also serves as Trustee of other Fidelity® funds. Prior to his retirement, Mr. Munoz served as Executive Chairman (2020-2021), Chief Executive Officer (2015-2020), President (2015-2016) and a member of the Board (2010-2021) of United Airlines Holdings, Inc. Mr. Munoz currently serves as a member of the Board of CBRE Group, Inc. (commercial real estate, 2020-present), a member of the Board of Univision Communications, Inc. (Hispanic media, 2020-present), a member of the Board of Archer Aviation Inc. (2021-present), a member of the Defense Business Board of the United States Department of Defense (2021-present) and a member of the Board of Salesforce.com, Inc. (cloud-based software, 2022-present). Previously, Mr. Munoz served as a Member of the Advisory Board of certain Fidelity® funds (2021).
David M. Thomas (1949)
Year of Election or Appointment: 2008
Trustee
Lead Independent Trustee
Mr. Thomas also serves as Trustee of other Fidelity® funds. Previously, Mr. Thomas served as Executive Chairman (2005-2006) and Chairman and Chief Executive Officer (2000-2005) of IMS Health, Inc. (pharmaceutical and healthcare information solutions). Mr. Thomas currently serves as a member of the Board of Fortune Brands Home and Security (home and security products, 2004-present) and as Director (2013-present) and Non-Executive Chairman of the Board (2022-present) of Interpublic Group of Companies, Inc. (marketing communication).
Susan Tomasky (1953)
Year of Election or Appointment: 2020
Trustee
Ms. Tomasky also serves as Trustee of other Fidelity® funds. Prior to her retirement, Ms. Tomasky served in various executive officer positions at American Electric Power Company, Inc. (1998-2011), including most recently as President of AEP Transmission (2007-2011). Ms. Tomasky currently serves as a member of the Board and Sustainability Committee and as Chair of the Audit Committee of Marathon Petroleum Corporation (2018-present) and as a member of the Board, Executive Committee, Corporate Governance Committee and Organization and Compensation Committee and as Lead Director of the Board of Public Service Enterprise Group, Inc. (utilities company, 2012-present) and as a member of the Board of its subsidiary company, Public Service Electric and Gas Co. (2021-present). In addition, Ms. Tomasky currently serves as a member (2009-present) and President (2020-present) of the Board of the Royal Shakespeare Company - America (2009-present), as a member of the Board of the Columbus Association for the Performing Arts (2011-present) and as a member of the Board and Kenyon in the World Committee of Kenyon College (2016-present). Previously, Ms. Tomasky served as a Member of the Advisory Board of certain Fidelity® funds (2020), as a member of the Board of the Columbus Regional Airport Authority (2007-2020), as a member of the Board (2011-2018) and Lead Independent Director (2015-2018) of Andeavor Corporation (previously Tesoro Corporation) (independent oil refiner and marketer) and as a member of the Board of Summit Midstream Partners LP (energy, 2012-2018).
Michael E. Wiley (1950)
Year of Election or Appointment: 2018
Trustee
Mr. Wiley also serves as Trustee of other Fidelity® funds. Previously, Mr. Wiley served as a member of the Advisory Board of certain Fidelity® funds (2018-2020), Chairman, President and CEO of Baker Hughes, Inc. (oilfield services, 2000-2004). Mr. Wiley also previously served as a member of the Board of Andeavor Corporation (independent oil refiner and marketer, 2005-2018), a member of the Board of Andeavor Logistics LP (natural resources logistics, 2015-2018) and a member of the Board of High Point Resources (exploration and production, 2005-2020).
+ The information includes the Trustee's principal occupation during the last five years and other information relating to the experience, attributes, and skills relevant to the Trustee's qualifications to serve as a Trustee, which led to the conclusion that the Trustee should serve as a Trustee for the fund.
Advisory Board Members and Officers:
Correspondence intended for a Member of the Advisory Board (if any) may be sent to Fidelity Investments, P.O. Box 55235, Boston, Massachusetts 02205-5235. Correspondence intended for an officer or Peter S. Lynch may be sent to Fidelity Investments, 245 Summer Street, Boston, Massachusetts 02210.
Name, Year of Birth; Principal Occupation
Peter S. Lynch (1944)
Year of Election or Appointment: 2004
Member of the Advisory Board
Mr. Lynch also serves as a Member of the Advisory Board of other Fidelity® funds. Mr. Lynch is Vice Chairman and a Director of Fidelity Management & Research Company LLC (investment adviser firm). In addition, Mr. Lynch serves as a Trustee of Boston College and as the Chairman of the Inner-City Scholarship Fund. Previously, Mr. Lynch served as Vice Chairman and a Director of FMR Co., Inc. (investment adviser firm) and on the Special Olympics International Board of Directors (1997-2006).
Karen B. Peetz (1955)
Year of Election or Appointment: 2023
Member of the Advisory Board
Ms. Peetz also serves as a Member of the Advisory Board of other funds. Previously, Ms. Peetz served as Chief Administration Officer (2020-2023) of Citigroup Inc. (a diversified financial service company). She also served in various capacities at Bank of New York Mellon Corporation, including President (2013-2016), Vice Chairman, Senior Executive Vice President and Chief Executive Officer of Financial Markets & Treasury Services (2010-2013), Senior Executive Vice President and Chief Executive Officer of Global Corporate Trust (2003-2008), Senior Vice President and Division Manager of Global Payments & Trade Services (2002-2003) and Senior Vice President and Division Manager of Domestic Corporate Trust (1998-2002). Ms. Peetz also served in various capacities at Chase Manhattan Corporation (1982-1998), including Senior Vice President and Manager of Corporate Trust International Business (1996-1998), Managing Director and Manager of Corporate Trust Services (1994-1996) and Managing Director and Group Manager of Financial Institution Sales (1990-1993). Ms. Peetz currently serves as Chair of Amherst Holdings Advisory Council (2018-present), Trustee of Johns Hopkins University (2016-present), Chair of the Carey Business School Advisory Council, Member of the Johns Hopkins Medicine Board and Finance Committee and Chair of the Lyme and Tick Related Disease Institute Advisory Council. Ms. Peetz previously served as a member of the Board of Guardian Life Insurance Company of America (2019-2023), a member of the Board of Trane Technologies (2018-2022), a member of the Board of Wells Fargo Corp. (2017-2019), a member of the Board of SunCoke Energy Inc. (2012-2016), a member of the Board of Private Export Funding Corporation (2010-2016) and as a Trustee of Penn State University (2010-2014) and the United Way of New York City (2008-2010).
Heather Bonner (1977)
Year of Election or Appointment: 2023
Assistant Treasurer
Ms. Bonner also serves as an officer of other funds. Ms. Bonner is a Senior Vice President (2022-present) and is an employee of Fidelity Investments (2022-present). Ms. Bonner serves as Assistant Treasurer of Fidelity CRET Trustee LLC (2022-present). Prior to joining Fidelity, Ms. Bonner served as Managing Director at AQR Capital Management (2013-2022) and was the Treasurer and Principal Financial Officer of the AQR Funds (2013-2022).
Craig S. Brown (1977)
Year of Election or Appointment: 2022
Deputy Treasurer
Mr. Brown also serves as an officer of other funds. Mr. Brown is a Vice President (2015-present) and is an employee of Fidelity Investments. Mr. Brown serves as Assistant Treasurer of FIMM, LLC (2021-present). Previously, Mr. Brown served as Assistant Treasurer of certain Fidelity® funds (2019-2022).
John J. Burke III (1964)
Year of Election or Appointment: 2018
Chief Financial Officer
Mr. Burke also serves as Chief Financial Officer of other funds. Mr. Burke is Head of Fidelity Fund and Investment Operations (2018-present) and is an employee of Fidelity Investments. Mr. Burke serves as President, Executive Vice President, or Director of certain Fidelity entities. Previously Mr. Burke served as head of Asset Management Investment Operations (2012-2018).
Margaret Carey (1973)
Year of Election or Appointment: 2023
Secretary and Chief Legal Officer (CLO)
Ms. Carey also serves as an officer of other funds and as CLO of certain Fidelity entities. Ms. Carey is a Senior Vice President, Deputy General Counsel (2019-present) and is an employee of Fidelity Investments.
William C. Coffey (1969)
Year of Election or Appointment: 2019
Assistant Secretary
Mr. Coffey also serves as Assistant Secretary of other funds. Mr. Coffey is a Senior Vice President, Deputy General Counsel (2010-present) and is an employee of Fidelity Investments. Previously, Mr. Coffey served as Secretary and CLO of certain funds (2018-2019); CLO, Secretary, or Senior Vice President of certain Fidelity entities and Assistant Secretary of certain funds (2009-2018).
Timothy M. Cohen (1969)
Year of Election or Appointment: 2017
Vice President
Mr. Cohen also serves as Vice President of other funds. Mr. Cohen is Co-Head of Equity (2018-present) and is an employee of Fidelity Investments. Mr. Cohen serves a Director of Fidelity Management & Research (Japan) Limited (investment adviser firm, 2016-present). Previously, Mr. Cohen served as Executive Vice President of Fidelity SelectCo, LLC (2019) and Head of Global Equity Research (2016-2018).
Jonathan Davis (1968)
Year of Election or Appointment: 2010
Assistant Treasurer
Mr. Davis also serves as an officer of other funds. Mr. Davis is a Vice President (2006-present) and is an employee of Fidelity Investments. Mr. Davis serves as Assistant Treasurer of certain Fidelity entities.
Laura M. Del Prato (1964)
Year of Election or Appointment: 2018
Assistant Treasurer
Ms. Del Prato also serves as an officer of other funds. Ms. Del Prato is a Senior Vice President (2017-present) and is an employee of Fidelity Investments. Ms. Del Prato serves as Vice President or Assistant Treasurer of certain Fidelity entities. Previously, Ms. Del Prato served as President and Treasurer of The North Carolina Capital Management Trust: Cash Portfolio and Term Portfolio (2018-2020).
Colm A. Hogan (1973)
Year of Election or Appointment: 2020
Assistant Treasurer
Mr. Hogan also serves as an officer of other funds. Mr. Hogan is a Vice President (2016-present) and is an employee of Fidelity Investments. Mr. Hogan serves as Assistant Treasurer of certain Fidelity entities. Previously, Mr. Hogan served as Deputy Treasurer of certain Fidelity® funds (2016-2020) and Assistant Treasurer of certain Fidelity® funds (2016-2018).
Pamela R. Holding (1964)
Year of Election or Appointment: 2018
Vice President
Ms. Holding also serves as Vice President of other funds. Ms. Holding is Co-Head of Equity (2018-present) and is an employee of Fidelity Investments. Previously, Ms. Holding served as Executive Vice President of Fidelity SelectCo, LLC (2019) and as Chief Investment Officer of Fidelity Institutional Asset Management (2013-2018).
Chris Maher (1972)
Year of Election or Appointment: 2020
Deputy Treasurer
Mr. Maher also serves as an officer of other funds. Mr. Maher is a Vice President (2008-present) and is an employee of Fidelity Investments. Mr. Maher serves as Assistant Treasurer of certain Fidelity entities. Previously, Mr. Maher served as Assistant Treasurer of certain funds (2013-2020).
Jason P. Pogorelec (1975)
Year of Election or Appointment: 2020
Chief Compliance Officer
Mr. Pogorelec also serves as Chief Compliance Officer of other funds. Mr. Pogorelec is a Senior Vice President of Asset Management Compliance (2020-present) and is an employee of Fidelity Investments. Mr. Pogorelec serves as Compliance Officer of Fidelity Management & Research Company LLC (investment adviser firm, 2023-present) and Ballyrock Investment Advisors LLC (2023-present). Previously, Mr. Pogorelec served as a Vice President, Associate General Counsel for Fidelity Investments (2010-2020) and Assistant Secretary of certain Fidelity® funds (2015-2020).
Brett Segaloff (1972)
Year of Election or Appointment: 2021
Anti-Money Laundering (AML) Officer
Mr. Segaloff also serves as AML Officer of other funds. Mr. Segaloff is a Vice President (2022-present) and is an employee of Fidelity Investments. Mr. Segaloff serves as Anti Money Laundering Compliance Officer or Anti Money Laundering/Bank Secrecy Act Compliance Officer of certain Fidelity entities.
Stacie M. Smith (1974)
Year of Election or Appointment: 2016
President and Treasurer
Ms. Smith also serves as an officer of other funds. Ms. Smith is a Senior Vice President (2016-present) and is an employee of Fidelity Investments. Ms. Smith serves as Assistant Treasurer of certain Fidelity entities and has served in other fund officer roles.
Jim Wegmann (1979)
Year of Election or Appointment: 2019
Assistant Treasurer
Mr. Wegmann also serves as an officer of other funds. Mr. Wegmann is a Vice President (2016-present) and is an employee of Fidelity Investments. Mr. Wegmann serves as Assistant Treasurer of FIMM, LLC (2021-present). Previously, Mr. Wegmann served as Assistant Treasurer of certain Fidelity® funds (2019-2021).
As a shareholder, you incur two types of costs: (1) transaction costs, which may include sales charges (loads) on purchase payments or redemption proceeds, as applicable and (2) ongoing costs, which generally include management fees, distribution and/or service (12b-1) fees and other Fund expenses. This Example is intended to help you understand your ongoing costs (in dollars) of investing in a fund and to compare these costs with the ongoing costs of investing in other mutual funds.
The Example is based on an investment of $1,000 invested at the beginning of the period and held for the entire period (April 1, 2023 to September 30, 2023).
|
Actual Expenses
The first line of the accompanying table provides information about actual account values and actual expenses. You may use the information in this line, together with the amount you invested, to estimate the expenses that you paid over the period. Simply divide your account value by $1,000.00 (for example, an $8,600 account value divided by $1,000.00 = 8.6), then multiply the result by the number in the first line for a class/Fund under the heading entitled "Expenses Paid During Period" to estimate the expenses you paid on your account during this period. If any fund is a shareholder of any underlying mutual funds or exchange-traded funds (ETFs) (the Underlying Funds), such fund indirectly bears its proportional share of the expenses of the Underlying Funds in addition to the direct expenses incurred presented in the table. These fees and expenses are not included in the annualized expense ratio used to calculate the expense estimate in the table below.
Hypothetical Example for Comparison Purposes
The second line of the accompanying table provides information about hypothetical account values and hypothetical expenses based on the actual expense ratio and an assumed rate of return of 5% per year before expenses, which is not the actual return. The hypothetical account values and expenses may not be used to estimate the actual ending account balance or expenses you paid for the period. You may use this information to compare the ongoing costs of investing in the Fund and other funds. To do so, compare this 5% hypothetical example with the 5% hypothetical examples that appear in the shareholder reports of the other funds. If any fund is a shareholder of any Underlying Funds, such fund indirectly bears its proportional share of the expenses of the Underlying Funds in addition to the direct expenses as presented in the table. These fees and expenses are not included in the annualized expense ratio used to calculate the expense estimate in the table below.
Please note that the expenses shown in the table are meant to highlight your ongoing costs only and do not reflect any transaction costs. Therefore, the second line of the table is useful in comparing ongoing costs only, and will not help you determine the relative total costs of owning different funds. In addition, if these transactional costs were included, your costs would have been higher.
|
|
|
|
|
Annualized Expense Ratio- A
|
|
Beginning Account Value April 1, 2023
|
|
Ending Account Value September 30, 2023
|
|
Expenses Paid During Period- C April 1, 2023 to September 30, 2023
|
|
|
|
|
|
|
|
|
|
|
|
Fidelity® Real Estate Equity Central Fund
|
|
|
|
0.0031%
|
|
|
|
|
|
|
Actual
|
|
|
|
|
|
$ 1,000
|
|
$ 945.70
|
|
$ .02
|
Hypothetical-B
|
|
|
|
|
|
$ 1,000
|
|
$ 1,025.05
|
|
$ .02
|
|
|
A Annualized expense ratio reflects expenses net of applicable fee waivers.
B 5% return per year before expenses
C Expenses are equal to the annualized expense ratio, multiplied by the average account value over the period, multiplied by 183/ 365 (to reflect the one-half year period). The fees and expenses of any Underlying Funds are not included in each annualized expense ratio.
The dividend and capital gains distributions for the fund(s) are available on Fidelity.com or Institutional.Fidelity.com.
The fund designates $411,694 of distributions paid during the fiscal year ended 2023 as qualifying to be taxed as section 163(j) interest dividends.
The fund designates 92.49%, 100.00%, and 100.00% of the dividends distributed in December, June, and September, respectively during the fiscal year as a section 199A dividend.
The fund will notify shareholders in January 2024 of amounts for use in preparing 2023 income tax returns.
Board Approval of Investment Advisory Contracts and Management Fees
Fidelity Real Estate Equity Central Fund
Each year, the Board of Directors, including the Independent Directors (together, the Board), considers the renewal of the fund's management contract with Fidelity Management & Research Company LLC (FMR) and the sub-advisory agreements (together, the Advisory Contracts) for the fund. FMR and the sub-advisers are referred to herein as the Investment Advisers. The Board, assisted by the advice of fund counsel and Independent Directors' counsel, requests and considers a broad range of information relevant to the renewal of the Advisory Contracts throughout the year.
The Board meets regularly and, at each of its meetings, covers an extensive agenda of topics and materials and considers factors that are relevant to its annual consideration of the renewal of the fund's Advisory Contracts, including the services and support provided to the fund and its shareholders. The Board, acting directly and through its Committees (each of which is composed of and chaired by Independent Directors), requests and receives information concerning the annual consideration of the renewal of the fund's Advisory Contracts. The Board also meets as needed to review matters specifically related to the Board's annual consideration of the renewal of the Advisory Contracts. Members of the Board may also meet with trustees of other Fidelity funds through joint ad hoc committees to discuss certain matters relevant to all of the Fidelity funds.
Approval of Stub Period Continuation. At its May 2023 meeting, the Board of Directors voted to continue the fund's management contract with FMR, and the sub-advisory agreements and sub-sub-advisory agreements, in each case, where applicable (together, the Advisory Contracts), without modification, for two months from June 1, 2023 through July 31, 2023. The Board considered that the approval of the fund's Advisory Contracts will not result in any changes in (i) the investment process or strategies employed in the management of the fund's assets; (ii) the fees and expenses paid by shareholders; (iii) the nature, extent or quality of services provided under the fund's Advisory Contracts; or (iv) the day-to-day management of the fund or the persons primarily responsible for such management. The Board also considered that since its last approval of the fund's Advisory Contracts, FMR had provided additional information on the fund in support of the annual contract renewal process, including competitive analyses on total expenses and management fees and in-depth reviews of fund performance and fund profitability information. The Board concluded that the fund's Advisory Contracts are fair and reasonable, and that the fund's Advisory Contracts should be renewed, without modification, through July 31, 2023, with the understanding that the Board would consider the annual renewal for a full one year period in July 2023.
At its July 2023 meeting, the Board unanimously determined to renew the fund's Advisory Contracts. In reaching its determination, the Board considered all factors it believed relevant and reached a determination, with the assistance of fund counsel and Independent Directors' counsel and through the exercise of its business judgment, that the renewal of the Advisory Contracts was in the best interests of the fund and its shareholders and the fact that no fee is payable under the management contract was fair and reasonable in light of all of the surrounding circumstances.
Nature, Extent, and Quality of Services Provided. The Board considered staffing as it relates to the fund, including the backgrounds and experience of investment personnel of the Investment Advisers, and also considered the Investment Advisers' implementation of the fund's investment program. The Independent Directors also had discussions with senior management of Fidelity's investment operations and investment groups. The Board considered the structure of the investment personnel compensation program and whether this structure provides appropriate incentives to act in the best interests of the fund.
Resources Dedicated to Investment Management and Support Services. The Board and the Fund Oversight and Research Committees reviewed the general qualifications and capabilities of Fidelity's investment staff, including its size, education, experience, and resources, as well as Fidelity's approach to recruiting, training, managing, and compensating investment personnel. The Board noted the resources devoted to expansion of Fidelity's global investment organization, and that Fidelity's analysts have extensive resources, tools, and capabilities that allow them to conduct sophisticated quantitative and fundamental analysis, as well as credit analysis of issuers, counterparties, and guarantors. Further, the Board considered that Fidelity's investment professionals have sufficient access to global information and data so as to provide competitive investment results over time, and that those professionals also have access to sophisticated tools that permit them to assess portfolio construction and risk and performance attribution characteristics continuously, as well as to transmit new information and research conclusions rapidly around the world. Additionally, in its deliberations, the Board considered Fidelity's trading, risk management, compliance, and technology and operations capabilities and resources, which are integral parts of the investment management process.
Administrative Services. The Board considered (i) the nature, extent, quality, and cost of advisory and administrative services performed by the Investment Advisers and their affiliates under the Advisory Contracts and under separate agreements covering transfer agency, pricing and bookkeeping, and securities lending services for the fund; (ii) the nature and extent of Fidelity's supervision of third party service providers, principally custodians, subcustodians, and pricing vendors; and (iii) the resources devoted by Fidelity to, and the record of compliance with, the fund's compliance policies and procedures. The Board also reviewed the allocation of fund brokerage, including allocations to brokers affiliated with the Investment Advisers, and the use of "soft" commission dollars to pay for research services. The Board also considered the fund's securities lending activities and any payments made to Fidelity relating to securities lending.
Investment Performance. The Board reviewed the fund's absolute investment performance, as well as the fund's relative investment performance, but did not consider performance to be a material factor in its decision to renew the fund's Advisory Contracts, as the fund is not publicly offered as a stand-alone investment product. In this regard, the Board noted that the fund is designed to offer a liquid investment option for other investment companies managed by Fidelity and ultimately to enhance the performance of those investment companies.
Based on its review, the Board concluded that the nature, extent, and quality of services provided to the fund under the Advisory Contracts should continue to benefit the shareholders of the fund.
Competitiveness of Management Fee and Total Expense Ratio. The Board considered that while the fund does not pay a management fee, FMR receives fees for providing services to funds that invest in the fund. The Board also noted that FMR bears all expenses of the fund with certain limited exceptions (i.e., custody fees, interest, taxes, fees and expenses of the Independent Directors, proxy and shareholder meeting expenses, and extraordinary expenses). The Board further noted that the fund pays its non-operating expenses, including brokerage commissions and fees and expenses associated with the fund's securities lending program, if applicable. Based on its review, the Board concluded that the management fee received for providing services to the fund and the fund's total expense ratio were reasonable in light of the services that the fund and its shareholders receive and the other factors considered.
Costs of the Services and Profitability. The Board considered the level of Fidelity's profits in respect of all the Fidelity funds, as well as the profitability of the funds that invest in the fund.
A public accounting firm has been engaged annually by the Board as part of the Board's assessment of Fidelity's profitability analysis. The engagement includes the review and assessment of the methodologies used by Fidelity in determining the revenues and expenses attributable to Fidelity's fund business, and completion of agreed-upon procedures in respect of the mathematical accuracy of certain fund profitability information and its conformity to established allocation methodologies. After considering the reports issued under the engagement and information provided by Fidelity, the Board concluded that while other allocation methods may also be reasonable, Fidelity's profitability methodologies are reasonable in all material respects.
The Board also reviewed Fidelity's non-fund businesses and potential indirect benefits such businesses may have received as a result of their association with Fidelity's fund business (i.e., fall-out benefits) as well as cases where Fidelity's affiliates may benefit from the funds' business. The Board considered areas where potential indirect benefits to the Fidelity funds from their relationships with Fidelity may exist. The Board's consideration of these matters was informed by the findings of a joint ad hoc committee created by it and the boards of other Fidelity funds to evaluate potential fall-out benefits.
The Board concluded that the costs of the services provided by and the profits realized by Fidelity in connection with the operation of the fund were not relevant to the renewal of the Advisory Contracts because the fund pays no advisory fees and FMR bears all expenses of the fund with certain exceptions.
Economies of Scale. The Board concluded that because the fund pays no advisory fees and FMR bears all expenses of the fund with certain exceptions, the realization of economies of scale was not a material factor in the Board's decision to renew the fund's Advisory Contract.
Additional Information Requested by the Board. In order to develop fully the factual basis for consideration of the Fidelity funds' advisory contracts, the Board requested and received additional information on certain topics, including: (i) fund flow and performance trends, in particular the underperformance of certain funds and strategies, and Fidelity's long-term strategies for certain funds, including any consideration of fund liquidations or mergers; (ii) the operation of performance fees and competitor use of performance fees; (iii) Fidelity's pricing philosophy compared to competitors; (iv) fund profitability methodology and data; (v) evaluation of competitive fund data and peer group classifications and fee and expense comparisons; (vi) the management fee and expense structures for different funds and classes and information about the differences between various fee and expense structures; (vii) group fee breakpoints and related voluntary fee waivers; and (viii) information regarding other accounts managed by Fidelity and the funds' sub-advisory arrangements.
Conclusion. Based on its evaluation of all of the conclusions noted above, and after considering all factors it believed relevant, the Board, including the Independent Directors, concluded that the advisory and sub-advisory fee arrangements are fair and reasonable in light of all of the surrounding circumstances and that the fund's Advisory Contracts should be renewed through July 31, 2024.
1.831584.117
ESCIP-ANN-1123
Fidelity® Floating Rate Central Fund
Annual Report
September 30, 2023
Contents
To view a fund's proxy voting guidelines and proxy voting record for the 12-month period ended June 30, visit http://www.fidelity.com/proxyvotingresults or visit the Securities and Exchange Commission's (SEC) web site at http://www.sec.gov.
You may also call 1-800-544-8544 to request a free copy of the proxy voting guidelines.
Standard & Poor's, S&P and S&P 500 are registered service marks of The McGraw-Hill Companies, Inc. and have been licensed for use by Fidelity Distributors Corporation.
Other third-party marks appearing herein are the property of their respective owners.
All other marks appearing herein are registered or unregistered trademarks or service marks of FMR LLC or an affiliated company. © 2023 FMR LLC. All rights reserved.
A fund files its complete schedule of portfolio holdings with the SEC for the first and third quarters of each fiscal year on Form N-PORT. Forms N-PORT are available on the SEC's web site at http://www.sec.gov. A fund's Forms N-PORT may be reviewed and copied at the SEC's Public Reference Room in Washington, DC. Information regarding the operation of the SEC's Public Reference Room may be obtained by calling 1-800-SEC-0330.
Average annual total return reflects the change in the value of an investment, assuming reinvestment of distributions from dividend income and capital gains (the profits earned upon the sale of securities that have grown in value, if any) and assuming a constant rate of performance each year. The hypothetical investment and the average annual total returns do not reflect the deduction of taxes that a shareholder would pay on fund distributions or the redemption of fund shares. During periods of reimbursement by Fidelity, a fund's total return will be greater than it would be had the reimbursement not occurred. How a fund did yesterday is no guarantee of how it will do tomorrow.
Average Annual Total Returns
|
|
|
|
|
|
Periods ended September 30, 2023
|
Past 1
year
|
Past 5
years
|
Past 10
years
|
Fidelity® Floating Rate Central Fund
|
13.65%
|
4.90%
|
4.75%
|
$10,000 Over 10 Years
|
|
|
Let's say hypothetically that $10,000 was invested in Fidelity® Floating Rate Central Fund on September 30, 2013.
The chart shows how the value of your investment would have changed, and also shows how the Morningstar® LSTA® US Performing Loans performed over the same period.
|
|
|
Market Recap:
Floating-rate bank loans gained 13.39% for the 12 months ending September 30, 2023, as measured by the Morningstar LSTA US Performing Loans Index. It was a robust period for loans, which rose steadily and outpaced all other U.S. fixed-income categories. Key factors fueling loan performance included a sharp rise in short- and longer-term interest rates, expectations that the U.S. Federal Reserve would keep rates higher for longer than originally anticipated, and generally favorable corporate earnings. Additional supportive factors were a decline in inflation from the highs reached in 2022, negligible net new loan supply and strong retail fund inflows late in the period. Within the Morningstar index, every industry registered a gain, led by home furnishings (+24%), publishing and insurance (+17% each). A number of other groups rose about 15% and topped the broader market. These included building & development, leisure goods/activities/movies, oil & gas, business equipment & services, industrial equipment, and food service. On the downside, radio & television (+4%) and all telecom (+8%) were the biggest "laggards." Food products, cable & satellite TV, and health care returned roughly 11% to 12% and also trailed the broader market. From a credit-rating perspective, mid-tier loans rated B rose 14.43% and were the only rating category to outperform the index.
Comments from Co-Managers Eric Mollenhauer, Kevin Nielsen and Chandler Perine:
For the fiscal year, the fund gained 13.65%, versus 13.39% for the benchmark Morningstar LSTA US Performing Loans Index. The fund's core investment in floating-rate leveraged loans rose 14.10% and contributed to performance versus the benchmark. By industry, security selection was the primary contributor, led by insurance, all telecom, and oil & gas. Positioning in health care also boosted relative performance. The top individual relative contributor was an overweight in Asurion (+31%). Asurion was one of our largest holdings. A second notable relative contributor was a non-benchmark stake in California Resources (+51%). An overweight in Great Outdoors (+28%), a sizable holding, also helped. This period we decreased our position in Great Outdoors. In contrast, the biggest detractor from performance versus the benchmark was the fund's position in cash. Security selection in leisure goods/activities/movies and radio & television also hurt. The largest individual relative detractor was an overweight in Diamond Sports (-68%). The second-biggest relative detractor was an overweight in Cineworld (-13%). A non-benchmark stake in Murray Energy returned roughly -11% and hurt. Notable changes in positioning include increased exposure to the insurance and financial intermediaries industry.
Note to shareholders:
On October 1, 2022, Chandler Perine assumed co-management responsibilities for the fund.
The views expressed above reflect those of the portfolio manager(s) only through the end of the period as stated on the cover of this report and do not necessarily represent the views of Fidelity or any other person in the Fidelity organization. Any such views are subject to change at any time based upon market or other conditions and Fidelity disclaims any responsibility to update such views. These views may not be relied on as investment advice and, because investment decisions for a Fidelity fund are based on numerous factors, may not be relied on as an indication of trading intent on behalf of any Fidelity fund.
Top Bond Issuers (% of Fund's net assets)
|
(with maturities greater than one year)
|
Bass Pro Group LLC
|
2.5
|
|
Asurion LLC
|
2.2
|
|
Fidelity Private Credit Central Fund LLC
|
1.7
|
|
Acrisure LLC
|
1.2
|
|
Intelsat Jackson Holdings SA
|
1.1
|
|
Ukg, Inc.
|
1.2
|
|
Caesars Entertainment, Inc.
|
0.9
|
|
ABG Intermediate Holdings 2 LLC
|
0.9
|
|
HUB International Ltd.
|
0.9
|
|
TransDigm, Inc.
|
0.9
|
|
|
|
13.5
|
|
|
|
Market Sectors (% of Fund's net assets)
|
|
|
Technology
|
15.2
|
|
Services
|
9.9
|
|
Telecommunications
|
6.5
|
|
Insurance
|
5.6
|
|
Healthcare
|
4.8
|
|
|
|
Quality Diversification (% of Fund's net assets)
|
|
|
|
|
We have used ratings from Moody's Investors Service, Inc. Where Moody's® ratings are not available, we have used S&P® ratings. All ratings are as of the date indicated and do not reflect subsequent changes.
|
Asset Allocation (% of Fund's net assets)
|
|
|
|
|
Geographic Diversification (% of Fund's net assets)
|
|
|
* Includes Short-Term investments and Net Other Assets (Liabilities).
Percentages are adjusted for the effect of derivatives, if applicable.
|
|
|
Showing Percentage of Net Assets
Bank Loan Obligations - 85.8%
|
|
|
|
Principal
Amount (a)
|
Value ($)
|
Aerospace - 0.8%
|
|
|
|
ADS Tactical, Inc. Tranche B 1LN, term loan CME Term SOFR 1 Month Index + 5.750% 11.1806% 3/19/26 (b)(c)(d)
|
|
1,680,285
|
1,644,579
|
Gemini HDPE LLC Tranche B 1LN, term loan CME Term SOFR 3 Month Index + 3.000% 8.6307% 12/31/27 (b)(c)(d)
|
|
1,199,049
|
1,194,552
|
TransDigm, Inc.:
|
|
|
|
1LN, term loan CME Term SOFR 1 Month Index + 3.250% 8.6401% 8/24/28 (b)(c)(d)
|
|
6,427,862
|
6,426,834
|
Tranche H 1LN, term loan CME Term SOFR 1 Month Index + 3.250% 8.6401% 2/22/27 (b)(c)(d)
|
|
2,366,035
|
2,367,313
|
TOTAL AEROSPACE
|
|
|
11,633,278
|
Air Transportation - 1.8%
|
|
|
|
AAdvantage Loyalty IP Ltd. Tranche B 1LN, term loan CME Term SOFR 3 Month Index + 4.750% 10.3378% 4/20/28 (b)(c)(d)
|
|
4,726,250
|
4,863,311
|
Air Canada Tranche B 1LN, term loan CME Term SOFR 3 Month Index + 3.500% 9.1284% 8/11/28 (b)(c)(d)
|
|
1,966,307
|
1,965,894
|
Echo Global Logistics, Inc.:
|
|
|
|
1LN, term loan 3 month U.S. LIBOR + 4.750% 10.1661% 11/23/28 (b)(c)(d)(e)
|
|
4,752,000
|
4,752,000
|
2LN, term loan:
|
|
|
|
3 month U.S. LIBOR + 8.000% 13.4161% 11/23/29 (b)(c)(d)(e)
|
|
900,000
|
900,000
|
CME Term SOFR 3 Month Index + 7.000% 13.4161% 11/23/29 (b)(c)(d)(e)
|
|
2,095,000
|
2,095,000
|
Mileage Plus Holdings LLC Tranche B 1LN, term loan 3 month U.S. LIBOR + 5.250% 10.7979% 7/2/27 (b)(c)(d)
|
|
4,185,000
|
4,342,398
|
Rand Parent LLC Tranche B 1LN, term loan CME Term SOFR 1 Month Index + 4.250% 9.6401% 3/17/30 (b)(c)(d)
|
|
1,014,900
|
982,342
|
SkyMiles IP Ltd. Tranche B 1LN, term loan CME Term SOFR 1 Month Index + 3.750% 9.0761% 10/20/27 (b)(c)(d)
|
|
2,542,817
|
2,630,875
|
STG Logistics, Inc. 1LN, term loan CME Term SOFR 1 Month Index + 6.000% 11.5401% 3/24/28 (b)(c)(d)(e)
|
|
1,481,250
|
1,395,338
|
United Airlines, Inc. Tranche B 1LN, term loan 3 month U.S. LIBOR + 3.750% 9.182% 4/21/28 (b)(c)(d)
|
|
2,705,951
|
2,706,573
|
TOTAL AIR TRANSPORTATION
|
|
|
26,633,731
|
Automotive & Auto Parts - 1.4%
|
|
|
|
American Trailer World Corp. Tranche B 1LN, term loan CME Term SOFR 1 Month Index + 3.750% 9.1661% 3/5/28 (b)(c)(d)
|
|
2,540,557
|
2,433,295
|
Belron Finance U.S. LLC Tranche B 1LN, term loan CME Term SOFR 3 Month Index + 2.750% 8.1599% 4/18/29 (b)(c)(d)
|
|
842,888
|
842,626
|
Clarios Global LP Tranche B 1LN, term loan CME Term SOFR 1 Month Index + 3.750% 9.0661% 4/20/30 (b)(c)(d)
|
|
2,595,000
|
2,586,904
|
CWGS Group LLC Tranche B 1LN, term loan CME Term SOFR 1 Month Index + 2.500% 7.9451% 6/3/28 (b)(c)(d)
|
|
4,717,192
|
4,429,443
|
Driven Holdings LLC Tranche B 1LN, term loan CME Term SOFR 1 Month Index + 3.000% 8.4342% 12/17/28 (b)(c)(d)
|
|
1,226,325
|
1,204,864
|
Ls Group Opco Acquistion LLC Tranche B 1LN, term loan CME Term SOFR 1 Month Index + 3.250% 8.692% 11/2/27 (b)(c)(d)
|
|
2,464,692
|
2,447,242
|
PECF USS Intermediate Holding III Corp. Tranche B 1LN, term loan CME Term SOFR 1 Month Index + 4.250% 9.8807% 12/17/28 (b)(c)(d)
|
|
3,077,101
|
2,457,557
|
Power Stop LLC 1LN, term loan CME Term SOFR 1 Month Index + 4.750% 10.1661% 1/26/29 (b)(c)(d)
|
|
1,630,026
|
1,342,049
|
Rough Country LLC:
|
|
|
|
2LN, term loan CME Term SOFR 3 Month Index + 6.500% 11.9161% 7/28/29 (b)(c)(d)
|
|
585,000
|
541,125
|
Tranche B 1LN, term loan CME Term SOFR 3 Month Index + 3.500% 8.9306% 7/28/28 (b)(c)(d)
|
|
351,520
|
341,962
|
Truck Hero, Inc. Tranche B 1LN, term loan CME Term SOFR 1 Month Index + 3.750% 9.1806% 1/29/28 (b)(c)(d)
|
|
2,171,249
|
2,069,656
|
TOTAL AUTOMOTIVE & AUTO PARTS
|
|
|
20,696,723
|
Banks & Thrifts - 0.6%
|
|
|
|
Citadel Securities LP Tranche B 1LN, term loan CME Term SOFR 1 Month Index + 2.500% 7.9306% 7/25/30 (b)(c)(d)
|
|
5,255,809
|
5,239,411
|
Deerfield Dakota Holding LLC Tranche B 1LN, term loan CME Term SOFR 3 Month Index + 3.750% 9.1401% 4/9/27 (b)(c)(d)
|
|
2,048,687
|
1,995,339
|
Novae LLC 1LN, term loan CME Term SOFR 3 Month Index + 5.000% 10.3383% 12/22/28 (b)(c)(d)
|
|
1,594,291
|
1,477,382
|
Superannuation & Investments U.S. LLC 1LN, term loan CME Term SOFR 1 Month Index + 3.750% 9.1806% 12/1/28 (b)(c)(d)
|
|
780,988
|
778,224
|
TOTAL BANKS & THRIFTS
|
|
|
9,490,356
|
Broadcasting - 1.6%
|
|
|
|
AppLovin Corp. Tranche B 1LN, term loan:
|
|
|
|
CME Term SOFR 1 Month Index + 3.000% 8.4161% 10/25/28 (b)(c)(d)
|
|
1,363,656
|
1,361,215
|
CME Term SOFR 1 Month Index + 3.100% 8.4161% 8/15/30 (b)(c)(d)
|
|
2,287,520
|
2,280,383
|
Diamond Sports Group LLC:
|
|
|
|
1LN, term loan CME Term SOFR 1 Month Index + 8.000% 15.4297% 8/24/26 (b)(c)(d)
|
|
2,355,262
|
1,185,474
|
2LN, term loan CME Term SOFR 1 Month Index + 3.250% 10.6625% (b)(c)(d)(f)
|
|
19,325,070
|
376,839
|
Dotdash Meredith, Inc. Tranche B 1LN, term loan CME Term SOFR 1 Month Index + 4.000% 9.4146% 12/1/28 (b)(c)(d)
|
|
5,358,761
|
5,151,109
|
Nexstar Media, Inc. Tranche B, term loan CME Term SOFR 1 Month Index + 2.500% 7.9306% 9/19/26 (b)(c)(d)
|
|
2,620,340
|
2,615,833
|
Sinclair Television Group, Inc. Tranche B 1LN, term loan CME Term SOFR 1 Month Index + 2.500% 7.9306% 9/30/26 (b)(c)(d)
|
|
836,868
|
721,799
|
Springer Nature Deutschland GmbH Tranche B18 1LN, term loan CME Term SOFR 3 Month Index + 3.000% 8.6517% 8/14/26 (b)(c)(d)
|
|
1,655,852
|
1,654,610
|
Univision Communications, Inc. Tranche B 1LN, term loan:
|
|
|
|
CME Term SOFR 1 Month Index + 3.250% 8.6806% 3/24/26 (b)(c)(d)
|
|
4,264,738
|
4,250,878
|
CME Term SOFR 1 Month Index + 3.250% 8.6806% 1/31/29 (b)(c)(d)
|
|
3,288,281
|
3,243,889
|
TOTAL BROADCASTING
|
|
|
22,842,029
|
Building Materials - 2.8%
|
|
|
|
Acproducts Holdings, Inc. Tranche B 1LN, term loan CME Term SOFR 3 Month Index + 4.250% 9.9017% 5/17/28 (b)(c)(d)
|
|
6,219,307
|
5,113,639
|
APi Group DE, Inc. Tranche B 1LN, term loan:
|
|
|
|
CME Term SOFR 1 Month Index + 2.500% 7.9306% 10/1/26 (b)(c)(d)
|
|
800,851
|
801,227
|
CME Term SOFR 1 Month Index + 2.750% 8.1806% 12/16/28 (b)(c)(d)
|
|
1,810,674
|
1,813,227
|
Emerson Climate Technologies Tranche B 1LN, term loan CME Term SOFR 1 Month Index + 3.000% 8.3311% 5/31/30 (b)(c)(d)
|
|
2,504,587
|
2,499,904
|
Hunter Douglas, Inc. Tranche B 1LN, term loan CME Term SOFR 3 Month Index + 3.500% 8.8911% 2/25/29 (b)(c)(d)
|
|
11,602,864
|
11,280,885
|
Ingersoll-Rand Services Co. Tranche B 1LN, term loan CME Term SOFR 1 Month Index + 1.750% 7.1661% 2/28/27 (b)(c)(d)
|
|
408,608
|
408,747
|
Janus International Group LLC Tranche B 1LN, term loan CME Term SOFR 1 Month Index + 3.250% 8.7643% 8/3/30 (b)(c)(d)
|
|
550,000
|
547,421
|
Oscar AcquisitionCo LLC 1LN, term loan CME Term SOFR 3 Month Index + 4.500% 9.9901% 4/29/29 (b)(c)(d)
|
|
3,982,263
|
3,948,851
|
Smyrna Ready Mix LLC Tranche B 1lN, term loan CME Term SOFR 1 Month Index + 4.250% 9.6661% 4/1/29 (b)(c)(d)
|
|
2,415,337
|
2,418,356
|
SRS Distribution, Inc. Tranche B 1LN, term loan:
|
|
|
|
CME Term SOFR 1 Month Index + 3.500% 8.9306% 6/4/28 (b)(c)(d)
|
|
2,065,439
|
2,042,202
|
CME Term SOFR 3 Month Index + 3.500% 8.9161% 6/2/28 (b)(c)(d)
|
|
3,078,125
|
3,045,435
|
Standard Industries, Inc./New Jersey Tranche B 1LN, term loan CME Term SOFR 1 Month Index + 2.250% 7.9379% 9/22/28 (b)(c)(d)
|
|
1,547,008
|
1,545,816
|
Traverse Midstream Partners Ll Tranche B, term loan CME TERM SOFR 6 MONTH INDEX + 4.250% 9.2156% 2/16/28 (b)(c)(d)
|
|
1,037,634
|
1,034,718
|
USIC Holdings, Inc. Tranche B 1LN, term loan CME Term SOFR 1 Month Index + 3.500% 8.9306% 5/14/28 (b)(c)(d)
|
|
1,768,676
|
1,737,724
|
White Capital Buyer LLC Tranche B 1LN, term loan 1 month U.S. LIBOR + 4.000% 9.0661% 10/19/27 (b)(c)(d)
|
|
2,386,152
|
2,379,638
|
TOTAL BUILDING MATERIALS
|
|
|
40,617,790
|
Cable/Satellite TV - 1.6%
|
|
|
|
Charter Communication Operating LLC Tranche B2 1LN, term loan CME Term SOFR 1 Month Index + 1.750% 7.1155% 2/1/27 (b)(c)(d)
|
|
4,163,488
|
4,156,743
|
Coral-U.S. Co.-Borrower LLC:
|
|
|
|
Tranche B, term loan CME Term SOFR 1 Month Index + 2.250% 7.6967% 1/31/28 (b)(c)(d)
|
|
2,740,000
|
2,713,888
|
Tranche B6 1LN, term loan CME Term SOFR 1 Month Index + 3.000% 8.4467% 10/15/29 (b)(c)(d)
|
|
1,940,000
|
1,926,963
|
CSC Holdings LLC:
|
|
|
|
Tranche B 5LN, term loan CME Term SOFR 1 Month Index + 2.500% 7.9467% 4/15/27 (b)(c)(d)
|
|
7,072,764
|
6,389,040
|
Tranche B6 LN, term loan CME Term SOFR 1 Month Index + 4.500% 9.8322% 1/18/28 (b)(c)(d)
|
|
1,645,718
|
1,556,569
|
DIRECTV Financing LLC 1LN, term loan CME Term SOFR 1 Month Index + 5.000% 10.4306% 8/2/27 (b)(c)(d)
|
|
376,048
|
367,064
|
Virgin Media Bristol LLC:
|
|
|
|
Tranche N, term loan CME Term SOFR 1 Month Index + 2.500% 7.9467% 1/31/28 (b)(c)(d)
|
|
2,373,792
|
2,302,886
|
Tranche Y 1LN, term loan CME Term SOFR 1 Month Index + 3.250% 8.3106% 3/6/31 (b)(c)(d)
|
|
3,820,000
|
3,721,788
|
TOTAL CABLE/SATELLITE TV
|
|
|
23,134,941
|
Capital Goods - 0.6%
|
|
|
|
Ali Group North America Corp. Tranche B 1LN, term loan CME Term SOFR 1 Month Index + 2.000% 7.4306% 7/22/29 (b)(c)(d)
|
|
1,452,790
|
1,450,771
|
Chart Industries, Inc. 1LN, term loan CME Term SOFR 1 Month Index + 3.750% 9.1741% 3/17/30 (b)(c)(d)
|
|
2,199,502
|
2,199,502
|
CPM Holdings, Inc.:
|
|
|
|
1LN, term loan CME Term SOFR 1 Month Index + 4.500% 9/22/28 (c)(d)(g)
|
|
715,000
|
712,769
|
2LN, term loan CME Term SOFR 1 Month Index + 8.250% 13.6942% 11/15/26 (b)(c)(d)
|
|
514,697
|
513,091
|
Griffon Corp. Tranche B 1LN, term loan CME Term SOFR 1 Month Index + 2.750% 7.7911% 1/24/29 (b)(c)(d)
|
|
1,302,830
|
1,301,528
|
TNT Crane & Rigging LLC 2LN, term loan 3 month U.S. LIBOR + 8.750% 14.4064% 4/16/25 (b)(c)(d)(e)
|
|
1,832,415
|
1,717,889
|
Vertical U.S. Newco, Inc. Tranche B 1LN, term loan CME TERM SOFR 6 MONTH INDEX + 3.500% 9.3811% 7/31/27 (b)(c)(d)
|
|
1,640,888
|
1,635,965
|
TOTAL CAPITAL GOODS
|
|
|
9,531,515
|
Chemicals - 3.3%
|
|
|
|
ARC Falcon I, Inc.:
|
|
|
|
Tranche B 1LN, term loan CME Term SOFR 1 Month Index + 3.750% 9.1661% 9/30/28 (b)(c)(d)
|
|
3,440,185
|
3,394,500
|
Tranche B 2LN, term loan CME Term SOFR 1 Month Index + 7.000% 12.4161% 9/22/29 (b)(c)(d)
|
|
930,000
|
833,513
|
Aruba Investment Holdings LLC:
|
|
|
|
2LN, term loan CME Term SOFR 1 Month Index + 7.750% 13.1661% 11/24/28 (b)(c)(d)
|
|
1,575,000
|
1,464,750
|
Tranche B 1LN, term loan CME Term SOFR 1 Month Index + 4.000% 9.4161% 11/24/27 (b)(c)(d)
|
|
3,445,691
|
3,372,470
|
Avient Corp. Tranche B7 1LN, term loan CME Term SOFR 1 Month Index + 2.500% 7.8718% 8/29/29 (b)(c)(d)
|
|
854,797
|
856,473
|
Bakelite U.S. Holding Ltd. 1LN, term loan CME Term SOFR 3 Month Index + 4.000% 9.5401% 5/27/29 (b)(c)(d)
|
|
1,740,413
|
1,718,658
|
Consolidated Energy Finance SA Tranche B 1LN, term loan 3 month U.S. LIBOR + 3.500% 8.9161% 5/7/25 (b)(c)(d)(e)
|
|
1,544,302
|
1,497,973
|
Discovery Purchaser Corp. 1LN, term loan CME Term SOFR 3 Month Index + 4.370% 9.7651% 10/4/29 (b)(c)(d)
|
|
3,700,358
|
3,560,041
|
Groupe Solmax, Inc. Tranche B 1LN, term loan CME Term SOFR 3 Month Index + 4.750% 10.2994% 5/27/28 (b)(c)(d)
|
|
1,885,575
|
1,759,091
|
Herens U.S. Holdco Corp. Tranche B 1LN, term loan CME Term SOFR 3 Month Index + 3.920% 9.4151% 7/3/28 (b)(c)(d)
|
|
2,214,530
|
1,956,626
|
Hexion Holdings Corp. 1LN, term loan CME Term SOFR 3 Month Index + 4.500% 10.0332% 3/15/29 (b)(c)(d)
|
|
3,925,151
|
3,721,789
|
Hexion, Inc. 2LN, term loan CME Term SOFR 1 Month Index + 7.430% 12.8559% 3/15/30 (b)(c)(d)
|
|
2,105,000
|
1,705,050
|
ICP Group Tranche B 1LN, term loan CME Term SOFR 1 Month Index + 3.750% 9.4017% 12/29/27 (b)(c)(d)
|
|
1,134,392
|
933,843
|
INEOS U.S. Finance LLC Tranche B 1LN, term loan CME Term SOFR 1 Month Index + 3.500% 8.9161% 2/10/30 (b)(c)(d)
|
|
947,625
|
939,333
|
INEOS U.S. Petrochem LLC:
|
|
|
|
1LN, term loan CME Term SOFR 1 Month Index + 3.750% 9.1661% 3/1/30 (b)(c)(d)
|
|
1,103,235
|
1,097,035
|
Tranche B 1LN, term loan CME Term SOFR 1 Month Index + 2.750% 8.1806% 1/20/26 (b)(c)(d)
|
|
2,594,236
|
2,579,968
|
Manchester Acquisition Sub LLC Tranche B 1LN, term loan CME Term SOFR 3 Month Index + 5.750% 11.3096% 12/1/26 (b)(c)(d)
|
|
1,679,597
|
1,533,690
|
Olympus Water U.S. Holding Corp. Tranche B 1LN, term loan:
|
|
|
|
CME Term SOFR 1 Month Index + 5.000% 10.3901% 11/9/28 (b)(c)(d)
|
|
2,215,000
|
2,206,229
|
CME Term SOFR 3 Month Index + 3.750% 9.4017% 11/9/28 (b)(c)(d)
|
|
3,986,632
|
3,928,267
|
Starfruit U.S. Holdco LLC Tranche B 1LN, term loan:
|
|
|
|
CME Term SOFR 1 Month Index + 4.000% 9.419% 4/3/28 (b)(c)(d)
|
|
1,640,000
|
1,618,139
|
CME Term SOFR 1 Month Index + 4.000% 9.4271% 4/3/28 (b)(c)(d)
|
|
3,114,120
|
3,069,993
|
The Chemours Co. LLC Tranche B2 1LN, term loan CME Term SOFR 1 Month Index + 3.500% 8.8161% 8/18/28 (b)(c)(d)
|
|
4,385,773
|
4,330,951
|
W.R. Grace Holding LLC Tranche B 1LN, term loan 3 month U.S. LIBOR + 3.750% 9.4017% 9/22/28 (b)(c)(d)
|
|
1,213,170
|
1,201,548
|
TOTAL CHEMICALS
|
|
|
49,279,930
|
Consumer Products - 2.2%
|
|
|
|
19Th Holdings Golf LLC Tranche B 1LN, term loan CME Term SOFR 1 Month Index + 3.250% 8.6775% 2/7/29 (b)(c)(d)
|
|
2,150,200
|
2,089,285
|
Aip Rd Buyer Corp. Tranche B 1LN, term loan CME Term SOFR 1 Month Index + 5.000% 10.3161% 12/23/28 (b)(c)(d)
|
|
3,117,188
|
3,113,291
|
BCPE Empire Holdings, Inc. Tranche B 1LN, term loan CME Term SOFR 1 Month Index + 4.750% 10.0661% 12/10/28 (b)(c)(d)
|
|
5,092,456
|
5,087,364
|
Bombardier Recreational Products, Inc. Tranche B 1LN, term loan:
|
|
|
|
CME Term SOFR 1 Month Index + 2.000% 7.4161% 5/23/27 (b)(c)(d)
|
|
294,266
|
292,183
|
CME Term SOFR 1 Month Index + 3.500% 8.8161% 12/13/29 (b)(c)(d)
|
|
2,828,625
|
2,827,607
|
CNT Holdings I Corp. Tranche B 1LN, term loan CME Term SOFR 1 Month Index + 3.500% 8.7995% 11/8/27 (b)(c)(d)
|
|
2,956,384
|
2,944,233
|
Conair Holdings LLC Tranche B 1LN, term loan 3 month U.S. LIBOR + 3.750% 9.4017% 5/17/28 (b)(c)(d)
|
|
1,031,072
|
985,529
|
Gloves Buyer, Inc. Tranche B 1LN, term loan CME Term SOFR 1 Month Index + 4.000% 9.4306% 1/6/28 (b)(c)(d)
|
|
62,470
|
60,284
|
Kronos Acquisition Holdings, Inc. Tranche B 1LN, term loan CME Term SOFR 3 Month Index + 3.750% 9.4017% 12/22/26 (b)(c)(d)
|
|
2,742,586
|
2,725,445
|
Mattress Firm, Inc. Tranche B 1LN, term loan 6 month U.S. LIBOR + 4.250% 9.95% 9/24/28 (b)(c)(d)
|
|
2,713,627
|
2,688,417
|
Petco Health & Wellness Co., Inc. Tranche B 1LN, term loan CME Term SOFR 3 Month Index + 3.250% 8.7535% 3/4/28 (b)(c)(d)
|
|
922,182
|
910,654
|
Runner Buyer, Inc. Tranche B 1LN, term loan CME Term SOFR 3 Month Index + 5.500% 11.0369% 10/21/28 (b)(c)(d)
|
|
1,465,132
|
1,152,575
|
Sweetwater Borrower LLC Tranche B 1LN, term loan CME Term SOFR 1 Month Index + 4.250% 9.6806% 8/5/28 (b)(c)(d)
|
|
3,185,820
|
3,082,281
|
Windsor Holdings III, LLC Tranche B 1LN, term loan CME Term SOFR 3 Month Index + 4.500% 9.8297% 8/1/30 (b)(c)(d)
|
|
3,080,000
|
3,064,600
|
Woof Holdings LLC:
|
|
|
|
Tranche B 1LN, term loan CME Term SOFR 1 Month Index + 3.750% 9.3972% 12/21/27 (b)(c)(d)
|
|
1,697,893
|
1,339,638
|
Tranche B 2LN, term loan CME Term SOFR 3 Month Index + 7.250% 12.6956% 12/21/28 (b)(c)(d)
|
|
605,000
|
423,500
|
TOTAL CONSUMER PRODUCTS
|
|
|
32,786,886
|
Containers - 1.9%
|
|
|
|
AOT Packaging Products AcquisitionCo LLC 1LN, term loan CME Term SOFR 1 Month Index + 3.250% 8.6806% 3/3/28 (b)(c)(d)
|
|
3,350,095
|
3,282,725
|
Berlin Packaging, LLC Tranche B 1LN, term loan:
|
|
|
|
CME Term SOFR 3 Month Index + 3.250% 8.5816% 3/11/28 (b)(c)(d)
|
|
575,252
|
565,760
|
CME Term SOFR 3 Month Index + 3.750% 9.1893% 3/11/28 (b)(c)(d)
|
|
3,616,544
|
3,573,290
|
Berry Global, Inc. Tranche Z 1LN, term loan CME Term SOFR 3 Month Index + 1.750% 7.2925% 7/1/26 (b)(c)(d)
|
|
2,503,885
|
2,502,508
|
Canister International Group, Inc. 1LN, term loan CME Term SOFR 1 Month Index + 4.750% 10.1661% 12/20/26 (b)(c)(d)
|
|
1,206,250
|
1,209,266
|
Charter NEX U.S., Inc. 1LN, term loan CME Term SOFR 1 Month Index + 3.750% 9.1806% 12/1/27 (b)(c)(d)
|
|
2,481,555
|
2,456,740
|
Graham Packaging Co., Inc. Tranche B 1LN, term loan CME Term SOFR 1 Month Index + 3.000% 8.4306% 8/4/27 (b)(c)(d)
|
|
3,396,531
|
3,387,429
|
Kloeckner Pentaplast of America, Inc. Tranche B 1LN, term loan CME TERM SOFR 6 MONTH INDEX + 4.750% 10.476% 2/9/26 (b)(c)(d)
|
|
2,115,750
|
2,031,120
|
Pregis TopCo Corp. 1LN, term loan:
|
|
|
|
CME Term SOFR 1 Month Index + 3.750% 9.1806% 8/1/26 (b)(c)(d)
|
|
490,000
|
487,859
|
CME Term SOFR 1 Month Index + 4.000% 9.0661% 7/31/26 (b)(c)(d)
|
|
1,409,520
|
1,405,488
|
Reynolds Consumer Products LLC Tranche B 1LN, term loan CME Term SOFR 1 Month Index + 1.750% 7.1661% 1/30/27 (b)(c)(d)
|
|
2,812,979
|
2,808,197
|
Reynolds Group Holdings, Inc. Tranche B 1LN, term loan:
|
|
|
|
CME Term SOFR 1 Month Index + 3.250% 8.6806% 2/5/26 (b)(c)(d)
|
|
846,631
|
845,759
|
CME Term SOFR 1 Month Index + 3.250% 8.6806% 9/24/28 (b)(c)(d)
|
|
2,092,102
|
2,088,566
|
Ring Container Technologies Group LLC Tranche B 1LN, term loan CME Term SOFR 1 Month Index + 3.500% 8.9306% 8/12/28 (b)(c)(d)
|
|
1,545,939
|
1,544,393
|
TOTAL CONTAINERS
|
|
|
28,189,100
|
Diversified Financial Services - 3.2%
|
|
|
|
AlixPartners LLP Tranche B 1LN, term loan CME Term SOFR 1 Month Index + 2.750% 8.1806% 2/4/28 (b)(c)(d)
|
|
1,932,235
|
1,929,336
|
AVSC Holding Corp. Tranche B2 1LN, term loan 3 month U.S. LIBOR + 5.500% 10.9161% 10/15/26 (b)(c)(d)
|
|
1,470,869
|
1,421,919
|
BCP Renaissance Parent LLC Tranche B3 1LN, term loan CME Term SOFR 3 Month Index + 3.500% 8.7419% 10/31/26 (b)(c)(d)
|
|
723,317
|
721,248
|
Broadstreet Partners, Inc.:
|
|
|
|
Tranche B 1LN, term loan CME Term SOFR 1 Month Index + 3.250% 8.6806% 1/27/27 (b)(c)(d)
|
|
1,764,000
|
1,754,439
|
Tranche B3 1LN, term loan CME Term SOFR 1 Month Index + 4.000% 9.3161% 1/26/29 (b)(c)(d)
|
|
867,825
|
866,740
|
Clue Opco LLC Tranche B 1LN, term loan CME Term SOFR 1 Month Index + 4.500% 9/22/30 (c)(d)(g)
|
|
3,285,000
|
3,200,148
|
Eagle 4 Ltd. Tranche B 1LN, term loan CME Term SOFR 3 Month Index + 3.250% 9.4017% 7/12/28 (b)(c)(d)
|
|
1,168,612
|
1,162,769
|
FinCo I LLC Tranche B 1LN, term loan CME Term SOFR 1 Month Index + 3.000% 8.3694% 6/27/29 (b)(c)(d)
|
|
561,123
|
560,658
|
Focus Financial Partners LLC:
|
|
|
|
Tranche B 1LN, term loan CME Term SOFR 1 Month Index + 2.500% 7.8161% 6/24/28 (b)(c)(d)
|
|
2,154,320
|
2,146,241
|
Tranche B5 1LN, term loan CME Term SOFR 1 Month Index + 3.250% 8.5661% 6/30/28 (b)(c)(d)
|
|
705,338
|
702,890
|
Fugue Finance LLC Tranche B 1LN, term loan CME Term SOFR 1 Month Index + 4.500% 9.3537% 1/25/28 (b)(c)(d)
|
|
1,725,664
|
1,726,631
|
GT Polaris, Inc. Tranche B 1LN, term loan 1 month U.S. LIBOR + 3.750% 9.3807% 9/24/27 (b)(c)(d)
|
|
1,824,122
|
1,754,422
|
GTCR W-2 Merger Sub LLC Tranche B 1LN, term loan CME Term SOFR 1 Month Index + 3.000% 9/21/30 (c)(d)(g)
|
|
10,560,000
|
10,552,291
|
HarbourVest Partners LLC Tranche B 1LN, term loan CME Term SOFR 1 Month Index + 2.750% 8.3901% 4/20/30 (b)(c)(d)
|
|
2,929,280
|
2,924,388
|
Hightower Holding LLC Tranche B 1LN, term loan CME Term SOFR 3 Month Index + 4.000% 9.6123% 4/21/28 (b)(c)(d)
|
|
2,605,449
|
2,598,936
|
LSF11 Trinity Bidco, Inc. Tranche B 1LN, term loan CME Term SOFR 1 Month Index + 4.500% 9.8322% 6/15/30 (b)(c)(d)
|
|
658,350
|
656,704
|
Nexus Buyer LLC:
|
|
|
|
2LN, term loan CME Term SOFR 1 Month Index + 6.250% 11.6661% 11/1/29 (b)(c)(d)
|
|
2,500,000
|
2,357,825
|
Tranche B 1LN, term loan CME Term SOFR 1 Month Index + 3.750% 9.1661% 11/8/26 (b)(c)(d)
|
|
451,851
|
444,829
|
Recess Holdings, Inc. 1LN, term loan CME Term SOFR 1 Month Index + 4.000% 9.3831% 3/24/27 (b)(c)(d)
|
|
910,000
|
907,161
|
TransUnion LLC:
|
|
|
|
Tranche B5 1LN, term loan CME Term SOFR 1 Month Index + 1.750% 7.1661% 11/16/26 (b)(c)(d)
|
|
2,164,269
|
2,160,654
|
Tranche B6 1LN, term loan CME Term SOFR 1 Month Index + 2.250% 7.6806% 12/1/28 (b)(c)(d)
|
|
1,660,907
|
1,658,632
|
UFC Holdings LLC Tranche B 1LN, term loan CME Term SOFR 1 Month Index + 2.750% 8.369% 4/29/26 (b)(c)(d)
|
|
1,264,805
|
1,262,794
|
WH Borrower LLC Tranche B 1LN, term loan:
|
|
|
|
CME Term SOFR 1 Month Index + 5.500% 10.808% 2/9/27 (b)(c)(d)
|
|
3,298,769
|
3,276,766
|
CME Term SOFR 1 Month Index + 5.500% 10.808% 2/15/27 (b)(c)(d)
|
|
497,498
|
493,767
|
TOTAL DIVERSIFIED FINANCIAL SERVICES
|
|
|
47,242,188
|
Diversified Media - 0.8%
|
|
|
|
Advantage Sales & Marketing, Inc. Tranche B 1LN, term loan CME Term SOFR 1 Month Index + 4.500% 10.1759% 10/28/27 (b)(c)(d)
|
|
2,444,966
|
2,350,615
|
Allen Media LLC Tranche B 1LN, term loan CME Term SOFR 3 Month Index + 5.500% 11.0401% 2/10/27 (b)(c)(d)
|
|
4,606,919
|
4,084,034
|
Cmg Media Corp. Tranche B 1LN, term loan CME Term SOFR 3 Month Index + 3.500% 8.9901% 12/17/26 (b)(c)(d)
|
|
6,257,900
|
5,710,334
|
TOTAL DIVERSIFIED MEDIA
|
|
|
12,144,983
|
Energy - 2.4%
|
|
|
|
Apro LLC Tranche B 1LN, term loan 3 month U.S. LIBOR + 3.750% 9.1919% 11/14/26 (b)(c)(d)
|
|
2,615,405
|
2,609,520
|
Array Technologies, Inc. Tranche B 1LN, term loan CME Term SOFR 3 Month Index + 3.250% 8.6879% 10/14/27 (b)(c)(d)
|
|
3,017,537
|
3,005,286
|
BW Gas & Convenience Holdings LLC Tranche B 1LN, term loan CME Term SOFR 3 Month Index + 3.500% 8.9306% 3/17/28 (b)(c)(d)
|
|
621,655
|
613,108
|
CQP Holdco LP / BIP-V Chinook Holdco LLC Tranche B 1LN, term loan CME Term SOFR 1 Month Index + 3.500% 8.9901% 6/4/28 (b)(c)(d)
|
|
8,394,852
|
8,392,921
|
Delek U.S. Holdings, Inc. Tranche B 1LN, term loan CME Term SOFR 1 Month Index + 3.500% 8.9161% 11/19/29 (b)(c)(d)
|
|
3,667,288
|
3,635,675
|
EG America LLC:
|
|
|
|
Tranche B 1LN, term loan CME Term SOFR 1 Month Index + 5.500% 9.4145% 2/7/28 (b)(c)(d)
|
|
402,009
|
386,934
|
Tranche BB 1LN, term loan 6 month U.S. LIBOR + 4.000% 9.1645% 2/5/25 (b)(c)(d)
|
|
287,198
|
286,480
|
Tranche BC 1LN, term loan:
|
|
|
|
CME Term SOFR 1 Month Index + 4.250% 9.4145% 2/7/28 (b)(c)(d)
|
|
790,046
|
752,029
|
CME Term SOFR 1 Month Index + 5.500% 9.1645% 2/7/28 (b)(c)(d)(e)
|
|
668,602
|
635,172
|
Esdec Solar Group BV Tranche B 1LN, term loan 6 month U.S. LIBOR + 4.750% 10.4017% 8/27/28 (b)(c)(d)
|
|
1,854,468
|
1,845,196
|
GIP II Blue Holding LP Tranche B 1LN, term loan CME Term SOFR 1 Month Index + 4.500% 9.9306% 9/29/28 (b)(c)(d)
|
|
4,785,366
|
4,791,348
|
GIP III Stetson I LP Tranche B, term loan CME Term SOFR 1 Month Index + 4.250% 9.6661% 7/18/25 (b)(c)(d)
|
|
2,724,334
|
2,721,501
|
Natgasoline LLC Tranche B, term loan CME Term SOFR 1 Month Index + 3.500% 8.9306% 11/14/25 (b)(c)(d)
|
|
667,346
|
664,843
|
Par Petroleum LLC Tranche B 1LN, term loan CME Term SOFR 1 Month Index + 4.250% 9.7725% 2/14/30 (b)(c)(d)
|
|
1,243,750
|
1,240,118
|
Rockwood Service Corp. Tranche B 1LN, term loan CME Term SOFR 1 Month Index + 4.000% 9.4306% 1/23/27 (b)(c)(d)
|
|
1,929,081
|
1,933,904
|
Win Waste Innovations Holdings Tranche B 1LN, term loan CME Term SOFR 1 Month Index + 2.750% 8.1806% 3/25/28 (b)(c)(d)
|
|
1,664,761
|
1,526,802
|
TOTAL ENERGY
|
|
|
35,040,837
|
Entertainment/Film - 0.2%
|
|
|
|
AP Core Holdings II LLC:
|
|
|
|
Tranche B1 1LN, term loan CME Term SOFR 1 Month Index + 5.500% 10.9306% 9/1/27 (b)(c)(d)
|
|
1,033,431
|
1,013,196
|
Tranche B2 1LN, term loan CME Term SOFR 1 Month Index + 5.500% 10.9306% 9/1/27 (b)(c)(d)
|
|
1,185,000
|
1,149,450
|
TOTAL ENTERTAINMENT/FILM
|
|
|
2,162,646
|
Environmental - 0.5%
|
|
|
|
Clean Harbors, Inc. Tranche B 1LN, term loan CME Term SOFR 1 Month Index + 2.000% 7.4306% 10/8/28 (b)(c)(d)
|
|
960,189
|
962,954
|
Covanta Holding Corp.:
|
|
|
|
Tranche B 1LN, term loan:
|
|
|
|
CME Term SOFR 1 Month Index + 2.500% 7.8311% 11/30/28 (b)(c)(d)
|
|
1,593,488
|
1,582,669
|
CME Term SOFR 1 Month Index + 3.000% 8.3336% 11/30/28 (b)(c)(d)
|
|
716,279
|
713,593
|
Tranche C 1LN, term loan:
|
|
|
|
CME Term SOFR 1 Month Index + 2.500% 7.8311% 11/30/28 (b)(c)(d)
|
|
121,180
|
120,357
|
CME Term SOFR 1 Month Index + 3.000% 8.3336% 11/30/28 (b)(c)(d)
|
|
53,721
|
53,519
|
Madison IAQ LLC Tranche B 1LN, term loan 3 month U.S. LIBOR + 3.250% 8.6886% 6/21/28 (b)(c)(d)
|
|
3,717,148
|
3,651,169
|
The Brickman Group, Ltd. Tranche B 1LN, term loan CME Term SOFR 1 Month Index + 3.250% 8.6191% 4/22/29 (b)(c)(d)
|
|
766,501
|
766,263
|
TOTAL ENVIRONMENTAL
|
|
|
7,850,524
|
Food & Drug Retail - 0.7%
|
|
|
|
8th Avenue Food & Provisions, Inc. Tranche B 1LN, term loan CME Term SOFR 1 Month Index + 4.750% 10.1806% 10/1/25 (b)(c)(d)
|
|
496,508
|
476,440
|
Cardenas Merger Sub, LLC 1LN, term loan CME TERM SOFR 6 MONTH INDEX + 6.750% 12.2401% 8/1/29 (b)(c)(d)
|
|
2,664,866
|
2,662,654
|
Froneri U.S., Inc. Tranche B 1LN, term loan CME Term SOFR 1 Month Index + 2.250% 7.6661% 1/29/27 (b)(c)(d)
|
|
2,459,243
|
2,438,831
|
JP Intermediate B LLC term loan CME Term SOFR 1 Month Index + 5.500% 11.1307% 11/20/27 (b)(c)(d)
|
|
4,914,811
|
1,597,314
|
Upfield U.S.A. Corp. Tranche B 1LN, term loan CME Term SOFR 1 Month Index + 4.750% 10.22% 1/31/28 (b)(c)(d)
|
|
2,540,000
|
2,470,150
|
TOTAL FOOD & DRUG RETAIL
|
|
|
9,645,389
|
Food/Beverage/Tobacco - 1.4%
|
|
|
|
8th Avenue Food & Provisions, Inc.:
|
|
|
|
2LN, term loan CME Term SOFR 1 Month Index + 7.750% 13.1806% 10/1/26 (b)(c)(d)
|
|
410,000
|
277,775
|
Tranche B 1LN, term loan CME Term SOFR 1 Month Index + 3.750% 9.1806% 10/1/25 (b)(c)(d)
|
|
542,910
|
521,080
|
Bengal Debt Merger Sub LLC:
|
|
|
|
1LN, term loan CME Term SOFR 3 Month Index + 3.250% 8.7401% 1/24/29 (b)(c)(d)
|
|
2,567,288
|
2,432,788
|
2LN, term loan CME Term SOFR 3 Month Index + 6.000% 11.4901% 1/24/30 (b)(c)(d)
|
|
2,185,000
|
1,763,710
|
Chobani LLC Tranche B 1LN, term loan CME Term SOFR 1 Month Index + 3.500% 8.9306% 10/23/27 (b)(c)(d)
|
|
2,737,973
|
2,735,399
|
Del Monte Foods, Inc. Tranche B 1LN, term loan CME Term SOFR 1 Month Index + 4.250% 9.6737% 5/16/29 (b)(c)(d)
|
|
4,939,764
|
4,796,215
|
Shearer's Foods, Inc. Tranche B 1LN, term loan CME Term SOFR 1 Month Index + 3.500% 8.9306% 9/23/27 (b)(c)(d)
|
|
2,477,625
|
2,471,431
|
Triton Water Holdings, Inc. Tranche B 1LN, term loan CME Term SOFR 1 Month Index + 3.250% 8.9017% 3/31/28 (b)(c)(d)
|
|
6,486,243
|
6,313,255
|
TOTAL FOOD/BEVERAGE/TOBACCO
|
|
|
21,311,653
|
Gaming - 3.4%
|
|
|
|
Caesars Entertainment, Inc. Tranche B 1LN, term loan CME Term SOFR 1 Month Index + 3.250% 8.6661% 1/26/30 (b)(c)(d)
|
|
12,308,150
|
12,300,519
|
Fertitta Entertainment LLC NV Tranche B 1LN, term loan CME Term SOFR 1 Month Index + 4.000% 9.3161% 1/27/29 (b)(c)(d)
|
|
10,668,731
|
10,548,708
|
Flutter Financing B.V. Tranche B 1LN, term loan CME Term SOFR 1 Month Index + 3.250% 8.9017% 7/4/28 (b)(c)(d)
|
|
1,346,400
|
1,347,073
|
Golden Entertainment, Inc. Tranche B 1LN, term loan CME Term SOFR 1 Month Index + 2.750% 8.1684% 5/26/30 (b)(c)(d)
|
|
3,620,925
|
3,611,873
|
GVC Holdings Gibraltar Ltd.:
|
|
|
|
Tranche B2 1LN, term loan CME TERM SOFR 6 MONTH INDEX + 3.500% 8.9901% 10/31/29 (b)(c)(d)
|
|
1,042,577
|
1,040,408
|
Tranche B4 1LN, term loan CME TERM SOFR 6 MONTH INDEX + 2.250% 7.9901% 3/16/27 (b)(c)(d)
|
|
2,420,271
|
2,413,785
|
J&J Ventures Gaming LLC:
|
|
|
|
1LN, term loan 3 month U.S. LIBOR + 4.000% 9.6517% 4/26/28 (b)(c)(d)
|
|
1,776,095
|
1,691,446
|
Tranche B 1LN, term loan CME Term SOFR 1 Month Index + 3.000% 9.6928% 4/26/28 (b)(c)(d)
|
|
561,786
|
536,505
|
Tranche DD2 1LN, term loan CME Term SOFR 1 Month Index + 4.250% 4/26/28 (c)(d)(g)
|
|
1,011,214
|
965,710
|
Ontario Gaming GTA LP Tranche B 1LN, term loan CME Term SOFR 1 Month Index + 4.250% 9.6219% 8/1/30 (b)(c)(d)
|
|
1,250,000
|
1,250,000
|
PCI Gaming Authority 1LN, term loan 3 month U.S. LIBOR + 2.500% 7.9306% 5/29/26 (b)(c)(d)
|
|
469,152
|
468,509
|
Scientific Games Corp. 1LN, term loan CME Term SOFR 1 Month Index + 3.000% 8.4336% 4/14/29 (b)(c)(d)
|
|
3,050,082
|
3,046,269
|
Scientific Games Holdings LP term loan CME Term SOFR 3 Month Index + 3.500% 8.9143% 4/4/29 (b)(c)(d)
|
|
2,060,385
|
2,046,642
|
Stars Group Holdings BV Tranche B 1LN, term loan CME Term SOFR 3 Month Index + 2.250% 7.9017% 7/21/26 (b)(c)(d)
|
|
3,806,092
|
3,800,954
|
Station Casinos LLC Tranche B 1LN, term loan CME Term SOFR 1 Month Index + 2.250% 7.6661% 2/7/27 (b)(c)(d)
|
|
4,601,793
|
4,588,218
|
TOTAL GAMING
|
|
|
49,656,619
|
Healthcare - 4.8%
|
|
|
|
Accelerated Health Systems LLC Tranche B1 LN, term loan CME Term SOFR 3 Month Index + 4.250% 9.7901% 2/15/29 (b)(c)(d)
|
|
1,546,644
|
1,289,514
|
AHP Health Partners, Inc. Tranche B 1LN, term loan CME Term SOFR 1 Month Index + 3.500% 8.9306% 8/24/28 (b)(c)(d)
|
|
2,210,824
|
2,209,166
|
Avantor Funding, Inc. Tranche B5 1LN, term loan CME Term SOFR 1 Month Index + 2.250% 7.6661% 11/6/27 (b)(c)(d)
|
|
1,453,756
|
1,451,779
|
Charlotte Buyer, Inc. Tranche B 1LN, term loan CME Term SOFR 3 Month Index + 5.250% 10.5793% 2/12/28 (b)(c)(d)
|
|
1,238,759
|
1,224,377
|
Da Vinci Purchaser Corp. Tranche B 1LN, term loan CME Term SOFR 1 Month Index + 4.000% 9.4306% 1/8/27 (b)(c)(d)
|
|
2,249,468
|
2,221,350
|
Elanco Animal Health, Inc. Tranche B 1LN, term loan CME Term SOFR 1 Month Index + 1.750% 7.1646% 8/1/27 (b)(c)(d)
|
|
3,253,937
|
3,188,403
|
Electron BidCo, Inc. Tranche B 1LN, term loan CME Term SOFR 1 Month Index + 3.000% 8.4306% 11/1/28 (b)(c)(d)
|
|
1,706,178
|
1,697,648
|
Embecta Corp. Tranche B 1LN, term loan CME Term SOFR 1 Month Index + 3.000% 8.3367% 3/31/29 (b)(c)(d)
|
|
1,737,506
|
1,699,767
|
Gainwell Acquisition Corp. Tranche B 1LN, term loan CME Term SOFR 3 Month Index + 4.000% 9.4901% 10/1/27 (b)(c)(d)
|
|
10,999,970
|
10,714,630
|
HAH Group Holding Co. LLC:
|
|
|
|
1LN, term loan CME Term SOFR 1 Month Index + 5.000% 10.42% 10/29/27 (b)(c)(d)
|
|
769,944
|
759,034
|
Tranche DD 1LN, term loan CME Term SOFR 3 Month Index + 5.000% 10.42% 10/29/27 (b)(c)(d)
|
|
97,427
|
96,046
|
Horizon Pharma U.S.A., Inc. Tranche B 1LN, term loan CME Term SOFR 1 Month Index + 1.750% 7.1842% 3/15/28 (b)(c)(d)
|
|
1,805,884
|
1,803,319
|
ICU Medical, Inc. Tranche B 1LN, term loan CME Term SOFR 1 Month Index + 2.500% 8.0401% 1/6/29 (b)(c)(d)
|
|
1,613,409
|
1,610,521
|
Insulet Corp. Tranche B 1LN, term loan CME Term SOFR 1 Month Index + 3.250% 8.6806% 5/4/28 (b)(c)(d)
|
|
5,537,091
|
5,525,574
|
Jazz Financing Lux SARL Tranche B 1LN, term loan CME Term SOFR 1 Month Index + 3.500% 8.9306% 5/5/28 (b)(c)(d)
|
|
4,682,276
|
4,677,734
|
Maravai Intermediate Holdings LLC Tranche B 1LN, term loan CME Term SOFR 3 Month Index + 3.000% 8.3201% 10/19/27 (b)(c)(d)
|
|
1,505,079
|
1,463,689
|
MED ParentCo LP:
|
|
|
|
1LN, term loan CME Term SOFR 1 Month Index + 4.250% 9.6806% 8/31/26 (b)(c)(d)
|
|
1,409,786
|
1,343,230
|
2LN, term loan CME Term SOFR 1 Month Index + 8.250% 13.6806% 8/30/27 (b)(c)(d)
|
|
1,310,000
|
1,130,897
|
Mozart Borrower LP Tranche B 1LN, term loan CME Term SOFR 1 Month Index + 3.250% 8.6806% 10/23/28 (b)(c)(d)
|
|
5,105,916
|
5,089,067
|
National Mentor Holdings, Inc. Tranche B 1LN, term loan CME Term SOFR 1 Month Index + 3.750% 9.1808% 3/2/28 (b)(c)(d)
|
|
734,848
|
652,486
|
Organon & Co. Tranche B 1LN, term loan CME Term SOFR 3 Month Index + 3.000% 8.4421% 6/2/28 (b)(c)(d)
|
|
4,514,714
|
4,501,169
|
Packaging Coordinators Midco, Inc. Tranche B 1LN, term loan CME Term SOFR 3 Month Index + 3.500% 9.1517% 11/30/27 (b)(c)(d)
|
|
1,782,809
|
1,773,343
|
Pathway Vet Alliance LLC Tranche B 1LN, term loan CME Term SOFR 1 Month Index + 3.750% 9.1806% 3/31/27 (b)(c)(d)
|
|
2,154,292
|
2,009,179
|
Phoenix Newco, Inc. Tranche B 1LN, term loan CME Term SOFR 1 Month Index + 3.250% 8.6806% 11/15/28 (b)(c)(d)
|
|
5,856,399
|
5,809,841
|
Pluto Acquisition I, Inc. term loan CME Term SOFR 1 Month Index + 4.000% 9.6841% 6/20/26 (b)(c)(d)
|
|
2,067,061
|
1,798,343
|
PRA Health Sciences, Inc. Tranche B 1LN, term loan CME Term SOFR 3 Month Index + 2.250% 7.9017% 7/3/28 (b)(c)(d)
|
|
1,291,565
|
1,290,532
|
Surgery Center Holdings, Inc. 1LN, term loan CME Term SOFR 1 Month Index + 3.750% 9.1886% 8/31/26 (b)(c)(d)
|
|
485,865
|
486,054
|
U.S. Anesthesia Partners, Inc.:
|
|
|
|
2LN, term loan CME Term SOFR 1 Month Index + 7.500% 12.9442% 10/1/29 (b)(c)(d)(e)
|
|
775,000
|
685,875
|
Tranche B 1LN, term loan CME Term SOFR 1 Month Index + 4.250% 9.6791% 10/1/28 (b)(c)(d)
|
|
547,431
|
501,288
|
U.S. Radiology Specialists, Inc. Tranche B 1LN, term loan 3 month U.S. LIBOR + 5.250% 10.7401% 12/15/27 (b)(c)(d)
|
|
639,571
|
619,104
|
Upstream Newco, Inc. 1LN, term loan 1 month U.S. LIBOR + 4.250% 9.6806% 11/20/26 (b)(c)(d)
|
|
1,201,088
|
1,149,441
|
TOTAL HEALTHCARE
|
|
|
70,472,400
|
Homebuilders/Real Estate - 0.8%
|
|
|
|
Breakwater Energy Partners LLC Tranche B 1LN, term loan 11.25% 9/1/26 (b)(d)(e)
|
|
3,842,968
|
3,718,072
|
DTZ U.S. Borrower LLC Tranche B 1LN, term loan:
|
|
|
|
CME Term SOFR 1 Month Index + 2.750% 8.1806% 8/21/25 (b)(c)(d)
|
|
45,609
|
45,507
|
CME Term SOFR 1 Month Index + 3.250% 8.6661% 1/31/30 (b)(c)(d)
|
|
1,965,240
|
1,929,218
|
CME Term SOFR 1 Month Index + 4.000% 9.3161% 1/31/30 (b)(c)(d)
|
|
970,000
|
960,300
|
Fluidra Finco SL Tranche B 1LN, term loan CME Term SOFR 1 Month Index + 2.000% 7.3411% 1/27/29 (b)(c)(d)
|
|
496,859
|
493,257
|
Greystar Real Estate Partners 1LN, term loan CME Term SOFR 1 Month Index + 3.750% 9.147% 8/21/30 (b)(c)(d)
|
|
1,245,000
|
1,241,888
|
Jones DesLauriers Insurance Management, Inc. Tranche B 1LN, term loan CME Term SOFR 1 Month Index + 4.250% 9.6153% 3/16/30 (b)(c)(d)
|
|
1,370,000
|
1,372,576
|
Ryan Specialty Group LLC Tranche B 1LN, term loan CME Term SOFR 1 Month Index + 3.000% 8.4161% 9/1/27 (b)(c)(d)
|
|
1,749,319
|
1,747,447
|
TOTAL HOMEBUILDERS/REAL ESTATE
|
|
|
11,508,265
|
Hotels - 2.0%
|
|
|
|
ASP LS Acquisition Corp. Tranche B 1LN, term loan CME Term SOFR 3 Month Index + 4.500% 10.3958% 5/7/28 (b)(c)(d)
|
|
508,025
|
469,161
|
BRE/Everbright M6 Borrower LLC Tranche B 1LN, term loan CME Term SOFR 1 Month Index + 5.000% 10.4241% 9/9/26 (b)(c)(d)
|
|
955,381
|
950,012
|
Carnival Finance LLC Tranche B 1LN, term loan CME Term SOFR 1 Month Index + 3.250% 8.6806% 10/18/28 (b)(c)(d)
|
|
6,085,854
|
6,047,817
|
Four Seasons Hotels Ltd. Tranche B 1LN, term loan CME Term SOFR 1 Month Index + 2.500% 7.9161% 11/30/29 (b)(c)(d)
|
|
3,663,908
|
3,666,949
|
Hilton Grand Vacations Borrower LLC Tranche B 1LN, term loan CME Term SOFR 1 Month Index + 3.000% 8.4306% 8/2/28 (b)(c)(d)
|
|
9,709,716
|
9,714,280
|
Hilton Worldwide Finance LLC Tranche B 1LN, term loan CME Term SOFR 3 Month Index + 1.750% 7.1697% 6/21/26 (b)(c)(d)
|
|
1,292,849
|
1,291,517
|
Marriott Ownership Resorts, Inc. Tranche B 1LN, term loan CME Term SOFR 1 Month Index + 1.750% 7.1661% 8/31/25 (b)(c)(d)
|
|
1,006,280
|
1,003,513
|
Oravel Stays Singapore Pte Ltd. Tranche B 1LN, term loan 3 month U.S. LIBOR + 8.250% 13.9077% 6/23/26 (b)(c)(d)
|
|
2,033,200
|
1,738,386
|
Playa Resorts Holding BV Tranche B 1LN, term loan CME Term SOFR 1 Month Index + 4.250% 9.5806% 1/5/29 (b)(c)(d)
|
|
1,436,016
|
1,435,527
|
Travelport Finance Luxembourg SARL 1LN, term loan:
|
|
|
|
CME Term SOFR 3 Month Index + 8.750% 12.6517% 2/28/25 (b)(c)(d)
|
|
2,452,790
|
2,323,724
|
U.S. Secured Overnight Fin. Rate (SOFR) Index + 6.750% 12.1401% 5/29/26 (b)(c)(d)
|
|
2,796,574
|
1,423,456
|
TOTAL HOTELS
|
|
|
30,064,342
|
Insurance - 5.6%
|
|
|
|
Acrisure LLC:
|
|
|
|
Tranche B 1LN, term loan:
|
|
|
|
CME Term SOFR 1 Month Index + 3.500% 8.9306% 2/15/27 (b)(c)(d)
|
|
7,302,386
|
7,190,221
|
CME Term SOFR 1 Month Index + 4.250% 9.6806% 2/15/27 (b)(c)(d)
|
|
2,534,850
|
2,523,773
|
CME Term SOFR 1 Month Index + 5.750% 11.1206% 2/15/27 (b)(c)(d)
|
|
6,321,342
|
6,337,145
|
Tranche B-2 1LN, term loan CME Term SOFR 1 Month Index + 3.750% 9.1806% 2/15/27 (b)(c)(d)
|
|
823,200
|
810,169
|
Alliant Holdings Intermediate LLC:
|
|
|
|
Tranche B3 1LN, term loan 1 month U.S. LIBOR + 3.500% 8.9306% 11/5/27 (b)(c)(d)
|
|
2,145,581
|
2,140,002
|
Tranche B5 1LN, term loan CME Term SOFR 1 Month Index + 3.500% 8.8306% 11/6/27 (b)(c)(d)
|
|
3,229,795
|
3,222,722
|
AmWINS Group, Inc. Tranche B 1LN, term loan:
|
|
|
|
CME Term SOFR 1 Month Index + 2.250% 7.6806% 2/19/28 (b)(c)(d)
|
|
3,184,654
|
3,162,584
|
CME Term SOFR 1 Month Index + 2.750% 8.1806% 2/19/28 (b)(c)(d)
|
|
1,290,250
|
1,287,837
|
Amynta Agency Borrower, Inc. Tranche B 1LN, term loan CME Term SOFR 1 Month Index + 5.000% 10.4161% 2/28/28 (b)(c)(d)
|
|
1,496,250
|
1,493,961
|
AssuredPartners, Inc. Tranche B 1LN, term loan:
|
|
|
|
CME Term SOFR 1 Month Index + 3.500% 8.9306% 2/13/27 (b)(c)(d)
|
|
190,613
|
190,374
|
CME Term SOFR 1 Month Index + 3.500% 8.9306% 2/13/27 (b)(c)(d)
|
|
3,505,149
|
3,495,299
|
Asurion LLC:
|
|
|
|
Tranche B11 1LN, term loan CME Term SOFR 1 Month Index + 4.250% 9.6661% 8/19/28 (b)(c)(d)
|
|
2,165,645
|
2,100,675
|
Tranche B3 2LN, term loan CME Term SOFR 1 Month Index + 5.250% 10.6806% 1/31/28 (b)(c)(d)
|
|
11,475,000
|
10,305,009
|
Tranche B4 2LN, term loan CME Term SOFR 1 Month Index + 5.250% 10.6806% 1/20/29 (b)(c)(d)
|
|
19,320,000
|
17,087,767
|
Tranche B8 1LN, term loan 1 month U.S. LIBOR + 3.250% 8.6661% 12/23/26 (b)(c)(d)
|
|
215,982
|
211,123
|
Tranche B9 1LN, term loan 1 month U.S. LIBOR + 3.250% 8.6806% 7/31/27 (b)(c)(d)
|
|
941,123
|
908,184
|
HUB International Ltd. Tranche B 1LN, term loan CME Term SOFR 1 Month Index + 4.250% 9.5835% 6/8/30 (b)(c)(d)
|
|
12,971,457
|
12,993,119
|
USI, Inc.:
|
|
|
|
1LN, term loan:
|
|
|
|
1 month U.S. LIBOR + 3.250% 8.7879% 12/2/26 (b)(c)(d)
|
|
0
|
0
|
CME Term SOFR 1 Month Index + 3.750% 9.1401% 11/22/29 (b)(c)(d)
|
|
3,998,492
|
3,992,374
|
Tranche B 1LN, term loan:
|
|
|
|
CME Term SOFR 1 Month Index + 3.250% 9/14/30 (c)(d)(g)
|
|
490,000
|
488,569
|
CME Term SOFR 1 Month Index + 3.250% 9/14/30 (c)(d)(g)
|
|
1,850,000
|
1,843,840
|
TOTAL INSURANCE
|
|
|
81,784,747
|
Leisure - 2.3%
|
|
|
|
Alterra Mountain Co. Tranche B 1LN, term loan CME Term SOFR 1 Month Index + 3.500% 8.9306% 8/17/28 (b)(c)(d)
|
|
2,811,061
|
2,801,700
|
Arcis Golf LLC Tranche B 1LN, term loan CME Term SOFR 1 Month Index + 4.250% 9.6806% 11/24/28 (b)(c)(d)
|
|
854,432
|
854,432
|
City Football Group Ltd. Tranche B 1LN, term loan CME Term SOFR 1 Month Index + 3.000% 8.4386% 7/21/28 (b)(c)(d)
|
|
5,561,486
|
5,526,726
|
ClubCorp Holdings, Inc. Tranche B 1LN, term loan 3 month U.S. LIBOR + 2.750% 8.1806% 9/18/24 (b)(c)(d)
|
|
1,283,175
|
1,260,719
|
Crown Finance U.S., Inc. 1LN, term loan CME Term SOFR 1 Month Index + 8.500% 14.3811% 7/31/28 (b)(c)(d)
|
|
3,299,299
|
3,361,689
|
Delta 2 SARL Tranche B 1LN, term loan CME Term SOFR 1 Month Index + 3.000% 8.3161% 1/15/30 (b)(c)(d)
|
|
4,130,000
|
4,125,870
|
Equinox Holdings, Inc.:
|
|
|
|
Tranche 2LN, term loan 3 month U.S. LIBOR + 7.000% 12.731% 9/8/24 (b)(c)(d)
|
|
1,000,000
|
899,840
|
Tranche B-1, term loan 3 month U.S. LIBOR + 3.000% 8.731% 3/8/24 (b)(c)(d)
|
|
3,594,559
|
3,471,445
|
Herschend Entertainment Co. LLC Tranche B 1LN, term loan CME Term SOFR 1 Month Index + 3.750% 9.1806% 8/27/28 (b)(c)(d)
|
|
803,376
|
801,617
|
Lids Holdings, Inc. 1LN, term loan CME Term SOFR 3 Month Index + 5.500% 11.0601% 12/14/26 (b)(c)(d)(e)
|
|
2,092,806
|
1,998,629
|
SeaWorld Parks & Entertainment, Inc. Tranche B 1LN, term loan CME Term SOFR 1 Month Index + 3.000% 8.4306% 8/25/28 (b)(c)(d)
|
|
0
|
0
|
Topgolf Callaway Brands Corp. Tranche B 1LN, term loan CME Term SOFR 1 Month Index + 3.500% 8.9161% 3/9/30 (b)(c)(d)
|
|
3,711,350
|
3,687,375
|
United PF Holdings LLC:
|
|
|
|
1LN, term loan CME Term SOFR 1 Month Index + 4.000% 9.6307% 12/30/26 (b)(c)(d)
|
|
4,327,607
|
3,508,088
|
2LN, term loan 3 month U.S. LIBOR + 8.500% 14.1307% 12/30/27 (b)(c)(d)(e)
|
|
750,000
|
577,500
|
Tranche B 1LN, term loan CME Term SOFR 1 Month Index + 8.500% 14.1307% 12/30/26 (b)(c)(d)
|
|
931,200
|
828,768
|
TOTAL LEISURE
|
|
|
33,704,398
|
Metals/Mining - 0.2%
|
|
|
|
Arsenal AIC Parent LLC Tranche B 1LN, term loan CME Term SOFR 1 Month Index + 4.500% 9.8792% 8/18/30 (b)(c)(d)
|
|
2,100,000
|
2,093,868
|
U.S. Silica Co. Tranche B 1LN, term loan CME Term SOFR 1 Month Index + 4.750% 10.1661% 3/23/30 (b)(c)(d)
|
|
1,437,212
|
1,437,988
|
TOTAL METALS/MINING
|
|
|
3,531,856
|
Paper - 0.8%
|
|
|
|
Ahlstrom-Munksjo OYJ 1LN, term loan 3 month U.S. LIBOR + 3.750% 9.6517% 2/4/28 (b)(c)(d)
|
|
931,772
|
903,819
|
Clydesdale Acquisition Holdings, Inc. 1LN, term loan CME Term SOFR 1 Month Index + 4.170% 9.5911% 4/13/29 (b)(c)(d)
|
|
11,332,987
|
11,166,279
|
TOTAL PAPER
|
|
|
12,070,098
|
Publishing/Printing - 0.5%
|
|
|
|
Century de Buyer LLC 1LN, term loan CME Term SOFR 1 Month Index + 4.000% 9/27/30 (c)(d)(g)
|
|
2,185,000
|
2,168,613
|
Harland Clarke Holdings Corp. 1LN, term loan CME Term SOFR 1 Month Index + 7.750% 13.4017% 6/16/26 (b)(c)(d)
|
|
1,470,221
|
1,336,063
|
Learning Care Group (U.S.) No 2, Inc. Tranche B 1LN, term loan CME Term SOFR 1 Month Index + 4.750% 10.1316% 8/11/28 (b)(c)(d)
|
|
1,625,000
|
1,622,286
|
MJH Healthcare Holdings LLC Tranche B 1LN, term loan CME Term SOFR 1 Month Index + 3.500% 8.9161% 1/28/29 (b)(c)(d)
|
|
1,371,557
|
1,366,413
|
RLG Holdings LLC:
|
|
|
|
2LN, term loan CME Term SOFR 1 Month Index + 7.500% 12.9306% 7/2/29 (b)(c)(d)
|
|
590,000
|
539,850
|
Tranche B 1LN, term loan CME Term SOFR 1 Month Index + 4.250% 9.6806% 7/8/28 (b)(c)(d)
|
|
833,720
|
781,612
|
TOTAL PUBLISHING/PRINTING
|
|
|
7,814,837
|
Railroad - 0.5%
|
|
|
|
AIT Worldwide Logistics Holdings, Inc. 1LN, term loan CME Term SOFR 1 Month Index + 4.750% 10.1793% 4/6/28 (b)(c)(d)
|
|
2,021,901
|
2,004,209
|
Echo Global Logistics, Inc. 1LN, term loan CME Term SOFR 1 Month Index + 3.500% 8.9161% 11/23/28 (b)(c)(d)
|
|
482,638
|
465,263
|
Genesee & Wyoming, Inc. 1LN, term loan CME Term SOFR 3 Month Index + 2.000% 7.4901% 12/30/26 (b)(c)(d)
|
|
2,416,097
|
2,410,806
|
Wwex Unified Topco Holdings LLC:
|
|
|
|
1LN, term loan CME Term SOFR 1 Month Index + 4.250% 9.6517% 7/26/28 (b)(c)(d)
|
|
1,606,028
|
1,577,585
|
Tranche B 2LN, term loan CME Term SOFR 3 Month Index + 7.000% 12.5035% 7/22/29 (b)(c)(d)
|
|
1,295,000
|
1,084,563
|
TOTAL RAILROAD
|
|
|
7,542,426
|
Restaurants - 0.9%
|
|
|
|
Burger King Worldwide, Inc. Tranche B5 1LN, term loan CME Term SOFR 1 Month Index + 2.250% 7.5661% 9/12/30 (b)(c)(d)
|
|
3,401,646
|
3,386,781
|
Dave & Buster's, Inc. Tranche B 1LN, term loan CME Term SOFR 1 Month Index + 3.750% 9.1875% 6/29/29 (b)(c)(d)
|
|
1,816,250
|
1,814,361
|
Flynn Restaurant Group LP Tranche B 1LN, term loan CME Term SOFR 1 Month Index + 4.250% 9.6806% 12/1/28 (b)(c)(d)
|
|
704,807
|
701,135
|
KFC Holding Co. Tranche B 1LN, term loan CME Term SOFR 1 Month Index + 1.750% 7.1951% 3/15/28 (b)(c)(d)
|
|
657,971
|
656,911
|
Pacific Bells LLC Tranche B 1LN, term loan CME Term SOFR 3 Month Index + 4.500% 10.1517% 10/20/28 (b)(c)(d)
|
|
561,229
|
553,339
|
PFC Acquisition Corp. Tranche B 1LN, term loan CME Term SOFR 3 Month Index + 6.250% 11.7691% 3/1/26 (b)(c)(d)
|
|
1,972,271
|
1,871,902
|
Whatabrands LLC Tranche B 1LN, term loan CME Term SOFR 1 Month Index + 3.000% 8.4306% 8/3/28 (b)(c)(d)
|
|
4,919,395
|
4,895,339
|
TOTAL RESTAURANTS
|
|
|
13,879,768
|
Services - 9.5%
|
|
|
|
ABG Intermediate Holdings 2 LLC:
|
|
|
|
Tranche B 2LN, term loan CME Term SOFR 1 Month Index + 6.000% 11.4161% 12/20/29 (b)(c)(d)
|
|
942,000
|
946,710
|
Tranche B1 LN, term loan CME Term SOFR 1 Month Index + 3.500% 8.9161% 12/21/28 (b)(c)(d)
|
|
4,894,083
|
4,882,728
|
Tranche B2 1LN, term loan CME Term SOFR 1 Month Index + 4.000% 9.4161% 12/21/28 (b)(c)(d)
|
|
6,332,433
|
6,328,507
|
Tranche DD 1LN, term loan CME Term SOFR 1 Month Index + 4.000% 4% 12/21/28 (b)(c)(d)(h)
|
|
1,213,333
|
1,212,581
|
Adtalem Global Education, Inc. Tranche B 1LN, term loan CME Term SOFR 1 Month Index + 4.000% 9.4306% 8/12/28 (b)(c)(d)
|
|
306,810
|
306,187
|
AEA International Holdings Luxembourg SARL Tranche B 1LN, term loan CME Term SOFR 3 Month Index + 3.750% 9.4017% 9/7/28 (b)(c)(d)
|
|
1,095,395
|
1,092,656
|
All-Star Bidco AB:
|
|
|
|
Tranche B 1LN, term loan CME Term SOFR 3 Month Index + 3.900% 8.95% 11/16/28 (b)(c)(d)
|
|
963,845
|
957,223
|
Tranche B1 1LN, term loan CME Term SOFR 3 Month Index + 3.500% 8.45% 11/16/28 (b)(c)(d)
|
|
2,403,351
|
2,380,831
|
Allied Universal Holdco LLC Tranche B 1LN, term loan:
|
|
|
|
CME Term SOFR 1 Month Index + 3.750% 9.1661% 5/14/28 (b)(c)(d)
|
|
4,877,080
|
4,703,602
|
CME Term SOFR 1 Month Index + 4.750% 10.0661% 5/14/28 (b)(c)(d)
|
|
430,000
|
423,013
|
APX Group, Inc. Tranche B 1LN, term loan CME Term SOFR 1 Month Index + 3.250% 8.6886% 7/9/28 (b)(c)(d)
|
|
2,572,607
|
2,569,031
|
Aramark Services, Inc. Tranche B 1LN, term loan CME Term SOFR 1 Month Index + 2.500% 7.9306% 6/22/30 (b)(c)(d)
|
|
3,105,989
|
3,098,224
|
Archkey Holdings, Inc. Tranche B 1LN, term loan CME Term SOFR 1 Month Index + 5.250% 10.785% 6/30/28 (b)(c)(d)
|
|
1,349,838
|
1,342,670
|
Ascend Learning LLC:
|
|
|
|
2LN, term loan CME Term SOFR 1 Month Index + 5.750% 11.1661% 12/10/29 (b)(c)(d)
|
|
2,705,000
|
2,298,114
|
Tranche B 1LN, term loan CME Term SOFR 1 Month Index + 3.500% 8.9161% 12/10/28 (b)(c)(d)
|
|
5,768,121
|
5,491,424
|
Asurion LLC 1LN, term loan CME Term SOFR 3 Month Index + 4.000% 9.4161% 8/19/28 (b)(c)(d)
|
|
1,536,970
|
1,488,617
|
Avis Budget Group, Inc. 1LN, term loan CME Term SOFR 1 Month Index + 3.500% 8.9161% 3/16/29 (b)(c)(d)
|
|
1,157,375
|
1,155,211
|
Brand Energy & Infrastructure Services, Inc. Tranche B 1LN, term loan CME Term SOFR 1 Month Index + 5.500% 10.8719% 8/1/30 (b)(c)(d)
|
|
4,405,000
|
4,285,228
|
Cast & Crew Payroll LLC Tranche B 1LN, term loan:
|
|
|
|
CME Term SOFR 1 Month Index + 3.500% 8.9306% 2/7/26 (b)(c)(d)
|
|
2,958,206
|
2,943,001
|
CME Term SOFR 1 Month Index + 3.750% 9.0661% 12/30/28 (b)(c)(d)
|
|
1,999,450
|
1,974,457
|
CHG Healthcare Services, Inc. 1LN, term loan CME Term SOFR 1 Month Index + 3.250% 8.6806% 9/30/28 (b)(c)(d)
|
|
959,198
|
954,076
|
CoreLogic, Inc. Tranche B 1LN, term loan CME Term SOFR 1 Month Index + 3.500% 8.9306% 6/2/28 (b)(c)(d)
|
|
7,099,566
|
6,546,368
|
EAB Global, Inc. Tranche B 1LN, term loan 3 month U.S. LIBOR + 3.500% 8.8719% 8/16/28 (b)(c)(d)
|
|
890,133
|
882,567
|
EmployBridge LLC Tranche B 1LN, term loan 3 month U.S. LIBOR + 4.750% 10.4071% 7/19/28 (b)(c)(d)
|
|
3,327,554
|
2,990,041
|
Ensemble RCM LLC 1LN, term loan CME Term SOFR 1 Month Index + 3.750% 9.2191% 8/1/26 (b)(c)(d)
|
|
2,604,882
|
2,605,819
|
Filtration Group Corp.:
|
|
|
|
1LN, term loan CME Term SOFR 1 Month Index + 4.250% 9.6806% 10/19/28 (b)(c)(d)
|
|
205,978
|
206,065
|
Tranche B 1LN, term loan CME Term SOFR 1 Month Index + 3.500% 8.9306% 10/21/28 (b)(c)(d)
|
|
2,934,700
|
2,920,642
|
Flexera Software LLC Tranche B 1LN, term loan CME Term SOFR 1 Month Index + 3.750% 9.1806% 3/3/28 (b)(c)(d)
|
|
821,157
|
813,529
|
Franchise Group, Inc. Tranche B 1LN, term loan:
|
|
|
|
CME Term SOFR 3 Month Index + 4.750% 10.3111% 3/10/26 (b)(c)(d)
|
|
3,146,789
|
2,875,378
|
CME Term SOFR 3 Month Index + 4.750% 10.3769% 3/10/26 (b)(c)(d)
|
|
1,746,225
|
1,589,065
|
Galaxy U.S. Opco, Inc. 1LN, term loan CME Term SOFR 1 Month Index + 4.750% 10.0661% 4/29/29 (b)(c)(d)
|
|
1,636,359
|
1,556,587
|
GEMS MENASA Cayman Ltd. Tranche B 1LN, term loan CME Term SOFR 3 Month Index + 4.750% 10.4341% 7/30/26 (b)(c)(d)
|
|
3,214,985
|
3,224,759
|
Greeneden U.S. Holdings II LLC Tranche B 1LN, term loan CME Term SOFR 1 Month Index + 4.000% 9.4306% 12/1/27 (b)(c)(d)
|
|
1,489,256
|
1,489,256
|
Indy U.S. Bidco LLC Tranche B 1LN, term loan CME Term SOFR 1 Month Index + 3.750% 9.0661% 3/5/28 (b)(c)(d)
|
|
678,045
|
647,533
|
Ion Trading Finance Ltd. Tranche B 1LN, term loan CME Term SOFR 3 Month Index + 4.750% 10.2401% 3/26/28 (b)(c)(d)
|
|
3,107,451
|
3,059,534
|
KNS Acquisitions, Inc. Tranche B 1LN, term loan CME Term SOFR 1 Month Index + 6.250% 11.6806% 4/21/27 (b)(c)(d)
|
|
1,752,750
|
1,481,810
|
KUEHG Corp. 1LN, term loan CME Term SOFR 1 Month Index + 5.000% 10.3901% 6/12/30 (b)(c)(d)
|
|
7,500,000
|
7,503,525
|
Maverick Purchaser Sub LLC:
|
|
|
|
Tranche B 1LN, term loan:
|
|
|
|
CME Term SOFR 1 Month Index + 4.000% 9.3306% 2/15/29 (b)(c)(d)
|
|
1,808,219
|
1,779,975
|
CME Term SOFR 1 Month Index + 4.000% 9.4306% 1/23/27 (b)(c)(d)
|
|
2,611,709
|
2,586,688
|
Tranche B 2LN, term loan CME Term SOFR 1 Month Index + 8.750% 14.1806% 1/31/28 (b)(c)(d)
|
|
3,060,000
|
2,770,585
|
Neptune BidCo U.S., Inc. Tranche B 1LN, term loan CME Term SOFR 1 Month Index + 5.000% 10.3985% 4/11/29 (b)(c)(d)
|
|
9,027,375
|
8,105,861
|
Omnia Partners LLC:
|
|
|
|
1LN, term loan CME Term SOFR 1 Month Index + 4.250% 9.6012% 7/25/30 (b)(c)(d)(h)
|
|
2,545,845
|
2,546,380
|
Tranche DD 1LN, term loan CME Term SOFR 1 Month Index + 4.250% 2.125% 7/19/30 (b)(c)(d)
|
|
239,155
|
239,205
|
Optiv Security, Inc. Tranche B 1LN, term loan CME Term SOFR 1 Month Index + 5.250% 10.3384% 8/14/26 (b)(c)(d)
|
|
1,590,000
|
1,536,735
|
Pilot Travel Centers LLC Tranche B 1LN, term loan CME Term SOFR 1 Month Index + 2.000% 7.4161% 8/4/28 (b)(c)(d)
|
|
4,473,424
|
4,465,416
|
PowerTeam Services LLC Tranche B 1LN, term loan CME Term SOFR 3 Month Index + 3.500% 8.8901% 3/6/25 (b)(c)(d)
|
|
722,741
|
674,411
|
Sabert Corp. Tranche B 1LN, term loan CME Term SOFR 1 Month Index + 4.500% 9.9306% 12/10/26 (b)(c)(d)
|
|
2,262,363
|
2,262,363
|
Sedgwick Claims Management Services, Inc. Tranche B 1LN, term loan CME Term SOFR 1 Month Index + 3.750% 9.0661% 2/24/28 (b)(c)(d)
|
|
1,129,325
|
1,126,366
|
Sitel Worldwide Corp. Tranche B 1LN, term loan CME Term SOFR 1 Month Index + 3.750% 9.1806% 8/27/28 (b)(c)(d)
|
|
1,410,989
|
1,373,514
|
Sotheby's Tranche B 1LN, term loan CME Term SOFR 1 Month Index + 4.500% 10.0696% 1/15/27 (b)(c)(d)
|
|
1,455,000
|
1,416,806
|
Spin Holdco, Inc. Tranche B 1LN, term loan 3 month U.S. LIBOR + 4.000% 9.6639% 3/4/28 (b)(c)(d)
|
|
12,197,659
|
10,516,700
|
SuperMoose Borrower LLC Tranche B 1LN, term loan CME Term SOFR 3 Month Index + 3.750% 9.2901% 8/29/25 (b)(c)(d)
|
|
1,249,971
|
1,179,836
|
The GEO Group, Inc. Tranche 1B 1LN, term loan CME Term SOFR 1 Month Index + 7.120% 12.4411% 3/23/27 (b)(c)(d)
|
|
1,848,521
|
1,881,535
|
Uber Technologies, Inc. Tranche B 1LN, term loan CME Term SOFR 1 Month Index + 3.000% 8.1594% 3/3/30 (b)(c)(d)
|
|
4,125,078
|
4,121,324
|
WMB Holdings, Inc. Tranche B 1LN, term loan CME Term SOFR 1 Month Index + 3.250% 8.6661% 11/3/29 (b)(c)(d)
|
|
901,219
|
900,093
|
TOTAL SERVICES
|
|
|
140,710,362
|
Specialty Retailing - 0.2%
|
|
|
|
New SK Holdco Sub LLC 1LN, term loan CME Term SOFR 1 Month Index + 8.350% 13.6741% 6/30/27 (b)(c)(d)
|
|
2,373,946
|
2,235,070
|
Steel - 0.1%
|
|
|
|
JMC Steel Group, Inc. 1LN, term loan CME Term SOFR 1 Month Index + 2.000% 7.4451% 1/24/27 (b)(c)(d)
|
|
1,375,413
|
1,372,167
|
Super Retail - 3.6%
|
|
|
|
Academy Ltd. Tranche B 1LN, term loan CME Term SOFR 1 Month Index + 3.750% 9.1791% 11/6/27 (b)(c)(d)
|
|
1,783,702
|
1,785,932
|
At Home Group, Inc. Tranche B 1LN, term loan CME Term SOFR 1 Month Index + 4.250% 9.6791% 7/24/28 (b)(c)(d)
|
|
1,641,269
|
717,235
|
Bass Pro Group LLC Tranche B 1LN, term loan CME Term SOFR 1 Month Index + 3.750% 9.4017% 3/5/28 (b)(c)(d)
|
|
37,621,473
|
37,493,937
|
Empire Today LLC Tranche B 1LN, term loan CME Term SOFR 1 Month Index + 5.000% 10.4386% 4/1/28 (b)(c)(d)
|
|
1,869,759
|
1,522,526
|
Hanesbrands, Inc. Tranche B 1LN, term loan CME Term SOFR 1 Month Index + 3.750% 9.0661% 3/8/30 (b)(c)(d)
|
|
1,343,250
|
1,313,027
|
Harbor Freight Tools U.S.A., Inc. Tranche B 1LN, term loan CME Term SOFR 1 Month Index + 2.750% 8.1806% 10/19/27 (b)(c)(d)
|
|
236,131
|
234,091
|
LBM Acquisition LLC Tranche B 1LN, term loan CME Term SOFR 1 Month Index + 3.750% 9.1661% 12/18/27 (b)(c)(d)
|
|
1,201,312
|
1,170,595
|
Michaels Companies, Inc. 1LN, term loan CME Term SOFR 3 Month Index + 4.250% 9.9017% 4/15/28 (b)(c)(d)
|
|
2,780,796
|
2,531,775
|
Red Ventures LLC Tranche B 1LN, term loan CME Term SOFR 1 Month Index + 3.000% 8.3161% 3/3/30 (b)(c)(d)
|
|
2,071,317
|
2,053,835
|
RH:
|
|
|
|
Tranche B 1LN, term loan CME Term SOFR 1 Month Index + 2.500% 7.9306% 10/20/28 (b)(c)(d)
|
|
1,194,455
|
1,144,933
|
Tranche B2 1LN, term loan CME Term SOFR 1 Month Index + 3.250% 8.6661% 10/20/28 (b)(c)(d)
|
|
2,756,391
|
2,647,872
|
TOTAL SUPER RETAIL
|
|
|
52,615,758
|
Technology - 15.0%
|
|
|
|
A&V Holdings Midco LLC Tranche B 1LN, term loan CME Term SOFR 3 Month Index + 5.370% 10.265% 3/10/27 (b)(c)(d)
|
|
1,821,299
|
1,784,873
|
Acuris Finance U.S., Inc. 1LN, term loan CME Term SOFR 3 Month Index + 4.000% 9.5401% 2/16/28 (b)(c)(d)
|
|
1,131,771
|
1,114,228
|
AI Aqua Merger Sub, Inc. Tranche B 1LN, term loan 1 month U.S. LIBOR + 3.750% 9.0836% 7/30/28 (b)(c)(d)
|
|
2,236,663
|
2,211,858
|
Alliance Laundry Systems LLC Tranche B 1LN, term loan CME Term SOFR 3 Month Index + 3.500% 8.9011% 10/8/27 (b)(c)(d)
|
|
1,582,348
|
1,580,370
|
Anastasia Parent LLC Tranche B, term loan CME Term SOFR 3 Month Index + 3.750% 9.4017% 8/10/25 (b)(c)(d)
|
|
5,383,137
|
3,824,288
|
Applied Systems, Inc. Tranche B 1LN, term loan CME Term SOFR 3 Month Index + 4.500% 9.8901% 9/19/26 (b)(c)(d)
|
|
0
|
0
|
Aptean, Inc. 1LN, term loan CME Term SOFR 1 Month Index + 4.250% 9.6661% 4/23/26 (b)(c)(d)
|
|
2,262,927
|
2,246,769
|
Athenahealth Group, Inc. Tranche B 1LN, term loan CME Term SOFR 1 Month Index + 3.500% 8.5684% 2/15/29 (b)(c)(d)
|
|
9,337,896
|
9,148,243
|
AZZ, Inc. Tranche B 1LN, term loan CME Term SOFR 1 Month Index + 4.250% 9.0661% 5/13/29 (b)(c)(d)
|
|
2,476,563
|
2,478,618
|
Byju's Alpha, Inc. Tranche B 1LN, term loan 3 month U.S. LIBOR + 8.000% 15.5% 11/24/26 (b)(c)(d)
|
|
3,326,947
|
1,071,277
|
Camelot Finance SA:
|
|
|
|
Tranche B 1LN, term loan CME Term SOFR 1 Month Index + 3.000% 8.4306% 10/31/26 (b)(c)(d)
|
|
2,575,150
|
2,568,712
|
Tranche B, term loan CME Term SOFR 1 Month Index + 3.000% 8.4306% 10/31/26 (b)(c)(d)
|
|
3,600,383
|
3,595,234
|
Central Parent, Inc. 1LN, term loan CME Term SOFR 3 Month Index + 4.250% 9.6401% 7/6/29 (b)(c)(d)
|
|
3,750,941
|
3,748,916
|
Ceridian HCM Holding, Inc. Tranche B, term loan CME Term SOFR 1 Month Index + 2.500% 7.9306% 4/30/25 (b)(c)(d)
|
|
1,631,692
|
1,629,995
|
Cloud Software Group, Inc. Tranche B 1LN, term loan CME Term SOFR 3 Month Index + 4.500% 9.9901% 3/30/29 (b)(c)(d)
|
|
4,832,857
|
4,640,558
|
Coherent Corp. Tranche B 1LN, term loan CME Term SOFR 1 Month Index + 2.750% 8.1806% 7/1/29 (b)(c)(d)
|
|
4,042,341
|
4,024,676
|
CommScope, Inc. Tranche B 1LN, term loan CME Term SOFR 1 Month Index + 3.250% 8.6806% 4/4/26 (b)(c)(d)
|
|
5,617,575
|
5,114,802
|
ConnectWise LLC Tranche B 1LN, term loan CME Term SOFR 1 Month Index + 3.500% 8.9306% 9/30/28 (b)(c)(d)
|
|
3,282,935
|
3,225,484
|
Constant Contact, Inc. Tranche B 1LN, term loan CME Term SOFR 1 Month Index + 4.000% 9.5611% 2/10/28 (b)(c)(d)
|
|
1,525,463
|
1,471,126
|
DCert Buyer, Inc.:
|
|
|
|
1LN, term loan CME Term SOFR 1 Month Index + 4.000% 9.3161% 10/16/26 (b)(c)(d)
|
|
3,680,762
|
3,652,752
|
Tranche B 2LN, term loan CME Term SOFR 3 Month Index + 7.000% 12.3161% 2/19/29 (b)(c)(d)
|
|
4,508,409
|
4,200,350
|
DG Investment Intermediate Holdings, Inc.:
|
|
|
|
2LN, term loan CME Term SOFR 1 Month Index + 6.750% 12.1806% 3/31/29 (b)(c)(d)
|
|
630,000
|
554,400
|
Tranche B 1LN, term loan CME Term SOFR 1 Month Index + 3.750% 9.1806% 3/31/28 (b)(c)(d)
|
|
1,230,061
|
1,207,256
|
ECL Entertainment LLC Tranche B 1LN, term loan CME Term SOFR 1 Month Index + 4.750% 10.1401% 8/16/30 (b)(c)(d)
|
|
995,000
|
992,095
|
Entegris, Inc. Tranche B 1LN, term loan CME Term SOFR 1 Month Index + 2.750% 7.8705% 7/6/29 (b)(c)(d)
|
|
4,929,654
|
4,928,126
|
Eos U.S. Finco LLC 1LN, term loan CME Term SOFR 3 Month Index + 6.000% 11.2684% 10/6/29 (b)(c)(d)
|
|
1,481,250
|
1,436,813
|
Epicor Software Corp.:
|
|
|
|
1LN, term loan CME Term SOFR 1 Month Index + 3.750% 7/31/27 (c)(d)(g)
|
|
750,000
|
750,188
|
Tranche B 1LN, term loan CME Term SOFR 1 Month Index + 3.250% 8.6806% 7/31/27 (b)(c)(d)
|
|
2,492,960
|
2,487,501
|
Gen Digital, Inc. Tranche B 1LN, term loan CME Term SOFR 1 Month Index + 2.000% 7.4161% 9/12/29 (b)(c)(d)
|
|
6,516,745
|
6,490,678
|
Global IID Parent LLC Tranche B 1LN, term loan CME Term SOFR 1 Month Index + 4.500% 10.1517% 12/16/28 (b)(c)(d)
|
|
542,545
|
499,141
|
GoDaddy, Inc. Tranche B 1LN, term loan CME Term SOFR 1 Month Index + 3.250% 7.8161% 11/9/29 (b)(c)(d)
|
|
1,671,814
|
1,672,332
|
Hunter U.S. Bidco, Inc. Tranche B 1LN, term loan CME Term SOFR 3 Month Index + 4.250% 9.7401% 8/19/28 (b)(c)(d)
|
|
1,779,431
|
1,772,758
|
Icon Luxembourg Sarl Tranche B 1LN, term loan CME Term SOFR 3 Month Index + 2.250% 7.9017% 7/3/28 (b)(c)(d)
|
|
5,183,872
|
5,179,725
|
Imprivata, Inc. Tranche B 1LN, term loan CME Term SOFR 1 Month Index + 3.750% 9.1806% 12/1/27 (b)(c)(d)
|
|
2,037,253
|
2,032,159
|
McAfee Corp. Tranche B 1LN, term loan CME Term SOFR 1 Month Index + 3.750% 9.1646% 3/1/29 (b)(c)(d)
|
|
4,794,133
|
4,675,766
|
MH Sub I LLC:
|
|
|
|
Tranche B 1LN, term loan CME Term SOFR 1 Month Index + 4.250% 9.5661% 5/3/28 (b)(c)(d)
|
|
11,849,492
|
11,447,675
|
Tranche B 2LN, term loan CME Term SOFR 1 Month Index + 6.250% 11.5661% 2/23/29 (b)(c)(d)
|
|
1,030,000
|
909,943
|
MKS Instruments, Inc. Tranche B 1LN, term loan CME Term SOFR 1 Month Index + 2.750% 8.1661% 8/17/29 (b)(c)(d)
|
|
3,596,104
|
3,590,314
|
NAVEX TopCo, Inc. 2LN, term loan CME Term SOFR 1 Month Index + 7.000% 12.4161% 9/4/26 (b)(c)(d)
|
|
415,000
|
407,347
|
Ncr Atleos LLC Tranche B 1LN, term loan CME Term SOFR 1 Month Index + 4.750% 3/22/29 (c)(d)(g)
|
|
2,240,000
|
2,157,411
|
Open Text Corp. Tranche B 1LN, term loan CME Term SOFR 1 Month Index + 2.750% 8.1661% 1/31/30 (b)(c)(d)
|
|
6,037,251
|
6,034,534
|
Park Place Technologies LLC 1LN, term loan CME Term SOFR 1 Month Index + 5.000% 10.4161% 11/10/27 (b)(c)(d)
|
|
2,683,364
|
2,637,532
|
Peraton Corp. Tranche B 1LN, term loan CME Term SOFR 1 Month Index + 3.750% 9.1661% 2/1/28 (b)(c)(d)
|
|
11,793,834
|
11,757,037
|
Polaris Newco LLC Tranche B 1LN, term loan 3 month U.S. LIBOR + 4.000% 9.4306% 6/2/28 (b)(c)(d)
|
|
8,316,292
|
7,950,958
|
Project Boost Purchaser LLC 1LN, term loan CME Term SOFR 1 Month Index + 3.500% 8.9306% 5/30/26 (b)(c)(d)
|
|
1,172,618
|
1,169,687
|
Proofpoint, Inc. Tranche B 1LN, term loan CME Term SOFR 1 Month Index + 3.250% 8.6806% 8/31/28 (b)(c)(d)
|
|
5,346,364
|
5,296,589
|
Rackspace Technology Global, Inc. Tranche B 1LN, term loan CME Term SOFR 1 Month Index + 2.750% 8.1938% 2/15/28 (b)(c)(d)
|
|
7,470,377
|
3,357,038
|
RealPage, Inc. Tranche B 1LN, term loan CME Term SOFR 1 Month Index + 3.000% 8.4306% 4/22/28 (b)(c)(d)
|
|
3,856,608
|
3,808,400
|
Red Planet Borrower LLC Tranche B 1LN, term loan CME Term SOFR 1 Month Index + 3.750% 9.1661% 9/30/28 (b)(c)(d)
|
|
1,979,698
|
1,888,137
|
Renaissance Holdings Corp. 1LN, term loan CME Term SOFR 1 Month Index + 4.750% 9.9919% 4/7/30 (b)(c)(d)
|
|
4,670,000
|
4,627,456
|
Roper Industrial Products Investment Co. Tranche B 1LN, term loan CME Term SOFR 1 Month Index + 4.250% 9.8901% 11/22/29 (b)(c)(d)
|
|
1,368,125
|
1,370,081
|
Sophia LP Tranche B 1LN, term loan 3 month U.S. LIBOR + 3.500% 8.8161% 10/7/27 (b)(c)(d)
|
|
3,087,737
|
3,078,103
|
Sovos Compliance LLC Tranche B 1LN, term loan CME Term SOFR 1 Month Index + 4.500% 9.9306% 8/11/28 (b)(c)(d)
|
|
890,472
|
875,093
|
SS&C Technologies, Inc.:
|
|
|
|
Tranche B 3LN, term loan CME Term SOFR 1 Month Index + 1.750% 7.1806% 4/16/25 (b)(c)(d)
|
|
1,755,212
|
1,753,878
|
Tranche B 4LN, term loan CME Term SOFR 1 Month Index + 1.750% 7.1806% 4/16/25 (b)(c)(d)
|
|
1,657,411
|
1,656,152
|
Tranche B 5LN, term loan CME Term SOFR 1 Month Index + 1.750% 7.1806% 4/16/25 (b)(c)(d)
|
|
3,514,982
|
3,512,943
|
Tempo Acquisition LLC 1LN, term loan U.S. Secured Overnight Fin. Rate (SOFR) Index + 3.000% 8.3311% 8/31/28 (b)(c)(d)
|
|
3,698,549
|
3,698,549
|
TTM Technologies, Inc. Tranche B 1LN, term loan CME Term SOFR 1 Month Index + 2.750% 8.0646% 5/30/30 (b)(c)(d)
|
|
1,584,387
|
1,584,387
|
Ukg, Inc.:
|
|
|
|
1LN, term loan:
|
|
|
|
CME Term SOFR 3 Month Index + 3.250% 8.6184% 5/4/26 (b)(c)(d)
|
|
3,873,063
|
3,858,965
|
CME Term SOFR 3 Month Index + 3.750% 9.2191% 5/4/26 (b)(c)(d)
|
|
5,305,738
|
5,295,816
|
2LN, term loan CME Term SOFR 3 Month Index + 5.250% 10.7643% 5/3/27 (b)(c)(d)
|
|
7,170,000
|
7,152,075
|
Veritas U.S., Inc. Tranche B 1LN, term loan CME Term SOFR 1 Month Index + 5.000% 10.4306% 9/1/25 (b)(c)(d)
|
|
3,114,865
|
2,690,465
|
Verscend Holding Corp. Tranche B 1LN, term loan CME Term SOFR 1 Month Index + 4.000% 9.4306% 8/27/25 (b)(c)(d)
|
|
3,497,794
|
3,494,051
|
VFH Parent LLC Tranche B 1LN, term loan CME Term SOFR 1 Month Index + 3.000% 8.4184% 1/13/29 (b)(c)(d)
|
|
3,237,150
|
3,208,145
|
Virgin Pulse, Inc. Tranche B 1LN, term loan CME Term SOFR 1 Month Index + 4.000% 9.1806% 4/6/28 (b)(c)(d)
|
|
2,495,793
|
2,489,554
|
VM Consolidated, Inc. Tranche B 1LN, term loan CME Term SOFR 1 Month Index + 3.250% 8.6806% 3/27/28 (b)(c)(d)
|
|
2,254,508
|
2,253,381
|
VS Buyer LLC Tranche B 1LN, term loan CME Term SOFR 1 Month Index + 3.000% 8.6661% 2/28/27 (b)(c)(d)
|
|
2,269,043
|
2,257,698
|
Weber-Stephen Products LLC Tranche B 1LN, term loan:
|
|
|
|
CME Term SOFR 1 Month Index + 3.250% 8.6806% 10/30/27 (b)(c)(d)
|
|
641,322
|
576,119
|
CME Term SOFR 1 Month Index + 4.250% 9.6661% 10/30/27 (b)(c)(d)
|
|
1,428,250
|
1,288,110
|
Zelis Payments Buyer, Inc. Tranche B 1LN, term loan CME Term SOFR 1 Month Index + 3.500% 8.9306% 9/30/26 (b)(c)(d)
|
|
3,556,687
|
3,554,837
|
TOTAL TECHNOLOGY
|
|
|
220,700,527
|
Telecommunications - 4.9%
|
|
|
|
Altice Financing SA Tranche B 1LN, term loan CME Term SOFR 1 Month Index + 5.000% 10.308% 10/31/27 (b)(c)(d)
|
|
1,304,198
|
1,288,978
|
Altice France SA Tranche B14 1LN, term loan CME Term SOFR 1 Month Index + 5.500% 10.808% 8/15/28 (b)(c)(d)
|
|
5,324,655
|
4,806,832
|
Aventiv Technologies LLC Tranche B, term loan:
|
|
|
|
3 month U.S. LIBOR + 4.500% 10.231% 11/1/24 (b)(c)(d)
|
|
8,496,228
|
7,591,125
|
3 month U.S. LIBOR + 8.250% 13.981% 11/1/25 (b)(c)(d)
|
|
7,055,000
|
4,997,691
|
Cablevision Lightpath LLC Tranche B 1LN, term loan CME Term SOFR 1 Month Index + 3.250% 8.6967% 11/30/27 (b)(c)(d)
|
|
991,994
|
978,354
|
Ciena Corp. Tranche B 1LN, term loan CME Term SOFR 1 Month Index + 2.500% 7.8248% 1/18/30 (b)(c)(d)
|
|
720,128
|
720,726
|
Connect U.S. Finco LLC Tranche B 1LN, term loan CME Term SOFR 1 Month Index + 3.500% 8.8161% 12/12/26 (b)(c)(d)
|
|
1,317,334
|
1,288,629
|
Consolidated Communications, Inc. Tranche B 1LN, term loan CME Term SOFR 1 Month Index + 3.500% 8.9306% 10/2/27 (b)(c)(d)
|
|
1,902,823
|
1,681,619
|
Crown Subsea Communications Holding, Inc.:
|
|
|
|
1LN, term loan CME Term SOFR 1 Month Index + 5.250% 10.6791% 4/27/27 (b)(c)(d)
|
|
1,431,875
|
1,435,455
|
Tranche B 1LN, term loan CME Term SOFR 1 Month Index + 5.000% 10.4291% 4/27/27 (b)(c)(d)
|
|
1,438,459
|
1,440,861
|
Frontier Communications Holdings LLC Tranche B 1LN, term loan CME Term SOFR 1 Month Index + 3.750% 9.1806% 5/1/28 (b)(c)(d)
|
|
7,073,437
|
6,856,212
|
GTT Communications, Inc. 1LN, term loan CME Term SOFR 3 Month Index + 9.000% 14.4901% 6/30/28 (b)(c)(d)
|
|
1,485,887
|
879,155
|
Gtt Remainco LLC 1LN, term loan CME Term SOFR 1 Month Index + 7.000% 12.4161% 12/30/27 (b)(c)(d)
|
|
1,830,009
|
1,564,658
|
Intelsat Jackson Holdings SA 1LN, term loan CME TERM SOFR 6 MONTH INDEX + 4.250% 9.7719% 2/1/29 (b)(c)(d)
|
|
10,733,593
|
10,699,460
|
Level 3 Financing, Inc. Tranche B 1LN, term loan CME Term SOFR 1 Month Index + 1.750% 7.1806% 3/1/27 (b)(c)(d)
|
|
2,855,504
|
2,692,027
|
Lumen Technologies, Inc. Tranche A 1LN, term loan CME Term SOFR 1 Month Index + 2.000% 7.4306% 1/31/25 (b)(c)(d)
|
|
3,855,682
|
3,589,640
|
Northwest Fiber LLC Tranche B 1LN, term loan CME Term SOFR 1 Month Index + 3.750% 9.1842% 4/30/27 (b)(c)(d)
|
|
3,436,146
|
3,383,882
|
Patagonia Holdco LLC Tranche B 1LN, term loan CME Term SOFR 3 Month Index + 5.750% 11.1174% 8/1/29 (b)(c)(d)
|
|
3,180,344
|
2,798,703
|
Radiate Holdco LLC Tranche B 1LN, term loan 1 month U.S. LIBOR + 3.250% 8.6806% 9/25/26 (b)(c)(d)
|
|
4,058,859
|
3,310,325
|
SBA Senior Finance II, LLC Tranche B, term loan 3 month U.S. LIBOR + 1.750% 7.17% 4/11/25 (b)(c)(d)
|
|
1,308,845
|
1,307,497
|
Windstream Services LLC Tranche B 1LN, term loan CME Term SOFR 1 Month Index + 6.250% 11.6661% 9/21/27 (b)(c)(d)
|
|
665,559
|
639,270
|
Zayo Group Holdings, Inc. 1LN, term loan CME Term SOFR 1 Month Index + 3.000% 8.4306% 3/9/27 (b)(c)(d)
|
|
10,088,135
|
8,214,869
|
TOTAL TELECOMMUNICATIONS
|
|
|
72,165,968
|
Textiles/Apparel - 0.7%
|
|
|
|
Crocs, Inc. Tranche B 1LN, term loan CME Term SOFR 1 Month Index + 3.000% 8.4161% 2/19/29 (b)(c)(d)
|
|
3,986,625
|
3,992,964
|
Fanatics Commerce Intermediate Holdco LLC Tranche B 1LN, term loan CME Term SOFR 3 Month Index + 3.250% 8.8277% 11/23/28 (b)(c)(d)
|
|
634,515
|
632,662
|
Jo-Ann Stores LLC Tranche B 1LN, term loan CME Term SOFR 3 Month Index + 4.750% 10.3623% 7/7/28 (b)(c)(d)
|
|
3,607,676
|
1,136,418
|
Tory Burch LLC Tranche B 1LN, term loan CME Term SOFR 1 Month Index + 3.500% 8.6806% 4/16/28 (b)(c)(d)
|
|
2,883,625
|
2,839,852
|
Victoria's Secret & Co. Tranche B 1LN, term loan CME Term SOFR 1 Month Index + 3.250% 8.9027% 8/2/28 (b)(c)(d)
|
|
1,016,280
|
990,873
|
TOTAL TEXTILES/APPAREL
|
|
|
9,592,769
|
Transportation Ex Air/Rail - 0.1%
|
|
|
|
ASP LS Acquisition Corp. 2LN, term loan CME Term SOFR 3 Month Index + 7.500% 13.3958% 5/7/29 (b)(c)(d)
|
|
2,500,000
|
2,062,500
|
Utilities - 2.1%
|
|
|
|
Brookfield WEC Holdings, Inc.:
|
|
|
|
1LN, term loan CME Term SOFR 1 Month Index + 3.750% 9.0661% 8/1/25 (b)(c)(d)
|
|
2,123,550
|
2,126,204
|
Tranche B 1LN, term loan CME Term SOFR 1 Month Index + 2.750% 8.1806% 8/1/25 (b)(c)(d)
|
|
6,371,807
|
6,364,416
|
ExGen Renewables IV, LLC Tranche B 1LN, term loan 3 month U.S. LIBOR + 2.500% 8.1841% 12/15/27 (b)(c)(d)
|
|
1,281,878
|
1,276,840
|
Generation Bridge Northeast LLC Tranche B 1LN, term loan CME Term SOFR 1 Month Index + 4.250% 9.5661% 8/7/29 (b)(c)(d)
|
|
1,485,000
|
1,483,144
|
Limetree Bay Terminals LLC Tranche B 1LN, term loan 3 month U.S. LIBOR + 4.000% 10.6517% 2/15/24 (b)(c)(d)
|
|
2,958,141
|
2,722,554
|
Luxembourg Investment Co. 428 SARL Tranche B 1LN, term loan CME Term SOFR 3 Month Index + 5.000% 10.5401% 1/3/29 (b)(c)(d)
|
|
1,220,044
|
883,312
|
Osmose Utilities Services, Inc. Tranche B 1LN, term loan CME Term SOFR 1 Month Index + 3.250% 8.6806% 6/23/28 (b)(c)(d)
|
|
539,834
|
535,111
|
PG&E Corp. Tranche B 1LN, term loan CME Term SOFR 1 Month Index + 3.000% 8.4306% 6/23/25 (b)(c)(d)
|
|
4,168,639
|
4,165,762
|
Pike Corp. Tranche B 1LN, term loan CME Term SOFR 1 Month Index + 3.000% 8.4306% 1/21/28 (b)(c)(d)
|
|
2,598,630
|
2,592,679
|
Vertiv Group Corp. Tranche B 1LN, term loan CME Term SOFR 1 Month Index + 2.750% 8.1791% 3/2/27 (b)(c)(d)
|
|
4,742,623
|
4,732,474
|
Vistra Operations Co. LLC Tranche B 3LN, term loan CME Term SOFR 1 Month Index + 1.750% 7.1806% 12/31/25 (b)(c)(d)
|
|
3,720,704
|
3,718,769
|
TOTAL UTILITIES
|
|
|
30,601,265
|
|
TOTAL BANK LOAN OBLIGATIONS
(Cost $1,319,766,524)
|
|
|
1,264,320,641
|
|
|
|
|
|
Nonconvertible Bonds - 6.6%
|
|
|
|
Principal
Amount (a)
|
Value ($)
|
Aerospace - 0.3%
|
|
|
|
TransDigm, Inc. 6.25% 3/15/26 (i)
|
|
4,000,000
|
3,930,323
|
Air Transportation - 0.1%
|
|
|
|
American Airlines, Inc. / AAdvantage Loyalty IP Ltd. 5.5% 4/20/26 (i)
|
|
1,012,917
|
989,278
|
Delta Air Lines, Inc. / SkyMiles IP Ltd. 4.5% 10/20/25 (i)
|
|
613,000
|
595,406
|
TOTAL AIR TRANSPORTATION
|
|
|
1,584,684
|
Automotive & Auto Parts - 0.9%
|
|
|
|
Clarios Global LP / Clarios U.S. Finance Co. 6.75% 5/15/28 (i)
|
|
1,205,000
|
1,176,381
|
Ford Motor Credit Co. LLC U.S. Secured Overnight Fin. Rate (SOFR) Index + 2.950% 8.2659% 3/6/26 (b)(c)
|
|
1,650,000
|
1,647,304
|
Rivian Holdco & Rivian LLC & Rivian Automotive LLC 6 month U.S. LIBOR + 5.620% 10.9311% 10/15/26 (b)(c)(i)
|
|
9,895,000
|
9,919,738
|
TOTAL AUTOMOTIVE & AUTO PARTS
|
|
|
12,743,423
|
Broadcasting - 0.3%
|
|
|
|
DISH Network Corp. 11.75% 11/15/27 (i)
|
|
2,985,000
|
3,007,286
|
Univision Communications, Inc.:
|
|
|
|
6.625% 6/1/27 (i)
|
|
1,205,000
|
1,122,249
|
8% 8/15/28 (i)
|
|
840,000
|
814,380
|
TOTAL BROADCASTING
|
|
|
4,943,915
|
Building Materials - 0.0%
|
|
|
|
SRS Distribution, Inc. 4.625% 7/1/28 (i)
|
|
160,000
|
138,225
|
Cable/Satellite TV - 0.4%
|
|
|
|
CCO Holdings LLC/CCO Holdings Capital Corp.:
|
|
|
|
5% 2/1/28 (i)
|
|
1,580,000
|
1,434,858
|
5.375% 6/1/29 (i)
|
|
3,160,000
|
2,835,178
|
Charter Communications Operating LLC/Charter Communications Operating Capital Corp. CME Term SOFR 3 Month Index + 1.910% 7.2835% 2/1/24 (b)(c)
|
|
1,750,000
|
1,755,978
|
TOTAL CABLE/SATELLITE TV
|
|
|
6,026,014
|
Capital Goods - 0.0%
|
|
|
|
Chart Industries, Inc. 7.5% 1/1/30 (i)
|
|
330,000
|
331,808
|
Chemicals - 0.1%
|
|
|
|
Kronos Acquisition Holdings, Inc. / KIK Custom Products, Inc. 5% 12/31/26 (i)
|
|
40,000
|
36,445
|
Olympus Water U.S. Holding Corp. 9.75% 11/15/28 (i)
|
|
1,220,000
|
1,217,363
|
TOTAL CHEMICALS
|
|
|
1,253,808
|
Containers - 0.2%
|
|
|
|
Ardagh Packaging Finance PLC/Ardagh MP Holdings U.S.A., Inc. 4.125% 8/15/26 (i)
|
|
2,945,000
|
2,692,770
|
Energy - 0.5%
|
|
|
|
Citgo Petroleum Corp.:
|
|
|
|
6.375% 6/15/26 (i)
|
|
1,000,000
|
987,517
|
7% 6/15/25 (i)
|
|
1,050,000
|
1,034,384
|
New Fortress Energy, Inc.:
|
|
|
|
6.5% 9/30/26 (i)
|
|
3,160,000
|
2,909,514
|
6.75% 9/15/25 (i)
|
|
1,485,000
|
1,417,590
|
Transocean Poseidon Ltd. 6.875% 2/1/27 (i)
|
|
855,000
|
841,106
|
TOTAL ENERGY
|
|
|
7,190,111
|
Gaming - 1.0%
|
|
|
|
Affinity Gaming LLC 6.875% 12/15/27 (i)
|
|
1,700,000
|
1,441,225
|
Caesars Entertainment, Inc. 7% 2/15/30 (i)
|
|
1,465,000
|
1,425,535
|
Fertitta Entertainment LLC / Fertitta Entertainment Finance Co., Inc. 4.625% 1/15/29 (i)
|
|
10,240,000
|
8,678,400
|
Golden Entertainment, Inc. 7.625% 4/15/26 (i)
|
|
1,065,000
|
1,062,721
|
Ontario Gaming GTA LP 8% 8/1/30 (i)
|
|
80,000
|
80,000
|
Sugarhouse HSP Gaming Prop Mezz LP/Sugarhouse HSP Gaming Finance Corp. 5.875% 5/15/25 (i)
|
|
1,367,000
|
1,319,154
|
VICI Properties LP / VICI Note Co.:
|
|
|
|
3.5% 2/15/25 (i)
|
|
240,000
|
229,627
|
4.25% 12/1/26 (i)
|
|
345,000
|
321,454
|
4.625% 12/1/29 (i)
|
|
200,000
|
177,410
|
TOTAL GAMING
|
|
|
14,735,526
|
Homebuilders/Real Estate - 0.3%
|
|
|
|
MPT Operating Partnership LP/MPT Finance Corp. 5% 10/15/27
|
|
2,400,000
|
1,859,584
|
Uniti Group LP / Uniti Group Finance, Inc. 10.5% 2/15/28 (i)
|
|
2,545,000
|
2,492,707
|
TOTAL HOMEBUILDERS/REAL ESTATE
|
|
|
4,352,291
|
Leisure - 0.1%
|
|
|
|
Carnival Corp. 7.625% 3/1/26 (i)
|
|
620,000
|
603,126
|
Royal Caribbean Cruises Ltd. 11.625% 8/15/27 (i)
|
|
1,205,000
|
1,307,563
|
TOTAL LEISURE
|
|
|
1,910,689
|
Metals/Mining - 0.0%
|
|
|
|
Arsenal AIC Parent LLC 8% 10/1/30 (i)
|
|
90,000
|
89,552
|
Paper - 0.0%
|
|
|
|
Ardagh Metal Packaging Finance U.S.A. LLC/Ardagh Metal Packaging Finance PLC 3.25% 9/1/28 (i)
|
|
895,000
|
746,244
|
Restaurants - 0.0%
|
|
|
|
1011778 BC Unlimited Liability Co./New Red Finance, Inc. 5.75% 4/15/25 (i)
|
|
160,000
|
158,773
|
Services - 0.4%
|
|
|
|
Brand Energy & Infrastructure Services, Inc. 10.375% 8/1/30 (i)
|
|
600,000
|
600,924
|
Neptune BidCo U.S., Inc. 9.29% 4/15/29 (i)
|
|
935,000
|
846,467
|
PowerTeam Services LLC 9.033% 12/4/25 (i)
|
|
5,115,000
|
4,718,588
|
TOTAL SERVICES
|
|
|
6,165,979
|
Super Retail - 0.2%
|
|
|
|
EG Global Finance PLC:
|
|
|
|
6.75% 2/7/25 (i)
|
|
1,000,000
|
982,500
|
8.5% 10/30/25 (i)
|
|
1,705,000
|
1,683,688
|
TOTAL SUPER RETAIL
|
|
|
2,666,188
|
Technology - 0.2%
|
|
|
|
Cloud Software Group, Inc. 9% 9/30/29 (i)
|
|
1,370,000
|
1,190,531
|
CNT PRNT/CDK GLO II/FIN 8% 6/15/29 (i)
|
|
515,000
|
513,094
|
CommScope, Inc. 6% 3/1/26 (i)
|
|
1,100,000
|
1,026,552
|
TOTAL TECHNOLOGY
|
|
|
2,730,177
|
Telecommunications - 1.5%
|
|
|
|
Altice Financing SA 5.75% 8/15/29 (i)
|
|
6,000,000
|
4,919,827
|
Altice France SA:
|
|
|
|
5.125% 1/15/29 (i)
|
|
855,000
|
607,580
|
5.125% 7/15/29 (i)
|
|
3,795,000
|
2,691,069
|
5.5% 10/15/29 (i)
|
|
1,630,000
|
1,172,717
|
Frontier Communications Holdings LLC 5% 5/1/28 (i)
|
|
1,160,000
|
990,434
|
Intelsat Jackson Holdings SA 6.5% 3/15/30 (i)
|
|
6,905,000
|
6,123,655
|
LCPR Senior Secured Financing DAC:
|
|
|
|
5.125% 7/15/29 (i)
|
|
205,000
|
164,717
|
6.75% 10/15/27 (i)
|
|
1,455,000
|
1,336,418
|
Northwest Fiber LLC/Northwest Fiber Finance Sub, Inc. 4.75% 4/30/27 (i)
|
|
195,000
|
173,550
|
Windstream Escrow LLC 7.75% 8/15/28 (i)
|
|
5,100,000
|
4,053,302
|
TOTAL TELECOMMUNICATIONS
|
|
|
22,233,269
|
Textiles/Apparel - 0.0%
|
|
|
|
Victoria's Secret & Co. 4.625% 7/15/29 (i)
|
|
910,000
|
659,678
|
Utilities - 0.1%
|
|
|
|
Exgen Texas Power LLC 3 month U.S. LIBOR + 6.750% 12.2371% 10/8/26 (b)(c)(e)
|
|
964,271
|
979,941
|
|
TOTAL NONCONVERTIBLE BONDS
(Cost $105,711,770)
|
|
|
98,263,388
|
|
|
|
|
|
Common Stocks - 2.3%
|
|
|
|
Shares
|
Value ($)
|
Capital Goods - 0.1%
|
|
|
|
TNT Crane & Rigging LLC (e)(j)
|
|
188,360
|
1,162,181
|
TNT Crane & Rigging LLC warrants 10/31/25 (e)(j)
|
|
9,492
|
190
|
TOTAL CAPITAL GOODS
|
|
|
1,162,371
|
Diversified Financial Services - 0.1%
|
|
|
|
ACNR Holdings, Inc. (e)(j)
|
|
15,697
|
1,402,370
|
Carnelian Point Holdings LP warrants (e)(j)
|
|
5,132
|
14,985
|
Lime Tree Bay Ltd. (e)(j)
|
|
776
|
39,723
|
TOTAL DIVERSIFIED FINANCIAL SERVICES
|
|
|
1,457,078
|
Energy - 1.5%
|
|
|
|
California Resources Corp.
|
|
129,771
|
7,268,474
|
California Resources Corp. warrants 10/27/24 (j)
|
|
7,511
|
160,059
|
Chesapeake Energy Corp. (k)
|
|
109,641
|
9,454,343
|
Chesapeake Energy Corp. (j)(l)
|
|
928
|
80,021
|
Denbury, Inc. (j)
|
|
48,694
|
4,772,499
|
EP Energy Corp. (e)(j)
|
|
15,785
|
26,045
|
TOTAL ENERGY
|
|
|
21,761,441
|
Entertainment/Film - 0.2%
|
|
|
|
New Cineworld Ltd. (e)
|
|
153,258
|
3,065,160
|
Restaurants - 0.1%
|
|
|
|
CEC Entertainment, Inc. (e)(j)
|
|
105,486
|
1,683,557
|
Super Retail - 0.0%
|
|
|
|
David's Bridal, Inc. rights (e)(j)
|
|
1,346
|
0
|
Telecommunications - 0.1%
|
|
|
|
GTT Communications, Inc. (e)
|
|
35,300
|
1,004,991
|
Utilities - 0.2%
|
|
|
|
TexGen Power LLC (e)(j)
|
|
85,051
|
3,372,272
|
|
TOTAL COMMON STOCKS
(Cost $24,203,744)
|
|
|
33,506,870
|
|
|
|
|
|
Nonconvertible Preferred Stocks - 0.3%
|
|
|
|
Shares
|
Value ($)
|
Diversified Financial Services - 0.3%
|
|
|
|
ACNR Holdings, Inc. (e)(j)
(Cost $1,123,250)
|
|
8,986
|
4,848,037
|
|
|
|
|
|
Preferred Securities - 0.9%
|
|
|
|
Principal
Amount (a)
|
Value ($)
|
Banks & Thrifts - 0.5%
|
|
|
|
Bank of America Corp.:
|
|
|
|
6.25% (b)(m)
|
|
2,595,000
|
2,564,631
|
8.8062% (b)(c)(m)
|
|
490,000
|
493,801
|
JPMorgan Chase & Co.:
|
|
|
|
6.1% (b)(m)
|
|
1,130,000
|
1,151,156
|
6.75% (b)(m)
|
|
1,370,000
|
1,385,055
|
8.9335% (b)(c)(m)
|
|
1,430,000
|
1,456,497
|
TOTAL BANKS & THRIFTS
|
|
|
7,051,140
|
Energy - 0.4%
|
|
|
|
Energy Transfer LP 3 month U.S. LIBOR + 4.020% 9.6542% (b)(c)(m)
|
|
6,720,000
|
6,366,417
|
|
TOTAL PREFERRED SECURITIES
(Cost $13,246,066)
|
|
|
13,417,557
|
|
|
|
|
|
Other - 1.7%
|
|
|
|
Shares
|
Value ($)
|
Other - 1.7%
|
|
|
|
Fidelity Private Credit Central Fund LLC (l)
(Cost $24,495,745)
|
|
2,462,525
|
25,093,125
|
|
|
|
|
|
Money Market Funds - 4.2%
|
|
|
|
Shares
|
Value ($)
|
Fidelity Cash Central Fund 5.39% (n)
|
|
52,223,691
|
52,234,136
|
Fidelity Securities Lending Cash Central Fund 5.39% (n)(o)
|
|
9,397,760
|
9,398,700
|
|
TOTAL MONEY MARKET FUNDS
(Cost $61,629,302)
|
|
|
61,632,836
|
|
|
|
|
|
|
TOTAL INVESTMENT IN SECURITIES - 101.8%
(Cost $1,550,176,401)
|
1,501,082,454
|
NET OTHER ASSETS (LIABILITIES) - (1.8)%
|
(26,938,842)
|
NET ASSETS - 100.0%
|
1,474,143,612
|
|
|
|
Legend
(a)
|
Amount is stated in United States dollars unless otherwise noted.
|
(b)
|
Coupon rates for floating and adjustable rate securities reflect the rates in effect at period end.
|
(c)
|
Coupon is indexed to a floating interest rate which may be multiplied by a specified factor and/or subject to caps or floors.
|
(d)
|
Remaining maturities of bank loan obligations may be less than the stated maturities shown as a result of contractual or optional prepayments by the borrower. Such prepayments cannot be predicted with certainty.
|
(f)
|
Non-income producing - Security is in default.
|
(g)
|
The coupon rate will be determined upon settlement of the loan after period end.
|
(h)
|
Position or a portion of the position represents an unfunded loan commitment. At period end, the total principal amount and market value of unfunded commitments totaled $1,452,488 and $1,451,786, respectively.
|
(i)
|
Security exempt from registration under Rule 144A of the Securities Act of 1933. These securities may be resold in transactions exempt from registration, normally to qualified institutional buyers. At the end of the period, the value of these securities amounted to $92,020,581 or 6.2% of net assets.
|
(k)
|
Security or a portion of the security is on loan at period end.
|
(l)
|
Restricted securities (including private placements) - Investment in securities not registered under the Securities Act of 1933 (excluding 144A issues). At the end of the period, the value of restricted securities (excluding 144A issues) amounted to $25,173,146 or 1.7% of net assets.
|
(m)
|
Security is perpetual in nature with no stated maturity date.
|
(n)
|
Affiliated fund that is generally available only to investment companies and other accounts managed by Fidelity Investments. The rate quoted is the annualized seven-day yield of the fund at period end. A complete unaudited listing of the fund's holdings as of its most recent quarter end is available upon request. In addition, each Fidelity Central Fund's financial statements, which are not covered by the Fund's Report of Independent Registered Public Accounting Firm, are available on the SEC's website or upon request.
|
(o)
|
Investment made with cash collateral received from securities on loan.
|
Additional information on each restricted holding is as follows:
|
Security
|
Acquisition Date
|
Acquisition Cost ($)
|
Chesapeake Energy Corp.
|
2/10/21
|
8,788
|
|
|
|
|
Fidelity Private Credit Central Fund LLC
|
4/23/22 - 9/11/23
|
24,495,745
|
|
|
|
|
Affiliated Central Funds
Fiscal year to date information regarding the Fund's investments in Fidelity Central Funds, including the ownership percentage, is presented below.
Affiliate
|
Value,
beginning
of period ($)
|
Purchases ($)
|
Sales
Proceeds ($)
|
Dividend
Income ($)
|
Realized
Gain (loss) ($)
|
Change in
Unrealized
appreciation
(depreciation) ($)
|
Value,
end
of period ($)
|
% ownership,
end
of period
|
Fidelity Cash Central Fund 5.39%
|
65,484,990
|
1,122,100,468
|
1,135,351,322
|
3,185,825
|
2,622
|
(2,622)
|
52,234,136
|
0.1%
|
Fidelity Private Credit Central Fund LLC
|
11,381,951
|
15,361,341
|
2,320,002
|
2,299,340
|
58
|
669,777
|
25,093,125
|
3.8%
|
Fidelity Securities Lending Cash Central Fund 5.39%
|
12,974,125
|
34,780,314
|
38,355,739
|
2,018
|
-
|
-
|
9,398,700
|
0.0%
|
Total
|
89,841,066
|
1,172,242,123
|
1,176,027,063
|
5,487,183
|
2,680
|
667,155
|
86,725,961
|
|
|
|
|
|
|
|
|
|
|
|
Amounts in the dividend income column in the above table include any capital gain distributions from underlying funds, which are presented in the corresponding line item in the Statement of Operations, if applicable.
Amounts in the dividend income column for Fidelity Securities Lending Cash Central Fund represents the income earned on investing cash collateral, less rebates paid to borrowers and any lending agent fees associated with the loan, plus any premium payments received for lending certain types of securities.
Amounts included in the purchases and sales proceeds columns may include in-kind transactions, if applicable.
Investment Valuation
The following is a summary of the inputs used, as of September 30, 2023, involving the Fund's assets and liabilities carried at fair value. The inputs or methodology used for valuing securities may not be an indication of the risk associated with investing in those securities. For more information on valuation inputs, and their aggregation into the levels used below, please refer to the Investment Valuation section in the accompanying Notes to Financial Statements.
Valuation Inputs at Reporting Date:
|
Description
|
Total ($)
|
Level 1 ($)
|
Level 2 ($)
|
Level 3 ($)
|
Investments in Securities:
|
|
|
|
|
|
|
Equities:
|
|
|
|
|
Communication Services
|
3,065,160
|
-
|
-
|
3,065,160
|
Consumer Discretionary
|
1,683,557
|
-
|
-
|
1,683,557
|
Energy
|
21,761,441
|
21,735,396
|
-
|
26,045
|
Financials
|
6,305,115
|
-
|
-
|
6,305,115
|
Industrials
|
1,162,371
|
-
|
-
|
1,162,371
|
Information Technology
|
1,004,991
|
-
|
-
|
1,004,991
|
Utilities
|
3,372,272
|
-
|
-
|
3,372,272
|
|
|
Bank Loan Obligations
|
1,264,320,641
|
-
|
1,244,347,193
|
19,973,448
|
|
|
Corporate Bonds
|
98,263,388
|
-
|
97,283,447
|
979,941
|
|
|
Preferred Securities
|
13,417,557
|
-
|
13,417,557
|
-
|
|
|
Other
|
25,093,125
|
-
|
25,093,125
|
-
|
|
|
Money Market Funds
|
61,632,836
|
61,632,836
|
-
|
-
|
Total Investments in Securities:
|
1,501,082,454
|
83,368,232
|
1,380,141,322
|
37,572,900
|
|
|
|
|
|
|
|
Net Unrealized Appreciation on Unfunded Commitments
|
27,428
|
-
|
27,428
|
-
|
Total
|
27,428
|
-
|
27,428
|
-
|
The following is a reconciliation of Investments in Securities for which Level 3 inputs were used in determining value:
|
|
Investments in Securities:
|
|
Bank Loan Obligations
|
|
|
|
Beginning Balance
|
$
|
90,917,868
|
|
Net Realized Gain (Loss) on Investment Securities
|
|
(296,377)
|
|
Net Unrealized Gain (Loss) on Investment Securities
|
|
395,056
|
|
Cost of Purchases
|
|
4,849,638
|
|
Proceeds of Sales
|
|
(23,763,063)
|
|
Amortization/Accretion
|
|
56,864
|
|
Transfers into Level 3
|
|
2,872,025
|
|
Transfers out of Level 3
|
|
(55,058,563)
|
|
Ending Balance
|
$
|
19,973,448
|
|
The change in unrealized gain (loss) for the period attributable to Level 3 securities held at September 30, 2023
|
$
|
(27,046)
|
|
Other Investments in Securities
|
|
|
|
Beginning Balance
|
$
|
14,096,046
|
|
Net Realized Gain (Loss) on Investment Securities
|
|
(86,832)
|
|
Net Unrealized Gain (Loss) on Investment Securities
|
|
(6,569,242)
|
|
Cost of Purchases
|
|
10,774,709
|
|
Proceeds of Sales
|
|
(615,229)
|
|
Amortization/Accretion
|
|
-
|
|
Transfers into Level 3
|
|
-
|
|
Transfers out of Level 3
|
|
-
|
|
Ending Balance
|
$
|
17,599,452
|
|
The change in unrealized gain (loss) for the period attributable to Level 3 securities held at September 30, 2023
|
$
|
(6,705,420)
|
|
|
The information used in the above reconciliation represents fiscal year to date activity for any Investments in Securities identified as using Level 3 inputs at either the beginning or the end of the current fiscal period. Cost of purchases and proceeds of sales may include securities received and/or delivered through in-kind transactions, corporate actions or exchanges. Transfers into Level 3 were attributable to a lack of observable market data resulting from decreases in market activity, decreases in liquidity, security restructurings or corporate actions. Transfers out of Level 3 were attributable to observable market data becoming available for those securities. Transfers in or out of Level 3 represent the beginning value of any Security or Instrument where a change in the pricing level occurred from the beginning to the end of the period. Realized and unrealized gains (losses) disclosed in the reconciliation are included in Net Gain (Loss) on the Fund's Statement of Operations.
|
|
Statement of Assets and Liabilities
|
|
|
|
|
September 30, 2023
|
|
|
|
|
|
|
Assets
|
|
|
|
|
Investment in securities, at value (including securities loaned of $9,157,626) - See accompanying schedule:
|
|
|
|
|
Unaffiliated issuers (cost $1,464,051,354)
|
$
|
1,414,356,493
|
|
|
Fidelity Central Funds (cost $86,125,047)
|
|
86,725,961
|
|
|
|
|
|
|
|
|
|
|
|
|
|
|
Total Investment in Securities (cost $1,550,176,401)
|
|
|
$
|
1,501,082,454
|
Cash
|
|
|
|
592,398
|
Receivable for investments sold
|
|
|
|
20,345,348
|
Unrealized appreciation on unfunded commitments
|
|
|
|
27,428
|
Receivable for fund shares sold
|
|
|
|
419
|
Dividends receivable
|
|
|
|
7,792
|
Interest receivable
|
|
|
|
14,308,513
|
Distributions receivable from Fidelity Central Funds
|
|
|
|
235,658
|
Receivable from investment adviser for expense reductions
|
|
|
|
11,210
|
Total assets
|
|
|
|
1,536,611,220
|
Liabilities
|
|
|
|
|
Payable for investments purchased
|
$
|
33,228,091
|
|
|
Payable for fund shares redeemed
|
|
19,786,507
|
|
|
Distributions payable
|
|
5,246
|
|
|
Other payables and accrued expenses
|
|
49,064
|
|
|
Collateral on securities loaned
|
|
9,398,700
|
|
|
Total Liabilities
|
|
|
|
62,467,608
|
Commitments and contingent liabilities (see Commitments note)
|
|
|
|
|
Net Assets
|
|
|
$
|
1,474,143,612
|
Net Assets consist of:
|
|
|
|
|
Paid in capital
|
|
|
$
|
1,637,845,274
|
Total accumulated earnings (loss)
|
|
|
|
(163,701,662)
|
Net Assets
|
|
|
$
|
1,474,143,612
|
Net Asset Value, offering price and redemption price per share ($1,474,143,612 ÷ 15,040,397 shares)
|
|
|
$
|
98.01
|
Statement of Operations
|
|
|
|
|
Year ended
September 30, 2023
|
Investment Income
|
|
|
|
|
Dividends
|
|
|
$
|
1,842,500
|
Interest
|
|
|
|
163,530,531
|
Income from Fidelity Central Funds (including $2,018 from security lending)
|
|
|
|
5,487,183
|
Payment from investment adviser
|
|
|
|
40,564
|
Total Income
|
|
|
|
170,900,778
|
Expenses
|
|
|
|
|
Custodian fees and expenses
|
$
|
6,743
|
|
|
Independent trustees' fees and expenses
|
|
12,166
|
|
|
Total expenses before reductions
|
|
18,909
|
|
|
Expense reductions
|
|
(6,166)
|
|
|
Total expenses after reductions
|
|
|
|
12,743
|
Net Investment income (loss)
|
|
|
|
170,888,035
|
Realized and Unrealized Gain (Loss)
|
|
|
|
|
Net realized gain (loss) on:
|
|
|
|
|
Investment Securities:
|
|
|
|
|
Unaffiliated issuers
|
|
(32,202,297)
|
|
|
Fidelity Central Funds
|
|
2,680
|
|
|
Total net realized gain (loss)
|
|
|
|
(32,199,617)
|
Change in net unrealized appreciation (depreciation) on:
|
|
|
|
|
Investment Securities:
|
|
|
|
|
Unaffiliated issuers
|
|
115,542,454
|
|
|
Fidelity Central Funds
|
|
667,155
|
|
|
Unfunded commitments
|
|
27,428
|
|
|
Total change in net unrealized appreciation (depreciation)
|
|
|
|
116,237,037
|
Net gain (loss)
|
|
|
|
84,037,420
|
Net increase (decrease) in net assets resulting from operations
|
|
|
$
|
254,925,455
|
Statement of Changes in Net Assets
|
|
|
|
|
Year ended
September 30, 2023
|
|
Year ended
September 30, 2022
|
Increase (Decrease) in Net Assets
|
|
|
|
|
Operations
|
|
|
|
|
Net investment income (loss)
|
$
|
170,888,035
|
$
|
144,865,396
|
Net realized gain (loss)
|
|
(32,199,617)
|
|
(16,547,082)
|
Change in net unrealized appreciation (depreciation)
|
|
116,237,037
|
|
(187,029,002)
|
Net increase (decrease) in net assets resulting from operations
|
|
254,925,455
|
|
(58,710,688)
|
Distributions to shareholders
|
|
(171,040,104)
|
|
(144,286,030)
|
|
|
|
|
|
|
Affiliated share transactions
|
|
|
|
|
Proceeds from sales of shares
|
|
66,769,136
|
|
691,985,364
|
Reinvestment of distributions
|
|
171,038,902
|
|
144,284,576
|
Cost of shares redeemed
|
|
(1,390,873,549)
|
|
(863,857,528)
|
|
|
|
|
|
|
Net increase (decrease) in net assets resulting from share transactions
|
|
(1,153,065,511)
|
|
(27,587,588)
|
Total increase (decrease) in net assets
|
|
(1,069,180,160)
|
|
(230,584,306)
|
|
|
|
|
|
|
Net Assets
|
|
|
|
|
Beginning of period
|
|
2,543,323,772
|
|
2,773,908,078
|
End of period
|
$
|
1,474,143,612
|
$
|
2,543,323,772
|
|
|
|
|
|
|
Other Information
|
|
|
|
|
Shares
|
|
|
|
|
Sold
|
|
695,160
|
|
6,910,842
|
Issued in reinvestment of distributions
|
|
1,773,731
|
|
1,474,153
|
Redeemed
|
|
(14,420,965)
|
|
(8,882,669)
|
Net increase (decrease)
|
|
(11,952,074)
|
|
(497,674)
|
|
|
|
|
|
|
Financial Highlights
Fidelity® Floating Rate Central Fund
|
|
|
Years ended September 30,
|
|
2023
|
|
2022
|
|
2021
|
|
2020
|
|
2019
|
Selected Per-Share Data
|
|
|
|
|
|
|
|
|
|
|
Net asset value, beginning of period
|
$
|
94.22
|
$
|
100.91
|
$
|
96.50
|
$
|
101.38
|
$
|
103.31
|
Income from Investment Operations
|
|
|
|
|
|
|
|
|
|
|
Net investment income (loss) A,B
|
|
8.494
|
|
4.767
|
|
4.112
|
|
4.985
|
|
6.104
|
Net realized and unrealized gain (loss)
|
|
3.878
|
|
(6.696)
|
|
4.431
|
|
(4.687)
|
|
(1.943)
|
Total from investment operations
|
|
12.372
|
|
(1.929)
|
|
8.543
|
|
.298
|
|
4.161
|
Distributions from net investment income
|
|
(8.582)
|
|
(4.761)
|
|
(4.133)
|
|
(5.178)
|
|
(6.091)
|
Total distributions
|
|
(8.582)
|
|
(4.761)
|
|
(4.133)
|
|
(5.178)
|
|
(6.091)
|
Net asset value, end of period
|
$
|
98.01
|
$
|
94.22
|
$
|
100.91
|
$
|
96.50
|
$
|
101.38
|
Total Return C
|
|
13.65%
|
|
(1.98)%
|
|
8.99%
|
|
.42%
|
|
4.20%
|
Ratios to Average Net Assets B,D,E
|
|
|
|
|
|
|
|
|
|
|
Expenses before reductions F
|
|
-%
|
|
-%
|
|
-%
|
|
-%
|
|
-%
|
Expenses net of fee waivers, if any F
|
|
-%
|
|
-%
|
|
-%
|
|
-%
|
|
-%
|
Expenses net of all reductions F
|
|
-%
|
|
-%
|
|
-%
|
|
-%
|
|
-%
|
Net investment income (loss)
|
|
8.78%
|
|
4.83%
|
|
4.14%
|
|
5.16%
|
|
6.01%
|
Supplemental Data
|
|
|
|
|
|
|
|
|
|
|
Net assets, end of period (000 omitted)
|
$
|
1,474,144
|
$
|
2,543,324
|
$
|
2,773,908
|
$
|
1,906,015
|
$
|
1,946,822
|
Portfolio turnover rate G
|
|
24%
|
|
39%
|
|
41%
|
|
40%
|
|
29%
|
ACalculated based on average shares outstanding during the period.
BNet investment income (loss) is affected by the timing of the declaration of dividends by any underlying mutual funds or exchange-traded funds (ETFs). Net investment income (loss) of any mutual funds or ETFs is not included in the Fund's net investment income (loss) ratio.
CTotal returns would have been lower if certain expenses had not been reduced during the applicable periods shown.
DFees and expenses of any underlying mutual funds or exchange-traded funds (ETFs) are not included in the Fund's expense ratio. The Fund indirectly bears its proportionate share of these expenses. For additional expense information related to investments in Fidelity Central Funds, please refer to the "Investments in Fidelity Central Funds" note found in the Notes to Financial Statements section of the most recent Annual or Semi-Annual report. For additional expense information related to investments in Fidelity Private Credit Central Fund LLC, please refer to the Investment in Fidelity Private Credit Central Fund LLC note found in the Notes to Financial Statements section of the most recent Annual or Semi-Annual report.
EExpense ratios reflect operating expenses of the class. Expenses before reductions do not reflect amounts reimbursed, waived, or reduced through arrangements with the investment adviser, brokerage services, or other offset arrangements, if applicable, and do not represent the amount paid by the class during periods when reimbursements, waivers or reductions occur.
FAmount represents less than .005%.
GAmount does not include the portfolio activity of any underlying mutual funds or exchange-traded funds (ETFs).
For the period ended September 30, 2023
1. Organization.
Fidelity Floating Rate Central Fund (the Fund) is a fund of Fidelity Central Investment Portfolios LLC (the LLC) and is authorized to issue an unlimited number of shares. Shares of the Fund are only offered to other investment companies and accounts managed by Fidelity Management & Research Company LLC (FMR), or its affiliates (the Investing Funds). The LLC is registered under the Investment Company Act of 1940, as amended (the 1940 Act), as an open-end management investment company organized as a Delaware Limited Liability Company.
2. Investments in Fidelity Central Funds.
Funds may invest in Fidelity Central Funds, which are open-end investment companies generally available only to other investment companies and accounts managed by the investment adviser and its affiliates. The Schedule of Investments lists any Fidelity Central Funds held as an investment as of period end, but does not include the underlying holdings of each Fidelity Central Fund. An investing fund indirectly bears its proportionate share of the expenses of the underlying Fidelity Central Funds.
Based on its investment objective, each Fidelity Central Fund may invest or participate in various investment vehicles or strategies that are similar to those of the investing fund. These strategies are consistent with the investment objectives of the investing fund and may involve certain economic risks which may cause a decline in value of each of the Fidelity Central Funds and thus a decline in the value of the investing fund.
Fidelity Central Fund
|
Investment Manager
|
Investment Objective
|
Investment Practices
|
Expense RatioA
|
Fidelity Money Market Central Funds
|
Fidelity Management & Research Company LLC (FMR)
|
Each fund seeks to obtain a high level of current income consistent with the preservation of capital and liquidity.
|
Short-term Investments
|
Less than .005%
|
A Expenses expressed as a percentage of average net assets and are as of each underlying Central Fund's most recent annual or semi-annual shareholder report.
A complete unaudited list of holdings for each Fidelity Central Fund is available upon request or at the Securities and Exchange Commission website at www.sec.gov. In addition, the financial statements of the Fidelity Central Funds which contain the significant accounting policies (including investment valuation policies) of those funds, and are not covered by the Report of Independent Registered Public Accounting Firm, are available on the Securities and Exchange Commission website or upon request.
3. Investment in Fidelity Private Credit Central Fund LLC.
The Fund invests in Fidelity Private Credit Central Fund LLC (formerly Fidelity Direct Lending Fund, LP), which is a limited liability company available only to certain investment companies managed by the investment adviser and its affiliates. On June 1, 2023, Fidelity Private Credit Central Fund elected to be regulated as a business development company (BDC). Fidelity Private Credit Central Fund LLC's units are not registered under the Securities Act of 1933 and are subject to substantial restrictions on transfer. The Fund has no redemption rights under Fidelity Private Credit Central Fund LLC's limited liability company agreement. There will be no trading market for the units.
Based on its investment objective, Fidelity Private Credit Central Fund LLC may invest or participate in various investments or strategies that are similar to those in which the Fund may invest or participate. These strategies are consistent with the investment objectives of the Fund and may involve certain economic risks which may cause a decline in value of Fidelity Private Credit Central Fund LLC and thus a decline in the value of the Fund. Fidelity Private Credit Central Fund LLC intends to invest primarily in directly originated loans to private companies but also with liquid credit investments, like broadly syndicated loans, and other select private credit investments.
The Schedule of Investments lists Fidelity Private Credit Central Fund LLC as an investment as of period end, but does not include the underlying holdings of Fidelity Private Credit Central Fund LLC. Fidelity Private Credit Central Fund LLC represented less than 5% of the Fund's net assets at period end. The Fund indirectly bears its proportionate share of the expenses of Fidelity Private Credit Central Fund LLC. The annualized expense ratio for Fidelity Private Credit Central Fund LLC for the nine month period ended September 30, 2023 was 9.63%.
4. Significant Accounting Policies.
The Fund is an investment company and applies the accounting and reporting guidance of the Financial Accounting Standards Board (FASB) Accounting Standards Codification Topic 946 Financial Services - Investment Companies. The financial statements have been prepared in conformity with accounting principles generally accepted in the United States of America (GAAP), which require management to make certain estimates and assumptions at the date of the financial statements. Actual results could differ from those estimates. Subsequent events, if any, through the date that the financial statements were issued have been evaluated in the preparation of the financial statements. The Fund's Schedule of Investments lists any underlying mutual funds or exchange-traded funds (ETFs) but does not include the underlying holdings of these funds. The following summarizes the significant accounting policies of the Fund:
Investment Valuation. Investments are valued as of 4:00 p.m. Eastern time on the last calendar day of the period. The Board of Directors (the Board) has designated the Fund's investment adviser as the valuation designee responsible for the fair valuation function and performing fair value determinations as needed. The investment adviser has established a Fair Value Committee (the Committee) to carry out the day-to-day fair valuation responsibilities and has adopted policies and procedures to govern the fair valuation process and the activities of the Committee. In accordance with these fair valuation policies and procedures, which have been approved by the Board, the Fund attempts to obtain prices from one or more third party pricing services or brokers to value its investments. When current market prices, quotations or currency exchange rates are not readily available or reliable, investments will be fair valued in good faith by the Committee, in accordance with the policies and procedures. Factors used in determining fair value vary by investment type and may include market or investment specific events, transaction data, estimated cash flows, and market observations of comparable investments. The frequency that the fair valuation procedures are used cannot be predicted and they may be utilized to a significant extent. The Committee manages the Fund's fair valuation practices and maintains the fair valuation policies and procedures. The Fund's investment adviser reports to the Board information regarding the fair valuation process and related material matters.
The Fund categorizes the inputs to valuation techniques used to value its investments into a disclosure hierarchy consisting of three levels as shown below:
Level 1 - unadjusted quoted prices in active markets for identical investments
Level 2 - other significant observable inputs (including quoted prices for similar investments, interest rates, prepayment speeds, etc.)
Level 3 - unobservable inputs (including the Fund's own assumptions based on the best information available)
Valuation techniques used to value the Fund's investments by major category are as follows:
Debt securities, including restricted securities, are valued based on evaluated prices received from third party pricing services or from brokers who make markets in such securities. Corporate bonds, bank loan obligations and preferred securities are valued by pricing services who utilize matrix pricing which considers yield or price of bonds of comparable quality, coupon, maturity and type or by broker-supplied prices. When independent prices are unavailable or unreliable, debt securities may be valued utilizing pricing methodologies which consider similar factors that would be used by third party pricing services. Debt securities are generally categorized as Level 2 in the hierarchy but may be Level 3 depending on the circumstances. The Fund invests a significant portion of its assets in below investment grade securities. The value of these securities can be more volatile due to changes in the credit quality of the issuer and is sensitive to changes in economic, market and regulatory conditions.
Equity securities, including restricted securities, for which market quotations are readily available, are valued at the last reported sale price or official closing price as reported by a third party pricing service on the primary market or exchange on which they are traded and are categorized as Level 1 in the hierarchy. In the event there were no sales during the day or closing prices are not available, securities are valued at the last quoted bid price or may be valued using the last available price and are generally categorized as Level 2 in the hierarchy. For foreign equity securities, when market or security specific events arise, comparisons to the valuation of American Depositary Receipts (ADRs), futures contracts, ETFs and certain indexes as well as quoted prices for similar securities may be used and would be categorized as Level 2 in the hierarchy. For equity securities, including restricted securities, where observable inputs are limited, assumptions about market activity and risk are used and these securities may be categorized as Level 3 in the hierarchy. Securities, including private placements or other restricted securities, for which observable inputs are not available are valued using alternate valuation approaches, including the market approach, the income approach and cost approach, and are categorized as Level 3 in the hierarchy. The market approach considers factors including the price of recent investments in the same or a similar security or financial metrics of comparable securities. The income approach considers factors including expected future cash flows, security specific risks and corresponding discount rates. The cost approach considers factors including the value of the security's underlying assets and liabilities.
Investments in open-end mutual funds, including the Fidelity Central Funds, are valued at their closing net asset value (NAV) each business day and are categorized as Level 1 in the hierarchy.
Fidelity Private Credit Central Fund LLC is valued at its net asset value (NAV) each month end and is categorized as Level 2 in the hierarchy.
The following provides information on Level 3 securities held by the Fund that were valued at period end based on unobservable inputs. These amounts exclude valuations provided by a broker and valuations using NAV as a practical expedient.
Asset Type
|
Fair Value
|
Valuation Technique(s)
|
Unobservable Input
|
Amount or Range/Weighted Average
|
Impact to Valuation from an Increase in InputA
|
Common Stock
|
$16,619,511
|
Market comparable
Market approach
Recovery value
Discounted cash flow
Black scholes
|
Enterprise value/EBITDA multiple (EV/EBITDA)
Capacity multiple ($/kW)
Transaction price
Recovery value
Discount rate
Discount rate
Volatility
Term
|
2.0 - 9.0 / 4.1
$238.00
$2.92
$0.00
13.1%
5.1% - 5.4% / 5.4%
32.5% - 42.5% / 32.5%
1.3 - 2.0 / 1.3
|
Increase
Increase
Increase
Increase
Decrease
Increase
Increase
Increase
|
Corporate Bonds
|
$979,941
|
Discounted cash flow
|
Yield
|
10.7%
|
Decrease
|
Bank Loan Obligations
|
$19,973,448
|
Market comparable
Indicative market price
Discounted cash flow
|
Enterprise value/EBITDA multiple (EV/EBITDA)
Evaluated bid
Yield
|
2.5
$77.00 - $97.00 / $92.99
8.8% - 15.8% / 12.2%
|
Increase
Increase
Decrease
|
A Represents the directional change in the fair value of the Level 3 investments that could have resulted from an increase in the corresponding input as of period end. A decrease to the unobservable input would have had the opposite effect. Significant changes in these inputs may have resulted in a significantly higher or lower fair value measurement at period end.
Changes in valuation techniques may result in transfers in or out of an assigned level within the disclosure hierarchy. The aggregate value of investments by input level as of September 30, 2023, as well as a roll forward of Level 3 investments, is included at the end of the Fund's Schedule of Investments.
Investment Transactions and Income. For financial reporting purposes, the Fund's investment holdings and NAV include trades executed through the end of the last business day of the period. The NAV per share for processing shareholder transactions is calculated as of the close of business of the New York Stock Exchange (NYSE), normally 4:00 p.m. Eastern time and includes trades executed through the end of the prior business day. Gains and losses on securities sold are determined on the basis of identified cost. Dividend income is recorded on the ex-dividend date, except for certain dividends from foreign securities where the ex-dividend date may have passed, which are recorded as soon as the Fund is informed of the ex-dividend date. Non-cash dividends included in dividend income, if any, are recorded at the fair market value of the securities received. Income and capital gain distributions from Fidelity Central Funds, if any, are recorded on the ex-dividend date. Certain distributions received by the Fund represent a return of capital or capital gain. The Fund determines the components of these distributions subsequent to the ex-dividend date, based upon receipt of tax filings or other correspondence relating to the underlying investment. These distributions are recorded as a reduction of cost of investments and/or as a realized gain. Interest income is accrued as earned and includes coupon interest and amortization of premium and accretion of discount on debt securities as applicable. Debt obligations may be placed on non-accrual status and related interest income may be reduced by ceasing current accruals and writing off interest receivables when the collection of all or a portion of interest has become doubtful based on consistently applied procedures. A debt obligation is removed from non-accrual status when the issuer resumes interest payments or when collectability of interest is reasonably assured. The Fund earns certain fees in connection with its floating rate loan purchasing activities. These fees are in addition to interest payments earned and may include amendment fees, consent fees and prepayment fees. These fees are recorded as Interest in the accompanying financial statements. The investment adviser has contractually agreed to reimburse the Fund with respect to the portion of the Fund's assets invested in Fidelity Private Credit Central Fund LLC until January 31, 2025 as presented in the Statement of Operations in payment from investment adviser.
Expenses. Expenses directly attributable to a fund are charged to that fund. Expenses attributable to more than one fund are allocated among the respective funds on the basis of relative net assets or other appropriate methods. Expenses included in the accompanying financial statements reflect the expenses of that fund and do not include any expenses associated with any underlying mutual funds or exchange-traded funds. Although not included in a fund's expenses, a fund indirectly bears its proportionate share of these expenses through the net asset value of each underlying mutual fund or exchange-traded fund. Expense estimates are accrued in the period to which they relate and adjustments are made when actual amounts are known.
Income Tax Information and Distributions to Shareholders. Each year, the Fund intends to qualify as a regulated investment company under Subchapter M of the Internal Revenue Code, including distributing substantially all of its taxable income and realized gains. As a result, no provision for U.S. Federal income taxes is required. As of September 30, 2023, the Fund did not have any unrecognized tax benefits in the financial statements; nor is the Fund aware of any tax positions for which it is reasonably possible that the total amounts of unrecognized tax benefits will significantly change in the next twelve months. The Fund files a U.S. federal tax return, in addition to state and local tax returns as required. The Fund's federal income tax returns are subject to examination by the Internal Revenue Service (IRS) for a period of three fiscal years after they are filed. State and local tax returns may be subject to examination for an additional fiscal year depending on the jurisdiction.
Distributions are declared and recorded daily and paid monthly from net investment income. Distributions from realized gains, if any, are declared and recorded on the ex-dividend date. Income and capital gain distributions are determined in accordance with income tax regulations, which may differ from GAAP.
Capital accounts within the financial statements are adjusted for permanent book-tax differences. These adjustments have no impact on net assets or the results of operations. Capital accounts are not adjusted for temporary book-tax differences which will reverse in a subsequent period.
Book-tax differences are primarily due to partnerships, capital loss carryforwards and losses deferred due to wash sales.
As of period end, the cost and unrealized appreciation (depreciation) in securities, and derivatives if applicable, for federal income tax purposes were as follows:
Gross unrealized appreciation
|
$36,444,757
|
Gross unrealized depreciation
|
(85,698,566)
|
Net unrealized appreciation (depreciation)
|
$(49,253,809)
|
Tax Cost
|
$1,550,363,691
|
The tax-based components of distributable earnings as of period end were as follows:
Capital loss carryforward
|
$(112,981,250)
|
Net unrealized appreciation (depreciation) on securities and other investments
|
$(49,253,809)
|
Capital loss carryforwards are only available to offset future capital gains of the Fund to the extent provided by regulations and may be limited. The capital loss carryforward information presented below, including any applicable limitation, is estimated as of fiscal period end and is subject to adjustment.
Short-term
|
$(9,937,845)
|
Long-term
|
(103,043,405)
|
Total capital loss carryforward
|
$(112,981,250)
|
The tax character of distributions paid was as follows:
|
September 30, 2023
|
September 30, 2022
|
Ordinary Income
|
$171,040,104
|
$144,286,030
|
Restricted Securities (including Private Placements). Funds may invest in securities that are subject to legal or contractual restrictions on resale. These securities generally may be resold in transactions exempt from registration or to the public if the securities are registered. Disposal of these securities may involve time-consuming negotiations and expense, and prompt sale at an acceptable price may be difficult. Information regarding restricted securities held at period end is included at the end of the Schedule of Investments, if applicable.
Loans and Other Direct Debt Instruments. Direct debt instruments are interests in amounts owed to lenders by corporate or other borrowers. These instruments may be in the form of loans, trade claims or other receivables and may include standby financing commitments such as revolving credit facilities that obligate a fund to supply additional cash to the borrower on demand. Loans may be acquired through assignment, participation, or may be made directly to a borrower. Such instruments are presented in the Bank Loan Obligations section in the Schedule of Investments. Certain funds may also invest in unfunded loan commitments, which are contractual obligations for future funding. Information regarding unfunded commitments is included at the end of the Schedule of Investments, if applicable.
Commitments. A commitment is an agreement to acquire an investment at a future date (subject to conditions) in connection with a potential public or non-public offering. Commitments outstanding at period end are presented in the table below. Unrealized appreciation (depreciation) on any commitments outstanding at period end is separately presented in the Statements of Assets and Liabilities as Unrealized appreciation (depreciation) on unfunded commitments, and any change in unrealized appreciation (depreciation) on unfunded commitments during the period is separately presented in the Statement of Operations, as applicable based on contractual conditions of each commitment.
|
Investment to be Acquired
|
Commitment Amount
|
Unrealized Appreciation (Depreciation)
|
Fidelity Floating Rate Central Fund
|
Fidelity Private Credit Central Fund LLC
|
$5,526,014
|
$-
|
Fidelity Floating Rate Central Fund
|
WH Borrower LLC
|
$2,260,000
|
$27,428
|
LIBOR Accounting Pronouncement. In March 2020, the Financial Accounting Standards Board (FASB) issued an Accounting Standards Update (ASU), ASU 2020-04, which provides optional, temporary relief with respect to the financial reporting of contracts subject to certain types of modifications due to the planned discontinuation of the London Interbank Offered Rate (LIBOR) and other IBOR-based reference rates. The temporary relief provided by ASU 2020-04 is effective for certain reference rate-related contract modifications that occur during the period March 12, 2020 through December 31, 2024. Management does not expect the adoption of ASU 2020-04 to have a material impact on the Fund's financial statements.
New Accounting Pronouncement. In June 2022, the Financial Accounting Standards Board (FASB) issued Accounting Standards Update (ASU) 2022-03 Fair Value Measurement (Topic 820): Fair Value Measurement of Equity Securities Subject to Contractual Sale Restrictions. The amendments in this ASU clarify that a contractual restriction on the sale of an equity security is not considered part of the unit of account of the equity security and, therefore, is not considered in measuring fair value. They also clarify that an entity cannot, as a separate unit of account, recognize and measure a contractual sale restriction. They also require additional disclosures for equity securities subject to contractual sale restrictions. ASU 2022-03 will be effective for fiscal years, including interim periods within those fiscal years, beginning after December 15, 2023, and allows for early adoption. ASU 2022-03 will only be applicable to an equity security in which the contractual arrangement that restricts its sale is executed or modified on or after the adoption date. Management is currently evaluating the potential impact of ASU 2022-03 to the financial statements.
5. Purchases and Sales of Investments.
Purchases and sales of securities, other than short-term securities and in-kind transactions, as applicable, are noted in the table below.
|
Purchases ($)
|
Sales ($)
|
Fidelity Floating Rate Central Fund
|
442,899,846
|
1,478,446,760
|
6. Fees and Other Transactions with Affiliates.
Management Fee and Expense Contract. Fidelity Management & Research Company LLC (the investment adviser) provides the Fund with investment management services. The Fund does not pay any fees for these services. Pursuant to the Fund's management contract, the investment adviser receives a monthly management fee that represents a portion of the management fees it receives from the Investing Funds. In addition, under an expense contract, the investment adviser also pays all other expenses of the Fund, excluding custody fees, the compensation of the independent Directors, and certain miscellaneous expenses such as proxy and shareholder meeting expenses.
Brokerage Commissions. A portion of portfolio transactions were placed with brokerage firms which are affiliates of the investment adviser. Brokerage commissions are included in net realized gain (loss) and change in net unrealized appreciation (depreciation) in the Statement of Operations. The commissions paid to these affiliated firms were as follows:
|
Amount
|
Fidelity Floating Rate Central Fund
|
$19
|
Interfund Trades. Funds may purchase from or sell securities to other Fidelity Funds under procedures adopted by the Board. The procedures have been designed to ensure these interfund trades are executed in accordance with Rule 17a-7 of the 1940 Act. Any interfund trades are included within the respective purchases and sales amounts shown in the Purchases and Sales of Investments note. Interfund trades during the period are noted in the table below.
|
Purchases ($)
|
Sales ($)
|
Realized Gain (Loss) ($)
|
Fidelity Floating Rate Central Fund
|
-
|
373,443
|
235,762
|
7. Security Lending.
Funds lend portfolio securities from time to time in order to earn additional income. Lending agents are used, including National Financial Services (NFS), an affiliate of the investment adviser. Pursuant to a securities lending agreement, NFS will receive a fee, which is capped at 9.9% of a fund's daily lending revenue, for its services as lending agent. A fund may lend securities to certain qualified borrowers, including NFS. On the settlement date of the loan, a fund receives collateral (in the form of U.S. Treasury obligations, letters of credit and/or cash) against the loaned securities and maintains collateral in an amount not less than 100% of the market value of the loaned securities during the period of the loan. The market value of the loaned securities is determined at the close of business of a fund and any additional required collateral is delivered to a fund on the next business day. A fund or borrower may terminate the loan at any time, and if the borrower defaults on its obligation to return the securities loaned because of insolvency or other reasons, a fund may apply collateral received from the borrower against the obligation. A fund may experience delays and costs in recovering the securities loaned. Any cash collateral received is invested in the Fidelity Securities Lending Cash Central Fund. Any loaned securities are identified as such in the Schedule of Investments, and the value of loaned securities and cash collateral at period end, as applicable, are presented in the Statement of Assets and Liabilities. Security lending income represents the income earned on investing cash collateral, less rebates paid to borrowers and any lending agent fees associated with the loan, plus any premium payments received for lending certain types of securities. Security lending income is presented in the Statement of Operations as a component of income from Fidelity Central Funds. Affiliated security lending activity, if any, was as follows:
|
Total Security Lending Fees Paid to NFS
|
Security Lending Income From Securities Loaned to NFS
|
Value of Securities Loaned to NFS at Period End
|
Fidelity Floating Rate Central Fund
|
$213
|
$-
|
$-
|
8. Expense Reductions.
Through arrangements with the Fund's custodian, credits realized as a result of certain uninvested cash balances were used to reduce the Fund's expenses by $6,166.
9. Other.
A fund's organizational documents provide former and current directors and officers with a limited indemnification against liabilities arising in connection with the performance of their duties to the fund. In the normal course of business, a fund may also enter into contracts that provide general indemnifications. A fund's maximum exposure under these arrangements is unknown as this would be dependent on future claims that may be made against a fund. The risk of material loss from such claims is considered remote.
At the end of the period, mutual funds managed by the investment adviser or its affiliates were the owners of record of all of the outstanding shares of the Fund.
10. Risk and Uncertainties.
Many factors affect a fund's performance. Developments that disrupt global economies and financial markets, such as pandemics, epidemics, outbreaks of infectious diseases, war, terrorism, and environmental disasters, may significantly affect a fund's investment performance. The effects of these developments to a fund will be impacted by the types of securities in which a fund invests, the financial condition, industry, economic sector, and geographic location of an issuer, and a fund's level of investment in the securities of that issuer. Significant concentrations in security types, issuers, industries, sectors, and geographic locations may magnify the factors that affect a fund's performance.
To the Board of Trustees of Fidelity Central Investment Portfolios LLC and the Shareholders of Fidelity Floating Rate Central Fund:
Opinion on the Financial Statements and Financial Highlights
We have audited the accompanying statement of assets and liabilities of Fidelity Floating Rate Central Fund (the "Fund"), a fund of Fidelity Central Investment Portfolios LLC, including the schedule of investments, as of September 30, 2023, the related statement of operations for the year then ended, the statement of changes in net assets for each of the two years in the period then ended, the financial highlights for each of the five years in the period then ended, and the related notes. In our opinion, the financial statements and financial highlights present fairly, in all material respects, the financial position of the Fund as of September 30, 2023, and the results of its operations for the year then ended, the changes in its net assets for each of the two years in the period then ended, and the financial highlights for each of the five years in the period then ended in conformity with accounting principles generally accepted in the United States of America.
Basis for Opinion
These financial statements and financial highlights are the responsibility of the Fund's management. Our responsibility is to express an opinion on the Fund's financial statements and financial highlights based on our audits. We are a public accounting firm registered with the Public Company Accounting Oversight Board (United States) (PCAOB) and are required to be independent with respect to the Fund in accordance with the U.S. federal securities laws and the applicable rules and regulations of the Securities and Exchange Commission and the PCAOB.
We conducted our audits in accordance with the standards of the PCAOB. Those standards require that we plan and perform the audit to obtain reasonable assurance about whether the financial statements and financial highlights are free of material misstatement, whether due to error or fraud. The Fund is not required to have, nor were we engaged to perform, an audit of its internal control over financial reporting. As part of our audits, we are required to obtain an understanding of internal control over financial reporting but not for the purpose of expressing an opinion on the effectiveness of the Fund's internal control over financial reporting. Accordingly, we express no such opinion.
Our audits included performing procedures to assess the risks of material misstatement of the financial statements and financial highlights, whether due to error or fraud, and performing procedures that respond to those risks. Such procedures included examining, on a test basis, evidence regarding the amounts and disclosures in the financial statements and financial highlights. Our audits also included evaluating the accounting principles used and significant estimates made by management, as well as evaluating the overall presentation of the financial statements and financial highlights. Our procedures included confirmation of securities owned as of September 30, 2023, by correspondence with the custodian, brokers and agent banks; when replies were not received from brokers or agent banks, we performed other auditing procedures. We believe that our audits provide a reasonable basis for our opinion.
/s/ Deloitte & Touche LLP
Boston, Massachusetts
November 16, 2023
We have served as the auditor of one or more of the Fidelity investment companies since 1999.
DIRECTORS AND OFFICERS (TRUSTEES AND OFFICERS)
The Trustees, Members of the Advisory Board (if any), and officers of the Fidelity Central Investment Portfolios LLC and fund, as applicable, are listed below. The Board of Trustees governs the fund and is responsible for protecting the interests of shareholders. The Trustees are experienced executives who meet periodically throughout the year to oversee the fund's activities, review contractual arrangements with companies that provide services to the fund, oversee management of the risks associated with such activities and contractual arrangements, and review the fund's performance. Except for Vijay Advani, each of the Trustees oversees 322 funds. Mr. Advani oversees 215 funds.
The Trustees hold office without limit in time except that (a) any Trustee may resign; (b) any Trustee may be removed by written instrument, signed by at least two-thirds of the number of Trustees prior to such removal; (c) any Trustee who requests to be retired or who has become incapacitated by illness or injury may be retired by written instrument signed by a majority of the other Trustees; and (d) any Trustee may be removed at any special meeting of shareholders by a two-thirds vote of the outstanding voting securities of the trust. Each Trustee who is not an interested person (as defined in the 1940 Act) of the trust and the fund is referred to herein as an Independent Trustee. Each Independent Trustee shall retire not later than the last day of the calendar year in which his or her 75th birthday occurs. The Independent Trustees may waive this mandatory retirement age policy with respect to individual Trustees. Officers and Advisory Board Members hold office without limit in time, except that any officer or Advisory Board Member may resign or may be removed by a vote of a majority of the Trustees at any regular meeting or any special meeting of the Trustees. Except as indicated, each individual has held the office shown or other offices in the same company for the past five years.
The fund's Statement of Additional Information (SAI) includes more information about the Trustees. To request a free copy, call Fidelity at 1-800-544-8544.
Experience, Skills, Attributes, and Qualifications of the Trustees. The Governance and Nominating Committee has adopted a statement of policy that describes the experience, qualifications, attributes, and skills that are necessary and desirable for potential Independent Trustee candidates (Statement of Policy). The Board believes that each Trustee satisfied at the time he or she was initially elected or appointed a Trustee, and continues to satisfy, the standards contemplated by the Statement of Policy. The Governance and Nominating Committee also engages professional search firms to help identify potential Independent Trustee candidates who have the experience, qualifications, attributes, and skills consistent with the Statement of Policy. From time to time, additional criteria based on the composition and skills of the current Independent Trustees, as well as experience or skills that may be appropriate in light of future changes to board composition, business conditions, and regulatory or other developments, have also been considered by the professional search firms and the Governance and Nominating Committee. In addition, the Board takes into account the Trustees' commitment and participation in Board and committee meetings, as well as their leadership of standing and ad hoc committees throughout their tenure.
In determining that a particular Trustee was and continues to be qualified to serve as a Trustee, the Board has considered a variety of criteria, none of which, in isolation, was controlling. The Board believes that, collectively, the Trustees have balanced and diverse experience, qualifications, attributes, and skills, which allow the Board to operate effectively in governing the fund and protecting the interests of shareholders. Information about the specific experience, skills, attributes, and qualifications of each Trustee, which in each case led to the Board's conclusion that the Trustee should serve (or continue to serve) as a trustee of the fund, is provided below.
Board Structure and Oversight Function. Robert A. Lawrence is an interested person and currently serves as Chair. The Trustees have determined that an interested Chair is appropriate and benefits shareholders because an interested Chair has a personal and professional stake in the quality and continuity of services provided to the fund. Independent Trustees exercise their informed business judgment to appoint an individual of their choosing to serve as Chair, regardless of whether the Trustee happens to be independent or a member of management. The Independent Trustees have determined that they can act independently and effectively without having an Independent Trustee serve as Chair and that a key structural component for assuring that they are in a position to do so is for the Independent Trustees to constitute a substantial majority for the Board. The Independent Trustees also regularly meet in executive session. David M. Thomas serves as Lead Independent Trustee and as such (i) acts as a liaison between the Independent Trustees and management with respect to matters important to the Independent Trustees and (ii) with management prepares agendas for Board meetings.
Fidelity® funds are overseen by different Boards of Trustees. The fund's Board oversees Fidelity's high income and certain equity funds, and other Boards oversee Fidelity's alternative investment, investment-grade bond, money market, asset allocation, and other equity funds. The asset allocation funds may invest in Fidelity® funds overseen by the fund's Board. The use of separate Boards, each with its own committee structure, allows the Trustees of each group of Fidelity® funds to focus on the unique issues of the funds they oversee, including common research, investment, and operational issues. On occasion, the separate Boards establish joint committees to address issues of overlapping consequences for the Fidelity® funds overseen by each Board.
The Trustees operate using a system of committees to facilitate the timely and efficient consideration of all matters of importance to the Trustees, the fund, and fund shareholders and to facilitate compliance with legal and regulatory requirements and oversight of the fund's activities and associated risks. The Board, acting through its committees, has charged FMR and its affiliates with (i) identifying events or circumstances the occurrence of which could have demonstrably adverse effects on the fund's business and/or reputation; (ii) implementing processes and controls to lessen the possibility that such events or circumstances occur or to mitigate the effects of such events or circumstances if they do occur; and (iii) creating and maintaining a system designed to evaluate continuously business and market conditions in order to facilitate the identification and implementation processes described in (i) and (ii) above. Because the day-to-day operations and activities of the fund are carried out by or through FMR, its affiliates, and other service providers, the fund's exposure to risks is mitigated but not eliminated by the processes overseen by the Trustees. While each of the Board's committees has responsibility for overseeing different aspects of the fund's activities, oversight is exercised primarily through the Operations, Audit, and Compliance Committees. Appropriate personnel, including but not limited to the fund's Chief Compliance Officer (CCO), FMR's internal auditor, the independent accountants, the fund's Treasurer and portfolio management personnel, make periodic reports to the Board's committees, as appropriate, including an annual review of Fidelity's risk management program for the Fidelity® funds. The responsibilities of each standing committee, including their oversight responsibilities, are described further under "Standing Committees of the Trustees."
Interested Trustees*:
Correspondence intended for a Trustee who is an interested person may be sent to Fidelity Investments, 245 Summer Street, Boston, Massachusetts 02210.
Name, Year of Birth; Principal Occupations and Other Relevant Experience+
Bettina Doulton (1964)
Year of Election or Appointment: 2020
Trustee
Ms. Doulton also serves as Trustee of other Fidelity® funds. Prior to her retirement, Ms. Doulton served in a variety of positions at Fidelity Investments, including as a managing director of research (2006-2007), portfolio manager to certain Fidelity® funds (1993-2005), equity analyst and portfolio assistant (1990-1993), and research assistant (1987-1990). Ms. Doulton currently owns and operates Phi Builders + Architects and Cellardoor Winery. Previously, Ms. Doulton served as a member of the Board of Brown Capital Management, LLC (2014-2018).
Robert A. Lawrence (1952)
Year of Election or Appointment: 2020
Trustee
Chair of the Board of Trustees
Mr. Lawrence also serves as Trustee of other funds. Previously, Mr. Lawrence served as a Trustee and Member of the Advisory Board of certain funds. Prior to his retirement in 2008, Mr. Lawrence served as Vice President of certain Fidelity® funds (2006-2008), Senior Vice President, Head of High Income Division of Fidelity Management & Research Company (investment adviser firm, 2006-2008), and President of Fidelity Strategic Investments (investment adviser firm, 2002-2005).
* Determined to be an "Interested Trustee" by virtue of, among other things, his or her affiliation with the Fidelity Central Investment Portfolios LLC or various entities under common control with FMR.
+ The information includes the Trustee's principal occupation during the last five years and other information relating to the experience, attributes, and skills relevant to the Trustee's qualifications to serve as a Trustee, which led to the conclusion that the Trustee should serve as a Trustee for the fund.
Independent Trustees:
Correspondence intended for an Independent Trustee may be sent to Fidelity Investments, P.O. Box 55235, Boston, Massachusetts 02205-5235.
Name, Year of Birth; Principal Occupations and Other Relevant Experience+
Vijay C. Advani (1960)
Year of Election or Appointment: 2023
Trustee
Mr. Advani also serves as Trustee or Member of the Advisory Board of other funds. Previously, Mr. Advani served as Executive Chairman (2020-2022), Chief Executive Officer (2017-2020) and Chief Operating Officer (2016-2017) of Nuveen (global investment manager). He also served in various capacities at Franklin Resources (global investment manager), including Co-President (2015-2016), Executive Vice President, Global Advisory Services (2008-2015), Head of Global Retail Distribution (2005-2008), Executive Managing Director, International Retail Development (2002-2005), Managing Director, Product Developments, Sales & Marketing, Asia, Eastern Europe and Africa (2000-2002) and President, Templeton Asset Management India (1995-2000). Mr. Advani also served as Senior Investment Officer of International Finance Corporation (private equity and venture capital arm of The World Bank, 1984-1995). Mr. Advani is Chairman Emeritus of the U.S. India Business Council (2018-present), a Director of The Global Impact Investing Network (2019-present), a Director of LOK Capital (Mauritius) (2022-present), a member of the Advisory Council of LOK Capital (2022-present), a Senior Advisor of Neuberger Berman (2021-present), a Senior Advisor of Seviora Holdings Pte. Ltd (Temasek-Singapore) (2021-present), a Director of Seviora Capital (Singapore) (2021-present) and an Advisor of EQUIAM (2021-present). Mr. Advani formerly served as a member of the Board of BowX Acquisition Corp. (special purpose acquisition company, 2020-2021), a member of the Board of Intellecap (advisory arm of The Aavishkaar Group, 2018-2020), a member of the Board of Nuveen Investments, Inc. (2017-2020) and a member of the Board of Docusign (software, 2016-2019).
Thomas P. Bostick (1956)
Year of Election or Appointment: 2021
Trustee
Lieutenant General Bostick also serves as Trustee of other Fidelity® funds. Prior to his retirement, General Bostick (United States Army, Retired) held a variety of positions within the U.S. Army, including Commanding General and Chief of Engineers, U.S. Army Corps of Engineers (2012-2016) and Deputy Chief of Staff and Director of Human Resources, U.S. Army (2009-2012). General Bostick currently serves as a member of the Board and Finance and Governance & Sustainability Committees of CSX Corporation (transportation, 2020-present) and a member of the Board and Corporate Governance and Nominating Committee of Perma-Fix Environmental Services, Inc. (nuclear waste management, 2020-present). General Bostick serves as Chief Executive Officer of Bostick Global Strategies, LLC (consulting, 2016-present), as a member of the Board of HireVue, Inc. (video interview and assessment, 2020-present), as a member of the Board of Allonnia (biotechnology and engineering solutions, 2022-present) and on the Advisory Board of Solugen, Inc. (specialty bio-based chemicals manufacturer, 2022-present). Previously, General Bostick served as a Member of the Advisory Board of certain Fidelity® funds (2021), President, Intrexon Bioengineering (2018-2020) and Chief Operating Officer (2017-2020) and Senior Vice President of the Environment Sector (2016-2017) of Intrexon Corporation (biopharmaceutical company).
Dennis J. Dirks (1948)
Year of Election or Appointment: 2005
Trustee
Mr. Dirks also serves as Trustee of other Fidelity® funds. Prior to his retirement in May 2003, Mr. Dirks served as Chief Operating Officer and as a member of the Board of The Depository Trust & Clearing Corporation (financial markets infrastructure), President, Chief Operating Officer and a member of the Board of The Depository Trust Company (DTC), President and a member of the Board of the National Securities Clearing Corporation (NSCC), Chief Executive Officer and a member of the Board of the Government Securities Clearing Corporation and Chief Executive Officer and a member of the Board of the Mortgage-Backed Securities Clearing Corporation. Mr. Dirks currently serves as a member of the Finance Committee (2016-present) and Board (2017-present) and is Treasurer (2018-present) of the Asolo Repertory Theatre.
Donald F. Donahue (1950)
Year of Election or Appointment: 2018
Trustee
Mr. Donahue also serves as Trustee of other Fidelity® funds. Mr. Donahue serves as President and Chief Executive Officer of Miranda Partners, LLC (risk consulting for the financial services industry, 2012-present). Previously, Mr. Donahue served as Chief Executive Officer (2006-2012), Chief Operating Officer (2003-2006) and Managing Director, Customer Marketing and Development (1999-2003) of The Depository Trust & Clearing Corporation (financial markets infrastructure). Mr. Donahue currently serves as a member (2007-present) and Co-Chairman (2016-present) of the Board of United Way of New York. Mr. Donahue previously served as a member of the Advisory Board of certain Fidelity® funds (2015-2018) and as a member of the Board of The Leadership Academy (previously NYC Leadership Academy) (2012-2022).
Vicki L. Fuller (1957)
Year of Election or Appointment: 2020
Trustee
Ms. Fuller also serves as Trustee of other Fidelity® funds. Previously, Ms. Fuller served as a member of the Advisory Board of certain Fidelity® funds (2018-2020), Chief Investment Officer of the New York State Common Retirement Fund (2012-2018) and held a variety of positions at AllianceBernstein L.P. (global asset management, 1985-2012), including Managing Director (2006-2012) and Senior Vice President and Senior Portfolio Manager (2001-2006). Ms. Fuller currently serves as a member of the Board, Audit Committee and Nominating and Governance Committee of two Blackstone business development companies (2020-present), as a member of the Board of Treliant, LLC (consulting, 2019-present), as a member of the Board of Ariel Alternatives, LLC (private equity, 2022-present) and as a member of the Board and Chair of the Audit Committee of Gusto, Inc. (software, 2021-present). In addition, Ms. Fuller currently serves as a member of the Board of Roosevelt University (2019-present) and as a member of the Executive Board of New York University's Stern School of Business. Ms. Fuller previously served as a member of the Board, Audit Committee and Nominating and Governance Committee of The Williams Companies, Inc. (natural gas infrastructure, 2018-2021).
Patricia L. Kampling (1959)
Year of Election or Appointment: 2020
Trustee
Ms. Kampling also serves as Trustee of other Fidelity® funds. Prior to her retirement, Ms. Kampling served as Chairman of the Board and Chief Executive Officer (2012-2019), President and Chief Operating Officer (2011-2012) and Executive Vice President and Chief Financial Officer (2010-2011) of Alliant Energy Corporation. Ms. Kampling currently serves as a member of the Board, Finance Committee and Governance, Compensation and Nominating Committee of Xcel Energy Inc. (utilities company, 2020-present) and as a member of the Board, Audit, Finance and Risk Committee and Safety, Environmental, Technology and Operations Committee and Chair of the Executive Development and Compensation Committee of American Water Works Company, Inc. (utilities company, 2019-present). In addition, Ms. Kampling currently serves as a member of the Board of the Nature Conservancy, Wisconsin Chapter (2019-present). Previously, Ms. Kampling served as a Member of the Advisory Board of certain Fidelity® funds (2020), a member of the Board, Compensation Committee and Executive Committee and Chair of the Audit Committee of Briggs & Stratton Corporation (manufacturing, 2011-2021), a member of the Board of Interstate Power and Light Company (2012-2019) and Wisconsin Power and Light Company (2012-2019) (each a subsidiary of Alliant Energy Corporation) and as a member of the Board and Workforce Development Committee of the Business Roundtable (2018-2019).
Thomas A. Kennedy (1955)
Year of Election or Appointment: 2021
Trustee
Mr. Kennedy also serves as Trustee of other Fidelity® funds. Previously, Mr. Kennedy served as a Member of the Advisory Board of certain Fidelity® funds (2020) and held a variety of positions at Raytheon Company (aerospace and defense, 1983-2020), including Chairman and Chief Executive Officer (2014-2020) and Executive Vice President and Chief Operating Officer (2013-2014). Mr. Kennedy served as Executive Chairman of the Board of Directors of Raytheon Technologies Corporation (aerospace and defense, 2020-2021). Mr. Kennedy serves as a Director of the Board of Directors of Textron Inc. (aerospace and defense, 2023-present).
Oscar Munoz (1959)
Year of Election or Appointment: 2021
Trustee
Mr. Munoz also serves as Trustee of other Fidelity® funds. Prior to his retirement, Mr. Munoz served as Executive Chairman (2020-2021), Chief Executive Officer (2015-2020), President (2015-2016) and a member of the Board (2010-2021) of United Airlines Holdings, Inc. Mr. Munoz currently serves as a member of the Board of CBRE Group, Inc. (commercial real estate, 2020-present), a member of the Board of Univision Communications, Inc. (Hispanic media, 2020-present), a member of the Board of Archer Aviation Inc. (2021-present), a member of the Defense Business Board of the United States Department of Defense (2021-present) and a member of the Board of Salesforce.com, Inc. (cloud-based software, 2022-present). Previously, Mr. Munoz served as a Member of the Advisory Board of certain Fidelity® funds (2021).
David M. Thomas (1949)
Year of Election or Appointment: 2008
Trustee
Lead Independent Trustee
Mr. Thomas also serves as Trustee of other Fidelity® funds. Previously, Mr. Thomas served as Executive Chairman (2005-2006) and Chairman and Chief Executive Officer (2000-2005) of IMS Health, Inc. (pharmaceutical and healthcare information solutions). Mr. Thomas currently serves as a member of the Board of Fortune Brands Home and Security (home and security products, 2004-present) and as Director (2013-present) and Non-Executive Chairman of the Board (2022-present) of Interpublic Group of Companies, Inc. (marketing communication).
Susan Tomasky (1953)
Year of Election or Appointment: 2020
Trustee
Ms. Tomasky also serves as Trustee of other Fidelity® funds. Prior to her retirement, Ms. Tomasky served in various executive officer positions at American Electric Power Company, Inc. (1998-2011), including most recently as President of AEP Transmission (2007-2011). Ms. Tomasky currently serves as a member of the Board and Sustainability Committee and as Chair of the Audit Committee of Marathon Petroleum Corporation (2018-present) and as a member of the Board, Executive Committee, Corporate Governance Committee and Organization and Compensation Committee and as Lead Director of the Board of Public Service Enterprise Group, Inc. (utilities company, 2012-present) and as a member of the Board of its subsidiary company, Public Service Electric and Gas Co. (2021-present). In addition, Ms. Tomasky currently serves as a member (2009-present) and President (2020-present) of the Board of the Royal Shakespeare Company - America (2009-present), as a member of the Board of the Columbus Association for the Performing Arts (2011-present) and as a member of the Board and Kenyon in the World Committee of Kenyon College (2016-present). Previously, Ms. Tomasky served as a Member of the Advisory Board of certain Fidelity® funds (2020), as a member of the Board of the Columbus Regional Airport Authority (2007-2020), as a member of the Board (2011-2018) and Lead Independent Director (2015-2018) of Andeavor Corporation (previously Tesoro Corporation) (independent oil refiner and marketer) and as a member of the Board of Summit Midstream Partners LP (energy, 2012-2018).
Michael E. Wiley (1950)
Year of Election or Appointment: 2018
Trustee
Mr. Wiley also serves as Trustee of other Fidelity® funds. Previously, Mr. Wiley served as a member of the Advisory Board of certain Fidelity® funds (2018-2020), Chairman, President and CEO of Baker Hughes, Inc. (oilfield services, 2000-2004). Mr. Wiley also previously served as a member of the Board of Andeavor Corporation (independent oil refiner and marketer, 2005-2018), a member of the Board of Andeavor Logistics LP (natural resources logistics, 2015-2018) and a member of the Board of High Point Resources (exploration and production, 2005-2020).
+ The information includes the Trustee's principal occupation during the last five years and other information relating to the experience, attributes, and skills relevant to the Trustee's qualifications to serve as a Trustee, which led to the conclusion that the Trustee should serve as a Trustee for the fund.
Advisory Board Members and Officers:
Correspondence intended for a Member of the Advisory Board (if any) may be sent to Fidelity Investments, P.O. Box 55235, Boston, Massachusetts 02205-5235. Correspondence intended for an officer or Peter S. Lynch may be sent to Fidelity Investments, 245 Summer Street, Boston, Massachusetts 02210.
Name, Year of Birth; Principal Occupation
Peter S. Lynch (1944)
Year of Election or Appointment: 2004
Member of the Advisory Board
Mr. Lynch also serves as a Member of the Advisory Board of other Fidelity® funds. Mr. Lynch is Vice Chairman and a Director of Fidelity Management & Research Company LLC (investment adviser firm). In addition, Mr. Lynch serves as a Trustee of Boston College and as the Chairman of the Inner-City Scholarship Fund. Previously, Mr. Lynch served as Vice Chairman and a Director of FMR Co., Inc. (investment adviser firm) and on the Special Olympics International Board of Directors (1997-2006).
Karen B. Peetz (1955)
Year of Election or Appointment: 2023
Member of the Advisory Board
Ms. Peetz also serves as a Member of the Advisory Board of other funds. Previously, Ms. Peetz served as Chief Administration Officer (2020-2023) of Citigroup Inc. (a diversified financial service company). She also served in various capacities at Bank of New York Mellon Corporation, including President (2013-2016), Vice Chairman, Senior Executive Vice President and Chief Executive Officer of Financial Markets & Treasury Services (2010-2013), Senior Executive Vice President and Chief Executive Officer of Global Corporate Trust (2003-2008), Senior Vice President and Division Manager of Global Payments & Trade Services (2002-2003) and Senior Vice President and Division Manager of Domestic Corporate Trust (1998-2002). Ms. Peetz also served in various capacities at Chase Manhattan Corporation (1982-1998), including Senior Vice President and Manager of Corporate Trust International Business (1996-1998), Managing Director and Manager of Corporate Trust Services (1994-1996) and Managing Director and Group Manager of Financial Institution Sales (1990-1993). Ms. Peetz currently serves as Chair of Amherst Holdings Advisory Council (2018-present), Trustee of Johns Hopkins University (2016-present), Chair of the Carey Business School Advisory Council, Member of the Johns Hopkins Medicine Board and Finance Committee and Chair of the Lyme and Tick Related Disease Institute Advisory Council. Ms. Peetz previously served as a member of the Board of Guardian Life Insurance Company of America (2019-2023), a member of the Board of Trane Technologies (2018-2022), a member of the Board of Wells Fargo Corp. (2017-2019), a member of the Board of SunCoke Energy Inc. (2012-2016), a member of the Board of Private Export Funding Corporation (2010-2016) and as a Trustee of Penn State University (2010-2014) and the United Way of New York City (2008-2010).
Heather Bonner (1977)
Year of Election or Appointment: 2023
Assistant Treasurer
Ms. Bonner also serves as an officer of other funds. Ms. Bonner is a Senior Vice President (2022-present) and is an employee of Fidelity Investments (2022-present). Ms. Bonner serves as Assistant Treasurer of Fidelity CRET Trustee LLC (2022-present). Prior to joining Fidelity, Ms. Bonner served as Managing Director at AQR Capital Management (2013-2022) and was the Treasurer and Principal Financial Officer of the AQR Funds (2013-2022).
Craig S. Brown (1977)
Year of Election or Appointment: 2022
Deputy Treasurer
Mr. Brown also serves as an officer of other funds. Mr. Brown is a Vice President (2015-present) and is an employee of Fidelity Investments. Mr. Brown serves as Assistant Treasurer of FIMM, LLC (2021-present). Previously, Mr. Brown served as Assistant Treasurer of certain Fidelity® funds (2019-2022).
John J. Burke III (1964)
Year of Election or Appointment: 2018
Chief Financial Officer
Mr. Burke also serves as Chief Financial Officer of other funds. Mr. Burke is Head of Fidelity Fund and Investment Operations (2018-present) and is an employee of Fidelity Investments. Mr. Burke serves as President, Executive Vice President, or Director of certain Fidelity entities. Previously Mr. Burke served as head of Asset Management Investment Operations (2012-2018).
Margaret Carey (1973)
Year of Election or Appointment: 2023
Secretary and Chief Legal Officer (CLO)
Ms. Carey also serves as an officer of other funds and as CLO of certain Fidelity entities. Ms. Carey is a Senior Vice President, Deputy General Counsel (2019-present) and is an employee of Fidelity Investments.
William C. Coffey (1969)
Year of Election or Appointment: 2019
Assistant Secretary
Mr. Coffey also serves as Assistant Secretary of other funds. Mr. Coffey is a Senior Vice President, Deputy General Counsel (2010-present) and is an employee of Fidelity Investments. Previously, Mr. Coffey served as Secretary and CLO of certain funds (2018-2019); CLO, Secretary, or Senior Vice President of certain Fidelity entities and Assistant Secretary of certain funds (2009-2018).
Timothy M. Cohen (1969)
Year of Election or Appointment: 2018
Vice President
Mr. Cohen also serves as Vice President of other funds. Mr. Cohen is Co-Head of Equity (2018-present) and is an employee of Fidelity Investments. Mr. Cohen serves a Director of Fidelity Management & Research (Japan) Limited (investment adviser firm, 2016-present). Previously, Mr. Cohen served as Executive Vice President of Fidelity SelectCo, LLC (2019) and Head of Global Equity Research (2016-2018).
Jonathan Davis (1968)
Year of Election or Appointment: 2010
Assistant Treasurer
Mr. Davis also serves as an officer of other funds. Mr. Davis is a Vice President (2006-present) and is an employee of Fidelity Investments. Mr. Davis serves as Assistant Treasurer of certain Fidelity entities.
Laura M. Del Prato (1964)
Year of Election or Appointment: 2018
Assistant Treasurer
Ms. Del Prato also serves as an officer of other funds. Ms. Del Prato is a Senior Vice President (2017-present) and is an employee of Fidelity Investments. Ms. Del Prato serves as Vice President or Assistant Treasurer of certain Fidelity entities. Previously, Ms. Del Prato served as President and Treasurer of The North Carolina Capital Management Trust: Cash Portfolio and Term Portfolio (2018-2020).
Colm A. Hogan (1973)
Year of Election or Appointment: 2020
Assistant Treasurer
Mr. Hogan also serves as an officer of other funds. Mr. Hogan is a Vice President (2016-present) and is an employee of Fidelity Investments. Mr. Hogan serves as Assistant Treasurer of certain Fidelity entities. Previously, Mr. Hogan served as Deputy Treasurer of certain Fidelity® funds (2016-2020) and Assistant Treasurer of certain Fidelity® funds (2016-2018).
Pamela R. Holding (1964)
Year of Election or Appointment: 2018
Vice President
Ms. Holding also serves as Vice President of other funds. Ms. Holding is Co-Head of Equity (2018-present) and is an employee of Fidelity Investments. Previously, Ms. Holding served as Executive Vice President of Fidelity SelectCo, LLC (2019) and as Chief Investment Officer of Fidelity Institutional Asset Management (2013-2018).
Chris Maher (1972)
Year of Election or Appointment: 2020
Deputy Treasurer
Mr. Maher also serves as an officer of other funds. Mr. Maher is a Vice President (2008-present) and is an employee of Fidelity Investments. Mr. Maher serves as Assistant Treasurer of certain Fidelity entities. Previously, Mr. Maher served as Assistant Treasurer of certain funds (2013-2020).
Jason P. Pogorelec (1975)
Year of Election or Appointment: 2020
Chief Compliance Officer
Mr. Pogorelec also serves as Chief Compliance Officer of other funds. Mr. Pogorelec is a Senior Vice President of Asset Management Compliance (2020-present) and is an employee of Fidelity Investments. Mr. Pogorelec serves as Compliance Officer of Fidelity Management & Research Company LLC (investment adviser firm, 2023-present) and Ballyrock Investment Advisors LLC (2023-present). Previously, Mr. Pogorelec served as a Vice President, Associate General Counsel for Fidelity Investments (2010-2020) and Assistant Secretary of certain Fidelity® funds (2015-2020).
Brett Segaloff (1972)
Year of Election or Appointment: 2021
Anti-Money Laundering (AML) Officer
Mr. Segaloff also serves as AML Officer of other funds. Mr. Segaloff is a Vice President (2022-present) and is an employee of Fidelity Investments. Mr. Segaloff serves as Anti Money Laundering Compliance Officer or Anti Money Laundering/Bank Secrecy Act Compliance Officer of certain Fidelity entities.
Stacie M. Smith (1974)
Year of Election or Appointment: 2016
President and Treasurer
Ms. Smith also serves as an officer of other funds. Ms. Smith is a Senior Vice President (2016-present) and is an employee of Fidelity Investments. Ms. Smith serves as Assistant Treasurer of certain Fidelity entities and has served in other fund officer roles.
Jim Wegmann (1979)
Year of Election or Appointment: 2019
Assistant Treasurer
Mr. Wegmann also serves as an officer of other funds. Mr. Wegmann is a Vice President (2016-present) and is an employee of Fidelity Investments. Mr. Wegmann serves as Assistant Treasurer of FIMM, LLC (2021-present). Previously, Mr. Wegmann served as Assistant Treasurer of certain Fidelity® funds (2019-2021).
As a shareholder, you incur two types of costs: (1) transaction costs, which may include sales charges (loads) on purchase payments or redemption proceeds, as applicable and (2) ongoing costs, which generally include management fees, distribution and/or service (12b-1) fees and other Fund expenses. This Example is intended to help you understand your ongoing costs (in dollars) of investing in a fund and to compare these costs with the ongoing costs of investing in other mutual funds.
The Example is based on an investment of $1,000 invested at the beginning of the period and held for the entire period (April 1, 2023 to September 30, 2023).
|
Actual Expenses
The first line of the accompanying table provides information about actual account values and actual expenses. You may use the information in this line, together with the amount you invested, to estimate the expenses that you paid over the period. Simply divide your account value by $1,000.00 (for example, an $8,600 account value divided by $1,000.00 = 8.6), then multiply the result by the number in the first line for a class/Fund under the heading entitled "Expenses Paid During Period" to estimate the expenses you paid on your account during this period. If any fund is a shareholder of any underlying mutual funds or exchange-traded funds (ETFs) (the Underlying Funds), such fund indirectly bears its proportional share of the expenses of the Underlying Funds in addition to the direct expenses incurred presented in the table. These fees and expenses are not included in the annualized expense ratio used to calculate the expense estimate in the table below.
Hypothetical Example for Comparison Purposes
The second line of the accompanying table provides information about hypothetical account values and hypothetical expenses based on the actual expense ratio and an assumed rate of return of 5% per year before expenses, which is not the actual return. The hypothetical account values and expenses may not be used to estimate the actual ending account balance or expenses you paid for the period. You may use this information to compare the ongoing costs of investing in the Fund and other funds. To do so, compare this 5% hypothetical example with the 5% hypothetical examples that appear in the shareholder reports of the other funds. If any fund is a shareholder of any Underlying Funds, such fund indirectly bears its proportional share of the expenses of the Underlying Funds in addition to the direct expenses as presented in the table. These fees and expenses are not included in the annualized expense ratio used to calculate the expense estimate in the table below.
Please note that the expenses shown in the table are meant to highlight your ongoing costs only and do not reflect any transaction costs. Therefore, the second line of the table is useful in comparing ongoing costs only, and will not help you determine the relative total costs of owning different funds. In addition, if these transactional costs were included, your costs would have been higher.
|
|
|
|
|
Annualized Expense Ratio- A
|
|
Beginning Account Value April 1, 2023
|
|
Ending Account Value September 30, 2023
|
|
Expenses Paid During Period- C April 1, 2023 to September 30, 2023
|
|
|
|
|
|
|
|
|
|
|
|
Fidelity® Floating Rate Central Fund
|
|
|
|
0.0014%
|
|
|
|
|
|
|
Actual
|
|
|
|
|
|
$ 1,000
|
|
$ 1,066.60
|
|
$ .01
|
Hypothetical-B
|
|
|
|
|
|
$ 1,000
|
|
$ 1,025.06
|
|
$ .01
|
|
|
A Annualized expense ratio reflects expenses net of applicable fee waivers.
B 5% return per year before expenses
C Expenses are equal to the annualized expense ratio, multiplied by the average account value over the period, multiplied by 183/ 365 (to reflect the one-half year period). The fees and expenses of any Underlying Funds are not included in each annualized expense ratio.
The dividend and capital gains distributions for the fund(s) are available on Fidelity.com or Institutional.Fidelity.com.
A total of 0.03% of the dividends distributed during the fiscal year was derived from interest on U.S. Government securities which is generally exempt from state income tax.
The fund designates $150,038,427 of distributions paid in the calendar year 2022 as qualifying to be taxed as interest-related dividends for nonresident alien shareholders.
The fund designates $171,040,104 of distributions paid during the fiscal year ended 2023 as qualifying to be taxed as section 163(j) interest dividends.
The fund will notify shareholders in January 2024 of amounts for use in preparing 2023 income tax returns.
Board Approval of Investment Advisory Contracts and Management Fees
Fidelity Floating Rate Central Fund
Each year, the Board of Directors, including the Independent Directors (together, the Board), considers the renewal of the fund's management contract with Fidelity Management & Research Company LLC (FMR) and the sub-advisory agreements (together, the Advisory Contracts) for the fund. FMR and the sub-advisers are referred to herein as the Investment Advisers. The Board, assisted by the advice of fund counsel and Independent Directors' counsel, requests and considers a broad range of information relevant to the renewal of the Advisory Contracts throughout the year.
The Board meets regularly and, at each of its meetings, covers an extensive agenda of topics and materials and considers factors that are relevant to its annual consideration of the renewal of the fund's Advisory Contracts, including the services and support provided to the fund and its shareholders. The Board, acting directly and through its Committees (each of which is composed of and chaired by Independent Directors), requests and receives information concerning the annual consideration of the renewal of the fund's Advisory Contracts. The Board also meets as needed to review matters specifically related to the Board's annual consideration of the renewal of the Advisory Contracts. Members of the Board may also meet with trustees of other Fidelity funds through joint ad hoc committees to discuss certain matters relevant to all of the Fidelity funds.
Approval of Stub Period Continuation. At its May 2023 meeting, the Board of Directors voted to continue the fund's management contract with FMR, and the sub-advisory agreements and sub-sub-advisory agreements, in each case, where applicable (together, the Advisory Contracts), without modification, for two months from June 1, 2023 through July 31, 2023. The Board considered that the approval of the fund's Advisory Contracts will not result in any changes in (i) the investment process or strategies employed in the management of the fund's assets; (ii) the fees and expenses paid by shareholders; (iii) the nature, extent or quality of services provided under the fund's Advisory Contracts; or (iv) the day-to-day management of the fund or the persons primarily responsible for such management. The Board also considered that since its last approval of the fund's Advisory Contracts, FMR had provided additional information on the fund in support of the annual contract renewal process, including competitive analyses on total expenses and management fees and in-depth reviews of fund performance and fund profitability information. The Board concluded that the fund's Advisory Contracts are fair and reasonable, and that the fund's Advisory Contracts should be renewed, without modification, through July 31, 2023, with the understanding that the Board would consider the annual renewal for a full one year period in July 2023.
At its July 2023 meeting, the Board unanimously determined to renew the fund's Advisory Contracts. In reaching its determination, the Board considered all factors it believed relevant and reached a determination, with the assistance of fund counsel and Independent Directors' counsel and through the exercise of its business judgment, that the renewal of the Advisory Contracts was in the best interests of the fund and its shareholders and the fact that no fee is payable under the management contract was fair and reasonable in light of all of the surrounding circumstances.
Nature, Extent, and Quality of Services Provided. The Board considered staffing as it relates to the fund, including the backgrounds and experience of investment personnel of the Investment Advisers, and also considered the Investment Advisers' implementation of the fund's investment program. The Independent Directors also had discussions with senior management of Fidelity's investment operations and investment groups. The Board considered the structure of the investment personnel compensation program and whether this structure provides appropriate incentives to act in the best interests of the fund.
Resources Dedicated to Investment Management and Support Services. The Board and the Fund Oversight and Research Committees reviewed the general qualifications and capabilities of Fidelity's investment staff, including its size, education, experience, and resources, as well as Fidelity's approach to recruiting, training, managing, and compensating investment personnel. The Board noted the resources devoted to expansion of Fidelity's global investment organization, and that Fidelity's analysts have extensive resources, tools, and capabilities that allow them to conduct sophisticated quantitative and fundamental analysis, as well as credit analysis of issuers, counterparties, and guarantors. Further, the Board considered that Fidelity's investment professionals have sufficient access to global information and data so as to provide competitive investment results over time, and that those professionals also have access to sophisticated tools that permit them to assess portfolio construction and risk and performance attribution characteristics continuously, as well as to transmit new information and research conclusions rapidly around the world. Additionally, in its deliberations, the Board considered Fidelity's trading, risk management, compliance, and technology and operations capabilities and resources, which are integral parts of the investment management process.
Administrative Services. The Board considered (i) the nature, extent, quality, and cost of advisory and administrative services performed by the Investment Advisers and their affiliates under the Advisory Contracts and under separate agreements covering transfer agency, pricing and bookkeeping, and securities lending services for the fund; (ii) the nature and extent of Fidelity's supervision of third party service providers, principally custodians, subcustodians, and pricing vendors; and (iii) the resources devoted by Fidelity to, and the record of compliance with, the fund's compliance policies and procedures. The Board also reviewed the allocation of fund brokerage, including allocations to brokers affiliated with the Investment Advisers, and the use of "soft" commission dollars to pay for research services. The Board also considered the fund's securities lending activities and any payments made to Fidelity relating to securities lending.
Investment Performance. The Board reviewed the fund's absolute investment performance, as well as the fund's relative investment performance, but did not consider performance to be a material factor in its decision to renew the fund's Advisory Contracts, as the fund is not publicly offered as a stand-alone investment product. In this regard, the Board noted that the fund is designed to offer a liquid investment option for other investment companies managed by Fidelity and ultimately to enhance the performance of those investment companies.
Based on its review, the Board concluded that the nature, extent, and quality of services provided to the fund under the Advisory Contracts should continue to benefit the shareholders of the fund.
Competitiveness of Management Fee and Total Expense Ratio. The Board considered that while the fund does not pay a management fee, FMR receives fees for providing services to funds that invest in the fund. The Board also noted that FMR bears all expenses of the fund with certain limited exceptions (i.e., custody fees, interest, taxes, fees and expenses of the Independent Directors, proxy and shareholder meeting expenses, and extraordinary expenses). The Board further noted that the fund pays its non-operating expenses, including brokerage commissions and fees and expenses associated with the fund's securities lending program, if applicable. Based on its review, the Board concluded that the management fee received for providing services to the fund and the fund's total expense ratio were reasonable in light of the services that the fund and its shareholders receive and the other factors considered.
Costs of the Services and Profitability. The Board considered the level of Fidelity's profits in respect of all the Fidelity funds, as well as the profitability of the funds that invest in the fund.
A public accounting firm has been engaged annually by the Board as part of the Board's assessment of Fidelity's profitability analysis. The engagement includes the review and assessment of the methodologies used by Fidelity in determining the revenues and expenses attributable to Fidelity's fund business, and completion of agreed-upon procedures in respect of the mathematical accuracy of certain fund profitability information and its conformity to established allocation methodologies. After considering the reports issued under the engagement and information provided by Fidelity, the Board concluded that while other allocation methods may also be reasonable, Fidelity's profitability methodologies are reasonable in all material respects.
The Board also reviewed Fidelity's non-fund businesses and potential indirect benefits such businesses may have received as a result of their association with Fidelity's fund business (i.e., fall-out benefits) as well as cases where Fidelity's affiliates may benefit from the funds' business. The Board considered areas where potential indirect benefits to the Fidelity funds from their relationships with Fidelity may exist. The Board's consideration of these matters was informed by the findings of a joint ad hoc committee created by it and the boards of other Fidelity funds to evaluate potential fall-out benefits.
The Board concluded that the costs of the services provided by and the profits realized by Fidelity in connection with the operation of the fund were not relevant to the renewal of the Advisory Contracts because the fund pays no advisory fees and FMR bears all expenses of the fund with certain exceptions.
Economies of Scale. The Board concluded that because the fund pays no advisory fees and FMR bears all expenses of the fund with certain exceptions, the realization of economies of scale was not a material factor in the Board's decision to renew the fund's Advisory Contract.
Additional Information Requested by the Board. In order to develop fully the factual basis for consideration of the Fidelity funds' advisory contracts, the Board requested and received additional information on certain topics, including: (i) fund flow and performance trends, in particular the underperformance of certain funds and strategies, and Fidelity's long-term strategies for certain funds, including any consideration of fund liquidations or mergers; (ii) the operation of performance fees and competitor use of performance fees; (iii) Fidelity's pricing philosophy compared to competitors; (iv) fund profitability methodology and data; (v) evaluation of competitive fund data and peer group classifications and fee and expense comparisons; (vi) the management fee and expense structures for different funds and classes and information about the differences between various fee and expense structures; (vii) group fee breakpoints and related voluntary fee waivers; and (viii) information regarding other accounts managed by Fidelity and the funds' sub-advisory arrangements.
Conclusion. Based on its evaluation of all of the conclusions noted above, and after considering all factors it believed relevant, the Board, including the Independent Directors, concluded that the advisory and sub-advisory fee arrangements are fair and reasonable in light of all of the surrounding circumstances and that the fund's Advisory Contracts should be renewed through July 31, 2024.
1.814672.118
FR1-ANN-1123
Item 2.
Code of Ethics
As of the end of the period, September 30, 2023, Fidelity Central Investment Portfolios LLC (the trust) has adopted a code of ethics, as defined in Item 2 of Form N-CSR, that applies to its President and Treasurer and its Chief Financial Officer. A copy of the code of ethics is filed as an exhibit to this Form N-CSR.
Item 3.
Audit Committee Financial Expert
The Board of Trustees of the trust has determined that Donald F. Donahue is an audit committee financial expert, as defined in Item 3 of Form N-CSR. Mr. Donahue is independent for purposes of Item 3 of Form N-CSR.
Item 4.
Principal Accountant Fees and Services
Fees and Services
The following table presents fees billed by Deloitte & Touche LLP, the member firms of Deloitte Touche Tohmatsu, and their respective affiliates (collectively, “Deloitte Entities”) in each of the last two fiscal years for services rendered to Fidelity Emerging Markets Equity Central Fund, Fidelity Floating Rate Central Fund, Fidelity International Equity Central Fund, and Fidelity Real Estate Equity Central Fund (the “Fund(s)”):
Services Billed by Deloitte Entities
September 30, 2023 FeesA
| | | | | |
|
| Audit Fees | Audit-Related Fees | Tax Fees | All Other Fees |
|
Fidelity Emerging Markets Equity Central Fund | $40,800 | $- | $10,800 | $1,100 |
| Fidelity Floating Rate Central Fund | $76,300 | $- | $9,700 | $1,800 |
| Fidelity International Equity Central Fund | $46,000 | $- | $11,000 | $1,200 |
| Fidelity Real Estate Equity Central Fund | $38,400 | $- | $8,900 | $1,000 |
| | | | | |
|
| Audit Fees | Audit-Related Fees | Tax Fees | All Other Fees |
| Fidelity Emerging Markets Equity Central Fund | $40,200 | $- | $10,300 | $1,000 |
| Fidelity Floating Rate Central Fund | $75,700 | $- | $9,100 | $1,700 |
| Fidelity International Equity Central Fund | $45,300 | $- | $10,300 | $1,100 |
| Fidelity Real Estate Central Fund | $37,900 | $- | $8,500 | $900 |
A Amounts may reflect rounding.
The following table(s) present(s) fees billed by Deloitte Entities that were required to be approved by the Audit Committee for services that relate directly to the operations and financial reporting of the Fund(s) and that are rendered on behalf of Fidelity Management & Research Company LLC ("FMR") and entities controlling, controlled by, or under common control with FMR (not including any sub-adviser whose role is primarily portfolio management and is subcontracted with or overseen by another investment adviser) that provide ongoing services to the Fund(s) (“Fund Service Providers”):
Services Billed by Deloitte Entities
| | | |
|
| September 30, 2023A | September 30, 2022A |
| Audit-Related Fees | $- | $- |
| Tax Fees | $- | $- |
| All Other Fees | $- | $- |
A Amounts may reflect rounding.
“Audit-Related Fees” represent fees billed for assurance and related services that are reasonably related to the performance of the fund audit or the review of the fund's financial statements and that are not reported under Audit Fees.
“Tax Fees” represent fees billed for tax compliance, tax advice or tax planning that relate directly to the operations and financial reporting of the fund.
“All Other Fees” represent fees billed for services provided to the fund or Fund Service Provider, a significant portion of which are assurance related, that relate directly to the operations and financial reporting of the fund, excluding those services that are reported under Audit Fees, Audit-Related Fees or Tax Fees.
Assurance services must be performed by an independent public accountant.
* * *
The aggregate non-audit fees billed by Deloitte Entities for services rendered to the Fund(s), FMR (not including any sub-adviser whose role is primarily portfolio management and is subcontracted with or overseen by another investment adviser), and any Fund Service Provider for each of the last two fiscal years of the Fund(s) are as follows:
| | | |
| Billed By | September 30, 2023A | September 30, 2022A |
| Deloitte Entities | $288,100 | $500,500 |
A Amounts may reflect rounding.
The trust's Audit Committee has considered non-audit services that were not pre-approved that were provided by Deloitte Entities to Fund Service Providers to be compatible with maintaining the independence of Deloitte Entities in its(their) audit of the Fund(s), taking into account representations from Deloitte Entities, in accordance with Public Company Accounting Oversight Board rules, regarding its independence from the Fund(s) and its(their) related entities and FMR’s review of the appropriateness and permissibility under applicable law of such non-audit services prior to their provision to the Fund(s) Service Providers.
Audit Committee Pre-Approval Policies and Procedures
The trust’s Audit Committee must pre-approve all audit and non-audit services provided by a fund’s independent registered public accounting firm relating to the operations or financial reporting of the fund. Prior to the commencement of any audit or non-audit services to a fund, the Audit Committee reviews the services to determine whether they are appropriate and permissible under applicable law.
The Audit Committee has adopted policies and procedures to, among other purposes, provide a framework for the Committee’s consideration of non-audit services by the audit firms that audit the Fidelity funds. The policies and procedures require that any non-audit service provided by a fund audit firm to a Fidelity fund and any non-audit service provided by a fund auditor to a Fund Service Provider that relates directly to the operations and financial reporting of a Fidelity fund (“Covered Service”) are subject to approval by the Audit Committee before such service is provided.
All Covered Services must be approved in advance of provision of the service either: (i) by formal resolution of the Audit Committee, or (ii) by oral or written approval of the service by the Chair of the Audit Committee (or if the Chair is unavailable, such other member of the Audit Committee as may be designated by the Chair to act in the Chair’s absence). The approval contemplated by (ii) above is permitted where the Treasurer determines that action on such an engagement is necessary before the next meeting of the Audit Committee.
Non-audit services provided by a fund audit firm to a Fund Service Provider that do not relate directly to the operations and financial reporting of a Fidelity fund are reported to the Audit Committee periodically.
Non-Audit Services Approved Pursuant to Rule 2-01(c)(7)(i)(C) and (ii) of Regulation S-X (“De Minimis Exception”)
There were no non-audit services approved or required to be approved by the Audit Committee pursuant to the De Minimis Exception during the Fund’s(s’) last two fiscal years relating to services provided to (i) the Fund(s) or (ii) any Fund Service Provider that relate directly to the operations and financial reporting of the Fund(s).
The Registrant has not retained, for the preparation of the audit report on the financial statements included in the Form N-CSR, a registered public accounting firm that has a branch or office that is located in a foreign jurisdiction and that the Public Company Accounting Oversight Board (the “PCAOB”) has determined that the PCAOB is unable to inspect or investigate completely because of a position taken by an authority in the foreign jurisdiction.
The Registrant is not a “foreign issuer,” as defined in 17 CFR 240.3b-4.
Item 5.
Audit Committee of Listed Registrants
Not applicable.
Item 6.
Investments
(a)
Not applicable.
(b)
Not applicable.
Item 7.
Disclosure of Proxy Voting Policies and Procedures for Closed-End Management Investment Companies
Not applicable.
Item 8.
Portfolio Managers of Closed-End Management Investment Companies
Not applicable.
Item 9.
Purchase of Equity Securities by Closed-End Management Investment Company and Affiliated Purchasers
Not applicable.
Item 10.
Submission of Matters to a Vote of Security Holders
There were no material changes to the procedures by which shareholders may recommend nominees to the trust’s Board of Trustees.
Item 11.
Controls and Procedures
(a)(i) The President and Treasurer and the Chief Financial Officer have concluded that the trust’s disclosure controls and procedures (as defined in Rule 30a-3(c) under the Investment Company Act) provide reasonable assurances that material information relating to the trust is made known to them by the appropriate persons, based on their evaluation of these controls and procedures as of a date within 90 days of the filing date of this report.
(a)(ii) There was no change in the trust’s internal control over financial reporting (as defined in Rule 30a-3(d) under the Investment Company Act) that occurred during the period covered by this report that has materially affected, or is reasonably likely to materially affect, the trust’s internal control over financial reporting.
Item 12.
Disclosure of Securities Lending Activities for Closed-End Management
Investment Companies
Not applicable.
Item 13.
Exhibits
SIGNATURES
Pursuant to the requirements of the Securities Exchange Act of 1934 and the Investment Company Act of 1940, the registrant has duly caused this report to be signed on its behalf by the undersigned, thereunto duly authorized.
Fidelity Central Investment Portfolios LLC
| | |
| By: | /s/Stacie M. Smith |
|
| Stacie M. Smith |
|
| President and Treasurer |
|
|
|
| Date: | November 21, 2023 |
Pursuant to the requirements of the Securities Exchange Act of 1934 and the Investment Company Act of 1940, this report has been signed below by the following persons on behalf of the registrant and in the capacities and on the dates indicated.
| | |
| By: | /s/Stacie M. Smith |
|
| Stacie M. Smith |
|
| President and Treasurer |
|
|
|
| Date: | November 21, 2023 |
| | |
| By: | /s/John J. Burke III |
|
| John J. Burke III |
|
| Chief Financial Officer |
|
|
|
| Date: | November 21, 2023 |
Exhibit EX-99.CERT
I, Stacie M. Smith, certify that:
1.
I have reviewed this report on Form N-CSR of Fidelity Central Investment Portfolios LLC;
2.
Based on my knowledge, this report does not contain any untrue statement of a material fact or omit to state a material fact necessary to make the statements made, in light of the circumstances under which such statements were made, not misleading with respect to the period covered by this report;
3.
Based on my knowledge, the financial statements, and other financial information included in this report, fairly present in all material respects the financial condition, results of operations, changes in net assets, and cash flows (if the financial statements are required to include a statement of cash flows) of the registrant as of, and for, the periods presented in this report;
4.
The registrant's other certifying officer(s) and I are responsible for establishing and maintaining disclosure controls and procedures (as defined in Rule 30a-3(c) under the Investment Company Act of 1940) and internal control over financial reporting (as defined in Rule 30a-3(d) under the Investment Company Act of 1940) for the registrant and have:
a.
Designed such disclosure controls and procedures, or caused such disclosure controls and procedures to be designed under our supervision, to ensure that material information relating to the registrant, including its consolidated subsidiaries, is made known to us by others within those entities, particularly during the period in which this report is being prepared;
b.
Designed such internal control over financial reporting, or caused such internal control over financial reporting to be designed under our supervision, to provide reasonable assurance regarding the reliability of financial reporting and the preparation of financial statements for external purposes in accordance with generally accepted accounting principles;
c.
Evaluated the effectiveness of the registrant's disclosure controls and procedures and presented in this report our conclusions about the effectiveness of the disclosure controls and procedures, as of a date within 90 days prior to the filing date of this report based upon such evaluation; and
d.
Disclosed in this report any change in the registrant’s internal control over financial reporting that occurred during the period covered by this report that has materially affected, or is reasonably likely to materially affect, the registrant’s internal control over financial reporting; and
5.
The registrant's other certifying officer(s) and I have disclosed to the registrant's auditors and the audit committee of the registrant's board of directors (or persons performing the equivalent functions):
a.
All significant deficiencies and material weaknesses in the design or operation of internal control over financial reporting which are reasonably likely to adversely affect the registrant's ability to record, process, summarize, and report financial information; and
b.
Any fraud, whether or not material, that involves management or other employees who have a significant role in the registrant's internal control over financial reporting.
Date:
November 21, 2023
|
/s/Stacie M. Smith
|
Stacie M. Smith
|
President and Treasurer
|
I, John J. Burke III, certify that:
1.
I have reviewed this report on Form N-CSR of Fidelity Central Investment Portfolios LLC;
2.
Based on my knowledge, this report does not contain any untrue statement of a material fact or omit to state a material fact necessary to make the statements made, in light of the circumstances under which such statements were made, not misleading with respect to the period covered by this report;
3.
Based on my knowledge, the financial statements, and other financial information included in this report, fairly present in all material respects the financial condition, results of operations, changes in net assets, and cash flows (if the financial statements are required to include a statement of cash flows) of the registrant as of, and for, the periods presented in this report;
4.
The registrant's other certifying officer(s) and I are responsible for establishing and maintaining disclosure controls and procedures (as defined in Rule 30a-3(c) under the Investment Company Act of 1940) and internal control over financial reporting (as defined in Rule 30a-3(d) under the Investment Company Act of 1940) for the registrant and have:
a.
Designed such disclosure controls and procedures, or caused such disclosure controls and procedures to be designed under our supervision, to ensure that material information relating to the registrant, including its consolidated subsidiaries, is made known to us by others within those entities, particularly during the period in which this report is being prepared;
b.
Designed such internal control over financial reporting, or caused such internal control over financial reporting to be designed under our supervision, to provide reasonable assurance regarding the reliability of financial reporting and the preparation of financial statements for external purposes in accordance with generally accepted accounting principles;
c.
Evaluated the effectiveness of the registrant's disclosure controls and procedures and presented in this report our conclusions about the effectiveness of the disclosure controls and procedures, as of a date within 90 days prior to the filing date of this report based upon such evaluation; and
d.
Disclosed in this report any change in the registrant’s internal control over financial reporting that occurred during the period covered by this report that has materially affected, or is reasonably likely to materially affect, the registrant’s internal control over financial reporting; and
5.
The registrant's other certifying officer(s) and I have disclosed to the registrant's auditors and the audit committee of the registrant's board of directors (or persons performing the equivalent functions):
a.
All significant deficiencies and material weaknesses in the design or operation of internal control over financial reporting which are reasonably likely to adversely affect the registrant's ability to record, process, summarize, and report financial information; and
b.
Any fraud, whether or not material, that involves management or other employees who have a significant role in the registrant's internal control over financial reporting.
Date:
November 21, 2023
|
/s/John J. Burke III
|
John J. Burke III
|
Chief Financial Officer
|
Exhibit EX-99.906CERT
Certification Pursuant to Section 906 of the Sarbanes-Oxley Act of 2002 (subsections (a) and (b) of section 1350, chapter 63 of title 18, United States Code)
In connection with the attached Report of Fidelity Central Investment Portfolios LLC (the “Trust”) on Form N-CSR to be filed with the Securities and Exchange Commission (the “Report”), each of the undersigned officers of the Trust does hereby certify that, to the best of such officer’s knowledge:
1.
The Report fully complies with the requirements of 13(a) or 15(d) of the Securities Exchange Act of 1934; and
2.
The information contained in the Report fairly presents, in all material respects, the financial condition and results of operations of the Trust as of, and for, the periods presented in the Report.
Dated: November 21, 2023
|
/s/Stacie M. Smith
|
Stacie M. Smith
|
President and Treasurer
|
Dated: November 21, 2023
|
/s/John J. Burke III
|
John J. Burke III
|
Chief Financial Officer
|
A signed original of this written statement required by Section 906, or other document authenticating, acknowledging, or otherwise adopting the signature that appears in typed form within the electronic version of this written statement required by Section 906, has been provided to the Trust and will be retained by the Trust and furnished to the Securities and Exchange Commission or its staff upon request.
Fidelity Investments
FIDELITY FUNDS’
CODE OF ETHICS
FOR PRESIDENT, TREASURER
AND PRINCIPAL ACCOUNTING OFFICER
2023
FIDELITY FUNDS’ CODE OF ETHICS FOR
PRESIDENT, TREASURER AND PRINCIPAL ACCOUNTING OFFICER
I. Purposes of the Code/Covered Officers
This document constitutes the Code of Ethics (Code) adopted by the Fidelity Funds (Funds) pursuant to Section 406 of the Sarbanes-Oxley Act of 2002. The Code applies to the Fidelity Funds’ President and Treasurer, and Chief Financial Officer (Covered Officers). Fidelity’s Ethics Office, within Enterprise Compliance, administers the Code.
The purposes of the Code are to deter wrongdoing and to promote, on the part of the Covered Officers:
·
honest and ethical conduct, including the ethical handling of actual or apparent conflicts of interest between personal and professional relationships;
·
full, fair, accurate, timely and understandable disclosure in reports and documents that the Fidelity Funds submit to the Securities and Exchange Commission (SEC), and in other public communications by a Fidelity Fund;
·
compliance with applicable laws and governmental rules and regulations;
·
the prompt internal reporting to an appropriate person or persons identified in the Code of violations of the Code; and
·
accountability for adherence to the Code.
Each Covered Officer should adhere to a high standard of business ethics and should be sensitive to situations that may give rise to actual as well as apparent conflicts of interest.
II.
Covered Officers Should Handle Ethically
Actual and Apparent Conflicts of Interest
Overview. A “conflict of interest” occurs when a Covered Officer’s private interest interferes with the interests of, or their service to, the Fidelity Funds. For example, a conflict of interest would arise if a Covered Officer, or a member of their family, receives improper personal benefits as a result of their position with the Fidelity Funds.
Certain conflicts of interest arise out of the relationships between Covered Officers and the Fidelity Funds and already are subject to conflict of interest provisions in the Investment Company Act of 1940 (Investment Company Act) and the Investment Advisers Act of 1940 (Investment Advisers Act). For example, Covered Officers may not individually engage in certain transactions (such as the purchase or sale of securities or other property) with a Fidelity Fund because of their status as “affiliated persons” of the Fund. Separate compliance programs and procedures of the Fidelity Funds, Fidelity Management & Research Company (FMR) and the other Fidelity companies are designed to prevent, or identify and correct, violations of these provisions. This Code does not, and is not intended to, repeat or replace these programs and procedures, and such conflicts fall outside of the parameters of this Code.
Although typically not presenting an opportunity for improper personal benefit, conflicts arise from, or as a result of, the contractual relationship between the Fidelity Funds and FMR (or another Fidelity company) of which the Covered Officers are also officers or employees. As a result, this Code recognizes that the Covered Officers will, in the normal course of their duties (whether formally for the Fidelity Funds, FMR or another Fidelity company), be involved in establishing policies and implementing decisions that have different effects on the Fidelity Funds, FMR and other Fidelity companies. The participation of the Covered Officers in such activities is inherent in the contractual relationship between the Fidelity Funds and FMR (or another Fidelity company) and is consistent with the performance by the Covered Officers of their duties as officers of the Fidelity Funds. Thus, if performed in conformity with the provisions of the Investment Company Act and the Investment Advisers Act, such activities will be deemed to have been handled ethically. In addition, it is recognized by the Funds’ Board of Trustees (Board) that the Covered Officers also may be officers or employees of one or more other Fidelity Funds covered by this Code.
Other conflicts of interest are covered by the Code, even if such conflicts of interest are not subject to provisions in the Investment Company Act and the Investment Advisers Act. The following list provides examples of conflicts of interest under the Code, but Covered Officers should keep in mind that these examples are not exhaustive. The overarching principle is that the personal interest of a Covered Officer should not be placed improperly before the interest of a Fidelity Fund.
* * *
Each Covered Officer must:
·
not use their personal influence or personal relationships improperly to influence investment decisions or financial reporting by any Fidelity Fund whereby the Covered Officer would benefit personally to the detriment of any Fidelity Fund;
·
not cause a Fidelity Fund to take action, or fail to take action, for the individual personal benefit of the Covered Officer rather than the benefit of the Fidelity Fund;
·
not engage in any outside business activity, including serving as a director or trustee, that prevents the Covered Officer from devoting appropriate time and attention to the Covered Officer’s responsibilities with the Fidelity Funds;
·
not have a consulting or employment relationship with any of the Fidelity Funds’ service providers that are not affiliated with Fidelity; and
·
not retaliate against any employee or Covered Officer for reports of actual or potential misconduct, which are made in good faith.
With respect to other fact patterns, if a Covered Officer is in doubt, other potential conflict of interest situations should be described immediately to the Fidelity Ethics Office for resolution. Similarly, any questions a Covered Officer has generally regarding the application or interpretation of the Code should be directed to the Fidelity Ethics Office immediately.
III. Disclosure and Compliance
·
Each Covered Officer should familiarize themself with the disclosure requirements generally applicable to the Fidelity Funds.
·
Each Covered Officer should not knowingly misrepresent, or cause others to misrepresent, facts about any Fidelity Fund to others, whether within or outside Fidelity, including to the Board and auditors, and to governmental regulators and self-regulatory organizations;
·
Each Covered Officer should, to the extent appropriate within their area of responsibility, consult with other officers and employees of the Fidelity Funds, FMR and the Fidelity service providers, and with the Board’s Compliance Committee, with the goal of promoting full, fair, accurate, timely and understandable disclosure in the reports and documents the Fidelity Funds file with, or submit to, the SEC and in other public communications made by the Fidelity Funds; and
·
It is the responsibility of each Covered Officer to promote compliance with the standards and restrictions imposed by applicable laws, rules and regulations.
IV. Reporting and Accountability
Each Covered Officer must:
·
upon receipt of the Code, and annually thereafter, submit to the Fidelity Ethics Office an acknowledgement stating that they have received, read, and understand the Code; and
·
notify the Fidelity Ethics Office promptly if they know of any violation of the Code. Failure to do so is itself a violation of this Code.
The Fidelity Ethics Office shall take all action it considers appropriate to investigate any actual or potential violations reported to it. Upon completion of the investigation, if necessary, the matter will be reviewed with senior management or other appropriate parties, and a determination will be made as to whether any action should be taken as detailed below. The Covered Officer will be informed of any action determined to be appropriate. The Fidelity Ethics Office will inform the Personal Trading Committee of all Code violations and actions taken in response. Without implied limitation, appropriate remedial, disciplinary or preventive action may include a written warning, a letter of censure, suspension, dismissal or, in the event of criminal or other serious violations of law, notification of the SEC or other appropriate law enforcement authorities. Additionally, other legal remedies may be pursued.
The policies and procedures described in the Code do not create any obligations to any person or entity other than the Fidelity Funds. The Code is intended solely for the internal use by the Fidelity Funds and does not constitute a promise, contract or an admission by or on behalf of any Fidelity Fund as to any fact, circumstance, or legal conclusion. The Fidelity Funds, the Fidelity companies and the Fidelity Head of Ethics retain the discretion to decide whether the Code applies to a specific situation, and how it should be interpreted.
V. Oversight
Material violations of this Code will be reported promptly by FMR (or another Fidelity company) to the Board’s Compliance Committee. In addition, at least once each year, FMR (or another Fidelity company) will provide a written report to the Board, which describes any issues arising under the Code since the last report to the Board, including, but not limited to, information about material violations of the Code and action taken in response to the material violations.
VI. Other Policies and Procedures
This Code shall be the sole code of ethics adopted by the Fidelity Funds for purposes of Section 406 of the Sarbanes-Oxley Act. Other Fidelity policies or procedures that cover the behavior or activities of Covered Officers are separate requirements applying to the Covered Officers (and others) and are not part of this Code.
VII. Amendments
Any material amendments or changes to this Code must be approved or ratified by a majority vote of the Board, including a majority of the Trustees who are not interested persons of the Fidelity Funds.
VIII. Records and Confidentiality
Records of any violation of the Code and of the actions taken as a result of such violations will be kept by the Fidelity Ethics Office. All reports and records prepared or maintained pursuant to this Code will be considered confidential and shall be maintained and protected accordingly. Except as otherwise required by law or this Code, such matters shall not be disclosed to anyone other than the Fidelity Ethics Office, the Personal Trading Committee, the Board, appropriate personnel at the relevant Fidelity company or companies and the legal counsel of any or all of the foregoing.
2023