
UNITED STATES
SECURITIES AND EXCHANGE COMMISSION
Washington, D.C. 20549
FORM N-CSR
CERTIFIED SHAREHOLDER REPORT OF REGISTERED
MANAGEMENT INVESTMENT COMPANIES
Investment Company Act file number 811-21667
Fidelity Central Investment Portfolios LLC
(Exact name of registrant as specified in charter)
245 Summer St., Boston, MA 02210
(Address of principal executive offices) (Zip code)
Margaret Carey, Secretary
245 Summer St.
Boston, Massachusetts 02210
(Name and address of agent for service)
Registrant's telephone number, including area code:
617-563-7000
|
Date of fiscal year end: |
August 31 |
|
|
|
|
Date of reporting period: |
February 28, 2023 |
Item 1.
Reports to Stockholders

Contents
|
Top Bond Issuers (% of Fund's net assets)
|
||
|
(with maturities greater than one year)
|
||
|
Occidental Petroleum Corp.
|
2.5
|
|
|
Mesquite Energy, Inc.
|
2.4
|
|
|
Community Health Systems, Inc.
|
1.9
|
|
|
Pacific Gas & Electric Co.
|
1.9
|
|
|
CCO Holdings LLC/CCO Holdings Capital Corp.
|
1.7
|
|
|
DISH Network Corp.
|
1.6
|
|
|
Tenet Healthcare Corp.
|
1.3
|
|
|
Uber Technologies, Inc.
|
1.3
|
|
|
Ford Motor Credit Co. LLC
|
1.3
|
|
|
Royal Caribbean Cruises Ltd.
|
1.1
|
|
|
17.0
|
||
|
Market Sectors (% of Fund's net assets)
|
||
|
Energy
|
17.1
|
|
|
Healthcare
|
6.9
|
|
|
Telecommunications
|
6.6
|
|
|
Services
|
5.8
|
|
|
Technology
|
5.3
|
|
|
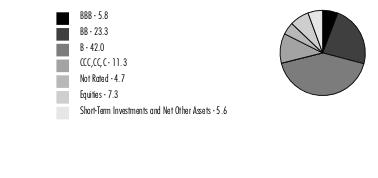
Quality Diversification (% of Fund's net assets)
|
|
|
We have used ratings from Moody's Investors Service, Inc. Where Moody's® ratings are not available, we have used S&P® ratings. All ratings are as of the date indicated and do not reflect subsequent changes.
|
|
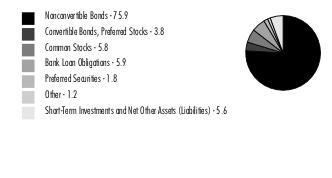
Asset Allocation (% of Fund's net assets)
|
|
|
Foreign investments - 16%
|
|
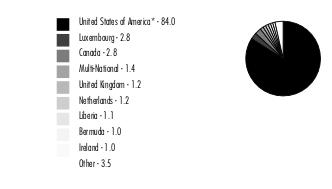
Geographic Diversification (% of Fund's net assets)
|
|
|
* Includes Short-Term investments and Net Other Assets (Liabilities).
Percentages are based on country or territory of incorporation and are adjusted for the effect of derivatives, if applicable.
|
|
Corporate Bonds - 79.4%
|
|||
|
Principal
Amount (a)
|
Value ($)
|
||
|
Convertible Bonds - 3.5%
|
|||
|
Broadcasting - 1.6%
|
|||
|
DISH Network Corp.:
|
|||
|
0% 12/15/25
|
3,263,000
|
2,080,163
|
|
|
2.375% 3/15/24
|
13,472,000
|
12,373,824
|
|
|
3.375% 8/15/26
|
20,439,000
|
13,062,159
|
|
|
27,516,146
|
|||
|
Diversified Financial Services - 0.2%
|
|||
|
New Cotai LLC 5% 2/24/27 (b)
|
1,592,432
|
3,440,131
|
|
|
Energy - 1.7%
|
|||
|
Mesquite Energy, Inc. 15% 7/15/23 (b)(c)
|
1,687,240
|
10,330,633
|
|
|
Mesquite Energy, Inc. 15% 7/15/23 (b)(c)
|
2,913,114
|
17,836,414
|
|
|
28,167,047
|
|||
|
TOTAL CONVERTIBLE BONDS
|
59,123,324
|
||
|
Nonconvertible Bonds - 75.9%
|
|||
|
Aerospace - 1.8%
|
|||
|
ATI, Inc.:
|
|||
|
4.875% 10/1/29
|
1,205,000
|
1,078,916
|
|
|
5.125% 10/1/31
|
845,000
|
744,260
|
|
|
5.875% 12/1/27
|
2,480,000
|
2,362,410
|
|
|
Bombardier, Inc.:
|
|||
|
6% 2/15/28 (d)
|
3,615,000
|
3,387,038
|
|
|
7.875% 4/15/27 (d)
|
6,180,000
|
6,144,969
|
|
|
Moog, Inc. 4.25% 12/15/27 (d)
|
735,000
|
672,531
|
|
|
TransDigm, Inc.:
|
|||
|
5.5% 11/15/27
|
12,450,000
|
11,438,438
|
|
|
7.5% 3/15/27
|
5,250,000
|
5,184,375
|
|
|
Wesco Aircraft Holdings, Inc. 8.5% 11/15/24 (d)
|
1,585,000
|
713,250
|
|
|
31,726,187
|
|||
|
Air Transportation - 0.9%
|
|||
|
Air Canada 3.875% 8/15/26 (d)
|
2,110,000
|
1,900,756
|
|
|
Allegiant Travel Co. 7.25% 8/15/27 (d)
|
1,545,000
|
1,517,963
|
|
|
Spirit Loyalty Cayman Ltd. / Spirit IP Cayman Ltd. 8% 9/20/25 (d)
|
8,125,000
|
8,163,594
|
|
|
United Airlines, Inc. 4.625% 4/15/29 (d)
|
1,650,000
|
1,462,784
|
|
|
Western Global Airlines LLC 10.375% 8/15/25 (d)
|
2,660,000
|
1,597,649
|
|
|
14,642,746
|
|||
|
Automotive - 0.4%
|
|||
|
Ford Motor Co. 6.1% 8/19/32
|
4,430,000
|
4,125,689
|
|
|
Ford Motor Credit Co. LLC 3.625% 6/17/31
|
2,480,000
|
1,964,709
|
|
|
6,090,398
|
|||
|
Automotive & Auto Parts - 2.2%
|
|||
|
Dana, Inc.:
|
|||
|
4.25% 9/1/30
|
1,400,000
|
1,130,878
|
|
|
5.625% 6/15/28
|
2,450,000
|
2,217,250
|
|
|
Ford Motor Co. 3.25% 2/12/32
|
4,510,000
|
3,408,607
|
|
|
Ford Motor Credit Co. LLC:
|
|||
|
2.9% 2/16/28
|
2,000,000
|
1,665,037
|
|
|
4.95% 5/28/27
|
5,375,000
|
5,007,834
|
|
|
5.125% 6/16/25
|
7,810,000
|
7,539,613
|
|
|
7.35% 11/4/27
|
5,000,000
|
5,065,500
|
|
|
General Motors Financial Co., Inc. 4.25% 5/15/23
|
615,000
|
613,648
|
|
|
LCM Investments Holdings 4.875% 5/1/29 (d)
|
3,665,000
|
2,978,883
|
|
|
Nesco Holdings II, Inc. 5.5% 4/15/29 (d)
|
1,770,000
|
1,577,513
|
|
|
PECF USS Intermediate Holding III Corp. 8% 11/15/29 (d)
|
875,000
|
615,069
|
|
|
Real Hero Merger Sub 2 6.25% 2/1/29 (d)
|
685,000
|
507,223
|
|
|
Rivian Holdco & Rivian LLC & Rivian Automotive LLC 6 month U.S. LIBOR + 5.620% 10.1636% 10/15/26 (d)(e)(f)
|
4,700,000
|
4,582,500
|
|
|
36,909,555
|
|||
|
Banks & Thrifts - 1.6%
|
|||
|
Ally Financial, Inc.:
|
|||
|
5.8% 5/1/25
|
20,000
|
20,013
|
|
|
8% 11/1/31
|
11,003,000
|
11,904,472
|
|
|
8% 11/1/31
|
5,273,000
|
5,707,955
|
|
|
CQP Holdco LP / BIP-V Chinook Holdco LLC 5.5% 6/15/31 (d)
|
7,280,000
|
6,388,200
|
|
|
VistaJet Malta Finance PLC / XO Management Holding, Inc. 6.375% 2/1/30 (d)
|
4,250,000
|
3,719,877
|
|
|
27,740,517
|
|||
|
Broadcasting - 1.6%
|
|||
|
Clear Channel Outdoor Holdings, Inc.:
|
|||
|
7.5% 6/1/29 (d)
|
2,590,000
|
2,097,900
|
|
|
7.75% 4/15/28 (d)
|
1,370,000
|
1,136,923
|
|
|
Diamond Sports Group LLC/Diamond Sports Finance Co. 5.375% 8/15/26 (d)
|
2,515,000
|
282,183
|
|
|
Gray Escrow II, Inc. 5.375% 11/15/31 (d)
|
2,970,000
|
2,205,084
|
|
|
iHeartCommunications, Inc. 9% 12/31/49 (b)(g)
|
780,000
|
0
|
|
|
Nexstar Broadcasting, Inc. 5.625% 7/15/27 (d)
|
2,755,000
|
2,558,658
|
|
|
Scripps Escrow II, Inc.:
|
|||
|
3.875% 1/15/29 (d)
|
2,170,000
|
1,729,447
|
|
|
5.375% 1/15/31 (d)
|
1,130,000
|
800,017
|
|
|
Scripps Escrow, Inc. 5.875% 7/15/27 (d)
|
1,780,000
|
1,425,284
|
|
|
Sirius XM Radio, Inc.:
|
|||
|
4.125% 7/1/30 (d)
|
2,155,000
|
1,751,433
|
|
|
5% 8/1/27 (d)
|
5,295,000
|
4,858,163
|
|
|
TEGNA, Inc. 5% 9/15/29
|
620,000
|
550,064
|
|
|
Univision Communications, Inc.:
|
|||
|
6.625% 6/1/27 (d)
|
5,150,000
|
4,889,307
|
|
|
7.375% 6/30/30 (d)
|
3,455,000
|
3,276,731
|
|
|
27,561,194
|
|||
|
Building Materials - 0.6%
|
|||
|
Advanced Drain Systems, Inc.:
|
|||
|
5% 9/30/27 (d)
|
505,000
|
469,802
|
|
|
6.375% 6/15/30 (d)
|
3,635,000
|
3,471,559
|
|
|
MIWD Holdco II LLC / MIWD Finance Corp. 5.5% 2/1/30 (d)
|
590,000
|
479,014
|
|
|
SRS Distribution, Inc.:
|
|||
|
4.625% 7/1/28 (d)
|
1,825,000
|
1,596,837
|
|
|
6% 12/1/29 (d)
|
1,705,000
|
1,424,016
|
|
|
6.125% 7/1/29 (d)
|
1,005,000
|
840,469
|
|
|
Victors Merger Corp. 6.375% 5/15/29 (d)
|
3,465,000
|
2,182,950
|
|
|
10,464,647
|
|||
|
Cable/Satellite TV - 4.7%
|
|||
|
CCO Holdings LLC/CCO Holdings Capital Corp.:
|
|||
|
4.25% 1/15/34 (d)
|
3,730,000
|
2,792,101
|
|
|
4.5% 8/15/30 (d)
|
3,095,000
|
2,545,699
|
|
|
4.5% 6/1/33 (d)
|
4,415,000
|
3,434,881
|
|
|
4.75% 3/1/30 (d)
|
5,200,000
|
4,373,044
|
|
|
5% 2/1/28 (d)
|
12,055,000
|
10,924,844
|
|
|
5.125% 5/1/27 (d)
|
3,920,000
|
3,627,058
|
|
|
6.375% 9/1/29 (d)
|
2,165,000
|
2,018,505
|
|
|
CSC Holdings LLC:
|
|||
|
3.375% 2/15/31 (d)
|
3,305,000
|
2,266,569
|
|
|
4.125% 12/1/30 (d)
|
2,590,000
|
1,871,741
|
|
|
4.5% 11/15/31 (d)
|
2,175,000
|
1,544,203
|
|
|
4.625% 12/1/30 (d)
|
5,895,000
|
3,173,721
|
|
|
5% 11/15/31 (d)
|
2,290,000
|
1,219,425
|
|
|
5.375% 2/1/28 (d)
|
4,625,000
|
3,857,713
|
|
|
5.75% 1/15/30 (d)
|
3,690,000
|
2,113,374
|
|
|
7.5% 4/1/28 (d)
|
4,545,000
|
3,043,832
|
|
|
DIRECTV Financing LLC / DIRECTV Financing Co-Obligor, Inc. 5.875% 8/15/27 (d)
|
2,505,000
|
2,239,517
|
|
|
DISH DBS Corp. 5.75% 12/1/28 (d)
|
1,465,000
|
1,170,242
|
|
|
Radiate Holdco LLC/Radiate Financial Service Ltd.:
|
|||
|
4.5% 9/15/26 (d)
|
6,820,000
|
5,089,089
|
|
|
6.5% 9/15/28 (d)
|
5,050,000
|
2,375,158
|
|
|
Telenet Finance Luxembourg Notes SARL 5.5% 3/1/28 (d)
|
8,600,000
|
8,024,230
|
|
|
VZ Secured Financing BV 5% 1/15/32 (d)
|
6,990,000
|
5,750,029
|
|
|
Ziggo Bond Co. BV:
|
|||
|
5.125% 2/28/30 (d)
|
1,155,000
|
933,390
|
|
|
6% 1/15/27 (d)
|
4,760,000
|
4,426,800
|
|
|
Ziggo BV 4.875% 1/15/30 (d)
|
1,730,000
|
1,462,997
|
|
|
80,278,162
|
|||
|
Chemicals - 2.0%
|
|||
|
Avient Corp. 5.75% 5/15/25 (d)
|
1,970,000
|
1,930,873
|
|
|
Axalta Coating Systems/Dutch Holding BV 4.75% 6/15/27 (d)
|
2,445,000
|
2,254,973
|
|
|
CVR Partners LP 6.125% 6/15/28 (d)
|
3,010,000
|
2,673,709
|
|
|
Kobe U.S. Midco 2, Inc. 9.25% 11/1/26 pay-in-kind (d)(e)
|
5,905,000
|
4,399,225
|
|
|
Kronos Acquisition Holdings, Inc. / KIK Custom Products, Inc.:
|
|||
|
5% 12/31/26 (d)
|
535,000
|
484,304
|
|
|
7% 12/31/27 (d)
|
680,000
|
583,100
|
|
|
LSB Industries, Inc. 6.25% 10/15/28 (d)
|
270,000
|
245,784
|
|
|
NOVA Chemicals Corp. 4.25% 5/15/29 (d)
|
2,650,000
|
2,194,068
|
|
|
Olympus Water U.S. Holding Corp. 7.125% 10/1/27 (d)
|
1,560,000
|
1,497,600
|
|
|
SCIH Salt Holdings, Inc.:
|
|||
|
4.875% 5/1/28 (d)
|
2,630,000
|
2,274,082
|
|
|
6.625% 5/1/29 (d)
|
1,755,000
|
1,424,976
|
|
|
The Chemours Co. LLC:
|
|||
|
4.625% 11/15/29 (d)
|
2,245,000
|
1,821,974
|
|
|
5.375% 5/15/27
|
2,940,000
|
2,677,311
|
|
|
5.75% 11/15/28 (d)
|
3,490,000
|
3,065,206
|
|
|
Tronox, Inc. 4.625% 3/15/29 (d)
|
2,210,000
|
1,801,150
|
|
|
W.R. Grace Holding LLC:
|
|||
|
4.875% 6/15/27 (d)
|
3,255,000
|
2,990,987
|
|
|
5.625% 8/15/29 (d)
|
2,375,000
|
1,904,282
|
|
|
34,223,604
|
|||
|
Consumer Products - 0.5%
|
|||
|
Central Garden & Pet Co. 4.125% 10/15/30
|
1,675,000
|
1,395,493
|
|
|
Diamond BC BV 4.625% 10/1/29 (d)
|
1,145,000
|
928,503
|
|
|
Ferrellgas LP/Ferrellgas Finance Corp. 5.375% 4/1/26 (d)
|
1,775,000
|
1,597,918
|
|
|
Gannett Holdings LLC 6% 11/1/26 (d)
|
1,390,000
|
1,167,683
|
|
|
Mattel, Inc. 3.375% 4/1/26 (d)
|
745,000
|
683,538
|
|
|
The Scotts Miracle-Gro Co. 4% 4/1/31
|
1,495,000
|
1,196,000
|
|
|
TKC Holdings, Inc. 10.5% 5/15/29 (d)
|
1,884,000
|
1,153,950
|
|
|
8,123,085
|
|||
|
Containers - 0.5%
|
|||
|
ARD Finance SA 6.5% 6/30/27 pay-in-kind (d)(e)
|
2,525,000
|
2,064,642
|
|
|
Berry Global, Inc.:
|
|||
|
4.5% 2/15/26 (d)
|
2,134,000
|
2,046,453
|
|
|
4.875% 7/15/26 (d)
|
1,355,000
|
1,297,413
|
|
|
Graham Packaging Co., Inc. 7.125% 8/15/28 (d)
|
1,430,000
|
1,229,959
|
|
|
Graphic Packaging International, Inc. 3.75% 2/1/30 (d)
|
1,185,000
|
1,009,857
|
|
|
Trivium Packaging Finance BV 5.5% 8/15/26 (d)
|
1,510,000
|
1,426,950
|
|
|
9,075,274
|
|||
|
Diversified Financial Services - 2.6%
|
|||
|
Altice France Holding SA 10.5% 5/15/27 (d)
|
4,240,000
|
3,501,943
|
|
|
Coinbase Global, Inc.:
|
|||
|
3.375% 10/1/28 (d)
|
9,125,000
|
5,976,875
|
|
|
3.625% 10/1/31 (d)
|
6,085,000
|
3,669,742
|
|
|
FLY Leasing Ltd. 7% 10/15/24 (d)
|
7,485,000
|
6,460,491
|
|
|
Hightower Holding LLC 6.75% 4/15/29 (d)
|
970,000
|
820,567
|
|
|
Icahn Enterprises LP/Icahn Enterprises Finance Corp.:
|
|||
|
4.75% 9/15/24
|
2,200,000
|
2,145,000
|
|
|
5.25% 5/15/27
|
5,970,000
|
5,552,100
|
|
|
6.375% 12/15/25
|
1,740,000
|
1,717,345
|
|
|
MSCI, Inc. 4% 11/15/29 (d)
|
5,785,000
|
5,120,304
|
|
|
OneMain Finance Corp. 7.125% 3/15/26
|
3,460,000
|
3,363,050
|
|
|
PRA Group, Inc. 5% 10/1/29 (d)
|
7,620,000
|
6,493,840
|
|
|
44,821,257
|
|||
|
Diversified Media - 0.4%
|
|||
|
Allen Media LLC 10.5% 2/15/28 (d)
|
7,650,000
|
3,289,500
|
|
|
Lamar Media Corp. 4.875% 1/15/29
|
1,980,000
|
1,827,841
|
|
|
Terrier Media Buyer, Inc. 8.875% 12/15/27 (d)
|
3,285,000
|
2,210,739
|
|
|
7,328,080
|
|||
|
Energy - 11.6%
|
|||
|
Antero Midstream Partners LP/Antero Midstream Finance Corp. 5.75% 1/15/28 (d)
|
2,220,000
|
2,084,025
|
|
|
Archrock Partners LP / Archrock Partners Finance Corp.:
|
|||
|
6.25% 4/1/28 (d)
|
2,475,000
|
2,349,468
|
|
|
6.875% 4/1/27 (d)
|
700,000
|
679,091
|
|
|
Atlantica Sustainable Infrastructure PLC 4.125% 6/15/28 (d)
|
1,235,000
|
1,089,990
|
|
|
California Resources Corp. 7.125% 2/1/26 (d)
|
3,735,000
|
3,763,199
|
|
|
Centennial Resource Production LLC 5.875% 7/1/29 (d)
|
2,610,000
|
2,335,950
|
|
|
Cheniere Energy, Inc. 4.625% 10/15/28
|
3,250,000
|
3,012,783
|
|
|
Citgo Holding, Inc. 9.25% 8/1/24 (d)
|
2,625,000
|
2,631,055
|
|
|
Citgo Petroleum Corp.:
|
|||
|
6.375% 6/15/26 (d)
|
2,610,000
|
2,519,915
|
|
|
7% 6/15/25 (d)
|
6,180,000
|
6,083,468
|
|
|
CNX Resources Corp.:
|
|||
|
6% 1/15/29 (d)
|
1,185,000
|
1,074,357
|
|
|
7.375% 1/15/31 (d)
|
1,685,000
|
1,605,300
|
|
|
Comstock Resources, Inc.:
|
|||
|
5.875% 1/15/30 (d)
|
1,595,000
|
1,371,700
|
|
|
6.75% 3/1/29 (d)
|
3,485,000
|
3,206,200
|
|
|
Crestwood Midstream Partners LP/Crestwood Midstream Finance Corp.:
|
|||
|
5.75% 4/1/25
|
1,045,000
|
1,013,611
|
|
|
6% 2/1/29 (d)
|
7,210,000
|
6,558,937
|
|
|
CrownRock LP/CrownRock Finance, Inc. 5% 5/1/29 (d)
|
830,000
|
751,594
|
|
|
CVR Energy, Inc.:
|
|||
|
5.25% 2/15/25 (d)
|
4,990,000
|
4,790,400
|
|
|
5.75% 2/15/28 (d)
|
3,995,000
|
3,545,762
|
|
|
DCP Midstream Operating LP 5.85% 5/21/43 (d)(e)
|
3,410,000
|
3,374,536
|
|
|
Delek Logistics Partners LP 7.125% 6/1/28 (d)
|
1,520,000
|
1,337,600
|
|
|
DT Midstream, Inc.:
|
|||
|
4.125% 6/15/29 (d)
|
2,545,000
|
2,182,338
|
|
|
4.375% 6/15/31 (d)
|
2,545,000
|
2,131,438
|
|
|
Endeavor Energy Resources LP/EER Finance, Inc. 5.75% 1/30/28 (d)
|
4,185,000
|
4,038,525
|
|
|
EnLink Midstream LLC:
|
|||
|
5.625% 1/15/28 (d)
|
1,060,000
|
1,009,650
|
|
|
6.5% 9/1/30 (d)
|
2,150,000
|
2,117,600
|
|
|
EQT Corp. 3.625% 5/15/31 (d)
|
1,720,000
|
1,443,510
|
|
|
Harvest Midstream I LP 7.5% 9/1/28 (d)
|
5,565,000
|
5,366,663
|
|
|
Hess Midstream Partners LP:
|
|||
|
4.25% 2/15/30 (d)
|
1,560,000
|
1,317,233
|
|
|
5.125% 6/15/28 (d)
|
2,905,000
|
2,665,377
|
|
|
5.5% 10/15/30 (d)
|
920,000
|
828,000
|
|
|
5.625% 2/15/26 (d)
|
6,900,000
|
6,714,873
|
|
|
KLX Energy Services Holdings, Inc. 11.5% 11/1/25 (d)
|
2,685,000
|
2,470,200
|
|
|
MC Brazil Downstream Trading SARL 7.25% 6/30/31 (d)
|
7,159,924
|
5,838,918
|
|
|
MEG Energy Corp. 5.875% 2/1/29 (d)
|
4,235,000
|
3,949,857
|
|
|
Nabors Industries, Inc. 5.75% 2/1/25
|
4,196,000
|
4,003,613
|
|
|
Neptune Energy Bondco PLC 6.625% 5/15/25 (d)
|
1,065,000
|
1,035,377
|
|
|
New Fortress Energy, Inc. 6.75% 9/15/25 (d)
|
6,830,000
|
6,404,218
|
|
|
NGL Energy Operating LLC/NGL Energy Finance Corp. 7.5% 2/1/26 (d)
|
7,325,000
|
6,994,768
|
|
|
Northern Oil & Gas, Inc. 8.125% 3/1/28 (d)
|
3,455,000
|
3,334,075
|
|
|
Occidental Petroleum Corp.:
|
|||
|
4.3% 8/15/39
|
880,000
|
688,600
|
|
|
4.4% 4/15/46
|
1,750,000
|
1,342,645
|
|
|
4.5% 7/15/44
|
815,000
|
635,854
|
|
|
5.875% 9/1/25
|
1,665,000
|
1,660,838
|
|
|
6.125% 1/1/31
|
4,345,000
|
4,375,893
|
|
|
6.2% 3/15/40
|
980,000
|
955,500
|
|
|
6.45% 9/15/36
|
1,717,000
|
1,725,585
|
|
|
6.6% 3/15/46
|
2,590,000
|
2,635,662
|
|
|
6.625% 9/1/30
|
8,330,000
|
8,559,075
|
|
|
6.95% 7/1/24
|
1,308,000
|
1,321,103
|
|
|
7.5% 5/1/31
|
10,215,000
|
10,930,050
|
|
|
8.875% 7/15/30
|
6,715,000
|
7,627,233
|
|
|
PBF Holding Co. LLC/PBF Finance Corp.:
|
|||
|
6% 2/15/28
|
5,755,000
|
5,368,437
|
|
|
7.25% 6/15/25
|
5,150,000
|
5,138,825
|
|
|
SM Energy Co.:
|
|||
|
6.5% 7/15/28
|
920,000
|
848,700
|
|
|
6.625% 1/15/27
|
1,145,000
|
1,089,181
|
|
|
6.75% 9/15/26
|
805,000
|
776,658
|
|
|
Southwestern Energy Co.:
|
|||
|
4.75% 2/1/32
|
2,135,000
|
1,834,670
|
|
|
5.375% 2/1/29
|
4,415,000
|
4,129,824
|
|
|
Suburban Propane Partners LP/Suburban Energy Finance Corp. 5.875% 3/1/27
|
3,905,000
|
3,709,580
|
|
|
Sunoco LP/Sunoco Finance Corp. 4.5% 5/15/29
|
2,280,000
|
2,000,960
|
|
|
Tallgrass Energy Partners LP / Tallgrass Energy Finance Corp. 6% 12/31/30 (d)
|
2,370,000
|
2,043,746
|
|
|
Tullow Oil PLC 10.25% 5/15/26 (d)
|
5,450,000
|
4,380,438
|
|
|
Valaris Ltd. 8.25% 4/30/28 pay-in-kind (e)
|
660,000
|
674,025
|
|
|
Venture Global Calcasieu Pass LLC:
|
|||
|
3.875% 8/15/29 (d)
|
2,220,000
|
1,914,750
|
|
|
4.125% 8/15/31 (d)
|
2,220,000
|
1,909,200
|
|
|
Viper Energy Partners LP 5.375% 11/1/27 (d)
|
1,105,000
|
1,050,634
|
|
|
198,352,840
|
|||
|
Environmental - 0.4%
|
|||
|
Covanta Holding Corp. 4.875% 12/1/29 (d)
|
1,355,000
|
1,144,510
|
|
|
Madison IAQ LLC:
|
|||
|
4.125% 6/30/28 (d)
|
1,795,000
|
1,531,315
|
|
|
5.875% 6/30/29 (d)
|
2,775,000
|
2,209,257
|
|
|
Stericycle, Inc. 3.875% 1/15/29 (d)
|
1,645,000
|
1,410,187
|
|
|
6,295,269
|
|||
|
Food & Drug Retail - 1.0%
|
|||
|
Albertsons Companies LLC/Safeway, Inc./New Albertson's, Inc./Albertson's LLC:
|
|||
|
3.5% 3/15/29 (d)
|
1,655,000
|
1,400,751
|
|
|
4.625% 1/15/27 (d)
|
4,615,000
|
4,338,100
|
|
|
4.875% 2/15/30 (d)
|
6,890,000
|
6,182,586
|
|
|
BellRing Brands, Inc. 7% 3/15/30 (d)
|
845,000
|
835,618
|
|
|
Emergent BioSolutions, Inc. 3.875% 8/15/28 (d)
|
1,470,000
|
889,350
|
|
|
Murphy Oil U.S.A., Inc. 3.75% 2/15/31 (d)
|
960,000
|
776,746
|
|
|
SEG Holding LLC/SEG Finance Corp. 5.625% 10/15/28 (d)
|
2,200,000
|
2,071,078
|
|
|
16,494,229
|
|||
|
Food/Beverage/Tobacco - 1.6%
|
|||
|
C&S Group Enterprises LLC 5% 12/15/28 (d)
|
1,905,000
|
1,467,104
|
|
|
Chobani LLC/Finance Corp., Inc.:
|
|||
|
4.625% 11/15/28 (d)
|
1,465,000
|
1,277,026
|
|
|
7.5% 4/15/25 (d)
|
450,000
|
438,422
|
|
|
KeHE Distributors LLC / KeHE Finance Corp. 8.625% 10/15/26 (d)
|
1,702,000
|
1,706,255
|
|
|
Kraft Heinz Foods Co.:
|
|||
|
4.375% 6/1/46
|
645,000
|
526,106
|
|
|
4.875% 10/1/49
|
3,225,000
|
2,831,859
|
|
|
5.5% 6/1/50
|
855,000
|
816,861
|
|
|
Lamb Weston Holdings, Inc. 4.125% 1/31/30 (d)
|
2,290,000
|
2,009,683
|
|
|
Performance Food Group, Inc.:
|
|||
|
4.25% 8/1/29 (d)
|
1,350,000
|
1,178,726
|
|
|
5.5% 10/15/27 (d)
|
5,775,000
|
5,476,375
|
|
|
6.875% 5/1/25 (d)
|
995,000
|
997,145
|
|
|
Post Holdings, Inc.:
|
|||
|
4.625% 4/15/30 (d)
|
625,000
|
541,888
|
|
|
5.75% 3/1/27 (d)
|
282,000
|
274,616
|
|
|
TreeHouse Foods, Inc. 4% 9/1/28
|
860,000
|
737,579
|
|
|
Triton Water Holdings, Inc. 6.25% 4/1/29 (d)
|
1,080,000
|
860,814
|
|
|
U.S. Foods, Inc.:
|
|||
|
4.625% 6/1/30 (d)
|
1,110,000
|
969,523
|
|
|
4.75% 2/15/29 (d)
|
3,100,000
|
2,793,813
|
|
|
United Natural Foods, Inc. 6.75% 10/15/28 (d)
|
1,810,000
|
1,713,245
|
|
|
26,617,040
|
|||
|
Gaming - 2.3%
|
|||
|
Affinity Gaming LLC 6.875% 12/15/27 (d)
|
890,000
|
793,836
|
|
|
Caesars Entertainment, Inc.:
|
|||
|
4.625% 10/15/29 (d)
|
2,860,000
|
2,446,158
|
|
|
8.125% 7/1/27 (d)
|
6,225,000
|
6,287,250
|
|
|
CDI Escrow Issuer, Inc. 5.75% 4/1/30 (d)
|
4,380,000
|
4,067,925
|
|
|
Fertitta Entertainment LLC / Fertitta Entertainment Finance Co., Inc.:
|
|||
|
4.625% 1/15/29 (d)
|
2,925,000
|
2,529,833
|
|
|
6.75% 1/15/30 (d)
|
5,120,000
|
4,243,302
|
|
|
Golden Entertainment, Inc. 7.625% 4/15/26 (d)
|
935,000
|
937,599
|
|
|
Jacobs Entertainment, Inc. 6.75% 2/15/29 (d)
|
1,245,000
|
1,133,236
|
|
|
Station Casinos LLC 4.625% 12/1/31 (d)
|
3,685,000
|
3,002,280
|
|
|
Studio City Finance Ltd. 6.5% 1/15/28 (d)
|
5,015,000
|
4,240,183
|
|
|
VICI Properties LP / VICI Note Co.:
|
|||
|
4.5% 9/1/26 (d)
|
4,310,000
|
4,021,148
|
|
|
4.625% 6/15/25 (d)
|
5,180,000
|
4,971,065
|
|
|
38,673,815
|
|||
|
Healthcare - 6.8%
|
|||
|
1375209 BC Ltd. 9% 1/30/28 (d)
|
1,023,000
|
1,021,445
|
|
|
AHP Health Partners, Inc. 5.75% 7/15/29 (d)
|
2,665,000
|
2,230,080
|
|
|
Akumin, Inc. 7% 11/1/25 (d)
|
4,155,000
|
3,304,868
|
|
|
Avantor Funding, Inc.:
|
|||
|
3.875% 11/1/29 (d)
|
2,290,000
|
1,980,850
|
|
|
4.625% 7/15/28 (d)
|
3,345,000
|
3,077,400
|
|
|
Bausch Health Companies, Inc.:
|
|||
|
11% 9/30/28 (d)
|
1,819,000
|
1,423,325
|
|
|
14% 10/15/30 (d)
|
359,000
|
227,340
|
|
|
Catalent Pharma Solutions 5% 7/15/27 (d)
|
825,000
|
795,193
|
|
|
Centene Corp.:
|
|||
|
3.375% 2/15/30
|
2,690,000
|
2,269,766
|
|
|
4.625% 12/15/29
|
3,825,000
|
3,497,935
|
|
|
Charles River Laboratories International, Inc.:
|
|||
|
3.75% 3/15/29 (d)
|
740,000
|
642,468
|
|
|
4% 3/15/31 (d)
|
2,080,000
|
1,779,771
|
|
|
4.25% 5/1/28 (d)
|
735,000
|
663,124
|
|
|
Community Health Systems, Inc.:
|
|||
|
4.75% 2/15/31 (d)
|
11,675,000
|
9,018,938
|
|
|
5.25% 5/15/30 (d)
|
4,900,000
|
3,920,588
|
|
|
6% 1/15/29 (d)
|
3,475,000
|
3,001,135
|
|
|
6.125% 4/1/30 (d)
|
5,840,000
|
3,999,232
|
|
|
6.875% 4/15/29 (d)
|
2,815,000
|
1,968,820
|
|
|
8% 3/15/26 (d)
|
12,925,000
|
12,601,875
|
|
|
DaVita HealthCare Partners, Inc.:
|
|||
|
3.75% 2/15/31 (d)
|
2,495,000
|
1,883,977
|
|
|
4.625% 6/1/30 (d)
|
6,965,000
|
5,740,344
|
|
|
Encompass Health Corp. 5.75% 9/15/25
|
4,660,000
|
4,580,489
|
|
|
Grifols Escrow Issuer SA 4.75% 10/15/28 (d)
|
1,085,000
|
927,675
|
|
|
HealthEquity, Inc. 4.5% 10/1/29 (d)
|
1,005,000
|
878,360
|
|
|
Hologic, Inc. 3.25% 2/15/29 (d)
|
2,525,000
|
2,177,308
|
|
|
Jazz Securities DAC 4.375% 1/15/29 (d)
|
1,980,000
|
1,753,587
|
|
|
Molina Healthcare, Inc.:
|
|||
|
3.875% 11/15/30 (d)
|
2,430,000
|
2,047,164
|
|
|
3.875% 5/15/32 (d)
|
3,315,000
|
2,721,648
|
|
|
4.375% 6/15/28 (d)
|
1,835,000
|
1,666,731
|
|
|
Mozart Borrower LP 3.875% 4/1/29 (d)
|
4,435,000
|
3,696,462
|
|
|
Option Care Health, Inc. 4.375% 10/31/29 (d)
|
1,060,000
|
908,494
|
|
|
Organon & Co. / Organon Foreign Debt Co-Issuer BV:
|
|||
|
4.125% 4/30/28 (d)
|
3,005,000
|
2,652,514
|
|
|
5.125% 4/30/31 (d)
|
2,995,000
|
2,542,006
|
|
|
RP Escrow Issuer LLC 5.25% 12/15/25 (d)
|
2,295,000
|
1,793,451
|
|
|
Surgery Center Holdings, Inc.:
|
|||
|
6.75% 7/1/25 (d)
|
124,000
|
122,388
|
|
|
10% 4/15/27 (d)
|
1,768,000
|
1,798,965
|
|
|
Tenet Healthcare Corp.:
|
|||
|
4.25% 6/1/29
|
6,200,000
|
5,429,340
|
|
|
4.375% 1/15/30
|
6,565,000
|
5,744,375
|
|
|
6.125% 10/1/28
|
7,085,000
|
6,553,625
|
|
|
6.125% 6/15/30 (d)
|
3,680,000
|
3,505,154
|
|
|
6.875% 11/15/31
|
330,000
|
304,425
|
|
|
116,852,635
|
|||
|
Homebuilders/Real Estate - 1.7%
|
|||
|
Arcosa, Inc. 4.375% 4/15/29 (d)
|
1,425,000
|
1,245,133
|
|
|
Ashton Woods U.S.A. LLC/Ashton Woods Finance Co.:
|
|||
|
4.625% 8/1/29 (d)
|
1,380,000
|
1,132,345
|
|
|
6.625% 1/15/28 (d)
|
40,000
|
36,202
|
|
|
Kennedy-Wilson, Inc.:
|
|||
|
4.75% 3/1/29
|
2,190,000
|
1,780,087
|
|
|
5% 3/1/31
|
2,190,000
|
1,675,685
|
|
|
New Home Co., Inc. 7.25% 10/15/25 (d)
|
1,685,000
|
1,558,625
|
|
|
Realogy Group LLC/Realogy Co-Issuer Corp. 5.75% 1/15/29 (d)
|
2,760,000
|
1,987,200
|
|
|
Realogy Group LLC/Realogy Co.-Issuer Corp. 5.25% 4/15/30 (d)
|
6,300,000
|
4,315,500
|
|
|
Starwood Property Trust, Inc. 4.75% 3/15/25
|
2,420,000
|
2,309,333
|
|
|
Taylor Morrison Communities, Inc./Monarch Communities, Inc. 5.75% 1/15/28 (d)
|
2,945,000
|
2,777,796
|
|
|
TRI Pointe Homes, Inc. 5.7% 6/15/28
|
795,000
|
739,011
|
|
|
Uniti Group LP / Uniti Group Finance, Inc.:
|
|||
|
4.75% 4/15/28 (d)
|
2,035,000
|
1,613,145
|
|
|
6.5% 2/15/29 (d)
|
3,300,000
|
2,161,517
|
|
|
10.5% 2/15/28 (d)
|
4,250,000
|
4,250,850
|
|
|
Weekley Homes LLC/Weekley Finance Corp. 4.875% 9/15/28 (d)
|
1,185,000
|
1,006,408
|
|
|
28,588,837
|
|||
|
Hotels - 0.8%
|
|||
|
Carnival Holdings (Bermuda) Ltd. 10.375% 5/1/28 (d)
|
5,095,000
|
5,451,650
|
|
|
Hilton Domestic Operating Co., Inc.:
|
|||
|
3.625% 2/15/32 (d)
|
1,470,000
|
1,206,855
|
|
|
3.75% 5/1/29 (d)
|
1,650,000
|
1,430,632
|
|
|
5.375% 5/1/25 (d)
|
3,525,000
|
3,480,747
|
|
|
Lindblad Expeditions LLC 6.75% 2/15/27 (d)
|
2,120,000
|
2,003,400
|
|
|
13,573,284
|
|||
|
Insurance - 1.7%
|
|||
|
Acrisure LLC / Acrisure Finance, Inc.:
|
|||
|
7% 11/15/25 (d)
|
9,401,000
|
8,785,464
|
|
|
10.125% 8/1/26 (d)
|
2,450,000
|
2,438,394
|
|
|
Alliant Holdings Intermediate LLC:
|
|||
|
5.875% 11/1/29 (d)
|
3,030,000
|
2,532,413
|
|
|
6.75% 10/15/27 (d)
|
9,895,000
|
8,992,378
|
|
|
AmWINS Group, Inc. 4.875% 6/30/29 (d)
|
1,400,000
|
1,189,025
|
|
|
AssuredPartners, Inc. 5.625% 1/15/29 (d)
|
1,445,000
|
1,224,338
|
|
|
HUB International Ltd. 7% 5/1/26 (d)
|
1,395,000
|
1,371,342
|
|
|
USI, Inc. 6.875% 5/1/25 (d)
|
3,250,000
|
3,193,123
|
|
|
29,726,477
|
|||
|
Leisure - 2.5%
|
|||
|
Carnival Corp.:
|
|||
|
5.75% 3/1/27 (d)
|
5,135,000
|
4,210,700
|
|
|
9.875% 8/1/27 (d)
|
4,130,000
|
4,204,299
|
|
|
10.5% 2/1/26 (d)
|
2,400,000
|
2,485,392
|
|
|
NCL Corp. Ltd.:
|
|||
|
5.875% 3/15/26 (d)
|
735,000
|
635,775
|
|
|
5.875% 2/15/27 (d)
|
2,890,000
|
2,680,475
|
|
|
7.75% 2/15/29 (d)
|
2,575,000
|
2,241,538
|
|
|
NCL Finance Ltd. 6.125% 3/15/28 (d)
|
910,000
|
757,575
|
|
|
Royal Caribbean Cruises Ltd.:
|
|||
|
4.25% 7/1/26 (d)
|
4,375,000
|
3,838,756
|
|
|
5.375% 7/15/27 (d)
|
1,975,000
|
1,735,894
|
|
|
5.5% 8/31/26 (d)
|
4,495,000
|
4,130,096
|
|
|
7.25% 1/15/30 (d)
|
1,620,000
|
1,627,088
|
|
|
11.625% 8/15/27 (d)
|
8,060,000
|
8,600,423
|
|
|
Studio City Co. Ltd. 7% 2/15/27 (d)
|
2,315,000
|
2,176,100
|
|
|
Vail Resorts, Inc. 6.25% 5/15/25 (d)
|
1,435,000
|
1,431,139
|
|
|
Viking Cruises Ltd. 13% 5/15/25 (d)
|
2,135,000
|
2,269,388
|
|
|
43,024,638
|
|||
|
Metals/Mining - 2.2%
|
|||
|
Alcoa Nederland Holding BV 4.125% 3/31/29 (d)
|
2,670,000
|
2,371,427
|
|
|
Alpha Natural Resources, Inc. 9.75% 12/31/99 (b)(g)
|
1,099,000
|
0
|
|
|
Arconic Corp. 6% 5/15/25 (d)
|
1,520,000
|
1,520,000
|
|
|
Cleveland-Cliffs, Inc.:
|
|||
|
4.625% 3/1/29 (d)
|
1,465,000
|
1,334,748
|
|
|
4.875% 3/1/31 (d)
|
1,465,000
|
1,333,575
|
|
|
Constellium NV 5.875% 2/15/26 (d)
|
990,000
|
966,740
|
|
|
ERO Copper Corp. 6.5% 2/15/30 (d)
|
7,425,000
|
6,283,406
|
|
|
First Quantum Minerals Ltd.:
|
|||
|
6.875% 3/1/26 (d)
|
3,930,000
|
3,696,656
|
|
|
6.875% 10/15/27 (d)
|
2,995,000
|
2,802,197
|
|
|
7.5% 4/1/25 (d)
|
2,320,000
|
2,251,560
|
|
|
FMG Resources Pty Ltd.:
|
|||
|
4.375% 4/1/31 (d)
|
1,615,000
|
1,364,885
|
|
|
5.125% 5/15/24 (d)
|
770,000
|
760,375
|
|
|
5.875% 4/15/30 (d)
|
4,300,000
|
4,047,503
|
|
|
Howmet Aerospace, Inc. 5.95% 2/1/37
|
1,505,000
|
1,474,779
|
|
|
HudBay Minerals, Inc. 6.125% 4/1/29 (d)
|
4,755,000
|
4,197,524
|
|
|
Mineral Resources Ltd.:
|
|||
|
8% 11/1/27 (d)
|
2,835,000
|
2,820,825
|
|
|
8.5% 5/1/30 (d)
|
680,000
|
680,823
|
|
|
37,907,023
|
|||
|
Paper - 0.8%
|
|||
|
Berry Global, Inc. 5.625% 7/15/27 (d)
|
1,110,000
|
1,068,375
|
|
|
Clydesdale Acquisition Holdings, Inc.:
|
|||
|
6.625% 4/15/29 (d)
|
1,070,000
|
1,020,846
|
|
|
8.75% 4/15/30 (d)
|
6,430,000
|
5,808,733
|
|
|
Enviva Partners LP / Enviva Partners Finance Corp. 6.5% 1/15/26 (d)
|
3,315,000
|
3,107,680
|
|
|
Mercer International, Inc. 5.125% 2/1/29
|
2,220,000
|
1,820,296
|
|
|
SPA Holdings 3 OY 4.875% 2/4/28 (d)
|
1,770,000
|
1,503,177
|
|
|
14,329,107
|
|||
|
Restaurants - 0.7%
|
|||
|
1011778 BC Unlimited Liability Co./New Red Finance, Inc. 4% 10/15/30 (d)
|
7,635,000
|
6,305,899
|
|
|
CEC Entertainment LLC 6.75% 5/1/26 (d)
|
2,250,000
|
2,093,160
|
|
|
KFC Holding Co./Pizza Hut Holding LLC 4.75% 6/1/27 (d)
|
1,325,000
|
1,258,750
|
|
|
Papa John's International, Inc. 3.875% 9/15/29 (d)
|
870,000
|
726,450
|
|
|
Yum! Brands, Inc. 4.625% 1/31/32
|
2,585,000
|
2,284,985
|
|
|
12,669,244
|
|||
|
Services - 4.5%
|
|||
|
Adtalem Global Education, Inc. 5.5% 3/1/28 (d)
|
4,564,000
|
4,201,304
|
|
|
Allied Universal Holdco LLC / Allied Universal Finance Corp. 6% 6/1/29 (d)
|
1,050,000
|
782,222
|
|
|
Aramark Services, Inc. 6.375% 5/1/25 (d)
|
3,410,000
|
3,387,801
|
|
|
ASGN, Inc. 4.625% 5/15/28 (d)
|
5,875,000
|
5,309,414
|
|
|
Atlas Luxco 4 SARL / Allied Universal Holdco LLC / Allied Universal Finance Corp. 4.625% 6/1/28 (d)
|
1,328,000
|
1,089,738
|
|
|
Avis Budget Car Rental LLC/Avis Budget Finance, Inc. 5.375% 3/1/29 (d)
|
1,470,000
|
1,323,228
|
|
|
Booz Allen Hamilton, Inc. 3.875% 9/1/28 (d)
|
2,405,000
|
2,135,015
|
|
|
Brand Energy & Infrastructure Services, Inc. 8.5% 7/15/25 (d)
|
15,565,000
|
13,023,701
|
|
|
CoreCivic, Inc. 8.25% 4/15/26
|
3,735,000
|
3,781,202
|
|
|
CoreLogic, Inc. 4.5% 5/1/28 (d)
|
920,000
|
708,400
|
|
|
GEMS MENASA Cayman Ltd. 7.125% 7/31/26 (d)
|
9,979,000
|
9,706,449
|
|
|
Hertz Corp.:
|
|||
|
4.625% 12/1/26 (d)
|
1,680,000
|
1,496,102
|
|
|
5% 12/1/29 (d)
|
2,190,000
|
1,818,204
|
|
|
5.5% 10/15/24 (b)(d)(g)
|
3,155,000
|
70,988
|
|
|
6% 1/15/28 (b)(d)(g)
|
3,900,000
|
229,125
|
|
|
6.25% 12/31/49 (b)(g)
|
2,880,000
|
3,600
|
|
|
7.125% 8/1/26 (b)(d)(g)
|
3,980,000
|
318,400
|
|
|
KAR Auction Services, Inc. 5.125% 6/1/25 (d)
|
178,000
|
173,497
|
|
|
Sabre GLBL, Inc. 7.375% 9/1/25 (d)
|
2,500,000
|
2,340,043
|
|
|
Service Corp. International 5.125% 6/1/29
|
1,845,000
|
1,727,381
|
|
|
The GEO Group, Inc.:
|
|||
|
9.5% 12/31/28 (d)
|
6,055,000
|
5,785,056
|
|
|
10.5% 6/30/28
|
2,453,000
|
2,495,928
|
|
|
Uber Technologies, Inc.:
|
|||
|
4.5% 8/15/29 (d)
|
12,875,000
|
11,382,530
|
|
|
6.25% 1/15/28 (d)
|
2,145,000
|
2,111,189
|
|
|
WASH Multifamily Acquisition, Inc. 5.75% 4/15/26 (d)
|
1,640,000
|
1,525,577
|
|
|
76,926,094
|
|||
|
Steel - 0.2%
|
|||
|
Commercial Metals Co. 3.875% 2/15/31
|
1,125,000
|
949,223
|
|
|
Infrabuild Australia Pty Ltd. 12% 10/1/24 (d)
|
2,660,000
|
2,573,550
|
|
|
Roller Bearing Co. of America, Inc. 4.375% 10/15/29 (d)
|
690,000
|
596,402
|
|
|
4,119,175
|
|||
|
Super Retail - 1.7%
|
|||
|
Asbury Automotive Group, Inc.:
|
|||
|
4.5% 3/1/28
|
681,000
|
609,409
|
|
|
4.625% 11/15/29 (d)
|
1,520,000
|
1,321,746
|
|
|
4.75% 3/1/30
|
680,000
|
589,118
|
|
|
5% 2/15/32 (d)
|
1,520,000
|
1,295,348
|
|
|
Bath & Body Works, Inc. 6.625% 10/1/30 (d)
|
5,045,000
|
4,778,775
|
|
|
Carvana Co. 4.875% 9/1/29 (d)
|
1,980,000
|
936,588
|
|
|
EG Global Finance PLC:
|
|||
|
6.75% 2/7/25 (d)
|
12,050,000
|
10,875,125
|
|
|
8.5% 10/30/25 (d)
|
2,520,000
|
2,268,896
|
|
|
Macy's Retail Holdings LLC:
|
|||
|
5.875% 3/15/30 (d)
|
915,000
|
806,545
|
|
|
6.125% 3/15/32 (d)
|
1,065,000
|
915,900
|
|
|
Michaels Companies, Inc.:
|
|||
|
5.25% 5/1/28 (d)
|
2,370,000
|
1,972,385
|
|
|
7.875% 5/1/29 (d)
|
3,590,000
|
2,701,475
|
|
|
29,071,310
|
|||
|
Technology - 4.0%
|
|||
|
Athenahealth Group, Inc. 6.5% 2/15/30 (d)
|
6,520,000
|
5,156,955
|
|
|
Block, Inc.:
|
|||
|
2.75% 6/1/26
|
2,555,000
|
2,279,791
|
|
|
3.5% 6/1/31
|
2,555,000
|
2,064,185
|
|
|
CA Magnum Holdings 5.375% (d)(h)
|
770,000
|
702,625
|
|
|
Camelot Finance SA 4.5% 11/1/26 (d)
|
2,285,000
|
2,095,431
|
|
|
CDW LLC/CDW Finance Corp. 4.25% 4/1/28
|
2,960,000
|
2,692,739
|
|
|
Coherent Corp. 5% 12/15/29 (d)
|
1,385,000
|
1,213,399
|
|
|
Elastic NV 4.125% 7/15/29 (d)
|
1,275,000
|
1,046,384
|
|
|
Gen Digital, Inc. 5% 4/15/25 (d)
|
6,075,000
|
5,901,012
|
|
|
Go Daddy Operating Co. LLC / GD Finance Co., Inc. 5.25% 12/1/27 (d)
|
2,235,000
|
2,115,115
|
|
|
Match Group Holdings II LLC:
|
|||
|
4.125% 8/1/30 (d)
|
2,335,000
|
1,935,663
|
|
|
5.625% 2/15/29 (d)
|
2,035,000
|
1,874,820
|
|
|
MicroStrategy, Inc. 6.125% 6/15/28 (d)
|
10,890,000
|
9,038,700
|
|
|
NCR Corp. 5.125% 4/15/29 (d)
|
1,775,000
|
1,515,889
|
|
|
Northwest Fiber LLC/Northwest Fiber Finance Sub, Inc. 10.75% 6/1/28 (d)
|
1,450,000
|
1,347,292
|
|
|
onsemi 3.875% 9/1/28 (d)
|
3,110,000
|
2,733,192
|
|
|
Open Text Corp. 3.875% 12/1/29 (d)
|
2,200,000
|
1,775,777
|
|
|
Open Text Holdings, Inc.:
|
|||
|
4.125% 2/15/30 (d)
|
3,095,000
|
2,546,872
|
|
|
4.125% 12/1/31 (d)
|
2,200,000
|
1,750,650
|
|
|
Rackspace Hosting, Inc. 5.375% 12/1/28 (d)
|
1,430,000
|
561,764
|
|
|
Roblox Corp. 3.875% 5/1/30 (d)
|
6,055,000
|
4,977,876
|
|
|
Sensata Technologies BV 4% 4/15/29 (d)
|
2,480,000
|
2,187,286
|
|
|
Synaptics, Inc. 4% 6/15/29 (d)
|
1,210,000
|
1,003,692
|
|
|
TTM Technologies, Inc. 4% 3/1/29 (d)
|
2,215,000
|
1,827,172
|
|
|
Uber Technologies, Inc.:
|
|||
|
7.5% 5/15/25 (d)
|
5,010,000
|
5,060,786
|
|
|
7.5% 9/15/27 (d)
|
2,765,000
|
2,803,461
|
|
|
Unisys Corp. 6.875% 11/1/27 (d)
|
1,425,000
|
1,074,740
|
|
|
69,283,268
|
|||
|
Telecommunications - 6.5%
|
|||
|
Altice Financing SA:
|
|||
|
5% 1/15/28 (d)
|
2,375,000
|
1,970,965
|
|
|
5.75% 8/15/29 (d)
|
7,480,000
|
6,117,219
|
|
|
Altice France SA:
|
|||
|
5.125% 1/15/29 (d)
|
2,270,000
|
1,742,573
|
|
|
5.5% 1/15/28 (d)
|
4,825,000
|
3,974,208
|
|
|
C&W Senior Financing Designated Activity Co. 6.875% 9/15/27 (d)
|
9,965,000
|
8,978,465
|
|
|
Cablevision Lightpath LLC:
|
|||
|
3.875% 9/15/27 (d)
|
1,280,000
|
1,043,406
|
|
|
5.625% 9/15/28 (d)
|
1,010,000
|
752,450
|
|
|
Consolidated Communications, Inc. 5% 10/1/28 (d)
|
1,320,000
|
877,919
|
|
|
Frontier Communications Holdings LLC:
|
|||
|
5% 5/1/28 (d)
|
2,480,000
|
2,176,200
|
|
|
5.875% 10/15/27 (d)
|
2,440,000
|
2,267,004
|
|
|
5.875% 11/1/29
|
615,475
|
492,835
|
|
|
6% 1/15/30 (d)
|
3,035,000
|
2,424,206
|
|
|
6.75% 5/1/29 (d)
|
2,795,000
|
2,348,345
|
|
|
Intelsat Jackson Holdings SA:
|
|||
|
5.5% 8/1/23 (b)(g)
|
7,570,000
|
1
|
|
|
6.5% 3/15/30 (d)
|
10,625,000
|
9,243,677
|
|
|
8.5% 10/15/24 (b)(d)(g)
|
2,965,000
|
0
|
|
|
LCPR Senior Secured Financing DAC:
|
|||
|
5.125% 7/15/29 (d)
|
2,520,000
|
2,118,564
|
|
|
6.75% 10/15/27 (d)
|
4,724,000
|
4,380,473
|
|
|
Level 3 Financing, Inc.:
|
|||
|
3.75% 7/15/29 (d)
|
3,850,000
|
2,420,149
|
|
|
4.25% 7/1/28 (d)
|
3,420,000
|
2,334,150
|
|
|
Lumen Technologies, Inc. 4% 2/15/27 (d)
|
4,225,000
|
3,244,378
|
|
|
Northwest Fiber LLC/Northwest Fiber Finance Sub, Inc.:
|
|||
|
4.75% 4/30/27 (d)
|
1,700,000
|
1,492,940
|
|
|
6% 2/15/28 (d)
|
790,000
|
628,050
|
|
|
Sable International Finance Ltd. 5.75% 9/7/27 (d)
|
4,895,000
|
4,496,669
|
|
|
Sabre GLBL, Inc. 9.25% 4/15/25 (d)
|
1,820,000
|
1,791,502
|
|
|
SBA Communications Corp. 3.875% 2/15/27
|
5,020,000
|
4,543,069
|
|
|
Sprint Capital Corp. 8.75% 3/15/32
|
16,540,000
|
19,690,705
|
|
|
Telecom Italia SpA 5.303% 5/30/24 (d)
|
2,020,000
|
1,967,137
|
|
|
Uniti Group, Inc. 6% 1/15/30 (d)
|
6,860,000
|
4,251,788
|
|
|
Windstream Escrow LLC 7.75% 8/15/28 (d)
|
10,615,000
|
8,674,578
|
|
|
Zayo Group Holdings, Inc.:
|
|||
|
4% 3/1/27 (d)
|
3,835,000
|
2,941,924
|
|
|
6.125% 3/1/28 (d)
|
2,115,000
|
1,332,323
|
|
|
110,717,872
|
|||
|
Textiles/Apparel - 0.4%
|
|||
|
Crocs, Inc.:
|
|||
|
4.125% 8/15/31 (d)
|
3,760,000
|
3,083,200
|
|
|
4.25% 3/15/29 (d)
|
3,735,000
|
3,202,763
|
|
|
Victoria's Secret & Co. 4.625% 7/15/29 (d)
|
1,665,000
|
1,357,857
|
|
|
7,643,820
|
|||
|
Transportation Ex Air/Rail - 0.5%
|
|||
|
Avolon Holdings Funding Ltd.:
|
|||
|
3.95% 7/1/24 (d)
|
9,000
|
8,703
|
|
|
4.375% 5/1/26 (d)
|
7,000
|
6,512
|
|
|
Navios South American Logistics, Inc./Navios Logistics Finance U.S., Inc. 10.75% 7/1/25 (d)
|
5,110,000
|
5,023,769
|
|
|
Seaspan Corp. 5.5% 8/1/29 (d)
|
3,695,000
|
2,780,665
|
|
|
7,819,649
|
|||
|
Utilities - 4.2%
|
|||
|
Clearway Energy Operating LLC 4.75% 3/15/28 (d)
|
5,885,000
|
5,400,665
|
|
|
DPL, Inc. 4.35% 4/15/29
|
9,480,000
|
8,200,200
|
|
|
NRG Energy, Inc.:
|
|||
|
3.875% 2/15/32 (d)
|
1,470,000
|
1,140,044
|
|
|
5.25% 6/15/29 (d)
|
3,050,000
|
2,714,500
|
|
|
6.625% 1/15/27
|
891,000
|
888,498
|
|
|
Pacific Gas & Electric Co.:
|
|||
|
3.75% 8/15/42
|
350,000
|
242,696
|
|
|
3.95% 12/1/47
|
2,495,000
|
1,701,389
|
|
|
4.55% 7/1/30
|
14,220,000
|
12,840,956
|
|
|
4.95% 7/1/50
|
23,225,000
|
18,336,049
|
|
|
PG&E Corp. 5.25% 7/1/30
|
9,430,000
|
8,416,275
|
|
|
Pike Corp. 5.5% 9/1/28 (d)
|
8,505,000
|
7,380,724
|
|
|
Vertiv Group Corp. 4.125% 11/15/28 (d)
|
3,055,000
|
2,654,153
|
|
|
Vistra Operations Co. LLC 5.625% 2/15/27 (d)
|
2,000,000
|
1,895,241
|
|
|
71,811,390
|
|||
|
TOTAL NONCONVERTIBLE BONDS
|
1,299,481,722
|
||
|
TOTAL CORPORATE BONDS
(Cost $1,513,303,317)
|
1,358,605,046
|
||
|
Common Stocks - 5.8%
|
|||
|
Shares
|
Value ($)
|
||
|
Automotive & Auto Parts - 0.0%
|
|||
|
UC Holdings, Inc. (b)(i)
|
32,168
|
207,162
|
|
|
Broadcasting - 0.0%
|
|||
|
iHeartMedia, Inc. (i)
|
8,204
|
59,561
|
|
|
Chemicals - 0.0%
|
|||
|
Corteva, Inc.
|
10,266
|
639,469
|
|
|
Energy - 3.8%
|
|||
|
California Resources Corp.
|
233,262
|
9,843,656
|
|
|
California Resources Corp. warrants 10/27/24 (i)
|
20,004
|
219,044
|
|
|
Chesapeake Energy Corp.
|
64,281
|
5,194,548
|
|
|
Denbury, Inc. (i)
|
42,041
|
3,504,958
|
|
|
Denbury, Inc. warrants 9/18/25 (i)
|
117,577
|
6,475,871
|
|
|
EP Energy Corp. (b)(i)
|
218,900
|
1,477,575
|
|
|
Forbes Energy Services Ltd. (i)
|
72,087
|
1
|
|
|
Jonah Energy Parent LLC (b)(i)
|
425,801
|
19,659,232
|
|
|
Mesquite Energy, Inc. (b)(i)
|
214,437
|
12,276,501
|
|
|
Noble Corp. PLC (i)
|
7,670
|
319,762
|
|
|
Noble Corp. PLC:
|
|||
|
warrants 2/4/28 (i)
|
27,051
|
792,597
|
|
|
warrants 2/4/28 (i)
|
27,051
|
810,989
|
|
|
PureWest Energy (b)
|
2,832
|
27,612
|
|
|
PureWest Energy rights (b)(i)
|
1,707
|
0
|
|
|
Superior Energy Services, Inc. Class A (b)(i)
|
15,005
|
1,104,368
|
|
|
Tidewater, Inc. warrants 11/14/42 (i)
|
8,251
|
443,244
|
|
|
Tribune Resources, Inc. (b)(i)
|
182,155
|
103,828
|
|
|
Tribune Resources, Inc. warrants 3/30/23 (b)(i)
|
51,925
|
1
|
|
|
Valaris Ltd. (i)
|
38,587
|
2,594,976
|
|
|
TOTAL ENERGY
|
64,848,763
|
||
|
Entertainment/Film - 0.1%
|
|||
|
New Cotai LLC/New Cotai Capital Corp. (b)(c)(i)
|
1,330,466
|
1,104,287
|
|
|
Food & Drug Retail - 1.0%
|
|||
|
Northeast Grocery, Inc. (b)(c)(i)
|
228,430
|
963,975
|
|
|
Southeastern Grocers, Inc. (b)(c)(i)
|
687,397
|
15,968,232
|
|
|
TOTAL FOOD & DRUG RETAIL
|
16,932,207
|
||
|
Gaming - 0.2%
|
|||
|
Caesars Entertainment, Inc. (i)
|
57,808
|
2,934,334
|
|
|
Studio City International Holdings Ltd.:
|
|||
|
ADR (d)
|
25,434
|
178,038
|
|
|
(NYSE) ADR (i)
|
28,000
|
196,000
|
|
|
TOTAL GAMING
|
3,308,372
|
||
|
Telecommunications - 0.1%
|
|||
|
CUI Acquisition Corp. Class E (b)(i)
|
0
|
0
|
|
|
Frontier Communications Parent, Inc. (i)
|
77,463
|
2,119,388
|
|
|
Intelsat Jackson Holdings SA:
|
|||
|
Series A rights (b)(i)
|
10,413
|
89,552
|
|
|
Series B rights (b)(i)
|
10,413
|
329,988
|
|
|
TOTAL TELECOMMUNICATIONS
|
2,538,928
|
||
|
Textiles/Apparel - 0.3%
|
|||
|
Intelsat Emergence SA (b)
|
99,434
|
4,941,870
|
|
|
Utilities - 0.3%
|
|||
|
Vistra Corp.
|
220,662
|
4,852,357
|
|
|
TOTAL COMMON STOCKS
(Cost $47,646,193)
|
99,432,976
|
||
|
Convertible Preferred Stocks - 0.3%
|
|||
|
Shares
|
Value ($)
|
||
|
Utilities - 0.3%
|
|||
|
PG&E Corp.
(Cost $4,642,646)
|
40,800
|
5,605,630
|
|
|
Bank Loan Obligations - 5.9%
|
|||
|
Principal
Amount (a)
|
Value ($)
|
||
|
Air Transportation - 0.9%
|
|||
|
Echo Global Logistics, Inc.:
|
|||
|
1LN, term loan 3 month U.S. LIBOR + 4.750% 9.3849% 11/23/28 (b)(e)(f)(j)
|
7,288,733
|
7,019,778
|
|
|
2LN, term loan 3 month U.S. LIBOR + 8.000% 12.6349% 11/23/29 (b)(e)(f)(j)
|
9,743,000
|
9,383,483
|
|
|
TOTAL AIR TRANSPORTATION
|
16,403,261
|
||
|
Banks & Thrifts - 0.1%
|
|||
|
First Eagle Holdings, Inc. Tranche B 1LN, term loan 3 month U.S. LIBOR + 2.500% 7.2299% 2/1/27 (e)(f)(j)
|
1,062,277
|
1,043,464
|
|
|
Broadcasting - 0.1%
|
|||
|
Diamond Sports Group LLC 1LN, term loan CME Term SOFR 1 Month Index + 8.000% 12.7755% 5/25/26 (e)(f)(j)
|
365,190
|
340,237
|
|
|
Springer Nature Deutschland GmbH Tranche B18 1LN, term loan 1 month U.S. LIBOR + 3.000% 7.7299% 8/14/26 (e)(f)(j)
|
1,130,162
|
1,127,812
|
|
|
TOTAL BROADCASTING
|
1,468,049
|
||
|
Building Materials - 0.1%
|
|||
|
Hunter Douglas, Inc. Tranche B 1LN, term loan CME TERM SOFR 3 MONTH INDEX + 3.500% 7.9971% 2/25/29 (e)(f)(j)
|
1,537,275
|
1,407,160
|
|
|
Cable/Satellite TV - 0.1%
|
|||
|
Numericable LLC Tranche B 13LN, term loan 3 month U.S. LIBOR + 4.000% 8.8636% 8/14/26 (e)(f)(j)
|
1,053,250
|
1,020,999
|
|
|
Chemicals - 0.5%
|
|||
|
Consolidated Energy Finance SA:
|
|||
|
Tranche B 1LN, term loan 3 month U.S. LIBOR + 3.500% 8.1349% 5/7/25 (b)(e)(f)(j)
|
5,698,225
|
5,527,278
|
|
|
Tranche B, term loan 3 month U.S. LIBOR + 2.500% 7.1349% 5/7/25 (e)(f)(j)
|
520,475
|
513,100
|
|
|
Discovery Purchaser Corp. 1LN, term loan CME TERM SOFR 3 MONTH INDEX + 4.370% 8.9625% 10/4/29 (e)(f)(j)
|
2,860,000
|
2,732,844
|
|
|
Starfruit U.S. Holdco LLC Tranche B, term loan 1 month U.S. LIBOR + 2.750% 7.526% 10/1/25 (e)(f)(j)
|
648,789
|
644,247
|
|
|
TOTAL CHEMICALS
|
9,417,469
|
||
|
Consumer Products - 0.1%
|
|||
|
The Golub Corp. 2LN, term loan 3 month U.S. LIBOR + 13.500% 18.35% 5/8/26 (b)(e)(f)(j)
|
1,333,616
|
1,286,940
|
|
|
Diversified Financial Services - 0.8%
|
|||
|
Cabazon Finance Authority term loan 11% 3/7/24 pay-in-kind (b)(e)(j)
|
3,050,723
|
2,932,660
|
|
|
HarbourVest Partners LLC Tranche B 1LN, term loan 3 month U.S. LIBOR + 2.250% 7.0797% 3/1/25 (e)(f)(j)
|
238,657
|
238,285
|
|
|
Softbank SVF II Cayman LP 1LN, term loan 3 month U.S. LIBOR + 5.000% 5% 12/31/24 (b)(e)(f)(j)
|
10,391,415
|
10,391,415
|
|
|
TOTAL DIVERSIFIED FINANCIAL SERVICES
|
13,562,360
|
||
|
Energy - 0.0%
|
|||
|
Mesquite Energy, Inc.:
|
|||
|
1LN, term loan 3 month U.S. LIBOR + 8.000% 0% (b)(f)(g)(j)
|
3,964,252
|
0
|
|
|
term loan 3 month U.S. LIBOR + 0.000% 0% (b)(f)(g)(j)
|
1,710,000
|
0
|
|
|
TOTAL ENERGY
|
0
|
||
|
Food/Beverage/Tobacco - 0.1%
|
|||
|
Del Monte Foods, Inc. Tranche B 1LN, term loan CME Term SOFR 1 Month Index + 4.250% 8.9108% 5/16/29 (e)(f)(j)
|
1,880,288
|
1,839,542
|
|
|
Gaming - 0.1%
|
|||
|
Golden Entertainment, Inc. Tranche B, term loan 3 month U.S. LIBOR + 3.000% 7.62% 10/20/24 (e)(f)(j)
|
927,188
|
924,870
|
|
|
Scientific Games Holdings LP term loan CME TERM SOFR 3 MONTH INDEX + 3.500% 8.1028% 4/4/29 (e)(f)(j)
|
453,863
|
445,847
|
|
|
TOTAL GAMING
|
1,370,717
|
||
|
Healthcare - 0.1%
|
|||
|
Electron BidCo, Inc. Tranche B 1LN, term loan 1 month U.S. LIBOR + 3.000% 7.6349% 11/1/28 (e)(f)(j)
|
287,825
|
284,901
|
|
|
Phoenix Newco, Inc. Tranche B 1LN, term loan 1 month U.S. LIBOR + 3.250% 7.8197% 11/15/28 (e)(f)(j)
|
1,126,488
|
1,102,268
|
|
|
TOTAL HEALTHCARE
|
1,387,169
|
||
|
Hotels - 0.0%
|
|||
|
Travelport Finance Luxembourg SARL 1LN, term loan 3 month U.S. LIBOR + 6.750% 11.4799% 5/30/26 (e)(f)(j)
|
1,392,469
|
783,264
|
|
|
Insurance - 0.1%
|
|||
|
Acrisure LLC Tranche B 1LN, term loan 1 month U.S. LIBOR + 4.250% 8.8849% 2/15/27 (e)(f)(j)
|
212,850
|
204,602
|
|
|
Alliant Holdings Intermediate LLC Tranche B5 1LN, term loan CME Term SOFR 1 Month Index + 3.500% 8.06% 2/13/27 (e)(f)(j)
|
1,023,122
|
1,009,054
|
|
|
USI, Inc. 1LN, term loan CME Term SOFR 1 Month Index + 3.750% 8.3302% 11/22/29 (e)(f)(j)
|
435,908
|
434,635
|
|
|
TOTAL INSURANCE
|
1,648,291
|
||
|
Leisure - 0.0%
|
|||
|
Alterra Mountain Co. Tranche B 1LN, term loan 1 month U.S. LIBOR + 3.500% 8.1349% 8/17/28 (e)(f)(j)
|
42,882
|
42,721
|
|
|
Railroad - 0.0%
|
|||
|
Einstein Merger Sub, Inc. 2LN, term loan 3 month U.S. LIBOR + 7.000% 11.6912% 11/23/29 (b)(e)(f)(j)
|
915,000
|
910,425
|
|
|
Services - 1.3%
|
|||
|
ABG Intermediate Holdings 2 LLC Tranche B 2LN, term loan CME Term SOFR 1 Month Index + 6.000% 10.7176% 12/20/29 (e)(f)(j)
|
165,000
|
151,800
|
|
|
Ascend Learning LLC 2LN, term loan 1 month U.S. LIBOR + 5.750% 10.3849% 12/10/29 (e)(f)(j)
|
305,000
|
264,398
|
|
|
Asurion LLC 1LN, term loan CME TERM SOFR 3 MONTH INDEX + 4.000% 8.6802% 8/17/28 (e)(f)(j)
|
4,289,250
|
4,013,494
|
|
|
CoreLogic, Inc. Tranche B 1LN, term loan 1 month U.S. LIBOR + 3.500% 8.1875% 6/2/28 (e)(f)(j)
|
575,000
|
491,481
|
|
|
Finastra U.S.A., Inc.:
|
|||
|
Tranche 2LN, term loan 3 month U.S. LIBOR + 7.250% 12.0753% 6/13/25 (e)(f)(j)
|
4,035,000
|
3,419,663
|
|
|
Tranche B 1LN, term loan 3 month U.S. LIBOR + 3.500% 8.3253% 6/13/24 (e)(f)(j)
|
3,909,093
|
3,679,434
|
|
|
KUEHG Corp. Tranche B 2LN, term loan 3 month U.S. LIBOR + 8.250% 12.9799% 8/22/25 (e)(f)(j)
|
2,230,000
|
2,101,775
|
|
|
Neptune BidCo U.S., Inc. Tranche B 1LN, term loan CME Term SOFR 1 Month Index + 5.000% 9.735% 4/11/29 (e)(f)(j)
|
5,535,000
|
5,078,363
|
|
|
Spin Holdco, Inc. Tranche B 1LN, term loan 3 month U.S. LIBOR + 4.000% 8.765% 3/4/28 (e)(f)(j)
|
3,978,575
|
3,341,446
|
|
|
TOTAL SERVICES
|
22,541,854
|
||
|
Super Retail - 0.2%
|
|||
|
Bass Pro Group LLC Tranche B 1LN, term loan 1 month U.S. LIBOR + 3.750% 8.3849% 3/5/28 (e)(f)(j)
|
2,622,967
|
2,581,157
|
|
|
Michaels Companies, Inc. 1LN, term loan 3 month U.S. LIBOR + 4.250% 8.9799% 4/15/28 (e)(f)(j)
|
920,975
|
841,541
|
|
|
TOTAL SUPER RETAIL
|
3,422,698
|
||
|
Technology - 1.3%
|
|||
|
Anastasia Parent LLC Tranche B, term loan 3 month U.S. LIBOR + 3.750% 8.4799% 8/10/25 (e)(f)(j)
|
4,910,256
|
4,057,099
|
|
|
Athenahealth Group, Inc.:
|
|||
|
Tranche B 1LN, term loan CME Term SOFR 1 Month Index + 3.500% 8.0608% 2/15/29 (e)(f)(j)
|
2,829,622
|
2,610,327
|
|
|
Tranche DD 1LN, term loan CME Term SOFR 1 Month Index + 3.500% 2/15/29 (f)(j)(k)
|
346,739
|
319,867
|
|
|
Ceridian HCM Holding, Inc. Tranche B, term loan 1 month U.S. LIBOR + 2.500% 7.1349% 4/30/25 (e)(f)(j)
|
1,570,300
|
1,564,019
|
|
|
Epicor Software Corp. 2LN, term loan 1 month U.S. LIBOR + 7.750% 12.3849% 7/31/28 (e)(f)(j)
|
1,945,000
|
1,935,275
|
|
|
UKG, Inc. 1LN, term loan 1 month U.S. LIBOR + 3.750% 8.5753% 5/4/26 (e)(f)(j)
|
691,763
|
681,822
|
|
|
Ultimate Software Group, Inc.:
|
|||
|
1LN, term loan 1 month U.S. LIBOR + 3.250% 8.0319% 5/3/26 (e)(f)(j)
|
3,908,570
|
3,826,490
|
|
|
2LN, term loan 3 month U.S. LIBOR + 5.250% 10.0319% 5/3/27 (e)(f)(j)
|
6,955,000
|
6,752,123
|
|
|
VS Buyer LLC Tranche B 1LN, term loan 1 month U.S. LIBOR + 2.000% 9.75% 2/28/27 (e)(f)(j)
|
437,625
|
431,498
|
|
|
TOTAL TECHNOLOGY
|
22,178,520
|
||
|
TOTAL BANK LOAN OBLIGATIONS
(Cost $108,202,607)
|
101,734,903
|
||
|
Preferred Securities - 1.8%
|
|||
|
Principal
Amount (a)
|
Value ($)
|
||
|
Banks & Thrifts - 1.6%
|
|||
|
Bank of America Corp.:
|
|||
|
4.3% (e)(h)
|
2,610,000
|
2,377,168
|
|
|
6.1% (e)(h)
|
3,690,000
|
3,755,690
|
|
|
6.25% (e)(h)
|
2,310,000
|
2,380,193
|
|
|
Citigroup, Inc. 8.8704% (e)(f)(h)
|
4,825,000
|
4,887,204
|
|
|
JPMorgan Chase & Co. 6% (e)(h)
|
11,680,000
|
11,701,852
|
|
|
Wells Fargo & Co. 5.9% (e)(h)
|
1,955,000
|
1,936,914
|
|
|
TOTAL BANKS & THRIFTS
|
27,039,021
|
||
|
Energy - 0.0%
|
|||
|
Summit Midstream Partners LP 3 month U.S. LIBOR + 7.430% 12.1759% (e)(f)(g)(h)
|
204,000
|
150,960
|
|
|
Insurance - 0.2%
|
|||
|
Alliant Holdings Intermediate LLC 9.75% (b)(h)
|
4,000,000
|
3,325,000
|
|
|
TOTAL PREFERRED SECURITIES
(Cost $32,215,267)
|
30,514,981
|
||
|
Other - 1.2%
|
|||
|
Shares
|
Value ($)
|
||
|
Other - 1.2%
|
|||
|
Fidelity Private Credit Central Fund LLC (c)(m)
|
2,031,166
|
20,128,831
|
|
|
Tribune Co. Claim (b)(i)
|
11,217
|
7,516
|
|
|
TOTAL OTHER
(Cost $20,224,253)
|
20,136,347
|
||
|
Money Market Funds - 3.9%
|
|||
|
Shares
|
Value ($)
|
||
|
Fidelity Cash Central Fund 4.63% (l)
(Cost $66,441,705)
|
66,428,419
|
66,441,705
|
|
|
TOTAL INVESTMENT IN SECURITIES - 98.3%
(Cost $1,792,675,988)
|
1,682,471,588
|
|
NET OTHER ASSETS (LIABILITIES) - 1.7%
|
29,722,350
|
|
NET ASSETS - 100.0%
|
1,712,193,938
|
|
(a)
|
Amount is stated in United States dollars unless otherwise noted.
|
|
(b)
|
Level 3 security
|
|
(c)
|
Restricted securities (including private placements) - Investment in securities not registered under the Securities Act of 1933 (excluding 144A issues). At the end of the period, the value of restricted securities (excluding 144A issues) amounted to $66,332,372 or 3.9% of net assets.
|
|
(d)
|
Security exempt from registration under Rule 144A of the Securities Act of 1933. These securities may be resold in transactions exempt from registration, normally to qualified institutional buyers. At the end of the period, the value of these securities amounted to $994,075,262 or 58.1% of net assets.
|
|
(e)
|
Coupon rates for floating and adjustable rate securities reflect the rates in effect at period end.
|
|
(f)
|
Coupon is indexed to a floating interest rate which may be multiplied by a specified factor and/or subject to caps or floors.
|
|
(g)
|
Non-income producing - Security is in default.
|
|
(h)
|
Security is perpetual in nature with no stated maturity date.
|
|
(i)
|
Non-income producing
|
|
(j)
|
Remaining maturities of bank loan obligations may be less than the stated maturities shown as a result of contractual or optional prepayments by the borrower. Such prepayments cannot be predicted with certainty.
|
|
(k)
|
Position or a portion of the position represents an unfunded loan commitment. At period end, the total principal amount and market value of unfunded commitments totaled $346,739 and $319,867, respectively.
|
|
(l)
|
Affiliated fund that is generally available only to investment companies and other accounts managed by Fidelity Investments. The rate quoted is the annualized seven-day yield of the fund at period end. A complete unaudited listing of the fund's holdings as of its most recent quarter end is available upon request. In addition, each Fidelity Central Fund's financial statements are available on the SEC's website or upon request.
|
|
(m)
|
Affiliated fund that is generally available only to investment companies and other accounts managed by Fidelity Investments.
|
|
Additional information on each restricted holding is as follows:
|
||
|
Security
|
Acquisition Date
|
Acquisition Cost ($)
|
|
Fidelity Private Credit Central Fund LLC
|
12/09/21 - 2/28/23
|
20,213,033
|
|
Mesquite Energy, Inc. 15% 7/15/23
|
7/10/20 - 1/18/22
|
1,687,240
|
|
Mesquite Energy, Inc. 15% 7/15/23
|
11/05/20 - 1/18/22
|
2,913,114
|
|
New Cotai LLC/New Cotai Capital Corp.
|
9/11/20
|
6,590,796
|
|
Northeast Grocery, Inc.
|
11/08/21
|
90,888
|
|
Southeastern Grocers, Inc.
|
6/01/18 - 4/26/19
|
5,072,958
|
|
Affiliate
|
Value,
beginning
of period ($)
|
Purchases ($)
|
Sales
Proceeds ($)
|
Dividend
Income ($)
|
Realized
Gain (loss) ($)
|
Change in
Unrealized
appreciation
(depreciation) ($)
|
Value,
end
of period ($)
|
% ownership,
end
of period
|
|
Fidelity Cash Central Fund 4.63%
|
99,248,396
|
334,379,708
|
367,186,399
|
1,468,071
|
-
|
-
|
66,441,705
|
0.2%
|
|
Fidelity Private Credit Central Fund LLC
|
11,189,162
|
11,234,588
|
2,293,998
|
870,336
|
335
|
(1,256)
|
20,128,831
|
12.1%
|
|
Fidelity Securities Lending Cash Central Fund 4.63%
|
10,580,000
|
17,106,476
|
27,686,476
|
1,932
|
-
|
-
|
-
|
0.0%
|
|
Total
|
121,017,558
|
362,720,772
|
397,166,873
|
2,340,339
|
335
|
(1,256)
|
86,570,536
|
|
|
Valuation Inputs at Reporting Date:
|
||||
|
Description
|
Total ($)
|
Level 1 ($)
|
Level 2 ($)
|
Level 3 ($)
|
|
Investments in Securities:
|
||||
|
Equities:
|
||||
|
Communication Services
|
7,540,359
|
2,178,949
|
-
|
5,361,410
|
|
Consumer Discretionary
|
4,619,821
|
3,308,372
|
-
|
1,311,449
|
|
Consumer Staples
|
16,932,207
|
-
|
-
|
16,932,207
|
|
Energy
|
64,821,151
|
23,280,531
|
6,919,115
|
34,621,505
|
|
Materials
|
639,469
|
639,469
|
-
|
-
|
|
Utilities
|
10,485,599
|
4,852,357
|
5,605,630
|
27,612
|
|
Corporate Bonds
|
1,358,605,046
|
-
|
1,326,375,754
|
32,229,292
|
|
Bank Loan Obligations
|
101,734,903
|
-
|
64,282,924
|
37,451,979
|
|
Preferred Securities
|
30,514,981
|
-
|
27,189,981
|
3,325,000
|
|
Other
|
7,516
|
-
|
-
|
7,516
|
|
Money Market Funds
|
66,441,705
|
66,441,705
|
-
|
-
|
|
Total Investments in Securities:
|
1,662,342,757
|
100,701,383
|
1,430,373,404
|
131,267,970
|
|
Investments in Securities:
|
|||
|
Consumer Staples
|
|||
|
Beginning Balance
|
$
|
15,928,515
|
|
|
Net Realized Gain (Loss) on Investment Securities
|
-
|
||
|
Net Unrealized Gain (Loss) on Investment Securities
|
1,003,692
|
||
|
Cost of Purchases
|
-
|
||
|
Proceeds of Sales
|
-
|
||
|
Amortization/Accretion
|
-
|
||
|
Transfers into Level 3
|
-
|
||
|
Transfers out of Level 3
|
-
|
||
|
Ending Balance
|
$
|
16,932,207
|
|
|
The change in unrealized gain (loss) for the period attributable to Level 3 securities held at February 28, 2023
|
$
|
1,003,692
|
|
|
Energy
|
|||
|
Beginning Balance
|
$
|
46,083,022
|
|
|
Net Realized Gain (Loss) on Investment Securities
|
437,800
|
||
|
Net Unrealized Gain (Loss) on Investment Securities
|
(11,461,510)
|
||
|
Cost of Purchases
|
-
|
||
|
Proceeds of Sales
|
(437,800)
|
||
|
Amortization/Accretion
|
-
|
||
|
Transfers into Level 3
|
-
|
||
|
Transfers out of Level 3
|
(7)
|
||
|
Ending Balance
|
$
|
34,621,505
|
|
|
The change in unrealized gain (loss) for the period attributable to Level 3 securities held at February 28, 2023
|
$
|
(11,461,510)
|
|
|
Corporate Bonds
|
|||
|
Beginning Balance
|
$
|
32,768,388
|
|
|
Net Realized Gain (Loss) on Investment Securities
|
-
|
||
|
Net Unrealized Gain (Loss) on Investment Securities
|
(582,823)
|
||
|
Cost of Purchases
|
38,120
|
||
|
Proceeds of Sales
|
-
|
||
|
Amortization/Accretion
|
5,607
|
||
|
Transfers into Level 3
|
-
|
||
|
Transfers out of Level 3
|
-
|
||
|
Ending Balance
|
$
|
32,229,292
|
|
|
The change in unrealized gain (loss) for the period attributable to Level 3 securities held at February 28, 2023
|
$
|
(582,823)
|
|
|
Bank Loan Obligations
|
|||
|
Beginning Balance
|
$
|
21,165,395
|
|
|
Net Realized Gain (Loss) on Investment Securities
|
5,373
|
||
|
Net Unrealized Gain (Loss) on Investment Securities
|
(188,096)
|
||
|
Cost of Purchases
|
16,647,135
|
||
|
Proceeds of Sales
|
(226,253)
|
||
|
Amortization/Accretion
|
48,425
|
||
|
Transfers into Level 3
|
-
|
||
|
Transfers out of Level 3
|
-
|
||
|
Ending Balance
|
$
|
37,451,979
|
|
|
The change in unrealized gain (loss) for the period attributable to Level 3 securities held at February 28, 2023
|
$
|
(188,096)
|
|
|
Other Investments in Securities
|
|||
|
Beginning Balance
|
$
|
8,458,444
|
|
|
Net Realized Gain (Loss) on Investment Securities
|
-
|
||
|
Net Unrealized Gain (Loss) on Investment Securities
|
1,574,543
|
||
|
Cost of Purchases
|
-
|
||
|
Proceeds of Sales
|
-
|
||
|
Amortization/Accretion
|
-
|
||
|
Transfers into Level 3
|
-
|
||
|
Transfers out of Level 3
|
-
|
||
|
Ending Balance
|
$
|
10,032,987
|
|
|
The change in unrealized gain (loss) for the period attributable to Level 3 securities held at February 28, 2023
|
$
|
1,574,543
|
|
|
The information used in the above reconciliation represents fiscal year to date activity for any Investments in Securities identified as using Level 3 inputs at either the beginning or the end of the current fiscal period. Cost of purchases and proceeds of sales may include securities received and/or delivered through in-kind transactions. Transfers into Level 3 were attributable to a lack of observable market data resulting from decreases in market activity, decreases in liquidity, security restructurings or corporate actions. Transfers out of Level 3 were attributable to observable market data becoming available for those securities. Transfers in or out of Level 3 represent the beginning value of any Security or Instrument where a change in the pricing level occurred from the beginning to the end of the period. The cost of purchases and the proceeds of sales may include securities received or delivered through corporate actions or exchanges. Realized and unrealized gains (losses) disclosed in the reconciliation are included in Net Gain (Loss) on the Fund's Statement of Operations.
|
|||
|
Statement of Assets and Liabilities
|
||||
|
February 28, 2023
(Unaudited)
|
||||
|
Assets
|
||||
|
Investment in securities, at value - See accompanying schedule:
|
||||
|
Unaffiliated issuers (cost $1,706,021,246)
|
$
|
1,595,901,052
|
||
|
Fidelity Central Funds (cost $86,654,742)
|
86,570,536
|
|||
|
Total Investment in Securities (cost $1,792,675,988)
|
$
|
1,682,471,588
|
||
|
Cash
|
6,508,680
|
|||
|
Receivable for investments sold
|
6,167,156
|
|||
|
Receivable for fund shares sold
|
2,890
|
|||
|
Dividends receivable
|
52,876
|
|||
|
Interest receivable
|
23,734,756
|
|||
|
Distributions receivable from Fidelity Central Funds
|
389,984
|
|||
|
Total assets
|
1,719,327,930
|
|||
|
Liabilities
|
||||
|
Payable for investments purchased
|
$
|
6,989,270
|
||
|
Payable for fund shares redeemed
|
143,835
|
|||
|
Other payables and accrued expenses
|
887
|
|||
|
Total Liabilities
|
7,133,992
|
|||
|
Net Assets
|
$
|
1,712,193,938
|
||
|
Net Assets consist of:
|
||||
|
Paid in capital
|
$
|
1,825,364,938
|
||
|
Total accumulated earnings (loss)
|
(113,171,000)
|
|||
|
Net Assets
|
$
|
1,712,193,938
|
||
|
Net Asset Value
, offering price and redemption price per share ($1,712,193,938 ÷ 16,761,557 shares)
|
$
|
102.15
|
||
|
Statement of Operations
|
||||
|
Six months ended
February 28, 2023
(Unaudited)
|
||||
|
Investment Income
|
||||
|
Dividends
|
$
|
17,693,812
|
||
|
Interest
|
53,345,483
|
|||
|
Income from Fidelity Central Funds (including $1,932 from security lending)
|
2,340,339
|
|||
|
Total Income
|
73,379,634
|
|||
|
Expenses
|
||||
|
Custodian fees and expenses
|
$
|
1,052
|
||
|
Independent trustees' fees and expenses
|
3,359
|
|||
|
Legal
|
248,980
|
|||
|
Total expenses before reductions
|
253,391
|
|||
|
Expense reductions
|
(427)
|
|||
|
Total expenses after reductions
|
252,964
|
|||
|
Net Investment income (loss)
|
73,126,670
|
|||
|
Realized and Unrealized Gain (Loss)
|
||||
|
Net realized gain (loss) on:
|
||||
|
Investment Securities:
|
||||
|
Unaffiliated issuers
|
(7,601,442)
|
|||
|
Fidelity Central Funds
|
335
|
|||
|
Total net realized gain (loss)
|
(7,601,107)
|
|||
|
Change in net unrealized appreciation (depreciation) on:
|
||||
|
Investment Securities:
|
||||
|
Unaffiliated issuers
|
(7,498,105)
|
|||
|
Fidelity Central Funds
|
(1,256)
|
|||
|
Total change in net unrealized appreciation (depreciation)
|
(7,499,361)
|
|||
|
Net gain (loss)
|
(15,100,468)
|
|||
|
Net increase (decrease) in net assets resulting from operations
|
$
|
58,026,202
|
||
|
Statement of Changes in Net Assets
|
||||
|
Six months ended
February 28, 2023
(Unaudited)
|
Year ended
August 31, 2022
|
|||
|
Increase (Decrease) in Net Assets
|
||||
|
Operations
|
||||
|
Net investment income (loss)
|
$
|
73,126,670
|
$
|
117,917,684
|
|
Net realized gain (loss)
|
(7,601,107)
|
32,474,161
|
||
|
Change in net unrealized appreciation (depreciation)
|
(7,499,361)
|
(268,320,213)
|
||
|
Net increase (decrease) in net assets resulting from operations
|
58,026,202
|
(117,928,368)
|
||
|
Distributions to shareholders
|
(71,554,920)
|
(114,089,238)
|
||
|
Affiliated share transactions
|
||||
|
Proceeds from sales of shares
|
6,841,474
|
33,321,999
|
||
|
Reinvestment of distributions
|
71,554,901
|
113,960,859
|
||
|
Cost of shares redeemed
|
(232,870,470)
|
(469,474,595)
|
||
|
Net increase (decrease) in net assets resulting from share transactions
|
(154,474,095)
|
(322,191,737)
|
||
|
Total increase (decrease) in net assets
|
(168,002,813)
|
(554,209,343)
|
||
|
Net Assets
|
||||
|
Beginning of period
|
1,880,196,751
|
2,434,406,094
|
||
|
End of period
|
$
|
1,712,193,938
|
$
|
1,880,196,751
|
|
Other Information
|
||||
|
Shares
|
||||
|
Sold
|
66,868
|
294,378
|
||
|
Issued in reinvestment of distributions
|
703,901
|
1,041,571
|
||
|
Redeemed
|
(2,262,713)
|
(4,157,418)
|
||
|
Net increase (decrease)
|
(1,491,944)
|
(2,821,469)
|
||
|
Fidelity® High Income Central Fund
|
|
Six months ended
(Unaudited) February 28, 2023
|
Years ended August 31, 2022
|
2021
|
2020
|
2019
|
2018
|
|||||||
|
Selected Per-Share Data
|
||||||||||||
|
Net asset value, beginning of period
|
$
|
103.00
|
$
|
115.51
|
$
|
106.08
|
$
|
111.37
|
$
|
112.30
|
$
|
113.78
|
|
Income from Investment Operations
|
||||||||||||
|
Net investment income (loss)
A,B
|
4.053
|
6.198
|
6.202
|
6.432
|
7.276
|
7.336
|
||||||
|
Net realized and unrealized gain (loss)
|
(.956)
|
(12.709)
|
9.246
|
(5.023)
|
(.267)
|
(1.497)
|
||||||
|
Total from investment operations
|
3.097
|
(6.511)
|
15.448
|
1.409
|
7.009
|
5.839
|
||||||
|
Distributions from net investment income
|
(3.864)
|
(5.999)
|
(6.018)
|
(6.685)
|
(7.089)
|
(7.240)
|
||||||
|
Distributions from net realized gain
|
(.083)
|
-
|
-
|
(.014)
|
(.850)
|
(.079)
|
||||||
|
Total distributions
|
(3.947)
|
(5.999)
|
(6.018)
|
(6.699)
|
(7.939)
|
(7.319)
|
||||||
|
Net asset value, end of period
|
$
|
102.15
|
$
|
103.00
|
$
|
115.51
|
$
|
106.08
|
$
|
111.37
|
$
|
112.30
|
|
Total Return
C,D
|
3.09%
|
(5.81)%
|
14.97%
|
1.45%
|
6.59%
|
5.29%
|
||||||
|
Ratios to Average Net Assets
B,E,F
|
||||||||||||
|
Expenses before reductions
|
.03%
G
|
.04%
|
-%
H
|
-%
H
|
-%
H
|
-%
H
|
||||||
|
Expenses net of fee waivers, if any
|
.03%
G
|
.04%
|
-%
H
|
-%
H
|
-%
H
|
-%
H
|
||||||
|
Expenses net of all reductions
|
.03%
G
|
.04%
|
-%
H
|
-%
H
|
-%
H
|
-%
H
|
||||||
|
Net investment income (loss)
|
8.03%
G
|
5.63%
|
5.62%
|
6.06%
|
6.70%
|
6.49%
|
||||||
|
Supplemental Data
|
||||||||||||
|
Net assets, end of period (000 omitted)
|
$
|
1,712,194
|
$
|
1,880,197
|
$
|
2,434,406
|
$
|
2,689,635
|
$
|
2,600,771
|
$
|
884,331
|
|
Portfolio turnover rate
I
|
13%
G
|
23%
|
37%
|
59%
J
|
39%
J,K
|
57%
|
|
Fidelity Central Fund
|
Investment Manager
|
Investment Objective
|
Investment Practices
|
Expense Ratio
A
|
|
Fidelity Money Market Central Funds
|
Fidelity Management & Research Company LLC (FMR)
|
Each fund seeks to obtain a high level of current income consistent with the preservation of capital and liquidity.
|
Short-term Investments
|
Less than .005%
|
|
Asset Type
|
Fair Value
|
Valuation Technique(s)
|
Unobservable Input
|
Amount or Range/Weighted Average
|
Impact to Valuation from an Increase in Input
A
|
|
Equities
|
$58,254,183
|
Market comparable
|
Enterprise value/EBITDA multiple (EV/EBITDA)
|
2.2 - 5.8 / 3.3
|
Increase
|
|
|
|
|
Enterprise value/Revenue multiple (EV/R)
|
0.3
|
Increase
|
|
|
|
|
Daily production multiple ($/Barrels of oil equivalent per day)
|
$18,250.00
|
Increase
|
|
|
|
|
Enterprise value/PV-10 multiple (EV/PV-10)
|
0.5 - 0.7 / 0.6
|
Increase
|
|
|
|
|
Enterprise value/Proved reserves multiple (EV/PR)
|
0.8 - 4.7 / 4.6
|
Increase
|
|
|
|
|
Daily production multiple ($/Million cubic feet per day)
|
$3,000.00
|
Increase
|
|
|
|
Recovery value
|
Recovery value
|
$0.00
|
Increase
|
|
|
|
Market approach
|
Transaction price
|
$0.77
|
Increase
|
|
|
|
Discounted cash flow
|
Discount rate
|
8.0% - 13.3% / 9.7%
|
Decrease
|
|
|
|
|
Reserve risk rate
|
50.0% - 95.0% / 72.5%
|
Increase
|
|
|
|
Black scholes
|
Discount rate
|
4.9% - 5.1% / 4.9%
|
Increase
|
|
|
|
|
Volatility
|
22.5% - 55.0% / 24.6%
|
Increase
|
|
|
|
|
Term
|
0.3 - 0.8 / 0.3
|
Increase
|
|
|
|
Straight line
|
Price of underlying security
|
$0.77
|
Increase
|
|
|
|
|
Strike price
|
$6.15
|
Decrease
|
|
Corporate Bonds
|
$32,229,292
|
Market comparable
|
Enterprise value/EBITDA multiple (EV/EBITDA)
|
2.2
|
Increase
|
|
|
|
|
Daily production multiple ($/Barrels of oil equivalent per day)
|
$18,250.00
|
Increase
|
|
|
|
|
Enterprise value/PV-10 multiple (EV/PV-10)
|
0.7
|
Increase
|
|
|
|
|
Enterprise value/Proved reserves multiple (EV/PR)
|
4.7
|
Increase
|
|
|
|
Recovery value
|
Recovery value
|
$0.00
|
Increase
|
|
|
|
Discounted cash flow
|
Discount rate
|
10.0%
|
Decrease
|
|
|
|
|
Reserve risk rate
|
50.0% - 95.0% / 72.5%
|
Increase
|
|
|
|
Indicative market price
|
Evaluated bid
|
$0.13 - $8.00 / $6.52
|
Increase
|
|
|
|
Black scholes
|
Discount rate
|
5.1%
|
Increase
|
|
|
|
|
Volatility
|
55.0%
|
Increase
|
|
|
|
|
Term
|
0.8
|
Increase
|
|
Preferred Securities
|
$3,325,000
|
Market comparable
|
Enterprise value/EBITDA multiple (EV/EBITDA)
|
15.0
|
Increase
|
|
Bank Loan Obligations
|
$37,451,979
|
Market comparable
|
Enterprise value/EBITDA multiple (EV/EBITDA)
|
6.5
|
Increase
|
|
|
|
Recovery value
|
Recovery value
|
$0.00
|
Increase
|
|
|
|
Market approach
|
Transaction price
|
$99.50
|
Increase
|
|
|
|
Discounted cash flow
|
Discount rate
|
10.7% - 19.4% / 13.3%
|
Decrease
|
|
|
|
|
Yield
|
6.1%
|
Decrease
|
|
|
|
Indicative market price
|
Evaluated bid
|
$97.00
|
Increase
|
|
Other
|
$7,516
|
Recovery value
|
Recovery value
|
$0.67
|
Increase
|
|
Gross unrealized appreciation
|
$103,020,712
|
|
Gross unrealized depreciation
|
(213,940,450)
|
|
Net unrealized appreciation (depreciation)
|
$(110,919,738)
|
|
Tax cost
|
$1,793,391,326
|
|
|
Investment to be Acquired
|
Commitment Amount
|
|
Fidelity High Income Central Fund
|
Fidelity Private Credit Central Fund LLC
|
$8,046,885
|
|
|
Purchases ($)
|
Sales ($)
|
|
Fidelity High Income Central Fund
|
107,334,987
|
239,047,760
|
|
|
Purchases ($)
|
Sales ($)
|
Realized Gain (Loss) ($)
|
|
Fidelity High Income Central Fund
|
-
|
4,405,645
|
2,953,805
|
|
|
Amount ($)
|
|
Fidelity High Income Central Fund
|
1,372
|
|
|
Total Security Lending Fees Paid to NFS
|
Security Lending Income From Securities Loaned to NFS
|
Value of Securities Loaned to NFS at Period End
|
|
Fidelity High Income Central Fund
|
$192
|
$-
|
$-
|
|
The Example is based on an investment of $1,000 invested at the beginning of the period and held for the entire period (September 1, 2022 to February 28, 2023).
|
|
Annualized Expense Ratio-
A
|
Beginning Account Value September 1, 2022
|
Ending Account Value February 28, 2023
|
Expenses Paid During Period-
C
September 1, 2022 to February 28, 2023
|
|||||||
|
Fidelity® High Income Central Fund
|
.0278%
|
|||||||||
|
Actual
|
$ 1,000
|
$ 1,030.90
|
$ .14
|
|||||||
|
Hypothetical-
B
|
$ 1,000
|
$ 1,024.66
|
$ .14
|
|||||||

|


Contents
|
Top Bond Issuers (% of Fund's net assets)
|
||
|
(with maturities greater than one year)
|
||
|
Occidental Petroleum Corp.
|
2.7
|
|
|
Icahn Enterprises LP/Icahn Enterprises Finance Corp.
|
2.7
|
|
|
CCO Holdings LLC/CCO Holdings Capital Corp.
|
2.6
|
|
|
Crestwood Midstream Partners LP/Crestwood Midstream Finance Corp.
|
2.3
|
|
|
PG&E Corp.
|
2.1
|
|
|
Sprint Capital Corp.
|
2.1
|
|
|
TransDigm, Inc.
|
1.7
|
|
|
Tenet Healthcare Corp.
|
1.6
|
|
|
Vistra Operations Co. LLC
|
1.6
|
|
|
Albertsons Companies LLC/Safeway Inc./New Albertson's, Inc./Albertson's LLC
|
1.5
|
|
|
20.9
|
||
|
Market Sectors (% of Fund's net assets)
|
||
|
Energy
|
15.0
|
|
|
Utilities
|
7.2
|
|
|
Healthcare
|
7.0
|
|
|
Telecommunications
|
6.1
|
|
|
Diversified Financial Services
|
5.5
|
|
|
Quality Diversification (% of Fund's net assets)
|
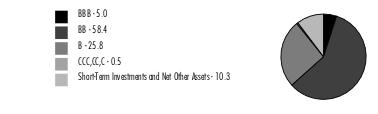
|
|
We have used ratings from Moody's Investors Service, Inc. Where Moody's® ratings are not available, we have used S&P® ratings. All ratings are as of the date indicated and do not reflect subsequent changes.
|
|
Asset Allocation (% of Fund's net assets)
|
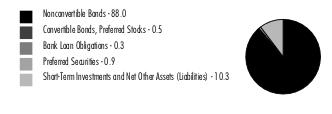
|
|
Foreign investments - 11.4%
|
|
Geographic Diversification (% of Fund's net assets)
|
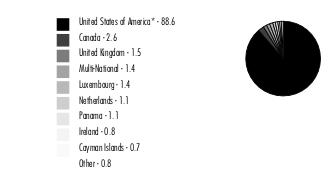
|
|
* Includes Short-Term investments and Net Other Assets (Liabilities).
Percentages are based on country or territory of incorporation and are adjusted for the effect of derivatives, if applicable.
|
|
Corporate Bonds - 88.5%
|
|||
|
Principal
Amount (a)
|
Value ($)
|
||
|
Convertible Bonds - 0.5%
|
|||
|
Broadcasting - 0.5%
|
|||
|
DISH Network Corp. 3.375% 8/15/26
|
2,658,000
|
1,698,675
|
|
|
Nonconvertible Bonds - 88.0%
|
|||
|
!UNKNOWN - 0.3%
|
|||
|
Hilcorp Energy I LP/Hilcorp Finance Co. 6.25% 4/15/32 (b)
|
1,000,000
|
906,790
|
|
|
Aerospace - 3.5%
|
|||
|
BWX Technologies, Inc. 4.125% 6/30/28 (b)
|
995,000
|
887,662
|
|
|
Howmet Aerospace, Inc. 6.75% 1/15/28
|
755,000
|
771,051
|
|
|
Kaiser Aluminum Corp. 4.625% 3/1/28 (b)
|
2,085,000
|
1,795,671
|
|
|
Moog, Inc. 4.25% 12/15/27 (b)
|
1,460,000
|
1,335,913
|
|
|
Rolls-Royce PLC 5.75% 10/15/27 (b)
|
1,270,000
|
1,225,956
|
|
|
TransDigm, Inc. 6.25% 3/15/26 (b)
|
5,853,000
|
5,775,423
|
|
|
11,791,676
|
|||
|
Air Transportation - 0.4%
|
|||
|
Rand Parent LLC 8.5% 2/15/30 (b)
|
710,000
|
681,675
|
|
|
United Airlines, Inc. 4.375% 4/15/26 (b)
|
670,000
|
630,590
|
|
|
1,312,265
|
|||
|
Automotive & Auto Parts - 2.1%
|
|||
|
Allison Transmission, Inc. 3.75% 1/30/31 (b)
|
1,270,000
|
1,054,100
|
|
|
Dana, Inc. 4.5% 2/15/32
|
365,000
|
290,916
|
|
|
Ford Motor Co.:
|
|||
|
3.25% 2/12/32
|
885,000
|
668,873
|
|
|
5.291% 12/8/46
|
445,000
|
348,213
|
|
|
Ford Motor Credit Co. LLC:
|
|||
|
2.3% 2/10/25
|
360,000
|
330,876
|
|
|
2.9% 2/10/29
|
360,000
|
293,036
|
|
|
4% 11/13/30
|
1,710,000
|
1,425,200
|
|
|
4.687% 6/9/25
|
1,005,000
|
960,865
|
|
|
5.113% 5/3/29
|
650,000
|
594,165
|
|
|
5.125% 6/16/25
|
660,000
|
637,150
|
|
|
LCM Investments Holdings 4.875% 5/1/29 (b)
|
160,000
|
130,047
|
|
|
Thor Industries, Inc. 4% 10/15/29 (b)
|
475,000
|
382,692
|
|
|
7,116,133
|
|||
|
Banks & Thrifts - 0.4%
|
|||
|
Jane Street Group LLC/JSG Finance, Inc. 4.5% 11/15/29 (b)
|
205,000
|
179,926
|
|
|
Quicken Loans LLC/Quicken Loans Co-Issuer, Inc. 3.625% 3/1/29 (b)
|
1,360,000
|
1,093,188
|
|
|
1,273,114
|
|||
|
Broadcasting - 1.7%
|
|||
|
Diamond Sports Group LLC/Diamond Sports Finance Co. 5.375% 8/15/26 (b)
|
650,000
|
72,930
|
|
|
Scripps Escrow II, Inc. 3.875% 1/15/29 (b)
|
465,000
|
370,596
|
|
|
Sirius XM Radio, Inc.:
|
|||
|
3.875% 9/1/31 (b)
|
365,000
|
283,817
|
|
|
5% 8/1/27 (b)
|
1,160,000
|
1,064,300
|
|
|
5.5% 7/1/29 (b)
|
2,845,000
|
2,567,613
|
|
|
TEGNA, Inc.:
|
|||
|
4.625% 3/15/28
|
1,270,000
|
1,130,300
|
|
|
5% 9/15/29
|
240,000
|
212,928
|
|
|
5,702,484
|
|||
|
Building Materials - 1.2%
|
|||
|
Advanced Drain Systems, Inc. 5% 9/30/27 (b)
|
1,880,000
|
1,748,964
|
|
|
Builders FirstSource, Inc. 4.25% 2/1/32 (b)
|
1,165,000
|
978,046
|
|
|
Standard Industries, Inc./New Jersey 4.375% 7/15/30 (b)
|
1,485,000
|
1,236,263
|
|
|
3,963,273
|
|||
|
Cable/Satellite TV - 4.3%
|
|||
|
CCO Holdings LLC/CCO Holdings Capital Corp.:
|
|||
|
4.25% 2/1/31 (b)
|
200,000
|
160,540
|
|
|
4.5% 8/15/30 (b)
|
1,995,000
|
1,640,927
|
|
|
4.5% 5/1/32
|
2,370,000
|
1,875,737
|
|
|
4.5% 6/1/33 (b)
|
730,000
|
567,942
|
|
|
5% 2/1/28 (b)
|
4,914,000
|
4,453,313
|
|
|
CSC Holdings LLC:
|
|||
|
3.375% 2/15/31 (b)
|
2,495,000
|
1,711,071
|
|
|
4.125% 12/1/30 (b)
|
5,000
|
3,613
|
|
|
4.625% 12/1/30 (b)
|
930,000
|
500,689
|
|
|
5.375% 2/1/28 (b)
|
700,000
|
583,870
|
|
|
5.5% 4/15/27 (b)
|
1,961,000
|
1,706,012
|
|
|
VZ Secured Financing BV 5% 1/15/32 (b)
|
1,805,000
|
1,484,807
|
|
|
14,688,521
|
|||
|
Chemicals - 5.1%
|
|||
|
Axalta Coating Systems/Dutch Holding BV 4.75% 6/15/27 (b)
|
1,200,000
|
1,106,735
|
|
|
INEOS Finance PLC 6.75% 5/15/28 (b)
|
690,000
|
673,688
|
|
|
Methanex Corp.:
|
|||
|
5.125% 10/15/27
|
1,585,000
|
1,489,789
|
|
|
5.25% 12/15/29
|
130,000
|
119,220
|
|
|
5.65% 12/1/44
|
1,034,000
|
842,710
|
|
|
NOVA Chemicals Corp. 5.25% 6/1/27 (b)
|
1,960,000
|
1,764,000
|
|
|
Nufarm Australia Ltd. 5% 1/27/30 (b)
|
895,000
|
781,339
|
|
|
Olin Corp.:
|
|||
|
5% 2/1/30
|
1,944,000
|
1,768,951
|
|
|
5.125% 9/15/27
|
2,525,000
|
2,400,063
|
|
|
SPCM SA 3.125% 3/15/27 (b)
|
360,000
|
310,358
|
|
|
The Chemours Co. LLC 5.375% 5/15/27
|
2,885,000
|
2,627,226
|
|
|
Valvoline, Inc. 4.25% 2/15/30 (b)
|
1,410,000
|
1,377,972
|
|
|
W.R. Grace Holding LLC:
|
|||
|
4.875% 6/15/27 (b)
|
630,000
|
578,901
|
|
|
5.625% 10/1/24 (b)
|
1,246,000
|
1,245,626
|
|
|
7.375% 3/1/31 (b)
|
125,000
|
124,091
|
|
|
17,210,669
|
|||
|
Consumer Products - 0.5%
|
|||
|
Mattel, Inc.:
|
|||
|
3.75% 4/1/29 (b)
|
630,000
|
544,950
|
|
|
6.2% 10/1/40
|
375,000
|
331,993
|
|
|
Newell Brands, Inc. 5.625% 4/1/36 (c)
|
565,000
|
478,524
|
|
|
Tempur Sealy International, Inc. 3.875% 10/15/31 (b)
|
375,000
|
302,239
|
|
|
1,657,706
|
|||
|
Containers - 1.4%
|
|||
|
Ardagh Packaging Finance PLC/Ardagh MP Holdings U.S.A., Inc. 4.125% 8/15/26 (b)
|
1,155,000
|
1,051,050
|
|
|
Ball Corp.:
|
|||
|
2.875% 8/15/30
|
1,035,000
|
826,137
|
|
|
3.125% 9/15/31
|
1,280,000
|
1,025,075
|
|
|
Graphic Packaging International, Inc. 3.75% 2/1/30 (b)
|
965,000
|
822,373
|
|
|
OI European Group BV 4.75% 2/15/30 (b)
|
370,000
|
329,333
|
|
|
Sealed Air Corp. 6.875% 7/15/33 (b)
|
680,000
|
692,104
|
|
|
4,746,072
|
|||
|
Diversified Financial Services - 5.5%
|
|||
|
Coinbase Global, Inc.:
|
|||
|
3.375% 10/1/28 (b)
|
905,000
|
592,775
|
|
|
3.625% 10/1/31 (b)
|
975,000
|
588,003
|
|
|
Icahn Enterprises LP/Icahn Enterprises Finance Corp.:
|
|||
|
5.25% 5/15/27
|
6,705,000
|
6,235,647
|
|
|
6.25% 5/15/26
|
3,149,000
|
3,054,530
|
|
|
Ladder Capital Finance Holdings LLLP/Ladder Capital Finance Corp. 4.25% 2/1/27 (b)
|
1,005,000
|
854,315
|
|
|
LPL Holdings, Inc. 4% 3/15/29 (b)
|
1,420,000
|
1,249,329
|
|
|
MSCI, Inc.:
|
|||
|
3.25% 8/15/33 (b)
|
285,000
|
224,731
|
|
|
3.875% 2/15/31 (b)
|
1,805,000
|
1,553,527
|
|
|
OneMain Finance Corp.:
|
|||
|
3.5% 1/15/27
|
2,475,000
|
2,078,569
|
|
|
6.875% 3/15/25
|
1,585,000
|
1,547,326
|
|
|
7.125% 3/15/26
|
624,000
|
606,515
|
|
|
18,585,267
|
|||
|
Diversified Media - 0.4%
|
|||
|
Advantage Sales & Marketing, Inc. 6.5% 11/15/28 (b)
|
1,765,000
|
1,348,654
|
|
|
Energy - 15.0%
|
|||
|
Altus Midstream LP 5.875% 6/15/30 (b)
|
340,000
|
314,231
|
|
|
Apache Corp.:
|
|||
|
4.25% 1/15/30
|
244,000
|
215,658
|
|
|
5.1% 9/1/40
|
686,000
|
564,455
|
|
|
5.25% 2/1/42
|
1,030,000
|
829,563
|
|
|
5.35% 7/1/49
|
170,000
|
134,655
|
|
|
Centennial Resource Production LLC 5.875% 7/1/29 (b)
|
190,000
|
170,050
|
|
|
Cheniere Energy Partners LP:
|
|||
|
3.25% 1/31/32
|
1,405,000
|
1,126,093
|
|
|
4% 3/1/31
|
1,355,000
|
1,167,533
|
|
|
Cheniere Energy, Inc. 4.625% 10/15/28
|
1,233,000
|
1,143,003
|
|
|
CNX Midstream Partners LP 4.75% 4/15/30 (b)
|
150,000
|
122,975
|
|
|
Continental Resources, Inc. 5.75% 1/15/31 (b)
|
1,860,000
|
1,760,602
|
|
|
Crestwood Midstream Partners LP/Crestwood Midstream Finance Corp.:
|
|||
|
5.625% 5/1/27 (b)
|
2,198,000
|
2,033,150
|
|
|
5.75% 4/1/25
|
3,871,000
|
3,754,726
|
|
|
6% 2/1/29 (b)
|
1,910,000
|
1,737,527
|
|
|
7.375% 2/1/31 (b)
|
370,000
|
360,424
|
|
|
CVR Energy, Inc.:
|
|||
|
5.25% 2/15/25 (b)
|
840,000
|
806,400
|
|
|
5.75% 2/15/28 (b)
|
175,000
|
155,321
|
|
|
DCP Midstream Operating LP:
|
|||
|
5.6% 4/1/44
|
100,000
|
93,799
|
|
|
6.45% 11/3/36 (b)
|
435,000
|
441,729
|
|
|
8.125% 8/16/30
|
30,000
|
33,225
|
|
|
Endeavor Energy Resources LP/EER Finance, Inc. 5.75% 1/30/28 (b)
|
905,000
|
873,325
|
|
|
EnLink Midstream LLC 5.625% 1/15/28 (b)
|
220,000
|
209,550
|
|
|
EnLink Midstream Partners LP:
|
|||
|
5.05% 4/1/45
|
290,000
|
221,712
|
|
|
5.45% 6/1/47
|
605,000
|
476,933
|
|
|
5.6% 4/1/44
|
1,018,000
|
829,670
|
|
|
EQM Midstream Partners LP:
|
|||
|
4.75% 1/15/31 (b)
|
1,140,000
|
926,250
|
|
|
5.5% 7/15/28
|
905,000
|
807,713
|
|
|
6.5% 7/15/48
|
550,000
|
409,684
|
|
|
7.5% 6/1/27 (b)
|
710,000
|
695,800
|
|
|
EQT Corp. 3.9% 10/1/27
|
1,654,000
|
1,512,451
|
|
|
Hess Midstream Partners LP:
|
|||
|
5.125% 6/15/28 (b)
|
1,130,000
|
1,036,790
|
|
|
5.625% 2/15/26 (b)
|
592,000
|
576,117
|
|
|
Hilcorp Energy I LP/Hilcorp Finance Co. 6.25% 11/1/28 (b)
|
380,000
|
353,053
|
|
|
Holly Energy Partners LP/Holly Energy Finance Corp.:
|
|||
|
5% 2/1/28 (b)
|
365,000
|
331,234
|
|
|
6.375% 4/15/27 (b)
|
300,000
|
290,916
|
|
|
New Fortress Energy, Inc. 6.5% 9/30/26 (b)
|
3,570,000
|
3,266,550
|
|
|
Occidental Petroleum Corp.:
|
|||
|
4.2% 3/15/48
|
645,000
|
493,425
|
|
|
4.3% 8/15/39
|
340,000
|
266,050
|
|
|
4.4% 4/15/46
|
995,000
|
763,389
|
|
|
4.4% 8/15/49
|
1,140,000
|
877,800
|
|
|
5.55% 3/15/26
|
1,660,000
|
1,650,986
|
|
|
6.125% 1/1/31
|
765,000
|
770,439
|
|
|
6.2% 3/15/40
|
330,000
|
321,750
|
|
|
6.45% 9/15/36
|
1,745,000
|
1,753,725
|
|
|
7.5% 5/1/31
|
1,330,000
|
1,423,100
|
|
|
7.875% 9/15/31
|
210,000
|
228,062
|
|
|
8.875% 7/15/30
|
715,000
|
812,133
|
|
|
Rockies Express Pipeline LLC:
|
|||
|
4.8% 5/15/30 (b)
|
1,095,000
|
946,777
|
|
|
4.95% 7/15/29 (b)
|
570,000
|
495,843
|
|
|
6.875% 4/15/40 (b)
|
220,000
|
180,151
|
|
|
Sunoco LP/Sunoco Finance Corp.:
|
|||
|
4.5% 5/15/29
|
1,295,000
|
1,136,510
|
|
|
5.875% 3/15/28
|
215,000
|
206,344
|
|
|
6% 4/15/27
|
1,405,000
|
1,380,413
|
|
|
Superior Plus LP / Superior General Partner, Inc. 4.5% 3/15/29 (b)
|
265,000
|
230,200
|
|
|
Tallgrass Energy Partners LP / Tallgrass Energy Finance Corp.:
|
|||
|
5.5% 1/15/28 (b)
|
255,000
|
229,021
|
|
|
6% 3/1/27 (b)
|
1,111,000
|
1,031,552
|
|
|
6% 12/31/30 (b)
|
1,360,000
|
1,172,782
|
|
|
Targa Resources Partners LP/Targa Resources Partners Finance Corp. 5.5% 3/1/30
|
280,000
|
265,215
|
|
|
Venture Global Calcasieu Pass LLC:
|
|||
|
3.875% 8/15/29 (b)
|
445,000
|
383,813
|
|
|
3.875% 11/1/33 (b)
|
365,000
|
297,621
|
|
|
4.125% 8/15/31 (b)
|
430,000
|
369,800
|
|
|
6.25% 1/15/30 (b)
|
515,000
|
507,919
|
|
|
Western Gas Partners LP:
|
|||
|
4.3% 2/1/30
|
2,950,000
|
2,613,530
|
|
|
4.65% 7/1/26
|
122,000
|
115,900
|
|
|
50,707,117
|
|||
|
Environmental - 0.7%
|
|||
|
Clean Harbors, Inc. 6.375% 2/1/31 (b)
|
150,000
|
148,933
|
|
|
Darling Ingredients, Inc.:
|
|||
|
5.25% 4/15/27 (b)
|
1,275,000
|
1,226,741
|
|
|
6% 6/15/30 (b)
|
220,000
|
212,574
|
|
|
Stericycle, Inc. 3.875% 1/15/29 (b)
|
925,000
|
792,962
|
|
|
2,381,210
|
|||
|
Food & Drug Retail - 1.8%
|
|||
|
Albertsons Companies LLC/Safeway, Inc./New Albertson's, Inc./Albertson's LLC:
|
|||
|
3.5% 3/15/29 (b)
|
3,770,000
|
3,190,834
|
|
|
4.625% 1/15/27 (b)
|
1,400,000
|
1,316,000
|
|
|
6.5% 2/15/28 (b)
|
695,000
|
691,073
|
|
|
Emergent BioSolutions, Inc. 3.875% 8/15/28 (b)
|
1,585,000
|
958,925
|
|
|
Murphy Oil U.S.A., Inc. 3.75% 2/15/31 (b)
|
165,000
|
133,503
|
|
|
6,290,335
|
|||
|
Food/Beverage/Tobacco - 2.1%
|
|||
|
JBS U.S.A. Lux SA / JBS Food Co. 5.5% 1/15/30 (b)
|
1,660,000
|
1,562,467
|
|
|
Lamb Weston Holdings, Inc. 4.375% 1/31/32 (b)
|
1,160,000
|
1,020,505
|
|
|
Pilgrim's Pride Corp. 4.25% 4/15/31
|
1,000,000
|
835,000
|
|
|
Post Holdings, Inc. 5.625% 1/15/28 (b)
|
2,000,000
|
1,910,000
|
|
|
U.S. Foods, Inc.:
|
|||
|
4.625% 6/1/30 (b)
|
175,000
|
152,853
|
|
|
6.25% 4/15/25 (b)
|
1,660,000
|
1,653,931
|
|
|
7,134,756
|
|||
|
Gaming - 1.9%
|
|||
|
Melco Resorts Finance Ltd.:
|
|||
|
5.375% 12/4/29 (b)
|
535,000
|
442,183
|
|
|
5.75% 7/21/28 (b)
|
805,000
|
691,793
|
|
|
MGM Resorts International 5.75% 6/15/25
|
620,000
|
608,841
|
|
|
VICI Properties LP / VICI Note Co.:
|
|||
|
4.25% 12/1/26 (b)
|
725,000
|
672,329
|
|
|
4.5% 9/1/26 (b)
|
2,592,000
|
2,418,287
|
|
|
4.625% 6/15/25 (b)
|
315,000
|
302,294
|
|
|
Wynn Las Vegas LLC/Wynn Las Vegas Capital Corp. 5.5% 3/1/25 (b)
|
1,330,000
|
1,290,513
|
|
|
6,426,240
|
|||
|
Healthcare - 7.0%
|
|||
|
180 Medical, Inc. 3.875% 10/15/29 (b)
|
1,175,000
|
1,023,061
|
|
|
Avantor Funding, Inc.:
|
|||
|
3.875% 11/1/29 (b)
|
1,000,000
|
865,000
|
|
|
4.625% 7/15/28 (b)
|
1,215,000
|
1,117,800
|
|
|
Catalent Pharma Solutions:
|
|||
|
3.125% 2/15/29 (b)
|
1,100,000
|
949,476
|
|
|
3.5% 4/1/30 (b)
|
1,625,000
|
1,411,361
|
|
|
Centene Corp.:
|
|||
|
2.45% 7/15/28
|
70,000
|
58,661
|
|
|
2.5% 3/1/31
|
1,390,000
|
1,083,324
|
|
|
3.375% 2/15/30
|
2,000,000
|
1,687,559
|
|
|
4.25% 12/15/27
|
1,425,000
|
1,316,771
|
|
|
Charles River Laboratories International, Inc.:
|
|||
|
3.75% 3/15/29 (b)
|
265,000
|
230,073
|
|
|
4.25% 5/1/28 (b)
|
150,000
|
135,332
|
|
|
Community Health Systems, Inc. 4.75% 2/15/31 (b)
|
1,720,000
|
1,328,700
|
|
|
DaVita HealthCare Partners, Inc. 4.625% 6/1/30 (b)
|
640,000
|
527,469
|
|
|
HCA Holdings, Inc. 5.375% 2/1/25
|
1,600,000
|
1,584,805
|
|
|
Hologic, Inc.:
|
|||
|
3.25% 2/15/29 (b)
|
1,125,000
|
970,088
|
|
|
4.625% 2/1/28 (b)
|
170,000
|
158,524
|
|
|
IQVIA, Inc. 5% 5/15/27 (b)
|
630,000
|
599,426
|
|
|
Jazz Securities DAC 4.375% 1/15/29 (b)
|
305,000
|
270,123
|
|
|
Molina Healthcare, Inc. 3.875% 5/15/32 (b)
|
485,000
|
398,190
|
|
|
Organon & Co. / Organon Foreign Debt Co-Issuer BV:
|
|||
|
4.125% 4/30/28 (b)
|
1,550,000
|
1,368,185
|
|
|
5.125% 4/30/31 (b)
|
1,050,000
|
891,188
|
|
|
Teleflex, Inc. 4.25% 6/1/28 (b)
|
305,000
|
275,290
|
|
|
Tenet Healthcare Corp.:
|
|||
|
4.625% 6/15/28
|
3,945,000
|
3,569,313
|
|
|
4.875% 1/1/26
|
690,000
|
657,147
|
|
|
5.125% 11/1/27
|
1,500,000
|
1,410,195
|
|
|
23,887,061
|
|||
|
Homebuilders/Real Estate - 3.0%
|
|||
|
Century Communities, Inc. 3.875% 8/15/29 (b)
|
430,000
|
351,525
|
|
|
HAT Holdings I LLC/HAT Holdings II LLC 3.375% 6/15/26 (b)
|
460,000
|
399,050
|
|
|
Howard Hughes Corp. 4.375% 2/1/31 (b)
|
1,935,000
|
1,576,638
|
|
|
Kennedy-Wilson, Inc. 4.75% 2/1/30
|
715,000
|
549,501
|
|
|
MPT Operating Partnership LP/MPT Finance Corp.:
|
|||
|
3.5% 3/15/31
|
1,205,000
|
825,979
|
|
|
5% 10/15/27
|
3,516,000
|
2,886,035
|
|
|
Ryan Specialty Group LLC 4.375% 2/1/30 (b)
|
530,000
|
453,129
|
|
|
Service Properties Trust:
|
|||
|
3.95% 1/15/28
|
85,000
|
67,403
|
|
|
4.375% 2/15/30
|
605,000
|
462,281
|
|
|
4.95% 10/1/29
|
515,000
|
406,249
|
|
|
5.5% 12/15/27
|
480,000
|
432,582
|
|
|
TopBuild Corp. 4.125% 2/15/32 (b)
|
765,000
|
628,157
|
|
|
Uniti Group LP / Uniti Group Finance, Inc. 4.75% 4/15/28 (b)
|
1,630,000
|
1,292,101
|
|
|
10,330,630
|
|||
|
Hotels - 1.3%
|
|||
|
Hilton Domestic Operating Co., Inc.:
|
|||
|
3.625% 2/15/32 (b)
|
1,130,000
|
927,719
|
|
|
4% 5/1/31 (b)
|
3,185,000
|
2,710,180
|
|
|
Hilton Worldwide Finance LLC/Hilton Worldwide Finance Corp. 4.875% 4/1/27
|
426,000
|
406,225
|
|
|
Wyndham Hotels & Resorts, Inc. 4.375% 8/15/28 (b)
|
592,000
|
536,183
|
|
|
4,580,307
|
|||
|
Leisure - 1.4%
|
|||
|
Carnival Corp.:
|
|||
|
7.625% 3/1/26 (b)
|
1,465,000
|
1,319,401
|
|
|
10.5% 2/1/26 (b)
|
2,290,000
|
2,371,478
|
|
|
NCL Corp. Ltd. 8.375% 2/1/28 (b)
|
865,000
|
881,253
|
|
|
Royal Caribbean Cruises Ltd. 5.375% 7/15/27 (b)
|
325,000
|
285,653
|
|
|
4,857,785
|
|||
|
Metals/Mining - 0.6%
|
|||
|
Cleveland-Cliffs, Inc. 4.875% 3/1/31 (b)
|
920,000
|
837,467
|
|
|
FMG Resources Pty Ltd. 4.5% 9/15/27 (b)
|
20,000
|
18,400
|
|
|
Howmet Aerospace, Inc. 5.95% 2/1/37
|
600,000
|
587,952
|
|
|
Mineral Resources Ltd. 8% 11/1/27 (b)
|
495,000
|
492,525
|
|
|
1,936,344
|
|||
|
Paper - 0.2%
|
|||
|
Ardagh Metal Packaging Finance U.S.A. LLC/Ardagh Metal Packaging Finance PLC 6% 6/15/27 (b)
|
475,000
|
459,677
|
|
|
Glatfelter Corp. 4.75% 11/15/29 (b)
|
290,000
|
190,146
|
|
|
649,823
|
|||
|
Restaurants - 0.4%
|
|||
|
Garden SpinCo Corp. 8.625% 7/20/30 (b)
|
150,000
|
158,262
|
|
|
Yum! Brands, Inc.:
|
|||
|
3.625% 3/15/31
|
1,285,000
|
1,075,005
|
|
|
5.35% 11/1/43
|
175,000
|
146,203
|
|
|
1,379,470
|
|||
|
Services - 5.2%
|
|||
|
ADT Corp.:
|
|||
|
4.125% 8/1/29 (b)
|
360,000
|
309,773
|
|
|
4.875% 7/15/32 (b)
|
355,000
|
304,451
|
|
|
Adtalem Global Education, Inc. 5.5% 3/1/28 (b)
|
196,000
|
180,424
|
|
|
AECOM 5.125% 3/15/27
|
2,030,000
|
1,941,342
|
|
|
Aramark Services, Inc. 5% 2/1/28 (b)
|
3,660,000
|
3,369,762
|
|
|
ASGN, Inc. 4.625% 5/15/28 (b)
|
3,400,000
|
3,072,682
|
|
|
Booz Allen Hamilton, Inc.:
|
|||
|
3.875% 9/1/28 (b)
|
1,595,000
|
1,415,945
|
|
|
4% 7/1/29 (b)
|
140,000
|
122,818
|
|
|
Fair Isaac Corp. 4% 6/15/28 (b)
|
435,000
|
395,050
|
|
|
Gartner, Inc.:
|
|||
|
3.625% 6/15/29 (b)
|
205,000
|
177,270
|
|
|
3.75% 10/1/30 (b)
|
530,000
|
448,724
|
|
|
GEMS MENASA Cayman Ltd. 7.125% 7/31/26 (b)
|
800,000
|
778,150
|
|
|
Iron Mountain, Inc. 4.875% 9/15/29 (b)
|
1,270,000
|
1,105,516
|
|
|
Neptune BidCo U.S., Inc. 9.29% 4/15/29 (b)
|
675,000
|
638,145
|
|
|
Prime Securities Services Borrower LLC/Prime Finance, Inc. 3.375% 8/31/27 (b)
|
2,545,000
|
2,201,151
|
|
|
Service Corp. International 5.125% 6/1/29
|
695,000
|
650,694
|
|
|
TriNet Group, Inc. 3.5% 3/1/29 (b)
|
595,000
|
496,827
|
|
|
17,608,724
|
|||
|
Steel - 0.2%
|
|||
|
Commercial Metals Co. 3.875% 2/15/31
|
755,000
|
637,034
|
|
|
Super Retail - 1.6%
|
|||
|
Asbury Automotive Group, Inc.:
|
|||
|
4.625% 11/15/29 (b)
|
230,000
|
200,001
|
|
|
5% 2/15/32 (b)
|
250,000
|
213,051
|
|
|
Bath & Body Works, Inc.:
|
|||
|
6.625% 10/1/30 (b)
|
1,095,000
|
1,037,217
|
|
|
6.875% 11/1/35
|
1,165,000
|
1,028,217
|
|
|
Gap, Inc. 3.875% 10/1/31 (b)
|
360,000
|
258,286
|
|
|
Hanesbrands, Inc. 4.875% 5/15/26 (b)
|
1,270,000
|
1,172,826
|
|
|
Levi Strauss & Co. 3.5% 3/1/31 (b)
|
525,000
|
429,188
|
|
|
The William Carter Co. 5.625% 3/15/27 (b)
|
1,154,000
|
1,109,175
|
|
|
5,447,961
|
|||
|
Technology - 5.4%
|
|||
|
Block, Inc. 2.75% 6/1/26
|
360,000
|
321,223
|
|
|
Broadcom, Inc. 2.45% 2/15/31 (b)
|
1,055,000
|
835,971
|
|
|
Central Parent, Inc./Central Merger Sub, Inc. 7.25% 6/15/29 (b)
|
440,000
|
430,241
|
|
|
Coherent Corp. 5% 12/15/29 (b)
|
1,385,000
|
1,213,399
|
|
|
Crowdstrike Holdings, Inc. 3% 2/15/29
|
610,000
|
513,784
|
|
|
Entegris, Inc. 4.375% 4/15/28 (b)
|
2,100,000
|
1,858,218
|
|
|
Gartner, Inc. 4.5% 7/1/28 (b)
|
820,000
|
752,782
|
|
|
Go Daddy Operating Co. LLC / GD Finance Co., Inc. 5.25% 12/1/27 (b)
|
1,400,000
|
1,324,904
|
|
|
Match Group Holdings II LLC:
|
|||
|
3.625% 10/1/31 (b)
|
575,000
|
449,938
|
|
|
4.125% 8/1/30 (b)
|
305,000
|
252,838
|
|
|
MicroStrategy, Inc. 6.125% 6/15/28 (b)
|
545,000
|
452,350
|
|
|
onsemi 3.875% 9/1/28 (b)
|
620,000
|
544,881
|
|
|
Open Text Corp.:
|
|||
|
3.875% 2/15/28 (b)
|
2,760,000
|
2,379,672
|
|
|
3.875% 12/1/29 (b)
|
1,200,000
|
968,606
|
|
|
Qorvo, Inc. 4.375% 10/15/29
|
950,000
|
847,106
|
|
|
Roblox Corp. 3.875% 5/1/30 (b)
|
890,000
|
731,678
|
|
|
Sensata Technologies BV:
|
|||
|
4% 4/15/29 (b)
|
1,115,000
|
983,397
|
|
|
5.625% 11/1/24 (b)
|
1,000,000
|
989,358
|
|
|
Sensata Technologies, Inc. 3.75% 2/15/31 (b)
|
1,335,000
|
1,112,885
|
|
|
TTM Technologies, Inc. 4% 3/1/29 (b)
|
460,000
|
379,458
|
|
|
Twilio, Inc. 3.875% 3/15/31
|
295,000
|
241,531
|
|
|
Viavi Solutions, Inc. 3.75% 10/1/29 (b)
|
725,000
|
605,158
|
|
|
18,189,378
|
|||
|
Telecommunications - 6.1%
|
|||
|
Altice Financing SA 5% 1/15/28 (b)
|
1,660,000
|
1,377,601
|
|
|
C&W Senior Financing Designated Activity Co. 6.875% 9/15/27 (b)
|
2,719,000
|
2,449,819
|
|
|
Cogent Communications Group, Inc. 7% 6/15/27 (b)
|
830,000
|
803,025
|
|
|
Millicom International Cellular SA:
|
|||
|
4.5% 4/27/31 (b)
|
200,000
|
161,500
|
|
|
5.125% 1/15/28 (b)
|
1,800,000
|
1,582,650
|
|
|
Sable International Finance Ltd. 5.75% 9/7/27 (b)
|
1,424,000
|
1,308,122
|
|
|
SBA Communications Corp.:
|
|||
|
3.125% 2/1/29
|
1,000,000
|
825,700
|
|
|
3.875% 2/15/27
|
705,000
|
638,021
|
|
|
Sprint Capital Corp.:
|
|||
|
6.875% 11/15/28
|
4,725,000
|
4,954,163
|
|
|
8.75% 3/15/32
|
1,720,000
|
2,047,643
|
|
|
Telecom Italia Capital SA:
|
|||
|
6% 9/30/34
|
739,000
|
617,435
|
|
|
7.2% 7/18/36
|
855,000
|
751,015
|
|
|
Virgin Media Secured Finance PLC 4.5% 8/15/30 (b)
|
3,700,000
|
3,062,527
|
|
|
20,579,221
|
|||
|
Textiles/Apparel - 0.1%
|
|||
|
Foot Locker, Inc. 4% 10/1/29 (b)
|
190,000
|
156,199
|
|
|
Kontoor Brands, Inc. 4.125% 11/15/29 (b)
|
125,000
|
105,938
|
|
|
262,137
|
|||
|
Transportation Ex Air/Rail - 0.1%
|
|||
|
Seaspan Corp. 5.5% 8/1/29 (b)
|
360,000
|
270,917
|
|
|
XPO, Inc. 6.25% 5/1/25 (b)
|
168,000
|
168,084
|
|
|
439,001
|
|||
|
Utilities - 7.1%
|
|||
|
Clearway Energy Operating LLC:
|
|||
|
3.75% 2/15/31 (b)
|
1,355,000
|
1,102,631
|
|
|
4.75% 3/15/28 (b)
|
290,000
|
266,133
|
|
|
DCP Midstream Operating LP 5.125% 5/15/29
|
3,305,000
|
3,181,300
|
|
|
FirstEnergy Corp. 2.25% 9/1/30
|
1,260,000
|
1,004,850
|
|
|
NextEra Energy Partners LP 4.25% 9/15/24 (b)
|
146,000
|
136,145
|
|
|
NRG Energy, Inc.:
|
|||
|
3.625% 2/15/31 (b)
|
1,710,000
|
1,325,894
|
|
|
5.25% 6/15/29 (b)
|
1,251,000
|
1,113,390
|
|
|
5.75% 1/15/28
|
1,319,000
|
1,243,289
|
|
|
6.625% 1/15/27
|
339,000
|
338,048
|
|
|
PG&E Corp.:
|
|||
|
5% 7/1/28
|
5,555,000
|
5,071,993
|
|
|
5.25% 7/1/30
|
2,395,000
|
2,137,538
|
|
|
TerraForm Power Operating LLC 5% 1/31/28 (b)
|
624,000
|
574,080
|
|
|
TransAlta Corp. 6.5% 3/15/40
|
545,000
|
495,950
|
|
|
Vertiv Group Corp. 4.125% 11/15/28 (b)
|
895,000
|
777,567
|
|
|
Vistra Operations Co. LLC:
|
|||
|
5% 7/31/27 (b)
|
2,705,000
|
2,512,823
|
|
|
5.5% 9/1/26 (b)
|
2,052,000
|
1,959,851
|
|
|
5.625% 2/15/27 (b)
|
960,000
|
909,716
|
|
|
24,151,198
|
|||
|
TOTAL NONCONVERTIBLE BONDS
|
298,178,356
|
||
|
TOTAL CORPORATE BONDS
(Cost $330,813,421)
|
299,877,031
|
||
|
Bank Loan Obligations - 0.3%
|
|||
|
Principal
Amount (a)
|
Value ($)
|
||
|
Services - 0.2%
|
|||
|
ABG Intermediate Holdings 2 LLC Tranche B1 LN, term loan CME Term SOFR 1 Month Index + 3.500% 8.2176% 12/21/28 (d)(e)(f)
|
129,350
|
126,683
|
|
|
Neptune BidCo U.S., Inc. Tranche B 1LN, term loan CME Term SOFR 1 Month Index + 5.000% 9.735% 4/11/29 (d)(e)(f)
|
820,000
|
752,350
|
|
|
TOTAL SERVICES
|
879,033
|
||
|
Utilities - 0.1%
|
|||
|
Brookfield WEC Holdings, Inc. 1LN, term loan CME Term SOFR 1 Month Index + 3.750% 8.3676% 8/1/25 (d)(e)(f)
|
329,175
|
328,711
|
|
|
TOTAL BANK LOAN OBLIGATIONS
(Cost $1,174,159)
|
1,207,744
|
||
|
Preferred Securities - 0.9%
|
|||
|
Principal
Amount (a)
|
Value ($)
|
||
|
Banks & Thrifts - 0.9%
|
|||
|
Ally Financial, Inc. 4.7% (d)(g)
(Cost $3,800,000)
|
3,800,000
|
2,984,894
|
|
|
Money Market Funds - 9.0%
|
|||
|
Shares
|
Value ($)
|
||
|
Fidelity Cash Central Fund 4.63% (h)
(Cost $30,346,526)
|
30,342,396
|
30,348,464
|
|
|
TOTAL INVESTMENT IN SECURITIES - 98.7%
(Cost $366,134,106)
|
334,418,133
|
|
NET OTHER ASSETS (LIABILITIES) - 1.3%
|
4,425,365
|
|
NET ASSETS - 100.0%
|
338,843,498
|
|
(a)
|
Amount is stated in United States dollars unless otherwise noted.
|
|
(b)
|
Security exempt from registration under Rule 144A of the Securities Act of 1933. These securities may be resold in transactions exempt from registration, normally to qualified institutional buyers. At the end of the period, the value of these securities amounted to $184,662,220 or 54.5% of net assets.
|
|
(c)
|
Security initially issued at one coupon which converts to a higher coupon at a specified date. The rate shown is the rate at period end.
|
|
(d)
|
Coupon rates for floating and adjustable rate securities reflect the rates in effect at period end.
|
|
(e)
|
Coupon is indexed to a floating interest rate which may be multiplied by a specified factor and/or subject to caps or floors.
|
|
(f)
|
Remaining maturities of bank loan obligations may be less than the stated maturities shown as a result of contractual or optional prepayments by the borrower. Such prepayments cannot be predicted with certainty.
|
|
(g)
|
Security is perpetual in nature with no stated maturity date.
|
|
(h)
|
Affiliated fund that is generally available only to investment companies and other accounts managed by Fidelity Investments. The rate quoted is the annualized seven-day yield of the fund at period end. A complete unaudited listing of the fund's holdings as of its most recent quarter end is available upon request. In addition, each Fidelity Central Fund's financial statements are available on the SEC's website or upon request.
|
|
Affiliate
|
Value,
beginning
of period ($)
|
Purchases ($)
|
Sales
Proceeds ($)
|
Dividend
Income ($)
|
Realized
Gain (loss) ($)
|
Change in
Unrealized
appreciation
(depreciation) ($)
|
Value,
end
of period ($)
|
% ownership,
end
of period
|
|
Fidelity Cash Central Fund 4.63%
|
33,916,027
|
26,382,398
|
29,949,960
|
649,114
|
-
|
(1)
|
30,348,464
|
0.1%
|
|
Total
|
33,916,027
|
26,382,398
|
29,949,960
|
649,114
|
-
|
(1)
|
30,348,464
|
|
|
Valuation Inputs at Reporting Date:
|
||||
|
Description
|
Total ($)
|
Level 1 ($)
|
Level 2 ($)
|
Level 3 ($)
|
|
Investments in Securities:
|
||||
|
Corporate Bonds
|
299,877,031
|
-
|
299,877,031
|
-
|
|
Bank Loan Obligations
|
1,207,744
|
-
|
1,207,744
|
-
|
|
Preferred Securities
|
2,984,894
|
-
|
2,984,894
|
-
|
|
Money Market Funds
|
30,348,464
|
30,348,464
|
-
|
-
|
|
Total Investments in Securities:
|
334,418,133
|
30,348,464
|
304,069,669
|
-
|
|
Statement of Assets and Liabilities
|
||||
|
February 28, 2023
(Unaudited)
|
||||
|
Assets
|
||||
|
Investment in securities, at value - See accompanying schedule:
|
||||
|
Unaffiliated issuers (cost $335,787,580)
|
$
|
304,069,669
|
||
|
Fidelity Central Funds (cost $30,346,526)
|
30,348,464
|
|||
|
Total Investment in Securities (cost $366,134,106)
|
$
|
334,418,133
|
||
|
Cash
|
821
|
|||
|
Dividends receivable
|
391
|
|||
|
Interest receivable
|
4,302,293
|
|||
|
Distributions receivable from Fidelity Central Funds
|
121,903
|
|||
|
Total assets
|
338,843,541
|
|||
|
Liabilities
|
||||
|
Other payables and accrued expenses
|
$
|
43
|
||
|
Total Liabilities
|
43
|
|||
|
Net Assets
|
$
|
338,843,498
|
||
|
Net Assets consist of:
|
||||
|
Paid in capital
|
$
|
377,413,956
|
||
|
Total accumulated earnings (loss)
|
(38,570,458)
|
|||
|
Net Assets
|
$
|
338,843,498
|
||
|
Net Asset Value
, offering price and redemption price per share ($338,843,498 ÷ 4,073,394 shares)
|
$
|
83.18
|
||
|
Statement of Operations
|
||||
|
Six months ended
February 28, 2023
(Unaudited)
|
||||
|
Investment Income
|
||||
|
Dividends
|
$
|
89,691
|
||
|
Interest
|
8,083,214
|
|||
|
Income from Fidelity Central Funds
|
649,114
|
|||
|
Total Income
|
8,822,019
|
|||
|
Expenses
|
||||
|
Custodian fees and expenses
|
$
|
37
|
||
|
Independent trustees' fees and expenses
|
603
|
|||
|
Total expenses before reductions
|
640
|
|||
|
Expense reductions
|
(60)
|
|||
|
Total expenses after reductions
|
580
|
|||
|
Net Investment income (loss)
|
8,821,439
|
|||
|
Realized and Unrealized Gain (Loss)
|
||||
|
Net realized gain (loss) on:
|
||||
|
Investment Securities:
|
||||
|
Unaffiliated issuers
|
(3,821,469)
|
|||
|
Total net realized gain (loss)
|
(3,821,469)
|
|||
|
Change in net unrealized appreciation (depreciation) on:
|
||||
|
Investment Securities:
|
||||
|
Unaffiliated issuers
|
1,160,426
|
|||
|
Fidelity Central Funds
|
(1)
|
|||
|
Total change in net unrealized appreciation (depreciation)
|
1,160,425
|
|||
|
Net gain (loss)
|
(2,661,044)
|
|||
|
Net increase (decrease) in net assets resulting from operations
|
$
|
6,160,395
|
||
|
Statement of Changes in Net Assets
|
||||
|
Six months ended
February 28, 2023
(Unaudited)
|
Year ended
August 31, 2022
|
|||
|
Increase (Decrease) in Net Assets
|
||||
|
Operations
|
||||
|
Net investment income (loss)
|
$
|
8,821,439
|
$
|
16,106,870
|
|
Net realized gain (loss)
|
(3,821,469)
|
(2,997,053)
|
||
|
Change in net unrealized appreciation (depreciation)
|
1,160,425
|
(49,825,397)
|
||
|
Net increase (decrease) in net assets resulting from operations
|
6,160,395
|
(36,715,580)
|
||
|
Distributions to shareholders
|
(8,420,508)
|
(28,332,812)
|
||
|
Affiliated share transactions
|
||||
|
Proceeds from sales of shares
|
-
|
15,400,000
|
||
|
Reinvestment of distributions
|
8,420,301
|
28,330,870
|
||
|
Cost of shares redeemed
|
(74,608)
|
(7,441,587)
|
||
|
Net increase (decrease) in net assets resulting from share transactions
|
8,345,693
|
36,289,283
|
||
|
Total increase (decrease) in net assets
|
6,085,580
|
(28,759,109)
|
||
|
Net Assets
|
||||
|
Beginning of period
|
332,757,918
|
361,517,027
|
||
|
End of period
|
$
|
338,843,498
|
$
|
332,757,918
|
|
Other Information
|
||||
|
Shares
|
||||
|
Sold
|
-
|
169,484
|
||
|
Issued in reinvestment of distributions
|
101,474
|
305,098
|
||
|
Redeemed
|
(900)
|
(84,911)
|
||
|
Net increase (decrease)
|
100,574
|
389,671
|
||
|
Fidelity® Specialized High Income Central Fund
|
|
Six months ended
(Unaudited) February 28, 2023
|
Years ended August 31, 2022
|
2021
|
2020
|
2019
|
2018
|
|||||||
|
Selected Per-Share Data
|
||||||||||||
|
Net asset value, beginning of period
|
$
|
83.76
|
$
|
100.89
|
$
|
100.01
|
$
|
102.28
|
$
|
99.83
|
$
|
104.63
|
|
Income from Investment Operations
|
||||||||||||
|
Net investment income (loss)
A,B
|
2.198
|
4.198
|
4.670
|
5.162
|
5.368
|
5.188
|
||||||
|
Net realized and unrealized gain (loss)
|
(.680)
|
(13.727)
|
1.582
|
(1.042)
|
2.981
|
(2.758)
|
||||||
|
Total from investment operations
|
1.518
|
(9.529)
|
6.252
|
4.120
|
8.349
|
2.430
|
||||||
|
Distributions from net investment income
|
(2.098)
|
(4.181)
|
(4.623)
|
(5.093)
|
(5.335)
|
(5.217)
|
||||||
|
Distributions from net realized gain
|
-
|
(3.420)
|
(.749)
|
(1.297)
|
(.564)
|
(2.013)
|
||||||
|
Total distributions
|
(2.098)
|
(7.601)
|
(5.372)
|
(6.390)
|
(5.899)
|
(7.230)
|
||||||
|
Net asset value, end of period
|
$
|
83.18
|
$
|
83.76
|
$
|
100.89
|
$
|
100.01
|
$
|
102.28
|
$
|
99.83
|
|
Total Return
C,D
|
1.84%
|
(9.98)%
|
6.46%
|
4.25%
|
8.73%
|
2.42%
|
||||||
|
Ratios to Average Net Assets
B,E,F
|
||||||||||||
|
Expenses before reductions
G
|
-%
H
|
-%
|
-%
|
-%
|
-%
|
-%
|
||||||
|
Expenses net of fee waivers, if any
G
|
-%
H
|
-%
|
-%
|
-%
|
-%
|
-%
|
||||||
|
Expenses net of all reductions
G
|
-%
H
|
-%
|
-%
|
-%
|
-%
|
-%
|
||||||
|
Net investment income (loss)
|
5.32%
H
|
4.61%
|
4.67%
|
5.20%
|
5.42%
|
5.13%
|
||||||
|
Supplemental Data
|
||||||||||||
|
Net assets, end of period (000 omitted)
|
$
|
338,843
|
$
|
332,758
|
$
|
361,517
|
$
|
531,050
|
$
|
601,159
|
$
|
719,197
|
|
Portfolio turnover rate
I
|
18%
H
|
23%
|
55%
|
54%
|
45%
J
|
62%
|
|
Fidelity Central Fund
|
Investment Manager
|
Investment Objective
|
Investment Practices
|
Expense Ratio
A
|
|
Fidelity Money Market Central Funds
|
Fidelity Management & Research Company LLC (FMR)
|
Each fund seeks to obtain a high level of current income consistent with the preservation of capital and liquidity.
|
Short-term Investments
|
Less than .005%
|
|
Gross unrealized appreciation
|
$2,329,412
|
|
Gross unrealized depreciation
|
(33,903,677)
|
|
Net unrealized appreciation (depreciation)
|
$(31,574,265)
|
|
Tax cost
|
$365,992,398
|
|
Short-term
|
$(751,491)
|
|
Long-term
|
(1,998,992)
|
|
Total capital loss carryforward
|
$(2,750,483)
|
|
|
Purchases ($)
|
Sales ($)
|
|
Fidelity Specialized High Income Central Fund
|
38,184,424
|
25,755,998
|
|
|
Amount
|
|
Fidelity Specialized High Income Central Fund
|
$11
|
|
The Example is based on an investment of $1,000 invested at the beginning of the period and held for the entire period (September 1, 2022 to February 28, 2023).
|
|
Annualized Expense Ratio-
A
|
Beginning Account Value September 1, 2022
|
Ending Account Value February 28, 2023
|
Expenses Paid During Period-
C
September 1, 2022 to February 28, 2023
|
|||||||
|
Fidelity® Specialized High Income Central Fund
|
0.0004%
|
|||||||||
|
Actual
|
$ 1,000
|
$ 1,018.40
|
$-
D
|
|||||||
|
Hypothetical-
B
|
$ 1,000
|
$ 1,024.79
|
$-
D
|
|||||||

|
Item 2.
Code of Ethics
Not applicable.
Item 3.
Audit Committee Financial Expert
Not applicable.
Item 4.
Principal Accountant Fees and Services
Not applicable.
Item 5.
Audit Committee of Listed Registrants
Not applicable.
Item 6.
Investments
(a)
Not applicable.
(b)
Not applicable
Item 7.
Disclosure of Proxy Voting Policies and Procedures for Closed-End Management Investment Companies
Not applicable.
Item 8.
Portfolio Managers of Closed-End Management Investment Companies
Not applicable.
Item 9.
Purchase of Equity Securities by Closed-End Management Investment Company and Affiliated Purchasers
Not applicable.
Item 10.
Submission of Matters to a Vote of Security Holders
There were no material changes to the procedures by which shareholders may recommend nominees to the Fidelity Central Investment Portfolios LLC’s Board of Trustees.
Item 11.
Controls and Procedures
(a)(i) The President and Treasurer and the Chief Financial Officer have concluded that the Fidelity Central Investment Portfolios LLC’s (the “Trust”) disclosure controls and procedures (as defined in Rule 30a-3(c) under the Investment Company Act) provide reasonable assurances that material information relating to the Trust is made known to them by the appropriate persons, based on their evaluation of these controls and procedures as of a date within 90 days of the filing date of this report.
(a)(ii) There was no change in the Trust’s internal control over financial reporting (as defined in Rule 30a-3(d) under the Investment Company Act) that occurred during the period covered by this report that has materially affected, or is reasonably likely to materially affect, the Trust’s internal control over financial reporting.
Item 12.
Disclosure of Securities Lending Activities for Closed-End Management
Investment Companies
Not applicable.
Item 13.
Exhibits
| (a) |
(1) |
Not applicable. |
| (a) |
(2) |
|
| (a) |
(3) |
Not applicable. |
| (b) |
|
SIGNATURES
Pursuant to the requirements of the Securities Exchange Act of 1934 and the Investment Company Act of 1940, the registrant has duly caused this report to be signed on its behalf by the undersigned, thereunto duly authorized.
Fidelity Central Investment Portfolios LLC
| By: |
/s/Stacie M. Smith |
| |
Stacie M. Smith |
| |
President and Treasurer |
| |
|
| Date: |
April 20, 2023 |
Pursuant to the requirements of the Securities Exchange Act of 1934 and the Investment Company Act of 1940, this report has been signed below by the following persons on behalf of the registrant and in the capacities and on the dates indicated.
| By: |
/s/Stacie M. Smith |
| |
Stacie M. Smith |
| |
President and Treasurer |
| |
|
| Date: |
April 20, 2023 |
| By: |
/s/John J. Burke III |
| |
John J. Burke III |
| |
Chief Financial Officer |
| |
|
| Date: |
April 20, 2023 |
Exhibit EX-99.CERT
I, Stacie M. Smith, certify that:
1.
I have reviewed this report on Form N-CSR of Fidelity Central Investment Portfolios LLC;
2.
Based on my knowledge, this report does not contain any untrue statement of a material fact or omit to state a material fact necessary to make the statements made, in light of the circumstances under which such statements were made, not misleading with respect to the period covered by this report;
3.
Based on my knowledge, the financial statements, and other financial information included in this report, fairly present in all material respects the financial condition, results of operations, changes in net assets, and cash flows (if the financial statements are required to include a statement of cash flows) of the registrant as of, and for, the periods presented in this report;
4.
The registrant's other certifying officer(s) and I are responsible for establishing and maintaining disclosure controls and procedures (as defined in Rule 30a-3(c) under the Investment Company Act of 1940) and internal control over financial reporting (as defined in Rule 30a-3(d) under the Investment Company Act of 1940) for the registrant and have:
a.
Designed such disclosure controls and procedures, or caused such disclosure controls and procedures to be designed under our supervision, to ensure that material information relating to the registrant, including its consolidated subsidiaries, is made known to us by others within those entities, particularly during the period in which this report is being prepared;
b.
Designed such internal control over financial reporting, or caused such internal control over financial reporting to be designed under our supervision, to provide reasonable assurance regarding the reliability of financial reporting and the preparation of financial statements for external purposes in accordance with generally accepted accounting principles;
c.
Evaluated the effectiveness of the registrant's disclosure controls and procedures and presented in this report our conclusions about the effectiveness of the disclosure controls and procedures, as of a date within 90 days prior to the filing date of this report based upon such evaluation; and
d.
Disclosed in this report any change in the registrant ’s internal control over financial reporting that occurred during the period covered by this report that has materially affected, or is reasonably likely to materially affect, the registrant ’s internal control over financial reporting; and
5.
The registrant's other certifying officer(s) and I have disclosed to the registrant's auditors and the audit committee of the registrant's board of directors (or persons performing the equivalent functions):
a.
All significant deficiencies and material weaknesses in the design or operation of internal control over financial reporting which are reasonably likely to adversely affect the registrant's ability to record, process, summarize, and report financial information; and
b.
Any fraud, whether or not material, that involves management or other employees who have a significant role in the registrant's internal control over financial reporting.
Date:
April 20, 2023
|
/s/Stacie M. Smith |
|
Stacie M. Smith |
|
President and Treasurer |
I, John J. Burke III, certify that:
1.
I have reviewed this report on Form N-CSR of Fidelity Central Investment Portfolios LLC;
2.
Based on my knowledge, this report does not contain any untrue statement of a material fact or omit to state a material fact necessary to make the statements made, in light of the circumstances under which such statements were made, not misleading with respect to the period covered by this report;
3.
Based on my knowledge, the financial statements, and other financial information included in this report, fairly present in all material respects the financial condition, results of operations, changes in net assets, and cash flows (if the financial statements are required to include a statement of cash flows) of the registrant as of, and for, the periods presented in this report;
4.
The registrant's other certifying officer(s) and I are responsible for establishing and maintaining disclosure controls and procedures (as defined in Rule 30a-3(c) under the Investment Company Act of 1940) and internal control over financial reporting (as defined in Rule 30a-3(d) under the Investment Company Act of 1940) for the registrant and have:
a.
Designed such disclosure controls and procedures, or caused such disclosure controls and procedures to be designed under our supervision, to ensure that material information relating to the registrant, including its consolidated subsidiaries, is made known to us by others within those entities, particularly during the period in which this report is being prepared;
b.
Designed such internal control over financial reporting, or caused such internal control over financial reporting to be designed under our supervision, to provide reasonable assurance regarding the reliability of financial reporting and the preparation of financial statements for external purposes in accordance with generally accepted accounting principles;
c.
Evaluated the effectiveness of the registrant's disclosure controls and procedures and presented in this report our conclusions about the effectiveness of the disclosure controls and procedures, as of a date within 90 days prior to the filing date of this report based upon such evaluation; and
d.
Disclosed in this report any change in the registrant ’s internal control over financial reporting that occurred during the period covered by this report that has materially affected, or is reasonably likely to materially affect, the registrant ’s internal control over financial reporting; and
5.
The registrant's other certifying officer(s) and I have disclosed to the registrant's auditors and the audit committee of the registrant's board of directors (or persons performing the equivalent functions):
a.
All significant deficiencies and material weaknesses in the design or operation of internal control over financial reporting which are reasonably likely to adversely affect the registrant's ability to record, process, summarize, and report financial information; and
b.
Any fraud, whether or not material, that involves management or other employees who have a significant role in the registrant's internal control over financial reporting.
Date:
April 20, 2023
|
/s/John J. Burke III |
|
John J. Burke III |
|
Chief Financial Officer |
Exhibit EX-99.906CERT
Certification Pursuant to Section 906 of the Sarbanes-Oxley Act of 2002 (subsections (a) and (b) of section 1350, chapter 63 of title 18, United States Code)
In connection with the attached Report of Fidelity Central Investment Portfolios LLC (the “Trust ”) on Form N-CSR to be filed with the Securities and Exchange Commission (the “Report ”), each of the undersigned officers of the Trust does hereby certify that, to the best of such officer ’s knowledge:
1.
The Report fully complies with the requirements of 13(a) or 15(d) of the Securities Exchange Act of 1934; and
2.
The information contained in the Report fairly presents, in all material respects, the financial condition and results of operations of the Trust as of, and for, the periods presented in the Report.
Dated: April 20, 2023
|
/s/Stacie M. Smith |
|
Stacie M. Smith |
|
President and Treasurer |
Dated: April 20, 2023
|
/s/John J. Burke III |
|
John J. Burke III |
|
Chief Financial Officer |
A signed original of this written statement required by Section 906, or other document authenticating, acknowledging, or otherwise adopting the signature that appears in typed form within the electronic version of this written statement required by Section 906, has been provided to the Trust and will be retained by the Trust and furnished to the Securities and Exchange Commission or its staff upon request.