2.1
9.7
1758186
6.2
12433
11545
1.7
4.1
2060024
3.4
0.1
10000
2.6
1.8
3.9
15.9
7.0
10.6
13696
18331
9425
10000
29.1
5.4
5.3
2.3
10.9
2.2
12.1
5.7
4.6
25457
4.3
1.3
13939
1.5
33026
2330110
1.8
17112
24201
5.3
1.4
7.7
7.0
19733
17208
2.1
5.3
1.8
11292
10203
1.2
7.0
2.3
4.7
1395102
5.3
3.3
52797
2.2
1.9
1387063
23170
15.3
2.3
4.2
1.8
8.9
10000
1134917
1367380
1.4
15757
3.0
4.7
1187130
4.7
40389
30748
37020
2.5
24170
4.7
9.1
13078
17.2
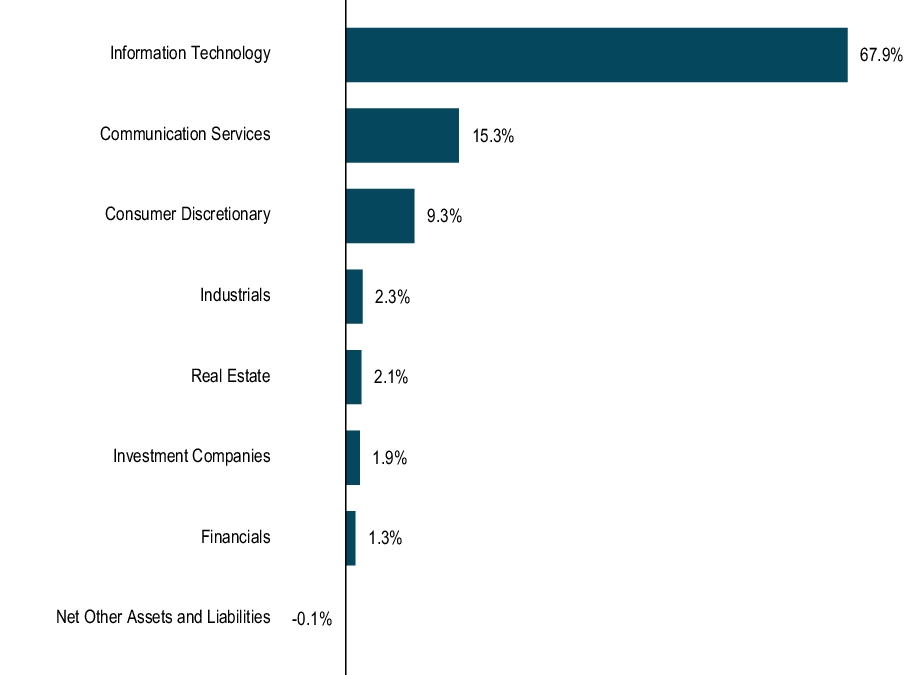
67.9
2.1
6.2
10000
2.1
1.6
12853
11096
9.3
1.3
2912897
4.7
38537
42515
4.8
1866071
3.3
4.6
1.4
43390
6.6
29238
3.1
11253
9.3
2.2
3.4
1.7
18.1
2.6
11144
2.0
1.9
4.7
2.3
5.7
4.8
2.3
6.6
14094
1888704
2.0
22076
1838818
3.9
5.4
4.5
26705
2.7
45175
19472
2.6
3.9
26511
1.6
9425
8.9
9.3
18968
0.1
2.0
1719499
2.1
67.9
3.5
9.6
1085161
5.7
4.5
4.5
1.9
5.7
9796
2.3
2.2
2365900
29885
2.0
18396
1.7
19976
1256617
1555813
3.3
1391407
2.6
10000
1.5
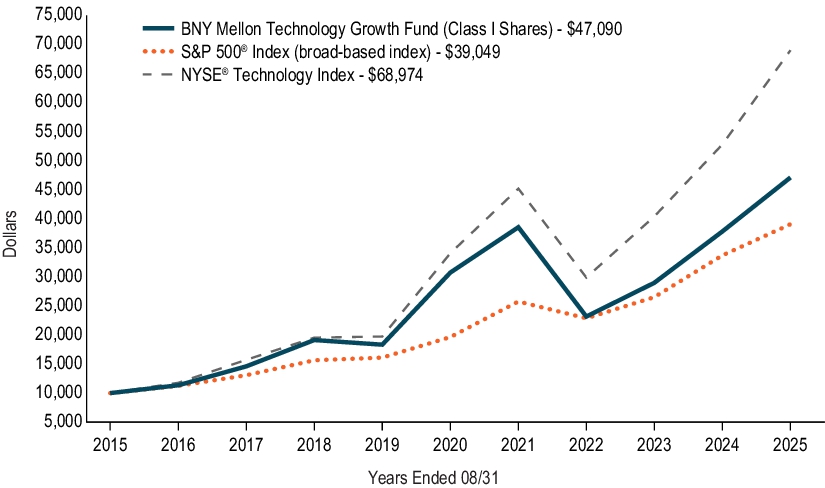
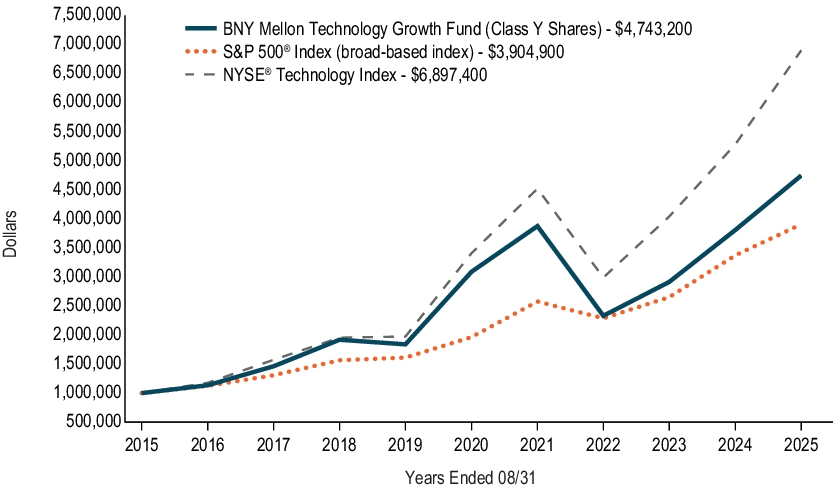
68974
2.6
9.3
10000
34505
4.5
9.3
3.8
29390
2.0
10000
11776
11349
2.2
10000
4.7
2.1
9.6
31957
1.8
3.8
1.5
22868
12.5
4743200
5.3
14378
1913926
3.8
19544
18.1
47090
0.1
4.9
2.3
7.2
3.0
19128
36276
25335
12.1
14171
9424
28639
3.5
3.7
2.5
1.3
2.3
3.7
4.7
1243619
1.8
26461
15.3
1.2
17597
1243317
4.7
18.1
2.1
24671
2.3
1.9
25.4
17.4
7.2
1000000
16167
12920
14259
12.1
17.4
1.9
3314500
6.2
11288
10000
6.6
5.7
2.7
1.9
2423080
4.1
37820
1.9
17227
1879308
67.9
12600
3.8
22797
2.9
9.3
25758
7.7
19135
4.6
4.2
35816
1.2
1.8
8.9
10.9
2.5
2.6
1.8
10.9
15649
18.1
1.8
13898
3.8
34073
21099
5.7
9.7
4.7
2.5
1.5
2.6
10000
25.4
1.5
17953
34934
3.4
19618
12934
21566
17.2
1.8
2.5
20564
1917692
3.8
16106
1.2
1.9
4.1
14544
1658304
12509
2.1
2.9
18541
3.0
2.1
2.0
1043994
15.9
2.1
7.2
3.8
10.9
4.6
10852
7.7
3.5
20131
17.4
5.3
1.3
4.1
9.7
4.7
1.8
12.5
10000
2202494
2.0
4.8
7.7
1.9
3.0
1389172
11227
17.2
2.0
15553
21485
7.7
3087636
21584
9.3
2.1
5.7
1455206
10.6
2.1
3806780
2.1
1013417
15729
3.4
14605
10746
4.3
1.6
2.2
17897
1000000
3873029
8.9
33703
2.7
3.9
9.7
2.1
3.0
2.0
6.6
9.1
1462019
1.9
7.2
10319
29.1
6.2
4.3
7.7
10672
2.2
3.4
1000000
2.3
2.3
1000000
0.1
25.4
5.7
3.1
26815
4.8
1990100
1.5
14292
1255651
2.7
2.3
5.4
15.3
2114343
4.9
67.9
1.9
19639
2.1
2.2
13653
4.2
1.2
3.0
15.3
4.7
17.4
10.6
2.0
39049
2948138
28974
13476
7.0
3.8
17461
15479
10000
19675
13826
22466
23406
13394
14118
12465
16844
22312
10134
21156
19047
29880
11602
18868
17444
13222
15654
10000
32823
23416
19381
17453
12185
13005
19535
26858
22322
18273
12532
13624
21814
10000
27077
18451
12974
11169
21263
12541
16296
38151
19517
16259
16487
12933
15545
17180
19716
25926
13517
15932
13602
13129
18729
30349
10000
10423
25812
10134
11844
18535
19367
12556
11886
19089
19915
10859
15543
13407
11658
17069
13815
12478
21648
12385
14457
18627
13636
15.9
2.6
1.2
7.7
2.6
1.6
3.4
2.5
29.1
5.3
12.5
2.9
4.9
2.7
29.1
3.7
3.7
2.6
1.2
9.6
2.7
12.5
3.1
2.7
2.6
9.1
3.0
3.0
3.1
15.9
2.7
3.4
5.3
9.1
4.9
2.5
9.6
2.9
7.7
0000914775
false
N-1A
0000914775
bmafi:C000001288Member
2015-08-31
2015-08-31
0000914775
bmafi:C000001289Member
2015-08-31
2015-08-31
0000914775
bmafi:C000001358Member
2015-08-31
2015-08-31
0000914775
bmafi:C000001360Member
2015-08-31
2015-08-31
0000914775
bmafi:C000001361Member
2015-08-31
2015-08-31
0000914775
bmafi:C000001368Member
2015-08-31
2015-08-31
0000914775
bmafi:C000001370Member
2015-08-31
2015-08-31
0000914775
bmafi:C000001371Member
2015-08-31
2015-08-31
0000914775
bmafi:C000064720Member
2015-08-31
2015-08-31
0000914775
bmafi:C000064721Member
2015-08-31
2015-08-31
0000914775
bmafi:C000130426Member
2015-08-31
2015-08-31
0000914775
bmafi:C000130427Member
2015-08-31
2015-08-31
0000914775
bmafi:C000174005Member
2015-08-31
2015-08-31
0000914775
bmafi:C000174006Member
2015-08-31
2015-08-31
0000914775
bmafi:C000174007Member
2015-08-31
2015-08-31
0000914775
bmafi:NYSETechnologyIndexMember
2015-08-31
2015-08-31
0000914775
bmafi:Russell1000IndexMember
2015-08-31
2015-08-31
0000914775
bmafi:Russell1000ValueIndexMember
2015-08-31
2015-08-31
0000914775
bmafi:Russell2000IndexMember
2015-08-31
2015-08-31
0000914775
bmafi:Russell3000IndexMember
2015-08-31
2015-08-31
0000914775
bmafi:RussellMidcapValueIndexMember
2015-08-31
2015-08-31
0000914775
us-gaap:StandardPoors500IndexMember
2015-08-31
2015-08-31
0000914775
bmafi:C000001288Member
2015-09-01
2017-08-31
0000914775
bmafi:C000001289Member
2015-09-01
2017-08-31
0000914775
bmafi:C000001358Member
2015-09-01
2017-08-31
0000914775
bmafi:C000001360Member
2015-09-01
2017-08-31
0000914775
bmafi:C000001361Member
2015-09-01
2017-08-31
0000914775
bmafi:C000001368Member
2015-09-01
2017-08-31
0000914775
bmafi:C000001370Member
2015-09-01
2017-08-31
0000914775
bmafi:C000001371Member
2015-09-01
2017-08-31
0000914775
bmafi:C000064720Member
2015-09-01
2017-08-31
0000914775
bmafi:C000064721Member
2015-09-01
2017-08-31
0000914775
bmafi:C000130426Member
2015-09-01
2017-08-31
0000914775
bmafi:C000130427Member
2015-09-01
2017-08-31
0000914775
bmafi:C000174005Member
2015-09-01
2017-08-31
0000914775
bmafi:C000174006Member
2015-09-01
2017-08-31
0000914775
bmafi:C000174007Member
2015-09-01
2017-08-31
0000914775
bmafi:NYSETechnologyIndexMember
2015-09-01
2017-08-31
0000914775
bmafi:Russell1000IndexMember
2015-09-01
2017-08-31
0000914775
bmafi:Russell1000ValueIndexMember
2015-09-01
2017-08-31
0000914775
bmafi:Russell2000IndexMember
2015-09-01
2017-08-31
0000914775
bmafi:Russell3000IndexMember
2015-09-01
2017-08-31
0000914775
bmafi:RussellMidcapValueIndexMember
2015-09-01
2017-08-31
0000914775
us-gaap:StandardPoors500IndexMember
2015-09-01
2017-08-31
0000914775
bmafi:C000001288Member
2015-09-01
2018-08-31
0000914775
bmafi:C000001289Member
2015-09-01
2018-08-31
0000914775
bmafi:C000001358Member
2015-09-01
2018-08-31
0000914775
bmafi:C000001360Member
2015-09-01
2018-08-31
0000914775
bmafi:C000001361Member
2015-09-01
2018-08-31
0000914775
bmafi:C000001368Member
2015-09-01
2018-08-31
0000914775
bmafi:C000001370Member
2015-09-01
2018-08-31
0000914775
bmafi:C000001371Member
2015-09-01
2018-08-31
0000914775
bmafi:C000064720Member
2015-09-01
2018-08-31
0000914775
bmafi:C000064721Member
2015-09-01
2018-08-31
0000914775
bmafi:C000130426Member
2015-09-01
2018-08-31
0000914775
bmafi:C000130427Member
2015-09-01
2018-08-31
0000914775
bmafi:C000174005Member
2015-09-01
2018-08-31
0000914775
bmafi:C000174006Member
2015-09-01
2018-08-31
0000914775
bmafi:C000174007Member
2015-09-01
2018-08-31
0000914775
bmafi:NYSETechnologyIndexMember
2015-09-01
2018-08-31
0000914775
bmafi:Russell1000IndexMember
2015-09-01
2018-08-31
0000914775
bmafi:Russell1000ValueIndexMember
2015-09-01
2018-08-31
0000914775
bmafi:Russell2000IndexMember
2015-09-01
2018-08-31
0000914775
bmafi:Russell3000IndexMember
2015-09-01
2018-08-31
0000914775
bmafi:RussellMidcapValueIndexMember
2015-09-01
2018-08-31
0000914775
us-gaap:StandardPoors500IndexMember
2015-09-01
2018-08-31
0000914775
bmafi:C000001288Member
2015-09-01
2019-08-31
0000914775
bmafi:C000001289Member
2015-09-01
2019-08-31
0000914775
bmafi:C000001358Member
2015-09-01
2019-08-31
0000914775
bmafi:C000001360Member
2015-09-01
2019-08-31
0000914775
bmafi:C000001361Member
2015-09-01
2019-08-31
0000914775
bmafi:C000001368Member
2015-09-01
2019-08-31
0000914775
bmafi:C000001370Member
2015-09-01
2019-08-31
0000914775
bmafi:C000001371Member
2015-09-01
2019-08-31
0000914775
bmafi:C000064720Member
2015-09-01
2019-08-31
0000914775
bmafi:C000064721Member
2015-09-01
2019-08-31
0000914775
bmafi:C000130426Member
2015-09-01
2019-08-31
0000914775
bmafi:C000130427Member
2015-09-01
2019-08-31
0000914775
bmafi:C000174005Member
2015-09-01
2019-08-31
0000914775
bmafi:C000174006Member
2015-09-01
2019-08-31
0000914775
bmafi:C000174007Member
2015-09-01
2019-08-31
0000914775
bmafi:NYSETechnologyIndexMember
2015-09-01
2019-08-31
0000914775
bmafi:Russell1000IndexMember
2015-09-01
2019-08-31
0000914775
bmafi:Russell1000ValueIndexMember
2015-09-01
2019-08-31
0000914775
bmafi:Russell2000IndexMember
2015-09-01
2019-08-31
0000914775
bmafi:Russell3000IndexMember
2015-09-01
2019-08-31
0000914775
bmafi:RussellMidcapValueIndexMember
2015-09-01
2019-08-31
0000914775
us-gaap:StandardPoors500IndexMember
2015-09-01
2019-08-31
0000914775
bmafi:C000001288Member
2015-09-01
2021-08-31
0000914775
bmafi:C000001289Member
2015-09-01
2021-08-31
0000914775
bmafi:C000001358Member
2015-09-01
2021-08-31
0000914775
bmafi:C000001360Member
2015-09-01
2021-08-31
0000914775
bmafi:C000001361Member
2015-09-01
2021-08-31
0000914775
bmafi:C000001368Member
2015-09-01
2021-08-31
0000914775
bmafi:C000001370Member
2015-09-01
2021-08-31
0000914775
bmafi:C000001371Member
2015-09-01
2021-08-31
0000914775
bmafi:C000064720Member
2015-09-01
2021-08-31
0000914775
bmafi:C000064721Member
2015-09-01
2021-08-31
0000914775
bmafi:C000130426Member
2015-09-01
2021-08-31
0000914775
bmafi:C000130427Member
2015-09-01
2021-08-31
0000914775
bmafi:C000174005Member
2015-09-01
2021-08-31
0000914775
bmafi:C000174006Member
2015-09-01
2021-08-31
0000914775
bmafi:C000174007Member
2015-09-01
2021-08-31
0000914775
bmafi:NYSETechnologyIndexMember
2015-09-01
2021-08-31
0000914775
bmafi:Russell1000IndexMember
2015-09-01
2021-08-31
0000914775
bmafi:Russell1000ValueIndexMember
2015-09-01
2021-08-31
0000914775
bmafi:Russell2000IndexMember
2015-09-01
2021-08-31
0000914775
bmafi:Russell3000IndexMember
2015-09-01
2021-08-31
0000914775
bmafi:RussellMidcapValueIndexMember
2015-09-01
2021-08-31
0000914775
us-gaap:StandardPoors500IndexMember
2015-09-01
2021-08-31
0000914775
bmafi:C000001288Member
2015-09-01
2022-08-31
0000914775
bmafi:C000001289Member
2015-09-01
2022-08-31
0000914775
bmafi:C000001358Member
2015-09-01
2022-08-31
0000914775
bmafi:C000001360Member
2015-09-01
2022-08-31
0000914775
bmafi:C000001361Member
2015-09-01
2022-08-31
0000914775
bmafi:C000001368Member
2015-09-01
2022-08-31
0000914775
bmafi:C000001370Member
2015-09-01
2022-08-31
0000914775
bmafi:C000001371Member
2015-09-01
2022-08-31
0000914775
bmafi:C000064720Member
2015-09-01
2022-08-31
0000914775
bmafi:C000064721Member
2015-09-01
2022-08-31
0000914775
bmafi:C000130426Member
2015-09-01
2022-08-31
0000914775
bmafi:C000130427Member
2015-09-01
2022-08-31
0000914775
bmafi:C000174005Member
2015-09-01
2022-08-31
0000914775
bmafi:C000174006Member
2015-09-01
2022-08-31
0000914775
bmafi:C000174007Member
2015-09-01
2022-08-31
0000914775
bmafi:NYSETechnologyIndexMember
2015-09-01
2022-08-31
0000914775
bmafi:Russell1000IndexMember
2015-09-01
2022-08-31
0000914775
bmafi:Russell1000ValueIndexMember
2015-09-01
2022-08-31
0000914775
bmafi:Russell2000IndexMember
2015-09-01
2022-08-31
0000914775
bmafi:Russell3000IndexMember
2015-09-01
2022-08-31
0000914775
bmafi:RussellMidcapValueIndexMember
2015-09-01
2022-08-31
0000914775
us-gaap:StandardPoors500IndexMember
2015-09-01
2022-08-31
0000914775
bmafi:C000001288Member
2015-09-01
2023-08-31
0000914775
bmafi:C000001289Member
2015-09-01
2023-08-31
0000914775
bmafi:C000001358Member
2015-09-01
2023-08-31
0000914775
bmafi:C000001360Member
2015-09-01
2023-08-31
0000914775
bmafi:C000001361Member
2015-09-01
2023-08-31
0000914775
bmafi:C000001368Member
2015-09-01
2023-08-31
0000914775
bmafi:C000001370Member
2015-09-01
2023-08-31
0000914775
bmafi:C000001371Member
2015-09-01
2023-08-31
0000914775
bmafi:C000064720Member
2015-09-01
2023-08-31
0000914775
bmafi:C000064721Member
2015-09-01
2023-08-31
0000914775
bmafi:C000130426Member
2015-09-01
2023-08-31
0000914775
bmafi:C000130427Member
2015-09-01
2023-08-31
0000914775
bmafi:C000174005Member
2015-09-01
2023-08-31
0000914775
bmafi:C000174006Member
2015-09-01
2023-08-31
0000914775
bmafi:C000174007Member
2015-09-01
2023-08-31
0000914775
bmafi:NYSETechnologyIndexMember
2015-09-01
2023-08-31
0000914775
bmafi:Russell1000IndexMember
2015-09-01
2023-08-31
0000914775
bmafi:Russell1000ValueIndexMember
2015-09-01
2023-08-31
0000914775
bmafi:Russell2000IndexMember
2015-09-01
2023-08-31
0000914775
bmafi:Russell3000IndexMember
2015-09-01
2023-08-31
0000914775
bmafi:RussellMidcapValueIndexMember
2015-09-01
2023-08-31
0000914775
us-gaap:StandardPoors500IndexMember
2015-09-01
2023-08-31
0000914775
bmafi:C000001288Member
2015-09-01
2024-08-31
0000914775
bmafi:C000001289Member
2015-09-01
2024-08-31
0000914775
bmafi:C000001358Member
2015-09-01
2024-08-31
0000914775
bmafi:C000001360Member
2015-09-01
2024-08-31
0000914775
bmafi:C000001361Member
2015-09-01
2024-08-31
0000914775
bmafi:C000001368Member
2015-09-01
2024-08-31
0000914775
bmafi:C000001370Member
2015-09-01
2024-08-31
0000914775
bmafi:C000001371Member
2015-09-01
2024-08-31
0000914775
bmafi:C000064720Member
2015-09-01
2024-08-31
0000914775
bmafi:C000064721Member
2015-09-01
2024-08-31
0000914775
bmafi:C000130426Member
2015-09-01
2024-08-31
0000914775
bmafi:C000130427Member
2015-09-01
2024-08-31
0000914775
bmafi:C000174005Member
2015-09-01
2024-08-31
0000914775
bmafi:C000174006Member
2015-09-01
2024-08-31
0000914775
bmafi:C000174007Member
2015-09-01
2024-08-31
0000914775
bmafi:NYSETechnologyIndexMember
2015-09-01
2024-08-31
0000914775
bmafi:Russell1000IndexMember
2015-09-01
2024-08-31
0000914775
bmafi:Russell1000ValueIndexMember
2015-09-01
2024-08-31
0000914775
bmafi:Russell2000IndexMember
2015-09-01
2024-08-31
0000914775
bmafi:Russell3000IndexMember
2015-09-01
2024-08-31
0000914775
bmafi:RussellMidcapValueIndexMember
2015-09-01
2024-08-31
0000914775
us-gaap:StandardPoors500IndexMember
2015-09-01
2024-08-31
0000914775
2024-09-01
2025-08-31
0000914775
bmafi:C000001288Member
2015-09-01
2020-08-31
0000914775
bmafi:C000001289Member
2015-09-01
2020-08-31
0000914775
bmafi:C000001358Member
2015-09-01
2020-08-31
0000914775
bmafi:C000001360Member
2015-09-01
2020-08-31
0000914775
bmafi:C000001361Member
2015-09-01
2020-08-31
0000914775
bmafi:C000001368Member
2015-09-01
2020-08-31
0000914775
bmafi:C000001370Member
2015-09-01
2020-08-31
0000914775
bmafi:C000001371Member
2015-09-01
2020-08-31
0000914775
bmafi:C000064720Member
2015-09-01
2020-08-31
0000914775
bmafi:C000064721Member
2015-09-01
2020-08-31
0000914775
bmafi:C000130426Member
2015-09-01
2020-08-31
0000914775
bmafi:C000130427Member
2015-09-01
2020-08-31
0000914775
bmafi:C000174005Member
2015-09-01
2020-08-31
0000914775
bmafi:C000174006Member
2015-09-01
2020-08-31
0000914775
bmafi:C000174007Member
2015-09-01
2020-08-31
0000914775
bmafi:NYSETechnologyIndexMember
2015-09-01
2020-08-31
0000914775
bmafi:Russell1000IndexMember
2015-09-01
2020-08-31
0000914775
bmafi:Russell1000ValueIndexMember
2015-09-01
2020-08-31
0000914775
bmafi:Russell2000IndexMember
2015-09-01
2020-08-31
0000914775
bmafi:Russell3000IndexMember
2015-09-01
2020-08-31
0000914775
bmafi:RussellMidcapValueIndexMember
2015-09-01
2020-08-31
0000914775
us-gaap:StandardPoors500IndexMember
2015-09-01
2020-08-31
0000914775
bmafi:C000001288Member
2020-09-01
2025-08-31
0000914775
bmafi:C000001288Member
oef:WithoutSalesLoadMember
2020-09-01
2025-08-31
0000914775
bmafi:C000001289Member
2020-09-01
2025-08-31
0000914775
bmafi:C000001358Member
2020-09-01
2025-08-31
0000914775
bmafi:C000001358Member
oef:WithoutSalesLoadMember
2020-09-01
2025-08-31
0000914775
bmafi:C000001360Member
2020-09-01
2025-08-31
0000914775
bmafi:C000001360Member
oef:WithoutSalesLoadMember
2020-09-01
2025-08-31
0000914775
bmafi:C000001361Member
2020-09-01
2025-08-31
0000914775
bmafi:C000001368Member
2020-09-01
2025-08-31
0000914775
bmafi:C000001368Member
oef:WithoutSalesLoadMember
2020-09-01
2025-08-31
0000914775
bmafi:C000001370Member
2020-09-01
2025-08-31
0000914775
bmafi:C000001370Member
oef:WithoutSalesLoadMember
2020-09-01
2025-08-31
0000914775
bmafi:C000001371Member
2020-09-01
2025-08-31
0000914775
bmafi:C000064720Member
2020-09-01
2025-08-31
0000914775
bmafi:C000064720Member
oef:WithoutSalesLoadMember
2020-09-01
2025-08-31
0000914775
bmafi:C000064721Member
2020-09-01
2025-08-31
0000914775
bmafi:C000130426Member
2020-09-01
2025-08-31
0000914775
bmafi:C000130427Member
2020-09-01
2025-08-31
0000914775
bmafi:C000174005Member
2020-09-01
2025-08-31
0000914775
bmafi:C000174006Member
2020-09-01
2025-08-31
0000914775
bmafi:C000174007Member
2020-09-01
2025-08-31
0000914775
bmafi:NYSETechnologyIndexMember
2020-09-01
2025-08-31
0000914775
bmafi:Russell1000IndexMember
2020-09-01
2025-08-31
0000914775
bmafi:Russell1000ValueIndexMember
2020-09-01
2025-08-31
0000914775
bmafi:Russell2000IndexMember
2020-09-01
2025-08-31
0000914775
bmafi:Russell3000IndexMember
2020-09-01
2025-08-31
0000914775
bmafi:RussellMidcapValueIndexMember
2020-09-01
2025-08-31
0000914775
us-gaap:StandardPoors500IndexMember
2020-09-01
2025-08-31
0000914775
bmafi:C000001288Member
2015-09-01
2016-08-31
0000914775
bmafi:C000001289Member
2015-09-01
2016-08-31
0000914775
bmafi:C000001358Member
2015-09-01
2016-08-31
0000914775
bmafi:C000001360Member
2015-09-01
2016-08-31
0000914775
bmafi:C000001361Member
2015-09-01
2016-08-31
0000914775
bmafi:C000001368Member
2015-09-01
2016-08-31
0000914775
bmafi:C000001370Member
2015-09-01
2016-08-31
0000914775
bmafi:C000001371Member
2015-09-01
2016-08-31
0000914775
bmafi:C000064720Member
2015-09-01
2016-08-31
0000914775
bmafi:C000064721Member
2015-09-01
2016-08-31
0000914775
bmafi:C000130426Member
2015-09-01
2016-08-31
0000914775
bmafi:C000130427Member
2015-09-01
2016-08-31
0000914775
bmafi:C000174005Member
2015-09-01
2016-08-31
0000914775
bmafi:C000174006Member
2015-09-01
2016-08-31
0000914775
bmafi:C000174007Member
2015-09-01
2016-08-31
0000914775
bmafi:NYSETechnologyIndexMember
2015-09-01
2016-08-31
0000914775
bmafi:Russell1000IndexMember
2015-09-01
2016-08-31
0000914775
bmafi:Russell1000ValueIndexMember
2015-09-01
2016-08-31
0000914775
bmafi:Russell2000IndexMember
2015-09-01
2016-08-31
0000914775
bmafi:Russell3000IndexMember
2015-09-01
2016-08-31
0000914775
bmafi:RussellMidcapValueIndexMember
2015-09-01
2016-08-31
0000914775
us-gaap:StandardPoors500IndexMember
2015-09-01
2016-08-31
0000914775
bmafi:C000001288Member
2024-09-01
2025-08-31
0000914775
bmafi:C000001288Member
oef:WithoutSalesLoadMember
2024-09-01
2025-08-31
0000914775
bmafi:C000001289Member
2024-09-01
2025-08-31
0000914775
bmafi:C000001358Member
2024-09-01
2025-08-31
0000914775
bmafi:C000001358Member
oef:WithoutSalesLoadMember
2024-09-01
2025-08-31
0000914775
bmafi:C000001360Member
2024-09-01
2025-08-31
0000914775
bmafi:C000001360Member
oef:WithoutSalesLoadMember
2024-09-01
2025-08-31
0000914775
bmafi:C000001361Member
2024-09-01
2025-08-31
0000914775
bmafi:C000001368Member
2024-09-01
2025-08-31
0000914775
bmafi:C000001368Member
oef:WithoutSalesLoadMember
2024-09-01
2025-08-31
0000914775
bmafi:C000001370Member
2024-09-01
2025-08-31
0000914775
bmafi:C000001370Member
oef:WithoutSalesLoadMember
2024-09-01
2025-08-31
0000914775
bmafi:C000001371Member
2024-09-01
2025-08-31
0000914775
bmafi:C000064720Member
2024-09-01
2025-08-31
0000914775
bmafi:C000064720Member
oef:WithoutSalesLoadMember
2024-09-01
2025-08-31
0000914775
bmafi:C000064721Member
2024-09-01
2025-08-31
0000914775
bmafi:C000130426Member
2024-09-01
2025-08-31
0000914775
bmafi:C000130427Member
2024-09-01
2025-08-31
0000914775
bmafi:C000174005Member
2024-09-01
2025-08-31
0000914775
bmafi:C000174006Member
2024-09-01
2025-08-31
0000914775
bmafi:C000174007Member
2024-09-01
2025-08-31
0000914775
bmafi:NYSETechnologyIndexMember
2024-09-01
2025-08-31
0000914775
bmafi:Russell1000IndexMember
2024-09-01
2025-08-31
0000914775
bmafi:Russell1000ValueIndexMember
2024-09-01
2025-08-31
0000914775
bmafi:Russell2000IndexMember
2024-09-01
2025-08-31
0000914775
bmafi:Russell3000IndexMember
2024-09-01
2025-08-31
0000914775
bmafi:RussellMidcapValueIndexMember
2024-09-01
2025-08-31
0000914775
us-gaap:StandardPoors500IndexMember
2024-09-01
2025-08-31
0000914775
bmafi:C000001288Member
2015-09-01
2025-08-31
0000914775
bmafi:C000001288Member
oef:WithoutSalesLoadMember
2015-09-01
2025-08-31
0000914775
bmafi:C000001289Member
2015-09-01
2025-08-31
0000914775
bmafi:C000001358Member
2015-09-01
2025-08-31
0000914775
bmafi:C000001358Member
oef:WithoutSalesLoadMember
2015-09-01
2025-08-31
0000914775
bmafi:C000001360Member
2015-09-01
2025-08-31
0000914775
bmafi:C000001360Member
oef:WithoutSalesLoadMember
2015-09-01
2025-08-31
0000914775
bmafi:C000001361Member
2015-09-01
2025-08-31
0000914775
bmafi:C000001368Member
2015-09-01
2025-08-31
0000914775
bmafi:C000001368Member
oef:WithoutSalesLoadMember
2015-09-01
2025-08-31
0000914775
bmafi:C000001370Member
2015-09-01
2025-08-31
0000914775
bmafi:C000001370Member
oef:WithoutSalesLoadMember
2015-09-01
2025-08-31
0000914775
bmafi:C000001371Member
2015-09-01
2025-08-31
0000914775
bmafi:C000064720Member
2015-09-01
2025-08-31
0000914775
bmafi:C000064720Member
oef:WithoutSalesLoadMember
2015-09-01
2025-08-31
0000914775
bmafi:C000064721Member
2015-09-01
2025-08-31
0000914775
bmafi:C000130426Member
2015-09-01
2025-08-31
0000914775
bmafi:C000130427Member
2015-09-01
2025-08-31
0000914775
bmafi:C000174005Member
2015-09-01
2025-08-31
0000914775
bmafi:C000174006Member
2015-09-01
2025-08-31
0000914775
bmafi:C000174007Member
2015-09-01
2025-08-31
0000914775
bmafi:NYSETechnologyIndexMember
2015-09-01
2025-08-31
0000914775
bmafi:Russell1000IndexMember
2015-09-01
2025-08-31
0000914775
bmafi:Russell1000ValueIndexMember
2015-09-01
2025-08-31
0000914775
bmafi:Russell2000IndexMember
2015-09-01
2025-08-31
0000914775
bmafi:Russell3000IndexMember
2015-09-01
2025-08-31
0000914775
bmafi:RussellMidcapValueIndexMember
2015-09-01
2025-08-31
0000914775
us-gaap:StandardPoors500IndexMember
2015-09-01
2025-08-31
0000914775
bmafi:C000001288Member
2025-08-31
0000914775
bmafi:C000001288Member
bmafi:AssurantIncMember
2025-08-31
0000914775
bmafi:C000001288Member
bmafi:BlockIncMember
2025-08-31
0000914775
bmafi:C000001288Member
oef:CommunicationsSectorMember
2025-08-31
0000914775
bmafi:C000001288Member
oef:ConsumerDiscretionarySectorMember
2025-08-31
0000914775
bmafi:C000001288Member
oef:ConsumerStaplesSectorMember
2025-08-31
0000914775
bmafi:C000001288Member
bmafi:DiamondbackEnergyIncMember
2025-08-31
0000914775
bmafi:C000001288Member
bmafi:DominionEnergyIncMember
2025-08-31
0000914775
bmafi:C000001288Member
us-gaap:EnergySectorMember
2025-08-31
0000914775
bmafi:C000001288Member
bmafi:ExelonCorpMember
2025-08-31
0000914775
bmafi:C000001288Member
bmafi:ExpediaGroupIncMember
2025-08-31
0000914775
bmafi:C000001288Member
us-gaap:FinancialServicesSectorMember
2025-08-31
0000914775
bmafi:C000001288Member
bmafi:FirstHorizonCorpMember
2025-08-31
0000914775
bmafi:C000001288Member
us-gaap:HealthcareSectorMember
2025-08-31
0000914775
bmafi:C000001288Member
oef:IndustrialSectorMember
2025-08-31
0000914775
bmafi:C000001288Member
oef:InformationTechnologySectorMember
2025-08-31
0000914775
bmafi:C000001288Member
bmafi:InvestmentCompaniesMember
2025-08-31
0000914775
bmafi:C000001288Member
oef:MaterialsSectorMember
2025-08-31
0000914775
bmafi:C000001288Member
bmafi:NetOtherAssetsAndLiabilitiesMember
2025-08-31
0000914775
bmafi:C000001288Member
bmafi:NewmontCorpMember
2025-08-31
0000914775
bmafi:C000001288Member
bmafi:QuantaServicesIncMember
2025-08-31
0000914775
bmafi:C000001288Member
us-gaap:RealEstateSectorMember
2025-08-31
0000914775
bmafi:C000001288Member
bmafi:RocketCosIncClAMember
2025-08-31
0000914775
bmafi:C000001288Member
oef:UtilitiesSectorMember
2025-08-31
0000914775
bmafi:C000001289Member
2025-08-31
0000914775
bmafi:C000001289Member
bmafi:AlamosGoldIncClAMember
2025-08-31
0000914775
bmafi:C000001289Member
bmafi:ClearwayEnergyIncClCMember
2025-08-31
0000914775
bmafi:C000001289Member
bmafi:ColumbiaBankingSystemIncMember
2025-08-31
0000914775
bmafi:C000001289Member
oef:CommunicationsSectorMember
2025-08-31
0000914775
bmafi:C000001289Member
oef:ConsumerDiscretionarySectorMember
2025-08-31
0000914775
bmafi:C000001289Member
oef:ConsumerStaplesSectorMember
2025-08-31
0000914775
bmafi:C000001289Member
us-gaap:EnergySectorMember
2025-08-31
0000914775
bmafi:C000001289Member
us-gaap:FinancialServicesSectorMember
2025-08-31
0000914775
bmafi:C000001289Member
bmafi:FirstBuseyCorpMember
2025-08-31
0000914775
bmafi:C000001289Member
bmafi:FirstHorizonCorpMember
2025-08-31
0000914775
bmafi:C000001289Member
bmafi:GeniusSportsLtdMember
2025-08-31
0000914775
bmafi:C000001289Member
us-gaap:HealthcareSectorMember
2025-08-31
0000914775
bmafi:C000001289Member
oef:IndustrialSectorMember
2025-08-31
0000914775
bmafi:C000001289Member
oef:InformationTechnologySectorMember
2025-08-31
0000914775
bmafi:C000001289Member
bmafi:InsmedIncMember
2025-08-31
0000914775
bmafi:C000001289Member
bmafi:InvestmentCompaniesMember
2025-08-31
0000914775
bmafi:C000001289Member
bmafi:MagniteIncMember
2025-08-31
0000914775
bmafi:C000001289Member
oef:MaterialsSectorMember
2025-08-31
0000914775
bmafi:C000001289Member
bmafi:NetOtherAssetsAndLiabilitiesMember
2025-08-31
0000914775
bmafi:C000001289Member
us-gaap:RealEstateSectorMember
2025-08-31
0000914775
bmafi:C000001289Member
bmafi:SkyWestIncMember
2025-08-31
0000914775
bmafi:C000001289Member
bmafi:TexasCapitalBancsharesIncMember
2025-08-31
0000914775
bmafi:C000001289Member
oef:UtilitiesSectorMember
2025-08-31
0000914775
bmafi:C000001358Member
2025-08-31
0000914775
bmafi:C000001358Member
bmafi:AmazonComIncMember
2025-08-31
0000914775
bmafi:C000001358Member
bmafi:AssurantIncMember
2025-08-31
0000914775
bmafi:C000001358Member
bmafi:ATAndTIncMember
2025-08-31
0000914775
bmafi:C000001358Member
bmafi:BerkshireHathawayIncCIBMember
2025-08-31
0000914775
bmafi:C000001358Member
bmafi:CapitalOneFinancialCorpMember
2025-08-31
0000914775
bmafi:C000001358Member
bmafi:CiscoSystemsIncMember
2025-08-31
0000914775
bmafi:C000001358Member
oef:CommunicationsSectorMember
2025-08-31
0000914775
bmafi:C000001358Member
oef:ConsumerDiscretionarySectorMember
2025-08-31
0000914775
bmafi:C000001358Member
oef:ConsumerStaplesSectorMember
2025-08-31
0000914775
bmafi:C000001358Member
bmafi:CRHPLCMember
2025-08-31
0000914775
bmafi:C000001358Member
us-gaap:EnergySectorMember
2025-08-31
0000914775
bmafi:C000001358Member
us-gaap:FinancialServicesSectorMember
2025-08-31
0000914775
bmafi:C000001358Member
us-gaap:HealthcareSectorMember
2025-08-31
0000914775
bmafi:C000001358Member
oef:IndustrialSectorMember
2025-08-31
0000914775
bmafi:C000001358Member
oef:InformationTechnologySectorMember
2025-08-31
0000914775
bmafi:C000001358Member
bmafi:JohnsonAndJohnsonMember
2025-08-31
0000914775
bmafi:C000001358Member
bmafi:JPMorganChaseAndCoMember
2025-08-31
0000914775
bmafi:C000001358Member
oef:MaterialsSectorMember
2025-08-31
0000914775
bmafi:C000001358Member
bmafi:MedtronicPLCMember
2025-08-31
0000914775
bmafi:C000001358Member
bmafi:NetOtherAssetsAndLiabilitiesMember
2025-08-31
0000914775
bmafi:C000001358Member
us-gaap:RealEstateSectorMember
2025-08-31
0000914775
bmafi:C000001360Member
2025-08-31
0000914775
bmafi:C000001360Member
bmafi:AmazonComIncMember
2025-08-31
0000914775
bmafi:C000001360Member
bmafi:AssurantIncMember
2025-08-31
0000914775
bmafi:C000001360Member
bmafi:ATAndTIncMember
2025-08-31
0000914775
bmafi:C000001360Member
bmafi:BerkshireHathawayIncCIBMember
2025-08-31
0000914775
bmafi:C000001360Member
bmafi:CapitalOneFinancialCorpMember
2025-08-31
0000914775
bmafi:C000001360Member
bmafi:CiscoSystemsIncMember
2025-08-31
0000914775
bmafi:C000001360Member
oef:CommunicationsSectorMember
2025-08-31
0000914775
bmafi:C000001360Member
oef:ConsumerDiscretionarySectorMember
2025-08-31
0000914775
bmafi:C000001360Member
oef:ConsumerStaplesSectorMember
2025-08-31
0000914775
bmafi:C000001360Member
bmafi:CRHPLCMember
2025-08-31
0000914775
bmafi:C000001360Member
us-gaap:EnergySectorMember
2025-08-31
0000914775
bmafi:C000001360Member
us-gaap:FinancialServicesSectorMember
2025-08-31
0000914775
bmafi:C000001360Member
us-gaap:HealthcareSectorMember
2025-08-31
0000914775
bmafi:C000001360Member
oef:IndustrialSectorMember
2025-08-31
0000914775
bmafi:C000001360Member
oef:InformationTechnologySectorMember
2025-08-31
0000914775
bmafi:C000001360Member
bmafi:JohnsonAndJohnsonMember
2025-08-31
0000914775
bmafi:C000001360Member
bmafi:JPMorganChaseAndCoMember
2025-08-31
0000914775
bmafi:C000001360Member
oef:MaterialsSectorMember
2025-08-31
0000914775
bmafi:C000001360Member
bmafi:MedtronicPLCMember
2025-08-31
0000914775
bmafi:C000001360Member
bmafi:NetOtherAssetsAndLiabilitiesMember
2025-08-31
0000914775
bmafi:C000001360Member
us-gaap:RealEstateSectorMember
2025-08-31
0000914775
bmafi:C000001361Member
2025-08-31
0000914775
bmafi:C000001361Member
bmafi:AmazonComIncMember
2025-08-31
0000914775
bmafi:C000001361Member
bmafi:AssurantIncMember
2025-08-31
0000914775
bmafi:C000001361Member
bmafi:ATAndTIncMember
2025-08-31
0000914775
bmafi:C000001361Member
bmafi:BerkshireHathawayIncCIBMember
2025-08-31
0000914775
bmafi:C000001361Member
bmafi:CapitalOneFinancialCorpMember
2025-08-31
0000914775
bmafi:C000001361Member
bmafi:CiscoSystemsIncMember
2025-08-31
0000914775
bmafi:C000001361Member
oef:CommunicationsSectorMember
2025-08-31
0000914775
bmafi:C000001361Member
oef:ConsumerDiscretionarySectorMember
2025-08-31
0000914775
bmafi:C000001361Member
oef:ConsumerStaplesSectorMember
2025-08-31
0000914775
bmafi:C000001361Member
bmafi:CRHPLCMember
2025-08-31
0000914775
bmafi:C000001361Member
us-gaap:EnergySectorMember
2025-08-31
0000914775
bmafi:C000001361Member
us-gaap:FinancialServicesSectorMember
2025-08-31
0000914775
bmafi:C000001361Member
us-gaap:HealthcareSectorMember
2025-08-31
0000914775
bmafi:C000001361Member
oef:IndustrialSectorMember
2025-08-31
0000914775
bmafi:C000001361Member
oef:InformationTechnologySectorMember
2025-08-31
0000914775
bmafi:C000001361Member
bmafi:JohnsonAndJohnsonMember
2025-08-31
0000914775
bmafi:C000001361Member
bmafi:JPMorganChaseAndCoMember
2025-08-31
0000914775
bmafi:C000001361Member
oef:MaterialsSectorMember
2025-08-31
0000914775
bmafi:C000001361Member
bmafi:MedtronicPLCMember
2025-08-31
0000914775
bmafi:C000001361Member
bmafi:NetOtherAssetsAndLiabilitiesMember
2025-08-31
0000914775
bmafi:C000001361Member
us-gaap:RealEstateSectorMember
2025-08-31
0000914775
bmafi:C000001368Member
2025-08-31
0000914775
bmafi:C000001368Member
bmafi:AmazonComIncMember
2025-08-31
0000914775
bmafi:C000001368Member
oef:CommunicationsSectorMember
2025-08-31
0000914775
bmafi:C000001368Member
oef:ConsumerDiscretionarySectorMember
2025-08-31
0000914775
bmafi:C000001368Member
us-gaap:FinancialServicesSectorMember
2025-08-31
0000914775
bmafi:C000001368Member
oef:IndustrialSectorMember
2025-08-31
0000914775
bmafi:C000001368Member
oef:InformationTechnologySectorMember
2025-08-31
0000914775
bmafi:C000001368Member
bmafi:IntuitIncMember
2025-08-31
0000914775
bmafi:C000001368Member
bmafi:InvestmentCompaniesMember
2025-08-31
0000914775
bmafi:C000001368Member
bmafi:MetaPlatformsIncClAMember
2025-08-31
0000914775
bmafi:C000001368Member
bmafi:MicronTechnologyIncMember
2025-08-31
0000914775
bmafi:C000001368Member
bmafi:MicrosoftCorpMember
2025-08-31
0000914775
bmafi:C000001368Member
bmafi:NetflixIncMember
2025-08-31
0000914775
bmafi:C000001368Member
bmafi:NetOtherAssetsAndLiabilitiesMember
2025-08-31
0000914775
bmafi:C000001368Member
bmafi:NVIDIACorpMember
2025-08-31
0000914775
bmafi:C000001368Member
bmafi:OracleCorpMember
2025-08-31
0000914775
bmafi:C000001368Member
us-gaap:RealEstateSectorMember
2025-08-31
0000914775
bmafi:C000001368Member
bmafi:ShopifyIncClAMember
2025-08-31
0000914775
bmafi:C000001368Member
bmafi:TaiwanSemiconductorManufacturingCoLtdADRMember
2025-08-31
0000914775
bmafi:C000001370Member
2025-08-31
0000914775
bmafi:C000001370Member
bmafi:AmazonComIncMember
2025-08-31
0000914775
bmafi:C000001370Member
oef:CommunicationsSectorMember
2025-08-31
0000914775
bmafi:C000001370Member
oef:ConsumerDiscretionarySectorMember
2025-08-31
0000914775
bmafi:C000001370Member
us-gaap:FinancialServicesSectorMember
2025-08-31
0000914775
bmafi:C000001370Member
oef:IndustrialSectorMember
2025-08-31
0000914775
bmafi:C000001370Member
oef:InformationTechnologySectorMember
2025-08-31
0000914775
bmafi:C000001370Member
bmafi:IntuitIncMember
2025-08-31
0000914775
bmafi:C000001370Member
bmafi:InvestmentCompaniesMember
2025-08-31
0000914775
bmafi:C000001370Member
bmafi:MetaPlatformsIncClAMember
2025-08-31
0000914775
bmafi:C000001370Member
bmafi:MicronTechnologyIncMember
2025-08-31
0000914775
bmafi:C000001370Member
bmafi:MicrosoftCorpMember
2025-08-31
0000914775
bmafi:C000001370Member
bmafi:NetflixIncMember
2025-08-31
0000914775
bmafi:C000001370Member
bmafi:NetOtherAssetsAndLiabilitiesMember
2025-08-31
0000914775
bmafi:C000001370Member
bmafi:NVIDIACorpMember
2025-08-31
0000914775
bmafi:C000001370Member
bmafi:OracleCorpMember
2025-08-31
0000914775
bmafi:C000001370Member
us-gaap:RealEstateSectorMember
2025-08-31
0000914775
bmafi:C000001370Member
bmafi:ShopifyIncClAMember
2025-08-31
0000914775
bmafi:C000001370Member
bmafi:TaiwanSemiconductorManufacturingCoLtdADRMember
2025-08-31
0000914775
bmafi:C000001371Member
2025-08-31
0000914775
bmafi:C000001371Member
bmafi:AmazonComIncMember
2025-08-31
0000914775
bmafi:C000001371Member
oef:CommunicationsSectorMember
2025-08-31
0000914775
bmafi:C000001371Member
oef:ConsumerDiscretionarySectorMember
2025-08-31
0000914775
bmafi:C000001371Member
us-gaap:FinancialServicesSectorMember
2025-08-31
0000914775
bmafi:C000001371Member
oef:IndustrialSectorMember
2025-08-31
0000914775
bmafi:C000001371Member
oef:InformationTechnologySectorMember
2025-08-31
0000914775
bmafi:C000001371Member
bmafi:IntuitIncMember
2025-08-31
0000914775
bmafi:C000001371Member
bmafi:InvestmentCompaniesMember
2025-08-31
0000914775
bmafi:C000001371Member
bmafi:MetaPlatformsIncClAMember
2025-08-31
0000914775
bmafi:C000001371Member
bmafi:MicronTechnologyIncMember
2025-08-31
0000914775
bmafi:C000001371Member
bmafi:MicrosoftCorpMember
2025-08-31
0000914775
bmafi:C000001371Member
bmafi:NetflixIncMember
2025-08-31
0000914775
bmafi:C000001371Member
bmafi:NetOtherAssetsAndLiabilitiesMember
2025-08-31
0000914775
bmafi:C000001371Member
bmafi:NVIDIACorpMember
2025-08-31
0000914775
bmafi:C000001371Member
bmafi:OracleCorpMember
2025-08-31
0000914775
bmafi:C000001371Member
us-gaap:RealEstateSectorMember
2025-08-31
0000914775
bmafi:C000001371Member
bmafi:ShopifyIncClAMember
2025-08-31
0000914775
bmafi:C000001371Member
bmafi:TaiwanSemiconductorManufacturingCoLtdADRMember
2025-08-31
0000914775
bmafi:C000064720Member
2025-08-31
0000914775
bmafi:C000064720Member
bmafi:AssurantIncMember
2025-08-31
0000914775
bmafi:C000064720Member
bmafi:BlockIncMember
2025-08-31
0000914775
bmafi:C000064720Member
oef:CommunicationsSectorMember
2025-08-31
0000914775
bmafi:C000064720Member
oef:ConsumerDiscretionarySectorMember
2025-08-31
0000914775
bmafi:C000064720Member
oef:ConsumerStaplesSectorMember
2025-08-31
0000914775
bmafi:C000064720Member
bmafi:DiamondbackEnergyIncMember
2025-08-31
0000914775
bmafi:C000064720Member
bmafi:DominionEnergyIncMember
2025-08-31
0000914775
bmafi:C000064720Member
us-gaap:EnergySectorMember
2025-08-31
0000914775
bmafi:C000064720Member
bmafi:ExelonCorpMember
2025-08-31
0000914775
bmafi:C000064720Member
bmafi:ExpediaGroupIncMember
2025-08-31
0000914775
bmafi:C000064720Member
us-gaap:FinancialServicesSectorMember
2025-08-31
0000914775
bmafi:C000064720Member
bmafi:FirstHorizonCorpMember
2025-08-31
0000914775
bmafi:C000064720Member
us-gaap:HealthcareSectorMember
2025-08-31
0000914775
bmafi:C000064720Member
oef:IndustrialSectorMember
2025-08-31
0000914775
bmafi:C000064720Member
oef:InformationTechnologySectorMember
2025-08-31
0000914775
bmafi:C000064720Member
bmafi:InvestmentCompaniesMember
2025-08-31
0000914775
bmafi:C000064720Member
oef:MaterialsSectorMember
2025-08-31
0000914775
bmafi:C000064720Member
bmafi:NetOtherAssetsAndLiabilitiesMember
2025-08-31
0000914775
bmafi:C000064720Member
bmafi:NewmontCorpMember
2025-08-31
0000914775
bmafi:C000064720Member
bmafi:QuantaServicesIncMember
2025-08-31
0000914775
bmafi:C000064720Member
us-gaap:RealEstateSectorMember
2025-08-31
0000914775
bmafi:C000064720Member
bmafi:RocketCosIncClAMember
2025-08-31
0000914775
bmafi:C000064720Member
oef:UtilitiesSectorMember
2025-08-31
0000914775
bmafi:C000064721Member
2025-08-31
0000914775
bmafi:C000064721Member
bmafi:AssurantIncMember
2025-08-31
0000914775
bmafi:C000064721Member
bmafi:BlockIncMember
2025-08-31
0000914775
bmafi:C000064721Member
oef:CommunicationsSectorMember
2025-08-31
0000914775
bmafi:C000064721Member
oef:ConsumerDiscretionarySectorMember
2025-08-31
0000914775
bmafi:C000064721Member
oef:ConsumerStaplesSectorMember
2025-08-31
0000914775
bmafi:C000064721Member
bmafi:DiamondbackEnergyIncMember
2025-08-31
0000914775
bmafi:C000064721Member
bmafi:DominionEnergyIncMember
2025-08-31
0000914775
bmafi:C000064721Member
us-gaap:EnergySectorMember
2025-08-31
0000914775
bmafi:C000064721Member
bmafi:ExelonCorpMember
2025-08-31
0000914775
bmafi:C000064721Member
bmafi:ExpediaGroupIncMember
2025-08-31
0000914775
bmafi:C000064721Member
us-gaap:FinancialServicesSectorMember
2025-08-31
0000914775
bmafi:C000064721Member
bmafi:FirstHorizonCorpMember
2025-08-31
0000914775
bmafi:C000064721Member
us-gaap:HealthcareSectorMember
2025-08-31
0000914775
bmafi:C000064721Member
oef:IndustrialSectorMember
2025-08-31
0000914775
bmafi:C000064721Member
oef:InformationTechnologySectorMember
2025-08-31
0000914775
bmafi:C000064721Member
bmafi:InvestmentCompaniesMember
2025-08-31
0000914775
bmafi:C000064721Member
oef:MaterialsSectorMember
2025-08-31
0000914775
bmafi:C000064721Member
bmafi:NetOtherAssetsAndLiabilitiesMember
2025-08-31
0000914775
bmafi:C000064721Member
bmafi:NewmontCorpMember
2025-08-31
0000914775
bmafi:C000064721Member
bmafi:QuantaServicesIncMember
2025-08-31
0000914775
bmafi:C000064721Member
us-gaap:RealEstateSectorMember
2025-08-31
0000914775
bmafi:C000064721Member
bmafi:RocketCosIncClAMember
2025-08-31
0000914775
bmafi:C000064721Member
oef:UtilitiesSectorMember
2025-08-31
0000914775
bmafi:C000130426Member
2025-08-31
0000914775
bmafi:C000130426Member
bmafi:AssurantIncMember
2025-08-31
0000914775
bmafi:C000130426Member
bmafi:BlockIncMember
2025-08-31
0000914775
bmafi:C000130426Member
oef:CommunicationsSectorMember
2025-08-31
0000914775
bmafi:C000130426Member
oef:ConsumerDiscretionarySectorMember
2025-08-31
0000914775
bmafi:C000130426Member
oef:ConsumerStaplesSectorMember
2025-08-31
0000914775
bmafi:C000130426Member
bmafi:DiamondbackEnergyIncMember
2025-08-31
0000914775
bmafi:C000130426Member
bmafi:DominionEnergyIncMember
2025-08-31
0000914775
bmafi:C000130426Member
us-gaap:EnergySectorMember
2025-08-31
0000914775
bmafi:C000130426Member
bmafi:ExelonCorpMember
2025-08-31
0000914775
bmafi:C000130426Member
bmafi:ExpediaGroupIncMember
2025-08-31
0000914775
bmafi:C000130426Member
us-gaap:FinancialServicesSectorMember
2025-08-31
0000914775
bmafi:C000130426Member
bmafi:FirstHorizonCorpMember
2025-08-31
0000914775
bmafi:C000130426Member
us-gaap:HealthcareSectorMember
2025-08-31
0000914775
bmafi:C000130426Member
oef:IndustrialSectorMember
2025-08-31
0000914775
bmafi:C000130426Member
oef:InformationTechnologySectorMember
2025-08-31
0000914775
bmafi:C000130426Member
bmafi:InvestmentCompaniesMember
2025-08-31
0000914775
bmafi:C000130426Member
oef:MaterialsSectorMember
2025-08-31
0000914775
bmafi:C000130426Member
bmafi:NetOtherAssetsAndLiabilitiesMember
2025-08-31
0000914775
bmafi:C000130426Member
bmafi:NewmontCorpMember
2025-08-31
0000914775
bmafi:C000130426Member
bmafi:QuantaServicesIncMember
2025-08-31
0000914775
bmafi:C000130426Member
us-gaap:RealEstateSectorMember
2025-08-31
0000914775
bmafi:C000130426Member
bmafi:RocketCosIncClAMember
2025-08-31
0000914775
bmafi:C000130426Member
oef:UtilitiesSectorMember
2025-08-31
0000914775
bmafi:C000130427Member
2025-08-31
0000914775
bmafi:C000130427Member
bmafi:AmazonComIncMember
2025-08-31
0000914775
bmafi:C000130427Member
bmafi:AssurantIncMember
2025-08-31
0000914775
bmafi:C000130427Member
bmafi:ATAndTIncMember
2025-08-31
0000914775
bmafi:C000130427Member
bmafi:BerkshireHathawayIncCIBMember
2025-08-31
0000914775
bmafi:C000130427Member
bmafi:CapitalOneFinancialCorpMember
2025-08-31
0000914775
bmafi:C000130427Member
bmafi:CiscoSystemsIncMember
2025-08-31
0000914775
bmafi:C000130427Member
oef:CommunicationsSectorMember
2025-08-31
0000914775
bmafi:C000130427Member
oef:ConsumerDiscretionarySectorMember
2025-08-31
0000914775
bmafi:C000130427Member
oef:ConsumerStaplesSectorMember
2025-08-31
0000914775
bmafi:C000130427Member
bmafi:CRHPLCMember
2025-08-31
0000914775
bmafi:C000130427Member
us-gaap:EnergySectorMember
2025-08-31
0000914775
bmafi:C000130427Member
us-gaap:FinancialServicesSectorMember
2025-08-31
0000914775
bmafi:C000130427Member
us-gaap:HealthcareSectorMember
2025-08-31
0000914775
bmafi:C000130427Member
oef:IndustrialSectorMember
2025-08-31
0000914775
bmafi:C000130427Member
oef:InformationTechnologySectorMember
2025-08-31
0000914775
bmafi:C000130427Member
bmafi:JohnsonAndJohnsonMember
2025-08-31
0000914775
bmafi:C000130427Member
bmafi:JPMorganChaseAndCoMember
2025-08-31
0000914775
bmafi:C000130427Member
oef:MaterialsSectorMember
2025-08-31
0000914775
bmafi:C000130427Member
bmafi:MedtronicPLCMember
2025-08-31
0000914775
bmafi:C000130427Member
bmafi:NetOtherAssetsAndLiabilitiesMember
2025-08-31
0000914775
bmafi:C000130427Member
us-gaap:RealEstateSectorMember
2025-08-31
0000914775
bmafi:C000174005Member
2025-08-31
0000914775
bmafi:C000174005Member
bmafi:AlamosGoldIncClAMember
2025-08-31
0000914775
bmafi:C000174005Member
bmafi:ClearwayEnergyIncClCMember
2025-08-31
0000914775
bmafi:C000174005Member
bmafi:ColumbiaBankingSystemIncMember
2025-08-31
0000914775
bmafi:C000174005Member
oef:CommunicationsSectorMember
2025-08-31
0000914775
bmafi:C000174005Member
oef:ConsumerDiscretionarySectorMember
2025-08-31
0000914775
bmafi:C000174005Member
oef:ConsumerStaplesSectorMember
2025-08-31
0000914775
bmafi:C000174005Member
us-gaap:EnergySectorMember
2025-08-31
0000914775
bmafi:C000174005Member
us-gaap:FinancialServicesSectorMember
2025-08-31
0000914775
bmafi:C000174005Member
bmafi:FirstBuseyCorpMember
2025-08-31
0000914775
bmafi:C000174005Member
bmafi:FirstHorizonCorpMember
2025-08-31
0000914775
bmafi:C000174005Member
bmafi:GeniusSportsLtdMember
2025-08-31
0000914775
bmafi:C000174005Member
us-gaap:HealthcareSectorMember
2025-08-31
0000914775
bmafi:C000174005Member
oef:IndustrialSectorMember
2025-08-31
0000914775
bmafi:C000174005Member
oef:InformationTechnologySectorMember
2025-08-31
0000914775
bmafi:C000174005Member
bmafi:InsmedIncMember
2025-08-31
0000914775
bmafi:C000174005Member
bmafi:InvestmentCompaniesMember
2025-08-31
0000914775
bmafi:C000174005Member
bmafi:MagniteIncMember
2025-08-31
0000914775
bmafi:C000174005Member
oef:MaterialsSectorMember
2025-08-31
0000914775
bmafi:C000174005Member
bmafi:NetOtherAssetsAndLiabilitiesMember
2025-08-31
0000914775
bmafi:C000174005Member
us-gaap:RealEstateSectorMember
2025-08-31
0000914775
bmafi:C000174005Member
bmafi:SkyWestIncMember
2025-08-31
0000914775
bmafi:C000174005Member
bmafi:TexasCapitalBancsharesIncMember
2025-08-31
0000914775
bmafi:C000174005Member
oef:UtilitiesSectorMember
2025-08-31
0000914775
bmafi:C000174006Member
2025-08-31
0000914775
bmafi:C000174006Member
bmafi:AlamosGoldIncClAMember
2025-08-31
0000914775
bmafi:C000174006Member
bmafi:ClearwayEnergyIncClCMember
2025-08-31
0000914775
bmafi:C000174006Member
bmafi:ColumbiaBankingSystemIncMember
2025-08-31
0000914775
bmafi:C000174006Member
oef:CommunicationsSectorMember
2025-08-31
0000914775
bmafi:C000174006Member
oef:ConsumerDiscretionarySectorMember
2025-08-31
0000914775
bmafi:C000174006Member
oef:ConsumerStaplesSectorMember
2025-08-31
0000914775
bmafi:C000174006Member
us-gaap:EnergySectorMember
2025-08-31
0000914775
bmafi:C000174006Member
us-gaap:FinancialServicesSectorMember
2025-08-31
0000914775
bmafi:C000174006Member
bmafi:FirstBuseyCorpMember
2025-08-31
0000914775
bmafi:C000174006Member
bmafi:FirstHorizonCorpMember
2025-08-31
0000914775
bmafi:C000174006Member
bmafi:GeniusSportsLtdMember
2025-08-31
0000914775
bmafi:C000174006Member
us-gaap:HealthcareSectorMember
2025-08-31
0000914775
bmafi:C000174006Member
oef:IndustrialSectorMember
2025-08-31
0000914775
bmafi:C000174006Member
oef:InformationTechnologySectorMember
2025-08-31
0000914775
bmafi:C000174006Member
bmafi:InsmedIncMember
2025-08-31
0000914775
bmafi:C000174006Member
bmafi:InvestmentCompaniesMember
2025-08-31
0000914775
bmafi:C000174006Member
bmafi:MagniteIncMember
2025-08-31
0000914775
bmafi:C000174006Member
oef:MaterialsSectorMember
2025-08-31
0000914775
bmafi:C000174006Member
bmafi:NetOtherAssetsAndLiabilitiesMember
2025-08-31
0000914775
bmafi:C000174006Member
us-gaap:RealEstateSectorMember
2025-08-31
0000914775
bmafi:C000174006Member
bmafi:SkyWestIncMember
2025-08-31
0000914775
bmafi:C000174006Member
bmafi:TexasCapitalBancsharesIncMember
2025-08-31
0000914775
bmafi:C000174006Member
oef:UtilitiesSectorMember
2025-08-31
0000914775
bmafi:C000174007Member
2025-08-31
0000914775
bmafi:C000174007Member
bmafi:AmazonComIncMember
2025-08-31
0000914775
bmafi:C000174007Member
oef:CommunicationsSectorMember
2025-08-31
0000914775
bmafi:C000174007Member
oef:ConsumerDiscretionarySectorMember
2025-08-31
0000914775
bmafi:C000174007Member
us-gaap:FinancialServicesSectorMember
2025-08-31
0000914775
bmafi:C000174007Member
oef:IndustrialSectorMember
2025-08-31
0000914775
bmafi:C000174007Member
oef:InformationTechnologySectorMember
2025-08-31
0000914775
bmafi:C000174007Member
bmafi:IntuitIncMember
2025-08-31
0000914775
bmafi:C000174007Member
bmafi:InvestmentCompaniesMember
2025-08-31
0000914775
bmafi:C000174007Member
bmafi:MetaPlatformsIncClAMember
2025-08-31
0000914775
bmafi:C000174007Member
bmafi:MicronTechnologyIncMember
2025-08-31
0000914775
bmafi:C000174007Member
bmafi:MicrosoftCorpMember
2025-08-31
0000914775
bmafi:C000174007Member
bmafi:NetflixIncMember
2025-08-31
0000914775
bmafi:C000174007Member
bmafi:NetOtherAssetsAndLiabilitiesMember
2025-08-31
0000914775
bmafi:C000174007Member
bmafi:NVIDIACorpMember
2025-08-31
0000914775
bmafi:C000174007Member
bmafi:OracleCorpMember
2025-08-31
0000914775
bmafi:C000174007Member
us-gaap:RealEstateSectorMember
2025-08-31
0000914775
bmafi:C000174007Member
bmafi:ShopifyIncClAMember
2025-08-31
0000914775
bmafi:C000174007Member
bmafi:TaiwanSemiconductorManufacturingCoLtdADRMember
2025-08-31
iso4217:USDiso4217:USDxbrli:sharesxbrli:purexbrli:sharesutr:Dbmafi:Holding
UNITED STATES
SECURITIES AND EXCHANGE COMMISSION
Washington, D.C. 20549
FORM N-CSR
CERTIFIED SHAREHOLDER REPORT OF REGISTERED MANAGEMENT INVESTMENT COMPANIES
Investment Company Act file number
BNY Mellon Advantage Funds, Inc.
(Exact name of registrant as specified in charter)
c/o BNY Mellon Investment Adviser, Inc.
240 Greenwich Street
New York, New York 10286
(Address of Principal Executive Officer) (Zip Code)
Deirdre Cunnane, Esq.
240 Greenwich Street
New York, New York 10286
(Name and Address of Agent for Service)
Registrant's telephone number, including area code:
Date of reporting period:
The following N-CSR relates only to the Registrant's series listed below and does not relate to any series of the Registrant with a different fiscal year end and, therefore, different N-CSR reporting requirements. A separate N-CSR will be filed for any series with a different fiscal year end, as appropriate.
BNY Mellon Dynamic Value Fund
BNY Mellon Opportunistic Midcap Value Fund
BNY Mellon Opportunistic Small Cap Fund
BNY Mellon Technology Growth Fund
ITEM 1 - Reports to Stockholders
BNY Mellon Dynamic Value Fund
ANNUAL
SHAREHOLDER
REPORT
August 31, 2025
Class A – DAGVX
This annual shareholder report contains important information about BNY Mellon Dynamic Value Fund (the “Fund”) for the period of September 1, 2024 to August 31, 2025. You can find additional information about the Fund at bny.com/investments/literaturecenter. You can also request this information by calling 1-800-373-9387 (inside the U.S. only) or by sending an e-mail request to info@bny.com.
What were the Fund’s costs for the last year ?
(based on a hypothetical $10,000 investment)
| Share Class |
Costs of a $10,000 investment |
Costs paid as a percentage of a $10,000 investment |
| Class A* |
$99 |
0.93% |
| * |
During the period, fees were waived and/or expenses reimbursed pursuant to an agreement with the Fund’s investment adviser, BNY Mellon Investment Adviser, Inc. If this agreement is not extended in the future, expenses could be higher.
|
How did the Fund perform last year ?
-
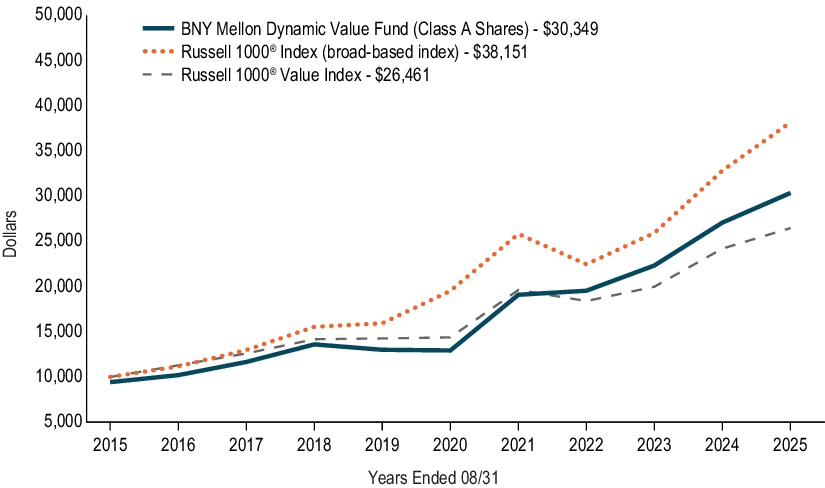
For the 12-month period ended August 31, 2025, the Fund’s Class A shares returned 12.09%.
-
In comparison, the Russell 1000® Value Index (the “Index”) returned 9.33% for the same period.
What affected the Fund’s performance?
-
U.S. stocks generally rose as investors looked beyond U.S. tariff and geopolitical uncertainty. Gains were led by growth-oriented, large-cap securities largely exposed to artificial intelligence.
-
Sector positioning and strong stock selection within both the utilities and industrial sectors bolstered the Fund’s performance relative to the Index, as did security selection within the consumer staples sector.
-
Overweight positioning and security selection within the health care sector was the sole detractor from the Fund’s relative returns over the period.
How did the Fund perform over the past 10 years?
The Fund’s past performance is not a good predictor of the Fund’s future performance. The graph and table do not reflect the deduction of taxes that a shareholder would pay on fund distributions or redemption of fund shares.
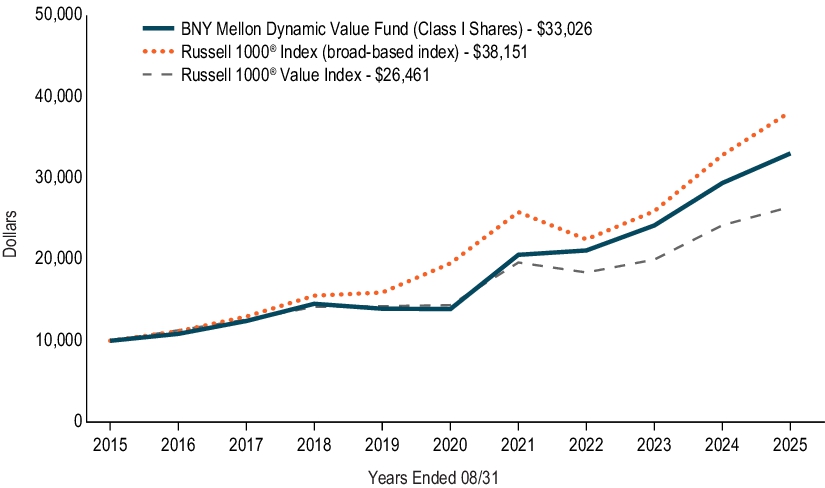
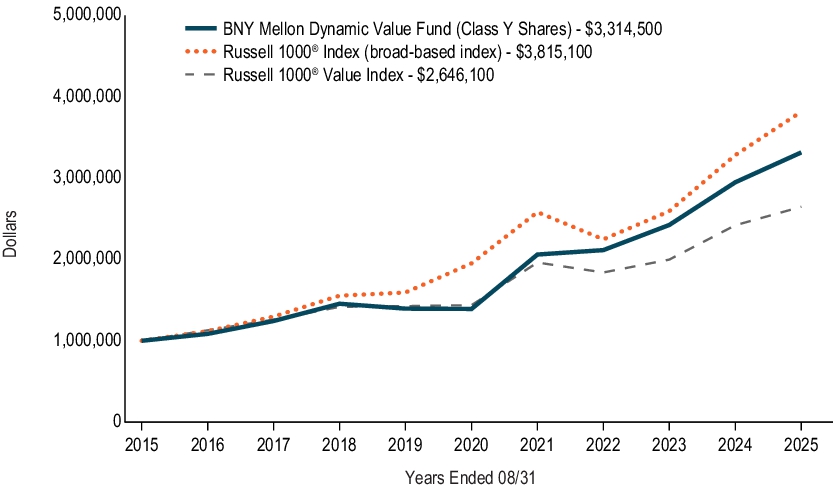
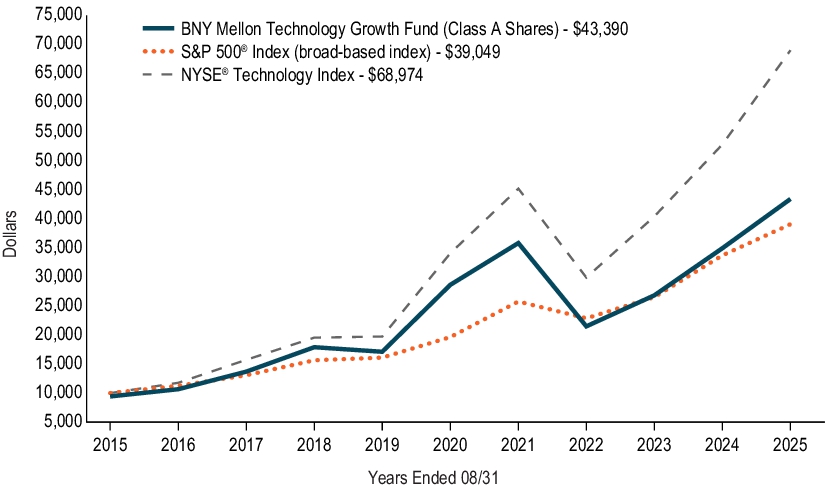
Cumulative Performance from September 1 , 2015 through August 31, 2025
Initial Investment of $10,000
The above graph compares a hypothetical $10,000 investment in the Fund’s Class A shares to a hypothetical investment of $10,000 made in each of the Russell 1000® Index (a broad-based index) and Russell 1000® Value Index on 8/31/2015. The performance shown takes into account the maximum initial sales charge on Class A shares and applicable fees and expenses of the Fund, including management fees and other expenses. The Fund’s performance also assumes the reinvestment of dividends and capital gains. Unlike the Fund, the indexes are not subject to charges, fees and other expenses. Investors cannot invest directly in any index.
AVERAGE ANNUAL TOTAL RETURNS (AS OF 8/31/25 )
| Class A Shares |
1YR |
|
5YR |
|
10YR |
|
| with Maximum Sales Charge - 5.75% |
5.64% |
|
17.21% |
|
11.74% |
|
| without Sales Charge |
12.09% |
|
18.60% |
|
12.41% |
|
| Russell 1000® Index (broad-based index) |
16.24% |
|
14.34% |
|
14.33% |
|
| Russell 1000® Value Index |
9.33% |
|
12.97% |
|
10.22% |
|
The performance data quoted represent past performance, which is no guarantee of future results. For more current information visit bny.com/investments/literaturecenter .
KEY FUND STATISTICS (AS OF 8/31/25 )
Fund Size (Millions) |
Number of Holdings |
Total Advisory Fee Paid During
Period |
Annual Portfolio Turnover |
| $9,145 |
74 |
$45,678,850 |
95.20% |
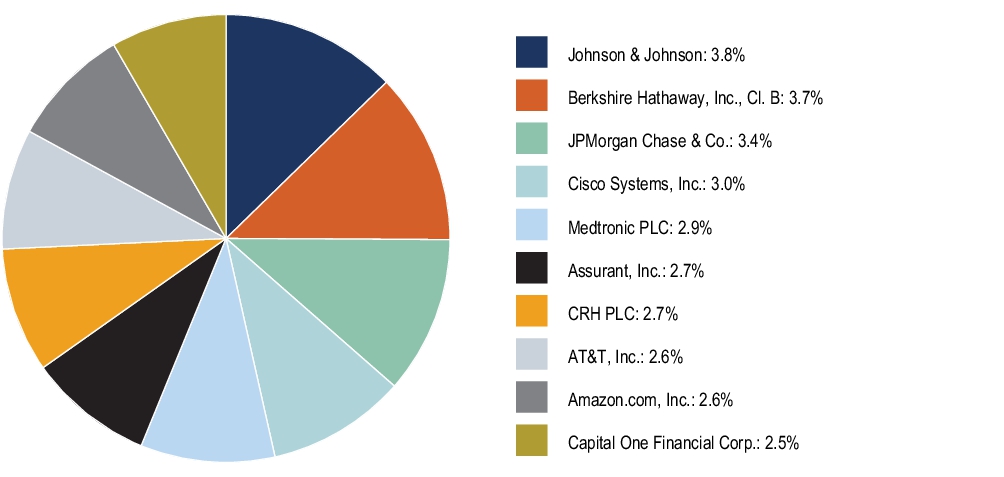
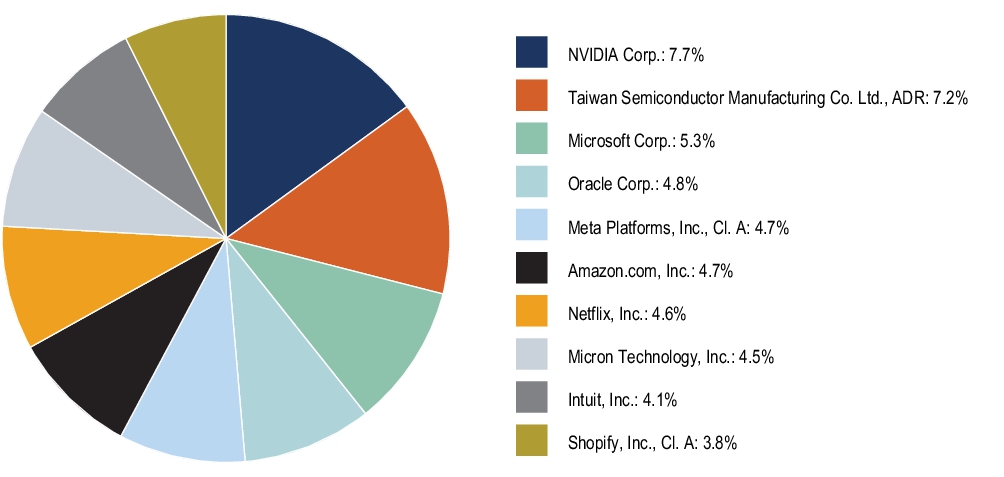
Portfolio Holdings (as of 8/31/25 )
Top Ten Holdings (Based on Net Assets) *
* Excludes money market funds or other short-term securities held for the investment of cash and cash collateral for securities loaned, if any.
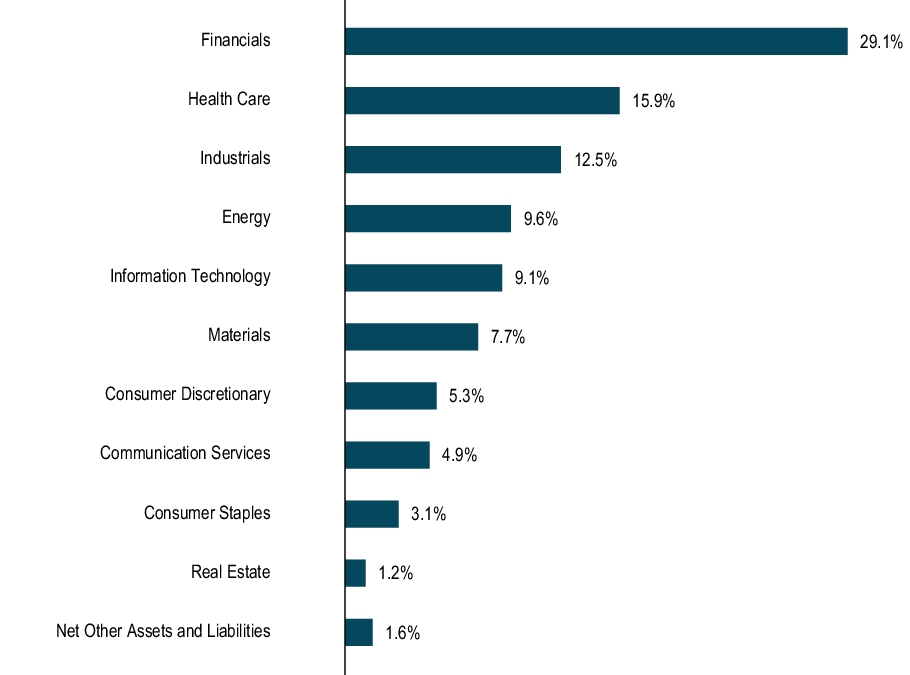
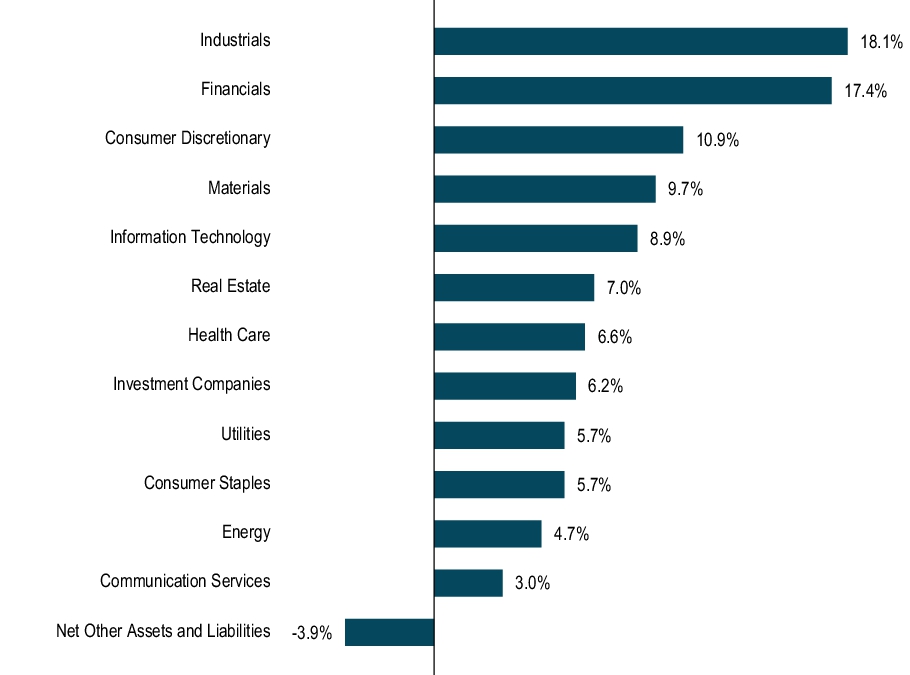
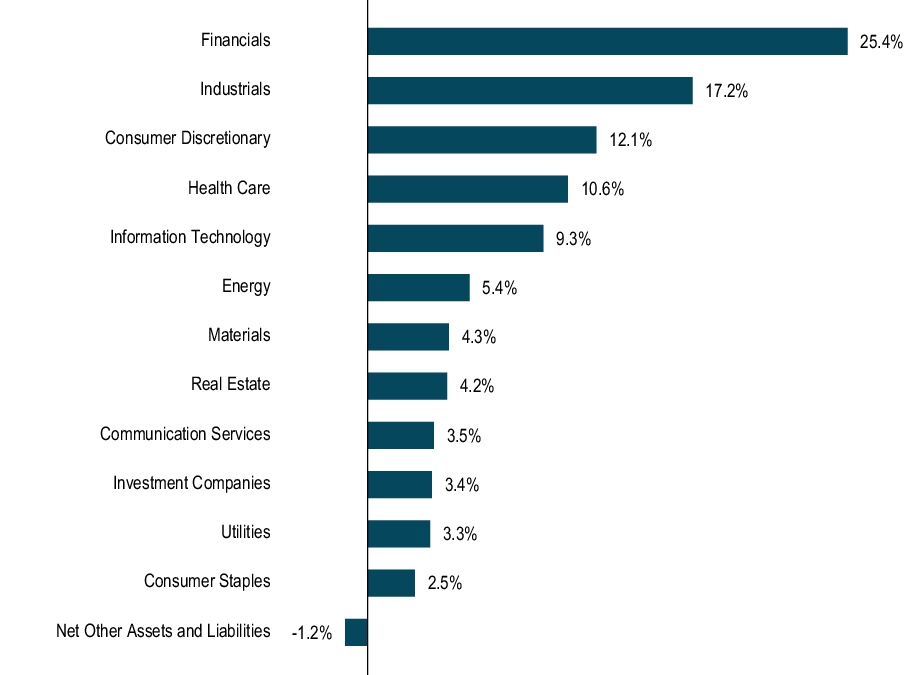
Sector Allocation (Based on Net Assets)
For additional information about the Fund, including its prospectus, financial information, portfolio holdings and proxy voting information, please visit bny.com/investments/literaturecenter .
Not FDIC Insured. Not Bank-Guaranteed. May Lose Value
© 2025 BNY Mellon Securities Corporation, Distributor,
240 Greenwich Street, 9th Floor, New York, NY 10286
Code-0257AR0825
BNY Mellon Dynamic Value Fund
ANNUAL
SHAREHOLDER
REPORT
August 31, 2025
Class C – DCGVX
This annual shareholder report contains important information about BNY Mellon Dynamic Value Fund (the “Fund”) for the period of September 1, 2024 to August 31, 2025. You can find additional information about the Fund at bny.com/investments/literaturecenter. You can also request this information by calling 1-800-373-9387 (inside the U.S. only) or by sending an e-mail request to info@bny.com.
What were the Fund’s costs for the last year ?
(based on a hypothetical $10,000 investment)
| Share Class |
Costs of a $10,000 investment |
Costs paid as a percentage of a $10,000 investment |
| Class C* |
$177 |
1.68% |
| * |
During the period, fees were waived and/or expenses reimbursed pursuant to an agreement with the Fund’s investment adviser, BNY Mellon Investment Adviser, Inc. If this agreement is not extended in the future, expenses could be higher.
|
How did the Fund perform last year ?
-
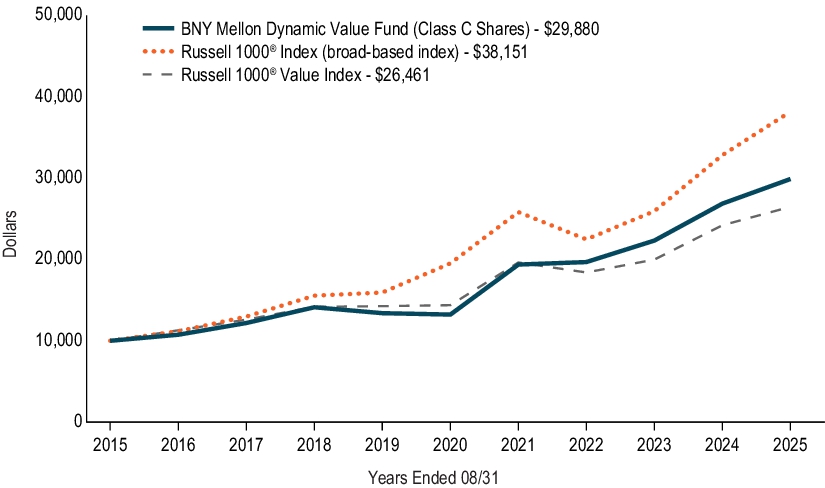
For the 12-month period ended August 31, 2025, the Fund’s Class C shares returned 11.24%.
-
In comparison, the Russell 1000® Value Index (the “Index”) returned 9.33% for the same period.
What affected the Fund’s performance?
-
U.S. stocks generally rose as investors looked beyond U.S. tariff and geopolitical uncertainty. Gains were led by growth-oriented, large-cap securities largely exposed to artificial intelligence.
-
Sector positioning and strong stock selection within both the utilities and industrial sectors bolstered the Fund’s performance relative to the Index, as did security selection within the consumer staples sector.
-
Overweight positioning and security selection within the health care sector was the sole detractor from the Fund’s relative returns over the period.
How did the Fund perform over the past 10 years?
The Fund’s past performance is not a good predictor of the Fund’s future performance. The graph and table do not reflect the deduction of taxes that a shareholder would pay on fund distributions or redemption of fund shares.
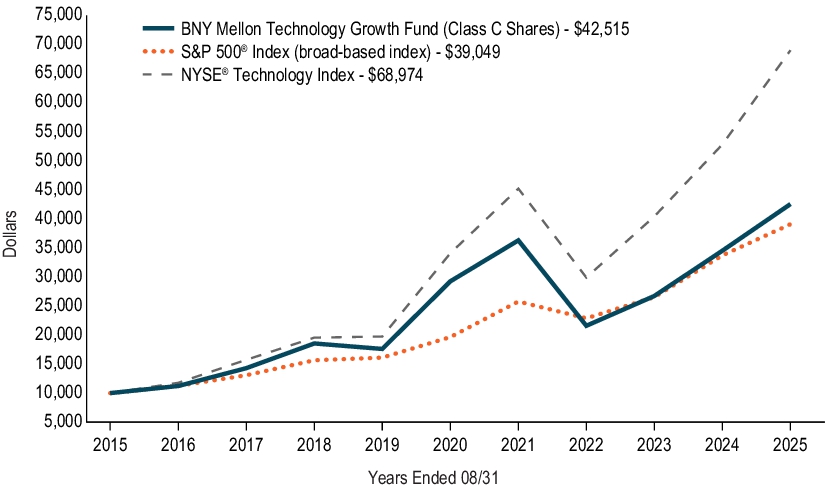
Cumulative Performance from September 1 , 2015 through August 31, 2025
Initial Investment of $10,000
The above graph compares a hypothetical $10,000 investment in the Fund’s Class C shares to a hypothetical investment of $10,000 made in each of the Russell 1000® Index (a broad-based index) and Russell 1000® Value Index on 8/31/2015. The performance shown takes into account the maximum deferred sales charge on Class C shares and applicable fees and expenses of the Fund, including management fees, 12b-1 fees and other expenses. The Fund’s performance also assumes the reinvestment of dividends and capital gains. Unlike the Fund, the indexes are not subject to charges, fees and other expenses. Investors cannot invest directly in any index.
AVERAGE ANNUAL TOTAL RETURNS (AS OF 8/31/25 )
| Class C Shares |
1YR |
|
5YR |
|
10YR |
|
| with Maximum Deferred Sales Charge - 1.00% |
10.24% |
*
|
17.71% |
|
11.57% |
|
| without Deferred Sales Charge |
11.24% |
|
17.71% |
|
11.57% |
|
| Russell 1000® Index (broad-based index) |
16.24% |
|
14.34% |
|
14.33% |
|
| Russell 1000® Value Index |
9.33% |
|
12.97% |
|
10.22% |
|
|
*
|
The maximum contingent deferred sales charge for Class C shares is 1.00% for shares redeemed within one year of the date purchased.
|
The performance data quoted represent past performance, which is no guarantee of future results. For more current information visit bny.com/investments/literaturecenter .
KEY FUND STATISTICS (AS OF 8/31/25 )
Fund Size (Millions) |
Number of Holdings |
Total Advisory Fee Paid During
Period |
Annual Portfolio Turnover |
| $9,145 |
74 |
$45,678,850 |
95.20% |
Portfolio Holdings (as of 8/31/25 )
Top Ten Holdings (Based on Net Assets) *
* Excludes money market funds or other short-term securities held for the investment of cash and cash collateral for securities loaned, if any.
Sector Allocation (Based on Net Assets)
For additional information about the Fund, including its prospectus, financial information, portfolio holdings and proxy voting information, please visit bny.com/investments/literaturecenter .
Not FDIC Insured. Not Bank-Guaranteed. May Lose Value
© 2025 BNY Mellon Securities Corporation, Distributor,
240 Greenwich Street, 9th Floor, New York, NY 10286
Code-0667AR0825
BNY Mellon Dynamic Value Fund
ANNUAL
SHAREHOLDER
REPORT
August 31, 2025
Class I – DRGVX
This annual shareholder report contains important information about BNY Mellon Dynamic Value Fund (the “Fund”) for the period of September 1, 2024 to August 31, 2025. You can find additional information about the Fund at bny.com/investments/literaturecenter. You can also request this information by calling 1-800-373-9387 (inside the U.S. only) or by sending an e-mail request to info@bny.com.
What were the Fund’s costs for the last year ?
(based on a hypothetical $10,000 investment)
| Share Class |
Costs of a $10,000 investment |
Costs paid as a percentage of a $10,000 investment |
| Class I* |
$72 |
0.68% |
| * |
During the period, fees were waived and/or expenses reimbursed pursuant to an agreement with the Fund’s investment adviser, BNY Mellon Investment Adviser, Inc. If this agreement is not extended in the future, expenses could be higher.
|
How did the Fund perform last year ?
-
For the 12-month period ended August 31, 2025, the Fund’s Class I shares returned 12.37%.
-
In comparison, the Russell 1000® Value Index (the “Index”) returned 9.33% for the same period.
What affected the Fund’s performance?
-
U.S. stocks generally rose as investors looked beyond U.S. tariff and geopolitical uncertainty. Gains were led by growth-oriented, large-cap securities largely exposed to artificial intelligence.
-
Sector positioning and strong stock selection within both the utilities and industrial sectors bolstered the Fund’s performance relative to the Index, as did security selection within the consumer staples sector.
-
Overweight positioning and security selection within the health care sector was the sole detractor from the Fund’s relative returns over the period.
How did the Fund perform over the past 10 years?
The Fund’s past performance is not a good predictor of the Fund’s future performance. The graph and table do not reflect the deduction of taxes that a shareholder would pay on fund distributions or redemption of fund shares.
Cumulative Performance from September 1 , 2015 through August 31, 2025
Initial Investment of $10,000
The above graph compares a hypothetical $10,000 investment in the Fund’s Class I shares to a hypothetical investment of $10,000 made in each of the Russell 1000® Index (a broad-based index) and Russell 1000® Value Index on 8/31/2015. The performance shown takes into account applicable fees and expenses of the Fund, including management fees and other expenses. The Fund’s performance also assumes the reinvestment of dividends and capital gains. Unlike the Fund, the indexes are not subject to charges, fees and other expenses. Investors cannot invest directly in any index.
AVERAGE ANNUAL TOTAL RETURNS (AS OF 8/31/25 )
| Share Class |
1YR |
|
5YR |
|
10YR |
|
| Class I |
12.37% |
|
18.90% |
|
12.69% |
|
| Russell 1000® Index (broad-based index) |
16.24% |
|
14.34% |
|
14.33% |
|
| Russell 1000® Value Index |
9.33% |
|
12.97% |
|
10.22% |
|
The performance data quoted represent past performance, which is no guarantee of future results. For more current information visit bny.com/investments/literaturecenter .
KEY FUND STATISTICS (AS OF 8/31/25 )
Fund Size (Millions) |
Number of Holdings |
Total Advisory Fee Paid During
Period |
Annual Portfolio Turnover |
| $9,145 |
74 |
$45,678,850 |
95.20% |
Portfolio Holdings (as of 8/31/25 )
Top Ten Holdings (Based on Net Assets) *
* Excludes money market funds or other short-term securities held for the investment of cash and cash collateral for securities loaned, if any.
Sector Allocation (Based on Net Assets)
For additional information about the Fund, including its prospectus, financial information, portfolio holdings and proxy voting information, please visit bny.com/investments/literaturecenter .
Not FDIC Insured. Not Bank-Guaranteed. May Lose Value
© 2025 BNY Mellon Securities Corporation, Distributor,
240 Greenwich Street, 9th Floor, New York, NY 10286
Code-0668AR0825
BNY Mellon Dynamic Value Fund
ANNUAL
SHAREHOLDER
REPORT
August 31, 2025
Class Y – DRGYX
This annual shareholder report contains important information about BNY Mellon Dynamic Value Fund (the “Fund”) for the period of September 1, 2024 to August 31, 2025. You can find additional information about the Fund at bny.com/investments/literaturecenter. You can also request this information by calling 1-800-373-9387 (inside the U.S. only) or by sending an e-mail request to info@bny.com.
What were the Fund’s costs for the last year ?
(based on a hypothetical $10,000 investment)
| Share Class |
Costs of a $10,000 investment |
Costs paid as a percentage of a $10,000 investment |
| Class Y |
$67 |
0.63% |
How did the Fund perform last year ?
-
For the 12-month period ended August 31, 2025, the Fund’s Class Y shares returned 12.42%.
-
In comparison, the Russell 1000® Value Index (the “Index”) returned 9.33% for the same period.
What affected the Fund’s performance?
-
U.S. stocks generally rose as investors looked beyond U.S. tariff and geopolitical uncertainty. Gains were led by growth-oriented, large-cap securities largely exposed to artificial intelligence.
-
Sector positioning and strong stock selection within both the utilities and industrial sectors bolstered the Fund’s performance relative to the Index, as did security selection within the consumer staples sector.
-
Overweight positioning and security selection within the health care sector was the sole detractor from the Fund’s relative returns over the period.
How did the Fund perform over the past 10 years?
The Fund’s past performance is not a good predictor of the Fund’s future performance. The graph and table do not reflect the deduction of taxes that a shareholder would pay on fund distributions or redemption of fund shares.
Cumulative Performance from September 1 , 2015 through August 31, 2025
Initial Investment of $1,000,000
The above graph compares a hypothetical $1,000,000 investment in the Fund’s Class Y shares to a hypothetical investment of $1,000,000 made in each of the Russell 1000® Index (a broad-based index) and Russell 1000® Value Index on 8/31/2015. The performance shown takes into account applicable fees and expenses of the Fund, including management fees and other expenses. The Fund’s performance also assumes the reinvestment of dividends and capital gains. Unlike the Fund, the indexes are not subject to charges, fees and other expenses. Investors cannot invest directly in any index.
AVERAGE ANNUAL TOTAL RETURNS (AS OF 8/31/25 )
| Share Class |
1YR |
|
5YR |
|
10YR |
|
| Class Y |
12.42% |
|
18.96% |
|
12.73% |
|
| Russell 1000® Index (broad-based index) |
16.24% |
|
14.34% |
|
14.33% |
|
| Russell 1000® Value Index |
9.33% |
|
12.97% |
|
10.22% |
|
The performance data quoted represent past performance, which is no guarantee of future results. For more current information visit bny.com/investments/literaturecenter .
KEY FUND STATISTICS (AS OF 8/31/25 )
Fund Size (Millions) |
Number of Holdings |
Total Advisory Fee Paid During
Period |
Annual Portfolio Turnover |
| $9,145 |
74 |
$45,678,850 |
95.20% |
Portfolio Holdings (as of 8/31/25 )
Top Ten Holdings (Based on Net Assets) *
* Excludes money market funds or other short-term securities held for the investment of cash and cash collateral for securities loaned, if any.
Sector Allocation (Based on Net Assets)
For additional information about the Fund, including its prospectus, financial information, portfolio holdings and proxy voting information, please visit bny.com/investments/literaturecenter .
Not FDIC Insured. Not Bank-Guaranteed. May Lose Value
© 2025 BNY Mellon Securities Corporation, Distributor,
240 Greenwich Street, 9th Floor, New York, NY 10286
Code-0711AR0825
BNY Mellon Opportunistic Midcap Value Fund
ANNUAL
SHAREHOLDER
REPORT
August 31, 2025
Class A – DMCVX
This annual shareholder report contains important information about BNY Mellon Opportunistic Midcap Value Fund (the “Fund”) for the period of September 1, 2024 to August 31, 2025. You can find additional information about the Fund at bny.com/investments/literaturecenter. You can also request this information by calling 1-800-373-9387 (inside the U.S. only) or by sending an e-mail request to info@bny.com.
What were the Fund’s costs for the last year ?
(based on a hypothetical $10,000 investment)
| Share Class |
Costs of a $10,000 investment |
Costs paid as a percentage of a $10,000 investment |
| Class A |
$120 |
1.16% |
How did the Fund perform last year ?
-
For the 12-month period ended August 31, 2025, the Fund’s Class A shares returned 7.13%.
-
In comparison, the Russell Midcap® Value Index (the “Index”) returned 8.24% for the same period.
What affected the Fund’s performance?
-
U.S. stocks generally rose despite tariff-related drawdowns, as inflation eased and interest rates plateaued, led by gains in large-cap and growth-oriented names.
-
Favorable stock selection in the materials sector bolstered the Fund’s relative performance, as did positioning and stock selection in industrials, specifically out-of-Index stock selection within electrical equipment.
-
Secondary positive contributors included stock selection within the utilities sector and underweight exposure to real estate.
-
Unfavorable stock selection within financials, along with overweight exposure and stock selection in health care and stock selection within energy, detracted most from the Fund’s relative returns.
-
Secondary detractors included disappointing stock selection in consumer staples and consumer discretionary.
How did the Fund perform over the past 10 years?
The Fund’s past performance is not a good predictor of the Fund’s future performance. The graph and table do not reflect the deduction of taxes that a shareholder would pay on fund distributions or redemption of fund shares.
Cumulative Performance from September 1 , 2015 through August 31, 2025
Initial Investment of $10,000
The above graph compares a hypothetical $10,000 investment in the Fund’s Class A shares to a hypothetical investment of $10,000 made in each of the Russell 3000® Index (a broad-based index) and Russell Midcap® Value Index on 8/31/2015. The performance shown takes into account the maximum initial sales charge on Class A shares and applicable fees and expenses of the Fund, including management fees and other expenses. The Fund’s performance also assumes the reinvestment of dividends and capital gains. Unlike the Fund, the indexes are not subject to charges, fees and other expenses. Investors cannot invest directly in any index.
AVERAGE ANNUAL TOTAL RETURNS (AS OF 8/31/25 )
| Class A Shares |
1YR |
|
5YR |
|
10YR |
|
| with Maximum Sales Charge - 5.75% |
0.98% |
|
9.60% |
|
7.99% |
|
| without Sales Charge |
7.13% |
|
10.91% |
|
8.63% |
|
| Russell 3000® Index (broad-based index) |
15.84% |
|
14.11% |
|
13.98% |
|
| Russell Midcap® Value Index |
8.24% |
|
12.86% |
|
9.45% |
|
The performance data quoted represent past performance, which is no guarantee of future results. For more current information visit bny.com/investments/literaturecenter .
KEY FUND STATISTICS (AS OF 8/31/25 )
Fund Size (Millions) |
Number of Holdings |
Total Advisory Fee Paid During
Period |
Annual Portfolio Turnover |
| $390 |
70 |
$2,922,972 |
64.98% |
Portfolio Holdings (as of 8/31/25 )
Top Ten Holdings (Based on Net Assets) *
* Excludes money market funds or other short-term securities held for the investment of cash and cash collateral for securities loaned, if any.
Sector Allocation (Based on Net Assets)
For additional information about the Fund, including its prospectus, financial information, portfolio holdings and proxy voting information, please visit bny.com/investments/literaturecenter .
Not FDIC Insured. Not Bank-Guaranteed. May Lose Value
© 2025 BNY Mellon Securities Corporation, Distributor,
240 Greenwich Street, 9th Floor, New York, NY 10286
Code-0258AR0825
BNY Mellon Opportunistic Midcap Value Fund
ANNUAL
SHAREHOLDER
REPORT
August 31, 2025
Class C – DVLCX
This annual shareholder report contains important information about BNY Mellon Opportunistic Midcap Value Fund (the “Fund”) for the period of September 1, 2024 to August 31, 2025. You can find additional information about the Fund at bny.com/investments/literaturecenter. You can also request this information by calling 1-800-373-9387 (inside the U.S. only) or by sending an e-mail request to info@bny.com.
What were the Fund’s costs for the last year ?
(based on a hypothetical $10,000 investment)
| Share Class |
Costs of a $10,000 investment |
Costs paid as a percentage of a $10,000 investment |
| Class C |
$205 |
1.99% |
How did the Fund perform last year ?
-
For the 12-month period ended August 31, 2025, the Fund’s Class C shares returned 6.23%.
-
In comparison, the Russell Midcap® Value Index (the “Index”) returned 8.24% for the same period.
What affected the Fund’s performance?
-
U.S. stocks generally rose despite tariff-related drawdowns, as inflation eased and interest rates plateaued, led by gains in large-cap and growth-oriented names.
-
Favorable stock selection in the materials sector bolstered the Fund’s relative performance, as did positioning and stock selection in industrials, specifically out-of-Index stock selection within electrical equipment.
-
Secondary positive contributors included stock selection within the utilities sector and underweight exposure to real estate.
-
Unfavorable stock selection within financials, along with overweight exposure and stock selection in health care and stock selection within energy, detracted most from the Fund’s relative returns.
-
Secondary detractors included disappointing stock selection in consumer staples and consumer discretionary.
How did the Fund perform over the past 10 years?
The Fund’s past performance is not a good predictor of the Fund’s future performance. The graph and table do not reflect the deduction of taxes that a shareholder would pay on fund distributions or redemption of fund shares.
Cumulative Performance from September 1 , 2015 through August 31, 2025
Initial Investment of $10,000
The above graph compares a hypothetical $10,000 investment in the Fund’s Class C shares to a hypothetical investment of $10,000 made in each of the Russell 3000® Index (a broad-based index) and Russell Midcap® Value Index on 8/31/2015. The performance shown takes into account the maximum deferred sales charge on Class C shares and applicable fees and expenses of the Fund, including management fees, 12b-1 fees and other expenses. The Fund’s performance also assumes the reinvestment of dividends and capital gains. Unlike the Fund, the indexes are not subject to charges, fees and other expenses. Investors cannot invest directly in any index.
AVERAGE ANNUAL TOTAL RETURNS (AS OF 8/31/25 )
| Class C Shares |
1YR |
|
5YR |
|
10YR |
|
| with Maximum Deferred Sales Charge - 1.00% |
5.29% |
*
|
10.01% |
|
7.78% |
|
| without Deferred Sales Charge |
6.23% |
|
10.01% |
|
7.78% |
|
| Russell 3000® Index (broad-based index) |
15.84% |
|
14.11% |
|
13.98% |
|
| Russell Midcap® Value Index |
8.24% |
|
12.86% |
|
9.45% |
|
|
*
|
The maximum contingent deferred sales charge for Class C shares is 1.00% for shares redeemed within one year of the date purchased.
|
The performance data quoted represent past performance, which is no guarantee of future results. For more current information visit bny.com/investments/literaturecenter .
KEY FUND STATISTICS (AS OF 8/31/25 )
Fund Size (Millions) |
Number of Holdings |
Total Advisory Fee Paid During
Period |
Annual Portfolio Turnover |
| $390 |
70 |
$2,922,972 |
64.98% |
Portfolio Holdings (as of 8/31/25 )
Top Ten Holdings (Based on Net Assets) *
* Excludes money market funds or other short-term securities held for the investment of cash and cash collateral for securities loaned, if any.
Sector Allocation (Based on Net Assets)
For additional information about the Fund, including its prospectus, financial information, portfolio holdings and proxy voting information, please visit bny.com/investments/literaturecenter .
Not FDIC Insured. Not Bank-Guaranteed. May Lose Value
© 2025 BNY Mellon Securities Corporation, Distributor,
240 Greenwich Street, 9th Floor, New York, NY 10286
Code-6229AR0825
BNY Mellon Opportunistic Midcap Value Fund
ANNUAL
SHAREHOLDER
REPORT
August 31, 2025
Class I – DVLIX
This annual shareholder report contains important information about BNY Mellon Opportunistic Midcap Value Fund (the “Fund”) for the period of September 1, 2024 to August 31, 2025. You can find additional information about the Fund at bny.com/investments/literaturecenter. You can also request this information by calling 1-800-373-9387 (inside the U.S. only) or by sending an e-mail request to info@bny.com.
What were the Fund’s costs for the last year ?
(based on a hypothetical $10,000 investment)
| Share Class |
Costs of a $10,000 investment |
Costs paid as a percentage of a $10,000 investment |
| Class I |
$102 |
0.98% |
How did the Fund perform last year ?
-
For the 12-month period ended August 31, 2025, the Fund’s Class I shares returned 7.30%.
-
In comparison, the Russell Midcap® Value Index (the “Index”) returned 8.24% for the same period.
What affected the Fund’s performance?
-
U.S. stocks generally rose despite tariff-related drawdowns, as inflation eased and interest rates plateaued, led by gains in large-cap and growth-oriented names.
-
Favorable stock selection in the materials sector bolstered the Fund’s relative performance, as did positioning and stock selection in industrials, specifically out-of-Index stock selection within electrical equipment.
-
Secondary positive contributors included stock selection within the utilities sector and underweight exposure to real estate.
-
Unfavorable stock selection within financials, along with overweight exposure and stock selection in health care and stock selection within energy, detracted most from the Fund’s relative returns.
-
Secondary detractors included disappointing stock selection in consumer staples and consumer discretionary.
How did the Fund perform over the past 10 years?
The Fund’s past performance is not a good predictor of the Fund’s future performance. The graph and table do not reflect the deduction of taxes that a shareholder would pay on fund distributions or redemption of fund shares.
Cumulative Performance from September 1 , 2015 through August 31, 2025
Initial Investment of $10,000
The above graph compares a hypothetical $10,000 investment in the Fund’s Class I shares to a hypothetical investment of $10,000 made in each of the Russell 3000® Index (a broad-based index) and Russell Midcap® Value Index on 8/31/2015. The performance shown takes into account applicable fees and expenses of the Fund, including management fees and other expenses. The Fund’s performance also assumes the reinvestment of dividends and capital gains. Unlike the Fund, the indexes are not subject to charges, fees and other expenses. Investors cannot invest directly in any index.
AVERAGE ANNUAL TOTAL RETURNS (AS OF 8/31/25 )
| Share Class |
1YR |
|
5YR |
|
10YR |
|
| Class I |
7.30% |
|
11.12% |
|
8.88% |
|
| Russell 3000® Index (broad-based index) |
15.84% |
|
14.11% |
|
13.98% |
|
| Russell Midcap® Value Index |
8.24% |
|
12.86% |
|
9.45% |
|
The performance data quoted represent past performance, which is no guarantee of future results. For more current information visit bny.com/investments/literaturecenter .
KEY FUND STATISTICS (AS OF 8/31/25 )
Fund Size (Millions) |
Number of Holdings |
Total Advisory Fee Paid During
Period |
Annual Portfolio Turnover |
| $390 |
70 |
$2,922,972 |
64.98% |
Portfolio Holdings (as of 8/31/25 )
Top Ten Holdings (Based on Net Assets) *
* Excludes money market funds or other short-term securities held for the investment of cash and cash collateral for securities loaned, if any.
Sector Allocation (Based on Net Assets)
For additional information about the Fund, including its prospectus, financial information, portfolio holdings and proxy voting information, please visit bny.com/investments/literaturecenter .
Not FDIC Insured. Not Bank-Guaranteed. May Lose Value
© 2025 BNY Mellon Securities Corporation, Distributor,
240 Greenwich Street, 9th Floor, New York, NY 10286
Code-6230AR0825
BNY Mellon Opportunistic Midcap Value Fund
ANNUAL
SHAREHOLDER
REPORT
August 31, 2025
Class Y – DMCYX
This annual shareholder report contains important information about BNY Mellon Opportunistic Midcap Value Fund (the “Fund”) for the period of September 1, 2024 to August 31, 2025. You can find additional information about the Fund at bny.com/investments/literaturecenter. You can also request this information by calling 1-800-373-9387 (inside the U.S. only) or by sending an e-mail request to info@bny.com.
What were the Fund’s costs for the last year ?
(based on a hypothetical $10,000 investment)
| Share Class |
Costs of a $10,000 investment |
Costs paid as a percentage of a $10,000 investment |
| Class Y |
$89 |
0.86% |
How did the Fund perform last year ?
-
For the 12-month period ended August 31, 2025, the Fund’s Class Y shares returned 7.43%.
-
In comparison, the Russell Midcap® Value Index (the “Index”) returned 8.24% for the same period.
What affected the Fund’s performance?
-
U.S. stocks generally rose despite tariff-related drawdowns, as inflation eased and interest rates plateaued, led by gains in large-cap and growth-oriented names.
-
Favorable stock selection in the materials sector bolstered the Fund’s relative performance, as did positioning and stock selection in industrials, specifically out-of-Index stock selection within electrical equipment.
-
Secondary positive contributors included stock selection within the utilities sector and underweight exposure to real estate.
-
Unfavorable stock selection within financials, along with overweight exposure and stock selection in health care and stock selection within energy, detracted most from the Fund’s relative returns.
-
Secondary detractors included disappointing stock selection in consumer staples and consumer discretionary.
How did the Fund perform over the past 10 years?
The Fund’s past performance is not a good predictor of the Fund’s future performance. The graph and table do not reflect the deduction of taxes that a shareholder would pay on fund distributions or redemption of fund shares.
Cumulative Performance from September 1 , 2015 through August 31, 2025
Initial Investment of $1,000,000
The above graph compares a hypothetical $1,000,000 investment in the Fund’s Class Y shares to a hypothetical investment of $1,000,000 made in each of the Russell 3000® Index (a broad-based index) and Russell Midcap® Value Index on 8/31/2015. The performance shown takes into account applicable fees and expenses of the Fund, including management fees and other expenses. The Fund’s performance also assumes the reinvestment of dividends and capital gains. Unlike the Fund, the indexes are not subject to charges, fees and other expenses. Investors cannot invest directly in any index.
AVERAGE ANNUAL TOTAL RETURNS (AS OF 8/31/25 )
| Share Class |
1YR |
|
5YR |
|
10YR |
|
| Class Y |
7.43% |
|
11.24% |
|
8.99% |
|
| Russell 3000® Index (broad-based index) |
15.84% |
|
14.11% |
|
13.98% |
|
| Russell Midcap® Value Index |
8.24% |
|
12.86% |
|
9.45% |
|
The performance data quoted represent past performance, which is no guarantee of future results. For more current information visit bny.com/investments/literaturecenter .
KEY FUND STATISTICS (AS OF 8/31/25 )
Fund Size (Millions) |
Number of Holdings |
Total Advisory Fee Paid During
Period |
Annual Portfolio Turnover |
| $390 |
70 |
$2,922,972 |
64.98% |
Portfolio Holdings (as of 8/31/25 )
Top Ten Holdings (Based on Net Assets) *
* Excludes money market funds or other short-term securities held for the investment of cash and cash collateral for securities loaned, if any.
Sector Allocation (Based on Net Assets)
For additional information about the Fund, including its prospectus, financial information, portfolio holdings and proxy voting information, please visit bny.com/investments/literaturecenter .
Not FDIC Insured. Not Bank-Guaranteed. May Lose Value
© 2025 BNY Mellon Securities Corporation, Distributor,
240 Greenwich Street, 9th Floor, New York, NY 10286
Code-0371AR0825
BNY Mellon Opportunistic Small Cap Fund
ANNUAL
SHAREHOLDER
REPORT
August 31, 2025
Investor Shares – DSCVX
This annual shareholder report contains important information about BNY Mellon Opportunistic Small Cap Fund (the “Fund”) for the period of September 1, 2024 to August 31, 2025. You can find additional information about the Fund at bny.com/investments/literaturecenter. You can also request this information by calling 1-800-373-9387 (inside the U.S. only) or by sending an e-mail request to info@bny.com.
This report describes changes to the Fund that occurred during the reporting period.
What were the Fund’s costs for the last year ?
(based on a hypothetical $10,000 investment)
| Share Class |
Costs of a $10,000 investment |
Costs paid as a percentage of a $10,000 investment |
| Investor Shares* |
$111 |
1.08% |
| * |
During the period, fees were waived and/or expenses reimbursed pursuant to an agreement with the Fund’s investment adviser, BNY Mellon Investment Adviser, Inc. If this agreement is not extended in the future, expenses could be higher.
|
How did the Fund perform last year ?
-
For the 12-month period ended August 31, 2025, the Fund’s Investor Shares returned 5.05%.
-
In comparison, the Russell 2000® Index returned 8.17% for the same period.
What affected the Fund’s performance?
-
U.S. stocks generally rose despite tariff-related drawdowns, as inflation eased and interest rates plateaued, led by gains in large-cap and growth-oriented names.
-
Stock selection in information technology, along with overweight exposure to energy, bolstered the Fund’s relative performance.
-
Secondary positive contributors included stock selection and overweight exposure to communication services, and underweight exposure to real estate.
-
Stock selection within the Industrials sector, as well as both selection and overweight exposure in financials, were the largest detractors from relative performance.
-
Disappointing stock selection within the consumer staples sector also detracted.
How did the Fund perform over the past 10 years?
The Fund’s past performance is not a good predictor of the Fund’s future performance. The graph and table do not reflect the deduction of taxes that a shareholder would pay on fund distributions or redemption of fund shares.
Cumulative Performance from September 1 , 2015 through August 31, 2025
Initial Investment of $10,000
The above graph compares a hypothetical $10,000 investment in the Fund’s Investor Shares to a hypothetical investment of $10,000 made in each of the Russell 3000® Index (a broad-based index) and Russell 2000® Index on 8/31/2015. The performance shown takes into account applicable fees and expenses of the Fund, including management fees and other expenses. The Fund’s performance also assumes the reinvestment of dividends and capital gains. Unlike the Fund, the indexes are not subject to charges, fees and other expenses. Investors cannot invest directly in any index.
AVERAGE ANNUAL TOTAL RETURNS (AS OF 8/31/25 )
| Share Class |
1YR |
|
5YR |
|
10YR |
|
| Investor Shares |
5.05% |
|
7.47% |
|
6.84% |
|
| Russell 3000® Index (broad-based index) |
15.84% |
|
14.11% |
|
13.98% |
|
| Russell 2000® Index |
8.17% |
|
10.13% |
|
8.88% |
|
The performance data quoted represent past performance, which is no guarantee of future results. For more current information visit bny.com/investments/literaturecenter .
KEY FUND STATISTICS (AS OF 8/31/25 )
Fund Size (Millions) |
Number of Holdings |
Total Advisory Fee Paid During
Period |
Annual Portfolio Turnover |
| $232 |
110 |
$1,508,150 |
68.31% |
Portfolio Holdings (as of 8/31/25 )
Top Ten Holdings (Based on Net Assets) *
* Excludes money market funds or other short-term securities held for the investment of cash and cash collateral for securities loaned, if any.
Sector Allocation (Based on Net Assets)
How has the Fund changed?
-
The Board of Directors of BNY Mellon Advantage Funds, Inc. (the “Company”) has approved, subject to shareholder approval, an Agreement and Plan of Reorganization (the “Agreement”) between the Company, on behalf of BNY Mellon Opportunistic Small Cap Fund (the “Fund”), and BNY Mellon Investment Funds I, on behalf of BNY Mellon Small Cap Value Fund (the “Acquiring Fund”). Shareholders of the Fund as of September 23, 2025 (the “Record Date”) will be asked to approve the Agreement on behalf of the Fund at a special meeting of shareholders to be held on or about December 9, 2025. If the Agreement is approved, the reorganization will be consummated on or about February 13, 2026. For more information, please refer to prospectus/proxy statement filed August 22, 2025.
This is a summary of certain changes to the Fund since September 1, 2024 . For more complete information, you may review the Fund’s current prospectus dated December 31, 2024 as supplemented on August 22, 2025 at bny.com/investments/literaturecenter or upon request at 1-800-373-9387.
For additional information about the Fund, including its prospectus, financial information, portfolio holdings and proxy voting information, please visit bny.com/investments/literaturecenter .
Not FDIC Insured. Not Bank-Guaranteed. May Lose Value
© 2025 BNY Mellon Securities Corporation, Distributor,
240 Greenwich Street, 9th Floor, New York, NY 10286
Code-0253AR0825
BNY Mellon Opportunistic Small Cap Fund
ANNUAL
SHAREHOLDER
REPORT
August 31, 2025
Class I – DOPIX
This annual shareholder report contains important information about BNY Mellon Opportunistic Small Cap Fund (the “Fund”) for the period of September 1, 2024 to August 31, 2025. You can find additional information about the Fund at bny.com/investments/literaturecenter. You can also request this information by calling 1-800-373-9387 (inside the U.S. only) or by sending an e-mail request to info@bny.com.
This report describes changes to the Fund that occurred during the reporting period.
What were the Fund’s costs for the last year ?
(based on a hypothetical $10,000 investment)
| Share Class |
Costs of a $10,000 investment |
Costs paid as a percentage of a $10,000 investment |
| Class I* |
$92 |
0.90% |
| * |
During the period, fees were waived and/or expenses reimbursed pursuant to an agreement with the Fund’s investment adviser, BNY Mellon Investment Adviser, Inc. If this agreement is not extended in the future, expenses could be higher.
|
How did the Fund perform last year ?
-
For the 12-month period ended August 31, 2025, the Fund’s Class I shares returned 5.27%.
-
In comparison, the Russell 2000® Index returned 8.17% for the same period.
What affected the Fund’s performance?
-
U.S. stocks generally rose despite tariff-related drawdowns, as inflation eased and interest rates plateaued, led by gains in large-cap and growth-oriented names.
-
Stock selection in information technology, along with overweight exposure to energy, bolstered the Fund’s relative performance.
-
Secondary positive contributors included stock selection and overweight exposure to communication services, and underweight exposure to real estate.
-
Stock selection within the Industrials sector, as well as both selection and overweight exposure in financials, were the largest detractors from relative performance.
-
Disappointing stock selection within the consumer staples sector also detracted.
How did the Fund perform over the past 10 years?
The Fund’s past performance is not a good predictor of the Fund’s future performance. The graph and table do not reflect the deduction of taxes that a shareholder would pay on fund distributions or redemption of fund shares.
Cumulative Performance from September 1 , 2015 through August 31, 2025
Initial Investment of $10,000
The above graph compares a hypothetical $10,000 investment in the Fund’s Class I shares to a hypothetical investment of $10,000 made in each of the Russell 3000® Index (a broad-based index) and Russell 2000® Index on 8/31/2015. The performance shown takes into account applicable fees and expenses of the Fund, including management fees and other expenses. The Fund’s performance also assumes the reinvestment of dividends and capital gains. Unlike the Fund, the indexes are not subject to charges, fees and other expenses. Investors cannot invest directly in any index.
AVERAGE ANNUAL TOTAL RETURNS (AS OF 8/31/25 )
| Share Class |
1YR |
|
5YR |
|
10YR |
|
| Class I |
5.27% |
|
7.67% |
|
7.02% |
|
| Russell 3000® Index (broad-based index) |
15.84% |
|
14.11% |
|
13.98% |
|
| Russell 2000® Index |
8.17% |
|
10.13% |
|
8.88% |
|
Periods prior to the inception date of the Fund’s Class I shares (9/30/2016) reflect the performance of the Fund’s Investor shares. Such performance figures have not been adjusted to reflect applicable class fees and expenses of Class I shares.
The performance data quoted represent past performance, which is no guarantee of future results. For more current information visit bny.com/investments/literaturecenter.
KEY FUND STATISTICS (AS OF 8/31/25 )
Fund Size (Millions) |
Number of Holdings |
Total Advisory Fee Paid During
Period |
Annual Portfolio Turnover |
| $232 |
110 |
$1,508,150 |
68.31% |
Portfolio Holdings (as of 8/31/25 )
Top Ten Holdings (Based on Net Assets) *
* Excludes money market funds or other short-term securities held for the investment of cash and cash collateral for securities loaned, if any.
Sector Allocation (Based on Net Assets)
How has the Fund changed?
-
The Board of Directors of BNY Mellon Advantage Funds, Inc. (the “Company”) has approved, subject to shareholder approval, an Agreement and Plan of Reorganization (the “Agreement”) between the Company, on behalf of BNY Mellon Opportunistic Small Cap Fund (the “Fund”), and BNY Mellon Investment Funds I, on behalf of BNY Mellon Small Cap Value Fund (the “Acquiring Fund”). Shareholders of the Fund as of September 23, 2025 (the “Record Date”) will be asked to approve the Agreement on behalf of the Fund at a special meeting of shareholders to be held on or about December 9, 2025. If the Agreement is approved, the reorganization will be consummated on or about February 13, 2026. For more information, please refer to prospectus/proxy statement filed August 22, 2025.
This is a summary of certain changes to the Fund since September 1, 2024 . For more complete information, you may review the Fund’s current prospectus dated December 31, 2024 as supplemented on August 22, 2025 at bny.com/investments/literaturecenter or upon request at 1-800-373-9387.
For additional information about the Fund, including its prospectus, financial information, portfolio holdings and proxy voting information, please visit bny.com/investments/literaturecenter .
Not FDIC Insured. Not Bank-Guaranteed. May Lose Value
© 2025 BNY Mellon Securities Corporation, Distributor,
240 Greenwich Street, 9th Floor, New York, NY 10286
Code-4048AR0825
BNY Mellon Opportunistic Small Cap Fund
ANNUAL
SHAREHOLDER
REPORT
August 31, 2025
Class Y – DSCYX
This annual shareholder report contains important information about BNY Mellon Opportunistic Small Cap Fund (the “Fund”) for the period of September 1, 2024 to August 31, 2025. You can find additional information about the Fund at bny.com/investments/literaturecenter. You can also request this information by calling 1-800-373-9387 (inside the U.S. only) or by sending an e-mail request to info@bny.com.
This report describes changes to the Fund that occurred during the reporting period.
What were the Fund’s costs for the last year ?
(based on a hypothetical $10,000 investment)
| Share Class |
Costs of a $10,000 investment |
Costs paid as a percentage of a $10,000 investment |
| Class Y* |
$80 |
0.78% |
| * |
During the period, fees were waived and/or expenses reimbursed pursuant to an agreement with the Fund’s investment adviser, BNY Mellon Investment Adviser, Inc. If this agreement is not extended in the future, expenses could be higher. |
How did the Fund perform last year ?
-
For the 12-month period ended August 31, 2025, the Fund’s Class Y shares returned 5.37%.
-
In comparison, the Russell 2000® Index returned 8.17% for the same period.
What affected the Fund’s performance?
-
U.S. stocks generally rose despite tariff-related drawdowns, as inflation eased and interest rates plateaued, led by gains in large-cap and growth-oriented names.
-
Stock selection in information technology, along with overweight exposure to energy, bolstered the Fund’s relative performance.
-
Secondary positive contributors included stock selection and overweight exposure to communication services, and underweight exposure to real estate.
-
Stock selection within the Industrials sector, as well as both selection and overweight exposure in financials, were the largest detractors from relative performance.
-
Disappointing stock selection within the consumer staples sector also detracted.
How did the Fund perform over the past 10 years?
The Fund’s past performance is not a good predictor of the Fund’s future performance. The graph and table do not reflect the deduction of taxes that a shareholder would pay on fund distributions or redemption of fund shares.
Cumulative Performance from September 1 , 2015 through August 31, 2025
Initial Investment of $1,000,000
The above graph compares a hypothetical $1,000,000 investment in the Fund’s Class Y shares to a hypothetical investment of $1,000,000 made in each of the Russell 3000® Index (a broad-based index) and Russell 2000® Index on 8/31/2015. The performance shown takes into account applicable fees and expenses of the Fund, including management fees and other expenses. The Fund’s performance also assumes the reinvestment of dividends and capital gains. Unlike the Fund, the indexes are not subject to charges, fees and other expenses. Investors cannot invest directly in any index.
AVERAGE ANNUAL TOTAL RETURNS (AS OF 8/31/25 )
| Share Class |
1YR |
|
5YR |
|
10YR |
|
| Class Y |
5.37% |
|
7.79% |
|
7.12% |
|
| Russell 3000® Index (broad-based index) |
15.84% |
|
14.11% |
|
13.98% |
|
| Russell 2000® Index |
8.17% |
|
10.13% |
|
8.88% |
|
Periods prior to the inception date of the Fund’s Class Y shares (9/30/2016) reflect the performance of the Fund’s Investor shares. Such performance figures have not been adjusted to reflect applicable class fees and expenses of Class Y shares.
The performance data quoted represent past performance, which is no guarantee of future results. For more current information visit bny.com/investments/literaturecenter.
KEY FUND STATISTICS (AS OF 8/31/25 )
Fund Size (Millions) |
Number of Holdings |
Total Advisory Fee Paid During
Period |
Annual Portfolio Turnover |
| $232 |
110 |
$1,508,150 |
68.31% |
Portfolio Holdings (as of 8/31/25 )
Top Ten Holdings (Based on Net Assets) *
* Excludes money market funds or other short-term securities held for the investment of cash and cash collateral for securities loaned, if any.
Sector Allocation (Based on Net Assets)
How has the Fund changed?
-
The Board of Directors of BNY Mellon Advantage Funds, Inc. (the “Company”) has approved, subject to shareholder approval, an Agreement and Plan of Reorganization (the “Agreement”) between the Company, on behalf of BNY Mellon Opportunistic Small Cap Fund (the “Fund”), and BNY Mellon Investment Funds I, on behalf of BNY Mellon Small Cap Value Fund (the “Acquiring Fund”). Shareholders of the Fund as of September 23, 2025 (the “Record Date”) will be asked to approve the Agreement on behalf of the Fund at a special meeting of shareholders to be held on or about December 9, 2025. If the Agreement is approved, the reorganization will be consummated on or about February 13, 2026. For more information, please refer to prospectus/proxy statement filed August 22, 2025.
This is a summary of certain changes to the Fund since September 1, 2024 . For more complete information, you may review the Fund’s current prospectus dated December 31, 2024 as supplemented on August 22, 2025 at bny.com/investments/literaturecenter or upon request at 1-800-373-9387.
For additional information about the Fund, including its prospectus, financial information, portfolio holdings and proxy voting information, please visit bny.com/investments/literaturecenter .
Not FDIC Insured. Not Bank-Guaranteed. May Lose Value
© 2025 BNY Mellon Securities Corporation, Distributor,
240 Greenwich Street, 9th Floor, New York, NY 10286
Code-0315AR0825
BNY Mellon Technology Growth Fund
ANNUAL
SHAREHOLDER
REPORT
August 31, 2025
Class A – DTGRX
This annual shareholder report contains important information about BNY Mellon Technology Growth Fund (the “Fund”) for the period of September 1, 2024 to August 31, 2025. You can find additional information about the Fund at bny.com/investments/literaturecenter. You can also request this information by calling 1-800-373-9387 (inside the U.S. only) or by sending an e-mail request to info@bny.com.
What were the Fund’s costs for the last year ?
(based on a hypothetical $10,000 investment)
| Share Class |
Costs of a $10,000 investment |
Costs paid as a percentage of a $10,000 investment |
| Class A |
$130 |
1.16% |
How did the Fund perform last year ?
-
For the 12-month period ended August 31, 2025, the Fund’s Class A shares returned 24.21%.
-
In comparison, the NYSE® Technology Index (the “Index”) returned 29.07% for the same period.
What affected the Fund’s performance?
-
Growth-oriented technology stocks delivered solid returns due to continued strength in the artificial intelligence (AI) theme as investors looked beyond U.S. tariff and geopolitical uncertainty.
-
The Fund’s returns relative to the Index benefited from overweight exposure to the communications services sector and emphasis on digital media companies providing streaming entertainment.
-
The industrial sector was a further source of attractive returns from a company launching a new product cycle that applies AI to improve security personnel productivity.
-
Software selection detracted from relative returns, especially due to underexposure to a major data analytics company with a high valuation.
-
The Fund also underperformed in the consumer discretionary sector due to underweight exposure to Chinese e-commerce companies.
How did the Fund perform over the past 10 years?
The Fund’s past performance is not a good predictor of the Fund’s future performance. The graph and table do not reflect the deduction of taxes that a shareholder would pay on fund distributions or redemption of fund shares.
Cumulative Performance from September 1 , 2015 through August 31, 2025
Initial Investment of $10,000
The above graph compares a hypothetical $10,000 investment in the Fund’s Class A shares to a hypothetical investment of $10,000 made in each of the S&P 500® Index (a broad-based index) and NYSE® Technology Index on 8/31/2015. The performance shown takes into account the maximum initial sales charge on Class A shares and applicable fees and expenses of the Fund, including management fees and other expenses. The Fund’s performance also assumes the reinvestment of dividends and capital gains. Unlike the Fund, the indexes are not subject to charges, fees and other expenses. Investors cannot invest directly in any index.
AVERAGE ANNUAL TOTAL RETURNS (AS OF 8/31/25 )
| Class A Shares |
1YR |
|
5YR |
|
10YR |
|
| with Maximum Sales Charge - 5.75% |
17.07% |
|
7.39% |
|
15.81% |
|
| without Sales Charge |
24.21% |
|
8.66% |
|
16.50% |
|
| S&P 500® Index (broad-based index) |
15.87% |
|
14.74% |
|
14.59% |
|
| NYSE® Technology Index |
29.07% |
|
15.13% |
|
21.30% |
|
The performance data quoted represent past performance, which is no guarantee of future results. For more current information visit bny.com/investments/literaturecenter .
KEY FUND STATISTICS (AS OF 8/31/25 )
Fund Size (Millions) |
Number of Holdings |
Total Advisory Fee Paid During
Period |
Annual Portfolio Turnover |
| $425 |
39 |
$2,920,428 |
33.84% |
Portfolio Holdings (as of 8/31/25 )
Top Ten Holdings (Based on Net Assets) *
* Excludes money market funds or other short-term securities held for the investment of cash and cash collateral for securities loaned, if any.
Sector Allocation (Based on Net Assets)
For additional information about the Fund, including its prospectus, financial information, portfolio holdings and proxy voting information, please visit bny.com/investments/literaturecenter .
Not FDIC Insured. Not Bank-Guaranteed. May Lose Value
© 2025 BNY Mellon Securities Corporation, Distributor,
240 Greenwich Street, 9th Floor, New York, NY 10286
Code-0255AR0825
BNY Mellon Technology Growth Fund
ANNUAL
SHAREHOLDER
REPORT
August 31, 2025
Class C – DTGCX
This annual shareholder report contains important information about BNY Mellon Technology Growth Fund (the “Fund”) for the period of September 1, 2024 to August 31, 2025. You can find additional information about the Fund at bny.com/investments/literaturecenter. You can also request this information by calling 1-800-373-9387 (inside the U.S. only) or by sending an e-mail request to info@bny.com.
What were the Fund’s costs for the last year ?
(based on a hypothetical $10,000 investment)
| Share Class |
Costs of a $10,000 investment |
Costs paid as a percentage of a $10,000 investment |
| Class C |
$220 |
1.97% |
How did the Fund perform last year ?
-
For the 12-month period ended August 31, 2025, the Fund’s Class C shares returned 23.21%.
-
In comparison, the NYSE® Technology Index (the “Index”) returned 29.07% for the same period.
What affected the Fund’s performance?
-
Growth-oriented technology stocks delivered solid returns due to continued strength in the artificial intelligence (AI) theme as investors looked beyond U.S. tariff and geopolitical uncertainty.
-
The Fund’s returns relative to the Index benefited from overweight exposure to the communications services sector and emphasis on digital media companies providing streaming entertainment.
-
The industrial sector was a further source of attractive returns from a company launching a new product cycle that applies AI to improve security personnel productivity.
-
Software selection detracted from relative returns, especially due to underexposure to a major data analytics company with a high valuation.
-
The Fund also underperformed in the consumer discretionary sector due to underweight exposure to Chinese e-commerce companies.
How did the Fund perform over the past 10 years?
The Fund’s past performance is not a good predictor of the Fund’s future performance. The graph and table do not reflect the deduction of taxes that a shareholder would pay on fund distributions or redemption of fund shares.
Cumulative Performance from September 1 , 2015 through August 31, 2025
Initial Investment of $10,000
The above graph compares a hypothetical $10,000 investment in the Fund’s Class C shares to a hypothetical investment of $10,000 made in each of the S&P 500® Index (a broad-based index) and NYSE® Technology Index on 8/31/2015. The performance shown takes into account the maximum deferred sales charge on Class C shares and applicable fees and expenses of the Fund, including management fees, 12b-1 fees and other expenses. The Fund’s performance also assumes the reinvestment of dividends and capital gains. Unlike the Fund, the indexes are not subject to charges, fees and other expenses. Investors cannot invest directly in any index.
AVERAGE ANNUAL TOTAL RETURNS (AS OF 8/31/25 )
| Class C Shares |
1YR |
|
5YR |
|
10YR |
|
| with Maximum Deferred Sales Charge - 1.00% |
22.21% |
*
|
7.78% |
|
15.57% |
|
| without Deferred Sales Charge |
23.21% |
|
7.78% |
|
15.57% |
|
| S&P 500® Index (broad-based index) |
15.87% |
|
14.74% |
|
14.59% |
|
| NYSE® Technology Index |
29.07% |
|
15.13% |
|
21.30% |
|
|
*
|
The maximum contingent deferred sales charge for Class C shares is 1.00% for shares redeemed within one year of the date purchased.
|
The performance data quoted represent past performance, which is no guarantee of future results. For more current information visit bny.com/investments/literaturecenter .
KEY FUND STATISTICS (AS OF 8/31/25 )
Fund Size (Millions) |
Number of Holdings |
Total Advisory Fee Paid During
Period |
Annual Portfolio Turnover |
| $425 |
39 |
$2,920,428 |
33.84% |
Portfolio Holdings (as of 8/31/25 )
Top Ten Holdings (Based on Net Assets) *
* Excludes money market funds or other short-term securities held for the investment of cash and cash collateral for securities loaned, if any.
Sector Allocation (Based on Net Assets)
For additional information about the Fund, including its prospectus, financial information, portfolio holdings and proxy voting information, please visit bny.com/investments/literaturecenter .
Not FDIC Insured. Not Bank-Guaranteed. May Lose Value
© 2025 BNY Mellon Securities Corporation, Distributor,
240 Greenwich Street, 9th Floor, New York, NY 10286
Code-0261AR0825
BNY Mellon Technology Growth Fund
ANNUAL
SHAREHOLDER
REPORT
August 31, 2025
Class I – DGVRX
This annual shareholder report contains important information about BNY Mellon Technology Growth Fund (the “Fund”) for the period of September 1, 2024 to August 31, 2025. You can find additional information about the Fund at bny.com/investments/literaturecenter. You can also request this information by calling 1-800-373-9387 (inside the U.S. only) or by sending an e-mail request to info@bny.com.
What were the Fund’s costs for the last year ?
(based on a hypothetical $10,000 investment)
| Share Class |
Costs of a $10,000 investment |
Costs paid as a percentage of a $10,000 investment |
| Class I |
$106 |
0.94% |
How did the Fund perform last year ?
-
For the 12-month period ended August 31, 2025, the Fund’s Class I shares returned 24.50%.
-
In comparison, the NYSE® Technology Index (the “Index”) returned 29.07% for the same period.
What affected the Fund’s performance?
-
Growth-oriented technology stocks delivered solid returns due to continued strength in the artificial intelligence (AI) theme as investors looked beyond U.S. tariff and geopolitical uncertainty.
-
The Fund’s returns relative to the Index benefited from overweight exposure to the communications services sector and emphasis on digital media companies providing streaming entertainment.
-
The industrial sector was a further source of attractive returns from a company launching a new product cycle that applies AI to improve security personnel productivity.
-
Software selection detracted from relative returns, especially due to underexposure to a major data analytics company with a high valuation.
-
The Fund also underperformed in the consumer discretionary sector due to underweight exposure to Chinese e-commerce companies.
How did the Fund perform over the past 10 years?
The Fund’s past performance is not a good predictor of the Fund’s future performance. The graph and table do not reflect the deduction of taxes that a shareholder would pay on fund distributions or redemption of fund shares.
Cumulative Performance from September 1 , 2015 through August 31, 2025
Initial Investment of $10,000
The above graph compares a hypothetical $10,000 investment in the Fund’s Class I shares to a hypothetical investment of $10,000 made in each of the S&P 500® Index (a broad-based index) and NYSE® Technology Index on 8/31/2015. The performance shown takes into account applicable fees and expenses of the Fund, including management fees and other expenses. The Fund’s performance also assumes the reinvestment of dividends and capital gains. Unlike the Fund, the indexes are not subject to charges, fees and other expenses. Investors cannot invest directly in any index.
AVERAGE ANNUAL TOTAL RETURNS (AS OF 8/31/25 )
| Share Class |
1YR |
|
5YR |
|
10YR |
|
| Class I |
24.50% |
|
8.90% |
|
16.76% |
|
| S&P 500® Index (broad-based index) |
15.87% |
|
14.74% |
|
14.59% |
|
| NYSE® Technology Index |
29.07% |
|
15.13% |
|
21.30% |
|
The performance data quoted represent past performance, which is no guarantee of future results. For more current information visit bny.com/investments/literaturecenter .
KEY FUND STATISTICS (AS OF 8/31/25 )
Fund Size (Millions) |
Number of Holdings |
Total Advisory Fee Paid During
Period |
Annual Portfolio Turnover |
| $425 |
39 |
$2,920,428 |
33.84% |
Portfolio Holdings (as of 8/31/25 )
Top Ten Holdings (Based on Net Assets) *
* Excludes money market funds or other short-term securities held for the investment of cash and cash collateral for securities loaned, if any.
Sector Allocation (Based on Net Assets)
For additional information about the Fund, including its prospectus, financial information, portfolio holdings and proxy voting information, please visit bny.com/investments/literaturecenter .
Not FDIC Insured. Not Bank-Guaranteed. May Lose Value
© 2025 BNY Mellon Securities Corporation, Distributor,
240 Greenwich Street, 9th Floor, New York, NY 10286
Code-0262AR0825
BNY Mellon Technology Growth Fund
ANNUAL
SHAREHOLDER
REPORT
August 31, 2025
Class Y – DTEYX
This annual shareholder report contains important information about BNY Mellon Technology Growth Fund (the “Fund”) for the period of September 1, 2024 to August 31, 2025. You can find additional information about the Fund at bny.com/investments/literaturecenter. You can also request this information by calling 1-800-373-9387 (inside the U.S. only) or by sending an e-mail request to info@bny.com.
What were the Fund’s costs for the last year ?
(based on a hypothetical $10,000 investment)
| Share Class |
Costs of a $10,000 investment |
Costs paid as a percentage of a $10,000 investment |
| Class Y |
$95 |
0.85% |
How did the Fund perform last year ?
-
For the 12-month period ended August 31, 2025, the Fund’s Class Y shares returned 24.60%.
-
In comparison, the NYSE® Technology Index (the “Index”) returned 29.07% for the same period.
What affected the Fund’s performance?
-
Growth-oriented technology stocks delivered solid returns due to continued strength in the artificial intelligence (AI) theme as investors looked beyond U.S. tariff and geopolitical uncertainty.
-
The Fund’s returns relative to the Index benefited from overweight exposure to the communications services sector and emphasis on digital media companies providing streaming entertainment.
-
The industrial sector was a further source of attractive returns from a company launching a new product cycle that applies AI to improve security personnel productivity.
-
Software selection detracted from relative returns, especially due to underexposure to a major data analytics company with a high valuation.
-
The Fund also underperformed in the consumer discretionary sector due to underweight exposure to Chinese e-commerce companies.
How did the Fund perform over the past 10 years?
The Fund’s past performance is not a good predictor of the Fund’s future performance. The graph and table do not reflect the deduction of taxes that a shareholder would pay on fund distributions or redemption of fund shares.
Cumulative Performance from September 1 , 2015 through August 31, 2025
Initial Investment of $1,000,000
The above graph compares a hypothetical $1,000,000 investment in the Fund’s Class Y shares to a hypothetical investment of $1,000,000 made in each of the S&P 500® Index (a broad-based index) and NYSE® Technology Index on 8/31/2015. The performance shown takes into account applicable fees and expenses of the Fund, including management fees and other expenses. The Fund’s performance also assumes the reinvestment of dividends and capital gains. Unlike the Fund, the indexes are not subject to charges, fees and other expenses. Investors cannot invest directly in any index.
AVERAGE ANNUAL TOTAL RETURNS (AS OF 8/31/25 )
| Share Class |
1YR |
|
5YR |
|
10YR |
|
| Class Y |
24.60% |
|
8.97% |
|
16.84% |
|
| S&P 500® Index (broad-based index) |
15.87% |
|
14.74% |
|
14.59% |
|
| NYSE® Technology Index |
29.07% |
|
15.13% |
|
21.30% |
|
Periods prior to the inception date of the Fund’s Class Y shares (9/30/2016) reflect the performance of the Fund’s Class I shares. Such performance figures have not been adjusted to reflect applicable class fees and expenses of Class Y shares.
The performance data quoted represent past performance, which is no guarantee of future results. For more current information visit bny.com/investments/literaturecenter.
KEY FUND STATISTICS (AS OF 8/31/25 )
Fund Size (Millions) |
Number of Holdings |
Total Advisory Fee Paid During
Period |
Annual Portfolio Turnover |
| $425 |
39 |
$2,920,428 |
33.84% |
Portfolio Holdings (as of 8/31/25 )
Top Ten Holdings (Based on Net Assets) *
* Excludes money market funds or other short-term securities held for the investment of cash and cash collateral for securities loaned, if any.
Sector Allocation (Based on Net Assets)
For additional information about the Fund, including its prospectus, financial information, portfolio holdings and proxy voting information, please visit bny.com/investments/literaturecenter .
Not FDIC Insured. Not Bank-Guaranteed. May Lose Value
© 2025 BNY Mellon Securities Corporation, Distributor,
240 Greenwich Street, 9th Floor, New York, NY 10286
Code-0313AR0825
The Registrant has adopted a code of ethics
that applies to the Registrant's principal executive officer, principal financial officer, principal accounting officer or controller,
or persons performing similar functions. There have been no amendments to, or waivers in connection with, the Code of Ethics during the
period covered by this Report.
|
Item 3. |
Audit Committee Financial Expert. |
The Registrant's Board has determined that Gina
D. France, a member of the Audit Committee of the Board, is an audit committee financial expert as defined by the Securities and Exchange
Commission (the "SEC"). Ms. France is "independent" as defined by the SEC for purposes of audit committee financial expert
determinations.
|
Item 4. |
Principal Accountant Fees and Services. |
(a) Audit
Fees. The aggregate fees billed for each of the last two fiscal years (the "Reporting Periods") for professional services
rendered by the Registrant's principal accountant (the "Auditor") for the audit of the Registrant's annual financial statements
or services that are normally provided by the Auditor in connection with the statutory and regulatory filings or engagements for the Reporting
Periods, were $147,944 in 2024 and $150,900 in 2025.
(b) Audit-Related
Fees. The aggregate fees billed in the Reporting Periods for assurance and related services by the Auditor that are reasonably
related to the performance of the audit of the Registrant's financial statements and are not reported under paragraph (a) of this Item
4 were $29,328 in 2024 and $36,435 in 2025. These services consisted of one or more of the following: (i) agreed upon procedures related
to compliance with Internal Revenue Code section 817(h), (ii) security counts required by Rule 17f-2 under the Investment Company Act
of 1940, as amended, (iii) advisory services as to the accounting or disclosure treatment of Registrant transactions or events and (iv)
advisory services to the accounting or disclosure treatment of the actual or potential impact to the Registrant of final or proposed rules,
standards or interpretations by the Securities and Exchange Commission, the Financial Accounting Standards Boards or other regulatory
or standard-setting bodies.
The aggregate fees billed in the Reporting Periods
for non-audit assurance and related services by the Auditor to the Registrant's investment adviser (not including any sub-investment adviser
whose role is primarily portfolio management and is subcontracted with or overseen by another investment adviser), and any entity controlling,
controlled by or under common control with the investment adviser that provides ongoing services to the Registrant ("Service Affiliates"),
that were reasonably related to the performance of the annual audit of the Service Affiliate, which required pre-approval by the Audit
Committee were $0 in 2024 and $0 in 2025.
(c) Tax
Fees. The aggregate fees billed in the Reporting Periods for professional services rendered by the Auditor for tax compliance,
tax advice, and tax planning ("Tax Services") were $19,051 in 2024 and $19,052 in 2025. These services consisted of: (i) review
or preparation of U.S. federal, state, local and excise tax returns; (ii) U.S. federal, state and local tax planning, advice and assistance
regarding statutory, regulatory or administrative developments; (iii) tax advice regarding tax qualification matters and/or treatment
of various financial instruments held or proposed to be acquired or held, and (iv) determination of Passive Foreign Investment Companies.
The aggregate fees billed in the Reporting Periods for Tax Services by the Auditor to Service Affiliates, which required pre-approval
by the Audit Committee were $28,329 in 2024 and $29,756 in 2025.
(d) All
Other Fees. The aggregate fees billed in the Reporting Periods for products and services provided by the Auditor, other than the
services reported in paragraphs (a) through (c) of this Item, were $13,151
in
2024
and
$14,171
in
2025.
These
services
consisted
of
a
review
of
the
Registrant's
anti-money
laundering
program.
The
aggregate
fees
billed
in
the
Reporting
Periods
for
Non-Audit
Services
by
the
Auditor
to
Service
Affiliates,
other
than
the
services
reported
in
paragraphs
(b)
through
(c)
of
this
Item,
which
required
pre-approval
by
the
Audit
Committee,
were
$0
in
2024
and
$0
in
2025.
(e)(1)
Audit
Committee
Pre-Approval
Policies
and
Procedures.
The
Registrant's
Audit
Committee
has
established
policies
and
procedures
(the
"Policy")
for
pre-approval
(within
specified
fee
limits)
of
the
Auditor's
engagements
for
non-audit
services
to
the
Registrant
and
Service
Affiliates
without
specific
case-by-case
consideration.
The
pre-approved
services
in
the
Policy
can
include
pre-approved
audit
services,
pre-approved
audit-related
services,
pre-approved
tax
services
and
pre-approved
all
other
services.
Pre-approval
considerations
include
whether
the
proposed
services
are
compatible
with
maintaining
the
Auditor's
independence.
Pre-approvals
pursuant
to
the
Policy
are
considered
annually.
(e)(2)
Note.
None
of
the
services
described
in
paragraphs
(b)
through
(d)
of
this
Item
4
were
approved
by
the
Audit
Committee
pursuant
to
paragraph
(c)(7)(i)(C)
of
Rule
2-01
of
Regulation
S-X.
(f)
None
of
the
hours
expended
on
the
principal
accountant's
engagement
to
audit
the
registrant's
financial
statements
for
the
most
recent
fiscal
year
were
attributed
to
work
performed
by
persons
other
than
the
principal
accountant's
full-time,
permanent
employees.
Non-Audit
Fees.
The
aggregate
non-audit
fees
billed
by
the
Auditor
for
services
rendered
to
the
Registrant,
and
rendered
to
Service
Affiliates,
for
the
Reporting
Periods
were
$1,639,482
in
2024
and
$1,822,595
in
2025.
Auditor
Independence.
The
Registrant's
Audit
Committee
has
considered
whether
the
provision
of
non-audit
services
that
were
rendered
to
Service
Affiliates,
which
were
not
pre-approved
(not
requiring
pre-approval),
is
compatible
with
maintaining
the
Auditor's
independence.
|
Item 5. |
Audit Committee of Listed Registrants. |
Not applicable.
Not applicable.
BNY Mellon Dynamic Value Fund
ANNUAL FINANCIALS
AND OTHER INFORMATION
Save
time. Save paper. View your next shareholder report online as soon as it’s available. Log into www.bny.com/investments
and sign up for eCommunications. It’s simple and only takes a few minutes.
The
views expressed in this report reflect those of the portfolio manager(s) only through the end of the period
covered and do not necessarily represent the views of BNY Mellon Investment Adviser, Inc. or any other
person in the BNY Mellon Investment Adviser, Inc. organization. Any such views are subject to change
at any time based upon market or other conditions and BNY Mellon Investment Adviser, Inc. disclaims
any responsibility to update such views. These views may not be relied on as investment advice and,
because investment decisions for a fund in the BNY Mellon Family of Funds are based on numerous factors,
may not be relied on as an indication of trading intent on behalf of any fund in the BNY Mellon
Family of
Funds.
Not FDIC-Insured
• Not Bank-Guaranteed • May Lose Value
Contents
Please note
the Annual Financials and Other Information only contains Items 7-11 required in Form
N-CSR. All other required items will be filed with the Securities and Exchange Commission
(the “SEC”).
Item
7. Financial Statements and Financial Highlights for Open-End Management Investment Companies.
BNY Mellon Dynamic Value Fund
SCHEDULE OF INVESTMENTS
|
|
|
|
|
|
|
|
|
|
|
|
|
|
|
|
|
|
|
|
|
|
|
|
|
|
|
|
|
|
|
|
|
|
|
|
|
|
|
|
|
|
|
|
|
|
|
|
|
|
|
|
|
|
|
|
|
|
|
|
|
|
|
|
|
|
|
|
|
|
|
|
|
|
|
|
Ferguson
Enterprises, Inc. |
|
|
|
|
|
Honeywell
International, Inc. |
|
|
|
|
|
|
|
|
|
|
|
|
|
|
|
|
|
|
|
L3Harris
Technologies, Inc. |
|
|
|
|
|
|
|
|
|
|
|
|
Commercial
& Professional Services — .5% |
|
|
|
|
|
|
|
Consumer
Discretionary Distribution & Retail — 3.5% |
|
|
|
|
|
|
|
|
|
|
|
|
|
|
|
|
|
|
|
|
|
|
|
|
|
|
|
|
|
|
Royal
Caribbean Cruises Ltd.(a)
|
|
|
|
|
|
|
|
|
|
|
|
|
|
|
|
|
|
|
|
|
|
|
|
|
|
|
|
|
|
|
|
|
|
|
|
|
|
|
|
|
|
|
|
|
|
|
|
|
|
|
|
|
|
|
|
|
|
|
|
|
|
|
|
Equity
Real Estate Investment Trusts — 1.2% |
|
|
|
|
|
|
|
Financial
Services — 13.2% |
Berkshire
Hathaway, Inc., Cl. B(b)
|
|
|
|
|
|
Capital
One Financial Corp. |
|
|
|
|
|
Intercontinental
Exchange, Inc. |
|
|
|
|
|
|
|
|
|
|
|
|
|
|
|
|
|
|
|
The
Goldman Sachs Group, Inc. |
|
|
|
|
|
|
|
|
|
|
|
|
|
|
|
|
|
|
|
Food,
Beverage & Tobacco — 1.0% |
Philip
Morris International, Inc. |
|
|
|
|
|
SCHEDULE OF INVESTMENTS (continued)
|
|
|
|
|
|
|
Common
Stocks — 99.1% (continued) |
Health
Care Equipment & Services — 8.7% |
|
|
|
|
|
|
|
Edwards
Lifesciences Corp.(b)
|
|
|
|
|
|
|
|
|
|
|
|
|
|
|
|
|
|
|
|
|
|
|
|
|
|
|
|
|
|
|
|
|
|
|
|
|
|
|
|
|
Household
& Personal Products — 2.1% |
|
|
|
|
|
|
|
The
Estee Lauder Companies, Inc., Cl. A |
|
|
|
|
|
|
|
|
|
|
|
|
|
|
American
International Group, Inc. |
|
|
|
|
|
|
|
|
|
|
|
|
|
|
|
|
|
|
|
|
|
|
|
|
|
|
|
|
|
|
|
|
|
|
|
|
|
|
|
|
|
|
International
Paper Co.(a)
|
|
|
|
|
|
|
|
|
|
|
|
|
Packaging
Corp. of America |
|
|
|
|
|
|
|
|
|
|
|
|
|
|
|
|
|
|
|
Media
& Entertainment — 2.2% |
|
|
|
|
|
|
|
|
|
|
|
|
|
|
|
|
|
|
|
|
|
Pharmaceuticals,
Biotechnology & Life Sciences — 7.2% |
|
|
|
|
|
|
|
|
|
|
|
|
|
|
|
|
|
|
|
|
|
|
|
|
|
|
|
|
Thermo
Fisher Scientific, Inc. |
|
|
|
|
|
|
|
|
|
|
|
|
Semiconductors
& Semiconductor Equipment — 2.0% |
Advanced
Micro Devices, Inc.(b)
|
|
|
|
|
|
|
|
|
|
|
|
|
|
|
|
|
|
|
|
|
|
|
|
|
|
|
|
|
|
|
|
|
|
Software
& Services — 3.1% |
Akamai
Technologies, Inc.(b)
|
|
|
|
|
|
Check
Point Software Technologies Ltd.(b)
|
|
|
|
|
|
Dolby
Laboratories, Inc., Cl. A |
|
|
|
|
|
International
Business Machines Corp. |
|
|
|
|
|
|
|
|
|
|
|
|
Technology
Hardware & Equipment — 4.1% |
|
|
|
|
|
|
|
|
|
|
|
|
|
|
|
|
|
|
|
|
|
|
|
|
|
|
|
|
Common
Stocks — 99.1% (continued) |
Telecommunication
Services — 2.6% |
|
|
|
|
|
|
|
|
|
|
|
|
|
|
|
|
|
|
|
|
|
|
|
|
|
|
|
|
|
|
|
|
|
|
|
|
|
|
|
Constellation
Energy Corp. |
|
|
|
|
|
Total
Common Stocks
(cost
$7,815,199,294) |
|
|
|
|
|
|
|
|
|
|
|
|
Investment
Companies — .6% |
Registered
Investment Companies — .6% |
Dreyfus
Institutional Preferred Government Plus Money Market Fund, Institutional
(cost
$58,507,925) |
|
|
|
|
|
Investment
of Cash Collateral for Securities Loaned — .1% |
|
|
|
|
|
Registered
Investment Companies — .1% |
|
|
|
|
|
Dreyfus
Institutional Preferred Government Plus Money Market Fund, Institutional
(cost
$3,969,923) |
|
|
|
|
|
Total
Investments (cost $7,877,677,142)
|
|
|
|
Cash
and Receivables (Net) |
|
|
|
|
|
|
|
ADR—American
Depositary Receipt |
|
|
Security,
or portion thereof, on loan. At August 31, 2025, the value of the fund’s securities on loan was $202,924,846 and the value of the
collateral was
$210,684,869,
consisting of cash collateral of $3,969,923 and U.S. Government & Agency securities valued at $206,714,946. In addition, the
value of
collateral
may include pending sales that are also on loan. |
|
|
Non-income
producing security. |
|
|
Investment
in real estate investment trust within the United States. |
|
|
Investment
in affiliated issuer. The investment objective of this investment company is publicly available and can be found within the investment
company’s
prospectus.
|
|
|
|
|
|
|
|
|
Dividends/
Distributions
($) |
Registered
Investment Companies - .6% |
Dreyfus
Institutional Preferred Government Plus Money
Market
Fund, Institutional Shares - .6% |
|
|
|
|
|
SCHEDULE OF INVESTMENTS (continued)
Affiliated
Issuers (continued) |
|
|
|
|
|
|
Dividends/
Distributions
($) |
Investment
of Cash Collateral for Securities Loaned - .1% |
Dreyfus
Institutional Preferred Government Plus Money
Market
Fund, Institutional Shares - .1% |
|
|
|
|
|
|
|
|
|
|
|
|
|
|
Includes
reinvested dividends/distributions. |
|
|
Represents
securities lending income earned from the reinvestment of cash collateral from loaned securities, net of fees and collateral investment
expenses, and
other
payments to and from borrowers of securities. |
See notes to financial
statements.
STATEMENT
OF ASSETS AND LIABILITIES
August 31, 2025
|
|
|
|
|
|
|
|
Investments
in securities—See Schedule of Investments
(including
securities on loan, valued at $202,924,846)—Note
1(c): |
|
|
|
|
|
|
|
|
|
|
|
|
|
|
Receivable
for investment securities sold |
|
|
Dividends
and securities lending income receivable |
|
|
Receivable
for shares of Common Stock subscribed |
|
|
Tax
reclaim receivable—Note 1(b)
|
|
|
|
|
|
|
|
|
|
|
|
|
|
|
Due
to BNY Mellon Investment Adviser, Inc. and affiliates—Note
3(c)
|
|
|
Payable
for investment securities purchased |
|
|
Payable
for shares of Common Stock redeemed |
|
|
Liability
for securities on loan—Note 1(c)
|
|
|
Directors’
fees and expenses payable |
|
|
|
|
|
|
|
|
|
|
|
|
|
|
Composition
of Net Assets ($): |
|
|
|
|
|
|
Total
distributable earnings (loss) |
|
|
|
|
|
|
Net
Asset Value Per Share |
|
|
|
|
|
|
|
|
|
|
|
|
|
|
|
|
Net
Asset Value Per Share ($) |
|
|
|
|
See notes to financial statements.
Year Ended August 31,
2025
|
|
|
|
|
|
|
|
|
Cash
dividends (net of $88,082 foreign taxes withheld at source): |
|
|
|
|
|
|
|
Affiliated
income net of rebates from securities lending—Note
1(c)
|
|
|
|
|
|
|
|
|
|
|
|
|
|
Shareholder
servicing costs—Note 3(c)
|
|
Directors’
fees and expenses—Note 3(d)
|
|
Distribution
Plan fees—Note 3(b)
|
|
|
|
|
Prospectus
and shareholders’ reports |
|
Loan
commitment fees—Note 2 |
|
|
|
|
|
|
|
Chief
Compliance Officer fees—Note 3(c)
|
|
|
|
|
Shareholder
and regulatory reports service fees—Note
3(c)
|
|
|
|
|
|
|
|
Less—reduction
in expenses due to undertaking—Note 3(a)
|
|
Less—reduction
in fees due to earnings credits—Note 3(c)
|
|
|
|
|
|
|
|
Realized
and Unrealized Gain (Loss) on Investments—Note 4 ($):
|
|
Net
realized gain (loss) on investments and foreign currency transactions |
|
Net
change in unrealized appreciation (depreciation) on investments and foreign currency transactions |
|
Net
Realized and Unrealized Gain (Loss) on Investments |
|
Net
Increase in Net Assets Resulting from Operations |
|
See notes to financial statements.
STATEMENT
OF CHANGES IN NET ASSETS
|
|
|
|
|
|
|
|
|
|
|
|
|
|
|
Net
realized gain (loss) on investments |
|
|
Net
change in unrealized appreciation (depreciation) on investments |
|
|
Net
Increase (Decrease) in Net Assets Resulting from Operations |
|
|
|
|
|
|
Distributions
to shareholders: |
|
|
|
|
|
|
|
|
|
|
|
|
|
|
|
|
|
|
|
|
|
|
Capital
Stock Transactions ($): |
|
|
Net
proceeds from shares sold: |
|
|
|
|
|
|
|
|
|
|
|
|
|
|
|
|
|
|
Distributions
reinvested: |
|
|
|
|
|
|
|
|
|
|
|
|
|
|
|
|
|
|
|
|
|
|
|
|
|
|
|
|
|
|
|
|
|
|
|
|
|
|
Increase
(Decrease) in Net Assets from Capital Stock Transactions |
|
|
Total
Increase (Decrease) in Net Assets |
|
|
|
|
|
|
|
|
|
|
|
|
|
|
STATEMENT
OF CHANGES IN NET ASSETS (continued)
|
|
|
|
|
|
|
Capital
Share Transactions (Shares): |
|
|
|
|
|
|
|
|
|
|
Shares
issued for distributions reinvested |
|
|
|
|
|
|
Net
Increase (Decrease) in Shares Outstanding |
|
|
|
|
|
|
|
|
|
|
Shares
issued for distributions reinvested |
|
|
|
|
|
|
Net
Increase (Decrease) in Shares Outstanding |
|
|
|
|
|
|
|
|
|
|
Shares
issued for distributions reinvested |
|
|
|
|
|
|
Net
Increase (Decrease) in Shares Outstanding |
|
|
|
|
|
|
|
|
|
|
Shares
issued for distributions reinvested |
|
|
|
|
|
|
Net
Increase (Decrease) in Shares Outstanding |
|
|
|
|
During
the period ended August 31, 2025, 823 Class C shares representing $33,353 were automatically converted to 713 Class A shares and during
the period
ended
August 31, 2024, 929 Class C shares representing $34,672 were automatically converted to 817 Class A shares. |
|
|
During
the period ended August 31, 2025, 10,128 Class A shares representing $470,359 were exchanged for 10,046 Class I shares and 9,744 Class
Y shares
representing
$458,176 were exchanged for 9,719 Class I shares. During the period ended August 31, 2024, 20,238 Class A shares representing $929,038
were
exchanged
for 20,075 Class I shares, 781 Class A shares representing $32,657 were exchanged for 778 Class Y shares and 16,041 Class Y shares representing
$688,093
were exchanged for 16,001 Class I shares. |
See notes to financial statements.
The
following tables describe the performance for each share class for the fiscal periods indicated. All information (except portfolio
turnover rate) reflects financial
results for a single fund share. Net asset value total return is calculated assuming an initial investment made at the net asset
value at the beginning of the period, reinvestment of all dividends and distributions at net asset value during the period, and redemption
at net asset value on the last day
of the period. Net asset value total return includes adjustments in accordance with accounting principles generally
accepted in the United States of America and as such, the net asset value for financial reporting purposes and the returns based upon
those net asset values may differ from the net asset
value and returns for shareholder transactions.
|
|
|
|
|
|
|
|
|
|
|
|
|
|
|
|
Net
asset value, beginning of period |
|
|
|
|
|
|
|
|
|
|
|
|
|
|
|
|
|
|
Net
realized and unrealized gain (loss) on investments |
|
|
|
|
|
Total
from Investment Operations |
|
|
|
|
|
|
|
|
|
|
|
|
Dividends
from net investment income |
|
|
|
|
|
Dividends
from net realized gain on investments |
|
|
|
|
|
|
|
|
|
|
|
|
Net
asset value, end of period |
|
|
|
|
|
|
|
|
|
|
|
|
Ratios/Supplemental
Data (%): |
|
|
|
|
Ratio
of total expenses to average net assets |
|
|
|
|
|
Ratio
of net expenses to average net assets(c)
|
|
|
|
|
|
Ratio
of net investment income to average net assets(c)
|
|
|
|
|
|
|
|
|
|
|
|
|
Net
Assets, end of period ($ x 1,000) |
|
|
|
|
|
|
|
Based
on average shares outstanding. |
|
|
Exclusive
of sales charge. |
|
|
Amount
inclusive of reduction in expenses due to undertaking. |
|
|
Amount
inclusive of reduction in fees due to earnings credits. |
See notes to financial statements.
FINANCIAL
HIGHLIGHTS (continued)
|
|
|
|
|
|
|
|
|
|
|
|
|
|
|
|
Net
asset value, beginning of period |
|
|
|
|
|
|
|
|
|
|
|
|
|
|
|
|
|
|
Net
realized and unrealized gain (loss) on investments |
|
|
|
|
|
Total
from Investment Operations |
|
|
|
|
|
|
|
|
|
|
|
|
Dividends
from net investment income |
|
|
|
|
|
Dividends
from net realized gain on investments |
|
|
|
|
|
|
|
|
|
|
|
|
Net
asset value, end of period |
|
|
|
|
|
|
|
|
|
|
|
|
Ratios/Supplemental
Data (%): |
|
|
|
|
Ratio
of total expenses to average net assets |
|
|
|
|
|
Ratio
of net expenses to average net assets(c)
|
|
|
|
|
|
Ratio
of net investment income to average net assets(c)
|
|
|
|
|
|
|
|
|
|
|
|
|
Net
Assets, end of period ($ x 1,000) |
|
|
|
|
|
|
|
Based
on average shares outstanding. |
|
|
Exclusive
of sales charge. |
|
|
Amount
inclusive of reduction in expenses due to undertaking. |
|
|
Amount
inclusive of reduction in fees due to earnings credits. |
See notes to financial statements.
|
|
|
|
|
|
|
|
|
|
|
|
|
|
|
|
Net
asset value, beginning of period |
|
|
|
|
|
|
|
|
|
|
|
|
|
|
|
|
|
|
Net
realized and unrealized gain (loss) on investments |
|
|
|
|
|
Total
from Investment Operations |
|
|
|
|
|
|
|
|
|
|
|
|
Dividends
from net investment income |
|
|
|
|
|
Dividends
from net realized gain on investments |
|
|
|
|
|
|
|
|
|
|
|
|
Net
asset value, end of period |
|
|
|
|
|
|
|
|
|
|
|
|
Ratios/Supplemental
Data (%): |
|
|
|
|
Ratio
of total expenses to average net assets |
|
|
|
|
|
Ratio
of net expenses to average net assets(b)
|
|
|
|
|
|
Ratio
of net investment income to average net assets(b)
|
|
|
|
|
|
|
|
|
|
|
|
|
Net
Assets, end of period ($ x 1,000) |
|
|
|
|
|
|
|
Based
on average shares outstanding. |
|
|
Amount
inclusive of reduction in expenses due to undertaking. |
|
|
Amount
inclusive of reduction in fees due to earnings credits. |
See notes to financial statements.
FINANCIAL
HIGHLIGHTS (continued)
|
|
|
|
|
|
|
|
|
|
|
|
|
|
|
|
Net
asset value, beginning of period |
|
|
|
|
|
|
|
|
|
|
|
|
|
|
|
|
|
|
Net
realized and unrealized gain (loss) on investments |
|
|
|
|
|
Total
from Investment Operations |
|
|
|
|
|
|
|
|
|
|
|
|
Dividends
from net investment income |
|
|
|
|
|
Dividends
from net realized gain on investments |
|
|
|
|
|
|
|
|
|
|
|
|
Net
asset value, end of period |
|
|
|
|
|
|
|
|
|
|
|
|
Ratios/Supplemental
Data (%): |
|
|
|
|
Ratio
of total expenses to average net assets |
|
|
|
|
|
Ratio
of net expenses to average net assets |
|
|
|
|
|
Ratio
of net investment income to average net assets |
|
|
|
|
|
|
|
|
|
|
|
|
Net
Assets, end of period ($ x 1,000) |
|
|
|
|
|
|
|
Based
on average shares outstanding. |
|
|
Amount
inclusive of reduction in fees due to earnings credits. |
See notes to financial statements.
NOTES
TO FINANCIAL STATEMENTS
NOTE
1—
Significant
Accounting Policies:
BNY Mellon
Dynamic Value Fund (the “fund”)
is a separate diversified series of BNY Mellon Advantage Funds, Inc. (the “Company”),
which is registered under the Investment
Company Act of 1940, as amended (the “Act”),
as an open-end management investment company
and operates as a series company currently offering six series, including the fund. The fund’s investment objective is to seek capital
appreciation. BNY Mellon Investment Adviser, Inc. (the “Adviser”),
a wholly-owned subsidiary of The Bank of New York Mellon Corporation
(“BNY”),
serves as the fund’s investment adviser. Newton Investment Management North America, LLC (the “Sub-Adviser”
or “NIMNA”),
an indirect wholly-owned subsidiary of BNY and an affiliate of the Adviser, serves as the fund’s sub-adviser. NIMNA’s
principal office is located at BNY Mellon Center, 201 Washington Street, Boston, Massachusetts 02108. NIMNA has entered
into a sub-sub-investment advisory agreement with its affiliate, Newton Investment Management Limited (“NIM”),
which enables NIM to provide certain
advisory services to the Sub-Adviser for the benefit of the fund, including, but not limited to, portfolio management
services. NIM is subject to the supervision of NIMNA and the Adviser. NIM is also an affiliate of the Adviser. NIM, located
at 160 Queen Victoria Street, London, EC4V, 4LA, England, was formed in 1978. NIM is an indirect subsidiary of BNY.
BNY Mellon
Securities Corporation (the “Distributor”), a wholly-owned subsidiary of the Adviser, is the distributor of the fund’s
shares. The fund is authorized to
issue 800 million shares of $.001 par value of Common Stock. The fund currently has authorized four classes of
shares: Class A (300 million shares authorized), Class C (100 million shares authorized), Class I (250 million shares authorized) and
Class Y (150 million shares authorized).
Class A and Class C shares are sold primarily to retail investors through financial intermediaries and
bear Distribution and/or Shareholder Services Plan fees. Class A shares generally are subject to a sales charge imposed at the time of
purchase. Class A shares bought
without an initial sales charge as part of an investment of $1 million or more may be charged a contingent
deferred sales charge (“CDSC”) of 1.00% if redeemed within one year. Class C shares are subject to a CDSC imposed on Class
C shares redeemed within one year of purchase. Class C shares automatically convert to Class A shares eight years after the date of purchase,
without the imposition of a sales charge. Class I shares are sold primarily to bank trust departments and other financial service providers
(including BNY and its affiliates), acting on behalf of customers having a qualified trust or an investment account or relationship
at such institution, and bear no Distribution or Shareholder Services Plan fees. Class Y shares are sold at net asset value per share
generally to institutional investors,
and bear no Distribution or Shareholder Services Plan fees. Class I and Class Y shares are offered without
a front-end sales charge or CDSC. Other differences between the classes include the services offered to and the expenses borne by
each class, the allocation of certain transfer agency costs and certain voting rights. Income, expenses (other than expenses attributable
to a specific class), and realized
and unrealized gains or losses on investments are allocated to each class of shares based on its relative net assets.
The Company
accounts separately for the assets, liabilities and operations of each series. Expenses directly attributable to each series are charged
to that series’ operations; expenses which are applicable to all series are allocated among them on a pro rata basis.
The Financial
Accounting Standards Board (“FASB”) Accounting Standards Codification (“ASC”) is the exclusive reference of authoritative
U.S. generally accepted accounting principles (“GAAP”) recognized by the FASB to be applied by nongovernmental entities. Rules
and interpretive releases of the SEC under authority of federal laws are also sources of authoritative GAAP for SEC registrants. The
fund is an investment company and applies the accounting and reporting guidance of the FASB ASC Topic 946 Financial Services-Investment
Companies. The fund’s financial statements are prepared in accordance with GAAP, which may require the use of management
estimates and assumptions. Actual results could differ from those estimates.
The Company
enters into contracts that contain a variety of indemnifications. The fund’s maximum exposure under these arrangements is
unknown. The fund does not anticipate recognizing any loss related to these arrangements.
(a) Portfolio
valuation: The fair value of a financial instrument
is the amount that would be received to sell an asset or paid to transfer a
liability in an orderly transaction between market participants at the measurement date (i.e., the exit price). GAAP establishes a fair
value hierarchy that prioritizes
the inputs of valuation techniques used to measure fair value. This hierarchy gives the highest priority to unadjusted
quoted prices in active markets for identical assets or liabilities (Level 1 measurements) and the lowest priority to unobservable
inputs (Level 3 measurements).
Additionally,
GAAP provides guidance on determining whether the volume and activity in a market has decreased significantly and whether
such a decrease in activity results in transactions that are not orderly. GAAP requires enhanced disclosures around valuation inputs
and techniques used during annual and interim periods.
NOTES
TO FINANCIAL STATEMENTS (continued)
Various
inputs are used in determining the value of the fund’s investments relating to fair value measurements. These inputs are summarized
in the three broad levels listed below:
Level 1—unadjusted
quoted prices in active markets for identical investments.
Level 2—other
significant observable inputs (including quoted prices for similar investments, interest rates, prepayment speeds, credit
risk, etc.).
Level 3—significant
unobservable inputs (including the fund’s own assumptions in determining the fair value of investments).
The inputs
or methodology used for valuing securities are not necessarily an indication of the risk associated with investing in those securities.
Changes in
valuation techniques may result in transfers in or out of an assigned level within the disclosure hierarchy. Valuation techniques
used to value the fund’s investments are as follows:
The Company’s
Board of Directors (the “Board”)
has designated the Adviser as the fund’s valuation designee to make all fair value determinations
with respect to the fund’s portfolio investments, subject to the Board’s oversight and pursuant to Rule 2a-5 under the Act.
Investments
in equity securities are valued at the last sales price on the securities exchange or national securities market on which such securities
are primarily traded. Securities listed on the National Market System for which market quotations are available are valued at the
official closing price or, if there is no official closing price that day, at the last sales price. For open short positions, asked prices
are used for valuation purposes.
Bid price is used when no asked price is available. Registered investment companies that are not
traded on an exchange are valued
at their net asset value. All of the preceding securities are generally categorized within Level 1 of the fair value hierarchy.
Securities
not listed on an exchange or the national securities market, or securities for which there were no transactions, are valued at the average
of the most recent bid and asked prices. These securities are generally categorized within Level 2 of the fair value hierarchy.
Fair valuing
of securities may be determined with the assistance of a pricing service using calculations based on indices of domestic securities
and other appropriate indicators, such as prices of relevant ADRs and futures. Utilizing these techniques may result in transfers between
Level 1 and Level 2 of the fair value hierarchy.
When market
quotations or official closing prices are not readily available, or are determined not to accurately reflect fair value, such as when
the value of a security has been significantly affected by events after the close of the exchange or market on which the security is principally
traded, but before the fund calculates its net asset value, the fund may value these investments at fair value as determined in accordance
with the procedures approved by the Board. Certain factors may be considered when fair valuing investments such as: fundamental
analytical data, the nature and duration of restrictions on disposition, an evaluation of the forces that influence the market in which
the securities are purchased and sold, and public trading in similar securities of the issuer or comparable issuers. These securities
are either categorized within Level 2 or 3 of the
fair value hierarchy depending on the relevant inputs used.
For securities
where observable inputs are limited, assumptions about market activity and risk are used and such securities are generally categorized
within Level 3 of the fair value hierarchy.
The following is a summary
of the inputs used as of August 31, 2025 in valuing the fund’s investments:
|
|
Level
1 -
Unadjusted
Quoted
Prices |
Level
2- Other
Significant
Observable
Inputs |
Level
3-
Significant
Unobservable
Inputs
|
|
|
|
|
|
|
|
Investments
in Securities:†
|
|
|
|
|
Equity
Securities - Common Stocks |
|
|
|
|
|
|
|
|
|
|
|
|
|
|
|
|
|
|
See
Schedule of Investments for additional detailed categorizations, if any. |
(b) Foreign
currency transactions: The fund does not isolate
that portion of the results of operations resulting from changes in foreign
NOTES
TO FINANCIAL STATEMENTS (continued)
exchange
rates on investments from the fluctuations arising from changes in the market prices of securities held. Such fluctuations are included
with the net realized and unrealized gain or loss on investments.
Net realized
foreign exchange gains or losses arise from sales of foreign currencies, currency gains or losses realized on securities transactions
between trade and settlement date, and the difference between the amounts of dividends, interest and foreign withholding taxes recorded
on the fund’s books and the U.S. dollar equivalent of the amounts actually received or paid. Net unrealized foreign exchange gains
and losses arise from changes in the value of assets and liabilities other than investments resulting from changes in exchange rates.
Foreign currency gains and losses
on foreign currency transactions are also included with net realized and unrealized gain or loss on investments.
Foreign taxes:
The fund may be subject to foreign taxes (a portion of which may be reclaimable) on income, stock dividends, realized and
unrealized capital gains on investments or certain foreign currency transactions. Foreign taxes are recorded in accordance with the applicable
foreign tax regulations and rates that exist in the foreign jurisdictions in which the fund invests. These foreign taxes, if any, are
paid by the fund and are reflected
in the Statement of Operations, if applicable. Foreign taxes payable or deferred or those subject to reclaims
as of August 31, 2025, if any, are disclosed in the fund’s Statement of Assets and Liabilities.
(c) Securities
transactions and investment income: Securities transactions
are recorded on a trade date basis. Realized gains and losses
from securities transactions are recorded on the identified cost basis. Dividend income is recognized on the ex-dividend date and interest
income, including, where applicable, accretion of discount and amortization of premium on investments, is recognized on the accrual
basis.
Pursuant to
a securities lending agreement with BNY, the fund may lend securities to qualified institutions. It is the fund’s policy that, at
origination, all loans are secured by collateral of at least 102% of the value of U.S. securities loaned and 105% of the value of foreign
securities loaned. Collateral equivalent
to at least 100% of the market value of securities on loan is maintained at all times. Collateral is either
in the form of cash, which can be invested in certain money market mutual funds managed by the Adviser, or U.S. Government and
Agency securities. Any non-cash collateral received cannot be sold or re-pledged by the fund, except in the event of borrower default,
and is not reflected in the Statement of Assets and Liabilities. The securities on loan, if any, are also disclosed in the fund’s
Schedule of Investments. The fund
is entitled to receive all dividends, interest and distributions on securities loaned, in addition to income
earned as a result of the lending transaction. Should a borrower fail to return the securities in a timely manner, BNY is required to
replace the securities for the benefit of the fund or credit the fund with the market value of the unreturned securities and is subrogated
to the fund’s rights against
the borrower and the collateral. Additionally, the contractual maturity of security lending transactions are on an
overnight and continuous basis. During the period ended August 31, 2025, BNY earned $21,062 from the lending of the fund’s
portfolio securities, pursuant to the securities
lending agreement.
For financial
reporting purposes, the fund elects not to offset assets and liabilities subject to a securities lending agreement, if any, in the Statement
of Assets and Liabilities. Therefore, all qualifying transactions are presented on a gross basis in the Statement of Assets and Liabilities.
As of August 31, 2025, the fund had securities lending and the impact of netting of assets and liabilities and the offsetting of collateral
pledged or received, if any, based on contractual netting/set-off provisions in the securities lending agreement are detailed in the
following table:
|
|
|
Gross
amount of securities loaned, at
value,
as disclosed in the Statement
of
Assets and Liabilities |
|
Collateral
(received)/posted not offset
in
the Statement of
Assets
and Liabilities |
|
|
|
|
|
|
The
value of the related collateral received by the fund exceeded the value of the securities loaned by the fund pursuant to the securities
lending agreement. In addition,
the
value of collateral may include pending sales that are also on loan. See Schedule of Investments for detailed information regarding collateral
received for open
securities
lending. |
(d) Affiliated
issuers: Investments in other investment companies
advised by the Adviser are considered “affiliated” under the Act.
(e) Market
Risk: The value of the securities in which the fund
invests may be affected by political, regulatory, economic and social developments,
and developments that impact specific economic sectors, industries or segments of the market. In addition, turbulence in
NOTES
TO FINANCIAL STATEMENTS (continued)
financial
markets and reduced liquidity in equity, credit and/or fixed-income markets may negatively affect many issuers, which could adversely
affect the fund. Global economies and financial markets are becoming increasingly interconnected, and conditions and events in
one country, region or financial market may adversely impact issuers in a different country, region or financial market. These risks may
be magnified if certain events or developments adversely interrupt the global supply chain; in these and other circumstances, such risks
might affect companies world-wide.
Foreign Investment Risk:
To the extent the fund invests in foreign securities, the fund’s performance will be influenced by political, social
and economic factors affecting investments in foreign issuers. Special risks associated with investments in foreign issuers include exposure
to currency fluctuations, less liquidity, less developed or less efficient trading markets, lack of comprehensive company information,
political and economic instability and differing auditing and legal standards.
(f) Dividends
and distributions to shareholders:
Dividends and distributions are recorded on the ex-dividend date. Dividends from net
investment income and dividends from net realized capital gains, if any, are normally declared and paid annually, but the fund may make
distributions on a more frequent basis to comply with the distribution requirements of the Internal Revenue Code of 1986, as amended
(the “Code”). To the extent that net realized capital gains can be offset by capital loss carryovers, it is the policy of
the fund not to distribute such
gains. Income and capital gain distributions are determined in accordance with income tax regulations, which may differ
from GAAP.
(g) Federal
income taxes: It is the policy of the fund to continue
to qualify as a regulated investment company, if such qualification is in
the best interests of its shareholders, by complying with the applicable provisions of the Code, and to make distributions of taxable
income and net realized capital gain sufficient to
relieve it from substantially all federal income and excise taxes.
As of and
during the period ended August 31, 2025, the fund did not have any liabilities for any uncertain tax positions. The fund recognizes
interest and penalties, if any, related to uncertain tax positions as income tax expense in the Statement of Operations. During the
period ended August 31, 2025, the fund did not incur any interest or penalties.
Each tax year
in the four-year period ended August 31, 2025 remains subject to examination by the Internal Revenue Service and state taxing
authorities.
At August
31, 2025, the components of accumulated earnings on a tax basis were as follows: undistributed ordinary income $3,701,380,
undistributed capital gains $503,217,359 and unrealized appreciation $1,183,714,441.
The tax character
of distributions paid to shareholders during the fiscal years ended August 31, 2025 and August 31, 2024 were as follows:
ordinary income $150,348,925 and $35,499,698, and long-term capital gains $391,512,764 and $161,009,776, respectively.
(h) Operating
segment reporting: In this reporting period, the
fund adopted FASB Accounting Standards Update 2023-07, Segment Reporting
(Topic 280) - Improvements to Reportable Segment Disclosures (“ASU 2023-07”). Adoption of the new standard impacted financial
statement disclosures only and did not affect the fund’s financial position or the results of its operations. The ASU 2023-07 is
effective for public entities for
fiscal years beginning after December 15, 2023, and requires retrospective application for all prior periods presented
within the financial statements.
Since its
commencement, the fund operates and is managed as a single reportable segment deriving returns in the form of dividends, interest
and/or gains from the investments made in pursuit of its single stated investment objective as outlined in the fund’s prospectus.
The accounting policies of the fund
are consistent with those described in these Notes to Financial Statements. The chief operating decision
maker (“CODM”) is represented by BNY Investments, the management of the Adviser, comprising Senior Management and Directors.
The CODM considers net increase in net assets resulting from operations in deciding whether to purchase additional investments
or to make distributions to fund shareholders. Detailed financial information for the fund is disclosed within these financial statements
with total assets and liabilities disclosed on the Statement of Assets and Liabilities, investments held on the Schedule of Investments,
results of operations and significant segment expenses on the Statement of Operations and other information about the fund’s
performance, including total return, portfolio turnover and ratios within the Financial Highlights.
NOTE
2—
Bank
Lines of Credit:
The fund participates with
other long-term open-end funds managed by the Adviser in a $738 million unsecured credit facility led by Citibank,
N.A. (the “Citibank Credit Facility”) and a $300 million unsecured credit facility provided by BNY (the “BNY Credit
Facility”), each to be utilized
primarily for temporary or emergency purposes, including the financing of redemptions (each, a “Facility”).
The Citibank Credit Facility is available in two tranches: (i) Tranche A is in an amount equal to $618 million and is available to all
long-term open-ended funds, including
the fund, and (ii) Tranche B is an amount equal to $120 million and is available only to BNY
NOTES
TO FINANCIAL STATEMENTS (continued)
Mellon
Floating Rate Income Fund, a series of BNY Mellon Investment Funds IV, Inc. In connection therewith, the fund has agreed to pay
its pro rata portion of commitment fees for Tranche A of the Citibank Credit Facility and the BNY Credit Facility. Interest is charged
to the fund based on rates determined pursuant to the terms of the respective Facility at the time of borrowing.
During the
period ended August 31, 2025, the fund was charged $22,067 for interest expense. These fees are included in Interest expense
in the Statement of Operations. The average amount of borrowings outstanding under the Citibank Credit Facility during the period
ended August 31, 2025 was approximately $415,068 with a related weighted average annualized interest rate of 5.32%. As of August
31, 2025, the fund has no outstanding loan balance from either Facility.
NOTE
3—
Management
Fee, Sub-Advisory Fee
and Other Transactions with Affiliates:
(a) Pursuant
to a management agreement with the Adviser, the management fee is computed at the annual rate of .60% of the value of the
fund’s average daily net assets and is payable monthly. The Adviser has contractually agreed, from September 1, 2024 through December
31, 2025, to waive receipt of its fees and/or assume the direct expenses of the fund so that the direct expenses of none of the fund’s
share classes (excluding Rule 12b-1 Distribution Plan fees, Shareholder Services Plan fees, taxes, interest expense, brokerage commissions,
commitment fees on borrowings and extraordinary expenses) exceed .68% of the value of the fund’s average daily net assets.
On or after December 31, 2025, the Adviser may terminate this expense limitation agreement at any time. The reduction in expenses,
pursuant to the undertaking, amounted to $1,446,660 during the period ended August 31, 2025.
Pursuant to
a sub-investment advisory agreement between the Adviser and the Sub-Adviser, the Adviser pays the Sub-Adviser a monthly fee
at an annual rate of .288% of the value of the fund’s average daily net assets.
During the
period ended August 31, 2025, the Distributor retained $111,966 from commissions earned on sales of the fund’s Class A shares and $8,191
and $19,337 from CDSC fees on redemptions of the fund’s Class A and Class C shares, respectively.
(b) Under
the Distribution Plan adopted pursuant to Rule 12b-1 under the Act, Class C shares pay the Distributor for distributing its shares
at an annual rate of .75% of the value of its average daily net assets. The Distributor may pay one or more Service Agents in respect
of advertising, marketing and other distribution services, and determines the amounts, if any, to be paid to Service Agents and the
basis on which such payments are made. During the period ended August 31, 2025, Class C shares were charged $619,982 pursuant to
the Distribution Plan.
(c) Under
the Shareholder Services Plan, Class A and Class C shares pay the Distributor at an annual rate of .25% of the value of their average
daily net assets for the provision of certain services. The services provided may include personal services relating to shareholder accounts,
such as answering shareholder inquiries regarding the fund, and services related to the maintenance of shareholder accounts. The
Distributor may make payments to Service Agents (securities dealers, financial institutions or other industry professionals) with respect
to these services. The Distributor determines the amounts to be paid to Service Agents. During the period ended August 31, 2025,
Class A and Class C shares were charged $3,295,669 and $206,661, respectively, pursuant to the Shareholder Services Plan.
The fund has
an arrangement with BNY Mellon Transfer, Inc., (the “Transfer Agent”), a subsidiary of BNY and an affiliate of the Adviser,
whereby the fund may receive earnings credits when positive cash balances are maintained, which are used to offset Transfer Agent
fees. For financial reporting purposes, the fund includes transfer agent net earnings credits, if any, as an expense offset in the Statement
of Operations.
The fund has
an arrangement with The Bank of New York Mellon (the “Custodian”), a subsidiary of BNY and an affiliate of the Adviser, whereby
the fund will receive interest income or be charged overdraft fees when cash balances are maintained. For financial reporting purposes,
the fund includes this interest income and overdraft fees, if any, as interest income in the Statement of Operations.
The fund compensates
the Transfer Agent, under a transfer agency agreement, for providing transfer agency and cash management services
for the fund. The majority of Transfer Agent fees are comprised of amounts paid on a per account basis, while cash management fees
are related to fund subscriptions and redemptions. During the period ended August 31, 2025, the fund was charged $130,431 for transfer
agency services. These fees are included in Shareholder servicing costs in the Statement of Operations. These fees were partially offset
by earnings credits of $20,930.
The fund compensates
the Custodian, under a custody agreement, for providing custodial services for the fund. These fees are determined
based on net assets, geographic region and transaction activity. During the period ended August 31, 2025, the fund was charged $102,334
pursuant to the custody agreement.
During the
period ended August 31, 2025, the fund was charged $28,227 for services performed by the fund’s Chief Compliance Officer
and his staff. These fees are included in Chief Compliance Officer fees in the Statement of Operations.
NOTES
TO FINANCIAL STATEMENTS (continued)
The
fund compensates the Custodian for providing shareholder reporting and regulatory services for the fund. These fees are included in
Shareholder and regulatory reports service fees in the Statement of Operations. During the period ended August 31, 2025, the Custodian
was compensated $8,583 for financial reporting and regulatory services.
The components
of “Due to BNY Mellon Investment Adviser, Inc. and affiliates” in the Statement of Assets and Liabilities consist of:
Management fee of $4,529,896, Distribution Plan fees of $63,042, Shareholder Services Plan fees of $319,302, Custodian fees of $31,200,
Chief Compliance Officer fees of $4,796, Transfer Agent fees of $26,948 and Shareholder and regulatory reports service fees of
$6,667, which are offset against an expense reimbursement currently in effect in the amount of $159,520.
(d) Each
board member of the fund also serves as a board member of other funds in the BNY Mellon Family of Funds complex. Annual retainer
fees and attendance fees are allocated to each fund based on net assets.
NOTE
4—
Securities
Transactions:
The aggregate
amount of purchases and sales of investment securities, excluding short-term securities, during the period ended August
31, 2025, amounted to $9,069,967,603 and $7,250,672,468, respectively.
At August
31, 2025, the cost of investments for federal income tax purposes was $7,944,540,779; accordingly, accumulated net unrealized
appreciation on investments was $1,183,702,107, consisting of $1,367,207,791 gross unrealized appreciation and $183,505,684
gross unrealized depreciation.
REPORT
OF INDEPENDENT REGISTERED PUBLIC ACCOUNTING FIRM
To the
Shareholders and the Board of Directors of BNY Mellon Dynamic Value Fund
Opinion on the Financial Statements
We have audited
the accompanying statement of assets and liabilities of BNY Mellon Dynamic Value Fund (the “Fund”) (one
of the funds constituting BNY
Mellon Advantage Funds, Inc. (the “Company”)),
including the schedule of investments, as of August 31, 2025, and the related statement of
operations for the year then ended, the statements of changes in net assets for each of the two years in the period then ended, the financial
highlights for each of the five years
in the period then ended and the related notes (collectively referred to as the “financial
statements”).
In our opinion, the financial statements
present fairly, in all material respects, the financial position of the Fund (one of the funds constituting BNY
Mellon Advantage Funds, Inc.) at
August 31, 2025, the results of its operations for the year then ended, the changes in its net assets for each of the two years in the
period then ended and its financial
highlights for each of the five years in the period then ended, in conformity with U.S. generally accepted accounting principles.
These financial
statements are the responsibility of the Company’s management. Our responsibility is to express an opinion on the Fund’s financial
statements based on our audits. We
are a public accounting firm registered with the Public Company Accounting Oversight Board (United States) (“PCAOB”)
and are required to be independent with respect to the Company in accordance with the U.S. federal securities laws and the applicable
rules and regulations of the Securities and Exchange
Commission and the PCAOB.
We conducted
our audits in accordance with the standards of the PCAOB. Those standards require that we plan and perform the audit to obtain reasonable
assurance about whether the financial statements are free of material misstatement, whether due to error or fraud. The Company is not
required to have, nor were we engaged
to perform, an audit of the Company’s internal control over financial reporting. As part of our audits, we are required
to obtain an understanding of internal control over financial reporting but not for the purpose of expressing an opinion on the effectiveness
of the Company’s internal control over financial
reporting. Accordingly, we express no such opinion.
Our audits
included performing procedures to assess the risks of material misstatement of the financial statements, whether due to error or fraud,
and performing procedures that respond
to those risks. Such procedures included examining, on a test basis, evidence regarding the amounts and disclosures
in the financial statements. Our procedures included confirmation of securities owned as of August 31, 2025, by correspondence with the
custodian, brokers and others; when
replies were not received from brokers and others, we performed other auditing procedures. Our audits also included
evaluating the accounting principles used and significant estimates made by management, as well as evaluating the overall presentation
of the financial statements. We believe that our audits
provide a reasonable basis for our opinion. 
We have served
as the auditor of one or more investment companies in the BNY Mellon Family of Funds since at least 1957, but we are unable to determine
the specific year.
New
York, New York
October 23, 2025
IMPORTANT
TAX INFORMATION (Unaudited)
For
federal tax purposes, the fund hereby reports 100% of the ordinary dividends paid during the fiscal year ended August 31, 2025 as
qualifying for the corporate dividends
received deduction. Also, certain dividends paid by the fund may be subject to a maximum tax rate
of 15%, as provided for by the Jobs and Growth Tax Relief Reconciliation Act of 2003. Of the distributions paid during the fiscal year,
$150,348,925 represents the maximum amount that may be considered qualified dividend income. Shareholders will receive notification
in early 2026 of the percentage applicable to the preparation of their 2025 income tax returns. The fund also hereby reports $2.7287
per share as a long-term capital gain distribution and $.5217 per share as a short-term capital gain distribution paid on December
4, 2024.
Item
8. Changes in and Disagreements with Accountants for Open-End Management Investment Companies
(Unaudited)
Item
9. Proxy Disclosures for Open-End Management Investment Companies (Unaudited)
Item
10. Remuneration Paid to Directors, Officers, and Others of Open-End Management Investment Companies
(Unaudited)
Each
board member also serves as a board member of other funds in the BNY Mellon Family of Funds complex, and annual retainer fees and
meeting attendance fees are allocated to each fund based on net assets. The fund is charged for services performed by the fund’s
Chief Compliance Officer. Compensation
paid by the fund during the period to the board members and the Chief Compliance Officer are
within Item 7. Statement of Operations as Directors’ fees and expenses and Chief Compliance Officer fees, respectively. The aggregate
amount of Directors’ fees and expenses and Chief Compliance Officer fees paid by the fund during the period was $724,719.
Item
11. Statement Regarding Basis for Approval of Investment Advisory Contracts (Unaudited)
At
a meeting of the fund’s Board of Directors (the “Board”)
held on March 4-5, 2025, the Board considered the renewal of the fund’s Management
Agreement, pursuant to which the Adviser provides the fund with investment advisory and administrative services, the Sub-Investment
Advisory Agreement, pursuant to which Newton Investment Management North America, LLC (the “Sub-Adviser”
or “NIMNA”)
provides day-to-day management of the fund’s investments, and the Sub-Sub-Investment Advisory Agreement (collectively with
the Management Agreement and Sub-Investment Advisory Agreement, the “Agreements”)
between NIMNA and Newton Investment
Management Limited (“NIM”),
pursuant to which NIMNA may use the investment advisory personnel, resources and capabilities
available at its sister company, NIM, in providing the day-to-day management of the fund’s investments. The Board members, none
of whom are “interested
persons”
(as defined in the Investment Company Act of 1940, as amended) of the fund, were assisted in their review
by independent legal counsel and met with counsel in executive session separate from representatives of the Adviser and the Sub-Adviser.
In considering the renewal of the Agreements, the Board considered several factors that it believed to be relevant, including those
discussed below. The Board did not identify any one factor as dispositive, and each Board member may have attributed different weights
to the factors considered.
Analysis
of Nature, Extent, and Quality of Services Provided to the Fund.
The Board considered information provided to it at the meeting
and in previous presentations from representatives of the Adviser regarding the nature, extent, and quality of the services provided
to funds in the BNY fund complex, including the fund. The Adviser provided the number of open accounts in the fund, the fund’s
asset size and the allocation of fund assets among distribution channels. The Adviser also had previously provided information regarding
the diverse intermediary relationships and distribution channels of funds in the BNY fund complex (such as retail direct or intermediary,
in which intermediaries typically are paid by the fund and/or the Adviser) and the Adviser’s corresponding need for broad, deep,
and diverse resources to be able to provide ongoing shareholder services to each intermediary or distribution channel, as applicable to
the fund.
The Board
also considered research support available to, and portfolio management capabilities of, the fund’s portfolio management personnel
and that the Adviser also provides oversight of day-to-day fund operations, including fund accounting and administration and
assistance in meeting legal and regulatory requirements. The Board also considered the Adviser’s extensive administrative, accounting
and compliance infrastructures, as well as the Adviser’s supervisory activities over the Sub-Adviser. The Board also considered
portfolio management’s brokerage
policies and practices (including policies and practices regarding soft dollars) and the standards applied
in seeking best execution.
Comparative
Analysis of the Fund’s Performance and Management Fee and Expense Ratio.
The Board reviewed reports prepared by Broadridge
Financial Solutions, Inc. (“Broadridge”),
an independent provider of investment company data based on classifications provided
by Thomson Reuters Lipper (“Lipper”),
which included information comparing (1) the performance of the fund’s Class I shares
with the performance of a group of institutional multi-cap value funds selected by Broadridge as comparable to the fund (the “Performance
Group”)
and with a broader group of funds consisting of all retail and institutional multi-cap value funds (the “Performance
Universe”),
all for various periods ended December 31, 2024, and (2) the fund’s actual and contractual management fees and total
expenses with those of the same group of funds in the Performance Group (the “Expense
Group”)
and with a broader group of funds
consisting of all institutional multi-cap value funds, excluding outliers (the “Expense
Universe”),
the information for which was derived
in part from fund financial statements available to Broadridge as of the date of its analysis. The Adviser previously had furnished the
Board with a description of the methodology Broadridge used to select the Performance Group and Performance Universe and the Expense
Group and Expense Universe.
Performance Comparisons.
Representatives of the Adviser stated that the usefulness of performance comparisons may be affected by a number
of factors, including different investment limitations and policies that may be applicable to the fund and comparison funds and the
end date selected. The Board also considered the fund’s performance in light of overall financial market conditions. The Board discussed
with representatives of the Adviser and the Sub-Adviser the results of the comparisons and considered that the fund’s total return
performance was above the Performance Group and Performance Universe medians for all periods and ranked first in the Performance
Group for the one-, three-, four-, and ten-year periods. The Adviser also provided a comparison of the fund’s calendar year total
returns to the returns of the fund’s benchmark indices, and it was noted that the fund’s returns were above the returns of
the Russell 1000 Value Index in
nine of the ten calendar years shown. The Board noted that the fund had a five star rating for each of the three-
and five-year periods and a five star overall rating from Morningstar based on Morningstar’s risk-adjusted return measures.
Management
Fee and Expense Ratio Comparisons. The Board reviewed
and considered the contractual management fee rate payable by the
fund to the Adviser in light of the nature, extent and quality of the management services and the sub-advisory services provided by the
Adviser and the Sub-Adviser, respectively. In addition, the Board reviewed and considered the actual management fee rate paid by the
fund over the fund’s last fiscal year, which included reductions for an expense limitation arrangement in place that reduced the
management fee paid to the Adviser.
The Board also reviewed the range of actual and contractual management fees and total expenses as
a percentage of average net assets of the Expense Group and Expense Universe funds and discussed the results of the comparisons.
The Board
considered that the fund’s contractual management fee was approximately equivalent to the Expense Group median contractual
management fee, the fund’s actual management fee was approximately equivalent to the Expense Group median and approximately
equivalent to the Expense Universe median actual management fee, and the fund’s total expenses were approximately equivalent to
the Expense Group median and lower than the Expense Universe median total expenses.
Representatives
of the Adviser stated that the Adviser has contractually agreed, until December 31, 2025, to waive receipt of its fees and/or
assume the direct expenses of the fund so that the direct expenses of none of the fund’s share classes (excluding Rule 12b-1 fees,
shareholder services fees, taxes,
interest expense, brokerage commissions, commitment fees on borrowings and extraordinary expenses) exceed
.68%.
Representatives
of the Adviser reviewed with the Board the management or investment advisory fees paid to the Adviser or the Sub-Adviser
for advising any separate accounts and/or other types of client portfolios that are considered to have similar investment strategies and
policies as the fund (the “Similar
Clients”),
and explained the nature of the Similar Clients. They discussed differences in fees paid and
the relationship of the fees paid in light of any differences in the services provided and other relevant factors. The Board considered
the relevance of the fee information
provided for the Similar Clients to evaluate the appropriateness of the fund’s management fee. Representatives
of the Adviser noted that there were no other funds advised by the Adviser that are in the same Lipper category as the fund.
The Board
considered the fee payable to the Sub-Adviser in relation to the fee payable to the Adviser by the fund and the respective services
provided by the Sub-Adviser and the Adviser. The Board also took into consideration that the Sub-Adviser’s fee is paid by the Adviser,
out of its fee from the fund, and not the fund.
Analysis
of Profitability and Economies of Scale. Representatives
of the Adviser reviewed the expenses allocated and profit received by the
Adviser and its affiliates and the resulting profitability percentage for managing the fund and the aggregate profitability percentage
to the Adviser and its affiliates
for managing the funds in the BNY fund complex, and the method used to determine the expenses and profit.
The Board concluded that the profitability results were not excessive, given the services rendered and service levels provided by the
Adviser and its affiliates. The Board also considered the expense limitation arrangement and its effect on the profitability of the Adviser
and its affiliates. The Board also had been provided with information prepared by an independent consulting firm regarding the Adviser’s
approach to allocating costs to, and determining the profitability of, individual funds and the entire BNY fund complex. The consulting
firm also had analyzed where any economies of scale might emerge in connection with the management of a fund.
The Board
considered, on the advice of its counsel, the profitability analysis (1) as part of its evaluation of whether the fees under the Agreements,
considered in relation to the mix of services provided by the Adviser and the Sub-Adviser, including the nature, extent and quality
of such services, supported the renewal of the Agreements and (2) in light of the relevant circumstances for the fund and the extent
to which economies of scale would be realized if the fund grows and whether fee levels reflect these economies of scale for the benefit
of fund shareholders. Representatives of the Adviser stated that, as a result of shared and allocated costs among funds in the BNY fund
complex, the extent of economies of scale could depend substantially on the level of assets in the complex as a whole, so that increases
and decreases in complex-wide assets can affect potential economies of scale in a manner that is disproportionate to, or even in the
opposite direction from, changes in the fund’s asset level. The Board also considered potential benefits to the Adviser and the
Sub-Adviser from acting as investment
adviser and sub-investment adviser, respectively, and took into consideration the soft dollar arrangements
in effect for trading the fund’s investments.
Item
11. Statement Regarding Basis for Approval of Investment Advisory Contracts (Unaudited) (continued)
At
the conclusion of these discussions, the Board agreed that it had been furnished with sufficient information to make an informed business
decision with respect to the renewal of the Agreements. Based on the discussions and considerations as described above, the Board
concluded and determined as follows.
●The
Board concluded that the nature, extent and quality of the services provided by the Adviser and the Sub-Adviser are satisfactory
and appropriate.
●The
Board was satisfied with the fund’s performance.
●The
Board concluded that the fees paid to the Adviser and the Sub-Adviser continued to be appropriate under the circumstances and
in light of the factors and the totality of the services provided as discussed above.
●The
Board determined that the economies of scale which may accrue to the Adviser and its affiliates in connection with the management
of the fund had been adequately considered by the Adviser in connection with the fee rate charged to the fund pursuant
to the Management Agreement and that, to the extent in the future it were determined that material economies of scale had
not been shared with the fund, the Board would seek to have those economies of scale shared with the fund.
In evaluating
the Agreements, the Board considered these conclusions and determinations and also relied on its previous knowledge, gained
through meetings and other interactions with the Adviser and its affiliates and the Sub-Adviser, of the Adviser and the Sub-Adviser
and the services provided to the fund by the Adviser and the Sub-Adviser. The Board also relied on information received on a routine
and regular basis throughout the year relating to the operations of the fund and the investment management and other services provided
under the Agreements, including information on the investment performance of the fund in comparison to similar mutual funds
and benchmark performance indices; general market outlook as applicable to the fund; and compliance reports. In addition, the Board’s
consideration of the contractual fee arrangements for the fund had the benefit of a number of years of reviews of the Agreements for
the fund, or substantially similar agreements for other BNY funds that the Board oversees, during which lengthy discussions took place
between the Board and representatives of the Adviser. Certain aspects of the arrangements may receive greater scrutiny in some years
than in others, and the Board’s conclusions may be based, in part, on its consideration of the fund’s arrangements, or substantially
similar arrangements for other BNY funds that the
Board oversees, in prior years. The Board determined to renew the Agreements.
©
2025 BNY Mellon Securities Corporation
Code-0257NCSRAR0825
BNY Mellon Opportunistic Midcap
Value Fund
ANNUAL FINANCIALS
AND OTHER INFORMATION
Save
time. Save paper. View your next shareholder report online as soon as it’s available. Log into www.bny.com/investments
and sign up for eCommunications. It’s simple and only takes a few minutes.
The
views expressed in this report reflect those of the portfolio manager(s) only through the end of the period
covered and do not necessarily represent the views of BNY Mellon Investment Adviser, Inc. or any other
person in the BNY Mellon Investment Adviser, Inc. organization. Any such views are subject to change
at any time based upon market or other conditions and BNY Mellon Investment Adviser, Inc. disclaims
any responsibility to update such views. These views may not be relied on as investment advice and,
because investment decisions for a fund in the BNY Mellon Family of Funds are based on numerous factors,
may not be relied on as an indication of trading intent on behalf of any fund in the BNY Mellon
Family of
Funds.
Not FDIC-Insured
• Not Bank-Guaranteed • May Lose Value
Contents
Please note
the Annual Financials and Other Information only contains Items 7-11 required in Form
N-CSR. All other required items will be filed with the Securities and Exchange Commission
(the “SEC”).
Item
7. Financial Statements and Financial Highlights for Open-End Management Investment Companies.
BNY Mellon Opportunistic Midcap Value
Fund
SCHEDULE OF INVESTMENTS
|
|
|
|
|
|
|
|
|
|
|
Columbia
Banking System, Inc.(a)
|
|
|
|
|
|
|
|
|
|
|
|
|
|
|
|
|
|
|
|
|
|
|
|
|
|
|
|
|
|
|
|
|
|
|
|
|
|
|
|
|
|
|
|
|
|
|
|
|
|
|
|
|
|
|
|
|
|
|
|
|
|
|
|
Johnson
Controls International PLC(a)
|
|
|
|
|
|
|
|
|
|
|
|
|
|
|
|
|
|
|
|
|
|
|
|
|
|
|
Commercial
& Professional Services — 4.5% |
CACI
International, Inc., Cl. A(b)
|
|
|
|
|
|
|
|
|
|
|
|
|
|
|
|
|
|
|
|
|
|
|
|
|
|
|
Consumer
Discretionary Distribution & Retail — 2.7% |
Burlington
Stores, Inc.(b)
|
|
|
|
|
|
|
|
|
|
|
|
|
|
|
|
|
|
|
|
Consumer
Durables & Apparel — 2.6% |
|
|
|
|
|
|
|
Skechers
USA, Inc., Cl. A(b)
|
|
|
|
|
|
|
|
|
|
|
|
|
|
|
|
|
|
|
|
|
|
|
|
|
|
|
|
|
Grand
Canyon Education, Inc.(b)
|
|
|
|
|
|
|
|
|
|
|
|
|
|
|
|
|
|
|
|
|
|
Antero
Resources Corp.(b)
|
|
|
|
|
|
|
|
|
|
|
|
|
|
|
|
|
|
|
|
|
|
|
|
|
|
|
Equity
Real Estate Investment Trusts — 7.0% |
Digital
Realty Trust, Inc.(c)
|
|
|
|
|
|
Federal
Realty Investment Trust(c)
|
|
|
|
|
|
Healthpeak
Properties, Inc.(c)
|
|
|
|
|
|
|
|
|
|
|
|
|
|
|
|
|
|
|
|
|
|
|
|
|
|
|
Financial
Services — 10.2% |
|
|
|
|
|
|
|
Fidelity
National Information Services, Inc. |
|
|
|
|
|
SCHEDULE OF INVESTMENTS (continued)
|
|
|
|
|
|
|
Common
Stocks — 96.3% (continued) |
Financial
Services — 10.2% (continued) |
LPL
Financial Holdings, Inc. |
|
|
|
|
|
Rocket
Cos., Inc., Cl. A(a)
|
|
|
|
|
|
|
|
|
|
|
|
|
|
|
|
|
|
|
|
|
|
|
|
|
|
|
Food,
Beverage & Tobacco — 2.5% |
Molson
Coors Beverage Co., Cl. B |
|
|
|
|
|
|
|
|
|
|
|
|
|
|
|
|
|
|
|
Health
Care Equipment & Services — 4.4% |
|
|
|
|
|
|
|
Globus
Medical, Inc., Cl. A(b)
|
|
|
|
|
|
|
|
|
|
|
|
|
|
|
|
|
|
|
|
Household
& Personal Products — 3.2% |
|
|
|
|
|
|
|
The
Estee Lauder Companies, Inc., Cl. A |
|
|
|
|
|
|
|
|
|
|
|
|
|
|
|
|
|
|
|
|
|
RenaissanceRe
Holdings Ltd. |
|
|
|
|
|
|
|
|
|
|
|
|
|
|
Axalta
Coating Systems Ltd.(b)
|
|
|
|
|
|
|
|
|
|
|
|
|
|
|
|
|
|
|
|
|
|
|
|
|
|
|
|
|
|
|
|
|
|
|
|
|
|
|
|
|
|
|
|
|
|
|
|
|
|
|
|
|
|
|
Media
& Entertainment — 3.0% |
|
|
|
|
|
|
|
Pinterest,
Inc., Cl. A(b)
|
|
|
|
|
|
|
|
|
|
|
|
|
Pharmaceuticals,
Biotechnology & Life Sciences — 2.2% |
|
|
|
|
|
|
|
Elanco
Animal Health, Inc.(b)
|
|
|
|
|
|
|
|
|
|
|
|
|
Semiconductors
& Semiconductor Equipment — 2.8% |
|
|
|
|
|
|
|
|
|
|
|
|
|
|
|
|
|
|
|
|
|
Software
& Services — 4.7% |
Check
Point Software Technologies Ltd.(b)
|
|
|
|
|
|
Cognizant
Technology Solutions Corp., Cl. A |
|
|
|
|
|
Dolby
Laboratories, Inc., Cl. A |
|
|
|
|
|
|
|
|
|
|
|
|
|
|
|
|
|
|
|
|
|
Knight-Swift
Transportation Holdings, Inc. |
|
|
|
|
|
|
|
|
|
|
|
|
Common
Stocks — 96.3% (continued) |
|
|
Constellation
Energy Corp. |
|
|
|
|
|
|
|
|
|
|
|
|
|
|
|
|
|
|
|
|
|
|
|
|
|
|
Total
Common Stocks
(cost
$300,887,462) |
|
|
|
|
|
|
|
Software
& Services — 1.4% |
Databricks,
Inc., Ser. H (b),(d)
|
|
|
|
|
|
Databricks,
Inc., Ser. I (b),(d)
|
|
|
|
|
|
Total
Private Equity
(cost
$2,596,384) |
|
|
|
|
|
|
|
|
|
|
|
|
Investment
Companies — 2.5% |
Registered
Investment Companies — 2.5% |
Dreyfus
Institutional Preferred Government Plus Money Market Fund, Institutional
(cost
$9,913,245) |
|
|
|
|
|
Investment
of Cash Collateral for Securities Loaned — 3.7% |
|
|
|
|
|
Registered
Investment Companies — 3.7% |
|
|
|
|
|
Dreyfus
Institutional Preferred Government Plus Money Market Fund, Institutional
(cost
$14,521,229) |
|
|
|
|
|
Total
Investments (cost $327,918,320)
|
|
|
|
Liabilities,
Less Cash and Receivables |
|
|
|
|
|
|
|
ADR—American
Depositary Receipt |
|
|
Security,
or portion thereof, on loan. At August 31, 2025, the value of the fund’s securities on loan was $18,229,760 and the value of the
collateral was
$18,770,823,
consisting of cash collateral of $14,521,229 and U.S. Government & Agency securities valued at $4,249,594. In addition, the
value of
collateral
may include pending sales that are also on loan. |
|
|
Non-income
producing security. |
|
|
Investment
in real estate investment trust within the United States. |
|
|
The
fund held Level 3 securities at August 31, 2025. These securities were valued at $5,299,800 or 1.4% of net assets.
|
|
|
Investment
in affiliated issuer. The investment objective of this investment company is publicly available and can be found within the investment
company’s
prospectus.
|
|
|
|
|
|
|
|
|
Dividends/
Distributions
($) |
Registered
Investment Companies - 2.5% |
Dreyfus
Institutional Preferred Government Plus Money
Market
Fund, Institutional Shares - 2.5% |
|
|
|
|
|
SCHEDULE OF INVESTMENTS (continued)
Affiliated
Issuers (continued) |
|
|
|
|
|
|
Dividends/
Distributions
($) |
Investment
of Cash Collateral for Securities Loaned - 3.7% |
Dreyfus
Institutional Preferred Government Plus Money
Market
Fund, Institutional Shares - 3.7% |
|
|
|
|
|
|
|
|
|
|
|
|
|
|
Includes
reinvested dividends/distributions. |
|
|
Represents
securities lending income earned from the reinvestment of cash collateral from loaned securities, net of fees and collateral investment
expenses, and
other
payments to and from borrowers of securities. |
See notes to financial
statements.
STATEMENT
OF ASSETS AND LIABILITIES
August 31, 2025
|
|
|
|
|
|
|
|
Investments
in securities—See Schedule of Investments
(including
securities on loan, valued at $18,229,760)—Note
1(c): |
|
|
|
|
|
|
|
|
|
|
|
|
|
|
Receivable
for investment securities sold |
|
|
Dividends
and securities lending income receivable |
|
|
Receivable
for shares of Common Stock subscribed |
|
|
Tax
reclaim receivable—Note 1(b)
|
|
|
|
|
|
|
|
|
|
|
|
|
|
|
Due
to BNY Mellon Investment Adviser, Inc. and affiliates—Note
3(c)
|
|
|
Liability
for securities on loan—Note 1(c)
|
|
|
Payable
for investment securities purchased |
|
|
Payable
for shares of Common Stock redeemed |
|
|
Directors’
fees and expenses payable |
|
|
|
|
|
|
|
|
|
|
|
|
|
|
Composition
of Net Assets ($): |
|
|
|
|
|
|
Total
distributable earnings (loss) |
|
|
|
|
|
|
Net
Asset Value Per Share |
|
|
|
|
|
|
|
|
|
|
|
|
|
|
|
|
Net
Asset Value Per Share ($) |
|
|
|
|
See notes to financial statements.
Year Ended August 31,
2025
|
|
|
|
|
|
|
|
|
Cash
dividends (net of $31,347 foreign taxes withheld at source): |
|
|
|
|
|
|
|
Affiliated
income net of rebates from securities lending—Note
1(c)
|
|
|
|
|
|
|
|
|
|
|
|
|
|
Shareholder
servicing costs—Note 3(c)
|
|
|
|
|
|
|
|
Prospectus
and shareholders’ reports |
|
Directors’
fees and expenses—Note 3(d)
|
|
Chief
Compliance Officer fees—Note 3(c)
|
|
Distribution
Plan fees—Note 3(b)
|
|
Loan
commitment fees—Note 2 |
|
Shareholder
and regulatory reports service fees—Note
3(c)
|
|
|
|
|
|
|
|
|
|
|
Less—reduction
in fees due to earnings credits—Note 3(c)
|
|
|
|
|
|
|
|
Realized
and Unrealized Gain (Loss) on Investments—Note 4 ($):
|
|
Net
realized gain (loss) on investments |
|
Net
change in unrealized appreciation (depreciation) on investments and foreign currency transactions |
|
Net
Realized and Unrealized Gain (Loss) on Investments |
|
Net
Increase in Net Assets Resulting from Operations |
|
See notes to financial statements.
STATEMENT
OF CHANGES IN NET ASSETS
|
|
|
|
|
|
|
|
|
|
|
|
|
|
|
Net
realized gain (loss) on investments |
|
|
Net
change in unrealized appreciation (depreciation) on investments |
|
|
Net
Increase (Decrease) in Net Assets Resulting from Operations |
|
|
|
|
|
|
Distributions
to shareholders: |
|
|
|
|
|
|
|
|
|
|
|
|
|
|
|
|
|
|
|
|
|
|
Capital
Stock Transactions ($): |
|
|
Net
proceeds from shares sold: |
|
|
|
|
|
|
|
|
|
|
|
|
|
|
|
|
|
|
Distributions
reinvested: |
|
|
|
|
|
|
|
|
|
|
|
|
|
|
|
|
|
|
|
|
|
|
|
|
|
|
|
|
|
|
|
|
|
|
|
|
|
|
Increase
(Decrease) in Net Assets from Capital Stock Transactions |
|
|
Total
Increase (Decrease) in Net Assets |
|
|
|
|
|
|
|
|
|
|
|
|
|
|
STATEMENT
OF CHANGES IN NET ASSETS (continued)
|
|
|
|
|
|
|
Capital
Share Transactions (Shares): |
|
|
|
|
|
|
|
|
|
|
Shares
issued for distributions reinvested |
|
|
|
|
|
|
Net
Increase (Decrease) in Shares Outstanding |
|
|
|
|
|
|
|
|
|
|
Shares
issued for distributions reinvested |
|
|
|
|
|
|
Net
Increase (Decrease) in Shares Outstanding |
|
|
|
|
|
|
|
|
|
|
Shares
issued for distributions reinvested |
|
|
|
|
|
|
Net
Increase (Decrease) in Shares Outstanding |
|
|
|
|
|
|
|
|
|
|
Shares
issued for distributions reinvested |
|
|
|
|
|
|
Net
Increase (Decrease) in Shares Outstanding |
|
|
|
|
During
the period ended August 31, 2025, 1,201 Class A shares representing $38,892 were exchanged for 1,208 Class I shares.
|
|
|
During
the period ended August 31, 2024, 480 Class C shares representing $10,892 were automatically converted to 368 Class A shares.
|
See notes to financial statements.
The
following tables describe the performance for each share class for the fiscal periods indicated. All information (except portfolio
turnover rate) reflects financial
results for a single fund share. Net asset value total return is calculated assuming an initial investment made at the net asset
value at the beginning of the period, reinvestment of all dividends and distributions at net asset value during the period, and redemption
at net asset value on the last day
of the period. Net asset value total return includes adjustments in accordance with accounting principles generally
accepted in the United States of America and as such, the net asset value for financial reporting purposes and the returns based upon
those net asset values may differ from the net asset
value and returns for shareholder transactions.
|
|
|
|
|
|
|
|
|
|
|
|
|
|
|
|
Net
asset value, beginning of period |
|
|
|
|
|
|
|
|
|
|
|
|
|
|
|
|
|
|
Net
realized and unrealized gain (loss) on investments |
|
|
|
|
|
Total
from Investment Operations |
|
|
|
|
|
|
|
|
|
|
|
|
Dividends
from net investment income |
|
|
|
|
|
Dividends
from net realized gain on investments |
|
|
|
|
|
|
|
|
|
|
|
|
Net
asset value, end of period |
|
|
|
|
|
|
|
|
|
|
|
|
Ratios/Supplemental
Data (%): |
|
|
|
|
Ratio
of total expenses to average net assets |
|
|
|
|
|
Ratio
of net expenses to average net assets |
|
|
|
|
|
Ratio
of net investment income to average net assets |
|
|
|
|
|
|
|
|
|
|
|
|
Net
Assets, end of period ($ x 1,000) |
|
|
|
|
|
|
|
Based
on average shares outstanding. |
|
|
Amount
inclusive of reduction in fees due to earnings credits. |
|
|
Amount
inclusive of reduction in expenses due to undertaking. |
See notes to financial statements.
FINANCIAL
HIGHLIGHTS (continued)
|
|
|
|
|
|
|
|
|
|
|
|
|
|
|
|
Net
asset value, beginning of period |
|
|
|
|
|
|
|
|
|
|
|
|
|
|
|
|
|
|
Net
realized and unrealized gain (loss) on investments |
|
|
|
|
|
Total
from Investment Operations |
|
|
|
|
|
|
|
|
|
|
|
|
Dividends
from net realized gain on investments |
|
|
|
|
|
Net
asset value, end of period |
|
|
|
|
|
|
|
|
|
|
|
|
Ratios/Supplemental
Data (%): |
|
|
|
|
Ratio
of total expenses to average net assets |
|
|
|
|
|
Ratio
of net expenses to average net assets |
|
|
|
|
|
Ratio
of net investment (loss) to average net assets |
|
|
|
|
|
|
|
|
|
|
|
|
Net
Assets, end of period ($ x 1,000) |
|
|
|
|
|
|
|
Based
on average shares outstanding. |
|
|
Amount
inclusive of reduction in fees due to earnings credits. |
|
|
Amount
inclusive of reduction in expenses due to undertaking. |
See notes to financial statements.
|
|
|
|
|
|
|
|
|
|
|
|
|
|
|
|
Net
asset value, beginning of period |
|
|
|
|
|
|
|
|
|
|
|
|
|
|
|
|
|
|
Net
realized and unrealized gain (loss) on investments |
|
|
|
|
|
Total
from Investment Operations |
|
|
|
|
|
|
|
|
|
|
|
|
Dividends
from net investment income |
|
|
|
|
|
Dividends
from net realized gain on investments |
|
|
|
|
|
|
|
|
|
|
|
|
Net
asset value, end of period |
|
|
|
|
|
|
|
|
|
|
|
|
Ratios/Supplemental
Data (%): |
|
|
|
|
Ratio
of total expenses to average net assets |
|
|
|
|
|
Ratio
of net expenses to average net assets |
|
|
|
|
|
Ratio
of net investment income to average net assets |
|
|
|
|
|
|
|
|
|
|
|
|
Net
Assets, end of period ($ x 1,000) |
|
|
|
|
|
|
|
Based
on average shares outstanding. |
|
|
Amount
inclusive of reduction in fees due to earnings credits. |
|
|
Amount
inclusive of reduction in expenses due to undertaking. |
See notes to financial statements.
FINANCIAL
HIGHLIGHTS (continued)
|
|
|
|
|
|
|
|
|
|
|
|
|
|
|
|
Net
asset value, beginning of period |
|
|
|
|
|
|
|
|
|
|
|
|
|
|
|
|
|
|
Net
realized and unrealized gain (loss) on investments |
|
|
|
|
|
Total
from Investment Operations |
|
|
|
|
|
|
|
|
|
|
|
|
Dividends
from net investment income |
|
|
|
|
|
Dividends
from net realized gain on investments |
|
|
|
|
|
|
|
|
|
|
|
|
Net
asset value, end of period |
|
|
|
|
|
|
|
|
|
|
|
|
Ratios/Supplemental
Data (%): |
|
|
|
|
Ratio
of total expenses to average net assets |
|
|
|
|
|
Ratio
of net expenses to average net assets |
|
|
|
|
|
Ratio
of net investment income to average net assets |
|
|
|
|
|
|
|
|
|
|
|
|
Net
Assets, end of period ($ x 1,000) |
|
|
|
|
|
|
|
Based
on average shares outstanding. |
|
|
Amount
inclusive of reduction in fees due to earnings credits. |
|
|
Amount
inclusive of reduction in expenses due to undertaking. |
See notes to financial statements.
NOTES
TO FINANCIAL STATEMENTS
NOTE
1—
Significant
Accounting Policies:
BNY Mellon
Opportunistic Midcap Value Fund (the “fund”)
is a separate diversified series of BNY Mellon Advantage Funds, Inc. (the “Company”),
which is registered under the Investment Company Act of 1940, as amended (the “Act”),
as an open-end management investment
company and operates as a series company currently offering six series, including the fund. The fund’s investment objective is
to seek to surpass the performance of the Russell Midcap® Value Index. BNY Mellon Investment Adviser, Inc. (the “Adviser”),
a wholly-owned subsidiary of The
Bank of New York Mellon Corporation (“BNY”),
serves as the fund’s investment adviser. Newton Investment
Management North America, LLC (the “Sub-Adviser”
or “NIMNA”),
an indirect wholly-owned subsidiary of BNY and an affiliate
of the Adviser, serves as the fund’s sub-adviser. NIMNA’s principal office is located at BNY Mellon Center, 201
Washington Street, Boston, Massachusetts 02108. NIMNA has entered into a sub-sub-investment advisory agreement with its affiliate,
Newton Investment Management Limited (“NIM”),
which enables NIM to provide certain advisory services to the Sub-Adviser
for the benefit of the fund, including, but not limited to, portfolio management services. NIM is subject to the supervision of NIMNA
and the Adviser. NIM is also an affiliate of the Adviser. NIM, located at 160 Queen Victoria Street, London, EC4V, 4LA, England,
was formed in 1978. NIM is an indirect subsidiary of BNY.
BNY Mellon
Securities Corporation (the “Distributor”), a wholly-owned subsidiary of the Adviser, is the distributor of the fund’s
shares. The fund is authorized to
issue 800 million shares of $.001 par value of Common Stock. The fund currently has authorized four classes of
shares: Class A (350 million shares authorized), Class C (125 million shares authorized), Class I (175 million shares authorized) and
Class Y (150 million shares authorized).
Class A and Class C shares are sold primarily to retail investors through financial intermediaries and
bear Distribution and/or Shareholder Services Plan fees. Class A shares generally are subject to a sales charge imposed at the time of
purchase. Class A shares bought
without an initial sales charge as part of an investment of $1 million or more may be charged a contingent
deferred sales charge (“CDSC”) of 1.00% if redeemed within one year. Class C shares are subject to a CDSC imposed on Class
C shares redeemed within one year of purchase. Class C shares automatically convert to Class A shares eight years after the date of purchase,
without the imposition of a sales charge. Class I shares are sold primarily to bank trust departments and other financial service providers
(including BNY and its affiliates), acting on behalf of customers having a qualified trust or an investment account or relationship
at such institution, and bear no Distribution or Shareholder Services Plan fees. Class Y shares are sold at net asset value per share
generally to institutional investors,
and bear no Distribution or Shareholder Services Plan fees. Class I and Class Y shares are offered without
a front-end sales charge or CDSC. Other differences between the classes include the services offered to and the expenses borne by
each class, the allocation of certain transfer agency costs and certain voting rights. Income, expenses (other than expenses attributable
to a specific class), and realized
and unrealized gains or losses on investments are allocated to each class of shares based on its relative net assets.
The Company
accounts separately for the assets, liabilities and operations of each series. Expenses directly attributable to each series are charged
to that series’ operations; expenses which are applicable to all series are allocated among them on a pro rata basis.
The Financial
Accounting Standards Board (“FASB”) Accounting Standards Codification (“ASC”) is the exclusive reference of authoritative
U.S. generally accepted accounting principles (“GAAP”) recognized by the FASB to be applied by nongovernmental entities. Rules
and interpretive releases of the SEC under authority of federal laws are also sources of authoritative GAAP for SEC registrants. The
fund is an investment company and applies the accounting and reporting guidance of the FASB ASC Topic 946 Financial Services-Investment
Companies. The fund’s financial statements are prepared in accordance with GAAP, which may require the use of management
estimates and assumptions. Actual results could differ from those estimates.
The Company
enters into contracts that contain a variety of indemnifications. The fund’s maximum exposure under these arrangements is
unknown. The fund does not anticipate recognizing any loss related to these arrangements.
(a) Portfolio
valuation: The fair value of a financial instrument
is the amount that would be received to sell an asset or paid to transfer a
liability in an orderly transaction between market participants at the measurement date (i.e., the exit price). GAAP establishes a fair
value hierarchy that prioritizes
the inputs of valuation techniques used to measure fair value. This hierarchy gives the highest priority to unadjusted
quoted prices in active markets for identical assets or liabilities (Level 1 measurements) and the lowest priority to unobservable
inputs (Level 3 measurements).
Additionally,
GAAP provides guidance on determining whether the volume and activity in a market has decreased significantly and whether
such a decrease in activity results in transactions that are not orderly. GAAP requires enhanced disclosures around valuation inputs
and techniques used during annual and interim periods.
NOTES
TO FINANCIAL STATEMENTS (continued)
Various
inputs are used in determining the value of the fund’s investments relating to fair value measurements. These inputs are summarized
in the three broad levels listed below:
Level 1—unadjusted
quoted prices in active markets for identical investments.
Level 2—other
significant observable inputs (including quoted prices for similar investments, interest rates, prepayment speeds, credit
risk, etc.).
Level 3—significant
unobservable inputs (including the fund’s own assumptions in determining the fair value of investments).
The inputs
or methodology used for valuing securities are not necessarily an indication of the risk associated with investing in those securities.
Changes in
valuation techniques may result in transfers in or out of an assigned level within the disclosure hierarchy. Valuation techniques
used to value the fund’s investments are as follows:
The Company’s
Board of Directors (the “Board”)
has designated the Adviser as the fund’s valuation designee to make all fair value determinations
with respect to the fund’s portfolio investments, subject to the Board’s oversight and pursuant to Rule 2a-5 under the Act.
Investments
in equity securities are valued at the last sales price on the securities exchange or national securities market on which such securities
are primarily traded. Securities listed on the National Market System for which market quotations are available are valued at the
official closing price or, if there is no official closing price that day, at the last sales price. For open short positions, asked prices
are used for valuation purposes.
Bid price is used when no asked price is available. Registered investment companies that are not
traded on an exchange are valued
at their net asset value. All of the preceding securities are generally categorized within Level 1 of the fair value hierarchy.
Securities
not listed on an exchange or the national securities market, or securities for which there were no transactions, are valued at the average
of the most recent bid and asked prices. These securities are generally categorized within Level 2 of the fair value hierarchy.
Fair valuing
of securities may be determined with the assistance of a pricing service using calculations based on indices of domestic securities
and other appropriate indicators, such as prices of relevant ADRs and futures. Utilizing these techniques may result in transfers between
Level 1 and Level 2 of the fair value hierarchy.
When market
quotations or official closing prices are not readily available, or are determined not to accurately reflect fair value, such as when
the value of a security has been significantly affected by events after the close of the exchange or market on which the security is principally
traded, but before the fund calculates its net asset value, the fund may value these investments at fair value as determined in accordance
with the procedures approved by the Board. Certain factors may be considered when fair valuing investments such as: fundamental
analytical data, the nature and duration of restrictions on disposition, an evaluation of the forces that influence the market in which
the securities are purchased and sold, and public trading in similar securities of the issuer or comparable issuers. These securities
are either categorized within Level 2 or 3 of the
fair value hierarchy depending on the relevant inputs used.
For securities
where observable inputs are limited, assumptions about market activity and risk are used and such securities are generally categorized
within Level 3 of the fair value hierarchy.
Investment
in private equity securities will be fair valued by the Board in accordance with valuation procedures approved by the Board. Those portfolio
valuations will be based on unobservable inputs and certain assumptions about how market participants would price the
instrument. The fund expects that inputs into the determination of fair value of those investments will require significant
management judgment or estimation. Because
valuations may fluctuate over short periods of time and may be based on estimates, fair value determinations
may differ materially from the value received in an actual transaction. Additionally, valuations of private companies are inherently
uncertain. The fund’s net asset value could be adversely affected if the fund’s determinations regarding the fair value
of those investments were materially
higher or lower than the values that it ultimately realized upon the disposal of such investments. These securities
are categorized within Level 3 of the fair value hierarchy.
NOTES
TO FINANCIAL STATEMENTS (continued)
The following
is a summary of the inputs used as of August 31, 2025 in valuing the fund’s investments:
|
|
Level
1 -
Unadjusted
Quoted
Prices |
Level
2- Other
Significant
Observable
Inputs |
Level
3-
Significant
Unobservable
Inputs
|
|
|
|
|
|
|
|
Investments
in Securities:†
|
|
|
|
|
Equity
Securities - Common Stocks |
|
|
|
|
Equity
Securities - Private Equity |
|
|
|
|
|
|
|
|
|
|
|
|
|
|
|
|
|
|
See
Schedule of Investments for additional detailed categorizations, if any. |
The following is a reconciliation
of Level 3 assets for which significant unobservable inputs were used to determine fair value:
|
|
Equity
Securities-Private Equity ($) |
|
|
|
|
|
|
|
|
|
|
|
|
Change
in unrealized appreciation (depreciation) |
|
|
|
|
|
|
|
|
|
|
The
amount of total gains (losses) for the period included in earnings attributable to the change in
unrealized
appreciation (depreciation) relating to investments still held at 8/31/2025 |
|
|
|
Securities
deemed as Level 3 due to the lack of observable inputs by management assessment. |
The following
table summarizes the significant unobservable inputs the fund used to value its investment categorized within Level 3 as of
August 31, 2025. In addition to the techniques and inputs noted in the table below, according to the fund’s valuation policy,
other valuation techniques and methodologies
when determining the fund’s fair value measurements may be used. The below table is not intended
to be all-inclusive, but rather provide information on the significant unobservable inputs as they are to the fund’s determination
of fair values at period end.
|
|
|
|
|
Amount
or Range/
Weighted
Average |
|
|
|
|
|
|
|
|
Valuation
techniques may change in order to reflect the Valuation Designee’s judgment of current market participant assumptions.
|
(b) Foreign
currency transactions: The fund does not isolate
that portion of the results of operations resulting from changes in foreign exchange
rates on investments from the fluctuations arising from changes in the market prices of securities held. Such fluctuations are included
with the net realized and unrealized gain or loss on investments.
Net realized
foreign exchange gains or losses arise from sales of foreign currencies, currency gains or losses realized on securities transactions
between trade and settlement date, and the difference between the amounts of dividends, interest and foreign withholding taxes recorded
on the fund’s books and the U.S. dollar equivalent of the amounts actually received or paid. Net unrealized foreign exchange gains
and losses arise from changes in the value of assets and liabilities other than investments resulting from changes in exchange rates.
Foreign currency gains and losses
on foreign currency transactions are also included with net realized and unrealized gain or loss on investments.
NOTES
TO FINANCIAL STATEMENTS (continued)
Foreign
taxes: The fund may be subject to foreign taxes (a
portion of which may be reclaimable) on income, stock dividends, realized and
unrealized capital gains on investments or certain foreign currency transactions. Foreign taxes are recorded in accordance with the applicable
foreign tax regulations and rates that exist in the foreign jurisdictions in which the fund invests. These foreign taxes, if any, are
paid by the fund and are reflected
in the Statement of Operations, if applicable. Foreign taxes payable or deferred or those subject to reclaims
as of August 31, 2025, if any, are disclosed in the fund’s Statement of Assets and Liabilities.
(c) Securities
transactions and investment income: Securities transactions
are recorded on a trade date basis. Realized gains and losses
from securities transactions are recorded on the identified cost basis. Dividend income is recognized on the ex-dividend date and interest
income, including, where applicable, accretion of discount and amortization of premium on investments, is recognized on the accrual
basis.
Pursuant to
a securities lending agreement with BNY, the fund may lend securities to qualified institutions. It is the fund’s policy that, at
origination, all loans are secured by collateral of at least 102% of the value of U.S. securities loaned and 105% of the value of foreign
securities loaned. Collateral equivalent
to at least 100% of the market value of securities on loan is maintained at all times. Collateral is either
in the form of cash, which can be invested in certain money market mutual funds managed by the Adviser, or U.S. Government and
Agency securities. Any non-cash collateral received cannot be sold or re-pledged by the fund, except in the event of borrower default,
and is not reflected in the Statement of Assets and Liabilities. The securities on loan, if any, are also disclosed in the fund’s
Schedule of Investments. The fund
is entitled to receive all dividends, interest and distributions on securities loaned, in addition to income
earned as a result of the lending transaction. Should a borrower fail to return the securities in a timely manner, BNY is required to
replace the securities for the benefit of the fund or credit the fund with the market value of the unreturned securities and is subrogated
to the fund’s rights against
the borrower and the collateral. Additionally, the contractual maturity of security lending transactions are on an
overnight and continuous basis. During the period ended August 31, 2025, BNY earned $23,131 from the lending of the fund’s
portfolio securities, pursuant to the securities
lending agreement.
For financial
reporting purposes, the fund elects not to offset assets and liabilities subject to a securities lending agreement, if any, in the Statement
of Assets and Liabilities. Therefore, all qualifying transactions are presented on a gross basis in the Statement of Assets and Liabilities.
As of August 31, 2025, the fund had securities lending and the impact of netting of assets and liabilities and the offsetting of collateral
pledged or received, if any, based on contractual netting/set-off provisions in the securities lending agreement are detailed in the
following table:
|
|
|
Gross
amount of securities loaned, at
value,
as disclosed in the Statement
of
Assets and Liabilities |
|
Collateral
(received)/posted not offset
in
the Statement of
Assets
and Liabilities |
|
|
|
|
|
|
The
value of the related collateral received by the fund exceeded the value of the securities loaned by the fund pursuant to the securities
lending agreement. In addition,
the
value of collateral may include pending sales that are also on loan. See Schedule of Investments for detailed information regarding collateral
received for open
securities
lending. |
(d) Affiliated
issuers: Investments in other investment companies
advised by the Adviser are considered “affiliated” under the Act.
(e) Market
Risk: The value of the securities in which the fund
invests may be affected by political, regulatory, economic and social developments,
and developments that impact specific economic sectors, industries or segments of the market. In addition, turbulence in financial
markets and reduced liquidity in equity, credit and/or fixed-income markets may negatively affect many issuers, which could adversely
affect the fund. Global economies and financial markets are becoming increasingly interconnected, and conditions and events in
one country, region or financial market may adversely impact issuers in a different country, region or financial market. These risks may
be magnified if certain events or developments adversely interrupt the global supply chain; in these and other circumstances, such risks
might affect companies world-wide.
(f) Dividends
and distributions to shareholders:
Dividends and distributions are recorded on the ex-dividend date. Dividends from net
investment income and dividends from net realized capital gains, if any, are normally declared and paid annually, but the fund may make
distributions on a more frequent basis to comply with the distribution requirements of the Internal Revenue Code of 1986, as
NOTES
TO FINANCIAL STATEMENTS (continued)
amended
(the “Code”). To the extent that net realized capital gains can be offset by capital loss carryovers, it is the policy of
the fund not to distribute such
gains. Income and capital gain distributions are determined in accordance with income tax regulations, which may differ
from GAAP.
(g) Federal
income taxes: It is the policy of the fund to continue
to qualify as a regulated investment company, if such qualification is in
the best interests of its shareholders, by complying with the applicable provisions of the Code, and to make distributions of taxable
income and net realized capital gain sufficient to
relieve it from substantially all federal income and excise taxes.
As of and
during the period ended August 31, 2025, the fund did not have any liabilities for any uncertain tax positions. The fund recognizes
interest and penalties, if any, related to uncertain tax positions as income tax expense in the Statement of Operations. During the
period ended August 31, 2025, the fund did not incur any interest or penalties.
Each tax year
in the four-year period ended August 31, 2025 remains subject to examination by the Internal Revenue Service and state taxing
authorities.
At August
31, 2025, the components of accumulated earnings on a tax basis were as follows: undistributed ordinary income $2,349,220,
undistributed capital gains $26,680,192 and unrealized appreciation $76,302,533.
The tax character
of distributions paid to shareholders during the fiscal years ended August 31, 2025 and August 31, 2024 were as follows:
ordinary income $1,924,307 and $2,680,360, and long-term capital gains $36,050,019 and $12,835,264, respectively.
During the
period ended August 31, 2025, as a result of permanent book to tax differences, primarily due to the tax treatment for treating
a portion of the proceeds from redemptions as a distribution for tax purposes, the fund decreased total distributable earnings (loss)
by $1,380,411 and increased paid-in capital by the same amount. Net assets and net asset value per share were not affected by this reclassification.
(h) Operating
segment reporting: In this reporting period, the
fund adopted FASB Accounting Standards Update 2023-07, Segment Reporting
(Topic 280) - Improvements to Reportable Segment Disclosures (“ASU 2023-07”). Adoption of the new standard impacted financial
statement disclosures only and did not affect the fund’s financial position or the results of its operations. The ASU 2023-07 is
effective for public entities for
fiscal years beginning after December 15, 2023, and requires retrospective application for all prior periods presented
within the financial statements.
Since its
commencement, the fund operates and is managed as a single reportable segment deriving returns in the form of dividends, interest
and/or gains from the investments made in pursuit of its single stated investment objective as outlined in the fund’s prospectus.
The accounting policies of the fund
are consistent with those described in these Notes to Financial Statements. The chief operating decision
maker (“CODM”) is represented by BNY Investments, the management of the Adviser, comprising Senior Management and Directors.
The CODM considers net increase in net assets resulting from operations in deciding whether to purchase additional investments
or to make distributions to fund shareholders. Detailed financial information for the fund is disclosed within these financial statements
with total assets and liabilities disclosed on the Statement of Assets and Liabilities, investments held on the Schedule of Investments,
results of operations and significant segment expenses on the Statement of Operations and other information about the fund’s
performance, including total return, portfolio turnover and ratios within the Financial Highlights.
NOTE
2—
Bank
Lines of Credit:
The fund participates with
other long-term open-end funds managed by the Adviser in a $738 million unsecured credit facility led by Citibank,
N.A. (the “Citibank Credit Facility”) and a $300 million unsecured credit facility provided by BNY (the “BNY Credit
Facility”), each to be utilized
primarily for temporary or emergency purposes, including the financing of redemptions (each, a “Facility”).
The Citibank Credit Facility is available in two tranches: (i) Tranche A is in an amount equal to $618 million and is available to all
long-term open-ended funds, including
the fund, and (ii) Tranche B is an amount equal to $120 million and is available only to BNY Mellon
Floating Rate Income Fund, a series of BNY Mellon Investment Funds IV, Inc. In connection therewith, the fund has agreed to pay
its pro rata portion of commitment fees for Tranche A of the Citibank Credit Facility and the BNY Credit Facility. Interest is charged
to the fund based on rates determined pursuant to the terms of the respective Facility at the time of borrowing. During the period
ended August 31, 2025, the fund did not borrow under either Facility.
NOTE
3—
Management
Fee, Sub-Advisory Fee
and Other Transactions with Affiliates:
(a) Pursuant
to a management agreement with the Adviser, the management fee is computed at the annual rate of .75% of the value of the
fund’s average daily net assets and is payable monthly.
NOTES
TO FINANCIAL STATEMENTS (continued)
Pursuant
to a sub-investment advisory agreement between the Adviser and the Sub-Adviser, the Adviser pays the Sub-Adviser a monthly fee
at an annual rate of .36% of the value of the fund’s average daily net assets.
During the
period ended August 31, 2025, the Distributor retained $900 from commissions earned on sales of the fund’s Class A shares and
$54 from CDSC fees on redemptions of the fund’s Class C shares.
(b) Under
the Distribution Plan adopted pursuant to Rule 12b-1 under the Act, Class C shares pay the Distributor for distributing its shares
at an annual rate of .75% of the value of its average daily net assets. The Distributor may pay one or more Service Agents in respect
of advertising, marketing and other distribution services, and determines the amounts, if any, to be paid to Service Agents and the
basis on which such payments are made. During the period ended August 31, 2025, Class C shares were charged $20,939 pursuant to
the Distribution Plan.
(c) Under
the Shareholder Services Plan, Class A and Class C shares pay the Distributor at an annual rate of .25% of the value of their average
daily net assets for the provision of certain services. The services provided may include personal services relating to shareholder accounts,
such as answering shareholder inquiries regarding the fund, and services related to the maintenance of shareholder accounts. The
Distributor may make payments to Service Agents (securities dealers, financial institutions or other industry professionals) with respect
to these services. The Distributor determines the amounts to be paid to Service Agents. During the period ended August 31, 2025,
Class A and Class C shares were charged $696,447 and $6,980, respectively, pursuant to the Shareholder Services Plan.
The fund has
an arrangement with BNY Mellon Transfer, Inc., (the “Transfer Agent”), a subsidiary of BNY and an affiliate of the Adviser,
whereby the fund may receive earnings credits when positive cash balances are maintained, which are used to offset Transfer Agent
fees. For financial reporting purposes, the fund includes transfer agent net earnings credits, if any, as an expense offset in the Statement
of Operations.
The fund has
an arrangement with The Bank of New York Mellon (the “Custodian”), a subsidiary of BNY and an affiliate of the Adviser, whereby
the fund will receive interest income or be charged overdraft fees when cash balances are maintained. For financial reporting purposes,
the fund includes this interest income and overdraft fees, if any, as interest income in the Statement of Operations.
The fund compensates
the Transfer Agent, under a transfer agency agreement, for providing transfer agency and cash management services
for the fund. The majority of Transfer Agent fees are comprised of amounts paid on a per account basis, while cash management fees
are related to fund subscriptions and redemptions. During the period ended August 31, 2025, the fund was charged $37,989 for transfer
agency services. These fees are included in Shareholder servicing costs in the Statement of Operations. These fees were partially offset
by earnings credits of $6,305.
The fund compensates
the Custodian, under a custody agreement, for providing custodial services for the fund. These fees are determined
based on net assets, geographic region and transaction activity. During the period ended August 31, 2025, the fund was charged $7,245
pursuant to the custody agreement.
During the
period ended August 31, 2025, the fund was charged $24,797 for services performed by the fund’s Chief Compliance Officer
and his staff. These fees are included in Chief Compliance Officer fees in the Statement of Operations.
The fund compensates
the Custodian for providing shareholder reporting and regulatory services for the fund. These fees are included in
Shareholder and regulatory reports service fees in the Statement of Operations. During the period ended August 31, 2025, the Custodian
was compensated $8,583 for financial reporting and regulatory services.
The components
of “Due to BNY Mellon Investment Adviser, Inc. and affiliates” in the Statement of Assets and Liabilities consist of:
Management fee of $245,451, Distribution Plan fees of $1,287, Shareholder Services Plan fees of $58,622, Custodian fees of $1,600,
Chief Compliance Officer fees of $3,258, Transfer Agent fees of $6,290 and Shareholder and regulatory reports service fees of $6,667.
(d) Each
board member of the fund also serves as a board member of other funds in the BNY Mellon Family of Funds complex. Annual retainer
fees and attendance fees are allocated to each fund based on net assets.
NOTE
4—
Securities
Transactions:
The aggregate
amount of purchases and sales of investment securities, excluding short-term securities, during the period ended August
31, 2025, amounted to $247,416,565 and $292,193,769, respectively.
NOTES
TO FINANCIAL STATEMENTS (continued)
At
August 31, 2025, the cost of investments for federal income tax purposes was $328,972,799; accordingly, accumulated net unrealized appreciation
on investments was $76,302,278, consisting of $83,417,020 gross unrealized appreciation and $7,114,742 gross unrealized
depreciation.
REPORT
OF INDEPENDENT REGISTERED PUBLIC ACCOUNTING FIRM
To the
Shareholders and the Board of Directors of BNY Mellon Opportunistic Midcap Value Fund
Opinion on the Financial Statements
We have audited
the accompanying statement of assets and liabilities of BNY Mellon Opportunistic Midcap Value Fund (the “Fund”) (one
of the funds constituting BNY
Mellon Advantage Funds, Inc. (the “Company”)),
including the schedule of investments, as of August 31, 2025, and the related
statement of operations for the year then ended, the statements of changes in net assets for each of the two years in the period then
ended, the financial highlights for
each of the five years in the period then ended and the related notes (collectively referred to as the “financial
statements”).
In our opinion, the financial statements
present fairly, in all material respects, the financial position of the Fund (one of the funds constituting BNY
Mellon Advantage Funds, Inc.) at
August 31, 2025, the results of its operations for the year then ended, the changes in its net assets for each of the two years
in the period then ended and its financial highlights for each of the five years in the period then ended, in conformity with U.S. generally
accepted accounting principles.
These financial
statements are the responsibility of the Company’s management. Our responsibility is to express an opinion on the Fund’s financial
statements based on our audits. We
are a public accounting firm registered with the Public Company Accounting Oversight Board (United States) (“PCAOB”)
and are required to be independent with respect to the Company in accordance with the U.S. federal securities laws and the applicable
rules and regulations of the Securities and Exchange
Commission and the PCAOB.
We conducted
our audits in accordance with the standards of the PCAOB. Those standards require that we plan and perform the audit to obtain reasonable
assurance about whether the financial statements are free of material misstatement, whether due to error or fraud. The Company is not
required to have, nor were we engaged
to perform, an audit of the Company’s internal control over financial reporting. As part of our audits, we are required
to obtain an understanding of internal control over financial reporting but not for the purpose of expressing an opinion on the effectiveness
of the Company’s internal control over financial
reporting. Accordingly, we express no such opinion.
Our audits
included performing procedures to assess the risks of material misstatement of the financial statements, whether due to error or fraud,
and performing procedures that respond
to those risks. Such procedures included examining, on a test basis, evidence regarding the amounts and disclosures
in the financial statements. Our procedures included confirmation of securities owned as of August 31, 2025, by correspondence with the
custodian, brokers and others; when
replies were not received from brokers and others, we performed other auditing procedures. Our audits also included
evaluating the accounting principles used and significant estimates made by management, as well as evaluating the overall presentation
of the financial statements. We believe that our audits
provide a reasonable basis for our opinion. 
We have served
as the auditor of one or more investment companies in the BNY Mellon Family of Funds since at least 1957, but we are unable to determine
the specific year.
New
York, New York
October 23, 2025
IMPORTANT
TAX INFORMATION (Unaudited)
For
federal tax purposes, the fund hereby reports 100% of the ordinary dividends paid during the fiscal year ended August 31, 2025 as
qualifying for the corporate dividends
received deduction. Also, certain dividends paid by the fund may be subject to a maximum tax rate
of 15%, as provided for by the Jobs and Growth Tax Relief Reconciliation Act of 2003. Of the distributions paid during the fiscal year,
$1,924,307 represents the maximum amount that may be considered qualified dividend income. Shareholders will receive notification
in early 2026 of the percentage applicable to the preparation of their 2025 income tax returns. The fund also hereby reports $3.0372
per share as a long-term capital gain distribution and $.0227 per share as a short-term capital gain distribution paid December
11, 2024.
Item
8. Changes in and Disagreements with Accountants for Open-End Management Investment Companies
(Unaudited)
Item
9. Proxy Disclosures for Open-End Management Investment Companies (Unaudited)
Item
10. Remuneration Paid to Directors, Officers, and Others of Open-End Management Investment Companies
(Unaudited)
Each
board member also serves as a board member of other funds in the BNY Mellon Family of Funds complex, and annual retainer fees and
meeting attendance fees are allocated to each fund based on net assets. The fund is charged for services performed by the fund’s
Chief Compliance Officer. Compensation
paid by the fund during the period to the board members and the Chief Compliance Officer are
within Item 7. Statement of Operations as Directors’ fees and expenses and Chief Compliance Officer fees, respectively. The aggregate
amount of Directors’ fees and expenses and Chief Compliance Officer fees paid by the fund during the period was $59,602.
Item
11. Statement Regarding Basis for Approval of Investment Advisory Contracts (Unaudited)
At
a meeting of the fund’s Board of Directors (the “Board”)
held on March 4-5, 2025, the Board considered the renewal of the fund’s Management
Agreement, pursuant to which the Adviser provides the fund with investment advisory and administrative services, the Sub-Investment
Advisory Agreement, pursuant to which Newton Investment Management North America, LLC (the “Sub-Adviser”
or “NIMNA”)
provides day-to-day management of the fund’s investments, and the Sub-Sub-Investment Advisory Agreement (collectively with
the Management Agreement and Sub-Investment Advisory Agreement, the “Agreements”)
between NIMNA and Newton Investment
Management Limited (“NIM”),
pursuant to which NIMNA may use the investment advisory personnel, resources and capabilities
available at its sister company, NIM, in providing the day-to-day management of the fund’s investments. The Board members, none
of whom are “interested
persons”
(as defined in the Investment Company Act of 1940, as amended) of the fund, were assisted in their review
by independent legal counsel and met with counsel in executive session separate from representatives of the Adviser and the Sub-Adviser.
In considering the renewal of the Agreements, the Board considered several factors that it believed to be relevant, including those
discussed below. The Board did not identify any one factor as dispositive, and each Board member may have attributed different weights
to the factors considered.
Analysis
of Nature, Extent, and Quality of Services Provided to the Fund.
The Board considered information provided to it at the meeting
and in previous presentations from representatives of the Adviser regarding the nature, extent, and quality of the services provided
to funds in the BNY fund complex, including the fund. The Adviser provided the number of open accounts in the fund, the fund’s
asset size and the allocation of fund assets among distribution channels. The Adviser also had previously provided information regarding
the diverse intermediary relationships and distribution channels of funds in the BNY fund complex (such as retail direct or intermediary,
in which intermediaries typically are paid by the fund and/or the Adviser) and the Adviser’s corresponding need for broad, deep,
and diverse resources to be able to provide ongoing shareholder services to each intermediary or distribution channel, as applicable to
the fund.
The Board
also considered research support available to, and portfolio management capabilities of, the fund’s portfolio management personnel
and that the Adviser also provides oversight of day-to-day fund operations, including fund accounting and administration and
assistance in meeting legal and regulatory requirements. The Board also considered the Adviser’s extensive administrative, accounting
and compliance infrastructures, as well as the Adviser’s supervisory activities over the Sub-Adviser. The Board also considered
portfolio management’s brokerage
policies and practices (including policies and practices regarding soft dollars) and the standards applied
in seeking best execution.
Comparative
Analysis of the Fund’s Performance and Management Fee and Expense Ratio.
The Board reviewed reports prepared by Broadridge
Financial Solutions, Inc. (“Broadridge”),
an independent provider of investment company data based on classifications provided
by Thomson Reuters Lipper (“Lipper”),
which included information comparing (1) the performance of the fund’s Class I shares
with the performance of a group of institutional mid-cap core funds selected by Broadridge as comparable to the fund (the “Performance
Group”)
and with a broader group of funds consisting of all retail and institutional mid-cap core funds (the “Performance
Universe”),
all for various periods ended December 31, 2024, and (2) the fund’s actual and contractual management fees and total expenses
with those of the same group of funds in the Performance Group (the “Expense
Group”)
and with a broader group of funds consisting
of all institutional mid-cap core funds, excluding outliers (the “Expense
Universe”),
the information for which was derived in part
from fund financial statements available to Broadridge as of the date of its analysis. The Adviser previously had furnished the Board
with a description of the methodology
Broadridge used to select the Performance Group and Performance Universe and the Expense Group
and Expense Universe.
Performance Comparisons.
Representatives of the Adviser stated that the usefulness of performance comparisons may be affected by a number
of factors, including different investment limitations and policies that may be applicable to the fund and comparison funds and the
end date selected. The Board also considered the fund’s performance in light of overall financial market conditions. The Board discussed
with representatives of the Adviser and the Sub-Adviser the results of the comparisons and considered that the fund’s total return
performance was below the Performance Group and the Performance Universe medians for all periods, except for the three- and five-year
periods when the fund’s total return performance was above the Performance Universe median. The Board discussed with representatives
of the Adviser and the Sub-Adviser the reasons for the fund’s underperformance versus the Performance Group and Performance
Universe during certain periods under review and noted that the primary portfolio manager was very experienced with a good
long-term track record and continued to apply a consistent investment strategy. The Adviser also provided a comparison of the
Item
11. Statement Regarding Basis for Approval of Investment Advisory Contracts (Unaudited) (continued)
fund’s
calendar year total returns to the returns of the fund’s benchmark indices. The Board noted that the fund had a four-star rating
for the three-year period from Morningstar based
on Morningstar’s risk-adjusted return measures.
Management Fee and Expense
Ratio Comparisons. The Board reviewed and considered
the contractual management fee rate payable by the
fund to the Adviser in light of the nature, extent and quality of the management services and the sub-advisory services provided by the
Adviser and the Sub-Adviser, respectively. In addition, the Board reviewed and considered the actual management fee rate paid by the
fund over the fund’s last fiscal year. The Board also reviewed the range of actual and contractual management fees and total expenses
as a percentage of average net assets of the Expense
Group and Expense Universe funds and discussed the results of the comparisons.
The Board
considered that the fund’s contractual management fee was equal to the Expense Group median contractual management fee,
the fund’s actual management fee was approximately equivalent to the Expense Group median and higher than the Expense Universe
median actual management fee, and the fund’s total expenses were higher than the Expense Group median and higher than the Expense
Universe median total expenses.
Representatives
of the Adviser reviewed with the Board the management or investment advisory fees paid to the Adviser or the Sub-Adviser
for advising the one separate account or other type of client portfolio that is considered to have similar investment strategies and policies
as the fund (the “Similar
Client”),
and explained the nature of the Similar Client. They discussed differences in fees paid and the relationship
of the fees paid in light of any differences in the services provided and other relevant factors. The Board considered the relevance
of the fee information provided for the Similar Client to evaluate the appropriateness of the fund’s management fee. Representatives
of the Adviser noted that there were no other funds advised by the Adviser that are in the same Lipper category as the fund.
The Board
considered the fee payable to the Sub-Adviser in relation to the fee payable to the Adviser by the fund and the respective services
provided by the Sub-Adviser and the Adviser. The Board also took into consideration that the Sub-Adviser’s fee is paid by the Adviser,
out of its fee from the fund, and not the fund.
Analysis
of Profitability and Economies of Scale. Representatives
of the Adviser reviewed the expenses allocated and profit received by the
Adviser and its affiliates and the resulting profitability percentage for managing the fund and the aggregate profitability percentage
to the Adviser and its affiliates
for managing the funds in the BNY fund complex, and the method used to determine the expenses and profit.
The Board concluded that the profitability results were not excessive, given the services rendered and service levels provided by the
Adviser and its affiliates. The Board also had been provided with information prepared by an independent consulting firm regarding the
Adviser’s approach to allocating costs to, and determining the profitability of, individual funds and the entire BNY fund complex.
The consulting firm also had analyzed where any economies
of scale might emerge in connection with the management of a fund.
The Board
considered, on the advice of its counsel, the profitability analysis (1) as part of its evaluation of whether the fees under the Agreements,
considered in relation to the mix of services provided by the Adviser and the Sub-Adviser, including the nature, extent and quality
of such services, supported the renewal of the Agreements and (2) in light of the relevant circumstances for the fund and the extent
to which economies of scale would be realized if the fund grows and whether fee levels reflect these economies of scale for the benefit
of fund shareholders. Representatives of the Adviser stated that a discussion of economies of scale is predicated on a fund having achieved
a substantial size with increasing assets and that, if a fund’s assets had been stable or decreasing, the possibility that the Adviser
may have realized any economies
of scale would be less. Representatives of the Adviser also stated that, as a result of shared and allocated costs
among funds in the BNY fund complex, the extent of economies of scale could depend substantially on the level of assets in the complex
as a whole, so that increases and decreases in complex-wide assets can affect potential economies of scale in a manner that is disproportionate
to, or even in the opposite direction from, changes in the fund’s asset level. The Board also considered potential benefits
to the Adviser and the Sub-Adviser from acting as investment adviser and sub-investment adviser, respectively, and took into consideration
the soft dollar arrangements in effect for trading the fund’s investments.
At
the conclusion of these discussions, the Board agreed that it had been furnished with sufficient information to make an informed business
decision with respect to the renewal of the Agreements. Based on the discussions and considerations as described above, the Board
concluded and determined as follows.
●The
Board concluded that the nature, extent and quality of the services provided by the Adviser and the Sub-Adviser are satisfactory
and appropriate.
●The
Board generally was satisfied with the fund’s overall performance.
●The
Board concluded that the fees paid to the Adviser and the Sub-Adviser continued to be appropriate under the circumstances and
in light of the factors and the totality of the services provided as discussed above.
●The
Board determined that the economies of scale which may accrue to the Adviser and its affiliates in connection with the management
of the fund had been adequately considered by the Adviser in connection with the fee rate charged to the fund pursuant
to the Management Agreement and that, to the extent in the future it were determined that material economies of scale had
not been shared with the fund, the Board would seek to have those economies of scale shared with the fund.
In evaluating
the Agreements, the Board considered these conclusions and determinations and also relied on its previous knowledge, gained
through meetings and other interactions with the Adviser and its affiliates and the Sub-Adviser, of the Adviser and the Sub-Adviser
and the services provided to the fund by the Adviser and the Sub-Adviser. The Board also relied on information received on a routine
and regular basis throughout the year relating to the operations of the fund and the investment management and other services provided
under the Agreements, including information on the investment performance of the fund in comparison to similar mutual funds
and benchmark performance indices; general market outlook as applicable to the fund; and compliance reports. In addition, the Board’s
consideration of the contractual fee arrangements for the fund had the benefit of a number of years of reviews of the Agreements for
the fund, or substantially similar agreements for other BNY funds that the Board oversees, during which lengthy discussions took place
between the Board and representatives of the Adviser. Certain aspects of the arrangements may receive greater scrutiny in some years
than in others, and the Board’s conclusions may be based, in part, on its consideration of the fund’s arrangements, or substantially
similar arrangements for other BNY funds that the
Board oversees, in prior years. The Board determined to renew the Agreements.
©
2025 BNY Mellon Securities Corporation
Code-0258NCSRAR0825
BNY Mellon Opportunistic Small
Cap Fund
ANNUAL FINANCIALS
AND OTHER INFORMATION
Save
time. Save paper. View your next shareholder report online as soon as it’s available. Log into www.bny.com/investments
and sign up for eCommunications. It’s simple and only takes a few minutes.
The
views expressed in this report reflect those of the portfolio manager(s) only through the end of the period
covered and do not necessarily represent the views of BNY Mellon Investment Adviser, Inc. or any other
person in the BNY Mellon Investment Adviser, Inc. organization. Any such views are subject to change
at any time based upon market or other conditions and BNY Mellon Investment Adviser, Inc. disclaims
any responsibility to update such views. These views may not be relied on as investment advice and,
because investment decisions for a fund in the BNY Mellon Family of Funds are based on numerous factors,
may not be relied on as an indication of trading intent on behalf of any fund in the BNY Mellon
Family of
Funds.
Not FDIC-Insured
• Not Bank-Guaranteed • May Lose Value
Contents
Please note
the Annual Financials and Other Information only contains Items 7-11 required in Form
N-CSR. All other required items will be filed with the Securities and Exchange Commission
(the “SEC”).
Item
7. Financial Statements and Financial Highlights for Open-End Management Investment Companies.
BNY Mellon Opportunistic Small Cap
Fund
SCHEDULE OF INVESTMENTS
|
|
|
|
|
|
|
|
|
Automobiles
& Components — .7% |
|
|
|
|
|
|
|
|
|
|
|
|
|
|
|
|
|
|
|
|
|
|
|
Columbia
Banking System, Inc.(a)
|
|
|
|
|
|
|
|
|
|
|
|
|
|
|
|
|
|
|
|
|
|
|
|
|
|
|
Metropolitan
Bank Holding Corp. |
|
|
|
|
|
|
|
|
|
|
|
|
Seacoast
Banking Corp. of Florida |
|
|
|
|
|
Simmons
First National Corp., Cl. A |
|
|
|
|
|
|
|
|
|
|
|
|
|
|
|
|
|
|
|
|
|
|
|
|
|
|
Texas
Capital Bancshares, Inc.(b)
|
|
|
|
|
|
|
|
|
|
|
|
|
|
|
|
|
|
|
|
|
|
|
|
|
|
|
|
|
|
|
|
|
|
|
|
|
|
|
|
|
|
|
|
|
|
|
|
|
|
Gates
Industrial Corp. PLC(b)
|
|
|
|
|
|
Hayward
Holdings, Inc.(b)
|
|
|
|
|
|
Janus
International Group, Inc.(b)
|
|
|
|
|
|
|
|
|
|
|
|
|
|
|
|
|
|
|
|
NPK
International, Inc.(b)
|
|
|
|
|
|
|
|
|
|
|
|
|
|
|
|
|
|
|
|
Commercial
& Professional Services — 2.9% |
ACV
Auctions, Inc., Cl. A(b)
|
|
|
|
|
|
BlackSky
Technology, Inc.(b)
|
|
|
|
|
|
|
|
|
|
|
|
|
|
|
|
|
|
|
|
|
|
|
|
|
|
|
Consumer
Discretionary Distribution & Retail — 1.5% |
Ollie’s
Bargain Outlet Holdings, Inc.(b)
|
|
|
|
|
|
Stitch
Fix, Inc., Cl. A(b)
|
|
|
|
|
|
|
|
|
|
|
|
|
Consumer
Durables & Apparel — 5.5% |
Cavco
Industries, Inc.(b)
|
|
|
|
|
|
|
|
|
|
|
|
|
Levi
Strauss & Co., Cl. A |
|
|
|
|
|
Malibu
Boats, Inc., Cl. A(b)
|
|
|
|
|
|
|
|
|
|
|
|
|
|
|
|
|
|
|
|
SCHEDULE OF INVESTMENTS (continued)
|
|
|
|
|
|
|
Common
Stocks — 96.9% (continued) |
Consumer
Durables & Apparel — 5.5% (continued) |
|
|
|
|
|
|
|
YETI
Holdings, Inc.(a),(b)
|
|
|
|
|
|
|
|
|
|
|
|
|
|
|
First
Watch Restaurant Group, Inc.(a),(b)
|
|
|
|
|
|
|
|
|
|
|
|
|
Lindblad
Expeditions Holdings, Inc.(b)
|
|
|
|
|
|
|
|
|
|
|
|
|
|
|
|
|
|
|
|
|
|
Centrus
Energy Corp., Cl. A(a),(b)
|
|
|
|
|
|
CNX
Resources Corp.(a),(b)
|
|
|
|
|
|
Crescent
Energy Co., Cl. A |
|
|
|
|
|
|
|
|
|
|
|
|
|
|
|
|
|
|
|
Viper
Energy, Inc., Cl. A |
|
|
|
|
|
|
|
|
|
|
|
|
Equity
Real Estate Investment Trusts — 4.1% |
Americold
Realty Trust, Inc.(c)
|
|
|
|
|
|
COPT
Defense Properties(c)
|
|
|
|
|
|
|
|
|
|
|
|
|
|
|
|
|
|
|
|
Ryman
Hospitality Properties, Inc.(c)
|
|
|
|
|
|
|
|
|
|
|
|
|
|
|
|
|
|
|
|
Financial
Services — 7.5% |
Euronet
Worldwide, Inc.(b)
|
|
|
|
|
|
HA
Sustainable Infrastructure Capital, Inc.(a)
|
|
|
|
|
|
|
|
|
|
|
|
|
|
|
|
|
|
|
|
PennyMac
Financial Services, Inc. |
|
|
|
|
|
PJT
Partners, Inc., Cl. A |
|
|
|
|
|
|
|
|
|
|
|
|
|
|
|
|
|
|
|
|
|
|
|
|
|
|
Food,
Beverage & Tobacco — 1.4% |
|
|
|
|
|
|
|
|
|
|
|
|
|
|
|
|
|
|
|
|
|
Health
Care Equipment & Services — 4.8% |
Acadia
Healthcare Co., Inc.(b)
|
|
|
|
|
|
|
|
|
|
|
|
|
|
|
|
|
|
|
|
Envista
Holdings Corp.(b)
|
|
|
|
|
|
Evolent
Health, Inc., Cl. A(a),(b)
|
|
|
|
|
|
Privia
Health Group, Inc.(b)
|
|
|
|
|
|
|
|
|
|
|
|
|
|
|
|
|
|
|
|
Household
& Personal Products — .8% |
Spectrum
Brands Holdings, Inc. |
|
|
|
|
|
|
|
|
|
|
|
|
Common
Stocks — 96.9% (continued) |
|
|
The
Baldwin Insurance Group, Inc.(a),(b)
|
|
|
|
|
|
|
|
|
|
|
|
|
|
|
|
|
|
|
|
|
|
|
|
|
|
|
|
|
|
|
|
|
|
|
|
|
|
|
|
|
|
|
Media
& Entertainment — 3.5% |
John
Wiley & Sons, Inc., Cl. A |
|
|
|
|
|
|
|
|
|
|
|
|
Starz
Entertainment Corp.(b)
|
|
|
|
|
|
|
|
|
|
|
|
|
Pharmaceuticals,
Biotechnology & Life Sciences — 5.8% |
|
|
|
|
|
|
|
|
|
|
|
|
|
|
KalVista
Pharmaceuticals, Inc.(b)
|
|
|
|
|
|
Mirum
Pharmaceuticals, Inc.(b)
|
|
|
|
|
|
Soleno
Therapeutics, Inc.(b)
|
|
|
|
|
|
|
|
|
|
|
|
|
Semiconductors
& Semiconductor Equipment — 3.1% |
|
|
|
|
|
|
|
|
|
|
|
|
|
|
|
|
|
|
|
|
|
Ultra
Clean Holdings, Inc.(b)
|
|
|
|
|
|
|
|
|
|
|
|
|
Software
& Services — 2.6% |
|
|
|
|
|
|
|
Dolby
Laboratories, Inc., Cl. A |
|
|
|
|
|
|
|
|
|
|
|
|
|
|
|
|
|
|
|
Technology
Hardware & Equipment — 3.1% |
|
|
|
|
|
|
|
Lumentum
Holdings, Inc.(a),(b)
|
|
|
|
|
|
|
|
|
|
|
|
|
|
|
|
|
|
|
|
|
|
|
|
|
|
|
|
|
|
|
|
|
|
|
|
Strata
Critical Medical, Inc.(b)
|
|
|
|
|
|
Sun
Country Airlines Holdings, Inc.(b)
|
|
|
|
|
|
|
|
|
|
|
|
|
|
|
Clearway
Energy, Inc., Cl. C(a)
|
|
|
|
|
|
|
|
|
|
|
|
|
|
|
|
|
|
|
|
|
|
|
|
|
|
|
Total
Common Stocks
(cost
$176,776,671) |
|
|
|
|
|
|
|
Consumer
Staples Distribution & Retail — .4% |
Supplying
Demand, Inc., Ser. E (b),(d)
|
|
|
|
|
|
SCHEDULE OF INVESTMENTS (continued)
|
|
|
|
|
|
|
Private
Equity — .9% (continued) |
Real
Estate Management & Development — .1% |
Roofstock,
Ser. E (b),(d)
|
|
|
|
|
|
Software
& Services — .4% |
Locus
Robotics, Ser. F (b),(d)
|
|
|
|
|
|
Total
Private Equity
(cost
$2,487,392) |
|
|
|
|
|
|
|
|
|
|
|
|
Investment
Companies — 2.3% |
Registered
Investment Companies — 2.3% |
Dreyfus
Institutional Preferred Government Plus Money Market Fund, Institutional Shares(e)
(cost
$5,259,806) |
|
|
|
|
|
Investment
of Cash Collateral for Securities Loaned — 1.1% |
|
|
|
|
|
Registered
Investment Companies — 1.1% |
|
|
|
|
|
Dreyfus
Institutional Preferred Government Plus Money Market Fund, Institutional Shares(e)
(cost
$2,591,903) |
|
|
|
|
|
Total
Investments (cost $187,115,772)
|
|
|
|
Liabilities,
Less Cash and Receivables |
|
|
|
|
|
|
|
|
|
Security,
or portion thereof, on loan. At August 31, 2025, the value of the fund’s securities on loan was $21,329,995 and the value of the
collateral was
$22,040,388,
consisting of cash collateral of $2,591,903 and U.S. Government & Agency securities valued at $19,448,485. In addition, the
value of
collateral
may include pending sales that are also on loan. |
|
|
Non-income
producing security. |
|
|
Investment
in real estate investment trust within the United States. |
|
|
The
fund held Level 3 securities at August 31, 2025. These securities were valued at $1,961,071 or .9% of net assets.
|
|
|
Investment
in affiliated issuer. The investment objective of this investment company is publicly available and can be found within the investment
company’s
prospectus.
|
|
|
|
|
|
|
|
|
Dividends/
Distributions
($) |
Registered
Investment Companies - 2.3% |
Dreyfus
Institutional Preferred Government Plus Money
Market
Fund, Institutional Shares - 2.3% |
|
|
|
|
|
Investment
of Cash Collateral for Securities Loaned - 1.1% |
Dreyfus
Institutional Preferred Government Plus Money
Market
Fund, Institutional Shares - 1.1% |
|
|
|
|
|
|
|
|
|
|
|
|
|
|
Includes
reinvested dividends/distributions. |
|
|
Represents
securities lending income earned from the reinvestment of cash collateral from loaned securities, net of fees and collateral investment
expenses, and
other
payments to and from borrowers of securities. |
See notes to financial
statements.
STATEMENT
OF ASSETS AND LIABILITIES
August 31, 2025
|
|
|
|
|
|
|
|
Investments
in securities—See Schedule of Investments
(including
securities on loan, valued at $21,329,995)—Note
1(c): |
|
|
|
|
|
|
|
|
|
|
Dividends
and securities lending income receivable |
|
|
Receivable
for shares of Common Stock subscribed |
|
|
Tax
reclaim receivable—Note 1(b)
|
|
|
|
|
|
|
|
|
|
|
|
|
|
|
Due
to BNY Mellon Investment Adviser, Inc. and affiliates—Note
3(b)
|
|
|
Cash
overdraft due to Custodian |
|
|
Liability
for securities on loan—Note 1(c)
|
|
|
Payable
for shares of Common Stock redeemed |
|
|
Directors’
fees and expenses payable |
|
|
|
|
|
|
|
|
|
|
|
|
|
|
Composition
of Net Assets ($): |
|
|
|
|
|
|
Total
distributable earnings (loss) |
|
|
|
|
|
|
Net
Asset Value Per Share |
|
|
|
|
|
|
|
|
|
|
|
|
|
Net
Asset Value Per Share ($) |
|
|
|
See notes to financial statements.
Year Ended August 31,
2025
|
|
|
|
|
|
|
|
|
Cash
dividends (net of $10,845 foreign taxes withheld at source): |
|
|
|
|
|
|
|
Affiliated
income net of rebates from securities lending—Note
1(c)
|
|
|
|
|
|
|
|
|
|
|
Shareholder
servicing costs—Note 3(b)
|
|
|
|
|
|
|
|
Prospectus
and shareholders’ reports |
|
Chief
Compliance Officer fees—Note 3(b)
|
|
Directors’
fees and expenses—Note 3(c)
|
|
Shareholder
and regulatory reports service fees—Note
3(b)
|
|
|
|
|
Loan
commitment fees—Note 2 |
|
|
|
|
|
|
|
Less—reduction
in expenses due to undertaking—Note 3(a)
|
|
Less—reduction
in fees due to earnings credits—Note 3(b)
|
|
|
|
|
|
|
|
Realized
and Unrealized Gain (Loss) on Investments—Note 4 ($):
|
|
Net
realized gain (loss) on investments |
|
Net
change in unrealized appreciation (depreciation) on investments |
|
Net
Realized and Unrealized Gain (Loss) on Investments |
|
Net
Increase in Net Assets Resulting from Operations |
|
See notes to financial statements.
STATEMENT
OF CHANGES IN NET ASSETS
|
|
|
|
|
|
|
|
|
|
|
|
|
|
|
Net
realized gain (loss) on investments |
|
|
Net
change in unrealized appreciation (depreciation) on investments |
|
|
Net
Increase (Decrease) in Net Assets Resulting from Operations |
|
|
|
|
|
|
Distributions
to shareholders: |
|
|
|
|
|
|
|
|
|
|
|
|
|
|
|
|
|
|
Capital
Stock Transactions ($): |
|
|
Net
proceeds from shares sold: |
|
|
|
|
|
|
|
|
|
|
|
|
|
|
Distributions
reinvested: |
|
|
|
|
|
|
|
|
|
|
|
|
|
|
|
|
|
|
|
|
|
|
|
|
|
|
|
|
|
|
Increase
(Decrease) in Net Assets from Capital Stock Transactions |
|
|
Total
Increase (Decrease) in Net Assets |
|
|
|
|
|
|
|
|
|
|
|
|
|
|
STATEMENT
OF CHANGES IN NET ASSETS (continued)
|
|
|
|
|
|
|
Capital
Share Transactions (Shares): |
|
|
|
|
|
|
|
|
|
|
Shares
issued for distributions reinvested |
|
|
|
|
|
|
Net
Increase (Decrease) in Shares Outstanding |
|
|
|
|
|
|
|
|
|
|
Shares
issued for distributions reinvested |
|
|
|
|
|
|
Net
Increase (Decrease) in Shares Outstanding |
|
|
|
|
|
|
|
|
|
|
Shares
issued for distributions reinvested |
|
|
|
|
|
|
Net
Increase (Decrease) in Shares Outstanding |
|
|
|
|
During
the period ended August 31, 2025, 6,916 Class Y shares representing $215,877 were exchanged for 6,948 Class I shares. During the period
ended
August
31, 2024, 1,324 Investor shares representing $40,911 were exchanged for 1,307 Class I shares and 33,545 Class Y shares representing $971,862
were
exchanged
for 33,676 Class I shares. |
See notes to financial statements.
The
following tables describe the performance for each share class for the fiscal periods indicated. All information (except portfolio
turnover rate) reflects financial
results for a single fund share. Net asset value total return is calculated assuming an initial investment made at the net asset
value at the beginning of the period, reinvestment of all dividends and distributions at net asset value during the period, and redemption
at net asset value on the last day
of the period. Net asset value total return includes adjustments in accordance with accounting principles generally
accepted in the United States of America and as such, the net asset value for financial reporting purposes and the returns based upon
those net asset values may differ from the net asset
value and returns for shareholder transactions.
|
|
|
|
|
|
|
|
|
|
|
|
|
|
|
|
Net
asset value, beginning of period |
|
|
|
|
|
|
|
|
|
|
|
Net
investment income (loss)(a)
|
|
|
|
|
|
Net
realized and unrealized gain (loss) on investments |
|
|
|
|
|
Total
from Investment Operations |
|
|
|
|
|
|
|
|
|
|
|
|
Dividends
from net investment income |
|
|
|
|
|
Dividends
from net realized gain on investments |
|
|
|
|
|
|
|
|
|
|
|
|
Net
asset value, end of period |
|
|
|
|
|
|
|
|
|
|
|
|
Ratios/Supplemental
Data (%): |
|
|
|
|
Ratio
of total expenses to average net assets |
|
|
|
|
|
Ratio
of net expenses to average net assets |
|
|
|
|
|
Ratio
of net investment income (loss) to average net assets |
|
|
|
|
|
|
|
|
|
|
|
|
Net
Assets, end of period ($ x 1,000) |
|
|
|
|
|
|
|
Based
on average shares outstanding. |
|
|
Amount
inclusive of reduction in expenses due to undertaking. |
|
|
Amount
inclusive of reduction in fees due to earnings credits. |
See notes to financial statements.
FINANCIAL
HIGHLIGHTS (continued)
|
|
|
|
|
|
|
|
|
|
|
|
|
|
|
|
Net
asset value, beginning of period |
|
|
|
|
|
|
|
|
|
|
|
Net
investment income (loss)(a)
|
|
|
|
|
|
Net
realized and unrealized gain (loss) on investments |
|
|
|
|
|
Total
from Investment Operations |
|
|
|
|
|
|
|
|
|
|
|
|
Dividends
from net investment income |
|
|
|
|
|
Dividends
from net realized gain on investments |
|
|
|
|
|
|
|
|
|
|
|
|
Net
asset value, end of period |
|
|
|
|
|
|
|
|
|
|
|
|
Ratios/Supplemental
Data (%): |
|
|
|
|
Ratio
of total expenses to average net assets |
|
|
|
|
|
Ratio
of net expenses to average net assets |
|
|
|
|
|
Ratio
of net investment income (loss) to average net assets |
|
|
|
|
|
|
|
|
|
|
|
|
Net
Assets, end of period ($ x 1,000) |
|
|
|
|
|
|
|
Based
on average shares outstanding. |
|
|
Amount
inclusive of reduction in expenses due to undertaking. |
|
|
Amount
inclusive of reduction in fees due to earnings credits. |
See notes to financial statements.
|
|
|
|
|
|
|
|
|
|
|
|
|
|
|
|
Net
asset value, beginning of period |
|
|
|
|
|
|
|
|
|
|
|
Net
investment income (loss)(a)
|
|
|
|
|
|
Net
realized and unrealized gain (loss) on investments |
|
|
|
|
|
Total
from Investment Operations |
|
|
|
|
|
|
|
|
|
|
|
|
Dividends
from net investment income |
|
|
|
|
|
Dividends
from net realized gain on investments |
|
|
|
|
|
|
|
|
|
|
|
|
Net
asset value, end of period |
|
|
|
|
|
|
|
|
|
|
|
|
Ratios/Supplemental
Data (%): |
|
|
|
|
Ratio
of total expenses to average net assets |
|
|
|
|
|
Ratio
of net expenses to average net assets |
|
|
|
|
|
Ratio
of net investment income (loss) to average net assets |
|
|
|
|
|
|
|
|
|
|
|
|
Net
Assets, end of period ($ x 1,000) |
|
|
|
|
|
|
|
Based
on average shares outstanding. |
|
|
Amount
inclusive of reduction in expenses due to undertaking. |
|
|
Amount
inclusive of reduction in fees due to earnings credits. |
See notes to financial statements.
NOTES
TO FINANCIAL STATEMENTS
NOTE
1—
Significant
Accounting Policies:
BNY Mellon
Opportunistic Small Cap Fund (the “fund”)
is a separate diversified series of BNY Mellon Advantage Funds, Inc. (the “Company”),
which is registered under the Investment Company Act of 1940, as amended (the “Act”),
as an open-end management investment
company and operates as a series company currently offering six series, including the fund. The fund’s investment objective is
to seek capital appreciation. BNY Mellon Investment Adviser, Inc. (the “Adviser”),
a wholly-owned subsidiary of The Bank of New York
Mellon Corporation (“BNY”),
serves as the fund’s investment adviser. Newton Investment Management North America, LLC (the “Sub-Adviser”
or “NIMNA”),
an indirect wholly-owned subsidiary of BNY and an affiliate of the Adviser, serves as the fund’s sub-adviser. NIMNA’s
principal office is located at BNY Mellon Center, 201 Washington Street, Boston, Massachusetts 02108. NIMNA has
entered into a sub-sub-investment advisory agreement with its affiliate, Newton Investment Management Limited (“NIM”),
which enables NIM to provide certain
advisory services to the Sub-Adviser for the benefit of the fund, including, but not limited to, portfolio management
services. NIM is subject to the supervision of NIMNA and the Adviser. NIM is also an affiliate of the Adviser. NIM, located
at 160 Queen Victoria Street, London, EC4V, 4LA, England, was formed in 1978. NIM is an indirect subsidiary of BNY.
BNY Mellon
Securities Corporation (the “Distributor”), a wholly-owned subsidiary of the Adviser, is the distributor of the fund’s
shares, which are sold without a
sales charge. The fund is authorized to issue 400 million shares of $.001 par value of Common Stock. The fund currently
has authorized three classes of shares: Investor (200 million shares authorized), Class I (100 million shares authorized) and Class
Y (100 million shares authorized). Investor shares are sold primarily to retail investors through financial intermediaries and bear Shareholder
Services Plan fees. Class I shares are sold primarily to bank trust departments and other financial service providers (including
BNY and its affiliates), acting on behalf of customers having a qualified trust or an investment account or relationship at such institution,
and bear no Shareholder Services Plan fees. Class Y shares are sold at net asset value per share generally to institutional investors,
and bear no Shareholder Service Plan fees. Other differences between the classes include the services offered to and the expenses
borne by each class, the allocation of certain transfer agency costs and certain voting rights. Income, expenses (other than expenses
attributable to a specific class), and realized and unrealized gains or losses on investments are allocated to each class of shares based
on its relative net assets.
The Company
accounts separately for the assets, liabilities and operations of each series. Expenses directly attributable to each series are charged
to that series’ operations; expenses which are applicable to all series are allocated among them on a pro rata basis.
The Financial
Accounting Standards Board (“FASB”) Accounting Standards Codification (“ASC”) is the exclusive reference of authoritative
U.S. generally accepted accounting principles (“GAAP”) recognized by the FASB to be applied by nongovernmental entities. Rules
and interpretive releases of the SEC under authority of federal laws are also sources of authoritative GAAP for SEC registrants. The
fund is an investment company and applies the accounting and reporting guidance of the FASB ASC Topic 946 Financial Services-Investment
Companies. The fund’s financial statements are prepared in accordance with GAAP, which may require the use of management
estimates and assumptions. Actual results could differ from those estimates.
The Company
enters into contracts that contain a variety of indemnifications. The fund’s maximum exposure under these arrangements is
unknown. The fund does not anticipate recognizing any loss related to these arrangements.
(a) Portfolio
valuation: The fair value of a financial instrument
is the amount that would be received to sell an asset or paid to transfer a
liability in an orderly transaction between market participants at the measurement date (i.e., the exit price). GAAP establishes a fair
value hierarchy that prioritizes
the inputs of valuation techniques used to measure fair value. This hierarchy gives the highest priority to unadjusted
quoted prices in active markets for identical assets or liabilities (Level 1 measurements) and the lowest priority to unobservable
inputs (Level 3 measurements).
Additionally,
GAAP provides guidance on determining whether the volume and activity in a market has decreased significantly and whether
such a decrease in activity results in transactions that are not orderly. GAAP requires enhanced disclosures around valuation inputs
and techniques used during annual and interim periods.
Various inputs
are used in determining the value of the fund’s investments relating to fair value measurements. These inputs are summarized
in the three broad levels listed below:
Level 1—unadjusted
quoted prices in active markets for identical investments.
Level 2—other
significant observable inputs (including quoted prices for similar investments, interest rates, prepayment speeds, credit
risk, etc.).
Level 3—significant
unobservable inputs (including the fund’s own assumptions in determining the fair value of investments).
NOTES
TO FINANCIAL STATEMENTS (continued)
The
inputs or methodology used for valuing securities are not necessarily an indication of the risk associated with investing in those securities.
Changes in
valuation techniques may result in transfers in or out of an assigned level within the disclosure hierarchy. Valuation techniques
used to value the fund’s investments are as follows:
The Company’s
Board of Directors (the “Board”)
has designated the Adviser as the fund’s valuation designee to make all fair value determinations
with respect to the fund’s portfolio investments, subject to the Board’s oversight and pursuant to Rule 2a-5 under the Act.
Investments
in equity securities are valued at the last sales price on the securities exchange or national securities market on which such securities
are primarily traded. Securities listed on the National Market System for which market quotations are available are valued at the
official closing price or, if there is no official closing price that day, at the last sales price. For open short positions, asked prices
are used for valuation purposes.
Bid price is used when no asked price is available. Registered investment companies that are not
traded on an exchange are valued
at their net asset value. All of the preceding securities are generally categorized within Level 1 of the fair value hierarchy.
Securities
not listed on an exchange or the national securities market, or securities for which there were no transactions, are valued at the average
of the most recent bid and asked prices. These securities are generally categorized within Level 2 of the fair value hierarchy.
Fair valuing
of securities may be determined with the assistance of a pricing service using calculations based on indices of domestic securities
and other appropriate indicators, such as prices of relevant American Depositary Receipts and futures. Utilizing these techniques
may result in transfers between Level 1 and Level 2 of the fair value hierarchy.
When market
quotations or official closing prices are not readily available, or are determined not to accurately reflect fair value, such as when
the value of a security has been significantly affected by events after the close of the exchange or market on which the security is principally
traded, but before the fund calculates its net asset value, the fund may value these investments at fair value as determined in accordance
with the procedures approved by the Board. Certain factors may be considered when fair valuing investments such as: fundamental
analytical data, the nature and duration of restrictions on disposition, an evaluation of the forces that influence the market in which
the securities are purchased and sold, and public trading in similar securities of the issuer or comparable issuers. These securities
are either categorized within Level 2 or 3 of the
fair value hierarchy depending on the relevant inputs used.
For securities
where observable inputs are limited, assumptions about market activity and risk are used and such securities are generally categorized
within Level 3 of the fair value hierarchy.
Investment
in private equity securities will be fair valued by the Board in accordance with valuation procedures approved by the Board. Those portfolio
valuations will be based on unobservable inputs and certain assumptions about how market participants would price the
instrument. The fund expects that inputs into the determination of fair value of those investments will require significant
management judgment or estimation. Because
valuations may fluctuate over short periods of time and may be based on estimates, fair value determinations
may differ materially from the value received in an actual transaction. Additionally, valuations of private companies are inherently
uncertain. The fund’s net asset value could be adversely affected if the fund’s determinations regarding the fair value
of those investments were materially
higher or lower than the values that it ultimately realized upon the disposal of such investments. These securities
are categorized within Level 3 of the fair value hierarchy.
The following is a summary
of the inputs used as of August 31, 2025 in valuing the fund’s investments:
|
|
Level
1 -
Unadjusted
Quoted
Prices |
Level
2- Other
Significant
Observable
Inputs |
Level
3-
Significant
Unobservable
Inputs
|
|
|
|
|
|
|
|
Investments
in Securities:†
|
|
|
|
|
Equity
Securities - Common Stocks |
|
|
|
|
NOTES
TO FINANCIAL STATEMENTS (continued)
|
|
Level
1 -
Unadjusted
Quoted
Prices |
Level
2- Other
Significant
Observable
Inputs |
Level
3-
Significant
Unobservable
Inputs
|
|
|
|
|
|
|
|
Equity
Securities - Private Equity |
|
|
|
|
|
|
|
|
|
|
|
|
|
|
|
|
|
|
See
Schedule of Investments for additional detailed categorizations, if any. |
The following
table summarizes the significant unobservable inputs the fund used to value its investment categorized within Level 3 as of
August 31, 2025. In addition to the techniques and inputs noted in the table below, according to the fund’s valuation policy,
other valuation techniques and methodologies
when determining the fund’s fair value measurements may be used. The below table is not intended
to be all-inclusive, but rather provide information on the significant unobservable inputs as they are to the fund’s determination
of fair values at period end.
|
|
|
|
|
Amount
or Range/
Weighted
Average |
|
|
|
Market
Comparables
Companies
|
Changes
in Enterprise Market
Value
of Comparables from
prior
month-end valuation |
|
|
|
|
|
Revenue
Multiple
during
the quarter |
|
|
|
Valuation
techniques may change in order to reflect the Valuation Designee’s judgment of current market participant assumptions.
|
(b) Foreign
taxes: The fund may be subject to foreign taxes (a
portion of which may be reclaimable) on income, stock dividends, realized
and unrealized capital gains on investments or certain foreign currency transactions. Foreign taxes are recorded in accordance with
the applicable foreign tax regulations and rates that exist in the foreign jurisdictions in which the fund invests. These foreign taxes,
if any, are paid by the fund and
are reflected in the Statement of Operations, if applicable. Foreign taxes payable or deferred or those subject
to reclaims as of August 31, 2025, if any, are disclosed in the fund’s Statement of Assets and Liabilities.
(c) Securities
transactions and investment income: Securities transactions
are recorded on a trade date basis. Realized gains and losses
from securities transactions are recorded on the identified cost basis. Dividend income is recognized on the ex-dividend date and interest
income, including, where applicable, accretion of discount and amortization of premium on investments, is recognized on the accrual
basis.
Pursuant to
a securities lending agreement with BNY, the fund may lend securities to qualified institutions. It is the fund’s policy that, at
origination, all loans are secured by collateral of at least 102% of the value of U.S. securities loaned and 105% of the value of foreign
securities loaned. Collateral equivalent
to at least 100% of the market value of securities on loan is maintained at all times. Collateral is either
in the form of cash, which can be invested in certain money market mutual funds managed by the Adviser, or U.S. Government and
Agency securities. Any non-cash collateral received cannot be sold or re-pledged by the fund, except in the event of borrower default,
and is not reflected in the Statement of Assets and Liabilities. The securities on loan, if any, are also disclosed in the fund’s
Schedule of Investments. The fund
is entitled to receive all dividends, interest and distributions on securities loaned, in addition to income
earned as a result of the lending transaction. Should a borrower fail to return the securities in a timely manner, BNY is required to
replace the securities for the benefit of the fund or credit the fund with the market value of the unreturned securities and is subrogated
to the fund’s rights against
the borrower and the collateral. Additionally, the contractual maturity of security lending transactions are on an
overnight and continuous basis. During the period ended August 31, 2025, BNY earned $4,457 from the lending of the fund’s
portfolio securities, pursuant to the securities
lending agreement.
For financial
reporting purposes, the fund elects not to offset assets and liabilities subject to a securities lending agreement, if any, in the Statement
of Assets and Liabilities. Therefore, all qualifying transactions are presented on a gross basis in the Statement of Assets and Liabilities.
As of August 31, 2025, the fund had securities lending and the impact of netting of assets and liabilities and the offsetting of
NOTES
TO FINANCIAL STATEMENTS (continued)
collateral
pledged or received, if any, based on contractual netting/set-off provisions in the securities lending agreement are detailed in the
following table:
|
|
|
Gross
amount of securities loaned, at
value,
as disclosed in the Statement
of
Assets and Liabilities |
|
Collateral
(received)/posted not offset
in
the Statement of
Assets
and Liabilities |
|
|
|
|
|
|
The
value of the related collateral received by the fund exceeded the value of the securities loaned by the fund pursuant to the securities
lending agreement. In addition,
the
value of collateral may include pending sales that are also on loan. See Schedule of Investments for detailed information regarding collateral
received for open
securities
lending. |
(d) Affiliated
issuers: Investments in other investment companies
advised by the Adviser are considered “affiliated” under the Act.
(e) Market
Risk: The value of the securities in which the fund
invests may be affected by political, regulatory, economic and social developments,
and developments that impact specific economic sectors, industries or segments of the market. In addition, turbulence in financial
markets and reduced liquidity in equity, credit and/or fixed-income markets may negatively affect many issuers, which could adversely
affect the fund. Global economies and financial markets are becoming increasingly interconnected, and conditions and events in
one country, region or financial market may adversely impact issuers in a different country, region or financial market. These risks may
be magnified if certain events or developments adversely interrupt the global supply chain; in these and other circumstances, such risks
might affect companies world-wide.
(f) Dividends
and distributions to shareholders:
Dividends and distributions are recorded on the ex-dividend date. Dividends from net
investment income and dividends from net realized capital gains, if any, are normally declared and paid annually, but the fund may make
distributions on a more frequent basis to comply with the distribution requirements of the Internal Revenue Code of 1986, as amended
(the “Code”). To the extent that net realized capital gains can be offset by capital loss carryovers, it is the policy of
the fund not to distribute such
gains. Income and capital gain distributions are determined in accordance with income tax regulations, which may differ
from GAAP.
(g) Federal
income taxes: It is the policy of the fund to continue
to qualify as a regulated investment company, if such qualification is in
the best interests of its shareholders, by complying with the applicable provisions of the Code, and to make distributions of taxable
income and net realized capital gain sufficient to
relieve it from substantially all federal income and excise taxes.
As of and
during the period ended August 31, 2025, the fund did not have any liabilities for any uncertain tax positions. The fund recognizes
interest and penalties, if any, related to uncertain tax positions as income tax expense in the Statement of Operations. During the
period ended August 31, 2025, the fund did not incur any interest or penalties.
Each tax year
in the four-year period ended August 31, 2025 remains subject to examination by the Internal Revenue Service and state taxing
authorities.
At August
31, 2025, the components of accumulated earnings on a tax basis were as follows: undistributed ordinary income $2,390,862,
accumulated capital losses $3,452,480 and unrealized appreciation $45,644,293.
The fund is
permitted to carry forward capital losses for an unlimited period. Furthermore, capital loss carryovers retain their character as
either short-term or long-term capital losses.
The accumulated
capital loss carryover is available for federal income tax purposes to be applied against future net realized capital gains, if
any, realized subsequent to August 31, 2025. The fund has $3,452,480 of short-term capital losses which can be carried forward for an
unlimited period.
The tax character
of distributions paid to shareholders during the fiscal years ended August 31, 2025 and August 31, 2024 were as follows:
ordinary income $1,265,210 and $1,468,332, and long-term capital gains $0 and $3,063,548, respectively.
(h) Operating
segment reporting: In this reporting period, the
fund adopted FASB Accounting Standards Update 2023-07, Segment Reporting
(Topic 280) - Improvements to Reportable Segment Disclosures (“ASU 2023-07”). Adoption of the new standard impacted financial
statement disclosures only and did not affect the fund’s financial position or the results of its operations. The ASU 2023-07 is
NOTES
TO FINANCIAL STATEMENTS (continued)
effective
for public entities for fiscal years beginning after December 15, 2023, and requires retrospective application for all prior periods presented
within the financial statements.
Since its
commencement, the fund operates and is managed as a single reportable segment deriving returns in the form of dividends, interest
and/or gains from the investments made in pursuit of its single stated investment objective as outlined in the fund’s prospectus.
The accounting policies of the fund
are consistent with those described in these Notes to Financial Statements. The chief operating decision
maker (“CODM”) is represented by BNY Investments, the management of the Adviser, comprising Senior Management and Directors.
The CODM considers net increase in net assets resulting from operations in deciding whether to purchase additional investments
or to make distributions to fund shareholders. Detailed financial information for the fund is disclosed within these financial statements
with total assets and liabilities disclosed on the Statement of Assets and Liabilities, investments held on the Schedule of Investments,
results of operations and significant segment expenses on the Statement of Operations and other information about the fund’s
performance, including total return, portfolio turnover and ratios within the Financial Highlights.
NOTE
2—
Bank
Lines of Credit:
The fund participates with
other long-term open-end funds managed by the Adviser in a $738 million unsecured credit facility led by Citibank,
N.A. (the “Citibank Credit Facility”) and a $300 million unsecured credit facility provided by BNY (the “BNY Credit
Facility”), each to be utilized
primarily for temporary or emergency purposes, including the financing of redemptions (each, a “Facility”).
The Citibank Credit Facility is available in two tranches: (i) Tranche A is in an amount equal to $618 million and is available to all
long-term open-ended funds, including
the fund, and (ii) Tranche B is an amount equal to $120 million and is available only to BNY Mellon
Floating Rate Income Fund, a series of BNY Mellon Investment Funds IV, Inc. In connection therewith, the fund has agreed to pay
its pro rata portion of commitment fees for Tranche A of the Citibank Credit Facility and the BNY Credit Facility. Interest is charged
to the fund based on rates determined pursuant to the terms of the respective Facility at the time of borrowing. During the period
ended August 31, 2025, the fund did not borrow under either Facility.
NOTE
3—
Management
Fee, Sub-Advisory Fee
and Other Transactions with Affiliates:
(a) Pursuant
to a management agreement with the Adviser, the management fee is computed at the annual rate of .75% of the value of the
fund’s average daily net assets and is payable monthly. The Adviser has contractually agreed, from September 1, 2024 through December
31, 2025, to waive receipt of a portion of its management fee in the amount of .10% of the value of the fund’s average daily
net assets. On or after December
31, 2025, the Adviser may terminate this waiver agreement at any time. The reduction in expenses, pursuant
to the undertaking, amounted to $232,023 during the period ended August 31, 2025.
Pursuant to
a sub-investment advisory agreement between the Adviser and the Sub-Adviser, the Adviser pays the Sub-Adviser a monthly fee
at an annual rate of .36% of the value of the fund’s average daily net assets.
(b) Under
the Shareholder Services Plan, Investor shares pay the Distributor at an annual rate of .25% of its average daily net assets for the
provision of certain services. The services provided may include personal services relating to shareholder accounts, such as answering
shareholder inquiries regarding
the fund, and services related to the maintenance of shareholder accounts. The Distributor may make payments
to Service Agents (securities dealers, financial institutions or other industry professionals) with respect to these services. The
Distributor determines the amounts
to be paid to Service Agents. During the period ended August 31, 2025, the fund was charged $502,503
pursuant to the Shareholder Services Plan.
The fund has
an arrangement with BNY Mellon Transfer, Inc., (the “Transfer Agent”), a subsidiary of BNY and an affiliate of the Adviser,
whereby the fund may receive earnings credits when positive cash balances are maintained, which are used to offset Transfer Agent
fees. For financial reporting purposes, the fund includes transfer agent net earnings credits, if any, as an expense offset in the Statement
of Operations.
The fund has
an arrangement with The Bank of New York Mellon (the “Custodian”), a subsidiary of BNY and an affiliate of the Adviser, whereby
the fund will receive interest income or be charged overdraft fees when cash balances are maintained. For financial reporting purposes,
the fund includes this interest income and overdraft fees, if any, as interest income in the Statement of Operations.
The fund compensates
the Transfer Agent, under a transfer agency agreement, for providing transfer agency and cash management services
for the fund. The majority of Transfer Agent fees are comprised of amounts paid on a per account basis, while cash management fees
are related to fund subscriptions and redemptions. During the period ended August 31, 2025, the fund was charged $45,359 for transfer
agency services. These fees are included in Shareholder servicing costs in the Statement of Operations. These fees were partially offset
by earnings credits of $7,761.
NOTES
TO FINANCIAL STATEMENTS (continued)
The
fund compensates the Custodian, under a custody agreement, for providing custodial services for the fund. These fees are determined
based on net assets, geographic region and transaction activity. During the period ended August 31, 2025, the fund was charged $7,861
pursuant to the custody agreement.
During the
period ended August 31, 2025, the fund was charged $25,463 for services performed by the fund’s Chief Compliance Officer
and his staff. These fees are included in Chief Compliance Officer fees in the Statement of Operations.
The fund compensates
the Custodian for providing shareholder reporting and regulatory services for the fund. These fees are included in
Shareholder and regulatory reports service fees in the Statement of Operations. During the period ended August 31, 2025, the Custodian
was compensated $8,083 for financial reporting and regulatory services.
The components
of “Due to BNY Mellon Investment Adviser, Inc. and affiliates” in the Statement of Assets and Liabilities consist of:
Management fee of $143,275, Shareholder Services Plan fees of $42,086, Custodian fees of $2,000, Chief Compliance Officer fees of
$3,553, Transfer Agent fees of $7,484 and Shareholder and regulatory reports service fees of $6,333, which are offset against an expense
reimbursement currently in effect in the amount of $18,747.
(c) Each
board member of the fund also serves as a board member of other funds in the BNY Mellon Family of Funds complex. Annual retainer
fees and attendance fees are allocated to each fund based on net assets.
NOTE
4—
Securities
Transactions:
The aggregate
amount of purchases and sales of investment securities, excluding short-term securities, during the period ended August
31, 2025, amounted to $156,074,439 and $195,965,221, respectively.
At August
31, 2025, the cost of investments for federal income tax purposes was $188,623,142; accordingly, accumulated net unrealized appreciation
on investments was $45,644,293, consisting of $56,701,637 gross unrealized appreciation and $11,057,344 gross unrealized
depreciation.
NOTE
5—
Plan
of Reorganization:
The fund’s
Board has approved, subject to shareholder approval, an Agreement and Plan of Reorganization (the “Agreement”) between the
fund and BNY Mellon Small Cap Value Fund (the “Acquiring Fund”), a series of BNY Mellon Investment Funds I. The Agreement
provides for the transfer of the
fund’s assets to the Acquiring Fund in a tax-free exchange for Class A shares, Class I shares and Class Y shares
of the Acquiring Fund having an aggregate net asset value equal to the value of the fund’s net assets and the assumption by the
Acquiring Fund of the stated liabilities
of the fund, the distribution of the corresponding class of shares (with holders of Investor shares of
the fund receiving Class A shares of the Acquiring Fund) of the Acquiring Fund to fund shareholders and the subsequent termination of
the fund (the “Reorganization”).
Shareholders
of the fund as of September 23, 2025 (the “Record Date”) will be asked to approve the Agreement on behalf of the fund at
a special meeting of shareholders to be held on or about December 9, 2025. If the Agreement is approved, the Reorganization will be consummated
on or about February 13, 2026.
REPORT
OF INDEPENDENT REGISTERED PUBLIC ACCOUNTING FIRM
To the
Shareholders and the Board of Directors of BNY Mellon Opportunistic Small Cap Fund
Opinion on the Financial Statements
We have audited
the accompanying statement of assets and liabilities of BNY Mellon Opportunistic Small Cap Fund (the “Fund”) (one
of the funds constituting BNY
Mellon Advantage Funds, Inc. (the “Company”)),
including the schedule of investments, as of August 31, 2025, and the related statement
of operations for the year then ended, the statements of changes in net assets for each of the two years in the period then ended, the
financial highlights for each of
the five years in the period then ended and the related notes (collectively referred to as the “financial
statements”).
In our opinion, the financial statements
present fairly, in all material respects, the financial position of the Fund (one of the funds constituting BNY
Mellon Advantage Funds, Inc.) at
August 31, 2025, the results of its operations for the year then ended, the changes in its net assets for each of the two years in the
period then ended and its financial
highlights for each of the five years in the period then ended, in conformity with U.S. generally accepted accounting principles.
These financial
statements are the responsibility of the Company’s management. Our responsibility is to express an opinion on the Fund’s financial
statements based on our audits. We
are a public accounting firm registered with the Public Company Accounting Oversight Board (United States) (“PCAOB”)
and are required to be independent with respect to the Company in accordance with the U.S. federal securities laws and the applicable
rules and regulations of the Securities and Exchange
Commission and the PCAOB.
We conducted
our audits in accordance with the standards of the PCAOB. Those standards require that we plan and perform the audit to obtain reasonable
assurance about whether the financial statements are free of material misstatement, whether due to error or fraud. The Company is not
required to have, nor were we engaged
to perform, an audit of the Company’s internal control over financial reporting. As part of our audits, we are required
to obtain an understanding of internal control over financial reporting but not for the purpose of expressing an opinion on the effectiveness
of the Company’s internal control over financial
reporting. Accordingly, we express no such opinion.
Our audits
included performing procedures to assess the risks of material misstatement of the financial statements, whether due to error or fraud,
and performing procedures that respond
to those risks. Such procedures included examining, on a test basis, evidence regarding the amounts and disclosures
in the financial statements. Our procedures included confirmation of securities owned as of August 31, 2025, by correspondence with the
custodian, brokers and others; when
replies were not received from brokers and others, we performed other auditing procedures. Our audits also included
evaluating the accounting principles used and significant estimates made by management, as well as evaluating the overall presentation
of the financial statements. We believe that our audits
provide a reasonable basis for our opinion. 
We have served
as the auditor of one or more investment companies in the BNY Mellon Family of Funds since at least 1957, but we are unable to determine
the specific year.
New
York, New York
October 23, 2025
IMPORTANT
TAX INFORMATION (Unaudited)
For
federal tax purposes, the fund hereby reports 99.96% of the ordinary dividends paid during the fiscal year ended August 31, 2025
as qualifying for the corporate
dividends received deduction. Also, certain dividends paid by the fund may be subject to a maximum tax rate
of 15%, as provided for by the Jobs and Growth Tax Relief Reconciliation Act of 2003. Of the distributions paid during the fiscal year,
$1,264,991 represents the maximum amount that may be considered qualified dividend income. Shareholders will receive notification
in early 2026 of the percentage applicable to the preparation of their 2025 income tax returns.
Item
8. Changes in and Disagreements with Accountants for Open-End Management Investment Companies
(Unaudited)
Item
9. Proxy Disclosures for Open-End Management Investment Companies (Unaudited)
Item
10. Remuneration Paid to Directors, Officers, and Others of Open-End Management Investment Companies
(Unaudited)
Each
board member also serves as a board member of other funds in the BNY Mellon Family of Funds complex, and annual retainer fees and
meeting attendance fees are allocated to each fund based on net assets. The fund is charged for services performed by the fund’s
Chief Compliance Officer. Compensation
paid by the fund during the period to the board members and the Chief Compliance Officer are
within Item 7. Statement of Operations as Directors’ fees and expenses and Chief Compliance Officer fees, respectively. The aggregate
amount of Directors’ fees and expenses and Chief Compliance Officer fees paid by the fund during the period was $45,001.
Item
11. Statement Regarding Basis for Approval of Investment Advisory Contracts (Unaudited)
At
a meeting of the fund’s Board of Directors (the “Board”)
held on March 4-5, 2025, the Board considered the renewal of the fund’s Management
Agreement, pursuant to which the Adviser provides the fund with investment advisory and administrative services, the Sub-Investment
Advisory Agreement, pursuant to which Newton Investment Management North America, LLC (the “Sub-Adviser”
or “NIMNA”)
provides day-to-day management of the fund’s investments, and the Sub-Sub-Investment Advisory Agreement (collectively with
the Management Agreement and Sub-Investment Advisory Agreement, the “Agreements”)
between NIMNA and Newton Investment
Management Limited (“NIM”),
pursuant to which NIMNA may use the investment advisory personnel, resources and capabilities
available at its sister company, NIM, in providing the day-to-day management of the fund’s investments. The Board members, none
of whom are “interested
persons”
(as defined in the Investment Company Act of 1940, as amended) of the fund, were assisted in their review
by independent legal counsel and met with counsel in executive session separate from representatives of the Adviser and the Sub-Adviser.
In considering the renewal of the Agreements, the Board considered several factors that it believed to be relevant, including those
discussed below. The Board did not identify any one factor as dispositive, and each Board member may have attributed different weights
to the factors considered.
Analysis
of Nature, Extent, and Quality of Services Provided to the Fund.
The Board considered information provided to it at the meeting
and in previous presentations from representatives of the Adviser regarding the nature, extent, and quality of the services provided
to funds in the BNY fund complex, including the fund. The Adviser provided the number of open accounts in the fund, the fund’s
asset size and the allocation of fund assets among distribution channels. The Adviser also had previously provided information regarding
the diverse intermediary relationships and distribution channels of funds in the BNY fund complex (such as retail direct or intermediary,
in which intermediaries typically are paid by the fund and/or the Adviser) and the Adviser’s corresponding need for broad, deep,
and diverse resources to be able to provide ongoing shareholder services to each intermediary or distribution channel, as applicable to
the fund.
The Board
also considered research support available to, and portfolio management capabilities of, the fund’s portfolio management personnel
and that the Adviser also provides oversight of day-to-day fund operations, including fund accounting and administration and
assistance in meeting legal and regulatory requirements. The Board also considered the Adviser’s extensive administrative, accounting
and compliance infrastructures, as well as the Adviser’s supervisory activities over the Sub-Adviser. The Board also considered
portfolio management’s brokerage
policies and practices (including policies and practices regarding soft dollars) and the standards applied
in seeking best execution.
Comparative
Analysis of the Fund’s Performance and Management Fee and Expense Ratio.
The Board reviewed reports prepared by Broadridge
Financial Solutions, Inc. (“Broadridge”),
an independent provider of investment company data based on classifications provided
by Thomson Reuters Lipper (“Lipper”),
which included information comparing (1) the performance of the fund’s Investor shares
with the performance of a group of retail no-load small-cap core funds selected by Broadridge as comparable to the fund (the “Performance
Group”)
and with a broader group of funds consisting of all retail and institutional small-cap core funds (the “Performance
Universe”),
all for various periods ended December 31, 2024, and (2) the fund’s actual and contractual management fees and total
expenses with those of the same group of funds in the Performance Group (the “Expense
Group”)
and with a broader group of funds
consisting of all retail no-load small-cap core funds, excluding outliers (the “Expense
Universe”),
the information for which was derived
in part from fund financial statements available to Broadridge as of the date of its analysis. The Adviser previously had furnished the
Board with a description of the methodology Broadridge used to select the Performance Group and Performance Universe and the Expense
Group and Expense Universe.
Performance Comparisons.
Representatives of the Adviser stated that the usefulness of performance comparisons may be affected by a number
of factors, including different investment limitations and policies that may be applicable to the fund and comparison funds and the
end date selected. The Board also considered the fund’s performance in light of overall financial market conditions. The Board discussed
with representatives of the Adviser and the Sub-Adviser the results of the comparisons and considered that the fund’s total return
performance was below the Performance Group and the Performance Universe medians for all periods. The Board discussed with representatives
of the Adviser and the Sub-Adviser the reasons for the fund’s underperformance versus the Performance Group and Performance
Universe during the periods under review and noted the Sub-Adviser’s efforts to improve performance going forward. The Adviser
also provided a comparison of the fund’s calendar year total returns to the returns of the fund’s benchmark indices.
Item
11. Statement Regarding Basis for Approval of Investment Advisory Contracts (Unaudited) (continued)
Management
Fee and Expense Ratio Comparisons. The Board reviewed
and considered the contractual management fee rate payable by the
fund to the Adviser in light of the nature, extent and quality of the management services and the sub-advisory services provided by the
Adviser and the Sub-Adviser, respectively. In addition, the Board reviewed and considered the actual management fee rate paid by the
fund over the fund’s last fiscal year, which included reductions for a fee waiver arrangement in place that reduced the management
fee paid to the Adviser. The Board
also reviewed the range of actual and contractual management fees and total expenses as a percentage of
average net assets of the Expense Group and Expense Universe funds and discussed the results of the comparisons.
The Board
considered that the fund’s contractual management fee was lower than the Expense Group median contractual management fee,
the fund’s actual management fee was lower than the Expense Group median and lower than the Expense Universe median actual management
fee, and the fund’s total expenses were approximately equivalent to the Expense Group median and approximately equivalent
to the Expense Universe median total expenses.
Representatives
of the Adviser stated that the Adviser has contractually agreed, until December 31, 2025, to waive receipt of a portion of
its management fee in the amount of .10% of the value of the fund’s average daily net assets.
Representatives
of the Adviser reviewed with the Board the management or investment advisory fees (1) paid by funds advised by the Adviser
that are in the same Lipper category as the fund and (2) paid to the Adviser or the Sub-Adviser for advising the one separate account
or other type of client portfolio considered to have similar investment strategies and policies as the fund (the “Similar
Clients”),
and explained the nature of the
Similar Clients. They discussed differences in fees paid and the relationship of the fees paid in light of any
differences in the services provided and other relevant factors. The Board considered the relevance of the fee information provided for
the Similar Clients to evaluate the appropriateness of the fund’s management fee.
The Board
considered the fee payable to the Sub-Adviser in relation to the fee payable to the Adviser by the fund and the respective services
provided by the Sub-Adviser and the Adviser. The Board also took into consideration that the Sub-Adviser’s fee is paid by the Adviser,
out of its fee from the fund, and not the fund.
Analysis
of Profitability and Economies of Scale. Representatives
of the Adviser reviewed the expenses allocated and profit received by the
Adviser and its affiliates and the resulting profitability percentage for managing the fund and the aggregate profitability percentage
to the Adviser and its affiliates
for managing the funds in the BNY fund complex, and the method used to determine the expenses and profit.
The Board concluded that the profitability results were not excessive, given the services rendered and service levels provided by the
Adviser and its affiliates. The Board also considered the fee waiver arrangement and its effect on the profitability of the Adviser and
its affiliates. The Board also had
been provided with information prepared by an independent consulting firm regarding the Adviser’s approach
to allocating costs to, and determining the profitability of, individual funds and the entire BNY fund complex. The consulting firm
also had analyzed where any economies of scale might emerge in connection with the management of a fund.
The Board
considered, on the advice of its counsel, the profitability analysis (1) as part of its evaluation of whether the fees under the Agreements,
considered in relation to the mix of services provided by the Adviser and the Sub-Adviser, including the nature, extent and quality
of such services, supported the renewal of the Agreements and (2) in light of the relevant circumstances for the fund and the extent
to which economies of scale would be realized if the fund grows and whether fee levels reflect these economies of scale for the benefit
of fund shareholders. Representatives of the Adviser stated that a discussion of economies of scale is predicated on a fund having achieved
a substantial size with increasing assets and that, if a fund’s assets had been stable or decreasing, the possibility that the Adviser
may have realized any economies
of scale would be less. Representatives of the Adviser also stated that, as a result of shared and allocated costs
among funds in the BNY fund complex, the extent of economies of scale could depend substantially on the level of assets in the complex
as a whole, so that increases and decreases in complex-wide assets can affect potential economies of scale in a manner that is disproportionate
to, or even in the opposite direction from, changes in the fund’s asset level. The Board also considered potential benefits
to the Adviser and the Sub-Adviser from acting as investment adviser and sub-investment adviser, respectively, and took into consideration
the soft dollar arrangements in effect for trading the fund’s investments.
At
the conclusion of these discussions, the Board agreed that it had been furnished with sufficient information to make an informed business
decision with respect to the renewal of the Agreements. Based on the discussions and considerations as described above, the Board
concluded and determined as follows.
●The
Board concluded that the nature, extent and quality of the services provided by the Adviser and the Sub-Adviser are satisfactory
and appropriate.
●The
Board agreed to closely monitor the fund’s performance and the Sub-Adviser’s efforts to improve performance, and determined
to approve renewal of the Agreements through September 30, 2025.
●The
Board concluded that the fees paid to the Adviser and the Sub-Adviser continued to be appropriate under the circumstances and
in light of the factors and the totality of the services provided as discussed above, subject to review no later than the next renewal
consideration.
●The
Board determined that the economies of scale which may accrue to the Adviser and its affiliates in connection with the management
of the fund had been adequately considered by the Adviser in connection with the fee rate charged to the fund pursuant
to the Management Agreement and that, to the extent in the future it were determined that material economies of scale had
not been shared with the fund, the Board would seek to have those economies of scale shared with the fund.
In evaluating
the Agreements, the Board considered these conclusions and determinations and also relied on its previous knowledge, gained
through meetings and other interactions with the Adviser and its affiliates and the Sub-Adviser, of the Adviser and the Sub-Adviser
and the services provided to the fund by the Adviser and the Sub-Adviser. The Board also relied on information received on a routine
and regular basis throughout the year relating to the operations of the fund and the investment management and other services provided
under the Agreements, including information on the investment performance of the fund in comparison to similar mutual funds
and benchmark performance indices; general market outlook as applicable to the fund; and compliance reports. In addition, the Board’s
consideration of the contractual fee arrangements for the fund had the benefit of a number of years of reviews of the Agreements for
the fund, or substantially similar agreements for other BNY funds that the Board oversees, during which lengthy discussions took place
between the Board and representatives of the Adviser. Certain aspects of the arrangements may receive greater scrutiny in some years
than in others, and the Board’s conclusions may be based, in part, on its consideration of the fund’s arrangements, or substantially
similar arrangements for other BNY
funds that the Board oversees, in prior years. The Board determined to renew the Agreements through
September 30, 2025.
**************************************************
At a meeting
of the fund’s Board of Directors (the “Board”)
held on August 21, 2025, the Board considered the renewal of the fund’s Management
Agreement, pursuant to which the Adviser provides the fund with investment advisory and administrative services, the Sub-Investment
Advisory Agreement, pursuant to which Newton Investment Management North America, LLC (the “Sub-Adviser”
or “NIMNA”)
provides day-to-day management of the fund’s investments, and the Sub-Sub-Investment Advisory Agreement (collectively with
the Management Agreement and Sub-Investment Advisory Agreement, the “Agreements”)
between NIMNA and Newton Investment
Management Limited (“NIM”),
pursuant to which NIMNA may use the investment advisory personnel, resources and capabilities
available at its sister company, NIM, in providing the day-to-day management of the fund’s investments. The Board members, none
of whom are “interested
persons”
(as defined in the Investment Company Act of 1940, as amended) of the fund, were assisted in their review
by independent legal counsel and met with counsel in executive session separate from representatives of the Adviser and the Sub-Adviser.
In considering the renewal of the Agreements, the Board considered several factors that it believed to be relevant, including those
discussed below. The Board did not identify any one factor as dispositive, and each Board member may have attributed different weights
to the factors considered.
Analysis
of Nature, Extent, and Quality of Services Provided to the Fund.
The Board considered information provided to it at the meeting
and in previous presentations from representatives of the Adviser regarding the nature, extent, and quality of the services provided
to funds in the BNY fund complex, including the fund. The Adviser provided the number of open accounts in the fund, the fund’s
asset size and the allocation of fund assets among distribution channels. The Adviser also had previously provided information regarding
the diverse intermediary relationships and distribution channels of funds in the BNY fund complex (such as retail direct or
Item
11. Statement Regarding Basis for Approval of Investment Advisory Contracts (Unaudited) (continued)
intermediary,
in which intermediaries typically are paid by the fund and/or the Adviser) and the Adviser’s corresponding need for broad, deep,
and diverse resources to be able to provide ongoing shareholder services to each intermediary or distribution channel, as applicable to
the fund.
The Board
also considered research support available to, and portfolio management capabilities of, the fund’s portfolio management personnel
and that the Adviser also provides oversight of day-to-day fund operations, including fund accounting and administration and
assistance in meeting legal and regulatory requirements. The Board also considered the Adviser’s extensive administrative, accounting
and compliance infrastructures, as well as the Adviser’s supervisory activities over the Sub-Adviser. The Board also considered
portfolio management’s brokerage
policies and practices (including policies and practices regarding soft dollars) and the standards applied
in seeking best execution.
Comparative
Analysis of the Fund’s Performance and Management Fee and Expense Ratio.
The Board reviewed reports prepared by Broadridge
Financial Solutions, Inc. (“Broadridge”),
an independent provider of investment company data based on classifications provided
by Thomson Reuters Lipper (“Lipper”),
which included information comparing (1) the performance of the fund’s Investor shares
with the performance of a group of retail no-load small-cap core funds selected by Broadridge as comparable to the fund (the “Performance
Group”)
and with a broader group of funds consisting of all retail and institutional small-cap core funds (the “Performance
Universe”),
all for various periods ended June 30, 2025, and (2) the fund’s actual and contractual management fees and total expenses
with those of the same group of funds in the Performance Group (the “Expense
Group”)
and with a broader group of funds consisting
of other retail no-load small-cap core funds, excluding outliers (the “Expense
Universe”),
the information for which was derived
in part from fund financial statements available to Broadridge as of the date of its analysis. The Adviser previously had furnished the
Board with a description of the methodology Broadridge used to select the Performance Group and Performance Universe and the Expense
Group and Expense Universe.
Performance Comparisons.
Representatives of the Adviser stated that the usefulness of performance comparisons may be affected by a number
of factors, including different investment limitations and policies that may be applicable to the fund and comparison funds and the
end date selected. The Board also considered the fund’s performance in light of overall financial market conditions. The Board discussed
with representatives of the Adviser and the Sub-Adviser the results of the comparisons and considered that the fund’s total return
performance was above the Performance Group median for the six-month and one‑year periods and below the Performance
Group median for all other periods, and was above the Performance Universe median for the six-month period and slightly below the
Performance Universe median for the one-year period and below the Performance Universe median for all other periods. The Board discussed
with representatives of the Adviser and the Sub-Adviser the reasons for the fund’s underperformance versus the Performance Group
and Performance Universe during certain periods under review and noted the recent improvement in the fund’s total return performance.
The Adviser also provided a comparison of the fund’s calendar year total returns to the returns of the fund’s benchmark indices.
Management Fee and Expense
Ratio Comparisons. The Board reviewed and considered
the contractual management fee rate payable by the
fund to the Adviser in light of the nature, extent and quality of the management services and the sub-advisory services provided by the
Adviser and the Sub-Adviser, respectively. In addition, the Board reviewed and considered the actual management fee rate paid by the
fund over the fund’s last fiscal year, which included reductions for a fee waiver arrangement in place that reduced the management
fee paid to the Adviser. The Board
also reviewed the range of actual and contractual management fees and total expenses as a percentage of
average net assets of the Expense Group and Expense Universe funds and discussed the results of the comparisons.
The Board
considered that the fund’s contractual management fee was lower than the Expense Group median contractual management fee,
the fund’s actual management fee was lower than the Expense Group median and lower than the Expense Universe median actual management
fee, and the fund’s total expenses were lower than the Expense Group median and lower than the Expense Universe median total
expenses.
Representatives
of the Adviser stated that the Adviser has contractually agreed, until December 31, 2025, to waive receipt of a portion of
its management fee in the amount of .10% of the value of the fund’s average daily net assets.
Representatives
of the Adviser reviewed with the Board the management or investment advisory fees (1) paid by funds advised by the Adviser
that are in the same Lipper category as the fund and (2) paid to the Adviser or the Sub-Adviser for advising the one separate
account
or other type of client portfolio considered to have similar investment strategies and policies as the fund (the “Similar
Clients”),
and explained the nature of the
Similar Clients. They discussed differences in fees paid and the relationship of the fees paid in light of any
differences in the services provided and other relevant factors. The Board considered the relevance of the fee information provided for
the Similar Clients to evaluate the appropriateness of the fund’s management fee.
The Board
considered the fee payable to the Sub-Adviser in relation to the fee payable to the Adviser by the fund and the respective services
provided by the Sub-Adviser and the Adviser. The Board also took into consideration that the Sub-Adviser’s fee is paid by the Adviser,
out of its fee from the fund, and not the fund.
Analysis
of Profitability and Economies of Scale. Representatives
of the Adviser reviewed the expenses allocated and profit received by the
Adviser and its affiliates and the resulting profitability percentage for managing the fund and the aggregate profitability percentage
to the Adviser and its affiliates
for managing the funds in the BNY fund complex, and the method used to determine the expenses and profit.
The Board concluded that the profitability results were not excessive, given the services rendered and service levels provided by the
Adviser and its affiliates. The Board also considered the fee waiver arrangement and its effect on the profitability of the Adviser and
its affiliates. The Board also had
been provided with information prepared by an independent consulting firm regarding the Adviser’s approach
to allocating costs to, and determining the profitability of, individual funds and the entire BNY fund complex. The consulting firm
also had analyzed where any economies of scale might emerge in connection with the management of a fund.
The Board
considered, on the advice of its counsel, the profitability analysis (1) as part of its evaluation of whether the fees under the Agreements,
considered in relation to the mix of services provided by the Adviser and the Sub-Adviser, including the nature, extent and quality
of such services, supported the renewal of the Agreements and (2) in light of the relevant circumstances for the fund and the extent
to which economies of scale would be realized if the fund grows and whether fee levels reflect these economies of scale for the benefit
of fund shareholders. Representatives of the Adviser stated that a discussion of economies of scale is predicated on a fund having achieved
a substantial size with increasing assets and that, if a fund’s assets had been stable or decreasing, the possibility that the Adviser
may have realized any economies
of scale would be less. Representatives of the Adviser also stated that, as a result of shared and allocated costs
among funds in the BNY fund complex, the extent of economies of scale could depend substantially on the level of assets in the complex
as a whole, so that increases and decreases in complex-wide assets can affect potential economies of scale in a manner that is disproportionate
to, or even in the opposite direction from, changes in the fund’s asset level. The Board also considered potential benefits
to the Adviser and the Sub-Adviser from acting as investment adviser and sub-investment adviser, respectively, and took into consideration
the soft dollar arrangements in effect for trading the fund’s investments.
At the conclusion
of these discussions, the Board agreed that it had been furnished with sufficient information to make an informed business
decision with respect to the renewal of the Agreements. Based on the discussions and considerations as described above, the Board
concluded and determined as follows.
●The
Board concluded that the nature, extent and quality of the services provided by the Adviser and the Sub-Adviser are satisfactory
and appropriate.
●The
Board was satisfied with the fund’s improved recent total return performance.
●The
Board concluded that the fees paid to the Adviser and the Sub-Adviser continued to be appropriate under the circumstances and
in light of the factors and the totality of the services provided as discussed above.
●The
Board determined that the economies of scale which may accrue to the Adviser and its affiliates in connection with the management
of the fund had been adequately considered by the Adviser in connection with the fee rate charged to the fund pursuant
to the Management Agreement and that, to the extent in the future it were determined that material economies of scale had
not been shared with the fund, the Board would seek to have those economies of scale shared with the fund.
In evaluating
the Agreements, the Board considered these conclusions and determinations and also relied on its previous knowledge, gained
through meetings and other interactions with the Adviser and its affiliates and the Sub-Adviser, of the Adviser and the Sub-Adviser
and the services provided to the fund by the Adviser and the Sub-Adviser. The Board also relied on information received on a routine
and regular basis throughout the year relating to the operations of the fund and the investment management and other services provided
under the Agreements, including information on the investment performance of the fund in comparison to similar mutual funds
and benchmark performance indices; general market outlook as applicable to the fund; and compliance reports. In addition, the
Item
11. Statement Regarding Basis for Approval of Investment Advisory Contracts (Unaudited) (continued)
Board’s
consideration of the contractual fee arrangements for the fund had the benefit of a number of years of reviews of the Agreements for
the fund, or substantially similar agreements for other BNY funds that the Board oversees, during which lengthy discussions took place
between the Board and representatives of the Adviser. Certain aspects of the arrangements may receive greater scrutiny in some years
than in others, and the Board’s conclusions may be based, in part, on its consideration of the fund’s arrangements, or substantially
similar arrangements for other BNY
funds that the Board oversees, in prior years. The Board determined to renew the Agreements for the
remainder of the one-year term.
©
2025 BNY Mellon Securities Corporation
Code-0253NCSRAR0825
BNY Mellon Technology Growth
Fund
ANNUAL FINANCIALS
AND OTHER INFORMATION
Save
time. Save paper. View your next shareholder report online as soon as it’s available. Log into www.bny.com/investments
and sign up for eCommunications. It’s simple and only takes a few minutes.
The
views expressed in this report reflect those of the portfolio manager(s) only through the end of the period
covered and do not necessarily represent the views of BNY Mellon Investment Adviser, Inc. or any other
person in the BNY Mellon Investment Adviser, Inc. organization. Any such views are subject to change
at any time based upon market or other conditions and BNY Mellon Investment Adviser, Inc. disclaims
any responsibility to update such views. These views may not be relied on as investment advice and,
because investment decisions for a fund in the BNY Mellon Family of Funds are based on numerous factors,
may not be relied on as an indication of trading intent on behalf of any fund in the BNY Mellon
Family of
Funds.
Not FDIC-Insured
• Not Bank-Guaranteed • May Lose Value
Contents
Please note
the Annual Financials and Other Information only contains Items 7-11 required in Form
N-CSR. All other required items will be filed with the Securities and Exchange Commission
(the “SEC”).
Item
7. Financial Statements and Financial Highlights for Open-End Management Investment Companies.
BNY Mellon Technology Growth Fund
SCHEDULE OF INVESTMENTS
|
|
|
|
|
|
|
|
|
Aerospace
& Defense — 2.4% |
Axon
Enterprise, Inc. (a)
|
|
|
|
|
|
Application
Software — 12.3% |
Atlassian
Corp., Cl. A (a)
|
|
|
|
|
|
|
|
|
|
|
|
|
|
|
|
|
|
|
|
|
|
|
|
|
|
|
|
|
|
|
|
|
|
|
|
|
|
|
|
|
|
|
|
|
|
|
|
|
|
Alibaba
Group Holding Ltd., ADR |
|
|
|
|
|
|
|
|
|
|
|
|
|
|
|
|
|
|
|
PDD
Holdings, Inc., ADR (a)
|
|
|
|
|
|
|
|
|
|
|
|
|
Interactive
Media & Services — 9.5% |
|
|
|
|
|
|
|
Meta
Platforms, Inc., Cl. A |
|
|
|
|
|
Tencent
Holdings Ltd., ADR |
|
|
|
|
|
|
|
|
|
|
|
|
Internet
Services & Infrastructure — 5.9% |
|
|
|
|
|
|
|
|
|
|
|
|
|
|
|
|
|
|
|
|
|
Movies
& Entertainment — 5.8% |
|
|
|
|
|
|
|
Spotify
Technology SA (a)
|
|
|
|
|
|
|
|
|
|
|
|
|
Real
Estate Services — 2.1% |
|
|
|
|
|
|
|
Semiconductor
Materials & Equipment — 5.6% |
|
|
|
|
|
|
|
|
|
|
|
|
|
|
|
|
|
|
|
|
|
|
|
|
|
|
|
|
|
|
Infineon
Technologies AG, ADR |
|
|
|
|
|
|
|
|
|
|
|
|
|
|
|
|
|
|
|
|
|
|
|
|
|
|
|
|
|
|
|
|
|
Taiwan
Semiconductor Manufacturing Co. Ltd., ADR |
|
|
|
|
|
|
|
|
|
|
|
|
|
|
|
|
|
|
|
|
|
|
|
|
|
|
|
|
SCHEDULE OF INVESTMENTS (continued)
|
|
|
|
|
|
|
Common
Stocks — 96.6% (continued) |
Systems
Software — 15.4% (continued) |
|
|
|
|
|
|
|
|
|
|
|
|
|
|
|
|
|
|
|
|
|
Technology
Hardware, Storage & Peripherals — 2.5% |
|
|
|
|
|
|
|
Transaction
& Payment Processing Services — 1.3% |
|
|
|
|
|
|
|
Total
Common Stocks
(cost
$216,729,346) |
|
|
|
|
|
|
|
Real
Estate Services — .0% |
Roofstock,
Ser. E (a),(b)
|
|
|
|
|
|
|
|
Databricks,
Inc., Ser. H (a),(b)
|
|
|
|
|
|
Databricks,
Inc., Ser. I (a),(b)
|
|
|
|
|
|
Databricks,
Inc., Ser. J (a),(b)
|
|
|
|
|
|
|
|
|
|
|
|
|
Total
Private Equity
(cost
$4,525,779) |
|
|
|
|
|
|
|
|
|
|
|
|
Investment
Companies — 1.9% |
|
|
|
|
|
Registered
Investment Companies — 1.9% |
|
|
|
|
|
Dreyfus
Institutional Preferred Government Plus Money Market Fund, Institutional
(cost
$7,862,375) |
|
|
|
|
|
Total
Investments (cost $229,117,500)
|
|
|
|
|
|
Liabilities,
Less Cash and Receivables |
|
|
|
|
|
|
|
|
|
|
|
|
ADR—American
Depositary Receipt |
|
|
Non-income
producing security. |
|
|
The
fund held Level 3 securities at August 31, 2025. These securities were valued at $6,919,695 or 1.6% of net assets.
|
|
|
Investment
in affiliated issuer. The investment objective of this investment company is publicly available and can be found within the investment
company’s
prospectus.
|
|
|
|
|
|
|
|
|
Dividends/
Distributions
($) |
Registered
Investment Companies - 1.9% |
Dreyfus
Institutional Preferred Government Plus Money
Market
Fund, Institutional Shares - 1.9% |
|
|
|
|
|
Affiliated
Issuers (continued) |
|
|
|
|
|
|
Dividends/
Distributions
($) |
Investment
of Cash Collateral for Securities Loaned - .0% |
Dreyfus
Institutional Preferred Government Plus Money
Market
Fund, Institutional Shares - .0% |
|
|
|
|
|
|
|
|
|
|
|
|
|
|
Includes
reinvested dividends/distributions. |
|
|
Represents
securities lending income earned from the reinvestment of cash collateral from loaned securities, net of fees and collateral investment
expenses, and
other
payments to and from borrowers of securities. |
See notes to financial
statements.
STATEMENT
OF ASSETS AND LIABILITIES
August 31, 2025
|
|
|
|
|
|
|
|
Investments
in securities—See Schedule of Investments: |
|
|
|
|
|
|
|
|
|
|
Cash
denominated in foreign currency |
|
|
|
|
|
|
Receivable
for shares of Common Stock subscribed |
|
|
Tax
reclaim receivable—Note 1(b)
|
|
|
|
|
|
|
|
|
|
|
|
|
|
|
Due
to BNY Mellon Investment Adviser, Inc. and affiliates—Note
3(c)
|
|
|
Payable
for shares of Common Stock redeemed |
|
|
Directors’
fees and expenses payable |
|
|
|
|
|
|
|
|
|
|
|
|
|
|
Composition
of Net Assets ($): |
|
|
|
|
|
|
Total
distributable earnings (loss) |
|
|
|
|
|
|
Net
Asset Value Per Share |
|
|
|
|
|
|
|
|
|
|
|
|
|
|
|
|
Net
Asset Value Per Share ($) |
|
|
|
|
See notes to financial statements.
Year Ended August 31,
2025
|
|
|
|
|
|
|
|
|
Cash
dividends (net of $94,101 foreign taxes withheld at source): |
|
|
|
|
|
|
|
Affiliated
income net of rebates from securities lending—Note
1(c)
|
|
|
|
|
|
|
|
|
|
|
Shareholder
servicing costs—Note 3(c)
|
|
|
|
|
|
|
|
Prospectus
and shareholders’ reports |
|
Directors’
fees and expenses—Note 3(d)
|
|
Distribution
Plan fees—Note 3(b)
|
|
Chief
Compliance Officer fees—Note 3(c)
|
|
Loan
commitment fees—Note 2 |
|
Shareholder
and regulatory reports service fees—Note
3(c)
|
|
|
|
|
|
|
|
|
|
|
Less—reduction
in fees due to earnings credits—Note 3(c)
|
|
|
|
|
|
|
|
Realized
and Unrealized Gain (Loss) on Investments—Note 4 ($):
|
|
Net
realized gain (loss) on investments |
|
Net
change in unrealized appreciation (depreciation) on investments and foreign currency transactions |
|
Net
Realized and Unrealized Gain (Loss) on Investments |
|
Net
Increase in Net Assets Resulting from Operations |
|
See notes to financial statements.
STATEMENT
OF CHANGES IN NET ASSETS
|
|
|
|
|
|
|
|
|
|
|
|
|
|
|
Net
realized gain (loss) on investments |
|
|
Net
change in unrealized appreciation (depreciation) on investments |
|
|
Net
Increase (Decrease) in Net Assets Resulting from Operations |
|
|
|
|
|
|
Distributions
to shareholders: |
|
|
|
|
|
|
|
|
|
|
|
|
|
|
|
|
|
|
|
|
|
|
Capital
Stock Transactions ($): |
|
|
Net
proceeds from shares sold: |
|
|
|
|
|
|
|
|
|
|
|
|
|
|
|
|
|
|
Distributions
reinvested: |
|
|
|
|
|
|
|
|
|
|
|
|
|
|
|
|
|
|
|
|
|
|
|
|
|
|
|
|
|
|
|
|
|
|
Increase
(Decrease) in Net Assets from Capital Stock Transactions |
|
|
Total
Increase (Decrease) in Net Assets |
|
|
|
|
|
|
|
|
|
|
|
|
|
|
|
|
|
|
|
|
|
Capital
Share Transactions (Shares): |
|
|
|
|
|
|
|
|
|
|
Shares
issued for distributions reinvested |
|
|
|
|
|
|
Net
Increase (Decrease) in Shares Outstanding |
|
|
|
|
|
|
|
|
|
|
Shares
issued for distributions reinvested |
|
|
|
|
|
|
Net
Increase (Decrease) in Shares Outstanding |
|
|
|
|
|
|
|
|
|
|
Shares
issued for distributions reinvested |
|
|
|
|
|
|
Net
Increase (Decrease) in Shares Outstanding |
|
|
|
|
|
|
|
|
|
|
|
|
|
|
Net
Increase (Decrease) in Shares Outstanding |
|
|
|
|
During
the period ended August 31, 2024, 988 Class A shares representing $54,081 were exchanged for 807 Class I shares. |
See notes to financial statements.
The
following tables describe the performance for each share class for the fiscal periods indicated. All information (except portfolio
turnover rate) reflects financial
results for a single fund share. Net asset value total return is calculated assuming an initial investment made at the net asset
value at the beginning of the period, reinvestment of all dividends and distributions at net asset value during the period, and redemption
at net asset value on the last day
of the period. Net asset value total return includes adjustments in accordance with accounting principles generally
accepted in the United States of America and as such, the net asset value for financial reporting purposes and the returns based upon
those net asset values may differ from the net asset
value and returns for shareholder transactions.
|
|
|
|
|
|
|
|
|
|
|
|
|
|
|
|
Net
asset value, beginning of period |
|
|
|
|
|
|
|
|
|
|
|
|
|
|
|
|
|
|
Net
realized and unrealized gain (loss) on investments |
|
|
|
|
|
Total
from Investment Operations |
|
|
|
|
|
|
|
|
|
|
|
|
Dividends
from net realized gain on investments |
|
|
|
|
|
Net
asset value, end of period |
|
|
|
|
|
|
|
|
|
|
|
|
Ratios/Supplemental
Data (%): |
|
|
|
|
Ratio
of total expenses to average net assets |
|
|
|
|
|
Ratio
of net expenses to average net assets |
|
|
|
|
|
Ratio
of net investment (loss) to average net assets |
|
|
|
|
|
|
|
|
|
|
|
|
Net
Assets, end of period ($ x 1,000) |
|
|
|
|
|
|
|
Based
on average shares outstanding. |
|
|
Exclusive
of sales charge. |
|
|
Amount
inclusive of reduction in fees due to earnings credits. |
|
|
Amount
inclusive of reduction in expenses due to undertaking. |
See notes to financial statements.
|
|
|
|
|
|
|
|
|
|
|
|
|
|
|
|
Net
asset value, beginning of period |
|
|
|
|
|
|
|
|
|
|
|
|
|
|
|
|
|
|
Net
realized and unrealized gain (loss) on investments |
|
|
|
|
|
Total
from Investment Operations |
|
|
|
|
|
|
|
|
|
|
|
|
Dividends
from net realized gain on investments |
|
|
|
|
|
Net
asset value, end of period |
|
|
|
|
|
|
|
|
|
|
|
|
Ratios/Supplemental
Data (%): |
|
|
|
|
Ratio
of total expenses to average net assets |
|
|
|
|
|
Ratio
of net expenses to average net assets |
|
|
|
|
|
Ratio
of net investment (loss) to average net assets |
|
|
|
|
|
|
|
|
|
|
|
|
Net
Assets, end of period ($ x 1,000) |
|
|
|
|
|
|
|
Based
on average shares outstanding. |
|
|
Exclusive
of sales charge. |
|
|
Amount
inclusive of reduction in fees due to earnings credits. |
|
|
Amount
inclusive of reduction in expenses due to undertaking. |
See notes to financial statements.
FINANCIAL
HIGHLIGHTS (continued)
|
|
|
|
|
|
|
|
|
|
|
|
|
|
|
|
Net
asset value, beginning of period |
|
|
|
|
|
|
|
|
|
|
|
|
|
|
|
|
|
|
Net
realized and unrealized gain (loss) on investments |
|
|
|
|
|
Total
from Investment Operations |
|
|
|
|
|
|
|
|
|
|
|
|
Dividends
from net realized gain on investments |
|
|
|
|
|
Net
asset value, end of period |
|
|
|
|
|
|
|
|
|
|
|
|
Ratios/Supplemental
Data (%): |
|
|
|
|
Ratio
of total expenses to average net assets |
|
|
|
|
|
Ratio
of net expenses to average net assets |
|
|
|
|
|
Ratio
of net investment (loss) to average net assets |
|
|
|
|
|
|
|
|
|
|
|
|
Net
Assets, end of period ($ x 1,000) |
|
|
|
|
|
|
|
Based
on average shares outstanding. |
|
|
Amount
inclusive of reduction in fees due to earnings credits. |
|
|
Amount
inclusive of reduction in expenses due to undertaking. |
See notes to financial statements.
|
|
|
|
|
|
|
|
|
|
|
|
|
|
|
|
Net
asset value, beginning of period |
|
|
|
|
|
|
|
|
|
|
|
|
|
|
|
|
|
|
Net
realized and unrealized gain (loss) on investments |
|
|
|
|
|
Total
from Investment Operations |
|
|
|
|
|
|
|
|
|
|
|
|
Dividends
from net realized gain on investments |
|
|
|
|
|
Net
asset value, end of period |
|
|
|
|
|
|
|
|
|
|
|
|
Ratios/Supplemental
Data (%): |
|
|
|
|
Ratio
of total expenses to average net assets |
|
|
|
|
|
Ratio
of net expenses to average net assets |
|
|
|
|
|
Ratio
of net investment (loss) to average net assets |
|
|
|
|
|
|
|
|
|
|
|
|
Net
Assets, end of period ($ x 1,000) |
|
|
|
|
|
|
|
Based
on average shares outstanding. |
|
|
Amount
inclusive of reduction in fees due to earnings credits. |
|
|
Amount
inclusive of reduction in expenses due to undertaking. |
See notes to financial statements.
NOTES
TO FINANCIAL STATEMENTS
NOTE
1—
Significant
Accounting Policies:
BNY Mellon
Technology Growth Fund (the “fund”)
is a separate diversified series of BNY Mellon Advantage Funds, Inc. (the “Company”),
which is registered under the Investment Company Act of 1940, as amended (the “Act”),
as an open-end management investment
company and operates as a series company currently offering six series, including the fund. The fund’s investment objective is to
seek capital appreciation. BNY Mellon
Investment Adviser, Inc. (the “Adviser”),
a wholly-owned subsidiary of The Bank of New York Mellon
Corporation (“BNY”),
serves as the fund’s investment adviser. Newton Investment Management North America, LLC (the “Sub-Adviser”
or “NIMNA”),
an indirect wholly-owned subsidiary of BNY and an affiliate of the Adviser, serves as the fund’s sub-adviser.
NIMNA’s principal office is located at BNY Mellon Center, 201 Washington Street, Boston, Massachusetts 02108. NIMNA has
entered into a sub-sub-investment advisory agreement with its affiliate, Newton Investment Management Limited (“NIM”),
which enables NIM to provide certain
advisory services to the Sub-Adviser for the benefit of the fund, including, but not limited to, portfolio management
services. NIM is subject to the supervision of NIMNA and the Adviser. NIM is also an affiliate of the Adviser. NIM, located
at 160 Queen Victoria Street, London, EC4V, 4LA, England, was formed in 1978. NIM is an indirect subsidiary of BNY.
BNY Mellon
Securities Corporation (the “Distributor”), a wholly-owned subsidiary of the Adviser, is the distributor of the fund’s
shares. The fund is authorized to
issue 700 million shares of $.001 par value of Common Stock. The fund currently has authorized four classes of
shares: Class A (200 million shares authorized), Class C (100 million shares authorized), Class I (250 million shares authorized) and
Class Y (150 million shares authorized).
Class A and Class C shares are sold primarily to retail investors through financial intermediaries and
bear Distribution and/or Shareholder Services Plan fees. Class A shares generally are subject to a sales charge imposed at the time of
purchase. Class A shares bought
without an initial sales charge as part of an investment of $1 million or more may be charged a contingent
deferred sales charge (“CDSC”) of 1.00% if redeemed within one year. Class C shares are subject to a CDSC imposed on Class
C shares redeemed within one year of purchase. Class C shares automatically convert to Class A shares eight years after the date of purchase,
without the imposition of a sales charge. Class I shares are sold primarily to bank trust departments and other financial service providers
(including BNY and its affiliates), acting on behalf of customers having a qualified trust or an investment account or relationship
at such institution, and bear no Distribution or Shareholder Services Plan fees. Class Y shares are sold at net asset value per share
generally to institutional investors,
and bear no Distribution or Shareholder Services Plan fees. Class I and Class Y shares are offered without
a front-end sales charge or CDSC. Other differences between the classes include the services offered to and the expenses borne by
each class, the allocation of certain transfer agency costs and certain voting rights. Income, expenses (other than expenses attributable
to a specific class), and realized
and unrealized gains or losses on investments are allocated to each class of shares based on its relative net assets.
As of August 31, 2025, MBC
Investments Corporation, an indirect subsidiary of BNY, held 217 Class Y shares of the fund.
The Company
accounts separately for the assets, liabilities and operations of each series. Expenses directly attributable to each series are charged
to that series’ operations; expenses which are applicable to all series are allocated among them on a pro rata basis.
The Financial
Accounting Standards Board (“FASB”) Accounting Standards Codification (“ASC”) is the exclusive reference of authoritative
U.S. generally accepted accounting principles (“GAAP”) recognized by the FASB to be applied by nongovernmental entities. Rules
and interpretive releases of the SEC under authority of federal laws are also sources of authoritative GAAP for SEC registrants. The
fund is an investment company and applies the accounting and reporting guidance of the FASB ASC Topic 946 Financial Services-Investment
Companies. The fund’s financial statements are prepared in accordance with GAAP, which may require the use of management
estimates and assumptions. Actual results could differ from those estimates.
The Company
enters into contracts that contain a variety of indemnifications. The fund’s maximum exposure under these arrangements is
unknown. The fund does not anticipate recognizing any loss related to these arrangements.
(a) Portfolio
valuation: The fair value of a financial instrument
is the amount that would be received to sell an asset or paid to transfer a
liability in an orderly transaction between market participants at the measurement date (i.e., the exit price). GAAP establishes a fair
value hierarchy that prioritizes
the inputs of valuation techniques used to measure fair value. This hierarchy gives the highest priority to unadjusted
quoted prices in active markets for identical assets or liabilities (Level 1 measurements) and the lowest priority to unobservable
inputs (Level 3 measurements).
Additionally,
GAAP provides guidance on determining whether the volume and activity in a market has decreased significantly and whether
such a decrease in activity results in transactions that are not orderly. GAAP requires enhanced disclosures around valuation inputs
and techniques used during annual and interim periods.
NOTES
TO FINANCIAL STATEMENTS (continued)
Various
inputs are used in determining the value of the fund’s investments relating to fair value measurements. These inputs are summarized
in the three broad levels listed below:
Level 1—unadjusted
quoted prices in active markets for identical investments.
Level 2—other
significant observable inputs (including quoted prices for similar investments, interest rates, prepayment speeds, credit
risk, etc.).
Level 3—significant
unobservable inputs (including the fund’s own assumptions in determining the fair value of investments).
The inputs
or methodology used for valuing securities are not necessarily an indication of the risk associated with investing in those securities.
Changes in
valuation techniques may result in transfers in or out of an assigned level within the disclosure hierarchy. Valuation techniques
used to value the fund’s investments are as follows:
The Company’s
Board of Directors (the “Board”)
has designated the Adviser as the fund’s valuation designee to make all fair value determinations
with respect to the fund’s portfolio investments, subject to the Board’s oversight and pursuant to Rule 2a-5 under the Act.
Investments
in equity securities are valued at the last sales price on the securities exchange or national securities market on which such securities
are primarily traded. Securities listed on the National Market System for which market quotations are available are valued at the
official closing price or, if there is no official closing price that day, at the last sales price. For open short positions, asked prices
are used for valuation purposes.
Bid price is used when no asked price is available. Registered investment companies that are not
traded on an exchange are valued
at their net asset value. All of the preceding securities are generally categorized within Level 1 of the fair value hierarchy.
Securities
not listed on an exchange or the national securities market, or securities for which there were no transactions, are valued at the average
of the most recent bid and asked prices. These securities are generally categorized within Level 2 of the fair value hierarchy.
Fair valuing
of securities may be determined with the assistance of a pricing service using calculations based on indices of domestic securities
and other appropriate indicators, such as prices of relevant ADRs and futures. Utilizing these techniques may result in transfers between
Level 1 and Level 2 of the fair value hierarchy.
When market
quotations or official closing prices are not readily available, or are determined not to accurately reflect fair value, such as when
the value of a security has been significantly affected by events after the close of the exchange or market on which the security is principally
traded, but before the fund calculates its net asset value, the fund may value these investments at fair value as determined in accordance
with the procedures approved by the Board. Certain factors may be considered when fair valuing investments such as: fundamental
analytical data, the nature and duration of restrictions on disposition, an evaluation of the forces that influence the market in which
the securities are purchased and sold, and public trading in similar securities of the issuer or comparable issuers. These securities
are either categorized within Level 2 or 3 of the
fair value hierarchy depending on the relevant inputs used.
For securities
where observable inputs are limited, assumptions about market activity and risk are used and such securities are generally categorized
within Level 3 of the fair value hierarchy.
Investment
in private equity securities will be fair valued by the Board in accordance with valuation procedures approved by the Board. Those portfolio
valuations will be based on unobservable inputs and certain assumptions about how market participants would price the
instrument. The fund expects that inputs into the determination of fair value of those investments will require significant
management judgment or estimation. Because
valuations may fluctuate over short periods of time and may be based on estimates, fair value determinations
may differ materially from the value received in an actual transaction. Additionally, valuations of private companies are inherently
uncertain. The fund’s net asset value could be adversely affected if the fund’s determinations regarding the fair value
of those investments were materially
higher or lower than the values that it ultimately realized upon the disposal of such investments. These securities
are categorized within Level 3 of the fair value hierarchy.
NOTES
TO FINANCIAL STATEMENTS (continued)
The following
is a summary of the inputs used as of August 31, 2025 in valuing the fund’s investments:
|
|
Level
1 -
Unadjusted
Quoted
Prices |
Level
2- Other
Significant
Observable
Inputs |
Level
3-
Significant
Unobservable
Inputs
|
|
|
|
|
|
|
|
Investments
in Securities:†
|
|
|
|
|
Equity
Securities - Common Stocks |
|
|
|
|
Equity
Securities - Private Equity |
|
|
|
|
|
|
|
|
|
|
|
|
|
|
|
|
|
|
See
Schedule of Investments for additional detailed categorizations, if any. |
The following is a reconciliation
of Level 3 assets for which significant unobservable inputs were used to determine fair value:
|
|
Equity
Securities-Private Equity ($) |
|
|
|
|
|
|
|
|
|
|
|
|
Change
in unrealized appreciation (depreciation) |
|
|
|
|
|
|
|
|
|
|
The
amount of total gains (losses) for the period included in earnings attributable to the change in
unrealized
appreciation (depreciation) relating to investments still held at 8/31/2025 |
|
|
|
Securities
deemed as Level 3 due to the lack of observable inputs by management assessment. |
The following
table summarizes the significant unobservable inputs the fund used to value its investment categorized within Level 3 as of
August 31, 2025. In addition to the techniques and inputs noted in the table below, according to the fund’s valuation policy,
other valuation techniques and methodologies
when determining the fund’s fair value measurements may be used. The below table is not intended
to be all-inclusive, but rather provide information on the significant unobservable inputs as they are to the fund’s determination
of fair values at period end.
|
|
|
|
|
Amount
or Range/
Weighted
Average |
|
|
|
Market
Comparables
Companies
|
Revenue
Multiple
during the
quarter |
|
|
|
|
|
|
|
|
†
Valuation techniques may change in order to reflect the Valuation Designee’s judgment of current market participant assumptions.
|
(b) Foreign
currency transactions: The fund does not isolate
that portion of the results of operations resulting from changes in foreign exchange
rates on investments from the fluctuations arising from changes in the market prices of securities held. Such fluctuations are included
with the net realized and unrealized gain or loss on investments.
Net realized
foreign exchange gains or losses arise from sales of foreign currencies, currency gains or losses realized on securities transactions
between trade and settlement date, and the difference between the amounts of dividends, interest and foreign withholding taxes recorded
on the fund’s books and the U.S. dollar equivalent of the amounts actually received or paid. Net unrealized foreign exchange
NOTES
TO FINANCIAL STATEMENTS (continued)
gains
and losses arise from changes in the value of assets and liabilities other than investments resulting from changes in exchange rates.
Foreign currency gains and losses
on foreign currency transactions are also included with net realized and unrealized gain or loss on investments.
Foreign taxes:
The fund may be subject to foreign taxes (a portion of which may be reclaimable) on income, stock dividends, realized and
unrealized capital gains on investments or certain foreign currency transactions. Foreign taxes are recorded in accordance with the applicable
foreign tax regulations and rates that exist in the foreign jurisdictions in which the fund invests. These foreign taxes, if any, are
paid by the fund and are reflected
in the Statement of Operations, if applicable. Foreign taxes payable or deferred or those subject to reclaims
as of August 31, 2025, if any, are disclosed in the fund’s Statement of Assets and Liabilities.
(c) Securities
transactions and investment income: Securities transactions
are recorded on a trade date basis. Realized gains and losses
from securities transactions are recorded on the identified cost basis. Dividend income is recognized on the ex-dividend date and interest
income, including, where applicable, accretion of discount and amortization of premium on investments, is recognized on the accrual
basis.
Pursuant to
a securities lending agreement with BNY, the fund may lend securities to qualified institutions. It is the fund’s policy that, at
origination, all loans are secured by collateral of at least 102% of the value of U.S. securities loaned and 105% of the value of foreign
securities loaned. Collateral equivalent
to at least 100% of the market value of securities on loan is maintained at all times. Collateral is either
in the form of cash, which can be invested in certain money market mutual funds managed by the Adviser, or U.S. Government and
Agency securities. Any non-cash collateral received cannot be sold or re-pledged by the fund, except in the event of borrower default,
and is not reflected in the Statement of Assets and Liabilities. The securities on loan, if any, are also disclosed in the fund’s
Schedule of Investments. The fund
is entitled to receive all dividends, interest and distributions on securities loaned, in addition to income
earned as a result of the lending transaction. Should a borrower fail to return the securities in a timely manner, BNY is required to
replace the securities for the benefit of the fund or credit the fund with the market value of the unreturned securities and is subrogated
to the fund’s rights against
the borrower and the collateral. Additionally, the contractual maturity of security lending transactions are on an
overnight and continuous basis. During the period ended August 31, 2025, BNY earned $1,450 from the lending of the fund’s
portfolio securities, pursuant to the securities
lending agreement.
For financial
reporting purposes, the fund elects not to offset assets and liabilities subject to a securities lending agreement, if any, in the Statement
of Assets and Liabilities. Therefore, all qualifying transactions are presented on a gross basis in the Statement of Assets and Liabilities.
As of August 31, 2025, the fund had no securities on loan.
(d) Affiliated
issuers: Investments in other investment companies
advised by the Adviser are considered “affiliated” under the Act.
(e) Market
Risk: The value of the securities in which the fund
invests may be affected by political, regulatory, economic and social developments,
and developments that impact specific economic sectors, industries or segments of the market. In addition, turbulence in financial
markets and reduced liquidity in equity, credit and/or fixed-income markets may negatively affect many issuers, which could adversely
affect the fund. Global economies and financial markets are becoming increasingly interconnected, and conditions and events in
one country, region or financial market may adversely impact issuers in a different country, region or financial market. These risks may
be magnified if certain events or developments adversely interrupt the global supply chain; in these and other circumstances, such risks
might affect companies world-wide.
Foreign Investment Risk:
To the extent the fund invests in foreign securities, the fund’s performance will be influenced by political, social
and economic factors affecting investments in foreign issuers. Special risks associated with investments in foreign issuers include exposure
to currency fluctuations, less liquidity, less developed or less efficient trading markets, lack of comprehensive company information,
political and economic instability and differing auditing and legal standards.
Technology Company Risk:
The technology sector has been among the most volatile sectors of the stock market. Because the fund’s investments are
concentrated in the technology sector, its performance will be significantly affected by developments in that sector. Technology companies,
especially small-cap technology companies, involve greater risk because their revenue and/or earnings tend to be less
predictable (and some companies may be experiencing significant losses) and their share prices tend to be more volatile. Certain
technology companies may have limited
product lines, markets or financial resources, or may depend on a limited management group. In
addition, these companies are strongly affected by worldwide technological developments, and their products and services may
not be economically successful or
may quickly become outdated. Investor perception may play a greater role in determining the day-to-day value
of tech stocks than it does in other sectors. Fund investments made in anticipation of future products and services may decline
dramatically in value if the anticipated
products or services are delayed or cancelled. The risks associated with technology companies
NOTES
TO FINANCIAL STATEMENTS (continued)
are magnified
in the case of small-cap technology companies. The shares of smaller technology companies tend to trade less frequently than
those of larger, more established companies, which can have an adverse effect on the pricing of these securities and on the
fund’s ability to sell these securities.
(f) Dividends
and distributions to shareholders:
Dividends and distributions are recorded on the ex-dividend date. Dividends from net
investment income and dividends from net realized capital gains, if any, are normally declared and paid annually, but the fund may make
distributions on a more frequent basis to comply with the distribution requirements of the Internal Revenue Code of 1986, as amended
(the “Code”). To the extent that net realized capital gains can be offset by capital loss carryovers, it is the policy of
the fund not to distribute such
gains. Income and capital gain distributions are determined in accordance with income tax regulations, which may differ
from GAAP.
(g) Federal
income taxes: It is the policy of the fund to continue
to qualify as a regulated investment company, if such qualification is in
the best interests of its shareholders, by complying with the applicable provisions of the Code, and to make distributions of taxable
income and net realized capital gain sufficient to
relieve it from substantially all federal income and excise taxes.
As of and
during the period ended August 31, 2025, the fund did not have any liabilities for any uncertain tax positions. The fund recognizes
interest and penalties, if any, related to uncertain tax positions as income tax expense in the Statement of Operations. During the
period ended August 31, 2025, the fund did not incur any interest or penalties.
Each tax year
in the four-year period ended August 31, 2025 remains subject to examination by the Internal Revenue Service and state taxing
authorities.
At August
31, 2025, the components of accumulated earnings on a tax basis were as follows: undistributed ordinary income $2,648,305,
undistributed capital gains $46,696,280 and unrealized appreciation $195,497,477.
The tax character
of distributions paid to shareholders during the fiscal years ended August 31, 2025 and August 31, 2024 were as follows:
long-term capital gains $17,000,471 and $0, respectively.
During the
period ended August 31, 2025, as a result of permanent book to tax differences, primarily due to the tax treatment for treating
a portion of the proceeds from redemptions as a distribution for tax purposes, the fund decreased total distributable earnings (loss)
by $3,985,701 and increased paid-in capital by the same amount. Net assets and net asset value per share were not affected by this reclassification.
(h) Operating
segment reporting: In this reporting period, the
fund adopted FASB Accounting Standards Update 2023-07, Segment Reporting
(Topic 280) - Improvements to Reportable Segment Disclosures (“ASU 2023-07”). Adoption of the new standard impacted financial
statement disclosures only and did not affect the fund’s financial position or the results of its operations. The ASU 2023-07 is
effective for public entities for
fiscal years beginning after December 15, 2023, and requires retrospective application for all prior periods presented
within the financial statements.
Since its
commencement, the fund operates and is managed as a single reportable segment deriving returns in the form of dividends, interest
and/or gains from the investments made in pursuit of its single stated investment objective as outlined in the fund’s prospectus.
The accounting policies of the fund
are consistent with those described in these Notes to Financial Statements. The chief operating decision
maker (“CODM”) is represented by BNY Investments, the management of the Adviser, comprising Senior Management and Directors.
The CODM considers net increase in net assets resulting from operations in deciding whether to purchase additional investments
or to make distributions to fund shareholders. Detailed financial information for the fund is disclosed within these financial statements
with total assets and liabilities disclosed on the Statement of Assets and Liabilities, investments held on the Schedule of Investments,
results of operations and significant segment expenses on the Statement of Operations and other information about the fund’s
performance, including total return, portfolio turnover and ratios within the Financial Highlights.
NOTE
2—
Bank
Lines of Credit:
The fund participates with
other long-term open-end funds managed by the Adviser in a $738 million unsecured credit facility led by Citibank,
N.A. (the “Citibank Credit Facility”) and a $300 million unsecured credit facility provided by BNY (the “BNY Credit
Facility”), each to be utilized
primarily for temporary or emergency purposes, including the financing of redemptions (each, a “Facility”).
The Citibank Credit Facility is available in two tranches: (i) Tranche A is in an amount equal to $618 million and is available to all
long-term open-ended funds, including
the fund, and (ii) Tranche B is an amount equal to $120 million and is available only to BNY Mellon
Floating Rate Income Fund, a series of BNY Mellon Investment Funds IV, Inc. In connection therewith, the fund has agreed to pay
its pro rata portion of commitment fees for Tranche A of the Citibank Credit Facility and the BNY Credit Facility. Interest is
NOTES
TO FINANCIAL STATEMENTS (continued)
charged
to the fund based on rates determined pursuant to the terms of the respective Facility at the time of borrowing. During the period
ended August 31, 2025, the fund did not borrow under either Facility.
NOTE
3—
Management
Fee, Sub-Advisory Fee
and Other Transactions with Affiliates:
(a) Pursuant
to a management agreement with the Adviser, the management fee is computed at the annual rate of .75% of the value of the
fund’s average daily net assets and is payable monthly.
Pursuant to
a sub-investment advisory agreement between the Adviser and the Sub-Adviser, the Adviser pays the Sub-Adviser a monthly fee
at an annual rate of .36% of the value of the fund’s average daily net assets.
During the
period ended August 31, 2025, the Distributor retained $5,824 from commissions earned on sales of the fund’s Class A shares
and $149 from CDSC fees on redemptions of the fund’s Class C shares.
(b) Under
the Distribution Plan adopted pursuant to Rule 12b-1 under the Act, Class C shares pay the Distributor for distributing its shares
at an annual rate of .75% of the value of its average daily net assets. The Distributor may pay one or more Service Agents in respect
of advertising, marketing and other distribution services, and determines the amounts, if any, to be paid to Service Agents and the
basis on which such payments are made. During the period ended August 31, 2025, Class C shares were charged $25,871 pursuant to
the Distribution Plan.
(c) Under
the Shareholder Services Plan, Class A and Class C shares pay the Distributor at an annual rate of .25% of the value of their average
daily net assets for the provision of certain services. The services provided may include personal services relating to shareholder accounts,
such as answering shareholder inquiries regarding the fund, and services related to the maintenance of shareholder accounts. The
Distributor may make payments to Service Agents (securities dealers, financial institutions or other industry professionals) with respect
to these services. The Distributor determines the amounts to be paid to Service Agents. During the period ended August 31, 2025,
Class A and Class C shares were charged $897,721 and $8,624, respectively, pursuant to the Shareholder Services Plan.
The fund has
an arrangement with BNY Mellon Transfer, Inc., (the “Transfer Agent”), a subsidiary of BNY and an affiliate of the Adviser,
whereby the fund may receive earnings credits when positive cash balances are maintained, which are used to offset Transfer Agent
fees. For financial reporting purposes, the fund includes transfer agent net earnings credits, if any, as an expense offset in the Statement
of Operations.
The fund has
an arrangement with The Bank of New York Mellon (the “Custodian”), a subsidiary of BNY and an affiliate of the Adviser, whereby
the fund will receive interest income or be charged overdraft fees when cash balances are maintained. For financial reporting purposes,
the fund includes this interest income and overdraft fees, if any, as interest income in the Statement of Operations.
The fund compensates
the Transfer Agent, under a transfer agency agreement, for providing transfer agency and cash management services
for the fund. The majority of Transfer Agent fees are comprised of amounts paid on a per account basis, while cash management fees
are related to fund subscriptions and redemptions. During the period ended August 31, 2025, the fund was charged $59,135 for transfer
agency services. These fees are included in Shareholder servicing costs in the Statement of Operations. These fees were partially offset
by earnings credits of $10,284.
The fund compensates
the Custodian, under a custody agreement, for providing custodial services for the fund. These fees are determined
based on net assets, geographic region and transaction activity. During the period ended August 31, 2025, the fund was charged $8,010
pursuant to the custody agreement.
During the
period ended August 31, 2025, the fund was charged $24,424 for services performed by the fund’s Chief Compliance Officer
and his staff. These fees are included in Chief Compliance Officer fees in the Statement of Operations.
The fund compensates
the Custodian for providing shareholder reporting and regulatory services for the fund. These fees are included in
Shareholder and regulatory reports service fees in the Statement of Operations. During the period ended August 31, 2025, the Custodian
was compensated $8,583 for financial reporting and regulatory services.
The components
of “Due to BNY Mellon Investment Adviser, Inc. and affiliates” in the Statement of Assets and Liabilities consist of:
Management fee of $269,091, Distribution Plan fees of $2,136, Shareholder Services Plan fees of $83,823, Custodian fees of $1,600,
Chief Compliance Officer fees of $3,085, Transfer Agent fees of $9,841 and Shareholder and regulatory reports service fees of $6,667.
(d) Each
board member of the fund also serves as a board member of other funds in the BNY Mellon Family of Funds complex. Annual retainer
fees and attendance fees are allocated to each fund based on net assets.
NOTES
TO FINANCIAL STATEMENTS (continued)
NOTE
4—
Securities
Transactions:
The aggregate
amount of purchases and sales of investment securities, excluding short-term securities, during the period ended August
31, 2025, amounted to $129,583,245 and $169,156,508, respectively.
At August
31, 2025, the cost of investments for federal income tax purposes was $229,450,780; accordingly, accumulated net unrealized appreciation
on investments was $195,497,292, consisting of $200,411,292 gross unrealized appreciation and $4,914,000 gross unrealized
depreciation.
REPORT
OF INDEPENDENT REGISTERED PUBLIC ACCOUNTING FIRM
To the
Shareholders and the Board of Directors of BNY Mellon Technology Growth Fund
Opinion on the Financial Statements
We have audited
the accompanying statement of assets and liabilities of BNY Mellon Technology Growth Fund (the “Fund”) (one
of the funds constituting BNY
Mellon Advantage Funds, Inc. (the “Company”)),
including the schedule of investments, as of August 31, 2025, and the related statement
of operations for the year then ended, the statements of changes in net assets for each of the two years in the period then ended, the
financial highlights for each of
the five years in the period then ended and the related notes (collectively referred to as the “financial
statements”).
In our opinion, the financial statements
present fairly, in all material respects, the financial position of the Fund (one of the funds constituting BNY
Mellon Advantage Funds, Inc.) at
August 31, 2025, the results of its operations for the year then ended, the changes in its net assets for each of the two years in the
period then ended and its financial
highlights for each of the five years in the period then ended, in conformity with U.S. generally accepted accounting principles.
These financial
statements are the responsibility of the Company’s management. Our responsibility is to express an opinion on the Fund’s financial
statements based on our audits. We
are a public accounting firm registered with the Public Company Accounting Oversight Board (United States) (“PCAOB”)
and are required to be independent with respect to the Company in accordance with the U.S. federal securities laws and the applicable
rules and regulations of the Securities and Exchange
Commission and the PCAOB.
We conducted
our audits in accordance with the standards of the PCAOB. Those standards require that we plan and perform the audit to obtain reasonable
assurance about whether the financial statements are free of material misstatement, whether due to error or fraud. The Company is not
required to have, nor were we engaged
to perform, an audit of the Company’s internal control over financial reporting. As part of our audits, we are required
to obtain an understanding of internal control over financial reporting but not for the purpose of expressing an opinion on the effectiveness
of the Company’s internal control over financial
reporting. Accordingly, we express no such opinion.
Our audits
included performing procedures to assess the risks of material misstatement of the financial statements, whether due to error or fraud,
and performing procedures that respond
to those risks. Such procedures included examining, on a test basis, evidence regarding the amounts and disclosures
in the financial statements. Our procedures included confirmation of securities owned as of August 31, 2025, by correspondence with the
custodian, brokers and others; when
replies were not received from brokers and others, we performed other auditing procedures. Our audits also included
evaluating the accounting principles used and significant estimates made by management, as well as evaluating the overall presentation
of the financial statements. We believe that our audits
provide a reasonable basis for our opinion. 
We have served
as the auditor of one or more investment companies in the BNY Mellon Family of Funds since at least 1957, but we are unable to determine
the specific year.
New
York, New York
October 23, 2025
IMPORTANT
TAX INFORMATION (Unaudited)
The fund
hereby reports $2.7527 per share as a long-term capital gain distribution paid on December 4, 2024
Item
8. Changes in and Disagreements with Accountants for Open-End Management Investment Companies
(Unaudited)
Item
9. Proxy Disclosures for Open-End Management Investment Companies (Unaudited)
Item
10. Remuneration Paid to Directors, Officers, and Others of Open-End Management Investment Companies
(Unaudited)
Each
board member also serves as a board member of other funds in the BNY Mellon Family of Funds complex, and annual retainer fees and
meeting attendance fees are allocated to each fund based on net assets. The fund is charged for services performed by the fund’s
Chief Compliance Officer. Compensation
paid by the fund during the period to the board members and the Chief Compliance Officer are
within Item 7. Statement of Operations as Directors’ fees and expenses and Chief Compliance Officer fees, respectively. The aggregate
amount of Directors’ fees and expenses and Chief Compliance Officer fees paid by the fund during the period was $58,746.
Item
11. Statement Regarding Basis for Approval of Investment Advisory Contracts (Unaudited)
At
a meeting of the fund’s Board of Directors (the “Board”)
held on March 4-5, 2025, the Board considered the renewal of the fund’s Management
Agreement, pursuant to which the Adviser provides the fund with investment advisory and administrative services, the Sub-Investment
Advisory Agreement, pursuant to which Newton Investment Management North America, LLC (the “Sub-Adviser”
or “NIMNA”)
provides day-to-day management of the fund’s investments, and the Sub-Sub-Investment Advisory Agreement (collectively with
the Management Agreement and Sub-Investment Advisory Agreement, the “Agreements”)
between NIMNA and Newton Investment
Management Limited (“NIM”),
pursuant to which NIMNA may use the investment advisory personnel, resources and capabilities
available at its sister company, NIM, in providing the day-to-day management of the fund’s investments. The Board members, none
of whom are “interested
persons”
(as defined in the Investment Company Act of 1940, as amended) of the fund, were assisted in their review
by independent legal counsel and met with counsel in executive session separate from representatives of the Adviser and the Sub-Adviser.
In considering the renewal of the Agreements, the Board considered several factors that it believed to be relevant, including those
discussed below. The Board did not identify any one factor as dispositive, and each Board member may have attributed different weights
to the factors considered.
Analysis
of Nature, Extent, and Quality of Services Provided to the Fund.
The Board considered information provided to it at the meeting
and in previous presentations from representatives of the Adviser regarding the nature, extent, and quality of the services provided
to funds in the BNY fund complex, including the fund. The Adviser provided the number of open accounts in the fund, the fund’s
asset size and the allocation of fund assets among distribution channels. The Adviser also had previously provided information regarding
the diverse intermediary relationships and distribution channels of funds in the BNY fund complex (such as retail direct or intermediary,
in which intermediaries typically are paid by the fund and/or the Adviser) and the Adviser’s corresponding need for broad, deep,
and diverse resources to be able to provide ongoing shareholder services to each intermediary or distribution channel, as applicable to
the fund.
The Board
also considered research support available to, and portfolio management capabilities of, the fund’s portfolio management personnel
and that the Adviser also provides oversight of day-to-day fund operations, including fund accounting and administration and
assistance in meeting legal and regulatory requirements. The Board also considered the Adviser’s extensive administrative, accounting
and compliance infrastructures, as well as the Adviser’s supervisory activities over the Sub-Adviser. The Board also considered
portfolio management’s brokerage
policies and practices (including policies and practices regarding soft dollars) and the standards applied
in seeking best execution.
Comparative
Analysis of the Fund’s Performance and Management Fee and Expense Ratio.
The Board reviewed reports prepared by Broadridge
Financial Solutions, Inc. (“Broadridge”),
an independent provider of investment company data based on classifications provided
by Thomson Reuters Lipper (“Lipper”),
which included information comparing (1) the performance of the fund’s Class I shares
with the performance of a group of institutional science and technology funds selected by Broadridge as comparable to the fund (the
“Performance
Group”)
and with a broader group of funds consisting of all retail and institutional science and technology funds (the “Performance
Universe”),
all for various periods ended December 31, 2024, and (2) the fund’s actual and contractual management fees and
total expenses with those of the same group of funds in the Performance Group (the “Expense
Group”)
and with a broader group of funds
consisting of all institutional science and technology funds, excluding outliers (the “Expense
Universe”),
the information for which was derived
in part from fund financial statements available to Broadridge as of the date of its analysis. The Adviser previously had furnished
the Board with a description of the methodology Broadridge used to select the Performance Group and Performance Universe and
the Expense Group and Expense Universe.
Performance Comparisons.
Representatives of the Adviser stated that the usefulness of performance comparisons may be affected by a number
of factors, including different investment limitations and policies that may be applicable to the fund and comparison funds and the
end date selected. The Board also considered the fund’s performance in light of overall financial market conditions. The Board discussed
with representatives of the Adviser and the Sub-Adviser the results of the comparisons and considered that the fund’s total return
performance was below the Performance Group and Performance Universe medians for all periods, except for the two-year period when
the fund’s total return performance was above the Performance Universe median. The Board discussed with representatives of the Adviser
and the Sub-Adviser the reasons for the fund’s underperformance versus the Performance Group and Performance Universe during
certain periods under review and noted the Sub-Adviser’s efforts to improve performance and that the portfolio managers assumed
responsibility for managing the fund’s portfolio in March 2022 and May 2024. The Adviser also provided a comparison of the fund’s
calendar year total returns to the returns of the fund’s benchmark indices.
Management
Fee and Expense Ratio Comparisons. The Board reviewed
and considered the contractual management fee rate payable by the
fund to the Adviser in light of the nature, extent and quality of the management services and the sub-advisory services provided by the
Adviser and the Sub-Adviser, respectively. In addition, the Board reviewed and considered the actual management fee rate paid by the
fund over the fund’s last fiscal year. The Board also reviewed the range of actual and contractual management fees and total expenses
as a percentage of average net assets of the Expense
Group and Expense Universe funds and discussed the results of the comparisons.
The Board
considered that the fund’s contractual management fee was lower than the Expense Group median contractual management fee,
the fund’s actual management fee was lower than the Expense Group median and lower than the Expense Universe median actual management
fee, and the fund’s total expenses were equal to the Expense Group median and slightly higher than the Expense Universe median
total expenses.
Representatives
of the Adviser noted that there were no other funds advised by the Adviser that are in the same Lipper category as the fund
or separate accounts and/or other types of client portfolios advised by the Adviser or the Sub-Adviser that are considered to have similar
investment strategies and policies as the fund.
The Board
considered the fee payable to the Sub-Adviser in relation to the fee payable to the Adviser by the fund and the respective services
provided by the Sub-Adviser and the Adviser. The Board also took into consideration that the Sub-Adviser’s fee is paid by the Adviser,
out of its fee from the fund, and not the fund.
Analysis
of Profitability and Economies of Scale. Representatives
of the Adviser reviewed the expenses allocated and profit received by the
Adviser and its affiliates and the resulting profitability percentage for managing the fund and the aggregate profitability percentage
to the Adviser and its affiliates
for managing the funds in the BNY fund complex, and the method used to determine the expenses and profit.
The Board concluded that the profitability results were not excessive, given the services rendered and service levels provided by the
Adviser and its affiliates. The Board also had been provided with information prepared by an independent consulting firm regarding the
Adviser’s approach to allocating costs to, and determining the profitability of, individual funds and the entire BNY fund complex.
The consulting firm also had analyzed where any economies
of scale might emerge in connection with the management of a fund.
The Board
considered, on the advice of its counsel, the profitability analysis (1) as part of its evaluation of whether the fees under the Agreements,
considered in relation to the mix of services provided by the Adviser and the Sub-Adviser, including the nature, extent and quality
of such services, supported the renewal of the Agreements and (2) in light of the relevant circumstances for the fund and the extent
to which economies of scale would be realized if the fund grows and whether fee levels reflect these economies of scale for the benefit
of fund shareholders. Representatives of the Adviser stated that a discussion of economies of scale is predicated on a fund having achieved
a substantial size with increasing assets and that, if a fund’s assets had been stable or decreasing, the possibility that the Adviser
may have realized any economies
of scale would be less. Representatives of the Adviser also stated that, as a result of shared and allocated costs
among funds in the BNY fund complex, the extent of economies of scale could depend substantially on the level of assets in the complex
as a whole, so that increases and decreases in complex-wide assets can affect potential economies of scale in a manner that is disproportionate
to, or even in the opposite direction from, changes in the fund’s asset level. The Board also considered potential benefits
to the Adviser and the Sub-Adviser from acting as investment adviser and sub-investment adviser, respectively, and took into consideration
the soft dollar arrangements in effect for trading the fund’s investments.
At the conclusion
of these discussions, the Board agreed that it had been furnished with sufficient information to make an informed business
decision with respect to the renewal of the Agreements. Based on the discussions and considerations as described above, the Board
concluded and determined as follows.
●The
Board concluded that the nature, extent and quality of the services provided by the Adviser and the Sub-Adviser are satisfactory
and appropriate.
●The
Board generally was satisfied with the Sub-Adviser’s efforts to improve the fund’s performance.
●The
Board concluded that the fees paid to the Adviser and the Sub-Adviser continued to be appropriate under the circumstances and
in light of the factors and the totality of the services provided as discussed above
●The
Board determined that the economies of scale which may accrue to the Adviser and its affiliates in connection with the management
of the fund had been adequately considered by the Adviser in connection with the fee rate charged to the fund
Item
11. Statement Regarding Basis for Approval of Investment Advisory Contracts (Unaudited) (continued)
pursuant
to the Management Agreement and that, to the extent in the future it were determined that material economies of scale had
not been shared with the fund, the Board would seek to have those economies of scale shared with the fund.
In evaluating
the Agreements, the Board considered these conclusions and determinations and also relied on its previous knowledge, gained
through meetings and other interactions with the Adviser and its affiliates and the Sub-Adviser, of the Adviser and the Sub-Adviser
and the services provided to the fund by the Adviser and the Sub-Adviser. The Board also relied on information received on a routine
and regular basis throughout the year relating to the operations of the fund and the investment management and other services provided
under the Agreements, including information on the investment performance of the fund in comparison to similar mutual funds
and benchmark performance indices; general market outlook as applicable to the fund; and compliance reports. In addition, the Board’s
consideration of the contractual fee arrangements for the fund had the benefit of a number of years of reviews of the Agreements for
the fund, or substantially similar agreements for other BNY funds that the Board oversees, during which lengthy discussions took place
between the Board and representatives of the Adviser. Certain aspects of the arrangements may receive greater scrutiny in some years
than in others, and the Board’s conclusions may be based, in part, on its consideration of the fund’s arrangements, or substantially
similar arrangements for other BNY funds that the
Board oversees, in prior years. The Board determined to renew the Agreements.
©
2025 BNY Mellon Securities Corporation
Code-0255NCSRAR0825
|
Item 12. |
Disclosure of Proxy Voting Policies and Procedures for Closed-End Management Investment Companies. |
Not applicable.
|
Item 13. |
Portfolio Managers for Closed-End Management Investment Companies. |
Not applicable.
|
Item 14. |
Purchases of Equity Securities By Closed-End Management Investment Companies and Affiliated Purchasers.
|
Not applicable.
|
Item 15. |
Submission of Matters to a Vote of Security Holders. |
There have been no material changes to the procedures
applicable to Item 15.
|
Item 16. |
Controls and Procedures. |
|
(a) |
The Registrant's principal executive and principal financial officers have concluded, based on their
evaluation of the Registrant's disclosure controls and procedures as of a date within 90 days of the filing date of this report, that
the Registrant's disclosure controls and procedures are reasonably designed to ensure that information required to be disclosed by the
Registrant on Form N-CSR is recorded, processed, summarized and reported within the required time periods and that information required
to be disclosed by the Registrant in the reports that it files or submits on Form N-CSR is accumulated and communicated to the Registrant's
management, including its principal executive and principal financial officers, as appropriate to allow timely decisions regarding required
disclosure. |
|
(b) |
There were no changes to the Registrant's internal control over financial reporting that occurred
during the period covered by this report that have materially affected, or are reasonably likely to materially affect, the Registrant's
internal control over financial reporting. |
|
Item 17. |
Disclosure of Securities Lending Activities for Closed-End Management Investment Companies. |
Not applicable.
|
Item 18. |
Recovery of Erroneously Awarded Compensation. |
Not applicable.
(a)(1) Code of ethics referred to in Item 2.
(a)(3) Not applicable.
SIGNATURES
Pursuant
to
the
requirements
of
the
Securities
Exchange
Act
of
1934
and
the
Investment
Company
Act
of
1940,
the
Registrant
has
duly
caused
this
Report
to
be
signed
on
its
behalf
by
the
undersigned,
thereunto
duly
authorized.
BNY
Mellon
Advantage
Funds,
Inc.
By: /s/
David
J.
DiPetrillo
David
J.
DiPetrillo
President
(Principal
Executive
Officer)
Date: October
22,
2025
Pursuant
to
the
requirements
of
the
Securities
Exchange
Act
of
1934
and
the
Investment
Company
Act
of
1940,
this
Report
has
been
signed
below
by
the
following
persons
on
behalf
of
the
Registrant
and
in
the
capacities
and
on
the
dates
indicated.
By: /s/
David
J.
DiPetrillo
David
J.
DiPetrillo
President
(Principal
Executive
Officer)
Date: October
22,
2025
By: /s/
James
Windels
James
Windels
Treasurer
(Principal
Financial
Officer)
Date: October
22,
2025
EXHIBIT
INDEX
|
(a)(1) |
Code of ethics referred to in Item 2. |
|
(a)(2) |
Certifications of principal executive and principal financial officers as required by Rule 30a-2(a)
under the Investment Company Act of 1940. (EX-99.CERT) |
|
(b) |
Certification of principal executive and principal financial officers as required by Rule 30a-2(b)
under the Investment Company Act of 1940. (EX-99.906CERT) |
THE BNY MELLON FAMILY OF
FUNDS
BNY MELLON FUNDS TRUST
Principal Executive Officer and Senior Financial
Officer
Code of Ethics
I.
Covered Officers/Purpose of the
Code
This code of ethics (the "Code"), adopted by
the funds in the BNY Mellon Family of Funds and BNY Mellon Funds Trust (each, a
"Fund"), applies to each Fund's Principal Executive Officer,
Principal Financial Officer, Principal Accounting Officer or Controller, or
other persons performing similar functions, each of whom is listed on Exhibit A (the "Covered Officers"),
for the purpose of promoting:
·
honest and ethical conduct,
including the ethical handling of actual or apparent conflicts of interest
between personal and professional relationships;
·
full, fair, accurate, timely and
understandable disclosure in reports and documents that the Fund files with, or
submits to, the Securities and Exchange Commission (the "SEC") and in
other public communications made by the Fund;
·
compliance with applicable laws
and governmental rules and regulations;
·
the prompt internal reporting of
violations of the Code to an appropriate person or persons identified in the
Code; and
·
accountability for adherence to
the Code.
Each Covered Officer should adhere to a high standard
of business ethics and should be sensitive to situations that may give rise to
actual as well as apparent conflicts of interest.
II.
Covered Officers Should Handle
Ethically Actual and Apparent Conflicts of Interest
Overview. A
"conflict of interest" occurs when a Covered Officer's private
interest interferes with the interests of, or his service to, the Fund. For
example, a conflict of interest would arise if a Covered Officer, or a member
of his family, receives improper personal benefits as a result of his position
with the Fund.
Certain conflicts of interest arise out of the
relationships between Covered Officers and the Fund and already are subject to
conflict of interest provisions in the Investment Company Act of 1940, as
amended (the "Investment Company Act"), and the Investment Advisers Act
of 1940, as amended (the "Investment Advisers Act"). For example,
Covered Officers may not individually engage in certain transactions (such as
the purchase or sale of securities or other property) with the Fund because of
their status as "affiliated persons" of the Fund. The compliance
programs and procedures of the Fund and the Fund's investment adviser (the
"Adviser") are designed to prevent, or identify and correct,
violations of these provisions. The Code does not, and is not intended to,
repeat or replace these programs and procedures, and the circumstances they
cover fall outside of the parameters of the Code.
Although typically not presenting an opportunity for
improper personal benefit, conflicts arise from, or as a result of, the
contractual relationship between the Fund and the Adviser of which the Covered
Officers are also officers or employees. As a result, the Code recognizes that
the Covered Officers, in the ordinary course of their duties (whether formally
for the Fund or for the Adviser, or for both), will be involved in establishing policies and implementing decisions that will
have different effects on the Adviser and the Fund. The participation of the
Covered Officers in such activities is inherent in the contractual relationship
between the Fund and the Adviser and is consistent with the performance by the
Covered Officers of their duties as officers of the Fund and, if addressed in
conformity with the provisions of the Investment Company Act and the Investment
Advisers Act, will be deemed to have been handled ethically. In addition, it
is recognized by the Fund's Board that the Covered Officers also may be
officers or employees of one or more other investment companies covered by this
or other codes of ethics.
Other conflicts of interest are covered by the Code,
even if such conflicts of interest are not subject to provisions in the
Investment Company Act and the Investment Advisers Act. Covered Officers
should keep in mind that the Code cannot enumerate every possible scenario.
The overarching principle of the Code is that the personal interest of a
Covered Officer should not be placed improperly before the interest of the
Fund.
Each Covered Officer must:
·
not use his personal influence or
personal relationships improperly to influence investment decisions or
financial reporting by the Fund whereby the Covered Officer would benefit
personally to the detriment of the Fund;
·
not cause the Fund to take action,
or fail to take action, for the individual personal benefit of the Covered
Officer rather than the benefit of the Fund; and
·
not retaliate against any employee
or Covered Officer for reports of potential violations that are made in good
faith.
III.
Disclosure and Compliance
·
Each Covered Officer should
familiarize himself with the disclosure requirements generally applicable to
the Fund within his area of responsibility;
·
each Covered Officer should not
knowingly misrepresent, or cause others to misrepresent, facts about the Fund
to others, whether within or outside the Fund, including to the Fund's Board
members and auditors, and to governmental regulators and self-regulatory
organizations;
·
each Covered Officer should, to
the extent appropriate within his area of responsibility, consult with other
officers and employees of the Fund and the Adviser with the goal of promoting
full, fair, accurate, timely and understandable disclosure in the reports and
documents the Fund files with, or submits to, the SEC and in other public
communications made by the Fund; and
·
it is the responsibility of each
Covered Officer to promote compliance with the standards and restrictions
imposed by applicable laws, rules and regulations.
IV.
Reporting and Accountability
Each Covered Officer must:
·
upon adoption of the Code (or
thereafter, as applicable, upon becoming a Covered Officer), affirm in writing
to the Board that he has received, read, and understands the Code;
·
annually thereafter affirm to the Board
that he has complied with the requirements of the Code; and
·
notify the Adviser's General
Counsel (the "General Counsel") promptly if he knows of any violation
of the Code. Failure to do so is itself a violation of the Code.
The General Counsel is responsible for applying the
Code to specific situations in which questions are presented under it and has
the authority to interpret the Code in any particular situation. However,
waivers sought by any Covered Officer will be considered by the Fund's Board.
The Fund will follow these procedures in investigating
and enforcing the Code:
·
the General Counsel will take all
appropriate action to investigate any potential violations reported to him;
·
if, after such investigation, the
General Counsel believes that no violation has occurred, the General Counsel is
not required to take any further action;
·
any matter that the General
Counsel believes is a violation will be reported to the Board;
·
if the Board concurs that a
violation has occurred, it will consider appropriate action, which may include:
review of, and appropriate modifications to, applicable policies and
procedures; notification to appropriate personnel of the Adviser or its board;
or dismissal of the Covered Officer;
·
the Board will be responsible for
granting waivers, as appropriate; and
·
any waivers of or amendments to
the Code, to the extent required, will be disclosed as provided by SEC rules.
V.
Other Policies and Procedures
The Code shall be the sole code of ethics adopted by
the Fund for purposes of Section 406 of the Sarbanes-Oxley Act of 2002 and the
rules and forms applicable to registered investment companies thereunder. The Fund's,
its principal underwriter's and the Adviser's codes of ethics under Rule 17j-1
under the Investment Company Act and the Adviser's additional policies and
procedures, including its Code of Conduct, are separate requirements applying
to the Covered Officers and others, and are not part of the Code.
VI.
Amendments
Except as to Exhibit A, the Code may not be amended
except in written form, which is specifically approved or ratified by a
majority vote of the Fund's Board, including a majority of independent Board
members.
VII.
Confidentiality
All reports and records prepared or maintained
pursuant to the Code will be considered confidential and shall be maintained
and protected accordingly. Except as otherwise required by law or the Code,
such matters shall not be disclosed to anyone other than the appropriate Funds
and their counsel, the appropriate Boards (or Committees) and their counsel and
the Adviser.
VIII.
Internal Use
The Code is intended solely for the internal use by
the Fund and does not constitute an admission, by or on behalf of the Fund, as
to any fact, circumstance, or legal conclusion.
Dated as of: January 14, 2021
Exhibit A
Persons Covered by the
Code of Ethics
|
David J. DiPetrillo
|
President
|
(Principal Executive
Officer, BNY Mellon Family of Funds)
|
|
|
|
|
|
Lisa M. Sampson
|
President
|
(Principal Executive
Officer, BNY Mellon Funds Trust)
|
|
|
|
|
|
James M. Windels
|
Treasurer
|
(Principal Financial and
Accounting Officer)
|
[EX-99.CERT]—Exhibit (a)(2)
SECTION 302 CERTIFICATION
I, David J. DiPetrillo, certify that:
1. I have reviewed this report on Form N-CSR of
BNY Mellon Advantage Funds, Inc.;
2. Based on my knowledge, this report does not
contain any untrue statement of a material fact or omit to state a material fact necessary to make the statements made, in light of the
circumstances under which such statements were made, not misleading with respect to the period covered by this report;
3. Based on my knowledge, the financial statements,
and other financial information included in this report, fairly present in all material respects the financial condition, results of operations,
changes in net assets, and cash flows (if the financial statements are required to include a statement of cash flows) of the registrant
as of, and for, the periods presented in this report;
4. The registrant's other certifying officer(s)
and I are responsible for establishing and maintaining disclosure controls and procedures (as defined in Rule 30a-3(c) under the Investment
Company Act of 1940) and internal control over financial reporting (as defined in Rule 30a-3(d) under the Investment Company Act of 1940)
for the registrant and have:
(a) Designed such disclosure controls and
procedures, or caused such disclosure controls and procedures to be designed under our supervision, to ensure that material information
relating to the registrant, including its consolidated subsidiaries, is made known to us by others within those entities, particularly
during the period in which this report is being prepared;
(b) Designed such internal control over
financial reporting, or caused such internal control over financial reporting to be designed under our supervision, to provide reasonable
assurance regarding the reliability of financial reporting and the preparation of financial statements for external purposes in accordance
with generally accepted accounting principles;
(c) Evaluated the effectiveness of the
registrant's disclosure controls and procedures and presented in this report our conclusions about the effectiveness of the disclosure
controls and procedures, as of a date within 90 days prior to the filing date of this report based on such evaluation; and
(d) Disclosed in this report any change
in the registrant's internal control over financial reporting that occurred during the period covered by this report that has materially
affected, or is reasonably likely to materially affect, the registrant's internal control over financial reporting; and
5. The registrant's other certifying officer(s)
and I have disclosed to the registrant's auditors and the audit committee of the registrant's board of directors (or persons performing
the equivalent functions):
(a) All significant deficiencies and material
weaknesses in the design or operation of internal control over financial reporting which are reasonably likely to adversely affect the
registrant's ability to record, process, summarize, and report financial information; and
(b) Any fraud, whether or not material,
that involves management or other employees who have a significant role in the registrant's internal control over financial reporting.
By: /s/ David J.
DiPetrillo
David J. DiPetrillo
President (Principal Executive Officer)
Date: October 22, 2025
SECTION 302 CERTIFICATION
I, James Windels, certify that:
1. I have reviewed this report on Form N-CSR of
BNY Mellon Advantage Funds, Inc.;
2. Based on my knowledge, this report does not
contain any untrue statement of a material fact or omit to state a material fact necessary to make the statements made, in light of the
circumstances under which such statements were made, not misleading with respect to the period covered by this report;
3. Based on my knowledge, the financial statements,
and other financial information included in this report, fairly present in all material respects the financial condition, results of operations,
changes in net assets, and cash flows (if the financial statements are required to include a statement of cash flows) of the registrant
as of, and for, the periods presented in this report;
4. The registrant's other certifying officer(s)
and I are responsible for establishing and maintaining disclosure controls and procedures (as defined in Rule 30a-3(c) under the Investment
Company Act of 1940) and internal control over financial reporting (as defined in Rule 30a-3(d) under the Investment Company Act of 1940)
for the registrant and have:
(a) Designed such disclosure controls and
procedures, or caused such disclosure controls and procedures to be designed under our supervision, to ensure that material information
relating to the registrant, including its consolidated subsidiaries, is made known to us by others within those entities, particularly
during the period in which this report is being prepared;
(b) Designed such internal control over
financial reporting, or caused such internal control over financial reporting to be designed under our supervision, to provide reasonable
assurance regarding the reliability of financial reporting and the preparation of financial statements for external purposes in accordance
with generally accepted accounting principles;
(c) Evaluated the effectiveness of the
registrant's disclosure controls and procedures and presented in this report our conclusions about the effectiveness of the disclosure
controls and procedures, as of a date within 90 days prior to the filing date of this report based on such evaluation; and
(d) Disclosed in this report any change
in the registrant's internal control over financial reporting that occurred during the period covered by this report that has materially
affected, or is reasonably likely to materially affect, the registrant's internal control over financial reporting; and
5. The registrant's other certifying officer(s)
and I have disclosed to the registrant's auditors and the audit committee of the registrant's board of directors (or persons performing
the equivalent functions):
(a) All significant deficiencies and material
weaknesses in the design or operation of internal control over financial reporting which are reasonably likely to adversely affect the
registrant's ability to record, process, summarize, and report financial information; and
(b) Any fraud, whether or not material,
that involves management or other employees who have a significant role in the registrant's internal control over financial reporting.
By: /s/ James Windels
James Windels
Treasurer (Principal Financial Officer)
Date: October 22, 2025
[EX-99.906CERT]
Exhibit (b)
SECTION 906 CERTIFICATIONS
In connection with this report on Form
N-CSR for the Registrant as furnished to the Securities and Exchange Commission on the date hereof (the "Report"), the undersigned
hereby certify, pursuant to Section 906 of the Sarbanes-Oxley Act of 2002, that:
(1) the
Report fully complies with the requirements of Section 13(a) or 15(d) of the Securities Exchange Act of 1934, as applicable; and
(2) the
information contained in the Report fairly presents, in all material respects, the financial condition and results of operations of the
Registrant.
By: /s/ David J.
DiPetrillo
David J. DiPetrillo
President (Principal Executive Officer)
Date: October 22, 2025
By: /s/ James Windels
James Windels
Treasurer (Principal Financial Officer)
Date: October 22, 2025
This certificate is furnished pursuant to the requirements of Form N-CSR and
shall not be deemed "filed" for purposes of Section 18 of the Securities Exchange Act of 1934, or otherwise subject to the liability
of that section, and shall not be deemed to be incorporated by reference into any filing under the Securities Act of 1933 or the Securities
Exchange Act of 1934.
v3.25.3
| X |
- DefinitionBoolean flag that is true when the XBRL content amends previously-filed or accepted submission.
| Name: |
dei_AmendmentFlag |
| Namespace Prefix: |
dei_ |
| Data Type: |
xbrli:booleanItemType |
| Balance Type: |
na |
| Period Type: |
duration |
|
| X |
- DefinitionFor the EDGAR submission types of Form 8-K: the date of the report, the date of the earliest event reported; for the EDGAR submission types of Form N-1A: the filing date; for all other submission types: the end of the reporting or transition period. The format of the date is YYYY-MM-DD.
| Name: |
dei_DocumentPeriodEndDate |
| Namespace Prefix: |
dei_ |
| Data Type: |
xbrli:dateItemType |
| Balance Type: |
na |
| Period Type: |
duration |
|
| X |
- DefinitionThe type of document being provided (such as 10-K, 10-Q, 485BPOS, etc). The document type is limited to the same value as the supporting SEC submission type, or the word 'Other'.
| Name: |
dei_DocumentType |
| Namespace Prefix: |
dei_ |
| Data Type: |
dei:submissionTypeItemType |
| Balance Type: |
na |
| Period Type: |
duration |
|
| X |
- DefinitionA unique 10-digit SEC-issued value to identify entities that have filed disclosures with the SEC. It is commonly abbreviated as CIK. Reference 1: http://www.xbrl.org/2003/role/presentationRef
-Publisher SEC
-Name Exchange Act
-Number 240
-Section 12
-Subsection b-2
| Name: |
dei_EntityCentralIndexKey |
| Namespace Prefix: |
dei_ |
| Data Type: |
dei:centralIndexKeyItemType |
| Balance Type: |
na |
| Period Type: |
duration |
|
| X |
- DefinitionOne of: N-1A (Mutual Fund), N-1 (Open-End Separate Account with No Variable Annuities), N-2 (Closed-End Investment Company), N-3 (Separate Account Registered as Open-End Management Investment Company), N-4 (Variable Annuity UIT Separate Account), N-5 (Small Business Investment Company), N-6 (Variable Life UIT Separate Account), S-1 or S-3 (Face Amount Certificate Company), S-6 (UIT, Non-Insurance Product). Reference 1: http://www.xbrl.org/2003/role/presentationRef
-Publisher SEC
-Name Regulation S-T
-Number 232
-Section 313
| Name: |
dei_EntityInvCompanyType |
| Namespace Prefix: |
dei_ |
| Data Type: |
dei:invCompanyType |
| Balance Type: |
na |
| Period Type: |
duration |
|
| X |
- DefinitionThe exact name of the entity filing the report as specified in its charter, which is required by forms filed with the SEC. Reference 1: http://www.xbrl.org/2003/role/presentationRef
-Publisher SEC
-Name Exchange Act
-Number 240
-Section 12
-Subsection b-2
| Name: |
dei_EntityRegistrantName |
| Namespace Prefix: |
dei_ |
| Data Type: |
xbrli:normalizedStringItemType |
| Balance Type: |
na |
| Period Type: |
duration |
|
| X |
- ReferencesReference 1: http://www.xbrl.org/2003/role/presentationRef
-Publisher SEC
-Name Form N-1A
-Section 27A
-Subsection d
-Paragraph 2
-Subparagraph instruction
-Clause 7
| Name: |
oef_ShareholderReportLineItems |
| Namespace Prefix: |
oef_ |
| Data Type: |
xbrli:stringItemType |
| Balance Type: |
na |
| Period Type: |
duration |
|
v3.25.3
Shareholder Report
|
12 Months Ended |
|
Aug. 31, 2025
USD ($)
Holding
|
|---|
| Shareholder Report [Line Items] |
|
|
| Document Type |
N-CSR
|
|
| Amendment Flag |
false
|
|
| Registrant Name |
BNY Mellon Advantage Funds, Inc.
|
|
| Entity Central Index Key |
0000914775
|
|
| Entity Investment Company Type |
N-1A
|
|
| Document Period End Date |
Aug. 31, 2025
|
|
| C000001288 [Member] |
|
|
| Shareholder Report [Line Items] |
|
|
| Fund Name |
BNY Mellon Opportunistic Midcap Value Fund
|
|
| Class Name |
Class A
|
|
| Trading Symbol |
DMCVX
|
|
| Annual or Semi-Annual Statement [Text Block] |
This annual shareholder report contains important information about BNY Mellon Opportunistic Midcap Value Fund (the “Fund”) for the period of September 1, 2024 to August 31, 2025.
|
|
| Shareholder Report Annual or Semi-Annual |
annual shareholder report
|
|
| Additional Information [Text Block] |
You can find additional information about the Fund at bny.com/investments/literaturecenter. You can also request this information by calling 1-800-373-9387 (inside the U.S. only) or by sending an e-mail request to info@bny.com.
|
|
| Additional Information Phone Number |
1-800-373-9387
|
|
| Additional Information Email |
info@bny.com
|
|
| Additional Information Website |
bny.com/investments/literaturecenter
|
|
| Expenses [Text Block] |
What were the Fund’s costs for the last year ?
(based on a hypothetical $10,000 investment)
| Share Class |
Costs of a $10,000 investment |
Costs paid as a percentage of a $10,000 investment |
| Class A |
$120 |
1.16% |
|
|
| Expenses Paid, Amount |
$ 120
|
|
| Expense Ratio, Percent |
1.16%
|
|
| Factors Affecting Performance [Text Block] |
How did the Fund perform last year ?
-
For the 12-month period ended August 31, 2025, the Fund’s Class A shares returned 7.13%.
-
In comparison, the Russell Midcap® Value Index (the “Index”) returned 8.24% for the same period.
What affected the Fund’s performance?
-
U.S. stocks generally rose despite tariff-related drawdowns, as inflation eased and interest rates plateaued, led by gains in large-cap and growth-oriented names.
-
Favorable stock selection in the materials sector bolstered the Fund’s relative performance, as did positioning and stock selection in industrials, specifically out-of-Index stock selection within electrical equipment.
-
Secondary positive contributors included stock selection within the utilities sector and underweight exposure to real estate.
-
Unfavorable stock selection within financials, along with overweight exposure and stock selection in health care and stock selection within energy, detracted most from the Fund’s relative returns.
-
Secondary detractors included disappointing stock selection in consumer staples and consumer discretionary.
|
|
| Performance Past Does Not Indicate Future [Text] |
The Fund’s past performance is not a good predictor of the Fund’s future performance.
|
|
| Line Graph [Table Text Block] |
How did the Fund perform over the past 10 years?
The Fund’s past performance is not a good predictor of the Fund’s future performance. The graph and table do not reflect the deduction of taxes that a shareholder would pay on fund distributions or redemption of fund shares.
Cumulative Performance from September 1 , 2015 through August 31, 2025
Initial Investment of $10,000
The above graph compares a hypothetical $10,000 investment in the Fund’s Class A shares to a hypothetical investment of $10,000 made in each of the Russell 3000® Index (a broad-based index) and Russell Midcap® Value Index on 8/31/2015. The performance shown takes into account the maximum initial sales charge on Class A shares and applicable fees and expenses of the Fund, including management fees and other expenses. The Fund’s performance also assumes the reinvestment of dividends and capital gains. Unlike the Fund, the indexes are not subject to charges, fees and other expenses. Investors cannot invest directly in any index.
|
|
| Average Annual Return [Table Text Block] |
AVERAGE ANNUAL TOTAL RETURNS (AS OF 8/31/25 )
| Class A Shares |
1YR |
|
5YR |
|
10YR |
|
| with Maximum Sales Charge - 5.75% |
0.98% |
|
9.60% |
|
7.99% |
|
| without Sales Charge |
7.13% |
|
10.91% |
|
8.63% |
|
| Russell 3000® Index (broad-based index) |
15.84% |
|
14.11% |
|
13.98% |
|
| Russell Midcap® Value Index |
8.24% |
|
12.86% |
|
9.45% |
|
|
|
| No Deduction of Taxes [Text Block] |
The graph and table do not reflect the deduction of taxes that a shareholder would pay on fund distributions or redemption of fund shares.
|
|
| Updated Performance Information Location [Text Block] |
For more current information visit bny.com/investments/literaturecenter .
|
|
| Net Assets |
$ 390,000,000
|
|
| Holdings Count | Holding |
70
|
|
| Advisory Fees Paid, Amount |
$ 2,922,972
|
|
| Investment Company Portfolio Turnover |
64.98%
|
|
| Additional Fund Statistics [Text Block] |
KEY FUND STATISTICS (AS OF 8/31/25 )
Fund Size (Millions) |
Number of Holdings |
Total Advisory Fee Paid During
Period |
Annual Portfolio Turnover |
| $390 |
70 |
$2,922,972 |
64.98% |
|
|
| Holdings [Text Block] |
Portfolio Holdings (as of 8/31/25 )
Top Ten Holdings (Based on Net Assets) *
* Excludes money market funds or other short-term securities held for the investment of cash and cash collateral for securities loaned, if any.
Sector Allocation (Based on Net Assets)
|
|
| Largest Holdings [Text Block] |
Top Ten Holdings (Based on Net Assets) *
* Excludes money market funds or other short-term securities held for the investment of cash and cash collateral for securities loaned, if any.
|
|
| C000064720 [Member] |
|
|
| Shareholder Report [Line Items] |
|
|
| Fund Name |
BNY Mellon Opportunistic Midcap Value Fund
|
|
| Class Name |
Class C
|
|
| Trading Symbol |
DVLCX
|
|
| Annual or Semi-Annual Statement [Text Block] |
This annual shareholder report contains important information about BNY Mellon Opportunistic Midcap Value Fund (the “Fund”) for the period of September 1, 2024 to August 31, 2025.
|
|
| Shareholder Report Annual or Semi-Annual |
annual shareholder report
|
|
| Additional Information [Text Block] |
You can find additional information about the Fund at bny.com/investments/literaturecenter. You can also request this information by calling 1-800-373-9387 (inside the U.S. only) or by sending an e-mail request to info@bny.com.
|
|
| Additional Information Phone Number |
1-800-373-9387
|
|
| Additional Information Email |
info@bny.com
|
|
| Additional Information Website |
bny.com/investments/literaturecenter
|
|
| Expenses [Text Block] |
What were the Fund’s costs for the last year ?
(based on a hypothetical $10,000 investment)
| Share Class |
Costs of a $10,000 investment |
Costs paid as a percentage of a $10,000 investment |
| Class C |
$205 |
1.99% |
|
|
| Expenses Paid, Amount |
$ 205
|
|
| Expense Ratio, Percent |
1.99%
|
|
| Factors Affecting Performance [Text Block] |
How did the Fund perform last year ?
-
For the 12-month period ended August 31, 2025, the Fund’s Class C shares returned 6.23%.
-
In comparison, the Russell Midcap® Value Index (the “Index”) returned 8.24% for the same period.
What affected the Fund’s performance?
-
U.S. stocks generally rose despite tariff-related drawdowns, as inflation eased and interest rates plateaued, led by gains in large-cap and growth-oriented names.
-
Favorable stock selection in the materials sector bolstered the Fund’s relative performance, as did positioning and stock selection in industrials, specifically out-of-Index stock selection within electrical equipment.
-
Secondary positive contributors included stock selection within the utilities sector and underweight exposure to real estate.
-
Unfavorable stock selection within financials, along with overweight exposure and stock selection in health care and stock selection within energy, detracted most from the Fund’s relative returns.
-
Secondary detractors included disappointing stock selection in consumer staples and consumer discretionary.
|
|
| Performance Past Does Not Indicate Future [Text] |
The Fund’s past performance is not a good predictor of the Fund’s future performance.
|
|
| Line Graph [Table Text Block] |
How did the Fund perform over the past 10 years?
The Fund’s past performance is not a good predictor of the Fund’s future performance. The graph and table do not reflect the deduction of taxes that a shareholder would pay on fund distributions or redemption of fund shares.
Cumulative Performance from September 1 , 2015 through August 31, 2025
Initial Investment of $10,000
The above graph compares a hypothetical $10,000 investment in the Fund’s Class C shares to a hypothetical investment of $10,000 made in each of the Russell 3000® Index (a broad-based index) and Russell Midcap® Value Index on 8/31/2015. The performance shown takes into account the maximum deferred sales charge on Class C shares and applicable fees and expenses of the Fund, including management fees, 12b-1 fees and other expenses. The Fund’s performance also assumes the reinvestment of dividends and capital gains. Unlike the Fund, the indexes are not subject to charges, fees and other expenses. Investors cannot invest directly in any index.
|
|
| Average Annual Return [Table Text Block] |
AVERAGE ANNUAL TOTAL RETURNS (AS OF 8/31/25 )
| Class C Shares |
1YR |
|
5YR |
|
10YR |
|
| with Maximum Deferred Sales Charge - 1.00% |
5.29% |
*
|
10.01% |
|
7.78% |
|
| without Deferred Sales Charge |
6.23% |
|
10.01% |
|
7.78% |
|
| Russell 3000® Index (broad-based index) |
15.84% |
|
14.11% |
|
13.98% |
|
| Russell Midcap® Value Index |
8.24% |
|
12.86% |
|
9.45% |
|
|
*
|
The maximum contingent deferred sales charge for Class C shares is 1.00% for shares redeemed within one year of the date purchased.
|
|
|
| No Deduction of Taxes [Text Block] |
The graph and table do not reflect the deduction of taxes that a shareholder would pay on fund distributions or redemption of fund shares.
|
|
| Updated Performance Information Location [Text Block] |
For more current information visitbny.com/investments/literaturecenter.
|
|
| Net Assets |
$ 390,000,000
|
|
| Holdings Count | Holding |
70
|
|
| Advisory Fees Paid, Amount |
$ 2,922,972
|
|
| Investment Company Portfolio Turnover |
64.98%
|
|
| Additional Fund Statistics [Text Block] |
KEY FUND STATISTICS (AS OF 8/31/25 )
Fund Size (Millions) |
Number of Holdings |
Total Advisory Fee Paid During
Period |
Annual Portfolio Turnover |
| $390 |
70 |
$2,922,972 |
64.98% |
|
|
| Holdings [Text Block] |
Portfolio Holdings (as of 8/31/25 ) Top Ten Holdings (Based on Net Assets) * * Excludes money market funds or other short-term securities held for the investment of cash and cash collateral for securities loaned, if any. Sector Allocation (Based on Net Assets)
|
|
| Largest Holdings [Text Block] |
Top Ten Holdings (Based on Net Assets) * * Excludes money market funds or other short-term securities held for the investment of cash and cash collateral for securities loaned, if any.
|
|
| C000064721 [Member] |
|
|
| Shareholder Report [Line Items] |
|
|
| Fund Name |
BNY Mellon Opportunistic Midcap Value Fund
|
|
| Class Name |
Class I
|
|
| Trading Symbol |
DVLIX
|
|
| Annual or Semi-Annual Statement [Text Block] |
This annual shareholder report contains important information about BNY Mellon Opportunistic Midcap Value Fund (the “Fund”) for the period of September 1, 2024 to August 31, 2025.
|
|
| Shareholder Report Annual or Semi-Annual |
annual shareholder report
|
|
| Additional Information [Text Block] |
You can find additional information about the Fund at bny.com/investments/literaturecenter. You can also request this information by calling 1-800-373-9387 (inside the U.S. only) or by sending an e-mail request to info@bny.com.
|
|
| Additional Information Phone Number |
1-800-373-9387
|
|
| Additional Information Email |
info@bny.com
|
|
| Additional Information Website |
bny.com/investments/literaturecenter
|
|
| Expenses [Text Block] |
What were the Fund’s costs for the last year ? (based on a hypothetical $10,000 investment)
| Share Class |
Costs of a $10,000 investment |
Costs paid as a percentage of a $10,000 investment |
| Class I |
$102 |
0.98% |
|
|
| Expenses Paid, Amount |
$ 102
|
|
| Expense Ratio, Percent |
0.98%
|
|
| Factors Affecting Performance [Text Block] |
How did the Fund perform last year ?
-
For the 12-month period ended August 31, 2025, the Fund’s Class I shares returned 7.30%.
-
In comparison, the Russell Midcap® Value Index (the “Index”) returned 8.24% for the same period.
What affected the Fund’s performance?
-
U.S. stocks generally rose despite tariff-related drawdowns, as inflation eased and interest rates plateaued, led by gains in large-cap and growth-oriented names.
-
Favorable stock selection in the materials sector bolstered the Fund’s relative performance, as did positioning and stock selection in industrials, specifically out-of-Index stock selection within electrical equipment.
-
Secondary positive contributors included stock selection within the utilities sector and underweight exposure to real estate.
-
Unfavorable stock selection within financials, along with overweight exposure and stock selection in health care and stock selection within energy, detracted most from the Fund’s relative returns.
-
Secondary detractors included disappointing stock selection in consumer staples and consumer discretionary.
|
|
| Performance Past Does Not Indicate Future [Text] |
The Fund’s past performance is not a good predictor of the Fund’s future performance.
|
|
| Line Graph [Table Text Block] |
How did the Fund perform over the past 10 years? The Fund’s past performance is not a good predictor of the Fund’s future performance. The graph and table do not reflect the deduction of taxes that a shareholder would pay on fund distributions or redemption of fund shares. Cumulative Performance from September 1 , 2015 through August 31, 2025
Initial Investment of $10,000 The above graph compares a hypothetical $10,000 investment in the Fund’s Class I shares to a hypothetical investment of $10,000 made in each of the Russell 3000® Index (a broad-based index) and Russell Midcap® Value Index on 8/31/2015. The performance shown takes into account applicable fees and expenses of the Fund, including management fees and other expenses. The Fund’s performance also assumes the reinvestment of dividends and capital gains. Unlike the Fund, the indexes are not subject to charges, fees and other expenses. Investors cannot invest directly in any index.
|
|
| Average Annual Return [Table Text Block] |
AVERAGE ANNUAL TOTAL RETURNS (AS OF 8/31/25 )
| Share Class |
1YR |
|
5YR |
|
10YR |
|
| Class I |
7.30% |
|
11.12% |
|
8.88% |
|
| Russell 3000® Index (broad-based index) |
15.84% |
|
14.11% |
|
13.98% |
|
| Russell Midcap® Value Index |
8.24% |
|
12.86% |
|
9.45% |
|
|
|
| No Deduction of Taxes [Text Block] |
The graph and table do not reflect the deduction of taxes that a shareholder would pay on fund distributions or redemption of fund shares.
|
|
| Updated Performance Information Location [Text Block] |
For more current information visitbny.com/investments/literaturecenter.
|
|
| Net Assets |
$ 390,000,000
|
|
| Holdings Count | Holding |
70
|
|
| Advisory Fees Paid, Amount |
$ 2,922,972
|
|
| Investment Company Portfolio Turnover |
64.98%
|
|
| Additional Fund Statistics [Text Block] |
KEY FUND STATISTICS (AS OF 8/31/25 )
Fund Size (Millions) |
Number of Holdings |
Total Advisory Fee Paid During
Period |
Annual Portfolio Turnover |
| $390 |
70 |
$2,922,972 |
64.98% |
|
|
| Holdings [Text Block] |
Portfolio Holdings (as of 8/31/25 ) Top Ten Holdings (Based on Net Assets) * * Excludes money market funds or other short-term securities held for the investment of cash and cash collateral for securities loaned, if any. Sector Allocation (Based on Net Assets)
|
|
| Largest Holdings [Text Block] |
Top Ten Holdings (Based on Net Assets) * * Excludes money market funds or other short-term securities held for the investment of cash and cash collateral for securities loaned, if any.
|
|
| C000130426 [Member] |
|
|
| Shareholder Report [Line Items] |
|
|
| Fund Name |
BNY Mellon Opportunistic Midcap Value Fund
|
|
| Class Name |
Class Y
|
|
| Trading Symbol |
DMCYX
|
|
| Annual or Semi-Annual Statement [Text Block] |
This annual shareholder report contains important information about BNY Mellon Opportunistic Midcap Value Fund (the “Fund”) for the period of September 1, 2024 to August 31, 2025.
|
|
| Shareholder Report Annual or Semi-Annual |
annual shareholder report
|
|
| Additional Information [Text Block] |
You can find additional information about the Fund at bny.com/investments/literaturecenter. You can also request this information by calling 1-800-373-9387 (inside the U.S. only) or by sending an e-mail request to info@bny.com.
|
|
| Additional Information Phone Number |
1-800-373-9387
|
|
| Additional Information Email |
info@bny.com
|
|
| Additional Information Website |
bny.com/investments/literaturecenter
|
|
| Expenses [Text Block] |
What were the Fund’s costs for the last year ?
(based on a hypothetical $10,000 investment)
| Share Class |
Costs of a $10,000 investment |
Costs paid as a percentage of a $10,000 investment |
| Class Y |
$89 |
0.86% |
|
|
| Expenses Paid, Amount |
$ 89
|
|
| Expense Ratio, Percent |
0.86%
|
|
| Factors Affecting Performance [Text Block] |
How did the Fund perform last year ?
-
For the 12-month period ended August 31, 2025, the Fund’s Class Y shares returned 7.43%.
-
In comparison, the Russell Midcap® Value Index (the “Index”) returned 8.24% for the same period.
What affected the Fund’s performance?
-
U.S. stocks generally rose despite tariff-related drawdowns, as inflation eased and interest rates plateaued, led by gains in large-cap and growth-oriented names.
-
Favorable stock selection in the materials sector bolstered the Fund’s relative performance, as did positioning and stock selection in industrials, specifically out-of-Index stock selection within electrical equipment.
-
Secondary positive contributors included stock selection within the utilities sector and underweight exposure to real estate.
-
Unfavorable stock selection within financials, along with overweight exposure and stock selection in health care and stock selection within energy, detracted most from the Fund’s relative returns.
-
Secondary detractors included disappointing stock selection in consumer staples and consumer discretionary.
|
|
| Performance Past Does Not Indicate Future [Text] |
The Fund’s past performance is not a good predictor of the Fund’s future performance.
|
|
| Line Graph [Table Text Block] |
How did the Fund perform over the past 10 years?
The Fund’s past performance is not a good predictor of the Fund’s future performance. The graph and table do not reflect the deduction of taxes that a shareholder would pay on fund distributions or redemption of fund shares.
Cumulative Performance from September 1 , 2015 through August 31, 2025
Initial Investment of $1,000,000
The above graph compares a hypothetical $1,000,000 investment in the Fund’s Class Y shares to a hypothetical investment of $1,000,000 made in each of the Russell 3000® Index (a broad-based index) and Russell Midcap® Value Index on 8/31/2015. The performance shown takes into account applicable fees and expenses of the Fund, including management fees and other expenses. The Fund’s performance also assumes the reinvestment of dividends and capital gains. Unlike the Fund, the indexes are not subject to charges, fees and other expenses. Investors cannot invest directly in any index.
|
|
| Average Annual Return [Table Text Block] |
AVERAGE ANNUAL TOTAL RETURNS (AS OF 8/31/25 )
| Share Class |
1YR |
|
5YR |
|
10YR |
|
| Class Y |
7.43% |
|
11.24% |
|
8.99% |
|
| Russell 3000® Index (broad-based index) |
15.84% |
|
14.11% |
|
13.98% |
|
| Russell Midcap® Value Index |
8.24% |
|
12.86% |
|
9.45% |
|
|
|
| No Deduction of Taxes [Text Block] |
The graph and table do not reflect the deduction of taxes that a shareholder would pay on fund distributions or redemption of fund shares.
|
|
| Updated Performance Information Location [Text Block] |
For more current information visit bny.com/investments/literaturecenter .
|
|
| Net Assets |
$ 390,000,000
|
|
| Holdings Count | Holding |
70
|
|
| Advisory Fees Paid, Amount |
$ 2,922,972
|
|
| Investment Company Portfolio Turnover |
64.98%
|
|
| Additional Fund Statistics [Text Block] |
KEY FUND STATISTICS (AS OF 8/31/25 )
Fund Size (Millions) |
Number of Holdings |
Total Advisory Fee Paid During
Period |
Annual Portfolio Turnover |
| $390 |
70 |
$2,922,972 |
64.98% |
|
|
| Holdings [Text Block] |
Portfolio Holdings (as of 8/31/25 )
Top Ten Holdings (Based on Net Assets) *
* Excludes money market funds or other short-term securities held for the investment of cash and cash collateral for securities loaned, if any.
Sector Allocation (Based on Net Assets)
|
|
| Largest Holdings [Text Block] |
Top Ten Holdings (Based on Net Assets) *
* Excludes money market funds or other short-term securities held for the investment of cash and cash collateral for securities loaned, if any.
|
|
| C000174005 [Member] |
|
|
| Shareholder Report [Line Items] |
|
|
| Fund Name |
BNY Mellon Opportunistic Small Cap Fund
|
|
| Class Name |
Class Y
|
|
| Trading Symbol |
DSCYX
|
|
| Annual or Semi-Annual Statement [Text Block] |
This annual shareholder report contains important information about BNY Mellon Opportunistic Small Cap Fund (the “Fund”) for the period of September 1, 2024 to August 31, 2025.
|
|
| Shareholder Report Annual or Semi-Annual |
annual shareholder report
|
|
| Additional Information [Text Block] |
You can find additional information about the Fund at bny.com/investments/literaturecenter. You can also request this information by calling 1-800-373-9387 (inside the U.S. only) or by sending an e-mail request to info@bny.com.
|
|
| Material Fund Change Notice [Text Block] |
This report describes changes to the Fund that occurred during the reporting period.
|
|
| Additional Information Phone Number |
1-800-373-9387
|
|
| Additional Information Email |
info@bny.com
|
|
| Additional Information Website |
bny.com/investments/literaturecenter
|
|
| Expenses [Text Block] |
What were the Fund’s costs for the last year ? (based on a hypothetical $10,000 investment)
| Share Class |
Costs of a $10,000 investment |
Costs paid as a percentage of a $10,000 investment |
| Class Y* |
$80 |
0.78% |
| * |
During the period, fees were waived and/or expenses reimbursed pursuant to an agreement with the Fund’s investment adviser, BNY Mellon Investment Adviser, Inc. If this agreement is not extended in the future, expenses could be higher. |
|
|
| Expenses Paid, Amount |
$ 80
|
[1] |
| Expense Ratio, Percent |
0.78%
|
[1] |
| Factors Affecting Performance [Text Block] |
How did the Fund perform last year ?
-
For the 12-month period ended August 31, 2025, the Fund’s Class Y shares returned 5.37%.
-
In comparison, the Russell 2000® Index returned 8.17% for the same period.
What affected the Fund’s performance?
-
U.S. stocks generally rose despite tariff-related drawdowns, as inflation eased and interest rates plateaued, led by gains in large-cap and growth-oriented names.
-
Stock selection in information technology, along with overweight exposure to energy, bolstered the Fund’s relative performance.
-
Secondary positive contributors included stock selection and overweight exposure to communication services, and underweight exposure to real estate.
-
Stock selection within the Industrials sector, as well as both selection and overweight exposure in financials, were the largest detractors from relative performance.
-
Disappointing stock selection within the consumer staples sector also detracted.
|
|
| Performance Past Does Not Indicate Future [Text] |
The Fund’s past performance is not a good predictor of the Fund’s future performance.
|
|
| Line Graph [Table Text Block] |
How did the Fund perform over the past 10 years? The Fund’s past performance is not a good predictor of the Fund’s future performance. The graph and table do not reflect the deduction of taxes that a shareholder would pay on fund distributions or redemption of fund shares. Cumulative Performance from September 1 , 2015 through August 31, 2025
Initial Investment of $1,000,000 The above graph compares a hypothetical $1,000,000 investment in the Fund’s Class Y shares to a hypothetical investment of $1,000,000 made in each of the Russell 3000® Index (a broad-based index) and Russell 2000® Index on 8/31/2015. The performance shown takes into account applicable fees and expenses of the Fund, including management fees and other expenses. The Fund’s performance also assumes the reinvestment of dividends and capital gains. Unlike the Fund, the indexes are not subject to charges, fees and other expenses. Investors cannot invest directly in any index.
|
|
| Average Annual Return [Table Text Block] |
AVERAGE ANNUAL TOTAL RETURNS (AS OF 8/31/25 )
| Share Class |
1YR |
|
5YR |
|
10YR |
|
| Class Y |
5.37% |
|
7.79% |
|
7.12% |
|
| Russell 3000® Index (broad-based index) |
15.84% |
|
14.11% |
|
13.98% |
|
| Russell 2000® Index |
8.17% |
|
10.13% |
|
8.88% |
|
|
|
| Performance Inception Date |
Sep. 30, 2016
|
|
| No Deduction of Taxes [Text Block] |
The graph and table do not reflect the deduction of taxes that a shareholder would pay on fund distributions or redemption of fund shares.
|
|
| Updated Performance Information Location [Text Block] |
For more current information visit bny.com/investments/literaturecenter.
|
|
| Net Assets |
$ 232,000,000
|
|
| Holdings Count | Holding |
110
|
|
| Advisory Fees Paid, Amount |
$ 1,508,150
|
|
| Investment Company Portfolio Turnover |
68.31%
|
|
| Additional Fund Statistics [Text Block] |
KEY FUND STATISTICS (AS OF 8/31/25 )
Fund Size (Millions) |
Number of Holdings |
Total Advisory Fee Paid During
Period |
Annual Portfolio Turnover |
| $232 |
110 |
$1,508,150 |
68.31% |
|
|
| Holdings [Text Block] |
Portfolio Holdings (as of 8/31/25 ) Top Ten Holdings (Based on Net Assets) * * Excludes money market funds or other short-term securities held for the investment of cash and cash collateral for securities loaned, if any. Sector Allocation (Based on Net Assets)
|
|
| Largest Holdings [Text Block] |
Top Ten Holdings (Based on Net Assets) * * Excludes money market funds or other short-term securities held for the investment of cash and cash collateral for securities loaned, if any.
|
|
| Material Fund Change [Text Block] |
How has the Fund changed?
-
The Board of Directors of BNY Mellon Advantage Funds, Inc. (the “Company”) has approved, subject to shareholder approval, an Agreement and Plan of Reorganization (the “Agreement”) between the Company, on behalf of BNY Mellon Opportunistic Small Cap Fund (the “Fund”), and BNY Mellon Investment Funds I, on behalf of BNY Mellon Small Cap Value Fund (the “Acquiring Fund”). Shareholders of the Fund as of September 23, 2025 (the “Record Date”) will be asked to approve the Agreement on behalf of the Fund at a special meeting of shareholders to be held on or about December 9, 2025. If the Agreement is approved, the reorganization will be consummated on or about February 13, 2026. For more information, please refer to prospectus/proxy statement filed August 22, 2025. This is a summary of certain changes to the Fund since September 1, 2024 . For more complete information, you may review the Fund’s current prospectus dated December 31, 2024 as supplemented on August 22, 2025 at bny.com/investments/literaturecenter or upon request at 1-800-373-9387.
|
|
| Summary of Change Legend [Text Block] |
This is a summary of certain changes to the Fund since September 1, 2024 . For more complete information, you may review the Fund’s current prospectus dated December 31, 2024 as supplemented on August 22, 2025 at bny.com/investments/literaturecenter or upon request at 1-800-373-9387.
|
|
| Updated Prospectus Phone Number |
1-800-373-9387
|
|
| Updated Prospectus Web Address |
bny.com/investments/literaturecenter
|
|
| C000001289 [Member] |
|
|
| Shareholder Report [Line Items] |
|
|
| Fund Name |
BNY Mellon Opportunistic Small Cap Fund
|
|
| Class Name |
Investor Shares
|
|
| Trading Symbol |
DSCVX
|
|
| Annual or Semi-Annual Statement [Text Block] |
This annual shareholder report contains important information about BNY Mellon Opportunistic Small Cap Fund (the “Fund”) for the period of September 1, 2024 to August 31, 2025.
|
|
| Shareholder Report Annual or Semi-Annual |
annual shareholder report
|
|
| Additional Information [Text Block] |
You can find additional information about the Fund at bny.com/investments/literaturecenter. You can also request this information by calling 1-800-373-9387 (inside the U.S. only) or by sending an e-mail request to info@bny.com.
|
|
| Material Fund Change Notice [Text Block] |
This report describes changes to the Fund that occurred during the reporting period.
|
|
| Additional Information Phone Number |
1-800-373-9387
|
|
| Additional Information Email |
info@bny.com
|
|
| Additional Information Website |
bny.com/investments/literaturecenter
|
|
| Expenses [Text Block] |
What were the Fund’s costs for the last year ?
(based on a hypothetical $10,000 investment)
| Share Class |
Costs of a $10,000 investment |
Costs paid as a percentage of a $10,000 investment |
| Investor Shares* |
$111 |
1.08% |
| * |
During the period, fees were waived and/or expenses reimbursed pursuant to an agreement with the Fund’s investment adviser, BNY Mellon Investment Adviser, Inc. If this agreement is not extended in the future, expenses could be higher.
|
|
|
| Expenses Paid, Amount |
$ 111
|
[2] |
| Expense Ratio, Percent |
1.08%
|
[2] |
| Factors Affecting Performance [Text Block] |
How did the Fund perform last year ?
-
For the 12-month period ended August 31, 2025, the Fund’s Investor Shares returned 5.05%.
-
In comparison, the Russell 2000® Index returned 8.17% for the same period.
What affected the Fund’s performance?
-
U.S. stocks generally rose despite tariff-related drawdowns, as inflation eased and interest rates plateaued, led by gains in large-cap and growth-oriented names.
-
Stock selection in information technology, along with overweight exposure to energy, bolstered the Fund’s relative performance.
-
Secondary positive contributors included stock selection and overweight exposure to communication services, and underweight exposure to real estate.
-
Stock selection within the Industrials sector, as well as both selection and overweight exposure in financials, were the largest detractors from relative performance.
-
Disappointing stock selection within the consumer staples sector also detracted.
|
|
| Performance Past Does Not Indicate Future [Text] |
The Fund’s past performance is not a good predictor of the Fund’s future performance.
|
|
| Line Graph [Table Text Block] |
How did the Fund perform over the past 10 years?
The Fund’s past performance is not a good predictor of the Fund’s future performance. The graph and table do not reflect the deduction of taxes that a shareholder would pay on fund distributions or redemption of fund shares.
Cumulative Performance from September 1 , 2015 through August 31, 2025
Initial Investment of $10,000
The above graph compares a hypothetical $10,000 investment in the Fund’s Investor Shares to a hypothetical investment of $10,000 made in each of the Russell 3000® Index (a broad-based index) and Russell 2000® Index on 8/31/2015. The performance shown takes into account applicable fees and expenses of the Fund, including management fees and other expenses. The Fund’s performance also assumes the reinvestment of dividends and capital gains. Unlike the Fund, the indexes are not subject to charges, fees and other expenses. Investors cannot invest directly in any index.
|
|
| Average Annual Return [Table Text Block] |
AVERAGE ANNUAL TOTAL RETURNS (AS OF 8/31/25 )
| Share Class |
1YR |
|
5YR |
|
10YR |
|
| Investor Shares |
5.05% |
|
7.47% |
|
6.84% |
|
| Russell 3000® Index (broad-based index) |
15.84% |
|
14.11% |
|
13.98% |
|
| Russell 2000® Index |
8.17% |
|
10.13% |
|
8.88% |
|
|
|
| No Deduction of Taxes [Text Block] |
The graph and table do not reflect the deduction of taxes that a shareholder would pay on fund distributions or redemption of fund shares.
|
|
| Updated Performance Information Location [Text Block] |
For more current information visit bny.com/investments/literaturecenter .
|
|
| Net Assets |
$ 232,000,000
|
|
| Holdings Count | Holding |
110
|
|
| Advisory Fees Paid, Amount |
$ 1,508,150
|
|
| Investment Company Portfolio Turnover |
68.31%
|
|
| Additional Fund Statistics [Text Block] |
KEY FUND STATISTICS (AS OF 8/31/25 )
Fund Size (Millions) |
Number of Holdings |
Total Advisory Fee Paid During
Period |
Annual Portfolio Turnover |
| $232 |
110 |
$1,508,150 |
68.31% |
|
|
| Holdings [Text Block] |
Portfolio Holdings (as of 8/31/25 )
Top Ten Holdings (Based on Net Assets) *
* Excludes money market funds or other short-term securities held for the investment of cash and cash collateral for securities loaned, if any.
Sector Allocation (Based on Net Assets)
|
|
| Largest Holdings [Text Block] |
Top Ten Holdings (Based on Net Assets) *
* Excludes money market funds or other short-term securities held for the investment of cash and cash collateral for securities loaned, if any.
|
|
| Material Fund Change [Text Block] |
How has the Fund changed?
-
The Board of Directors of BNY Mellon Advantage Funds, Inc. (the “Company”) has approved, subject to shareholder approval, an Agreement and Plan of Reorganization (the “Agreement”) between the Company, on behalf of BNY Mellon Opportunistic Small Cap Fund (the “Fund”), and BNY Mellon Investment Funds I, on behalf of BNY Mellon Small Cap Value Fund (the “Acquiring Fund”). Shareholders of the Fund as of September 23, 2025 (the “Record Date”) will be asked to approve the Agreement on behalf of the Fund at a special meeting of shareholders to be held on or about December 9, 2025. If the Agreement is approved, the reorganization will be consummated on or about February 13, 2026. For more information, please refer to prospectus/proxy statement filed August 22, 2025.
This is a summary of certain changes to the Fund since September 1, 2024 . For more complete information, you may review the Fund’s current prospectus dated December 31, 2024 as supplemented on August 22, 2025 at bny.com/investments/literaturecenter or upon request at 1-800-373-9387.
|
|
| Summary of Change Legend [Text Block] |
This is a summary of certain changes to the Fund since September 1, 2024 . For more complete information, you may review the Fund’s current prospectus dated December 31, 2024 as supplemented on August 22, 2025 at bny.com/investments/literaturecenter or upon request at 1-800-373-9387.
|
|
| Updated Prospectus Phone Number |
1-800-373-9387
|
|
| Updated Prospectus Web Address |
bny.com/investments/literaturecenter
|
|
| C000174006 [Member] |
|
|
| Shareholder Report [Line Items] |
|
|
| Fund Name |
BNY Mellon Opportunistic Small Cap Fund
|
|
| Class Name |
Class I
|
|
| Trading Symbol |
DOPIX
|
|
| Annual or Semi-Annual Statement [Text Block] |
This annual shareholder report contains important information about BNY Mellon Opportunistic Small Cap Fund (the “Fund”) for the period of September 1, 2024 to August 31, 2025.
|
|
| Shareholder Report Annual or Semi-Annual |
annual shareholder report
|
|
| Additional Information [Text Block] |
You can find additional information about the Fund at bny.com/investments/literaturecenter. You can also request this information by calling 1-800-373-9387 (inside the U.S. only) or by sending an e-mail request to info@bny.com.
|
|
| Material Fund Change Notice [Text Block] |
This report describes changes to the Fund that occurred during the reporting period.
|
|
| Additional Information Phone Number |
1-800-373-9387
|
|
| Additional Information Email |
info@bny.com
|
|
| Additional Information Website |
bny.com/investments/literaturecenter
|
|
| Expenses [Text Block] |
What were the Fund’s costs for the last year ?
(based on a hypothetical $10,000 investment)
| Share Class |
Costs of a $10,000 investment |
Costs paid as a percentage of a $10,000 investment |
| Class I* |
$92 |
0.90% |
| * |
During the period, fees were waived and/or expenses reimbursed pursuant to an agreement with the Fund’s investment adviser, BNY Mellon Investment Adviser, Inc. If this agreement is not extended in the future, expenses could be higher.
|
|
|
| Expenses Paid, Amount |
$ 92
|
[3] |
| Expense Ratio, Percent |
0.90%
|
[3] |
| Factors Affecting Performance [Text Block] |
How did the Fund perform last year ?
-
For the 12-month period ended August 31, 2025, the Fund’s Class I shares returned 5.27%.
-
In comparison, the Russell 2000® Index returned 8.17% for the same period.
What affected the Fund’s performance?
-
U.S. stocks generally rose despite tariff-related drawdowns, as inflation eased and interest rates plateaued, led by gains in large-cap and growth-oriented names.
-
Stock selection in information technology, along with overweight exposure to energy, bolstered the Fund’s relative performance.
-
Secondary positive contributors included stock selection and overweight exposure to communication services, and underweight exposure to real estate.
-
Stock selection within the Industrials sector, as well as both selection and overweight exposure in financials, were the largest detractors from relative performance.
-
Disappointing stock selection within the consumer staples sector also detracted.
|
|
| Performance Past Does Not Indicate Future [Text] |
The Fund’s past performance is not a good predictor of the Fund’s future performance.
|
|
| Line Graph [Table Text Block] |
How did the Fund perform over the past 10 years?
The Fund’s past performance is not a good predictor of the Fund’s future performance. The graph and table do not reflect the deduction of taxes that a shareholder would pay on fund distributions or redemption of fund shares.
Cumulative Performance from September 1 , 2015 through August 31, 2025
Initial Investment of $10,000
The above graph compares a hypothetical $10,000 investment in the Fund’s Class I shares to a hypothetical investment of $10,000 made in each of the Russell 3000® Index (a broad-based index) and Russell 2000® Index on 8/31/2015. The performance shown takes into account applicable fees and expenses of the Fund, including management fees and other expenses. The Fund’s performance also assumes the reinvestment of dividends and capital gains. Unlike the Fund, the indexes are not subject to charges, fees and other expenses. Investors cannot invest directly in any index.
|
|
| Average Annual Return [Table Text Block] |
AVERAGE ANNUAL TOTAL RETURNS (AS OF 8/31/25 )
| Share Class |
1YR |
|
5YR |
|
10YR |
|
| Class I |
5.27% |
|
7.67% |
|
7.02% |
|
| Russell 3000® Index (broad-based index) |
15.84% |
|
14.11% |
|
13.98% |
|
| Russell 2000® Index |
8.17% |
|
10.13% |
|
8.88% |
|
|
|
| Performance Inception Date |
Sep. 30, 2016
|
|
| No Deduction of Taxes [Text Block] |
The graph and table do not reflect the deduction of taxes that a shareholder would pay on fund distributions or redemption of fund shares.
|
|
| Updated Performance Information Location [Text Block] |
For more current information visit bny.com/investments/literaturecenter.
|
|
| Net Assets |
$ 232,000,000
|
|
| Holdings Count | Holding |
110
|
|
| Advisory Fees Paid, Amount |
$ 1,508,150
|
|
| Investment Company Portfolio Turnover |
68.31%
|
|
| Additional Fund Statistics [Text Block] |
KEY FUND STATISTICS (AS OF 8/31/25 )
Fund Size (Millions) |
Number of Holdings |
Total Advisory Fee Paid During
Period |
Annual Portfolio Turnover |
| $232 |
110 |
$1,508,150 |
68.31% |
|
|
| Holdings [Text Block] |
Portfolio Holdings (as of 8/31/25 )
Top Ten Holdings (Based on Net Assets) *
* Excludes money market funds or other short-term securities held for the investment of cash and cash collateral for securities loaned, if any.
Sector Allocation (Based on Net Assets)
|
|
| Largest Holdings [Text Block] |
Top Ten Holdings (Based on Net Assets) *
* Excludes money market funds or other short-term securities held for the investment of cash and cash collateral for securities loaned, if any.
|
|
| Material Fund Change [Text Block] |
How has the Fund changed?
-
The Board of Directors of BNY Mellon Advantage Funds, Inc. (the “Company”) has approved, subject to shareholder approval, an Agreement and Plan of Reorganization (the “Agreement”) between the Company, on behalf of BNY Mellon Opportunistic Small Cap Fund (the “Fund”), and BNY Mellon Investment Funds I, on behalf of BNY Mellon Small Cap Value Fund (the “Acquiring Fund”). Shareholders of the Fund as of September 23, 2025 (the “Record Date”) will be asked to approve the Agreement on behalf of the Fund at a special meeting of shareholders to be held on or about December 9, 2025. If the Agreement is approved, the reorganization will be consummated on or about February 13, 2026. For more information, please refer to prospectus/proxy statement filed August 22, 2025.
This is a summary of certain changes to the Fund since September 1, 2024 . For more complete information, you may review the Fund’s current prospectus dated December 31, 2024 as supplemented on August 22, 2025 at bny.com/investments/literaturecenter or upon request at 1-800-373-9387.
|
|
| Summary of Change Legend [Text Block] |
This is a summary of certain changes to the Fund since September 1, 2024 . For more complete information, you may review the Fund’s current prospectus dated December 31, 2024 as supplemented on August 22, 2025 at bny.com/investments/literaturecenter or upon request at 1-800-373-9387.
|
|
| Updated Prospectus Phone Number |
1-800-373-9387
|
|
| Updated Prospectus Web Address |
bny.com/investments/literaturecenter
|
|
| C000001358 [Member] |
|
|
| Shareholder Report [Line Items] |
|
|
| Fund Name |
BNY Mellon Dynamic Value Fund
|
|
| Class Name |
Class A
|
|
| Trading Symbol |
DAGVX
|
|
| Annual or Semi-Annual Statement [Text Block] |
This annual shareholder report contains important information about BNY Mellon Dynamic Value Fund (the “Fund”) for the period of September 1, 2024 to August 31, 2025.
|
|
| Shareholder Report Annual or Semi-Annual |
annual shareholder report
|
|
| Additional Information [Text Block] |
You can find additional information about the Fund at bny.com/investments/literaturecenter. You can also request this information by calling 1-800-373-9387 (inside the U.S. only) or by sending an e-mail request to info@bny.com.
|
|
| Additional Information Phone Number |
1-800-373-9387
|
|
| Additional Information Email |
info@bny.com
|
|
| Additional Information Website |
bny.com/investments/literaturecenter
|
|
| Expenses [Text Block] |
What were the Fund’s costs for the last year ?
(based on a hypothetical $10,000 investment)
| Share Class |
Costs of a $10,000 investment |
Costs paid as a percentage of a $10,000 investment |
| Class A* |
$99 |
0.93% |
| * |
During the period, fees were waived and/or expenses reimbursed pursuant to an agreement with the Fund’s investment adviser, BNY Mellon Investment Adviser, Inc. If this agreement is not extended in the future, expenses could be higher.
|
|
|
| Expenses Paid, Amount |
$ 99
|
[4] |
| Expense Ratio, Percent |
0.93%
|
[4] |
| Factors Affecting Performance [Text Block] |
How did the Fund perform last year ?
-
For the 12-month period ended August 31, 2025, the Fund’s Class A shares returned 12.09%.
-
In comparison, the Russell 1000® Value Index (the “Index”) returned 9.33% for the same period.
What affected the Fund’s performance?
-
U.S. stocks generally rose as investors looked beyond U.S. tariff and geopolitical uncertainty. Gains were led by growth-oriented, large-cap securities largely exposed to artificial intelligence.
-
Sector positioning and strong stock selection within both the utilities and industrial sectors bolstered the Fund’s performance relative to the Index, as did security selection within the consumer staples sector.
-
Overweight positioning and security selection within the health care sector was the sole detractor from the Fund’s relative returns over the period.
|
|
| Performance Past Does Not Indicate Future [Text] |
The Fund’s past performance is not a good predictor of the Fund’s future performance.
|
|
| Line Graph [Table Text Block] |
How did the Fund perform over the past 10 years?
The Fund’s past performance is not a good predictor of the Fund’s future performance. The graph and table do not reflect the deduction of taxes that a shareholder would pay on fund distributions or redemption of fund shares.
Cumulative Performance from September 1 , 2015 through August 31, 2025
Initial Investment of $10,000
The above graph compares a hypothetical $10,000 investment in the Fund’s Class A shares to a hypothetical investment of $10,000 made in each of the Russell 1000® Index (a broad-based index) and Russell 1000® Value Index on 8/31/2015. The performance shown takes into account the maximum initial sales charge on Class A shares and applicable fees and expenses of the Fund, including management fees and other expenses. The Fund’s performance also assumes the reinvestment of dividends and capital gains. Unlike the Fund, the indexes are not subject to charges, fees and other expenses. Investors cannot invest directly in any index.
|
|
| Average Annual Return [Table Text Block] |
AVERAGE ANNUAL TOTAL RETURNS (AS OF 8/31/25 )
| Class A Shares |
1YR |
|
5YR |
|
10YR |
|
| with Maximum Sales Charge - 5.75% |
5.64% |
|
17.21% |
|
11.74% |
|
| without Sales Charge |
12.09% |
|
18.60% |
|
12.41% |
|
| Russell 1000® Index (broad-based index) |
16.24% |
|
14.34% |
|
14.33% |
|
| Russell 1000® Value Index |
9.33% |
|
12.97% |
|
10.22% |
|
|
|
| No Deduction of Taxes [Text Block] |
The graph and table do not reflect the deduction of taxes that a shareholder would pay on fund distributions or redemption of fund shares.
|
|
| Updated Performance Information Location [Text Block] |
For more current information visitbny.com/investments/literaturecenter.
|
|
| Net Assets |
$ 9,145,000,000
|
|
| Holdings Count | Holding |
74
|
|
| Advisory Fees Paid, Amount |
$ 45,678,850
|
|
| Investment Company Portfolio Turnover |
95.20%
|
|
| Additional Fund Statistics [Text Block] |
KEY FUND STATISTICS (AS OF 8/31/25 )
Fund Size (Millions) |
Number of Holdings |
Total Advisory Fee Paid During
Period |
Annual Portfolio Turnover |
| $9,145 |
74 |
$45,678,850 |
95.20% |
|
|
| Holdings [Text Block] |
Portfolio Holdings (as of 8/31/25 )
Top Ten Holdings (Based on Net Assets) *
* Excludes money market funds or other short-term securities held for the investment of cash and cash collateral for securities loaned, if any.
Sector Allocation (Based on Net Assets)
|
|
| Largest Holdings [Text Block] |
Top Ten Holdings (Based on Net Assets) *
* Excludes money market funds or other short-term securities held for the investment of cash and cash collateral for securities loaned, if any.
|
|
| C000001360 [Member] |
|
|
| Shareholder Report [Line Items] |
|
|
| Fund Name |
BNY Mellon Dynamic Value Fund
|
|
| Class Name |
Class C
|
|
| Trading Symbol |
DCGVX
|
|
| Annual or Semi-Annual Statement [Text Block] |
This annual shareholder report contains important information about BNY Mellon Dynamic Value Fund (the “Fund”) for the period of September 1, 2024 to August 31, 2025.
|
|
| Shareholder Report Annual or Semi-Annual |
annual shareholder report
|
|
| Additional Information [Text Block] |
You can find additional information about the Fund at bny.com/investments/literaturecenter. You can also request this information by calling 1-800-373-9387 (inside the U.S. only) or by sending an e-mail request to info@bny.com.
|
|
| Additional Information Phone Number |
1-800-373-9387
|
|
| Additional Information Email |
info@bny.com
|
|
| Additional Information Website |
bny.com/investments/literaturecenter
|
|
| Expenses [Text Block] |
What were the Fund’s costs for the last year ?
(based on a hypothetical $10,000 investment)
| Share Class |
Costs of a $10,000 investment |
Costs paid as a percentage of a $10,000 investment |
| Class C* |
$177 |
1.68% |
| * |
During the period, fees were waived and/or expenses reimbursed pursuant to an agreement with the Fund’s investment adviser, BNY Mellon Investment Adviser, Inc. If this agreement is not extended in the future, expenses could be higher.
|
|
|
| Expenses Paid, Amount |
$ 177
|
[5] |
| Expense Ratio, Percent |
1.68%
|
[5] |
| Factors Affecting Performance [Text Block] |
How did the Fund perform last year ?
-
For the 12-month period ended August 31, 2025, the Fund’s Class C shares returned 11.24%.
-
In comparison, the Russell 1000® Value Index (the “Index”) returned 9.33% for the same period.
What affected the Fund’s performance?
-
U.S. stocks generally rose as investors looked beyond U.S. tariff and geopolitical uncertainty. Gains were led by growth-oriented, large-cap securities largely exposed to artificial intelligence.
-
Sector positioning and strong stock selection within both the utilities and industrial sectors bolstered the Fund’s performance relative to the Index, as did security selection within the consumer staples sector.
-
Overweight positioning and security selection within the health care sector was the sole detractor from the Fund’s relative returns over the period.
|
|
| Performance Past Does Not Indicate Future [Text] |
The Fund’s past performance is not a good predictor of the Fund’s future performance.
|
|
| Line Graph [Table Text Block] |
How did the Fund perform over the past 10 years?
The Fund’s past performance is not a good predictor of the Fund’s future performance. The graph and table do not reflect the deduction of taxes that a shareholder would pay on fund distributions or redemption of fund shares.
Cumulative Performance from September 1 , 2015 through August 31, 2025
Initial Investment of $10,000
The above graph compares a hypothetical $10,000 investment in the Fund’s Class C shares to a hypothetical investment of $10,000 made in each of the Russell 1000® Index (a broad-based index) and Russell 1000® Value Index on 8/31/2015. The performance shown takes into account the maximum deferred sales charge on Class C shares and applicable fees and expenses of the Fund, including management fees, 12b-1 fees and other expenses. The Fund’s performance also assumes the reinvestment of dividends and capital gains. Unlike the Fund, the indexes are not subject to charges, fees and other expenses. Investors cannot invest directly in any index.
|
|
| Average Annual Return [Table Text Block] |
AVERAGE ANNUAL TOTAL RETURNS (AS OF 8/31/25 )
| Class C Shares |
1YR |
|
5YR |
|
10YR |
|
| with Maximum Deferred Sales Charge - 1.00% |
10.24% |
*
|
17.71% |
|
11.57% |
|
| without Deferred Sales Charge |
11.24% |
|
17.71% |
|
11.57% |
|
| Russell 1000® Index (broad-based index) |
16.24% |
|
14.34% |
|
14.33% |
|
| Russell 1000® Value Index |
9.33% |
|
12.97% |
|
10.22% |
|
|
*
|
The maximum contingent deferred sales charge for Class C shares is 1.00% for shares redeemed within one year of the date purchased.
|
|
|
| No Deduction of Taxes [Text Block] |
The graph and table do not reflect the deduction of taxes that a shareholder would pay on fund distributions or redemption of fund shares.
|
|
| Updated Performance Information Location [Text Block] |
For more current information visitbny.com/investments/literaturecenter.
|
|
| Net Assets |
$ 9,145,000,000
|
|
| Holdings Count | Holding |
74
|
|
| Advisory Fees Paid, Amount |
$ 45,678,850
|
|
| Investment Company Portfolio Turnover |
95.20%
|
|
| Additional Fund Statistics [Text Block] |
KEY FUND STATISTICS (AS OF 8/31/25 )
Fund Size (Millions) |
Number of Holdings |
Total Advisory Fee Paid During
Period |
Annual Portfolio Turnover |
| $9,145 |
74 |
$45,678,850 |
95.20% |
|
|
| Holdings [Text Block] |
Portfolio Holdings (as of 8/31/25 )
Top Ten Holdings (Based on Net Assets) *
* Excludes money market funds or other short-term securities held for the investment of cash and cash collateral for securities loaned, if any.
Sector Allocation (Based on Net Assets)
|
|
| Largest Holdings [Text Block] |
Top Ten Holdings (Based on Net Assets) *
* Excludes money market funds or other short-term securities held for the investment of cash and cash collateral for securities loaned, if any.
|
|
| C000001361 [Member] |
|
|
| Shareholder Report [Line Items] |
|
|
| Fund Name |
BNY Mellon Dynamic Value Fund
|
|
| Class Name |
Class I
|
|
| Trading Symbol |
DRGVX
|
|
| Annual or Semi-Annual Statement [Text Block] |
This annual shareholder report contains important information about BNY Mellon Dynamic Value Fund (the “Fund”) for the period of September 1, 2024 to August 31, 2025.
|
|
| Shareholder Report Annual or Semi-Annual |
annual shareholder report
|
|
| Additional Information [Text Block] |
You can find additional information about the Fund at bny.com/investments/literaturecenter. You can also request this information by calling 1-800-373-9387 (inside the U.S. only) or by sending an e-mail request to info@bny.com.
|
|
| Additional Information Phone Number |
1-800-373-9387
|
|
| Additional Information Email |
info@bny.com
|
|
| Additional Information Website |
bny.com/investments/literaturecenter
|
|
| Expenses [Text Block] |
What were the Fund’s costs for the last year ?
(based on a hypothetical $10,000 investment)
| Share Class |
Costs of a $10,000 investment |
Costs paid as a percentage of a $10,000 investment |
| Class I* |
$72 |
0.68% |
| * |
During the period, fees were waived and/or expenses reimbursed pursuant to an agreement with the Fund’s investment adviser, BNY Mellon Investment Adviser, Inc. If this agreement is not extended in the future, expenses could be higher.
|
|
|
| Expenses Paid, Amount |
$ 72
|
[6] |
| Expense Ratio, Percent |
0.68%
|
[6] |
| Factors Affecting Performance [Text Block] |
How did the Fund perform last year ?
-
For the 12-month period ended August 31, 2025, the Fund’s Class I shares returned 12.37%.
-
In comparison, the Russell 1000® Value Index (the “Index”) returned 9.33% for the same period.
What affected the Fund’s performance?
-
U.S. stocks generally rose as investors looked beyond U.S. tariff and geopolitical uncertainty. Gains were led by growth-oriented, large-cap securities largely exposed to artificial intelligence.
-
Sector positioning and strong stock selection within both the utilities and industrial sectors bolstered the Fund’s performance relative to the Index, as did security selection within the consumer staples sector.
-
Overweight positioning and security selection within the health care sector was the sole detractor from the Fund’s relative returns over the period.
|
|
| Performance Past Does Not Indicate Future [Text] |
The Fund’s past performance is not a good predictor of the Fund’s future performance.
|
|
| Line Graph [Table Text Block] |
How did the Fund perform over the past 10 years?
The Fund’s past performance is not a good predictor of the Fund’s future performance. The graph and table do not reflect the deduction of taxes that a shareholder would pay on fund distributions or redemption of fund shares.
Cumulative Performance from September 1 , 2015 through August 31, 2025
Initial Investment of $10,000
The above graph compares a hypothetical $10,000 investment in the Fund’s Class I shares to a hypothetical investment of $10,000 made in each of the Russell 1000® Index (a broad-based index) and Russell 1000® Value Index on 8/31/2015. The performance shown takes into account applicable fees and expenses of the Fund, including management fees and other expenses. The Fund’s performance also assumes the reinvestment of dividends and capital gains. Unlike the Fund, the indexes are not subject to charges, fees and other expenses. Investors cannot invest directly in any index.
|
|
| Average Annual Return [Table Text Block] |
AVERAGE ANNUAL TOTAL RETURNS (AS OF 8/31/25 )
| Share Class |
1YR |
|
5YR |
|
10YR |
|
| Class I |
12.37% |
|
18.90% |
|
12.69% |
|
| Russell 1000® Index (broad-based index) |
16.24% |
|
14.34% |
|
14.33% |
|
| Russell 1000® Value Index |
9.33% |
|
12.97% |
|
10.22% |
|
|
|
| No Deduction of Taxes [Text Block] |
The graph and table do not reflect the deduction of taxes that a shareholder would pay on fund distributions or redemption of fund shares.
|
|
| Updated Performance Information Location [Text Block] |
For more current information visitbny.com/investments/literaturecenter .
|
|
| Net Assets |
$ 9,145,000,000
|
|
| Holdings Count | Holding |
74
|
|
| Advisory Fees Paid, Amount |
$ 45,678,850
|
|
| Investment Company Portfolio Turnover |
95.20%
|
|
| Additional Fund Statistics [Text Block] |
KEY FUND STATISTICS (AS OF 8/31/25 )
Fund Size (Millions) |
Number of Holdings |
Total Advisory Fee Paid During
Period |
Annual Portfolio Turnover |
| $9,145 |
74 |
$45,678,850 |
95.20% |
|
|
| Holdings [Text Block] |
Portfolio Holdings (as of 8/31/25 )
Top Ten Holdings (Based on Net Assets) *
* Excludes money market funds or other short-term securities held for the investment of cash and cash collateral for securities loaned, if any.
Sector Allocation (Based on Net Assets)
|
|
| Largest Holdings [Text Block] |
Top Ten Holdings (Based on Net Assets) *
* Excludes money market funds or other short-term securities held for the investment of cash and cash collateral for securities loaned, if any.
|
|
| C000130427 [Member] |
|
|
| Shareholder Report [Line Items] |
|
|
| Fund Name |
BNY Mellon Dynamic Value Fund
|
|
| Class Name |
Class Y
|
|
| Trading Symbol |
DRGYX
|
|
| Annual or Semi-Annual Statement [Text Block] |
This annual shareholder report contains important information about BNY Mellon Dynamic Value Fund (the “Fund”) for the period of September 1, 2024 to August 31, 2025.
|
|
| Shareholder Report Annual or Semi-Annual |
annual shareholder report
|
|
| Additional Information [Text Block] |
You can find additional information about the Fund at bny.com/investments/literaturecenter. You can also request this information by calling 1-800-373-9387 (inside the U.S. only) or by sending an e-mail request to info@bny.com.
|
|
| Additional Information Phone Number |
1-800-373-9387
|
|
| Additional Information Email |
info@bny.com
|
|
| Additional Information Website |
bny.com/investments/literaturecenter
|
|
| Expenses [Text Block] |
What were the Fund’s costs for the last year ? (based on a hypothetical $10,000 investment)
| Share Class |
Costs of a $10,000 investment |
Costs paid as a percentage of a $10,000 investment |
| Class Y |
$67 |
0.63% |
|
|
| Expenses Paid, Amount |
$ 67
|
|
| Expense Ratio, Percent |
0.63%
|
|
| Factors Affecting Performance [Text Block] |
How did the Fund perform last year ?
-
For the 12-month period ended August 31, 2025, the Fund’s Class Y shares returned 12.42%.
-
In comparison, the Russell 1000® Value Index (the “Index”) returned 9.33% for the same period.
What affected the Fund’s performance?
-
U.S. stocks generally rose as investors looked beyond U.S. tariff and geopolitical uncertainty. Gains were led by growth-oriented, large-cap securities largely exposed to artificial intelligence.
-
Sector positioning and strong stock selection within both the utilities and industrial sectors bolstered the Fund’s performance relative to the Index, as did security selection within the consumer staples sector.
-
Overweight positioning and security selection within the health care sector was the sole detractor from the Fund’s relative returns over the period.
|
|
| Performance Past Does Not Indicate Future [Text] |
The Fund’s past performance is not a good predictor of the Fund’s future performance.
|
|
| Line Graph [Table Text Block] |
How did the Fund perform over the past 10 years? The Fund’s past performance is not a good predictor of the Fund’s future performance. The graph and table do not reflect the deduction of taxes that a shareholder would pay on fund distributions or redemption of fund shares. Cumulative Performance from September 1 , 2015 through August 31, 2025
Initial Investment of $1,000,000 The above graph compares a hypothetical $1,000,000 investment in the Fund’s Class Y shares to a hypothetical investment of $1,000,000 made in each of the Russell 1000® Index (a broad-based index) and Russell 1000® Value Index on 8/31/2015. The performance shown takes into account applicable fees and expenses of the Fund, including management fees and other expenses. The Fund’s performance also assumes the reinvestment of dividends and capital gains. Unlike the Fund, the indexes are not subject to charges, fees and other expenses. Investors cannot invest directly in any index.
|
|
| Average Annual Return [Table Text Block] |
AVERAGE ANNUAL TOTAL RETURNS (AS OF 8/31/25 )
| Share Class |
1YR |
|
5YR |
|
10YR |
|
| Class Y |
12.42% |
|
18.96% |
|
12.73% |
|
| Russell 1000® Index (broad-based index) |
16.24% |
|
14.34% |
|
14.33% |
|
| Russell 1000® Value Index |
9.33% |
|
12.97% |
|
10.22% |
|
|
|
| No Deduction of Taxes [Text Block] |
The graph and table do not reflect the deduction of taxes that a shareholder would pay on fund distributions or redemption of fund shares.
|
|
| Updated Performance Information Location [Text Block] |
For more current information visitbny.com/investments/literaturecenter.
|
|
| Net Assets |
$ 9,145,000,000
|
|
| Holdings Count | Holding |
74
|
|
| Advisory Fees Paid, Amount |
$ 45,678,850
|
|
| Investment Company Portfolio Turnover |
95.20%
|
|
| Additional Fund Statistics [Text Block] |
KEY FUND STATISTICS (AS OF 8/31/25 )
Fund Size (Millions) |
Number of Holdings |
Total Advisory Fee Paid During
Period |
Annual Portfolio Turnover |
| $9,145 |
74 |
$45,678,850 |
95.20% |
|
|
| Holdings [Text Block] |
Portfolio Holdings (as of 8/31/25 ) Top Ten Holdings (Based on Net Assets) * * Excludes money market funds or other short-term securities held for the investment of cash and cash collateral for securities loaned, if any. Sector Allocation (Based on Net Assets)
|
|
| Largest Holdings [Text Block] |
Top Ten Holdings (Based on Net Assets) * * Excludes money market funds or other short-term securities held for the investment of cash and cash collateral for securities loaned, if any.
|
|
| C000001368 [Member] |
|
|
| Shareholder Report [Line Items] |
|
|
| Fund Name |
BNY Mellon Technology Growth Fund
|
|
| Class Name |
Class A
|
|
| Trading Symbol |
DTGRX
|
|
| Annual or Semi-Annual Statement [Text Block] |
This annual shareholder report contains important information about BNY Mellon Technology Growth Fund (the “Fund”) for the period of September 1, 2024 to August 31, 2025.
|
|
| Shareholder Report Annual or Semi-Annual |
annual shareholder report
|
|
| Additional Information [Text Block] |
You can find additional information about the Fund at bny.com/investments/literaturecenter. You can also request this information by calling 1-800-373-9387 (inside the U.S. only) or by sending an e-mail request to info@bny.com.
|
|
| Additional Information Phone Number |
1-800-373-9387
|
|
| Additional Information Email |
info@bny.com
|
|
| Additional Information Website |
bny.com/investments/literaturecenter
|
|
| Expenses [Text Block] |
What were the Fund’s costs for the last year ?
(based on a hypothetical $10,000 investment)
| Share Class |
Costs of a $10,000 investment |
Costs paid as a percentage of a $10,000 investment |
| Class A |
$130 |
1.16% |
|
|
| Expenses Paid, Amount |
$ 130
|
|
| Expense Ratio, Percent |
1.16%
|
|
| Factors Affecting Performance [Text Block] |
How did the Fund perform last year ?
-
For the 12-month period ended August 31, 2025, the Fund’s Class A shares returned 24.21%.
-
In comparison, the NYSE® Technology Index (the “Index”) returned 29.07% for the same period.
What affected the Fund’s performance?
-
Growth-oriented technology stocks delivered solid returns due to continued strength in the artificial intelligence (AI) theme as investors looked beyond U.S. tariff and geopolitical uncertainty.
-
The Fund’s returns relative to the Index benefited from overweight exposure to the communications services sector and emphasis on digital media companies providing streaming entertainment.
-
The industrial sector was a further source of attractive returns from a company launching a new product cycle that applies AI to improve security personnel productivity.
-
Software selection detracted from relative returns, especially due to underexposure to a major data analytics company with a high valuation.
-
The Fund also underperformed in the consumer discretionary sector due to underweight exposure to Chinese e-commerce companies.
|
|
| Performance Past Does Not Indicate Future [Text] |
The Fund’s past performance is not a good predictor of the Fund’s future performance.
|
|
| Line Graph [Table Text Block] |
How did the Fund perform over the past 10 years?
The Fund’s past performance is not a good predictor of the Fund’s future performance. The graph and table do not reflect the deduction of taxes that a shareholder would pay on fund distributions or redemption of fund shares.
Cumulative Performance from September 1 , 2015 through August 31, 2025
Initial Investment of $10,000
The above graph compares a hypothetical $10,000 investment in the Fund’s Class A shares to a hypothetical investment of $10,000 made in each of the S&P 500® Index (a broad-based index) and NYSE® Technology Index on 8/31/2015. The performance shown takes into account the maximum initial sales charge on Class A shares and applicable fees and expenses of the Fund, including management fees and other expenses. The Fund’s performance also assumes the reinvestment of dividends and capital gains. Unlike the Fund, the indexes are not subject to charges, fees and other expenses. Investors cannot invest directly in any index.
|
|
| Average Annual Return [Table Text Block] |
AVERAGE ANNUAL TOTAL RETURNS (AS OF 8/31/25 )
| Class A Shares |
1YR |
|
5YR |
|
10YR |
|
| with Maximum Sales Charge - 5.75% |
17.07% |
|
7.39% |
|
15.81% |
|
| without Sales Charge |
24.21% |
|
8.66% |
|
16.50% |
|
| S&P 500® Index (broad-based index) |
15.87% |
|
14.74% |
|
14.59% |
|
| NYSE® Technology Index |
29.07% |
|
15.13% |
|
21.30% |
|
|
|
| No Deduction of Taxes [Text Block] |
The graph and table do not reflect the deduction of taxes that a shareholder would pay on fund distributions or redemption of fund shares.
|
|
| Updated Performance Information Location [Text Block] |
For more current information visitbny.com/investments/literaturecenter.
|
|
| Net Assets |
$ 425,000,000
|
|
| Holdings Count | Holding |
39
|
|
| Advisory Fees Paid, Amount |
$ 2,920,428
|
|
| Investment Company Portfolio Turnover |
33.84%
|
|
| Additional Fund Statistics [Text Block] |
KEY FUND STATISTICS (AS OF 8/31/25 )
Fund Size (Millions) |
Number of Holdings |
Total Advisory Fee Paid During
Period |
Annual Portfolio Turnover |
| $425 |
39 |
$2,920,428 |
33.84% |
|
|
| Holdings [Text Block] |
Portfolio Holdings (as of 8/31/25 )
Top Ten Holdings (Based on Net Assets) *
* Excludes money market funds or other short-term securities held for the investment of cash and cash collateral for securities loaned, if any.
Sector Allocation (Based on Net Assets)
|
|
| Largest Holdings [Text Block] |
Top Ten Holdings (Based on Net Assets) *
* Excludes money market funds or other short-term securities held for the investment of cash and cash collateral for securities loaned, if any.
|
|
| C000001370 [Member] |
|
|
| Shareholder Report [Line Items] |
|
|
| Fund Name |
BNY Mellon Technology Growth Fund
|
|
| Class Name |
Class C
|
|
| Trading Symbol |
DTGCX
|
|
| Annual or Semi-Annual Statement [Text Block] |
This annual shareholder report contains important information about BNY Mellon Technology Growth Fund (the “Fund”) for the period of September 1, 2024 to August 31, 2025.
|
|
| Shareholder Report Annual or Semi-Annual |
annual shareholder report
|
|
| Additional Information [Text Block] |
You can find additional information about the Fund at bny.com/investments/literaturecenter. You can also request this information by calling 1-800-373-9387 (inside the U.S. only) or by sending an e-mail request to info@bny.com.
|
|
| Additional Information Phone Number |
1-800-373-9387
|
|
| Additional Information Email |
info@bny.com
|
|
| Additional Information Website |
bny.com/investments/literaturecenter
|
|
| Expenses [Text Block] |
What were the Fund’s costs for the last year ?
(based on a hypothetical $10,000 investment)
| Share Class |
Costs of a $10,000 investment |
Costs paid as a percentage of a $10,000 investment |
| Class C |
$220 |
1.97% |
|
|
| Expenses Paid, Amount |
$ 220
|
|
| Expense Ratio, Percent |
1.97%
|
|
| Factors Affecting Performance [Text Block] |
How did the Fund perform last year ?
-
For the 12-month period ended August 31, 2025, the Fund’s Class C shares returned 23.21%.
-
In comparison, the NYSE® Technology Index (the “Index”) returned 29.07% for the same period.
What affected the Fund’s performance?
-
Growth-oriented technology stocks delivered solid returns due to continued strength in the artificial intelligence (AI) theme as investors looked beyond U.S. tariff and geopolitical uncertainty.
-
The Fund’s returns relative to the Index benefited from overweight exposure to the communications services sector and emphasis on digital media companies providing streaming entertainment.
-
The industrial sector was a further source of attractive returns from a company launching a new product cycle that applies AI to improve security personnel productivity.
-
Software selection detracted from relative returns, especially due to underexposure to a major data analytics company with a high valuation.
-
The Fund also underperformed in the consumer discretionary sector due to underweight exposure to Chinese e-commerce companies.
|
|
| Performance Past Does Not Indicate Future [Text] |
The Fund’s past performance is not a good predictor of the Fund’s future performance.
|
|
| Line Graph [Table Text Block] |
How did the Fund perform over the past 10 years?
The Fund’s past performance is not a good predictor of the Fund’s future performance. The graph and table do not reflect the deduction of taxes that a shareholder would pay on fund distributions or redemption of fund shares.
Cumulative Performance from September 1 , 2015 through August 31, 2025
Initial Investment of $10,000
The above graph compares a hypothetical $10,000 investment in the Fund’s Class C shares to a hypothetical investment of $10,000 made in each of the S&P 500® Index (a broad-based index) and NYSE® Technology Index on 8/31/2015. The performance shown takes into account the maximum deferred sales charge on Class C shares and applicable fees and expenses of the Fund, including management fees, 12b-1 fees and other expenses. The Fund’s performance also assumes the reinvestment of dividends and capital gains. Unlike the Fund, the indexes are not subject to charges, fees and other expenses. Investors cannot invest directly in any index.
|
|
| Average Annual Return [Table Text Block] |
AVERAGE ANNUAL TOTAL RETURNS (AS OF 8/31/25 )
| Class C Shares |
1YR |
|
5YR |
|
10YR |
|
| with Maximum Deferred Sales Charge - 1.00% |
22.21% |
*
|
7.78% |
|
15.57% |
|
| without Deferred Sales Charge |
23.21% |
|
7.78% |
|
15.57% |
|
| S&P 500® Index (broad-based index) |
15.87% |
|
14.74% |
|
14.59% |
|
| NYSE® Technology Index |
29.07% |
|
15.13% |
|
21.30% |
|
|
*
|
The maximum contingent deferred sales charge for Class C shares is 1.00% for shares redeemed within one year of the date purchased.
|
|
|
| No Deduction of Taxes [Text Block] |
The graph and table do not reflect the deduction of taxes that a shareholder would pay on fund distributions or redemption of fund shares.
|
|
| Updated Performance Information Location [Text Block] |
For more current information visit bny.com/investments/literaturecenter .
|
|
| Net Assets |
$ 425,000,000
|
|
| Holdings Count | Holding |
39
|
|
| Advisory Fees Paid, Amount |
$ 2,920,428
|
|
| Investment Company Portfolio Turnover |
33.84%
|
|
| Additional Fund Statistics [Text Block] |
KEY FUND STATISTICS (AS OF 8/31/25 )
Fund Size (Millions) |
Number of Holdings |
Total Advisory Fee Paid During
Period |
Annual Portfolio Turnover |
| $425 |
39 |
$2,920,428 |
33.84% |
|
|
| Holdings [Text Block] |
Portfolio Holdings (as of 8/31/25 )
Top Ten Holdings (Based on Net Assets) *
* Excludes money market funds or other short-term securities held for the investment of cash and cash collateral for securities loaned, if any.
Sector Allocation (Based on Net Assets)
|
|
| Largest Holdings [Text Block] |
Top Ten Holdings (Based on Net Assets) *
* Excludes money market funds or other short-term securities held for the investment of cash and cash collateral for securities loaned, if any.
|
|
| C000001371 [Member] |
|
|
| Shareholder Report [Line Items] |
|
|
| Fund Name |
BNY Mellon Technology Growth Fund
|
|
| Class Name |
Class I
|
|
| Trading Symbol |
DGVRX
|
|
| Annual or Semi-Annual Statement [Text Block] |
This annual shareholder report contains important information about BNY Mellon Technology Growth Fund (the “Fund”) for the period of September 1, 2024 to August 31, 2025.
|
|
| Shareholder Report Annual or Semi-Annual |
annual shareholder report
|
|
| Additional Information [Text Block] |
You can find additional information about the Fund at bny.com/investments/literaturecenter. You can also request this information by calling 1-800-373-9387 (inside the U.S. only) or by sending an e-mail request to info@bny.com.
|
|
| Additional Information Phone Number |
1-800-373-9387
|
|
| Additional Information Email |
info@bny.com
|
|
| Additional Information Website |
bny.com/investments/literaturecenter
|
|
| Expenses [Text Block] |
What were the Fund’s costs for the last year ?
(based on a hypothetical $10,000 investment)
| Share Class |
Costs of a $10,000 investment |
Costs paid as a percentage of a $10,000 investment |
| Class I |
$106 |
0.94% |
|
|
| Expenses Paid, Amount |
$ 106
|
|
| Expense Ratio, Percent |
0.94%
|
|
| Factors Affecting Performance [Text Block] |
How did the Fund perform last year ?
-
For the 12-month period ended August 31, 2025, the Fund’s Class I shares returned 24.50%.
-
In comparison, the NYSE® Technology Index (the “Index”) returned 29.07% for the same period.
What affected the Fund’s performance?
-
Growth-oriented technology stocks delivered solid returns due to continued strength in the artificial intelligence (AI) theme as investors looked beyond U.S. tariff and geopolitical uncertainty.
-
The Fund’s returns relative to the Index benefited from overweight exposure to the communications services sector and emphasis on digital media companies providing streaming entertainment.
-
The industrial sector was a further source of attractive returns from a company launching a new product cycle that applies AI to improve security personnel productivity.
-
Software selection detracted from relative returns, especially due to underexposure to a major data analytics company with a high valuation.
-
The Fund also underperformed in the consumer discretionary sector due to underweight exposure to Chinese e-commerce companies.
|
|
| Performance Past Does Not Indicate Future [Text] |
The Fund’s past performance is not a good predictor of the Fund’s future performance.
|
|
| Line Graph [Table Text Block] |
How did the Fund perform over the past 10 years? The Fund’s past performance is not a good predictor of the Fund’s future performance. The graph and table do not reflect the deduction of taxes that a shareholder would pay on fund distributions or redemption of fund shares. Cumulative Performance from September 1 , 2015 through August 31, 2025
Initial Investment of $10,000 The above graph compares a hypothetical $10,000 investment in the Fund’s Class I shares to a hypothetical investment of $10,000 made in each of the S&P 500® Index (a broad-based index) and NYSE® Technology Index on 8/31/2015. The performance shown takes into account applicable fees and expenses of the Fund, including management fees and other expenses. The Fund’s performance also assumes the reinvestment of dividends and capital gains. Unlike the Fund, the indexes are not subject to charges, fees and other expenses. Investors cannot invest directly in any index.
|
|
| Average Annual Return [Table Text Block] |
AVERAGE ANNUAL TOTAL RETURNS (AS OF 8/31/25 )
| Share Class |
1YR |
|
5YR |
|
10YR |
|
| Class I |
24.50% |
|
8.90% |
|
16.76% |
|
| S&P 500® Index (broad-based index) |
15.87% |
|
14.74% |
|
14.59% |
|
| NYSE® Technology Index |
29.07% |
|
15.13% |
|
21.30% |
|
|
|
| No Deduction of Taxes [Text Block] |
The graph and table do not reflect the deduction of taxes that a shareholder would pay on fund distributions or redemption of fund shares.
|
|
| Updated Performance Information Location [Text Block] |
For more current information visit bny.com/investments/literaturecenter .
|
|
| Net Assets |
$ 425,000,000
|
|
| Holdings Count | Holding |
39
|
|
| Advisory Fees Paid, Amount |
$ 2,920,428
|
|
| Investment Company Portfolio Turnover |
33.84%
|
|
| Additional Fund Statistics [Text Block] |
KEY FUND STATISTICS (AS OF 8/31/25 )
Fund Size (Millions) |
Number of Holdings |
Total Advisory Fee Paid During
Period |
Annual Portfolio Turnover |
| $425 |
39 |
$2,920,428 |
33.84% |
|
|
| Holdings [Text Block] |
Portfolio Holdings (as of 8/31/25 )
Top Ten Holdings (Based on Net Assets) *
* Excludes money market funds or other short-term securities held for the investment of cash and cash collateral for securities loaned, if any.
Sector Allocation (Based on Net Assets)
|
|
| Largest Holdings [Text Block] |
Top Ten Holdings (Based on Net Assets) *
* Excludes money market funds or other short-term securities held for the investment of cash and cash collateral for securities loaned, if any.
|
|
| C000174007 [Member] |
|
|
| Shareholder Report [Line Items] |
|
|
| Fund Name |
BNY Mellon Technology Growth Fund
|
|
| Class Name |
Class Y
|
|
| Trading Symbol |
DTEYX
|
|
| Annual or Semi-Annual Statement [Text Block] |
This annual shareholder report contains important information about BNY Mellon Technology Growth Fund (the “Fund”) for the period of September 1, 2024 to August 31, 2025.
|
|
| Shareholder Report Annual or Semi-Annual |
annual shareholder report
|
|
| Additional Information [Text Block] |
You can find additional information about the Fund at bny.com/investments/literaturecenter. You can also request this information by calling 1-800-373-9387 (inside the U.S. only) or by sending an e-mail request to info@bny.com.
|
|
| Additional Information Phone Number |
1-800-373-9387
|
|
| Additional Information Email |
info@bny.com
|
|
| Additional Information Website |
bny.com/investments/literaturecenter
|
|
| Expenses [Text Block] |
What were the Fund’s costs for the last year ?
(based on a hypothetical $10,000 investment)
| Share Class |
Costs of a $10,000 investment |
Costs paid as a percentage of a $10,000 investment |
| Class Y |
$95 |
0.85% |
|
|
| Expenses Paid, Amount |
$ 95
|
|
| Expense Ratio, Percent |
0.85%
|
|
| Factors Affecting Performance [Text Block] |
How did the Fund perform last year ?
-
For the 12-month period ended August 31, 2025, the Fund’s Class Y shares returned 24.60%.
-
In comparison, the NYSE® Technology Index (the “Index”) returned 29.07% for the same period.
What affected the Fund’s performance?
-
Growth-oriented technology stocks delivered solid returns due to continued strength in the artificial intelligence (AI) theme as investors looked beyond U.S. tariff and geopolitical uncertainty.
-
The Fund’s returns relative to the Index benefited from overweight exposure to the communications services sector and emphasis on digital media companies providing streaming entertainment.
-
The industrial sector was a further source of attractive returns from a company launching a new product cycle that applies AI to improve security personnel productivity.
-
Software selection detracted from relative returns, especially due to underexposure to a major data analytics company with a high valuation.
-
The Fund also underperformed in the consumer discretionary sector due to underweight exposure to Chinese e-commerce companies.
|
|
| Performance Past Does Not Indicate Future [Text] |
The Fund’s past performance is not a good predictor of the Fund’s future performance.
|
|
| Line Graph [Table Text Block] |
How did the Fund perform over the past 10 years?
The Fund’s past performance is not a good predictor of the Fund’s future performance. The graph and table do not reflect the deduction of taxes that a shareholder would pay on fund distributions or redemption of fund shares.
Cumulative Performance from September 1 , 2015 through August 31, 2025
Initial Investment of $1,000,000
The above graph compares a hypothetical $1,000,000 investment in the Fund’s Class Y shares to a hypothetical investment of $1,000,000 made in each of the S&P 500® Index (a broad-based index) and NYSE® Technology Index on 8/31/2015. The performance shown takes into account applicable fees and expenses of the Fund, including management fees and other expenses. The Fund’s performance also assumes the reinvestment of dividends and capital gains. Unlike the Fund, the indexes are not subject to charges, fees and other expenses. Investors cannot invest directly in any index.
|
|
| Average Annual Return [Table Text Block] |
AVERAGE ANNUAL TOTAL RETURNS (AS OF 8/31/25 )
| Share Class |
1YR |
|
5YR |
|
10YR |
|
| Class Y |
24.60% |
|
8.97% |
|
16.84% |
|
| S&P 500® Index (broad-based index) |
15.87% |
|
14.74% |
|
14.59% |
|
| NYSE® Technology Index |
29.07% |
|
15.13% |
|
21.30% |
|
|
|
| No Deduction of Taxes [Text Block] |
The graph and table do not reflect the deduction of taxes that a shareholder would pay on fund distributions or redemption of fund shares.
|
|
| Updated Performance Information Location [Text Block] |
For more current information visit bny.com/investments/literaturecenter.
|
|
| Net Assets |
$ 425,000,000
|
|
| Holdings Count | Holding |
39
|
|
| Advisory Fees Paid, Amount |
$ 2,920,428
|
|
| Investment Company Portfolio Turnover |
33.84%
|
|
| Additional Fund Statistics [Text Block] |
KEY FUND STATISTICS (AS OF 8/31/25 )
Fund Size (Millions) |
Number of Holdings |
Total Advisory Fee Paid During
Period |
Annual Portfolio Turnover |
| $425 |
39 |
$2,920,428 |
33.84% |
|
|
| Holdings [Text Block] |
Portfolio Holdings (as of 8/31/25 )
Top Ten Holdings (Based on Net Assets) *
* Excludes money market funds or other short-term securities held for the investment of cash and cash collateral for securities loaned, if any.
Sector Allocation (Based on Net Assets)
|
|
| Largest Holdings [Text Block] |
Top Ten Holdings (Based on Net Assets) *
* Excludes money market funds or other short-term securities held for the investment of cash and cash collateral for securities loaned, if any.
|
|
|
|
| X |
- DefinitionBoolean flag that is true when the XBRL content amends previously-filed or accepted submission.
| Name: |
dei_AmendmentFlag |
| Namespace Prefix: |
dei_ |
| Data Type: |
xbrli:booleanItemType |
| Balance Type: |
na |
| Period Type: |
duration |
|
| X |
- DefinitionFor the EDGAR submission types of Form 8-K: the date of the report, the date of the earliest event reported; for the EDGAR submission types of Form N-1A: the filing date; for all other submission types: the end of the reporting or transition period. The format of the date is YYYY-MM-DD.
| Name: |
dei_DocumentPeriodEndDate |
| Namespace Prefix: |
dei_ |
| Data Type: |
xbrli:dateItemType |
| Balance Type: |
na |
| Period Type: |
duration |
|
| X |
- DefinitionThe type of document being provided (such as 10-K, 10-Q, 485BPOS, etc). The document type is limited to the same value as the supporting SEC submission type, or the word 'Other'.
| Name: |
dei_DocumentType |
| Namespace Prefix: |
dei_ |
| Data Type: |
dei:submissionTypeItemType |
| Balance Type: |
na |
| Period Type: |
duration |
|
| X |
- DefinitionA unique 10-digit SEC-issued value to identify entities that have filed disclosures with the SEC. It is commonly abbreviated as CIK. Reference 1: http://www.xbrl.org/2003/role/presentationRef
-Publisher SEC
-Name Exchange Act
-Number 240
-Section 12
-Subsection b-2
| Name: |
dei_EntityCentralIndexKey |
| Namespace Prefix: |
dei_ |
| Data Type: |
dei:centralIndexKeyItemType |
| Balance Type: |
na |
| Period Type: |
duration |
|
| X |
- DefinitionOne of: N-1A (Mutual Fund), N-1 (Open-End Separate Account with No Variable Annuities), N-2 (Closed-End Investment Company), N-3 (Separate Account Registered as Open-End Management Investment Company), N-4 (Variable Annuity UIT Separate Account), N-5 (Small Business Investment Company), N-6 (Variable Life UIT Separate Account), S-1 or S-3 (Face Amount Certificate Company), S-6 (UIT, Non-Insurance Product). Reference 1: http://www.xbrl.org/2003/role/presentationRef
-Publisher SEC
-Name Regulation S-T
-Number 232
-Section 313
| Name: |
dei_EntityInvCompanyType |
| Namespace Prefix: |
dei_ |
| Data Type: |
dei:invCompanyType |
| Balance Type: |
na |
| Period Type: |
duration |
|
| X |
- DefinitionThe exact name of the entity filing the report as specified in its charter, which is required by forms filed with the SEC. Reference 1: http://www.xbrl.org/2003/role/presentationRef
-Publisher SEC
-Name Exchange Act
-Number 240
-Section 12
-Subsection b-2
| Name: |
dei_EntityRegistrantName |
| Namespace Prefix: |
dei_ |
| Data Type: |
xbrli:normalizedStringItemType |
| Balance Type: |
na |
| Period Type: |
duration |
|
| X |
- DefinitionTrading symbol of an instrument as listed on an exchange.
| Name: |
dei_TradingSymbol |
| Namespace Prefix: |
dei_ |
| Data Type: |
dei:tradingSymbolItemType |
| Balance Type: |
na |
| Period Type: |
duration |
|
| X |
- ReferencesReference 1: http://www.xbrl.org/2003/role/presentationRef
-Publisher SEC
-Name Form N-1A
-Section 27A
-Subsection e
| Name: |
oef_AddlFundStatisticsTextBlock |
| Namespace Prefix: |
oef_ |
| Data Type: |
dtr-types:textBlockItemType |
| Balance Type: |
na |
| Period Type: |
duration |
|
| X |
- ReferencesReference 1: http://www.xbrl.org/2003/role/presentationRef
-Publisher SEC
-Name Form N-1A
-Section 27A
-Subsection b
-Paragraph instruction
-Subparagraph 2
| Name: |
oef_AddlInfoEmail |
| Namespace Prefix: |
oef_ |
| Data Type: |
xbrli:stringItemType |
| Balance Type: |
na |
| Period Type: |
duration |
|
| X |
- ReferencesReference 1: http://www.xbrl.org/2003/role/presentationRef
-Publisher SEC
-Name Form N-1A
-Section 27A
-Subsection b
-Paragraph instruction
-Subparagraph 2
| Name: |
oef_AddlInfoPhoneNumber |
| Namespace Prefix: |
oef_ |
| Data Type: |
xbrli:stringItemType |
| Balance Type: |
na |
| Period Type: |
duration |
|
| X |
- ReferencesReference 1: http://www.xbrl.org/2003/role/presentationRef
-Publisher SEC
-Name Form N-1A
-Section 27A
-Subsection b
-Paragraph 4
| Name: |
oef_AddlInfoTextBlock |
| Namespace Prefix: |
oef_ |
| Data Type: |
dtr-types:textBlockItemType |
| Balance Type: |
na |
| Period Type: |
duration |
|
| X |
- ReferencesReference 1: http://www.xbrl.org/2003/role/presentationRef
-Publisher SEC
-Name Form N-1A
-Section 27A
-Subsection b
-Paragraph instruction
-Subparagraph 2
| Name: |
oef_AddlInfoWebsite |
| Namespace Prefix: |
oef_ |
| Data Type: |
xbrli:stringItemType |
| Balance Type: |
na |
| Period Type: |
duration |
|
| X |
- ReferencesReference 1: http://www.xbrl.org/2003/role/presentationRef
-Publisher SEC
-Name Form N-1A
-Section 27A
-Subsection e
| Name: |
oef_AdvisoryFeesPaidAmt |
| Namespace Prefix: |
oef_ |
| Data Type: |
xbrli:monetaryItemType |
| Balance Type: |
na |
| Period Type: |
duration |
|
| X |
- ReferencesReference 1: http://www.xbrl.org/2003/role/presentationRef
-Publisher SEC
-Name Form N-1A
-Section 27A
-Subsection b
-Paragraph 3
| Name: |
oef_AnnlOrSemiAnnlStatementTextBlock |
| Namespace Prefix: |
oef_ |
| Data Type: |
dtr-types:textBlockItemType |
| Balance Type: |
na |
| Period Type: |
duration |
|
| X |
- ReferencesReference 1: http://www.xbrl.org/2003/role/presentationRef
-Publisher SEC
-Name Form N-1A
-Section 27A
-Subsection d
-Paragraph 2
-Subparagraph instruction
-Clause 7
| Name: |
oef_AvgAnnlRtrTableTextBlock |
| Namespace Prefix: |
oef_ |
| Data Type: |
dtr-types:textBlockItemType |
| Balance Type: |
na |
| Period Type: |
duration |
|
| X |
- ReferencesReference 1: http://www.xbrl.org/2003/role/presentationRef
-Publisher SEC
-Name Form N-1A
-Section 27A
-Subsection b
-Paragraph instruction
-Subparagraph 2
| Name: |
oef_ClassName |
| Namespace Prefix: |
oef_ |
| Data Type: |
dei:securityTitleItemType |
| Balance Type: |
na |
| Period Type: |
duration |
|
| X |
- ReferencesReference 1: http://www.xbrl.org/2003/role/presentationRef
-Publisher SEC
-Name Form N-1A
-Section 27A
-Subsection c
-Paragraph iii
| Name: |
oef_ExpenseRatioPct |
| Namespace Prefix: |
oef_ |
| Data Type: |
dtr-types:percentItemType |
| Balance Type: |
na |
| Period Type: |
duration |
|
| X |
- ReferencesReference 1: http://www.xbrl.org/2003/role/presentationRef
-Publisher SEC
-Name Form N-1A
-Section 27A
-Subsection c
-Paragraph ii
| Name: |
oef_ExpensesPaidAmt |
| Namespace Prefix: |
oef_ |
| Data Type: |
xbrli:monetaryItemType |
| Balance Type: |
na |
| Period Type: |
duration |
|
| X |
- ReferencesReference 1: http://www.xbrl.org/2003/role/presentationRef
-Publisher SEC
-Name Form N-1A
-Section 27A
-Subsection c
| Name: |
oef_ExpensesTextBlock |
| Namespace Prefix: |
oef_ |
| Data Type: |
dtr-types:textBlockItemType |
| Balance Type: |
na |
| Period Type: |
duration |
|
| X |
- ReferencesReference 1: http://www.xbrl.org/2003/role/presentationRef
-Publisher SEC
-Name Form N-1A
-Section 27A
-Subsection d
-Paragraph 1
| Name: |
oef_FactorsAffectingPerfTextBlock |
| Namespace Prefix: |
oef_ |
| Data Type: |
dtr-types:textBlockItemType |
| Balance Type: |
na |
| Period Type: |
duration |
|
| X |
- ReferencesReference 1: http://www.xbrl.org/2003/role/presentationRef
-Publisher SEC
-Name Form N-1A
-Section 27A
-Subsection b
-Paragraph 1
| Name: |
oef_FundName |
| Namespace Prefix: |
oef_ |
| Data Type: |
xbrli:normalizedStringItemType |
| Balance Type: |
na |
| Period Type: |
duration |
|
| X |
- ReferencesReference 1: http://www.xbrl.org/2003/role/presentationRef
-Publisher SEC
-Name Form N-1A
-Section 27A
-Subsection e
| Name: |
oef_HoldingsCount |
| Namespace Prefix: |
oef_ |
| Data Type: |
xbrli:integerItemType |
| Balance Type: |
na |
| Period Type: |
instant |
|
| X |
- ReferencesReference 1: http://www.xbrl.org/2003/role/presentationRef
-Publisher SEC
-Name Form N-1A
-Section 27A
-Subsection f
| Name: |
oef_HoldingsTableTextBlock |
| Namespace Prefix: |
oef_ |
| Data Type: |
dtr-types:textBlockItemType |
| Balance Type: |
na |
| Period Type: |
duration |
|
| X |
- ReferencesReference 1: http://www.xbrl.org/2003/role/presentationRef
-Publisher SEC
-Name Form N-1A
-Section 27A
-Subsection f
| Name: |
oef_LargestHoldingsTableTextBlock |
| Namespace Prefix: |
oef_ |
| Data Type: |
dtr-types:textBlockItemType |
| Balance Type: |
na |
| Period Type: |
duration |
|
| X |
- ReferencesReference 1: http://www.xbrl.org/2003/role/presentationRef
-Publisher SEC
-Name Form N-1A
-Section 27A
-Subsection d
-Paragraph 2
| Name: |
oef_LineGraphTableTextBlock |
| Namespace Prefix: |
oef_ |
| Data Type: |
dtr-types:textBlockItemType |
| Balance Type: |
na |
| Period Type: |
duration |
|
| X |
- ReferencesReference 1: http://www.xbrl.org/2003/role/presentationRef
-Publisher SEC
-Name Form N-1A
-Section 27A
-Subsection b
-Paragraph 5
| Name: |
oef_MaterialFundChngNoticeTextBlock |
| Namespace Prefix: |
oef_ |
| Data Type: |
dtr-types:textBlockItemType |
| Balance Type: |
na |
| Period Type: |
duration |
|
| X |
- ReferencesReference 1: http://www.xbrl.org/2003/role/presentationRef
-Publisher SEC
-Name Form N-1A
-Section 27A
-Subsection g
| Name: |
oef_MaterialFundChngTextBlock |
| Namespace Prefix: |
oef_ |
| Data Type: |
dtr-types:textBlockItemType |
| Balance Type: |
na |
| Period Type: |
duration |
|
| X |
- ReferencesReference 1: http://www.xbrl.org/2003/role/presentationRef
-Publisher SEC
-Name Form N-1A
-Section 27A
-Subsection d
-Paragraph 2
-Subparagraph iii
-Clause B
| Name: |
oef_NoDeductionOfTaxesTextBlock |
| Namespace Prefix: |
oef_ |
| Data Type: |
dtr-types:textBlockItemType |
| Balance Type: |
na |
| Period Type: |
duration |
|
| X |
- ReferencesReference 1: http://www.xbrl.org/2003/role/presentationRef
-Publisher SEC
-Name Form N-1A
-Section 27A
-Subsection d
-Paragraph 2
-Subparagraph i
| Name: |
oef_PerfInceptionDate |
| Namespace Prefix: |
oef_ |
| Data Type: |
xbrli:dateItemType |
| Balance Type: |
na |
| Period Type: |
duration |
|
| X |
- ReferencesReference 1: http://www.xbrl.org/2003/role/presentationRef
-Publisher SEC
-Name Form N-1A
-Section 27A
-Subsection b
-Paragraph 3
| Name: |
oef_ShareholderReportAnnualOrSemiAnnual |
| Namespace Prefix: |
oef_ |
| Data Type: |
oef:shareholderReportTypeItemType |
| Balance Type: |
na |
| Period Type: |
duration |
|
| X |
- ReferencesReference 1: http://www.xbrl.org/2003/role/presentationRef
-Publisher SEC
-Name Form N-1A
-Section 27A
-Subsection d
-Paragraph 2
-Subparagraph instruction
-Clause 7
| Name: |
oef_ShareholderReportLineItems |
| Namespace Prefix: |
oef_ |
| Data Type: |
xbrli:stringItemType |
| Balance Type: |
na |
| Period Type: |
duration |
|
| X |
- ReferencesReference 1: http://www.xbrl.org/2003/role/presentationRef
-Publisher SEC
-Name Form N-1A
-Section 27A
-Subsection g
-Paragraph instruction
-Subparagraph 2
| Name: |
oef_SummaryOfChngLegendTextBlock |
| Namespace Prefix: |
oef_ |
| Data Type: |
dtr-types:textBlockItemType |
| Balance Type: |
na |
| Period Type: |
duration |
|
| X |
- ReferencesReference 1: http://www.xbrl.org/2003/role/presentationRef
-Publisher SEC
-Name Form N-1A
-Section 27A
-Subsection d
-Paragraph 2
-Subparagraph instruction
-Clause 15
| Name: |
oef_UpdPerfInfoLocationTextBlock |
| Namespace Prefix: |
oef_ |
| Data Type: |
dtr-types:textBlockItemType |
| Balance Type: |
na |
| Period Type: |
duration |
|
| X |
- ReferencesReference 1: http://www.xbrl.org/2003/role/presentationRef
-Publisher SEC
-Name Form N-1A
-Section 27A
-Subsection g
-Paragraph instruction
-Subparagraph 2
| Name: |
oef_UpdProspectusPhoneNumber |
| Namespace Prefix: |
oef_ |
| Data Type: |
xbrli:stringItemType |
| Balance Type: |
na |
| Period Type: |
duration |
|
| X |
- ReferencesReference 1: http://www.xbrl.org/2003/role/presentationRef
-Publisher SEC
-Name Form N-1A
-Section 27A
-Subsection g
-Paragraph instruction
-Subparagraph 2
| Name: |
oef_UpdProspectusWebAddress |
| Namespace Prefix: |
oef_ |
| Data Type: |
xbrli:stringItemType |
| Balance Type: |
na |
| Period Type: |
duration |
|
| X |
- DefinitionAmount of net assets (liabilities). Reference 1: http://fasb.org/us-gaap/role/ref/legacyRef
-Name Accounting Standards Codification
-Section 50
-Paragraph 1
-SubTopic 30
-Topic 205
-Publisher FASB
-URI https://asc.fasb.org/1943274/2147479910/205-30-50-1
| Name: |
us-gaap_AssetsNet |
| Namespace Prefix: |
us-gaap_ |
| Data Type: |
xbrli:monetaryItemType |
| Balance Type: |
debit |
| Period Type: |
instant |
|
| X |
- DefinitionPercentage of lesser of purchase or sale of portfolio securities to average value of portfolio securities owned. Reference 1: http://www.xbrl.org/2009/role/commonPracticeRef
-Topic 946
-SubTopic 205
-Name Accounting Standards Codification
-Section 50
-Paragraph 27
-Publisher FASB
-URI https://asc.fasb.org/1943274/2147478494/946-205-50-27
| Name: |
us-gaap_InvestmentCompanyPortfolioTurnover |
| Namespace Prefix: |
us-gaap_ |
| Data Type: |
dtr-types:percentItemType |
| Balance Type: |
na |
| Period Type: |
duration |
|
| X |
- Details
| Name: |
oef_ClassAxis=bmafi_C000001288Member |
| Namespace Prefix: |
|
| Data Type: |
na |
| Balance Type: |
|
| Period Type: |
|
|
| X |
- Details
| Name: |
oef_ClassAxis=bmafi_C000064720Member |
| Namespace Prefix: |
|
| Data Type: |
na |
| Balance Type: |
|
| Period Type: |
|
|
| X |
- Details
| Name: |
oef_ClassAxis=bmafi_C000064721Member |
| Namespace Prefix: |
|
| Data Type: |
na |
| Balance Type: |
|
| Period Type: |
|
|
| X |
- Details
| Name: |
oef_ClassAxis=bmafi_C000130426Member |
| Namespace Prefix: |
|
| Data Type: |
na |
| Balance Type: |
|
| Period Type: |
|
|
| X |
- Details
| Name: |
oef_ClassAxis=bmafi_C000174005Member |
| Namespace Prefix: |
|
| Data Type: |
na |
| Balance Type: |
|
| Period Type: |
|
|
| X |
- Details
| Name: |
oef_ClassAxis=bmafi_C000001289Member |
| Namespace Prefix: |
|
| Data Type: |
na |
| Balance Type: |
|
| Period Type: |
|
|
| X |
- Details
| Name: |
oef_ClassAxis=bmafi_C000174006Member |
| Namespace Prefix: |
|
| Data Type: |
na |
| Balance Type: |
|
| Period Type: |
|
|
| X |
- Details
| Name: |
oef_ClassAxis=bmafi_C000001358Member |
| Namespace Prefix: |
|
| Data Type: |
na |
| Balance Type: |
|
| Period Type: |
|
|
| X |
- Details
| Name: |
oef_ClassAxis=bmafi_C000001360Member |
| Namespace Prefix: |
|
| Data Type: |
na |
| Balance Type: |
|
| Period Type: |
|
|
| X |
- Details
| Name: |
oef_ClassAxis=bmafi_C000001361Member |
| Namespace Prefix: |
|
| Data Type: |
na |
| Balance Type: |
|
| Period Type: |
|
|
| X |
- Details
| Name: |
oef_ClassAxis=bmafi_C000130427Member |
| Namespace Prefix: |
|
| Data Type: |
na |
| Balance Type: |
|
| Period Type: |
|
|
| X |
- Details
| Name: |
oef_ClassAxis=bmafi_C000001368Member |
| Namespace Prefix: |
|
| Data Type: |
na |
| Balance Type: |
|
| Period Type: |
|
|
| X |
- Details
| Name: |
oef_ClassAxis=bmafi_C000001370Member |
| Namespace Prefix: |
|
| Data Type: |
na |
| Balance Type: |
|
| Period Type: |
|
|
| X |
- Details
| Name: |
oef_ClassAxis=bmafi_C000001371Member |
| Namespace Prefix: |
|
| Data Type: |
na |
| Balance Type: |
|
| Period Type: |
|
|
| X |
- Details
| Name: |
oef_ClassAxis=bmafi_C000174007Member |
| Namespace Prefix: |
|
| Data Type: |
na |
| Balance Type: |
|
| Period Type: |
|
|
v3.25.3
Shareholder Report, Line Graph (Details) - USD ($)
|
|
12 Months Ended |
24 Months Ended |
36 Months Ended |
48 Months Ended |
60 Months Ended |
72 Months Ended |
84 Months Ended |
96 Months Ended |
108 Months Ended |
120 Months Ended |
Aug. 31, 2015 |
Aug. 31, 2025 |
Aug. 31, 2016 |
Aug. 31, 2017 |
Aug. 31, 2018 |
Aug. 31, 2019 |
Aug. 31, 2020 |
Aug. 31, 2021 |
Aug. 31, 2022 |
Aug. 31, 2023 |
Aug. 31, 2024 |
Aug. 31, 2025 |
| C000001288 [Member] |
|
|
|
|
|
|
|
|
|
|
|
|
| Account Value [Line Items] |
|
|
|
|
|
|
|
|
|
|
|
|
| Line Graph and Table Measure Name |
|
with Maximum Sales Charge - 5.75%
|
|
|
|
|
|
|
|
|
|
|
| Accumulated Value |
$ 9,424
|
|
$ 9,796
|
$ 11,096
|
$ 12,920
|
$ 11,545
|
$ 12,853
|
$ 17,208
|
$ 16,167
|
$ 17,227
|
$ 20,131
|
$ 21,566
|
| C000064720 [Member] |
|
|
|
|
|
|
|
|
|
|
|
|
| Account Value [Line Items] |
|
|
|
|
|
|
|
|
|
|
|
|
| Line Graph and Table Measure Name |
|
with Maximum Deferred Sales Charge - 1.00%
|
|
|
|
|
|
|
|
|
|
|
| Accumulated Value |
10,000
|
|
10,319
|
11,602
|
13,407
|
11,886
|
13,129
|
17,444
|
16,259
|
17,180
|
19,915
|
21,156
|
| C000064721 [Member] |
|
|
|
|
|
|
|
|
|
|
|
|
| Account Value [Line Items] |
|
|
|
|
|
|
|
|
|
|
|
|
| Line Graph and Table Measure Name |
|
Class I
|
|
|
|
|
|
|
|
|
|
|
| Accumulated Value |
10,000
|
|
10,423
|
11,844
|
13,826
|
12,385
|
13,815
|
18,535
|
17,453
|
18,627
|
21,814
|
23,406
|
| C000130426 [Member] |
|
|
|
|
|
|
|
|
|
|
|
|
| Account Value [Line Items] |
|
|
|
|
|
|
|
|
|
|
|
|
| Line Graph and Table Measure Name |
|
Class Y
|
|
|
|
|
|
|
|
|
|
|
| Accumulated Value |
1,000,000
|
|
1,043,994
|
1,187,130
|
1,387,063
|
1,243,619
|
1,389,172
|
1,866,071
|
1,758,186
|
1,879,308
|
2,202,494
|
2,365,900
|
| C000174005 [Member] |
|
|
|
|
|
|
|
|
|
|
|
|
| Account Value [Line Items] |
|
|
|
|
|
|
|
|
|
|
|
|
| Line Graph and Table Measure Name |
|
Class Y
|
|
|
|
|
|
|
|
|
|
|
| Accumulated Value |
1,000,000
|
|
1,013,417
|
1,255,651
|
1,555,813
|
1,256,617
|
1,367,380
|
1,913,926
|
1,658,304
|
1,719,499
|
1,888,704
|
1,990,100
|
| C000001289 [Member] |
|
|
|
|
|
|
|
|
|
|
|
|
| Account Value [Line Items] |
|
|
|
|
|
|
|
|
|
|
|
|
| Line Graph and Table Measure Name |
|
Investor Shares
|
|
|
|
|
|
|
|
|
|
|
| Accumulated Value |
10,000
|
|
10,134
|
12,532
|
15,479
|
12,465
|
13,517
|
18,868
|
16,296
|
16,844
|
18,451
|
19,381
|
| C000174006 [Member] |
|
|
|
|
|
|
|
|
|
|
|
|
| Account Value [Line Items] |
|
|
|
|
|
|
|
|
|
|
|
|
| Line Graph and Table Measure Name |
|
Class I
|
|
|
|
|
|
|
|
|
|
|
| Accumulated Value |
10,000
|
|
10,134
|
12,556
|
15,543
|
12,541
|
13,624
|
19,047
|
16,487
|
17,069
|
18,729
|
19,716
|
| C000001358 [Member] |
|
|
|
|
|
|
|
|
|
|
|
|
| Account Value [Line Items] |
|
|
|
|
|
|
|
|
|
|
|
|
| Line Graph and Table Measure Name |
|
with Maximum Sales Charge - 5.75%
|
|
|
|
|
|
|
|
|
|
|
| Accumulated Value |
9,425
|
|
10,203
|
11,658
|
13,602
|
13,005
|
12,933
|
19,089
|
19,535
|
22,322
|
27,077
|
30,349
|
| C000001360 [Member] |
|
|
|
|
|
|
|
|
|
|
|
|
| Account Value [Line Items] |
|
|
|
|
|
|
|
|
|
|
|
|
| Line Graph and Table Measure Name |
|
with Maximum Deferred Sales Charge - 1.00%
|
|
|
|
|
|
|
|
|
|
|
| Accumulated Value |
10,000
|
|
10,746
|
12,185
|
14,118
|
13,394
|
13,222
|
19,367
|
19,675
|
22,312
|
26,858
|
29,880
|
| C000001361 [Member] |
|
|
|
|
|
|
|
|
|
|
|
|
| Account Value [Line Items] |
|
|
|
|
|
|
|
|
|
|
|
|
| Line Graph and Table Measure Name |
|
Class I
|
|
|
|
|
|
|
|
|
|
|
| Accumulated Value |
10,000
|
|
10,852
|
12,433
|
14,544
|
13,939
|
13,898
|
20,564
|
21,099
|
24,170
|
29,390
|
33,026
|
| C000130427 [Member] |
|
|
|
|
|
|
|
|
|
|
|
|
| Account Value [Line Items] |
|
|
|
|
|
|
|
|
|
|
|
|
| Line Graph and Table Measure Name |
|
Class Y
|
|
|
|
|
|
|
|
|
|
|
| Accumulated Value |
1,000,000
|
|
1,085,161
|
1,243,317
|
1,455,206
|
1,395,102
|
1,391,407
|
2,060,024
|
2,114,343
|
2,423,080
|
2,948,138
|
3,314,500
|
| C000001368 [Member] |
|
|
|
|
|
|
|
|
|
|
|
|
| Account Value [Line Items] |
|
|
|
|
|
|
|
|
|
|
|
|
| Line Graph and Table Measure Name |
|
with Maximum Sales Charge - 5.75%
|
|
|
|
|
|
|
|
|
|
|
| Accumulated Value |
9,425
|
|
10,672
|
13,696
|
17,897
|
17,112
|
28,639
|
35,816
|
21,485
|
26,815
|
34,934
|
43,390
|
| C000001370 [Member] |
|
|
|
|
|
|
|
|
|
|
|
|
| Account Value [Line Items] |
|
|
|
|
|
|
|
|
|
|
|
|
| Line Graph and Table Measure Name |
|
with Maximum Deferred Sales Charge - 1.00%
|
|
|
|
|
|
|
|
|
|
|
| Accumulated Value |
10,000
|
|
11,227
|
14,292
|
18,541
|
17,597
|
29,238
|
36,276
|
21,584
|
26,705
|
34,505
|
42,515
|
| C000001371 [Member] |
|
|
|
|
|
|
|
|
|
|
|
|
| Account Value [Line Items] |
|
|
|
|
|
|
|
|
|
|
|
|
| Line Graph and Table Measure Name |
|
Class I
|
|
|
|
|
|
|
|
|
|
|
| Accumulated Value |
10,000
|
|
11,349
|
14,605
|
19,128
|
18,331
|
30,748
|
38,537
|
23,170
|
28,974
|
37,820
|
47,090
|
| C000174007 [Member] |
|
|
|
|
|
|
|
|
|
|
|
|
| Account Value [Line Items] |
|
|
|
|
|
|
|
|
|
|
|
|
| Line Graph and Table Measure Name |
|
Class Y
|
|
|
|
|
|
|
|
|
|
|
| Accumulated Value |
1,000,000
|
|
1,134,917
|
1,462,019
|
1,917,692
|
1,838,818
|
3,087,636
|
3,873,029
|
2,330,110
|
2,912,897
|
3,806,780
|
4,743,200
|
| Russell 3000 Index [Member] |
|
|
|
|
|
|
|
|
|
|
|
|
| Account Value [Line Items] |
|
|
|
|
|
|
|
|
|
|
|
|
| Line Graph and Table Measure Name |
|
Russell 3000® Index (broad-based index)
|
|
|
|
|
|
|
|
|
|
|
| Accumulated Value |
10,000
|
|
11,144
|
12,934
|
15,553
|
15,757
|
19,135
|
25,457
|
22,076
|
25,335
|
31,957
|
37,020
|
| Russell 2000 Index [Member] |
|
|
|
|
|
|
|
|
|
|
|
|
| Account Value [Line Items] |
|
|
|
|
|
|
|
|
|
|
|
|
| Line Graph and Table Measure Name |
|
Russell 2000® Index
|
|
|
|
|
|
|
|
|
|
|
| Accumulated Value |
10,000
|
|
10,859
|
12,478
|
15,654
|
13,636
|
14,457
|
21,263
|
17,461
|
18,273
|
21,648
|
23,416
|
| Russell 1000 Index [Member] |
|
|
|
|
|
|
|
|
|
|
|
|
| Account Value [Line Items] |
|
|
|
|
|
|
|
|
|
|
|
|
| Line Graph and Table Measure Name |
|
Russell 1000® Index (broad-based index)
|
|
|
|
|
|
|
|
|
|
|
| Accumulated Value |
10,000
|
|
11,169
|
12,974
|
15,545
|
15,932
|
19,517
|
25,812
|
22,466
|
25,926
|
32,823
|
38,151
|
| NYSE Technology Index [Member] |
|
|
|
|
|
|
|
|
|
|
|
|
| Account Value [Line Items] |
|
|
|
|
|
|
|
|
|
|
|
|
| Line Graph and Table Measure Name |
|
NYSE® Technology Index
|
|
|
|
|
|
|
|
|
|
|
| Accumulated Value |
10,000
|
|
11,776
|
15,729
|
19,544
|
19,733
|
34,073
|
45,175
|
29,885
|
40,389
|
52,797
|
68,974
|
| Standard & Poor's 500 Index [Member] |
|
|
|
|
|
|
|
|
|
|
|
|
| Account Value [Line Items] |
|
|
|
|
|
|
|
|
|
|
|
|
| Line Graph and Table Measure Name |
|
S&P 500® Index (broad-based index)
|
|
|
|
|
|
|
|
|
|
|
| Accumulated Value |
10,000
|
|
11,253
|
13,078
|
15,649
|
16,106
|
19,639
|
25,758
|
22,868
|
26,511
|
33,703
|
39,049
|
| Russell Midcap Value Index [Member] |
|
|
|
|
|
|
|
|
|
|
|
|
| Account Value [Line Items] |
|
|
|
|
|
|
|
|
|
|
|
|
| Line Graph and Table Measure Name |
|
Russell Midcap® Value Index
|
|
|
|
|
|
|
|
|
|
|
| Accumulated Value |
10,000
|
|
11,288
|
12,509
|
14,094
|
13,653
|
13,476
|
19,472
|
17,953
|
18,968
|
22,797
|
24,671
|
| Russell 1000 Value Index [Member] |
|
|
|
|
|
|
|
|
|
|
|
|
| Account Value [Line Items] |
|
|
|
|
|
|
|
|
|
|
|
|
| Line Graph and Table Measure Name |
|
Russell 1000® Value Index
|
|
|
|
|
|
|
|
|
|
|
| Accumulated Value |
$ 10,000
|
|
$ 11,292
|
$ 12,600
|
$ 14,171
|
$ 14,259
|
$ 14,378
|
$ 19,618
|
$ 18,396
|
$ 19,976
|
$ 24,201
|
$ 26,461
|
| X |
- ReferencesReference 1: http://www.xbrl.org/2003/role/presentationRef
-Publisher SEC
-Name Form N-1A
-Section 27A
-Subsection d
-Paragraph 2
-Subparagraph i
| Name: |
oef_AccmVal |
| Namespace Prefix: |
oef_ |
| Data Type: |
xbrli:monetaryItemType |
| Balance Type: |
na |
| Period Type: |
duration |
|
| X |
- ReferencesReference 1: http://www.xbrl.org/2003/role/presentationRef
-Publisher SEC
-Name Form N-1A
-Section 27A
-Subsection d
-Paragraph 2
| Name: |
oef_AccountValueLineItems |
| Namespace Prefix: |
oef_ |
| Data Type: |
xbrli:stringItemType |
| Balance Type: |
na |
| Period Type: |
duration |
|
| X |
- ReferencesReference 1: http://www.xbrl.org/2003/role/presentationRef
-Publisher SEC
-Name Form N-1A
-Section 27A
-Subsection d
-Paragraph 2
-Subparagraph i
| Name: |
oef_LineGraphAndTableMeasureName |
| Namespace Prefix: |
oef_ |
| Data Type: |
xbrli:stringItemType |
| Balance Type: |
na |
| Period Type: |
duration |
|
| X |
- Details
| Name: |
oef_ClassAxis=bmafi_C000001288Member |
| Namespace Prefix: |
|
| Data Type: |
na |
| Balance Type: |
|
| Period Type: |
|
|
| X |
- Details
| Name: |
oef_ClassAxis=bmafi_C000064720Member |
| Namespace Prefix: |
|
| Data Type: |
na |
| Balance Type: |
|
| Period Type: |
|
|
| X |
- Details
| Name: |
oef_ClassAxis=bmafi_C000064721Member |
| Namespace Prefix: |
|
| Data Type: |
na |
| Balance Type: |
|
| Period Type: |
|
|
| X |
- Details
| Name: |
oef_ClassAxis=bmafi_C000130426Member |
| Namespace Prefix: |
|
| Data Type: |
na |
| Balance Type: |
|
| Period Type: |
|
|
| X |
- Details
| Name: |
oef_ClassAxis=bmafi_C000174005Member |
| Namespace Prefix: |
|
| Data Type: |
na |
| Balance Type: |
|
| Period Type: |
|
|
| X |
- Details
| Name: |
oef_ClassAxis=bmafi_C000001289Member |
| Namespace Prefix: |
|
| Data Type: |
na |
| Balance Type: |
|
| Period Type: |
|
|
| X |
- Details
| Name: |
oef_ClassAxis=bmafi_C000174006Member |
| Namespace Prefix: |
|
| Data Type: |
na |
| Balance Type: |
|
| Period Type: |
|
|
| X |
- Details
| Name: |
oef_ClassAxis=bmafi_C000001358Member |
| Namespace Prefix: |
|
| Data Type: |
na |
| Balance Type: |
|
| Period Type: |
|
|
| X |
- Details
| Name: |
oef_ClassAxis=bmafi_C000001360Member |
| Namespace Prefix: |
|
| Data Type: |
na |
| Balance Type: |
|
| Period Type: |
|
|
| X |
- Details
| Name: |
oef_ClassAxis=bmafi_C000001361Member |
| Namespace Prefix: |
|
| Data Type: |
na |
| Balance Type: |
|
| Period Type: |
|
|
| X |
- Details
| Name: |
oef_ClassAxis=bmafi_C000130427Member |
| Namespace Prefix: |
|
| Data Type: |
na |
| Balance Type: |
|
| Period Type: |
|
|
| X |
- Details
| Name: |
oef_ClassAxis=bmafi_C000001368Member |
| Namespace Prefix: |
|
| Data Type: |
na |
| Balance Type: |
|
| Period Type: |
|
|
| X |
- Details
| Name: |
oef_ClassAxis=bmafi_C000001370Member |
| Namespace Prefix: |
|
| Data Type: |
na |
| Balance Type: |
|
| Period Type: |
|
|
| X |
- Details
| Name: |
oef_ClassAxis=bmafi_C000001371Member |
| Namespace Prefix: |
|
| Data Type: |
na |
| Balance Type: |
|
| Period Type: |
|
|
| X |
- Details
| Name: |
oef_ClassAxis=bmafi_C000174007Member |
| Namespace Prefix: |
|
| Data Type: |
na |
| Balance Type: |
|
| Period Type: |
|
|
| X |
- Details
| Name: |
oef_BroadBasedIndexAxis=bmafi_Russell3000IndexMember |
| Namespace Prefix: |
|
| Data Type: |
na |
| Balance Type: |
|
| Period Type: |
|
|
| X |
- Details
| Name: |
oef_BroadBasedIndexAxis=bmafi_Russell2000IndexMember |
| Namespace Prefix: |
|
| Data Type: |
na |
| Balance Type: |
|
| Period Type: |
|
|
| X |
- Details
| Name: |
oef_BroadBasedIndexAxis=bmafi_Russell1000IndexMember |
| Namespace Prefix: |
|
| Data Type: |
na |
| Balance Type: |
|
| Period Type: |
|
|
| X |
- Details
| Name: |
oef_BroadBasedIndexAxis=bmafi_NYSETechnologyIndexMember |
| Namespace Prefix: |
|
| Data Type: |
na |
| Balance Type: |
|
| Period Type: |
|
|
| X |
- Details
| Name: |
oef_BroadBasedIndexAxis=us-gaap_StandardPoors500IndexMember |
| Namespace Prefix: |
|
| Data Type: |
na |
| Balance Type: |
|
| Period Type: |
|
|
| X |
- Details
| Name: |
oef_AdditionalIndexAxis=bmafi_RussellMidcapValueIndexMember |
| Namespace Prefix: |
|
| Data Type: |
na |
| Balance Type: |
|
| Period Type: |
|
|
| X |
- Details
| Name: |
oef_AdditionalIndexAxis=bmafi_Russell1000ValueIndexMember |
| Namespace Prefix: |
|
| Data Type: |
na |
| Balance Type: |
|
| Period Type: |
|
|
v3.25.3
Shareholder Report, Average Annual Return (Details)
|
12 Months Ended |
60 Months Ended |
120 Months Ended |
Aug. 31, 2025 |
Aug. 31, 2025 |
Aug. 31, 2025 |
| C000001288 [Member] |
|
|
|
|
| Average Annual Return [Line Items] |
|
|
|
|
| Line Graph and Table Measure Name |
with Maximum Sales Charge - 5.75%
|
|
|
|
| Average Annual Return, Percent |
0.98%
|
|
9.60%
|
7.99%
|
| C000064720 [Member] |
|
|
|
|
| Average Annual Return [Line Items] |
|
|
|
|
| Line Graph and Table Measure Name |
with Maximum Deferred Sales Charge - 1.00%
|
|
|
|
| Average Annual Return, Percent |
5.29%
|
[1] |
10.01%
|
7.78%
|
| C000064721 [Member] |
|
|
|
|
| Average Annual Return [Line Items] |
|
|
|
|
| Line Graph and Table Measure Name |
Class I
|
|
|
|
| Average Annual Return, Percent |
7.30%
|
|
11.12%
|
8.88%
|
| C000130426 [Member] |
|
|
|
|
| Average Annual Return [Line Items] |
|
|
|
|
| Line Graph and Table Measure Name |
Class Y
|
|
|
|
| Average Annual Return, Percent |
7.43%
|
|
11.24%
|
8.99%
|
| C000174005 [Member] |
|
|
|
|
| Average Annual Return [Line Items] |
|
|
|
|
| Line Graph and Table Measure Name |
Class Y
|
|
|
|
| Average Annual Return, Percent |
5.37%
|
|
7.79%
|
7.12%
|
| C000001289 [Member] |
|
|
|
|
| Average Annual Return [Line Items] |
|
|
|
|
| Line Graph and Table Measure Name |
Investor Shares
|
|
|
|
| Average Annual Return, Percent |
5.05%
|
|
7.47%
|
6.84%
|
| C000174006 [Member] |
|
|
|
|
| Average Annual Return [Line Items] |
|
|
|
|
| Line Graph and Table Measure Name |
Class I
|
|
|
|
| Average Annual Return, Percent |
5.27%
|
|
7.67%
|
7.02%
|
| C000001358 [Member] |
|
|
|
|
| Average Annual Return [Line Items] |
|
|
|
|
| Line Graph and Table Measure Name |
with Maximum Sales Charge - 5.75%
|
|
|
|
| Average Annual Return, Percent |
5.64%
|
|
17.21%
|
11.74%
|
| C000001360 [Member] |
|
|
|
|
| Average Annual Return [Line Items] |
|
|
|
|
| Line Graph and Table Measure Name |
with Maximum Deferred Sales Charge - 1.00%
|
|
|
|
| Average Annual Return, Percent |
10.24%
|
[2] |
17.71%
|
11.57%
|
| C000001361 [Member] |
|
|
|
|
| Average Annual Return [Line Items] |
|
|
|
|
| Line Graph and Table Measure Name |
Class I
|
|
|
|
| Average Annual Return, Percent |
12.37%
|
|
18.90%
|
12.69%
|
| C000130427 [Member] |
|
|
|
|
| Average Annual Return [Line Items] |
|
|
|
|
| Line Graph and Table Measure Name |
Class Y
|
|
|
|
| Average Annual Return, Percent |
12.42%
|
|
18.96%
|
12.73%
|
| C000001368 [Member] |
|
|
|
|
| Average Annual Return [Line Items] |
|
|
|
|
| Line Graph and Table Measure Name |
with Maximum Sales Charge - 5.75%
|
|
|
|
| Average Annual Return, Percent |
17.07%
|
|
7.39%
|
15.81%
|
| C000001370 [Member] |
|
|
|
|
| Average Annual Return [Line Items] |
|
|
|
|
| Line Graph and Table Measure Name |
with Maximum Deferred Sales Charge - 1.00%
|
|
|
|
| Average Annual Return, Percent |
22.21%
|
[3] |
7.78%
|
15.57%
|
| C000001371 [Member] |
|
|
|
|
| Average Annual Return [Line Items] |
|
|
|
|
| Line Graph and Table Measure Name |
Class I
|
|
|
|
| Average Annual Return, Percent |
24.50%
|
|
8.90%
|
16.76%
|
| C000174007 [Member] |
|
|
|
|
| Average Annual Return [Line Items] |
|
|
|
|
| Line Graph and Table Measure Name |
Class Y
|
|
|
|
| Average Annual Return, Percent |
24.60%
|
|
8.97%
|
16.84%
|
| Without Sales Load [Member] | C000001288 [Member] |
|
|
|
|
| Average Annual Return [Line Items] |
|
|
|
|
| Line Graph and Table Measure Name |
without Sales Charge
|
|
|
|
| Average Annual Return, Percent |
7.13%
|
|
10.91%
|
8.63%
|
| Without Sales Load [Member] | C000064720 [Member] |
|
|
|
|
| Average Annual Return [Line Items] |
|
|
|
|
| Line Graph and Table Measure Name |
without Deferred Sales Charge
|
|
|
|
| Average Annual Return, Percent |
6.23%
|
|
10.01%
|
7.78%
|
| Without Sales Load [Member] | C000001358 [Member] |
|
|
|
|
| Average Annual Return [Line Items] |
|
|
|
|
| Line Graph and Table Measure Name |
without Sales Charge
|
|
|
|
| Average Annual Return, Percent |
12.09%
|
|
18.60%
|
12.41%
|
| Without Sales Load [Member] | C000001360 [Member] |
|
|
|
|
| Average Annual Return [Line Items] |
|
|
|
|
| Line Graph and Table Measure Name |
without Deferred Sales Charge
|
|
|
|
| Average Annual Return, Percent |
11.24%
|
|
17.71%
|
11.57%
|
| Without Sales Load [Member] | C000001368 [Member] |
|
|
|
|
| Average Annual Return [Line Items] |
|
|
|
|
| Line Graph and Table Measure Name |
without Sales Charge
|
|
|
|
| Average Annual Return, Percent |
24.21%
|
|
8.66%
|
16.50%
|
| Without Sales Load [Member] | C000001370 [Member] |
|
|
|
|
| Average Annual Return [Line Items] |
|
|
|
|
| Line Graph and Table Measure Name |
without Deferred Sales Charge
|
|
|
|
| Average Annual Return, Percent |
23.21%
|
|
7.78%
|
15.57%
|
| Russell 3000 Index [Member] |
|
|
|
|
| Average Annual Return [Line Items] |
|
|
|
|
| Line Graph and Table Measure Name |
Russell 3000® Index (broad-based index)
|
|
|
|
| Average Annual Return, Percent |
15.84%
|
|
14.11%
|
13.98%
|
| Russell 2000 Index [Member] |
|
|
|
|
| Average Annual Return [Line Items] |
|
|
|
|
| Line Graph and Table Measure Name |
Russell 2000® Index
|
|
|
|
| Average Annual Return, Percent |
8.17%
|
|
10.13%
|
8.88%
|
| Russell 1000 Index [Member] |
|
|
|
|
| Average Annual Return [Line Items] |
|
|
|
|
| Line Graph and Table Measure Name |
Russell 1000® Index (broad-based index)
|
|
|
|
| Average Annual Return, Percent |
16.24%
|
|
14.34%
|
14.33%
|
| NYSE Technology Index [Member] |
|
|
|
|
| Average Annual Return [Line Items] |
|
|
|
|
| Line Graph and Table Measure Name |
NYSE® Technology Index
|
|
|
|
| Average Annual Return, Percent |
29.07%
|
|
15.13%
|
21.30%
|
| Standard & Poor's 500 Index [Member] |
|
|
|
|
| Average Annual Return [Line Items] |
|
|
|
|
| Line Graph and Table Measure Name |
S&P 500® Index (broad-based index)
|
|
|
|
| Average Annual Return, Percent |
15.87%
|
|
14.74%
|
14.59%
|
| Russell Midcap Value Index [Member] |
|
|
|
|
| Average Annual Return [Line Items] |
|
|
|
|
| Line Graph and Table Measure Name |
Russell Midcap® Value Index
|
|
|
|
| Average Annual Return, Percent |
8.24%
|
|
12.86%
|
9.45%
|
| Russell 1000 Value Index [Member] |
|
|
|
|
| Average Annual Return [Line Items] |
|
|
|
|
| Line Graph and Table Measure Name |
Russell 1000® Value Index
|
|
|
|
| Average Annual Return, Percent |
9.33%
|
|
12.97%
|
10.22%
|
|
|
| X |
- ReferencesReference 1: http://www.xbrl.org/2003/role/presentationRef
-Publisher SEC
-Name Form N-1A
-Section 4
-Subsection b
-Paragraph 2
-Subparagraph iii
| Name: |
oef_AverageAnnualReturnLineItems |
| Namespace Prefix: |
oef_ |
| Data Type: |
xbrli:stringItemType |
| Balance Type: |
na |
| Period Type: |
duration |
|
| X |
- ReferencesReference 1: http://www.xbrl.org/2003/role/presentationRef
-Publisher SEC
-Name Form N-1A
-Section 27A
-Subsection d
-Paragraph 2
-Subparagraph instruction
-Clause 7
| Name: |
oef_AvgAnnlRtrPct |
| Namespace Prefix: |
oef_ |
| Data Type: |
dtr-types:percentItemType |
| Balance Type: |
na |
| Period Type: |
duration |
|
| X |
- ReferencesReference 1: http://www.xbrl.org/2003/role/presentationRef
-Publisher SEC
-Name Form N-1A
-Section 27A
-Subsection d
-Paragraph 2
-Subparagraph i
| Name: |
oef_LineGraphAndTableMeasureName |
| Namespace Prefix: |
oef_ |
| Data Type: |
xbrli:stringItemType |
| Balance Type: |
na |
| Period Type: |
duration |
|
| X |
- Details
| Name: |
oef_ClassAxis=bmafi_C000001288Member |
| Namespace Prefix: |
|
| Data Type: |
na |
| Balance Type: |
|
| Period Type: |
|
|
| X |
- Details
| Name: |
oef_ClassAxis=bmafi_C000064720Member |
| Namespace Prefix: |
|
| Data Type: |
na |
| Balance Type: |
|
| Period Type: |
|
|
| X |
- Details
| Name: |
oef_ClassAxis=bmafi_C000064721Member |
| Namespace Prefix: |
|
| Data Type: |
na |
| Balance Type: |
|
| Period Type: |
|
|
| X |
- Details
| Name: |
oef_ClassAxis=bmafi_C000130426Member |
| Namespace Prefix: |
|
| Data Type: |
na |
| Balance Type: |
|
| Period Type: |
|
|
| X |
- Details
| Name: |
oef_ClassAxis=bmafi_C000174005Member |
| Namespace Prefix: |
|
| Data Type: |
na |
| Balance Type: |
|
| Period Type: |
|
|
| X |
- Details
| Name: |
oef_ClassAxis=bmafi_C000001289Member |
| Namespace Prefix: |
|
| Data Type: |
na |
| Balance Type: |
|
| Period Type: |
|
|
| X |
- Details
| Name: |
oef_ClassAxis=bmafi_C000174006Member |
| Namespace Prefix: |
|
| Data Type: |
na |
| Balance Type: |
|
| Period Type: |
|
|
| X |
- Details
| Name: |
oef_ClassAxis=bmafi_C000001358Member |
| Namespace Prefix: |
|
| Data Type: |
na |
| Balance Type: |
|
| Period Type: |
|
|
| X |
- Details
| Name: |
oef_ClassAxis=bmafi_C000001360Member |
| Namespace Prefix: |
|
| Data Type: |
na |
| Balance Type: |
|
| Period Type: |
|
|
| X |
- Details
| Name: |
oef_ClassAxis=bmafi_C000001361Member |
| Namespace Prefix: |
|
| Data Type: |
na |
| Balance Type: |
|
| Period Type: |
|
|
| X |
- Details
| Name: |
oef_ClassAxis=bmafi_C000130427Member |
| Namespace Prefix: |
|
| Data Type: |
na |
| Balance Type: |
|
| Period Type: |
|
|
| X |
- Details
| Name: |
oef_ClassAxis=bmafi_C000001368Member |
| Namespace Prefix: |
|
| Data Type: |
na |
| Balance Type: |
|
| Period Type: |
|
|
| X |
- Details
| Name: |
oef_ClassAxis=bmafi_C000001370Member |
| Namespace Prefix: |
|
| Data Type: |
na |
| Balance Type: |
|
| Period Type: |
|
|
| X |
- Details
| Name: |
oef_ClassAxis=bmafi_C000001371Member |
| Namespace Prefix: |
|
| Data Type: |
na |
| Balance Type: |
|
| Period Type: |
|
|
| X |
- Details
| Name: |
oef_ClassAxis=bmafi_C000174007Member |
| Namespace Prefix: |
|
| Data Type: |
na |
| Balance Type: |
|
| Period Type: |
|
|
| X |
- Details
| Name: |
oef_SalesLoadAxis=oef_WithoutSalesLoadMember |
| Namespace Prefix: |
|
| Data Type: |
na |
| Balance Type: |
|
| Period Type: |
|
|
| X |
- Details
| Name: |
oef_BroadBasedIndexAxis=bmafi_Russell3000IndexMember |
| Namespace Prefix: |
|
| Data Type: |
na |
| Balance Type: |
|
| Period Type: |
|
|
| X |
- Details
| Name: |
oef_BroadBasedIndexAxis=bmafi_Russell2000IndexMember |
| Namespace Prefix: |
|
| Data Type: |
na |
| Balance Type: |
|
| Period Type: |
|
|
| X |
- Details
| Name: |
oef_BroadBasedIndexAxis=bmafi_Russell1000IndexMember |
| Namespace Prefix: |
|
| Data Type: |
na |
| Balance Type: |
|
| Period Type: |
|
|
| X |
- Details
| Name: |
oef_BroadBasedIndexAxis=bmafi_NYSETechnologyIndexMember |
| Namespace Prefix: |
|
| Data Type: |
na |
| Balance Type: |
|
| Period Type: |
|
|
| X |
- Details
| Name: |
oef_BroadBasedIndexAxis=us-gaap_StandardPoors500IndexMember |
| Namespace Prefix: |
|
| Data Type: |
na |
| Balance Type: |
|
| Period Type: |
|
|
| X |
- Details
| Name: |
oef_AdditionalIndexAxis=bmafi_RussellMidcapValueIndexMember |
| Namespace Prefix: |
|
| Data Type: |
na |
| Balance Type: |
|
| Period Type: |
|
|
| X |
- Details
| Name: |
oef_AdditionalIndexAxis=bmafi_Russell1000ValueIndexMember |
| Namespace Prefix: |
|
| Data Type: |
na |
| Balance Type: |
|
| Period Type: |
|
|
v3.25.3
| X |
- ReferencesReference 1: http://www.xbrl.org/2003/role/presentationRef
-Publisher SEC
-Name Form N-1A
-Section 27A
-Subsection f
| Name: |
oef_HoldingsLineItems |
| Namespace Prefix: |
oef_ |
| Data Type: |
xbrli:stringItemType |
| Balance Type: |
na |
| Period Type: |
duration |
|
| X |
- ReferencesReference 1: http://www.xbrl.org/2003/role/presentationRef
-Publisher SEC
-Name Form N-1A
-Section 27A
-Subsection f
| Name: |
oef_PctOfNav |
| Namespace Prefix: |
oef_ |
| Data Type: |
dtr-types:percentItemType |
| Balance Type: |
na |
| Period Type: |
instant |
|
| X |
- Details
| Name: |
oef_ClassAxis=bmafi_C000001288Member |
| Namespace Prefix: |
|
| Data Type: |
na |
| Balance Type: |
|
| Period Type: |
|
|
| X |
- Details
| Name: |
oef_LargestHoldingAxis=bmafi_FirstHorizonCorpMember |
| Namespace Prefix: |
|
| Data Type: |
na |
| Balance Type: |
|
| Period Type: |
|
|
| X |
- Details
| Name: |
oef_LargestHoldingAxis=bmafi_AssurantIncMember |
| Namespace Prefix: |
|
| Data Type: |
na |
| Balance Type: |
|
| Period Type: |
|
|
| X |
- Details
| Name: |
oef_LargestHoldingAxis=bmafi_NewmontCorpMember |
| Namespace Prefix: |
|
| Data Type: |
na |
| Balance Type: |
|
| Period Type: |
|
|
| X |
- Details
| Name: |
oef_LargestHoldingAxis=bmafi_DominionEnergyIncMember |
| Namespace Prefix: |
|
| Data Type: |
na |
| Balance Type: |
|
| Period Type: |
|
|
| X |
- Details
| Name: |
oef_LargestHoldingAxis=bmafi_RocketCosIncClAMember |
| Namespace Prefix: |
|
| Data Type: |
na |
| Balance Type: |
|
| Period Type: |
|
|
| X |
- Details
| Name: |
oef_LargestHoldingAxis=bmafi_ExelonCorpMember |
| Namespace Prefix: |
|
| Data Type: |
na |
| Balance Type: |
|
| Period Type: |
|
|
| X |
- Details
| Name: |
oef_LargestHoldingAxis=bmafi_BlockIncMember |
| Namespace Prefix: |
|
| Data Type: |
na |
| Balance Type: |
|
| Period Type: |
|
|
| X |
- Details
| Name: |
oef_LargestHoldingAxis=bmafi_QuantaServicesIncMember |
| Namespace Prefix: |
|
| Data Type: |
na |
| Balance Type: |
|
| Period Type: |
|
|
| X |
- Details
| Name: |
oef_LargestHoldingAxis=bmafi_DiamondbackEnergyIncMember |
| Namespace Prefix: |
|
| Data Type: |
na |
| Balance Type: |
|
| Period Type: |
|
|
| X |
- Details
| Name: |
oef_LargestHoldingAxis=bmafi_ExpediaGroupIncMember |
| Namespace Prefix: |
|
| Data Type: |
na |
| Balance Type: |
|
| Period Type: |
|
|
| X |
- Details
| Name: |
oef_IndustrySectorAxis=us-gaap_EnergySectorMember |
| Namespace Prefix: |
|
| Data Type: |
na |
| Balance Type: |
|
| Period Type: |
|
|
| X |
- Details
| Name: |
oef_IndustrySectorAxis=us-gaap_FinancialServicesSectorMember |
| Namespace Prefix: |
|
| Data Type: |
na |
| Balance Type: |
|
| Period Type: |
|
|
| X |
- Details
| Name: |
oef_IndustrySectorAxis=us-gaap_HealthcareSectorMember |
| Namespace Prefix: |
|
| Data Type: |
na |
| Balance Type: |
|
| Period Type: |
|
|
| X |
- Details
| Name: |
oef_IndustrySectorAxis=us-gaap_RealEstateSectorMember |
| Namespace Prefix: |
|
| Data Type: |
na |
| Balance Type: |
|
| Period Type: |
|
|
| X |
- Details
| Name: |
oef_IndustrySectorAxis=oef_CommunicationsSectorMember |
| Namespace Prefix: |
|
| Data Type: |
na |
| Balance Type: |
|
| Period Type: |
|
|
| X |
- Details
| Name: |
oef_IndustrySectorAxis=oef_ConsumerDiscretionarySectorMember |
| Namespace Prefix: |
|
| Data Type: |
na |
| Balance Type: |
|
| Period Type: |
|
|
| X |
- Details
| Name: |
oef_IndustrySectorAxis=oef_ConsumerStaplesSectorMember |
| Namespace Prefix: |
|
| Data Type: |
na |
| Balance Type: |
|
| Period Type: |
|
|
| X |
- Details
| Name: |
oef_IndustrySectorAxis=oef_IndustrialSectorMember |
| Namespace Prefix: |
|
| Data Type: |
na |
| Balance Type: |
|
| Period Type: |
|
|
| X |
- Details
| Name: |
oef_IndustrySectorAxis=oef_UtilitiesSectorMember |
| Namespace Prefix: |
|
| Data Type: |
na |
| Balance Type: |
|
| Period Type: |
|
|
| X |
- Details
| Name: |
oef_IndustrySectorAxis=oef_MaterialsSectorMember |
| Namespace Prefix: |
|
| Data Type: |
na |
| Balance Type: |
|
| Period Type: |
|
|
| X |
- Details
| Name: |
us-gaap_InvestmentTypeAxis=bmafi_InvestmentCompaniesMember |
| Namespace Prefix: |
|
| Data Type: |
na |
| Balance Type: |
|
| Period Type: |
|
|
| X |
- Details
| Name: |
us-gaap_InvestmentTypeAxis=bmafi_NetOtherAssetsAndLiabilitiesMember |
| Namespace Prefix: |
|
| Data Type: |
na |
| Balance Type: |
|
| Period Type: |
|
|
| X |
- Details
| Name: |
oef_ClassAxis=bmafi_C000064720Member |
| Namespace Prefix: |
|
| Data Type: |
na |
| Balance Type: |
|
| Period Type: |
|
|
| X |
- Details
| Name: |
oef_ClassAxis=bmafi_C000064721Member |
| Namespace Prefix: |
|
| Data Type: |
na |
| Balance Type: |
|
| Period Type: |
|
|
| X |
- Details
| Name: |
oef_ClassAxis=bmafi_C000130426Member |
| Namespace Prefix: |
|
| Data Type: |
na |
| Balance Type: |
|
| Period Type: |
|
|
| X |
- Details
| Name: |
oef_ClassAxis=bmafi_C000174005Member |
| Namespace Prefix: |
|
| Data Type: |
na |
| Balance Type: |
|
| Period Type: |
|
|
| X |
- Details
| Name: |
oef_LargestHoldingAxis=bmafi_InsmedIncMember |
| Namespace Prefix: |
|
| Data Type: |
na |
| Balance Type: |
|
| Period Type: |
|
|
| X |
- Details
| Name: |
oef_LargestHoldingAxis=bmafi_GeniusSportsLtdMember |
| Namespace Prefix: |
|
| Data Type: |
na |
| Balance Type: |
|
| Period Type: |
|
|
| X |
- Details
| Name: |
oef_LargestHoldingAxis=bmafi_MagniteIncMember |
| Namespace Prefix: |
|
| Data Type: |
na |
| Balance Type: |
|
| Period Type: |
|
|
| X |
- Details
| Name: |
oef_LargestHoldingAxis=bmafi_SkyWestIncMember |
| Namespace Prefix: |
|
| Data Type: |
na |
| Balance Type: |
|
| Period Type: |
|
|
| X |
- Details
| Name: |
oef_LargestHoldingAxis=bmafi_TexasCapitalBancsharesIncMember |
| Namespace Prefix: |
|
| Data Type: |
na |
| Balance Type: |
|
| Period Type: |
|
|
| X |
- Details
| Name: |
oef_LargestHoldingAxis=bmafi_AlamosGoldIncClAMember |
| Namespace Prefix: |
|
| Data Type: |
na |
| Balance Type: |
|
| Period Type: |
|
|
| X |
- Details
| Name: |
oef_LargestHoldingAxis=bmafi_FirstBuseyCorpMember |
| Namespace Prefix: |
|
| Data Type: |
na |
| Balance Type: |
|
| Period Type: |
|
|
| X |
- Details
| Name: |
oef_LargestHoldingAxis=bmafi_ClearwayEnergyIncClCMember |
| Namespace Prefix: |
|
| Data Type: |
na |
| Balance Type: |
|
| Period Type: |
|
|
| X |
- Details
| Name: |
oef_LargestHoldingAxis=bmafi_ColumbiaBankingSystemIncMember |
| Namespace Prefix: |
|
| Data Type: |
na |
| Balance Type: |
|
| Period Type: |
|
|
| X |
- Details
| Name: |
oef_ClassAxis=bmafi_C000001289Member |
| Namespace Prefix: |
|
| Data Type: |
na |
| Balance Type: |
|
| Period Type: |
|
|
| X |
- Details
| Name: |
oef_ClassAxis=bmafi_C000174006Member |
| Namespace Prefix: |
|
| Data Type: |
na |
| Balance Type: |
|
| Period Type: |
|
|
| X |
- Details
| Name: |
oef_ClassAxis=bmafi_C000001358Member |
| Namespace Prefix: |
|
| Data Type: |
na |
| Balance Type: |
|
| Period Type: |
|
|
| X |
- Details
| Name: |
oef_LargestHoldingAxis=bmafi_JohnsonAndJohnsonMember |
| Namespace Prefix: |
|
| Data Type: |
na |
| Balance Type: |
|
| Period Type: |
|
|
| X |
- Details
| Name: |
oef_LargestHoldingAxis=bmafi_BerkshireHathawayIncCIBMember |
| Namespace Prefix: |
|
| Data Type: |
na |
| Balance Type: |
|
| Period Type: |
|
|
| X |
- Details
| Name: |
oef_LargestHoldingAxis=bmafi_JPMorganChaseAndCoMember |
| Namespace Prefix: |
|
| Data Type: |
na |
| Balance Type: |
|
| Period Type: |
|
|
| X |
- Details
| Name: |
oef_LargestHoldingAxis=bmafi_CiscoSystemsIncMember |
| Namespace Prefix: |
|
| Data Type: |
na |
| Balance Type: |
|
| Period Type: |
|
|
| X |
- Details
| Name: |
oef_LargestHoldingAxis=bmafi_MedtronicPLCMember |
| Namespace Prefix: |
|
| Data Type: |
na |
| Balance Type: |
|
| Period Type: |
|
|
| X |
- Details
| Name: |
oef_LargestHoldingAxis=bmafi_CRHPLCMember |
| Namespace Prefix: |
|
| Data Type: |
na |
| Balance Type: |
|
| Period Type: |
|
|
| X |
- Details
| Name: |
oef_LargestHoldingAxis=bmafi_ATAndTIncMember |
| Namespace Prefix: |
|
| Data Type: |
na |
| Balance Type: |
|
| Period Type: |
|
|
| X |
- Details
| Name: |
oef_LargestHoldingAxis=bmafi_AmazonComIncMember |
| Namespace Prefix: |
|
| Data Type: |
na |
| Balance Type: |
|
| Period Type: |
|
|
| X |
- Details
| Name: |
oef_LargestHoldingAxis=bmafi_CapitalOneFinancialCorpMember |
| Namespace Prefix: |
|
| Data Type: |
na |
| Balance Type: |
|
| Period Type: |
|
|
| X |
- Details
| Name: |
oef_ClassAxis=bmafi_C000001360Member |
| Namespace Prefix: |
|
| Data Type: |
na |
| Balance Type: |
|
| Period Type: |
|
|
| X |
- Details
| Name: |
oef_ClassAxis=bmafi_C000001361Member |
| Namespace Prefix: |
|
| Data Type: |
na |
| Balance Type: |
|
| Period Type: |
|
|
| X |
- Details
| Name: |
oef_ClassAxis=bmafi_C000130427Member |
| Namespace Prefix: |
|
| Data Type: |
na |
| Balance Type: |
|
| Period Type: |
|
|
| X |
- Details
| Name: |
oef_ClassAxis=bmafi_C000001368Member |
| Namespace Prefix: |
|
| Data Type: |
na |
| Balance Type: |
|
| Period Type: |
|
|
| X |
- Details
| Name: |
oef_LargestHoldingAxis=bmafi_NVIDIACorpMember |
| Namespace Prefix: |
|
| Data Type: |
na |
| Balance Type: |
|
| Period Type: |
|
|
| X |
- Details
| Name: |
oef_LargestHoldingAxis=bmafi_TaiwanSemiconductorManufacturingCoLtdADRMember |
| Namespace Prefix: |
|
| Data Type: |
na |
| Balance Type: |
|
| Period Type: |
|
|
| X |
- Details
| Name: |
oef_LargestHoldingAxis=bmafi_MicrosoftCorpMember |
| Namespace Prefix: |
|
| Data Type: |
na |
| Balance Type: |
|
| Period Type: |
|
|
| X |
- Details
| Name: |
oef_LargestHoldingAxis=bmafi_OracleCorpMember |
| Namespace Prefix: |
|
| Data Type: |
na |
| Balance Type: |
|
| Period Type: |
|
|
| X |
- Details
| Name: |
oef_LargestHoldingAxis=bmafi_NetflixIncMember |
| Namespace Prefix: |
|
| Data Type: |
na |
| Balance Type: |
|
| Period Type: |
|
|
| X |
- Details
| Name: |
oef_LargestHoldingAxis=bmafi_MicronTechnologyIncMember |
| Namespace Prefix: |
|
| Data Type: |
na |
| Balance Type: |
|
| Period Type: |
|
|
| X |
- Details
| Name: |
oef_LargestHoldingAxis=bmafi_IntuitIncMember |
| Namespace Prefix: |
|
| Data Type: |
na |
| Balance Type: |
|
| Period Type: |
|
|
| X |
- Details
| Name: |
oef_LargestHoldingAxis=bmafi_ShopifyIncClAMember |
| Namespace Prefix: |
|
| Data Type: |
na |
| Balance Type: |
|
| Period Type: |
|
|
| X |
- Details
| Name: |
oef_ClassAxis=bmafi_C000001370Member |
| Namespace Prefix: |
|
| Data Type: |
na |
| Balance Type: |
|
| Period Type: |
|
|
| X |
- Details
| Name: |
oef_ClassAxis=bmafi_C000001371Member |
| Namespace Prefix: |
|
| Data Type: |
na |
| Balance Type: |
|
| Period Type: |
|
|
| X |
- Details
| Name: |
oef_ClassAxis=bmafi_C000174007Member |
| Namespace Prefix: |
|
| Data Type: |
na |
| Balance Type: |
|
| Period Type: |
|
|
{
"version": "2.2",
"instance": {
"output.htm": {
"nsprefix": "bmafi",
"nsuri": "http://www.bny.com/20251016",
"dts": {
"schema": {
"local": [
"bmafi-20251016.xsd"
],
"remote": [
"http://www.xbrl.org/2003/xbrl-instance-2003-12-31.xsd",
"http://www.xbrl.org/2003/xbrl-linkbase-2003-12-31.xsd",
"http://www.xbrl.org/2003/xl-2003-12-31.xsd",
"http://www.xbrl.org/2003/xlink-2003-12-31.xsd",
"http://www.xbrl.org/2005/xbrldt-2005.xsd",
"http://www.xbrl.org/2006/ref-2006-02-27.xsd",
"http://www.xbrl.org/lrr/arcrole/deprecated-2009-12-16.xsd",
"http://www.xbrl.org/lrr/role/negated-2009-12-16.xsd",
"http://www.xbrl.org/lrr/role/reference-2009-12-16.xsd",
"https://www.xbrl.org/2020/extensible-enumerations-2.0.xsd",
"https://www.xbrl.org/dtr/type/2020-01-21/types.xsd",
"https://www.xbrl.org/dtr/type/2024-01-31/types.xsd",
"https://xbrl.fasb.org/srt/2025/elts/srt-2025.xsd",
"https://xbrl.fasb.org/srt/2025/elts/srt-roles-2025.xsd",
"https://xbrl.fasb.org/srt/2025/elts/srt-types-2025.xsd",
"https://xbrl.fasb.org/us-gaap/2025/elts/us-gaap-2025.xsd",
"https://xbrl.fasb.org/us-gaap/2025/elts/us-roles-2025.xsd",
"https://xbrl.fasb.org/us-gaap/2025/elts/us-types-2025.xsd",
"https://xbrl.sec.gov/country/2025/country-2025.xsd",
"https://xbrl.sec.gov/country/2025/country-2025_def.xsd",
"https://xbrl.sec.gov/dei/2025/dei-2025.xsd",
"https://xbrl.sec.gov/oef/2025/oef-2025.xsd",
"https://xbrl.sec.gov/oef/2025/oef-2025_lab.xsd",
"https://xbrl.sec.gov/oef/2025/oef-sr-2025.xsd",
"https://xbrl.sec.gov/stpr/2025/stpr-2025.xsd"
]
},
"inline": {
"local": [
"output.htm"
]
}
},
"keyStandard": 41,
"keyCustom": 0,
"axisStandard": 7,
"axisCustom": 0,
"memberStandard": 13,
"memberCustom": 60,
"hidden": {
"total": 562,
"http://xbrl.sec.gov/oef/2025": 559,
"http://xbrl.sec.gov/dei/2025": 3
},
"contextCount": 637,
"entityCount": 1,
"segmentCount": 73,
"elementCount": 195,
"unitCount": 6,
"baseTaxonomies": {
"http://xbrl.sec.gov/oef/2025": 1110,
"http://fasb.org/us-gaap/2025": 30,
"http://xbrl.sec.gov/dei/2025": 21
},
"report": {
"R1": {
"role": "http://xbrl.sec.gov/oef/role/NcsrCover",
"longName": "030000 - Disclosure - Form N-CSR Cover",
"shortName": "Form N-CSR Cover",
"isDefault": "true",
"groupType": "disclosure",
"subGroupType": "",
"menuCat": "Cover",
"order": "1",
"firstAnchor": {
"contextRef": "DefaultContext",
"name": "dei:DocumentType",
"unitRef": null,
"xsiNil": "false",
"lang": "en-US",
"decimals": null,
"ancestors": [
"div",
"div",
"div",
"div",
"div",
"div",
"div",
"body",
"html"
],
"reportCount": 1,
"baseRef": "output.htm",
"first": true
},
"uniqueAnchor": null
},
"R2": {
"role": "http://xbrl.sec.gov/oef/role/ShareholderReport",
"longName": "030001 - Disclosure - Shareholder Report",
"shortName": "Shareholder Report",
"isDefault": "false",
"groupType": "disclosure",
"subGroupType": "",
"menuCat": "Notes",
"order": "2",
"firstAnchor": {
"contextRef": "DefaultContext",
"name": "dei:DocumentType",
"unitRef": null,
"xsiNil": "false",
"lang": "en-US",
"decimals": null,
"ancestors": [
"div",
"div",
"div",
"div",
"div",
"div",
"div",
"body",
"html"
],
"reportCount": 1,
"baseRef": "output.htm",
"first": true
},
"uniqueAnchor": {
"contextRef": "FY2025_C000001288Member",
"name": "oef:FundName",
"unitRef": null,
"xsiNil": "false",
"lang": "en-US",
"decimals": null,
"ancestors": [
"div",
"div",
"div",
"div",
"div",
"div",
"div",
"div",
"div",
"div",
"body",
"html"
],
"reportCount": 1,
"baseRef": "output.htm",
"unique": true
}
},
"R3": {
"role": "http://xbrl.sec.gov/oef/role/ShareholderReportLineGraphDetails",
"longName": "040010 - Disclosure - Shareholder Report, Line Graph (Details)",
"shortName": "Shareholder Report, Line Graph (Details)",
"isDefault": "false",
"groupType": "disclosure",
"subGroupType": "details",
"menuCat": "Details",
"order": "3",
"firstAnchor": {
"contextRef": "FY2025_C000001288Member",
"name": "oef:LineGraphAndTableMeasureName",
"unitRef": null,
"xsiNil": "false",
"lang": "en-US",
"decimals": null,
"ancestors": [
"td",
"tr",
"table",
"ix:continuation",
"div",
"div",
"div",
"div",
"div",
"div",
"div",
"body",
"html"
],
"reportCount": 1,
"baseRef": "output.htm",
"first": true
},
"uniqueAnchor": null
},
"R4": {
"role": "http://xbrl.sec.gov/oef/role/ShareholderReportAverageAnnualReturnDetails",
"longName": "040015 - Disclosure - Shareholder Report, Average Annual Return (Details)",
"shortName": "Shareholder Report, Average Annual Return (Details)",
"isDefault": "false",
"groupType": "disclosure",
"subGroupType": "details",
"menuCat": "Details",
"order": "4",
"firstAnchor": {
"contextRef": "FY2025_C000001288Member",
"name": "oef:LineGraphAndTableMeasureName",
"unitRef": null,
"xsiNil": "false",
"lang": "en-US",
"decimals": null,
"ancestors": [
"td",
"tr",
"table",
"ix:continuation",
"div",
"div",
"div",
"div",
"div",
"div",
"div",
"body",
"html"
],
"reportCount": 1,
"baseRef": "output.htm",
"first": true
},
"uniqueAnchor": {
"contextRef": "FY2025_C000001288Member",
"name": "oef:AvgAnnlRtrPct",
"unitRef": "pure",
"xsiNil": "false",
"lang": null,
"decimals": "4",
"ancestors": [
"td",
"tr",
"table",
"ix:continuation",
"div",
"div",
"div",
"div",
"div",
"div",
"div",
"body",
"html"
],
"reportCount": 1,
"baseRef": "output.htm",
"unique": true
}
},
"R5": {
"role": "http://xbrl.sec.gov/oef/role/ShareholderReportHoldingsDetails",
"longName": "040020 - Disclosure - Shareholder Report, Holdings (Details)",
"shortName": "Shareholder Report, Holdings (Details)",
"isDefault": "false",
"groupType": "disclosure",
"subGroupType": "details",
"menuCat": "Details",
"order": "5",
"firstAnchor": null,
"uniqueAnchor": null
}
},
"tag": {
"bmafi_ATAndTIncMember": {
"xbrltype": "domainItemType",
"nsuri": "http://www.bny.com/20251016",
"localname": "ATAndTIncMember",
"presentation": [
"http://xbrl.sec.gov/oef/role/ShareholderReportHoldingsDetails"
],
"lang": {
"en-us": {
"role": {
"label": "AT And T Inc [Member]"
}
}
},
"auth_ref": []
},
"oef_AccmVal": {
"xbrltype": "monetaryItemType",
"nsuri": "http://xbrl.sec.gov/oef/2025",
"localname": "AccmVal",
"presentation": [
"http://xbrl.sec.gov/oef/role/ShareholderReportLineGraphDetails"
],
"lang": {
"en-us": {
"role": {
"label": "Accumulated Value"
}
}
},
"auth_ref": [
"r39"
]
},
"oef_AccountValueLineItems": {
"xbrltype": "stringItemType",
"nsuri": "http://xbrl.sec.gov/oef/2025",
"localname": "AccountValueLineItems",
"presentation": [
"http://xbrl.sec.gov/oef/role/ShareholderReportLineGraphDetails"
],
"lang": {
"en-us": {
"role": {
"label": "Account Value [Line Items]"
}
}
},
"auth_ref": [
"r38"
]
},
"oef_AccountValueTable": {
"xbrltype": "stringItemType",
"nsuri": "http://xbrl.sec.gov/oef/2025",
"localname": "AccountValueTable",
"presentation": [
"http://xbrl.sec.gov/oef/role/ShareholderReportLineGraphDetails"
],
"lang": {
"en-us": {
"role": {
"label": "Account Value [Table]"
}
}
},
"auth_ref": [
"r38"
]
},
"oef_AccountValueTableAbstract": {
"xbrltype": "stringItemType",
"nsuri": "http://xbrl.sec.gov/oef/2025",
"localname": "AccountValueTableAbstract",
"lang": {
"en-us": {
"role": {
"label": "Account Value Table [Abstract]"
}
}
},
"auth_ref": [
"r38"
]
},
"oef_AccountantChngDate": {
"xbrltype": "dateItemType",
"nsuri": "http://xbrl.sec.gov/oef/2025",
"localname": "AccountantChngDate",
"presentation": [
"http://xbrl.sec.gov/oef/role/ShareholderReport"
],
"lang": {
"en-us": {
"role": {
"label": "Accountant Change Date"
}
}
},
"auth_ref": [
"r62"
]
},
"oef_AccountantChngDisagreementsTextBlock": {
"xbrltype": "textBlockItemType",
"nsuri": "http://xbrl.sec.gov/oef/2025",
"localname": "AccountantChngDisagreementsTextBlock",
"presentation": [
"http://xbrl.sec.gov/oef/role/ShareholderReport"
],
"lang": {
"en-us": {
"role": {
"label": "Accountant Change Disagreements [Text Block]"
}
}
},
"auth_ref": [
"r63"
]
},
"oef_AccountantChngStatementTextBlock": {
"xbrltype": "textBlockItemType",
"nsuri": "http://xbrl.sec.gov/oef/2025",
"localname": "AccountantChngStatementTextBlock",
"presentation": [
"http://xbrl.sec.gov/oef/role/ShareholderReport"
],
"lang": {
"en-us": {
"role": {
"label": "Accountant Change Statement [Text Block]"
}
}
},
"auth_ref": [
"r62"
]
},
"oef_AdditionalIndexAxis": {
"xbrltype": "stringItemType",
"nsuri": "http://xbrl.sec.gov/oef/2025",
"localname": "AdditionalIndexAxis",
"presentation": [
"http://xbrl.sec.gov/oef/role/ShareholderReportAverageAnnualReturnDetails",
"http://xbrl.sec.gov/oef/role/ShareholderReportLineGraphDetails"
],
"lang": {
"en-us": {
"role": {
"label": "Additional Index [Axis]"
}
}
},
"auth_ref": [
"r38"
]
},
"oef_AdditionalIndexDomain": {
"xbrltype": "domainItemType",
"nsuri": "http://xbrl.sec.gov/oef/2025",
"localname": "AdditionalIndexDomain",
"presentation": [
"http://xbrl.sec.gov/oef/role/ShareholderReportAverageAnnualReturnDetails",
"http://xbrl.sec.gov/oef/role/ShareholderReportLineGraphDetails"
],
"lang": {
"en-us": {
"role": {
"label": "Additional Index [Domain]"
}
}
},
"auth_ref": [
"r38"
]
},
"oef_AddlFundStatisticsSignificanceOrLimitsTextBlock": {
"xbrltype": "textBlockItemType",
"nsuri": "http://xbrl.sec.gov/oef/2025",
"localname": "AddlFundStatisticsSignificanceOrLimitsTextBlock",
"presentation": [
"http://xbrl.sec.gov/oef/role/ShareholderReport"
],
"lang": {
"en-us": {
"role": {
"label": "Additional Fund Statistics Significance or Limits [Text Block]"
}
}
},
"auth_ref": [
"r52"
]
},
"oef_AddlFundStatisticsTextBlock": {
"xbrltype": "textBlockItemType",
"nsuri": "http://xbrl.sec.gov/oef/2025",
"localname": "AddlFundStatisticsTextBlock",
"presentation": [
"http://xbrl.sec.gov/oef/role/ShareholderReport"
],
"lang": {
"en-us": {
"role": {
"label": "Additional Fund Statistics [Text Block]"
}
}
},
"auth_ref": [
"r51"
]
},
"oef_AddlInfoEmail": {
"xbrltype": "stringItemType",
"nsuri": "http://xbrl.sec.gov/oef/2025",
"localname": "AddlInfoEmail",
"presentation": [
"http://xbrl.sec.gov/oef/role/ShareholderReport"
],
"lang": {
"en-us": {
"role": {
"label": "Additional Information Email"
}
}
},
"auth_ref": [
"r30"
]
},
"oef_AddlInfoPhoneNumber": {
"xbrltype": "stringItemType",
"nsuri": "http://xbrl.sec.gov/oef/2025",
"localname": "AddlInfoPhoneNumber",
"presentation": [
"http://xbrl.sec.gov/oef/role/ShareholderReport"
],
"lang": {
"en-us": {
"role": {
"label": "Additional Information Phone Number"
}
}
},
"auth_ref": [
"r30"
]
},
"oef_AddlInfoTextBlock": {
"xbrltype": "textBlockItemType",
"nsuri": "http://xbrl.sec.gov/oef/2025",
"localname": "AddlInfoTextBlock",
"presentation": [
"http://xbrl.sec.gov/oef/role/ShareholderReport"
],
"lang": {
"en-us": {
"role": {
"label": "Additional Information [Text Block]"
}
}
},
"auth_ref": [
"r28"
]
},
"oef_AddlInfoWebsite": {
"xbrltype": "stringItemType",
"nsuri": "http://xbrl.sec.gov/oef/2025",
"localname": "AddlInfoWebsite",
"presentation": [
"http://xbrl.sec.gov/oef/role/ShareholderReport"
],
"lang": {
"en-us": {
"role": {
"label": "Additional Information Website"
}
}
},
"auth_ref": [
"r30"
]
},
"oef_AdvisoryFeesPaidAmt": {
"xbrltype": "monetaryItemType",
"nsuri": "http://xbrl.sec.gov/oef/2025",
"localname": "AdvisoryFeesPaidAmt",
"presentation": [
"http://xbrl.sec.gov/oef/role/ShareholderReport"
],
"lang": {
"en-us": {
"role": {
"label": "Advisory Fees Paid, Amount"
}
}
},
"auth_ref": [
"r51"
]
},
"bmafi_AlamosGoldIncClAMember": {
"xbrltype": "domainItemType",
"nsuri": "http://www.bny.com/20251016",
"localname": "AlamosGoldIncClAMember",
"presentation": [
"http://xbrl.sec.gov/oef/role/ShareholderReportHoldingsDetails"
],
"lang": {
"en-us": {
"role": {
"label": "Alamos Gold Inc Cl A [Member]"
}
}
},
"auth_ref": []
},
"bmafi_AmazonComIncMember": {
"xbrltype": "domainItemType",
"nsuri": "http://www.bny.com/20251016",
"localname": "AmazonComIncMember",
"presentation": [
"http://xbrl.sec.gov/oef/role/ShareholderReportHoldingsDetails"
],
"lang": {
"en-us": {
"role": {
"label": "Amazon com Inc [Member]"
}
}
},
"auth_ref": []
},
"dei_AmendmentDescription": {
"xbrltype": "stringItemType",
"nsuri": "http://xbrl.sec.gov/dei/2025",
"localname": "AmendmentDescription",
"presentation": [
"http://xbrl.sec.gov/oef/role/NcsrCover",
"http://xbrl.sec.gov/oef/role/ShareholderReport"
],
"lang": {
"en-us": {
"role": {
"label": "Amendment Description",
"documentation": "Description of changes contained within amended document."
}
}
},
"auth_ref": []
},
"dei_AmendmentFlag": {
"xbrltype": "booleanItemType",
"nsuri": "http://xbrl.sec.gov/dei/2025",
"localname": "AmendmentFlag",
"presentation": [
"http://xbrl.sec.gov/oef/role/NcsrCover",
"http://xbrl.sec.gov/oef/role/ShareholderReport"
],
"lang": {
"en-us": {
"role": {
"label": "Amendment Flag",
"documentation": "Boolean flag that is true when the XBRL content amends previously-filed or accepted submission."
}
}
},
"auth_ref": []
},
"oef_AnnlOrSemiAnnlStatementTextBlock": {
"xbrltype": "textBlockItemType",
"nsuri": "http://xbrl.sec.gov/oef/2025",
"localname": "AnnlOrSemiAnnlStatementTextBlock",
"presentation": [
"http://xbrl.sec.gov/oef/role/ShareholderReport"
],
"lang": {
"en-us": {
"role": {
"label": "Annual or Semi-Annual Statement [Text Block]"
}
}
},
"auth_ref": [
"r27"
]
},
"us-gaap_AssetsNet": {
"xbrltype": "monetaryItemType",
"nsuri": "http://fasb.org/us-gaap/2025",
"localname": "AssetsNet",
"crdr": "debit",
"presentation": [
"http://xbrl.sec.gov/oef/role/ShareholderReport"
],
"lang": {
"en-us": {
"role": {
"label": "Net Assets",
"documentation": "Amount of net assets (liabilities)."
}
}
},
"auth_ref": [
"r0"
]
},
"bmafi_AssurantIncMember": {
"xbrltype": "domainItemType",
"nsuri": "http://www.bny.com/20251016",
"localname": "AssurantIncMember",
"presentation": [
"http://xbrl.sec.gov/oef/role/ShareholderReportHoldingsDetails"
],
"lang": {
"en-us": {
"role": {
"label": "Assurant Inc [Member]"
}
}
},
"auth_ref": []
},
"oef_AverageAnnualReturnAbstract": {
"xbrltype": "stringItemType",
"nsuri": "http://xbrl.sec.gov/oef/2025",
"localname": "AverageAnnualReturnAbstract",
"lang": {
"en-us": {
"role": {
"label": "Average Annual Return:"
}
}
},
"auth_ref": [
"r66"
]
},
"oef_AverageAnnualReturnLineItems": {
"xbrltype": "stringItemType",
"nsuri": "http://xbrl.sec.gov/oef/2025",
"localname": "AverageAnnualReturnLineItems",
"presentation": [
"http://xbrl.sec.gov/oef/role/ShareholderReportAverageAnnualReturnDetails"
],
"lang": {
"en-us": {
"role": {
"label": "Average Annual Return [Line Items]"
}
}
},
"auth_ref": [
"r66"
]
},
"oef_AverageAnnualReturnTable": {
"xbrltype": "stringItemType",
"nsuri": "http://xbrl.sec.gov/oef/2025",
"localname": "AverageAnnualReturnTable",
"presentation": [
"http://xbrl.sec.gov/oef/role/ShareholderReportAverageAnnualReturnDetails"
],
"lang": {
"en-us": {
"role": {
"label": "Average Annual Return [Table]"
}
}
},
"auth_ref": [
"r66"
]
},
"oef_AvgAnnlRtrPct": {
"xbrltype": "percentItemType",
"nsuri": "http://xbrl.sec.gov/oef/2025",
"localname": "AvgAnnlRtrPct",
"presentation": [
"http://xbrl.sec.gov/oef/role/ShareholderReportAverageAnnualReturnDetails"
],
"lang": {
"en-us": {
"role": {
"label": "Average Annual Return, Percent"
}
}
},
"auth_ref": [
"r45"
]
},
"oef_AvgAnnlRtrTableTextBlock": {
"xbrltype": "textBlockItemType",
"nsuri": "http://xbrl.sec.gov/oef/2025",
"localname": "AvgAnnlRtrTableTextBlock",
"presentation": [
"http://xbrl.sec.gov/oef/role/ShareholderReport"
],
"lang": {
"en-us": {
"role": {
"label": "Average Annual Return [Table Text Block]"
}
}
},
"auth_ref": [
"r45"
]
},
"bmafi_BerkshireHathawayIncCIBMember": {
"xbrltype": "domainItemType",
"nsuri": "http://www.bny.com/20251016",
"localname": "BerkshireHathawayIncCIBMember",
"presentation": [
"http://xbrl.sec.gov/oef/role/ShareholderReportHoldingsDetails"
],
"lang": {
"en-us": {
"role": {
"label": "Berkshire Hathaway Inc CI B [Member]"
}
}
},
"auth_ref": []
},
"bmafi_BlockIncMember": {
"xbrltype": "domainItemType",
"nsuri": "http://www.bny.com/20251016",
"localname": "BlockIncMember",
"presentation": [
"http://xbrl.sec.gov/oef/role/ShareholderReportHoldingsDetails"
],
"lang": {
"en-us": {
"role": {
"label": "Block Inc [Member]"
}
}
},
"auth_ref": []
},
"oef_BroadBasedIndexAxis": {
"xbrltype": "stringItemType",
"nsuri": "http://xbrl.sec.gov/oef/2025",
"localname": "BroadBasedIndexAxis",
"presentation": [
"http://xbrl.sec.gov/oef/role/ShareholderReportAverageAnnualReturnDetails",
"http://xbrl.sec.gov/oef/role/ShareholderReportLineGraphDetails"
],
"lang": {
"en-us": {
"role": {
"label": "Broad Based Index [Axis]"
}
}
},
"auth_ref": [
"r38"
]
},
"oef_BroadBasedIndexDomain": {
"xbrltype": "domainItemType",
"nsuri": "http://xbrl.sec.gov/oef/2025",
"localname": "BroadBasedIndexDomain",
"presentation": [
"http://xbrl.sec.gov/oef/role/ShareholderReportAverageAnnualReturnDetails",
"http://xbrl.sec.gov/oef/role/ShareholderReportLineGraphDetails"
],
"lang": {
"en-us": {
"role": {
"label": "Broad Based Index [Domain]"
}
}
},
"auth_ref": [
"r38"
]
},
"bmafi_C000001288Member": {
"xbrltype": "domainItemType",
"nsuri": "http://www.bny.com/20251016",
"localname": "C000001288Member",
"presentation": [
"http://xbrl.sec.gov/oef/role/ShareholderReport",
"http://xbrl.sec.gov/oef/role/ShareholderReportAverageAnnualReturnDetails",
"http://xbrl.sec.gov/oef/role/ShareholderReportHoldingsDetails",
"http://xbrl.sec.gov/oef/role/ShareholderReportLineGraphDetails"
],
"lang": {
"en-us": {
"role": {
"label": "C000001288 [Member]",
"terseLabel": "Class A"
}
}
},
"auth_ref": []
},
"bmafi_C000001289Member": {
"xbrltype": "domainItemType",
"nsuri": "http://www.bny.com/20251016",
"localname": "C000001289Member",
"presentation": [
"http://xbrl.sec.gov/oef/role/ShareholderReport",
"http://xbrl.sec.gov/oef/role/ShareholderReportAverageAnnualReturnDetails",
"http://xbrl.sec.gov/oef/role/ShareholderReportHoldingsDetails",
"http://xbrl.sec.gov/oef/role/ShareholderReportLineGraphDetails"
],
"lang": {
"en-us": {
"role": {
"label": "C000001289 [Member]"
}
}
},
"auth_ref": []
},
"bmafi_C000001358Member": {
"xbrltype": "domainItemType",
"nsuri": "http://www.bny.com/20251016",
"localname": "C000001358Member",
"presentation": [
"http://xbrl.sec.gov/oef/role/ShareholderReport",
"http://xbrl.sec.gov/oef/role/ShareholderReportAverageAnnualReturnDetails",
"http://xbrl.sec.gov/oef/role/ShareholderReportHoldingsDetails",
"http://xbrl.sec.gov/oef/role/ShareholderReportLineGraphDetails"
],
"lang": {
"en-us": {
"role": {
"label": "C000001358 [Member]"
}
}
},
"auth_ref": []
},
"bmafi_C000001360Member": {
"xbrltype": "domainItemType",
"nsuri": "http://www.bny.com/20251016",
"localname": "C000001360Member",
"presentation": [
"http://xbrl.sec.gov/oef/role/ShareholderReport",
"http://xbrl.sec.gov/oef/role/ShareholderReportAverageAnnualReturnDetails",
"http://xbrl.sec.gov/oef/role/ShareholderReportHoldingsDetails",
"http://xbrl.sec.gov/oef/role/ShareholderReportLineGraphDetails"
],
"lang": {
"en-us": {
"role": {
"label": "C000001360 [Member]"
}
}
},
"auth_ref": []
},
"bmafi_C000001361Member": {
"xbrltype": "domainItemType",
"nsuri": "http://www.bny.com/20251016",
"localname": "C000001361Member",
"presentation": [
"http://xbrl.sec.gov/oef/role/ShareholderReport",
"http://xbrl.sec.gov/oef/role/ShareholderReportAverageAnnualReturnDetails",
"http://xbrl.sec.gov/oef/role/ShareholderReportHoldingsDetails",
"http://xbrl.sec.gov/oef/role/ShareholderReportLineGraphDetails"
],
"lang": {
"en-us": {
"role": {
"label": "C000001361 [Member]"
}
}
},
"auth_ref": []
},
"bmafi_C000001368Member": {
"xbrltype": "domainItemType",
"nsuri": "http://www.bny.com/20251016",
"localname": "C000001368Member",
"presentation": [
"http://xbrl.sec.gov/oef/role/ShareholderReport",
"http://xbrl.sec.gov/oef/role/ShareholderReportAverageAnnualReturnDetails",
"http://xbrl.sec.gov/oef/role/ShareholderReportHoldingsDetails",
"http://xbrl.sec.gov/oef/role/ShareholderReportLineGraphDetails"
],
"lang": {
"en-us": {
"role": {
"label": "C000001368 [Member]"
}
}
},
"auth_ref": []
},
"bmafi_C000001370Member": {
"xbrltype": "domainItemType",
"nsuri": "http://www.bny.com/20251016",
"localname": "C000001370Member",
"presentation": [
"http://xbrl.sec.gov/oef/role/ShareholderReport",
"http://xbrl.sec.gov/oef/role/ShareholderReportAverageAnnualReturnDetails",
"http://xbrl.sec.gov/oef/role/ShareholderReportHoldingsDetails",
"http://xbrl.sec.gov/oef/role/ShareholderReportLineGraphDetails"
],
"lang": {
"en-us": {
"role": {
"label": "C000001370 [Member]"
}
}
},
"auth_ref": []
},
"bmafi_C000001371Member": {
"xbrltype": "domainItemType",
"nsuri": "http://www.bny.com/20251016",
"localname": "C000001371Member",
"presentation": [
"http://xbrl.sec.gov/oef/role/ShareholderReport",
"http://xbrl.sec.gov/oef/role/ShareholderReportAverageAnnualReturnDetails",
"http://xbrl.sec.gov/oef/role/ShareholderReportHoldingsDetails",
"http://xbrl.sec.gov/oef/role/ShareholderReportLineGraphDetails"
],
"lang": {
"en-us": {
"role": {
"label": "C000001371 [Member]"
}
}
},
"auth_ref": []
},
"bmafi_C000064720Member": {
"xbrltype": "domainItemType",
"nsuri": "http://www.bny.com/20251016",
"localname": "C000064720Member",
"presentation": [
"http://xbrl.sec.gov/oef/role/ShareholderReport",
"http://xbrl.sec.gov/oef/role/ShareholderReportAverageAnnualReturnDetails",
"http://xbrl.sec.gov/oef/role/ShareholderReportHoldingsDetails",
"http://xbrl.sec.gov/oef/role/ShareholderReportLineGraphDetails"
],
"lang": {
"en-us": {
"role": {
"label": "C000064720 [Member]",
"terseLabel": "Class C"
}
}
},
"auth_ref": []
},
"bmafi_C000064721Member": {
"xbrltype": "domainItemType",
"nsuri": "http://www.bny.com/20251016",
"localname": "C000064721Member",
"presentation": [
"http://xbrl.sec.gov/oef/role/ShareholderReport",
"http://xbrl.sec.gov/oef/role/ShareholderReportAverageAnnualReturnDetails",
"http://xbrl.sec.gov/oef/role/ShareholderReportHoldingsDetails",
"http://xbrl.sec.gov/oef/role/ShareholderReportLineGraphDetails"
],
"lang": {
"en-us": {
"role": {
"label": "C000064721 [Member]",
"terseLabel": "Class I"
}
}
},
"auth_ref": []
},
"bmafi_C000130426Member": {
"xbrltype": "domainItemType",
"nsuri": "http://www.bny.com/20251016",
"localname": "C000130426Member",
"presentation": [
"http://xbrl.sec.gov/oef/role/ShareholderReport",
"http://xbrl.sec.gov/oef/role/ShareholderReportAverageAnnualReturnDetails",
"http://xbrl.sec.gov/oef/role/ShareholderReportHoldingsDetails",
"http://xbrl.sec.gov/oef/role/ShareholderReportLineGraphDetails"
],
"lang": {
"en-us": {
"role": {
"label": "C000130426 [Member]",
"terseLabel": "Class Y"
}
}
},
"auth_ref": []
},
"bmafi_C000130427Member": {
"xbrltype": "domainItemType",
"nsuri": "http://www.bny.com/20251016",
"localname": "C000130427Member",
"presentation": [
"http://xbrl.sec.gov/oef/role/ShareholderReport",
"http://xbrl.sec.gov/oef/role/ShareholderReportAverageAnnualReturnDetails",
"http://xbrl.sec.gov/oef/role/ShareholderReportHoldingsDetails",
"http://xbrl.sec.gov/oef/role/ShareholderReportLineGraphDetails"
],
"lang": {
"en-us": {
"role": {
"label": "C000130427 [Member]"
}
}
},
"auth_ref": []
},
"bmafi_C000174005Member": {
"xbrltype": "domainItemType",
"nsuri": "http://www.bny.com/20251016",
"localname": "C000174005Member",
"presentation": [
"http://xbrl.sec.gov/oef/role/ShareholderReport",
"http://xbrl.sec.gov/oef/role/ShareholderReportAverageAnnualReturnDetails",
"http://xbrl.sec.gov/oef/role/ShareholderReportHoldingsDetails",
"http://xbrl.sec.gov/oef/role/ShareholderReportLineGraphDetails"
],
"lang": {
"en-us": {
"role": {
"label": "C000174005 [Member]",
"terseLabel": "Investor Shares"
}
}
},
"auth_ref": []
},
"bmafi_C000174006Member": {
"xbrltype": "domainItemType",
"nsuri": "http://www.bny.com/20251016",
"localname": "C000174006Member",
"presentation": [
"http://xbrl.sec.gov/oef/role/ShareholderReport",
"http://xbrl.sec.gov/oef/role/ShareholderReportAverageAnnualReturnDetails",
"http://xbrl.sec.gov/oef/role/ShareholderReportHoldingsDetails",
"http://xbrl.sec.gov/oef/role/ShareholderReportLineGraphDetails"
],
"lang": {
"en-us": {
"role": {
"label": "C000174006 [Member]"
}
}
},
"auth_ref": []
},
"bmafi_C000174007Member": {
"xbrltype": "domainItemType",
"nsuri": "http://www.bny.com/20251016",
"localname": "C000174007Member",
"presentation": [
"http://xbrl.sec.gov/oef/role/ShareholderReport",
"http://xbrl.sec.gov/oef/role/ShareholderReportAverageAnnualReturnDetails",
"http://xbrl.sec.gov/oef/role/ShareholderReportHoldingsDetails",
"http://xbrl.sec.gov/oef/role/ShareholderReportLineGraphDetails"
],
"lang": {
"en-us": {
"role": {
"label": "C000174007 [Member]"
}
}
},
"auth_ref": []
},
"bmafi_CRHPLCMember": {
"xbrltype": "domainItemType",
"nsuri": "http://www.bny.com/20251016",
"localname": "CRHPLCMember",
"presentation": [
"http://xbrl.sec.gov/oef/role/ShareholderReportHoldingsDetails"
],
"lang": {
"en-us": {
"role": {
"label": "CRH PLC [Member]"
}
}
},
"auth_ref": []
},
"bmafi_CapitalOneFinancialCorpMember": {
"xbrltype": "domainItemType",
"nsuri": "http://www.bny.com/20251016",
"localname": "CapitalOneFinancialCorpMember",
"presentation": [
"http://xbrl.sec.gov/oef/role/ShareholderReportHoldingsDetails"
],
"lang": {
"en-us": {
"role": {
"label": "Capital One Financial Corp [Member]"
}
}
},
"auth_ref": []
},
"bmafi_CiscoSystemsIncMember": {
"xbrltype": "domainItemType",
"nsuri": "http://www.bny.com/20251016",
"localname": "CiscoSystemsIncMember",
"presentation": [
"http://xbrl.sec.gov/oef/role/ShareholderReportHoldingsDetails"
],
"lang": {
"en-us": {
"role": {
"label": "Cisco Systems Inc [Member]"
}
}
},
"auth_ref": []
},
"oef_ClassAxis": {
"xbrltype": "stringItemType",
"nsuri": "http://xbrl.sec.gov/oef/2025",
"localname": "ClassAxis",
"presentation": [
"http://xbrl.sec.gov/oef/role/ShareholderReport",
"http://xbrl.sec.gov/oef/role/ShareholderReportAverageAnnualReturnDetails",
"http://xbrl.sec.gov/oef/role/ShareholderReportHoldingsDetails",
"http://xbrl.sec.gov/oef/role/ShareholderReportLineGraphDetails"
],
"lang": {
"en-us": {
"role": {
"label": "Class [Axis]"
}
}
},
"auth_ref": [
"r25"
]
},
"oef_ClassName": {
"xbrltype": "securityTitleItemType",
"nsuri": "http://xbrl.sec.gov/oef/2025",
"localname": "ClassName",
"presentation": [
"http://xbrl.sec.gov/oef/role/ShareholderReport"
],
"lang": {
"en-us": {
"role": {
"label": "Class Name"
}
}
},
"auth_ref": [
"r30"
]
},
"bmafi_ClearwayEnergyIncClCMember": {
"xbrltype": "domainItemType",
"nsuri": "http://www.bny.com/20251016",
"localname": "ClearwayEnergyIncClCMember",
"presentation": [
"http://xbrl.sec.gov/oef/role/ShareholderReportHoldingsDetails"
],
"lang": {
"en-us": {
"role": {
"label": "Clearway Energy Inc Cl C [Member]"
}
}
},
"auth_ref": []
},
"bmafi_ColumbiaBankingSystemIncMember": {
"xbrltype": "domainItemType",
"nsuri": "http://www.bny.com/20251016",
"localname": "ColumbiaBankingSystemIncMember",
"presentation": [
"http://xbrl.sec.gov/oef/role/ShareholderReportHoldingsDetails"
],
"lang": {
"en-us": {
"role": {
"label": "Columbia Banking System Inc [Member]"
}
}
},
"auth_ref": []
},
"oef_CommunicationsSectorMember": {
"xbrltype": "domainItemType",
"nsuri": "http://xbrl.sec.gov/oef/2025",
"localname": "CommunicationsSectorMember",
"presentation": [
"http://xbrl.sec.gov/oef/role/ShareholderReportHoldingsDetails"
],
"lang": {
"en-us": {
"role": {
"label": "Communications Sector [Member]"
}
}
},
"auth_ref": [
"r53"
]
},
"oef_ConsumerDiscretionarySectorMember": {
"xbrltype": "domainItemType",
"nsuri": "http://xbrl.sec.gov/oef/2025",
"localname": "ConsumerDiscretionarySectorMember",
"presentation": [
"http://xbrl.sec.gov/oef/role/ShareholderReportHoldingsDetails"
],
"lang": {
"en-us": {
"role": {
"label": "Consumer Discretionary Sector [Member]"
}
}
},
"auth_ref": [
"r53"
]
},
"oef_ConsumerStaplesSectorMember": {
"xbrltype": "domainItemType",
"nsuri": "http://xbrl.sec.gov/oef/2025",
"localname": "ConsumerStaplesSectorMember",
"presentation": [
"http://xbrl.sec.gov/oef/role/ShareholderReportHoldingsDetails"
],
"lang": {
"en-us": {
"role": {
"label": "Consumer Staples Sector [Member]"
}
}
},
"auth_ref": [
"r53"
]
},
"dei_CoverAbstract": {
"xbrltype": "stringItemType",
"nsuri": "http://xbrl.sec.gov/dei/2025",
"localname": "CoverAbstract",
"lang": {
"en-us": {
"role": {
"documentation": "Cover page."
}
}
},
"auth_ref": []
},
"oef_CreditQualityAxis": {
"xbrltype": "stringItemType",
"nsuri": "http://xbrl.sec.gov/oef/2025",
"localname": "CreditQualityAxis",
"presentation": [
"http://xbrl.sec.gov/oef/role/ShareholderReportHoldingsDetails"
],
"lang": {
"en-us": {
"role": {
"label": "Credit Quality [Axis]"
}
}
},
"auth_ref": [
"r53"
]
},
"oef_CreditQualityDomain": {
"xbrltype": "domainItemType",
"nsuri": "http://xbrl.sec.gov/oef/2025",
"localname": "CreditQualityDomain",
"presentation": [
"http://xbrl.sec.gov/oef/role/ShareholderReportHoldingsDetails"
],
"lang": {
"en-us": {
"role": {
"label": "Credit Quality [Domain]"
}
}
},
"auth_ref": [
"r53"
]
},
"oef_CreditQualityExplanationTextBlock": {
"xbrltype": "textBlockItemType",
"nsuri": "http://xbrl.sec.gov/oef/2025",
"localname": "CreditQualityExplanationTextBlock",
"presentation": [
"http://xbrl.sec.gov/oef/role/ShareholderReport"
],
"lang": {
"en-us": {
"role": {
"label": "Credit Quality Explanation [Text Block]"
}
}
},
"auth_ref": [
"r53"
]
},
"srt_CreditRatingAMBestDomain": {
"xbrltype": "domainItemType",
"nsuri": "http://fasb.org/srt/2025",
"localname": "CreditRatingAMBestDomain",
"presentation": [
"http://xbrl.sec.gov/oef/role/ShareholderReportHoldingsDetails"
],
"auth_ref": [
"r18",
"r68"
]
},
"oef_CreditRatingsSelectionTextBlock": {
"xbrltype": "textBlockItemType",
"nsuri": "http://xbrl.sec.gov/oef/2025",
"localname": "CreditRatingsSelectionTextBlock",
"presentation": [
"http://xbrl.sec.gov/oef/role/ShareholderReport"
],
"lang": {
"en-us": {
"role": {
"label": "Credit Ratings Selection [Text Block]"
}
}
},
"auth_ref": [
"r53"
]
},
"bmafi_DiamondbackEnergyIncMember": {
"xbrltype": "domainItemType",
"nsuri": "http://www.bny.com/20251016",
"localname": "DiamondbackEnergyIncMember",
"presentation": [
"http://xbrl.sec.gov/oef/role/ShareholderReportHoldingsDetails"
],
"lang": {
"en-us": {
"role": {
"label": "Diamondback Energy Inc [Member]"
}
}
},
"auth_ref": []
},
"oef_DistOfCapitalTextBlock": {
"xbrltype": "textBlockItemType",
"nsuri": "http://xbrl.sec.gov/oef/2025",
"localname": "DistOfCapitalTextBlock",
"presentation": [
"http://xbrl.sec.gov/oef/role/ShareholderReport"
],
"lang": {
"en-us": {
"role": {
"label": "Distribution of Capital [Text Block]"
}
}
},
"auth_ref": [
"r47"
]
},
"dei_DocumentPeriodEndDate": {
"xbrltype": "dateItemType",
"nsuri": "http://xbrl.sec.gov/dei/2025",
"localname": "DocumentPeriodEndDate",
"presentation": [
"http://xbrl.sec.gov/oef/role/NcsrCover",
"http://xbrl.sec.gov/oef/role/ShareholderReport"
],
"lang": {
"en-us": {
"role": {
"label": "Document Period End Date",
"documentation": "For the EDGAR submission types of Form 8-K: the date of the report, the date of the earliest event reported; for the EDGAR submission types of Form N-1A: the filing date; for all other submission types: the end of the reporting or transition period. The format of the date is YYYY-MM-DD."
}
}
},
"auth_ref": []
},
"dei_DocumentType": {
"xbrltype": "submissionTypeItemType",
"nsuri": "http://xbrl.sec.gov/dei/2025",
"localname": "DocumentType",
"presentation": [
"http://xbrl.sec.gov/oef/role/NcsrCover",
"http://xbrl.sec.gov/oef/role/ShareholderReport"
],
"lang": {
"en-us": {
"role": {
"label": "Document Type",
"documentation": "The type of document being provided (such as 10-K, 10-Q, 485BPOS, etc). The document type is limited to the same value as the supporting SEC submission type, or the word 'Other'."
}
}
},
"auth_ref": []
},
"bmafi_DominionEnergyIncMember": {
"xbrltype": "domainItemType",
"nsuri": "http://www.bny.com/20251016",
"localname": "DominionEnergyIncMember",
"presentation": [
"http://xbrl.sec.gov/oef/role/ShareholderReportHoldingsDetails"
],
"lang": {
"en-us": {
"role": {
"label": "Dominion Energy Inc [Member]"
}
}
},
"auth_ref": []
},
"us-gaap_EnergySectorMember": {
"xbrltype": "domainItemType",
"nsuri": "http://fasb.org/us-gaap/2025",
"localname": "EnergySectorMember",
"presentation": [
"http://xbrl.sec.gov/oef/role/ShareholderReportHoldingsDetails"
],
"lang": {
"en-us": {
"role": {
"label": "Energy Sector [Member]",
"documentation": "Sector of economy consisting of companies engaged in business activity related to energy."
}
}
},
"auth_ref": [
"r19",
"r20",
"r21",
"r70",
"r71",
"r72",
"r76"
]
},
"dei_EntityCentralIndexKey": {
"xbrltype": "centralIndexKeyItemType",
"nsuri": "http://xbrl.sec.gov/dei/2025",
"localname": "EntityCentralIndexKey",
"presentation": [
"http://xbrl.sec.gov/oef/role/NcsrCover",
"http://xbrl.sec.gov/oef/role/ShareholderReport"
],
"lang": {
"en-us": {
"role": {
"label": "Entity Central Index Key",
"documentation": "A unique 10-digit SEC-issued value to identify entities that have filed disclosures with the SEC. It is commonly abbreviated as CIK."
}
}
},
"auth_ref": [
"r23"
]
},
"dei_EntityDomain": {
"xbrltype": "domainItemType",
"nsuri": "http://xbrl.sec.gov/dei/2025",
"localname": "EntityDomain",
"presentation": [
"http://xbrl.sec.gov/oef/role/ShareholderReportAverageAnnualReturnDetails"
],
"lang": {
"en-us": {
"role": {
"label": "Series",
"documentation": "All the names of the entities being reported upon in a document. Any legal structure used to conduct activities or to hold assets. Some examples of such structures are corporations, partnerships, limited liability companies, grantor trusts, and other trusts. This item does not include business and geographical segments which are included in the geographical or business segments domains."
}
}
},
"auth_ref": []
},
"dei_EntityInvCompanyType": {
"xbrltype": "invCompanyType",
"nsuri": "http://xbrl.sec.gov/dei/2025",
"localname": "EntityInvCompanyType",
"presentation": [
"http://xbrl.sec.gov/oef/role/NcsrCover",
"http://xbrl.sec.gov/oef/role/ShareholderReport"
],
"lang": {
"en-us": {
"role": {
"label": "Entity Investment Company Type",
"documentation": "One of: N-1A (Mutual Fund), N-1 (Open-End Separate Account with No Variable Annuities), N-2 (Closed-End Investment Company), N-3 (Separate Account Registered as Open-End Management Investment Company), N-4 (Variable Annuity UIT Separate Account), N-5 (Small Business Investment Company), N-6 (Variable Life UIT Separate Account), S-1 or S-3 (Face Amount Certificate Company), S-6 (UIT, Non-Insurance Product)."
}
}
},
"auth_ref": [
"r67"
]
},
"dei_EntityRegistrantName": {
"xbrltype": "normalizedStringItemType",
"nsuri": "http://xbrl.sec.gov/dei/2025",
"localname": "EntityRegistrantName",
"presentation": [
"http://xbrl.sec.gov/oef/role/NcsrCover",
"http://xbrl.sec.gov/oef/role/ShareholderReport"
],
"lang": {
"en-us": {
"role": {
"label": "Registrant Name",
"documentation": "The exact name of the entity filing the report as specified in its charter, which is required by forms filed with the SEC."
}
}
},
"auth_ref": [
"r23"
]
},
"oef_EtfDiscountNumDays": {
"xbrltype": "integerItemType",
"nsuri": "http://xbrl.sec.gov/oef/2025",
"localname": "EtfDiscountNumDays",
"presentation": [
"http://xbrl.sec.gov/oef/role/ShareholderReport"
],
"lang": {
"en-us": {
"role": {
"label": "ETF Discount, Number of Days"
}
}
},
"auth_ref": [
"r48"
]
},
"oef_EtfPastPerfTextBlock": {
"xbrltype": "textBlockItemType",
"nsuri": "http://xbrl.sec.gov/oef/2025",
"localname": "EtfPastPerfTextBlock",
"presentation": [
"http://xbrl.sec.gov/oef/role/ShareholderReport"
],
"lang": {
"en-us": {
"role": {
"label": "ETF Past Performance [Text Block]"
}
}
},
"auth_ref": [
"r50"
]
},
"oef_EtfPremiumDiscountTextBlock": {
"xbrltype": "textBlockItemType",
"nsuri": "http://xbrl.sec.gov/oef/2025",
"localname": "EtfPremiumDiscountTextBlock",
"presentation": [
"http://xbrl.sec.gov/oef/role/ShareholderReport"
],
"lang": {
"en-us": {
"role": {
"label": "ETF Premium Discount [Text Block]"
}
}
},
"auth_ref": [
"r48"
]
},
"oef_EtfPremiumNumDays": {
"xbrltype": "integerItemType",
"nsuri": "http://xbrl.sec.gov/oef/2025",
"localname": "EtfPremiumNumDays",
"presentation": [
"http://xbrl.sec.gov/oef/role/ShareholderReport"
],
"lang": {
"en-us": {
"role": {
"label": "ETF Premium, Number of Days"
}
}
},
"auth_ref": [
"r48"
]
},
"oef_EtfPurchaseExplanationTextBlock": {
"xbrltype": "textBlockItemType",
"nsuri": "http://xbrl.sec.gov/oef/2025",
"localname": "EtfPurchaseExplanationTextBlock",
"presentation": [
"http://xbrl.sec.gov/oef/role/ShareholderReport"
],
"lang": {
"en-us": {
"role": {
"label": "ETF Purchase Explanation [Text Block]"
}
}
},
"auth_ref": [
"r49"
]
},
"bmafi_ExelonCorpMember": {
"xbrltype": "domainItemType",
"nsuri": "http://www.bny.com/20251016",
"localname": "ExelonCorpMember",
"presentation": [
"http://xbrl.sec.gov/oef/role/ShareholderReportHoldingsDetails"
],
"lang": {
"en-us": {
"role": {
"label": "Exelon Corp [Member]"
}
}
},
"auth_ref": []
},
"bmafi_ExpediaGroupIncMember": {
"xbrltype": "domainItemType",
"nsuri": "http://www.bny.com/20251016",
"localname": "ExpediaGroupIncMember",
"presentation": [
"http://xbrl.sec.gov/oef/role/ShareholderReportHoldingsDetails"
],
"lang": {
"en-us": {
"role": {
"label": "Expedia Group Inc [Member]"
}
}
},
"auth_ref": []
},
"oef_ExpenseRatioPct": {
"xbrltype": "percentItemType",
"nsuri": "http://xbrl.sec.gov/oef/2025",
"localname": "ExpenseRatioPct",
"presentation": [
"http://xbrl.sec.gov/oef/role/ShareholderReport"
],
"lang": {
"en-us": {
"role": {
"label": "Expense Ratio, Percent"
}
}
},
"auth_ref": [
"r33"
]
},
"oef_ExpensesExclExtraordinaryExpensesPct": {
"xbrltype": "percentItemType",
"nsuri": "http://xbrl.sec.gov/oef/2025",
"localname": "ExpensesExclExtraordinaryExpensesPct",
"presentation": [
"http://xbrl.sec.gov/oef/role/ShareholderReport"
],
"lang": {
"en-us": {
"role": {
"label": "Expenses Excluding Extraordinary Expenses, Percent"
}
}
},
"auth_ref": [
"r36"
]
},
"oef_ExpensesPaidAmt": {
"xbrltype": "monetaryItemType",
"nsuri": "http://xbrl.sec.gov/oef/2025",
"localname": "ExpensesPaidAmt",
"presentation": [
"http://xbrl.sec.gov/oef/role/ShareholderReport"
],
"lang": {
"en-us": {
"role": {
"label": "Expenses Paid, Amount"
}
}
},
"auth_ref": [
"r32"
]
},
"oef_ExpensesRepresentBothMasterAndFeeder": {
"xbrltype": "stringItemType",
"nsuri": "http://xbrl.sec.gov/oef/2025",
"localname": "ExpensesRepresentBothMasterAndFeeder",
"presentation": [
"http://xbrl.sec.gov/oef/role/ShareholderReport"
],
"lang": {
"en-us": {
"role": {
"label": "Expenses Represent Both Master and Feeder [Text]"
}
}
},
"auth_ref": [
"r34",
"r64"
]
},
"oef_ExpensesShortPeriodFnTextBlock": {
"xbrltype": "textBlockItemType",
"nsuri": "http://xbrl.sec.gov/oef/2025",
"localname": "ExpensesShortPeriodFnTextBlock",
"presentation": [
"http://xbrl.sec.gov/oef/role/ShareholderReport"
],
"lang": {
"en-us": {
"role": {
"label": "Expenses Short Period Footnote [Text Block]"
}
}
},
"auth_ref": [
"r35"
]
},
"oef_ExpensesTextBlock": {
"xbrltype": "textBlockItemType",
"nsuri": "http://xbrl.sec.gov/oef/2025",
"localname": "ExpensesTextBlock",
"presentation": [
"http://xbrl.sec.gov/oef/role/ShareholderReport"
],
"lang": {
"en-us": {
"role": {
"label": "Expenses [Text Block]"
}
}
},
"auth_ref": [
"r31"
]
},
"oef_ExposureBasisExplanationTextBlock": {
"xbrltype": "textBlockItemType",
"nsuri": "http://xbrl.sec.gov/oef/2025",
"localname": "ExposureBasisExplanationTextBlock",
"presentation": [
"http://xbrl.sec.gov/oef/role/ShareholderReport"
],
"lang": {
"en-us": {
"role": {
"label": "Exposure Basis Explanation [Text Block]"
}
}
},
"auth_ref": [
"r53"
]
},
"srt_ExternalCreditRatingFitchMember": {
"xbrltype": "domainItemType",
"nsuri": "http://fasb.org/srt/2025",
"localname": "ExternalCreditRatingFitchMember",
"presentation": [
"http://xbrl.sec.gov/oef/role/ShareholderReportHoldingsDetails"
],
"auth_ref": [
"r18",
"r68"
]
},
"srt_ExternalCreditRatingMoodysMember": {
"xbrltype": "domainItemType",
"nsuri": "http://fasb.org/srt/2025",
"localname": "ExternalCreditRatingMoodysMember",
"presentation": [
"http://xbrl.sec.gov/oef/role/ShareholderReportHoldingsDetails"
],
"auth_ref": [
"r18",
"r68"
]
},
"srt_ExternalCreditRatingStandardPoorsMember": {
"xbrltype": "domainItemType",
"nsuri": "http://fasb.org/srt/2025",
"localname": "ExternalCreditRatingStandardPoorsMember",
"presentation": [
"http://xbrl.sec.gov/oef/role/ShareholderReportHoldingsDetails"
],
"auth_ref": [
"r18",
"r68"
]
},
"oef_ExtraordinaryExpensesFnTextBlock": {
"xbrltype": "textBlockItemType",
"nsuri": "http://xbrl.sec.gov/oef/2025",
"localname": "ExtraordinaryExpensesFnTextBlock",
"presentation": [
"http://xbrl.sec.gov/oef/role/ShareholderReport"
],
"lang": {
"en-us": {
"role": {
"label": "Extraordinary Expenses Footnote [Text Block]"
}
}
},
"auth_ref": [
"r36"
]
},
"oef_FactorsAffectingPerfTextBlock": {
"xbrltype": "textBlockItemType",
"nsuri": "http://xbrl.sec.gov/oef/2025",
"localname": "FactorsAffectingPerfTextBlock",
"presentation": [
"http://xbrl.sec.gov/oef/role/ShareholderReport"
],
"lang": {
"en-us": {
"role": {
"label": "Factors Affecting Performance [Text Block]"
}
}
},
"auth_ref": [
"r37"
]
},
"us-gaap_FinancialServicesSectorMember": {
"xbrltype": "domainItemType",
"nsuri": "http://fasb.org/us-gaap/2025",
"localname": "FinancialServicesSectorMember",
"presentation": [
"http://xbrl.sec.gov/oef/role/ShareholderReportHoldingsDetails"
],
"lang": {
"en-us": {
"role": {
"label": "Financial Services Sector [Member]",
"documentation": "Sector of the economy consisting of companies engaged in financial services."
}
}
},
"auth_ref": [
"r19",
"r22",
"r70",
"r71",
"r72",
"r76"
]
},
"bmafi_FirstBuseyCorpMember": {
"xbrltype": "domainItemType",
"nsuri": "http://www.bny.com/20251016",
"localname": "FirstBuseyCorpMember",
"presentation": [
"http://xbrl.sec.gov/oef/role/ShareholderReportHoldingsDetails"
],
"lang": {
"en-us": {
"role": {
"label": "First Busey Corp [Member]"
}
}
},
"auth_ref": []
},
"bmafi_FirstHorizonCorpMember": {
"xbrltype": "domainItemType",
"nsuri": "http://www.bny.com/20251016",
"localname": "FirstHorizonCorpMember",
"presentation": [
"http://xbrl.sec.gov/oef/role/ShareholderReportHoldingsDetails"
],
"lang": {
"en-us": {
"role": {
"label": "First Horizon Corp [Member]"
}
}
},
"auth_ref": []
},
"oef_FundName": {
"xbrltype": "normalizedStringItemType",
"nsuri": "http://xbrl.sec.gov/oef/2025",
"localname": "FundName",
"presentation": [
"http://xbrl.sec.gov/oef/role/ShareholderReport"
],
"lang": {
"en-us": {
"role": {
"label": "Fund Name"
}
}
},
"auth_ref": [
"r26"
]
},
"bmafi_GeniusSportsLtdMember": {
"xbrltype": "domainItemType",
"nsuri": "http://www.bny.com/20251016",
"localname": "GeniusSportsLtdMember",
"presentation": [
"http://xbrl.sec.gov/oef/role/ShareholderReportHoldingsDetails"
],
"lang": {
"en-us": {
"role": {
"label": "Genius Sports Ltd [Member]"
}
}
},
"auth_ref": []
},
"oef_GeographicRegionAxis": {
"xbrltype": "stringItemType",
"nsuri": "http://xbrl.sec.gov/oef/2025",
"localname": "GeographicRegionAxis",
"presentation": [
"http://xbrl.sec.gov/oef/role/ShareholderReportHoldingsDetails"
],
"lang": {
"en-us": {
"role": {
"label": "Geographic Region [Axis]"
}
}
},
"auth_ref": [
"r53"
]
},
"oef_GeographicRegionDomain": {
"xbrltype": "domainItemType",
"nsuri": "http://xbrl.sec.gov/oef/2025",
"localname": "GeographicRegionDomain",
"presentation": [
"http://xbrl.sec.gov/oef/role/ShareholderReportHoldingsDetails"
],
"lang": {
"en-us": {
"role": {
"label": "Geographic Region [Domain]"
}
}
},
"auth_ref": [
"r53"
]
},
"us-gaap_HealthcareSectorMember": {
"xbrltype": "domainItemType",
"nsuri": "http://fasb.org/us-gaap/2025",
"localname": "HealthcareSectorMember",
"presentation": [
"http://xbrl.sec.gov/oef/role/ShareholderReportHoldingsDetails"
],
"lang": {
"en-us": {
"role": {
"label": "Healthcare Sector [Member]",
"documentation": "Sector of the economy consisting of companies engaged in healthcare-related business activities."
}
}
},
"auth_ref": [
"r19",
"r20",
"r21",
"r22",
"r70",
"r71",
"r72",
"r76"
]
},
"oef_HoldingsAbstract": {
"xbrltype": "stringItemType",
"nsuri": "http://xbrl.sec.gov/oef/2025",
"localname": "HoldingsAbstract",
"lang": {
"en-us": {
"role": {
"label": "Holdings [Abstract]"
}
}
},
"auth_ref": [
"r53"
]
},
"oef_HoldingsCount": {
"xbrltype": "integerItemType",
"nsuri": "http://xbrl.sec.gov/oef/2025",
"localname": "HoldingsCount",
"presentation": [
"http://xbrl.sec.gov/oef/role/ShareholderReport"
],
"lang": {
"en-us": {
"role": {
"label": "Holdings Count"
}
}
},
"auth_ref": [
"r51"
]
},
"oef_HoldingsLineItems": {
"xbrltype": "stringItemType",
"nsuri": "http://xbrl.sec.gov/oef/2025",
"localname": "HoldingsLineItems",
"presentation": [
"http://xbrl.sec.gov/oef/role/ShareholderReportHoldingsDetails"
],
"lang": {
"en-us": {
"role": {
"label": "Holdings [Line Items]"
}
}
},
"auth_ref": [
"r53"
]
},
"oef_HoldingsTable": {
"xbrltype": "stringItemType",
"nsuri": "http://xbrl.sec.gov/oef/2025",
"localname": "HoldingsTable",
"presentation": [
"http://xbrl.sec.gov/oef/role/ShareholderReportHoldingsDetails"
],
"lang": {
"en-us": {
"role": {
"label": "Holdings [Table]"
}
}
},
"auth_ref": [
"r53"
]
},
"oef_HoldingsTableTextBlock": {
"xbrltype": "textBlockItemType",
"nsuri": "http://xbrl.sec.gov/oef/2025",
"localname": "HoldingsTableTextBlock",
"presentation": [
"http://xbrl.sec.gov/oef/role/ShareholderReport"
],
"lang": {
"en-us": {
"role": {
"label": "Holdings [Text Block]"
}
}
},
"auth_ref": [
"r53"
]
},
"oef_InabilityToMeetDistLevelTextBlock": {
"xbrltype": "textBlockItemType",
"nsuri": "http://xbrl.sec.gov/oef/2025",
"localname": "InabilityToMeetDistLevelTextBlock",
"presentation": [
"http://xbrl.sec.gov/oef/role/ShareholderReport"
],
"lang": {
"en-us": {
"role": {
"label": "Inability to Meet Distribution Level [Text Block]"
}
}
},
"auth_ref": [
"r47"
]
},
"oef_IndustrialSectorMember": {
"xbrltype": "domainItemType",
"nsuri": "http://xbrl.sec.gov/oef/2025",
"localname": "IndustrialSectorMember",
"presentation": [
"http://xbrl.sec.gov/oef/role/ShareholderReportHoldingsDetails"
],
"lang": {
"en-us": {
"role": {
"label": "Industrial Sector [Member]"
}
}
},
"auth_ref": [
"r53"
]
},
"oef_IndustrySectorAxis": {
"xbrltype": "stringItemType",
"nsuri": "http://xbrl.sec.gov/oef/2025",
"localname": "IndustrySectorAxis",
"presentation": [
"http://xbrl.sec.gov/oef/role/ShareholderReportHoldingsDetails"
],
"lang": {
"en-us": {
"role": {
"label": "Industry Sector [Axis]"
}
}
},
"auth_ref": [
"r53"
]
},
"oef_IndustrySectorDomain": {
"xbrltype": "domainItemType",
"nsuri": "http://xbrl.sec.gov/oef/2025",
"localname": "IndustrySectorDomain",
"presentation": [
"http://xbrl.sec.gov/oef/role/ShareholderReportHoldingsDetails"
],
"lang": {
"en-us": {
"role": {
"label": "Industry Sector [Domain]"
}
}
},
"auth_ref": [
"r53"
]
},
"oef_InformationTechnologySectorMember": {
"xbrltype": "domainItemType",
"nsuri": "http://xbrl.sec.gov/oef/2025",
"localname": "InformationTechnologySectorMember",
"presentation": [
"http://xbrl.sec.gov/oef/role/ShareholderReportHoldingsDetails"
],
"lang": {
"en-us": {
"role": {
"label": "Information Technology Sector [Member]"
}
}
},
"auth_ref": [
"r53"
]
},
"bmafi_InsmedIncMember": {
"xbrltype": "domainItemType",
"nsuri": "http://www.bny.com/20251016",
"localname": "InsmedIncMember",
"presentation": [
"http://xbrl.sec.gov/oef/role/ShareholderReportHoldingsDetails"
],
"lang": {
"en-us": {
"role": {
"label": "Insmed Inc [Member]"
}
}
},
"auth_ref": []
},
"bmafi_IntuitIncMember": {
"xbrltype": "domainItemType",
"nsuri": "http://www.bny.com/20251016",
"localname": "IntuitIncMember",
"presentation": [
"http://xbrl.sec.gov/oef/role/ShareholderReportHoldingsDetails"
],
"lang": {
"en-us": {
"role": {
"label": "Intuit Inc [Member]"
}
}
},
"auth_ref": []
},
"bmafi_InvestmentCompaniesMember": {
"xbrltype": "domainItemType",
"nsuri": "http://www.bny.com/20251016",
"localname": "InvestmentCompaniesMember",
"presentation": [
"http://xbrl.sec.gov/oef/role/ShareholderReportHoldingsDetails"
],
"lang": {
"en-us": {
"role": {
"label": "Investment Companies [Member]"
}
}
},
"auth_ref": []
},
"us-gaap_InvestmentCompanyPortfolioTurnover": {
"xbrltype": "percentItemType",
"nsuri": "http://fasb.org/us-gaap/2025",
"localname": "InvestmentCompanyPortfolioTurnover",
"presentation": [
"http://xbrl.sec.gov/oef/role/ShareholderReport"
],
"lang": {
"en-us": {
"role": {
"label": "Investment Company Portfolio Turnover",
"documentation": "Percentage of lesser of purchase or sale of portfolio securities to average value of portfolio securities owned."
}
}
},
"auth_ref": [
"r69"
]
},
"us-gaap_InvestmentTypeAxis": {
"xbrltype": "stringItemType",
"nsuri": "http://fasb.org/us-gaap/2025",
"localname": "InvestmentTypeAxis",
"presentation": [
"http://xbrl.sec.gov/oef/role/ShareholderReportHoldingsDetails"
],
"lang": {
"en-us": {
"role": {
"label": "Investment Type [Axis]",
"documentation": "Information by type of investments."
}
}
},
"auth_ref": [
"r1",
"r2",
"r3",
"r4",
"r5",
"r6",
"r7",
"r8",
"r9",
"r10",
"r11",
"r12",
"r13",
"r14",
"r15",
"r16",
"r22"
]
},
"us-gaap_InvestmentTypeCategorizationMember": {
"xbrltype": "domainItemType",
"nsuri": "http://fasb.org/us-gaap/2025",
"localname": "InvestmentTypeCategorizationMember",
"presentation": [
"http://xbrl.sec.gov/oef/role/ShareholderReportHoldingsDetails"
],
"lang": {
"en-us": {
"role": {
"documentation": "Asset obtained to generate income or appreciate in value."
}
}
},
"auth_ref": [
"r1",
"r2",
"r3",
"r4",
"r5",
"r6",
"r7",
"r8",
"r9",
"r10",
"r11",
"r12",
"r13",
"r14",
"r15",
"r16",
"r22"
]
},
"bmafi_JPMorganChaseAndCoMember": {
"xbrltype": "domainItemType",
"nsuri": "http://www.bny.com/20251016",
"localname": "JPMorganChaseAndCoMember",
"presentation": [
"http://xbrl.sec.gov/oef/role/ShareholderReportHoldingsDetails"
],
"lang": {
"en-us": {
"role": {
"label": "JPMorgan Chase And Co [Member]"
}
}
},
"auth_ref": []
},
"bmafi_JohnsonAndJohnsonMember": {
"xbrltype": "domainItemType",
"nsuri": "http://www.bny.com/20251016",
"localname": "JohnsonAndJohnsonMember",
"presentation": [
"http://xbrl.sec.gov/oef/role/ShareholderReportHoldingsDetails"
],
"lang": {
"en-us": {
"role": {
"label": "Johnson And Johnson [Member]"
}
}
},
"auth_ref": []
},
"oef_LargestHoldingAxis": {
"xbrltype": "stringItemType",
"nsuri": "http://xbrl.sec.gov/oef/2025",
"localname": "LargestHoldingAxis",
"presentation": [
"http://xbrl.sec.gov/oef/role/ShareholderReportHoldingsDetails"
],
"lang": {
"en-us": {
"role": {
"label": "Largest Holding [Axis]"
}
}
},
"auth_ref": [
"r53"
]
},
"oef_LargestHoldingsDomain": {
"xbrltype": "domainItemType",
"nsuri": "http://xbrl.sec.gov/oef/2025",
"localname": "LargestHoldingsDomain",
"presentation": [
"http://xbrl.sec.gov/oef/role/ShareholderReportHoldingsDetails"
],
"lang": {
"en-us": {
"role": {
"label": "Largest Holdings [Domain]"
}
}
},
"auth_ref": [
"r53"
]
},
"oef_LargestHoldingsTableTextBlock": {
"xbrltype": "textBlockItemType",
"nsuri": "http://xbrl.sec.gov/oef/2025",
"localname": "LargestHoldingsTableTextBlock",
"presentation": [
"http://xbrl.sec.gov/oef/role/ShareholderReport"
],
"lang": {
"en-us": {
"role": {
"label": "Largest Holdings [Text Block]"
}
}
},
"auth_ref": [
"r53"
]
},
"dei_LegalEntityAxis": {
"xbrltype": "stringItemType",
"nsuri": "http://xbrl.sec.gov/dei/2025",
"localname": "LegalEntityAxis",
"presentation": [
"http://xbrl.sec.gov/oef/role/ShareholderReportAverageAnnualReturnDetails"
],
"lang": {
"en-us": {
"role": {
"label": "Series [Axis]",
"documentation": "The set of legal entities associated with a report."
}
}
},
"auth_ref": []
},
"oef_LineGraphAndTableMeasureName": {
"xbrltype": "stringItemType",
"nsuri": "http://xbrl.sec.gov/oef/2025",
"localname": "LineGraphAndTableMeasureName",
"presentation": [
"http://xbrl.sec.gov/oef/role/ShareholderReportAverageAnnualReturnDetails",
"http://xbrl.sec.gov/oef/role/ShareholderReportLineGraphDetails"
],
"lang": {
"en-us": {
"role": {
"label": "Line Graph and Table Measure Name"
}
}
},
"auth_ref": [
"r39"
]
},
"oef_LineGraphTableTextBlock": {
"xbrltype": "textBlockItemType",
"nsuri": "http://xbrl.sec.gov/oef/2025",
"localname": "LineGraphTableTextBlock",
"presentation": [
"http://xbrl.sec.gov/oef/role/ShareholderReport"
],
"lang": {
"en-us": {
"role": {
"label": "Line Graph [Table Text Block]"
}
}
},
"auth_ref": [
"r38"
]
},
"bmafi_MagniteIncMember": {
"xbrltype": "domainItemType",
"nsuri": "http://www.bny.com/20251016",
"localname": "MagniteIncMember",
"presentation": [
"http://xbrl.sec.gov/oef/role/ShareholderReportHoldingsDetails"
],
"lang": {
"en-us": {
"role": {
"label": "Magnite Inc [Member]"
}
}
},
"auth_ref": []
},
"oef_MaterialChngDate": {
"xbrltype": "dateItemType",
"nsuri": "http://xbrl.sec.gov/oef/2025",
"localname": "MaterialChngDate",
"presentation": [
"http://xbrl.sec.gov/oef/role/ShareholderReport"
],
"lang": {
"en-us": {
"role": {
"label": "Material Change Date"
}
}
},
"auth_ref": [
"r43"
]
},
"oef_MaterialChngDescriptionTextBlock": {
"xbrltype": "textBlockItemType",
"nsuri": "http://xbrl.sec.gov/oef/2025",
"localname": "MaterialChngDescriptionTextBlock",
"presentation": [
"http://xbrl.sec.gov/oef/role/ShareholderReport"
],
"lang": {
"en-us": {
"role": {
"label": "Material Change Description [Text Block]"
}
}
},
"auth_ref": [
"r43"
]
},
"oef_MaterialFundChngAdviserTextBlock": {
"xbrltype": "textBlockItemType",
"nsuri": "http://xbrl.sec.gov/oef/2025",
"localname": "MaterialFundChngAdviserTextBlock",
"presentation": [
"http://xbrl.sec.gov/oef/role/ShareholderReport"
],
"lang": {
"en-us": {
"role": {
"label": "Material Fund Change Adviser [Text Block]"
}
}
},
"auth_ref": [
"r60"
]
},
"oef_MaterialFundChngExpensesTextBlock": {
"xbrltype": "textBlockItemType",
"nsuri": "http://xbrl.sec.gov/oef/2025",
"localname": "MaterialFundChngExpensesTextBlock",
"presentation": [
"http://xbrl.sec.gov/oef/role/ShareholderReport"
],
"lang": {
"en-us": {
"role": {
"label": "Material Fund Change Expenses [Text Block]"
}
}
},
"auth_ref": [
"r57"
]
},
"oef_MaterialFundChngNameTextBlock": {
"xbrltype": "textBlockItemType",
"nsuri": "http://xbrl.sec.gov/oef/2025",
"localname": "MaterialFundChngNameTextBlock",
"presentation": [
"http://xbrl.sec.gov/oef/role/ShareholderReport"
],
"lang": {
"en-us": {
"role": {
"label": "Material Fund Change Name [Text Block]"
}
}
},
"auth_ref": [
"r55"
]
},
"oef_MaterialFundChngNoticeTextBlock": {
"xbrltype": "textBlockItemType",
"nsuri": "http://xbrl.sec.gov/oef/2025",
"localname": "MaterialFundChngNoticeTextBlock",
"presentation": [
"http://xbrl.sec.gov/oef/role/ShareholderReport"
],
"lang": {
"en-us": {
"role": {
"label": "Material Fund Change Notice [Text Block]"
}
}
},
"auth_ref": [
"r29"
]
},
"oef_MaterialFundChngObjectivesTextBlock": {
"xbrltype": "textBlockItemType",
"nsuri": "http://xbrl.sec.gov/oef/2025",
"localname": "MaterialFundChngObjectivesTextBlock",
"presentation": [
"http://xbrl.sec.gov/oef/role/ShareholderReport"
],
"lang": {
"en-us": {
"role": {
"label": "Material Fund Change Objectives [Text Block]"
}
}
},
"auth_ref": [
"r56"
]
},
"oef_MaterialFundChngRisksChngTextBlock": {
"xbrltype": "textBlockItemType",
"nsuri": "http://xbrl.sec.gov/oef/2025",
"localname": "MaterialFundChngRisksChngTextBlock",
"presentation": [
"http://xbrl.sec.gov/oef/role/ShareholderReport"
],
"lang": {
"en-us": {
"role": {
"label": "Material Fund Change Risks Change [Text Block]"
}
}
},
"auth_ref": [
"r59"
]
},
"oef_MaterialFundChngStrategiesTextBlock": {
"xbrltype": "textBlockItemType",
"nsuri": "http://xbrl.sec.gov/oef/2025",
"localname": "MaterialFundChngStrategiesTextBlock",
"presentation": [
"http://xbrl.sec.gov/oef/role/ShareholderReport"
],
"lang": {
"en-us": {
"role": {
"label": "Material Fund Change Strategies [Text Block]"
}
}
},
"auth_ref": [
"r58"
]
},
"oef_MaterialFundChngTextBlock": {
"xbrltype": "textBlockItemType",
"nsuri": "http://xbrl.sec.gov/oef/2025",
"localname": "MaterialFundChngTextBlock",
"presentation": [
"http://xbrl.sec.gov/oef/role/ShareholderReport"
],
"lang": {
"en-us": {
"role": {
"label": "Material Fund Change [Text Block]"
}
}
},
"auth_ref": [
"r54"
]
},
"oef_MaterialsSectorMember": {
"xbrltype": "domainItemType",
"nsuri": "http://xbrl.sec.gov/oef/2025",
"localname": "MaterialsSectorMember",
"presentation": [
"http://xbrl.sec.gov/oef/role/ShareholderReportHoldingsDetails"
],
"lang": {
"en-us": {
"role": {
"label": "Materials Sector [Member]"
}
}
},
"auth_ref": [
"r53"
]
},
"oef_MaturityAxis": {
"xbrltype": "stringItemType",
"nsuri": "http://xbrl.sec.gov/oef/2025",
"localname": "MaturityAxis",
"presentation": [
"http://xbrl.sec.gov/oef/role/ShareholderReportHoldingsDetails"
],
"lang": {
"en-us": {
"role": {
"label": "Maturity [Axis]"
}
}
},
"auth_ref": [
"r53"
]
},
"oef_MaturityDomain": {
"xbrltype": "domainItemType",
"nsuri": "http://xbrl.sec.gov/oef/2025",
"localname": "MaturityDomain",
"presentation": [
"http://xbrl.sec.gov/oef/role/ShareholderReportHoldingsDetails"
],
"lang": {
"en-us": {
"role": {
"label": "Maturity [Domain]"
}
}
},
"auth_ref": [
"r53"
]
},
"bmafi_MedtronicPLCMember": {
"xbrltype": "domainItemType",
"nsuri": "http://www.bny.com/20251016",
"localname": "MedtronicPLCMember",
"presentation": [
"http://xbrl.sec.gov/oef/role/ShareholderReportHoldingsDetails"
],
"lang": {
"en-us": {
"role": {
"label": "Medtronic PLC [Member]"
}
}
},
"auth_ref": []
},
"bmafi_MetaPlatformsIncClAMember": {
"xbrltype": "domainItemType",
"nsuri": "http://www.bny.com/20251016",
"localname": "MetaPlatformsIncClAMember",
"presentation": [
"http://xbrl.sec.gov/oef/role/ShareholderReportHoldingsDetails"
],
"lang": {
"en-us": {
"role": {
"label": "Meta Platforms Inc Cl A [Member]"
}
}
},
"auth_ref": []
},
"bmafi_MicronTechnologyIncMember": {
"xbrltype": "domainItemType",
"nsuri": "http://www.bny.com/20251016",
"localname": "MicronTechnologyIncMember",
"presentation": [
"http://xbrl.sec.gov/oef/role/ShareholderReportHoldingsDetails"
],
"lang": {
"en-us": {
"role": {
"label": "Micron Technology Inc [Member]"
}
}
},
"auth_ref": []
},
"bmafi_MicrosoftCorpMember": {
"xbrltype": "domainItemType",
"nsuri": "http://www.bny.com/20251016",
"localname": "MicrosoftCorpMember",
"presentation": [
"http://xbrl.sec.gov/oef/role/ShareholderReportHoldingsDetails"
],
"lang": {
"en-us": {
"role": {
"label": "Microsoft Corp [Member]"
}
}
},
"auth_ref": []
},
"bmafi_NVIDIACorpMember": {
"xbrltype": "domainItemType",
"nsuri": "http://www.bny.com/20251016",
"localname": "NVIDIACorpMember",
"presentation": [
"http://xbrl.sec.gov/oef/role/ShareholderReportHoldingsDetails"
],
"lang": {
"en-us": {
"role": {
"label": "NVIDIA Corp [Member]"
}
}
},
"auth_ref": []
},
"bmafi_NYSETechnologyIndexMember": {
"xbrltype": "domainItemType",
"nsuri": "http://www.bny.com/20251016",
"localname": "NYSETechnologyIndexMember",
"presentation": [
"http://xbrl.sec.gov/oef/role/ShareholderReportAverageAnnualReturnDetails",
"http://xbrl.sec.gov/oef/role/ShareholderReportLineGraphDetails"
],
"lang": {
"en-us": {
"role": {
"label": "NYSE Technology Index [Member]"
}
}
},
"auth_ref": []
},
"bmafi_NetOtherAssetsAndLiabilitiesMember": {
"xbrltype": "domainItemType",
"nsuri": "http://www.bny.com/20251016",
"localname": "NetOtherAssetsAndLiabilitiesMember",
"presentation": [
"http://xbrl.sec.gov/oef/role/ShareholderReportHoldingsDetails"
],
"lang": {
"en-us": {
"role": {
"label": "Net Other Assets and Liabilities [Member]"
}
}
},
"auth_ref": []
},
"bmafi_NetflixIncMember": {
"xbrltype": "domainItemType",
"nsuri": "http://www.bny.com/20251016",
"localname": "NetflixIncMember",
"presentation": [
"http://xbrl.sec.gov/oef/role/ShareholderReportHoldingsDetails"
],
"lang": {
"en-us": {
"role": {
"label": "Netflix Inc [Member]"
}
}
},
"auth_ref": []
},
"bmafi_NewmontCorpMember": {
"xbrltype": "domainItemType",
"nsuri": "http://www.bny.com/20251016",
"localname": "NewmontCorpMember",
"presentation": [
"http://xbrl.sec.gov/oef/role/ShareholderReportHoldingsDetails"
],
"lang": {
"en-us": {
"role": {
"label": "Newmont Corp [Member]"
}
}
},
"auth_ref": []
},
"oef_NoDeductionOfTaxesTextBlock": {
"xbrltype": "textBlockItemType",
"nsuri": "http://xbrl.sec.gov/oef/2025",
"localname": "NoDeductionOfTaxesTextBlock",
"presentation": [
"http://xbrl.sec.gov/oef/role/ShareholderReport"
],
"lang": {
"en-us": {
"role": {
"label": "No Deduction of Taxes [Text Block]"
}
}
},
"auth_ref": [
"r40"
]
},
"dei_NoTradingSymbolFlag": {
"xbrltype": "trueItemType",
"nsuri": "http://xbrl.sec.gov/dei/2025",
"localname": "NoTradingSymbolFlag",
"presentation": [
"http://xbrl.sec.gov/oef/role/ShareholderReport"
],
"lang": {
"en-us": {
"role": {
"label": "No Trading Symbol Flag",
"documentation": "Boolean flag that is true only for a security having no trading symbol."
}
}
},
"auth_ref": []
},
"bmafi_OracleCorpMember": {
"xbrltype": "domainItemType",
"nsuri": "http://www.bny.com/20251016",
"localname": "OracleCorpMember",
"presentation": [
"http://xbrl.sec.gov/oef/role/ShareholderReportHoldingsDetails"
],
"lang": {
"en-us": {
"role": {
"label": "Oracle Corp [Member]"
}
}
},
"auth_ref": []
},
"oef_OtherCategory1Axis": {
"xbrltype": "stringItemType",
"nsuri": "http://xbrl.sec.gov/oef/2025",
"localname": "OtherCategory1Axis",
"presentation": [
"http://xbrl.sec.gov/oef/role/ShareholderReportHoldingsDetails"
],
"lang": {
"en-us": {
"role": {
"label": "Other Category 1 [Axis]"
}
}
},
"auth_ref": [
"r53"
]
},
"oef_OtherCategory1Domain": {
"xbrltype": "domainItemType",
"nsuri": "http://xbrl.sec.gov/oef/2025",
"localname": "OtherCategory1Domain",
"presentation": [
"http://xbrl.sec.gov/oef/role/ShareholderReportHoldingsDetails"
],
"lang": {
"en-us": {
"role": {
"label": "Other Category 1 [Domain]"
}
}
},
"auth_ref": [
"r53"
]
},
"oef_OtherCategory2Axis": {
"xbrltype": "stringItemType",
"nsuri": "http://xbrl.sec.gov/oef/2025",
"localname": "OtherCategory2Axis",
"presentation": [
"http://xbrl.sec.gov/oef/role/ShareholderReportHoldingsDetails"
],
"lang": {
"en-us": {
"role": {
"label": "Other Category 2 [Axis]"
}
}
},
"auth_ref": [
"r53"
]
},
"oef_OtherCategory2Domain": {
"xbrltype": "domainItemType",
"nsuri": "http://xbrl.sec.gov/oef/2025",
"localname": "OtherCategory2Domain",
"presentation": [
"http://xbrl.sec.gov/oef/role/ShareholderReportHoldingsDetails"
],
"lang": {
"en-us": {
"role": {
"label": "Other Category 2 [Domain]"
}
}
},
"auth_ref": [
"r53"
]
},
"oef_PctOfNav": {
"xbrltype": "percentItemType",
"nsuri": "http://xbrl.sec.gov/oef/2025",
"localname": "PctOfNav",
"presentation": [
"http://xbrl.sec.gov/oef/role/ShareholderReportHoldingsDetails"
],
"lang": {
"en-us": {
"role": {
"label": "Percent of Net Asset Value"
}
}
},
"auth_ref": [
"r53"
]
},
"oef_PctOfNetLongExposure": {
"xbrltype": "percentItemType",
"nsuri": "http://xbrl.sec.gov/oef/2025",
"localname": "PctOfNetLongExposure",
"presentation": [
"http://xbrl.sec.gov/oef/role/ShareholderReportHoldingsDetails"
],
"lang": {
"en-us": {
"role": {
"label": "Percent of Net Long Exposure"
}
}
},
"auth_ref": [
"r53"
]
},
"oef_PctOfNetShortExposure": {
"xbrltype": "percentItemType",
"nsuri": "http://xbrl.sec.gov/oef/2025",
"localname": "PctOfNetShortExposure",
"presentation": [
"http://xbrl.sec.gov/oef/role/ShareholderReportHoldingsDetails"
],
"lang": {
"en-us": {
"role": {
"label": "Percent of Net Short Exposure"
}
}
},
"auth_ref": [
"r53"
]
},
"oef_PctOfTotalInv": {
"xbrltype": "percentItemType",
"nsuri": "http://xbrl.sec.gov/oef/2025",
"localname": "PctOfTotalInv",
"presentation": [
"http://xbrl.sec.gov/oef/role/ShareholderReportHoldingsDetails"
],
"lang": {
"en-us": {
"role": {
"label": "Percent of Total Investments"
}
}
},
"auth_ref": [
"r53"
]
},
"oef_PctOfTotalLongExposure": {
"xbrltype": "percentItemType",
"nsuri": "http://xbrl.sec.gov/oef/2025",
"localname": "PctOfTotalLongExposure",
"presentation": [
"http://xbrl.sec.gov/oef/role/ShareholderReportHoldingsDetails"
],
"lang": {
"en-us": {
"role": {
"label": "Percent of Total Long Exposure"
}
}
},
"auth_ref": [
"r53"
]
},
"oef_PctOfTotalShortExposure": {
"xbrltype": "percentItemType",
"nsuri": "http://xbrl.sec.gov/oef/2025",
"localname": "PctOfTotalShortExposure",
"presentation": [
"http://xbrl.sec.gov/oef/role/ShareholderReportHoldingsDetails"
],
"lang": {
"en-us": {
"role": {
"label": "Percent of Total Short Exposure"
}
}
},
"auth_ref": [
"r53"
]
},
"oef_PerfInceptionDate": {
"xbrltype": "dateItemType",
"nsuri": "http://xbrl.sec.gov/oef/2025",
"localname": "PerfInceptionDate",
"presentation": [
"http://xbrl.sec.gov/oef/role/ShareholderReport"
],
"lang": {
"en-us": {
"role": {
"label": "Performance Inception Date"
}
}
},
"auth_ref": [
"r39"
]
},
"oef_PerfTableMarketIndexChngdTextBlock": {
"xbrltype": "textBlockItemType",
"nsuri": "http://xbrl.sec.gov/oef/2025",
"localname": "PerfTableMarketIndexChngdTextBlock",
"presentation": [
"http://xbrl.sec.gov/oef/role/ShareholderReport"
],
"lang": {
"en-us": {
"role": {
"label": "Performance Table Market Index Changed [Text Block]"
}
}
},
"auth_ref": [
"r46"
]
},
"oef_PerformancePastDoesNotIndicateFuture": {
"xbrltype": "stringItemType",
"nsuri": "http://xbrl.sec.gov/oef/2025",
"localname": "PerformancePastDoesNotIndicateFuture",
"presentation": [
"http://xbrl.sec.gov/oef/role/ShareholderReport"
],
"lang": {
"en-us": {
"role": {
"label": "Performance Past Does Not Indicate Future [Text]"
}
}
},
"auth_ref": [
"r41",
"r65"
]
},
"oef_PreviousInvestmentAdviserTextBlock": {
"xbrltype": "textBlockItemType",
"nsuri": "http://xbrl.sec.gov/oef/2025",
"localname": "PreviousInvestmentAdviserTextBlock",
"presentation": [
"http://xbrl.sec.gov/oef/role/ShareholderReport"
],
"lang": {
"en-us": {
"role": {
"label": "Previous Investment Adviser [Text Block]"
}
}
},
"auth_ref": [
"r42"
]
},
"oef_PriorMarketIndexComparisonTextBlock": {
"xbrltype": "textBlockItemType",
"nsuri": "http://xbrl.sec.gov/oef/2025",
"localname": "PriorMarketIndexComparisonTextBlock",
"presentation": [
"http://xbrl.sec.gov/oef/role/ShareholderReport"
],
"lang": {
"en-us": {
"role": {
"label": "Prior Market Index Comparison [Text Block]"
}
}
},
"auth_ref": [
"r46"
]
},
"bmafi_QuantaServicesIncMember": {
"xbrltype": "domainItemType",
"nsuri": "http://www.bny.com/20251016",
"localname": "QuantaServicesIncMember",
"presentation": [
"http://xbrl.sec.gov/oef/role/ShareholderReportHoldingsDetails"
],
"lang": {
"en-us": {
"role": {
"label": "Quanta Services Inc [Member]"
}
}
},
"auth_ref": []
},
"us-gaap_RealEstateSectorMember": {
"xbrltype": "domainItemType",
"nsuri": "http://fasb.org/us-gaap/2025",
"localname": "RealEstateSectorMember",
"presentation": [
"http://xbrl.sec.gov/oef/role/ShareholderReportHoldingsDetails"
],
"lang": {
"en-us": {
"role": {
"label": "Real Estate Sector [Member]",
"documentation": "Sector of the economy consisting of companies engaged in real estate business activities."
}
}
},
"auth_ref": [
"r17",
"r19",
"r70",
"r71",
"r72",
"r76"
]
},
"bmafi_RocketCosIncClAMember": {
"xbrltype": "domainItemType",
"nsuri": "http://www.bny.com/20251016",
"localname": "RocketCosIncClAMember",
"presentation": [
"http://xbrl.sec.gov/oef/role/ShareholderReportHoldingsDetails"
],
"lang": {
"en-us": {
"role": {
"label": "Rocket Cos Inc Cl A [Member]"
}
}
},
"auth_ref": []
},
"bmafi_Russell1000IndexMember": {
"xbrltype": "domainItemType",
"nsuri": "http://www.bny.com/20251016",
"localname": "Russell1000IndexMember",
"presentation": [
"http://xbrl.sec.gov/oef/role/ShareholderReportAverageAnnualReturnDetails",
"http://xbrl.sec.gov/oef/role/ShareholderReportLineGraphDetails"
],
"lang": {
"en-us": {
"role": {
"label": "Russell 1000 Index [Member]"
}
}
},
"auth_ref": []
},
"bmafi_Russell1000ValueIndexMember": {
"xbrltype": "domainItemType",
"nsuri": "http://www.bny.com/20251016",
"localname": "Russell1000ValueIndexMember",
"presentation": [
"http://xbrl.sec.gov/oef/role/ShareholderReportAverageAnnualReturnDetails",
"http://xbrl.sec.gov/oef/role/ShareholderReportLineGraphDetails"
],
"lang": {
"en-us": {
"role": {
"label": "Russell 1000 Value Index [Member]"
}
}
},
"auth_ref": []
},
"bmafi_Russell2000IndexMember": {
"xbrltype": "domainItemType",
"nsuri": "http://www.bny.com/20251016",
"localname": "Russell2000IndexMember",
"presentation": [
"http://xbrl.sec.gov/oef/role/ShareholderReportAverageAnnualReturnDetails",
"http://xbrl.sec.gov/oef/role/ShareholderReportLineGraphDetails"
],
"lang": {
"en-us": {
"role": {
"label": "Russell 2000 Index [Member]"
}
}
},
"auth_ref": []
},
"bmafi_Russell3000IndexMember": {
"xbrltype": "domainItemType",
"nsuri": "http://www.bny.com/20251016",
"localname": "Russell3000IndexMember",
"presentation": [
"http://xbrl.sec.gov/oef/role/ShareholderReportAverageAnnualReturnDetails",
"http://xbrl.sec.gov/oef/role/ShareholderReportLineGraphDetails"
],
"lang": {
"en-us": {
"role": {
"label": "Russell 3000 Index [Member]"
}
}
},
"auth_ref": []
},
"bmafi_RussellMidcapValueIndexMember": {
"xbrltype": "domainItemType",
"nsuri": "http://www.bny.com/20251016",
"localname": "RussellMidcapValueIndexMember",
"presentation": [
"http://xbrl.sec.gov/oef/role/ShareholderReportAverageAnnualReturnDetails",
"http://xbrl.sec.gov/oef/role/ShareholderReportLineGraphDetails"
],
"lang": {
"en-us": {
"role": {
"label": "Russell Midcap Value Index [Member]"
}
}
},
"auth_ref": []
},
"oef_SalesLoadAxis": {
"xbrltype": "stringItemType",
"nsuri": "http://xbrl.sec.gov/oef/2025",
"localname": "SalesLoadAxis",
"presentation": [
"http://xbrl.sec.gov/oef/role/ShareholderReportAverageAnnualReturnDetails"
],
"lang": {
"en-us": {
"role": {
"label": "Sales Load [Axis]"
}
}
},
"auth_ref": [
"r45"
]
},
"dei_SecurityExchangeName": {
"xbrltype": "edgarExchangeCodeItemType",
"nsuri": "http://xbrl.sec.gov/dei/2025",
"localname": "SecurityExchangeName",
"presentation": [
"http://xbrl.sec.gov/oef/role/ShareholderReport"
],
"lang": {
"en-us": {
"role": {
"label": "Security Exchange Name",
"terseLabel": "Exchange",
"documentation": "Name of the Exchange on which a security is registered."
}
}
},
"auth_ref": [
"r24"
]
},
"oef_ShareClassDomain": {
"xbrltype": "domainItemType",
"nsuri": "http://xbrl.sec.gov/oef/2025",
"localname": "ShareClassDomain",
"presentation": [
"http://xbrl.sec.gov/oef/role/ShareholderReport",
"http://xbrl.sec.gov/oef/role/ShareholderReportAverageAnnualReturnDetails",
"http://xbrl.sec.gov/oef/role/ShareholderReportHoldingsDetails",
"http://xbrl.sec.gov/oef/role/ShareholderReportLineGraphDetails"
],
"lang": {
"en-us": {
"role": {
"label": "Share Classes"
}
}
},
"auth_ref": [
"r25"
]
},
"oef_ShareholderReportAbstract": {
"xbrltype": "stringItemType",
"nsuri": "http://xbrl.sec.gov/oef/2025",
"localname": "ShareholderReportAbstract",
"lang": {
"en-us": {
"role": {
"label": "Shareholder Report [Abstract]"
}
}
},
"auth_ref": [
"r45"
]
},
"oef_ShareholderReportAnnualOrSemiAnnual": {
"xbrltype": "shareholderReportTypeItemType",
"nsuri": "http://xbrl.sec.gov/oef/2025",
"localname": "ShareholderReportAnnualOrSemiAnnual",
"presentation": [
"http://xbrl.sec.gov/oef/role/ShareholderReport"
],
"lang": {
"en-us": {
"role": {
"label": "Shareholder Report Annual or Semi-Annual"
}
}
},
"auth_ref": [
"r27"
]
},
"oef_ShareholderReportLineItems": {
"xbrltype": "stringItemType",
"nsuri": "http://xbrl.sec.gov/oef/2025",
"localname": "ShareholderReportLineItems",
"presentation": [
"http://xbrl.sec.gov/oef/role/NcsrCover",
"http://xbrl.sec.gov/oef/role/ShareholderReport"
],
"lang": {
"en-us": {
"role": {
"label": "Shareholder Report [Line Items]"
}
}
},
"auth_ref": [
"r45"
]
},
"oef_ShareholderReportTable": {
"xbrltype": "stringItemType",
"nsuri": "http://xbrl.sec.gov/oef/2025",
"localname": "ShareholderReportTable",
"presentation": [
"http://xbrl.sec.gov/oef/role/NcsrCover",
"http://xbrl.sec.gov/oef/role/ShareholderReport"
],
"lang": {
"en-us": {
"role": {
"label": "Shareholder Report [Table]"
}
}
},
"auth_ref": [
"r45"
]
},
"bmafi_ShopifyIncClAMember": {
"xbrltype": "domainItemType",
"nsuri": "http://www.bny.com/20251016",
"localname": "ShopifyIncClAMember",
"presentation": [
"http://xbrl.sec.gov/oef/role/ShareholderReportHoldingsDetails"
],
"lang": {
"en-us": {
"role": {
"label": "Shopify Inc Cl A [Member]"
}
}
},
"auth_ref": []
},
"bmafi_SkyWestIncMember": {
"xbrltype": "domainItemType",
"nsuri": "http://www.bny.com/20251016",
"localname": "SkyWestIncMember",
"presentation": [
"http://xbrl.sec.gov/oef/role/ShareholderReportHoldingsDetails"
],
"lang": {
"en-us": {
"role": {
"label": "SkyWest Inc [Member]"
}
}
},
"auth_ref": []
},
"us-gaap_StandardPoors500IndexMember": {
"xbrltype": "domainItemType",
"nsuri": "http://fasb.org/us-gaap/2025",
"localname": "StandardPoors500IndexMember",
"presentation": [
"http://xbrl.sec.gov/oef/role/ShareholderReportAverageAnnualReturnDetails",
"http://xbrl.sec.gov/oef/role/ShareholderReportLineGraphDetails"
],
"lang": {
"en-us": {
"role": {
"label": "Standard & Poor's 500 Index [Member]",
"documentation": "Index of 500 large companies trading on stock exchanges in United States of America (US)."
}
}
},
"auth_ref": [
"r73",
"r74",
"r75"
]
},
"oef_SummaryOfChngLegendTextBlock": {
"xbrltype": "textBlockItemType",
"nsuri": "http://xbrl.sec.gov/oef/2025",
"localname": "SummaryOfChngLegendTextBlock",
"presentation": [
"http://xbrl.sec.gov/oef/role/ShareholderReport"
],
"lang": {
"en-us": {
"role": {
"label": "Summary of Change Legend [Text Block]"
}
}
},
"auth_ref": [
"r61"
]
},
"bmafi_TaiwanSemiconductorManufacturingCoLtdADRMember": {
"xbrltype": "domainItemType",
"nsuri": "http://www.bny.com/20251016",
"localname": "TaiwanSemiconductorManufacturingCoLtdADRMember",
"presentation": [
"http://xbrl.sec.gov/oef/role/ShareholderReportHoldingsDetails"
],
"lang": {
"en-us": {
"role": {
"label": "Taiwan Semiconductor Manufacturing Co Ltd ADR [Member]"
}
}
},
"auth_ref": []
},
"bmafi_TexasCapitalBancsharesIncMember": {
"xbrltype": "domainItemType",
"nsuri": "http://www.bny.com/20251016",
"localname": "TexasCapitalBancsharesIncMember",
"presentation": [
"http://xbrl.sec.gov/oef/role/ShareholderReportHoldingsDetails"
],
"lang": {
"en-us": {
"role": {
"label": "Texas Capital Bancshares Inc [Member]"
}
}
},
"auth_ref": []
},
"dei_TradingSymbol": {
"xbrltype": "tradingSymbolItemType",
"nsuri": "http://xbrl.sec.gov/dei/2025",
"localname": "TradingSymbol",
"presentation": [
"http://xbrl.sec.gov/oef/role/ShareholderReport"
],
"lang": {
"en-us": {
"role": {
"label": "Trading Symbol",
"terseLabel": "Ticker",
"documentation": "Trading symbol of an instrument as listed on an exchange."
}
}
},
"auth_ref": []
},
"oef_UpdPerfInfoLocationTextBlock": {
"xbrltype": "textBlockItemType",
"nsuri": "http://xbrl.sec.gov/oef/2025",
"localname": "UpdPerfInfoLocationTextBlock",
"presentation": [
"http://xbrl.sec.gov/oef/role/ShareholderReport"
],
"lang": {
"en-us": {
"role": {
"label": "Updated Performance Information Location [Text Block]"
}
}
},
"auth_ref": [
"r44"
]
},
"oef_UpdProspectusEmailAddress": {
"xbrltype": "stringItemType",
"nsuri": "http://xbrl.sec.gov/oef/2025",
"localname": "UpdProspectusEmailAddress",
"presentation": [
"http://xbrl.sec.gov/oef/role/ShareholderReport"
],
"lang": {
"en-us": {
"role": {
"label": "Updated Prospectus Email Address"
}
}
},
"auth_ref": [
"r61"
]
},
"oef_UpdProspectusPhoneNumber": {
"xbrltype": "stringItemType",
"nsuri": "http://xbrl.sec.gov/oef/2025",
"localname": "UpdProspectusPhoneNumber",
"presentation": [
"http://xbrl.sec.gov/oef/role/ShareholderReport"
],
"lang": {
"en-us": {
"role": {
"label": "Updated Prospectus Phone Number"
}
}
},
"auth_ref": [
"r61"
]
},
"oef_UpdProspectusWebAddress": {
"xbrltype": "stringItemType",
"nsuri": "http://xbrl.sec.gov/oef/2025",
"localname": "UpdProspectusWebAddress",
"presentation": [
"http://xbrl.sec.gov/oef/role/ShareholderReport"
],
"lang": {
"en-us": {
"role": {
"label": "Updated Prospectus Web Address"
}
}
},
"auth_ref": [
"r61"
]
},
"oef_UtilitiesSectorMember": {
"xbrltype": "domainItemType",
"nsuri": "http://xbrl.sec.gov/oef/2025",
"localname": "UtilitiesSectorMember",
"presentation": [
"http://xbrl.sec.gov/oef/role/ShareholderReportHoldingsDetails"
],
"lang": {
"en-us": {
"role": {
"label": "Utilities Sector [Member]"
}
}
},
"auth_ref": [
"r53"
]
},
"oef_WithSalesLoadMember": {
"xbrltype": "domainItemType",
"nsuri": "http://xbrl.sec.gov/oef/2025",
"localname": "WithSalesLoadMember",
"presentation": [
"http://xbrl.sec.gov/oef/role/ShareholderReportAverageAnnualReturnDetails"
],
"lang": {
"en-us": {
"role": {
"label": "With Sales Load [Member]"
}
}
},
"auth_ref": [
"r45"
]
},
"oef_WithoutSalesLoadMember": {
"xbrltype": "domainItemType",
"nsuri": "http://xbrl.sec.gov/oef/2025",
"localname": "WithoutSalesLoadMember",
"presentation": [
"http://xbrl.sec.gov/oef/role/ShareholderReportAverageAnnualReturnDetails"
],
"lang": {
"en-us": {
"role": {
"label": "Without Sales Load [Member]"
}
}
},
"auth_ref": [
"r45"
]
}
}
}
},
"std_ref": {
"r0": {
"role": "http://fasb.org/us-gaap/role/ref/legacyRef",
"Name": "Accounting Standards Codification",
"Section": "50",
"Paragraph": "1",
"SubTopic": "30",
"Topic": "205",
"Publisher": "FASB",
"URI": "https://asc.fasb.org/1943274/2147479910/205-30-50-1"
},
"r1": {
"role": "http://www.xbrl.org/2003/role/disclosureRef",
"Topic": "946",
"SubTopic": "210",
"Name": "Accounting Standards Codification",
"Section": "50",
"Paragraph": "1",
"Subparagraph": "(b)(1)",
"Publisher": "FASB",
"URI": "https://asc.fasb.org/1943274/2147478795/946-210-50-1"
},
"r2": {
"role": "http://www.xbrl.org/2003/role/disclosureRef",
"Topic": "946",
"SubTopic": "210",
"Name": "Accounting Standards Codification",
"Section": "50",
"Paragraph": "1",
"Subparagraph": "(c)(1)",
"Publisher": "FASB",
"URI": "https://asc.fasb.org/1943274/2147478795/946-210-50-1"
},
"r3": {
"role": "http://www.xbrl.org/2003/role/disclosureRef",
"Topic": "946",
"SubTopic": "210",
"Name": "Accounting Standards Codification",
"Section": "50",
"Paragraph": "1",
"Subparagraph": "(c)(2)",
"Publisher": "FASB",
"URI": "https://asc.fasb.org/1943274/2147478795/946-210-50-1"
},
"r4": {
"role": "http://www.xbrl.org/2003/role/disclosureRef",
"Topic": "946",
"SubTopic": "210",
"Name": "Accounting Standards Codification",
"Section": "50",
"Paragraph": "6",
"Subparagraph": "(a)(1)",
"Publisher": "FASB",
"URI": "https://asc.fasb.org/1943274/2147478795/946-210-50-6"
},
"r5": {
"role": "http://www.xbrl.org/2003/role/disclosureRef",
"Topic": "946",
"SubTopic": "210",
"Name": "Accounting Standards Codification",
"Section": "50",
"Paragraph": "6",
"Subparagraph": "(c)",
"Publisher": "FASB",
"URI": "https://asc.fasb.org/1943274/2147478795/946-210-50-6"
},
"r6": {
"role": "http://www.xbrl.org/2003/role/disclosureRef",
"Topic": "946",
"SubTopic": "320",
"Name": "Accounting Standards Codification",
"Section": "S99",
"Paragraph": "1",
"Subparagraph": "(SX 210.12-12(Column A)(Footnote 1))",
"Publisher": "FASB",
"URI": "https://asc.fasb.org/1943274/2147477271/946-320-S99-1"
},
"r7": {
"role": "http://www.xbrl.org/2003/role/disclosureRef",
"Topic": "946",
"SubTopic": "320",
"Name": "Accounting Standards Codification",
"Section": "S99",
"Paragraph": "1",
"Subparagraph": "(SX 210.12-12(Column C)(Footnote 5))",
"Publisher": "FASB",
"URI": "https://asc.fasb.org/1943274/2147477271/946-320-S99-1"
},
"r8": {
"role": "http://www.xbrl.org/2003/role/disclosureRef",
"Topic": "946",
"SubTopic": "320",
"Name": "Accounting Standards Codification",
"Section": "S99",
"Paragraph": "2",
"Subparagraph": "(SX 210.12-12A(Column C)(Footnote 4))",
"Publisher": "FASB",
"URI": "https://asc.fasb.org/1943274/2147477271/946-320-S99-2"
},
"r9": {
"role": "http://www.xbrl.org/2003/role/disclosureRef",
"Topic": "946",
"SubTopic": "320",
"Name": "Accounting Standards Codification",
"Section": "S99",
"Paragraph": "3",
"Subparagraph": "(SX 210.12-12B(Column A)(Footnote 7))",
"Publisher": "FASB",
"URI": "https://asc.fasb.org/1943274/2147477271/946-320-S99-3"
},
"r10": {
"role": "http://www.xbrl.org/2003/role/disclosureRef",
"Topic": "946",
"SubTopic": "320",
"Name": "Accounting Standards Codification",
"Section": "S99",
"Paragraph": "3",
"Subparagraph": "(SX 210.12-12B(Column C)(Footnote 2))",
"Publisher": "FASB",
"URI": "https://asc.fasb.org/1943274/2147477271/946-320-S99-3"
},
"r11": {
"role": "http://www.xbrl.org/2003/role/disclosureRef",
"Topic": "946",
"SubTopic": "320",
"Name": "Accounting Standards Codification",
"Section": "S99",
"Paragraph": "5D",
"Subparagraph": "(SX 210.12-13D(Column A)(Footnote 2)(i))",
"Publisher": "FASB",
"URI": "https://asc.fasb.org/1943274/2147477271/946-320-S99-5D"
},
"r12": {
"role": "http://www.xbrl.org/2003/role/disclosureRef",
"Topic": "946",
"SubTopic": "320",
"Name": "Accounting Standards Codification",
"Section": "S99",
"Paragraph": "6",
"Subparagraph": "(SX 210.12-14(Column F)(Footnote 7))",
"Publisher": "FASB",
"URI": "https://asc.fasb.org/1943274/2147477271/946-320-S99-6"
},
"r13": {
"role": "http://www.xbrl.org/2003/role/disclosureRef",
"Topic": "946",
"SubTopic": "320",
"Name": "Accounting Standards Codification",
"Section": "S99",
"Paragraph": "7",
"Subparagraph": "(SX 210.12-15(Column A))",
"Publisher": "FASB",
"URI": "https://asc.fasb.org/1943274/2147477271/946-320-S99-7"
},
"r14": {
"role": "http://www.xbrl.org/2003/role/disclosureRef",
"Topic": "946",
"SubTopic": "320",
"Name": "Accounting Standards Codification",
"Section": "S99",
"Paragraph": "7",
"Subparagraph": "(SX 210.12-15(Column B))",
"Publisher": "FASB",
"URI": "https://asc.fasb.org/1943274/2147477271/946-320-S99-7"
},
"r15": {
"role": "http://www.xbrl.org/2003/role/disclosureRef",
"Topic": "946",
"SubTopic": "320",
"Name": "Accounting Standards Codification",
"Section": "S99",
"Paragraph": "7",
"Subparagraph": "(SX 210.12-15(Column C))",
"Publisher": "FASB",
"URI": "https://asc.fasb.org/1943274/2147477271/946-320-S99-7"
},
"r16": {
"role": "http://www.xbrl.org/2003/role/disclosureRef",
"Topic": "946",
"SubTopic": "320",
"Name": "Accounting Standards Codification",
"Section": "S99",
"Paragraph": "7",
"Subparagraph": "(SX 210.12-15(Column D))",
"Publisher": "FASB",
"URI": "https://asc.fasb.org/1943274/2147477271/946-320-S99-7"
},
"r17": {
"role": "http://www.xbrl.org/2003/role/exampleRef",
"Topic": "326",
"SubTopic": "20",
"Name": "Accounting Standards Codification",
"Section": "55",
"Paragraph": "12",
"Subparagraph": "(c)(1)",
"Publisher": "FASB",
"URI": "https://asc.fasb.org/1943274/2147479294/326-20-55-12"
},
"r18": {
"role": "http://www.xbrl.org/2003/role/exampleRef",
"Topic": "326",
"SubTopic": "20",
"Name": "Accounting Standards Codification",
"Section": "55",
"Paragraph": "15",
"Subparagraph": "(b)",
"Publisher": "FASB",
"URI": "https://asc.fasb.org/1943274/2147479294/326-20-55-15"
},
"r19": {
"role": "http://www.xbrl.org/2003/role/exampleRef",
"Topic": "820",
"SubTopic": "10",
"Name": "Accounting Standards Codification",
"Section": "55",
"Paragraph": "100",
"Publisher": "FASB",
"URI": "https://asc.fasb.org/1943274/2147482078/820-10-55-100"
},
"r20": {
"role": "http://www.xbrl.org/2003/role/exampleRef",
"Topic": "820",
"SubTopic": "10",
"Name": "Accounting Standards Codification",
"Section": "55",
"Paragraph": "101",
"Publisher": "FASB",
"URI": "https://asc.fasb.org/1943274/2147482078/820-10-55-101"
},
"r21": {
"role": "http://www.xbrl.org/2003/role/exampleRef",
"Topic": "820",
"SubTopic": "10",
"Name": "Accounting Standards Codification",
"Section": "55",
"Paragraph": "103",
"Publisher": "FASB",
"URI": "https://asc.fasb.org/1943274/2147482078/820-10-55-103"
},
"r22": {
"role": "http://www.xbrl.org/2003/role/exampleRef",
"Topic": "946",
"SubTopic": "210",
"Name": "Accounting Standards Codification",
"Section": "55",
"Paragraph": "1",
"Publisher": "FASB",
"URI": "https://asc.fasb.org/1943274/2147477439/946-210-55-1"
},
"r23": {
"role": "http://www.xbrl.org/2003/role/presentationRef",
"Publisher": "SEC",
"Name": "Exchange Act",
"Number": "240",
"Section": "12",
"Subsection": "b-2"
},
"r24": {
"role": "http://www.xbrl.org/2003/role/presentationRef",
"Publisher": "SEC",
"Name": "Exchange Act",
"Number": "240",
"Section": "12",
"Subsection": "d1-1"
},
"r25": {
"role": "http://www.xbrl.org/2003/role/presentationRef",
"Publisher": "SEC",
"Name": "Form N-1A",
"Section": "1",
"Subsection": "a",
"Paragraph": "1"
},
"r26": {
"role": "http://www.xbrl.org/2003/role/presentationRef",
"Publisher": "SEC",
"Name": "Form N-1A",
"Section": "27A",
"Subsection": "b",
"Paragraph": "1"
},
"r27": {
"role": "http://www.xbrl.org/2003/role/presentationRef",
"Publisher": "SEC",
"Name": "Form N-1A",
"Section": "27A",
"Subsection": "b",
"Paragraph": "3"
},
"r28": {
"role": "http://www.xbrl.org/2003/role/presentationRef",
"Publisher": "SEC",
"Name": "Form N-1A",
"Section": "27A",
"Subsection": "b",
"Paragraph": "4"
},
"r29": {
"role": "http://www.xbrl.org/2003/role/presentationRef",
"Publisher": "SEC",
"Name": "Form N-1A",
"Section": "27A",
"Subsection": "b",
"Paragraph": "5"
},
"r30": {
"role": "http://www.xbrl.org/2003/role/presentationRef",
"Publisher": "SEC",
"Name": "Form N-1A",
"Section": "27A",
"Subsection": "b",
"Paragraph": "instruction",
"Subparagraph": "2"
},
"r31": {
"role": "http://www.xbrl.org/2003/role/presentationRef",
"Publisher": "SEC",
"Name": "Form N-1A",
"Section": "27A",
"Subsection": "c"
},
"r32": {
"role": "http://www.xbrl.org/2003/role/presentationRef",
"Publisher": "SEC",
"Name": "Form N-1A",
"Section": "27A",
"Subsection": "c",
"Paragraph": "ii"
},
"r33": {
"role": "http://www.xbrl.org/2003/role/presentationRef",
"Publisher": "SEC",
"Name": "Form N-1A",
"Section": "27A",
"Subsection": "c",
"Paragraph": "iii"
},
"r34": {
"role": "http://www.xbrl.org/2003/role/presentationRef",
"Publisher": "SEC",
"Name": "Form N-1A",
"Section": "27A",
"Subsection": "c",
"Paragraph": "instruction",
"Sentence": "1",
"Clause": "b"
},
"r35": {
"role": "http://www.xbrl.org/2003/role/presentationRef",
"Publisher": "SEC",
"Name": "Form N-1A",
"Section": "27A",
"Subsection": "c",
"Paragraph": "instruction",
"Subparagraph": "1",
"Clause": "c"
},
"r36": {
"role": "http://www.xbrl.org/2003/role/presentationRef",
"Publisher": "SEC",
"Name": "Form N-1A",
"Section": "27A",
"Subsection": "c",
"Paragraph": "instruction",
"Subparagraph": "1",
"Clause": "d"
},
"r37": {
"role": "http://www.xbrl.org/2003/role/presentationRef",
"Publisher": "SEC",
"Name": "Form N-1A",
"Section": "27A",
"Subsection": "d",
"Paragraph": "1"
},
"r38": {
"role": "http://www.xbrl.org/2003/role/presentationRef",
"Publisher": "SEC",
"Name": "Form N-1A",
"Section": "27A",
"Subsection": "d",
"Paragraph": "2"
},
"r39": {
"role": "http://www.xbrl.org/2003/role/presentationRef",
"Publisher": "SEC",
"Name": "Form N-1A",
"Section": "27A",
"Subsection": "d",
"Paragraph": "2",
"Subparagraph": "i"
},
"r40": {
"role": "http://www.xbrl.org/2003/role/presentationRef",
"Publisher": "SEC",
"Name": "Form N-1A",
"Section": "27A",
"Subsection": "d",
"Paragraph": "2",
"Subparagraph": "iii",
"Clause": "B"
},
"r41": {
"role": "http://www.xbrl.org/2003/role/presentationRef",
"Publisher": "SEC",
"Name": "Form N-1A",
"Section": "27A",
"Subsection": "d",
"Paragraph": "2",
"Subparagraph": "iiii",
"Clause": "A"
},
"r42": {
"role": "http://www.xbrl.org/2003/role/presentationRef",
"Publisher": "SEC",
"Name": "Form N-1A",
"Section": "27A",
"Subsection": "d",
"Paragraph": "2",
"Subparagraph": "instruction",
"Clause": "12"
},
"r43": {
"role": "http://www.xbrl.org/2003/role/presentationRef",
"Publisher": "SEC",
"Name": "Form N-1A",
"Section": "27A",
"Subsection": "d",
"Paragraph": "2",
"Subparagraph": "instruction",
"Clause": "14"
},
"r44": {
"role": "http://www.xbrl.org/2003/role/presentationRef",
"Publisher": "SEC",
"Name": "Form N-1A",
"Section": "27A",
"Subsection": "d",
"Paragraph": "2",
"Subparagraph": "instruction",
"Clause": "15"
},
"r45": {
"role": "http://www.xbrl.org/2003/role/presentationRef",
"Publisher": "SEC",
"Name": "Form N-1A",
"Section": "27A",
"Subsection": "d",
"Paragraph": "2",
"Subparagraph": "instruction",
"Clause": "7"
},
"r46": {
"role": "http://www.xbrl.org/2003/role/presentationRef",
"Publisher": "SEC",
"Name": "Form N-1A",
"Section": "27A",
"Subsection": "d",
"Paragraph": "2",
"Subparagraph": "instruction",
"Clause": "8"
},
"r47": {
"role": "http://www.xbrl.org/2003/role/presentationRef",
"Publisher": "SEC",
"Name": "Form N-1A",
"Section": "27A",
"Subsection": "d",
"Paragraph": "3"
},
"r48": {
"role": "http://www.xbrl.org/2003/role/presentationRef",
"Publisher": "SEC",
"Name": "Form N-1A",
"Section": "27A",
"Subsection": "d",
"Paragraph": "4"
},
"r49": {
"role": "http://www.xbrl.org/2003/role/presentationRef",
"Publisher": "SEC",
"Name": "Form N-1A",
"Section": "27A",
"Subsection": "d",
"Paragraph": "4",
"Subparagraph": "instruction",
"Clause": "3"
},
"r50": {
"role": "http://www.xbrl.org/2003/role/presentationRef",
"Publisher": "SEC",
"Name": "Form N-1A",
"Section": "27A",
"Subsection": "d",
"Paragraph": "4",
"Subparagraph": "instruction",
"Clause": "4"
},
"r51": {
"role": "http://www.xbrl.org/2003/role/presentationRef",
"Publisher": "SEC",
"Name": "Form N-1A",
"Section": "27A",
"Subsection": "e"
},
"r52": {
"role": "http://www.xbrl.org/2003/role/presentationRef",
"Publisher": "SEC",
"Name": "Form N-1A",
"Section": "27A",
"Subsection": "e",
"Paragraph": "instruction",
"Subparagraph": "6"
},
"r53": {
"role": "http://www.xbrl.org/2003/role/presentationRef",
"Publisher": "SEC",
"Name": "Form N-1A",
"Section": "27A",
"Subsection": "f"
},
"r54": {
"role": "http://www.xbrl.org/2003/role/presentationRef",
"Publisher": "SEC",
"Name": "Form N-1A",
"Section": "27A",
"Subsection": "g"
},
"r55": {
"role": "http://www.xbrl.org/2003/role/presentationRef",
"Publisher": "SEC",
"Name": "Form N-1A",
"Section": "27A",
"Subsection": "g",
"Paragraph": "1"
},
"r56": {
"role": "http://www.xbrl.org/2003/role/presentationRef",
"Publisher": "SEC",
"Name": "Form N-1A",
"Section": "27A",
"Subsection": "g",
"Paragraph": "2"
},
"r57": {
"role": "http://www.xbrl.org/2003/role/presentationRef",
"Publisher": "SEC",
"Name": "Form N-1A",
"Section": "27A",
"Subsection": "g",
"Paragraph": "3"
},
"r58": {
"role": "http://www.xbrl.org/2003/role/presentationRef",
"Publisher": "SEC",
"Name": "Form N-1A",
"Section": "27A",
"Subsection": "g",
"Paragraph": "4"
},
"r59": {
"role": "http://www.xbrl.org/2003/role/presentationRef",
"Publisher": "SEC",
"Name": "Form N-1A",
"Section": "27A",
"Subsection": "g",
"Paragraph": "5"
},
"r60": {
"role": "http://www.xbrl.org/2003/role/presentationRef",
"Publisher": "SEC",
"Name": "Form N-1A",
"Section": "27A",
"Subsection": "g",
"Paragraph": "6"
},
"r61": {
"role": "http://www.xbrl.org/2003/role/presentationRef",
"Publisher": "SEC",
"Name": "Form N-1A",
"Section": "27A",
"Subsection": "g",
"Paragraph": "instruction",
"Subparagraph": "2"
},
"r62": {
"role": "http://www.xbrl.org/2003/role/presentationRef",
"Publisher": "SEC",
"Name": "Form N-1A",
"Section": "27A",
"Subsection": "h",
"Paragraph": "1"
},
"r63": {
"role": "http://www.xbrl.org/2003/role/presentationRef",
"Publisher": "SEC",
"Name": "Form N-1A",
"Section": "27A",
"Subsection": "h",
"Paragraph": "2"
},
"r64": {
"role": "http://www.xbrl.org/2003/role/presentationRef",
"Publisher": "SEC",
"Name": "Form N-1A",
"Section": "3",
"Subsection": "instruction",
"Paragraph": "1",
"Subparagraph": "d",
"Sentence": "i"
},
"r65": {
"role": "http://www.xbrl.org/2003/role/presentationRef",
"Publisher": "SEC",
"Name": "Form N-1A",
"Section": "4",
"Subsection": "b",
"Paragraph": "2",
"Subparagraph": "i"
},
"r66": {
"role": "http://www.xbrl.org/2003/role/presentationRef",
"Publisher": "SEC",
"Name": "Form N-1A",
"Section": "4",
"Subsection": "b",
"Paragraph": "2",
"Subparagraph": "iii"
},
"r67": {
"role": "http://www.xbrl.org/2003/role/presentationRef",
"Publisher": "SEC",
"Name": "Regulation S-T",
"Number": "232",
"Section": "313"
},
"r68": {
"role": "http://www.xbrl.org/2009/role/commonPracticeRef",
"Topic": "326",
"SubTopic": "20",
"Name": "Accounting Standards Codification",
"Section": "50",
"Paragraph": "5",
"Subparagraph": "(b)",
"Publisher": "FASB",
"URI": "https://asc.fasb.org/1943274/2147479319/326-20-50-5"
},
"r69": {
"role": "http://www.xbrl.org/2009/role/commonPracticeRef",
"Topic": "946",
"SubTopic": "205",
"Name": "Accounting Standards Codification",
"Section": "50",
"Paragraph": "27",
"Publisher": "FASB",
"URI": "https://asc.fasb.org/1943274/2147478494/946-205-50-27"
},
"r70": {
"role": "http://www.xbrl.org/2009/role/commonPracticeRef",
"Topic": "946",
"SubTopic": "320",
"Name": "Accounting Standards Codification",
"Section": "S99",
"Paragraph": "1",
"Subparagraph": "(SX 210.12-12(Column A)(Footnote 2)(ii))",
"Publisher": "FASB",
"URI": "https://asc.fasb.org/1943274/2147477271/946-320-S99-1"
},
"r71": {
"role": "http://www.xbrl.org/2009/role/commonPracticeRef",
"Topic": "946",
"SubTopic": "320",
"Name": "Accounting Standards Codification",
"Section": "S99",
"Paragraph": "2",
"Subparagraph": "(SX 210.12-12A(Column A)(Footnote 2))",
"Publisher": "FASB",
"URI": "https://asc.fasb.org/1943274/2147477271/946-320-S99-2"
},
"r72": {
"role": "http://www.xbrl.org/2009/role/commonPracticeRef",
"Topic": "946",
"SubTopic": "320",
"Name": "Accounting Standards Codification",
"Section": "S99",
"Paragraph": "3",
"Subparagraph": "(SX 210.12-12B(Column A)(Footnote 1)(b))",
"Publisher": "FASB",
"URI": "https://asc.fasb.org/1943274/2147477271/946-320-S99-3"
},
"r73": {
"role": "http://www.xbrl.org/2009/role/commonPracticeRef",
"Topic": "946",
"SubTopic": "320",
"Name": "Accounting Standards Codification",
"Section": "S99",
"Paragraph": "5",
"Subparagraph": "(SX 210.12-13(Column A)(Footnote 3))",
"Publisher": "FASB",
"URI": "https://asc.fasb.org/1943274/2147477271/946-320-S99-5"
},
"r74": {
"role": "http://www.xbrl.org/2009/role/commonPracticeRef",
"Topic": "946",
"SubTopic": "320",
"Name": "Accounting Standards Codification",
"Section": "S99",
"Paragraph": "5C",
"Subparagraph": "(SX 210.12-13C(Column A)(Footnote 3))",
"Publisher": "FASB",
"URI": "https://asc.fasb.org/1943274/2147477271/946-320-S99-5C"
},
"r75": {
"role": "http://www.xbrl.org/2009/role/commonPracticeRef",
"Topic": "946",
"SubTopic": "320",
"Name": "Accounting Standards Codification",
"Section": "S99",
"Paragraph": "5C",
"Subparagraph": "(SX 210.12-13C(Column B)(Footnote 3))",
"Publisher": "FASB",
"URI": "https://asc.fasb.org/1943274/2147477271/946-320-S99-5C"
},
"r76": {
"role": "http://www.xbrl.org/2009/role/commonPracticeRef",
"Topic": "946",
"SubTopic": "320",
"Name": "Accounting Standards Codification",
"Section": "S99",
"Paragraph": "6",
"Subparagraph": "(SX 210.12-14(Column A)(Footnote 2))",
"Publisher": "FASB",
"URI": "https://asc.fasb.org/1943274/2147477271/946-320-S99-6"
}
}
}