UNITED STATES
SECURITIES AND EXCHANGE COMMISSION
Washington, D.C. 20549
FORM N-CSR
CERTIFIED SHAREHOLDER REPORT OF
REGISTERED MANAGEMENT INVESTMENT COMPANIES
Investment Company Act file number 811-03732
MFS VARIABLE INSURANCE TRUST II
(Exact name of registrant as specified in charter)
111 Huntington Avenue, Boston, Massachusetts 02199
(Address of principal executive offices) (Zip code)
Christopher R. Bohane
Massachusetts Financial Services Company
111 Huntington Avenue
Boston, Massachusetts 02199
(Name and address of agents for service)
Registrant’s telephone number, including area code: (617) 954-5000
Date of fiscal year end: December 31
Date of reporting
period: December 31, 2021
| ITEM 1. |
REPORTS TO STOCKHOLDERS. |
Annual Report
December 31, 2021
MFS® Blended Research®
Core Equity Portfolio
MFS® Variable
Insurance Trust II
MFS® Blended
Research® Core Equity Portfolio
|
1
|
|
2
|
|
3
|
|
5
|
|
7
|
|
8
|
|
13
|
|
14
|
|
15
|
|
16
|
|
18
|
|
24
|
|
25
|
|
28
|
|
31
|
|
31
|
|
31
|
|
31
|
|
31
|
|
32
|
The report is prepared for the general information of contract owners. It
is authorized for distribution to prospective investors only when preceded or accompanied by a current prospectus.
NOT FDIC INSURED • MAY LOSE VALUE
• NO BANK OR CREDIT UNION GUARANTEE •
NOT A DEPOSIT • NOT INSURED BY ANY FEDERAL GOVERNMENT
AGENCY OR NCUA/NCUSIF
MFS Blended Research
Core Equity Portfolio
Dear Contract Owners:
After a powerful rally in 2021 that was spurred by the
introduction of effective coronavirus vaccines and high levels of monetary and fiscal stimulus, markets have recently experienced a rise in volatility. Rising inflation (mostly due to pandemic-related labor and supply chain disruptions), new
COVID-19 variants that are vaccine-resistant, and the prospect of tighter monetary and fiscal policies around the world have all increased investor anxiety.
Rising real (inflation-adjusted) bond yields in the United
States are a headwind for richly valued U.S. growth stocks, though many non-U.S. markets have experienced lower levels of turbulence. In recent months, global economic growth has moderated, with the spread of the Delta and Omicron variants and a
regulatory crackdown in China featuring prominently. Stress in China’s property development sector has also contributed to the slowdown there. A further concern for investors is the tightening of global energy and raw materials supplies caused
in part by geopolitical uncertainty.
However,
above-trend economic growth, strong corporate balance sheets, and nascent signs that global supply chain bottlenecks may be easing, along with a dovish policy shift in China, are supportive fundamentals that we feel could help calm recent market
jitters.
It is times of market transition that
demonstrate the importance of having a deep understanding of company fundamentals, and we have built our global research platform to do just that.
At MFS®, we put our clients’ assets to work responsibly by carefully navigating the increasing complexity of global markets and economies. Guided by our commitment to long-term
investing, we tune out the noise and try to uncover what we believe are the best, most durable investment opportunities in the market. Our unique global investment platform combines collective expertise, long-term discipline, and thoughtful risk
management to create sustainable value for investors.
Respectfully,
Michael W.
Roberge
Chief Executive Officer
MFS Investment Management
February 15, 2022
The opinions expressed in this letter are subject to
change and may not be relied upon for investment advice. No forecasts can be guaranteed.
MFS Blended Research Core
Equity Portfolio
Top ten holdings
| Microsoft
Corp. |
7.9%
|
| Apple,
Inc. |
6.0%
|
| Amazon.com,
Inc. |
3.8%
|
| Alphabet,
Inc., “C” |
3.1%
|
| Alphabet,
Inc., “A” |
2.8%
|
| JPMorgan
Chase & Co. |
2.4%
|
| Johnson
& Johnson |
2.3%
|
| Accenture
PLC, “A” |
2.2%
|
| Meta
Platforms, Inc., “A” |
1.9%
|
| Applied
Materials, Inc. |
1.8%
|
GICS equity sectors (g)
| Information
Technology |
29.6%
|
| Health
Care |
13.9%
|
| Consumer
Discretionary |
12.2%
|
| Financials
|
10.5%
|
| Communication
Services |
10.2%
|
| Industrials
|
7.2%
|
| Consumer
Staples |
6.2%
|
| Real
Estate |
3.5%
|
| Energy
|
2.6%
|
| Materials
|
2.0%
|
| Utilities
|
1.8%
|
| (g)
|
The
Global Industry Classification Standard (GICS®) was developed by and/or is the exclusive property of MSCI, Inc. and S&P Global Market Intelligence Inc. (“S&P
Global Market Intelligence”). GICS is a service mark of MSCI and S&P Global Market Intelligence and has been licensed for use by MFS. MFS has applied its own internal sector/industry classification methodology for equity securities and
non-equity securities that are unclassified by GICS. |
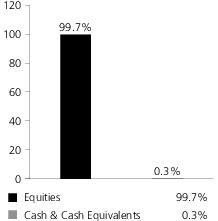
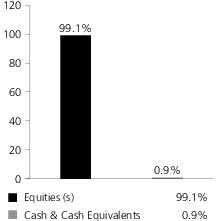
Cash & Cash Equivalents includes any cash, investments in
money market funds, short-term securities, and other assets less liabilities. Please see the Statement of Assets and Liabilities for additional information related to the fund’s cash position and other assets and liabilities.
Percentages are based on net assets as of December 31,
2021.
The portfolio is actively managed and current
holdings may be different.
MFS Blended Research Core
Equity Portfolio
Management Review
Summary of Results
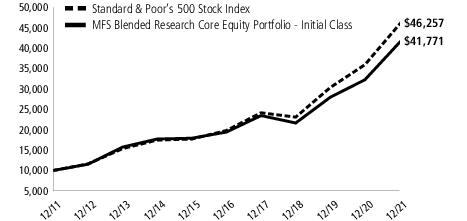
For the twelve months ended December 31, 2021, Initial
Class shares of the MFS Blended Research Core Equity Portfolio (fund) provided a total return of 29.53%, while Service Class shares of the fund provided a total return of 29.18%. These compare with a return of 28.71% over the same period for the
fund's benchmark, the Standard & Poor’s 500 Stock Index (S&P 500 Index).
Market Environment
Over the past year, the global economy was buffeted by an
array of crosscurrents as it adjusted to the ebbs and flows of the pandemic. Among the supportive currents were ample fiscal stimulus, loose monetary policy and the rollout of several highly effective coronavirus vaccines. Negative currents included
the rapid spread of several coronavirus variants, widespread global production bottlenecks and a surge in inflation. After experiencing a burst of exceptionally strong economic activity as the global economy began to reopen, activity became more
muted in the second half of the period amid ongoing supply chain disruptions and a new wave of coronavirus infections, albeit a seemingly milder strain.
Amid rising inflation, markets anticipated a transition
from an exceptionally accommodative environment to a more mixed monetary landscape ahead. Indeed, several central banks in emerging markets have already tightened policy and the US Federal Reserve reduced the pace of its asset purchases in November
and again in December. However, the European Central Bank, the Bank of Japan and the People's Bank of China are expected to maintain accommodative policies. Sovereign bond yields moved modestly higher during the period amid higher inflation and on
expectations of a tighter Fed but remain historically low.
A harsher Chinese regulatory environment toward industries
such as online gaming, food delivery and education increased market volatility as has stress in China's highly leveraged property development sector. Trade relations between the United States and China remained quite strained despite a change in
presidential administrations.
Signs of excess
investor enthusiasm continued to be seen in pockets of the market such as “meme stocks” popular with users of online message boards, cryptocurrencies and heavy retail participation in the market for short-dated options.
Contributors to Performance
Stock selection in the industrials, communication services
and information technology sectors benefited the fund’s performance relative to the S&P 500 Index. There were no individual stocks within the industrials sector, either in the fund or in the benchmark, that were among the fund's top
relative contributors over the reporting period. Within the communication services sector, the fund’s overweight position in technology company Alphabet, and its underweight position in diversified entertainment company Walt Disney(h), boosted
relative performance. The stock price of Alphabet climbed as the company reported strong advertising sales growth across Google Services, particularly in search and YouTube, and continued revenue growth in cloud. Within the information technology
sector, the fund’s overweight positions in semiconductor chips and electronics engineering solutions provider Applied Materials, IT servicing firm Accenture and software giant Microsoft also supported relative returns. The share price of
Applied Materials advanced on strength in its semiconductor equipment segment and as management raised its 2021 guidance and outlook, citing acceleration in its semiconductor business as demand for semiconductors rose.
Elsewhere, the fund's overweight positions in real estate
investment trust Extra Space Storage, financial services firm Bank of America, hospital operator HCA Healthcare, financial services firm Goldman Sachs Group and pharmaceutical company Eli Lilly bolstered relative results. The share price of Extra
Space Storage climbed on the back of stronger-than-expected occupancy and rent levels, robust net operating income and lower expenses.
Detractors from Performance
Security selection in the consumer discretionary sector
held back relative performance, led by the fund's underweight position in electric vehicle manufacturer Tesla. The share price of Tesla advanced considerably during the second half of the year, following significantly better-than-expected vehicle
deliveries and the company's ability to overcome supply chain issues that affected the whole auto industry. Moreover, favorable pricing of its model 3 and Y vehicles helped improve Tesla’s profitability, which also had a positive impact on its
share price growth.
Stock selection in both the
health care and consumer staples sectors also weakened relative results. Within the health care sector, the fund’s overweight positions in medical device maker Medtronic, pharmaceutical company Merck and diversified medical products maker
Johnson & Johnson dampened relative returns. The share price of Medtronic fell as the company reported weaker-than-expected revenue growth, led by impacts from COVID-19 that considerably affected its Cardiovascular and NeuroScience segments. As
a result, Medtronic reduced its organic growth guidance, which further pressured the stock price. The timing of the fund’s ownership in shares of pharmaceutical giant Pfizer further weighed on relative performance. Within the consumer staples
sector, overweight positions in retail giant Walmart and global consumer products company Colgate-Palmolive were among the fund’s top relative detractors.
MFS Blended Research Core
Equity Portfolio
Management Review - continued
Elsewhere, the fund’s underweight positions in
computer graphics processor maker NVIDIA and diversified financial services firm Wells Fargo, and its overweight position in cable services provider Charter Communications, further hindered relative results. The share price of NVIDIA appreciated as
the company posted strong revenue growth, driven by better-than-anticipated broad-based demand and capacity additions at its Gaming, Datacenter, and Pro Vis segments.
Respectfully,
Portfolio Manager(s)
Jim Fallon, Matt Krummell, Jonathan Sage, and Jed
Stocks
| (h)
|
Security was not held in
the portfolio at period end. |
The
views expressed in this report are those of the portfolio manager(s) only through the end of the period of the report as stated on the cover and do not necessarily reflect the views of MFS or any other person in the MFS organization. These views are
subject to change at any time based on market or other conditions, and MFS disclaims any responsibility to update such views. These views may not be relied upon as investment advice or an indication of trading intent on behalf of any MFS portfolio.
References to specific securities are not recommendations of such securities, and may not be representative of any MFS portfolio’s current or future investments.
MFS Blended Research Core
Equity Portfolio
Performance Summary Through 12/31/21
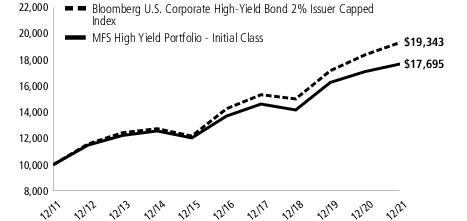
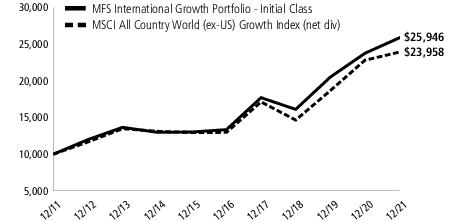
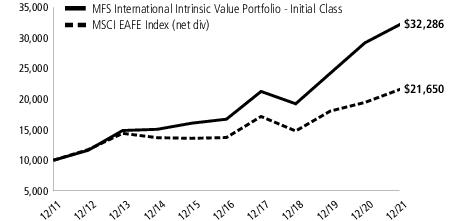
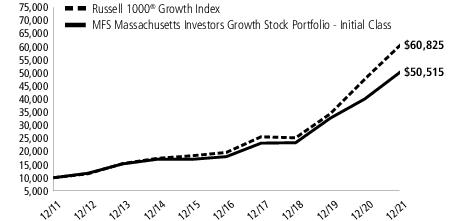
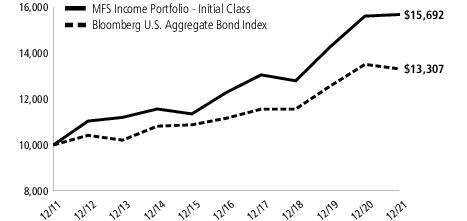
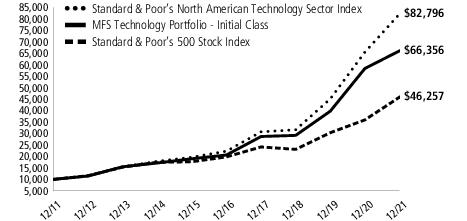
The following chart illustrates the historical performance
of the fund in comparison to its benchmark(s). Benchmarks are unmanaged and may not be invested in directly. Benchmark returns do not reflect any fees or expenses. The performance of other share classes will be greater than or less than that of the
class depicted below. (See Notes to Performance Summary.)
Performance data shown represents past performance and is no
guarantee of future results. Investment return and principal value fluctuate so your units, when sold, may be worth more or less than the original cost; current performance may be lower or higher than quoted. The performance shown does not reflect
the deduction of taxes, if any, that a contract holder would pay on fund distributions or the redemption of contract units. The returns for the fund shown also do not reflect the deduction of expenses associated with variable products, such as
mortality and expense risk charges, separate account charges, and sales charges imposed by the insurance company separate accounts. Such expenses would reduce the overall returns shown.
Growth of a Hypothetical $10,000 Investment
Total Returns
through 12/31/21
Average annual with sales
charge
| Share
Class |
Class
Inception Date |
1-yr
|
5-yr
|
10-yr
|
| Initial
Class |
11/14/86
|
29.53%
|
16.54%
|
15.37%
|
| Service
Class |
8/24/01
|
29.18%
|
16.25%
|
15.08%
|
Comparative benchmark(s)
| Standard
& Poor's 500 Stock Index (f) |
28.71%
|
18.47%
|
16.55%
|
| (f)
|
Source:
FactSet Research Systems Inc. |
Benchmark Definition(s)
Standard & Poor's 500 Stock Index(g) – a market capitalization-weighted index of 500 widely held equity securities, designed to measure broad U.S. equity performance.
It is not possible to invest directly in an index.
| (g)
|
“Standard
& Poor's®” and “S&P®” are registered trademarks of Standard &
Poor's Financial Services LLC (“S&P”) and Dow Jones is a registered trademark of Dow Jones Trademark Holdings LLC (“Dow Jones”) and have been licensed for use by S&P Dow Jones Indices LLC and sublicensed for certain
purposes by MFS. The S&P 500® is a product of S&P Dow Jones Indices LLC, and has been licensed for use by MFS. MFS's product(s) is not sponsored, endorsed, sold, or
promoted by S&P Dow Jones Indices LLC, Dow Jones, S&P, or their respective affiliates, and neither S&P Dow Jones Indices LLC, Dow Jones, S&P, nor their respective affiliates make any representation regarding the advisability of
investing in such product(s). |
Notes
to Performance Summary
Average annual total return
represents the average annual change in value for each share class for the periods presented.
Performance results reflect any applicable expense
subsidies and waivers in effect during the periods shown. Without such subsidies and waivers the fund's performance results would be less favorable. Please see the prospectus and financial statements for complete details. All results are historical
and assume the reinvestment of any dividends and capital gains distributions.
MFS Blended Research Core
Equity Portfolio
Performance Summary – continued
Performance results do not include adjustments made for
financial reporting purposes in accordance with U.S. generally accepted accounting principles and may differ from amounts reported in the financial highlights.
From time to time the fund may receive proceeds from
litigation settlements, without which performance would be lower.
MFS Blended Research Core
Equity Portfolio
Expense Table
Fund Expenses Borne by the Contract Holders during the
Period,
July 1, 2021 through December 31, 2021
As
a contract holder of the fund, you incur ongoing costs, including management fees; distribution and/or service (12b-1) fees; and other fund expenses. This example is intended to help you understand your ongoing costs (in dollars) of investing in the
fund and to compare these costs with the ongoing costs of investing in other mutual funds.
The example is based on an investment of $1,000 invested at
the beginning of the period and held for the entire period July 1, 2021 through December 31, 2021.
Actual Expenses
The first line for each share class in the following table
provides information about actual account values and actual expenses. You may use the information in this line, together with the amount you invested, to estimate the expenses that you paid over the period. Simply divide your account value by $1,000
(for example, an $8,600 account value divided by $1,000 = 8.6), then multiply the result by the number in the first line under the heading entitled “Expenses Paid During Period” to estimate the expenses you paid on your account during
this period.
Hypothetical Example for Comparison
Purposes
The second line for each share class in the
following table provides information about hypothetical account values and hypothetical expenses based on the fund’s actual expense ratio and an assumed rate of return of 5% per year before expenses, which is not the fund’s actual
return. The hypothetical account values and expenses may not be used to estimate the actual ending account balance or expenses you paid for the period. You may use this information to compare the ongoing costs of investing in the fund and other
funds. To do so, compare this 5% hypothetical example with the 5% hypothetical examples that appear in the shareholder reports of the other funds.
Please note that the expenses shown in the table are meant
to highlight the fund's ongoing costs only and do not take into account the fees and expenses imposed under the variable contracts through which your investment in the fund is made. Therefore, the second line for each share class in the table is
useful in comparing ongoing costs associated with an investment in vehicles (such as the fund) which fund benefits under variable annuity and variable life insurance contracts and to qualified pension and retirement plans only, and will not help you
determine the relative total costs of investing in the fund through variable annuity and variable life insurance contracts. If the fees and expenses imposed under the variable contracts were included, your costs would have been higher.
Share
Class |
|
Annualized
Expense
Ratio |
Beginning
Account Value
7/01/21 |
Ending
Account Value
12/31/21 |
Expenses
Paid During
Period (p)
7/01/21-12/31/21 |
| Initial
Class |
Actual
|
0.43%
|
$1,000.00
|
$1,103.40
|
$2.28
|
| Hypothetical
(h) |
0.43%
|
$1,000.00
|
$1,023.04
|
$2.19
|
| Service
Class |
Actual
|
0.68%
|
$1,000.00
|
$1,101.89
|
$3.60
|
| Hypothetical
(h) |
0.68%
|
$1,000.00
|
$1,021.78
|
$3.47
|
| (h)
|
5% class return per year
before expenses. |
| (p)
|
“Expenses
Paid During Period” are equal to each class's annualized expense ratio, as shown above, multiplied by the average account value over the period, multiplied by 184/365 (to reflect the one-half year period). |
MFS Blended Research Core
Equity Portfolio
Portfolio of Investments − 12/31/21
The Portfolio of Investments is a complete list of all
securities owned by your fund. It is categorized by broad-based asset classes.
| Issuer
|
|
|
Shares/Par
|
Value
($) |
| Common
Stocks – 99.7% |
| Aerospace
& Defense – 1.5% |
|
| Honeywell
International, Inc. |
|
8,574
|
$
1,787,765 |
| Huntington
Ingalls Industries, Inc. |
|
5,871
|
1,096,350 |
| Northrop
Grumman Corp. |
|
12,383
|
4,793,088 |
| Raytheon
Technologies Corp. |
|
6,147
|
529,011 |
| |
|
|
|
$8,206,214 |
| Alcoholic
Beverages – 0.2% |
|
| Constellation
Brands, Inc., “A” |
|
5,212
|
$
1,308,056 |
| Apparel
Manufacturers – 0.2% |
|
| NIKE,
Inc., “B” |
|
7,321
|
$
1,220,191 |
| Automotive
– 2.0% |
|
| Lear
Corp. |
|
13,455
|
$
2,461,592 |
| LKQ
Corp. |
|
26,262
|
1,576,508 |
| Tesla,
Inc. (a) |
|
6,087
|
6,432,620 |
| |
|
|
|
$10,470,720 |
| Biotechnology
– 1.5% |
|
| Biogen,
Inc. (a) |
|
10,553
|
$
2,531,876 |
| Gilead
Sciences, Inc. |
|
15,569
|
1,130,465 |
| Incyte
Corp. (a) |
|
6,117
|
448,988 |
| Vertex
Pharmaceuticals, Inc. (a) |
|
17,375
|
3,815,550 |
| |
|
|
|
$7,926,879 |
| Brokerage
& Asset Managers – 0.6% |
|
| Invesco
Ltd. |
|
83,316
|
$
1,917,934 |
| KKR
& Co., Inc. |
|
13,849
|
1,031,751 |
| |
|
|
|
$2,949,685 |
| Business
Services – 2.9% |
|
| Accenture
PLC, “A” |
|
28,620
|
$
11,864,421 |
| Amdocs
Ltd. |
|
7,899
|
591,161 |
| PayPal
Holdings, Inc. (a) |
|
17,308
|
3,263,943 |
| |
|
|
|
$15,719,525 |
| Cable
TV – 1.8% |
|
| Charter
Communications, Inc., “A” (a) |
|
11,225
|
$
7,318,363 |
| Comcast
Corp., “A” |
|
42,134
|
2,120,604 |
| |
|
|
|
$9,438,967 |
| Chemicals
– 0.5% |
|
| Eastman
Chemical Co. |
|
23,395
|
$
2,828,689 |
| Computer
Software – 10.0% |
|
| Adobe
Systems, Inc. (a) |
|
16,417
|
$
9,309,424 |
| Atlassian
Corp. PLC, “A” (a) |
|
5,304
|
2,022,362 |
| Microsoft
Corp. |
|
126,068
|
42,399,190 |
| |
|
|
|
$53,730,976 |
MFS Blended Research Core
Equity Portfolio
Portfolio of Investments – continued
| Issuer
|
|
|
Shares/Par
|
Value
($) |
| Common
Stocks – continued |
| Computer
Software - Systems – 7.9% |
|
| Apple,
Inc. |
|
179,634
|
$
31,897,609 |
| EPAM
Systems, Inc. (a) |
|
1,840
|
1,229,948 |
| HP,
Inc. |
|
125,830
|
4,740,016 |
| ServiceNow,
Inc. (a) |
|
3,027
|
1,964,856 |
| SS&C
Technologies Holdings, Inc. |
|
18,860
|
1,546,143 |
| Zebra
Technologies Corp., “A” (a) |
|
1,926
|
1,146,355 |
| |
|
|
|
$42,524,927 |
| Construction
– 0.5% |
|
| Otis
Worldwide Corp. |
|
14,473
|
$
1,260,164 |
| Sherwin-Williams
Co. |
|
3,687
|
1,298,414 |
| |
|
|
|
$2,558,578 |
| Consumer
Products – 1.2% |
|
| Colgate-Palmolive
Co. |
|
73,506
|
$
6,273,002 |
| Consumer
Services – 1.1% |
|
| Booking
Holdings, Inc. (a) |
|
2,452
|
$
5,882,912 |
| Electrical
Equipment – 1.5% |
|
| Johnson
Controls International PLC |
|
57,808
|
$
4,700,368 |
| TE
Connectivity Ltd. |
|
20,497
|
3,306,986 |
| |
|
|
|
$8,007,354 |
| Electronics
– 7.0% |
|
| Advanced
Micro Devices (a) |
|
22,462
|
$
3,232,282 |
| Applied
Materials, Inc. |
|
62,879
|
9,894,639 |
| Intel
Corp. |
|
99,235
|
5,110,603 |
| NVIDIA
Corp. |
|
20,680
|
6,082,195 |
| NXP
Semiconductors N.V. |
|
20,217
|
4,605,028 |
| Texas
Instruments, Inc. |
|
44,194
|
8,329,243 |
| |
|
|
|
$37,253,990 |
| Energy
- Independent – 1.4% |
|
| EOG
Resources, Inc. |
|
29,852
|
$
2,651,753 |
| Valero
Energy Corp. |
|
65,755
|
4,938,858 |
| |
|
|
|
$7,590,611 |
| Food
& Beverages – 3.2% |
|
| Archer
Daniels Midland Co. |
|
68,638
|
$
4,639,242 |
| General
Mills, Inc. |
|
21,281
|
1,433,914 |
| J.M.
Smucker Co. |
|
15,738
|
2,137,535 |
| Mondelez
International, Inc. |
|
75,613
|
5,013,898 |
| PepsiCo,
Inc. |
|
23,395
|
4,063,946 |
| |
|
|
|
$17,288,535 |
| Food
& Drug Stores – 1.4% |
|
| Wal-Mart
Stores, Inc. |
|
50,636
|
$
7,326,523 |
| Forest
& Paper Products – 0.3% |
|
| Rayonier,
Inc., REIT |
|
20,889
|
$
843,080 |
| Weyerhaeuser
Co., REIT |
|
20,649
|
850,326 |
| |
|
|
|
$1,693,406 |
MFS Blended Research Core
Equity Portfolio
Portfolio of Investments – continued
| Issuer
|
|
|
Shares/Par
|
Value
($) |
| Common
Stocks – continued |
| Gaming
& Lodging – 0.4% |
|
| International
Game Technology PLC |
|
32,903
|
$
951,226 |
| Marriott
International, Inc., “A” (a) |
|
8,137
|
1,344,558 |
| |
|
|
|
$2,295,784 |
| Health
Maintenance Organizations – 1.5% |
|
| Cigna
Corp. |
|
19,115
|
$
4,389,377 |
| Humana,
Inc. |
|
6,502
|
3,016,018 |
| UnitedHealth
Group, Inc. |
|
1,120
|
562,397 |
| |
|
|
|
$7,967,792 |
| Insurance
– 3.1% |
|
| Berkshire
Hathaway, Inc., “B” (a) |
|
6,201
|
$
1,854,099 |
| Equitable
Holdings, Inc. |
|
44,479
|
1,458,466 |
| Everest
Re Group Ltd. |
|
19,241
|
5,270,495 |
| Hartford
Financial Services Group, Inc. |
|
8,114
|
560,191 |
| MetLife,
Inc. |
|
110,214
|
6,887,273 |
| Reinsurance
Group of America, Inc. |
|
3,901
|
427,120 |
| |
|
|
|
$16,457,644 |
| Internet
– 8.3% |
|
| Alphabet,
Inc., “A” (a) |
|
5,213
|
$
15,102,270 |
| Alphabet,
Inc., “C” (a) |
|
5,683
|
16,444,272 |
| Gartner,
Inc. (a) |
|
8,325
|
2,783,214 |
| Meta
Platforms, Inc., “A” (a) |
|
29,521
|
9,929,388 |
| |
|
|
|
$44,259,144 |
| Leisure
& Toys – 1.9% |
|
| Brunswick
Corp. |
|
55,785
|
$
5,619,223 |
| Electronic
Arts, Inc. |
|
15,140
|
1,996,966 |
| Polaris,
Inc. |
|
20,870
|
2,293,822 |
| |
|
|
|
$9,910,011 |
| Machinery
& Tools – 2.0% |
|
| AGCO
Corp. |
|
21,628
|
$
2,509,281 |
| Eaton
Corp. PLC |
|
35,614
|
6,154,811 |
| Regal
Rexnord Corp. |
|
12,488
|
2,125,208 |
| |
|
|
|
$10,789,300 |
| Major
Banks – 5.7% |
|
| Bank
of America Corp. |
|
98,199
|
$
4,368,874 |
| Goldman
Sachs Group, Inc. |
|
21,819
|
8,346,858 |
| JPMorgan
Chase & Co. |
|
79,725
|
12,624,454 |
| Wells
Fargo & Co. |
|
104,640
|
5,020,627 |
| |
|
|
|
$30,360,813 |
| Medical
& Health Technology & Services – 2.9% |
|
| HCA
Healthcare, Inc. |
|
8,851
|
$
2,273,999 |
| Laboratory
Corp. of America Holdings (a) |
|
15,835
|
4,975,515 |
| McKesson
Corp. |
|
32,576
|
8,097,416 |
| |
|
|
|
$15,346,930 |
| Medical
Equipment – 2.9% |
|
| Abbott
Laboratories |
|
12,849
|
$
1,808,368 |
| Align
Technology, Inc. (a) |
|
1,453
|
954,883 |
| Boston
Scientific Corp. (a) |
|
25,126
|
1,067,352 |
MFS Blended Research Core
Equity Portfolio
Portfolio of Investments – continued
| Issuer
|
|
|
Shares/Par
|
Value
($) |
| Common
Stocks – continued |
| Medical
Equipment – continued |
|
| Danaher
Corp. |
|
5,886
|
$
1,936,553 |
| Medtronic
PLC |
|
52,450
|
5,425,953 |
| Thermo
Fisher Scientific, Inc. |
|
6,260
|
4,176,922 |
| |
|
|
|
$15,370,031 |
| Natural
Gas - Pipeline – 1.0% |
|
| Cheniere
Energy, Inc. |
|
26,618
|
$
2,699,598 |
| ONEOK,
Inc. |
|
43,095
|
2,532,262 |
| |
|
|
|
$5,231,860 |
| Oil
Services – 0.2% |
|
| NOV,
Inc. |
|
70,783
|
$
959,110 |
| Other
Banks & Diversified Financials – 1.7% |
|
| American
Express Co. |
|
7,968
|
$
1,303,565 |
| SLM
Corp. |
|
204,260
|
4,017,794 |
| Synchrony
Financial |
|
21,859
|
1,014,039 |
| Visa,
Inc., “A” |
|
13,888
|
3,009,668 |
| |
|
|
|
$9,345,066 |
| Pharmaceuticals
– 5.2% |
|
| Bristol-Myers
Squibb Co. |
|
8,532
|
$
531,970 |
| Eli
Lilly & Co. |
|
22,990
|
6,350,298 |
| Johnson
& Johnson |
|
71,524
|
12,235,611 |
| Merck
& Co., Inc. |
|
103,657
|
7,944,272 |
| Pfizer,
Inc. |
|
10,006
|
590,854 |
| |
|
|
|
$27,653,005 |
| Railroad
& Shipping – 1.1% |
|
| CSX
Corp. |
|
160,253
|
$
6,025,513 |
| Real
Estate – 3.2% |
|
| Extra
Space Storage, Inc., REIT |
|
33,265
|
$
7,542,174 |
| Life
Storage, Inc., REIT |
|
21,146
|
3,239,144 |
| Simon
Property Group, Inc., REIT |
|
31,041
|
4,959,421 |
| Spirit
Realty Capital, Inc., REIT |
|
31,665
|
1,525,936 |
| |
|
|
|
$17,266,675 |
| Restaurants
– 1.4% |
|
| Starbucks
Corp. |
|
48,088
|
$
5,624,853 |
| Texas
Roadhouse, Inc. |
|
23,478
|
2,096,116 |
| |
|
|
|
$7,720,969 |
| Specialty
Chemicals – 1.2% |
|
| Corteva,
Inc. |
|
48,796
|
$
2,307,075 |
| DuPont
de Nemours, Inc. |
|
20,425
|
1,649,932 |
| Linde
PLC |
|
7,543
|
2,613,121 |
| |
|
|
|
$6,570,128 |
| Specialty
Stores – 5.6% |
|
| Amazon.com,
Inc. (a) |
|
6,142
|
$
20,479,516 |
| AutoZone,
Inc. (a) |
|
952
|
1,995,763 |
| Home
Depot, Inc. |
|
14,161
|
5,876,957 |
MFS Blended Research Core
Equity Portfolio
Portfolio of Investments – continued
| Issuer
|
|
|
Shares/Par
|
Value
($) |
| Common
Stocks – continued |
| Specialty
Stores – continued |
|
| Ross
Stores, Inc. |
|
12,430
|
$
1,420,500 |
| |
|
|
|
$29,772,736 |
| Telephone
Services – 0.3% |
|
| Lumen
Technologies, Inc. |
|
139,994
|
$
1,756,925 |
| Tobacco
– 0.2% |
|
| Philip
Morris International, Inc. |
|
11,763
|
$
1,117,485 |
| Trucking
– 1.4% |
|
| Knight-Swift
Transportation Holdings, Inc. |
|
30,360
|
$
1,850,138 |
| United
Parcel Service, Inc., “B” |
|
26,700
|
5,722,878 |
| |
|
|
|
$7,573,016 |
| Utilities
- Electric Power – 1.8% |
|
| American
Electric Power Co., Inc. |
|
6,167
|
$
548,678 |
| CenterPoint
Energy, Inc. |
|
36,244
|
1,011,570 |
| Exelon
Corp. |
|
138,235
|
7,984,454 |
| |
|
|
|
$9,544,702 |
| Total
Common Stocks (Identified Cost, $322,426,262) |
|
$533,494,379
|
| Investment
Companies (h) – 0.3% |
| Money
Market Funds – 0.3% |
|
| MFS
Institutional Money Market Portfolio, 0.07% (v) (Identified Cost, $1,708,524) |
|
|
1,708,524
|
$
1,708,524 |
| Other
Assets, Less Liabilities – (0.0)% |
|
(116,031) |
| Net
Assets – 100.0% |
$535,086,872
|
| (a) |
Non-income producing
security. |
|
|
|
| (h)
|
An
affiliated issuer, which may be considered one in which the fund owns 5% or more of the outstanding voting securities, or a company which is under common control. At period end, the aggregate values of the fund's investments in affiliated issuers
and in unaffiliated issuers were $1,708,524 and $533,494,379, respectively. |
|
|
|
| (v)
|
Affiliated
issuer that is available only to investment companies managed by MFS. The rate quoted for the MFS Institutional Money Market Portfolio is the annualized seven-day yield of the fund at period end. |
|
|
|
| The
following abbreviations are used in this report and are defined: |
| REIT
|
Real
Estate Investment Trust |
See Notes to
Financial Statements
MFS Blended Research Core
Equity Portfolio
| Financial
Statements |
Statement of Assets and
Liabilities |
This statement
represents your fund’s balance sheet, which details the assets and liabilities comprising the total value of the fund.
| At
12/31/21 Assets |
|
| Investments
in unaffiliated issuers, at value (identified cost, $322,426,262) |
$533,494,379
|
| Investments
in affiliated issuers, at value (identified cost, $1,708,524) |
1,708,524
|
| Cash
|
20,733
|
| Receivables
for |
|
| Fund
shares sold |
4,110
|
| Dividends
|
356,534
|
| Other
assets |
2,453
|
| Total
assets |
$535,586,733
|
| Liabilities
|
|
| Payables
for |
|
| Fund
shares reacquired |
$408,924
|
| Payable
to affiliates |
|
| Investment
adviser |
11,371
|
| Administrative
services fee |
452
|
| Shareholder
servicing costs |
117
|
| Distribution
and/or service fees |
3,045
|
| Payable
for independent Trustees' compensation |
183
|
| Accrued
expenses and other liabilities |
75,769
|
| Total
liabilities |
$499,861
|
| Net
assets |
$535,086,872
|
| Net
assets consist of |
|
| Paid-in
capital |
$244,442,827
|
| Total
distributable earnings (loss) |
290,644,045
|
| Net
assets |
$535,086,872
|
| Shares
of beneficial interest outstanding |
7,847,426
|
| |
Net
assets |
Shares
outstanding |
Net
asset value
per share |
| Initial
Class |
$313,788,176
|
4,579,162
|
$68.53
|
| Service
Class |
221,298,696
|
3,268,264
|
67.71
|
See Notes to Financial Statements
MFS Blended Research Core
Equity Portfolio
| Financial
Statements |
Statement of Operations
|
This statement describes how much
your fund earned in investment income and accrued in expenses. It also describes any gains and/or losses generated by fund operations.
| Year
ended 12/31/21 |
|
| Net
investment income (loss) |
|
| Income
|
|
| Dividends
|
$7,234,636
|
| Other
|
19,505
|
| Dividends
from affiliated issuers |
1,289
|
| Income
on securities loaned |
903
|
| Foreign
taxes withheld |
(4,122)
|
| Total
investment income |
$7,252,211
|
| Expenses
|
|
| Management
fee |
$2,051,308
|
| Distribution
and/or service fees |
527,268
|
| Shareholder
servicing costs |
17,906
|
| Administrative
services fee |
77,500
|
| Independent
Trustees' compensation |
9,279
|
| Custodian
fee |
23,112
|
| Shareholder
communications |
23,711
|
| Audit
and tax fees |
56,230
|
| Legal
fees |
2,541
|
| Miscellaneous
|
24,811
|
| Total
expenses |
$2,813,666
|
| Reduction
of expenses by investment adviser |
(65,158)
|
| Net
expenses |
$2,748,508
|
| Net
investment income (loss) |
$4,503,703
|
| Realized
and unrealized gain (loss) |
|
| Realized
gain (loss) (identified cost basis) |
|
| Unaffiliated
issuers |
$75,588,447
|
| Change
in unrealized appreciation or depreciation |
|
| Unaffiliated
issuers |
$50,895,083
|
| Net
realized and unrealized gain (loss) |
$126,483,530
|
| Change
in net assets from operations |
$130,987,233
|
See Notes to Financial Statements
MFS Blended Research Core
Equity Portfolio
| Financial
Statements |
Statements of Changes in
Net Assets |
These statements describe
the increases and/or decreases in net assets resulting from operations, any distributions, and any shareholder transactions.
| |
Year
ended |
| |
12/31/21
|
12/31/20
|
| Change
in net assets |
|
|
| From
operations |
|
|
| Net
investment income (loss) |
$4,503,703
|
$5,213,358
|
| Net
realized gain (loss) |
75,588,447
|
34,962,421
|
| Net
unrealized gain (loss) |
50,895,083
|
22,756,111
|
| Change
in net assets from operations |
$130,987,233
|
$62,931,890
|
| Total
distributions to shareholders |
$(40,220,081)
|
$(29,241,138)
|
| Change
in net assets from fund share transactions |
$(28,019,737)
|
$(33,385,390)
|
| Total
change in net assets |
$62,747,415
|
$305,362
|
| Net
assets |
|
|
| At
beginning of period |
472,339,457
|
472,034,095
|
| At
end of period |
$535,086,872
|
$472,339,457
|
See Notes to Financial Statements
MFS Blended Research Core
Equity Portfolio
| Financial
Statements |
Financial Highlights
|
The financial highlights table is
intended to help you understand the fund's financial performance for the past 5 years. Certain information reflects financial results for a single fund share. The total returns in the table represent the rate that an investor would have earned (or
lost) on an investment in the fund share class (assuming reinvestment of all distributions) held for the entire period.
| Initial
Class |
Year
ended |
| |
12/31/21
|
12/31/20
|
12/31/19
|
12/31/18
|
12/31/17
|
| Net
asset value, beginning of period |
$57.28
|
$53.06
|
$45.29
|
$54.23
|
$46.62
|
| Income
(loss) from investment operations |
|
|
|
|
|
| Net
investment income (loss) (d) |
$0.63
|
$0.67
|
$0.80
|
$0.74
|
$0.68
|
| Net
realized and unrealized gain (loss) |
15.96
|
7.21
|
11.74
|
(4.12)
|
8.80
|
| Total
from investment operations |
$16.59
|
$7.88
|
$12.54
|
$(3.38)
|
$9.48
|
| Less
distributions declared to shareholders |
|
|
|
|
|
| From
net investment income |
$(0.74)
|
$(0.88)
|
$(0.79)
|
$(0.77)
|
$(0.78)
|
| From
net realized gain |
(4.60)
|
(2.78)
|
(3.98)
|
(4.79)
|
(1.09)
|
| Total
distributions declared to shareholders |
$(5.34)
|
$(3.66)
|
$(4.77)
|
$(5.56)
|
$(1.87)
|
| Net
asset value, end of period (x) |
$68.53
|
$57.28
|
$53.06
|
$45.29
|
$54.23
|
| Total
return (%) (k)(r)(s)(x) |
29.53
|
15.34
|
29.17
|
(7.74)
|
20.76
|
Ratios
(%) (to average net assets)
and Supplemental data: |
|
|
|
|
|
| Expenses
before expense reductions |
0.45
|
0.45
|
0.45
|
0.45
|
0.46
|
| Expenses
after expense reductions |
0.43
|
0.44
|
0.44
|
0.44
|
0.45
|
| Net
investment income (loss) |
0.98
|
1.30
|
1.58
|
1.39
|
1.35
|
| Portfolio
turnover |
51
|
56
|
46
|
54
|
51
|
| Net
assets at end of period (000 omitted) |
$313,788
|
$280,679
|
$285,654
|
$256,439
|
$320,384
|
| Service
Class |
Year
ended |
| |
12/31/21
|
12/31/20
|
12/31/19
|
12/31/18
|
12/31/17
|
| Net
asset value, beginning of period |
$56.68
|
$52.54
|
$44.87
|
$53.79
|
$46.26
|
| Income
(loss) from investment operations |
|
|
|
|
|
| Net
investment income (loss) (d) |
$0.47
|
$0.54
|
$0.67
|
$0.61
|
$0.55
|
| Net
realized and unrealized gain (loss) |
15.76
|
7.12
|
11.64
|
(4.11)
|
8.73
|
| Total
from investment operations |
$16.23
|
$7.66
|
$12.31
|
$(3.50)
|
$9.28
|
| Less
distributions declared to shareholders |
|
|
|
|
|
| From
net investment income |
$(0.60)
|
$(0.74)
|
$(0.66)
|
$(0.63)
|
$(0.66)
|
| From
net realized gain |
(4.60)
|
(2.78)
|
(3.98)
|
(4.79)
|
(1.09)
|
| Total
distributions declared to shareholders |
$(5.20)
|
$(3.52)
|
$(4.64)
|
$(5.42)
|
$(1.75)
|
| Net
asset value, end of period (x) |
$67.71
|
$56.68
|
$52.54
|
$44.87
|
$53.79
|
| Total
return (%) (k)(r)(s)(x) |
29.18
|
15.06
|
28.87
|
(7.99)
|
20.47
|
Ratios
(%) (to average net assets)
and Supplemental data: |
|
|
|
|
|
| Expenses
before expense reductions |
0.70
|
0.70
|
0.70
|
0.70
|
0.71
|
| Expenses
after expense reductions |
0.68
|
0.69
|
0.69
|
0.69
|
0.70
|
| Net
investment income (loss) |
0.73
|
1.05
|
1.33
|
1.14
|
1.10
|
| Portfolio
turnover |
51
|
56
|
46
|
54
|
51
|
| Net
assets at end of period (000 omitted) |
$221,299
|
$191,661
|
$186,380
|
$157,522
|
$182,103
|
See Notes to Financial Statements
MFS Blended Research Core
Equity Portfolio
Financial Highlights - continued
| (d)
|
Per share data
is based on average shares outstanding. |
| (k)
|
The total
return does not reflect expenses that apply to separate accounts. Inclusion of these charges would reduce the total return figures for all periods shown. |
| (r)
|
Certain
expenses have been reduced without which performance would have been lower. |
| (s)
|
From time to
time the fund may receive proceeds from litigation settlements, without which performance would be lower. |
| (x)
|
The
net asset values and total returns have been calculated on net assets which include adjustments made in accordance with U.S. generally accepted accounting principles required at period end for financial reporting purposes. |
See Notes to Financial Statements
MFS Blended Research Core
Equity Portfolio
Notes to Financial Statements
(1) Business and Organization
MFS Blended Research Core Equity Portfolio (the fund) is a
diversified series of MFS Variable Insurance Trust II (the trust). The trust is organized as a Massachusetts business trust and is registered under the Investment Company Act of 1940, as amended, as an open-end management investment company. The
shareholders of each series of the trust are separate accounts of insurance companies, which offer variable annuity and/or life insurance products, and qualified retirement and pension plans.
The fund is an investment company and accordingly follows
the investment company accounting and reporting guidance of the Financial Accounting Standards Board (FASB) Accounting Standards Codification Topic 946 Financial Services - Investment Companies.
(2) Significant Accounting Policies
General — The
preparation of financial statements in conformity with U.S. generally accepted accounting principles requires management to make estimates and assumptions that affect the reported amounts of assets and liabilities, and disclosure of contingent
assets and liabilities at the date of the financial statements and the reported amounts of increases and decreases in net assets from operations during the reporting period. Actual results could differ from those estimates. In the preparation of
these financial statements, management has evaluated subsequent events occurring after the date of the fund’s Statement of Assets and Liabilities through the date that the financial statements were issued.
Balance Sheet Offsetting
— The fund's accounting policy with respect to balance sheet offsetting is that, absent an event of default by the counterparty or a termination of the agreement, the International Swaps and Derivatives Association (ISDA) Master Agreement, or
similar agreement, does not result in an offset of reported amounts of financial assets and financial liabilities in the Statement of Assets and Liabilities across transactions between the fund and the applicable counterparty. The fund's right to
setoff may be restricted or prohibited by the bankruptcy or insolvency laws of the particular jurisdiction to which a specific master netting agreement counterparty is subject. Balance sheet offsetting disclosures, to the extent applicable to the
fund, have been included in the fund’s Significant Accounting Policies note under the captions for each of the fund’s in-scope financial instruments and transactions.
Investment Valuations
— Equity securities, including restricted equity securities, are generally valued at the last sale or official closing price on their primary market or exchange as provided by a third-party pricing
service. Equity securities, for which there were no sales reported that day, are generally valued at the last quoted daily bid quotation on their primary market or exchange as provided by a third-party pricing service. Short-term instruments with a maturity at issuance of 60 days or less may be valued at amortized cost, which approximates market value. Open-end investment companies are
generally valued at net asset value per share.
Securities and
other assets generally valued on the basis of information from a third-party pricing service may also be valued at a broker/dealer bid quotation. In determining values, third-party pricing services can utilize both transaction data and market
information such as yield, quality, coupon rate, maturity, type of issue, trading characteristics, and other market data.
The Board of Trustees has delegated primary responsibility
for determining or causing to be determined the value of the fund’s investments (including any fair valuation) to the adviser pursuant to valuation policies and procedures approved by the Board. If the adviser determines that reliable market
quotations are not readily available, investments are valued at fair value as determined in good faith by the adviser in accordance with such procedures under the oversight of the Board of Trustees. Under the fund’s valuation policies and
procedures, market quotations are not considered to be readily available for most types of debt instruments and floating rate loans and many types of derivatives. These investments are generally valued at fair value based on information from
third-party pricing services. In addition, investments may be valued at fair value if the adviser determines that an investment’s value has been materially affected by events occurring after the close of the exchange or market on which the
investment is principally traded (such as foreign exchange or market) and prior to the determination of the fund’s net asset value, or after the halt of trading of a specific security where trading does not resume prior to the close of the
exchange or market on which the security is principally traded. Events that occur after foreign markets close (such as developments in foreign markets and significant movements in the U.S. markets) and prior to the determination of the fund’s
net asset value may be deemed to have a material effect on the value of securities traded in foreign markets. Accordingly, the fund’s foreign equity securities may often be valued at fair value. The adviser generally relies on third-party
pricing services or other information (such as the correlation with price movements of similar securities in the same or other markets; the type, cost and investment characteristics of the security; the business and financial condition of the
issuer; and trading and other market data) to assist in determining whether to fair value and at what value to fair value an investment. The value of an investment for purposes of calculating the fund’s net asset value can differ depending on
the source and method used to determine value. When fair valuation is used, the value of an investment used to determine the fund’s net asset value may differ from quoted or published prices for the same investment. There can be no assurance
that the fund could obtain the fair value assigned to an investment if it were to sell the investment at the same time at which the fund determines its net asset value per share.
MFS Blended Research Core
Equity Portfolio
Notes to Financial Statements - continued
Various inputs are used in determining the value of the
fund's assets or liabilities. These inputs are categorized into three broad levels. In certain cases, the inputs used to measure fair value may fall into different levels of the fair value hierarchy. In such cases, an investment's level within the
fair value hierarchy is based on the lowest level of input that is significant to the fair value measurement. The fund's assessment of the significance of a particular input to the fair value measurement in its entirety requires judgment, and
considers factors specific to the investment. Level 1 includes unadjusted quoted prices in active markets for identical assets or liabilities. Level 2 includes other significant observable market-based inputs (including quoted prices for similar
securities, interest rates, prepayment speed, and credit risk). Level 3 includes unobservable inputs, which may include the adviser's own assumptions in determining the fair value of investments. The following is a summary of the levels used as of
December 31, 2021 in valuing the fund's assets and liabilities:
| Financial
Instruments |
Level
1 |
Level
2 |
Level
3 |
Total
|
| Equity
Securities |
$533,494,379
|
$—
|
$—
|
$533,494,379
|
| Mutual
Funds |
1,708,524
|
—
|
—
|
1,708,524
|
| Total
|
$535,202,903
|
$—
|
$—
|
$535,202,903
|
For further information
regarding security characteristics, see the Portfolio of Investments.
Security Loans —
Under its Securities Lending Agency Agreement with the fund, State Street Bank and Trust Company, as lending agent, loans the securities of the fund to certain qualified institutions (the “Borrowers”) approved by the fund. Security loans
can be terminated at the discretion of either the lending agent or the fund and the related securities must be returned within the earlier of the standard trade settlement period for such securities or within three business days. The loans are
collateralized by cash and/or U.S. Treasury and federal agency obligations in an amount typically at least equal to the market value of the securities loaned. On loans collateralized by cash, the cash collateral is invested in a money market fund.
The market value of the loaned securities is determined at the close of business of the fund and any additional required collateral is delivered to the fund on the next business day. The lending agent provides the fund with indemnification against
Borrower default. In the event of Borrower default, the lending agent will, for the benefit of the fund, either purchase securities identical to those loaned or, when such purchase is commercially impracticable, pay the fund the market value of the
loaned securities. In return, the lending agent assumes the fund's rights to the related collateral. If the collateral value is less than the cost to purchase identical securities, the lending agent is responsible for the shortfall, but only to the
extent that such shortfall is not due to a decline in collateral value resulting from collateral reinvestment for which the fund bears the risk of loss. A portion of the income generated upon investment of the collateral is remitted to the
Borrowers, and the remainder is allocated between the fund and the lending agent. On loans collateralized by U.S. Treasury and/or federal agency obligations, a fee is received from the Borrower, and is allocated between the fund and the lending
agent. Income from securities lending is separately reported in the Statement of Operations. The dividend and interest income earned on the securities loaned is accounted for in the same manner as other dividend and interest income. At December 31,
2021, there were no securities on loan or collateral outstanding.
Indemnifications —
Under the fund's organizational documents, its officers and Trustees may be indemnified against certain liabilities and expenses arising out of the performance of their duties to the fund. Additionally, in the normal course of business, the fund
enters into agreements with service providers that may contain indemnification clauses. The fund's maximum exposure under these agreements is unknown as this would involve future claims that may be made against the fund that have not yet
occurred.
Investment Transactions and Income — Investment transactions are recorded on the trade date. Dividends received in cash are recorded on the ex-dividend date. Certain dividends from foreign securities will be
recorded when the fund is informed of the dividend if such information is obtained subsequent to the ex-dividend date. Dividend payments received in additional securities are recorded on the ex-dividend date in an amount equal to the value of the
security on such date.
The fund may receive
proceeds from litigation settlements. Any proceeds received from litigation involving portfolio holdings are reflected in the Statement of Operations in realized gain/loss if the security has been disposed of by the fund or in unrealized gain/loss
if the security is still held by the fund. Any other proceeds from litigation not related to portfolio holdings are reflected as other income in the Statement of Operations.
Tax Matters and Distributions — The fund intends to qualify as a regulated investment company, as defined under Subchapter M of the Internal Revenue Code, and to distribute all of its taxable income, including realized capital gains. As a
result, no provision for federal income tax is required. The fund’s federal tax returns, when filed, will remain subject to examination by the Internal Revenue Service for a three year period. Management has analyzed the fund’s tax
positions taken on federal and state tax returns for all open tax years and does not believe that there are any uncertain tax positions that require recognition of a tax liability. Foreign taxes, if any, have been accrued by the fund in the
accompanying financial statements in accordance with the applicable foreign tax law. Foreign income taxes may be withheld by certain countries in which the fund invests. Additionally, capital gains realized by the fund on securities issued in or by
certain foreign countries may be subject to capital gains tax imposed by those countries.
MFS Blended Research Core
Equity Portfolio
Notes to Financial Statements - continued
Distributions to shareholders are recorded on the
ex-dividend date. Income and capital gain distributions are determined in accordance with income tax regulations, which may differ from U.S. generally accepted accounting principles. Certain capital accounts in the financial statements are
periodically adjusted for permanent differences in order to reflect their tax character. These adjustments have no impact on net assets or net asset value per share. Temporary differences which arise from recognizing certain items of income,
expense, gain or loss in different periods for financial statement and tax purposes will reverse at some time in the future.
Book/tax differences primarily relate to wash sale loss
deferrals.
The tax character of distributions
declared to shareholders for the last two fiscal years is as follows:
| |
Year
ended
12/31/21 |
Year
ended
12/31/20 |
| Ordinary
income (including any short-term capital gains) |
$8,025,024
|
$6,680,112
|
| Long-term
capital gains |
32,195,057
|
22,561,026
|
| Total
distributions |
$40,220,081
|
$29,241,138
|
The federal tax cost and the tax
basis components of distributable earnings were as follows:
| As
of 12/31/21 |
|
| Cost
of investments |
$324,625,853
|
| Gross
appreciation |
213,958,647
|
| Gross
depreciation |
(3,381,597)
|
| Net
unrealized appreciation (depreciation) |
$210,577,050
|
| Undistributed
ordinary income |
22,857,328
|
| Undistributed
long-term capital gain |
57,209,667
|
| Total
distributable earnings (loss) |
$290,644,045
|
Multiple Classes of Shares of
Beneficial Interest — The fund offers multiple classes of shares, which differ in their respective distribution and/or service fees. The fund's income, realized and unrealized gain (loss), and common expenses
are allocated to shareholders based on the daily net assets of each class. Dividends are declared separately for each class. Differences in per share dividend rates are generally due to differences in separate class expenses. The fund’s
distributions declared to shareholders as reported in the Statements of Changes in Net Assets are presented by class as follows:
| |
Year
ended
12/31/21 |
|
Year
ended
12/31/20 |
| Initial
Class |
$23,828,611
|
|
$17,686,199
|
| Service
Class |
16,391,470
|
|
11,554,939
|
| Total
|
$40,220,081
|
|
$29,241,138
|
(3) Transactions with
Affiliates
Investment Adviser — The fund has an investment advisory agreement with MFS to provide overall investment management and related administrative services and facilities to the fund. The
management fee is computed daily and paid monthly at the following annual rates based on the fund's average daily net assets:
| Up
to $1 billion |
0.40%
|
| In
excess of $1 billion and up to $2.5 billion |
0.375%
|
| In
excess of $2.5 billion |
0.35%
|
MFS has agreed in writing to
reduce its management fee by a specified amount if certain MFS mutual fund assets exceed thresholds agreed to by MFS and the fund's Board of Trustees. For the year ended December 31, 2021, this management fee reduction amounted to $65,158, which is
included in the reduction of total expenses in the Statement of Operations. The management fee incurred for the year ended December 31, 2021 was equivalent to an annual effective rate of 0.39% of the fund's average daily net assets.
Distributor — MFS
Fund Distributors, Inc. (MFD), a wholly-owned subsidiary of MFS, is the distributor of shares of the fund. The Trustees have adopted a distribution plan for the Service Class shares pursuant to Rule 12b-1 under the Investment Company Act of
1940.
MFS Blended Research Core
Equity Portfolio
Notes to Financial Statements - continued
The
fund's distribution plan provides that the fund will pay MFD distribution and/or service fees equal to 0.25% per annum of its average daily net assets attributable to Service Class shares as partial consideration for services performed and expenses
incurred by MFD and financial intermediaries (including participating insurance companies that invest in the fund to fund variable annuity and variable life insurance contracts, sponsors of qualified retirement and pension plans that invest in the
fund, and affiliates of these participating insurance companies and plan sponsors) in connection with the sale and distribution of the Service Class shares. MFD may subsequently pay all, or a portion, of the distribution and/or service fees to
financial intermediaries.
Shareholder Servicing Agent — MFS Service Center, Inc. (MFSC), a wholly-owned subsidiary of MFS, receives a fee from the fund for its services as shareholder servicing agent. For the year ended December 31, 2021, the fee was $17,113, which
equated to 0.0033% annually of the fund's average daily net assets. MFSC also receives reimbursement from the fund for out-of-pocket expenses paid by MFSC on behalf of the fund. For the year ended December 31, 2021, these costs amounted to
$793.
Administrator — MFS provides certain financial, legal, shareholder communications, compliance, and other administrative services to the fund. Under an administrative services agreement, the fund reimburses MFS the costs incurred
to provide these services. The fund is charged an annual fixed amount of $17,500 plus a fee based on average daily net assets. The administrative services fee incurred for the year ended December 31, 2021 was equivalent to an annual effective rate
of 0.0151% of the fund's average daily net assets.
Trustees’ and Officers’ Compensation — The fund pays compensation to independent Trustees in the form of a retainer, attendance fees, and additional compensation to Board and Committee chairpersons. The fund does not pay compensation directly to
Trustees or officers of the fund who are also officers of the investment adviser, all of whom receive remuneration from MFS for their services to the fund. Certain officers and Trustees of the fund are officers or directors of MFS, MFD, and
MFSC.
Other
— The fund invests in the MFS Institutional Money Market Portfolio which is managed by MFS and seeks current income consistent with preservation of capital and liquidity. This money market fund does not pay a
management fee to MFS but does incur investment and operating costs.
The fund is permitted to engage in purchase and sale
transactions with funds and accounts for which MFS serves as investment adviser or sub-adviser (“cross-trades”) pursuant to a policy adopted by the Board of Trustees. This policy has been designed to ensure that cross-trades conducted by
the fund comply with Rule 17a-7 under the Investment Company Act of 1940. During the year ended December 31, 2021, the fund engaged in sale transactions pursuant to this policy, which amounted to $9,435. The sales transactions resulted in net
realized gains (losses) of $2,295.
The adviser has
voluntarily undertaken to reimburse the fund from its own resources on a quarterly basis for the cost of investment research embedded in the cost of the fund’s securities trades. This agreement may be rescinded at any time. For the year ended
December 31, 2021, this reimbursement amounted to $19,440, which is included in “Other” income in the Statement of Operations.
(4) Portfolio Securities
For the year ended December 31, 2021, purchases and sales
of investments, other than short-term obligations, aggregated $257,887,132 and $320,219,004, respectively.
(5) Shares of Beneficial Interest
The fund's Declaration of Trust permits the Trustees to
issue an unlimited number of full and fractional shares of beneficial interest. Transactions in fund shares were as follows:
| |
Year
ended
12/31/21 |
|
Year
ended
12/31/20 |
| |
Shares
|
Amount
|
|
Shares
|
Amount
|
| Shares
sold |
|
|
|
|
|
| Initial
Class |
87,937
|
$5,655,805
|
|
63,891
|
$3,132,327
|
| Service
Class |
205,265
|
13,181,638
|
|
183,279
|
8,493,425
|
| |
293,202
|
$18,837,443
|
|
247,170
|
$11,625,752
|
Shares
issued to shareholders
in reinvestment of distributions |
|
|
|
|
|
| Initial
Class |
363,572
|
$23,508,544
|
|
326,069
|
$17,421,868
|
| Service
Class |
256,317
|
16,391,470
|
|
218,389
|
11,554,939
|
| |
619,889
|
$39,900,014
|
|
544,458
|
$28,976,807
|
MFS Blended Research Core
Equity Portfolio
Notes to Financial Statements - continued
| |
Year
ended
12/31/21 |
|
Year
ended
12/31/20 |
| |
Shares
|
Amount
|
|
Shares
|
Amount
|
| Shares
reacquired |
|
|
|
|
|
| Initial
Class |
(772,417)
|
$(49,707,987)
|
|
(873,552)
|
$(45,226,511)
|
| Service
Class |
(574,966)
|
(37,049,207)
|
|
(567,361)
|
(28,761,438)
|
| |
(1,347,383)
|
$(86,757,194)
|
|
(1,440,913)
|
$(73,987,949)
|
| Net
change |
|
|
|
|
|
| Initial
Class |
(320,908)
|
$(20,543,638)
|
|
(483,592)
|
$(24,672,316)
|
| Service
Class |
(113,384)
|
(7,476,099)
|
|
(165,693)
|
(8,713,074)
|
| |
(434,292)
|
$(28,019,737)
|
|
(649,285)
|
$(33,385,390)
|
(6) Line of
Credit
The fund and certain other funds managed by
MFS participate in a $1.25 billion unsecured committed line of credit of which $1 billion is reserved for use by the fund and certain other MFS U.S. funds. The line of credit is provided by a syndicate of banks under a credit agreement. Borrowings
may be made for temporary financing needs. Interest is charged to each fund, based on its borrowings, generally at a rate equal to the highest of one month LIBOR, the Federal Funds Effective Rate and the Overnight Bank Funding Rate, plus an agreed
upon spread. A commitment fee, based on the average daily, unused portion of the committed line of credit, is allocated among the participating funds. In addition, the fund and other funds managed by MFS have established unsecured uncommitted
borrowing arrangements with certain banks for temporary financing needs. Interest is charged to each fund, based on its borrowings, at rates equal to customary reference rates plus an agreed upon spread. For the year ended December 31, 2021, the
fund’s commitment fee and interest expense were $1,576 and $0, respectively, and are included in “Miscellaneous” expense in the Statement of Operations.
(7) Investments in Affiliated Issuers
An affiliated issuer may be considered one in which the
fund owns 5% or more of the outstanding voting securities, or a company which is under common control. For the purposes of this report, the following were affiliated issuers:
| Affiliated
Issuers |
Beginning
Value |
Purchases
|
Sales
Proceeds |
Realized
Gain
(Loss) |
Change
in
Unrealized
Appreciation or
Depreciation |
Ending
Value |
| MFS
Institutional Money Market Portfolio |
$2,205,534
|
$65,904,090
|
$66,401,100
|
$—
|
$—
|
$1,708,524
|
| Affiliated
Issuers |
Dividend
Income |
Capital
Gain
Distributions |
| MFS
Institutional Money Market Portfolio |
$1,289
|
$—
|
(8) Impacts of
COVID-19
The pandemic related to the global spread of
novel coronavirus disease (COVID-19), which was first detected in December 2019, has resulted in significant disruptions to global business activity and the global economy, as well as the economies of individual countries, the financial performance
of individual companies and sectors, and the securities and commodities markets in general. Multiple surges in cases globally, the availability and widespread adoption of vaccines, and the emergence of variant strains of the virus continue to create
uncertainty as to the future and long-term impacts resulting from the pandemic including impacts to the prices and liquidity of the fund's investments and the fund's performance.
(9) LIBOR Transition
Certain of the fund's investments, including its
investments in derivatives, as well as any debt issued by the fund and other contractual arrangements of the fund may be based on reference interest rates such as the London Interbank Offered Rate (“LIBOR”). In 2017, the regulatory
authority that oversees financial services firms in the United Kingdom announced plans to transition away from LIBOR by the end of 2021. In March 2021, the administrator of LIBOR announced the extension of the publication of the more commonly used
U.S. dollar LIBOR settings to the end of June 2023. Although the full impacts of the
MFS Blended Research Core
Equity Portfolio
Notes to Financial Statements - continued
transition away
from LIBOR are not fully known, the transition may result in, among other things, an increase in volatility or illiquidity of the markets for instruments that currently rely on LIBOR to determine interest rates and this could have an adverse impact
on the fund's performance. With respect to the fund's accounting for investments, including its investments in derivatives, as well as any debt issued by the fund and other contractual arrangements of the fund that undergo reference rate-related
modifications as a result of the transition, management will rely upon the relief provided by FASB Codification Topic 848 – Reference Rate Reform (Topic 848). The guidance in Topic 848 permits the fund to disregard the GAAP accounting
requirements around certain contract modifications resulting from the LIBOR transition such that for contracts considered in scope, the fund can account for those modified contracts as a continuation of the existing contracts. While the cessation of
the one-week and two-month U.S. dollar LIBOR tenors along with certain other non-U.S. dollar denominated LIBOR settings at December 31, 2021 did not have a material impact on the fund, management is still evaluating the impact to the fund of the
June 30, 2023 planned discontinuation of the more commonly used U.S. dollar LIBOR settings.
MFS Blended Research Core
Equity Portfolio
Report of Independent Registered Public Accounting
Firm
To the Board of Trustees of MFS Variable
Insurance Trust II and the Shareholders of MFS Blended Research Core Equity Portfolio:
Opinion on the Financial Statements and Financial
Highlights
We have audited the accompanying statement
of assets and liabilities of MFS Blended Research Core Equity Portfolio (the “Fund”), including the portfolio of investments, as of December 31, 2021, the related statement of operations for the year then ended, the statements of changes
in net assets for each of the two years in the period then ended, the financial highlights for each of the five years in the period then ended, and the related notes. In our opinion, the financial statements and financial highlights present fairly,
in all material respects, the financial position of the Fund as of December 31, 2021, and the results of its operations for the year then ended, the changes in its net assets for each of the two years in the period then ended, and the financial
highlights for each of the five years in the period then ended, in conformity with accounting principles generally accepted in the United States of America.
Basis for Opinion
These financial statements and financial highlights are the
responsibility of the Fund's management. Our responsibility is to express an opinion on the Fund's financial statements and financial highlights based on our audits. We are a public accounting firm registered with the Public Company Accounting
Oversight Board (United States) (PCAOB) and are required to be independent with respect to the Fund in accordance with the U.S. federal securities laws and the applicable rules and regulations of the Securities and Exchange Commission and the
PCAOB.
We conducted our audits in accordance with the
standards of the PCAOB. Those standards require that we plan and perform the audit to obtain reasonable assurance about whether the financial statements and financial highlights are free of material misstatement, whether due to error or fraud. The
Fund is not required to have, nor were we engaged to perform, an audit of its internal control over financial reporting. As part of our audits, we are required to obtain an understanding of internal control over financial reporting but not for the
purpose of expressing an opinion on the effectiveness of the Fund's internal control over financial reporting. Accordingly, we express no such opinion.
Our audits included performing procedures to assess the
risks of material misstatement of the financial statements and financial highlights, whether due to error or fraud, and performing procedures that respond to those risks. Such procedures included examining, on a test basis, evidence regarding the
amounts and disclosures in the financial statements and financial highlights. Our audits also included evaluating the accounting principles used and significant estimates made by management, as well as evaluating the overall presentation of the
financial statements and financial highlights. Our procedures included confirmation of securities owned as of December 31, 2021, by correspondence with the custodian. We believe that our audits provide a reasonable basis for our opinion.
DELOITTE & TOUCHE LLP
Boston, Massachusetts
February 15, 2022
We have served as the auditor of one or more of the MFS
investment companies since 1924.
MFS Blended Research Core
Equity Portfolio
Trustees and Officers — Identification and
Background
The Trustees and Officers of the Trust, as
of February 1, 2022, are listed below, together with their principal occupations during the past five years. (Their titles may have varied during that period.) The address of each Trustee and Officer is 111 Huntington Avenue, Boston, Massachusetts
02199-7618.
| Name,
Age |
|
Position(s)
Held with Fund |
|
Trustee/Officer
Since(h) |
|
Number
of MFS Funds overseen by the Trustee |
|
Principal
Occupations During
the Past Five Years |
|
Other
Directorships During
the Past Five Years (j) |
| INTERESTED
TRUSTEES |
|
|
|
|
|
|
|
|
|
|
Michael
W. Roberge (k)
(age 55) |
|
Trustee
|
|
January
2021 |
|
135
|
|
Massachusetts
Financial Services Company, Chairman (since January 2021); Chief Executive Officer (since January 2017); Director; Chairman of the Board (since January 2022); President (until December 2018); Chief Investment Officer (until December 2018) |
|
N/A
|
| INDEPENDENT
TRUSTEES |
|
|
|
|
|
|
|
|
|
|
John
P. Kavanaugh
(age 67) |
|
Trustee
and Chair of Trustees |
|
January
2009 |
|
135
|
|
Private
investor |
|
N/A
|
Steven
E. Buller
(age 70) |
|
Trustee
|
|
February
2014 |
|
135
|
|
Private
investor |
|
N/A
|
John
A. Caroselli
(age 67) |
|
Trustee
|
|
March
2017 |
|
135
|
|
Private
investor; JC Global Advisors, LLC (management consulting), President (since 2015) |
|
N/A
|
Maureen
R. Goldfarb
(age 66) |
|
Trustee
|
|
January
2009 |
|
135
|
|
Private
investor |
|
N/A
|
Peter
D. Jones
(age 66) |
|
Trustee
|
|
January
2019 |
|
135
|
|
Private
investor |
|
N/A
|
James
W. Kilman, Jr.
(age 60) |
|
Trustee
|
|
January
2019 |
|
135
|
|
Burford
Capital Limited (finance and investment management), Senior Advisor (since May 3, 2021), Chief Financial Officer (2019 - May 2, 2021); KielStrand Capital LLC (family office), Chief Executive Officer (since 2016) |
|
Alpha-En
Corporation, Director (2016-2019) |
Clarence
Otis, Jr.
(age 65) |
|
Trustee
|
|
March
2017 |
|
135
|
|
Private
investor |
|
VF
Corporation, Director; Verizon Communications, Inc., Director; The Travelers Companies, Director |
Maryanne
L. Roepke
(age 65) |
|
Trustee
|
|
May
2014 |
|
135
|
|
Private
investor |
|
N/A
|
Laurie
J. Thomsen
(age 64) |
|
Trustee
|
|
March
2005 |
|
135
|
|
Private
investor |
|
The
Travelers Companies, Director; Dycom Industries, Inc., Director |
MFS Blended Research Core
Equity Portfolio
Trustees and Officers - continued
| Name,
Age |
|
Position(s)
Held with
Fund |
|
Trustee/Officer
Since(h) |
|
Number
of MFS Funds for which the Person is an Officer |
|
Principal
Occupations During
the Past Five Years |
| OFFICERS
|
|
|
|
|
|
|
|
|
Christopher
R. Bohane (k)
(age 48) |
|
Assistant
Secretary and Assistant Clerk |
|
July
2005 |
|
135
|
|
Massachusetts
Financial Services Company, Senior Vice President and Associate General Counsel |
Kino
Clark (k)
(age 53) |
|
Assistant
Treasurer |
|
January
2012 |
|
135
|
|
Massachusetts
Financial Services Company, Vice President |
John
W. Clark, Jr. (k)
(age 54) |
|
Assistant
Treasurer |
|
April
2017 |
|
135
|
|
Massachusetts
Financial Services Company, Vice President (since March 2017); Deutsche Bank (financial services), Department Head - Treasurer's Office (until February 2017) |
Thomas
H. Connors (k)
(age 62) |
|
Assistant
Secretary and Assistant Clerk |
|
September
2012 |
|
135
|
|
Massachusetts
Financial Services Company, Vice President and Senior Counsel |
David
L. DiLorenzo (k)
(age 53) |
|
President
|
|
July
2005 |
|
135
|
|
Massachusetts
Financial Services Company, Senior Vice President |
Heidi
W. Hardin (k)
(age 54) |
|
Secretary
and Clerk |
|
April
2017 |
|
135
|
|
Massachusetts
Financial Services Company, Executive Vice President and General Counsel (since March 2017); Harris Associates (investment management), General Counsel (until January 2017) |
Brian
E. Langenfeld (k)
(age 48) |
|
Assistant
Secretary and Assistant Clerk |
|
June
2006 |
|
135
|
|
Massachusetts
Financial Services Company, Vice President and Senior Counsel |
Amanda
S. Mooradian (k)
(age 42) |
|
Assistant
Secretary and Assistant Clerk |
|
September
2018 |
|
135
|
|
Massachusetts
Financial Services Company, Assistant Vice President and Senior Counsel |
Susan
A. Pereira (k)
(age 51) |
|
Assistant
Secretary and Assistant Clerk |
|
July
2005 |
|
135
|
|
Massachusetts
Financial Services Company, Vice President and Assistant General Counsel |
Kasey
L. Phillips (k)
(age 51) |
|
Assistant
Treasurer |
|
September
2012 |
|
135
|
|
Massachusetts
Financial Services Company, Vice President |
Matthew
A. Stowe (k)
(age 47) |
|
Assistant
Secretary and Assistant Clerk |
|
October
2014 |
|
135
|
|
Massachusetts
Financial Services Company, Vice President and Assistant General Counsel |
Martin
J. Wolin (k)
(age 54) |
|
Chief
Compliance Officer |
|
July
2015 |
|
135
|
|
Massachusetts
Financial Services Company, Senior Vice President and Chief Compliance Officer |
James
O. Yost (k)
(age 61) |
|
Treasurer
|
|
September
1990 |
|
135
|
|
Massachusetts
Financial Services Company, Senior Vice President |
| (h)
|
Date
first appointed to serve as Trustee/Officer of an MFS Fund. Each Trustee has served continuously since appointment unless indicated otherwise. From January 2012 through December 2016, Messrs. DiLorenzo and Yost served as Treasurer and Deputy
Treasurer of the Funds, respectively. |
| (j)
|
Directorships or
trusteeships of companies required to report to the Securities and Exchange Commission (i.e., “public companies”). |
| (k)
|
“Interested
person” of the Trust within the meaning of the Investment Company Act of 1940 (referred to as the 1940 Act), which is the principal federal law governing investment companies like the fund, as a result of a position with MFS. The address of
MFS is 111 Huntington Avenue, Boston, Massachusetts 02199-7618. |
Each Trustee (other than Messrs. Jones, Kilman and Roberge)
has been elected by shareholders and each Trustee and Officer holds office until his or her successor is chosen and qualified or until his or her earlier death, resignation, retirement or removal. Mr. Roberge became a Trustee of the Funds on January
1, 2021 and Messrs. Jones and Kilman became Trustees of the Funds on January 1, 2019. The Trust does not hold annual meetings for the purpose of electing Trustees, and Trustees are not elected for fixed terms. Under the terms of the Board's
retirement policy, an Independent Trustee shall retire at the end of the calendar year in which he or she reaches the earlier of 75 years of age or 15 years of service on the Board (or, in the case of any Independent Trustee who joined the Board
prior to 2015, 20 years of service on the Board).
Messrs. Buller, Kilman and Otis and Ms. Roepke are members
of the Trust’s Audit Committee.
MFS Blended Research Core
Equity Portfolio
Trustees and Officers - continued
Each
of the Interested Trustees and certain Officers hold comparable officer positions with certain affiliates of MFS.
The Statement of Additional Information for a Fund includes
further information about the Trustees and is available without charge upon request by calling 1-800-225-2606.
| Investment
Adviser |
Custodian
|
Massachusetts Financial
Services Company
111 Huntington Avenue
Boston, MA 02199-7618 |
State Street
Bank and Trust Company
1 Lincoln Street
Boston, MA 02111-2900 |
| Distributor
|
Independent
Registered Public Accounting Firm |
MFS Fund
Distributors, Inc.
111 Huntington Avenue
Boston, MA 02199-7618 |
Deloitte
& Touche LLP
200 Berkeley Street
Boston, MA 02116 |
| Portfolio
Manager(s) |
|
Jim
Fallon
Matt Krummell
Jonathan Sage
Jed Stocks |
|
MFS Blended Research Core
Equity Portfolio
Board Review of Investment Advisory Agreement
MFS Blended Research Core Equity Portfolio
The Investment Company Act of 1940 requires that both the
full Board of Trustees and a majority of the non-interested (“independent”) Trustees, voting separately, annually approve the continuation of the Fund’s investment advisory agreement with MFS. The Trustees consider matters
bearing on the Fund and its advisory arrangements at their meetings throughout the year, including a review of performance data at each regular meeting. In addition, the independent Trustees met several times by videoconference (in accordance
with Securities and Exchange Commission relief) over the course of three months beginning in May and ending in July, 2021 (“contract review meetings”) for the specific purpose of considering whether to approve the continuation of the
investment advisory agreement for the Fund and the other investment companies that the Board oversees (the “MFS Funds”). The independent Trustees were assisted in their evaluation of the Fund’s investment advisory agreement
by independent legal counsel, from whom they received separate legal advice and with whom they met separately from MFS during various contract review meetings. The independent Trustees were also assisted in this process by an independent
consultant who was retained by and reported to the independent Trustees.
In connection with their deliberations regarding the
continuation of the investment advisory agreement, the Trustees, including the independent Trustees, considered such information and factors as they believed, in light of the legal advice furnished to them and their own business judgment, to be
relevant. The investment advisory agreement for the Fund was considered separately, although the Trustees also took into account the common interests of all MFS Funds in their review. As described below, the Trustees considered the
nature, quality, and extent of the various investment advisory, administrative, and shareholder services performed by MFS under the existing investment advisory agreement and other arrangements with the Fund.
In connection with their contract review meetings, the
Trustees received and relied upon materials that included, among other items: (i) information provided by Broadridge Financial Solutions, Inc. (“Broadridge”), an independent third party, on the investment performance of the Fund for
various time periods ended December 31, 2020 and the investment performance of a group of funds with substantially similar investment classifications/objectives (the “Broadridge performance universe”), (ii) information provided by
Broadridge on the Fund’s advisory fees and other expenses and the advisory fees and other expenses of comparable funds identified by Broadridge as well as all other funds in the same investment classification/category (the “Broadridge
expense group and universe”), (iii) information provided by MFS on the advisory fees of portfolios of other clients of MFS, including institutional separate accounts and other clients, (iv) information as to whether and to what extent
applicable expense waivers, reimbursements or fee “breakpoints” are observed for the Fund, (v) information regarding MFS’ financial results and financial condition, including MFS’ and certain of its affiliates’
estimated profitability from services performed for the Fund and the MFS Funds as a whole, and compared to MFS’ institutional business, (vi) MFS’ views regarding the outlook for the mutual fund industry and the strategic business plans
of MFS, (vii) descriptions of various functions performed by MFS for the Funds, such as compliance monitoring and portfolio trading practices, and (viii) information regarding the overall organization of MFS, including information about MFS’
senior management and other personnel providing investment advisory, administrative and other services to the Fund and the other MFS Funds. The comparative performance, fee and expense information prepared and provided by Broadridge was not
independently verified and the independent Trustees did not independently verify any information provided to them by MFS.
The Trustees’ conclusion as to the continuation of
the investment advisory agreement was based on a comprehensive consideration of all information provided to the Trustees and not the result of any single factor. Some of the factors that figured particularly in the Trustees’
deliberations are described below, although individual Trustees may have evaluated the information presented differently from one another, giving different weights to various factors. It is also important to recognize that the fee arrangements
for the Fund and other MFS Funds are the result of years of review and discussion between the independent Trustees and MFS, that certain aspects of such arrangements may receive greater scrutiny in some years than in others, and that the
Trustees’ conclusions may be based, in part, on their consideration of these same arrangements during the course of the year and in prior years.
Based on information provided by Broadridge and MFS, the
Trustees reviewed the Fund’s total return investment performance as well as the Broadridge performance universe over various time periods. The Trustees placed particular emphasis on the total return performance of the Fund’s
Initial Class shares in comparison to the performance of funds in its Broadridge performance universe over the five-year period ended December 31, 2020, which the Trustees believed was a long enough period to reflect differing market
conditions. The total return performance of the Fund’s Initial Class shares was in the 5th quintile relative to the other funds in the universe for this five-year
period (the 1st quintile being the best performers and the 5th quintile being the worst
performers). The total return performance of the Fund’s Initial Class shares was in the 4th quintile for the one-year period and the 5th quintile for the three-year period ended December 31, 2020 relative to the Broadridge performance universe. Because of the passage of time, these performance results may
differ from the performance results for more recent periods, including those shown elsewhere in this report.
The Trustees expressed continued concern to MFS about the
substandard investment performance of the Fund and the Fund’s retail counterpart, MFS Blended Research Core Equity Fund, which has substantially similar investment strategies and experienced substantially similar investment performance as the
Fund. In the course of their deliberations, the Trustees took into account information provided by MFS in connection with the contract review meetings, as well as during investment review meetings
MFS Blended Research Core
Equity Portfolio
Board Review of Investment Advisory Agreement - continued
conducted with
portfolio management personnel during the course of the year as to MFS’ efforts to improve the performance of the Fund and the Fund’s retail counterpart. In addition, the Trustees requested that they receive a separate update on
the Fund’s retail counterpart at each of their regular meetings. After reviewing these and related factors, the Trustees concluded, within the context of their overall conclusions regarding the investment advisory agreement, that
MFS’ responses and efforts and plans to improve investment performance were sufficient to support approval of the continuance of the investment advisory agreement for an additional one-year period, but that they would continue to closely
monitor the performance of the Fund’s retail counterpart.
In assessing the reasonableness of the Fund’s
advisory fee, the Trustees considered, among other information, the Fund’s advisory fee and the total expense ratio of the Fund’s Initial Class shares as a percentage of average daily net assets and the advisory fee and total expense
ratios of the Broadridge expense group based on information provided by Broadridge. The Trustees considered that, according to the data provided by Broadridge (which takes into account any fee reductions or expense limitations that were in
effect during the Fund’s last fiscal year), the Fund’s effective advisory fee rate and total expense ratio were each lower than the Broadridge expense group median.
The Trustees also considered the advisory fees charged by
MFS to any institutional separate accounts advised by MFS (“separate accounts”) and unaffiliated investment companies for which MFS serves as subadviser (“subadvised funds”) that have comparable investment strategies to the
Fund, if any. In comparing these fees, the Trustees considered information provided by MFS as to the generally broader scope of services provided by MFS to the Fund, as well as the more extensive regulatory burdens imposed on MFS in managing the
Fund, in comparison to separate accounts and subadvised funds. The Trustees also considered the higher demands placed on MFS’ investment personnel and trading infrastructure as a result of the daily cash in-flows and out-flows of the Fund
in comparison to separate accounts.
The Trustees also
considered whether the Fund may benefit from any economies of scale in the management of the Fund in the event of growth in assets of the Fund and/or growth in assets of the MFS Funds as a whole. They noted that the Fund’s advisory fee
rate schedule is subject to contractual breakpoints that reduce the Fund’s advisory fee rate on average daily net assets over $1 billion and $2.5 billion. The Trustees also noted that MFS has agreed in writing to waive a portion of the
management fees of certain MFS Funds, including the Fund, if the total combined assets of certain funds within the MFS Funds’ complex increase above agreed upon thresholds (the “group fee waiver”), enabling the Fund’s
shareholders to share in the benefits from any economies of scale at the complex level. The group fee waiver is reviewed and renewed annually between the Board and MFS. The Trustees concluded that the breakpoints and the group fee waiver
were sufficient to allow the Fund to benefit from economies of scale as its assets and overall complex assets grow.
The Trustees also considered information prepared by MFS
relating to MFS’ costs and profits with respect to the Fund, the MFS Funds considered as a group, and other investment companies and accounts advised by MFS, as well as MFS’ methodologies used to determine and allocate its costs to the
MFS Funds, the Fund and other accounts and products for purposes of estimating profitability.
After reviewing these and other factors described herein,
the Trustees concluded, within the context of their overall conclusions regarding the investment advisory agreement, that the advisory fees charged to the Fund represent reasonable compensation in light of the services being provided by MFS to the
Fund.
In addition, the Trustees considered MFS’
resources and related efforts to continue to retain, attract and motivate capable personnel to serve the Fund. The Trustees also considered current and developing conditions in the financial services industry, including the presence of large
and well-capitalized companies which are spending, and appear to be prepared to continue to spend, substantial sums to engage personnel and to provide services to competing investment companies. In this regard, the Trustees also considered the
financial resources of MFS and its ultimate parent, Sun Life Financial Inc. The Trustees also considered the advantages and possible disadvantages to the Fund of having an adviser that also serves other investment companies as well as other
accounts.
The Trustees also considered the nature,
quality, cost, and extent of administrative, transfer agency, and distribution services provided to the Fund by MFS and its affiliates under agreements and plans other than the investment advisory agreement, including any 12b-1 fees the Fund pays to
MFS Fund Distributors, Inc., an affiliate of MFS. The Trustees also considered the nature, extent and quality of certain other services MFS performs or arranges for on the Fund’s behalf, which may include securities lending programs,
directed expense payment programs, class action recovery programs, and MFS’ interaction with third-party service providers, principally custodians and sub-custodians. The Trustees concluded that the various non-advisory services provided
by MFS and its affiliates on behalf of the Fund were satisfactory.
The Trustees considered so-called “fall-out
benefits” to MFS such as reputational value derived from serving as investment manager to the MFS Funds. The Trustees also considered that MFS discontinued its historic practice of obtaining investment research from portfolio brokerage
commissions paid by certain MFS Funds effective January 2018, and directly pays or voluntarily reimburses a Fund, if applicable, for the costs of external research acquired through the use of the Fund’s portfolio brokerage commissions.
MFS Blended Research Core
Equity Portfolio
Board Review of Investment Advisory Agreement - continued
Based on their evaluation of factors that they deemed to be
material, including those factors described above, the Board of Trustees, including the independent Trustees, concluded that the Fund’s investment advisory agreement with MFS should be continued for an additional one-year period, commencing
August 1, 2021.
MFS Blended Research Core
Equity Portfolio
Proxy Voting Policies and Information
MFS votes proxies on behalf of the fund pursuant to proxy
voting policies and procedures that are available without charge, upon request, by calling 1-800-225-2606, by visiting mfs.com/proxyvoting, or by visiting the SEC’s Web site at http://www.sec.gov.
Information regarding how the fund voted proxies relating
to portfolio securities during the most recent twelve-month period ended June 30 is available by August 31 of each year without charge by visiting mfs.com/proxyvoting, or by visiting the SEC’s Web site
at http://www.sec.gov.
Quarterly Portfolio Disclosure
The fund files a complete schedule of portfolio holdings
with the SEC for the first and third quarters of each fiscal year as an exhibit to its reports on Form N-PORT. The fund’s Form N-PORT reports are available on the SEC’s Web site at
http://www.sec.gov. A shareholder can obtain the portfolio holdings report for the first and third quarters of the fund's fiscal year at mfs.com/vit2 by
choosing the fund's name and then scrolling to the “Resources” section and clicking on the “Prospectus and Reports” tab.
FURTHER INFORMATION
From time to time, MFS may post important information about
the fund or the MFS Funds on the MFS Web site (mfs.com). This information is available at https://www.mfs.com/announcements or at
mfs.com/vit2 by choosing the fund's name and then scrolling to the “Resources” section and clicking on the “Announcements” tab, if any.
Information About Fund Contracts and Legal Claims
The fund has entered into contractual arrangements with an
investment adviser, administrator, distributor, shareholder servicing agent, 529 program manager (if applicable), and custodian who each provide services to the fund. Unless expressly stated otherwise, shareholders are not parties to, or intended
beneficiaries of these contractual arrangements, and these contractual arrangements are not intended to create any shareholder right to enforce them against the service providers or to seek any remedy under them against the service providers, either
directly or on behalf of the fund.
Under the
Trust’s By-Laws and Declaration of Trust, any claims asserted against or on behalf of the MFS Funds, including claims against Trustees and Officers, must be brought in state and federal courts located within the Commonwealth of
Massachusetts.
Federal Tax Information (unaudited)
The following information is provided pursuant to
provisions of the Internal Revenue Code.
The fund
designates $35,415,000 as capital gain dividends paid during the fiscal year.
For corporate shareholders, 82.81% of the ordinary income
dividends paid during the fiscal year qualify for the corporate dividends received deduction.
| FACTS
|
WHAT
DOES MFS DO WITH YOUR PERSONAL INFORMATION? |
| Why?
|
Financial
companies choose how they share your personal information. Federal law gives consumers the right to limit some but not all sharing. Federal law also requires us to tell you how we collect, share, and protect your personal information. Please read
this notice carefully to understand what we do. |
| What?
|
The types of
personal information we collect and share depend on the product or service you have with us. This information can include: |
| • Social
Security number and account balances |
| • Account
transactions and transaction history |
| • Checking
account information and wire transfer instructions |
| When
you are no longer our customer, we continue to share your information as described in this notice. |
| How?
|
All
financial companies need to share customers' personal information to run their everyday business. In the section below, we list the reasons financial companies can share their customers' personal information; the reasons MFS chooses to share; and
whether you can limit this sharing. |
Reasons
we can share your
personal information |
Does
MFS share? |
Can
you limit
this sharing? |
For
our everyday business purposes –
such as to process your transactions, maintain your
account(s), respond to court orders and legal
investigations, or report to credit bureaus |
Yes
|
No
|
For
our marketing purposes –
to offer our products and services to you |
No
|
We
don't share |
For
joint marketing with other
financial companies |
No
|
We
don't share |
For
our affiliates' everyday business purposes –
information about your transactions and experiences |
No
|
We
don't share |
For
our affiliates' everyday business purposes –
information about your creditworthiness |
No
|
We
don't share |
| For
nonaffiliates to market to you |
No
|
We
don't share |
| Questions?
|
Call
800-225-2606 or go to mfs.com. |
| Who
we are |
| Who
is providing this notice? |
MFS
Funds, MFS Investment Management, MFS Institutional Advisors, Inc., and MFS Heritage Trust Company. |
| What
we do |
How
does MFS
protect my personal
information? |
To
protect your personal information from unauthorized access and use, we use security measures that comply with federal law. These measures include procedural, electronic, and physical safeguards for the protection of the personal information we
collect about you. |
How
does MFS
collect my personal
information? |
We
collect your personal information, for example, when you |
| • open
an account or provide account information |
| • direct
us to buy securities or direct us to sell your securities |
| • make
a wire transfer |
| We
also collect your personal information from others, such as credit bureaus, affiliates, or other companies. |
| Why
can't I limit all sharing? |
Federal
law gives you the right to limit only |
| • sharing
for affiliates' everyday business purposes – information about your creditworthiness |
| • affiliates
from using your information to market to you |
| • sharing
for nonaffiliates to market to you |
| State
laws and individual companies may give you additional rights to limit sharing. |
| Definitions
|
| Affiliates
|
Companies
related by common ownership or control. They can be financial and nonfinancial companies. |
| •
MFS does not share personal information with affiliates, except for everyday business purposes as described on page one of this notice. |
| Nonaffiliates
|
Companies
not related by common ownership or control. They can be financial and nonfinancial companies. |
| •
MFS does not share with nonaffiliates so they can market to you. |
| Joint
marketing |
A
formal agreement between nonaffiliated financial companies that together market financial products or services to you. |
| •
MFS doesn't jointly market. |
| Other
important information |
| If
you own an MFS product or receive an MFS service in the name of a third party such as a bank or broker-dealer, their privacy policy may apply to you instead of ours. |
Annual Report
December 31, 2021
MFS® Corporate Bond Portfolio
MFS® Variable
Insurance Trust II
MFS® Corporate
Bond Portfolio
|
1
|
|
2
|
|
3
|
|
4
|
|
6
|
|
7
|
|
16
|
|
17
|
|
18
|
|
19
|
|
21
|
|
28
|
|
29
|
|
32
|
|
35
|
|
35
|
|
35
|
|
35
|
|
35
|
|
36
|
The report is prepared for the general information of contract owners. It
is authorized for distribution to prospective investors only when preceded or accompanied by a current prospectus.
NOT FDIC INSURED • MAY LOSE VALUE
• NO BANK OR CREDIT UNION GUARANTEE •
NOT A DEPOSIT • NOT INSURED BY ANY FEDERAL GOVERNMENT
AGENCY OR NCUA/NCUSIF
MFS Corporate Bond
Portfolio
Dear Contract Owners:
After a powerful rally in 2021 that was spurred by the
introduction of effective coronavirus vaccines and high levels of monetary and fiscal stimulus, markets have recently experienced a rise in volatility. Rising inflation (mostly due to pandemic-related labor and supply chain disruptions), new
COVID-19 variants that are vaccine-resistant, and the prospect of tighter monetary and fiscal policies around the world have all increased investor anxiety.
Rising real (inflation-adjusted) bond yields in the United
States are a headwind for richly valued U.S. growth stocks, though many non-U.S. markets have experienced lower levels of turbulence. In recent months, global economic growth has moderated, with the spread of the Delta and Omicron variants and a
regulatory crackdown in China featuring prominently. Stress in China’s property development sector has also contributed to the slowdown there. A further concern for investors is the tightening of global energy and raw materials supplies caused
in part by geopolitical uncertainty.
However,
above-trend economic growth, strong corporate balance sheets, and nascent signs that global supply chain bottlenecks may be easing, along with a dovish policy shift in China, are supportive fundamentals that we feel could help calm recent market
jitters.
It is times of market transition that
demonstrate the importance of having a deep understanding of company fundamentals, and we have built our global research platform to do just that.
At MFS®, we put our clients’ assets to work responsibly by carefully navigating the increasing complexity of global markets and economies. Guided by our commitment to long-term
investing, we tune out the noise and try to uncover what we believe are the best, most durable investment opportunities in the market. Our unique global investment platform combines collective expertise, long-term discipline, and thoughtful risk
management to create sustainable value for investors.
Respectfully,
Michael W.
Roberge
Chief Executive Officer
MFS Investment Management
February 15, 2022
The opinions expressed in this letter are subject to
change and may not be relied upon for investment advice. No forecasts can be guaranteed.
MFS Corporate Bond
Portfolio
Portfolio structure (i)
Fixed income
sectors (i)
| Investment
Grade Corporates |
80.3%
|
| High
Yield Corporates |
10.6%
|
| Emerging
Markets Bonds |
3.9%
|
| U.S.
Treasury Securities |
2.5%
|
| Municipal
Bonds |
1.8%
|
| Commercial
Mortgage-Backed Securities |
1.4%
|
| Non-U.S.
Government Bonds |
0.3%
|
| Collateralized
Debt Obligations |
0.3%
|
| Asset-Backed
Securities (o) |
0.0%
|
Composition including fixed income credit quality (a)(i)
| AAA
|
2.1%
|
| AA
|
5.1%
|
| A
|
24.6%
|
| BBB
|
54.7%
|
| BB
|
8.5%
|
| B
|
3.4%
|
| C
|
0.1%
|
| Not
Rated |
2.6%
|
| Cash
& Cash Equivalents |
1.4%
|
| Other
|
(2.5)%
|
Portfolio facts (i)
| Average
Duration (d) |
7.9
|
| Average
Effective Maturity (m) |
11.5
yrs. |
| (a)
|
For all
securities other than those specifically described below, ratings are assigned to underlying securities utilizing ratings from Moody’s, Fitch, and Standard & Poor’s rating agencies and applying the following hierarchy: If all three
agencies provide a rating, the middle rating (after dropping the highest and lowest ratings) is assigned; if two of the three agencies rate a security, the lower of the two is assigned. If none of the 3 rating agencies above assign a rating, but the
security is rated by DBRS Morningstar, then the DBRS Morningstar rating is assigned. If none of the 4 rating agencies listed above rate the security, but the security is rated by the Kroll Bond Rating Agency (KBRA), then the KBRA rating is assigned.
Ratings are shown in the S&P and Fitch scale (e.g., AAA). Securities rated BBB or higher are considered investment grade. All ratings are subject to change. U.S. Government includes securities issued by the U.S. Department of the Treasury.
Federal Agencies includes rated and unrated U.S. Agency fixed-income securities, U.S. Agency mortgage-backed securities, and collateralized mortgage obligations of U.S. Agency mortgage-backed securities. Not Rated includes fixed income securities
and fixed income derivatives that have not been rated by any rating agency. The fund may or may not have held all of these instruments on this date. The fund is not rated by these agencies. |
| (d)
|
Duration is
a measure of how much a bond’s price is likely to fluctuate with general changes in interest rates, e.g., if rates rise 1.00%, a bond with a 5-year duration is likely to lose about 5.00% of its value due to the interest rate move.
|
| (i)
|
For
purposes of this presentation, the components include the value of securities, and reflect the impact of the equivalent exposure of derivative positions, if any. These amounts may be negative from time to time. Equivalent exposure is a calculated
amount that translates the derivative position into a reasonable approximation of the amount of the underlying asset that the portfolio would have to hold at a given point in time to have the same price sensitivity that results from the
portfolio’s ownership of the derivative contract. When dealing with derivatives, equivalent exposure is a more representative measure of the potential impact of a position on portfolio performance than value. The bond component will include
any accrued interest amounts. |
| (m)
|
In
determining each instrument’s effective maturity for purposes of calculating the fund’s dollar-weighted average effective maturity, MFS uses the instrument’s stated maturity or, if applicable, an earlier date on which MFS believes
it is probable that a maturity-shortening device (such as a put, pre-refunding or prepayment) will cause the instrument to be repaid. Such an earlier date can be substantially shorter than the instrument’s stated maturity. |
Where the fund holds
convertible bonds, they are treated as part of the equity portion of the portfolio.
Cash & Cash Equivalents includes any cash,
investments in money market funds, short-term securities, and other assets less liabilities. Please see the Statement of Assets and Liabilities for additional information related to the fund’s cash position and other assets and
liabilities.
Other includes equivalent
exposure from currency derivatives and/or any offsets to derivative positions and may be negative.
Percentages are based on net assets as of December
31, 2021.
The portfolio is actively managed
and current holdings may be different.
MFS Corporate Bond
Portfolio
Management Review
Summary of Results
For the twelve months ended December 31, 2021, Initial
Class shares of the MFS Corporate Bond Portfolio (fund) provided a total return of -1.40%, while Service Class shares of the fund provided a total return of -1.66%. These compare with a return of -1.08% over the same period for the fund’s
benchmark, the Bloomberg U.S. Credit Bond Index.
Market
Environment
Over the past year, the global economy
was buffeted by an array of crosscurrents as it adjusted to the ebbs and flows of the pandemic. Among the supportive currents were ample fiscal stimulus, loose monetary policy and the rollout of several highly effective coronavirus vaccines.
Negative currents included the rapid spread of several coronavirus variants, widespread global production bottlenecks and a surge in inflation. After experiencing a burst of exceptionally strong economic activity as the global economy began to
reopen, activity became more muted in the second half of the period amid ongoing supply chain disruptions and a new wave of coronavirus infections, albeit a seemingly milder strain.
Amid rising inflation, markets anticipated a transition
from an exceptionally accommodative environment to a more mixed monetary landscape ahead. Indeed, several central banks in emerging markets have already tightened policy and the US Federal Reserve reduced the pace of its asset purchases in November
and again in December. However, the European Central Bank, the Bank of Japan and the People's Bank of China are expected to maintain accommodative policies. Sovereign bond yields moved modestly higher during the period amid higher inflation and on
expectations of a tighter Fed but remain historically low.
A harsher Chinese regulatory environment toward industries
such as online gaming, food delivery and education increased market volatility as has stress in China's highly leveraged property development sector. Trade relations between the United States and China remained quite strained despite a change in
presidential administrations.
Signs of excess
investor enthusiasm continued to be seen in pockets of the market such as “meme stocks” popular with users of online message boards, cryptocurrencies and heavy retail participation in the market for short-dated options.
Factors Affecting Performance
During the reporting period, the fund's security selection
within “BBB” rated securities, particularly within the capital goods and local authority sectors, held back performance relative to the Bloomberg U.S. Credit Bond Index. The fund's positioning along the yield curve(y) also weighed on
relative returns.
Conversely, the fund’s
out-of-benchmark exposure to “BB” rated(r) bonds, and its lesser exposure to “A” rated securities, contributed to relative performance. A lesser-than-benchmark exposure to the banking sector also benefited the fund’s
relative returns. Additionally, the fund's shorter duration(d) stance aided relative performance as interest rates generally rose during the reporting period.
Respectfully,
Portfolio Manager(s)
Alexander Mackey and Henry Peabody
Note to Contract Owners: Effective June 30, 2021, Robert
Persons is no longer a Portfolio Manager of the fund.
| (d)
|
Duration is
a measure of how much a bond’s price is likely to fluctuate with general changes in interest rates, e.g., if rates rise 1.00%, a bond with a 5-year duration is likely to lose about 5.00% of its value. |
| (r)
|
Securities
rated “BBB”, “Baa”, or higher are considered investment grade; securities rated “BB”, “Ba”, or below are considered non-investment grade. Ratings are assigned to underlying securities utilizing
ratings from Moody's, Fitch, and Standard & Poor's and applying the following hierarchy: If all three agencies provide a rating, the middle rating (after dropping the highest and lowest ratings) is assigned; if two of the three agencies rate a
security, the lower of the two is assigned. If none of the 3 rating agencies above assign a rating, but the security is rated by DBRS Morningstar, then the DBRS Morningstar rating is assigned. If none of the 4 rating agencies listed above rate the
security, but the security is rated by the Kroll Bond Rating Agency (KBRA), then the KBRA rating is assigned. Ratings are shown in the S&P and Fitch scale (e.g., AAA). For securities that are not rated by any of the rating agencies, the security
is considered Not Rated. |
| (y)
|
A yield
curve graphically depicts the yields of different maturity bonds of the same credit quality and type; a normal yield curve is upward sloping, with short-term rates lower than long-term rates. |
The views expressed in this report are those of the portfolio
manager(s) only through the end of the period of the report as stated on the cover and do not necessarily reflect the views of MFS or any other person in the MFS organization. These views are subject to change at any time based on market or other
conditions, and MFS disclaims any responsibility to update such views. These views may not be relied upon as investment advice or an indication of trading intent on behalf of any MFS portfolio. References to specific securities are not
recommendations of such securities, and may not be representative of any MFS portfolio’s current or future investments.
MFS Corporate Bond
Portfolio
Performance Summary Through 12/31/21
The following chart illustrates the historical performance
of the fund in comparison to its benchmark(s). Benchmarks are unmanaged and may not be invested in directly. Benchmark returns do not reflect any fees or expenses. The performance of other share classes will be greater than or less than that of the
class depicted below. (See Notes to Performance Summary.)
Performance data shown represents past performance and is no
guarantee of future results. Investment return and principal value fluctuate so your units, when sold, may be worth more or less than the original cost; current performance may be lower or higher than quoted. The performance shown does not reflect
the deduction of taxes, if any, that a contract holder would pay on fund distributions or the redemption of contract units. The returns for the fund shown also do not reflect the deduction of expenses associated with variable products, such as
mortality and expense risk charges, separate account charges, and sales charges imposed by the insurance company separate accounts. Such expenses would reduce the overall returns shown.
Growth of a Hypothetical $10,000 Investment
Total Returns
through 12/31/21
Average annual total returns
| Share
Class |
Class
Inception Date |
1-yr
|
5-yr
|
10-yr
|
| Initial
Class |
5/06/98
|
(1.40)%
|
5.22%
|
4.84%
|
| Service
Class |
8/24/01
|
(1.66)%
|
4.97%
|
4.59%
|
Comparative benchmark(s)
| Bloomberg
U.S. Credit Bond Index (f) |
(1.08)%
|
5.05%
|
4.45%
|
| (f)
|
Source:
FactSet Research Systems Inc. |
Benchmark Definition(s)
Bloomberg U.S. Credit Bond Index(a) – a market capitalization-weighted index that measures the performance of publicly issued, SEC-registered, U.S. corporate and specified foreign debentures and secured
notes that meet specified maturity, liquidity, and quality requirements.
It is not possible to invest directly in an index.
| (a)
|
Source:
Bloomberg Index Services Limited. BLOOMBERG® is a trademark and service mark of Bloomberg Finance L.P. and its affiliates (collectively “Bloomberg”). Bloomberg
or Bloomberg's licensors own all proprietary rights in the Bloomberg Indices. Bloomberg neither approves or endorses this material, or guarantees the accuracy or completeness of any information herein, or makes any warranty, express or implied, as
to the results to be obtained therefrom and, to the maximum extent allowed by law, neither shall have any liability or responsibility for injury or damages arising in connection therewith. |
Notes to Performance Summary
Average annual total return represents the average annual
change in value for each share class for the periods presented.
Performance results reflect any applicable expense
subsidies and waivers in effect during the periods shown. Without such subsidies and waivers the fund's performance results would be less favorable. Please see the prospectus and financial statements for complete details. All results are historical
and assume the reinvestment of any dividends and capital gains distributions.
MFS Corporate Bond
Portfolio
Performance Summary – continued
Performance results do not include adjustments made for
financial reporting purposes in accordance with U.S. generally accepted accounting principles and may differ from amounts reported in the financial highlights.
From time to time the fund may receive proceeds from
litigation settlements, without which performance would be lower.
MFS Corporate Bond
Portfolio
Expense Table
Fund Expenses Borne by the Contract Holders during the
Period,
July 1, 2021 through December 31, 2021
As
a contract holder of the fund, you incur ongoing costs, including management fees; distribution and/or service (12b-1) fees; and other fund expenses. This example is intended to help you understand your ongoing costs (in dollars) of investing in the
fund and to compare these costs with the ongoing costs of investing in other mutual funds.
The example is based on an investment of $1,000 invested at
the beginning of the period and held for the entire period July 1, 2021 through December 31, 2021.
Actual Expenses
The first line for each share class in the following table
provides information about actual account values and actual expenses. You may use the information in this line, together with the amount you invested, to estimate the expenses that you paid over the period. Simply divide your account value by $1,000
(for example, an $8,600 account value divided by $1,000 = 8.6), then multiply the result by the number in the first line under the heading entitled “Expenses Paid During Period” to estimate the expenses you paid on your account during
this period.
Hypothetical Example for Comparison
Purposes
The second line for each share class in the
following table provides information about hypothetical account values and hypothetical expenses based on the fund’s actual expense ratio and an assumed rate of return of 5% per year before expenses, which is not the fund’s actual
return. The hypothetical account values and expenses may not be used to estimate the actual ending account balance or expenses you paid for the period. You may use this information to compare the ongoing costs of investing in the fund and other
funds. To do so, compare this 5% hypothetical example with the 5% hypothetical examples that appear in the shareholder reports of the other funds.
Please note that the expenses shown in the table are meant
to highlight the fund's ongoing costs only and do not take into account the fees and expenses imposed under the variable contracts through which your investment in the fund is made. Therefore, the second line for each share class in the table is
useful in comparing ongoing costs associated with an investment in vehicles (such as the fund) which fund benefits under variable annuity and variable life insurance contracts and to qualified pension and retirement plans only, and will not help you
determine the relative total costs of investing in the fund through variable annuity and variable life insurance contracts. If the fees and expenses imposed under the variable contracts were included, your costs would have been higher.
Share
Class |
|
Annualized
Expense
Ratio |
Beginning
Account Value
7/01/21 |
Ending
Account Value
12/31/21 |
Expenses
Paid During
Period (p)
7/01/21-12/31/21 |
| Initial
Class |
Actual
|
0.63%
|
$1,000.00
|
$999.37
|
$3.17
|
| Hypothetical
(h) |
0.63%
|
$1,000.00
|
$1,022.03
|
$3.21
|
| Service
Class |
Actual
|
0.88%
|
$1,000.00
|
$998.55
|
$4.43
|
| Hypothetical
(h) |
0.88%
|
$1,000.00
|
$1,020.77
|
$4.48
|
| (h)
|
5% class return per year
before expenses. |
| (p)
|
“Expenses
Paid During Period” are equal to each class's annualized expense ratio, as shown above, multiplied by the average account value over the period, multiplied by 184/365 (to reflect the one-half year period). |
MFS Corporate Bond
Portfolio
Portfolio of Investments − 12/31/21
The Portfolio of Investments is a complete list of all
securities owned by your fund. It is categorized by broad-based asset classes.
| Issuer
|
|
|
Shares/Par
|
Value
($) |
| Bonds
– 97.7% |
| Aerospace
& Defense – 2.0% |
| Boeing
Co., 5.15%, 5/01/2030 |
|
$
|
1,171,000
|
$
1,364,333 |
| Boeing
Co., 3.75%, 2/01/2050 |
|
|
342,000
|
355,453 |
| Raytheon
Technologies Corp., 1.9%, 9/01/2031 |
|
|
293,000
|
282,704 |
| Raytheon
Technologies Corp., 2.375%, 3/15/2032 |
|
|
434,000
|
433,529 |
| Raytheon
Technologies Corp., 3.03%, 3/15/2052 |
|
|
434,000
|
436,087 |
| TransDigm,
Inc., 6.25%, 3/15/2026 (n) |
|
|
609,000
|
632,979 |
| TransDigm,
Inc., 4.625%, 1/15/2029 |
|
|
633,000
|
630,898 |
| |
|
|
|
$4,135,983 |
| Apparel
Manufacturers – 0.5% |
| Tapestry,
Inc., 4.125%, 7/15/2027 |
|
$
|
95,000
|
$
102,632 |
| Tapestry,
Inc., 3.05%, 3/15/2032 |
|
|
924,000
|
929,429 |
| |
|
|
|
$1,032,061 |
| Asset-Backed
& Securitized – 1.7% |
| 3650R
Commercial Mortgage Trust, 2021-PF1, “XA”, 1.038%, 11/15/2054 (i) |
|
$
|
3,888,264
|
$
283,322 |
| ACREC
2021-FL1 Ltd., “A”, FLR, 1.253% (LIBOR - 1mo. + 1.15%), 10/16/2036 (n) |
|
|
656,500
|
656,500 |
| Bayview
Financial Revolving Mortgage Loan Trust, FLR, 1.701% (LIBOR - 1mo. + 1.6%), 12/28/2040 (n) |
|
|
70,066
|
77,990 |
| Benchmark
Mortgage Trust, 2021-B27, “XA”, 1.271%, 7/15/2054 (i) |
|
|
7,063,509
|
660,028 |
| JPMorgan
Chase Commercial Mortgage Securities Corp., 5.65%, 7/15/2042 (n) |
|
|
98,666
|
80,831 |
| KREF
Ltd., 2018-FT1, “A”, FLR, 1.178% (LIBOR - 1mo. + 1.1%), 2/15/2039 (n) |
|
|
288,000
|
287,472 |
| KREF
Ltd., 2018-FT1, “AS”, FLR, 1.408% (LIBOR - 1mo. + 1.3%), 2/15/2039 (n) |
|
|
316,500
|
314,163 |
| Lehman
Brothers Commercial Conduit Mortgage Trust, 0.904%, 2/18/2030 (i) |
|
|
10,257
|
0 |
| PFP
III, 2021-8, “A”, FLR, 1.108% (LIBOR - 1mo. + 1%), 8/09/2037 (n) |
|
|
575,000
|
572,204 |
| PFP
III, 2021-8, “AS”, FLR, 1.358% (LIBOR - 1mo. + 1.25%), 8/09/2037 (n) |
|
|
603,000
|
600,834 |
| |
|
|
|
$3,533,344 |
| Automotive
– 1.7% |
| Daimler
Trucks Finance North America LLC, 2.5%, 12/14/2031 (n) |
|
$
|
478,000
|
$
477,940 |
| Hyundai
Capital America, 3%, 2/10/2027 (n) |
|
|
1,274,000
|
1,318,240 |
| Hyundai
Capital America, 2%, 6/15/2028 (n) |
|
|
1,255,000
|
1,223,523 |
| Hyundai
Capital America, 6.375%, 4/08/2030 (n) |
|
|
352,000
|
443,671 |
| |
|
|
|
$3,463,374 |
| Broadcasting
– 2.1% |
| Discovery,
Inc., 4.125%, 5/15/2029 |
|
$
|
373,000
|
$
412,369 |
| Discovery,
Inc., 5.3%, 5/15/2049 |
|
|
600,000
|
751,222 |
| Prosus
N.V., 3.832%, 2/08/2051 (n) |
|
|
542,000
|
505,501 |
| Walt
Disney Co., 3.5%, 5/13/2040 |
|
|
1,825,000
|
1,998,728 |
| Walt
Disney Co., 3.6%, 1/13/2051 |
|
|
593,000
|
670,604 |
| |
|
|
|
$4,338,424 |
| Brokerage
& Asset Managers – 2.8% |
| Banco
BTG Pactual S.A. (Cayman Islands), 7.75% to 2/15/2024, FLR (CMT - 5yr. + 5.257%) to 2/15/2029 (n) |
|
$
|
615,000
|
$
645,756 |
| Brookfield
Finance, Inc., 2.34%, 1/30/2032 |
|
|
1,147,000
|
1,118,840 |
| Charles
Schwab Corp., 1.95%, 12/01/2031 |
|
|
1,724,000
|
1,693,017 |
| Intercontinental
Exchange, Inc., 2.1%, 6/15/2030 |
|
|
1,456,000
|
1,446,696 |
| Intercontinental
Exchange, Inc., 1.85%, 9/15/2032 |
|
|
412,000
|
394,361 |
| Intercontinental
Exchange, Inc., 3%, 9/15/2060 |
|
|
413,000
|
406,275 |
| |
|
|
|
$5,704,945 |
MFS Corporate Bond
Portfolio
Portfolio of
Investments – continued
| Issuer
|
|
|
Shares/Par
|
Value
($) |
| Bonds
– continued |
| Building
– 1.1% |
| CRH
America Finance, Inc., 4.5%, 4/04/2048 (n) |
|
$
|
896,000
|
$
1,092,587 |
| Vulcan
Materials Co., 3.5%, 6/01/2030 |
|
|
671,000
|
724,748 |
| Vulcan
Materials Co., 4.5%, 6/15/2047 |
|
|
447,000
|
548,781 |
| |
|
|
|
$2,366,116 |
| Business
Services – 4.9% |
| Equinix,
Inc., 2.625%, 11/18/2024 |
|
$
|
838,000
|
$
863,449 |
| Equinix,
Inc., 2.5%, 5/15/2031 |
|
|
934,000
|
933,352 |
| Equinix,
Inc., 3%, 7/15/2050 |
|
|
661,000
|
632,316 |
| Fiserv,
Inc., 2.25%, 6/01/2027 |
|
|
817,000
|
831,210 |
| Fiserv,
Inc., 4.4%, 7/01/2049 |
|
|
711,000
|
847,047 |
| Global
Payments, Inc., 2.9%, 5/15/2030 |
|
|
963,000
|
980,481 |
| IHS
Markit Ltd., 4.25%, 5/01/2029 |
|
|
465,000
|
528,937 |
| Mastercard,
Inc., 3.85%, 3/26/2050 |
|
|
965,000
|
1,159,748 |
| NXP
B.V./NXP Funding LLC/NXP USA, Inc., 2.5%, 5/11/2031 (n) |
|
|
753,000
|
754,922 |
| NXP
B.V./NXP Funding LLC/NXP USA, Inc., 3.25%, 5/11/2041 (n) |
|
|
646,000
|
667,683 |
| Visa,
Inc., 3.65%, 9/15/2047 |
|
|
865,000
|
1,006,634 |
| Visa,
Inc., 2%, 8/15/2050 |
|
|
1,117,000
|
978,244 |
| |
|
|
|
$10,184,023 |
| Cable
TV – 2.7% |
| CCO
Holdings LLC/CCO Holdings Capital Corp., 4.5%, 8/15/2030 (n) |
|
$
|
304,000
|
$
311,050 |
| CCO
Holdings LLC/CCO Holdings Capital Corp., 4.5%, 5/01/2032 |
|
|
305,000
|
313,769 |
| Charter
Communications Operating LLC/Charter Communications Operating Capital Corp., 6.384%, 10/23/2035 |
|
|
58,000
|
74,921 |
| Charter
Communications Operating LLC/Charter Communications Operating Capital Corp., 5.375%, 5/01/2047 |
|
|
1,079,000
|
1,287,901 |
| Comcast
Corp., 1.95%, 1/15/2031 |
|
|
371,000
|
363,502 |
| Comcast
Corp., 2.8%, 1/15/2051 |
|
|
545,000
|
525,054 |
| Sirius
XM Radio, Inc., 5%, 8/01/2027 (n) |
|
|
594,000
|
617,368 |
| Sirius
XM Radio, Inc., 5.5%, 7/01/2029 (n) |
|
|
292,000
|
314,630 |
| Sirius
XM Radio, Inc., 4.125%, 7/01/2030 (n) |
|
|
644,000
|
644,000 |
| Time
Warner Cable, Inc., 4.5%, 9/15/2042 |
|
|
955,000
|
1,041,152 |
| |
|
|
|
$5,493,347 |
| Chemicals
– 0.4% |
| RPM
International, Inc., 4.55%, 3/01/2029 |
|
$
|
131,000
|
$
148,265 |
| RPM
International, Inc., 4.25%, 1/15/2048 |
|
|
67,000
|
76,246 |
| Sherwin-Williams
Co., 4.5%, 6/01/2047 |
|
|
500,000
|
623,103 |
| |
|
|
|
$847,614 |
| Computer
Software – 0.5% |
| Microsoft
Corp., 2.525%, 6/01/2050 |
|
$
|
1,047,000
|
$
1,021,022 |
| Computer
Software - Systems – 2.2% |
| Apple,
Inc., 2.05%, 9/11/2026 (f) |
|
$
|
2,000,000
|
$
2,054,520 |
| Apple,
Inc., 1.7%, 8/05/2031 |
|
|
717,000
|
699,687 |
| Apple,
Inc., 2.7%, 8/05/2051 |
|
|
727,000
|
719,158 |
| Commscope,
Inc., 4.75%, 9/01/2029 (n) |
|
|
1,156,000
|
1,148,844 |
| |
|
|
|
$4,622,209 |
| Conglomerates
– 2.4% |
| Carrier
Global Corp., 2.722%, 2/15/2030 |
|
$
|
918,000
|
$
937,499 |
| Carrier
Global Corp., 3.377%, 4/05/2040 |
|
|
608,000
|
635,249 |
| Otis
Worldwide Corp., 2.565%, 2/15/2030 |
|
|
1,339,000
|
1,358,249 |
| Westinghouse
Air Brake Technologies Corp., 3.2%, 6/15/2025 |
|
|
1,501,000
|
1,562,150 |
MFS Corporate Bond
Portfolio
Portfolio of
Investments – continued
| Issuer
|
|
|
Shares/Par
|
Value
($) |
| Bonds
– continued |
| Conglomerates
– continued |
| Westinghouse
Air Brake Technologies Corp., 4.95%, 9/15/2028 |
|
$
|
337,000
|
$
383,071 |
| |
|
|
|
$4,876,218 |
| Consumer
Products – 0.8% |
| Hasbro,
Inc., 3.9%, 11/19/2029 |
|
$
|
783,000
|
$
863,286 |
| Mattel,
Inc., 3.75%, 4/01/2029 (n) |
|
|
801,000
|
830,036 |
| |
|
|
|
$1,693,322 |
| Consumer
Services – 0.9% |
| Booking
Holdings, Inc., 3.6%, 6/01/2026 |
|
$
|
1,761,000
|
$
1,898,810 |
| Electrical
Equipment – 0.7% |
| Arrow
Electronics, Inc., 3.875%, 1/12/2028 |
|
$
|
1,261,000
|
$
1,365,432 |
| Electronics
– 1.9% |
| Broadcom,
Inc., 4.3%, 11/15/2032 |
|
$
|
1,056,000
|
$
1,186,707 |
| Broadcom,
Inc., 3.469%, 4/15/2034 (n) |
|
|
512,000
|
535,895 |
| Broadcom,
Inc., 3.187%, 11/15/2036 (n) |
|
|
976,000
|
974,300 |
| Sensata
Technologies, Inc., 4.375%, 2/15/2030 (n) |
|
|
1,150,000
|
1,207,500 |
| |
|
|
|
$3,904,402 |
| Emerging
Market Quasi-Sovereign – 0.8% |
| Ecopetrol
S.A. (Republic of Colombia), 5.375%, 6/26/2026 |
|
$
|
301,000
|
$
317,182 |
| Ecopetrol
S.A. (Republic of Colombia), 6.875%, 4/29/2030 |
|
|
451,000
|
503,433 |
| Qatar
Petroleum, 3.125%, 7/12/2041 (n) |
|
|
781,000
|
789,291 |
| |
|
|
|
$1,609,906 |
| Emerging
Market Sovereign – 0.3% |
| United
Mexican States, 4.28%, 8/14/2041 |
|
$
|
576,000
|
$
596,880 |
| Energy
- Independent – 0.5% |
| Diamondback
Energy, Inc., 3.125%, 3/24/2031 |
|
$
|
612,000
|
$
630,758 |
| Hess
Corp., 5.8%, 4/01/2047 |
|
|
297,000
|
379,431 |
| |
|
|
|
$1,010,189 |
| Energy
- Integrated – 1.9% |
| Cenovus
Energy, Inc., 5.375%, 7/15/2025 |
|
$
|
551,000
|
$
608,042 |
| Cenovus
Energy, Inc., 4.4%, 4/15/2029 |
|
|
212,000
|
234,551 |
| Cenovus
Energy, Inc., 2.65%, 1/15/2032 |
|
|
604,000
|
590,937 |
| Cenovus
Energy, Inc., 3.75%, 2/15/2052 |
|
|
143,000
|
143,348 |
| Eni
S.p.A., 4.75%, 9/12/2028 (n) |
|
|
761,000
|
876,649 |
| Eni
S.p.A., 4.25%, 5/09/2029 (n) |
|
|
940,000
|
1,057,266 |
| Total
Capital International S.A., 3.127%, 5/29/2050 |
|
|
437,000
|
447,937 |
| |
|
|
|
$3,958,730 |
| Entertainment
– 0.6% |
| Royal
Caribbean Cruises Ltd., 4.25%, 7/01/2026 (n) |
|
$
|
1,093,000
|
$
1,058,674 |
| Royal
Caribbean Cruises Ltd., 5.5%, 4/01/2028 (n) |
|
|
250,000
|
252,890 |
| |
|
|
|
$1,311,564 |
| Financial
Institutions – 2.3% |
| AerCap
Ireland Capital DAC/AerCap Global Aviation Trust, 3.65%, 7/21/2027 |
|
$
|
1,576,000
|
$
1,660,821 |
| AerCap
Ireland Capital DAC/AerCap Global Aviation Trust, 3.3%, 1/30/2032 |
|
|
260,000
|
264,881 |
| AerCap
Ireland Capital DAC/AerCap Global Aviation Trust, 3.85%, 10/29/2041 |
|
|
207,000
|
215,619 |
MFS Corporate Bond
Portfolio
Portfolio of
Investments – continued
| Issuer
|
|
|
Shares/Par
|
Value
($) |
| Bonds
– continued |
| Financial
Institutions – continued |
| Avolon
Holdings Funding Ltd., 2.125%, 2/21/2026 (n) |
|
$
|
294,000
|
$
288,554 |
| Avolon
Holdings Funding Ltd., 4.25%, 4/15/2026 (n) |
|
|
243,000
|
257,506 |
| Avolon
Holdings Funding Ltd., 4.375%, 5/01/2026 (n) |
|
|
624,000
|
668,341 |
| Avolon
Holdings Funding Ltd., 3.25%, 2/15/2027 (n) |
|
|
621,000
|
625,336 |
| Avolon
Holdings Funding Ltd., 2.75%, 2/21/2028 (n) |
|
|
841,000
|
825,199 |
| |
|
|
|
$4,806,257 |
| Food
& Beverages – 4.8% |
| Anheuser-Busch
InBev Worldwide, Inc., 3.5%, 6/01/2030 |
|
$
|
594,000
|
$
651,055 |
| Anheuser-Busch
InBev Worldwide, Inc., 4.375%, 4/15/2038 |
|
|
527,000
|
617,146 |
| Anheuser-Busch
InBev Worldwide, Inc., 5.55%, 1/23/2049 |
|
|
566,000
|
783,037 |
| Anheuser-Busch
InBev Worldwide, Inc., 4.75%, 4/15/2058 |
|
|
444,000
|
548,946 |
| Aramark
Services, Inc., 6.375%, 5/01/2025 (n) |
|
|
534,000
|
558,030 |
| Aramark
Services, Inc., 5%, 2/01/2028 (n) |
|
|
539,000
|
557,191 |
| Constellation
Brands, Inc., 2.25%, 8/01/2031 |
|
|
761,000
|
743,776 |
| Constellation
Brands, Inc., 3.75%, 5/01/2050 |
|
|
242,000
|
264,323 |
| Diageo
Capital PLC, 2.375%, 10/24/2029 |
|
|
1,023,000
|
1,044,733 |
| JBS
USA Lux S.A./JBS USA Finance, Inc., 6.75%, 2/15/2028 (n) |
|
|
630,000
|
679,619 |
| JBS
USA Lux S.A./JBS USA Finance, Inc., 6.5%, 4/15/2029 (n) |
|
|
714,000
|
785,407 |
| JBS
USA Lux S.A./JBS USA Finance, Inc., 5.5%, 1/15/2030 (n) |
|
|
308,000
|
334,950 |
| JBS
USA Lux S.A./JBS USA Finance, Inc., 3.75%, 12/01/2031 (n) |
|
|
308,000
|
312,620 |
| Lamb
Weston Holdings, Inc., 4.375%, 1/31/2032 (n) |
|
|
1,213,000
|
1,250,930 |
| SYSCO
Corp., 2.4%, 2/15/2030 |
|
|
148,000
|
148,434 |
| SYSCO
Corp., 2.45%, 12/14/2031 |
|
|
284,000
|
284,353 |
| SYSCO
Corp., 4.45%, 3/15/2048 |
|
|
320,000
|
376,533 |
| |
|
|
|
$9,941,083 |
| Gaming
& Lodging – 2.5% |
| GLP
Capital LP/GLP Financing II, Inc., 5.75%, 6/01/2028 |
|
$
|
932,000
|
$
1,076,124 |
| GLP
Capital LP/GLP Financing II, Inc., 3.25%, 1/15/2032 |
|
|
389,000
|
391,097 |
| Hilton
Domestic Operating Co., Inc., 4.875%, 1/15/2030 |
|
|
485,000
|
518,344 |
| Hilton
Domestic Operating Co., Inc., 3.625%, 2/15/2032 (n) |
|
|
588,000
|
584,907 |
| Las
Vegas Sands Corp., 3.9%, 8/08/2029 |
|
|
856,000
|
861,968 |
| Marriott
International, Inc., 4%, 4/15/2028 |
|
|
1,026,000
|
1,107,166 |
| Marriott
International, Inc., 2.85%, 4/15/2031 |
|
|
608,000
|
606,139 |
| |
|
|
|
$5,145,745 |
| Insurance
- Health – 1.3% |
| UnitedHealth
Group, Inc., 2.3%, 5/15/2031 |
|
$
|
316,000
|
$
321,504 |
| UnitedHealth
Group, Inc., 4.625%, 7/15/2035 |
|
|
1,690,000
|
2,111,730 |
| UnitedHealth
Group, Inc., 3.25%, 5/15/2051 |
|
|
287,000
|
310,485 |
| |
|
|
|
$2,743,719 |
| Insurance
- Property & Casualty – 1.4% |
| Aon
Corp., 3.75%, 5/02/2029 |
|
$
|
1,376,000
|
$
1,508,383 |
| Aon
Corp./Aon Global Holdings PLC, 2.6%, 12/02/2031 |
|
|
111,000
|
112,930 |
| Fairfax
Financial Holdings Ltd., 3.375%, 3/03/2031 |
|
|
347,000
|
357,171 |
| Hartford
Financial Services Group, Inc., 3.6%, 8/19/2049 |
|
|
585,000
|
640,309 |
| Marsh
& McLennan Cos., Inc., 2.375%, 12/15/2031 |
|
|
284,000
|
286,695 |
| |
|
|
|
$2,905,488 |
| International
Market Quasi-Sovereign – 0.3% |
| Ontario
Teachers' Cadillac Fairview Properties, 2.5%, 10/15/2031 (n) |
|
$
|
699,000
|
$
695,765 |
MFS Corporate Bond
Portfolio
Portfolio of
Investments – continued
| Issuer
|
|
|
Shares/Par
|
Value
($) |
| Bonds
– continued |
| Machinery
& Tools – 0.9% |
| CNH
Industrial Capital LLC, 4.2%, 1/15/2024 |
|
$
|
515,000
|
$
543,559 |
| CNH
Industrial Capital LLC, 1.875%, 1/15/2026 |
|
|
288,000
|
288,123 |
| CNH
Industrial Capital LLC, 3.85%, 11/15/2027 |
|
|
905,000
|
985,141 |
| |
|
|
|
$1,816,823 |
| Major
Banks – 15.8% |
| Australia
and New Zealand Banking Group Ltd., 2.57%, 11/25/2035 (n) |
|
$
|
827,000
|
$
791,865 |
| Bank
of America Corp., 3.5%, 4/19/2026 |
|
|
2,000,000
|
2,154,376 |
| Bank
of America Corp., 3.419% to 12/20/2027, FLR (LIBOR - 3mo. + 1.04%) to 12/20/2028 |
|
|
351,000
|
374,750 |
| Bank
of America Corp., 2.676% to 6/19/2040, FLR (SOFR + 1.93%) to 6/19/2041 |
|
|
721,000
|
694,012 |
| Bank
of America Corp., 3.311% to 4/22/2041, FLR (SOFR + 1.58%) to 4/22/2042 |
|
|
1,498,000
|
1,574,428 |
| Barclays
PLC, 2.894% to 11/24/2031, FLR (CMT - 1yr. + 1.3%) to 11/24/2032 |
|
|
1,022,000
|
1,029,240 |
| Commonwealth
Bank of Australia, 3.61% to 9/12/2029, FLR (CMT - 1yr. + 2.05%) to 9/12/2034 (n) |
|
|
431,000
|
450,614 |
| Commonwealth
Bank of Australia, 3.305%, 3/11/2041 (n) |
|
|
849,000
|
865,470 |
| Credit
Agricole S.A., 1.247% to 1/26/2026, FLR (SOFR + 0.89162%) to 1/26/2027 (n) |
|
|
447,000
|
434,958 |
| Credit
Suisse Group AG, 4.194% to 4/01/2030, FLR (SOFR + 3.73%) to 4/01/2031 (n) |
|
|
694,000
|
765,370 |
| Credit
Suisse Group AG, 3.091% to 5/14/2031, FLR (SOFR + 1.73%) to 5/14/2032 (n) |
|
|
250,000
|
254,388 |
| Goldman
Sachs Group, Inc., 2.6%, 2/07/2030 |
|
|
339,000
|
344,677 |
| Goldman
Sachs Group, Inc., 2.65% to 10/21/2031, FLR (SOFR + 1.264%) to 10/21/2032 |
|
|
1,188,000
|
1,195,433 |
| Goldman
Sachs Group, Inc., 2.908%, 7/21/2042 |
|
|
1,142,000
|
1,135,380 |
| HSBC
Holdings PLC, 2.357% to 8/18/2030, FLR (SOFR + 1.947%) to 8/18/2031 |
|
|
1,345,000
|
1,314,057 |
| HSBC
Holdings PLC, 5.25%, 3/14/2044 |
|
|
293,000
|
382,193 |
| JPMorgan
Chase & Co., 3.125%, 1/23/2025 |
|
|
688,000
|
722,419 |
| JPMorgan
Chase & Co., 3.54%, 5/01/2028 |
|
|
1,709,000
|
1,856,032 |
| JPMorgan
Chase & Co., 2.545% to 11/08/2031, FLR (SOFR + 1.18%) to 11/08/2032 |
|
|
899,000
|
904,054 |
| JPMorgan
Chase & Co., 3.897% to 1/23/2048, FLR (LIBOR - 3mo. + 1.22%) to 1/23/2049 |
|
|
1,111,000
|
1,287,083 |
| Mitsubishi
UFJ Financial Group, Inc., 1.64% to 10/13/2026, FLR (CMT - 1yr. + 0.67%) to 10/13/2027 |
|
|
423,000
|
417,473 |
| Mitsubishi
UFJ Financial Group, Inc., 2.494% to 10/13/2031, FLR (CMT - 1yr. + 0.97%) to 10/13/2032 |
|
|
532,000
|
532,657 |
| Morgan
Stanley, 4.431% to 1/23/2029, FLR (LIBOR - 3mo. + 1.63%) to 1/23/2030 |
|
|
439,000
|
500,266 |
| Morgan
Stanley, 2.699% to 1/22/2030, FLR (SOFR + 1.143%) to 1/22/2031 |
|
|
2,000,000
|
2,046,169 |
| Morgan
Stanley, 3.622% to 4/01/2030, FLR (SOFR + 3.12%) to 4/01/2031 |
|
|
2,049,000
|
2,232,781 |
| Morgan
Stanley, 3.217% to 4/22/2041, FLR (SOFR + 1.485%) to 4/22/2042 |
|
|
459,000
|
480,871 |
| Nordea
Bank Abp, 1.5%, 9/30/2026 (n) |
|
|
1,448,000
|
1,423,000 |
| Royal
Bank of Canada, 2.3%, 11/03/2031 |
|
|
1,541,000
|
1,548,177 |
| Sumitomo
Mitsui Financial Group, Inc., 1.71%, 1/12/2031 |
|
|
1,054,000
|
992,582 |
| Toronto
Dominion Bank, 1.25%, 9/10/2026 |
|
|
712,000
|
699,510 |
| Toronto
Dominion Bank, 2%, 9/10/2031 |
|
|
1,423,000
|
1,402,641 |
| UBS
Group AG, 3.126% to 8/13/2029, FLR (LIBOR - 3mo. + 1.468%) to 8/13/2030 (n) |
|
|
454,000
|
474,535 |
| UBS
Group AG, 4.375% to 2/10/2031, FLR (CMT - 1yr. + 3.313%) to 8/10/2069 (n) |
|
|
961,000
|
949,276 |
| UniCredit
S.p.A., 2.569% to 9/22/2025, FLR (CMT - 1yr. + 2.3%) to 9/22/2026 (n) |
|
|
350,000
|
349,322 |
| |
|
|
|
$32,580,059 |
| Medical
& Health Technology & Services – 3.1% |
| Alcon,
Inc., 2.6%, 5/27/2030 (n) |
|
$
|
1,215,000
|
$
1,226,123 |
| Alcon,
Inc., 3.8%, 9/23/2049 (n) |
|
|
492,000
|
547,843 |
| Becton,
Dickinson and Co., 3.734%, 12/15/2024 |
|
|
44,000
|
46,769 |
| Becton,
Dickinson and Co., 4.685%, 12/15/2044 |
|
|
847,000
|
1,066,444 |
| Becton,
Dickinson and Co., 4.669%, 6/06/2047 |
|
|
111,000
|
139,952 |
| HCA,
Inc., 5.25%, 6/15/2026 |
|
|
978,000
|
1,099,834 |
| HCA,
Inc., 5.875%, 2/01/2029 |
|
|
807,000
|
961,581 |
| HCA,
Inc., 3.5%, 9/01/2030 |
|
|
122,000
|
128,939 |
| HCA,
Inc., 5.125%, 6/15/2039 |
|
|
207,000
|
254,927 |
| Thermo
Fisher Scientific, Inc., 2.8%, 10/15/2041 |
|
|
847,000
|
856,828 |
| |
|
|
|
$6,329,240 |
MFS Corporate Bond
Portfolio
Portfolio of
Investments – continued
| Issuer
|
|
|
Shares/Par
|
Value
($) |
| Bonds
– continued |
| Medical
Equipment – 1.1% |
| Boston
Scientific Corp., 3.75%, 3/01/2026 |
|
$
|
548,000
|
$
588,693 |
| Boston
Scientific Corp., 2.65%, 6/01/2030 |
|
|
339,000
|
345,580 |
| Danaher
Corp., 2.6%, 10/01/2050 |
|
|
957,000
|
912,215 |
| Teleflex,
Inc., 4.625%, 11/15/2027 |
|
|
125,000
|
130,000 |
| Teleflex,
Inc., 4.25%, 6/01/2028 (n) |
|
|
191,000
|
196,767 |
| |
|
|
|
$2,173,255 |
| Metals
& Mining – 2.4% |
| Anglo
American Capital PLC, 2.25%, 3/17/2028 (n) |
|
$
|
389,000
|
$
382,011 |
| Anglo
American Capital PLC, 2.625%, 9/10/2030 (n) |
|
|
827,000
|
810,923 |
| Anglo
American Capital PLC, 2.875%, 3/17/2031 (n) |
|
|
454,000
|
451,859 |
| ArcelorMittal
S.A., 4.25%, 7/16/2029 |
|
|
431,000
|
471,915 |
| FMG
Resources Ltd., 4.375%, 4/01/2031 (n) |
|
|
1,110,000
|
1,165,500 |
| Glencore
Funding LLC, 2.5%, 9/01/2030 (n) |
|
|
293,000
|
283,748 |
| Glencore
Funding LLC, 2.85%, 4/27/2031 (n) |
|
|
611,000
|
603,960 |
| Novelis
Corp., 4.75%, 1/30/2030 (n) |
|
|
781,000
|
821,026 |
| |
|
|
|
$4,990,942 |
| Midstream
– 3.6% |
| Cheniere
Corpus Christi Holdings LLC, 3.7%, 11/15/2029 |
|
$
|
512,000
|
$
548,432 |
| DT
Midstream, Inc., 4.125%, 6/15/2029 (n) |
|
|
461,000
|
471,949 |
| DT
Midstream, Inc., 4.375%, 6/15/2031 (n) |
|
|
461,000
|
479,440 |
| Energy
Transfer LP, 4%, 10/01/2027 |
|
|
285,000
|
306,009 |
| Energy
Transfer LP, 3.75%, 5/15/2030 |
|
|
307,000
|
325,314 |
| Energy
Transfer Operating Co., 5%, 5/15/2050 |
|
|
409,000
|
470,635 |
| Galaxy
Pipeline Assets Bidco Ltd., 1.75%, 9/30/2027 (n) |
|
|
1,335,857
|
1,337,287 |
| Galaxy
Pipeline Assets Bidco Ltd., 2.16%, 3/31/2034 (n) |
|
|
489,000
|
479,279 |
| Plains
All American Pipeline, 4.9%, 2/15/2045 |
|
|
309,000
|
335,339 |
| Plains
All American Pipeline LP/PAA Finance Corp., 4.65%, 10/15/2025 |
|
|
301,000
|
328,298 |
| Plains
All American Pipeline LP/PAA Finance Corp., 3.55%, 12/15/2029 |
|
|
476,000
|
493,101 |
| Sabine
Pass Liquefaction LLC, 5.625%, 3/01/2025 |
|
|
133,000
|
147,660 |
| Sabine
Pass Liquefaction LLC, 5.875%, 6/30/2026 |
|
|
289,000
|
331,571 |
| Sabine
Pass Liquefaction LLC, 4.2%, 3/15/2028 |
|
|
1,021,000
|
1,118,374 |
| Sabine
Pass Liquefaction LLC, 4.5%, 5/15/2030 |
|
|
203,000
|
228,989 |
| |
|
|
|
$7,401,677 |
| Municipals
– 1.8% |
| Florida
State Board of Administration Finance Corp. Rev., “A”, 1.705%, 7/01/2027 |
|
$
|
1,146,000
|
$
1,143,137 |
| Golden
State, CA, Tobacco Securitization Corp., Tobacco Settlement Rev., “B”, 2.746%, 6/01/2034 |
|
|
340,000
|
342,025 |
| Golden
State, CA, Tobacco Securitization Corp., Tobacco Settlement Rev., “B”, 3%, 6/01/2046 |
|
|
330,000
|
338,037 |
| New
Jersey Economic Development Authority State Pension Funding Rev., “A”, NPFG, 7.425%, 2/15/2029 |
|
|
1,500,000
|
1,885,248 |
| |
|
|
|
$3,708,447 |
| Natural
Gas - Distribution – 1.1% |
| NiSource,
Inc., 5.65%, 2/01/2045 |
|
$
|
284,000
|
$
383,506 |
| Sempra
Energy, 3.25%, 6/15/2027 |
|
|
1,787,000
|
1,884,793 |
| |
|
|
|
$2,268,299 |
| Natural
Gas - Pipeline – 0.8% |
| APT
Pipelines Ltd., 5%, 3/23/2035 (n) |
|
$
|
1,375,000
|
$
1,664,763 |
| Network
& Telecom – 2.0% |
| AT&T,
Inc., 3.3%, 2/01/2052 |
|
$
|
545,000
|
$
533,712 |
| AT&T,
Inc., 3.55%, 9/15/2055 |
|
|
728,000
|
730,642 |
| Verizon
Communications, Inc., 2.1%, 3/22/2028 |
|
|
159,000
|
159,303 |
MFS Corporate Bond
Portfolio
Portfolio of
Investments – continued
| Issuer
|
|
|
Shares/Par
|
Value
($) |
| Bonds
– continued |
| Network
& Telecom – continued |
| Verizon
Communications, Inc., 3.15%, 3/22/2030 |
|
$
|
310,000
|
$
327,965 |
| Verizon
Communications, Inc., 2.55%, 3/21/2031 |
|
|
1,767,000
|
1,782,749 |
| Verizon
Communications, Inc., 3.4%, 3/22/2041 |
|
|
580,000
|
607,227 |
| |
|
|
|
$4,141,598 |
| Oils
– 0.6% |
| Puma
International Financing S.A., 5%, 1/24/2026 |
|
$
|
604,000
|
$
604,000 |
| Valero
Energy Corp., 2.8%, 12/01/2031 |
|
|
722,000
|
719,747 |
| |
|
|
|
$1,323,747 |
| Other
Banks & Diversified Financials – 0.6% |
| Groupe
BPCE S.A., 4.5%, 3/15/2025 (n) |
|
$
|
760,000
|
$
818,938 |
| Mizrahi
Tefahot Bank Ltd., 3.077% to 4/07/2026, FLR (CMT - 5yr. + 2.25%) to 4/07/2031 (n) |
|
|
416,000
|
412,880 |
| |
|
|
|
$1,231,818 |
| Personal
Computers & Peripherals – 0.9% |
| Equifax,
Inc., 3.1%, 5/15/2030 |
|
$
|
502,000
|
$
525,433 |
| Equifax,
Inc., 2.35%, 9/15/2031 |
|
|
1,449,000
|
1,429,359 |
| |
|
|
|
$1,954,792 |
| Railroad
& Shipping – 0.2% |
| Canadian
Pacific Railway Co., 3%, 12/02/2041 |
|
$
|
192,000
|
$
196,333 |
| Canadian
Pacific Railway Co., 3.1%, 12/02/2051 |
|
|
285,000
|
293,072 |
| |
|
|
|
$489,405 |
| Real
Estate - Apartment – 0.7% |
| American
Homes 4 Rent, L.P., 2.375%, 7/15/2031 |
|
$
|
677,000
|
$
663,484 |
| American
Homes 4 Rent, L.P., 3.375%, 7/15/2051 |
|
|
674,000
|
676,613 |
| |
|
|
|
$1,340,097 |
| Real
Estate - Office – 0.7% |
| Corporate
Office Property LP, REIT, 2%, 1/15/2029 |
|
$
|
790,000
|
$
759,531 |
| Corporate
Office Property LP, REIT, 2.75%, 4/15/2031 |
|
|
594,000
|
590,596 |
| |
|
|
|
$1,350,127 |
| Real
Estate - Other – 1.0% |
| EPR
Properties, REIT, 3.6%, 11/15/2031 |
|
$
|
447,000
|
$
442,236 |
| Lexington
Realty Trust Co., 2.375%, 10/01/2031 |
|
|
865,000
|
829,697 |
| W.P.
Carey, Inc., 2.45%, 2/01/2032 |
|
|
745,000
|
726,506 |
| |
|
|
|
$1,998,439 |
| Real
Estate - Retail – 1.3% |
| Brixmor
Operating Partnership LP, REIT, 4.125%, 5/15/2029 |
|
$
|
114,000
|
$
126,293 |
| Brixmor
Operating Partnership LP, REIT, 4.05%, 7/01/2030 |
|
|
418,000
|
456,114 |
| Brixmor
Operating Partnership LP, REIT, 2.5%, 8/16/2031 |
|
|
586,000
|
573,452 |
| Spirit
Realty, LP, 4.45%, 9/15/2026 |
|
|
303,000
|
333,324 |
| Spirit
Realty, LP, 3.2%, 2/15/2031 |
|
|
368,000
|
380,319 |
| STORE
Capital Corp., REIT, 4.625%, 3/15/2029 |
|
|
179,000
|
200,530 |
| STORE
Capital Corp., REIT, 2.7%, 12/01/2031 |
|
|
709,000
|
693,305 |
| |
|
|
|
$2,763,337 |
MFS Corporate Bond
Portfolio
Portfolio of
Investments – continued
| Issuer
|
|
|
Shares/Par
|
Value
($) |
| Bonds
– continued |
| Retailers
– 2.7% |
| Alimentation
Couche-Tard, Inc., 3.8%, 1/25/2050 (n) |
|
$
|
910,000
|
$
984,409 |
| Home
Depot, Inc., 3.3%, 4/15/2040 |
|
|
1,070,000
|
1,160,069 |
| Home
Depot, Inc., 4.875%, 2/15/2044 |
|
|
760,000
|
1,002,205 |
| Kohl's
Corp., 3.375%, 5/01/2031 |
|
|
827,000
|
842,237 |
| MercadoLibre,
Inc., 3.125%, 1/14/2031 |
|
|
790,000
|
746,558 |
| Nordstrom,
Inc., 4.25%, 8/01/2031 |
|
|
605,000
|
594,415 |
| Nordstrom,
Inc., 5%, 1/15/2044 |
|
|
288,000
|
268,560 |
| |
|
|
|
$5,598,453 |
| Telecommunications
- Wireless – 3.8% |
| American
Tower Corp., REIT, 3.6%, 1/15/2028 |
|
$
|
1,133,000
|
$
1,220,578 |
| American
Tower Corp., REIT, 3.8%, 8/15/2029 |
|
|
553,000
|
601,612 |
| American
Tower Corp., REIT, 2.95%, 1/15/2051 |
|
|
700,000
|
663,050 |
| Cellnex
Finance Co. S.A., 3.875%, 7/07/2041 (n) |
|
|
793,000
|
758,362 |
| Crown
Castle International Corp., 4.45%, 2/15/2026 |
|
|
338,000
|
369,922 |
| Crown
Castle International Corp., 3.7%, 6/15/2026 |
|
|
533,000
|
571,216 |
| Millicom
International Cellular S.A., 4.5%, 4/27/2031 (n) |
|
|
556,000
|
560,176 |
| T-Mobile
USA, Inc., 2.625%, 4/15/2026 |
|
|
597,000
|
599,985 |
| T-Mobile
USA, Inc., 2.05%, 2/15/2028 |
|
|
795,000
|
789,123 |
| T-Mobile
USA, Inc., 4.5%, 4/15/2050 |
|
|
613,000
|
717,457 |
| Vodafone
Group PLC, 4.125% to 6/04/2031, FLR (CMT - 1yr. + 2.767%) to 6/04/2051, FLR (CMT - 1yr. + 3.517%) to 6/04/2081 |
|
|
1,064,000
|
1,053,317 |
| |
|
|
|
$7,904,798 |
| Transportation
- Services – 0.4% |
| ERAC
USA Finance LLC, 7%, 10/15/2037 (n) |
|
$
|
421,000
|
$
620,223 |
| ERAC
USA Finance LLC, 4.5%, 2/15/2045 (n) |
|
|
201,000
|
243,026 |
| |
|
|
|
$863,249 |
| Utilities
- Electric Power – 6.2% |
| American
Transmission Systems, Inc., 2.65%, 1/15/2032 (n) |
|
$
|
181,000
|
$
182,681 |
| Berkshire
Hathaway Energy Co., 4.5%, 2/01/2045 |
|
|
597,000
|
722,911 |
| Berkshire
Hathaway Energy Co., 4.25%, 10/15/2050 |
|
|
195,000
|
238,209 |
| CenterPoint
Energy, Inc., 2.65%, 6/01/2031 |
|
|
613,000
|
621,308 |
| Dominion
Energy, Inc., 2.25%, 8/15/2031 |
|
|
838,000
|
818,402 |
| Duke
Energy Corp., 3.3%, 6/15/2041 |
|
|
310,000
|
314,631 |
| Duke
Energy Corp., 3.75%, 9/01/2046 |
|
|
814,000
|
868,453 |
| Enel
Finance International N.V., 4.75%, 5/25/2047 (n) |
|
|
460,000
|
564,164 |
| Evergy,
Inc., 2.9%, 9/15/2029 |
|
|
1,510,000
|
1,545,585 |
| FirstEnergy
Corp., 4.4%, 7/15/2027 |
|
|
707,000
|
761,465 |
| FirstEnergy
Corp., 3.4%, 3/01/2050 |
|
|
587,000
|
575,260 |
| Florida
Power & Light Co., 2.85%, 4/01/2025 |
|
|
287,000
|
299,693 |
| Florida
Power & Light Co., 3.95%, 3/01/2048 |
|
|
287,000
|
340,352 |
| Jersey
Central Power & Light Co., 2.75%, 3/01/2032 (n) |
|
|
614,000
|
622,229 |
| NextEra
Energy Capital Holdings, Inc., 3.8%, 3/15/2082 |
|
|
551,000
|
560,553 |
| Pacific
Gas & Electric Co., 2.1%, 8/01/2027 |
|
|
544,000
|
525,201 |
| Pacific
Gas & Electric Co., 2.5%, 2/01/2031 |
|
|
1,043,000
|
993,521 |
| Pacific
Gas & Electric Co., 4.95%, 7/01/2050 |
|
|
307,000
|
334,340 |
| Southern
California Edison Co., 4.5%, 9/01/2040 |
|
|
273,000
|
308,024 |
| Southern
California Edison Co., 3.65%, 2/01/2050 |
|
|
795,000
|
841,219 |
| Southern
California Edison Co., 2.95%, 2/01/2051 |
|
|
288,000
|
274,227 |
| Virginia
Electric & Power Co., 2.875%, 7/15/2029 |
|
|
579,000
|
607,234 |
| |
|
|
|
$12,919,662 |
| Total
Bonds (Identified Cost, $195,918,931) |
|
$
202,018,999 |
MFS Corporate Bond
Portfolio
Portfolio of
Investments – continued
| Issuer
|
|
|
Shares/Par
|
Value
($) |
| Investment
Companies (h) – 1.4% |
| Money
Market Funds – 1.4% |
|
| MFS
Institutional Money Market Portfolio, 0.07% (v) (Identified Cost, $2,827,617) |
|
|
2,827,617
|
$
2,827,617 |
| Other
Assets, Less Liabilities – 0.9% |
|
1,939,504 |
| Net
Assets – 100.0% |
$
206,786,120 |
| (f) |
All or a portion of the
security has been segregated as collateral for open futures contracts. |
|
|
|
| (h)
|
An
affiliated issuer, which may be considered one in which the fund owns 5% or more of the outstanding voting securities, or a company which is under common control. At period end, the aggregate values of the fund's investments in affiliated issuers
and in unaffiliated issuers were $2,827,617 and $202,018,999, respectively. |
|
|
|
| (i)
|
Interest
only security for which the fund receives interest on notional principal (Par amount). Par amount shown is the notional principal and does not reflect the cost of the security. |
|
|
|
| (n)
|
Securities
exempt from registration under Rule 144A of the Securities Act of 1933. These securities may be sold in the ordinary course of business in transactions exempt from registration, normally to qualified institutional buyers. At period end, the
aggregate value of these securities was $52,843,908, representing 25.6% of net assets. |
|
|
|
| (v)
|
Affiliated
issuer that is available only to investment companies managed by MFS. The rate quoted for the MFS Institutional Money Market Portfolio is the annualized seven-day yield of the fund at period end. |
|
|
|
| The
following abbreviations are used in this report and are defined: |
| CMT
|
Constant
Maturity Treasury |
| FLR
|
Floating
Rate. Interest rate resets periodically based on the parenthetically disclosed reference rate plus a spread (if any). The period-end rate reported may not be the current rate. All reference rates are USD unless otherwise noted. |
| LIBOR
|
London
Interbank Offered Rate |
| NPFG
|
National
Public Finance Guarantee Corp. |
| REIT
|
Real Estate
Investment Trust |
| SOFR
|
Secured
Overnight Financing Rate |
| Derivative
Contracts at 12/31/21 |
| Futures
Contracts |
| Description
|
Long/
Short |
Currency
|
Contracts
|
Notional
Amount |
Expiration
Date |
Value/Unrealized
Appreciation
(Depreciation) |
| Asset
Derivatives |
| Interest
Rate Futures |
|
|
| U.S.
Treasury Note 5 yr |
Long
|
USD
|
58
|
$7,016,641
|
March
– 2022 |
$27,157
|
| Liability
Derivatives |
| Interest
Rate Futures |
|
|
| U.S.
Treasury Note 2 yr |
Long
|
USD
|
98
|
$21,380,844
|
March
– 2022 |
$(7,204)
|
| U.S.
Treasury Ultra Note 10 yr |
Short
|
USD
|
158
|
23,137,125
|
March
– 2022 |
(433,370)
|
| |
|
|
|
|
|
$(440,574)
|
At December 31, 2021, the fund had
liquid securities with an aggregate value of $447,885 to cover any collateral or margin obligations for certain derivative contracts.
See Notes to Financial Statements
MFS Corporate Bond
Portfolio
| Financial
Statements |
Statement of Assets and
Liabilities |
This statement
represents your fund’s balance sheet, which details the assets and liabilities comprising the total value of the fund.
| At
12/31/21 Assets |
|
| Investments
in unaffiliated issuers, at value (identified cost, $195,918,931) |
$202,018,999
|
| Investments
in affiliated issuers, at value (identified cost, $2,827,617) |
2,827,617
|
| Receivables
for |
|
| Fund
shares sold |
407,713
|
| Interest
|
1,795,252
|
| Receivable
from investment adviser |
4,039
|
| Other
assets |
1,204
|
| Total
assets |
$207,054,824
|
| Liabilities
|
|
| Payables
for |
|
| Net
daily variation margin on open futures contracts |
$33,250
|
| Fund
shares reacquired |
153,391
|
| Payable
to affiliates |
|
| Administrative
services fee |
210
|
| Shareholder
servicing costs |
52
|
| Distribution
and/or service fees |
2,101
|
| Payable
for independent Trustees' compensation |
182
|
| Accrued
expenses and other liabilities |
79,518
|
| Total
liabilities |
$268,704
|
| Net
assets |
$206,786,120
|
| Net
assets consist of |
|
| Paid-in
capital |
$186,608,984
|
| Total
distributable earnings (loss) |
20,177,136
|
| Net
assets |
$206,786,120
|
| Shares
of beneficial interest outstanding |
17,519,852
|
| |
Net
assets |
Shares
outstanding |
Net
asset value
per share |
| Initial
Class |
$53,206,192
|
4,458,458
|
$11.93
|
| Service
Class |
153,579,928
|
13,061,394
|
11.76
|
See Notes to Financial Statements
MFS Corporate Bond
Portfolio
| Financial
Statements |
Statement of Operations
|
This statement describes how much
your fund earned in investment income and accrued in expenses. It also describes any gains and/or losses generated by fund operations.
| Year
ended 12/31/21 |
|
| Net
investment income (loss) |
|
| Income
|
|
| Interest
|
$6,771,512
|
| Dividends
from affiliated issuers |
2,836
|
| Other
|
2,103
|
| Total
investment income |
$6,776,451
|
| Expenses
|
|
| Management
fee |
$1,296,512
|
| Distribution
and/or service fees |
403,627
|
| Shareholder
servicing costs |
8,689
|
| Administrative
services fee |
39,004
|
| Independent
Trustees' compensation |
5,253
|
| Custodian
fee |
16,085
|
| Shareholder
communications |
13,387
|
| Audit
and tax fees |
77,970
|
| Legal
fees |
1,034
|
| Miscellaneous
|
32,298
|
| Total
expenses |
$1,893,859
|
| Reduction
of expenses by investment adviser |
(128,066)
|
| Net
expenses |
$1,765,793
|
| Net
investment income (loss) |
$5,010,658
|
| Realized
and unrealized gain (loss) |
|
| Realized
gain (loss) (identified cost basis) |
|
| Unaffiliated
issuers |
$9,872,180
|
| Futures
contracts |
(141,684)
|
| Net
realized gain (loss) |
$9,730,496
|
| Change
in unrealized appreciation or depreciation |
|
| Unaffiliated
issuers |
$(17,879,391)
|
| Futures
contracts |
(359,353)
|
| Net
unrealized gain (loss) |
$(18,238,744)
|
| Net
realized and unrealized gain (loss) |
$(8,508,248)
|
| Change
in net assets from operations |
$(3,497,590)
|
See Notes to Financial Statements
MFS Corporate Bond
Portfolio
| Financial
Statements |
Statements of Changes in
Net Assets |
These statements describe
the increases and/or decreases in net assets resulting from operations, any distributions, and any shareholder transactions.
| |
Year
ended |
| |
12/31/21
|
12/31/20
|
| Change
in net assets |
|
|
| From
operations |
|
|
| Net
investment income (loss) |
$5,010,658
|
$5,813,824
|
| Net
realized gain (loss) |
9,730,496
|
4,504,182
|
| Net
unrealized gain (loss) |
(18,238,744)
|
9,420,324
|
| Change
in net assets from operations |
$(3,497,590)
|
$19,738,330
|
| Total
distributions to shareholders |
$(10,100,201)
|
$(7,693,047)
|
| Change
in net assets from fund share transactions |
$(7,988,584)
|
$(3,220,009)
|
| Total
change in net assets |
$(21,586,375)
|
$8,825,274
|
| Net
assets |
|
|
| At
beginning of period |
228,372,495
|
219,547,221
|
| At
end of period |
$206,786,120
|
$228,372,495
|
See Notes to Financial Statements
MFS Corporate Bond
Portfolio
| Financial
Statements |
Financial Highlights
|
The financial highlights table is
intended to help you understand the fund's financial performance for the past 5 years. Certain information reflects financial results for a single fund share. The total returns in the table represent the rate that an investor would have earned (or
lost) on an investment in the fund share class (assuming reinvestment of all distributions) held for the entire period.
| Initial
Class |
Year
ended |
| |
12/31/21
|
12/31/20
|
12/31/19
|
12/31/18
|
12/31/17
|
| Net
asset value, beginning of period |
$12.71
|
$11.94
|
$10.81
|
$11.64
|
$11.36
|
| Income
(loss) from investment operations |
|
|
|
|
|
| Net
investment income (loss) (d) |
$0.31
|
$0.36
|
$0.39
|
$0.38
|
$0.39
|
| Net
realized and unrealized gain (loss) |
(0.49)
|
0.89
|
1.19
|
(0.72)
|
0.33
|
| Total
from investment operations |
$(0.18)
|
$1.25
|
$1.58
|
$(0.34)
|
$0.72
|
| Less
distributions declared to shareholders |
|
|
|
|
|
| From
net investment income |
$(0.36)
|
$(0.44)
|
$(0.45)
|
$(0.44)
|
$(0.44)
|
| From
net realized gain |
(0.24)
|
(0.04)
|
—
|
(0.05)
|
—
|
| Total
distributions declared to shareholders |
$(0.60)
|
$(0.48)
|
$(0.45)
|
$(0.49)
|
$(0.44)
|
| Net
asset value, end of period (x) |
$11.93
|
$12.71
|
$11.94
|
$10.81
|
$11.64
|
| Total
return (%) (k)(r)(s)(x) |
(1.40)
|
10.57
|
14.65
|
(3.00)
|
6.39
|
Ratios
(%) (to average net assets)
and Supplemental data: |
|
|
|
|
|
| Expenses
before expense reductions |
0.69
|
0.70
|
0.69
|
0.68
|
0.68
|
| Expenses
after expense reductions |
0.63
|
0.63
|
0.63
|
0.63
|
0.63
|
| Net
investment income (loss) |
2.51
|
2.90
|
3.33
|
3.44
|
3.37
|
| Portfolio
turnover |
55
|
41
|
34
|
32
|
36
|
| Net
assets at end of period (000 omitted) |
$53,206
|
$59,133
|
$57,714
|
$56,506
|
$65,445
|
| Service
Class |
Year
ended |
| |
12/31/21
|
12/31/20
|
12/31/19
|
12/31/18
|
12/31/17
|
| Net
asset value, beginning of period |
$12.54
|
$11.78
|
$10.66
|
$11.49
|
$11.22
|
| Income
(loss) from investment operations |
|
|
|
|
|
| Net
investment income (loss) (d) |
$0.27
|
$0.32
|
$0.35
|
$0.35
|
$0.36
|
| Net
realized and unrealized gain (loss) |
(0.48)
|
0.89
|
1.19
|
(0.72)
|
0.32
|
| Total
from investment operations |
$(0.21)
|
$1.21
|
$1.54
|
$(0.37)
|
$0.68
|
| Less
distributions declared to shareholders |
|
|
|
|
|
| From
net investment income |
$(0.33)
|
$(0.41)
|
$(0.42)
|
$(0.41)
|
$(0.41)
|
| From
net realized gain |
(0.24)
|
(0.04)
|
—
|
(0.05)
|
—
|
| Total
distributions declared to shareholders |
$(0.57)
|
$(0.45)
|
$(0.42)
|
$(0.46)
|
$(0.41)
|
| Net
asset value, end of period (x) |
$11.76
|
$12.54
|
$11.78
|
$10.66
|
$11.49
|
| Total
return (%) (k)(r)(s)(x) |
(1.66)
|
10.34
|
14.46
|
(3.31)
|
6.11
|
Ratios
(%) (to average net assets)
and Supplemental data: |
|
|
|
|
|
| Expenses
before expense reductions |
0.94
|
0.95
|
0.94
|
0.93
|
0.93
|
| Expenses
after expense reductions |
0.88
|
0.88
|
0.88
|
0.88
|
0.88
|
| Net
investment income (loss) |
2.26
|
2.65
|
3.08
|
3.18
|
3.12
|
| Portfolio
turnover |
55
|
41
|
34
|
32
|
36
|
| Net
assets at end of period (000 omitted) |
$153,580
|
$169,239
|
$161,833
|
$154,370
|
$194,337
|
See Notes to Financial Statements
MFS Corporate Bond
Portfolio
Financial Highlights - continued
| (d)
|
Per share data
is based on average shares outstanding. |
| (k)
|
The total
return does not reflect expenses that apply to separate accounts. Inclusion of these charges would reduce the total return figures for all periods shown. |
| (r)
|
Certain
expenses have been reduced without which performance would have been lower. |
| (s)
|
From time to
time the fund may receive proceeds from litigation settlements, without which performance would be lower. |
| (x)
|
The
net asset values and total returns have been calculated on net assets which include adjustments made in accordance with U.S. generally accepted accounting principles required at period end for financial reporting purposes. |
See Notes to Financial Statements
MFS Corporate Bond
Portfolio
Notes to Financial Statements
(1) Business and Organization
MFS Corporate Bond Portfolio (the fund) is a diversified
series of MFS Variable Insurance Trust II (the trust). The trust is organized as a Massachusetts business trust and is registered under the Investment Company Act of 1940, as amended, as an open-end management investment company. The shareholders of
each series of the trust are separate accounts of insurance companies, which offer variable annuity and/or life insurance products, and qualified retirement and pension plans.
The fund is an investment company and accordingly follows
the investment company accounting and reporting guidance of the Financial Accounting Standards Board (FASB) Accounting Standards Codification Topic 946 Financial Services - Investment Companies.
(2) Significant Accounting Policies
General — The
preparation of financial statements in conformity with U.S. generally accepted accounting principles requires management to make estimates and assumptions that affect the reported amounts of assets and liabilities, and disclosure of contingent
assets and liabilities at the date of the financial statements and the reported amounts of increases and decreases in net assets from operations during the reporting period. Actual results could differ from those estimates. In the preparation of
these financial statements, management has evaluated subsequent events occurring after the date of the fund’s Statement of Assets and Liabilities through the date that the financial statements were issued. The fund invests in foreign securities. Investments in foreign securities are vulnerable to the effects of changes in the relative values of the local currency and the U.S. dollar and to the effects of changes in each
country’s market, economic, industrial, political, regulatory, geopolitical, environmental, public health, and other conditions.
Balance Sheet Offsetting
— The fund's accounting policy with respect to balance sheet offsetting is that, absent an event of default by the counterparty or a termination of the agreement, the International Swaps and Derivatives Association (ISDA) Master Agreement, or
similar agreement, does not result in an offset of reported amounts of financial assets and financial liabilities in the Statement of Assets and Liabilities across transactions between the fund and the applicable counterparty. The fund's right to
setoff may be restricted or prohibited by the bankruptcy or insolvency laws of the particular jurisdiction to which a specific master netting agreement counterparty is subject. Balance sheet offsetting disclosures, to the extent applicable to the
fund, have been included in the fund’s Significant Accounting Policies note under the captions for each of the fund’s in-scope financial instruments and transactions.
Investment Valuations
— Debt instruments and floating rate loans, including restricted debt instruments, are generally valued at an evaluated or composite bid as provided by a third-party pricing service. Short-term
instruments with a maturity at issuance of 60 days or less may be valued at amortized cost, which approximates market value. Futures contracts are generally valued at last posted settlement price on their
primary exchange as provided by a third-party pricing service. Futures contracts for which there were no trades that day for a particular position are generally valued at the closing bid quotation on their primary exchange as provided by a
third-party pricing service. Open-end investment companies are generally valued at net asset value per share. Securities and other assets generally valued on the basis
of information from a third-party pricing service may also be valued at a broker/dealer bid quotation. In determining values, third-party pricing services can utilize both transaction data and market
information such as yield, quality, coupon rate, maturity, type of issue, trading characteristics, and other market data. The values of foreign securities and other assets and liabilities expressed in foreign
currencies are converted to U.S. dollars using the mean of bid and asked prices for rates provided by a third-party pricing service.
The Board of Trustees has delegated primary responsibility
for determining or causing to be determined the value of the fund’s investments (including any fair valuation) to the adviser pursuant to valuation policies and procedures approved by the Board. If the adviser determines that reliable market
quotations are not readily available, investments are valued at fair value as determined in good faith by the adviser in accordance with such procedures under the oversight of the Board of Trustees. Under the fund’s valuation policies and
procedures, market quotations are not considered to be readily available for most types of debt instruments and floating rate loans and many types of derivatives. These investments are generally valued at fair value based on information from
third-party pricing services. In addition, investments may be valued at fair value if the adviser determines that an investment’s value has been materially affected by events occurring after the close of the exchange or market on which the
investment is principally traded (such as foreign exchange or market) and prior to the determination of the fund’s net asset value, or after the halt of trading of a specific security where trading does not resume prior to the close of the
exchange or market on which the security is principally traded. The adviser generally relies on third-party pricing services or other information (such as the correlation with price movements of similar securities in the same or other markets; the
type, cost and investment characteristics of the security; the business and financial condition of the issuer; and trading and other market data) to assist in determining whether to fair value and at what value to fair value an investment. The value
of an investment for purposes of calculating the fund’s net asset value can differ depending on
MFS Corporate Bond
Portfolio
Notes to Financial Statements - continued
the source and
method used to determine value. When fair valuation is used, the value of an investment used to determine the fund’s net asset value may differ from quoted or published prices for the same investment. There can be no assurance that the fund
could obtain the fair value assigned to an investment if it were to sell the investment at the same time at which the fund determines its net asset value per share.
Various inputs are used in determining the value of the
fund's assets or liabilities. These inputs are categorized into three broad levels. In certain cases, the inputs used to measure fair value may fall into different levels of the fair value hierarchy. In such cases, an investment's level within the
fair value hierarchy is based on the lowest level of input that is significant to the fair value measurement. The fund's assessment of the significance of a particular input to the fair value measurement in its entirety requires judgment, and
considers factors specific to the investment. Level 1 includes unadjusted quoted prices in active markets for identical assets or liabilities. Level 2 includes other significant observable market-based inputs (including quoted prices for similar
securities, interest rates, prepayment speed, and credit risk). Level 3 includes unobservable inputs, which may include the adviser's own assumptions in determining the fair value of investments. Other financial instruments are derivative
instruments, such as futures contracts. The following is a summary of the levels used as of December 31, 2021 in valuing the fund's assets and liabilities:
| Financial
Instruments |
Level
1 |
Level
2 |
Level
3 |
Total
|
| Non
- U.S. Sovereign Debt |
$—
|
$2,902,551
|
$—
|
$2,902,551
|
| Municipal
Bonds |
—
|
3,708,447
|
—
|
3,708,447
|
| U.S.
Corporate Bonds |
—
|
141,364,464
|
—
|
141,364,464
|
| Commercial
Mortgage-Backed Securities |
—
|
2,853,719
|
—
|
2,853,719
|
| Asset-Backed
Securities (including CDOs) |
—
|
679,625
|
—
|
679,625
|
| Foreign
Bonds |
—
|
50,510,193
|
—
|
50,510,193
|
| Mutual
Funds |
2,827,617
|
—
|
—
|
2,827,617
|
| Total
|
$2,827,617
|
$202,018,999
|
$—
|
$204,846,616
|
| Other
Financial Instruments |
|
|
|
|
| Futures
Contracts – Assets |
$27,157
|
$—
|
$—
|
$27,157
|
| Futures
Contracts – Liabilities |
(440,574)
|
—
|
—
|
(440,574)
|
For further information
regarding security characteristics, see the Portfolio of Investments.
Derivatives — The
fund uses derivatives primarily to increase or decrease exposure to a particular market or segment of the market, or security, to increase or decrease interest rate or currency exposure, or as alternatives to direct investments. Derivatives are used
for hedging or non-hedging purposes. While hedging can reduce or eliminate losses, it can also reduce or eliminate gains. When the fund uses derivatives as an investment to increase market exposure, or for hedging purposes, gains and losses from
derivative instruments may be substantially greater than the derivative’s original cost.
The derivative instruments used by the fund during the
period were futures contracts. Depending on the type of derivative, a fund may exit a derivative position by entering into an offsetting transaction with a counterparty or exchange, negotiating an agreement with the derivative counterparty, or
novating the position to a third party. The fund may be unable to promptly close out a futures position in instances where the daily fluctuation in the price for that type of future exceeds the daily limit set by the exchange. The fund's period end
derivatives, as presented in the Portfolio of Investments and the associated Derivative Contract tables, generally are indicative of the volume of its derivative activity during the period.
The following table presents, by major type of derivative
contract, the fair value, on a gross basis, of the asset and liability components of derivatives held by the fund at December 31, 2021 as reported in the Statement of Assets and Liabilities:
| |
|
Fair
Value (a) |
| Risk
|
Derivative
Contracts |
Asset
Derivatives |
Liability
Derivatives |
| Interest
Rate |
Futures
Contracts |
$27,157
|
$(440,574)
|
(a) Values presented in this table
for futures contracts correspond to the values reported in the Portfolio of Investments. Only the current day net variation margin for futures contracts is separately reported within the Statement of Assets and Liabilities.
The following table presents, by major type of derivative
contract, the realized gain (loss) on derivatives held by the fund for the year ended December 31, 2021 as reported in the Statement of Operations:
| Risk
|
Futures
Contracts |
| Interest
Rate |
$(141,684)
|
MFS Corporate Bond
Portfolio
Notes to Financial Statements - continued
The
following table presents, by major type of derivative contract, the change in unrealized appreciation or depreciation on derivatives held by the fund for the year ended December 31, 2021 as reported in the Statement of Operations:
| Risk
|
Futures
Contracts |
| Interest
Rate |
$(359,353)
|
Derivative counterparty credit
risk is managed through formal evaluation of the creditworthiness of all potential counterparties. On certain, but not all, uncleared derivatives, the fund attempts to reduce its exposure to counterparty credit risk whenever possible by entering
into an ISDA Master Agreement on a bilateral basis. The ISDA Master Agreement gives each party to the agreement the right to terminate all transactions traded under such agreement if there is a specified deterioration in the credit quality of the
other party. Upon an event of default or a termination of the ISDA Master Agreement, the non-defaulting party has the right to close out all transactions traded under such agreement and to net amounts owed under each agreement to one net amount
payable by one party to the other. This right to close out and net payments across all transactions traded under the ISDA Master Agreement could result in a reduction of the fund's credit risk to such counterparty equal to any amounts payable by the
fund under the applicable transactions, if any.
Collateral and margin requirements differ by type of
derivative. For cleared derivatives (e.g., futures contracts, cleared swaps, and exchange-traded options), margin requirements are set by the clearing broker and the clearing house and collateral, in the form of cash or securities, is posted by the
fund directly with the clearing broker. Collateral terms are counterparty agreement specific for uncleared derivatives (e.g., forward foreign currency exchange contracts, uncleared swap agreements, and uncleared options) and collateral, in the form
of cash and securities, is held in segregated accounts with the fund's custodian in connection with these agreements. For derivatives traded under an ISDA Master Agreement, which contains a collateral support annex, the collateral requirements are
netted across all transactions traded under such counterparty-specific agreement and an amount is posted from one party to the other to collateralize such obligations. Cash that has been segregated or delivered to cover the fund's collateral or
margin obligations under derivative contracts, if any, will be reported separately in the Statement of Assets and Liabilities as restricted cash for uncleared derivatives and/or deposits with brokers for cleared derivatives. Securities pledged as
collateral or margin for the same purpose, if any, are noted in the Portfolio of Investments. The fund may be required to make payments of interest on uncovered collateral or margin obligations with the broker. Any such payments are included in
“Miscellaneous” expense in the Statement of Operations.
Futures Contracts —
The fund entered into futures contracts which may be used to hedge against or obtain broad market exposure, interest rate exposure, currency exposure, or to manage duration. A futures contract represents a commitment for the future purchase or sale
of an asset at a specified price on a specified date.
Upon entering into a futures contract, the fund is required
to deposit with the broker, either in cash or securities, an initial margin in an amount equal to a specified percentage of the notional amount of the contract. Subsequent payments (variation margin) are made or received by the fund each day,
depending on the daily fluctuations in the value of the contract, and are recorded for financial statement purposes as unrealized gain or loss by the fund until the contract is closed or expires at which point the gain or loss on futures contracts
is realized.
The fund bears the risk of interest
rates, exchange rates or securities prices moving unexpectedly, in which case, the fund may not achieve the anticipated benefits of the futures contracts and may realize a loss. While futures contracts may present less counterparty risk to the fund
since the contracts are exchange traded and the exchange’s clearinghouse guarantees payments to the broker, there is still counterparty credit risk due to the insolvency of the broker. The fund’s maximum risk of loss due to counterparty
credit risk is equal to the margin posted by the fund to the broker plus any gains or minus any losses on the outstanding futures contracts.
Indemnifications —
Under the fund's organizational documents, its officers and Trustees may be indemnified against certain liabilities and expenses arising out of the performance of their duties to the fund. Additionally, in the normal course of business, the fund
enters into agreements with service providers that may contain indemnification clauses. The fund's maximum exposure under these agreements is unknown as this would involve future claims that may be made against the fund that have not yet
occurred.
Investment Transactions and Income — Investment transactions are recorded on the trade date. Interest income is recorded on the accrual basis. All premium and
discount is amortized or accreted for financial statement purposes in accordance with U.S. generally accepted accounting principles. Interest payments received in additional securities are recorded on the
ex-interest date in an amount equal to the value of the security on such date.
The fund may receive proceeds from litigation settlements.
Any proceeds received from litigation involving portfolio holdings are reflected in the Statement of Operations in realized gain/loss if the security has been disposed of by the fund or in unrealized gain/loss if the security is still held by the
fund. Any other proceeds from litigation not related to portfolio holdings are reflected as other income in the Statement of Operations.
MFS Corporate Bond
Portfolio
Notes to Financial Statements - continued
Tax
Matters and Distributions — The fund intends to qualify as a regulated investment company, as defined under Subchapter M of the Internal Revenue Code, and to distribute all of its taxable income, including
realized capital gains. As a result, no provision for federal income tax is required. The fund’s federal tax returns, when filed, will remain subject to examination by the Internal Revenue Service for a three year period. Management has
analyzed the fund’s tax positions taken on federal and state tax returns for all open tax years and does not believe that there are any uncertain tax positions that require recognition of a tax liability. Foreign taxes, if any, have been
accrued by the fund in the accompanying financial statements in accordance with the applicable foreign tax law. Foreign income taxes may be withheld by certain countries in which the fund invests. Additionally, capital gains realized by the fund on
securities issued in or by certain foreign countries may be subject to capital gains tax imposed by those countries.
Distributions to shareholders are recorded on the
ex-dividend date. Income and capital gain distributions are determined in accordance with income tax regulations, which may differ from U.S. generally accepted accounting principles. Certain capital accounts in the financial statements are
periodically adjusted for permanent differences in order to reflect their tax character. These adjustments have no impact on net assets or net asset value per share. Temporary differences which arise from recognizing certain items of income,
expense, gain or loss in different periods for financial statement and tax purposes will reverse at some time in the future.
Book/tax differences primarily relate to amortization and
accretion of debt securities and derivative transactions.
The tax character of distributions declared to shareholders
for the last two fiscal years is as follows:
| |
Year
ended
12/31/21 |
Year
ended
12/31/20 |
| Ordinary
income (including any short-term capital gains) |
$5,901,029
|
$7,393,039
|
| Long-term
capital gains |
4,199,172
|
300,008
|
| Total
distributions |
$10,100,201
|
$7,693,047
|
The federal tax cost and the tax
basis components of distributable earnings were as follows:
| As
of 12/31/21 |
|
| Cost
of investments |
$198,691,851
|
| Gross
appreciation |
7,640,118
|
| Gross
depreciation |
(1,898,770)
|
| Net
unrealized appreciation (depreciation) |
$5,741,348
|
| Undistributed
ordinary income |
5,478,404
|
| Undistributed
long-term capital gain |
8,957,384
|
| Total
distributable earnings (loss) |
$20,177,136
|
Multiple Classes of Shares of
Beneficial Interest — The fund offers multiple classes of shares, which differ in their respective distribution and/or service fees. The fund's income, realized and unrealized gain (loss), and common expenses
are allocated to shareholders based on the daily net assets of each class. Dividends are declared separately for each class. Differences in per share dividend rates are generally due to differences in separate class expenses. The fund’s
distributions declared to shareholders as reported in the Statements of Changes in Net Assets are presented by class as follows:
| |
Year
ended
12/31/21 |
|
Year
ended
12/31/20 |
| Initial
Class |
$2,631,294
|
|
$2,184,264
|
| Service
Class |
7,468,907
|
|
5,508,783
|
| Total
|
$10,100,201
|
|
$7,693,047
|
(3) Transactions with
Affiliates
Investment Adviser — The fund has an investment advisory agreement with MFS to provide overall investment management and related administrative services and facilities to the fund. The
management fee is computed daily and paid monthly at the following annual rates based on the fund's average daily net assets:
| Up
to $1 billion |
0.60%
|
| In
excess of $1 billion |
0.50%
|
MFS Corporate Bond
Portfolio
Notes to Financial Statements - continued
MFS
has agreed in writing to reduce its management fee by a specified amount if certain MFS mutual fund assets exceed thresholds agreed to by MFS and the fund's Board of Trustees. For the year ended December 31, 2021, this management fee reduction
amounted to $27,346, which is included in the reduction of total expenses in the Statement of Operations. The management fee incurred for the year ended December 31, 2021 was equivalent to an annual effective rate of 0.59% of the fund's average
daily net assets.
The investment adviser has agreed
in writing to pay a portion of the fund’s total annual operating expenses, excluding interest, taxes, extraordinary expenses, brokerage and transaction costs, and investment-related expenses, such that total annual operating expenses do not
exceed 0.63% of average daily net assets for the Initial Class shares and 0.88% of average daily net assets for the Service Class shares. This written agreement will continue until modified by the fund’s Board of Trustees, but such agreement
will continue at least until April 30, 2023. For the year ended December 31, 2021, this reduction amounted to $100,720, which is included in the reduction of total expenses in the Statement of Operations.
Distributor — MFS
Fund Distributors, Inc. (MFD), a wholly-owned subsidiary of MFS, is the distributor of shares of the fund. The Trustees have adopted a distribution plan for the Service Class shares pursuant to Rule 12b-1 under the Investment Company Act of
1940.
The fund's distribution plan provides
that the fund will pay MFD distribution and/or service fees equal to 0.25% per annum of its average daily net assets attributable to Service Class shares as partial consideration for services performed and expenses incurred by MFD and financial
intermediaries (including participating insurance companies that invest in the fund to fund variable annuity and variable life insurance contracts, sponsors of qualified retirement and pension plans that invest in the fund, and affiliates of these
participating insurance companies and plan sponsors) in connection with the sale and distribution of the Service Class shares. MFD may subsequently pay all, or a portion, of the distribution and/or service fees to financial intermediaries.
Shareholder Servicing Agent
— MFS Service Center, Inc. (MFSC), a wholly-owned subsidiary of MFS, receives a fee from the fund for its services as shareholder servicing agent. For the year ended December 31, 2021, the fee was $8,368, which equated to 0.0039% annually of
the fund's average daily net assets. MFSC also receives reimbursement from the fund for out-of-pocket expenses paid by MFSC on behalf of the fund. For the year ended December 31, 2021, these costs amounted to $321.
Administrator — MFS
provides certain financial, legal, shareholder communications, compliance, and other administrative services to the fund. Under an administrative services agreement, the fund reimburses MFS the costs incurred to provide these services. The fund is
charged an annual fixed amount of $17,500 plus a fee based on average daily net assets. The administrative services fee incurred for the year ended December 31, 2021 was equivalent to an annual effective rate of 0.0181% of the fund's average daily
net assets.
Trustees’ and Officers’
Compensation — The fund pays compensation to independent Trustees in the form of a retainer, attendance fees, and additional compensation to Board and Committee chairpersons. The fund does not pay compensation
directly to Trustees or officers of the fund who are also officers of the investment adviser, all of whom receive remuneration from MFS for their services to the fund. Certain officers and Trustees of the fund are officers or directors of MFS, MFD,
and MFSC.
Other — The fund invests in the MFS Institutional Money Market Portfolio which is managed by MFS and seeks current income consistent with preservation of capital and liquidity. This money market fund does not pay a
management fee to MFS but does incur investment and operating costs.
(4) Portfolio Securities
For the year ended December 31, 2021, purchases and sales
of investments, other than short-term obligations, were as follows:
| |
Purchases
|
Sales
|
| U.S.
Government securities |
$—
|
$2,619,860
|
| Non-U.S.
Government securities |
115,969,795
|
124,938,499
|
(5) Shares of
Beneficial Interest
The fund's Declaration of Trust
permits the Trustees to issue an unlimited number of full and fractional shares of beneficial interest. Transactions in fund shares were as follows:
MFS Corporate Bond
Portfolio
Notes to Financial Statements - continued
| |
Year
ended
12/31/21 |
|
Year
ended
12/31/20 |
| |
Shares
|
Amount
|
|
Shares
|
Amount
|
| Shares
sold |
|
|
|
|
|
| Initial
Class |
353,381
|
$4,334,640
|
|
512,275
|
$6,356,882
|
| Service
Class |
1,492,051
|
17,814,591
|
|
2,413,646
|
29,610,213
|
| |
1,845,432
|
$22,149,231
|
|
2,925,921
|
$35,967,095
|
Shares
issued to shareholders
in reinvestment of distributions |
|
|
|
|
|
| Initial
Class |
218,910
|
$2,631,294
|
|
177,294
|
$2,184,264
|
| Service
Class |
630,288
|
7,468,907
|
|
453,025
|
5,508,783
|
| |
849,198
|
$10,100,201
|
|
630,319
|
$7,693,047
|
| Shares
reacquired |
|
|
|
|
|
| Initial
Class |
(764,833)
|
$(9,381,834)
|
|
(873,200)
|
$(10,710,012)
|
| Service
Class |
(2,560,611)
|
(30,856,182)
|
|
(3,109,400)
|
(36,170,139)
|
| |
(3,325,444)
|
$(40,238,016)
|
|
(3,982,600)
|
$(46,880,151)
|
| Net
change |
|
|
|
|
|
| Initial
Class |
(192,542)
|
$(2,415,900)
|
|
(183,631)
|
$(2,168,866)
|
| Service
Class |
(438,272)
|
(5,572,684)
|
|
(242,729)
|
(1,051,143)
|
| |
(630,814)
|
$(7,988,584)
|
|
(426,360)
|
$(3,220,009)
|
(6) Line of
Credit
The fund and certain other funds managed by
MFS participate in a $1.25 billion unsecured committed line of credit of which $1 billion is reserved for use by the fund and certain other MFS U.S. funds. The line of credit is provided by a syndicate of banks under a credit agreement. Borrowings
may be made for temporary financing needs. Interest is charged to each fund, based on its borrowings, generally at a rate equal to the highest of one month LIBOR, the Federal Funds Effective Rate and the Overnight Bank Funding Rate, plus an agreed
upon spread. A commitment fee, based on the average daily, unused portion of the committed line of credit, is allocated among the participating funds. In addition, the fund and other funds managed by MFS have established unsecured uncommitted
borrowing arrangements with certain banks for temporary financing needs. Interest is charged to each fund, based on its borrowings, at rates equal to customary reference rates plus an agreed upon spread. For the year ended December 31, 2021, the
fund’s commitment fee and interest expense were $634 and $0, respectively, and are included in “Miscellaneous” expense in the Statement of Operations.
(7) Investments in Affiliated Issuers
An affiliated issuer may be considered one in which the
fund owns 5% or more of the outstanding voting securities, or a company which is under common control. For the purposes of this report, the following were affiliated issuers:
| Affiliated
Issuers |
Beginning
Value |
Purchases
|
Sales
Proceeds |
Realized
Gain
(Loss) |
Change
in
Unrealized
Appreciation or
Depreciation |
Ending
Value |
| MFS
Institutional Money Market Portfolio |
$4,930,371
|
$93,735,425
|
$95,838,179
|
$—
|
$—
|
$2,827,617
|
| Affiliated
Issuers |
Dividend
Income |
Capital
Gain
Distributions |
| MFS
Institutional Money Market Portfolio |
$2,836
|
$—
|
(8) Impacts of
COVID-19
The pandemic related to the global spread of
novel coronavirus disease (COVID-19), which was first detected in December 2019, has resulted in significant disruptions to global business activity and the global economy, as well as the economies of individual countries, the financial performance
of individual companies and sectors, and the securities and commodities markets in general. Multiple
MFS Corporate Bond
Portfolio
Notes to Financial Statements - continued
surges in cases
globally, the availability and widespread adoption of vaccines, and the emergence of variant strains of the virus continue to create uncertainty as to the future and long-term impacts resulting from the pandemic including impacts to the prices and
liquidity of the fund's investments and the fund's performance.
(9) LIBOR Transition
Certain of the fund's investments, including its
investments in derivatives, as well as any debt issued by the fund and other contractual arrangements of the fund may be based on reference interest rates such as the London Interbank Offered Rate (“LIBOR”). In 2017, the regulatory
authority that oversees financial services firms in the United Kingdom announced plans to transition away from LIBOR by the end of 2021. In March 2021, the administrator of LIBOR announced the extension of the publication of the more commonly used
U.S. dollar LIBOR settings to the end of June 2023. Although the full impacts of the transition away from LIBOR are not fully known, the transition may result in, among other things, an increase in volatility or illiquidity of the markets for
instruments that currently rely on LIBOR to determine interest rates and this could have an adverse impact on the fund's performance. With respect to the fund's accounting for investments, including its investments in derivatives, as well as any
debt issued by the fund and other contractual arrangements of the fund that undergo reference rate-related modifications as a result of the transition, management will rely upon the relief provided by FASB Codification Topic 848 – Reference
Rate Reform (Topic 848). The guidance in Topic 848 permits the fund to disregard the GAAP accounting requirements around certain contract modifications resulting from the LIBOR transition such that for contracts considered in scope, the fund can
account for those modified contracts as a continuation of the existing contracts. While the cessation of the one-week and two-month U.S. dollar LIBOR tenors along with certain other non-U.S. dollar denominated LIBOR settings at December 31, 2021 did
not have a material impact on the fund, management is still evaluating the impact to the fund of the June 30, 2023 planned discontinuation of the more commonly used U.S. dollar LIBOR settings.
MFS Corporate Bond
Portfolio
Report of Independent Registered Public Accounting
Firm
To the Board of Trustees of MFS Variable
Insurance Trust II and the Shareholders of MFS Corporate Bond Portfolio:
Opinion on the Financial Statements and Financial
Highlights
We have audited the accompanying statement
of assets and liabilities of MFS Corporate Bond Portfolio (the “Fund”), including the portfolio of investments, as of December 31, 2021, the related statement of operations for the year then ended, the statements of changes in net assets
for each of the two years in the period then ended, the financial highlights for each of the five years in the period then ended, and the related notes. In our opinion, the financial statements and financial highlights present fairly, in all
material respects, the financial position of the Fund as of December 31, 2021, and the results of its operations for the year then ended, the changes in its net assets for each of the two years in the period then ended, and the financial highlights
for each of the five years in the period then ended, in conformity with accounting principles generally accepted in the United States of America.
Basis for Opinion
These financial statements and financial highlights are the
responsibility of the Fund's management. Our responsibility is to express an opinion on the Fund's financial statements and financial highlights based on our audits. We are a public accounting firm registered with the Public Company Accounting
Oversight Board (United States) (PCAOB) and are required to be independent with respect to the Fund in accordance with the U.S. federal securities laws and the applicable rules and regulations of the Securities and Exchange Commission and the
PCAOB.
We conducted our audits in accordance with the
standards of the PCAOB. Those standards require that we plan and perform the audit to obtain reasonable assurance about whether the financial statements and financial highlights are free of material misstatement, whether due to error or fraud. The
Fund is not required to have, nor were we engaged to perform, an audit of its internal control over financial reporting. As part of our audits, we are required to obtain an understanding of internal control over financial reporting but not for the
purpose of expressing an opinion on the effectiveness of the Fund's internal control over financial reporting. Accordingly, we express no such opinion.
Our audits included performing procedures to assess the
risks of material misstatement of the financial statements and financial highlights, whether due to error or fraud, and performing procedures that respond to those risks. Such procedures included examining, on a test basis, evidence regarding the
amounts and disclosures in the financial statements and financial highlights. Our audits also included evaluating the accounting principles used and significant estimates made by management, as well as evaluating the overall presentation of the
financial statements and financial highlights. Our procedures included confirmation of securities owned as of December 31, 2021, by correspondence with the custodian and brokers; when replies were not received from brokers, we performed other
auditing procedures. We believe that our audits provide a reasonable basis for our opinion.
DELOITTE & TOUCHE LLP
Boston, Massachusetts
February 15, 2022
We have served as the auditor of one or more of the MFS
investment companies since 1924.
MFS Corporate Bond
Portfolio
Trustees and Officers — Identification and
Background
The Trustees and Officers of the Trust, as
of February 1, 2022, are listed below, together with their principal occupations during the past five years. (Their titles may have varied during that period.) The address of each Trustee and Officer is 111 Huntington Avenue, Boston, Massachusetts
02199-7618.
| Name,
Age |
|
Position(s)
Held with Fund |
|
Trustee/Officer
Since(h) |
|
Number
of MFS Funds overseen by the Trustee |
|
Principal
Occupations During
the Past Five Years |
|
Other
Directorships During
the Past Five Years (j) |
| INTERESTED
TRUSTEES |
|
|
|
|
|
|
|
|
|
|
Michael
W. Roberge (k)
(age 55) |
|
Trustee
|
|
January
2021 |
|
135
|
|
Massachusetts
Financial Services Company, Chairman (since January 2021); Chief Executive Officer (since January 2017); Director; Chairman of the Board (since January 2022); President (until December 2018); Chief Investment Officer (until December 2018) |
|
N/A
|
| INDEPENDENT
TRUSTEES |
|
|
|
|
|
|
|
|
|
|
John
P. Kavanaugh
(age 67) |
|
Trustee
and Chair of Trustees |
|
January
2009 |
|
135
|
|
Private
investor |
|
N/A
|
Steven
E. Buller
(age 70) |
|
Trustee
|
|
February
2014 |
|
135
|
|
Private
investor |
|
N/A
|
John
A. Caroselli
(age 67) |
|
Trustee
|
|
March
2017 |
|
135
|
|
Private
investor; JC Global Advisors, LLC (management consulting), President (since 2015) |
|
N/A
|
Maureen
R. Goldfarb
(age 66) |
|
Trustee
|
|
January
2009 |
|
135
|
|
Private
investor |
|
N/A
|
Peter
D. Jones
(age 66) |
|
Trustee
|
|
January
2019 |
|
135
|
|
Private
investor |
|
N/A
|
James
W. Kilman, Jr.
(age 60) |
|
Trustee
|
|
January
2019 |
|
135
|
|
Burford
Capital Limited (finance and investment management), Senior Advisor (since May 3, 2021), Chief Financial Officer (2019 - May 2, 2021); KielStrand Capital LLC (family office), Chief Executive Officer (since 2016) |
|
Alpha-En
Corporation, Director (2016-2019) |
Clarence
Otis, Jr.
(age 65) |
|
Trustee
|
|
March
2017 |
|
135
|
|
Private
investor |
|
VF
Corporation, Director; Verizon Communications, Inc., Director; The Travelers Companies, Director |
Maryanne
L. Roepke
(age 65) |
|
Trustee
|
|
May
2014 |
|
135
|
|
Private
investor |
|
N/A
|
Laurie
J. Thomsen
(age 64) |
|
Trustee
|
|
March
2005 |
|
135
|
|
Private
investor |
|
The
Travelers Companies, Director; Dycom Industries, Inc., Director |
MFS Corporate Bond
Portfolio
Trustees and Officers - continued
| Name,
Age |
|
Position(s)
Held with
Fund |
|
Trustee/Officer
Since(h) |
|
Number
of MFS Funds for which the Person is an Officer |
|
Principal
Occupations During
the Past Five Years |
| OFFICERS
|
|
|
|
|
|
|
|
|
Christopher
R. Bohane (k)
(age 48) |
|
Assistant
Secretary and Assistant Clerk |
|
July
2005 |
|
135
|
|
Massachusetts
Financial Services Company, Senior Vice President and Associate General Counsel |
Kino
Clark (k)
(age 53) |
|
Assistant
Treasurer |
|
January
2012 |
|
135
|
|
Massachusetts
Financial Services Company, Vice President |
John
W. Clark, Jr. (k)
(age 54) |
|
Assistant
Treasurer |
|
April
2017 |
|
135
|
|
Massachusetts
Financial Services Company, Vice President (since March 2017); Deutsche Bank (financial services), Department Head - Treasurer's Office (until February 2017) |
Thomas
H. Connors (k)
(age 62) |
|
Assistant
Secretary and Assistant Clerk |
|
September
2012 |
|
135
|
|
Massachusetts
Financial Services Company, Vice President and Senior Counsel |
David
L. DiLorenzo (k)
(age 53) |
|
President
|
|
July
2005 |
|
135
|
|
Massachusetts
Financial Services Company, Senior Vice President |
Heidi
W. Hardin (k)
(age 54) |
|
Secretary
and Clerk |
|
April
2017 |
|
135
|
|
Massachusetts
Financial Services Company, Executive Vice President and General Counsel (since March 2017); Harris Associates (investment management), General Counsel (until January 2017) |
Brian
E. Langenfeld (k)
(age 48) |
|
Assistant
Secretary and Assistant Clerk |
|
June
2006 |
|
135
|
|
Massachusetts
Financial Services Company, Vice President and Senior Counsel |
Amanda
S. Mooradian (k)
(age 42) |
|
Assistant
Secretary and Assistant Clerk |
|
September
2018 |
|
135
|
|
Massachusetts
Financial Services Company, Assistant Vice President and Senior Counsel |
Susan
A. Pereira (k)
(age 51) |
|
Assistant
Secretary and Assistant Clerk |
|
July
2005 |
|
135
|
|
Massachusetts
Financial Services Company, Vice President and Assistant General Counsel |
Kasey
L. Phillips (k)
(age 51) |
|
Assistant
Treasurer |
|
September
2012 |
|
135
|
|
Massachusetts
Financial Services Company, Vice President |
Matthew
A. Stowe (k)
(age 47) |
|
Assistant
Secretary and Assistant Clerk |
|
October
2014 |
|
135
|
|
Massachusetts
Financial Services Company, Vice President and Assistant General Counsel |
Martin
J. Wolin (k)
(age 54) |
|
Chief
Compliance Officer |
|
July
2015 |
|
135
|
|
Massachusetts
Financial Services Company, Senior Vice President and Chief Compliance Officer |
James
O. Yost (k)
(age 61) |
|
Treasurer
|
|
September
1990 |
|
135
|
|
Massachusetts
Financial Services Company, Senior Vice President |
| (h)
|
Date
first appointed to serve as Trustee/Officer of an MFS Fund. Each Trustee has served continuously since appointment unless indicated otherwise. From January 2012 through December 2016, Messrs. DiLorenzo and Yost served as Treasurer and Deputy
Treasurer of the Funds, respectively. |
| (j)
|
Directorships or
trusteeships of companies required to report to the Securities and Exchange Commission (i.e., “public companies”). |
| (k)
|
“Interested
person” of the Trust within the meaning of the Investment Company Act of 1940 (referred to as the 1940 Act), which is the principal federal law governing investment companies like the fund, as a result of a position with MFS. The address of
MFS is 111 Huntington Avenue, Boston, Massachusetts 02199-7618. |
Each Trustee (other than Messrs. Jones, Kilman and Roberge)
has been elected by shareholders and each Trustee and Officer holds office until his or her successor is chosen and qualified or until his or her earlier death, resignation, retirement or removal. Mr. Roberge became a Trustee of the Funds on January
1, 2021 and Messrs. Jones and Kilman became Trustees of the Funds on January 1, 2019. The Trust does not hold annual meetings for the purpose of electing Trustees, and Trustees are not elected for fixed terms. Under the terms of the Board's
retirement policy, an Independent Trustee shall retire at the end of the calendar year in which he or she reaches the earlier of 75 years of age or 15 years of service on the Board (or, in the case of any Independent Trustee who joined the Board
prior to 2015, 20 years of service on the Board).
Messrs. Buller, Kilman and Otis and Ms. Roepke are members
of the Trust’s Audit Committee.
MFS Corporate Bond
Portfolio
Trustees and Officers - continued
Each
of the Interested Trustees and certain Officers hold comparable officer positions with certain affiliates of MFS.
The Statement of Additional Information for a Fund includes
further information about the Trustees and is available without charge upon request by calling 1-800-225-2606.
| Investment
Adviser |
Custodian
|
Massachusetts Financial
Services Company
111 Huntington Avenue
Boston, MA 02199-7618 |
State Street
Bank and Trust Company
1 Lincoln Street
Boston, MA 02111-2900 |
| Distributor
|
Independent
Registered Public Accounting Firm |
MFS Fund
Distributors, Inc.
111 Huntington Avenue
Boston, MA 02199-7618 |
Deloitte
& Touche LLP
200 Berkeley Street
Boston, MA 02116 |
| Portfolio
Manager(s) |
|
Alexander
Mackey
Henry Peabody |
|
MFS Corporate Bond
Portfolio
Board Review of Investment Advisory Agreement
MFS Corporate Bond Portfolio
The Investment Company Act of 1940 requires that both the
full Board of Trustees and a majority of the non-interested (“independent”) Trustees, voting separately, annually approve the continuation of the Fund’s investment advisory agreement with MFS. The Trustees consider matters bearing
on the Fund and its advisory arrangements at their meetings throughout the year, including a review of performance data at each regular meeting. In addition, the independent Trustees met several times by videoconference (in accordance with
Securities and Exchange Commission relief) over the course of three months beginning in May and ending in July, 2021 (“contract review meetings”) for the specific purpose of considering whether to approve the continuation of the
investment advisory agreement for the Fund and the other investment companies that the Board oversees (the “MFS Funds”). The independent Trustees were assisted in their evaluation of the Fund’s investment advisory agreement by
independent legal counsel, from whom they received separate legal advice and with whom they met separately from MFS during various contract review meetings. The independent Trustees were also assisted in this process by an independent consultant who
was retained by and reported to the independent Trustees.
In connection with their deliberations regarding the
continuation of the investment advisory agreement, the Trustees, including the independent Trustees, considered such information and factors as they believed, in light of the legal advice furnished to them and their own business judgment, to be
relevant. The investment advisory agreement for the Fund was considered separately, although the Trustees also took into account the common interests of all MFS Funds in their review. As described below, the Trustees considered the nature, quality,
and extent of the various investment advisory, administrative, and shareholder services performed by MFS under the existing investment advisory agreement and other arrangements with the Fund.
In connection with their contract review meetings, the
Trustees received and relied upon materials that included, among other items: (i) information provided by Broadridge Financial Solutions, Inc. (“Broadridge”), an independent third party, on the investment performance of the Fund for
various time periods ended December 31, 2020 and the investment performance of a group of funds with substantially similar investment classifications/objectives (the “Broadridge performance universe”), (ii) information provided by
Broadridge on the Fund’s advisory fees and other expenses and the advisory fees and other expenses of comparable funds identified by Broadridge as well as all other funds in the same investment classification/category (the “Broadridge
expense group and universe”), (iii) information provided by MFS on the advisory fees of portfolios of other clients of MFS, including institutional separate accounts and other clients, (iv) information as to whether and to what extent
applicable expense waivers, reimbursements or fee “breakpoints” are observed for the Fund, (v) information regarding MFS’ financial results and financial condition, including MFS’ and certain of its affiliates’
estimated profitability from services performed for the Fund and the MFS Funds as a whole, and compared to MFS’ institutional business, (vi) MFS’ views regarding the outlook for the mutual fund industry and the strategic business plans
of MFS, (vii) descriptions of various functions performed by MFS for the Funds, such as compliance monitoring and portfolio trading practices, and (viii) information regarding the overall organization of MFS, including information about MFS’
senior management and other personnel providing investment advisory, administrative and other services to the Fund and the other MFS Funds. The comparative performance, fee and expense information prepared and provided by Broadridge was not
independently verified and the independent Trustees did not independently verify any information provided to them by MFS.
The Trustees’ conclusion as to the continuation of
the investment advisory agreement was based on a comprehensive consideration of all information provided to the Trustees and not the result of any single factor. Some of the factors that figured particularly in the Trustees’ deliberations are
described below, although individual Trustees may have evaluated the information presented differently from one another, giving different weights to various factors. It is also important to recognize that the fee arrangements for the Fund and other
MFS Funds are the result of years of review and discussion between the independent Trustees and MFS, that certain aspects of such arrangements may receive greater scrutiny in some years than in others, and that the Trustees’ conclusions may be
based, in part, on their consideration of these same arrangements during the course of the year and in prior years.
Based on information provided by Broadridge and MFS, the
Trustees reviewed the Fund’s total return investment performance as well as the Broadridge performance universe over various time periods. The Trustees placed particular emphasis on the total return performance of the Fund’s Initial
Class shares in comparison to the performance of funds in its Broadridge performance universe over the five-year period ended December 31, 2020, which the Trustees believed was a long enough period to reflect differing market conditions. The total
return performance of the Fund’s Initial Class shares was in the 3rd quintile relative to the other funds in the universe for this five-year period (the 1st quintile being the best performers and the 5th quintile being the worst performers).
The total return performance of the Fund’s Initial Class shares was in the 2nd quintile for each of the one- and three-year periods ended December 31, 2020 relative to the Broadridge performance universe. Because of the passage of time, these
performance results may differ from the performance results for more recent periods, including those shown elsewhere in this report.
MFS Corporate Bond
Portfolio
Board Review of Investment Advisory Agreement - continued
In
the course of their deliberations, the Trustees took into account information provided by MFS in connection with the contract review meetings, as well as during investment review meetings conducted with portfolio management personnel during the
course of the year regarding the Fund’s performance. After reviewing these and related factors, the Trustees concluded, within the context of their overall conclusions regarding the investment advisory agreement, that they were satisfied with
MFS’ responses and efforts relating to investment performance.
In assessing the reasonableness of the Fund’s
advisory fee, the Trustees considered, among other information, the Fund’s advisory fee and the total expense ratio of the Fund’s Initial Class shares as a percentage of average daily net assets and the advisory fee and total expense
ratios of the Broadridge expense group based on information provided by Broadridge. The Trustees considered that MFS currently observes an expense limitation for the Fund, which may not be changed without the Trustees’ approval. The Trustees
also considered that, according to the data provided by Broadridge (which takes into account any fee reductions or expense limitations that were in effect during the Fund’s last fiscal year), the Fund’s effective advisory fee rate and
total expense ratio were each approximately at the Broadridge expense group median.
The Trustees also considered the advisory fees charged by
MFS to any institutional separate accounts advised by MFS (“separate accounts”) and unaffiliated investment companies for which MFS serves as subadviser (“subadvised funds”) that have comparable investment strategies to the
Fund, if any. In comparing these fees, the Trustees considered information provided by MFS as to the generally broader scope of services provided by MFS to the Fund, as well as the more extensive regulatory burdens imposed on MFS in managing the
Fund, in comparison to separate accounts and subadvised funds. The Trustees also considered the higher demands placed on MFS’ investment personnel and trading infrastructure as a result of the daily cash in-flows and out-flows of the Fund in
comparison to separate accounts.
The Trustees also
considered whether the Fund may benefit from any economies of scale in the management of the Fund in the event of growth in assets of the Fund and/or growth in assets of the MFS Funds as a whole. They noted that the Fund’s advisory fee rate
schedule is subject to a contractual breakpoint that reduces the Fund’s advisory fee rate on average daily net assets over $1 billion. The Trustees also noted that MFS has agreed in writing to waive a portion of the management fees of certain
MFS Funds, including the Fund, if the total combined assets of certain funds within the MFS Funds’ complex increase above agreed upon thresholds (the “group fee waiver”), enabling the Fund’s shareholders to share in the
benefits from any economies of scale at the complex level. The group fee waiver is reviewed and renewed annually between the Board and MFS. The Trustees concluded that the breakpoint and the group fee waiver were sufficient to allow the Fund to
benefit from economies of scale as its assets and overall complex assets grow.
The Trustees also considered information prepared by MFS
relating to MFS’ costs and profits with respect to the Fund, the MFS Funds considered as a group, and other investment companies and accounts advised by MFS, as well as MFS’ methodologies used to determine and allocate its costs to the
MFS Funds, the Fund and other accounts and products for purposes of estimating profitability.
After reviewing these and other factors described herein,
the Trustees concluded, within the context of their overall conclusions regarding the investment advisory agreement, that the advisory fees charged to the Fund represent reasonable compensation in light of the services being provided by MFS to the
Fund.
In addition, the Trustees considered MFS’
resources and related efforts to continue to retain, attract and motivate capable personnel to serve the Fund. The Trustees also considered current and developing conditions in the financial services industry, including the presence of large and
well-capitalized companies which are spending, and appear to be prepared to continue to spend, substantial sums to engage personnel and to provide services to competing investment companies. In this regard, the Trustees also considered the financial
resources of MFS and its ultimate parent, Sun Life Financial Inc. The Trustees also considered the advantages and possible disadvantages to the Fund of having an adviser that also serves other investment companies as well as other accounts.
The Trustees also considered the nature, quality, cost, and
extent of administrative, transfer agency, and distribution services provided to the Fund by MFS and its affiliates under agreements and plans other than the investment advisory agreement, including any 12b-1 fees the Fund pays to MFS Fund
Distributors, Inc., an affiliate of MFS. The Trustees also considered the nature, extent and quality of certain other services MFS performs or arranges for on the Fund’s behalf, which may include securities lending programs, directed expense
payment programs, class action recovery programs, and MFS’ interaction with third-party service providers, principally custodians and sub-custodians. The Trustees concluded that the various non-advisory services provided by MFS and its
affiliates on behalf of the Fund were satisfactory.
The Trustees considered so-called “fall-out
benefits” to MFS such as reputational value derived from serving as investment manager to the MFS Funds. The Trustees also considered that MFS discontinued its historic practice of obtaining investment research from portfolio brokerage
commissions paid by certain MFS Funds effective January 2018, and directly pays or voluntarily reimburses a Fund, if applicable, for the costs of external research acquired through the use of the Fund’s portfolio brokerage commissions.
MFS Corporate Bond
Portfolio
Board Review of Investment Advisory Agreement - continued
Based on their evaluation of factors that they deemed to be
material, including those factors described above, the Board of Trustees, including the independent Trustees, concluded that the Fund’s investment advisory agreement with MFS should be continued for an additional one-year period, commencing
August 1, 2021.
MFS Corporate Bond
Portfolio
Proxy Voting Policies and Information
MFS votes proxies on behalf of the fund pursuant to proxy
voting policies and procedures that are available without charge, upon request, by calling 1-800-225-2606, by visiting mfs.com/proxyvoting, or by visiting the SEC’s Web site at http://www.sec.gov.
Information regarding how the fund voted proxies relating
to portfolio securities during the most recent twelve-month period ended June 30 is available by August 31 of each year without charge by visiting mfs.com/proxyvoting, or by visiting the SEC’s Web site
at http://www.sec.gov.
Quarterly Portfolio Disclosure
The fund files a complete schedule of portfolio holdings
with the SEC for the first and third quarters of each fiscal year as an exhibit to its reports on Form N-PORT. The fund’s Form N-PORT reports are available on the SEC’s Web site at
http://www.sec.gov. A shareholder can obtain the portfolio holdings report for the first and third quarters of the fund's fiscal year at mfs.com/vit2 by
choosing the fund's name and then scrolling to the “Resources” section and clicking on the “Prospectus and Reports” tab.
FURTHER INFORMATION
From time to time, MFS may post important information about
the fund or the MFS Funds on the MFS Web site (mfs.com). This information is available at https://www.mfs.com/announcements or at
mfs.com/vit2 by choosing the fund's name and then scrolling to the “Resources” section and clicking on the “Announcements” tab, if any.
Information About Fund Contracts and Legal Claims
The fund has entered into contractual arrangements with an
investment adviser, administrator, distributor, shareholder servicing agent, 529 program manager (if applicable), and custodian who each provide services to the fund. Unless expressly stated otherwise, shareholders are not parties to, or intended
beneficiaries of these contractual arrangements, and these contractual arrangements are not intended to create any shareholder right to enforce them against the service providers or to seek any remedy under them against the service providers, either
directly or on behalf of the fund.
Under the
Trust’s By-Laws and Declaration of Trust, any claims asserted against or on behalf of the MFS Funds, including claims against Trustees and Officers, must be brought in state and federal courts located within the Commonwealth of
Massachusetts.
Federal Tax Information (unaudited)
The following information is provided pursuant to
provisions of the Internal Revenue Code.
The fund
designates $4,620,000 as capital gain dividends paid during the fiscal year.
The fund intends to pass through the maximum amount
allowable as Section 163(j) Interest Dividends as defined in Treasury Regulation §1.163(j)-1(b).
| FACTS
|
WHAT
DOES MFS DO WITH YOUR PERSONAL INFORMATION? |
| Why?
|
Financial
companies choose how they share your personal information. Federal law gives consumers the right to limit some but not all sharing. Federal law also requires us to tell you how we collect, share, and protect your personal information. Please read
this notice carefully to understand what we do. |
| What?
|
The types of
personal information we collect and share depend on the product or service you have with us. This information can include: |
| • Social
Security number and account balances |
| • Account
transactions and transaction history |
| • Checking
account information and wire transfer instructions |
| When
you are no longer our customer, we continue to share your information as described in this notice. |
| How?
|
All
financial companies need to share customers' personal information to run their everyday business. In the section below, we list the reasons financial companies can share their customers' personal information; the reasons MFS chooses to share; and
whether you can limit this sharing. |
Reasons
we can share your
personal information |
Does
MFS share? |
Can
you limit
this sharing? |
For
our everyday business purposes –
such as to process your transactions, maintain your
account(s), respond to court orders and legal
investigations, or report to credit bureaus |
Yes
|
No
|
For
our marketing purposes –
to offer our products and services to you |
No
|
We
don't share |
For
joint marketing with other
financial companies |
No
|
We
don't share |
For
our affiliates' everyday business purposes –
information about your transactions and experiences |
No
|
We
don't share |
For
our affiliates' everyday business purposes –
information about your creditworthiness |
No
|
We
don't share |
| For
nonaffiliates to market to you |
No
|
We
don't share |
| Questions?
|
Call
800-225-2606 or go to mfs.com. |
| Who
we are |
| Who
is providing this notice? |
MFS
Funds, MFS Investment Management, MFS Institutional Advisors, Inc., and MFS Heritage Trust Company. |
| What
we do |
How
does MFS
protect my personal
information? |
To
protect your personal information from unauthorized access and use, we use security measures that comply with federal law. These measures include procedural, electronic, and physical safeguards for the protection of the personal information we
collect about you. |
How
does MFS
collect my personal
information? |
We
collect your personal information, for example, when you |
| • open
an account or provide account information |
| • direct
us to buy securities or direct us to sell your securities |
| • make
a wire transfer |
| We
also collect your personal information from others, such as credit bureaus, affiliates, or other companies. |
| Why
can't I limit all sharing? |
Federal
law gives you the right to limit only |
| • sharing
for affiliates' everyday business purposes – information about your creditworthiness |
| • affiliates
from using your information to market to you |
| • sharing
for nonaffiliates to market to you |
| State
laws and individual companies may give you additional rights to limit sharing. |
| Definitions
|
| Affiliates
|
Companies
related by common ownership or control. They can be financial and nonfinancial companies. |
| •
MFS does not share personal information with affiliates, except for everyday business purposes as described on page one of this notice. |
| Nonaffiliates
|
Companies
not related by common ownership or control. They can be financial and nonfinancial companies. |
| •
MFS does not share with nonaffiliates so they can market to you. |
| Joint
marketing |
A
formal agreement between nonaffiliated financial companies that together market financial products or services to you. |
| •
MFS doesn't jointly market. |
| Other
important information |
| If
you own an MFS product or receive an MFS service in the name of a third party such as a bank or broker-dealer, their privacy policy may apply to you instead of ours. |
Annual Report
December 31, 2021
MFS® Core Equity Portfolio
MFS® Variable
Insurance Trust II
MFS® Core
Equity Portfolio
|
1
|
|
2
|
|
3
|
|
5
|
|
7
|
|
8
|
|
15
|
|
16
|
|
17
|
|
18
|
|
20
|
|
26
|
|
27
|
|
30
|
|
33
|
|
33
|
|
33
|
|
33
|
|
33
|
|
34
|
The report is prepared for the general information of contract owners. It
is authorized for distribution to prospective investors only when preceded or accompanied by a current prospectus.
NOT FDIC INSURED • MAY LOSE VALUE
• NO BANK OR CREDIT UNION GUARANTEE •
NOT A DEPOSIT • NOT INSURED BY ANY FEDERAL GOVERNMENT
AGENCY OR NCUA/NCUSIF
MFS Core Equity
Portfolio
Dear Contract Owners:
After a powerful rally in 2021 that was spurred by the
introduction of effective coronavirus vaccines and high levels of monetary and fiscal stimulus, markets have recently experienced a rise in volatility. Rising inflation (mostly due to pandemic-related labor and supply chain disruptions), new
COVID-19 variants that are vaccine-resistant, and the prospect of tighter monetary and fiscal policies around the world have all increased investor anxiety.
Rising real (inflation-adjusted) bond yields in the United
States are a headwind for richly valued U.S. growth stocks, though many non-U.S. markets have experienced lower levels of turbulence. In recent months, global economic growth has moderated, with the spread of the Delta and Omicron variants and a
regulatory crackdown in China featuring prominently. Stress in China’s property development sector has also contributed to the slowdown there. A further concern for investors is the tightening of global energy and raw materials supplies caused
in part by geopolitical uncertainty.
However,
above-trend economic growth, strong corporate balance sheets, and nascent signs that global supply chain bottlenecks may be easing, along with a dovish policy shift in China, are supportive fundamentals that we feel could help calm recent market
jitters.
It is times of market transition that
demonstrate the importance of having a deep understanding of company fundamentals, and we have built our global research platform to do just that.
At MFS®, we put our clients’ assets to work responsibly by carefully navigating the increasing complexity of global markets and economies. Guided by our commitment to long-term
investing, we tune out the noise and try to uncover what we believe are the best, most durable investment opportunities in the market. Our unique global investment platform combines collective expertise, long-term discipline, and thoughtful risk
management to create sustainable value for investors.
Respectfully,
Michael W.
Roberge
Chief Executive Officer
MFS Investment Management
February 15, 2022
The opinions expressed in this letter are subject to
change and may not be relied upon for investment advice. No forecasts can be guaranteed.
MFS Core Equity
Portfolio
Portfolio structure
Top ten
holdings
| Apple,
Inc. |
6.5%
|
| Microsoft
Corp. |
6.2%
|
| Alphabet,
Inc., “A” |
4.1%
|
| Amazon.com,
Inc. |
3.6%
|
| Meta
Platforms, Inc., “A” |
1.8%
|
| JPMorgan
Chase & Co. |
1.6%
|
| Home
Depot, Inc. |
1.5%
|
| Visa,
Inc., “A” |
1.5%
|
| Johnson
& Johnson |
1.4%
|
| Adobe
Systems, Inc. |
1.3%
|
Global equity sectors (k)
| Technology
|
33.6%
|
| Health
Care (s) |
14.0%
|
| Financial
Services |
13.8%
|
| Capital
Goods |
13.4%
|
| Consumer
Cyclicals |
12.4%
|
| Energy
|
5.4%
|
| Consumer
Staples |
4.2%
|
| Telecommunications
and Cable Television (s) |
2.3%
|
| (k)
|
The sectors set forth
above and the associated portfolio composition are based on MFS’ own custom sector classification methodology. |
| (s)
|
Includes securities sold
short. |
Cash & Cash
Equivalents includes any cash, investments in money market funds, short-term securities, and other assets less liabilities. Please see the Statement of Assets and Liabilities for additional information related to the fund’s cash position and
other assets and liabilities.
Percentages are
based on net assets as of December 31, 2021.
The portfolio is actively managed and current
holdings may be different.
MFS Core Equity
Portfolio
Management Review
Summary of Results
For the twelve months ended December 31, 2021, Initial
Class shares of the MFS Core Equity Portfolio (fund) provided a total return of 25.31%, while Service Class shares of the fund provided a total return of 25.05%. These compare with a return of 25.66% over the same period for the fund’s
benchmark, the Russell 3000® Index.
Market Environment
Over the past year, the global economy was buffeted by an
array of crosscurrents as it adjusted to the ebbs and flows of the pandemic. Among the supportive currents were ample fiscal stimulus, loose monetary policy and the rollout of several highly effective coronavirus vaccines. Negative currents included
the rapid spread of several coronavirus variants, widespread global production bottlenecks and a surge in inflation. After experiencing a burst of exceptionally strong economic activity as the global economy began to reopen, activity became more
muted in the second half of the period amid ongoing supply chain disruptions and a new wave of coronavirus infections, albeit a seemingly milder strain.
Amid rising inflation, markets anticipated a transition
from an exceptionally accommodative environment to a more mixed monetary landscape ahead. Indeed, several central banks in emerging markets have already tightened policy and the US Federal Reserve reduced the pace of its asset purchases in November
and again in December. However, the European Central Bank, the Bank of Japan and the People's Bank of China are expected to maintain accommodative policies. Sovereign bond yields moved modestly higher during the period amid higher inflation and on
expectations of a tighter Fed but remain historically low.
A harsher Chinese regulatory environment toward industries
such as online gaming, food delivery and education increased market volatility as has stress in China's highly leveraged property development sector. Trade relations between the United States and China remained quite strained despite a change in
presidential administrations.
Signs of excess
investor enthusiasm continued to be seen in pockets of the market such as “meme stocks” popular with users of online message boards, cryptocurrencies and heavy retail participation in the market for short-dated options.
Detractors from Performance
Security selection within the consumer cyclicals sector
detracted from performance relative to the Russell 3000® Index, led by the fund’s overweight position in video game maker Electronic Arts.
Stock selection in the capital goods sector also hindered
relative performance. Within this sector, not holding shares of electric vehicle manufacturer Tesla weakened relative returns. The share price of Tesla advanced considerably during the second half of the year, following significantly
better-than-expected vehicle deliveries and the company's ability to overcome supply chain issues that affected the whole auto industry. Moreover, favorable pricing of its Model 3 and Model Y vehicles helped improve Tesla’s profitability,
which also had a positive impact on its share price.
Elsewhere, not holding shares of computer graphics
processor maker NVIDIA and pharmaceutical giant Pfizer held back relative performance. The stock price of NVIDIA climbed as the company reported strong revenue growth, driven by better-than-anticipated broad-based demand and capacity additions at
its Gaming, Datacenter, and Pro Vis segments. The fund's overweight positions in wireless communications services provider T-Mobile US, global payments technology company Visa, pharmaceutical company Merck & Company and communications business
Liberty Broadband, and the timing of the fund's ownership in shares of biotechnology company Biogen and analytics services provider Clarivate (United Kingdom), also weighed on relative performance.
Contributors to Performance
Stock selection in the health care sector contributed to
the fund’s relative performance. Within this sector, holding shares of clinical research organization ICON(b) (Ireland) aided relative returns. The stock price of ICON advanced following the company's acquisition of PRA Health Sciences, and as
management reported solid financial results that were driven by strong revenue growth from net business wins. The fund's overweight position in pharmaceutical company Eli Lilly, and its short position in healthcare services provider Healthcare
Services Group, also strengthened relative performance.
Stock selection in the financial services sector benefited
relative returns, led by the fund's overweight positions in financial services firm Goldman Sachs Group(h) and real estate investment trust EPR Properties(h), and not owning shares of weak-performing debit and credit transaction processing company
Mastercard. The stock price of Goldman Sachs Group advanced as the company reported earnings per share and revenue results that were ahead of expectations, driven by higher-than-expected private equity gains, coupled with strength in its investment
banking, consumer and wealth management business segments.
Stocks in other sectors that aided relative returns
included the fund’s overweight positions in semiconductor chips and electronics engineering solutions provider Applied Materials, specialty auto parts provider LKQ, software giant Microsoft and software development company Atlassian.
MFS Core Equity
Portfolio
Management Review - continued
Respectfully,
Portfolio Manager(s)
Joseph MacDougall
| (b)
|
Security is not a
benchmark constituent. |
| (h)
|
Security was not held in
the portfolio at period end. |
The
views expressed in this report are those of the portfolio manager(s) only through the end of the period of the report as stated on the cover and do not necessarily reflect the views of MFS or any other person in the MFS organization. These views are
subject to change at any time based on market or other conditions, and MFS disclaims any responsibility to update such views. These views may not be relied upon as investment advice or an indication of trading intent on behalf of any MFS portfolio.
References to specific securities are not recommendations of such securities, and may not be representative of any MFS portfolio’s current or future investments.
MFS Core Equity
Portfolio
Performance Summary Through 12/31/21
The following chart illustrates the historical performance
of the fund in comparison to its benchmark(s). Benchmarks are unmanaged and may not be invested in directly. Benchmark returns do not reflect any fees or expenses. The performance of other share classes will be greater than or less than that of the
class depicted below. (See Notes to Performance Summary.)
Performance data shown represents past performance and is no
guarantee of future results. Investment return and principal value fluctuate so your units, when sold, may be worth more or less than the original cost; current performance may be lower or higher than quoted. The performance shown does not reflect
the deduction of taxes, if any, that a contract holder would pay on fund distributions or the redemption of contract units. The returns for the fund shown also do not reflect the deduction of expenses associated with variable products, such as
mortality and expense risk charges, separate account charges, and sales charges imposed by the insurance company separate accounts. Such expenses would reduce the overall returns shown.
Growth of a Hypothetical $10,000 Investment
Total Returns
through 12/31/21
Average annual total returns
| Share
Class |
Class
Inception Date |
1-yr
|
5-yr
|
10-yr
|
| Initial
Class |
5/12/97
|
25.31%
|
18.92%
|
16.53%
|
| Service
Class |
8/24/01
|
25.05%
|
18.63%
|
16.25%
|
Comparative benchmark(s)
| Russell
3000® Index (f) |
25.66%
|
17.97%
|
16.30%
|
| (f)
|
Source:
FactSet Research Systems Inc. |
Benchmark Definition(s)
Russell 3000® Index(h) – constructed to provide a comprehensive barometer for the 3,000 largest U.S. companies
based on total market capitalization, which represents approximately 98% of the investable U.S. equity market.
It is not possible to invest directly in an index.
| (h)
|
Frank
Russell Company (“Russell”) is the source and owner of the trademarks, service marks, and copyrights related to the Russell Indexes. Russell® is a trademark of
Frank Russell Company. Neither Russell nor its licensors accept any liability for any errors or omissions in the Russell Indexes and/or Russell ratings or underlying data and no party may rely on any Russell Indexes and/or Russell ratings and/or
underlying data contained in this document. No further distribution of Russell Data is permitted without Russell's express written consent. Russell does not promote, sponsor, or endorse the content of this document. |
Notes to Performance Summary
Average annual total return represents the average annual
change in value for each share class for the periods presented.
Performance results reflect any applicable expense
subsidies and waivers in effect during the periods shown. Without such subsidies and waivers the fund's performance results would be less favorable. Please see the prospectus and financial statements for complete details. All results are historical
and assume the reinvestment of any dividends and capital gains distributions.
MFS Core Equity
Portfolio
Performance Summary – continued
Performance results do not include adjustments made for
financial reporting purposes in accordance with U.S. generally accepted accounting principles and may differ from amounts reported in the financial highlights.
From time to time the fund may receive proceeds from
litigation settlements, without which performance would be lower.
MFS Core Equity
Portfolio
Expense Table
Fund Expenses Borne by the Contract Holders during the
Period,
July 1, 2021 through December 31, 2021
As
a contract holder of the fund, you incur ongoing costs, including management fees; distribution and/or service (12b-1) fees; and other fund expenses. This example is intended to help you understand your ongoing costs (in dollars) of investing in the
fund and to compare these costs with the ongoing costs of investing in other mutual funds.
The example is based on an investment of $1,000 invested at
the beginning of the period and held for the entire period July 1, 2021 through December 31, 2021.
Actual Expenses
The first line for each share class in the following table
provides information about actual account values and actual expenses. You may use the information in this line, together with the amount you invested, to estimate the expenses that you paid over the period. Simply divide your account value by $1,000
(for example, an $8,600 account value divided by $1,000 = 8.6), then multiply the result by the number in the first line under the heading entitled “Expenses Paid During Period” to estimate the expenses you paid on your account during
this period.
Hypothetical Example for Comparison
Purposes
The second line for each share class in the
following table provides information about hypothetical account values and hypothetical expenses based on the fund’s actual expense ratio and an assumed rate of return of 5% per year before expenses, which is not the fund’s actual
return. The hypothetical account values and expenses may not be used to estimate the actual ending account balance or expenses you paid for the period. You may use this information to compare the ongoing costs of investing in the fund and other
funds. To do so, compare this 5% hypothetical example with the 5% hypothetical examples that appear in the shareholder reports of the other funds.
Please note that the expenses shown in the table are meant
to highlight the fund's ongoing costs only and do not take into account the fees and expenses imposed under the variable contracts through which your investment in the fund is made. Therefore, the second line for each share class in the table is
useful in comparing ongoing costs associated with an investment in vehicles (such as the fund) which fund benefits under variable annuity and variable life insurance contracts and to qualified pension and retirement plans only, and will not help you
determine the relative total costs of investing in the fund through variable annuity and variable life insurance contracts. If the fees and expenses imposed under the variable contracts were included, your costs would have been higher.
Share
Class |
|
Annualized
Expense
Ratio |
Beginning
Account Value
7/01/21 |
Ending
Account Value
12/31/21 |
Expenses
Paid During
Period (p)
7/01/21-12/31/21 |
| Initial
Class |
Actual
|
0.83%
|
$1,000.00
|
$1,091.78
|
$4.38
|
| Hypothetical
(h) |
0.83%
|
$1,000.00
|
$1,021.02
|
$4.23
|
| Service
Class |
Actual
|
1.08%
|
$1,000.00
|
$1,090.36
|
$5.69
|
| Hypothetical
(h) |
1.08%
|
$1,000.00
|
$1,019.76
|
$5.50
|
| (h)
|
5% class return per year
before expenses. |
| (p)
|
“Expenses
Paid During Period” are equal to each class's annualized expense ratio, as shown above, multiplied by the average account value over the period, multiplied by 184/365 (to reflect the one-half year period). |
Notes to Expense Table
Expense ratios include 0.02% of investment related expenses
from short sales (See Note 2 of the Notes to Financial Statements) that are outside of the expense limitation arrangement (See Note 3 of the Notes to Financial Statements).
MFS Core Equity Portfolio
Portfolio of Investments − 12/31/21
The Portfolio of Investments is a complete list of all
securities owned by your fund. It is categorized by broad-based asset classes.
| Issuer
|
|
|
Shares/Par
|
Value
($) |
| Common
Stocks – 99.5% |
| Aerospace
& Defense – 2.3% |
|
| CACI
International, Inc., “A” (a) |
|
985
|
$
265,172 |
| Curtiss-Wright
Corp. |
|
3,359
|
465,793 |
| Honeywell
International, Inc. |
|
8,446
|
1,761,075 |
| Howmet
Aerospace, Inc. |
|
22,673
|
721,682 |
| L3Harris
Technologies, Inc. |
|
2,784
|
593,660 |
| Leidos
Holdings, Inc. |
|
2,990
|
265,811 |
| Northrop
Grumman Corp. |
|
1,535
|
594,152 |
| Parsons
Corp. (a) |
|
6,303
|
212,096 |
| Raytheon
Technologies Corp. |
|
17,862
|
1,537,204 |
| |
|
|
|
$6,416,645 |
| Alcoholic
Beverages – 0.3% |
|
| Constellation
Brands, Inc., “A” |
|
3,129
|
$
785,285 |
| Apparel
Manufacturers – 0.6% |
|
| NIKE,
Inc., “B” |
|
5,548
|
$
924,685 |
| Skechers
USA, Inc., “A” (a) |
|
17,842
|
774,343 |
| |
|
|
|
$1,699,028 |
| Automotive
– 1.3% |
|
| Aptiv
PLC (a) |
|
6,624
|
$
1,092,629 |
| LKQ
Corp. |
|
32,981
|
1,979,850 |
| Magna
International, Inc. |
|
6,127
|
495,919 |
| |
|
|
|
$3,568,398 |
| Biotechnology
– 1.3% |
|
| Adaptive
Biotechnologies Corp. (a) |
|
6,406
|
$
179,752 |
| Biogen,
Inc. (a) |
|
3,727
|
894,182 |
| Illumina,
Inc. (a) |
|
1,339
|
509,409 |
| Oxford
Nanopore Technologies PLC (a) |
|
16,248
|
153,508 |
| Vertex
Pharmaceuticals, Inc. (a) |
|
9,034
|
1,983,866 |
| |
|
|
|
$3,720,717 |
| Broadcasting
– 1.2% |
|
| Discovery
Communications, Inc., “C” (a) |
|
26,956
|
$
617,293 |
| Walt
Disney Co. (a) |
|
17,253
|
2,672,317 |
| |
|
|
|
$3,289,610 |
| Brokerage
& Asset Managers – 1.6% |
|
| Charles
Schwab Corp. |
|
15,011
|
$
1,262,425 |
| CME
Group, Inc. |
|
4,796
|
1,095,694 |
| Invesco
Ltd. |
|
48,639
|
1,119,670 |
| KKR
& Co., Inc. |
|
14,800
|
1,102,600 |
| |
|
|
|
$4,580,389 |
| Business
Services – 2.7% |
|
| Accenture
PLC, “A” |
|
2,647
|
$
1,097,314 |
| Amdocs
Ltd. |
|
7,861
|
588,317 |
| Clarivate
PLC (a) |
|
48,524
|
1,141,284 |
| Cognizant
Technology Solutions Corp., “A” |
|
7,054
|
625,831 |
| Fidelity
National Information Services, Inc. |
|
7,815
|
853,007 |
| Fiserv,
Inc. (a) |
|
8,169
|
847,861 |
| Global
Payments, Inc. |
|
4,698
|
635,076 |
| PayPal
Holdings, Inc. (a) |
|
7,943
|
1,497,891 |
MFS Core Equity Portfolio
Portfolio of
Investments – continued
| Issuer
|
|
|
Shares/Par
|
Value
($) |
| Common
Stocks – continued |
| Business
Services – continued |
|
| Thoughtworks
Holding, Inc. (a) |
|
15,764
|
$
422,633 |
| |
|
|
|
$7,709,214 |
| Cable
TV – 0.1% |
|
| Cable
One, Inc. |
|
138
|
$
243,356 |
| Chemicals
– 0.4% |
|
| Element
Solutions, Inc. |
|
36,792
|
$
893,310 |
| FMC
Corp. |
|
3,357
|
368,900 |
| |
|
|
|
$1,262,210 |
| Computer
Software – 10.8% |
|
| Adobe
Systems, Inc. (a) |
|
6,361
|
$
3,607,069 |
| Atlassian
Corp. PLC, “A” (a) |
|
5,755
|
2,194,324 |
| Avalara,
Inc. (a) |
|
5,246
|
677,311 |
| Black
Knight, Inc. (a) |
|
6,877
|
570,034 |
| Cadence
Design Systems, Inc. (a) |
|
13,576
|
2,529,888 |
| Microsoft
Corp. (s) |
|
52,146
|
17,537,743 |
| Ping
Identity Holding Corp. (a) |
|
12,150
|
277,992 |
| salesforce.com,
inc. (a) |
|
11,962
|
3,039,903 |
| |
|
|
|
$30,434,264 |
| Computer
Software - Systems – 8.6% |
|
| Apple,
Inc. (s) |
|
103,844
|
$
18,439,579 |
| Block,
Inc., “A” (a) |
|
4,265
|
688,840 |
| NICE
Systems Ltd., ADR (a) |
|
3,843
|
1,166,735 |
| Rapid7,
Inc. (a) |
|
7,197
|
847,015 |
| ServiceNow,
Inc. (a) |
|
3,072
|
1,994,066 |
| Zebra
Technologies Corp., “A” (a) |
|
1,955
|
1,163,616 |
| |
|
|
|
$24,299,851 |
| Construction
– 1.7% |
|
| AvalonBay
Communities, Inc., REIT |
|
3,960
|
$
1,000,256 |
| AZEK
Co., Inc. (a) |
|
16,926
|
782,658 |
| Masco
Corp. |
|
14,821
|
1,040,731 |
| Otis
Worldwide Corp. |
|
7,261
|
632,215 |
| Sherwin-Williams
Co. |
|
1,369
|
482,107 |
| Vulcan
Materials Co. |
|
3,927
|
815,167 |
| |
|
|
|
$4,753,134 |
| Consumer
Products – 1.3% |
|
| Colgate-Palmolive
Co. |
|
13,249
|
$
1,130,670 |
| International
Flavors & Fragrances, Inc. |
|
3,051
|
459,633 |
| Kimberly-Clark
Corp. |
|
6,249
|
893,107 |
| Procter
& Gamble Co. |
|
7,976
|
1,304,714 |
| |
|
|
|
$3,788,124 |
| Consumer
Services – 0.7% |
|
| Booking
Holdings, Inc. (a) |
|
293
|
$
702,974 |
| Bright
Horizons Family Solutions, Inc. (a) |
|
4,762
|
599,441 |
| Grand
Canyon Education, Inc. (a) |
|
8,469
|
725,878 |
| |
|
|
|
$2,028,293 |
| Containers
– 0.3% |
|
| Ball
Corp. |
|
8,430
|
$
811,556 |
MFS Core Equity Portfolio
Portfolio of
Investments – continued
| Issuer
|
|
|
Shares/Par
|
Value
($) |
| Common
Stocks – continued |
| Electrical
Equipment – 1.4% |
|
| AMETEK,
Inc. |
|
3,266
|
$
480,233 |
| Amphenol
Corp., “A” |
|
3,614
|
316,080 |
| Fortive
Corp. |
|
5,525
|
421,502 |
| Johnson
Controls International PLC |
|
15,419
|
1,253,719 |
| Sensata
Technologies Holding PLC (a) |
|
19,455
|
1,200,179 |
| TE
Connectivity Ltd. |
|
2,181
|
351,883 |
| |
|
|
|
$4,023,596 |
| Electronics
– 5.1% |
|
| Advanced
Micro Devices (a) |
|
14,773
|
$
2,125,835 |
| Applied
Materials, Inc. |
|
13,236
|
2,082,817 |
| Broadcom,
Inc. |
|
4,245
|
2,824,665 |
| Intel
Corp. |
|
24,446
|
1,258,969 |
| Lam
Research Corp. |
|
2,126
|
1,528,913 |
| Monolithic
Power Systems, Inc. |
|
1,459
|
719,768 |
| NXP
Semiconductors N.V. |
|
7,579
|
1,726,345 |
| Silicon
Laboratories, Inc. (a) |
|
1,410
|
291,052 |
| Texas
Instruments, Inc. |
|
10,394
|
1,958,957 |
| |
|
|
|
$14,517,321 |
| Energy
- Independent – 1.0% |
|
| ConocoPhillips
|
|
14,387
|
$
1,038,453 |
| Diamondback
Energy, Inc. |
|
5,601
|
604,068 |
| Pioneer
Natural Resources Co. |
|
3,086
|
561,282 |
| Valero
Energy Corp. |
|
6,757
|
507,518 |
| |
|
|
|
$2,711,321 |
| Energy
- Integrated – 1.0% |
|
| Chevron
Corp. |
|
23,143
|
$
2,715,831 |
| Engineering
- Construction – 0.2% |
|
| APi
Group, Inc. (a) |
|
25,280
|
$
651,466 |
| Food
& Beverages – 2.2% |
|
| Archer
Daniels Midland Co. |
|
11,519
|
$
778,569 |
| Coca-Cola
Co. |
|
6,995
|
414,174 |
| Coca-Cola
Europacific Partners PLC |
|
6,649
|
371,879 |
| Hostess
Brands, Inc. (a) |
|
8,672
|
177,082 |
| J.M.
Smucker Co. |
|
2,874
|
390,347 |
| Mondelez
International, Inc. |
|
24,679
|
1,636,464 |
| Oatly
Group AB, ADR (a) |
|
32,796
|
261,056 |
| PepsiCo,
Inc. |
|
13,035
|
2,264,310 |
| |
|
|
|
$6,293,881 |
| Food
& Drug Stores – 0.5% |
|
| Wal-Mart
Stores, Inc. |
|
10,541
|
$
1,525,177 |
| Forest
& Paper Products – 0.4% |
|
| Rayonier,
Inc., REIT |
|
28,623
|
$
1,155,224 |
| Gaming
& Lodging – 0.9% |
|
| International
Game Technology PLC |
|
19,429
|
$
561,692 |
| Marriott
International, Inc., “A” (a) |
|
5,651
|
933,771 |
| Penn
National Gaming, Inc. (a) |
|
3,417
|
177,172 |
MFS Core Equity Portfolio
Portfolio of
Investments – continued
| Issuer
|
|
|
Shares/Par
|
Value
($) |
| Common
Stocks – continued |
| Gaming
& Lodging – continued |
|
| Wyndham
Hotels & Resorts, Inc. |
|
8,969
|
$
804,071 |
| |
|
|
|
$2,476,706 |
| General
Merchandise – 0.9% |
|
| Dollar
General Corp. |
|
10,415
|
$
2,456,169 |
| Health
Maintenance Organizations – 1.4% |
|
| Cigna
Corp. |
|
11,954
|
$
2,744,997 |
| Humana,
Inc. |
|
2,832
|
1,313,652 |
| |
|
|
|
$4,058,649 |
| Insurance
– 3.2% |
|
| Aon
PLC |
|
9,652
|
$
2,901,005 |
| Arthur
J. Gallagher & Co. |
|
9,252
|
1,569,787 |
| Assurant,
Inc. |
|
4,832
|
753,115 |
| Chubb
Ltd. |
|
7,994
|
1,545,320 |
| Everest
Re Group Ltd. |
|
1,855
|
508,122 |
| Hartford
Financial Services Group, Inc. |
|
11,043
|
762,409 |
| MetLife,
Inc. |
|
10,661
|
666,206 |
| Reinsurance
Group of America, Inc. |
|
3,212
|
351,682 |
| SiriusPoint
Ltd. (a) |
|
1,642
|
13,349 |
| |
|
|
|
$9,070,995 |
| Internet
– 5.9% |
|
| Alphabet,
Inc., “A” (a)(s) |
|
3,975
|
$
11,515,734 |
| Meta
Platforms, Inc., “A” (a) |
|
15,187
|
5,108,147 |
| |
|
|
|
$16,623,881 |
| Leisure
& Toys – 0.7% |
|
| Electronic
Arts, Inc. |
|
11,358
|
$
1,498,120 |
| Roblox
Corp., “A” (a) |
|
4,303
|
443,898 |
| |
|
|
|
$1,942,018 |
| Machinery
& Tools – 2.5% |
|
| Eaton
Corp. PLC |
|
10,051
|
$
1,737,014 |
| IDEX
Corp. |
|
1,651
|
390,164 |
| Ingersoll
Rand, Inc. |
|
19,348
|
1,197,061 |
| PACCAR,
Inc. |
|
13,959
|
1,232,021 |
| Regal
Rexnord Corp. |
|
4,360
|
741,985 |
| Roper
Technologies, Inc. |
|
3,455
|
1,699,376 |
| |
|
|
|
$6,997,621 |
| Major
Banks – 3.4% |
|
| JPMorgan
Chase & Co. (s) |
|
29,072
|
$
4,603,551 |
| Morgan
Stanley |
|
25,522
|
2,505,240 |
| PNC
Financial Services Group, Inc. |
|
12,758
|
2,558,234 |
| |
|
|
|
$9,667,025 |
| Medical
& Health Technology & Services – 1.7% |
|
| Guardant
Health, Inc. (a) |
|
2,010
|
$
201,040 |
| ICON
PLC (a) |
|
7,512
|
2,326,467 |
| McKesson
Corp. |
|
8,844
|
2,198,353 |
| |
|
|
|
$4,725,860 |
MFS Core Equity Portfolio
Portfolio of
Investments – continued
| Issuer
|
|
|
Shares/Par
|
Value
($) |
| Common
Stocks – continued |
| Medical
Equipment – 5.0% |
|
| Align
Technology, Inc. (a) |
|
908
|
$
596,720 |
| Becton,
Dickinson and Co. |
|
8,900
|
2,238,172 |
| Boston
Scientific Corp. (a) |
|
45,530
|
1,934,115 |
| Envista
Holdings Corp. (a) |
|
10,840
|
488,450 |
| Maravai
Lifesciences Holdings, Inc., “A” (a) |
|
50,628
|
2,121,313 |
| Medtronic
PLC |
|
18,863
|
1,951,377 |
| Quidel
Corp. (a) |
|
5,826
|
786,452 |
| STERIS
PLC |
|
7,273
|
1,770,321 |
| Thermo
Fisher Scientific, Inc. |
|
3,489
|
2,328,000 |
| |
|
|
|
$14,214,920 |
| Natural
Gas - Pipeline – 0.3% |
|
| Cheniere
Energy, Inc. |
|
3,695
|
$
374,747 |
| Enterprise
Products Partners LP |
|
19,214
|
421,939 |
| |
|
|
|
$796,686 |
| Network
& Telecom – 0.5% |
|
| Equinix,
Inc., REIT |
|
1,750
|
$
1,480,220 |
| Oil
Services – 0.3% |
|
| Cactus,
Inc., “A” |
|
10,011
|
$
381,719 |
| ChampionX
Corp. (a) |
|
24,317
|
491,447 |
| |
|
|
|
$873,166 |
| Other
Banks & Diversified Financials – 4.2% |
|
| Bank
OZK |
|
8,647
|
$
402,345 |
| First
Interstate BancSystem, Inc. |
|
13,513
|
549,574 |
| Moody's
Corp. |
|
2,843
|
1,110,419 |
| Northern
Trust Corp. |
|
6,123
|
732,372 |
| Signature
Bank |
|
2,410
|
779,562 |
| SLM
Corp. |
|
38,931
|
765,773 |
| Truist
Financial Corp. |
|
49,603
|
2,904,255 |
| United
Community Bank, Inc. |
|
17,287
|
621,295 |
| Visa,
Inc., “A” |
|
19,256
|
4,172,968 |
| |
|
|
|
$12,038,563 |
| Pharmaceuticals
– 4.8% |
|
| Eli
Lilly & Co. |
|
9,842
|
$
2,718,557 |
| Johnson
& Johnson |
|
22,505
|
3,849,930 |
| Merck
& Co., Inc. |
|
41,447
|
3,176,498 |
| Organon
& Co. |
|
20,479
|
623,586 |
| Zoetis,
Inc. |
|
12,796
|
3,122,608 |
| |
|
|
|
$13,491,179 |
| Pollution
Control – 0.3% |
|
| GFL
Environmental, Inc. |
|
22,041
|
$
834,252 |
| Printing
& Publishing – 0.1% |
|
| Warner
Music Group Corp. |
|
6,510
|
$
281,102 |
| Railroad
& Shipping – 1.2% |
|
| Canadian
Pacific Railway Ltd. |
|
29,301
|
$
2,107,914 |
| CSX
Corp. |
|
34,103
|
1,282,273 |
| |
|
|
|
$3,390,187 |
MFS Core Equity Portfolio
Portfolio of
Investments – continued
| Issuer
|
|
|
Shares/Par
|
Value
($) |
| Common
Stocks – continued |
| Real
Estate – 1.3% |
|
| Broadstone
Net Lease, Inc., REIT |
|
24,141
|
$
599,180 |
| Empire
State Realty Trust, REIT, “A” |
|
45,320
|
403,348 |
| Extra
Space Storage, Inc., REIT |
|
3,613
|
819,175 |
| Innovative
Industrial Properties, Inc., REIT |
|
1,658
|
435,905 |
| STORE
Capital Corp., REIT |
|
27,466
|
944,830 |
| Sun
Communities, Inc., REIT |
|
1,793
|
376,476 |
| |
|
|
|
$3,578,914 |
| Restaurants
– 1.0% |
|
| Starbucks
Corp. |
|
16,315
|
$
1,908,366 |
| Wendy's
Co. |
|
44,127
|
1,052,429 |
| |
|
|
|
$2,960,795 |
| Specialty
Chemicals – 1.4% |
|
| Air
Products & Chemicals, Inc. |
|
2,456
|
$
747,263 |
| Ashland
Global Holdings, Inc. |
|
7,069
|
761,049 |
| Avient
Corp. |
|
11,530
|
645,103 |
| Axalta
Coating Systems Ltd. (a) |
|
20,483
|
678,397 |
| Diversey
Holdings Ltd. (a) |
|
33,427
|
444,913 |
| DuPont
de Nemours, Inc. |
|
10,458
|
844,797 |
| |
|
|
|
$4,121,522 |
| Specialty
Stores – 5.8% |
|
| Amazon.com,
Inc. (a)(s) |
|
3,060
|
$
10,203,081 |
| Burlington
Stores, Inc. (a) |
|
1,938
|
564,946 |
| Farfetch
Ltd., “A” (a) |
|
21,170
|
707,713 |
| Home
Depot, Inc. |
|
10,477
|
4,348,060 |
| Ross
Stores, Inc. |
|
5,030
|
574,828 |
| |
|
|
|
$16,398,628 |
| Telecommunications
- Wireless – 2.4% |
|
| Liberty
Broadband Corp. (a) |
|
13,337
|
$
2,148,591 |
| SBA
Communications Corp., REIT |
|
5,124
|
1,993,338 |
| T-Mobile
US, Inc. (a) |
|
22,361
|
2,593,429 |
| |
|
|
|
$6,735,358 |
| Tobacco
– 0.4% |
|
| Philip
Morris International, Inc. |
|
11,988
|
$
1,138,860 |
| Utilities
- Electric Power – 2.9% |
|
| American
Electric Power Co., Inc. |
|
5,775
|
$
513,802 |
| CenterPoint
Energy, Inc. |
|
29,611
|
826,443 |
| Dominion
Energy, Inc. |
|
4,728
|
371,432 |
| Duke
Energy Corp. |
|
5,949
|
624,050 |
| Evergy,
Inc. |
|
7,342
|
503,735 |
| Exelon
Corp. |
|
15,355
|
886,905 |
| Generac
Holdings, Inc. (a) |
|
1,438
|
506,061 |
| NextEra
Energy, Inc. |
|
20,787
|
1,940,674 |
| PG&E
Corp. (a) |
|
64,272
|
780,262 |
| Pinnacle West
Capital Corp. |
|
1,331
|
93,955 |
| Southern
Co. |
|
7,948
|
545,074 |
| Xcel
Energy, Inc. |
|
8,163
|
552,635 |
| |
|
|
|
$8,145,028 |
| Total
Common Stocks (Identified Cost, $163,656,464) |
|
$
281,482,195 |
MFS Core Equity Portfolio
Portfolio of
Investments – continued
| Issuer
|
|
|
Shares/Par
|
Value
($) |
| Investment
Companies (h) – 0.9% |
| Money
Market Funds – 0.9% |
|
| MFS
Institutional Money Market Portfolio, 0.07% (v) (Identified Cost, $2,418,811) |
|
|
2,418,811
|
$
2,418,811 |
| Securities
Sold Short – (0.4)% |
| Medical
& Health Technology & Services – (0.2)% |
| Healthcare
Services Group, Inc. |
|
|
(42,085)
|
$
(748,692) |
| Telecommunications
- Wireless – (0.2)% |
| Crown
Castle International Corp., REIT |
|
|
(2,286)
|
$
(477,180) |
| Total
Securities Sold Short (Proceeds Received, $1,478,521) |
$
(1,225,872) |
| Other
Assets, Less Liabilities – 0.0% |
|
68,481 |
| Net
Assets – 100.0% |
$
282,743,615 |
| (a) |
Non-income producing
security. |
|
|
|
| (h)
|
An
affiliated issuer, which may be considered one in which the fund owns 5% or more of the outstanding voting securities, or a company which is under common control. At period end, the aggregate values of the fund's investments in affiliated issuers
and in unaffiliated issuers were $2,418,811 and $281,482,195, respectively. |
|
|
|
| (s)
|
Security or
a portion of the security was pledged to cover collateral requirements for securities sold short. |
|
|
|
| (v)
|
Affiliated
issuer that is available only to investment companies managed by MFS. The rate quoted for the MFS Institutional Money Market Portfolio is the annualized seven-day yield of the fund at period end. |
|
|
|
| The
following abbreviations are used in this report and are defined: |
| ADR
|
American
Depositary Receipt |
| REIT
|
Real Estate
Investment Trust |
At December 31,
2021, the fund had cash collateral of $22,653 and other liquid securities with an aggregate value of $2,923,365 to cover any collateral or margin obligations for securities sold short. Restricted cash and/or deposits with brokers in the Statement of
Assets and Liabilities are comprised of cash collateral.
See Notes to Financial Statements
MFS Core Equity
Portfolio
| Financial
Statements |
Statement of Assets and
Liabilities |
This statement
represents your fund’s balance sheet, which details the assets and liabilities comprising the total value of the fund.
| At
12/31/21 Assets |
|
| Investments
in unaffiliated issuers, at value (identified cost, $163,656,464) |
$281,482,195
|
| Investments
in affiliated issuers, at value (identified cost, $2,418,811) |
2,418,811
|
| Deposits
with brokers for |
|
| Securities
sold short |
22,653
|
| Receivables
for |
|
| Fund
shares sold |
89,372
|
| Dividends
|
221,044
|
| Other
assets |
1,556
|
| Total
assets |
$284,235,631
|
| Liabilities
|
|
| Payables
for |
|
| Securities
sold short, at value (proceeds received, $1,478,521) |
$1,225,872
|
| Fund
shares reacquired |
183,529
|
| Payable
to affiliates |
|
| Investment
adviser |
11,445
|
| Administrative
services fee |
267
|
| Shareholder
servicing costs |
122
|
| Distribution
and/or service fees |
1,053
|
| Payable
for independent Trustees' compensation |
17
|
| Accrued
expenses and other liabilities |
69,711
|
| Total
liabilities |
$1,492,016
|
| Net
assets |
$282,743,615
|
| Net
assets consist of |
|
| Paid-in
capital |
$137,442,783
|
| Total
distributable earnings (loss) |
145,300,832
|
| Net
assets |
$282,743,615
|
| Shares
of beneficial interest outstanding |
8,781,206
|
| |
Net
assets |
Shares
outstanding |
Net
asset value
per share |
| Initial
Class |
$206,059,719
|
6,372,749
|
$32.33
|
| Service
Class |
76,683,896
|
2,408,457
|
31.84
|
See Notes to Financial Statements
MFS Core Equity
Portfolio
| Financial
Statements |
Statement of Operations
|
This statement describes how much
your fund earned in investment income and accrued in expenses. It also describes any gains and/or losses generated by fund operations.
| Year
ended 12/31/21 |
|
| Net
investment income (loss) |
|
| Income
|
|
| Dividends
|
$2,976,242
|
| Other
|
14,199
|
| Dividends
from affiliated issuers |
1,353
|
| Income
on securities loaned |
359
|
| Foreign
taxes withheld |
(4,838)
|
| Total
investment income |
$2,987,315
|
| Expenses
|
|
| Management
fee |
$1,975,532
|
| Distribution
and/or service fees |
169,167
|
| Shareholder
servicing costs |
20,938
|
| Administrative
services fee |
45,157
|
| Independent
Trustees' compensation |
5,727
|
| Custodian
fee |
12,552
|
| Shareholder
communications |
24,497
|
| Audit
and tax fees |
59,087
|
| Legal
fees |
1,706
|
| Dividend
and interest expense on securities sold short |
55,909
|
| Interest
expense and fees |
884
|
| Miscellaneous
|
29,966
|
| Total
expenses |
$2,401,122
|
| Reduction
of expenses by investment adviser |
(33,505)
|
| Net
expenses |
$2,367,617
|
| Net
investment income (loss) |
$619,698
|
| Realized
and unrealized gain (loss) |
|
| Realized
gain (loss) (identified cost basis) |
|
| Unaffiliated
issuers |
$27,250,690
|
| Securities
sold short |
(325,119)
|
| Foreign
currency |
65
|
| Net
realized gain (loss) |
$26,925,636
|
| Change
in unrealized appreciation or depreciation |
|
| Unaffiliated
issuers |
$30,406,416
|
| Securities
sold short |
488,897
|
| Translation
of assets and liabilities in foreign currencies |
34
|
| Net
unrealized gain (loss) |
$30,895,347
|
| Net
realized and unrealized gain (loss) |
$57,820,983
|
| Change
in net assets from operations |
$58,440,681
|
See Notes to Financial Statements
MFS Core Equity
Portfolio
| Financial
Statements |
Statements of Changes in
Net Assets |
These statements describe
the increases and/or decreases in net assets resulting from operations, any distributions, and any shareholder transactions.
| |
Year
ended |
| |
12/31/21
|
12/31/20
|
| Change
in net assets |
|
|
| From
operations |
|
|
| Net
investment income (loss) |
$619,698
|
$1,048,577
|
| Net
realized gain (loss) |
26,925,636
|
19,666,571
|
| Net
unrealized gain (loss) |
30,895,347
|
16,236,950
|
| Change
in net assets from operations |
$58,440,681
|
$36,952,098
|
| Total
distributions to shareholders |
$(20,746,234)
|
$(11,731,291)
|
| Change
in net assets from fund share transactions |
$12,660,144
|
$(7,064,004)
|
| Total
change in net assets |
$50,354,591
|
$18,156,803
|
| Net
assets |
|
|
| At
beginning of period |
232,389,024
|
214,232,221
|
| At
end of period |
$282,743,615
|
$232,389,024
|
See Notes to Financial Statements
MFS Core Equity
Portfolio
| Financial
Statements |
Financial Highlights
|
The financial highlights table is
intended to help you understand the fund's financial performance for the past 5 years. Certain information reflects financial results for a single fund share. The total returns in the table represent the rate that an investor would have earned (or
lost) on an investment in the fund share class (assuming reinvestment of all distributions) held for the entire period.
| Initial
Class |
Year
ended |
| |
12/31/21
|
12/31/20
|
12/31/19
|
12/31/18
|
12/31/17
|
| Net
asset value, beginning of period |
$27.88
|
$24.81
|
$21.68
|
$25.21
|
$21.67
|
| Income
(loss) from investment operations |
|
|
|
|
|
| Net
investment income (loss) (d) |
$0.09
|
$0.14
|
$0.18
|
$0.20
|
$0.17
|
| Net
realized and unrealized gain (loss) |
6.85
|
4.38
|
6.59
|
(0.78)
|
5.04
|
| Total
from investment operations |
$6.94
|
$4.52
|
$6.77
|
$(0.58)
|
$5.21
|
| Less
distributions declared to shareholders |
|
|
|
|
|
| From
net investment income |
$(0.14)
|
$(0.18)
|
$(0.21)
|
$(0.18)
|
$(0.23)
|
| From
net realized gain |
(2.35)
|
(1.27)
|
(3.43)
|
(2.77)
|
(1.44)
|
| Total
distributions declared to shareholders |
$(2.49)
|
$(1.45)
|
$(3.64)
|
$(2.95)
|
$(1.67)
|
| Net
asset value, end of period (x) |
$32.33
|
$27.88
|
$24.81
|
$21.68
|
$25.21
|
| Total
return (%) (k)(r)(s)(x) |
25.31
|
18.71
|
33.19
|
(3.83)
|
24.82
|
Ratios
(%) (to average net assets)
and Supplemental data: |
|
|
|
|
|
| Expenses
before expense reductions |
0.85
|
0.87
|
0.88
|
0.87
|
0.87
|
| Expenses
after expense reductions |
0.83
|
0.86
|
0.87
|
0.86
|
0.86
|
| Net
investment income (loss) |
0.29
|
0.56
|
0.75
|
0.79
|
0.72
|
| Portfolio
turnover |
35
|
46
|
37
|
40
|
39
|
| Net
assets at end of period (000 omitted) |
$206,060
|
$177,571
|
$167,488
|
$144,991
|
$171,038
|
| Supplemental
Ratios (%): |
|
|
|
|
|
| Ratios
of expenses to average net assets after expense reductions excluding short sale expenses and interest expense and fees |
0.81
|
0.83
|
0.83
|
0.83
|
0.84
|
See Notes to Financial Statements
MFS Core Equity
Portfolio
Financial Highlights - continued
| Service
Class |
Year
ended |
| |
12/31/21
|
12/31/20
|
12/31/19
|
12/31/18
|
12/31/17
|
| Net
asset value, beginning of period |
$27.50
|
$24.50
|
$21.44
|
$24.96
|
$21.47
|
| Income
(loss) from investment operations |
|
|
|
|
|
| Net
investment income (loss) (d) |
$0.02
|
$0.08
|
$0.12
|
$0.14
|
$0.11
|
| Net
realized and unrealized gain (loss) |
6.76
|
4.31
|
6.51
|
(0.78)
|
4.99
|
| Total
from investment operations |
$6.78
|
$4.39
|
$6.63
|
$(0.64)
|
$5.10
|
| Less
distributions declared to shareholders |
|
|
|
|
|
| From
net investment income |
$(0.09)
|
$(0.12)
|
$(0.14)
|
$(0.11)
|
$(0.17)
|
| From
net realized gain |
(2.35)
|
(1.27)
|
(3.43)
|
(2.77)
|
(1.44)
|
| Total
distributions declared to shareholders |
$(2.44)
|
$(1.39)
|
$(3.57)
|
$(2.88)
|
$(1.61)
|
| Net
asset value, end of period (x) |
$31.84
|
$27.50
|
$24.50
|
$21.44
|
$24.96
|
| Total
return (%) (k)(r)(s)(x) |
25.05
|
18.39
|
32.87
|
(4.07)
|
24.50
|
Ratios
(%) (to average net assets)
and Supplemental data: |
|
|
|
|
|
| Expenses
before expense reductions |
1.10
|
1.12
|
1.13
|
1.12
|
1.12
|
| Expenses
after expense reductions |
1.08
|
1.11
|
1.12
|
1.11
|
1.11
|
| Net
investment income (loss) |
0.07
|
0.32
|
0.50
|
0.54
|
0.47
|
| Portfolio
turnover |
35
|
46
|
37
|
40
|
39
|
| Net
assets at end of period (000 omitted) |
$76,684
|
$54,818
|
$46,744
|
$41,195
|
$46,453
|
| Supplemental
Ratios (%): |
|
|
|
|
|
| Ratios
of expenses to average net assets after expense reductions excluding short sale expenses and interest expense and fees |
1.06
|
1.08
|
1.08
|
1.08
|
1.09
|
| (d)
|
Per share
data is based on average shares outstanding. |
| (k)
|
The total
return does not reflect expenses that apply to separate accounts. Inclusion of these charges would reduce the total return figures for all periods shown. |
| (r)
|
Certain
expenses have been reduced without which performance would have been lower. |
| (s)
|
From time to
time the fund may receive proceeds from litigation settlements, without which performance would be lower. Excluding the effect of the proceeds received from a non-recurring litigation settlement against Household International, Inc., the total
return for the year ended December 31, 2017 would have been lower by approximately 0.78%. |
| (x)
|
The
net asset values and total returns have been calculated on net assets which include adjustments made in accordance with U.S. generally accepted accounting principles required at period end for financial reporting purposes. |
See Notes to Financial Statements
MFS Core Equity
Portfolio
Notes to Financial Statements
(1) Business and Organization
MFS Core Equity Portfolio (the fund) is a diversified
series of MFS Variable Insurance Trust II (the trust). The trust is organized as a Massachusetts business trust and is registered under the Investment Company Act of 1940, as amended, as an open-end management investment company. The shareholders of
each series of the trust are separate accounts of insurance companies, which offer variable annuity and/or life insurance products, and qualified retirement and pension plans.
The fund is an investment company and accordingly follows
the investment company accounting and reporting guidance of the Financial Accounting Standards Board (FASB) Accounting Standards Codification Topic 946 Financial Services - Investment Companies.
(2) Significant Accounting Policies
General — The
preparation of financial statements in conformity with U.S. generally accepted accounting principles requires management to make estimates and assumptions that affect the reported amounts of assets and liabilities, and disclosure of contingent
assets and liabilities at the date of the financial statements and the reported amounts of increases and decreases in net assets from operations during the reporting period. Actual results could differ from those estimates. In the preparation of
these financial statements, management has evaluated subsequent events occurring after the date of the fund’s Statement of Assets and Liabilities through the date that the financial statements were issued.
Balance Sheet Offsetting
— The fund's accounting policy with respect to balance sheet offsetting is that, absent an event of default by the counterparty or a termination of the agreement, the International Swaps and Derivatives Association (ISDA) Master Agreement, or
similar agreement, does not result in an offset of reported amounts of financial assets and financial liabilities in the Statement of Assets and Liabilities across transactions between the fund and the applicable counterparty. The fund's right to
setoff may be restricted or prohibited by the bankruptcy or insolvency laws of the particular jurisdiction to which a specific master netting agreement counterparty is subject. Balance sheet offsetting disclosures, to the extent applicable to the
fund, have been included in the fund’s Significant Accounting Policies note under the captions for each of the fund’s in-scope financial instruments and transactions.
Investment Valuations
— Equity securities, including restricted equity securities and equity securities sold short, are generally valued at the last sale or official closing price on their primary market or exchange as
provided by a third-party pricing service. Equity securities, for which there were no sales reported that day, are generally valued at the last quoted daily bid quotation on their primary market or exchange as provided by a third-party pricing
service. Equity securities sold short, for which there were no sales reported that day, are generally valued at the last quoted daily ask quotation on their primary market or exchange as provided by a third-party pricing service. Short-term instruments with a maturity at issuance of 60 days or less may be valued at amortized cost, which approximates market value. Open-end investment companies are
generally valued at net asset value per share. Securities and other assets generally valued on the basis of information from a third-party pricing service may also be valued at a broker/dealer bid
quotation. In determining values, third-party pricing services can utilize both transaction data and market information such as yield, quality, coupon rate, maturity, type of issue, trading characteristics,
and other market data. The values of foreign securities and other assets and liabilities expressed in foreign currencies are converted to U.S. dollars using the mean of bid and asked prices for rates provided
by a third-party pricing service.
The Board of
Trustees has delegated primary responsibility for determining or causing to be determined the value of the fund’s investments (including any fair valuation) to the adviser pursuant to valuation policies and procedures approved by the Board. If
the adviser determines that reliable market quotations are not readily available, investments are valued at fair value as determined in good faith by the adviser in accordance with such procedures under the oversight of the Board of Trustees. Under
the fund’s valuation policies and procedures, market quotations are not considered to be readily available for most types of debt instruments and floating rate loans and many types of derivatives. These investments are generally valued at fair
value based on information from third-party pricing services. In addition, investments may be valued at fair value if the adviser determines that an investment’s value has been materially affected by events occurring after the close of the
exchange or market on which the investment is principally traded (such as foreign exchange or market) and prior to the determination of the fund’s net asset value, or after the halt of trading of a specific security where trading does not
resume prior to the close of the exchange or market on which the security is principally traded. Events that occur after foreign markets close (such as developments in foreign markets and significant movements in the U.S. markets) and prior to the
determination of the fund’s net asset value may be deemed to have a material effect on the value of securities traded in foreign markets. Accordingly, the fund’s foreign equity securities may often be valued at fair value. The adviser
generally relies on third-party pricing services or other information (such as the correlation with price movements of similar securities in the same or other markets; the type, cost and investment characteristics of the security; the business and
financial condition of the issuer; and trading and other market data) to assist in determining whether to fair value and at what value to fair value an investment. The value of an investment for purposes of calculating the fund’s net asset
value can differ depending on the source and
MFS Core Equity
Portfolio
Notes to Financial Statements - continued
method used to
determine value. When fair valuation is used, the value of an investment used to determine the fund’s net asset value may differ from quoted or published prices for the same investment. There can be no assurance that the fund could obtain the
fair value assigned to an investment if it were to sell the investment at the same time at which the fund determines its net asset value per share.
Various inputs are used in determining the value of the
fund's assets or liabilities. These inputs are categorized into three broad levels. In certain cases, the inputs used to measure fair value may fall into different levels of the fair value hierarchy. In such cases, an investment's level within the
fair value hierarchy is based on the lowest level of input that is significant to the fair value measurement. The fund's assessment of the significance of a particular input to the fair value measurement in its entirety requires judgment, and
considers factors specific to the investment. Level 1 includes unadjusted quoted prices in active markets for identical assets or liabilities. Level 2 includes other significant observable market-based inputs (including quoted prices for similar
securities, interest rates, prepayment speed, and credit risk). Level 3 includes unobservable inputs, which may include the adviser's own assumptions in determining the fair value of investments. The following is a summary of the levels used as of
December 31, 2021 in valuing the fund's assets and liabilities:
| Financial
Instruments |
Level
1 |
Level
2 |
Level
3 |
Total
|
| Equity
Securities |
$281,482,195
|
$—
|
$—
|
$281,482,195
|
| Mutual
Funds |
2,418,811
|
—
|
—
|
2,418,811
|
| Total
|
$283,901,006
|
$—
|
$—
|
$283,901,006
|
| Securities
Sold Short |
$(1,225,872)
|
$—
|
$—
|
$(1,225,872)
|
For further information
regarding security characteristics, see the Portfolio of Investments.
Foreign Currency
Translation — Purchases and sales of foreign investments, income, and expenses are converted into U.S. dollars based upon currency exchange rates prevailing on the respective dates of such transactions or on
the reporting date for foreign denominated receivables and payables. Gains and losses attributable to foreign currency exchange rates on sales of securities are recorded for financial statement purposes as net realized gains and losses on
investments. Gains and losses attributable to foreign exchange rate movements on receivables, payables, income and expenses are recorded for financial statement purposes as foreign currency transaction gains and losses. That portion of both realized
and unrealized gains and losses on investments that results from fluctuations in foreign currency exchange rates is not separately disclosed.
Short Sales — The
fund entered into short sales whereby it sells a security it does not own in anticipation of a decline in the value of that security. The fund will realize a gain if the security price decreases and a loss if the security price increases between the
date of the short sale and the date on which the fund replaces the borrowed security. Losses from short sales can exceed the proceeds of the security sold; and they can also exceed the potential loss from an ordinary buy and sell transaction. The
amount of any premium, dividends, or interest the fund may be required to pay in connection with a short sale will be recognized as a fund expense. During the year ended December 31, 2021, this expense amounted to $55,909. The fund segregates cash
or marketable securities in an amount that, when combined with the amount of proceeds from the short sale deposited with the broker, at least equals the current market value of the security sold short.
Security Loans —
Under its Securities Lending Agency Agreement with the fund, State Street Bank and Trust Company, as lending agent, loans the securities of the fund to certain qualified institutions (the “Borrowers”) approved by the fund. Security loans
can be terminated at the discretion of either the lending agent or the fund and the related securities must be returned within the earlier of the standard trade settlement period for such securities or within three business days. The loans are
collateralized by cash and/or U.S. Treasury and federal agency obligations in an amount typically at least equal to the market value of the securities loaned. On loans collateralized by cash, the cash collateral is invested in a money market fund.
The market value of the loaned securities is determined at the close of business of the fund and any additional required collateral is delivered to the fund on the next business day. The lending agent provides the fund with indemnification against
Borrower default. In the event of Borrower default, the lending agent will, for the benefit of the fund, either purchase securities identical to those loaned or, when such purchase is commercially impracticable, pay the fund the market value of the
loaned securities. In return, the lending agent assumes the fund's rights to the related collateral. If the collateral value is less than the cost to purchase identical securities, the lending agent is responsible for the shortfall, but only to the
extent that such shortfall is not due to a decline in collateral value resulting from collateral reinvestment for which the fund bears the risk of loss. A portion of the income generated upon investment of the collateral is remitted to the
Borrowers, and the remainder is allocated between the fund and the lending agent. On loans collateralized by U.S. Treasury and/or federal agency obligations, a fee is received from the Borrower, and is allocated between the fund and the lending
agent. Income from securities lending is separately reported in the Statement of Operations. The dividend and interest income earned on the securities loaned is accounted for in the same manner as other dividend and interest income. At December 31,
2021, there were no securities on loan or collateral outstanding.
MFS Core Equity
Portfolio
Notes to Financial Statements - continued
Indemnifications —
Under the fund's organizational documents, its officers and Trustees may be indemnified against certain liabilities and expenses arising out of the performance of their duties to the fund. Additionally, in the normal course of business, the fund
enters into agreements with service providers that may contain indemnification clauses. The fund's maximum exposure under these agreements is unknown as this would involve future claims that may be made against the fund that have not yet
occurred.
Investment Transactions and Income — Investment transactions are recorded on the trade date. Dividends received in cash are recorded on the ex-dividend date. Certain dividends from foreign securities will be
recorded when the fund is informed of the dividend if such information is obtained subsequent to the ex-dividend date. Dividend payments received in additional securities are recorded on the ex-dividend date in an amount equal to the value of the
security on such date.
The fund may receive
proceeds from litigation settlements. Any proceeds received from litigation involving portfolio holdings are reflected in the Statement of Operations in realized gain/loss if the security has been disposed of by the fund or in unrealized gain/loss
if the security is still held by the fund. Any other proceeds from litigation not related to portfolio holdings are reflected as other income in the Statement of Operations.
Tax Matters and Distributions — The fund intends to qualify as a regulated investment company, as defined under Subchapter M of the Internal Revenue Code, and to distribute all of its taxable income, including realized capital gains. As a
result, no provision for federal income tax is required. The fund’s federal tax returns, when filed, will remain subject to examination by the Internal Revenue Service for a three year period. Management has analyzed the fund’s tax
positions taken on federal and state tax returns for all open tax years and does not believe that there are any uncertain tax positions that require recognition of a tax liability. Foreign taxes, if any, have been accrued by the fund in the
accompanying financial statements in accordance with the applicable foreign tax law. Foreign income taxes may be withheld by certain countries in which the fund invests. Additionally, capital gains realized by the fund on securities issued in or by
certain foreign countries may be subject to capital gains tax imposed by those countries.
Distributions to shareholders are recorded on the
ex-dividend date. Income and capital gain distributions are determined in accordance with income tax regulations, which may differ from U.S. generally accepted accounting principles. Certain capital accounts in the financial statements are
periodically adjusted for permanent differences in order to reflect their tax character. These adjustments have no impact on net assets or net asset value per share. Temporary differences which arise from recognizing certain items of income,
expense, gain or loss in different periods for financial statement and tax purposes will reverse at some time in the future.
Book/tax differences primarily relate to wash sale loss
deferrals and partnership adjustments.
The tax
character of distributions declared to shareholders for the last two fiscal years is as follows:
| |
Year
ended
12/31/21 |
Year
ended
12/31/20 |
| Ordinary
income (including any short-term capital gains) |
$2,074,180
|
$3,863,247
|
| Long-term
capital gains |
18,672,054
|
7,868,044
|
| Total
distributions |
$20,746,234
|
$11,731,291
|
The federal tax cost and the tax
basis components of distributable earnings were as follows:
| As
of 12/31/21 |
|
| Cost
of investments |
$165,133,602
|
| Gross
appreciation |
120,808,520
|
| Gross
depreciation |
(3,266,988)
|
| Net
unrealized appreciation (depreciation) |
$117,541,532
|
| Undistributed
ordinary income |
8,272,058
|
| Undistributed
long-term capital gain |
19,314,781
|
| Other
temporary differences |
172,461
|
| Total
distributable earnings (loss) |
$145,300,832
|
Multiple Classes of Shares of
Beneficial Interest — The fund offers multiple classes of shares, which differ in their respective distribution and/or service fees. The fund's income, realized and unrealized gain (loss), and common expenses
are allocated to shareholders based on the daily net assets of each class. Dividends are declared separately for each class. Differences in per share dividend rates are generally due to differences in separate class expenses. The fund’s
distributions declared to shareholders as reported in the Statements of Changes in Net Assets are presented by class as follows:
MFS Core Equity
Portfolio
Notes to Financial Statements - continued
| |
Year
ended
12/31/21 |
|
Year
ended
12/31/20 |
| Initial
Class |
$15,244,249
|
|
$9,114,275
|
| Service
Class |
5,501,985
|
|
2,617,016
|
| Total
|
$20,746,234
|
|
$11,731,291
|
(3) Transactions with
Affiliates
Investment Adviser — The fund has an investment advisory agreement with MFS to provide overall investment management and related administrative services and facilities to the fund. The
management fee is computed daily and paid monthly at the following annual rates based on the fund's average daily net assets:
| Up
to $1 billion |
0.75%
|
| In
excess of $1 billion and up to $2.5 billion |
0.65%
|
| In
excess of $2.5 billion |
0.60%
|
MFS has agreed in writing to
reduce its management fee by a specified amount if certain MFS mutual fund assets exceed thresholds agreed to by MFS and the fund's Board of Trustees. For the year ended December 31, 2021, this management fee reduction amounted to $33,505, which is
included in the reduction of total expenses in the Statement of Operations. The management fee incurred for the year ended December 31, 2021 was equivalent to an annual effective rate of 0.74% of the fund's average daily net assets.
For the period from January 1, 2021 through July 31, 2021,
the investment adviser had agreed in writing to pay a portion of the fund’s total annual operating expenses, excluding interest, taxes, extraordinary expenses, brokerage and transaction costs, and investment-related expenses (such as short
sale dividend and interest expenses incurred in connection with the fund's investment activity), such that total annual operating expenses did not exceed 0.84% of average daily net assets for the Initial Class shares and 1.09% of average daily net
assets for the Service Class shares. This written agreement was terminated on July 31, 2021. For the period from January 1, 2021 through July 31, 2021, the fund’s actual operating expenses did not exceed the limit and therefore, the investment
adviser did not pay any portion of the fund’s expenses related to this agreement. Effective August 1, 2021, the investment adviser has agreed in writing to pay a portion of the fund’s total annual operating expenses, excluding interest,
taxes, extraordinary expenses, brokerage and transaction costs, and investment-related expenses (such as short sale dividend and interest expenses incurred in connection with the fund’s investment activity), such that total annual operating
expenses do not exceed 0.81% of average daily net assets for the Initial Class shares and 1.06% of average daily net assets for the Service Class shares. This written agreement will continue until modified by the fund’s Board of Trustees, but
such agreement will continue at least until April 30, 2023. For the period from August 1, 2021 through December 31, 2021, the fund’s actual operating expenses did not exceed the limit and therefore, the investment adviser did not pay any
portion of the fund’s expenses related to this agreement.
Distributor — MFS
Fund Distributors, Inc. (MFD), a wholly-owned subsidiary of MFS, is the distributor of shares of the fund. The Trustees have adopted a distribution plan for the Service Class shares pursuant to Rule 12b-1 under the Investment Company Act of
1940.
The fund's distribution plan provides
that the fund will pay MFD distribution and/or service fees equal to 0.25% per annum of its average daily net assets attributable to Service Class shares as partial consideration for services performed and expenses incurred by MFD and financial
intermediaries (including participating insurance companies that invest in the fund to fund variable annuity and variable life insurance contracts, sponsors of qualified retirement and pension plans that invest in the fund, and affiliates of these
participating insurance companies and plan sponsors) in connection with the sale and distribution of the Service Class shares. MFD may subsequently pay all, or a portion, of the distribution and/or service fees to financial intermediaries.
Shareholder Servicing Agent
— MFS Service Center, Inc. (MFSC), a wholly-owned subsidiary of MFS, receives a fee from the fund for its services as shareholder servicing agent. For the year ended December 31, 2021, the fee was $20,195, which equated to 0.0077% annually of
the fund's average daily net assets. MFSC also receives reimbursement from the fund for out-of-pocket expenses paid by MFSC on behalf of the fund. For the year ended December 31, 2021, these costs amounted to $743.
Administrator — MFS
provides certain financial, legal, shareholder communications, compliance, and other administrative services to the fund. Under an administrative services agreement, the fund reimburses MFS the costs incurred to provide these services. The fund is
charged an annual fixed amount of $17,500 plus a fee based on average daily net assets. The administrative services fee incurred for the year ended December 31, 2021 was equivalent to an annual effective rate of 0.0171% of the fund's average daily
net assets.
MFS Core Equity
Portfolio
Notes to Financial Statements - continued
Trustees’ and Officers’ Compensation — The fund pays compensation to independent Trustees in the form of a retainer, attendance fees, and additional compensation to Board and Committee chairpersons. The fund does not pay compensation directly to
Trustees or officers of the fund who are also officers of the investment adviser, all of whom receive remuneration from MFS for their services to the fund. Certain officers and Trustees of the fund are officers or directors of MFS, MFD, and
MFSC.
Other
— The fund invests in the MFS Institutional Money Market Portfolio which is managed by MFS and seeks current income consistent with preservation of capital and liquidity. This money market fund does not pay a
management fee to MFS but does incur investment and operating costs.
The fund is permitted to engage in purchase and sale
transactions with funds and accounts for which MFS serves as investment adviser or sub-adviser (“cross-trades”) pursuant to a policy adopted by the Board of Trustees. This policy has been designed to ensure that cross-trades conducted by
the fund comply with Rule 17a-7 under the Investment Company Act of 1940. During the year ended December 31, 2021, the fund engaged in purchase and sale transactions pursuant to this policy, which amounted to $34,096 and $169,988, respectively. The
sales transactions resulted in net realized gains (losses) of $37,093.
The adviser has voluntarily undertaken to reimburse the
fund from its own resources on a quarterly basis for the cost of investment research embedded in the cost of the fund’s securities trades. This agreement may be rescinded at any time. For the year ended December 31, 2021, this reimbursement
amounted to $14,477, which is included in “Other” income in the Statement of Operations.
(4) Portfolio Securities
For the year ended December 31, 2021, purchases and sales
of investments, other than short sales and short-term obligations, aggregated $91,493,404 and $100,301,120, respectively.
(5) Shares of Beneficial Interest
The fund's Declaration of Trust permits the Trustees to
issue an unlimited number of full and fractional shares of beneficial interest. Transactions in fund shares were as follows:
| |
Year
ended
12/31/21 |
|
Year
ended
12/31/20 |
| |
Shares
|
Amount
|
|
Shares
|
Amount
|
| Shares
sold |
|
|
|
|
|
| Initial
Class |
625,283
|
$19,234,200
|
|
328,117
|
$8,057,874
|
| Service
Class |
752,461
|
22,860,413
|
|
404,275
|
9,377,983
|
| |
1,377,744
|
$42,094,613
|
|
732,392
|
$17,435,857
|
Shares
issued to shareholders
in reinvestment of distributions |
|
|
|
|
|
| Initial
Class |
493,821
|
$15,244,249
|
|
354,090
|
$9,114,275
|
| Service
Class |
180,808
|
5,501,985
|
|
102,951
|
2,617,016
|
| |
674,629
|
$20,746,234
|
|
457,041
|
$11,731,291
|
| Shares
reacquired |
|
|
|
|
|
| Initial
Class |
(1,116,226)
|
$(34,482,616)
|
|
(1,063,282)
|
$(26,098,196)
|
| Service
Class |
(517,854)
|
(15,698,087)
|
|
(422,060)
|
(10,132,956)
|
| |
(1,634,080)
|
$(50,180,703)
|
|
(1,485,342)
|
$(36,231,152)
|
| Net
change |
|
|
|
|
|
| Initial
Class |
2,878
|
$(4,167)
|
|
(381,075)
|
$(8,926,047)
|
| Service
Class |
415,415
|
12,664,311
|
|
85,166
|
1,862,043
|
| |
418,293
|
$12,660,144
|
|
(295,909)
|
$(7,064,004)
|
(6) Line of
Credit
The fund and certain other funds managed by
MFS participate in a $1.25 billion unsecured committed line of credit of which $1 billion is reserved for use by the fund and certain other MFS U.S. funds. The line of credit is provided by a syndicate of banks under a credit agreement. Borrowings
may be made for temporary financing needs. Interest is charged to each fund, based on its borrowings, generally at a rate equal to the highest of one month LIBOR, the Federal Funds Effective Rate and the Overnight Bank Funding Rate, plus an agreed
upon spread. A commitment fee, based on the average daily, unused portion of the committed line of credit, is allocated among the participating funds. In addition, the fund and other funds managed by MFS have established
MFS Core Equity
Portfolio
Notes to Financial Statements - continued
unsecured
uncommitted borrowing arrangements with certain banks for temporary financing needs. Interest is charged to each fund, based on its borrowings, at rates equal to customary reference rates plus an agreed upon spread. For the year ended December 31,
2021, the fund’s commitment fee and interest expense were $879 and $0, respectively, and are included in “Interest expense and fees” in the Statement of Operations.
(7) Investments in Affiliated Issuers
An affiliated issuer may be considered one in which the
fund owns 5% or more of the outstanding voting securities, or a company which is under common control. For the purposes of this report, the following were affiliated issuers:
| Affiliated
Issuers |
Beginning
Value |
Purchases
|
Sales
Proceeds |
Realized
Gain
(Loss) |
Change
in
Unrealized
Appreciation or
Depreciation |
Ending
Value |
| MFS
Institutional Money Market Portfolio |
$1,489,118
|
$51,594,670
|
$50,664,977
|
$—
|
$—
|
$2,418,811
|
| Affiliated
Issuers |
Dividend
Income |
Capital
Gain
Distributions |
| MFS
Institutional Money Market Portfolio |
$1,353
|
$—
|
(8) Impacts of
COVID-19
The pandemic related to the global spread of
novel coronavirus disease (COVID-19), which was first detected in December 2019, has resulted in significant disruptions to global business activity and the global economy, as well as the economies of individual countries, the financial performance
of individual companies and sectors, and the securities and commodities markets in general. Multiple surges in cases globally, the availability and widespread adoption of vaccines, and the emergence of variant strains of the virus continue to create
uncertainty as to the future and long-term impacts resulting from the pandemic including impacts to the prices and liquidity of the fund's investments and the fund's performance.
(9) LIBOR Transition
Certain of the fund's investments, including its
investments in derivatives, as well as any debt issued by the fund and other contractual arrangements of the fund may be based on reference interest rates such as the London Interbank Offered Rate (“LIBOR”). In 2017, the regulatory
authority that oversees financial services firms in the United Kingdom announced plans to transition away from LIBOR by the end of 2021. In March 2021, the administrator of LIBOR announced the extension of the publication of the more commonly used
U.S. dollar LIBOR settings to the end of June 2023. Although the full impacts of the transition away from LIBOR are not fully known, the transition may result in, among other things, an increase in volatility or illiquidity of the markets for
instruments that currently rely on LIBOR to determine interest rates and this could have an adverse impact on the fund's performance. With respect to the fund's accounting for investments, including its investments in derivatives, as well as any
debt issued by the fund and other contractual arrangements of the fund that undergo reference rate-related modifications as a result of the transition, management will rely upon the relief provided by FASB Codification Topic 848 – Reference
Rate Reform (Topic 848). The guidance in Topic 848 permits the fund to disregard the GAAP accounting requirements around certain contract modifications resulting from the LIBOR transition such that for contracts considered in scope, the fund can
account for those modified contracts as a continuation of the existing contracts. While the cessation of the one-week and two-month U.S. dollar LIBOR tenors along with certain other non-U.S. dollar denominated LIBOR settings at December 31, 2021 did
not have a material impact on the fund, management is still evaluating the impact to the fund of the June 30, 2023 planned discontinuation of the more commonly used U.S. dollar LIBOR settings.
MFS Core Equity
Portfolio
Report of Independent Registered Public Accounting
Firm
To the Board of Trustees of MFS Variable
Insurance Trust II and the Shareholders of MFS Core Equity Portfolio:
Opinion on the Financial Statements and Financial
Highlights
We have audited the accompanying statement
of assets and liabilities of MFS Core Equity Portfolio (the “Fund”), including the portfolio of investments, as of December 31, 2021, the related statement of operations for the year then ended, the statements of changes in net assets
for each of the two years in the period then ended, the financial highlights for each of the five years in the period then ended, and the related notes. In our opinion, the financial statements and financial highlights present fairly, in all
material respects, the financial position of the Fund as of December 31, 2021, and the results of its operations for the year then ended, the changes in its net assets for each of the two years in the period then ended, and the financial highlights
for each of the five years in the period then ended, in conformity with accounting principles generally accepted in the United States of America.
Basis for Opinion
These financial statements and financial highlights are the
responsibility of the Fund's management. Our responsibility is to express an opinion on the Fund's financial statements and financial highlights based on our audits. We are a public accounting firm registered with the Public Company Accounting
Oversight Board (United States) (PCAOB) and are required to be independent with respect to the Fund in accordance with the U.S. federal securities laws and the applicable rules and regulations of the Securities and Exchange Commission and the
PCAOB.
We conducted our audits in accordance with the
standards of the PCAOB. Those standards require that we plan and perform the audit to obtain reasonable assurance about whether the financial statements and financial highlights are free of material misstatement, whether due to error or fraud. The
Fund is not required to have, nor were we engaged to perform, an audit of its internal control over financial reporting. As part of our audits, we are required to obtain an understanding of internal control over financial reporting but not for the
purpose of expressing an opinion on the effectiveness of the Fund's internal control over financial reporting. Accordingly, we express no such opinion.
Our audits included performing procedures to assess the
risks of material misstatement of the financial statements and financial highlights, whether due to error or fraud, and performing procedures that respond to those risks. Such procedures included examining, on a test basis, evidence regarding the
amounts and disclosures in the financial statements and financial highlights. Our audits also included evaluating the accounting principles used and significant estimates made by management, as well as evaluating the overall presentation of the
financial statements and financial highlights. Our procedures included confirmation of securities owned as of December 31, 2021, by correspondence with the custodian and brokers. We believe that our audits provide a reasonable basis for our
opinion.
DELOITTE & TOUCHE LLP
Boston, Massachusetts
February 15, 2022
We have served as the auditor of one or more of the MFS
investment companies since 1924.
MFS Core Equity
Portfolio
Trustees and Officers — Identification and
Background
The Trustees and Officers of the Trust, as
of February 1, 2022, are listed below, together with their principal occupations during the past five years. (Their titles may have varied during that period.) The address of each Trustee and Officer is 111 Huntington Avenue, Boston, Massachusetts
02199-7618.
| Name,
Age |
|
Position(s)
Held with Fund |
|
Trustee/Officer
Since(h) |
|
Number
of MFS Funds overseen by the Trustee |
|
Principal
Occupations During
the Past Five Years |
|
Other
Directorships During
the Past Five Years (j) |
| INTERESTED
TRUSTEES |
|
|
|
|
|
|
|
|
|
|
Michael
W. Roberge (k)
(age 55) |
|
Trustee
|
|
January
2021 |
|
135
|
|
Massachusetts
Financial Services Company, Chairman (since January 2021); Chief Executive Officer (since January 2017); Director; Chairman of the Board (since January 2022); President (until December 2018); Chief Investment Officer (until December 2018) |
|
N/A
|
| INDEPENDENT
TRUSTEES |
|
|
|
|
|
|
|
|
|
|
John
P. Kavanaugh
(age 67) |
|
Trustee
and Chair of Trustees |
|
January
2009 |
|
135
|
|
Private
investor |
|
N/A
|
Steven
E. Buller
(age 70) |
|
Trustee
|
|
February
2014 |
|
135
|
|
Private
investor |
|
N/A
|
John
A. Caroselli
(age 67) |
|
Trustee
|
|
March
2017 |
|
135
|
|
Private
investor; JC Global Advisors, LLC (management consulting), President (since 2015) |
|
N/A
|
Maureen
R. Goldfarb
(age 66) |
|
Trustee
|
|
January
2009 |
|
135
|
|
Private
investor |
|
N/A
|
Peter
D. Jones
(age 66) |
|
Trustee
|
|
January
2019 |
|
135
|
|
Private
investor |
|
N/A
|
James
W. Kilman, Jr.
(age 60) |
|
Trustee
|
|
January
2019 |
|
135
|
|
Burford
Capital Limited (finance and investment management), Senior Advisor (since May 3, 2021), Chief Financial Officer (2019 - May 2, 2021); KielStrand Capital LLC (family office), Chief Executive Officer (since 2016) |
|
Alpha-En
Corporation, Director (2016-2019) |
Clarence
Otis, Jr.
(age 65) |
|
Trustee
|
|
March
2017 |
|
135
|
|
Private
investor |
|
VF
Corporation, Director; Verizon Communications, Inc., Director; The Travelers Companies, Director |
Maryanne
L. Roepke
(age 65) |
|
Trustee
|
|
May
2014 |
|
135
|
|
Private
investor |
|
N/A
|
Laurie
J. Thomsen
(age 64) |
|
Trustee
|
|
March
2005 |
|
135
|
|
Private
investor |
|
The
Travelers Companies, Director; Dycom Industries, Inc., Director |
MFS Core Equity
Portfolio
Trustees and Officers - continued
| Name,
Age |
|
Position(s)
Held with
Fund |
|
Trustee/Officer
Since(h) |
|
Number
of MFS Funds for which the Person is an Officer |
|
Principal
Occupations During
the Past Five Years |
| OFFICERS
|
|
|
|
|
|
|
|
|
Christopher
R. Bohane (k)
(age 48) |
|
Assistant
Secretary and Assistant Clerk |
|
July
2005 |
|
135
|
|
Massachusetts
Financial Services Company, Senior Vice President and Associate General Counsel |
Kino
Clark (k)
(age 53) |
|
Assistant
Treasurer |
|
January
2012 |
|
135
|
|
Massachusetts
Financial Services Company, Vice President |
John
W. Clark, Jr. (k)
(age 54) |
|
Assistant
Treasurer |
|
April
2017 |
|
135
|
|
Massachusetts
Financial Services Company, Vice President (since March 2017); Deutsche Bank (financial services), Department Head - Treasurer's Office (until February 2017) |
Thomas
H. Connors (k)
(age 62) |
|
Assistant
Secretary and Assistant Clerk |
|
September
2012 |
|
135
|
|
Massachusetts
Financial Services Company, Vice President and Senior Counsel |
David
L. DiLorenzo (k)
(age 53) |
|
President
|
|
July
2005 |
|
135
|
|
Massachusetts
Financial Services Company, Senior Vice President |
Heidi
W. Hardin (k)
(age 54) |
|
Secretary
and Clerk |
|
April
2017 |
|
135
|
|
Massachusetts
Financial Services Company, Executive Vice President and General Counsel (since March 2017); Harris Associates (investment management), General Counsel (until January 2017) |
Brian
E. Langenfeld (k)
(age 48) |
|
Assistant
Secretary and Assistant Clerk |
|
June
2006 |
|
135
|
|
Massachusetts
Financial Services Company, Vice President and Senior Counsel |
Amanda
S. Mooradian (k)
(age 42) |
|
Assistant
Secretary and Assistant Clerk |
|
September
2018 |
|
135
|
|
Massachusetts
Financial Services Company, Assistant Vice President and Senior Counsel |
Susan
A. Pereira (k)
(age 51) |
|
Assistant
Secretary and Assistant Clerk |
|
July
2005 |
|
135
|
|
Massachusetts
Financial Services Company, Vice President and Assistant General Counsel |
Kasey
L. Phillips (k)
(age 51) |
|
Assistant
Treasurer |
|
September
2012 |
|
135
|
|
Massachusetts
Financial Services Company, Vice President |
Matthew
A. Stowe (k)
(age 47) |
|
Assistant
Secretary and Assistant Clerk |
|
October
2014 |
|
135
|
|
Massachusetts
Financial Services Company, Vice President and Assistant General Counsel |
Martin
J. Wolin (k)
(age 54) |
|
Chief
Compliance Officer |
|
July
2015 |
|
135
|
|
Massachusetts
Financial Services Company, Senior Vice President and Chief Compliance Officer |
James
O. Yost (k)
(age 61) |
|
Treasurer
|
|
September
1990 |
|
135
|
|
Massachusetts
Financial Services Company, Senior Vice President |
| (h)
|
Date
first appointed to serve as Trustee/Officer of an MFS Fund. Each Trustee has served continuously since appointment unless indicated otherwise. From January 2012 through December 2016, Messrs. DiLorenzo and Yost served as Treasurer and Deputy
Treasurer of the Funds, respectively. |
| (j)
|
Directorships or
trusteeships of companies required to report to the Securities and Exchange Commission (i.e., “public companies”). |
| (k)
|
“Interested
person” of the Trust within the meaning of the Investment Company Act of 1940 (referred to as the 1940 Act), which is the principal federal law governing investment companies like the fund, as a result of a position with MFS. The address of
MFS is 111 Huntington Avenue, Boston, Massachusetts 02199-7618. |
Each Trustee (other than Messrs. Jones, Kilman and Roberge)
has been elected by shareholders and each Trustee and Officer holds office until his or her successor is chosen and qualified or until his or her earlier death, resignation, retirement or removal. Mr. Roberge became a Trustee of the Funds on January
1, 2021 and Messrs. Jones and Kilman became Trustees of the Funds on January 1, 2019. The Trust does not hold annual meetings for the purpose of electing Trustees, and Trustees are not elected for fixed terms. Under the terms of the Board's
retirement policy, an Independent Trustee shall retire at the end of the calendar year in which he or she reaches the earlier of 75 years of age or 15 years of service on the Board (or, in the case of any Independent Trustee who joined the Board
prior to 2015, 20 years of service on the Board).
Messrs. Buller, Kilman and Otis and Ms. Roepke are members
of the Trust’s Audit Committee.
MFS Core Equity
Portfolio
Trustees and Officers - continued
Each
of the Interested Trustees and certain Officers hold comparable officer positions with certain affiliates of MFS.
The Statement of Additional Information for a Fund includes
further information about the Trustees and is available without charge upon request by calling 1-800-225-2606.
| Investment
Adviser |
Custodian
|
Massachusetts Financial
Services Company
111 Huntington Avenue
Boston, MA 02199-7618 |
State Street
Bank and Trust Company
1 Lincoln Street
Boston, MA 02111-2900 |
| Distributor
|
Independent
Registered Public Accounting Firm |
MFS Fund
Distributors, Inc.
111 Huntington Avenue
Boston, MA 02199-7618 |
Deloitte
& Touche LLP
200 Berkeley Street
Boston, MA 02116 |
| Portfolio
Manager(s) |
|
| Joseph
MacDougall |
|
MFS Core Equity
Portfolio
Board Review of Investment Advisory Agreement
MFS Core Equity Portfolio
The Investment Company Act of 1940 requires that both the
full Board of Trustees and a majority of the non-interested (“independent”) Trustees, voting separately, annually approve the continuation of the Fund’s investment advisory agreement with MFS. The Trustees consider matters bearing
on the Fund and its advisory arrangements at their meetings throughout the year, including a review of performance data at each regular meeting. In addition, the independent Trustees met several times by videoconference (in accordance with
Securities and Exchange Commission relief) over the course of three months beginning in May and ending in July, 2021 (“contract review meetings”) for the specific purpose of considering whether to approve the continuation of the
investment advisory agreement for the Fund and the other investment companies that the Board oversees (the “MFS Funds”). The independent Trustees were assisted in their evaluation of the Fund’s investment advisory agreement by
independent legal counsel, from whom they received separate legal advice and with whom they met separately from MFS during various contract review meetings. The independent Trustees were also assisted in this process by an independent consultant who
was retained by and reported to the independent Trustees.
In connection with their deliberations regarding the
continuation of the investment advisory agreement, the Trustees, including the independent Trustees, considered such information and factors as they believed, in light of the legal advice furnished to them and their own business judgment, to be
relevant. The investment advisory agreement for the Fund was considered separately, although the Trustees also took into account the common interests of all MFS Funds in their review. As described below, the Trustees considered the nature, quality,
and extent of the various investment advisory, administrative, and shareholder services performed by MFS under the existing investment advisory agreement and other arrangements with the Fund.
In connection with their contract review meetings, the
Trustees received and relied upon materials that included, among other items: (i) information provided by Broadridge Financial Solutions, Inc. (“Broadridge”), an independent third party, on the investment performance of the Fund for
various time periods ended December 31, 2020 and the investment performance of a group of funds with substantially similar investment classifications/objectives (the “Broadridge performance universe”), (ii) information provided by
Broadridge on the Fund’s advisory fees and other expenses and the advisory fees and other expenses of comparable funds identified by Broadridge as well as all other funds in the same investment classification/category (the “Broadridge
expense group and universe”), (iii) information provided by MFS on the advisory fees of portfolios of other clients of MFS, including institutional separate accounts and other clients, (iv) information as to whether and to what extent
applicable expense waivers, reimbursements or fee “breakpoints” are observed for the Fund, (v) information regarding MFS’ financial results and financial condition, including MFS’ and certain of its affiliates’
estimated profitability from services performed for the Fund and the MFS Funds as a whole, and compared to MFS’ institutional business, (vi) MFS’ views regarding the outlook for the mutual fund industry and the strategic business plans
of MFS, (vii) descriptions of various functions performed by MFS for the Funds, such as compliance monitoring and portfolio trading practices, and (viii) information regarding the overall organization of MFS, including information about MFS’
senior management and other personnel providing investment advisory, administrative and other services to the Fund and the other MFS Funds. The comparative performance, fee and expense information prepared and provided by Broadridge was not
independently verified and the independent Trustees did not independently verify any information provided to them by MFS.
The Trustees’ conclusion as to the continuation of
the investment advisory agreement was based on a comprehensive consideration of all information provided to the Trustees and not the result of any single factor. Some of the factors that figured particularly in the Trustees’ deliberations are
described below, although individual Trustees may have evaluated the information presented differently from one another, giving different weights to various factors. It is also important to recognize that the fee arrangements for the Fund and other
MFS Funds are the result of years of review and discussion between the independent Trustees and MFS, that certain aspects of such arrangements may receive greater scrutiny in some years than in others, and that the Trustees’ conclusions may be
based, in part, on their consideration of these same arrangements during the course of the year and in prior years.
Based on information provided by Broadridge and MFS, the
Trustees reviewed the Fund’s total return investment performance as well as the Broadridge performance universe over various time periods. The Trustees placed particular emphasis on the total return performance of the Fund’s Initial
Class shares in comparison to the performance of funds in its Broadridge performance universe over the five-year period ended December 31, 2020, which the Trustees believed was a long enough period to reflect differing market conditions. The total
return performance of the Fund’s Initial Class shares was in the 1st quintile relative to the other funds in the universe for this five-year period (the 1st quintile being the best performers and the 5th quintile being the worst performers).
The total return performance of the Fund’s Initial Class shares was in the 2nd quintile for the one-year period and the 1st quintile for the three-year period ended December 31, 2020 relative to the Broadridge performance universe. Because of
the passage of time, these performance results may differ from the performance results for more recent periods, including those shown elsewhere in this report.
MFS Core Equity
Portfolio
Board Review of Investment Advisory Agreement - continued
In
the course of their deliberations, the Trustees took into account information provided by MFS in connection with the contract review meetings, as well as during investment review meetings conducted with portfolio management personnel during the
course of the year regarding the Fund’s performance. After reviewing these and related factors, the Trustees concluded, within the context of their overall conclusions regarding the investment advisory agreement, that they were satisfied with
MFS’ responses and efforts relating to investment performance.
In assessing the reasonableness of the Fund’s
advisory fee, the Trustees considered, among other information, the Fund’s advisory fee and the total expense ratio of the Fund’s Initial Class shares as a percentage of average daily net assets and the advisory fee and total expense
ratios of the Broadridge expense group based on information provided by Broadridge. The Trustees considered that MFS currently observes an expense limitation for the Fund, which may not be changed without the Trustees’ approval. The Trustees
also considered that, according to the data provided by Broadridge (which takes into account any fee reductions or expense limitations that were in effect during the Fund’s last fiscal year), the Fund’s effective advisory fee rate and
total expense ratio were each higher than the Broadridge expense group median. The Trustees also noted that MFS has agreed to further reduce the expense limitation for the Fund effective August 1, 2021, which may not be changed without the
Trustees’ approval.
The Trustees also
considered the advisory fees charged by MFS to any institutional separate accounts advised by MFS (“separate accounts”) and unaffiliated investment companies for which MFS serves as subadviser (“subadvised funds”) that have
comparable investment strategies to the Fund, if any. In comparing these fees, the Trustees considered information provided by MFS as to the generally broader scope of services provided by MFS to the Fund, as well as the more extensive regulatory
burdens imposed on MFS in managing the Fund, in comparison to separate accounts and subadvised funds. The Trustees also considered the higher demands placed on MFS’ investment personnel and trading infrastructure as a result of the daily cash
in-flows and out-flows of the Fund in comparison to separate accounts.
The Trustees also considered whether the Fund may benefit
from any economies of scale in the management of the Fund in the event of growth in assets of the Fund and/or growth in assets of the MFS Funds as a whole. They noted that the Fund’s advisory fee rate schedule is subject to contractual
breakpoints that reduce the Fund’s advisory fee rate on average daily net assets over $1 billion and $2.5 billion. The Trustees also noted that MFS has agreed in writing to waive a portion of the management fees of certain MFS Funds, including
the Fund, if the total combined assets of certain funds within the MFS Funds’ complex increase above agreed upon thresholds (the “group fee waiver”), enabling the Fund’s shareholders to share in the benefits from any
economies of scale at the complex level. The group fee waiver is reviewed and renewed annually between the Board and MFS. The Trustees concluded that the breakpoints and the group fee waiver were sufficient to allow the Fund to benefit from
economies of scale as its assets and overall complex assets grow.
The Trustees also considered information prepared by MFS
relating to MFS’ costs and profits with respect to the Fund, the MFS Funds considered as a group, and other investment companies and accounts advised by MFS, as well as MFS’ methodologies used to determine and allocate its costs to the
MFS Funds, the Fund and other accounts and products for purposes of estimating profitability.
After reviewing these and other factors described herein,
the Trustees concluded, within the context of their overall conclusions regarding the investment advisory agreement, that the advisory fees charged to the Fund represent reasonable compensation in light of the services being provided by MFS to the
Fund.
In addition, the Trustees considered MFS’
resources and related efforts to continue to retain, attract and motivate capable personnel to serve the Fund. The Trustees also considered current and developing conditions in the financial services industry, including the presence of large and
well-capitalized companies which are spending, and appear to be prepared to continue to spend, substantial sums to engage personnel and to provide services to competing investment companies. In this regard, the Trustees also considered the financial
resources of MFS and its ultimate parent, Sun Life Financial Inc. The Trustees also considered the advantages and possible disadvantages to the Fund of having an adviser that also serves other investment companies as well as other accounts.
The Trustees also considered the nature, quality, cost, and
extent of administrative, transfer agency, and distribution services provided to the Fund by MFS and its affiliates under agreements and plans other than the investment advisory agreement, including any 12b-1 fees the Fund pays to MFS Fund
Distributors, Inc., an affiliate of MFS. The Trustees also considered the nature, extent and quality of certain other services MFS performs or arranges for on the Fund’s behalf, which may include securities lending programs, directed expense
payment programs, class action recovery programs, and MFS’ interaction with third-party service providers, principally custodians and sub-custodians. The Trustees concluded that the various non-advisory services provided by MFS and its
affiliates on behalf of the Fund were satisfactory.
The Trustees considered so-called “fall-out
benefits” to MFS such as reputational value derived from serving as investment manager to the MFS Funds. The Trustees also considered that MFS discontinued its historic practice of obtaining investment research from portfolio brokerage
commissions paid by certain MFS Funds effective January 2018, and directly pays or voluntarily reimburses a Fund, if applicable, for the costs of external research acquired through the use of the Fund’s portfolio brokerage commissions.
MFS Core Equity
Portfolio
Board Review of Investment Advisory Agreement - continued
Based on their evaluation of factors that they deemed to be
material, including those factors described above, the Board of Trustees, including the independent Trustees, concluded that the Fund’s investment advisory agreement with MFS should be continued for an additional one-year period, commencing
August 1, 2021.
MFS Core Equity
Portfolio
Proxy Voting Policies and Information
MFS votes proxies on behalf of the fund pursuant to proxy
voting policies and procedures that are available without charge, upon request, by calling 1-800-225-2606, by visiting mfs.com/proxyvoting, or by visiting the SEC’s Web site at http://www.sec.gov.
Information regarding how the fund voted proxies relating
to portfolio securities during the most recent twelve-month period ended June 30 is available by August 31 of each year without charge by visiting mfs.com/proxyvoting, or by visiting the SEC’s Web site
at http://www.sec.gov.
Quarterly Portfolio Disclosure
The fund files a complete schedule of portfolio holdings
with the SEC for the first and third quarters of each fiscal year as an exhibit to its reports on Form N-PORT. The fund’s Form N-PORT reports are available on the SEC’s Web site at
http://www.sec.gov. A shareholder can obtain the portfolio holdings report for the first and third quarters of the fund's fiscal year at mfs.com/vit2 by
choosing the fund's name and then scrolling to the “Resources” section and clicking on the “Prospectus and Reports” tab.
FURTHER INFORMATION
From time to time, MFS may post important information about
the fund or the MFS Funds on the MFS Web site (mfs.com). This information is available at https://www.mfs.com/announcements or at
mfs.com/vit2 by choosing the fund's name and then scrolling to the “Resources” section and clicking on the “Announcements” tab, if any.
Information About Fund Contracts and Legal Claims
The fund has entered into contractual arrangements with an
investment adviser, administrator, distributor, shareholder servicing agent, 529 program manager (if applicable), and custodian who each provide services to the fund. Unless expressly stated otherwise, shareholders are not parties to, or intended
beneficiaries of these contractual arrangements, and these contractual arrangements are not intended to create any shareholder right to enforce them against the service providers or to seek any remedy under them against the service providers, either
directly or on behalf of the fund.
Under the
Trust’s By-Laws and Declaration of Trust, any claims asserted against or on behalf of the MFS Funds, including claims against Trustees and Officers, must be brought in state and federal courts located within the Commonwealth of
Massachusetts.
Federal Tax Information (unaudited)
The following information is provided pursuant to
provisions of the Internal Revenue Code.
The fund
designates $20,540,000 as capital gain dividends paid during the fiscal year.
For corporate shareholders, 100% of the ordinary income
dividends paid during the fiscal year qualify for the corporate dividends received deduction.
| FACTS
|
WHAT
DOES MFS DO WITH YOUR PERSONAL INFORMATION? |
| Why?
|
Financial
companies choose how they share your personal information. Federal law gives consumers the right to limit some but not all sharing. Federal law also requires us to tell you how we collect, share, and protect your personal information. Please read
this notice carefully to understand what we do. |
| What?
|
The types of
personal information we collect and share depend on the product or service you have with us. This information can include: |
| • Social
Security number and account balances |
| • Account
transactions and transaction history |
| • Checking
account information and wire transfer instructions |
| When
you are no longer our customer, we continue to share your information as described in this notice. |
| How?
|
All
financial companies need to share customers' personal information to run their everyday business. In the section below, we list the reasons financial companies can share their customers' personal information; the reasons MFS chooses to share; and
whether you can limit this sharing. |
Reasons
we can share your
personal information |
Does
MFS share? |
Can
you limit
this sharing? |
For
our everyday business purposes –
such as to process your transactions, maintain your
account(s), respond to court orders and legal
investigations, or report to credit bureaus |
Yes
|
No
|
For
our marketing purposes –
to offer our products and services to you |
No
|
We
don't share |
For
joint marketing with other
financial companies |
No
|
We
don't share |
For
our affiliates' everyday business purposes –
information about your transactions and experiences |
No
|
We
don't share |
For
our affiliates' everyday business purposes –
information about your creditworthiness |
No
|
We
don't share |
| For
nonaffiliates to market to you |
No
|
We
don't share |
| Questions?
|
Call
800-225-2606 or go to mfs.com. |
| Who
we are |
| Who
is providing this notice? |
MFS
Funds, MFS Investment Management, MFS Institutional Advisors, Inc., and MFS Heritage Trust Company. |
| What
we do |
How
does MFS
protect my personal
information? |
To
protect your personal information from unauthorized access and use, we use security measures that comply with federal law. These measures include procedural, electronic, and physical safeguards for the protection of the personal information we
collect about you. |
How
does MFS
collect my personal
information? |
We
collect your personal information, for example, when you |
| • open
an account or provide account information |
| • direct
us to buy securities or direct us to sell your securities |
| • make
a wire transfer |
| We
also collect your personal information from others, such as credit bureaus, affiliates, or other companies. |
| Why
can't I limit all sharing? |
Federal
law gives you the right to limit only |
| • sharing
for affiliates' everyday business purposes – information about your creditworthiness |
| • affiliates
from using your information to market to you |
| • sharing
for nonaffiliates to market to you |
| State
laws and individual companies may give you additional rights to limit sharing. |
| Definitions
|
| Affiliates
|
Companies
related by common ownership or control. They can be financial and nonfinancial companies. |
| •
MFS does not share personal information with affiliates, except for everyday business purposes as described on page one of this notice. |
| Nonaffiliates
|
Companies
not related by common ownership or control. They can be financial and nonfinancial companies. |
| •
MFS does not share with nonaffiliates so they can market to you. |
| Joint
marketing |
A
formal agreement between nonaffiliated financial companies that together market financial products or services to you. |
| •
MFS doesn't jointly market. |
| Other
important information |
| If
you own an MFS product or receive an MFS service in the name of a third party such as a bank or broker-dealer, their privacy policy may apply to you instead of ours. |
Annual Report
December 31, 2021
MFS® Emerging Markets
Equity Portfolio
MFS® Variable
Insurance Trust II
MFS® Emerging
Markets Equity Portfolio
|
1
|
|
2
|
|
3
|
|
5
|
|
7
|
|
8
|
|
12
|
|
13
|
|
14
|
|
15
|
|
17
|
|
23
|
|
24
|
|
27
|
|
29
|
|
29
|
|
29
|
|
29
|
|
29
|
|
30
|
The report is prepared for the general information of contract owners. It
is authorized for distribution to prospective investors only when preceded or accompanied by a current prospectus.
NOT FDIC INSURED • MAY LOSE VALUE
• NO BANK OR CREDIT UNION GUARANTEE •
NOT A DEPOSIT • NOT INSURED BY ANY FEDERAL GOVERNMENT
AGENCY OR NCUA/NCUSIF
MFS Emerging Markets
Equity Portfolio
Dear Contract Owners:
After a powerful rally in 2021 that was spurred by the
introduction of effective coronavirus vaccines and high levels of monetary and fiscal stimulus, markets have recently experienced a rise in volatility. Rising inflation (mostly due to pandemic-related labor and supply chain disruptions), new
COVID-19 variants that are vaccine-resistant, and the prospect of tighter monetary and fiscal policies around the world have all increased investor anxiety.
Rising real (inflation-adjusted) bond yields in the United
States are a headwind for richly valued U.S. growth stocks, though many non-U.S. markets have experienced lower levels of turbulence. In recent months, global economic growth has moderated, with the spread of the Delta and Omicron variants and a
regulatory crackdown in China featuring prominently. Stress in China’s property development sector has also contributed to the slowdown there. A further concern for investors is the tightening of global energy and raw materials supplies caused
in part by geopolitical uncertainty.
However,
above-trend economic growth, strong corporate balance sheets, and nascent signs that global supply chain bottlenecks may be easing, along with a dovish policy shift in China, are supportive fundamentals that we feel could help calm recent market
jitters.
It is times of market transition that
demonstrate the importance of having a deep understanding of company fundamentals, and we have built our global research platform to do just that.
At MFS®, we put our clients’ assets to work responsibly by carefully navigating the increasing complexity of global markets and economies. Guided by our commitment to long-term
investing, we tune out the noise and try to uncover what we believe are the best, most durable investment opportunities in the market. Our unique global investment platform combines collective expertise, long-term discipline, and thoughtful risk
management to create sustainable value for investors.
Respectfully,
Michael W.
Roberge
Chief Executive Officer
MFS Investment Management
February 15, 2022
The opinions expressed in this letter are subject to
change and may not be relied upon for investment advice. No forecasts can be guaranteed.
MFS Emerging Markets Equity
Portfolio
Portfolio structure
Top ten
holdings
| Taiwan
Semiconductor Manufacturing Co. Ltd. |
9.6%
|
| Samsung
Electronics Co. Ltd. |
6.2%
|
| Tencent
Holdings Ltd. |
6.0%
|
| Alibaba
Group Holding Ltd., ADR |
3.5%
|
| Sberbank
of Russia PJSC |
2.8%
|
| Tata
Consultancy Services Ltd. |
2.7%
|
| HDFC
Bank Ltd. |
2.4%
|
| Yum
China Holdings, Inc. |
2.4%
|
| AIA
Group Ltd. |
2.2%
|
| Samsung
Fire & Marine Insurance Co. Ltd. |
2.1%
|
GICS equity sectors (g)
| Information
Technology |
21.7%
|
| Financials
|
21.6%
|
| Communication
Services |
13.2%
|
| Consumer
Discretionary |
13.1%
|
| Consumer
Staples |
10.5%
|
| Materials
|
6.3%
|
| Energy
|
3.8%
|
| Industrials
|
3.6%
|
| Real
Estate |
2.2%
|
| Health
Care |
1.4%
|
| Utilities
|
1.1%
|
Issuer country weightings (x)
| China
|
29.3%
|
| South
Korea |
13.0%
|
| Taiwan
|
11.4%
|
| India
|
11.1%
|
| Russia
|
8.0%
|
| Brazil
|
5.2%
|
| Hong
Kong |
5.2%
|
| Mexico
|
3.3%
|
| United
States |
2.6%
|
| Other
Countries |
10.9%
|
Currency exposure weightings
(y)
| Hong
Kong Dollar |
24.1%
|
| South
Korean Won |
13.0%
|
| Taiwan
Dollar |
11.4%
|
| Indian
Rupee |
10.4%
|
| Chinese
Renminbi |
7.9%
|
| United
States Dollar |
7.4%
|
| Russian
Ruble |
6.6%
|
| Brazilian
Real |
5.2%
|
| Euro
|
3.4%
|
| Other
Currencies |
10.6%
|
| (g)
|
The
Global Industry Classification Standard (GICS®) was developed by and/or is the exclusive property of MSCI, Inc. and S&P Global Market Intelligence Inc. (“S&P
Global Market Intelligence”). GICS is a service mark of MSCI and S&P Global Market Intelligence and has been licensed for use by MFS. MFS has applied its own internal sector/industry classification methodology for equity securities and
non-equity securities that are unclassified by GICS. |
| (x)
|
Represents
the portfolio’s exposure to issuer countries as a percentage of a portfolio’s net assets. For purposes of this presentation, United States includes Cash & Cash Equivalents. |
| (y)
|
Represents
the portfolio’s exposure to a particular currency as a percentage of a portfolio's net assets. For purposes of this presentation, United States Dollar includes Cash & Cash Equivalents. |
Cash & Cash Equivalents includes any cash,
investments in money market funds, short-term securities, and other assets less liabilities. Please see the Statement of Assets and Liabilities for additional information related to the fund’s cash position and other assets and
liabilities.
Percentages are based on net
assets as of December 31, 2021.
The portfolio
is actively managed and current holdings may be different.
MFS Emerging Markets
Equity Portfolio
Management Review
Summary of Results
For the twelve months ended December 31, 2021, Initial
Class shares of the MFS Emerging Markets Equity Portfolio (fund) provided a total return of -6.75%, while Service Class shares of the fund provided a total return of -7.02%. These compare with a return of -2.54% for the fund’s benchmark, the
MSCI Emerging Markets Index (net div).
Market
Environment
Over the past year, the global economy
was buffeted by an array of crosscurrents as it adjusted to the ebbs and flows of the pandemic. Among the supportive currents were ample fiscal stimulus, loose monetary policy and the rollout of several highly effective coronavirus vaccines.
Negative currents included the rapid spread of several coronavirus variants, widespread global production bottlenecks and a surge in inflation. After experiencing a burst of exceptionally strong economic activity as the global economy began to
reopen, activity became more muted in the second half of the period amid ongoing supply chain disruptions and a new wave of coronavirus infections, albeit a seemingly milder strain.
Amid rising inflation, markets anticipated a transition
from an exceptionally accommodative environment to a more mixed monetary landscape ahead. Indeed, several central banks in emerging markets have already tightened policy and the US Federal Reserve reduced the pace of its asset purchases in November
and again in December. However, the European Central Bank, the Bank of Japan and the People's Bank of China are expected to maintain accommodative policies. Sovereign bond yields moved modestly higher during the period amid higher inflation and on
expectations of a tighter Fed but remain historically low.
A harsher Chinese regulatory environment toward industries
such as online gaming, food delivery and education increased market volatility as has stress in China's highly leveraged property development sector. Trade relations between the United States and China remained quite strained despite a change in
presidential administrations.
Signs of excess
investor enthusiasm continued to be seen in pockets of the market such as “meme stocks” popular with users of online message boards, cryptocurrencies and heavy retail participation in the market for short-dated options.
Detractors from Performance
Security selection in the financials sector detracted from
performance relative to the MSCI Emerging Markets Index. Within this sector, the fund's overweight positions in trading services provider B3 Sa - Brasil Bolsa Balcao (Brazil) and insurance company Ping An Insurance (China) held back relative
results. The stock price of B3 Sa - Brasil Bolsa Balcao declined on a slowdown in the company's revenue growth, which was driven by weaker-than-expected equity and derivative trading volumes.
Stock selection and, to a lesser extent, an overweight
position in the consumer discretionary sector also weakened relative results, led by the fund’s holdings of technology platforms provider Prosus(b)(h) (Netherlands) and air conditioner manufacturer Gree Electric Appliances(b) (China). The
stock price of Prosus fell as an increase in gaming regulations from Chinese authorities, including limiting online gaming, appeared to have weighed on investor sentiment with respect to their holdings of internet-based, multiple services company
Tencent. Additionally, the fund's overweight positions in online and mobile commerce company Alibaba Group (China) and private educational services provider New Oriental Education & Technology Group (China) hindered relative results. The stock
price of Alibaba Group Holding declined as the company delivered weaker-than-expected financial results. Core growth in Alibaba’s online shopping platform Taobao was softer than already-lowered expectations due to decreased market share and
losses in its investment areas, which were materially greater than anticipated.
Stock selection and an underweight position in the energy
sector dampened relative returns, led by the fund’s underweight position in oil and gas exploration and production company Petroleo Brasileiro(h) (Brazil).
Elsewhere, the fund's overweight position in retail store
chain BIM Birlesik Magazalar (Turkey), and not holding shares of technology consulting firm Infosys (India) and fabless semiconductor company MediaTek (Taiwan), further weighed on relative performance.
Contributors to Performance
Stock selection and, to a lesser extent, an overweight
position in the communication services sector contributed to relative performance, driven by the timing of the fund's ownership in shares of internet search provider Baidu (China), and its overweight positions in telecommunication services provider
Hellenic Telecommunications Organization (Greece) and internet search engine and online computer games provider NAVER (South Korea). The stock price of Hellenic Telecommunications Organization advanced as the company delivered strong financial
results, led by robust revenue upside and stronger-than-expected broadband customer base growth.
The fund’s underweight position in the health care
sector also benefited relative results. There were no individual stocks within this sector, either in the fund or in the benchmark, that were among the fund's largest relative contributors during the period.
MFS Emerging Markets Equity
Portfolio
Management Review - continued
Stocks in other sectors that contributed to relative
performance included the fund’s avoidance of weak-performing agriculture-focused technology platform Pinduoduo (China), and its overweight positions in information technology services and solutions firm Tata Consultancy Services (India),
semiconductor manufacturer Taiwan Semiconductor Manufacturing (Taiwan), commercial banking firm Sberbank (Russia) and agrochemical company UPL (India). The stock price of Tata Consultancy Services advanced as the company signed an agreement to help
Neptune Energy with its digital transformation, and as the COVID-19 Delta variant faded in India and Indian equity markets reached all-time highs. Additionally, holding shares of electronic power tools manufacturer Techtronic Industries(b) (Hong
Kong) and investment holding company Jardine Strategic Holdings(b)(h) (China) further supported the fund’s relative returns.
Respectfully,
Portfolio Manager(s)
Jose Luis Garcia, Rajesh Nair, and Harry Purcell
Note to Contract Owners: Effective August 1, 2021, Robert
Lau is no longer a Portfolio Manager of the fund. Effective August 1, 2021, Rajesh Nair was added as a Portfolio Manager of the fund. Effective April 15, 2023, Jose Luis Garcia will no longer be a Portfolio Manager of the fund.
| (b)
|
Security is not a
benchmark constituent. |
| (h)
|
Security was not held in
the portfolio at period end. |
The
views expressed in this report are those of the portfolio manager(s) only through the end of the period of the report as stated on the cover and do not necessarily reflect the views of MFS or any other person in the MFS organization. These views are
subject to change at any time based on market or other conditions, and MFS disclaims any responsibility to update such views. These views may not be relied upon as investment advice or an indication of trading intent on behalf of any MFS portfolio.
References to specific securities are not recommendations of such securities, and may not be representative of any MFS portfolio’s current or future investments.
MFS Emerging Markets
Equity Portfolio
Performance Summary Through 12/31/21
The following chart illustrates the historical performance
of the fund in comparison to its benchmark(s). Benchmarks are unmanaged and may not be invested in directly. Benchmark returns do not reflect any fees or expenses. The performance of other share classes will be greater than or less than that of the
class depicted below. (See Notes to Performance Summary.)
Performance data shown represents past performance and is no
guarantee of future results. Investment return and principal value fluctuate so your units, when sold, may be worth more or less than the original cost; current performance may be lower or higher than quoted. The performance shown does not reflect
the deduction of taxes, if any, that a contract holder would pay on fund distributions or the redemption of contract units. The returns for the fund shown also do not reflect the deduction of expenses associated with variable products, such as
mortality and expense risk charges, separate account charges, and sales charges imposed by the insurance company separate accounts. Such expenses would reduce the overall returns shown.
Growth of a Hypothetical $10,000 Investment
Total Returns
through 12/31/21
Average annual total returns
| Share
Class |
Class
Inception Date |
1-yr
|
5-yr
|
10-yr
|
| Initial
Class |
6/05/96
|
(6.75)%
|
8.09%
|
3.99%
|
| Service
Class |
8/24/01
|
(7.02)%
|
7.82%
|
3.72%
|
Comparative benchmark(s)
| MSCI
Emerging Markets Index (net div) (f) |
(2.54)%
|
9.87%
|
5.49%
|
| (f)
|
Source:
FactSet Research Systems Inc. |
Benchmark Definition(s)
MSCI Emerging Markets Index(e) (net div) – a market capitalization-weighted index that is designed to measure equity market performance in the global emerging markets.
It is not possible to invest directly in an index.
| (e)
|
Morgan
Stanley Capital International (“MSCI”) makes no express or implied warranties or representations and shall have no liability whatsoever with respect to any MSCI data contained herein. The MSCI data may not be further redistributed or
used as a basis for other indices or any securities or financial products. This report is not approved, reviewed, or produced by MSCI. |
MFS Emerging Markets Equity
Portfolio
Performance Summary – continued
Notes
to Performance Summary
Average annual total return
represents the average annual change in value for each share class for the periods presented.
Performance results reflect any applicable expense
subsidies and waivers in effect during the periods shown. Without such subsidies and waivers the fund's performance results would be less favorable. Please see the prospectus and financial statements for complete details. All results are historical
and assume the reinvestment of any dividends and capital gains distributions.
Performance results do not include adjustments made for
financial reporting purposes in accordance with U.S. generally accepted accounting principles and may differ from amounts reported in the financial highlights.
From time to time the fund may receive proceeds from
litigation settlements, without which performance would be lower.
MFS Emerging Markets
Equity Portfolio
Expense Table
Fund Expenses Borne by the Contract Holders during the
Period,
July 1, 2021 through December 31, 2021
As
a contract holder of the fund, you incur ongoing costs, including management fees; distribution and/or service (12b-1) fees; and other fund expenses. This example is intended to help you understand your ongoing costs (in dollars) of investing in the
fund and to compare these costs with the ongoing costs of investing in other mutual funds.
The example is based on an investment of $1,000 invested at
the beginning of the period and held for the entire period July 1, 2021 through December 31, 2021.
Actual Expenses
The first line for each share class in the following table
provides information about actual account values and actual expenses. You may use the information in this line, together with the amount you invested, to estimate the expenses that you paid over the period. Simply divide your account value by $1,000
(for example, an $8,600 account value divided by $1,000 = 8.6), then multiply the result by the number in the first line under the heading entitled “Expenses Paid During Period” to estimate the expenses you paid on your account during
this period.
Hypothetical Example for Comparison
Purposes
The second line for each share class in the
following table provides information about hypothetical account values and hypothetical expenses based on the fund’s actual expense ratio and an assumed rate of return of 5% per year before expenses, which is not the fund’s actual
return. The hypothetical account values and expenses may not be used to estimate the actual ending account balance or expenses you paid for the period. You may use this information to compare the ongoing costs of investing in the fund and other
funds. To do so, compare this 5% hypothetical example with the 5% hypothetical examples that appear in the shareholder reports of the other funds.
Please note that the expenses shown in the table are meant
to highlight the fund's ongoing costs only and do not take into account the fees and expenses imposed under the variable contracts through which your investment in the fund is made. Therefore, the second line for each share class in the table is
useful in comparing ongoing costs associated with an investment in vehicles (such as the fund) which fund benefits under variable annuity and variable life insurance contracts and to qualified pension and retirement plans only, and will not help you
determine the relative total costs of investing in the fund through variable annuity and variable life insurance contracts. If the fees and expenses imposed under the variable contracts were included, your costs would have been higher.
Share
Class |
|
Annualized
Expense
Ratio |
Beginning
Account Value
7/01/21 |
Ending
Account Value
12/31/21 |
Expenses
Paid During
Period (p)
7/01/21-12/31/21 |
| Initial
Class |
Actual
|
1.23%
|
$1,000.00
|
$889.27
|
$5.86
|
| Hypothetical
(h) |
1.23%
|
$1,000.00
|
$1,019.00
|
$6.26
|
| Service
Class |
Actual
|
1.48%
|
$1,000.00
|
$887.97
|
$7.04
|
| Hypothetical
(h) |
1.48%
|
$1,000.00
|
$1,017.74
|
$7.53
|
| (h)
|
5% class return per year
before expenses. |
| (p)
|
“Expenses
Paid During Period” are equal to each class's annualized expense ratio, as shown above, multiplied by the average account value over the period, multiplied by 184/365 (to reflect the one-half year period). |
MFS Emerging Markets Equity
Portfolio
Portfolio of Investments − 12/31/21
The Portfolio of Investments is a complete list of all
securities owned by your fund. It is categorized by broad-based asset classes.
| Issuer
|
|
|
Shares/Par
|
Value
($) |
| Common
Stocks – 98.5% |
| Airlines
– 0.7% |
|
| Shanghai
International Air Co., Ltd. (a) |
|
41,500
|
$
304,021 |
| Alcoholic
Beverages – 3.9% |
|
| Ambev
S.A., ADR |
|
81,207
|
$
227,380 |
| China
Resources Beer Holdings Co. Ltd. |
|
74,000
|
605,947 |
| Jiangsu
Yanghe Brewery JSC Ltd. |
|
5,400
|
139,572 |
| Kweichow
Moutai Co. Ltd., “A” |
|
2,300
|
739,799 |
| |
|
|
|
$1,712,698 |
| Automotive
– 3.4% |
|
| Hero
MotoCorp Ltd. |
|
9,038
|
$
299,351 |
| Mahindra
& Mahindra Ltd. |
|
54,530
|
614,104 |
| PT
United Tractors Tbk |
|
386,200
|
600,198 |
| |
|
|
|
$1,513,653 |
| Biotechnology
– 0.6% |
|
| Hugel,
Inc. |
|
2,158
|
$
278,657 |
| Brokerage
& Asset Managers – 2.6% |
|
| B3
Brasil Bolsa Balcao S.A. |
|
211,100
|
$
422,200 |
| Moscow
Exchange MICEX-RTS PJSC |
|
365,745
|
746,115 |
| |
|
|
|
$1,168,315 |
| Business
Services – 4.3% |
|
| Cognizant
Technology Solutions Corp., “A” |
|
5,596
|
$
496,477 |
| GDS
Holdings Ltd., “A” (a) |
|
12,800
|
74,362 |
| Kingsoft
Cloud Holdings, ADR (a) |
|
8,713
|
137,230 |
| Tata
Consultancy Services Ltd. |
|
24,170
|
1,215,512 |
| |
|
|
|
$1,923,581 |
| Chemicals
– 1.2% |
|
| UPL
Ltd. |
|
52,957
|
$
532,237 |
| Computer
Software – 3.5% |
|
| NAVER
Corp. (a) |
|
2,735
|
$
870,828 |
| NetEase.com,
Inc., ADR |
|
6,782
|
690,272 |
| |
|
|
|
$1,561,100 |
| Computer
Software - Systems – 7.5% |
|
| Hon
Hai Precision Industry Co. Ltd. |
|
153,000
|
$
575,126 |
| Samsung
Electronics Co. Ltd. |
|
41,678
|
2,745,226 |
| |
|
|
|
$3,320,352 |
| Construction
– 2.9% |
|
| Gree
Electric Appliances, Inc., “A” |
|
129,800
|
$
754,155 |
| Techtronic
Industries Co. Ltd. |
|
27,000
|
537,400 |
| |
|
|
|
$1,291,555 |
| Consumer
Products – 0.2% |
|
| AmorePacific
Corp. (a) |
|
584
|
$
82,042 |
MFS Emerging Markets
Equity Portfolio
Portfolio of Investments – continued
| Issuer
|
|
|
Shares/Par
|
Value
($) |
| Common
Stocks – continued |
| Consumer
Services – 1.2% |
|
| 51job,
Inc., ADR (a) |
|
2,908
|
$
142,288 |
| MakeMyTrip
Ltd. (a) |
|
11,605
|
321,575 |
| New
Oriental Education & Technology Group, Inc. (a) |
|
29,933
|
62,859 |
| |
|
|
|
$526,722 |
| Electronics
– 9.6% |
|
| Taiwan
Semiconductor Manufacturing Co. Ltd. |
|
191,258
|
$
4,251,407 |
| Energy
- Integrated – 2.4% |
|
| Galp
Energia SGPS S.A., “B” |
|
39,783
|
$
385,896 |
| LUKOIL
PJSC, ADR |
|
7,719
|
690,850 |
| |
|
|
|
$1,076,746 |
| Engineering
- Construction – 0.9% |
|
| Doosan
Bobcat, Inc. (a) |
|
11,843
|
$
405,974 |
| Food
& Beverages – 4.8% |
|
| Gruma
S.A.B. de C.V. |
|
40,721
|
$
522,091 |
| Inner
Mongolia Yili Industrial Group Co. Ltd., “A” |
|
132,341
|
860,906 |
| Orion
Corp. (a) |
|
4,930
|
429,237 |
| Tingyi
(Cayman Islands) Holding Corp. |
|
158,000
|
324,610 |
| |
|
|
|
$2,136,844 |
| Forest
& Paper Products – 0.9% |
|
| Suzano
S.A. (a) |
|
35,500
|
$
383,107 |
| Gaming
& Lodging – 0.1% |
|
| Kangwon
Land, Inc. (a) |
|
1,003
|
$
20,292 |
| General
Merchandise – 1.7% |
|
| Bim
Birlesik Magazalar A.S. |
|
56,075
|
$
259,838 |
| Walmart
de Mexico S.A.B. de C.V. |
|
128,194
|
476,388 |
| |
|
|
|
$736,226 |
| Insurance
– 5.9% |
|
| AIA
Group Ltd. |
|
95,000
|
$
957,608 |
| Ping
An Insurance Co. of China Ltd., “H” |
|
103,000
|
741,701 |
| Samsung
Fire & Marine Insurance Co. Ltd. (a) |
|
5,433
|
923,210 |
| |
|
|
|
$2,622,519 |
| Internet
– 10.1% |
|
| Alibaba
Group Holding Ltd. (a) |
|
2,900
|
$
44,220 |
| Alibaba
Group Holding Ltd., ADR (a) |
|
13,021
|
1,546,764 |
| Baidu,
Inc., ADR (a) |
|
1,339
|
199,230 |
| Tencent
Holdings Ltd. |
|
45,800
|
2,683,079 |
| |
|
|
|
$4,473,293 |
| Machinery
& Tools – 0.4% |
|
| AirTAC
International Group |
|
5,000
|
$
184,335 |
| Major
Banks – 2.0% |
|
| China
Construction Bank Corp. |
|
848,670
|
$
587,726 |
| Erste
Group Bank AG |
|
6,274
|
294,932 |
| |
|
|
|
$882,658 |
MFS Emerging Markets Equity
Portfolio
Portfolio of
Investments – continued
| Issuer
|
|
|
Shares/Par
|
Value
($) |
| Common
Stocks – continued |
| Medical
& Health Technology & Services – 0.2% |
|
| Burning
Rock Biotech Ltd., ADR (a) |
|
9,052
|
$
86,266 |
| Metals
& Mining – 1.6% |
|
| Alrosa
PJSC |
|
67,755
|
$
110,807 |
| Vale
S.A., ADR |
|
41,510
|
581,970 |
| |
|
|
|
$692,777 |
| Natural
Gas - Distribution – 1.2% |
|
| China
Resources Gas Group Ltd. |
|
90,000
|
$
508,429 |
| Network
& Telecom – 0.3% |
|
| VTech
Holdings Ltd. |
|
17,800
|
$
139,363 |
| Other
Banks & Diversified Financials – 11.0% |
|
| Credicorp
Ltd. |
|
5,826
|
$
711,180 |
| E.Sun
Financial Holding Co. Ltd. |
|
55,371
|
56,137 |
| Grupo
Financiero Inbursa S.A. de C.V. (a) |
|
169,332
|
202,780 |
| HDFC
Bank Ltd. |
|
54,063
|
1,075,941 |
| Housing
Development Finance Corp. Ltd. |
|
22,605
|
786,523 |
| Komercni
Banka A.S. |
|
7,583
|
324,226 |
| Muthoot
Finance Ltd. |
|
4,588
|
92,312 |
| Sberbank
of Russia PJSC |
|
321,885
|
1,258,669 |
| Tisco
Financial Group PCL |
|
134,700
|
387,104 |
| |
|
|
|
$4,894,872 |
| Pharmaceuticals
– 0.6% |
|
| Genomma
Lab Internacional S.A., “B” |
|
254,774
|
$
267,273 |
| Precious
Metals & Minerals – 1.7% |
|
| Gold
Fields Ltd., ADR |
|
15,451
|
$
169,806 |
| Polymetal
International PLC |
|
32,484
|
576,650 |
| |
|
|
|
$746,456 |
| Real
Estate – 1.5% |
|
| ESR
Cayman Ltd. (a) |
|
95,600
|
$
323,058 |
| Hang
Lung Properties Ltd. |
|
111,000
|
228,333 |
| Swire
Properties Ltd. |
|
47,600
|
119,282 |
| |
|
|
|
$670,673 |
| Restaurants
– 2.4% |
|
| Yum
China Holdings, Inc. |
|
21,542
|
$
1,073,653 |
| Specialty
Chemicals – 1.0% |
|
| PTT
Global Chemical PLC |
|
260,700
|
$
458,498 |
| Specialty
Stores – 3.1% |
|
| Lojas
Renner S.A. |
|
89,517
|
$
392,782 |
| Meituan,
“B” (a) |
|
17,700
|
511,645 |
| Multiplan
Empreendimentos Imobiliarios S.A. |
|
89,839
|
301,937 |
| Vipshop
Holdings Ltd., ADR (a) |
|
19,066
|
160,154 |
| |
|
|
|
$1,366,518 |
| Telecommunications
- Wireless – 0.3% |
|
| Mobile
TeleSystems PJSC, ADR |
|
17,937
|
$
142,599 |
MFS Emerging Markets
Equity Portfolio
Portfolio of Investments – continued
| Issuer
|
|
|
Shares/Par
|
Value
($) |
| Common
Stocks – continued |
| Telephone
Services – 2.8% |
|
| Hellenic
Telecommunications Organization S.A. |
|
43,645
|
$
807,708 |
| PT
Telekom Indonesia |
|
1,591,600
|
451,153 |
| |
|
|
|
$1,258,861 |
| Total
Common Stocks (Identified Cost, $32,055,291) |
|
$43,694,572
|
| Investment
Companies (h) – 1.8% |
| Money
Market Funds – 1.8% |
|
| MFS
Institutional Money Market Portfolio, 0.07% (v) (Identified Cost, $801,674) |
|
|
801,674
|
$
801,674 |
| Other
Assets, Less Liabilities – (0.3)% |
|
(149,504) |
| Net
Assets – 100.0% |
$44,346,742
|
| (a) |
Non-income producing
security. |
|
|
|
| (h)
|
An
affiliated issuer, which may be considered one in which the fund owns 5% or more of the outstanding voting securities, or a company which is under common control. At period end, the aggregate values of the fund's investments in affiliated issuers
and in unaffiliated issuers were $801,674 and $43,694,572, respectively. |
|
|
|
| (v)
|
Affiliated
issuer that is available only to investment companies managed by MFS. The rate quoted for the MFS Institutional Money Market Portfolio is the annualized seven-day yield of the fund at period end. |
|
|
|
| The
following abbreviations are used in this report and are defined: |
| ADR
|
American
Depositary Receipt |
| PCL
|
Public
Company Limited |
See Notes to Financial
Statements
MFS Emerging Markets Equity
Portfolio
| Financial
Statements |
Statement of Assets and
Liabilities |
This statement
represents your fund’s balance sheet, which details the assets and liabilities comprising the total value of the fund.
| At
12/31/21 Assets |
|
| Investments
in unaffiliated issuers, at value (identified cost, $32,055,291) |
$43,694,572
|
| Investments
in affiliated issuers, at value (identified cost, $801,674) |
801,674
|
| Foreign
currency, at value (identified cost, $5,677) |
5,677
|
| Receivables
for |
|
| Investments
sold |
181,752
|
| Fund
shares sold |
24,755
|
| Dividends
|
67,367
|
| Receivable
from investment adviser |
26,309
|
| Other
assets |
467
|
| Total
assets |
$44,802,573
|
| Liabilities
|
|
| Payables
for |
|
| Investments
purchased |
$207,844
|
| Fund
shares reacquired |
8,009
|
| Payable
to affiliates |
|
| Administrative
services fee |
96
|
| Shareholder
servicing costs |
48
|
| Distribution
and/or service fees |
338
|
| Payable
for independent Trustees' compensation |
61
|
| Deferred
country tax expense payable |
115,817
|
| Accrued
expenses and other liabilities |
123,618
|
| Total
liabilities |
$455,831
|
| Net
assets |
$44,346,742
|
| Net
assets consist of |
|
| Paid-in
capital |
$30,099,428
|
| Total
distributable earnings (loss) |
14,247,314
|
| Net
assets |
$44,346,742
|
| Shares
of beneficial interest outstanding |
2,793,477
|
| |
Net
assets |
Shares
outstanding |
Net
asset value
per share |
| Initial
Class |
$19,498,072
|
1,216,722
|
$16.03
|
| Service
Class |
24,848,670
|
1,576,755
|
15.76
|
See Notes to Financial Statements
MFS Emerging Markets
Equity Portfolio
| Financial
Statements |
Statement of Operations
|
This statement describes how much
your fund earned in investment income and accrued in expenses. It also describes any gains and/or losses generated by fund operations.
| Year
ended 12/31/21 |
|
| Net
investment income (loss) |
|
| Income
|
|
| Dividends
|
$1,242,824
|
| Other
|
10,024
|
| Dividends
from affiliated issuers |
398
|
| Income
on securities loaned |
61
|
| Foreign
taxes withheld |
(148,550)
|
| Total
investment income |
$1,104,757
|
| Expenses
|
|
| Management
fee |
$486,760
|
| Distribution
and/or service fees |
63,863
|
| Shareholder
servicing costs |
8,631
|
| Administrative
services fee |
17,500
|
| Independent
Trustees' compensation |
3,042
|
| Custodian
fee |
101,681
|
| Shareholder
communications |
12,192
|
| Audit
and tax fees |
97,087
|
| Legal
fees |
311
|
| Miscellaneous
|
22,061
|
| Total
expenses |
$813,128
|
| Reduction
of expenses by investment adviser |
(179,193)
|
| Net
expenses |
$633,935
|
| Net
investment income (loss) |
$470,822
|
| Realized
and unrealized gain (loss) |
|
| Realized
gain (loss) (identified cost basis) |
|
| Unaffiliated
issuers (net of $11,539 country tax) |
$3,021,049
|
| Foreign
currency |
(14,930)
|
| Net
realized gain (loss) |
$3,006,119
|
| Change
in unrealized appreciation or depreciation |
|
| Unaffiliated
issuers (net of $11,398 increase in deferred country tax) |
$(6,672,509)
|
| Translation
of assets and liabilities in foreign currencies |
(97)
|
| Net
unrealized gain (loss) |
$(6,672,606)
|
| Net
realized and unrealized gain (loss) |
$(3,666,487)
|
| Change
in net assets from operations |
$(3,195,665)
|
See Notes to Financial Statements
MFS Emerging Markets Equity
Portfolio
| Financial
Statements |
Statements of Changes in
Net Assets |
These statements describe
the increases and/or decreases in net assets resulting from operations, any distributions, and any shareholder transactions.
| |
Year
ended |
| |
12/31/21
|
12/31/20
|
| Change
in net assets |
|
|
| From
operations |
|
|
| Net
investment income (loss) |
$470,822
|
$339,255
|
| Net
realized gain (loss) |
3,006,119
|
489,572
|
| Net
unrealized gain (loss) |
(6,672,606)
|
3,857,039
|
| Change
in net assets from operations |
$(3,195,665)
|
$4,685,866
|
| Total
distributions to shareholders |
$(177,020)
|
$(3,615,028)
|
| Change
in net assets from fund share transactions |
$1,741,105
|
$(1,773,884)
|
| Total
change in net assets |
$(1,631,580)
|
$(703,046)
|
| Net
assets |
|
|
| At
beginning of period |
45,978,322
|
46,681,368
|
| At
end of period |
$44,346,742
|
$45,978,322
|
See Notes to Financial Statements
MFS Emerging Markets
Equity Portfolio
| Financial
Statements |
Financial Highlights
|
The financial highlights table is
intended to help you understand the fund's financial performance for the past 5 years. Certain information reflects financial results for a single fund share. The total returns in the table represent the rate that an investor would have earned (or
lost) on an investment in the fund share class (assuming reinvestment of all distributions) held for the entire period.
| Initial
Class |
Year
ended |
| |
12/31/21
|
12/31/20
|
12/31/19
|
12/31/18
|
12/31/17
|
| Net
asset value, beginning of period |
$17.28
|
$17.04
|
$14.75
|
$17.19
|
$12.59
|
| Income
(loss) from investment operations |
|
|
|
|
|
| Net
investment income (loss) (d) |
$0.20
|
$0.14
|
$0.28
|
$0.11
|
$0.06
|
| Net
realized and unrealized gain (loss) |
(1.36)
|
1.47
|
2.63
|
(2.49)
|
4.71
|
| Total
from investment operations |
$(1.16)
|
$1.61
|
$2.91
|
$(2.38)
|
$4.77
|
| Less
distributions declared to shareholders |
|
|
|
|
|
| From
net investment income |
$(0.09)
|
$(0.50)
|
$(0.11)
|
$(0.06)
|
$(0.17)
|
| From
net realized gain |
(0.00)(w)
|
(0.87)
|
(0.51)
|
—
|
—
|
| Total
distributions declared to shareholders |
$(0.09)
|
$(1.37)
|
$(0.62)
|
$(0.06)
|
$(0.17)
|
| Net
asset value, end of period (x) |
$16.03
|
$17.28
|
$17.04
|
$14.75
|
$17.19
|
| Total
return (%) (k)(r)(s)(x) |
(6.75)
|
10.63
|
20.45
|
(13.89)
|
37.98
|
Ratios
(%) (to average net assets)
and Supplemental data: |
|
|
|
|
|
| Expenses
before expense reductions |
1.62
|
1.73
|
1.55
|
1.50
|
1.53
|
| Expenses
after expense reductions |
1.23
|
1.23
|
1.29
|
1.37
|
1.40
|
| Net
investment income (loss) |
1.16
|
0.94
|
1.76
|
0.65
|
0.41
|
| Portfolio
turnover |
41
|
48
|
21
|
31
|
27
|
| Net
assets at end of period (000 omitted) |
$19,498
|
$20,335
|
$21,065
|
$20,887
|
$28,026
|
| Service
Class |
Year
ended |
| |
12/31/21
|
12/31/20
|
12/31/19
|
12/31/18
|
12/31/17
|
| Net
asset value, beginning of period |
$16.99
|
$16.78
|
$14.53
|
$16.94
|
$12.41
|
| Income
(loss) from investment operations |
|
|
|
|
|
| Net
investment income (loss) (d) |
$0.15
|
$0.11
|
$0.24
|
$0.07
|
$0.02
|
| Net
realized and unrealized gain (loss) |
(1.33)
|
1.43
|
2.58
|
(2.46)
|
4.64
|
| Total
from investment operations |
$(1.18)
|
$1.54
|
$2.82
|
$(2.39)
|
$4.66
|
| Less
distributions declared to shareholders |
|
|
|
|
|
| From
net investment income |
$(0.05)
|
$(0.46)
|
$(0.06)
|
$(0.02)
|
$(0.13)
|
| From
net realized gain |
(0.00)(w)
|
(0.87)
|
(0.51)
|
—
|
—
|
| Total
distributions declared to shareholders |
$(0.05)
|
$(1.33)
|
$(0.57)
|
$(0.02)
|
$(0.13)
|
| Net
asset value, end of period (x) |
$15.76
|
$16.99
|
$16.78
|
$14.53
|
$16.94
|
| Total
return (%) (k)(r)(s)(x) |
(6.97)
|
10.33
|
20.11
|
(14.13)
|
37.66
|
Ratios
(%) (to average net assets)
and Supplemental data: |
|
|
|
|
|
| Expenses
before expense reductions |
1.87
|
1.98
|
1.80
|
1.75
|
1.78
|
| Expenses
after expense reductions |
1.48
|
1.48
|
1.54
|
1.62
|
1.65
|
| Net
investment income (loss) |
0.90
|
0.71
|
1.52
|
0.40
|
0.16
|
| Portfolio
turnover |
41
|
48
|
21
|
31
|
27
|
| Net
assets at end of period (000 omitted) |
$24,849
|
$25,643
|
$25,616
|
$23,973
|
$29,665
|
See Notes to Financial Statements
MFS Emerging Markets Equity
Portfolio
Financial Highlights - continued
| (d)
|
Per share data
is based on average shares outstanding. |
| (k)
|
The total
return does not reflect expenses that apply to separate accounts. Inclusion of these charges would reduce the total return figures for all periods shown. |
| (r)
|
Certain
expenses have been reduced without which performance would have been lower. |
| (s)
|
From time to
time the fund may receive proceeds from litigation settlements, without which performance would be lower. |
| (w)
|
Per share
amount was less than $0.01. |
| (x)
|
The
net asset values and total returns have been calculated on net assets which include adjustments made in accordance with U.S. generally accepted accounting principles required at period end for financial reporting purposes. |
See Notes to Financial Statements
MFS Emerging Markets
Equity Portfolio
Notes to Financial Statements
(1) Business and Organization
MFS Emerging Markets Equity Portfolio (the fund) is a
diversified series of MFS Variable Insurance Trust II (the trust). The trust is organized as a Massachusetts business trust and is registered under the Investment Company Act of 1940, as amended, as an open-end management investment company. The
shareholders of each series of the trust are separate accounts of insurance companies, which offer variable annuity and/or life insurance products, and qualified retirement and pension plans.
The fund is an investment company and accordingly follows
the investment company accounting and reporting guidance of the Financial Accounting Standards Board (FASB) Accounting Standards Codification Topic 946 Financial Services - Investment Companies.
(2) Significant Accounting Policies
General — The
preparation of financial statements in conformity with U.S. generally accepted accounting principles requires management to make estimates and assumptions that affect the reported amounts of assets and liabilities, and disclosure of contingent
assets and liabilities at the date of the financial statements and the reported amounts of increases and decreases in net assets from operations during the reporting period. Actual results could differ from those estimates. In the preparation of
these financial statements, management has evaluated subsequent events occurring after the date of the fund’s Statement of Assets and Liabilities through the date that the financial statements were issued. The fund invests in foreign securities, including securities of emerging market issuers. Investments in foreign securities are vulnerable to the effects of changes in the relative values of the local currency and the
U.S. dollar and to the effects of changes in each country’s market, economic, industrial, political, regulatory, geopolitical, environmental, public health, and other conditions. Investments in emerging markets can involve additional and
greater risks than the risks associated with investments in developed foreign markets. Emerging markets can have less developed markets, greater custody and operational risk, less developed legal, regulatory, accounting, and auditing systems, and
greater political, social, and economic instability than developed markets.
Balance Sheet Offsetting
— The fund's accounting policy with respect to balance sheet offsetting is that, absent an event of default by the counterparty or a termination of the agreement, the International Swaps and Derivatives Association (ISDA) Master Agreement, or
similar agreement, does not result in an offset of reported amounts of financial assets and financial liabilities in the Statement of Assets and Liabilities across transactions between the fund and the applicable counterparty. The fund's right to
setoff may be restricted or prohibited by the bankruptcy or insolvency laws of the particular jurisdiction to which a specific master netting agreement counterparty is subject. Balance sheet offsetting disclosures, to the extent applicable to the
fund, have been included in the fund’s Significant Accounting Policies note under the captions for each of the fund’s in-scope financial instruments and transactions.
Investment Valuations
— Equity securities, including restricted equity securities, are generally valued at the last sale or official closing price on their primary market or exchange as provided by a third-party pricing
service. Equity securities, for which there were no sales reported that day, are generally valued at the last quoted daily bid quotation on their primary market or exchange as provided by a third-party pricing service. Short-term instruments with a maturity at issuance of 60 days or less may be valued at amortized cost, which approximates market value. Open-end investment companies are
generally valued at net asset value per share.
Securities and
other assets generally valued on the basis of information from a third-party pricing service may also be valued at a broker/dealer bid quotation. In determining values, third-party pricing services can utilize both transaction data and market
information such as yield, quality, coupon rate, maturity, type of issue, trading characteristics, and other market data. The values of foreign securities and other assets and liabilities expressed in foreign currencies are converted to U.S. dollars
using the mean of bid and asked prices for rates provided by a third-party pricing service.
The Board of Trustees has delegated primary responsibility
for determining or causing to be determined the value of the fund’s investments (including any fair valuation) to the adviser pursuant to valuation policies and procedures approved by the Board. If the adviser determines that reliable market
quotations are not readily available, investments are valued at fair value as determined in good faith by the adviser in accordance with such procedures under the oversight of the Board of Trustees. Under the fund’s valuation policies and
procedures, market quotations are not considered to be readily available for most types of debt instruments and floating rate loans and many types of derivatives. These investments are generally valued at fair value based on information from
third-party pricing services. In addition, investments may be valued at fair value if the adviser determines that an investment’s value has been materially affected by events occurring after the close of the exchange or market on which the
investment is principally traded (such as foreign exchange or market) and prior to the determination of the fund’s net asset value, or after the halt of trading of a specific security where trading does not resume prior to the close of the
exchange or market on which the security is principally traded. Events that occur after foreign markets close (such as developments in foreign markets and significant movements in the U.S. markets) and prior to the determination of the fund’s
net asset value may be deemed to have a material effect on the value of securities traded in foreign markets. Accordingly, the fund’s foreign equity securities may often be valued at fair value. The adviser
MFS Emerging Markets Equity
Portfolio
Notes to Financial Statements - continued
generally relies on
third-party pricing services or other information (such as the correlation with price movements of similar securities in the same or other markets; the type, cost and investment characteristics of the security; the business and financial condition
of the issuer; and trading and other market data) to assist in determining whether to fair value and at what value to fair value an investment. The value of an investment for purposes of calculating the fund’s net asset value can differ
depending on the source and method used to determine value. When fair valuation is used, the value of an investment used to determine the fund’s net asset value may differ from quoted or published prices for the same investment. There can be
no assurance that the fund could obtain the fair value assigned to an investment if it were to sell the investment at the same time at which the fund determines its net asset value per share.
Various inputs are used in determining the value of the
fund's assets or liabilities. These inputs are categorized into three broad levels. In certain cases, the inputs used to measure fair value may fall into different levels of the fair value hierarchy. In such cases, an investment's level within the
fair value hierarchy is based on the lowest level of input that is significant to the fair value measurement. The fund's assessment of the significance of a particular input to the fair value measurement in its entirety requires judgment, and
considers factors specific to the investment. Level 1 includes unadjusted quoted prices in active markets for identical assets or liabilities. Level 2 includes other significant observable market-based inputs (including quoted prices for similar
securities, interest rates, prepayment speed, and credit risk). Level 3 includes unobservable inputs, which may include the adviser's own assumptions in determining the fair value of investments. The following is a summary of the levels used as of
December 31, 2021 in valuing the fund's assets and liabilities:
| Financial
Instruments |
Level
1 |
Level
2 |
Level
3 |
Total
|
| Equity
Securities: |
|
|
|
|
| China
|
$12,978,888
|
$—
|
$—
|
$12,978,888
|
| South
Korea |
5,755,466
|
—
|
—
|
5,755,466
|
| Taiwan
|
5,067,005
|
—
|
—
|
5,067,005
|
| India
|
4,937,555
|
—
|
—
|
4,937,555
|
| Russia
|
1,410,099
|
2,115,591
|
—
|
3,525,690
|
| Brazil
|
2,309,376
|
—
|
—
|
2,309,376
|
| Hong
Kong |
2,305,044
|
—
|
—
|
2,305,044
|
| Mexico
|
1,468,532
|
—
|
—
|
1,468,532
|
| Indonesia
|
1,051,351
|
—
|
—
|
1,051,351
|
| Other
Countries |
2,830,905
|
1,464,760
|
—
|
4,295,665
|
| Mutual
Funds |
801,674
|
—
|
—
|
801,674
|
| Total
|
$40,915,895
|
$3,580,351
|
$—
|
$44,496,246
|
For further information
regarding security characteristics, see the Portfolio of Investments.
Foreign Currency
Translation — Purchases and sales of foreign investments, income, and expenses are converted into U.S. dollars based upon currency exchange rates prevailing on the respective dates of such transactions or on
the reporting date for foreign denominated receivables and payables. Gains and losses attributable to foreign currency exchange rates on sales of securities are recorded for financial statement purposes as net realized gains and losses on
investments. Gains and losses attributable to foreign exchange rate movements on receivables, payables, income and expenses are recorded for financial statement purposes as foreign currency transaction gains and losses. That portion of both realized
and unrealized gains and losses on investments that results from fluctuations in foreign currency exchange rates is not separately disclosed.
Security Loans —
Under its Securities Lending Agency Agreement with the fund, State Street Bank and Trust Company, as lending agent, loans the securities of the fund to certain qualified institutions (the “Borrowers”) approved by the fund. Security loans
can be terminated at the discretion of either the lending agent or the fund and the related securities must be returned within the earlier of the standard trade settlement period for such securities or within three business days. The loans are
collateralized by cash and/or U.S. Treasury and federal agency obligations in an amount typically at least equal to the market value of the securities loaned. On loans collateralized by cash, the cash collateral is invested in a money market fund.
The market value of the loaned securities is determined at the close of business of the fund and any additional required collateral is delivered to the fund on the next business day. The lending agent provides the fund with indemnification against
Borrower default. In the event of Borrower default, the lending agent will, for the benefit of the fund, either purchase securities identical to those loaned or, when such purchase is commercially impracticable, pay the fund the market value of the
loaned securities. In return, the lending agent assumes the fund's rights to the related collateral. If the collateral value is less than the cost to purchase identical securities, the lending agent is responsible for the shortfall, but only to the
extent that such shortfall is not due to a decline in collateral value resulting from collateral reinvestment for which the fund bears the risk of loss. A portion of the income generated upon investment of the collateral is remitted to the
Borrowers, and the remainder is allocated between the fund and the lending agent. On loans collateralized by
MFS Emerging Markets
Equity Portfolio
Notes to Financial Statements - continued
U.S. Treasury
and/or federal agency obligations, a fee is received from the Borrower, and is allocated between the fund and the lending agent. Income from securities lending is separately reported in the Statement of Operations. The dividend and interest income
earned on the securities loaned is accounted for in the same manner as other dividend and interest income. At December 31, 2021, there were no securities on loan or collateral outstanding.
Indemnifications —
Under the fund's organizational documents, its officers and Trustees may be indemnified against certain liabilities and expenses arising out of the performance of their duties to the fund. Additionally, in the normal course of business, the fund
enters into agreements with service providers that may contain indemnification clauses. The fund's maximum exposure under these agreements is unknown as this would involve future claims that may be made against the fund that have not yet
occurred.
Investment Transactions and Income — Investment transactions are recorded on the trade date. Dividends received in cash are recorded on the ex-dividend date. Certain dividends from foreign securities will be
recorded when the fund is informed of the dividend if such information is obtained subsequent to the ex-dividend date. Dividend payments received in additional securities are recorded on the ex-dividend date in an amount equal to the value of the
security on such date.
The fund may receive
proceeds from litigation settlements. Any proceeds received from litigation involving portfolio holdings are reflected in the Statement of Operations in realized gain/loss if the security has been disposed of by the fund or in unrealized gain/loss
if the security is still held by the fund. Any other proceeds from litigation not related to portfolio holdings are reflected as other income in the Statement of Operations.
Tax Matters and Distributions — The fund intends to qualify as a regulated investment company, as defined under Subchapter M of the Internal Revenue Code, and to distribute all of its taxable income, including realized capital gains. As a
result, no provision for federal income tax is required. The fund’s federal tax returns, when filed, will remain subject to examination by the Internal Revenue Service for a three year period. Management has analyzed the fund’s tax
positions taken on federal and state tax returns for all open tax years and does not believe that there are any uncertain tax positions that require recognition of a tax liability. Foreign taxes, if any, have been accrued by the fund in the
accompanying financial statements in accordance with the applicable foreign tax law. Foreign income taxes may be withheld by certain countries in which the fund invests. Additionally, capital gains realized by the fund on securities issued in or by
certain foreign countries may be subject to capital gains tax imposed by those countries.
Distributions to shareholders are recorded on the
ex-dividend date. Income and capital gain distributions are determined in accordance with income tax regulations, which may differ from U.S. generally accepted accounting principles. Certain capital accounts in the financial statements are
periodically adjusted for permanent differences in order to reflect their tax character. These adjustments have no impact on net assets or net asset value per share. Temporary differences which arise from recognizing certain items of income,
expense, gain or loss in different periods for financial statement and tax purposes will reverse at some time in the future.
Book/tax differences primarily relate to passive foreign
investment companies, wash sale loss deferrals, and foreign taxes.
The tax character of distributions declared to shareholders
for the last two fiscal years is as follows:
| |
Year
ended
12/31/21 |
Year
ended
12/31/20 |
| Ordinary
income (including any short-term capital gains) |
$177,020
|
$1,860,481
|
| Long-term
capital gains |
—
|
1,754,547
|
| Total
distributions |
$177,020
|
$3,615,028
|
The federal tax cost and the tax
basis components of distributable earnings were as follows:
| As
of 12/31/21 |
|
| Cost
of investments |
$34,303,417
|
| Gross
appreciation |
13,109,576
|
| Gross
depreciation |
(2,916,747)
|
| Net
unrealized appreciation (depreciation) |
$10,192,829
|
| Undistributed
ordinary income |
1,895,976
|
| Undistributed
long-term capital gain |
2,183,073
|
| Other
temporary differences |
(24,564)
|
| Total
distributable earnings (loss) |
$14,247,314
|
MFS Emerging Markets Equity
Portfolio
Notes to Financial Statements - continued
Multiple Classes of Shares of Beneficial Interest — The fund offers multiple classes of shares, which differ in their respective distribution and/or service fees. The fund's income, realized and unrealized gain (loss), and common expenses are allocated to
shareholders based on the daily net assets of each class. Dividends are declared separately for each class. Differences in per share dividend rates are generally due to differences in separate class expenses. The fund’s distributions declared
to shareholders as reported in the Statements of Changes in Net Assets are presented by class as follows:
| |
Year
ended
12/31/21 |
|
Year
ended
12/31/20 |
| Initial
Class |
$106,466
|
|
$1,583,859
|
| Service
Class |
70,554
|
|
2,031,169
|
| Total
|
$177,020
|
|
$3,615,028
|
(3) Transactions with
Affiliates
Investment Adviser — The fund has an investment advisory agreement with MFS to provide overall investment management and related administrative services and facilities to the fund. The
management fee is computed daily and paid monthly at the following annual rates based on the fund's average daily net assets:
| Up
to $500 million |
1.05%
|
| In
excess of $500 million |
1.00%
|
MFS has agreed in writing to
reduce its management fee by a specified amount if certain MFS mutual fund assets exceed thresholds agreed to by MFS and the fund's Board of Trustees. For the year ended December 31, 2021, this management fee reduction amounted to $5,866, which is
included in the reduction of total expenses in the Statement of Operations. The management fee incurred for the year ended December 31, 2021 was equivalent to an annual effective rate of 1.04% of the fund's average daily net assets.
The investment adviser has agreed in writing to pay a
portion of the fund’s total annual operating expenses, excluding interest, taxes, extraordinary expenses, brokerage and transaction costs, and investment-related expenses, such that total annual operating expenses do not exceed 1.23% of
average daily net assets for the Initial Class shares and 1.48% of average daily net assets for the Service Class shares. This written agreement will continue until modified by the fund’s Board of Trustees, but such agreement will continue at
least until April 30, 2023. For the year ended December 31, 2021, this reduction amounted to $173,327, which is included in the reduction of total expenses in the Statement of Operations.
Distributor — MFS
Fund Distributors, Inc. (MFD), a wholly-owned subsidiary of MFS, is the distributor of shares of the fund. The Trustees have adopted a distribution plan for the Service Class shares pursuant to Rule 12b-1 under the Investment Company Act of
1940.
The fund's distribution plan provides
that the fund will pay MFD distribution and/or service fees equal to 0.25% per annum of its average daily net assets attributable to Service Class shares as partial consideration for services performed and expenses incurred by MFD and financial
intermediaries (including participating insurance companies that invest in the fund to fund variable annuity and variable life insurance contracts, sponsors of qualified retirement and pension plans that invest in the fund, and affiliates of these
participating insurance companies and plan sponsors) in connection with the sale and distribution of the Service Class shares. MFD may subsequently pay all, or a portion, of the distribution and/or service fees to financial intermediaries.
Shareholder Servicing Agent
— MFS Service Center, Inc. (MFSC), a wholly-owned subsidiary of MFS, receives a fee from the fund for its services as shareholder servicing agent. For the year ended December 31, 2021, the fee was $8,269, which equated to 0.0178% annually of
the fund's average daily net assets. MFSC also receives reimbursement from the fund for out-of-pocket expenses paid by MFSC on behalf of the fund. For the year ended December 31, 2021, these costs amounted to $362.
Administrator — MFS
provides certain financial, legal, shareholder communications, compliance, and other administrative services to the fund. Under an administrative services agreement, the fund reimburses MFS the costs incurred to provide these services. The fund is
charged an annual fixed amount of $17,500 plus a fee based on average daily net assets. The administrative services fee incurred for the year ended December 31, 2021 was equivalent to an annual effective rate of 0.0378% of the fund's average daily
net assets.
Trustees’ and Officers’
Compensation — The fund pays compensation to independent Trustees in the form of a retainer, attendance fees, and additional compensation to Board and Committee chairpersons. The fund does not pay compensation
directly to Trustees or officers of the fund who are also officers of the investment adviser, all of whom receive remuneration from MFS for their services to the fund. Certain officers and Trustees of the fund are officers or directors of MFS, MFD,
and MFSC.
MFS Emerging Markets
Equity Portfolio
Notes to Financial Statements - continued
Other — The fund invests in the MFS Institutional Money Market Portfolio which is managed by MFS and seeks current income consistent with preservation of capital and liquidity. This money market fund does not pay a
management fee to MFS but does incur investment and operating costs.
The adviser has voluntarily undertaken to reimburse the
fund from its own resources on a quarterly basis for the cost of investment research embedded in the cost of the fund’s securities trades. This agreement may be rescinded at any time. For the year ended December 31, 2021, this reimbursement
amounted to $10,010, which is included in “Other” income in the Statement of Operations.
(4) Portfolio Securities
For the year ended December 31, 2021, purchases and sales
of investments, other than short-term obligations, aggregated $20,250,167 and $18,355,651, respectively.
(5) Shares of Beneficial Interest
The fund's Declaration of Trust permits the Trustees to
issue an unlimited number of full and fractional shares of beneficial interest. Transactions in fund shares were as follows:
| |
Year
ended
12/31/21 |
|
Year
ended
12/31/20 |
| |
Shares
|
Amount
|
|
Shares
|
Amount
|
| Shares
sold |
|
|
|
|
|
| Initial
Class |
233,978
|
$4,138,929
|
|
79,334
|
$1,140,804
|
| Service
Class |
290,742
|
4,858,335
|
|
264,438
|
3,399,163
|
| |
524,720
|
$8,997,264
|
|
343,772
|
$4,539,967
|
Shares
issued to shareholders
in reinvestment of distributions |
|
|
|
|
|
| Initial
Class |
6,356
|
$106,466
|
|
105,240
|
$1,583,859
|
| Service
Class |
4,281
|
70,554
|
|
137,148
|
2,031,169
|
| |
10,637
|
$177,020
|
|
242,388
|
$3,615,028
|
| Shares
reacquired |
|
|
|
|
|
| Initial
Class |
(200,577)
|
$(3,532,147)
|
|
(243,942)
|
$(3,723,611)
|
| Service
Class |
(227,204)
|
(3,901,032)
|
|
(419,024)
|
(6,205,268)
|
| |
(427,781)
|
$(7,433,179)
|
|
(662,966)
|
$(9,928,879)
|
| Net
change |
|
|
|
|
|
| Initial
Class |
39,757
|
$713,248
|
|
(59,368)
|
$(998,948)
|
| Service
Class |
67,819
|
1,027,857
|
|
(17,438)
|
(774,936)
|
| |
107,576
|
$1,741,105
|
|
(76,806)
|
$(1,773,884)
|
The fund is one of several
mutual funds in which certain MFS funds may invest. The MFS funds do not invest in the underlying funds for the purpose of exercising management or control. At the end of the period, the MFS Growth Allocation Portfolio was the owner of record of
approximately 8% of the value of outstanding voting shares of the fund.
(6) Line of Credit
The fund and certain other funds managed by MFS participate
in a $1.25 billion unsecured committed line of credit of which $1 billion is reserved for use by the fund and certain other MFS U.S. funds. The line of credit is provided by a syndicate of banks under a credit agreement. Borrowings may be made for
temporary financing needs. Interest is charged to each fund, based on its borrowings, generally at a rate equal to the highest of one month LIBOR, the Federal Funds Effective Rate and the Overnight Bank Funding Rate, plus an agreed upon spread. A
commitment fee, based on the average daily, unused portion of the committed line of credit, is allocated among the participating funds. In addition, the fund and other funds managed by MFS have established unsecured uncommitted borrowing
arrangements with certain banks for temporary financing needs. Interest is charged to each fund, based on its borrowings, at rates equal to customary reference rates plus an agreed upon spread. For the year ended December 31, 2021, the fund’s
commitment fee and interest expense were $128 and $0, respectively, and are included in “Miscellaneous” expense in the Statement of Operations.
MFS Emerging Markets Equity
Portfolio
Notes to Financial Statements - continued
(7) Investments in Affiliated Issuers
An affiliated issuer may be considered one in which the
fund owns 5% or more of the outstanding voting securities, or a company which is under common control. For the purposes of this report, the following were affiliated issuers:
| Affiliated
Issuers |
Beginning
Value |
Purchases
|
Sales
Proceeds |
Realized
Gain
(Loss) |
Change
in
Unrealized
Appreciation or
Depreciation |
Ending
Value |
| MFS
Institutional Money Market Portfolio |
$506,370
|
$13,837,227
|
$13,541,923
|
$—
|
$—
|
$801,674
|
| Affiliated
Issuers |
Dividend
Income |
Capital
Gain
Distributions |
| MFS
Institutional Money Market Portfolio |
$398
|
$—
|
(8) Impacts of
COVID-19
The pandemic related to the global spread of
novel coronavirus disease (COVID-19), which was first detected in December 2019, has resulted in significant disruptions to global business activity and the global economy, as well as the economies of individual countries, the financial performance
of individual companies and sectors, and the securities and commodities markets in general. Multiple surges in cases globally, the availability and widespread adoption of vaccines, and the emergence of variant strains of the virus continue to create
uncertainty as to the future and long-term impacts resulting from the pandemic including impacts to the prices and liquidity of the fund's investments and the fund's performance.
(9) LIBOR Transition
Certain of the fund's investments, including its
investments in derivatives, as well as any debt issued by the fund and other contractual arrangements of the fund may be based on reference interest rates such as the London Interbank Offered Rate (“LIBOR”). In 2017, the regulatory
authority that oversees financial services firms in the United Kingdom announced plans to transition away from LIBOR by the end of 2021. In March 2021, the administrator of LIBOR announced the extension of the publication of the more commonly used
U.S. dollar LIBOR settings to the end of June 2023. Although the full impacts of the transition away from LIBOR are not fully known, the transition may result in, among other things, an increase in volatility or illiquidity of the markets for
instruments that currently rely on LIBOR to determine interest rates and this could have an adverse impact on the fund's performance. With respect to the fund's accounting for investments, including its investments in derivatives, as well as any
debt issued by the fund and other contractual arrangements of the fund that undergo reference rate-related modifications as a result of the transition, management will rely upon the relief provided by FASB Codification Topic 848 – Reference
Rate Reform (Topic 848). The guidance in Topic 848 permits the fund to disregard the GAAP accounting requirements around certain contract modifications resulting from the LIBOR transition such that for contracts considered in scope, the fund can
account for those modified contracts as a continuation of the existing contracts. While the cessation of the one-week and two-month U.S. dollar LIBOR tenors along with certain other non-U.S. dollar denominated LIBOR settings at December 31, 2021 did
not have a material impact on the fund, management is still evaluating the impact to the fund of the June 30, 2023 planned discontinuation of the more commonly used U.S. dollar LIBOR settings.
MFS Emerging Markets
Equity Portfolio
Report of Independent Registered Public Accounting
Firm
To the Board of Trustees of MFS Variable
Insurance Trust II and the Shareholders of MFS Emerging Markets Equity Portfolio:
Opinion on the Financial Statements and Financial
Highlights
We have audited the accompanying statement
of assets and liabilities of MFS Emerging Markets Equity Portfolio (the “Fund”), including the portfolio of investments, as of December 31, 2021, the related statement of operations for the year then ended, the statements of changes in
net assets for each of the two years in the period then ended, the financial highlights for each of the five years in the period then ended, and the related notes. In our opinion, the financial statements and financial highlights present fairly, in
all material respects, the financial position of the Fund as of December 31, 2021, and the results of its operations for the year then ended, the changes in its net assets for each of the two years in the period then ended, and the financial
highlights for each of the five years in the period then ended, in conformity with accounting principles generally accepted in the United States of America.
Basis for Opinion
These financial statements and financial highlights are the
responsibility of the Fund's management. Our responsibility is to express an opinion on the Fund's financial statements and financial highlights based on our audits. We are a public accounting firm registered with the Public Company Accounting
Oversight Board (United States) (PCAOB) and are required to be independent with respect to the Fund in accordance with the U.S. federal securities laws and the applicable rules and regulations of the Securities and Exchange Commission and the
PCAOB.
We conducted our audits in accordance with the
standards of the PCAOB. Those standards require that we plan and perform the audit to obtain reasonable assurance about whether the financial statements and financial highlights are free of material misstatement, whether due to error or fraud. The
Fund is not required to have, nor were we engaged to perform, an audit of its internal control over financial reporting. As part of our audits, we are required to obtain an understanding of internal control over financial reporting but not for the
purpose of expressing an opinion on the effectiveness of the Fund's internal control over financial reporting. Accordingly, we express no such opinion.
Our audits included performing procedures to assess the
risks of material misstatement of the financial statements and financial highlights, whether due to error or fraud, and performing procedures that respond to those risks. Such procedures included examining, on a test basis, evidence regarding the
amounts and disclosures in the financial statements and financial highlights. Our audits also included evaluating the accounting principles used and significant estimates made by management, as well as evaluating the overall presentation of the
financial statements and financial highlights. Our procedures included confirmation of securities owned as of December 31, 2021, by correspondence with the custodian and brokers; when replies were not received from brokers, we performed other
auditing procedures. We believe that our audits provide a reasonable basis for our opinion.
DELOITTE & TOUCHE LLP
Boston, Massachusetts
February 15, 2022
We have served as the auditor of one or more of the MFS
investment companies since 1924.
MFS Emerging Markets Equity
Portfolio
Trustees and Officers — Identification and
Background
The Trustees and Officers of the Trust, as
of February 1, 2022, are listed below, together with their principal occupations during the past five years. (Their titles may have varied during that period.) The address of each Trustee and Officer is 111 Huntington Avenue, Boston, Massachusetts
02199-7618.
| Name,
Age |
|
Position(s)
Held with Fund |
|
Trustee/Officer
Since(h) |
|
Number
of MFS Funds overseen by the Trustee |
|
Principal
Occupations During
the Past Five Years |
|
Other
Directorships During
the Past Five Years (j) |
| INTERESTED
TRUSTEES |
|
|
|
|
|
|
|
|
|
|
Michael
W. Roberge (k)
(age 55) |
|
Trustee
|
|
January
2021 |
|
135
|
|
Massachusetts
Financial Services Company, Chairman (since January 2021); Chief Executive Officer (since January 2017); Director; Chairman of the Board (since January 2022); President (until December 2018); Chief Investment Officer (until December 2018) |
|
N/A
|
| INDEPENDENT
TRUSTEES |
|
|
|
|
|
|
|
|
|
|
John
P. Kavanaugh
(age 67) |
|
Trustee
and Chair of Trustees |
|
January
2009 |
|
135
|
|
Private
investor |
|
N/A
|
Steven
E. Buller
(age 70) |
|
Trustee
|
|
February
2014 |
|
135
|
|
Private
investor |
|
N/A
|
John
A. Caroselli
(age 67) |
|
Trustee
|
|
March
2017 |
|
135
|
|
Private
investor; JC Global Advisors, LLC (management consulting), President (since 2015) |
|
N/A
|
Maureen
R. Goldfarb
(age 66) |
|
Trustee
|
|
January
2009 |
|
135
|
|
Private
investor |
|
N/A
|
Peter
D. Jones
(age 66) |
|
Trustee
|
|
January
2019 |
|
135
|
|
Private
investor |
|
N/A
|
James
W. Kilman, Jr.
(age 60) |
|
Trustee
|
|
January
2019 |
|
135
|
|
Burford
Capital Limited (finance and investment management), Senior Advisor (since May 3, 2021), Chief Financial Officer (2019 - May 2, 2021); KielStrand Capital LLC (family office), Chief Executive Officer (since 2016) |
|
Alpha-En
Corporation, Director (2016-2019) |
Clarence
Otis, Jr.
(age 65) |
|
Trustee
|
|
March
2017 |
|
135
|
|
Private
investor |
|
VF
Corporation, Director; Verizon Communications, Inc., Director; The Travelers Companies, Director |
Maryanne
L. Roepke
(age 65) |
|
Trustee
|
|
May
2014 |
|
135
|
|
Private
investor |
|
N/A
|
Laurie
J. Thomsen
(age 64) |
|
Trustee
|
|
March
2005 |
|
135
|
|
Private
investor |
|
The
Travelers Companies, Director; Dycom Industries, Inc., Director |
MFS Emerging Markets
Equity Portfolio
Trustees and Officers - continued
| Name,
Age |
|
Position(s)
Held with
Fund |
|
Trustee/Officer
Since(h) |
|
Number
of MFS Funds for which the Person is an Officer |
|
Principal
Occupations During
the Past Five Years |
| OFFICERS
|
|
|
|
|
|
|
|
|
Christopher
R. Bohane (k)
(age 48) |
|
Assistant
Secretary and Assistant Clerk |
|
July
2005 |
|
135
|
|
Massachusetts
Financial Services Company, Senior Vice President and Associate General Counsel |
Kino
Clark (k)
(age 53) |
|
Assistant
Treasurer |
|
January
2012 |
|
135
|
|
Massachusetts
Financial Services Company, Vice President |
John
W. Clark, Jr. (k)
(age 54) |
|
Assistant
Treasurer |
|
April
2017 |
|
135
|
|
Massachusetts
Financial Services Company, Vice President (since March 2017); Deutsche Bank (financial services), Department Head - Treasurer's Office (until February 2017) |
Thomas
H. Connors (k)
(age 62) |
|
Assistant
Secretary and Assistant Clerk |
|
September
2012 |
|
135
|
|
Massachusetts
Financial Services Company, Vice President and Senior Counsel |
David
L. DiLorenzo (k)
(age 53) |
|
President
|
|
July
2005 |
|
135
|
|
Massachusetts
Financial Services Company, Senior Vice President |
Heidi
W. Hardin (k)
(age 54) |
|
Secretary
and Clerk |
|
April
2017 |
|
135
|
|
Massachusetts
Financial Services Company, Executive Vice President and General Counsel (since March 2017); Harris Associates (investment management), General Counsel (until January 2017) |
Brian
E. Langenfeld (k)
(age 48) |
|
Assistant
Secretary and Assistant Clerk |
|
June
2006 |
|
135
|
|
Massachusetts
Financial Services Company, Vice President and Senior Counsel |
Amanda
S. Mooradian (k)
(age 42) |
|
Assistant
Secretary and Assistant Clerk |
|
September
2018 |
|
135
|
|
Massachusetts
Financial Services Company, Assistant Vice President and Senior Counsel |
Susan
A. Pereira (k)
(age 51) |
|
Assistant
Secretary and Assistant Clerk |
|
July
2005 |
|
135
|
|
Massachusetts
Financial Services Company, Vice President and Assistant General Counsel |
Kasey
L. Phillips (k)
(age 51) |
|
Assistant
Treasurer |
|
September
2012 |
|
135
|
|
Massachusetts
Financial Services Company, Vice President |
Matthew
A. Stowe (k)
(age 47) |
|
Assistant
Secretary and Assistant Clerk |
|
October
2014 |
|
135
|
|
Massachusetts
Financial Services Company, Vice President and Assistant General Counsel |
Martin
J. Wolin (k)
(age 54) |
|
Chief
Compliance Officer |
|
July
2015 |
|
135
|
|
Massachusetts
Financial Services Company, Senior Vice President and Chief Compliance Officer |
James
O. Yost (k)
(age 61) |
|
Treasurer
|
|
September
1990 |
|
135
|
|
Massachusetts
Financial Services Company, Senior Vice President |
| (h)
|
Date
first appointed to serve as Trustee/Officer of an MFS Fund. Each Trustee has served continuously since appointment unless indicated otherwise. From January 2012 through December 2016, Messrs. DiLorenzo and Yost served as Treasurer and Deputy
Treasurer of the Funds, respectively. |
| (j)
|
Directorships or
trusteeships of companies required to report to the Securities and Exchange Commission (i.e., “public companies”). |
| (k)
|
“Interested
person” of the Trust within the meaning of the Investment Company Act of 1940 (referred to as the 1940 Act), which is the principal federal law governing investment companies like the fund, as a result of a position with MFS. The address of
MFS is 111 Huntington Avenue, Boston, Massachusetts 02199-7618. |
Each Trustee (other than Messrs. Jones, Kilman and Roberge)
has been elected by shareholders and each Trustee and Officer holds office until his or her successor is chosen and qualified or until his or her earlier death, resignation, retirement or removal. Mr. Roberge became a Trustee of the Funds on January
1, 2021 and Messrs. Jones and Kilman became Trustees of the Funds on January 1, 2019. The Trust does not hold annual meetings for the purpose of electing Trustees, and Trustees are not elected for fixed terms. Under the terms of the Board's
retirement policy, an Independent Trustee shall retire at the end of the calendar year in which he or she reaches the earlier of 75 years of age or 15 years of service on the Board (or, in the case of any Independent Trustee who joined the Board
prior to 2015, 20 years of service on the Board).
Messrs. Buller, Kilman and Otis and Ms. Roepke are members
of the Trust’s Audit Committee.
MFS Emerging Markets Equity
Portfolio
Trustees and Officers - continued
Each
of the Interested Trustees and certain Officers hold comparable officer positions with certain affiliates of MFS.
The Statement of Additional Information for a Fund includes
further information about the Trustees and is available without charge upon request by calling 1-800-225-2606.
| Investment
Adviser |
Custodian
|
Massachusetts Financial
Services Company
111 Huntington Avenue
Boston, MA 02199-7618 |
State Street
Bank and Trust Company
1 Lincoln Street
Boston, MA 02111-2900 |
| Distributor
|
Independent
Registered Public Accounting Firm |
MFS Fund
Distributors, Inc.
111 Huntington Avenue
Boston, MA 02199-7618 |
Deloitte
& Touche LLP
200 Berkeley Street
Boston, MA 02116 |
| Portfolio
Manager(s) |
|
Jose Luis
Garcia
Rajesh Nair
Harry Purcell |
|
MFS Emerging Markets
Equity Portfolio
Board Review of Investment Advisory Agreement
MFS Emerging Markets Equity Portfolio
The Investment Company Act of 1940 requires that both the
full Board of Trustees and a majority of the non-interested (“independent”) Trustees, voting separately, annually approve the continuation of the Fund’s investment advisory agreement with MFS. The Trustees consider matters bearing
on the Fund and its advisory arrangements at their meetings throughout the year, including a review of performance data at each regular meeting. In addition, the independent Trustees met several times by videoconference (in accordance with
Securities and Exchange Commission relief) over the course of three months beginning in May and ending in July, 2021 (“contract review meetings”) for the specific purpose of considering whether to approve the continuation of the
investment advisory agreement for the Fund and the other investment companies that the Board oversees (the “MFS Funds”). The independent Trustees were assisted in their evaluation of the Fund’s investment advisory agreement by
independent legal counsel, from whom they received separate legal advice and with whom they met separately from MFS during various contract review meetings. The independent Trustees were also assisted in this process by an independent consultant who
was retained by and reported to the independent Trustees.
In connection with their deliberations regarding the
continuation of the investment advisory agreement, the Trustees, including the independent Trustees, considered such information and factors as they believed, in light of the legal advice furnished to them and their own business judgment, to be
relevant. The investment advisory agreement for the Fund was considered separately, although the Trustees also took into account the common interests of all MFS Funds in their review. As described below, the Trustees considered the nature, quality,
and extent of the various investment advisory, administrative, and shareholder services performed by MFS under the existing investment advisory agreement and other arrangements with the Fund.
In connection with their contract review meetings, the
Trustees received and relied upon materials that included, among other items: (i) information provided by Broadridge Financial Solutions, Inc. (“Broadridge”), an independent third party, on the investment performance of the Fund for
various time periods ended December 31, 2020 and the investment performance of a group of funds with substantially similar investment classifications/objectives (the “Broadridge performance universe”), (ii) information provided by
Broadridge on the Fund’s advisory fees and other expenses and the advisory fees and other expenses of comparable funds identified by Broadridge as well as all other funds in the same investment classification/category (the “Broadridge
expense group and universe”), (iii) information provided by MFS on the advisory fees of portfolios of other clients of MFS, including institutional separate accounts and other clients, (iv) information as to whether and to what extent
applicable expense waivers, reimbursements or fee “breakpoints” are observed for the Fund, (v) information regarding MFS’ financial results and financial condition, including MFS’ and certain of its affiliates’
estimated profitability from services performed for the Fund and the MFS Funds as a whole, and compared to MFS’ institutional business, (vi) MFS’ views regarding the outlook for the mutual fund industry and the strategic business plans
of MFS, (vii) descriptions of various functions performed by MFS for the Funds, such as compliance monitoring and portfolio trading practices, and (viii) information regarding the overall organization of MFS, including information about MFS’
senior management and other personnel providing investment advisory, administrative and other services to the Fund and the other MFS Funds. The comparative performance, fee and expense information prepared and provided by Broadridge was not
independently verified and the independent Trustees did not independently verify any information provided to them by MFS.
The Trustees’ conclusion as to the continuation of
the investment advisory agreement was based on a comprehensive consideration of all information provided to the Trustees and not the result of any single factor. Some of the factors that figured particularly in the Trustees’ deliberations are
described below, although individual Trustees may have evaluated the information presented differently from one another, giving different weights to various factors. It is also important to recognize that the fee arrangements for the Fund and other
MFS Funds are the result of years of review and discussion between the independent Trustees and MFS, that certain aspects of such arrangements may receive greater scrutiny in some years than in others, and that the Trustees’ conclusions may be
based, in part, on their consideration of these same arrangements during the course of the year and in prior years.
Based on information provided by Broadridge and MFS, the
Trustees reviewed the Fund’s total return investment performance as well as the Broadridge performance universe over various time periods. The Trustees placed particular emphasis on the total return performance of the Fund’s Initial
Class shares in comparison to the performance of funds in its Broadridge performance universe over the five-year period ended December 31, 2020, which the Trustees believed was a long enough period to reflect differing market conditions. The total
return performance of the Fund’s Initial Class shares was in the 4th quintile relative to the other funds in the universe for this five-year period (the 1st quintile being the best performers and the 5th quintile being the worst performers).
The total return performance of the Fund’s Initial Class shares was in the 5th quintile for the one-year period and the 4th quintile for the three-year period ended December 31, 2020 relative to the Broadridge performance universe. Because of
the passage of time, these performance results may differ from the performance results for more recent periods, including those shown elsewhere in this report.
In the course of their deliberations, the Trustees took
into account information provided by MFS in connection with the contract review meetings, as well as during investment review meetings conducted with portfolio management personnel during the course of the year regarding the Fund’s
performance. The Trustees noted that the total return performance (Class I shares) of the Fund’s retail counterpart, MFS Emerging Markets Equity Fund, which has substantially similar investment strategies, was in the 3rd quintile
MFS Emerging Markets Equity
Portfolio
Board Review of Investment Advisory Agreement - continued
relative to the
other funds in its Broadridge performance universe for the five-year period ended December 31, 2020. After reviewing these and related factors, the Trustees concluded, within the context of their overall conclusions regarding the investment advisory
agreement, that they were satisfied with MFS’ responses and efforts relating to investment performance.
In assessing the reasonableness of the Fund’s
advisory fee, the Trustees considered, among other information, the Fund’s advisory fee and the total expense ratio of the Fund’s Initial Class shares as a percentage of average daily net assets and the advisory fee and total expense
ratios of the Broadridge expense group based on information provided by Broadridge. The Trustees considered that MFS currently observes an expense limitation for the Fund, which may not be changed without the Trustees’ approval. The Trustees
also considered that, according to the data provided by Broadridge (which takes into account any fee reductions or expense limitations that were in effect during the Fund’s last fiscal year), the Fund’s effective advisory fee rate was
lower than the Broadridge expense group median and the Fund’s total expense ratio was higher than the Broadridge expense group median.
The Trustees also considered the advisory fees charged by
MFS to any institutional separate accounts advised by MFS (“separate accounts”) and unaffiliated investment companies for which MFS serves as subadviser (“subadvised funds”) that have comparable investment strategies to the
Fund, if any. In comparing these fees, the Trustees considered information provided by MFS as to the generally broader scope of services provided by MFS to the Fund, as well as the more extensive regulatory burdens imposed on MFS in managing the
Fund, in comparison to separate accounts and subadvised funds. The Trustees also considered the higher demands placed on MFS’ investment personnel and trading infrastructure as a result of the daily cash in-flows and out-flows of the Fund in
comparison to separate accounts.
The Trustees also
considered whether the Fund may benefit from any economies of scale in the management of the Fund in the event of growth in assets of the Fund and/or growth in assets of the MFS Funds as a whole. They noted that the Fund’s advisory fee rate
schedule is subject to a contractual breakpoint that reduces the Fund’s advisory fee rate on average daily net assets over $500 million. The Trustees also noted that MFS has agreed in writing to waive a portion of the management fees of
certain MFS Funds, including the Fund, if the total combined assets of certain funds within the MFS Funds’ complex increase above agreed upon thresholds (the “group fee waiver”), enabling the Fund’s shareholders to share in
the benefits from any economies of scale at the complex level. The group fee waiver is reviewed and renewed annually between the Board and MFS. The Trustees concluded that the breakpoint and the group fee waiver were sufficient to allow the Fund to
benefit from economies of scale as its assets and overall complex assets grow.
The Trustees also considered information prepared by MFS
relating to MFS’ costs and profits with respect to the Fund, the MFS Funds considered as a group, and other investment companies and accounts advised by MFS, as well as MFS’ methodologies used to determine and allocate its costs to the
MFS Funds, the Fund and other accounts and products for purposes of estimating profitability.
After reviewing these and other factors described herein,
the Trustees concluded, within the context of their overall conclusions regarding the investment advisory agreement, that the advisory fees charged to the Fund represent reasonable compensation in light of the services being provided by MFS to the
Fund.
In addition, the Trustees considered MFS’
resources and related efforts to continue to retain, attract and motivate capable personnel to serve the Fund. The Trustees also considered current and developing conditions in the financial services industry, including the presence of large and
well-capitalized companies which are spending, and appear to be prepared to continue to spend, substantial sums to engage personnel and to provide services to competing investment companies. In this regard, the Trustees also considered the financial
resources of MFS and its ultimate parent, Sun Life Financial Inc. The Trustees also considered the advantages and possible disadvantages to the Fund of having an adviser that also serves other investment companies as well as other accounts.
The Trustees also considered the nature, quality, cost, and
extent of administrative, transfer agency, and distribution services provided to the Fund by MFS and its affiliates under agreements and plans other than the investment advisory agreement, including any 12b-1 fees the Fund pays to MFS Fund
Distributors, Inc., an affiliate of MFS. The Trustees also considered the nature, extent and quality of certain other services MFS performs or arranges for on the Fund’s behalf, which may include securities lending programs, directed expense
payment programs, class action recovery programs, and MFS’ interaction with third-party service providers, principally custodians and sub-custodians. The Trustees concluded that the various non-advisory services provided by MFS and its
affiliates on behalf of the Fund were satisfactory.
The Trustees considered so-called “fall-out
benefits” to MFS such as reputational value derived from serving as investment manager to the MFS Funds. The Trustees also considered that MFS discontinued its historic practice of obtaining investment research from portfolio brokerage
commissions paid by certain MFS Funds effective January 2018, and directly pays or voluntarily reimburses a Fund, if applicable, for the costs of external research acquired through the use of the Fund’s portfolio brokerage commissions.
Based on their evaluation of factors that they deemed to be
material, including those factors described above, the Board of Trustees, including the independent Trustees, concluded that the Fund’s investment advisory agreement with MFS should be continued for an additional one-year period, commencing
August 1, 2021.
MFS Emerging Markets
Equity Portfolio
Proxy Voting Policies and Information
MFS votes proxies on behalf of the fund pursuant to proxy
voting policies and procedures that are available without charge, upon request, by calling 1-800-225-2606, by visiting mfs.com/proxyvoting, or by visiting the SEC’s Web site at http://www.sec.gov.
Information regarding how the fund voted proxies relating
to portfolio securities during the most recent twelve-month period ended June 30 is available by August 31 of each year without charge by visiting mfs.com/proxyvoting, or by visiting the SEC’s Web site
at http://www.sec.gov.
Quarterly Portfolio Disclosure
The fund files a complete schedule of portfolio holdings
with the SEC for the first and third quarters of each fiscal year as an exhibit to its reports on Form N-PORT. The fund’s Form N-PORT reports are available on the SEC’s Web site at
http://www.sec.gov. A shareholder can obtain the portfolio holdings report for the first and third quarters of the fund's fiscal year at mfs.com/vit2 by
choosing the fund's name and then scrolling to the “Resources” section and clicking on the “Prospectus and Reports” tab.
FURTHER INFORMATION
From time to time, MFS may post important information about
the fund or the MFS Funds on the MFS Web site (mfs.com). This information is available at https://www.mfs.com/announcements or at
mfs.com/vit2 by choosing the fund's name and then scrolling to the “Resources” section and clicking on the “Announcements” tab, if any.
Information About Fund Contracts and Legal Claims
The fund has entered into contractual arrangements with an
investment adviser, administrator, distributor, shareholder servicing agent, 529 program manager (if applicable), and custodian who each provide services to the fund. Unless expressly stated otherwise, shareholders are not parties to, or intended
beneficiaries of these contractual arrangements, and these contractual arrangements are not intended to create any shareholder right to enforce them against the service providers or to seek any remedy under them against the service providers, either
directly or on behalf of the fund.
Under the
Trust’s By-Laws and Declaration of Trust, any claims asserted against or on behalf of the MFS Funds, including claims against Trustees and Officers, must be brought in state and federal courts located within the Commonwealth of
Massachusetts.
Federal Tax Information (unaudited)
The following information is provided pursuant to
provisions of the Internal Revenue Code.
Income
derived from foreign sources was $1,231,404. The fund intends to pass through foreign tax credits of $155,006 for the fiscal year.
| FACTS
|
WHAT
DOES MFS DO WITH YOUR PERSONAL INFORMATION? |
| Why?
|
Financial
companies choose how they share your personal information. Federal law gives consumers the right to limit some but not all sharing. Federal law also requires us to tell you how we collect, share, and protect your personal information. Please read
this notice carefully to understand what we do. |
| What?
|
The types of
personal information we collect and share depend on the product or service you have with us. This information can include: |
| • Social
Security number and account balances |
| • Account
transactions and transaction history |
| • Checking
account information and wire transfer instructions |
| When
you are no longer our customer, we continue to share your information as described in this notice. |
| How?
|
All
financial companies need to share customers' personal information to run their everyday business. In the section below, we list the reasons financial companies can share their customers' personal information; the reasons MFS chooses to share; and
whether you can limit this sharing. |
Reasons
we can share your
personal information |
Does
MFS share? |
Can
you limit
this sharing? |
For
our everyday business purposes –
such as to process your transactions, maintain your
account(s), respond to court orders and legal
investigations, or report to credit bureaus |
Yes
|
No
|
For
our marketing purposes –
to offer our products and services to you |
No
|
We
don't share |
For
joint marketing with other
financial companies |
No
|
We
don't share |
For
our affiliates' everyday business purposes –
information about your transactions and experiences |
No
|
We
don't share |
For
our affiliates' everyday business purposes –
information about your creditworthiness |
No
|
We
don't share |
| For
nonaffiliates to market to you |
No
|
We
don't share |
| Questions?
|
Call
800-225-2606 or go to mfs.com. |
| Who
we are |
| Who
is providing this notice? |
MFS
Funds, MFS Investment Management, MFS Institutional Advisors, Inc., and MFS Heritage Trust Company. |
| What
we do |
How
does MFS
protect my personal
information? |
To
protect your personal information from unauthorized access and use, we use security measures that comply with federal law. These measures include procedural, electronic, and physical safeguards for the protection of the personal information we
collect about you. |
How
does MFS
collect my personal
information? |
We
collect your personal information, for example, when you |
| • open
an account or provide account information |
| • direct
us to buy securities or direct us to sell your securities |
| • make
a wire transfer |
| We
also collect your personal information from others, such as credit bureaus, affiliates, or other companies. |
| Why
can't I limit all sharing? |
Federal
law gives you the right to limit only |
| • sharing
for affiliates' everyday business purposes – information about your creditworthiness |
| • affiliates
from using your information to market to you |
| • sharing
for nonaffiliates to market to you |
| State
laws and individual companies may give you additional rights to limit sharing. |
| Definitions
|
| Affiliates
|
Companies
related by common ownership or control. They can be financial and nonfinancial companies. |
| •
MFS does not share personal information with affiliates, except for everyday business purposes as described on page one of this notice. |
| Nonaffiliates
|
Companies
not related by common ownership or control. They can be financial and nonfinancial companies. |
| •
MFS does not share with nonaffiliates so they can market to you. |
| Joint
marketing |
A
formal agreement between nonaffiliated financial companies that together market financial products or services to you. |
| •
MFS doesn't jointly market. |
| Other
important information |
| If
you own an MFS product or receive an MFS service in the name of a third party such as a bank or broker-dealer, their privacy policy may apply to you instead of ours. |
Annual Report
December 31, 2021
MFS® Global
Governments Portfolio
MFS® Variable
Insurance Trust II
MFS® Global
Governments Portfolio
|
1
|
|
2
|
|
4
|
|
5
|
|
6
|
|
7
|
|
13
|
|
14
|
|
15
|
|
16
|
|
17
|
|
25
|
|
26
|
|
29
|
|
31
|
|
31
|
|
31
|
|
31
|
|
31
|
|
32
|
The report is prepared for the general information of contract owners. It
is authorized for distribution to prospective investors only when preceded or accompanied by a current prospectus.
NOT FDIC INSURED • MAY LOSE VALUE
• NO BANK OR CREDIT UNION GUARANTEE •
NOT A DEPOSIT • NOT INSURED BY ANY FEDERAL GOVERNMENT
AGENCY OR NCUA/NCUSIF
MFS Global Governments
Portfolio
Dear Contract Owners:
After a powerful rally in 2021 that was spurred by the
introduction of effective coronavirus vaccines and high levels of monetary and fiscal stimulus, markets have recently experienced a rise in volatility. Rising inflation (mostly due to pandemic-related labor and supply chain disruptions), new
COVID-19 variants that are vaccine-resistant, and the prospect of tighter monetary and fiscal policies around the world have all increased investor anxiety.
Rising real (inflation-adjusted) bond yields in the United
States are a headwind for richly valued U.S. growth stocks, though many non-U.S. markets have experienced lower levels of turbulence. In recent months, global economic growth has moderated, with the spread of the Delta and Omicron variants and a
regulatory crackdown in China featuring prominently. Stress in China’s property development sector has also contributed to the slowdown there. A further concern for investors is the tightening of global energy and raw materials supplies caused
in part by geopolitical uncertainty.
However,
above-trend economic growth, strong corporate balance sheets, and nascent signs that global supply chain bottlenecks may be easing, along with a dovish policy shift in China, are supportive fundamentals that we feel could help calm recent market
jitters.
It is times of market transition that
demonstrate the importance of having a deep understanding of company fundamentals, and we have built our global research platform to do just that.
At MFS®, we put our clients’ assets to work responsibly by carefully navigating the increasing complexity of global markets and economies. Guided by our commitment to long-term
investing, we tune out the noise and try to uncover what we believe are the best, most durable investment opportunities in the market. Our unique global investment platform combines collective expertise, long-term discipline, and thoughtful risk
management to create sustainable value for investors.
Respectfully,
Michael W.
Roberge
Chief Executive Officer
MFS Investment Management
February 15, 2022
The opinions expressed in this letter are subject to
change and may not be relied upon for investment advice. No forecasts can be guaranteed.
MFS Global Governments
Portfolio
Portfolio structure (i)
Fixed income
sectors (i)
| Non-U.S.
Government Bonds |
55.9%
|
| U.S.
Treasury Securities |
33.1%
|
| Emerging
Markets Bonds |
3.3%
|
| Commercial
Mortgage-Backed Securities |
1.1%
|
| Municipal
Bonds |
1.0%
|
| Mortgage-Backed
Securities |
0.3%
|
| U.S.
Government Agencies |
0.3%
|
| Investment
Grade Corporates |
0.2%
|
| Collateralized
Debt Obligations |
0.2%
|
Composition including fixed
income credit quality (a)(i)
| AAA
|
10.3%
|
| AA
|
14.0%
|
| A
|
13.0%
|
| BBB
|
17.1%
|
| BB
|
2.1%
|
| U.S.
Government |
33.1%
|
| Federal
Agencies |
0.5%
|
| Not
Rated |
5.3%
|
| Cash
& Cash Equivalents |
4.6%
|
| Other
(o) |
0.0%
|
Portfolio facts (i)
| Average
Duration (d) |
8.1
|
| Average
Effective Maturity (m) |
10.1 yrs.
|
Issuer country weightings
(i)(x)
| United
States |
40.8%
|
| Japan
|
12.7%
|
| Italy
|
11.6%
|
| Spain
|
9.6%
|
| United
Kingdom |
6.8%
|
| Canada
|
3.4%
|
| Australia
|
3.0%
|
| Norway
|
2.0%
|
| Germany
|
1.8%
|
| Other
Countries |
8.3%
|
Currency exposure weightings
(i)(y)
| United
States Dollar |
47.6%
|
| Euro
|
23.5%
|
| Japanese
Yen |
18.4%
|
| British
Pound Sterling |
5.9%
|
| Australian
Dollar |
2.8%
|
| Canadian
Dollar |
2.0%
|
| Danish
Krone |
0.3%
|
| Uruguay
Peso |
0.3%
|
| New
Zealand Dollar |
(1.0)%
|
| Other
Currencies |
0.2%
|
| (a)
|
For all
securities other than those specifically described below, ratings are assigned to underlying securities utilizing ratings from Moody’s, Fitch, and Standard & Poor’s rating agencies and applying the following hierarchy: If all three
agencies provide a rating, the middle rating (after dropping the highest and lowest ratings) is assigned; if two of the three agencies rate a security, the lower of the two is assigned. If none of the 3 rating agencies above assign a rating, but the
security is rated by DBRS Morningstar, then the DBRS Morningstar rating is assigned. If none of the 4 rating agencies listed above rate the security, but the security is rated by the Kroll Bond Rating Agency (KBRA), then the KBRA rating is assigned.
Ratings are shown in the S&P and Fitch scale (e.g., AAA). Securities rated BBB or higher are considered investment grade. All ratings are subject to change. U.S. Government includes securities issued by the U.S. Department of the Treasury.
Federal Agencies includes rated and unrated U.S. Agency fixed-income securities, U.S. Agency mortgage-backed securities, and collateralized mortgage obligations of U.S. Agency mortgage-backed securities. Not Rated includes fixed income securities
and fixed income derivatives that have not been rated by any rating agency. The fund may or may not have held all of these instruments on this date. The fund is not rated by these agencies. |
| (d)
|
Duration is
a measure of how much a bond’s price is likely to fluctuate with general changes in interest rates, e.g., if rates rise 1.00%, a bond with a 5-year duration is likely to lose about 5.00% of its value due to the interest rate move.
|
MFS Global Governments
Portfolio
Portfolio Composition - continued
| (i)
|
For
purposes of this presentation, the components include the value of securities, and reflect the impact of the equivalent exposure of derivative positions, if any. These amounts may be negative from time to time. Equivalent exposure is a calculated
amount that translates the derivative position into a reasonable approximation of the amount of the underlying asset that the portfolio would have to hold at a given point in time to have the same price sensitivity that results from the
portfolio’s ownership of the derivative contract. When dealing with derivatives, equivalent exposure is a more representative measure of the potential impact of a position on portfolio performance than value. The bond component will include
any accrued interest amounts. |
| (m)
|
In
determining each instrument’s effective maturity for purposes of calculating the fund’s dollar-weighted average effective maturity, MFS uses the instrument’s stated maturity or, if applicable, an earlier date on which MFS believes
it is probable that a maturity-shortening device (such as a put, pre-refunding or prepayment) will cause the instrument to be repaid. Such an earlier date can be substantially shorter than the instrument’s stated maturity. |
| (x)
|
Represents
the portfolio’s exposure to issuer countries as a percentage of a portfolio’s net assets. For purposes of this presentation, United States includes Cash & Cash Equivalents. |
| (y)
|
Represents
the portfolio’s exposure to a particular currency as a percentage of a portfolio's net assets. For purposes of this presentation, United States Dollar includes Cash & Cash Equivalents. |
Cash & Cash Equivalents includes any cash, investments in
money market funds, short-term securities, and other assets less liabilities. Please see the Statement of Assets and Liabilities for additional information related to the fund’s cash position and other assets and liabilities.
Other includes equivalent exposure from currency derivatives
and/or any offsets to derivative positions and may be negative.
Percentages are based on net assets as of December 31,
2021.
The portfolio is actively managed and current
holdings may be different.
MFS Global Governments
Portfolio
Management Review
Summary of Results
For the twelve months ended December 31, 2021, Initial
Class shares of the MFS Global Governments Portfolio (fund) provided a total return of -7.43%, while Service Class shares of the fund provided a total return of -7.72%. These compare with a return of -6.50% for the fund’s benchmark, the
JPMorgan Global Government Bond Index (Unhedged).
Market Environment
Over the past year, the global economy was buffeted by an
array of crosscurrents as it adjusted to the ebbs and flows of the pandemic. Among the supportive currents were ample fiscal stimulus, loose monetary policy and the rollout of several highly effective coronavirus vaccines. Negative currents included
the rapid spread of several coronavirus variants, widespread global production bottlenecks and a surge in inflation. After experiencing a burst of exceptionally strong economic activity as the global economy began to reopen, activity became more
muted in the second half of the period amid ongoing supply chain disruptions and a new wave of coronavirus infections, albeit a seemingly milder strain.
Amid rising inflation, markets anticipated a transition
from an exceptionally accommodative environment to a more mixed monetary landscape ahead. Indeed, several central banks in emerging markets have already tightened policy and the US Federal Reserve reduced the pace of its asset purchases in November
and again in December. However, the European Central Bank, the Bank of Japan and the People's Bank of China are expected to maintain accommodative policies. Sovereign bond yields moved modestly higher during the period amid higher inflation and on
expectations of a tighter Fed but remain historically low.
A harsher Chinese regulatory environment toward industries
such as online gaming, food delivery and education increased market volatility as has stress in China's highly leveraged property development sector. Trade relations between the United States and China remained quite strained despite a change in
presidential administrations.
Signs of excess
investor enthusiasm continued to be seen in pockets of the market such as “meme stocks” popular with users of online message boards, cryptocurrencies and heavy retail participation in the market for short-dated options.
Factors Affecting Performance
From an asset allocation perspective, the fund’s
out-of-benchmark exposure to Norwegian-issued bonds, and overweight exposure to Italian bonds, detracted from performance relative to the JPMorgan Global Government Bond Index (Unhedged). The fund's shorter duration(d) stance also held back relative
returns.
On the positive side, favorable security
selection within US and Italian-issued debt strengthened the fund’s relative performance. Yield curve(y) positioning, particularly the fund’s lesser exposure to shifts in the middle portion (centered around maturities of 5 years) of the
US yield curve, further benefited relative returns.
Respectfully,
Portfolio Manager(s)
Robert Spector and Erik Weisman
| (d)
|
Duration is
a measure of how much a bond’s price is likely to fluctuate with general changes in interest rates, e.g., if rates rise 1.00%, a bond with a 5-year duration is likely to lose about 5.00% of its value. |
| (y)
|
A yield
curve graphically depicts the yields of different maturity bonds of the same credit quality and type; a normal yield curve is upward sloping, with short-term rates lower than long-term rates. |
The views expressed in this report are those of the portfolio
manager(s) only through the end of the period of the report as stated on the cover and do not necessarily reflect the views of MFS or any other person in the MFS organization. These views are subject to change at any time based on market or other
conditions, and MFS disclaims any responsibility to update such views. These views may not be relied upon as investment advice or an indication of trading intent on behalf of any MFS portfolio. References to specific securities are not
recommendations of such securities, and may not be representative of any MFS portfolio’s current or future investments.
MFS Global Governments
Portfolio
Performance Summary Through 12/31/21
The following chart illustrates the historical performance
of the fund in comparison to its benchmark(s). Benchmarks are unmanaged and may not be invested in directly. Benchmark returns do not reflect any fees or expenses. The performance of other share classes will be greater than or less than that of the
class depicted below. (See Notes to Performance Summary.)
Performance data shown represents past performance and is no
guarantee of future results. Investment return and principal value fluctuate so your units, when sold, may be worth more or less than the original cost; current performance may be lower or higher than quoted. The performance shown does not reflect
the deduction of taxes, if any, that a contract holder would pay on fund distributions or the redemption of contract units. The returns for the fund shown also do not reflect the deduction of expenses associated with variable products, such as
mortality and expense risk charges, separate account charges, and sales charges imposed by the insurance company separate accounts. Such expenses would reduce the overall returns shown.
Growth of a Hypothetical $10,000 Investment
Total Returns
through 12/31/21
Average annual total returns
| Share
Class |
Class
Inception Date |
1-yr
|
5-yr
|
10-yr
|
| Initial
Class |
5/16/88
|
(7.43)%
|
2.82%
|
0.65%
|
| Service
Class |
8/24/01
|
(7.72)%
|
2.55%
|
0.39%
|
Comparative benchmark(s)
| JPMorgan
Global Government Bond Index (Unhedged) (f) |
(6.50)%
|
2.90%
|
1.06%
|
| (f)
|
Source:
FactSet Research Systems Inc. |
Benchmark Definition(s)
JPMorgan Global Government Bond Index (Unhedged) –
measures developed government bond markets around the world.
It is not possible to invest directly in an index.
Notes to Performance Summary
Average annual total return represents the average annual
change in value for each share class for the periods presented.
Performance results reflect any applicable expense
subsidies and waivers in effect during the periods shown. Without such subsidies and waivers the fund’s performance results would be less favorable. Please see the prospectus and financial statements for completedetails. All results are
historical and assume the reinvestment of any dividends and capital gains distributions.
Performance results do not include adjustments made for
financial reporting purposes in accordance with U.S. generally accepted accounting principles and may differ from amounts reported in the financial highlights.
From time to time the fund may receive proceeds from
litigation settlements, without which performance would be lower.
MFS Global Governments
Portfolio
Expense Table
Fund Expenses Borne by the Contract Holders during the
Period,
July 1, 2021 through December 31, 2021
As
a contract holder of the fund, you incur ongoing costs, including management fees; distribution and/or service (12b-1) fees; and other fund expenses. This example is intended to help you understand your ongoing costs (in dollars) of investing in the
fund and to compare these costs with the ongoing costs of investing in other mutual funds.
The example is based on an investment of $1,000 invested at
the beginning of the period and held for the entire period July 1, 2021 through December 31, 2021.
Actual Expenses
The first line for each share class in the following table
provides information about actual account values and actual expenses. You may use the information in this line, together with the amount you invested, to estimate the expenses that you paid over the period. Simply divide your account value by $1,000
(for example, an $8,600 account value divided by $1,000 = 8.6), then multiply the result by the number in the first line under the heading entitled “Expenses Paid During Period” to estimate the expenses you paid on your account during
this period.
Hypothetical Example for Comparison
Purposes
The second line for each share class in the
following table provides information about hypothetical account values and hypothetical expenses based on the fund’s actual expense ratio and an assumed rate of return of 5% per year before expenses, which is not the fund’s actual
return. The hypothetical account values and expenses may not be used to estimate the actual ending account balance or expenses you paid for the period. You may use this information to compare the ongoing costs of investing in the fund and other
funds. To do so, compare this 5% hypothetical example with the 5% hypothetical examples that appear in the shareholder reports of the other funds.
Please note that the expenses shown in the table are meant
to highlight the fund's ongoing costs only and do not take into account the fees and expenses imposed under the variable contracts through which your investment in the fund is made. Therefore, the second line for each share class in the table is
useful in comparing ongoing costs associated with an investment in vehicles (such as the fund) which fund benefits under variable annuity and variable life insurance contracts and to qualified pension and retirement plans only, and will not help you
determine the relative total costs of investing in the fund through variable annuity and variable life insurance contracts. If the fees and expenses imposed under the variable contracts were included, your costs would have been higher.
Share
Class |
|
Annualized
Expense
Ratio |
Beginning
Account Value
7/01/21 |
Ending
Account Value
12/31/21 |
Expenses
Paid During
Period (p)
7/01/21-12/31/21 |
| Initial
Class |
Actual
|
0.76%
|
$1,000.00
|
$974.05
|
$3.78
|
| Hypothetical
(h) |
0.76%
|
$1,000.00
|
$1,021.37
|
$3.87
|
| Service
Class |
Actual
|
1.01%
|
$1,000.00
|
$971.95
|
$5.02
|
| Hypothetical
(h) |
1.01%
|
$1,000.00
|
$1,020.11
|
$5.14
|
| (h)
|
5% fund return per year
before expenses. |
| (p)
|
“Expenses
Paid During Period” are equal to each class's annualized expense ratio, as shown above, multiplied by the average account value over the period, multiplied by 184/365 (to reflect the one-half year period). |
MFS Global Governments
Portfolio
Portfolio of Investments − 12/31/21
The Portfolio of Investments is a complete list of all
securities owned by your fund. It is categorized by broad-based asset classes.
| Issuer
|
|
|
Shares/Par
|
Value
($) |
| Bonds
– 95.0% |
| Foreign
Bonds – 59.0% |
| Australia
– 3.0% |
| Commonwealth
of Australia, 5.5%, 4/21/2023 |
|
AUD
|
750,000
|
$
581,853 |
| Commonwealth
of Australia, 1%, 12/21/2030 |
|
|
1,950,000
|
1,343,585 |
| Commonwealth
of Australia, 3.25%, 6/21/2039 |
|
|
2,065,000
|
1,741,646 |
| Commonwealth
of Australia, 1.75%, 6/21/2051 |
|
|
125,000
|
78,843 |
| |
|
|
|
$3,745,927 |
| Belgium
– 1.6% |
| Kingdom
of Belgium, 0.4%, 6/22/2040 (n) |
|
EUR
|
1,075,000
|
$
1,163,753 |
| Kingdom
of Belgium, 1.6%, 6/22/2047 |
|
|
355,000
|
471,531 |
| Kingdom
of Belgium, 2.15%, 6/22/2066 |
|
|
200,000
|
316,643 |
| |
|
|
|
$1,951,927 |
| Canada
– 3.4% |
| Government
of Canada, 0.25%, 8/01/2022 |
|
CAD
|
2,850,000
|
$
2,250,102 |
| Government
of Canada, 0.25%, 2/01/2023 |
|
|
1,700,000
|
1,336,495 |
| Province
of Ontario, 1.8%, 10/14/2031 |
|
$
|
250,000
|
248,593 |
| Province
of Ontario, 1.9%, 12/02/2051 |
|
CAD
|
600,000
|
419,452 |
| |
|
|
|
$4,254,642 |
| Cote
d'Ivoire – 0.1% |
| Republic
of Cote d'Ivoire, 6.875%, 10/17/2040 |
|
EUR
|
100,000
|
$
118,691 |
| France
– 1.0% |
| Republic
of France, 0.75%, 5/25/2028 |
|
EUR
|
850,000
|
$
1,025,428 |
| Republic
of France, 4%, 4/25/2055 (n) |
|
|
115,000
|
246,470 |
| |
|
|
|
$1,271,898 |
| Germany
– 1.8% |
| Government
of Germany, 0%, 2/15/2031 |
|
EUR
|
1,370,000
|
$
1,591,551 |
| Government
of Germany, 0%, 8/15/2050 |
|
|
300,000
|
330,865 |
| Landwirtschaftliche
Rentenbank (Federal Republic of Germany), 0.5%, 5/27/2025 |
|
$
|
300,000
|
293,624 |
| |
|
|
|
$2,216,040 |
| Greece
– 1.4% |
| Hellenic
Republic (Republic of Greece), 4.375%, 8/01/2022 |
|
EUR
|
1,500,000
|
$
1,753,432 |
| Italy
– 11.5% |
| Republic
of Italy, 0.95%, 3/15/2023 |
|
EUR
|
1,500,000
|
$
1,735,138 |
| Republic
of Italy, 0.35%, 2/01/2025 |
|
|
3,200,000
|
3,670,180 |
| Republic
of Italy, 2%, 2/01/2028 |
|
|
3,190,000
|
3,932,884 |
| Republic
of Italy, 3.5%, 3/01/2030 |
|
|
2,685,000
|
3,688,727 |
| Republic
of Italy, 2.45%, 9/01/2033 |
|
|
570,000
|
730,780 |
| Republic
of Italy, 5%, 9/01/2040 |
|
|
128,000
|
223,889 |
| Republic
of Italy, 1.7%, 9/01/2051 |
|
|
180,000
|
192,017 |
| |
|
|
|
$14,173,615 |
| Japan
– 12.7% |
| Government
of Japan, 0.8%, 6/20/2023 |
|
JPY
|
60,000,000
|
$
528,394 |
| Government
of Japan, 1.7%, 12/20/2031 |
|
|
627,000,000
|
6,321,619 |
| Government
of Japan, 0.4%, 9/20/2040 |
|
|
535,000,000
|
4,608,497 |
| Government
of Japan, 1.5%, 12/20/2044 |
|
|
110,000,000
|
1,152,786 |
| Government
of Japan, 0.6%, 9/20/2050 |
|
|
150,000,000
|
1,278,058 |
| Government
of Japan, 0.4%, 3/20/2056 |
|
|
90,000,000
|
709,226 |
| Japan
Bank for International Cooperation, 0.625%, 7/15/2025 |
|
$
|
300,000
|
293,205 |
| Japan
Finance Organization for Municipalities, 0.625%, 9/02/2025 (n) |
|
|
250,000
|
243,307 |
| Japan
International Cooperation Agency, 1%, 7/22/2030 |
|
|
250,000
|
238,586 |
MFS Global Governments
Portfolio
Portfolio of
Investments – continued
| Issuer
|
|
|
Shares/Par
|
Value
($) |
| Bonds
– continued |
| Foreign
Bonds – continued |
| Japan
– continued |
| Tokyo
Metropolitan Government , 0.75%, 7/16/2025 (n) |
|
$
|
250,000
|
$
244,263 |
| |
|
|
|
$15,617,941 |
| New
Zealand – 0.9% |
| Government
of New Zealand, 5.5%, 4/15/2023 |
|
NZD
|
1,600,000
|
$
1,150,391 |
| Norway
– 2.0% |
| City
of Oslo, 1.6%, 5/05/2022 |
|
NOK
|
6,000,000
|
$
682,544 |
| Kingdom
of Norway, 2%, 5/24/2023 (n) |
|
|
15,000,000
|
1,723,179 |
| |
|
|
|
$2,405,723 |
| Saudi
Arabia – 0.2% |
| Kingdom
of Saudi Arabia, 2.25%, 2/02/2033 (n) |
|
$
|
200,000
|
$
194,952 |
| Serbia
– 0.2% |
| Republic
of Serbia, 2.125%, 12/01/2030 (n) |
|
$
|
200,000
|
$
187,140 |
| South
Africa – 0.4% |
| Republic
of South Africa, 8.25%, 3/31/2032 |
|
ZAR
|
9,000,000
|
$
509,440 |
| South
Korea – 0.5% |
| Republic
of Korea, 0.875%, 12/10/2023 |
|
KRW
|
750,000,000
|
$
621,400 |
| Spain
– 9.5% |
| Kingdom
of Spain, 0.4%, 4/30/2022 |
|
EUR
|
500,000
|
$
571,322 |
| Kingdom
of Spain, 0.35%, 7/30/2023 |
|
|
2,600,000
|
3,003,233 |
| Kingdom
of Spain, 3.8%, 4/30/2024 |
|
|
1,000,000
|
1,253,372 |
| Kingdom
of Spain, 0.1%, 4/30/2031 (n) |
|
|
4,725,000
|
5,188,979 |
| Kingdom
of Spain, 4.7%, 7/30/2041 |
|
|
215,000
|
402,134 |
| Kingdom
of Spain, 5.15%, 10/31/2044 |
|
|
555,000
|
1,137,513 |
| United
Mexican States, 1%, 10/31/2050 |
|
|
200,000
|
206,679 |
| |
|
|
|
$11,763,232 |
| Supranational
– 0.4% |
| Corporacion
Andina de Fomento, 1.625%, 9/23/2025 |
|
$
|
300,000
|
$
299,482 |
| Inter-American
Development Bank, 0.625%, 7/15/2025 |
|
|
250,000
|
245,272 |
| |
|
|
|
$544,754 |
| Sweden
– 1.3% |
| Kingdom
of Sweden, 0.75%, 11/12/2029 |
|
SEK
|
8,345,000
|
$
965,749 |
| Kommuninvest
I Sverige AB, 0.375%, 2/16/2024 (n) |
|
$
|
300,000
|
296,905 |
| Swedish
Export Credit Corp., 0.625%, 5/14/2025 |
|
|
300,000
|
294,156 |
| |
|
|
|
$1,556,810 |
| United
Kingdom – 6.8% |
| United
Kingdom Treasury, 0.75%, 7/22/2023 |
|
GBP
|
1,000,000
|
$
1,358,565 |
| United
Kingdom Treasury, 4.75%, 12/07/2030 |
|
|
1,515,000
|
2,725,922 |
| United
Kingdom Treasury, 1.75%, 9/07/2037 |
|
|
455,000
|
667,455 |
| United
Kingdom Treasury, 3.25%, 1/22/2044 |
|
|
270,000
|
511,033 |
| United
Kingdom Treasury, 4.25%, 12/07/2046 |
|
|
125,000
|
280,498 |
| United
Kingdom Treasury, 4.25%, 12/07/2049 |
|
|
535,000
|
1,260,436 |
| United
Kingdom Treasury, 3.75%, 7/22/2052 |
|
|
214,000
|
485,254 |
| United
Kingdom Treasury, 4%, 1/22/2060 |
|
|
195,000
|
512,786 |
| United
Kingdom Treasury, 3.5%, 7/22/2068 |
|
|
230,000
|
609,428 |
| |
|
|
|
$8,411,377 |
| Uruguay
– 0.3% |
| Oriental
Republic of Uruguay, 8.25%, 5/21/2031 |
|
UYU
|
15,991,000
|
$
344,182 |
| Total
Foreign Bonds |
|
|
$
72,793,514 |
MFS Global Governments
Portfolio
Portfolio of
Investments – continued
| Issuer
|
|
|
Shares/Par
|
Value
($) |
| Bonds
– continued |
| U.S.
Bonds – 36.0% |
| Asset-Backed
& Securitized – 1.3% |
| 3650R
Commercial Mortgage Trust, 2021-PF1, “XA”, 1.038%, 11/15/2054 (i) |
|
$
|
1,039,900
|
$
75,773 |
| Arbor
Multifamily Mortgage Securities, 2021-MF3, “XA”, 0.742%, 10/15/2054 (i)(n) |
|
|
3,167,404
|
172,690 |
| Cantor
Commercial Real Estate, 2019-CF3, “A4”, 3.005%, 1/15/2053 |
|
|
315,000
|
332,017 |
| Citigroup
Commercial Mortgage Trust, 2019-C7, “A4”, 3.102%, 12/15/2072 |
|
|
233,275
|
248,200 |
| Commercial
Mortgage Pass-Through Certificates, 2019-BN24, “A3”, 2.96%, 11/15/2062 |
|
|
170,384
|
180,426 |
| Morgan
Stanley Capital I Trust, 2021-L7, “XA”, 1.107%, 10/15/2054 (i) |
|
|
3,827,713
|
302,294 |
| ReadyCap
Commercial Mortgage Trust, 2021-FL7, “A”, FLR, 1.28% (LIBOR - 1mo. + 1.2%), 11/25/2036 (z) |
|
|
194,989
|
194,870 |
| ReadyCap
Commercial Mortgage Trust, 2021-FL7, “AS”, FLR, 1.58% (LIBOR - 1mo. + 1.5%), 11/25/2036 (z) |
|
|
100,000
|
99,907 |
| |
|
|
|
$1,606,177 |
| Consumer
Services – 0.1% |
| Conservation
Fund, 3.474%, 12/15/2029 |
|
$
|
158,000
|
$
166,757 |
| Industrial
– 0.1% |
| Howard
University, Washington D.C., 2.738%, 10/01/2022 |
|
$
|
28,000
|
$
28,173 |
| Howard
University, Washington D.C., 2.801%, 10/01/2023 |
|
|
30,000
|
30,666 |
| Howard
University, Washington D.C., AGM, 2.416%, 10/01/2024 |
|
|
33,000
|
33,637 |
| Howard
University, Washington D.C., AGM, 2.516%, 10/01/2025 |
|
|
42,000
|
42,359 |
| |
|
|
|
$134,835 |
| Mortgage-Backed
– 0.3% |
| Freddie
Mac, 1.169%, 9/25/2030 (i) |
|
$
|
329,805
|
$
30,762 |
| Freddie
Mac, 0.536%, 9/25/2031 (i) |
|
|
2,295,212
|
111,712 |
| Freddie
Mac, 0.855%, 9/25/2031 (i) |
|
|
706,831
|
53,349 |
| Freddie
Mac, 0.349%, 11/25/2031 (i) |
|
|
3,422,551
|
111,472 |
| Freddie
Mac, 0.567%, 12/25/2031 (i) |
|
|
568,544
|
28,337 |
| |
|
|
|
$335,632 |
| Municipals
– 1.0% |
| California
Earthquake Authority Rev., “B”, 1.477%, 7/01/2023 |
|
$
|
60,000
|
$
60,533 |
| Chicago,
IL, Board of Education, “E”, BAM, 6.138%, 12/01/2039 |
|
|
250,000
|
335,415 |
| Illinois
Sales Tax Securitization Corp., Second Lien, “B”, BAM, 3.411%, 1/01/2043 |
|
|
240,000
|
256,213 |
| Massachusetts
Educational Financing Authority, Education Loan Rev., “A”, 2.562%, 7/01/2026 |
|
|
20,000
|
20,622 |
| Massachusetts
Educational Financing Authority, Education Loan Rev., “A”, 2.682%, 7/01/2027 |
|
|
100,000
|
103,673 |
| Michigan
Finance Authority Hospital Rev. (Trinity Health Credit Group), 3.384%, 12/01/2040 |
|
|
285,000
|
310,282 |
| West
Virginia Tobacco Settlement Financing Authority Asset-Backed Refunding, “A-1”, 1.497%, 6/01/2024 |
|
|
80,000
|
80,044 |
| West
Virginia Tobacco Settlement Financing Authority Asset-Backed Refunding, “A-1”, 1.647%, 6/01/2025 |
|
|
65,000
|
64,699 |
| |
|
|
|
$1,231,481 |
| U.S.
Government Agencies and Equivalents – 0.3% |
| Small
Business Administration, 4.57%, 6/01/2025 |
|
$
|
1,557
|
$
1,606 |
| Small
Business Administration, 5.09%, 10/01/2025 |
|
|
1,625
|
1,690 |
| Small
Business Administration, 5.21%, 1/01/2026 |
|
|
21,650
|
22,636 |
| Small
Business Administration, 2.22%, 3/01/2033 |
|
|
289,402
|
293,176 |
| |
|
|
|
$319,108 |
| U.S.
Treasury Obligations – 32.9% |
| U.S.
Treasury Bonds, 4.5%, 8/15/2039 |
|
$
|
2,931,400
|
$
4,139,687 |
| U.S.
Treasury Bonds, 2.75%, 11/15/2042 |
|
|
2,111,000
|
2,405,880 |
| U.S.
Treasury Bonds, 3.625%, 2/15/2044 |
|
|
1,180,000
|
1,535,613 |
| U.S.
Treasury Bonds, 3%, 2/15/2048 |
|
|
810,000
|
988,643 |
| U.S.
Treasury Bonds, 3%, 2/15/2049 |
|
|
3,320,000
|
4,081,784 |
| U.S.
Treasury Notes, 1.625%, 4/30/2023 |
|
|
5,350,000
|
5,427,115 |
| U.S.
Treasury Notes, 0.125%, 1/15/2024 |
|
|
7,400,000
|
7,306,633 |
| U.S.
Treasury Notes, 2.125%, 5/15/2025 |
|
|
8,570,700
|
8,871,679 |
| U.S.
Treasury Notes, 2.875%, 8/15/2028 |
|
|
4,850,000
|
5,296,731 |
MFS Global Governments
Portfolio
Portfolio of
Investments – continued
| Issuer
|
|
|
Shares/Par
|
Value
($) |
| Bonds
– continued |
| U.S.
Bonds – continued |
| U.S.
Treasury Obligations – continued |
| U.S.
Treasury Notes, 1.25%, 8/15/2031 |
|
$
|
550,000
|
$
537,711 |
| |
|
|
|
$40,591,476 |
| Total
U.S. Bonds |
|
|
|
$
44,385,466 |
| Total
Bonds (Identified Cost, $117,338,596) |
|
$
117,178,980 |
| Investment
Companies (h) – 4.3% |
| Money
Market Funds – 4.3% |
|
| MFS
Institutional Money Market Portfolio, 0.07% (v) (Identified Cost, $5,318,456) |
|
|
5,318,456
|
$
5,318,456 |
| Other
Assets, Less Liabilities – 0.7% |
|
924,674 |
| Net
Assets – 100.0% |
|
$
123,422,110 |
| (h) |
An affiliated issuer, which
may be considered one in which the fund owns 5% or more of the outstanding voting securities, or a company which is under common control. At period end, the aggregate values of the fund's investments in affiliated issuers and in unaffiliated issuers
were $5,318,456 and $117,178,980, respectively. |
| (i)
|
Interest
only security for which the fund receives interest on notional principal (Par amount). Par amount shown is the notional principal and does not reflect the cost of the security. |
| (n)
|
Securities
exempt from registration under Rule 144A of the Securities Act of 1933. These securities may be sold in the ordinary course of business in transactions exempt from registration, normally to qualified institutional buyers. At period end, the
aggregate value of these securities was $9,661,638, representing 7.8% of net assets. |
| (v)
|
Affiliated
issuer that is available only to investment companies managed by MFS. The rate quoted for the MFS Institutional Money Market Portfolio is the annualized seven-day yield of the fund at period end. |
| (z)
|
Restricted
securities are not registered under the Securities Act of 1933 and are subject to legal restrictions on resale. These securities generally may be resold in transactions exempt from registration or to the public if the securities are subsequently
registered. Disposal of these securities may involve time-consuming negotiations and prompt sale at an acceptable price may be difficult. The fund holds the following restricted securities: |
| Restricted
Securities |
Acquisition
Date |
Cost
|
Value
|
| ReadyCap
Commercial Mortgage Trust, 2021-FL7, “A”, FLR, 1.28% (LIBOR - 1mo. + 1.2%), 11/25/2036 |
11/12/21
|
$194,989
|
$194,870
|
| ReadyCap
Commercial Mortgage Trust, 2021-FL7, “AS”, FLR, 1.58% (LIBOR - 1mo. + 1.5%), 11/25/2036 |
11/12/21
|
100,000
|
99,907
|
| Total
Restricted Securities |
|
|
$294,777
|
| %
of Net assets |
|
|
0.2%
|
| The
following abbreviations are used in this report and are defined: |
| AGM
|
Assured
Guaranty Municipal |
| BAM
|
Build
America Mutual |
| FLR
|
Floating
Rate. Interest rate resets periodically based on the parenthetically disclosed reference rate plus a spread (if any). The period-end rate reported may not be the current rate. All reference rates are USD unless otherwise noted. |
| LIBOR
|
London
Interbank Offered Rate |
| Abbreviations
indicate amounts shown in currencies other than the U.S. dollar. All amounts are stated in U.S. dollars unless otherwise indicated. A list of abbreviations is shown below: |
| AUD
|
Australian
Dollar |
| BRL
|
Brazilian
Real |
| CAD
|
Canadian
Dollar |
| CLP
|
Chilean
Peso |
| CZK
|
Czech
Koruna |
| DKK
|
Danish
Krone |
| EUR
|
Euro
|
| GBP
|
British
Pound |
| JPY
|
Japanese
Yen |
MFS Global Governments
Portfolio
Portfolio of
Investments – continued
| KRW
|
South Korean Won |
| NOK
|
Norwegian
Krone |
| NZD
|
New Zealand
Dollar |
| SEK
|
Swedish
Krona |
| TWD
|
Taiwan
Dollar |
| UYU
|
Uruguayan
Peso |
| ZAR
|
South
African Rand |
| Derivative
Contracts at 12/31/21 |
| Forward
Foreign Currency Exchange Contracts |
Currency
Purchased |
Currency
Sold |
Counterparty
|
Settlement
Date |
Unrealized
Appreciation
(Depreciation) |
| Asset
Derivatives |
| AUD
|
1,346,506
|
USD
|
979,571
|
Morgan
Stanley Capital Services, Inc. |
1/14/2022
|
$
104 |
| AUD
|
2,507,000
|
USD
|
1,788,114
|
State
Street Bank Corp. |
1/14/2022
|
35,901
|
| CZK
|
13,549,000
|
USD
|
613,607
|
Goldman
Sachs International |
1/14/2022
|
5,916
|
| EUR
|
318,128
|
USD
|
358,107
|
Barclays
Bank PLC |
1/14/2022
|
4,153
|
| EUR
|
664,457
|
USD
|
748,541
|
Brown
Brothers Harriman |
1/14/2022
|
8,092
|
| EUR
|
2,556,613
|
USD
|
2,896,084
|
Goldman
Sachs International |
1/14/2022
|
15,191
|
| EUR
|
697,248
|
USD
|
792,278
|
JPMorgan
Chase Bank N.A. |
1/14/2022
|
1,695
|
| GBP
|
479,000
|
USD
|
646,315
|
Brown
Brothers Harriman |
1/14/2022
|
2,023
|
| GBP
|
432,000
|
USD
|
575,549
|
Morgan
Stanley Capital Services, Inc. |
1/14/2022
|
9,173
|
| USD
|
1,184,809
|
AUD
|
1,600,000
|
Deutsche
Bank AG |
4/08/2022
|
20,422
|
| USD
|
817,574
|
AUD
|
1,096,434
|
Morgan
Stanley Capital Services, Inc. |
1/14/2022
|
19,842
|
| USD
|
1,169,877
|
AUD
|
1,560,480
|
State
Street Bank Corp. |
1/14/2022
|
34,522
|
| USD
|
2,519,648
|
CAD
|
3,164,496
|
HSBC
Bank |
1/14/2022
|
17,990
|
| USD
|
2,554,829
|
CAD
|
3,159,499
|
Morgan
Stanley Capital Services, Inc. |
1/14/2022
|
57,121
|
| USD
|
603
|
CLP
|
494,000
|
Goldman
Sachs International |
2/18/2022
|
27
|
| USD
|
37,561
|
DKK
|
241,000
|
State
Street Bank Corp. |
1/14/2022
|
658
|
| USD
|
786,851
|
EUR
|
676,811
|
Barclays
Bank PLC |
4/12/2022
|
14,650
|
| USD
|
491,035
|
EUR
|
422,345
|
Citibank
N.A. |
1/14/2022
|
10,100
|
| USD
|
2,011,112
|
EUR
|
1,736,022
|
Deutsche
Bank AG |
1/14/2022
|
34,264
|
| USD
|
18,820,098
|
EUR
|
16,264,015
|
Morgan
Stanley Capital Services, Inc. |
1/14/2022
|
299,881
|
| USD
|
1,849,453
|
EUR
|
1,592,864
|
UBS
AG |
1/14/2022
|
35,620
|
| USD
|
5,364,067
|
GBP
|
3,911,405
|
Deutsche
Bank AG |
1/14/2022
|
69,887
|
| USD
|
602,690
|
GBP
|
438,595
|
Merrill
Lynch International |
1/14/2022
|
9,041
|
| USD
|
1,336,158
|
JPY
|
151,433,064
|
Deutsche
Bank AG |
1/14/2022
|
19,610
|
| USD
|
470,101
|
JPY
|
53,972,000
|
JPMorgan
Chase Bank N.A. |
1/14/2022
|
873
|
| USD
|
274,395
|
JPY
|
30,952,000
|
State
Street Bank Corp. |
1/14/2022
|
5,300
|
| USD
|
1,226,202
|
NOK
|
10,348,035
|
Deutsche
Bank AG |
1/14/2022
|
51,384
|
| USD
|
1,265,670
|
NOK
|
10,637,000
|
Morgan
Stanley Capital Services, Inc. |
1/14/2022
|
58,046
|
| USD
|
50,147
|
NOK
|
429,000
|
State
Street Bank Corp. |
1/14/2022
|
1,442
|
| USD
|
613,904
|
NZD
|
881,703
|
Goldman
Sachs International |
1/14/2022
|
10,078
|
| USD
|
602,134
|
NZD
|
852,721
|
JPMorgan
Chase Bank N.A. |
1/14/2022
|
18,155
|
| USD
|
1,251,410
|
NZD
|
1,768,000
|
Morgan
Stanley Capital Services, Inc. |
1/14/2022
|
40,611
|
| USD
|
3,506,341
|
SEK
|
30,835,950
|
JPMorgan
Chase Bank N.A. |
1/14/2022
|
93,575
|
| USD
|
1,240,569
|
SEK
|
10,913,000
|
Morgan
Stanley Capital Services, Inc. |
1/14/2022
|
32,774
|
| USD
|
1,250,703
|
SEK
|
10,727,000
|
State
Street Bank Corp. |
1/14/2022
|
63,494
|
| USD
|
1,050
|
TWD
|
29,000
|
JPMorgan
Chase Bank N.A. |
2/18/2022
|
2
|
| USD
|
543,147
|
ZAR
|
8,360,013
|
State
Street Bank Corp. |
1/14/2022
|
19,237
|
| |
|
|
|
|
|
$
1,120,854 |
| Liability
Derivatives |
| AUD
|
831,000
|
USD
|
624,440
|
Brown
Brothers Harriman |
1/14/2022
|
$
(19,831) |
| AUD
|
2,555,000
|
USD
|
1,885,476
|
Deutsche
Bank AG |
1/14/2022
|
(26,538)
|
| AUD
|
846,000
|
USD
|
621,998
|
JPMorgan
Chase Bank N.A. |
1/14/2022
|
(6,475)
|
| AUD
|
1,468,452
|
USD
|
1,099,243
|
Morgan
Stanley Capital Services, Inc. |
1/14/2022
|
(30,843)
|
| AUD
|
998,000
|
USD
|
730,675
|
State
Street Bank Corp. |
1/14/2022
|
(4,562)
|
MFS Global Governments
Portfolio
Portfolio of
Investments – continued
| Forward
Foreign Currency Exchange Contracts - continued |
Currency
Purchased |
Currency
Sold |
Counterparty
|
Settlement
Date |
Unrealized
Appreciation
(Depreciation) |
| Liability
Derivatives - continued |
| CAD
|
847,000
|
USD
|
679,795
|
BNP
Paribas S.A. |
1/14/2022
|
$
(10,209) |
| CAD
|
950,405
|
USD
|
769,121
|
Deutsche
Bank AG |
1/14/2022
|
(17,788)
|
| CAD
|
773,000
|
USD
|
625,670
|
Goldman
Sachs International |
1/14/2022
|
(14,583)
|
| CAD
|
1,881,610
|
USD
|
1,524,797
|
HSBC
Bank |
1/14/2022
|
(37,311)
|
| DKK
|
2,939,237
|
USD
|
457,052
|
Morgan
Stanley Capital Services, Inc. |
1/14/2022
|
(6,987)
|
| EUR
|
1,330,739
|
USD
|
1,527,157
|
Brown
Brothers Harriman |
1/14/2022
|
(11,812)
|
| EUR
|
3,384,466
|
USD
|
3,901,293
|
Deutsche
Bank AG |
1/14/2022
|
(47,322)
|
| EUR
|
556,505
|
USD
|
651,525
|
HSBC
Bank |
1/14/2022
|
(17,820)
|
| EUR
|
3,300,180
|
USD
|
3,847,827
|
JPMorgan
Chase Bank N.A. |
1/14/2022
|
(89,833)
|
| EUR
|
1,678,476
|
USD
|
1,943,461
|
Morgan
Stanley Capital Services, Inc. |
1/14/2022
|
(32,141)
|
| EUR
|
1,600,000
|
USD
|
1,822,979
|
State
Street Bank Corp. |
1/14/2022
|
(1,021)
|
| EUR
|
1,897,876
|
USD
|
2,201,212
|
UBS
AG |
1/14/2022
|
(40,055)
|
| GBP
|
4,160,823
|
USD
|
5,663,585
|
State
Street Bank Corp. |
1/14/2022
|
(31,811)
|
| JPY
|
181,819,792
|
USD
|
1,596,408
|
Brown
Brothers Harriman |
1/14/2022
|
(15,681)
|
| JPY
|
106,529,000
|
USD
|
941,530
|
HSBC
Bank |
1/14/2022
|
(15,375)
|
| JPY
|
915,247,373
|
USD
|
8,237,808
|
JPMorgan
Chase Bank N.A. |
1/14/2022
|
(280,718)
|
| NZD
|
1,765,000
|
USD
|
1,234,343
|
State
Street Bank Corp. |
1/14/2022
|
(25,599)
|
| SEK
|
10,867,000
|
USD
|
1,259,920
|
Brown
Brothers Harriman |
1/14/2022
|
(57,216)
|
| SEK
|
7,869,000
|
USD
|
908,098
|
Deutsche
Bank AG |
1/14/2022
|
(37,197)
|
| SEK
|
21,403,602
|
USD
|
2,412,268
|
Goldman
Sachs International |
1/14/2022
|
(43,426)
|
| SEK
|
5,716,000
|
USD
|
654,785
|
JPMorgan
Chase Bank N.A. |
1/14/2022
|
(22,168)
|
| ZAR
|
371,000
|
USD
|
25,426
|
Brown
Brothers Harriman |
1/14/2022
|
(2,176)
|
| USD
|
3,030,160
|
AUD
|
4,189,376
|
Morgan
Stanley Capital Services, Inc. |
1/14/2022
|
(17,898)
|
| USD
|
1,855,413
|
AUD
|
2,563,000
|
State
Street Bank Corp. |
1/14/2022
|
(9,345)
|
| USD
|
18,098
|
BRL
|
103,465
|
JPMorgan
Chase Bank N.A. |
3/03/2022
|
(222)
|
| USD
|
602,655
|
CZK
|
13,549,000
|
Morgan
Stanley Capital Services, Inc. |
1/14/2022
|
(16,869)
|
| USD
|
534,140
|
EUR
|
470,000
|
BNP
Paribas S.A. |
1/14/2022
|
(1,060)
|
| USD
|
87,488
|
EUR
|
77,000
|
Brown
Brothers Harriman |
1/14/2022
|
(194)
|
| USD
|
372,536
|
EUR
|
330,000
|
UBS
AG |
1/14/2022
|
(3,242)
|
| USD
|
584,866
|
GBP
|
434,000
|
JPMorgan
Chase Bank N.A. |
1/14/2022
|
(2,563)
|
| USD
|
613,965
|
GBP
|
460,000
|
Morgan
Stanley Capital Services, Inc. |
1/14/2022
|
(8,656)
|
| USD
|
930,435
|
GBP
|
703,000
|
State
Street Bank Corp. |
1/14/2022
|
(21,091)
|
| USD
|
307,857
|
JPY
|
35,471,000
|
HSBC
Bank |
1/14/2022
|
(525)
|
| USD
|
624,100
|
KRW
|
743,492,202
|
Morgan
Stanley Capital Services, Inc. |
2/16/2022
|
(747)
|
| USD
|
1,232,657
|
NZD
|
1,828,000
|
JPMorgan
Chase Bank N.A. |
1/14/2022
|
(19,233)
|
| |
|
|
|
|
|
$(1,048,143)
|
At December 31, 2021, the fund had
cash collateral of $330,000 to cover any collateral or margin obligations and certain derivative contracts. Restricted cash and/or deposits with brokers in the Statement of Assets and Liabilities are comprised of cash collateral.
See Notes to Financial Statements
MFS Global Governments
Portfolio
| Financial
Statements |
Statement of Assets and
Liabilities |
This statement
represents your fund’s balance sheet, which details the assets and liabilities comprising the total value of the fund.
| At
12/31/21 Assets |
|
| Investments
in unaffiliated issuers, at value (identified cost, $117,338,596) |
$117,178,980
|
| Investments
in affiliated issuers, at value (identified cost, $5,318,456) |
5,318,456
|
| Foreign
currency, at value (identified cost, $19) |
20
|
| Restricted
cash for |
|
| Forward
foreign currency exchange contracts |
330,000
|
| Receivables
for |
|
| Forward
foreign currency exchange contracts |
1,120,854
|
| Fund
shares sold |
20,368
|
| Interest
|
555,311
|
| Receivable
from investment adviser |
15,975
|
| Other
assets |
876
|
| Total
assets |
$124,540,840
|
| Liabilities
|
|
| Payables
for |
|
| Forward
foreign currency exchange contracts |
$1,048,143
|
| Fund
shares reacquired |
463
|
| Payable
to affiliates |
|
| Administrative
services fee |
149
|
| Shareholder
servicing costs |
12
|
| Distribution
and/or service fees |
11
|
| Payable
for independent Trustees' compensation |
99
|
| Accrued
expenses and other liabilities |
69,853
|
| Total
liabilities |
$1,118,730
|
| Net
assets |
$123,422,110
|
| Net
assets consist of |
|
| Paid-in
capital |
$124,615,183
|
| Total
distributable earnings (loss) |
(1,193,073)
|
| Net
assets |
$123,422,110
|
| Shares
of beneficial interest outstanding |
11,681,383
|
| |
Net
assets |
Shares
outstanding |
Net
asset value
per share |
| Initial
Class |
$122,645,602
|
11,606,381
|
$10.57
|
| Service
Class |
776,508
|
75,002
|
10.35
|
See Notes to Financial Statements
MFS Global Governments
Portfolio
| Financial
Statements |
Statement of Operations
|
This statement describes how much
your fund earned in investment income and accrued in expenses. It also describes any gains and/or losses generated by fund operations.
| Year
ended 12/31/21 |
|
| Net
investment income (loss) |
|
| Income
|
|
| Interest
|
$1,357,419
|
| Dividends
from affiliated issuers |
2,531
|
| Other
|
29
|
| Foreign
taxes withheld |
(2,812)
|
| Total
investment income |
$1,357,167
|
| Expenses
|
|
| Management
fee |
$952,272
|
| Distribution
and/or service fees |
1,977
|
| Shareholder
servicing costs |
2,246
|
| Administrative
services fee |
27,467
|
| Independent
Trustees' compensation |
4,046
|
| Custodian
fee |
31,768
|
| Shareholder
communications |
5,800
|
| Audit
and tax fees |
77,378
|
| Legal
fees |
675
|
| Miscellaneous
|
32,363
|
| Total
expenses |
$1,135,992
|
| Reduction
of expenses by investment adviser |
(167,846)
|
| Net
expenses |
$968,146
|
| Net
investment income (loss) |
$389,021
|
| Realized
and unrealized gain (loss) |
|
| Realized
gain (loss) (identified cost basis) |
|
| Unaffiliated
issuers (net of $514 country tax) |
$1,852,530
|
| Futures
contracts |
(58,375)
|
| Forward
foreign currency exchange contracts |
(389,484)
|
| Foreign
currency |
15,892
|
| Net
realized gain (loss) |
$1,420,563
|
| Change
in unrealized appreciation or depreciation |
|
| Unaffiliated
issuers |
$(11,947,548)
|
| Futures
contracts |
8,295
|
| Forward
foreign currency exchange contracts |
253,018
|
| Translation
of assets and liabilities in foreign currencies |
(36,218)
|
| Net
unrealized gain (loss) |
$(11,722,453)
|
| Net
realized and unrealized gain (loss) |
$(10,301,890)
|
| Change
in net assets from operations |
$(9,912,869)
|
See Notes to Financial Statements
MFS Global Governments
Portfolio
| Financial
Statements |
Statements of Changes in
Net Assets |
These statements describe
the increases and/or decreases in net assets resulting from operations, any distributions, and any shareholder transactions.
| |
Year
ended |
| |
12/31/21
|
12/31/20
|
| Change
in net assets |
|
|
| From
operations |
|
|
| Net
investment income (loss) |
$389,021
|
$565,320
|
| Net
realized gain (loss) |
1,420,563
|
4,900,087
|
| Net
unrealized gain (loss) |
(11,722,453)
|
6,923,550
|
| Change
in net assets from operations |
$(9,912,869)
|
$12,388,957
|
| Total
distributions to shareholders |
$(2,960,087)
|
$(1,660,302)
|
| Change
in net assets from fund share transactions |
$6,053,242
|
$(10,857,191)
|
| Total
change in net assets |
$(6,819,714)
|
$(128,536)
|
| Net
assets |
|
|
| At
beginning of period |
130,241,824
|
130,370,360
|
| At
end of period |
$123,422,110
|
$130,241,824
|
See Notes to Financial Statements
MFS Global Governments
Portfolio
| Financial
Statements |
Financial Highlights
|
The financial highlights table is
intended to help you understand the fund's financial performance for the past 5 years. Certain information reflects financial results for a single fund share. The total returns in the table represent the rate that an investor would have earned (or
lost) on an investment in the fund share class (assuming reinvestment of all distributions) held for the entire period.
| Initial
Class |
Year
ended |
| |
12/31/21
|
12/31/20
|
12/31/19
|
12/31/18
|
12/31/17
|
| Net
asset value, beginning of period |
$11.69
|
$10.71
|
$10.34
|
$10.56
|
$9.87
|
| Income
(loss) from investment operations |
|
|
|
|
|
| Net
investment income (loss) (d) |
$0.03
|
$0.05
|
$0.11
|
$0.11
|
$0.08
|
| Net
realized and unrealized gain (loss) |
(0.89)
|
1.08
|
0.53
|
(0.23)
|
0.61
|
| Total
from investment operations |
$(0.86)
|
$1.13
|
$0.64
|
$(0.12)
|
$0.69
|
| Less
distributions declared to shareholders |
|
|
|
|
|
| From
net investment income |
$(0.26)
|
$(0.15)
|
$(0.27)
|
$(0.10)
|
$—
|
| Net
asset value, end of period (x) |
$10.57
|
$11.69
|
$10.71
|
$10.34
|
$10.56
|
| Total
return (%) (k)(r)(s)(x) |
(7.43)
|
10.60
|
6.08
|
(1.11)
|
6.99
|
Ratios
(%) (to average net assets)
and Supplemental data: |
|
|
|
|
|
| Expenses
before expense reductions |
0.89
|
0.90
|
0.88
|
0.87
|
0.86
|
| Expenses
after expense reductions |
0.76
|
0.83
|
0.87
|
0.86
|
0.85
|
| Net
investment income (loss) |
0.31
|
0.46
|
1.01
|
1.05
|
0.77
|
| Portfolio
turnover |
132
|
98
|
107
|
79
|
67
|
| Net
assets at end of period (000 omitted) |
$122,646
|
$129,401
|
$129,565
|
$135,008
|
$159,652
|
| Service
Class |
Year
ended |
| |
12/31/21
|
12/31/20
|
12/31/19
|
12/31/18
|
12/31/17
|
| Net
asset value, beginning of period |
$11.46
|
$10.50
|
$10.14
|
$10.34
|
$9.69
|
| Income
(loss) from investment operations |
|
|
|
|
|
| Net
investment income (loss) (d) |
$0.01
|
$0.02
|
$0.08
|
$0.08
|
$0.05
|
| Net
realized and unrealized gain (loss) |
(0.89)
|
1.06
|
0.51
|
(0.22)
|
0.60
|
| Total
from investment operations |
$(0.88)
|
$1.08
|
$0.59
|
$(0.14)
|
$0.65
|
| Less
distributions declared to shareholders |
|
|
|
|
|
| From
net investment income |
$(0.23)
|
$(0.12)
|
$(0.23)
|
$(0.06)
|
$—
|
| Net
asset value, end of period (x) |
$10.35
|
$11.46
|
$10.50
|
$10.14
|
$10.34
|
| Total
return (%) (k)(r)(s)(x) |
(7.72)
|
10.35
|
5.79
|
(1.32)
|
6.71
|
Ratios
(%) (to average net assets)
and Supplemental data: |
|
|
|
|
|
| Expenses
before expense reductions |
1.14
|
1.15
|
1.13
|
1.12
|
1.11
|
| Expenses
after expense reductions |
1.01
|
1.08
|
1.12
|
1.11
|
1.10
|
| Net
investment income (loss) |
0.06
|
0.20
|
0.76
|
0.80
|
0.52
|
| Portfolio
turnover |
132
|
98
|
107
|
79
|
67
|
| Net
assets at end of period (000 omitted) |
$777
|
$841
|
$806
|
$826
|
$1,034
|
| (d)
|
Per share
data is based on average shares outstanding. |
| (k)
|
The total
return does not reflect expenses that apply to separate accounts. Inclusion of these charges would reduce the total return figures for all periods shown. |
| (r)
|
Certain
expenses have been reduced without which performance would have been lower. |
| (s)
|
From time to
time the fund may receive proceeds from litigation settlements, without which performance would be lower. |
| (x)
|
The
net asset values and total returns have been calculated on net assets which include adjustments made in accordance with U.S. generally accepted accounting principles required at period end for financial reporting purposes. |
See Notes to Financial Statements
MFS Global Governments
Portfolio
Notes to Financial Statements
(1) Business and Organization
MFS Global Governments Portfolio (the fund) is a
non-diversified series of MFS Variable Insurance Trust II (the trust). The trust is organized as a Massachusetts business trust and is registered under the Investment Company Act of 1940, as amended, as an open-end management investment company. The
shareholders of each series of the trust are separate accounts of insurance companies, which offer variable annuity and/or life insurance products, and qualified retirement and pension plans.
The fund is an investment company and accordingly follows
the investment company accounting and reporting guidance of the Financial Accounting Standards Board (FASB) Accounting Standards Codification Topic 946 Financial Services - Investment Companies.
(2) Significant Accounting Policies
General — The
preparation of financial statements in conformity with U.S. generally accepted accounting principles requires management to make estimates and assumptions that affect the reported amounts of assets and liabilities, and disclosure of contingent
assets and liabilities at the date of the financial statements and the reported amounts of increases and decreases in net assets from operations during the reporting period. Actual results could differ from those estimates. In the preparation of
these financial statements, management has evaluated subsequent events occurring after the date of the fund’s Statement of Assets and Liabilities through the date that the financial statements were issued. The fund invests in foreign securities. Investments in foreign securities are vulnerable to the effects of changes in the relative values of the local currency and the U.S. dollar and to the effects of changes in each
country’s market, economic, industrial, political, regulatory, geopolitical, environmental, public health, and other conditions.
Balance Sheet Offsetting
— The fund's accounting policy with respect to balance sheet offsetting is that, absent an event of default by the counterparty or a termination of the agreement, the International Swaps and Derivatives Association (ISDA) Master Agreement, or
similar agreement, does not result in an offset of reported amounts of financial assets and financial liabilities in the Statement of Assets and Liabilities across transactions between the fund and the applicable counterparty. The fund's right to
setoff may be restricted or prohibited by the bankruptcy or insolvency laws of the particular jurisdiction to which a specific master netting agreement counterparty is subject. Balance sheet offsetting disclosures, to the extent applicable to the
fund, have been included in the fund’s Significant Accounting Policies note under the captions for each of the fund’s in-scope financial instruments and transactions.
Investment Valuations
— Debt instruments and floating rate loans, including restricted debt instruments, are generally valued at an evaluated or composite bid as provided by a third-party pricing service. Short-term
instruments with a maturity at issuance of 60 days or less may be valued at amortized cost, which approximates market value. Futures contracts are generally valued at last posted settlement price on their
primary exchange as provided by a third-party pricing service. Futures contracts for which there were no trades that day for a particular position are generally valued at the closing bid quotation on their primary exchange as provided by a
third-party pricing service. Forward foreign currency exchange contracts are generally valued at the mean of bid and asked prices for the time period interpolated from rates provided by a third-party pricing
service for proximate time periods. Open-end investment companies are generally valued at net asset value per share. Securities and other assets generally valued on
the basis of information from a third-party pricing service may also be valued at a broker/dealer bid quotation. In determining values, third-party pricing services can utilize both transaction data and
market information such as yield, quality, coupon rate, maturity, type of issue, trading characteristics, and other market data. The values of foreign securities and other assets and liabilities expressed in
foreign currencies are converted to U.S. dollars using the mean of bid and asked prices for rates provided by a third-party pricing service.
The Board of Trustees has delegated primary responsibility
for determining or causing to be determined the value of the fund’s investments (including any fair valuation) to the adviser pursuant to valuation policies and procedures approved by the Board. If the adviser determines that reliable market
quotations are not readily available, investments are valued at fair value as determined in good faith by the adviser in accordance with such procedures under the oversight of the Board of Trustees. Under the fund’s valuation policies and
procedures, market quotations are not considered to be readily available for most types of debt instruments and floating rate loans and many types of derivatives. These investments are generally valued at fair value based on information from
third-party pricing services. In addition, investments may be valued at fair value if the adviser determines that an investment’s value has been materially affected by events occurring after the close of the exchange or market on which the
investment is principally traded (such as foreign exchange or market) and prior to the determination of the fund’s net asset value, or after the halt of trading of a specific security where trading does not resume prior to the close of the
exchange or market on which the security is principally traded. The adviser generally relies on third-party pricing services or other information (such as the correlation with price movements of similar securities in the same or other markets; the
type, cost and investment characteristics of the security; the business and financial condition of the issuer; and trading and other market data) to assist in determining whether to fair value and at what value to fair value an investment. The value
of an investment for purposes of calculating the fund’s net asset value can differ depending on
MFS Global Governments
Portfolio
Notes to Financial Statements - continued
the source and
method used to determine value. When fair valuation is used, the value of an investment used to determine the fund’s net asset value may differ from quoted or published prices for the same investment. There can be no assurance that the fund
could obtain the fair value assigned to an investment if it were to sell the investment at the same time at which the fund determines its net asset value per share.
Various inputs are used in determining the value of the
fund's assets or liabilities. These inputs are categorized into three broad levels. In certain cases, the inputs used to measure fair value may fall into different levels of the fair value hierarchy. In such cases, an investment's level within the
fair value hierarchy is based on the lowest level of input that is significant to the fair value measurement. The fund's assessment of the significance of a particular input to the fair value measurement in its entirety requires judgment, and
considers factors specific to the investment. Level 1 includes unadjusted quoted prices in active markets for identical assets or liabilities. Level 2 includes other significant observable market-based inputs (including quoted prices for similar
securities, interest rates, prepayment speed, and credit risk). Level 3 includes unobservable inputs, which may include the adviser's own assumptions in determining the fair value of investments. Other financial instruments are derivative
instruments, such as forward foreign currency exchange contracts. The following is a summary of the levels used as of December 31, 2021 in valuing the fund's assets and liabilities:
| Financial
Instruments |
Level
1 |
Level
2 |
Level
3 |
Total
|
| U.S.
Treasury Bonds & U.S. Government Agencies & Equivalents |
$—
|
$40,910,584
|
$—
|
$40,910,584
|
| Non
- U.S. Sovereign Debt |
—
|
70,901,757
|
—
|
70,901,757
|
| Municipal
Bonds |
—
|
1,231,481
|
—
|
1,231,481
|
| U.S.
Corporate Bonds |
—
|
301,592
|
—
|
301,592
|
| Residential
Mortgage-Backed Securities |
—
|
335,631
|
—
|
335,631
|
| Commercial
Mortgage-Backed Securities |
—
|
1,311,400
|
—
|
1,311,400
|
| Asset-Backed
Securities (including CDOs) |
—
|
294,777
|
—
|
294,777
|
| Foreign
Bonds |
—
|
1,891,758
|
—
|
1,891,758
|
| Mutual
Funds |
5,318,456
|
—
|
—
|
5,318,456
|
| Total
|
$5,318,456
|
$117,178,980
|
$—
|
$122,497,436
|
| Other
Financial Instruments |
|
|
|
|
| Forward
Foreign Currency Exchange Contracts – Assets |
$—
|
$1,120,854
|
$—
|
$1,120,854
|
| Forward
Foreign Currency Exchange Contracts – Liabilities |
—
|
(1,048,143)
|
—
|
(1,048,143)
|
For further information
regarding security characteristics, see the Portfolio of Investments.
Foreign Currency
Translation — Purchases and sales of foreign investments, income, and expenses are converted into U.S. dollars based upon currency exchange rates prevailing on the respective dates of such transactions or on
the reporting date for foreign denominated receivables and payables. Gains and losses attributable to foreign currency exchange rates on sales of securities are recorded for financial statement purposes as net realized gains and losses on
investments. Gains and losses attributable to foreign exchange rate movements on receivables, payables, income and expenses are recorded for financial statement purposes as foreign currency transaction gains and losses. That portion of both realized
and unrealized gains and losses on investments that results from fluctuations in foreign currency exchange rates is not separately disclosed.
Derivatives — The
fund uses derivatives primarily to increase or decrease exposure to a particular market or segment of the market, or security, to increase or decrease interest rate or currency exposure, or as alternatives to direct investments. Derivatives are used
for hedging or non-hedging purposes. While hedging can reduce or eliminate losses, it can also reduce or eliminate gains. When the fund uses derivatives as an investment to increase market exposure, or for hedging purposes, gains and losses from
derivative instruments may be substantially greater than the derivative’s original cost.
The derivative instruments used by the fund during the
period were futures contracts and forward foreign currency exchange contracts. Depending on the type of derivative, a fund may exit a derivative position by entering into an offsetting transaction with a counterparty or exchange, negotiating an
agreement with the derivative counterparty, or novating the position to a third party. The fund's period end derivatives, as presented in the Portfolio of Investments and the associated Derivative Contract tables, generally are indicative of the
volume of its derivative activity during the period.
The following table presents, by major type of derivative
contract, the fair value, on a gross basis, of the asset and liability components of derivatives held by the fund at December 31, 2021 as reported in the Statement of Assets and Liabilities:
MFS Global Governments
Portfolio
Notes to Financial Statements - continued
| |
|
Fair
Value |
| Risk
|
Derivative
Contracts |
Asset
Derivatives |
Liability
Derivatives |
| Foreign
Exchange |
Forward
Foreign Currency Exchange Contracts |
$1,120,854
|
$(1,048,143)
|
The following table presents, by
major type of derivative contract, the realized gain (loss) on derivatives held by the fund for the year ended December 31, 2021 as reported in the Statement of Operations:
| Risk
|
Futures
Contracts |
Forward
Foreign
Currency
Exchange
Contracts |
| Interest
Rate |
$(58,375)
|
$—
|
| Foreign
Exchange |
—
|
(389,484)
|
| Total
|
$(58,375)
|
$(389,484)
|
The following table presents, by
major type of derivative contract, the change in unrealized appreciation or depreciation on derivatives held by the fund for the year ended December 31, 2021 as reported in the Statement of Operations:
| Risk
|
Futures
Contracts |
Forward
Foreign
Currency
Exchange
Contracts |
| Interest
Rate |
$8,295
|
$—
|
| Foreign
Exchange |
—
|
253,018
|
| Total
|
$8,295
|
$253,018
|
Derivative counterparty credit
risk is managed through formal evaluation of the creditworthiness of all potential counterparties. On certain, but not all, uncleared derivatives, the fund attempts to reduce its exposure to counterparty credit risk whenever possible by entering
into an ISDA Master Agreement on a bilateral basis. The ISDA Master Agreement gives each party to the agreement the right to terminate all transactions traded under such agreement if there is a specified deterioration in the credit quality of the
other party. Upon an event of default or a termination of the ISDA Master Agreement, the non-defaulting party has the right to close out all transactions traded under such agreement and to net amounts owed under each agreement to one net amount
payable by one party to the other. This right to close out and net payments across all transactions traded under the ISDA Master Agreement could result in a reduction of the fund's credit risk to such counterparty equal to any amounts payable by the
fund under the applicable transactions, if any.
Collateral and margin requirements differ by type of
derivative. For cleared derivatives (e.g., futures contracts, cleared swaps, and exchange-traded options), margin requirements are set by the clearing broker and the clearing house and collateral, in the form of cash or securities, is posted by the
fund directly with the clearing broker. Collateral terms are counterparty agreement specific for uncleared derivatives (e.g., forward foreign currency exchange contracts, uncleared swap agreements, and uncleared options) and collateral, in the form
of cash and securities, is held in segregated accounts with the fund's custodian in connection with these agreements. For derivatives traded under an ISDA Master Agreement, which contains a collateral support annex, the collateral requirements are
netted across all transactions traded under such counterparty-specific agreement and an amount is posted from one party to the other to collateralize such obligations. Cash that has been segregated or delivered to cover the fund's collateral or
margin obligations under derivative contracts, if any, will be reported separately in the Statement of Assets and Liabilities as restricted cash for uncleared derivatives and/or deposits with brokers for cleared derivatives. Securities pledged as
collateral or margin for the same purpose, if any, are noted in the Portfolio of Investments. The fund may be required to make payments of interest on uncovered collateral or margin obligations with the broker. Any such payments are included in
“Miscellaneous” expense in the Statement of Operations.
Futures Contracts —
The fund entered into futures contracts which may be used to hedge against or obtain broad market exposure, interest rate exposure, currency exposure, or to manage duration. A futures contract represents a commitment for the future purchase or sale
of an asset at a specified price on a specified date.
Upon entering into a futures contract, the fund is required
to deposit with the broker, either in cash or securities, an initial margin in an amount equal to a specified percentage of the notional amount of the contract. Subsequent payments (variation margin) are made or received by the fund each day,
depending on the daily fluctuations in the value of the contract, and are recorded for financial statement purposes as unrealized gain or loss by the fund until the contract is closed or expires at which point the gain or loss on futures contracts
is realized.
MFS Global Governments
Portfolio
Notes to Financial Statements - continued
The
fund bears the risk of interest rates, exchange rates or securities prices moving unexpectedly, in which case, the fund may not achieve the anticipated benefits of the futures contracts and may realize a loss. While futures contracts may present
less counterparty risk to the fund since the contracts are exchange traded and the exchange’s clearinghouse guarantees payments to the broker, there is still counterparty credit risk due to the insolvency of the broker. The fund’s
maximum risk of loss due to counterparty credit risk is equal to the margin posted by the fund to the broker plus any gains or minus any losses on the outstanding futures contracts.
Forward Foreign Currency Exchange Contracts — The fund entered into forward foreign currency exchange contracts for the purchase or sale of a specific foreign currency at a fixed price on a future date. These contracts may be used to hedge the fund’s
currency risk or for non-hedging purposes. For hedging purposes, the fund may enter into contracts to deliver or receive foreign currency that the fund will receive from or use in its normal investment activities. The fund may also use contracts to
hedge against declines in the value of foreign currency denominated securities due to unfavorable exchange rate movements. For non-hedging purposes, the fund may enter into contracts with the intent of changing the relative exposure of the
fund’s portfolio of securities to different currencies to take advantage of anticipated exchange rate changes.
Forward foreign currency exchange contracts are adjusted by
the daily exchange rate of the underlying currency and any unrealized gains or losses are recorded as a receivable or payable for forward foreign currency exchange contracts until the contract settlement date. On contract settlement date, any gain
or loss on the contract is recorded as realized gains or losses on forward foreign currency exchange contracts.
Risks may arise upon entering into these contracts from
unanticipated movements in the value of the contract and from the potential inability of counterparties to meet the terms of their contracts. Generally, the fund’s maximum risk due to counterparty credit risk is the unrealized gain on the
contract due to the use of Continuous Linked Settlement, a multicurrency cash settlement system for the centralized settlement of foreign transactions. This risk is mitigated in cases where there is an ISDA Master Agreement between the fund and the
counterparty providing for netting as described above and, where applicable, by the posting of collateral by the counterparty to the fund to cover the fund’s exposure to the counterparty under such ISDA Master Agreement.
Indemnifications —
Under the fund's organizational documents, its officers and Trustees may be indemnified against certain liabilities and expenses arising out of the performance of their duties to the fund. Additionally, in the normal course of business, the fund
enters into agreements with service providers that may contain indemnification clauses. The fund's maximum exposure under these agreements is unknown as this would involve future claims that may be made against the fund that have not yet
occurred.
Investment Transactions and Income — Investment transactions are recorded on the trade date. Interest income is recorded on the accrual basis. All premium and
discount is amortized or accreted for financial statement purposes in accordance with U.S. generally accepted accounting principles. Interest payments received in additional securities are recorded on the
ex-interest date in an amount equal to the value of the security on such date.
The fund may receive proceeds from litigation settlements.
Any proceeds received from litigation involving portfolio holdings are reflected in the Statement of Operations in realized gain/loss if the security has been disposed of by the fund or in unrealized gain/loss if the security is still held by the
fund. Any other proceeds from litigation not related to portfolio holdings are reflected as other income in the Statement of Operations.
Tax Matters and Distributions — The fund intends to qualify as a regulated investment company, as defined under Subchapter M of the Internal Revenue Code, and to distribute all of its taxable income, including realized capital gains. As a
result, no provision for federal income tax is required. The fund’s federal tax returns, when filed, will remain subject to examination by the Internal Revenue Service for a three year period. Management has analyzed the fund’s tax
positions taken on federal and state tax returns for all open tax years and does not believe that there are any uncertain tax positions that require recognition of a tax liability. Foreign taxes, if any, have been accrued by the fund in the
accompanying financial statements in accordance with the applicable foreign tax law. Foreign income taxes may be withheld by certain countries in which the fund invests. Additionally, capital gains realized by the fund on securities issued in or by
certain foreign countries may be subject to capital gains tax imposed by those countries.
Distributions to shareholders are recorded on the
ex-dividend date. Income and capital gain distributions are determined in accordance with income tax regulations, which may differ from U.S. generally accepted accounting principles. Certain capital accounts in the financial statements are
periodically adjusted for permanent differences in order to reflect their tax character. These adjustments have no impact on net assets or net asset value per share. Temporary differences which arise from recognizing certain items of income,
expense, gain or loss in different periods for financial statement and tax purposes will reverse at some time in the future.
Book/tax differences primarily relate to amortization and
accretion of debt securities, wash sale loss deferrals, straddle loss deferrals, and derivative transactions.
The tax character of distributions declared to shareholders
for the last two fiscal years is as follows:
MFS Global Governments
Portfolio
Notes to Financial Statements - continued
| |
Year
ended
12/31/21 |
Year
ended
12/31/20 |
| Ordinary
income (including any short-term capital gains) |
$2,960,087
|
$1,660,302
|
The federal tax cost and the tax
basis components of distributable earnings were as follows:
| As
of 12/31/21 |
|
| Cost
of investments |
$124,781,451
|
| Gross
appreciation |
2,573,643
|
| Gross
depreciation |
(4,784,947)
|
| Net
unrealized appreciation (depreciation) |
$(2,211,304)
|
| Undistributed
ordinary income |
1,545,805
|
| Capital
loss carryforwards |
(522,529)
|
| Other
temporary differences |
(5,045)
|
| Total
distributable earnings (loss) |
$(1,193,073)
|
As of December 31, 2021, the
fund had capital loss carryforwards available to offset future realized gains. These net capital losses may be carried forward indefinitely and their character is retained as short-term and/or long-term losses. Such losses are characterized as
follows:
Multiple Classes of Shares of
Beneficial Interest — The fund offers multiple classes of shares, which differ in their respective distribution and/or service fees. The fund's income, realized and unrealized gain (loss), and common expenses
are allocated to shareholders based on the daily net assets of each class. Dividends are declared separately for each class. Differences in per share dividend rates are generally due to differences in separate class expenses. The fund’s
distributions declared to shareholders as reported in the Statements of Changes in Net Assets are presented by class as follows:
| |
Year
ended
12/31/21 |
|
Year
ended
12/31/20 |
| Initial
Class |
$2,943,258
|
|
$1,651,619
|
| Service
Class |
16,829
|
|
8,683
|
| Total
|
$2,960,087
|
|
$1,660,302
|
(3) Transactions with
Affiliates
Investment Adviser — The fund has an investment advisory agreement with MFS to provide overall investment management and related administrative services and facilities to the fund. The
management fee is computed daily and paid monthly at the following annual rates based on the fund's average daily net assets:
| Up
to $300 million |
0.75%
|
| In
excess of $300 million and up to $1 billion |
0.675%
|
| In
excess of $1 billion |
0.625%
|
MFS has agreed in writing to
reduce its management fee by a specified amount if certain MFS mutual fund assets exceed thresholds agreed to by MFS and the fund's Board of Trustees. For the year ended December 31, 2021, this management fee reduction amounted to $16,075, which is
included in the reduction of total expenses in the Statement of Operations. The management fee incurred for the year ended December 31, 2021 was equivalent to an annual effective rate of 0.74% of the fund's average daily net assets.
The investment adviser has agreed in writing to pay a
portion of the fund’s total annual operating expenses, excluding interest, taxes, extraordinary expenses, brokerage and transaction costs, and investment-related expenses, such that total annual operating expenses do not exceed 0.76% of
average daily net assets for the Initial Class shares and 1.01% of average daily net assets for the Service Class shares. This written agreement will continue until modified by the fund’s Board of Trustees, but such agreement will continue at
least until April 30, 2023. For the year ended December 31, 2021, this reduction amounted to $151,771, which is included in the reduction of total expenses in the Statement of Operations.
Distributor — MFS
Fund Distributors, Inc. (MFD), a wholly-owned subsidiary of MFS, is the distributor of shares of the fund. The Trustees have adopted a distribution plan for the Service Class shares pursuant to Rule 12b-1 under the Investment Company Act of
1940.
MFS Global Governments
Portfolio
Notes to Financial Statements - continued
The
fund's distribution plan provides that the fund will pay MFD distribution and/or service fees equal to 0.25% per annum of its average daily net assets attributable to Service Class shares as partial consideration for services performed and expenses
incurred by MFD and financial intermediaries (including participating insurance companies that invest in the fund to fund variable annuity and variable life insurance contracts, sponsors of qualified retirement and pension plans that invest in the
fund, and affiliates of these participating insurance companies and plan sponsors) in connection with the sale and distribution of the Service Class shares. MFD may subsequently pay all, or a portion, of the distribution and/or service fees to
financial intermediaries.
Shareholder Servicing Agent — MFS Service Center, Inc. (MFSC), a wholly-owned subsidiary of MFS, receives a fee from the fund for its services as shareholder servicing agent. For the year ended December 31, 2021, the fee was $2,079, which
equated to 0.0016% annually of the fund's average daily net assets. MFSC also receives reimbursement from the fund for out-of-pocket expenses paid by MFSC on behalf of the fund. For the year ended December 31, 2021, these costs amounted to
$167.
Administrator — MFS provides certain financial, legal, shareholder communications, compliance, and other administrative services to the fund. Under an administrative services agreement, the fund reimburses MFS the costs incurred
to provide these services. The fund is charged an annual fixed amount of $17,500 plus a fee based on average daily net assets. The administrative services fee incurred for the year ended December 31, 2021 was equivalent to an annual effective rate
of 0.0216% of the fund's average daily net assets.
Trustees’ and Officers’ Compensation — The fund pays compensation to independent Trustees in the form of a retainer, attendance fees, and additional compensation to Board and Committee chairpersons. The fund does not pay compensation directly to
Trustees or officers of the fund who are also officers of the investment adviser, all of whom receive remuneration from MFS for their services to the fund. Certain officers and Trustees of the fund are officers or directors of MFS, MFD, and
MFSC.
Other
— The fund invests in the MFS Institutional Money Market Portfolio which is managed by MFS and seeks current income consistent with preservation of capital and liquidity. This money market fund does not pay a
management fee to MFS but does incur investment and operating costs.
(4) Portfolio Securities
For the year ended December 31, 2021, purchases and sales
of investments, other than short-term obligations, were as follows:
| |
Purchases
|
Sales
|
| U.S.
Government securities |
$48,673,217
|
$45,993,622
|
| Non-U.S.
Government securities |
114,718,002
|
114,038,951
|
(5) Shares of
Beneficial Interest
The fund's Declaration of Trust
permits the Trustees to issue an unlimited number of full and fractional shares of beneficial interest. Transactions in fund shares were as follows:
| |
Year
ended
12/31/21 |
|
Year
ended
12/31/20 |
| |
Shares
|
Amount
|
|
Shares
|
Amount
|
| Shares
sold |
|
|
|
|
|
| Initial
Class |
537,565
|
$6,073,303
|
|
1,052,245
|
$11,850,341
|
| Service
Class |
7,112
|
77,014
|
|
7,826
|
87,385
|
| |
544,677
|
$6,150,317
|
|
1,060,071
|
$11,937,726
|
Shares
issued to shareholders
in reinvestment of distributions |
|
|
|
|
|
| Initial
Class |
269,529
|
$2,943,258
|
|
145,517
|
$1,651,619
|
| Service
Class |
1,573
|
16,829
|
|
779
|
8,683
|
| |
271,102
|
$2,960,087
|
|
146,296
|
$1,660,302
|
| Shares
reacquired |
|
|
|
|
|
| Initial
Class |
(268,769)
|
$(2,979,729)
|
|
(2,224,850)
|
$(24,324,361)
|
| Service
Class |
(7,050)
|
(77,433)
|
|
(11,946)
|
(130,858)
|
| |
(275,819)
|
$(3,057,162)
|
|
(2,236,796)
|
$(24,455,219)
|
MFS Global Governments
Portfolio
Notes to Financial Statements - continued
| |
Year
ended
12/31/21 |
|
Year
ended
12/31/20 |
| |
Shares
|
Amount
|
|
Shares
|
Amount
|
| Net
change |
|
|
|
|
|
| Initial
Class |
538,325
|
$6,036,832
|
|
(1,027,088)
|
$(10,822,401)
|
| Service
Class |
1,635
|
16,410
|
|
(3,341)
|
(34,790)
|
| |
539,960
|
$6,053,242
|
|
(1,030,429)
|
$(10,857,191)
|
The fund is one of several
mutual funds in which certain MFS funds may invest. The MFS funds do not invest in the underlying funds for the purpose of exercising management or control. At the end of the period, the MFS Moderate Allocation Portfolio, the MFS Conservative
Allocation Portfolio, and the MFS Growth Allocation Portfolio were the owners of record of approximately 54%, 26%, and 11%, respectively, of the value of outstanding voting shares of the fund.
(6) Line of Credit
The fund and certain other funds managed by MFS participate
in a $1.25 billion unsecured committed line of credit of which $1 billion is reserved for use by the fund and certain other MFS U.S. funds. The line of credit is provided by a syndicate of banks under a credit agreement. Borrowings may be made for
temporary financing needs. Interest is charged to each fund, based on its borrowings, generally at a rate equal to the highest of one month LIBOR, the Federal Funds Effective Rate and the Overnight Bank Funding Rate, plus an agreed upon spread. A
commitment fee, based on the average daily, unused portion of the committed line of credit, is allocated among the participating funds. In addition, the fund and other funds managed by MFS have established unsecured uncommitted borrowing
arrangements with certain banks for temporary financing needs. Interest is charged to each fund, based on its borrowings, at rates equal to customary reference rates plus an agreed upon spread. For the year ended December 31, 2021, the fund’s
commitment fee and interest expense were $358 and $0, respectively, and are included in “Miscellaneous” expense in the Statement of Operations.
(7) Investments in Affiliated Issuers
An affiliated issuer may be considered one in which the
fund owns 5% or more of the outstanding voting securities, or a company which is under common control. For the purposes of this report, the following were affiliated issuers:
| Affiliated
Issuers |
Beginning
Value |
Purchases
|
Sales
Proceeds |
Realized
Gain
(Loss) |
Change
in
Unrealized
Appreciation or
Depreciation |
Ending
Value |
| MFS
Institutional Money Market Portfolio |
$2,150,119
|
$84,309,023
|
$81,140,686
|
$—
|
$—
|
$5,318,456
|
| Affiliated
Issuers |
Dividend
Income |
Capital
Gain
Distributions |
| MFS
Institutional Money Market Portfolio |
$2,531
|
$—
|
(8) Impacts of
COVID-19
The pandemic related to the global spread of
novel coronavirus disease (COVID-19), which was first detected in December 2019, has resulted in significant disruptions to global business activity and the global economy, as well as the economies of individual countries, the financial performance
of individual companies and sectors, and the securities and commodities markets in general. Multiple surges in cases globally, the availability and widespread adoption of vaccines, and the emergence of variant strains of the virus continue to create
uncertainty as to the future and long-term impacts resulting from the pandemic including impacts to the prices and liquidity of the fund's investments and the fund's performance.
(9) LIBOR Transition
Certain of the fund's investments, including its
investments in derivatives, as well as any debt issued by the fund and other contractual arrangements of the fund may be based on reference interest rates such as the London Interbank Offered Rate (“LIBOR”). In 2017, the regulatory
authority that oversees financial services firms in the United Kingdom announced plans to transition away from LIBOR by the end of 2021. In March 2021, the administrator of LIBOR announced the extension of the publication of the more commonly used
U.S. dollar LIBOR settings to the end of June 2023. Although the full impacts of the
MFS Global Governments
Portfolio
Notes to Financial Statements - continued
transition away
from LIBOR are not fully known, the transition may result in, among other things, an increase in volatility or illiquidity of the markets for instruments that currently rely on LIBOR to determine interest rates and this could have an adverse impact
on the fund's performance. With respect to the fund's accounting for investments, including its investments in derivatives, as well as any debt issued by the fund and other contractual arrangements of the fund that undergo reference rate-related
modifications as a result of the transition, management will rely upon the relief provided by FASB Codification Topic 848 – Reference Rate Reform (Topic 848). The guidance in Topic 848 permits the fund to disregard the GAAP accounting
requirements around certain contract modifications resulting from the LIBOR transition such that for contracts considered in scope, the fund can account for those modified contracts as a continuation of the existing contracts. While the cessation of
the one-week and two-month U.S. dollar LIBOR tenors along with certain other non-U.S. dollar denominated LIBOR settings at December 31, 2021 did not have a material impact on the fund, management is still evaluating the impact to the fund of the
June 30, 2023 planned discontinuation of the more commonly used U.S. dollar LIBOR settings.
MFS Global Governments
Portfolio
Report of Independent Registered Public Accounting
Firm
To the Board of Trustees of MFS Variable
Insurance Trust II and the Shareholders of MFS Global Governments Portfolio:
Opinion on the Financial Statements and Financial
Highlights
We have audited the accompanying statement
of assets and liabilities of MFS Global Governments Portfolio (the “Fund”), including the portfolio of investments, as of December 31, 2021, the related statement of operations for the year then ended, the statements of changes in net
assets for each of the two years in the period then ended, the financial highlights for each of the five years in the period then ended, and the related notes. In our opinion, the financial statements and financial highlights present fairly, in all
material respects, the financial position of the Fund as of December 31, 2021, and the results of its operations for the year then ended, the changes in its net assets for each of the two years in the period then ended, and the financial highlights
for each of the five years in the period then ended, in conformity with accounting principles generally accepted in the United States of America.
Basis for Opinion
These financial statements and financial highlights are the
responsibility of the Fund's management. Our responsibility is to express an opinion on the Fund's financial statements and financial highlights based on our audits. We are a public accounting firm registered with the Public Company Accounting
Oversight Board (United States) (PCAOB) and are required to be independent with respect to the Fund in accordance with the U.S. federal securities laws and the applicable rules and regulations of the Securities and Exchange Commission and the
PCAOB.
We conducted our audits in accordance with the
standards of the PCAOB. Those standards require that we plan and perform the audit to obtain reasonable assurance about whether the financial statements and financial highlights are free of material misstatement, whether due to error or fraud. The
Fund is not required to have, nor were we engaged to perform, an audit of its internal control over financial reporting. As part of our audits, we are required to obtain an understanding of internal control over financial reporting but not for the
purpose of expressing an opinion on the effectiveness of the Fund's internal control over financial reporting. Accordingly, we express no such opinion.
Our audits included performing procedures to assess the
risks of material misstatement of the financial statements and financial highlights, whether due to error or fraud, and performing procedures that respond to those risks. Such procedures included examining, on a test basis, evidence regarding the
amounts and disclosures in the financial statements and financial highlights. Our audits also included evaluating the accounting principles used and significant estimates made by management, as well as evaluating the overall presentation of the
financial statements and financial highlights. Our procedures included confirmation of securities owned as of December 31, 2021, by correspondence with the custodian and brokers; when replies were not received from brokers, we performed other
auditing procedures. We believe that our audits provide a reasonable basis for our opinion.
DELOITTE & TOUCHE LLP
Boston, Massachusetts
February 15, 2022
We have served as the auditor of one or more of the MFS
investment companies since 1924.
MFS Global Governments
Portfolio
Trustees and Officers — Identification and
Background
The Trustees and Officers of the Trust, as
of February 1, 2022, are listed below, together with their principal occupations during the past five years. (Their titles may have varied during that period.) The address of each Trustee and Officer is 111 Huntington Avenue, Boston, Massachusetts
02199-7618.
| Name,
Age |
|
Position(s)
Held with Fund |
|
Trustee/Officer
Since(h) |
|
Number
of MFS Funds overseen by the Trustee |
|
Principal
Occupations During
the Past Five Years |
|
Other
Directorships During
the Past Five Years (j) |
| INTERESTED
TRUSTEES |
|
|
|
|
|
|
|
|
|
|
Michael
W. Roberge (k)
(age 55) |
|
Trustee
|
|
January
2021 |
|
135
|
|
Massachusetts
Financial Services Company, Chairman (since January 2021); Chief Executive Officer (since January 2017); Director; Chairman of the Board (since January 2022); President (until December 2018); Chief Investment Officer (until December 2018) |
|
N/A
|
| INDEPENDENT
TRUSTEES |
|
|
|
|
|
|
|
|
|
|
John
P. Kavanaugh
(age 67) |
|
Trustee
and Chair of Trustees |
|
January
2009 |
|
135
|
|
Private
investor |
|
N/A
|
Steven
E. Buller
(age 70) |
|
Trustee
|
|
February
2014 |
|
135
|
|
Private
investor |
|
N/A
|
John
A. Caroselli
(age 67) |
|
Trustee
|
|
March
2017 |
|
135
|
|
Private
investor; JC Global Advisors, LLC (management consulting), President (since 2015) |
|
N/A
|
Maureen
R. Goldfarb
(age 66) |
|
Trustee
|
|
January
2009 |
|
135
|
|
Private
investor |
|
N/A
|
Peter
D. Jones
(age 66) |
|
Trustee
|
|
January
2019 |
|
135
|
|
Private
investor |
|
N/A
|
James
W. Kilman, Jr.
(age 60) |
|
Trustee
|
|
January
2019 |
|
135
|
|
Burford
Capital Limited (finance and investment management), Senior Advisor (since May 3, 2021), Chief Financial Officer (2019 - May 2, 2021); KielStrand Capital LLC (family office), Chief Executive Officer (since 2016) |
|
Alpha-En
Corporation, Director (2016-2019) |
Clarence
Otis, Jr.
(age 65) |
|
Trustee
|
|
March
2017 |
|
135
|
|
Private
investor |
|
VF
Corporation, Director; Verizon Communications, Inc., Director; The Travelers Companies, Director |
Maryanne
L. Roepke
(age 65) |
|
Trustee
|
|
May
2014 |
|
135
|
|
Private
investor |
|
N/A
|
Laurie
J. Thomsen
(age 64) |
|
Trustee
|
|
March
2005 |
|
135
|
|
Private
investor |
|
The
Travelers Companies, Director; Dycom Industries, Inc., Director |
MFS Global Governments
Portfolio
Trustees and Officers - continued
| Name,
Age |
|
Position(s)
Held with
Fund |
|
Trustee/Officer
Since(h) |
|
Number
of MFS Funds for which the Person is an Officer |
|
Principal
Occupations During
the Past Five Years |
| OFFICERS
|
|
|
|
|
|
|
|
|
Christopher
R. Bohane (k)
(age 48) |
|
Assistant
Secretary and Assistant Clerk |
|
July
2005 |
|
135
|
|
Massachusetts
Financial Services Company, Senior Vice President and Associate General Counsel |
Kino
Clark (k)
(age 53) |
|
Assistant
Treasurer |
|
January
2012 |
|
135
|
|
Massachusetts
Financial Services Company, Vice President |
John
W. Clark, Jr. (k)
(age 54) |
|
Assistant
Treasurer |
|
April
2017 |
|
135
|
|
Massachusetts
Financial Services Company, Vice President (since March 2017); Deutsche Bank (financial services), Department Head - Treasurer's Office (until February 2017) |
Thomas
H. Connors (k)
(age 62) |
|
Assistant
Secretary and Assistant Clerk |
|
September
2012 |
|
135
|
|
Massachusetts
Financial Services Company, Vice President and Senior Counsel |
David
L. DiLorenzo (k)
(age 53) |
|
President
|
|
July
2005 |
|
135
|
|
Massachusetts
Financial Services Company, Senior Vice President |
Heidi
W. Hardin (k)
(age 54) |
|
Secretary
and Clerk |
|
April
2017 |
|
135
|
|
Massachusetts
Financial Services Company, Executive Vice President and General Counsel (since March 2017); Harris Associates (investment management), General Counsel (until January 2017) |
Brian
E. Langenfeld (k)
(age 48) |
|
Assistant
Secretary and Assistant Clerk |
|
June
2006 |
|
135
|
|
Massachusetts
Financial Services Company, Vice President and Senior Counsel |
Amanda
S. Mooradian (k)
(age 42) |
|
Assistant
Secretary and Assistant Clerk |
|
September
2018 |
|
135
|
|
Massachusetts
Financial Services Company, Assistant Vice President and Senior Counsel |
Susan
A. Pereira (k)
(age 51) |
|
Assistant
Secretary and Assistant Clerk |
|
July
2005 |
|
135
|
|
Massachusetts
Financial Services Company, Vice President and Assistant General Counsel |
Kasey
L. Phillips (k)
(age 51) |
|
Assistant
Treasurer |
|
September
2012 |
|
135
|
|
Massachusetts
Financial Services Company, Vice President |
Matthew
A. Stowe (k)
(age 47) |
|
Assistant
Secretary and Assistant Clerk |
|
October
2014 |
|
135
|
|
Massachusetts
Financial Services Company, Vice President and Assistant General Counsel |
Martin
J. Wolin (k)
(age 54) |
|
Chief
Compliance Officer |
|
July
2015 |
|
135
|
|
Massachusetts
Financial Services Company, Senior Vice President and Chief Compliance Officer |
James
O. Yost (k)
(age 61) |
|
Treasurer
|
|
September
1990 |
|
135
|
|
Massachusetts
Financial Services Company, Senior Vice President |
| (h)
|
Date
first appointed to serve as Trustee/Officer of an MFS Fund. Each Trustee has served continuously since appointment unless indicated otherwise. From January 2012 through December 2016, Messrs. DiLorenzo and Yost served as Treasurer and Deputy
Treasurer of the Funds, respectively. |
| (j)
|
Directorships or
trusteeships of companies required to report to the Securities and Exchange Commission (i.e., “public companies”). |
| (k)
|
“Interested
person” of the Trust within the meaning of the Investment Company Act of 1940 (referred to as the 1940 Act), which is the principal federal law governing investment companies like the fund, as a result of a position with MFS. The address of
MFS is 111 Huntington Avenue, Boston, Massachusetts 02199-7618. |
Each Trustee (other than Messrs. Jones, Kilman and Roberge)
has been elected by shareholders and each Trustee and Officer holds office until his or her successor is chosen and qualified or until his or her earlier death, resignation, retirement or removal. Mr. Roberge became a Trustee of the Funds on January
1, 2021 and Messrs. Jones and Kilman became Trustees of the Funds on January 1, 2019. The Trust does not hold annual meetings for the purpose of electing Trustees, and Trustees are not elected for fixed terms. Under the terms of the Board's
retirement policy, an Independent Trustee shall retire at the end of the calendar year in which he or she reaches the earlier of 75 years of age or 15 years of service on the Board (or, in the case of any Independent Trustee who joined the Board
prior to 2015, 20 years of service on the Board).
Messrs. Buller, Kilman and Otis and Ms. Roepke are members
of the Trust’s Audit Committee.
MFS Global Governments
Portfolio
Trustees and Officers - continued
Each
of the Interested Trustees and certain Officers hold comparable officer positions with certain affiliates of MFS.
The Statement of Additional Information for a Fund includes
further information about the Trustees and is available without charge upon request by calling 1-800-225-2606.
| Investment
Adviser |
Custodian
|
Massachusetts Financial
Services Company
111 Huntington Avenue
Boston, MA 02199-7618 |
State Street
Bank and Trust Company
1 Lincoln Street
Boston, MA 02111-2900 |
| Distributor
|
Independent
Registered Public Accounting Firm |
MFS Fund
Distributors, Inc.
111 Huntington Avenue
Boston, MA 02199-7618 |
Deloitte
& Touche LLP
200 Berkeley Street
Boston, MA 02116 |
| Portfolio
Manager(s) |
|
Robert
Spector
Erik Weisman |
|
MFS Global Governments
Portfolio
Board Review of Investment Advisory Agreement
MFS Global Governments Portfolio
The Investment Company Act of 1940 requires that both the
full Board of Trustees and a majority of the non-interested (“independent”) Trustees, voting separately, annually approve the continuation of the Fund’s investment advisory agreement with MFS. The Trustees consider matters bearing
on the Fund and its advisory arrangements at their meetings throughout the year, including a review of performance data at each regular meeting. In addition, the independent Trustees met several times by videoconference (in accordance with
Securities and Exchange Commission relief) over the course of three months beginning in May and ending in July, 2021 (“contract review meetings”) for the specific purpose of considering whether to approve the continuation of the
investment advisory agreement for the Fund and the other investment companies that the Board oversees (the “MFS Funds”). The independent Trustees were assisted in their evaluation of the Fund’s investment advisory agreement by
independent legal counsel, from whom they received separate legal advice and with whom they met separately from MFS during various contract review meetings. The independent Trustees were also assisted in this process by an independent consultant who
was retained by and reported to the independent Trustees.
In connection with their deliberations regarding the
continuation of the investment advisory agreement, the Trustees, including the independent Trustees, considered such information and factors as they believed, in light of the legal advice furnished to them and their own business judgment, to be
relevant. The investment advisory agreement for the Fund was considered separately, although the Trustees also took into account the common interests of all MFS Funds in their review. As described below, the Trustees considered the nature, quality,
and extent of the various investment advisory, administrative, and shareholder services performed by MFS under the existing investment advisory agreement and other arrangements with the Fund.
In connection with their contract review meetings, the
Trustees received and relied upon materials that included, among other items: (i) information provided by Broadridge Financial Solutions, Inc. (“Broadridge”), an independent third party, on the investment performance of the Fund for
various time periods ended December 31, 2020 and the investment performance of a group of funds with substantially similar investment classifications/objectives (the “Broadridge performance universe”), (ii) information provided by
Broadridge on the Fund’s advisory fees and other expenses and the advisory fees and other expenses of comparable funds identified by Broadridge as well as all other funds in the same investment classification/category (the “Broadridge
expense group and universe”), (iii) information provided by MFS on the advisory fees of portfolios of other clients of MFS, including institutional separate accounts and other clients, (iv) information as to whether and to what extent
applicable expense waivers, reimbursements or fee “breakpoints” are observed for the Fund, (v) information regarding MFS’ financial results and financial condition, including MFS’ and certain of its affiliates’
estimated profitability from services performed for the Fund and the MFS Funds as a whole, and compared to MFS’ institutional business, (vi) MFS’ views regarding the outlook for the mutual fund industry and the strategic business plans
of MFS, (vii) descriptions of various functions performed by MFS for the Funds, such as compliance monitoring and portfolio trading practices, and (viii) information regarding the overall organization of MFS, including information about MFS’
senior management and other personnel providing investment advisory, administrative and other services to the Fund and the other MFS Funds. The comparative performance, fee and expense information prepared and provided by Broadridge was not
independently verified and the independent Trustees did not independently verify any information provided to them by MFS.
The Trustees’ conclusion as to the continuation of
the investment advisory agreement was based on a comprehensive consideration of all information provided to the Trustees and not the result of any single factor. Some of the factors that figured particularly in the Trustees’ deliberations are
described below, although individual Trustees may have evaluated the information presented differently from one another, giving different weights to various factors. It is also important to recognize that the fee arrangements for the Fund and other
MFS Funds are the result of years of review and discussion between the independent Trustees and MFS, that certain aspects of such arrangements may receive greater scrutiny in some years than in others, and that the Trustees’ conclusions may be
based, in part, on their consideration of these same arrangements during the course of the year and in prior years.
Based on information provided by Broadridge and MFS, the
Trustees reviewed the Fund’s total return investment performance as well as the Broadridge performance universe over various time periods. The Trustees placed particular emphasis on the total return performance of the Fund’s Initial
Class shares in comparison to the performance of funds in its Broadridge performance universe over the five-year period ended December 31, 2020, which the Trustees believed was a long enough period to reflect differing market conditions. The total
return performance of the Fund’s Initial Class shares was in the 4th quintile relative to the other funds in the universe for this five-year period (the 1st quintile being the best performers and the 5th quintile being the worst performers).
The total return performance of the Fund’s Initial Class shares was in the 2nd quintile for the one-year period and the 3rd quintile for the three-year period ended December 31, 2020 relative to the Broadridge performance universe. Because of
the passage of time, these performance results may differ from the performance results for more recent periods, including those shown elsewhere in this report.
The Trustees expressed concern to MFS about the substandard
investment performance of the Fund. In the course of their deliberations, the Trustees took into account information provided by MFS in connection with the contract review meetings, as well as during investment review meetings conducted with
portfolio management personnel during the course of the year, as to MFS’ efforts to improve the Fund’s performance. In addition, the Trustees requested that they receive a separate update on the Fund’s
MFS Global Governments
Portfolio
Board Review of Investment Advisory Agreement - continued
performance at each
of their regular meetings. After reviewing these and related factors, the Trustees concluded, within the context of their overall conclusions regarding the investment advisory agreement, that MFS’ responses and efforts and plans to improve
investment performance were sufficient to support approval of the continuance of the investment advisory agreement for an additional one-year period, but that they would continue to closely monitor the performance of the Fund.
In assessing the reasonableness of the Fund’s
advisory fee, the Trustees considered, among other information, the Fund’s advisory fee and the total expense ratio of the Fund’s Initial Class shares as a percentage of average daily net assets and the advisory fee and total expense
ratios of the Broadridge expense group based on information provided by Broadridge. The Trustees considered that MFS currently observes an expense limitation for the Fund, which may not be changed without the Trustees’ approval. The Trustees
also considered that, according to the data provided by Broadridge (which takes into account any fee reductions or expense limitations that were in effect during the Fund’s last fiscal year), the Fund’s effective advisory fee rate and
total expense ratio were each higher than the Broadridge expense group median.
The Trustees also considered the advisory fees charged by
MFS to any institutional separate accounts advised by MFS (“separate accounts”) and unaffiliated investment companies for which MFS serves as subadviser (“subadvised funds”) that have comparable investment strategies to the
Fund, if any. In comparing these fees, the Trustees considered information provided by MFS as to the generally broader scope of services provided by MFS to the Fund, as well as the more extensive regulatory burdens imposed on MFS in managing the
Fund, in comparison to separate accounts and subadvised funds. The Trustees also considered the higher demands placed on MFS’ investment personnel and trading infrastructure as a result of the daily cash in-flows and out-flows of the Fund in
comparison to separate accounts.
The Trustees also
considered whether the Fund may benefit from any economies of scale in the management of the Fund in the event of growth in assets of the Fund and/or growth in assets of the MFS Funds as a whole. They noted that the Fund’s advisory fee rate
schedule is subject to contractual breakpoints that reduce the Fund’s advisory fee rate on average daily net assets over $300 million and $1 billion. The Trustees also noted that MFS has agreed in writing to waive a portion of the management
fees of certain MFS Funds, including the Fund, if the total combined assets of certain funds within the MFS Funds’ complex increase above agreed upon thresholds (the “group fee waiver”), enabling the Fund’s shareholders to
share in the benefits from any economies of scale at the complex level. The group fee waiver is reviewed and renewed annually between the Board and MFS. The Trustees concluded that the breakpoints and the group fee waiver were sufficient to allow
the Fund to benefit from economies of scale as its assets and overall complex assets grow.
The Trustees also considered information prepared by MFS
relating to MFS’ costs and profits with respect to the Fund, the MFS Funds considered as a group, and other investment companies and accounts advised by MFS, as well as MFS’ methodologies used to determine and allocate its costs to the
MFS Funds, the Fund and other accounts and products for purposes of estimating profitability.
After reviewing these and other factors described herein,
the Trustees concluded, within the context of their overall conclusions regarding the investment advisory agreement, that the advisory fees charged to the Fund represent reasonable compensation in light of the services being provided by MFS to the
Fund.
In addition, the Trustees considered MFS’
resources and related efforts to continue to retain, attract and motivate capable personnel to serve the Fund. The Trustees also considered current and developing conditions in the financial services industry, including the presence of large and
well-capitalized companies which are spending, and appear to be prepared to continue to spend, substantial sums to engage personnel and to provide services to competing investment companies. In this regard, the Trustees also considered the financial
resources of MFS and its ultimate parent, Sun Life Financial Inc. The Trustees also considered the advantages and possible disadvantages to the Fund of having an adviser that also serves other investment companies as well as other accounts.
The Trustees also considered the nature, quality, cost, and
extent of administrative, transfer agency, and distribution services provided to the Fund by MFS and its affiliates under agreements and plans other than the investment advisory agreement, including any 12b-1 fees the Fund pays to MFS Fund
Distributors, Inc., an affiliate of MFS. The Trustees also considered the nature, extent and quality of certain other services MFS performs or arranges for on the Fund’s behalf, which may include securities lending programs, directed expense
payment programs, class action recovery programs, and MFS’ interaction with third-party service providers, principally custodians and sub-custodians. The Trustees concluded that the various non-advisory services provided by MFS and its
affiliates on behalf of the Fund were satisfactory.
The Trustees considered so-called “fall-out
benefits” to MFS such as reputational value derived from serving as investment manager to the MFS Funds. The Trustees also considered that MFS discontinued its historic practice of obtaining investment research from portfolio brokerage
commissions paid by certain MFS Funds effective January 2018, and directly pays or voluntarily reimburses a Fund, if applicable, for the costs of external research acquired through the use of the Fund’s portfolio brokerage commissions.
Based on their evaluation of factors that they deemed to be
material, including those factors described above, the Board of Trustees, including the independent Trustees, concluded that the Fund’s investment advisory agreement with MFS should be continued for an additional one-year period, commencing
August 1, 2021.
MFS Global Governments
Portfolio
Proxy Voting Policies and Information
MFS votes proxies on behalf of the fund pursuant to proxy
voting policies and procedures that are available without charge, upon request, by calling 1-800-225-2606, by visiting mfs.com/proxyvoting, or by visiting the SEC’s Web site at http://www.sec.gov.
Information regarding how the fund voted proxies relating
to portfolio securities during the most recent twelve-month period ended June 30 is available by August 31 of each year without charge by visiting mfs.com/proxyvoting, or by visiting the SEC’s Web site
at http://www.sec.gov.
Quarterly Portfolio Disclosure
The fund files a complete schedule of portfolio holdings
with the SEC for the first and third quarters of each fiscal year as an exhibit to its reports on Form N-PORT. The fund’s Form N-PORT reports are available on the SEC’s Web site at
http://www.sec.gov. A shareholder can obtain the portfolio holdings report for the first and third quarters of the fund's fiscal year at mfs.com/vit2 by
choosing the fund's name and then scrolling to the “Resources” section and clicking on the “Prospectus and Reports” tab.
FURTHER INFORMATION
From time to time, MFS may post important information about
the fund or the MFS Funds on the MFS Web site (mfs.com). This information is available at https://www.mfs.com/announcements or at
mfs.com/vit2 by choosing the fund's name and then scrolling to the “Resources” section and clicking on the “Announcements” tab, if any.
Information About Fund Contracts and Legal Claims
The fund has entered into contractual arrangements with an
investment adviser, administrator, distributor, shareholder servicing agent, 529 program manager (if applicable), and custodian who each provide services to the fund. Unless expressly stated otherwise, shareholders are not parties to, or intended
beneficiaries of these contractual arrangements, and these contractual arrangements are not intended to create any shareholder right to enforce them against the service providers or to seek any remedy under them against the service providers, either
directly or on behalf of the fund.
Under the
Trust’s By-Laws and Declaration of Trust, any claims asserted against or on behalf of the MFS Funds, including claims against Trustees and Officers, must be brought in state and federal courts located within the Commonwealth of
Massachusetts.
Federal Tax Information (unaudited)
The following information is provided pursuant to
provisions of the Internal Revenue Code.
The fund
intends to pass through the maximum amount allowable as Section 163(j) Interest Dividends as defined in Treasury Regulation §1.163(j)-1(b).
| FACTS
|
WHAT
DOES MFS DO WITH YOUR PERSONAL INFORMATION? |
| Why?
|
Financial
companies choose how they share your personal information. Federal law gives consumers the right to limit some but not all sharing. Federal law also requires us to tell you how we collect, share, and protect your personal information. Please read
this notice carefully to understand what we do. |
| What?
|
The types of
personal information we collect and share depend on the product or service you have with us. This information can include: |
| • Social
Security number and account balances |
| • Account
transactions and transaction history |
| • Checking
account information and wire transfer instructions |
| When
you are no longer our customer, we continue to share your information as described in this notice. |
| How?
|
All
financial companies need to share customers' personal information to run their everyday business. In the section below, we list the reasons financial companies can share their customers' personal information; the reasons MFS chooses to share; and
whether you can limit this sharing. |
Reasons
we can share your
personal information |
Does
MFS share? |
Can
you limit
this sharing? |
For
our everyday business purposes –
such as to process your transactions, maintain your
account(s), respond to court orders and legal
investigations, or report to credit bureaus |
Yes
|
No
|
For
our marketing purposes –
to offer our products and services to you |
No
|
We
don't share |
For
joint marketing with other
financial companies |
No
|
We
don't share |
For
our affiliates' everyday business purposes –
information about your transactions and experiences |
No
|
We
don't share |
For
our affiliates' everyday business purposes –
information about your creditworthiness |
No
|
We
don't share |
| For
nonaffiliates to market to you |
No
|
We
don't share |
| Questions?
|
Call
800-225-2606 or go to mfs.com. |
| Who
we are |
| Who
is providing this notice? |
MFS
Funds, MFS Investment Management, MFS Institutional Advisors, Inc., and MFS Heritage Trust Company. |
| What
we do |
How
does MFS
protect my personal
information? |
To
protect your personal information from unauthorized access and use, we use security measures that comply with federal law. These measures include procedural, electronic, and physical safeguards for the protection of the personal information we
collect about you. |
How
does MFS
collect my personal
information? |
We
collect your personal information, for example, when you |
| • open
an account or provide account information |
| • direct
us to buy securities or direct us to sell your securities |
| • make
a wire transfer |
| We
also collect your personal information from others, such as credit bureaus, affiliates, or other companies. |
| Why
can't I limit all sharing? |
Federal
law gives you the right to limit only |
| • sharing
for affiliates' everyday business purposes – information about your creditworthiness |
| • affiliates
from using your information to market to you |
| • sharing
for nonaffiliates to market to you |
| State
laws and individual companies may give you additional rights to limit sharing. |
| Definitions
|
| Affiliates
|
Companies
related by common ownership or control. They can be financial and nonfinancial companies. |
| •
MFS does not share personal information with affiliates, except for everyday business purposes as described on page one of this notice. |
| Nonaffiliates
|
Companies
not related by common ownership or control. They can be financial and nonfinancial companies. |
| •
MFS does not share with nonaffiliates so they can market to you. |
| Joint
marketing |
A
formal agreement between nonaffiliated financial companies that together market financial products or services to you. |
| •
MFS doesn't jointly market. |
| Other
important information |
| If
you own an MFS product or receive an MFS service in the name of a third party such as a bank or broker-dealer, their privacy policy may apply to you instead of ours. |
Annual Report
December 31, 2021
MFS® Global Growth Portfolio
MFS® Variable
Insurance Trust II
MFS® Global
Growth Portfolio
|
1
|
|
2
|
|
3
|
|
5
|
|
7
|
|
8
|
|
12
|
|
13
|
|
14
|
|
15
|
|
17
|
|
23
|
|
24
|
|
27
|
|
30
|
|
30
|
|
30
|
|
30
|
|
30
|
|
31
|
The report is prepared for the general information of contract owners. It
is authorized for distribution to prospective investors only when preceded or accompanied by a current prospectus.
NOT FDIC INSURED • MAY LOSE VALUE
• NO BANK OR CREDIT UNION GUARANTEE •
NOT A DEPOSIT • NOT INSURED BY ANY FEDERAL GOVERNMENT
AGENCY OR NCUA/NCUSIF
MFS Global Growth
Portfolio
Dear Contract Owners:
After a powerful rally in 2021 that was spurred by the
introduction of effective coronavirus vaccines and high levels of monetary and fiscal stimulus, markets have recently experienced a rise in volatility. Rising inflation (mostly due to pandemic-related labor and supply chain disruptions), new
COVID-19 variants that are vaccine-resistant, and the prospect of tighter monetary and fiscal policies around the world have all increased investor anxiety.
Rising real (inflation-adjusted) bond yields in the United
States are a headwind for richly valued U.S. growth stocks, though many non-U.S. markets have experienced lower levels of turbulence. In recent months, global economic growth has moderated, with the spread of the Delta and Omicron variants and a
regulatory crackdown in China featuring prominently. Stress in China’s property development sector has also contributed to the slowdown there. A further concern for investors is the tightening of global energy and raw materials supplies caused
in part by geopolitical uncertainty.
However,
above-trend economic growth, strong corporate balance sheets, and nascent signs that global supply chain bottlenecks may be easing, along with a dovish policy shift in China, are supportive fundamentals that we feel could help calm recent market
jitters.
It is times of market transition that
demonstrate the importance of having a deep understanding of company fundamentals, and we have built our global research platform to do just that.
At MFS®, we put our clients’ assets to work responsibly by carefully navigating the increasing complexity of global markets and economies. Guided by our commitment to long-term
investing, we tune out the noise and try to uncover what we believe are the best, most durable investment opportunities in the market. Our unique global investment platform combines collective expertise, long-term discipline, and thoughtful risk
management to create sustainable value for investors.
Respectfully,
Michael W.
Roberge
Chief Executive Officer
MFS Investment Management
February 15, 2022
The opinions expressed in this letter are subject to
change and may not be relied upon for investment advice. No forecasts can be guaranteed.
MFS Global Growth
Portfolio
Portfolio structure
Top ten
holdings
| Alphabet,
Inc., “A” |
6.1%
|
| Microsoft
Corp. |
5.3%
|
| Accenture
PLC, “A” |
3.0%
|
| Apple,
Inc. |
2.9%
|
| Church
& Dwight Co., Inc. |
2.4%
|
| Canadian
Pacific Railway Ltd. |
2.4%
|
| Dollarama,
Inc. |
2.2%
|
| ICON
PLC |
2.2%
|
| Tencent
Holdings Ltd. |
2.0%
|
| Alibaba
Group Holding Ltd. |
2.0%
|
GICS equity sectors (g)
| Information
Technology |
24.9%
|
| Health
Care |
14.7%
|
| Consumer
Discretionary |
13.9%
|
| Consumer
Staples |
12.2%
|
| Communication
Services |
12.1%
|
| Industrials
|
9.6%
|
| Financials
|
8.1%
|
| Real
Estate |
1.9%
|
| Materials
|
1.3%
|
| Utilities
|
0.9%
|
Issuer country weightings (x)
| United
States |
65.8%
|
| Canada
|
5.6%
|
| China
|
5.0%
|
| United
Kingdom |
4.4%
|
| Switzerland
|
4.2%
|
| Ireland
|
2.8%
|
| Japan
|
2.3%
|
| South
Korea |
2.1%
|
| Germany
|
1.8%
|
| Other
Countries |
6.0%
|
Currency exposure weightings
(y)
| United
States Dollar |
71.1%
|
| British
Pound Sterling |
5.1%
|
| Swiss
Franc |
4.2%
|
| Euro
|
4.2%
|
| Hong
Kong Dollar |
4.0%
|
| Canadian
Dollar |
3.2%
|
| Japanese
Yen |
2.3%
|
| South
Korean Won |
2.1%
|
| Indian
Rupee |
1.5%
|
| Other
Currencies |
2.3%
|
| (g)
|
The
Global Industry Classification Standard (GICS®) was developed by and/or is the exclusive property of MSCI, Inc. and S&P Global Market Intelligence Inc. (“S&P
Global Market Intelligence”). GICS is a service mark of MSCI and S&P Global Market Intelligence and has been licensed for use by MFS. MFS has applied its own internal sector/industry classification methodology for equity securities and
non-equity securities that are unclassified by GICS. |
| (x)
|
Represents
the portfolio’s exposure to issuer countries as a percentage of a portfolio’s net assets. For purposes of this presentation, United States includes Cash & Cash Equivalents. |
| (y)
|
Represents
the portfolio’s exposure to a particular currency as a percentage of a portfolio's net assets. For purposes of this presentation, United States Dollar includes Cash & Cash Equivalents. |
Cash & Cash Equivalents includes any cash,
investments in money market funds, short-term securities, and other assets less liabilities. Please see the Statement of Assets and Liabilities for additional information related to the fund’s cash position and other assets and
liabilities.
Percentages are based on net
assets as of December 31, 2021.
The portfolio
is actively managed and current holdings may be different.
MFS Global Growth
Portfolio
Management Review
Summary of Results
For the twelve months ended December 31, 2021, Initial
Class shares of the MFS Global Growth Portfolio (fund) provided a total return of 18.52%, while Service Class shares of the fund provided a total return of 18.21%. These compare with a return of 17.10% over the same period for the fund’s
benchmark, the MSCI All Country World Growth Index (net div).
Market Environment
Over the past year, the global economy was buffeted by an
array of crosscurrents as it adjusted to the ebbs and flows of the pandemic. Among the supportive currents were ample fiscal stimulus, loose monetary policy and the rollout of several highly effective coronavirus vaccines. Negative currents included
the rapid spread of several coronavirus variants, widespread global production bottlenecks and a surge in inflation. After experiencing a burst of exceptionally strong economic activity as the global economy began to reopen, activity became more
muted in the second half of the period amid ongoing supply chain disruptions and a new wave of coronavirus infections, albeit a seemingly milder strain.
Amid rising inflation, markets anticipated a transition
from an exceptionally accommodative environment to a more mixed monetary landscape ahead. Indeed, several central banks in emerging markets have already tightened policy and the US Federal Reserve reduced the pace of its asset purchases in November
and again in December. However, the European Central Bank, the Bank of Japan and the People's Bank of China are expected to maintain accommodative policies. Sovereign bond yields moved modestly higher during the period amid higher inflation and on
expectations of a tighter Fed but remain historically low.
A harsher Chinese regulatory environment toward industries
such as online gaming, food delivery and education increased market volatility as has stress in China's highly leveraged property development sector. Trade relations between the United States and China remained quite strained despite a change in
presidential administrations.
Signs of excess
investor enthusiasm continued to be seen in pockets of the market such as “meme stocks” popular with users of online message boards, cryptocurrencies and heavy retail participation in the market for short-dated options.
Contributors to Performance
Security selection in both the communication services and
financials sectors contributed to the fund's performance relative to the MSCI All Country World Growth Index. Within the communication services sector, the timing of the fund's ownership in shares of internet search provider Baidu(h) (China), and
its overweight holding of technology company Alphabet, aided relative results. Within the financials sector, the fund's holdings of financial services provider Charles Schwab(b) and global alternative asset manager Blackstone Group(b) bolstered
relative returns. Overweight positions in risk management and human capital consulting services provider Aon and professional services firm Marsh & McLennan further contributed to relative performance.
Elsewhere, the fund's overweight positions in IT servicing
firm Accenture and consumer credit reporting agency Equifax strengthened relative results. The stock price of Accenture advanced after the company reported solid earnings results, driven by forward sales guidance that came in well ahead of consensus
expectations. Accenture also saw strong customer demand, which further supported its stock price. Not owning shares of internet retailer Amazon.com also contributed to relative returns. Although Amazon.com reported accelerated AWS and advertising
growth, its stock price declined as retail sales growth slowed more than anticipated against difficult comparisons to heightened levels during the pandemic. Further, the company noted that it experienced significant labor and material cost pressure,
due to inflation and global supply chain disruption, which held back its near-term profitability. The fund’s position in clinical research provider ICON(b) (Ireland) also supported relative performance.
Detractors from Performance
Security selection and an underweight position in the
information technology sector weakened the fund’s relative performance over the reporting period. Here, not owning shares of computer graphics processor maker NVIDIA held back relative results. The share price of NVIDIA appreciated as the
company posted strong revenue growth, driven by better-than-anticipated broad-based demand and capacity additions at its Gaming, Datacenter, and Pro Vis segments. The fund's underweight holdings of computer and personal electronics maker Apple and
software giant Microsoft also held back relative performance. The fund's position in global banking and payments technology provider Fidelity National Information Services(b), and its overweight position in financial technology services company
Fiserv, further weakened relative returns.
Stock
selection within the consumer discretionary sector detracted from relative performance, led by the fund's overweight position in online and mobile commerce company Alibaba Group Holding (China) and sporting goods producer Adidas (Germany). Not
owning shares of electric vehicle manufacturer Tesla also dampened relative performance. The share price of Tesla advanced considerably during the second half of the year, following significantly better-than-expected vehicle deliveries and the
company's ability to overcome supply chain issues that affected the whole auto industry. Moreover, favorable pricing of its Model 3 and Model Y vehicles helped improve Tesla’s profitability, which also had a positive impact on its share price
growth.
MFS Global Growth
Portfolio
Management Review - continued
Stocks in other sectors that held back relative returns
included the fund's overweight positions in cosmetic products manufacturer Kose (Japan) and video game maker Electronic Arts.
Respectfully,
Portfolio Manager(s)
Jeffrey Constantino and Joseph
Skorski
Note to Contract Owners: Effective April 15,
2021, David Antonelli is no longer a Portfolio Manager of the fund.
| (b)
|
Security is not a
benchmark constituent. |
| (h)
|
Security was not held in
the portfolio at period end. |
The
views expressed in this report are those of the portfolio manager(s) only through the end of the period of the report as stated on the cover and do not necessarily reflect the views of MFS or any other person in the MFS organization. These views are
subject to change at any time based on market or other conditions, and MFS disclaims any responsibility to update such views. These views may not be relied upon as investment advice or an indication of trading intent on behalf of any MFS portfolio.
References to specific securities are not recommendations of such securities, and may not be representative of any MFS portfolio’s current or future investments.
MFS Global Growth
Portfolio
Performance Summary Through 12/31/21
The following chart illustrates the historical performance
of the fund in comparison to its benchmark(s). Benchmarks are unmanaged and may not be invested in directly. Benchmark returns do not reflect any fees or expenses. The performance of other share classes will be greater than or less than that of the
class depicted below. (See Notes to Performance Summary.)
Performance data shown represents past performance and is no
guarantee of future results. Investment return and principal value fluctuate so your units, when sold, may be worth more or less than the original cost; current performance may be lower or higher than quoted. The performance shown does not reflect
the deduction of taxes, if any, that a contract holder would pay on fund distributions or the redemption of contract units. The returns for the fund shown also do not reflect the deduction of expenses associated with variable products, such as
mortality and expense risk charges, separate account charges, and sales charges imposed by the insurance company separate accounts. Such expenses would reduce the overall returns shown.
Growth of a Hypothetical $10,000 Investment
Total Returns
through 12/31/21
Average annual total returns
| Share
Class |
Class
Inception Date |
1-yr
|
5-yr
|
10-yr
|
| Initial
Class |
11/16/93
|
18.52%
|
19.61%
|
14.50%
|
| Service
Class |
8/24/01
|
18.21%
|
19.31%
|
14.21%
|
Comparative benchmark(s)
| MSCI
All Country World Growth Index (net div) (f) |
17.10%
|
19.92%
|
14.70%
|
| (f)
|
Source:
FactSet Research Systems Inc. |
Benchmark Definition(s)
MSCI All Country World Growth Index(e) (net div) – a market capitalization-weighted index that is designed to measure equity market performance for growth securities in the global developed and emerging
markets.
It is not possible to invest directly in an
index.
| (e)
|
Morgan
Stanley Capital International (“MSCI”) makes no express or implied warranties or representations and shall have no liability whatsoever with respect to any MSCI data contained herein. The MSCI data may not be further redistributed or
used as a basis for other indices or any securities or financial products. This report is not approved, reviewed, or produced by MSCI. |
Notes to Performance Summary
Average annual total return represents the average annual
change in value for each share class for the periods presented.
Performance results reflect any applicable expense
subsidies and waivers in effect during the periods shown. Without such subsidies and waivers the fund's performance results would be less favorable. Please see the prospectus and financial statements for complete details. All results are historical
and assume the reinvestment of any dividends and capital gains distributions.
Performance results do not include adjustments made for
financial reporting purposes in accordance with U.S. generally accepted accounting principles and may differ from amounts reported in the financial highlights.
MFS Global Growth
Portfolio
Performance Summary – continued
From
time to time the fund may receive proceeds from litigation settlements, without which performance would be lower.
MFS Global Growth
Portfolio
Expense Table
Fund Expenses Borne by the Contract Holders during the
Period,
July 1, 2021 through December 31, 2021
As
a contract holder of the fund, you incur ongoing costs, including management fees; distribution and/or service (12b-1) fees; and other fund expenses. This example is intended to help you understand your ongoing costs (in dollars) of investing in the
fund and to compare these costs with the ongoing costs of investing in other mutual funds.
The example is based on an investment of $1,000 invested at
the beginning of the period and held for the entire period July 1, 2021 through December 31, 2021.
Actual Expenses
The first line for each share class in the following table
provides information about actual account values and actual expenses. You may use the information in this line, together with the amount you invested, to estimate the expenses that you paid over the period. Simply divide your account value by $1,000
(for example, an $8,600 account value divided by $1,000 = 8.6), then multiply the result by the number in the first line under the heading entitled “Expenses Paid During Period” to estimate the expenses you paid on your account during
this period.
Hypothetical Example for Comparison
Purposes
The second line for each share class in the
following table provides information about hypothetical account values and hypothetical expenses based on the fund’s actual expense ratio and an assumed rate of return of 5% per year before expenses, which is not the fund’s actual
return. The hypothetical account values and expenses may not be used to estimate the actual ending account balance or expenses you paid for the period. You may use this information to compare the ongoing costs of investing in the fund and other
funds. To do so, compare this 5% hypothetical example with the 5% hypothetical examples that appear in the shareholder reports of the other funds.
Please note that the expenses shown in the table are meant
to highlight the fund's ongoing costs only and do not take into account the fees and expenses imposed under the variable contracts through which your investment in the fund is made. Therefore, the second line for each share class in the table is
useful in comparing ongoing costs associated with an investment in vehicles (such as the fund) which fund benefits under variable annuity and variable life insurance contracts and to qualified pension and retirement plans only, and will not help you
determine the relative total costs of investing in the fund through variable annuity and variable life insurance contracts. If the fees and expenses imposed under the variable contracts were included, your costs would have been higher.
Share
Class |
|
Annualized
Expense
Ratio |
Beginning
Account Value
7/01/21 |
Ending
Account Value
12/31/21 |
Expenses
Paid During
Period (p)
7/01/21-12/31/21 |
| Initial
Class |
Actual
|
1.00%
|
$1,000.00
|
$1,066.38
|
$5.21
|
| Hypothetical
(h) |
1.00%
|
$1,000.00
|
$1,020.16
|
$5.09
|
| Service
Class |
Actual
|
1.25%
|
$1,000.00
|
$1,065.10
|
$6.51
|
| Hypothetical
(h) |
1.25%
|
$1,000.00
|
$1,018.90
|
$6.36
|
| (h)
|
5% class return per year
before expenses. |
| (p)
|
“Expenses
Paid During Period” are equal to each class's annualized expense ratio, as shown above, multiplied by the average account value over the period, multiplied by 184/365 (to reflect the one-half year period). |
MFS Global Growth Portfolio
Portfolio of Investments − 12/31/21
The Portfolio of Investments is a complete list of all
securities owned by your fund. It is categorized by broad-based asset classes.
| Issuer
|
|
|
Shares/Par
|
Value
($) |
| Common
Stocks – 99.6% |
| Alcoholic
Beverages – 2.7% |
|
| Diageo
PLC |
|
19,949
|
$
1,089,799 |
| Kweichow
Moutai Co. Ltd., “A” |
|
1,900
|
611,139 |
| |
|
|
|
$1,700,938 |
| Apparel
Manufacturers – 5.8% |
|
| Adidas
AG |
|
3,842
|
$
1,107,526 |
| Burberry
Group PLC |
|
24,356
|
599,176 |
| LVMH
Moet Hennessy Louis Vuitton SE |
|
1,092
|
903,837 |
| NIKE,
Inc., “B” |
|
6,029
|
1,004,853 |
| |
|
|
|
$3,615,392 |
| Brokerage
& Asset Managers – 2.1% |
|
| Blackstone,
Inc. |
|
1,654
|
$
214,011 |
| Charles
Schwab Corp. |
|
12,810
|
1,077,321 |
| |
|
|
|
$1,291,332 |
| Business
Services – 9.9% |
|
| Accenture
PLC, “A” |
|
4,544
|
$
1,883,715 |
| CGI,
Inc. (a) |
|
6,776
|
599,151 |
| Cognizant
Technology Solutions Corp., “A” |
|
5,934
|
526,464 |
| Equifax,
Inc. |
|
2,669
|
781,457 |
| Fidelity
National Information Services, Inc. |
|
6,659
|
726,830 |
| Fiserv,
Inc. (a) |
|
9,729
|
1,009,773 |
| Verisk
Analytics, Inc., “A” |
|
2,962
|
677,498 |
| |
|
|
|
$6,204,888 |
| Cable
TV – 1.0% |
|
| Charter
Communications, Inc., “A” (a) |
|
999
|
$
651,318 |
| Computer
Software – 6.7% |
|
| Microsoft
Corp. |
|
9,837
|
$
3,308,380 |
| NAVER
Corp. (a) |
|
2,797
|
890,569 |
| |
|
|
|
$4,198,949 |
| Computer
Software - Systems – 3.5% |
|
| Apple,
Inc. |
|
10,127
|
$
1,798,252 |
| Samsung
Electronics Co. Ltd. |
|
6,330
|
416,941 |
| |
|
|
|
$2,215,193 |
| Construction
– 1.9% |
|
| Otis
Worldwide Corp. |
|
7,312
|
$
636,656 |
| Sherwin-Williams
Co. |
|
1,509
|
531,409 |
| |
|
|
|
$1,168,065 |
| Consumer
Products – 6.6% |
|
| Church
& Dwight Co., Inc. |
|
14,765
|
$
1,513,412 |
| Colgate-Palmolive
Co. |
|
6,840
|
583,726 |
| Estee
Lauder Cos., Inc., “A” |
|
1,114
|
412,403 |
| KOSE
Corp. |
|
7,400
|
839,520 |
| Reckitt
Benckiser Group PLC |
|
8,874
|
761,763 |
| |
|
|
|
$4,110,824 |
MFS Global Growth
Portfolio
Portfolio of
Investments – continued
| Issuer
|
|
|
Shares/Par
|
Value
($) |
| Common
Stocks – continued |
| Electrical
Equipment – 4.2% |
|
| Amphenol
Corp., “A” |
|
13,121
|
$
1,147,563 |
| Fortive
Corp. |
|
10,474
|
799,061 |
| TE
Connectivity Ltd. |
|
4,384
|
707,315 |
| |
|
|
|
$2,653,939 |
| Electronics
– 3.1% |
|
| Analog
Devices, Inc. |
|
3,224
|
$
566,682 |
| Taiwan
Semiconductor Manufacturing Co. Ltd., ADR |
|
7,013
|
843,734 |
| Texas
Instruments, Inc. |
|
2,868
|
540,532 |
| |
|
|
|
$1,950,948 |
| Food
& Beverages – 2.9% |
|
| McCormick
& Co., Inc. |
|
7,542
|
$
728,633 |
| Nestle
S.A. |
|
5,345
|
747,549 |
| PepsiCo,
Inc. |
|
1,829
|
317,715 |
| |
|
|
|
$1,793,897 |
| Gaming
& Lodging – 0.7% |
|
| Flutter
Entertainment PLC (a) |
|
2,563
|
$
407,972 |
| General
Merchandise – 2.7% |
|
| B&M
European Value Retail S.A. |
|
37,100
|
$
318,374 |
| Dollarama,
Inc. |
|
27,759
|
1,389,321 |
| |
|
|
|
$1,707,695 |
| Health
Maintenance Organizations – 0.7% |
|
| Cigna
Corp. |
|
1,939
|
$
445,253 |
| Insurance
– 2.4% |
|
| Aon
PLC |
|
3,351
|
$
1,007,176 |
| Marsh
& McLennan Cos., Inc. |
|
2,723
|
473,312 |
| |
|
|
|
$1,480,488 |
| Internet
– 10.1% |
|
| Alibaba
Group Holding Ltd. (a) |
|
80,312
|
$
1,224,628 |
| Alphabet,
Inc., “A” (a) |
|
1,321
|
3,826,990 |
| Tencent
Holdings Ltd. |
|
21,800
|
1,277,098 |
| |
|
|
|
$6,328,716 |
| Leisure
& Toys – 1.4% |
|
| Electronic
Arts, Inc. |
|
6,833
|
$
901,273 |
| Machinery
& Tools – 1.6% |
|
| Daikin
Industries Ltd. |
|
2,600
|
$
589,707 |
| Schindler
Holding AG |
|
1,586
|
425,527 |
| |
|
|
|
$1,015,234 |
| Medical
& Health Technology & Services – 2.2% |
|
| ICON
PLC (a) |
|
4,478
|
$
1,386,837 |
| Medical
Equipment – 10.5% |
|
| Abbott
Laboratories |
|
2,694
|
$
379,154 |
| Agilent
Technologies, Inc. |
|
2,498
|
398,806 |
| Becton,
Dickinson and Co. |
|
2,976
|
748,404 |
MFS Global Growth Portfolio
Portfolio of
Investments – continued
| Issuer
|
|
|
Shares/Par
|
Value
($) |
| Common
Stocks – continued |
| Medical
Equipment – continued |
|
| Boston
Scientific Corp. (a) |
|
26,512
|
$
1,126,230 |
| Danaher
Corp. |
|
2,919
|
960,380 |
| Medtronic
PLC |
|
4,556
|
471,318 |
| STERIS
PLC |
|
2,682
|
652,826 |
| Stryker
Corp. |
|
2,947
|
788,087 |
| Thermo
Fisher Scientific, Inc. |
|
1,522
|
1,015,539 |
| |
|
|
|
$6,540,744 |
| Other
Banks & Diversified Financials – 6.1% |
|
| Credicorp
Ltd. |
|
3,773
|
$
460,570 |
| HDFC
Bank Ltd. |
|
46,121
|
917,883 |
| Julius
Baer Group Ltd. |
|
5,085
|
339,808 |
| Mastercard,
Inc., “A” |
|
1,098
|
394,533 |
| Moody's
Corp. |
|
1,524
|
595,244 |
| Visa,
Inc., “A” |
|
5,139
|
1,113,673 |
| |
|
|
|
$3,821,711 |
| Pharmaceuticals
– 1.3% |
|
| Roche
Holding AG |
|
1,984
|
$
822,438 |
| Printing
& Publishing – 1.0% |
|
| Wolters
Kluwer N.V. |
|
5,278
|
$
622,533 |
| Railroad
& Shipping – 2.4% |
|
| Canadian
Pacific Railway Ltd. |
|
20,922
|
$
1,505,129 |
| Restaurants
– 0.9% |
|
| Starbucks
Corp. |
|
4,998
|
$
584,616 |
| Specialty
Chemicals – 0.5% |
|
| Sika
AG |
|
750
|
$
311,322 |
| Specialty
Stores – 1.9% |
|
| Ross
Stores, Inc. |
|
5,328
|
$
608,884 |
| TJX
Cos., Inc. |
|
7,475
|
567,502 |
| |
|
|
|
$1,176,386 |
| Telecommunications
- Wireless – 1.9% |
|
| American
Tower Corp., REIT |
|
4,085
|
$
1,194,862 |
| Utilities
- Electric Power – 0.9% |
|
| Xcel
Energy, Inc. |
|
8,348
|
$
565,160 |
| Total
Common Stocks (Identified Cost, $31,930,926) |
|
$62,374,052
|
| Investment
Companies (h) – 0.4% |
| Money
Market Funds – 0.4% |
|
| MFS
Institutional Money Market Portfolio, 0.07% (v) (Identified Cost, $263,435) |
|
|
263,436
|
$
263,435 |
| Other
Assets, Less Liabilities – (0.0)% |
|
(27,108) |
| Net
Assets – 100.0% |
$62,610,379
|
MFS Global Growth
Portfolio
Portfolio of
Investments – continued
| (a) |
Non-income producing
security. |
|
|
|
| (h)
|
An
affiliated issuer, which may be considered one in which the fund owns 5% or more of the outstanding voting securities, or a company which is under common control. At period end, the aggregate values of the fund's investments in affiliated issuers
and in unaffiliated issuers were $263,435 and $62,374,052, respectively. |
|
|
|
| (v)
|
Affiliated
issuer that is available only to investment companies managed by MFS. The rate quoted for the MFS Institutional Money Market Portfolio is the annualized seven-day yield of the fund at period end. |
|
|
|
| The
following abbreviations are used in this report and are defined: |
| ADR
|
American
Depositary Receipt |
| REIT
|
Real Estate
Investment Trust |
See Notes to Financial
Statements
MFS Global Growth
Portfolio
| Financial
Statements |
Statement of Assets and
Liabilities |
This statement
represents your fund’s balance sheet, which details the assets and liabilities comprising the total value of the fund.
| At
12/31/21 Assets |
|
| Investments
in unaffiliated issuers, at value (identified cost, $31,930,926) |
$62,374,052
|
| Investments
in affiliated issuers, at value (identified cost, $263,435) |
263,435
|
| Cash
|
93,744
|
| Foreign
currency, at value (identified cost, $27) |
27
|
| Receivables
for |
|
| Fund
shares sold |
6,443
|
| Dividends
|
93,223
|
| Receivable
from investment adviser |
2,155
|
| Other
assets |
565
|
| Total
assets |
$62,833,644
|
| Liabilities
|
|
| Payables
for |
|
| Fund
shares reacquired |
$133,013
|
| Payable
to affiliates |
|
| Administrative
services fee |
105
|
| Shareholder
servicing costs |
24
|
| Distribution
and/or service fees |
97
|
| Payable
for independent Trustees' compensation |
45
|
| Deferred
country tax expense payable |
31,340
|
| Accrued
expenses and other liabilities |
58,641
|
| Total
liabilities |
$223,265
|
| Net
assets |
$62,610,379
|
| Net
assets consist of |
|
| Paid-in
capital |
$26,455,350
|
| Total
distributable earnings (loss) |
36,155,029
|
| Net
assets |
$62,610,379
|
| Shares
of beneficial interest outstanding |
1,907,412
|
| |
Net
assets |
Shares
outstanding |
Net
asset value
per share |
| Initial
Class |
$55,500,860
|
1,689,773
|
$32.85
|
| Service
Class |
7,109,519
|
217,639
|
32.67
|
See Notes to Financial Statements
MFS Global Growth
Portfolio
| Financial
Statements |
Statement of Operations
|
This statement describes how much
your fund earned in investment income and accrued in expenses. It also describes any gains and/or losses generated by fund operations.
| Year
ended 12/31/21 |
|
| Net
investment income (loss) |
|
| Income
|
|
| Dividends
|
$734,865
|
| Other
|
1,973
|
| Dividends
from affiliated issuers |
269
|
| Income
on securities loaned |
6
|
| Foreign
taxes withheld |
(34,090)
|
| Total
investment income |
$703,023
|
| Expenses
|
|
| Management
fee |
$542,136
|
| Distribution
and/or service fees |
13,422
|
| Shareholder
servicing costs |
3,865
|
| Administrative
services fee |
18,828
|
| Independent
Trustees' compensation |
3,137
|
| Custodian
fee |
13,661
|
| Shareholder
communications |
5,414
|
| Audit
and tax fees |
80,077
|
| Legal
fees |
377
|
| Miscellaneous
|
22,703
|
| Total
expenses |
$703,620
|
| Reduction
of expenses by investment adviser |
(87,655)
|
| Net
expenses |
$615,965
|
| Net
investment income (loss) |
$87,058
|
| Realized
and unrealized gain (loss) |
|
| Realized
gain (loss) (identified cost basis) |
|
| Unaffiliated
issuers (net of $2,131 country tax) |
$5,888,530
|
| Foreign
currency |
(2,548)
|
| Net
realized gain (loss) |
$5,885,982
|
| Change
in unrealized appreciation or depreciation |
|
| Unaffiliated
issuers (net of $5,580 decrease in deferred country tax) |
$4,183,054
|
| Translation
of assets and liabilities in foreign currencies |
(3,290)
|
| Net
unrealized gain (loss) |
$4,179,764
|
| Net
realized and unrealized gain (loss) |
$10,065,746
|
| Change
in net assets from operations |
$10,152,804
|
See Notes to Financial Statements
MFS Global Growth
Portfolio
| Financial
Statements |
Statements of Changes in
Net Assets |
These statements describe
the increases and/or decreases in net assets resulting from operations, any distributions, and any shareholder transactions.
| |
Year
ended |
| |
12/31/21
|
12/31/20
|
| Change
in net assets |
|
|
| From
operations |
|
|
| Net
investment income (loss) |
$87,058
|
$43,748
|
| Net
realized gain (loss) |
5,885,982
|
6,924,262
|
| Net
unrealized gain (loss) |
4,179,764
|
2,933,827
|
| Change
in net assets from operations |
$10,152,804
|
$9,901,837
|
| Total
distributions to shareholders |
$(7,022,050)
|
$(5,057,056)
|
| Change
in net assets from fund share transactions |
$2,938,411
|
$(1,323,240)
|
| Total
change in net assets |
$6,069,165
|
$3,521,541
|
| Net
assets |
|
|
| At
beginning of period |
56,541,214
|
53,019,673
|
| At
end of period |
$62,610,379
|
$56,541,214
|
See Notes to Financial Statements
MFS Global Growth
Portfolio
| Financial
Statements |
Financial Highlights
|
The financial highlights table is
intended to help you understand the fund's financial performance for the past 5 years. Certain information reflects financial results for a single fund share. The total returns in the table represent the rate that an investor would have earned (or
lost) on an investment in the fund share class (assuming reinvestment of all distributions) held for the entire period.
| Initial
Class |
Year
ended |
| |
12/31/21
|
12/31/20
|
12/31/19
|
12/31/18
|
12/31/17
|
| Net
asset value, beginning of period |
$31.23
|
$28.60
|
$23.72
|
$26.53
|
$21.00
|
| Income
(loss) from investment operations |
|
|
|
|
|
| Net
investment income (loss) (d) |
$0.06
|
$0.03
|
$0.14
|
$0.15
|
$0.13
|
| Net
realized and unrealized gain (loss) |
5.57
|
5.57
|
8.00
|
(1.23)
|
6.51
|
| Total
from investment operations |
$5.63
|
$5.60
|
$8.14
|
$(1.08)
|
$6.64
|
| Less
distributions declared to shareholders |
|
|
|
|
|
| From
net investment income |
$(0.03)
|
$(0.14)
|
$(0.16)
|
$(0.14)
|
$(0.27)
|
| From
net realized gain |
(3.98)
|
(2.83)
|
(3.10)
|
(1.59)
|
(0.84)
|
| Total
distributions declared to shareholders |
$(4.01)
|
$(2.97)
|
$(3.26)
|
$(1.73)
|
$(1.11)
|
| Net
asset value, end of period (x) |
$32.85
|
$31.23
|
$28.60
|
$23.72
|
$26.53
|
| Total
return (%) (k)(r)(s)(x) |
18.52
|
20.76
|
36.01
|
(4.83)
|
32.14
|
Ratios
(%) (to average net assets)
and Supplemental data: |
|
|
|
|
|
| Expenses
before expense reductions |
1.15
|
1.21
|
1.21
|
1.17
|
1.17
|
| Expenses
after expense reductions |
1.00
|
1.00
|
1.00
|
1.00
|
1.00
|
| Net
investment income (loss) |
0.17
|
0.10
|
0.53
|
0.56
|
0.55
|
| Portfolio
turnover |
19
|
34
|
22
|
22
|
21
|
| Net
assets at end of period (000 omitted) |
$55,501
|
$53,591
|
$50,911
|
$43,919
|
$54,886
|
| Service
Class |
Year
ended |
| |
12/31/21
|
12/31/20
|
12/31/19
|
12/31/18
|
12/31/17
|
| Net
asset value, beginning of period |
$31.13
|
$28.52
|
$23.65
|
$26.44
|
$20.94
|
| Income
(loss) from investment operations |
|
|
|
|
|
| Net
investment income (loss) (d) |
$(0.03)
|
$(0.04)
|
$0.07
|
$0.09
|
$0.07
|
| Net
realized and unrealized gain (loss) |
5.55
|
5.56
|
7.98
|
(1.24)
|
6.48
|
| Total
from investment operations |
$5.52
|
$5.52
|
$8.05
|
$(1.15)
|
$6.55
|
| Less
distributions declared to shareholders |
|
|
|
|
|
| From
net investment income |
$—
|
$(0.08)
|
$(0.08)
|
$(0.05)
|
$(0.21)
|
| From
net realized gain |
(3.98)
|
(2.83)
|
(3.10)
|
(1.59)
|
(0.84)
|
| Total
distributions declared to shareholders |
$(3.98)
|
$(2.91)
|
$(3.18)
|
$(1.64)
|
$(1.05)
|
| Net
asset value, end of period (x) |
$32.67
|
$31.13
|
$28.52
|
$23.65
|
$26.44
|
| Total
return (%) (k)(r)(s)(x) |
18.21
|
20.49
|
35.66
|
(5.06)
|
31.77
|
Ratios
(%) (to average net assets)
and Supplemental data: |
|
|
|
|
|
| Expenses
before expense reductions |
1.39
|
1.46
|
1.46
|
1.42
|
1.42
|
| Expenses
after expense reductions |
1.25
|
1.25
|
1.25
|
1.25
|
1.25
|
| Net
investment income (loss) |
(0.10)
|
(0.16)
|
0.26
|
0.34
|
0.31
|
| Portfolio
turnover |
19
|
34
|
22
|
22
|
21
|
| Net
assets at end of period (000 omitted) |
$7,110
|
$2,950
|
$2,109
|
$1,754
|
$2,530
|
See Notes to Financial Statements
MFS Global Growth
Portfolio
Financial Highlights - continued
| (d)
|
Per share data
is based on average shares outstanding. |
| (k)
|
The total
return does not reflect expenses that apply to separate accounts. Inclusion of these charges would reduce the total return figures for all periods shown. |
| (r)
|
Certain
expenses have been reduced without which performance would have been lower. |
| (s)
|
From time to
time the fund may receive proceeds from litigation settlements, without which performance would be lower. |
| (x)
|
The
net asset values and total returns have been calculated on net assets which include adjustments made in accordance with U.S. generally accepted accounting principles required at period end for financial reporting purposes. |
See Notes to Financial Statements
MFS Global Growth
Portfolio
Notes to Financial Statements
(1) Business and Organization
MFS Global Growth Portfolio (the fund) is a diversified
series of MFS Variable Insurance Trust II (the trust). The trust is organized as a Massachusetts business trust and is registered under the Investment Company Act of 1940, as amended, as an open-end management investment company. The shareholders of
each series of the trust are separate accounts of insurance companies, which offer variable annuity and/or life insurance products, and qualified retirement and pension plans.
The fund is an investment company and accordingly follows
the investment company accounting and reporting guidance of the Financial Accounting Standards Board (FASB) Accounting Standards Codification Topic 946 Financial Services - Investment Companies.
(2) Significant Accounting Policies
General — The
preparation of financial statements in conformity with U.S. generally accepted accounting principles requires management to make estimates and assumptions that affect the reported amounts of assets and liabilities, and disclosure of contingent
assets and liabilities at the date of the financial statements and the reported amounts of increases and decreases in net assets from operations during the reporting period. Actual results could differ from those estimates. In the preparation of
these financial statements, management has evaluated subsequent events occurring after the date of the fund’s Statement of Assets and Liabilities through the date that the financial statements were issued. The fund invests in foreign securities, including securities of emerging market issuers. Investments in foreign securities are vulnerable to the effects of changes in the relative values of the local currency and the
U.S. dollar and to the effects of changes in each country’s market, economic, industrial, political, regulatory, geopolitical, environmental, public health, and other conditions. Investments in emerging markets can involve additional and
greater risks than the risks associated with investments in developed foreign markets. Emerging markets can have less developed markets, greater custody and operational risk, less developed legal, regulatory, accounting, and auditing systems, and
greater political, social, and economic instability than developed markets.
Balance Sheet Offsetting
— The fund's accounting policy with respect to balance sheet offsetting is that, absent an event of default by the counterparty or a termination of the agreement, the International Swaps and Derivatives Association (ISDA) Master Agreement, or
similar agreement, does not result in an offset of reported amounts of financial assets and financial liabilities in the Statement of Assets and Liabilities across transactions between the fund and the applicable counterparty. The fund's right to
setoff may be restricted or prohibited by the bankruptcy or insolvency laws of the particular jurisdiction to which a specific master netting agreement counterparty is subject. Balance sheet offsetting disclosures, to the extent applicable to the
fund, have been included in the fund’s Significant Accounting Policies note under the captions for each of the fund’s in-scope financial instruments and transactions.
Investment Valuations
— Equity securities, including restricted equity securities, are generally valued at the last sale or official closing price on their primary market or exchange as provided by a third-party pricing
service. Equity securities, for which there were no sales reported that day, are generally valued at the last quoted daily bid quotation on their primary market or exchange as provided by a third-party pricing service. Short-term instruments with a maturity at issuance of 60 days or less may be valued at amortized cost, which approximates market value. Open-end investment companies are
generally valued at net asset value per share.
Securities and
other assets generally valued on the basis of information from a third-party pricing service may also be valued at a broker/dealer bid quotation. In determining values, third-party pricing services can utilize both transaction data and market
information such as yield, quality, coupon rate, maturity, type of issue, trading characteristics, and other market data. The values of foreign securities and other assets and liabilities expressed in foreign currencies are converted to U.S. dollars
using the mean of bid and asked prices for rates provided by a third-party pricing service.
The Board of Trustees has delegated primary responsibility
for determining or causing to be determined the value of the fund’s investments (including any fair valuation) to the adviser pursuant to valuation policies and procedures approved by the Board. If the adviser determines that reliable market
quotations are not readily available, investments are valued at fair value as determined in good faith by the adviser in accordance with such procedures under the oversight of the Board of Trustees. Under the fund’s valuation policies and
procedures, market quotations are not considered to be readily available for most types of debt instruments and floating rate loans and many types of derivatives. These investments are generally valued at fair value based on information from
third-party pricing services. In addition, investments may be valued at fair value if the adviser determines that an investment’s value has been materially affected by events occurring after the close of the exchange or market on which the
investment is principally traded (such as foreign exchange or market) and prior to the determination of the fund’s net asset value, or after the halt of trading of a specific security where trading does not resume prior to the close of the
exchange or market on which the security is principally traded. Events that occur after foreign markets close (such as developments in foreign markets and significant movements in the U.S. markets) and prior to the determination of the fund’s
net asset value may be deemed to have a material effect on the value of securities traded in foreign markets. Accordingly, the fund’s foreign equity securities may often be valued at fair value. The adviser
MFS Global Growth
Portfolio
Notes to Financial Statements - continued
generally relies on
third-party pricing services or other information (such as the correlation with price movements of similar securities in the same or other markets; the type, cost and investment characteristics of the security; the business and financial condition
of the issuer; and trading and other market data) to assist in determining whether to fair value and at what value to fair value an investment. The value of an investment for purposes of calculating the fund’s net asset value can differ
depending on the source and method used to determine value. When fair valuation is used, the value of an investment used to determine the fund’s net asset value may differ from quoted or published prices for the same investment. There can be
no assurance that the fund could obtain the fair value assigned to an investment if it were to sell the investment at the same time at which the fund determines its net asset value per share.
Various inputs are used in determining the value of the
fund's assets or liabilities. These inputs are categorized into three broad levels. In certain cases, the inputs used to measure fair value may fall into different levels of the fair value hierarchy. In such cases, an investment's level within the
fair value hierarchy is based on the lowest level of input that is significant to the fair value measurement. The fund's assessment of the significance of a particular input to the fair value measurement in its entirety requires judgment, and
considers factors specific to the investment. Level 1 includes unadjusted quoted prices in active markets for identical assets or liabilities. Level 2 includes other significant observable market-based inputs (including quoted prices for similar
securities, interest rates, prepayment speed, and credit risk). Level 3 includes unobservable inputs, which may include the adviser's own assumptions in determining the fair value of investments. The following is a summary of the levels used as of
December 31, 2021 in valuing the fund's assets and liabilities:
| Financial
Instruments |
Level
1 |
Level
2 |
Level
3 |
Total
|
| Equity
Securities: |
|
|
|
|
| United
States |
$40,964,201
|
$—
|
$—
|
$40,964,201
|
| Canada
|
3,493,601
|
—
|
—
|
3,493,601
|
| China
|
3,112,865
|
—
|
—
|
3,112,865
|
| United
Kingdom |
2,769,112
|
—
|
—
|
2,769,112
|
| Switzerland
|
747,549
|
1,899,095
|
—
|
2,646,644
|
| Ireland
|
1,794,809
|
—
|
—
|
1,794,809
|
| Japan
|
1,429,227
|
—
|
—
|
1,429,227
|
| South
Korea |
1,307,510
|
—
|
—
|
1,307,510
|
| Germany
|
1,107,526
|
—
|
—
|
1,107,526
|
| Other
Countries |
3,748,557
|
—
|
—
|
3,748,557
|
| Mutual
Funds |
263,435
|
—
|
—
|
263,435
|
| Total
|
$60,738,392
|
$1,899,095
|
$—
|
$62,637,487
|
For further information
regarding security characteristics, see the Portfolio of Investments.
Foreign Currency
Translation — Purchases and sales of foreign investments, income, and expenses are converted into U.S. dollars based upon currency exchange rates prevailing on the respective dates of such transactions or on
the reporting date for foreign denominated receivables and payables. Gains and losses attributable to foreign currency exchange rates on sales of securities are recorded for financial statement purposes as net realized gains and losses on
investments. Gains and losses attributable to foreign exchange rate movements on receivables, payables, income and expenses are recorded for financial statement purposes as foreign currency transaction gains and losses. That portion of both realized
and unrealized gains and losses on investments that results from fluctuations in foreign currency exchange rates is not separately disclosed.
Security Loans —
Under its Securities Lending Agency Agreement with the fund, State Street Bank and Trust Company, as lending agent, loans the securities of the fund to certain qualified institutions (the “Borrowers”) approved by the fund. Security loans
can be terminated at the discretion of either the lending agent or the fund and the related securities must be returned within the earlier of the standard trade settlement period for such securities or within three business days. The loans are
collateralized by cash and/or U.S. Treasury and federal agency obligations in an amount typically at least equal to the market value of the securities loaned. On loans collateralized by cash, the cash collateral is invested in a money market fund.
The market value of the loaned securities is determined at the close of business of the fund and any additional required collateral is delivered to the fund on the next business day. The lending agent provides the fund with indemnification against
Borrower default. In the event of Borrower default, the lending agent will, for the benefit of the fund, either purchase securities identical to those loaned or, when such purchase is commercially impracticable, pay the fund the market value of the
loaned securities. In return, the lending agent assumes the fund's rights to the related collateral. If the collateral value is less than the cost to purchase identical securities, the lending agent is responsible for the shortfall, but only to the
extent that such shortfall is not due to a decline in collateral value resulting from collateral reinvestment for which the fund bears the risk of loss. A portion of the income generated upon investment of the collateral is remitted to the
Borrowers, and the remainder is allocated between the fund and the lending agent. On loans collateralized by
MFS Global Growth
Portfolio
Notes to Financial Statements - continued
U.S. Treasury
and/or federal agency obligations, a fee is received from the Borrower, and is allocated between the fund and the lending agent. Income from securities lending is separately reported in the Statement of Operations. The dividend and interest income
earned on the securities loaned is accounted for in the same manner as other dividend and interest income. At December 31, 2021, there were no securities on loan or collateral outstanding.
Indemnifications —
Under the fund's organizational documents, its officers and Trustees may be indemnified against certain liabilities and expenses arising out of the performance of their duties to the fund. Additionally, in the normal course of business, the fund
enters into agreements with service providers that may contain indemnification clauses. The fund's maximum exposure under these agreements is unknown as this would involve future claims that may be made against the fund that have not yet
occurred.
Investment Transactions and Income — Investment transactions are recorded on the trade date. Dividends received in cash are recorded on the ex-dividend date. Certain dividends from foreign securities will be
recorded when the fund is informed of the dividend if such information is obtained subsequent to the ex-dividend date. Dividend payments received in additional securities are recorded on the ex-dividend date in an amount equal to the value of the
security on such date.
The fund may receive
proceeds from litigation settlements. Any proceeds received from litigation involving portfolio holdings are reflected in the Statement of Operations in realized gain/loss if the security has been disposed of by the fund or in unrealized gain/loss
if the security is still held by the fund. Any other proceeds from litigation not related to portfolio holdings are reflected as other income in the Statement of Operations.
Tax Matters and Distributions — The fund intends to qualify as a regulated investment company, as defined under Subchapter M of the Internal Revenue Code, and to distribute all of its taxable income, including realized capital gains. As a
result, no provision for federal income tax is required. The fund’s federal tax returns, when filed, will remain subject to examination by the Internal Revenue Service for a three year period. Management has analyzed the fund’s tax
positions taken on federal and state tax returns for all open tax years and does not believe that there are any uncertain tax positions that require recognition of a tax liability. Foreign taxes, if any, have been accrued by the fund in the
accompanying financial statements in accordance with the applicable foreign tax law. Foreign income taxes may be withheld by certain countries in which the fund invests. Additionally, capital gains realized by the fund on securities issued in or by
certain foreign countries may be subject to capital gains tax imposed by those countries.
Distributions to shareholders are recorded on the
ex-dividend date. Income and capital gain distributions are determined in accordance with income tax regulations, which may differ from U.S. generally accepted accounting principles. Certain capital accounts in the financial statements are
periodically adjusted for permanent differences in order to reflect their tax character. These adjustments have no impact on net assets or net asset value per share. Temporary differences which arise from recognizing certain items of income,
expense, gain or loss in different periods for financial statement and tax purposes will reverse at some time in the future.
Book/tax differences primarily relate to wash sale loss
deferrals.
The tax character of distributions
declared to shareholders for the last two fiscal years is as follows:
| |
Year
ended
12/31/21 |
Year
ended
12/31/20 |
| Ordinary
income (including any short-term capital gains) |
$274,048
|
$556,052
|
| Long-term
capital gains |
6,748,002
|
4,501,004
|
| Total
distributions |
$7,022,050
|
$5,057,056
|
The federal tax cost and the tax
basis components of distributable earnings were as follows:
| As
of 12/31/21 |
|
| Cost
of investments |
$32,357,346
|
| Gross
appreciation |
30,701,080
|
| Gross
depreciation |
(420,939)
|
| Net
unrealized appreciation (depreciation) |
$30,280,141
|
| Undistributed
ordinary income |
700,135
|
| Undistributed
long-term capital gain |
5,173,575
|
| Other
temporary differences |
1,178
|
| Total
distributable earnings (loss) |
$36,155,029
|
MFS Global Growth
Portfolio
Notes to Financial Statements - continued
Multiple Classes of Shares of Beneficial Interest — The fund offers multiple classes of shares, which differ in their respective distribution and/or service fees. The fund's income, realized and unrealized gain (loss), and common expenses are allocated to
shareholders based on the daily net assets of each class. Dividends are declared separately for each class. Differences in per share dividend rates are generally due to differences in separate class expenses. The fund’s distributions declared
to shareholders as reported in the Statements of Changes in Net Assets are presented by class as follows:
| |
Year
ended
12/31/21 |
|
Year
ended
12/31/20 |
| Initial
Class |
$6,286,826
|
|
$4,835,637
|
| Service
Class |
735,224
|
|
221,419
|
| Total
|
$7,022,050
|
|
$5,057,056
|
(3) Transactions with
Affiliates
Investment Adviser — The fund has an investment advisory agreement with MFS to provide overall investment management and related administrative services and facilities to the fund. The
management fee is computed daily and paid monthly at the following annual rates based on the fund's average daily net assets:
| Up
to $1 billion |
0.90%
|
| In
excess of $1 billion and up to $2 billion |
0.75%
|
| In
excess of $2 billion |
0.65%
|
MFS has agreed in writing to
reduce its management fee by a specified amount if certain MFS mutual fund assets exceed thresholds agreed to by MFS and the fund's Board of Trustees. For the year ended December 31, 2021, this management fee reduction amounted to $7,647, which is
included in the reduction of total expenses in the Statement of Operations. The management fee incurred for the year ended December 31, 2021 was equivalent to an annual effective rate of 0.89% of the fund's average daily net assets.
The investment adviser has agreed in writing to pay a
portion of the fund’s total annual operating expenses, excluding interest, taxes, extraordinary expenses, brokerage and transaction costs, and investment-related expenses, such that total annual operating expenses do not exceed 1.00% of
average daily net assets for the Initial Class shares and 1.25% of average daily net assets for the Service Class shares. This written agreement will continue until modified by the fund’s Board of Trustees, but such agreement will continue at
least until April 30, 2023. For the year ended December 31, 2021, this reduction amounted to $80,008, which is included in the reduction of total expenses in the Statement of Operations.
Distributor — MFS
Fund Distributors, Inc. (MFD), a wholly-owned subsidiary of MFS, is the distributor of shares of the fund. The Trustees have adopted a distribution plan for the Service Class shares pursuant to Rule 12b-1 under the Investment Company Act of
1940.
The fund's distribution plan provides
that the fund will pay MFD distribution and/or service fees equal to 0.25% per annum of its average daily net assets attributable to Service Class shares as partial consideration for services performed and expenses incurred by MFD and financial
intermediaries (including participating insurance companies that invest in the fund to fund variable annuity and variable life insurance contracts, sponsors of qualified retirement and pension plans that invest in the fund, and affiliates of these
participating insurance companies and plan sponsors) in connection with the sale and distribution of the Service Class shares. MFD may subsequently pay all, or a portion, of the distribution and/or service fees to financial intermediaries.
Shareholder Servicing Agent
— MFS Service Center, Inc. (MFSC), a wholly-owned subsidiary of MFS, receives a fee from the fund for its services as shareholder servicing agent. For the year ended December 31, 2021, the fee was $3,681, which equated to 0.0061% annually of
the fund's average daily net assets. MFSC also receives reimbursement from the fund for out-of-pocket expenses paid by MFSC on behalf of the fund. For the year ended December 31, 2021, these costs amounted to $184.
Administrator — MFS
provides certain financial, legal, shareholder communications, compliance, and other administrative services to the fund. Under an administrative services agreement, the fund reimburses MFS the costs incurred to provide these services. The fund is
charged an annual fixed amount of $17,500 plus a fee based on average daily net assets. The administrative services fee incurred for the year ended December 31, 2021 was equivalent to an annual effective rate of 0.0313% of the fund's average daily
net assets.
MFS Global Growth
Portfolio
Notes to Financial Statements - continued
Trustees’ and Officers’ Compensation — The fund pays compensation to independent Trustees in the form of a retainer, attendance fees, and additional compensation to Board and Committee chairpersons. The fund does not pay compensation directly to
Trustees or officers of the fund who are also officers of the investment adviser, all of whom receive remuneration from MFS for their services to the fund. Certain officers and Trustees of the fund are officers or directors of MFS, MFD, and
MFSC.
Other
— The fund invests in the MFS Institutional Money Market Portfolio which is managed by MFS and seeks current income consistent with preservation of capital and liquidity. This money market fund does not pay a
management fee to MFS but does incur investment and operating costs.
The fund is permitted to engage in purchase and sale
transactions with funds and accounts for which MFS serves as investment adviser or sub-adviser (“cross-trades”) pursuant to a policy adopted by the Board of Trustees. This policy has been designed to ensure that cross-trades conducted by
the fund comply with Rule 17a-7 under the Investment Company Act of 1940. During the year ended December 31, 2021, the fund engaged in purchase and sale transactions pursuant to this policy, which amounted to $26,247 and $7,076, respectively. The
sales transactions resulted in net realized gains (losses) of $(145).
The adviser has voluntarily undertaken to reimburse the
fund from its own resources on a quarterly basis for the cost of investment research embedded in the cost of the fund’s securities trades. This agreement may be rescinded at any time. For the year ended December 31, 2021, this reimbursement
amounted to $1,956, which is included in “Other” income in the Statement of Operations.
(4) Portfolio Securities
For the year ended December 31, 2021, purchases and sales
of investments, other than short-term obligations, aggregated $11,506,919 and $15,255,968, respectively.
(5) Shares of Beneficial Interest
The fund's Declaration of Trust permits the Trustees to
issue an unlimited number of full and fractional shares of beneficial interest. Transactions in fund shares were as follows:
| |
Year
ended
12/31/21 |
|
Year
ended
12/31/20 |
| |
Shares
|
Amount
|
|
Shares
|
Amount
|
| Shares
sold |
|
|
|
|
|
| Initial
Class |
45,404
|
$1,488,071
|
|
63,657
|
$1,741,046
|
| Service
Class |
112,594
|
3,745,462
|
|
22,786
|
663,768
|
| |
157,998
|
$5,233,533
|
|
86,443
|
$2,404,814
|
Shares
issued to shareholders
in reinvestment of distributions |
|
|
|
|
|
| Initial
Class |
198,762
|
$6,286,826
|
|
172,148
|
$4,835,637
|
| Service
Class |
23,348
|
735,224
|
|
7,902
|
221,419
|
| |
222,110
|
$7,022,050
|
|
180,050
|
$5,057,056
|
| Shares
reacquired |
|
|
|
|
|
| Initial
Class |
(270,459)
|
$(8,881,980)
|
|
(299,956)
|
$(8,508,716)
|
| Service
Class |
(13,091)
|
(435,192)
|
|
(9,827)
|
(276,394)
|
| |
(283,550)
|
$(9,317,172)
|
|
(309,783)
|
$(8,785,110)
|
| Net
change |
|
|
|
|
|
| Initial
Class |
(26,293)
|
$(1,107,083)
|
|
(64,151)
|
$(1,932,033)
|
| Service
Class |
122,851
|
4,045,494
|
|
20,861
|
608,793
|
| |
96,558
|
$2,938,411
|
|
(43,290)
|
$(1,323,240)
|
(6) Line of
Credit
The fund and certain other funds managed by
MFS participate in a $1.25 billion unsecured committed line of credit of which $1 billion is reserved for use by the fund and certain other MFS U.S. funds. The line of credit is provided by a syndicate of banks under a credit agreement. Borrowings
may be made for temporary financing needs. Interest is charged to each fund, based on its borrowings, generally at a rate equal to the highest of one month LIBOR, the Federal Funds Effective Rate and the Overnight Bank Funding Rate, plus an agreed
upon spread. A commitment fee, based on the average daily, unused portion of the committed line of credit, is allocated among the participating funds. In addition, the fund and other funds managed by MFS have established
MFS Global Growth
Portfolio
Notes to Financial Statements - continued
unsecured
uncommitted borrowing arrangements with certain banks for temporary financing needs. Interest is charged to each fund, based on its borrowings, at rates equal to customary reference rates plus an agreed upon spread. For the year ended December 31,
2021, the fund’s commitment fee and interest expense were $193 and $0, respectively, and are included in “Miscellaneous” expense in the Statement of Operations.
(7) Investments in Affiliated Issuers
An affiliated issuer may be considered one in which the
fund owns 5% or more of the outstanding voting securities, or a company which is under common control. For the purposes of this report, the following were affiliated issuers:
| Affiliated
Issuers |
Beginning
Value |
Purchases
|
Sales
Proceeds |
Realized
Gain
(Loss) |
Change
in
Unrealized
Appreciation or
Depreciation |
Ending
Value |
| MFS
Institutional Money Market Portfolio |
$461,131
|
$10,373,300
|
$10,570,996
|
$—
|
$—
|
$263,435
|
| Affiliated
Issuers |
Dividend
Income |
Capital
Gain
Distributions |
| MFS
Institutional Money Market Portfolio |
$269
|
$—
|
(8) Impacts of
COVID-19
The pandemic related to the global spread of
novel coronavirus disease (COVID-19), which was first detected in December 2019, has resulted in significant disruptions to global business activity and the global economy, as well as the economies of individual countries, the financial performance
of individual companies and sectors, and the securities and commodities markets in general. Multiple surges in cases globally, the availability and widespread adoption of vaccines, and the emergence of variant strains of the virus continue to create
uncertainty as to the future and long-term impacts resulting from the pandemic including impacts to the prices and liquidity of the fund's investments and the fund's performance.
(9) LIBOR Transition
Certain of the fund's investments, including its
investments in derivatives, as well as any debt issued by the fund and other contractual arrangements of the fund may be based on reference interest rates such as the London Interbank Offered Rate (“LIBOR”). In 2017, the regulatory
authority that oversees financial services firms in the United Kingdom announced plans to transition away from LIBOR by the end of 2021. In March 2021, the administrator of LIBOR announced the extension of the publication of the more commonly used
U.S. dollar LIBOR settings to the end of June 2023. Although the full impacts of the transition away from LIBOR are not fully known, the transition may result in, among other things, an increase in volatility or illiquidity of the markets for
instruments that currently rely on LIBOR to determine interest rates and this could have an adverse impact on the fund's performance. With respect to the fund's accounting for investments, including its investments in derivatives, as well as any
debt issued by the fund and other contractual arrangements of the fund that undergo reference rate-related modifications as a result of the transition, management will rely upon the relief provided by FASB Codification Topic 848 – Reference
Rate Reform (Topic 848). The guidance in Topic 848 permits the fund to disregard the GAAP accounting requirements around certain contract modifications resulting from the LIBOR transition such that for contracts considered in scope, the fund can
account for those modified contracts as a continuation of the existing contracts. While the cessation of the one-week and two-month U.S. dollar LIBOR tenors along with certain other non-U.S. dollar denominated LIBOR settings at December 31, 2021 did
not have a material impact on the fund, management is still evaluating the impact to the fund of the June 30, 2023 planned discontinuation of the more commonly used U.S. dollar LIBOR settings.
MFS Global Growth
Portfolio
Report of Independent Registered Public Accounting
Firm
To the Board of Trustees of MFS Variable
Insurance Trust II and the Shareholders of MFS Global Growth Portfolio:
Opinion on the Financial Statements and Financial
Highlights
We have audited the accompanying statement
of assets and liabilities of MFS Global Growth Portfolio (the “Fund”), including the portfolio of investments, as of December 31, 2021, the related statement of operations for the year then ended, the statements of changes in net assets
for each of the two years in the period then ended, the financial highlights for each of the five years in the period then ended, and the related notes. In our opinion, the financial statements and financial highlights present fairly, in all
material respects, the financial position of the Fund as of December 31, 2021, and the results of its operations for the year then ended, the changes in its net assets for each of the two years in the period then ended, and the financial highlights
for each of the five years in the period then ended, in conformity with accounting principles generally accepted in the United States of America.
Basis for Opinion
These financial statements and financial highlights are the
responsibility of the Fund's management. Our responsibility is to express an opinion on the Fund's financial statements and financial highlights based on our audits. We are a public accounting firm registered with the Public Company Accounting
Oversight Board (United States) (PCAOB) and are required to be independent with respect to the Fund in accordance with the U.S. federal securities laws and the applicable rules and regulations of the Securities and Exchange Commission and the
PCAOB.
We conducted our audits in accordance with the
standards of the PCAOB. Those standards require that we plan and perform the audit to obtain reasonable assurance about whether the financial statements and financial highlights are free of material misstatement, whether due to error or fraud. The
Fund is not required to have, nor were we engaged to perform, an audit of its internal control over financial reporting. As part of our audits, we are required to obtain an understanding of internal control over financial reporting but not for the
purpose of expressing an opinion on the effectiveness of the Fund's internal control over financial reporting. Accordingly, we express no such opinion.
Our audits included performing procedures to assess the
risks of material misstatement of the financial statements and financial highlights, whether due to error or fraud, and performing procedures that respond to those risks. Such procedures included examining, on a test basis, evidence regarding the
amounts and disclosures in the financial statements and financial highlights. Our audits also included evaluating the accounting principles used and significant estimates made by management, as well as evaluating the overall presentation of the
financial statements and financial highlights. Our procedures included confirmation of securities owned as of December 31, 2021, by correspondence with the custodian. We believe that our audits provide a reasonable basis for our opinion.
DELOITTE & TOUCHE LLP
Boston, Massachusetts
February 15, 2022
We have served as the auditor of one or more of the MFS
investment companies since 1924.
MFS Global Growth
Portfolio
Trustees and Officers — Identification and
Background
The Trustees and Officers of the Trust, as
of February 1, 2022, are listed below, together with their principal occupations during the past five years. (Their titles may have varied during that period.) The address of each Trustee and Officer is 111 Huntington Avenue, Boston, Massachusetts
02199-7618.
| Name,
Age |
|
Position(s)
Held with Fund |
|
Trustee/Officer
Since(h) |
|
Number
of MFS Funds overseen by the Trustee |
|
Principal
Occupations During
the Past Five Years |
|
Other
Directorships During
the Past Five Years (j) |
| INTERESTED
TRUSTEES |
|
|
|
|
|
|
|
|
|
|
Michael
W. Roberge (k)
(age 55) |
|
Trustee
|
|
January
2021 |
|
135
|
|
Massachusetts
Financial Services Company, Chairman (since January 2021); Chief Executive Officer (since January 2017); Director; Chairman of the Board (since January 2022); President (until December 2018); Chief Investment Officer (until December 2018) |
|
N/A
|
| INDEPENDENT
TRUSTEES |
|
|
|
|
|
|
|
|
|
|
John
P. Kavanaugh
(age 67) |
|
Trustee
and Chair of Trustees |
|
January
2009 |
|
135
|
|
Private
investor |
|
N/A
|
Steven
E. Buller
(age 70) |
|
Trustee
|
|
February
2014 |
|
135
|
|
Private
investor |
|
N/A
|
John
A. Caroselli
(age 67) |
|
Trustee
|
|
March
2017 |
|
135
|
|
Private
investor; JC Global Advisors, LLC (management consulting), President (since 2015) |
|
N/A
|
Maureen
R. Goldfarb
(age 66) |
|
Trustee
|
|
January
2009 |
|
135
|
|
Private
investor |
|
N/A
|
Peter
D. Jones
(age 66) |
|
Trustee
|
|
January
2019 |
|
135
|
|
Private
investor |
|
N/A
|
James
W. Kilman, Jr.
(age 60) |
|
Trustee
|
|
January
2019 |
|
135
|
|
Burford
Capital Limited (finance and investment management), Senior Advisor (since May 3, 2021), Chief Financial Officer (2019 - May 2, 2021); KielStrand Capital LLC (family office), Chief Executive Officer (since 2016) |
|
Alpha-En
Corporation, Director (2016-2019) |
Clarence
Otis, Jr.
(age 65) |
|
Trustee
|
|
March
2017 |
|
135
|
|
Private
investor |
|
VF
Corporation, Director; Verizon Communications, Inc., Director; The Travelers Companies, Director |
Maryanne
L. Roepke
(age 65) |
|
Trustee
|
|
May
2014 |
|
135
|
|
Private
investor |
|
N/A
|
Laurie
J. Thomsen
(age 64) |
|
Trustee
|
|
March
2005 |
|
135
|
|
Private
investor |
|
The
Travelers Companies, Director; Dycom Industries, Inc., Director |
MFS Global Growth
Portfolio
Trustees and Officers - continued
| Name,
Age |
|
Position(s)
Held with
Fund |
|
Trustee/Officer
Since(h) |
|
Number
of MFS Funds for which the Person is an Officer |
|
Principal
Occupations During
the Past Five Years |
| OFFICERS
|
|
|
|
|
|
|
|
|
Christopher
R. Bohane (k)
(age 48) |
|
Assistant
Secretary and Assistant Clerk |
|
July
2005 |
|
135
|
|
Massachusetts
Financial Services Company, Senior Vice President and Associate General Counsel |
Kino
Clark (k)
(age 53) |
|
Assistant
Treasurer |
|
January
2012 |
|
135
|
|
Massachusetts
Financial Services Company, Vice President |
John
W. Clark, Jr. (k)
(age 54) |
|
Assistant
Treasurer |
|
April
2017 |
|
135
|
|
Massachusetts
Financial Services Company, Vice President (since March 2017); Deutsche Bank (financial services), Department Head - Treasurer's Office (until February 2017) |
Thomas
H. Connors (k)
(age 62) |
|
Assistant
Secretary and Assistant Clerk |
|
September
2012 |
|
135
|
|
Massachusetts
Financial Services Company, Vice President and Senior Counsel |
David
L. DiLorenzo (k)
(age 53) |
|
President
|
|
July
2005 |
|
135
|
|
Massachusetts
Financial Services Company, Senior Vice President |
Heidi
W. Hardin (k)
(age 54) |
|
Secretary
and Clerk |
|
April
2017 |
|
135
|
|
Massachusetts
Financial Services Company, Executive Vice President and General Counsel (since March 2017); Harris Associates (investment management), General Counsel (until January 2017) |
Brian
E. Langenfeld (k)
(age 48) |
|
Assistant
Secretary and Assistant Clerk |
|
June
2006 |
|
135
|
|
Massachusetts
Financial Services Company, Vice President and Senior Counsel |
Amanda
S. Mooradian (k)
(age 42) |
|
Assistant
Secretary and Assistant Clerk |
|
September
2018 |
|
135
|
|
Massachusetts
Financial Services Company, Assistant Vice President and Senior Counsel |
Susan
A. Pereira (k)
(age 51) |
|
Assistant
Secretary and Assistant Clerk |
|
July
2005 |
|
135
|
|
Massachusetts
Financial Services Company, Vice President and Assistant General Counsel |
Kasey
L. Phillips (k)
(age 51) |
|
Assistant
Treasurer |
|
September
2012 |
|
135
|
|
Massachusetts
Financial Services Company, Vice President |
Matthew
A. Stowe (k)
(age 47) |
|
Assistant
Secretary and Assistant Clerk |
|
October
2014 |
|
135
|
|
Massachusetts
Financial Services Company, Vice President and Assistant General Counsel |
Martin
J. Wolin (k)
(age 54) |
|
Chief
Compliance Officer |
|
July
2015 |
|
135
|
|
Massachusetts
Financial Services Company, Senior Vice President and Chief Compliance Officer |
James
O. Yost (k)
(age 61) |
|
Treasurer
|
|
September
1990 |
|
135
|
|
Massachusetts
Financial Services Company, Senior Vice President |
| (h)
|
Date
first appointed to serve as Trustee/Officer of an MFS Fund. Each Trustee has served continuously since appointment unless indicated otherwise. From January 2012 through December 2016, Messrs. DiLorenzo and Yost served as Treasurer and Deputy
Treasurer of the Funds, respectively. |
| (j)
|
Directorships or
trusteeships of companies required to report to the Securities and Exchange Commission (i.e., “public companies”). |
| (k)
|
“Interested
person” of the Trust within the meaning of the Investment Company Act of 1940 (referred to as the 1940 Act), which is the principal federal law governing investment companies like the fund, as a result of a position with MFS. The address of
MFS is 111 Huntington Avenue, Boston, Massachusetts 02199-7618. |
Each Trustee (other than Messrs. Jones, Kilman and Roberge)
has been elected by shareholders and each Trustee and Officer holds office until his or her successor is chosen and qualified or until his or her earlier death, resignation, retirement or removal. Mr. Roberge became a Trustee of the Funds on January
1, 2021 and Messrs. Jones and Kilman became Trustees of the Funds on January 1, 2019. The Trust does not hold annual meetings for the purpose of electing Trustees, and Trustees are not elected for fixed terms. Under the terms of the Board's
retirement policy, an Independent Trustee shall retire at the end of the calendar year in which he or she reaches the earlier of 75 years of age or 15 years of service on the Board (or, in the case of any Independent Trustee who joined the Board
prior to 2015, 20 years of service on the Board).
Messrs. Buller, Kilman and Otis and Ms. Roepke are members
of the Trust’s Audit Committee.
MFS Global Growth
Portfolio
Trustees and Officers - continued
Each
of the Interested Trustees and certain Officers hold comparable officer positions with certain affiliates of MFS.
The Statement of Additional Information for a Fund includes
further information about the Trustees and is available without charge upon request by calling 1-800-225-2606.
| Investment
Adviser |
Custodian
|
Massachusetts Financial
Services Company
111 Huntington Avenue
Boston, MA 02199-7618 |
State Street
Bank and Trust Company
1 Lincoln Street
Boston, MA 02111-2900 |
| Distributor
|
Independent
Registered Public Accounting Firm |
MFS Fund
Distributors, Inc.
111 Huntington Avenue
Boston, MA 02199-7618 |
Deloitte
& Touche LLP
200 Berkeley Street
Boston, MA 02116 |
| Portfolio
Manager(s) |
|
Jeffrey
Constantino
Joseph Skorski |
|
MFS Global Growth
Portfolio
Board Review of Investment Advisory Agreement
MFS Global Growth Portfolio
The Investment Company Act of 1940 requires that both the
full Board of Trustees and a majority of the non-interested (“independent”) Trustees, voting separately, annually approve the continuation of the Fund’s investment advisory agreement with MFS. The Trustees consider matters bearing
on the Fund and its advisory arrangements at their meetings throughout the year, including a review of performance data at each regular meeting. In addition, the independent Trustees met several times by videoconference (in accordance with
Securities and Exchange Commission relief) over the course of three months beginning in May and ending in July, 2021 (“contract review meetings”) for the specific purpose of considering whether to approve the continuation of the
investment advisory agreement for the Fund and the other investment companies that the Board oversees (the “MFS Funds”). The independent Trustees were assisted in their evaluation of the Fund’s investment advisory agreement by
independent legal counsel, from whom they received separate legal advice and with whom they met separately from MFS during various contract review meetings. The independent Trustees were also assisted in this process by an independent consultant who
was retained by and reported to the independent Trustees.
In connection with their deliberations regarding the
continuation of the investment advisory agreement, the Trustees, including the independent Trustees, considered such information and factors as they believed, in light of the legal advice furnished to them and their own business judgment, to be
relevant. The investment advisory agreement for the Fund was considered separately, although the Trustees also took into account the common interests of all MFS Funds in their review. As described below, the Trustees considered the nature, quality,
and extent of the various investment advisory, administrative, and shareholder services performed by MFS under the existing investment advisory agreement and other arrangements with the Fund.
In connection with their contract review meetings, the
Trustees received and relied upon materials that included, among other items: (i) information provided by Broadridge Financial Solutions, Inc. (“Broadridge”), an independent third party, on the investment performance of the Fund for
various time periods ended December 31, 2020 and the investment performance of a group of funds with substantially similar investment classifications/objectives (the “Broadridge performance universe”), (ii) information provided by
Broadridge on the Fund’s advisory fees and other expenses and the advisory fees and other expenses of comparable funds identified by Broadridge as well as all other funds in the same investment classification/category (the “Broadridge
expense group and universe”), (iii) information provided by MFS on the advisory fees of portfolios of other clients of MFS, including institutional separate accounts and other clients, (iv) information as to whether and to what extent
applicable expense waivers, reimbursements or fee “breakpoints” are observed for the Fund, (v) information regarding MFS’ financial results and financial condition, including MFS’ and certain of its affiliates’
estimated profitability from services performed for the Fund and the MFS Funds as a whole, and compared to MFS’ institutional business, (vi) MFS’ views regarding the outlook for the mutual fund industry and the strategic business plans
of MFS, (vii) descriptions of various functions performed by MFS for the Funds, such as compliance monitoring and portfolio trading practices, and (viii) information regarding the overall organization of MFS, including information about MFS’
senior management and other personnel providing investment advisory, administrative and other services to the Fund and the other MFS Funds. The comparative performance, fee and expense information prepared and provided by Broadridge was not
independently verified and the independent Trustees did not independently verify any information provided to them by MFS.
The Trustees’ conclusion as to the continuation of
the investment advisory agreement was based on a comprehensive consideration of all information provided to the Trustees and not the result of any single factor. Some of the factors that figured particularly in the Trustees’ deliberations are
described below, although individual Trustees may have evaluated the information presented differently from one another, giving different weights to various factors. It is also important to recognize that the fee arrangements for the Fund and other
MFS Funds are the result of years of review and discussion between the independent Trustees and MFS, that certain aspects of such arrangements may receive greater scrutiny in some years than in others, and that the Trustees’ conclusions may be
based, in part, on their consideration of these same arrangements during the course of the year and in prior years.
Based on information provided by Broadridge and MFS, the
Trustees reviewed the Fund’s total return investment performance as well as the Broadridge performance universe over various time periods. The Trustees placed particular emphasis on the total return performance of the Fund’s Initial
Class shares in comparison to the performance of funds in its Broadridge performance universe over the five-year period ended December 31, 2020, which the Trustees believed was a long enough period to reflect differing market conditions. The total
return performance of the Fund’s Initial Class shares was in the 1st quintile relative to the other funds in the universe for this five-year period (the 1st quintile being the best performers and the 5th quintile being the worst performers).
The total return performance of the Fund’s Initial Class shares was in the 2nd quintile for the one-year period and the 1st quintile for the three-year period ended December 31, 2020 relative to the Broadridge performance universe. Because of
the passage of time, these performance results may differ from the performance results for more recent periods, including those shown elsewhere in this report.
MFS Global Growth
Portfolio
Board Review of Investment Advisory Agreement - continued
In
the course of their deliberations, the Trustees took into account information provided by MFS in connection with the contract review meetings, as well as during investment review meetings conducted with portfolio management personnel during the
course of the year regarding the Fund’s performance. After reviewing these and related factors, the Trustees concluded, within the context of their overall conclusions regarding the investment advisory agreement, that they were satisfied with
MFS’ responses and efforts relating to investment performance.
In assessing the reasonableness of the Fund’s
advisory fee, the Trustees considered, among other information, the Fund’s advisory fee and the total expense ratio of the Fund’s Initial Class shares as a percentage of average daily net assets and the advisory fee and total expense
ratios of the Broadridge expense group based on information provided by Broadridge. The Trustees considered that MFS currently observes an expense limitation for the Fund, which may not be changed without the Trustees’ approval. The Trustees
also considered that, according to the data provided by Broadridge (which takes into account any fee reductions or expense limitations that were in effect during the Fund’s last fiscal year), the Fund’s effective advisory fee rate and
total expense ratio were each higher than the Broadridge expense group median.
The Trustees also considered the advisory fees charged by
MFS to any institutional separate accounts advised by MFS (“separate accounts”) and unaffiliated investment companies for which MFS serves as subadviser (“subadvised funds”) that have comparable investment strategies to the
Fund, if any. In comparing these fees, the Trustees considered information provided by MFS as to the generally broader scope of services provided by MFS to the Fund, as well as the more extensive regulatory burdens imposed on MFS in managing the
Fund, in comparison to separate accounts and subadvised funds. The Trustees also considered the higher demands placed on MFS’ investment personnel and trading infrastructure as a result of the daily cash in-flows and out-flows of the Fund in
comparison to separate accounts.
The Trustees also
considered whether the Fund may benefit from any economies of scale in the management of the Fund in the event of growth in assets of the Fund and/or growth in assets of the MFS Funds as a whole. They noted that the Fund’s advisory fee rate
schedule is subject to contractual breakpoints that reduce the Fund’s advisory fee rate on average daily net assets over $1 billion and $2 billion. The Trustees also noted that MFS has agreed in writing to waive a portion of the management
fees of certain MFS Funds, including the Fund, if the total combined assets of certain funds within the MFS Funds’ complex increase above agreed upon thresholds (the “group fee waiver”), enabling the Fund’s shareholders to
share in the benefits from any economies of scale at the complex level. The group fee waiver is reviewed and renewed annually between the Board and MFS. The Trustees concluded that the breakpoints and the group fee waiver were sufficient to allow
the Fund to benefit from economies of scale as its assets and overall complex assets grow.
The Trustees also considered information prepared by MFS
relating to MFS’ costs and profits with respect to the Fund, the MFS Funds considered as a group, and other investment companies and accounts advised by MFS, as well as MFS’ methodologies used to determine and allocate its costs to the
MFS Funds, the Fund and other accounts and products for purposes of estimating profitability.
After reviewing these and other factors described herein,
the Trustees concluded, within the context of their overall conclusions regarding the investment advisory agreement, that the advisory fees charged to the Fund represent reasonable compensation in light of the services being provided by MFS to the
Fund.
In addition, the Trustees considered MFS’
resources and related efforts to continue to retain, attract and motivate capable personnel to serve the Fund. The Trustees also considered current and developing conditions in the financial services industry, including the presence of large and
well-capitalized companies which are spending, and appear to be prepared to continue to spend, substantial sums to engage personnel and to provide services to competing investment companies. In this regard, the Trustees also considered the financial
resources of MFS and its ultimate parent, Sun Life Financial Inc. The Trustees also considered the advantages and possible disadvantages to the Fund of having an adviser that also serves other investment companies as well as other accounts.
The Trustees also considered the nature, quality, cost, and
extent of administrative, transfer agency, and distribution services provided to the Fund by MFS and its affiliates under agreements and plans other than the investment advisory agreement, including any 12b-1 fees the Fund pays to MFS Fund
Distributors, Inc., an affiliate of MFS. The Trustees also considered the nature, extent and quality of certain other services MFS performs or arranges for on the Fund’s behalf, which may include securities lending programs, directed expense
payment programs, class action recovery programs, and MFS’ interaction with third-party service providers, principally custodians and sub-custodians. The Trustees concluded that the various non-advisory services provided by MFS and its
affiliates on behalf of the Fund were satisfactory.
The Trustees considered so-called “fall-out
benefits” to MFS such as reputational value derived from serving as investment manager to the MFS Funds. The Trustees also considered that MFS discontinued its historic practice of obtaining investment research from portfolio brokerage
commissions paid by certain MFS Funds effective January 2018, and directly pays or voluntarily reimburses a Fund, if applicable, for the costs of external research acquired through the use of the Fund’s portfolio brokerage commissions.
MFS Global Growth
Portfolio
Board Review of Investment Advisory Agreement - continued
Based on their evaluation of factors that they deemed to be
material, including those factors described above, the Board of Trustees, including the independent Trustees, concluded that the Fund’s investment advisory agreement with MFS should be continued for an additional one-year period, commencing
August 1, 2021.
MFS Global Growth
Portfolio
Proxy Voting Policies and Information
MFS votes proxies on behalf of the fund pursuant to proxy
voting policies and procedures that are available without charge, upon request, by calling 1-800-225-2606, by visiting mfs.com/proxyvoting, or by visiting the SEC’s Web site at http://www.sec.gov.
Information regarding how the fund voted proxies relating
to portfolio securities during the most recent twelve-month period ended June 30 is available by August 31 of each year without charge by visiting mfs.com/proxyvoting, or by visiting the SEC’s Web site
at http://www.sec.gov.
Quarterly Portfolio Disclosure
The fund files a complete schedule of portfolio holdings
with the SEC for the first and third quarters of each fiscal year as an exhibit to its reports on Form N-PORT. The fund’s Form N-PORT reports are available on the SEC’s Web site at
http://www.sec.gov. A shareholder can obtain the portfolio holdings report for the first and third quarters of the fund's fiscal year at mfs.com/vit2 by
choosing the fund's name and then scrolling to the “Resources” section and clicking on the “Prospectus and Reports” tab.
FURTHER INFORMATION
From time to time, MFS may post important information about
the fund or the MFS Funds on the MFS Web site (mfs.com). This information is available at https://www.mfs.com/announcements or at
mfs.com/vit2 by choosing the fund's name and then scrolling to the “Resources” section and clicking on the “Announcements” tab, if any.
Information About Fund Contracts and Legal Claims
The fund has entered into contractual arrangements with an
investment adviser, administrator, distributor, shareholder servicing agent, 529 program manager (if applicable), and custodian who each provide services to the fund. Unless expressly stated otherwise, shareholders are not parties to, or intended
beneficiaries of these contractual arrangements, and these contractual arrangements are not intended to create any shareholder right to enforce them against the service providers or to seek any remedy under them against the service providers, either
directly or on behalf of the fund.
Under the
Trust’s By-Laws and Declaration of Trust, any claims asserted against or on behalf of the MFS Funds, including claims against Trustees and Officers, must be brought in state and federal courts located within the Commonwealth of
Massachusetts.
Federal Tax Information (unaudited)
The following information is provided pursuant to
provisions of the Internal Revenue Code.
The fund
designates $7,423,000 as capital gain dividends paid during the fiscal year.
For corporate shareholders, 98.60% of the ordinary income
dividends paid during the fiscal year qualify for the corporate dividends received deduction.
| FACTS
|
WHAT
DOES MFS DO WITH YOUR PERSONAL INFORMATION? |
| Why?
|
Financial
companies choose how they share your personal information. Federal law gives consumers the right to limit some but not all sharing. Federal law also requires us to tell you how we collect, share, and protect your personal information. Please read
this notice carefully to understand what we do. |
| What?
|
The types of
personal information we collect and share depend on the product or service you have with us. This information can include: |
| • Social
Security number and account balances |
| • Account
transactions and transaction history |
| • Checking
account information and wire transfer instructions |
| When
you are no longer our customer, we continue to share your information as described in this notice. |
| How?
|
All
financial companies need to share customers' personal information to run their everyday business. In the section below, we list the reasons financial companies can share their customers' personal information; the reasons MFS chooses to share; and
whether you can limit this sharing. |
Reasons
we can share your
personal information |
Does
MFS share? |
Can
you limit
this sharing? |
For
our everyday business purposes –
such as to process your transactions, maintain your
account(s), respond to court orders and legal
investigations, or report to credit bureaus |
Yes
|
No
|
For
our marketing purposes –
to offer our products and services to you |
No
|
We
don't share |
For
joint marketing with other
financial companies |
No
|
We
don't share |
For
our affiliates' everyday business purposes –
information about your transactions and experiences |
No
|
We
don't share |
For
our affiliates' everyday business purposes –
information about your creditworthiness |
No
|
We
don't share |
| For
nonaffiliates to market to you |
No
|
We
don't share |
| Questions?
|
Call
800-225-2606 or go to mfs.com. |
| Who
we are |
| Who
is providing this notice? |
MFS
Funds, MFS Investment Management, MFS Institutional Advisors, Inc., and MFS Heritage Trust Company. |
| What
we do |
How
does MFS
protect my personal
information? |
To
protect your personal information from unauthorized access and use, we use security measures that comply with federal law. These measures include procedural, electronic, and physical safeguards for the protection of the personal information we
collect about you. |
How
does MFS
collect my personal
information? |
We
collect your personal information, for example, when you |
| • open
an account or provide account information |
| • direct
us to buy securities or direct us to sell your securities |
| • make
a wire transfer |
| We
also collect your personal information from others, such as credit bureaus, affiliates, or other companies. |
| Why
can't I limit all sharing? |
Federal
law gives you the right to limit only |
| • sharing
for affiliates' everyday business purposes – information about your creditworthiness |
| • affiliates
from using your information to market to you |
| • sharing
for nonaffiliates to market to you |
| State
laws and individual companies may give you additional rights to limit sharing. |
| Definitions
|
| Affiliates
|
Companies
related by common ownership or control. They can be financial and nonfinancial companies. |
| •
MFS does not share personal information with affiliates, except for everyday business purposes as described on page one of this notice. |
| Nonaffiliates
|
Companies
not related by common ownership or control. They can be financial and nonfinancial companies. |
| •
MFS does not share with nonaffiliates so they can market to you. |
| Joint
marketing |
A
formal agreement between nonaffiliated financial companies that together market financial products or services to you. |
| •
MFS doesn't jointly market. |
| Other
important information |
| If
you own an MFS product or receive an MFS service in the name of a third party such as a bank or broker-dealer, their privacy policy may apply to you instead of ours. |
Annual Report
December 31, 2021
MFS® Global Research Portfolio
MFS® Variable
Insurance Trust II
MFS® Global
Research Portfolio
|
1
|
|
2
|
|
3
|
|
5
|
|
7
|
|
8
|
|
13
|
|
14
|
|
15
|
|
16
|
|
18
|
|
24
|
|
25
|
|
28
|
|
30
|
|
30
|
|
30
|
|
30
|
|
30
|
|
31
|
The report is prepared for the general information of contract owners. It
is authorized for distribution to prospective investors only when preceded or accompanied by a current prospectus.
NOT FDIC INSURED • MAY LOSE VALUE
• NO BANK OR CREDIT UNION GUARANTEE •
NOT A DEPOSIT • NOT INSURED BY ANY FEDERAL GOVERNMENT
AGENCY OR NCUA/NCUSIF
MFS Global Research
Portfolio
Dear Contract Owners:
After a powerful rally in 2021 that was spurred by the
introduction of effective coronavirus vaccines and high levels of monetary and fiscal stimulus, markets have recently experienced a rise in volatility. Rising inflation (mostly due to pandemic-related labor and supply chain disruptions), new
COVID-19 variants that are vaccine-resistant, and the prospect of tighter monetary and fiscal policies around the world have all increased investor anxiety.
Rising real (inflation-adjusted) bond yields in the United
States are a headwind for richly valued U.S. growth stocks, though many non-U.S. markets have experienced lower levels of turbulence. In recent months, global economic growth has moderated, with the spread of the Delta and Omicron variants and a
regulatory crackdown in China featuring prominently. Stress in China’s property development sector has also contributed to the slowdown there. A further concern for investors is the tightening of global energy and raw materials supplies caused
in part by geopolitical uncertainty.
However,
above-trend economic growth, strong corporate balance sheets, and nascent signs that global supply chain bottlenecks may be easing, along with a dovish policy shift in China, are supportive fundamentals that we feel could help calm recent market
jitters.
It is times of market transition that
demonstrate the importance of having a deep understanding of company fundamentals, and we have built our global research platform to do just that.
At MFS®, we put our clients’ assets to work responsibly by carefully navigating the increasing complexity of global markets and economies. Guided by our commitment to long-term
investing, we tune out the noise and try to uncover what we believe are the best, most durable investment opportunities in the market. Our unique global investment platform combines collective expertise, long-term discipline, and thoughtful risk
management to create sustainable value for investors.
Respectfully,
Michael W.
Roberge
Chief Executive Officer
MFS Investment Management
February 15, 2022
The opinions expressed in this letter are subject to
change and may not be relied upon for investment advice. No forecasts can be guaranteed.
MFS Global Research
Portfolio
Portfolio structure
Top ten
holdings
| Microsoft
Corp. |
5.0%
|
| Alphabet,
Inc., “A” |
3.2%
|
| Amazon.com,
Inc. |
2.8%
|
| Taiwan
Semiconductor Manufacturing Co. Ltd. |
1.8%
|
| Apple,
Inc. |
1.7%
|
| Aon
PLC |
1.5%
|
| Visa,
Inc., “A” |
1.5%
|
| Roche
Holding AG |
1.5%
|
| salesforce.com,
inc. |
1.5%
|
| Adobe
Systems, Inc. |
1.5%
|
Global equity sectors (k)
| Technology
|
28.7%
|
| Capital
Goods |
17.0%
|
| Financial
Services |
16.2%
|
| Health
Care |
11.5%
|
| Consumer
Cyclicals |
11.4%
|
| Energy
|
6.3%
|
| Consumer
Staples |
5.7%
|
| Telecommunications/Cable
Television |
2.8%
|
Issuer country weightings (x)
| United
States |
63.2%
|
| Switzerland
|
4.7%
|
| France
|
4.3%
|
| China
|
3.6%
|
| United
Kingdom |
3.0%
|
| Japan
|
3.0%
|
| Germany
|
2.5%
|
| Hong
Kong |
2.0%
|
| Canada
|
2.0%
|
| Other
Countries |
11.7%
|
Currency exposure weightings
(y)
| United
States Dollar |
65.1%
|
| Euro
|
11.0%
|
| Hong
Kong Dollar |
4.7%
|
| Swiss
Franc |
4.7%
|
| British
Pound Sterling |
3.5%
|
| Japanese
Yen |
3.0%
|
| Taiwan
Dollar |
1.8%
|
| Canadian
Dollar |
1.4%
|
| Australian
Dollar |
1.2%
|
| Other
Currencies |
3.6%
|
| (k)
|
The sectors set forth
above and the associated portfolio composition are based on MFS’ own custom sector classification methodology. |
| (x)
|
Represents
the portfolio’s exposure to issuer countries as a percentage of a portfolio’s net assets. For purposes of this presentation, United States includes Cash & Cash Equivalents. |
| (y)
|
Represents
the portfolio’s exposure to a particular currency as a percentage of a portfolio's net assets. For purposes of this presentation, United States Dollar includes Cash & Cash Equivalents. |
Cash & Cash Equivalents includes any cash,
investments in money market funds, short-term securities, and other assets less liabilities. Please see the Statement of Assets and Liabilities for additional information related to the fund’s cash position and other assets and
liabilities.
Percentages are based on net
assets as of December 31, 2021.
The portfolio
is actively managed and current holdings may be different.
MFS Global Research
Portfolio
Management Review
Summary of Results
For the twelve months ended December 31, 2021, Initial
Class shares of the MFS Global Research Portfolio (fund) provided a total return of 18.51%, while Service Class shares of the fund provided a total return of 18.20%. These compare with a return of 18.54% over the same period for the fund’s
benchmark, the MSCI All Country World Index (net div).
Market Environment
Over the past year, the global economy was buffeted by an
array of crosscurrents as it adjusted to the ebbs and flows of the pandemic. Among the supportive currents were ample fiscal stimulus, loose monetary policy and the rollout of several highly effective coronavirus vaccines. Negative currents included
the rapid spread of several coronavirus variants, widespread global production bottlenecks and a surge in inflation. After experiencing a burst of exceptionally strong economic activity as the global economy began to reopen, activity became more
muted in the second half of the period amid ongoing supply chain disruptions and a new wave of coronavirus infections, albeit a seemingly milder strain.
Amid rising inflation, markets anticipated a transition
from an exceptionally accommodative environment to a more mixed monetary landscape ahead. Indeed, several central banks in emerging markets have already tightened policy and the US Federal Reserve reduced the pace of its asset purchases in November
and again in December. However, the European Central Bank, the Bank of Japan and the People's Bank of China are expected to maintain accommodative policies. Sovereign bond yields moved modestly higher during the period amid higher inflation and on
expectations of a tighter Fed but remain historically low.
A harsher Chinese regulatory environment toward industries
such as online gaming, food delivery and education increased market volatility as has stress in China's highly leveraged property development sector. Trade relations between the United States and China remained quite strained despite a change in
presidential administrations.
Signs of excess
investor enthusiasm continued to be seen in pockets of the market such as “meme stocks” popular with users of online message boards, cryptocurrencies and heavy retail participation in the market for short-dated options.
Detractors from Performance
Stock selection in the energy sector weakened performance
relative to the MSCI All Country World Index, led by the fund's overweight position in renewable energy solutions provider Orsted (Denmark). The stock price of Orsted declined as the company’s financial results came in below market
expectations, primarily driven by provisions for cabling issues.
Security selection within the financial services sector
also held back relative performance. Here, the fund's overweight positions in insurance company AIA Group (Hong Kong) and real estate company LEG Immobilien (Germany) dampened relative results. Although AIA Group reported in-line financial results,
its stock price declined on a slowdown in insurance sales in China and COVID-19 related disruptions.
Elsewhere, not holding shares of computer graphics
processor maker NVIDIA and electric vehicle manufacturer Tesla weakened relative performance. The stock price of NVIDIA climbed as the company reported strong revenue growth, driven by better-than-anticipated broad-based demand and capacity
additions at its Gaming, Datacenter, and Pro Vis segments. The fund's overweight holdings of electronic payment services company Global Payments, internet-based, multiple services company Tencent Holdings (China), global banking and payments
technology provider Fidelity National Information Services and online betting and gaming operator Flutter Entertainment (Ireland) also held back relative results. An underweight position in computer and personal electronics maker Apple further
weakened relative results. The share price of Apple rose over the reporting period as investors appeared to have reacted favorably to the company's earnings, which were in line with expectations. Notably, growth in China came in ahead of estimates,
and services revenue was strong, which helped offset Apple’s weaker-than-expected iPhone sales constrained by supply chain disruptions.
Contributors to Performance
Security selection in the capital goods sector contributed
to the fund’s relative performance. There were no individual stocks within this sector, either in the fund or in the benchmark, that were among the fund's largest relative contributors during the period.
Security selection within the technology sector also lifted
relative performance, led by the fund’s avoidance of weak-performing online and mobile commerce company Alibaba Group Holding (China). The stock price of Alibaba Group Holding declined as the company delivered weaker-than-expected financial
results. Core growth in the company's online shopping platform Taobao was softer than already-lowered expectations, due to decreased market share, and losses in its investment areas were materially greater than anticipated. The fund's overweight
holdings of software giant Microsoft, semiconductor chips and electronics engineering solutions provider Applied Materials and software engineering solutions and technology services provider EPAM Systems(h) also contributed to relative results. The
stock price of Microsoft rose as the company posted earnings results that topped investor
MFS Global Research
Portfolio
Management Review - continued
estimates, mainly
driven by robust revenue in the MS Azure Cloud Services division. Microsoft’s stock price was further supported by revenue guidance that was ahead of consensus, primarily due to accelerated digital transformation investments combined with the
company's increasingly competitive offerings in cloud, communication and security.
Stocks in other sectors that benefited the fund's relative
returns included its overweight positions in financial services provider Charles Schwab, risk management and human capital consulting services provider Aon, financial services firm Goldman Sachs Group, oil and gas company ConocoPhillips and
healthcare equipment manufacturer Danaher. The fund's holdings of clinical research provider ICON(b) (Ireland) also supported relative results. The stock price of ICON advanced following the company's acquisition of PRA Health Sciences, which gave
the combined company the second largest scale in the industry, leading to a broader service offering with a larger geographic footprint.
Respectfully,
Portfolio Manager(s)
Akira Fuse and James Keating
| (b)
|
Security is not a
benchmark constituent. |
| (h)
|
Security was not held in
the portfolio at period end. |
The
views expressed in this report are those of the portfolio manager(s) only through the end of the period of the report as stated on the cover and do not necessarily reflect the views of MFS or any other person in the MFS organization. These views are
subject to change at any time based on market or other conditions, and MFS disclaims any responsibility to update such views. These views may not be relied upon as investment advice or an indication of trading intent on behalf of any MFS portfolio.
References to specific securities are not recommendations of such securities, and may not be representative of any MFS portfolio’s current or future investments.
MFS Global Research
Portfolio
Performance Summary Through 12/31/21
The following chart illustrates the historical performance
of the fund in comparison to its benchmark(s). Benchmarks are unmanaged and may not be invested in directly. Benchmark returns do not reflect any fees or expenses. The performance of other share classes will be greater than or less than that of the
class depicted below. (See Notes to Performance Summary.)
Performance data shown represents past performance and is no
guarantee of future results. Investment return and principal value fluctuate so your units, when sold, may be worth more or less than the original cost; current performance may be lower or higher than quoted. The performance shown does not reflect
the deduction of taxes, if any, that a contract holder would pay on fund distributions or the redemption of contract units. The returns for the fund shown also do not reflect the deduction of expenses associated with variable products, such as
mortality and expense risk charges, separate account charges, and sales charges imposed by the insurance company separate accounts. Such expenses would reduce the overall returns shown.
Growth of a Hypothetical $10,000 Investment
Total Returns
through 12/31/21
Average annual total returns
| Share
Class |
Class
Inception Date |
1-yr
|
5-yr
|
10-yr
|
| Initial
Class |
11/07/94
|
18.51%
|
15.83%
|
12.45%
|
| Service
Class |
8/24/01
|
18.20%
|
15.53%
|
12.18%
|
Comparative benchmark(s)
| MSCI
All Country World Index (net div) (f) |
18.54%
|
14.40%
|
11.85%
|
| (f)
|
Source:
FactSet Research Systems Inc. |
Benchmark Definition(s)
MSCI All Country World Index(e) (net div) – a market capitalization-weighted index that is designed to measure equity market performance in the global developed and emerging markets.
It is not possible to invest directly in an index.
| (e)
|
Morgan
Stanley Capital International (“MSCI”) makes no express or implied warranties or representations and shall have no liability whatsoever with respect to any MSCI data contained herein. The MSCI data may not be further redistributed or
used as a basis for other indices or any securities or financial products. This report is not approved, reviewed, or produced by MSCI. |
MFS Global Research
Portfolio
Performance Summary – continued
Notes
to Performance Summary
Average annual total return
represents the average annual change in value for each share class for the periods presented.
Performance results reflect any applicable expense
subsidies and waivers in effect during the periods shown. Without such subsidies and waivers the fund's performance results would be less favorable. Please see the prospectus and financial statements for complete details. All results are historical
and assume the reinvestment of any dividends and capital gains distributions.
Performance results do not include adjustments made for
financial reporting purposes in accordance with U.S. generally accepted accounting principles and may differ from amounts reported in the financial highlights.
From time to time the fund may receive proceeds from
litigation settlements, without which performance would be lower.
MFS Global Research
Portfolio
Expense Table
Fund Expenses Borne by the Contract Holders during the
Period,
July 1, 2021 through December 31, 2021
As
a contract holder of the fund, you incur ongoing costs, including management fees; distribution and/or service (12b-1) fees; and other fund expenses. This example is intended to help you understand your ongoing costs (in dollars) of investing in the
fund and to compare these costs with the ongoing costs of investing in other mutual funds.
The example is based on an investment of $1,000 invested at
the beginning of the period and held for the entire period July 1, 2021 through December 31, 2021.
Actual Expenses
The first line for each share class in the following table
provides information about actual account values and actual expenses. You may use the information in this line, together with the amount you invested, to estimate the expenses that you paid over the period. Simply divide your account value by $1,000
(for example, an $8,600 account value divided by $1,000 = 8.6), then multiply the result by the number in the first line under the heading entitled “Expenses Paid During Period” to estimate the expenses you paid on your account during
this period.
Hypothetical Example for Comparison
Purposes
The second line for each share class in the
following table provides information about hypothetical account values and hypothetical expenses based on the fund’s actual expense ratio and an assumed rate of return of 5% per year before expenses, which is not the fund’s actual
return. The hypothetical account values and expenses may not be used to estimate the actual ending account balance or expenses you paid for the period. You may use this information to compare the ongoing costs of investing in the fund and other
funds. To do so, compare this 5% hypothetical example with the 5% hypothetical examples that appear in the shareholder reports of the other funds.
Please note that the expenses shown in the table are meant
to highlight the fund's ongoing costs only and do not take into account the fees and expenses imposed under the variable contracts through which your investment in the fund is made. Therefore, the second line for each share class in the table is
useful in comparing ongoing costs associated with an investment in vehicles (such as the fund) which fund benefits under variable annuity and variable life insurance contracts and to qualified pension and retirement plans only, and will not help you
determine the relative total costs of investing in the fund through variable annuity and variable life insurance contracts. If the fees and expenses imposed under the variable contracts were included, your costs would have been higher.
Share
Class |
|
Annualized
Expense
Ratio |
Beginning
Account Value
7/01/21 |
Ending
Account Value
12/31/21 |
Expenses
Paid During
Period (p)
7/01/21-12/31/21 |
| Initial
Class |
Actual
|
0.85%
|
$1,000.00
|
$1,062.02
|
$4.42
|
| Hypothetical
(h) |
0.85%
|
$1,000.00
|
$1,020.92
|
$4.33
|
| Service
Class |
Actual
|
1.10%
|
$1,000.00
|
$1,060.68
|
$5.71
|
| Hypothetical
(h) |
1.10%
|
$1,000.00
|
$1,019.66
|
$5.60
|
| (h)
|
5% class return per year
before expenses. |
| (p)
|
“Expenses
Paid During Period” are equal to each class's annualized expense ratio, as shown above, multiplied by the average account value over the period, multiplied by 184/365 (to reflect the one-half year period). |
MFS Global Research
Portfolio
Portfolio of Investments − 12/31/21
The Portfolio of Investments is a complete list of all
securities owned by your fund. It is categorized by broad-based asset classes.
| Issuer
|
|
|
Shares/Par
|
Value
($) |
| Common
Stocks – 99.6% |
| Aerospace
& Defense – 2.9% |
|
| Honeywell
International, Inc. |
|
4,607
|
$
960,606 |
| Howmet
Aerospace, Inc. |
|
10,388
|
330,650 |
| L3Harris
Technologies, Inc. |
|
2,169
|
462,517 |
| Northrop
Grumman Corp. |
|
1,238
|
479,193 |
| Raytheon
Technologies Corp. |
|
7,384
|
635,467 |
| |
|
|
|
$2,868,433 |
| Alcoholic
Beverages – 1.8% |
|
| China
Resources Beer Holdings Co. Ltd. |
|
40,000
|
$
327,539 |
| Constellation
Brands, Inc., “A” |
|
1,947
|
488,638 |
| Diageo
PLC |
|
13,473
|
736,020 |
| Kweichow
Moutai Co. Ltd., “A” |
|
900
|
289,487 |
| |
|
|
|
$1,841,684 |
| Apparel
Manufacturers – 3.0% |
|
| Adidas
AG |
|
2,631
|
$
758,433 |
| Burberry
Group PLC |
|
16,095
|
395,949 |
| LVMH
Moet Hennessy Louis Vuitton SE |
|
1,285
|
1,063,581 |
| NIKE,
Inc., “B” |
|
4,635
|
772,516 |
| |
|
|
|
$2,990,479 |
| Biotechnology
– 0.4% |
|
| Illumina,
Inc. (a) |
|
1,022
|
$
388,810 |
| Brokerage
& Asset Managers – 2.4% |
|
| Charles
Schwab Corp. |
|
16,951
|
$
1,425,579 |
| Euronext
N.V. |
|
9,269
|
962,939 |
| |
|
|
|
$2,388,518 |
| Business
Services – 3.9% |
|
| Accenture
PLC, “A” |
|
3,163
|
$
1,311,222 |
| Cognizant
Technology Solutions Corp., “A” |
|
6,055
|
537,199 |
| Fidelity
National Information Services, Inc. |
|
6,404
|
698,996 |
| Fiserv,
Inc. (a) |
|
8,139
|
844,747 |
| Global
Payments, Inc. |
|
3,576
|
483,404 |
| |
|
|
|
$3,875,568 |
| Computer
Software – 11.0% |
|
| Adobe
Systems, Inc. (a) |
|
2,581
|
$
1,463,582 |
| Atlassian
Corp. PLC, “A” (a) |
|
1,659
|
632,560 |
| Cadence
Design Systems, Inc. (a) |
|
5,486
|
1,022,316 |
| Microsoft
Corp. (s) |
|
15,016
|
5,050,181 |
| NAVER
Corp. (a) |
|
2,654
|
845,038 |
| NetEase.com,
Inc., ADR |
|
5,524
|
562,233 |
| salesforce.com,
inc. (a) |
|
5,833
|
1,482,340 |
| |
|
|
|
$11,058,250 |
| Computer
Software - Systems – 3.6% |
|
| Apple,
Inc. (s) |
|
9,877
|
$
1,753,859 |
| Constellation
Software, Inc. |
|
556
|
1,031,581 |
| Hitachi
Ltd. |
|
6,200
|
335,791 |
| NICE
Systems Ltd., ADR (a) |
|
1,744
|
529,478 |
| |
|
|
|
$3,650,709 |
MFS Global Research
Portfolio
Portfolio of
Investments – continued
| Issuer
|
|
|
Shares/Par
|
Value
($) |
| Common
Stocks – continued |
| Construction
– 2.7% |
|
| Masco
Corp. |
|
7,312
|
$
513,449 |
| Otis
Worldwide Corp. |
|
6,437
|
560,470 |
| Sherwin-Williams
Co. |
|
1,807
|
636,353 |
| Techtronic
Industries Co. Ltd. |
|
24,000
|
477,688 |
| Vulcan
Materials Co. |
|
2,707
|
561,919 |
| |
|
|
|
$2,749,879 |
| Consumer
Products – 1.0% |
|
| Colgate-Palmolive
Co. |
|
4,619
|
$
394,185 |
| Kao
Corp. |
|
5,300
|
277,325 |
| Reckitt
Benckiser Group PLC |
|
4,355
|
373,843 |
| |
|
|
|
$1,045,353 |
| Electrical
Equipment – 2.8% |
|
| Johnson
Controls International PLC |
|
9,976
|
$
811,149 |
| Schneider
Electric SE |
|
5,951
|
1,168,453 |
| TE
Connectivity Ltd. |
|
3,619
|
583,889 |
| Vertiv
Holdings Co. |
|
11,430
|
285,407 |
| |
|
|
|
$2,848,898 |
| Electronics
– 4.2% |
|
| Applied
Materials, Inc. |
|
5,335
|
$
839,516 |
| Lam
Research Corp. |
|
672
|
483,269 |
| NXP
Semiconductors N.V. |
|
5,034
|
1,146,644 |
| Taiwan
Semiconductor Manufacturing Co. Ltd. |
|
81,000
|
1,800,520 |
| |
|
|
|
$4,269,949 |
| Energy
- Independent – 1.5% |
|
| ConocoPhillips
|
|
12,208
|
$
881,174 |
| Santos
Ltd. |
|
43,669
|
200,477 |
| Valero
Energy Corp. |
|
5,821
|
437,215 |
| |
|
|
|
$1,518,866 |
| Energy
- Integrated – 1.0% |
|
| Capricorn
Energy PLC |
|
132,322
|
$
337,254 |
| Galp
Energia SGPS S.A., “B” |
|
73,593
|
713,853 |
| |
|
|
|
$1,051,107 |
| Food
& Beverages – 2.3% |
|
| Mondelez
International, Inc. |
|
8,855
|
$
587,175 |
| Nestle
S.A. |
|
7,238
|
1,012,304 |
| PepsiCo,
Inc. |
|
3,913
|
679,727 |
| |
|
|
|
$2,279,206 |
| Gaming
& Lodging – 0.7% |
|
| Flutter
Entertainment PLC (a) |
|
3,297
|
$
524,808 |
| Whitbread
PLC (a) |
|
5,598
|
226,937 |
| |
|
|
|
$751,745 |
| General
Merchandise – 0.8% |
|
| Dollar
General Corp. |
|
3,392
|
$
799,935 |
| Health
Maintenance Organizations – 0.9% |
|
| Cigna
Corp. |
|
4,037
|
$
927,016 |
MFS Global Research
Portfolio
Portfolio of
Investments – continued
| Issuer
|
|
|
Shares/Par
|
Value
($) |
| Common
Stocks – continued |
| Insurance
– 3.5% |
|
| AIA
Group Ltd. |
|
104,000
|
$
1,048,329 |
| Aon
PLC |
|
5,199
|
1,562,612 |
| Chubb
Ltd. |
|
4,619
|
892,899 |
| |
|
|
|
$3,503,840 |
| Internet
– 5.4% |
|
| Alphabet,
Inc., “A” (a)(s) |
|
1,113
|
$
3,224,405 |
| Meta
Platforms, Inc., “A” (a) |
|
2,638
|
887,291 |
| Tencent
Holdings Ltd. |
|
21,800
|
1,277,099 |
| |
|
|
|
$5,388,795 |
| Leisure
& Toys – 0.9% |
|
| Electronic
Arts, Inc. |
|
4,587
|
$
605,025 |
| Prosus
N.V. |
|
3,926
|
328,661 |
| |
|
|
|
$933,686 |
| Machinery
& Tools – 3.6% |
|
| GEA
Group AG |
|
8,571
|
$
469,266 |
| Ingersoll
Rand, Inc. |
|
14,924
|
923,348 |
| Kubota
Corp. |
|
21,500
|
477,269 |
| Roper
Technologies, Inc. |
|
1,708
|
840,097 |
| Schindler
Holding AG |
|
1,456
|
390,647 |
| SMC
Corp. |
|
800
|
539,616 |
| |
|
|
|
$3,640,243 |
| Major
Banks – 2.6% |
|
| BNP
Paribas |
|
16,741
|
$
1,158,253 |
| Goldman
Sachs Group, Inc. |
|
2,543
|
972,825 |
| Mitsubishi
UFJ Financial Group, Inc. |
|
88,300
|
479,689 |
| |
|
|
|
$2,610,767 |
| Medical
& Health Technology & Services – 1.2% |
|
| ICON
PLC (a) |
|
3,867
|
$
1,197,610 |
| Medical
Equipment – 4.4% |
|
| Becton,
Dickinson and Co. |
|
2,591
|
$
651,585 |
| Boston
Scientific Corp. (a)(s) |
|
23,550
|
1,000,404 |
| Danaher
Corp. |
|
2,083
|
685,328 |
| Medtronic
PLC |
|
7,545
|
780,530 |
| QIAGEN
N.V. (a) |
|
8,674
|
482,101 |
| Thermo
Fisher Scientific, Inc. |
|
1,232
|
822,039 |
| |
|
|
|
$4,421,987 |
| Natural
Gas - Distribution – 0.5% |
|
| China
Resources Gas Group Ltd. |
|
94,000
|
$
531,026 |
| Natural
Gas - Pipeline – 0.4% |
|
| TC
Energy Corp. |
|
8,320
|
$
386,945 |
| Network
& Telecom – 0.7% |
|
| Equinix,
Inc., REIT |
|
812
|
$
686,822 |
MFS Global Research
Portfolio
Portfolio of
Investments – continued
| Issuer
|
|
|
Shares/Par
|
Value
($) |
| Common
Stocks – continued |
| Other
Banks & Diversified Financials – 6.4% |
|
| HDFC
Bank Ltd. |
|
56,257
|
$
1,119,606 |
| Julius
Baer Group Ltd. |
|
17,860
|
1,193,505 |
| Macquarie
Group Ltd. |
|
6,483
|
968,811 |
| Moody's
Corp. |
|
1,366
|
533,532 |
| Truist
Financial Corp. |
|
18,339
|
1,073,748 |
| Visa,
Inc., “A” |
|
7,098
|
1,538,208 |
| |
|
|
|
$6,427,410 |
| Pharmaceuticals
– 4.6% |
|
| Johnson
& Johnson |
|
5,777
|
$
988,271 |
| Merck
& Co., Inc. |
|
10,448
|
800,735 |
| Roche
Holding AG |
|
3,620
|
1,500,618 |
| Santen
Pharmaceutical Co. Ltd. |
|
38,200
|
467,247 |
| Zoetis,
Inc. |
|
3,666
|
894,614 |
| |
|
|
|
$4,651,485 |
| Printing
& Publishing – 0.7% |
|
| Wolters
Kluwer N.V. |
|
6,219
|
$
733,522 |
| Railroad
& Shipping – 0.6% |
|
| Canadian
Pacific Railway Ltd. |
|
8,055
|
$
579,477 |
| Real
Estate – 1.3% |
|
| LEG
Immobilien SE |
|
5,952
|
$
831,458 |
| STORE
Capital Corp., REIT |
|
15,178
|
522,123 |
| |
|
|
|
$1,353,581 |
| Restaurants
– 1.5% |
|
| Starbucks
Corp. |
|
3,633
|
$
424,952 |
| Wendy's
Co. |
|
18,552
|
442,465 |
| Yum
China Holdings, Inc. |
|
12,080
|
602,068 |
| |
|
|
|
$1,469,485 |
| Specialty
Chemicals – 4.4% |
|
| Air
Products & Chemicals, Inc. |
|
1,659
|
$
504,767 |
| Akzo
Nobel N.V. |
|
3,883
|
426,607 |
| Axalta
Coating Systems Ltd. (a) |
|
15,506
|
513,559 |
| Croda
International PLC |
|
5,183
|
709,964 |
| DuPont
de Nemours, Inc. |
|
8,890
|
718,134 |
| Linde
PLC |
|
2,846
|
991,492 |
| Sika
AG |
|
1,456
|
604,379 |
| |
|
|
|
$4,468,902 |
| Specialty
Stores – 3.8% |
|
| Amazon.com,
Inc. (a)(s) |
|
842
|
$
2,807,514 |
| Home
Depot, Inc. |
|
2,372
|
984,404 |
| |
|
|
|
$3,791,918 |
| Telecommunications
- Wireless – 2.4% |
|
| Advanced
Info Service Public Co. Ltd. |
|
66,700
|
$
459,243 |
| Cellnex
Telecom S.A. |
|
7,728
|
448,688 |
| KDDI
Corp. |
|
15,000
|
438,407 |
| Liberty
Broadband Corp. (a) |
|
3,437
|
553,701 |
MFS Global Research
Portfolio
Portfolio of
Investments – continued
| Issuer
|
|
|
Shares/Par
|
Value
($) |
| Common
Stocks – continued |
| Telecommunications
- Wireless – continued |
|
| T-Mobile
US, Inc. (a) |
|
4,052
|
$
469,951 |
| |
|
|
|
$2,369,990 |
| Telephone
Services – 0.4% |
|
| Hellenic
Telecommunications Organization S.A. |
|
21,518
|
$
398,219 |
| Tobacco
– 0.6% |
|
| British
American Tobacco PLC |
|
7,167
|
$
265,174 |
| Philip
Morris International, Inc. |
|
3,205
|
304,475 |
| |
|
|
|
$569,649 |
| Utilities
- Electric Power – 2.8% |
|
| CLP
Holdings Ltd. |
|
50,500
|
$
510,016 |
| Iberdrola
S.A. |
|
51,572
|
604,345 |
| NextEra
Energy, Inc. |
|
7,201
|
672,285 |
| Orsted
A/S |
|
3,328
|
427,364 |
| Southern
Co. |
|
8,926
|
612,145 |
| |
|
|
|
$2,826,155 |
| Total
Common Stocks (Identified Cost, $60,866,634) |
|
$
100,245,919 |
| Investment
Companies (h) – 0.5% |
| Money
Market Funds – 0.5% |
|
| MFS
Institutional Money Market Portfolio, 0.07% (v) (Identified Cost, $496,235) |
|
|
496,235
|
$
496,235 |
| Other
Assets, Less Liabilities – (0.1)% |
|
(71,695) |
| Net
Assets – 100.0% |
$
100,670,459 |
| (a) |
Non-income producing
security. |
|
|
|
| (h)
|
An
affiliated issuer, which may be considered one in which the fund owns 5% or more of the outstanding voting securities, or a company which is under common control. At period end, the aggregate values of the fund's investments in affiliated issuers
and in unaffiliated issuers were $496,235 and $100,245,919, respectively. |
|
|
|
| (s)
|
Security or
a portion of the security was pledged to cover collateral requirements for certain derivative transactions. |
|
|
|
| (v)
|
Affiliated
issuer that is available only to investment companies managed by MFS. The rate quoted for the MFS Institutional Money Market Portfolio is the annualized seven-day yield of the fund at period end. |
|
|
|
| The
following abbreviations are used in this report and are defined: |
| ADR
|
American
Depositary Receipt |
| REIT
|
Real Estate
Investment Trust |
At December 31,
2021, the fund had cash collateral of $2,587 and other liquid securities with an aggregate value of $575,498 to cover any collateral or margin obligations for certain derivative contracts. Restricted cash and/or deposits with brokers in the
Statement of Assets and Liabilities are comprised of cash collateral.
See Notes to Financial Statements
MFS Global Research
Portfolio
| Financial
Statements |
Statement of Assets and
Liabilities |
This statement
represents your fund’s balance sheet, which details the assets and liabilities comprising the total value of the fund.
| At
12/31/21 Assets |
|
| Investments
in unaffiliated issuers, at value (identified cost, $60,866,634) |
$100,245,919
|
| Investments
in affiliated issuers, at value (identified cost, $496,235) |
496,235
|
| Deposits
with brokers |
2,587
|
| Receivables
for |
|
| Dividends
|
157,870
|
| Receivable
from investment adviser |
3,673
|
| Other
assets |
733
|
| Total
assets |
$100,907,017
|
| Liabilities
|
|
| Payables
for |
|
| Fund
shares reacquired |
$117,643
|
| Payable
to affiliates |
|
| Administrative
services fee |
133
|
| Shareholder
servicing costs |
16
|
| Distribution
and/or service fees |
110
|
| Payable
for independent Trustees' compensation |
74
|
| Deferred
country tax expense payable |
48,636
|
| Accrued
expenses and other liabilities |
69,946
|
| Total
liabilities |
$236,558
|
| Net
assets |
$100,670,459
|
| Net
assets consist of |
|
| Paid-in
capital |
$53,871,965
|
| Total
distributable earnings (loss) |
46,798,494
|
| Net
assets |
$100,670,459
|
| Shares
of beneficial interest outstanding |
2,648,187
|
| |
Net
assets |
Shares
outstanding |
Net
asset value
per share |
| Initial
Class |
$92,642,347
|
2,435,925
|
$38.03
|
| Service
Class |
8,028,112
|
212,262
|
37.82
|
See Notes to Financial Statements
MFS Global Research
Portfolio
| Financial
Statements |
Statement of Operations
|
This statement describes how much
your fund earned in investment income and accrued in expenses. It also describes any gains and/or losses generated by fund operations.
| Year
ended 12/31/21 |
|
| Net
investment income (loss) |
|
| Income
|
|
| Dividends
|
$1,393,502
|
| Income
on securities loaned |
803
|
| Dividends
from affiliated issuers |
299
|
| Other
|
29
|
| Foreign
taxes withheld |
(66,191)
|
| Total
investment income |
$1,328,442
|
| Expenses
|
|
| Management
fee |
$745,982
|
| Distribution
and/or service fees |
19,526
|
| Shareholder
servicing costs |
2,371
|
| Administrative
services fee |
23,904
|
| Independent
Trustees' compensation |
3,693
|
| Custodian
fee |
27,241
|
| Shareholder
communications |
11,098
|
| Audit
and tax fees |
62,868
|
| Legal
fees |
977
|
| Miscellaneous
|
27,599
|
| Total
expenses |
$925,259
|
| Reduction
of expenses by investment adviser |
(59,958)
|
| Net
expenses |
$865,301
|
| Net
investment income (loss) |
$463,141
|
| Realized
and unrealized gain (loss) |
|
| Realized
gain (loss) (identified cost basis) |
|
| Unaffiliated
issuers (net of $4,577 country tax) |
$7,026,361
|
| Foreign
currency |
(3,710)
|
| Net
realized gain (loss) |
$7,022,651
|
| Change
in unrealized appreciation or depreciation |
|
| Unaffiliated
issuers (net of $9,991 increase in deferred country tax) |
$9,330,533
|
| Translation
of assets and liabilities in foreign currencies |
(3,367)
|
| Net
unrealized gain (loss) |
$9,327,166
|
| Net
realized and unrealized gain (loss) |
$16,349,817
|
| Change
in net assets from operations |
$16,812,958
|
See Notes to Financial Statements
MFS Global Research
Portfolio
| Financial
Statements |
Statements of Changes in
Net Assets |
These statements describe
the increases and/or decreases in net assets resulting from operations, any distributions, and any shareholder transactions.
| |
Year
ended |
| |
12/31/21
|
12/31/20
|
| Change
in net assets |
|
|
| From
operations |
|
|
| Net
investment income (loss) |
$463,141
|
$584,760
|
| Net
realized gain (loss) |
7,022,651
|
7,007,762
|
| Net
unrealized gain (loss) |
9,327,166
|
6,103,129
|
| Change
in net assets from operations |
$16,812,958
|
$13,695,651
|
| Total
distributions to shareholders |
$(7,696,062)
|
$(6,967,015)
|
| Change
in net assets from fund share transactions |
$(4,826,833)
|
$(3,519,648)
|
| Total
change in net assets |
$4,290,063
|
$3,208,988
|
| Net
assets |
|
|
| At
beginning of period |
96,380,396
|
93,171,408
|
| At
end of period |
$100,670,459
|
$96,380,396
|
See Notes to Financial Statements
MFS Global Research
Portfolio
| Financial
Statements |
Financial Highlights
|
The financial highlights table is
intended to help you understand the fund's financial performance for the past 5 years. Certain information reflects financial results for a single fund share. The total returns in the table represent the rate that an investor would have earned (or
lost) on an investment in the fund share class (assuming reinvestment of all distributions) held for the entire period.
| Initial
Class |
Year
ended |
| |
12/31/21
|
12/31/20
|
12/31/19
|
12/31/18
|
12/31/17
|
| Net
asset value, beginning of period |
$34.70
|
$32.19
|
$27.00
|
$31.74
|
$25.69
|
| Income
(loss) from investment operations |
|
|
|
|
|
| Net
investment income (loss) (d) |
$0.18
|
$0.22
|
$0.40
|
$0.32
|
$0.28
|
| Net
realized and unrealized gain (loss) |
6.17
|
4.87
|
7.88
|
(2.82)
|
6.24
|
| Total
from investment operations |
$6.35
|
$5.09
|
$8.28
|
$(2.50)
|
$6.52
|
| Less
distributions declared to shareholders |
|
|
|
|
|
| From
net investment income |
$(0.22)
|
$(0.42)
|
$(0.34)
|
$(0.33)
|
$(0.47)
|
| From
net realized gain |
(2.80)
|
(2.16)
|
(2.75)
|
(1.91)
|
—
|
| Total
distributions declared to shareholders |
$(3.02)
|
$(2.58)
|
$(3.09)
|
$(2.24)
|
$(0.47)
|
| Net
asset value, end of period (x) |
$38.03
|
$34.70
|
$32.19
|
$27.00
|
$31.74
|
| Total
return (%) (k)(r)(s)(x) |
18.51
|
16.49
|
31.96
|
(8.83)
|
25.51
|
Ratios
(%) (to average net assets)
and Supplemental data: |
|
|
|
|
|
| Expenses
before expense reductions |
0.91
|
0.95
|
0.94
|
0.93
|
0.92
|
| Expenses
after expense reductions |
0.85
|
0.85
|
0.85
|
0.88
|
0.92
|
| Net
investment income (loss) |
0.49
|
0.69
|
1.29
|
1.01
|
0.97
|
| Portfolio
turnover |
15
|
32
|
27
|
22
|
33
|
| Net
assets at end of period (000 omitted) |
$92,642
|
$88,676
|
$87,138
|
$77,345
|
$98,434
|
| Service
Class |
Year
ended |
| |
12/31/21
|
12/31/20
|
12/31/19
|
12/31/18
|
12/31/17
|
| Net
asset value, beginning of period |
$34.54
|
$32.06
|
$26.89
|
$31.61
|
$25.59
|
| Income
(loss) from investment operations |
|
|
|
|
|
| Net
investment income (loss) (d) |
$0.09
|
$0.13
|
$0.32
|
$0.24
|
$0.21
|
| Net
realized and unrealized gain (loss) |
6.13
|
4.87
|
7.85
|
(2.82)
|
6.20
|
| Total
from investment operations |
$6.22
|
$5.00
|
$8.17
|
$(2.58)
|
$6.41
|
| Less
distributions declared to shareholders |
|
|
|
|
|
| From
net investment income |
$(0.14)
|
$(0.36)
|
$(0.25)
|
$(0.23)
|
$(0.39)
|
| From
net realized gain |
(2.80)
|
(2.16)
|
(2.75)
|
(1.91)
|
—
|
| Total
distributions declared to shareholders |
$(2.94)
|
$(2.52)
|
$(3.00)
|
$(2.14)
|
$(0.39)
|
| Net
asset value, end of period (x) |
$37.82
|
$34.54
|
$32.06
|
$26.89
|
$31.61
|
| Total
return (%) (k)(r)(s)(x) |
18.20
|
16.24
|
31.62
|
(9.06)
|
25.17
|
Ratios
(%) (to average net assets)
and Supplemental data: |
|
|
|
|
|
| Expenses
before expense reductions |
1.16
|
1.21
|
1.19
|
1.18
|
1.17
|
| Expenses
after expense reductions |
1.10
|
1.10
|
1.10
|
1.13
|
1.17
|
| Net
investment income (loss) |
0.24
|
0.40
|
1.06
|
0.76
|
0.73
|
| Portfolio
turnover |
15
|
32
|
27
|
22
|
33
|
| Net
assets at end of period (000 omitted) |
$8,028
|
$7,705
|
$6,034
|
$5,519
|
$7,312
|
See Notes to Financial Statements
MFS Global Research
Portfolio
Financial Highlights - continued
| (d)
|
Per share data
is based on average shares outstanding. |
| (k)
|
The total
return does not reflect expenses that apply to separate accounts. Inclusion of these charges would reduce the total return figures for all periods shown. |
| (r)
|
Certain
expenses have been reduced without which performance would have been lower. |
| (s)
|
From time to
time the fund may receive proceeds from litigation settlements, without which performance would be lower. |
| (x)
|
The
net asset values and total returns have been calculated on net assets which include adjustments made in accordance with U.S. generally accepted accounting principles required at period end for financial reporting purposes. |
See Notes to Financial Statements
MFS Global Research
Portfolio
Notes to Financial Statements
(1) Business and Organization
MFS Global Research Portfolio (the fund) is a diversified
series of MFS Variable Insurance Trust II (the trust). The trust is organized as a Massachusetts business trust and is registered under the Investment Company Act of 1940, as amended, as an open-end management investment company. The shareholders of
each series of the trust are separate accounts of insurance companies, which offer variable annuity and/or life insurance products, and qualified retirement and pension plans.
The fund is an investment company and accordingly follows
the investment company accounting and reporting guidance of the Financial Accounting Standards Board (FASB) Accounting Standards Codification Topic 946 Financial Services - Investment Companies.
(2) Significant Accounting Policies
General — The
preparation of financial statements in conformity with U.S. generally accepted accounting principles requires management to make estimates and assumptions that affect the reported amounts of assets and liabilities, and disclosure of contingent
assets and liabilities at the date of the financial statements and the reported amounts of increases and decreases in net assets from operations during the reporting period. Actual results could differ from those estimates. In the preparation of
these financial statements, management has evaluated subsequent events occurring after the date of the fund’s Statement of Assets and Liabilities through the date that the financial statements were issued. The fund invests in foreign securities. Investments in foreign securities are vulnerable to the effects of changes in the relative values of the local currency and the U.S. dollar and to the effects of changes in each
country’s market, economic, industrial, political, regulatory, geopolitical, environmental, public health, and other conditions.
Balance Sheet Offsetting
— The fund's accounting policy with respect to balance sheet offsetting is that, absent an event of default by the counterparty or a termination of the agreement, the International Swaps and Derivatives Association (ISDA) Master Agreement, or
similar agreement, does not result in an offset of reported amounts of financial assets and financial liabilities in the Statement of Assets and Liabilities across transactions between the fund and the applicable counterparty. The fund's right to
setoff may be restricted or prohibited by the bankruptcy or insolvency laws of the particular jurisdiction to which a specific master netting agreement counterparty is subject. Balance sheet offsetting disclosures, to the extent applicable to the
fund, have been included in the fund’s Significant Accounting Policies note under the captions for each of the fund’s in-scope financial instruments and transactions.
Investment Valuations
— Equity securities, including restricted equity securities, are generally valued at the last sale or official closing price on their primary market or exchange as provided by a third-party pricing
service. Equity securities, for which there were no sales reported that day, are generally valued at the last quoted daily bid quotation on their primary market or exchange as provided by a third-party pricing service. Short-term instruments with a maturity at issuance of 60 days or less may be valued at amortized cost, which approximates market value. Open-end investment companies are
generally valued at net asset value per share.
Securities and
other assets generally valued on the basis of information from a third-party pricing service may also be valued at a broker/dealer bid quotation. In determining values, third-party pricing services can utilize both transaction data and market
information such as yield, quality, coupon rate, maturity, type of issue, trading characteristics, and other market data. The values of foreign securities and other assets and liabilities expressed in foreign currencies are converted to U.S. dollars
using the mean of bid and asked prices for rates provided by a third-party pricing service.
The Board of Trustees has delegated primary responsibility
for determining or causing to be determined the value of the fund’s investments (including any fair valuation) to the adviser pursuant to valuation policies and procedures approved by the Board. If the adviser determines that reliable market
quotations are not readily available, investments are valued at fair value as determined in good faith by the adviser in accordance with such procedures under the oversight of the Board of Trustees. Under the fund’s valuation policies and
procedures, market quotations are not considered to be readily available for most types of debt instruments and floating rate loans and many types of derivatives. These investments are generally valued at fair value based on information from
third-party pricing services. In addition, investments may be valued at fair value if the adviser determines that an investment’s value has been materially affected by events occurring after the close of the exchange or market on which the
investment is principally traded (such as foreign exchange or market) and prior to the determination of the fund’s net asset value, or after the halt of trading of a specific security where trading does not resume prior to the close of the
exchange or market on which the security is principally traded. Events that occur after foreign markets close (such as developments in foreign markets and significant movements in the U.S. markets) and prior to the determination of the fund’s
net asset value may be deemed to have a material effect on the value of securities traded in foreign markets. Accordingly, the fund’s foreign equity securities may often be valued at fair value. The adviser generally relies on third-party
pricing services or other information (such as the correlation with price movements of similar securities in the same or other markets; the type, cost and investment characteristics of the security; the business and financial condition of the
issuer; and trading and other market data) to assist in determining whether to fair value and at what value to fair value an
MFS Global Research
Portfolio
Notes to Financial Statements - continued
investment. The
value of an investment for purposes of calculating the fund’s net asset value can differ depending on the source and method used to determine value. When fair valuation is used, the value of an investment used to determine the fund’s net
asset value may differ from quoted or published prices for the same investment. There can be no assurance that the fund could obtain the fair value assigned to an investment if it were to sell the investment at the same time at which the fund
determines its net asset value per share.
Various
inputs are used in determining the value of the fund's assets or liabilities. These inputs are categorized into three broad levels. In certain cases, the inputs used to measure fair value may fall into different levels of the fair value hierarchy.
In such cases, an investment's level within the fair value hierarchy is based on the lowest level of input that is significant to the fair value measurement. The fund's assessment of the significance of a particular input to the fair value
measurement in its entirety requires judgment, and considers factors specific to the investment. Level 1 includes unadjusted quoted prices in active markets for identical assets or liabilities. Level 2 includes other significant observable
market-based inputs (including quoted prices for similar securities, interest rates, prepayment speed, and credit risk). Level 3 includes unobservable inputs, which may include the adviser's own assumptions in determining the fair value of
investments. The following is a summary of the levels used as of December 31, 2021 in valuing the fund's assets and liabilities:
| Financial
Instruments |
Level
1 |
Level
2 |
Level
3 |
Total
|
| Equity
Securities: |
|
|
|
|
| United
States |
$63,239,159
|
$—
|
$—
|
$63,239,159
|
| Switzerland
|
1,012,304
|
3,689,149
|
—
|
4,701,453
|
| France
|
4,353,226
|
—
|
—
|
4,353,226
|
| China
|
3,589,452
|
—
|
—
|
3,589,452
|
| United
Kingdom |
3,045,141
|
—
|
—
|
3,045,141
|
| Japan
|
3,015,344
|
—
|
—
|
3,015,344
|
| Germany
|
2,541,258
|
—
|
—
|
2,541,258
|
| Hong
Kong |
2,036,033
|
—
|
—
|
2,036,033
|
| Canada
|
1,998,003
|
—
|
—
|
1,998,003
|
| Other
Countries |
9,787,210
|
1,939,640
|
—
|
11,726,850
|
| Mutual
Funds |
496,235
|
—
|
—
|
496,235
|
| Total
|
$95,113,365
|
$5,628,789
|
$—
|
$100,742,154
|
For further information
regarding security characteristics, see the Portfolio of Investments.
Foreign Currency
Translation — Purchases and sales of foreign investments, income, and expenses are converted into U.S. dollars based upon currency exchange rates prevailing on the respective dates of such transactions or on
the reporting date for foreign denominated receivables and payables. Gains and losses attributable to foreign currency exchange rates on sales of securities are recorded for financial statement purposes as net realized gains and losses on
investments. Gains and losses attributable to foreign exchange rate movements on receivables, payables, income and expenses are recorded for financial statement purposes as foreign currency transaction gains and losses. That portion of both realized
and unrealized gains and losses on investments that results from fluctuations in foreign currency exchange rates is not separately disclosed.
Security Loans —
Under its Securities Lending Agency Agreement with the fund, State Street Bank and Trust Company, as lending agent, loans the securities of the fund to certain qualified institutions (the “Borrowers”) approved by the fund. Security loans
can be terminated at the discretion of either the lending agent or the fund and the related securities must be returned within the earlier of the standard trade settlement period for such securities or within three business days. The loans are
collateralized by cash and/or U.S. Treasury and federal agency obligations in an amount typically at least equal to the market value of the securities loaned. On loans collateralized by cash, the cash collateral is invested in a money market fund.
The market value of the loaned securities is determined at the close of business of the fund and any additional required collateral is delivered to the fund on the next business day. The lending agent provides the fund with indemnification against
Borrower default. In the event of Borrower default, the lending agent will, for the benefit of the fund, either purchase securities identical to those loaned or, when such purchase is commercially impracticable, pay the fund the market value of the
loaned securities. In return, the lending agent assumes the fund's rights to the related collateral. If the collateral value is less than the cost to purchase identical securities, the lending agent is responsible for the shortfall, but only to the
extent that such shortfall is not due to a decline in collateral value resulting from collateral reinvestment for which the fund bears the risk of loss. A portion of the income generated upon investment of the collateral is remitted to the
Borrowers, and the remainder is allocated between the fund and the lending agent. On loans collateralized by U.S. Treasury and/or federal agency obligations, a fee is received from the Borrower, and is allocated between the fund and the lending
agent. Income from securities lending is separately reported in the Statement of Operations. The dividend and interest income earned on the securities loaned is accounted for in the same manner as other dividend and interest income. At December 31,
2021, there were no securities on loan or collateral outstanding.
MFS Global Research
Portfolio
Notes to Financial Statements - continued
Indemnifications —
Under the fund's organizational documents, its officers and Trustees may be indemnified against certain liabilities and expenses arising out of the performance of their duties to the fund. Additionally, in the normal course of business, the fund
enters into agreements with service providers that may contain indemnification clauses. The fund's maximum exposure under these agreements is unknown as this would involve future claims that may be made against the fund that have not yet
occurred.
Investment Transactions and Income — Investment transactions are recorded on the trade date. Dividends received in cash are recorded on the ex-dividend date. Certain dividends from foreign securities will be
recorded when the fund is informed of the dividend if such information is obtained subsequent to the ex-dividend date. Dividend payments received in additional securities are recorded on the ex-dividend date in an amount equal to the value of the
security on such date.
The fund may receive
proceeds from litigation settlements. Any proceeds received from litigation involving portfolio holdings are reflected in the Statement of Operations in realized gain/loss if the security has been disposed of by the fund or in unrealized gain/loss
if the security is still held by the fund. Any other proceeds from litigation not related to portfolio holdings are reflected as other income in the Statement of Operations.
Tax Matters and Distributions — The fund intends to qualify as a regulated investment company, as defined under Subchapter M of the Internal Revenue Code, and to distribute all of its taxable income, including realized capital gains. As a
result, no provision for federal income tax is required. The fund’s federal tax returns, when filed, will remain subject to examination by the Internal Revenue Service for a three year period. Management has analyzed the fund’s tax
positions taken on federal and state tax returns for all open tax years and does not believe that there are any uncertain tax positions that require recognition of a tax liability. Foreign taxes, if any, have been accrued by the fund in the
accompanying financial statements in accordance with the applicable foreign tax law. Foreign income taxes may be withheld by certain countries in which the fund invests. Additionally, capital gains realized by the fund on securities issued in or by
certain foreign countries may be subject to capital gains tax imposed by those countries.
Distributions to shareholders are recorded on the
ex-dividend date. Income and capital gain distributions are determined in accordance with income tax regulations, which may differ from U.S. generally accepted accounting principles. Certain capital accounts in the financial statements are
periodically adjusted for permanent differences in order to reflect their tax character. These adjustments have no impact on net assets or net asset value per share. Temporary differences which arise from recognizing certain items of income,
expense, gain or loss in different periods for financial statement and tax purposes will reverse at some time in the future.
Book/tax differences primarily relate to wash sale loss
deferrals.
The tax character of distributions
declared to shareholders for the last two fiscal years is as follows:
| |
Year
ended
12/31/21 |
Year
ended
12/31/20 |
| Ordinary
income (including any short-term capital gains) |
$1,290,016
|
$1,126,006
|
| Long-term
capital gains |
6,406,046
|
5,841,009
|
| Total
distributions |
$7,696,062
|
$6,967,015
|
The federal tax cost and the tax
basis components of distributable earnings were as follows:
| As
of 12/31/21 |
|
| Cost
of investments |
$61,460,890
|
| Gross
appreciation |
40,354,608
|
| Gross
depreciation |
(1,073,344)
|
| Net
unrealized appreciation (depreciation) |
$39,281,264
|
| Undistributed
ordinary income |
1,609,256
|
| Undistributed
long-term capital gain |
5,905,169
|
| Other
temporary differences |
2,805
|
| Total
distributable earnings (loss) |
$46,798,494
|
Multiple Classes of Shares of
Beneficial Interest — The fund offers multiple classes of shares, which differ in their respective distribution and/or service fees. The fund's income, realized and unrealized gain (loss), and common expenses
are allocated to shareholders based on the daily net assets of each class. Dividends are declared separately for each class. Differences in per share dividend rates are generally due to differences in separate class expenses. The fund’s
distributions declared to shareholders as reported in the Statements of Changes in Net Assets are presented by class as follows:
MFS Global Research
Portfolio
Notes to Financial Statements - continued
| |
Year
ended
12/31/21 |
|
Year
ended
12/31/20 |
| Initial
Class |
$7,108,197
|
|
$6,392,513
|
| Service
Class |
587,865
|
|
574,502
|
| Total
|
$7,696,062
|
|
$6,967,015
|
(3) Transactions with
Affiliates
Investment Adviser — The fund has an investment advisory agreement with MFS to provide overall investment management and related administrative services and facilities to the fund. The
management fee is computed daily and paid monthly at the following annual rates based on the fund's average daily net assets:
| Up
to $300 million |
0.75%
|
| In
excess of $300 million |
0.675%
|
MFS has agreed in writing to
reduce its management fee by a specified amount if certain MFS mutual fund assets exceed thresholds agreed to by MFS and the fund's Board of Trustees. For the year ended December 31, 2021, this management fee reduction amounted to $12,610, which is
included in the reduction of total expenses in the Statement of Operations. The management fee incurred for the year ended December 31, 2021 was equivalent to an annual effective rate of 0.74% of the fund's average daily net assets.
The investment adviser has agreed in writing to pay a
portion of the fund’s total annual operating expenses, excluding interest, taxes, extraordinary expenses, brokerage and transaction costs, and investment-related expenses, such that total annual operating expenses do not exceed 0.85% of
average daily net assets for the Initial Class shares and 1.10% of average daily net assets for the Service Class shares. This written agreement will continue until modified by the fund’s Board of Trustees, but such agreement will continue at
least until April 30, 2023. For the year ended December 31, 2021, this reduction amounted to $47,348, which is included in the reduction of total expenses in the Statement of Operations.
Distributor — MFS
Fund Distributors, Inc. (MFD), a wholly-owned subsidiary of MFS, is the distributor of shares of the fund. The Trustees have adopted a distribution plan for the Service Class shares pursuant to Rule 12b-1 under the Investment Company Act of
1940.
The fund's distribution plan provides
that the fund will pay MFD distribution and/or service fees equal to 0.25% per annum of its average daily net assets attributable to Service Class shares as partial consideration for services performed and expenses incurred by MFD and financial
intermediaries (including participating insurance companies that invest in the fund to fund variable annuity and variable life insurance contracts, sponsors of qualified retirement and pension plans that invest in the fund, and affiliates of these
participating insurance companies and plan sponsors) in connection with the sale and distribution of the Service Class shares. MFD may subsequently pay all, or a portion, of the distribution and/or service fees to financial intermediaries.
Shareholder Servicing Agent
— MFS Service Center, Inc. (MFSC), a wholly-owned subsidiary of MFS, receives a fee from the fund for its services as shareholder servicing agent. For the year ended December 31, 2021, the fee was $2,246, which equated to 0.0023% annually of
the fund's average daily net assets. MFSC also receives reimbursement from the fund for out-of-pocket expenses paid by MFSC on behalf of the fund. For the year ended December 31, 2021, these costs amounted to $125.
Administrator — MFS
provides certain financial, legal, shareholder communications, compliance, and other administrative services to the fund. Under an administrative services agreement, the fund reimburses MFS the costs incurred to provide these services. The fund is
charged an annual fixed amount of $17,500 plus a fee based on average daily net assets. The administrative services fee incurred for the year ended December 31, 2021 was equivalent to an annual effective rate of 0.0240% of the fund's average daily
net assets.
Trustees’ and Officers’
Compensation — The fund pays compensation to independent Trustees in the form of a retainer, attendance fees, and additional compensation to Board and Committee chairpersons. The fund does not pay compensation
directly to Trustees or officers of the fund who are also officers of the investment adviser, all of whom receive remuneration from MFS for their services to the fund. Certain officers and Trustees of the fund are officers or directors of MFS, MFD,
and MFSC.
Other — The fund invests in the MFS Institutional Money Market Portfolio which is managed by MFS and seeks current income consistent with preservation of capital and liquidity. This money market fund does not pay a
management fee to MFS but does incur investment and operating costs.
MFS Global Research
Portfolio
Notes to Financial Statements - continued
(4) Portfolio Securities
For the year ended December 31, 2021, purchases and sales
of investments, other than short-term obligations, aggregated $14,782,637 and $26,718,280, respectively.
(5) Shares of Beneficial Interest
The fund's Declaration of Trust permits the Trustees to
issue an unlimited number of full and fractional shares of beneficial interest. Transactions in fund shares were as follows:
| |
Year
ended
12/31/21 |
|
Year
ended
12/31/20 |
| |
Shares
|
Amount
|
|
Shares
|
Amount
|
| Shares
sold |
|
|
|
|
|
| Initial
Class |
32,311
|
$1,189,874
|
|
26,914
|
$846,212
|
| Service
Class |
3,188
|
114,787
|
|
83,361
|
2,590,298
|
| |
35,499
|
$1,304,661
|
|
110,275
|
$3,436,510
|
Shares
issued to shareholders
in reinvestment of distributions |
|
|
|
|
|
| Initial
Class |
191,286
|
$7,108,197
|
|
199,517
|
$6,392,513
|
| Service
Class |
15,897
|
587,865
|
|
17,998
|
574,502
|
| |
207,183
|
$7,696,062
|
|
217,515
|
$6,967,015
|
| Shares
reacquired |
|
|
|
|
|
| Initial
Class |
(343,195)
|
$(12,731,621)
|
|
(378,252)
|
$(11,870,001)
|
| Service
Class |
(29,917)
|
(1,095,935)
|
|
(66,439)
|
(2,053,172)
|
| |
(373,112)
|
$(13,827,556)
|
|
(444,691)
|
$(13,923,173)
|
| Net
change |
|
|
|
|
|
| Initial
Class |
(119,598)
|
$(4,433,550)
|
|
(151,821)
|
$(4,631,276)
|
| Service
Class |
(10,832)
|
(393,283)
|
|
34,920
|
1,111,628
|
| |
(130,430)
|
$(4,826,833)
|
|
(116,901)
|
$(3,519,648)
|
(6) Line of
Credit
The fund and certain other funds managed by
MFS participate in a $1.25 billion unsecured committed line of credit of which $1 billion is reserved for use by the fund and certain other MFS U.S. funds. The line of credit is provided by a syndicate of banks under a credit agreement. Borrowings
may be made for temporary financing needs. Interest is charged to each fund, based on its borrowings, generally at a rate equal to the highest of one month LIBOR, the Federal Funds Effective Rate and the Overnight Bank Funding Rate, plus an agreed
upon spread. A commitment fee, based on the average daily, unused portion of the committed line of credit, is allocated among the participating funds. In addition, the fund and other funds managed by MFS have established unsecured uncommitted
borrowing arrangements with certain banks for temporary financing needs. Interest is charged to each fund, based on its borrowings, at rates equal to customary reference rates plus an agreed upon spread. For the year ended December 31, 2021, the
fund’s commitment fee and interest expense were $304 and $0, respectively, and are included in “Miscellaneous” expense in the Statement of Operations.
(7) Investments in Affiliated Issuers
An affiliated issuer may be considered one in which the
fund owns 5% or more of the outstanding voting securities, or a company which is under common control. For the purposes of this report, the following were affiliated issuers:
| Affiliated
Issuers |
Beginning
Value |
Purchases
|
Sales
Proceeds |
Realized
Gain
(Loss) |
Change
in
Unrealized
Appreciation or
Depreciation |
Ending
Value |
| MFS
Institutional Money Market Portfolio |
$365,105
|
$14,039,702
|
$13,908,572
|
$—
|
$—
|
$496,235
|
MFS Global Research
Portfolio
Notes to Financial Statements - continued
| Affiliated
Issuers |
Dividend
Income |
Capital
Gain
Distributions |
| MFS
Institutional Money Market Portfolio |
$299
|
$—
|
(8) Impacts of
COVID-19
The pandemic related to the global spread of
novel coronavirus disease (COVID-19), which was first detected in December 2019, has resulted in significant disruptions to global business activity and the global economy, as well as the economies of individual countries, the financial performance
of individual companies and sectors, and the securities and commodities markets in general. Multiple surges in cases globally, the availability and widespread adoption of vaccines, and the emergence of variant strains of the virus continue to create
uncertainty as to the future and long-term impacts resulting from the pandemic including impacts to the prices and liquidity of the fund's investments and the fund's performance.
(9) LIBOR Transition
Certain of the fund's investments, including its
investments in derivatives, as well as any debt issued by the fund and other contractual arrangements of the fund may be based on reference interest rates such as the London Interbank Offered Rate (“LIBOR”). In 2017, the regulatory
authority that oversees financial services firms in the United Kingdom announced plans to transition away from LIBOR by the end of 2021. In March 2021, the administrator of LIBOR announced the extension of the publication of the more commonly used
U.S. dollar LIBOR settings to the end of June 2023. Although the full impacts of the transition away from LIBOR are not fully known, the transition may result in, among other things, an increase in volatility or illiquidity of the markets for
instruments that currently rely on LIBOR to determine interest rates and this could have an adverse impact on the fund's performance. With respect to the fund's accounting for investments, including its investments in derivatives, as well as any
debt issued by the fund and other contractual arrangements of the fund that undergo reference rate-related modifications as a result of the transition, management will rely upon the relief provided by FASB Codification Topic 848 – Reference
Rate Reform (Topic 848). The guidance in Topic 848 permits the fund to disregard the GAAP accounting requirements around certain contract modifications resulting from the LIBOR transition such that for contracts considered in scope, the fund can
account for those modified contracts as a continuation of the existing contracts. While the cessation of the one-week and two-month U.S. dollar LIBOR tenors along with certain other non-U.S. dollar denominated LIBOR settings at December 31, 2021 did
not have a material impact on the fund, management is still evaluating the impact to the fund of the June 30, 2023 planned discontinuation of the more commonly used U.S. dollar LIBOR settings.
MFS Global Research
Portfolio
Report of Independent Registered Public Accounting
Firm
To the Board of Trustees of MFS Variable
Insurance Trust II and the Shareholders of MFS Global Research Portfolio:
Opinion on the Financial Statements and Financial
Highlights
We have audited the accompanying statement
of assets and liabilities of MFS Global Research Portfolio (the “Fund”), including the portfolio of investments, as of December 31, 2021, the related statement of operations for the year then ended, the statements of changes in net
assets for each of the two years in the period then ended, the financial highlights for each of the five years in the period then ended, and the related notes. In our opinion, the financial statements and financial highlights present fairly, in all
material respects, the financial position of the Fund as of December 31, 2021, and the results of its operations for the year then ended, the changes in its net assets for each of the two years in the period then ended, and the financial highlights
for each of the five years in the period then ended, in conformity with accounting principles generally accepted in the United States of America.
Basis for Opinion
These financial statements and financial highlights are the
responsibility of the Fund's management. Our responsibility is to express an opinion on the Fund's financial statements and financial highlights based on our audits. We are a public accounting firm registered with the Public Company Accounting
Oversight Board (United States) (PCAOB) and are required to be independent with respect to the Fund in accordance with the U.S. federal securities laws and the applicable rules and regulations of the Securities and Exchange Commission and the
PCAOB.
We conducted our audits in accordance with the
standards of the PCAOB. Those standards require that we plan and perform the audit to obtain reasonable assurance about whether the financial statements and financial highlights are free of material misstatement, whether due to error or fraud. The
Fund is not required to have, nor were we engaged to perform, an audit of its internal control over financial reporting. As part of our audits, we are required to obtain an understanding of internal control over financial reporting but not for the
purpose of expressing an opinion on the effectiveness of the Fund's internal control over financial reporting. Accordingly, we express no such opinion.
Our audits included performing procedures to assess the
risks of material misstatement of the financial statements and financial highlights, whether due to error or fraud, and performing procedures that respond to those risks. Such procedures included examining, on a test basis, evidence regarding the
amounts and disclosures in the financial statements and financial highlights. Our audits also included evaluating the accounting principles used and significant estimates made by management, as well as evaluating the overall presentation of the
financial statements and financial highlights. Our procedures included confirmation of securities owned as of December 31, 2021, by correspondence with the custodian and brokers. We believe that our audits provide a reasonable basis for our
opinion.
DELOITTE & TOUCHE LLP
Boston, Massachusetts
February 15, 2022
We have served as the auditor of one or more of the MFS
investment companies since 1924.
MFS Global Research
Portfolio
Trustees and Officers — Identification and
Background
The Trustees and Officers of the Trust, as
of February 1, 2022, are listed below, together with their principal occupations during the past five years. (Their titles may have varied during that period.) The address of each Trustee and Officer is 111 Huntington Avenue, Boston, Massachusetts
02199-7618.
| Name,
Age |
|
Position(s)
Held with Fund |
|
Trustee/Officer
Since(h) |
|
Number
of MFS Funds overseen by the Trustee |
|
Principal
Occupations During
the Past Five Years |
|
Other
Directorships During
the Past Five Years (j) |
| INTERESTED
TRUSTEES |
|
|
|
|
|
|
|
|
|
|
Michael
W. Roberge (k)
(age 55) |
|
Trustee
|
|
January
2021 |
|
135
|
|
Massachusetts
Financial Services Company, Chairman (since January 2021); Chief Executive Officer (since January 2017); Director; Chairman of the Board (since January 2022); President (until December 2018); Chief Investment Officer (until December 2018) |
|
N/A
|
| INDEPENDENT
TRUSTEES |
|
|
|
|
|
|
|
|
|
|
John
P. Kavanaugh
(age 67) |
|
Trustee
and Chair of Trustees |
|
January
2009 |
|
135
|
|
Private
investor |
|
N/A
|
Steven
E. Buller
(age 70) |
|
Trustee
|
|
February
2014 |
|
135
|
|
Private
investor |
|
N/A
|
John
A. Caroselli
(age 67) |
|
Trustee
|
|
March
2017 |
|
135
|
|
Private
investor; JC Global Advisors, LLC (management consulting), President (since 2015) |
|
N/A
|
Maureen
R. Goldfarb
(age 66) |
|
Trustee
|
|
January
2009 |
|
135
|
|
Private
investor |
|
N/A
|
Peter
D. Jones
(age 66) |
|
Trustee
|
|
January
2019 |
|
135
|
|
Private
investor |
|
N/A
|
James
W. Kilman, Jr.
(age 60) |
|
Trustee
|
|
January
2019 |
|
135
|
|
Burford
Capital Limited (finance and investment management), Senior Advisor (since May 3, 2021), Chief Financial Officer (2019 - May 2, 2021); KielStrand Capital LLC (family office), Chief Executive Officer (since 2016) |
|
Alpha-En
Corporation, Director (2016-2019) |
Clarence
Otis, Jr.
(age 65) |
|
Trustee
|
|
March
2017 |
|
135
|
|
Private
investor |
|
VF
Corporation, Director; Verizon Communications, Inc., Director; The Travelers Companies, Director |
Maryanne
L. Roepke
(age 65) |
|
Trustee
|
|
May
2014 |
|
135
|
|
Private
investor |
|
N/A
|
Laurie
J. Thomsen
(age 64) |
|
Trustee
|
|
March
2005 |
|
135
|
|
Private
investor |
|
The
Travelers Companies, Director; Dycom Industries, Inc., Director |
MFS Global Research
Portfolio
Trustees and Officers - continued
| Name,
Age |
|
Position(s)
Held with
Fund |
|
Trustee/Officer
Since(h) |
|
Number
of MFS Funds for which the Person is an Officer |
|
Principal
Occupations During
the Past Five Years |
| OFFICERS
|
|
|
|
|
|
|
|
|
Christopher
R. Bohane (k)
(age 48) |
|
Assistant
Secretary and Assistant Clerk |
|
July
2005 |
|
135
|
|
Massachusetts
Financial Services Company, Senior Vice President and Associate General Counsel |
Kino
Clark (k)
(age 53) |
|
Assistant
Treasurer |
|
January
2012 |
|
135
|
|
Massachusetts
Financial Services Company, Vice President |
John
W. Clark, Jr. (k)
(age 54) |
|
Assistant
Treasurer |
|
April
2017 |
|
135
|
|
Massachusetts
Financial Services Company, Vice President (since March 2017); Deutsche Bank (financial services), Department Head - Treasurer's Office (until February 2017) |
Thomas
H. Connors (k)
(age 62) |
|
Assistant
Secretary and Assistant Clerk |
|
September
2012 |
|
135
|
|
Massachusetts
Financial Services Company, Vice President and Senior Counsel |
David
L. DiLorenzo (k)
(age 53) |
|
President
|
|
July
2005 |
|
135
|
|
Massachusetts
Financial Services Company, Senior Vice President |
Heidi
W. Hardin (k)
(age 54) |
|
Secretary
and Clerk |
|
April
2017 |
|
135
|
|
Massachusetts
Financial Services Company, Executive Vice President and General Counsel (since March 2017); Harris Associates (investment management), General Counsel (until January 2017) |
Brian
E. Langenfeld (k)
(age 48) |
|
Assistant
Secretary and Assistant Clerk |
|
June
2006 |
|
135
|
|
Massachusetts
Financial Services Company, Vice President and Senior Counsel |
Amanda
S. Mooradian (k)
(age 42) |
|
Assistant
Secretary and Assistant Clerk |
|
September
2018 |
|
135
|
|
Massachusetts
Financial Services Company, Assistant Vice President and Senior Counsel |
Susan
A. Pereira (k)
(age 51) |
|
Assistant
Secretary and Assistant Clerk |
|
July
2005 |
|
135
|
|
Massachusetts
Financial Services Company, Vice President and Assistant General Counsel |
Kasey
L. Phillips (k)
(age 51) |
|
Assistant
Treasurer |
|
September
2012 |
|
135
|
|
Massachusetts
Financial Services Company, Vice President |
Matthew
A. Stowe (k)
(age 47) |
|
Assistant
Secretary and Assistant Clerk |
|
October
2014 |
|
135
|
|
Massachusetts
Financial Services Company, Vice President and Assistant General Counsel |
Martin
J. Wolin (k)
(age 54) |
|
Chief
Compliance Officer |
|
July
2015 |
|
135
|
|
Massachusetts
Financial Services Company, Senior Vice President and Chief Compliance Officer |
James
O. Yost (k)
(age 61) |
|
Treasurer
|
|
September
1990 |
|
135
|
|
Massachusetts
Financial Services Company, Senior Vice President |
| (h)
|
Date
first appointed to serve as Trustee/Officer of an MFS Fund. Each Trustee has served continuously since appointment unless indicated otherwise. From January 2012 through December 2016, Messrs. DiLorenzo and Yost served as Treasurer and Deputy
Treasurer of the Funds, respectively. |
| (j)
|
Directorships or
trusteeships of companies required to report to the Securities and Exchange Commission (i.e., “public companies”). |
| (k)
|
“Interested
person” of the Trust within the meaning of the Investment Company Act of 1940 (referred to as the 1940 Act), which is the principal federal law governing investment companies like the fund, as a result of a position with MFS. The address of
MFS is 111 Huntington Avenue, Boston, Massachusetts 02199-7618. |
Each Trustee (other than Messrs. Jones, Kilman and Roberge)
has been elected by shareholders and each Trustee and Officer holds office until his or her successor is chosen and qualified or until his or her earlier death, resignation, retirement or removal. Mr. Roberge became a Trustee of the Funds on January
1, 2021 and Messrs. Jones and Kilman became Trustees of the Funds on January 1, 2019. The Trust does not hold annual meetings for the purpose of electing Trustees, and Trustees are not elected for fixed terms. Under the terms of the Board's
retirement policy, an Independent Trustee shall retire at the end of the calendar year in which he or she reaches the earlier of 75 years of age or 15 years of service on the Board (or, in the case of any Independent Trustee who joined the Board
prior to 2015, 20 years of service on the Board).
Messrs. Buller, Kilman and Otis and Ms. Roepke are members
of the Trust’s Audit Committee.
MFS Global Research
Portfolio
Trustees and Officers - continued
Each
of the Interested Trustees and certain Officers hold comparable officer positions with certain affiliates of MFS.
The Statement of Additional Information for a Fund includes
further information about the Trustees and is available without charge upon request by calling 1-800-225-2606.
| Investment
Adviser |
Custodian
|
Massachusetts Financial
Services Company
111 Huntington Avenue
Boston, MA 02199-7618 |
State Street
Bank and Trust Company
1 Lincoln Street
Boston, MA 02111-2900 |
| Distributor
|
Independent
Registered Public Accounting Firm |
MFS Fund
Distributors, Inc.
111 Huntington Avenue
Boston, MA 02199-7618 |
Deloitte
& Touche LLP
200 Berkeley Street
Boston, MA 02116 |
| Portfolio
Manager(s) |
|
Akira
Fuse
James Keating |
|
MFS Global Research
Portfolio
Board Review of Investment Advisory Agreement
MFS Global Research Portfolio
The Investment Company Act of 1940 requires that both the
full Board of Trustees and a majority of the non-interested (“independent”) Trustees, voting separately, annually approve the continuation of the Fund’s investment advisory agreement with MFS. The Trustees consider matters bearing
on the Fund and its advisory arrangements at their meetings throughout the year, including a review of performance data at each regular meeting. In addition, the independent Trustees met several times by videoconference (in accordance with
Securities and Exchange Commission relief) over the course of three months beginning in May and ending in July, 2021 (“contract review meetings”) for the specific purpose of considering whether to approve the continuation of the
investment advisory agreement for the Fund and the other investment companies that the Board oversees (the “MFS Funds”). The independent Trustees were assisted in their evaluation of the Fund’s investment advisory agreement by
independent legal counsel, from whom they received separate legal advice and with whom they met separately from MFS during various contract review meetings. The independent Trustees were also assisted in this process by an independent consultant who
was retained by and reported to the independent Trustees.
In connection with their deliberations regarding the
continuation of the investment advisory agreement, the Trustees, including the independent Trustees, considered such information and factors as they believed, in light of the legal advice furnished to them and their own business judgment, to be
relevant. The investment advisory agreement for the Fund was considered separately, although the Trustees also took into account the common interests of all MFS Funds in their review. As described below, the Trustees considered the nature, quality,
and extent of the various investment advisory, administrative, and shareholder services performed by MFS under the existing investment advisory agreement and other arrangements with the Fund.
In connection with their contract review meetings, the
Trustees received and relied upon materials that included, among other items: (i) information provided by Broadridge Financial Solutions, Inc. (“Broadridge”), an independent third party, on the investment performance of the Fund for
various time periods ended December 31, 2020 and the investment performance of a group of funds with substantially similar investment classifications/objectives (the “Broadridge performance universe”), (ii) information provided by
Broadridge on the Fund’s advisory fees and other expenses and the advisory fees and other expenses of comparable funds identified by Broadridge as well as all other funds in the same investment classification/category (the “Broadridge
expense group and universe”), (iii) information provided by MFS on the advisory fees of portfolios of other clients of MFS, including institutional separate accounts and other clients, (iv) information as to whether and to what extent
applicable expense waivers, reimbursements or fee “breakpoints” are observed for the Fund, (v) information regarding MFS’ financial results and financial condition, including MFS’ and certain of its affiliates’
estimated profitability from services performed for the Fund and the MFS Funds as a whole, and compared to MFS’ institutional business, (vi) MFS’ views regarding the outlook for the mutual fund industry and the strategic business plans
of MFS, (vii) descriptions of various functions performed by MFS for the Funds, such as compliance monitoring and portfolio trading practices, and (viii) information regarding the overall organization of MFS, including information about MFS’
senior management and other personnel providing investment advisory, administrative and other services to the Fund and the other MFS Funds. The comparative performance, fee and expense information prepared and provided by Broadridge was not
independently verified and the independent Trustees did not independently verify any information provided to them by MFS.
The Trustees’ conclusion as to the continuation of
the investment advisory agreement was based on a comprehensive consideration of all information provided to the Trustees and not the result of any single factor. Some of the factors that figured particularly in the Trustees’ deliberations are
described below, although individual Trustees may have evaluated the information presented differently from one another, giving different weights to various factors. It is also important to recognize that the fee arrangements for the Fund and other
MFS Funds are the result of years of review and discussion between the independent Trustees and MFS, that certain aspects of such arrangements may receive greater scrutiny in some years than in others, and that the Trustees’ conclusions may be
based, in part, on their consideration of these same arrangements during the course of the year and in prior years.
Based on information provided by Broadridge and MFS, the
Trustees reviewed the Fund’s total return investment performance as well as the Broadridge performance universe over various time periods. The Trustees placed particular emphasis on the total return performance of the Fund’s Initial
Class shares in comparison to the performance of funds in its Broadridge performance universe over the five-year period ended December 31, 2020, which the Trustees believed was a long enough period to reflect differing market conditions. The total
return performance of the Fund’s Initial Class shares was in the 2nd quintile relative to the other funds in the universe for this five-year period (the 1st quintile being the best performers and the 5th quintile being the worst performers).
The total return performance of the Fund’s Initial Class shares was in the 2nd quintile for the one-year period and the 3rd quintile for the three-year period ended December 31, 2020 relative to the Broadridge performance universe. Because of
the passage of time, these performance results may differ from the performance results for more recent periods, including those shown elsewhere in this report.
In addition to considering the performance information
provided in connection with the contract review meetings, the Trustees noted that, in light of the Fund’s substandard relative performance at the time of their contract review meetings in 2020, they had met at each of their regular meetings
since then with MFS’ senior investment management personnel to discuss the Fund’s performance and MFS’ efforts to improve the Fund’s performance. The Trustees further noted that the Fund’s five-year performance as
compared to its
MFS Global Research
Portfolio
Board Review of Investment Advisory Agreement - continued
Broadridge
performance universe improved for the period ended December 31, 2020, as compared to the prior year. Taking this information into account, the Trustees concluded, within the context of their overall conclusions regarding the investment advisory
agreement, that they were satisfied with MFS’ responses and efforts relating to investment performance.
In assessing the reasonableness of the Fund’s
advisory fee, the Trustees considered, among other information, the Fund’s advisory fee and the total expense ratio of the Fund’s Initial Class shares as a percentage of average daily net assets and the advisory fee and total expense
ratios of the Broadridge expense group based on information provided by Broadridge. The Trustees considered that MFS currently observes an expense limitation for the Fund, which may not be changed without the Trustees’ approval. The Trustees
also considered that, according to the data provided by Broadridge (which takes into account any fee reductions or expense limitations that were in effect during the Fund’s last fiscal year), the Fund’s effective advisory fee rate and
total expense ratio were each approximately at the Broadridge expense group median.
The Trustees also considered the advisory fees charged by
MFS to any institutional separate accounts advised by MFS (“separate accounts”) and unaffiliated investment companies for which MFS serves as subadviser (“subadvised funds”) that have comparable investment strategies to the
Fund, if any. In comparing these fees, the Trustees considered information provided by MFS as to the generally broader scope of services provided by MFS to the Fund, as well as the more extensive regulatory burdens imposed on MFS in managing the
Fund, in comparison to separate accounts and subadvised funds. The Trustees also considered the higher demands placed on MFS’ investment personnel and trading infrastructure as a result of the daily cash in-flows and out-flows of the Fund in
comparison to separate accounts.
The Trustees also
considered whether the Fund may benefit from any economies of scale in the management of the Fund in the event of growth in assets of the Fund and/or growth in assets of the MFS Funds as a whole. They noted that the Fund’s advisory fee rate
schedule is subject to a contractual breakpoint that reduces the Fund’s advisory fee rate on average daily net assets over $300 million. The Trustees also noted that MFS has agreed in writing to waive a portion of the management fees of
certain MFS Funds, including the Fund, if the total combined assets of certain funds within the MFS Funds’ complex increase above agreed upon thresholds (the “group fee waiver”), enabling the Fund’s shareholders to share in
the benefits from any economies of scale at the complex level. The group fee waiver is reviewed and renewed annually between the Board and MFS. The Trustees concluded that the breakpoint and the group fee waiver were sufficient to allow the Fund to
benefit from economies of scale as its assets and overall complex assets grow.
The Trustees also considered information prepared by MFS
relating to MFS’ costs and profits with respect to the Fund, the MFS Funds considered as a group, and other investment companies and accounts advised by MFS, as well as MFS’ methodologies used to determine and allocate its costs to the
MFS Funds, the Fund and other accounts and products for purposes of estimating profitability.
After reviewing these and other factors described herein,
the Trustees concluded, within the context of their overall conclusions regarding the investment advisory agreement, that the advisory fees charged to the Fund represent reasonable compensation in light of the services being provided by MFS to the
Fund.
In addition, the Trustees considered MFS’
resources and related efforts to continue to retain, attract and motivate capable personnel to serve the Fund. The Trustees also considered current and developing conditions in the financial services industry, including the presence of large and
well-capitalized companies which are spending, and appear to be prepared to continue to spend, substantial sums to engage personnel and to provide services to competing investment companies. In this regard, the Trustees also considered the financial
resources of MFS and its ultimate parent, Sun Life Financial Inc. The Trustees also considered the advantages and possible disadvantages to the Fund of having an adviser that also serves other investment companies as well as other accounts.
The Trustees also considered the nature, quality, cost, and
extent of administrative, transfer agency, and distribution services provided to the Fund by MFS and its affiliates under agreements and plans other than the investment advisory agreement, including any 12b-1 fees the Fund pays to MFS Fund
Distributors, Inc., an affiliate of MFS. The Trustees also considered the nature, extent and quality of certain other services MFS performs or arranges for on the Fund’s behalf, which may include securities lending programs, directed expense
payment programs, class action recovery programs, and MFS’ interaction with third-party service providers, principally custodians and sub-custodians. The Trustees concluded that the various non-advisory services provided by MFS and its
affiliates on behalf of the Fund were satisfactory.
The Trustees considered so-called “fall-out
benefits” to MFS such as reputational value derived from serving as investment manager to the MFS Funds. The Trustees also considered that MFS discontinued its historic practice of obtaining investment research from portfolio brokerage
commissions paid by certain MFS Funds effective January 2018, and directly pays or voluntarily reimburses a Fund, if applicable, for the costs of external research acquired through the use of the Fund’s portfolio brokerage commissions.
Based on their evaluation of factors that they deemed to be
material, including those factors described above, the Board of Trustees, including the independent Trustees, concluded that the Fund’s investment advisory agreement with MFS should be continued for an additional one-year period, commencing
August 1, 2021.
MFS Global Research
Portfolio
Proxy Voting Policies and Information
MFS votes proxies on behalf of the fund pursuant to proxy
voting policies and procedures that are available without charge, upon request, by calling 1-800-225-2606, by visiting mfs.com/proxyvoting, or by visiting the SEC’s Web site at http://www.sec.gov.
Information regarding how the fund voted proxies relating
to portfolio securities during the most recent twelve-month period ended June 30 is available by August 31 of each year without charge by visiting mfs.com/proxyvoting, or by visiting the SEC’s Web site
at http://www.sec.gov.
Quarterly Portfolio Disclosure
The fund files a complete schedule of portfolio holdings
with the SEC for the first and third quarters of each fiscal year as an exhibit to its reports on Form N-PORT. The fund’s Form N-PORT reports are available on the SEC’s Web site at
http://www.sec.gov. A shareholder can obtain the portfolio holdings report for the first and third quarters of the fund's fiscal year at mfs.com/vit2 by
choosing the fund's name and then scrolling to the “Resources” section and clicking on the “Prospectus and Reports” tab.
FURTHER INFORMATION
From time to time, MFS may post important information about
the fund or the MFS Funds on the MFS Web site (mfs.com). This information is available at https://www.mfs.com/announcements or at
mfs.com/vit2 by choosing the fund's name and then scrolling to the “Resources” section and clicking on the “Announcements” tab, if any.
Information About Fund Contracts and Legal Claims
The fund has entered into contractual arrangements with an
investment adviser, administrator, distributor, shareholder servicing agent, 529 program manager (if applicable), and custodian who each provide services to the fund. Unless expressly stated otherwise, shareholders are not parties to, or intended
beneficiaries of these contractual arrangements, and these contractual arrangements are not intended to create any shareholder right to enforce them against the service providers or to seek any remedy under them against the service providers, either
directly or on behalf of the fund.
Under the
Trust’s By-Laws and Declaration of Trust, any claims asserted against or on behalf of the MFS Funds, including claims against Trustees and Officers, must be brought in state and federal courts located within the Commonwealth of
Massachusetts.
Federal Tax Information (unaudited)
The following information is provided pursuant to
provisions of the Internal Revenue Code.
The fund
designates $7,047,000 as capital gain dividends paid during the fiscal year.
For corporate shareholders, 42.22% of the ordinary income
dividends paid during the fiscal year qualify for the corporate dividends received deduction.
| FACTS
|
WHAT
DOES MFS DO WITH YOUR PERSONAL INFORMATION? |
| Why?
|
Financial
companies choose how they share your personal information. Federal law gives consumers the right to limit some but not all sharing. Federal law also requires us to tell you how we collect, share, and protect your personal information. Please read
this notice carefully to understand what we do. |
| What?
|
The types of
personal information we collect and share depend on the product or service you have with us. This information can include: |
| • Social
Security number and account balances |
| • Account
transactions and transaction history |
| • Checking
account information and wire transfer instructions |
| When
you are no longer our customer, we continue to share your information as described in this notice. |
| How?
|
All
financial companies need to share customers' personal information to run their everyday business. In the section below, we list the reasons financial companies can share their customers' personal information; the reasons MFS chooses to share; and
whether you can limit this sharing. |
Reasons
we can share your
personal information |
Does
MFS share? |
Can
you limit
this sharing? |
For
our everyday business purposes –
such as to process your transactions, maintain your
account(s), respond to court orders and legal
investigations, or report to credit bureaus |
Yes
|
No
|
For
our marketing purposes –
to offer our products and services to you |
No
|
We
don't share |
For
joint marketing with other
financial companies |
No
|
We
don't share |
For
our affiliates' everyday business purposes –
information about your transactions and experiences |
No
|
We
don't share |
For
our affiliates' everyday business purposes –
information about your creditworthiness |
No
|
We
don't share |
| For
nonaffiliates to market to you |
No
|
We
don't share |
| Questions?
|
Call
800-225-2606 or go to mfs.com. |
| Who
we are |
| Who
is providing this notice? |
MFS
Funds, MFS Investment Management, MFS Institutional Advisors, Inc., and MFS Heritage Trust Company. |
| What
we do |
How
does MFS
protect my personal
information? |
To
protect your personal information from unauthorized access and use, we use security measures that comply with federal law. These measures include procedural, electronic, and physical safeguards for the protection of the personal information we
collect about you. |
How
does MFS
collect my personal
information? |
We
collect your personal information, for example, when you |
| • open
an account or provide account information |
| • direct
us to buy securities or direct us to sell your securities |
| • make
a wire transfer |
| We
also collect your personal information from others, such as credit bureaus, affiliates, or other companies. |
| Why
can't I limit all sharing? |
Federal
law gives you the right to limit only |
| • sharing
for affiliates' everyday business purposes – information about your creditworthiness |
| • affiliates
from using your information to market to you |
| • sharing
for nonaffiliates to market to you |
| State
laws and individual companies may give you additional rights to limit sharing. |
| Definitions
|
| Affiliates
|
Companies
related by common ownership or control. They can be financial and nonfinancial companies. |
| •
MFS does not share personal information with affiliates, except for everyday business purposes as described on page one of this notice. |
| Nonaffiliates
|
Companies
not related by common ownership or control. They can be financial and nonfinancial companies. |
| •
MFS does not share with nonaffiliates so they can market to you. |
| Joint
marketing |
A
formal agreement between nonaffiliated financial companies that together market financial products or services to you. |
| •
MFS doesn't jointly market. |
| Other
important information |
| If
you own an MFS product or receive an MFS service in the name of a third party such as a bank or broker-dealer, their privacy policy may apply to you instead of ours. |
Annual Report
December 31, 2021
MFS® Global Tactical
Allocation Portfolio
MFS® Variable
Insurance Trust II
MFS® Global
Tactical Allocation Portfolio
|
1
|
|
2
|
|
4
|
|
6
|
|
8
|
|
9
|
|
33
|
|
34
|
|
35
|
|
36
|
|
38
|
|
51
|
|
52
|
|
55
|
|
58
|
|
58
|
|
58
|
|
58
|
|
58
|
|
59
|
The report is prepared for the general information of contract owners. It
is authorized for distribution to prospective investors only when preceded or accompanied by a current prospectus.
NOT FDIC INSURED • MAY LOSE VALUE
• NO BANK OR CREDIT UNION GUARANTEE •
NOT A DEPOSIT • NOT INSURED BY ANY FEDERAL GOVERNMENT
AGENCY OR NCUA/NCUSIF
MFS Global Tactical
Allocation Portfolio
Dear Contract Owners:
After a powerful rally in 2021 that was spurred by the
introduction of effective coronavirus vaccines and high levels of monetary and fiscal stimulus, markets have recently experienced a rise in volatility. Rising inflation (mostly due to pandemic-related labor and supply chain disruptions), new
COVID-19 variants that are vaccine-resistant, and the prospect of tighter monetary and fiscal policies around the world have all increased investor anxiety.
Rising real (inflation-adjusted) bond yields in the United
States are a headwind for richly valued U.S. growth stocks, though many non-U.S. markets have experienced lower levels of turbulence. In recent months, global economic growth has moderated, with the spread of the Delta and Omicron variants and a
regulatory crackdown in China featuring prominently. Stress in China’s property development sector has also contributed to the slowdown there. A further concern for investors is the tightening of global energy and raw materials supplies caused
in part by geopolitical uncertainty.
However,
above-trend economic growth, strong corporate balance sheets, and nascent signs that global supply chain bottlenecks may be easing, along with a dovish policy shift in China, are supportive fundamentals that we feel could help calm recent market
jitters.
It is times of market transition that
demonstrate the importance of having a deep understanding of company fundamentals, and we have built our global research platform to do just that.
At MFS®, we put our clients’ assets to work responsibly by carefully navigating the increasing complexity of global markets and economies. Guided by our commitment to long-term
investing, we tune out the noise and try to uncover what we believe are the best, most durable investment opportunities in the market. Our unique global investment platform combines collective expertise, long-term discipline, and thoughtful risk
management to create sustainable value for investors.
Respectfully,
Michael W.
Roberge
Chief Executive Officer
MFS Investment Management
February 15, 2022
The opinions expressed in this letter are subject to
change and may not be relied upon for investment advice. No forecasts can be guaranteed.
MFS Global Tactical
Allocation Portfolio
| |
|
Tactical
Overlay (b) |
| |
|
Active
Security
Selection (a) |
Long
|
Short
|
Net
Market
Exposure (c) |
| Fixed
Income |
U.S.
|
12.8%
|
24.4%
|
(6.7)%
|
30.5%
|
| |
Emerging
Markets |
14.2%
|
0.0%
|
0.0%
|
14.2%
|
| |
Asia/Pacific
ex-Japan |
1.8%
|
10.0%
|
0.0%
|
11.8%
|
| |
Europe
ex-U.K. |
12.8%
|
0.0%
|
(5.2)%
|
7.6%
|
| |
Supranational
|
2.3%
|
0.0%
|
0.0%
|
2.3%
|
| |
North
America ex-U.S. |
(0.2)%
|
1.7%
|
0.0%
|
1.5%
|
| |
Japan
|
3.9%
|
0.0%
|
(3.3)%
|
0.6%
|
| |
Developed
- Middle East/Africa |
0.1%
|
0.0%
|
0.0%
|
0.1%
|
| |
United
Kingdom |
4.4%
|
0.0%
|
(6.6)%
|
(2.2)%
|
| |
Total
|
52.1%
|
36.1%
|
(21.8)%
|
66.4%
|
| Equity
|
Europe
ex-U.K. |
7.4%
|
8.4%
|
(3.8)%
|
12.0%
|
| |
U.S.
Large Cap |
14.6%
|
0.0%
|
(5.7)%
|
8.9%
|
| |
United
Kingdom |
2.7%
|
2.7%
|
0.0%
|
5.4%
|
| |
Japan
|
2.2%
|
0.5%
|
0.0%
|
2.7%
|
| |
North
America ex-U.S. |
1.2%
|
0.9%
|
0.0%
|
2.1%
|
| |
U.S.
Small/Mid Cap |
4.7%
|
0.0%
|
(2.7)%
|
2.0%
|
| |
Emerging
Markets |
2.6%
|
6.1%
|
(8.5)%
|
0.2%
|
| |
Asia/Pacific
ex-Japan |
0.6%
|
1.1%
|
(4.0)%
|
(2.3)%
|
| |
Total
|
36.0%
|
19.7%
|
(24.7)%
|
31.0%
|
| Real
Estate-related |
U.S.
|
1.0%
|
0.0%
|
0.0%
|
1.0%
|
| |
Non-U.S.
|
0.1%
|
0.0%
|
0.0%
|
0.1%
|
| |
Total
|
1.1%
|
0.0%
|
0.0%
|
1.1%
|
| Cash
|
Cash
& Cash Equivalents (d) |
|
|
|
2.1%
|
| |
Other
(e) |
|
|
|
(0.6)%
|
| |
Total
|
|
|
|
1.5%
|
| |
Total
Net Exposure Summary |
|
|
|
100.0%
|
Strategic Allocation Targets & Net
Exposure Ranges
| Asset
Class |
Target
(w) |
Ranges
(z) |
| Equities
|
35%
|
0
to 70% |
| Fixed
Income, Cash and Cash Equivalents |
65%
|
30
to 100% |
Top ten holdings (c)
| USD
Interest Rate Swap, Receive 0.29% - SEP 2023 |
13.1%
|
| USD
Interest Rate Swap, Receive 0.79% - SEP 2026 |
11.3%
|
| Australian
Bond 10 yr Future - MAR 2022 |
10.0%
|
| Euro-Bobl
5 yr Future - MAR 2022 |
4.2%
|
| OMX
Index Future - JAN 2022 |
3.9%
|
| S&P/ASX
200 Index Future - MAR 2022 |
(4.0)%
|
| U.S.
Treasury Note 5 yr Future - MAR 2022 |
(4.0)%
|
| Long
Gilt 10 yr Future - MAR 2022 |
(4.5)%
|
| S&P
500 E-Mini Index Future - MAR 2022 |
(5.7)%
|
| Euro-Bund
10 yr Future - MAR 2022 |
(9.9)%
|
| (a)
|
Represents
the actively managed portion of the portfolio and for purposes of this presentation, components include the value of securities, less any securities sold short. The bond component will include any accrued interest amounts. This also reflects the
equivalent exposure of certain derivative positions. These amounts may be negative from time to time. |
| (b)
|
Represents
the tactical overlay portion of the portfolio which is how the fund manages its exposure to markets and currencies through the use of derivative positions. Percentages reflect the equivalent exposure of those derivative positions.
|
MFS Global Tactical
Allocation Portfolio
Portfolio Composition - continued
| (c)
|
For
purposes of this presentation, the components include the value of securities, less any securities sold short, and reflect the impact of the equivalent exposure of all derivative positions. These amounts may be negative from time to time. The bond
component will include any accrued interest amounts. |
| (d)
|
Cash
& Cash Equivalents includes any cash, investments in money market funds, short-term securities, and other assets less liabilities. Please see the Statement of Assets and Liabilities for additional information related to the fund’s cash
position and other assets and liabilities. |
| (e)
|
Other
includes currency derivatives and/or the offsetting of the leverage produced by the fund’s derivative positions, including payables and/or receivables of the finance leg of interest rate swaps and the unrealized gain or loss in connection with
forward currency exchange contracts. |
| (w)
|
The
strategic asset class allocations have been selected for investment over longer time periods. The actual strategic asset class weightings can deviate due to market movements and cash flows. |
| (z)
|
The fund’s net
exposures to the asset classes referenced will normally fall within these ranges after taking into account the tactical overlay. |
Equivalent exposure is a calculated amount that translates the
derivative position into a reasonable approximation of the amount of the underlying asset that the portfolio would have to hold at a given point in time to have the same price sensitivity that results from the portfolio’s ownership of the
derivative contract. When dealing with derivatives, equivalent exposure is a more representative measure of the potential impact of a position on portfolio performance than value. The value of derivatives may be different.
Where the fund holds convertible bonds, they are treated as
part of the equity portion of the portfolio.
Percentages
are based on net assets as of December 31, 2021.
The
portfolio is actively managed and current holdings may be different.
MFS Global Tactical
Allocation Portfolio
Management Review
Summary of Results
For the twelve months ended December 31, 2021, Initial
Class shares of the MFS Global Tactical Allocation Portfolio (fund) provided a total return of 2.79%, while Service Class shares of the fund provided a total return of 2.58%. These compare with a return of -4.71% over the same period for the
fund’s benchmark, the Bloomberg Global Aggregate Index. The fund’s other benchmarks, the MSCI World Index (net div) and the MFS Global Tactical Allocation Blended Index (Blended Index), generated total returns of 21.82% and 5.94%,
respectively. The Blended Index reflects the blended returns of equity and fixed income indices, with percentage allocations to each index designed to resemble the strategic allocations of the fund. The market indices and related percentage
allocations used to compile the Blended Index are set forth in the Performance Summary.
The fund’s investment objective is to seek total
return. MFS seeks to achieve the fund’s objective by generating returns from a combination of (1) individual security selection of a combination of debt instruments and equity securities and (2) a tactical asset allocation overlay primarily
using derivative instruments to manage the fund’s exposure to asset classes (e.g. equity and fixed income), markets (e.g. U.S. and foreign countries), and currencies (e.g. U.S. dollar and Japanese yen). Derivatives include futures, forward
contracts, options and swaps.
Market Environment
Over the past year, the global economy was buffeted by an
array of crosscurrents as it adjusted to the ebbs and flows of the pandemic. Among the supportive currents were ample fiscal stimulus, loose monetary policy and the rollout of several highly effective coronavirus vaccines. Negative currents included
the rapid spread of several coronavirus variants, widespread global production bottlenecks and a surge in inflation. After experiencing a burst of exceptionally strong economic activity as the global economy began to reopen, activity became more
muted in the second half of the period amid ongoing supply chain disruptions and a new wave of coronavirus infections, albeit a seemingly milder strain.
Amid rising inflation, markets anticipated a transition
from an exceptionally accommodative environment to a more mixed monetary landscape ahead. Indeed, several central banks in emerging markets have already tightened policy and the US Federal Reserve reduced the pace of its asset purchases in November
and again in December. However, the European Central Bank, the Bank of Japan and the People's Bank of China are expected to maintain accommodative policies. Sovereign bond yields moved modestly higher during the period amid higher inflation and on
expectations of a tighter Fed but remain historically low.
A harsher Chinese regulatory environment toward industries
such as online gaming, food delivery and education increased market volatility as has stress in China's highly leveraged property development sector. Trade relations between the United States and China remained quite strained despite a change in
presidential administrations.
Signs of excess
investor enthusiasm continued to be seen in pockets of the market such as “meme stocks” popular with users of online message boards, cryptocurrencies and heavy retail participation in the market for short-dated options.
Detractors from Performance
Within the equity portion of the fund, stock selection and,
to a lesser extent, an underweight position in the information technology sector held back performance relative to the MSCI World Index. Within this sector, the fund’s underweight position in software giant Microsoft, not owning shares of
computer graphics processor maker NVIDIA and computer and personal electronics maker Apple, and holdings of microchip and electronics manufacturer Samsung Electronics(b) (South Korea) weakened relative results.
The combination of an overweight position and stock
selection in the consumer staples sector also hindered relative returns, led by the fund's overweight position in chemical products company Henkel (Germany).
Stock selection in the communication services sector
further dampened relative performance. Within this sector, not owning shares of technology company Alphabet, and the fund’s overweight position in telecommunications company KDDI (Japan), detracted from relative results.
Elsewhere, not owing shares of strong-performing electric
vehicle manufacturer Tesla, the fund's exposure to Standard & Poor's 500 Index Put Options, and its overweight position in security services provider SECOM (Japan) also held back relative returns.
Within the fixed income portion of the fund, currency
positioning weakened performance relative to the Bloomberg Global Aggregate Index. The fund's greater exposure to the Japanese yen, Brazilian real and Chilean peso weighed on relative returns. Yield curve(y) positioning, particularly along the
United Kingdom and euro curves, further weakened relative returns. The fund’s out-of-benchmark exposure to the US 10-year Interest Rate Swaption was another detractor from relative performance.
Within the fund’s tactical overlay, a short exposure
to the equity markets of India and the Netherlands, and long exposures to the Hong Kong and Japan equity markets, via equity index futures, hurt relative performance. From a currency perspective, the fund's long exposures to both the Norwegian krone
and Swedish krone weighed on relative returns.
MFS Global Tactical
Allocation Portfolio
Management Review - continued
Contributors to Performance
Within the equity portion of the fund, stock selection in
the industrials sector contributed to performance relative to the MSCI World Index, led by the fund's overweight positions in diversified industrial manufacturer Eaton (Ireland), building controls and systems supplier Johnson Controls International
and electrical distribution equipment manufacturer Schneider Electric (France).
Security selection and, to a lesser extent, the
fund’s overweight position in the financials sector also supported relative returns, driven by the fund’s overweight positions in financial services provider Charles Schwab, risk management and human capital consulting services provider
Aon and financial services firm Goldman Sachs Group.
Stock selection and an underweight position in the consumer
discretionary sector further aided the fund’s relative performance. Here, not owning shares of internet retailer Amazon.com, and an overweight position in luxury goods company Richemont (Switzerland), bolstered relative results.
Elsewhere, not owning diversified entertainment company
Walt Disney and digital payment technology developer PayPal further helped relative returns.
Within the fixed income portion of the fund, a shorter
duration(d) stance to the US dollar yield curve supported performance relative to the Bloomberg Global Aggregate Index as interest rates in the US generally rose during the reporting period. From a sector perspective, the fund’s overweight
exposures to both the industrials and financial institutions sectors, coupled with strong security selection within both sectors, contributed to relative results. A lesser exposure to the treasury sector also supported relative returns. From a
credit quality perspective, the fund's overweight exposure to “BBB” rated(r) bonds, combined with favorable security selection within this credit quality segment, aided relative performance. Positive security selection within
“AAA” rated credit quality segments further benefited the fund's relative returns.
Within the fund’s tactical overlay, the fund’s
long exposure to Mexican and Turkish equity markets, and short exposure to Australian equity markets, via equity index futures, contributed to relative performance. The fund's short exposure to the fixed income markets of the United Kingdom also
helped. From a currency perspective, the fund's short exposure to the euro benefited the fund’s relative returns.
Respectfully,
Portfolio Manager(s)
Pilar Gomez-Bravo, Steven Gorham, Andy Li, Johnathan Munko,
Vipin Narula, Benjamin Nastou, Henry Peabody, Jonathan Sage, Natalie Shapiro, Erich Shigley, Robert Spector, and Erik Weisman
Note to Contract Owners: Effective January 1, 2021,
Johnathan Munko was added as a Portfolio Manager of the fund. Effective June 30, 2021, Robert Persons is no longer a Portfolio Manager of the fund. Effective November 1, 2021, Erich Shigley was added as a Portfolio Manager of the fund. Effective
January 3, 2022, David Shindler was added as a Portfolio Manager of the fund. Effective September 30, 2022, Vipin Narula will no longer be a Portfolio Manager of the fund.
| (b)
|
Security is not a
benchmark constituent. |
| (d)
|
Duration is
a measure of how much a bond’s price is likely to fluctuate with general changes in interest rates, e.g., if rates rise 1.00%, a bond with a 5-year duration is likely to lose about 5.00% of its value. |
| (r)
|
Securities
rated “BBB”, “Baa”, or higher are considered investment grade; securities rated “BB”, “Ba”, or below are considered non-investment grade. Ratings are assigned to underlying securities utilizing
ratings from Moody's, Fitch, and Standard & Poor's and applying the following hierarchy: If all three agencies provide a rating, the middle rating (after dropping the highest and lowest ratings) is assigned; if two of the three agencies rate a
security, the lower of the two is assigned. If none of the 3 rating agencies above assign a rating, but the security is rated by DBRS Morningstar, then the DBRS Morningstar rating is assigned. If none of the 4 rating agencies listed above rate the
security, but the security is rated by the Kroll Bond Rating Agency (KBRA), then the KBRA rating is assigned. Ratings are shown in the S&P and Fitch scale (e.g., AAA). For securities that are not rated by any of the rating agencies, the security
is considered Not Rated. |
| (y)
|
A yield
curve graphically depicts the yields of different maturity bonds of the same credit quality and type; a normal yield curve is upward sloping, with short-term rates lower than long-term rates. |
The views expressed in this report are those of the portfolio
manager(s) only through the end of the period of the report as stated on the cover and do not necessarily reflect the views of MFS or any other person in the MFS organization. These views are subject to change at any time based on market or other
conditions, and MFS disclaims any responsibility to update such views. These views may not be relied upon as investment advice or an indication of trading intent on behalf of any MFS portfolio. References to specific securities are not
recommendations of such securities, and may not be representative of any MFS portfolio’s current or future investments.
MFS Global Tactical
Allocation Portfolio
Performance Summary Through 12/31/21
The following chart illustrates the historical performance
of the fund in comparison to its benchmark(s). Benchmarks are unmanaged and may not be invested in directly. Benchmark returns do not reflect any fees or expenses. The performance of other share classes will be greater than or less than that of the
class depicted below. (See Notes to Performance Summary.)
Performance data shown represents past performance and is no
guarantee of future results. Investment return and principal value fluctuate so your units, when sold, may be worth more or less than the original cost; current performance may be lower or higher than quoted. The performance shown does not reflect
the deduction of taxes, if any, that a contract holder would pay on fund distributions or the redemption of contract units. The returns for the fund shown also do not reflect the deduction of expenses associated with variable products, such as
mortality and expense risk charges, separate account charges, and sales charges imposed by the insurance company separate accounts. Such expenses would reduce the overall returns shown.
Growth of a Hypothetical $10,000 Investment
Total Returns
through 12/31/21
Average annual total returns
| Share
Class |
Class
Inception Date |
1-yr
|
5-yr
|
10-yr
|
| Initial
Class |
11/07/94
|
2.79%
|
5.78%
|
5.53%
|
| Service
Class |
8/24/01
|
2.58%
|
5.52%
|
5.27%
|
Comparative benchmark(s)
| Bloomberg
Global Aggregate Index (f) |
(4.71)%
|
3.36%
|
1.77%
|
| MFS
Global Tactical Allocation Blended Index (f)(w) |
5.94%
|
7.60%
|
6.65%
|
| Bloomberg
Global Aggregate Index (USD Hedged) (f) |
(1.39)%
|
3.39%
|
3.49%
|
| MSCI
World Index (net div) (f) |
21.82%
|
15.03%
|
12.70%
|
| (f)
|
Source:
FactSet Research Systems Inc. |
| (w)
|
As
of December 31, 2021, the MFS Global Tactical Allocation Blended Index (a custom index) was comprised of 35% MSCI World Index (net div), 54% Bloomberg Global Aggregate Index (USD Hedged), and 11% Bloomberg Global Aggregate Index. |
Benchmark Definition(s)
Bloomberg Global Aggregate Index(a) – provides a broad-based measure of the global investment-grade fixed income markets. The three major components of this index are the U.S. Aggregate, the Pan-European
Aggregate, and the Asian-Pacific Aggregate Indices. The index also includes Eurodollar and Euro-Yen corporate bonds, Canadian government, agency and corporate securities, and USD investment grade 144A securities.
Bloomberg Global Aggregate Index(a) (USD Hedged) – provides a broad-based measure of the currency-hedged performance of global investment-grade fixed income markets. The three major components of this index
are the U.S. Aggregate, the Pan-European Aggregate, and the Asian-Pacific Aggregate Indices. The index also includes Eurodollar and Euro-Yen corporate bonds, Canadian government, agency and corporate securities, and USD investment grade 144A
securities.
MFS Global Tactical
Allocation Portfolio
Performance Summary – continued
MSCI
World Index(e) (net div) – a market capitalization-weighted index that is designed to measure equity market performance in the global developed markets.
It is not possible to invest directly in an index.
| (a)
|
Source:
Bloomberg Index Services Limited. BLOOMBERG® is a trademark and service mark of Bloomberg Finance L.P. and its affiliates (collectively “Bloomberg”). Bloomberg
or Bloomberg's licensors own all proprietary rights in the Bloomberg Indices. Bloomberg neither approves or endorses this material, or guarantees the accuracy or completeness of any information herein, or makes any warranty, express or implied, as
to the results to be obtained therefrom and, to the maximum extent allowed by law, neither shall have any liability or responsibility for injury or damages arising in connection therewith. |
| (e)
|
Morgan
Stanley Capital International (“MSCI”) makes no express or implied warranties or representations and shall have no liability whatsoever with respect to any MSCI data contained herein. The MSCI data may not be further redistributed or
used as a basis for other indices or any securities or financial products. This report is not approved, reviewed, or produced by MSCI. |
Notes to Performance Summary
Average annual total return represents the average annual
change in value for each share class for the periods presented.
Performance results reflect any applicable expense
subsidies and waivers in effect during the periods shown. Without such subsidies and waivers the fund's performance results would be less favorable. Please see the prospectus and financial statements for complete details. All results are historical
and assume the reinvestment of any dividends and capital gains distributions.
Performance results do not include adjustments made for
financial reporting purposes in accordance with U.S. generally accepted accounting principles and may differ from amounts reported in the financial highlights.
From time to time the fund may receive proceeds from
litigation settlements, without which performance would be lower.
MFS Global Tactical
Allocation Portfolio
Expense Table
Fund Expenses Borne by the Contract Holders during the
Period,
July 1, 2021 through December 31, 2021
As
a contract holder of the fund, you incur ongoing costs, including management fees; distribution and/or service (12b-1) fees; and other fund expenses. This example is intended to help you understand your ongoing costs (in dollars) of investing in the
fund and to compare these costs with the ongoing costs of investing in other mutual funds.
The example is based on an investment of $1,000 invested at
the beginning of the period and held for the entire period July 1, 2021 through December 31, 2021.
Actual Expenses
The first line for each share class in the following table
provides information about actual account values and actual expenses. You may use the information in this line, together with the amount you invested, to estimate the expenses that you paid over the period. Simply divide your account value by $1,000
(for example, an $8,600 account value divided by $1,000 = 8.6), then multiply the result by the number in the first line under the heading entitled “Expenses Paid During Period” to estimate the expenses you paid on your account during
this period.
Hypothetical Example for Comparison
Purposes
The second line for each share class in the
following table provides information about hypothetical account values and hypothetical expenses based on the fund’s actual expense ratio and an assumed rate of return of 5% per year before expenses, which is not the fund’s actual
return. The hypothetical account values and expenses may not be used to estimate the actual ending account balance or expenses you paid for the period. You may use this information to compare the ongoing costs of investing in the fund and other
funds. To do so, compare this 5% hypothetical example with the 5% hypothetical examples that appear in the shareholder reports of the other funds.
Please note that the expenses shown in the table are meant
to highlight the fund's ongoing costs only and do not take into account the fees and expenses imposed under the variable contracts through which your investment in the fund is made. Therefore, the second line for each share class in the table is
useful in comparing ongoing costs associated with an investment in vehicles (such as the fund) which fund benefits under variable annuity and variable life insurance contracts and to qualified pension and retirement plans only, and will not help you
determine the relative total costs of investing in the fund through variable annuity and variable life insurance contracts. If the fees and expenses imposed under the variable contracts were included, your costs would have been higher.
Share
Class |
|
Annualized
Expense
Ratio |
Beginning
Account Value
7/01/21 |
Ending
Account Value
12/31/21 |
Expenses
Paid During
Period (p)
7/01/21-12/31/21 |
| Initial
Class |
Actual
|
0.77%
|
$1,000.00
|
$1,000.01
|
$3.88
|
| Hypothetical
(h) |
0.77%
|
$1,000.00
|
$1,021.32
|
$3.92
|
| Service
Class |
Actual
|
1.02%
|
$1,000.00
|
$999.37
|
$5.14
|
| Hypothetical
(h) |
1.02%
|
$1,000.00
|
$1,020.06
|
$5.19
|
| (h)
|
5% class return per year
before expenses. |
| (p)
|
“Expenses
Paid During Period” are equal to each class's annualized expense ratio, as shown above, multiplied by the average account value over the period, multiplied by 184/365 (to reflect the one-half year period). |
Notes to Expense Table
Expense ratios include 0.01% of interest expense on
uncovered collateral or margin obligations with the broker (See Note 2 of the Notes to Financial Statements) that are outside of the expense limitation arrangement (See Note 3 of the Notes to Financial Statements).
MFS Global Tactical
Allocation Portfolio
Portfolio of Investments − 12/31/21
The Portfolio of Investments is a complete list of all
securities owned by your fund. It is categorized by broad-based asset classes.
| Issuer
|
|
|
Shares/Par
|
Value
($) |
| Bonds
– 61.4% |
| Aerospace
& Defense – 0.1% |
| Lockheed
Martin Corp., 2.8%, 6/15/2050 |
|
$
|
594,000
|
$
592,041 |
| Airlines
– 0.2% |
| EasyJet
FinCo B.V., 1.875%, 3/03/2028 |
|
EUR
|
630,000
|
$
719,526 |
| National
Express Group PLC, 4.25%, 11/26/2069 |
|
GBP
|
300,000
|
413,305 |
| |
|
|
|
$1,132,831 |
| Apparel
Manufacturers – 0.1% |
| Tapestry,
Inc., 3.05%, 3/15/2032 |
|
$
|
516,000
|
$
519,032 |
| Asset-Backed
& Securitized – 5.0% |
| Acres
PLC, 2021-FL2, “AS”, FLR, 1.84% (LIBOR - 1mo. + 1.75%), 1/15/2037 (z) |
|
$
|
370,000
|
$
370,002 |
| Acres
PLC, 2021-FL2, “B”, FLR, 2.352% (LIBOR - 1mo. + 2.25%), 1/15/2037 (z) |
|
|
604,000
|
604,003 |
| Arbor
Multi-Family Mortgage Securities Trust, Inc., 2021-MF2, “A5”, 2.513%, 6/15/2054 (n) |
|
|
612,000
|
626,224 |
| Arbor
Multi-Family Mortgage Securities Trust, Inc., 2021-MF3, “A5”, 2.575%, 10/15/2054 (i)(n) |
|
|
1,200,000
|
1,234,076 |
| Arbor
Realty Trust, Inc., CLO, 2019-FL2, “AS”, FLR, 1.614% (LIBOR - 1mo. + 1.45%), 9/15/2034 (n) |
|
|
600,000
|
599,813 |
| Arbor
Realty Trust, Inc., CLO, 2021-FL1, “B”, FLR, 1.609% (LIBOR - 1mo. + 1.5%), 12/15/2035 (n) |
|
|
214,500
|
213,494 |
| Arbor
Realty Trust, Inc., CLO, 2021-FL2, “B”, FLR, 1.71% (LIBOR - 1mo. + 1.6%), 5/15/2036 (n) |
|
|
143,000
|
142,374 |
| Arbor
Realty Trust, Inc., CLO, 2021-FL2, “C”, FLR, 2.059% (LIBOR - 1mo. + 1.95%), 5/15/2036 (n) |
|
|
426,500
|
424,501 |
| Barclays
Commercial Mortgage Securities LLC, 2020-C7, “XA”, 1.627%, 4/15/2053 (i) |
|
|
994,548
|
97,390 |
| BBCMS
Mortgage Trust, 2021-C10, “XA”, 1.307%, 7/15/2054 (i) |
|
|
2,939,664
|
277,878 |
| BBCMS
Mortgage Trust, 2021-C9, “XA”, 1.638%, 2/15/2054 (i) |
|
|
6,696,953
|
785,492 |
| Benchmark
Mortgage Trust, 2021-B24, “XA”, 1.154%, 3/15/2054 (i) |
|
|
2,027,793
|
165,188 |
| Benchmark
Mortgage Trust, 2021-B26, “XA”, 0.999%, 6/15/2054 (i) |
|
|
5,583,216
|
362,561 |
| Benchmark
Mortgage Trust, 2021-B27, “XA”, 1.271%, 7/15/2054 (i) |
|
|
6,780,085
|
633,544 |
| Benchmark
Mortgage Trust, 2021-B28, “XA”, 1.291%, 8/15/2054 (i) |
|
|
5,308,439
|
498,889 |
| BPCRE
Holder LLC, FLR, 1.658% (LIBOR - 1mo. + 1.55%), 2/15/2037 (n) |
|
|
706,000
|
705,310 |
| BSPRT
Issuer Ltd., 2021-FL7, “B”, FLR, 2.15% (LIBOR - 1mo. + 2.05%), 12/15/2038 (n) |
|
|
177,500
|
177,500 |
| BSPRT
Issuer Ltd., 2021-FL7, “C”, FLR, 2.4% (LIBOR - 1mo. + 2.3%), 12/15/2038 (n) |
|
|
161,000
|
161,000 |
| Business
Jet Securities LLC, 2020-1A, “A”, 2.981%, 11/15/2035 (n) |
|
|
231,235
|
230,886 |
| Business
Jet Securities LLC, 2021-1A, “A”, 2.162%, 4/15/2036 (n) |
|
|
213,220
|
209,340 |
| BXMT
Ltd., 2021-FL4, “AS”, FLR, 1.409% (LIBOR - 1mo. + 1.3%), 5/15/2038 (n) |
|
|
900,000
|
897,187 |
| BXMT
Ltd., 2021-FL4, “B”, FLR, 1.659% (LIBOR - 1mo. + 1.55%), 5/15/2038 (n) |
|
|
1,797,000
|
1,789,136 |
| Capital
Automotive, 2020-1A, “A4”, REIT, 3.19%, 2/15/2050 (n) |
|
|
261,194
|
266,050 |
| CF
Hippolyta Issuer LLC, 2020-1, “A1”, 1.69%, 7/15/2060 (n) |
|
|
201,862
|
200,239 |
| Commercial
Mortgage Pass-Through Certificates, 2020-BN28, “A4”, 1.844%, 3/15/2063 |
|
|
237,641
|
231,648 |
| Commercial
Mortgage Pass-Through Certificates, 2020-BN29, “A4”, 1.997%, 11/15/2053 |
|
|
1,033,946
|
1,019,472 |
| Commercial
Mortgage Pass-Through Certificates, 2021-BN32, “XA”, 0.783%, 4/15/2054 (i) |
|
|
1,240,544
|
70,607 |
| Commercial
Mortgage Pass-Through Certificates, 2021-BN34, “A5”, 2.438%, 6/15/2063 |
|
|
1,021,000
|
1,040,822 |
| Commercial
Mortgage Pass-Through Certificates, 2021-BN34, “XA”, 0.979%, 6/15/2063 (i) |
|
|
2,971,484
|
216,880 |
| Commercial
Mortgage Pass-Through Certificates, 2021-BN35, “XA”, 1.053%, 6/15/2064 (i) |
|
|
2,951,340
|
231,838 |
| Credit
Acceptance Auto Loan Trust, 2021-3A, “A”, 1%, 5/15/2030 (n) |
|
|
738,000
|
731,949 |
| FS
Rialto 2019-FL1 Issuer Ltd., 2021-FL2, “AS”, FLR, 1.657% (LIBOR - 1mo. + 1.6%), 4/16/2028 (n) |
|
|
701,500
|
701,019 |
| LoanCore
Ltd., 2021-CRE5, “AS”, FLR, 1.859% (LIBOR - 1mo. + 1.75%), 7/15/2036 (n) |
|
|
865,000
|
863,933 |
| LoanCore
Ltd., 2021-CRE5, “B”, FLR, 2.11% (LIBOR - 1mo. + 2%), 7/15/2036 (n) |
|
|
367,000
|
366,295 |
| MF1
CLO Ltd., 2020-FL3, “AS”, FLR, 3.014% (LIBOR - 1mo. + 2.85%), 7/15/2035 (z) |
|
|
357,000
|
361,550 |
| MF1
CLO Ltd., 2021-FL5, “AS”, FLR, 1.364% (LIBOR - 1mo. + 1.2%), 7/15/2036 (n) |
|
|
677,000
|
676,400 |
| MF1
CLO Ltd., 2021-FL5, “B”, FLR, 1.614% (LIBOR - 1mo. + 1.45%), 7/15/2036 (n) |
|
|
847,500
|
843,849 |
| MF1
CLO Ltd., 2021-FL5, “C”, FLR, 1.864% (LIBOR - 1mo. + 1.7%), 7/15/2036 (n) |
|
|
200,000
|
199,941 |
| MF1
CLO Ltd., 2021-FL6, “AS”, FLR, 1.557% (LIBOR - 1mo. + 1.45%), 7/16/2036 (n) |
|
|
1,050,000
|
1,048,083 |
| Morgan
Stanley Capital I Trust, 2021-L5, “XA”, 1.3%, 5/15/2054 (i) |
|
|
2,263,826
|
208,555 |
| Morgan
Stanley Capital I Trust, 2021-L6, “XA”, 1.237%, 6/15/2054 (i) |
|
|
4,885,322
|
408,938 |
| Multi-Family
Housing Mortgage, MF1-2021, “B”, FLR, 1.757% (LIBOR - 1mo. + 1.65%), 7/16/2036 (n) |
|
|
1,000,000
|
998,228 |
| PFP
III Ltd., 2021-7, “AS”, FLR, 1.259% (LIBOR - 1mo. + 1.15%), 4/14/2038 (n) |
|
|
612,469
|
609,523 |
| PFP
III Ltd., 2021-7, “B”, FLR, 1.507% (LIBOR - 1mo. + 1.4%), 4/14/2038 (n) |
|
|
239,988
|
237,809 |
MFS Global Tactical
Allocation Portfolio
Portfolio of Investments – continued
| Issuer
|
|
|
Shares/Par
|
Value
($) |
| Bonds
– continued |
| Asset-Backed
& Securitized – continued |
| PFP
III Ltd., 2021-8, “B”, FLR, 1.608% (LIBOR - 1mo. + 1.5%), 8/09/2037 (n) |
|
$
|
238,000
|
$
237,145 |
| Starwood
Commercial Mortgage, 2021-FL2, “AS”, FLR, 1.558% (LIBOR - 1mo. + 1.45%), 4/18/2038 (n) |
|
|
700,000
|
699,562 |
| Starwood
Commercial Mortgage, 2021-FL2, “B”, FLR, 1.908% (LIBOR - 1mo. + 1.8%), 4/18/2038 (n) |
|
|
534,500
|
534,165 |
| TPG
Real Estate Finance, 2021-FL4, “A”, FLR, 1.309% (LIBOR - 1mo. + 1.2%), 3/15/2038 (n) |
|
|
325,500
|
325,297 |
| TPG
Real Estate Finance, 2021-FL4, “AS”, FLR, 1.508% (LIBOR - 1mo. + 1.4%), 3/15/2038 (n) |
|
|
350,000
|
349,125 |
| Wells
Fargo Commercial Mortgage Trust, 2020-C58, “A4”, 2.092%, 7/15/2053 |
|
|
418,000
|
413,715 |
| Wells
Fargo Commercial Mortgage Trust, 2021-C60, “XA”, 1.557%, 8/15/2054 (i) |
|
|
4,990,206
|
578,353 |
| |
|
|
|
$25,876,778 |
| Automotive
– 0.7% |
| Daimler
Finance North America LLC, 1.45%, 3/02/2026 (n) |
|
$
|
817,000
|
$
808,828 |
| Daimler
Trucks Finance North America LLC, 2.5%, 12/14/2031 (n) |
|
|
322,000
|
321,960 |
| Faurecia
SE, 2.75%, 2/15/2027 |
|
EUR
|
635,000
|
736,206 |
| Hyundai
Capital America, 2%, 6/15/2028 (n) |
|
$
|
400,000
|
389,968 |
| Hyundai
Capital America, 6.375%, 4/08/2030 (n) |
|
|
742,000
|
935,238 |
| Volkswagen
International Finance N.V., 3.5% to 3/20/2030, FLR (EUR Swap Rate - 15yr. + 3.06%) to 3/20/2050, FLR (EUR Swap Rate - 15yr. + 3.81%) to 12/29/2166 |
|
EUR
|
470,000
|
574,558 |
| |
|
|
|
$3,766,758 |
| Broadcasting
– 0.2% |
| Discovery,
Inc., 4.125%, 5/15/2029 |
|
$
|
664,000
|
$
734,083 |
| Prosus
N.V., 1.539%, 8/03/2028 |
|
EUR
|
300,000
|
344,160 |
| Prosus
N.V., 3.68%, 1/21/2030 (n) |
|
$
|
200,000
|
205,832 |
| |
|
|
|
$1,284,075 |
| Brokerage
& Asset Managers – 0.2% |
| Intercontinental
Exchange, Inc., 3%, 9/15/2060 |
|
$
|
417,000
|
$
410,210 |
| Low
Income Investment Fund, 3.386%, 7/01/2026 |
|
|
150,000
|
155,853 |
| Low
Income Investment Fund, 3.711%, 7/01/2029 |
|
|
400,000
|
425,376 |
| |
|
|
|
$991,439 |
| Building
– 0.4% |
| CRH
America Finance, Inc., 4.5%, 4/04/2048 (n) |
|
$
|
347,000
|
$
423,134 |
| Holcim
Sterling Finance (Netherlands) B.V., 2.25%, 4/04/2034 |
|
GBP
|
470,000
|
623,184 |
| Imerys
S.A., 1%, 7/15/2031 |
|
EUR
|
500,000
|
555,559 |
| Vulcan
Materials Co., 3.5%, 6/01/2030 |
|
$
|
453,000
|
489,286 |
| |
|
|
|
$2,091,163 |
| Business
Services – 0.7% |
| Equinix,
Inc., REIT, 1%, 3/15/2033 |
|
EUR
|
645,000
|
$
704,865 |
| Euronet
Worldwide, Inc., 1.375%, 5/22/2026 |
|
|
680,000
|
788,524 |
| Fiserv,
Inc., 4.4%, 7/01/2049 |
|
$
|
356,000
|
424,119 |
| Nexi
S.p.A., 2.125%, 4/30/2029 |
|
EUR
|
260,000
|
289,903 |
| NXP
Semiconductors N.V., 3.4%, 5/01/2030 (n) |
|
$
|
813,000
|
866,423 |
| Visa,
Inc., 3.65%, 9/15/2047 |
|
|
596,000
|
693,588 |
| |
|
|
|
$3,767,422 |
| Cable
TV – 0.4% |
| Charter
Communications Operating LLC/Charter Communications Operating Capital Corp., 6.384%, 10/23/2035 |
|
$
|
262,000
|
$
338,437 |
| Charter
Communications Operating LLC/Charter Communications Operating Capital Corp., 4.8%, 3/01/2050 |
|
|
267,000
|
298,943 |
| Eutelsat
S.A., 2.25%, 7/13/2027 |
|
EUR
|
500,000
|
591,042 |
| Eutelsat
S.A., 1.5%, 10/13/2028 |
|
|
300,000
|
344,738 |
| Time
Warner Cable, Inc., 4.5%, 9/15/2042 |
|
$
|
388,000
|
423,002 |
| |
|
|
|
$1,996,162 |
MFS Global Tactical
Allocation Portfolio
Portfolio of Investments – continued
| Issuer
|
|
|
Shares/Par
|
Value
($) |
| Bonds
– continued |
| Chemicals
– 0.1% |
| Alpek
SAB de C.V., 3.25%, 2/25/2031 (n) |
|
$
|
219,000
|
$
218,453 |
| SCIL
IV LLC/SCIL USA Holdings LLC, 4.375%, 11/01/2026 |
|
EUR
|
310,000
|
358,670 |
| |
|
|
|
$577,123 |
| Computer
Software – 0.3% |
| Microsoft
Corp., 2.525%, 6/01/2050 |
|
$
|
523,000
|
$
510,023 |
| Microsoft
Corp., 2.921%, 3/17/2052 |
|
|
455,000
|
483,082 |
| Microsoft
Corp., 2.675%, 6/01/2060 |
|
|
228,000
|
227,247 |
| VeriSign,
Inc., 4.75%, 7/15/2027 |
|
|
347,000
|
360,446 |
| |
|
|
|
$1,580,798 |
| Computer
Software - Systems – 0.2% |
| Apple,
Inc., 4.5%, 2/23/2036 |
|
$
|
947,000
|
$
1,188,124 |
| Conglomerates
– 0.7% |
| Carrier
Global Corp., 2.722%, 2/15/2030 |
|
$
|
402,000
|
$
410,539 |
| Carrier
Global Corp., 3.577%, 4/05/2050 |
|
|
822,000
|
873,973 |
| Grupo
KUO S.A.B. de C.V., 5.75%, 7/07/2027 (n) |
|
|
919,000
|
945,890 |
| Highland
Holdings S.á r.l. Co., 0.318%, 12/15/2026 |
|
EUR
|
163,000
|
185,113 |
| Highland
Holdings S.á r.l. Co., 0.934%, 12/15/2031 |
|
|
140,000
|
159,565 |
| Westinghouse
Air Brake Technologies Corp., 4.95%, 9/15/2028 |
|
$
|
746,000
|
847,986 |
| |
|
|
|
$3,423,066 |
| Consumer
Products – 0.2% |
| JAB
Holdings B.V., 1%, 7/14/2031 |
|
EUR
|
400,000
|
$
441,809 |
| JAB
Holdings B.V., 2.25%, 12/19/2039 |
|
|
300,000
|
353,395 |
| Reckitt
Benckiser Treasury Services PLC, 3%, 6/26/2027 (n) |
|
$
|
425,000
|
450,968 |
| |
|
|
|
$1,246,172 |
| Consumer
Services – 0.1% |
| AA
Bond Co. Ltd., 3.25%, 7/31/2028 |
|
GBP
|
330,000
|
$
442,291 |
| Containers
– 0.1% |
| DS
Smith PLC, 2.875%, 7/26/2029 |
|
GBP
|
270,000
|
$
379,590 |
| Electrical
Equipment – 0.1% |
| Telefonaktiebolaget
LM Ericsson, 1%, 5/26/2029 |
|
EUR
|
640,000
|
$
710,220 |
| Electronics
– 0.1% |
| Broadcom,
Inc., 4.15%, 11/15/2030 |
|
$
|
228,000
|
$
252,865 |
| Broadcom,
Inc., 3.469%, 4/15/2034 (n) |
|
|
240,000
|
251,200 |
| Broadcom,
Inc., 3.137%, 11/15/2035 (n) |
|
|
174,000
|
175,037 |
| Broadcom,
Inc., 3.187%, 11/15/2036 (n) |
|
|
12,000
|
11,979 |
| |
|
|
|
$691,081 |
| Emerging
Market Quasi-Sovereign – 1.6% |
| China
Construction Bank Corp., Hong Kong Branch, 1.25%, 8/04/2025 |
|
$
|
900,000
|
$
887,814 |
| Emirates
Development Bank PJSC, 1.639%, 6/15/2026 |
|
|
970,000
|
964,422 |
| Export-Import
Bank of India, 3.375%, 8/05/2026 |
|
|
600,000
|
628,669 |
| Export-Import
Bank of India, 3.875%, 2/01/2028 |
|
|
600,000
|
641,582 |
| First
Abu Dhabi Bank PJSC, 0.125%, 2/16/2026 |
|
EUR
|
600,000
|
679,479 |
| Huarong
Finance 2017 Co. Ltd., 4.95%, 11/07/2047 |
|
$
|
470,000
|
451,788 |
| MDGH
- GMTN B.V. (United Arab Emirates), 2.5%, 11/07/2024 |
|
|
398,000
|
409,767 |
| MDGH
- GMTN B.V. (United Arab Emirates), 1%, 3/10/2034 |
|
EUR
|
760,000
|
859,272 |
| MDGH
- GMTN RSC Ltd. (United Arab Emirates), 2.5%, 6/03/2031 |
|
$
|
830,000
|
837,302 |
MFS Global Tactical
Allocation Portfolio
Portfolio of Investments – continued
| Issuer
|
|
|
Shares/Par
|
Value
($) |
| Bonds
– continued |
| Emerging
Market Quasi-Sovereign – continued |
| Ooredoo
International Finance Ltd. (State of Qatar), 2.625%, 4/08/2031 |
|
$
|
470,000
|
$
471,762 |
| PT
Pertamina (Persero) (Republic of Indonesia), 3.65%, 7/30/2029 |
|
|
550,000
|
583,709 |
| Qatar
Petroleum, 2.25%, 7/12/2031 |
|
|
664,000
|
657,737 |
| Qatar
Petroleum, 3.125%, 7/12/2041 |
|
|
436,000
|
440,629 |
| |
|
|
|
$8,513,932 |
| Emerging
Market Sovereign – 9.7% |
| Arab
Republic of Egypt, 7.052%, 1/15/2032 |
|
$
|
300,000
|
$
276,480 |
| Dominican
Republic, 4.875%, 9/23/2032 |
|
|
750,000
|
762,187 |
| Federative
Republic of Brazil, 10%, 1/01/2023 |
|
BRL
|
20,400,000
|
3,603,753 |
| Kingdom
of Morocco, 2.375%, 12/15/2027 |
|
$
|
450,000
|
438,188 |
| Oriental
Republic of Uruguay, 4.375%, 1/23/2031 |
|
|
1,309,000
|
1,506,999 |
| Oriental
Republic of Uruguay, 8.25%, 5/21/2031 |
|
UYU
|
82,148,000
|
1,768,112 |
| People's
Republic of China, 3.03%, 3/11/2026 |
|
CNY
|
88,630,000
|
14,155,748 |
| People's
Republic of China, 2.68%, 5/21/2030 |
|
|
43,550,000
|
6,731,628 |
| Republic
of Chile, 4.7%, 9/01/2030 |
|
CLP
|
775,000,000
|
853,094 |
| Republic
of Cote d'Ivoire, 6.875%, 10/17/2040 |
|
EUR
|
600,000
|
712,145 |
| Republic
of Guatemala, 3.7%, 10/07/2033 |
|
$
|
227,000
|
223,879 |
| Republic
of Korea, 1.875%, 6/10/2029 |
|
KRW
|
8,628,190,000
|
7,091,448 |
| Republic
of Korea, 1.375%, 6/10/2030 |
|
|
5,259,400,000
|
4,122,407 |
| Republic
of Peru, 1.95%, 11/17/2036 |
|
EUR
|
766,000
|
856,055 |
| Republic
of South Africa, 8.25%, 3/31/2032 |
|
ZAR
|
80,050,000
|
4,531,187 |
| State
of Qatar, 4%, 3/14/2029 (n) |
|
$
|
462,000
|
520,480 |
| State
of Qatar, 4.4%, 4/16/2050 |
|
|
200,000
|
248,458 |
| United
Arab Emirates International Government, 3.25%, 10/19/2061 |
|
|
345,000
|
359,317 |
| United
Mexican States, 2.659%, 5/24/2031 |
|
|
1,246,000
|
1,214,862 |
| United
Mexican States, 3.771%, 5/24/2061 |
|
|
534,000
|
491,686 |
| |
|
|
|
$50,468,113 |
| Energy
- Independent – 0.4% |
| Diamondback
Energy, Inc., 4.4%, 3/24/2051 |
|
$
|
644,000
|
$
738,160 |
| Energean
Israel Finance Ltd., 4.875%, 3/30/2026 |
|
|
325,000
|
322,156 |
| Tengizchevroil
Finance Co. International Ltd., 4%, 8/15/2026 (n) |
|
|
1,200,000
|
1,266,499 |
| |
|
|
|
$2,326,815 |
| Energy
- Integrated – 0.7% |
| Cenovus
Energy, Inc., 2.65%, 1/15/2032 |
|
$
|
522,000
|
$
510,710 |
| Eni
S.p.A., 4.25%, 5/09/2029 (n) |
|
|
578,000
|
650,106 |
| Eni
S.p.A., 2.625% to 1/13/2026, FLR (EUR Swap Rate - 5yr. + 3.167%) to 1/13/2031, FLR (EUR Swap Rate - 5yr. + 3.417%) to 1/13/2046, FLR (EUR Swap Rate - 5yr. + 4.167%) to 1/13/2170 |
|
EUR
|
119,000
|
140,223 |
| Eni
S.p.A., 2.75% to 5/11/2030, FLR (EUR Swap Rate - 5yr. + 2.771%) to 5/11/2035, FLR (EUR Swap Rate - 5yr. + 3.021%) to 5/11/2050, FLR (EUR Swap Rate - 5yr. + 3.771%) to 5/11/2170 |
|
|
560,000
|
636,725 |
| Galp
Energia SGPS S.A., 2%, 1/15/2026 |
|
|
700,000
|
833,491 |
| MOL
PLC, 1.5%, 10/08/2027 |
|
|
410,000
|
473,310 |
| OMV
AG, 2.5% to 9/01/2026, FLR (EUR Swap Rate - 5yr. + 2.82%) to 9/01/2030, FLR (EUR Swap Rate - 5yr. + 3.82%) to 9/01/2070 |
|
|
200,000
|
235,920 |
| |
|
|
|
$3,480,485 |
| Entertainment
– 0.1% |
| Royal
Caribbean Cruises Ltd., 4.25%, 7/01/2026 (n) |
|
$
|
682,000
|
$
660,582 |
| Financial
Institutions – 1.5% |
| Adler
Group S.A., 2.75%, 11/13/2026 |
|
EUR
|
400,000
|
$
382,536 |
| Adler
Group S.A., 2.25%, 4/27/2027 |
|
|
300,000
|
286,048 |
| Adler
Group S.A., 2.25%, 1/14/2029 |
|
|
500,000
|
471,054 |
| AerCap
Ireland Capital DAC/AerCap Global Aviation Trust, 3.65%, 7/21/2027 |
|
$
|
1,173,000
|
1,236,131 |
MFS Global Tactical
Allocation Portfolio
Portfolio of Investments – continued
| Issuer
|
|
|
Shares/Par
|
Value
($) |
| Bonds
– continued |
| Financial
Institutions – continued |
| AerCap
Ireland Capital DAC/AerCap Global Aviation Trust, 3.3%, 1/30/2032 |
|
$
|
209,000
|
$
212,923 |
| AerCap
Ireland Capital DAC/AerCap Global Aviation Trust, 3.85%, 10/29/2041 |
|
|
166,000
|
172,912 |
| Atrium
European Real Estate Ltd., 3.625% to 11/04/2026, FLR (EUR Swap Rate - 5yr. + 3.625%) to 11/04/2031, FLR (EUR Swap Rate - 5yr. + 4.625%) to 5/04/2170 |
|
EUR
|
425,000
|
436,686 |
| Avolon
Holdings Funding Ltd., 4.25%, 4/15/2026 (n) |
|
$
|
263,000
|
278,700 |
| Avolon
Holdings Funding Ltd., 4.375%, 5/01/2026 (n) |
|
|
266,000
|
284,902 |
| Avolon
Holdings Funding Ltd., 2.75%, 2/21/2028 (n) |
|
|
335,000
|
328,706 |
| Crédit
Logement S.A., 1.081%, 2/15/2034 |
|
EUR
|
600,000
|
679,076 |
| CTP
N.V., 1.25%, 6/21/2029 |
|
|
370,000
|
411,865 |
| CTP
N.V., 1.5%, 9/27/2031 |
|
|
570,000
|
627,385 |
| EXOR
N.V., 0.875%, 1/19/2031 |
|
|
275,000
|
306,325 |
| Logicor
Financing S.à r.l., 0.875%, 1/14/2031 |
|
|
200,000
|
216,012 |
| Samhallsbyggnadsbolaget
i Norden AB, 2.625%, 3/14/2170 |
|
|
300,000
|
331,099 |
| VGP
Group LLC, 1.5%, 4/08/2029 |
|
|
500,000
|
554,914 |
| Vonovia
SE, 1.5%, 6/14/2041 |
|
|
400,000
|
437,356 |
| Vonovia
SE, 1.625%, 9/01/2051 |
|
|
300,000
|
312,271 |
| |
|
|
|
$7,966,901 |
| Food
& Beverages – 1.1% |
| Anheuser-Busch
InBev Worldwide, Inc., 4.375%, 4/15/2038 |
|
$
|
206,000
|
$
241,238 |
| Anheuser-Busch
InBev Worldwide, Inc., 5.55%, 1/23/2049 |
|
|
513,000
|
709,714 |
| Aramark
Services, Inc., 6.375%, 5/01/2025 (n) |
|
|
400,000
|
418,000 |
| Bacardi
Ltd., 5.15%, 5/15/2038 (n) |
|
|
335,000
|
413,808 |
| Constellation
Brands, Inc., 4.4%, 11/15/2025 |
|
|
481,000
|
527,228 |
| Constellation
Brands, Inc., 3.15%, 8/01/2029 |
|
|
776,000
|
818,454 |
| Constellation
Brands, Inc., 2.25%, 8/01/2031 |
|
|
478,000
|
467,181 |
| JDE
Peet's N.V., 0.625%, 2/09/2028 |
|
EUR
|
280,000
|
315,697 |
| JDE
Peet's N.V., 0.5%, 1/16/2029 |
|
|
340,000
|
376,787 |
| PepsiCo,
Inc., 0.75%, 10/14/2033 |
|
|
381,000
|
431,144 |
| PT
Indofood CBP Sukses Makmur Tbk, 3.398%, 6/09/2031 |
|
$
|
950,000
|
956,730 |
| |
|
|
|
$5,675,981 |
| Gaming
& Lodging – 0.6% |
| Accor
S.A., 2.375%, 11/29/2028 |
|
EUR
|
500,000
|
$
569,990 |
| Hilton
Domestic Operating Co., Inc., 3.625%, 2/15/2032 (n) |
|
$
|
450,000
|
447,633 |
| InterContinental
Hotels Group PLC, 3.375%, 10/08/2028 |
|
GBP
|
410,000
|
581,381 |
| Las
Vegas Sands Corp., 3.9%, 8/08/2029 |
|
$
|
550,000
|
553,834 |
| Marriott
International, Inc., 2.85%, 4/15/2031 |
|
|
499,000
|
497,473 |
| Whitbread
Group PLC, 3%, 5/31/2031 |
|
GBP
|
225,000
|
306,873 |
| |
|
|
|
$2,957,184 |
| Industrial
– 0.3% |
| CPI
Property Group S.A., 3.75% to 7/27/2028, FLR (EUR Swap Rate - 5yr. + 4.338%) to 7/27/2033, FLR (EUR Swap Rate - 5yr. + 4.588%) to 7/27/2048, FLR (EUR Swap Rate - 5yr. + 5.338%) to 1/27/2170 |
|
EUR
|
660,000
|
$
705,416 |
| Trustees
of the University of Pennsylvania, 2.396%, 10/01/2050 |
|
$
|
845,000
|
805,737 |
| |
|
|
|
$1,511,153 |
| Insurance
– 0.8% |
| AIA
Group Ltd., 0.88% to 9/09/2028, FLR (EUR Swap Rate - 5yr. + 1.1%) to 9/09/2033 |
|
EUR
|
340,000
|
$
380,857 |
| Argentum
Netherlands B.V., 5.125%, 6/01/2048 |
|
$
|
360,000
|
400,500 |
| Aviva
PLC, 4% to 6/03/2035, FLR (GBP Government Yield - 5yr. + 4.7%) to 6/03/2055 |
|
GBP
|
575,000
|
838,119 |
| CNP
Assurances, 4.75%, 6/27/2028 |
|
EUR
|
600,000
|
770,195 |
| Credit
Agricole Assurances S.A., 2%, 7/17/2030 |
|
|
200,000
|
235,071 |
| La
Mondiale, 4.375% to 10/24/2029, FLR (EUR Swap Rate - 5yr. + 4.411%) to 4/24/2069 |
|
|
600,000
|
738,499 |
| Zurich
Finance (Ireland) DAC, 1.875% to 9/17/2030, FLR (EURIBOR - 3mo. + 2.95%) to 9/17/2050 |
|
|
386,000
|
450,969 |
MFS Global Tactical
Allocation Portfolio
Portfolio of Investments – continued
| Issuer
|
|
|
Shares/Par
|
Value
($) |
| Bonds
– continued |
| Insurance
– continued |
| Zurich
Finance (Ireland) DAC, 3% to 4/19/2031, FLR (CMT - 5yr. + 2.777%) to 4/19/2051 |
|
$
|
430,000
|
$
417,515 |
| |
|
|
|
$4,231,725 |
| Insurance
- Property & Casualty – 0.5% |
| Aon
Corp./Aon Global Holdings PLC, 2.6%, 12/02/2031 |
|
$
|
130,000
|
$
132,261 |
| Hartford
Financial Services Group, Inc., 3.6%, 8/19/2049 |
|
|
626,000
|
685,185 |
| Marsh
& McLennan Cos., Inc., 2.25%, 11/15/2030 |
|
|
340,000
|
339,287 |
| QBE
Insurance Group Ltd., 2.5% to 9/13/2028, FLR (GBP Government Yield - 5yr. + 2.061%) to 9/13/2038 |
|
GBP
|
408,000
|
528,651 |
| Willis
North America, Inc., 3.875%, 9/15/2049 |
|
$
|
621,000
|
673,845 |
| |
|
|
|
$2,359,229 |
| International
Market Quasi-Sovereign – 0.5% |
| Electricite
de France S.A., 1%, 11/29/2033 |
|
EUR
|
200,000
|
$
225,600 |
| Electricite
de France S.A., 2.625% to 6/01/2028, FLR (EUR Swap Rate - 5yr. + 2.86%) to 6/01/2033, FLR (EUR Swap Rate - 5yr. + 3.11%) to 6/01/2048, FLR (EUR Swap Rate - 5yr. + 3.86%) to 12/29/2049 |
|
|
400,000
|
456,538 |
| Electricite
de France S.A., 2.875% to 3/15/2027, FLR (EUR Swap Rate - 5yr. + 3.373%) to 3/15/2031, FLR (EUR Swap Rate - 5yr. + 3.623%) to 3/15/2047, FLR (EUR Swap Rate - 5yr. + 4.373%) to 3/15/2070 |
|
|
600,000
|
700,177 |
| Electricite
de France S.A., 5.875% to 1/22/2029, FLR (GBP Swap Rate - 15yr. + 3.046%) to 1/22/2049, FLR (GBP Swap Rate - 15yr. + 3.796%) to 12/31/2165 |
|
GBP
|
400,000
|
595,562 |
| La
Banque Postale S.A. (Republic of France), 0.875% to 1/26/2026, FLR (EUR Swap Rate - 5yr. + 1.38%) to 1/26/2031 |
|
EUR
|
300,000
|
337,517 |
| Ontario
Teachers' Cadillac Fairview Properties, 2.5%, 10/15/2031 (n) |
|
$
|
517,000
|
514,607 |
| |
|
|
|
$2,830,001 |
| International
Market Sovereign – 10.9% |
| Commonwealth
of Australia, 3.25%, 6/21/2039 |
|
AUD
|
5,095,000
|
$
4,297,185 |
| Government
of Bermuda, 2.375%, 8/20/2030 (n) |
|
$
|
220,000
|
219,450 |
| Government
of Canada, 4%, 6/01/2041 |
|
CAD
|
1,604,000
|
1,760,970 |
| Government
of Japan, 0.4%, 3/20/2036 |
|
JPY
|
261,100,000
|
2,309,292 |
| Government
of Japan, 2.3%, 3/20/2040 |
|
|
1,368,300,000
|
15,776,786 |
| Government
of Japan, 0.6%, 9/20/2050 |
|
|
212,900,000
|
1,813,990 |
| Kingdom
of Belgium, 0.4%, 6/22/2040 (n) |
|
EUR
|
2,488,000
|
2,693,413 |
| Kingdom
of Spain, 1.25%, 10/31/2030 (n) |
|
|
6,227,000
|
7,596,226 |
| Kingdom
of Spain, 1.85%, 7/30/2035 |
|
|
4,531,000
|
5,819,454 |
| Republic
of Cyprus, 0%, 2/09/2026 |
|
|
879,000
|
993,176 |
| Republic
of Cyprus, 0.625%, 1/21/2030 |
|
|
1,196,000
|
1,358,556 |
| Republic
of Italy, 0.5%, 7/15/2028 |
|
|
2,132,000
|
2,395,144 |
| Republic
of Italy, 0.6%, 8/01/2031 (n) |
|
|
2,265,000
|
2,454,729 |
| Republic
of Italy, 1.65%, 3/01/2032 |
|
|
4,077,000
|
4,864,007 |
| Republic
of Italy, 1.7%, 9/01/2051 |
|
|
1,029,000
|
1,097,697 |
| United
Kingdom Treasury, 1.75%, 9/07/2037 |
|
GBP
|
716,000
|
1,050,325 |
| United
Kingdom Treasury, 1.75%, 1/22/2049 |
|
|
325,000
|
501,465 |
| |
|
|
|
$57,001,865 |
| Leisure
& Toys – 0.1% |
| Ubisoft
Entertainment S.A., 0.878%, 11/24/2027 |
|
EUR
|
600,000
|
$
667,806 |
| Local
Authorities – 0.9% |
| Oslo
kommune, 2.17%, 5/18/2029 |
|
NOK
|
7,000,000
|
$
789,545 |
| Province
of Alberta, 4.5%, 12/01/2040 |
|
CAD
|
665,000
|
679,725 |
| Province
of British Columbia, 2.95%, 6/18/2050 |
|
|
300,000
|
263,513 |
| Province
of Ontario, 1.9%, 12/02/2051 |
|
|
4,463,000
|
3,120,025 |
| |
|
|
|
$4,852,808 |
MFS Global Tactical
Allocation Portfolio
Portfolio of Investments – continued
| Issuer
|
|
|
Shares/Par
|
Value
($) |
| Bonds
– continued |
| Machinery
& Tools – 0.2% |
| CNH
Industrial Capital LLC, 1.875%, 1/15/2026 |
|
$
|
611,000
|
$
611,260 |
| Sarens
Finance Co. N.V., 5.75%, 2/21/2027 |
|
EUR
|
260,000
|
291,792 |
| |
|
|
|
$903,052 |
| Major
Banks – 2.6% |
| Australia
and New Zealand Banking Group Ltd., 2.57%, 11/25/2035 (n) |
|
$
|
528,000
|
$
505,568 |
| Banco
de Sabadell S.A., 5% to 11/19/2027, FLR (EUR Swap Rate - 5yr. + 5.171%) to 2/19/2170 |
|
EUR
|
600,000
|
686,515 |
| Bank
of America Corp., 3.5%, 4/19/2026 |
|
$
|
1,079,000
|
1,162,286 |
| Bank
of America Corp., 3.419% to 12/20/2027, FLR (LIBOR - 3mo. + 1.04%) to 12/20/2028 |
|
|
279,000
|
297,878 |
| Bank
of America Corp., 0.694% to 3/22/2030, FLR (EURIBOR - 3mo. + 0.79%) to 3/22/2031 |
|
EUR
|
350,000
|
392,257 |
| Bank
of America Corp., 2.687% to 4/22/2031, FLR (SOFR + 1.32%) to 4/22/2032 |
|
$
|
917,000
|
930,596 |
| Barclays
PLC, 1.125% to 3/22/2026, FLR (EUR Swap Rate - 5yr. + 1.55%) to 3/22/2031 |
|
EUR
|
250,000
|
283,965 |
| Commonwealth
Bank of Australia, 2.688%, 3/11/2031 (n) |
|
$
|
735,000
|
722,809 |
| Credit
Suisse Group AG, 3.091% to 5/14/2031, FLR (SOFR + 1.73%) to 5/14/2032 (n) |
|
|
250,000
|
254,388 |
| Deutsche
Bank AG, 3.729% to 1/14/2031, FLR (SOFR + 2.757%) to 1/14/2032 |
|
|
618,000
|
631,794 |
| Goldman
Sachs Group, Inc., 2.383% to 7/21/2031, FLR (SOFR + 1.248%) to 7/21/2032 |
|
|
615,000
|
605,527 |
| HSBC
Holdings PLC, 2.099% to 6/04/2025, FLR (SOFR + 1.929%) to 6/04/2026 |
|
|
535,000
|
538,467 |
| JPMorgan
Chase & Co., 3.54%, 5/01/2028 |
|
|
605,000
|
657,050 |
| JPMorgan
Chase & Co., 3.109% to 4/22/2050, FLR (SOFR + 2.44%) to 4/22/2051 |
|
|
669,000
|
691,191 |
| Mitsubishi
UFJ Financial Group, Inc., 2.494% to 10/13/2031, FLR (CMT - 1yr. + 0.97%) to 10/13/2032 |
|
|
271,000
|
271,335 |
| Morgan
Stanley, 1.593% to 5/04/2026, FLR (SOFR + 0.879%) to 5/04/2027 |
|
|
1,146,000
|
1,134,703 |
| Morgan
Stanley, 3.622% to 4/01/2030, FLR (SOFR + 3.12%) to 4/01/2031 |
|
|
276,000
|
300,755 |
| Morgan
Stanley, 1.102%, 4/29/2033 |
|
EUR
|
345,000
|
392,381 |
| Natwest
Group PLC, 1.043% to 9/14/2027, FLR (EUR Swap Rate - 5yr. + 1.27%) to 9/14/2032 |
|
|
170,000
|
190,583 |
| Nordea
Bank Abp, 1.625% to 12/09/2027, FLR (GBP Government Yield - 5yr. + 1.3%) to 12/09/2032 |
|
GBP
|
230,000
|
299,068 |
| Standard
Chartered PLC, 0.8% to 11/17/2028, FLR (EUR Swap Rate - 1yr. + 0.85%) to 11/17/2029 |
|
EUR
|
340,000
|
384,731 |
| Unicaja
Banco S.A., 1% to 12/01/2025, FLR (EUR ICE Swap Rate - 1yr. + 1.15%) to 12/01/2026 |
|
|
500,000
|
566,671 |
| UniCredit
S.p.A., 2.2% to 7/22/2026, FLR (EURIBOR - 3mo. + 2.55%) to 7/22/2027 |
|
|
787,000
|
944,220 |
| Wells
Fargo & Co., 2.125%, 9/24/2031 |
|
GBP
|
570,000
|
767,063 |
| |
|
|
|
$13,611,801 |
| Medical
& Health Technology & Services – 1.0% |
| Alcon,
Inc., 3.8%, 9/23/2049 (n) |
|
$
|
626,000
|
$
697,052 |
| Becton
Dickinson Euro Finance S.à r.l., 1.213%, 2/12/2036 |
|
EUR
|
100,000
|
110,952 |
| Becton
Dickinson Euro Finance S.à r.l., 1.336%, 8/13/2041 |
|
|
190,000
|
205,715 |
| HCA,
Inc., 5.25%, 6/15/2026 |
|
$
|
559,000
|
628,637 |
| HCA,
Inc., 5.125%, 6/15/2039 |
|
|
195,000
|
240,148 |
| Laboratory
Corp. of America Holdings, 3.6%, 2/01/2025 |
|
|
550,000
|
580,580 |
| Memorial
Sloan-Kettering Cancer Center, 2.955%, 1/01/2050 |
|
|
350,000
|
357,506 |
| New
York Society for the Relief of the Ruptured & Crippled, 2.667%, 10/01/2050 |
|
|
650,000
|
607,743 |
| ProMedica
Toledo Hospital, “B”, AGM, 6.015%, 11/15/2048 |
|
|
309,000
|
451,997 |
| Thermo
Fisher Scientific (Finance I) Co., 1.125%, 10/18/2033 |
|
EUR
|
390,000
|
450,464 |
| Thermo
Fisher Scientific (Finance I) Co., 2%, 10/18/2051 |
|
|
210,000
|
246,309 |
| Thermo
Fisher Scientific, Inc., 1.75%, 10/15/2028 |
|
$
|
626,000
|
621,910 |
| |
|
|
|
$5,199,013 |
| Metals
& Mining – 0.2% |
| Anglo
American Capital PLC, 5.625%, 4/01/2030 (n) |
|
$
|
326,000
|
$
386,260 |
| Glencore
Funding LLC, 2.85%, 4/27/2031 (n) |
|
|
590,000
|
583,202 |
| |
|
|
|
$969,462 |
| Midstream
– 0.7% |
| Enterprise
Products Partners LP, 3.125%, 7/31/2029 |
|
$
|
446,000
|
$
473,608 |
| Galaxy
Pipeline Assets Bidco Ltd., 2.16%, 3/31/2034 (n) |
|
|
548,000
|
537,106 |
| Plains
All American Pipeline LP/PAA Finance Corp., 3.55%, 12/15/2029 |
|
|
1,023,000
|
1,059,752 |
| Sabine
Pass Liquefaction LLC, 5%, 3/15/2027 |
|
|
356,000
|
399,850 |
MFS Global Tactical
Allocation Portfolio
Portfolio of Investments – continued
| Issuer
|
|
|
Shares/Par
|
Value
($) |
| Bonds
– continued |
| Midstream
– continued |
| Sabine
Pass Liquefaction LLC, 4.2%, 3/15/2028 |
|
$
|
730,000
|
$
799,621 |
| Sabine
Pass Liquefaction LLC, 4.5%, 5/15/2030 |
|
|
335,000
|
377,888 |
| |
|
|
|
$3,647,825 |
| Mortgage-Backed
– 4.1% |
|
| Fannie
Mae, 4.5%, 7/01/2023 - 2/01/2046 |
|
$
|
3,284,227
|
$
3,618,316 |
| Fannie
Mae, 5%, 3/01/2036 - 8/01/2040 |
|
|
1,104,376
|
1,247,097 |
| Fannie
Mae, 5.5%, 11/01/2036 - 4/01/2037 |
|
|
92,931
|
105,999 |
| Fannie
Mae, 6%, 9/01/2037 - 6/01/2038 |
|
|
132,401
|
152,138 |
| Fannie
Mae, 4%, 11/01/2040 - 12/01/2040 |
|
|
745,358
|
816,456 |
| Fannie
Mae, 3.5%, 5/01/2043 - 12/01/2046 |
|
|
1,662,797
|
1,783,893 |
| Fannie
Mae, UMBS, 2.5%, 6/01/2050 - 12/01/2051 |
|
|
338,951
|
350,273 |
| Fannie
Mae, UMBS, 2%, 1/01/2051 - 2/01/2051 |
|
|
605,793
|
606,542 |
| Fannie
Mae, UMBS, 3%, 12/01/2051 |
|
|
204,687
|
213,879 |
| Freddie
Mac, 4%, 7/01/2025 |
|
|
36,862
|
38,711 |
| Freddie
Mac, 1.367%, 3/25/2027 (i) |
|
|
809,000
|
54,101 |
| Freddie
Mac, 3.286%, 11/25/2027 |
|
|
1,303,000
|
1,424,533 |
| Freddie
Mac, 3.9%, 4/25/2028 |
|
|
400,000
|
453,220 |
| Freddie
Mac, 1.798%, 4/25/2030 (i) |
|
|
1,420,926
|
193,129 |
| Freddie
Mac, 1.868%, 4/25/2030 (i) |
|
|
1,365,340
|
192,705 |
| Freddie
Mac, 1.662%, 5/25/2030 (i) |
|
|
1,747,943
|
222,720 |
| Freddie
Mac, 1.796%, 5/25/2030 (i) |
|
|
3,920,368
|
537,102 |
| Freddie
Mac, 1.341%, 6/25/2030 (i) |
|
|
1,615,349
|
167,709 |
| Freddie
Mac, 1.599%, 8/25/2030 (i) |
|
|
1,436,842
|
179,907 |
| Freddie
Mac, 1.169%, 9/25/2030 (i) |
|
|
905,456
|
84,453 |
| Freddie
Mac, 1.081%, 11/25/2030 (i) |
|
|
1,823,916
|
160,300 |
| Freddie
Mac, 0.33%, 1/25/2031 (i) |
|
|
6,728,823
|
173,818 |
| Freddie
Mac, 0.529%, 3/25/2031 (i) |
|
|
8,189,128
|
346,652 |
| Freddie
Mac, 0.937%, 7/25/2031 (i) |
|
|
1,499,257
|
123,553 |
| Freddie
Mac, 0.536%, 9/25/2031 (i) |
|
|
6,201,367
|
301,832 |
| Freddie
Mac, 0.855%, 9/25/2031 (i) |
|
|
1,902,494
|
143,594 |
| Freddie
Mac, 0.567%, 12/25/2031 (i) |
|
|
1,517,361
|
75,627 |
| Freddie
Mac, 5.5%, 5/01/2034 - 7/01/2037 |
|
|
20,424
|
23,073 |
| Freddie
Mac, 5%, 10/01/2036 - 7/01/2041 |
|
|
316,560
|
356,815 |
| Freddie
Mac, 4.5%, 12/01/2039 - 5/01/2042 |
|
|
601,532
|
664,414 |
| Freddie
Mac, 3.5%, 1/01/2047 |
|
|
343,030
|
365,763 |
| Freddie
Mac, UMBS, 3%, 6/01/2050 |
|
|
56,684
|
59,600 |
| Freddie
Mac, UMBS, 2.5%, 10/01/2051 - 12/01/2051 |
|
|
198,998
|
204,500 |
| Ginnie
Mae, 5%, 5/15/2040 |
|
|
47,718
|
54,656 |
| Ginnie
Mae, 3.5%, 6/20/2043 |
|
|
544,925
|
583,761 |
| Ginnie
Mae, 3%, 6/20/2051 |
|
|
93,916
|
97,284 |
| Ginnie
Mae, 2.5%, 8/20/2051 - 11/20/2051 |
|
|
668,279
|
685,209 |
| Ginnie
Mae, TBA, 3%, 7/20/2049 |
|
|
50,000
|
51,733 |
| Ginnie
Mae, TBA, 2%, 1/21/2052 |
|
|
400,000
|
403,611 |
| Ginnie
Mae, TBA, 2.5%, 1/21/2052 |
|
|
300,000
|
307,218 |
| UMBS,
TBA, 2%, 7/25/2051 |
|
|
1,500,000
|
1,495,378 |
| UMBS,
TBA, 2.5%, 7/25/2051 |
|
|
750,000
|
765,179 |
| UMBS,
TBA, 3%, 1/13/2052 |
|
|
1,525,000
|
1,579,844 |
| |
|
|
|
$21,466,297 |
| Municipals
– 0.4% |
| Massachusetts
Educational Financing Authority, Education Loan Subordinate Rev., “A”, 2.641%, 7/01/2037 |
|
$
|
695,000
|
$
699,033 |
| Michigan
Finance Authority Hospital Rev. (Trinity Health Credit Group), 3.384%, 12/01/2040 |
|
|
480,000
|
522,580 |
| Oklahoma
Development Finance Authority, Health System Rev. (OU Medicine Project), “C”, 5.45%, 8/15/2028 |
|
|
275,000
|
307,772 |
| State
of Florida, “A”, 2.154%, 7/01/2030 |
|
|
650,000
|
648,466 |
| |
|
|
|
$2,177,851 |
MFS Global Tactical
Allocation Portfolio
Portfolio of Investments – continued
| Issuer
|
|
|
Shares/Par
|
Value
($) |
| Bonds
– continued |
| Natural
Gas - Distribution – 0.1% |
| National
Grid PLC, 1.125%, 1/14/2033 |
|
GBP
|
487,000
|
$
585,028 |
| Natural
Gas - Pipeline – 0.4% |
| APT
Pipelines Ltd., 0.75%, 3/15/2029 |
|
EUR
|
540,000
|
$
599,306 |
| APT
Pipelines Ltd., 1.25%, 3/15/2033 |
|
|
725,000
|
797,216 |
| APT
Pipelines Ltd., 2.5%, 3/15/2036 |
|
GBP
|
470,000
|
621,958 |
| |
|
|
|
$2,018,480 |
| Network
& Telecom – 0.5% |
| AT&T,
Inc., 3.5%, 9/15/2053 |
|
$
|
229,000
|
$
231,037 |
| Iliad
Holding S.A.S., 5.125%, 10/15/2026 |
|
EUR
|
350,000
|
415,908 |
| Lorca
Telecom Bondco S.A.U., 4%, 9/18/2027 |
|
|
520,000
|
601,640 |
| Verizon
Communications, Inc., 2.1%, 3/22/2028 |
|
$
|
291,000
|
291,555 |
| Verizon
Communications, Inc., 2.55%, 3/21/2031 |
|
|
735,000
|
741,551 |
| Verizon
Communications, Inc., 4%, 3/22/2050 |
|
|
349,000
|
400,733 |
| |
|
|
|
$2,682,424 |
| Oil
Services – 0.1% |
| Halliburton
Co., 5%, 11/15/2045 |
|
$
|
365,000
|
$
436,073 |
| Oils
– 0.4% |
| Neste
Oyj, 0.75%, 3/25/2028 |
|
EUR
|
700,000
|
$
791,483 |
| PBF
Holding Co. LLC/PBF Finance Corp., 7.25%, 6/15/2025 |
|
$
|
575,000
|
409,687 |
| Puma
International Financing S.A., 5%, 1/24/2026 |
|
|
475,000
|
475,000 |
| Valero
Energy Corp., 2.8%, 12/01/2031 |
|
|
347,000
|
345,917 |
| |
|
|
|
$2,022,087 |
| Other
Banks & Diversified Financials – 1.8% |
| Alpha
Bank, 4.25%, 2/13/2030 |
|
EUR
|
590,000
|
$
649,602 |
| Bank
Hapoalim B.M., 3.255% to 1/21/2027, FLR (CMT - 5yr. + 2.155%) to 1/21/2032 (n) |
|
$
|
397,000
|
393,030 |
| Bank
of Cyprus PCL, 2.5% to 6/24/2026, FLR (EUR Swap Rate - 5yr. + 2.785%) to 6/24/2027 |
|
EUR
|
670,000
|
728,469 |
| Banque
Federative du Credit Mutuel S.A., 1.125%, 11/19/2031 |
|
|
400,000
|
446,743 |
| Belfius
Bank S.A., 1.25% to 4/06/2029, FLR (EUR Swap Rate - 5yr. + 1.3%) to 4/06/2034 |
|
|
400,000
|
446,897 |
| BPCE
S.A., 2.5% to 11/30/2027, FLR (GBP Swap Rate - 5yr. + 1.83%) to 11/30/2032 |
|
GBP
|
300,000
|
405,276 |
| Deutsche
Bank AG, 1.875% to 12/22/2027, FLR (SONIA + 1.634%) to 12/22/2028 |
|
|
100,000
|
131,857 |
| Deutsche
Bank AG, 1.375% to 2/17/2031, FLR (EURIBOR - 3mo. + 1.5%) to 2/17/2032 |
|
EUR
|
200,000
|
227,086 |
| Groupe
BPCE S.A., 4.5%, 3/15/2025 (n) |
|
$
|
584,000
|
629,289 |
| Groupe
des Assurances du Credit Mutuel, 1.85%, 4/21/2042 |
|
EUR
|
400,000
|
454,874 |
| Intesa
Sanpaolo S.p.A., 2.625%, 3/11/2036 |
|
GBP
|
690,000
|
922,677 |
| Intesa
Sanpaolo S.p.A., 4.125%, 2/27/2070 |
|
EUR
|
670,000
|
742,771 |
| Stichting
AK Rabobank Certificaten, 6.5%, 3/29/2071 |
|
|
950,000
|
1,487,165 |
| UBS
AG, 5.125%, 5/15/2024 |
|
$
|
866,000
|
926,620 |
| Virgin
Money UK PLC, 5.125% to 12/11/2025, FLR (GBP Government Yield - 5yr. + 5.25%) to 12/11/2030 |
|
GBP
|
475,000
|
694,037 |
| |
|
|
|
$9,286,393 |
| Railroad
& Shipping – 0.3% |
| Canadian
Pacific Railway Co., 2.45%, 12/02/2031 |
|
$
|
487,000
|
$
496,535 |
| Wabtec
Transportation Netherlands B.V., 1.25%, 12/03/2027 |
|
EUR
|
705,000
|
809,847 |
| |
|
|
|
$1,306,382 |
| Real
Estate - Office – 0.2% |
| Corporate
Office Property LP, REIT, 2.25%, 3/15/2026 |
|
$
|
356,000
|
$
360,039 |
| Corporate
Office Property LP, REIT, 2%, 1/15/2029 |
|
|
237,000
|
227,859 |
| Corporate
Office Property LP, REIT, 2.75%, 4/15/2031 |
|
|
490,000
|
487,193 |
| |
|
|
|
$1,075,091 |
MFS Global Tactical
Allocation Portfolio
Portfolio of Investments – continued
| Issuer
|
|
|
Shares/Par
|
Value
($) |
| Bonds
– continued |
| Real
Estate - Other – 0.3% |
| EPR
Properties, REIT, 3.6%, 11/15/2031 |
|
$
|
405,000
|
$
400,684 |
| Lexington
Realty Trust Co., 2.7%, 9/15/2030 |
|
|
466,000
|
461,577 |
| W.P.
Carey, Inc., REIT, 2.4%, 2/01/2031 |
|
|
681,000
|
669,167 |
| |
|
|
|
$1,531,428 |
| Real
Estate - Retail – 0.4% |
| Brixmor
Operating Partnership LP, REIT, 4.05%, 7/01/2030 |
|
$
|
610,000
|
$
665,622 |
| Hammerson
Ireland Finance DAC, 1.75%, 6/03/2027 |
|
EUR
|
337,000
|
376,883 |
| Regency
Centers Corp., 3.7%, 6/15/2030 |
|
$
|
165,000
|
180,578 |
| STORE
Capital Corp., REIT, 2.75%, 11/18/2030 |
|
|
786,000
|
779,462 |
| |
|
|
|
$2,002,545 |
| Retailers
– 0.5% |
| Home
Depot, Inc., 3%, 4/01/2026 |
|
$
|
525,000
|
$
557,773 |
| Home
Depot, Inc., 4.875%, 2/15/2044 |
|
|
453,000
|
597,367 |
| Kohl's
Corp., 3.375%, 5/01/2031 |
|
|
539,000
|
548,930 |
| MercadoLibre,
Inc., 3.125%, 1/14/2031 |
|
|
683,000
|
645,442 |
| Nordstrom,
Inc., 4.25%, 8/01/2031 |
|
|
438,000
|
430,337 |
| |
|
|
|
$2,779,849 |
| Supermarkets
– 0.2% |
| Iceland
Bondco PLC, 4.375%, 5/15/2028 |
|
GBP
|
610,000
|
$
720,400 |
| Loblaw
Cos. Ltd., 4.86%, 9/12/2023 |
|
CAD
|
680,000
|
563,320 |
| |
|
|
|
$1,283,720 |
| Supranational
– 2.3% |
| Corporacion
Andina de Fomento, 1.625%, 9/23/2025 |
|
$
|
530,000
|
$
529,085 |
| European
Financial Stability Facility, 1.45%, 9/05/2040 |
|
EUR
|
738,000
|
977,600 |
| European
Union, 0%, 10/04/2030 |
|
|
4,935,000
|
5,601,179 |
| European
Union, 0%, 7/04/2035 |
|
|
2,737,000
|
2,979,259 |
| European
Union, 0.75%, 1/04/2047 |
|
|
291,000
|
346,716 |
| International
Bank for Reconstruction and Development, 4.25%, 6/24/2025 |
|
AUD
|
465,000
|
370,758 |
| West
African Development Bank, 4.7%, 10/22/2031 |
|
$
|
900,000
|
979,344 |
| West
African Development Bank, 2.75%, 1/22/2033 |
|
EUR
|
340,000
|
406,503 |
| |
|
|
|
$12,190,444 |
| Telecommunications
- Wireless – 0.6% |
| American
Tower Corp., REIT, 2.95%, 1/15/2051 |
|
$
|
410,000
|
$
388,358 |
| Crown
Castle International Corp., 1.35%, 7/15/2025 |
|
|
285,000
|
281,142 |
| Crown
Castle International Corp., 3.7%, 6/15/2026 |
|
|
345,000
|
369,736 |
| Millicom
International Cellular S.A., 4.5%, 4/27/2031 (n) |
|
|
400,000
|
403,004 |
| Rogers
Communications, Inc., 3.7%, 11/15/2049 |
|
|
316,000
|
331,676 |
| Vodafone
Group PLC, 3.25% to 9/04/2026, FLR (CMT - 5yr. + 2.447%) to 9/04/2031, FLR (CMT - 5yr. + 2.697%) to 9/04/2046, FLR (CMT - 5yr. + 3.447%) to 6/04/2081 |
|
|
1,223,000
|
1,199,127 |
| |
|
|
|
$2,973,043 |
| Telephone
Services – 0.2% |
| TELUS
Corp., 2.85%, 11/13/2031 |
|
CAD
|
1,000,000
|
$
787,588 |
| Tobacco
– 0.2% |
| British
American Tobacco PLC, 3.75% to 9/27/2029, FLR (EUR Swap Rate - 5yr. + 3.952%) to 9/27/2034, FLR (EUR Swap Rate - 5yr. + 4.202%) to 9/27/2049, FLR (EUR Swap Rate - 5yr. + 4.952%) to 12/29/2149 |
|
EUR
|
410,000
|
$
456,399 |
| British
American Tobacco PLC, 3% to 12/27/2026, FLR (EUR Swap Rate - 5yr. + 3.372%) to 12/27/2031, FLR (EUR Swap Rate - 5yr. + 3.622%) to 12/27/2046, FLR (EUR Swap Rate - 5yr. + 4.372%) to 9/27/2170 |
|
|
425,000
|
474,388 |
| |
|
|
|
$930,787 |
MFS Global Tactical
Allocation Portfolio
Portfolio of Investments – continued
| Issuer
|
|
|
Shares/Par
|
Value
($) |
| Bonds
– continued |
| Transportation
- Services – 0.3% |
| ERAC
USA Finance LLC, 7%, 10/15/2037 (n) |
|
$
|
494,000
|
$
727,768 |
| Promontoria
Holding 264 B.V., 6.75%, 8/15/2023 |
|
EUR
|
590,000
|
669,505 |
| |
|
|
|
$1,397,273 |
| U.S.
Government Agencies and Equivalents – 0.1% |
| Small
Business Administration, 5.31%, 5/01/2027 |
|
$
|
18,331
|
$
19,593 |
| Small
Business Administration, 2.22%, 3/01/2033 |
|
|
641,059
|
649,419 |
| |
|
|
|
$669,012 |
| U.S.
Treasury Obligations – 1.7% |
| U.S.
Treasury Bonds, 1.75%, 8/15/2041 |
|
$
|
892,000
|
$
864,822 |
| U.S.
Treasury Bonds, 2.375%, 11/15/2049 (f) |
|
|
334,000
|
366,904 |
| U.S.
Treasury Notes, 1.125%, 8/15/2040 (f) |
|
|
8,739,000
|
7,630,239 |
| |
|
|
|
$8,861,965 |
| Utilities
- Electric Power – 2.0% |
| Adani
Green Energy (UP) Ltd./Prayatna Developers Private Ltd., 6.25%, 12/10/2024 (n) |
|
$
|
731,000
|
$
793,135 |
| American
Transmission Systems, Inc., 2.65%, 1/15/2032 (n) |
|
|
104,000
|
104,966 |
| Bruce
Power LP, 2.68%, 12/21/2028 |
|
CAD
|
915,000
|
734,546 |
| ContourGlobal
Power Holdings S.A., 3.125%, 1/01/2028 |
|
EUR
|
375,000
|
418,847 |
| Enel
Americas S.A., 4%, 10/25/2026 |
|
$
|
1,891,000
|
2,013,915 |
| Enel
Finance International N.V., 4.75%, 5/25/2047 (n) |
|
|
343,000
|
420,670 |
| Enel
S.p.A., 2.25% to 3/10/2027, FLR (EUR Swap Rate - 5yr. + 2.679%) to 3/10/2032, FLR (EUR Swap Rate - 5yr. + 2.929%) to 3/10/2047, FLR (EUR Swap Rate - 5yr. + 3.679%) to 3/10/2070 |
|
EUR
|
425,000
|
499,443 |
| Enel
S.p.A., 1.875% to 9/08/2030, FLR (EUR Swap Rate - 5yr. + 2.011%) to 9/08/2035, FLR (EUR Swap Rate - 5yr. + 2.261%) to 9/08/2050, FLR (EUR Swap Rate - 5yr. + 3.011%) to 3/08/2170 |
|
|
525,000
|
579,034 |
| ENGIE
Energía Chile S.A., 4.5%, 1/29/2025 (n) |
|
$
|
1,180,000
|
1,256,700 |
| Evergy,
Inc., 2.9%, 9/15/2029 |
|
|
615,000
|
629,493 |
| Iberdrola
Finanzas, S.A.U., 1.575% to 11/16/2027, FLR (EUR Swap Rate - 5yr. + 1.676%) to 11/16/2032, FLR (EUR Swap Rate - 5yr. + 1.926%) to 11/16/2047, FLR (EUR Swap Rate - 5yr. + 2.676%) to 11/16/2170 |
|
EUR
|
300,000
|
339,842 |
| Jersey
Central Power & Light Co., 2.75%, 3/01/2032 (n) |
|
$
|
427,000
|
432,722 |
| NextEra
Energy, Inc., 4.5%, 9/15/2027 (n) |
|
|
300,000
|
324,000 |
| Pacific
Gas & Electric Co., 4.95%, 7/01/2050 |
|
|
384,000
|
418,198 |
| Southern
California Edison Co., 3.65%, 2/01/2050 |
|
|
252,000
|
266,651 |
| Virginia
Electric & Power Co., 3.5%, 3/15/2027 |
|
|
1,005,000
|
1,082,647 |
| Virginia
Electric & Power Co., 2.875%, 7/15/2029 |
|
|
217,000
|
227,582 |
| |
|
|
|
$10,542,391 |
| Total
Bonds (Identified Cost, $322,978,557) |
|
$321,098,050
|
| Common
Stocks – 35.6% |
| Aerospace
& Defense – 0.9% |
|
| Honeywell
International, Inc. (f) |
|
8,761
|
$
1,826,756 |
| L3Harris
Technologies, Inc. |
|
4,027
|
858,717 |
| Lockheed
Martin Corp. (f) |
|
3,476
|
1,235,405 |
| Northrop
Grumman Corp. |
|
2,207
|
854,264 |
| |
|
|
|
$4,775,142 |
| Alcoholic
Beverages – 0.8% |
|
| Diageo
PLC |
|
30,440
|
$
1,662,915 |
| Heineken
N.V. |
|
8,522
|
959,169 |
| Kirin
Holdings Co. Ltd. |
|
15,100
|
242,456 |
| Pernod
Ricard S.A. |
|
5,698
|
1,372,037 |
| |
|
|
|
$4,236,577 |
MFS Global Tactical
Allocation Portfolio
Portfolio of Investments – continued
| Issuer
|
|
|
Shares/Par
|
Value
($) |
| Common
Stocks – continued |
| Apparel
Manufacturers – 0.5% |
|
| Adidas
AG |
|
2,844
|
$
819,834 |
| Compagnie
Financiere Richemont S.A. |
|
12,010
|
1,793,371 |
| |
|
|
|
$2,613,205 |
| Automotive
– 0.9% |
|
| Aptiv
PLC (a) |
|
5,388
|
$
888,750 |
| Ford
Otomotiv Sanayi A.S. |
|
9,643
|
173,558 |
| Lear
Corp. |
|
6,666
|
1,219,545 |
| LKQ
Corp. |
|
22,258
|
1,336,148 |
| Magna
International, Inc. |
|
11,879
|
961,157 |
| |
|
|
|
$4,579,158 |
| Biotechnology
– 0.1% |
|
| Biogen,
Inc. (a) |
|
948
|
$
227,444 |
| Gilead
Sciences, Inc. |
|
2,213
|
160,686 |
| |
|
|
|
$388,130 |
| Brokerage
& Asset Managers – 0.8% |
|
| Cboe
Global Markets, Inc. |
|
7,533
|
$
982,303 |
| Charles
Schwab Corp. (f) |
|
26,198
|
2,203,252 |
| NASDAQ,
Inc. |
|
3,757
|
789,008 |
| |
|
|
|
$3,974,563 |
| Business
Services – 1.6% |
|
| Accenture
PLC, “A” (s) |
|
4,871
|
$
2,019,273 |
| Amdocs
Ltd. |
|
10,363
|
775,567 |
| CGI,
Inc. (a) |
|
12,346
|
1,091,664 |
| Equifax,
Inc. |
|
1,812
|
530,536 |
| Experian
PLC |
|
15,597
|
766,763 |
| Fidelity
National Information Services, Inc. |
|
8,867
|
967,833 |
| Fiserv,
Inc. (a)(f) |
|
9,095
|
943,970 |
| Nomura
Research Institute Ltd. |
|
6,200
|
265,991 |
| Secom
Co. Ltd. |
|
12,500
|
867,817 |
| |
|
|
|
$8,229,414 |
| Cable
TV – 0.5% |
|
| Comcast
Corp., “A” (f) |
|
52,775
|
$
2,656,166 |
| Chemicals
– 0.4% |
|
| PPG
Industries, Inc. |
|
11,346
|
$
1,956,504 |
| Computer
Software – 0.4% |
|
| Adobe
Systems, Inc. (a) |
|
348
|
$
197,337 |
| Microsoft
Corp. |
|
5,260
|
1,769,043 |
| |
|
|
|
$1,966,380 |
| Computer
Software - Systems – 1.3% |
|
| Amadeus
IT Group S.A. (a) |
|
15,343
|
$
1,033,421 |
| Asustek
Computer, Inc. |
|
13,000
|
176,673 |
| Compal
Electronics |
|
162,000
|
141,700 |
| Fujitsu
Ltd. |
|
7,400
|
1,269,251 |
| Hitachi
Ltd. |
|
27,500
|
1,489,394 |
| Hon
Hai Precision Industry Co. Ltd. |
|
179,000
|
672,859 |
| Lenovo
Group Ltd. |
|
224,000
|
257,394 |
MFS Global Tactical
Allocation Portfolio
Portfolio of Investments – continued
| Issuer
|
|
|
Shares/Par
|
Value
($) |
| Common
Stocks – continued |
| Computer
Software - Systems – continued |
|
| Samsung
Electronics Co. Ltd. |
|
29,871
|
$
1,967,528 |
| |
|
|
|
$7,008,220 |
| Construction
– 0.7% |
|
| Masco
Corp. |
|
19,994
|
$
1,403,979 |
| Stanley
Black & Decker, Inc. |
|
5,962
|
1,124,553 |
| Vulcan
Materials Co. |
|
5,630
|
1,168,675 |
| |
|
|
|
$3,697,207 |
| Consumer
Products – 1.1% |
|
| Colgate-Palmolive
Co. (f) |
|
30,676
|
$
2,617,890 |
| Kimberly-Clark
Corp. (f) |
|
12,340
|
1,763,633 |
| Reckitt
Benckiser Group PLC |
|
18,014
|
1,546,360 |
| |
|
|
|
$5,927,883 |
| Electrical
Equipment – 1.2% |
|
| Johnson
Controls International PLC |
|
23,133
|
$
1,880,944 |
| Legrand
S.A. |
|
8,141
|
953,732 |
| Schneider
Electric SE |
|
17,498
|
3,435,656 |
| |
|
|
|
$6,270,332 |
| Electronics
– 1.9% |
|
| Intel
Corp. |
|
33,026
|
$
1,700,839 |
| Kyocera
Corp. |
|
11,200
|
699,769 |
| NXP
Semiconductors N.V. |
|
5,648
|
1,286,501 |
| Taiwan
Semiconductor Manufacturing Co. Ltd., ADR |
|
21,730
|
2,614,336 |
| Texas
Instruments, Inc. (f) |
|
18,063
|
3,404,334 |
| |
|
|
|
$9,705,779 |
| Energy
- Independent – 0.4% |
|
| ConocoPhillips
|
|
20,681
|
$
1,492,754 |
| Hess
Corp. |
|
8,990
|
665,530 |
| |
|
|
|
$2,158,284 |
| Energy
- Integrated – 0.5% |
|
| China
Petroleum & Chemical Corp. |
|
2,946,000
|
$
1,371,454 |
| Eni
S.p.A. |
|
58,262
|
805,393 |
| LUKOIL
PJSC, ADR |
|
1,455
|
130,222 |
| Suncor
Energy, Inc. |
|
8,138
|
203,619 |
| |
|
|
|
$2,510,688 |
| Food
& Beverages – 1.6% |
|
| Archer
Daniels Midland Co. |
|
6,240
|
$
421,762 |
| Coca-Cola
FEMSA S.A.B. de C.V. |
|
3,501
|
191,820 |
| Danone
S.A. |
|
20,548
|
1,277,072 |
| General
Mills, Inc. (f) |
|
27,858
|
1,877,072 |
| J.M.
Smucker Co. |
|
13,246
|
1,799,072 |
| JBS
S.A. |
|
28,064
|
191,208 |
| Nestle
S.A. |
|
18,341
|
2,565,163 |
| |
|
|
|
$8,323,169 |
MFS Global Tactical
Allocation Portfolio
Portfolio of Investments – continued
| Issuer
|
|
|
Shares/Par
|
Value
($) |
| Common
Stocks – continued |
| Food
& Drug Stores – 0.4% |
|
| Albertsons
Cos., Inc., “A” |
|
13,647
|
$
412,003 |
| Tesco
PLC |
|
441,441
|
1,732,189 |
| |
|
|
|
$2,144,192 |
| Gaming
& Lodging – 0.1% |
|
| International
Game Technology PLC |
|
12,653
|
$
365,798 |
| Tabcorp
Holdings Ltd. |
|
34,223
|
124,993 |
| |
|
|
|
$490,791 |
| General
Merchandise – 0.0% |
|
| Bim
Birlesik Magazalar A.S. |
|
46,218
|
$
214,163 |
| Health
Maintenance Organizations – 0.3% |
|
| Cigna
Corp. |
|
7,617
|
$
1,749,092 |
| Insurance
– 2.3% |
|
| Aon
PLC (s) |
|
9,639
|
$
2,897,098 |
| China
Pacific Insurance Co. Ltd. |
|
53,800
|
145,927 |
| Chubb
Ltd. |
|
10,440
|
2,018,156 |
| Equitable
Holdings, Inc. |
|
18,401
|
603,369 |
| Everest
Re Group Ltd. |
|
1,128
|
308,982 |
| Hartford
Financial Services Group, Inc. |
|
7,670
|
529,537 |
| Manulife
Financial Corp. |
|
84,966
|
1,619,455 |
| MetLife,
Inc. |
|
9,777
|
610,965 |
| Samsung
Fire & Marine Insurance Co. Ltd. (a) |
|
3,414
|
580,129 |
| Travelers
Cos., Inc. |
|
8,001
|
1,251,596 |
| Willis
Towers Watson PLC |
|
6,215
|
1,476,000 |
| |
|
|
|
$12,041,214 |
| Internet
– 0.0% |
|
| Gartner,
Inc. (a) |
|
599
|
$
200,258 |
| Leisure
& Toys – 0.2% |
|
| Brunswick
Corp. |
|
4,116
|
$
414,605 |
| DeNA
Co. Ltd. |
|
7,000
|
107,772 |
| Nintendo
Co. Ltd. |
|
500
|
233,200 |
| Polaris,
Inc. |
|
952
|
104,634 |
| |
|
|
|
$860,211 |
| Machinery
& Tools – 1.5% |
|
| Eaton
Corp. PLC |
|
21,486
|
$
3,713,210 |
| GEA
Group AG |
|
3,048
|
166,879 |
| Ingersoll
Rand, Inc. |
|
31,296
|
1,936,284 |
| Kubota
Corp. |
|
51,300
|
1,138,786 |
| PACCAR,
Inc. |
|
4,595
|
405,555 |
| Regal
Rexnord Corp. |
|
3,790
|
644,982 |
| |
|
|
|
$8,005,696 |
| Major
Banks – 3.6% |
|
| Bank
of America Corp. (s) |
|
53,064
|
$
2,360,817 |
| BNP
Paribas |
|
28,934
|
2,001,846 |
| China
Construction Bank Corp. |
|
738,000
|
511,084 |
| DBS
Group Holdings Ltd. |
|
74,300
|
1,800,711 |
| Erste
Group Bank AG |
|
8,740
|
410,856 |
| Goldman
Sachs Group, Inc. (f) |
|
6,047
|
2,313,280 |
MFS Global Tactical
Allocation Portfolio
Portfolio of Investments – continued
| Issuer
|
|
|
Shares/Par
|
Value
($) |
| Common
Stocks – continued |
| Major
Banks – continued |
|
| JPMorgan
Chase & Co. (f) |
|
18,115
|
$
2,868,510 |
| Mitsubishi
UFJ Financial Group, Inc. |
|
202,500
|
1,100,080 |
| NatWest
Group PLC |
|
531,746
|
1,624,464 |
| UBS
Group AG |
|
209,452
|
3,759,264 |
| |
|
|
|
$18,750,912 |
| Medical
& Health Technology & Services – 0.4% |
|
| McKesson
Corp. |
|
4,878
|
$
1,212,524 |
| Quest
Diagnostics, Inc. |
|
3,121
|
539,964 |
| Sonic
Healthcare Ltd. |
|
5,346
|
181,367 |
| |
|
|
|
$1,933,855 |
| Medical
Equipment – 1.0% |
|
| Becton,
Dickinson and Co. |
|
4,855
|
$
1,220,935 |
| Boston
Scientific Corp. (a)(s) |
|
26,343
|
1,119,051 |
| Danaher
Corp. |
|
1,833
|
603,075 |
| Medtronic
PLC |
|
14,743
|
1,525,163 |
| Thermo
Fisher Scientific, Inc. |
|
1,556
|
1,038,226 |
| |
|
|
|
$5,506,450 |
| Metals
& Mining – 0.8% |
|
| Fortescue
Metals Group Ltd. |
|
34,424
|
$
481,118 |
| Glencore
PLC |
|
47,731
|
242,241 |
| POSCO
|
|
1,190
|
274,789 |
| Rio
Tinto PLC |
|
39,562
|
2,619,624 |
| Vale
S.A. |
|
33,500
|
468,880 |
| |
|
|
|
$4,086,652 |
| Natural
Gas - Distribution – 0.0% |
|
| UGI
Corp. |
|
4,781
|
$
219,496 |
| Natural
Gas - Pipeline – 0.1% |
|
| Equitrans
Midstream Corp. |
|
28,542
|
$
295,124 |
| Pembina
Pipeline Corp. (l) |
|
8,882
|
269,420 |
| |
|
|
|
$564,544 |
| Other
Banks & Diversified Financials – 0.9% |
|
| Hana
Financial Group, Inc. |
|
4,776
|
$
168,943 |
| KBC
Group N.V. |
|
11,163
|
959,027 |
| Sberbank
of Russia PJSC, ADR |
|
35,343
|
567,255 |
| SLM
Corp. |
|
26,251
|
516,357 |
| Tisco
Financial Group PCL |
|
137,400
|
394,863 |
| Truist
Financial Corp. |
|
32,850
|
1,923,367 |
| |
|
|
|
$4,529,812 |
| Pharmaceuticals
– 3.6% |
|
| Bayer
AG |
|
28,058
|
$
1,501,369 |
| Johnson
& Johnson (f) |
|
32,914
|
5,630,598 |
| Merck
& Co., Inc. (f) |
|
44,535
|
3,413,163 |
| Novartis
AG |
|
12,693
|
1,114,652 |
| Novo
Nordisk A.S., “B” |
|
8,434
|
942,877 |
| Organon
& Co. |
|
14,674
|
446,823 |
| Roche
Holding AG |
|
13,367
|
5,541,094 |
| |
|
|
|
$18,590,576 |
MFS Global Tactical
Allocation Portfolio
Portfolio of Investments – continued
| Issuer
|
|
|
Shares/Par
|
Value
($) |
| Common
Stocks – continued |
| Printing
& Publishing – 0.5% |
|
| RELX
PLC |
|
25,405
|
$
824,900 |
| Transcontinental,
Inc., “A” |
|
5,714
|
91,744 |
| Wolters
Kluwer N.V. |
|
14,718
|
1,735,967 |
| |
|
|
|
$2,652,611 |
| Railroad
& Shipping – 0.5% |
|
| Canadian
Pacific Railway Ltd. |
|
18,480
|
$
1,329,152 |
| Union
Pacific Corp. |
|
5,363
|
1,351,100 |
| |
|
|
|
$2,680,252 |
| Real
Estate – 0.1% |
|
| Extra
Space Storage, Inc., REIT |
|
1,908
|
$
432,601 |
| National
Storage Affiliates Trust, REIT |
|
2,273
|
157,291 |
| |
|
|
|
$589,892 |
| Restaurants
– 0.1% |
|
| Yum
China Holdings, Inc. |
|
14,469
|
$
721,135 |
| Specialty
Chemicals – 0.3% |
|
| Akzo
Nobel N.V. |
|
8,572
|
$
941,765 |
| Axalta
Coating Systems Ltd. (a) |
|
20,600
|
682,272 |
| |
|
|
|
$1,624,037 |
| Specialty
Stores – 0.2% |
|
| Home
Depot, Inc. |
|
2,627
|
$
1,090,231 |
| Telecommunications
- Wireless – 1.2% |
|
| KDDI
Corp. |
|
118,100
|
$
3,451,728 |
| T-Mobile
US, Inc. (a) |
|
11,134
|
1,291,321 |
| Turkcell
Iletisim Hizmetleri A.S. |
|
98,299
|
137,168 |
| Vodafone
Group PLC |
|
759,559
|
1,154,146 |
| |
|
|
|
$6,034,363 |
| Telephone
Services – 0.2% |
|
| Hellenic
Telecommunications Organization S.A. |
|
27,310
|
$
505,407 |
| PT
Telekom Indonesia |
|
903,500
|
256,105 |
| Quebecor,
Inc., “B” |
|
22,230
|
501,733 |
| |
|
|
|
$1,263,245 |
| Tobacco
– 0.7% |
|
| British
American Tobacco PLC |
|
31,652
|
$
1,171,101 |
| Imperial
Tobacco Group PLC |
|
25,374
|
555,187 |
| Japan
Tobacco, Inc. (l) |
|
29,400
|
593,597 |
| Philip
Morris International, Inc. (s) |
|
13,124
|
1,246,780 |
| |
|
|
|
$3,566,665 |
| Utilities
- Electric Power – 1.0% |
|
| American
Electric Power Co., Inc. |
|
2,843
|
$
252,942 |
| CLP
Holdings Ltd. |
|
45,000
|
454,470 |
| Duke
Energy Corp. |
|
11,284
|
1,183,691 |
| E.ON
SE |
|
117,326
|
1,628,554 |
| ENGIE
Energía Brasil S.A. |
|
17,600
|
121,367 |
| Exelon
Corp. |
|
15,042
|
868,826 |
| Iberdrola
S.A. |
|
31,625
|
370,597 |
MFS Global Tactical
Allocation Portfolio
Portfolio of Investments – continued
| Issuer
|
|
|
Shares/Par
|
Value
($) |
| Common
Stocks – continued |
| Utilities
- Electric Power – continued |
|
| Terna
Participacoes S.A., IEU |
|
60,517
|
$
395,153 |
| |
|
|
|
$5,275,600 |
| Total
Common Stocks (Identified Cost, $114,402,066) |
|
$186,362,746
|
| Preferred
Stocks – 0.3% |
| Computer
Software - Systems – 0.1% |
|
|
|
|
| Samsung
Electronics Co. Ltd. |
|
8,484
|
$
508,148 |
| Consumer
Products – 0.2% |
|
|
|
|
| Henkel
AG & Co. KGaA |
|
14,136
|
$
1,144,915 |
| Total
Preferred Stocks (Identified Cost, $1,195,176) |
|
$
1,653,063 |
| Convertible
Preferred Stocks – 0.1% |
| Medical
Equipment – 0.1% |
|
| Boston
Scientific Corp., 5.5% |
|
2,435
|
$
279,197 |
| Danaher
Corp., 4.75% |
|
101
|
221,594 |
| Total
Convertible Preferred Stocks (Identified Cost, $364,211) |
$
500,791 |
| Investment
Companies (h) – 2.5% |
| Money
Market Funds – 2.5% |
|
| MFS
Institutional Money Market Portfolio, 0.07% (v) (Identified Cost, $12,950,052) |
|
|
12,950,052
|
$
12,950,052 |
| Underlying/Expiration
Date/Exercise Price |
Put/Call
|
Counterparty
|
Notional
Amount |
Par
Amount/
Number of
Contracts |
|
| Purchased
Options – 0.2% |
|
| Market
Index Securities – 0.0% |
|
| S&P
500 Index – January 2022 @ $4,450 |
Put
|
Merrill
Lynch International |
$
7,149,270 |
15
|
$
14,175 |
| Other
– 0.2% |
|
| U.S.
Treasury 10 yr - Interest Rate Swap - Fund pays 1.75%, Fund receives FLR (3-month LIBOR) – September 2022 |
Put
|
Merrill
Lynch International |
$ 39,000,000
|
$ 39,000,000
|
$
842,604 |
Total
Purchased Options
(Premiums Paid, $437,296) |
|
$
856,779 |
| Other
Assets, Less Liabilities – (0.1)% |
(678,253)
|
| Net
Assets – 100.0% |
$522,743,228
|
| (a) |
Non-income producing
security. |
| (f)
|
All or a
portion of the security has been segregated as collateral for open futures contracts and cleared swap agreements. |
| (h)
|
An
affiliated issuer, which may be considered one in which the fund owns 5% or more of the outstanding voting securities, or a company which is under common control. At period end, the aggregate values of the fund's investments in affiliated issuers
and in unaffiliated issuers were $12,950,052 and $510,471,429, respectively. |
| (i)
|
Interest
only security for which the fund receives interest on notional principal (Par amount). Par amount shown is the notional principal and does not reflect the cost of the security. |
| (l)
|
A portion
of this security is on loan. See Note 2 for additional information. |
| (n)
|
Securities
exempt from registration under Rule 144A of the Securities Act of 1933. These securities may be sold in the ordinary course of business in transactions exempt from registration, normally to qualified institutional buyers. At period end, the
aggregate value of these securities was $51,223,873, representing 9.8% of net assets. |
| (s)
|
Security or
a portion of the security was pledged to cover collateral requirements for certain derivative transactions. |
MFS Global Tactical
Allocation Portfolio
Portfolio of Investments – continued
| (v) |
Affiliated issuer that is
available only to investment companies managed by MFS. The rate quoted for the MFS Institutional Money Market Portfolio is the annualized seven-day yield of the fund at period end. |
| (z)
|
Restricted
securities are not registered under the Securities Act of 1933 and are subject to legal restrictions on resale. These securities generally may be resold in transactions exempt from registration or to the public if the securities are subsequently
registered. Disposal of these securities may involve time-consuming negotiations and prompt sale at an acceptable price may be difficult. The fund holds the following restricted securities: |
| Restricted
Securities |
Acquisition
Date |
Cost
|
Value
|
| Acres
PLC, 2021-FL2, “AS”, FLR, 1.84% (LIBOR - 1mo. + 1.75%), 1/15/2037 |
12/07/2021
|
$370,000
|
$370,002
|
| Acres
PLC, 2021-FL2, “B”, FLR, 2.352% (LIBOR - 1mo. + 2.25%), 1/15/2037 |
12/07/2021
|
604,000
|
604,003
|
| MF1
CLO Ltd., 2020-FL3, “AS”, FLR, 3.014% (LIBOR - 1mo. + 2.85%), 7/15/2035 |
6/12/2020
|
357,000
|
361,550
|
| Total
Restricted Securities |
|
|
$1,335,555
|
| %
of Net assets |
|
|
0.3%
|
| The
following abbreviations are used in this report and are defined: |
| ADR
|
American
Depositary Receipt |
| AGM
|
Assured
Guaranty Municipal |
| CLO
|
Collateralized
Loan Obligation |
| CMT
|
Constant
Maturity Treasury |
| EURIBOR
|
Euro
Interbank Offered Rate |
| FLR
|
Floating
Rate. Interest rate resets periodically based on the parenthetically disclosed reference rate plus a spread (if any). The period-end rate reported may not be the current rate. All reference rates are USD unless otherwise noted. |
| ICE
|
Intercontinental
Exchange |
| IEU
|
International
Equity Unit |
| LIBOR
|
London
Interbank Offered Rate |
| PCL
|
Public
Company Limited |
| REIT
|
Real Estate
Investment Trust |
| SOFR
|
Secured
Overnight Financing Rate |
| SONIA
|
Sterling
Overnight Index Average |
| TBA
|
To Be
Announced |
| UMBS
|
Uniform
Mortgage-Backed Security |
| Abbreviations
indicate amounts shown in currencies other than the U.S. dollar. All amounts are stated in U.S. dollars unless otherwise indicated. A list of abbreviations is shown below: |
| AUD
|
Australian
Dollar |
| BRL
|
Brazilian
Real |
| CAD
|
Canadian
Dollar |
| CHF
|
Swiss Franc
|
| CLP
|
Chilean
Peso |
| CNH
|
Chinese
Yuan Renminbi (Offshore) |
| CNY
|
China Yuan
Renminbi |
| COP
|
Colombian
Peso |
| CZK
|
Czech
Koruna |
| DKK
|
Danish
Krone |
| EUR
|
Euro
|
| GBP
|
British
Pound |
| HKD
|
Hong Kong
Dollar |
| HUF
|
Hungarian
Forint |
| IDR
|
Indonesian
Rupiah |
| ILS
|
Israeli
Shekel |
| JPY
|
Japanese
Yen |
| KRW
|
South
Korean Won |
| MXN
|
Mexican
Peso |
| NOK
|
Norwegian
Krone |
| NZD
|
New Zealand
Dollar |
| PLN
|
Polish
Zloty |
| RUB
|
Russian
Ruble |
MFS Global Tactical
Allocation Portfolio
Portfolio of Investments – continued
| SEK
|
Swedish Krona |
| SGD
|
Singapore
Dollar |
| THB
|
Thai Baht
|
| TRY
|
Turkish
Lira |
| TWD
|
Taiwan
Dollar |
| UYU
|
Uruguayan
Peso |
| ZAR
|
South
African Rand |
| Derivative
Contracts at 12/31/21 |
| Forward
Foreign Currency Exchange Contracts |
Currency
Purchased |
Currency
Sold |
Counterparty
|
Settlement
Date |
Unrealized
Appreciation
(Depreciation) |
| Asset
Derivatives |
| AUD
|
4,620,000
|
USD
|
3,325,682
|
Deutsche
Bank AG |
1/14/2022
|
$
35,684 |
| AUD
|
2,323,000
|
USD
|
1,662,152
|
Goldman
Sachs International |
1/14/2022
|
27,989
|
| AUD
|
2,350,000
|
USD
|
1,688,051
|
JPMorgan
Chase Bank N.A. |
1/14/2022
|
21,735
|
| AUD
|
832,272
|
USD
|
595,268
|
JPMorgan
Chase Bank N.A. |
3/16/2022
|
10,356
|
| AUD
|
1,924,984
|
USD
|
1,399,029
|
UBS
AG |
1/14/2022
|
1,529
|
| CAD
|
2,050,000
|
USD
|
1,617,530
|
Merrill
Lynch International |
1/14/2022
|
3,075
|
| CHF
|
637,653
|
USD
|
691,000
|
JPMorgan
Chase Bank N.A. |
3/11/2022
|
9,996
|
| CHF
|
1,782,000
|
USD
|
1,931,035
|
JPMorgan
Chase Bank N.A. |
3/16/2022
|
28,268
|
| CNH
|
5,500,000
|
USD
|
853,993
|
Goldman
Sachs International |
1/14/2022
|
10,737
|
| CNH
|
4,500,000
|
USD
|
694,304
|
HSBC
Bank |
1/14/2022
|
13,203
|
| CNH
|
21,582,000
|
USD
|
3,362,823
|
JPMorgan
Chase Bank N.A. |
1/14/2022
|
30,377
|
| CNH
|
13,099,000
|
USD
|
2,040,406
|
JPMorgan
Chase Bank N.A. |
3/16/2022
|
10,842
|
| CNY
|
2,190,993
|
USD
|
341,000
|
JPMorgan
Chase Bank N.A. |
3/11/2022
|
1,079
|
| CZK
|
8,239,000
|
USD
|
372,098
|
Citibank
N.A. |
1/14/2022
|
4,627
|
| CZK
|
64,545,000
|
USD
|
2,874,633
|
JPMorgan
Chase Bank N.A. |
1/14/2022
|
76,663
|
| CZK
|
10,305,000
|
USD
|
465,533
|
UBS
AG |
1/14/2022
|
5,660
|
| DKK
|
4,719,079
|
USD
|
718,040
|
JPMorgan
Chase Bank N.A. |
3/16/2022
|
5,495
|
| EUR
|
160,561
|
USD
|
181,959
|
Deutsche
Bank AG |
1/14/2022
|
876
|
| EUR
|
6,845,235
|
USD
|
7,756,455
|
Goldman
Sachs International |
1/14/2022
|
38,377
|
| EUR
|
1,011,064
|
USD
|
1,141,085
|
HSBC
Bank |
1/14/2022
|
10,237
|
| EUR
|
1,553,369
|
USD
|
1,757,000
|
JPMorgan
Chase Bank N.A. |
3/11/2022
|
13,897
|
| EUR
|
1,143,788
|
USD
|
1,292,355
|
UBS
AG |
1/14/2022
|
10,104
|
| GBP
|
3,652,992
|
USD
|
4,888,511
|
Deutsche
Bank AG |
1/14/2022
|
55,900
|
| GBP
|
564,301
|
USD
|
747,241
|
HSBC
Bank |
1/14/2022
|
16,553
|
| GBP
|
2,488,432
|
USD
|
3,289,207
|
JPMorgan
Chase Bank N.A. |
3/16/2022
|
77,987
|
| IDR
|
16,199,936,460
|
USD
|
1,125,777
|
Citibank
N.A. |
2/22/2022
|
6,353
|
| IDR
|
3,000,000,000
|
USD
|
209,205
|
JPMorgan
Chase Bank N.A. |
1/28/2022
|
918
|
| JPY
|
25,000,000
|
USD
|
216,851
|
Morgan
Stanley Capital Services, Inc. |
1/14/2022
|
497
|
| MXN
|
52,185,808
|
USD
|
2,445,413
|
JPMorgan
Chase Bank N.A. |
3/16/2022
|
71,338
|
| NOK
|
187,226,109
|
USD
|
20,708,676
|
Goldman
Sachs International |
3/11/2022
|
525,080
|
| NOK
|
21,571,603
|
USD
|
2,394,817
|
JPMorgan
Chase Bank N.A. |
1/14/2022
|
54,219
|
| NOK
|
48,815,574
|
USD
|
5,422,327
|
JPMorgan
Chase Bank N.A. |
3/16/2022
|
113,418
|
| NZD
|
852,001
|
USD
|
577,426
|
JPMorgan
Chase Bank N.A. |
3/16/2022
|
5,474
|
| PLN
|
5,954,931
|
USD
|
1,448,183
|
JPMorgan
Chase Bank N.A. |
3/16/2022
|
21,877
|
| SEK
|
28,500,000
|
USD
|
3,151,985
|
Deutsche
Bank AG |
1/14/2022
|
2,249
|
| SEK
|
136,875,807
|
USD
|
15,045,266
|
Goldman
Sachs International |
3/11/2022
|
110,345
|
| SGD
|
972,000
|
USD
|
711,664
|
JPMorgan
Chase Bank N.A. |
3/16/2022
|
9,348
|
| TRY
|
274,000
|
USD
|
18,710
|
JPMorgan
Chase Bank N.A. |
3/16/2022
|
754
|
| USD
|
293,914
|
AUD
|
403,734
|
Citibank
N.A. |
1/14/2022
|
170
|
| USD
|
1,966,314
|
AUD
|
2,631,865
|
Deutsche
Bank AG |
1/14/2022
|
51,453
|
| USD
|
1,769,396
|
CAD
|
2,213,257
|
Deutsche
Bank AG |
1/14/2022
|
19,730
|
| USD
|
1,695,622
|
CAD
|
2,100,000
|
Goldman
Sachs International |
1/14/2022
|
35,490
|
| USD
|
5,316,538
|
CAD
|
6,583,397
|
HSBC
Bank |
1/14/2022
|
112,104
|
| USD
|
289,757
|
COP
|
1,149,784,960
|
JPMorgan
Chase Bank N.A. |
3/11/2022
|
9,068
|
MFS Global Tactical
Allocation Portfolio
Portfolio of Investments – continued
| Forward
Foreign Currency Exchange Contracts - continued |
Currency
Purchased |
Currency
Sold |
Counterparty
|
Settlement
Date |
Unrealized
Appreciation
(Depreciation) |
| Asset
Derivatives - continued |
| USD
|
11,677,048
|
EUR
|
10,058,610
|
Deutsche
Bank AG |
1/14/2022
|
$
223,071 |
| USD
|
2,874,559
|
EUR
|
2,478,429
|
Goldman
Sachs International |
1/14/2022
|
52,313
|
| USD
|
1,521,652
|
EUR
|
1,313,008
|
HSBC
Bank |
1/14/2022
|
26,499
|
| USD
|
1,066,059
|
EUR
|
921,618
|
JPMorgan
Chase Bank N.A. |
1/14/2022
|
16,590
|
| USD
|
1,736,451
|
EUR
|
1,495,709
|
Morgan
Stanley Capital Services, Inc. |
1/14/2022
|
33,251
|
| USD
|
1,236,677
|
EUR
|
1,057,000
|
NatWest
Markets PLC |
1/14/2022
|
33,047
|
| USD
|
5,009,683
|
EUR
|
4,316,211
|
UBS
AG |
1/14/2022
|
94,712
|
| USD
|
4,920,736
|
GBP
|
3,610,522
|
Deutsche
Bank AG |
1/14/2022
|
33,808
|
| USD
|
586,553
|
GBP
|
425,000
|
HSBC
Bank |
1/14/2022
|
11,306
|
| USD
|
1,674,246
|
HUF
|
537,973,000
|
Goldman
Sachs International |
1/14/2022
|
17,832
|
| USD
|
1,843,307
|
JPY
|
210,000,000
|
Barclays
Bank PLC |
1/14/2022
|
17,583
|
| USD
|
884,084
|
JPY
|
101,027,653
|
Deutsche
Bank AG |
1/14/2022
|
5,757
|
| USD
|
1,524,944
|
JPY
|
173,504,448
|
Goldman
Sachs International |
1/14/2022
|
16,510
|
| USD
|
956,008
|
JPY
|
109,112,072
|
JPMorgan
Chase Bank N.A. |
1/14/2022
|
7,396
|
| USD
|
34,978,426
|
JPY
|
3,968,956,490
|
JPMorgan
Chase Bank N.A. |
3/11/2022
|
457,352
|
| USD
|
3,001,087
|
JPY
|
338,767,365
|
UBS
AG |
1/14/2022
|
55,869
|
| USD
|
683,214
|
KRW
|
805,816,610
|
Barclays
Bank PLC |
2/11/2022
|
5,922
|
| USD
|
372,767
|
KRW
|
437,994,000
|
BNP
Paribas S.A. |
2/11/2022
|
4,632
|
| USD
|
3,319,015
|
KRW
|
3,902,332,070
|
Goldman
Sachs International |
1/24/2022
|
37,820
|
| USD
|
4,528,705
|
KRW
|
5,368,708,184
|
Goldman
Sachs International |
2/16/2022
|
16,725
|
| USD
|
2,150,400
|
KRW
|
2,536,934,400
|
JPMorgan
Chase Bank N.A. |
2/11/2022
|
18,097
|
| USD
|
153,594
|
NOK
|
1,300,000
|
Goldman
Sachs International |
1/14/2022
|
6,004
|
| USD
|
5,192,499
|
NOK
|
44,500,000
|
JPMorgan
Chase Bank N.A. |
1/14/2022
|
140,390
|
| USD
|
1,670,738
|
NZD
|
2,350,000
|
Citibank
N.A. |
1/14/2022
|
61,361
|
| USD
|
3,296,271
|
NZD
|
4,800,000
|
Goldman
Sachs International |
1/14/2022
|
9,033
|
| USD
|
886,057
|
PLN
|
3,500,000
|
JPMorgan
Chase Bank N.A. |
1/14/2022
|
17,901
|
| USD
|
496,248
|
RUB
|
37,544,092
|
JPMorgan
Chase Bank N.A. |
3/11/2022
|
2,916
|
| USD
|
3,343,483
|
SEK
|
28,995,000
|
JPMorgan
Chase Bank N.A. |
1/14/2022
|
134,464
|
| USD
|
32,371
|
TWD
|
894,000
|
JPMorgan
Chase Bank N.A. |
2/18/2022
|
59
|
| USD
|
355,885
|
ZAR
|
5,455,963
|
Brown
Brothers Harriman |
1/14/2022
|
13,968
|
| |
|
|
|
|
|
$
3,243,319 |
| Liability
Derivatives |
| AUD
|
5,292,553
|
USD
|
3,919,811
|
Deutsche
Bank AG |
1/14/2022
|
$
(69,117) |
| AUD
|
1,734,875
|
USD
|
1,281,550
|
UBS
AG |
1/14/2022
|
(19,311)
|
| CAD
|
5,209,269
|
USD
|
4,215,631
|
Deutsche
Bank AG |
1/14/2022
|
(97,499)
|
| CAD
|
2,391,685
|
USD
|
1,938,146
|
HSBC
Bank |
1/14/2022
|
(47,426)
|
| CAD
|
494,950
|
USD
|
391,365
|
JPMorgan
Chase Bank N.A. |
3/11/2022
|
(133)
|
| CAD
|
2,713,329
|
USD
|
2,145,094
|
JPMorgan
Chase Bank N.A. |
3/16/2022
|
(400)
|
| CAD
|
501,000
|
USD
|
403,479
|
State
Street Bank Corp. |
1/14/2022
|
(7,419)
|
| CAD
|
820,000
|
USD
|
663,398
|
UBS
AG |
1/14/2022
|
(15,156)
|
| CLP
|
134,879,000
|
USD
|
164,647
|
Goldman
Sachs International |
2/18/2022
|
(7,388)
|
| COP
|
1,321,303,000
|
USD
|
331,866
|
Goldman
Sachs International |
3/11/2022
|
(9,306)
|
| EUR
|
280,000
|
USD
|
324,563
|
Citibank
N.A. |
1/14/2022
|
(5,720)
|
| EUR
|
1,300,000
|
USD
|
1,480,577
|
Credit
Suisse Group |
1/14/2022
|
(236)
|
| EUR
|
7,422,908
|
USD
|
8,527,130
|
Deutsche
Bank AG |
1/14/2022
|
(74,490)
|
| EUR
|
3,250,519
|
USD
|
3,778,405
|
HSBC
Bank |
1/14/2022
|
(76,962)
|
| EUR
|
6,020,798
|
USD
|
6,998,495
|
JPMorgan
Chase Bank N.A. |
1/14/2022
|
(142,469)
|
| EUR
|
2,900,000
|
USD
|
3,395,295
|
Merrill
Lynch International |
1/14/2022
|
(92,997)
|
| EUR
|
595,826
|
USD
|
690,197
|
Morgan
Stanley Capital Services, Inc. |
1/14/2022
|
(11,715)
|
| EUR
|
1,249,340
|
USD
|
1,446,348
|
UBS
AG |
1/14/2022
|
(23,694)
|
| GBP
|
56,513
|
USD
|
78,121
|
Brown
Brothers Harriman |
1/14/2022
|
(1,628)
|
| GBP
|
2,139,308
|
USD
|
2,928,933
|
Deutsche
Bank AG |
1/14/2022
|
(33,328)
|
MFS Global Tactical
Allocation Portfolio
Portfolio of Investments – continued
| Forward
Foreign Currency Exchange Contracts - continued |
Currency
Purchased |
Currency
Sold |
Counterparty
|
Settlement
Date |
Unrealized
Appreciation
(Depreciation) |
| Liability
Derivatives - continued |
| GBP
|
257,538
|
USD
|
352,640
|
HSBC
Bank |
1/14/2022
|
$
(4,056) |
| GBP
|
475,000
|
USD
|
648,683
|
JPMorgan
Chase Bank N.A. |
1/14/2022
|
(5,760)
|
| HUF
|
122,993,000
|
USD
|
395,820
|
Goldman
Sachs International |
1/14/2022
|
(17,126)
|
| HUF
|
351,206,000
|
USD
|
1,075,999
|
JPMorgan
Chase Bank N.A. |
3/16/2022
|
(1,377)
|
| HUF
|
138,660,000
|
USD
|
446,313
|
UBS
AG |
1/14/2022
|
(19,380)
|
| ILS
|
1,799,000
|
USD
|
580,803
|
JPMorgan
Chase Bank N.A. |
3/16/2022
|
(1,804)
|
| JPY
|
181,345,341
|
USD
|
1,594,259
|
Brown
Brothers Harriman |
1/14/2022
|
(17,656)
|
| JPY
|
167,730,248
|
USD
|
1,472,741
|
Deutsche
Bank AG |
1/14/2022
|
(14,508)
|
| JPY
|
191,000,000
|
USD
|
1,686,212
|
Goldman
Sachs International |
1/14/2022
|
(25,673)
|
| JPY
|
136,468,345
|
USD
|
1,206,799
|
HSBC
Bank |
1/14/2022
|
(20,354)
|
| JPY
|
3,027,675,272
|
USD
|
26,659,886
|
JPMorgan
Chase Bank N.A. |
3/16/2022
|
(324,125)
|
| JPY
|
35,000,000
|
USD
|
307,862
|
NatWest
Markets PLC |
1/14/2022
|
(3,575)
|
| NZD
|
2,400,000
|
USD
|
1,684,813
|
Goldman
Sachs International |
1/14/2022
|
(41,194)
|
| RUB
|
43,746,000
|
USD
|
599,482
|
Citibank
N.A. |
4/25/2022
|
(30,806)
|
| SEK
|
44,867,000
|
USD
|
5,074,916
|
Goldman
Sachs International |
1/14/2022
|
(109,265)
|
| SEK
|
1,400,000
|
USD
|
163,636
|
JPMorgan
Chase Bank N.A. |
1/14/2022
|
(8,691)
|
| THB
|
55,300,000
|
USD
|
1,689,220
|
JPMorgan
Chase Bank N.A. |
2/18/2022
|
(29,280)
|
| THB
|
88,169,000
|
USD
|
2,693,581
|
JPMorgan
Chase Bank N.A. |
3/17/2022
|
(54,930)
|
| USD
|
174,107
|
AUD
|
245,030
|
Deutsche
Bank AG |
1/14/2022
|
(4,168)
|
| USD
|
10,291,620
|
AUD
|
14,555,070
|
JPMorgan
Chase Bank N.A. |
3/11/2022
|
(299,546)
|
| USD
|
4,090,852
|
AUD
|
5,719,608
|
JPMorgan
Chase Bank N.A. |
3/16/2022
|
(71,169)
|
| USD
|
477,657
|
AUD
|
670,685
|
UBS
AG |
1/14/2022
|
(10,313)
|
| USD
|
3,781,762
|
BRL
|
21,584,409
|
Merrill
Lynch International |
3/03/2022
|
(39,953)
|
| USD
|
2,127,261
|
CAD
|
2,725,695
|
HSBC
Bank |
1/14/2022
|
(27,508)
|
| USD
|
267,506
|
CHF
|
244,000
|
Deutsche
Bank AG |
1/14/2022
|
(341)
|
| USD
|
24,045,360
|
CHF
|
22,206,275
|
JPMorgan
Chase Bank N.A. |
3/11/2022
|
(366,837)
|
| USD
|
2,737,535
|
CNH
|
17,567,000
|
JPMorgan
Chase Bank N.A. |
3/16/2022
|
(13,382)
|
| USD
|
21,073,546
|
CNY
|
135,207,871
|
Barclays
Bank PLC |
3/11/2022
|
(36,401)
|
| USD
|
3,322,808
|
CZK
|
74,899,000
|
JPMorgan
Chase Bank N.A. |
1/14/2022
|
(101,921)
|
| USD
|
344,931
|
CZK
|
7,843,822
|
JPMorgan
Chase Bank N.A. |
3/11/2022
|
(11,789)
|
| USD
|
755,953
|
DKK
|
4,986,301
|
JPMorgan
Chase Bank N.A. |
3/11/2022
|
(8,460)
|
| USD
|
707,571
|
EUR
|
624,000
|
Barclays
Bank PLC |
1/14/2022
|
(2,992)
|
| USD
|
2,313,634
|
EUR
|
2,050,000
|
Credit
Suisse Group |
1/14/2022
|
(20,749)
|
| USD
|
2,865,107
|
EUR
|
2,529,212
|
Deutsche
Bank AG |
1/14/2022
|
(14,967)
|
| USD
|
220,413
|
EUR
|
195,598
|
Goldman
Sachs International |
1/14/2022
|
(2,319)
|
| USD
|
80,041,256
|
EUR
|
70,979,325
|
Goldman
Sachs International |
3/11/2022
|
(877,759)
|
| USD
|
5,987,449
|
EUR
|
5,293,149
|
HSBC
Bank |
1/14/2022
|
(39,986)
|
| USD
|
7,297,237
|
EUR
|
6,472,079
|
JPMorgan
Chase Bank N.A. |
3/11/2022
|
(81,169)
|
| USD
|
19,184,238
|
EUR
|
16,953,362
|
JPMorgan
Chase Bank N.A. |
3/16/2022
|
(145,511)
|
| USD
|
566,886
|
EUR
|
497,830
|
NatWest
Markets PLC |
1/14/2022
|
(4)
|
| USD
|
560,737
|
EUR
|
499,705
|
UBS
AG |
1/14/2022
|
(8,288)
|
| USD
|
1,663,218
|
GBP
|
1,230,000
|
Credit
Suisse Group |
1/14/2022
|
(1,616)
|
| USD
|
2,674,740
|
GBP
|
2,010,218
|
Deutsche
Bank AG |
1/14/2022
|
(46,140)
|
| USD
|
6,399,355
|
GBP
|
4,834,069
|
Goldman
Sachs International |
3/11/2022
|
(141,983)
|
| USD
|
1,678,187
|
GBP
|
1,245,000
|
JPMorgan
Chase Bank N.A. |
1/14/2022
|
(6,951)
|
| USD
|
1,653,240
|
GBP
|
1,251,000
|
JPMorgan
Chase Bank N.A. |
3/16/2022
|
(39,536)
|
| USD
|
171,437
|
GBP
|
128,033
|
Morgan
Stanley Capital Services, Inc. |
1/14/2022
|
(1,858)
|
| USD
|
1,114,124
|
IDR
|
16,018,869,000
|
JPMorgan
Chase Bank N.A. |
2/22/2022
|
(5,353)
|
| USD
|
423,025
|
ILS
|
1,321,342
|
JPMorgan
Chase Bank N.A. |
3/11/2022
|
(2,205)
|
| USD
|
404,501
|
JPY
|
46,642,784
|
HSBC
Bank |
1/14/2022
|
(1,008)
|
| USD
|
743,066
|
MXN
|
15,905,487
|
Goldman
Sachs International |
3/11/2022
|
(24,732)
|
| USD
|
1,709,862
|
NZD
|
2,510,000
|
Goldman
Sachs International |
1/14/2022
|
(9,090)
|
MFS Global Tactical
Allocation Portfolio
Portfolio of Investments – continued
| Forward
Foreign Currency Exchange Contracts - continued |
Currency
Purchased |
Currency
Sold |
Counterparty
|
Settlement
Date |
Unrealized
Appreciation
(Depreciation) |
| Liability
Derivatives - continued |
| USD
|
1,657,286
|
NZD
|
2,454,000
|
JPMorgan
Chase Bank N.A. |
1/14/2022
|
$
(23,315) |
| USD
|
3,361,438
|
NZD
|
4,980,114
|
JPMorgan
Chase Bank N.A. |
3/11/2022
|
(46,097)
|
| USD
|
581,426
|
PLN
|
2,384,778
|
Goldman
Sachs International |
3/11/2022
|
(7,542)
|
| USD
|
2,035,556
|
SEK
|
18,432,333
|
JPMorgan
Chase Bank N.A. |
3/16/2022
|
(5,479)
|
| USD
|
554,729
|
SGD
|
758,723
|
JPMorgan
Chase Bank N.A. |
3/11/2022
|
(8,083)
|
| USD
|
413,310
|
TWD
|
11,514,000
|
Barclays
Bank PLC |
1/21/2022
|
(2,843)
|
| USD
|
1,281,917
|
TWD
|
35,686,000
|
JPMorgan
Chase Bank N.A. |
1/21/2022
|
(7,891)
|
| USD
|
1,662,570
|
TWD
|
46,000,000
|
JPMorgan
Chase Bank N.A. |
2/18/2022
|
(13)
|
| USD
|
4,261,057
|
ZAR
|
68,980,122
|
JPMorgan
Chase Bank N.A. |
3/16/2022
|
(24,200)
|
| |
|
|
|
|
|
$(4,057,421)
|
| Futures
Contracts |
| Description
|
Long/
Short |
Currency
|
Contracts
|
Notional
Amount |
Expiration
Date |
Value/Unrealized
Appreciation
(Depreciation) |
| Asset
Derivatives |
| Equity
Futures |
|
|
| CAC
40 Index |
Long
|
EUR
|
47
|
$3,822,182
|
January
– 2022 |
$91,116
|
| FTSE
100 Index |
Long
|
GBP
|
143
|
14,176,162
|
March
– 2022 |
177,783
|
| FTSE
MIB Index |
Long
|
EUR
|
129
|
20,009,085
|
March
– 2022 |
291,613
|
| FTSE/JSE
Top 40 Index |
Long
|
ZAR
|
110
|
4,624,487
|
March
– 2022 |
104,098
|
| Hang
Seng Index |
Long
|
HKD
|
34
|
5,112,722
|
January
– 2022 |
55,464
|
| Mexbol
Index |
Long
|
MXN
|
332
|
8,717,240
|
March
– 2022 |
410,582
|
| MSCI
Singapore Index |
Long
|
SGD
|
13
|
328,135
|
January
– 2022 |
3,810
|
| OMX
30 Index |
Long
|
SEK
|
764
|
20,454,472
|
January
– 2022 |
608,163
|
| S&P/TSX
60 Index |
Long
|
CAD
|
23
|
4,658,002
|
March
– 2022 |
76,222
|
| Topix
Index |
Long
|
JPY
|
14
|
2,424,411
|
March
– 2022 |
50,740
|
| |
|
|
|
|
|
$1,869,591
|
| Interest
Rate Futures |
|
|
| Canadian
Treasury Bond 10 yr |
Long
|
CAD
|
48
|
$5,411,882
|
March
– 2022 |
$79,750
|
| Euro-Bund
10 yr |
Short
|
EUR
|
265
|
51,702,740
|
March
– 2022 |
879,147
|
| Euro-Buxl
30 yr |
Short
|
EUR
|
12
|
2,824,481
|
March
– 2022 |
143,697
|
| Japan
Government Bond 10 yr |
Short
|
JPY
|
13
|
17,131,792
|
March
– 2022 |
54,077
|
| Long
Gilt 10 yr |
Short
|
GBP
|
138
|
23,330,058
|
March
– 2022 |
354,641
|
| |
|
|
|
|
|
$1,511,312
|
| |
|
|
|
|
|
$3,380,903
|
| Liability
Derivatives |
| Equity
Futures |
|
|
| AEX
25 Index |
Short
|
EUR
|
62
|
$11,261,305
|
January
– 2022 |
$(121,023)
|
| BIST
30 Index |
Long
|
TRY
|
7,203
|
11,417,863
|
February
– 2022 |
(300,431)
|
| DAX
Index |
Short
|
EUR
|
13
|
5,866,916
|
March
– 2022 |
(35,449)
|
| FTSE
Taiwan Index |
Short
|
USD
|
293
|
18,793,020
|
January
– 2022 |
(108,996)
|
| IBEX
35 Index |
Short
|
EUR
|
26
|
2,570,669
|
January
– 2022 |
(78,987)
|
| IBOV
Index |
Long
|
BRL
|
367
|
6,972,012
|
February
– 2022 |
(307,173)
|
| KOSPI
200 Index |
Short
|
KRW
|
93
|
7,710,883
|
March
– 2022 |
(104,299)
|
| NIFTY
Index |
Short
|
USD
|
510
|
17,788,290
|
January
– 2022 |
(198,319)
|
| Russell
2000 Index |
Short
|
USD
|
121
|
13,568,940
|
March
– 2022 |
(167,057)
|
| S&P
500 E-Mini Index |
Short
|
USD
|
126
|
29,978,550
|
March
– 2022 |
(623,633)
|
MFS Global Tactical
Allocation Portfolio
Portfolio of Investments – continued
| Description
|
Long/
Short |
Currency
|
Contracts
|
Notional
Amount |
Expiration
Date |
Value/Unrealized
Appreciation
(Depreciation) |
| Liability
Derivatives - continued |
| Equity
Futures - continued |
| S&P/ASX
200 Index |
Short
|
AUD
|
155
|
$20,713,076
|
March
– 2022 |
$(259,822)
|
| |
|
|
|
|
|
$(2,305,189)
|
| Interest
Rate Futures |
|
|
| Australian
Bond 10 yr |
Long
|
AUD
|
515
|
$52,144,363
|
March
– 2022 |
$(130,864)
|
| Canadian
Treasury Bond 5 yr |
Short
|
CAD
|
78
|
7,553,042
|
March
– 2022 |
(26,898)
|
| Euro-Bobl
5 yr |
Long
|
EUR
|
145
|
21,995,585
|
March
– 2022 |
(180,273)
|
| U.S.
Treasury Bond |
Short
|
USD
|
22
|
3,529,625
|
March
– 2022 |
(49,617)
|
| U.S.
Treasury Note 10 yr |
Short
|
USD
|
36
|
4,696,875
|
March
– 2022 |
(39,974)
|
| U.S.
Treasury Note 2 yr |
Long
|
USD
|
38
|
8,290,531
|
March
– 2022 |
(2,793)
|
| U.S.
Treasury Note 5 yr |
Short
|
USD
|
175
|
21,170,898
|
March
– 2022 |
(82,574)
|
| U.S.
Treasury Ultra Bond |
Long
|
USD
|
13
|
2,562,625
|
March
– 2022 |
(55,339)
|
| U.S.
Treasury Ultra Note 10 yr |
Short
|
USD
|
87
|
12,740,062
|
March
– 2022 |
(239,045)
|
| |
|
|
|
|
|
$(807,377)
|
| |
|
|
|
|
|
$(3,112,566)
|
| Cleared
Swap Agreements |
Maturity
Date |
Notional
Amount |
Counterparty
|
Cash
Flows
to Receive/
Frequency |
Cash
Flows
to Pay/
Frequency |
Unrealized
Appreciation
(Depreciation) |
|
Net
Unamortized
Upfront Payments
(Receipts) |
|
Value
|
| Asset
Derivatives |
|
|
|
|
|
| Interest
Rate Swaps |
|
|
|
|
|
| 9/17/31
|
USD
|
14,500,000
|
centrally
cleared |
0.12%
FLR (3-Month LIBOR)/Quarterly |
1.21%/Semi-annually
|
$408,998
|
|
$13,324
|
|
$422,322
|
| Liability
Derivatives |
|
|
|
|
|
| Interest
Rate Swaps |
|
|
|
|
|
| 9/20/23
|
USD
|
69,300,000
|
centrally
cleared |
0.29%/Semi-annually
|
0.12%
FLR (3-Month LIBOR)/Quarterly |
$(578,813)
|
|
$(9,308)
|
|
$(588,121)
|
| 9/16/26
|
USD
|
60,500,000
|
centrally
cleared |
0.79%/Semi-annually
|
0.12%
FLR (3-Month LIBOR)/Quarterly |
(1,376,012)
|
|
(25,513)
|
|
(1,401,525)
|
| 11/06/49
|
USD
|
13,102,083
|
centrally
cleared |
0.12%
FLR (3-Month LIBOR)/Quarterly |
1.89%/Semi-annually
|
(502,027)
|
|
—
|
|
(502,027)
|
| |
|
|
|
|
|
$(2,456,852)
|
|
$(34,821)
|
|
$(2,491,673)
|
MFS Global Tactical
Allocation Portfolio
Portfolio of Investments – continued
| Uncleared
Swap Agreements |
Maturity
Date |
Notional
Amount |
Counterparty
|
Cash
Flows
to Receive/
Frequency |
Cash
Flows
to Pay/
Frequency |
Unrealized
Appreciation
(Depreciation) |
|
Net
Unamortized
Upfront Payments
(Receipts) |
|
Value
|
| Asset
Derivatives |
|
|
|
|
|
| Credit
Default Swaps |
|
|
|
|
|
| 12/20/26
|
EUR
|
542,000
|
Goldman
Sachs International |
5.00%/Quarterly
|
(1)
|
$(1,191)
|
|
$117,524
|
|
$116,333
|
| 12/20/31
|
EUR
|
640,000
|
Barclays
Bank PLC |
1.00%/Quarterly
|
(2)
|
(544)
|
|
6,965
|
|
6,421
|
| |
|
|
|
|
|
$(1,735)
|
|
$124,489
|
|
$122,754
|
(1) Fund, as protection seller, to
pay notional amount upon a defined credit event Glencore Funding LLC, 1.875%, 9/13/23 a BBB+ rated bond. The fund entered into the contract to gain issuer exposure.
(2) Fund, as protection seller, to pay notional amount upon a
defined credit event Daimler Finance North America LLC, 1.4%, 1/12/24 a A- rated bond. The fund entered into the contract to gain issuer exposure.
The credit ratings presented here are an indicator of the
current payment/performance risk of the related swap agreement, the reference obligation for which may be either a single security or, in the case of a credit default swap index, a basket of securities issued by corporate or sovereign issuers.
Ratings are assigned to each reference security, including each individual security within a reference basket of securities, utilizing ratings from Moody's, Fitch, and Standard & Poor's rating agencies and applying the following hierarchy: If
all three agencies provide a rating, the middle rating (after dropping the highest and lowest ratings) is assigned; if two of the three agencies rate a security, the lower of the two is assigned. If none of the 3 rating agencies above assign a
rating, but the security is rated by DBRS Morningstar, than the DBRS Morningstar rating is assigned. If none of the 4 rating agencies listed above rate the security, but the security is rated by the Kroll Bond Rating Agency (KBRA), then the KBRA
rating is assigned. Ratings are shown in the S&P and Fitch scale (e.g., AAA). The ratings for a credit default swap index are calculated by MFS as a weighted average of the external credit ratings of the individual securities that compose the
index's reference basket of securities.
At December 31,
2021, the fund had cash collateral of $1,680,448 and other liquid securities with an aggregate value of $38,205,703 to cover any collateral or margin obligations for certain derivative contracts. Restricted cash and/or deposits with brokers in the
Statement of Assets and Liabilities are comprised of cash collateral.
See Notes to Financial Statements
MFS Global Tactical
Allocation Portfolio
| Financial
Statements |
Statement of Assets and
Liabilities |
This statement
represents your fund’s balance sheet, which details the assets and liabilities comprising the total value of the fund.
| At
12/31/21 Assets |
|
| Investments
in unaffiliated issuers, at value, including $428,492 of securities on loan (identified cost, $439,377,306) |
$510,471,429
|
| Investments
in affiliated issuers, at value (identified cost, $12,950,052) |
12,950,052
|
| Cash
|
32,645
|
| Foreign
currency, at value (identified cost, $16,939) |
16,989
|
| Restricted
cash for |
|
| Forward
foreign currency exchange contracts |
370,000
|
| Deposits
with brokers for |
|
| Futures
contracts |
1,298,880
|
| Cleared
options |
11,568
|
| Receivables
for |
|
| Forward
foreign currency exchange contracts |
3,243,319
|
| Investments
sold |
660,032
|
| TBA
sale commitments |
103,631
|
| Fund
shares sold |
8,439
|
| Interest
and dividends |
3,025,665
|
| Uncleared
swaps, at value (net of unamortized premiums paid, $124,489) |
122,754
|
| Receivable
from investment adviser |
46,987
|
| Other
assets |
2,468
|
| Total
assets |
$532,364,858
|
| Liabilities
|
|
| Payables
for |
|
| Net
daily variation margin on open cleared swap agreements |
$56,962
|
| Forward
foreign currency exchange contracts |
4,057,421
|
| Net
daily variation margin on open futures contracts |
256,033
|
| Investments
purchased |
105,209
|
| TBA
purchase commitments |
4,716,570
|
| Fund
shares reacquired |
212,767
|
| Payable
to affiliates |
|
| Administrative
services fee |
442
|
| Shareholder
servicing costs |
88
|
| Distribution
and/or service fees |
6,632
|
| Payable
for independent Trustees' compensation |
474
|
| Deferred
country tax expense payable |
4,922
|
| Accrued
expenses and other liabilities |
204,110
|
| Total
liabilities |
$9,621,630
|
| Net
assets |
$522,743,228
|
| Net
assets consist of |
|
| Paid-in
capital |
$419,918,156
|
| Total
distributable earnings (loss) |
102,825,072
|
| Net
assets |
$522,743,228
|
| Shares
of beneficial interest outstanding |
34,687,461
|
| |
Net
assets |
Shares
outstanding |
Net
asset value
per share |
| Initial
Class |
$39,122,531
|
2,548,067
|
$15.35
|
| Service
Class |
483,620,697
|
32,139,394
|
15.05
|
See Notes to Financial Statements
MFS Global Tactical
Allocation Portfolio
| Financial
Statements |
Statement of Operations
|
This statement describes how much
your fund earned in investment income and accrued in expenses. It also describes any gains and/or losses generated by fund operations.
| Year
ended 12/31/21 |
|
| Net
investment income (loss) |
|
| Income
|
|
| Interest
|
$7,968,163
|
| Dividends
|
5,431,104
|
| Dividends
from affiliated issuers |
11,694
|
| Income
on securities loaned |
2,028
|
| Other
|
59
|
| Foreign
taxes withheld |
(298,670)
|
| Total
investment income |
$13,114,378
|
| Expenses
|
|
| Management
fee |
$3,957,960
|
| Distribution
and/or service fees |
1,279,041
|
| Shareholder
servicing costs |
13,885
|
| Administrative
services fee |
82,628
|
| Independent
Trustees' compensation |
9,928
|
| Custodian
fee |
129,611
|
| Shareholder
communications |
103,538
|
| Audit
and tax fees |
94,943
|
| Legal
fees |
2,772
|
| Miscellaneous
|
124,614
|
| Total
expenses |
$5,798,920
|
| Reduction
of expenses by investment adviser |
(215,559)
|
| Net
expenses |
$5,583,361
|
| Net
investment income (loss) |
$7,531,017
|
| Realized
and unrealized gain (loss) |
|
| Realized
gain (loss) (identified cost basis) |
|
| Unaffiliated
issuers (net of $261 country tax) |
$33,932,650
|
| Written
options |
605,605
|
| Futures
contracts |
(6,291,504)
|
| Swap
agreements |
1,000,796
|
| Forward
foreign currency exchange contracts |
5,178,956
|
| Foreign
currency |
(1,007,641)
|
| Net
realized gain (loss) |
$33,418,862
|
| Change
in unrealized appreciation or depreciation |
|
| Unaffiliated
issuers (net of $4,922 increase in deferred country tax) |
$(26,732,246)
|
| Futures
contracts |
921,188
|
| Swap
agreements |
(1,298,368)
|
| Forward
foreign currency exchange contracts |
848,884
|
| Translation
of assets and liabilities in foreign currencies |
(305,314)
|
| Net
unrealized gain (loss) |
$(26,565,856)
|
| Net
realized and unrealized gain (loss) |
$6,853,006
|
| Change
in net assets from operations |
$14,384,023
|
See Notes to Financial Statements
MFS Global Tactical
Allocation Portfolio
| Financial
Statements |
Statements of Changes in
Net Assets |
These statements describe
the increases and/or decreases in net assets resulting from operations, any distributions, and any shareholder transactions.
| |
Year
ended |
| |
12/31/21
|
12/31/20
|
| Change
in net assets |
|
|
| From
operations |
|
|
| Net
investment income (loss) |
$7,531,017
|
$6,760,505
|
| Net
realized gain (loss) |
33,418,862
|
19,865,576
|
| Net
unrealized gain (loss) |
(26,565,856)
|
4,492,245
|
| Change
in net assets from operations |
$14,384,023
|
$31,118,326
|
| Total
distributions to shareholders |
$(29,054,748)
|
$(34,497,547)
|
| Change
in net assets from fund share transactions |
$(36,801,795)
|
$(21,278,512)
|
| Total
change in net assets |
$(51,472,520)
|
$(24,657,733)
|
| Net
assets |
|
|
| At
beginning of period |
574,215,748
|
598,873,481
|
| At
end of period |
$522,743,228
|
$574,215,748
|
See Notes to Financial Statements
MFS Global Tactical
Allocation Portfolio
| Financial
Statements |
Financial Highlights
|
The financial highlights table is
intended to help you understand the fund's financial performance for the past 5 years. Certain information reflects financial results for a single fund share. The total returns in the table represent the rate that an investor would have earned (or
lost) on an investment in the fund share class (assuming reinvestment of all distributions) held for the entire period.
| Initial
Class |
Year
ended |
| |
12/31/21
|
12/31/20
|
12/31/19
|
12/31/18
|
12/31/17
|
| Net
asset value, beginning of period |
$15.79
|
$15.86
|
$14.58
|
$16.11
|
$15.04
|
| Income
(loss) from investment operations |
|
|
|
|
|
| Net
investment income (loss) (d) |
$0.25
|
$0.22
|
$0.29
|
$0.29
|
$0.26
|
| Net
realized and unrealized gain (loss) |
0.19
|
0.71
|
1.80
|
(0.99)
|
1.36
|
| Total
from investment operations |
$0.44
|
$0.93
|
$2.09
|
$(0.70)
|
$1.62
|
| Less
distributions declared to shareholders |
|
|
|
|
|
| From
net investment income |
$(0.16)
|
$(0.28)
|
$(0.45)
|
$(0.13)
|
$(0.51)
|
| From
net realized gain |
(0.72)
|
(0.72)
|
(0.36)
|
(0.70)
|
(0.04)
|
| Total
distributions declared to shareholders |
$(0.88)
|
$(1.00)
|
$(0.81)
|
$(0.83)
|
$(0.55)
|
| Net
asset value, end of period (x) |
$15.35
|
$15.79
|
$15.86
|
$14.58
|
$16.11
|
| Total
return (%) (k)(r)(s)(x) |
2.79
|
6.23
|
14.58
|
(4.50)
|
10.83
|
Ratios
(%) (to average net assets)
and Supplemental data: |
|
|
|
|
|
| Expenses
before expense reductions |
0.82
|
0.83
|
0.81
|
0.81
|
0.81
|
| Expenses
after expense reductions |
0.78
|
0.82
|
0.80
|
0.80
|
0.80
|
| Net
investment income (loss) |
1.59
|
1.45
|
1.85
|
1.83
|
1.64
|
| Portfolio
turnover |
132
|
120
|
82
|
86
|
35
|
| Net
assets at end of period (000 omitted) |
$39,123
|
$43,513
|
$46,175
|
$47,517
|
$56,096
|
| Service
Class |
Year
ended |
| |
12/31/21
|
12/31/20
|
12/31/19
|
12/31/18
|
12/31/17
|
| Net
asset value, beginning of period |
$15.49
|
$15.57
|
$14.32
|
$15.84
|
$14.79
|
| Income
(loss) from investment operations |
|
|
|
|
|
| Net
investment income (loss) (d) |
$0.21
|
$0.18
|
$0.24
|
$0.24
|
$0.22
|
| Net
realized and unrealized gain (loss) |
0.19
|
0.70
|
1.77
|
(0.98)
|
1.34
|
| Total
from investment operations |
$0.40
|
$0.88
|
$2.01
|
$(0.74)
|
$1.56
|
| Less
distributions declared to shareholders |
|
|
|
|
|
| From
net investment income |
$(0.12)
|
$(0.24)
|
$(0.40)
|
$(0.08)
|
$(0.47)
|
| From
net realized gain |
(0.72)
|
(0.72)
|
(0.36)
|
(0.70)
|
(0.04)
|
| Total
distributions declared to shareholders |
$(0.84)
|
$(0.96)
|
$(0.76)
|
$(0.78)
|
$(0.51)
|
| Net
asset value, end of period (x) |
$15.05
|
$15.49
|
$15.57
|
$14.32
|
$15.84
|
| Total
return (%) (k)(r)(s)(x) |
2.58
|
5.99
|
14.30
|
(4.80)
|
10.58
|
Ratios
(%) (to average net assets)
and Supplemental data: |
|
|
|
|
|
| Expenses
before expense reductions |
1.07
|
1.08
|
1.06
|
1.06
|
1.06
|
| Expenses
after expense reductions |
1.03
|
1.07
|
1.05
|
1.05
|
1.05
|
| Net
investment income (loss) |
1.34
|
1.19
|
1.60
|
1.58
|
1.39
|
| Portfolio
turnover |
132
|
120
|
82
|
86
|
35
|
| Net
assets at end of period (000 omitted) |
$483,621
|
$530,703
|
$552,698
|
$559,478
|
$706,456
|
See Notes to Financial Statements
MFS Global Tactical
Allocation Portfolio
Financial Highlights - continued
| (d)
|
Per share data
is based on average shares outstanding. |
| (k)
|
The total
return does not reflect expenses that apply to separate accounts. Inclusion of these charges would reduce the total return figures for all periods shown. |
| (r)
|
Certain
expenses have been reduced without which performance would have been lower. |
| (s)
|
From time to
time the fund may receive proceeds from litigation settlements, without which performance would be lower. |
| (x)
|
The
net asset values and total returns have been calculated on net assets which include adjustments made in accordance with U.S. generally accepted accounting principles required at period end for financial reporting purposes. |
See Notes to Financial Statements
MFS Global Tactical
Allocation Portfolio
Notes to Financial Statements
(1) Business and Organization
MFS Global Tactical Allocation Portfolio (the fund) is a
diversified series of MFS Variable Insurance Trust II (the trust). The trust is organized as a Massachusetts business trust and is registered under the Investment Company Act of 1940, as amended, as an open-end management investment company. The
shareholders of each series of the trust are separate accounts of insurance companies, which offer variable annuity and/or life insurance products, and qualified retirement and pension plans.
The fund is an investment company and accordingly follows
the investment company accounting and reporting guidance of the Financial Accounting Standards Board (FASB) Accounting Standards Codification Topic 946 Financial Services - Investment Companies.
(2) Significant Accounting Policies
General — The
preparation of financial statements in conformity with U.S. generally accepted accounting principles requires management to make estimates and assumptions that affect the reported amounts of assets and liabilities, and disclosure of contingent
assets and liabilities at the date of the financial statements and the reported amounts of increases and decreases in net assets from operations during the reporting period. Actual results could differ from those estimates. In the preparation of
these financial statements, management has evaluated subsequent events occurring after the date of the fund’s Statement of Assets and Liabilities through the date that the financial statements were issued. The fund invests in derivatives as part of its principal investment strategy. Derivatives can be highly volatile and involve risks in addition to the risks of the underlying indicators on which the derivative is based.
Derivatives can involve leverage. The fund invests in foreign securities, including securities of emerging market issuers. Investments in foreign securities are vulnerable to the effects of changes in the
relative values of the local currency and the U.S. dollar and to the effects of changes in each country’s market, economic, industrial, political, regulatory, geopolitical, environmental, public health, and other conditions. Investments in
emerging markets can involve additional and greater risks than the risks associated with investments in developed foreign markets. Emerging markets can have less developed markets, greater custody and operational risk, less developed legal,
regulatory, accounting, and auditing systems, and greater political, social, and economic instability than developed markets.
Balance Sheet Offsetting
— The fund's accounting policy with respect to balance sheet offsetting is that, absent an event of default by the counterparty or a termination of the agreement, the International Swaps and Derivatives Association (ISDA) Master Agreement, or
similar agreement, does not result in an offset of reported amounts of financial assets and financial liabilities in the Statement of Assets and Liabilities across transactions between the fund and the applicable counterparty. The fund's right to
setoff may be restricted or prohibited by the bankruptcy or insolvency laws of the particular jurisdiction to which a specific master netting agreement counterparty is subject. Balance sheet offsetting disclosures, to the extent applicable to the
fund, have been included in the fund’s Significant Accounting Policies note under the captions for each of the fund’s in-scope financial instruments and transactions.
Investment Valuations
— Equity securities, including restricted equity securities, are generally valued at the last sale or official closing price on their primary market or exchange as provided by a third-party pricing
service. Equity securities, for which there were no sales reported that day, are generally valued at the last quoted daily bid quotation on their primary market or exchange as provided by a third-party pricing service. Debt instruments and floating rate loans, including restricted debt instruments, are generally valued at an evaluated or composite bid as provided by a third-party pricing service. Short-term instruments with a maturity
at issuance of 60 days or less may be valued at amortized cost, which approximates market value. Exchange-traded options are generally valued at the last sale or official closing price on their primary
exchange as provided by a third-party pricing service. Exchange-traded options for which there were no sales reported that day are generally valued at the last daily bid quotation on their primary exchange as provided by a third-party pricing
service. For put options, the position may be valued at the last daily ask quotation if there are no trades reported during the day. Options not traded on an exchange are generally valued at a broker/dealer bid quotation. Foreign currency options
are generally valued at valuations provided by a third-party pricing service. Futures contracts are generally valued at last posted settlement price on their primary exchange as provided by a third-party
pricing service. Futures contracts for which there were no trades that day for a particular position are generally valued at the closing bid quotation on their primary exchange as provided by a third-party pricing service. Forward foreign currency exchange contracts are generally valued at the mean of bid and asked prices for the time period interpolated from rates provided by a third-party pricing service for proximate time
periods. Swap agreements are generally valued using valuations provided by a third-party pricing service, which for cleared swaps includes an evaluation of any trading activity at the clearinghouses. Open-end investment companies are generally valued at net asset value per share. Securities and other assets generally valued on the basis of information from a third-party
pricing service may also be valued at a broker/dealer bid quotation. In determining values, third-party pricing services can utilize both transaction data and market information such as yield, quality, coupon
rate, maturity, type of issue, trading characteristics, and other market data. The values of foreign securities and other assets and liabilities expressed in foreign currencies are converted to U.S. dollars
using the mean of bid and asked prices for rates provided by a third-party pricing service.
MFS Global Tactical
Allocation Portfolio
Notes to Financial Statements - continued
The
Board of Trustees has delegated primary responsibility for determining or causing to be determined the value of the fund’s investments (including any fair valuation) to the adviser pursuant to valuation policies and procedures approved by the
Board. If the adviser determines that reliable market quotations are not readily available, investments are valued at fair value as determined in good faith by the adviser in accordance with such procedures under the oversight of the Board of
Trustees. Under the fund’s valuation policies and procedures, market quotations are not considered to be readily available for most types of debt instruments and floating rate loans and many types of derivatives. These investments are
generally valued at fair value based on information from third-party pricing services. In addition, investments may be valued at fair value if the adviser determines that an investment’s value has been materially affected by events occurring
after the close of the exchange or market on which the investment is principally traded (such as foreign exchange or market) and prior to the determination of the fund’s net asset value, or after the halt of trading of a specific security
where trading does not resume prior to the close of the exchange or market on which the security is principally traded. Events that occur after foreign markets close (such as developments in foreign markets and significant movements in the U.S.
markets) and prior to the determination of the fund’s net asset value may be deemed to have a material effect on the value of securities traded in foreign markets. Accordingly, the fund’s foreign equity securities may often be valued at
fair value. The adviser generally relies on third-party pricing services or other information (such as the correlation with price movements of similar securities in the same or other markets; the type, cost and investment characteristics of the
security; the business and financial condition of the issuer; and trading and other market data) to assist in determining whether to fair value and at what value to fair value an investment. The value of an investment for purposes of calculating the
fund’s net asset value can differ depending on the source and method used to determine value. When fair valuation is used, the value of an investment used to determine the fund’s net asset value may differ from quoted or published prices
for the same investment. There can be no assurance that the fund could obtain the fair value assigned to an investment if it were to sell the investment at the same time at which the fund determines its net asset value per share.
Various inputs are used in determining the value of the
fund's assets or liabilities. These inputs are categorized into three broad levels. In certain cases, the inputs used to measure fair value may fall into different levels of the fair value hierarchy. In such cases, an investment's level within the
fair value hierarchy is based on the lowest level of input that is significant to the fair value measurement. The fund's assessment of the significance of a particular input to the fair value measurement in its entirety requires judgment, and
considers factors specific to the investment. Level 1 includes unadjusted quoted prices in active markets for identical assets or liabilities. Level 2 includes other significant observable market-based inputs (including quoted prices for similar
securities, interest rates, prepayment speed, and credit risk). Level 3 includes unobservable inputs, which may include the adviser's own assumptions in determining the fair value of investments. Other financial instruments are derivative
instruments, such as futures contracts, forward foreign currency exchange contracts, and swap agreements. The following is a summary of the levels used as of December 31, 2021 in valuing the fund's assets and liabilities:
| Financial
Instruments |
Level
1 |
Level
2 |
Level
3 |
Total
|
| Equity
Securities: |
|
|
|
|
| United
States |
$102,966,663
|
$—
|
$—
|
$102,966,663
|
| Switzerland
|
2,565,163
|
12,208,381
|
—
|
14,773,544
|
| United
Kingdom |
13,899,890
|
—
|
—
|
13,899,890
|
| Japan
|
11,459,841
|
—
|
—
|
11,459,841
|
| France
|
9,040,343
|
—
|
—
|
9,040,343
|
| Canada
|
6,067,944
|
—
|
—
|
6,067,944
|
| Germany
|
5,261,551
|
—
|
—
|
5,261,551
|
| Netherlands
|
3,636,901
|
—
|
—
|
3,636,901
|
| Taiwan
|
3,605,568
|
—
|
—
|
3,605,568
|
| Other
Countries |
13,860,523
|
3,958,007
|
—
|
17,818,530
|
| U.S.
Treasury Bonds & U.S. Government Agencies & Equivalents |
—
|
10,373,581
|
—
|
10,373,581
|
| Non
- U.S. Sovereign Debt |
—
|
131,004,355
|
—
|
131,004,355
|
| Municipal
Bonds |
—
|
2,177,851
|
—
|
2,177,851
|
| U.S.
Corporate Bonds |
—
|
53,656,296
|
—
|
53,656,296
|
| Residential
Mortgage-Backed Securities |
—
|
21,466,297
|
—
|
21,466,297
|
| Commercial
Mortgage-Backed Securities |
—
|
15,169,958
|
—
|
15,169,958
|
| Asset-Backed
Securities (including CDOs) |
—
|
10,706,820
|
—
|
10,706,820
|
| Foreign
Bonds |
—
|
77,385,496
|
—
|
77,385,496
|
| Mutual
Funds |
12,950,052
|
—
|
—
|
12,950,052
|
| Total
|
$185,314,439
|
$338,107,042
|
$—
|
$523,421,481
|
MFS Global Tactical
Allocation Portfolio
Notes to Financial Statements - continued
| Other
Financial Instruments |
|
|
|
|
| Futures
Contracts – Assets |
$2,481,127
|
$899,776
|
$—
|
$3,380,903
|
| Futures
Contracts – Liabilities |
(2,998,130)
|
(114,436)
|
—
|
(3,112,566)
|
| Forward
Foreign Currency Exchange Contracts – Assets |
—
|
3,243,319
|
—
|
3,243,319
|
| Forward
Foreign Currency Exchange Contracts – Liabilities |
—
|
(4,057,421)
|
—
|
(4,057,421)
|
| Swap
Agreements – Assets |
—
|
545,076
|
—
|
545,076
|
| Swap
Agreements – Liabilities |
—
|
(2,491,673)
|
—
|
(2,491,673)
|
For further information
regarding security characteristics, see the Portfolio of Investments.
Inflation-Adjusted Debt Securities — The fund invests in inflation-adjusted debt securities issued by the U.S. Treasury. The principal value of these debt securities is adjusted through income according to changes in the Consumer Price Index. These
debt securities typically pay a fixed rate of interest, but this fixed rate is applied to the inflation-adjusted principal amount. The principal paid at maturity of the debt security is typically equal to the inflation-adjusted principal amount, or
the security’s original par value, whichever is greater. Other types of inflation-adjusted securities may use other methods to adjust for other measures of inflation.
Foreign Currency
Translation — Purchases and sales of foreign investments, income, and expenses are converted into U.S. dollars based upon currency exchange rates prevailing on the respective dates of such transactions or on
the reporting date for foreign denominated receivables and payables. Gains and losses attributable to foreign currency exchange rates on sales of securities are recorded for financial statement purposes as net realized gains and losses on
investments. Gains and losses attributable to foreign exchange rate movements on receivables, payables, income and expenses are recorded for financial statement purposes as foreign currency transaction gains and losses. That portion of both realized
and unrealized gains and losses on investments that results from fluctuations in foreign currency exchange rates is not separately disclosed.
Derivatives — The
fund uses derivatives in an attempt to adjust exposure to markets, asset classes, and currencies based on the adviser’s assessment of the relative attractiveness of such markets, asset classes, and currencies. Derivatives are used to increase
or decrease the fund’s exposure to markets, asset classes, or currencies resulting from the fund’s individual security selections, and to expose the fund to markets, asset classes, or currencies in which the fund’s individual
security selection has resulted in little or no exposure. Derivatives are used for hedging or non-hedging purposes. While hedging can reduce or eliminate losses, it can also reduce or eliminate gains. When the fund uses derivatives as an investment
to increase or decrease market exposure, or for hedging purposes, gains and losses from derivative instruments may be substantially greater than the derivative’s original cost.
The derivative instruments used by the fund during the
period were written options, purchased options, futures contracts, forward foreign currency exchange contracts, and swap agreements. Depending on the type of derivative, a fund may exit a derivative position by entering into an offsetting
transaction with a counterparty or exchange, negotiating an agreement with the derivative counterparty, or novating the position to a third party. The fund may be unable to promptly close out a futures position in instances where the daily
fluctuation in the price for that type of future exceeds the daily limit set by the exchange. The fund's period end derivatives, as presented in the Portfolio of Investments and the associated Derivative Contract tables, generally are indicative of
the volume of its derivative activity during the period.
The following table presents, by major type of derivative
contract, the fair value, on a gross basis, of the asset and liability components of derivatives held by the fund at December 31, 2021 as reported in the Statement of Assets and Liabilities:
| |
|
Fair
Value (a) |
| Risk
|
Derivative
Contracts |
Asset
Derivatives |
Liability
Derivatives |
| Interest
Rate |
Futures
Contracts |
$1,511,312
|
$(807,377)
|
| Equity
|
Futures
Contracts |
1,869,591
|
(2,305,189)
|
| Interest
Rate |
Cleared
Swap Agreements |
422,322
|
(2,491,673)
|
| Credit
|
Uncleared
Swap Agreements |
122,754
|
—
|
| Foreign
Exchange |
Forward
Foreign Currency Exchange Contracts |
3,243,319
|
(4,057,421)
|
| Interest
Rate |
Purchased
Option Contracts |
842,604
|
—
|
| Equity
|
Purchased
Option Contracts |
14,175
|
—
|
| Total
|
|
$8,026,077
|
$(9,661,660)
|
(a) The value of purchased options
outstanding is included in investments in unaffiliated issuers, at value, within the Statement of Assets and Liabilities. Values presented in this table for futures contracts and cleared swap agreements correspond to the values reported in the
Portfolio of Investments. Only the current day net variation margin for futures contracts and cleared swap agreements is separately reported within the Statement of Assets and Liabilities.
MFS Global Tactical
Allocation Portfolio
Notes to Financial Statements - continued
The
following table presents, by major type of derivative contract, the realized gain (loss) on derivatives held by the fund for the year ended December 31, 2021 as reported in the Statement of Operations:
| Risk
|
Futures
Contracts |
Swap
Agreements |
Forward
Foreign
Currency
Exchange
Contracts |
Unaffiliated
Issuers
(Purchased
Options) |
Written
Options |
| Interest
Rate |
$2,149,581
|
$980,171
|
$—
|
$—
|
$—
|
| Foreign
Exchange |
—
|
—
|
5,178,956
|
—
|
—
|
| Credit
|
—
|
20,625
|
—
|
(174,196)
|
53,264
|
| Equity
|
(8,441,085)
|
—
|
—
|
(1,088,849)
|
552,341
|
| Total
|
$(6,291,504)
|
$1,000,796
|
$5,178,956
|
$(1,263,045)
|
$605,605
|
The following table presents, by
major type of derivative contract, the change in unrealized appreciation or depreciation on derivatives held by the fund for the year ended December 31, 2021 as reported in the Statement of Operations:
| Risk
|
Futures
Contracts |
Swap
Agreements |
Forward
Foreign
Currency
Exchange
Contracts |
Unaffiliated
Issuers
(Purchased
Options) |
| Interest
Rate |
$1,031,385
|
$(1,292,640)
|
$—
|
$349,624
|
| Foreign
Exchange |
—
|
—
|
848,884
|
—
|
| Equity
|
(110,197)
|
—
|
—
|
31,477
|
| Credit
|
—
|
(5,728)
|
—
|
—
|
| Total
|
$921,188
|
$(1,298,368)
|
$848,884
|
$381,101
|
Derivative counterparty credit
risk is managed through formal evaluation of the creditworthiness of all potential counterparties. On certain, but not all, uncleared derivatives, the fund attempts to reduce its exposure to counterparty credit risk whenever possible by entering
into an ISDA Master Agreement on a bilateral basis. The ISDA Master Agreement gives each party to the agreement the right to terminate all transactions traded under such agreement if there is a specified deterioration in the credit quality of the
other party. Upon an event of default or a termination of the ISDA Master Agreement, the non-defaulting party has the right to close out all transactions traded under such agreement and to net amounts owed under each agreement to one net amount
payable by one party to the other. This right to close out and net payments across all transactions traded under the ISDA Master Agreement could result in a reduction of the fund's credit risk to such counterparty equal to any amounts payable by the
fund under the applicable transactions, if any.
Collateral and margin requirements differ by type of
derivative. For cleared derivatives (e.g., futures contracts, cleared swaps, and exchange-traded options), margin requirements are set by the clearing broker and the clearing house and collateral, in the form of cash or securities, is posted by the
fund directly with the clearing broker. Collateral terms are counterparty agreement specific for uncleared derivatives (e.g., forward foreign currency exchange contracts, uncleared swap agreements, and uncleared options) and collateral, in the form
of cash and securities, is held in segregated accounts with the fund's custodian in connection with these agreements. For derivatives traded under an ISDA Master Agreement, which contains a collateral support annex, the collateral requirements are
netted across all transactions traded under such counterparty-specific agreement and an amount is posted from one party to the other to collateralize such obligations. Cash that has been segregated or delivered to cover the fund's collateral or
margin obligations under derivative contracts, if any, will be reported separately in the Statement of Assets and Liabilities as restricted cash for uncleared derivatives and/or deposits with brokers for cleared derivatives. Securities pledged as
collateral or margin for the same purpose, if any, are noted in the Portfolio of Investments. The fund may be required to make payments of interest on uncovered collateral or margin obligations with the broker. Any such payments are included in
“Miscellaneous” expense in the Statement of Operations.
The following table presents the fund's derivative assets
and liabilities (by type) on a gross basis as of December 31, 2021:
MFS Global Tactical
Allocation Portfolio
Notes to Financial Statements - continued
| Gross
Amounts of: |
Derivative
Assets |
Derivative
Liabilities |
| Futures
Contracts (a) |
$—
|
$(256,033)
|
| Uncleared
Swaps, at value |
122,754
|
—
|
| Cleared
Swap Agreements (a) |
—
|
(56,962)
|
| Forward
Foreign Currency Exchange Contracts |
3,243,319
|
(4,057,421)
|
| Purchased
Options |
856,779
|
—
|
Total
Gross Amount of Derivative Assets
and Liabilities Presented in the
Statement of Assets & Liabilities |
$4,222,852
|
$(4,370,416)
|
Less:
Derivatives Assets and Liabilities Not Subject
to a Master Netting Agreement or
Similar Arrangement |
409,630
|
(660,036)
|
Total
Gross Amount of Derivative Assets and
Liabilities Subject to a Master Netting Agreement or
Similar Arrangement |
$3,813,222
|
$(3,710,380)
|
(a) The amount presented here
represents the fund's current day net variation margin for futures contracts and for cleared swaps agreements. This amount, which is recognized within the Statement of Assets and Liabilities, differs from the fair value of the futures contracts and
cleared swap agreements which is presented in the tables that follow the Portfolio of Investments.
The following table presents (by counterparty) the fund's
derivative assets net of amounts available for offset under Master Netting Agreements (or similar arrangements) and net of the related collateral held by the fund at December 31, 2021:
| |
|
Amounts
Not Offset in the
Statement of Assets & Liabilities |
| |
Gross
Amount
of Derivative
Assets Subject
to a Master
Netting
Agreement (or
Similar
Arrangement)
by Counterparty |
Financial
Instruments
Available
for Offset |
Financial
Instruments
Collateral
Received (b) |
Cash
Collateral
Received (b) |
Net
Amount
of Derivative
Assets by
Counterparty |
| Barclays
Bank PLC |
$29,926
|
$(29,926)
|
$—
|
$—
|
$—
|
| Brown
Brothers Harriman Co. |
13,968
|
(13,968)
|
—
|
—
|
—
|
| Citibank
N.A. |
72,511
|
(36,526)
|
—
|
—
|
35,985
|
| Deutsche
Bank AG |
428,528
|
(354,558)
|
—
|
—
|
73,970
|
| Goldman
Sachs International |
1,020,588
|
(1,020,588)
|
—
|
—
|
—
|
| JPMorgan
Chase Bank N.A. |
1,368,274
|
(1,368,274)
|
—
|
—
|
—
|
| Merrill
Lynch International |
845,679
|
(132,950)
|
—
|
(712,729)
|
—
|
| Morgan
Stanley Capital Services, Inc. |
33,748
|
(13,573)
|
—
|
—
|
20,175
|
| Total
|
$3,813,222
|
$(2,970,363)
|
$—
|
$(712,729)
|
$130,130
|
The following table presents (by
counterparty) the fund's derivative liabilities net of amounts available for offset under Master Netting Agreements (or similar arrangements) and net of the related collateral pledged by the fund at December 31, 2021:
MFS Global Tactical
Allocation Portfolio
Notes to Financial Statements - continued
| |
|
Amounts
Not Offset in the
Statement of Assets & Liabilities |
| |
Gross
Amount
of Derivative
Liabilities Subject
to a Master
Netting
Agreement (or
Similar
Arrangement)
by Counterparty |
Financial
Instruments
Available
for Offset |
Financial
Instruments
Collateral
Pledged (b) |
Cash
Collateral
Pledged (b) |
Net
Amount
of Derivative
Liabilities by
Counterparty |
| Barclays
Bank PLC |
$(42,236)
|
$29,926
|
$—
|
$—
|
$(12,310)
|
| Brown
Brothers Harriman Co. |
(19,284)
|
13,968
|
—
|
—
|
(5,316)
|
| Citibank
N.A. |
(36,526)
|
36,526
|
—
|
—
|
—
|
| Deutsche
Bank AG |
(354,558)
|
354,558
|
—
|
—
|
—
|
| Goldman
Sachs International |
(1,273,377)
|
1,020,588
|
—
|
—
|
(252,789)
|
| JPMorgan
Chase Bank N.A. |
(1,837,876)
|
1,368,274
|
—
|
370,000
|
(99,602)
|
| Merrill
Lynch International |
(132,950)
|
132,950
|
—
|
—
|
—
|
| Morgan
Stanley Capital Services, Inc. |
(13,573)
|
13,573
|
—
|
—
|
—
|
| Total
|
$(3,710,380)
|
$2,970,363
|
$—
|
$370,000
|
$(370,017)
|
(b) The amount presented here may be
less than the total amount of collateral (received)/pledged as the excess collateral (received)/pledged is not shown for purposes of this presentation.
Written Options — In
exchange for a premium, the fund wrote call options on securities for which it anticipated the price would decline and also wrote put options on securities for which it anticipated the price would increase. At the time the option was written, the
fund believed the premium received exceeded the potential loss that could result from adverse price changes in the options’ underlying securities. In a written option, the fund as the option writer grants the buyer the right to purchase from,
or sell to, the fund a specified number of shares or units of a particular security, currency or index at a specified price within a specified period of time.
The premium received is initially recorded as a liability
in the Statement of Assets and Liabilities. The option is subsequently marked-to-market daily with the difference between the premium received and the market value of the written option being recorded as unrealized appreciation or depreciation. When
a written option expires, the fund realizes a gain equal to the amount of the premium received. The difference between the premium received and the amount paid on effecting a closing transaction is considered a realized gain or loss. When a written
call option is exercised, the premium received is offset against the proceeds to determine the realized gain or loss. When a written put option is exercised, the premium reduces the cost basis of the security purchased by the fund.
At the initiation of the written option contract, for
exchange traded options, the fund is required to deposit securities or cash as collateral with the custodian for the benefit of the broker or directly with the clearing broker, based on the type of option. For uncleared options, the fund may post
collateral subject to the terms of an ISDA Master Agreement as generally described above if the market value of the options contract moves against it. The fund, as writer of an option, may have no control over whether the underlying securities may
be sold (call) or purchased (put) and, as a result, bears the market risk of an unfavorable change in the price of the securities underlying the written option. Losses from writing options can exceed the premium received and can exceed the potential
loss from an ordinary buy and sell transaction. Although the fund’s market risk may be significant, the maximum counterparty credit risk to the fund is equal to the market value of any collateral posted to the broker. For uncleared options,
this risk is mitigated in cases where there is an ISDA Master Agreement between the fund and the counterparty providing for netting as described above.
Purchased Options —
The fund purchased call and put options for a premium. Purchased call and put options entitle the holder to buy and sell a specified number of shares or units of a particular security, currency or index at a specified price at a specified date or
within a specified period of time. Purchasing call options may hedge against an anticipated increase in the dollar cost of securities or currency to be acquired or increase the fund’s exposure to an underlying instrument. Purchasing put
options may hedge against an anticipated decline in the value of portfolio securities or currency or decrease the fund's exposure to an underlying instrument.
The premium paid is initially recorded as an investment in
the Statement of Assets and Liabilities. That investment is subsequently marked-to-market daily with the difference between the premium paid and the market value of the purchased option being recorded as unrealized appreciation or depreciation.
Premiums paid for purchased call and put options which have expired are treated as
MFS Global Tactical
Allocation Portfolio
Notes to Financial Statements - continued
realized losses on
investments in the Statement of Operations. Upon the exercise or closing of a purchased call option, the premium paid is added to the cost of the security or financial instrument purchased. Upon the exercise or closing of a purchased put option, the
premium paid is offset against the proceeds on the sale of the underlying security or financial instrument in order to determine the realized gain or loss on investments.
Whether or not the option is exercised, the fund's maximum
risk of loss from purchasing an option is the amount of premium paid. All option contracts involve credit risk if the counterparty to the option contract fails to perform. For uncleared options, this risk is mitigated in cases where there is an ISDA
Master Agreement between the fund and the counterparty providing for netting as described above and, where applicable, by the posting of collateral by the counterparty to the fund to cover the fund’s exposure to the counterparty under such
ISDA Master Agreement.
Futures Contracts — The fund entered into futures contracts which may be used to hedge against or obtain broad market exposure, interest rate exposure, currency exposure, or to manage duration. A futures contract represents a
commitment for the future purchase or sale of an asset at a specified price on a specified date.
Upon entering into a futures contract, the fund is required
to deposit with the broker, either in cash or securities, an initial margin in an amount equal to a specified percentage of the notional amount of the contract. Subsequent payments (variation margin) are made or received by the fund each day,
depending on the daily fluctuations in the value of the contract, and are recorded for financial statement purposes as unrealized gain or loss by the fund until the contract is closed or expires at which point the gain or loss on futures contracts
is realized.
The fund bears the risk of interest
rates, exchange rates or securities prices moving unexpectedly, in which case, the fund may not achieve the anticipated benefits of the futures contracts and may realize a loss. While futures contracts may present less counterparty risk to the fund
since the contracts are exchange traded and the exchange’s clearinghouse guarantees payments to the broker, there is still counterparty credit risk due to the insolvency of the broker. The fund’s maximum risk of loss due to counterparty
credit risk is equal to the margin posted by the fund to the broker plus any gains or minus any losses on the outstanding futures contracts.
Forward Foreign Currency Exchange Contracts — The fund entered into forward foreign currency exchange contracts for the purchase or sale of a specific foreign currency at a fixed price on a future date. These contracts may be used to hedge the fund’s
currency risk or for non-hedging purposes. For hedging purposes, the fund may enter into contracts to deliver or receive foreign currency that the fund will receive from or use in its normal investment activities. The fund may also use contracts to
hedge against declines in the value of foreign currency denominated securities due to unfavorable exchange rate movements. For non-hedging purposes, the fund may enter into contracts with the intent of changing the relative exposure of the
fund’s portfolio of securities to different currencies to take advantage of anticipated exchange rate changes.
Forward foreign currency exchange contracts are adjusted by
the daily exchange rate of the underlying currency and any unrealized gains or losses are recorded as a receivable or payable for forward foreign currency exchange contracts until the contract settlement date. On contract settlement date, any gain
or loss on the contract is recorded as realized gains or losses on forward foreign currency exchange contracts.
Risks may arise upon entering into these contracts from
unanticipated movements in the value of the contract and from the potential inability of counterparties to meet the terms of their contracts. Generally, the fund’s maximum risk due to counterparty credit risk is the unrealized gain on the
contract due to the use of Continuous Linked Settlement, a multicurrency cash settlement system for the centralized settlement of foreign transactions. This risk is mitigated in cases where there is an ISDA Master Agreement between the fund and the
counterparty providing for netting as described above and, where applicable, by the posting of collateral by the counterparty to the fund to cover the fund’s exposure to the counterparty under such ISDA Master Agreement.
Swap Agreements —
During the period the fund entered into swap agreements. Swap agreements generally involve a periodic exchange of cash payments on a net basis, at specified intervals or upon the occurrence of specified events, between the fund and a counterparty.
Certain swap agreements may be entered into as a bilateral contract (“uncleared swaps”) while others are required to be centrally cleared (“cleared swaps”). In a cleared swap transaction, the ultimate counterparty to the
transaction is a clearinghouse (the “clearinghouse”). The contract is transferred and accepted by the clearinghouse immediately following execution of the swap contract with an executing broker. Thereafter, throughout the term of the
cleared swap, the fund interfaces indirectly with the clearinghouse through a clearing broker and has counterparty risk to the clearing broker as well.
Both cleared and uncleared swap agreements are marked to
market daily. The value of uncleared swap agreements is reported in the Statement of Assets and Liabilities as “Uncleared swaps, at value” which includes any related interest accruals to be paid or received by the fund. For cleared
swaps, payments (variation margin) are made or received by the fund each day, depending on the daily fluctuations in the value of the cleared swap, such that only the current day net receivable or payable for variation margin is reported in the
Statement of Assets and Liabilities.
MFS Global Tactical
Allocation Portfolio
Notes to Financial Statements - continued
For
both cleared and uncleared swaps, the periodic exchange of net cash payments, at specified intervals or upon the occurrence of specified events as stipulated by the agreement, is recorded as realized gain or loss on swap agreements in the Statement
of Operations. Premiums paid or received at the inception of the agreements are amortized using the effective interest method over the term of the agreement as realized gain or loss on swap agreements in the Statement of Operations. A liquidation
payment received or made upon early termination is recorded as a realized gain or loss on swap agreements in the Statement of Operations. The change in unrealized appreciation or depreciation on swap agreements in the Statement of Operations
reflects the aggregate change over the reporting period in the value of swaps net of any unamortized premiums paid or received.
Risks related to swap agreements include the possible lack
of a liquid market, unfavorable market and interest rate movements of the underlying instrument and the failure of the counterparty to perform under the terms of the agreements. The fund's maximum risk of loss from counterparty credit risk is the
discounted net value of the cash flows to be received from/paid to the counterparty over the contract's remaining life, to the extent that the amount is positive. To address counterparty risk, uncleared swap agreements are limited to only
highly-rated counterparties. Risk is further reduced by having an ISDA Master Agreement between the fund and the counterparty providing for netting as described above and, where applicable, by the posting of collateral by the counterparty to the
fund to cover the fund’s exposure to the counterparty under such ISDA Master Agreement. The fund's counterparty risk due to cleared swaps is mitigated by the fact that the clearinghouse is the true counterparty to the transaction and the
regulatory requirement safeguards in the event of a clearing broker bankruptcy.
The fund entered into interest rate swap agreements in
order to manage its exposure to interest or foreign exchange rate fluctuations. Interest rate swap agreements involve the periodic exchange of cash flows, between the fund and a counterparty, based on the difference between two interest rates
applied to a notional principal amount. The two interest rates exchanged may either be a fixed rate and a floating rate or two floating rates based on different indices.
The fund entered into credit default swap agreements in
order to manage its exposure to the market or certain sectors of the market, to reduce its credit risk exposure to defaults of corporate and sovereign issuers or to create exposure to corporate or sovereign issuers to which it is not otherwise
exposed. In a credit default swap agreement, the protection buyer can make an upfront payment and will make a stream of payments to the protection seller based on a fixed percentage applied to the agreement notional amount in exchange for the right
to receive a specified return upon the occurrence of a defined credit event on the reference obligation (which may be either a single security or a basket of securities issued by corporate or sovereign issuers) and, with respect to the cases where
physical settlement applies, the delivery by the buyer to the seller of a defined deliverable obligation. Although agreement-specific, credit events generally consist of a combination of the following: bankruptcy, failure to pay, restructuring,
obligation acceleration, obligation default, or repudiation/moratorium, each as defined in the 2003 ISDA Credit Derivatives Definitions as amended by the relevant agreement. Restructuring is generally not applicable when the reference obligation is
issued by a North American corporation and obligation acceleration, obligation default, or repudiation/moratorium are generally only applicable when the reference obligation is issued by a sovereign entity or an entity in an emerging country. Upon
determination of the final price for the deliverable obligation (or upon delivery of the deliverable obligation in the case of physical settlement), the difference between the value of the deliverable obligation and the swap agreement’s
notional amount is recorded as realized gain or loss on swap agreements in the Statement of Operations.
Credit default swap agreements are considered to have
credit-risk-related contingent features since they trigger payment by the protection seller to the protection buyer upon the occurrence of a defined credit event. The aggregate fair value of credit default swap agreements in a net liability position
as of December 31, 2021 is disclosed in the footnotes to the Portfolio of Investments. The maximum amount of future, undiscounted payments that the fund, as protection seller, could be required to make is equal to the swap agreement’s notional
amount. The protection seller’s payment obligation would be offset to the extent of the value of the agreement’s deliverable obligation. If a defined credit event had occurred as of December 31, 2021, the swap agreement's
credit-risk-related contingent features would have been triggered and, for those swap agreements in a net liability position for which the fund is the protection seller, the fund in order to settle these swap agreements would have been required to
either (1) pay the swap agreement’s notional value of EUR 1,182,000 less the value of the agreements’ related deliverable obligations as decided through an ISDA auction or (2) pay the notional value of the swap agreements in return for
physical receipt of the deliverable obligations. The fund’s maximum risk of loss from counterparty risk, either as the protection seller or as the protection buyer, is the fair value of the agreement.
Security Loans —
Under its Securities Lending Agency Agreement with the fund, State Street Bank and Trust Company, as lending agent, loans the securities of the fund to certain qualified institutions (the “Borrowers”) approved by the fund. Security loans
can be terminated at the discretion of either the lending agent or the fund and the related securities must be returned within the earlier of the standard trade settlement period for such securities or within three business days. The loans are
collateralized by cash and/or U.S. Treasury and federal agency obligations in an amount typically at least equal to the market value of the securities loaned. On loans collateralized by cash, the cash collateral is invested in a money market fund.
The market value of the loaned securities is determined at the close of business of the fund and any additional required collateral is delivered to the fund on the next business
MFS Global Tactical
Allocation Portfolio
Notes to Financial Statements - continued
day. The lending
agent provides the fund with indemnification against Borrower default. In the event of Borrower default, the lending agent will, for the benefit of the fund, either purchase securities identical to those loaned or, when such purchase is commercially
impracticable, pay the fund the market value of the loaned securities. In return, the lending agent assumes the fund's rights to the related collateral. If the collateral value is less than the cost to purchase identical securities, the lending
agent is responsible for the shortfall, but only to the extent that such shortfall is not due to a decline in collateral value resulting from collateral reinvestment for which the fund bears the risk of loss. At period end, the fund had investment
securities on loan, all of which were classified as equity securities in the fund’s Portfolio of Investments, with a fair value of $428,492. The fair value of the fund’s investment securities on loan is presented gross in the Statement
of Assets and Liabilities. These loans were collateralized by U.S. Treasury Obligations of $451,456 held by the lending agent. The collateral on securities loaned exceeded the value of securities on loan at period end. A portion of the income
generated upon investment of the collateral is remitted to the Borrowers, and the remainder is allocated between the fund and the lending agent. On loans collateralized by U.S. Treasury and/or federal agency obligations, a fee is received from the
Borrower, and is allocated between the fund and the lending agent. Income from securities lending is separately reported in the Statement of Operations. The dividend and interest income earned on the securities loaned is accounted for in the same
manner as other dividend and interest income.
Indemnifications —
Under the fund's organizational documents, its officers and Trustees may be indemnified against certain liabilities and expenses arising out of the performance of their duties to the fund. Additionally, in the normal course of business, the fund
enters into agreements with service providers that may contain indemnification clauses. The fund's maximum exposure under these agreements is unknown as this would involve future claims that may be made against the fund that have not yet
occurred.
Investment Transactions and Income — Investment transactions are recorded on the trade date. Some securities may be purchased or sold on an extended settlement basis, which means that the receipt or delivery
of the securities by the fund and related payments occur at a future date, usually beyond the customary settlement period. Interest income is recorded on the accrual basis.
All premium and discount is amortized or accreted for financial statement
purposes in accordance with U.S. generally accepted accounting principles. Dividends received in cash are recorded on the ex-dividend date. Certain dividends from foreign securities will be recorded when the fund is informed of the dividend if such
information is obtained subsequent to the ex-dividend date. Dividend and interest payments received in additional securities are recorded on the ex-dividend or ex-interest date in an amount equal to the value of the security on such date.
The fund may receive proceeds from litigation settlements.
Any proceeds received from litigation involving portfolio holdings are reflected in the Statement of Operations in realized gain/loss if the security has been disposed of by the fund or in unrealized gain/loss if the security is still held by the
fund. Any other proceeds from litigation not related to portfolio holdings are reflected as other income in the Statement of Operations.
The fund invests a significant portion of its assets in
asset-backed and/or mortgage-backed securities. For these securities, the value of the debt instrument also depends on the credit quality and adequacy of the underlying assets or collateral as well as whether there is a security interest in the
underlying assets or collateral. Enforcing rights, if any, against the underlying assets or collateral may be difficult. U.S. Government securities not supported as to the payment of principal or interest by the U.S. Treasury, such as those issued
by Fannie Mae, Freddie Mac, and the Federal Home Loan Banks, are subject to greater credit risk than are U.S. Government securities supported by the U.S. Treasury, such as those issued by Ginnie Mae.
The fund may purchase or sell mortgage-backed securities on
a “To Be Announced” (TBA) basis. A TBA transaction is subject to extended settlement and typically does not designate the actual security to be delivered, but instead includes an approximate principal amount. The price of the TBA
security and the date that it will be settled are fixed at the time the transaction is negotiated. The value of the security varies with market fluctuations and no interest accrues to the fund until settlement takes place. TBA purchase and sale
commitments are held at carrying amount, which approximates fair value and are categorized as level 2 within the fair value hierarchy and included in TBA purchase and TBA sale commitments in the Statement of Assets and Liabilities. Losses may arise
as a result of changes in the value of the TBA investment prior to settlement date or due to counterparty non-performance. At the time that it enters into a TBA transaction, the fund is required to have sufficient cash and/or liquid securities to
cover its commitments.
The fund may also enter into
mortgage dollar rolls, typically TBA dollar rolls, in which the fund sells TBA mortgage-backed securities to financial institutions and simultaneously agrees to repurchase similar (same issuer, type and coupon) securities at a later date at an
agreed-upon price. During the period between the sale and repurchase, the fund will not be entitled to receive interest and principal payments on the securities sold. The fund accounts for dollar roll transactions as purchases and sales and realizes
gains and losses on these transactions. Dollar roll transactions involve the risk that the market value of the securities that the fund is required to purchase may decline below the agreed upon repurchase price of those securities.
MFS Global Tactical
Allocation Portfolio
Notes to Financial Statements - continued
To
mitigate the counterparty credit risk on TBA transactions, mortgage dollar rolls, and other types of forward settling mortgage-backed and asset-backed security transactions, the fund whenever possible enters into a Master Securities Forward
Transaction Agreement (“MSFTA”) on a bilateral basis with each of the counterparties with whom it undertakes a significant volume of transactions. The MSFTA gives each party to the agreement the right to terminate all transactions traded
under such agreement if there is a specified deterioration in the credit quality of the other party. Upon an event of default or a termination of the MSFTA, the non-defaulting party has the right to close out all transactions traded under such
agreement and to net amounts owed under each transaction to one net amount payable by one party to the other. This right to close out and net payments across all transactions traded under the MSFTA could result in a reduction of the fund's credit
risk to such counterparty equal to any amounts payable by the fund under the applicable transactions, if any.
For mortgage-backed and asset-backed securities traded
under a MSFTA, the collateral and margining requirements are contract specific. Collateral amounts across all transactions traded under such agreement are netted and an amount is posted from one party to the other to collateralize such obligations.
Cash that has been pledged to cover the fund's collateral or margin obligations under a MSFTA, if any, will be reported separately on the Statement of Assets and Liabilities as restricted cash. Securities pledged as collateral or margin for the same
purpose, if any, are noted in the Portfolio of Investments.
Tax Matters and Distributions — The fund intends to qualify as a regulated investment company, as defined under Subchapter M of the Internal Revenue Code, and to distribute all of its taxable income, including realized capital gains. As a
result, no provision for federal income tax is required. The fund’s federal tax returns, when filed, will remain subject to examination by the Internal Revenue Service for a three year period. Management has analyzed the fund’s tax
positions taken on federal and state tax returns for all open tax years and does not believe that there are any uncertain tax positions that require recognition of a tax liability. Foreign taxes, if any, have been accrued by the fund in the
accompanying financial statements in accordance with the applicable foreign tax law. Foreign income taxes may be withheld by certain countries in which the fund invests. Additionally, capital gains realized by the fund on securities issued in or by
certain foreign countries may be subject to capital gains tax imposed by those countries.
Distributions to shareholders are recorded on the
ex-dividend date. Income and capital gain distributions are determined in accordance with income tax regulations, which may differ from U.S. generally accepted accounting principles. Certain capital accounts in the financial statements are
periodically adjusted for permanent differences in order to reflect their tax character. These adjustments have no impact on net assets or net asset value per share. Temporary differences which arise from recognizing certain items of income,
expense, gain or loss in different periods for financial statement and tax purposes will reverse at some time in the future.
Book/tax differences primarily relate to amortization and
accretion of debt securities, wash sale loss deferrals, straddle loss deferrals, and derivative transactions.
The tax character of distributions declared to shareholders
for the last two fiscal years is as follows:
| |
Year
ended
12/31/21 |
Year
ended
12/31/20 |
| Ordinary
income (including any short-term capital gains) |
$10,579,419
|
$27,045,497
|
| Long-term
capital gains |
18,475,329
|
7,452,050
|
| Total
distributions |
$29,054,748
|
$34,497,547
|
The federal tax cost and the tax
basis components of distributable earnings were as follows:
| As
of 12/31/21 |
|
| Cost
of investments |
$456,006,420
|
| Gross
appreciation |
75,977,158
|
| Gross
depreciation |
(11,054,459)
|
| Net
unrealized appreciation (depreciation) |
$64,922,699
|
| Undistributed
ordinary income |
8,902,326
|
| Undistributed
long-term capital gain |
29,236,775
|
| Other
temporary differences |
(236,728)
|
| Total
distributable earnings (loss) |
$102,825,072
|
MFS Global Tactical
Allocation Portfolio
Notes to Financial Statements - continued
Multiple Classes of Shares of Beneficial Interest — The fund offers multiple classes of shares, which differ in their respective distribution and/or service fees. The fund's income, realized and unrealized gain (loss), and common expenses are allocated to
shareholders based on the daily net assets of each class. Dividends are declared separately for each class. Differences in per share dividend rates are generally due to differences in separate class expenses. The fund’s distributions declared
to shareholders as reported in the Statements of Changes in Net Assets are presented by class as follows:
| |
Year
ended
12/31/21 |
|
Year
ended
12/31/20 |
| Initial
Class |
$2,213,951
|
|
$2,739,813
|
| Service
Class |
26,840,797
|
|
31,757,734
|
| Total
|
$29,054,748
|
|
$34,497,547
|
(3) Transactions with
Affiliates
Investment Adviser — The fund has an investment advisory agreement with MFS to provide overall investment management and related administrative services and facilities to the fund. The
management fee is computed daily and paid monthly at the following annual rates based on the fund's average daily net assets:
| Up
to $300 million |
0.75%
|
| In
excess of $300 million and up to $2.5 billion |
0.675%
|
| In
excess of $2.5 billion |
0.65%
|
MFS has agreed in writing to
reduce its management fee by a specified amount if certain MFS mutual fund assets exceed thresholds agreed to by MFS and the fund's Board of Trustees. For the year ended December 31, 2021, this management fee reduction amounted to $69,953, which is
included in the reduction of total expenses in the Statement of Operations. The management fee incurred for the year ended December 31, 2021 was equivalent to an annual effective rate of 0.70% of the fund's average daily net assets.
For the period from January 1, 2021 through July 31, 2021,
the investment adviser had agreed in writing to pay a portion of the fund’s total annual operating expenses, excluding interest, taxes, extraordinary expenses, brokerage and transaction costs, and investment-related expenses, such that total
annual operating expenses do not exceed 0.90% of average daily net assets for the Initial Class shares and 1.15% of average daily net assets for the Service Class shares. This written agreement terminated on July 31, 2021. For the period from
January 1, 2021 through July 31, 2021, the fund’s actual operating expenses did not exceed the limit and therefore, the investment adviser did not pay any portion of the fund’s expenses related to this agreement. Effective August 1,
2021, the investment adviser has agreed in writing to pay a portion of the fund’s total annual operating expenses, excluding interest, taxes, extraordinary expenses, brokerage and transaction costs, and investment-related expenses, such that
total annual operating expenses do not exceed 0.76% of average daily net assets for the Initial Class shares and 1.01% of average daily net assets for the Service Class shares. This written agreement will continue until modified by the fund’s
Board of Trustees, but such agreement will continue at least until April 30, 2023. For the period from August 1, 2021 through December 31, 2021, this reduction amounted to $145,606, which is included in the reduction of total expenses in the
Statement of Operations.
Distributor — MFS Fund Distributors, Inc. (MFD), a wholly-owned subsidiary of MFS, is the distributor of shares of the fund. The Trustees have adopted a distribution plan for the Service Class shares pursuant to Rule 12b-1
under the Investment Company Act of 1940.
The
fund's distribution plan provides that the fund will pay MFD distribution and/or service fees equal to 0.25% per annum of its average daily net assets attributable to Service Class shares as partial consideration for services performed and expenses
incurred by MFD and financial intermediaries (including participating insurance companies that invest in the fund to fund variable annuity and variable life insurance contracts, sponsors of qualified retirement and pension plans that invest in the
fund, and affiliates of these participating insurance companies and plan sponsors) in connection with the sale and distribution of the Service Class shares. MFD may subsequently pay all, or a portion, of the distribution and/or service fees to
financial intermediaries.
Shareholder Servicing Agent — MFS Service Center, Inc. (MFSC), a wholly-owned subsidiary of MFS, receives a fee from the fund for its services as shareholder servicing agent. For the year ended December 31, 2021, the fee was $13,599, which
equated to 0.0025% annually of the fund's average daily net assets. MFSC also receives reimbursement from the fund for out-of-pocket expenses paid by MFSC on behalf of the fund. For the year ended December 31, 2021, these costs amounted to
$286.
MFS Global Tactical
Allocation Portfolio
Notes to Financial Statements - continued
Administrator — MFS
provides certain financial, legal, shareholder communications, compliance, and other administrative services to the fund. Under an administrative services agreement, the fund reimburses MFS the costs incurred to provide these services. The fund is
charged an annual fixed amount of $17,500 plus a fee based on average daily net assets. The administrative services fee incurred for the year ended December 31, 2021 was equivalent to an annual effective rate of 0.0149% of the fund's average daily
net assets.
Trustees’ and Officers’
Compensation — The fund pays compensation to independent Trustees in the form of a retainer, attendance fees, and additional compensation to Board and Committee chairpersons. The fund does not pay compensation
directly to Trustees or officers of the fund who are also officers of the investment adviser, all of whom receive remuneration from MFS for their services to the fund. Certain officers and Trustees of the fund are officers or directors of MFS, MFD,
and MFSC.
Other — The fund invests in the MFS Institutional Money Market Portfolio which is managed by MFS and seeks current income consistent with preservation of capital and liquidity. This money market fund does not pay a
management fee to MFS but does incur investment and operating costs.
The fund is permitted to engage in purchase and sale
transactions with funds and accounts for which MFS serves as investment adviser or sub-adviser (“cross-trades”) pursuant to a policy adopted by the Board of Trustees. This policy has been designed to ensure that cross-trades conducted by
the fund comply with Rule 17a-7 under the Investment Company Act of 1940. During the year ended December 31, 2021, the fund engaged in purchase and sale transactions pursuant to this policy, which amounted to $13,326,496 and $1,410,600,
respectively. The sales transactions resulted in net realized gains (losses) of $171,505.
(4) Portfolio Securities
For the year ended December 31, 2021, purchases and sales
of investments, other than purchased option transactions and short-term obligations, were as follows:
| |
Purchases
|
Sales
|
| U.S.
Government securities |
$132,168,087
|
$154,859,473
|
| Non-U.S.
Government securities |
562,046,404
|
575,412,944
|
(5) Shares of
Beneficial Interest
The fund's Declaration of Trust
permits the Trustees to issue an unlimited number of full and fractional shares of beneficial interest. Transactions in fund shares were as follows:
| |
Year
ended
12/31/21 |
|
Year
ended
12/31/20 |
| |
Shares
|
Amount
|
|
Shares
|
Amount
|
| Shares
sold |
|
|
|
|
|
| Initial
Class |
69,401
|
$1,081,967
|
|
100,173
|
$1,507,014
|
| Service
Class |
734,621
|
11,362,268
|
|
1,140,931
|
17,184,459
|
| |
804,022
|
$12,444,235
|
|
1,241,104
|
$18,691,473
|
Shares
issued to shareholders
in reinvestment of distributions |
|
|
|
|
|
| Initial
Class |
143,205
|
$2,213,951
|
|
183,634
|
$2,739,813
|
| Service
Class |
1,770,501
|
26,840,797
|
|
2,167,763
|
31,757,734
|
| |
1,913,706
|
$29,054,748
|
|
2,351,397
|
$34,497,547
|
| Shares
reacquired |
|
|
|
|
|
| Initial
Class |
(419,823)
|
$(6,649,980)
|
|
(440,732)
|
$(6,677,947)
|
| Service
Class |
(4,618,366)
|
(71,650,798)
|
|
(4,551,744)
|
(67,789,585)
|
| |
(5,038,189)
|
$(78,300,778)
|
|
(4,992,476)
|
$(74,467,532)
|
| Net
change |
|
|
|
|
|
| Initial
Class |
(207,217)
|
$(3,354,062)
|
|
(156,925)
|
$(2,431,120)
|
| Service
Class |
(2,113,244)
|
(33,447,733)
|
|
(1,243,050)
|
(18,847,392)
|
| |
(2,320,461)
|
$(36,801,795)
|
|
(1,399,975)
|
$(21,278,512)
|
MFS Global Tactical
Allocation Portfolio
Notes to Financial Statements - continued
(6) Line of Credit
The fund and certain other funds managed by MFS participate
in a $1.25 billion unsecured committed line of credit of which $1 billion is reserved for use by the fund and certain other MFS U.S. funds. The line of credit is provided by a syndicate of banks under a credit agreement. Borrowings may be made for
temporary financing needs. Interest is charged to each fund, based on its borrowings, generally at a rate equal to the highest of one month LIBOR, the Federal Funds Effective Rate and the Overnight Bank Funding Rate, plus an agreed upon spread. A
commitment fee, based on the average daily, unused portion of the committed line of credit, is allocated among the participating funds. In addition, the fund and other funds managed by MFS have established unsecured uncommitted borrowing
arrangements with certain banks for temporary financing needs. Interest is charged to each fund, based on its borrowings, at rates equal to customary reference rates plus an agreed upon spread. For the year ended December 31, 2021, the fund’s
commitment fee and interest expense were $1,489 and $0, respectively, and are included in “Miscellaneous” expense in the Statement of Operations.
(7) Investments in Affiliated Issuers
An affiliated issuer may be considered one in which the
fund owns 5% or more of the outstanding voting securities, or a company which is under common control. For the purposes of this report, the following were affiliated issuers:
| Affiliated
Issuers |
Beginning
Value |
Purchases
|
Sales
Proceeds |
Realized
Gain
(Loss) |
Change
in
Unrealized
Appreciation or
Depreciation |
Ending
Value |
| MFS
Institutional Money Market Portfolio |
$37,119,815
|
$487,904,156
|
$512,073,919
|
$—
|
$—
|
$12,950,052
|
| Affiliated
Issuers |
Dividend
Income |
Capital
Gain
Distributions |
| MFS
Institutional Money Market Portfolio |
$11,694
|
$—
|
(8) Impacts of
COVID-19
The pandemic related to the global spread of
novel coronavirus disease (COVID-19), which was first detected in December 2019, has resulted in significant disruptions to global business activity and the global economy, as well as the economies of individual countries, the financial performance
of individual companies and sectors, and the securities and commodities markets in general. Multiple surges in cases globally, the availability and widespread adoption of vaccines, and the emergence of variant strains of the virus continue to create
uncertainty as to the future and long-term impacts resulting from the pandemic including impacts to the prices and liquidity of the fund's investments and the fund's performance.
(9) LIBOR Transition
Certain of the fund's investments, including its
investments in derivatives, as well as any debt issued by the fund and other contractual arrangements of the fund may be based on reference interest rates such as the London Interbank Offered Rate (“LIBOR”). In 2017, the regulatory
authority that oversees financial services firms in the United Kingdom announced plans to transition away from LIBOR by the end of 2021. In March 2021, the administrator of LIBOR announced the extension of the publication of the more commonly used
U.S. dollar LIBOR settings to the end of June 2023. Although the full impacts of the transition away from LIBOR are not fully known, the transition may result in, among other things, an increase in volatility or illiquidity of the markets for
instruments that currently rely on LIBOR to determine interest rates and this could have an adverse impact on the fund's performance. With respect to the fund's accounting for investments, including its investments in derivatives, as well as any
debt issued by the fund and other contractual arrangements of the fund that undergo reference rate-related modifications as a result of the transition, management will rely upon the relief provided by FASB Codification Topic 848 – Reference
Rate Reform (Topic 848). The guidance in Topic 848 permits the fund to disregard the GAAP accounting requirements around certain contract modifications resulting from the LIBOR transition such that for contracts considered in scope, the fund can
account for those modified contracts as a continuation of the existing contracts. While the cessation of the one-week and two-month U.S. dollar LIBOR tenors along with certain other non-U.S. dollar denominated LIBOR settings at December 31, 2021 did
not have a material impact on the fund, management is still evaluating the impact to the fund of the June 30, 2023 planned discontinuation of the more commonly used U.S. dollar LIBOR settings.
MFS Global Tactical
Allocation Portfolio
Report of Independent Registered Public Accounting
Firm
To the Board of Trustees of MFS Variable
Insurance Trust II and the Shareholders of MFS Global Tactical Allocation Portfolio:
Opinion on the Financial Statements and Financial
Highlights
We have audited the accompanying statement
of assets and liabilities of MFS Global Tactical Allocation Portfolio (the “Fund”), including the portfolio of investments, as of December 31, 2021, the related statement of operations for the year then ended, the statements of changes
in net assets for each of the two years in the period then ended, the financial highlights for each of the five years in the period then ended, and the related notes. In our opinion, the financial statements and financial highlights present fairly,
in all material respects, the financial position of the Fund as of December 31, 2021, and the results of its operations for the year then ended, the changes in its net assets for each of the two years in the period then ended, and the financial
highlights for each of the five years in the period then ended, in conformity with accounting principles generally accepted in the United States of America.
Basis for Opinion
These financial statements and financial highlights are the
responsibility of the Fund's management. Our responsibility is to express an opinion on the Fund's financial statements and financial highlights based on our audits. We are a public accounting firm registered with the Public Company Accounting
Oversight Board (United States) (PCAOB) and are required to be independent with respect to the Fund in accordance with the U.S. federal securities laws and the applicable rules and regulations of the Securities and Exchange Commission and the
PCAOB.
We conducted our audits in accordance with the
standards of the PCAOB. Those standards require that we plan and perform the audit to obtain reasonable assurance about whether the financial statements and financial highlights are free of material misstatement, whether due to error or fraud. The
Fund is not required to have, nor were we engaged to perform, an audit of its internal control over financial reporting. As part of our audits, we are required to obtain an understanding of internal control over financial reporting but not for the
purpose of expressing an opinion on the effectiveness of the Fund's internal control over financial reporting. Accordingly, we express no such opinion.
Our audits included performing procedures to assess the
risks of material misstatement of the financial statements and financial highlights, whether due to error or fraud, and performing procedures that respond to those risks. Such procedures included examining, on a test basis, evidence regarding the
amounts and disclosures in the financial statements and financial highlights. Our audits also included evaluating the accounting principles used and significant estimates made by management, as well as evaluating the overall presentation of the
financial statements and financial highlights. Our procedures included confirmation of securities owned as of December 31, 2021, by correspondence with the custodian and brokers; when replies were not received from brokers, we performed other
auditing procedures. We believe that our audits provide a reasonable basis for our opinion.
DELOITTE & TOUCHE LLP
Boston, Massachusetts
February 15, 2022
We have served as the auditor of one or more of the MFS
investment companies since 1924.
MFS Global Tactical
Allocation Portfolio
Trustees and Officers — Identification and
Background
The Trustees and Officers of the Trust, as
of February 1, 2022, are listed below, together with their principal occupations during the past five years. (Their titles may have varied during that period.) The address of each Trustee and Officer is 111 Huntington Avenue, Boston, Massachusetts
02199-7618.
| Name,
Age |
|
Position(s)
Held with Fund |
|
Trustee/Officer
Since(h) |
|
Number
of MFS Funds overseen by the Trustee |
|
Principal
Occupations During
the Past Five Years |
|
Other
Directorships During
the Past Five Years (j) |
| INTERESTED
TRUSTEES |
|
|
|
|
|
|
|
|
|
|
Michael
W. Roberge (k)
(age 55) |
|
Trustee
|
|
January
2021 |
|
135
|
|
Massachusetts
Financial Services Company, Chairman (since January 2021); Chief Executive Officer (since January 2017); Director; Chairman of the Board (since January 2022); President (until December 2018); Chief Investment Officer (until December 2018) |
|
N/A
|
| INDEPENDENT
TRUSTEES |
|
|
|
|
|
|
|
|
|
|
John
P. Kavanaugh
(age 67) |
|
Trustee
and Chair of Trustees |
|
January
2009 |
|
135
|
|
Private
investor |
|
N/A
|
Steven
E. Buller
(age 70) |
|
Trustee
|
|
February
2014 |
|
135
|
|
Private
investor |
|
N/A
|
John
A. Caroselli
(age 67) |
|
Trustee
|
|
March
2017 |
|
135
|
|
Private
investor; JC Global Advisors, LLC (management consulting), President (since 2015) |
|
N/A
|
Maureen
R. Goldfarb
(age 66) |
|
Trustee
|
|
January
2009 |
|
135
|
|
Private
investor |
|
N/A
|
Peter
D. Jones
(age 66) |
|
Trustee
|
|
January
2019 |
|
135
|
|
Private
investor |
|
N/A
|
James
W. Kilman, Jr.
(age 60) |
|
Trustee
|
|
January
2019 |
|
135
|
|
Burford
Capital Limited (finance and investment management), Senior Advisor (since May 3, 2021), Chief Financial Officer (2019 - May 2, 2021); KielStrand Capital LLC (family office), Chief Executive Officer (since 2016) |
|
Alpha-En
Corporation, Director (2016-2019) |
Clarence
Otis, Jr.
(age 65) |
|
Trustee
|
|
March
2017 |
|
135
|
|
Private
investor |
|
VF
Corporation, Director; Verizon Communications, Inc., Director; The Travelers Companies, Director |
Maryanne
L. Roepke
(age 65) |
|
Trustee
|
|
May
2014 |
|
135
|
|
Private
investor |
|
N/A
|
Laurie
J. Thomsen
(age 64) |
|
Trustee
|
|
March
2005 |
|
135
|
|
Private
investor |
|
The
Travelers Companies, Director; Dycom Industries, Inc., Director |
MFS Global Tactical
Allocation Portfolio
Trustees and Officers - continued
| Name,
Age |
|
Position(s)
Held with
Fund |
|
Trustee/Officer
Since(h) |
|
Number
of MFS Funds for which the Person is an Officer |
|
Principal
Occupations During
the Past Five Years |
| OFFICERS
|
|
|
|
|
|
|
|
|
Christopher
R. Bohane (k)
(age 48) |
|
Assistant
Secretary and Assistant Clerk |
|
July
2005 |
|
135
|
|
Massachusetts
Financial Services Company, Senior Vice President and Associate General Counsel |
Kino
Clark (k)
(age 53) |
|
Assistant
Treasurer |
|
January
2012 |
|
135
|
|
Massachusetts
Financial Services Company, Vice President |
John
W. Clark, Jr. (k)
(age 54) |
|
Assistant
Treasurer |
|
April
2017 |
|
135
|
|
Massachusetts
Financial Services Company, Vice President (since March 2017); Deutsche Bank (financial services), Department Head - Treasurer's Office (until February 2017) |
Thomas
H. Connors (k)
(age 62) |
|
Assistant
Secretary and Assistant Clerk |
|
September
2012 |
|
135
|
|
Massachusetts
Financial Services Company, Vice President and Senior Counsel |
David
L. DiLorenzo (k)
(age 53) |
|
President
|
|
July
2005 |
|
135
|
|
Massachusetts
Financial Services Company, Senior Vice President |
Heidi
W. Hardin (k)
(age 54) |
|
Secretary
and Clerk |
|
April
2017 |
|
135
|
|
Massachusetts
Financial Services Company, Executive Vice President and General Counsel (since March 2017); Harris Associates (investment management), General Counsel (until January 2017) |
Brian
E. Langenfeld (k)
(age 48) |
|
Assistant
Secretary and Assistant Clerk |
|
June
2006 |
|
135
|
|
Massachusetts
Financial Services Company, Vice President and Senior Counsel |
Amanda
S. Mooradian (k)
(age 42) |
|
Assistant
Secretary and Assistant Clerk |
|
September
2018 |
|
135
|
|
Massachusetts
Financial Services Company, Assistant Vice President and Senior Counsel |
Susan
A. Pereira (k)
(age 51) |
|
Assistant
Secretary and Assistant Clerk |
|
July
2005 |
|
135
|
|
Massachusetts
Financial Services Company, Vice President and Assistant General Counsel |
Kasey
L. Phillips (k)
(age 51) |
|
Assistant
Treasurer |
|
September
2012 |
|
135
|
|
Massachusetts
Financial Services Company, Vice President |
Matthew
A. Stowe (k)
(age 47) |
|
Assistant
Secretary and Assistant Clerk |
|
October
2014 |
|
135
|
|
Massachusetts
Financial Services Company, Vice President and Assistant General Counsel |
Martin
J. Wolin (k)
(age 54) |
|
Chief
Compliance Officer |
|
July
2015 |
|
135
|
|
Massachusetts
Financial Services Company, Senior Vice President and Chief Compliance Officer |
James
O. Yost (k)
(age 61) |
|
Treasurer
|
|
September
1990 |
|
135
|
|
Massachusetts
Financial Services Company, Senior Vice President |
| (h)
|
Date
first appointed to serve as Trustee/Officer of an MFS Fund. Each Trustee has served continuously since appointment unless indicated otherwise. From January 2012 through December 2016, Messrs. DiLorenzo and Yost served as Treasurer and Deputy
Treasurer of the Funds, respectively. |
| (j)
|
Directorships or
trusteeships of companies required to report to the Securities and Exchange Commission (i.e., “public companies”). |
| (k)
|
“Interested
person” of the Trust within the meaning of the Investment Company Act of 1940 (referred to as the 1940 Act), which is the principal federal law governing investment companies like the fund, as a result of a position with MFS. The address of
MFS is 111 Huntington Avenue, Boston, Massachusetts 02199-7618. |
Each Trustee (other than Messrs. Jones, Kilman and Roberge)
has been elected by shareholders and each Trustee and Officer holds office until his or her successor is chosen and qualified or until his or her earlier death, resignation, retirement or removal. Mr. Roberge became a Trustee of the Funds on January
1, 2021 and Messrs. Jones and Kilman became Trustees of the Funds on January 1, 2019. The Trust does not hold annual meetings for the purpose of electing Trustees, and Trustees are not elected for fixed terms. Under the terms of the Board's
retirement policy, an Independent Trustee shall retire at the end of the calendar year in which he or she reaches the earlier of 75 years of age or 15 years of service on the Board (or, in the case of any Independent Trustee who joined the Board
prior to 2015, 20 years of service on the Board).
Messrs. Buller, Kilman and Otis and Ms. Roepke are members
of the Trust’s Audit Committee.
MFS Global Tactical
Allocation Portfolio
Trustees and Officers - continued
Each
of the Interested Trustees and certain Officers hold comparable officer positions with certain affiliates of MFS.
The Statement of Additional Information for a Fund includes
further information about the Trustees and is available without charge upon request by calling 1-800-225-2606.
| Investment
Adviser |
Custodian
|
Massachusetts Financial
Services Company
111 Huntington Avenue
Boston, MA 02199-7618 |
State Street
Bank and Trust Company
1 Lincoln Street
Boston, MA 02111-2900 |
| Distributor
|
Independent
Registered Public Accounting Firm |
MFS Fund
Distributors, Inc.
111 Huntington Avenue
Boston, MA 02199-7618 |
Deloitte
& Touche LLP
200 Berkeley Street
Boston, MA 02116 |
| Portfolio
Manager(s) |
|
Pilar
Gomez-Bravo
Steven Gorham
Andy Li
Johnathan Munko
Vipin Narula
Benjamin Nastou
Henry Peabody
Jonathan Sage
Natalie Shapiro
Erich Shigley
Robert Spector
Erik Weisman |
|
MFS Global Tactical
Allocation Portfolio
Board Review of Investment Advisory Agreement
MFS Global Tactical Allocation Portfolio
The Investment Company Act of 1940 requires that both the
full Board of Trustees and a majority of the non-interested (“independent”) Trustees, voting separately, annually approve the continuation of the Fund’s investment advisory agreement with MFS. The Trustees consider matters bearing
on the Fund and its advisory arrangements at their meetings throughout the year, including a review of performance data at each regular meeting. In addition, the independent Trustees met several times by videoconference (in accordance with
Securities and Exchange Commission relief) over the course of three months beginning in May and ending in July, 2021 (“contract review meetings”) for the specific purpose of considering whether to approve the continuation of the
investment advisory agreement for the Fund and the other investment companies that the Board oversees (the “MFS Funds”). The independent Trustees were assisted in their evaluation of the Fund’s investment advisory agreement by
independent legal counsel, from whom they received separate legal advice and with whom they met separately from MFS during various contract review meetings. The independent Trustees were also assisted in this process by an independent consultant who
was retained by and reported to the independent Trustees.
In connection with their deliberations regarding the
continuation of the investment advisory agreement, the Trustees, including the independent Trustees, considered such information and factors as they believed, in light of the legal advice furnished to them and their own business judgment, to be
relevant. The investment advisory agreement for the Fund was considered separately, although the Trustees also took into account the common interests of all MFS Funds in their review. As described below, the Trustees considered the nature, quality,
and extent of the various investment advisory, administrative, and shareholder services performed by MFS under the existing investment advisory agreement and other arrangements with the Fund.
In connection with their contract review meetings, the
Trustees received and relied upon materials that included, among other items: (i) information provided by Broadridge Financial Solutions, Inc. (“Broadridge”), an independent third party, on the investment performance of the Fund for
various time periods ended December 31, 2020 and the investment performance of a group of funds with substantially similar investment classifications/objectives (the “Broadridge performance universe”), (ii) information provided by
Broadridge on the Fund’s advisory fees and other expenses and the advisory fees and other expenses of comparable funds identified by Broadridge as well as all other funds in the same investment classification/category (the “Broadridge
expense group and universe”), (iii) information provided by MFS on the advisory fees of portfolios of other clients of MFS, including institutional separate accounts and other clients, (iv) information as to whether and to what extent
applicable expense waivers, reimbursements or fee “breakpoints” are observed for the Fund, (v) information regarding MFS’ financial results and financial condition, including MFS’ and certain of its affiliates’
estimated profitability from services performed for the Fund and the MFS Funds as a whole, and compared to MFS’ institutional business, (vi) MFS’ views regarding the outlook for the mutual fund industry and the strategic business plans
of MFS, (vii) descriptions of various functions performed by MFS for the Funds, such as compliance monitoring and portfolio trading practices, and (viii) information regarding the overall organization of MFS, including information about MFS’
senior management and other personnel providing investment advisory, administrative and other services to the Fund and the other MFS Funds. The comparative performance, fee and expense information prepared and provided by Broadridge was not
independently verified and the independent Trustees did not independently verify any information provided to them by MFS.
The Trustees’ conclusion as to the continuation of
the investment advisory agreement was based on a comprehensive consideration of all information provided to the Trustees and not the result of any single factor. Some of the factors that figured particularly in the Trustees’ deliberations are
described below, although individual Trustees may have evaluated the information presented differently from one another, giving different weights to various factors. It is also important to recognize that the fee arrangements for the Fund and other
MFS Funds are the result of years of review and discussion between the independent Trustees and MFS, that certain aspects of such arrangements may receive greater scrutiny in some years than in others, and that the Trustees’ conclusions may be
based, in part, on their consideration of these same arrangements during the course of the year and in prior years.
Based on information provided by Broadridge and MFS, the
Trustees reviewed the Fund’s total return investment performance as well as the Broadridge performance universe over various time periods. The Trustees placed particular emphasis on the total return performance of the Fund’s Initial
Class shares in comparison to the performance of funds in its Broadridge performance universe over the five-year period ended December 31, 2020, which the Trustees believed was a long enough period to reflect differing market conditions. The total
return performance of the Fund’s Initial Class shares was in the 4th quintile relative to the other funds in the universe for this five-year period (the 1st quintile being the best performers and the 5th quintile being the worst performers).
The total return performance of the Fund’s Initial Class shares was in the 4th quintile for each of the one- and three-year periods ended December 31, 2020 relative to the Broadridge performance universe. Because of the passage of time, these
performance results may differ from the performance results for more recent periods, including those shown elsewhere in this report.
The Trustees expressed concern to MFS about the substandard
investment performance of the Fund. In the course of their deliberations, the Trustees took into account information provided by MFS in connection with the contract review meetings, as well as during investment review meetings conducted with
portfolio management personnel during the course of the year, as to MFS’ efforts to improve the Fund’s performance. In addition, the Trustees requested that they receive a separate update on the Fund’s
MFS Global Tactical
Allocation Portfolio
Board Review of Investment Advisory Agreement - continued
performance at each
of their regular meetings. After reviewing these and related factors, the Trustees concluded, within the context of their overall conclusions regarding the investment advisory agreement, that MFS’ responses and efforts and plans to improve
investment performance were sufficient to support approval of the continuance of the investment advisory agreement for an additional one-year period, but that they would continue to closely monitor the performance of the Fund.
In assessing the reasonableness of the Fund’s
advisory fee, the Trustees considered, among other information, the Fund’s advisory fee and the total expense ratio of the Fund’s Initial Class shares as a percentage of average daily net assets and the advisory fee and total expense
ratios of the Broadridge expense group based on information provided by Broadridge. The Trustees considered that MFS currently observes an expense limitation for the Fund, which may not be changed without the Trustees’ approval. The Trustees
also considered that, according to the data provided by Broadridge (which takes into account any fee reductions or expense limitations that were in effect during the Fund’s last fiscal year), the Fund’s effective advisory fee rate and
total expense ratio were each higher than the Broadridge expense group median. The Trustees also noted that MFS has agreed to further reduce the expense limitation for the Fund effective August 1, 2021, which may not be changed without the
Trustees’ approval.
The Trustees also
considered the advisory fees charged by MFS to any institutional separate accounts advised by MFS (“separate accounts”) and unaffiliated investment companies for which MFS serves as subadviser (“subadvised funds”) that have
comparable investment strategies to the Fund, if any. In comparing these fees, the Trustees considered information provided by MFS as to the generally broader scope of services provided by MFS to the Fund, as well as the more extensive regulatory
burdens imposed on MFS in managing the Fund, in comparison to separate accounts and subadvised funds. The Trustees also considered the higher demands placed on MFS’ investment personnel and trading infrastructure as a result of the daily cash
in-flows and out-flows of the Fund in comparison to separate accounts.
The Trustees also considered whether the Fund may benefit
from any economies of scale in the management of the Fund in the event of growth in assets of the Fund and/or growth in assets of the MFS Funds as a whole. They noted that the Fund’s advisory fee rate schedule is subject to contractual
breakpoints that reduce the Fund’s advisory fee rate on average daily net assets over $300 million and $2.5 billion. The Trustees also noted that MFS has agreed in writing to waive a portion of the management fees of certain MFS Funds,
including the Fund, if the total combined assets of certain funds within the MFS Funds’ complex increase above agreed upon thresholds (the “group fee waiver”), enabling the Fund’s shareholders to share in the benefits from
any economies of scale at the complex level. The group fee waiver is reviewed and renewed annually between the Board and MFS. The Trustees concluded that the breakpoints and the group fee waiver were sufficient to allow the Fund to benefit from
economies of scale as its assets and overall complex assets grow.
The Trustees also considered information prepared by MFS
relating to MFS’ costs and profits with respect to the Fund, the MFS Funds considered as a group, and other investment companies and accounts advised by MFS, as well as MFS’ methodologies used to determine and allocate its costs to the
MFS Funds, the Fund and other accounts and products for purposes of estimating profitability.
After reviewing these and other factors described herein,
the Trustees concluded, within the context of their overall conclusions regarding the investment advisory agreement, that the advisory fees charged to the Fund represent reasonable compensation in light of the services being provided by MFS to the
Fund.
In addition, the Trustees considered MFS’
resources and related efforts to continue to retain, attract and motivate capable personnel to serve the Fund. The Trustees also considered current and developing conditions in the financial services industry, including the presence of large and
well-capitalized companies which are spending, and appear to be prepared to continue to spend, substantial sums to engage personnel and to provide services to competing investment companies. In this regard, the Trustees also considered the financial
resources of MFS and its ultimate parent, Sun Life Financial Inc. The Trustees also considered the advantages and possible disadvantages to the Fund of having an adviser that also serves other investment companies as well as other accounts.
The Trustees also considered the nature, quality, cost, and
extent of administrative, transfer agency, and distribution services provided to the Fund by MFS and its affiliates under agreements and plans other than the investment advisory agreement, including any 12b-1 fees the Fund pays to MFS Fund
Distributors, Inc., an affiliate of MFS. The Trustees also considered the nature, extent and quality of certain other services MFS performs or arranges for on the Fund’s behalf, which may include securities lending programs, directed expense
payment programs, class action recovery programs, and MFS’ interaction with third-party service providers, principally custodians and sub-custodians. The Trustees concluded that the various non-advisory services provided by MFS and its
affiliates on behalf of the Fund were satisfactory.
The Trustees considered so-called “fall-out
benefits” to MFS such as reputational value derived from serving as investment manager to the MFS Funds. The Trustees also considered that MFS discontinued its historic practice of obtaining investment research from portfolio brokerage
commissions paid by certain MFS Funds effective January 2018, and directly pays or voluntarily reimburses a Fund, if applicable, for the costs of external research acquired through the use of the Fund’s portfolio brokerage commissions.
MFS Global Tactical
Allocation Portfolio
Board Review of Investment Advisory Agreement - continued
Based on their evaluation of factors that they deemed to be
material, including those factors described above, the Board of Trustees, including the independent Trustees, concluded that the Fund’s investment advisory agreement with MFS should be continued for an additional one-year period, commencing
August 1, 2021.
MFS Global Tactical
Allocation Portfolio
Proxy Voting Policies and Information
MFS votes proxies on behalf of the fund pursuant to proxy
voting policies and procedures that are available without charge, upon request, by calling 1-800-225-2606, by visiting mfs.com/proxyvoting, or by visiting the SEC’s Web site at http://www.sec.gov.
Information regarding how the fund voted proxies relating
to portfolio securities during the most recent twelve-month period ended June 30 is available by August 31 of each year without charge by visiting mfs.com/proxyvoting, or by visiting the SEC’s Web site
at http://www.sec.gov.
Quarterly Portfolio Disclosure
The fund files a complete schedule of portfolio holdings
with the SEC for the first and third quarters of each fiscal year as an exhibit to its reports on Form N-PORT. The fund’s Form N-PORT reports are available on the SEC’s Web site at
http://www.sec.gov. A shareholder can obtain the portfolio holdings report for the first and third quarters of the fund's fiscal year at mfs.com/vit2 by
choosing the fund's name and then scrolling to the “Resources” section and clicking on the “Prospectus and Reports” tab.
FURTHER INFORMATION
From time to time, MFS may post important information about
the fund or the MFS Funds on the MFS Web site (mfs.com). This information is available at https://www.mfs.com/announcements or at
mfs.com/vit2 by choosing the fund's name and then scrolling to the “Resources” section and clicking on the “Announcements” tab, if any.
Information About Fund Contracts and Legal Claims
The fund has entered into contractual arrangements with an
investment adviser, administrator, distributor, shareholder servicing agent, 529 program manager (if applicable), and custodian who each provide services to the fund. Unless expressly stated otherwise, shareholders are not parties to, or intended
beneficiaries of these contractual arrangements, and these contractual arrangements are not intended to create any shareholder right to enforce them against the service providers or to seek any remedy under them against the service providers, either
directly or on behalf of the fund.
Under the
Trust’s By-Laws and Declaration of Trust, any claims asserted against or on behalf of the MFS Funds, including claims against Trustees and Officers, must be brought in state and federal courts located within the Commonwealth of
Massachusetts.
Federal Tax Information (unaudited)
The following information is provided pursuant to
provisions of the Internal Revenue Code.
The fund
designates $20,323,000 as capital gain dividends paid during the fiscal year.
For corporate shareholders, 19.94% of the ordinary income
dividends paid during the fiscal year qualify for the corporate dividends received deduction.
The fund intends to pass through the maximum amount
allowable as Section 163(j) Interest Dividends as defined in Treasury Regulation §1.163(j)-1(b).
| FACTS
|
WHAT
DOES MFS DO WITH YOUR PERSONAL INFORMATION? |
| Why?
|
Financial
companies choose how they share your personal information. Federal law gives consumers the right to limit some but not all sharing. Federal law also requires us to tell you how we collect, share, and protect your personal information. Please read
this notice carefully to understand what we do. |
| What?
|
The types of
personal information we collect and share depend on the product or service you have with us. This information can include: |
| • Social
Security number and account balances |
| • Account
transactions and transaction history |
| • Checking
account information and wire transfer instructions |
| When
you are no longer our customer, we continue to share your information as described in this notice. |
| How?
|
All
financial companies need to share customers' personal information to run their everyday business. In the section below, we list the reasons financial companies can share their customers' personal information; the reasons MFS chooses to share; and
whether you can limit this sharing. |
Reasons
we can share your
personal information |
Does
MFS share? |
Can
you limit
this sharing? |
For
our everyday business purposes –
such as to process your transactions, maintain your
account(s), respond to court orders and legal
investigations, or report to credit bureaus |
Yes
|
No
|
For
our marketing purposes –
to offer our products and services to you |
No
|
We
don't share |
For
joint marketing with other
financial companies |
No
|
We
don't share |
For
our affiliates' everyday business purposes –
information about your transactions and experiences |
No
|
We
don't share |
For
our affiliates' everyday business purposes –
information about your creditworthiness |
No
|
We
don't share |
| For
nonaffiliates to market to you |
No
|
We
don't share |
| Questions?
|
Call
800-225-2606 or go to mfs.com. |
| Who
we are |
| Who
is providing this notice? |
MFS
Funds, MFS Investment Management, MFS Institutional Advisors, Inc., and MFS Heritage Trust Company. |
| What
we do |
How
does MFS
protect my personal
information? |
To
protect your personal information from unauthorized access and use, we use security measures that comply with federal law. These measures include procedural, electronic, and physical safeguards for the protection of the personal information we
collect about you. |
How
does MFS
collect my personal
information? |
We
collect your personal information, for example, when you |
| • open
an account or provide account information |
| • direct
us to buy securities or direct us to sell your securities |
| • make
a wire transfer |
| We
also collect your personal information from others, such as credit bureaus, affiliates, or other companies. |
| Why
can't I limit all sharing? |
Federal
law gives you the right to limit only |
| • sharing
for affiliates' everyday business purposes – information about your creditworthiness |
| • affiliates
from using your information to market to you |
| • sharing
for nonaffiliates to market to you |
| State
laws and individual companies may give you additional rights to limit sharing. |
| Definitions
|
| Affiliates
|
Companies
related by common ownership or control. They can be financial and nonfinancial companies. |
| •
MFS does not share personal information with affiliates, except for everyday business purposes as described on page one of this notice. |
| Nonaffiliates
|
Companies
not related by common ownership or control. They can be financial and nonfinancial companies. |
| •
MFS does not share with nonaffiliates so they can market to you. |
| Joint
marketing |
A
formal agreement between nonaffiliated financial companies that together market financial products or services to you. |
| •
MFS doesn't jointly market. |
| Other
important information |
| If
you own an MFS product or receive an MFS service in the name of a third party such as a bank or broker-dealer, their privacy policy may apply to you instead of ours. |
Annual Report
December 31, 2021
MFS® Government
Securities Portfolio
MFS® Variable
Insurance Trust II
MFS® Government
Securities Portfolio
|
1
|
|
2
|
|
3
|
|
4
|
|
6
|
|
7
|
|
13
|
|
14
|
|
15
|
|
16
|
|
17
|
|
26
|
|
27
|
|
30
|
|
33
|
|
33
|
|
33
|
|
33
|
|
33
|
|
34
|
The report is prepared for the general information of contract owners. It
is authorized for distribution to prospective investors only when preceded or accompanied by a current prospectus.
NOT FDIC INSURED • MAY LOSE VALUE
• NO BANK OR CREDIT UNION GUARANTEE •
NOT A DEPOSIT • NOT INSURED BY ANY FEDERAL GOVERNMENT
AGENCY OR NCUA/NCUSIF
MFS Government
Securities Portfolio
Dear Contract Owners:
After a powerful rally in 2021 that was spurred by the
introduction of effective coronavirus vaccines and high levels of monetary and fiscal stimulus, markets have recently experienced a rise in volatility. Rising inflation (mostly due to pandemic-related labor and supply chain disruptions), new
COVID-19 variants that are vaccine-resistant, and the prospect of tighter monetary and fiscal policies around the world have all increased investor anxiety.
Rising real (inflation-adjusted) bond yields in the United
States are a headwind for richly valued U.S. growth stocks, though many non-U.S. markets have experienced lower levels of turbulence. In recent months, global economic growth has moderated, with the spread of the Delta and Omicron variants and a
regulatory crackdown in China featuring prominently. Stress in China’s property development sector has also contributed to the slowdown there. A further concern for investors is the tightening of global energy and raw materials supplies caused
in part by geopolitical uncertainty.
However,
above-trend economic growth, strong corporate balance sheets, and nascent signs that global supply chain bottlenecks may be easing, along with a dovish policy shift in China, are supportive fundamentals that we feel could help calm recent market
jitters.
It is times of market transition that
demonstrate the importance of having a deep understanding of company fundamentals, and we have built our global research platform to do just that.
At MFS®, we put our clients’ assets to work responsibly by carefully navigating the increasing complexity of global markets and economies. Guided by our commitment to long-term
investing, we tune out the noise and try to uncover what we believe are the best, most durable investment opportunities in the market. Our unique global investment platform combines collective expertise, long-term discipline, and thoughtful risk
management to create sustainable value for investors.
Respectfully,
Michael W.
Roberge
Chief Executive Officer
MFS Investment Management
February 15, 2022
The opinions expressed in this letter are subject to
change and may not be relied upon for investment advice. No forecasts can be guaranteed.
MFS Government Securities
Portfolio
Portfolio structure (i)
Fixed income
sectors (i)
| Mortgage-Backed
Securities |
47.8%
|
| U.S.
Treasury Securities |
39.3%
|
| Commercial
Mortgage-Backed Securities |
4.0%
|
| Collateralized
Debt Obligations |
2.7%
|
| Municipal
Bonds |
1.8%
|
| Investment
Grade Corporates |
0.9%
|
| U.S.
Government Agencies |
0.8%
|
| Non-U.S.
Government Bonds |
0.4%
|
| Asset-Backed
Securities |
0.1%
|
Composition including fixed income credit quality (a)(i)
| AAA
|
5.4%
|
| AA
|
2.0%
|
| A
|
2.2%
|
| BBB
|
0.3%
|
| U.S.
Government |
37.7%
|
| Federal
Agencies |
48.6%
|
| Not
Rated |
1.6%
|
| Cash
& Cash Equivalents |
3.7%
|
| Other
|
(1.5)%
|
Portfolio facts (i)
| Average
Duration (d) |
5.6
|
| Average
Effective Maturity (m) |
7.0
yrs. |
| (a)
|
For all
securities other than those specifically described below, ratings are assigned to underlying securities utilizing ratings from Moody’s, Fitch, and Standard & Poor’s rating agencies and applying the following hierarchy: If all three
agencies provide a rating, the middle rating (after dropping the highest and lowest ratings) is assigned; if two of the three agencies rate a security, the lower of the two is assigned. If none of the 3 rating agencies above assign a rating, but the
security is rated by DBRS Morningstar, then the DBRS Morningstar rating is assigned. If none of the 4 rating agencies listed above rate the security, but the security is rated by the Kroll Bond Rating Agency (KBRA), then the KBRA rating is assigned.
Ratings are shown in the S&P and Fitch scale (e.g., AAA). Securities rated BBB or higher are considered investment grade. All ratings are subject to change. U.S. Government includes securities issued by the U.S. Department of the Treasury.
Federal Agencies includes rated and unrated U.S. Agency fixed-income securities, U.S. Agency mortgage-backed securities, and collateralized mortgage obligations of U.S. Agency mortgage-backed securities. Not Rated includes fixed income securities
and fixed income derivatives that have not been rated by any rating agency. The fund may or may not have held all of these instruments on this date. The fund is not rated by these agencies. |
| (d)
|
Duration is
a measure of how much a bond’s price is likely to fluctuate with general changes in interest rates, e.g., if rates rise 1.00%, a bond with a 5-year duration is likely to lose about 5.00% of its value due to the interest rate move.
|
| (i)
|
For
purposes of this presentation, the components include the value of securities, and reflect the impact of the equivalent exposure of derivative positions, if any. These amounts may be negative from time to time. Equivalent exposure is a calculated
amount that translates the derivative position into a reasonable approximation of the amount of the underlying asset that the portfolio would have to hold at a given point in time to have the same price sensitivity that results from the
portfolio’s ownership of the derivative contract. When dealing with derivatives, equivalent exposure is a more representative measure of the potential impact of a position on portfolio performance than value. The bond component will include
any accrued interest amounts. |
| (m)
|
In
determining each instrument’s effective maturity for purposes of calculating the fund’s dollar-weighted average effective maturity, MFS uses the instrument’s stated maturity or, if applicable, an earlier date on which MFS believes
it is probable that a maturity-shortening device (such as a put, pre-refunding or prepayment) will cause the instrument to be repaid. Such an earlier date can be substantially shorter than the instrument’s stated maturity. |
Where the fund holds convertible bonds, they
are treated as part of the equity portion of the portfolio.
Cash & Cash Equivalents includes any cash,
investments in money market funds, short-term securities, and other assets less liabilities. Please see the Statement of Assets and Liabilities for additional information related to the fund’s cash position and other assets and
liabilities.
Other includes equivalent
exposure from currency derivatives and/or any offsets to derivative positions and may be negative.
Percentages are based on net assets as of December
31, 2021.
The portfolio is actively managed
and current holdings may be different.
MFS Government Securities
Portfolio
Management Review
Summary of Results
For the twelve months ended December 31, 2021, Initial
Class shares of the MFS Government Securities Portfolio (fund) provided a total return of -1.89%, while Service Class shares of the fund provided a total return of -2.14%. These compare with a return of -1.77% over the same period for the
fund’s benchmark, the Bloomberg U.S. Government/Mortgage Bond Index.
Market Environment
Over the past year, the global economy was buffeted by an
array of crosscurrents as it adjusted to the ebbs and flows of the pandemic. Among the supportive currents were ample fiscal stimulus, loose monetary policy and the rollout of several highly effective coronavirus vaccines. Negative currents included
the rapid spread of several coronavirus variants, widespread global production bottlenecks and a surge in inflation. After experiencing a burst of exceptionally strong economic activity as the global economy began to reopen, activity became more
muted in the second half of the period amid ongoing supply chain disruptions and a new wave of coronavirus infections, albeit a seemingly milder strain.
Amid rising inflation, markets anticipated a transition
from an exceptionally accommodative environment to a more mixed monetary landscape ahead. Indeed, several central banks in emerging markets have already tightened policy and the US Federal Reserve reduced the pace of its asset purchases in November
and again in December. However, the European Central Bank, the Bank of Japan and the People's Bank of China are expected to maintain accommodative policies. Sovereign bond yields moved modestly higher during the period amid higher inflation and on
expectations of a tighter Fed but remain historically low.
A harsher Chinese regulatory environment toward industries
such as online gaming, food delivery and education increased market volatility as has stress in China's highly leveraged property development sector. Trade relations between the United States and China remained quite strained despite a change in
presidential administrations.
Signs of excess
investor enthusiasm continued to be seen in pockets of the market such as “meme stocks” popular with users of online message boards, cryptocurrencies and heavy retail participation in the market for short-dated options.
Factors Affecting Performance
Relative to the Bloomberg U.S. Government/Mortgage Bond
Index, yield curve(y) positioning, particularly the fund’s lesser exposure to shifts in the long end (centered around maturities of 30 years) of the yield curve, detracted from relative performance.
On the positive side, the fund’s out-of-benchmark
exposure to commercial mortgage-backed securities (CMBS) contributed to relative returns. Favorable security selection within the mortgage-backed securities (MBS) and treasury sectors was another area of relative strength. Additionally, the fund's
shorter duration(d) stance benefited relative returns as interest rates generally rose during the reporting period.
Respectfully,
Portfolio Manager(s)
Geoffrey Schechter and Jake
Stone
| (d)
|
Duration is
a measure of how much a bond’s price is likely to fluctuate with general changes in interest rates, e.g., if rates rise 1.00%, a bond with a 5-year duration is likely to lose about 5.00% of its value. |
| (y)
|
A yield
curve graphically depicts the yields of different maturity bonds of the same credit quality and type; a normal yield curve is upward sloping, with short-term rates lower than long-term rates. |
The views expressed in this report are those of the portfolio
manager(s) only through the end of the period of the report as stated on the cover and do not necessarily reflect the views of MFS or any other person in the MFS organization. These views are subject to change at any time based on market or other
conditions, and MFS disclaims any responsibility to update such views. These views may not be relied upon as investment advice or an indication of trading intent on behalf of any MFS portfolio. References to specific securities are not
recommendations of such securities, and may not be representative of any MFS portfolio’s current or future investments.
MFS Government Securities
Portfolio
Performance Summary Through 12/31/21
The following chart illustrates the historical performance
of the fund in comparison to its benchmark(s). Benchmarks are unmanaged and may not be invested in directly. Benchmark returns do not reflect any fees or expenses. The performance of other share classes will be greater than or less than that of the
class depicted below. (See Notes to Performance Summary.)
Performance data shown represents past performance and is no
guarantee of future results. Investment return and principal value fluctuate so your units, when sold, may be worth more or less than the original cost; current performance may be lower or higher than quoted. The performance shown does not reflect
the deduction of taxes, if any, that a contract holder would pay on fund distributions or the redemption of contract units. The returns for the fund shown also do not reflect the deduction of expenses associated with variable products, such as
mortality and expense risk charges, separate account charges, and sales charges imposed by the insurance company separate accounts. Such expenses would reduce the overall returns shown.
Growth of a Hypothetical $10,000 Investment
Total Returns
through 12/31/21
Average annual total returns
| Share
Class |
Class
Inception Date |
1-yr
|
5-yr
|
10-yr
|
| Initial
Class |
6/12/85
|
(1.89)%
|
2.69%
|
1.96%
|
| Service
Class |
8/24/01
|
(2.14)%
|
2.45%
|
1.70%
|
Comparative benchmark(s)
| Bloomberg
U.S. Government/Mortgage Bond Index (f) |
(1.77)%
|
2.85%
|
2.21%
|
| (f)
|
Source:
FactSet Research Systems Inc. |
Benchmark Definition(s)
Bloomberg U.S. Government/Mortgage Bond Index(a) – measures debt issued by the U.S. Government, and its agencies, as well as mortgage-backed pass-through securities of Ginnie Mae (GNMA), Fannie Mae (FNMA), and Freddie
Mac (FHLMC).
It is not possible to invest directly in
an index.
| (a)
|
Source:
Bloomberg Index Services Limited. BLOOMBERG® is a trademark and service mark of Bloomberg Finance L.P. and its affiliates (collectively “Bloomberg”). Bloomberg
or Bloomberg's licensors own all proprietary rights in the Bloomberg Indices. Bloomberg neither approves or endorses this material, or guarantees the accuracy or completeness of any information herein, or makes any warranty, express or implied, as
to the results to be obtained therefrom and, to the maximum extent allowed by law, neither shall have any liability or responsibility for injury or damages arising in connection therewith. |
MFS Government Securities
Portfolio
Performance Summary – continued
Notes
to Performance Summary
Average annual total return
represents the average annual change in value for each share class for the periods presented.
Performance results reflect any applicable expense
subsidies and waivers in effect during the periods shown. Without such subsidies and waivers the fund's performance results would be less favorable. Please see the prospectus and financial statements for complete details. All results are historical
and assume the reinvestment of any dividends and capital gains distributions.
Performance results do not include adjustments made for
financial reporting purposes in accordance with U.S. generally accepted accounting principles and may differ from amounts reported in the financial highlights.
From time to time the fund may receive proceeds from
litigation settlements, without which performance would be lower.
MFS Government Securities
Portfolio
Expense Table
Fund Expenses Borne by the Contract Holders during the
Period,
July 1, 2021 through December 31, 2021
As
a contract holder of the fund, you incur ongoing costs, including management fees; distribution and/or service (12b-1) fees; and other fund expenses. This example is intended to help you understand your ongoing costs (in dollars) of investing in the
fund and to compare these costs with the ongoing costs of investing in other mutual funds.
The example is based on an investment of $1,000 invested at
the beginning of the period and held for the entire period July 1, 2021 through December 31, 2021.
Actual Expenses
The first line for each share class in the following table
provides information about actual account values and actual expenses. You may use the information in this line, together with the amount you invested, to estimate the expenses that you paid over the period. Simply divide your account value by $1,000
(for example, an $8,600 account value divided by $1,000 = 8.6), then multiply the result by the number in the first line under the heading entitled “Expenses Paid During Period” to estimate the expenses you paid on your account during
this period.
Hypothetical Example for Comparison
Purposes
The second line for each share class in the
following table provides information about hypothetical account values and hypothetical expenses based on the fund’s actual expense ratio and an assumed rate of return of 5% per year before expenses, which is not the fund’s actual
return. The hypothetical account values and expenses may not be used to estimate the actual ending account balance or expenses you paid for the period. You may use this information to compare the ongoing costs of investing in the fund and other
funds. To do so, compare this 5% hypothetical example with the 5% hypothetical examples that appear in the shareholder reports of the other funds.
Please note that the expenses shown in the table are meant
to highlight the fund's ongoing costs only and do not take into account the fees and expenses imposed under the variable contracts through which your investment in the fund is made. Therefore, the second line for each share class in the table is
useful in comparing ongoing costs associated with an investment in vehicles (such as the fund) which fund benefits under variable annuity and variable life insurance contracts and to qualified pension and retirement plans only, and will not help you
determine the relative total costs of investing in the fund through variable annuity and variable life insurance contracts. If the fees and expenses imposed under the variable contracts were included, your costs would have been higher.
Share
Class |
|
Annualized
Expense
Ratio |
Beginning
Account Value
7/01/21 |
Ending
Account Value
12/31/21 |
Expenses
Paid During
Period (p)
7/01/21-12/31/21 |
| Initial
Class |
Actual
|
0.58%
|
$1,000.00
|
$997.41
|
$2.92
|
| Hypothetical
(h) |
0.58%
|
$1,000.00
|
$1,022.28
|
$2.96
|
| Service
Class |
Actual
|
0.83%
|
$1,000.00
|
$995.72
|
$4.18
|
| Hypothetical
(h) |
0.83%
|
$1,000.00
|
$1,021.02
|
$4.23
|
| (h)
|
5% class return per year
before expenses. |
| (p)
|
“Expenses
Paid During Period” are equal to each class's annualized expense ratio, as shown above, multiplied by the average account value over the period, multiplied by 184/365 (to reflect the one-half year period). |
MFS Government Securities
Portfolio
Portfolio of Investments − 12/31/21
The Portfolio of Investments is a complete list of all
securities owned by your fund. It is categorized by broad-based asset classes.
| Issuer
|
|
|
Shares/Par
|
Value
($) |
| Bonds
– 95.8% |
| Asset-Backed
& Securitized – 6.8% |
| 3650R
Commercial Mortgage Trust, 2021-PF1, “XA”, 1.038%, 11/15/2054 (i) |
|
$
|
3,622,462
|
$
263,954 |
| ACREC
2021-FL1 Ltd., “AS”, FLR, 1.603% (LIBOR - 1mo. + 1.5%), 10/16/2036 (n) |
|
|
1,293,000
|
1,287,193 |
| ACREC
2021-FL1 Ltd., “B”, FLR, 1.903% (LIBOR - 1mo. + 1.8%), 10/16/2036 (n) |
|
|
1,003,500
|
998,961 |
| Allegro
CLO Ltd., 2016-1A, “BR2”, FLR, 1.673% (LIBOR - 3mo. + 1.55%), 1/15/2030 (n) |
|
|
635,246
|
635,260 |
| Arbor
Realty Trust, Inc., CLO, 2021-FL1, “B”, FLR, 1.609% (LIBOR - 1mo. + 1.5%), 12/15/2035 (n) |
|
|
671,500
|
668,352 |
| Arbor
Realty Trust, Inc., CLO, 2021-FL3, “AS”, FLR, 1.509% (LIBOR - 1mo. + 1.4%), 8/15/2034 (n) |
|
|
1,107,000
|
1,102,901 |
| BBCMS
Mortgage Trust, 2021-C10, “XA”, 1.307%, 7/15/2054 (i) |
|
|
3,665,568
|
346,496 |
| BBCMS
Mortgage Trust, 2021-C9, “XA”, 1.638%, 2/15/2054 (i) |
|
|
2,398,010
|
281,265 |
| BDS
Ltd., 2021-FL9, “A”, 1.173%, 11/16/2038 (n) |
|
|
989,500
|
984,687 |
| Benchmark
Mortgage Trust, 2021-B23, “XA”, 1.276%, 2/15/2054 (i) |
|
|
7,645,914
|
679,635 |
| Benchmark
Mortgage Trust, 2021-B24, “XA”, 1.154%, 3/15/2054 (i) |
|
|
4,512,845
|
367,625 |
| Benchmark
Mortgage Trust, 2021-B26, “XA”, 0.999%, 6/15/2054 (i) |
|
|
6,480,340
|
420,818 |
| Benchmark
Mortgage Trust, 2021-B27, “XA”, 1.271%, 7/15/2054 (i) |
|
|
5,817,849
|
543,631 |
| Benchmark
Mortgage Trust, 2021-B28, “XA”, 1.291%, 8/15/2054 (i) |
|
|
6,809,503
|
639,960 |
| Benchmark
Mortgage Trust, 2021-B29, “XA”, 1.049%, 9/15/2054 (i)(n) |
|
|
7,601,572
|
564,866 |
| BPCRE
Holder LLC, FLR, 0.958% (LIBOR - 1mo. + 0.85%), 2/15/2037 (n) |
|
|
215,525
|
215,279 |
| BPCRE
Holder LLC, FLR, 1.658% (LIBOR - 1mo. + 1.55%), 2/15/2037 (n) |
|
|
225,500
|
225,280 |
| BSPDF
2021-FL1 Issuer Ltd., “A”, 1.309%, 10/15/2036 (n) |
|
|
614,500
|
612,220 |
| BSPDF
2021-FL1 Issuer Ltd., “AS”, FLR, 1.589% (LIBOR - 1mo. + 1.48%), 10/15/2036 (n) |
|
|
777,500
|
779,681 |
| BXMT
Ltd., 2021-FL4, “AS”, FLR, 1.409% (LIBOR - 1mo. + 1.3%), 5/15/2038 (n) |
|
|
1,344,000
|
1,339,800 |
| Capital
Automotive, 2020-1A, “A4”, REIT, 3.19%, 2/15/2050 (n) |
|
|
268,454
|
273,444 |
| Citigroup
Commercial Mortgage Trust, 2019-XA, “C7”, 0.873%, 12/15/2072 (i)(n) |
|
|
4,431,845
|
257,722 |
| Commercial
Mortgage Pass-Through Certificates, 2021-BN31, “XA”, 1.334%, 2/15/2054 (i) |
|
|
5,893,544
|
575,747 |
| Commercial
Mortgage Pass-Through Certificates, 2021-BN32, “XA”, 0.783%, 4/15/2054 (i) |
|
|
3,312,648
|
188,544 |
| Commercial
Mortgage Pass-Through Certificates, 2021-BN35, “XA”, 1.053%, 6/15/2064 (i) |
|
|
2,252,164
|
176,915 |
| Commercial
Mortgage Trust, 2015-DC1, “A5”, 3.35%, 2/10/2048 |
|
|
1,136,000
|
1,190,638 |
| CSAIL
Commercial Mortgage Trust, 2015-C2, “A4”, 3.504%, 6/15/2057 |
|
|
144,366
|
152,144 |
| GS
Mortgage Securities Trust, 2015-GC30, “A4”, 3.382%, 5/10/2050 |
|
|
1,965,000
|
2,071,191 |
| GS
Mortgage Securities Trust, 2015-GC32, “A2”, 3.062%, 7/10/2048 |
|
|
115,678
|
116,985 |
| LoanCore
Ltd., 2021-CRE5, “AS”, FLR, 1.859% (LIBOR - 1mo. + 1.75%), 7/15/2036 (n) |
|
|
1,110,500
|
1,109,131 |
| Madison
Park Funding Ltd., 2014-13A, “BR2”, FLR, 1.623% (LIBOR - 3mo. + 1.5%), 4/19/2030 (n) |
|
|
1,572,067
|
1,578,862 |
| MF1
CLO Ltd., 2021-FL5, “AS”, FLR, 1.364% (LIBOR - 1mo. + 1.2%), 7/15/2036 (n) |
|
|
664,500
|
663,911 |
| MF1
CLO Ltd., 2021-FL5, “B”, FLR, 1.614% (LIBOR - 1mo. + 1.45%), 7/15/2036 (n) |
|
|
836,500
|
832,897 |
| MF1
Multi-Family Housing Mortgage Loan Trust, 2020-FL4, “A”, FLR, 1.864% (LIBOR - 1mo. + 1.7%), 11/15/2035 (n) |
|
|
836,000
|
838,938 |
| Morgan
Stanley Capital I Trust, 2018-H4, “XA”, 0.836%, 12/15/2051 (i) |
|
|
6,087,658
|
299,430 |
| Morgan
Stanley Capital I Trust, 2021-L5, “XA”, 1.3%, 5/15/2054 (i) |
|
|
2,881,313
|
265,441 |
| Morgan
Stanley Capital I Trust, 2021-L6, “XA”, 1.237%, 6/15/2054 (i) |
|
|
3,548,805
|
297,061 |
| Morgan
Stanley Capital I Trust, 2021-L7, “XA”, 1.107%, 10/15/2054 (i) |
|
|
13,457,623
|
1,062,817 |
| Palmer
Square Loan Funding Ltd., 2020-1A, “A2”, FLR, 1.509% (LIBOR - 3mo. + 1.35%), 2/20/2028 (n) |
|
|
680,583
|
677,677 |
| PFP
III Ltd., 2021-7, “AS”, FLR, 1.259% (LIBOR - 1mo. + 1.15%), 4/14/2038 (n) |
|
|
932,953
|
928,465 |
| ReadyCap
Commercial Mortgage Trust, 2021-FL7, “A”, FLR, 1.28% (LIBOR - 1mo. + 1.2%), 11/25/2036 (z) |
|
|
669,964
|
669,555 |
| ReadyCap
Commercial Mortgage Trust, 2021-FL7, “AS”, FLR, 1.58% (LIBOR - 1mo. + 1.5%), 11/25/2036 (z) |
|
|
206,000
|
205,808 |
| Symphony
CLO Ltd., 2016-17A, “BR”, FLR, 1.323% (LIBOR - 3mo. + 1.2%), 4/15/2028 (n) |
|
|
1,332,260
|
1,329,588 |
| Wells
Fargo Commercial Mortgage Trust, 2018-C48, “XA”, 0.949%, 1/15/2052 (i)(n) |
|
|
3,520,396
|
202,379 |
| Wells
Fargo Commercial Mortgage Trust, 2021-C60, “XA”, 1.557%, 8/15/2054 (i) |
|
|
1,331,195
|
154,282 |
| |
|
|
|
$29,077,436 |
| Automotive
– 0.1% |
| Hyundai
Capital America, 2.375%, 2/10/2023 (n) |
|
$
|
405,000
|
$
410,606 |
| Consumer
Services – 0.1% |
| Conservation
Fund, 3.474%, 12/15/2029 |
|
$
|
563,000
|
$
594,203 |
MFS Government Securities
Portfolio
Portfolio of
Investments – continued
| Issuer
|
|
|
Shares/Par
|
Value
($) |
| Bonds
– continued |
| Industrial
– 0.1% |
| Howard
University, Washington D.C., 2.738%, 10/01/2022 |
|
$
|
98,000
|
$
98,605 |
| Howard
University, Washington D.C., 2.801%, 10/01/2023 |
|
|
108,000
|
110,397 |
| Howard
University, Washington D.C., AGM, 2.416%, 10/01/2024 |
|
|
119,000
|
121,297 |
| Howard
University, Washington D.C., AGM, 2.516%, 10/01/2025 |
|
|
147,000
|
148,259 |
| |
|
|
|
$478,558 |
| Major
Banks – 0.2% |
| JPMorgan
Chase & Co., 1.578% to 4/22/2026, FLR (SOFR + 0.885%) to 4/22/2027 |
|
$
|
938,000
|
$
926,945 |
| Medical
& Health Technology & Services – 0.3% |
| ProMedica
Toledo Hospital, “B”, AGM, 5.325%, 11/15/2028 |
|
$
|
879,000
|
$
1,033,880 |
| ProMedica
Toledo Hospital, “B”, AGM, 5.75%, 11/15/2038 |
|
|
246,000
|
287,062 |
| |
|
|
|
$1,320,942 |
| Mortgage-Backed
– 47.7% |
|
| Fannie
Mae, 5.5%, 5/01/2022 - 3/01/2038 |
|
$
|
3,766,168
|
$
4,280,025 |
| Fannie
Mae, 2.152%, 1/25/2023 |
|
|
488,645
|
492,353 |
| Fannie
Mae, 2.73%, 4/01/2023 |
|
|
456,465
|
463,907 |
| Fannie
Mae, 2.41%, 5/01/2023 |
|
|
576,196
|
584,635 |
| Fannie
Mae, 2.55%, 5/01/2023 |
|
|
494,940
|
502,820 |
| Fannie
Mae, 4.5%, 5/01/2025 - 4/01/2041 |
|
|
2,638,793
|
2,904,056 |
| Fannie
Mae, 4%, 3/25/2028 - 2/01/2045 |
|
|
9,172,371
|
10,017,233 |
| Fannie
Mae, 3%, 11/01/2028 - 5/25/2053 |
|
|
5,976,622
|
6,254,742 |
| Fannie
Mae, 6.5%, 9/01/2031 - 10/01/2037 |
|
|
375,317
|
427,846 |
| Fannie
Mae, 2.5%, 11/01/2031 - 10/01/2046 |
|
|
975,144
|
995,626 |
| Fannie
Mae, 3.5%, 12/25/2031 - 2/25/2036 (i) |
|
|
363,079
|
35,730 |
| Fannie
Mae, 3%, 2/25/2033 (i) |
|
|
421,801
|
41,483 |
| Fannie
Mae, 5%, 11/01/2033 - 3/01/2041 |
|
|
2,526,338
|
2,847,343 |
| Fannie
Mae, 6%, 8/01/2034 - 7/01/2037 |
|
|
411,819
|
467,502 |
| Fannie
Mae, 3.5%, 4/01/2038 - 7/01/2046 |
|
|
4,226,060
|
4,536,038 |
| Fannie
Mae, 2%, 10/25/2040 - 4/25/2046 |
|
|
618,536
|
624,308 |
| Fannie
Mae, 1.75%, 10/25/2041 |
|
|
969,522
|
974,221 |
| Fannie
Mae, 2.75%, 9/25/2042 |
|
|
399,713
|
410,580 |
| Fannie
Mae, UMBS, 2.5%, 2/01/2050 - 12/01/2051 |
|
|
2,678,718
|
2,752,202 |
| Fannie
Mae, UMBS, 2%, 1/01/2051 - 2/01/2051 |
|
|
762,305
|
763,247 |
| Fannie
Mae, UMBS, 3%, 12/01/2051 |
|
|
1,749,556
|
1,827,747 |
| Freddie
Mac, 5.5%, 5/01/2022 - 6/01/2041 |
|
|
898,226
|
1,024,813 |
| Freddie
Mac, 4.5%, 11/01/2022 - 5/01/2042 |
|
|
1,074,714
|
1,180,324 |
| Freddie
Mac, 3.32%, 2/25/2023 |
|
|
1,936,790
|
1,984,950 |
| Freddie
Mac, 5%, 4/01/2023 - 12/01/2044 |
|
|
1,489,999
|
1,674,365 |
| Freddie
Mac, 3.25%, 4/25/2023 |
|
|
3,486,705
|
3,577,268 |
| Freddie
Mac, 6%, 6/01/2023 - 10/01/2038 |
|
|
1,204,868
|
1,356,898 |
| Freddie
Mac, 3.06%, 7/25/2023 |
|
|
326,000
|
335,727 |
| Freddie
Mac, 0.893%, 4/25/2024 (i) |
|
|
13,086,159
|
224,242 |
| Freddie
Mac, 0.603%, 7/25/2024 (i) |
|
|
17,091,016
|
180,905 |
| Freddie
Mac, 3.064%, 8/25/2024 |
|
|
1,685,495
|
1,758,158 |
| Freddie
Mac, 2.67%, 12/25/2024 |
|
|
3,924,000
|
4,076,283 |
| Freddie
Mac, 2.811%, 1/25/2025 |
|
|
3,025,000
|
3,156,549 |
| Freddie
Mac, 4%, 7/01/2025 - 4/01/2044 |
|
|
1,031,255
|
1,122,404 |
| Freddie
Mac, 3.5%, 1/15/2027 - 10/25/2058 |
|
|
11,797,499
|
12,614,665 |
| Freddie
Mac, 1.367%, 3/25/2027 (i) |
|
|
1,030,000
|
68,880 |
| Freddie
Mac, 0.576%, 7/25/2027 (i) |
|
|
29,692,784
|
862,840 |
| Freddie
Mac, 0.429%, 8/25/2027 (i) |
|
|
24,554,128
|
550,791 |
| Freddie
Mac, 0.291%, 1/25/2028 (i) |
|
|
42,487,512
|
757,302 |
| Freddie
Mac, 0.302%, 1/25/2028 (i) |
|
|
17,498,615
|
320,835 |
| Freddie
Mac, 0.132%, 2/25/2028 (i) |
|
|
49,468,415
|
464,197 |
MFS Government Securities
Portfolio
Portfolio of
Investments – continued
| Issuer
|
|
|
Shares/Par
|
Value
($) |
| Bonds
– continued |
| Mortgage-Backed
– continued |
|
| Freddie
Mac, 2.5%, 3/15/2028 |
|
$
|
154,431
|
$
155,955 |
| Freddie
Mac, 0.119%, 4/25/2028 (i) |
|
|
31,865,556
|
279,082 |
| Freddie
Mac, 3%, 6/15/2028 - 2/25/2059 |
|
|
8,506,741
|
8,954,124 |
| Freddie
Mac, 1.089%, 7/25/2029 (i) |
|
|
4,428,938
|
325,408 |
| Freddie
Mac, 1.143%, 8/25/2029 (i) |
|
|
7,686,107
|
592,466 |
| Freddie
Mac, 1.798%, 4/25/2030 (i) |
|
|
1,602,831
|
217,853 |
| Freddie
Mac, 1.868%, 4/25/2030 (i) |
|
|
4,034,514
|
569,433 |
| Freddie
Mac, 1.662%, 5/25/2030 (i) |
|
|
2,174,913
|
277,124 |
| Freddie
Mac, 1.796%, 5/25/2030 (i) |
|
|
4,905,689
|
672,094 |
| Freddie
Mac, 1.341%, 6/25/2030 (i) |
|
|
1,983,331
|
205,914 |
| Freddie
Mac, 1.599%, 8/25/2030 (i) |
|
|
1,814,781
|
227,229 |
| Freddie
Mac, 1.169%, 9/25/2030 (i) |
|
|
1,149,690
|
107,233 |
| Freddie
Mac, 1.081%, 11/25/2030 (i) |
|
|
2,249,951
|
197,743 |
| Freddie
Mac, 0.33%, 1/25/2031 (i) |
|
|
8,737,404
|
225,703 |
| Freddie
Mac, 0.781%, 1/25/2031 (i) |
|
|
3,359,280
|
220,201 |
| Freddie
Mac, 0.936%, 1/25/2031 (i) |
|
|
2,545,825
|
197,335 |
| Freddie
Mac, 0.529%, 3/25/2031 (i) |
|
|
6,970,433
|
295,064 |
| Freddie
Mac, 0.74%, 3/25/2031 (i) |
|
|
2,967,667
|
187,263 |
| Freddie
Mac, 1.224%, 5/25/2031 (i) |
|
|
1,210,235
|
125,864 |
| Freddie
Mac, 0.937%, 7/25/2031 (i) |
|
|
1,944,368
|
160,234 |
| Freddie
Mac, 0.508%, 8/25/2031 (i) |
|
|
2,464,577
|
109,156 |
| Freddie
Mac, 0.536%, 9/25/2031 (i) |
|
|
8,016,720
|
390,189 |
| Freddie
Mac, 0.855%, 9/25/2031 (i) |
|
|
2,478,687
|
187,083 |
| Freddie
Mac, 0.349%, 11/25/2031 (i) |
|
|
11,978,818
|
390,147 |
| Freddie
Mac, 0.567%, 12/25/2031 (i) |
|
|
1,981,491
|
98,760 |
| Freddie
Mac, 6.5%, 8/01/2032 - 5/01/2037 |
|
|
221,041
|
251,583 |
| Freddie
Mac, 5.5%, 2/15/2036 (i) |
|
|
103,483
|
18,561 |
| Freddie
Mac, 4.5%, 12/15/2040 (i) |
|
|
37,047
|
3,550 |
| Freddie
Mac, 1.75%, 8/15/2041 |
|
|
314,967
|
319,383 |
| Freddie
Mac, UMBS, 6.5%, 8/01/2032 |
|
|
20,851
|
23,531 |
| Freddie
Mac, UMBS, 3%, 7/01/2050 |
|
|
24,415
|
25,705 |
| Freddie
Mac, UMBS, 2.5%, 10/01/2051 - 12/01/2051 |
|
|
1,490,663
|
1,532,536 |
| Ginnie
Mae, 5.5%, 7/15/2033 - 1/20/2042 |
|
|
821,035
|
939,492 |
| Ginnie
Mae, 5.691%, 8/20/2034 |
|
|
308,303
|
346,395 |
| Ginnie
Mae, 4%, 5/16/2039 - 7/20/2041 |
|
|
871,091
|
934,369 |
| Ginnie
Mae, 4.5%, 8/15/2039 - 9/20/2041 |
|
|
2,054,429
|
2,296,196 |
| Ginnie
Mae, 3.5%, 10/20/2041 (i) |
|
|
161,000
|
10,879 |
| Ginnie
Mae, 3.5%, 12/15/2041 - 6/20/2043 |
|
|
2,596,830
|
2,801,224 |
| Ginnie
Mae, 2.5%, 6/20/2042 - 11/20/2051 |
|
|
5,149,651
|
5,280,399 |
| Ginnie
Mae, 4%, 8/16/2042 (i) |
|
|
180,401
|
23,653 |
| Ginnie
Mae, 2.25%, 9/20/2043 |
|
|
179,955
|
181,358 |
| Ginnie
Mae, 3%, 4/20/2045 - 11/20/2051 |
|
|
5,370,497
|
5,592,007 |
| Ginnie
Mae, 0.585%, 2/16/2059 (i) |
|
|
822,973
|
34,659 |
| Ginnie
Mae, TBA, 3%, 7/20/2049 |
|
|
1,225,000
|
1,267,450 |
| Ginnie
Mae, TBA, 4%, 1/20/2052 |
|
|
250,000
|
263,258 |
| Ginnie
Mae, TBA, 2%, 1/21/2052 |
|
|
3,525,000
|
3,556,825 |
| Ginnie
Mae, TBA, 2.5%, 1/21/2052 |
|
|
2,125,000
|
2,176,130 |
| Ginnie
Mae, TBA, 3.5%, 1/21/2052 |
|
|
3,525,000
|
3,670,391 |
| UMBS,
TBA, 2%, 1/16/2036 - 7/25/2051 |
|
|
44,900,000
|
44,976,365 |
| UMBS,
TBA, 2.5%, 1/18/2037 - 7/25/2051 |
|
|
20,650,000
|
21,085,999 |
| UMBS,
TBA, 1.5%, 1/19/2037 |
|
|
2,125,000
|
2,130,687 |
| UMBS,
TBA, 3%, 1/19/2037 - 1/13/2052 |
|
|
9,725,000
|
10,076,669 |
| |
|
|
|
$
204,683,951 |
MFS Government Securities
Portfolio
Portfolio of
Investments – continued
| Issuer
|
|
|
Shares/Par
|
Value
($) |
| Bonds
– continued |
| Municipals
– 1.8% |
| California
Earthquake Authority Rev., “B”, 1.477%, 7/01/2023 |
|
$
|
210,000
|
$
211,866 |
| Golden
State, CA, Tobacco Securitization Corp., Tobacco Settlement Rev., “B”, 3%, 6/01/2046 |
|
|
780,000
|
798,997 |
| Massachusetts
Educational Financing Authority, Education Loan Rev., “A”, 2.562%, 7/01/2026 |
|
|
70,000
|
72,177 |
| Massachusetts
Educational Financing Authority, Education Loan Rev., “A”, 2.682%, 7/01/2027 |
|
|
335,000
|
347,306 |
| Michigan
Finance Authority Tobacco Settlement Asset-Backed Rev. (2006 Sold Tobacco Receipts), “A-1”, 2.326%, 6/01/2030 |
|
|
313,269
|
318,731 |
| New
Jersey Economic Development Authority State Pension Funding Rev., Capital Appreciation, “B”, AGM, 0%, 2/15/2023 |
|
|
2,991,000
|
2,961,749 |
| New
York Transportation Development Corp., Special Facilities Taxable Rev. (Terminal 4 John F. Kennedy International Airport Project), “B”, 1.61%, 12/01/2022 |
|
|
130,000
|
130,669 |
| Philadelphia,
PA, School District, “A”, AGM, 5.995%, 9/01/2030 |
|
|
960,000
|
1,227,687 |
| Port
of Oakland, CA, Senior Lien Refunding Taxable Rev., “R”, 1.517%, 5/01/2026 |
|
|
295,000
|
294,155 |
| Rhode
Island Student Loan Authority, Education Loan Rev., “1”, 2.195%, 12/01/2039 |
|
|
55,000
|
55,327 |
| Texas
Transportation Commission, Central Texas Turnpike System First Tier Refunding Rev., Taxable, “B”, 1.98%, 8/15/2042 |
|
|
690,000
|
694,448 |
| West
Virginia Tobacco Settlement Financing Authority Asset-Backed Refunding, “A-1”, 1.497%, 6/01/2024 |
|
|
280,000
|
280,156 |
| West
Virginia Tobacco Settlement Financing Authority Asset-Backed Refunding, “A-1”, 1.647%, 6/01/2025 |
|
|
225,000
|
223,957 |
| |
|
|
|
$7,617,225 |
| Supranational
– 0.4% |
| Inter-American
Development Bank, 4.375%, 1/24/2044 |
|
$
|
1,093,000
|
$
1,509,877 |
| U.S.
Government Agencies and Equivalents – 0.8% |
| Small
Business Administration, 6.07%, 3/01/2022 |
|
$
|
7,749
|
$
7,764 |
| Small
Business Administration, 4.98%, 11/01/2023 |
|
|
23,735
|
24,445 |
| Small
Business Administration, 4.77%, 4/01/2024 |
|
|
74,742
|
76,855 |
| Small
Business Administration, 5.52%, 6/01/2024 |
|
|
33,313
|
34,514 |
| Small
Business Administration, 4.99%, 9/01/2024 |
|
|
6,803
|
6,975 |
| Small
Business Administration, 5.11%, 4/01/2025 |
|
|
52,414
|
54,444 |
| Small
Business Administration, 2.21%, 2/01/2033 |
|
|
468,242
|
474,012 |
| Small
Business Administration, 2.22%, 3/01/2033 |
|
|
730,516
|
740,042 |
| Small
Business Administration, 3.15%, 7/01/2033 |
|
|
709,318
|
742,010 |
| Small
Business Administration, 3.16%, 8/01/2033 |
|
|
412,835
|
431,723 |
| Small
Business Administration, 3.62%, 9/01/2033 |
|
|
274,559
|
290,526 |
| Tennessee
Valley Authority, 0.75%, 5/15/2025 |
|
|
707,000
|
697,251 |
| |
|
|
|
$3,580,561 |
| U.S.
Treasury Obligations – 37.5% |
| U.S.
Treasury Bonds, 6.25%, 8/15/2023 |
|
$
|
2,891,000
|
$
3,153,900 |
| U.S.
Treasury Bonds, 6%, 2/15/2026 |
|
|
2,699,000
|
3,224,040 |
| U.S.
Treasury Bonds, 6.75%, 8/15/2026 |
|
|
1,862,000
|
2,320,663 |
| U.S.
Treasury Bonds, 6.375%, 8/15/2027 |
|
|
326,000
|
415,421 |
| U.S.
Treasury Bonds, 1.625%, 5/15/2031 |
|
|
6,239,000
|
6,317,962 |
| U.S.
Treasury Bonds, 4.5%, 8/15/2039 |
|
|
1,287,500
|
1,818,191 |
| U.S.
Treasury Bonds, 3.125%, 2/15/2043 |
|
|
8,176,700
|
9,855,159 |
| U.S.
Treasury Bonds, 2.875%, 5/15/2043 |
|
|
13,519,500
|
15,710,081 |
| U.S.
Treasury Bonds, 2.5%, 2/15/2045 (f) |
|
|
21,059,000
|
23,159,142 |
| U.S.
Treasury Bonds, 2.875%, 11/15/2046 |
|
|
2,917,000
|
3,450,150 |
| U.S.
Treasury Notes, 1.5%, 9/15/2022 |
|
|
2,500,000
|
2,521,387 |
| U.S.
Treasury Notes, 0.125%, 9/30/2022 |
|
|
8,770,000
|
8,758,352 |
| U.S.
Treasury Notes, 0.125%, 2/28/2023 |
|
|
15,517,800
|
15,454,153 |
| U.S.
Treasury Notes, 2.5%, 3/31/2023 |
|
|
9,000,000
|
9,221,836 |
| U.S.
Treasury Notes, 0.125%, 5/31/2023 |
|
|
8,057,000
|
8,006,958 |
| U.S.
Treasury Notes, 0.125%, 6/30/2023 |
|
|
7,893,000
|
7,839,661 |
| U.S.
Treasury Notes, 0.375%, 10/31/2023 |
|
|
2,189,900
|
2,176,983 |
| U.S.
Treasury Notes, 0.75%, 12/31/2023 |
|
|
12,875,300
|
12,877,815 |
| U.S.
Treasury Notes, 2.5%, 5/15/2024 |
|
|
5,385,000
|
5,594,089 |
| U.S.
Treasury Notes, 2%, 8/15/2025 |
|
|
438,000
|
451,722 |
| U.S.
Treasury Notes, 2.625%, 12/31/2025 |
|
|
2,800,000
|
2,960,563 |
MFS Government Securities
Portfolio
Portfolio of
Investments – continued
| Issuer
|
|
|
Shares/Par
|
Value
($) |
| Bonds
– continued |
| U.S.
Treasury Obligations – continued |
| U.S.
Treasury Notes, 2.75%, 2/15/2028 |
|
$
|
6,000,000
|
$
6,484,688 |
| U.S.
Treasury Notes, 1.5%, 2/15/2030 |
|
|
3,800,000
|
3,819,594 |
| U.S.
Treasury Notes, 1.375%, 11/15/2031 |
|
|
4,361,500
|
4,306,300 |
| U.S.
Treasury Notes, 1.875%, 11/15/2051 |
|
|
1,291,400
|
1,281,109 |
| |
|
|
|
$
161,179,919 |
| Total
Bonds (Identified Cost, $397,759,778) |
|
$
411,380,223 |
| Investment
Companies (h) – 24.0% |
| Money
Market Funds – 24.0% |
|
| MFS
Institutional Money Market Portfolio, 0.07% (v) (Identified Cost, $102,834,176) |
|
|
102,834,176
|
$
102,834,176 |
| Other
Assets, Less Liabilities – (19.8)% |
|
(84,961,918)
|
| Net
Assets – 100.0% |
$
429,252,481 |
| (f) |
All or a portion of the
security has been segregated as collateral for open futures contracts. |
| (h)
|
An
affiliated issuer, which may be considered one in which the fund owns 5% or more of the outstanding voting securities, or a company which is under common control. At period end, the aggregate values of the fund's investments in affiliated issuers
and in unaffiliated issuers were $102,834,176 and $411,380,223, respectively. |
| (i)
|
Interest
only security for which the fund receives interest on notional principal (Par amount). Par amount shown is the notional principal and does not reflect the cost of the security. |
| (n)
|
Securities
exempt from registration under Rule 144A of the Securities Act of 1933. These securities may be sold in the ordinary course of business in transactions exempt from registration, normally to qualified institutional buyers. At period end, the
aggregate value of these securities was $18,518,100, representing 4.3% of net assets. |
| (v)
|
Affiliated
issuer that is available only to investment companies managed by MFS. The rate quoted for the MFS Institutional Money Market Portfolio is the annualized seven-day yield of the fund at period end. |
| (z)
|
Restricted
securities are not registered under the Securities Act of 1933 and are subject to legal restrictions on resale. These securities generally may be resold in transactions exempt from registration or to the public if the securities are subsequently
registered. Disposal of these securities may involve time-consuming negotiations and prompt sale at an acceptable price may be difficult. The fund holds the following restricted securities: |
| Restricted
Securities |
Acquisition
Date |
Cost
|
Value
|
| ReadyCap
Commercial Mortgage Trust, 2021-FL7, “A”, FLR, 1.28% (LIBOR - 1mo. + 1.2%), 11/25/2036 |
11/12/21
|
$669,964
|
$669,555
|
| ReadyCap
Commercial Mortgage Trust, 2021-FL7, “AS”, FLR, 1.58% (LIBOR - 1mo. + 1.5%), 11/25/2036 |
11/12/21
|
206,000
|
205,808
|
| Total
Restricted Securities |
|
|
$875,363
|
| %
of Net assets |
|
|
0.2%
|
| The
following abbreviations are used in this report and are defined: |
| AGM
|
Assured
Guaranty Municipal |
| CLO
|
Collateralized
Loan Obligation |
| FLR
|
Floating
Rate. Interest rate resets periodically based on the parenthetically disclosed reference rate plus a spread (if any). The period-end rate reported may not be the current rate. All reference rates are USD unless otherwise noted. |
| LIBOR
|
London
Interbank Offered Rate |
| REIT
|
Real Estate
Investment Trust |
| SOFR
|
Secured
Overnight Financing Rate |
| TBA
|
To Be
Announced |
| UMBS
|
Uniform
Mortgage-Backed Security |
| Abbreviations
indicate amounts shown in currencies other than the U.S. dollar. All amounts are stated in U.S. dollars unless otherwise indicated. A list of abbreviations is shown below: |
| JPY
|
Japanese
Yen |
MFS Government Securities
Portfolio
Portfolio of
Investments – continued
| Derivative
Contracts at 12/31/21 |
| Forward
Foreign Currency Exchange Contracts |
Currency
Purchased |
Currency
Sold |
Counterparty
|
Settlement
Date |
Unrealized
Appreciation
(Depreciation) |
| Asset
Derivatives |
| USD
|
43,080,998
|
JPY
|
4,880,000,000
|
State
Street Bank Corp. |
1/04/2022
|
$
657,282 |
| Liability
Derivatives |
| JPY
|
920,003,000
|
USD
|
8,059,998
|
HSBC
Bank |
1/04/2022
|
$
(62,058) |
| JPY
|
1,584,662,000
|
USD
|
13,890,481
|
JPMorgan
Chase Bank N.A. |
1/04/2022
|
(114,406)
|
| USD
|
40,533
|
JPY
|
4,665,000
|
Merrill
Lynch International |
1/04/2022
|
(21)
|
| |
|
|
|
|
|
$(176,485)
|
| Futures
Contracts |
| Description
|
Long/
Short |
Currency
|
Contracts
|
Notional
Amount |
Expiration
Date |
Value/Unrealized
Appreciation
(Depreciation) |
| Asset
Derivatives |
| Interest
Rate Futures |
|
|
| U.S.
Treasury Note 10 yr |
Long
|
USD
|
352
|
$45,925,000
|
March
– 2022 |
$442,439
|
| U.S.
Treasury Note 2 yr |
Short
|
USD
|
91
|
19,853,641
|
March
– 2022 |
2,963
|
| U.S.
Treasury Ultra Bond |
Long
|
USD
|
9
|
1,774,125
|
March
– 2022 |
44,966
|
| |
|
|
|
|
|
$490,368
|
| Liability
Derivatives |
| Interest
Rate Futures |
|
|
| U.S.
Treasury Bond |
Short
|
USD
|
60
|
$9,626,250
|
March
– 2022 |
$(135,317)
|
| U.S.
Treasury Note 5 yr |
Short
|
USD
|
79
|
9,557,148
|
March
– 2022 |
(31,458)
|
| U.S.
Treasury Ultra Note 10 yr |
Short
|
USD
|
12
|
1,757,250
|
March
– 2022 |
(1,731)
|
| |
|
|
|
|
|
$(168,506)
|
At December 31, 2021, the fund had
liquid securities with an aggregate value of $477,283 to cover any collateral or margin obligations for certain derivative contracts.
See Notes to Financial Statements
MFS Government Securities
Portfolio
| Financial
Statements |
Statement of Assets and
Liabilities |
This statement
represents your fund’s balance sheet, which details the assets and liabilities comprising the total value of the fund.
| At
12/31/21 Assets |
|
| Investments
in unaffiliated issuers, at value (identified cost, $397,759,778) |
$411,380,223
|
| Investments
in affiliated issuers, at value (identified cost, $102,834,176) |
102,834,176
|
| Cash
|
18,000
|
| Foreign
currency, at value (identified cost, $21,000,618) |
20,690,254
|
| Receivables
for |
|
| Forward
foreign currency exchange contracts |
657,282
|
| Investments
sold |
15,032
|
| TBA
sale commitments |
7,542,942
|
| Fund
shares sold |
278
|
| Interest
|
1,499,711
|
| Other
assets |
2,172
|
| Total
assets |
$544,640,070
|
| Liabilities
|
|
| Payables
for |
|
| Forward
foreign currency exchange contracts |
$176,485
|
| Net
daily variation margin on open futures contracts |
4,420
|
| Investments
purchased |
18,071,908
|
| TBA
purchase commitments |
96,895,852
|
| Fund
shares reacquired |
131,102
|
| Payable
to affiliates |
|
| Investment
adviser |
5,131
|
| Administrative
services fee |
373
|
| Shareholder
servicing costs |
57
|
| Distribution
and/or service fees |
2,085
|
| Payable
for independent Trustees' compensation |
319
|
| Accrued
expenses and other liabilities |
99,857
|
| Total
liabilities |
$115,387,589
|
| Net
assets |
$429,252,481
|
| Net
assets consist of |
|
| Paid-in
capital |
$436,104,685
|
| Total
distributable earnings (loss) |
(6,852,204)
|
| Net
assets |
$429,252,481
|
| Shares
of beneficial interest outstanding |
34,844,616
|
| |
Net
assets |
Shares
outstanding |
Net
asset value
per share |
| Initial
Class |
$276,951,429
|
22,435,318
|
$12.34
|
| Service
Class |
152,301,052
|
12,409,298
|
12.27
|
See Notes to Financial Statements
MFS Government Securities
Portfolio
| Financial
Statements |
Statement of Operations
|
This statement describes how much
your fund earned in investment income and accrued in expenses. It also describes any gains and/or losses generated by fund operations.
| Year
ended 12/31/21 |
|
| Net
investment income (loss) |
|
| Income
|
|
| Interest
|
$8,307,310
|
| Dividends
from affiliated issuers |
47,782
|
| Other
|
68
|
| Total
investment income |
$8,355,160
|
| Expenses
|
|
| Management
fee |
$2,448,087
|
| Distribution
and/or service fees |
392,508
|
| Shareholder
servicing costs |
9,001
|
| Administrative
services fee |
68,667
|
| Independent
Trustees' compensation |
8,411
|
| Custodian
fee |
28,822
|
| Shareholder
communications |
27,610
|
| Audit
and tax fees |
65,569
|
| Legal
fees |
2,138
|
| Miscellaneous
|
54,938
|
| Total
expenses |
$3,105,751
|
| Reduction
of expenses by investment adviser |
(117,632)
|
| Net
expenses |
$2,988,119
|
| Net
investment income (loss) |
$5,367,041
|
| Realized
and unrealized gain (loss) |
|
| Realized
gain (loss) (identified cost basis) |
|
| Unaffiliated
issuers |
$1,979,581
|
| Futures
contracts |
(227,260)
|
| Forward
foreign currency exchange contracts |
(118,925)
|
| Foreign
currency |
38
|
| Net
realized gain (loss) |
$1,633,434
|
| Change
in unrealized appreciation or depreciation |
|
| Unaffiliated
issuers |
$(16,197,374)
|
| Futures
contracts |
140,288
|
| Forward
foreign currency exchange contracts |
792,356
|
| Translation
of assets and liabilities in foreign currencies |
(657,639)
|
| Net
unrealized gain (loss) |
$(15,922,369)
|
| Net
realized and unrealized gain (loss) |
$(14,288,935)
|
| Change
in net assets from operations |
$(8,921,894)
|
See Notes to Financial Statements
MFS Government Securities
Portfolio
| Financial
Statements |
Statements of Changes in
Net Assets |
These statements describe
the increases and/or decreases in net assets resulting from operations, any distributions, and any shareholder transactions.
| |
Year
ended |
| |
12/31/21
|
12/31/20
|
| Change
in net assets |
|
|
| From
operations |
|
|
| Net
investment income (loss) |
$5,367,041
|
$8,911,228
|
| Net
realized gain (loss) |
1,633,434
|
3,747,385
|
| Net
unrealized gain (loss) |
(15,922,369)
|
14,592,878
|
| Change
in net assets from operations |
$(8,921,894)
|
$27,251,491
|
| Total
distributions to shareholders |
$(9,420,124)
|
$(12,348,081)
|
| Change
in net assets from fund share transactions |
$(3,014,218)
|
$(26,909,816)
|
| Total
change in net assets |
$(21,356,236)
|
$(12,006,406)
|
| Net
assets |
|
|
| At
beginning of period |
450,608,717
|
462,615,123
|
| At
end of period |
$429,252,481
|
$450,608,717
|
See Notes to Financial Statements
MFS Government Securities
Portfolio
| Financial
Statements |
Financial Highlights
|
The financial highlights table is
intended to help you understand the fund's financial performance for the past 5 years. Certain information reflects financial results for a single fund share. The total returns in the table represent the rate that an investor would have earned (or
lost) on an investment in the fund share class (assuming reinvestment of all distributions) held for the entire period.
| Initial
Class |
Year
ended |
| |
12/31/21
|
12/31/20
|
12/31/19
|
12/31/18
|
12/31/17
|
| Net
asset value, beginning of period |
$12.86
|
$12.45
|
$12.04
|
$12.39
|
$12.51
|
| Income
(loss) from investment operations |
|
|
|
|
|
| Net
investment income (loss) (d) |
$0.16
|
$0.27
|
$0.31
|
$0.30
|
$0.31
|
| Net
realized and unrealized gain (loss) |
(0.40)
|
0.52
|
0.48
|
(0.25)
|
(0.03)
|
| Total
from investment operations |
$(0.24)
|
$0.79
|
$0.79
|
$0.05
|
$0.28
|
| Less
distributions declared to shareholders |
|
|
|
|
|
| From
net investment income |
$(0.28)
|
$(0.38)
|
$(0.38)
|
$(0.40)
|
$(0.40)
|
| Net
asset value, end of period (x) |
$12.34
|
$12.86
|
$12.45
|
$12.04
|
$12.39
|
| Total
return (%) (k)(r)(s)(x) |
(1.89)
|
6.38
|
6.53
|
0.47
|
2.22
|
Ratios
(%) (to average net assets)
and Supplemental data: |
|
|
|
|
|
| Expenses
before expense reductions |
0.61
|
0.61
|
0.60
|
0.60
|
0.60
|
| Expenses
after expense reductions |
0.58
|
0.58
|
0.58
|
0.59
|
0.60
|
| Net
investment income (loss) |
1.29
|
2.11
|
2.53
|
2.45
|
2.45
|
| Portfolio
turnover |
314
|
154
|
47
|
35
|
24
|
| Net
assets at end of period (000 omitted) |
$276,951
|
$290,413
|
$298,414
|
$310,387
|
$364,445
|
| Service
Class |
Year
ended |
| |
12/31/21
|
12/31/20
|
12/31/19
|
12/31/18
|
12/31/17
|
| Net
asset value, beginning of period |
$12.79
|
$12.38
|
$11.96
|
$12.31
|
$12.42
|
| Income
(loss) from investment operations |
|
|
|
|
|
| Net
investment income (loss) (d) |
$0.13
|
$0.24
|
$0.28
|
$0.26
|
$0.27
|
| Net
realized and unrealized gain (loss) |
(0.40)
|
0.52
|
0.48
|
(0.24)
|
(0.02)
|
| Total
from investment operations |
$(0.27)
|
$0.76
|
$0.76
|
$0.02
|
$0.25
|
| Less
distributions declared to shareholders |
|
|
|
|
|
| From
net investment income |
$(0.25)
|
$(0.35)
|
$(0.34)
|
$(0.37)
|
$(0.36)
|
| Net
asset value, end of period (x) |
$12.27
|
$12.79
|
$12.38
|
$11.96
|
$12.31
|
| Total
return (%) (k)(r)(s)(x) |
(2.14)
|
6.12
|
6.35
|
0.17
|
2.03
|
Ratios
(%) (to average net assets)
and Supplemental data: |
|
|
|
|
|
| Expenses
before expense reductions |
0.86
|
0.86
|
0.85
|
0.85
|
0.85
|
| Expenses
after expense reductions |
0.83
|
0.83
|
0.83
|
0.84
|
0.85
|
| Net
investment income (loss) |
1.04
|
1.86
|
2.27
|
2.20
|
2.20
|
| Portfolio
turnover |
314
|
154
|
47
|
35
|
24
|
| Net
assets at end of period (000 omitted) |
$152,301
|
$160,196
|
$164,201
|
$171,938
|
$212,050
|
| (d)
|
Per share
data is based on average shares outstanding. |
| (k)
|
The total
return does not reflect expenses that apply to separate accounts. Inclusion of these charges would reduce the total return figures for all periods shown. |
| (r)
|
Certain
expenses have been reduced without which performance would have been lower. |
| (s)
|
From time to
time the fund may receive proceeds from litigation settlements, without which performance would be lower. |
| (x)
|
The
net asset values and total returns have been calculated on net assets which include adjustments made in accordance with U.S. generally accepted accounting principles required at period end for financial reporting purposes. |
See Notes to Financial Statements
MFS Government Securities
Portfolio
Notes to Financial Statements
(1) Business and Organization
MFS Government Securities Portfolio (the fund) is a
diversified series of MFS Variable Insurance Trust II (the trust). The trust is organized as a Massachusetts business trust and is registered under the Investment Company Act of 1940, as amended, as an open-end management investment company. The
shareholders of each series of the trust are separate accounts of insurance companies, which offer variable annuity and/or life insurance products, and qualified retirement and pension plans.
The fund is an investment company and accordingly follows
the investment company accounting and reporting guidance of the Financial Accounting Standards Board (FASB) Accounting Standards Codification Topic 946 Financial Services - Investment Companies.
(2) Significant Accounting Policies
General — The
preparation of financial statements in conformity with U.S. generally accepted accounting principles requires management to make estimates and assumptions that affect the reported amounts of assets and liabilities, and disclosure of contingent
assets and liabilities at the date of the financial statements and the reported amounts of increases and decreases in net assets from operations during the reporting period. Actual results could differ from those estimates. In the preparation of
these financial statements, management has evaluated subsequent events occurring after the date of the fund’s Statement of Assets and Liabilities through the date that the financial statements were issued.
Balance Sheet Offsetting
— The fund's accounting policy with respect to balance sheet offsetting is that, absent an event of default by the counterparty or a termination of the agreement, the International Swaps and Derivatives Association (ISDA) Master Agreement, or
similar agreement, does not result in an offset of reported amounts of financial assets and financial liabilities in the Statement of Assets and Liabilities across transactions between the fund and the applicable counterparty. The fund's right to
setoff may be restricted or prohibited by the bankruptcy or insolvency laws of the particular jurisdiction to which a specific master netting agreement counterparty is subject. Balance sheet offsetting disclosures, to the extent applicable to the
fund, have been included in the fund’s Significant Accounting Policies note under the captions for each of the fund’s in-scope financial instruments and transactions.
Investment Valuations
— Debt instruments and floating rate loans, including restricted debt instruments, are generally valued at an evaluated or composite bid as provided by a third-party pricing service. Short-term
instruments with a maturity at issuance of 60 days or less may be valued at amortized cost, which approximates market value. Futures contracts are generally valued at last posted settlement price on their
primary exchange as provided by a third-party pricing service. Futures contracts for which there were no trades that day for a particular position are generally valued at the closing bid quotation on their primary exchange as provided by a
third-party pricing service. Forward foreign currency exchange contracts are generally valued at the mean of bid and asked prices for the time period interpolated from rates provided by a third-party pricing
service for proximate time periods. Open-end investment companies are generally valued at net asset value per share. Securities and other assets generally valued on
the basis of information from a third-party pricing service may also be valued at a broker/dealer bid quotation. In determining values, third-party pricing services can utilize both transaction data and
market information such as yield, quality, coupon rate, maturity, type of issue, trading characteristics, and other market data.
The Board of Trustees has delegated primary responsibility
for determining or causing to be determined the value of the fund’s investments (including any fair valuation) to the adviser pursuant to valuation policies and procedures approved by the Board. If the adviser determines that reliable market
quotations are not readily available, investments are valued at fair value as determined in good faith by the adviser in accordance with such procedures under the oversight of the Board of Trustees. Under the fund’s valuation policies and
procedures, market quotations are not considered to be readily available for most types of debt instruments and floating rate loans and many types of derivatives. These investments are generally valued at fair value based on information from
third-party pricing services. In addition, investments may be valued at fair value if the adviser determines that an investment’s value has been materially affected by events occurring after the close of the exchange or market on which the
investment is principally traded (such as foreign exchange or market) and prior to the determination of the fund’s net asset value, or after the halt of trading of a specific security where trading does not resume prior to the close of the
exchange or market on which the security is principally traded. The adviser generally relies on third-party pricing services or other information (such as the correlation with price movements of similar securities in the same or other markets; the
type, cost and investment characteristics of the security; the business and financial condition of the issuer; and trading and other market data) to assist in determining whether to fair value and at what value to fair value an investment. The value
of an investment for purposes of calculating the fund’s net asset value can differ depending on the source and method used to determine value. When fair valuation is used, the value of an investment used to determine the fund’s net asset
value may differ from quoted or published prices for the same investment. There can be no assurance that the fund could obtain the fair value assigned to an investment if it were to sell the investment at the same time at which the fund determines
its net asset value per share.
MFS Government Securities
Portfolio
Notes to Financial Statements - continued
Various inputs are used in determining the value of the
fund's assets or liabilities. These inputs are categorized into three broad levels. In certain cases, the inputs used to measure fair value may fall into different levels of the fair value hierarchy. In such cases, an investment's level within the
fair value hierarchy is based on the lowest level of input that is significant to the fair value measurement. The fund's assessment of the significance of a particular input to the fair value measurement in its entirety requires judgment, and
considers factors specific to the investment. Level 1 includes unadjusted quoted prices in active markets for identical assets or liabilities. Level 2 includes other significant observable market-based inputs (including quoted prices for similar
securities, interest rates, prepayment speed, and credit risk). Level 3 includes unobservable inputs, which may include the adviser's own assumptions in determining the fair value of investments. Other financial instruments are derivative
instruments, such as futures contracts and forward foreign currency exchange contracts. The following is a summary of the levels used as of December 31, 2021 in valuing the fund's assets and liabilities:
| Financial
Instruments |
Level
1 |
Level
2 |
Level
3 |
Total
|
| U.S.
Treasury Bonds & U.S. Government Agencies & Equivalents |
$—
|
$164,760,480
|
$—
|
$164,760,480
|
| Non
- U.S. Sovereign Debt |
—
|
1,509,877
|
—
|
1,509,877
|
| Municipal
Bonds |
—
|
7,617,225
|
—
|
7,617,225
|
| U.S.
Corporate Bonds |
—
|
3,731,254
|
—
|
3,731,254
|
| Residential
Mortgage-Backed Securities |
—
|
204,683,951
|
—
|
204,683,951
|
| Commercial
Mortgage-Backed Securities |
—
|
17,223,655
|
—
|
17,223,655
|
| Asset-Backed
Securities (including CDOs) |
—
|
11,853,781
|
—
|
11,853,781
|
| Mutual
Funds |
102,834,176
|
—
|
—
|
102,834,176
|
| Total
|
$102,834,176
|
$411,380,223
|
$—
|
$514,214,399
|
| Other
Financial Instruments |
|
|
|
|
| Futures
Contracts – Assets |
$490,368
|
$—
|
$—
|
$490,368
|
| Futures
Contracts – Liabilities |
(168,506)
|
—
|
—
|
(168,506)
|
| Forward
Foreign Currency Exchange Contracts – Assets |
—
|
657,282
|
—
|
657,282
|
| Forward
Foreign Currency Exchange Contracts – Liabilities |
—
|
(176,485)
|
—
|
(176,485)
|
For further information
regarding security characteristics, see the Portfolio of Investments.
Inflation-Adjusted Debt Securities — The fund invests in inflation-adjusted debt securities issued by the U.S. Treasury. The principal value of these debt securities is adjusted through income according to changes in the Consumer Price Index. These
debt securities typically pay a fixed rate of interest, but this fixed rate is applied to the inflation-adjusted principal amount. The principal paid at maturity of the debt security is typically equal to the inflation-adjusted principal amount, or
the security’s original par value, whichever is greater. Other types of inflation-adjusted securities may use other methods to adjust for other measures of inflation.
Derivatives — The
fund uses derivatives primarily to increase or decrease exposure to a particular market or segment of the market, or security, to increase or decrease interest rate or currency exposure, or as alternatives to direct investments. Derivatives are used
for hedging or non-hedging purposes. While hedging can reduce or eliminate losses, it can also reduce or eliminate gains. When the fund uses derivatives as an investment to increase market exposure, or for hedging purposes, gains and losses from
derivative instruments may be substantially greater than the derivative’s original cost.
The derivative instruments used by the fund during the
period were futures contracts and forward foreign currency exchange contracts. Depending on the type of derivative, a fund may exit a derivative position by entering into an offsetting transaction with a counterparty or exchange, negotiating an
agreement with the derivative counterparty, or novating the position to a third party. The fund may be unable to promptly close out a futures position in instances where the daily fluctuation in the price for that type of future exceeds the daily
limit set by the exchange. The fund's period end derivatives, as presented in the Portfolio of Investments and the associated Derivative Contract tables, generally are indicative of the volume of its derivative activity during the period.
The following table presents, by major type of derivative
contract, the fair value, on a gross basis, of the asset and liability components of derivatives held by the fund at December 31, 2021 as reported in the Statement of Assets and Liabilities:
MFS Government Securities
Portfolio
Notes to Financial Statements - continued
| |
|
Fair
Value (a) |
| Risk
|
Derivative
Contracts |
Asset
Derivatives |
Liability
Derivatives |
| Interest
Rate |
Futures
Contracts |
$490,368
|
$(168,506)
|
| Foreign
Exchange |
Forward
Foreign Currency Exchange Contracts |
657,282
|
(176,485)
|
| Total
|
|
$1,147,650
|
$(344,991)
|
(a) Values presented in this table
for futures contracts correspond to the values reported in the Portfolio of Investments. Only the current day net variation margin for futures contracts is separately reported within the Statement of Assets and Liabilities.
The following table presents, by major type of derivative
contract, the realized gain (loss) on derivatives held by the fund for the year ended December 31, 2021 as reported in the Statement of Operations:
| Risk
|
Futures
Contracts |
Forward
Foreign
Currency
Exchange
Contracts |
| Interest
Rate |
$(227,260)
|
$—
|
| Foreign
Exchange |
—
|
(118,925)
|
| Total
|
$(227,260)
|
$(118,925)
|
The following table presents, by
major type of derivative contract, the change in unrealized appreciation or depreciation on derivatives held by the fund for the year ended December 31, 2021 as reported in the Statement of Operations:
| Risk
|
Futures
Contracts |
Forward
Foreign
Currency
Exchange
Contracts |
| Interest
Rate |
$140,288
|
$—
|
| Foreign
Exchange |
—
|
792,356
|
| Total
|
$140,288
|
$792,356
|
Derivative counterparty credit
risk is managed through formal evaluation of the creditworthiness of all potential counterparties. On certain, but not all, uncleared derivatives, the fund attempts to reduce its exposure to counterparty credit risk whenever possible by entering
into an ISDA Master Agreement on a bilateral basis. The ISDA Master Agreement gives each party to the agreement the right to terminate all transactions traded under such agreement if there is a specified deterioration in the credit quality of the
other party. Upon an event of default or a termination of the ISDA Master Agreement, the non-defaulting party has the right to close out all transactions traded under such agreement and to net amounts owed under each agreement to one net amount
payable by one party to the other. This right to close out and net payments across all transactions traded under the ISDA Master Agreement could result in a reduction of the fund's credit risk to such counterparty equal to any amounts payable by the
fund under the applicable transactions, if any.
Collateral and margin requirements differ by type of
derivative. For cleared derivatives (e.g., futures contracts, cleared swaps, and exchange-traded options), margin requirements are set by the clearing broker and the clearing house and collateral, in the form of cash or securities, is posted by the
fund directly with the clearing broker. Collateral terms are counterparty agreement specific for uncleared derivatives (e.g., forward foreign currency exchange contracts, uncleared swap agreements, and uncleared options) and collateral, in the form
of cash and securities, is held in segregated accounts with the fund's custodian in connection with these agreements. For derivatives traded under an ISDA Master Agreement, which contains a collateral support annex, the collateral requirements are
netted across all transactions traded under such counterparty-specific agreement and an amount is posted from one party to the other to collateralize such obligations. Cash that has been segregated or delivered to cover the fund's collateral or
margin obligations under derivative contracts, if any, will be reported separately in the Statement of Assets and Liabilities as restricted cash for uncleared derivatives and/or deposits with brokers for cleared derivatives. Securities pledged as
collateral or margin for the same purpose, if any, are noted in the Portfolio of Investments. The fund may be required to make payments of interest on uncovered collateral or margin obligations with the broker. Any such payments are included in
“Miscellaneous” expense in the Statement of Operations.
Futures Contracts —
The fund entered into futures contracts which may be used to hedge against or obtain broad market exposure, interest rate exposure, or to manage duration. A futures contract represents a commitment for the future purchase or sale of an asset at a
specified price on a specified date.
MFS Government Securities
Portfolio
Notes to Financial Statements - continued
Upon
entering into a futures contract, the fund is required to deposit with the broker, either in cash or securities, an initial margin in an amount equal to a specified percentage of the notional amount of the contract. Subsequent payments (variation
margin) are made or received by the fund each day, depending on the daily fluctuations in the value of the contract, and are recorded for financial statement purposes as unrealized gain or loss by the fund until the contract is closed or expires at
which point the gain or loss on futures contracts is realized.
The fund bears the risk of interest rates or securities
prices moving unexpectedly, in which case, the fund may not achieve the anticipated benefits of the futures contracts and may realize a loss. While futures contracts may present less counterparty risk to the fund since the contracts are exchange
traded and the exchange’s clearinghouse guarantees payments to the broker, there is still counterparty credit risk due to the insolvency of the broker. The fund's maximum risk of loss due to counterparty credit risk is equal to the margin
posted by the fund to the broker plus any gains or minus any losses on the outstanding futures contracts.
Forward Foreign Currency Exchange Contracts — The fund entered into forward foreign currency exchange contracts for the purchase or sale of a specific foreign currency at a fixed price on a future date. These contracts may be used to hedge the fund’s
currency risk or for non-hedging purposes. For hedging purposes, the fund may enter into contracts to deliver or receive foreign currency that the fund will receive from or use in its normal investment activities. The fund may also use contracts to
hedge against declines in the value of foreign currency denominated securities due to unfavorable exchange rate movements. For non-hedging purposes, the fund may enter into contracts with the intent of changing the relative exposure of the
fund’s portfolio of securities to different currencies to take advantage of anticipated exchange rate changes.
Forward foreign currency exchange contracts are adjusted by
the daily exchange rate of the underlying currency and any unrealized gains or losses are recorded as a receivable or payable for forward foreign currency exchange contracts until the contract settlement date. On contract settlement date, any gain
or loss on the contract is recorded as realized gains or losses on forward foreign currency exchange contracts.
Risks may arise upon entering into these contracts from
unanticipated movements in the value of the contract and from the potential inability of counterparties to meet the terms of their contracts. Generally, the fund’s maximum risk due to counterparty credit risk is the unrealized gain on the
contract due to the use of Continuous Linked Settlement, a multicurrency cash settlement system for the centralized settlement of foreign transactions. This risk is mitigated in cases where there is an ISDA Master Agreement between the fund and the
counterparty providing for netting as described above and, where applicable, by the posting of collateral by the counterparty to the fund to cover the fund’s exposure to the counterparty under such ISDA Master Agreement.
Indemnifications —
Under the fund's organizational documents, its officers and Trustees may be indemnified against certain liabilities and expenses arising out of the performance of their duties to the fund. Additionally, in the normal course of business, the fund
enters into agreements with service providers that may contain indemnification clauses. The fund's maximum exposure under these agreements is unknown as this would involve future claims that may be made against the fund that have not yet
occurred.
Investment Transactions and Income — Investment transactions are recorded on the trade date. Some securities may be purchased or sold on an extended settlement basis, which means that the receipt or delivery
of the securities by the fund and related payments occur at a future date, usually beyond the customary settlement period. Interest income is recorded on the accrual basis.
All premium and discount is amortized or accreted for financial statement
purposes in accordance with U.S. generally accepted accounting principles. Interest payments received in additional securities are recorded on the ex-interest date in an amount equal to the value of the security on such date.
The fund may receive proceeds from litigation settlements.
Any proceeds received from litigation involving portfolio holdings are reflected in the Statement of Operations in realized gain/loss if the security has been disposed of by the fund or in unrealized gain/loss if the security is still held by the
fund. Any other proceeds from litigation not related to portfolio holdings are reflected as other income in the Statement of Operations.
The fund invests a significant portion of its assets in
asset-backed and/or mortgage-backed securities. For these securities, the value of the debt instrument also depends on the credit quality and adequacy of the underlying assets or collateral as well as whether there is a security interest in the
underlying assets or collateral. Enforcing rights, if any, against the underlying assets or collateral may be difficult. U.S. Government securities not supported as to the payment of principal or interest by the U.S. Treasury, such as those issued
by Fannie Mae, Freddie Mac, and the Federal Home Loan Banks, are subject to greater credit risk than are U.S. Government securities supported by the U.S. Treasury, such as those issued by Ginnie Mae.
The fund may purchase or sell mortgage-backed securities on
a “To Be Announced” (TBA) basis. A TBA transaction is subject to extended settlement and typically does not designate the actual security to be delivered, but instead includes an approximate principal amount. The price of the TBA
security and the date that it will be settled are fixed at the time the transaction is negotiated. The value of the security varies with market fluctuations and no interest accrues to the fund until settlement takes place. TBA purchase and sale
commitments are held at carrying amount, which approximates fair value and are categorized as level 2 within the
MFS Government Securities
Portfolio
Notes to Financial Statements - continued
fair value
hierarchy and included in TBA purchase and TBA sale commitments in the Statement of Assets and Liabilities. Losses may arise as a result of changes in the value of the TBA investment prior to settlement date or due to counterparty non-performance.
At the time that it enters into a TBA transaction, the fund is required to have sufficient cash and/or liquid securities to cover its commitments.
The fund may also enter into mortgage dollar rolls,
typically TBA dollar rolls, in which the fund sells TBA mortgage-backed securities to financial institutions and simultaneously agrees to repurchase similar (same issuer, type and coupon) securities at a later date at an agreed-upon price. During
the period between the sale and repurchase, the fund will not be entitled to receive interest and principal payments on the securities sold. The fund accounts for dollar roll transactions as purchases and sales and realizes gains and losses on these
transactions. Dollar roll transactions involve the risk that the market value of the securities that the fund is required to purchase may decline below the agreed upon repurchase price of those securities.
To mitigate the counterparty credit risk on TBA
transactions, mortgage dollar rolls, and other types of forward settling mortgage-backed and asset-backed security transactions, the fund whenever possible enters into a Master Securities Forward Transaction Agreement (“MSFTA”) on a
bilateral basis with each of the counterparties with whom it undertakes a significant volume of transactions. The MSFTA gives each party to the agreement the right to terminate all transactions traded under such agreement if there is a specified
deterioration in the credit quality of the other party. Upon an event of default or a termination of the MSFTA, the non-defaulting party has the right to close out all transactions traded under such agreement and to net amounts owed under each
transaction to one net amount payable by one party to the other. This right to close out and net payments across all transactions traded under the MSFTA could result in a reduction of the fund's credit risk to such counterparty equal to any amounts
payable by the fund under the applicable transactions, if any.
For mortgage-backed and asset-backed securities traded
under a MSFTA, the collateral and margining requirements are contract specific. Collateral amounts across all transactions traded under such agreement are netted and an amount is posted from one party to the other to collateralize such obligations.
Cash that has been pledged to cover the fund's collateral or margin obligations under a MSFTA, if any, will be reported separately on the Statement of Assets and Liabilities as restricted cash. Securities pledged as collateral or margin for the same
purpose, if any, are noted in the Portfolio of Investments.
Tax Matters and Distributions — The fund intends to qualify as a regulated investment company, as defined under Subchapter M of the Internal Revenue Code, and to distribute all of its taxable income, including realized capital gains. As a
result, no provision for federal income tax is required. The fund’s federal tax returns, when filed, will remain subject to examination by the Internal Revenue Service for a three year period. Management has analyzed the fund’s tax
positions taken on federal and state tax returns for all open tax years and does not believe that there are any uncertain tax positions that require recognition of a tax liability. Foreign taxes, if any, have been accrued by the fund in the
accompanying financial statements in accordance with the applicable foreign tax law. Foreign income taxes may be withheld by certain countries in which the fund invests. Additionally, capital gains realized by the fund on securities issued in or by
certain foreign countries may be subject to capital gains tax imposed by those countries.
Distributions to shareholders are recorded on the
ex-dividend date. Income and capital gain distributions are determined in accordance with income tax regulations, which may differ from U.S. generally accepted accounting principles. Certain capital accounts in the financial statements are
periodically adjusted for permanent differences in order to reflect their tax character. These adjustments have no impact on net assets or net asset value per share. Temporary differences which arise from recognizing certain items of income,
expense, gain or loss in different periods for financial statement and tax purposes will reverse at some time in the future.
Book/tax differences primarily relate to amortization and
accretion of debt securities, wash sale loss deferrals, and derivative transactions.
The tax character of distributions declared to shareholders
for the last two fiscal years is as follows:
| |
Year
ended
12/31/21 |
Year
ended
12/31/20 |
| Ordinary
income (including any short-term capital gains) |
$9,420,124
|
$12,348,081
|
The federal tax cost and the tax
basis components of distributable earnings were as follows:
MFS Government Securities
Portfolio
Notes to Financial Statements - continued
| As
of 12/31/21 |
|
| Cost
of investments |
$504,252,543
|
| Gross
appreciation |
12,338,049
|
| Gross
depreciation |
(1,573,534)
|
| Net
unrealized appreciation (depreciation) |
$10,764,515
|
| Undistributed
ordinary income |
6,870,469
|
| Capital
loss carryforwards |
(24,176,824)
|
| Other
temporary differences |
(310,364)
|
| Total
distributable earnings (loss) |
$(6,852,204)
|
As of December 31, 2021, the
fund had capital loss carryforwards available to offset future realized gains. These net capital losses may be carried forward indefinitely and their character is retained as short-term and/or long-term losses. Such losses are characterized as
follows:
| Short-Term
|
$(4,831,240)
|
| Long-Term
|
(19,345,584)
|
| Total
|
$(24,176,824)
|
Multiple Classes of Shares of
Beneficial Interest — The fund offers multiple classes of shares, which differ in their respective distribution and/or service fees. The fund's income, realized and unrealized gain (loss), and common expenses
are allocated to shareholders based on the daily net assets of each class. Dividends are declared separately for each class. Differences in per share dividend rates are generally due to differences in separate class expenses. The fund’s
distributions declared to shareholders as reported in the Statements of Changes in Net Assets are presented by class as follows:
| |
Year
ended
12/31/21 |
|
Year
ended
12/31/20 |
| Initial
Class |
$6,321,329
|
|
$8,352,164
|
| Service
Class |
3,098,795
|
|
3,995,917
|
| Total
|
$9,420,124
|
|
$12,348,081
|
(3) Transactions with
Affiliates
Investment Adviser — The fund has an investment advisory agreement with MFS to provide overall investment management and related administrative services and facilities to the fund. The
management fee is computed daily and paid monthly at the following annual rates based on the fund's average daily net assets:
| Up
to $1 billion |
0.55%
|
| In
excess of $1 billion |
0.50%
|
MFS has agreed in writing to
reduce its management fee by a specified amount if certain MFS mutual fund assets exceed thresholds agreed to by MFS and the fund's Board of Trustees. For the year ended December 31, 2021, this management fee reduction amounted to $56,349, which is
included in the reduction of total expenses in the Statement of Operations. The management fee incurred for the year ended December 31, 2021 was equivalent to an annual effective rate of 0.54% of the fund's average daily net assets.
The investment adviser has agreed in writing to pay a
portion of the fund’s total annual operating expenses, excluding interest, taxes, extraordinary expenses, brokerage and transaction costs, and investment-related expenses, such that total annual operating expenses do not exceed 0.58% of
average daily net assets for the Initial Class shares and 0.83% of average daily net assets for the Service Class shares. This written agreement will continue until modified by the fund’s Board of Trustees, but such agreement will continue at
least until April 30, 2023. For the year ended December 31, 2021, this reduction amounted to $61,283, which is included in the reduction of total expenses in the Statement of Operations.
Distributor — MFS
Fund Distributors, Inc. (MFD), a wholly-owned subsidiary of MFS, is the distributor of shares of the fund. The Trustees have adopted a distribution plan for the Service Class shares pursuant to Rule 12b-1 under the Investment Company Act of
1940.
The fund's distribution plan provides
that the fund will pay MFD distribution and/or service fees equal to 0.25% per annum of its average daily net assets attributable to Service Class shares as partial consideration for services performed and expenses incurred by MFD and financial
intermediaries (including participating insurance companies that invest in the fund to fund variable annuity and
MFS Government Securities
Portfolio
Notes to Financial Statements - continued
variable life
insurance contracts, sponsors of qualified retirement and pension plans that invest in the fund, and affiliates of these participating insurance companies and plan sponsors) in connection with the sale and distribution of the Service Class shares.
MFD may subsequently pay all, or a portion, of the distribution and/or service fees to financial intermediaries.
Shareholder Servicing Agent
— MFS Service Center, Inc. (MFSC), a wholly-owned subsidiary of MFS, receives a fee from the fund for its services as shareholder servicing agent. For the year ended December 31, 2021, the fee was $8,536, which equated to 0.0019% annually of
the fund's average daily net assets. MFSC also receives reimbursement from the fund for out-of-pocket expenses paid by MFSC on behalf of the fund. For the year ended December 31, 2021, these costs amounted to $465.
Administrator — MFS
provides certain financial, legal, shareholder communications, compliance, and other administrative services to the fund. Under an administrative services agreement, the fund reimburses MFS the costs incurred to provide these services. The fund is
charged an annual fixed amount of $17,500 plus a fee based on average daily net assets. The administrative services fee incurred for the year ended December 31, 2021 was equivalent to an annual effective rate of 0.0154% of the fund's average daily
net assets.
Trustees’ and Officers’
Compensation — The fund pays compensation to independent Trustees in the form of a retainer, attendance fees, and additional compensation to Board and Committee chairpersons. The fund does not pay compensation
directly to Trustees or officers of the fund who are also officers of the investment adviser, all of whom receive remuneration from MFS for their services to the fund. Certain officers and Trustees of the fund are officers or directors of MFS, MFD,
and MFSC.
Other — The fund invests in the MFS Institutional Money Market Portfolio which is managed by MFS and seeks current income consistent with preservation of capital and liquidity. This money market fund does not pay a
management fee to MFS but does incur investment and operating costs.
(4) Portfolio Securities
For the year ended December 31, 2021, purchases and sales
of investments, other than short-term obligations, were as follows:
| |
Purchases
|
Sales
|
| U.S.
Government securities |
$1,304,239,219
|
$1,277,137,160
|
| Non-U.S.
Government securities |
25,743,842
|
55,519,173
|
(5) Shares of
Beneficial Interest
The fund's Declaration of Trust
permits the Trustees to issue an unlimited number of full and fractional shares of beneficial interest. Transactions in fund shares were as follows:
| |
Year
ended
12/31/21 |
|
Year
ended
12/31/20 |
| |
Shares
|
Amount
|
|
Shares
|
Amount
|
| Shares
sold |
|
|
|
|
|
| Initial
Class |
1,560,415
|
$19,830,990
|
|
2,525,329
|
$33,014,801
|
| Service
Class |
1,405,435
|
17,566,861
|
|
2,337,906
|
30,171,357
|
| |
2,965,850
|
$37,397,851
|
|
4,863,235
|
$63,186,158
|
Shares
issued to shareholders
in reinvestment of distributions |
|
|
|
|
|
| Initial
Class |
508,145
|
$6,321,329
|
|
649,974
|
$8,352,164
|
| Service
Class |
250,307
|
3,098,795
|
|
312,425
|
3,995,917
|
| |
758,452
|
$9,420,124
|
|
962,399
|
$12,348,081
|
| Shares
reacquired |
|
|
|
|
|
| Initial
Class |
(2,207,397)
|
$(27,733,951)
|
|
(4,567,529)
|
$(58,895,260)
|
| Service
Class |
(1,768,881)
|
(22,098,242)
|
|
(3,392,174)
|
(43,548,795)
|
| |
(3,976,278)
|
$(49,832,193)
|
|
(7,959,703)
|
$(102,444,055)
|
| Net
change |
|
|
|
|
|
| Initial
Class |
(138,837)
|
$(1,581,632)
|
|
(1,392,226)
|
$(17,528,295)
|
| Service
Class |
(113,139)
|
(1,432,586)
|
|
(741,843)
|
(9,381,521)
|
| |
(251,976)
|
$(3,014,218)
|
|
(2,134,069)
|
$(26,909,816)
|
MFS Government Securities
Portfolio
Notes to Financial Statements - continued
The
fund is one of several mutual funds in which certain MFS funds may invest. The MFS funds do not invest in the underlying funds for the purpose of exercising management or control. At the end of the period, the MFS Moderate Allocation Portfolio and
the MFS Conservative Allocation Portfolio were the owners of record of approximately 31% and 9%, respectively, of the value of outstanding voting shares of the fund.
(6) Line of Credit
The fund and certain other funds managed by MFS participate
in a $1.25 billion unsecured committed line of credit of which $1 billion is reserved for use by the fund and certain other MFS U.S. funds. The line of credit is provided by a syndicate of banks under a credit agreement. Borrowings may be made for
temporary financing needs. Interest is charged to each fund, based on its borrowings, generally at a rate equal to the highest of one month LIBOR, the Federal Funds Effective Rate and the Overnight Bank Funding Rate, plus an agreed upon spread. A
commitment fee, based on the average daily, unused portion of the committed line of credit, is allocated among the participating funds. In addition, the fund and other funds managed by MFS have established unsecured uncommitted borrowing
arrangements with certain banks for temporary financing needs. Interest is charged to each fund, based on its borrowings, at rates equal to customary reference rates plus an agreed upon spread. For the year ended December 31, 2021, the fund’s
commitment fee and interest expense were $1,246 and $0, respectively, and are included in “Miscellaneous” expense in the Statement of Operations.
(7) Investments in Affiliated Issuers
An affiliated issuer may be considered one in which the
fund owns 5% or more of the outstanding voting securities, or a company which is under common control. For the purposes of this report, the following were affiliated issuers:
| Affiliated
Issuers |
Beginning
Value |
Purchases
|
Sales
Proceeds |
Realized
Gain
(Loss) |
Change
in
Unrealized
Appreciation or
Depreciation |
Ending
Value |
| MFS
Institutional Money Market Portfolio |
$36,456,029
|
$234,324,303
|
$167,946,156
|
$—
|
$—
|
$102,834,176
|
| Affiliated
Issuers |
Dividend
Income |
Capital
Gain
Distributions |
| MFS
Institutional Money Market Portfolio |
$47,782
|
$—
|
(8) Impacts of
COVID-19
The pandemic related to the global spread of
novel coronavirus disease (COVID-19), which was first detected in December 2019, has resulted in significant disruptions to global business activity and the global economy, as well as the economies of individual countries, the financial performance
of individual companies and sectors, and the securities and commodities markets in general. Multiple surges in cases globally, the availability and widespread adoption of vaccines, and the emergence of variant strains of the virus continue to create
uncertainty as to the future and long-term impacts resulting from the pandemic including impacts to the prices and liquidity of the fund's investments and the fund's performance.
(9) LIBOR Transition
Certain of the fund's investments, including its
investments in derivatives, as well as any debt issued by the fund and other contractual arrangements of the fund may be based on reference interest rates such as the London Interbank Offered Rate (“LIBOR”). In 2017, the regulatory
authority that oversees financial services firms in the United Kingdom announced plans to transition away from LIBOR by the end of 2021. In March 2021, the administrator of LIBOR announced the extension of the publication of the more commonly used
U.S. dollar LIBOR settings to the end of June 2023. Although the full impacts of the transition away from LIBOR are not fully known, the transition may result in, among other things, an increase in volatility or illiquidity of the markets for
instruments that currently rely on LIBOR to determine interest rates and this could have an adverse impact on the fund's performance. With respect to the fund's accounting for investments, including its investments in derivatives, as well as any
debt issued by the fund and other contractual arrangements of the fund that undergo reference rate-related modifications as a result of the transition, management will rely upon the relief provided by FASB Codification Topic 848 – Reference
Rate Reform (Topic 848). The guidance in Topic 848 permits the fund to disregard the GAAP accounting requirements around certain contract modifications resulting from the LIBOR transition such that for contracts considered in scope, the fund can
account for those modified contracts as
MFS Government Securities
Portfolio
Notes to Financial Statements - continued
a continuation of
the existing contracts. While the cessation of the one-week and two-month U.S. dollar LIBOR tenors along with certain other non-U.S. dollar denominated LIBOR settings at December 31, 2021 did not have a material impact on the fund, management is
still evaluating the impact to the fund of the June 30, 2023 planned discontinuation of the more commonly used U.S. dollar LIBOR settings.
MFS Government Securities
Portfolio
Report of Independent Registered Public Accounting
Firm
To the Board of Trustees of MFS Variable
Insurance Trust II and the Shareholders of MFS Government Securities Portfolio:
Opinion on the Financial Statements and Financial
Highlights
We have audited the accompanying statement
of assets and liabilities of MFS Government Securities Portfolio (the “Fund”), including the portfolio of investments, as of December 31, 2021, the related statement of operations for the year then ended, the statements of changes in net
assets for each of the two years in the period then ended, the financial highlights for each of the five years in the period then ended, and the related notes. In our opinion, the financial statements and financial highlights present fairly, in all
material respects, the financial position of the Fund as of December 31, 2021, and the results of its operations for the year then ended, the changes in its net assets for each of the two years in the period then ended, and the financial highlights
for each of the five years in the period then ended, in conformity with accounting principles generally accepted in the United States of America.
Basis for Opinion
These financial statements and financial highlights are the
responsibility of the Fund's management. Our responsibility is to express an opinion on the Fund's financial statements and financial highlights based on our audits. We are a public accounting firm registered with the Public Company Accounting
Oversight Board (United States) (PCAOB) and are required to be independent with respect to the Fund in accordance with the U.S. federal securities laws and the applicable rules and regulations of the Securities and Exchange Commission and the
PCAOB.
We conducted our audits in accordance with the
standards of the PCAOB. Those standards require that we plan and perform the audit to obtain reasonable assurance about whether the financial statements and financial highlights are free of material misstatement, whether due to error or fraud. The
Fund is not required to have, nor were we engaged to perform, an audit of its internal control over financial reporting. As part of our audits, we are required to obtain an understanding of internal control over financial reporting but not for the
purpose of expressing an opinion on the effectiveness of the Fund's internal control over financial reporting. Accordingly, we express no such opinion.
Our audits included performing procedures to assess the
risks of material misstatement of the financial statements and financial highlights, whether due to error or fraud, and performing procedures that respond to those risks. Such procedures included examining, on a test basis, evidence regarding the
amounts and disclosures in the financial statements and financial highlights. Our audits also included evaluating the accounting principles used and significant estimates made by management, as well as evaluating the overall presentation of the
financial statements and financial highlights. Our procedures included confirmation of securities owned as of December 31, 2021, by correspondence with the custodian and brokers; when replies were not received from brokers, we performed other
auditing procedures. We believe that our audits provide a reasonable basis for our opinion.
DELOITTE & TOUCHE LLP
Boston, Massachusetts
February 15, 2022
We have served as the auditor of one or more of the MFS
investment companies since 1924.
MFS Government Securities
Portfolio
Trustees and Officers — Identification and
Background
The Trustees and Officers of the Trust, as
of February 1, 2022, are listed below, together with their principal occupations during the past five years. (Their titles may have varied during that period.) The address of each Trustee and Officer is 111 Huntington Avenue, Boston, Massachusetts
02199-7618.
| Name,
Age |
|
Position(s)
Held with Fund |
|
Trustee/Officer
Since(h) |
|
Number
of MFS Funds overseen by the Trustee |
|
Principal
Occupations During
the Past Five Years |
|
Other
Directorships During
the Past Five Years (j) |
| INTERESTED
TRUSTEES |
|
|
|
|
|
|
|
|
|
|
Michael
W. Roberge (k)
(age 55) |
|
Trustee
|
|
January
2021 |
|
135
|
|
Massachusetts
Financial Services Company, Chairman (since January 2021); Chief Executive Officer (since January 2017); Director; Chairman of the Board (since January 2022); President (until December 2018); Chief Investment Officer (until December 2018) |
|
N/A
|
| INDEPENDENT
TRUSTEES |
|
|
|
|
|
|
|
|
|
|
John
P. Kavanaugh
(age 67) |
|
Trustee
and Chair of Trustees |
|
January
2009 |
|
135
|
|
Private
investor |
|
N/A
|
Steven
E. Buller
(age 70) |
|
Trustee
|
|
February
2014 |
|
135
|
|
Private
investor |
|
N/A
|
John
A. Caroselli
(age 67) |
|
Trustee
|
|
March
2017 |
|
135
|
|
Private
investor; JC Global Advisors, LLC (management consulting), President (since 2015) |
|
N/A
|
Maureen
R. Goldfarb
(age 66) |
|
Trustee
|
|
January
2009 |
|
135
|
|
Private
investor |
|
N/A
|
Peter
D. Jones
(age 66) |
|
Trustee
|
|
January
2019 |
|
135
|
|
Private
investor |
|
N/A
|
James
W. Kilman, Jr.
(age 60) |
|
Trustee
|
|
January
2019 |
|
135
|
|
Burford
Capital Limited (finance and investment management), Senior Advisor (since May 3, 2021), Chief Financial Officer (2019 - May 2, 2021); KielStrand Capital LLC (family office), Chief Executive Officer (since 2016) |
|
Alpha-En
Corporation, Director (2016-2019) |
Clarence
Otis, Jr.
(age 65) |
|
Trustee
|
|
March
2017 |
|
135
|
|
Private
investor |
|
VF
Corporation, Director; Verizon Communications, Inc., Director; The Travelers Companies, Director |
Maryanne
L. Roepke
(age 65) |
|
Trustee
|
|
May
2014 |
|
135
|
|
Private
investor |
|
N/A
|
Laurie
J. Thomsen
(age 64) |
|
Trustee
|
|
March
2005 |
|
135
|
|
Private
investor |
|
The
Travelers Companies, Director; Dycom Industries, Inc., Director |
MFS Government Securities
Portfolio
Trustees and Officers - continued
| Name,
Age |
|
Position(s)
Held with
Fund |
|
Trustee/Officer
Since(h) |
|
Number
of MFS Funds for which the Person is an Officer |
|
Principal
Occupations During
the Past Five Years |
| OFFICERS
|
|
|
|
|
|
|
|
|
Christopher
R. Bohane (k)
(age 48) |
|
Assistant
Secretary and Assistant Clerk |
|
July
2005 |
|
135
|
|
Massachusetts
Financial Services Company, Senior Vice President and Associate General Counsel |
Kino
Clark (k)
(age 53) |
|
Assistant
Treasurer |
|
January
2012 |
|
135
|
|
Massachusetts
Financial Services Company, Vice President |
John
W. Clark, Jr. (k)
(age 54) |
|
Assistant
Treasurer |
|
April
2017 |
|
135
|
|
Massachusetts
Financial Services Company, Vice President (since March 2017); Deutsche Bank (financial services), Department Head - Treasurer's Office (until February 2017) |
Thomas
H. Connors (k)
(age 62) |
|
Assistant
Secretary and Assistant Clerk |
|
September
2012 |
|
135
|
|
Massachusetts
Financial Services Company, Vice President and Senior Counsel |
David
L. DiLorenzo (k)
(age 53) |
|
President
|
|
July
2005 |
|
135
|
|
Massachusetts
Financial Services Company, Senior Vice President |
Heidi
W. Hardin (k)
(age 54) |
|
Secretary
and Clerk |
|
April
2017 |
|
135
|
|
Massachusetts
Financial Services Company, Executive Vice President and General Counsel (since March 2017); Harris Associates (investment management), General Counsel (until January 2017) |
Brian
E. Langenfeld (k)
(age 48) |
|
Assistant
Secretary and Assistant Clerk |
|
June
2006 |
|
135
|
|
Massachusetts
Financial Services Company, Vice President and Senior Counsel |
Amanda
S. Mooradian (k)
(age 42) |
|
Assistant
Secretary and Assistant Clerk |
|
September
2018 |
|
135
|
|
Massachusetts
Financial Services Company, Assistant Vice President and Senior Counsel |
Susan
A. Pereira (k)
(age 51) |
|
Assistant
Secretary and Assistant Clerk |
|
July
2005 |
|
135
|
|
Massachusetts
Financial Services Company, Vice President and Assistant General Counsel |
Kasey
L. Phillips (k)
(age 51) |
|
Assistant
Treasurer |
|
September
2012 |
|
135
|
|
Massachusetts
Financial Services Company, Vice President |
Matthew
A. Stowe (k)
(age 47) |
|
Assistant
Secretary and Assistant Clerk |
|
October
2014 |
|
135
|
|
Massachusetts
Financial Services Company, Vice President and Assistant General Counsel |
Martin
J. Wolin (k)
(age 54) |
|
Chief
Compliance Officer |
|
July
2015 |
|
135
|
|
Massachusetts
Financial Services Company, Senior Vice President and Chief Compliance Officer |
James
O. Yost (k)
(age 61) |
|
Treasurer
|
|
September
1990 |
|
135
|
|
Massachusetts
Financial Services Company, Senior Vice President |
| (h)
|
Date
first appointed to serve as Trustee/Officer of an MFS Fund. Each Trustee has served continuously since appointment unless indicated otherwise. From January 2012 through December 2016, Messrs. DiLorenzo and Yost served as Treasurer and Deputy
Treasurer of the Funds, respectively. |
| (j)
|
Directorships or
trusteeships of companies required to report to the Securities and Exchange Commission (i.e., “public companies”). |
| (k)
|
“Interested
person” of the Trust within the meaning of the Investment Company Act of 1940 (referred to as the 1940 Act), which is the principal federal law governing investment companies like the fund, as a result of a position with MFS. The address of
MFS is 111 Huntington Avenue, Boston, Massachusetts 02199-7618. |
Each Trustee (other than Messrs. Jones, Kilman and Roberge)
has been elected by shareholders and each Trustee and Officer holds office until his or her successor is chosen and qualified or until his or her earlier death, resignation, retirement or removal. Mr. Roberge became a Trustee of the Funds on January
1, 2021 and Messrs. Jones and Kilman became Trustees of the Funds on January 1, 2019. The Trust does not hold annual meetings for the purpose of electing Trustees, and Trustees are not elected for fixed terms. Under the terms of the Board's
retirement policy, an Independent Trustee shall retire at the end of the calendar year in which he or she reaches the earlier of 75 years of age or 15 years of service on the Board (or, in the case of any Independent Trustee who joined the Board
prior to 2015, 20 years of service on the Board).
Messrs. Buller, Kilman and Otis and Ms. Roepke are members
of the Trust’s Audit Committee.
MFS Government Securities
Portfolio
Trustees and Officers - continued
Each
of the Interested Trustees and certain Officers hold comparable officer positions with certain affiliates of MFS.
The Statement of Additional Information for a Fund includes
further information about the Trustees and is available without charge upon request by calling 1-800-225-2606.
| Investment
Adviser |
Custodian
|
Massachusetts Financial
Services Company
111 Huntington Avenue
Boston, MA 02199-7618 |
State Street
Bank and Trust Company
1 Lincoln Street
Boston, MA 02111-2900 |
| Distributor
|
Independent
Registered Public Accounting Firm |
MFS Fund
Distributors, Inc.
111 Huntington Avenue
Boston, MA 02199-7618 |
Deloitte
& Touche LLP
200 Berkeley Street
Boston, MA 02116 |
| Portfolio
Manager(s) |
|
Geoffrey
Schechter
Jake Stone |
|
MFS Government Securities
Portfolio
Board Review of Investment Advisory Agreement
MFS Government Securities Portfolio
The Investment Company Act of 1940 requires that both the
full Board of Trustees and a majority of the non-interested (“independent”) Trustees, voting separately, annually approve the continuation of the Fund’s investment advisory agreement with MFS. The Trustees consider matters bearing
on the Fund and its advisory arrangements at their meetings throughout the year, including a review of performance data at each regular meeting. In addition, the independent Trustees met several times by videoconference (in accordance with
Securities and Exchange Commission relief) over the course of three months beginning in May and ending in July, 2021 (“contract review meetings”) for the specific purpose of considering whether to approve the continuation of the
investment advisory agreement for the Fund and the other investment companies that the Board oversees (the “MFS Funds”). The independent Trustees were assisted in their evaluation of the Fund’s investment advisory agreement by
independent legal counsel, from whom they received separate legal advice and with whom they met separately from MFS during various contract review meetings. The independent Trustees were also assisted in this process by an independent consultant who
was retained by and reported to the independent Trustees.
In connection with their deliberations regarding the
continuation of the investment advisory agreement, the Trustees, including the independent Trustees, considered such information and factors as they believed, in light of the legal advice furnished to them and their own business judgment, to be
relevant. The investment advisory agreement for the Fund was considered separately, although the Trustees also took into account the common interests of all MFS Funds in their review. As described below, the Trustees considered the nature, quality,
and extent of the various investment advisory, administrative, and shareholder services performed by MFS under the existing investment advisory agreement and other arrangements with the Fund.
In connection with their contract review meetings, the
Trustees received and relied upon materials that included, among other items: (i) information provided by Broadridge Financial Solutions, Inc. (“Broadridge”), an independent third party, on the investment performance of the Fund for
various time periods ended December 31, 2020 and the investment performance of a group of funds with substantially similar investment classifications/objectives (the “Broadridge performance universe”), (ii) information provided by
Broadridge on the Fund’s advisory fees and other expenses and the advisory fees and other expenses of comparable funds identified by Broadridge as well as all other funds in the same investment classification/category (the “Broadridge
expense group and universe”), (iii) information provided by MFS on the advisory fees of portfolios of other clients of MFS, including institutional separate accounts and other clients, (iv) information as to whether and to what extent
applicable expense waivers, reimbursements or fee “breakpoints” are observed for the Fund, (v) information regarding MFS’ financial results and financial condition, including MFS’ and certain of its affiliates’
estimated profitability from services performed for the Fund and the MFS Funds as a whole, and compared to MFS’ institutional business, (vi) MFS’ views regarding the outlook for the mutual fund industry and the strategic business plans
of MFS, (vii) descriptions of various functions performed by MFS for the Funds, such as compliance monitoring and portfolio trading practices, and (viii) information regarding the overall organization of MFS, including information about MFS’
senior management and other personnel providing investment advisory, administrative and other services to the Fund and the other MFS Funds. The comparative performance, fee and expense information prepared and provided by Broadridge was not
independently verified and the independent Trustees did not independently verify any information provided to them by MFS.
The Trustees’ conclusion as to the continuation of
the investment advisory agreement was based on a comprehensive consideration of all information provided to the Trustees and not the result of any single factor. Some of the factors that figured particularly in the Trustees’ deliberations are
described below, although individual Trustees may have evaluated the information presented differently from one another, giving different weights to various factors. It is also important to recognize that the fee arrangements for the Fund and other
MFS Funds are the result of years of review and discussion between the independent Trustees and MFS, that certain aspects of such arrangements may receive greater scrutiny in some years than in others, and that the Trustees’ conclusions may be
based, in part, on their consideration of these same arrangements during the course of the year and in prior years.
Based on information provided by Broadridge and MFS, the
Trustees reviewed the Fund’s total return investment performance as well as the Broadridge performance universe over various time periods. The Trustees placed particular emphasis on the total return performance of the Fund’s Initial
Class shares in comparison to the performance of funds in its Broadridge performance universe over the five-year period ended December 31, 2020, which the Trustees believed was a long enough period to reflect differing market conditions. The total
return performance of the Fund’s Initial Class shares was in the 2nd quintile relative to the other funds in the universe for this five-year period (the 1st quintile being the best performers and the 5th quintile being the worst performers).
The total return performance of the Fund's Initial Class shares was in the 3rd quintile for the one-year period and the 2nd quintile for the three-year period ended December 31, 2020 relative to the Broadridge performance universe. Because of the
passage of time, these performance results may differ from the performance results for more recent periods, including those shown elsewhere in this report.
MFS Government Securities
Portfolio
Board Review of Investment Advisory Agreement - continued
In
the course of their deliberations, the Trustees took into account information provided by MFS in connection with the contract review meetings, as well as during investment review meetings conducted with portfolio management personnel during the
course of the year regarding the Fund’s performance. After reviewing these and related factors, the Trustees concluded, within the context of their overall conclusions regarding the investment advisory agreement, that they were satisfied with
MFS’ responses and efforts relating to investment performance.
In assessing the reasonableness of the Fund’s
advisory fee, the Trustees considered, among other information, the Fund’s advisory fee and the total expense ratio of the Fund’s Initial Class shares as a percentage of average daily net assets and the advisory fee and total expense
ratios of the Broadridge expense group based on information provided by Broadridge. The Trustees considered that MFS currently observes an expense limitation for the Fund, which may not be changed without the Trustees’ approval. The Trustees
also considered that, according to the data provided by Broadridge (which takes into account any fee reductions or expense limitations that were in effect during the Fund’s last fiscal year), the Fund’s effective advisory fee rate and
total expense ratio were each approximately at the Broadridge expense group median.
The Trustees also considered the advisory fees charged by
MFS to any institutional separate accounts advised by MFS (“separate accounts”) and unaffiliated investment companies for which MFS serves as subadviser (“subadvised funds”) that have comparable investment strategies to the
Fund, if any. In comparing these fees, the Trustees considered information provided by MFS as to the generally broader scope of services provided by MFS to the Fund, as well as the more extensive regulatory burdens imposed on MFS in managing the
Fund, in comparison to separate accounts and subadvised funds. The Trustees also considered the higher demands placed on MFS’ investment personnel and trading infrastructure as a result of the daily cash in-flows and out-flows of the Fund in
comparison to separate accounts.
The Trustees also
considered whether the Fund may benefit from any economies of scale in the management of the Fund in the event of growth in assets of the Fund and/or growth in assets of the MFS Funds as a whole. They noted that the Fund’s advisory fee rate
schedule is subject to a contractual breakpoint that reduces the Fund’s advisory fee rate on average daily net assets over $1 billion. The Trustees also noted that MFS has agreed in writing to waive a portion of the management fees of certain
MFS Funds, including the Fund, if the total combined assets of certain funds within the MFS Funds’ complex increase above agreed upon thresholds (the “group fee waiver”), enabling the Fund’s shareholders to share in the
benefits from any economies of scale at the complex level. The group fee waiver is reviewed and renewed annually between the Board and MFS. The Trustees concluded that the breakpoint and the group fee waiver were sufficient to allow the Fund to
benefit from economies of scale as its assets and overall complex assets grow.
The Trustees also considered information prepared by MFS
relating to MFS’ costs and profits with respect to the Fund, the MFS Funds considered as a group, and other investment companies and accounts advised by MFS, as well as MFS’ methodologies used to determine and allocate its costs to the
MFS Funds, the Fund and other accounts and products for purposes of estimating profitability.
After reviewing these and other factors described herein,
the Trustees concluded, within the context of their overall conclusions regarding the investment advisory agreement, that the advisory fees charged to the Fund represent reasonable compensation in light of the services being provided by MFS to the
Fund.
In addition, the Trustees considered MFS’
resources and related efforts to continue to retain, attract and motivate capable personnel to serve the Fund. The Trustees also considered current and developing conditions in the financial services industry, including the presence of large and
well-capitalized companies which are spending, and appear to be prepared to continue to spend, substantial sums to engage personnel and to provide services to competing investment companies. In this regard, the Trustees also considered the financial
resources of MFS and its ultimate parent, Sun Life Financial Inc. The Trustees also considered the advantages and possible disadvantages to the Fund of having an adviser that also serves other investment companies as well as other accounts.
The Trustees also considered the nature, quality, cost, and
extent of administrative, transfer agency, and distribution services provided to the Fund by MFS and its affiliates under agreements and plans other than the investment advisory agreement, including any 12b-1 fees the Fund pays to MFS Fund
Distributors, Inc., an affiliate of MFS. The Trustees also considered the nature, extent and quality of certain other services MFS performs or arranges for on the Fund’s behalf, which may include securities lending programs, directed expense
payment programs, class action recovery programs, and MFS’ interaction with third-party service providers, principally custodians and sub-custodians. The Trustees concluded that the various non-advisory services provided by MFS and its
affiliates on behalf of the Fund were satisfactory.
The Trustees considered so-called “fall-out
benefits” to MFS such as reputational value derived from serving as investment manager to the MFS Funds. The Trustees also considered that MFS discontinued its historic practice of obtaining investment research from portfolio brokerage
commissions paid by certain MFS Funds effective January 2018, and directly pays or voluntarily reimburses a Fund, if applicable, for the costs of external research acquired through the use of the Fund’s portfolio brokerage commissions.
MFS Government Securities
Portfolio
Board Review of Investment Advisory Agreement - continued
Based on their evaluation of factors that they deemed to be
material, including those factors described above, the Board of Trustees, including the independent Trustees, concluded that the Fund’s investment advisory agreement with MFS should be continued for an additional one-year period, commencing
August 1, 2021.
MFS Government Securities
Portfolio
Proxy Voting Policies and Information
MFS votes proxies on behalf of the fund pursuant to proxy
voting policies and procedures that are available without charge, upon request, by calling 1-800-225-2606, by visiting mfs.com/proxyvoting, or by visiting the SEC’s Web site at http://www.sec.gov.
Information regarding how the fund voted proxies relating
to portfolio securities during the most recent twelve-month period ended June 30 is available by August 31 of each year without charge by visiting mfs.com/proxyvoting, or by visiting the SEC’s Web site
at http://www.sec.gov.
Quarterly Portfolio Disclosure
The fund files a complete schedule of portfolio holdings
with the SEC for the first and third quarters of each fiscal year as an exhibit to its reports on Form N-PORT. The fund’s Form N-PORT reports are available on the SEC’s Web site at
http://www.sec.gov. A shareholder can obtain the portfolio holdings report for the first and third quarters of the fund's fiscal year at mfs.com/vit2 by
choosing the fund's name and then scrolling to the “Resources” section and clicking on the “Prospectus and Reports” tab.
FURTHER INFORMATION
From time to time, MFS may post important information about
the fund or the MFS Funds on the MFS Web site (mfs.com). This information is available at https://www.mfs.com/announcements or at
mfs.com/vit2 by choosing the fund's name and then scrolling to the “Resources” section and clicking on the “Announcements” tab, if any.
Information About Fund Contracts and Legal Claims
The fund has entered into contractual arrangements with an
investment adviser, administrator, distributor, shareholder servicing agent, 529 program manager (if applicable), and custodian who each provide services to the fund. Unless expressly stated otherwise, shareholders are not parties to, or intended
beneficiaries of these contractual arrangements, and these contractual arrangements are not intended to create any shareholder right to enforce them against the service providers or to seek any remedy under them against the service providers, either
directly or on behalf of the fund.
Under the
Trust’s By-Laws and Declaration of Trust, any claims asserted against or on behalf of the MFS Funds, including claims against Trustees and Officers, must be brought in state and federal courts located within the Commonwealth of
Massachusetts.
Federal Tax Information (unaudited)
The following information is provided pursuant to
provisions of the Internal Revenue Code.
The fund
intends to pass through the maximum amount allowable as Section 163(j) Interest Dividends as defined in Treasury Regulation §1.163(j)-1(b).
| FACTS
|
WHAT
DOES MFS DO WITH YOUR PERSONAL INFORMATION? |
| Why?
|
Financial
companies choose how they share your personal information. Federal law gives consumers the right to limit some but not all sharing. Federal law also requires us to tell you how we collect, share, and protect your personal information. Please read
this notice carefully to understand what we do. |
| What?
|
The types of
personal information we collect and share depend on the product or service you have with us. This information can include: |
| • Social
Security number and account balances |
| • Account
transactions and transaction history |
| • Checking
account information and wire transfer instructions |
| When
you are no longer our customer, we continue to share your information as described in this notice. |
| How?
|
All
financial companies need to share customers' personal information to run their everyday business. In the section below, we list the reasons financial companies can share their customers' personal information; the reasons MFS chooses to share; and
whether you can limit this sharing. |
Reasons
we can share your
personal information |
Does
MFS share? |
Can
you limit
this sharing? |
For
our everyday business purposes –
such as to process your transactions, maintain your
account(s), respond to court orders and legal
investigations, or report to credit bureaus |
Yes
|
No
|
For
our marketing purposes –
to offer our products and services to you |
No
|
We
don't share |
For
joint marketing with other
financial companies |
No
|
We
don't share |
For
our affiliates' everyday business purposes –
information about your transactions and experiences |
No
|
We
don't share |
For
our affiliates' everyday business purposes –
information about your creditworthiness |
No
|
We
don't share |
| For
nonaffiliates to market to you |
No
|
We
don't share |
| Questions?
|
Call
800-225-2606 or go to mfs.com. |
| Who
we are |
| Who
is providing this notice? |
MFS
Funds, MFS Investment Management, MFS Institutional Advisors, Inc., and MFS Heritage Trust Company. |
| What
we do |
How
does MFS
protect my personal
information? |
To
protect your personal information from unauthorized access and use, we use security measures that comply with federal law. These measures include procedural, electronic, and physical safeguards for the protection of the personal information we
collect about you. |
How
does MFS
collect my personal
information? |
We
collect your personal information, for example, when you |
| • open
an account or provide account information |
| • direct
us to buy securities or direct us to sell your securities |
| • make
a wire transfer |
| We
also collect your personal information from others, such as credit bureaus, affiliates, or other companies. |
| Why
can't I limit all sharing? |
Federal
law gives you the right to limit only |
| • sharing
for affiliates' everyday business purposes – information about your creditworthiness |
| • affiliates
from using your information to market to you |
| • sharing
for nonaffiliates to market to you |
| State
laws and individual companies may give you additional rights to limit sharing. |
| Definitions
|
| Affiliates
|
Companies
related by common ownership or control. They can be financial and nonfinancial companies. |
| •
MFS does not share personal information with affiliates, except for everyday business purposes as described on page one of this notice. |
| Nonaffiliates
|
Companies
not related by common ownership or control. They can be financial and nonfinancial companies. |
| •
MFS does not share with nonaffiliates so they can market to you. |
| Joint
marketing |
A
formal agreement between nonaffiliated financial companies that together market financial products or services to you. |
| •
MFS doesn't jointly market. |
| Other
important information |
| If
you own an MFS product or receive an MFS service in the name of a third party such as a bank or broker-dealer, their privacy policy may apply to you instead of ours. |
Annual Report
December 31, 2021
MFS® High Yield Portfolio
MFS® Variable
Insurance Trust II
MFS® High
Yield Portfolio
|
1
|
|
2
|
|
3
|
|
5
|
|
7
|
|
8
|
|
19
|
|
20
|
|
21
|
|
22
|
|
24
|
|
33
|
|
34
|
|
37
|
|
39
|
|
39
|
|
39
|
|
39
|
|
39
|
|
40
|
The report is prepared for the general information of contract owners. It
is authorized for distribution to prospective investors only when preceded or accompanied by a current prospectus.
NOT FDIC INSURED • MAY LOSE VALUE
• NO BANK OR CREDIT UNION GUARANTEE •
NOT A DEPOSIT • NOT INSURED BY ANY FEDERAL GOVERNMENT
AGENCY OR NCUA/NCUSIF
Dear Contract Owners:
After a powerful rally in 2021 that was spurred by the
introduction of effective coronavirus vaccines and high levels of monetary and fiscal stimulus, markets have recently experienced a rise in volatility. Rising inflation (mostly due to pandemic-related labor and supply chain disruptions), new
COVID-19 variants that are vaccine-resistant, and the prospect of tighter monetary and fiscal policies around the world have all increased investor anxiety.
Rising real (inflation-adjusted) bond yields in the United
States are a headwind for richly valued U.S. growth stocks, though many non-U.S. markets have experienced lower levels of turbulence. In recent months, global economic growth has moderated, with the spread of the Delta and Omicron variants and a
regulatory crackdown in China featuring prominently. Stress in China’s property development sector has also contributed to the slowdown there. A further concern for investors is the tightening of global energy and raw materials supplies caused
in part by geopolitical uncertainty.
However,
above-trend economic growth, strong corporate balance sheets, and nascent signs that global supply chain bottlenecks may be easing, along with a dovish policy shift in China, are supportive fundamentals that we feel could help calm recent market
jitters.
It is times of market transition that
demonstrate the importance of having a deep understanding of company fundamentals, and we have built our global research platform to do just that.
At MFS®, we put our clients’ assets to work responsibly by carefully navigating the increasing complexity of global markets and economies. Guided by our commitment to long-term
investing, we tune out the noise and try to uncover what we believe are the best, most durable investment opportunities in the market. Our unique global investment platform combines collective expertise, long-term discipline, and thoughtful risk
management to create sustainable value for investors.
Respectfully,
Michael W.
Roberge
Chief Executive Officer
MFS Investment Management
February 15, 2022
The opinions expressed in this letter are subject to
change and may not be relied upon for investment advice. No forecasts can be guaranteed.
Portfolio structure (i)
Top five
industries (i)
| Cable
TV |
7.9%
|
| Gaming
& Lodging |
6.6%
|
| Medical
& Health Technology & Services |
6.3%
|
| Midstream
|
4.5%
|
| Metals
& Mining |
4.0%
|
Composition including fixed income credit quality (a)(i)
| BBB
|
0.6%
|
| BB
|
43.6%
|
| B
|
38.7%
|
| CCC
|
13.2%
|
| CC
|
0.1%
|
| C
(o) |
0.0%
|
| Not
Rated |
(1.3)%
|
| Non-Fixed
Income |
0.2%
|
| Cash
& Cash Equivalents |
3.4%
|
| Other
|
1.5%
|
Portfolio facts (i)
| Average
Duration (d) |
3.6
|
| Average
Effective Maturity (m) |
4.3 yrs.
|
| (a)
|
For all
securities other than those specifically described below, ratings are assigned to underlying securities utilizing ratings from Moody’s, Fitch, and Standard & Poor’s rating agencies and applying the following hierarchy: If all three
agencies provide a rating, the middle rating (after dropping the highest and lowest ratings) is assigned; if two of the three agencies rate a security, the lower of the two is assigned. If none of the 3 rating agencies above assign a rating, but the
security is rated by DBRS Morningstar, then the DBRS Morningstar rating is assigned. If none of the 4 rating agencies listed above rate the security, but the security is rated by the Kroll Bond Rating Agency (KBRA), then the KBRA rating is assigned.
Ratings are shown in the S&P and Fitch scale (e.g., AAA). Securities rated BBB or higher are considered investment grade. All ratings are subject to change. Not Rated includes fixed income securities and fixed income derivatives that have not
been rated by any rating agency. Non-Fixed Income includes equity securities (including convertible bonds and equity derivatives) and/or commodity-linked derivatives. The fund may or may not have held all of these instruments on this date. The fund
is not rated by these agencies. |
| (d)
|
Duration is
a measure of how much a bond’s price is likely to fluctuate with general changes in interest rates, e.g., if rates rise 1.00%, a bond with a 5-year duration is likely to lose about 5.00% of its value due to the interest rate move.
|
| (i)
|
For
purposes of this presentation, the components include the value of securities, and reflect the impact of the equivalent exposure of derivative positions, if any. These amounts may be negative from time to time. Equivalent exposure is a calculated
amount that translates the derivative position into a reasonable approximation of the amount of the underlying asset that the portfolio would have to hold at a given point in time to have the same price sensitivity that results from the
portfolio’s ownership of the derivative contract. When dealing with derivatives, equivalent exposure is a more representative measure of the potential impact of a position on portfolio performance than value. The bond component will include
any accrued interest amounts. |
| (m)
|
In
determining each instrument’s effective maturity for purposes of calculating the fund’s dollar-weighted average effective maturity, MFS uses the instrument’s stated maturity or, if applicable, an earlier date on which MFS believes
it is probable that a maturity-shortening device (such as a put, pre-refunding or prepayment) will cause the instrument to be repaid. Such an earlier date can be substantially shorter than the instrument’s stated maturity. |
Where the fund holds
convertible bonds, they are treated as part of the equity portion of the portfolio.
Cash & Cash Equivalents includes any cash,
investments in money market funds, short-term securities, and other assets less liabilities. Please see the Statement of Assets and Liabilities for additional information related to the fund’s cash position and other assets and
liabilities.
Other includes equivalent
exposure from currency derivatives and/or any offsets to derivative positions and may be negative.
Percentages are based on net assets as of December
31, 2021.
The portfolio is actively managed
and current holdings may be different.
Management Review
Summary of Results
For the twelve months ended December 31, 2021, Initial
Class shares of the MFS High Yield Portfolio (fund) provided a total return of 3.49%, while Service Class shares of the fund provided a total return of 3.08%. These compare with a return of 5.26% over the same period for the fund’s benchmark,
the Bloomberg U.S. Corporate High-Yield Bond 2% Issuer Capped Index.
Market Environment
Over the past year, the global economy was buffeted by an
array of crosscurrents as it adjusted to the ebbs and flows of the pandemic. Among the supportive currents were ample fiscal stimulus, loose monetary policy and the rollout of several highly effective coronavirus vaccines. Negative currents included
the rapid spread of several coronavirus variants, widespread global production bottlenecks and a surge in inflation. After experiencing a burst of exceptionally strong economic activity as the global economy began to reopen, activity became more
muted in the second half of the period amid ongoing supply chain disruptions and a new wave of coronavirus infections, albeit a seemingly milder strain.
Amid rising inflation, markets anticipated a transition
from an exceptionally accommodative environment to a more mixed monetary landscape ahead. Indeed, several central banks in emerging markets have already tightened policy and the US Federal Reserve reduced the pace of its asset purchases in November
and again in December. However, the European Central Bank, the Bank of Japan and the People's Bank of China are expected to maintain accommodative policies. Sovereign bond yields moved modestly higher during the period amid higher inflation and on
expectations of a tighter Fed but remain historically low.
A harsher Chinese regulatory environment toward industries
such as online gaming, food delivery and education increased market volatility as has stress in China's highly leveraged property development sector. Trade relations between the United States and China remained quite strained despite a change in
presidential administrations.
Signs of excess
investor enthusiasm continued to be seen in pockets of the market such as “meme stocks” popular with users of online message boards, cryptocurrencies and heavy retail participation in the market for short-dated options.
Detractors from Performance
Relative to the Bloomberg U.S. Corporate High-Yield Bond 2%
Issuer Capped Index, the fund's out-of-benchmark allocation to non-rated(r) bonds during the reporting period hurt relative performance. From a sector perspective, the fund’s underweight allocation to the energy sector, and its overweight
allocation to the capital goods sector, also held back relative results.
Security selection within BB and CCC rated bonds further
weakened the fund’s relative performance, most notably within the basic industry, technology and consumer cyclical sectors.
Top individual detractors for the reporting period included
the fund's underweight exposures to oil and gas exploration and production company Occidental Petroleum (energy) and food and beverage products manufacturer Kraft Heinz Food(h) (consumer non-cyclical). The fund’s overweight exposure to
clinical research services provider IQVIA Holdings (consumer non-cyclical) also detracted from relative performance.
Contributors to Performance
The fund's shorter duration(d) stance contributed to
relative returns as interest rates generally rose during the reporting period.
Top individual contributors for the reporting period
included the fund’s overweight exposures to specialty retailer Bath & Body Works (formerly L Brands) (consumer cyclical), oil refinery operator PBF Holding (energy) and wireless service provider Sprint (communications).
Respectfully,
Portfolio Manager(s)
David Cole and Michael Skatrud
| (d)
|
Duration is
a measure of how much a bond’s price is likely to fluctuate with general changes in interest rates, e.g., if rates rise 1.00%, a bond with a 5-year duration is likely to lose about 5.00% of its value. |
| (h)
|
Security was not held in
the portfolio at period end. |
| (r)
|
Securities
rated “BBB”, “Baa”, or higher are considered investment grade; securities rated “BB”, “Ba”, or below are considered non-investment grade. Ratings are assigned to underlying securities utilizing
ratings from Moody's, Fitch, and Standard & Poor's and applying the following hierarchy: If all three agencies provide a rating, the middle rating (after dropping the highest and lowest ratings) is assigned; if two of the three agencies rate a
security, the |
Management Review - continued
lower of the two is assigned. If none of the 3 rating
agencies above assign a rating, but the security is rated by DBRS Morningstar, then the DBRS Morningstar rating is assigned. If none of the 4 rating agencies listed above rate the security, but the security is rated by the Kroll Bond Rating Agency
(KBRA), then the KBRA rating is assigned. Ratings are shown in the S&P and Fitch scale (e.g., AAA). For securities that are not rated by any of the rating agencies, the security is considered Not Rated.
The views expressed in this report are those of the portfolio
manager(s) only through the end of the period of the report as stated on the cover and do not necessarily reflect the views of MFS or any other person in the MFS organization. These views are subject to change at any time based on market or other
conditions, and MFS disclaims any responsibility to update such views. These views may not be relied upon as investment advice or an indication of trading intent on behalf of any MFS portfolio. References to specific securities are not
recommendations of such securities, and may not be representative of any MFS portfolio’s current or future investments.
Performance Summary Through 12/31/21
The following chart illustrates the historical performance
of the fund in comparison to its benchmark(s). Benchmarks are unmanaged and may not be invested in directly. Benchmark returns do not reflect any fees or expenses. The performance of other share classes will be greater than or less than that of the
class depicted below. (See Notes to Performance Summary.)
Performance data shown represents past performance and is no
guarantee of future results. Investment return and principal value fluctuate so your units, when sold, may be worth more or less than the original cost; current performance may be lower or higher than quoted. The performance shown does not reflect
the deduction of taxes, if any, that a contract holder would pay on fund distributions or the redemption of contract units. The returns for the fund shown also do not reflect the deduction of expenses associated with variable products, such as
mortality and expense risk charges, separate account charges, and sales charges imposed by the insurance company separate accounts. Such expenses would reduce the overall returns shown.
Growth of a Hypothetical $10,000 Investment
Total Returns
through 12/31/21
Average annual total returns
| Share
Class |
Class
Inception Date |
1-yr
|
5-yr
|
10-yr
|
| Initial
Class |
6/12/85
|
3.49%
|
5.24%
|
5.87%
|
| Service
Class |
8/24/01
|
3.08%
|
4.93%
|
5.58%
|
Comparative benchmark(s)
| Bloomberg
U.S. Corporate High-Yield Bond 2% Issuer Capped Index (f) |
5.26%
|
6.28%
|
6.82%
|
| (f)
|
Source:
FactSet Research Systems Inc. |
Benchmark Definition(s)
Bloomberg U.S. Corporate High-Yield Bond 2% Issuer Capped
Index(a) – a component of the Bloomberg U.S. Corporate High-Yield Bond Index, which measures performance of non-investment grade, fixed rate debt. The index limits the
maximum exposure to any one issuer to 2%.
It is not
possible to invest directly in an index.
| (a)
|
Source:
Bloomberg Index Services Limited. BLOOMBERG® is a trademark and service mark of Bloomberg Finance L.P. and its affiliates (collectively “Bloomberg”). Bloomberg
or Bloomberg's licensors own all proprietary rights in the Bloomberg Indices. Bloomberg neither approves or endorses this material, or guarantees the accuracy or completeness of any information herein, or makes any warranty, express or implied, as
to the results to be obtained therefrom and, to the maximum extent allowed by law, neither shall have any liability or responsibility for injury or damages arising in connection therewith. |
Performance Summary – continued
Notes
to Performance Summary
Average annual total return
represents the average annual change in value for each share class for the periods presented.
Performance results reflect any applicable expense
subsidies and waivers in effect during the periods shown. Without such subsidies and waivers the fund's performance results would be less favorable. Please see the prospectus and financial statements for complete details. All results are historical
and assume the reinvestment of any dividends and capital gains distributions.
Performance results do not include adjustments made for
financial reporting purposes in accordance with U.S. generally accepted accounting principles and may differ from amounts reported in the financial highlights.
From time to time the fund may receive proceeds from
litigation settlements, without which performance would be lower.
Expense Table
Fund Expenses Borne by the Contract Holders during the
Period,
July 1, 2021 through December 31, 2021
As
a contract holder of the fund, you incur ongoing costs, including management fees; distribution and/or service (12b-1) fees; and other fund expenses. This example is intended to help you understand your ongoing costs (in dollars) of investing in the
fund and to compare these costs with the ongoing costs of investing in other mutual funds.
The example is based on an investment of $1,000 invested at
the beginning of the period and held for the entire period July 1, 2021 through December 31, 2021.
Actual Expenses
The first line for each share class in the following table
provides information about actual account values and actual expenses. You may use the information in this line, together with the amount you invested, to estimate the expenses that you paid over the period. Simply divide your account value by $1,000
(for example, an $8,600 account value divided by $1,000 = 8.6), then multiply the result by the number in the first line under the heading entitled “Expenses Paid During Period” to estimate the expenses you paid on your account during
this period.
Hypothetical Example for Comparison
Purposes
The second line for each share class in the
following table provides information about hypothetical account values and hypothetical expenses based on the fund’s actual expense ratio and an assumed rate of return of 5% per year before expenses, which is not the fund’s actual
return. The hypothetical account values and expenses may not be used to estimate the actual ending account balance or expenses you paid for the period. You may use this information to compare the ongoing costs of investing in the fund and other
funds. To do so, compare this 5% hypothetical example with the 5% hypothetical examples that appear in the shareholder reports of the other funds.
Please note that the expenses shown in the table are meant
to highlight the fund's ongoing costs only and do not take into account the fees and expenses imposed under the variable contracts through which your investment in the fund is made. Therefore, the second line for each share class in the table is
useful in comparing ongoing costs associated with an investment in vehicles (such as the fund) which fund benefits under variable annuity and variable life insurance contracts and to qualified pension and retirement plans only, and will not help you
determine the relative total costs of investing in the fund through variable annuity and variable life insurance contracts. If the fees and expenses imposed under the variable contracts were included, your costs would have been higher.
Share
Class |
|
Annualized
Expense
Ratio |
Beginning
Account Value
7/01/21 |
Ending
Account Value
12/31/21 |
Expenses
Paid During
Period (p)
7/01/21-12/31/21 |
| Initial
Class |
Actual
|
0.72%
|
$1,000.00
|
$1,009.97
|
$3.65
|
| Hypothetical
(h) |
0.72%
|
$1,000.00
|
$1,021.58
|
$3.67
|
| Service
Class |
Actual
|
0.97%
|
$1,000.00
|
$1,007.48
|
$4.91
|
| Hypothetical
(h) |
0.97%
|
$1,000.00
|
$1,020.32
|
$4.94
|
| (h)
|
5% class return per year
before expenses. |
| (p)
|
“Expenses
Paid During Period” are equal to each class's annualized expense ratio, as shown above, multiplied by the average account value over the period, multiplied by 184/365 (to reflect the one-half year period). |
Portfolio of Investments − 12/31/21
The Portfolio of Investments is a complete list of all
securities owned by your fund. It is categorized by broad-based asset classes.
| Issuer
|
|
|
Shares/Par
|
Value
($) |
| Bonds
– 95.0% |
| Aerospace
& Defense – 2.2% |
| Bombardier,
Inc., 7.5%, 3/15/2025 (n) |
|
$
|
738,000
|
$
751,838 |
| Bombardier,
Inc., 7.125%, 6/15/2026 (n) |
|
|
727,000
|
754,197 |
| F-Brasile
S.p.A./F-Brasile U.S. LLC, 7.375%, 8/15/2026 (n) |
|
|
1,070,000
|
1,064,650 |
| Moog,
Inc., 4.25%, 12/15/2027 (n) |
|
|
1,515,000
|
1,526,362 |
| TransDigm,
Inc., 6.25%, 3/15/2026 (n) |
|
|
1,060,000
|
1,101,737 |
| TransDigm,
Inc., 6.375%, 6/15/2026 |
|
|
985,000
|
1,012,063 |
| TransDigm,
Inc., 5.5%, 11/15/2027 |
|
|
705,000
|
726,150 |
| TransDigm,
Inc., 4.625%, 1/15/2029 |
|
|
614,000
|
611,962 |
| |
|
|
|
$7,548,959 |
| Asset-Backed
& Securitized – 0.0% |
| CWCapital
Cobalt Ltd., CDO, “F”, FLR, 0%, (0% cash or 2.291% PIK), (LIBOR - 3mo. + 1.3%), 4/26/2050 (a)(n)(p) |
|
$
|
1,288,571
|
$
129 |
| Automotive
– 2.5% |
| Dana,
Inc., 5.375%, 11/15/2027 |
|
$
|
726,000
|
$
761,353 |
| Dana,
Inc., 5.625%, 6/15/2028 |
|
|
147,000
|
156,188 |
| Dana,
Inc., 4.25%, 9/01/2030 |
|
|
480,000
|
486,600 |
| Dornoch
Debt Merger Sub Inc., 6.625%, 10/15/2029 (n) |
|
|
650,000
|
641,875 |
| Ford
Motor Co., 5.113%, 5/03/2029 |
|
|
720,000
|
818,100 |
| Ford
Motor Co., 4.75%, 1/15/2043 |
|
|
805,000
|
888,519 |
| Ford
Motor Credit Co. LLC, 4.134%, 8/04/2025 |
|
|
650,000
|
689,812 |
| IAA
Spinco, Inc., 5.5%, 6/15/2027 (n) |
|
|
1,070,000
|
1,108,787 |
| Panther
BR Aggregator 2 LP/Panther Finance Co., Inc., 8.5%, 5/15/2027 (n) |
|
|
1,520,000
|
1,611,200 |
| Real
Hero Merger Sub 2, Inc., 6.25%, 2/01/2029 (n) |
|
|
700,000
|
698,908 |
| Wheel
Pros, Inc., 6.5%, 5/15/2029 (n) |
|
|
645,000
|
619,200 |
| |
|
|
|
$8,480,542 |
| Broadcasting
– 3.1% |
| Advantage
Sales & Marketing, Inc., 6.5%, 11/15/2028 (n) |
|
$
|
980,000
|
$
1,026,550 |
| Gray
Escrow II, Inc., 5.375%, 11/15/2031 (n) |
|
|
1,595,000
|
1,640,856 |
| iHeartCommunications,
Inc., 8.375%, 5/01/2027 |
|
|
935,000
|
985,808 |
| Nexstar
Escrow Corp., 5.625%, 7/15/2027 (n) |
|
|
605,000
|
637,743 |
| Scripps
Escrow II, Inc., 5.875%, 7/15/2027 (n) |
|
|
1,105,000
|
1,160,872 |
| Summer
(BC) Bidco B LLC, 5.5%, 10/31/2026 (n) |
|
|
810,000
|
829,213 |
| Summer
(BC) Holdco S.à r.l., “A”, 9.25%, 10/31/2027 |
|
EUR
|
297,347
|
364,737 |
| Univision
Communications, Inc., 4.5%, 5/01/2029 (n) |
|
$
|
1,875,000
|
1,893,750 |
| WMG
Acquisition Corp., 3.875%, 7/15/2030 (n) |
|
|
1,765,000
|
1,793,681 |
| |
|
|
|
$10,333,210 |
| Brokerage
& Asset Managers – 1.3% |
| Aretec
Escrow Issuer, Inc., 7.5%, 4/01/2029 (n) |
|
$
|
640,000
|
$
654,950 |
| LPL
Holdings, Inc., 4.625%, 11/15/2027 (n) |
|
|
1,375,000
|
1,423,125 |
| LPL
Holdings, Inc., 4%, 3/15/2029 (n) |
|
|
1,037,000
|
1,061,629 |
| NFP
Corp., 4.875%, 8/15/2028 (n) |
|
|
815,000
|
823,150 |
| NFP
Corp., 6.875%, 8/15/2028 (n) |
|
|
325,000
|
325,839 |
| |
|
|
|
$4,288,693 |
| Building
– 3.4% |
| ABC
Supply Co., Inc., 4%, 1/15/2028 (n) |
|
$
|
2,145,000
|
$
2,194,828 |
| GYP
Holding III Corp., 4.625%, 5/01/2029 (n) |
|
|
1,265,000
|
1,268,162 |
| Interface,
Inc., 5.5%, 12/01/2028 (n) |
|
|
1,095,000
|
1,147,013 |
| New
Enterprise Stone & Lime Co., Inc., 5.25%, 7/15/2028 (n) |
|
|
490,000
|
496,860 |
| New
Enterprise Stone & Lime Co., Inc., 9.75%, 7/15/2028 (n) |
|
|
649,000
|
694,430 |
| Park
River Holdings, Inc., 5.625%, 2/01/2029 (n) |
|
|
720,000
|
687,600 |
Portfolio of
Investments – continued
| Issuer
|
|
|
Shares/Par
|
Value
($) |
| Bonds
– continued |
| Building
– continued |
| Patrick
Industries, Inc., 7.5%, 10/15/2027 (n) |
|
$
|
1,045,000
|
$
1,112,925 |
| SRM
Escrow Issuer LLC, 6%, 11/01/2028 (n) |
|
|
1,020,000
|
1,088,901 |
| SRS
Distribution, Inc., 6.125%, 7/01/2029 (n) |
|
|
765,000
|
779,627 |
| Standard
Industries, Inc., 4.375%, 7/15/2030 (n) |
|
|
1,062,000
|
1,083,776 |
| Standard
Industries, Inc., 3.375%, 1/15/2031 (n) |
|
|
240,000
|
231,190 |
| White
Cap Buyer LLC, 6.875%, 10/15/2028 (n) |
|
|
755,000
|
787,088 |
| |
|
|
|
$11,572,400 |
| Business
Services – 2.2% |
| Austin
BidCo, Inc., 7.125%, 12/15/2028 (n) |
|
$
|
610,000
|
$
629,825 |
| HealthEquity,
Inc., 4.5%, 10/01/2029 (n) |
|
|
980,000
|
970,200 |
| Iron
Mountain, Inc., 5.25%, 3/15/2028 (n) |
|
|
515,000
|
535,600 |
| Iron
Mountain, Inc., REIT, 4.875%, 9/15/2027 (n) |
|
|
955,000
|
990,316 |
| Nielsen
Finance LLC, 4.5%, 7/15/2029 (n) |
|
|
1,060,000
|
1,042,764 |
| Paysafe
Finance PLC, 4%, 6/15/2029 (z) |
|
|
985,000
|
913,588 |
| Switch
Ltd., 3.75%, 9/15/2028 (n) |
|
|
1,244,000
|
1,253,330 |
| Switch
Ltd., 4.125%, 6/15/2029 (n) |
|
|
360,000
|
368,100 |
| Verscend
Escrow Corp., 9.75%, 8/15/2026 (n) |
|
|
770,000
|
818,464 |
| |
|
|
|
$7,522,187 |
| Cable
TV – 7.7% |
| CCO
Holdings LLC/CCO Holdings Capital Corp., 4.75%, 3/01/2030 (n) |
|
$
|
2,590,000
|
$
2,693,600 |
| CCO
Holdings LLC/CCO Holdings Capital Corp., 4.5%, 8/15/2030 (n) |
|
|
1,010,000
|
1,033,422 |
| CCO
Holdings LLC/CCO Holdings Capital Corp., 4.25%, 2/01/2031 (n) |
|
|
1,395,000
|
1,407,248 |
| CCO
Holdings LLC/CCO Holdings Capital Corp., 4.25%, 1/15/2034 (n) |
|
|
760,000
|
747,709 |
| CSC
Holdings LLC, 5.375%, 2/01/2028 (n) |
|
|
450,000
|
465,917 |
| CSC
Holdings LLC, 5.75%, 1/15/2030 (n) |
|
|
1,595,000
|
1,589,019 |
| CSC
Holdings LLC, 4.125%, 12/01/2030 (n) |
|
|
1,605,000
|
1,566,881 |
| DISH
DBS Corp., 7.75%, 7/01/2026 |
|
|
415,000
|
437,825 |
| DISH
DBS Corp., 5.25%, 12/01/2026 (n) |
|
|
800,000
|
812,628 |
| DISH
DBS Corp., 5.125%, 6/01/2029 |
|
|
675,000
|
614,250 |
| Intelsat
Jackson Holdings S.A., 5.5%, 8/01/2023 (a)(d) |
|
|
695,000
|
314,710 |
| Intelsat
Jackson Holdings S.A., 9.75%, 7/15/2025 (a)(d)(n) |
|
|
440,000
|
201,991 |
| LCPR
Senior Secured Financing DAC, 6.75%, 10/15/2027 (n) |
|
|
882,000
|
926,100 |
| LCPR
Senior Secured Financing DAC, 5.125%, 7/15/2029 (n) |
|
|
325,000
|
326,625 |
| Sirius
XM Holdings, Inc., 3.875%, 9/01/2031 (n) |
|
|
1,195,000
|
1,171,638 |
| Sirius
XM Radio, Inc., 4%, 7/15/2028 (n) |
|
|
1,153,000
|
1,159,445 |
| Sirius
XM Radio, Inc., 5.5%, 7/01/2029 (n) |
|
|
2,055,000
|
2,214,262 |
| Telenet
Finance Luxembourg S.A., 5.5%, 3/01/2028 (n) |
|
|
1,600,000
|
1,648,000 |
| Videotron
Ltd., 5.375%, 6/15/2024 (n) |
|
|
190,000
|
203,300 |
| Videotron
Ltd., 5.125%, 4/15/2027 (n) |
|
|
2,020,000
|
2,080,600 |
| Virgin
Media Finance PLC, 5%, 7/15/2030 (n) |
|
|
1,200,000
|
1,194,000 |
| Virgin
Media Vendor Financing Notes IV DAC, 5%, 7/15/2028 (n) |
|
|
1,465,000
|
1,476,053 |
| Ziggo
Bond Finance B.V., 5.125%, 2/28/2030 (n) |
|
|
1,715,000
|
1,723,575 |
| |
|
|
|
$26,008,798 |
| Chemicals
– 2.4% |
| Axalta
Coating Systems Ltd., 4.75%, 6/15/2027 (n) |
|
$
|
834,000
|
$
869,445 |
| Axalta
Coating Systems Ltd., 3.375%, 2/15/2029 (n) |
|
|
1,180,000
|
1,141,650 |
| Consolidated
Energy Finance S.A., 5.625%, 10/15/2028 (n) |
|
|
1,003,000
|
980,433 |
| Element
Solutions, Inc., 3.875%, 9/01/2028 (n) |
|
|
1,137,000
|
1,142,685 |
| Herens
Holdco S.à r.l., 4.75%, 5/15/2028 (n) |
|
|
890,000
|
872,200 |
| Ingevity
Corp., 3.875%, 11/01/2028 (n) |
|
|
1,230,000
|
1,197,712 |
| LSF11
A5 HoldCo LLC, 6.625%, 10/15/2029 (n) |
|
|
650,000
|
640,250 |
| S.P.C.M.
S.A., 3.125%, 3/15/2027 (n) |
|
|
300,000
|
296,454 |
Portfolio of
Investments – continued
| Issuer
|
|
|
Shares/Par
|
Value
($) |
| Bonds
– continued |
| Chemicals
– continued |
| S.P.C.M.
S.A., 3.375%, 3/15/2030 (n) |
|
$
|
1,051,000
|
$
1,011,587 |
| |
|
|
|
$8,152,416 |
| Computer
Software – 1.2% |
| Camelot
Finance S.A., 4.5%, 11/01/2026 (n) |
|
$
|
855,000
|
$
884,925 |
| Clarivate
Science Holdings Corp., 4.875%, 7/01/2029 (n) |
|
|
1,145,000
|
1,161,167 |
| Dun
& Bradstreet Corp., 5%, 12/15/2029 (n) |
|
|
650,000
|
664,970 |
| PTC,
Inc., 3.625%, 2/15/2025 (n) |
|
|
920,000
|
932,650 |
| PTC,
Inc., 4%, 2/15/2028 (n) |
|
|
440,000
|
447,700 |
| |
|
|
|
$4,091,412 |
| Computer
Software - Systems – 1.4% |
| Fair
Isaac Corp., 5.25%, 5/15/2026 (n) |
|
$
|
1,765,000
|
$
1,939,973 |
| Fair
Isaac Corp., 4%, 6/15/2028 (n) |
|
|
250,000
|
256,982 |
| SS&C
Technologies Holdings, Inc., 5.5%, 9/30/2027 (n) |
|
|
1,280,000
|
1,337,600 |
| Viavi
Solutions, Inc., 3.75%, 10/01/2029 (n) |
|
|
1,225,000
|
1,224,939 |
| |
|
|
|
$4,759,494 |
| Conglomerates
– 3.2% |
| Amsted
Industries Co., 5.625%, 7/01/2027 (n) |
|
$
|
1,335,000
|
$
1,388,400 |
| BWX
Technologies, Inc., 4.125%, 6/30/2028 (n) |
|
|
338,000
|
343,070 |
| BWX
Technologies, Inc., 4.125%, 4/15/2029 (n) |
|
|
1,555,000
|
1,574,437 |
| EnerSys,
4.375%, 12/15/2027 (n) |
|
|
495,000
|
513,563 |
| Gates
Global LLC, 6.25%, 1/15/2026 (n) |
|
|
840,000
|
867,300 |
| Granite
Holdings U.S. Acquisition Co., 11%, 10/01/2027 (n) |
|
|
715,000
|
777,563 |
| Griffon
Corp., 5.75%, 3/01/2028 |
|
|
1,195,000
|
1,241,402 |
| Madison
IAQ LLC, 5.875%, 6/30/2029 (n) |
|
|
820,000
|
820,000 |
| Stevens
Holding Co., Inc., 6.125%, 10/01/2026 (n) |
|
|
1,030,000
|
1,098,237 |
| TriMas
Corp., 4.125%, 4/15/2029 (n) |
|
|
2,236,000
|
2,241,590 |
| |
|
|
|
$10,865,562 |
| Construction
– 1.6% |
| Empire
Communities Corp., 7%, 12/15/2025 (n) |
|
$
|
760,000
|
$
786,600 |
| Mattamy
Group Corp., 5.25%, 12/15/2027 (n) |
|
|
510,000
|
536,393 |
| Mattamy
Group Corp., 4.625%, 3/01/2030 (n) |
|
|
680,000
|
692,546 |
| Shea
Homes LP/Shea Homes Funding Corp., 4.75%, 2/15/2028 (n) |
|
|
1,245,000
|
1,273,012 |
| Taylor
Morrison Communities, Inc., 5.75%, 1/15/2028 (n) |
|
|
565,000
|
631,387 |
| Taylor
Morrison Communities, Inc., 5.125%, 8/01/2030 (n) |
|
|
550,000
|
605,000 |
| Weekley
Homes LLC/Weekley Finance Corp., 4.875%, 9/15/2028 (n) |
|
|
938,000
|
966,140 |
| |
|
|
|
$5,491,078 |
| Consumer
Products – 1.1% |
| Mattel,
Inc., 3.375%, 4/01/2026 (n) |
|
$
|
783,000
|
$
802,982 |
| Mattel,
Inc., 5.875%, 12/15/2027 (n) |
|
|
546,000
|
586,928 |
| Mattel,
Inc., 5.45%, 11/01/2041 |
|
|
315,000
|
376,031 |
| Prestige
Consumer Healthcare, Inc., 5.125%, 1/15/2028 (n) |
|
|
845,000
|
879,857 |
| Prestige
Consumer Healthcare, Inc., 3.75%, 4/01/2031 (n) |
|
|
420,000
|
407,400 |
| SWF
Escrow Issuer Corp., 6.5%, 10/01/2029 (n) |
|
|
815,000
|
783,382 |
| |
|
|
|
$3,836,580 |
| Consumer
Services – 3.8% |
| Allied
Universal Holdco LLC, 6.625%, 7/15/2026 (n) |
|
$
|
320,000
|
$
335,744 |
| Allied
Universal Holdco LLC, 9.75%, 7/15/2027 (n) |
|
|
970,000
|
1,036,372 |
| Allied
Universal Holdco LLC, 6%, 6/01/2029 (n) |
|
|
465,000
|
452,213 |
| ANGI
Group LLC, 3.875%, 8/15/2028 (n) |
|
|
1,130,000
|
1,104,575 |
Portfolio of
Investments – continued
| Issuer
|
|
|
Shares/Par
|
Value
($) |
| Bonds
– continued |
| Consumer
Services – continued |
| Arches
Buyer, Inc., 6.125%, 12/01/2028 (n) |
|
$
|
935,000
|
$
940,839 |
| Garda
World Security Corp., 4.625%, 2/15/2027 (n) |
|
|
350,000
|
348,250 |
| GoDaddy,
Inc., 3.5%, 3/01/2029 (n) |
|
|
1,728,000
|
1,714,772 |
| GW
B-CR Security Corp., 9.5%, 11/01/2027 (n) |
|
|
728,000
|
784,919 |
| Match
Group Holdings II LLC, 3.625%, 10/01/2031 (n) |
|
|
80,000
|
77,700 |
| Match
Group, Inc., 5%, 12/15/2027 (n) |
|
|
815,000
|
847,600 |
| Match
Group, Inc., 4.625%, 6/01/2028 (n) |
|
|
1,240,000
|
1,290,096 |
| Match
Group, Inc., 4.125%, 8/01/2030 (n) |
|
|
365,000
|
368,650 |
| Realogy
Group LLC, 9.375%, 4/01/2027 (n) |
|
|
750,000
|
810,000 |
| Realogy
Group LLC, 5.75%, 1/15/2029 (n) |
|
|
490,000
|
502,250 |
| TriNet
Group, Inc., 3.5%, 3/01/2029 (n) |
|
|
1,374,000
|
1,368,847 |
| WASH
Multifamily Acquisition, Inc., 5.75%, 4/15/2026 (n) |
|
|
630,000
|
662,099 |
| |
|
|
|
$12,644,926 |
| Containers
– 2.3% |
| ARD
Finance S.A., 6.5%, (6.5% cash or 7.25% PIK) 6/30/2027 (n)(p) |
|
$
|
610,000
|
$
628,300 |
| Ardagh
Metal Packaging, 3.25%, 9/01/2028 (n) |
|
|
550,000
|
543,826 |
| Ardagh
Metal Packaging, 4%, 9/01/2029 (n) |
|
|
950,000
|
941,213 |
| Ardagh
Packaging Finance PLC/Ardagh MP Holdings USA, Inc., 5.25%, 8/15/2027 (n) |
|
|
1,105,000
|
1,111,906 |
| Can-Pack
S.A., 3.875%, 11/15/2029 (n) |
|
|
1,428,000
|
1,394,085 |
| Crown
Americas LLC/Crown Americas Capital Corp. V, 4.25%, 9/30/2026 |
|
|
1,510,000
|
1,611,925 |
| Crown
Americas LLC/Crown Americas Capital Corp. VI, 4.75%, 2/01/2026 |
|
|
485,000
|
497,125 |
| Greif,
Inc., 6.5%, 3/01/2027 (n) |
|
|
890,000
|
923,375 |
| |
|
|
|
$7,651,755 |
| Electrical
Equipment – 0.4% |
| CommScope
Technologies LLC, 5%, 3/15/2027 (n) |
|
$
|
1,510,000
|
$
1,411,850 |
| Electronics
– 1.9% |
| Diebold
Nixdorf, Inc., 8.5%, 4/15/2024 |
|
$
|
365,000
|
$
365,000 |
| Diebold
Nixdorf, Inc., 9.375%, 7/15/2025 (n) |
|
|
570,000
|
613,742 |
| Entegris,
Inc., 4.375%, 4/15/2028 (n) |
|
|
390,000
|
400,725 |
| Entegris,
Inc., 3.625%, 5/01/2029 (n) |
|
|
825,000
|
827,062 |
| Sensata
Technologies B.V., 5.625%, 11/01/2024 (n) |
|
|
745,000
|
818,979 |
| Sensata
Technologies B.V., 5%, 10/01/2025 (n) |
|
|
1,280,000
|
1,388,800 |
| Sensata
Technologies, Inc., 4.375%, 2/15/2030 (n) |
|
|
675,000
|
708,750 |
| Synaptics,
Inc., 4%, 6/15/2029 (n) |
|
|
1,140,000
|
1,157,100 |
| |
|
|
|
$6,280,158 |
| Energy
- Independent – 3.8% |
| Apache
Corp., 5.35%, 7/01/2049 |
|
$
|
155,000
|
$
177,088 |
| Ascent
Resources Utica Holdings LLC/ARU Finance Corp., 7%, 11/01/2026 (n) |
|
|
365,000
|
370,019 |
| Callon
Petroleum Co., 6.125%, 10/01/2024 |
|
|
485,000
|
477,725 |
| Callon
Petroleum Co., 8%, 8/01/2028 (n) |
|
|
415,000
|
419,150 |
| CNX
Resources Corp., 6%, 1/15/2029 (n) |
|
|
1,140,000
|
1,185,600 |
| Comstock
Resources, Inc., 6.75%, 3/01/2029 (n) |
|
|
790,000
|
856,834 |
| CrownRock
LP/CrownRock Finance, Inc., “F”, 5%, 5/01/2029 (n) |
|
|
405,000
|
420,188 |
| Encino
Acquisition Partners Holdings LLC, 8.5%, 5/01/2028 (n) |
|
|
550,000
|
571,312 |
| EQT
Corp., 3.125%, 5/15/2026 (n) |
|
|
165,000
|
169,377 |
| EQT
Corp., 5%, 1/15/2029 |
|
|
855,000
|
946,912 |
| Occidental
Petroleum Corp., 5.875%, 9/01/2025 |
|
|
745,000
|
821,362 |
| Occidental
Petroleum Corp., 5.5%, 12/01/2025 |
|
|
845,000
|
937,418 |
| Occidental
Petroleum Corp., 6.625%, 9/01/2030 |
|
|
820,000
|
1,014,750 |
| Occidental
Petroleum Corp., 6.45%, 9/15/2036 |
|
|
410,000
|
522,752 |
| Occidental
Petroleum Corp., 6.6%, 3/15/2046 |
|
|
600,000
|
778,500 |
| Range
Resources Corp., 8.25%, 1/15/2029 |
|
|
615,000
|
685,725 |
Portfolio of
Investments – continued
| Issuer
|
|
|
Shares/Par
|
Value
($) |
| Bonds
– continued |
| Energy
- Independent – continued |
| SM
Energy Co., 5.625%, 6/01/2025 |
|
$
|
505,000
|
$
508,788 |
| SM
Energy Co., 6.5%, 7/15/2028 |
|
|
370,000
|
382,950 |
| Southwestern
Energy Co., 6.45%, 1/23/2025 |
|
|
65,400
|
71,875 |
| Southwestern
Energy Co., 8.375%, 9/15/2028 |
|
|
455,000
|
507,894 |
| Southwestern
Energy Co., 5.375%, 3/15/2030 |
|
|
665,000
|
712,534 |
| Southwestern
Energy Co., 4.75%, 2/01/2032 |
|
|
325,000
|
342,259 |
| |
|
|
|
$12,881,012 |
| Entertainment
– 3.5% |
| AMC
Entertainment Holdings, Inc., 10%, (10% cash or 12% PIK) 6/15/2026 (n)(p) |
|
$
|
330,000
|
$
326,058 |
| Boyne
USA, Inc., 4.75%, 5/15/2029 (n) |
|
|
1,175,000
|
1,210,250 |
| Carnival
Corp. PLC, 7.625%, 3/01/2026 (n) |
|
|
1,770,000
|
1,855,402 |
| Carnival
Corp. PLC, 5.75%, 3/01/2027 (n) |
|
|
790,000
|
790,000 |
| Carnival
Corp. PLC, 6%, 5/01/2029 (n) |
|
|
245,000
|
243,775 |
| Cedar
Fair LP/Canada's Wonderland Co./Magnum Management Corp./Millennium Operations LLC, 5.375%, 4/15/2027 |
|
|
570,000
|
584,250 |
| Live
Nation Entertainment, Inc., 5.625%, 3/15/2026 (n) |
|
|
1,168,000
|
1,205,960 |
| Live
Nation Entertainment, Inc., 3.75%, 1/15/2028 (n) |
|
|
535,000
|
530,987 |
| Motion
Bondco DAC, 6.625%, 11/15/2027 (n) |
|
|
855,000
|
863,550 |
| NCL
Corp. Ltd., 3.625%, 12/15/2024 (n) |
|
|
545,000
|
514,344 |
| NCL
Corp. Ltd., 5.875%, 3/15/2026 (n) |
|
|
610,000
|
607,298 |
| Royal
Caribbean Cruises Ltd., 5.5%, 4/01/2028 (n) |
|
|
1,195,000
|
1,208,814 |
| SeaWorld
Parks & Entertainment, 5.25%, 8/15/2029 (n) |
|
|
1,265,000
|
1,288,093 |
| Viking
Cruises Ltd. Co., 5.875%, 9/15/2027 (n) |
|
|
490,000
|
466,578 |
| |
|
|
|
$11,695,359 |
| Financial
Institutions – 2.9% |
| Avation
Capital S.A., 8.25%, (8.25% cash or 9% PIK) 10/31/2026 (n)(p) |
|
$
|
645,169
|
$
541,942 |
| Credit
Acceptance Corp., 5.125%, 12/31/2024 (n) |
|
|
1,180,000
|
1,209,500 |
| Freedom
Mortgage Corp., 7.625%, 5/01/2026 (n) |
|
|
1,000,000
|
1,021,260 |
| Global
Aircraft Leasing Co. Ltd., 6.5% (6.5% cash or 7.25% PIK), 9/15/2024 (n)(p) |
|
|
2,353,878
|
2,271,492 |
| Howard
Hughes Corp., 4.125%, 2/01/2029 (n) |
|
|
1,390,000
|
1,408,556 |
| Nationstar
Mortgage Holdings, Inc., 6%, 1/15/2027 (n) |
|
|
1,055,000
|
1,098,994 |
| Nationstar
Mortgage Holdings, Inc., 5.75%, 11/15/2031 (n) |
|
|
405,000
|
402,975 |
| OneMain
Finance Corp., 6.875%, 3/15/2025 |
|
|
555,000
|
617,438 |
| OneMain
Finance Corp., 8.875%, 6/01/2025 |
|
|
509,000
|
544,630 |
| OneMain
Finance Corp., 7.125%, 3/15/2026 |
|
|
475,000
|
541,500 |
| |
|
|
|
$9,658,287 |
| Food
& Beverages – 3.0% |
| Aramark
Services, Inc., 6.375%, 5/01/2025 (n) |
|
$
|
1,440,000
|
$
1,504,800 |
| JBS
USA Lux S.A./JBS USA Finance, Inc., 6.75%, 2/15/2028 (n) |
|
|
1,750,000
|
1,887,830 |
| Lamb
Weston Holdings, Inc., 4.125%, 1/31/2030 (n) |
|
|
1,915,000
|
1,965,154 |
| Performance
Food Group Co., 5.5%, 10/15/2027 (n) |
|
|
1,110,000
|
1,158,562 |
| Post
Holdings, Inc., 5.625%, 1/15/2028 (n) |
|
|
805,000
|
853,091 |
| Post
Holdings, Inc., 4.625%, 4/15/2030 (n) |
|
|
805,000
|
819,893 |
| Primo
Water Holding, Inc., 4.375%, 4/30/2029 (n) |
|
|
780,000
|
772,200 |
| U.S.
Foods Holding Corp., 4.75%, 2/15/2029 (n) |
|
|
1,205,000
|
1,224,581 |
| |
|
|
|
$10,186,111 |
| Gaming
& Lodging – 6.5% |
| Boyd
Gaming Corp., 4.75%, 12/01/2027 |
|
$
|
1,000,000
|
$
1,020,000 |
| Boyd
Gaming Corp., 4.75%, 6/15/2031 (n) |
|
|
405,000
|
413,100 |
| Caesars
Entertainment, Inc., 4.625%, 10/15/2029 (n) |
|
|
815,000
|
815,000 |
| CCM
Merger, Inc., 6.375%, 5/01/2026 (n) |
|
|
880,000
|
916,300 |
| Colt
Merger Sub, Inc., 5.75%, 7/01/2025 (n) |
|
|
695,000
|
725,799 |
| Colt
Merger Sub, Inc., 8.125%, 7/01/2027 (n) |
|
|
857,000
|
949,076 |
Portfolio of
Investments – continued
| Issuer
|
|
|
Shares/Par
|
Value
($) |
| Bonds
– continued |
| Gaming
& Lodging – continued |
| Hilton
Domestic Operating Co., Inc., 3.75%, 5/01/2029 (n) |
|
$
|
1,125,000
|
$
1,133,437 |
| Hilton
Domestic Operating Co., Inc., 3.625%, 2/15/2032 (n) |
|
|
1,045,000
|
1,039,503 |
| International
Game Technology PLC, 4.125%, 4/15/2026 (n) |
|
|
1,305,000
|
1,344,241 |
| International
Game Technology PLC, 6.25%, 1/15/2027 (n) |
|
|
330,000
|
369,600 |
| Marriott
Ownership Resorts, Inc., 4.5%, 6/15/2029 (n) |
|
|
985,000
|
991,422 |
| MGM
China Holdings Ltd., 5.875%, 5/15/2026 (n) |
|
|
535,000
|
536,338 |
| MGM
China Holdings Ltd., 4.75%, 2/01/2027 (n) |
|
|
354,000
|
350,644 |
| MGM
Growth Properties LLC, 4.625%, 6/15/2025 (n) |
|
|
1,070,000
|
1,140,716 |
| MGM
Growth Properties LLC, 5.75%, 2/01/2027 |
|
|
415,000
|
468,950 |
| MGM
Growth Properties LLC, 3.875%, 2/15/2029 (n) |
|
|
708,000
|
743,400 |
| Penn
National Gaming, Inc., 4.125%, 7/01/2029 (n) |
|
|
765,000
|
742,050 |
| Scientific
Games Corp., 8.625%, 7/01/2025 (n) |
|
|
250,000
|
266,875 |
| Scientific
Games Corp., 8.25%, 3/15/2026 (n) |
|
|
615,000
|
647,288 |
| Scientific
Games International, Inc., 7%, 5/15/2028 (n) |
|
|
645,000
|
686,925 |
| VICI
Properties LP, REIT, 4.25%, 12/01/2026 (n) |
|
|
595,000
|
619,675 |
| VICI
Properties LP, REIT, 3.75%, 2/15/2027 (n) |
|
|
1,135,000
|
1,172,279 |
| Wyndham
Hotels & Resorts, Inc., 4.375%, 8/15/2028 (n) |
|
|
1,495,000
|
1,539,850 |
| Wynn
Las Vegas LLC/Wynn Las Vegas Capital Corp., 5.25%, 5/15/2027 (n) |
|
|
660,000
|
674,731 |
| Wynn
Macau Ltd., 4.875%, 10/01/2024 (n) |
|
|
280,000
|
263,200 |
| Wynn
Macau Ltd., 5.5%, 1/15/2026 (n) |
|
|
575,000
|
540,500 |
| Wynn
Macau Ltd., 5.625%, 8/26/2028 (n) |
|
|
1,028,000
|
951,913 |
| Wynn
Resorts Finance LLC/Wynn Resorts Capital Corp., 5.125%, 10/01/2029 (n) |
|
|
815,000
|
827,225 |
| |
|
|
|
$21,890,037 |
| Industrial
– 1.1% |
| Albion
Financing 2 S.a.r.l., 8.75%, 4/15/2027 (n) |
|
$
|
340,000
|
$
345,610 |
| APi
Escrow Corp., 4.75%, 10/15/2029 (n) |
|
|
895,000
|
912,900 |
| Dycom
Industries, Inc., 4.5%, 4/15/2029 (n) |
|
|
1,140,000
|
1,161,375 |
| Williams
Scotsman International, Inc., 4.625%, 8/15/2028 (n) |
|
|
1,178,000
|
1,216,285 |
| |
|
|
|
$3,636,170 |
| Insurance
- Property & Casualty – 1.0% |
| Alliant
Holdings Intermediate LLC, 6.75%, 10/15/2027 (n) |
|
$
|
1,515,000
|
$
1,571,812 |
| AssuredPartners,
Inc., 5.625%, 1/15/2029 (n) |
|
|
665,000
|
646,713 |
| GTCR
(AP) Finance, Inc., 8%, 5/15/2027 (n) |
|
|
320,000
|
332,000 |
| Hub
International Ltd., 5.625%, 12/01/2029 (n) |
|
|
935,000
|
963,256 |
| |
|
|
|
$3,513,781 |
| Machinery
& Tools – 0.4% |
| Ritchie
Bros. Holdings Ltd., 4.75%, 12/15/2031 (n) |
|
$
|
405,000
|
$
422,719 |
| Terex
Corp., 5%, 5/15/2029 (n) |
|
|
985,000
|
1,012,087 |
| |
|
|
|
$1,434,806 |
| Medical
& Health Technology & Services – 6.3% |
| 180
Medical, Inc., 3.875%, 10/15/2029 (n) |
|
$
|
1,120,000
|
$
1,134,000 |
| Avantor
Funding, Inc., 4.625%, 7/15/2028 (n) |
|
|
1,314,000
|
1,369,845 |
| BCPE
Cycle Merger Sub II, Inc., 10.625%, 7/15/2027 (n) |
|
|
715,000
|
725,725 |
| Catalent,
Inc., 3.125%, 2/15/2029 (n) |
|
|
1,810,000
|
1,785,384 |
| Charles
River Laboratories International, Inc., 3.75%, 3/15/2029 (n) |
|
|
2,182,000
|
2,203,820 |
| CHS/Community
Health Systems, Inc., 8%, 12/15/2027 (n) |
|
|
565,000
|
610,200 |
| CHS/Community
Health Systems, Inc., 6.125%, 4/01/2030 (n) |
|
|
1,410,000
|
1,394,941 |
| DaVita,
Inc., 4.625%, 6/01/2030 (n) |
|
|
765,000
|
783,169 |
| DaVita,
Inc., 3.75%, 2/15/2031 (n) |
|
|
624,000
|
607,982 |
| Encompass
Health Corp., 5.75%, 9/15/2025 |
|
|
515,000
|
526,588 |
| HCA,
Inc., 5.875%, 2/15/2026 |
|
|
1,345,000
|
1,516,999 |
| HealthSouth
Corp., 5.125%, 3/15/2023 |
|
|
337,000
|
337,000 |
Portfolio of
Investments – continued
| Issuer
|
|
|
Shares/Par
|
Value
($) |
| Bonds
– continued |
| Medical
& Health Technology & Services – continued |
| IQVIA
Holdings, Inc., 5%, 10/15/2026 (n) |
|
$
|
1,200,000
|
$
1,231,500 |
| IQVIA
Holdings, Inc., 5%, 5/15/2027 (n) |
|
|
1,510,000
|
1,563,303 |
| LifePoint
Health, Inc., 4.375%, 2/15/2027 (n) |
|
|
380,000
|
382,850 |
| MPH
Acquisition Holdings LLC, 5.5%, 9/01/2028 (n) |
|
|
615,000
|
623,456 |
| Regional
Care/LifePoint Health, Inc., 9.75%, 12/01/2026 (n) |
|
|
675,000
|
713,273 |
| Syneos
Health, Inc., 3.625%, 1/15/2029 (n) |
|
|
1,471,000
|
1,452,612 |
| Tenet
Healthcare Corp., 6.125%, 10/01/2028 (n) |
|
|
1,295,000
|
1,367,792 |
| US
Acute Care Solutions LLC, 6.375%, 3/01/2026 (n) |
|
|
715,000
|
748,962 |
| |
|
|
|
$21,079,401 |
| Medical
Equipment – 0.6% |
| Mozart
Debt Merger Sub, Inc., 5.25%, 10/01/2029 (n) |
|
$
|
815,000
|
$
826,117 |
| Teleflex,
Inc., 4.625%, 11/15/2027 |
|
|
1,230,000
|
1,279,200 |
| |
|
|
|
$2,105,317 |
| Metals
& Mining – 3.9% |
| Baffinland
Iron Mines Corp./Baffinland Iron Mines LP, 8.75%, 7/15/2026 (n) |
|
$
|
1,140,000
|
$
1,185,600 |
| Coeur
Mining, Inc., 5.125%, 2/15/2029 (n) |
|
|
1,155,000
|
1,058,500 |
| Compass
Minerals International, Inc., 6.75%, 12/01/2027 (n) |
|
|
985,000
|
1,042,948 |
| Eldorado
Gold Corp., 6.25%, 9/01/2029 (n) |
|
|
900,000
|
915,192 |
| First
Quantum Minerals Ltd., 6.875%, 3/01/2026 (n) |
|
|
470,000
|
488,212 |
| First
Quantum Minerals Ltd., 6.875%, 10/15/2027 (n) |
|
|
678,000
|
729,697 |
| FMG
Resources Ltd., 4.375%, 4/01/2031 (n) |
|
|
1,190,000
|
1,249,500 |
| Freeport-McMoRan,
Inc., 4.375%, 8/01/2028 |
|
|
550,000
|
576,812 |
| Freeport-McMoRan,
Inc., 5.25%, 9/01/2029 |
|
|
810,000
|
886,950 |
| GrafTech
Finance, Inc., 4.625%, 12/15/2028 (n) |
|
|
736,000
|
747,040 |
| Kaiser
Aluminum Corp., 4.625%, 3/01/2028 (n) |
|
|
1,505,000
|
1,520,050 |
| Kaiser
Aluminum Corp., 4.5%, 6/01/2031 (n) |
|
|
645,000
|
634,519 |
| Novelis
Corp., 3.25%, 11/15/2026 (n) |
|
|
406,000
|
409,553 |
| Novelis
Corp., 4.75%, 1/30/2030 (n) |
|
|
950,000
|
998,687 |
| Novelis
Corp., 3.875%, 8/15/2031 (n) |
|
|
488,000
|
484,950 |
| Petra
Diamonds US$ Treasury PLC, 10.5%, (0% cash or 10.5% PIK) 3/08/2026 (n)(p) |
|
|
342,749
|
353,031 |
| |
|
|
|
$13,281,241 |
| Midstream
– 4.5% |
| Cheniere
Energy Partners LP, 4.5%, 10/01/2029 |
|
$
|
314,000
|
$
332,840 |
| Cheniere
Energy Partners, L.P, 4%, 3/01/2031 |
|
|
1,385,000
|
1,452,796 |
| DT
Midstream, Inc., 4.125%, 6/15/2029 (n) |
|
|
771,000
|
789,311 |
| DT
Midstream, Inc., 4.375%, 6/15/2031 (n) |
|
|
1,296,000
|
1,347,840 |
| EnLink
Midstream Partners LP, 5.625%, 1/15/2028 (n) |
|
|
712,000
|
740,480 |
| EQM
Midstream Partners LP, 6%, 7/01/2025 (n) |
|
|
248,000
|
269,700 |
| EQM
Midstream Partners LP, 6.5%, 7/01/2027 (n) |
|
|
145,000
|
162,400 |
| EQM
Midstream Partners LP, 5.5%, 7/15/2028 |
|
|
1,810,000
|
1,977,434 |
| EQM
Midstream Partners LP, 4.5%, 1/15/2029 (n) |
|
|
480,000
|
499,200 |
| Genesis
Energy LP/Genesis Energy Finance Corp., 6.25%, 5/15/2026 |
|
|
405,500
|
395,363 |
| Northriver
Midstream Finance LP, 5.625%, 2/15/2026 (n) |
|
|
1,235,000
|
1,285,400 |
| Targa
Resources Partners LP/Targa Resources Finance Corp., 6.875%, 1/15/2029 |
|
|
1,385,000
|
1,549,510 |
| Targa
Resources Partners LP/Targa Resources Finance Corp., 4.875%, 2/01/2031 |
|
|
680,000
|
738,446 |
| Targa
Resources Partners LP/Targa Resources Finance Corp., 4%, 1/15/2032 (n) |
|
|
395,000
|
412,775 |
| Venture
Global Calcasieu Pass LLC, 3.875%, 8/15/2029 (n) |
|
|
720,000
|
747,000 |
| Venture
Global Calcasieu Pass LLC, 4.125%, 8/15/2031 (n) |
|
|
720,000
|
763,200 |
| Western
Midstream Operating LP, 5.3%, 2/01/2030 |
|
|
850,000
|
934,184 |
| Western
Midstream Operation LP, 4.65%, 7/01/2026 |
|
|
320,000
|
348,287 |
| Western
Midstream Operation LP, 5.5%, 8/15/2048 |
|
|
260,000
|
310,575 |
| |
|
|
|
$15,056,741 |
Portfolio of
Investments – continued
| Issuer
|
|
|
Shares/Par
|
Value
($) |
| Bonds
– continued |
| Municipals
– 0.1% |
| Puerto
Rico Industrial, Tourist, Educational, Medical & Environmental Control Facilities Financing Authority Rev. (Cogeneration Facilities - AES Puerto Rico Project), 9.12%, 6/01/2022 |
|
$
|
155,000
|
$
158,875 |
| Network
& Telecom – 0.6% |
| Front
Range BidCo, Inc., 6.125%, 3/01/2028 (n) |
|
$
|
730,000
|
$
719,050 |
| Iliad
Holding S.A.S., 7%, 10/15/2028 (n) |
|
|
1,117,000
|
1,174,604 |
| |
|
|
|
$1,893,654 |
| Oil
Services – 0.2% |
| Solaris
Midstream Holding LLC, 7.625%, 4/01/2026 (n) |
|
$
|
530,000
|
$
557,825 |
| Oils
– 0.7% |
| Parkland
Corp., 4.625%, 5/01/2030 (n) |
|
$
|
1,290,000
|
$
1,281,937 |
| PBF
Holding Co. LLC/PBF Finance Corp., 7.25%, 6/15/2025 |
|
|
655,000
|
466,687 |
| PBF
Holding Co. LLC/PBF Finance Corp., 6%, 2/15/2028 |
|
|
675,000
|
433,688 |
| |
|
|
|
$2,182,312 |
| Personal
Computers & Peripherals – 0.6% |
| NCR
Corp., 5%, 10/01/2028 (n) |
|
$
|
1,195,000
|
$
1,230,850 |
| NCR
Corp., 5.125%, 4/15/2029 (n) |
|
|
590,000
|
610,768 |
| |
|
|
|
$1,841,618 |
| Pharmaceuticals
– 2.5% |
| Bausch
Health Companies, Inc., 6.125%, 4/15/2025 (n) |
|
$
|
1,849,000
|
$
1,883,317 |
| Bausch
Health Companies, Inc., 5%, 1/30/2028 (n) |
|
|
1,775,000
|
1,633,000 |
| Bausch
Health Companies, Inc., 5%, 2/15/2029 (n) |
|
|
580,000
|
511,850 |
| Endo
Luxembourg Finance Co I S.à r.l., 6.125%, 4/01/2029 (n) |
|
|
550,000
|
539,000 |
| Jazz
Securities DAC, 4.375%, 1/15/2029 (n) |
|
|
1,450,000
|
1,501,388 |
| Organon
Finance 1 LLC, 4.125%, 4/30/2028 (n) |
|
|
781,000
|
793,691 |
| Organon
Finance 1 LLC, 5.125%, 4/30/2031 (n) |
|
|
1,026,000
|
1,071,842 |
| Par
Pharmaceutical, Inc., 7.5%, 4/01/2027 (n) |
|
|
575,000
|
587,610 |
| |
|
|
|
$8,521,698 |
| Pollution
Control – 0.8% |
| GFL
Environmental, Inc., 4%, 8/01/2028 (n) |
|
$
|
945,000
|
$
926,100 |
| GFL
Environmental, Inc., 4.75%, 6/15/2029 (n) |
|
|
320,000
|
322,800 |
| GFL
Environmental, Inc., 4.375%, 8/15/2029 (n) |
|
|
410,000
|
406,156 |
| Stericycle,
Inc., 3.875%, 1/15/2029 (n) |
|
|
1,115,000
|
1,098,275 |
| |
|
|
|
$2,753,331 |
| Precious
Metals & Minerals – 0.4% |
| IAMGOLD
Corp., 5.75%, 10/15/2028 (n) |
|
$
|
845,000
|
$
830,212 |
| Taseko
Mines Ltd., 7%, 2/15/2026 (n) |
|
|
635,000
|
660,400 |
| |
|
|
|
$1,490,612 |
| Printing
& Publishing – 0.4% |
| Cimpress
N.V., 7%, 6/15/2026 (n) |
|
$
|
1,255,000
|
$
1,303,631 |
| Railroad
& Shipping – 0.3% |
| Watco
Cos. LLC/Watco Finance Corp., 6.5%, 6/15/2027 (n) |
|
$
|
993,000
|
$
1,032,720 |
Portfolio of
Investments – continued
| Issuer
|
|
|
Shares/Par
|
Value
($) |
| Bonds
– continued |
| Real
Estate - Other – 0.6% |
| InterMed
Holdings Ltd., 5.875%, 10/01/2028 (n) |
|
$
|
1,235,000
|
$
1,284,400 |
| XHR
LP, REIT, 4.875%, 6/01/2029 (n) |
|
|
865,000
|
880,137 |
| |
|
|
|
$2,164,537 |
| Retailers
– 1.1% |
| Asbury
Automotive Group, Inc., 4.625%, 11/15/2029 (n) |
|
$
|
544,000
|
$
554,200 |
| Bath
& Body Works, Inc., 5.25%, 2/01/2028 |
|
|
2,150,000
|
2,375,750 |
| Victoria's
Secret & Co., 4.625%, 7/15/2029 (n) |
|
|
900,000
|
920,250 |
| |
|
|
|
$3,850,200 |
| Specialty
Chemicals – 0.3% |
| Univar
Solutions USA, Inc., 5.125%, 12/01/2027 (n) |
|
$
|
955,000
|
$
996,514 |
| Specialty
Stores – 1.2% |
| Group
1 Automotive, Inc., 4%, 8/15/2028 (n) |
|
$
|
828,000
|
$
824,895 |
| Magic
Mergeco, Inc., 5.25%, 5/01/2028 (n) |
|
|
550,000
|
550,242 |
| Magic
Mergeco, Inc., 7.875%, 5/01/2029 (n) |
|
|
655,000
|
645,175 |
| Penske
Automotive Group Co., 3.75%, 6/15/2029 |
|
|
1,257,000
|
1,246,001 |
| PetSmart,
Inc./PetSmart Finance Corp., 4.75%, 2/15/2028 (n) |
|
|
500,000
|
513,125 |
| PetSmart,
Inc./PetSmart Finance Corp., 7.75%, 2/15/2029 (n) |
|
|
350,000
|
380,188 |
| |
|
|
|
$4,159,626 |
| Supermarkets
– 0.6% |
| Albertsons
Cos. LLC/Safeway, Inc., 4.625%, 1/15/2027 (n) |
|
$
|
1,120,000
|
$
1,175,373 |
| Albertsons
Cos. LLC/Safeway, Inc., 3.5%, 3/15/2029 (n) |
|
|
825,000
|
826,617 |
| |
|
|
|
$2,001,990 |
| Telecommunications
- Wireless – 2.3% |
| Altice
France S.A., 6%, 2/15/2028 (n) |
|
$
|
975,000
|
$
931,125 |
| SBA
Communications Corp., 3.875%, 2/15/2027 |
|
|
654,000
|
673,620 |
| SBA
Communications Corp., 3.125%, 2/01/2029 (n) |
|
|
1,725,000
|
1,656,000 |
| Sprint
Capital Corp., 6.875%, 11/15/2028 |
|
|
1,365,000
|
1,726,725 |
| Sprint
Corp., 7.125%, 6/15/2024 |
|
|
410,000
|
460,288 |
| Sprint
Corp., 7.625%, 3/01/2026 |
|
|
1,775,000
|
2,131,065 |
| |
|
|
|
$7,578,823 |
| Tobacco
– 0.3% |
| Vector
Group Ltd., 10.5%, 11/01/2026 (n) |
|
$
|
545,000
|
$
564,756 |
| Vector
Group Ltd., 5.75%, 2/01/2029 (n) |
|
|
540,000
|
525,453 |
| |
|
|
|
$1,090,209 |
| Utilities
- Electric Power – 2.8% |
| Calpine
Corp., 4.5%, 2/15/2028 (n) |
|
$
|
995,000
|
$
1,032,312 |
| Calpine
Corp., 5.125%, 3/15/2028 (n) |
|
|
1,290,000
|
1,309,556 |
| Clearway
Energy Operating LLC, 4.75%, 3/15/2028 (n) |
|
|
615,000
|
646,519 |
| Clearway
Energy Operating LLC, 3.75%, 2/15/2031 (n) |
|
|
1,895,000
|
1,890,262 |
| NextEra
Energy, Inc., 4.25%, 7/15/2024 (n) |
|
|
638,000
|
662,723 |
| NextEra
Energy, Inc., 4.25%, 9/15/2024 (n) |
|
|
146,000
|
151,110 |
| NextEra
Energy, Inc., 4.5%, 9/15/2027 (n) |
|
|
805,000
|
869,400 |
| TerraForm
Global Operating LLC, 6.125%, 3/01/2026 (n) |
|
|
650,000
|
662,188 |
| TerraForm
Power Operating LLC, 5%, 1/31/2028 (n) |
|
|
1,450,000
|
1,535,840 |
| TerraForm
Power Operating LLC, 4.75%, 1/15/2030 (n) |
|
|
480,000
|
503,215 |
| |
|
|
|
$9,263,125 |
| Total
Bonds (Identified Cost, $317,541,721) |
|
$
320,199,712 |
Portfolio of
Investments – continued
| Issuer
|
|
|
Shares/Par
|
Value
($) |
| Common
Stocks – 0.2% |
| Construction
– 0.1% |
|
| ICA
Tenedora, S.A. de C.V. (a)(u) |
|
147,380
|
$
122,364 |
| Oil
Services – 0.1% |
|
| LTRI
Holdings LP (a)(u) |
|
1,115
|
$
320,663 |
| Precious
Metals & Minerals – 0.0% |
|
| Petra
Diamonds Ltd. (a) |
|
54,099
|
$
54,187 |
| Total
Common Stocks (Identified Cost, $449,277) |
|
$
497,214 |
| Floating
Rate Loans (r) – 0.0% |
| Chemicals
– 0.0% |
|
|
| Axalta
Coating Systems U.S. Holdings, Inc., Term Loan B3, 1.973%, 6/01/2024 (Identified Cost, $813) |
$
|
812
|
$
813 |
| |
Strike
Price |
First
Exercise |
|
|
| Warrants
– 0.0% |
|
|
|
|
| Other
Banks & Diversified Financials – 0.0% |
| Avation
Capital S.A. Warrants (1 share for 1 warrant, Expiration 10/31/26) (a)(u) (Identified Cost, $0) |
GBP
1.14 |
3/16/21
|
11,113
|
$
1,710 |
| |
|
|
|
|
| Investment
Companies (h) – 3.3% |
| Money
Market Funds – 3.3% |
|
| MFS
Institutional Money Market Portfolio, 0.07% (v) (Identified Cost, $11,123,705) |
|
|
11,123,705
|
$
11,123,705 |
| Other
Assets, Less Liabilities – 1.5% |
|
5,066,661 |
| Net
Assets – 100.0% |
$336,889,815
|
| (a) |
Non-income producing
security. |
| (d)
|
In default.
|
| (h)
|
An
affiliated issuer, which may be considered one in which the fund owns 5% or more of the outstanding voting securities, or a company which is under common control. At period end, the aggregate values of the fund's investments in affiliated issuers
and in unaffiliated issuers were $11,123,705 and $320,699,449, respectively. |
| (n)
|
Securities
exempt from registration under Rule 144A of the Securities Act of 1933. These securities may be sold in the ordinary course of business in transactions exempt from registration, normally to qualified institutional buyers. At period end, the
aggregate value of these securities was $270,825,581, representing 80.4% of net assets. |
| (p)
|
Payment-in-kind
(PIK) security for which interest income may be received in additional securities and/or cash. |
| (r)
|
The
remaining maturities of floating rate loans may be less than the stated maturities shown as a result of contractual or optional prepayments by the borrower. Such prepayments cannot be predicted with certainty. These loans may be subject to
restrictions on resale. The interest rate shown represents the weighted average of the floating interest rates on settled contracts within the loan facility at period end, unless otherwise indicated. The floating interest rates on settled contracts
are determined periodically by reference to a base lending rate and a spread. |
| (u)
|
The
security was valued using significant unobservable inputs and is considered level 3 under the fair value hierarchy. For further information about the fund’s level 3 holdings, please see Note 2 in the Notes to Financial Statements. |
| (v)
|
Affiliated
issuer that is available only to investment companies managed by MFS. The rate quoted for the MFS Institutional Money Market Portfolio is the annualized seven-day yield of the fund at period end. |
| (z)
|
Restricted
securities are not registered under the Securities Act of 1933 and are subject to legal restrictions on resale. These securities generally may be resold in transactions exempt from registration or to the public if the securities are subsequently
registered. Disposal of these securities may involve time-consuming negotiations and prompt sale at an acceptable price may be difficult. The fund holds the following restricted securities: |
Portfolio of
Investments – continued
| Restricted
Securities |
Acquisition
Date |
Cost
|
Value
|
| Paysafe
Finance PLC, 4%, 6/15/2029 |
6/10/2021
|
$979,256
|
$913,588
|
| %
of Net assets |
|
|
0.3%
|
| The
following abbreviations are used in this report and are defined: |
| CDO
|
Collateralized
Debt Obligation |
| FLR
|
Floating
Rate. Interest rate resets periodically based on the parenthetically disclosed reference rate plus a spread (if any). The period-end rate reported may not be the current rate. All reference rates are USD unless otherwise noted. |
| LIBOR
|
London
Interbank Offered Rate |
| REIT
|
Real Estate
Investment Trust |
| Abbreviations
indicate amounts shown in currencies other than the U.S. dollar. All amounts are stated in U.S. dollars unless otherwise indicated. A list of abbreviations is shown below: |
| EUR
|
Euro
|
| GBP
|
British
Pound |
| Derivative
Contracts at 12/31/21 |
| Forward
Foreign Currency Exchange Contracts |
Currency
Purchased |
Currency
Sold |
Counterparty
|
Settlement
Date |
Unrealized
Appreciation
(Depreciation) |
| Asset
Derivatives |
| USD
|
381,014
|
EUR
|
329,180
|
JPMorgan
Chase Bank N.A. |
1/14/2022
|
$6,169
|
| Futures
Contracts |
| Description
|
Long/
Short |
Currency
|
Contracts
|
Notional
Amount |
Expiration
Date |
Value/Unrealized
Appreciation
(Depreciation) |
| Asset
Derivatives |
| Interest
Rate Futures |
|
|
| U.S.
Treasury Bond |
Long
|
USD
|
32
|
$5,134,000
|
March
– 2022 |
$75,353
|
| U.S.
Treasury Ultra Bond |
Long
|
USD
|
5
|
985,625
|
March
– 2022 |
24,981
|
| |
|
|
|
|
|
$100,334
|
| Liability
Derivatives |
| Interest
Rate Futures |
|
|
| U.S.
Treasury Note 10 yr |
Short
|
USD
|
85
|
$11,089,844
|
March
– 2022 |
$(123,158)
|
At December 31, 2021, the fund had
cash collateral of $61,625 to cover any collateral or margin obligations for certain derivative contracts. Restricted cash and/or deposits with brokers in the Statement of Assets and Liabilities are comprised of cash collateral.
See Notes to Financial Statements
| Financial
Statements |
Statement of Assets and
Liabilities |
This statement
represents your fund’s balance sheet, which details the assets and liabilities comprising the total value of the fund.
| At
12/31/21 Assets |
|
| Investments
in unaffiliated issuers, at value (identified cost, $317,991,811) |
$320,699,449
|
| Investments
in affiliated issuers, at value (identified cost, $11,123,705) |
11,123,705
|
| Cash
|
219,531
|
| Deposits
with brokers for |
|
| Futures
contracts |
61,625
|
| Receivables
for |
|
| Forward
foreign currency exchange contracts |
6,169
|
| Net
daily variation margin on open futures contracts |
20,508
|
| Investments
sold |
521,608
|
| Fund
shares sold |
18,114
|
| Interest
|
4,607,946
|
| Receivable
from investment adviser |
3,294
|
| Other
assets |
1,730
|
| Total
assets |
$337,283,679
|
| Liabilities
|
|
| Payables
for |
|
| Fund
shares reacquired |
$266,469
|
| Payable
to affiliates |
|
| Administrative
services fee |
306
|
| Shareholder
servicing costs |
88
|
| Distribution
and/or service fees |
527
|
| Payable
for independent Trustees' compensation |
252
|
| Accrued
expenses and other liabilities |
126,222
|
| Total
liabilities |
$393,864
|
| Net
assets |
$336,889,815
|
| Net
assets consist of |
|
| Paid-in
capital |
$360,945,628
|
| Total
distributable earnings (loss) |
(24,055,813)
|
| Net
assets |
$336,889,815
|
| Shares
of beneficial interest outstanding |
60,390,809
|
| |
Net
assets |
Shares
outstanding |
Net
asset value
per share |
| Initial
Class |
$298,460,067
|
53,421,426
|
$5.59
|
| Service
Class |
38,429,748
|
6,969,383
|
5.51
|
See Notes to Financial Statements
| Financial
Statements |
Statement of Operations
|
This statement describes how much
your fund earned in investment income and accrued in expenses. It also describes any gains and/or losses generated by fund operations.
| Year
ended 12/31/21 |
|
| Net
investment income (loss) |
|
| Income
|
|
| Interest
|
$16,553,461
|
| Dividends
|
101,300
|
| Other
|
19,148
|
| Dividends
from affiliated issuers |
4,638
|
| Income
on securities loaned |
261
|
| Foreign
taxes withheld |
(10,130)
|
| Total
investment income |
$16,668,678
|
| Expenses
|
|
| Management
fee |
$2,406,491
|
| Distribution
and/or service fees |
98,763
|
| Shareholder
servicing costs |
15,304
|
| Administrative
services fee |
55,548
|
| Independent
Trustees' compensation |
7,027
|
| Custodian
fee |
21,209
|
| Shareholder
communications |
44,844
|
| Audit
and tax fees |
82,437
|
| Legal
fees |
1,657
|
| Miscellaneous
|
37,464
|
| Total
expenses |
$2,770,744
|
| Reduction
of expenses by investment adviser |
(195,654)
|
| Net
expenses |
$2,575,090
|
| Net
investment income (loss) |
$14,093,588
|
| Realized
and unrealized gain (loss) |
|
| Realized
gain (loss) (identified cost basis) |
|
| Unaffiliated
issuers |
$6,151,550
|
| Affiliated
issuers |
(1,981)
|
| Futures
contracts |
(6,033)
|
| Forward
foreign currency exchange contracts |
11,155
|
| Foreign
currency |
(27)
|
| Net
realized gain (loss) |
$6,154,664
|
| Change
in unrealized appreciation or depreciation |
|
| Unaffiliated
issuers |
$(8,792,269)
|
| Affiliated
issuers |
1,982
|
| Futures
contracts |
(22,824)
|
| Forward
foreign currency exchange contracts |
6,169
|
| Translation
of assets and liabilities in foreign currencies |
12
|
| Net
unrealized gain (loss) |
$(8,806,930)
|
| Net
realized and unrealized gain (loss) |
$(2,652,266)
|
| Change
in net assets from operations |
$11,441,322
|
See Notes to Financial Statements
| Financial
Statements |
Statements of Changes in
Net Assets |
These statements describe
the increases and/or decreases in net assets resulting from operations, any distributions, and any shareholder transactions.
| |
Year
ended |
| |
12/31/21
|
12/31/20
|
| Change
in net assets |
|
|
| From
operations |
|
|
| Net
investment income (loss) |
$14,093,588
|
$15,210,983
|
| Net
realized gain (loss) |
6,154,664
|
(2,471,599)
|
| Net
unrealized gain (loss) |
(8,806,930)
|
2,203,310
|
| Change
in net assets from operations |
$11,441,322
|
$14,942,694
|
| Total
distributions to shareholders |
$(16,802,373)
|
$(18,798,097)
|
| Change
in net assets from fund share transactions |
$(9,041,399)
|
$(13,092,189)
|
| Total
change in net assets |
$(14,402,450)
|
$(16,947,592)
|
| Net
assets |
|
|
| At
beginning of period |
351,292,265
|
368,239,857
|
| At
end of period |
$336,889,815
|
$351,292,265
|
See Notes to Financial Statements
| Financial
Statements |
Financial Highlights
|
The financial highlights table is
intended to help you understand the fund's financial performance for the past 5 years. Certain information reflects financial results for a single fund share. The total returns in the table represent the rate that an investor would have earned (or
lost) on an investment in the fund share class (assuming reinvestment of all distributions) held for the entire period.
| Initial
Class |
Year
ended |
| |
12/31/21
|
12/31/20
|
12/31/19
|
12/31/18
|
12/31/17
|
| Net
asset value, beginning of period |
$5.68
|
$5.72
|
$5.28
|
$5.77
|
$5.78
|
| Income
(loss) from investment operations |
|
|
|
|
|
| Net
investment income (loss) (d) |
$0.23
|
$0.25
|
$0.27
|
$0.28
|
$0.28
|
| Net
realized and unrealized gain (loss) |
(0.03)
|
0.03(g)
|
0.50
|
(0.45)
|
0.10
|
| Total
from investment operations |
$0.20
|
$0.28
|
$0.77
|
$(0.17)
|
$0.38
|
| Less
distributions declared to shareholders |
|
|
|
|
|
| From
net investment income |
$(0.29)
|
$(0.32)
|
$(0.33)
|
$(0.32)
|
$(0.39)
|
| Net
asset value, end of period (x) |
$5.59
|
$5.68
|
$5.72
|
$5.28
|
$5.77
|
| Total
return (%) (k)(r)(s)(x) |
3.49
|
5.09
|
14.81
|
(3.08)
|
6.69
|
Ratios
(%) (to average net assets)
and Supplemental data: |
|
|
|
|
|
| Expenses
before expense reductions |
0.78
|
0.78
|
0.77
|
0.77
|
0.78
|
| Expenses
after expense reductions |
0.72
|
0.72
|
0.72
|
0.72
|
0.72
|
| Net
investment income (loss) |
4.13
|
4.50
|
4.78
|
4.91
|
4.78
|
| Portfolio
turnover |
63
|
54
|
59
|
40
|
49
|
| Net
assets at end of period (000 omitted) |
$298,460
|
$310,121
|
$324,544
|
$320,380
|
$384,393
|
| Service
Class |
Year
ended |
| |
12/31/21
|
12/31/20
|
12/31/19
|
12/31/18
|
12/31/17
|
| Net
asset value, beginning of period |
$5.61
|
$5.65
|
$5.22
|
$5.70
|
$5.72
|
| Income
(loss) from investment operations |
|
|
|
|
|
| Net
investment income (loss) (d) |
$0.22
|
$0.23
|
$0.25
|
$0.26
|
$0.26
|
| Net
realized and unrealized gain (loss) |
(0.05)
|
0.03(g)
|
0.49
|
(0.43)
|
0.10
|
| Total
from investment operations |
$0.17
|
$0.26
|
$0.74
|
$(0.17)
|
$0.36
|
| Less
distributions declared to shareholders |
|
|
|
|
|
| From
net investment income |
$(0.27)
|
$(0.30)
|
$(0.31)
|
$(0.31)
|
$(0.38)
|
| Net
asset value, end of period (x) |
$5.51
|
$5.61
|
$5.65
|
$5.22
|
$5.70
|
| Total
return (%) (k)(r)(s)(x) |
3.08
|
4.85
|
14.44
|
(3.24)
|
6.31
|
Ratios
(%) (to average net assets)
and Supplemental data: |
|
|
|
|
|
| Expenses
before expense reductions |
1.03
|
1.03
|
1.02
|
1.02
|
1.03
|
| Expenses
after expense reductions |
0.97
|
0.97
|
0.97
|
0.97
|
0.97
|
| Net
investment income (loss) |
3.88
|
4.25
|
4.54
|
4.66
|
4.54
|
| Portfolio
turnover |
63
|
54
|
59
|
40
|
49
|
| Net
assets at end of period (000 omitted) |
$38,430
|
$41,171
|
$43,696
|
$44,995
|
$58,499
|
See Notes to Financial Statements
Financial Highlights - continued
| (d)
|
Per share data
is based on average shares outstanding. |
| (g)
|
The per share
amount varies from the net realized and unrealized gain/loss for the period because of the timing of sales of fund shares and the per share amount of realized and unrealized gains and losses at such time. |
| (k)
|
The total
return does not reflect expenses that apply to separate accounts. Inclusion of these charges would reduce the total return figures for all periods shown. |
| (r)
|
Certain
expenses have been reduced without which performance would have been lower. |
| (s)
|
From time to
time the fund may receive proceeds from litigation settlements, without which performance would be lower. |
| (x)
|
The
net asset values and total returns have been calculated on net assets which include adjustments made in accordance with U.S. generally accepted accounting principles required at period end for financial reporting purposes. |
See Notes to Financial Statements
Notes to Financial Statements
(1) Business and Organization
MFS High Yield Portfolio (the fund) is a diversified series
of MFS Variable Insurance Trust II (the trust). The trust is organized as a Massachusetts business trust and is registered under the Investment Company Act of 1940, as amended, as an open-end management investment company. The shareholders of each
series of the trust are separate accounts of insurance companies, which offer variable annuity and/or life insurance products, and qualified retirement and pension plans.
The fund is an investment company and accordingly follows
the investment company accounting and reporting guidance of the Financial Accounting Standards Board (FASB) Accounting Standards Codification Topic 946 Financial Services - Investment Companies.
(2) Significant Accounting Policies
General — The
preparation of financial statements in conformity with U.S. generally accepted accounting principles requires management to make estimates and assumptions that affect the reported amounts of assets and liabilities, and disclosure of contingent
assets and liabilities at the date of the financial statements and the reported amounts of increases and decreases in net assets from operations during the reporting period. Actual results could differ from those estimates. In the preparation of
these financial statements, management has evaluated subsequent events occurring after the date of the fund’s Statement of Assets and Liabilities through the date that the financial statements were issued. The fund invests in high-yield securities rated below investment grade. Investments in below investment grade quality securities can involve a substantially greater risk of default or can already be in default, and
their values can decline significantly. Below investment grade quality securities tend to be more sensitive to adverse news about the issuer, or the market or economy in general, than higher quality debt instruments. The fund invests in foreign securities. Investments in foreign securities are vulnerable to the effects of changes in the relative values of the local currency and the U.S. dollar and to the effects of changes in each
country’s market, economic, industrial, political, regulatory, geopolitical, environmental, public health, and other conditions.
Balance Sheet Offsetting
— The fund's accounting policy with respect to balance sheet offsetting is that, absent an event of default by the counterparty or a termination of the agreement, the International Swaps and Derivatives Association (ISDA) Master Agreement, or
similar agreement, does not result in an offset of reported amounts of financial assets and financial liabilities in the Statement of Assets and Liabilities across transactions between the fund and the applicable counterparty. The fund's right to
setoff may be restricted or prohibited by the bankruptcy or insolvency laws of the particular jurisdiction to which a specific master netting agreement counterparty is subject. Balance sheet offsetting disclosures, to the extent applicable to the
fund, have been included in the fund’s Significant Accounting Policies note under the captions for each of the fund’s in-scope financial instruments and transactions.
Investment Valuations
— Equity securities, including restricted equity securities, are generally valued at the last sale or official closing price on their primary market or exchange as provided by a third-party pricing
service. Equity securities, for which there were no sales reported that day, are generally valued at the last quoted daily bid quotation on their primary market or exchange as provided by a third-party pricing service. Debt instruments and floating rate loans, including restricted debt instruments, are generally valued at an evaluated or composite bid as provided by a third-party pricing service. Short-term instruments with a maturity
at issuance of 60 days or less may be valued at amortized cost, which approximates market value. Futures contracts are generally valued at last posted settlement price on their primary exchange as provided by
a third-party pricing service. Futures contracts for which there were no trades that day for a particular position are generally valued at the closing bid quotation on their primary exchange as provided by a third-party pricing service. Forward foreign currency exchange contracts are generally valued at the mean of bid and asked prices for the time period interpolated from rates provided by a third-party pricing service for proximate time
periods.
Open-end investment companies are generally valued
at net asset value per share. Securities and other assets generally valued on the basis of information from a third-party pricing service may also be valued at a broker/dealer bid quotation. In determining values, third-party pricing services can
utilize both transaction data and market information such as yield, quality, coupon rate, maturity, type of issue, trading characteristics, and other market data. The values of foreign securities and other assets and liabilities expressed in foreign
currencies are converted to U.S. dollars using the mean of bid and asked prices for rates provided by a third-party pricing service.
The Board of Trustees has delegated primary responsibility
for determining or causing to be determined the value of the fund’s investments (including any fair valuation) to the adviser pursuant to valuation policies and procedures approved by the Board. If the adviser determines that reliable market
quotations are not readily available, investments are valued at fair value as determined in good faith by the adviser in accordance with such procedures under the oversight of the Board of Trustees. Under the fund’s valuation policies and
procedures, market quotations are not considered to be readily available for most types of debt instruments and floating rate loans and many types of derivatives. These investments are generally valued at fair value based on information from
third-party pricing services. In addition, investments may be valued at fair value if the adviser determines that an investment’s value
Notes to Financial Statements - continued
has been materially
affected by events occurring after the close of the exchange or market on which the investment is principally traded (such as foreign exchange or market) and prior to the determination of the fund’s net asset value, or after the halt of
trading of a specific security where trading does not resume prior to the close of the exchange or market on which the security is principally traded. The adviser generally relies on third-party pricing services or other information (such as the
correlation with price movements of similar securities in the same or other markets; the type, cost and investment characteristics of the security; the business and financial condition of the issuer; and trading and other market data) to assist in
determining whether to fair value and at what value to fair value an investment. The value of an investment for purposes of calculating the fund’s net asset value can differ depending on the source and method used to determine value. When fair
valuation is used, the value of an investment used to determine the fund’s net asset value may differ from quoted or published prices for the same investment. There can be no assurance that the fund could obtain the fair value assigned to an
investment if it were to sell the investment at the same time at which the fund determines its net asset value per share.
Various inputs are used in determining the value of the
fund's assets or liabilities. These inputs are categorized into three broad levels. In certain cases, the inputs used to measure fair value may fall into different levels of the fair value hierarchy. In such cases, an investment's level within the
fair value hierarchy is based on the lowest level of input that is significant to the fair value measurement. The fund's assessment of the significance of a particular input to the fair value measurement in its entirety requires judgment, and
considers factors specific to the investment. Level 1 includes unadjusted quoted prices in active markets for identical assets or liabilities. Level 2 includes other significant observable market-based inputs (including quoted prices for similar
securities, interest rates, prepayment speed, and credit risk). Level 3 includes unobservable inputs, which may include the adviser's own assumptions in determining the fair value of investments. Other financial instruments are derivative
instruments, such as futures contracts and forward foreign currency exchange contracts. The following is a summary of the levels used as of December 31, 2021 in valuing the fund's assets and liabilities:
| Financial
Instruments |
Level
1 |
Level
2 |
Level
3 |
Total
|
| Equity
Securities: |
|
|
|
|
| United
States |
$—
|
$—
|
$320,663
|
$320,663
|
| Mexico
|
—
|
—
|
122,364
|
122,364
|
| United
Kingdom |
54,187
|
—
|
1,710
|
55,897
|
| Municipal
Bonds |
—
|
158,875
|
—
|
158,875
|
| U.S.
Corporate Bonds |
—
|
276,231,397
|
—
|
276,231,397
|
| Asset-Backed
Securities (including CDOs) |
—
|
129
|
—
|
129
|
| Foreign
Bonds |
—
|
43,809,311
|
—
|
43,809,311
|
| Floating
Rate Loans |
—
|
813
|
—
|
813
|
| Mutual
Funds |
11,123,705
|
—
|
—
|
11,123,705
|
| Total
|
$11,177,892
|
$320,200,525
|
$444,737
|
$331,823,154
|
| Other
Financial Instruments |
|
|
|
|
| Futures
Contracts – Assets |
$100,334
|
$—
|
$—
|
$100,334
|
| Futures
Contracts – Liabilities |
(123,158)
|
—
|
—
|
(123,158)
|
| Forward
Foreign Currency Exchange Contracts – Assets |
—
|
6,169
|
—
|
6,169
|
For further information
regarding security characteristics, see the Portfolio of Investments.
The following is a reconciliation of level 3 assets for
which significant unobservable inputs were used to determine fair value. The table presents the activity of level 3 securities held at the beginning and the end of the period.
| |
Equity
Securities |
| Balance
as of 12/31/20 |
$315,010
|
| Change
in unrealized appreciation or depreciation |
5,653
|
| Transfers
into level 3 |
122,364
|
| Received
as part of a corporate action |
1,710
|
| Balance
as of 12/31/21 |
$444,737
|
The net change in unrealized
appreciation or depreciation from investments held as level 3 at December 31, 2021 is $5,653. At December 31, 2021, the fund held three level 3 securities.
Foreign Currency
Translation — Purchases and sales of foreign investments, income, and expenses are converted into U.S. dollars based upon currency exchange rates prevailing on the respective dates of such transactions or on
the reporting date for foreign denominated receivables and payables. Gains and losses attributable to foreign currency exchange rates on sales of securities are recorded for financial statement purposes as net realized gains and losses on
investments. Gains and losses attributable to foreign
Notes to Financial Statements - continued
exchange rate
movements on receivables, payables, income and expenses are recorded for financial statement purposes as foreign currency transaction gains and losses. That portion of both realized and unrealized gains and losses on investments that results from
fluctuations in foreign currency exchange rates is not separately disclosed.
Derivatives — The
fund uses derivatives primarily to increase or decrease exposure to a particular market or segment of the market, or security, to increase or decrease interest rate exposure, or as alternatives to direct investments. Derivatives are used for hedging
or non-hedging purposes. While hedging can reduce or eliminate losses, it can also reduce or eliminate gains. When the fund uses derivatives as an investment to increase market exposure, or for hedging purposes, gains and losses from derivative
instruments may be substantially greater than the derivative’s original cost.
The derivative instruments used by the fund during the
period were futures contracts and forward foreign currency exchange contracts. Depending on the type of derivative, a fund may exit a derivative position by entering into an offsetting transaction with a counterparty or exchange, negotiating an
agreement with the derivative counterparty, or novating the position to a third party. The fund may be unable to promptly close out a futures position in instances where the daily fluctuation in the price for that type of future exceeds the daily
limit set by the exchange. The fund's period end derivatives, as presented in the Portfolio of Investments and the associated Derivative Contract tables, generally are indicative of the volume of its derivative activity during the period.
The following table presents, by major type of derivative
contract, the fair value, on a gross basis, of the asset and liability components of derivatives held by the fund at December 31, 2021 as reported in the Statement of Assets and Liabilities:
| |
|
Fair
Value (a) |
| Risk
|
Derivative
Contracts |
Asset
Derivatives |
Liability
Derivatives |
| Interest
Rate |
Futures
Contracts |
$100,334
|
$(123,158)
|
| Foreign
Exchange |
Forward
Foreign Currency Exchange Contracts |
6,169
|
—
|
| Total
|
|
$106,503
|
$(123,158)
|
(a) Values presented in this table
for futures contracts correspond to the values reported in the Portfolio of Investments. Only the current day net variation margin for futures contracts is separately reported within the Statement of Assets and Liabilities.
The following table presents, by major type of derivative
contract, the realized gain (loss) on derivatives held by the fund for the year ended December 31, 2021 as reported in the Statement of Operations:
| Risk
|
Futures
Contracts |
Forward
Foreign
Currency
Exchange
Contracts |
| Interest
Rate |
$(6,033)
|
$—
|
| Foreign
Exchange |
—
|
11,155
|
| Total
|
$(6,033)
|
$11,155
|
The following table presents, by
major type of derivative contract, the change in unrealized appreciation or depreciation on derivatives held by the fund for the year ended December 31, 2021 as reported in the Statement of Operations:
| Risk
|
Futures
Contracts |
Forward
Foreign
Currency
Exchange
Contracts |
| Interest
Rate |
$(22,824)
|
$—
|
| Foreign
Exchange |
—
|
6,169
|
| Total
|
$(22,824)
|
$6,169
|
Derivative counterparty credit
risk is managed through formal evaluation of the creditworthiness of all potential counterparties. On certain, but not all, uncleared derivatives, the fund attempts to reduce its exposure to counterparty credit risk whenever possible by entering
into an ISDA Master Agreement on a bilateral basis. The ISDA Master Agreement gives each party to the agreement the right to terminate all transactions traded under such agreement if there is a specified deterioration in the credit quality of the
other party. Upon an event of default or a termination of the ISDA Master Agreement, the non-defaulting party has the right to close out all transactions traded under such agreement and to net amounts owed under each agreement to one net amount
payable by one party to the other. This right to close out and net payments across all transactions traded under the ISDA Master Agreement could result in a reduction of the fund's credit risk to such counterparty equal to any amounts payable by the
fund under the applicable transactions, if any.
Notes to Financial Statements - continued
Collateral and margin requirements differ by type of
derivative. For cleared derivatives (e.g., futures contracts, cleared swaps, and exchange-traded options), margin requirements are set by the clearing broker and the clearing house and collateral, in the form of cash or securities, is posted by the
fund directly with the clearing broker. Collateral terms are counterparty agreement specific for uncleared derivatives (e.g., forward foreign currency exchange contracts, uncleared swap agreements, and uncleared options) and collateral, in the form
of cash and securities, is held in segregated accounts with the fund's custodian in connection with these agreements. For derivatives traded under an ISDA Master Agreement, which contains a collateral support annex, the collateral requirements are
netted across all transactions traded under such counterparty-specific agreement and an amount is posted from one party to the other to collateralize such obligations. Cash that has been segregated or delivered to cover the fund's collateral or
margin obligations under derivative contracts, if any, will be reported separately in the Statement of Assets and Liabilities as restricted cash for uncleared derivatives and/or deposits with brokers for cleared derivatives. Securities pledged as
collateral or margin for the same purpose, if any, are noted in the Portfolio of Investments. The fund may be required to make payments of interest on uncovered collateral or margin obligations with the broker. Any such payments are included in
“Miscellaneous” expense in the Statement of Operations.
Futures Contracts —
The fund entered into futures contracts which may be used to hedge against or obtain broad market exposure, interest rate exposure, currency exposure, or to manage duration. A futures contract represents a commitment for the future purchase or sale
of an asset at a specified price on a specified date.
Upon entering into a futures contract, the fund is required
to deposit with the broker, either in cash or securities, an initial margin in an amount equal to a specified percentage of the notional amount of the contract. Subsequent payments (variation margin) are made or received by the fund each day,
depending on the daily fluctuations in the value of the contract, and are recorded for financial statement purposes as unrealized gain or loss by the fund until the contract is closed or expires at which point the gain or loss on futures contracts
is realized.
The fund bears the risk of interest
rates, exchange rates or securities prices moving unexpectedly, in which case, the fund may not achieve the anticipated benefits of the futures contracts and may realize a loss. While futures contracts may present less counterparty risk to the fund
since the contracts are exchange traded and the exchange’s clearinghouse guarantees payments to the broker, there is still counterparty credit risk due to the insolvency of the broker. The fund’s maximum risk of loss due to counterparty
credit risk is equal to the margin posted by the fund to the broker plus any gains or minus any losses on the outstanding futures contracts.
Forward Foreign Currency Exchange Contracts — The fund entered into forward foreign currency exchange contracts for the purchase or sale of a specific foreign currency at a fixed price on a future date. These contracts may be used to hedge the fund’s
currency risk or for non-hedging purposes. For hedging purposes, the fund may enter into contracts to deliver or receive foreign currency that the fund will receive from or use in its normal investment activities. The fund may also use contracts to
hedge against declines in the value of foreign currency denominated securities due to unfavorable exchange rate movements. For non-hedging purposes, the fund may enter into contracts with the intent of changing the relative exposure of the
fund’s portfolio of securities to different currencies to take advantage of anticipated exchange rate changes.
Forward foreign currency exchange contracts are adjusted by
the daily exchange rate of the underlying currency and any unrealized gains or losses are recorded as a receivable or payable for forward foreign currency exchange contracts until the contract settlement date. On contract settlement date, any gain
or loss on the contract is recorded as realized gains or losses on forward foreign currency exchange contracts.
Risks may arise upon entering into these contracts from
unanticipated movements in the value of the contract and from the potential inability of counterparties to meet the terms of their contracts. Generally, the fund’s maximum risk due to counterparty credit risk is the unrealized gain on the
contract due to the use of Continuous Linked Settlement, a multicurrency cash settlement system for the centralized settlement of foreign transactions. This risk is mitigated in cases where there is an ISDA Master Agreement between the fund and the
counterparty providing for netting as described above and, where applicable, by the posting of collateral by the counterparty to the fund to cover the fund’s exposure to the counterparty under such ISDA Master Agreement.
Security Loans —
Under its Securities Lending Agency Agreement with the fund, State Street Bank and Trust Company, as lending agent, loans the securities of the fund to certain qualified institutions (the “Borrowers”) approved by the fund. Security loans
can be terminated at the discretion of either the lending agent or the fund and the related securities must be returned within the earlier of the standard trade settlement period for such securities or within three business days. The loans are
collateralized by cash and/or U.S. Treasury and federal agency obligations in an amount typically at least equal to the market value of the securities loaned. On loans collateralized by cash, the cash collateral is invested in a money market fund.
The market value of the loaned securities is determined at the close of business of the fund and any additional required collateral is delivered to the fund on the next business day. The lending agent provides the fund with indemnification against
Borrower default. In the event of Borrower default, the lending agent will, for the benefit of the fund, either purchase securities identical to those loaned or, when such purchase is commercially impracticable, pay the fund the market value of the
loaned securities. In return, the lending agent assumes the fund's
Notes to Financial Statements - continued
rights to the
related collateral. If the collateral value is less than the cost to purchase identical securities, the lending agent is responsible for the shortfall, but only to the extent that such shortfall is not due to a decline in collateral value resulting
from collateral reinvestment for which the fund bears the risk of loss. A portion of the income generated upon investment of the collateral is remitted to the Borrowers, and the remainder is allocated between the fund and the lending agent. On loans
collateralized by U.S. Treasury and/or federal agency obligations, a fee is received from the Borrower, and is allocated between the fund and the lending agent. Income from securities lending is separately reported in the Statement of Operations.
The dividend and interest income earned on the securities loaned is accounted for in the same manner as other dividend and interest income. At December 31, 2021, there were no securities on loan or collateral outstanding.
Loans and Other Direct Debt Instruments — The fund invests in loans and loan participations or other receivables. These investments may include standby financing commitments, including revolving credit facilities, which contractually obligate the fund
to supply additional cash to the borrower on demand. The fund generally provides this financial support in order to preserve its existing investment or to obtain a more senior secured interest in the assets of the borrower. Loan participations
involve a risk of insolvency of the lending bank or other financial intermediary.
Indemnifications —
Under the fund's organizational documents, its officers and Trustees may be indemnified against certain liabilities and expenses arising out of the performance of their duties to the fund. Additionally, in the normal course of business, the fund
enters into agreements with service providers that may contain indemnification clauses. The fund's maximum exposure under these agreements is unknown as this would involve future claims that may be made against the fund that have not yet
occurred.
Investment Transactions and Income — Investment transactions are recorded on the trade date. Interest income is recorded on the accrual basis. All premium and
discount is amortized or accreted for financial statement purposes in accordance with U.S. generally accepted accounting principles. Dividends received in cash are recorded on the ex-dividend date. Certain
dividends from foreign securities will be recorded when the fund is informed of the dividend if such information is obtained subsequent to the ex-dividend date. Dividend and interest payments received in additional securities are recorded on the
ex-dividend or ex-interest date in an amount equal to the value of the security on such date. The fund earns certain fees in connection with its floating rate loan purchasing activities. These fees are in
addition to interest payments earned and may include amendment fees, commitment fees, facility fees, consent fees, and prepayment fees. Commitment fees are recorded on an accrual basis as income in the accompanying financial statements. Debt obligations may be placed on non-accrual status or set to accrue at a rate of interest less than the contractual coupon when the collection of all or a portion of interest has become doubtful. Interest income for
those debt obligations may be further reduced by the write-off of the related interest receivables when deemed uncollectible.
The fund may receive proceeds from litigation settlements.
Any proceeds received from litigation involving portfolio holdings are reflected in the Statement of Operations in realized gain/loss if the security has been disposed of by the fund or in unrealized gain/loss if the security is still held by the
fund. Any other proceeds from litigation not related to portfolio holdings are reflected as other income in the Statement of Operations.
Tax Matters and Distributions — The fund intends to qualify as a regulated investment company, as defined under Subchapter M of the Internal Revenue Code, and to distribute all of its taxable income, including realized capital gains. As a
result, no provision for federal income tax is required. The fund’s federal tax returns, when filed, will remain subject to examination by the Internal Revenue Service for a three year period. Management has analyzed the fund’s tax
positions taken on federal and state tax returns for all open tax years and does not believe that there are any uncertain tax positions that require recognition of a tax liability. Foreign taxes, if any, have been accrued by the fund in the
accompanying financial statements in accordance with the applicable foreign tax law. Foreign income taxes may be withheld by certain countries in which the fund invests. Additionally, capital gains realized by the fund on securities issued in or by
certain foreign countries may be subject to capital gains tax imposed by those countries.
Distributions to shareholders are recorded on the
ex-dividend date. Income and capital gain distributions are determined in accordance with income tax regulations, which may differ from U.S. generally accepted accounting principles. Certain capital accounts in the financial statements are
periodically adjusted for permanent differences in order to reflect their tax character. These adjustments have no impact on net assets or net asset value per share. Temporary differences which arise from recognizing certain items of income,
expense, gain or loss in different periods for financial statement and tax purposes will reverse at some time in the future.
Book/tax differences primarily relate to amortization and
accretion of debt securities.
The tax character of
distributions declared to shareholders for the last two fiscal years is as follows:
| |
Year
ended
12/31/21 |
Year
ended
12/31/20 |
| Ordinary
income (including any short-term capital gains) |
$16,802,373
|
$18,798,097
|
Notes to Financial Statements - continued
The
federal tax cost and the tax basis components of distributable earnings were as follows:
| As
of 12/31/21 |
|
| Cost
of investments |
$330,596,934
|
| Gross
appreciation |
4,950,628
|
| Gross
depreciation |
(3,741,063)
|
| Net
unrealized appreciation (depreciation) |
$1,209,565
|
| Undistributed
ordinary income |
15,311,606
|
| Capital
loss carryforwards |
(40,576,996)
|
| Other
temporary differences |
12
|
| Total
distributable earnings (loss) |
$(24,055,813)
|
As of December 31, 2021, the
fund had capital loss carryforwards available to offset future realized gains. These net capital losses may be carried forward indefinitely and their character is retained as short-term and/or long-term losses. Such losses are characterized as
follows:
Multiple Classes of Shares of
Beneficial Interest — The fund offers multiple classes of shares, which differ in their respective distribution and/or service fees. The fund's income, realized and unrealized gain (loss), and common expenses
are allocated to shareholders based on the daily net assets of each class. Dividends are declared separately for each class. Differences in per share dividend rates are generally due to differences in separate class expenses. The fund’s
distributions declared to shareholders as reported in the Statements of Changes in Net Assets are presented by class as follows:
| |
Year
ended
12/31/21 |
|
Year
ended
12/31/20 |
| Initial
Class |
$14,930,072
|
|
$16,642,508
|
| Service
Class |
1,872,301
|
|
2,155,589
|
| Total
|
$16,802,373
|
|
$18,798,097
|
(3) Transactions with
Affiliates
Investment Adviser — The fund has an investment advisory agreement with MFS to provide overall investment management and related administrative services and facilities to the fund. The
management fee is computed daily and paid monthly at the following annual rates based on the fund's average daily net assets:
| Up
to $1 billion |
0.70%
|
| In
excess of $1 billion |
0.65%
|
MFS has agreed in writing to
reduce its management fee by a specified amount if certain MFS mutual fund assets exceed thresholds agreed to by MFS and the fund's Board of Trustees. For the year ended December 31, 2021, this management fee reduction amounted to $43,532, which is
included in the reduction of total expenses in the Statement of Operations. The management fee incurred for the year ended December 31, 2021 was equivalent to an annual effective rate of 0.69% of the fund's average daily net assets.
The investment adviser has agreed in writing to pay a
portion of the fund’s total annual operating expenses, excluding interest, taxes, extraordinary expenses, brokerage and transaction costs, and investment-related expenses, such that total annual operating expenses do not exceed 0.72% of
average daily net assets for the Initial Class shares and 0.97% of average daily net assets for the Service Class shares. This written agreement will continue until modified by the fund’s Board of Trustees, but such agreement will continue at
least until April 30, 2023. For the year ended December 31, 2021, this reduction amounted to $152,122, which is included in the reduction of total expenses in the Statement of Operations.
Distributor — MFS
Fund Distributors, Inc. (MFD), a wholly-owned subsidiary of MFS, is the distributor of shares of the fund. The Trustees have adopted a distribution plan for the Service Class shares pursuant to Rule 12b-1 under the Investment Company Act of
1940.
The fund's distribution plan provides
that the fund will pay MFD distribution and/or service fees equal to 0.25% per annum of its average daily net assets attributable to Service Class shares as partial consideration for services performed and expenses incurred by MFD and financial
intermediaries (including participating insurance companies that invest in the fund to fund variable annuity and
Notes to Financial Statements - continued
variable life
insurance contracts, sponsors of qualified retirement and pension plans that invest in the fund, and affiliates of these participating insurance companies and plan sponsors) in connection with the sale and distribution of the Service Class shares.
MFD may subsequently pay all, or a portion, of the distribution and/or service fees to financial intermediaries.
Shareholder Servicing Agent
— MFS Service Center, Inc. (MFSC), a wholly-owned subsidiary of MFS, receives a fee from the fund for its services as shareholder servicing agent. For the year ended December 31, 2021, the fee was $14,369, which equated to 0.0042% annually of
the fund's average daily net assets. MFSC also receives reimbursement from the fund for out-of-pocket expenses paid by MFSC on behalf of the fund. For the year ended December 31, 2021, these costs amounted to $935.
Administrator — MFS
provides certain financial, legal, shareholder communications, compliance, and other administrative services to the fund. Under an administrative services agreement, the fund reimburses MFS the costs incurred to provide these services. The fund is
charged an annual fixed amount of $17,500 plus a fee based on average daily net assets. The administrative services fee incurred for the year ended December 31, 2021 was equivalent to an annual effective rate of 0.0162% of the fund's average daily
net assets.
Trustees’ and Officers’
Compensation — The fund pays compensation to independent Trustees in the form of a retainer, attendance fees, and additional compensation to Board and Committee chairpersons. The fund does not pay compensation
directly to Trustees or officers of the fund who are also officers of the investment adviser, all of whom receive remuneration from MFS for their services to the fund. Certain officers and Trustees of the fund are officers or directors of MFS, MFD,
and MFSC.
Other — The fund invests in the MFS Institutional Money Market Portfolio which is managed by MFS and seeks current income consistent with preservation of capital and liquidity. This money market fund does not pay a
management fee to MFS but does incur investment and operating costs.
The fund is permitted to engage in purchase and sale
transactions with funds and accounts for which MFS serves as investment adviser or sub-adviser (“cross-trades”) pursuant to a policy adopted by the Board of Trustees. This policy has been designed to ensure that cross-trades conducted by
the fund comply with Rule 17a-7 under the Investment Company Act of 1940. During the year ended December 31, 2021, the fund engaged in sale transactions pursuant to this policy, which amounted to $23,992. The sales transactions resulted in net
realized gains (losses) of $(72).
(4) Portfolio Securities
For the year ended December 31, 2021, purchases and sales
of investments, other than short-term obligations, aggregated $210,222,876 and $215,323,055, respectively.
(5) Shares of Beneficial Interest
The fund's Declaration of Trust permits the Trustees to
issue an unlimited number of full and fractional shares of beneficial interest. Transactions in fund shares were as follows:
| |
Year
ended
12/31/21 |
|
Year
ended
12/31/20 |
| |
Shares
|
Amount
|
|
Shares
|
Amount
|
| Shares
sold |
|
|
|
|
|
| Initial
Class |
2,767,138
|
$15,658,509
|
|
3,732,526
|
$20,503,790
|
| Service
Class |
492,471
|
2,759,659
|
|
890,297
|
4,876,990
|
| |
3,259,609
|
$18,418,168
|
|
4,622,823
|
$25,380,780
|
Shares
issued to shareholders
in reinvestment of distributions |
|
|
|
|
|
| Initial
Class |
2,666,936
|
$14,828,166
|
|
3,048,078
|
$16,642,508
|
| Service
Class |
341,038
|
1,872,301
|
|
399,183
|
2,155,589
|
| |
3,007,974
|
$16,700,467
|
|
3,447,261
|
$18,798,097
|
| Shares
reacquired |
|
|
|
|
|
| Initial
Class |
(6,600,705)
|
$(37,426,650)
|
|
(8,904,252)
|
$(48,212,643)
|
| Service
Class |
(1,202,510)
|
(6,733,384)
|
|
(1,679,808)
|
(9,058,423)
|
| |
(7,803,215)
|
$(44,160,034)
|
|
(10,584,060)
|
$(57,271,066)
|
Notes to Financial Statements - continued
| |
Year
ended
12/31/21 |
|
Year
ended
12/31/20 |
| |
Shares
|
Amount
|
|
Shares
|
Amount
|
| Net
change |
|
|
|
|
|
| Initial
Class |
(1,166,631)
|
$(6,939,975)
|
|
(2,123,648)
|
$(11,066,345)
|
| Service
Class |
(369,001)
|
(2,101,424)
|
|
(390,328)
|
(2,025,844)
|
| |
(1,535,632)
|
$(9,041,399)
|
|
(2,513,976)
|
$(13,092,189)
|
The fund is one of several
mutual funds in which certain MFS funds may invest. The MFS funds do not invest in the underlying funds for the purpose of exercising management or control. At the end of the period, the MFS Moderate Allocation Portfolio, the MFS Conservative
Allocation Portfolio, and the MFS Growth Allocation Portfolio were the owners of record of approximately 20%, 6%, and 5%, respectively, of the value of outstanding voting shares of the fund.
(6) Line of Credit
The fund and certain other funds managed by MFS participate
in a $1.25 billion unsecured committed line of credit of which $1 billion is reserved for use by the fund and certain other MFS U.S. funds. The line of credit is provided by a syndicate of banks under a credit agreement. Borrowings may be made for
temporary financing needs. Interest is charged to each fund, based on its borrowings, generally at a rate equal to the highest of one month LIBOR, the Federal Funds Effective Rate and the Overnight Bank Funding Rate, plus an agreed upon spread. A
commitment fee, based on the average daily, unused portion of the committed line of credit, is allocated among the participating funds. In addition, the fund and other funds managed by MFS have established unsecured uncommitted borrowing
arrangements with certain banks for temporary financing needs. Interest is charged to each fund, based on its borrowings, at rates equal to customary reference rates plus an agreed upon spread. For the year ended December 31, 2021, the fund’s
commitment fee and interest expense were $928 and $0, respectively, and are included in “Miscellaneous” expense in the Statement of Operations.
(7) Investments in Affiliated Issuers
An affiliated issuer may be considered one in which the
fund owns 5% or more of the outstanding voting securities, or a company which is under common control. For the purposes of this report, the following were affiliated issuers:
| Affiliated
Issuers |
Beginning
Value |
Purchases
|
Sales
Proceeds |
Realized
Gain
(Loss) |
Change
in
Unrealized
Appreciation or
Depreciation |
Ending
Value |
| MFS
Institutional Money Market Portfolio |
$15,433,544
|
$91,266,183
|
$95,576,023
|
$(1,981)
|
$1,982
|
$11,123,705
|
| Affiliated
Issuers |
Dividend
Income |
Capital
Gain
Distributions |
| MFS
Institutional Money Market Portfolio |
$4,638
|
$—
|
(8) Impacts of
COVID-19
The pandemic related to the global spread of
novel coronavirus disease (COVID-19), which was first detected in December 2019, has resulted in significant disruptions to global business activity and the global economy, as well as the economies of individual countries, the financial performance
of individual companies and sectors, and the securities and commodities markets in general. Multiple surges in cases globally, the availability and widespread adoption of vaccines, and the emergence of variant strains of the virus continue to create
uncertainty as to the future and long-term impacts resulting from the pandemic including impacts to the prices and liquidity of the fund's investments and the fund's performance.
(9) LIBOR Transition
Certain of the fund's investments, including its
investments in derivatives, as well as any debt issued by the fund and other contractual arrangements of the fund may be based on reference interest rates such as the London Interbank Offered Rate (“LIBOR”). In 2017, the regulatory
authority that oversees financial services firms in the United Kingdom announced plans to transition away from LIBOR by the end of 2021. In March 2021, the administrator of LIBOR announced the extension of the publication of the more commonly used
U.S. dollar LIBOR settings to the end of June 2023. Although the full impacts of the
Notes to Financial Statements - continued
transition away
from LIBOR are not fully known, the transition may result in, among other things, an increase in volatility or illiquidity of the markets for instruments that currently rely on LIBOR to determine interest rates and this could have an adverse impact
on the fund's performance. With respect to the fund's accounting for investments, including its investments in derivatives, as well as any debt issued by the fund and other contractual arrangements of the fund that undergo reference rate-related
modifications as a result of the transition, management will rely upon the relief provided by FASB Codification Topic 848 – Reference Rate Reform (Topic 848). The guidance in Topic 848 permits the fund to disregard the GAAP accounting
requirements around certain contract modifications resulting from the LIBOR transition such that for contracts considered in scope, the fund can account for those modified contracts as a continuation of the existing contracts. While the cessation of
the one-week and two-month U.S. dollar LIBOR tenors along with certain other non-U.S. dollar denominated LIBOR settings at December 31, 2021 did not have a material impact on the fund, management is still evaluating the impact to the fund of the
June 30, 2023 planned discontinuation of the more commonly used U.S. dollar LIBOR settings.
Report of Independent Registered Public Accounting
Firm
To the Board of Trustees of MFS Variable
Insurance Trust II and the Shareholders of MFS High Yield Portfolio:
Opinion on the Financial Statements and Financial
Highlights
We have audited the accompanying statement
of assets and liabilities of MFS High Yield Portfolio (the “Fund”), including the portfolio of investments, as of December 31, 2021, the related statement of operations for the year then ended, the statements of changes in net assets for
each of the two years in the period then ended, the financial highlights for each of the five years in the period then ended, and the related notes. In our opinion, the financial statements and financial highlights present fairly, in all material
respects, the financial position of the Fund as of December 31, 2021, and the results of its operations for the year then ended, the changes in its net assets for each of the two years in the period then ended, and the financial highlights for each
of the five years in the period then ended, in conformity with accounting principles generally accepted in the United States of America.
Basis for Opinion
These financial statements and financial highlights are the
responsibility of the Fund's management. Our responsibility is to express an opinion on the Fund's financial statements and financial highlights based on our audits. We are a public accounting firm registered with the Public Company Accounting
Oversight Board (United States) (PCAOB) and are required to be independent with respect to the Fund in accordance with the U.S. federal securities laws and the applicable rules and regulations of the Securities and Exchange Commission and the
PCAOB.
We conducted our audits in accordance with the
standards of the PCAOB. Those standards require that we plan and perform the audit to obtain reasonable assurance about whether the financial statements and financial highlights are free of material misstatement, whether due to error or fraud. The
Fund is not required to have, nor were we engaged to perform, an audit of its internal control over financial reporting. As part of our audits, we are required to obtain an understanding of internal control over financial reporting but not for the
purpose of expressing an opinion on the effectiveness of the Fund's internal control over financial reporting. Accordingly, we express no such opinion.
Our audits included performing procedures to assess the
risks of material misstatement of the financial statements and financial highlights, whether due to error or fraud, and performing procedures that respond to those risks. Such procedures included examining, on a test basis, evidence regarding the
amounts and disclosures in the financial statements and financial highlights. Our audits also included evaluating the accounting principles used and significant estimates made by management, as well as evaluating the overall presentation of the
financial statements and financial highlights. Our procedures included confirmation of securities owned as of December 31, 2021, by correspondence with the custodian, brokers and agent banks; when replies were not received from brokers, we performed
other auditing procedures. We believe that our audits provide a reasonable basis for our opinion.
DELOITTE & TOUCHE LLP
Boston, Massachusetts
February 15, 2022
We have served as the auditor of one or more of the MFS
investment companies since 1924.
Trustees and Officers — Identification and
Background
The Trustees and Officers of the Trust, as
of February 1, 2022, are listed below, together with their principal occupations during the past five years. (Their titles may have varied during that period.) The address of each Trustee and Officer is 111 Huntington Avenue, Boston, Massachusetts
02199-7618.
| Name,
Age |
|
Position(s)
Held with Fund |
|
Trustee/Officer
Since(h) |
|
Number
of MFS Funds overseen by the Trustee |
|
Principal
Occupations During
the Past Five Years |
|
Other
Directorships During
the Past Five Years (j) |
| INTERESTED
TRUSTEES |
|
|
|
|
|
|
|
|
|
|
Michael
W. Roberge (k)
(age 55) |
|
Trustee
|
|
January
2021 |
|
135
|
|
Massachusetts
Financial Services Company, Chairman (since January 2021); Chief Executive Officer (since January 2017); Director; Chairman of the Board (since January 2022); President (until December 2018); Chief Investment Officer (until December 2018) |
|
N/A
|
| INDEPENDENT
TRUSTEES |
|
|
|
|
|
|
|
|
|
|
John
P. Kavanaugh
(age 67) |
|
Trustee
and Chair of Trustees |
|
January
2009 |
|
135
|
|
Private
investor |
|
N/A
|
Steven
E. Buller
(age 70) |
|
Trustee
|
|
February
2014 |
|
135
|
|
Private
investor |
|
N/A
|
John
A. Caroselli
(age 67) |
|
Trustee
|
|
March
2017 |
|
135
|
|
Private
investor; JC Global Advisors, LLC (management consulting), President (since 2015) |
|
N/A
|
Maureen
R. Goldfarb
(age 66) |
|
Trustee
|
|
January
2009 |
|
135
|
|
Private
investor |
|
N/A
|
Peter
D. Jones
(age 66) |
|
Trustee
|
|
January
2019 |
|
135
|
|
Private
investor |
|
N/A
|
James
W. Kilman, Jr.
(age 60) |
|
Trustee
|
|
January
2019 |
|
135
|
|
Burford
Capital Limited (finance and investment management), Senior Advisor (since May 3, 2021), Chief Financial Officer (2019 - May 2, 2021); KielStrand Capital LLC (family office), Chief Executive Officer (since 2016) |
|
Alpha-En
Corporation, Director (2016-2019) |
Clarence
Otis, Jr.
(age 65) |
|
Trustee
|
|
March
2017 |
|
135
|
|
Private
investor |
|
VF
Corporation, Director; Verizon Communications, Inc., Director; The Travelers Companies, Director |
Maryanne
L. Roepke
(age 65) |
|
Trustee
|
|
May
2014 |
|
135
|
|
Private
investor |
|
N/A
|
Laurie
J. Thomsen
(age 64) |
|
Trustee
|
|
March
2005 |
|
135
|
|
Private
investor |
|
The
Travelers Companies, Director; Dycom Industries, Inc., Director |
Trustees and Officers - continued
| Name,
Age |
|
Position(s)
Held with
Fund |
|
Trustee/Officer
Since(h) |
|
Number
of MFS Funds for which the Person is an Officer |
|
Principal
Occupations During
the Past Five Years |
| OFFICERS
|
|
|
|
|
|
|
|
|
Christopher
R. Bohane (k)
(age 48) |
|
Assistant
Secretary and Assistant Clerk |
|
July
2005 |
|
135
|
|
Massachusetts
Financial Services Company, Senior Vice President and Associate General Counsel |
Kino
Clark (k)
(age 53) |
|
Assistant
Treasurer |
|
January
2012 |
|
135
|
|
Massachusetts
Financial Services Company, Vice President |
John
W. Clark, Jr. (k)
(age 54) |
|
Assistant
Treasurer |
|
April
2017 |
|
135
|
|
Massachusetts
Financial Services Company, Vice President (since March 2017); Deutsche Bank (financial services), Department Head - Treasurer's Office (until February 2017) |
Thomas
H. Connors (k)
(age 62) |
|
Assistant
Secretary and Assistant Clerk |
|
September
2012 |
|
135
|
|
Massachusetts
Financial Services Company, Vice President and Senior Counsel |
David
L. DiLorenzo (k)
(age 53) |
|
President
|
|
July
2005 |
|
135
|
|
Massachusetts
Financial Services Company, Senior Vice President |
Heidi
W. Hardin (k)
(age 54) |
|
Secretary
and Clerk |
|
April
2017 |
|
135
|
|
Massachusetts
Financial Services Company, Executive Vice President and General Counsel (since March 2017); Harris Associates (investment management), General Counsel (until January 2017) |
Brian
E. Langenfeld (k)
(age 48) |
|
Assistant
Secretary and Assistant Clerk |
|
June
2006 |
|
135
|
|
Massachusetts
Financial Services Company, Vice President and Senior Counsel |
Amanda
S. Mooradian (k)
(age 42) |
|
Assistant
Secretary and Assistant Clerk |
|
September
2018 |
|
135
|
|
Massachusetts
Financial Services Company, Assistant Vice President and Senior Counsel |
Susan
A. Pereira (k)
(age 51) |
|
Assistant
Secretary and Assistant Clerk |
|
July
2005 |
|
135
|
|
Massachusetts
Financial Services Company, Vice President and Assistant General Counsel |
Kasey
L. Phillips (k)
(age 51) |
|
Assistant
Treasurer |
|
September
2012 |
|
135
|
|
Massachusetts
Financial Services Company, Vice President |
Matthew
A. Stowe (k)
(age 47) |
|
Assistant
Secretary and Assistant Clerk |
|
October
2014 |
|
135
|
|
Massachusetts
Financial Services Company, Vice President and Assistant General Counsel |
Martin
J. Wolin (k)
(age 54) |
|
Chief
Compliance Officer |
|
July
2015 |
|
135
|
|
Massachusetts
Financial Services Company, Senior Vice President and Chief Compliance Officer |
James
O. Yost (k)
(age 61) |
|
Treasurer
|
|
September
1990 |
|
135
|
|
Massachusetts
Financial Services Company, Senior Vice President |
| (h)
|
Date
first appointed to serve as Trustee/Officer of an MFS Fund. Each Trustee has served continuously since appointment unless indicated otherwise. From January 2012 through December 2016, Messrs. DiLorenzo and Yost served as Treasurer and Deputy
Treasurer of the Funds, respectively. |
| (j)
|
Directorships or
trusteeships of companies required to report to the Securities and Exchange Commission (i.e., “public companies”). |
| (k)
|
“Interested
person” of the Trust within the meaning of the Investment Company Act of 1940 (referred to as the 1940 Act), which is the principal federal law governing investment companies like the fund, as a result of a position with MFS. The address of
MFS is 111 Huntington Avenue, Boston, Massachusetts 02199-7618. |
Each Trustee (other than Messrs. Jones, Kilman and Roberge)
has been elected by shareholders and each Trustee and Officer holds office until his or her successor is chosen and qualified or until his or her earlier death, resignation, retirement or removal. Mr. Roberge became a Trustee of the Funds on January
1, 2021 and Messrs. Jones and Kilman became Trustees of the Funds on January 1, 2019. The Trust does not hold annual meetings for the purpose of electing Trustees, and Trustees are not elected for fixed terms. Under the terms of the Board's
retirement policy, an Independent Trustee shall retire at the end of the calendar year in which he or she reaches the earlier of 75 years of age or 15 years of service on the Board (or, in the case of any Independent Trustee who joined the Board
prior to 2015, 20 years of service on the Board).
Messrs. Buller, Kilman and Otis and Ms. Roepke are members
of the Trust’s Audit Committee.
Trustees and Officers - continued
Each
of the Interested Trustees and certain Officers hold comparable officer positions with certain affiliates of MFS.
The Statement of Additional Information for a Fund includes
further information about the Trustees and is available without charge upon request by calling 1-800-225-2606.
| Investment
Adviser |
Custodian
|
Massachusetts Financial
Services Company
111 Huntington Avenue
Boston, MA 02199-7618 |
State Street
Bank and Trust Company
1 Lincoln Street
Boston, MA 02111-2900 |
| Distributor
|
Independent
Registered Public Accounting Firm |
MFS Fund
Distributors, Inc.
111 Huntington Avenue
Boston, MA 02199-7618 |
Deloitte
& Touche LLP
200 Berkeley Street
Boston, MA 02116 |
| Portfolio
Manager(s) |
|
David
Cole
Michael Skatrud |
|
Board Review of Investment Advisory Agreement
MFS High Yield Portfolio
The Investment Company Act of 1940 requires that both the
full Board of Trustees and a majority of the non-interested (“independent”) Trustees, voting separately, annually approve the continuation of the Fund’s investment advisory agreement with MFS. The Trustees consider matters bearing
on the Fund and its advisory arrangements at their meetings throughout the year, including a review of performance data at each regular meeting. In addition, the independent Trustees met several times by videoconference (in accordance with
Securities and Exchange Commission relief) over the course of three months beginning in May and ending in July, 2021 (“contract review meetings”) for the specific purpose of considering whether to approve the continuation of the
investment advisory agreement for the Fund and the other investment companies that the Board oversees (the “MFS Funds”). The independent Trustees were assisted in their evaluation of the Fund’s investment advisory agreement by
independent legal counsel, from whom they received separate legal advice and with whom they met separately from MFS during various contract review meetings. The independent Trustees were also assisted in this process by an independent consultant who
was retained by and reported to the independent Trustees.
In connection with their deliberations regarding the
continuation of the investment advisory agreement, the Trustees, including the independent Trustees, considered such information and factors as they believed, in light of the legal advice furnished to them and their own business judgment, to be
relevant. The investment advisory agreement for the Fund was considered separately, although the Trustees also took into account the common interests of all MFS Funds in their review. As described below, the Trustees considered the nature, quality,
and extent of the various investment advisory, administrative, and shareholder services performed by MFS under the existing investment advisory agreement and other arrangements with the Fund.
In connection with their contract review meetings, the
Trustees received and relied upon materials that included, among other items: (i) information provided by Broadridge Financial Solutions, Inc. (“Broadridge”), an independent third party, on the investment performance of the Fund for
various time periods ended December 31, 2020 and the investment performance of a group of funds with substantially similar investment classifications/objectives (the “Broadridge performance universe”), (ii) information provided by
Broadridge on the Fund’s advisory fees and other expenses and the advisory fees and other expenses of comparable funds identified by Broadridge as well as all other funds in the same investment classification/category (the “Broadridge
expense group and universe”), (iii) information provided by MFS on the advisory fees of portfolios of other clients of MFS, including institutional separate accounts and other clients, (iv) information as to whether and to what extent
applicable expense waivers, reimbursements or fee “breakpoints” are observed for the Fund, (v) information regarding MFS’ financial results and financial condition, including MFS’ and certain of its affiliates’
estimated profitability from services performed for the Fund and the MFS Funds as a whole, and compared to MFS’ institutional business, (vi) MFS’ views regarding the outlook for the mutual fund industry and the strategic business plans
of MFS, (vii) descriptions of various functions performed by MFS for the Funds, such as compliance monitoring and portfolio trading practices, and (viii) information regarding the overall organization of MFS, including information about MFS’
senior management and other personnel providing investment advisory, administrative and other services to the Fund and the other MFS Funds. The comparative performance, fee and expense information prepared and provided by Broadridge was not
independently verified and the independent Trustees did not independently verify any information provided to them by MFS.
The Trustees’ conclusion as to the continuation of
the investment advisory agreement was based on a comprehensive consideration of all information provided to the Trustees and not the result of any single factor. Some of the factors that figured particularly in the Trustees’ deliberations are
described below, although individual Trustees may have evaluated the information presented differently from one another, giving different weights to various factors. It is also important to recognize that the fee arrangements for the Fund and other
MFS Funds are the result of years of review and discussion between the independent Trustees and MFS, that certain aspects of such arrangements may receive greater scrutiny in some years than in others, and that the Trustees’ conclusions may be
based, in part, on their consideration of these same arrangements during the course of the year and in prior years.
Based on information provided by Broadridge and MFS, the
Trustees reviewed the Fund’s total return investment performance as well as the Broadridge performance universe over various time periods. The Trustees placed particular emphasis on the total return performance of the Fund’s Initial
Class shares in comparison to the performance of funds in its Broadridge performance universe over the five-year period ended December 31, 2020, which the Trustees believed was a long enough period to reflect differing market conditions. The total
return performance of the Fund’s Initial Class shares was in the 4th quintile relative to the other funds in the universe for this five-year period (the 1st quintile being the best performers and the 5th quintile being the worst performers).
The total return performance of the Fund’s Initial Class shares was in the 4th quintile for each of the one- and three-year periods ended December 31, 2020 relative to the Broadridge performance universe. Because of the passage of time, these
performance results may differ from the performance results for more recent periods, including those shown elsewhere in this report.
In the course of their deliberations, the Trustees took
into account information provided by MFS in connection with the contract review meetings, as well as during investment review meetings conducted with portfolio management personnel during the course of the year regarding the Fund’s
performance. The Trustees noted that the total return performance (Class I shares) of the Fund’s retail counterpart, MFS High Income Fund, which has substantially similar investment strategies, was in the 3rd quintile relative to the
Board Review of Investment Advisory Agreement - continued
other funds in its
Broadridge performance universe for the five-year period ended December 31, 2020. After reviewing these and related factors, the Trustees concluded, within the context of their overall conclusions regarding the investment advisory agreement, that
they were satisfied with MFS’ responses and efforts relating to investment performance.
In assessing the reasonableness of the Fund’s
advisory fee, the Trustees considered, among other information, the Fund’s advisory fee and the total expense ratio of the Fund’s Initial Class shares as a percentage of average daily net assets and the advisory fee and total expense
ratios of the Broadridge expense group based on information provided by Broadridge. The Trustees considered that MFS currently observes an expense limitation for the Fund, which may not be changed without the Trustees’ approval. The Trustees
also considered that, according to the data provided by Broadridge (which takes into account any fee reductions or expense limitations that were in effect during the Fund’s last fiscal year), the Fund’s effective advisory fee rate and
total expense ratio were each approximately at the Broadridge expense group median.
The Trustees also considered the advisory fees charged by
MFS to any institutional separate accounts advised by MFS (“separate accounts”) and unaffiliated investment companies for which MFS serves as subadviser (“subadvised funds”) that have comparable investment strategies to the
Fund, if any. In comparing these fees, the Trustees considered information provided by MFS as to the generally broader scope of services provided by MFS to the Fund, as well as the more extensive regulatory burdens imposed on MFS in managing the
Fund, in comparison to separate accounts and subadvised funds. The Trustees also considered the higher demands placed on MFS’ investment personnel and trading infrastructure as a result of the daily cash in-flows and out-flows of the Fund in
comparison to separate accounts.
The Trustees also
considered whether the Fund may benefit from any economies of scale in the management of the Fund in the event of growth in assets of the Fund and/or growth in assets of the MFS Funds as a whole. They noted that the Fund’s advisory fee rate
schedule is subject to a contractual breakpoint that reduces the Fund’s advisory fee rate on average daily net assets over $1 billion. The Trustees also noted that MFS has agreed in writing to waive a portion of the management fees of certain
MFS Funds, including the Fund, if the total combined assets of certain funds within the MFS Funds’ complex increase above agreed upon thresholds (the “group fee waiver”), enabling the Fund’s shareholders to share in the
benefits from any economies of scale at the complex level. The group fee waiver is reviewed and renewed annually between the Board and MFS. The Trustees concluded that the breakpoint and the group fee waiver were sufficient to allow the Fund to
benefit from economies of scale as its assets and overall complex assets grow.
The Trustees also considered information prepared by MFS
relating to MFS’ costs and profits with respect to the Fund, the MFS Funds considered as a group, and other investment companies and accounts advised by MFS, as well as MFS’ methodologies used to determine and allocate its costs to the
MFS Funds, the Fund and other accounts and products for purposes of estimating profitability.
After reviewing these and other factors described herein,
the Trustees concluded, within the context of their overall conclusions regarding the investment advisory agreement, that the advisory fees charged to the Fund represent reasonable compensation in light of the services being provided by MFS to the
Fund.
In addition, the Trustees considered MFS’
resources and related efforts to continue to retain, attract and motivate capable personnel to serve the Fund. The Trustees also considered current and developing conditions in the financial services industry, including the presence of large and
well-capitalized companies which are spending, and appear to be prepared to continue to spend, substantial sums to engage personnel and to provide services to competing investment companies. In this regard, the Trustees also considered the financial
resources of MFS and its ultimate parent, Sun Life Financial Inc. The Trustees also considered the advantages and possible disadvantages to the Fund of having an adviser that also serves other investment companies as well as other accounts.
The Trustees also considered the nature, quality, cost, and
extent of administrative, transfer agency, and distribution services provided to the Fund by MFS and its affiliates under agreements and plans other than the investment advisory agreement, including any 12b-1 fees the Fund pays to MFS Fund
Distributors, Inc., an affiliate of MFS. The Trustees also considered the nature, extent and quality of certain other services MFS performs or arranges for on the Fund’s behalf, which may include securities lending programs, directed expense
payment programs, class action recovery programs, and MFS’ interaction with third-party service providers, principally custodians and sub-custodians. The Trustees concluded that the various non-advisory services provided by MFS and its
affiliates on behalf of the Fund were satisfactory.
The Trustees considered so-called “fall-out
benefits” to MFS such as reputational value derived from serving as investment manager to the MFS Funds. The Trustees also considered that MFS discontinued its historic practice of obtaining investment research from portfolio brokerage
commissions paid by certain MFS Funds effective January 2018, and directly pays or voluntarily reimburses a Fund, if applicable, for the costs of external research acquired through the use of the Fund’s portfolio brokerage commissions.
Based on their evaluation of factors that they deemed to be
material, including those factors described above, the Board of Trustees, including the independent Trustees, concluded that the Fund’s investment advisory agreement with MFS should be continued for an additional one-year period, commencing
August 1, 2021.
Proxy Voting Policies and Information
MFS votes proxies on behalf of the fund pursuant to proxy
voting policies and procedures that are available without charge, upon request, by calling 1-800-225-2606, by visiting mfs.com/proxyvoting, or by visiting the SEC’s Web site at http://www.sec.gov.
Information regarding how the fund voted proxies relating
to portfolio securities during the most recent twelve-month period ended June 30 is available by August 31 of each year without charge by visiting mfs.com/proxyvoting, or by visiting the SEC’s Web site
at http://www.sec.gov.
Quarterly Portfolio Disclosure
The fund files a complete schedule of portfolio holdings
with the SEC for the first and third quarters of each fiscal year as an exhibit to its reports on Form N-PORT. The fund’s Form N-PORT reports are available on the SEC’s Web site at
http://www.sec.gov. A shareholder can obtain the portfolio holdings report for the first and third quarters of the fund's fiscal year at mfs.com/vit2 by
choosing the fund's name and then scrolling to the “Resources” section and clicking on the “Prospectus and Reports” tab.
FURTHER INFORMATION
From time to time, MFS may post important information about
the fund or the MFS Funds on the MFS Web site (mfs.com). This information is available at https://www.mfs.com/announcements or at
mfs.com/vit2 by choosing the fund's name and then scrolling to the “Resources” section and clicking on the “Announcements” tab, if any.
Information About Fund Contracts and Legal Claims
The fund has entered into contractual arrangements with an
investment adviser, administrator, distributor, shareholder servicing agent, 529 program manager (if applicable), and custodian who each provide services to the fund. Unless expressly stated otherwise, shareholders are not parties to, or intended
beneficiaries of these contractual arrangements, and these contractual arrangements are not intended to create any shareholder right to enforce them against the service providers or to seek any remedy under them against the service providers, either
directly or on behalf of the fund.
Under the
Trust’s By-Laws and Declaration of Trust, any claims asserted against or on behalf of the MFS Funds, including claims against Trustees and Officers, must be brought in state and federal courts located within the Commonwealth of
Massachusetts.
Federal Tax Information (unaudited)
The following information is provided pursuant to
provisions of the Internal Revenue Code.
The fund
intends to pass through the maximum amount allowable as Section 163(j) Interest Dividends as defined in Treasury Regulation §1.163(j)-1(b).
| FACTS
|
WHAT
DOES MFS DO WITH YOUR PERSONAL INFORMATION? |
| Why?
|
Financial
companies choose how they share your personal information. Federal law gives consumers the right to limit some but not all sharing. Federal law also requires us to tell you how we collect, share, and protect your personal information. Please read
this notice carefully to understand what we do. |
| What?
|
The types of
personal information we collect and share depend on the product or service you have with us. This information can include: |
| • Social
Security number and account balances |
| • Account
transactions and transaction history |
| • Checking
account information and wire transfer instructions |
| When
you are no longer our customer, we continue to share your information as described in this notice. |
| How?
|
All
financial companies need to share customers' personal information to run their everyday business. In the section below, we list the reasons financial companies can share their customers' personal information; the reasons MFS chooses to share; and
whether you can limit this sharing. |
Reasons
we can share your
personal information |
Does
MFS share? |
Can
you limit
this sharing? |
For
our everyday business purposes –
such as to process your transactions, maintain your
account(s), respond to court orders and legal
investigations, or report to credit bureaus |
Yes
|
No
|
For
our marketing purposes –
to offer our products and services to you |
No
|
We
don't share |
For
joint marketing with other
financial companies |
No
|
We
don't share |
For
our affiliates' everyday business purposes –
information about your transactions and experiences |
No
|
We
don't share |
For
our affiliates' everyday business purposes –
information about your creditworthiness |
No
|
We
don't share |
| For
nonaffiliates to market to you |
No
|
We
don't share |
| Questions?
|
Call
800-225-2606 or go to mfs.com. |
| Who
we are |
| Who
is providing this notice? |
MFS
Funds, MFS Investment Management, MFS Institutional Advisors, Inc., and MFS Heritage Trust Company. |
| What
we do |
How
does MFS
protect my personal
information? |
To
protect your personal information from unauthorized access and use, we use security measures that comply with federal law. These measures include procedural, electronic, and physical safeguards for the protection of the personal information we
collect about you. |
How
does MFS
collect my personal
information? |
We
collect your personal information, for example, when you |
| • open
an account or provide account information |
| • direct
us to buy securities or direct us to sell your securities |
| • make
a wire transfer |
| We
also collect your personal information from others, such as credit bureaus, affiliates, or other companies. |
| Why
can't I limit all sharing? |
Federal
law gives you the right to limit only |
| • sharing
for affiliates' everyday business purposes – information about your creditworthiness |
| • affiliates
from using your information to market to you |
| • sharing
for nonaffiliates to market to you |
| State
laws and individual companies may give you additional rights to limit sharing. |
| Definitions
|
| Affiliates
|
Companies
related by common ownership or control. They can be financial and nonfinancial companies. |
| •
MFS does not share personal information with affiliates, except for everyday business purposes as described on page one of this notice. |
| Nonaffiliates
|
Companies
not related by common ownership or control. They can be financial and nonfinancial companies. |
| •
MFS does not share with nonaffiliates so they can market to you. |
| Joint
marketing |
A
formal agreement between nonaffiliated financial companies that together market financial products or services to you. |
| •
MFS doesn't jointly market. |
| Other
important information |
| If
you own an MFS product or receive an MFS service in the name of a third party such as a bank or broker-dealer, their privacy policy may apply to you instead of ours. |
Annual Report
December 31, 2021
MFS® International
Growth Portfolio
MFS® Variable
Insurance Trust II
MFS® International
Growth Portfolio
|
1
|
|
2
|
|
3
|
|
5
|
|
7
|
|
8
|
|
12
|
|
13
|
|
14
|
|
15
|
|
17
|
|
23
|
|
24
|
|
27
|
|
30
|
|
30
|
|
30
|
|
30
|
|
30
|
|
31
|
The report is prepared for the general information of contract owners. It
is authorized for distribution to prospective investors only when preceded or accompanied by a current prospectus.
NOT FDIC INSURED • MAY LOSE VALUE
• NO BANK OR CREDIT UNION GUARANTEE •
NOT A DEPOSIT • NOT INSURED BY ANY FEDERAL GOVERNMENT
AGENCY OR NCUA/NCUSIF
MFS International Growth
Portfolio
Dear Contract Owners:
After a powerful rally in 2021 that was spurred by the
introduction of effective coronavirus vaccines and high levels of monetary and fiscal stimulus, markets have recently experienced a rise in volatility. Rising inflation (mostly due to pandemic-related labor and supply chain disruptions), new
COVID-19 variants that are vaccine-resistant, and the prospect of tighter monetary and fiscal policies around the world have all increased investor anxiety.
Rising real (inflation-adjusted) bond yields in the United
States are a headwind for richly valued U.S. growth stocks, though many non-U.S. markets have experienced lower levels of turbulence. In recent months, global economic growth has moderated, with the spread of the Delta and Omicron variants and a
regulatory crackdown in China featuring prominently. Stress in China’s property development sector has also contributed to the slowdown there. A further concern for investors is the tightening of global energy and raw materials supplies caused
in part by geopolitical uncertainty.
However,
above-trend economic growth, strong corporate balance sheets, and nascent signs that global supply chain bottlenecks may be easing, along with a dovish policy shift in China, are supportive fundamentals that we feel could help calm recent market
jitters.
It is times of market transition that
demonstrate the importance of having a deep understanding of company fundamentals, and we have built our global research platform to do just that.
At MFS®, we put our clients’ assets to work responsibly by carefully navigating the increasing complexity of global markets and economies. Guided by our commitment to long-term
investing, we tune out the noise and try to uncover what we believe are the best, most durable investment opportunities in the market. Our unique global investment platform combines collective expertise, long-term discipline, and thoughtful risk
management to create sustainable value for investors.
Respectfully,
Michael W.
Roberge
Chief Executive Officer
MFS Investment Management
February 15, 2022
The opinions expressed in this letter are subject to
change and may not be relied upon for investment advice. No forecasts can be guaranteed.
MFS International Growth
Portfolio
Portfolio structure
Top ten
holdings
| Nestle
S.A. |
4.9%
|
| Taiwan
Semiconductor Manufacturing Co. Ltd., ADR |
4.5%
|
| Roche
Holding AG |
4.5%
|
| LVMH
Moet Hennessy Louis Vuitton SE |
3.3%
|
| SAP
SE |
3.2%
|
| Schneider
Electric SE |
3.2%
|
| Hitachi
Ltd. |
3.0%
|
| Linde
PLC |
2.9%
|
| Diageo
PLC |
2.9%
|
| EssilorLuxottica
|
2.7%
|
GICS equity sectors (g)
| Industrials
|
17.1%
|
| Consumer
Staples |
16.4%
|
| Health
Care |
12.8%
|
| Information
Technology |
12.6%
|
| Consumer
Discretionary |
11.9%
|
| Materials
|
11.0%
|
| Financials
|
9.7%
|
| Communication
Services |
3.6%
|
| Energy
|
1.5%
|
| Utilities
|
0.8%
|
Issuer country weightings (x)
| France
|
16.2%
|
| Switzerland
|
13.4%
|
| United
Kingdom |
9.2%
|
| Germany
|
8.8%
|
| Japan
|
8.3%
|
| Canada
|
6.7%
|
| United
States |
6.4%
|
| Taiwan
|
5.9%
|
| China
|
4.6%
|
| Other
Countries |
20.5%
|
Currency exposure weightings
(y)
| Euro
|
31.4%
|
| Swiss
Franc |
13.4%
|
| British
Pound Sterling |
10.2%
|
| Japanese
Yen |
8.3%
|
| Hong
Kong Dollar |
6.6%
|
| United
States Dollar |
6.2%
|
| Taiwan
Dollar |
5.9%
|
| Canadian
Dollar |
5.0%
|
| Indian
Rupee |
4.3%
|
| Other
Currencies |
8.7%
|
| (g)
|
The
Global Industry Classification Standard (GICS®) was developed by and/or is the exclusive property of MSCI, Inc. and S&P Global Market Intelligence Inc. (“S&P
Global Market Intelligence”). GICS is a service mark of MSCI and S&P Global Market Intelligence and has been licensed for use by MFS. MFS has applied its own internal sector/industry classification methodology for equity securities and
non-equity securities that are unclassified by GICS. |
| (x)
|
Represents
the portfolio’s exposure to issuer countries as a percentage of a portfolio’s net assets. For purposes of this presentation, United States includes Cash & Cash Equivalents. |
| (y)
|
Represents
the portfolio’s exposure to a particular currency as a percentage of a portfolio's net assets. For purposes of this presentation, United States Dollar includes Cash & Cash Equivalents. |
Cash & Cash Equivalents includes any cash,
investments in money market funds, short-term securities, and other assets less liabilities. Please see the Statement of Assets and Liabilities for additional information related to the fund’s cash position and other assets and
liabilities.
Percentages are based on net
assets as of December 31, 2021.
The portfolio
is actively managed and current holdings may be different.
MFS International Growth
Portfolio
Management Review
Summary of Results
For the twelve months ended December 31, 2021, Initial
Class shares of the MFS International Growth Portfolio (fund) provided a total return of 9.27%, while Service Class shares of the fund provided a total return of 8.99%. These compare with a return of 5.09% over the same period for the fund’s
benchmark, the MSCI All Country World (ex-US) Growth Index (net div).
Market Environment
Over the past year, the global economy was buffeted by an
array of crosscurrents as it adjusted to the ebbs and flows of the pandemic. Among the supportive currents were ample fiscal stimulus, loose monetary policy and the rollout of several highly effective coronavirus vaccines. Negative currents included
the rapid spread of several coronavirus variants, widespread global production bottlenecks and a surge in inflation. After experiencing a burst of exceptionally strong economic activity as the global economy began to reopen, activity became more
muted in the second half of the period amid ongoing supply chain disruptions and a new wave of coronavirus infections, albeit a seemingly milder strain.
Amid rising inflation, markets anticipated a transition
from an exceptionally accommodative environment to a more mixed monetary landscape ahead. Indeed, several central banks in emerging markets have already tightened policy and the US Federal Reserve reduced the pace of its asset purchases in November
and again in December. However, the European Central Bank, the Bank of Japan and the People's Bank of China are expected to maintain accommodative policies. Sovereign bond yields moved modestly higher during the period amid higher inflation and on
expectations of a tighter Fed but remain historically low.
A harsher Chinese regulatory environment toward industries
such as online gaming, food delivery and education increased market volatility as has stress in China's highly leveraged property development sector. Trade relations between the United States and China remained quite strained despite a change in
presidential administrations.
Signs of excess
investor enthusiasm continued to be seen in pockets of the market such as “meme stocks” popular with users of online message boards, cryptocurrencies and heavy retail participation in the market for short-dated options.
Contributors to Performance
Stock selection and, to a lesser extent, an underweight
allocation to the consumer discretionary sector strengthened the fund’s performance relative to the MSCI All Country World (ex-US) Growth Index, led by its overweight positions in eyewear manufacturer EssilorLuxottica (France) and luxury goods
company LVMH Moet Hennessy Louis Vuitton (France). The share price of LVMH climbed during the period after management reported strong organic sales growth, particularly in its Fashion and Leather Goods division. Not owning shares of e-commerce
platform developer Pinduoduo (China) also contributed to the fund’s relative results as the company’s share price declined on revenues that missed market estimates due to a decline in online marketplace revenues amid softer-than-expected
macro-economic conditions.
Security selection within
the industrials sector also aided relative performance, driven by the fund's overweight holdings of electrical distribution equipment manufacturer Schneider Electric (France), electronics company Hitachi (Japan) and mechanical engineering firm GEA
Group (Germany). The stock price of Schneider Electric advanced as the company reported better-than-expected organic sales growth, led by strong performance in its energy management segment.
Stocks in other sectors that bolstered relative performance
included the fund's position in industrial gas supplier Linde(b) (Germany), and its overweight holdings of premium drinks distributor Diageo (United Kingdom), internet-based multiple services company Tencent Holdings (China) and global food company
Nestle (Switzerland).
Detractors from Performance
Stock selection in the financials sector detracted from
relative performance over the reporting period, led by the fund’s overweight position in insurance company AIA Group (Hong Kong). The share price of AIA Group declined over the reporting period after the company reported in-line financial
results, with a slowdown in insurance sales in China and COVID-19 disruptions.
Elsewhere, not owning shares of ASML (Netherlands), a
lithography systems manufacturer for the semiconductor industry, and luxury goods company Compagnie Financière Richemont (Switzerland) dampened relative performance. The fund's overweight holdings of online betting and gaming operator Flutter
Entertainment (Ireland), precious metals exploration company Agnico Eagle Mines (Canada), industrial equipment distributor Ritchie Bros. Auctioneers (Canada) and household and industrial products manufacturer Kao (Japan) also held back relative
results. The fund's holdings of pharmaceutical company Novartis(b) (Switzerland) and internet-based research and development company Kingsoft(b) (Hong Kong) further weighed on relative returns.
The fund’s cash and/or cash equivalents position
during the period was another detractor from relative performance. Under normal market conditions, the fund strives to be fully invested and generally holds cash to buy new holdings and to provide liquidity. In a period when equity markets rose, as
measured by the fund’s benchmark, holding cash held back performance versus the benchmark, which has no cash position.
MFS International Growth
Portfolio
Management Review - continued
Respectfully,
Portfolio Manager(s)
Matthew Barrett and Kevin Dwan
Note to Contract Owners: Effective April 15, 2021, David
Antonelli is no longer a Portfolio Manager of the fund.
| (b)
|
Security is not a
benchmark constituent. |
The views
expressed in this report are those of the portfolio manager(s) only through the end of the period of the report as stated on the cover and do not necessarily reflect the views of MFS or any other person in the MFS organization. These views are
subject to change at any time based on market or other conditions, and MFS disclaims any responsibility to update such views. These views may not be relied upon as investment advice or an indication of trading intent on behalf of any MFS portfolio.
References to specific securities are not recommendations of such securities, and may not be representative of any MFS portfolio’s current or future investments.
MFS International Growth
Portfolio
Performance Summary Through 12/31/21
The following chart illustrates the historical performance
of the fund in comparison to its benchmark(s). Benchmarks are unmanaged and may not be invested in directly. Benchmark returns do not reflect any fees or expenses. The performance of other share classes will be greater than or less than that of the
class depicted below. (See Notes to Performance Summary.)
Performance data shown represents past performance and is no
guarantee of future results. Investment return and principal value fluctuate so your units, when sold, may be worth more or less than the original cost; current performance may be lower or higher than quoted. The performance shown does not reflect
the deduction of taxes, if any, that a contract holder would pay on fund distributions or the redemption of contract units. The returns for the fund shown also do not reflect the deduction of expenses associated with variable products, such as
mortality and expense risk charges, separate account charges, and sales charges imposed by the insurance company separate accounts. Such expenses would reduce the overall returns shown.
Growth of a Hypothetical $10,000 Investment
Total Returns
through 12/31/21
Average annual total returns
| Share
Class |
Class
Inception Date |
1-yr
|
5-yr
|
10-yr
|
| Initial
Class |
6/03/96
|
9.27%
|
14.22%
|
10.00%
|
| Service
Class |
8/24/01
|
8.99%
|
13.95%
|
9.73%
|
Comparative benchmark(s)
| MSCI
All Country World (ex-US) Growth Index (net div) (f) |
5.09%
|
13.06%
|
9.13%
|
| (f)
|
Source:
FactSet Research Systems Inc. |
Benchmark Definition(s)
MSCI All Country World (ex-U.S.) Growth Index(e) (net div) – a market capitalization-weighted index that is designed to measure equity market performance for growth securities in the global developed and emerging
markets, excluding the U.S.
It is not possible to
invest directly in an index.
| (e)
|
Morgan
Stanley Capital International (“MSCI”) makes no express or implied warranties or representations and shall have no liability whatsoever with respect to any MSCI data contained herein. The MSCI data may not be further redistributed or
used as a basis for other indices or any securities or financial products. This report is not approved, reviewed, or produced by MSCI. |
Notes to Performance Summary
Average annual total return represents the average annual
change in value for each share class for the periods presented.
Performance results reflect any applicable expense
subsidies and waivers in effect during the periods shown. Without such subsidies and waivers the fund's performance results would be less favorable. Please see the prospectus and financial statements for complete details. All results are historical
and assume the reinvestment of any dividends and capital gains distributions.
Performance results do not include adjustments made for
financial reporting purposes in accordance with U.S. generally accepted accounting principles and may differ from amounts reported in the financial highlights.
MFS International Growth
Portfolio
Performance Summary – continued
From
time to time the fund may receive proceeds from litigation settlements, without which performance would be lower.
MFS International Growth
Portfolio
Expense Table
Fund Expenses Borne by the Contract Holders during the
Period,
July 1, 2021 through December 31, 2021
As
a contract holder of the fund, you incur ongoing costs, including management fees; distribution and/or service (12b-1) fees; and other fund expenses. This example is intended to help you understand your ongoing costs (in dollars) of investing in the
fund and to compare these costs with the ongoing costs of investing in other mutual funds.
The example is based on an investment of $1,000 invested at
the beginning of the period and held for the entire period July 1, 2021 through December 31, 2021.
Actual Expenses
The first line for each share class in the following table
provides information about actual account values and actual expenses. You may use the information in this line, together with the amount you invested, to estimate the expenses that you paid over the period. Simply divide your account value by $1,000
(for example, an $8,600 account value divided by $1,000 = 8.6), then multiply the result by the number in the first line under the heading entitled “Expenses Paid During Period” to estimate the expenses you paid on your account during
this period.
Hypothetical Example for Comparison
Purposes
The second line for each share class in the
following table provides information about hypothetical account values and hypothetical expenses based on the fund’s actual expense ratio and an assumed rate of return of 5% per year before expenses, which is not the fund’s actual
return. The hypothetical account values and expenses may not be used to estimate the actual ending account balance or expenses you paid for the period. You may use this information to compare the ongoing costs of investing in the fund and other
funds. To do so, compare this 5% hypothetical example with the 5% hypothetical examples that appear in the shareholder reports of the other funds.
Please note that the expenses shown in the table are meant
to highlight the fund's ongoing costs only and do not take into account the fees and expenses imposed under the variable contracts through which your investment in the fund is made. Therefore, the second line for each share class in the table is
useful in comparing ongoing costs associated with an investment in vehicles (such as the fund) which fund benefits under variable annuity and variable life insurance contracts and to qualified pension and retirement plans only, and will not help you
determine the relative total costs of investing in the fund through variable annuity and variable life insurance contracts. If the fees and expenses imposed under the variable contracts were included, your costs would have been higher.
Share
Class |
|
Annualized
Expense
Ratio |
Beginning
Account Value
7/01/21 |
Ending
Account Value
12/31/21 |
Expenses
Paid During
Period (p)
7/01/21-12/31/21 |
| Initial
Class |
Actual
|
0.88%
|
$1,000.00
|
$1,015.66
|
$4.47
|
| Hypothetical
(h) |
0.88%
|
$1,000.00
|
$1,020.77
|
$4.48
|
| Service
Class |
Actual
|
1.13%
|
$1,000.00
|
$1,014.03
|
$5.74
|
| Hypothetical
(h) |
1.13%
|
$1,000.00
|
$1,019.51
|
$5.75
|
| (h)
|
5% class return per year
before expenses. |
| (p)
|
“Expenses
Paid During Period” are equal to each class's annualized expense ratio, as shown above, multiplied by the average account value over the period, multiplied by 184/365 (to reflect the one-half year period). |
MFS International Growth
Portfolio
Portfolio of Investments − 12/31/21
The Portfolio of Investments is a complete list of all
securities owned by your fund. It is categorized by broad-based asset classes.
| Issuer
|
|
|
Shares/Par
|
Value
($) |
| Common
Stocks – 97.4% |
| Aerospace
& Defense – 0.9% |
|
| Rolls-Royce
Holdings PLC (a) |
|
1,173,236
|
$
1,951,376 |
| Alcoholic
Beverages – 4.9% |
|
| Diageo
PLC |
|
112,283
|
$
6,133,939 |
| Pernod
Ricard S.A. |
|
17,785
|
4,282,498 |
| |
|
|
|
$10,416,437 |
| Apparel
Manufacturers – 5.2% |
|
| Burberry
Group PLC |
|
63,701
|
$
1,567,094 |
| Kering
S.A. |
|
2,924
|
2,353,251 |
| LVMH
Moet Hennessy Louis Vuitton SE |
|
8,522
|
7,053,567 |
| |
|
|
|
$10,973,912 |
| Automotive
– 0.5% |
|
| Koito
Manufacturing Co. Ltd. |
|
22,100
|
$
1,170,034 |
| Biotechnology
– 0.1% |
|
| Hugel,
Inc. |
|
1,923
|
$
248,312 |
| Brokerage
& Asset Managers – 1.3% |
|
| Deutsche
Boerse AG |
|
11,876
|
$
1,988,913 |
| London
Stock Exchange Group |
|
9,284
|
870,848 |
| |
|
|
|
$2,859,761 |
| Business
Services – 2.7% |
|
| Cap
Gemini S.A. |
|
8,815
|
$
2,162,731 |
| Experian
PLC |
|
73,757
|
3,625,963 |
| |
|
|
|
$5,788,694 |
| Chemicals
– 0.6% |
|
| UPL
Ltd. |
|
138,685
|
$
1,393,834 |
| Computer
Software – 5.9% |
|
| Dassault
Systemes SE |
|
23,881
|
$
1,422,231 |
| Kingsoft
Corp. |
|
161,800
|
710,691 |
| NAVER
Corp. (a) |
|
6,919
|
2,203,021 |
| Oracle
Corp. Japan |
|
12,700
|
964,949 |
| SAP
SE |
|
48,000
|
6,855,408 |
| Wisetech
Global Ltd. |
|
11,255
|
479,687 |
| |
|
|
|
$12,635,987 |
| Computer
Software - Systems – 4.1% |
|
| Amadeus
IT Group S.A. (a) |
|
20,232
|
$
1,362,717 |
| Hitachi
Ltd. |
|
115,900
|
6,277,119 |
| NICE
Systems Ltd., ADR (a) |
|
3,251
|
987,004 |
| |
|
|
|
$8,626,840 |
| Consumer
Products – 4.4% |
|
| AmorePacific
Corp. (a) |
|
7,906
|
$
1,110,664 |
| Kao
Corp. |
|
24,200
|
1,266,276 |
| KOSE
Corp. |
|
6,900
|
782,796 |
| L'Oréal
|
|
2,612
|
1,239,910 |
MFS International Growth
Portfolio
Portfolio of
Investments – continued
| Issuer
|
|
|
Shares/Par
|
Value
($) |
| Common
Stocks – continued |
| Consumer
Products – continued |
|
| Reckitt
Benckiser Group PLC |
|
57,037
|
$
4,896,178 |
| |
|
|
|
$9,295,824 |
| Electrical
Equipment – 4.3% |
|
| Prysmian
S.p.A. |
|
60,879
|
$
2,294,878 |
| Schneider
Electric SE |
|
34,694
|
6,812,016 |
| |
|
|
|
$9,106,894 |
| Electronics
– 5.9% |
|
| Delta
Electronics, Inc. |
|
285,000
|
$
2,832,797 |
| Taiwan
Semiconductor Manufacturing Co. Ltd., ADR |
|
80,276
|
9,658,006 |
| |
|
|
|
$12,490,803 |
| Energy
- Independent – 1.5% |
|
| Reliance
Industries Ltd. |
|
71,605
|
$
2,281,158 |
| Santos
Ltd. |
|
179,431
|
823,739 |
| |
|
|
|
$3,104,897 |
| Food
& Beverages – 4.9% |
|
| Nestle
S.A. |
|
74,386
|
$
10,403,591 |
| Food
& Drug Stores – 0.4% |
|
| Sugi
Holdings Co. Ltd. |
|
14,800
|
$
896,775 |
| Gaming
& Lodging – 1.1% |
|
| Flutter
Entertainment PLC (a) |
|
14,506
|
$
2,309,028 |
| General
Merchandise – 0.3% |
|
| Walmart
de Mexico S.A.B. de C.V. |
|
193,337
|
$
718,469 |
| Insurance
– 2.8% |
|
| AIA
Group Ltd. |
|
483,800
|
$
4,876,747 |
| Ping
An Insurance Co. of China Ltd., “H” |
|
139,500
|
1,004,537 |
| |
|
|
|
$5,881,284 |
| Internet
– 3.4% |
|
| Alibaba
Group Holding Ltd. (a) |
|
162,800
|
$
2,482,436 |
| Tencent
Holdings Ltd. |
|
47,500
|
2,782,669 |
| Z
Holdings Corp. |
|
333,300
|
1,933,795 |
| |
|
|
|
$7,198,900 |
| Leisure
& Toys – 0.5% |
|
| Prosus
N.V. |
|
12,592
|
$
1,054,125 |
| Machinery
& Tools – 4.8% |
|
| Assa
Abloy AB |
|
74,031
|
$
2,248,909 |
| GEA
Group AG |
|
48,179
|
2,637,822 |
| Ingersoll
Rand, Inc. |
|
32,438
|
2,006,939 |
| Ritchie
Bros. Auctioneers, Inc. |
|
52,457
|
3,210,163 |
| |
|
|
|
$10,103,833 |
| Major
Banks – 1.3% |
|
| DBS
Group Holdings Ltd. |
|
116,800
|
$
2,830,727 |
MFS International Growth
Portfolio
Portfolio of
Investments – continued
| Issuer
|
|
|
Shares/Par
|
Value
($) |
| Common
Stocks – continued |
| Medical
& Health Technology & Services – 0.3% |
|
| Alcon,
Inc. |
|
7,710
|
$
679,289 |
| Medical
Equipment – 5.0% |
|
| EssilorLuxottica
|
|
26,400
|
$
5,627,759 |
| QIAGEN
N.V. (a) |
|
51,539
|
2,871,870 |
| Terumo
Corp. |
|
49,900
|
2,108,267 |
| |
|
|
|
$10,607,896 |
| Natural
Gas - Distribution – 0.8% |
|
| China
Resources Gas Group Ltd. |
|
288,000
|
$
1,626,972 |
| Other
Banks & Diversified Financials – 4.3% |
|
| AEON
Financial Service Co. Ltd. |
|
65,700
|
$
709,375 |
| Credicorp
Ltd. |
|
10,152
|
1,239,255 |
| Element
Fleet Management Corp. (l) |
|
177,539
|
1,807,741 |
| Grupo
Financiero Banorte S.A. de C.V. |
|
166,256
|
1,080,090 |
| HDFC
Bank Ltd. |
|
216,273
|
4,304,183 |
| |
|
|
|
$9,140,644 |
| Pharmaceuticals
– 10.0% |
|
| Bayer
AG |
|
36,710
|
$
1,964,333 |
| Hypera
S.A. |
|
78,691
|
399,389 |
| Novartis
AG |
|
60,476
|
5,310,778 |
| Novo
Nordisk A.S., “B” |
|
35,086
|
3,922,431 |
| Roche
Holding AG |
|
23,245
|
9,635,874 |
| |
|
|
|
$21,232,805 |
| Precious
Metals & Minerals – 1.9% |
|
| Agnico
Eagle Mines Ltd. |
|
38,305
|
$
2,034,636 |
| Franco-Nevada
Corp. |
|
14,068
|
1,945,576 |
| |
|
|
|
$3,980,212 |
| Railroad
& Shipping – 2.5% |
|
| Canadian
National Railway Co. |
|
29,085
|
$
3,573,383 |
| Canadian
Pacific Railway Ltd. |
|
23,236
|
1,671,221 |
| |
|
|
|
$5,244,604 |
| Restaurants
– 0.6% |
|
| Yum
China Holdings, Inc. |
|
16,045
|
$
799,683 |
| Yum
China Holdings, Inc. |
|
8,250
|
404,800 |
| |
|
|
|
$1,204,483 |
| Specialty
Chemicals – 8.5% |
|
| Akzo
Nobel N.V. |
|
19,354
|
$
2,126,331 |
| L'Air
Liquide S.A. |
|
20,113
|
3,510,820 |
| Linde
PLC |
|
17,753
|
6,184,806 |
| Nitto
Denko Corp. |
|
17,900
|
1,383,387 |
| Sika
AG |
|
5,943
|
2,466,913 |
| Symrise
AG |
|
15,800
|
2,343,875 |
| |
|
|
|
$18,016,132 |
MFS International Growth
Portfolio
Portfolio of
Investments – continued
| Issuer
|
|
|
Shares/Par
|
Value
($) |
| Common
Stocks – continued |
| Specialty
Stores – 0.4% |
|
| Just
Eat Takeaway (a) |
|
10,183
|
$
561,929 |
| Ocado
Group PLC (a) |
|
16,155
|
366,922 |
| |
|
|
|
$928,851 |
| Tobacco
– 1.3% |
|
| ITC
Ltd. |
|
403,844
|
$
1,184,602 |
| Swedish
Match AB |
|
186,801
|
1,484,217 |
| |
|
|
|
$2,668,819 |
| Total
Common Stocks (Identified Cost, $123,205,864) |
|
$206,791,044
|
| Investment
Companies (h) – 2.2% |
| Money
Market Funds – 2.2% |
|
| MFS
Institutional Money Market Portfolio, 0.07% (v) (Identified Cost, $4,586,283) |
|
|
4,586,283
|
$
4,586,283 |
| Other
Assets, Less Liabilities – 0.4% |
|
838,362 |
| Net
Assets – 100.0% |
$212,215,689
|
| (a) |
Non-income producing
security. |
|
|
|
| (h)
|
An
affiliated issuer, which may be considered one in which the fund owns 5% or more of the outstanding voting securities, or a company which is under common control. At period end, the aggregate values of the fund's investments in affiliated issuers
and in unaffiliated issuers were $4,586,283 and $206,791,044, respectively. |
|
|
|
| (l)
|
A portion
of this security is on loan. See Note 2 for additional information. |
|
|
|
| (v)
|
Affiliated
issuer that is available only to investment companies managed by MFS. The rate quoted for the MFS Institutional Money Market Portfolio is the annualized seven-day yield of the fund at period end. |
|
|
|
| The
following abbreviations are used in this report and are defined: |
| ADR
|
American
Depositary Receipt |
See Notes to
Financial Statements
MFS International Growth
Portfolio
| Financial
Statements |
Statement of Assets and
Liabilities |
This statement
represents your fund’s balance sheet, which details the assets and liabilities comprising the total value of the fund.
| At
12/31/21 Assets |
|
| Investments
in unaffiliated issuers, at value, including $15,864 of securities on loan (identified cost, $123,205,864) |
$206,791,044
|
| Investments
in affiliated issuers, at value (identified cost, $4,586,283) |
4,586,283
|
| Receivables
for |
|
| Investments
sold |
5,276
|
| Fund
shares sold |
233,417
|
| Interest
and dividends |
941,046
|
| Receivable
from investment adviser |
10,504
|
| Other
assets |
1,225
|
| Total
assets |
$212,568,795
|
| Liabilities
|
|
| Payable
to custodian |
$635
|
| Payables
for |
|
| Fund
shares reacquired |
47,822
|
| Payable
to affiliates |
|
| Administrative
services fee |
214
|
| Shareholder
servicing costs |
95
|
| Distribution
and/or service fees |
1,194
|
| Deferred
country tax expense payable |
225,201
|
| Accrued
expenses and other liabilities |
77,945
|
| Total
liabilities |
$353,106
|
| Net
assets |
$212,215,689
|
| Net
assets consist of |
|
| Paid-in
capital |
$118,383,930
|
| Total
distributable earnings (loss) |
93,831,759
|
| Net
assets |
$212,215,689
|
| Shares
of beneficial interest outstanding |
12,717,222
|
| |
Net
assets |
Shares
outstanding |
Net
asset value
per share |
| Initial
Class |
$124,670,767
|
7,428,336
|
$16.78
|
| Service
Class |
87,544,922
|
5,288,886
|
16.55
|
See Notes to Financial Statements
MFS International Growth
Portfolio
| Financial
Statements |
Statement of Operations
|
This statement describes how much
your fund earned in investment income and accrued in expenses. It also describes any gains and/or losses generated by fund operations.
| Year
ended 12/31/21 |
|
| Net
investment income (loss) |
|
| Income
|
|
| Dividends
|
$3,082,147
|
| Income
on securities loaned |
3,166
|
| Dividends
from affiliated issuers |
1,664
|
| Other
|
29
|
| Foreign
taxes withheld |
(361,001)
|
| Total
investment income |
$2,726,005
|
| Expenses
|
|
| Management
fee |
$1,774,516
|
| Distribution
and/or service fees |
182,424
|
| Shareholder
servicing costs |
14,998
|
| Administrative
services fee |
36,586
|
| Independent
Trustees' compensation |
4,867
|
| Custodian
fee |
66,010
|
| Shareholder
communications |
9,153
|
| Audit
and tax fees |
69,795
|
| Legal
fees |
1,077
|
| Miscellaneous
|
23,957
|
| Total
expenses |
$2,183,383
|
| Reduction
of expenses by investment adviser |
(265,585)
|
| Net
expenses |
$1,917,798
|
| Net
investment income (loss) |
$808,207
|
| Realized
and unrealized gain (loss) |
|
| Realized
gain (loss) (identified cost basis) |
|
| Unaffiliated
issuers (net of $35,205 country tax) |
$10,818,436
|
| Foreign
currency |
(17,753)
|
| Net
realized gain (loss) |
$10,800,683
|
| Change
in unrealized appreciation or depreciation |
|
| Unaffiliated
issuers (net of $104,456 increase in deferred country tax) |
$5,353,751
|
| Translation
of assets and liabilities in foreign currencies |
(30,405)
|
| Net
unrealized gain (loss) |
$5,323,346
|
| Net
realized and unrealized gain (loss) |
$16,124,029
|
| Change
in net assets from operations |
$16,932,236
|
See Notes to Financial Statements
MFS International Growth
Portfolio
| Financial
Statements |
Statements of Changes in
Net Assets |
These statements describe
the increases and/or decreases in net assets resulting from operations, any distributions, and any shareholder transactions.
| |
Year
ended |
| |
12/31/21
|
12/31/20
|
| Change
in net assets |
|
|
| From
operations |
|
|
| Net
investment income (loss) |
$808,207
|
$933,931
|
| Net
realized gain (loss) |
10,800,683
|
8,441,039
|
| Net
unrealized gain (loss) |
5,323,346
|
14,193,358
|
| Change
in net assets from operations |
$16,932,236
|
$23,568,328
|
| Total
distributions to shareholders |
$(9,355,125)
|
$(3,926,189)
|
| Change
in net assets from fund share transactions |
$32,495,568
|
$5,625,171
|
| Total
change in net assets |
$40,072,679
|
$25,267,310
|
| Net
assets |
|
|
| At
beginning of period |
172,143,010
|
146,875,700
|
| At
end of period |
$212,215,689
|
$172,143,010
|
See Notes to Financial Statements
MFS International Growth
Portfolio
| Financial
Statements |
Financial Highlights
|
The financial highlights table is
intended to help you understand the fund's financial performance for the past 5 years. Certain information reflects financial results for a single fund share. The total returns in the table represent the rate that an investor would have earned (or
lost) on an investment in the fund share class (assuming reinvestment of all distributions) held for the entire period.
| Initial
Class |
Year
ended |
| |
12/31/21
|
12/31/20
|
12/31/19
|
12/31/18
|
12/31/17
|
| Net
asset value, beginning of period |
$16.09
|
$14.26
|
$12.78
|
$15.50
|
$12.13
|
| Income
(loss) from investment operations |
|
|
|
|
|
| Net
investment income (loss) (d) |
$0.09
|
$0.10
|
$0.21
|
$0.17
|
$0.14
|
| Net
realized and unrealized gain (loss) |
1.39
|
2.12
|
3.07
|
(1.38)
|
3.77
|
| Total
from investment operations |
$1.48
|
$2.22
|
$3.28
|
$(1.21)
|
$3.91
|
| Less
distributions declared to shareholders |
|
|
|
|
|
| From
net investment income |
$(0.09)
|
$(0.21)
|
$(0.18)
|
$(0.16)
|
$(0.20)
|
| From
net realized gain |
(0.70)
|
(0.18)
|
(1.62)
|
(1.35)
|
(0.34)
|
| Total
distributions declared to shareholders |
$(0.79)
|
$(0.39)
|
$(1.80)
|
$(1.51)
|
$(0.54)
|
| Net
asset value, end of period (x) |
$16.78
|
$16.09
|
$14.26
|
$12.78
|
$15.50
|
| Total
return (%) (k)(r)(s)(x) |
9.27
|
15.84
|
27.30
|
(9.02)
|
32.64
|
Ratios
(%) (to average net assets)
and Supplemental data: |
|
|
|
|
|
| Expenses
before expense reductions |
1.01
|
1.04
|
1.05
|
1.05
|
1.05
|
| Expenses
after expense reductions |
0.88
|
0.88
|
0.88
|
0.97
|
1.05
|
| Net
investment income (loss) |
0.52
|
0.72
|
1.49
|
1.16
|
0.96
|
| Portfolio
turnover |
14
|
26
|
7
|
18
|
10
|
| Net
assets at end of period (000 omitted) |
$124,671
|
$120,291
|
$112,259
|
$105,919
|
$130,591
|
| Service
Class |
Year
ended |
| |
12/31/21
|
12/31/20
|
12/31/19
|
12/31/18
|
12/31/17
|
| Net
asset value, beginning of period |
$15.90
|
$14.11
|
$12.65
|
$15.37
|
$12.03
|
| Income
(loss) from investment operations |
|
|
|
|
|
| Net
investment income (loss) (d) |
$0.04
|
$0.06
|
$0.16
|
$0.13
|
$0.10
|
| Net
realized and unrealized gain (loss) |
1.38
|
2.09
|
3.07
|
(1.38)
|
3.74
|
| Total
from investment operations |
$1.42
|
$2.15
|
$3.23
|
$(1.25)
|
$3.84
|
| Less
distributions declared to shareholders |
|
|
|
|
|
| From
net investment income |
$(0.07)
|
$(0.18)
|
$(0.15)
|
$(0.12)
|
$(0.16)
|
| From
net realized gain |
(0.70)
|
(0.18)
|
(1.62)
|
(1.35)
|
(0.34)
|
| Total
distributions declared to shareholders |
$(0.77)
|
$(0.36)
|
$(1.77)
|
$(1.47)
|
$(0.50)
|
| Net
asset value, end of period (x) |
$16.55
|
$15.90
|
$14.11
|
$12.65
|
$15.37
|
| Total
return (%) (k)(r)(s)(x) |
8.99
|
15.50
|
27.11
|
(9.30)
|
32.35
|
Ratios
(%) (to average net assets)
and Supplemental data: |
|
|
|
|
|
| Expenses
before expense reductions |
1.27
|
1.29
|
1.30
|
1.30
|
1.30
|
| Expenses
after expense reductions |
1.13
|
1.13
|
1.13
|
1.22
|
1.30
|
| Net
investment income (loss) |
0.22
|
0.44
|
1.18
|
0.87
|
0.70
|
| Portfolio
turnover |
14
|
26
|
7
|
18
|
10
|
| Net
assets at end of period (000 omitted) |
$87,545
|
$51,852
|
$34,616
|
$27,233
|
$29,544
|
See Notes to Financial Statements
MFS International Growth
Portfolio
Financial Highlights - continued
| (d)
|
Per share data
is based on average shares outstanding. |
| (k)
|
The total
return does not reflect expenses that apply to separate accounts. Inclusion of these charges would reduce the total return figures for all periods shown. |
| (r)
|
Certain
expenses have been reduced without which performance would have been lower. |
| (s)
|
From time to
time the fund may receive proceeds from litigation settlements, without which performance would be lower. |
| (x)
|
The
net asset values and total returns have been calculated on net assets which include adjustments made in accordance with U.S. generally accepted accounting principles required at period end for financial reporting purposes. |
See Notes to Financial Statements
MFS International Growth
Portfolio
Notes to Financial Statements
(1) Business and Organization
MFS International Growth Portfolio (the fund) is a
diversified series of MFS Variable Insurance Trust II (the trust). The trust is organized as a Massachusetts business trust and is registered under the Investment Company Act of 1940, as amended, as an open-end management investment company. The
shareholders of each series of the trust are separate accounts of insurance companies, which offer variable annuity and/or life insurance products, and qualified retirement and pension plans.
The fund is an investment company and accordingly follows
the investment company accounting and reporting guidance of the Financial Accounting Standards Board (FASB) Accounting Standards Codification Topic 946 Financial Services - Investment Companies.
(2) Significant Accounting Policies
General — The
preparation of financial statements in conformity with U.S. generally accepted accounting principles requires management to make estimates and assumptions that affect the reported amounts of assets and liabilities, and disclosure of contingent
assets and liabilities at the date of the financial statements and the reported amounts of increases and decreases in net assets from operations during the reporting period. Actual results could differ from those estimates. In the preparation of
these financial statements, management has evaluated subsequent events occurring after the date of the fund’s Statement of Assets and Liabilities through the date that the financial statements were issued. The fund invests in foreign securities, including securities of emerging market issuers. Investments in foreign securities are vulnerable to the effects of changes in the relative values of the local currency and the
U.S. dollar and to the effects of changes in each country’s market, economic, industrial, political, regulatory, geopolitical, environmental, public health, and other conditions. Investments in emerging markets can involve additional and
greater risks than the risks associated with investments in developed foreign markets. Emerging markets can have less developed markets, greater custody and operational risk, less developed legal, regulatory, accounting, and auditing systems, and
greater political, social, and economic instability than developed markets.
Balance Sheet Offsetting
— The fund's accounting policy with respect to balance sheet offsetting is that, absent an event of default by the counterparty or a termination of the agreement, the International Swaps and Derivatives Association (ISDA) Master Agreement, or
similar agreement, does not result in an offset of reported amounts of financial assets and financial liabilities in the Statement of Assets and Liabilities across transactions between the fund and the applicable counterparty. The fund's right to
setoff may be restricted or prohibited by the bankruptcy or insolvency laws of the particular jurisdiction to which a specific master netting agreement counterparty is subject. Balance sheet offsetting disclosures, to the extent applicable to the
fund, have been included in the fund’s Significant Accounting Policies note under the captions for each of the fund’s in-scope financial instruments and transactions.
Investment Valuations
— Equity securities, including restricted equity securities, are generally valued at the last sale or official closing price on their primary market or exchange as provided by a third-party pricing
service. Equity securities, for which there were no sales reported that day, are generally valued at the last quoted daily bid quotation on their primary market or exchange as provided by a third-party pricing service. Short-term instruments with a maturity at issuance of 60 days or less may be valued at amortized cost, which approximates market value. Open-end investment companies are
generally valued at net asset value per share.
Securities and
other assets generally valued on the basis of information from a third-party pricing service may also be valued at a broker/dealer bid quotation. In determining values, third-party pricing services can utilize both transaction data and market
information such as yield, quality, coupon rate, maturity, type of issue, trading characteristics, and other market data. The values of foreign securities and other assets and liabilities expressed in foreign currencies are converted to U.S. dollars
using the mean of bid and asked prices for rates provided by a third-party pricing service.
The Board of Trustees has delegated primary responsibility
for determining or causing to be determined the value of the fund’s investments (including any fair valuation) to the adviser pursuant to valuation policies and procedures approved by the Board. If the adviser determines that reliable market
quotations are not readily available, investments are valued at fair value as determined in good faith by the adviser in accordance with such procedures under the oversight of the Board of Trustees. Under the fund’s valuation policies and
procedures, market quotations are not considered to be readily available for most types of debt instruments and floating rate loans and many types of derivatives. These investments are generally valued at fair value based on information from
third-party pricing services. In addition, investments may be valued at fair value if the adviser determines that an investment’s value has been materially affected by events occurring after the close of the exchange or market on which the
investment is principally traded (such as foreign exchange or market) and prior to the determination of the fund’s net asset value, or after the halt of trading of a specific security where trading does not resume prior to the close of the
exchange or market on which the security is principally traded. Events that occur after foreign markets close (such as developments in foreign markets and significant movements in the U.S. markets) and prior to the determination of the fund’s
net asset value may be deemed to have a material effect on the value of securities traded in foreign markets. Accordingly, the fund’s foreign equity securities may often be valued at fair value. The adviser
MFS International Growth
Portfolio
Notes to Financial Statements - continued
generally relies on
third-party pricing services or other information (such as the correlation with price movements of similar securities in the same or other markets; the type, cost and investment characteristics of the security; the business and financial condition
of the issuer; and trading and other market data) to assist in determining whether to fair value and at what value to fair value an investment. The value of an investment for purposes of calculating the fund’s net asset value can differ
depending on the source and method used to determine value. When fair valuation is used, the value of an investment used to determine the fund’s net asset value may differ from quoted or published prices for the same investment. There can be
no assurance that the fund could obtain the fair value assigned to an investment if it were to sell the investment at the same time at which the fund determines its net asset value per share.
Various inputs are used in determining the value of the
fund's assets or liabilities. These inputs are categorized into three broad levels. In certain cases, the inputs used to measure fair value may fall into different levels of the fair value hierarchy. In such cases, an investment's level within the
fair value hierarchy is based on the lowest level of input that is significant to the fair value measurement. The fund's assessment of the significance of a particular input to the fair value measurement in its entirety requires judgment, and
considers factors specific to the investment. Level 1 includes unadjusted quoted prices in active markets for identical assets or liabilities. Level 2 includes other significant observable market-based inputs (including quoted prices for similar
securities, interest rates, prepayment speed, and credit risk). Level 3 includes unobservable inputs, which may include the adviser's own assumptions in determining the fair value of investments. The following is a summary of the levels used as of
December 31, 2021 in valuing the fund's assets and liabilities:
| Financial
Instruments |
Level
1 |
Level
2 |
Level
3 |
Total
|
| Equity
Securities: |
|
|
|
|
| France
|
$34,464,783
|
$—
|
$—
|
$34,464,783
|
| Switzerland
|
10,403,591
|
18,092,854
|
—
|
28,496,445
|
| United
Kingdom |
19,412,320
|
—
|
—
|
19,412,320
|
| Germany
|
8,934,943
|
9,727,278
|
—
|
18,662,221
|
| Japan
|
17,492,773
|
—
|
—
|
17,492,773
|
| Canada
|
14,242,720
|
—
|
—
|
14,242,720
|
| Taiwan
|
12,490,803
|
—
|
—
|
12,490,803
|
| China
|
9,811,788
|
—
|
—
|
9,811,788
|
| India
|
9,163,777
|
—
|
—
|
9,163,777
|
| Other
Countries |
33,535,140
|
9,018,274
|
—
|
42,553,414
|
| Mutual
Funds |
4,586,283
|
—
|
—
|
4,586,283
|
| Total
|
$174,538,921
|
$36,838,406
|
$—
|
$211,377,327
|
For further information
regarding security characteristics, see the Portfolio of Investments.
Foreign Currency
Translation — Purchases and sales of foreign investments, income, and expenses are converted into U.S. dollars based upon currency exchange rates prevailing on the respective dates of such transactions or on
the reporting date for foreign denominated receivables and payables. Gains and losses attributable to foreign currency exchange rates on sales of securities are recorded for financial statement purposes as net realized gains and losses on
investments. Gains and losses attributable to foreign exchange rate movements on receivables, payables, income and expenses are recorded for financial statement purposes as foreign currency transaction gains and losses. That portion of both realized
and unrealized gains and losses on investments that results from fluctuations in foreign currency exchange rates is not separately disclosed.
Security Loans —
Under its Securities Lending Agency Agreement with the fund, State Street Bank and Trust Company, as lending agent, loans the securities of the fund to certain qualified institutions (the “Borrowers”) approved by the fund. Security loans
can be terminated at the discretion of either the lending agent or the fund and the related securities must be returned within the earlier of the standard trade settlement period for such securities or within three business days. The loans are
collateralized by cash and/or U.S. Treasury and federal agency obligations in an amount typically at least equal to the market value of the securities loaned. On loans collateralized by cash, the cash collateral is invested in a money market fund.
The market value of the loaned securities is determined at the close of business of the fund and any additional required collateral is delivered to the fund on the next business day. The lending agent provides the fund with indemnification against
Borrower default. In the event of Borrower default, the lending agent will, for the benefit of the fund, either purchase securities identical to those loaned or, when such purchase is commercially impracticable, pay the fund the market value of the
loaned securities. In return, the lending agent assumes the fund's rights to the related collateral. If the collateral value is less than the cost to purchase identical securities, the lending agent is responsible for the shortfall, but only to the
extent that such shortfall is not due to a decline in collateral value resulting from collateral reinvestment for which the fund bears the risk of loss. At period end, the fund had investment securities on loan, all of which were classified as
equity securities in the fund’s Portfolio of Investments, with a fair value of $15,864. The fair value of the fund’s investment securities on loan is presented gross in the Statement of Assets and Liabilities. These loans were
collateralized by U.S. Treasury Obligations of $16,709 held by the lending agent. The collateral on securities loaned exceeded the value of securities
MFS International Growth
Portfolio
Notes to Financial Statements - continued
on loan at period
end. A portion of the income generated upon investment of the collateral is remitted to the Borrowers, and the remainder is allocated between the fund and the lending agent. On loans collateralized by U.S. Treasury and/or federal agency obligations,
a fee is received from the Borrower, and is allocated between the fund and the lending agent. Income from securities lending is separately reported in the Statement of Operations. The dividend and interest income earned on the securities loaned is
accounted for in the same manner as other dividend and interest income.
Indemnifications —
Under the fund's organizational documents, its officers and Trustees may be indemnified against certain liabilities and expenses arising out of the performance of their duties to the fund. Additionally, in the normal course of business, the fund
enters into agreements with service providers that may contain indemnification clauses. The fund's maximum exposure under these agreements is unknown as this would involve future claims that may be made against the fund that have not yet
occurred.
Investment Transactions and Income — Investment transactions are recorded on the trade date. Dividends received in cash are recorded on the ex-dividend date. Certain dividends from foreign securities will be
recorded when the fund is informed of the dividend if such information is obtained subsequent to the ex-dividend date. Dividend payments received in additional securities are recorded on the ex-dividend date in an amount equal to the value of the
security on such date.
The fund may receive
proceeds from litigation settlements. Any proceeds received from litigation involving portfolio holdings are reflected in the Statement of Operations in realized gain/loss if the security has been disposed of by the fund or in unrealized gain/loss
if the security is still held by the fund. Any other proceeds from litigation not related to portfolio holdings are reflected as other income in the Statement of Operations.
Tax Matters and Distributions — The fund intends to qualify as a regulated investment company, as defined under Subchapter M of the Internal Revenue Code, and to distribute all of its taxable income, including realized capital gains. As a
result, no provision for federal income tax is required. The fund’s federal tax returns, when filed, will remain subject to examination by the Internal Revenue Service for a three year period. Management has analyzed the fund’s tax
positions taken on federal and state tax returns for all open tax years and does not believe that there are any uncertain tax positions that require recognition of a tax liability. Foreign taxes, if any, have been accrued by the fund in the
accompanying financial statements in accordance with the applicable foreign tax law. Foreign income taxes may be withheld by certain countries in which the fund invests. Additionally, capital gains realized by the fund on securities issued in or by
certain foreign countries may be subject to capital gains tax imposed by those countries.
Distributions to shareholders are recorded on the
ex-dividend date. Income and capital gain distributions are determined in accordance with income tax regulations, which may differ from U.S. generally accepted accounting principles. Certain capital accounts in the financial statements are
periodically adjusted for permanent differences in order to reflect their tax character. These adjustments have no impact on net assets or net asset value per share. Temporary differences which arise from recognizing certain items of income,
expense, gain or loss in different periods for financial statement and tax purposes will reverse at some time in the future.
Book/tax differences primarily relate to passive foreign
investment companies and wash sale loss deferrals.
The tax character of distributions declared to shareholders
for the last two fiscal years is as follows:
| |
Year
ended
12/31/21 |
Year
ended
12/31/20 |
| Ordinary
income (including any short-term capital gains) |
$1,563,110
|
$2,433,126
|
| Long-term
capital gains |
7,792,015
|
1,493,063
|
| Total
distributions |
$9,355,125
|
$3,926,189
|
The federal tax cost and the tax
basis components of distributable earnings were as follows:
| As
of 12/31/21 |
|
| Cost
of investments |
$129,405,184
|
| Gross
appreciation |
90,121,730
|
| Gross
depreciation |
(8,149,587)
|
| Net
unrealized appreciation (depreciation) |
$81,972,143
|
| Undistributed
ordinary income |
1,969,437
|
| Undistributed
long-term capital gain |
9,870,372
|
| Other
temporary differences |
19,807
|
| Total
distributable earnings (loss) |
$93,831,759
|
MFS International Growth
Portfolio
Notes to Financial Statements - continued
Multiple Classes of Shares of Beneficial Interest — The fund offers multiple classes of shares, which differ in their respective distribution and/or service fees. The fund's income, realized and unrealized gain (loss), and common expenses are allocated to
shareholders based on the daily net assets of each class. Dividends are declared separately for each class. Differences in per share dividend rates are generally due to differences in separate class expenses. The fund’s distributions declared
to shareholders as reported in the Statements of Changes in Net Assets are presented by class as follows:
| |
Year
ended
12/31/21 |
|
Year
ended
12/31/20 |
| Initial
Class |
$5,715,069
|
|
$2,927,657
|
| Service
Class |
3,640,056
|
|
998,532
|
| Total
|
$9,355,125
|
|
$3,926,189
|
(3) Transactions with
Affiliates
Investment Adviser — The fund has an investment advisory agreement with MFS to provide overall investment management and related administrative services and facilities to the fund. The
management fee is computed daily and paid monthly at the following annual rates based on the fund's average daily net assets:
| Up
to $1 billion |
0.90%
|
| In
excess of $1 billion and up to $2 billion |
0.80%
|
| In
excess of $2 billion |
0.70%
|
MFS has agreed in writing to
reduce its management fee by a specified amount if certain MFS mutual fund assets exceed thresholds agreed to by MFS and the fund's Board of Trustees. For the year ended December 31, 2021, this management fee reduction amounted to $25,095, which is
included in the reduction of total expenses in the Statement of Operations. The management fee incurred for the year ended December 31, 2021 was equivalent to an annual effective rate of 0.89% of the fund's average daily net assets.
The investment adviser has agreed in writing to pay a
portion of the fund’s total annual operating expenses, excluding interest, taxes, extraordinary expenses, brokerage and transaction costs, and investment-related expenses, such that total annual operating expenses do not exceed 0.88% of
average daily net assets for the Initial Class shares and 1.13% of average daily net assets for the Service Class shares. This written agreement will continue until modified by the fund’s Board of Trustees, but such agreement will continue at
least until April 30, 2023. For the year ended December 31, 2021, this reduction amounted to $240,490, which is included in the reduction of total expenses in the Statement of Operations.
Distributor — MFS
Fund Distributors, Inc. (MFD), a wholly-owned subsidiary of MFS, is the distributor of shares of the fund. The Trustees have adopted a distribution plan for the Service Class shares pursuant to Rule 12b-1 under the Investment Company Act of
1940.
The fund's distribution plan provides
that the fund will pay MFD distribution and/or service fees equal to 0.25% per annum of its average daily net assets attributable to Service Class shares as partial consideration for services performed and expenses incurred by MFD and financial
intermediaries (including participating insurance companies that invest in the fund to fund variable annuity and variable life insurance contracts, sponsors of qualified retirement and pension plans that invest in the fund, and affiliates of these
participating insurance companies and plan sponsors) in connection with the sale and distribution of the Service Class shares. MFD may subsequently pay all, or a portion, of the distribution and/or service fees to financial intermediaries.
Shareholder Servicing Agent
— MFS Service Center, Inc. (MFSC), a wholly-owned subsidiary of MFS, receives a fee from the fund for its services as shareholder servicing agent. For the year ended December 31, 2021, the fee was $14,150, which equated to 0.0072% annually of
the fund's average daily net assets. MFSC also receives reimbursement from the fund for out-of-pocket expenses paid by MFSC on behalf of the fund. For the year ended December 31, 2021, these costs amounted to $848.
Administrator — MFS
provides certain financial, legal, shareholder communications, compliance, and other administrative services to the fund. Under an administrative services agreement, the fund reimburses MFS the costs incurred to provide these services. The fund is
charged an annual fixed amount of $17,500 plus a fee based on average daily net assets. The administrative services fee incurred for the year ended December 31, 2021 was equivalent to an annual effective rate of 0.0186% of the fund's average daily
net assets.
MFS International Growth
Portfolio
Notes to Financial Statements - continued
Trustees’ and Officers’ Compensation — The fund pays compensation to independent Trustees in the form of a retainer, attendance fees, and additional compensation to Board and Committee chairpersons. The fund does not pay compensation directly to
Trustees or officers of the fund who are also officers of the investment adviser, all of whom receive remuneration from MFS for their services to the fund. Certain officers and Trustees of the fund are officers or directors of MFS, MFD, and
MFSC.
Other
— The fund invests in the MFS Institutional Money Market Portfolio which is managed by MFS and seeks current income consistent with preservation of capital and liquidity. This money market fund does not pay a
management fee to MFS but does incur investment and operating costs.
The fund is permitted to engage in purchase and sale
transactions with funds and accounts for which MFS serves as investment adviser or sub-adviser (“cross-trades”) pursuant to a policy adopted by the Board of Trustees. This policy has been designed to ensure that cross-trades conducted by
the fund comply with Rule 17a-7 under the Investment Company Act of 1940. During the year ended December 31, 2021, the fund engaged in sale transactions pursuant to this policy, which amounted to $20,919. The sales transactions resulted in net
realized gains (losses) of $3,363.
(4) Portfolio Securities
For the year ended December 31, 2021, purchases and sales
of investments, other than short-term obligations, aggregated $47,810,167 and $27,397,172, respectively.
(5) Shares of Beneficial Interest
The fund's Declaration of Trust permits the Trustees to
issue an unlimited number of full and fractional shares of beneficial interest. Transactions in fund shares were as follows:
| |
Year
ended
12/31/21 |
|
Year
ended
12/31/20 |
| |
Shares
|
Amount
|
|
Shares
|
Amount
|
| Shares
sold |
|
|
|
|
|
| Initial
Class |
736,218
|
$12,306,356
|
|
824,973
|
$11,064,566
|
| Service
Class |
2,496,290
|
41,263,750
|
|
1,697,426
|
23,498,214
|
| |
3,232,508
|
$53,570,106
|
|
2,522,399
|
$34,562,780
|
Shares
issued to shareholders
in reinvestment of distributions |
|
|
|
|
|
| Initial
Class |
345,113
|
$5,715,069
|
|
199,296
|
$2,927,657
|
| Service
Class |
222,633
|
3,640,056
|
|
68,722
|
998,532
|
| |
567,746
|
$9,355,125
|
|
268,018
|
$3,926,189
|
| Shares
reacquired |
|
|
|
|
|
| Initial
Class |
(1,130,683)
|
$(18,993,670)
|
|
(1,416,593)
|
$(19,892,313)
|
| Service
Class |
(691,959)
|
(11,435,993)
|
|
(957,919)
|
(12,971,485)
|
| |
(1,822,642)
|
$(30,429,663)
|
|
(2,374,512)
|
$(32,863,798)
|
| Net
change |
|
|
|
|
|
| Initial
Class |
(49,352)
|
$(972,245)
|
|
(392,324)
|
$(5,900,090)
|
| Service
Class |
2,026,964
|
33,467,813
|
|
808,229
|
11,525,261
|
| |
1,977,612
|
$32,495,568
|
|
415,905
|
$5,625,171
|
The fund is one of several
mutual funds in which certain MFS funds may invest. The MFS funds do not invest in the underlying funds for the purpose of exercising management or control. At the end of the period, the MFS Moderate Allocation Portfolio, the MFS Growth Allocation
Portfolio, and the MFS Conservative Allocation Portfolio were the owners of record of approximately 19%, 8%, and 4%, respectively, of the value of outstanding voting shares of the fund.
(6) Line of Credit
The fund and certain other funds managed by MFS participate
in a $1.25 billion unsecured committed line of credit of which $1 billion is reserved for use by the fund and certain other MFS U.S. funds. The line of credit is provided by a syndicate of banks under a credit agreement. Borrowings may be made for
temporary financing needs. Interest is charged to each fund, based on its borrowings, generally at a rate equal to the highest of one month LIBOR, the Federal Funds Effective Rate and the Overnight Bank Funding Rate, plus an agreed upon spread. A
commitment fee, based on the average daily, unused portion of the committed line of credit, is allocated among the participating funds. In addition, the fund and other funds managed by MFS have established
MFS International Growth
Portfolio
Notes to Financial Statements - continued
unsecured
uncommitted borrowing arrangements with certain banks for temporary financing needs. Interest is charged to each fund, based on its borrowings, at rates equal to customary reference rates plus an agreed upon spread. For the year ended December 31,
2021, the fund’s commitment fee and interest expense were $673 and $0, respectively, and are included in “Miscellaneous” expense in the Statement of Operations.
(7) Investments in Affiliated Issuers
An affiliated issuer may be considered one in which the
fund owns 5% or more of the outstanding voting securities, or a company which is under common control. For the purposes of this report, the following were affiliated issuers:
| Affiliated
Issuers |
Beginning
Value |
Purchases
|
Sales
Proceeds |
Realized
Gain
(Loss) |
Change
in
Unrealized
Appreciation or
Depreciation |
Ending
Value |
| MFS
Institutional Money Market Portfolio |
$1,012,087
|
$37,121,699
|
$33,547,503
|
$—
|
$—
|
$4,586,283
|
| Affiliated
Issuers |
Dividend
Income |
Capital
Gain
Distributions |
| MFS
Institutional Money Market Portfolio |
$1,664
|
$—
|
(8) Impacts of
COVID-19
The pandemic related to the global spread of
novel coronavirus disease (COVID-19), which was first detected in December 2019, has resulted in significant disruptions to global business activity and the global economy, as well as the economies of individual countries, the financial performance
of individual companies and sectors, and the securities and commodities markets in general. Multiple surges in cases globally, the availability and widespread adoption of vaccines, and the emergence of variant strains of the virus continue to create
uncertainty as to the future and long-term impacts resulting from the pandemic including impacts to the prices and liquidity of the fund's investments and the fund's performance.
(9) LIBOR Transition
Certain of the fund's investments, including its
investments in derivatives, as well as any debt issued by the fund and other contractual arrangements of the fund may be based on reference interest rates such as the London Interbank Offered Rate (“LIBOR”). In 2017, the regulatory
authority that oversees financial services firms in the United Kingdom announced plans to transition away from LIBOR by the end of 2021. In March 2021, the administrator of LIBOR announced the extension of the publication of the more commonly used
U.S. dollar LIBOR settings to the end of June 2023. Although the full impacts of the transition away from LIBOR are not fully known, the transition may result in, among other things, an increase in volatility or illiquidity of the markets for
instruments that currently rely on LIBOR to determine interest rates and this could have an adverse impact on the fund's performance. With respect to the fund's accounting for investments, including its investments in derivatives, as well as any
debt issued by the fund and other contractual arrangements of the fund that undergo reference rate-related modifications as a result of the transition, management will rely upon the relief provided by FASB Codification Topic 848 – Reference
Rate Reform (Topic 848). The guidance in Topic 848 permits the fund to disregard the GAAP accounting requirements around certain contract modifications resulting from the LIBOR transition such that for contracts considered in scope, the fund can
account for those modified contracts as a continuation of the existing contracts. While the cessation of the one-week and two-month U.S. dollar LIBOR tenors along with certain other non-U.S. dollar denominated LIBOR settings at December 31, 2021 did
not have a material impact on the fund, management is still evaluating the impact to the fund of the June 30, 2023 planned discontinuation of the more commonly used U.S. dollar LIBOR settings.
MFS International Growth
Portfolio
Report of Independent Registered Public Accounting
Firm
To the Board of Trustees of MFS Variable
Insurance Trust II and the Shareholders of MFS International Growth Portfolio:
Opinion on the Financial Statements and Financial
Highlights
We have audited the accompanying statement
of assets and liabilities of MFS International Growth Portfolio (the “Fund”), including the portfolio of investments, as of December 31, 2021, the related statement of operations for the year then ended, the statements of changes in net
assets for each of the two years in the period then ended, the financial highlights for each of the five years in the period then ended, and the related notes. In our opinion, the financial statements and financial highlights present fairly, in all
material respects, the financial position of the Fund as of December 31, 2021, and the results of its operations for the year then ended, the changes in its net assets for each of the two years in the period then ended, and the financial highlights
for each of the five years in the period then ended, in conformity with accounting principles generally accepted in the United States of America.
Basis for Opinion
These financial statements and financial highlights are the
responsibility of the Fund's management. Our responsibility is to express an opinion on the Fund's financial statements and financial highlights based on our audits. We are a public accounting firm registered with the Public Company Accounting
Oversight Board (United States) (PCAOB) and are required to be independent with respect to the Fund in accordance with the U.S. federal securities laws and the applicable rules and regulations of the Securities and Exchange Commission and the
PCAOB.
We conducted our audits in accordance with the
standards of the PCAOB. Those standards require that we plan and perform the audit to obtain reasonable assurance about whether the financial statements and financial highlights are free of material misstatement, whether due to error or fraud. The
Fund is not required to have, nor were we engaged to perform, an audit of its internal control over financial reporting. As part of our audits, we are required to obtain an understanding of internal control over financial reporting but not for the
purpose of expressing an opinion on the effectiveness of the Fund's internal control over financial reporting. Accordingly, we express no such opinion.
Our audits included performing procedures to assess the
risks of material misstatement of the financial statements and financial highlights, whether due to error or fraud, and performing procedures that respond to those risks. Such procedures included examining, on a test basis, evidence regarding the
amounts and disclosures in the financial statements and financial highlights. Our audits also included evaluating the accounting principles used and significant estimates made by management, as well as evaluating the overall presentation of the
financial statements and financial highlights. Our procedures included confirmation of securities owned as of December 31, 2021, by correspondence with the custodian and brokers. We believe that our audits provide a reasonable basis for our
opinion.
DELOITTE & TOUCHE LLP
Boston, Massachusetts
February 15, 2022
We have served as the auditor of one or more of the MFS
investment companies since 1924.
MFS International Growth
Portfolio
Trustees and Officers — Identification and
Background
The Trustees and Officers of the Trust, as
of February 1, 2022, are listed below, together with their principal occupations during the past five years. (Their titles may have varied during that period.) The address of each Trustee and Officer is 111 Huntington Avenue, Boston, Massachusetts
02199-7618.
| Name,
Age |
|
Position(s)
Held with Fund |
|
Trustee/Officer
Since(h) |
|
Number
of MFS Funds overseen by the Trustee |
|
Principal
Occupations During
the Past Five Years |
|
Other
Directorships During
the Past Five Years (j) |
| INTERESTED
TRUSTEES |
|
|
|
|
|
|
|
|
|
|
Michael
W. Roberge (k)
(age 55) |
|
Trustee
|
|
January
2021 |
|
135
|
|
Massachusetts
Financial Services Company, Chairman (since January 2021); Chief Executive Officer (since January 2017); Director; Chairman of the Board (since January 2022); President (until December 2018); Chief Investment Officer (until December 2018) |
|
N/A
|
| INDEPENDENT
TRUSTEES |
|
|
|
|
|
|
|
|
|
|
John
P. Kavanaugh
(age 67) |
|
Trustee
and Chair of Trustees |
|
January
2009 |
|
135
|
|
Private
investor |
|
N/A
|
Steven
E. Buller
(age 70) |
|
Trustee
|
|
February
2014 |
|
135
|
|
Private
investor |
|
N/A
|
John
A. Caroselli
(age 67) |
|
Trustee
|
|
March
2017 |
|
135
|
|
Private
investor; JC Global Advisors, LLC (management consulting), President (since 2015) |
|
N/A
|
Maureen
R. Goldfarb
(age 66) |
|
Trustee
|
|
January
2009 |
|
135
|
|
Private
investor |
|
N/A
|
Peter
D. Jones
(age 66) |
|
Trustee
|
|
January
2019 |
|
135
|
|
Private
investor |
|
N/A
|
James
W. Kilman, Jr.
(age 60) |
|
Trustee
|
|
January
2019 |
|
135
|
|
Burford
Capital Limited (finance and investment management), Senior Advisor (since May 3, 2021), Chief Financial Officer (2019 - May 2, 2021); KielStrand Capital LLC (family office), Chief Executive Officer (since 2016) |
|
Alpha-En
Corporation, Director (2016-2019) |
Clarence
Otis, Jr.
(age 65) |
|
Trustee
|
|
March
2017 |
|
135
|
|
Private
investor |
|
VF
Corporation, Director; Verizon Communications, Inc., Director; The Travelers Companies, Director |
Maryanne
L. Roepke
(age 65) |
|
Trustee
|
|
May
2014 |
|
135
|
|
Private
investor |
|
N/A
|
Laurie
J. Thomsen
(age 64) |
|
Trustee
|
|
March
2005 |
|
135
|
|
Private
investor |
|
The
Travelers Companies, Director; Dycom Industries, Inc., Director |
MFS International Growth
Portfolio
Trustees and Officers - continued
| Name,
Age |
|
Position(s)
Held with
Fund |
|
Trustee/Officer
Since(h) |
|
Number
of MFS Funds for which the Person is an Officer |
|
Principal
Occupations During
the Past Five Years |
| OFFICERS
|
|
|
|
|
|
|
|
|
Christopher
R. Bohane (k)
(age 48) |
|
Assistant
Secretary and Assistant Clerk |
|
July
2005 |
|
135
|
|
Massachusetts
Financial Services Company, Senior Vice President and Associate General Counsel |
Kino
Clark (k)
(age 53) |
|
Assistant
Treasurer |
|
January
2012 |
|
135
|
|
Massachusetts
Financial Services Company, Vice President |
John
W. Clark, Jr. (k)
(age 54) |
|
Assistant
Treasurer |
|
April
2017 |
|
135
|
|
Massachusetts
Financial Services Company, Vice President (since March 2017); Deutsche Bank (financial services), Department Head - Treasurer's Office (until February 2017) |
Thomas
H. Connors (k)
(age 62) |
|
Assistant
Secretary and Assistant Clerk |
|
September
2012 |
|
135
|
|
Massachusetts
Financial Services Company, Vice President and Senior Counsel |
David
L. DiLorenzo (k)
(age 53) |
|
President
|
|
July
2005 |
|
135
|
|
Massachusetts
Financial Services Company, Senior Vice President |
Heidi
W. Hardin (k)
(age 54) |
|
Secretary
and Clerk |
|
April
2017 |
|
135
|
|
Massachusetts
Financial Services Company, Executive Vice President and General Counsel (since March 2017); Harris Associates (investment management), General Counsel (until January 2017) |
Brian
E. Langenfeld (k)
(age 48) |
|
Assistant
Secretary and Assistant Clerk |
|
June
2006 |
|
135
|
|
Massachusetts
Financial Services Company, Vice President and Senior Counsel |
Amanda
S. Mooradian (k)
(age 42) |
|
Assistant
Secretary and Assistant Clerk |
|
September
2018 |
|
135
|
|
Massachusetts
Financial Services Company, Assistant Vice President and Senior Counsel |
Susan
A. Pereira (k)
(age 51) |
|
Assistant
Secretary and Assistant Clerk |
|
July
2005 |
|
135
|
|
Massachusetts
Financial Services Company, Vice President and Assistant General Counsel |
Kasey
L. Phillips (k)
(age 51) |
|
Assistant
Treasurer |
|
September
2012 |
|
135
|
|
Massachusetts
Financial Services Company, Vice President |
Matthew
A. Stowe (k)
(age 47) |
|
Assistant
Secretary and Assistant Clerk |
|
October
2014 |
|
135
|
|
Massachusetts
Financial Services Company, Vice President and Assistant General Counsel |
Martin
J. Wolin (k)
(age 54) |
|
Chief
Compliance Officer |
|
July
2015 |
|
135
|
|
Massachusetts
Financial Services Company, Senior Vice President and Chief Compliance Officer |
James
O. Yost (k)
(age 61) |
|
Treasurer
|
|
September
1990 |
|
135
|
|
Massachusetts
Financial Services Company, Senior Vice President |
| (h)
|
Date
first appointed to serve as Trustee/Officer of an MFS Fund. Each Trustee has served continuously since appointment unless indicated otherwise. From January 2012 through December 2016, Messrs. DiLorenzo and Yost served as Treasurer and Deputy
Treasurer of the Funds, respectively. |
| (j)
|
Directorships or
trusteeships of companies required to report to the Securities and Exchange Commission (i.e., “public companies”). |
| (k)
|
“Interested
person” of the Trust within the meaning of the Investment Company Act of 1940 (referred to as the 1940 Act), which is the principal federal law governing investment companies like the fund, as a result of a position with MFS. The address of
MFS is 111 Huntington Avenue, Boston, Massachusetts 02199-7618. |
Each Trustee (other than Messrs. Jones, Kilman and Roberge)
has been elected by shareholders and each Trustee and Officer holds office until his or her successor is chosen and qualified or until his or her earlier death, resignation, retirement or removal. Mr. Roberge became a Trustee of the Funds on January
1, 2021 and Messrs. Jones and Kilman became Trustees of the Funds on January 1, 2019. The Trust does not hold annual meetings for the purpose of electing Trustees, and Trustees are not elected for fixed terms. Under the terms of the Board's
retirement policy, an Independent Trustee shall retire at the end of the calendar year in which he or she reaches the earlier of 75 years of age or 15 years of service on the Board (or, in the case of any Independent Trustee who joined the Board
prior to 2015, 20 years of service on the Board).
Messrs. Buller, Kilman and Otis and Ms. Roepke are members
of the Trust’s Audit Committee.
MFS International Growth
Portfolio
Trustees and Officers - continued
Each
of the Interested Trustees and certain Officers hold comparable officer positions with certain affiliates of MFS.
The Statement of Additional Information for a Fund includes
further information about the Trustees and is available without charge upon request by calling 1-800-225-2606.
| Investment
Adviser |
Custodian
|
Massachusetts Financial
Services Company
111 Huntington Avenue
Boston, MA 02199-7618 |
State Street
Bank and Trust Company
1 Lincoln Street
Boston, MA 02111-2900 |
| Distributor
|
Independent
Registered Public Accounting Firm |
MFS Fund
Distributors, Inc.
111 Huntington Avenue
Boston, MA 02199-7618 |
Deloitte
& Touche LLP
200 Berkeley Street
Boston, MA 02116 |
| Portfolio
Manager(s) |
|
Matthew
Barrett
Kevin Dwan
|
|
MFS International Growth
Portfolio
Board Review of Investment Advisory Agreement
MFS International Growth Portfolio
The Investment Company Act of 1940 requires that both the
full Board of Trustees and a majority of the non-interested (“independent”) Trustees, voting separately, annually approve the continuation of the Fund’s investment advisory agreement with MFS. The Trustees consider matters bearing
on the Fund and its advisory arrangements at their meetings throughout the year, including a review of performance data at each regular meeting. In addition, the independent Trustees met several times by videoconference (in accordance with
Securities and Exchange Commission relief) over the course of three months beginning in May and ending in July, 2021 (“contract review meetings”) for the specific purpose of considering whether to approve the continuation of the
investment advisory agreement for the Fund and the other investment companies that the Board oversees (the “MFS Funds”). The independent Trustees were assisted in their evaluation of the Fund’s investment advisory agreement by
independent legal counsel, from whom they received separate legal advice and with whom they met separately from MFS during various contract review meetings. The independent Trustees were also assisted in this process by an independent consultant who
was retained by and reported to the independent Trustees.
In connection with their deliberations regarding the
continuation of the investment advisory agreement, the Trustees, including the independent Trustees, considered such information and factors as they believed, in light of the legal advice furnished to them and their own business judgment, to be
relevant. The investment advisory agreement for the Fund was considered separately, although the Trustees also took into account the common interests of all MFS Funds in their review. As described below, the Trustees considered the nature, quality,
and extent of the various investment advisory, administrative, and shareholder services performed by MFS under the existing investment advisory agreement and other arrangements with the Fund.
In connection with their contract review meetings, the
Trustees received and relied upon materials that included, among other items: (i) information provided by Broadridge Financial Solutions, Inc. (“Broadridge”), an independent third party, on the investment performance of the Fund for
various time periods ended December 31, 2020 and the investment performance of a group of funds with substantially similar investment classifications/objectives (the “Broadridge performance universe”), (ii) information provided by
Broadridge on the Fund’s advisory fees and other expenses and the advisory fees and other expenses of comparable funds identified by Broadridge as well as all other funds in the same investment classification/category (the “Broadridge
expense group and universe”), (iii) information provided by MFS on the advisory fees of portfolios of other clients of MFS, including institutional separate accounts and other clients, (iv) information as to whether and to what extent
applicable expense waivers, reimbursements or fee “breakpoints” are observed for the Fund, (v) information regarding MFS’ financial results and financial condition, including MFS’ and certain of its affiliates’
estimated profitability from services performed for the Fund and the MFS Funds as a whole, and compared to MFS’ institutional business, (vi) MFS’ views regarding the outlook for the mutual fund industry and the strategic business plans
of MFS, (vii) descriptions of various functions performed by MFS for the Funds, such as compliance monitoring and portfolio trading practices, and (viii) information regarding the overall organization of MFS, including information about MFS’
senior management and other personnel providing investment advisory, administrative and other services to the Fund and the other MFS Funds. The comparative performance, fee and expense information prepared and provided by Broadridge was not
independently verified and the independent Trustees did not independently verify any information provided to them by MFS.
The Trustees’ conclusion as to the continuation of
the investment advisory agreement was based on a comprehensive consideration of all information provided to the Trustees and not the result of any single factor. Some of the factors that figured particularly in the Trustees’ deliberations are
described below, although individual Trustees may have evaluated the information presented differently from one another, giving different weights to various factors. It is also important to recognize that the fee arrangements for the Fund and other
MFS Funds are the result of years of review and discussion between the independent Trustees and MFS, that certain aspects of such arrangements may receive greater scrutiny in some years than in others, and that the Trustees’ conclusions may be
based, in part, on their consideration of these same arrangements during the course of the year and in prior years.
Based on information provided by Broadridge and MFS, the
Trustees reviewed the Fund’s total return investment performance as well as the Broadridge performance universe over various time periods. The Trustees placed particular emphasis on the total return performance of the Fund’s Initial
Class shares in comparison to the performance of funds in its Broadridge performance universe over the five-year period ended December 31, 2020, which the Trustees believed was a long enough period to reflect differing market conditions. The total
return performance of the Fund’s Initial Class shares was in the 1st quintile relative to the other funds in the universe for this five-year period (the 1st quintile being the best performers and the 5th quintile being the worst performers).
The total return performance of the Fund’s Initial Class shares was in the 3rd quintile for the one-year period and the 2nd quintile for the three-year period ended December 31, 2020 relative to the Broadridge performance universe. Because of
the passage of time, these performance results may differ from the performance results for more recent periods, including those shown elsewhere in this report.
MFS International Growth
Portfolio
Board Review of Investment Advisory Agreement - continued
In
the course of their deliberations, the Trustees took into account information provided by MFS in connection with the contract review meetings, as well as during investment review meetings conducted with portfolio management personnel during the
course of the year regarding the Fund’s performance. After reviewing these and related factors, the Trustees concluded, within the context of their overall conclusions regarding the investment advisory agreement, that they were satisfied with
MFS’ responses and efforts relating to investment performance.
In assessing the reasonableness of the Fund’s
advisory fee, the Trustees considered, among other information, the Fund’s advisory fee and the total expense ratio of the Fund’s Initial Class shares as a percentage of average daily net assets and the advisory fee and total expense
ratios of the Broadridge expense group based on information provided by Broadridge. The Trustees considered that MFS currently observes an expense limitation for the Fund, which may not be changed without the Trustees’ approval. The Trustees
also considered that, according to the data provided by Broadridge (which takes into account any fee reductions or expense limitations that were in effect during the Fund’s last fiscal year), the Fund’s effective advisory fee rate was
higher than the Broadridge expense group median and the Fund’s total expense ratio was lower than the Broadridge expense group median.
The Trustees also considered the advisory fees charged by
MFS to any institutional separate accounts advised by MFS (“separate accounts”) and unaffiliated investment companies for which MFS serves as subadviser (“subadvised funds”) that have comparable investment strategies to the
Fund, if any. In comparing these fees, the Trustees considered information provided by MFS as to the generally broader scope of services provided by MFS to the Fund, as well as the more extensive regulatory burdens imposed on MFS in managing the
Fund, in comparison to separate accounts and subadvised funds. The Trustees also considered the higher demands placed on MFS’ investment personnel and trading infrastructure as a result of the daily cash in-flows and out-flows of the Fund in
comparison to separate accounts.
The Trustees also
considered whether the Fund may benefit from any economies of scale in the management of the Fund in the event of growth in assets of the Fund and/or growth in assets of the MFS Funds as a whole. They noted that the Fund’s advisory fee rate
schedule is subject to contractual breakpoints that reduce the Fund’s advisory fee rate on average daily net assets over $1 billion and $2 billion. The Trustees also noted that MFS has agreed in writing to waive a portion of the management
fees of certain MFS Funds, including the Fund, if the total combined assets of certain funds within the MFS Funds’ complex increase above agreed upon thresholds (the “group fee waiver”), enabling the Fund’s shareholders to
share in the benefits from any economies of scale at the complex level. The group fee waiver is reviewed and renewed annually between the Board and MFS. The Trustees concluded that the breakpoints and the group fee waiver were sufficient to allow
the Fund to benefit from economies of scale as its assets and overall complex assets grow.
The Trustees also considered information prepared by MFS
relating to MFS’ costs and profits with respect to the Fund, the MFS Funds considered as a group, and other investment companies and accounts advised by MFS, as well as MFS’ methodologies used to determine and allocate its costs to the
MFS Funds, the Fund and other accounts and products for purposes of estimating profitability.
After reviewing these and other factors described herein,
the Trustees concluded, within the context of their overall conclusions regarding the investment advisory agreement, that the advisory fees charged to the Fund represent reasonable compensation in light of the services being provided by MFS to the
Fund.
In addition, the Trustees considered MFS’
resources and related efforts to continue to retain, attract and motivate capable personnel to serve the Fund. The Trustees also considered current and developing conditions in the financial services industry, including the presence of large and
well-capitalized companies which are spending, and appear to be prepared to continue to spend, substantial sums to engage personnel and to provide services to competing investment companies. In this regard, the Trustees also considered the financial
resources of MFS and its ultimate parent, Sun Life Financial Inc. The Trustees also considered the advantages and possible disadvantages to the Fund of having an adviser that also serves other investment companies as well as other accounts.
The Trustees also considered the nature, quality, cost, and
extent of administrative, transfer agency, and distribution services provided to the Fund by MFS and its affiliates under agreements and plans other than the investment advisory agreement, including any 12b-1 fees the Fund pays to MFS Fund
Distributors, Inc., an affiliate of MFS. The Trustees also considered the nature, extent and quality of certain other services MFS performs or arranges for on the Fund’s behalf, which may include securities lending programs, directed expense
payment programs, class action recovery programs, and MFS’ interaction with third-party service providers, principally custodians and sub-custodians. The Trustees concluded that the various non-advisory services provided by MFS and its
affiliates on behalf of the Fund were satisfactory.
The Trustees considered so-called “fall-out
benefits” to MFS such as reputational value derived from serving as investment manager to the MFS Funds. The Trustees also considered that MFS discontinued its historic practice of obtaining investment research from portfolio brokerage
commissions paid by certain MFS Funds effective January 2018, and directly pays or voluntarily reimburses a Fund, if applicable, for the costs of external research acquired through the use of the Fund’s portfolio brokerage commissions.
MFS International Growth
Portfolio
Board Review of Investment Advisory Agreement - continued
Based on their evaluation of factors that they deemed to be
material, including those factors described above, the Board of Trustees, including the independent Trustees, concluded that the Fund’s investment advisory agreement with MFS should be continued for an additional one-year period, commencing
August 1, 2021.
MFS International Growth
Portfolio
Proxy Voting Policies and Information
MFS votes proxies on behalf of the fund pursuant to proxy
voting policies and procedures that are available without charge, upon request, by calling 1-800-225-2606, by visiting mfs.com/proxyvoting, or by visiting the SEC’s Web site at http://www.sec.gov.
Information regarding how the fund voted proxies relating
to portfolio securities during the most recent twelve-month period ended June 30 is available by August 31 of each year without charge by visiting mfs.com/proxyvoting, or by visiting the SEC’s Web site
at http://www.sec.gov.
Quarterly Portfolio Disclosure
The fund files a complete schedule of portfolio holdings
with the SEC for the first and third quarters of each fiscal year as an exhibit to its reports on Form N-PORT. The fund’s Form N-PORT reports are available on the SEC’s Web site at
http://www.sec.gov. A shareholder can obtain the portfolio holdings report for the first and third quarters of the fund's fiscal year at mfs.com/vit2 by
choosing the fund's name and then scrolling to the “Resources” section and clicking on the “Prospectus and Reports” tab.
FURTHER INFORMATION
From time to time, MFS may post important information about
the fund or the MFS Funds on the MFS Web site (mfs.com). This information is available at https://www.mfs.com/announcements or at
mfs.com/vit2 by choosing the fund's name and then scrolling to the “Resources” section and clicking on the “Announcements” tab, if any.
Information About Fund Contracts and Legal Claims
The fund has entered into contractual arrangements with an
investment adviser, administrator, distributor, shareholder servicing agent, 529 program manager (if applicable), and custodian who each provide services to the fund. Unless expressly stated otherwise, shareholders are not parties to, or intended
beneficiaries of these contractual arrangements, and these contractual arrangements are not intended to create any shareholder right to enforce them against the service providers or to seek any remedy under them against the service providers, either
directly or on behalf of the fund.
Under the
Trust’s By-Laws and Declaration of Trust, any claims asserted against or on behalf of the MFS Funds, including claims against Trustees and Officers, must be brought in state and federal courts located within the Commonwealth of
Massachusetts.
Federal Tax Information (unaudited)
The following information is provided pursuant to
provisions of the Internal Revenue Code.
The fund
designates $8,572,000 as capital gain dividends paid during the fiscal year.
Income derived from foreign sources was $3,070,340. The
fund intends to pass through foreign tax credits of $384,735 for the fiscal year.
| FACTS
|
WHAT
DOES MFS DO WITH YOUR PERSONAL INFORMATION? |
| Why?
|
Financial
companies choose how they share your personal information. Federal law gives consumers the right to limit some but not all sharing. Federal law also requires us to tell you how we collect, share, and protect your personal information. Please read
this notice carefully to understand what we do. |
| What?
|
The types of
personal information we collect and share depend on the product or service you have with us. This information can include: |
| • Social
Security number and account balances |
| • Account
transactions and transaction history |
| • Checking
account information and wire transfer instructions |
| When
you are no longer our customer, we continue to share your information as described in this notice. |
| How?
|
All
financial companies need to share customers' personal information to run their everyday business. In the section below, we list the reasons financial companies can share their customers' personal information; the reasons MFS chooses to share; and
whether you can limit this sharing. |
Reasons
we can share your
personal information |
Does
MFS share? |
Can
you limit
this sharing? |
For
our everyday business purposes –
such as to process your transactions, maintain your
account(s), respond to court orders and legal
investigations, or report to credit bureaus |
Yes
|
No
|
For
our marketing purposes –
to offer our products and services to you |
No
|
We
don't share |
For
joint marketing with other
financial companies |
No
|
We
don't share |
For
our affiliates' everyday business purposes –
information about your transactions and experiences |
No
|
We
don't share |
For
our affiliates' everyday business purposes –
information about your creditworthiness |
No
|
We
don't share |
| For
nonaffiliates to market to you |
No
|
We
don't share |
| Questions?
|
Call
800-225-2606 or go to mfs.com. |
| Who
we are |
| Who
is providing this notice? |
MFS
Funds, MFS Investment Management, MFS Institutional Advisors, Inc., and MFS Heritage Trust Company. |
| What
we do |
How
does MFS
protect my personal
information? |
To
protect your personal information from unauthorized access and use, we use security measures that comply with federal law. These measures include procedural, electronic, and physical safeguards for the protection of the personal information we
collect about you. |
How
does MFS
collect my personal
information? |
We
collect your personal information, for example, when you |
| • open
an account or provide account information |
| • direct
us to buy securities or direct us to sell your securities |
| • make
a wire transfer |
| We
also collect your personal information from others, such as credit bureaus, affiliates, or other companies. |
| Why
can't I limit all sharing? |
Federal
law gives you the right to limit only |
| • sharing
for affiliates' everyday business purposes – information about your creditworthiness |
| • affiliates
from using your information to market to you |
| • sharing
for nonaffiliates to market to you |
| State
laws and individual companies may give you additional rights to limit sharing. |
| Definitions
|
| Affiliates
|
Companies
related by common ownership or control. They can be financial and nonfinancial companies. |
| •
MFS does not share personal information with affiliates, except for everyday business purposes as described on page one of this notice. |
| Nonaffiliates
|
Companies
not related by common ownership or control. They can be financial and nonfinancial companies. |
| •
MFS does not share with nonaffiliates so they can market to you. |
| Joint
marketing |
A
formal agreement between nonaffiliated financial companies that together market financial products or services to you. |
| •
MFS doesn't jointly market. |
| Other
important information |
| If
you own an MFS product or receive an MFS service in the name of a third party such as a bank or broker-dealer, their privacy policy may apply to you instead of ours. |
Annual Report
December 31, 2021
MFS® International Intrinsic
Value Portfolio
MFS® Variable
Insurance Trust II
MFS® International
Intrinsic Value Portfolio
|
1
|
|
2
|
|
3
|
|
5
|
|
7
|
|
8
|
|
12
|
|
13
|
|
14
|
|
15
|
|
17
|
|
24
|
|
25
|
|
28
|
|
31
|
|
31
|
|
31
|
|
31
|
|
31
|
|
32
|
The report is prepared for the general information of contract owners. It
is authorized for distribution to prospective investors only when preceded or accompanied by a current prospectus.
NOT FDIC INSURED • MAY LOSE VALUE
• NO BANK OR CREDIT UNION GUARANTEE •
NOT A DEPOSIT • NOT INSURED BY ANY FEDERAL GOVERNMENT
AGENCY OR NCUA/NCUSIF
MFS International
Intrinsic Value Portfolio
Dear Contract Owners:
After a powerful rally in 2021 that was spurred by the
introduction of effective coronavirus vaccines and high levels of monetary and fiscal stimulus, markets have recently experienced a rise in volatility. Rising inflation (mostly due to pandemic-related labor and supply chain disruptions), new
COVID-19 variants that are vaccine-resistant, and the prospect of tighter monetary and fiscal policies around the world have all increased investor anxiety.
Rising real (inflation-adjusted) bond yields in the United
States are a headwind for richly valued U.S. growth stocks, though many non-U.S. markets have experienced lower levels of turbulence. In recent months, global economic growth has moderated, with the spread of the Delta and Omicron variants and a
regulatory crackdown in China featuring prominently. Stress in China’s property development sector has also contributed to the slowdown there. A further concern for investors is the tightening of global energy and raw materials supplies caused
in part by geopolitical uncertainty.
However,
above-trend economic growth, strong corporate balance sheets, and nascent signs that global supply chain bottlenecks may be easing, along with a dovish policy shift in China, are supportive fundamentals that we feel could help calm recent market
jitters.
It is times of market transition that
demonstrate the importance of having a deep understanding of company fundamentals, and we have built our global research platform to do just that.
At MFS®, we put our clients’ assets to work responsibly by carefully navigating the increasing complexity of global markets and economies. Guided by our commitment to long-term
investing, we tune out the noise and try to uncover what we believe are the best, most durable investment opportunities in the market. Our unique global investment platform combines collective expertise, long-term discipline, and thoughtful risk
management to create sustainable value for investors.
Respectfully,
Michael W.
Roberge
Chief Executive Officer
MFS Investment Management
February 15, 2022
The opinions expressed in this letter are subject to
change and may not be relied upon for investment advice. No forecasts can be guaranteed.
MFS International Intrinsic
Value Portfolio
Portfolio structure
Top ten
holdings
| Cadence
Design Systems, Inc. |
5.2%
|
| Nestle
S.A. |
5.0%
|
| Schneider
Electric SE |
3.9%
|
| Givaudan
S.A. |
3.7%
|
| Taiwan
Semiconductor Manufacturing Co. Ltd., ADR |
3.4%
|
| Pernod
Ricard S.A. |
2.8%
|
| L'Oréal
|
2.8%
|
| Diageo
PLC |
2.5%
|
| Legrand
S.A. |
2.4%
|
| ANSYS,
Inc. |
2.2%
|
GICS equity sectors (g)
| Information
Technology |
27.2%
|
| Consumer
Staples |
24.6%
|
| Industrials
|
21.9%
|
| Materials
|
11.8%
|
| Consumer
Discretionary |
4.4%
|
| Health
Care |
3.5%
|
| Financials
|
2.9%
|
| Real
Estate |
1.8%
|
| Equity
Warrants (o) |
0.0%
|
Issuer country weightings (x)
| France
|
16.7%
|
| Japan
|
16.7%
|
| Switzerland
|
16.5%
|
| United
States |
13.8%
|
| United
Kingdom |
12.7%
|
| Germany
|
8.4%
|
| Taiwan
|
3.4%
|
| Canada
|
2.9%
|
| Denmark
|
2.1%
|
| Other
Countries |
6.8%
|
Currency exposure weightings
(y)
| Euro
|
28.4%
|
| Japanese
Yen |
16.7%
|
| Swiss
Franc |
16.5%
|
| United
States Dollar |
14.2%
|
| British
Pound Sterling |
12.7%
|
| Taiwan
Dollar |
3.4%
|
| Canadian
Dollar |
2.9%
|
| Danish
Krone |
2.1%
|
| South
Korean Won |
2.0%
|
| Other
Currencies |
1.1%
|
| (g)
|
The
Global Industry Classification Standard (GICS®) was developed by and/or is the exclusive property of MSCI, Inc. and S&P Global Market Intelligence Inc. (“S&P
Global Market Intelligence”). GICS is a service mark of MSCI and S&P Global Market Intelligence and has been licensed for use by MFS. MFS has applied its own internal sector/industry classification methodology for equity securities and
non-equity securities that are unclassified by GICS. |
| (x)
|
Represents
the portfolio’s exposure to issuer countries as a percentage of a portfolio’s net assets. For purposes of this presentation, United States includes Cash & Cash Equivalents and Other. |
| (y)
|
Represents
the portfolio’s exposure to a particular currency as a percentage of a portfolio's net assets. For purposes of this presentation, United States Dollar includes Cash & Cash Equivalents. |
Cash & Cash Equivalents includes any cash,
investments in money market funds, short-term securities, and other assets less liabilities. Please see the Statement of Assets and Liabilities for additional information related to the fund’s cash position and other assets and
liabilities.
Other includes equivalent
exposure from currency derivatives and/or any offsets to derivative positions and may be negative.
Percentages are based on net assets as of December
31, 2021.
The portfolio is actively managed
and current holdings may be different.
MFS International
Intrinsic Value Portfolio
Management Review
Summary of Results
For the twelve months ended December 31, 2021, Initial
Class shares of the MFS International Intrinsic Value Portfolio (fund) provided a total return of 10.55%, while Service Class shares of the fund provided a total return of 10.28%. These compare with a return of 11.26% over the same period for the
fund’s benchmark, the MSCI EAFE Index (net div).
Market Environment
Over the past year, the global economy was buffeted by an
array of crosscurrents as it adjusted to the ebbs and flows of the pandemic. Among the supportive currents were ample fiscal stimulus, loose monetary policy and the rollout of several highly effective coronavirus vaccines. Negative currents included
the rapid spread of several coronavirus variants, widespread global production bottlenecks and a surge in inflation. After experiencing a burst of exceptionally strong economic activity as the global economy began to reopen, activity became more
muted in the second half of the period amid ongoing supply chain disruptions and a new wave of coronavirus infections, albeit a seemingly milder strain.
Amid rising inflation, markets anticipated a transition
from an exceptionally accommodative environment to a more mixed monetary landscape ahead. Indeed, several central banks in emerging markets have already tightened policy and the US Federal Reserve reduced the pace of its asset purchases in November
and again in December. However, the European Central Bank, the Bank of Japan and the People's Bank of China are expected to maintain accommodative policies. Sovereign bond yields moved modestly higher during the period amid higher inflation and on
expectations of a tighter Fed but remain historically low.
A harsher Chinese regulatory environment toward industries
such as online gaming, food delivery and education increased market volatility as has stress in China's highly leveraged property development sector. Trade relations between the United States and China remained quite strained despite a change in
presidential administrations.
Signs of excess
investor enthusiasm continued to be seen in pockets of the market such as “meme stocks” popular with users of online message boards, cryptocurrencies and heavy retail participation in the market for short-dated options.
Detractors from Performance
Stock selection and an overweight position in the consumer
staples sector were primary factors that weakened performance relative to the MSCI EAFE Index over the reporting period. Here, the fund's overweight positions in chemical products company Henkel (Germany), pharmaceutical products manufacturer
Kobayashi Pharmaceutical (Japan), household and industrial products manufacturer Kao (Japan) and beverage manufacturer ITO EN (Japan) detracted from relative returns. The stock price of Henkel came under pressure during the reporting period as both
higher raw materials costs and weakness in both its adhesives and beauty segments appeared to have weighed on investor sentiment.
An underweight position in both the financials and energy
sectors also held back relative performance. Within both sectors, there were no individual stocks, either in the fund or in the benchmark, that were among the fund's top relative detractors for the reporting period.
Turning to stocks in other sectors, not holding shares of
strong-performing lithography systems ASML (Netherlands) and pharmaceutical company Novo Nordisk (Denmark), and the fund's overweight positions in security services provider Secom (Japan) and pharmaceutical products manufacturer Santen
Pharmaceutical (Japan), dampened relative results. Lastly, the fund’s holdings of microchip and electronics manufacturer Samsung Electronics(b) (South Korea) also hindered relative performance as investors appeared to have reacted negatively
to the release of the company's former co-Vice President, Jay Y. Lee, from prison, which created uncertainty around how he might influence business operations, despite being barred from returning to his former position at the company.
The fund's cash and/or cash equivalents position during the
period was also a detractor from relative performance. Under normal market conditions, the fund strives to be fully invested and generally holds cash to buy new holdings and to provide liquidity. In a period when equity markets rose, as measured by
the fund's benchmark, holding cash hurt performance versus the benchmark, which has no cash position.
Contributors to Performance
Stock selection in both the industrials and materials
sectors benefited relative performance over the reporting period. Within the industrials sector, the fund's overweight positions in electrical distribution equipment manufacturer Schneider Electric (France), industrial and commercial steam systems
developer Spirax-Sarco Engineering (United Kingdom) and wiring devices and cable systems manufacturer Legrand (France), as well as its holdings of global engineering company IMI(b) (United Kingdom), lifted relative returns. The share price of
Schneider Electric advanced as better-than-expected organic growth, primarily within its energy management division, drove strong earnings results. Within the materials sector, overweight positions in fragrance and flavor products
MFS International Intrinsic
Value Portfolio
Management Review - continued
manufacturer
Givaudan (Switzerland) and biotechnology firm Novozymes (Denmark) strengthened the fund’s relative results. The stock price of Givaudan ended the reporting period higher on the back of a strong recovery from COVID-19 related weakness in its
food services segment and from solid demand in its other business lines, including fragrance & beauty and taste & wellbeing.
An underweight position in the poor-performing
communication services sector also aided relative performance. Here, not holding shares of benchmark constituent and technology investment firm SoftBank (Japan) supported relative returns as the company’s shares came under pressure as Chinese
regulators announced more stringent rules governing technology firms.
Elsewhere, the fund's holdings of integrated circuits and
electronic devices developer Cadence Design Systems(b), and overweight positions in alcoholic beverage distributors Diageo (United Kingdom) and Pernod Ricard (France), helped relative performance.
During the reporting period, the fund's relative currency
exposure, resulting primarily from differences between the fund's and the benchmark's exposures to holdings of securities denominated in foreign currencies, was a contributor to relative performance. All of MFS' investment decisions are driven by
the fundamentals of each individual opportunity and as such, it is common for our portfolios to have different currency exposure than the benchmark.
Respectfully,
Portfolio Manager(s)
Pablo de la Mata, Philip Evans, and Benjamin Stone
Note to Contract Owners: Effective April 15, 2022, Pablo de
la Mata will no longer be a Portfolio Manager of the fund.
| (b)
|
Security is not a
benchmark constituent. |
The views
expressed in this report are those of the portfolio manager(s) only through the end of the period of the report as stated on the cover and do not necessarily reflect the views of MFS or any other person in the MFS organization. These views are
subject to change at any time based on market or other conditions, and MFS disclaims any responsibility to update such views. These views may not be relied upon as investment advice or an indication of trading intent on behalf of any MFS portfolio.
References to specific securities are not recommendations of such securities, and may not be representative of any MFS portfolio’s current or future investments.
MFS International
Intrinsic Value Portfolio
Performance Summary Through 12/31/21
The following chart illustrates the historical performance
of the fund in comparison to its benchmark(s). Benchmarks are unmanaged and may not be invested in directly. Benchmark returns do not reflect any fees or expenses. The performance of other share classes will be greater than or less than that of the
class depicted below. (See Notes to Performance Summary.)
Performance data shown represents past performance and is no
guarantee of future results. Investment return and principal value fluctuate so your units, when sold, may be worth more or less than the original cost; current performance may be lower or higher than quoted. The performance shown does not reflect
the deduction of taxes, if any, that a contract holder would pay on fund distributions or the redemption of contract units. The returns for the fund shown also do not reflect the deduction of expenses associated with variable products, such as
mortality and expense risk charges, separate account charges, and sales charges imposed by the insurance company separate accounts. Such expenses would reduce the overall returns shown.
Growth of a Hypothetical $10,000 Investment
Total Returns
through 12/31/21
Average annual total returns
| Share
Class |
Class
Inception Date |
1-yr
|
5-yr
|
10-yr
|
| Initial
Class |
10/02/95
|
10.55%
|
14.07%
|
12.43%
|
| Service
Class |
8/24/01
|
10.28%
|
13.78%
|
12.16%
|
Comparative benchmark(s)
| MSCI
EAFE Index (net div) (f) |
11.26%
|
9.55%
|
8.03%
|
| (f)
|
Source:
FactSet Research Systems Inc. |
Benchmark Definition(s)
MSCI EAFE (Europe, Australasia, Far East) Index(e) (net div) – a market capitalization-weighted index that is designed to measure equity market performance in the developed markets, excluding the U.S. and Canada.
It is not possible to invest directly in an index.
| (e)
|
Morgan
Stanley Capital International (“MSCI”) makes no express or implied warranties or representations and shall have no liability whatsoever with respect to any MSCI data contained herein. The MSCI data may not be further redistributed or
used as a basis for other indices or any securities or financial products. This report is not approved, reviewed, or produced by MSCI. |
Notes to Performance Summary
Average annual total return represents the average annual
change in value for each share class for the periods presented.
Performance results reflect any applicable expense
subsidies and waivers in effect during the periods shown. Without such subsidies and waivers the fund's performance results would be less favorable. Please see the prospectus and financial statements for complete details. All results are historical
and assume the reinvestment of any dividends and capital gains distributions.
Performance results do not include adjustments made for
financial reporting purposes in accordance with U.S. generally accepted accounting principles and may differ from amounts reported in the financial highlights.
MFS International Intrinsic
Value Portfolio
Performance Summary – continued
From
time to time the fund may receive proceeds from litigation settlements, without which performance would be lower.
MFS International
Intrinsic Value Portfolio
Expense Table
Fund Expenses Borne by the Contract Holders during the
Period,
July 1, 2021 through December 31, 2021
As
a contract holder of the fund, you incur ongoing costs, including management fees; distribution and/or service (12b-1) fees; and other fund expenses. This example is intended to help you understand your ongoing costs (in dollars) of investing in the
fund and to compare these costs with the ongoing costs of investing in other mutual funds.
The example is based on an investment of $1,000 invested at
the beginning of the period and held for the entire period July 1, 2021 through December 31, 2021.
Actual Expenses
The first line for each share class in the following table
provides information about actual account values and actual expenses. You may use the information in this line, together with the amount you invested, to estimate the expenses that you paid over the period. Simply divide your account value by $1,000
(for example, an $8,600 account value divided by $1,000 = 8.6), then multiply the result by the number in the first line under the heading entitled “Expenses Paid During Period” to estimate the expenses you paid on your account during
this period.
Hypothetical Example for Comparison
Purposes
The second line for each share class in the
following table provides information about hypothetical account values and hypothetical expenses based on the fund’s actual expense ratio and an assumed rate of return of 5% per year before expenses, which is not the fund’s actual
return. The hypothetical account values and expenses may not be used to estimate the actual ending account balance or expenses you paid for the period. You may use this information to compare the ongoing costs of investing in the fund and other
funds. To do so, compare this 5% hypothetical example with the 5% hypothetical examples that appear in the shareholder reports of the other funds.
Please note that the expenses shown in the table are meant
to highlight the fund's ongoing costs only and do not take into account the fees and expenses imposed under the variable contracts through which your investment in the fund is made. Therefore, the second line for each share class in the table is
useful in comparing ongoing costs associated with an investment in vehicles (such as the fund) which fund benefits under variable annuity and variable life insurance contracts and to qualified pension and retirement plans only, and will not help you
determine the relative total costs of investing in the fund through variable annuity and variable life insurance contracts. If the fees and expenses imposed under the variable contracts were included, your costs would have been higher.
Share
Class |
|
Annualized
Expense
Ratio |
Beginning
Account Value
7/01/21 |
Ending
Account Value
12/31/21 |
Expenses
Paid During
Period (p)
7/01/21-12/31/21 |
| Initial
Class |
Actual
|
0.89%
|
$1,000.00
|
$1,054.12
|
$4.61
|
| Hypothetical
(h) |
0.89%
|
$1,000.00
|
$1,020.72
|
$4.53
|
| Service
Class |
Actual
|
1.14%
|
$1,000.00
|
$1,052.68
|
$5.90
|
| Hypothetical
(h) |
1.14%
|
$1,000.00
|
$1,019.46
|
$5.80
|
| (h)
|
5% class return per year
before expenses. |
| (p)
|
“Expenses
Paid During Period” are equal to each class's annualized expense ratio, as shown above, multiplied by the average account value over the period, multiplied by 184/365 (to reflect the one-half year period). |
MFS International Intrinsic
Value Portfolio
Portfolio of Investments − 12/31/21
The Portfolio of Investments is a complete list of all
securities owned by your fund. It is categorized by broad-based asset classes.
| Issuer
|
|
|
Shares/Par
|
Value
($) |
| Common
Stocks – 96.5% |
| Airlines
– 0.7% |
|
| Ryanair
Holdings PLC, ADR (a) |
|
116,622
|
$
11,933,929 |
| Alcoholic
Beverages – 5.4% |
|
| Diageo
PLC |
|
774,105
|
$
42,288,796 |
| Pernod
Ricard S.A. |
|
195,828
|
47,153,947 |
| |
|
|
|
$89,442,743 |
| Apparel
Manufacturers – 2.6% |
|
| Adidas
AG |
|
37,747
|
$
10,881,256 |
| Compagnie
Financiere Richemont S.A. |
|
116,261
|
17,360,458 |
| LVMH
Moet Hennessy Louis Vuitton SE |
|
17,364
|
14,371,996 |
| |
|
|
|
$42,613,710 |
| Automotive
– 1.0% |
|
| Compagnie
Generale des Etablissements Michelin SCA |
|
51,202
|
$
8,403,002 |
| Knorr-Bremse
AG |
|
88,167
|
8,701,014 |
| |
|
|
|
$17,104,016 |
| Biotechnology
– 1.7% |
|
| Novozymes
A.S. |
|
347,071
|
$
28,420,749 |
| Brokerage
& Asset Managers – 0.8% |
|
| Euronext
N.V. |
|
124,258
|
$
12,908,926 |
| Business
Services – 5.9% |
|
| Experian
PLC |
|
504,329
|
$
24,793,285 |
| Intertek
Group PLC |
|
198,644
|
15,137,639 |
| Nomura
Research Institute Ltd. |
|
373,800
|
16,036,712 |
| Secom
Co. Ltd. |
|
174,900
|
12,142,497 |
| SGS
S.A. |
|
8,038
|
26,774,720 |
| Sohgo
Security Services Co. Ltd. |
|
81,600
|
3,241,867 |
| |
|
|
|
$98,126,720 |
| Chemicals
– 3.7% |
|
| Givaudan
S.A. |
|
11,639
|
$
61,209,491 |
| Computer
Software – 10.5% |
|
| ANSYS,
Inc. (a) |
|
91,254
|
$
36,603,805 |
| Cadence
Design Systems, Inc. (a) |
|
463,401
|
86,354,776 |
| Dassault
Systemes SE |
|
353,613
|
21,059,392 |
| OBIC
Co. Ltd. |
|
74,900
|
14,064,505 |
| SAP
SE |
|
121,885
|
17,407,738 |
| |
|
|
|
$175,490,216 |
| Computer
Software - Systems – 3.4% |
|
| Amadeus
IT Group S.A. (a) |
|
215,919
|
$
14,543,125 |
| NICE
Systems Ltd., ADR (a) |
|
14,237
|
4,322,353 |
| Samsung
Electronics Co. Ltd. |
|
497,397
|
32,762,301 |
| Wix.com
Ltd. (a) |
|
37,019
|
5,841,228 |
| |
|
|
|
$57,469,007 |
| Construction
– 0.8% |
|
| Geberit
AG |
|
16,923
|
$
13,776,169 |
MFS International
Intrinsic Value Portfolio
Portfolio of Investments – continued
| Issuer
|
|
|
Shares/Par
|
Value
($) |
| Common
Stocks – continued |
| Consumer
Products – 8.7% |
|
| Colgate-Palmolive
Co. |
|
70,748
|
$
6,037,634 |
| Kao
Corp. |
|
397,900
|
20,820,309 |
| Kobayashi
Pharmaceutical Co. Ltd. |
|
204,500
|
16,071,286 |
| KOSE
Corp. |
|
29,500
|
3,346,736 |
| Lion
Corp. |
|
324,000
|
4,329,201 |
| L'Oréal
|
|
98,454
|
46,735,859 |
| Reckitt
Benckiser Group PLC |
|
363,907
|
31,238,555 |
| ROHTO
Pharmaceutical Co. Ltd. |
|
457,500
|
13,820,851 |
| Svenska
Cellulosa Aktiebolaget |
|
141,219
|
2,501,546 |
| |
|
|
|
$144,901,977 |
| Electrical
Equipment – 9.2% |
|
| Halma
PLC |
|
465,417
|
$
20,158,885 |
| Legrand
S.A. |
|
341,278
|
39,981,267 |
| OMRON
Corp. |
|
138,900
|
13,838,077 |
| Schneider
Electric SE |
|
329,229
|
64,642,680 |
| Spectris
PLC |
|
160,635
|
7,953,498 |
| Yokogawa
Electric Corp. |
|
324,700
|
5,854,367 |
| |
|
|
|
$152,428,774 |
| Electronics
– 8.0% |
|
| Analog
Devices, Inc. |
|
180,295
|
$
31,690,452 |
| DISCO
Corp. |
|
27,700
|
8,464,357 |
| Hirose
Electric Co. Ltd. |
|
134,300
|
22,579,866 |
| Infineon
Technologies AG |
|
66,664
|
3,093,559 |
| Taiwan
Semiconductor Manufacturing Co. Ltd., ADR |
|
468,940
|
56,418,172 |
| Texas
Instruments, Inc. |
|
54,389
|
10,250,695 |
| |
|
|
|
$132,497,101 |
| Engineering
- Construction – 1.3% |
|
| IMI
PLC |
|
892,621
|
$
20,974,475 |
| Food
& Beverages – 8.8% |
|
| Chocoladefabriken
Lindt & Sprungli AG |
|
382
|
$
5,275,738 |
| Danone
S.A. |
|
106,870
|
6,642,045 |
| Ezaki
Glico Co. Ltd. |
|
166,500
|
5,297,662 |
| ITO
EN Ltd. |
|
283,400
|
14,880,779 |
| Kerry
Group PLC |
|
91,212
|
11,760,427 |
| Nestle
S.A. |
|
591,565
|
82,736,000 |
| Nissan
Foods Holdings Co. Ltd. |
|
55,100
|
4,018,856 |
| Toyo
Suisan Kaisha Ltd. |
|
379,700
|
16,091,780 |
| |
|
|
|
$146,703,287 |
| Insurance
– 0.3% |
|
| Hiscox
Ltd. |
|
430,017
|
$
5,010,282 |
| Machinery
& Tools – 6.5% |
|
| Epiroc
AB |
|
453,319
|
$
11,498,275 |
| GEA
Group AG |
|
263,950
|
14,451,381 |
| Nordson
Corp. |
|
45,041
|
11,497,616 |
| Schindler
Holding AG |
|
61,619
|
16,532,499 |
| SMC
Corp. |
|
29,500
|
19,898,331 |
| Spirax-Sarco
Engineering PLC |
|
142,184
|
30,888,730 |
| Wartsila
Oyj Abp |
|
211,440
|
2,944,615 |
| |
|
|
|
$107,711,447 |
MFS International Intrinsic
Value Portfolio
Portfolio
of Investments – continued
| Issuer
|
|
|
Shares/Par
|
Value
($) |
| Common
Stocks – continued |
| Major
Banks – 0.6% |
|
| UBS
Group AG |
|
527,129
|
$
9,460,961 |
| Medical
Equipment – 4.3% |
|
| Agilent
Technologies, Inc. |
|
49,378
|
$
7,883,198 |
| Bruker
BioSciences Corp. |
|
99,128
|
8,317,830 |
| EssilorLuxottica
|
|
76,380
|
16,282,128 |
| Nihon
Kohden Corp. |
|
281,200
|
7,712,649 |
| Shimadzu
Corp. |
|
549,600
|
23,196,627 |
| Terumo
Corp. |
|
180,800
|
7,638,773 |
| |
|
|
|
$71,031,205 |
| Other
Banks & Diversified Financials – 1.2% |
|
| Chiba
Bank Ltd. |
|
560,600
|
$
3,211,644 |
| Hachijuni
Bank Ltd. |
|
549,900
|
1,878,733 |
| Julius
Baer Group Ltd. |
|
80,458
|
5,376,653 |
| Jyske
Bank A.S. (a) |
|
69,829
|
3,596,956 |
| Mebuki
Financial Group, Inc. |
|
926,400
|
1,908,692 |
| North
Pacific Bank Ltd. |
|
824,500
|
1,791,924 |
| Sydbank
A.S. |
|
92,597
|
2,931,554 |
| |
|
|
|
$20,696,156 |
| Pharmaceuticals
– 1.6% |
|
| Roche
Holding AG |
|
41,978
|
$
17,401,366 |
| Santen
Pharmaceutical Co. Ltd. |
|
768,000
|
9,393,862 |
| |
|
|
|
$26,795,228 |
| Precious
Metals & Minerals – 2.9% |
|
| Agnico
Eagle Mines Ltd. |
|
175,459
|
$
9,319,807 |
| Franco-Nevada
Corp. |
|
232,596
|
32,167,552 |
| Wheaton
Precious Metals Corp. |
|
173,817
|
7,458,624 |
| |
|
|
|
$48,945,983 |
| Printing
& Publishing – 0.9% |
|
| Wolters
Kluwer N.V. |
|
125,522
|
$
14,805,139 |
| Real
Estate – 1.8% |
|
| LEG
Immobilien SE |
|
68,686
|
$
9,595,016 |
| TAG
Immobilien AG |
|
262,853
|
7,364,740 |
| Vonovia
SE, REIT |
|
234,786
|
12,964,233 |
| |
|
|
|
$29,923,989 |
| Specialty
Chemicals – 3.3% |
|
| Croda
International PLC |
|
66,818
|
$
9,152,680 |
| Kansai
Paint Co. Ltd. |
|
264,000
|
5,737,634 |
| Sika
AG |
|
43,987
|
18,258,811 |
| Symrise
AG |
|
141,814
|
21,037,610 |
| |
|
|
|
$54,186,735 |
| Specialty
Stores – 0.6% |
|
| Ocado
Group PLC (a) |
|
169,262
|
$
3,844,375 |
| Zalando
SE (a) |
|
79,652
|
6,459,127 |
| |
|
|
|
$10,303,502 |
| Total
Common Stocks (Identified Cost, $922,246,420) |
|
$1,604,871,917
|
MFS International
Intrinsic Value Portfolio
Portfolio of Investments – continued
| Issuer
|
|
|
Shares/Par
|
Value
($) |
| Preferred
Stocks – 1.6% |
| Consumer
Products – 1.6% |
|
|
|
|
| Henkel
AG & Co. KGaA (Identified Cost, $39,059,313) |
|
332,407
|
$
26,922,595 |
| Issuer
|
Strike
Price |
First
Exercise |
|
|
| Warrants
– 0.0% |
|
|
|
|
| Apparel
Manufacturers – 0.0% |
| Compagnie
Financiere Richemont S.A. (1 share for 2 warrants, Expiration 12/04/23) (a) (Identified Cost, $0) |
CHF
67.00 |
11/20/23
|
224,332
|
$
246,194 |
| |
|
|
|
|
| Investment
Companies (h) – 1.7% |
| Money
Market Funds – 1.7% |
|
| MFS
Institutional Money Market Portfolio, 0.07% (v) (Identified Cost, $27,180,912) |
|
|
27,183,142
|
$
27,183,142 |
| Other
Assets, Less Liabilities – 0.2% |
|
3,824,862 |
| Net
Assets – 100.0% |
$1,663,048,710
|
| (a) |
Non-income producing
security. |
|
|
|
| (h)
|
An
affiliated issuer, which may be considered one in which the fund owns 5% or more of the outstanding voting securities, or a company which is under common control. At period end, the aggregate values of the fund's investments in affiliated issuers
and in unaffiliated issuers were $27,183,142 and $1,632,040,706, respectively. |
|
|
|
| (v)
|
Affiliated
issuer that is available only to investment companies managed by MFS. The rate quoted for the MFS Institutional Money Market Portfolio is the annualized seven-day yield of the fund at period end. |
|
|
|
| The
following abbreviations are used in this report and are defined: |
| ADR
|
American
Depositary Receipt |
| REIT
|
Real Estate
Investment Trust |
| Abbreviations
indicate amounts shown in currencies other than the U.S. dollar. All amounts are stated in U.S. dollars unless otherwise indicated. A list of abbreviations is shown below: |
| CHF
|
Swiss
Franc |
See Notes to Financial
Statements
MFS International Intrinsic
Value Portfolio
| Financial
Statements |
Statement of Assets and
Liabilities |
This statement
represents your fund’s balance sheet, which details the assets and liabilities comprising the total value of the fund.
| At
12/31/21 Assets |
|
| Investments
in unaffiliated issuers, at value (identified cost, $961,305,733) |
$1,632,040,706
|
| Investments
in affiliated issuers, at value (identified cost, $27,180,912) |
27,183,142
|
| Receivables
for |
|
| Investments
sold |
128,292
|
| Fund
shares sold |
855,806
|
| Dividends
|
3,661,797
|
| Other
assets |
6,316
|
| Total
assets |
$1,663,876,059
|
| Liabilities
|
|
| Payables
for |
|
| Fund
shares reacquired |
$561,267
|
| Payable
to affiliates |
|
| Investment
adviser |
77,226
|
| Administrative
services fee |
1,277
|
| Shareholder
servicing costs |
302
|
| Distribution
and/or service fees |
18,096
|
| Payable
for independent Trustees' compensation |
304
|
| Accrued
expenses and other liabilities |
168,877
|
| Total
liabilities |
$827,349
|
| Net
assets |
$1,663,048,710
|
| Net
assets consist of |
|
| Paid-in
capital |
$934,532,997
|
| Total
distributable earnings (loss) |
728,515,713
|
| Net
assets |
$1,663,048,710
|
| Shares
of beneficial interest outstanding |
44,835,359
|
| |
Net
assets |
Shares
outstanding |
Net
asset value
per share |
| Initial
Class |
$344,051,799
|
9,145,793
|
$37.62
|
| Service
Class |
1,318,996,911
|
35,689,566
|
36.96
|
See Notes to Financial Statements
MFS International
Intrinsic Value Portfolio
| Financial
Statements |
Statement of Operations
|
This statement describes how much
your fund earned in investment income and accrued in expenses. It also describes any gains and/or losses generated by fund operations.
| Year
ended 12/31/21 |
|
| Net
investment income (loss) |
|
| Income
|
|
| Dividends
|
$23,478,694
|
| Dividends
from affiliated issuers |
15,579
|
| Income
on securities loaned |
8,807
|
| Other
|
173
|
| Foreign
taxes withheld |
(2,383,905)
|
| Total
investment income |
$21,119,348
|
| Expenses
|
|
| Management
fee |
$13,652,740
|
| Distribution
and/or service fees |
3,113,313
|
| Shareholder
servicing costs |
44,674
|
| Administrative
services fee |
216,078
|
| Independent
Trustees' compensation |
23,412
|
| Custodian
fee |
182,031
|
| Shareholder
communications |
60,709
|
| Audit
and tax fees |
61,422
|
| Legal
fees |
7,900
|
| Miscellaneous
|
36,648
|
| Total
expenses |
$17,398,927
|
| Reduction
of expenses by investment adviser |
(200,998)
|
| Net
expenses |
$17,197,929
|
| Net
investment income (loss) |
$3,921,419
|
| Realized
and unrealized gain (loss) |
|
| Realized
gain (loss) (identified cost basis) |
|
| Unaffiliated
issuers |
$58,972,330
|
| Affiliated
issuers |
1,494
|
| Forward
foreign currency exchange contracts |
2,264,909
|
| Foreign
currency |
60,488
|
| Net
realized gain (loss) |
$61,299,221
|
| Change
in unrealized appreciation or depreciation |
|
| Unaffiliated
issuers |
$92,801,537
|
| Affiliated
issuers |
(1,494)
|
| Forward
foreign currency exchange contracts |
1,227,680
|
| Translation
of assets and liabilities in foreign currencies |
(340,468)
|
| Net
unrealized gain (loss) |
$93,687,255
|
| Net
realized and unrealized gain (loss) |
$154,986,476
|
| Change
in net assets from operations |
$158,907,895
|
See Notes to Financial Statements
MFS International Intrinsic
Value Portfolio
| Financial
Statements |
Statements of Changes in
Net Assets |
These statements describe
the increases and/or decreases in net assets resulting from operations, any distributions, and any shareholder transactions.
| |
Year
ended |
| |
12/31/21
|
12/31/20
|
| Change
in net assets |
|
|
| From
operations |
|
|
| Net
investment income (loss) |
$3,921,419
|
$5,201,242
|
| Net
realized gain (loss) |
61,299,221
|
42,607,038
|
| Net
unrealized gain (loss) |
93,687,255
|
206,247,474
|
| Change
in net assets from operations |
$158,907,895
|
$254,055,754
|
| Total
distributions to shareholders |
$(45,822,539)
|
$(38,136,630)
|
| Change
in net assets from fund share transactions |
$44,576,605
|
$(66,701,792)
|
| Total
change in net assets |
$157,661,961
|
$149,217,332
|
| Net
assets |
|
|
| At
beginning of period |
1,505,386,749
|
1,356,169,417
|
| At
end of period |
$1,663,048,710
|
$1,505,386,749
|
See Notes to Financial Statements
MFS International
Intrinsic Value Portfolio
| Financial
Statements |
Financial Highlights
|
The financial highlights table is
intended to help you understand the fund's financial performance for the past 5 years. Certain information reflects financial results for a single fund share. The total returns in the table represent the rate that an investor would have earned (or
lost) on an investment in the fund share class (assuming reinvestment of all distributions) held for the entire period.
| Initial
Class |
Year
ended |
| |
12/31/21
|
12/31/20
|
12/31/19
|
12/31/18
|
12/31/17
|
| Net
asset value, beginning of period |
$35.05
|
$29.94
|
$25.02
|
$28.25
|
$22.57
|
| Income
(loss) from investment operations |
|
|
|
|
|
| Net
investment income (loss) (d) |
$0.16
|
$0.18
|
$0.28
|
$0.30
|
$0.29
|
| Net
realized and unrealized gain (loss) |
3.51
|
5.87
|
6.06
|
(2.91)
|
5.80
|
| Total
from investment operations |
$3.67
|
$6.05
|
$6.34
|
$(2.61)
|
$6.09
|
| Less
distributions declared to shareholders |
|
|
|
|
|
| From
net investment income |
$(0.12)
|
$(0.31)
|
$(0.54)
|
$(0.31)
|
$(0.39)
|
| From
net realized gain |
(0.98)
|
(0.63)
|
(0.88)
|
(0.31)
|
(0.02)
|
| Total
distributions declared to shareholders |
$(1.10)
|
$(0.94)
|
$(1.42)
|
$(0.62)
|
$(0.41)
|
| Net
asset value, end of period (x) |
$37.62
|
$35.05
|
$29.94
|
$25.02
|
$28.25
|
| Total
return (%) (k)(r)(s)(x) |
10.55
|
20.52
|
25.94
|
(9.49)
|
27.14
|
Ratios
(%) (to average net assets)
and Supplemental data: |
|
|
|
|
|
| Expenses
before expense reductions |
0.90
|
0.92
|
0.92
|
0.91
|
0.91
|
| Expenses
after expense reductions |
0.89
|
0.90
|
0.90
|
0.90
|
0.90
|
| Net
investment income (loss) |
0.45
|
0.59
|
0.99
|
1.08
|
1.13
|
| Portfolio
turnover |
13
|
10
|
13
|
16
|
10
|
| Net
assets at end of period (000 omitted) |
$344,052
|
$328,247
|
$308,053
|
$282,244
|
$317,415
|
| Service
Class |
Year
ended |
| |
12/31/21
|
12/31/20
|
12/31/19
|
12/31/18
|
12/31/17
|
| Net
asset value, beginning of period |
$34.47
|
$29.47
|
$24.60
|
$27.80
|
$22.23
|
| Income
(loss) from investment operations |
|
|
|
|
|
| Net
investment income (loss) (d) |
$0.07
|
$0.10
|
$0.20
|
$0.27
|
$0.23
|
| Net
realized and unrealized gain (loss) |
3.45
|
5.77
|
5.97
|
(2.91)
|
5.70
|
| Total
from investment operations |
$3.52
|
$5.87
|
$6.17
|
$(2.64)
|
$5.93
|
| Less
distributions declared to shareholders |
|
|
|
|
|
| From
net investment income |
$(0.05)
|
$(0.24)
|
$(0.42)
|
$(0.25)
|
$(0.34)
|
| From
net realized gain |
(0.98)
|
(0.63)
|
(0.88)
|
(0.31)
|
(0.02)
|
| Total
distributions declared to shareholders |
$(1.03)
|
$(0.87)
|
$(1.30)
|
$(0.56)
|
$(0.36)
|
| Net
asset value, end of period (x) |
$36.96
|
$34.47
|
$29.47
|
$24.60
|
$27.80
|
| Total
return (%) (k)(r)(s)(x) |
10.28
|
20.21
|
25.65
|
(9.72)
|
26.82
|
Ratios
(%) (to average net assets)
and Supplemental data: |
|
|
|
|
|
| Expenses
before expense reductions |
1.15
|
1.17
|
1.17
|
1.15
|
1.16
|
| Expenses
after expense reductions |
1.14
|
1.15
|
1.15
|
1.14
|
1.15
|
| Net
investment income (loss) |
0.19
|
0.34
|
0.72
|
0.97
|
0.89
|
| Portfolio
turnover |
13
|
10
|
13
|
16
|
10
|
| Net
assets at end of period (000 omitted) |
$1,318,997
|
$1,177,140
|
$1,048,117
|
$858,278
|
$1,728,247
|
See Notes to Financial Statements
MFS International Intrinsic
Value Portfolio
Financial Highlights - continued
| (d)
|
Per share data
is based on average shares outstanding. |
| (k)
|
The total
return does not reflect expenses that apply to separate accounts. Inclusion of these charges would reduce the total return figures for all periods shown. |
| (r)
|
Certain
expenses have been reduced without which performance would have been lower. |
| (s)
|
From time to
time the fund may receive proceeds from litigation settlements, without which performance would be lower. |
| (x)
|
The
net asset values and total returns have been calculated on net assets which include adjustments made in accordance with U.S. generally accepted accounting principles required at period end for financial reporting purposes. |
See Notes to Financial Statements
MFS International
Intrinsic Value Portfolio
Notes to Financial Statements
(1) Business and Organization
MFS International Intrinsic Value Portfolio (the fund) is a
diversified series of MFS Variable Insurance Trust II (the trust). The trust is organized as a Massachusetts business trust and is registered under the Investment Company Act of 1940, as amended, as an open-end management investment company. The
shareholders of each series of the trust are separate accounts of insurance companies, which offer variable annuity and/or life insurance products, and qualified retirement and pension plans.
The fund is an investment company and accordingly follows
the investment company accounting and reporting guidance of the Financial Accounting Standards Board (FASB) Accounting Standards Codification Topic 946 Financial Services - Investment Companies.
(2) Significant Accounting Policies
General — The
preparation of financial statements in conformity with U.S. generally accepted accounting principles requires management to make estimates and assumptions that affect the reported amounts of assets and liabilities, and disclosure of contingent
assets and liabilities at the date of the financial statements and the reported amounts of increases and decreases in net assets from operations during the reporting period. Actual results could differ from those estimates. In the preparation of
these financial statements, management has evaluated subsequent events occurring after the date of the fund’s Statement of Assets and Liabilities through the date that the financial statements were issued. The fund invests in foreign securities. Investments in foreign securities are vulnerable to the effects of changes in the relative values of the local currency and the U.S. dollar and to the effects of changes in each
country’s market, economic, industrial, political, regulatory, geopolitical, environmental, public health, and other conditions.
Balance Sheet Offsetting
— The fund's accounting policy with respect to balance sheet offsetting is that, absent an event of default by the counterparty or a termination of the agreement, the International Swaps and Derivatives Association (ISDA) Master Agreement, or
similar agreement, does not result in an offset of reported amounts of financial assets and financial liabilities in the Statement of Assets and Liabilities across transactions between the fund and the applicable counterparty. The fund's right to
setoff may be restricted or prohibited by the bankruptcy or insolvency laws of the particular jurisdiction to which a specific master netting agreement counterparty is subject. Balance sheet offsetting disclosures, to the extent applicable to the
fund, have been included in the fund’s Significant Accounting Policies note under the captions for each of the fund’s in-scope financial instruments and transactions.
Investment Valuations
— Equity securities, including restricted equity securities, are generally valued at the last sale or official closing price on their primary market or exchange as provided by a third-party pricing
service. Equity securities, for which there were no sales reported that day, are generally valued at the last quoted daily bid quotation on their primary market or exchange as provided by a third-party pricing service. Short-term instruments with a maturity at issuance of 60 days or less may be valued at amortized cost, which approximates market value. Forward foreign currency exchange
contracts are generally valued at the mean of bid and asked prices for the time period interpolated from rates provided by a third-party pricing service for proximate time periods.
Open-end investment companies are generally valued at net asset value per
share. Securities and other assets generally valued on the basis of information from a third-party pricing service may also be valued at a broker/dealer bid quotation. In determining values, third-party pricing services can utilize both transaction
data and market information such as yield, quality, coupon rate, maturity, type of issue, trading characteristics, and other market data. The values of foreign securities and other assets and liabilities expressed in foreign currencies are converted
to U.S. dollars using the mean of bid and asked prices for rates provided by a third-party pricing service.
The Board of Trustees has delegated primary responsibility
for determining or causing to be determined the value of the fund’s investments (including any fair valuation) to the adviser pursuant to valuation policies and procedures approved by the Board. If the adviser determines that reliable market
quotations are not readily available, investments are valued at fair value as determined in good faith by the adviser in accordance with such procedures under the oversight of the Board of Trustees. Under the fund’s valuation policies and
procedures, market quotations are not considered to be readily available for most types of debt instruments and floating rate loans and many types of derivatives. These investments are generally valued at fair value based on information from
third-party pricing services. In addition, investments may be valued at fair value if the adviser determines that an investment’s value has been materially affected by events occurring after the close of the exchange or market on which the
investment is principally traded (such as foreign exchange or market) and prior to the determination of the fund’s net asset value, or after the halt of trading of a specific security where trading does not resume prior to the close of the
exchange or market on which the security is principally traded. Events that occur after foreign markets close (such as developments in foreign markets and significant movements in the U.S. markets) and prior to the determination of the fund’s
net asset value may be deemed to have a material effect on the value of securities traded in foreign markets. Accordingly, the fund’s foreign equity securities may often be valued at fair value. The adviser generally relies on third-party
pricing services or other information (such as the correlation with price movements of similar securities
MFS International Intrinsic
Value Portfolio
Notes to Financial Statements - continued
in the same or
other markets; the type, cost and investment characteristics of the security; the business and financial condition of the issuer; and trading and other market data) to assist in determining whether to fair value and at what value to fair value an
investment. The value of an investment for purposes of calculating the fund’s net asset value can differ depending on the source and method used to determine value. When fair valuation is used, the value of an investment used to determine the
fund’s net asset value may differ from quoted or published prices for the same investment. There can be no assurance that the fund could obtain the fair value assigned to an investment if it were to sell the investment at the same time at
which the fund determines its net asset value per share.
Various inputs are used in determining the value of the
fund's assets or liabilities. These inputs are categorized into three broad levels. In certain cases, the inputs used to measure fair value may fall into different levels of the fair value hierarchy. In such cases, an investment's level within the
fair value hierarchy is based on the lowest level of input that is significant to the fair value measurement. The fund's assessment of the significance of a particular input to the fair value measurement in its entirety requires judgment, and
considers factors specific to the investment. Level 1 includes unadjusted quoted prices in active markets for identical assets or liabilities. Level 2 includes other significant observable market-based inputs (including quoted prices for similar
securities, interest rates, prepayment speed, and credit risk). Level 3 includes unobservable inputs, which may include the adviser's own assumptions in determining the fair value of investments. The following is a summary of the levels used as of
December 31, 2021 in valuing the fund's assets and liabilities:
| Financial
Instruments |
Level
1 |
Level
2 |
Level
3 |
Total
|
| Equity
Securities: |
|
|
|
|
| France
|
$278,181,242
|
$—
|
$—
|
$278,181,242
|
| Japan
|
277,268,577
|
—
|
—
|
277,268,577
|
| Switzerland
|
144,191,685
|
130,217,375
|
—
|
274,409,060
|
| United
Kingdom |
211,441,200
|
—
|
—
|
211,441,200
|
| United
States |
198,636,006
|
—
|
—
|
198,636,006
|
| Germany
|
106,310,390
|
32,567,879
|
—
|
138,878,269
|
| Taiwan
|
56,418,172
|
—
|
—
|
56,418,172
|
| Canada
|
48,945,983
|
—
|
—
|
48,945,983
|
| Denmark
|
2,931,554
|
32,017,705
|
—
|
34,949,259
|
| Other
Countries |
92,923,652
|
19,989,286
|
—
|
112,912,938
|
| Mutual
Funds |
27,183,142
|
—
|
—
|
27,183,142
|
| Total
|
$1,444,431,603
|
$214,792,245
|
$—
|
$1,659,223,848
|
For further information
regarding security characteristics, see the Portfolio of Investments.
Foreign Currency
Translation — Purchases and sales of foreign investments, income, and expenses are converted into U.S. dollars based upon currency exchange rates prevailing on the respective dates of such transactions or on
the reporting date for foreign denominated receivables and payables. Gains and losses attributable to foreign currency exchange rates on sales of securities are recorded for financial statement purposes as net realized gains and losses on
investments. Gains and losses attributable to foreign exchange rate movements on receivables, payables, income and expenses are recorded for financial statement purposes as foreign currency transaction gains and losses. That portion of both realized
and unrealized gains and losses on investments that results from fluctuations in foreign currency exchange rates is not separately disclosed.
Derivatives — The
fund uses derivatives primarily to increase or decrease exposure to a particular market or segment of the market, or security, to increase or decrease interest rate or currency exposure, or as alternatives to direct investments. Derivatives are used
for hedging or non-hedging purposes. While hedging can reduce or eliminate losses, it can also reduce or eliminate gains. When the fund uses derivatives as an investment to increase market exposure, or for hedging purposes, gains and losses from
derivative instruments may be substantially greater than the derivative’s original cost.
The derivative instruments used by the fund during the
period were forward foreign currency exchange contracts. Depending on the type of derivative, a fund may exit a derivative position by entering into an offsetting transaction with a counterparty or exchange, negotiating an agreement with the
derivative counterparty, or novating the position to a third party. At December 31, 2021, the fund did not have any outstanding derivative instruments.
The following table presents, by major type of derivative
contract, the realized gain (loss) on derivatives held by the fund for the year ended December 31, 2021 as reported in the Statement of Operations:
MFS International
Intrinsic Value Portfolio
Notes to Financial Statements - continued
| Risk
|
Forward
Foreign
Currency
Exchange
Contracts |
| Foreign
Exchange |
$2,264,909
|
The following table presents, by
major type of derivative contract, the change in unrealized appreciation or depreciation on derivatives held by the fund for the year ended December 31, 2021 as reported in the Statement of Operations:
| Risk
|
Forward
Foreign
Currency
Exchange
Contracts |
| Foreign
Exchange |
$1,227,680
|
Derivative counterparty credit
risk is managed through formal evaluation of the creditworthiness of all potential counterparties. On certain, but not all, uncleared derivatives, the fund attempts to reduce its exposure to counterparty credit risk whenever possible by entering
into an ISDA Master Agreement on a bilateral basis. The ISDA Master Agreement gives each party to the agreement the right to terminate all transactions traded under such agreement if there is a specified deterioration in the credit quality of the
other party. Upon an event of default or a termination of the ISDA Master Agreement, the non-defaulting party has the right to close out all transactions traded under such agreement and to net amounts owed under each agreement to one net amount
payable by one party to the other. This right to close out and net payments across all transactions traded under the ISDA Master Agreement could result in a reduction of the fund's credit risk to such counterparty equal to any amounts payable by the
fund under the applicable transactions, if any.
Collateral and margin requirements differ by type of
derivative. For cleared derivatives (e.g., futures contracts, cleared swaps, and exchange-traded options), margin requirements are set by the clearing broker and the clearing house and collateral, in the form of cash or securities, is posted by the
fund directly with the clearing broker. Collateral terms are counterparty agreement specific for uncleared derivatives (e.g., forward foreign currency exchange contracts, uncleared swap agreements, and uncleared options) and collateral, in the form
of cash and securities, is held in segregated accounts with the fund's custodian in connection with these agreements. For derivatives traded under an ISDA Master Agreement, which contains a collateral support annex, the collateral requirements are
netted across all transactions traded under such counterparty-specific agreement and an amount is posted from one party to the other to collateralize such obligations. Cash that has been segregated or delivered to cover the fund's collateral or
margin obligations under derivative contracts, if any, will be reported separately in the Statement of Assets and Liabilities as restricted cash for uncleared derivatives and/or deposits with brokers for cleared derivatives. Securities pledged as
collateral or margin for the same purpose, if any, are noted in the Portfolio of Investments. The fund may be required to make payments of interest on uncovered collateral or margin obligations with the broker. Any such payments are included in
“Miscellaneous” expense in the Statement of Operations.
Forward Foreign Currency Exchange Contracts — The fund entered into forward foreign currency exchange contracts for the purchase or sale of a specific foreign currency at a fixed price on a future date. These contracts may be used to hedge the fund’s
currency risk or for non-hedging purposes. For hedging purposes, the fund may enter into contracts to deliver or receive foreign currency that the fund will receive from or use in its normal investment activities. The fund may also use contracts to
hedge against declines in the value of foreign currency denominated securities due to unfavorable exchange rate movements. For non-hedging purposes, the fund may enter into contracts with the intent of changing the relative exposure of the
fund’s portfolio of securities to different currencies to take advantage of anticipated exchange rate changes.
Forward foreign currency exchange contracts are adjusted by
the daily exchange rate of the underlying currency and any unrealized gains or losses are recorded as a receivable or payable for forward foreign currency exchange contracts until the contract settlement date. On contract settlement date, any gain
or loss on the contract is recorded as realized gains or losses on forward foreign currency exchange contracts.
Risks may arise upon entering into these contracts from
unanticipated movements in the value of the contract and from the potential inability of counterparties to meet the terms of their contracts. Generally, the fund’s maximum risk due to counterparty credit risk is the unrealized gain on the
contract due to the use of Continuous Linked Settlement, a multicurrency cash settlement system for the centralized settlement of foreign transactions. This risk is mitigated in cases where there is an ISDA Master Agreement between the fund and the
counterparty providing for netting as described above and, where applicable, by the posting of collateral by the counterparty to the fund to cover the fund’s exposure to the counterparty under such ISDA Master Agreement.
MFS International Intrinsic
Value Portfolio
Notes to Financial Statements - continued
Security Loans —
Under its Securities Lending Agency Agreement with the fund, State Street Bank and Trust Company, as lending agent, loans the securities of the fund to certain qualified institutions (the “Borrowers”) approved by the fund. Security loans
can be terminated at the discretion of either the lending agent or the fund and the related securities must be returned within the earlier of the standard trade settlement period for such securities or within three business days. The loans are
collateralized by cash and/or U.S. Treasury and federal agency obligations in an amount typically at least equal to the market value of the securities loaned. On loans collateralized by cash, the cash collateral is invested in a money market fund.
The market value of the loaned securities is determined at the close of business of the fund and any additional required collateral is delivered to the fund on the next business day. The lending agent provides the fund with indemnification against
Borrower default. In the event of Borrower default, the lending agent will, for the benefit of the fund, either purchase securities identical to those loaned or, when such purchase is commercially impracticable, pay the fund the market value of the
loaned securities. In return, the lending agent assumes the fund's rights to the related collateral. If the collateral value is less than the cost to purchase identical securities, the lending agent is responsible for the shortfall, but only to the
extent that such shortfall is not due to a decline in collateral value resulting from collateral reinvestment for which the fund bears the risk of loss. A portion of the income generated upon investment of the collateral is remitted to the
Borrowers, and the remainder is allocated between the fund and the lending agent. On loans collateralized by U.S. Treasury and/or federal agency obligations, a fee is received from the Borrower, and is allocated between the fund and the lending
agent. Income from securities lending is separately reported in the Statement of Operations. The dividend and interest income earned on the securities loaned is accounted for in the same manner as other dividend and interest income. At December 31,
2021, there were no securities on loan or collateral outstanding.
Indemnifications —
Under the fund's organizational documents, its officers and Trustees may be indemnified against certain liabilities and expenses arising out of the performance of their duties to the fund. Additionally, in the normal course of business, the fund
enters into agreements with service providers that may contain indemnification clauses. The fund's maximum exposure under these agreements is unknown as this would involve future claims that may be made against the fund that have not yet
occurred.
Investment Transactions and Income — Investment transactions are recorded on the trade date. Dividends received in cash are recorded on the ex-dividend date. Certain dividends from foreign securities will be
recorded when the fund is informed of the dividend if such information is obtained subsequent to the ex-dividend date. Dividend payments received in additional securities are recorded on the ex-dividend date in an amount equal to the value of the
security on such date.
The fund may receive
proceeds from litigation settlements. Any proceeds received from litigation involving portfolio holdings are reflected in the Statement of Operations in realized gain/loss if the security has been disposed of by the fund or in unrealized gain/loss
if the security is still held by the fund. Any other proceeds from litigation not related to portfolio holdings are reflected as other income in the Statement of Operations.
Tax Matters and Distributions — The fund intends to qualify as a regulated investment company, as defined under Subchapter M of the Internal Revenue Code, and to distribute all of its taxable income, including realized capital gains. As a
result, no provision for federal income tax is required. The fund’s federal tax returns, when filed, will remain subject to examination by the Internal Revenue Service for a three year period. Management has analyzed the fund’s tax
positions taken on federal and state tax returns for all open tax years and does not believe that there are any uncertain tax positions that require recognition of a tax liability. Foreign taxes, if any, have been accrued by the fund in the
accompanying financial statements in accordance with the applicable foreign tax law. Foreign income taxes may be withheld by certain countries in which the fund invests. Additionally, capital gains realized by the fund on securities issued in or by
certain foreign countries may be subject to capital gains tax imposed by those countries.
Distributions to shareholders are recorded on the
ex-dividend date. Income and capital gain distributions are determined in accordance with income tax regulations, which may differ from U.S. generally accepted accounting principles. Certain capital accounts in the financial statements are
periodically adjusted for permanent differences in order to reflect their tax character. These adjustments have no impact on net assets or net asset value per share. Temporary differences which arise from recognizing certain items of income,
expense, gain or loss in different periods for financial statement and tax purposes will reverse at some time in the future.
Book/tax differences primarily relate to wash sale loss
deferrals.
The tax character of distributions
declared to shareholders for the last two fiscal years is as follows:
| |
Year
ended
12/31/21 |
Year
ended
12/31/20 |
| Ordinary
income (including any short-term capital gains) |
$3,637,214
|
$12,548,204
|
| Long-term
capital gains |
42,185,325
|
25,588,426
|
| Total
distributions |
$45,822,539
|
$38,136,630
|
MFS International
Intrinsic Value Portfolio
Notes to Financial Statements - continued
The
federal tax cost and the tax basis components of distributable earnings were as follows:
| As
of 12/31/21 |
|
| Cost
of investments |
$997,006,143
|
| Gross
appreciation |
692,084,447
|
| Gross
depreciation |
(29,866,742)
|
| Net
unrealized appreciation (depreciation) |
$662,217,705
|
| Undistributed
ordinary income |
12,440,765
|
| Undistributed
long-term capital gain |
53,930,299
|
| Other
temporary differences |
(73,056)
|
| Total
distributable earnings (loss) |
$728,515,713
|
Multiple Classes of Shares of
Beneficial Interest — The fund offers multiple classes of shares, which differ in their respective distribution and/or service fees. The fund's income, realized and unrealized gain (loss), and common expenses
are allocated to shareholders based on the daily net assets of each class. Dividends are declared separately for each class. Differences in per share dividend rates are generally due to differences in separate class expenses. The fund’s
distributions declared to shareholders as reported in the Statements of Changes in Net Assets are presented by class as follows:
| |
Year
ended
12/31/21 |
|
Year
ended
12/31/20 |
| Initial
Class |
$10,070,073
|
|
$8,702,058
|
| Service
Class |
35,752,466
|
|
29,434,572
|
| Total
|
$45,822,539
|
|
$38,136,630
|
(3) Transactions with
Affiliates
Investment Adviser — The fund has an investment advisory agreement with MFS to provide overall investment management and related administrative services and facilities to the fund. The
management fee is computed daily and paid monthly at the following annual rates based on the fund's average daily net assets:
| Up
to $1 billion |
0.90%
|
| In
excess of $1 billion and up to $2 billion |
0.80%
|
| In
excess of $2 billion |
0.70%
|
MFS has agreed in writing to
reduce its management fee by a specified amount if certain MFS mutual fund assets exceed thresholds agreed to by MFS and the fund's Board of Trustees. For the year ended December 31, 2021, this management fee reduction amounted to $200,998, which is
included in the reduction of total expenses in the Statement of Operations. The management fee incurred for the year ended December 31, 2021 was equivalent to an annual effective rate of 0.85% of the fund's average daily net assets.
The investment adviser has agreed in writing to pay a
portion of the fund’s total annual operating expenses, excluding interest, taxes, extraordinary expenses, brokerage and transaction costs, and investment-related expenses, such that total annual operating expenses do not exceed 0.90% of
average daily net assets for the Initial Class shares and 1.15% of average daily net assets for the Service Class shares. This written agreement will continue until modified by the fund’s Board of Trustees, but such agreement will continue at
least until April 30, 2023. For the year ended December 31, 2021, the fund’s actual operating expenses did not exceed the limit and therefore, the investment adviser did not pay any portion of the fund’s expenses related to this
agreement.
Distributor — MFS
Fund Distributors, Inc. (MFD), a wholly-owned subsidiary of MFS, is the distributor of shares of the fund. The Trustees have adopted a distribution plan for the Service Class shares pursuant to Rule 12b-1 under the Investment Company Act of
1940.
The fund's distribution plan provides
that the fund will pay MFD distribution and/or service fees equal to 0.25% per annum of its average daily net assets attributable to Service Class shares as partial consideration for services performed and expenses incurred by MFD and financial
intermediaries (including participating insurance companies that invest in the fund to fund variable annuity and variable life insurance contracts, sponsors of qualified retirement and pension plans that invest in the fund, and affiliates of these
participating insurance companies and plan sponsors) in connection with the sale and distribution of the Service Class shares. MFD may subsequently pay all, or a portion, of the distribution and/or service fees to financial intermediaries.
MFS International Intrinsic
Value Portfolio
Notes to Financial Statements - continued
Shareholder Servicing Agent
— MFS Service Center, Inc. (MFSC), a wholly-owned subsidiary of MFS, receives a fee from the fund for its services as shareholder servicing agent. For the year ended December 31, 2021, the fee was $42,909, which equated to 0.0027% annually of
the fund's average daily net assets. MFSC also receives reimbursement from the fund for out-of-pocket expenses paid by MFSC on behalf of the fund. For the year ended December 31, 2021, these costs amounted to $1,765.
Administrator — MFS
provides certain financial, legal, shareholder communications, compliance, and other administrative services to the fund. Under an administrative services agreement, the fund reimburses MFS the costs incurred to provide these services. The fund is
charged an annual fixed amount of $17,500 plus a fee based on average daily net assets. The administrative services fee incurred for the year ended December 31, 2021 was equivalent to an annual effective rate of 0.0137% of the fund's average daily
net assets.
Trustees’ and Officers’
Compensation — The fund pays compensation to independent Trustees in the form of a retainer, attendance fees, and additional compensation to Board and Committee chairpersons. The fund does not pay compensation
directly to Trustees or officers of the fund who are also officers of the investment adviser, all of whom receive remuneration from MFS for their services to the fund. Certain officers and Trustees of the fund are officers or directors of MFS, MFD,
and MFSC.
Other — The fund invests in the MFS Institutional Money Market Portfolio which is managed by MFS and seeks current income consistent with preservation of capital and liquidity. This money market fund does not pay a
management fee to MFS but does incur investment and operating costs.
(4) Portfolio Securities
For the year ended December 31, 2021, purchases and sales
of investments, other than short-term obligations, aggregated $228,744,395 and $199,801,589, respectively.
(5) Shares of Beneficial Interest
The fund's Declaration of Trust permits the Trustees to
issue an unlimited number of full and fractional shares of beneficial interest. Transactions in fund shares were as follows:
| |
Year
ended
12/31/21 |
|
Year
ended
12/31/20 |
| |
Shares
|
Amount
|
|
Shares
|
Amount
|
| Shares
sold |
|
|
|
|
|
| Initial
Class |
1,560,198
|
$55,767,129
|
|
1,545,411
|
$46,930,881
|
| Service
Class |
5,119,497
|
180,287,362
|
|
4,685,053
|
136,442,604
|
| |
6,679,695
|
$236,054,491
|
|
6,230,464
|
$183,373,485
|
Shares
issued to shareholders
in reinvestment of distributions |
|
|
|
|
|
| Initial
Class |
268,496
|
$9,856,486
|
|
262,777
|
$8,408,861
|
| Service
Class |
990,373
|
35,752,466
|
|
934,431
|
29,434,572
|
| |
1,258,869
|
$45,608,952
|
|
1,197,208
|
$37,843,433
|
| Shares
reacquired |
|
|
|
|
|
| Initial
Class |
(2,047,578)
|
$(73,961,957)
|
|
(2,732,208)
|
$(81,847,531)
|
| Service
Class |
(4,570,255)
|
(163,124,881)
|
|
(7,040,629)
|
(206,071,179)
|
| |
(6,617,833)
|
$(237,086,838)
|
|
(9,772,837)
|
$(287,918,710)
|
| Net
change |
|
|
|
|
|
| Initial
Class |
(218,884)
|
$(8,338,342)
|
|
(924,020)
|
$(26,507,789)
|
| Service
Class |
1,539,615
|
52,914,947
|
|
(1,421,145)
|
(40,194,003)
|
| |
1,320,731
|
$44,576,605
|
|
(2,345,165)
|
$(66,701,792)
|
The fund is one of several
mutual funds in which certain MFS funds may invest. The MFS funds do not invest in the underlying funds for the purpose of exercising management or control. At the end of the period, the MFS Moderate Allocation Portfolio and the MFS Growth
Allocation Portfolio were the owners of record of approximately 2% and 1%, respectively, of the value of outstanding voting shares of the fund. In addition, the MFS Conservative Allocation Portfolio was the owner of record of less than 1% of the
value of outstanding voting shares of the fund.
Effective at the close of business on October 16, 2017, the
fund is closed to new investors subject to certain exceptions. Please see the fund's prospectus for details.
MFS International
Intrinsic Value Portfolio
Notes to Financial Statements - continued
(6) Line of Credit
The fund and certain other funds managed by MFS participate
in a $1.25 billion unsecured committed line of credit of which $1 billion is reserved for use by the fund and certain other MFS U.S. funds. The line of credit is provided by a syndicate of banks under a credit agreement. Borrowings may be made for
temporary financing needs. Interest is charged to each fund, based on its borrowings, generally at a rate equal to the highest of one month LIBOR, the Federal Funds Effective Rate and the Overnight Bank Funding Rate, plus an agreed upon spread. A
commitment fee, based on the average daily, unused portion of the committed line of credit, is allocated among the participating funds. In addition, the fund and other funds managed by MFS have established unsecured uncommitted borrowing
arrangements with certain banks for temporary financing needs. Interest is charged to each fund, based on its borrowings, at rates equal to customary reference rates plus an agreed upon spread. For the year ended December 31, 2021, the fund’s
commitment fee and interest expense were $5,335 and $0, respectively, and are included in “Miscellaneous” expense in the Statement of Operations.
(7) Investments in Affiliated Issuers
An affiliated issuer may be considered one in which the
fund owns 5% or more of the outstanding voting securities, or a company which is under common control. For the purposes of this report, the following were affiliated issuers:
| Affiliated
Issuers |
Beginning
Value |
Purchases
|
Sales
Proceeds |
Realized
Gain
(Loss) |
Change
in
Unrealized
Appreciation or
Depreciation |
Ending
Value |
| MFS
Institutional Money Market Portfolio |
$42,517,675
|
$189,938,594
|
$205,273,127
|
$1,494
|
$(1,494)
|
$27,183,142
|
| Affiliated
Issuers |
Dividend
Income |
Capital
Gain
Distributions |
| MFS
Institutional Money Market Portfolio |
$15,579
|
$—
|
(8) Impacts of
COVID-19
The pandemic related to the global spread of
novel coronavirus disease (COVID-19), which was first detected in December 2019, has resulted in significant disruptions to global business activity and the global economy, as well as the economies of individual countries, the financial performance
of individual companies and sectors, and the securities and commodities markets in general. Multiple surges in cases globally, the availability and widespread adoption of vaccines, and the emergence of variant strains of the virus continue to create
uncertainty as to the future and long-term impacts resulting from the pandemic including impacts to the prices and liquidity of the fund's investments and the fund's performance.
(9) LIBOR Transition
Certain of the fund's investments, including its
investments in derivatives, as well as any debt issued by the fund and other contractual arrangements of the fund may be based on reference interest rates such as the London Interbank Offered Rate (“LIBOR”). In 2017, the regulatory
authority that oversees financial services firms in the United Kingdom announced plans to transition away from LIBOR by the end of 2021. In March 2021, the administrator of LIBOR announced the extension of the publication of the more commonly used
U.S. dollar LIBOR settings to the end of June 2023. Although the full impacts of the transition away from LIBOR are not fully known, the transition may result in, among other things, an increase in volatility or illiquidity of the markets for
instruments that currently rely on LIBOR to determine interest rates and this could have an adverse impact on the fund's performance. With respect to the fund's accounting for investments, including its investments in derivatives, as well as any
debt issued by the fund and other contractual arrangements of the fund that undergo reference rate-related modifications as a result of the transition, management will rely upon the relief provided by FASB Codification Topic 848 – Reference
Rate Reform (Topic 848). The guidance in Topic 848 permits the fund to disregard the GAAP accounting requirements around certain contract modifications resulting from the LIBOR transition such that for contracts considered in scope, the fund can
account for those modified contracts as a continuation of the existing contracts. While the cessation of the one-week and two-month U.S. dollar LIBOR tenors along with certain other non-U.S. dollar denominated LIBOR settings at December 31, 2021 did
not have a material impact on the fund, management is still evaluating the impact to the fund of the June 30, 2023 planned discontinuation of the more commonly used U.S. dollar LIBOR settings.
MFS International Intrinsic
Value Portfolio
Report of Independent Registered Public Accounting
Firm
To the Board of Trustees of MFS Variable
Insurance Trust II and the Shareholders of MFS International Intrinsic Value Portfolio:
Opinion on the Financial Statements and Financial
Highlights
We have audited the accompanying statement
of assets and liabilities of MFS International Intrinsic Value Portfolio (the “Fund”), including the portfolio of investments, as of December 31, 2021, the related statement of operations for the year then ended, the statements of
changes in net assets for each of the two years in the period then ended, the financial highlights for each of the five years in the period then ended, and the related notes. In our opinion, the financial statements and financial highlights present
fairly, in all material respects, the financial position of the Fund as of December 31, 2021, and the results of its operations for the year then ended, the changes in its net assets for each of the two years in the period then ended, and the
financial highlights for each of the five years in the period then ended, in conformity with accounting principles generally accepted in the United States of America.
Basis for Opinion
These financial statements and financial highlights are the
responsibility of the Fund's management. Our responsibility is to express an opinion on the Fund's financial statements and financial highlights based on our audits. We are a public accounting firm registered with the Public Company Accounting
Oversight Board (United States) (PCAOB) and are required to be independent with respect to the Fund in accordance with the U.S. federal securities laws and the applicable rules and regulations of the Securities and Exchange Commission and the
PCAOB.
We conducted our audits in accordance with the
standards of the PCAOB. Those standards require that we plan and perform the audit to obtain reasonable assurance about whether the financial statements and financial highlights are free of material misstatement, whether due to error or fraud. The
Fund is not required to have, nor were we engaged to perform, an audit of its internal control over financial reporting. As part of our audits, we are required to obtain an understanding of internal control over financial reporting but not for the
purpose of expressing an opinion on the effectiveness of the Fund's internal control over financial reporting. Accordingly, we express no such opinion.
Our audits included performing procedures to assess the
risks of material misstatement of the financial statements and financial highlights, whether due to error or fraud, and performing procedures that respond to those risks. Such procedures included examining, on a test basis, evidence regarding the
amounts and disclosures in the financial statements and financial highlights. Our audits also included evaluating the accounting principles used and significant estimates made by management, as well as evaluating the overall presentation of the
financial statements and financial highlights. Our procedures included confirmation of securities owned as of December 31, 2021, by correspondence with the custodian. We believe that our audits provide a reasonable basis for our opinion.
DELOITTE & TOUCHE LLP
Boston, Massachusetts
February 15, 2022
We have served as the auditor of one or more of the MFS
investment companies since 1924.
MFS International
Intrinsic Value Portfolio
Trustees and Officers — Identification and
Background
The Trustees and Officers of the Trust, as
of February 1, 2022, are listed below, together with their principal occupations during the past five years. (Their titles may have varied during that period.) The address of each Trustee and Officer is 111 Huntington Avenue, Boston, Massachusetts
02199-7618.
| Name,
Age |
|
Position(s)
Held with Fund |
|
Trustee/Officer
Since(h) |
|
Number
of MFS Funds overseen by the Trustee |
|
Principal
Occupations During
the Past Five Years |
|
Other
Directorships During
the Past Five Years (j) |
| INTERESTED
TRUSTEES |
|
|
|
|
|
|
|
|
|
|
Michael
W. Roberge (k)
(age 55) |
|
Trustee
|
|
January
2021 |
|
135
|
|
Massachusetts
Financial Services Company, Chairman (since January 2021); Chief Executive Officer (since January 2017); Director; Chairman of the Board (since January 2022); President (until December 2018); Chief Investment Officer (until December 2018) |
|
N/A
|
| INDEPENDENT
TRUSTEES |
|
|
|
|
|
|
|
|
|
|
John
P. Kavanaugh
(age 67) |
|
Trustee
and Chair of Trustees |
|
January
2009 |
|
135
|
|
Private
investor |
|
N/A
|
Steven
E. Buller
(age 70) |
|
Trustee
|
|
February
2014 |
|
135
|
|
Private
investor |
|
N/A
|
John
A. Caroselli
(age 67) |
|
Trustee
|
|
March
2017 |
|
135
|
|
Private
investor; JC Global Advisors, LLC (management consulting), President (since 2015) |
|
N/A
|
Maureen
R. Goldfarb
(age 66) |
|
Trustee
|
|
January
2009 |
|
135
|
|
Private
investor |
|
N/A
|
Peter
D. Jones
(age 66) |
|
Trustee
|
|
January
2019 |
|
135
|
|
Private
investor |
|
N/A
|
James
W. Kilman, Jr.
(age 60) |
|
Trustee
|
|
January
2019 |
|
135
|
|
Burford
Capital Limited (finance and investment management), Senior Advisor (since May 3, 2021), Chief Financial Officer (2019 - May 2, 2021); KielStrand Capital LLC (family office), Chief Executive Officer (since 2016) |
|
Alpha-En
Corporation, Director (2016-2019) |
Clarence
Otis, Jr.
(age 65) |
|
Trustee
|
|
March
2017 |
|
135
|
|
Private
investor |
|
VF
Corporation, Director; Verizon Communications, Inc., Director; The Travelers Companies, Director |
Maryanne
L. Roepke
(age 65) |
|
Trustee
|
|
May
2014 |
|
135
|
|
Private
investor |
|
N/A
|
Laurie
J. Thomsen
(age 64) |
|
Trustee
|
|
March
2005 |
|
135
|
|
Private
investor |
|
The
Travelers Companies, Director; Dycom Industries, Inc., Director |
MFS International Intrinsic
Value Portfolio
Trustees and Officers - continued
| Name,
Age |
|
Position(s)
Held with
Fund |
|
Trustee/Officer
Since(h) |
|
Number
of MFS Funds for which the Person is an Officer |
|
Principal
Occupations During
the Past Five Years |
| OFFICERS
|
|
|
|
|
|
|
|
|
Christopher
R. Bohane (k)
(age 48) |
|
Assistant
Secretary and Assistant Clerk |
|
July
2005 |
|
135
|
|
Massachusetts
Financial Services Company, Senior Vice President and Associate General Counsel |
Kino
Clark (k)
(age 53) |
|
Assistant
Treasurer |
|
January
2012 |
|
135
|
|
Massachusetts
Financial Services Company, Vice President |
John
W. Clark, Jr. (k)
(age 54) |
|
Assistant
Treasurer |
|
April
2017 |
|
135
|
|
Massachusetts
Financial Services Company, Vice President (since March 2017); Deutsche Bank (financial services), Department Head - Treasurer's Office (until February 2017) |
Thomas
H. Connors (k)
(age 62) |
|
Assistant
Secretary and Assistant Clerk |
|
September
2012 |
|
135
|
|
Massachusetts
Financial Services Company, Vice President and Senior Counsel |
David
L. DiLorenzo (k)
(age 53) |
|
President
|
|
July
2005 |
|
135
|
|
Massachusetts
Financial Services Company, Senior Vice President |
Heidi
W. Hardin (k)
(age 54) |
|
Secretary
and Clerk |
|
April
2017 |
|
135
|
|
Massachusetts
Financial Services Company, Executive Vice President and General Counsel (since March 2017); Harris Associates (investment management), General Counsel (until January 2017) |
Brian
E. Langenfeld (k)
(age 48) |
|
Assistant
Secretary and Assistant Clerk |
|
June
2006 |
|
135
|
|
Massachusetts
Financial Services Company, Vice President and Senior Counsel |
Amanda
S. Mooradian (k)
(age 42) |
|
Assistant
Secretary and Assistant Clerk |
|
September
2018 |
|
135
|
|
Massachusetts
Financial Services Company, Assistant Vice President and Senior Counsel |
Susan
A. Pereira (k)
(age 51) |
|
Assistant
Secretary and Assistant Clerk |
|
July
2005 |
|
135
|
|
Massachusetts
Financial Services Company, Vice President and Assistant General Counsel |
Kasey
L. Phillips (k)
(age 51) |
|
Assistant
Treasurer |
|
September
2012 |
|
135
|
|
Massachusetts
Financial Services Company, Vice President |
Matthew
A. Stowe (k)
(age 47) |
|
Assistant
Secretary and Assistant Clerk |
|
October
2014 |
|
135
|
|
Massachusetts
Financial Services Company, Vice President and Assistant General Counsel |
Martin
J. Wolin (k)
(age 54) |
|
Chief
Compliance Officer |
|
July
2015 |
|
135
|
|
Massachusetts
Financial Services Company, Senior Vice President and Chief Compliance Officer |
James
O. Yost (k)
(age 61) |
|
Treasurer
|
|
September
1990 |
|
135
|
|
Massachusetts
Financial Services Company, Senior Vice President |
| (h)
|
Date
first appointed to serve as Trustee/Officer of an MFS Fund. Each Trustee has served continuously since appointment unless indicated otherwise. From January 2012 through December 2016, Messrs. DiLorenzo and Yost served as Treasurer and Deputy
Treasurer of the Funds, respectively. |
| (j)
|
Directorships or
trusteeships of companies required to report to the Securities and Exchange Commission (i.e., “public companies”). |
| (k)
|
“Interested
person” of the Trust within the meaning of the Investment Company Act of 1940 (referred to as the 1940 Act), which is the principal federal law governing investment companies like the fund, as a result of a position with MFS. The address of
MFS is 111 Huntington Avenue, Boston, Massachusetts 02199-7618. |
Each Trustee (other than Messrs. Jones, Kilman and Roberge)
has been elected by shareholders and each Trustee and Officer holds office until his or her successor is chosen and qualified or until his or her earlier death, resignation, retirement or removal. Mr. Roberge became a Trustee of the Funds on January
1, 2021 and Messrs. Jones and Kilman became Trustees of the Funds on January 1, 2019. The Trust does not hold annual meetings for the purpose of electing Trustees, and Trustees are not elected for fixed terms. Under the terms of the Board's
retirement policy, an Independent Trustee shall retire at the end of the calendar year in which he or she reaches the earlier of 75 years of age or 15 years of service on the Board (or, in the case of any Independent Trustee who joined the Board
prior to 2015, 20 years of service on the Board).
Messrs. Buller, Kilman and Otis and Ms. Roepke are members
of the Trust’s Audit Committee.
MFS International
Intrinsic Value Portfolio
Trustees and Officers - continued
Each
of the Interested Trustees and certain Officers hold comparable officer positions with certain affiliates of MFS.
The Statement of Additional Information for a Fund includes
further information about the Trustees and is available without charge upon request by calling 1-800-225-2606.
| Investment
Adviser |
Custodian
|
Massachusetts Financial
Services Company
111 Huntington Avenue
Boston, MA 02199-7618 |
State Street
Bank and Trust Company
1 Lincoln Street
Boston, MA 02111-2900 |
| Distributor
|
Independent
Registered Public Accounting Firm |
MFS Fund
Distributors, Inc.
111 Huntington Avenue
Boston, MA 02199-7618 |
Deloitte
& Touche LLP
200 Berkeley Street
Boston, MA 02116 |
| Portfolio
Manager(s) |
|
Pablo de la
Mata
Philip Evans
Benjamin Stone |
|
MFS International Intrinsic
Value Portfolio
Board Review of Investment Advisory Agreement
MFS International Intrinsic Value Portfolio
The Investment Company Act of 1940 requires that both the
full Board of Trustees and a majority of the non-interested (“independent”) Trustees, voting separately, annually approve the continuation of the Fund’s investment advisory agreement with MFS. The Trustees consider matters bearing
on the Fund and its advisory arrangements at their meetings throughout the year, including a review of performance data at each regular meeting. In addition, the independent Trustees met several times by videoconference (in accordance with
Securities and Exchange Commission relief) over the course of three months beginning in May and ending in July, 2021 (“contract review meetings”) for the specific purpose of considering whether to approve the continuation of the
investment advisory agreement for the Fund and the other investment companies that the Board oversees (the “MFS Funds”). The independent Trustees were assisted in their evaluation of the Fund’s investment advisory agreement by
independent legal counsel, from whom they received separate legal advice and with whom they met separately from MFS during various contract review meetings. The independent Trustees were also assisted in this process by an independent consultant who
was retained by and reported to the independent Trustees.
In connection with their deliberations regarding the
continuation of the investment advisory agreement, the Trustees, including the independent Trustees, considered such information and factors as they believed, in light of the legal advice furnished to them and their own business judgment, to be
relevant. The investment advisory agreement for the Fund was considered separately, although the Trustees also took into account the common interests of all MFS Funds in their review. As described below, the Trustees considered the nature, quality,
and extent of the various investment advisory, administrative, and shareholder services performed by MFS under the existing investment advisory agreement and other arrangements with the Fund.
In connection with their contract review meetings, the
Trustees received and relied upon materials that included, among other items: (i) information provided by Broadridge Financial Solutions, Inc. (“Broadridge”), an independent third party, on the investment performance of the Fund for
various time periods ended December 31, 2020 and the investment performance of a group of funds with substantially similar investment classifications/objectives (the “Broadridge performance universe”), (ii) information provided by
Broadridge on the Fund’s advisory fees and other expenses and the advisory fees and other expenses of comparable funds identified by Broadridge as well as all other funds in the same investment classification/category (the “Broadridge
expense group and universe”), (iii) information provided by MFS on the advisory fees of portfolios of other clients of MFS, including institutional separate accounts and other clients, (iv) information as to whether and to what extent
applicable expense waivers, reimbursements or fee “breakpoints” are observed for the Fund, (v) information regarding MFS’ financial results and financial condition, including MFS’ and certain of its affiliates’
estimated profitability from services performed for the Fund and the MFS Funds as a whole, and compared to MFS’ institutional business, (vi) MFS’ views regarding the outlook for the mutual fund industry and the strategic business plans
of MFS, (vii) descriptions of various functions performed by MFS for the Funds, such as compliance monitoring and portfolio trading practices, and (viii) information regarding the overall organization of MFS, including information about MFS’
senior management and other personnel providing investment advisory, administrative and other services to the Fund and the other MFS Funds. The comparative performance, fee and expense information prepared and provided by Broadridge was not
independently verified and the independent Trustees did not independently verify any information provided to them by MFS.
The Trustees’ conclusion as to the continuation of
the investment advisory agreement was based on a comprehensive consideration of all information provided to the Trustees and not the result of any single factor. Some of the factors that figured particularly in the Trustees’ deliberations are
described below, although individual Trustees may have evaluated the information presented differently from one another, giving different weights to various factors. It is also important to recognize that the fee arrangements for the Fund and other
MFS Funds are the result of years of review and discussion between the independent Trustees and MFS, that certain aspects of such arrangements may receive greater scrutiny in some years than in others, and that the Trustees’ conclusions may be
based, in part, on their consideration of these same arrangements during the course of the year and in prior years.
Based on information provided by Broadridge and MFS, the
Trustees reviewed the Fund’s total return investment performance as well as the Broadridge performance universe over various time periods. The Trustees placed particular emphasis on the total return performance of the Fund’s Initial
Class shares in comparison to the performance of funds in its Broadridge performance universe over the five-year period ended December 31, 2020, which the Trustees believed was a long enough period to reflect differing market conditions. The total
return performance of the Fund’s Initial Class shares was in the 2nd quintile relative to the other funds in the universe for this five-year period (the 1st quintile being the best performers and the 5th quintile being the worst performers).
The total return performance of the Fund’s Initial Class shares was in the 3rd quintile for the one-year period and the 2nd quintile for the three-year period ended December 31, 2020 relative to the Broadridge performance universe. Because of
the passage of time, these performance results may differ from the performance results for more recent periods, including those shown elsewhere in this report.
MFS International
Intrinsic Value Portfolio
Board Review of Investment Advisory Agreement - continued
In
the course of their deliberations, the Trustees took into account information provided by MFS in connection with the contract review meetings, as well as during investment review meetings conducted with portfolio management personnel during the
course of the year regarding the Fund’s performance. After reviewing these and related factors, the Trustees concluded, within the context of their overall conclusions regarding the investment advisory agreement, that they were satisfied with
MFS’ responses and efforts relating to investment performance.
In assessing the reasonableness of the Fund’s
advisory fee, the Trustees considered, among other information, the Fund’s advisory fee and the total expense ratio of the Fund’s Initial Class shares as a percentage of average daily net assets and the advisory fee and total expense
ratios of the Broadridge expense group based on information provided by Broadridge. The Trustees considered that MFS currently observes an expense limitation for the Fund, which may not be changed without the Trustees’ approval. The Trustees
also considered that, according to the data provided by Broadridge (which takes into account any fee reductions or expense limitations that were in effect during the Fund’s last fiscal year), the Fund’s effective advisory fee rate and
total expense ratio were each higher than the Broadridge expense group median.
The Trustees also considered the advisory fees charged by
MFS to any institutional separate accounts advised by MFS (“separate accounts”) and unaffiliated investment companies for which MFS serves as subadviser (“subadvised funds”) that have comparable investment strategies to the
Fund, if any. In comparing these fees, the Trustees considered information provided by MFS as to the generally broader scope of services provided by MFS to the Fund, as well as the more extensive regulatory burdens imposed on MFS in managing the
Fund, in comparison to separate accounts and subadvised funds. The Trustees also considered the higher demands placed on MFS’ investment personnel and trading infrastructure as a result of the daily cash in-flows and out-flows of the Fund in
comparison to separate accounts.
The Trustees also
considered whether the Fund may benefit from any economies of scale in the management of the Fund in the event of growth in assets of the Fund and/or growth in assets of the MFS Funds as a whole. They noted that the Fund’s advisory fee rate
schedule is subject to contractual breakpoints that reduce the Fund’s advisory fee rate on average daily net assets over $1 billion and $2 billion. The Trustees also noted that MFS has agreed in writing to waive a portion of the management
fees of certain MFS Funds, including the Fund, if the total combined assets of certain funds within the MFS Funds’ complex increase above agreed upon thresholds (the “group fee waiver”), enabling the Fund’s shareholders to
share in the benefits from any economies of scale at the complex level. The group fee waiver is reviewed and renewed annually between the Board and MFS. The Trustees concluded that the breakpoints and the group fee waiver were sufficient to allow
the Fund to benefit from economies of scale as its assets and overall complex assets grow.
The Trustees also considered information prepared by MFS
relating to MFS’ costs and profits with respect to the Fund, the MFS Funds considered as a group, and other investment companies and accounts advised by MFS, as well as MFS’ methodologies used to determine and allocate its costs to the
MFS Funds, the Fund and other accounts and products for purposes of estimating profitability.
After reviewing these and other factors described herein,
the Trustees concluded, within the context of their overall conclusions regarding the investment advisory agreement, that the advisory fees charged to the Fund represent reasonable compensation in light of the services being provided by MFS to the
Fund.
In addition, the Trustees considered MFS’
resources and related efforts to continue to retain, attract and motivate capable personnel to serve the Fund. The Trustees also considered current and developing conditions in the financial services industry, including the presence of large and
well-capitalized companies which are spending, and appear to be prepared to continue to spend, substantial sums to engage personnel and to provide services to competing investment companies. In this regard, the Trustees also considered the financial
resources of MFS and its ultimate parent, Sun Life Financial Inc. The Trustees also considered the advantages and possible disadvantages to the Fund of having an adviser that also serves other investment companies as well as other accounts.
The Trustees also considered the nature, quality, cost, and
extent of administrative, transfer agency, and distribution services provided to the Fund by MFS and its affiliates under agreements and plans other than the investment advisory agreement, including any 12b-1 fees the Fund pays to MFS Fund
Distributors, Inc., an affiliate of MFS. The Trustees also considered the nature, extent and quality of certain other services MFS performs or arranges for on the Fund’s behalf, which may include securities lending programs, directed expense
payment programs, class action recovery programs, and MFS’ interaction with third-party service providers, principally custodians and sub-custodians. The Trustees concluded that the various non-advisory services provided by MFS and its
affiliates on behalf of the Fund were satisfactory.
The Trustees considered so-called “fall-out
benefits” to MFS such as reputational value derived from serving as investment manager to the MFS Funds. The Trustees also considered that MFS discontinued its historic practice of obtaining investment research from portfolio brokerage
commissions paid by certain MFS Funds effective January 2018, and directly pays or voluntarily reimburses a Fund, if applicable, for the costs of external research acquired through the use of the Fund’s portfolio brokerage commissions.
MFS International Intrinsic
Value Portfolio
Board Review of Investment Advisory Agreement - continued
Based on their evaluation of factors that they deemed to be
material, including those factors described above, the Board of Trustees, including the independent Trustees, concluded that the Fund’s investment advisory agreement with MFS should be continued for an additional one-year period, commencing
August 1, 2021.
MFS International
Intrinsic Value Portfolio
Proxy Voting Policies and Information
MFS votes proxies on behalf of the fund pursuant to proxy
voting policies and procedures that are available without charge, upon request, by calling 1-800-225-2606, by visiting mfs.com/proxyvoting, or by visiting the SEC’s Web site at http://www.sec.gov.
Information regarding how the fund voted proxies relating
to portfolio securities during the most recent twelve-month period ended June 30 is available by August 31 of each year without charge by visiting mfs.com/proxyvoting, or by visiting the SEC’s Web site
at http://www.sec.gov.
Quarterly Portfolio Disclosure
The fund files a complete schedule of portfolio holdings
with the SEC for the first and third quarters of each fiscal year as an exhibit to its reports on Form N-PORT. The fund’s Form N-PORT reports are available on the SEC’s Web site at
http://www.sec.gov. A shareholder can obtain the portfolio holdings report for the first and third quarters of the fund's fiscal year at mfs.com/vit2 by
choosing the fund's name and then scrolling to the “Resources” section and clicking on the “Prospectus and Reports” tab.
FURTHER INFORMATION
From time to time, MFS may post important information about
the fund or the MFS Funds on the MFS Web site (mfs.com). This information is available at https://www.mfs.com/announcements or at
mfs.com/vit2 by choosing the fund's name and then scrolling to the “Resources” section and clicking on the “Announcements” tab, if any.
Information About Fund Contracts and Legal Claims
The fund has entered into contractual arrangements with an
investment adviser, administrator, distributor, shareholder servicing agent, 529 program manager (if applicable), and custodian who each provide services to the fund. Unless expressly stated otherwise, shareholders are not parties to, or intended
beneficiaries of these contractual arrangements, and these contractual arrangements are not intended to create any shareholder right to enforce them against the service providers or to seek any remedy under them against the service providers, either
directly or on behalf of the fund.
Under the
Trust’s By-Laws and Declaration of Trust, any claims asserted against or on behalf of the MFS Funds, including claims against Trustees and Officers, must be brought in state and federal courts located within the Commonwealth of
Massachusetts.
Federal Tax Information (unaudited)
The following information is provided pursuant to
provisions of the Internal Revenue Code.
The fund
designates $46,404,000 as capital gain dividends paid during the fiscal year.
For corporate shareholders, 28.26% of the ordinary income
dividends paid during the fiscal year qualify for the corporate dividends received deduction.
Income derived from foreign sources was $22,047,960. The
fund intends to pass through foreign tax credits of $2,358,829 for the fiscal year.
| FACTS
|
WHAT
DOES MFS DO WITH YOUR PERSONAL INFORMATION? |
| Why?
|
Financial
companies choose how they share your personal information. Federal law gives consumers the right to limit some but not all sharing. Federal law also requires us to tell you how we collect, share, and protect your personal information. Please read
this notice carefully to understand what we do. |
| What?
|
The types of
personal information we collect and share depend on the product or service you have with us. This information can include: |
| • Social
Security number and account balances |
| • Account
transactions and transaction history |
| • Checking
account information and wire transfer instructions |
| When
you are no longer our customer, we continue to share your information as described in this notice. |
| How?
|
All
financial companies need to share customers' personal information to run their everyday business. In the section below, we list the reasons financial companies can share their customers' personal information; the reasons MFS chooses to share; and
whether you can limit this sharing. |
Reasons
we can share your
personal information |
Does
MFS share? |
Can
you limit
this sharing? |
For
our everyday business purposes –
such as to process your transactions, maintain your
account(s), respond to court orders and legal
investigations, or report to credit bureaus |
Yes
|
No
|
For
our marketing purposes –
to offer our products and services to you |
No
|
We
don't share |
For
joint marketing with other
financial companies |
No
|
We
don't share |
For
our affiliates' everyday business purposes –
information about your transactions and experiences |
No
|
We
don't share |
For
our affiliates' everyday business purposes –
information about your creditworthiness |
No
|
We
don't share |
| For
nonaffiliates to market to you |
No
|
We
don't share |
| Questions?
|
Call
800-225-2606 or go to mfs.com. |
| Who
we are |
| Who
is providing this notice? |
MFS
Funds, MFS Investment Management, MFS Institutional Advisors, Inc., and MFS Heritage Trust Company. |
| What
we do |
How
does MFS
protect my personal
information? |
To
protect your personal information from unauthorized access and use, we use security measures that comply with federal law. These measures include procedural, electronic, and physical safeguards for the protection of the personal information we
collect about you. |
How
does MFS
collect my personal
information? |
We
collect your personal information, for example, when you |
| • open
an account or provide account information |
| • direct
us to buy securities or direct us to sell your securities |
| • make
a wire transfer |
| We
also collect your personal information from others, such as credit bureaus, affiliates, or other companies. |
| Why
can't I limit all sharing? |
Federal
law gives you the right to limit only |
| • sharing
for affiliates' everyday business purposes – information about your creditworthiness |
| • affiliates
from using your information to market to you |
| • sharing
for nonaffiliates to market to you |
| State
laws and individual companies may give you additional rights to limit sharing. |
| Definitions
|
| Affiliates
|
Companies
related by common ownership or control. They can be financial and nonfinancial companies. |
| •
MFS does not share personal information with affiliates, except for everyday business purposes as described on page one of this notice. |
| Nonaffiliates
|
Companies
not related by common ownership or control. They can be financial and nonfinancial companies. |
| •
MFS does not share with nonaffiliates so they can market to you. |
| Joint
marketing |
A
formal agreement between nonaffiliated financial companies that together market financial products or services to you. |
| •
MFS doesn't jointly market. |
| Other
important information |
| If
you own an MFS product or receive an MFS service in the name of a third party such as a bank or broker-dealer, their privacy policy may apply to you instead of ours. |
Annual Report
December 31, 2021
MFS® Massachusetts Investors
Growth Stock Portfolio
MFS® Variable
Insurance Trust II
MFS® Massachusetts
Investors Growth Stock Portfolio
|
1
|
|
2
|
|
3
|
|
5
|
|
7
|
|
8
|
|
11
|
|
12
|
|
13
|
|
14
|
|
16
|
|
22
|
|
23
|
|
26
|
|
28
|
|
28
|
|
28
|
|
28
|
|
28
|
|
29
|
The report is prepared for the general information of contract owners. It
is authorized for distribution to prospective investors only when preceded or accompanied by a current prospectus.
NOT FDIC INSURED • MAY LOSE VALUE
• NO BANK OR CREDIT UNION GUARANTEE •
NOT A DEPOSIT • NOT INSURED BY ANY FEDERAL GOVERNMENT
AGENCY OR NCUA/NCUSIF
MFS Massachusetts
Investors Growth Stock Portfolio
Dear Contract Owners:
After a powerful rally in 2021 that was spurred by the
introduction of effective coronavirus vaccines and high levels of monetary and fiscal stimulus, markets have recently experienced a rise in volatility. Rising inflation (mostly due to pandemic-related labor and supply chain disruptions), new
COVID-19 variants that are vaccine-resistant, and the prospect of tighter monetary and fiscal policies around the world have all increased investor anxiety.
Rising real (inflation-adjusted) bond yields in the United
States are a headwind for richly valued U.S. growth stocks, though many non-U.S. markets have experienced lower levels of turbulence. In recent months, global economic growth has moderated, with the spread of the Delta and Omicron variants and a
regulatory crackdown in China featuring prominently. Stress in China’s property development sector has also contributed to the slowdown there. A further concern for investors is the tightening of global energy and raw materials supplies caused
in part by geopolitical uncertainty.
However,
above-trend economic growth, strong corporate balance sheets, and nascent signs that global supply chain bottlenecks may be easing, along with a dovish policy shift in China, are supportive fundamentals that we feel could help calm recent market
jitters.
It is times of market transition that
demonstrate the importance of having a deep understanding of company fundamentals, and we have built our global research platform to do just that.
At MFS®, we put our clients’ assets to work responsibly by carefully navigating the increasing complexity of global markets and economies. Guided by our commitment to long-term
investing, we tune out the noise and try to uncover what we believe are the best, most durable investment opportunities in the market. Our unique global investment platform combines collective expertise, long-term discipline, and thoughtful risk
management to create sustainable value for investors.
Respectfully,
Michael W.
Roberge
Chief Executive Officer
MFS Investment Management
February 15, 2022
The opinions expressed in this letter are subject to
change and may not be relied upon for investment advice. No forecasts can be guaranteed.
MFS Massachusetts Investors
Growth Stock Portfolio
Portfolio structure
Top ten
holdings
| Microsoft
Corp. |
12.0%
|
| Alphabet,
Inc., “A” |
8.5%
|
| Apple,
Inc. |
5.3%
|
| Accenture
PLC, “A” |
4.2%
|
| Church
& Dwight Co., Inc. |
2.9%
|
| Visa,
Inc., “A” |
2.8%
|
| Colgate-Palmolive
Co. |
2.4%
|
| Amphenol
Corp., “A” |
2.3%
|
| Boston
Scientific Corp. |
2.1%
|
| Charles
Schwab Corp. |
2.1%
|
GICS equity sectors (g)
| Information
Technology |
36.1%
|
| Health
Care |
15.1%
|
| Communication
Services |
12.2%
|
| Consumer
Discretionary |
10.7%
|
| Consumer
Staples |
8.3%
|
| Financials
|
6.9%
|
| Industrials
|
6.4%
|
| Real
Estate |
2.0%
|
| Materials
|
1.1%
|
| Utilities
|
0.9%
|
| (g)
|
The
Global Industry Classification Standard (GICS®) was developed by and/or is the exclusive property of MSCI, Inc. and S&P Global Market Intelligence Inc. (“S&P
Global Market Intelligence”). GICS is a service mark of MSCI and S&P Global Market Intelligence and has been licensed for use by MFS. MFS has applied its own internal sector/industry classification methodology for equity securities and
non-equity securities that are unclassified by GICS. |
Cash & Cash Equivalents includes any cash,
investments in money market funds, short-term securities, and other assets less liabilities. Please see the Statement of Assets and Liabilities for additional information related to the fund’s cash position and other assets and
liabilities.
Percentages are based on net
assets as of December 31, 2021.
The portfolio
is actively managed and current holdings may be different.
MFS Massachusetts
Investors Growth Stock Portfolio
Management Review
Summary of Results
For the twelve months ended December 31, 2021, Initial
Class shares of the MFS Massachusetts Investors Growth Stock Portfolio (fund) provided a total return of 25.97%, while Service Class shares of the fund provided a total return of 25.66%. These compare with a return of 27.60% over the same period for
the fund’s benchmark, the Russell 1000® Growth Index.
Market Environment
Over the past year, the global economy was buffeted by an
array of crosscurrents as it adjusted to the ebbs and flows of the pandemic. Among the supportive currents were ample fiscal stimulus, loose monetary policy and the rollout of several highly effective coronavirus vaccines. Negative currents included
the rapid spread of several coronavirus variants, widespread global production bottlenecks and a surge in inflation. After experiencing a burst of exceptionally strong economic activity as the global economy began to reopen, activity became more
muted in the second half of the period amid ongoing supply chain disruptions and a new wave of coronavirus infections, albeit a seemingly milder strain.
Amid rising inflation, markets anticipated a transition
from an exceptionally accommodative environment to a more mixed monetary landscape ahead. Indeed, several central banks in emerging markets have already tightened policy and the US Federal Reserve reduced the pace of its asset purchases in November
and again in December. However, the European Central Bank, the Bank of Japan and the People's Bank of China are expected to maintain accommodative policies. Sovereign bond yields moved modestly higher during the period amid higher inflation and on
expectations of a tighter Fed but remain historically low.
A harsher Chinese regulatory environment toward industries
such as online gaming, food delivery and education increased market volatility as has stress in China's highly leveraged property development sector. Trade relations between the United States and China remained quite strained despite a change in
presidential administrations.
Signs of excess
investor enthusiasm continued to be seen in pockets of the market such as “meme stocks” popular with users of online message boards, cryptocurrencies and heavy retail participation in the market for short-dated options.
Detractors from Performance
Stock selection and, to a lesser extent, an underweight
position in the information technology sector weakened the fund’s performance relative to the Russell 1000® Growth Index. Within this sector, not holding shares of
strong-performing computer graphics processor maker NVIDIA, and the fund's overweight position in financial technology services provider Fiserv, held back relative returns. The share price of NVIDIA climbed as the company reported strong revenue
growth, driven by better-than-anticipated broad-based demand and capacity additions at its Gaming, Datacenter, and Pro Vis segments. Additionally, holding shares of global banking and payment technologies provider Fidelity National Information
Services(b) further detracted from relative results.
Stock selection in the consumer discretionary sector also
hindered relative performance. Within this sector, holding shares of online and mobile commerce company Alibaba Group Holding(b) (China) and sportswear and sports equipment manufacturer Adidas(b) (Germany) dampened relative performance. The stock
price decline of Alibaba Group Holding was primarily due to concerns that the recent increase in regulatory actions within China would lead to additional changes that may negatively impact future growth of the company’s platforms.
Additionally, not holding shares of electric vehicle manufacturer Tesla weakened relative results. The share price of Tesla advanced considerably during the second half of the year, following significantly better-than-expected vehicle deliveries and
the company's ability to overcome supply chain issues that affected the whole auto industry. Moreover, favorable pricing of its Model 3 and Model Y vehicles helped improve Tesla’s profitability, which also had a positive impact on its share
price growth.
Elsewhere, the fund's overweight
positions in video game maker Electronic Arts and global consumer products company Colgate-Palmolive, and its holdings of multinational technology conglomerate Tencent Holdings(b) (China) and medical technology company Becton, Dickinson and Co.(b),
detracted from relative results.
Contributors to
Performance
Stock selection and, to a lesser extent,
an overweight position in the financials sector contributed to the fund’s relative performance. Within this sector, holding shares of financial services provider Charles Schwab(b), the timing of the fund's ownership in shares of global
alternative asset manager Blackstone, and its overweight position in risk management and human capital consulting services provider Aon helped relative performance.
Stock selection in the industrials sector also benefited
the fund’s relative returns. However, there were no individual securities within this sector, either in the fund or in the benchmark, that were among the fund’s top relative contributors during the reporting period.
Stocks in other sectors that aided relative performance
included the fund’s avoidance of internet retailer Amazon.com and digital payment technology developer PayPal. Although Amazon.com reported accelerated Amazon Web Services and advertising growth, the company’s retail sales growth slowed
more than anticipated against difficult comparisons to heightened levels during the pandemic. Further, Amazon.com noted that it experienced significant labor and material cost pressure, driven by inflation and global
MFS Massachusetts Investors
Growth Stock Portfolio
Management Review - continued
supply chain
disruption, which weighed on its near-term profitability. Additionally, the fund's overweight positions in IT servicing firm Accenture, technology company Alphabet, outsourced clinical development services provider PRA Health Sciences(h) and life
sciences supply company Thermo Fisher Scientific contributed to relative returns. The stock price of Alphabet climbed as the company reported strong advertising sales growth across Google Services, particularly in search and YouTube, and continued
revenue growth in cloud. The fund’s holdings of outsourced clinical development services provider ICON(b) (Ireland) further supported relative performance.
Respectfully,
Portfolio Manager(s)
Jeffrey Constantino and Joseph Skorski
| (b)
|
Security is not a
benchmark constituent. |
| (h)
|
Security was not held in
the portfolio at period end. |
The
views expressed in this report are those of the portfolio manager(s) only through the end of the period of the report as stated on the cover and do not necessarily reflect the views of MFS or any other person in the MFS organization. These views are
subject to change at any time based on market or other conditions, and MFS disclaims any responsibility to update such views. These views may not be relied upon as investment advice or an indication of trading intent on behalf of any MFS portfolio.
References to specific securities are not recommendations of such securities, and may not be representative of any MFS portfolio’s current or future investments.
MFS Massachusetts
Investors Growth Stock Portfolio
Performance Summary Through 12/31/21
The following chart illustrates the historical performance
of the fund in comparison to its benchmark(s). Benchmarks are unmanaged and may not be invested in directly. Benchmark returns do not reflect any fees or expenses. The performance of other share classes will be greater than or less than that of the
class depicted below. (See Notes to Performance Summary.)
Performance data shown represents past performance and is no
guarantee of future results. Investment return and principal value fluctuate so your units, when sold, may be worth more or less than the original cost; current performance may be lower or higher than quoted. The performance shown does not reflect
the deduction of taxes, if any, that a contract holder would pay on fund distributions or the redemption of contract units. The returns for the fund shown also do not reflect the deduction of expenses associated with variable products, such as
mortality and expense risk charges, separate account charges, and sales charges imposed by the insurance company separate accounts. Such expenses would reduce the overall returns shown.
Growth of a Hypothetical $10,000 Investment
Total Returns
through 12/31/21
Average annual total returns
| Share
Class |
Class
Inception Date |
1-yr
|
5-yr
|
10-yr
|
| Initial
Class |
5/06/98
|
25.97%
|
22.84%
|
17.58%
|
| Service
Class |
8/24/01
|
25.66%
|
22.53%
|
17.29%
|
Comparative benchmark(s)
| Russell
1000® Growth Index (f) |
27.60%
|
25.32%
|
19.79%
|
| (f)
|
Source:
FactSet Research Systems Inc. |
Benchmark Definition(s)
Russell 1000® Growth Index(h) – constructed to provide a comprehensive barometer for growth securities in the
large-cap segment of the U.S. equity universe. Companies in this index generally have higher price-to-book ratios and higher forecasted growth values.
It is not possible to invest directly in an index.
| (h)
|
Frank
Russell Company (“Russell”) is the source and owner of the trademarks, service marks, and copyrights related to the Russell Indexes. Russell® is a trademark of
Frank Russell Company. Neither Russell nor its licensors accept any liability for any errors or omissions in the Russell Indexes and/or Russell ratings or underlying data and no party may rely on any Russell Indexes and/or Russell ratings and/or
underlying data contained in this document. No further distribution of Russell Data is permitted without Russell's express written consent. Russell does not promote, sponsor, or endorse the content of this document. |
MFS Massachusetts Investors
Growth Stock Portfolio
Performance Summary – continued
Notes
to Performance Summary
Average annual total return
represents the average annual change in value for each share class for the periods presented.
Performance results reflect any applicable expense
subsidies and waivers in effect during the periods shown. Without such subsidies and waivers the fund's performance results would be less favorable. Please see the prospectus and financial statements for complete details. All results are historical
and assume the reinvestment of any dividends and capital gains distributions.
Performance results do not include adjustments made for
financial reporting purposes in accordance with U.S. generally accepted accounting principles and may differ from amounts reported in the financial highlights.
From time to time the fund may receive proceeds from
litigation settlements, without which performance would be lower.
MFS Massachusetts
Investors Growth Stock Portfolio
Expense Table
Fund Expenses Borne by the Contract Holders during the
Period,
July 1, 2021 through December 31, 2021
As
a contract holder of the fund, you incur ongoing costs, including management fees; distribution and/or service (12b-1) fees; and other fund expenses. This example is intended to help you understand your ongoing costs (in dollars) of investing in the
fund and to compare these costs with the ongoing costs of investing in other mutual funds.
The example is based on an investment of $1,000 invested at
the beginning of the period and held for the entire period July 1, 2021 through December 31, 2021.
Actual Expenses
The first line for each share class in the following table
provides information about actual account values and actual expenses. You may use the information in this line, together with the amount you invested, to estimate the expenses that you paid over the period. Simply divide your account value by $1,000
(for example, an $8,600 account value divided by $1,000 = 8.6), then multiply the result by the number in the first line under the heading entitled “Expenses Paid During Period” to estimate the expenses you paid on your account during
this period.
Hypothetical Example for Comparison
Purposes
The second line for each share class in the
following table provides information about hypothetical account values and hypothetical expenses based on the fund’s actual expense ratio and an assumed rate of return of 5% per year before expenses, which is not the fund’s actual
return. The hypothetical account values and expenses may not be used to estimate the actual ending account balance or expenses you paid for the period. You may use this information to compare the ongoing costs of investing in the fund and other
funds. To do so, compare this 5% hypothetical example with the 5% hypothetical examples that appear in the shareholder reports of the other funds.
Please note that the expenses shown in the table are meant
to highlight the fund's ongoing costs only and do not take into account the fees and expenses imposed under the variable contracts through which your investment in the fund is made. Therefore, the second line for each share class in the table is
useful in comparing ongoing costs associated with an investment in vehicles (such as the fund) which fund benefits under variable annuity and variable life insurance contracts and to qualified pension and retirement plans only, and will not help you
determine the relative total costs of investing in the fund through variable annuity and variable life insurance contracts. If the fees and expenses imposed under the variable contracts were included, your costs would have been higher.
Share
Class |
|
Annualized
Expense
Ratio |
Beginning
Account Value
7/01/21 |
Ending
Account Value
12/31/21 |
Expenses
Paid During
Period (p)
7/01/21-12/31/21 |
| Initial
Class |
Actual
|
0.76%
|
$1,000.00
|
$1,120.65
|
$4.06
|
| Hypothetical
(h) |
0.76%
|
$1,000.00
|
$1,021.37
|
$3.87
|
| Service
Class |
Actual
|
1.01%
|
$1,000.00
|
$1,119.12
|
$5.39
|
| Hypothetical
(h) |
1.01%
|
$1,000.00
|
$1,020.11
|
$5.14
|
| (h)
|
5% class return per year
before expenses. |
| (p)
|
“Expenses
Paid During Period” are equal to each class's annualized expense ratio, as shown above, multiplied by the average account value over the period, multiplied by 184/365 (to reflect the one-half year period). |
MFS Massachusetts Investors
Growth Stock Portfolio
Portfolio of Investments − 12/31/21
The Portfolio of Investments is a complete list of all
securities owned by your fund. It is categorized by broad-based asset classes.
| Issuer
|
|
|
Shares/Par
|
Value
($) |
| Common
Stocks – 99.7% |
| Apparel
Manufacturers – 4.1% |
|
| Adidas
AG |
|
56,965
|
$
16,421,193 |
| LVMH
Moet Hennessy Louis Vuitton SE |
|
11,993
|
9,926,477 |
| NIKE,
Inc., “B” |
|
138,360
|
23,060,461 |
| |
|
|
|
$49,408,131 |
| Brokerage
& Asset Managers – 2.7% |
|
| Blackstone,
Inc. |
|
48,224
|
$
6,239,703 |
| Charles
Schwab Corp. |
|
302,297
|
25,423,178 |
| |
|
|
|
$31,662,881 |
| Business
Services – 10.7% |
|
| Accenture
PLC, “A” |
|
120,844
|
$
50,095,880 |
| Cognizant
Technology Solutions Corp., “A” |
|
102,732
|
9,114,383 |
| Equifax,
Inc. |
|
54,153
|
15,855,457 |
| Fidelity
National Information Services, Inc. |
|
149,971
|
16,369,335 |
| Fiserv,
Inc. (a) |
|
226,002
|
23,456,747 |
| Verisk
Analytics, Inc., “A” |
|
56,953
|
13,026,860 |
| |
|
|
|
$127,918,662 |
| Cable
TV – 1.0% |
|
| Charter
Communications, Inc., “A” (a) |
|
17,922
|
$
11,684,606 |
| Computer
Software – 12.0% |
|
| Microsoft
Corp. |
|
424,240
|
$
142,680,397 |
| Computer
Software - Systems – 5.3% |
|
| Apple,
Inc. |
|
355,662
|
$
63,154,901 |
| Construction
– 2.3% |
|
| Otis
Worldwide Corp. |
|
158,475
|
$
13,798,418 |
| Sherwin-Williams
Co. |
|
37,119
|
13,071,827 |
| |
|
|
|
$26,870,245 |
| Consumer
Products – 5.9% |
|
| Church
& Dwight Co., Inc. |
|
332,104
|
$
34,040,660 |
| Colgate-Palmolive
Co. |
|
331,139
|
28,259,402 |
| Estee
Lauder Cos., Inc., “A” |
|
21,314
|
7,890,443 |
| |
|
|
|
$70,190,505 |
| Electrical
Equipment – 5.4% |
|
| Amphenol
Corp., “A” |
|
319,043
|
$
27,903,501 |
| Fortive
Corp. |
|
225,750
|
17,222,467 |
| TE
Connectivity Ltd. |
|
115,228
|
18,590,886 |
| |
|
|
|
$63,716,854 |
| Electronics
– 2.8% |
|
| Analog
Devices, Inc. |
|
70,571
|
$
12,404,265 |
| Taiwan
Semiconductor Manufacturing Co. Ltd., ADR |
|
70,689
|
8,504,593 |
| Texas
Instruments, Inc. |
|
64,413
|
12,139,918 |
| |
|
|
|
$33,048,776 |
MFS Massachusetts
Investors Growth Stock Portfolio
Portfolio of Investments – continued
| Issuer
|
|
|
Shares/Par
|
Value
($) |
| Common
Stocks – continued |
| Food
& Beverages – 2.4% |
|
| McCormick
& Co., Inc. |
|
141,635
|
$
13,683,357 |
| PepsiCo,
Inc. |
|
86,334
|
14,997,079 |
| |
|
|
|
$28,680,436 |
| General
Merchandise – 1.7% |
|
| Dollarama,
Inc. |
|
410,146
|
$
20,527,565 |
| Health
Maintenance Organizations – 0.8% |
|
| Cigna
Corp. |
|
41,606
|
$
9,553,986 |
| Insurance
– 3.2% |
|
| Aon
PLC |
|
84,329
|
$
25,345,924 |
| Marsh
& McLennan Cos., Inc. |
|
73,515
|
12,778,378 |
| |
|
|
|
$38,124,302 |
| Internet
– 10.8% |
|
| Alibaba
Group Holding Ltd. (a) |
|
991,572
|
$
15,119,866 |
| Alphabet,
Inc., “A” (a) |
|
34,905
|
101,121,181 |
| Tencent
Holdings Ltd. |
|
210,500
|
12,331,617 |
| |
|
|
|
$128,572,664 |
| Leisure
& Toys – 1.7% |
|
| Electronic
Arts, Inc. |
|
154,664
|
$
20,400,182 |
| Medical
& Health Technology & Services – 1.5% |
|
| ICON
PLC (a) |
|
56,169
|
$
17,395,539 |
| Medical
Equipment – 12.5% |
|
| Abbott
Laboratories |
|
87,691
|
$
12,341,631 |
| Agilent
Technologies, Inc. |
|
58,276
|
9,303,763 |
| Becton,
Dickinson and Co. |
|
73,310
|
18,435,999 |
| Boston
Scientific Corp. (a) |
|
601,712
|
25,560,726 |
| Danaher
Corp. |
|
48,742
|
16,036,605 |
| Medtronic
PLC |
|
81,962
|
8,478,969 |
| STERIS
PLC |
|
56,151
|
13,667,715 |
| Stryker
Corp. |
|
76,362
|
20,420,726 |
| Thermo
Fisher Scientific, Inc. |
|
36,262
|
24,195,457 |
| |
|
|
|
$148,441,591 |
| Other
Banks & Diversified Financials – 4.9% |
|
| Mastercard,
Inc., “A” |
|
34,152
|
$
12,271,497 |
| Moody's
Corp. |
|
32,294
|
12,613,390 |
| Visa,
Inc., “A” |
|
152,856
|
33,125,424 |
| |
|
|
|
$58,010,311 |
| Pharmaceuticals
– 0.4% |
|
| Roche
Holding AG |
|
10,520
|
$
4,360,912 |
| Railroad
& Shipping – 1.3% |
|
| Union
Pacific Corp. |
|
63,350
|
$
15,959,766 |
| Restaurants
– 1.2% |
|
| Starbucks
Corp. |
|
125,944
|
$
14,731,670 |
MFS Massachusetts Investors
Growth Stock Portfolio
Portfolio of Investments – continued
| Issuer
|
|
|
Shares/Par
|
Value
($) |
| Common
Stocks – continued |
| Specialty
Stores – 2.2% |
|
| Ross
Stores, Inc. |
|
127,995
|
$
14,627,269 |
| TJX
Cos., Inc. |
|
159,633
|
12,119,337 |
| |
|
|
|
$26,746,606 |
| Telecommunications
- Wireless – 2.0% |
|
| American
Tower Corp., REIT |
|
80,535
|
$
23,556,488 |
| Utilities
- Electric Power – 0.9% |
|
| Xcel
Energy, Inc. |
|
154,142
|
$
10,435,413 |
| Total
Common Stocks (Identified Cost, $519,704,911) |
|
$1,185,833,389
|
| Investment
Companies (h) – 0.4% |
| Money
Market Funds – 0.4% |
|
| MFS
Institutional Money Market Portfolio, 0.07% (v) (Identified Cost, $4,764,975) |
|
|
4,764,975
|
$
4,764,975 |
| Other
Assets, Less Liabilities – (0.1)% |
|
(597,264) |
| Net
Assets – 100.0% |
$1,190,001,100
|
| (a) |
Non-income producing
security. |
|
|
|
| (h)
|
An
affiliated issuer, which may be considered one in which the fund owns 5% or more of the outstanding voting securities, or a company which is under common control. At period end, the aggregate values of the fund's investments in affiliated issuers
and in unaffiliated issuers were $4,764,975 and $1,185,833,389, respectively. |
|
|
|
| (v)
|
Affiliated
issuer that is available only to investment companies managed by MFS. The rate quoted for the MFS Institutional Money Market Portfolio is the annualized seven-day yield of the fund at period end. |
|
|
|
| The
following abbreviations are used in this report and are defined: |
| ADR
|
American
Depositary Receipt |
| REIT
|
Real Estate
Investment Trust |
See Notes to Financial
Statements
MFS Massachusetts
Investors Growth Stock Portfolio
| Financial
Statements |
Statement of Assets and
Liabilities |
This statement
represents your fund’s balance sheet, which details the assets and liabilities comprising the total value of the fund.
| At
12/31/21 Assets |
|
| Investments
in unaffiliated issuers, at value (identified cost, $519,704,911) |
$1,185,833,389
|
| Investments
in affiliated issuers, at value (identified cost, $4,764,975) |
4,764,975
|
| Receivables
for |
|
| Fund
shares sold |
158,270
|
| Dividends
|
712,187
|
| Other
assets |
4,717
|
| Total
assets |
$1,191,473,538
|
| Liabilities
|
|
| Payables
for |
|
| Fund
shares reacquired |
$1,276,649
|
| Payable
to affiliates |
|
| Investment
adviser |
47,073
|
| Administrative
services fee |
932
|
| Shareholder
servicing costs |
241
|
| Distribution
and/or service fees |
6,533
|
| Payable
for independent Trustees' compensation |
326
|
| Accrued
expenses and other liabilities |
140,684
|
| Total
liabilities |
$1,472,438
|
| Net
assets |
$1,190,001,100
|
| Net
assets consist of |
|
| Paid-in
capital |
$393,514,043
|
| Total
distributable earnings (loss) |
796,487,057
|
| Net
assets |
$1,190,001,100
|
| Shares
of beneficial interest outstanding |
43,479,214
|
| |
Net
assets |
Shares
outstanding |
Net
asset value
per share |
| Initial
Class |
$714,523,518
|
25,917,610
|
$27.57
|
| Service
Class |
475,477,582
|
17,561,604
|
27.07
|
See Notes to Financial Statements
MFS Massachusetts Investors
Growth Stock Portfolio
| Financial
Statements |
Statement of Operations
|
This statement describes how much
your fund earned in investment income and accrued in expenses. It also describes any gains and/or losses generated by fund operations.
| Year
ended 12/31/21 |
|
| Net
investment income (loss) |
|
| Income
|
|
| Dividends
|
$10,355,726
|
| Other
|
23,523
|
| Dividends
from affiliated issuers |
3,325
|
| Foreign
taxes withheld |
(102,032)
|
| Total
investment income |
$10,280,542
|
| Expenses
|
|
| Management
fee |
$8,310,949
|
| Distribution
and/or service fees |
1,122,562
|
| Shareholder
servicing costs |
36,819
|
| Administrative
services fee |
156,799
|
| Independent
Trustees' compensation |
17,345
|
| Custodian
fee |
58,414
|
| Shareholder
communications |
49,940
|
| Audit
and tax fees |
60,650
|
| Legal
fees |
5,607
|
| Miscellaneous
|
32,460
|
| Total
expenses |
$9,851,545
|
| Reduction
of expenses by investment adviser |
(142,883)
|
| Net
expenses |
$9,708,662
|
| Net
investment income (loss) |
$571,880
|
| Realized
and unrealized gain (loss) |
|
| Realized
gain (loss) (identified cost basis) |
|
| Unaffiliated
issuers |
$131,556,932
|
| Foreign
currency |
21,922
|
| Net
realized gain (loss) |
$131,578,854
|
| Change
in unrealized appreciation or depreciation |
|
| Unaffiliated
issuers |
$126,855,928
|
| Affiliated
issuers |
(1)
|
| Translation
of assets and liabilities in foreign currencies |
(5,435)
|
| Net
unrealized gain (loss) |
$126,850,492
|
| Net
realized and unrealized gain (loss) |
$258,429,346
|
| Change
in net assets from operations |
$259,001,226
|
See Notes to Financial Statements
MFS Massachusetts
Investors Growth Stock Portfolio
| Financial
Statements |
Statements of Changes in
Net Assets |
These statements describe
the increases and/or decreases in net assets resulting from operations, any distributions, and any shareholder transactions.
| |
Year
ended |
| |
12/31/21
|
12/31/20
|
| Change
in net assets |
|
|
| From
operations |
|
|
| Net
investment income (loss) |
$571,880
|
$1,639,300
|
| Net
realized gain (loss) |
131,578,854
|
146,310,591
|
| Net
unrealized gain (loss) |
126,850,492
|
52,925,899
|
| Change
in net assets from operations |
$259,001,226
|
$200,875,790
|
| Total
distributions to shareholders |
$(148,535,842)
|
$(96,440,810)
|
| Change
in net assets from fund share transactions |
$9,979,941
|
$(40,476,255)
|
| Total
change in net assets |
$120,445,325
|
$63,958,725
|
| Net
assets |
|
|
| At
beginning of period |
1,069,555,775
|
1,005,597,050
|
| At
end of period |
$1,190,001,100
|
$1,069,555,775
|
See Notes to Financial Statements
MFS Massachusetts Investors
Growth Stock Portfolio
| Financial
Statements |
Financial Highlights
|
The financial highlights table is
intended to help you understand the fund's financial performance for the past 5 years. Certain information reflects financial results for a single fund share. The total returns in the table represent the rate that an investor would have earned (or
lost) on an investment in the fund share class (assuming reinvestment of all distributions) held for the entire period.
| Initial
Class |
Year
ended |
| |
12/31/21
|
12/31/20
|
12/31/19
|
12/31/18
|
12/31/17
|
| Net
asset value, beginning of period |
$25.06
|
$22.58
|
$17.60
|
$18.60
|
$15.38
|
| Income
(loss) from investment operations |
|
|
|
|
|
| Net
investment income (loss) (d) |
$0.04
|
$0.06
|
$0.11
|
$0.13
|
$0.11
|
| Net
realized and unrealized gain (loss) |
6.24
|
4.80
|
6.71
|
0.16
|
4.16
|
| Total
from investment operations |
$6.28
|
$4.86
|
$6.82
|
$0.29
|
$4.27
|
| Less
distributions declared to shareholders |
|
|
|
|
|
| From
net investment income |
$(0.07)
|
$(0.11)
|
$(0.13)
|
$(0.12)
|
$(0.12)
|
| From
net realized gain |
(3.70)
|
(2.27)
|
(1.71)
|
(1.17)
|
(0.93)
|
| Total
distributions declared to shareholders |
$(3.77)
|
$(2.38)
|
$(1.84)
|
$(1.29)
|
$(1.05)
|
| Net
asset value, end of period (x) |
$27.57
|
$25.06
|
$22.58
|
$17.60
|
$18.60
|
| Total
return (%) (k)(r)(s)(x) |
25.97
|
22.53
|
39.95
|
0.81
|
28.42
|
Ratios
(%) (to average net assets)
and Supplemental data: |
|
|
|
|
|
| Expenses
before expense reductions |
0.78
|
0.79
|
0.79
|
0.80
|
0.81
|
| Expenses
after expense reductions |
0.76
|
0.78
|
0.78
|
0.79
|
0.80
|
| Net
investment income (loss) |
0.15
|
0.27
|
0.51
|
0.65
|
0.66
|
| Portfolio
turnover |
15
|
33
|
22
|
23
|
21
|
| Net
assets at end of period (000 omitted) |
$714,524
|
$641,267
|
$603,369
|
$493,783
|
$562,471
|
| Service
Class |
Year
ended |
| |
12/31/21
|
12/31/20
|
12/31/19
|
12/31/18
|
12/31/17
|
| Net
asset value, beginning of period |
$24.67
|
$22.27
|
$17.38
|
$18.38
|
$15.21
|
| Income
(loss) from investment operations |
|
|
|
|
|
| Net
investment income (loss) (d) |
$(0.03)
|
$0.00(w)
|
$0.05
|
$0.08
|
$0.07
|
| Net
realized and unrealized gain (loss) |
6.14
|
4.72
|
6.62
|
0.16
|
4.10
|
| Total
from investment operations |
$6.11
|
$4.72
|
$6.67
|
$0.24
|
$4.17
|
| Less
distributions declared to shareholders |
|
|
|
|
|
| From
net investment income |
$(0.01)
|
$(0.05)
|
$(0.07)
|
$(0.07)
|
$(0.07)
|
| From
net realized gain |
(3.70)
|
(2.27)
|
(1.71)
|
(1.17)
|
(0.93)
|
| Total
distributions declared to shareholders |
$(3.71)
|
$(2.32)
|
$(1.78)
|
$(1.24)
|
$(1.00)
|
| Net
asset value, end of period (x) |
$27.07
|
$24.67
|
$22.27
|
$17.38
|
$18.38
|
| Total
return (%) (k)(r)(s)(x) |
25.66
|
22.20
|
39.58
|
0.58
|
28.10
|
Ratios
(%) (to average net assets)
and Supplemental data: |
|
|
|
|
|
| Expenses
before expense reductions |
1.03
|
1.04
|
1.04
|
1.05
|
1.06
|
| Expenses
after expense reductions |
1.01
|
1.03
|
1.03
|
1.04
|
1.05
|
| Net
investment income (loss) |
(0.10)
|
0.02
|
0.26
|
0.40
|
0.41
|
| Portfolio
turnover |
15
|
33
|
22
|
23
|
21
|
| Net
assets at end of period (000 omitted) |
$475,478
|
$428,289
|
$402,228
|
$319,950
|
$369,950
|
See Notes to Financial Statements
MFS Massachusetts
Investors Growth Stock Portfolio
Financial Highlights - continued
| (d)
|
Per share data
is based on average shares outstanding. |
| (k)
|
The total
return does not reflect expenses that apply to separate accounts. Inclusion of these charges would reduce the total return figures for all periods shown. |
| (r)
|
Certain
expenses have been reduced without which performance would have been lower. |
| (s)
|
From time to
time the fund may receive proceeds from litigation settlements, without which performance would be lower. |
| (w)
|
Per share
amount was less than $0.01. |
| (x)
|
The
net asset values and total returns have been calculated on net assets which include adjustments made in accordance with U.S. generally accepted accounting principles required at period end for financial reporting purposes. |
See Notes to Financial Statements
MFS Massachusetts Investors
Growth Stock Portfolio
Notes to Financial Statements
(1) Business and Organization
MFS Massachusetts Investors Growth Stock Portfolio (the
fund) is a diversified series of MFS Variable Insurance Trust II (the trust). The trust is organized as a Massachusetts business trust and is registered under the Investment Company Act of 1940, as amended, as an open-end management investment
company. The shareholders of each series of the trust are separate accounts of insurance companies, which offer variable annuity and/or life insurance products, and qualified retirement and pension plans.
The fund is an investment company and accordingly follows
the investment company accounting and reporting guidance of the Financial Accounting Standards Board (FASB) Accounting Standards Codification Topic 946 Financial Services - Investment Companies.
(2) Significant Accounting Policies
General — The
preparation of financial statements in conformity with U.S. generally accepted accounting principles requires management to make estimates and assumptions that affect the reported amounts of assets and liabilities, and disclosure of contingent
assets and liabilities at the date of the financial statements and the reported amounts of increases and decreases in net assets from operations during the reporting period. Actual results could differ from those estimates. In the preparation of
these financial statements, management has evaluated subsequent events occurring after the date of the fund’s Statement of Assets and Liabilities through the date that the financial statements were issued.
Balance Sheet Offsetting
— The fund's accounting policy with respect to balance sheet offsetting is that, absent an event of default by the counterparty or a termination of the agreement, the International Swaps and Derivatives Association (ISDA) Master Agreement, or
similar agreement, does not result in an offset of reported amounts of financial assets and financial liabilities in the Statement of Assets and Liabilities across transactions between the fund and the applicable counterparty. The fund's right to
setoff may be restricted or prohibited by the bankruptcy or insolvency laws of the particular jurisdiction to which a specific master netting agreement counterparty is subject. Balance sheet offsetting disclosures, to the extent applicable to the
fund, have been included in the fund’s Significant Accounting Policies note under the captions for each of the fund’s in-scope financial instruments and transactions.
Investment Valuations
— Equity securities, including restricted equity securities, are generally valued at the last sale or official closing price on their primary market or exchange as provided by a third-party pricing
service. Equity securities, for which there were no sales reported that day, are generally valued at the last quoted daily bid quotation on their primary market or exchange as provided by a third-party pricing service. Short-term instruments with a maturity at issuance of 60 days or less may be valued at amortized cost, which approximates market value. Open-end investment companies are
generally valued at net asset value per share.
Securities and
other assets generally valued on the basis of information from a third-party pricing service may also be valued at a broker/dealer bid quotation. In determining values, third-party pricing services can utilize both transaction data and market
information such as yield, quality, coupon rate, maturity, type of issue, trading characteristics, and other market data. The values of foreign securities and other assets and liabilities expressed in foreign currencies are converted to U.S. dollars
using the mean of bid and asked prices for rates provided by a third-party pricing service.
The Board of Trustees has delegated primary responsibility
for determining or causing to be determined the value of the fund’s investments (including any fair valuation) to the adviser pursuant to valuation policies and procedures approved by the Board. If the adviser determines that reliable market
quotations are not readily available, investments are valued at fair value as determined in good faith by the adviser in accordance with such procedures under the oversight of the Board of Trustees. Under the fund’s valuation policies and
procedures, market quotations are not considered to be readily available for most types of debt instruments and floating rate loans and many types of derivatives. These investments are generally valued at fair value based on information from
third-party pricing services. In addition, investments may be valued at fair value if the adviser determines that an investment’s value has been materially affected by events occurring after the close of the exchange or market on which the
investment is principally traded (such as foreign exchange or market) and prior to the determination of the fund’s net asset value, or after the halt of trading of a specific security where trading does not resume prior to the close of the
exchange or market on which the security is principally traded. Events that occur after foreign markets close (such as developments in foreign markets and significant movements in the U.S. markets) and prior to the determination of the fund’s
net asset value may be deemed to have a material effect on the value of securities traded in foreign markets. Accordingly, the fund’s foreign equity securities may often be valued at fair value. The adviser generally relies on third-party
pricing services or other information (such as the correlation with price movements of similar securities in the same or other markets; the type, cost and investment characteristics of the security; the business and financial condition of the
issuer; and trading and other market data) to assist in determining whether to fair value and at what value to fair value an investment. The value of an investment for purposes of calculating the fund’s net asset value can differ depending on
the source and
MFS Massachusetts
Investors Growth Stock Portfolio
Notes to Financial Statements - continued
method used to
determine value. When fair valuation is used, the value of an investment used to determine the fund’s net asset value may differ from quoted or published prices for the same investment. There can be no assurance that the fund could obtain the
fair value assigned to an investment if it were to sell the investment at the same time at which the fund determines its net asset value per share.
Various inputs are used in determining the value of the
fund's assets or liabilities. These inputs are categorized into three broad levels. In certain cases, the inputs used to measure fair value may fall into different levels of the fair value hierarchy. In such cases, an investment's level within the
fair value hierarchy is based on the lowest level of input that is significant to the fair value measurement. The fund's assessment of the significance of a particular input to the fair value measurement in its entirety requires judgment, and
considers factors specific to the investment. Level 1 includes unadjusted quoted prices in active markets for identical assets or liabilities. Level 2 includes other significant observable market-based inputs (including quoted prices for similar
securities, interest rates, prepayment speed, and credit risk). Level 3 includes unobservable inputs, which may include the adviser's own assumptions in determining the fair value of investments. The following is a summary of the levels used as of
December 31, 2021 in valuing the fund's assets and liabilities:
| Financial
Instruments |
Level
1 |
Level
2 |
Level
3 |
Total
|
| Equity
Securities: |
|
|
|
|
| United
States |
$1,081,245,627
|
$—
|
$—
|
$1,081,245,627
|
| China
|
27,451,483
|
—
|
—
|
27,451,483
|
| Canada
|
20,527,565
|
—
|
—
|
20,527,565
|
| Ireland
|
17,395,539
|
—
|
—
|
17,395,539
|
| Germany
|
16,421,193
|
—
|
—
|
16,421,193
|
| France
|
9,926,477
|
—
|
—
|
9,926,477
|
| Taiwan
|
8,504,593
|
—
|
—
|
8,504,593
|
| Switzerland
|
—
|
4,360,912
|
—
|
4,360,912
|
| Mutual
Funds |
4,764,975
|
—
|
—
|
4,764,975
|
| Total
|
$1,186,237,452
|
$4,360,912
|
$—
|
$1,190,598,364
|
For further information
regarding security characteristics, see the Portfolio of Investments.
Foreign Currency
Translation — Purchases and sales of foreign investments, income, and expenses are converted into U.S. dollars based upon currency exchange rates prevailing on the respective dates of such transactions or on
the reporting date for foreign denominated receivables and payables. Gains and losses attributable to foreign currency exchange rates on sales of securities are recorded for financial statement purposes as net realized gains and losses on
investments. Gains and losses attributable to foreign exchange rate movements on receivables, payables, income and expenses are recorded for financial statement purposes as foreign currency transaction gains and losses. That portion of both realized
and unrealized gains and losses on investments that results from fluctuations in foreign currency exchange rates is not separately disclosed.
Indemnifications —
Under the fund's organizational documents, its officers and Trustees may be indemnified against certain liabilities and expenses arising out of the performance of their duties to the fund. Additionally, in the normal course of business, the fund
enters into agreements with service providers that may contain indemnification clauses. The fund's maximum exposure under these agreements is unknown as this would involve future claims that may be made against the fund that have not yet
occurred.
Investment Transactions and Income — Investment transactions are recorded on the trade date. Dividends received in cash are recorded on the ex-dividend date. Certain dividends from foreign securities will be
recorded when the fund is informed of the dividend if such information is obtained subsequent to the ex-dividend date. Dividend payments received in additional securities are recorded on the ex-dividend date in an amount equal to the value of the
security on such date.
The fund may receive
proceeds from litigation settlements. Any proceeds received from litigation involving portfolio holdings are reflected in the Statement of Operations in realized gain/loss if the security has been disposed of by the fund or in unrealized gain/loss
if the security is still held by the fund. Any other proceeds from litigation not related to portfolio holdings are reflected as other income in the Statement of Operations.
Tax Matters and Distributions — The fund intends to qualify as a regulated investment company, as defined under Subchapter M of the Internal Revenue Code, and to distribute all of its taxable income, including realized capital gains. As a
result, no provision for federal income tax is required. The fund’s federal tax returns, when filed, will remain subject to examination by the Internal Revenue Service for a three year period. Management has analyzed the fund’s tax
positions taken on federal and state tax returns for all open tax years and does not believe that there are any uncertain tax positions that require recognition of a tax liability. Foreign taxes, if any, have been accrued by the fund in the
accompanying financial statements in accordance with the applicable foreign tax law. Foreign income taxes may be withheld by certain countries in which the fund invests. Additionally, capital gains realized by the fund on securities issued in or by
certain foreign countries may be subject to capital gains tax imposed by those countries.
MFS Massachusetts Investors
Growth Stock Portfolio
Notes to Financial Statements - continued
Distributions to shareholders are recorded on the
ex-dividend date. Income and capital gain distributions are determined in accordance with income tax regulations, which may differ from U.S. generally accepted accounting principles. Certain capital accounts in the financial statements are
periodically adjusted for permanent differences in order to reflect their tax character. These adjustments have no impact on net assets or net asset value per share. Temporary differences which arise from recognizing certain items of income,
expense, gain or loss in different periods for financial statement and tax purposes will reverse at some time in the future.
Book/tax differences primarily relate to wash sale loss
deferrals.
The tax character of distributions
declared to shareholders for the last two fiscal years is as follows:
| |
Year
ended
12/31/21 |
Year
ended
12/31/20 |
| Ordinary
income (including any short-term capital gains) |
$6,118,487
|
$9,714,474
|
| Long-term
capital gains |
142,417,355
|
86,726,336
|
| Total
distributions |
$148,535,842
|
$96,440,810
|
The federal tax cost and the tax
basis components of distributable earnings were as follows:
| As
of 12/31/21 |
|
| Cost
of investments |
$525,752,043
|
| Gross
appreciation |
671,386,477
|
| Gross
depreciation |
(6,540,156)
|
| Net
unrealized appreciation (depreciation) |
$664,846,321
|
| Undistributed
ordinary income |
16,601,169
|
| Undistributed
long-term capital gain |
115,033,560
|
| Other
temporary differences |
6,007
|
| Total
distributable earnings (loss) |
$796,487,057
|
Multiple Classes of Shares of
Beneficial Interest — The fund offers multiple classes of shares, which differ in their respective distribution and/or service fees. The fund's income, realized and unrealized gain (loss), and common expenses
are allocated to shareholders based on the daily net assets of each class. Dividends are declared separately for each class. Differences in per share dividend rates are generally due to differences in separate class expenses. The fund’s
distributions declared to shareholders as reported in the Statements of Changes in Net Assets are presented by class as follows:
| |
Year
ended
12/31/21 |
|
Year
ended
12/31/20 |
| Initial
Class |
$89,257,028
|
|
$58,026,955
|
| Service
Class |
59,278,814
|
|
38,413,855
|
| Total
|
$148,535,842
|
|
$96,440,810
|
(3) Transactions with
Affiliates
Investment Adviser — The fund has an investment advisory agreement with MFS to provide overall investment management and related administrative services and facilities to the fund. The
management fee is computed daily and paid monthly at the following annual rates based on the fund's average daily net assets:
| Up
to $1 billion |
0.75%
|
| In
excess of $1 billion |
0.65%
|
MFS has agreed in writing to
reduce its management fee by a specified amount if certain MFS mutual fund assets exceed thresholds agreed to by MFS and the fund's Board of Trustees. For the year ended December 31, 2021, this management fee reduction amounted to $142,883, which is
included in the reduction of total expenses in the Statement of Operations. The management fee incurred for the year ended December 31, 2021 was equivalent to an annual effective rate of 0.73% of the fund's average daily net assets.
The investment adviser has agreed in writing to pay a
portion of the fund’s total annual operating expenses, excluding interest, taxes, extraordinary expenses, brokerage and transaction costs, and investment-related expenses, such that total annual operating expenses do not exceed 0.82% of
average daily net assets for the Initial Class shares and 1.07% of average daily net assets for the Service
MFS Massachusetts
Investors Growth Stock Portfolio
Notes to Financial Statements - continued
Class shares. This
written agreement will continue until modified by the fund’s Board of Trustees, but such agreement will continue at least until April 30, 2023. For the year ended December 31, 2021, the fund’s actual operating expenses did not exceed the
limit and therefore, the investment adviser did not pay any portion of the fund’s expenses related to this agreement.
Distributor — MFS
Fund Distributors, Inc. (MFD), a wholly-owned subsidiary of MFS, is the distributor of shares of the fund. The Trustees have adopted a distribution plan for the Service Class shares pursuant to Rule 12b-1 under the Investment Company Act of
1940.
The fund's distribution plan provides
that the fund will pay MFD distribution and/or service fees equal to 0.25% per annum of its average daily net assets attributable to Service Class shares as partial consideration for services performed and expenses incurred by MFD and financial
intermediaries (including participating insurance companies that invest in the fund to fund variable annuity and variable life insurance contracts, sponsors of qualified retirement and pension plans that invest in the fund, and affiliates of these
participating insurance companies and plan sponsors) in connection with the sale and distribution of the Service Class shares. MFD may subsequently pay all, or a portion, of the distribution and/or service fees to financial intermediaries.
Shareholder Servicing Agent
— MFS Service Center, Inc. (MFSC), a wholly-owned subsidiary of MFS, receives a fee from the fund for its services as shareholder servicing agent. For the year ended December 31, 2021, the fee was $35,379, which equated to 0.0031% annually of
the fund's average daily net assets. MFSC also receives reimbursement from the fund for out-of-pocket expenses paid by MFSC on behalf of the fund. For the year ended December 31, 2021, these costs amounted to $1,440.
Administrator — MFS
provides certain financial, legal, shareholder communications, compliance, and other administrative services to the fund. Under an administrative services agreement, the fund reimburses MFS the costs incurred to provide these services. The fund is
charged an annual fixed amount of $17,500 plus a fee based on average daily net assets. The administrative services fee incurred for the year ended December 31, 2021 was equivalent to an annual effective rate of 0.0139% of the fund's average daily
net assets.
Trustees’ and Officers’
Compensation — The fund pays compensation to independent Trustees in the form of a retainer, attendance fees, and additional compensation to Board and Committee chairpersons. The fund does not pay compensation
directly to Trustees or officers of the fund who are also officers of the investment adviser, all of whom receive remuneration from MFS for their services to the fund. Certain officers and Trustees of the fund are officers or directors of MFS, MFD,
and MFSC.
Other — The fund invests in the MFS Institutional Money Market Portfolio which is managed by MFS and seeks current income consistent with preservation of capital and liquidity. This money market fund does not pay a
management fee to MFS but does incur investment and operating costs.
The fund is permitted to engage in purchase and sale
transactions with funds and accounts for which MFS serves as investment adviser or sub-adviser (“cross-trades”) pursuant to a policy adopted by the Board of Trustees. This policy has been designed to ensure that cross-trades conducted by
the fund comply with Rule 17a-7 under the Investment Company Act of 1940. During the year ended December 31, 2021, the fund engaged in purchase and sale transactions pursuant to this policy, which amounted to $579,362 and $5,507,196, respectively.
The sales transactions resulted in net realized gains (losses) of $1,485,174.
The adviser has voluntarily undertaken to reimburse the
fund from its own resources on a quarterly basis for the cost of investment research embedded in the cost of the fund’s securities trades. This agreement may be rescinded at any time. For the year ended December 31, 2021, this reimbursement
amounted to $23,395, which is included in “Other” income in the Statement of Operations.
(4) Portfolio Securities
For the year ended December 31, 2021, purchases and sales
of investments, other than short-term obligations, aggregated $169,374,250 and $302,845,318, respectively.
(5) Shares of Beneficial Interest
The fund's Declaration of Trust permits the Trustees to
issue an unlimited number of full and fractional shares of beneficial interest. Transactions in fund shares were as follows:
MFS Massachusetts Investors
Growth Stock Portfolio
Notes to Financial Statements - continued
| |
Year
ended
12/31/21 |
|
Year
ended
12/31/20 |
| |
Shares
|
Amount
|
|
Shares
|
Amount
|
| Shares
sold |
|
|
|
|
|
| Initial
Class |
301,917
|
$8,152,931
|
|
536,906
|
$11,499,519
|
| Service
Class |
638,576
|
16,756,952
|
|
1,322,375
|
28,371,478
|
| |
940,493
|
$24,909,883
|
|
1,859,281
|
$39,870,997
|
Shares
issued to shareholders
in reinvestment of distributions |
|
|
|
|
|
| Initial
Class |
3,431,643
|
$89,257,028
|
|
2,538,362
|
$58,026,955
|
| Service
Class |
2,318,295
|
59,278,814
|
|
1,705,766
|
38,413,855
|
| |
5,749,938
|
$148,535,842
|
|
4,244,128
|
$96,440,810
|
| Shares
reacquired |
|
|
|
|
|
| Initial
Class |
(3,409,834)
|
$(91,134,490)
|
|
(4,205,948)
|
$(94,166,872)
|
| Service
Class |
(2,755,500)
|
(72,331,294)
|
|
(3,730,825)
|
(82,621,190)
|
| |
(6,165,334)
|
$(163,465,784)
|
|
(7,936,773)
|
$(176,788,062)
|
| Net
change |
|
|
|
|
|
| Initial
Class |
323,726
|
$6,275,469
|
|
(1,130,680)
|
$(24,640,398)
|
| Service
Class |
201,371
|
3,704,472
|
|
(702,684)
|
(15,835,857)
|
| |
525,097
|
$9,979,941
|
|
(1,833,364)
|
$(40,476,255)
|
(6) Line of
Credit
The fund and certain other funds managed by
MFS participate in a $1.25 billion unsecured committed line of credit of which $1 billion is reserved for use by the fund and certain other MFS U.S. funds. The line of credit is provided by a syndicate of banks under a credit agreement. Borrowings
may be made for temporary financing needs. Interest is charged to each fund, based on its borrowings, generally at a rate equal to the highest of one month LIBOR, the Federal Funds Effective Rate and the Overnight Bank Funding Rate, plus an agreed
upon spread. A commitment fee, based on the average daily, unused portion of the committed line of credit, is allocated among the participating funds. In addition, the fund and other funds managed by MFS have established unsecured uncommitted
borrowing arrangements with certain banks for temporary financing needs. Interest is charged to each fund, based on its borrowings, at rates equal to customary reference rates plus an agreed upon spread. For the year ended December 31, 2021, the
fund’s commitment fee and interest expense were $3,718 and $0, respectively, and are included in “Miscellaneous” expense in the Statement of Operations.
(7) Investments in Affiliated Issuers
An affiliated issuer may be considered one in which the
fund owns 5% or more of the outstanding voting securities, or a company which is under common control. For the purposes of this report, the following were affiliated issuers:
| Affiliated
Issuers |
Beginning
Value |
Purchases
|
Sales
Proceeds |
Realized
Gain
(Loss) |
Change
in
Unrealized
Appreciation or
Depreciation |
Ending
Value |
| MFS
Institutional Money Market Portfolio |
$8,618,176
|
$165,467,990
|
$169,321,190
|
$—
|
$(1)
|
$4,764,975
|
| Affiliated
Issuers |
Dividend
Income |
Capital
Gain
Distributions |
| MFS
Institutional Money Market Portfolio |
$3,325
|
$—
|
(8) Impacts of
COVID-19
The pandemic related to the global spread of
novel coronavirus disease (COVID-19), which was first detected in December 2019, has resulted in significant disruptions to global business activity and the global economy, as well as the economies of individual countries, the financial performance
of individual companies and sectors, and the securities and commodities markets in general. Multiple
MFS Massachusetts
Investors Growth Stock Portfolio
Notes to Financial Statements - continued
surges in cases
globally, the availability and widespread adoption of vaccines, and the emergence of variant strains of the virus continue to create uncertainty as to the future and long-term impacts resulting from the pandemic including impacts to the prices and
liquidity of the fund's investments and the fund's performance.
(9) LIBOR Transition
Certain of the fund's investments, including its
investments in derivatives, as well as any debt issued by the fund and other contractual arrangements of the fund may be based on reference interest rates such as the London Interbank Offered Rate (“LIBOR”). In 2017, the regulatory
authority that oversees financial services firms in the United Kingdom announced plans to transition away from LIBOR by the end of 2021. In March 2021, the administrator of LIBOR announced the extension of the publication of the more commonly used
U.S. dollar LIBOR settings to the end of June 2023. Although the full impacts of the transition away from LIBOR are not fully known, the transition may result in, among other things, an increase in volatility or illiquidity of the markets for
instruments that currently rely on LIBOR to determine interest rates and this could have an adverse impact on the fund's performance. With respect to the fund's accounting for investments, including its investments in derivatives, as well as any
debt issued by the fund and other contractual arrangements of the fund that undergo reference rate-related modifications as a result of the transition, management will rely upon the relief provided by FASB Codification Topic 848 – Reference
Rate Reform (Topic 848). The guidance in Topic 848 permits the fund to disregard the GAAP accounting requirements around certain contract modifications resulting from the LIBOR transition such that for contracts considered in scope, the fund can
account for those modified contracts as a continuation of the existing contracts. While the cessation of the one-week and two-month U.S. dollar LIBOR tenors along with certain other non-U.S. dollar denominated LIBOR settings at December 31, 2021 did
not have a material impact on the fund, management is still evaluating the impact to the fund of the June 30, 2023 planned discontinuation of the more commonly used U.S. dollar LIBOR settings.
MFS Massachusetts Investors
Growth Stock Portfolio
Report of Independent Registered Public Accounting
Firm
To the Board of Trustees of MFS Variable
Insurance Trust II and the Shareholders of
MFS Massachusetts Investors Growth Stock Portfolio:
Opinion on the Financial Statements and Financial
Highlights
We have audited the accompanying statement
of assets and liabilities of MFS Massachusetts Investors Growth Stock Portfolio (the “Fund”), including the portfolio of investments, as of December 31, 2021, the related statement of operations for the year then ended, the statements of
changes in net assets for each of the two years in the period then ended, the financial highlights for each of the five years in the period then ended, and the related notes. In our opinion, the financial statements and financial highlights present
fairly, in all material respects, the financial position of the Fund as of December 31, 2021, and the results of its operations for the year then ended, the changes in its net assets for each of the two years in the period then ended, and the
financial highlights for each of the five years in the period then ended, in conformity with accounting principles generally accepted in the United States of America.
Basis for Opinion
These financial statements and financial highlights are the
responsibility of the Fund's management. Our responsibility is to express an opinion on the Fund's financial statements and financial highlights based on our audits. We are a public accounting firm registered with the Public Company Accounting
Oversight Board (United States) (PCAOB) and are required to be independent with respect to the Fund in accordance with the U.S. federal securities laws and the applicable rules and regulations of the Securities and Exchange Commission and the
PCAOB.
We conducted our audits in accordance with the
standards of the PCAOB. Those standards require that we plan and perform the audit to obtain reasonable assurance about whether the financial statements and financial highlights are free of material misstatement, whether due to error or fraud. The
Fund is not required to have, nor were we engaged to perform, an audit of its internal control over financial reporting. As part of our audits, we are required to obtain an understanding of internal control over financial reporting but not for the
purpose of expressing an opinion on the effectiveness of the Fund's internal control over financial reporting. Accordingly, we express no such opinion.
Our audits included performing procedures to assess the
risks of material misstatement of the financial statements and financial highlights, whether due to error or fraud, and performing procedures that respond to those risks. Such procedures included examining, on a test basis, evidence regarding the
amounts and disclosures in the financial statements and financial highlights. Our audits also included evaluating the accounting principles used and significant estimates made by management, as well as evaluating the overall presentation of the
financial statements and financial highlights. Our procedures included confirmation of securities owned as of December 31, 2021, by correspondence with the custodian. We believe that our audits provide a reasonable basis for our opinion.
DELOITTE & TOUCHE LLP
Boston, Massachusetts
February 15, 2022
We have served as the auditor of one or more of the MFS
investment companies since 1924.
MFS Massachusetts
Investors Growth Stock Portfolio
Trustees and Officers — Identification and
Background
The Trustees and Officers of the Trust, as
of February 1, 2022, are listed below, together with their principal occupations during the past five years. (Their titles may have varied during that period.) The address of each Trustee and Officer is 111 Huntington Avenue, Boston, Massachusetts
02199-7618.
| Name,
Age |
|
Position(s)
Held with Fund |
|
Trustee/Officer
Since(h) |
|
Number
of MFS Funds overseen by the Trustee |
|
Principal
Occupations During
the Past Five Years |
|
Other
Directorships During
the Past Five Years (j) |
| INTERESTED
TRUSTEES |
|
|
|
|
|
|
|
|
|
|
Michael
W. Roberge (k)
(age 55) |
|
Trustee
|
|
January
2021 |
|
135
|
|
Massachusetts
Financial Services Company, Chairman (since January 2021); Chief Executive Officer (since January 2017); Director; Chairman of the Board (since January 2022); President (until December 2018); Chief Investment Officer (until December 2018) |
|
N/A
|
| INDEPENDENT
TRUSTEES |
|
|
|
|
|
|
|
|
|
|
John
P. Kavanaugh
(age 67) |
|
Trustee
and Chair of Trustees |
|
January
2009 |
|
135
|
|
Private
investor |
|
N/A
|
Steven
E. Buller
(age 70) |
|
Trustee
|
|
February
2014 |
|
135
|
|
Private
investor |
|
N/A
|
John
A. Caroselli
(age 67) |
|
Trustee
|
|
March
2017 |
|
135
|
|
Private
investor; JC Global Advisors, LLC (management consulting), President (since 2015) |
|
N/A
|
Maureen
R. Goldfarb
(age 66) |
|
Trustee
|
|
January
2009 |
|
135
|
|
Private
investor |
|
N/A
|
Peter
D. Jones
(age 66) |
|
Trustee
|
|
January
2019 |
|
135
|
|
Private
investor |
|
N/A
|
James
W. Kilman, Jr.
(age 60) |
|
Trustee
|
|
January
2019 |
|
135
|
|
Burford
Capital Limited (finance and investment management), Senior Advisor (since May 3, 2021), Chief Financial Officer (2019 - May 2, 2021); KielStrand Capital LLC (family office), Chief Executive Officer (since 2016) |
|
Alpha-En
Corporation, Director (2016-2019) |
Clarence
Otis, Jr.
(age 65) |
|
Trustee
|
|
March
2017 |
|
135
|
|
Private
investor |
|
VF
Corporation, Director; Verizon Communications, Inc., Director; The Travelers Companies, Director |
Maryanne
L. Roepke
(age 65) |
|
Trustee
|
|
May
2014 |
|
135
|
|
Private
investor |
|
N/A
|
Laurie
J. Thomsen
(age 64) |
|
Trustee
|
|
March
2005 |
|
135
|
|
Private
investor |
|
The
Travelers Companies, Director; Dycom Industries, Inc., Director |
MFS Massachusetts Investors
Growth Stock Portfolio
Trustees and Officers - continued
| Name,
Age |
|
Position(s)
Held with
Fund |
|
Trustee/Officer
Since(h) |
|
Number
of MFS Funds for which the Person is an Officer |
|
Principal
Occupations During
the Past Five Years |
| OFFICERS
|
|
|
|
|
|
|
|
|
Christopher
R. Bohane (k)
(age 48) |
|
Assistant
Secretary and Assistant Clerk |
|
July
2005 |
|
135
|
|
Massachusetts
Financial Services Company, Senior Vice President and Associate General Counsel |
Kino
Clark (k)
(age 53) |
|
Assistant
Treasurer |
|
January
2012 |
|
135
|
|
Massachusetts
Financial Services Company, Vice President |
John
W. Clark, Jr. (k)
(age 54) |
|
Assistant
Treasurer |
|
April
2017 |
|
135
|
|
Massachusetts
Financial Services Company, Vice President (since March 2017); Deutsche Bank (financial services), Department Head - Treasurer's Office (until February 2017) |
Thomas
H. Connors (k)
(age 62) |
|
Assistant
Secretary and Assistant Clerk |
|
September
2012 |
|
135
|
|
Massachusetts
Financial Services Company, Vice President and Senior Counsel |
David
L. DiLorenzo (k)
(age 53) |
|
President
|
|
July
2005 |
|
135
|
|
Massachusetts
Financial Services Company, Senior Vice President |
Heidi
W. Hardin (k)
(age 54) |
|
Secretary
and Clerk |
|
April
2017 |
|
135
|
|
Massachusetts
Financial Services Company, Executive Vice President and General Counsel (since March 2017); Harris Associates (investment management), General Counsel (until January 2017) |
Brian
E. Langenfeld (k)
(age 48) |
|
Assistant
Secretary and Assistant Clerk |
|
June
2006 |
|
135
|
|
Massachusetts
Financial Services Company, Vice President and Senior Counsel |
Amanda
S. Mooradian (k)
(age 42) |
|
Assistant
Secretary and Assistant Clerk |
|
September
2018 |
|
135
|
|
Massachusetts
Financial Services Company, Assistant Vice President and Senior Counsel |
Susan
A. Pereira (k)
(age 51) |
|
Assistant
Secretary and Assistant Clerk |
|
July
2005 |
|
135
|
|
Massachusetts
Financial Services Company, Vice President and Assistant General Counsel |
Kasey
L. Phillips (k)
(age 51) |
|
Assistant
Treasurer |
|
September
2012 |
|
135
|
|
Massachusetts
Financial Services Company, Vice President |
Matthew
A. Stowe (k)
(age 47) |
|
Assistant
Secretary and Assistant Clerk |
|
October
2014 |
|
135
|
|
Massachusetts
Financial Services Company, Vice President and Assistant General Counsel |
Martin
J. Wolin (k)
(age 54) |
|
Chief
Compliance Officer |
|
July
2015 |
|
135
|
|
Massachusetts
Financial Services Company, Senior Vice President and Chief Compliance Officer |
James
O. Yost (k)
(age 61) |
|
Treasurer
|
|
September
1990 |
|
135
|
|
Massachusetts
Financial Services Company, Senior Vice President |
| (h)
|
Date
first appointed to serve as Trustee/Officer of an MFS Fund. Each Trustee has served continuously since appointment unless indicated otherwise. From January 2012 through December 2016, Messrs. DiLorenzo and Yost served as Treasurer and Deputy
Treasurer of the Funds, respectively. |
| (j)
|
Directorships or
trusteeships of companies required to report to the Securities and Exchange Commission (i.e., “public companies”). |
| (k)
|
“Interested
person” of the Trust within the meaning of the Investment Company Act of 1940 (referred to as the 1940 Act), which is the principal federal law governing investment companies like the fund, as a result of a position with MFS. The address of
MFS is 111 Huntington Avenue, Boston, Massachusetts 02199-7618. |
Each Trustee (other than Messrs. Jones, Kilman and Roberge)
has been elected by shareholders and each Trustee and Officer holds office until his or her successor is chosen and qualified or until his or her earlier death, resignation, retirement or removal. Mr. Roberge became a Trustee of the Funds on January
1, 2021 and Messrs. Jones and Kilman became Trustees of the Funds on January 1, 2019. The Trust does not hold annual meetings for the purpose of electing Trustees, and Trustees are not elected for fixed terms. Under the terms of the Board's
retirement policy, an Independent Trustee shall retire at the end of the calendar year in which he or she reaches the earlier of 75 years of age or 15 years of service on the Board (or, in the case of any Independent Trustee who joined the Board
prior to 2015, 20 years of service on the Board).
Messrs. Buller, Kilman and Otis and Ms. Roepke are members
of the Trust’s Audit Committee.
MFS Massachusetts
Investors Growth Stock Portfolio
Trustees and Officers - continued
Each
of the Interested Trustees and certain Officers hold comparable officer positions with certain affiliates of MFS.
The Statement of Additional Information for a Fund includes
further information about the Trustees and is available without charge upon request by calling 1-800-225-2606.
| Investment
Adviser |
Custodian
|
Massachusetts Financial
Services Company
111 Huntington Avenue
Boston, MA 02199-7618 |
State Street
Bank and Trust Company
1 Lincoln Street
Boston, MA 02111-2900 |
| Distributor
|
Independent
Registered Public Accounting Firm |
MFS Fund
Distributors, Inc.
111 Huntington Avenue
Boston, MA 02199-7618 |
Deloitte
& Touche LLP
200 Berkeley Street
Boston, MA 02116 |
| Portfolio
Manager(s) |
|
Jeffrey
Constantino
Joseph Skorski |
|
MFS Massachusetts Investors
Growth Stock Portfolio
Board Review of Investment Advisory Agreement
MFS Massachusetts Investors Growth Stock Portfolio
The Investment Company Act of 1940 requires that both the
full Board of Trustees and a majority of the non-interested (“independent”) Trustees, voting separately, annually approve the continuation of the Fund’s investment advisory agreement with MFS. The Trustees consider matters bearing
on the Fund and its advisory arrangements at their meetings throughout the year, including a review of performance data at each regular meeting. In addition, the independent Trustees met several times by videoconference (in accordance with
Securities and Exchange Commission relief) over the course of three months beginning in May and ending in July, 2021 (“contract review meetings”) for the specific purpose of considering whether to approve the continuation of the
investment advisory agreement for the Fund and the other investment companies that the Board oversees (the “MFS Funds”). The independent Trustees were assisted in their evaluation of the Fund’s investment advisory agreement by
independent legal counsel, from whom they received separate legal advice and with whom they met separately from MFS during various contract review meetings. The independent Trustees were also assisted in this process by an independent consultant who
was retained by and reported to the independent Trustees.
In connection with their deliberations regarding the
continuation of the investment advisory agreement, the Trustees, including the independent Trustees, considered such information and factors as they believed, in light of the legal advice furnished to them and their own business judgment, to be
relevant. The investment advisory agreement for the Fund was considered separately, although the Trustees also took into account the common interests of all MFS Funds in their review. As described below, the Trustees considered the nature, quality,
and extent of the various investment advisory, administrative, and shareholder services performed by MFS under the existing investment advisory agreement and other arrangements with the Fund.
In connection with their contract review meetings, the
Trustees received and relied upon materials that included, among other items: (i) information provided by Broadridge Financial Solutions, Inc. (“Broadridge”), an independent third party, on the investment performance of the Fund for
various time periods ended December 31, 2020 and the investment performance of a group of funds with substantially similar investment classifications/objectives (the “Broadridge performance universe”), (ii) information provided by
Broadridge on the Fund’s advisory fees and other expenses and the advisory fees and other expenses of comparable funds identified by Broadridge as well as all other funds in the same investment classification/category (the “Broadridge
expense group and universe”), (iii) information provided by MFS on the advisory fees of portfolios of other clients of MFS, including institutional separate accounts and other clients, (iv) information as to whether and to what extent
applicable expense waivers, reimbursements or fee “breakpoints” are observed for the Fund, (v) information regarding MFS’ financial results and financial condition, including MFS’ and certain of its affiliates’
estimated profitability from services performed for the Fund and the MFS Funds as a whole, and compared to MFS’ institutional business, (vi) MFS’ views regarding the outlook for the mutual fund industry and the strategic business plans
of MFS, (vii) descriptions of various functions performed by MFS for the Funds, such as compliance monitoring and portfolio trading practices, and (viii) information regarding the overall organization of MFS, including information about MFS’
senior management and other personnel providing investment advisory, administrative and other services to the Fund and the other MFS Funds. The comparative performance, fee and expense information prepared and provided by Broadridge was not
independently verified and the independent Trustees did not independently verify any information provided to them by MFS.
The Trustees’ conclusion as to the continuation of
the investment advisory agreement was based on a comprehensive consideration of all information provided to the Trustees and not the result of any single factor. Some of the factors that figured particularly in the Trustees’ deliberations are
described below, although individual Trustees may have evaluated the information presented differently from one another, giving different weights to various factors. It is also important to recognize that the fee arrangements for the Fund and other
MFS Funds are the result of years of review and discussion between the independent Trustees and MFS, that certain aspects of such arrangements may receive greater scrutiny in some years than in others, and that the Trustees’ conclusions may be
based, in part, on their consideration of these same arrangements during the course of the year and in prior years.
Based on information provided by Broadridge and MFS, the
Trustees reviewed the Fund’s total return investment performance as well as the Broadridge performance universe over various time periods. The Trustees placed particular emphasis on the total return performance of the Fund’s Initial
Class shares in comparison to the performance of funds in its Broadridge performance universe over the five-year period ended December 31, 2020, which the Trustees believed was a long enough period to reflect differing market conditions. The total
return performance of the Fund’s Initial Class shares was in the 4th quintile relative to the other funds in the universe for this five-year period (the 1st quintile being the best performers and the 5th quintile being the worst performers).
The total return performance of the Fund’s Initial Class shares was in the 5th quintile for the one-year period and the 4th quintile for the three-year period ended December 31, 2020 relative to the Broadridge performance universe. Because of
the passage of time, these performance results may differ from the performance results for more recent periods, including those shown elsewhere in this report.
In the course of their deliberations, the Trustees took
into account information provided by MFS in connection with the contract review meetings, as well as during investment review meetings conducted with portfolio management personnel during the course of the year regarding the Fund’s
performance. The Trustees noted that the total return performance (Class I shares) of the Fund’s retail counterpart, Massachusetts Investors Growth Stock Fund, which has substantially similar investment strategies, was in the 2nd
MFS Massachusetts
Investors Growth Stock Portfolio
Board Review of Investment Advisory Agreement - continued
quintile relative
to the other funds in its Broadridge performance universe for the five-year period ended December 31, 2020. After reviewing these and related factors, the Trustees concluded, within the context of their overall conclusions regarding the investment
advisory agreement, that they were satisfied with MFS’ responses and efforts relating to investment performance.
In assessing the reasonableness of the Fund’s
advisory fee, the Trustees considered, among other information, the Fund’s advisory fee and the total expense ratio of the Fund’s Initial Class shares as a percentage of average daily net assets and the advisory fee and total expense
ratios of the Broadridge expense group based on information provided by Broadridge. The Trustees considered that MFS currently observes an expense limitation for the Fund, which may not be changed without the Trustees’ approval. The Trustees
also considered that, according to the data provided by Broadridge (which takes into account any fee reductions or expense limitations that were in effect during the Fund’s last fiscal year), the Fund’s effective advisory fee rate and
total expense ratio were each higher than the Broadridge expense group median.
The Trustees also considered the advisory fees charged by
MFS to any institutional separate accounts advised by MFS (“separate accounts”) and unaffiliated investment companies for which MFS serves as subadviser (“subadvised funds”) that have comparable investment strategies to the
Fund, if any. In comparing these fees, the Trustees considered information provided by MFS as to the generally broader scope of services provided by MFS to the Fund, as well as the more extensive regulatory burdens imposed on MFS in managing the
Fund, in comparison to separate accounts and subadvised funds. The Trustees also considered the higher demands placed on MFS’ investment personnel and trading infrastructure as a result of the daily cash in-flows and out-flows of the Fund in
comparison to separate accounts.
The Trustees also
considered whether the Fund may benefit from any economies of scale in the management of the Fund in the event of growth in assets of the Fund and/or growth in assets of the MFS Funds as a whole. They noted that the Fund’s advisory fee rate
schedule is subject to a contractual breakpoint that reduces the Fund’s advisory fee rate on average daily net assets over $1 billion. The Trustees also noted that MFS has agreed in writing to waive a portion of the management fees of certain
MFS Funds, including the Fund, if the total combined assets of certain funds within the MFS Funds’ complex increase above agreed upon thresholds (the “group fee waiver”), enabling the Fund’s shareholders to share in the
benefits from any economies of scale at the complex level. The group fee waiver is reviewed and renewed annually between the Board and MFS. The Trustees concluded that the breakpoint and the group fee waiver were sufficient to allow the Fund to
benefit from economies of scale as its assets and overall complex assets grow.
The Trustees also considered information prepared by MFS
relating to MFS’ costs and profits with respect to the Fund, the MFS Funds considered as a group, and other investment companies and accounts advised by MFS, as well as MFS’ methodologies used to determine and allocate its costs to the
MFS Funds, the Fund and other accounts and products for purposes of estimating profitability.
After reviewing these and other factors described herein,
the Trustees concluded, within the context of their overall conclusions regarding the investment advisory agreement, that the advisory fees charged to the Fund represent reasonable compensation in light of the services being provided by MFS to the
Fund.
In addition, the Trustees considered MFS’
resources and related efforts to continue to retain, attract and motivate capable personnel to serve the Fund. The Trustees also considered current and developing conditions in the financial services industry, including the presence of large and
well-capitalized companies which are spending, and appear to be prepared to continue to spend, substantial sums to engage personnel and to provide services to competing investment companies. In this regard, the Trustees also considered the financial
resources of MFS and its ultimate parent, Sun Life Financial Inc. The Trustees also considered the advantages and possible disadvantages to the Fund of having an adviser that also serves other investment companies as well as other accounts.
The Trustees also considered the nature, quality, cost, and
extent of administrative, transfer agency, and distribution services provided to the Fund by MFS and its affiliates under agreements and plans other than the investment advisory agreement, including any 12b-1 fees the Fund pays to MFS Fund
Distributors, Inc., an affiliate of MFS. The Trustees also considered the nature, extent and quality of certain other services MFS performs or arranges for on the Fund’s behalf, which may include securities lending programs, directed expense
payment programs, class action recovery programs, and MFS’ interaction with third-party service providers, principally custodians and sub-custodians. The Trustees concluded that the various non-advisory services provided by MFS and its
affiliates on behalf of the Fund were satisfactory.
The Trustees considered so-called “fall-out
benefits” to MFS such as reputational value derived from serving as investment manager to the MFS Funds. The Trustees also considered that MFS discontinued its historic practice of obtaining investment research from portfolio brokerage
commissions paid by certain MFS Funds effective January 2018, and directly pays or voluntarily reimburses a Fund, if applicable, for the costs of external research acquired through the use of the Fund’s portfolio brokerage commissions.
Based on their evaluation of factors that they deemed to be
material, including those factors described above, the Board of Trustees, including the independent Trustees, concluded that the Fund’s investment advisory agreement with MFS should be continued for an additional one-year period, commencing
August 1, 2021.
MFS Massachusetts Investors
Growth Stock Portfolio
Proxy Voting Policies and Information
MFS votes proxies on behalf of the fund pursuant to proxy
voting policies and procedures that are available without charge, upon request, by calling 1-800-225-2606, by visiting mfs.com/proxyvoting, or by visiting the SEC’s Web site at http://www.sec.gov.
Information regarding how the fund voted proxies relating
to portfolio securities during the most recent twelve-month period ended June 30 is available by August 31 of each year without charge by visiting mfs.com/proxyvoting, or by visiting the SEC’s Web site
at http://www.sec.gov.
Quarterly Portfolio Disclosure
The fund files a complete schedule of portfolio holdings
with the SEC for the first and third quarters of each fiscal year as an exhibit to its reports on Form N-PORT. The fund’s Form N-PORT reports are available on the SEC’s Web site at
http://www.sec.gov. A shareholder can obtain the portfolio holdings report for the first and third quarters of the fund's fiscal year at mfs.com/vit2 by
choosing the fund's name and then scrolling to the “Resources” section and clicking on the “Prospectus and Reports” tab.
FURTHER INFORMATION
From time to time, MFS may post important information about
the fund or the MFS Funds on the MFS Web site (mfs.com). This information is available at https://www.mfs.com/announcements or at
mfs.com/vit2 by choosing the fund's name and then scrolling to the “Resources” section and clicking on the “Announcements” tab, if any.
Information About Fund Contracts and Legal Claims
The fund has entered into contractual arrangements with an
investment adviser, administrator, distributor, shareholder servicing agent, 529 program manager (if applicable), and custodian who each provide services to the fund. Unless expressly stated otherwise, shareholders are not parties to, or intended
beneficiaries of these contractual arrangements, and these contractual arrangements are not intended to create any shareholder right to enforce them against the service providers or to seek any remedy under them against the service providers, either
directly or on behalf of the fund.
Under the
Trust’s By-Laws and Declaration of Trust, any claims asserted against or on behalf of the MFS Funds, including claims against Trustees and Officers, must be brought in state and federal courts located within the Commonwealth of
Massachusetts.
Federal Tax Information (unaudited)
The following information is provided pursuant to
provisions of the Internal Revenue Code.
The fund
designates $156,660,000 as capital gain dividends paid during the fiscal year.
For corporate shareholders, 100% of the ordinary income
dividends paid during the fiscal year qualify for the corporate dividends received deduction.
| FACTS
|
WHAT
DOES MFS DO WITH YOUR PERSONAL INFORMATION? |
| Why?
|
Financial
companies choose how they share your personal information. Federal law gives consumers the right to limit some but not all sharing. Federal law also requires us to tell you how we collect, share, and protect your personal information. Please read
this notice carefully to understand what we do. |
| What?
|
The types of
personal information we collect and share depend on the product or service you have with us. This information can include: |
| • Social
Security number and account balances |
| • Account
transactions and transaction history |
| • Checking
account information and wire transfer instructions |
| When
you are no longer our customer, we continue to share your information as described in this notice. |
| How?
|
All
financial companies need to share customers' personal information to run their everyday business. In the section below, we list the reasons financial companies can share their customers' personal information; the reasons MFS chooses to share; and
whether you can limit this sharing. |
Reasons
we can share your
personal information |
Does
MFS share? |
Can
you limit
this sharing? |
For
our everyday business purposes –
such as to process your transactions, maintain your
account(s), respond to court orders and legal
investigations, or report to credit bureaus |
Yes
|
No
|
For
our marketing purposes –
to offer our products and services to you |
No
|
We
don't share |
For
joint marketing with other
financial companies |
No
|
We
don't share |
For
our affiliates' everyday business purposes –
information about your transactions and experiences |
No
|
We
don't share |
For
our affiliates' everyday business purposes –
information about your creditworthiness |
No
|
We
don't share |
| For
nonaffiliates to market to you |
No
|
We
don't share |
| Questions?
|
Call
800-225-2606 or go to mfs.com. |
| Who
we are |
| Who
is providing this notice? |
MFS
Funds, MFS Investment Management, MFS Institutional Advisors, Inc., and MFS Heritage Trust Company. |
| What
we do |
How
does MFS
protect my personal
information? |
To
protect your personal information from unauthorized access and use, we use security measures that comply with federal law. These measures include procedural, electronic, and physical safeguards for the protection of the personal information we
collect about you. |
How
does MFS
collect my personal
information? |
We
collect your personal information, for example, when you |
| • open
an account or provide account information |
| • direct
us to buy securities or direct us to sell your securities |
| • make
a wire transfer |
| We
also collect your personal information from others, such as credit bureaus, affiliates, or other companies. |
| Why
can't I limit all sharing? |
Federal
law gives you the right to limit only |
| • sharing
for affiliates' everyday business purposes – information about your creditworthiness |
| • affiliates
from using your information to market to you |
| • sharing
for nonaffiliates to market to you |
| State
laws and individual companies may give you additional rights to limit sharing. |
| Definitions
|
| Affiliates
|
Companies
related by common ownership or control. They can be financial and nonfinancial companies. |
| •
MFS does not share personal information with affiliates, except for everyday business purposes as described on page one of this notice. |
| Nonaffiliates
|
Companies
not related by common ownership or control. They can be financial and nonfinancial companies. |
| •
MFS does not share with nonaffiliates so they can market to you. |
| Joint
marketing |
A
formal agreement between nonaffiliated financial companies that together market financial products or services to you. |
| •
MFS doesn't jointly market. |
| Other
important information |
| If
you own an MFS product or receive an MFS service in the name of a third party such as a bank or broker-dealer, their privacy policy may apply to you instead of ours. |
Annual Report
December 31, 2021
MFS® Research
International Portfolio
MFS® Variable
Insurance Trust II
MFS® Research
International Portfolio
|
1
|
|
2
|
|
3
|
|
5
|
|
7
|
|
8
|
|
13
|
|
14
|
|
15
|
|
16
|
|
18
|
|
24
|
|
25
|
|
28
|
|
31
|
|
31
|
|
31
|
|
31
|
|
31
|
|
32
|
The report is prepared for the general information of contract owners. It
is authorized for distribution to prospective investors only when preceded or accompanied by a current prospectus.
NOT FDIC INSURED • MAY LOSE VALUE
• NO BANK OR CREDIT UNION GUARANTEE •
NOT A DEPOSIT • NOT INSURED BY ANY FEDERAL GOVERNMENT
AGENCY OR NCUA/NCUSIF
MFS Research
International Portfolio
Dear Contract Owners:
After a powerful rally in 2021 that was spurred by the
introduction of effective coronavirus vaccines and high levels of monetary and fiscal stimulus, markets have recently experienced a rise in volatility. Rising inflation (mostly due to pandemic-related labor and supply chain disruptions), new
COVID-19 variants that are vaccine-resistant, and the prospect of tighter monetary and fiscal policies around the world have all increased investor anxiety.
Rising real (inflation-adjusted) bond yields in the United
States are a headwind for richly valued U.S. growth stocks, though many non-U.S. markets have experienced lower levels of turbulence. In recent months, global economic growth has moderated, with the spread of the Delta and Omicron variants and a
regulatory crackdown in China featuring prominently. Stress in China’s property development sector has also contributed to the slowdown there. A further concern for investors is the tightening of global energy and raw materials supplies caused
in part by geopolitical uncertainty.
However,
above-trend economic growth, strong corporate balance sheets, and nascent signs that global supply chain bottlenecks may be easing, along with a dovish policy shift in China, are supportive fundamentals that we feel could help calm recent market
jitters.
It is times of market transition that
demonstrate the importance of having a deep understanding of company fundamentals, and we have built our global research platform to do just that.
At MFS®, we put our clients’ assets to work responsibly by carefully navigating the increasing complexity of global markets and economies. Guided by our commitment to long-term
investing, we tune out the noise and try to uncover what we believe are the best, most durable investment opportunities in the market. Our unique global investment platform combines collective expertise, long-term discipline, and thoughtful risk
management to create sustainable value for investors.
Respectfully,
Michael W.
Roberge
Chief Executive Officer
MFS Investment Management
February 15, 2022
The opinions expressed in this letter are subject to
change and may not be relied upon for investment advice. No forecasts can be guaranteed.
MFS Research International
Portfolio
Portfolio structure
Top ten
holdings
| Roche
Holding AG |
3.4%
|
| Nestle
S.A. |
3.3%
|
| Novo
Nordisk A.S., “B” |
3.3%
|
| Schneider
Electric SE |
2.9%
|
| Linde
PLC |
2.6%
|
| LVMH
Moet Hennessy Louis Vuitton SE |
2.4%
|
| Aon
PLC |
2.1%
|
| Hitachi
Ltd. |
1.7%
|
| Diageo
PLC |
1.7%
|
| BNP
Paribas |
1.6%
|
Global equity sectors (k)
| Capital
Goods |
24.2%
|
| Financial
Services |
19.3%
|
| Technology
|
14.3%
|
| Health
Care |
12.2%
|
| Consumer
Cyclicals |
10.3%
|
| Consumer
Staples |
9.0%
|
| Energy
|
6.5%
|
| Telecommunications/Cable
Television |
2.9%
|
Issuer country weightings (x)
| Japan
|
19.0%
|
| Switzerland
|
13.4%
|
| France
|
9.9%
|
| United
Kingdom |
9.4%
|
| United
States |
9.4%
|
| Germany
|
9.1%
|
| Hong
Kong |
4.2%
|
| Netherlands
|
4.1%
|
| China
|
3.7%
|
| Other
Countries |
17.8%
|
Currency exposure weightings
(y)
| Euro
|
30.7%
|
| Japanese
Yen |
19.0%
|
| Swiss
Franc |
13.4%
|
| British
Pound Sterling |
10.0%
|
| United
States Dollar |
7.4%
|
| Hong
Kong Dollar |
7.3%
|
| Danish
Krone |
3.7%
|
| Australian
Dollar |
2.4%
|
| Canadian
Dollar |
2.1%
|
| Other
Currencies |
4.0%
|
| (k)
|
The sectors set forth
above and the associated portfolio composition are based on MFS’ own custom sector classification methodology. |
| (x)
|
Represents
the portfolio’s exposure to issuer countries as a percentage of a portfolio’s net assets. For purposes of this presentation, United States includes Cash & Cash Equivalents and Other. |
| (y)
|
Represents
the portfolio’s exposure to a particular currency as a percentage of a portfolio's net assets. For purposes of this presentation, United States Dollar includes Cash & Cash Equivalents. |
Cash & Cash Equivalents includes any cash,
investments in money market funds, short-term securities, and other assets less liabilities. Please see the Statement of Assets and Liabilities for additional information related to the fund’s cash position and other assets and
liabilities.
Other includes equivalent
exposure from currency derivatives and/or any offsets to derivative positions and may be negative.
Percentages are based on net assets as of December
31, 2021.
The portfolio is actively managed
and current holdings may be different.
MFS Research International
Portfolio
Management Review
Summary of Results
For the twelve months ended December 31, 2021, Initial
Class shares of the MFS Research International Portfolio (fund) provided a total return of 11.57%, while Service Class shares of the fund provided a total return of 11.27%. These compare with a return of 11.26% over the same period for the fund's
benchmark, the MSCI EAFE Index (net div).
Market
Environment
Over the past year, the global economy
was buffeted by an array of crosscurrents as it adjusted to the ebbs and flows of the pandemic. Among the supportive currents were ample fiscal stimulus, loose monetary policy and the rollout of several highly effective coronavirus vaccines.
Negative currents included the rapid spread of several coronavirus variants, widespread global production bottlenecks and a surge in inflation. After experiencing a burst of exceptionally strong economic activity as the global economy began to
reopen, activity became more muted in the second half of the period amid ongoing supply chain disruptions and a new wave of coronavirus infections, albeit a seemingly milder strain.
Amid rising inflation, markets anticipated a transition
from an exceptionally accommodative environment to a more mixed monetary landscape ahead. Indeed, several central banks in emerging markets have already tightened policy and the US Federal Reserve reduced the pace of its asset purchases in November
and again in December. However, the European Central Bank, the Bank of Japan and the People's Bank of China are expected to maintain accommodative policies. Sovereign bond yields moved modestly higher during the period amid higher inflation and on
expectations of a tighter Fed but remain historically low.
A harsher Chinese regulatory environment toward industries
such as online gaming, food delivery and education increased market volatility as has stress in China's highly leveraged property development sector. Trade relations between the United States and China remained quite strained despite a change in
presidential administrations.
Signs of excess
investor enthusiasm continued to be seen in pockets of the market such as “meme stocks” popular with users of online message boards, cryptocurrencies and heavy retail participation in the market for short-dated options.
Contributors to Performance
Stock selection within the capital goods, consumer staples
and health care sectors benefited the fund’s performance relative to the MSCI EAFE Index. Within the capital goods sector, holding shares of industrial gas supplier Linde(b) (United Kingdom), and the fund's overweight positions in electrical
distribution equipment manufacturer Schneider Electric (France), specialty chemical products maker Croda International (United Kingdom), mechanical engineering firm GEA Group (Germany), specialty chemical company Sika (Switzerland) and electronics
manufacturer Techtronic Industries (Hong Kong), lifted relative returns. The share price of Schneider Electric advanced as better-than-expected organic growth, primarily within its energy management division, drove strong earnings results. Although
security selection within the consumer staples sector aided relative performance, there were no individual stocks within this sector, held by either the fund or the benchmark, that were among the fund’s top relative contributors over the
reporting period. Within the health care sector, the fund’s overweight position in pharmaceutical company Novo Nordisk (Denmark) contributed to relative results as the company's share price outperformed the benchmark over the reporting period,
driven by strong sales in its diabetes care and biopharma businesses.
Elsewhere, holding shares of risk management and human
capital consulting services provider Aon(b) and software engineering solutions and technology services provider EPAM Systems(b), in addition to an overweight position in global banking group BNP Paribas (France), helped the fund’s relative
performance. Aon's stock price rose after it announced the termination of its proposed acquisition of Willis Towers Watson due to the DOJ's civil antitrust action to block the deal. An upside earnings surprise also provided additional support to
Aon’s stock price, owing to solid margins and strong organic growth from new business generation.
During the reporting period, the fund's relative currency
exposure, resulting primarily from differences between the fund's and the benchmark's exposures to holdings of securities denominated in foreign currencies, was a contributor to relative performance. All of MFS' investment decisions are driven by
the fundamentals of each individual opportunity and as such, it is common for our portfolios to have different currency exposure than the benchmark.
Detractors from Performance
Security selection in both the energy and technology
sectors weakened relative performance. However, there were no individual stocks within the energy sector, held in the fund or in the benchmark, that were among the fund’s top relative detractors over the reporting period. Within the technology
sector, not holding shares of lithography systems manufacturer ASML (Netherlands), and the fund’s holdings of internet-based, multiple services company Tencent Holdings(b) (China), weighed on relative returns. The stock price of Tencent
Holdings fell over the reporting period as new technology, gaming and education regulations from Chinese authorities appeared to have weighed on investor sentiment.
MFS Research International
Portfolio
Management Review - continued
Stocks in other sectors that detracted from relative
results included the fund’s overweight positions in medical technology company Koninklijke Philips (Netherlands), pharmaceutical and medical device company Santen Pharmaceutical (Japan), consumer products company Kao (Japan), sporting goods
producer Adidas (Germany), automotive lighting systems manufacturer Koito Manufacturing (Japan), insurance company AIA Group (Hong Kong) and real estate company Leg Immobilien (Germany). Koninklijke Philips' stock price came under pressure late in
the reporting period as the company reported weaker-than-expected sales and management lowered its full-year 2021 sales guidance. Lastly, the fund's position in multinational media company Naspers(b)(h) (South Africa) held back relative results as
the stock’s performance lagged the benchmark over the fund's holding period.
Respectfully,
Portfolio Manager(s)
Victoria Higley and Camille Humphries-Lee
| (b)
|
Security is not a
benchmark constituent. |
| (h)
|
Security was not held in
the portfolio at period end. |
The
views expressed in this report are those of the portfolio manager(s) only through the end of the period of the report as stated on the cover and do not necessarily reflect the views of MFS or any other person in the MFS organization. These views are
subject to change at any time based on market or other conditions, and MFS disclaims any responsibility to update such views. These views may not be relied upon as investment advice or an indication of trading intent on behalf of any MFS portfolio.
References to specific securities are not recommendations of such securities, and may not be representative of any MFS portfolio’s current or future investments.
MFS Research International
Portfolio
Performance Summary Through 12/31/21
The following chart illustrates the historical performance
of the fund in comparison to its benchmark(s). Benchmarks are unmanaged and may not be invested in directly. Benchmark returns do not reflect any fees or expenses. The performance of other share classes will be greater than or less than that of the
class depicted below. (See Notes to Performance Summary.)
Performance data shown represents past performance and is no
guarantee of future results. Investment return and principal value fluctuate so your units, when sold, may be worth more or less than the original cost; current performance may be lower or higher than quoted. The performance shown does not reflect
the deduction of taxes, if any, that a contract holder would pay on fund distributions or the redemption of contract units. The returns for the fund shown also do not reflect the deduction of expenses associated with variable products, such as
mortality and expense risk charges, separate account charges, and sales charges imposed by the insurance company separate accounts. Such expenses would reduce the overall returns shown.
Growth of a Hypothetical $10,000 Investment
Total Returns
through 12/31/21
Average annual total returns
| Share
Class |
Class
Inception Date |
1-yr
|
5-yr
|
10-yr
|
| Initial
Class |
5/06/98
|
11.57%
|
12.19%
|
8.38%
|
| Service
Class |
8/24/01
|
11.27%
|
11.90%
|
8.11%
|
Comparative benchmark(s)
| MSCI
EAFE Index (net div) (f) |
11.26%
|
9.55%
|
8.03%
|
| (f)
|
Source:
FactSet Research Systems Inc. |
Benchmark Definition(s)
MSCI EAFE (Europe, Australasia, Far East) Index(e) (net div) – a market capitalization-weighted index that is designed to measure equity market performance in the developed markets, excluding the U.S. and Canada.
It is not possible to invest directly in an index.
| (e)
|
Morgan
Stanley Capital International (“MSCI”) makes no express or implied warranties or representations and shall have no liability whatsoever with respect to any MSCI data contained herein. The MSCI data may not be further redistributed or
used as a basis for other indices or any securities or financial products. This report is not approved, reviewed, or produced by MSCI. |
Notes to Performance Summary
Average annual total return represents the average annual
change in value for each share class for the periods presented.
Performance results reflect any applicable expense
subsidies and waivers in effect during the periods shown. Without such subsidies and waivers the fund's performance results would be less favorable. Please see the prospectus and financial statements for complete details. All results are historical
and assume the reinvestment of any dividends and capital gains distributions.
Performance results do not include adjustments made for
financial reporting purposes in accordance with U.S. generally accepted accounting principles and may differ from amounts reported in the financial highlights.
MFS Research International
Portfolio
Performance Summary – continued
From
time to time the fund may receive proceeds from litigation settlements, without which performance would be lower.
MFS Research International
Portfolio
Expense Table
Fund Expenses Borne by the Contract Holders during the
Period,
July 1, 2021 through December 31, 2021
As
a contract holder of the fund, you incur ongoing costs, including management fees; distribution and/or service (12b-1) fees; and other fund expenses. This example is intended to help you understand your ongoing costs (in dollars) of investing in the
fund and to compare these costs with the ongoing costs of investing in other mutual funds.
The example is based on an investment of $1,000 invested at
the beginning of the period and held for the entire period July 1, 2021 through December 31, 2021.
Actual Expenses
The first line for each share class in the following table
provides information about actual account values and actual expenses. You may use the information in this line, together with the amount you invested, to estimate the expenses that you paid over the period. Simply divide your account value by $1,000
(for example, an $8,600 account value divided by $1,000 = 8.6), then multiply the result by the number in the first line under the heading entitled “Expenses Paid During Period” to estimate the expenses you paid on your account during
this period.
Hypothetical Example for Comparison
Purposes
The second line for each share class in the
following table provides information about hypothetical account values and hypothetical expenses based on the fund’s actual expense ratio and an assumed rate of return of 5% per year before expenses, which is not the fund’s actual
return. The hypothetical account values and expenses may not be used to estimate the actual ending account balance or expenses you paid for the period. You may use this information to compare the ongoing costs of investing in the fund and other
funds. To do so, compare this 5% hypothetical example with the 5% hypothetical examples that appear in the shareholder reports of the other funds.
Please note that the expenses shown in the table are meant
to highlight the fund's ongoing costs only and do not take into account the fees and expenses imposed under the variable contracts through which your investment in the fund is made. Therefore, the second line for each share class in the table is
useful in comparing ongoing costs associated with an investment in vehicles (such as the fund) which fund benefits under variable annuity and variable life insurance contracts and to qualified pension and retirement plans only, and will not help you
determine the relative total costs of investing in the fund through variable annuity and variable life insurance contracts. If the fees and expenses imposed under the variable contracts were included, your costs would have been higher.
Share
Class |
|
Annualized
Expense
Ratio |
Beginning
Account Value
7/01/21 |
Ending
Account Value
12/31/21 |
Expenses
Paid During
Period (p)
7/01/21-12/31/21 |
| Initial
Class |
Actual
|
0.95%
|
$1,000.00
|
$1,037.36
|
$4.88
|
| Hypothetical
(h) |
0.95%
|
$1,000.00
|
$1,020.42
|
$4.84
|
| Service
Class |
Actual
|
1.20%
|
$1,000.00
|
$1,035.71
|
$6.16
|
| Hypothetical
(h) |
1.20%
|
$1,000.00
|
$1,019.16
|
$6.11
|
| (h)
|
5% class return per year
before expenses. |
| (p)
|
“Expenses
Paid During Period” are equal to each class's annualized expense ratio, as shown above, multiplied by the average account value over the period, multiplied by 184/365 (to reflect the one-half year period). |
MFS Research International
Portfolio
Portfolio of Investments − 12/31/21
The Portfolio of Investments is a complete list of all
securities owned by your fund. It is categorized by broad-based asset classes.
| Issuer
|
|
|
Shares/Par
|
Value
($) |
| Common
Stocks – 98.7% |
| Aerospace
& Defense – 0.6% |
|
| MTU
Aero Engines Holding AG |
|
15,851
|
$
3,222,763 |
| Airlines
– 0.4% |
|
| Ryanair
Holdings PLC, ADR (a) |
|
21,777
|
$
2,228,440 |
| Alcoholic
Beverages – 2.2% |
|
| Diageo
PLC |
|
161,928
|
$
8,846,010 |
| Kirin
Holdings Co. Ltd. |
|
163,600
|
2,626,873 |
| |
|
|
|
$11,472,883 |
| Apparel
Manufacturers – 4.9% |
|
| Adidas
AG |
|
23,131
|
$
6,667,930 |
| Burberry
Group PLC |
|
59,265
|
1,457,965 |
| Compagnie
Financiere Richemont S.A. |
|
35,397
|
5,285,591 |
| LVMH
Moet Hennessy Louis Vuitton SE |
|
15,360
|
12,713,306 |
| |
|
|
|
$26,124,792 |
| Automotive
– 2.4% |
|
| Bridgestone
Corp. |
|
65,100
|
$
2,800,834 |
| Continental
AG (a) |
|
25,522
|
2,705,477 |
| Koito
Manufacturing Co. Ltd. |
|
70,700
|
3,743,050 |
| Toyota
Industries Corp. |
|
40,400
|
3,227,645 |
| |
|
|
|
$12,477,006 |
| Brokerage
& Asset Managers – 1.8% |
|
| Euronext
N.V. |
|
54,530
|
$
5,665,017 |
| Hong
Kong Exchanges & Clearing Ltd. |
|
61,700
|
3,603,463 |
| |
|
|
|
$9,268,480 |
| Business
Services – 0.9% |
|
| Nomura
Research Institute Ltd. |
|
115,200
|
$
4,942,293 |
| Computer
Software – 3.0% |
|
| Cadence
Design Systems, Inc. (a) |
|
19,927
|
$
3,713,397 |
| NAVER
Corp. (a) |
|
10,524
|
3,350,859 |
| NetEase.com,
Inc., ADR |
|
84,704
|
8,621,173 |
| |
|
|
|
$15,685,429 |
| Computer
Software - Systems – 6.3% |
|
| Amadeus
IT Group S.A. (a) |
|
57,171
|
$
3,850,727 |
| Constellation
Software, Inc. |
|
2,836
|
5,261,806 |
| EPAM
Systems, Inc. (a) |
|
7,564
|
5,056,156 |
| Fujitsu
Ltd. |
|
36,700
|
6,294,801 |
| Hitachi
Ltd. |
|
169,800
|
9,196,331 |
| Samsung
Electronics Co. Ltd. |
|
52,012
|
3,425,901 |
| |
|
|
|
$33,085,722 |
| Construction
– 1.2% |
|
| Techtronic
Industries Co. Ltd. |
|
312,000
|
$
6,209,951 |
MFS Research International
Portfolio
Portfolio of
Investments – continued
| Issuer
|
|
|
Shares/Par
|
Value
($) |
| Common
Stocks – continued |
| Consumer
Products – 1.7% |
|
| Kao
Corp. |
|
60,700
|
$
3,176,157 |
| Reckitt
Benckiser Group PLC |
|
69,472
|
5,963,625 |
| |
|
|
|
$9,139,782 |
| Consumer
Services – 1.0% |
|
| Carsales.com
Ltd. |
|
82,544
|
$
1,506,777 |
| Persol
Holdings Co. Ltd. |
|
72,700
|
2,110,910 |
| SEEK
Ltd. |
|
72,885
|
1,738,241 |
| |
|
|
|
$5,355,928 |
| Electrical
Equipment – 4.2% |
|
| Legrand
S.A. |
|
55,270
|
$
6,474,970 |
| Schneider
Electric SE |
|
79,246
|
15,559,607 |
| |
|
|
|
$22,034,577 |
| Electronics
– 2.7% |
|
| Kyocera
Corp. |
|
49,700
|
$
3,105,224 |
| NXP
Semiconductors N.V. |
|
22,914
|
5,219,351 |
| Taiwan
Semiconductor Manufacturing Co. Ltd. |
|
260,804
|
5,797,320 |
| |
|
|
|
$14,121,895 |
| Energy
- Independent – 0.4% |
|
| Santos
Ltd. |
|
443,707
|
$
2,036,988 |
| Energy
- Integrated – 2.4% |
|
| Capricorn
Energy PLC |
|
705,588
|
$
1,798,357 |
| Eni
S.p.A. |
|
332,034
|
4,589,916 |
| Galp
Energia SGPS S.A., “B” |
|
359,107
|
3,483,344 |
| Idemitsu
Kosan Co. Ltd. |
|
104,000
|
2,655,377 |
| |
|
|
|
$12,526,994 |
| Food
& Beverages – 3.9% |
|
| Danone
S.A. |
|
54,618
|
$
3,394,546 |
| Nestle
S.A. |
|
123,263
|
17,239,505 |
| |
|
|
|
$20,634,051 |
| Food
& Drug Stores – 0.3% |
|
| Sugi
Holdings Co. Ltd. |
|
23,800
|
$
1,442,111 |
| Gaming
& Lodging – 0.8% |
|
| Flutter
Entertainment PLC (a) |
|
19,212
|
$
3,058,118 |
| Whitbread
PLC (a) |
|
29,727
|
1,205,097 |
| |
|
|
|
$4,263,215 |
| Insurance
– 4.9% |
|
| AIA
Group Ltd. |
|
696,200
|
$
7,017,758 |
| Aon
PLC |
|
37,083
|
11,145,667 |
| Beazley
PLC (a) |
|
160,115
|
1,010,582 |
| Hiscox
Ltd. |
|
157,180
|
1,831,360 |
| Zurich
Insurance Group AG |
|
11,146
|
4,884,494 |
| |
|
|
|
$25,889,861 |
MFS Research International
Portfolio
Portfolio of
Investments – continued
| Issuer
|
|
|
Shares/Par
|
Value
($) |
| Common
Stocks – continued |
| Internet
– 1.5% |
|
| Scout24
AG |
|
35,224
|
$
2,469,281 |
| Tencent
Holdings Ltd. |
|
89,700
|
5,254,851 |
| |
|
|
|
$7,724,132 |
| Leisure
& Toys – 0.9% |
|
| Prosus
N.V. |
|
31,742
|
$
2,657,246 |
| Yamaha
Corp. |
|
43,000
|
2,119,534 |
| |
|
|
|
$4,776,780 |
| Machinery
& Tools – 6.4% |
|
| Daikin
Industries Ltd. |
|
34,500
|
$
7,824,959 |
| GEA
Group AG |
|
98,971
|
5,418,706 |
| Kubota
Corp. |
|
286,000
|
6,348,787 |
| Ritchie
Bros. Auctioneers, Inc. |
|
51,113
|
3,127,916 |
| Schindler
Holding AG |
|
15,757
|
4,227,634 |
| SMC
Corp. |
|
9,400
|
6,340,485 |
| Weir
Group PLC |
|
28,503
|
660,301 |
| |
|
|
|
$33,948,788 |
| Major
Banks – 6.2% |
|
| BNP
Paribas |
|
125,617
|
$
8,691,016 |
| Credit
Suisse Group AG |
|
365,689
|
3,546,906 |
| ING
Groep N.V. |
|
338,741
|
4,721,207 |
| Mitsubishi
UFJ Financial Group, Inc. |
|
786,700
|
4,273,744 |
| NatWest
Group PLC |
|
1,683,394
|
5,142,705 |
| UBS
Group AG |
|
344,328
|
6,180,032 |
| |
|
|
|
$32,555,610 |
| Medical
Equipment – 3.3% |
|
| ConvaTec
Group PLC |
|
872,822
|
$
2,281,890 |
| Koninklijke
Philips N.V. |
|
134,954
|
5,034,181 |
| QIAGEN
N.V. (a) |
|
114,930
|
6,404,161 |
| Terumo
Corp. |
|
85,600
|
3,616,587 |
| |
|
|
|
$17,336,819 |
| Metals
& Mining – 0.9% |
|
| Glencore
PLC |
|
922,613
|
$
4,682,386 |
| Natural
Gas - Distribution – 0.5% |
|
| China
Resources Gas Group Ltd. |
|
442,000
|
$
2,496,951 |
| Natural
Gas - Pipeline – 0.8% |
|
| APA
Group |
|
233,012
|
$
1,705,450 |
| TC
Energy Corp. |
|
55,805
|
2,595,366 |
| |
|
|
|
$4,300,816 |
| Other
Banks & Diversified Financials – 4.1% |
|
| AIB
Group PLC (a) |
|
748,581
|
$
1,823,834 |
| HDFC
Bank Ltd. |
|
319,755
|
6,363,643 |
| Julius
Baer Group Ltd. |
|
65,547
|
4,380,217 |
| Macquarie
Group Ltd. |
|
37,648
|
5,626,071 |
| Visa,
Inc., “A” |
|
16,903
|
3,663,049 |
| |
|
|
|
$21,856,814 |
MFS Research International
Portfolio
Portfolio of
Investments – continued
| Issuer
|
|
|
Shares/Par
|
Value
($) |
| Common
Stocks – continued |
| Pharmaceuticals
– 8.9% |
|
| Bayer
AG |
|
51,874
|
$
2,775,751 |
| Kyowa
Kirin Co. Ltd. |
|
178,000
|
4,851,169 |
| Novo
Nordisk A.S., “B” |
|
153,841
|
17,198,618 |
| Roche
Holding AG |
|
43,678
|
18,106,076 |
| Santen
Pharmaceutical Co. Ltd. |
|
334,200
|
4,087,798 |
| |
|
|
|
$47,019,412 |
| Printing
& Publishing – 0.7% |
|
| Wolters
Kluwer N.V. |
|
31,915
|
$
3,764,328 |
| Real
Estate – 2.3% |
|
| ESR
Cayman Ltd. (a) |
|
835,200
|
$
2,822,363 |
| Grand
City Properties S.A. |
|
170,112
|
4,043,881 |
| LEG
Immobilien SE |
|
39,720
|
5,548,642 |
| |
|
|
|
$12,414,886 |
| Restaurants
– 0.6% |
|
| Yum
China Holdings, Inc. |
|
64,497
|
$
3,214,531 |
| Specialty
Chemicals – 8.5% |
|
| Akzo
Nobel N.V. |
|
47,653
|
$
5,235,407 |
| Croda
International PLC |
|
52,821
|
7,235,381 |
| Kansai
Paint Co. Ltd. |
|
98,000
|
2,129,879 |
| Linde
PLC |
|
39,813
|
13,870,088 |
| Nitto
Denko Corp. |
|
53,000
|
4,096,062 |
| Sika
AG |
|
16,553
|
6,871,078 |
| Symrise
AG |
|
38,996
|
5,784,920 |
| |
|
|
|
$45,222,815 |
| Specialty
Stores – 0.6% |
|
| Ocado
Group PLC (a) |
|
53,311
|
$
1,210,830 |
| ZOZO,
Inc. |
|
67,300
|
2,100,382 |
| |
|
|
|
$3,311,212 |
| Telecommunications
- Wireless – 2.5% |
|
| Advanced
Info Service Public Co. Ltd. |
|
361,100
|
$
2,486,244 |
| Cellnex
Telecom S.A. |
|
55,159
|
3,202,534 |
| KDDI
Corp. |
|
155,300
|
4,538,978 |
| SoftBank
Group Corp. |
|
62,900
|
2,971,387 |
| |
|
|
|
$13,199,143 |
| Telephone
Services – 0.4% |
|
| Hellenic
Telecommunications Organization S.A. |
|
124,086
|
$
2,296,374 |
| Tobacco
– 1.2% |
|
| British
American Tobacco PLC |
|
178,071
|
$
6,588,500 |
| Utilities
- Electric Power – 2.4% |
|
| CLP
Holdings Ltd. |
|
262,500
|
$
2,651,073 |
| E.ON
SE |
|
217,213
|
3,015,044 |
| Iberdrola
S.A. |
|
423,128
|
4,958,413 |
| Orsted
A/S |
|
16,468
|
2,114,732 |
| |
|
|
|
$12,739,262 |
| Total
Common Stocks (Identified Cost, $383,360,465) |
|
$521,612,720
|
MFS Research International
Portfolio
Portfolio of
Investments – continued
| Issuer
|
Strike
Price |
First
Exercise |
Shares/Par
|
Value
($) |
| Warrants
– 0.0% |
|
|
|
|
| Apparel
Manufacturers – 0.0% |
| Compagnie
Financiere Richemont S.A. (1 share for 2 warrants, Expiration 12/04/23) (a) (Identified Cost, $0) |
CHF
67.00 |
11/20/23
|
72,208
|
$
79,245 |
| Issuer
|
|
|
|
|
| Investment
Companies (h) – 1.1% |
| Money
Market Funds – 1.1% |
|
| MFS
Institutional Money Market Portfolio, 0.07% (v) (Identified Cost, $5,858,779) |
|
|
5,858,779
|
$
5,858,779 |
| Other
Assets, Less Liabilities – 0.2% |
|
1,289,823 |
| Net
Assets – 100.0% |
$528,840,567
|
| (a) |
Non-income producing
security. |
|
|
|
| (h)
|
An
affiliated issuer, which may be considered one in which the fund owns 5% or more of the outstanding voting securities, or a company which is under common control. At period end, the aggregate values of the fund's investments in affiliated issuers
and in unaffiliated issuers were $5,858,779 and $521,691,965, respectively. |
|
|
|
| (v)
|
Affiliated
issuer that is available only to investment companies managed by MFS. The rate quoted for the MFS Institutional Money Market Portfolio is the annualized seven-day yield of the fund at period end. |
|
|
|
| The
following abbreviations are used in this report and are defined: |
| ADR
|
American
Depositary Receipt |
| Abbreviations
indicate amounts shown in currencies other than the U.S. dollar. All amounts are stated in U.S. dollars unless otherwise indicated. A list of abbreviations is shown below: |
| CHF
|
Swiss
Franc |
See Notes to Financial
Statements
MFS Research International
Portfolio
| Financial
Statements |
Statement of Assets and
Liabilities |
This statement
represents your fund’s balance sheet, which details the assets and liabilities comprising the total value of the fund.
| At
12/31/21 Assets |
|
| Investments
in unaffiliated issuers, at value (identified cost, $383,360,465) |
$521,691,965
|
| Investments
in affiliated issuers, at value (identified cost, $5,858,779) |
5,858,779
|
| Foreign
currency, at value (identified cost, $174,896) |
174,896
|
| Receivables
for |
|
| Investments
sold |
64,719
|
| Fund
shares sold |
213,601
|
| Dividends
|
1,755,532
|
| Other
assets |
2,451
|
| Total
assets |
$529,761,943
|
| Liabilities
|
|
| Payables
for |
|
| Investments
purchased |
$281,720
|
| Fund
shares reacquired |
253,255
|
| Payable
to affiliates |
|
| Investment
adviser |
25,641
|
| Administrative
services fee |
445
|
| Shareholder
servicing costs |
123
|
| Distribution
and/or service fees |
1,934
|
| Payable
for independent Trustees' compensation |
196
|
| Deferred
country tax expense payable |
236,056
|
| Accrued
expenses and other liabilities |
122,006
|
| Total
liabilities |
$921,376
|
| Net
assets |
$528,840,567
|
| Net
assets consist of |
|
| Paid-in
capital |
$379,877,464
|
| Total
distributable earnings (loss) |
148,963,103
|
| Net
assets |
$528,840,567
|
| Shares
of beneficial interest outstanding |
27,763,809
|
| |
Net
assets |
Shares
outstanding |
Net
asset value
per share |
| Initial
Class |
$387,369,927
|
20,254,566
|
$19.13
|
| Service
Class |
141,470,640
|
7,509,243
|
18.84
|
See Notes to Financial Statements
MFS Research International
Portfolio
| Financial
Statements |
Statement of Operations
|
This statement describes how much
your fund earned in investment income and accrued in expenses. It also describes any gains and/or losses generated by fund operations.
| Year
ended 12/31/21 |
|
| Net
investment income (loss) |
|
| Income
|
|
| Dividends
|
$10,810,097
|
| Income
on securities loaned |
9,234
|
| Dividends
from affiliated issuers |
1,918
|
| Other
|
62
|
| Foreign
taxes withheld |
(995,819)
|
| Total
investment income |
$9,825,492
|
| Expenses
|
|
| Management
fee |
$4,641,084
|
| Distribution
and/or service fees |
328,609
|
| Shareholder
servicing costs |
20,448
|
| Administrative
services fee |
77,892
|
| Independent
Trustees' compensation |
9,292
|
| Custodian
fee |
111,084
|
| Shareholder
communications |
20,476
|
| Audit
and tax fees |
61,961
|
| Legal
fees |
2,649
|
| Miscellaneous
|
26,656
|
| Total
expenses |
$5,300,151
|
| Reduction
of expenses by investment adviser |
(65,497)
|
| Net
expenses |
$5,234,654
|
| Net
investment income (loss) |
$4,590,838
|
| Realized
and unrealized gain (loss) |
|
| Realized
gain (loss) (identified cost basis) |
|
| Unaffiliated
issuers (net of $15,334 country tax) |
$6,949,114
|
| Foreign
currency |
(8,186)
|
| Net
realized gain (loss) |
$6,940,928
|
| Change
in unrealized appreciation or depreciation |
|
| Unaffiliated
issuers (net of $72,142 increase in deferred country tax) |
$44,396,489
|
| Translation
of assets and liabilities in foreign currencies |
(51,911)
|
| Net
unrealized gain (loss) |
$44,344,578
|
| Net
realized and unrealized gain (loss) |
$51,285,506
|
| Change
in net assets from operations |
$55,876,344
|
See Notes to Financial Statements
MFS Research International
Portfolio
| Financial
Statements |
Statements of Changes in
Net Assets |
These statements describe
the increases and/or decreases in net assets resulting from operations, any distributions, and any shareholder transactions.
| |
Year
ended |
| |
12/31/21
|
12/31/20
|
| Change
in net assets |
|
|
| From
operations |
|
|
| Net
investment income (loss) |
$4,590,838
|
$4,289,206
|
| Net
realized gain (loss) |
6,940,928
|
24,915,531
|
| Net
unrealized gain (loss) |
44,344,578
|
24,197,204
|
| Change
in net assets from operations |
$55,876,344
|
$53,401,941
|
| Total
distributions to shareholders |
$(28,944,311)
|
$(22,406,392)
|
| Change
in net assets from fund share transactions |
$11,923,218
|
$2,253,946
|
| Total
change in net assets |
$38,855,251
|
$33,249,495
|
| Net
assets |
|
|
| At
beginning of period |
489,985,316
|
456,735,821
|
| At
end of period |
$528,840,567
|
$489,985,316
|
See Notes to Financial Statements
MFS Research International
Portfolio
| Financial
Statements |
Financial Highlights
|
The financial highlights table is
intended to help you understand the fund's financial performance for the past 5 years. Certain information reflects financial results for a single fund share. The total returns in the table represent the rate that an investor would have earned (or
lost) on an investment in the fund share class (assuming reinvestment of all distributions) held for the entire period.
| Initial
Class |
Year
ended |
| |
12/31/21
|
12/31/20
|
12/31/19
|
12/31/18
|
12/31/17
|
| Net
asset value, beginning of period |
$18.14
|
$16.96
|
$14.07
|
$17.05
|
$13.54
|
| Income
(loss) from investment operations |
|
|
|
|
|
| Net
investment income (loss) (d) |
$0.18
|
$0.17
|
$0.31
|
$0.25
|
$0.22
|
| Net
realized and unrealized gain (loss) |
1.91
|
1.92
|
3.51
|
(2.56)
|
3.59
|
| Total
from investment operations |
$2.09
|
$2.09
|
$3.82
|
$(2.31)
|
$3.81
|
| Less
distributions declared to shareholders |
|
|
|
|
|
| From
net investment income |
$(0.16)
|
$(0.34)
|
$(0.24)
|
$(0.25)
|
$(0.30)
|
| From
net realized gain |
(0.94)
|
(0.57)
|
(0.69)
|
(0.42)
|
—
|
| Total
distributions declared to shareholders |
$(1.10)
|
$(0.91)
|
$(0.93)
|
$(0.67)
|
$(0.30)
|
| Net
asset value, end of period (x) |
$19.13
|
$18.14
|
$16.96
|
$14.07
|
$17.05
|
| Total
return (%) (k)(r)(s)(x) |
11.57
|
12.95
|
28.04
|
(14.12)
|
28.29
|
Ratios
(%) (to average net assets)
and Supplemental data: |
|
|
|
|
|
| Expenses
before expense reductions |
0.96
|
0.98
|
0.99
|
0.98
|
1.00
|
| Expenses
after expense reductions |
0.95
|
0.96
|
0.96
|
0.97
|
0.99
|
| Net
investment income (loss) |
0.96
|
1.06
|
1.99
|
1.51
|
1.44
|
| Portfolio
turnover |
23
|
28
|
24
|
25
|
27
|
| Net
assets at end of period (000 omitted) |
$387,370
|
$369,243
|
$356,291
|
$302,386
|
$341,613
|
| Service
Class |
Year
ended |
| |
12/31/21
|
12/31/20
|
12/31/19
|
12/31/18
|
12/31/17
|
| Net
asset value, beginning of period |
$17.90
|
$16.74
|
$13.90
|
$16.84
|
$13.38
|
| Income
(loss) from investment operations |
|
|
|
|
|
| Net
investment income (loss) (d) |
$0.13
|
$0.14
|
$0.26
|
$0.21
|
$0.19
|
| Net
realized and unrealized gain (loss) |
1.88
|
1.89
|
3.47
|
(2.53)
|
3.52
|
| Total
from investment operations |
$2.01
|
$2.03
|
$3.73
|
$(2.32)
|
$3.71
|
| Less
distributions declared to shareholders |
|
|
|
|
|
| From
net investment income |
$(0.13)
|
$(0.30)
|
$(0.20)
|
$(0.20)
|
$(0.25)
|
| From
net realized gain |
(0.94)
|
(0.57)
|
(0.69)
|
(0.42)
|
—
|
| Total
distributions declared to shareholders |
$(1.07)
|
$(0.87)
|
$(0.89)
|
$(0.62)
|
$(0.25)
|
| Net
asset value, end of period (x) |
$18.84
|
$17.90
|
$16.74
|
$13.90
|
$16.84
|
| Total
return (%) (k)(r)(s)(x) |
11.27
|
12.71
|
27.67
|
(14.32)
|
27.90
|
Ratios
(%) (to average net assets)
and Supplemental data: |
|
|
|
|
|
| Expenses
before expense reductions |
1.22
|
1.23
|
1.24
|
1.23
|
1.25
|
| Expenses
after expense reductions |
1.20
|
1.21
|
1.21
|
1.22
|
1.24
|
| Net
investment income (loss) |
0.69
|
0.87
|
1.65
|
1.27
|
1.26
|
| Portfolio
turnover |
23
|
28
|
24
|
25
|
27
|
| Net
assets at end of period (000 omitted) |
$141,471
|
$120,742
|
$100,445
|
$66,789
|
$80,634
|
See Notes to Financial Statements
MFS Research International
Portfolio
Financial Highlights - continued
| (d)
|
Per share data
is based on average shares outstanding. |
| (k)
|
The total
return does not reflect expenses that apply to separate accounts. Inclusion of these charges would reduce the total return figures for all periods shown. |
| (r)
|
Certain
expenses have been reduced without which performance would have been lower. |
| (s)
|
From time to
time the fund may receive proceeds from litigation settlements, without which performance would be lower. |
| (x)
|
The
net asset values and total returns have been calculated on net assets which include adjustments made in accordance with U.S. generally accepted accounting principles required at period end for financial reporting purposes. |
See Notes to Financial Statements
MFS Research International
Portfolio
Notes to Financial Statements
(1) Business and Organization
MFS Research International Portfolio (the fund) is a
diversified series of MFS Variable Insurance Trust II (the trust). The trust is organized as a Massachusetts business trust and is registered under the Investment Company Act of 1940, as amended, as an open-end management investment company. The
shareholders of each series of the trust are separate accounts of insurance companies, which offer variable annuity and/or life insurance products, and qualified retirement and pension plans.
The fund is an investment company and accordingly follows
the investment company accounting and reporting guidance of the Financial Accounting Standards Board (FASB) Accounting Standards Codification Topic 946 Financial Services - Investment Companies.
(2) Significant Accounting Policies
General — The
preparation of financial statements in conformity with U.S. generally accepted accounting principles requires management to make estimates and assumptions that affect the reported amounts of assets and liabilities, and disclosure of contingent
assets and liabilities at the date of the financial statements and the reported amounts of increases and decreases in net assets from operations during the reporting period. Actual results could differ from those estimates. In the preparation of
these financial statements, management has evaluated subsequent events occurring after the date of the fund’s Statement of Assets and Liabilities through the date that the financial statements were issued. The fund invests in foreign securities. Investments in foreign securities are vulnerable to the effects of changes in the relative values of the local currency and the U.S. dollar and to the effects of changes in each
country’s market, economic, industrial, political, regulatory, geopolitical, environmental, public health, and other conditions.
Balance Sheet Offsetting
— The fund's accounting policy with respect to balance sheet offsetting is that, absent an event of default by the counterparty or a termination of the agreement, the International Swaps and Derivatives Association (ISDA) Master Agreement, or
similar agreement, does not result in an offset of reported amounts of financial assets and financial liabilities in the Statement of Assets and Liabilities across transactions between the fund and the applicable counterparty. The fund's right to
setoff may be restricted or prohibited by the bankruptcy or insolvency laws of the particular jurisdiction to which a specific master netting agreement counterparty is subject. Balance sheet offsetting disclosures, to the extent applicable to the
fund, have been included in the fund’s Significant Accounting Policies note under the captions for each of the fund’s in-scope financial instruments and transactions.
Investment Valuations
— Equity securities, including restricted equity securities, are generally valued at the last sale or official closing price on their primary market or exchange as provided by a third-party pricing
service. Equity securities, for which there were no sales reported that day, are generally valued at the last quoted daily bid quotation on their primary market or exchange as provided by a third-party pricing service. Short-term instruments with a maturity at issuance of 60 days or less may be valued at amortized cost, which approximates market value. Open-end investment companies are
generally valued at net asset value per share.
Securities and
other assets generally valued on the basis of information from a third-party pricing service may also be valued at a broker/dealer bid quotation. In determining values, third-party pricing services can utilize both transaction data and market
information such as yield, quality, coupon rate, maturity, type of issue, trading characteristics, and other market data. The values of foreign securities and other assets and liabilities expressed in foreign currencies are converted to U.S. dollars
using the mean of bid and asked prices for rates provided by a third-party pricing service.
The Board of Trustees has delegated primary responsibility
for determining or causing to be determined the value of the fund’s investments (including any fair valuation) to the adviser pursuant to valuation policies and procedures approved by the Board. If the adviser determines that reliable market
quotations are not readily available, investments are valued at fair value as determined in good faith by the adviser in accordance with such procedures under the oversight of the Board of Trustees. Under the fund’s valuation policies and
procedures, market quotations are not considered to be readily available for most types of debt instruments and floating rate loans and many types of derivatives. These investments are generally valued at fair value based on information from
third-party pricing services. In addition, investments may be valued at fair value if the adviser determines that an investment’s value has been materially affected by events occurring after the close of the exchange or market on which the
investment is principally traded (such as foreign exchange or market) and prior to the determination of the fund’s net asset value, or after the halt of trading of a specific security where trading does not resume prior to the close of the
exchange or market on which the security is principally traded. Events that occur after foreign markets close (such as developments in foreign markets and significant movements in the U.S. markets) and prior to the determination of the fund’s
net asset value may be deemed to have a material effect on the value of securities traded in foreign markets. Accordingly, the fund’s foreign equity securities may often be valued at fair value. The adviser generally relies on third-party
pricing services or other information (such as the correlation with price movements of similar securities in the same or other markets; the type, cost and investment characteristics of the security; the business and financial condition of the
issuer; and trading and other market data) to assist in determining whether to fair value and at what value to fair value an
MFS Research International
Portfolio
Notes to Financial Statements - continued
investment. The
value of an investment for purposes of calculating the fund’s net asset value can differ depending on the source and method used to determine value. When fair valuation is used, the value of an investment used to determine the fund’s net
asset value may differ from quoted or published prices for the same investment. There can be no assurance that the fund could obtain the fair value assigned to an investment if it were to sell the investment at the same time at which the fund
determines its net asset value per share.
Various
inputs are used in determining the value of the fund's assets or liabilities. These inputs are categorized into three broad levels. In certain cases, the inputs used to measure fair value may fall into different levels of the fair value hierarchy.
In such cases, an investment's level within the fair value hierarchy is based on the lowest level of input that is significant to the fair value measurement. The fund's assessment of the significance of a particular input to the fair value
measurement in its entirety requires judgment, and considers factors specific to the investment. Level 1 includes unadjusted quoted prices in active markets for identical assets or liabilities. Level 2 includes other significant observable
market-based inputs (including quoted prices for similar securities, interest rates, prepayment speed, and credit risk). Level 3 includes unobservable inputs, which may include the adviser's own assumptions in determining the fair value of
investments. The following is a summary of the levels used as of December 31, 2021 in valuing the fund's assets and liabilities:
| Financial
Instruments |
Level
1 |
Level
2 |
Level
3 |
Total
|
| Equity
Securities: |
|
|
|
|
| Japan
|
$100,621,357
|
$—
|
$—
|
$100,621,357
|
| Switzerland
|
17,318,750
|
53,482,028
|
—
|
70,800,778
|
| France
|
52,498,462
|
—
|
—
|
52,498,462
|
| United
Kingdom |
49,914,989
|
—
|
—
|
49,914,989
|
| Germany
|
35,960,351
|
12,096,205
|
—
|
48,056,556
|
| United
States |
42,667,708
|
—
|
—
|
42,667,708
|
| Hong
Kong |
22,304,608
|
—
|
—
|
22,304,608
|
| Netherlands
|
21,412,369
|
—
|
—
|
21,412,369
|
| China
|
19,587,506
|
—
|
—
|
19,587,506
|
| Other
Countries |
55,426,448
|
38,401,184
|
—
|
93,827,632
|
| Mutual
Funds |
5,858,779
|
—
|
—
|
5,858,779
|
| Total
|
$423,571,327
|
$103,979,417
|
$—
|
$527,550,744
|
For further information
regarding security characteristics, see the Portfolio of Investments.
Foreign Currency
Translation — Purchases and sales of foreign investments, income, and expenses are converted into U.S. dollars based upon currency exchange rates prevailing on the respective dates of such transactions or on
the reporting date for foreign denominated receivables and payables. Gains and losses attributable to foreign currency exchange rates on sales of securities are recorded for financial statement purposes as net realized gains and losses on
investments. Gains and losses attributable to foreign exchange rate movements on receivables, payables, income and expenses are recorded for financial statement purposes as foreign currency transaction gains and losses. That portion of both realized
and unrealized gains and losses on investments that results from fluctuations in foreign currency exchange rates is not separately disclosed.
Security Loans —
Under its Securities Lending Agency Agreement with the fund, State Street Bank and Trust Company, as lending agent, loans the securities of the fund to certain qualified institutions (the “Borrowers”) approved by the fund. Security loans
can be terminated at the discretion of either the lending agent or the fund and the related securities must be returned within the earlier of the standard trade settlement period for such securities or within three business days. The loans are
collateralized by cash and/or U.S. Treasury and federal agency obligations in an amount typically at least equal to the market value of the securities loaned. On loans collateralized by cash, the cash collateral is invested in a money market fund.
The market value of the loaned securities is determined at the close of business of the fund and any additional required collateral is delivered to the fund on the next business day. The lending agent provides the fund with indemnification against
Borrower default. In the event of Borrower default, the lending agent will, for the benefit of the fund, either purchase securities identical to those loaned or, when such purchase is commercially impracticable, pay the fund the market value of the
loaned securities. In return, the lending agent assumes the fund's rights to the related collateral. If the collateral value is less than the cost to purchase identical securities, the lending agent is responsible for the shortfall, but only to the
extent that such shortfall is not due to a decline in collateral value resulting from collateral reinvestment for which the fund bears the risk of loss. A portion of the income generated upon investment of the collateral is remitted to the
Borrowers, and the remainder is allocated between the fund and the lending agent. On loans collateralized by U.S. Treasury and/or federal agency obligations, a fee is received from the Borrower, and is allocated between the fund and the lending
agent. Income from securities lending is separately reported in the Statement of Operations. The dividend and interest income earned on the securities loaned is accounted for in the same manner as other dividend and interest income. At December 31,
2021, there were no securities on loan or collateral outstanding.
MFS Research International
Portfolio
Notes to Financial Statements - continued
Indemnifications —
Under the fund's organizational documents, its officers and Trustees may be indemnified against certain liabilities and expenses arising out of the performance of their duties to the fund. Additionally, in the normal course of business, the fund
enters into agreements with service providers that may contain indemnification clauses. The fund's maximum exposure under these agreements is unknown as this would involve future claims that may be made against the fund that have not yet
occurred.
Investment Transactions and Income — Investment transactions are recorded on the trade date. Dividends received in cash are recorded on the ex-dividend date. Certain dividends from foreign securities will be
recorded when the fund is informed of the dividend if such information is obtained subsequent to the ex-dividend date. Dividend payments received in additional securities are recorded on the ex-dividend date in an amount equal to the value of the
security on such date.
The fund may receive
proceeds from litigation settlements. Any proceeds received from litigation involving portfolio holdings are reflected in the Statement of Operations in realized gain/loss if the security has been disposed of by the fund or in unrealized gain/loss
if the security is still held by the fund. Any other proceeds from litigation not related to portfolio holdings are reflected as other income in the Statement of Operations.
Tax Matters and Distributions — The fund intends to qualify as a regulated investment company, as defined under Subchapter M of the Internal Revenue Code, and to distribute all of its taxable income, including realized capital gains. As a
result, no provision for federal income tax is required. The fund’s federal tax returns, when filed, will remain subject to examination by the Internal Revenue Service for a three year period. Management has analyzed the fund’s tax
positions taken on federal and state tax returns for all open tax years and does not believe that there are any uncertain tax positions that require recognition of a tax liability. Foreign taxes, if any, have been accrued by the fund in the
accompanying financial statements in accordance with the applicable foreign tax law. Foreign income taxes may be withheld by certain countries in which the fund invests. Additionally, capital gains realized by the fund on securities issued in or by
certain foreign countries may be subject to capital gains tax imposed by those countries.
Distributions to shareholders are recorded on the
ex-dividend date. Income and capital gain distributions are determined in accordance with income tax regulations, which may differ from U.S. generally accepted accounting principles. Certain capital accounts in the financial statements are
periodically adjusted for permanent differences in order to reflect their tax character. These adjustments have no impact on net assets or net asset value per share. Temporary differences which arise from recognizing certain items of income,
expense, gain or loss in different periods for financial statement and tax purposes will reverse at some time in the future.
Book/tax differences primarily relate to passive foreign
investment companies and wash sale loss deferrals.
The tax character of distributions declared to shareholders
for the last two fiscal years is as follows:
| |
Year
ended
12/31/21 |
Year
ended
12/31/20 |
| Ordinary
income (including any short-term capital gains) |
$6,016,271
|
$8,553,340
|
| Long-term
capital gains |
22,928,040
|
13,853,052
|
| Total
distributions |
$28,944,311
|
$22,406,392
|
The federal tax cost and the tax
basis components of distributable earnings were as follows:
| As
of 12/31/21 |
|
| Cost
of investments |
$392,343,732
|
| Gross
appreciation |
153,414,500
|
| Gross
depreciation |
(18,207,488)
|
| Net
unrealized appreciation (depreciation) |
$135,207,012
|
| Undistributed
ordinary income |
10,499,955
|
| Undistributed
long-term capital gain |
3,270,374
|
| Other
temporary differences |
(14,238)
|
| Total
distributable earnings (loss) |
$148,963,103
|
Multiple Classes of Shares of
Beneficial Interest — The fund offers multiple classes of shares, which differ in their respective distribution and/or service fees. The fund's income, realized and unrealized gain (loss), and common expenses
are allocated to shareholders based on the daily net assets of each class. Dividends are declared separately for each class. Differences in per share dividend rates are generally due to differences in separate class expenses. The fund’s
distributions declared to shareholders as reported in the Statements of Changes in Net Assets are presented by class as follows:
MFS Research International
Portfolio
Notes to Financial Statements - continued
| |
Year
ended
12/31/21 |
|
Year
ended
12/31/20 |
| Initial
Class |
$21,510,111
|
|
$18,500,918
|
| Service
Class |
7,434,200
|
|
3,905,474
|
| Total
|
$28,944,311
|
|
$22,406,392
|
(3) Transactions with
Affiliates
Investment Adviser — The fund has an investment advisory agreement with MFS to provide overall investment management and related administrative services and facilities to the fund. The
management fee is computed daily and paid monthly at the following annual rates based on the fund's average daily net assets:
| Up
to $1 billion |
0.90%
|
| In
excess of $1 billion and up to $2 billion |
0.80%
|
| In
excess of $2 billion |
0.70%
|
MFS has agreed in writing to
reduce its management fee by a specified amount if certain MFS mutual fund assets exceed thresholds agreed to by MFS and the fund's Board of Trustees. For the year ended December 31, 2021, this management fee reduction amounted to $65,497, which is
included in the reduction of total expenses in the Statement of Operations. The management fee incurred for the year ended December 31, 2021 was equivalent to an annual effective rate of 0.89% of the fund's average daily net assets.
The investment adviser has agreed in writing to pay a
portion of the fund’s total annual operating expenses, excluding interest, taxes, extraordinary expenses, brokerage and transaction costs, and investment-related expenses, such that total annual operating expenses do not exceed 0.96% of
average daily net assets for the Initial Class shares and 1.21% of average daily net assets for the Service Class shares. This written agreement will continue until modified by the fund’s Board of Trustees, but such agreement will continue at
least until April 30, 2023. For the year ended December 31, 2021, the fund’s actual operating expenses did not exceed the limit and therefore, the investment adviser did not pay any portion of the fund’s expenses related to this
agreement.
Distributor — MFS
Fund Distributors, Inc. (MFD), a wholly-owned subsidiary of MFS, is the distributor of shares of the fund. The Trustees have adopted a distribution plan for the Service Class shares pursuant to Rule 12b-1 under the Investment Company Act of
1940.
The fund's distribution plan provides
that the fund will pay MFD distribution and/or service fees equal to 0.25% per annum of its average daily net assets attributable to Service Class shares as partial consideration for services performed and expenses incurred by MFD and financial
intermediaries (including participating insurance companies that invest in the fund to fund variable annuity and variable life insurance contracts, sponsors of qualified retirement and pension plans that invest in the fund, and affiliates of these
participating insurance companies and plan sponsors) in connection with the sale and distribution of the Service Class shares. MFD may subsequently pay all, or a portion, of the distribution and/or service fees to financial intermediaries.
Shareholder Servicing Agent
— MFS Service Center, Inc. (MFSC), a wholly-owned subsidiary of MFS, receives a fee from the fund for its services as shareholder servicing agent. For the year ended December 31, 2021, the fee was $19,286, which equated to 0.0037% annually of
the fund's average daily net assets. MFSC also receives reimbursement from the fund for out-of-pocket expenses paid by MFSC on behalf of the fund. For the year ended December 31, 2021, these costs amounted to $1,162.
Administrator — MFS
provides certain financial, legal, shareholder communications, compliance, and other administrative services to the fund. Under an administrative services agreement, the fund reimburses MFS the costs incurred to provide these services. The fund is
charged an annual fixed amount of $17,500 plus a fee based on average daily net assets. The administrative services fee incurred for the year ended December 31, 2021 was equivalent to an annual effective rate of 0.0151% of the fund's average daily
net assets.
Trustees’ and Officers’
Compensation — The fund pays compensation to independent Trustees in the form of a retainer, attendance fees, and additional compensation to Board and Committee chairpersons. The fund does not pay compensation
directly to Trustees or officers of the fund who are also officers of the investment adviser, all of whom receive remuneration from MFS for their services to the fund. Certain officers and Trustees of the fund are officers or directors of MFS, MFD,
and MFSC.
Other — The fund invests in the MFS Institutional Money Market Portfolio which is managed by MFS and seeks current income consistent with preservation of capital and liquidity. This money market fund does not pay a
management fee to MFS but does incur investment and operating costs.
MFS Research International
Portfolio
Notes to Financial Statements - continued
The
fund is permitted to engage in purchase and sale transactions with funds and accounts for which MFS serves as investment adviser or sub-adviser (“cross-trades”) pursuant to a policy adopted by the Board of Trustees. This policy has been
designed to ensure that cross-trades conducted by the fund comply with Rule 17a-7 under the Investment Company Act of 1940. During the year ended December 31, 2021, the fund engaged in purchase and sale transactions pursuant to this policy, which
amounted to $1,143,393 and $6,243, respectively. The sales transactions resulted in net realized gains (losses) of $(1,699).
(4) Portfolio Securities
For the year ended December 31, 2021, purchases and sales
of investments, other than short-term obligations, aggregated $133,560,953 and $115,015,519, respectively.
(5) Shares of Beneficial Interest
The fund's Declaration of Trust permits the Trustees to
issue an unlimited number of full and fractional shares of beneficial interest. Transactions in fund shares were as follows:
| |
Year
ended
12/31/21 |
|
Year
ended
12/31/20 |
| |
Shares
|
Amount
|
|
Shares
|
Amount
|
| Shares
sold |
|
|
|
|
|
| Initial
Class |
1,505,288
|
$28,286,847
|
|
1,877,609
|
$27,251,600
|
| Service
Class |
1,163,923
|
21,941,026
|
|
3,047,104
|
51,507,599
|
| |
2,669,211
|
$50,227,873
|
|
4,924,713
|
$78,759,199
|
Shares
issued to shareholders
in reinvestment of distributions |
|
|
|
|
|
| Initial
Class |
1,130,326
|
$21,510,111
|
|
1,129,482
|
$18,500,918
|
| Service
Class |
396,279
|
7,434,200
|
|
241,377
|
3,905,474
|
| |
1,526,605
|
$28,944,311
|
|
1,370,859
|
$22,406,392
|
| Shares
reacquired |
|
|
|
|
|
| Initial
Class |
(2,738,021)
|
$(52,292,691)
|
|
(3,661,504)
|
$(57,937,592)
|
| Service
Class |
(796,926)
|
(14,956,275)
|
|
(2,541,987)
|
(40,974,053)
|
| |
(3,534,947)
|
$(67,248,966)
|
|
(6,203,491)
|
$(98,911,645)
|
| Net
change |
|
|
|
|
|
| Initial
Class |
(102,407)
|
$(2,495,733)
|
|
(654,413)
|
$(12,185,074)
|
| Service
Class |
763,276
|
14,418,951
|
|
746,494
|
14,439,020
|
| |
660,869
|
$11,923,218
|
|
92,081
|
$2,253,946
|
The fund is one of several
mutual funds in which certain MFS funds may invest. The MFS funds do not invest in the underlying funds for the purpose of exercising management or control. At the end of the period, the MFS Moderate Allocation Portfolio, the MFS Growth Allocation
Portfolio, and the MFS Conservative Allocation Portfolio were the owners of record of approximately 18%, 6%, and 3%, respectively, of the value of outstanding voting shares of the fund.
(6) Line of Credit
The fund and certain other funds managed by MFS participate
in a $1.25 billion unsecured committed line of credit of which $1 billion is reserved for use by the fund and certain other MFS U.S. funds. The line of credit is provided by a syndicate of banks under a credit agreement. Borrowings may be made for
temporary financing needs. Interest is charged to each fund, based on its borrowings, generally at a rate equal to the highest of one month LIBOR, the Federal Funds Effective Rate and the Overnight Bank Funding Rate, plus an agreed upon spread. A
commitment fee, based on the average daily, unused portion of the committed line of credit, is allocated among the participating funds. In addition, the fund and other funds managed by MFS have established unsecured uncommitted borrowing
arrangements with certain banks for temporary financing needs. Interest is charged to each fund, based on its borrowings, at rates equal to customary reference rates plus an agreed upon spread. For the year ended December 31, 2021, the fund’s
commitment fee and interest expense were $1,669 and $0, respectively, and are included in “Miscellaneous” expense in the Statement of Operations.
MFS Research International
Portfolio
Notes to Financial Statements - continued
(7) Investments in Affiliated Issuers
An affiliated issuer may be considered one in which the
fund owns 5% or more of the outstanding voting securities, or a company which is under common control. For the purposes of this report, the following were affiliated issuers:
| Affiliated
Issuers |
Beginning
Value |
Purchases
|
Sales
Proceeds |
Realized
Gain
(Loss) |
Change
in
Unrealized
Appreciation or
Depreciation |
Ending
Value |
| MFS
Institutional Money Market Portfolio |
$3,433,184
|
$110,325,649
|
$107,900,054
|
$—
|
$—
|
$5,858,779
|
| Affiliated
Issuers |
Dividend
Income |
Capital
Gain
Distributions |
| MFS
Institutional Money Market Portfolio |
$1,918
|
$—
|
(8) Impacts of
COVID-19
The pandemic related to the global spread of
novel coronavirus disease (COVID-19), which was first detected in December 2019, has resulted in significant disruptions to global business activity and the global economy, as well as the economies of individual countries, the financial performance
of individual companies and sectors, and the securities and commodities markets in general. Multiple surges in cases globally, the availability and widespread adoption of vaccines, and the emergence of variant strains of the virus continue to create
uncertainty as to the future and long-term impacts resulting from the pandemic including impacts to the prices and liquidity of the fund's investments and the fund's performance.
(9) LIBOR Transition
Certain of the fund's investments, including its
investments in derivatives, as well as any debt issued by the fund and other contractual arrangements of the fund may be based on reference interest rates such as the London Interbank Offered Rate (“LIBOR”). In 2017, the regulatory
authority that oversees financial services firms in the United Kingdom announced plans to transition away from LIBOR by the end of 2021. In March 2021, the administrator of LIBOR announced the extension of the publication of the more commonly used
U.S. dollar LIBOR settings to the end of June 2023. Although the full impacts of the transition away from LIBOR are not fully known, the transition may result in, among other things, an increase in volatility or illiquidity of the markets for
instruments that currently rely on LIBOR to determine interest rates and this could have an adverse impact on the fund's performance. With respect to the fund's accounting for investments, including its investments in derivatives, as well as any
debt issued by the fund and other contractual arrangements of the fund that undergo reference rate-related modifications as a result of the transition, management will rely upon the relief provided by FASB Codification Topic 848 – Reference
Rate Reform (Topic 848). The guidance in Topic 848 permits the fund to disregard the GAAP accounting requirements around certain contract modifications resulting from the LIBOR transition such that for contracts considered in scope, the fund can
account for those modified contracts as a continuation of the existing contracts. While the cessation of the one-week and two-month U.S. dollar LIBOR tenors along with certain other non-U.S. dollar denominated LIBOR settings at December 31, 2021 did
not have a material impact on the fund, management is still evaluating the impact to the fund of the June 30, 2023 planned discontinuation of the more commonly used U.S. dollar LIBOR settings.
(10) Subsequent Event
On January 10, 2022, the fund recorded redemption proceeds
for a distribution in-kind of portfolio securities and cash that were valued at $130,118,114. The redeeming shareholder generally receives a pro rata share of the securities held by the fund. The distribution of such securities generated a realized
gain (loss) of $42,503,070 for the fund.
MFS Research International
Portfolio
Report of Independent Registered Public Accounting
Firm
To the Board of Trustees of MFS Variable
Insurance Trust II and the Shareholders of MFS Research International Portfolio:
Opinion on the Financial Statements and Financial
Highlights
We have audited the accompanying statement
of assets and liabilities of MFS Research International Portfolio (the “Fund”), including the portfolio of investments, as of December 31, 2021, the related statement of operations for the year then ended, the statements of changes in
net assets for each of the two years in the period then ended, the financial highlights for each of the five years in the period then ended, and the related notes. In our opinion, the financial statements and financial highlights present fairly, in
all material respects, the financial position of the Fund as of December 31, 2021, and the results of its operations for the year then ended, the changes in its net assets for each of the two years in the period then ended, and the financial
highlights for each of the five years in the period then ended, in conformity with accounting principles generally accepted in the United States of America.
Basis for Opinion
These financial statements and financial highlights are the
responsibility of the Fund's management. Our responsibility is to express an opinion on the Fund's financial statements and financial highlights based on our audits. We are a public accounting firm registered with the Public Company Accounting
Oversight Board (United States) (PCAOB) and are required to be independent with respect to the Fund in accordance with the U.S. federal securities laws and the applicable rules and regulations of the Securities and Exchange Commission and the
PCAOB.
We conducted our audits in accordance with the
standards of the PCAOB. Those standards require that we plan and perform the audit to obtain reasonable assurance about whether the financial statements and financial highlights are free of material misstatement, whether due to error or fraud. The
Fund is not required to have, nor were we engaged to perform, an audit of its internal control over financial reporting. As part of our audits, we are required to obtain an understanding of internal control over financial reporting but not for the
purpose of expressing an opinion on the effectiveness of the Fund's internal control over financial reporting. Accordingly, we express no such opinion.
Our audits included performing procedures to assess the
risks of material misstatement of the financial statements and financial highlights, whether due to error or fraud, and performing procedures that respond to those risks. Such procedures included examining, on a test basis, evidence regarding the
amounts and disclosures in the financial statements and financial highlights. Our audits also included evaluating the accounting principles used and significant estimates made by management, as well as evaluating the overall presentation of the
financial statements and financial highlights. Our procedures included confirmation of securities owned as of December 31, 2021, by correspondence with the custodian and brokers; when replies were not received from brokers, we performed other
auditing procedures. We believe that our audits provide a reasonable basis for our opinion.
DELOITTE & TOUCHE LLP
Boston, Massachusetts
February 15, 2022
We have served as the auditor of one or more of the MFS
investment companies since 1924.
MFS Research International
Portfolio
Trustees and Officers — Identification and
Background
The Trustees and Officers of the Trust, as
of February 1, 2022, are listed below, together with their principal occupations during the past five years. (Their titles may have varied during that period.) The address of each Trustee and Officer is 111 Huntington Avenue, Boston, Massachusetts
02199-7618.
| Name,
Age |
|
Position(s)
Held with Fund |
|
Trustee/Officer
Since(h) |
|
Number
of MFS Funds overseen by the Trustee |
|
Principal
Occupations During
the Past Five Years |
|
Other
Directorships During
the Past Five Years (j) |
| INTERESTED
TRUSTEES |
|
|
|
|
|
|
|
|
|
|
Michael
W. Roberge (k)
(age 55) |
|
Trustee
|
|
January
2021 |
|
135
|
|
Massachusetts
Financial Services Company, Chairman (since January 2021); Chief Executive Officer (since January 2017); Director; Chairman of the Board (since January 2022); President (until December 2018); Chief Investment Officer (until December 2018) |
|
N/A
|
| INDEPENDENT
TRUSTEES |
|
|
|
|
|
|
|
|
|
|
John
P. Kavanaugh
(age 67) |
|
Trustee
and Chair of Trustees |
|
January
2009 |
|
135
|
|
Private
investor |
|
N/A
|
Steven
E. Buller
(age 70) |
|
Trustee
|
|
February
2014 |
|
135
|
|
Private
investor |
|
N/A
|
John
A. Caroselli
(age 67) |
|
Trustee
|
|
March
2017 |
|
135
|
|
Private
investor; JC Global Advisors, LLC (management consulting), President (since 2015) |
|
N/A
|
Maureen
R. Goldfarb
(age 66) |
|
Trustee
|
|
January
2009 |
|
135
|
|
Private
investor |
|
N/A
|
Peter
D. Jones
(age 66) |
|
Trustee
|
|
January
2019 |
|
135
|
|
Private
investor |
|
N/A
|
James
W. Kilman, Jr.
(age 60) |
|
Trustee
|
|
January
2019 |
|
135
|
|
Burford
Capital Limited (finance and investment management), Senior Advisor (since May 3, 2021), Chief Financial Officer (2019 - May 2, 2021); KielStrand Capital LLC (family office), Chief Executive Officer (since 2016) |
|
Alpha-En
Corporation, Director (2016-2019) |
Clarence
Otis, Jr.
(age 65) |
|
Trustee
|
|
March
2017 |
|
135
|
|
Private
investor |
|
VF
Corporation, Director; Verizon Communications, Inc., Director; The Travelers Companies, Director |
Maryanne
L. Roepke
(age 65) |
|
Trustee
|
|
May
2014 |
|
135
|
|
Private
investor |
|
N/A
|
Laurie
J. Thomsen
(age 64) |
|
Trustee
|
|
March
2005 |
|
135
|
|
Private
investor |
|
The
Travelers Companies, Director; Dycom Industries, Inc., Director |
MFS Research International
Portfolio
Trustees and Officers - continued
| Name,
Age |
|
Position(s)
Held with
Fund |
|
Trustee/Officer
Since(h) |
|
Number
of MFS Funds for which the Person is an Officer |
|
Principal
Occupations During
the Past Five Years |
| OFFICERS
|
|
|
|
|
|
|
|
|
Christopher
R. Bohane (k)
(age 48) |
|
Assistant
Secretary and Assistant Clerk |
|
July
2005 |
|
135
|
|
Massachusetts
Financial Services Company, Senior Vice President and Associate General Counsel |
Kino
Clark (k)
(age 53) |
|
Assistant
Treasurer |
|
January
2012 |
|
135
|
|
Massachusetts
Financial Services Company, Vice President |
John
W. Clark, Jr. (k)
(age 54) |
|
Assistant
Treasurer |
|
April
2017 |
|
135
|
|
Massachusetts
Financial Services Company, Vice President (since March 2017); Deutsche Bank (financial services), Department Head - Treasurer's Office (until February 2017) |
Thomas
H. Connors (k)
(age 62) |
|
Assistant
Secretary and Assistant Clerk |
|
September
2012 |
|
135
|
|
Massachusetts
Financial Services Company, Vice President and Senior Counsel |
David
L. DiLorenzo (k)
(age 53) |
|
President
|
|
July
2005 |
|
135
|
|
Massachusetts
Financial Services Company, Senior Vice President |
Heidi
W. Hardin (k)
(age 54) |
|
Secretary
and Clerk |
|
April
2017 |
|
135
|
|
Massachusetts
Financial Services Company, Executive Vice President and General Counsel (since March 2017); Harris Associates (investment management), General Counsel (until January 2017) |
Brian
E. Langenfeld (k)
(age 48) |
|
Assistant
Secretary and Assistant Clerk |
|
June
2006 |
|
135
|
|
Massachusetts
Financial Services Company, Vice President and Senior Counsel |
Amanda
S. Mooradian (k)
(age 42) |
|
Assistant
Secretary and Assistant Clerk |
|
September
2018 |
|
135
|
|
Massachusetts
Financial Services Company, Assistant Vice President and Senior Counsel |
Susan
A. Pereira (k)
(age 51) |
|
Assistant
Secretary and Assistant Clerk |
|
July
2005 |
|
135
|
|
Massachusetts
Financial Services Company, Vice President and Assistant General Counsel |
Kasey
L. Phillips (k)
(age 51) |
|
Assistant
Treasurer |
|
September
2012 |
|
135
|
|
Massachusetts
Financial Services Company, Vice President |
Matthew
A. Stowe (k)
(age 47) |
|
Assistant
Secretary and Assistant Clerk |
|
October
2014 |
|
135
|
|
Massachusetts
Financial Services Company, Vice President and Assistant General Counsel |
Martin
J. Wolin (k)
(age 54) |
|
Chief
Compliance Officer |
|
July
2015 |
|
135
|
|
Massachusetts
Financial Services Company, Senior Vice President and Chief Compliance Officer |
James
O. Yost (k)
(age 61) |
|
Treasurer
|
|
September
1990 |
|
135
|
|
Massachusetts
Financial Services Company, Senior Vice President |
| (h)
|
Date
first appointed to serve as Trustee/Officer of an MFS Fund. Each Trustee has served continuously since appointment unless indicated otherwise. From January 2012 through December 2016, Messrs. DiLorenzo and Yost served as Treasurer and Deputy
Treasurer of the Funds, respectively. |
| (j)
|
Directorships or
trusteeships of companies required to report to the Securities and Exchange Commission (i.e., “public companies”). |
| (k)
|
“Interested
person” of the Trust within the meaning of the Investment Company Act of 1940 (referred to as the 1940 Act), which is the principal federal law governing investment companies like the fund, as a result of a position with MFS. The address of
MFS is 111 Huntington Avenue, Boston, Massachusetts 02199-7618. |
Each Trustee (other than Messrs. Jones, Kilman and Roberge)
has been elected by shareholders and each Trustee and Officer holds office until his or her successor is chosen and qualified or until his or her earlier death, resignation, retirement or removal. Mr. Roberge became a Trustee of the Funds on January
1, 2021 and Messrs. Jones and Kilman became Trustees of the Funds on January 1, 2019. The Trust does not hold annual meetings for the purpose of electing Trustees, and Trustees are not elected for fixed terms. Under the terms of the Board's
retirement policy, an Independent Trustee shall retire at the end of the calendar year in which he or she reaches the earlier of 75 years of age or 15 years of service on the Board (or, in the case of any Independent Trustee who joined the Board
prior to 2015, 20 years of service on the Board).
Messrs. Buller, Kilman and Otis and Ms. Roepke are members
of the Trust’s Audit Committee.
MFS Research International
Portfolio
Trustees and Officers - continued
Each
of the Interested Trustees and certain Officers hold comparable officer positions with certain affiliates of MFS.
The Statement of Additional Information for a Fund includes
further information about the Trustees and is available without charge upon request by calling 1-800-225-2606.
| Investment
Adviser |
Custodian
|
Massachusetts Financial
Services Company
111 Huntington Avenue
Boston, MA 02199-7618 |
State Street
Bank and Trust Company
1 Lincoln Street
Boston, MA 02111-2900 |
| Distributor
|
Independent
Registered Public Accounting Firm |
MFS Fund
Distributors, Inc.
111 Huntington Avenue
Boston, MA 02199-7618 |
Deloitte
& Touche LLP
200 Berkeley Street
Boston, MA 02116 |
| Portfolio
Manager(s) |
|
Victoria
Higley
Camille Humphries-Lee |
|
MFS Research International
Portfolio
Board Review of Investment Advisory Agreement
MFS Research International Portfolio
The Investment Company Act of 1940 requires that both the
full Board of Trustees and a majority of the non-interested (“independent”) Trustees, voting separately, annually approve the continuation of the Fund’s investment advisory agreement with MFS. The Trustees consider matters bearing
on the Fund and its advisory arrangements at their meetings throughout the year, including a review of performance data at each regular meeting. In addition, the independent Trustees met several times by videoconference (in accordance with
Securities and Exchange Commission relief) over the course of three months beginning in May and ending in July, 2021 (“contract review meetings”) for the specific purpose of considering whether to approve the continuation of the
investment advisory agreement for the Fund and the other investment companies that the Board oversees (the “MFS Funds”). The independent Trustees were assisted in their evaluation of the Fund’s investment advisory agreement by
independent legal counsel, from whom they received separate legal advice and with whom they met separately from MFS during various contract review meetings. The independent Trustees were also assisted in this process by an independent consultant who
was retained by and reported to the independent Trustees.
In connection with their deliberations regarding the
continuation of the investment advisory agreement, the Trustees, including the independent Trustees, considered such information and factors as they believed, in light of the legal advice furnished to them and their own business judgment, to be
relevant. The investment advisory agreement for the Fund was considered separately, although the Trustees also took into account the common interests of all MFS Funds in their review. As described below, the Trustees considered the nature, quality,
and extent of the various investment advisory, administrative, and shareholder services performed by MFS under the existing investment advisory agreement and other arrangements with the Fund.
In connection with their contract review meetings, the
Trustees received and relied upon materials that included, among other items: (i) information provided by Broadridge Financial Solutions, Inc. (“Broadridge”), an independent third party, on the investment performance of the Fund for
various time periods ended December 31, 2020 and the investment performance of a group of funds with substantially similar investment classifications/objectives (the “Broadridge performance universe”), (ii) information provided by
Broadridge on the Fund’s advisory fees and other expenses and the advisory fees and other expenses of comparable funds identified by Broadridge as well as all other funds in the same investment classification/category (the “Broadridge
expense group and universe”), (iii) information provided by MFS on the advisory fees of portfolios of other clients of MFS, including institutional separate accounts and other clients, (iv) information as to whether and to what extent
applicable expense waivers, reimbursements or fee “breakpoints” are observed for the Fund, (v) information regarding MFS’ financial results and financial condition, including MFS’ and certain of its affiliates’
estimated profitability from services performed for the Fund and the MFS Funds as a whole, and compared to MFS’ institutional business, (vi) MFS’ views regarding the outlook for the mutual fund industry and the strategic business plans
of MFS, (vii) descriptions of various functions performed by MFS for the Funds, such as compliance monitoring and portfolio trading practices, and (viii) information regarding the overall organization of MFS, including information about MFS’
senior management and other personnel providing investment advisory, administrative and other services to the Fund and the other MFS Funds. The comparative performance, fee and expense information prepared and provided by Broadridge was not
independently verified and the independent Trustees did not independently verify any information provided to them by MFS.
The Trustees’ conclusion as to the continuation of
the investment advisory agreement was based on a comprehensive consideration of all information provided to the Trustees and not the result of any single factor. Some of the factors that figured particularly in the Trustees’ deliberations are
described below, although individual Trustees may have evaluated the information presented differently from one another, giving different weights to various factors. It is also important to recognize that the fee arrangements for the Fund and other
MFS Funds are the result of years of review and discussion between the independent Trustees and MFS, that certain aspects of such arrangements may receive greater scrutiny in some years than in others, and that the Trustees’ conclusions may be
based, in part, on their consideration of these same arrangements during the course of the year and in prior years.
Based on information provided by Broadridge and MFS, the
Trustees reviewed the Fund’s total return investment performance as well as the Broadridge performance universe over various time periods. The Trustees placed particular emphasis on the total return performance of the Fund’s Initial
Class shares in comparison to the performance of funds in its Broadridge performance universe over the five-year period ended December 31, 2020, which the Trustees believed was a long enough period to reflect differing market conditions. The total
return performance of the Fund’s Initial Class shares was in the 1st quintile relative to the other funds in the universe for this five-year period (the 1st quintile being the best performers and the 5th quintile being the worst performers).
The total return performance of the Fund’s Initial Class shares was in the 1st quintile for each of the one- and three-year periods ended December 31, 2020 relative to the Broadridge performance universe. Because of the passage of time, these
performance results may differ from the performance results for more recent periods, including those shown elsewhere in this report.
MFS Research International
Portfolio
Board Review of Investment Advisory Agreement - continued
In
the course of their deliberations, the Trustees took into account information provided by MFS in connection with the contract review meetings, as well as during investment review meetings conducted with portfolio management personnel during the
course of the year regarding the Fund’s performance. After reviewing these and related factors, the Trustees concluded, within the context of their overall conclusions regarding the investment advisory agreement, that they were satisfied with
MFS’ responses and efforts relating to investment performance.
In assessing the reasonableness of the Fund’s
advisory fee, the Trustees considered, among other information, the Fund’s advisory fee and the total expense ratio of the Fund’s Initial Class shares as a percentage of average daily net assets and the advisory fee and total expense
ratios of the Broadridge expense group based on information provided by Broadridge. The Trustees considered that MFS currently observes an expense limitation for the Fund, which may not be changed without the Trustees’ approval. The Trustees
also considered that, according to the data provided by Broadridge (which takes into account any fee reductions or expense limitations that were in effect during the Fund’s last fiscal year), the Fund’s effective advisory fee rate and
total expense ratio were each higher than the Broadridge expense group median.
The Trustees also considered the advisory fees charged by
MFS to any institutional separate accounts advised by MFS (“separate accounts”) and unaffiliated investment companies for which MFS serves as subadviser (“subadvised funds”) that have comparable investment strategies to the
Fund, if any. In comparing these fees, the Trustees considered information provided by MFS as to the generally broader scope of services provided by MFS to the Fund, as well as the more extensive regulatory burdens imposed on MFS in managing the
Fund, in comparison to separate accounts and subadvised funds. The Trustees also considered the higher demands placed on MFS’ investment personnel and trading infrastructure as a result of the daily cash in-flows and out-flows of the Fund in
comparison to separate accounts.
The Trustees also
considered whether the Fund may benefit from any economies of scale in the management of the Fund in the event of growth in assets of the Fund and/or growth in assets of the MFS Funds as a whole. They noted that the Fund’s advisory fee rate
schedule is subject to contractual breakpoints that reduce the Fund’s advisory fee rate on average daily net assets over $1 billion and $2 billion. The Trustees also noted that MFS has agreed in writing to waive a portion of the management
fees of certain MFS Funds, including the Fund, if the total combined assets of certain funds within the MFS Funds’ complex increase above agreed upon thresholds (the “group fee waiver”), enabling the Fund’s shareholders to
share in the benefits from any economies of scale at the complex level. The group fee waiver is reviewed and renewed annually between the Board and MFS. The Trustees concluded that the breakpoints and the group fee waiver were sufficient to allow
the Fund to benefit from economies of scale as its assets and overall complex assets grow.
The Trustees also considered information prepared by MFS
relating to MFS’ costs and profits with respect to the Fund, the MFS Funds considered as a group, and other investment companies and accounts advised by MFS, as well as MFS’ methodologies used to determine and allocate its costs to the
MFS Funds, the Fund and other accounts and products for purposes of estimating profitability.
After reviewing these and other factors described herein,
the Trustees concluded, within the context of their overall conclusions regarding the investment advisory agreement, that the advisory fees charged to the Fund represent reasonable compensation in light of the services being provided by MFS to the
Fund.
In addition, the Trustees considered MFS’
resources and related efforts to continue to retain, attract and motivate capable personnel to serve the Fund. The Trustees also considered current and developing conditions in the financial services industry, including the presence of large and
well-capitalized companies which are spending, and appear to be prepared to continue to spend, substantial sums to engage personnel and to provide services to competing investment companies. In this regard, the Trustees also considered the financial
resources of MFS and its ultimate parent, Sun Life Financial Inc. The Trustees also considered the advantages and possible disadvantages to the Fund of having an adviser that also serves other investment companies as well as other accounts.
The Trustees also considered the nature, quality, cost, and
extent of administrative, transfer agency, and distribution services provided to the Fund by MFS and its affiliates under agreements and plans other than the investment advisory agreement, including any 12b-1 fees the Fund pays to MFS Fund
Distributors, Inc., an affiliate of MFS. The Trustees also considered the nature, extent and quality of certain other services MFS performs or arranges for on the Fund’s behalf, which may include securities lending programs, directed expense
payment programs, class action recovery programs, and MFS’ interaction with third-party service providers, principally custodians and sub-custodians. The Trustees concluded that the various non-advisory services provided by MFS and its
affiliates on behalf of the Fund were satisfactory.
The Trustees considered so-called “fall-out
benefits” to MFS such as reputational value derived from serving as investment manager to the MFS Funds. The Trustees also considered that MFS discontinued its historic practice of obtaining investment research from portfolio brokerage
commissions paid by certain MFS Funds effective January 2018, and directly pays or voluntarily reimburses a Fund, if applicable, for the costs of external research acquired through the use of the Fund’s portfolio brokerage commissions.
MFS Research International
Portfolio
Board Review of Investment Advisory Agreement - continued
Based on their evaluation of factors that they deemed to be
material, including those factors described above, the Board of Trustees, including the independent Trustees, concluded that the Fund’s investment advisory agreement with MFS should be continued for an additional one-year period, commencing
August 1, 2021.
MFS Research International
Portfolio
Proxy Voting Policies and Information
MFS votes proxies on behalf of the fund pursuant to proxy
voting policies and procedures that are available without charge, upon request, by calling 1-800-225-2606, by visiting mfs.com/proxyvoting, or by visiting the SEC’s Web site at http://www.sec.gov.
Information regarding how the fund voted proxies relating
to portfolio securities during the most recent twelve-month period ended June 30 is available by August 31 of each year without charge by visiting mfs.com/proxyvoting, or by visiting the SEC’s Web site
at http://www.sec.gov.
Quarterly Portfolio Disclosure
The fund files a complete schedule of portfolio holdings
with the SEC for the first and third quarters of each fiscal year as an exhibit to its reports on Form N-PORT. The fund’s Form N-PORT reports are available on the SEC’s Web site at
http://www.sec.gov. A shareholder can obtain the portfolio holdings report for the first and third quarters of the fund's fiscal year at mfs.com/vit2 by
choosing the fund's name and then scrolling to the “Resources” section and clicking on the “Prospectus and Reports” tab.
FURTHER INFORMATION
From time to time, MFS may post important information about
the fund or the MFS Funds on the MFS Web site (mfs.com). This information is available at https://www.mfs.com/announcements or at
mfs.com/vit2 by choosing the fund's name and then scrolling to the “Resources” section and clicking on the “Announcements” tab, if any.
Information About Fund Contracts and Legal Claims
The fund has entered into contractual arrangements with an
investment adviser, administrator, distributor, shareholder servicing agent, 529 program manager (if applicable), and custodian who each provide services to the fund. Unless expressly stated otherwise, shareholders are not parties to, or intended
beneficiaries of these contractual arrangements, and these contractual arrangements are not intended to create any shareholder right to enforce them against the service providers or to seek any remedy under them against the service providers, either
directly or on behalf of the fund.
Under the
Trust’s By-Laws and Declaration of Trust, any claims asserted against or on behalf of the MFS Funds, including claims against Trustees and Officers, must be brought in state and federal courts located within the Commonwealth of
Massachusetts.
Federal Tax Information (unaudited)
The following information is provided pursuant to
provisions of the Internal Revenue Code.
The fund
designates $25,221,000 as capital gain dividends paid during the fiscal year.
Income derived from foreign sources was $10,771,849. The
fund intends to pass through foreign tax credits of $943,995 for the fiscal year.
| FACTS
|
WHAT
DOES MFS DO WITH YOUR PERSONAL INFORMATION? |
| Why?
|
Financial
companies choose how they share your personal information. Federal law gives consumers the right to limit some but not all sharing. Federal law also requires us to tell you how we collect, share, and protect your personal information. Please read
this notice carefully to understand what we do. |
| What?
|
The types of
personal information we collect and share depend on the product or service you have with us. This information can include: |
| • Social
Security number and account balances |
| • Account
transactions and transaction history |
| • Checking
account information and wire transfer instructions |
| When
you are no longer our customer, we continue to share your information as described in this notice. |
| How?
|
All
financial companies need to share customers' personal information to run their everyday business. In the section below, we list the reasons financial companies can share their customers' personal information; the reasons MFS chooses to share; and
whether you can limit this sharing. |
Reasons
we can share your
personal information |
Does
MFS share? |
Can
you limit
this sharing? |
For
our everyday business purposes –
such as to process your transactions, maintain your
account(s), respond to court orders and legal
investigations, or report to credit bureaus |
Yes
|
No
|
For
our marketing purposes –
to offer our products and services to you |
No
|
We
don't share |
For
joint marketing with other
financial companies |
No
|
We
don't share |
For
our affiliates' everyday business purposes –
information about your transactions and experiences |
No
|
We
don't share |
For
our affiliates' everyday business purposes –
information about your creditworthiness |
No
|
We
don't share |
| For
nonaffiliates to market to you |
No
|
We
don't share |
| Questions?
|
Call
800-225-2606 or go to mfs.com. |
| Who
we are |
| Who
is providing this notice? |
MFS
Funds, MFS Investment Management, MFS Institutional Advisors, Inc., and MFS Heritage Trust Company. |
| What
we do |
How
does MFS
protect my personal
information? |
To
protect your personal information from unauthorized access and use, we use security measures that comply with federal law. These measures include procedural, electronic, and physical safeguards for the protection of the personal information we
collect about you. |
How
does MFS
collect my personal
information? |
We
collect your personal information, for example, when you |
| • open
an account or provide account information |
| • direct
us to buy securities or direct us to sell your securities |
| • make
a wire transfer |
| We
also collect your personal information from others, such as credit bureaus, affiliates, or other companies. |
| Why
can't I limit all sharing? |
Federal
law gives you the right to limit only |
| • sharing
for affiliates' everyday business purposes – information about your creditworthiness |
| • affiliates
from using your information to market to you |
| • sharing
for nonaffiliates to market to you |
| State
laws and individual companies may give you additional rights to limit sharing. |
| Definitions
|
| Affiliates
|
Companies
related by common ownership or control. They can be financial and nonfinancial companies. |
| •
MFS does not share personal information with affiliates, except for everyday business purposes as described on page one of this notice. |
| Nonaffiliates
|
Companies
not related by common ownership or control. They can be financial and nonfinancial companies. |
| •
MFS does not share with nonaffiliates so they can market to you. |
| Joint
marketing |
A
formal agreement between nonaffiliated financial companies that together market financial products or services to you. |
| •
MFS doesn't jointly market. |
| Other
important information |
| If
you own an MFS product or receive an MFS service in the name of a third party such as a bank or broker-dealer, their privacy policy may apply to you instead of ours. |
Annual Report
December 31, 2021
MFS® Variable
Insurance Trust II
|
1
|
|
2
|
|
4
|
|
6
|
|
8
|
|
9
|
|
16
|
|
17
|
|
18
|
|
19
|
|
21
|
|
30
|
|
31
|
|
34
|
|
37
|
|
37
|
|
37
|
|
37
|
|
37
|
|
38
|
The report is prepared for the general information of contract owners. It
is authorized for distribution to prospective investors only when preceded or accompanied by a current prospectus.
NOT FDIC INSURED • MAY LOSE VALUE
• NO BANK OR CREDIT UNION GUARANTEE •
NOT A DEPOSIT • NOT INSURED BY ANY FEDERAL GOVERNMENT
AGENCY OR NCUA/NCUSIF
Dear Contract Owners:
After a powerful rally in 2021 that was spurred by the
introduction of effective coronavirus vaccines and high levels of monetary and fiscal stimulus, markets have recently experienced a rise in volatility. Rising inflation (mostly due to pandemic-related labor and supply chain disruptions), new
COVID-19 variants that are vaccine-resistant, and the prospect of tighter monetary and fiscal policies around the world have all increased investor anxiety.
Rising real (inflation-adjusted) bond yields in the United
States are a headwind for richly valued U.S. growth stocks, though many non-U.S. markets have experienced lower levels of turbulence. In recent months, global economic growth has moderated, with the spread of the Delta and Omicron variants and a
regulatory crackdown in China featuring prominently. Stress in China’s property development sector has also contributed to the slowdown there. A further concern for investors is the tightening of global energy and raw materials supplies caused
in part by geopolitical uncertainty.
However,
above-trend economic growth, strong corporate balance sheets, and nascent signs that global supply chain bottlenecks may be easing, along with a dovish policy shift in China, are supportive fundamentals that we feel could help calm recent market
jitters.
It is times of market transition that
demonstrate the importance of having a deep understanding of company fundamentals, and we have built our global research platform to do just that.
At MFS®, we put our clients’ assets to work responsibly by carefully navigating the increasing complexity of global markets and economies. Guided by our commitment to long-term
investing, we tune out the noise and try to uncover what we believe are the best, most durable investment opportunities in the market. Our unique global investment platform combines collective expertise, long-term discipline, and thoughtful risk
management to create sustainable value for investors.
Respectfully,
Michael W.
Roberge
Chief Executive Officer
MFS Investment Management
February 15, 2022
The opinions expressed in this letter are subject to
change and may not be relied upon for investment advice. No forecasts can be guaranteed.
Portfolio structure at value (v)
Portfolio structure reflecting equivalent exposure of derivative positions
(i)
Fixed income sectors (i)
| U.S.
Treasury Securities |
37.4%
|
| Investment
Grade Corporates |
22.4%
|
| Collateralized
Debt Obligations |
14.9%
|
| High
Yield Corporates |
14.5%
|
| Emerging
Markets Bonds |
9.2%
|
| Commercial
Mortgage-Backed Securities |
8.0%
|
| Municipal
Bonds |
3.8%
|
| Asset-Backed
Securities |
1.5%
|
| Residential
Mortgage-Backed Securities |
0.3%
|
| U.S.
Government Agencies |
0.1%
|
| Mortgage-Backed
Securities |
0.1%
|
Composition including fixed
income credit quality (a)(i)
| AAA
|
6.0%
|
| AA
|
5.2%
|
| A
|
10.8%
|
| BBB
|
30.0%
|
| BB
|
12.2%
|
| B
|
7.3%
|
| CCC
|
1.7%
|
| CC
(o) |
0.0%
|
| C
(o) |
0.0%
|
| D
(o) |
0.0%
|
| U.S.
Government |
18.9%
|
| Federal
Agencies |
0.1%
|
| Not
Rated |
20.0%
|
| Non-Fixed
Income |
0.1%
|
| Cash
& Cash Equivalents |
6.1%
|
| Other
|
(18.4)%
|
Portfolio facts (i)
| Average
Duration (d) |
6.2
|
| Average
Effective Maturity (m) |
6.8 yrs.
|
Portfolio
Composition - continued
| (a)
|
For all
securities other than those specifically described below, ratings are assigned to underlying securities utilizing ratings from Moody’s, Fitch, and Standard & Poor’s rating agencies and applying the following hierarchy: If all three
agencies provide a rating, the middle rating (after dropping the highest and lowest ratings) is assigned; if two of the three agencies rate a security, the lower of the two is assigned. If none of the 3 rating agencies above assign a rating, but the
security is rated by DBRS Morningstar, then the DBRS Morningstar rating is assigned. If none of the 4 rating agencies listed above rate the security, but the security is rated by the Kroll Bond Rating Agency (KBRA), then the KBRA rating is assigned.
Ratings are shown in the S&P and Fitch scale (e.g., AAA). Securities rated BBB or higher are considered investment grade. All ratings are subject to change. U.S. Government includes securities issued by the U.S. Department of the Treasury.
Federal Agencies includes rated and unrated U.S. Agency fixed-income securities, U.S. Agency mortgage-backed securities, and collateralized mortgage obligations of U.S. Agency mortgage-backed securities. Not Rated includes fixed income securities
and fixed income derivatives that have not been rated by any rating agency. Non-Fixed Income includes equity securities (including convertible bonds and equity derivatives) and/or commodity-linked derivatives. The fund may or may not have held all
of these instruments on this date. The fund is not rated by these agencies. |
| (d)
|
Duration is
a measure of how much a bond’s price is likely to fluctuate with general changes in interest rates, e.g., if rates rise 1.00%, a bond with a 5-year duration is likely to lose about 5.00% of its value due to the interest rate move.
|
| (i)
|
For
purposes of this presentation, the components include the value of securities, and reflect the impact of the equivalent exposure of derivative positions, if any. These amounts may be negative from time to time. Equivalent exposure is a calculated
amount that translates the derivative position into a reasonable approximation of the amount of the underlying asset that the portfolio would have to hold at a given point in time to have the same price sensitivity that results from the
portfolio’s ownership of the derivative contract. When dealing with derivatives, equivalent exposure is a more representative measure of the potential impact of a position on portfolio performance than value. The bond component will include
any accrued interest amounts. |
| (m)
|
In
determining each instrument’s effective maturity for purposes of calculating the fund’s dollar-weighted average effective maturity, MFS uses the instrument’s stated maturity or, if applicable, an earlier date on which MFS believes
it is probable that a maturity-shortening device (such as a put, pre-refunding or prepayment) will cause the instrument to be repaid. Such an earlier date can be substantially shorter than the instrument’s stated maturity. |
| (v)
|
For purposes of this
presentation, market value of fixed income and/or equity derivatives, if any, is included in Cash & Cash Equivalents. |
Where the fund holds convertible bonds, they are treated as
part of the equity portion of the portfolio.
The fund
invests a portion of its assets in the MFS High Yield Pooled Portfolio. Percentages include the indirect exposure to the underlying holdings, including investments in money market funds and Other, of the MFS High Yield Pooled Portfolio and not the
direct exposure from investing in the MFS High Yield Pooled Portfolio itself.
Cash & Cash Equivalents includes any direct exposure to
cash, direct and indirect exposure to investments in money market funds, cash equivalents, short-term securities, and other assets less liabilities. Please see the Statement of Assets and Liabilities for additional information related to the
fund’s direct cash position and other assets and liabilities.
Other includes the direct and indirect equivalent exposure from
currency derivatives and/or any offsets to derivative positions and may be negative.
Percentages are based on net assets as of December 31,
2021.
The portfolio is actively managed and current
holdings may be different.
Management Review
Summary of Results
For the twelve months ended December 31, 2021, Initial
Class shares of the MFS Income Portfolio (fund) provided a total return of 0.47%, while Service Class shares of the fund provided a total return of 0.10%. These compare with a return of -1.54% over the same period for the fund’s benchmark, the
Bloomberg U.S. Aggregate Bond Index.
Market
Environment
Over the past year, the global economy
was buffeted by an array of crosscurrents as it adjusted to the ebbs and flows of the pandemic. Among the supportive currents were ample fiscal stimulus, loose monetary policy and the rollout of several highly effective coronavirus vaccines.
Negative currents included the rapid spread of several coronavirus variants, widespread global production bottlenecks and a surge in inflation. After experiencing a burst of exceptionally strong economic activity as the global economy began to
reopen, activity became more muted in the second half of the period amid ongoing supply chain disruptions and a new wave of coronavirus infections, albeit a seemingly milder strain.
Amid rising inflation, markets anticipated a transition
from an exceptionally accommodative environment to a more mixed monetary landscape ahead. Indeed, several central banks in emerging markets have already tightened policy and the US Federal Reserve reduced the pace of its asset purchases in November
and again in December. However, the European Central Bank, the Bank of Japan and the People's Bank of China are expected to maintain accommodative policies. Sovereign bond yields moved modestly higher during the period amid higher inflation and on
expectations of a tighter Fed but remain historically low.
A harsher Chinese regulatory environment toward industries
such as online gaming, food delivery and education increased market volatility as has stress in China's highly leveraged property development sector. Trade relations between the United States and China remained quite strained despite a change in
presidential administrations.
Signs of excess
investor enthusiasm continued to be seen in pockets of the market such as “meme stocks” popular with users of online message boards, cryptocurrencies and heavy retail participation in the market for short-dated options.
Factors Affecting Performance
Relative to the Bloomberg U.S. Aggregate Bond Index, the
fund’s asset allocation decisions were a primary factor that benefited relative performance. From a sector perspective, the combination of the fund's out-of-benchmark allocation to the collateralized mortgage obligation (CMO) and municipal
bond sectors, its overweight allocation to the industrials sector, and underweight allocation to the mortgage-backed securities (MBS) agency fixed rate sector, lifted relative returns. From a credit quality perspective, the fund's out-of-benchmark
holdings of 'BB' rated(r), non-rated and 'B' rated bonds strengthened relative performance.
The fund's shorter duration(d) stance also contributed to
relative returns as interest rates generally rose over the reporting period.
Favorable security selection further supported the
fund’s relative performance over the reporting period. From a sector perspective, bond selection within the financial institutions sector helped relative returns. From a credit quality perspective, selection within the 'BBB' rated quality
segment contributed to relative performance.
Conversely, the fund's positioning along the yield
curve(y), notably its lesser exposure to the 20-year and 30-year key rates, was a detractor from relative results.
Respectfully,
Portfolio Manager(s)
Neeraj Arora, Philipp Burgener, David Cole, Alexander
Mackey, Joshua Marston, and Michael Skatrud
Note to
Contract Owners: Effective June 30, 2021, Robert Persons is no longer a Portfolio Manager of the fund.
| (d)
|
Duration is
a measure of how much a bond’s price is likely to fluctuate with general changes in interest rates, e.g., if rates rise 1.00%, a bond with a 5-year duration is likely to lose about 5.00% of its value. |
| (r)
|
Securities
rated “BBB”, “Baa”, or higher are considered investment grade; securities rated “BB”, “Ba”, or below are considered non-investment grade. Ratings are assigned to underlying securities utilizing
ratings from Moody's, Fitch, and Standard & Poor's and applying the following hierarchy: If all three agencies provide a rating, the middle rating (after dropping the highest and lowest ratings) is assigned; if two of the three agencies rate a
security, the |
Management
Review - continued
lower of the two is assigned. If none of the 3 rating
agencies above assign a rating, but the security is rated by DBRS Morningstar, then the DBRS Morningstar rating is assigned. If none of the 4 rating agencies listed above rate the security, but the security is rated by the Kroll Bond Rating Agency
(KBRA), then the KBRA rating is assigned. Ratings are shown in the S&P and Fitch scale (e.g., AAA). For securities that are not rated by any of the rating agencies, the security is considered Not Rated.
| (y)
|
A yield
curve graphically depicts the yields of different maturity bonds of the same credit quality and type; a normal yield curve is upward sloping, with short-term rates lower than long-term rates. |
The views expressed in this report are those of the portfolio
manager(s) only through the end of the period of the report as stated on the cover and do not necessarily reflect the views of MFS or any other person in the MFS organization. These views are subject to change at any time based on market or other
conditions, and MFS disclaims any responsibility to update such views. These views may not be relied upon as investment advice or an indication of trading intent on behalf of any MFS portfolio. References to specific securities are not
recommendations of such securities, and may not be representative of any MFS portfolio’s current or future investments.
Performance Summary Through 12/31/21
The following chart illustrates the historical performance
of the fund in comparison to its benchmark(s). Benchmarks are unmanaged and may not be invested in directly. Benchmark returns do not reflect any fees or expenses. The performance of other share classes will be greater than or less than that of the
class depicted below. (See Notes to Performance Summary.)
Performance data shown represents past performance and is no
guarantee of future results. Investment return and principal value fluctuate so your units, when sold, may be worth more or less than the original cost; current performance may be lower or higher than quoted. The performance shown does not reflect
the deduction of taxes, if any, that a contract holder would pay on fund distributions or the redemption of contract units. The returns for the fund shown also do not reflect the deduction of expenses associated with variable products, such as
mortality and expense risk charges, separate account charges, and sales charges imposed by the insurance company separate accounts. Such expenses would reduce the overall returns shown.
Growth of a Hypothetical $10,000 Investment
Total Returns
through 12/31/21
Average annual total returns
| Share
Class |
Class
Inception Date |
1-yr
|
5-yr
|
10-yr
|
| Initial
Class |
5/06/98
|
0.47%
|
5.01%
|
4.61%
|
| Service
Class |
8/24/01
|
0.10%
|
4.73%
|
4.35%
|
Comparative benchmark(s)
| Bloomberg
U.S. Aggregate Bond Index (f) |
(1.54)%
|
3.57%
|
2.90%
|
| (f)
|
Source:
FactSet Research Systems Inc. |
Benchmark Definition(s)
Bloomberg U.S. Aggregate Bond Index(a) – a market capitalization-weighted index that measures the performance of the U.S. investment-grade, fixed rate bond market, with index components for government and
corporate securities, mortgage pass-through securities, and asset-backed securities with at least one year to final maturity.
It is not possible to invest directly in an index.
| (a)
|
Source:
Bloomberg Index Services Limited. BLOOMBERG® is a trademark and service mark of Bloomberg Finance L.P. and its affiliates (collectively “Bloomberg”). Bloomberg
or Bloomberg's licensors own all proprietary rights in the Bloomberg Indices. Bloomberg neither approves or endorses this material, or guarantees the accuracy or completeness of any information herein, or makes any warranty, express or implied, as
to the results to be obtained therefrom and, to the maximum extent allowed by law, neither shall have any liability or responsibility for injury or damages arising in connection therewith. |
Performance
Summary – continued
Notes to Performance Summary
Performance information prior to December 2, 2019 reflects
time periods when the fund had (i) a policy permitting the fund to invest up to 100% of its assets in below investment grade quality debt instruments and (ii) a policy permitting the fund to invest in equity securities as a principal investment
strategy. The fund’s investment policies and strategies changed effective December 2, 2019.
Average annual total return represents the average annual
change in value for each share class for the periods presented.
Performance results reflect any applicable expense
subsidies and waivers in effect during the periods shown. Without such subsidies and waivers the fund's performance results would be less favorable. Please see the prospectus and financial statements for complete details. All results are historical
and assume the reinvestment of any dividends and capital gains distributions.
Performance results do not include adjustments made for
financial reporting purposes in accordance with U.S. generally accepted accounting principles and may differ from amounts reported in the financial highlights.
From time to time the fund may receive proceeds from
litigation settlements, without which performance would be lower.
Expense Table
Fund Expenses Borne by the Contract Holders during the
Period,
July 1, 2021 through December 31, 2021
As
a contract holder of the fund, you incur ongoing costs, including management fees; distribution and/or service (12b-1) fees; and other fund expenses. This example is intended to help you understand your ongoing costs (in dollars) of investing in the
fund and to compare these costs with the ongoing costs of investing in other mutual funds.
In addition to the fees and expenses which the fund bears
directly, the fund indirectly bears a pro rata share of the fees and expenses of the MFS High Yield Pooled Portfolio, an underlying MFS Pooled Portfolio in which the fund invests. MFS Pooled Portfolios are mutual funds advised by MFS that do not pay
management fees to MFS but do incur investment and operating costs. If these transactional and indirect costs were included, your costs would have been higher.
The example is based on an investment of $1,000 invested at
the beginning of the period and held for the entire period July 1, 2021 through December 31, 2021.
Actual Expenses
The first line for each share class in the following table
provides information about actual account values and actual expenses. You may use the information in this line, together with the amount you invested, to estimate the expenses that you paid over the period. Simply divide your account value by $1,000
(for example, an $8,600 account value divided by $1,000 = 8.6), then multiply the result by the number in the first line under the heading entitled “Expenses Paid During Period” to estimate the expenses you paid on your account during
this period.
Hypothetical Example for Comparison
Purposes
The second line for each share class in the
following table provides information about hypothetical account values and hypothetical expenses based on the fund’s actual expense ratio and an assumed rate of return of 5% per year before expenses, which is not the fund’s actual
return. The hypothetical account values and expenses may not be used to estimate the actual ending account balance or expenses you paid for the period. You may use this information to compare the ongoing costs of investing in the fund and other
funds. To do so, compare this 5% hypothetical example with the 5% hypothetical examples that appear in the shareholder reports of the other funds.
Please note that the expenses shown in the table are meant
to highlight the fund's ongoing costs only and do not take into account the fees and expenses imposed under the variable contracts through which your investment in the fund is made. Therefore, the second line for each share class in the table is
useful in comparing ongoing costs associated with an investment in vehicles (such as the fund) which fund benefits under variable annuity and variable life insurance contracts and to qualified pension and retirement plans only, and will not help you
determine the relative total costs of investing in the fund through variable annuity and variable life insurance contracts. If the fees and expenses imposed under the variable contracts were included, your costs would have been higher.
Share
Class |
|
Annualized
Expense
Ratio |
Beginning
Account Value
7/01/21 |
Ending
Account Value
12/31/21 |
Expenses
Paid During
Period (p)
7/01/21-12/31/21 |
| Initial
Class |
Actual
|
0.75%
|
$1,000.00
|
$1,002.76
|
$3.79
|
| Hypothetical
(h) |
0.75%
|
$1,000.00
|
$1,021.42
|
$3.82
|
| Service
Class |
Actual
|
1.00%
|
$1,000.00
|
$1,000.99
|
$5.04
|
| Hypothetical
(h) |
1.00%
|
$1,000.00
|
$1,020.16
|
$5.09
|
| (h)
|
5% class return per year
before expenses. |
| (p)
|
“Expenses
Paid During Period” are equal to each class's annualized expense ratio, as shown above, multiplied by the average account value over the period, multiplied by 184/365 (to reflect the one-half year period). In addition to the fees and expenses
which the fund bears directly, the fund indirectly bears a pro rata share of the fees and expenses of the underlying funds in which the fund invests. If these indirect costs were included, your costs would have been higher. |
Portfolio of Investments − 12/31/21
The Portfolio of Investments is a complete list of all
securities owned by your fund. It is categorized by broad-based asset classes.
| Issuer
|
|
|
Shares/Par
|
Value
($) |
| Bonds
– 81.1% |
| Aerospace
& Defense – 0.8% |
| Boeing
Co., 2.196%, 2/04/2026 |
|
$
|
202,000
|
$
201,952 |
| Boeing
Co., 2.95%, 2/01/2030 |
|
|
43,000
|
43,809 |
| Boeing
Co., 5.705%, 5/01/2040 |
|
|
34,000
|
43,670 |
| Boeing
Co., 5.805%, 5/01/2050 |
|
|
33,000
|
44,686 |
| |
|
|
|
$334,117 |
| Asset-Backed
& Securitized – 24.7% |
| Allegro
CLO Ltd., 2014-1RA, “C”, FLR, 3.129% (LIBOR - 3mo. + 3%), 10/21/2028 (n) |
|
$
|
250,000
|
$
246,025 |
| Allegro
CLO Ltd., 2015-1X, “CR”, FLR, 1.773% (LIBOR - 3mo. + 1.65%), 7/25/2027 (n) |
|
|
250,000
|
250,047 |
| Arbor
Realty Trust, Inc., CLO, 2018-FL1, “A”, FLR, 1.259% (LIBOR - 1mo. + 1.15%), 6/15/2028 (n) |
|
|
260,000
|
259,919 |
| Arbor
Realty Trust, Inc., CLO, 2020-FL1, “D”, FLR, 2.614% (LIBOR - 1mo. + 2.45%), 2/15/2035 (n) |
|
|
232,000
|
231,565 |
| Arbor
Realty Trust, Inc., CLO, 2021-FL1, “D”, FLR, 3.059% (LIBOR - 1mo. + 2.95%), 12/15/2035 (n) |
|
|
100,000
|
99,750 |
| Arbor
Realty Trust, Inc., CLO, 2021-FL3, “C”, FLR, 1.959% (LIBOR - 1mo. + 1.85%), 8/15/2034 (n) |
|
|
200,000
|
199,136 |
| Arbor
Realty Trust, Inc., CLO, 2021-FL3, “D”, FLR, 2.31% (LIBOR - 1mo. + 2.2%), 8/15/2034 (n) |
|
|
100,000
|
99,259 |
| Arbor
Realty Trust, Inc., CLO, 2021-FL4, “D”, FLR, 2.99% (LIBOR - 1mo. + 2.9%), 11/15/2036 (n) |
|
|
256,500
|
256,179 |
| AREIT
CRE Trust, 2019-CRE3, “D”, FLR, 2.814% (LIBOR - 1mo. + 2.65%), 9/14/2036 (n) |
|
|
271,000
|
268,446 |
| Babson
CLO Ltd., 2013-IIA, “BR”, FLR, 1.381% (LIBOR - 3mo. + 1.25%), 1/20/2028 (n) |
|
|
250,000
|
250,000 |
| Bancorp
Commercial Mortgage Trust, 2018-CRE3, “D”, FLR, 2.81% (LIBOR - 1mo. + 2.7%), 1/15/2033 (n) |
|
|
224,743
|
223,665 |
| Bancorp
Commercial Mortgage Trust, 2019-CRE5, “D”, FLR, 2.459% (LIBOR - 1mo. + 2.35%), 3/15/2036 (n) |
|
|
237,302
|
235,553 |
| Bancorp
Commercial Mortgage Trust, 2019-CRE6, “D”, FLR, 2.464% (LIBOR - 1mo. + 2.54%), 9/15/2036 (n) |
|
|
265,000
|
263,871 |
| Bayview
Financial Revolving Mortgage Loan Trust, FLR, 1.701% (LIBOR - 1mo. + 1.6%), 12/28/2040 (n) |
|
|
74,538
|
82,968 |
| BSPRT
Issuer Ltd., 2019-FL5, “C”, FLR, 2.109% (LIBOR - 1mo. + 2%), 5/15/2029 (n) |
|
|
245,000
|
243,868 |
| Business
Jet Securities LLC, 2020-1A, “A”, 2.981%, 11/15/2035 (n) |
|
|
69,440
|
69,335 |
| Capital
Automotive, 2020-1A, “B1”, REIT, 4.17%, 2/15/2050 (n) |
|
|
110,227
|
113,204 |
| CHCP
2021-FL1 Ltd., “B”, FLR, 1.814% (LIBOR - 1mo. + 1.65%), 2/15/2038 (n) |
|
|
250,000
|
249,081 |
| CHCP
2021-FL1 Ltd., “C”, FLR, 2.264% (LIBOR - 1mo. + 2.1%), 2/15/2038 (n) |
|
|
100,000
|
99,748 |
| CLNC
Ltd., 2019-FL1, “C”, FLR, 2.564% (LIBOR - 1mo. + 2.4%), 8/20/2035 (n) |
|
|
265,000
|
263,528 |
| Commercial
Equipment Finance LLC, 2021-A, “A”, 2.05%, 2/16/2027 (n) |
|
|
165,752
|
165,365 |
| Commercial
Mortgage Pass-Through Certificates, 2019-BN24, “A3”, 2.96%, 11/15/2062 |
|
|
134,719
|
142,659 |
| Commercial
Mortgage Pass-Through Certificates, 2020-BN28, “A4”, 1.844%, 3/15/2063 |
|
|
61,262
|
59,717 |
| Commercial
Mortgage Trust, 2015-PC1, “A5”, 3.902%, 7/10/2050 |
|
|
346,107
|
368,855 |
| Crest
Ltd., CDO, 7%, (0.001% cash or 7% PIK) 1/28/2040 (a)(p) |
|
|
686,262
|
7 |
| Cutwater
Ltd., 2015-1A, “BR”, FLR, 1.924% (LIBOR - 3mo. + 1.8%), 1/15/2029 (n) |
|
|
250,000
|
247,443 |
| DT
Auto Owner Trust, 2020-1A, “C”, 2.29%, 11/17/2025 (n) |
|
|
123,000
|
124,195 |
| Exeter
Automobile Receivables Trust, 2020-1A, 2.49%, 1/15/2025 (n) |
|
|
40,000
|
40,321 |
| Flagship
CLO, 2014-8A, “BRR”, FLR, 1.522% (LIBOR - 3mo. + 1.4%), 1/16/2026 (n) |
|
|
90,247
|
90,201 |
| GS
Mortgage Securities Trust, 2019-GSA1, “A4”, 3.047%, 11/10/2052 |
|
|
261,722
|
277,190 |
| Invitation
Homes Trust, 2018-SFR1, “C”, FLR, 1.359% (LIBOR - 1mo. + 1.25%), 3/17/2037 (n) |
|
|
129,981
|
129,790 |
| KKR
Real Estate Financial Trust, Inc., 2021-FL2, “D”, FLR, 2.308% (LIBOR - 1mo. + 2.2%), 2/15/2039 (n) |
|
|
163,000
|
162,804 |
| LCCM
2021-FL2 Trust, “C”, FLR, 2.259% (LIBOR - 1mo. + 2.15%), 12/13/2038 (n) |
|
|
100,000
|
100,000 |
| Lehman
Brothers Commercial Conduit Mortgage Trust, 0.904%, 2/18/2030 (i) |
|
|
2,184
|
0 |
| LoanCore
Ltd., 2018-CRE1, “C”, FLR, 2.659% (LIBOR - 1mo. + 2.55%), 5/15/2028 (n) |
|
|
260,000
|
259,609 |
| LoanCore
Ltd., 2018-CRE1, “C”, FLR, 2.059% (LIBOR - 1mo. + 1.95%), 4/15/2034 (n) |
|
|
219,150
|
218,414 |
| LoanCore
Ltd., 2019-CRE2, “D”, FLR, 2.56% (LIBOR - 1mo. + 2.45%), 5/15/2036 (n) |
|
|
209,000
|
206,075 |
| MF1
CLO Ltd., 2019-FL2, “A”, FLR, 2.514% (LIBOR - 1mo. + 2.35%), 12/25/2034 (n) |
|
|
259,000
|
258,938 |
| MF1
CLO Ltd., 2021-FL6, “C”, FLR, 1.957%, 7/16/2036 (n) |
|
|
247,581
|
246,741 |
| MF1
Multi-Family Housing Mortgage Loan Trust, 2020-FL4, “B”, FLR, 2.914% (LIBOR - 1mo. + 2.75%), 11/15/2035 (n) |
|
|
250,000
|
250,761 |
| Morgan
Stanley Capital I Trust, 2017-H1, “A5”, 3.53%, 6/15/2050 |
|
|
187,518
|
201,957 |
| Neuberger
Berman CLO Ltd., 2013-15A, “CR2”, FLR, 1.974% (LIBOR - 3mo. + 1.85%), 10/15/2029 (n) |
|
|
250,000
|
249,269 |
| Oaktree
CLO Ltd., 2019-1A, “CR”, FLR, 2.478% (LIBOR - 3mo. + 2.35%), 4/22/2030 (n) |
|
|
263,644
|
262,696 |
| Palmer
Square Loan Funding Ltd., 2020-1A, “B”, FLR, 2.059% (LIBOR - 3mo. + 1.9%), 2/20/2028 (n) |
|
|
250,000
|
245,688 |
| Parallel
Ltd., 2015-1A, “DR”, FLR, 2.681% (LIBOR - 3mo. + 2.55%), 7/20/2027 (n) |
|
|
250,000
|
249,825 |
| Race
Point CLO Ltd., 2013-8A, “CR2”, FLR, 2.209% (LIBOR - 3mo. + 2.05%), 2/20/2030 (n) |
|
|
250,000
|
250,049 |
| ReadyCap
Commercial Mortgage Trust, 2021-FL7, “D”, FLR, 3.052% (LIBOR - 1mo. + 2.95%), 11/25/2036 (z) |
|
|
120,000
|
119,777 |
| Securitized
Term Auto Receivable Trust, 2019-CRTA, “C”, 2.849%, 3/25/2026 (n) |
|
|
41,040
|
41,504 |
Portfolio of
Investments – continued
| Issuer
|
|
|
Shares/Par
|
Value
($) |
| Bonds
– continued |
| Asset-Backed
& Securitized – continued |
| UBS
Commercial Mortgage Trust, 2017-C1, “A4”, 3.544%, 11/15/2050 |
|
$
|
251,247
|
$
271,221 |
| UBS
Commercial Mortgage Trust, 2017-C7, “A4”, 3.679%, 12/15/2050 |
|
|
155,000
|
167,889 |
| UBS
Commercial Mortgage Trust, 2019-C17, “A4”, 2.921%, 10/15/2052 |
|
|
197,844
|
207,216 |
| Veros
Auto Receivables Trust, 2020-1, “A”, 1.67%, 9/15/2023 (n) |
|
|
4,519
|
4,521 |
| Voya
CLO Ltd., 2012-4A, “C1R3”, FLR, 3.423% (LIBOR - 3mo. + 3.3%), 10/15/2030 (n) |
|
|
250,000
|
246,197 |
| Wells
Fargo Commercial Mortgage Trust, 2019-C54, “A4”, 3.146%, 12/15/2052 |
|
|
167,746
|
179,319 |
| Wind
River CLO Ltd., 2015-2A, “CR”, FLR, 1.823% (LIBOR - 3mo. + 1.7%), 10/15/2027 (n) |
|
|
250,000
|
250,312 |
| |
|
|
|
$
10,301,672 |
| Automotive
– 0.8% |
| Hyundai
Capital America, 6.375%, 4/08/2030 (n) |
|
$
|
250,000
|
$
315,107 |
| Broadcasting
– 0.3% |
| Discovery,
Inc., 4.65%, 5/15/2050 |
|
$
|
95,000
|
$
111,445 |
| Brokerage
& Asset Managers – 1.2% |
| E*TRADE
Financial Corp., 4.5%, 6/20/2028 |
|
$
|
217,000
|
$
244,145 |
| Intercontinental
Exchange, Inc., 2.1%, 6/15/2030 |
|
|
101,000
|
100,355 |
| Raymond
James Financial, 4.65%, 4/01/2030 |
|
|
134,000
|
155,381 |
| |
|
|
|
$499,881 |
| Business
Services – 0.6% |
| Global
Payments, Inc., 2.9%, 5/15/2030 |
|
$
|
120,000
|
$
122,178 |
| NXP
Semiconductors N.V., 3.4%, 5/01/2030 (n) |
|
|
35,000
|
37,300 |
| RELX
Capital, Inc., 3%, 5/22/2030 |
|
|
76,000
|
79,675 |
| |
|
|
|
$239,153 |
| Cable
TV – 0.6% |
| Charter
Communications Operating LLC/Charter Communications Operating Capital Corp., 3.9%, 6/01/2052 |
|
$
|
176,000
|
$
176,487 |
| Time
Warner Cable, Inc., 4.5%, 9/15/2042 |
|
|
77,000
|
83,946 |
| |
|
|
|
$260,433 |
| Chemicals
– 0.5% |
| Sasol
Financing (USA) LLC, 4.375%, 9/18/2026 |
|
$
|
200,000
|
$
201,250 |
| Computer
Software – 0.4% |
| Dell
International LLC/EMC Corp., 5.3%, 10/01/2029 |
|
$
|
149,000
|
$
174,657 |
| Conglomerates
– 0.8% |
| Westinghouse
Air Brake Technologies Corp., 4.95%, 9/15/2028 |
|
$
|
304,000
|
$
345,560 |
| Consumer
Services – 0.8% |
| Expedia
Group, Inc., 3.25%, 2/15/2030 |
|
$
|
175,000
|
$
178,588 |
| Toll
Road Investors Partnership II LP, Capital Appreciation, NPFG, 0%, 2/15/2026 (n) |
|
|
46,000
|
38,979 |
| Toll
Road Investors Partnership II LP, Capital Appreciation, NPFG, 0%, 2/15/2029 (n) |
|
|
132,000
|
96,705 |
| Toll
Road Investors Partnership II LP, Capital Appreciation, NPFG, 0%, 2/15/2031 (n) |
|
|
46,000
|
30,738 |
| |
|
|
|
$345,010 |
| Electronics
– 0.8% |
| Broadcom,
Inc., 4.3%, 11/15/2032 |
|
$
|
96,000
|
$
107,883 |
| Broadcom,
Inc., 3.187%, 11/15/2036 (n) |
|
|
245,000
|
244,573 |
| |
|
|
|
$352,456 |
Portfolio of
Investments – continued
| Issuer
|
|
|
Shares/Par
|
Value
($) |
| Bonds
– continued |
| Emerging
Market Quasi-Sovereign – 1.7% |
| Huarong
Finance 2019 Co. Ltd. (People's Republic of China), 3.25%, 11/13/2024 |
|
$
|
200,000
|
$
198,250 |
| Ipoteka
Bank (Republic of Uzbekistan), 5.5%, 11/19/2025 |
|
|
200,000
|
203,124 |
| Office
Cherifien des Phosphates S.A. (Kingdom of Morocco), 3.75%, 6/23/2031 (n) |
|
|
200,000
|
194,080 |
| Petroleos
Mexicanos, 5.95%, 1/28/2031 |
|
|
108,000
|
104,946 |
| |
|
|
|
$700,400 |
| Emerging
Market Sovereign – 2.3% |
| Dominican
Republic, 4.875%, 9/23/2032 (n) |
|
$
|
150,000
|
$
152,437 |
| Government
of Ukraine, GDP Linked Bond, 0%, 5/31/2040 |
|
|
138,000
|
125,442 |
| Oriental
Republic of Uruguay, 8.5%, 3/15/2028 |
|
UYU
|
4,753,000
|
105,449 |
| Republic
of Chile, 5%, 10/01/2028 (n) |
|
CLP
|
60,000,000
|
68,013 |
| Republic
of Cote d'Ivoire, 4.875%, 1/30/2032 (n) |
|
EUR
|
100,000
|
109,369 |
| Republic
of Kenya, 8%, 5/22/2032 |
|
$
|
200,000
|
218,120 |
| Republic
of Romania, 2%, 4/14/2033 (n) |
|
EUR
|
69,000
|
71,511 |
| Republic
of South Africa, 8.25%, 3/31/2032 |
|
ZAR
|
1,732,000
|
98,039 |
| |
|
|
|
$948,380 |
| Energy
- Independent – 0.6% |
| Diamondback
Energy, Inc., 4.4%, 3/24/2051 |
|
$
|
60,000
|
$
68,773 |
| Leviathan
Bond Ltd., 6.75%, 6/30/2030 (n) |
|
|
175,000
|
187,743 |
| |
|
|
|
$256,516 |
| Energy
- Integrated – 0.1% |
| Cenovus
Energy, Inc., 3.75%, 2/15/2052 |
|
$
|
50,000
|
$
50,122 |
| Financial
Institutions – 2.3% |
| AerCap
Ireland Capital DAC/AerCap Global Aviation Trust, 6.5%, 7/15/2025 |
|
$
|
150,000
|
$
171,411 |
| AerCap
Ireland Capital DAC/AerCap Global Aviation Trust, 3.65%, 7/21/2027 |
|
|
195,000
|
205,495 |
| Avolon
Holdings Funding Ltd., 3.25%, 2/15/2027 (n) |
|
|
195,000
|
196,362 |
| Avolon
Holdings Funding Ltd., 2.75%, 2/21/2028 (n) |
|
|
194,000
|
190,355 |
| Shriram
Transport Finance Co. Ltd., 4.4%, 3/13/2024 (n) |
|
|
200,000
|
202,500 |
| |
|
|
|
$966,123 |
| Food
& Beverages – 1.1% |
| Anheuser-Busch
InBev Worldwide, Inc., 4.439%, 10/06/2048 |
|
$
|
92,491
|
$
110,547 |
| Bacardi
Ltd., 5.15%, 5/15/2038 (n) |
|
|
115,000
|
142,054 |
| Indofood
CBP, 3.541%, 4/27/2032 |
|
|
200,000
|
201,504 |
| |
|
|
|
$454,105 |
| Gaming
& Lodging – 0.7% |
| GLP
Capital LP/GLP Financing II, Inc., 4%, 1/15/2030 |
|
$
|
118,000
|
$
124,849 |
| GLP
Capital LP/GLP Financing II, Inc., 4%, 1/15/2031 |
|
|
45,000
|
48,015 |
| Marriott
International, Inc., 4.625%, 6/15/2030 |
|
|
63,000
|
70,872 |
| Marriott
International, Inc., 2.85%, 4/15/2031 |
|
|
61,000
|
60,813 |
| |
|
|
|
$304,549 |
| Industrial
– 0.5% |
| Arabian
Centres Sukuk II Ltd., 5.625%, 10/07/2026 |
|
$
|
200,000
|
$
197,320 |
| Insurance
- Property & Casualty – 1.6% |
| Allied
World Assurance Co. Holdings Ltd., 4.35%, 10/29/2025 |
|
$
|
191,000
|
$
204,940 |
| Aon
Corp., 4.5%, 12/15/2028 |
|
|
115,000
|
130,878 |
| Fairfax
Financial Holdings Ltd., 4.85%, 4/17/2028 |
|
|
283,000
|
314,787 |
Portfolio of
Investments – continued
| Issuer
|
|
|
Shares/Par
|
Value
($) |
| Bonds
– continued |
| Insurance
- Property & Casualty – continued |
| Fairfax
Financial Holdings Ltd., 3.375%, 3/03/2031 |
|
$
|
15,000
|
$
15,440 |
| |
|
|
|
$666,045 |
| Machinery
& Tools – 0.4% |
| CNH
Industrial Capital LLC, 3.85%, 11/15/2027 |
|
$
|
145,000
|
$
157,840 |
| Major
Banks – 2.9% |
| Bank
of America Corp., 4.271% to 7/23/2028, FLR (LIBOR - 3mo. + 1.31%) to 7/23/2029 |
|
$
|
61,000
|
$
68,011 |
| Bank
of New York Mellon Corp., 4.7% to 9/20/2025, FLR (CMT - 5yr. + 4.358%) to 9/20/2070 |
|
|
200,000
|
213,350 |
| Barclays
PLC, 4.375%, 1/12/2026 |
|
|
200,000
|
218,640 |
| Deutsche
Bank, 2.311% to 11/16/2026, FLR (SOFR + 1.219%) to 11/16/2027 |
|
|
150,000
|
149,933 |
| HSBC
Holdings PLC, 4.7% to 9/09/2031, FLR (CMT - 1yr. + 3.25%) to 9/09/2169 |
|
|
200,000
|
200,000 |
| JPMorgan
Chase & Co., 2.956% to 5/13/2030, FLR (SOFR + 2.515%) to 5/13/2031 |
|
|
81,000
|
83,865 |
| JPMorgan
Chase & Co., 3.882% to 7/24/2037, FLR (LIBOR - 3mo. + 1.36%) to 7/24/2038 |
|
|
83,000
|
94,205 |
| UBS
Group AG, 4.375% to 2/10/2031, FLR (CMT - 1yr. + 3.313%) to 8/10/2069 (n) |
|
|
200,000
|
197,560 |
| |
|
|
|
$1,225,564 |
| Medical
& Health Technology & Services – 1.5% |
| ProMedica
Toledo Hospital, “B”, 5.325%, 11/15/2028 |
|
$
|
239,000
|
$
267,830 |
| ProMedica
Toledo Hospital, “B”, AGM, 5.75%, 11/15/2038 |
|
|
89,000
|
103,856 |
| Tower
Health, 4.451%, 2/01/2050 |
|
|
270,000
|
244,350 |
| |
|
|
|
$616,036 |
| Metals
& Mining – 0.2% |
| Glencore
Funding LLC, 2.85%, 4/27/2031 (n) |
|
$
|
88,000
|
$
86,986 |
| Midstream
– 3.1% |
| Cheniere
Corpus Christi Holdings LLC, 3.7%, 11/15/2029 |
|
$
|
263,000
|
$
281,714 |
| Cheniere
Corpus Christi Holdings LLC, 2.742%, 12/31/2039 (n) |
|
|
81,000
|
79,023 |
| Enbridge,
Inc., 3.125%, 11/15/2029 |
|
|
150,000
|
157,080 |
| Enbridge,
Inc., 2.5%, 8/01/2033 |
|
|
170,000
|
166,845 |
| Galaxy
Pipeline Assets Bidco Ltd., 2.625%, 3/31/2036 (n) |
|
|
200,000
|
195,398 |
| MPLX
LP, 4.5%, 4/15/2038 |
|
|
199,000
|
222,851 |
| Plains
All American Pipeline LP, 3.8%, 9/15/2030 |
|
|
135,000
|
140,973 |
| Sabine
Pass Liquefaction LLC, 4.5%, 5/15/2030 |
|
|
53,000
|
59,785 |
| |
|
|
|
$1,303,669 |
| Mortgage-Backed
– 0.1% |
|
| Fannie
Mae, 6.5%, 4/01/2032 |
|
$
|
10,540
|
$
12,044 |
| Fannie
Mae, 3%, 2/25/2033 (i) |
|
|
40,987
|
4,031 |
| Fannie
Mae, 5.5%, 9/01/2034 |
|
|
5,214
|
5,833 |
| |
|
|
|
$21,908 |
| Municipals
– 3.7% |
| Bridgeview,
IL, Stadium and Redevelopment Projects, AAC, 5.14%, 12/01/2036 |
|
$
|
195,000
|
$
208,598 |
| Escambia
County, FL, Health Facilities Authority Rev. (Baptist Health Care Corp.), “B”, AGM, 3.607%, 8/15/2040 |
|
|
270,000
|
286,728 |
| New
Jersey Economic Development Authority State Pension Funding Rev., “A”, NPFG, 7.425%, 2/15/2029 |
|
|
177,000
|
222,459 |
| New
Jersey Economic Development Authority State Pension Funding Rev., Capital Appreciation, “B”, AGM, 0%, 2/15/2023 |
|
|
350,000
|
346,577 |
| Port
Beaumont, TX, Industrial Development Authority Facility Taxable Rev. (Jefferson Gulf Coast Energy Project), “B”, 4.1%, 1/01/2028 (n) |
|
|
245,000
|
237,236 |
| Puerto
Rico Electric Power Authority Rev., “A”, 5%, 7/01/2042 (a)(d) |
|
|
5,000
|
4,981 |
| Puerto
Rico Electric Power Authority Rev., “ZZ”, 5%, 7/01/2018 (a)(d) |
|
|
75,000
|
73,219 |
| Puerto
Rico Sales Tax Financing Corp., Restructured Sales Tax Rev., Capital Appreciation, “2019A-1”, 4.55%, 7/01/2040 |
|
|
174,000
|
177,110 |
| |
|
|
|
$1,556,908 |
Portfolio of
Investments – continued
| Issuer
|
|
|
Shares/Par
|
Value
($) |
| Bonds
– continued |
| Natural
Gas - Distribution – 0.5% |
| ENN
Clean Energy International Investment Ltd., 3.375%, 5/12/2026 (n) |
|
$
|
200,000
|
$
198,826 |
| Oils
– 0.5% |
| FS
Luxembourg S.à r.l., 10%, 12/15/2025 (n) |
|
$
|
200,000
|
$
219,252 |
| Other
Banks & Diversified Financials – 0.5% |
| Mizrahi
Tefahot Bank Ltd., 3.077% to 4/07/2026, FLR (CMT - 5yr. + 2.25%) to 4/07/2031 (n) |
|
$
|
200,000
|
$
198,500 |
| Real
Estate - Apartment – 0.2% |
| Mid-America
Apartments LP, 2.75%, 3/15/2030 |
|
$
|
82,000
|
$
84,917 |
| Real
Estate - Office – 0.3% |
| Boston
Properties, Inc., REIT, 2.55%, 4/01/2032 |
|
$
|
147,000
|
$
145,901 |
| Retailers
– 0.3% |
| Alimentation
Couche-Tard, Inc., 2.95%, 1/25/2030 (n) |
|
$
|
65,000
|
$
67,141 |
| Nordstrom,
Inc., 2.3%, 4/08/2024 |
|
|
51,000
|
51,000 |
| |
|
|
|
$118,141 |
| Supranational
– 0.8% |
| Corporacion
Andina de Fomento, 4.375%, 6/15/2022 |
|
$
|
340,000
|
$
345,699 |
| Telecommunications
- Wireless – 1.3% |
| American
Tower Corp., REIT, 3.55%, 7/15/2027 |
|
$
|
60,000
|
$
64,091 |
| Cellnex
Finance Co. S.A., 3.875%, 7/07/2041 (n) |
|
|
200,000
|
191,264 |
| Crown
Castle International Corp., 4.15%, 7/01/2050 |
|
|
75,000
|
84,339 |
| T-Mobile
USA, Inc., 4.375%, 4/15/2040 |
|
|
173,000
|
197,771 |
| |
|
|
|
$537,465 |
| Tobacco
– 0.6% |
| B.A.T.
Capital Corp., 3.215%, 9/06/2026 |
|
$
|
231,000
|
$
240,388 |
| Transportation
- Services – 0.5% |
| Delhi
International Airport Ltd., 6.125%, 10/31/2026 |
|
$
|
200,000
|
$
204,600 |
| U.S.
Government Agencies and Equivalents – 0.1% |
| Small
Business Administration, 4.77%, 4/01/2024 |
|
$
|
5,737
|
$
5,898 |
| Small
Business Administration, 4.99%, 9/01/2024 |
|
|
5,019
|
5,145 |
| Small
Business Administration, 4.86%, 1/01/2025 |
|
|
6,667
|
6,881 |
| Small
Business Administration, 4.625%, 2/01/2025 |
|
|
9,834
|
10,144 |
| Small
Business Administration, 5.11%, 8/01/2025 |
|
|
7,964
|
8,300 |
| |
|
|
|
$36,368 |
| U.S.
Treasury Obligations – 18.9% |
| U.S.
Treasury Bonds, 1.375%, 11/15/2040 |
|
$
|
900,000
|
$
820,195 |
| U.S.
Treasury Bonds, 2.375%, 11/15/2049 |
|
|
770,000
|
845,857 |
| U.S.
Treasury Notes, 0.25%, 9/30/2023 (f) |
|
|
1,100,000
|
1,092,266 |
| U.S.
Treasury Notes, 0.375%, 10/31/2023 |
|
|
4,400,000
|
4,374,047 |
| U.S.
Treasury Notes, 0.25%, 9/30/2025 |
|
|
500,000
|
484,180 |
| U.S.
Treasury Notes, 0.875%, 6/30/2026 |
|
|
250,000
|
246,035 |
| |
|
|
|
$7,862,580 |
Portfolio of
Investments – continued
| Issuer
|
|
|
Shares/Par
|
Value
($) |
| Bonds
– continued |
| Utilities
- Electric Power – 1.5% |
| FirstEnergy
Corp., 5.35%, 7/15/2047 |
|
$
|
270,000
|
$
320,964 |
| Jersey
Central Power & Light Co., 2.75%, 3/01/2032 (n) |
|
|
34,000
|
34,456 |
| Pacific
Gas & Electric Co., 3%, 6/15/2028 |
|
|
44,000
|
44,319 |
| Pacific
Gas & Electric Co., 3.5%, 8/01/2050 |
|
|
250,000
|
231,591 |
| |
|
|
|
$631,330 |
| Total
Bonds (Identified Cost, $33,543,577) |
|
$
33,817,179 |
| Investment
Companies (h) – 12.8% |
| Bond
Funds – 12.4% |
| MFS
High Yield Pooled Portfolio (v) |
|
|
563,325
|
$
5,165,690 |
| Money
Market Funds – 0.4% |
|
| MFS
Institutional Money Market Portfolio, 0.07% (v) |
|
|
201,300
|
$
201,300 |
| Total
Investment Companies (Identified Cost, $5,455,790) |
$
5,366,990 |
| Other
Assets, Less Liabilities – 6.1% |
|
2,525,706 |
| Net
Assets – 100.0% |
$
41,709,875 |
| (a) |
Non-income producing
security. |
| (d)
|
In default.
|
| (f)
|
All or a
portion of the security has been segregated as collateral for open futures contracts. |
| (h)
|
An
affiliated issuer, which may be considered one in which the fund owns 5% or more of the outstanding voting securities, or a company which is under common control. At period end, the aggregate values of the fund's investments in affiliated issuers
and in unaffiliated issuers were $5,366,990 and $33,817,179, respectively. |
| (i)
|
Interest
only security for which the fund receives interest on notional principal (Par amount). Par amount shown is the notional principal and does not reflect the cost of the security. |
| (n)
|
Securities
exempt from registration under Rule 144A of the Securities Act of 1933. These securities may be sold in the ordinary course of business in transactions exempt from registration, normally to qualified institutional buyers. At period end, the
aggregate value of these securities was $12,289,333, representing 29.5% of net assets. |
| (p)
|
Payment-in-kind
(PIK) security for which interest income may be received in additional securities and/or cash. |
| (v)
|
Affiliated
issuer that is available only to investment companies managed by MFS. The rate quoted for the MFS Institutional Money Market Portfolio is the annualized seven-day yield of the fund at period end. |
| (z)
|
Restricted
securities are not registered under the Securities Act of 1933 and are subject to legal restrictions on resale. These securities generally may be resold in transactions exempt from registration or to the public if the securities are subsequently
registered. Disposal of these securities may involve time-consuming negotiations and prompt sale at an acceptable price may be difficult. The fund holds the following restricted securities: |
| Restricted
Securities |
Acquisition
Date |
Cost
|
Value
|
| ReadyCap
Commercial Mortgage Trust, 2021-FL7, “D”, FLR, 3.052% (LIBOR - 1mo. + 2.95%), 11/25/2036 |
11/12/21
|
$120,000
|
$119,777
|
| %
of Net assets |
|
|
0.3%
|
| The
following abbreviations are used in this report and are defined: |
| AAC
|
Ambac
Assurance Corp. |
| AGM
|
Assured
Guaranty Municipal |
| CDO
|
Collateralized
Debt Obligation |
| CLO
|
Collateralized
Loan Obligation |
| CMT
|
Constant
Maturity Treasury |
| FLR
|
Floating
Rate. Interest rate resets periodically based on the parenthetically disclosed reference rate plus a spread (if any). The period-end rate reported may not be the current rate. All reference rates are USD unless otherwise noted. |
| LIBOR
|
London
Interbank Offered Rate |
| NPFG
|
National
Public Finance Guarantee Corp. |
| REIT
|
Real Estate
Investment Trust |
Portfolio of
Investments – continued
| SOFR
|
Secured Overnight Financing
Rate |
| Abbreviations
indicate amounts shown in currencies other than the U.S. dollar. All amounts are stated in U.S. dollars unless otherwise indicated. A list of abbreviations is shown below: |
| CLP
|
Chilean
Peso |
| EUR
|
Euro
|
| INR
|
Indian
Rupee |
| JPY
|
Japanese
Yen |
| MYR
|
Malaysian
Ringgit |
| UYU
|
Uruguayan
Peso |
| ZAR
|
South
African Rand |
| Derivative
Contracts at 12/31/21 |
| Forward
Foreign Currency Exchange Contracts |
Currency
Purchased |
Currency
Sold |
Counterparty
|
Settlement
Date |
Unrealized
Appreciation
(Depreciation) |
| Asset
Derivatives |
| INR
|
8,247,000
|
USD
|
108,011
|
Barclays
Bank PLC |
3/14/2022
|
$
2,088 |
| MYR
|
473,000
|
USD
|
111,132
|
Barclays
Bank PLC |
2/11/2022
|
2,215
|
| USD
|
190,944
|
EUR
|
164,955
|
JPMorgan
Chase Bank N.A. |
1/14/2022
|
3,106
|
| USD
|
91,748
|
JPY
|
10,531,000
|
Brown
Brothers Harriman |
1/04/2022
|
198
|
| USD
|
4,237,475
|
JPY
|
480,000,000
|
State
Street Bank Corp. |
1/04/2022
|
64,651
|
| USD
|
104,508
|
ZAR
|
1,608,571
|
State
Street Bank Corp. |
1/14/2022
|
3,701
|
| |
|
|
|
|
|
$
75,959 |
| Liability
Derivatives |
| JPY
|
92,460,000
|
USD
|
810,019
|
HSBC
Bank |
1/04/2022
|
$
(6,229) |
| JPY
|
147,999,000
|
USD
|
1,297,270
|
JPMorgan
Chase Bank N.A. |
1/04/2022
|
(10,658)
|
| |
|
|
|
|
|
$(16,887)
|
| Futures
Contracts |
| Description
|
Long/
Short |
Currency
|
Contracts
|
Notional
Amount |
Expiration
Date |
Value/Unrealized
Appreciation
(Depreciation) |
| Asset
Derivatives |
| Interest
Rate Futures |
|
|
| U.S.
Treasury Ultra Bond |
Long
|
USD
|
18
|
$3,548,250
|
March
– 2022 |
$89,933
|
| Liability
Derivatives |
| Interest
Rate Futures |
|
|
| U.S.
Treasury Note 2 yr |
Long
|
USD
|
23
|
$5,017,953
|
March
– 2022 |
$(1,789)
|
| U.S.
Treasury Ultra Note 10 yr |
Short
|
USD
|
5
|
732,187
|
March
– 2022 |
(13,738)
|
| |
|
|
|
|
|
$(15,527)
|
At December 31, 2021, the fund had
liquid securities with an aggregate value of $129,086 to cover any collateral or margin obligations for certain derivative contracts.
See Notes to Financial Statements
| Financial
Statements |
Statement of Assets and
Liabilities |
This statement
represents your fund’s balance sheet, which details the assets and liabilities comprising the total value of the fund.
| At
12/31/21 Assets |
|
| Investments
in unaffiliated issuers, at value (identified cost, $33,543,577) |
$33,817,179
|
| Investments
in affiliated issuers, at value (identified cost, $5,455,790) |
5,366,990
|
| Cash
|
126,288
|
| Foreign
currency, at value (identified cost, $2,205,948) |
2,173,346
|
| Receivables
for |
|
| Forward
foreign currency exchange contracts |
75,959
|
| Net
daily variation margin on open futures contracts |
27,920
|
| Investments
sold |
390
|
| Fund
shares sold |
12,658
|
| Interest
|
193,771
|
| Receivable
from investment adviser |
6,829
|
| Other
assets |
459
|
| Total
assets |
$41,801,789
|
| Liabilities
|
|
| Payables
for |
|
| Forward
foreign currency exchange contracts |
$16,887
|
| Investments
purchased |
2,274
|
| Fund
shares reacquired |
2,741
|
| Payable
to affiliates |
|
| Administrative
services fee |
96
|
| Shareholder
servicing costs |
69
|
| Distribution
and/or service fees |
76
|
| Payable
for independent Trustees' compensation |
59
|
| Accrued
expenses and other liabilities |
69,712
|
| Total
liabilities |
$91,914
|
| Net
assets |
$41,709,875
|
| Net
assets consist of |
|
| Paid-in
capital |
$40,995,648
|
| Total
distributable earnings (loss) |
714,227
|
| Net
assets |
$41,709,875
|
| Shares
of beneficial interest outstanding |
4,258,240
|
| |
Net
assets |
Shares
outstanding |
Net
asset value
per share |
| Initial
Class |
$36,162,628
|
3,687,697
|
$9.81
|
| Service
Class |
5,547,247
|
570,543
|
9.72
|
See Notes to Financial Statements
| Financial
Statements |
Statement of Operations
|
This statement describes how much
your fund earned in investment income and accrued in expenses. It also describes any gains and/or losses generated by fund operations.
| Year
ended 12/31/21 |
|
| Net
investment income (loss) |
|
| Income
|
|
| Interest
|
$982,371
|
| Dividends
from affiliated issuers |
344,952
|
| Other
|
511
|
| Income
on securities loaned |
23
|
| Foreign
taxes withheld |
(234)
|
| Total
investment income |
$1,327,623
|
| Expenses
|
|
| Management
fee |
$219,045
|
| Distribution
and/or service fees |
14,374
|
| Shareholder
servicing costs |
12,268
|
| Administrative
services fee |
17,500
|
| Independent
Trustees' compensation |
3,037
|
| Custodian
fee |
12,415
|
| Shareholder
communications |
12,152
|
| Audit
and tax fees |
82,104
|
| Legal
fees |
199
|
| Miscellaneous
|
32,665
|
| Total
expenses |
$405,759
|
| Reduction
of expenses by investment adviser |
(61,852)
|
| Net
expenses |
$343,907
|
| Net
investment income (loss) |
$983,716
|
| Realized
and unrealized gain (loss) |
|
| Realized
gain (loss) (identified cost basis) |
|
| Unaffiliated
issuers |
$584,844
|
| Affiliated
issuers |
(467,135)
|
| Futures
contracts |
(131,172)
|
| Forward
foreign currency exchange contracts |
(36,705)
|
| Foreign
currency |
481
|
| Net
realized gain (loss) |
$(49,687)
|
| Change
in unrealized appreciation or depreciation |
|
| Unaffiliated
issuers |
$(1,294,244)
|
| Affiliated
issuers |
387,611
|
| Futures
contracts |
70,443
|
| Forward
foreign currency exchange contracts |
93,800
|
| Translation
of assets and liabilities in foreign currencies |
(42,154)
|
| Net
unrealized gain (loss) |
$(784,544)
|
| Net
realized and unrealized gain (loss) |
$(834,231)
|
| Change
in net assets from operations |
$149,485
|
See Notes to Financial Statements
| Financial
Statements |
Statements of Changes in
Net Assets |
These statements describe
the increases and/or decreases in net assets resulting from operations, any distributions, and any shareholder transactions.
| |
Year
ended |
| |
12/31/21
|
12/31/20
|
| Change
in net assets |
|
|
| From
operations |
|
|
| Net
investment income (loss) |
$983,716
|
$1,246,108
|
| Net
realized gain (loss) |
(49,687)
|
1,844,524
|
| Net
unrealized gain (loss) |
(784,544)
|
832,785
|
| Change
in net assets from operations |
$149,485
|
$3,923,417
|
| Total
distributions to shareholders |
$(3,069,012)
|
$(1,603,085)
|
| Change
in net assets from fund share transactions |
$(2,634,018)
|
$(97,382)
|
| Total
change in net assets |
$(5,553,545)
|
$2,222,950
|
| Net
assets |
|
|
| At
beginning of period |
47,263,420
|
45,040,470
|
| At
end of period |
$41,709,875
|
$47,263,420
|
See Notes to Financial Statements
| Financial
Statements |
Financial Highlights
|
The financial highlights table is
intended to help you understand the fund's financial performance for the past 5 years. Certain information reflects financial results for a single fund share. The total returns in the table represent the rate that an investor would have earned (or
lost) on an investment in the fund share class (assuming reinvestment of all distributions) held for the entire period.
| Initial
Class |
Year
ended |
| |
12/31/21
|
12/31/20
|
12/31/19
|
12/31/18
|
12/31/17
|
| Net
asset value, beginning of period |
$10.51
|
$9.98
|
$9.26
|
$9.84
|
$9.71
|
| Income
(loss) from investment operations |
|
|
|
|
|
| Net
investment income (loss) (d) |
$0.23
|
$0.29
|
$0.33
|
$0.33
|
$0.34
|
| Net
realized and unrealized gain (loss) |
(0.17)
|
0.63
|
0.74
|
(0.52)
|
0.26
|
| Total
from investment operations |
$0.06
|
$0.92
|
$1.07
|
$(0.19)
|
$0.60
|
| Less
distributions declared to shareholders |
|
|
|
|
|
| From
net investment income |
$(0.33)
|
$(0.39)
|
$(0.35)
|
$(0.39)
|
$(0.47)
|
| From
net realized gain |
(0.43)
|
—
|
—
|
—
|
—
|
| Total
distributions declared to shareholders |
$(0.76)
|
$(0.39)
|
$(0.35)
|
$(0.39)
|
$(0.47)
|
| Net
asset value, end of period (x) |
$9.81
|
$10.51
|
$9.98
|
$9.26
|
$9.84
|
| Total
return (%) (k)(r)(s)(x) |
0.47
|
9.35
|
11.60
|
(1.99)
|
6.24
|
Ratios
(%) (to average net assets)
and Supplemental data: |
|
|
|
|
|
| Expenses
before expense reductions (h) |
0.89
|
0.89
|
1.01
|
1.03
|
1.02
|
| Expenses
after expense reductions (h) |
0.75
|
0.75
|
0.78
|
0.80
|
0.80
|
| Net
investment income (loss) |
2.28
|
2.83
|
3.32
|
3.42
|
3.39
|
| Portfolio
turnover |
72
|
112
|
104
|
59
|
72
|
| Net
assets at end of period (000 omitted) |
$36,163
|
$41,438
|
$38,670
|
$38,111
|
$42,409
|
| Service
Class |
Year
ended |
| |
12/31/21
|
12/31/20
|
12/31/19
|
12/31/18
|
12/31/17
|
| Net
asset value, beginning of period |
$10.43
|
$9.90
|
$9.19
|
$9.75
|
$9.63
|
| Income
(loss) from investment operations |
|
|
|
|
|
| Net
investment income (loss) (d) |
$0.21
|
$0.26
|
$0.30
|
$0.30
|
$0.31
|
| Net
realized and unrealized gain (loss) |
(0.19)
|
0.63
|
0.74
|
(0.50)
|
0.25
|
| Total
from investment operations |
$0.02
|
$0.89
|
$1.04
|
$(0.20)
|
$0.56
|
| Less
distributions declared to shareholders |
|
|
|
|
|
| From
net investment income |
$(0.30)
|
$(0.36)
|
$(0.33)
|
$(0.36)
|
$(0.44)
|
| From
net realized gain |
(0.43)
|
—
|
—
|
—
|
—
|
| Total
distributions declared to shareholders |
$(0.73)
|
$(0.36)
|
$(0.33)
|
$(0.36)
|
$(0.44)
|
| Net
asset value, end of period (x) |
$9.72
|
$10.43
|
$9.90
|
$9.19
|
$9.75
|
| Total
return (%) (k)(r)(s)(x) |
0.10
|
9.11
|
11.29
|
(2.11)
|
5.88
|
Ratios
(%) (to average net assets)
and Supplemental data: |
|
|
|
|
|
| Expenses
before expense reductions (h) |
1.14
|
1.14
|
1.26
|
1.28
|
1.27
|
| Expenses
after expense reductions (h) |
1.00
|
1.00
|
1.03
|
1.05
|
1.05
|
| Net
investment income (loss) |
2.03
|
2.59
|
3.07
|
3.17
|
3.16
|
| Portfolio
turnover |
72
|
112
|
104
|
59
|
72
|
| Net
assets at end of period (000 omitted) |
$5,547
|
$5,825
|
$6,371
|
$6,614
|
$7,287
|
See Notes to Financial Statements
Financial
Highlights - continued
| (d)
|
Per share data
is based on average shares outstanding. |
| (h)
|
In addition to
the fees and expenses which the fund bears directly, the fund indirectly bears a pro rata share of the fees and expenses of the underlying affiliated funds in which the fund invests. Accordingly, the expense ratio for the fund reflects only those
fees and expenses borne directly by the fund. Because the underlying affiliated funds have varied expense and fee levels and the fund may own different proportions of the underlying affiliated funds at different times, the amount of fees and
expenses incurred indirectly by the fund will vary. |
| (k)
|
The total
return does not reflect expenses that apply to separate accounts. Inclusion of these charges would reduce the total return figures for all periods shown. |
| (r)
|
Certain
expenses have been reduced without which performance would have been lower. |
| (s)
|
From time to
time the fund may receive proceeds from litigation settlements, without which performance would be lower. |
| (x)
|
The
net asset values and total returns have been calculated on net assets which include adjustments made in accordance with U.S. generally accepted accounting principles required at period end for financial reporting purposes. |
See Notes to Financial Statements
Notes to Financial Statements
(1) Business and Organization
MFS Income Portfolio (the fund) is a diversified series of
MFS Variable Insurance Trust II (the trust). The trust is organized as a Massachusetts business trust and is registered under the Investment Company Act of 1940, as amended, as an open-end management investment company. The shareholders of each
series of the trust are separate accounts of insurance companies, which offer variable annuity and/or life insurance products, and qualified retirement and pension plans.
The fund is an investment company and accordingly follows
the investment company accounting and reporting guidance of the Financial Accounting Standards Board (FASB) Accounting Standards Codification Topic 946 Financial Services - Investment Companies.
(2) Significant Accounting Policies
General — The
preparation of financial statements in conformity with U.S. generally accepted accounting principles requires management to make estimates and assumptions that affect the reported amounts of assets and liabilities, and disclosure of contingent
assets and liabilities at the date of the financial statements and the reported amounts of increases and decreases in net assets from operations during the reporting period. Actual results could differ from those estimates. In the preparation of
these financial statements, management has evaluated subsequent events occurring after the date of the fund’s Statement of Assets and Liabilities through the date that the financial statements were issued. The fund invests in the MFS High Yield Pooled Portfolio (“High Yield Pooled Portfolio”). MFS does not receive a management fee from the High Yield Pooled Portfolio. The High Yield Pooled Portfolio’s
investment objective is to seek total return with an emphasis on high current income, but also considering capital appreciation. The accounting policies of the High Yield Pooled Portfolio are outlined in its shareholder report, which is available
without charge by calling 1-800-225-2606 and on the Securities and Exchange Commission (SEC) web site at http://www.sec.gov. The accounting policies detailed in the Significant Accounting Policies note cover both the fund and the High Yield Pooled
Portfolio. For purposes of this policy disclosure, “fund” refers to both the fund and the High Yield Pooled Portfolio in which the fund invests. The High Yield Pooled Portfolio's shareholder report is not covered by this report. The fund
and the High Yield Pooled Portfolio invest in high-yield securities rated below investment grade. Investments in below investment grade quality securities can involve a substantially greater risk of default or can already be in default, and their
values can decline significantly. Below investment grade quality securities tend to be more sensitive to adverse news about the issuer, or the market or economy in general, than higher quality debt instruments. The fund and the High Yield Pooled
Portfolio invest in foreign securities. Investments in foreign securities are vulnerable to the effects of changes in the relative values of the local currency and the U.S. dollar and to the effects of changes in each country’s market,
economic, industrial, political, regulatory, geopolitical, environmental, public health, and other conditions.
Balance Sheet Offsetting
— The fund's accounting policy with respect to balance sheet offsetting is that, absent an event of default by the counterparty or a termination of the agreement, the International Swaps and Derivatives Association (ISDA) Master Agreement, or
similar agreement, does not result in an offset of reported amounts of financial assets and financial liabilities in the Statement of Assets and Liabilities across transactions between the fund and the applicable counterparty. The fund's right to
setoff may be restricted or prohibited by the bankruptcy or insolvency laws of the particular jurisdiction to which a specific master netting agreement counterparty is subject. Balance sheet offsetting disclosures, to the extent applicable to the
fund, have been included in the fund’s Significant Accounting Policies note under the captions for each of the fund’s in-scope financial instruments and transactions.
Investment Valuations
— The investments of the fund and the High Yield Pooled Portfolio are valued as described below.
Equity securities, including restricted equity securities,
are generally valued at the last sale or official closing price on their primary market or exchange as provided by a third-party pricing service. Equity securities, for which there were no sales reported that day, are generally valued at the last
quoted daily bid quotation on their primary market or exchange as provided by a third-party pricing service. Debt instruments and floating rate loans, including restricted debt instruments, are generally valued at an evaluated or composite bid as
provided by a third-party pricing service. Short-term instruments with a maturity at issuance of 60 days or less may be valued at amortized cost, which approximates market value. Exchange-traded options are generally valued at the last sale or
official closing price on their primary exchange as provided by a third-party pricing service. Exchange-traded options for which there were no sales reported that day are generally valued at the last daily bid quotation on their primary exchange as
provided by a third-party pricing service. For put options, the position may be valued at the last daily ask quotation if there are no trades reported during the day. Options not traded on an exchange are generally valued at a broker/dealer bid
quotation. Foreign currency options are generally valued at valuations provided by a third-party pricing service. Futures contracts are generally valued at last posted settlement price on their primary exchange as provided by a third-party pricing
service. Futures contracts for which there were no trades that day for a particular position are generally valued at the closing bid quotation on their primary exchange as provided by a third-party pricing service. Forward foreign currency exchange
contracts are generally valued at the mean of bid and asked prices for the time period interpolated from rates provided by a third-party pricing service for proximate time periods. Open-end investment
Notes to
Financial Statements - continued
companies are generally valued at net asset value per share. Securities
and other assets generally valued on the basis of information from a third-party pricing service may also be valued at a broker/dealer bid quotation. In determining values, third-party pricing services can utilize both transaction data and market
information such as yield, quality, coupon rate, maturity, type of issue, trading characteristics, and other market data. The values of foreign securities and other assets and liabilities expressed in foreign currencies are converted to U.S. dollars
using the mean of bid and asked prices for rates provided by a third-party pricing service.
The Board of Trustees has delegated primary responsibility
for determining or causing to be determined the value of the fund’s investments (including any fair valuation) to the adviser pursuant to valuation policies and procedures approved by the Board. If the adviser determines that reliable market
quotations are not readily available, investments are valued at fair value as determined in good faith by the adviser in accordance with such procedures under the oversight of the Board of Trustees. Under the fund’s valuation policies and
procedures, market quotations are not considered to be readily available for most types of debt instruments and floating rate loans and many types of derivatives. These investments are generally valued at fair value based on information from
third-party pricing services. In addition, investments may be valued at fair value if the adviser determines that an investment’s value has been materially affected by events occurring after the close of the exchange or market on which the
investment is principally traded (such as foreign exchange or market) and prior to the determination of the fund’s net asset value, or after the halt of trading of a specific security where trading does not resume prior to the close of the
exchange or market on which the security is principally traded. The adviser generally relies on third-party pricing services or other information (such as the correlation with price movements of similar securities in the same or other markets; the
type, cost and investment characteristics of the security; the business and financial condition of the issuer; and trading and other market data) to assist in determining whether to fair value and at what value to fair value an investment. The value
of an investment for purposes of calculating the fund’s net asset value can differ depending on the source and method used to determine value. When fair valuation is used, the value of an investment used to determine the fund’s net asset
value may differ from quoted or published prices for the same investment. There can be no assurance that the fund could obtain the fair value assigned to an investment if it were to sell the investment at the same time at which the fund determines
its net asset value per share.
Various inputs are
used in determining the value of the fund's assets or liabilities. These inputs are categorized into three broad levels. In certain cases, the inputs used to measure fair value may fall into different levels of the fair value hierarchy. In such
cases, an investment's level within the fair value hierarchy is based on the lowest level of input that is significant to the fair value measurement. The fund's assessment of the significance of a particular input to the fair value measurement in
its entirety requires judgment, and considers factors specific to the investment. Level 1 includes unadjusted quoted prices in active markets for identical assets or liabilities. Level 2 includes other significant observable market-based inputs
(including quoted prices for similar securities, interest rates, prepayment speed, and credit risk). Level 3 includes unobservable inputs, which may include the adviser's own assumptions in determining the fair value of investments. Other financial
instruments are derivative instruments, such as futures contracts and forward foreign currency exchange contracts. The following is a summary of the levels used as of December 31, 2021 in valuing the fund's assets and liabilities:
| Financial
Instruments |
Level
1 |
Level
2 |
Level
3 |
Total
|
| U.S.
Treasury Bonds & U.S. Government Agencies & Equivalents |
$—
|
$7,898,948
|
$—
|
$7,898,948
|
| Non
- U.S. Sovereign Debt |
—
|
1,994,479
|
—
|
1,994,479
|
| Municipal
Bonds |
—
|
1,556,908
|
—
|
1,556,908
|
| U.S.
Corporate Bonds |
—
|
6,689,146
|
—
|
6,689,146
|
| Residential
Mortgage-Backed Securities |
—
|
151,698
|
—
|
151,698
|
| Commercial
Mortgage-Backed Securities |
—
|
3,344,910
|
—
|
3,344,910
|
| Asset-Backed
Securities (including CDOs) |
—
|
6,826,972
|
—
|
6,826,972
|
| Foreign
Bonds |
—
|
5,354,118
|
—
|
5,354,118
|
| Mutual
Funds |
5,366,990
|
—
|
—
|
5,366,990
|
| Total
|
$5,366,990
|
$33,817,179
|
$—
|
$39,184,169
|
| Other
Financial Instruments |
|
|
|
|
| Futures
Contracts – Assets |
$89,933
|
$—
|
$—
|
$89,933
|
| Futures
Contracts – Liabilities |
(15,527)
|
—
|
—
|
(15,527)
|
| Forward
Foreign Currency Exchange Contracts – Assets |
—
|
75,959
|
—
|
75,959
|
| Forward
Foreign Currency Exchange Contracts – Liabilities |
—
|
(16,887)
|
—
|
(16,887)
|
For further information
regarding security characteristics, see the Portfolio of Investments. Please refer to the High Yield Pooled Portfolio's shareholder report for further information regarding the levels used in valuing its assets or liabilities.
Notes to
Financial Statements - continued
Foreign Currency
Translation — Purchases and sales of foreign investments, income, and expenses are converted into U.S. dollars based upon currency exchange rates prevailing on the respective dates of such transactions or on
the reporting date for foreign denominated receivables and payables. Gains and losses attributable to foreign currency exchange rates on sales of securities are recorded for financial statement purposes as net realized gains and losses on
investments. Gains and losses attributable to foreign exchange rate movements on receivables, payables, income and expenses are recorded for financial statement purposes as foreign currency transaction gains and losses. That portion of both realized
and unrealized gains and losses on investments that results from fluctuations in foreign currency exchange rates is not separately disclosed.
Derivatives — The
fund uses derivatives primarily to increase or decrease exposure to a particular market or segment of the market, or security, to increase or decrease interest rate or currency exposure, or as alternatives to direct investments. Derivatives are used
for hedging or non-hedging purposes. While hedging can reduce or eliminate losses, it can also reduce or eliminate gains. When the fund uses derivatives as an investment to increase market exposure, or for hedging purposes, gains and losses from
derivative instruments may be substantially greater than the derivative’s original cost.
The derivative instruments used by the fund during the
period were futures contracts and forward foreign currency exchange contracts. Depending on the type of derivative, a fund may exit a derivative position by entering into an offsetting transaction with a counterparty or exchange, negotiating an
agreement with the derivative counterparty, or novating the position to a third party. The fund may be unable to promptly close out a futures position in instances where the daily fluctuation in the price for that type of future exceeds the daily
limit set by the exchange. The fund's period end derivatives, as presented in the Portfolio of Investments and the associated Derivative Contract tables, generally are indicative of the volume of its derivative activity during the period.
The following table presents, by major type of derivative
contract, the fair value, on a gross basis, of the asset and liability components of derivatives held by the fund at December 31, 2021 as reported in the Statement of Assets and Liabilities:
| |
|
Fair
Value (a) |
| Risk
|
Derivative
Contracts |
Asset
Derivatives |
Liability
Derivatives |
| Interest
Rate |
Futures
Contracts |
$89,933
|
$(15,527)
|
| Foreign
Exchange |
Forward
Foreign Currency Exchange Contracts |
75,959
|
(16,887)
|
| Total
|
|
$165,892
|
$(32,414)
|
(a) Values presented in this table
for futures contracts correspond to the values reported in the Portfolio of Investments. Only the current day net variation margin for futures contracts is separately reported within the Statement of Assets and Liabilities.
The following table presents, by major type of derivative
contract, the realized gain (loss) on derivatives held by the fund for the year ended December 31, 2021 as reported in the Statement of Operations:
| Risk
|
Futures
Contracts |
Forward
Foreign
Currency
Exchange
Contracts |
| Interest
Rate |
$(131,172)
|
$—
|
| Foreign
Exchange |
—
|
(36,705)
|
| Total
|
$(131,172)
|
$(36,705)
|
The following table presents, by
major type of derivative contract, the change in unrealized appreciation or depreciation on derivatives held by the fund for the year ended December 31, 2021 as reported in the Statement of Operations:
| Risk
|
Futures
Contracts |
Forward
Foreign
Currency
Exchange
Contracts |
| Interest
Rate |
$70,443
|
$—
|
| Foreign
Exchange |
—
|
93,800
|
| Total
|
$70,443
|
$93,800
|
Derivative counterparty credit
risk is managed through formal evaluation of the creditworthiness of all potential counterparties. On certain, but not all, uncleared derivatives, the fund attempts to reduce its exposure to counterparty credit risk whenever possible by entering
into an ISDA Master Agreement on a bilateral basis. The ISDA Master Agreement gives each party to the agreement the right to terminate all transactions traded under such agreement if there is a specified deterioration in the credit quality of the
other party. Upon an event of default or a termination of the ISDA Master Agreement, the non-defaulting party has the right to close out
Notes to
Financial Statements - continued
all transactions traded under such agreement and to net amounts owed under
each agreement to one net amount payable by one party to the other. This right to close out and net payments across all transactions traded under the ISDA Master Agreement could result in a reduction of the fund's credit risk to such counterparty
equal to any amounts payable by the fund under the applicable transactions, if any.
Collateral and margin requirements differ by type of
derivative. For cleared derivatives (e.g., futures contracts, cleared swaps, and exchange-traded options), margin requirements are set by the clearing broker and the clearing house and collateral, in the form of cash or securities, is posted by the
fund directly with the clearing broker. Collateral terms are counterparty agreement specific for uncleared derivatives (e.g., forward foreign currency exchange contracts, uncleared swap agreements, and uncleared options) and collateral, in the form
of cash and securities, is held in segregated accounts with the fund's custodian in connection with these agreements. For derivatives traded under an ISDA Master Agreement, which contains a collateral support annex, the collateral requirements are
netted across all transactions traded under such counterparty-specific agreement and an amount is posted from one party to the other to collateralize such obligations. Cash that has been segregated or delivered to cover the fund's collateral or
margin obligations under derivative contracts, if any, will be reported separately in the Statement of Assets and Liabilities as restricted cash for uncleared derivatives and/or deposits with brokers for cleared derivatives. Securities pledged as
collateral or margin for the same purpose, if any, are noted in the Portfolio of Investments. The fund may be required to make payments of interest on uncovered collateral or margin obligations with the broker. Any such payments are included in
“Miscellaneous” expense in the Statement of Operations.
Futures Contracts —
The fund entered into futures contracts which may be used to hedge against or obtain broad market exposure, interest rate exposure, currency exposure, or to manage duration. A futures contract represents a commitment for the future purchase or sale
of an asset at a specified price on a specified date.
Upon entering into a futures contract, the fund is required
to deposit with the broker, either in cash or securities, an initial margin in an amount equal to a specified percentage of the notional amount of the contract. Subsequent payments (variation margin) are made or received by the fund each day,
depending on the daily fluctuations in the value of the contract, and are recorded for financial statement purposes as unrealized gain or loss by the fund until the contract is closed or expires at which point the gain or loss on futures contracts
is realized.
The fund bears the risk of interest
rates, exchange rates or securities prices moving unexpectedly, in which case, the fund may not achieve the anticipated benefits of the futures contracts and may realize a loss. While futures contracts may present less counterparty risk to the fund
since the contracts are exchange traded and the exchange’s clearinghouse guarantees payments to the broker, there is still counterparty credit risk due to the insolvency of the broker. The fund’s maximum risk of loss due to counterparty
credit risk is equal to the margin posted by the fund to the broker plus any gains or minus any losses on the outstanding futures contracts.
Forward Foreign Currency Exchange Contracts — The fund entered into forward foreign currency exchange contracts for the purchase or sale of a specific foreign currency at a fixed price on a future date. These contracts may be used to hedge the fund’s
currency risk or for non-hedging purposes. For hedging purposes, the fund may enter into contracts to deliver or receive foreign currency that the fund will receive from or use in its normal investment activities. The fund may also use contracts to
hedge against declines in the value of foreign currency denominated securities due to unfavorable exchange rate movements. For non-hedging purposes, the fund may enter into contracts with the intent of changing the relative exposure of the
fund’s portfolio of securities to different currencies to take advantage of anticipated exchange rate changes.
Forward foreign currency exchange contracts are adjusted by
the daily exchange rate of the underlying currency and any unrealized gains or losses are recorded as a receivable or payable for forward foreign currency exchange contracts until the contract settlement date. On contract settlement date, any gain
or loss on the contract is recorded as realized gains or losses on forward foreign currency exchange contracts.
Risks may arise upon entering into these contracts from
unanticipated movements in the value of the contract and from the potential inability of counterparties to meet the terms of their contracts. Generally, the fund’s maximum risk due to counterparty credit risk is the unrealized gain on the
contract due to the use of Continuous Linked Settlement, a multicurrency cash settlement system for the centralized settlement of foreign transactions. This risk is mitigated in cases where there is an ISDA Master Agreement between the fund and the
counterparty providing for netting as described above and, where applicable, by the posting of collateral by the counterparty to the fund to cover the fund’s exposure to the counterparty under such ISDA Master Agreement.
Security Loans —
Under its Securities Lending Agency Agreement with the fund, State Street Bank and Trust Company, as lending agent, loans the securities of the fund to certain qualified institutions (the “Borrowers”) approved by the fund. Security loans
can be terminated at the discretion of either the lending agent or the fund and the related securities must be returned within the earlier of the standard trade settlement period for such securities or within three business days. The loans are
collateralized by cash and/or U.S. Treasury and federal agency obligations in an amount typically at least equal to the market value of the securities loaned. On
Notes to
Financial Statements - continued
loans collateralized by cash, the cash collateral is invested in a money
market fund. The market value of the loaned securities is determined at the close of business of the fund and any additional required collateral is delivered to the fund on the next business day. The lending agent provides the fund with
indemnification against Borrower default. In the event of Borrower default, the lending agent will, for the benefit of the fund, either purchase securities identical to those loaned or, when such purchase is commercially impracticable, pay the fund
the market value of the loaned securities. In return, the lending agent assumes the fund's rights to the related collateral. If the collateral value is less than the cost to purchase identical securities, the lending agent is responsible for the
shortfall, but only to the extent that such shortfall is not due to a decline in collateral value resulting from collateral reinvestment for which the fund bears the risk of loss. A portion of the income generated upon investment of the collateral
is remitted to the Borrowers, and the remainder is allocated between the fund and the lending agent. On loans collateralized by U.S. Treasury and/or federal agency obligations, a fee is received from the Borrower, and is allocated between the fund
and the lending agent. Income from securities lending is separately reported in the Statement of Operations. The dividend and interest income earned on the securities loaned is accounted for in the same manner as other dividend and interest income.
At December 31, 2021, there were no securities on loan or collateral outstanding.
Loans and Other Direct Debt Instruments — The fund invests in loans and loan participations or other receivables. These investments may include standby financing commitments, including revolving credit facilities, which contractually obligate the fund
to supply additional cash to the borrower on demand. The fund generally provides this financial support in order to preserve its existing investment or to obtain a more senior secured interest in the assets of the borrower. Loan participations
involve a risk of insolvency of the lending bank or other financial intermediary.
Indemnifications —
Under the fund's organizational documents, its officers and Trustees may be indemnified against certain liabilities and expenses arising out of the performance of their duties to the fund. Additionally, in the normal course of business, the fund
enters into agreements with service providers that may contain indemnification clauses. The fund's maximum exposure under these agreements is unknown as this would involve future claims that may be made against the fund that have not yet
occurred.
Investment Transactions and Income — Investment transactions are recorded on the trade date. Interest income is recorded on the accrual basis. All premium and
discount is amortized or accreted for financial statement purposes in accordance with U.S. generally accepted accounting principles. Interest payments received in additional securities are recorded on the
ex-interest date in an amount equal to the value of the security on such date. Debt obligations may be placed on non-accrual status or set to accrue at a rate of interest less than the contractual coupon when
the collection of all or a portion of interest has become doubtful. Interest income for those debt obligations may be further reduced by the write-off of the related interest receivables when deemed uncollectible.
The fund may receive proceeds from litigation settlements.
Any proceeds received from litigation involving portfolio holdings are reflected in the Statement of Operations in realized gain/loss if the security has been disposed of by the fund or in unrealized gain/loss if the security is still held by the
fund. Any other proceeds from litigation not related to portfolio holdings are reflected as other income in the Statement of Operations.
To mitigate the counterparty credit risk on TBA
transactions, mortgage dollar rolls, and other types of forward settling mortgage-backed and asset-backed security transactions, the fund whenever possible enters into a Master Securities Forward Transaction Agreement (“MSFTA”) on a
bilateral basis with each of the counterparties with whom it undertakes a significant volume of transactions. The MSFTA gives each party to the agreement the right to terminate all transactions traded under such agreement if there is a specified
deterioration in the credit quality of the other party. Upon an event of default or a termination of the MSFTA, the non-defaulting party has the right to close out all transactions traded under such agreement and to net amounts owed under each
transaction to one net amount payable by one party to the other. This right to close out and net payments across all transactions traded under the MSFTA could result in a reduction of the fund's credit risk to such counterparty equal to any amounts
payable by the fund under the applicable transactions, if any.
For mortgage-backed and asset-backed securities traded
under a MSFTA, the collateral and margining requirements are contract specific. Collateral amounts across all transactions traded under such agreement are netted and an amount is posted from one party to the other to collateralize such obligations.
Cash that has been pledged to cover the fund's collateral or margin obligations under a MSFTA, if any, will be reported separately on the Statement of Assets and Liabilities as restricted cash. Securities pledged as collateral or margin for the same
purpose, if any, are noted in the Portfolio of Investments.
Tax Matters and Distributions — The fund intends to qualify as a regulated investment company, as defined under Subchapter M of the Internal Revenue Code, and to distribute all of its taxable income, including realized capital gains. As a
result, no provision for federal income tax is required. The fund’s federal tax returns, when filed, will remain subject to examination by the Internal Revenue Service for a three year period. Management has analyzed the fund’s tax
positions taken on federal and state tax returns for all open tax years and does not believe that there are any uncertain tax positions that require recognition of a tax liability. Foreign taxes, if any,
Notes to
Financial Statements - continued
have been accrued by the fund in the accompanying financial statements in
accordance with the applicable foreign tax law. Foreign income taxes may be withheld by certain countries in which the fund invests. Additionally, capital gains realized by the fund on securities issued in or by certain foreign countries may be
subject to capital gains tax imposed by those countries.
Distributions to shareholders are recorded on the
ex-dividend date. Income and capital gain distributions are determined in accordance with income tax regulations, which may differ from U.S. generally accepted accounting principles. Certain capital accounts in the financial statements are
periodically adjusted for permanent differences in order to reflect their tax character. These adjustments have no impact on net assets or net asset value per share. Temporary differences which arise from recognizing certain items of income,
expense, gain or loss in different periods for financial statement and tax purposes will reverse at some time in the future.
Book/tax differences primarily relate to defaulted bonds,
amortization and accretion of debt securities, wash sale loss deferrals, and derivative transactions.
The tax character of distributions declared to shareholders
for the last two fiscal years is as follows:
| |
Year
ended
12/31/21 |
Year
ended
12/31/20 |
| Ordinary
income (including any short-term capital gains) |
$2,283,010
|
$1,603,085
|
| Long-term
capital gains |
786,002
|
—
|
| Total
distributions |
$3,069,012
|
$1,603,085
|
The federal tax cost and the tax
basis components of distributable earnings were as follows:
| As
of 12/31/21 |
|
| Cost
of investments |
$40,040,915
|
| Gross
appreciation |
783,584
|
| Gross
depreciation |
(1,506,852)
|
| Net
unrealized appreciation (depreciation) |
$(723,268)
|
| Undistributed
ordinary income |
1,145,526
|
| Undistributed
long-term capital gain |
325,023
|
| Other
temporary differences |
(33,054)
|
| Total
distributable earnings (loss) |
$714,227
|
Multiple Classes of Shares of
Beneficial Interest — The fund offers multiple classes of shares, which differ in their respective distribution and/or service fees. The fund's income, realized and unrealized gain (loss), and common expenses
are allocated to shareholders based on the daily net assets of each class. Dividends are declared separately for each class. Differences in per share dividend rates are generally due to differences in separate class expenses. The fund’s
distributions declared to shareholders as reported in the Statements of Changes in Net Assets are presented by class as follows:
| |
Year
ended
12/31/21 |
|
Year
ended
12/31/20 |
| Initial
Class |
$2,672,197
|
|
$1,407,184
|
| Service
Class |
396,815
|
|
195,901
|
| Total
|
$3,069,012
|
|
$1,603,085
|
(3) Transactions with
Affiliates
Investment Adviser — The fund has an investment advisory agreement with MFS to provide overall investment management and related administrative services and facilities to the fund. The
management fee is computed daily and paid monthly at the following annual rates based on the fund's average daily net assets:
| Up
to $1 billion |
0.50%
|
| In
excess of $1 billion |
0.45%
|
Notes to
Financial Statements - continued
MFS has agreed in writing to reduce its management fee by a
specified amount if certain MFS mutual fund assets exceed thresholds agreed to by MFS and the fund's Board of Trustees. For the year ended December 31, 2021, this management fee reduction amounted to $5,540, which is included in the reduction of
total expenses in the Statement of Operations. The management fee incurred for the year ended December 31, 2021 was equivalent to an annual effective rate of 0.49% of the fund's average daily net assets.
The investment adviser has agreed in writing to pay a
portion of the fund’s total annual operating expenses, excluding interest, taxes, extraordinary expenses, brokerage and transaction costs, and investment-related expenses (such as fees and expenses associated with investments in investment
companies and other similar investment vehicles), such that total annual operating expenses do not exceed 0.75% of average daily net assets for the Initial Class shares and 1.00% of average daily net assets for the Service Class shares. This written
agreement will continue until modified by the fund’s Board of Trustees, but such agreement will continue at least until April 30, 2023. For the year ended December 31, 2021, this reduction amounted to $56,312, which is included in the
reduction of total expenses in the Statement of Operations.
Distributor — MFS
Fund Distributors, Inc. (MFD), a wholly-owned subsidiary of MFS, is the distributor of shares of the fund. The Trustees have adopted a distribution plan for the Service Class shares pursuant to Rule 12b-1 under the Investment Company Act of
1940.
The fund's distribution plan provides
that the fund will pay MFD distribution and/or service fees equal to 0.25% per annum of its average daily net assets attributable to Service Class shares as partial consideration for services performed and expenses incurred by MFD and financial
intermediaries (including participating insurance companies that invest in the fund to fund variable annuity and variable life insurance contracts, sponsors of qualified retirement and pension plans that invest in the fund, and affiliates of these
participating insurance companies and plan sponsors) in connection with the sale and distribution of the Service Class shares. MFD may subsequently pay all, or a portion, of the distribution and/or service fees to financial intermediaries.
Shareholder Servicing Agent
— MFS Service Center, Inc. (MFSC), a wholly-owned subsidiary of MFS, receives a fee from the fund for its services as shareholder servicing agent. For the year ended December 31, 2021, the fee was $11,649, which equated to 0.0266% annually of
the fund's average daily net assets. MFSC also receives reimbursement from the fund for out-of-pocket expenses paid by MFSC on behalf of the fund. For the year ended December 31, 2021, these costs amounted to $619.
Administrator — MFS
provides certain financial, legal, shareholder communications, compliance, and other administrative services to the fund. Under an administrative services agreement, the fund reimburses MFS the costs incurred to provide these services. The fund is
charged an annual fixed amount of $17,500 plus a fee based on average daily net assets. The administrative services fee incurred for the year ended December 31, 2021 was equivalent to an annual effective rate of 0.0399% of the fund's average daily
net assets.
Trustees’ and Officers’
Compensation — The fund pays compensation to independent Trustees in the form of a retainer, attendance fees, and additional compensation to Board and Committee chairpersons. The fund does not pay compensation
directly to Trustees or officers of the fund who are also officers of the investment adviser, all of whom receive remuneration from MFS for their services to the fund. Certain officers and Trustees of the fund are officers or directors of MFS, MFD,
and MFSC.
Other — The fund invests in the MFS Institutional Money Market Portfolio which is managed by MFS and seeks current income consistent with preservation of capital and liquidity. This money market fund does not pay a
management fee to MFS but does incur investment and operating costs.
The fund invests in the High Yield Pooled Portfolio, which
is a mutual fund advised by MFS that does not pay management fees to MFS but does incur investment and operating costs. The fund invests in the High Yield Pooled Portfolio to gain exposure to high income debt instruments, rather than investing in
high income debt instruments directly. Income earned on this investment is included in “Dividends from affiliated issuers” in the Statement of Operations. The High Yield Pooled Portfolio does not pay distribution and/or service fees to
MFD.
(4) Portfolio Securities
For the year ended December 31, 2021, purchases and sales
of investments, other than short-term obligations, were as follows:
| |
Purchases
|
Sales
|
| U.S.
Government securities |
$18,776,956
|
$13,104,280
|
| Non-U.S.
Government securities |
12,161,048
|
22,465,666
|
Notes to
Financial Statements - continued
(5) Shares of Beneficial Interest
The fund's Declaration of Trust permits the Trustees to
issue an unlimited number of full and fractional shares of beneficial interest. Transactions in fund shares were as follows:
| |
Year
ended
12/31/21 |
|
Year
ended
12/31/20 |
| |
Shares
|
Amount
|
|
Shares
|
Amount
|
| Shares
sold |
|
|
|
|
|
| Initial
Class |
267,640
|
$2,743,079
|
|
593,426
|
$6,061,887
|
| Service
Class |
64,759
|
661,621
|
|
75,762
|
764,983
|
| |
332,399
|
$3,404,700
|
|
669,188
|
$6,826,870
|
Shares
issued to shareholders
in reinvestment of distributions |
|
|
|
|
|
| Initial
Class |
271,288
|
$2,672,197
|
|
138,366
|
$1,407,184
|
| Service
Class |
40,574
|
396,815
|
|
19,396
|
195,901
|
| |
311,862
|
$3,069,012
|
|
157,762
|
$1,603,085
|
| Shares
reacquired |
|
|
|
|
|
| Initial
Class |
(792,450)
|
$(8,158,937)
|
|
(665,666)
|
$(6,694,271)
|
| Service
Class |
(93,346)
|
(948,793)
|
|
(180,269)
|
(1,833,066)
|
| |
(885,796)
|
$(9,107,730)
|
|
(845,935)
|
$(8,527,337)
|
| Net
change |
|
|
|
|
|
| Initial
Class |
(253,522)
|
$(2,743,661)
|
|
66,126
|
$774,800
|
| Service
Class |
11,987
|
109,643
|
|
(85,111)
|
(872,182)
|
| |
(241,535)
|
$(2,634,018)
|
|
(18,985)
|
$(97,382)
|
(6) Line of
Credit
The fund and certain other funds managed by
MFS participate in a $1.25 billion unsecured committed line of credit of which $1 billion is reserved for use by the fund and certain other MFS U.S. funds. The line of credit is provided by a syndicate of banks under a credit agreement. Borrowings
may be made for temporary financing needs. Interest is charged to each fund, based on its borrowings, generally at a rate equal to the highest of one month LIBOR, the Federal Funds Effective Rate and the Overnight Bank Funding Rate, plus an agreed
upon spread. A commitment fee, based on the average daily, unused portion of the committed line of credit, is allocated among the participating funds. In addition, the fund and other funds managed by MFS have established unsecured uncommitted
borrowing arrangements with certain banks for temporary financing needs. Interest is charged to each fund, based on its borrowings, at rates equal to customary reference rates plus an agreed upon spread. For the year ended December 31, 2021, the
fund’s commitment fee and interest expense were $132 and $0, respectively, and are included in “Miscellaneous” expense in the Statement of Operations.
(7) Investments in Affiliated Issuers
An affiliated issuer may be considered one in which the
fund owns 5% or more of the outstanding voting securities, or a company which is under common control. For the purposes of this report, the following were affiliated issuers:
| Affiliated
Issuers |
Beginning
Value |
Purchases
|
Sales
Proceeds |
Realized
Gain
(Loss) |
Change
in
Unrealized
Appreciation or
Depreciation |
Ending
Value |
| MFS
High Yield Pooled Portfolio |
$6,184,285
|
$1,648,291
|
$2,587,362
|
$(467,135)
|
$387,611
|
$5,165,690
|
| MFS
Institutional Money Market Portfolio |
517,217
|
37,564,164
|
37,880,081
|
—
|
—
|
201,300
|
| |
$6,701,502
|
$39,212,455
|
$40,467,443
|
$(467,135)
|
$387,611
|
$5,366,990
|
Notes to
Financial Statements - continued
| Affiliated
Issuers |
Dividend
Income |
Capital
Gain
Distributions |
| MFS
High Yield Pooled Portfolio |
$344,507
|
$—
|
| MFS
Institutional Money Market Portfolio |
445
|
—
|
| |
$344,952
|
$—
|
(8) Impacts of
COVID-19
The pandemic related to the global spread of
novel coronavirus disease (COVID-19), which was first detected in December 2019, has resulted in significant disruptions to global business activity and the global economy, as well as the economies of individual countries, the financial performance
of individual companies and sectors, and the securities and commodities markets in general. Multiple surges in cases globally, the availability and widespread adoption of vaccines, and the emergence of variant strains of the virus continue to create
uncertainty as to the future and long-term impacts resulting from the pandemic including impacts to the prices and liquidity of the fund's investments and the fund's performance.
(9) LIBOR Transition
Certain of the fund's investments, including its
investments in derivatives, as well as any debt issued by the fund and other contractual arrangements of the fund may be based on reference interest rates such as the London Interbank Offered Rate (“LIBOR”). In 2017, the regulatory
authority that oversees financial services firms in the United Kingdom announced plans to transition away from LIBOR by the end of 2021. In March 2021, the administrator of LIBOR announced the extension of the publication of the more commonly used
U.S. dollar LIBOR settings to the end of June 2023. Although the full impacts of the transition away from LIBOR are not fully known, the transition may result in, among other things, an increase in volatility or illiquidity of the markets for
instruments that currently rely on LIBOR to determine interest rates and this could have an adverse impact on the fund's performance. With respect to the fund's accounting for investments, including its investments in derivatives, as well as any
debt issued by the fund and other contractual arrangements of the fund that undergo reference rate-related modifications as a result of the transition, management will rely upon the relief provided by FASB Codification Topic 848 – Reference
Rate Reform (Topic 848). The guidance in Topic 848 permits the fund to disregard the GAAP accounting requirements around certain contract modifications resulting from the LIBOR transition such that for contracts considered in scope, the fund can
account for those modified contracts as a continuation of the existing contracts. While the cessation of the one-week and two-month U.S. dollar LIBOR tenors along with certain other non-U.S. dollar denominated LIBOR settings at December 31, 2021 did
not have a material impact on the fund, management is still evaluating the impact to the fund of the June 30, 2023 planned discontinuation of the more commonly used U.S. dollar LIBOR settings.
Report of Independent Registered Public Accounting
Firm
To the Board of Trustees of MFS Variable
Insurance Trust II and the Shareholders of MFS Income Portfolio:
Opinion on the Financial Statements and Financial
Highlights
We have audited the accompanying statement
of assets and liabilities of MFS Income Portfolio (the “Fund”), including the portfolio of investments, as of December 31, 2021, the related statement of operations for the year then ended, the statements of changes in net assets for
each of the two years in the period then ended, the financial highlights for each of the five years in the period then ended, and the related notes. In our opinion, the financial statements and financial highlights present fairly, in all material
respects, the financial position of the Fund as of December 31, 2021, and the results of its operations for the year then ended, the changes in its net assets for each of the two years in the period then ended, and the financial highlights for each
of the five years in the period then ended, in conformity with accounting principles generally accepted in the United States of America.
Basis for Opinion
These financial statements and financial highlights are the
responsibility of the Fund's management. Our responsibility is to express an opinion on the Fund's financial statements and financial highlights based on our audits. We are a public accounting firm registered with the Public Company Accounting
Oversight Board (United States) (PCAOB) and are required to be independent with respect to the Fund in accordance with the U.S. federal securities laws and the applicable rules and regulations of the Securities and Exchange Commission and the
PCAOB.
We conducted our audits in accordance with the
standards of the PCAOB. Those standards require that we plan and perform the audit to obtain reasonable assurance about whether the financial statements and financial highlights are free of material misstatement, whether due to error or fraud. The
Fund is not required to have, nor were we engaged to perform, an audit of its internal control over financial reporting. As part of our audits, we are required to obtain an understanding of internal control over financial reporting but not for the
purpose of expressing an opinion on the effectiveness of the Fund's internal control over financial reporting. Accordingly, we express no such opinion.
Our audits included performing procedures to assess the
risks of material misstatement of the financial statements and financial highlights, whether due to error or fraud, and performing procedures that respond to those risks. Such procedures included examining, on a test basis, evidence regarding the
amounts and disclosures in the financial statements and financial highlights. Our audits also included evaluating the accounting principles used and significant estimates made by management, as well as evaluating the overall presentation of the
financial statements and financial highlights. Our procedures included confirmation of securities owned as of December 31, 2021, by correspondence with the custodian and brokers; when replies were not received from brokers, we performed other
auditing procedures. We believe that our audits provide a reasonable basis for our opinion.
DELOITTE & TOUCHE LLP
Boston, Massachusetts
February 15, 2022
We have served as the auditor of one or more of the MFS
investment companies since 1924.
Trustees and Officers — Identification and
Background
The Trustees and Officers of the Trust, as
of February 1, 2022, are listed below, together with their principal occupations during the past five years. (Their titles may have varied during that period.) The address of each Trustee and Officer is 111 Huntington Avenue, Boston, Massachusetts
02199-7618.
| Name,
Age |
|
Position(s)
Held with Fund |
|
Trustee/Officer
Since(h) |
|
Number
of MFS Funds overseen by the Trustee |
|
Principal
Occupations During
the Past Five Years |
|
Other
Directorships During
the Past Five Years (j) |
| INTERESTED
TRUSTEES |
|
|
|
|
|
|
|
|
|
|
Michael
W. Roberge (k)
(age 55) |
|
Trustee
|
|
January
2021 |
|
135
|
|
Massachusetts
Financial Services Company, Chairman (since January 2021); Chief Executive Officer (since January 2017); Director; Chairman of the Board (since January 2022); President (until December 2018); Chief Investment Officer (until December 2018) |
|
N/A
|
| INDEPENDENT
TRUSTEES |
|
|
|
|
|
|
|
|
|
|
John
P. Kavanaugh
(age 67) |
|
Trustee
and Chair of Trustees |
|
January
2009 |
|
135
|
|
Private
investor |
|
N/A
|
Steven
E. Buller
(age 70) |
|
Trustee
|
|
February
2014 |
|
135
|
|
Private
investor |
|
N/A
|
John
A. Caroselli
(age 67) |
|
Trustee
|
|
March
2017 |
|
135
|
|
Private
investor; JC Global Advisors, LLC (management consulting), President (since 2015) |
|
N/A
|
Maureen
R. Goldfarb
(age 66) |
|
Trustee
|
|
January
2009 |
|
135
|
|
Private
investor |
|
N/A
|
Peter
D. Jones
(age 66) |
|
Trustee
|
|
January
2019 |
|
135
|
|
Private
investor |
|
N/A
|
James
W. Kilman, Jr.
(age 60) |
|
Trustee
|
|
January
2019 |
|
135
|
|
Burford
Capital Limited (finance and investment management), Senior Advisor (since May 3, 2021), Chief Financial Officer (2019 - May 2, 2021); KielStrand Capital LLC (family office), Chief Executive Officer (since 2016) |
|
Alpha-En
Corporation, Director (2016-2019) |
Clarence
Otis, Jr.
(age 65) |
|
Trustee
|
|
March
2017 |
|
135
|
|
Private
investor |
|
VF
Corporation, Director; Verizon Communications, Inc., Director; The Travelers Companies, Director |
Maryanne
L. Roepke
(age 65) |
|
Trustee
|
|
May
2014 |
|
135
|
|
Private
investor |
|
N/A
|
Laurie
J. Thomsen
(age 64) |
|
Trustee
|
|
March
2005 |
|
135
|
|
Private
investor |
|
The
Travelers Companies, Director; Dycom Industries, Inc., Director |
Trustees and
Officers - continued
| Name,
Age |
|
Position(s)
Held with
Fund |
|
Trustee/Officer
Since(h) |
|
Number
of MFS Funds for which the Person is an Officer |
|
Principal
Occupations During
the Past Five Years |
| OFFICERS
|
|
|
|
|
|
|
|
|
Christopher
R. Bohane (k)
(age 48) |
|
Assistant
Secretary and Assistant Clerk |
|
July
2005 |
|
135
|
|
Massachusetts
Financial Services Company, Senior Vice President and Associate General Counsel |
Kino
Clark (k)
(age 53) |
|
Assistant
Treasurer |
|
January
2012 |
|
135
|
|
Massachusetts
Financial Services Company, Vice President |
John
W. Clark, Jr. (k)
(age 54) |
|
Assistant
Treasurer |
|
April
2017 |
|
135
|
|
Massachusetts
Financial Services Company, Vice President (since March 2017); Deutsche Bank (financial services), Department Head - Treasurer's Office (until February 2017) |
Thomas
H. Connors (k)
(age 62) |
|
Assistant
Secretary and Assistant Clerk |
|
September
2012 |
|
135
|
|
Massachusetts
Financial Services Company, Vice President and Senior Counsel |
David
L. DiLorenzo (k)
(age 53) |
|
President
|
|
July
2005 |
|
135
|
|
Massachusetts
Financial Services Company, Senior Vice President |
Heidi
W. Hardin (k)
(age 54) |
|
Secretary
and Clerk |
|
April
2017 |
|
135
|
|
Massachusetts
Financial Services Company, Executive Vice President and General Counsel (since March 2017); Harris Associates (investment management), General Counsel (until January 2017) |
Brian
E. Langenfeld (k)
(age 48) |
|
Assistant
Secretary and Assistant Clerk |
|
June
2006 |
|
135
|
|
Massachusetts
Financial Services Company, Vice President and Senior Counsel |
Amanda
S. Mooradian (k)
(age 42) |
|
Assistant
Secretary and Assistant Clerk |
|
September
2018 |
|
135
|
|
Massachusetts
Financial Services Company, Assistant Vice President and Senior Counsel |
Susan
A. Pereira (k)
(age 51) |
|
Assistant
Secretary and Assistant Clerk |
|
July
2005 |
|
135
|
|
Massachusetts
Financial Services Company, Vice President and Assistant General Counsel |
Kasey
L. Phillips (k)
(age 51) |
|
Assistant
Treasurer |
|
September
2012 |
|
135
|
|
Massachusetts
Financial Services Company, Vice President |
Matthew
A. Stowe (k)
(age 47) |
|
Assistant
Secretary and Assistant Clerk |
|
October
2014 |
|
135
|
|
Massachusetts
Financial Services Company, Vice President and Assistant General Counsel |
Martin
J. Wolin (k)
(age 54) |
|
Chief
Compliance Officer |
|
July
2015 |
|
135
|
|
Massachusetts
Financial Services Company, Senior Vice President and Chief Compliance Officer |
James
O. Yost (k)
(age 61) |
|
Treasurer
|
|
September
1990 |
|
135
|
|
Massachusetts
Financial Services Company, Senior Vice President |
| (h)
|
Date
first appointed to serve as Trustee/Officer of an MFS Fund. Each Trustee has served continuously since appointment unless indicated otherwise. From January 2012 through December 2016, Messrs. DiLorenzo and Yost served as Treasurer and Deputy
Treasurer of the Funds, respectively. |
| (j)
|
Directorships or
trusteeships of companies required to report to the Securities and Exchange Commission (i.e., “public companies”). |
| (k)
|
“Interested
person” of the Trust within the meaning of the Investment Company Act of 1940 (referred to as the 1940 Act), which is the principal federal law governing investment companies like the fund, as a result of a position with MFS. The address of
MFS is 111 Huntington Avenue, Boston, Massachusetts 02199-7618. |
Each Trustee (other than Messrs. Jones, Kilman and Roberge)
has been elected by shareholders and each Trustee and Officer holds office until his or her successor is chosen and qualified or until his or her earlier death, resignation, retirement or removal. Mr. Roberge became a Trustee of the Funds on January
1, 2021 and Messrs. Jones and Kilman became Trustees of the Funds on January 1, 2019. The Trust does not hold annual meetings for the purpose of electing Trustees, and Trustees are not elected for fixed terms. Under the terms of the Board's
retirement policy, an Independent Trustee shall retire at the end of the calendar year in which he or she reaches the earlier of 75 years of age or 15 years of service on the Board (or, in the case of any Independent Trustee who joined the Board
prior to 2015, 20 years of service on the Board).
Messrs. Buller, Kilman and Otis and Ms. Roepke are members
of the Trust’s Audit Committee.
Trustees and
Officers - continued
Each of the Interested Trustees and certain Officers hold
comparable officer positions with certain affiliates of MFS.
The Statement of Additional Information for a Fund includes
further information about the Trustees and is available without charge upon request by calling 1-800-225-2606.
| Investment
Adviser |
Custodian
|
Massachusetts Financial
Services Company
111 Huntington Avenue
Boston, MA 02199-7618 |
State Street
Bank and Trust Company
1 Lincoln Street
Boston, MA 02111-2900 |
| Distributor
|
Independent
Registered Public Accounting Firm |
MFS Fund
Distributors, Inc.
111 Huntington Avenue
Boston, MA 02199-7618 |
Deloitte
& Touche LLP
200 Berkeley Street
Boston, MA 02116 |
| Portfolio
Manager(s) |
|
Neeraj
Arora
Philipp Burgener
David Cole
Alexander Mackey
Joshua Marston
Michael Skatrud |
|
Board Review of Investment Advisory Agreement
MFS Income Portfolio
The Investment Company Act of 1940 requires that both the
full Board of Trustees and a majority of the non-interested (“independent”) Trustees, voting separately, annually approve the continuation of the Fund’s investment advisory agreement with MFS. The Trustees consider matters bearing
on the Fund and its advisory arrangements at their meetings throughout the year, including a review of performance data at each regular meeting. In addition, the independent Trustees met several times by videoconference (in accordance with
Securities and Exchange Commission relief) over the course of three months beginning in May and ending in July, 2021 (“contract review meetings”) for the specific purpose of considering whether to approve the continuation of the
investment advisory agreement for the Fund and the other investment companies that the Board oversees (the “MFS Funds”). The independent Trustees were assisted in their evaluation of the Fund’s investment advisory agreement by
independent legal counsel, from whom they received separate legal advice and with whom they met separately from MFS during various contract review meetings. The independent Trustees were also assisted in this process by an independent consultant who
was retained by and reported to the independent Trustees.
In connection with their deliberations regarding the
continuation of the investment advisory agreement, the Trustees, including the independent Trustees, considered such information and factors as they believed, in light of the legal advice furnished to them and their own business judgment, to be
relevant. The investment advisory agreement for the Fund was considered separately, although the Trustees also took into account the common interests of all MFS Funds in their review. As described below, the Trustees considered the nature, quality,
and extent of the various investment advisory, administrative, and shareholder services performed by MFS under the existing investment advisory agreement and other arrangements with the Fund.
In connection with their contract review meetings, the
Trustees received and relied upon materials that included, among other items: (i) information provided by Broadridge Financial Solutions, Inc. (“Broadridge”), an independent third party, on the investment performance of the Fund for
various time periods ended December 31, 2020 and the investment performance of a group of funds with substantially similar investment classifications/objectives (the “Broadridge performance universe”), (ii) information provided by
Broadridge on the Fund’s advisory fees and other expenses and the advisory fees and other expenses of comparable funds identified by Broadridge as well as all other funds in the same investment classification/category (the “Broadridge
expense group and universe”), (iii) information provided by MFS on the advisory fees of portfolios of other clients of MFS, including institutional separate accounts and other clients, (iv) information as to whether and to what extent
applicable expense waivers, reimbursements or fee “breakpoints” are observed for the Fund, (v) information regarding MFS’ financial results and financial condition, including MFS’ and certain of its affiliates’
estimated profitability from services performed for the Fund and the MFS Funds as a whole, and compared to MFS’ institutional business, (vi) MFS’ views regarding the outlook for the mutual fund industry and the strategic business plans
of MFS, (vii) descriptions of various functions performed by MFS for the Funds, such as compliance monitoring and portfolio trading practices, and (viii) information regarding the overall organization of MFS, including information about MFS’
senior management and other personnel providing investment advisory, administrative and other services to the Fund and the other MFS Funds. The comparative performance, fee and expense information prepared and provided by Broadridge was not
independently verified and the independent Trustees did not independently verify any information provided to them by MFS.
The Trustees’ conclusion as to the continuation of
the investment advisory agreement was based on a comprehensive consideration of all information provided to the Trustees and not the result of any single factor. Some of the factors that figured particularly in the Trustees’ deliberations are
described below, although individual Trustees may have evaluated the information presented differently from one another, giving different weights to various factors. It is also important to recognize that the fee arrangements for the Fund and other
MFS Funds are the result of years of review and discussion between the independent Trustees and MFS, that certain aspects of such arrangements may receive greater scrutiny in some years than in others, and that the Trustees’ conclusions may be
based, in part, on their consideration of these same arrangements during the course of the year and in prior years.
Based on information provided by Broadridge and MFS, the
Trustees reviewed the Fund’s total return investment performance as well as the Broadridge performance universe over various time periods. The Trustees placed particular emphasis on the total return performance of the Fund’s Initial
Class shares in comparison to the performance of funds in its Broadridge performance universe over the five-year period ended December 31, 2020, which the Trustees believed was a long enough period to reflect differing market conditions. The total
return performance of the Fund’s Initial Class shares was in the 1st quintile relative to the other funds in the universe for this five-year period (the 1st quintile being the best performers and the 5th quintile being the worst performers).
The total return performance of the Fund’s Initial Class shares was in the 1st quintile for each of the one- and three-year periods ended December 31, 2020 relative to the Broadridge performance universe. Because of the passage of time, these
performance results may differ from the performance results for more recent periods, including those shown elsewhere in this report.
Board Review
of Investment Advisory Agreement - continued
In the course of their deliberations, the Trustees took
into account information provided by MFS in connection with the contract review meetings, as well as during investment review meetings conducted with portfolio management personnel during the course of the year regarding the Fund’s
performance. After reviewing these and related factors, the Trustees concluded, within the context of their overall conclusions regarding the investment advisory agreement, that they were satisfied with MFS’ responses and efforts relating to
investment performance.
In assessing the
reasonableness of the Fund’s advisory fee, the Trustees considered, among other information, the Fund’s advisory fee and the total expense ratio of the Fund’s Initial Class shares as a percentage of average daily net assets and the
advisory fee and total expense ratios of the Broadridge expense group based on information provided by Broadridge. The Trustees considered that MFS currently observes an expense limitation for the Fund, which may not be changed without the
Trustees’ approval. The Trustees also considered that, according to the data provided by Broadridge (which takes into account any fee reductions or expense limitations that were in effect during the Fund’s last fiscal year), the
Fund’s effective advisory fee rate was approximately at the Broadridge expense group median and the Fund’s total expense ratio was higher than the Broadridge expense group median.
The Trustees also considered the advisory fees charged by
MFS to any institutional separate accounts advised by MFS (“separate accounts”) and unaffiliated investment companies for which MFS serves as subadviser (“subadvised funds”) that have comparable investment strategies to the
Fund, if any. In comparing these fees, the Trustees considered information provided by MFS as to the generally broader scope of services provided by MFS to the Fund, as well as the more extensive regulatory burdens imposed on MFS in managing the
Fund, in comparison to separate accounts and subadvised funds. The Trustees also considered the higher demands placed on MFS’ investment personnel and trading infrastructure as a result of the daily cash in-flows and out-flows of the Fund in
comparison to separate accounts.
The Trustees also
considered whether the Fund may benefit from any economies of scale in the management of the Fund in the event of growth in assets of the Fund and/or growth in assets of the MFS Funds as a whole. They noted that the Fund’s advisory fee rate
schedule is subject to a contractual breakpoint that reduces the Fund’s advisory fee rate on average daily net assets over $1 billion. The Trustees also noted that MFS has agreed in writing to waive a portion of the management fees of certain
MFS Funds, including the Fund, if the total combined assets of certain funds within the MFS Funds’ complex increase above agreed upon thresholds (the “group fee waiver”), enabling the Fund’s shareholders to share in the
benefits from any economies of scale at the complex level. The group fee waiver is reviewed and renewed annually between the Board and MFS. The Trustees concluded that the breakpoint and the group fee waiver were sufficient to allow the Fund to
benefit from economies of scale as its assets and overall complex assets grow.
The Trustees also considered information prepared by MFS
relating to MFS’ costs and profits with respect to the Fund, the MFS Funds considered as a group, and other investment companies and accounts advised by MFS, as well as MFS’ methodologies used to determine and allocate its costs to the
MFS Funds, the Fund and other accounts and products for purposes of estimating profitability.
After reviewing these and other factors described herein,
the Trustees concluded, within the context of their overall conclusions regarding the investment advisory agreement, that the advisory fees charged to the Fund represent reasonable compensation in light of the services being provided by MFS to the
Fund.
In addition, the Trustees considered MFS’
resources and related efforts to continue to retain, attract and motivate capable personnel to serve the Fund. The Trustees also considered current and developing conditions in the financial services industry, including the presence of large and
well-capitalized companies which are spending, and appear to be prepared to continue to spend, substantial sums to engage personnel and to provide services to competing investment companies. In this regard, the Trustees also considered the financial
resources of MFS and its ultimate parent, Sun Life Financial Inc. The Trustees also considered the advantages and possible disadvantages to the Fund of having an adviser that also serves other investment companies as well as other accounts.
The Trustees also considered the nature, quality, cost, and
extent of administrative, transfer agency, and distribution services provided to the Fund by MFS and its affiliates under agreements and plans other than the investment advisory agreement, including any 12b-1 fees the Fund pays to MFS Fund
Distributors, Inc., an affiliate of MFS. The Trustees also considered the nature, extent and quality of certain other services MFS performs or arranges for on the Fund’s behalf, which may include securities lending programs, directed expense
payment programs, class action recovery programs, and MFS’ interaction with third-party service providers, principally custodians and sub-custodians. The Trustees concluded that the various non-advisory services provided by MFS and its
affiliates on behalf of the Fund were satisfactory.
The Trustees considered so-called “fall-out
benefits” to MFS such as reputational value derived from serving as investment manager to the MFS Funds. The Trustees also considered that MFS discontinued its historic practice of obtaining investment research from portfolio brokerage
commissions paid by certain MFS Funds effective January 2018, and directly pays or voluntarily reimburses a Fund, if applicable, for the costs of external research acquired through the use of the Fund’s portfolio brokerage commissions.
Board Review
of Investment Advisory Agreement - continued
Based on their evaluation of factors that they deemed to be
material, including those factors described above, the Board of Trustees, including the independent Trustees, concluded that the Fund’s investment advisory agreement with MFS should be continued for an additional one-year period, commencing
August 1, 2021.
Proxy Voting Policies and Information
MFS votes proxies on behalf of the fund pursuant to proxy
voting policies and procedures that are available without charge, upon request, by calling 1-800-225-2606, by visiting mfs.com/proxyvoting, or by visiting the SEC’s Web site at http://www.sec.gov.
Information regarding how the fund voted proxies relating
to portfolio securities during the most recent twelve-month period ended June 30 is available by August 31 of each year without charge by visiting mfs.com/proxyvoting, or by visiting the SEC’s Web site
at http://www.sec.gov.
Quarterly Portfolio Disclosure
The fund files a complete schedule of portfolio holdings
with the SEC for the first and third quarters of each fiscal year as an exhibit to its reports on Form N-PORT. The fund’s Form N-PORT reports are available on the SEC’s Web site at
http://www.sec.gov. A shareholder can obtain the portfolio holdings report for the first and third quarters of the fund's fiscal year at mfs.com/vit2 by
choosing the fund's name and then scrolling to the “Resources” section and clicking on the “Prospectus and Reports” tab.
FURTHER INFORMATION
From time to time, MFS may post important information about
the fund or the MFS Funds on the MFS Web site (mfs.com). This information is available at https://www.mfs.com/announcements or at
mfs.com/vit2 by choosing the fund's name and then scrolling to the “Resources” section and clicking on the “Announcements” tab, if any.
Information About Fund Contracts and Legal Claims
The fund has entered into contractual arrangements with an
investment adviser, administrator, distributor, shareholder servicing agent, 529 program manager (if applicable), and custodian who each provide services to the fund. Unless expressly stated otherwise, shareholders are not parties to, or intended
beneficiaries of these contractual arrangements, and these contractual arrangements are not intended to create any shareholder right to enforce them against the service providers or to seek any remedy under them against the service providers, either
directly or on behalf of the fund.
Under the
Trust’s By-Laws and Declaration of Trust, any claims asserted against or on behalf of the MFS Funds, including claims against Trustees and Officers, must be brought in state and federal courts located within the Commonwealth of
Massachusetts.
Federal Tax Information (unaudited)
The following information is provided pursuant to
provisions of the Internal Revenue Code.
The fund
designates $865,000 as capital gain dividends paid during the fiscal year.
The fund intends to pass through the maximum amount
allowable as Section 163(j) Interest Dividends as defined in Treasury Regulation §1.163(j)-1(b).
| FACTS
|
WHAT
DOES MFS DO WITH YOUR PERSONAL INFORMATION? |
| Why?
|
Financial
companies choose how they share your personal information. Federal law gives consumers the right to limit some but not all sharing. Federal law also requires us to tell you how we collect, share, and protect your personal information. Please read
this notice carefully to understand what we do. |
| What?
|
The types of
personal information we collect and share depend on the product or service you have with us. This information can include: |
| • Social
Security number and account balances |
| • Account
transactions and transaction history |
| • Checking
account information and wire transfer instructions |
| When
you are no longer our customer, we continue to share your information as described in this notice. |
| How?
|
All
financial companies need to share customers' personal information to run their everyday business. In the section below, we list the reasons financial companies can share their customers' personal information; the reasons MFS chooses to share; and
whether you can limit this sharing. |
Reasons
we can share your
personal information |
Does
MFS share? |
Can
you limit
this sharing? |
For
our everyday business purposes –
such as to process your transactions, maintain your
account(s), respond to court orders and legal
investigations, or report to credit bureaus |
Yes
|
No
|
For
our marketing purposes –
to offer our products and services to you |
No
|
We
don't share |
For
joint marketing with other
financial companies |
No
|
We
don't share |
For
our affiliates' everyday business purposes –
information about your transactions and experiences |
No
|
We
don't share |
For
our affiliates' everyday business purposes –
information about your creditworthiness |
No
|
We
don't share |
| For
nonaffiliates to market to you |
No
|
We
don't share |
| Questions?
|
Call
800-225-2606 or go to mfs.com. |
| Who
we are |
| Who
is providing this notice? |
MFS
Funds, MFS Investment Management, MFS Institutional Advisors, Inc., and MFS Heritage Trust Company. |
| What
we do |
How
does MFS
protect my personal
information? |
To
protect your personal information from unauthorized access and use, we use security measures that comply with federal law. These measures include procedural, electronic, and physical safeguards for the protection of the personal information we
collect about you. |
How
does MFS
collect my personal
information? |
We
collect your personal information, for example, when you |
| • open
an account or provide account information |
| • direct
us to buy securities or direct us to sell your securities |
| • make
a wire transfer |
| We
also collect your personal information from others, such as credit bureaus, affiliates, or other companies. |
| Why
can't I limit all sharing? |
Federal
law gives you the right to limit only |
| • sharing
for affiliates' everyday business purposes – information about your creditworthiness |
| • affiliates
from using your information to market to you |
| • sharing
for nonaffiliates to market to you |
| State
laws and individual companies may give you additional rights to limit sharing. |
| Definitions
|
| Affiliates
|
Companies
related by common ownership or control. They can be financial and nonfinancial companies. |
| •
MFS does not share personal information with affiliates, except for everyday business purposes as described on page one of this notice. |
| Nonaffiliates
|
Companies
not related by common ownership or control. They can be financial and nonfinancial companies. |
| •
MFS does not share with nonaffiliates so they can market to you. |
| Joint
marketing |
A
formal agreement between nonaffiliated financial companies that together market financial products or services to you. |
| •
MFS doesn't jointly market. |
| Other
important information |
| If
you own an MFS product or receive an MFS service in the name of a third party such as a bank or broker-dealer, their privacy policy may apply to you instead of ours. |
Annual Report
December 31, 2021
MFS® Technology Portfolio
MFS® Variable
Insurance Trust II
MFS® Technology
Portfolio
|
1
|
|
2
|
|
3
|
|
5
|
|
7
|
|
8
|
|
11
|
|
12
|
|
13
|
|
14
|
|
16
|
|
24
|
|
25
|
|
28
|
|
30
|
|
30
|
|
30
|
|
30
|
|
30
|
|
31
|
The report is prepared for the general information of contract owners. It
is authorized for distribution to prospective investors only when preceded or accompanied by a current prospectus.
NOT FDIC INSURED • MAY LOSE VALUE
• NO BANK OR CREDIT UNION GUARANTEE •
NOT A DEPOSIT • NOT INSURED BY ANY FEDERAL GOVERNMENT
AGENCY OR NCUA/NCUSIF
Dear Contract Owners:
After a powerful rally in 2021 that was spurred by the
introduction of effective coronavirus vaccines and high levels of monetary and fiscal stimulus, markets have recently experienced a rise in volatility. Rising inflation (mostly due to pandemic-related labor and supply chain disruptions), new
COVID-19 variants that are vaccine-resistant, and the prospect of tighter monetary and fiscal policies around the world have all increased investor anxiety.
Rising real (inflation-adjusted) bond yields in the United
States are a headwind for richly valued U.S. growth stocks, though many non-U.S. markets have experienced lower levels of turbulence. In recent months, global economic growth has moderated, with the spread of the Delta and Omicron variants and a
regulatory crackdown in China featuring prominently. Stress in China’s property development sector has also contributed to the slowdown there. A further concern for investors is the tightening of global energy and raw materials supplies caused
in part by geopolitical uncertainty.
However,
above-trend economic growth, strong corporate balance sheets, and nascent signs that global supply chain bottlenecks may be easing, along with a dovish policy shift in China, are supportive fundamentals that we feel could help calm recent market
jitters.
It is times of market transition that
demonstrate the importance of having a deep understanding of company fundamentals, and we have built our global research platform to do just that.
At MFS®, we put our clients’ assets to work responsibly by carefully navigating the increasing complexity of global markets and economies. Guided by our commitment to long-term
investing, we tune out the noise and try to uncover what we believe are the best, most durable investment opportunities in the market. Our unique global investment platform combines collective expertise, long-term discipline, and thoughtful risk
management to create sustainable value for investors.
Respectfully,
Michael W.
Roberge
Chief Executive Officer
MFS Investment Management
February 15, 2022
The opinions expressed in this letter are subject to
change and may not be relied upon for investment advice. No forecasts can be guaranteed.
Portfolio structure
Top ten
holdings
| Microsoft
Corp. |
11.9%
|
| Amazon.com,
Inc. |
9.4%
|
| Alphabet,
Inc., “A” |
8.8%
|
| Mastercard,
Inc., “A” |
4.0%
|
| Adobe
Systems, Inc. |
3.7%
|
| NVIDIA
Corp. |
3.5%
|
| Booking
Holdings, Inc. |
2.8%
|
| Global
Payments, Inc. |
2.6%
|
| salesforce.com,
inc. |
2.2%
|
| PayPal
Holdings, Inc. |
2.1%
|
Top five industries
| Computer
Software |
25.5%
|
| Internet
|
12.6%
|
| Electronics
|
12.4%
|
| Specialty
Stores |
11.5%
|
| Business
Services |
11.4%
|
Cash & Cash Equivalents includes any cash,
investments in money market funds, short-term securities, and other assets less liabilities. Please see the Statement of Assets and Liabilities for additional information related to the fund’s cash position and other assets and
liabilities.
Percentages are based on net
assets as of December 31, 2021.
The portfolio
is actively managed and current holdings may be different.
Management Review
Summary of Results
For the twelve months ended December 31, 2021, Initial
Class shares of the MFS Technology Portfolio (fund) provided a total return of 13.68%, while Service Class shares of the fund provided a total return of 13.43%. These compare with a return of 28.71% over the same period for the fund’s
benchmark, the Standard & Poor's 500 Stock Index, and a return of 26.40% for the fund’s other benchmark, the Standard & Poor's North American Technology Sector Index.
Market Environment
Over the past year, the global economy was buffeted by an
array of crosscurrents as it adjusted to the ebbs and flows of the pandemic. Among the supportive currents were ample fiscal stimulus, loose monetary policy and the rollout of several highly effective coronavirus vaccines. Negative currents included
the rapid spread of several coronavirus variants, widespread global production bottlenecks and a surge in inflation. After experiencing a burst of exceptionally strong economic activity as the global economy began to reopen, activity became more
muted in the second half of the period amid ongoing supply chain disruptions and a new wave of coronavirus infections, albeit a seemingly milder strain.
Amid rising inflation, markets anticipated a transition
from an exceptionally accommodative environment to a more mixed monetary landscape ahead. Indeed, several central banks in emerging markets have already tightened policy and the US Federal Reserve reduced the pace of its asset purchases in November
and again in December. However, the European Central Bank, the Bank of Japan and the People's Bank of China are expected to maintain accommodative policies. Sovereign bond yields moved modestly higher during the period amid higher inflation and on
expectations of a tighter Fed but remain historically low.
A harsher Chinese regulatory environment toward industries
such as online gaming, food delivery and education increased market volatility as has stress in China's highly leveraged property development sector. Trade relations between the United States and China remained quite strained despite a change in
presidential administrations.
Signs of excess
investor enthusiasm continued to be seen in pockets of the market such as “meme stocks” popular with users of online message boards, cryptocurrencies and heavy retail participation in the market for short-dated options.
Detractors from Performance
Stock selection and, to a lesser extent, overweight
positions in both the IT services and internet & direct marketing retail industries weighed on the fund’s performance relative to the Standard & Poor’s North American Technology Sector Index. Within the IT services industry, the
fund's overweight positions in electronic payment services company Global Payments, payment processing and information management solutions firm WEX and debit and credit transaction platform company MasterCard hurt relative returns as these
companies underperformed the benchmark over the reporting period. The stock price of Global Payments declined as COVID-19 related closures and lockdowns weighed on its merchant solutions business and as higher expenses pressured corporate margins.
Within the internet & direct marketing retail industry, holding shares of luxury fashion technology platform provider Fartech(b) (United Kingdom) dampened relative results. The company's share price came under pressure as higher-than-expected
shipping costs and lighter-than-expected sales activity appeared to have weighed on investor sentiment.
Security selection and, to a lesser extent, an underweight
position in the interactive media & services industry also detracted from relative performance. Here, the fund's underweight position in strong-performing technology holding company Alphabet held back relative returns. Alphabet's stock price
rose over the reporting period on the back of strong advertising sales, notably in search and YouTube, as well as strength in its cloud computing business.
Turning to stocks in other sectors, the fund's overweight
position in global enterprise cloud communications and collaboration solutions provider RingCentral, as well as its underweight positions in shares of computer graphics processor maker NVIDIA and computer and personal electronics maker Apple,
hindered relative returns. Lastly, the timing of the fund's short position in video game, consumer electronics and gaming merchandise retailer GameStop(b)(h), and its holdings of technology platform operator Uber Technologies(b), detracted from
relative performance.
Contributors to Performance
Stock selection in the software industry was a primary
factor that supported relative performance. Here, the fund's overweight positions in digital workforce platform provider Asana, software giant Microsoft and internet marketing software firm HubSpot, in addition to not holding shares of
poor-performing online telecommunications firm Zoom Video Communications, benefited relative returns. The stock price of Asana climbed over the reporting period as the company reported better-than-expected revenue growth and progress in moving
upmarket to acquire larger enterprise customers.
Management Review - continued
Elsewhere, the fund's holdings of technology services
provider Endava(b) and digital outsourcing services provider TaskUS(b), and its overweight positions in IT services firm EPAM Systems, networking chip maker Marvell Technology Group and integrated circuits supplier Xilinx, strengthened relative
returns. The share price of Endava ended the reporting period higher on the back of solid financial results that were driven by new customer additions and strong performance in its payments and financial services segment. Lastly, not holding shares
of poor-performing semiconductor company Intel also helped relative performance.
Respectfully,
Portfolio Manager(s)
Matthew Sabel
| (b)
|
Security is not a
benchmark constituent. |
| (h)
|
Security was not held in
the portfolio at period end. |
The
views expressed in this report are those of the portfolio manager(s) only through the end of the period of the report as stated on the cover and do not necessarily reflect the views of MFS or any other person in the MFS organization. These views are
subject to change at any time based on market or other conditions, and MFS disclaims any responsibility to update such views. These views may not be relied upon as investment advice or an indication of trading intent on behalf of any MFS portfolio.
References to specific securities are not recommendations of such securities, and may not be representative of any MFS portfolio’s current or future investments.
Performance Summary Through 12/31/21
The following chart illustrates the historical performance
of the fund in comparison to its benchmark(s). Benchmarks are unmanaged and may not be invested in directly. Benchmark returns do not reflect any fees or expenses. The performance of other share classes will be greater than or less than that of the
class depicted below. (See Notes to Performance Summary.)
Performance data shown represents past performance and is no
guarantee of future results. Investment return and principal value fluctuate so your units, when sold, may be worth more or less than the original cost; current performance may be lower or higher than quoted. The performance shown does not reflect
the deduction of taxes, if any, that a contract holder would pay on fund distributions or the redemption of contract units. The returns for the fund shown also do not reflect the deduction of expenses associated with variable products, such as
mortality and expense risk charges, separate account charges, and sales charges imposed by the insurance company separate accounts. Such expenses would reduce the overall returns shown.
Growth of a Hypothetical $10,000 Investment
Total Returns
through 12/31/21
Average annual total returns
| Share
Class |
Class
Inception Date |
1-yr
|
5-yr
|
10-yr
|
| Initial
Class |
6/16/00
|
13.68%
|
26.30%
|
20.83%
|
| Service
Class |
8/24/01
|
13.43%
|
26.00%
|
20.52%
|
Comparative benchmark(s)
| Standard
& Poor's 500 Stock Index (f) |
28.71%
|
18.47%
|
16.55%
|
| Standard
& Poor's North American Technology Sector Index (f) |
26.40%
|
29.99%
|
23.54%
|
| (f)
|
Source:
FactSet Research Systems Inc. |
Benchmark Definition(s)
Standard & Poor's 500 Stock Index(g) – a market capitalization-weighted index of 500 widely held equity securities, designed to measure broad U.S. equity performance.
Standard & Poor's North American Technology Sector
Index(g) - a modified market capitalization-weighted index that measures the performance of selected technology stocks.
It is not possible to invest directly in an index.
| (g)
|
“Standard
& Poor's®” and “S&P®” are registered trademarks of Standard &
Poor's Financial Services LLC (“S&P”) and Dow Jones is a registered trademark of Dow Jones Trademark Holdings LLC (“Dow Jones”) and have been licensed for use by S&P Dow Jones Indices LLC and sublicensed for certain
purposes by MFS. The S&P 500® is a product of S&P Dow Jones Indices LLC, and has been licensed for use by MFS. MFS's product(s) is not sponsored, endorsed, sold, or
promoted by S&P Dow Jones Indices LLC, Dow Jones, S&P, or their respective affiliates, and neither S&P Dow Jones Indices LLC, Dow Jones, S&P, nor their respective affiliates make any representation regarding the advisability of
investing in such product(s). |
Performance Summary – continued
Notes
to Performance Summary
Average annual total return
represents the average annual change in value for each share class for the periods presented.
Performance results reflect any applicable expense
subsidies and waivers in effect during the periods shown. Without such subsidies and waivers the fund's performance results would be less favorable. Please see the prospectus and financial statements for complete details. All results are historical
and assume the reinvestment of any dividends and capital gains distributions.
Performance results do not include adjustments made for
financial reporting purposes in accordance with U.S. generally accepted accounting principles and may differ from amounts reported in the financial highlights.
From time to time the fund may receive proceeds from
litigation settlements, without which performance would be lower.
Expense Table
Fund Expenses Borne by the Contract Holders during the
Period,
July 1, 2021 through December 31, 2021
As
a contract holder of the fund, you incur ongoing costs, including management fees; distribution and/or service (12b-1) fees; and other fund expenses. This example is intended to help you understand your ongoing costs (in dollars) of investing in the
fund and to compare these costs with the ongoing costs of investing in other mutual funds.
The example is based on an investment of $1,000 invested at
the beginning of the period and held for the entire period July 1, 2021 through December 31, 2021.
Actual Expenses
The first line for each share class in the following table
provides information about actual account values and actual expenses. You may use the information in this line, together with the amount you invested, to estimate the expenses that you paid over the period. Simply divide your account value by $1,000
(for example, an $8,600 account value divided by $1,000 = 8.6), then multiply the result by the number in the first line under the heading entitled “Expenses Paid During Period” to estimate the expenses you paid on your account during
this period.
Hypothetical Example for Comparison
Purposes
The second line for each share class in the
following table provides information about hypothetical account values and hypothetical expenses based on the fund’s actual expense ratio and an assumed rate of return of 5% per year before expenses, which is not the fund’s actual
return. The hypothetical account values and expenses may not be used to estimate the actual ending account balance or expenses you paid for the period. You may use this information to compare the ongoing costs of investing in the fund and other
funds. To do so, compare this 5% hypothetical example with the 5% hypothetical examples that appear in the shareholder reports of the other funds.
Please note that the expenses shown in the table are meant
to highlight the fund's ongoing costs only and do not take into account the fees and expenses imposed under the variable contracts through which your investment in the fund is made. Therefore, the second line for each share class in the table is
useful in comparing ongoing costs associated with an investment in vehicles (such as the fund) which fund benefits under variable annuity and variable life insurance contracts and to qualified pension and retirement plans only, and will not help you
determine the relative total costs of investing in the fund through variable annuity and variable life insurance contracts. If the fees and expenses imposed under the variable contracts were included, your costs would have been higher.
Share
Class |
|
Annualized
Expense
Ratio |
Beginning
Account Value
7/01/21 |
Ending
Account Value
12/31/21 |
Expenses
Paid During
Period (p)
7/01/21-12/31/21 |
| Initial
Class |
Actual
|
0.86%
|
$1,000.00
|
$1,024.80
|
$4.39
|
| Hypothetical
(h) |
0.86%
|
$1,000.00
|
$1,020.87
|
$4.38
|
| Service
Class |
Actual
|
1.11%
|
$1,000.00
|
$1,023.66
|
$5.66
|
| Hypothetical
(h) |
1.11%
|
$1,000.00
|
$1,019.61
|
$5.65
|
| (h)
|
5% class return per year
before expenses. |
| (p)
|
“Expenses
Paid During Period” are equal to each class's annualized expense ratio, as shown above, multiplied by the average account value over the period, multiplied by 184/365 (to reflect the one-half year period). |
Portfolio of Investments − 12/31/21
The Portfolio of Investments is a complete list of all
securities owned by your fund. It is categorized by broad-based asset classes.
| Issuer
|
|
|
Shares/Par
|
Value
($) |
| Common
Stocks – 97.7% |
| Broadcasting
– 0.5% |
|
| Netflix,
Inc. (a) |
|
1,069
|
$
644,008 |
| Brokerage
& Asset Managers – 2.2% |
|
| Charles
Schwab Corp. |
|
11,464
|
$
964,122 |
| CME
Group, Inc. |
|
2,249
|
513,807 |
| Morningstar,
Inc. |
|
1,180
|
403,548 |
| Tradeweb
Markets, Inc. |
|
11,045
|
1,106,046 |
| |
|
|
|
$2,987,523 |
| Business
Services – 11.4% |
|
| Clarivate
PLC (a) |
|
43,546
|
$
1,024,202 |
| Endava
PLC, ADR (a) |
|
11,580
|
1,944,514 |
| Equifax,
Inc. |
|
2,081
|
609,296 |
| FleetCor
Technologies, Inc. (a) |
|
4,222
|
945,052 |
| Global
Payments, Inc. |
|
25,608
|
3,461,691 |
| MSCI,
Inc. |
|
903
|
553,259 |
| Paya,
Inc. (a) |
|
81,915
|
519,341 |
| PayPal
Holdings, Inc. (a) |
|
14,810
|
2,792,870 |
| TaskUs,
Inc., “A” (a) |
|
10,955
|
591,132 |
| Thoughtworks
Holding, Inc. (a) |
|
38,950
|
1,044,250 |
| Verisk
Analytics, Inc., “A” |
|
3,417
|
781,570 |
| WEX,
Inc. (a) |
|
7,783
|
1,092,655 |
| |
|
|
|
$15,359,832 |
| Cable
TV – 0.2% |
|
| Charter
Communications, Inc., “A” (a) |
|
361
|
$
235,361 |
| Computer
Software – 25.5% |
|
| Adobe
Systems, Inc. (a) |
|
8,722
|
$
4,945,897 |
| AppLovin
Corp. (a) |
|
4,870
|
459,046 |
| Asana,
Inc. (a) |
|
7,074
|
527,367 |
| Atlassian
Corp. PLC, “A” (a) |
|
2,638
|
1,005,843 |
| Autodesk,
Inc. (a) |
|
5,556
|
1,562,292 |
| Avalara,
Inc. (a) |
|
2,686
|
346,790 |
| Black
Knight, Inc. (a) |
|
11,295
|
936,243 |
| Couchbase,
Inc. (a) |
|
2,931
|
73,158 |
| DoubleVerify
Holdings, Inc. (a) |
|
16,293
|
542,231 |
| Eventbrite,
Inc. (a) |
|
31,910
|
556,510 |
| Freshworks,
Inc, “A” (a) |
|
5,873
|
154,225 |
| HashiCorp,
Inc., “A” (a) |
|
1,403
|
127,729 |
| Intuit,
Inc. |
|
2,402
|
1,545,014 |
| Microsoft
Corp. (s) |
|
47,607
|
16,011,186 |
| Paycor
HCM, Inc. (a) |
|
19,358
|
557,704 |
| Qualtrics
International, “A” (a) |
|
7,511
|
265,889 |
| RAKUS
Co. Ltd. |
|
2,400
|
64,679 |
| RingCentral,
Inc. (a) |
|
5,552
|
1,040,167 |
| salesforce.com,
inc. (a) |
|
11,722
|
2,978,912 |
| Topicus.com,
Inc. (a) |
|
6,197
|
568,775 |
| |
|
|
|
$34,269,657 |
| Computer
Software - Systems – 9.4% |
|
| Apple,
Inc. (s) |
|
8,954
|
$
1,589,962 |
| Block,
Inc., “A” (a) |
|
2,502
|
404,098 |
| CDW
Corp. |
|
2,111
|
432,291 |
Portfolio of
Investments – continued
| Issuer
|
|
|
Shares/Par
|
Value
($) |
| Common
Stocks – continued |
| Computer
Software - Systems – continued |
|
| Constellation
Software, Inc. |
|
765
|
$
1,419,352 |
| Descartes
Systems Group, Inc. (a) |
|
11,200
|
926,316 |
| EPAM
Systems, Inc. (a) |
|
1,979
|
1,322,862 |
| HubSpot,
Inc. (a) |
|
1,723
|
1,135,715 |
| Nuvei
Corp. (a) |
|
12,647
|
821,802 |
| Q2
Holdings, Inc. (a) |
|
6,799
|
540,113 |
| ServiceNow,
Inc. (a) |
|
3,631
|
2,356,918 |
| TransUnion
|
|
9,567
|
1,134,455 |
| Wix.com
Ltd. (a) |
|
3,353
|
529,070 |
| |
|
|
|
$12,612,954 |
| Consumer
Services – 3.4% |
|
| Booking
Holdings, Inc. (a) |
|
1,573
|
$
3,773,989 |
| Uber
Technologies, Inc. (a) |
|
18,731
|
785,391 |
| |
|
|
|
$4,559,380 |
| Electronics
– 12.4% |
|
| Advanced
Micro Devices (a)(s) |
|
16,975
|
$
2,442,703 |
| KLA
Corp. |
|
4,550
|
1,957,001 |
| Lam
Research Corp. |
|
3,181
|
2,287,616 |
| Marvell
Technology, Inc. |
|
23,039
|
2,015,682 |
| Micron
Technology, Inc. |
|
17,288
|
1,610,377 |
| NVIDIA
Corp. |
|
15,976
|
4,698,701 |
| Xilinx,
Inc. |
|
7,901
|
1,675,249 |
| |
|
|
|
$16,687,329 |
| Insurance
– 0.7% |
|
| Arthur
J. Gallagher & Co. |
|
5,684
|
$
964,404 |
| Internet
– 12.6% |
|
| Alphabet,
Inc., “A” (a)(s) |
|
4,087
|
$
11,840,202 |
| Match
Group, Inc. (a) |
|
3,223
|
426,242 |
| Mercadolibre,
Inc. (a) |
|
607
|
818,479 |
| Meta
Platforms, Inc., “A” (a) |
|
6,349
|
2,135,486 |
| Pinterest,
Inc. (a) |
|
5,859
|
212,975 |
| Tencent
Holdings Ltd. |
|
25,000
|
1,464,562 |
| |
|
|
|
$16,897,946 |
| Leisure
& Toys – 0.7% |
|
| Take-Two
Interactive Software, Inc. (a) |
|
4,937
|
$
877,404 |
| Machinery
& Tools – 0.2% |
|
| Xometry,
Inc., “A” (a) |
|
6,018
|
$
308,423 |
| Medical
& Health Technology & Services – 0.3% |
|
| Guardant
Health, Inc. (a) |
|
3,660
|
$
366,073 |
| Medical
Equipment – 1.0% |
|
| Bio-Techne
Corp. |
|
1,544
|
$
798,773 |
| Maravai
Lifesciences Holdings, Inc., “A” (a) |
|
12,581
|
527,144 |
| |
|
|
|
$1,325,917 |
Portfolio of
Investments – continued
| Issuer
|
|
|
Shares/Par
|
Value
($) |
| Common
Stocks – continued |
| Other
Banks & Diversified Financials – 5.5% |
|
| Mastercard,
Inc., “A” |
|
15,131
|
$
5,436,871 |
| Visa,
Inc., “A” |
|
9,207
|
1,995,249 |
| |
|
|
|
$7,432,120 |
| Specialty
Stores – 11.5% |
|
| ACV
Auctions, Inc. (a) |
|
9,071
|
$
170,898 |
| Amazon.com,
Inc. (a)(s) |
|
3,790
|
12,637,149 |
| Chewy,
Inc., “A” (a) |
|
7,362
|
434,137 |
| Farfetch
Ltd., “A” (a) |
|
38,283
|
1,279,801 |
| Pinduoduo,
Inc., ADR (a) |
|
5,795
|
337,848 |
| Sea
Ltd., ADR (a) |
|
2,498
|
558,827 |
| |
|
|
|
$15,418,660 |
| Utilities
- Electric Power – 0.2% |
|
| Generac
Holdings, Inc. (a) |
|
775
|
$
272,738 |
| Total
Common Stocks (Identified Cost, $76,680,983) |
|
$
131,219,729 |
| Investment
Companies (h) – 2.3% |
| Money
Market Funds – 2.3% |
|
| MFS
Institutional Money Market Portfolio, 0.07% (v) (Identified Cost, $3,118,400) |
|
|
3,118,400
|
$
3,118,400 |
| Other
Assets, Less Liabilities – 0.0% |
|
26,282 |
| Net
Assets – 100.0% |
$
134,364,411 |
| (a) |
Non-income producing
security. |
|
|
|
| (h)
|
An
affiliated issuer, which may be considered one in which the fund owns 5% or more of the outstanding voting securities, or a company which is under common control. At period end, the aggregate values of the fund's investments in affiliated issuers
and in unaffiliated issuers were $3,118,400 and $131,219,729, respectively. |
|
|
|
| (s)
|
Security or
a portion of the security was pledged to cover collateral requirements for securities sold short. At December 31, 2021, the fund had no short sales outstanding. |
|
|
|
| (v)
|
Affiliated
issuer that is available only to investment companies managed by MFS. The rate quoted for the MFS Institutional Money Market Portfolio is the annualized seven-day yield of the fund at period end. |
|
|
|
| The
following abbreviations are used in this report and are defined: |
| ADR
|
American
Depositary Receipt |
At December 31,
2021, the fund had cash collateral of $4,581 and other liquid securities with an aggregate value of $568,552 to cover any collateral or margin obligations for securities sold short. Restricted cash and/or deposits with brokers in the Statement of
Assets and Liabilities are comprised of cash collateral.
See Notes to Financial Statements
| Financial
Statements |
Statement of Assets and
Liabilities |
This statement
represents your fund’s balance sheet, which details the assets and liabilities comprising the total value of the fund.
| At
12/31/21 Assets |
|
| Investments
in unaffiliated issuers, at value (identified cost, $76,680,983) |
$131,219,729
|
| Investments
in affiliated issuers, at value (identified cost, $3,118,400) |
3,118,400
|
| Deposits
with brokers for |
|
| Securities
sold short |
4,581
|
| Receivables
for |
|
| Investments
sold |
39,297
|
| Fund
shares sold |
92,110
|
| Dividends
|
13,390
|
| Other
assets |
914
|
| Total
assets |
$134,488,421
|
| Liabilities
|
|
| Payables
for |
|
| Fund
shares reacquired |
$68,975
|
| Payable
to affiliates |
|
| Investment
adviser |
5,455
|
| Administrative
services fee |
158
|
| Shareholder
servicing costs |
66
|
| Distribution
and/or service fees |
1,456
|
| Accrued
expenses and other liabilities |
47,900
|
| Total
liabilities |
$124,010
|
| Net
assets |
$134,364,411
|
| Net
assets consist of |
|
| Paid-in
capital |
$70,160,011
|
| Total
distributable earnings (loss) |
64,204,400
|
| Net
assets |
$134,364,411
|
| Shares
of beneficial interest outstanding |
4,231,837
|
| |
Net
assets |
Shares
outstanding |
Net
asset value
per share |
| Initial
Class |
$28,740,217
|
855,755
|
$33.58
|
| Service
Class |
105,624,194
|
3,376,082
|
31.29
|
See Notes to Financial Statements
| Financial
Statements |
Statement of Operations
|
This statement describes how much
your fund earned in investment income and accrued in expenses. It also describes any gains and/or losses generated by fund operations.
| Year
ended 12/31/21 |
|
| Net
investment income (loss) |
|
| Income
|
|
| Dividends
|
$290,970
|
| Other
|
6,877
|
| Dividends
from affiliated issuers |
1,334
|
| Income
on securities loaned |
218
|
| Foreign
taxes withheld |
(718)
|
| Total
investment income |
$298,681
|
| Expenses
|
|
| Management
fee |
$925,292
|
| Distribution
and/or service fees |
232,898
|
| Shareholder
servicing costs |
11,169
|
| Administrative
services fee |
27,016
|
| Independent
Trustees' compensation |
3,932
|
| Custodian
fee |
10,807
|
| Shareholder
communications |
11,705
|
| Audit
and tax fees |
58,647
|
| Legal
fees |
697
|
| Dividend
and interest expense on securities sold short |
5,933
|
| Interest
expense and fees |
503
|
| Miscellaneous
|
27,829
|
| Total
expenses |
$1,316,428
|
| Reduction
of expenses by investment adviser |
(15,720)
|
| Net
expenses |
$1,300,708
|
| Net
investment income (loss) |
$(1,002,027)
|
| Realized
and unrealized gain (loss) |
|
| Realized
gain (loss) (identified cost basis) |
|
| Unaffiliated
issuers |
$11,689,496
|
| Written
options |
68,052
|
| Securities
sold short |
(595,062)
|
| Foreign
currency |
(303)
|
| Net
realized gain (loss) |
$11,162,183
|
| Change
in unrealized appreciation or depreciation |
|
| Unaffiliated
issuers |
$4,968,309
|
| Net
realized and unrealized gain (loss) |
$16,130,492
|
| Change
in net assets from operations |
$15,128,465
|
See Notes to Financial Statements
| Financial
Statements |
Statements of Changes in
Net Assets |
These statements describe
the increases and/or decreases in net assets resulting from operations, any distributions, and any shareholder transactions.
| |
Year
ended |
| |
12/31/21
|
12/31/20
|
| Change
in net assets |
|
|
| From
operations |
|
|
| Net
investment income (loss) |
$(1,002,027)
|
$(580,483)
|
| Net
realized gain (loss) |
11,162,183
|
7,550,353
|
| Net
unrealized gain (loss) |
4,968,309
|
24,235,909
|
| Change
in net assets from operations |
$15,128,465
|
$31,205,779
|
| Total
distributions to shareholders |
$(6,980,065)
|
$—
|
| Change
in net assets from fund share transactions |
$21,904,529
|
$4,958,901
|
| Total
change in net assets |
$30,052,929
|
$36,164,680
|
| Net
assets |
|
|
| At
beginning of period |
104,311,482
|
68,146,802
|
| At
end of period |
$134,364,411
|
$104,311,482
|
See Notes to Financial Statements
| Financial
Statements |
Financial Highlights
|
The financial highlights table is
intended to help you understand the fund's financial performance for the past 5 years. Certain information reflects financial results for a single fund share. The total returns in the table represent the rate that an investor would have earned (or
lost) on an investment in the fund share class (assuming reinvestment of all distributions) held for the entire period.
| Initial
Class |
Year
ended |
| |
12/31/21
|
12/31/20
|
12/31/19
|
12/31/18
|
12/31/17
|
| Net
asset value, beginning of period |
$31.10
|
$21.18
|
$17.34
|
$17.96
|
$13.19
|
| Income
(loss) from investment operations |
|
|
|
|
|
| Net
investment income (loss) (d) |
$(0.21)
|
$(0.14)
|
$(0.09)
|
$(0.07)
|
$(0.05)
|
| Net
realized and unrealized gain (loss) |
4.47
|
10.06
|
6.16
|
0.58
|
5.16
|
| Total
from investment operations |
$4.26
|
$9.92
|
$6.07
|
$0.51
|
$5.11
|
| Less
distributions declared to shareholders |
|
|
|
|
|
| From
net realized gain |
$(1.78)
|
$—
|
$(2.23)
|
$(1.13)
|
$(0.34)
|
| Net
asset value, end of period (x) |
$33.58
|
$31.10
|
$21.18
|
$17.34
|
$17.96
|
| Total
return (%) (k)(r)(s)(x) |
13.68
|
46.84
|
36.16
|
1.73
|
39.00
|
Ratios
(%) (to average net assets)
and Supplemental data: |
|
|
|
|
|
| Expenses
before expense reductions |
0.88
|
0.94
|
0.97
|
0.94
|
0.88
|
| Expenses
after expense reductions |
0.87
|
0.93
|
0.96
|
0.93
|
0.88
|
| Net
investment income (loss) |
(0.62)
|
(0.55)
|
(0.44)
|
(0.38)
|
(0.29)
|
| Portfolio
turnover |
44
|
57
|
33
|
39
|
31
|
| Net
assets at end of period (000 omitted) |
$28,740
|
$28,768
|
$19,336
|
$17,056
|
$27,659
|
| Supplemental
Ratios (%): |
|
|
|
|
|
| Ratios
of expenses to average net assets after expense reductions excluding short sale expenses and interest expense and fees |
0.86
|
0.91
|
0.93
|
0.85
|
0.85
|
See Notes to Financial Statements
Financial Highlights - continued
| Service
Class |
Year
ended |
| |
12/31/21
|
12/31/20
|
12/31/19
|
12/31/18
|
12/31/17
|
| Net
asset value, beginning of period |
$29.15
|
$19.91
|
$16.44
|
$17.11
|
$12.61
|
| Income
(loss) from investment operations |
|
|
|
|
|
| Net
investment income (loss) (d) |
$(0.27)
|
$(0.19)
|
$(0.13)
|
$(0.12)
|
$(0.08)
|
| Net
realized and unrealized gain (loss) |
4.19
|
9.43
|
5.83
|
0.58
|
4.92
|
| Total
from investment operations |
$3.92
|
$9.24
|
$5.70
|
$0.46
|
$4.84
|
| Less
distributions declared to shareholders |
|
|
|
|
|
| From
net realized gain |
$(1.78)
|
$—
|
$(2.23)
|
$(1.13)
|
$(0.34)
|
| Net
asset value, end of period (x) |
$31.29
|
$29.15
|
$19.91
|
$16.44
|
$17.11
|
| Total
return (%) (k)(r)(s)(x) |
13.43
|
46.41
|
35.88
|
1.52
|
38.65
|
Ratios
(%) (to average net assets)
and Supplemental data: |
|
|
|
|
|
| Expenses
before expense reductions |
1.13
|
1.19
|
1.22
|
1.16
|
1.14
|
| Expenses
after expense reductions |
1.12
|
1.18
|
1.21
|
1.15
|
1.13
|
| Net
investment income (loss) |
(0.87)
|
(0.81)
|
(0.69)
|
(0.61)
|
(0.53)
|
| Portfolio
turnover |
44
|
57
|
33
|
39
|
31
|
| Net
assets at end of period (000 omitted) |
$105,624
|
$75,544
|
$48,811
|
$39,272
|
$203,610
|
| Supplemental
Ratios (%): |
|
|
|
|
|
| Ratios
of expenses to average net assets after expense reductions excluding short sale expenses and interest expense and fees |
1.11
|
1.16
|
1.18
|
1.07
|
1.10
|
| (d)
|
Per share
data is based on average shares outstanding. |
| (k)
|
The total
return does not reflect expenses that apply to separate accounts. Inclusion of these charges would reduce the total return figures for all periods shown. |
| (r)
|
Certain
expenses have been reduced without which performance would have been lower. |
| (s)
|
From time to
time the fund may receive proceeds from litigation settlements, without which performance would be lower. |
| (x)
|
The
net asset values and total returns have been calculated on net assets which include adjustments made in accordance with U.S. generally accepted accounting principles required at period end for financial reporting purposes. |
See Notes to Financial Statements
Notes to Financial Statements
(1) Business and Organization
MFS Technology Portfolio (the fund) is a non-diversified
series of MFS Variable Insurance Trust II (the trust). The trust is organized as a Massachusetts business trust and is registered under the Investment Company Act of 1940, as amended, as an open-end management investment company. The shareholders of
each series of the trust are separate accounts of insurance companies, which offer variable annuity and/or life insurance products, and qualified retirement and pension plans.
The fund is an investment company and accordingly follows
the investment company accounting and reporting guidance of the Financial Accounting Standards Board (FASB) Accounting Standards Codification Topic 946 Financial Services - Investment Companies.
(2) Significant Accounting Policies
General — The
preparation of financial statements in conformity with U.S. generally accepted accounting principles requires management to make estimates and assumptions that affect the reported amounts of assets and liabilities, and disclosure of contingent
assets and liabilities at the date of the financial statements and the reported amounts of increases and decreases in net assets from operations during the reporting period. Actual results could differ from those estimates. In the preparation of
these financial statements, management has evaluated subsequent events occurring after the date of the fund’s Statement of Assets and Liabilities through the date that the financial statements were issued. The fund invests primarily in securities of issuers in the technology industry. Issuers in a single industry can react similarly to market, currency, political, economic, regulatory, geopolitical, environmental, public
health, and other conditions. The value of stocks in the technology sector can be very volatile due to the rapid pace of product change, technological developments, and other factors.
Balance Sheet Offsetting
— The fund's accounting policy with respect to balance sheet offsetting is that, absent an event of default by the counterparty or a termination of the agreement, the International Swaps and Derivatives Association (ISDA) Master Agreement, or
similar agreement, does not result in an offset of reported amounts of financial assets and financial liabilities in the Statement of Assets and Liabilities across transactions between the fund and the applicable counterparty. The fund's right to
setoff may be restricted or prohibited by the bankruptcy or insolvency laws of the particular jurisdiction to which a specific master netting agreement counterparty is subject. Balance sheet offsetting disclosures, to the extent applicable to the
fund, have been included in the fund’s Significant Accounting Policies note under the captions for each of the fund’s in-scope financial instruments and transactions.
Investment Valuations
— Equity securities, including restricted equity securities and equity securities sold short, are generally valued at the last sale or official closing price on their primary market or exchange as
provided by a third-party pricing service. Equity securities, for which there were no sales reported that day, are generally valued at the last quoted daily bid quotation on their primary market or exchange as provided by a third-party pricing
service. Equity securities sold short, for which there were no sales reported that day, are generally valued at the last quoted daily ask quotation on their primary market or exchange as provided by a third-party pricing service. Short-term instruments with a maturity at issuance of 60 days or less may be valued at amortized cost, which approximates market value. Exchange-traded options are generally
valued at the last sale or official closing price on their primary exchange as provided by a third-party pricing service. Exchange-traded options for which there were no sales reported that day are generally valued at the last daily bid quotation on
their primary exchange as provided by a third-party pricing service. For put options, the position may be valued at the last daily ask quotation if there are no trades reported during the day. Options not traded on an exchange are generally valued
at a broker/dealer bid quotation. Foreign currency options are generally valued at valuations provided by a third-party pricing service. Open-end investment companies are generally valued at net asset value
per share. Securities and other assets generally valued on the basis of information from a third-party pricing service may also be valued at a broker/dealer bid quotation. In determining values, third-party pricing services can utilize both transaction data and market information such as yield, quality, coupon rate, maturity, type of issue, trading characteristics, and other market
data. The values of foreign securities and other assets and liabilities expressed in foreign currencies are converted to U.S. dollars using the mean of bid and asked prices for rates provided by a third-party
pricing service.
The Board of Trustees has
delegated primary responsibility for determining or causing to be determined the value of the fund’s investments (including any fair valuation) to the adviser pursuant to valuation policies and procedures approved by the Board. If the adviser
determines that reliable market quotations are not readily available, investments are valued at fair value as determined in good faith by the adviser in accordance with such procedures under the oversight of the Board of Trustees. Under the
fund’s valuation policies and procedures, market quotations are not considered to be readily available for most types of debt instruments and floating rate loans and many types of derivatives. These investments are generally valued at fair
value based on information from third-party pricing services. In addition, investments may be valued at fair value if the adviser determines that an investment’s value has been materially affected by events occurring after the close of the
exchange or market on which the investment is principally traded (such as foreign exchange or market) and prior to the determination of the fund’s net asset value, or after the halt of trading
Notes to Financial Statements - continued
of a specific
security where trading does not resume prior to the close of the exchange or market on which the security is principally traded. Events that occur after foreign markets close (such as developments in foreign markets and significant movements in the
U.S. markets) and prior to the determination of the fund’s net asset value may be deemed to have a material effect on the value of securities traded in foreign markets. Accordingly, the fund’s foreign equity securities may often be
valued at fair value. The adviser generally relies on third-party pricing services or other information (such as the correlation with price movements of similar securities in the same or other markets; the type, cost and investment characteristics
of the security; the business and financial condition of the issuer; and trading and other market data) to assist in determining whether to fair value and at what value to fair value an investment. The value of an investment for purposes of
calculating the fund’s net asset value can differ depending on the source and method used to determine value. When fair valuation is used, the value of an investment used to determine the fund’s net asset value may differ from quoted or
published prices for the same investment. There can be no assurance that the fund could obtain the fair value assigned to an investment if it were to sell the investment at the same time at which the fund determines its net asset value per
share.
Various inputs are used in determining the
value of the fund's assets or liabilities. These inputs are categorized into three broad levels. In certain cases, the inputs used to measure fair value may fall into different levels of the fair value hierarchy. In such cases, an investment's level
within the fair value hierarchy is based on the lowest level of input that is significant to the fair value measurement. The fund's assessment of the significance of a particular input to the fair value measurement in its entirety requires judgment,
and considers factors specific to the investment. Level 1 includes unadjusted quoted prices in active markets for identical assets or liabilities. Level 2 includes other significant observable market-based inputs (including quoted prices for similar
securities, interest rates, prepayment speed, and credit risk). Level 3 includes unobservable inputs, which may include the adviser's own assumptions in determining the fair value of investments. The following is a summary of the levels used as of
December 31, 2021 in valuing the fund's assets and liabilities:
| Financial
Instruments |
Level
1 |
Level
2 |
Level
3 |
Total
|
| Equity
Securities |
$131,219,729
|
$—
|
$—
|
$131,219,729
|
| Mutual
Funds |
3,118,400
|
—
|
—
|
3,118,400
|
| Total
|
$134,338,129
|
$—
|
$—
|
$134,338,129
|
For further information
regarding security characteristics, see the Portfolio of Investments.
Foreign Currency
Translation — Purchases and sales of foreign investments, income, and expenses are converted into U.S. dollars based upon currency exchange rates prevailing on the respective dates of such transactions or on
the reporting date for foreign denominated receivables and payables. Gains and losses attributable to foreign currency exchange rates on sales of securities are recorded for financial statement purposes as net realized gains and losses on
investments. Gains and losses attributable to foreign exchange rate movements on receivables, payables, income and expenses are recorded for financial statement purposes as foreign currency transaction gains and losses. That portion of both realized
and unrealized gains and losses on investments that results from fluctuations in foreign currency exchange rates is not separately disclosed.
Derivatives — The
fund uses derivatives primarily to increase or decrease exposure to a particular market or segment of the market, or security, to increase or decrease interest rate or currency exposure, or as alternatives to direct investments. Derivatives are used
for hedging or non-hedging purposes. While hedging can reduce or eliminate losses, it can also reduce or eliminate gains. When the fund uses derivatives as an investment to increase market exposure, or for hedging purposes, gains and losses from
derivative instruments may be substantially greater than the derivative’s original cost.
The derivative instruments used by the fund during the
period were written options. Depending on the type of derivative, a fund may exit a derivative position by entering into an offsetting transaction with a counterparty or exchange, negotiating an agreement with the derivative counterparty, or
novating the position to a third party. At December 31, 2021, the fund did not have any outstanding derivative instruments.
The following table presents, by major type of derivative
contract, the realized gain (loss) on derivatives held by the fund for the year ended December 31, 2021 as reported in the Statement of Operations:
| Risk
|
Written
Options |
| Equity
|
$68,052
|
There is no change in unrealized
appreciation (depreciation) on derivative transactions at period end.
Derivative counterparty credit risk is managed through
formal evaluation of the creditworthiness of all potential counterparties. On certain, but not all, uncleared derivatives, the fund attempts to reduce its exposure to counterparty credit risk whenever possible by entering into an ISDA Master
Agreement on a bilateral basis. The ISDA Master Agreement gives each party to the agreement the
Notes to Financial Statements - continued
right to terminate
all transactions traded under such agreement if there is a specified deterioration in the credit quality of the other party. Upon an event of default or a termination of the ISDA Master Agreement, the non-defaulting party has the right to close out
all transactions traded under such agreement and to net amounts owed under each agreement to one net amount payable by one party to the other. This right to close out and net payments across all transactions traded under the ISDA Master Agreement
could result in a reduction of the fund's credit risk to such counterparty equal to any amounts payable by the fund under the applicable transactions, if any.
Collateral and margin requirements differ by type of
derivative. For cleared derivatives (e.g., futures contracts, cleared swaps, and exchange-traded options), margin requirements are set by the clearing broker and the clearing house and collateral, in the form of cash or securities, is posted by the
fund directly with the clearing broker. Collateral terms are counterparty agreement specific for uncleared derivatives (e.g., forward foreign currency exchange contracts, uncleared swap agreements, and uncleared options) and collateral, in the form
of cash and securities, is held in segregated accounts with the fund's custodian in connection with these agreements. For derivatives traded under an ISDA Master Agreement, which contains a collateral support annex, the collateral requirements are
netted across all transactions traded under such counterparty-specific agreement and an amount is posted from one party to the other to collateralize such obligations. Cash that has been segregated or delivered to cover the fund's collateral or
margin obligations under derivative contracts, if any, will be reported separately in the Statement of Assets and Liabilities as restricted cash for uncleared derivatives and/or deposits with brokers for cleared derivatives. Securities pledged as
collateral or margin for the same purpose, if any, are noted in the Portfolio of Investments. The fund may be required to make payments of interest on uncovered collateral or margin obligations with the broker. Any such payments are included in
“Miscellaneous” expense in the Statement of Operations.
Written Options — In
exchange for a premium, the fund wrote put options on securities for which it anticipated the price would increase. At the time the option was written, the fund believed the premium received exceeded the potential loss that could result from adverse
price changes in the options’ underlying securities. In a written option, the fund as the option writer grants the buyer the right to purchase from, or sell to, the fund a specified number of shares or units of a particular security, currency
or index at a specified price within a specified period of time.
The premium received is initially recorded as a liability
in the Statement of Assets and Liabilities. The option is subsequently marked-to-market daily with the difference between the premium received and the market value of the written option being recorded as unrealized appreciation or depreciation. When
a written option expires, the fund realizes a gain equal to the amount of the premium received. The difference between the premium received and the amount paid on effecting a closing transaction is considered a realized gain or loss. When a written
put option is exercised, the premium reduces the cost basis of the security purchased by the fund.
At the initiation of the written option contract, for
exchange traded options, the fund is required to deposit securities or cash as collateral with the custodian for the benefit of the broker or directly with the clearing broker, based on the type of option. For uncleared options, the fund may post
collateral subject to the terms of an ISDA Master Agreement as generally described above if the market value of the options contract moves against it. The fund, as writer of an option, may have no control over whether the underlying securities may
be sold (call) or purchased (put) and, as a result, bears the market risk of an unfavorable change in the price of the securities underlying the written option. Losses from writing options can exceed the premium received and can exceed the potential
loss from an ordinary buy and sell transaction. Although the fund’s market risk may be significant, the maximum counterparty credit risk to the fund is equal to the market value of any collateral posted to the broker. For uncleared options,
this risk is mitigated in cases where there is an ISDA Master Agreement between the fund and the counterparty providing for netting as described above.
Short Sales — The
fund entered into short sales whereby it sells a security it does not own in anticipation of a decline in the value of that security. The fund will realize a gain if the security price decreases and a loss if the security price increases between the
date of the short sale and the date on which the fund replaces the borrowed security. Losses from short sales can exceed the proceeds of the security sold; and they can also exceed the potential loss from an ordinary buy and sell transaction. The
amount of any premium, dividends, or interest the fund may be required to pay in connection with a short sale will be recognized as a fund expense. During the year ended December 31, 2021, this expense amounted to $5,933. The fund segregates cash or
marketable securities in an amount that, when combined with the amount of proceeds from the short sale deposited with the broker, at least equals the current market value of the security sold short. At December 31, 2021, the fund had no short sales
outstanding.
Security Loans — Under its Securities Lending Agency Agreement with the fund, State Street Bank and Trust Company, as lending agent, loans the securities of the fund to certain qualified institutions (the
“Borrowers”) approved by the fund. Security loans can be terminated at the discretion of either the lending agent or the fund and the related securities must be returned within the earlier of the standard trade settlement period for such
securities or within three business days. The loans are collateralized by cash and/or U.S. Treasury and federal agency obligations in an amount typically at least equal to the market value of the securities loaned. On
Notes to Financial Statements - continued
loans
collateralized by cash, the cash collateral is invested in a money market fund. The market value of the loaned securities is determined at the close of business of the fund and any additional required collateral is delivered to the fund on the next
business day. The lending agent provides the fund with indemnification against Borrower default. In the event of Borrower default, the lending agent will, for the benefit of the fund, either purchase securities identical to those loaned or, when
such purchase is commercially impracticable, pay the fund the market value of the loaned securities. In return, the lending agent assumes the fund's rights to the related collateral. If the collateral value is less than the cost to purchase
identical securities, the lending agent is responsible for the shortfall, but only to the extent that such shortfall is not due to a decline in collateral value resulting from collateral reinvestment for which the fund bears the risk of loss. A
portion of the income generated upon investment of the collateral is remitted to the Borrowers, and the remainder is allocated between the fund and the lending agent. On loans collateralized by U.S. Treasury and/or federal agency obligations, a fee
is received from the Borrower, and is allocated between the fund and the lending agent. Income from securities lending is separately reported in the Statement of Operations. The dividend and interest income earned on the securities loaned is
accounted for in the same manner as other dividend and interest income. At December 31, 2021, there were no securities on loan or collateral outstanding.
Indemnifications —
Under the fund's organizational documents, its officers and Trustees may be indemnified against certain liabilities and expenses arising out of the performance of their duties to the fund. Additionally, in the normal course of business, the fund
enters into agreements with service providers that may contain indemnification clauses. The fund's maximum exposure under these agreements is unknown as this would involve future claims that may be made against the fund that have not yet
occurred.
Investment Transactions and Income — Investment transactions are recorded on the trade date. Dividends received in cash are recorded on the ex-dividend date. Certain dividends from foreign securities will be
recorded when the fund is informed of the dividend if such information is obtained subsequent to the ex-dividend date. Dividend payments received in additional securities are recorded on the ex-dividend date in an amount equal to the value of the
security on such date.
The fund may receive
proceeds from litigation settlements. Any proceeds received from litigation involving portfolio holdings are reflected in the Statement of Operations in realized gain/loss if the security has been disposed of by the fund or in unrealized gain/loss
if the security is still held by the fund. Any other proceeds from litigation not related to portfolio holdings are reflected as other income in the Statement of Operations.
Tax Matters and Distributions — The fund intends to qualify as a regulated investment company, as defined under Subchapter M of the Internal Revenue Code, and to distribute all of its taxable income, including realized capital gains. As a
result, no provision for federal income tax is required. The fund’s federal tax returns, when filed, will remain subject to examination by the Internal Revenue Service for a three year period. Management has analyzed the fund’s tax
positions taken on federal and state tax returns for all open tax years and does not believe that there are any uncertain tax positions that require recognition of a tax liability. Foreign taxes, if any, have been accrued by the fund in the
accompanying financial statements in accordance with the applicable foreign tax law. Foreign income taxes may be withheld by certain countries in which the fund invests. Additionally, capital gains realized by the fund on securities issued in or by
certain foreign countries may be subject to capital gains tax imposed by those countries.
Distributions to shareholders are recorded on the
ex-dividend date. Income and capital gain distributions are determined in accordance with income tax regulations, which may differ from U.S. generally accepted accounting principles. Certain capital accounts in the financial statements are
periodically adjusted for permanent differences in order to reflect their tax character. These adjustments have no impact on net assets or net asset value per share. Temporary differences which arise from recognizing certain items of income,
expense, gain or loss in different periods for financial statement and tax purposes will reverse at some time in the future.
Book/tax differences primarily relate to wash sale loss
deferrals and straddle loss deferrals.
The tax
character of distributions declared to shareholders for the last two fiscal years is as follows:
| |
Year
ended
12/31/21 |
Year
ended
12/31/20 |
| Ordinary
income (including any short-term capital gains) |
$1,121,029
|
$—
|
| Long-term
capital gains |
5,859,036
|
—
|
| Total
distributions |
$6,980,065
|
$—
|
The federal tax cost and the tax
basis components of distributable earnings were as follows:
Notes to Financial Statements - continued
| As
of 12/31/21 |
|
| Cost
of investments |
$80,266,514
|
| Gross
appreciation |
57,052,625
|
| Gross
depreciation |
(2,981,010)
|
| Net
unrealized appreciation (depreciation) |
$54,071,615
|
| Undistributed
ordinary income |
1,463,425
|
| Undistributed
long-term capital gain |
8,669,360
|
| Total
distributable earnings (loss) |
$64,204,400
|
Multiple Classes of Shares of
Beneficial Interest — The fund offers multiple classes of shares, which differ in their respective distribution and/or service fees. The fund's income, realized and unrealized gain (loss), and common expenses
are allocated to shareholders based on the daily net assets of each class. Dividends are declared separately for each class. Differences in per share dividend rates are generally due to differences in separate class expenses. The fund’s
distributions declared to shareholders as reported in the Statements of Changes in Net Assets are presented by class as follows:
| |
Year
ended
12/31/21 |
|
Year
ended
12/31/20 |
| Initial
Class |
$1,553,491
|
|
$—
|
| Service
Class |
5,426,574
|
|
—
|
| Total
|
$6,980,065
|
|
$—
|
(3) Transactions with
Affiliates
Investment Adviser — The fund has an investment advisory agreement with MFS to provide overall investment management and related administrative services and facilities to the fund. The
management fee is computed daily and paid monthly at the following annual rates based on the fund's average daily net assets:
| Up
to $1 billion |
0.75%
|
| In
excess of $1 billion |
0.70%
|
MFS has agreed in writing to
reduce its management fee by a specified amount if certain MFS mutual fund assets exceed thresholds agreed to by MFS and the fund's Board of Trustees. For the year ended December 31, 2021, this management fee reduction amounted to $15,720, which is
included in the reduction of total expenses in the Statement of Operations. The management fee incurred for the year ended December 31, 2021 was equivalent to an annual effective rate of 0.74% of the fund's average daily net assets.
The investment adviser has agreed in writing to pay a
portion of the fund’s total annual operating expenses, excluding interest, taxes, extraordinary expenses, brokerage and transaction costs, and investment-related expenses (such as short sale dividend and interest expenses incurred in
connection with the fund's investment activity), such that total annual operating expenses do not exceed 1.00% of average daily net assets for the Initial Class shares and 1.25% of average daily net assets for the Service Class shares. This written
agreement will continue until modified by the fund’s Board of Trustees, but such agreement will continue at least until April 30, 2023. For the year ended December 31, 2021, the fund's actual operating expenses did not exceed the limit and
therefore, the investment adviser did not pay any portion of the fund's expenses related to this agreement.
Distributor — MFS
Fund Distributors, Inc. (MFD), a wholly-owned subsidiary of MFS, is the distributor of shares of the fund. The Trustees have adopted a distribution plan for the Service Class shares pursuant to Rule 12b-1 under the Investment Company Act of
1940.
The fund's distribution plan provides
that the fund will pay MFD distribution and/or service fees equal to 0.25% per annum of its average daily net assets attributable to Service Class shares as partial consideration for services performed and expenses incurred by MFD and financial
intermediaries (including participating insurance companies that invest in the fund to fund variable annuity and variable life insurance contracts, sponsors of qualified retirement and pension plans that invest in the fund, and affiliates of these
participating insurance companies and plan sponsors) in connection with the sale and distribution of the Service Class shares. MFD may subsequently pay all, or a portion, of the distribution and/or service fees to financial intermediaries.
Notes to Financial Statements - continued
Shareholder Servicing Agent
— MFS Service Center, Inc. (MFSC), a wholly-owned subsidiary of MFS, receives a fee from the fund for its services as shareholder servicing agent. For the year ended December 31, 2021, the fee was $10,690, which equated to 0.0087% annually of
the fund's average daily net assets. MFSC also receives reimbursement from the fund for out-of-pocket expenses paid by MFSC on behalf of the fund. For the year ended December 31, 2021, these costs amounted to $479.
Administrator — MFS
provides certain financial, legal, shareholder communications, compliance, and other administrative services to the fund. Under an administrative services agreement, the fund reimburses MFS the costs incurred to provide these services. The fund is
charged an annual fixed amount of $17,500 plus a fee based on average daily net assets. The administrative services fee incurred for the year ended December 31, 2021 was equivalent to an annual effective rate of 0.0219% of the fund's average daily
net assets.
Trustees’ and Officers’
Compensation — The fund pays compensation to independent Trustees in the form of a retainer, attendance fees, and additional compensation to Board and Committee chairpersons. The fund does not pay compensation
directly to Trustees or officers of the fund who are also officers of the investment adviser, all of whom receive remuneration from MFS for their services to the fund. Certain officers and Trustees of the fund are officers or directors of MFS, MFD,
and MFSC.
Other — The fund invests in the MFS Institutional Money Market Portfolio which is managed by MFS and seeks current income consistent with preservation of capital and liquidity. This money market fund does not pay a
management fee to MFS but does incur investment and operating costs.
The fund is permitted to engage in purchase and sale
transactions with funds and accounts for which MFS serves as investment adviser or sub-adviser (“cross-trades”) pursuant to a policy adopted by the Board of Trustees. This policy has been designed to ensure that cross-trades conducted by
the fund comply with Rule 17a-7 under the Investment Company Act of 1940. During the year ended December 31, 2021, the fund engaged in sale transactions pursuant to this policy, which amounted to $160,596. The sales transactions resulted in net
realized gains (losses) of $(128,821).
The adviser
has voluntarily undertaken to reimburse the fund from its own resources on a quarterly basis for the cost of investment research embedded in the cost of the fund’s securities trades. This agreement may be rescinded at any time. For the year
ended December 31, 2021, this reimbursement amounted to $6,739, which is included in “Other” income in the Statement of Operations.
(4) Portfolio Securities
For the year ended December 31, 2021, purchases and sales
of investments, other than short-term obligations, aggregated $66,162,489 and $52,438,595, respectively.
(5) Shares of Beneficial Interest
The fund's Declaration of Trust permits the Trustees to
issue an unlimited number of full and fractional shares of beneficial interest. Transactions in fund shares were as follows:
| |
Year
ended
12/31/21 |
|
Year
ended
12/31/20 |
| |
Shares
|
Amount
|
|
Shares
|
Amount
|
| Shares
sold |
|
|
|
|
|
| Initial
Class |
115,612
|
$3,776,656
|
|
215,421
|
$5,537,761
|
| Service
Class |
1,413,331
|
43,584,533
|
|
1,213,821
|
29,404,672
|
| |
1,528,943
|
$47,361,189
|
|
1,429,242
|
$34,942,433
|
Shares
issued to shareholders
in reinvestment of distributions |
|
|
|
|
|
| Initial
Class |
46,249
|
$1,553,491
|
|
—
|
$—
|
| Service
Class |
173,262
|
5,426,574
|
|
—
|
—
|
| |
219,511
|
$6,980,065
|
|
—
|
$—
|
| Shares
reacquired |
|
|
|
|
|
| Initial
Class |
(231,079)
|
$(7,709,675)
|
|
(203,201)
|
$(5,171,507)
|
| Service
Class |
(802,009)
|
(24,727,050)
|
|
(1,074,446)
|
(24,812,025)
|
| |
(1,033,088)
|
$(32,436,725)
|
|
(1,277,647)
|
$(29,983,532)
|
Notes to Financial Statements - continued
| |
Year
ended
12/31/21 |
|
Year
ended
12/31/20 |
| |
Shares
|
Amount
|
|
Shares
|
Amount
|
| Net
change |
|
|
|
|
|
| Initial
Class |
(69,218)
|
$(2,379,528)
|
|
12,220
|
$366,254
|
| Service
Class |
784,584
|
24,284,057
|
|
139,375
|
4,592,647
|
| |
715,366
|
$21,904,529
|
|
151,595
|
$4,958,901
|
(6) Line of
Credit
The fund and certain other funds managed by
MFS participate in a $1.25 billion unsecured committed line of credit of which $1 billion is reserved for use by the fund and certain other MFS U.S. funds. The line of credit is provided by a syndicate of banks under a credit agreement. Borrowings
may be made for temporary financing needs. Interest is charged to each fund, based on its borrowings, generally at a rate equal to the highest of one month LIBOR, the Federal Funds Effective Rate and the Overnight Bank Funding Rate, plus an agreed
upon spread. A commitment fee, based on the average daily, unused portion of the committed line of credit, is allocated among the participating funds. In addition, the fund and other funds managed by MFS have established unsecured uncommitted
borrowing arrangements with certain banks for temporary financing needs. Interest is charged to each fund, based on its borrowings, at rates equal to customary reference rates plus an agreed upon spread. For the year ended December 31, 2021, the
fund’s commitment fee and interest expense were $487 and $0, respectively, and are included in “Interest expense and fees” in the Statement of Operations.
(7) Investments in Affiliated Issuers
An affiliated issuer may be considered one in which the
fund owns 5% or more of the outstanding voting securities, or a company which is under common control. For the purposes of this report, the following were affiliated issuers:
| Affiliated
Issuers |
Beginning
Value |
Purchases
|
Sales
Proceeds |
Realized
Gain
(Loss) |
Change
in
Unrealized
Appreciation or
Depreciation |
Ending
Value |
| MFS
Institutional Money Market Portfolio |
$3,257,002
|
$41,982,324
|
$42,120,926
|
$—
|
$—
|
$3,118,400
|
| Affiliated
Issuers |
Dividend
Income |
Capital
Gain
Distributions |
| MFS
Institutional Money Market Portfolio |
$1,334
|
$—
|
(8) Impacts of
COVID-19
The pandemic related to the global spread of
novel coronavirus disease (COVID-19), which was first detected in December 2019, has resulted in significant disruptions to global business activity and the global economy, as well as the economies of individual countries, the financial performance
of individual companies and sectors, and the securities and commodities markets in general. Multiple surges in cases globally, the availability and widespread adoption of vaccines, and the emergence of variant strains of the virus continue to create
uncertainty as to the future and long-term impacts resulting from the pandemic including impacts to the prices and liquidity of the fund's investments and the fund's performance.
(9) LIBOR Transition
Certain of the fund's investments, including its
investments in derivatives, as well as any debt issued by the fund and other contractual arrangements of the fund may be based on reference interest rates such as the London Interbank Offered Rate (“LIBOR”). In 2017, the regulatory
authority that oversees financial services firms in the United Kingdom announced plans to transition away from LIBOR by the end of 2021. In March 2021, the administrator of LIBOR announced the extension of the publication of the more commonly used
U.S. dollar LIBOR settings to the end of June 2023. Although the full impacts of the transition away from LIBOR are not fully known, the transition may result in, among other things, an increase in volatility or illiquidity of the markets for
instruments that currently rely on LIBOR to determine interest rates and this could have an adverse impact on the fund's performance. With respect to the fund's accounting for investments, including its investments in derivatives, as well as any
debt issued by the fund and other contractual arrangements of the fund that undergo reference rate-related modifications as a result
Notes to Financial Statements - continued
of the transition,
management will rely upon the relief provided by FASB Codification Topic 848 – Reference Rate Reform (Topic 848). The guidance in Topic 848 permits the fund to disregard the GAAP accounting requirements around certain contract modifications
resulting from the LIBOR transition such that for contracts considered in scope, the fund can account for those modified contracts as a continuation of the existing contracts. While the cessation of the one-week and two-month U.S. dollar LIBOR
tenors along with certain other non-U.S. dollar denominated LIBOR settings at December 31, 2021 did not have a material impact on the fund, management is still evaluating the impact to the fund of the June 30, 2023 planned discontinuation of the
more commonly used U.S. dollar LIBOR settings.
Report of Independent Registered Public Accounting
Firm
To the Board of Trustees of MFS Variable
Insurance Trust II and the Shareholders of MFS Technology Portfolio:
Opinion on the Financial Statements and Financial
Highlights
We have audited the accompanying statement
of assets and liabilities of MFS Technology Portfolio (the “Fund”), including the portfolio of investments, as of December 31, 2021, the related statement of operations for the year then ended, the statements of changes in net assets for
each of the two years in the period then ended, the financial highlights for each of the five years in the period then ended, and the related notes. In our opinion, the financial statements and financial highlights present fairly, in all material
respects, the financial position of the Fund as of December 31, 2021, and the results of its operations for the year then ended, the changes in its net assets for each of the two years in the period then ended, and the financial highlights for each
of the five years in the period then ended, in conformity with accounting principles generally accepted in the United States of America.
Basis for Opinion
These financial statements and financial highlights are the
responsibility of the Fund's management. Our responsibility is to express an opinion on the Fund's financial statements and financial highlights based on our audits. We are a public accounting firm registered with the Public Company Accounting
Oversight Board (United States) (PCAOB) and are required to be independent with respect to the Fund in accordance with the U.S. federal securities laws and the applicable rules and regulations of the Securities and Exchange Commission and the
PCAOB.
We conducted our audits in accordance with the
standards of the PCAOB. Those standards require that we plan and perform the audit to obtain reasonable assurance about whether the financial statements and financial highlights are free of material misstatement, whether due to error or fraud. The
Fund is not required to have, nor were we engaged to perform, an audit of its internal control over financial reporting. As part of our audits, we are required to obtain an understanding of internal control over financial reporting but not for the
purpose of expressing an opinion on the effectiveness of the Fund's internal control over financial reporting. Accordingly, we express no such opinion.
Our audits included performing procedures to assess the
risks of material misstatement of the financial statements and financial highlights, whether due to error or fraud, and performing procedures that respond to those risks. Such procedures included examining, on a test basis, evidence regarding the
amounts and disclosures in the financial statements and financial highlights. Our audits also included evaluating the accounting principles used and significant estimates made by management, as well as evaluating the overall presentation of the
financial statements and financial highlights. Our procedures included confirmation of securities owned as of December 31, 2021, by correspondence with the custodian and brokers. We believe that our audits provide a reasonable basis for our
opinion.
DELOITTE & TOUCHE LLP
Boston, Massachusetts
February 15, 2022
We have served as the auditor of one or more of the MFS
investment companies since 1924.
Trustees and Officers — Identification and
Background
The Trustees and Officers of the Trust, as
of February 1, 2022, are listed below, together with their principal occupations during the past five years. (Their titles may have varied during that period.) The address of each Trustee and Officer is 111 Huntington Avenue, Boston, Massachusetts
02199-7618.
| Name,
Age |
|
Position(s)
Held with Fund |
|
Trustee/Officer
Since(h) |
|
Number
of MFS Funds overseen by the Trustee |
|
Principal
Occupations During
the Past Five Years |
|
Other
Directorships During
the Past Five Years (j) |
| INTERESTED
TRUSTEES |
|
|
|
|
|
|
|
|
|
|
Michael
W. Roberge (k)
(age 55) |
|
Trustee
|
|
January
2021 |
|
135
|
|
Massachusetts
Financial Services Company, Chairman (since January 2021); Chief Executive Officer (since January 2017); Director; Chairman of the Board (since January 2022); President (until December 2018); Chief Investment Officer (until December 2018) |
|
N/A
|
| INDEPENDENT
TRUSTEES |
|
|
|
|
|
|
|
|
|
|
John
P. Kavanaugh
(age 67) |
|
Trustee
and Chair of Trustees |
|
January
2009 |
|
135
|
|
Private
investor |
|
N/A
|
Steven
E. Buller
(age 70) |
|
Trustee
|
|
February
2014 |
|
135
|
|
Private
investor |
|
N/A
|
John
A. Caroselli
(age 67) |
|
Trustee
|
|
March
2017 |
|
135
|
|
Private
investor; JC Global Advisors, LLC (management consulting), President (since 2015) |
|
N/A
|
Maureen
R. Goldfarb
(age 66) |
|
Trustee
|
|
January
2009 |
|
135
|
|
Private
investor |
|
N/A
|
Peter
D. Jones
(age 66) |
|
Trustee
|
|
January
2019 |
|
135
|
|
Private
investor |
|
N/A
|
James
W. Kilman, Jr.
(age 60) |
|
Trustee
|
|
January
2019 |
|
135
|
|
Burford
Capital Limited (finance and investment management), Senior Advisor (since May 3, 2021), Chief Financial Officer (2019 - May 2, 2021); KielStrand Capital LLC (family office), Chief Executive Officer (since 2016) |
|
Alpha-En
Corporation, Director (2016-2019) |
Clarence
Otis, Jr.
(age 65) |
|
Trustee
|
|
March
2017 |
|
135
|
|
Private
investor |
|
VF
Corporation, Director; Verizon Communications, Inc., Director; The Travelers Companies, Director |
Maryanne
L. Roepke
(age 65) |
|
Trustee
|
|
May
2014 |
|
135
|
|
Private
investor |
|
N/A
|
Laurie
J. Thomsen
(age 64) |
|
Trustee
|
|
March
2005 |
|
135
|
|
Private
investor |
|
The
Travelers Companies, Director; Dycom Industries, Inc., Director |
Trustees and Officers - continued
| Name,
Age |
|
Position(s)
Held with
Fund |
|
Trustee/Officer
Since(h) |
|
Number
of MFS Funds for which the Person is an Officer |
|
Principal
Occupations During
the Past Five Years |
| OFFICERS
|
|
|
|
|
|
|
|
|
Christopher
R. Bohane (k)
(age 48) |
|
Assistant
Secretary and Assistant Clerk |
|
July
2005 |
|
135
|
|
Massachusetts
Financial Services Company, Senior Vice President and Associate General Counsel |
Kino
Clark (k)
(age 53) |
|
Assistant
Treasurer |
|
January
2012 |
|
135
|
|
Massachusetts
Financial Services Company, Vice President |
John
W. Clark, Jr. (k)
(age 54) |
|
Assistant
Treasurer |
|
April
2017 |
|
135
|
|
Massachusetts
Financial Services Company, Vice President (since March 2017); Deutsche Bank (financial services), Department Head - Treasurer's Office (until February 2017) |
Thomas
H. Connors (k)
(age 62) |
|
Assistant
Secretary and Assistant Clerk |
|
September
2012 |
|
135
|
|
Massachusetts
Financial Services Company, Vice President and Senior Counsel |
David
L. DiLorenzo (k)
(age 53) |
|
President
|
|
July
2005 |
|
135
|
|
Massachusetts
Financial Services Company, Senior Vice President |
Heidi
W. Hardin (k)
(age 54) |
|
Secretary
and Clerk |
|
April
2017 |
|
135
|
|
Massachusetts
Financial Services Company, Executive Vice President and General Counsel (since March 2017); Harris Associates (investment management), General Counsel (until January 2017) |
Brian
E. Langenfeld (k)
(age 48) |
|
Assistant
Secretary and Assistant Clerk |
|
June
2006 |
|
135
|
|
Massachusetts
Financial Services Company, Vice President and Senior Counsel |
Amanda
S. Mooradian (k)
(age 42) |
|
Assistant
Secretary and Assistant Clerk |
|
September
2018 |
|
135
|
|
Massachusetts
Financial Services Company, Assistant Vice President and Senior Counsel |
Susan
A. Pereira (k)
(age 51) |
|
Assistant
Secretary and Assistant Clerk |
|
July
2005 |
|
135
|
|
Massachusetts
Financial Services Company, Vice President and Assistant General Counsel |
Kasey
L. Phillips (k)
(age 51) |
|
Assistant
Treasurer |
|
September
2012 |
|
135
|
|
Massachusetts
Financial Services Company, Vice President |
Matthew
A. Stowe (k)
(age 47) |
|
Assistant
Secretary and Assistant Clerk |
|
October
2014 |
|
135
|
|
Massachusetts
Financial Services Company, Vice President and Assistant General Counsel |
Martin
J. Wolin (k)
(age 54) |
|
Chief
Compliance Officer |
|
July
2015 |
|
135
|
|
Massachusetts
Financial Services Company, Senior Vice President and Chief Compliance Officer |
James
O. Yost (k)
(age 61) |
|
Treasurer
|
|
September
1990 |
|
135
|
|
Massachusetts
Financial Services Company, Senior Vice President |
| (h)
|
Date
first appointed to serve as Trustee/Officer of an MFS Fund. Each Trustee has served continuously since appointment unless indicated otherwise. From January 2012 through December 2016, Messrs. DiLorenzo and Yost served as Treasurer and Deputy
Treasurer of the Funds, respectively. |
| (j)
|
Directorships or
trusteeships of companies required to report to the Securities and Exchange Commission (i.e., “public companies”). |
| (k)
|
“Interested
person” of the Trust within the meaning of the Investment Company Act of 1940 (referred to as the 1940 Act), which is the principal federal law governing investment companies like the fund, as a result of a position with MFS. The address of
MFS is 111 Huntington Avenue, Boston, Massachusetts 02199-7618. |
Each Trustee (other than Messrs. Jones, Kilman and Roberge)
has been elected by shareholders and each Trustee and Officer holds office until his or her successor is chosen and qualified or until his or her earlier death, resignation, retirement or removal. Mr. Roberge became a Trustee of the Funds on January
1, 2021 and Messrs. Jones and Kilman became Trustees of the Funds on January 1, 2019. The Trust does not hold annual meetings for the purpose of electing Trustees, and Trustees are not elected for fixed terms. Under the terms of the Board's
retirement policy, an Independent Trustee shall retire at the end of the calendar year in which he or she reaches the earlier of 75 years of age or 15 years of service on the Board (or, in the case of any Independent Trustee who joined the Board
prior to 2015, 20 years of service on the Board).
Messrs. Buller, Kilman and Otis and Ms. Roepke are members
of the Trust’s Audit Committee.
Trustees and Officers - continued
Each
of the Interested Trustees and certain Officers hold comparable officer positions with certain affiliates of MFS.
The Statement of Additional Information for a Fund includes
further information about the Trustees and is available without charge upon request by calling 1-800-225-2606.
| Investment
Adviser |
Custodian
|
Massachusetts Financial
Services Company
111 Huntington Avenue
Boston, MA 02199-7618 |
State Street
Bank and Trust Company
1 Lincoln Street
Boston, MA 02111-2900 |
| Distributor
|
Independent
Registered Public Accounting Firm |
MFS Fund
Distributors, Inc.
111 Huntington Avenue
Boston, MA 02199-7618 |
Deloitte
& Touche LLP
200 Berkeley Street
Boston, MA 02116 |
| Portfolio
Manager(s) |
|
| Matthew
Sabel |
|
Board Review of Investment Advisory Agreement
MFS Technology Portfolio
The Investment Company Act of 1940 requires that both the
full Board of Trustees and a majority of the non-interested (“independent”) Trustees, voting separately, annually approve the continuation of the Fund’s investment advisory agreement with MFS. The Trustees consider matters bearing
on the Fund and its advisory arrangements at their meetings throughout the year, including a review of performance data at each regular meeting. In addition, the independent Trustees met several times by videoconference (in accordance with
Securities and Exchange Commission relief) over the course of three months beginning in May and ending in July, 2021 (“contract review meetings”) for the specific purpose of considering whether to approve the continuation of the
investment advisory agreement for the Fund and the other investment companies that the Board oversees (the “MFS Funds”). The independent Trustees were assisted in their evaluation of the Fund’s investment advisory agreement by
independent legal counsel, from whom they received separate legal advice and with whom they met separately from MFS during various contract review meetings. The independent Trustees were also assisted in this process by an independent consultant who
was retained by and reported to the independent Trustees.
In connection with their deliberations regarding the
continuation of the investment advisory agreement, the Trustees, including the independent Trustees, considered such information and factors as they believed, in light of the legal advice furnished to them and their own business judgment, to be
relevant. The investment advisory agreement for the Fund was considered separately, although the Trustees also took into account the common interests of all MFS Funds in their review. As described below, the Trustees considered the nature, quality,
and extent of the various investment advisory, administrative, and shareholder services performed by MFS under the existing investment advisory agreement and other arrangements with the Fund.
In connection with their contract review meetings, the
Trustees received and relied upon materials that included, among other items: (i) information provided by Broadridge Financial Solutions, Inc. (“Broadridge”), an independent third party, on the investment performance of the Fund for
various time periods ended December 31, 2020 and the investment performance of a group of funds with substantially similar investment classifications/objectives (the “Broadridge performance universe”), (ii) information provided by
Broadridge on the Fund’s advisory fees and other expenses and the advisory fees and other expenses of comparable funds identified by Broadridge as well as all other funds in the same investment classification/category (the “Broadridge
expense group and universe”), (iii) information provided by MFS on the advisory fees of portfolios of other clients of MFS, including institutional separate accounts and other clients, (iv) information as to whether and to what extent
applicable expense waivers, reimbursements or fee “breakpoints” are observed for the Fund, (v) information regarding MFS’ financial results and financial condition, including MFS’ and certain of its affiliates’
estimated profitability from services performed for the Fund and the MFS Funds as a whole, and compared to MFS’ institutional business, (vi) MFS’ views regarding the outlook for the mutual fund industry and the strategic business plans
of MFS, (vii) descriptions of various functions performed by MFS for the Funds, such as compliance monitoring and portfolio trading practices, and (viii) information regarding the overall organization of MFS, including information about MFS’
senior management and other personnel providing investment advisory, administrative and other services to the Fund and the other MFS Funds. The comparative performance, fee and expense information prepared and provided by Broadridge was not
independently verified and the independent Trustees did not independently verify any information provided to them by MFS.
The Trustees’ conclusion as to the continuation of
the investment advisory agreement was based on a comprehensive consideration of all information provided to the Trustees and not the result of any single factor. Some of the factors that figured particularly in the Trustees’ deliberations are
described below, although individual Trustees may have evaluated the information presented differently from one another, giving different weights to various factors. It is also important to recognize that the fee arrangements for the Fund and other
MFS Funds are the result of years of review and discussion between the independent Trustees and MFS, that certain aspects of such arrangements may receive greater scrutiny in some years than in others, and that the Trustees’ conclusions may be
based, in part, on their consideration of these same arrangements during the course of the year and in prior years.
Based on information provided by Broadridge and MFS, the
Trustees reviewed the Fund’s total return investment performance as well as the Broadridge performance universe over various time periods. The Trustees placed particular emphasis on the total return performance of the Fund’s Initial
Class shares in comparison to the performance of funds in its Broadridge performance universe over the five-year period ended December 31, 2020, which the Trustees believed was a long enough period to reflect differing market conditions. The total
return performance of the Fund’s Initial Class shares was in the 4th quintile relative to the other funds in the universe for this five-year period (the 1st quintile being the best performers and the 5th quintile being the worst performers).
The total return performance of the Fund’s Initial Class shares was in the 3rd quintile for the one-year period and the 4th quintile for the three-year period ended December 31, 2020 relative to the Broadridge performance universe. Because of
the passage of time, these performance results may differ from the performance results for more recent periods, including those shown elsewhere in this report.
In the course of their deliberations, the Trustees took
into account information provided by MFS in connection with the contract review meetings, as well as during investment review meetings conducted with portfolio management personnel during the course of the year regarding the Fund’s
performance. The Trustees noted that the total return performance (Class I shares) of the Fund’s retail counterpart, MFS Technology Fund, which has substantially similar investment strategies, was in the 3rd quintile relative to the
Board Review of Investment Advisory Agreement - continued
other funds in its
Broadridge performance universe for the five-year period ended December 31, 2020. After reviewing these and related factors, the Trustees concluded, within the context of their overall conclusions regarding the investment advisory agreement, that
they were satisfied with MFS’ responses and efforts relating to investment performance.
In assessing the reasonableness of the Fund’s
advisory fee, the Trustees considered, among other information, the Fund’s advisory fee and the total expense ratio of the Fund’s Initial Class shares as a percentage of average daily net assets and the advisory fee and total expense
ratios of the Broadridge expense group based on information provided by Broadridge. The Trustees considered that MFS currently observes an expense limitation for the Fund, which may not be changed without the Trustees’ approval. The Trustees
also considered that, according to the data provided by Broadridge (which takes into account any fee reductions or expense limitations that were in effect during the Fund’s last fiscal year), the Fund’s effective advisory fee rate and
total expense ratio were each approximately at the Broadridge expense group median.
The Trustees also considered the advisory fees charged by
MFS to any institutional separate accounts advised by MFS (“separate accounts”) and unaffiliated investment companies for which MFS serves as subadviser (“subadvised funds”) that have comparable investment strategies to the
Fund, if any. In comparing these fees, the Trustees considered information provided by MFS as to the generally broader scope of services provided by MFS to the Fund, as well as the more extensive regulatory burdens imposed on MFS in managing the
Fund, in comparison to separate accounts and subadvised funds. The Trustees also considered the higher demands placed on MFS’ investment personnel and trading infrastructure as a result of the daily cash in-flows and out-flows of the Fund in
comparison to separate accounts.
The Trustees also
considered whether the Fund may benefit from any economies of scale in the management of the Fund in the event of growth in assets of the Fund and/or growth in assets of the MFS Funds as a whole. They noted that the Fund’s advisory fee rate
schedule is subject to a contractual breakpoint that reduces the Fund’s advisory fee rate on average daily net assets over $1 billion. The Trustees also noted that MFS has agreed in writing to waive a portion of the management fees of certain
MFS Funds, including the Fund, if the total combined assets of certain funds within the MFS Funds’ complex increase above agreed upon thresholds (the “group fee waiver”), enabling the Fund’s shareholders to share in the
benefits from any economies of scale at the complex level. The group fee waiver is reviewed and renewed annually between the Board and MFS. The Trustees concluded that the breakpoint and the group fee waiver were sufficient to allow the Fund to
benefit from economies of scale as its assets and overall complex assets grow.
The Trustees also considered information prepared by MFS
relating to MFS’ costs and profits with respect to the Fund, the MFS Funds considered as a group, and other investment companies and accounts advised by MFS, as well as MFS’ methodologies used to determine and allocate its costs to the
MFS Funds, the Fund and other accounts and products for purposes of estimating profitability.
After reviewing these and other factors described herein,
the Trustees concluded, within the context of their overall conclusions regarding the investment advisory agreement, that the advisory fees charged to the Fund represent reasonable compensation in light of the services being provided by MFS to the
Fund.
In addition, the Trustees considered MFS’
resources and related efforts to continue to retain, attract and motivate capable personnel to serve the Fund. The Trustees also considered current and developing conditions in the financial services industry, including the presence of large and
well-capitalized companies which are spending, and appear to be prepared to continue to spend, substantial sums to engage personnel and to provide services to competing investment companies. In this regard, the Trustees also considered the financial
resources of MFS and its ultimate parent, Sun Life Financial Inc. The Trustees also considered the advantages and possible disadvantages to the Fund of having an adviser that also serves other investment companies as well as other accounts.
The Trustees also considered the nature, quality, cost, and
extent of administrative, transfer agency, and distribution services provided to the Fund by MFS and its affiliates under agreements and plans other than the investment advisory agreement, including any 12b-1 fees the Fund pays to MFS Fund
Distributors, Inc., an affiliate of MFS. The Trustees also considered the nature, extent and quality of certain other services MFS performs or arranges for on the Fund’s behalf, which may include securities lending programs, directed expense
payment programs, class action recovery programs, and MFS’ interaction with third-party service providers, principally custodians and sub-custodians. The Trustees concluded that the various non-advisory services provided by MFS and its
affiliates on behalf of the Fund were satisfactory.
The Trustees considered so-called “fall-out
benefits” to MFS such as reputational value derived from serving as investment manager to the MFS Funds. The Trustees also considered that MFS discontinued its historic practice of obtaining investment research from portfolio brokerage
commissions paid by certain MFS Funds effective January 2018, and directly pays or voluntarily reimburses a Fund, if applicable, for the costs of external research acquired through the use of the Fund’s portfolio brokerage commissions.
Based on their evaluation of factors that they deemed to be
material, including those factors described above, the Board of Trustees, including the independent Trustees, concluded that the Fund’s investment advisory agreement with MFS should be continued for an additional one-year period, commencing
August 1, 2021.
Proxy Voting Policies and Information
MFS votes proxies on behalf of the fund pursuant to proxy
voting policies and procedures that are available without charge, upon request, by calling 1-800-225-2606, by visiting mfs.com/proxyvoting, or by visiting the SEC’s Web site at http://www.sec.gov.
Information regarding how the fund voted proxies relating
to portfolio securities during the most recent twelve-month period ended June 30 is available by August 31 of each year without charge by visiting mfs.com/proxyvoting, or by visiting the SEC’s Web site
at http://www.sec.gov.
Quarterly Portfolio Disclosure
The fund files a complete schedule of portfolio holdings
with the SEC for the first and third quarters of each fiscal year as an exhibit to its reports on Form N-PORT. The fund’s Form N-PORT reports are available on the SEC’s Web site at
http://www.sec.gov. A shareholder can obtain the portfolio holdings report for the first and third quarters of the fund's fiscal year at mfs.com/vit2 by
choosing the fund's name and then scrolling to the “Resources” section and clicking on the “Prospectus and Reports” tab.
FURTHER INFORMATION
From time to time, MFS may post important information about
the fund or the MFS Funds on the MFS Web site (mfs.com). This information is available at https://www.mfs.com/announcements or at
mfs.com/vit2 by choosing the fund's name and then scrolling to the “Resources” section and clicking on the “Announcements” tab, if any.
Information About Fund Contracts and Legal Claims
The fund has entered into contractual arrangements with an
investment adviser, administrator, distributor, shareholder servicing agent, 529 program manager (if applicable), and custodian who each provide services to the fund. Unless expressly stated otherwise, shareholders are not parties to, or intended
beneficiaries of these contractual arrangements, and these contractual arrangements are not intended to create any shareholder right to enforce them against the service providers or to seek any remedy under them against the service providers, either
directly or on behalf of the fund.
Under the
Trust’s By-Laws and Declaration of Trust, any claims asserted against or on behalf of the MFS Funds, including claims against Trustees and Officers, must be brought in state and federal courts located within the Commonwealth of
Massachusetts.
Federal Tax Information (unaudited)
The following information is provided pursuant to
provisions of the Internal Revenue Code.
The fund
designates $6,445,000 as capital gain dividends paid during the fiscal year.
For corporate shareholders, 21.12% of the ordinary income
dividends paid during the fiscal year qualify for the corporate dividends received deduction.
| FACTS
|
WHAT
DOES MFS DO WITH YOUR PERSONAL INFORMATION? |
| Why?
|
Financial
companies choose how they share your personal information. Federal law gives consumers the right to limit some but not all sharing. Federal law also requires us to tell you how we collect, share, and protect your personal information. Please read
this notice carefully to understand what we do. |
| What?
|
The types of
personal information we collect and share depend on the product or service you have with us. This information can include: |
| • Social
Security number and account balances |
| • Account
transactions and transaction history |
| • Checking
account information and wire transfer instructions |
| When
you are no longer our customer, we continue to share your information as described in this notice. |
| How?
|
All
financial companies need to share customers' personal information to run their everyday business. In the section below, we list the reasons financial companies can share their customers' personal information; the reasons MFS chooses to share; and
whether you can limit this sharing. |
Reasons
we can share your
personal information |
Does
MFS share? |
Can
you limit
this sharing? |
For
our everyday business purposes –
such as to process your transactions, maintain your
account(s), respond to court orders and legal
investigations, or report to credit bureaus |
Yes
|
No
|
For
our marketing purposes –
to offer our products and services to you |
No
|
We
don't share |
For
joint marketing with other
financial companies |
No
|
We
don't share |
For
our affiliates' everyday business purposes –
information about your transactions and experiences |
No
|
We
don't share |
For
our affiliates' everyday business purposes –
information about your creditworthiness |
No
|
We
don't share |
| For
nonaffiliates to market to you |
No
|
We
don't share |
| Questions?
|
Call
800-225-2606 or go to mfs.com. |
| Who
we are |
| Who
is providing this notice? |
MFS
Funds, MFS Investment Management, MFS Institutional Advisors, Inc., and MFS Heritage Trust Company. |
| What
we do |
How
does MFS
protect my personal
information? |
To
protect your personal information from unauthorized access and use, we use security measures that comply with federal law. These measures include procedural, electronic, and physical safeguards for the protection of the personal information we
collect about you. |
How
does MFS
collect my personal
information? |
We
collect your personal information, for example, when you |
| • open
an account or provide account information |
| • direct
us to buy securities or direct us to sell your securities |
| • make
a wire transfer |
| We
also collect your personal information from others, such as credit bureaus, affiliates, or other companies. |
| Why
can't I limit all sharing? |
Federal
law gives you the right to limit only |
| • sharing
for affiliates' everyday business purposes – information about your creditworthiness |
| • affiliates
from using your information to market to you |
| • sharing
for nonaffiliates to market to you |
| State
laws and individual companies may give you additional rights to limit sharing. |
| Definitions
|
| Affiliates
|
Companies
related by common ownership or control. They can be financial and nonfinancial companies. |
| •
MFS does not share personal information with affiliates, except for everyday business purposes as described on page one of this notice. |
| Nonaffiliates
|
Companies
not related by common ownership or control. They can be financial and nonfinancial companies. |
| •
MFS does not share with nonaffiliates so they can market to you. |
| Joint
marketing |
A
formal agreement between nonaffiliated financial companies that together market financial products or services to you. |
| •
MFS doesn't jointly market. |
| Other
important information |
| If
you own an MFS product or receive an MFS service in the name of a third party such as a bank or broker-dealer, their privacy policy may apply to you instead of ours. |
Annual Report
December 31, 2021
MFS® U.S. Government
Money Market Portfolio
MFS® Variable
Insurance Trust II
MFS® U.S.
Government Money Market Portfolio
|
1
|
|
2
|
|
3
|
|
4
|
|
5
|
|
6
|
|
7
|
|
8
|
|
9
|
|
10
|
|
15
|
|
16
|
|
19
|
|
21
|
|
21
|
|
21
|
|
21
|
|
21
|
|
22
|
The report is prepared for the general information of contract owners. It
is authorized for distribution to prospective investors only when preceded or accompanied by a current prospectus.
NOT FDIC INSURED • MAY LOSE VALUE
• NO BANK OR CREDIT UNION GUARANTEE •
NOT A DEPOSIT • NOT INSURED BY ANY FEDERAL GOVERNMENT
AGENCY OR NCUA/NCUSIF
MFS U.S. Government
Money Market Portfolio
Dear Contract Owners:
After a powerful rally in 2021 that was spurred by the
introduction of effective coronavirus vaccines and high levels of monetary and fiscal stimulus, markets have recently experienced a rise in volatility. Rising inflation (mostly due to pandemic-related labor and supply chain disruptions), new
COVID-19 variants that are vaccine-resistant, and the prospect of tighter monetary and fiscal policies around the world have all increased investor anxiety.
Rising real (inflation-adjusted) bond yields in the United
States are a headwind for richly valued U.S. growth stocks, though many non-U.S. markets have experienced lower levels of turbulence. In recent months, global economic growth has moderated, with the spread of the Delta and Omicron variants and a
regulatory crackdown in China featuring prominently. Stress in China’s property development sector has also contributed to the slowdown there. A further concern for investors is the tightening of global energy and raw materials supplies caused
in part by geopolitical uncertainty.
However,
above-trend economic growth, strong corporate balance sheets, and nascent signs that global supply chain bottlenecks may be easing, along with a dovish policy shift in China, are supportive fundamentals that we feel could help calm recent market
jitters.
It is times of market transition that
demonstrate the importance of having a deep understanding of company fundamentals, and we have built our global research platform to do just that.
At MFS®, we put our clients’ assets to work responsibly by carefully navigating the increasing complexity of global markets and economies. Guided by our commitment to long-term
investing, we tune out the noise and try to uncover what we believe are the best, most durable investment opportunities in the market. Our unique global investment platform combines collective expertise, long-term discipline, and thoughtful risk
management to create sustainable value for investors.
Respectfully,
Michael W.
Roberge
Chief Executive Officer
MFS Investment Management
February 15, 2022
The opinions expressed in this letter are subject to
change and may not be relied upon for investment advice. No forecasts can be guaranteed.
MFS U.S. Government Money
Market Portfolio
Portfolio structure (u)
Composition
including fixed income credit quality (a)(u)
| A-1+
|
52.8%
|
| A-1
|
47.2%
|
| Other
Assets Less Liabilities (o) |
0.0%
|
Maturity breakdown (u)
| 0
- 7 days |
34.7%
|
| 8
- 29 days |
14.7%
|
| 30
- 59 days |
31.8%
|
| 60
- 89 days |
18.8%
|
| 90
- 365 days |
0.0%
|
| Other
Assets Less Liabilities (o) |
0.0%
|
| (a)
|
Ratings
are assigned to portfolio securities utilizing ratings from Moody’s, Fitch, and Standard & Poor’s rating agencies and applying the following hierarchy: If all three agencies provide a rating, the middle rating (after dropping the
highest and lowest ratings) is assigned; if two of the three agencies rate a security, the lower of the two is assigned. Ratings are shown in the S&P scale. All ratings are subject to change. The fund is not rated by these agencies.
|
| (u)
|
For purposes of this
presentation, accrued interest, where applicable, is included. |
Percentages are based on net assets as of December
31, 2021.
The portfolio is actively managed
and current holdings may be different.
MFS U.S. Government Money
Market Portfolio
Performance Summary Through 12/31/21
Total returns as well as the current 7-day yield have been
provided for the applicable time periods. Performance results reflect the percentage change in net asset value, including the reinvestment of any dividends and capital gains distributions. (See Notes to Performance Summary.)
Performance data shown represents past performance and is no
guarantee of future results. You could lose money by investing in the portfolio. Although the portfolio seeks to preserve the value of your investment at $1.00 per unit, it cannot guarantee it will do so. An investment in the portfolio is not
insured or guaranteed by the Federal Deposit Insurance Corporation or any other governmental agency. The portfolio’s sponsor has no legal obligation to provide financial support to the portfolio, and you should not expect the sponsor will
provide financial support to the portfolio at any time. The performance shown does not reflect the deduction of taxes, if any, that a contract holder would pay on portfolio distributions or the redemption of contract units. The returns for the
portfolio shown also do not reflect the deduction of expenses associated with variable products, such as mortality and expense risk charges, separate account charges, and sales charges imposed by the insurance company separate accounts. Such
expenses would reduce the overall returns shown.
| Share
Class |
Inception
|
1-Year
Total Return |
Current
7-day yield |
| Initial
Class |
7/19/85
|
0.00%
|
0.00%
|
| Service
Class |
8/24/01
|
0.00%
|
0.00%
|
Notes to Performance Summary
Yields quoted are based on the latest seven days ended as
of December 31, 2021, with dividends annualized. The yield quotations more closely reflect the current earnings of the portfolio than the total return quotations.
Performance results reflect any applicable expense
subsidies, waivers and adjustments in effect during the periods shown. Without such subsidies and waivers the portfolio's performance results would be less favorable. Please see the prospectus and financial statements for complete details. All
results are historical and assume the reinvestment of any dividends and capital gain distributions.
MFS U.S. Government Money
Market Portfolio
Expense Table
Fund Expenses Borne by the Contract Holders during the
Period,
July 1, 2021 through December 31, 2021
As
a contract holder of the fund, you incur ongoing costs, including management fees; distribution and/or service (12b-1) fees; and other fund expenses. This example is intended to help you understand your ongoing costs (in dollars) of investing in the
fund and to compare these costs with the ongoing costs of investing in other mutual funds.
The example is based on an investment of $1,000 invested at
the beginning of the period and held for the entire period July 1, 2021 through December 31, 2021.
Actual Expenses
The first line for each share class in the following table
provides information about actual account values and actual expenses. You may use the information in this line, together with the amount you invested, to estimate the expenses that you paid over the period. Simply divide your account value by $1,000
(for example, an $8,600 account value divided by $1,000 = 8.6), then multiply the result by the number in the first line under the heading entitled “Expenses Paid During Period” to estimate the expenses you paid on your account during
this period.
Hypothetical Example for Comparison
Purposes
The second line for each share class in the
following table provides information about hypothetical account values and hypothetical expenses based on the fund’s actual expense ratio and an assumed rate of return of 5% per year before expenses, which is not the fund’s actual
return. The hypothetical account values and expenses may not be used to estimate the actual ending account balance or expenses you paid for the period. You may use this information to compare the ongoing costs of investing in the fund and other
funds. To do so, compare this 5% hypothetical example with the 5% hypothetical examples that appear in the shareholder reports of the other funds.
Please note that the expenses shown in the table are meant
to highlight the fund's ongoing costs only and do not take into account the fees and expenses imposed under the variable contracts through which your investment in the fund is made. Therefore, the second line for each share class in the table is
useful in comparing ongoing costs associated with an investment in vehicles (such as the fund) which fund benefits under variable annuity and variable life insurance contracts and to qualified pension and retirement plans only, and will not help you
determine the relative total costs of investing in the fund through variable annuity and variable life insurance contracts. If the fees and expenses imposed under the variable contracts were included, your costs would have been higher.
Share
Class |
|
Annualized
Expense
Ratio |
Beginning
Account Value
7/01/21 |
Ending
Account Value
12/31/21 |
Expenses
Paid During
Period (p)
7/01/21-12/31/21 |
| Initial
Class |
Actual
|
0.04%
|
$1,000.00
|
$1,000.00
|
$0.20
|
| Hypothetical
(h) |
0.04%
|
$1,000.00
|
$1,025.00
|
$0.20
|
| Service
Class |
Actual
|
0.04%
|
$1,000.00
|
$1,000.00
|
$0.20
|
| Hypothetical
(h) |
0.04%
|
$1,000.00
|
$1,025.00
|
$0.20
|
| (h)
|
5% class return per year
before expenses. |
| (p)
|
“Expenses
Paid During Period” are equal to each class's annualized expense ratio, as shown above, multiplied by the average account value over the period, multiplied by 184/365 (to reflect the one-half year period). |
Notes to Expense Table
As more fully disclosed in Note 3 in the Notes to Financial
Statements, the expense ratios reported above include additional expense reductions to avoid a negative yield.
MFS U.S. Government Money
Market Portfolio
Portfolio of Investments − 12/31/21
The Portfolio of Investments is a complete list of all
securities owned by your fund. It is categorized by broad-based asset classes.
| Issuer
|
|
|
Shares/Par
|
Value
($) |
| U.S.
Government Agencies and Equivalents (y) – 74.8% |
| Fannie
Mae, 0.03%, due 1/05/2022 |
|
$
1,593,000 |
$
1,592,995 |
| Fannie
Mae, 0.035%, due 1/26/2022 |
|
2,268,000
|
2,267,945 |
| Fannie
Mae, 0.044%, due 3/02/2022 |
|
4,524,000
|
4,523,676 |
| Fannie
Mae, 0.054%, due 3/09/2022 |
|
5,984,000
|
5,983,410 |
| Fannie
Mae, 0.046%, due 3/16/2022 |
|
1,538,000
|
1,537,858 |
| Federal
Farm Credit Bank, 0.03%, due 1/12/2022 |
|
9,119,000
|
9,118,916 |
| Federal
Farm Credit Bank, 0.041%, due 1/14/2022 |
|
5,030,000
|
5,029,927 |
| Federal
Farm Credit Bank, 0.051%, due 2/03/2022 |
|
1,512,000
|
1,511,931 |
| Federal
Farm Credit Bank, 0.041%, due 2/10/2022 |
|
7,175,000
|
7,174,681 |
| Federal
Home Loan Bank, 0.03%, due 1/12/2022 |
|
9,196,000
|
9,195,916 |
| Federal
Home Loan Bank, 0.051%, due 2/02/2022 |
|
2,020,000
|
2,019,910 |
| Federal
Home Loan Bank, 0.051%, due 2/04/2022 |
|
6,017,000
|
6,016,716 |
| U.S.
Treasury Bill, 0.028%, due 1/04/2022 |
|
13,542,000
|
13,541,969 |
| U.S.
Treasury Bill, 0.028%, due 1/06/2022 |
|
9,049,000
|
9,048,965 |
| U.S.
Treasury Bill, 0.03%, due 1/13/2022 |
|
6,806,000
|
6,805,909 |
| U.S.
Treasury Bill, 0.041%, due 1/13/2022 |
|
1,035,000
|
1,034,990 |
| U.S.
Treasury Bill, 0.046%, due 1/18/2022 |
|
3,904,000
|
3,903,917 |
| U.S.
Treasury Bill, 0.051%, due 2/15/2022 |
|
8,761,000
|
8,760,452 |
| U.S.
Treasury Bill, 0.051%, due 2/17/2022 |
|
16,013,000
|
16,011,955 |
| U.S.
Treasury Bill, 0.041%, due 2/22/2022 |
|
19,930,000
|
19,928,848 |
| U.S.
Treasury Bill, 0.041%, due 2/24/2022 |
|
5,107,000
|
5,106,694 |
| U.S.
Treasury Bill, 0.051%, due 3/01/2022 |
|
14,681,000
|
14,679,797 |
| U.S.
Treasury Bill, 0.041%, due 3/03/2022 |
|
12,133,000
|
12,132,178 |
| U.S.
Treasury Bill, 0.046%, due 3/08/2022 |
|
7,599,000
|
7,598,373 |
| U.S.
Treasury Bill, 0.046%, due 3/10/2022 |
|
5,107,000
|
5,106,566 |
| U.S.
Treasury Bill, 0.046%, due 3/15/2022 |
|
6,269,000
|
6,268,428 |
| U.S.
Treasury Bill, 0.046%, due 3/17/2022 |
|
4,722,000
|
4,721,557 |
| Total
U.S. Government Agencies and Equivalents, at Amortized Cost and Value |
|
|
$
190,624,479 |
| Repurchase
Agreements – 25.2% |
|
| Bank
of America Corp. Repurchase Agreement, 0.05%, dated 12/31/2021, due 1/03/2022, total to be received $32,194,134 (secured by U.S. Treasury and Federal Agency obligations valued at $32,941,710) |
|
$32,194,000
|
$
32,194,000 |
| JPMorgan
Chase & Co. Repurchase Agreement, 0.05%, dated 12/31/2021, due 1/03/2022, total to be received $32,151,134 (secured by U.S. Treasury and Federal Agency obligations valued at $32,794,242) |
|
32,151,000
|
32,151,000 |
| Total
Repurchase Agreements, at Cost and Value |
|
|
|
$
64,345,000 |
| Other
Assets, Less Liabilities – 0.0% |
|
|
43,526 |
| Net
Assets – 100.0% |
|
|
$
255,013,005 |
| (y) |
The rate shown represents an
annualized yield at time of purchase. |
See Notes to Financial Statements
MFS U.S. Government Money
Market Portfolio
| Financial
Statements |
Statement of Assets and
Liabilities |
This statement
represents your fund’s balance sheet, which details the assets and liabilities comprising the total value of the fund.
| At
12/31/21 Assets |
|
| Investments
in unaffiliated issuers, at cost and value |
$190,624,479
|
| Investments
in unaffiliated repurchase agreements, at cost and value |
64,345,000
|
| Cash
|
653
|
| Receivables
for |
|
| Fund
shares sold |
409,297
|
| Interest
|
90
|
| Receivable
from investment adviser and distributor |
9,477
|
| Other
assets |
1,499
|
| Total
assets |
$255,390,495
|
| Liabilities
|
|
| Payables
for |
|
| Fund
shares reacquired |
$317,781
|
| Payable
to affiliates |
|
| Administrative
services fee |
246
|
| Shareholder
servicing costs |
41
|
| Payable
for independent Trustees' compensation |
241
|
| Accrued
expenses and other liabilities |
59,181
|
| Total
liabilities |
$377,490
|
| Net
assets |
$255,013,005
|
| Net
assets consist of |
|
| Paid-in
capital |
$254,987,805
|
| Total
distributable earnings (loss) |
25,200
|
| Net
assets |
$255,013,005
|
| Shares
of beneficial interest outstanding |
255,207,536
|
| |
Net
assets |
Shares
outstanding |
Net
asset value
per share |
| Initial
Class |
$149,895,759
|
150,009,697
|
$1.00
|
| Service
Class |
105,117,246
|
105,197,839
|
1.00
|
See Notes to Financial Statements
MFS U.S. Government Money
Market Portfolio
| Financial
Statements |
Statement of Operations
|
This statement describes how much
your fund earned in investment income and accrued in expenses. It also describes any gains and/or losses generated by fund operations.
| Year
ended 12/31/21 |
|
| Net
investment income (loss) |
|
| Income
|
|
| Interest
|
$94,162
|
| Other
|
4,024
|
| Total
investment income |
$98,186
|
| Expenses
|
|
| Management
fee |
$1,056,951
|
| Distribution
and/or service fees |
273,368
|
| Shareholder
servicing costs |
5,878
|
| Administrative
services fee |
45,244
|
| Independent
Trustees' compensation |
5,941
|
| Custodian
fee |
12,021
|
| Shareholder
communications |
18,814
|
| Audit
and tax fees |
37,919
|
| Legal
fees |
1,226
|
| Miscellaneous
|
30,212
|
| Total
expenses |
$1,487,574
|
| Reduction
of expenses by investment adviser and distributor |
(1,389,388)
|
| Net
expenses |
$98,186
|
| Net
investment income (loss) |
$0
|
| Realized
gain (loss) (identified cost basis) |
|
| Unaffiliated
issuers |
$25,200
|
| Change
in net assets from operations |
$25,200
|
See Notes to Financial Statements
MFS U.S. Government Money
Market Portfolio
| Financial
Statements |
Statements of Changes in
Net Assets |
These statements describe
the increases and/or decreases in net assets resulting from operations, any distributions, and any shareholder transactions.
| |
Year
ended |
| |
12/31/21
|
12/31/20
|
| Change
in net assets |
|
|
| From
operations |
|
|
| Net
investment income (loss) |
$0
|
$569,717
|
| Net
realized gain (loss) |
25,200
|
300
|
| Change
in net assets from operations |
$25,200
|
$570,017
|
| Total
distributions to shareholders |
$—
|
$(569,717)
|
| Change
in net assets from fund share transactions |
$(15,934,157)
|
$6,689,361
|
| Total
change in net assets |
$(15,908,957)
|
$6,689,661
|
| Net
assets |
|
|
| At
beginning of period |
270,921,962
|
264,232,301
|
| At
end of period |
$255,013,005
|
$270,921,962
|
See Notes to Financial Statements
MFS U.S. Government Money
Market Portfolio
| Financial
Statements |
Financial Highlights
|
The financial highlights table is
intended to help you understand the fund's financial performance for the past 5 years. Certain information reflects financial results for a single fund share. The total returns in the table represent the rate that an investor would have earned (or
lost) on an investment in the fund share class (assuming reinvestment of all distributions) held for the entire period.
| Initial
Class |
Year
ended |
| |
12/31/21
|
12/31/20
|
12/31/19
|
12/31/18
|
12/31/17
|
| Net
asset value, beginning of period |
$1.00
|
$1.00
|
$1.00
|
$1.00
|
$1.00
|
| Income
(loss) from investment operations |
|
|
|
|
|
| Net
investment income (loss) (d) |
$0.00
|
$0.00(w)
|
$0.02
|
$0.01
|
$0.00(w)
|
| Net
realized and unrealized gain (loss) |
0.00(w)
|
0.00(w)
|
0.00(w)
|
—
|
0.00(w)
|
| Total
from investment operations |
$0.00(w)
|
$0.00(w)
|
$0.02
|
$0.01
|
$0.00(w)
|
| Less
distributions declared to shareholders |
|
|
|
|
|
| From
net investment income |
$—
|
$(0.00)(w)
|
$(0.02)
|
$(0.01)
|
$(0.00)(w)
|
| Net
asset value, end of period |
$1.00
|
$1.00
|
$1.00
|
$1.00
|
$1.00
|
| Total
return (%) (k)(r) |
0.00
|
0.22
|
1.63
|
1.26
|
0.30
|
Ratios
(%) (to average net assets)
and Supplemental data: |
|
|
|
|
|
| Expenses
before expense reductions |
0.46
|
0.52
|
0.56
|
0.56
|
0.56
|
| Expenses
after expense reductions |
0.04
|
0.24
|
0.55
|
0.55
|
0.54
|
| Net
investment income (loss) |
0.00
|
0.20
|
1.63
|
1.25
|
0.29
|
| Net
assets at end of period (000 omitted) |
$149,896
|
$155,937
|
$149,689
|
$160,304
|
$168,107
|
| Service
Class |
Year
ended |
| |
12/31/21
|
12/31/20
|
12/31/19
|
12/31/18
|
12/31/17
|
| Net
asset value, beginning of period |
$1.00
|
$1.00
|
$1.00
|
$1.00
|
$1.00
|
| Income
(loss) from investment operations |
|
|
|
|
|
| Net
investment income (loss) (d) |
$0.00
|
$0.00(w)
|
$0.02
|
$0.01
|
$0.00(w)
|
| Net
realized and unrealized gain (loss) |
0.00(w)
|
0.00(w)
|
0.00(w)
|
—
|
0.00(w)
|
| Total
from investment operations |
$0.00(w)
|
$0.00(w)
|
$0.02
|
$0.01
|
$0.00(w)
|
| Less
distributions declared to shareholders |
|
|
|
|
|
| From
net investment income |
$—
|
$(0.00)(w)
|
$(0.02)
|
$(0.01)
|
$(0.00)(w)
|
| Net
asset value, end of period |
$1.00
|
$1.00
|
$1.00
|
$1.00
|
$1.00
|
| Total
return (%) (k)(r) |
0.00
|
0.22
|
1.63
|
1.26
|
0.29
|
Ratios
(%) (to average net assets)
and Supplemental data: |
|
|
|
|
|
| Expenses
before expense reductions |
0.71
|
0.77
|
0.81
|
0.81
|
0.81
|
| Expenses
after expense reductions |
0.04
|
0.25
|
0.55
|
0.55
|
0.55
|
| Net
investment income (loss) |
0.00
|
0.21
|
1.64
|
1.24
|
0.27
|
| Net
assets at end of period (000 omitted) |
$105,117
|
$114,985
|
$114,543
|
$128,156
|
$146,428
|
| (d)
|
Per share
data is based on average shares outstanding. |
| (k)
|
The total
return does not reflect expenses that apply to separate accounts. Inclusion of these charges would reduce the total return figures for all periods shown. |
| (r)
|
Certain
expenses have been reduced without which performance would have been lower. |
| (w)
|
Per
share amount was less than $0.01. |
See Notes to
Financial Statements
MFS U.S. Government Money
Market Portfolio
Notes to Financial Statements
(1) Business and Organization
MFS U.S. Government Money Market Portfolio (the fund) is a
diversified series of MFS Variable Insurance Trust II (the trust). The trust is organized as a Massachusetts business trust and is registered under the Investment Company Act of 1940, as amended, as an open-end management investment company. The
shareholders of each series of the trust are separate accounts of insurance companies, which offer variable annuity and/or life insurance products, and qualified retirement and pension plans.
The fund is an investment company and accordingly follows
the investment company accounting and reporting guidance of the Financial Accounting Standards Board (FASB) Accounting Standards Codification Topic 946 Financial Services - Investment Companies.
(2) Significant Accounting Policies
General — The
preparation of financial statements in conformity with U.S. generally accepted accounting principles requires management to make estimates and assumptions that affect the reported amounts of assets and liabilities, and disclosure of contingent
assets and liabilities at the date of the financial statements and the reported amounts of increases and decreases in net assets from operations during the reporting period. Actual results could differ from those estimates. In the preparation of
these financial statements, management has evaluated subsequent events occurring after the date of the fund’s Statement of Assets and Liabilities through the date that the financial statements were issued.
Balance Sheet Offsetting
— The fund's accounting policy with respect to balance sheet offsetting is that, absent an event of default by the counterparty or a termination of the agreement, the International Swaps and Derivatives Association (ISDA) Master Agreement, or
similar agreement, does not result in an offset of reported amounts of financial assets and financial liabilities in the Statement of Assets and Liabilities across transactions between the fund and the applicable counterparty. The fund's right to
setoff may be restricted or prohibited by the bankruptcy or insolvency laws of the particular jurisdiction to which a specific master netting agreement counterparty is subject. Balance sheet offsetting disclosures, to the extent applicable to the
fund, have been included in the fund’s Significant Accounting Policies note under the captions for each of the fund’s in-scope financial instruments and transactions.
Investment Valuations
— Pursuant to procedures approved by the Board of Trustees, investments held by the fund are generally valued at amortized cost, which approximates market value. Amortized cost involves valuing an
instrument at its cost as adjusted for amortization of premium or accretion of discount rather than its current market value. The amortized cost value of an instrument can be different from the market value of an instrument.
Various inputs are used in determining the value of the
fund's assets or liabilities. These inputs are categorized into three broad levels. In certain cases, the inputs used to measure fair value may fall into different levels of the fair value hierarchy. In such cases, an investment's level within the
fair value hierarchy is based on the lowest level of input that is significant to the fair value measurement. The fund's assessment of the significance of a particular input to the fair value measurement in its entirety requires judgment, and
considers factors specific to the investment. Level 1 includes unadjusted quoted prices in active markets for identical assets or liabilities. Level 2 includes other significant observable market-based inputs (including quoted prices for similar
securities, interest rates, prepayment speed, and credit risk). Level 3 includes unobservable inputs, which may include the adviser's own assumptions in determining the fair value of investments. The following is a summary of the levels used as of
December 31, 2021 in valuing the fund's assets and liabilities:
| Financial
Instruments |
Level
1 |
Level
2 |
Level
3 |
Total
|
| Short-Term
Securities |
$—
|
$254,969,479
|
$—
|
$254,969,479
|
For further information
regarding security characteristics, see the Portfolio of Investments.
Repurchase Agreements
— The fund enters into repurchase agreements under the terms of Master Repurchase Agreements with approved counterparties. Each repurchase agreement is recorded at cost. The fund requires that the securities collateral in a repurchase
transaction be transferred to a custodian. The fund monitors, on a daily basis, the value of the collateral to ensure that its value, including accrued interest, is greater than amounts owed to the fund under each such repurchase agreement. Upon an
event of default under a Master Repurchase Agreement, the non-defaulting party may close out all transactions traded under such agreement and net amounts owed under each transaction to one net amount payable by one party to the other. Absent an
event of default, the Master Repurchase Agreement does not result in an offset of reported amounts of assets and liabilities in the Statement of Assets and Liabilities across transactions between the fund and the applicable counterparty. At December
31, 2021, the fund had investments in repurchase agreements with a gross value of $64,345,000 in the Statement of Assets and Liabilities. The value of the related collateral exceeded the value of the repurchase agreements at period end.
MFS U.S. Government Money
Market Portfolio
Notes to Financial Statements - continued
Indemnifications —
Under the fund's organizational documents, its officers and Trustees may be indemnified against certain liabilities and expenses arising out of the performance of their duties to the fund. Additionally, in the normal course of business, the fund
enters into agreements with service providers that may contain indemnification clauses. The fund's maximum exposure under these agreements is unknown as this would involve future claims that may be made against the fund that have not yet
occurred.
Investment Transactions and Income — Investment transactions are recorded on the trade date. Interest income is recorded on the accrual basis. All premium and
discount is amortized or accreted for financial statement purposes in accordance with U.S. generally accepted accounting principles.
Tax Matters and Distributions — The fund intends to qualify as a regulated investment company, as defined under Subchapter M of the Internal Revenue Code, and to distribute all of its taxable income, including realized capital gains. As a
result, no provision for federal income tax is required. The fund’s federal tax returns, when filed, will remain subject to examination by the Internal Revenue Service for a three year period. Management has analyzed the fund’s tax
positions taken on federal and state tax returns for all open tax years and does not believe that there are any uncertain tax positions that require recognition of a tax liability.
Distributions to shareholders are recorded on the
ex-dividend date. Income and capital gain distributions are determined in accordance with income tax regulations, which may differ from U.S. generally accepted accounting principles. Certain capital accounts in the financial statements are
periodically adjusted for permanent differences in order to reflect their tax character. These adjustments have no impact on net assets or net asset value per share. Temporary differences which arise from recognizing certain items of income,
expense, gain or loss in different periods for financial statement and tax purposes will reverse at some time in the future.
During the year ended December 31, 2021, there were no
significant adjustments due to differences between book and tax accounting.
The tax character of distributions declared to shareholders
for the last two fiscal years is as follows:
| |
Year
ended
12/31/21 |
Year
ended
12/31/20 |
| Ordinary
income (including any short-term capital gains) |
$—
|
$569,717
|
The federal tax cost and the tax
basis components of distributable earnings were as follows:
| As
of 12/31/21 |
|
| Cost
of investments |
$254,969,479
|
| Undistributed
ordinary income |
25,200
|
| Total
distributable earnings (loss) |
$25,200
|
Multiple Classes of Shares of
Beneficial Interest — The fund offers multiple classes of shares, which differ in their respective distribution and/or service fees. The fund's income and common expenses are allocated to shareholders based on
the value of settled shares outstanding of each class. The fund's realized and unrealized gain (loss) are allocated to shareholders based on the daily net assets of each class. Dividends are declared separately for each class. Differences in per
share dividend rates are generally due to differences in separate class expenses. The fund’s distributions declared to shareholders as reported in the Statements of Changes in Net Assets are presented by class as follows:
| |
Year
ended
12/31/21 |
|
Year
ended
12/31/20 |
| Initial
Class |
$—
|
|
$326,608
|
| Service
Class |
—
|
|
243,109
|
| Total
|
$—
|
|
$569,717
|
(3) Transactions with
Affiliates
Investment Adviser — The fund has an investment advisory agreement with MFS to provide overall investment management and related administrative services and facilities to the fund. The
management fee is computed daily and paid monthly at the following annual rates based on the fund's average daily net assets:
| Up
to $1 billion |
0.40%
|
| In
excess of $1 billion |
0.35%
|
MFS U.S. Government Money
Market Portfolio
Notes to Financial Statements - continued
MFS
has agreed in writing to reduce its management fee by a specified amount if certain MFS mutual fund assets exceed thresholds agreed to by MFS and the fund’s Board of Trustees. For the year ended December 31, 2021, this management fee reduction
amounted to $33,451, which is included in the reduction of total expenses in the Statement of Operations. MFS has also agreed to voluntarily waive receipt of the fund’s management fee in order to avoid a negative yield. For the year ended
December 31, 2021, this voluntary waiver amounted to $1,020,026 and had the effect of reducing the management fee by 0.39% of average daily net assets on an annualized basis. The management fee incurred for the year ended December 31, 2021 was
equivalent to an annual effective rate of 0.00% of the fund’s average daily net assets.
The investment adviser has agreed in writing to pay a
portion of the fund’s total annual operating expenses, excluding interest, taxes, extraordinary expenses, brokerage and transaction costs, and investment-related expenses, such that total annual operating expenses do not exceed 0.45% of
average daily net assets for each of the Initial Class and Service Class shares. This written agreement will continue until modified by the fund’s Board of Trustees, but such agreement will continue at least until April 30, 2023. For the year
ended December 31, 2021, the fund’s actual operating expenses did not exceed the limits described above and therefore, the investment adviser did not pay any portion of the fund’s expenses related to this agreement. MFS has also agreed
to voluntarily reimburse the fund’s operating expenses in order to avoid a negative yield. For the year ended December 31, 2021, this voluntary reimbursement amounted to $62,543 and had the effect of reducing operating expenses by 0.02% of
average daily net assets on an annualized basis.
Distributor — MFS
Fund Distributors, Inc. (MFD), a wholly-owned subsidiary of MFS, is the distributor of shares of the fund. The Trustees have adopted a distribution plan for the Service Class shares pursuant to Rule 12b-1 under the Investment Company Act of
1940.
The fund's distribution plan provides
that the fund will pay MFD distribution and/or service fees equal to 0.25% per annum of its average daily net assets attributable to Service Class shares as partial consideration for services performed and expenses incurred by MFD and financial
intermediaries (including participating insurance companies that invest in the fund to fund variable annuity and variable life insurance contracts, sponsors of qualified retirement and pension plans that invest in the fund, and affiliates of these
participating insurance companies and plan sponsors) in connection with the sale and distribution of the Service Class shares. MFD may subsequently pay all, or a portion, of the distribution and/or service fees to financial intermediaries. MFD has
agreed in writing to waive the entire 0.25% distribution and/or service fee. This written agreement will continue until modified by the fund’s Board of Trustees, but such agreement will continue at least until April 30, 2023. For the year
ended December 31, 2021, this waiver amounted to $273,368, which is included in the reduction of total expenses in the Statement of Operations. The distribution and/or service fees incurred for the year ended December 31, 2021 were equivalent to an
annual effective rate of 0.00% of the average daily net assets attributable to Service Class shares.
Shareholder Servicing Agent
— MFS Service Center, Inc. (MFSC), a wholly-owned subsidiary of MFS, receives a fee from the fund for its services as shareholder servicing agent. For the year ended December 31, 2021, the fee was $5,543, which equated to 0.0021% annually of
the fund's average daily net assets. MFSC also receives reimbursement from the fund for out-of-pocket expenses paid by MFSC on behalf of the fund. For the year ended December 31, 2021, these costs amounted to $335.
Administrator — MFS
provides certain financial, legal, shareholder communications, compliance, and other administrative services to the fund. Under an administrative services agreement, the fund reimburses MFS the costs incurred to provide these services. The fund is
charged an annual fixed amount of $17,500 plus a fee based on average daily net assets. The administrative services fee incurred for the year ended December 31, 2021 was equivalent to an annual effective rate of 0.0171% of the fund's average daily
net assets.
Trustees’ and Officers’
Compensation — The fund pays compensation to independent Trustees in the form of a retainer, attendance fees, and additional compensation to Board and Committee chairpersons. The fund does not pay compensation
directly to Trustees or officers of the fund who are also officers of the investment adviser, all of whom receive remuneration from MFS for their services to the fund. Certain officers and Trustees of the fund are officers or directors of MFS, MFD,
and MFSC.
(4) Shares of Beneficial
Interest
The fund's Declaration of Trust permits the
Trustees to issue an unlimited number of full and fractional shares of beneficial interest. The number of shares sold, reinvested and reacquired corresponds to the net proceeds from the sale of shares, reinvestment of distributions and cost of
shares reacquired, respectively, since shares are sold and reacquired at $1.00 per share. Transactions in fund shares were as follows:
MFS U.S. Government Money
Market Portfolio
Notes to Financial Statements - continued
| |
Year
ended
12/31/21 |
|
Year
ended
12/31/20 |
| Shares
sold |
|
|
|
| Initial
Class |
41,542,048
|
|
71,530,784
|
| Service
Class |
26,866,611
|
|
64,994,305
|
| |
68,408,659
|
|
136,525,089
|
Shares
issued to shareholders in
reinvestment of distributions |
|
|
|
| Initial
Class |
—
|
|
326,608
|
| Service
Class |
—
|
|
243,109
|
| |
—
|
|
569,717
|
| Shares
reacquired |
|
|
|
| Initial
Class |
(47,603,051)
|
|
(65,600,762)
|
| Service
Class |
(36,739,765)
|
|
(64,804,683)
|
| |
(84,342,816)
|
|
(130,405,445)
|
| Net
change |
|
|
|
| Initial
Class |
(6,061,003)
|
|
6,256,630
|
| Service
Class |
(9,873,154)
|
|
432,731
|
| |
(15,934,157)
|
|
6,689,361
|
(5) Line of
Credit
The fund and certain other funds managed by
MFS participate in a $1.25 billion unsecured committed line of credit of which $1 billion is reserved for use by the fund and certain other MFS U.S. funds. The line of credit is provided by a syndicate of banks under a credit agreement. Borrowings
may be made for temporary financing needs. Interest is charged to each fund, based on its borrowings, generally at a rate equal to the highest of one month LIBOR, the Federal Funds Effective Rate and the Overnight Bank Funding Rate, plus an agreed
upon spread. A commitment fee, based on the average daily, unused portion of the committed line of credit, is allocated among the participating funds. In addition, the fund and other funds managed by MFS have established unsecured uncommitted
borrowing arrangements with certain banks for temporary financing needs. Interest is charged to each fund, based on its borrowings, at rates equal to customary reference rates plus an agreed upon spread. For the year ended December 31, 2021, the
fund’s commitment fee and interest expense were $852 and $0, respectively, and are included in “Miscellaneous” expense in the Statement of Operations.
(6) Impacts of COVID-19
The pandemic related to the global spread of novel
coronavirus disease (COVID-19), which was first detected in December 2019, has resulted in significant disruptions to global business activity and the global economy, as well as the economies of individual countries, the financial performance of
individual companies and sectors, and the securities and commodities markets in general. Multiple surges in cases globally, the availability and widespread adoption of vaccines, and the emergence of variant strains of the virus continue to create
uncertainty as to the future and long-term impacts resulting from the pandemic including impacts to the prices and liquidity of the fund's investments and the fund's performance.
(7) LIBOR Transition
Certain of the fund's investments, including its
investments in derivatives, as well as any debt issued by the fund and other contractual arrangements of the fund may be based on reference interest rates such as the London Interbank Offered Rate (“LIBOR”). In 2017, the regulatory
authority that oversees financial services firms in the United Kingdom announced plans to transition away from LIBOR by the end of 2021. In March 2021, the administrator of LIBOR announced the extension of the publication of the more commonly used
U.S. dollar LIBOR settings to the end of June 2023. Although the full impacts of the transition away from LIBOR are not fully known, the transition may result in, among other things, an increase in volatility or illiquidity of the markets for
instruments that currently rely on LIBOR to determine interest rates and this could have an adverse impact on the fund's performance. With respect to the fund's accounting for investments, including its investments in derivatives, as well as any
debt issued by the fund and other contractual arrangements of the fund that undergo reference rate-related modifications as a result of the transition, management will rely upon the relief provided by FASB Codification Topic 848 – Reference
Rate Reform (Topic 848). The guidance in Topic 848 permits the fund to disregard the GAAP accounting requirements around certain contract modifications resulting from the LIBOR transition such that for contracts considered in scope, the fund can
account for those modified contracts as
MFS U.S. Government Money
Market Portfolio
Notes to Financial Statements - continued
a continuation of
the existing contracts. While the cessation of the one-week and two-month U.S. dollar LIBOR tenors along with certain other non-U.S. dollar denominated LIBOR settings at December 31, 2021 did not have a material impact on the fund, management is
still evaluating the impact to the fund of the June 30, 2023 planned discontinuation of the more commonly used U.S. dollar LIBOR settings.
MFS U.S. Government Money
Market Portfolio
Report of Independent Registered Public Accounting
Firm
To the Board of Trustees of MFS Variable
Insurance Trust II and the Shareholders of
MFS U.S.
Government Money Market Portfolio:
Opinion on the
Financial Statements and Financial Highlights
We have
audited the accompanying statement of assets and liabilities of MFS U.S. Government Money Market Portfolio (the “Fund”), including the portfolio of investments, as of December 31, 2021, the related statement of operations for the year
then ended, the statements of changes in net assets for each of the two years in the period then ended, the financial highlights for each of the five years in the period then ended, and the related notes. In our opinion, the financial statements and
financial highlights present fairly, in all material respects, the financial position of the Fund as of December 31, 2021, and the results of its operations for the year then ended, the changes in its net assets for each of the two years in the
period then ended, and the financial highlights for each of the five years in the period then ended, in conformity with accounting principles generally accepted in the United States of America.
Basis for Opinion
These financial statements and financial highlights are the
responsibility of the Fund's management. Our responsibility is to express an opinion on the Fund's financial statements and financial highlights based on our audits. We are a public accounting firm registered with the Public Company Accounting
Oversight Board (United States) (PCAOB) and are required to be independent with respect to the Fund in accordance with the U.S. federal securities laws and the applicable rules and regulations of the Securities and Exchange Commission and the
PCAOB.
We conducted our audits in accordance with the
standards of the PCAOB. Those standards require that we plan and perform the audit to obtain reasonable assurance about whether the financial statements and financial highlights are free of material misstatement, whether due to error or fraud. The
Fund is not required to have, nor were we engaged to perform, an audit of its internal control over financial reporting. As part of our audits, we are required to obtain an understanding of internal control over financial reporting but not for the
purpose of expressing an opinion on the effectiveness of the Fund's internal control over financial reporting. Accordingly, we express no such opinion.
Our audits included performing procedures to assess the
risks of material misstatement of the financial statements and financial highlights, whether due to error or fraud, and performing procedures that respond to those risks. Such procedures included examining, on a test basis, evidence regarding the
amounts and disclosures in the financial statements and financial highlights. Our audits also included evaluating the accounting principles used and significant estimates made by management, as well as evaluating the overall presentation of the
financial statements and financial highlights. Our procedures included confirmation of securities owned as of December 31, 2021, by correspondence with the custodian and brokers. We believe that our audits provide a reasonable basis for our
opinion.
DELOITTE & TOUCHE LLP
Boston, Massachusetts
February 15, 2022
We have served as the auditor of one or more of the MFS
investment companies since 1924.
MFS U.S. Government Money
Market Portfolio
Trustees and Officers — Identification and
Background
The Trustees and Officers of the Trust, as
of February 1, 2022, are listed below, together with their principal occupations during the past five years. (Their titles may have varied during that period.) The address of each Trustee and Officer is 111 Huntington Avenue, Boston, Massachusetts
02199-7618.
| Name,
Age |
|
Position(s)
Held with Fund |
|
Trustee/Officer
Since(h) |
|
Number
of MFS Funds overseen by the Trustee |
|
Principal
Occupations During
the Past Five Years |
|
Other
Directorships During
the Past Five Years (j) |
| INTERESTED
TRUSTEES |
|
|
|
|
|
|
|
|
|
|
Michael
W. Roberge (k)
(age 55) |
|
Trustee
|
|
January
2021 |
|
135
|
|
Massachusetts
Financial Services Company, Chairman (since January 2021); Chief Executive Officer (since January 2017); Director; Chairman of the Board (since January 2022); President (until December 2018); Chief Investment Officer (until December 2018) |
|
N/A
|
| INDEPENDENT
TRUSTEES |
|
|
|
|
|
|
|
|
|
|
John
P. Kavanaugh
(age 67) |
|
Trustee
and Chair of Trustees |
|
January
2009 |
|
135
|
|
Private
investor |
|
N/A
|
Steven
E. Buller
(age 70) |
|
Trustee
|
|
February
2014 |
|
135
|
|
Private
investor |
|
N/A
|
John
A. Caroselli
(age 67) |
|
Trustee
|
|
March
2017 |
|
135
|
|
Private
investor; JC Global Advisors, LLC (management consulting), President (since 2015) |
|
N/A
|
Maureen
R. Goldfarb
(age 66) |
|
Trustee
|
|
January
2009 |
|
135
|
|
Private
investor |
|
N/A
|
Peter
D. Jones
(age 66) |
|
Trustee
|
|
January
2019 |
|
135
|
|
Private
investor |
|
N/A
|
James
W. Kilman, Jr.
(age 60) |
|
Trustee
|
|
January
2019 |
|
135
|
|
Burford
Capital Limited (finance and investment management), Senior Advisor (since May 3, 2021), Chief Financial Officer (2019 - May 2, 2021); KielStrand Capital LLC (family office), Chief Executive Officer (since 2016) |
|
Alpha-En
Corporation, Director (2016-2019) |
Clarence
Otis, Jr.
(age 65) |
|
Trustee
|
|
March
2017 |
|
135
|
|
Private
investor |
|
VF
Corporation, Director; Verizon Communications, Inc., Director; The Travelers Companies, Director |
Maryanne
L. Roepke
(age 65) |
|
Trustee
|
|
May
2014 |
|
135
|
|
Private
investor |
|
N/A
|
Laurie
J. Thomsen
(age 64) |
|
Trustee
|
|
March
2005 |
|
135
|
|
Private
investor |
|
The
Travelers Companies, Director; Dycom Industries, Inc., Director |
MFS U.S. Government Money
Market Portfolio
Trustees and Officers - continued
| Name,
Age |
|
Position(s)
Held with
Fund |
|
Trustee/Officer
Since(h) |
|
Number
of MFS Funds for which the Person is an Officer |
|
Principal
Occupations During
the Past Five Years |
| OFFICERS
|
|
|
|
|
|
|
|
|
Christopher
R. Bohane (k)
(age 48) |
|
Assistant
Secretary and Assistant Clerk |
|
July
2005 |
|
135
|
|
Massachusetts
Financial Services Company, Senior Vice President and Associate General Counsel |
Kino
Clark (k)
(age 53) |
|
Assistant
Treasurer |
|
January
2012 |
|
135
|
|
Massachusetts
Financial Services Company, Vice President |
John
W. Clark, Jr. (k)
(age 54) |
|
Assistant
Treasurer |
|
April
2017 |
|
135
|
|
Massachusetts
Financial Services Company, Vice President (since March 2017); Deutsche Bank (financial services), Department Head - Treasurer's Office (until February 2017) |
Thomas
H. Connors (k)
(age 62) |
|
Assistant
Secretary and Assistant Clerk |
|
September
2012 |
|
135
|
|
Massachusetts
Financial Services Company, Vice President and Senior Counsel |
David
L. DiLorenzo (k)
(age 53) |
|
President
|
|
July
2005 |
|
135
|
|
Massachusetts
Financial Services Company, Senior Vice President |
Heidi
W. Hardin (k)
(age 54) |
|
Secretary
and Clerk |
|
April
2017 |
|
135
|
|
Massachusetts
Financial Services Company, Executive Vice President and General Counsel (since March 2017); Harris Associates (investment management), General Counsel (until January 2017) |
Brian
E. Langenfeld (k)
(age 48) |
|
Assistant
Secretary and Assistant Clerk |
|
June
2006 |
|
135
|
|
Massachusetts
Financial Services Company, Vice President and Senior Counsel |
Amanda
S. Mooradian (k)
(age 42) |
|
Assistant
Secretary and Assistant Clerk |
|
September
2018 |
|
135
|
|
Massachusetts
Financial Services Company, Assistant Vice President and Senior Counsel |
Susan
A. Pereira (k)
(age 51) |
|
Assistant
Secretary and Assistant Clerk |
|
July
2005 |
|
135
|
|
Massachusetts
Financial Services Company, Vice President and Assistant General Counsel |
Kasey
L. Phillips (k)
(age 51) |
|
Assistant
Treasurer |
|
September
2012 |
|
135
|
|
Massachusetts
Financial Services Company, Vice President |
Matthew
A. Stowe (k)
(age 47) |
|
Assistant
Secretary and Assistant Clerk |
|
October
2014 |
|
135
|
|
Massachusetts
Financial Services Company, Vice President and Assistant General Counsel |
Martin
J. Wolin (k)
(age 54) |
|
Chief
Compliance Officer |
|
July
2015 |
|
135
|
|
Massachusetts
Financial Services Company, Senior Vice President and Chief Compliance Officer |
James
O. Yost (k)
(age 61) |
|
Treasurer
|
|
September
1990 |
|
135
|
|
Massachusetts
Financial Services Company, Senior Vice President |
| (h)
|
Date
first appointed to serve as Trustee/Officer of an MFS Fund. Each Trustee has served continuously since appointment unless indicated otherwise. From January 2012 through December 2016, Messrs. DiLorenzo and Yost served as Treasurer and Deputy
Treasurer of the Funds, respectively. |
| (j)
|
Directorships or
trusteeships of companies required to report to the Securities and Exchange Commission (i.e., “public companies”). |
| (k)
|
“Interested
person” of the Trust within the meaning of the Investment Company Act of 1940 (referred to as the 1940 Act), which is the principal federal law governing investment companies like the fund, as a result of a position with MFS. The address of
MFS is 111 Huntington Avenue, Boston, Massachusetts 02199-7618. |
Each Trustee (other than Messrs. Jones, Kilman and Roberge)
has been elected by shareholders and each Trustee and Officer holds office until his or her successor is chosen and qualified or until his or her earlier death, resignation, retirement or removal. Mr. Roberge became a Trustee of the Funds on January
1, 2021 and Messrs. Jones and Kilman became Trustees of the Funds on January 1, 2019. The Trust does not hold annual meetings for the purpose of electing Trustees, and Trustees are not elected for fixed terms. Under the terms of the Board's
retirement policy, an Independent Trustee shall retire at the end of the calendar year in which he or she reaches the earlier of 75 years of age or 15 years of service on the Board (or, in the case of any Independent Trustee who joined the Board
prior to 2015, 20 years of service on the Board).
Messrs. Buller, Kilman and Otis and Ms. Roepke are members
of the Trust’s Audit Committee.
MFS U.S. Government Money
Market Portfolio
Trustees and Officers - continued
Each
of the Interested Trustees and certain Officers hold comparable officer positions with certain affiliates of MFS.
The Statement of Additional Information for a Fund includes
further information about the Trustees and is available without charge upon request by calling 1-800-225-2606.
| Investment
Adviser |
Custodian
|
Massachusetts Financial
Services Company
111 Huntington Avenue
Boston, MA 02199-7618 |
State Street
Bank and Trust Company
1 Lincoln Street
Boston, MA 02111-2900 |
| Distributor
|
Independent
Registered Public Accounting Firm |
MFS Fund
Distributors, Inc.
111 Huntington Avenue
Boston, MA 02199-7618 |
Deloitte
& Touche LLP
200 Berkeley Street
Boston, MA 02116 |
MFS U.S. Government Money
Market Portfolio
Board Review of Investment Advisory Agreement
MFS U.S. Government Money Market Portfolio
The Investment Company Act of 1940 requires that both the
full Board of Trustees and a majority of the non-interested (“independent”) Trustees, voting separately, annually approve the continuation of the Fund’s investment advisory agreement with MFS. The Trustees consider matters bearing
on the Fund and its advisory arrangements at their meetings throughout the year, including a review of performance data at each regular meeting. In addition, the independent Trustees met several times by videoconference (in accordance with
Securities and Exchange Commission relief) over the course of three months beginning in May and ending in July, 2021 (“contract review meetings”) for the specific purpose of considering whether to approve the continuation of the
investment advisory agreement for the Fund and the other investment companies that the Board oversees (the “MFS Funds”). The independent Trustees were assisted in their evaluation of the Fund’s investment advisory agreement by
independent legal counsel, from whom they received separate legal advice and with whom they met separately from MFS during various contract review meetings. The independent Trustees were also assisted in this process by an independent consultant who
was retained by and reported to the independent Trustees.
In connection with their deliberations regarding the
continuation of the investment advisory agreement, the Trustees, including the independent Trustees, considered such information and factors as they believed, in light of the legal advice furnished to them and their own business judgment, to be
relevant. The investment advisory agreement for the Fund was considered separately, although the Trustees also took into account the common interests of all MFS Funds in their review. As described below, the Trustees considered the nature, quality,
and extent of the various investment advisory, administrative, and shareholder services performed by MFS under the existing investment advisory agreement and other arrangements with the Fund.
In connection with their contract review meetings, the
Trustees received and relied upon materials that included, among other items: (i) information provided by Broadridge Financial Solutions, Inc. (“Broadridge”), an independent third party, on the investment performance of the Fund for
various time periods ended December 31, 2020 and the investment performance of a group of funds with substantially similar investment classifications/objectives (the “Broadridge performance universe”), (ii) information provided by
Broadridge on the Fund’s advisory fees and other expenses and the advisory fees and other expenses of comparable funds identified by Broadridge as well as all other funds in the same investment classification/category (the “Broadridge
expense group and universe”), (iii) information provided by MFS on the advisory fees of portfolios of other clients of MFS, including institutional separate accounts and other clients, (iv) information as to whether and to what extent
applicable expense waivers, reimbursements or fee “breakpoints” are observed for the Fund, (v) information regarding MFS’ financial results and financial condition, including MFS’ and certain of its affiliates’
estimated profitability from services performed for the Fund and the MFS Funds as a whole, and compared to MFS’ institutional business, (vi) MFS’ views regarding the outlook for the mutual fund industry and the strategic business plans
of MFS, (vii) descriptions of various functions performed by MFS for the Funds, such as compliance monitoring and portfolio trading practices, and (viii) information regarding the overall organization of MFS, including information about MFS’
senior management and other personnel providing investment advisory, administrative and other services to the Fund and the other MFS Funds. The comparative performance, fee and expense information prepared and provided by Broadridge was not
independently verified and the independent Trustees did not independently verify any information provided to them by MFS.
The Trustees’ conclusion as to the continuation of
the investment advisory agreement was based on a comprehensive consideration of all information provided to the Trustees and not the result of any single factor. Some of the factors that figured particularly in the Trustees’ deliberations are
described below, although individual Trustees may have evaluated the information presented differently from one another, giving different weights to various factors. It is also important to recognize that the fee arrangements for the Fund and other
MFS Funds are the result of years of review and discussion between the independent Trustees and MFS, that certain aspects of such arrangements may receive greater scrutiny in some years than in others, and that the Trustees’ conclusions may be
based, in part, on their consideration of these same arrangements during the course of the year and in prior years.
Based on information provided by Broadridge and MFS, the
Trustees reviewed the Fund’s total return investment performance as well as the Broadridge performance universe over various time periods. The Trustees placed particular emphasis on the total return performance of the Fund’s Initial
Class shares in comparison to the performance of funds in its Broadridge performance universe over the five-year period ended December 31, 2020, which the Trustees believed was a long enough period to reflect differing market conditions. The total
return performance of the Fund’s Initial Class shares was in the 4th quintile relative to the other funds in the universe for this five-year period (the 1st quintile being the best performers and the 5th quintile being the worst performers).
The total return performance of the Fund’s Initial Class shares was in the 4th quintile for each of the one- and three-year periods ended December 31, 2020 relative to the Broadridge performance universe. Because of the passage of time, these
performance results may differ from the performance results for more recent periods, including those shown elsewhere in this report.
In the course of their deliberations, the Trustees took
into account information provided by MFS in connection with the contract review meetings, as well as during investment review meetings conducted with portfolio management personnel during the course of the year regarding the Fund’s
performance. In addition, the Trustees noted the market conditions affecting all money market funds, in particular the low interest rate environment during portions of the one-, three- and five-year periods, and MFS’ voluntary
MFS U.S. Government Money
Market Portfolio
Board Review of Investment Advisory Agreement - continued
waiver of all or a
portion of its fees to ensure that the Fund avoided a negative yield during certain periods. After reviewing these and related factors, the Trustees concluded, within the context of their overall conclusions regarding the investment advisory
agreement, that they were satisfied with MFS’ responses and efforts relating to investment performance.
In assessing the reasonableness of the Fund’s
advisory fee, the Trustees considered, among other information, the Fund’s advisory fee and the total expense ratio of the Fund’s Initial Class shares as a percentage of average daily net assets and the advisory fee and total expense
ratios of the Broadridge expense group based on information provided by Broadridge. The Trustees considered that MFS currently observes an expense limitation for the Fund, which may not be changed without the Trustees’ approval. The Trustees
also considered that, according to the data provided by Broadridge (which takes into account any fee reductions or expense limitations that were in effect during the Fund’s last fiscal year), the Fund’s effective advisory fee rate and
total expense ratio were each lower than the Broadridge expense group median.
The Trustees also considered the advisory fees charged by
MFS to any institutional separate accounts advised by MFS (“separate accounts”) and unaffiliated investment companies for which MFS serves as subadviser (“subadvised funds”) that have comparable investment strategies to the
Fund, if any. In comparing these fees, the Trustees considered information provided by MFS as to the generally broader scope of services provided by MFS to the Fund, as well as the more extensive regulatory burdens imposed on MFS in managing the
Fund, in comparison to separate accounts and subadvised funds. The Trustees also considered the higher demands placed on MFS’ investment personnel and trading infrastructure as a result of the daily cash in-flows and out-flows of the Fund in
comparison to separate accounts.
The Trustees also
considered whether the Fund may benefit from any economies of scale in the management of the Fund in the event of growth in assets of the Fund and/or growth in assets of the MFS Funds as a whole. They noted that the Fund’s advisory fee rate
schedule is subject to a contractual breakpoint that reduces the Fund’s advisory fee rate on average daily net assets over $1 billion. The Trustees also noted that MFS has agreed in writing to waive a portion of the management fees of certain
MFS Funds, including the Fund, if the total combined assets of certain funds within the MFS Funds’ complex increase above agreed upon thresholds (the “group fee waiver”), enabling the Fund’s shareholders to share in the
benefits from any economies of scale at the complex level. The group fee waiver is reviewed and renewed annually between the Board and MFS. The Trustees concluded that the breakpoint and the group fee waiver were sufficient to allow the Fund to
benefit from economies of scale as its assets and overall complex assets grow.
The Trustees also considered information prepared by MFS
relating to MFS’ costs and profits with respect to the Fund, the MFS Funds considered as a group, and other investment companies and accounts advised by MFS, as well as MFS’ methodologies used to determine and allocate its costs to the
MFS Funds, the Fund and other accounts and products for purposes of estimating profitability.
After reviewing these and other factors described herein,
the Trustees concluded, within the context of their overall conclusions regarding the investment advisory agreement, that the advisory fees charged to the Fund represent reasonable compensation in light of the services being provided by MFS to the
Fund.
In addition, the Trustees considered MFS’
resources and related efforts to continue to retain, attract and motivate capable personnel to serve the Fund. The Trustees also considered current and developing conditions in the financial services industry, including the presence of large and
well-capitalized companies which are spending, and appear to be prepared to continue to spend, substantial sums to engage personnel and to provide services to competing investment companies. In this regard, the Trustees also considered the financial
resources of MFS and its ultimate parent, Sun Life Financial Inc. The Trustees also considered the advantages and possible disadvantages to the Fund of having an adviser that also serves other investment companies as well as other accounts.
The Trustees also considered the nature, quality, cost, and
extent of administrative, transfer agency, and distribution services provided to the Fund by MFS and its affiliates under agreements and plans other than the investment advisory agreement, including any 12b-1 fees the Fund pays to MFS Fund
Distributors, Inc., an affiliate of MFS. The Trustees also considered the nature, extent and quality of certain other services MFS performs or arranges for on the Fund’s behalf, which may include securities lending programs, directed expense
payment programs, class action recovery programs, and MFS’ interaction with third-party service providers, principally custodians and sub-custodians. The Trustees concluded that the various non-advisory services provided by MFS and its
affiliates on behalf of the Fund were satisfactory.
The Trustees considered so-called “fall-out
benefits” to MFS such as reputational value derived from serving as investment manager to the MFS Funds. The Trustees also considered that MFS discontinued its historic practice of obtaining investment research from portfolio brokerage
commissions paid by certain MFS Funds effective January 2018, and directly pays or voluntarily reimburses a Fund, if applicable, for the costs of external research acquired through the use of the Fund’s portfolio brokerage commissions.
Based on their evaluation of factors that they deemed to be
material, including those factors described above, the Board of Trustees, including the independent Trustees, concluded that the Fund’s investment advisory agreement with MFS should be continued for an additional one-year period, commencing
August 1, 2021.
MFS U.S. Government Money
Market Portfolio
Proxy Voting Policies and Information
MFS votes proxies on behalf of the fund pursuant to proxy
voting policies and procedures that are available without charge, upon request, by calling 1-800-225-2606, by visiting mfs.com/proxyvoting, or by visiting the SEC’s Web site at http://www.sec.gov.
Information regarding how the fund voted proxies relating
to portfolio securities during the most recent twelve-month period ended June 30 is available by August 31 of each year without charge by visiting mfs.com/proxyvoting, or by visiting the SEC’s Web site
at http://www.sec.gov.
Portfolio Holdings Information
The fund files monthly portfolio information with the SEC
on Form N-MFP. The fund’s Form N-MFP reports are available on the SEC’s Web site at http://www.sec.gov. A shareholder can also access the fund’s portfolio holdings as of each month end
and the fund’s Form N-MFP reports at mfs.com/vit2 after choosing “Click here for access to Money Market fund reports”.
FURTHER INFORMATION
From time to time, MFS may post important information about
the fund or the MFS Funds on the MFS Web site (mfs.com). This information is available at https://www.mfs.com/announcements or at
mfs.com/vit2 by choosing the fund's name and then scrolling to the “Resources” section and clicking on the “Announcements” tab, if any.
Information About Fund Contracts and Legal Claims
The fund has entered into contractual arrangements with an
investment adviser, administrator, distributor, shareholder servicing agent, 529 program manager (if applicable), and custodian who each provide services to the fund. Unless expressly stated otherwise, shareholders are not parties to, or intended
beneficiaries of these contractual arrangements, and these contractual arrangements are not intended to create any shareholder right to enforce them against the service providers or to seek any remedy under them against the service providers, either
directly or on behalf of the fund.
Under the
Trust’s By-Laws and Declaration of Trust, any claims asserted against or on behalf of the MFS Funds, including claims against Trustees and Officers, must be brought in state and federal courts located within the Commonwealth of
Massachusetts.
Federal Tax Information (unaudited)
The following information is provided pursuant to
provisions of the Internal Revenue Code.
The fund
intends to pass through the maximum amount allowable as Section 163(j) Interest Dividends as defined in Treasury Regulation §1.163(j)-1(b).
| FACTS
|
WHAT
DOES MFS DO WITH YOUR PERSONAL INFORMATION? |
| Why?
|
Financial
companies choose how they share your personal information. Federal law gives consumers the right to limit some but not all sharing. Federal law also requires us to tell you how we collect, share, and protect your personal information. Please read
this notice carefully to understand what we do. |
| What?
|
The types of
personal information we collect and share depend on the product or service you have with us. This information can include: |
| • Social
Security number and account balances |
| • Account
transactions and transaction history |
| • Checking
account information and wire transfer instructions |
| When
you are no longer our customer, we continue to share your information as described in this notice. |
| How?
|
All
financial companies need to share customers' personal information to run their everyday business. In the section below, we list the reasons financial companies can share their customers' personal information; the reasons MFS chooses to share; and
whether you can limit this sharing. |
Reasons
we can share your
personal information |
Does
MFS share? |
Can
you limit
this sharing? |
For
our everyday business purposes –
such as to process your transactions, maintain your
account(s), respond to court orders and legal
investigations, or report to credit bureaus |
Yes
|
No
|
For
our marketing purposes –
to offer our products and services to you |
No
|
We
don't share |
For
joint marketing with other
financial companies |
No
|
We
don't share |
For
our affiliates' everyday business purposes –
information about your transactions and experiences |
No
|
We
don't share |
For
our affiliates' everyday business purposes –
information about your creditworthiness |
No
|
We
don't share |
| For
nonaffiliates to market to you |
No
|
We
don't share |
| Questions?
|
Call
800-225-2606 or go to mfs.com. |
| Who
we are |
| Who
is providing this notice? |
MFS
Funds, MFS Investment Management, MFS Institutional Advisors, Inc., and MFS Heritage Trust Company. |
| What
we do |
How
does MFS
protect my personal
information? |
To
protect your personal information from unauthorized access and use, we use security measures that comply with federal law. These measures include procedural, electronic, and physical safeguards for the protection of the personal information we
collect about you. |
How
does MFS
collect my personal
information? |
We
collect your personal information, for example, when you |
| • open
an account or provide account information |
| • direct
us to buy securities or direct us to sell your securities |
| • make
a wire transfer |
| We
also collect your personal information from others, such as credit bureaus, affiliates, or other companies. |
| Why
can't I limit all sharing? |
Federal
law gives you the right to limit only |
| • sharing
for affiliates' everyday business purposes – information about your creditworthiness |
| • affiliates
from using your information to market to you |
| • sharing
for nonaffiliates to market to you |
| State
laws and individual companies may give you additional rights to limit sharing. |
| Definitions
|
| Affiliates
|
Companies
related by common ownership or control. They can be financial and nonfinancial companies. |
| •
MFS does not share personal information with affiliates, except for everyday business purposes as described on page one of this notice. |
| Nonaffiliates
|
Companies
not related by common ownership or control. They can be financial and nonfinancial companies. |
| •
MFS does not share with nonaffiliates so they can market to you. |
| Joint
marketing |
A
formal agreement between nonaffiliated financial companies that together market financial products or services to you. |
| •
MFS doesn't jointly market. |
| Other
important information |
| If
you own an MFS product or receive an MFS service in the name of a third party such as a bank or broker-dealer, their privacy policy may apply to you instead of ours. |
Not applicable.
The Registrant has adopted a Code of Ethics (the “Code”) pursuant to Section 406 of the Sarbanes-Oxley Act and as defined in Form N-CSR that applies to the Registrant’s principal executive officer and principal financial and accounting officer. During the period covered by this report, the Registrant has not amended any provision in the
Code that relates to an element of the Code’s definition enumerated in paragraph (b) of Item 2 of this Form N-CSR. During the period covered by this report, the Registrant did not grant a waiver,
including an implicit waiver, from any provision of the Code.
A copy of the Code is filed as an exhibit to this Form
N-CSR.
| ITEM 3. |
AUDIT COMMITTEE FINANCIAL EXPERT. |
Messrs. Steven E. Buller, James Kilman, and Clarence Otis, Jr. and Ms. Maryanne L. Roepke, members of the Audit Committee, have been determined by
the Board of Trustees in their reasonable business judgment to meet the definition of “audit committee financial expert” as such term is defined in Form N-CSR. In addition, Messrs. Buller,
Kilman, and Otis and Ms. Roepke are “independent” members of the Audit Committee (as such term has been defined by the Securities and Exchange Commission in regulations implementing Section 407 of the Sarbanes-Oxley Act of 2002).
The Securities and Exchange Commission has stated that the designation of a person as an audit committee financial expert pursuant to this Item 3 on the Form N-CSR does not impose on such a person any duties,
obligations or liability that are greater than the duties, obligations or liability imposed on such person as a member of the Audit Committee and the Board of Trustees in the absence of such designation or identification.
| ITEM 4. |
PRINCIPAL ACCOUNTANT FEES AND SERVICES. |
Items 4(a) through 4(d) and 4(g):
The Board of Trustees
has appointed Deloitte & Touche LLP (“Deloitte”) to serve as independent accountants to the Registrant (hereinafter the “Registrant” or the “Fund”). The tables below set forth the audit fees billed to the Fund
as well as fees for non-audit services provided to the Fund and/or to the Fund’s investment adviser, Massachusetts Financial Services Company (“MFS”), and to various entities either controlling,
controlled by, or under common control with MFS that provide ongoing services to the Fund (“MFS Related Entities”).
For the fiscal years ended December 31, 2021 and 2020, audit fees billed to the Fund by Deloitte were as
follows:
|
|
|
|
|
|
|
|
|
| |
|
Audit Fees |
|
| |
2021 |
|
|
2020 |
|
| Fees billed by Deloitte: |
|
|
|
|
|
|
|
|
| MFS Blended Research Core Equity Portfolio |
|
|
47,221 |
|
|
|
46,547 |
|
| MFS Core Equity Portfolio |
|
|
49,448 |
|
|
|
48,743 |
|
| MFS Corporate Bond Portfolio |
|
|
69,002 |
|
|
|
68,027 |
|
| MFS Emerging Markets Equity Portfolio |
|
|
49,762 |
|
|
|
49,053 |
|
| MFS Global Governments Portfolio |
|
|
66,552 |
|
|
|
65,611 |
|
| MFS Global Growth Portfolio |
|
|
60,763 |
|
|
|
59,902 |
|
| MFS Global Research Portfolio |
|
|
48,178 |
|
|
|
47,491 |
|
| MFS Global Tactical Allocation Portfolio |
|
|
66,592 |
|
|
|
65,650 |
|
| MFS Government Securities Portfolio |
|
|
56,568 |
|
|
|
55,765 |
|
| MFS High Yield Portfolio |
|
|
73,453 |
|
|
|
72,417 |
|
| MFS Income Portfolio |
|
|
73,167 |
|
|
|
72,135 |
|
| MFS International Growth Portfolio |
|
|
49,762 |
|
|
|
49,053 |
|
| MFS International Intrinsic Value Portfolio |
|
|
50,716 |
|
|
|
49,994 |
|
| MFS Massachusetts Investors Growth Stock Portfolio |
|
|
49,338 |
|
|
|
48,635 |
|
| MFS Research International Portfolio |
|
|
47,221 |
|
|
|
46,547 |
|
| MFS Technology Portfolio |
|
|
47,331 |
|
|
|
46,655 |
|
| MFS U.S. Government Money Market Portfolio |
|
|
29,199 |
|
|
|
28,774 |
|
|
|
|
|
|
|
|
|
|
| Total |
|
|
934,273 |
|
|
|
920,999 |
|
For the fiscal years ended December 31, 2021 and 2020, fees billed by Deloitte for audit-related, tax and other services
provided to each Fund and for audit-related, tax and other services provided to MFS and MFS Related Entities were as follows:
|
|
|
|
|
|
|
|
|
|
|
|
|
|
|
|
|
|
|
|
|
|
|
|
|
| |
|
Audit-Related Fees1 |
|
|
Tax Fees2 |
|
|
All Other Fees3 |
|
| |
2021 |
|
|
2020 |
|
|
2021 |
|
|
2020 |
|
|
2021 |
|
|
2020 |
|
| Fees billed by Deloitte: |
|
|
|
|
|
|
|
|
|
|
|
|
|
|
|
|
|
|
|
|
|
|
|
|
| To MFS Blended Research Core Equity Portfolio |
|
|
2,400 |
|
|
|
2,400 |
|
|
|
5,664 |
|
|
|
5,591 |
|
|
|
0 |
|
|
|
0 |
|
| To MFS Core Equity Portfolio |
|
|
2,400 |
|
|
|
2,400 |
|
|
|
5,914 |
|
|
|
5,841 |
|
|
|
0 |
|
|
|
0 |
|
| To MFS Corporate Bond Portfolio |
|
|
2,400 |
|
|
|
2,400 |
|
|
|
5,664 |
|
|
|
5,591 |
|
|
|
0 |
|
|
|
0 |
|
| To MFS Emerging Markets Equity Portfolio |
|
|
2,400 |
|
|
|
2,400 |
|
|
|
5,664 |
|
|
|
5,591 |
|
|
|
0 |
|
|
|
0 |
|
| To MFS Global Governments Portfolio |
|
|
2,400 |
|
|
|
2,400 |
|
|
|
5,664 |
|
|
|
5,591 |
|
|
|
0 |
|
|
|
0 |
|
| To MFS Global Growth Portfolio |
|
|
2,400 |
|
|
|
2,400 |
|
|
|
5,664 |
|
|
|
5,841 |
|
|
|
0 |
|
|
|
0 |
|
| To MFS Global Research Portfolio |
|
|
2,400 |
|
|
|
2,400 |
|
|
|
5,914 |
|
|
|
5,841 |
|
|
|
0 |
|
|
|
0 |
|
| To MFS Global Tactical Allocation Portfolio |
|
|
2,400 |
|
|
|
2,400 |
|
|
|
5,914 |
|
|
|
5,591 |
|
|
|
0 |
|
|
|
0 |
|
| To MFS Government Securities Portfolio |
|
|
2,400 |
|
|
|
2,400 |
|
|
|
5,664 |
|
|
|
5,591 |
|
|
|
0 |
|
|
|
0 |
|
| To MFS High Yield Portfolio |
|
|
2,400 |
|
|
|
2,400 |
|
|
|
5,664 |
|
|
|
5,591 |
|
|
|
0 |
|
|
|
0 |
|
| To MFS Income Portfolio |
|
|
2,400 |
|
|
|
2,400 |
|
|
|
5,664 |
|
|
|
5,591 |
|
|
|
0 |
|
|
|
0 |
|
| To MFS International Growth Portfolio |
|
|
2,400 |
|
|
|
2,400 |
|
|
|
5,664 |
|
|
|
5,591 |
|
|
|
0 |
|
|
|
0 |
|
| To MFS International Intrinsic Value Portfolio |
|
|
2,400 |
|
|
|
2,400 |
|
|
|
5,664 |
|
|
|
5,591 |
|
|
|
0 |
|
|
|
0 |
|
| To MFS Massachusetts Investors Growth Stock Portfolio |
|
|
2,400 |
|
|
|
2,400 |
|
|
|
5,664 |
|
|
|
5,841 |
|
|
|
0 |
|
|
|
0 |
|
| To MFS Research International Portfolio |
|
|
2,400 |
|
|
|
2,400 |
|
|
|
5,664 |
|
|
|
5,591 |
|
|
|
0 |
|
|
|
0 |
|
| To MFS Technology Portfolio |
|
|
2,400 |
|
|
|
2,400 |
|
|
|
5,914 |
|
|
|
5,591 |
|
|
|
0 |
|
|
|
0 |
|
| To MFS U.S. Government Money Market Portfolio |
|
|
2,400 |
|
|
|
2,400 |
|
|
|
5,664 |
|
|
|
5,591 |
|
|
|
0 |
|
|
|
0 |
|
| Total fees billed by Deloitte To above Funds: |
|
|
40,800 |
|
|
|
40,800 |
|
|
|
97,288 |
|
|
|
96,047 |
|
|
|
0 |
|
|
|
0 |
|
|
|
|
|
|
|
|
|
|
|
|
|
|
|
|
|
|
|
|
|
|
|
|
|
|
| |
|
Audit-Related Fees1 |
|
|
Tax Fees2 |
|
|
All Other Fees3 |
|
| |
2021 |
|
|
2020 |
|
|
2021 |
|
|
2020 |
|
|
2021 |
|
|
2020 |
|
| Fees billed by Deloitte: |
|
|
|
|
|
|
|
|
|
|
|
|
|
|
|
|
|
|
|
|
|
|
|
|
| To MFS and MFS Related Entities of MFS Blended Research Core Equity Portfolio* |
|
|
0 |
|
|
|
0 |
|
|
|
0 |
|
|
|
0 |
|
|
|
5,390 |
|
|
|
5,390 |
|
| To MFS and MFS Related Entities of MFS Core Equity Portfolio* |
|
|
0 |
|
|
|
0 |
|
|
|
0 |
|
|
|
0 |
|
|
|
5,390 |
|
|
|
5,390 |
|
| To MFS and MFS Related Entities of MFS Corporate Bond Portfolio* |
|
|
0 |
|
|
|
0 |
|
|
|
0 |
|
|
|
0 |
|
|
|
5,390 |
|
|
|
5,390 |
|
| To MFS and MFS Related Entities of MFS Emerging Markets Equity Portfolio* |
|
|
0 |
|
|
|
0 |
|
|
|
0 |
|
|
|
0 |
|
|
|
5,390 |
|
|
|
5,390 |
|
| To MFS and MFS Related Entities of MFS Global Governments Portfolio* |
|
|
0 |
|
|
|
0 |
|
|
|
0 |
|
|
|
0 |
|
|
|
5,390 |
|
|
|
5,390 |
|
| To MFS and MFS Related Entities of MFS Global Growth Portfolio* |
|
|
0 |
|
|
|
0 |
|
|
|
0 |
|
|
|
0 |
|
|
|
5,390 |
|
|
|
5,390 |
|
| To MFS and MFS Related Entities of MFS Global Research Portfolio* |
|
|
0 |
|
|
|
0 |
|
|
|
0 |
|
|
|
0 |
|
|
|
5,390 |
|
|
|
5,390 |
|
| To MFS and MFS Related Entities of MFS Global Tactical Allocation Portfolio* |
|
|
0 |
|
|
|
0 |
|
|
|
0 |
|
|
|
0 |
|
|
|
5,390 |
|
|
|
5,390 |
|
| To MFS and MFS Related Entities of MFS Government Securities Portfolio* |
|
|
0 |
|
|
|
0 |
|
|
|
0 |
|
|
|
0 |
|
|
|
5,390 |
|
|
|
5,390 |
|
| To MFS and MFS Related Entities of MFS High Yield Portfolio* |
|
|
0 |
|
|
|
0 |
|
|
|
0 |
|
|
|
0 |
|
|
|
5,390 |
|
|
|
5,390 |
|
| To MFS and MFS Related Entities of MFS Income Portfolio* |
|
|
0 |
|
|
|
0 |
|
|
|
0 |
|
|
|
0 |
|
|
|
5,390 |
|
|
|
5,390 |
|
| To MFS and MFS Related Entities of MFS International Growth Portfolio* |
|
|
0 |
|
|
|
0 |
|
|
|
0 |
|
|
|
0 |
|
|
|
5,390 |
|
|
|
5,390 |
|
| To MFS and MFS Related Entities of MFS International Intrinsic Value Portfolio* |
|
|
0 |
|
|
|
0 |
|
|
|
0 |
|
|
|
0 |
|
|
|
5,390 |
|
|
|
5,390 |
|
| To MFS and MFS Related Entities of MFS Massachusetts Investors Growth Stock Portfolio* |
|
|
0 |
|
|
|
0 |
|
|
|
0 |
|
|
|
0 |
|
|
|
5,390 |
|
|
|
5,390 |
|
| To MFS and MFS Related Entities of MFS Research International Portfolio* |
|
|
0 |
|
|
|
0 |
|
|
|
0 |
|
|
|
0 |
|
|
|
5,390 |
|
|
|
5,390 |
|
| To MFS and MFS Related Entities of MFS Technology Portfolio* |
|
|
0 |
|
|
|
0 |
|
|
|
0 |
|
|
|
0 |
|
|
|
5,390 |
|
|
|
5,390 |
|
| To MFS and MFS Related Entities of MFS U.S. Government Money Market Portfolio * |
|
|
0 |
|
|
|
0 |
|
|
|
0 |
|
|
|
0 |
|
|
|
5,390 |
|
|
|
5,390 |
|
|
|
|
|
|
|
|
|
|
| |
|
Aggregate fees for non-audit
services: |
|
| |
2021 |
|
|
2020 |
|
| Fees billed by Deloitte: |
|
|
|
|
|
|
|
|
| To MFS Blended Research Core Equity Portfolio, MFS and MFS
Related Entities# |
|
|
13,454 |
|
|
|
557,131 |
|
| To MFS Core Equity Portfolio, MFS and MFS Related Entities# |
|
|
13,704 |
|
|
|
557,381 |
|
| To MFS Corporate Bond Portfolio, MFS and MFS Related Entities# |
|
|
13,454 |
|
|
|
557,131 |
|
| To MFS Emerging Markets Equity Portfolio, MFS and MFS
Related Entities# |
|
|
13,454 |
|
|
|
557,131 |
|
| To MFS Global Governments Portfolio, MFS and MFS Related Entities# |
|
|
13,454 |
|
|
|
557,131 |
|
| To MFS Global Growth Portfolio MFS and MFS Related Entities# |
|
|
13,454 |
|
|
|
557,381 |
|
| To MFS Global Research Portfolio, MFS and MFS Related Entities# |
|
|
13,704 |
|
|
|
557,381 |
|
| To MFS Global Tactical Allocation Portfolio, MFS and MFS Related Entities# |
|
|
13,704 |
|
|
|
557,131 |
|
| To MFS Government Securities Portfolio, MFS and MFS Related Entities# |
|
|
13,454 |
|
|
|
557,131 |
|
| To MFS High Yield Portfolio, MFS and MFS Related Entities# |
|
|
13,454 |
|
|
|
557,131 |
|
| To MFS Income Portfolio, MFS and MFS Related
Entities# |
|
|
13,454 |
|
|
|
557,131 |
|
| To MFS International Growth Portfolio, MFS and MFS Related
Entities# |
|
|
13,454 |
|
|
|
557,131 |
|
| To MFS International Intrinsic Value Portfolio, MFS and MFS Related Entities# |
|
|
13,454 |
|
|
|
557,131 |
|
| To MFS Massachusetts Investors Growth Stock Portfolio, MFS and MFS Related Entities# |
|
|
13,454 |
|
|
|
557,381 |
|
| To MFS Research International Portfolio, MFS and MFS Related
Entities# |
|
|
13,454 |
|
|
|
557,131 |
|
| To MFS Technology Portfolio, MFS and MFS Related Entities# |
|
|
13,704 |
|
|
|
557,131 |
|
| To MFS U.S. Government Money Market Portfolio, MFS and
MFS Related Entities# |
|
|
13,454 |
|
|
|
557,131 |
|
| * |
This amount reflects the fees billed to MFS and MFS Related Entities for
non-audit services relating directly to the operations and financial reporting of the Fund (portions of which services also related to the operations and financial reporting of other funds within the MFS Funds
complex). |
| # |
This amount reflects the aggregate fees billed by Deloitte for
non-audit services rendered to the Fund and for non-audit services rendered to MFS and the MFS Related Entities. |
| 1 |
The fees included under “Audit-Related Fees” are fees related to assurance and related services that
are reasonably related to the performance of the audit or review of financial statements, but not reported under ‘‘Audit Fees,’’ including accounting consultations, agreed-upon procedure reports, attestation reports, comfort
letters and internal control reviews. |
| 2 |
The fees included under “Tax Fees” are fees associated with tax compliance, tax advice and tax
planning, including services relating to the filing or amendment of federal, state or local income tax returns, regulated investment company qualification reviews and tax distribution and analysis. |
| 3 |
The fees included under “All Other Fees” are fees for products and services provided by Deloitte
other than those reported under “Audit Fees,” “Audit-Related Fees” and “Tax Fees”. |
Item 4(e)(1):
Set forth below are the policies and procedures established by the Audit Committee of the Board of Trustees relating to the pre-approval of audit and non-audit related services:
To the extent required by
applicable law, pre-approval by the Audit Committee of the Board is needed for all audit and permissible non-audit services rendered to the Fund and all permissible non-audit services rendered to MFS or MFS Related Entities if the services relate directly to the operations and financial reporting of the Registrant. Pre-approval is
currently on an engagement-by-engagement basis. In the event pre-approval of such services is necessary between regular meetings
of the Audit Committee and it is not practical to wait to seek pre-approval at the next regular meeting of the Audit Committee, pre-approval of such services may be
referred to the Chair of the Audit Committee for approval; provided that the Chair may not pre-approve any individual engagement for such services exceeding $50,000 or multiple engagements for such services in
the aggregate exceeding $100,000 between such regular meetings of the Audit Committee. Any engagement pre-approved by the Chair between regular meetings of the Audit Committee shall be presented for
ratification by the entire Audit Committee at its next regularly scheduled meeting.
Item 4(e)(2):
None, or 0%, of the services relating to the Audit-Related Fees, Tax Fees and All Other Fees paid by the Fund and MFS and MFS Related Entities relating
directly to the operations and financial reporting of the Registrant disclosed above were approved by the audit committee pursuant to paragraphs (c)(7)(i)(C) of Rule 2-01 of Regulation S-X (which permits audit committee approval after the start of the engagement with respect to services other than audit, review or attest services, if certain conditions are satisfied).
Item 4(f):
Not applicable.
Item 4(h):
The Registrant’s Audit Committee
has considered whether the provision by a Registrant’s independent registered public accounting firm of non-audit services to MFS and MFS Related Entities that were not
pre-approved by the Committee (because such services were provided prior to the effectiveness of SEC rules requiring pre-approval or because such services did not relate
directly to the operations and financial reporting of the Registrant) was compatible with maintaining the independence of the independent registered public accounting firm as the Registrant’s principal auditors.
| ITEM 5. |
AUDIT COMMITTEE OF LISTED REGISTRANTS. |
Not applicable to the Registrant.
| ITEM 6. |
SCHEDULE OF INVESTMENTS |
A schedule of investments of each series of the Registrant is included as part of the report to shareholders of such series under Item 1(a) of this Form N-CSR.
| ITEM 7. |
DISCLOSURE OF PROXY VOTING POLICIES AND PROCEDURES FOR CLOSED-END
MANAGEMENT INVESTMENT COMPANIES. |
Not applicable to the Registrant.
| ITEM 8. |
PORTFOLIO MANAGERS OF CLOSED-END MANAGEMENT INVESTMENT COMPANIES.
|
Not applicable to the Registrant.
| ITEM 9. |
PURCHASES OF EQUITY SECURITIES BY CLOSED-END MANAGEMENT INVESTMENT
COMPANY AND AFFILIATED PURCHASERS. |
Not applicable to the Registrant.
| ITEM 10. |
SUBMISSION OF MATTERS TO A VOTE OF SECURITY HOLDERS. |
There were no material changes to the procedures by which shareholders may send recommendations to the Board for nominees to the Registrant’s Board since
the Registrant last provided disclosure as to such procedures in response to the requirements of Item 407 (c)(2)(iv) of Regulation S-K or this Item.
| ITEM 11. |
CONTROLS AND PROCEDURES. |
| (a) |
Based upon their evaluation of the effectiveness of the registrant’s disclosure controls and procedures
(as defined in Rule 30a-3(c) under the Investment Company Act of 1940 (the “Act”)) as conducted within 90 days of the filing date of this report on Form N-CSR,
the registrant’s principal financial officer and principal executive officer have concluded that those disclosure controls and procedures provide reasonable assurance that the material information required to be disclosed by the registrant on
this report is recorded, processed, summarized and reported within the time periods specified in the Securities and Exchange Commission’s rules and forms. |
| (b) |
There were no changes in the registrant’s internal controls over financial reporting (as defined in Rule 30a-3(d) under the Act) that occurred during the period covered by the report that have materially affected, or are reasonably likely to materially affect, the registrant’s internal control over financial
reporting. |
| ITEM 12. |
DISCLOSURE OF SECURITIES LENDING ACTIVITIES FOR CLOSED-END
MANAGEMENT INVESTMENT COMPANIES. |
Not applicable to the Registrant.
| (a) (1) |
Any code of ethics, or amendment thereto, that is the subject of the disclosure required by Item 2, to the
extent that the registrant intends to satisfy the Item 2 requirements through filing of an exhibit: Attached hereto as EX-99.COE. |
| |
(2) |
A separate certification for each principal executive officer and principal financial officer of the registrant
as required by Rule 30a-2(a) under the Act (17 CFR 270.30a-2): Attached hereto as
EX-99.302CERT. |
| |
(3) |
Any written solicitation to purchase securities under Rule 23c-1 under
the Act (17 CFR 270.23c-1) sent or given during the period covered by the report by or on behalf of the registrant to 10 or more persons. Not applicable. |
| |
(4) |
Change in the registrant’s independent public accountant. Not applicable. |
| (b) |
If the report is filed under Section 13(a) or 15(d) of the Exchange Act, provide the certifications
required by Rule 30a-2(b) under the Act (17 CFR 270.30a-2(b)), Rule 13a-14(b) or Rule
15d-14(b) under the Exchange Act (17 CFR 240.13a-14(b) or 240.15d-14(b)) and Section 1350 of Chapter 63 of Title 18 of the
United States Code (18 U.S.C. 1350) as an exhibit. A certification furnished pursuant to this paragraph will not be deemed “filed” for the purposes of Section 18 of the Exchange Act (15 U.S.C. 78r), or otherwise subject to the
liability of that section. Such certification will not be deemed to be incorporated by reference into any filing under the Securities Act of 1933 or the Exchange Act, except to the extent that the registrant specifically incorporates it by
reference. Attached hereto as EX-99.906CERT. |
Notice
A copy of the Amended and Restated Declaration of Trust, as amended, of the Registrant is on file with the Secretary of State of The Commonwealth of
Massachusetts and notice is hereby given that this instrument is executed on behalf of the Registrant by an officer of the Registrant as an officer and not individually and the obligations of or arising out of this instrument are not binding upon
any of the Trustees or shareholders individually, but are binding only upon the assets and property of the respective constituent series of the Registrant.
SIGNATURES
Pursuant to the requirements of the Securities Exchange Act of 1934 and the Investment Company Act of 1940, the registrant has duly caused this report to be
signed on its behalf by the undersigned, thereunto duly authorized.
(Registrant) MFS VARIABLE INSURANCE TRUST II
|
|
|
| By (Signature and Title)* |
|
/S/ DAVID L. DILORENZO |
|
|
David L. DiLorenzo, President |
Date: February 15, 2022
Pursuant to the requirements of the Securities Exchange Act of 1934 and the Investment Company Act of 1940, this report has been signed below by the following
persons on behalf of the registrant and in the capacities and on the dates indicated.
|
|
|
| By (Signature and Title)* |
|
/S/ DAVID L. DILORENZO |
|
|
David L. DiLorenzo, President |
|
|
(Principal Executive Officer) |
Date: February 15, 2022
|
|
|
| By (Signature and Title)* |
|
/S/ JAMES O. YOST |
|
|
James O. Yost, Treasurer
(Principal Financial Officer and Accounting
Officer) |
Date: February 15, 2022
| * |
Print name and title of each signing officer under his or her signature. |
EX-99.COE

Code of Ethics for Principal Executive and Principal Financial Officers
Effective February 13, 2018
| I. |
Policy Purpose and Summary |
Section 406 of the Sarbanes-Oxley Act requires that each MFS Fund registered under the Investment Company Act of 1940 disclose whether or
not it has adopted a code of ethics for senior financial officers, applicable to its principal financial officer and principal accounting officer.
| |
A. |
Covered Officers/Purpose of the Code |
This code of ethics (this “Code”) has been adopted by the funds (collectively, “Funds” and each, “Fund”) under
supervision of the MFS Funds Board (the “Board”) and applies to the Funds’ Principal Executive Officer and Principal Financial Officer (the “Covered Officers” each of whom is set forth in Exhibit A) for the purpose of
promoting:
| |
• |
|
honest and ethical conduct, including the ethical handling of actual or apparent conflicts of interest between
personal and professional relationships; |
| |
• |
|
full, fair, accurate, timely and understandable disclosure in reports and documents that the Funds file with, or
submit to, the Securities and Exchange Commission (“SEC”) and in other public communications made by the Funds; |
| |
• |
|
compliance by the Funds with applicable laws and governmental rules and regulations; |
| |
• |
|
the prompt internal reporting of violations of the Code to an appropriate person or persons identified in the
Code; and |
| |
• |
|
accountability for adherence to the Code. |
Each Covered Officer should adhere to a high standard of business ethics and should be sensitive to situations that may give rise to actual as
well as apparent conflicts of interest. In addition, each Covered Officer should not place his or her personal interests ahead of the Funds’ interests and should endeavor to act honestly and ethically. In furtherance of the foregoing, each
Covered Officer must:
| |
• |
|
not use his or her personal influence or personal relationships improperly to influence investment decisions or
financial reporting for any Fund whereby the Covered Officer would benefit personally to the detriment of the Fund; and |
| |
• |
|
not cause a Fund to take action, or fail to take action, for the individual personal benefit of the Covered
Officer rather than the benefit the Fund. |
The following activities, which could create the appearance of a conflict of
interest, are permitted only with the approval of the Funds’ Chief Legal Officer (“CLO”):
| |
• |
|
service as a director on the board of any “for profit” company other than the board of the Funds’
investment adviser or its subsidiaries or board of a pooled investment vehicle sponsored by the Funds’ investment adviser or its subsidiaries; |
| |
• |
|
running for political office; |
| |
• |
|
the receipt of any Fund business-related gift or any entertainment from any company with which a Fund has current
or prospective business dealings unless such gift or entertainment is permitted by the gifts and entertainment policy of the Funds’ investment adviser; |
| |
• |
|
any material ownership interest in, or any consulting or employment relationship with, any Fund service providers
(e.g., custodian banks, audit firms), other than the Funds’ investment adviser, principal underwriter, administrator or any affiliated person thereof; |
| |
• |
|
a direct or indirect financial interest in commissions, transaction charges or spreads paid by a Fund for
effecting portfolio transactions or for selling or redeeming shares, other than an interest arising from the Covered Officer’s employment or securities ownership. |
| |
C. |
Disclosure and Compliance |
| |
• |
|
Each Covered Officer should familiarize himself or herself with the disclosure requirements generally applicable
to the Funds; |
| |
• |
|
each Covered Officer should not knowingly misrepresent, or cause others to misrepresent, facts about a Fund to
others, whether within or outside the Fund, including to the Fund’s trustees and auditors, and to governmental regulators and self-regulatory organizations; |
| |
• |
|
each Covered Officer should, to the extent appropriate within his or her area of Fund responsibility, consult
with other officers and employees of the Funds and the adviser with the goal of promoting full, fair, accurate, timely and understandable disclosure in the reports and documents the Funds file with, or submit to, the SEC and in other public
communications made by the Funds; and |
| |
• |
|
it is the responsibility of each Covered Officer to promote compliance within his or her area of Fund
responsibility with the standards and restrictions imposed by applicable laws, rules and regulations. |
| |
D. |
Reporting and Accountability |
Each Covered Officer must:
| |
• |
|
upon adoption of the Code (or thereafter as applicable, upon becoming a Covered Officer), affirm in writing to
the Board that he or she has received, read, and understands the Code; |
| |
• |
|
annually thereafter affirm to the Board that he or she has complied with the requirements of the Code;
|
| |
• |
|
annually report to the CLO affiliations and relationships which are or may raise the appearance of a conflict of
interest with the Covered Officer’s duties to the Funds, as identified in the annual Trustee and Officer Questionnaire; |
| |
• |
|
not retaliate against any other Covered Officer or any officer or employee of the Funds or their affiliated
persons for reports of potential violations that are made in good faith; and |
| |
• |
|
notify the CLO promptly if he or she knows of any violation of this Code. Failure to do so is itself a violation
of this Code. |
The CLO is responsible for applying this Code to specific situations in which questions are presented
under it, granting waivers upon consultation with the Board or its designee, investigating violations, and has the authority to interpret this Code in any particular situation. The CLO will report requests for waivers to the Board (or a designee
thereof) promptly upon receipt of a waiver request and will periodically report to the Board any approvals granted since the last report.
The CLO will take all appropriate action to investigate any potential violations reported to him or her and to report any violations to the
Board. If the Board concurs that a violation has occurred, it will consider appropriate action, which may include review of, and appropriate modifications to, applicable policies and procedures; notification to appropriate personnel of the
investment adviser or its board; or a recommendation to dismiss the Covered Officer.
Any changes to or waivers of this Code will, to the
extent required, be disclosed as provided by SEC rules.
All reports and records prepared or maintained pursuant to this Code and under the direction of the CLO will be considered confidential and
shall be maintained and protected accordingly. Except as otherwise required by law or this Code, such matters shall not be disclosed to anyone other than the Funds’ Board, its counsel, counsel to the Board’s independent trustees and senior
management and the board of directors of the Fund’s investment adviser and its counsel.
The Code is intended solely for the internal use by the Funds and does not constitute an admission, by or on behalf of any Fund, as to any
fact, circumstance, or legal conclusion.
The Board of Trustees of the Funds, including a majority of the Trustees who are not “interested persons” (as defined in the 1940
Act) of the Funds, shall review no less frequently than annually, a report from the CLO regarding the affirmations of the principal executive officer and the principal financial officer as to compliance with this Code.
| IV. |
Interpretation and Escalation |
Breaches of the Code are reviewed by the CLO and communicated to the Board of Trustees of the affected Fund(s). Interpretations of this Policy
shall be made from time to time by the CLO, as needed, and questions regarding the application of this Policy to a specific set of facts are escalated to the CLO.
Section 406 of the Sarbanes-Oxley Act.
Adherence to this policy is monitored by the CLO.
This Code shall be the sole code of ethics adopted by the Funds for purposes of Section 406 of the Sarbanes-Oxley Act and the rules and
forms applicable to registered investment companies thereunder. Insofar as other policies or procedures of the Funds, the Funds’ adviser, principal underwriter, or other service providers govern or purport to govern the behavior or activities
of the Covered Officers who are subject to this Code, they are superseded by this Code to the extent that they overlap or conflict with the provisions of this Code. The Funds’ and their investment adviser’s codes of ethics under Rule 17j-1 under the Investment Company Act and any other codes or policies or procedures adopted by the Funds or their investment adviser or other service providers are separate requirements and are not part of this
Code.
Any amendments to this Code, other than amendments to Exhibit A, must be approved or ratified by a majority vote of the Board, including a
majority of independent trustees.
All required books, records and other documentation shall be retained in accordance with MFS’ related record retention policy.
Additional procedures may need to be implemented by departments to properly comply with this policy.
Exhibit A
As of January 1, 2017
Persons Covered by this Code of Ethics
Funds’ Principal Executive Officer: David L. DiLorenzo
Funds’ Principal Financial Officer: James O. Yost
EX-99.302CERT
MFS VARIABLE INSURANCE TRUST II
CERTIFICATION PURSUANT TO SECTION 302 OF THE SARBANES-OXLEY ACT
I, James O. Yost, certify that:
| 1. |
I have reviewed this report on Form N-CSR of MFS Variable Insurance
Trust II; |
| 2. |
Based on my knowledge, this report does not contain any untrue statement of a material fact or omit to state a
material fact necessary to make the statements made, in light of the circumstances under which such statements were made, not misleading with respect to the period covered by this report; |
| 3. |
Based on my knowledge, the financial statements, and other financial information included in this report,
fairly present in all material respects the financial condition, results of operations, changes in net assets, and cash flows (if the financial statements are required to include a statement of cash flows) of the registrant as of, and for, the
periods presented in this report; |
| 4. |
The registrant’s other certifying officer and I are responsible for establishing and maintaining
disclosure controls and procedures (as defined in Rule 30a-3(c) under the Investment Company Act of 1940) and internal control over financial reporting (as defined in Rule
30a-3(d) under the Investment Company Act of 1940) for the registrant and have: |
| |
a. |
Designed such disclosure controls and procedures, or caused such disclosure controls and procedures to be
designed under our supervision, to ensure that material information relating to the registrant, including its consolidated subsidiaries, is made known to us by others within those entities, particularly during the period in which this report is
being prepared; |
| |
b. |
Designed such internal control over financial reporting, or caused such internal control over financial
reporting to be designed under our supervision, to provide reasonable assurance regarding the reliability of financial reporting and the preparation of financial statements for external purposes in accordance with generally accepted accounting
principles; |
| |
c. |
Evaluated the effectiveness of the registrant’s disclosure controls and procedures and presented in this
report our conclusions about the effectiveness of the disclosure controls and procedures as of a date within 90 days prior to the filing date of this report based on such evaluation; and |
| |
d. |
Disclosed in this report any change in the registrant’s internal control over financial reporting that
occurred during the period covered by the report that has materially affected, or is reasonably likely to materially affect, the registrant’s internal control over financial reporting; and |
| 5. |
The registrant’s other certifying officer and I have disclosed to the registrant’s auditors and the
audit committee of the registrant’s board of directors (or persons performing the equivalent functions): |
| |
a. |
All significant deficiencies and material weaknesses in the design or operation of internal control over
financial reporting which are reasonably likely to adversely affect the registrant’s ability to record, process, summarize, and report financial information; and |
| |
b. |
Any fraud, whether or not material, that involves management or other employees who have a significant role in
the registrant’s internal control over financial reporting. |
|
|
|
|
|
| Date: February 15, 2022 |
|
|
|
/S/ JAMES O. YOST |
|
|
|
|
James O. Yost |
|
|
|
|
Treasurer (Principal Financial Officer and
Accounting Officer) |
EX-99.302CERT
MFS VARIABLE INSURANCE TRUST II
CERTIFICATION PURSUANT TO SECTION 302 OF THE SARBANES-OXLEY ACT
I, David L. DiLorenzo, certify that:
| 1. |
I have reviewed this report on Form N-CSR of MFS Variable Insurance
Trust II; |
| 2. |
Based on my knowledge, this report does not contain any untrue statement of a material fact or omit to state a
material fact necessary to make the statements made, in light of the circumstances under which such statements were made, not misleading with respect to the period covered by this report; |
| 3. |
Based on my knowledge, the financial statements, and other financial information included in this report,
fairly present in all material respects the financial condition, results of operations, changes in net assets, and cash flows (if the financial statements are required to include a statement of cash flows) of the registrant as of, and for, the
periods presented in this report; |
| 4. |
The registrant’s other certifying officer and I are responsible for establishing and maintaining
disclosure controls and procedures (as defined in Rule 30a-3(c) under the Investment Company Act of 1940) and internal control over financial reporting (as defined in Rule
30a-3(d) under the Investment Company Act of 1940) for the registrant and have: |
| |
a. |
Designed such disclosure controls and procedures, or caused such disclosure controls and procedures to be
designed under our supervision, to ensure that material information relating to the registrant, including its consolidated subsidiaries, is made known to us by others within those entities, particularly during the period in which this report is
being prepared; |
| |
b. |
Designed such internal control over financial reporting, or caused such internal control over financial
reporting to be designed under our supervision, to provide reasonable assurance regarding the reliability of financial reporting and the preparation of financial statements for external purposes in accordance with generally accepted accounting
principles; |
| |
c. |
Evaluated the effectiveness of the registrant’s disclosure controls and procedures and presented in this
report our conclusions about the effectiveness of the disclosure controls and procedures as of a date within 90 days prior to the filing date of this report based on such evaluation; and |
| |
d. |
Disclosed in this report any change in the registrant’s internal control over financial reporting that
occurred during the period covered by the report that has materially affected, or is reasonably likely to materially affect, the registrant’s internal control over financial reporting; and |
| 5. |
The registrant’s other certifying officer and I have disclosed to the registrant’s auditors and the
audit committee of the registrant’s board of directors (or persons performing the equivalent functions): |
| |
a. |
All significant deficiencies and material weaknesses in the design or operation of internal control over
financial reporting which are reasonably likely to adversely affect the registrant’s ability to record, process, summarize, and report financial information; and |
| |
b. |
Any fraud, whether or not material, that involves management or other employees who have a significant role in
the registrant’s internal control over financial reporting. |
|
|
|
|
|
| Date: February 15, 2022 |
|
|
|
/S/ DAVID L. DILORENZO |
|
|
|
|
David L. DiLorenzo |
|
|
|
|
President (Principal Executive Officer) |
EX-99.906CERT
MFS VARIABLE INSURANCE TRUST II
CERTIFICATION PURSUANT TO SECTION 906 OF THE SARBANES-OXLEY ACT
I, James O. Yost, certify that, to my knowledge:
| 1. |
The Form N-CSR (the “Report”) of MFS Variable Insurance Trust
II (the “Registrant”) fully complies for the period covered by the Report with the requirements of Section 13(a) or 15(d) of the Securities Exchange Act of 1934; and |
| 2. |
The information contained in the Report fairly presents, in all material respects, the financial condition and
results of operations of the Registrant. |
|
|
|
|
|
| Date: February 15, 2022 |
|
|
|
/S/ JAMES O. YOST |
|
|
|
|
James O. Yost |
|
|
|
|
Treasurer (Principal Financial Officer and
Accounting Officer) |
A signed original of this written statement required by Section 906 has been provided to the Registrant and will be
retained by the Registrant and furnished to the Securities and Exchange Commission or its staff upon request.
EX-99.906CERT
MFS VARIABLE INSURANCE TRUST II
CERTIFICATION PURSUANT TO SECTION 906 OF THE SARBANES-OXLEY ACT
I, David L. DiLorenzo, certify that, to my knowledge:
| 1. |
The Form N-CSR (the “Report”) of MFS Variable Insurance Trust
II (the “Registrant”) fully complies for the period covered by the Report with the requirements of Section 13(a) or 15(d) of the Securities Exchange Act of 1934; and |
| 2. |
The information contained in the Report fairly presents, in all material respects, the financial condition and
results of operations of the Registrant. |
|
|
|
|
|
| Date: February 15, 2022 |
|
|
|
/S/ DAVID L. DILORENZO |
| |
|
|
|
David L. DiLorenzo |
|
|
|
|
President (Principal Executive Officer) |
A signed original of this written statement required by Section 906 has been provided to the Registrant and will be
retained by the Registrant and furnished to the Securities and Exchange Commission or its staff upon request.