13282 10175 12152 16825 9475 10000 12297 11514 16287 10000 15763 8496 11681 11168 9647 11501 20564 15376 15929 16979 13485 9755 15494 18882 16774 10000 10000 9692 10000 9744 8688 11843 10390 15759 22474 19176 8688 8574 10071 12752 14344 11681 10923 9755 11517 16156 19369 12283 11430 13692 14381 10041 9215 11375 18738 11335 13181 18826 20498 12159 13769 8182 9696 11775 17012 10390 0000922457 false 0000922457 2023-07-01 2024-06-30 0000922457 bragfi:C000007429Member 2019-07-01 2024-06-30 0000922457 bragfi:C000007429Member oef:WithoutSalesLoadMember 2019-07-01 2024-06-30 0000922457 bragfi:C000007431Member 2019-07-01 2024-06-30 0000922457 bragfi:C000007431Member oef:WithoutSalesLoadMember 2019-07-01 2024-06-30 0000922457 bragfi:C000007432Member 2019-07-01 2024-06-30 0000922457 bragfi:C000007433Member 2019-07-01 2024-06-30 0000922457 bragfi:C000199761Member 2019-07-01 2024-06-30 0000922457 bragfi:MSCIAllCountryWorldIndexMember 2019-07-01 2024-06-30 0000922457 bragfi:C000007429Member 2023-07-01 2024-06-30 0000922457 bragfi:C000007429Member oef:WithoutSalesLoadMember 2023-07-01 2024-06-30 0000922457 bragfi:C000007431Member 2023-07-01 2024-06-30 0000922457 bragfi:C000007431Member oef:WithoutSalesLoadMember 2023-07-01 2024-06-30 0000922457 bragfi:C000007432Member 2023-07-01 2024-06-30 0000922457 bragfi:C000007433Member 2023-07-01 2024-06-30 0000922457 bragfi:C000199761Member 2023-07-01 2024-06-30 0000922457 bragfi:MSCIAllCountryWorldIndexMember 2023-07-01 2024-06-30 0000922457 bragfi:C000007429Member 2014-07-01 2024-06-30 0000922457 bragfi:C000007429Member oef:WithoutSalesLoadMember 2014-07-01 2024-06-30 0000922457 bragfi:C000007431Member 2014-07-01 2024-06-30 0000922457 bragfi:C000007431Member oef:WithoutSalesLoadMember 2014-07-01 2024-06-30 0000922457 bragfi:C000007432Member 2014-07-01 2024-06-30 0000922457 bragfi:C000007433Member 2014-07-01 2024-06-30 0000922457 bragfi:C000199761Member 2014-07-01 2024-06-30 0000922457 bragfi:MSCIAllCountryWorldIndexMember 2014-07-01 2024-06-30 0000922457 bragfi:C000007429Member oef:WithoutSalesLoadMember 2014-06-30 0000922457 bragfi:C000007431Member oef:WithoutSalesLoadMember 2014-06-30 0000922457 bragfi:C000007432Member 2014-06-30 0000922457 bragfi:C000007433Member 2014-06-30 0000922457 bragfi:C000199761Member 2014-06-30 0000922457 bragfi:MSCIAllCountryWorldIndexMember 2014-06-30 0000922457 bragfi:C000007429Member oef:WithoutSalesLoadMember 2015-06-30 0000922457 bragfi:C000007431Member oef:WithoutSalesLoadMember 2015-06-30 0000922457 bragfi:C000007432Member 2015-06-30 0000922457 bragfi:C000007433Member 2015-06-30 0000922457 bragfi:C000199761Member 2015-06-30 0000922457 bragfi:MSCIAllCountryWorldIndexMember 2015-06-30 0000922457 bragfi:C000007429Member oef:WithoutSalesLoadMember 2016-06-30 0000922457 bragfi:C000007431Member oef:WithoutSalesLoadMember 2016-06-30 0000922457 bragfi:C000007432Member 2016-06-30 0000922457 bragfi:C000007433Member 2016-06-30 0000922457 bragfi:C000199761Member 2016-06-30 0000922457 bragfi:MSCIAllCountryWorldIndexMember 2016-06-30 0000922457 bragfi:C000007429Member oef:WithoutSalesLoadMember 2017-06-30 0000922457 bragfi:C000007431Member oef:WithoutSalesLoadMember 2017-06-30 0000922457 bragfi:C000007432Member 2017-06-30 0000922457 bragfi:C000007433Member 2017-06-30 0000922457 bragfi:C000199761Member 2017-06-30 0000922457 bragfi:MSCIAllCountryWorldIndexMember 2017-06-30 0000922457 bragfi:C000007429Member oef:WithoutSalesLoadMember 2018-06-30 0000922457 bragfi:C000007431Member oef:WithoutSalesLoadMember 2018-06-30 0000922457 bragfi:C000007432Member 2018-06-30 0000922457 bragfi:C000007433Member 2018-06-30 0000922457 bragfi:C000199761Member 2018-06-30 0000922457 bragfi:MSCIAllCountryWorldIndexMember 2018-06-30 0000922457 bragfi:C000007429Member oef:WithoutSalesLoadMember 2019-06-30 0000922457 bragfi:C000007431Member oef:WithoutSalesLoadMember 2019-06-30 0000922457 bragfi:C000007432Member 2019-06-30 0000922457 bragfi:C000007433Member 2019-06-30 0000922457 bragfi:C000199761Member 2019-06-30 0000922457 bragfi:MSCIAllCountryWorldIndexMember 2019-06-30 0000922457 bragfi:C000007429Member oef:WithoutSalesLoadMember 2020-06-30 0000922457 bragfi:C000007431Member oef:WithoutSalesLoadMember 2020-06-30 0000922457 bragfi:C000007432Member 2020-06-30 0000922457 bragfi:C000007433Member 2020-06-30 0000922457 bragfi:C000199761Member 2020-06-30 0000922457 bragfi:MSCIAllCountryWorldIndexMember 2020-06-30 0000922457 bragfi:C000007429Member oef:WithoutSalesLoadMember 2021-06-30 0000922457 bragfi:C000007431Member oef:WithoutSalesLoadMember 2021-06-30 0000922457 bragfi:C000007432Member 2021-06-30 0000922457 bragfi:C000007433Member 2021-06-30 0000922457 bragfi:C000199761Member 2021-06-30 0000922457 bragfi:MSCIAllCountryWorldIndexMember 2021-06-30 0000922457 bragfi:C000007429Member oef:WithoutSalesLoadMember 2022-06-30 0000922457 bragfi:C000007431Member oef:WithoutSalesLoadMember 2022-06-30 0000922457 bragfi:C000007432Member 2022-06-30 0000922457 bragfi:C000007433Member 2022-06-30 0000922457 bragfi:C000199761Member 2022-06-30 0000922457 bragfi:MSCIAllCountryWorldIndexMember 2022-06-30 0000922457 bragfi:C000007429Member oef:WithoutSalesLoadMember 2023-06-30 0000922457 bragfi:C000007431Member oef:WithoutSalesLoadMember 2023-06-30 0000922457 bragfi:C000007432Member 2023-06-30 0000922457 bragfi:C000007433Member 2023-06-30 0000922457 bragfi:C000199761Member 2023-06-30 0000922457 bragfi:MSCIAllCountryWorldIndexMember 2023-06-30 0000922457 bragfi:C000007429Member 2024-06-30 0000922457 bragfi:C000007429Member bragfi:AlphabetIncClassAMember 2024-06-30 0000922457 bragfi:C000007429Member bragfi:AmazonComIncMember 2024-06-30 0000922457 bragfi:C000007429Member bragfi:AppleIncMember 2024-06-30 0000922457 bragfi:C000007429Member country:CA 2024-06-30 0000922457 bragfi:C000007429Member country:CH 2024-06-30 0000922457 bragfi:C000007429Member country:CN 2024-06-30 0000922457 bragfi:C000007429Member bragfi:ComcastCorpClassAMember 2024-06-30 0000922457 bragfi:C000007429Member country:DE 2024-06-30 0000922457 bragfi:C000007429Member country:DK 2024-06-30 0000922457 bragfi:C000007429Member country:ES 2024-06-30 0000922457 bragfi:C000007429Member country:IN 2024-06-30 0000922457 bragfi:C000007429Member bragfi:JohnsonAndJohnsonMember 2024-06-30 0000922457 bragfi:C000007429Member country:JP 2024-06-30 0000922457 bragfi:C000007429Member bragfi:LamResearchCorpMember 2024-06-30 0000922457 bragfi:C000007429Member bragfi:MicrosoftCorpMember 2024-06-30 0000922457 bragfi:C000007429Member bragfi:NVIDIACorpMember 2024-06-30 0000922457 bragfi:C000007429Member bragfi:OtherAssetsLessLiabilitiesMember 2024-06-30 0000922457 bragfi:C000007429Member bragfi:OtherMember 2024-06-30 0000922457 bragfi:C000007429Member bragfi:QUALCOMMIncMember 2024-06-30 0000922457 bragfi:C000007429Member bragfi:SAndPGlobalIncMember 2024-06-30 0000922457 bragfi:C000007429Member country:TW 2024-06-30 0000922457 bragfi:C000007429Member country:US 2024-06-30 0000922457 bragfi:C000007429Member oef:WithoutSalesLoadMember 2024-06-30 0000922457 bragfi:C000007431Member 2024-06-30 0000922457 bragfi:C000007431Member bragfi:AlphabetIncClassAMember 2024-06-30 0000922457 bragfi:C000007431Member bragfi:AmazonComIncMember 2024-06-30 0000922457 bragfi:C000007431Member bragfi:AppleIncMember 2024-06-30 0000922457 bragfi:C000007431Member country:CA 2024-06-30 0000922457 bragfi:C000007431Member country:CH 2024-06-30 0000922457 bragfi:C000007431Member country:CN 2024-06-30 0000922457 bragfi:C000007431Member bragfi:ComcastCorpClassAMember 2024-06-30 0000922457 bragfi:C000007431Member country:DE 2024-06-30 0000922457 bragfi:C000007431Member country:DK 2024-06-30 0000922457 bragfi:C000007431Member country:ES 2024-06-30 0000922457 bragfi:C000007431Member country:IN 2024-06-30 0000922457 bragfi:C000007431Member bragfi:JohnsonAndJohnsonMember 2024-06-30 0000922457 bragfi:C000007431Member country:JP 2024-06-30 0000922457 bragfi:C000007431Member bragfi:LamResearchCorpMember 2024-06-30 0000922457 bragfi:C000007431Member bragfi:MicrosoftCorpMember 2024-06-30 0000922457 bragfi:C000007431Member bragfi:NVIDIACorpMember 2024-06-30 0000922457 bragfi:C000007431Member bragfi:OtherAssetsLessLiabilitiesMember 2024-06-30 0000922457 bragfi:C000007431Member bragfi:OtherMember 2024-06-30 0000922457 bragfi:C000007431Member bragfi:QUALCOMMIncMember 2024-06-30 0000922457 bragfi:C000007431Member bragfi:SAndPGlobalIncMember 2024-06-30 0000922457 bragfi:C000007431Member country:TW 2024-06-30 0000922457 bragfi:C000007431Member country:US 2024-06-30 0000922457 bragfi:C000007431Member oef:WithoutSalesLoadMember 2024-06-30 0000922457 bragfi:C000007432Member 2024-06-30 0000922457 bragfi:C000007432Member bragfi:AlphabetIncClassAMember 2024-06-30 0000922457 bragfi:C000007432Member bragfi:AmazonComIncMember 2024-06-30 0000922457 bragfi:C000007432Member bragfi:AppleIncMember 2024-06-30 0000922457 bragfi:C000007432Member country:CA 2024-06-30 0000922457 bragfi:C000007432Member country:CH 2024-06-30 0000922457 bragfi:C000007432Member country:CN 2024-06-30 0000922457 bragfi:C000007432Member bragfi:ComcastCorpClassAMember 2024-06-30 0000922457 bragfi:C000007432Member country:DE 2024-06-30 0000922457 bragfi:C000007432Member country:DK 2024-06-30 0000922457 bragfi:C000007432Member country:ES 2024-06-30 0000922457 bragfi:C000007432Member country:IN 2024-06-30 0000922457 bragfi:C000007432Member bragfi:JohnsonAndJohnsonMember 2024-06-30 0000922457 bragfi:C000007432Member country:JP 2024-06-30 0000922457 bragfi:C000007432Member bragfi:LamResearchCorpMember 2024-06-30 0000922457 bragfi:C000007432Member bragfi:MicrosoftCorpMember 2024-06-30 0000922457 bragfi:C000007432Member bragfi:NVIDIACorpMember 2024-06-30 0000922457 bragfi:C000007432Member bragfi:OtherAssetsLessLiabilitiesMember 2024-06-30 0000922457 bragfi:C000007432Member bragfi:OtherMember 2024-06-30 0000922457 bragfi:C000007432Member bragfi:QUALCOMMIncMember 2024-06-30 0000922457 bragfi:C000007432Member bragfi:SAndPGlobalIncMember 2024-06-30 0000922457 bragfi:C000007432Member country:TW 2024-06-30 0000922457 bragfi:C000007432Member country:US 2024-06-30 0000922457 bragfi:C000007433Member 2024-06-30 0000922457 bragfi:C000007433Member bragfi:AlphabetIncClassAMember 2024-06-30 0000922457 bragfi:C000007433Member bragfi:AmazonComIncMember 2024-06-30 0000922457 bragfi:C000007433Member bragfi:AppleIncMember 2024-06-30 0000922457 bragfi:C000007433Member country:CA 2024-06-30 0000922457 bragfi:C000007433Member country:CH 2024-06-30 0000922457 bragfi:C000007433Member country:CN 2024-06-30 0000922457 bragfi:C000007433Member bragfi:ComcastCorpClassAMember 2024-06-30 0000922457 bragfi:C000007433Member country:DE 2024-06-30 0000922457 bragfi:C000007433Member country:DK 2024-06-30 0000922457 bragfi:C000007433Member country:ES 2024-06-30 0000922457 bragfi:C000007433Member country:IN 2024-06-30 0000922457 bragfi:C000007433Member bragfi:JohnsonAndJohnsonMember 2024-06-30 0000922457 bragfi:C000007433Member country:JP 2024-06-30 0000922457 bragfi:C000007433Member bragfi:LamResearchCorpMember 2024-06-30 0000922457 bragfi:C000007433Member bragfi:MicrosoftCorpMember 2024-06-30 0000922457 bragfi:C000007433Member bragfi:NVIDIACorpMember 2024-06-30 0000922457 bragfi:C000007433Member bragfi:OtherAssetsLessLiabilitiesMember 2024-06-30 0000922457 bragfi:C000007433Member bragfi:OtherMember 2024-06-30 0000922457 bragfi:C000007433Member bragfi:QUALCOMMIncMember 2024-06-30 0000922457 bragfi:C000007433Member bragfi:SAndPGlobalIncMember 2024-06-30 0000922457 bragfi:C000007433Member country:TW 2024-06-30 0000922457 bragfi:C000007433Member country:US 2024-06-30 0000922457 bragfi:C000199761Member 2024-06-30 0000922457 bragfi:C000199761Member bragfi:AlphabetIncClassAMember 2024-06-30 0000922457 bragfi:C000199761Member bragfi:AmazonComIncMember 2024-06-30 0000922457 bragfi:C000199761Member bragfi:AppleIncMember 2024-06-30 0000922457 bragfi:C000199761Member country:CA 2024-06-30 0000922457 bragfi:C000199761Member country:CH 2024-06-30 0000922457 bragfi:C000199761Member country:CN 2024-06-30 0000922457 bragfi:C000199761Member bragfi:ComcastCorpClassAMember 2024-06-30 0000922457 bragfi:C000199761Member country:DE 2024-06-30 0000922457 bragfi:C000199761Member country:DK 2024-06-30 0000922457 bragfi:C000199761Member country:ES 2024-06-30 0000922457 bragfi:C000199761Member country:IN 2024-06-30 0000922457 bragfi:C000199761Member bragfi:JohnsonAndJohnsonMember 2024-06-30 0000922457 bragfi:C000199761Member country:JP 2024-06-30 0000922457 bragfi:C000199761Member bragfi:LamResearchCorpMember 2024-06-30 0000922457 bragfi:C000199761Member bragfi:MicrosoftCorpMember 2024-06-30 0000922457 bragfi:C000199761Member bragfi:NVIDIACorpMember 2024-06-30 0000922457 bragfi:C000199761Member bragfi:OtherAssetsLessLiabilitiesMember 2024-06-30 0000922457 bragfi:C000199761Member bragfi:OtherMember 2024-06-30 0000922457 bragfi:C000199761Member bragfi:QUALCOMMIncMember 2024-06-30 0000922457 bragfi:C000199761Member bragfi:SAndPGlobalIncMember 2024-06-30 0000922457 bragfi:C000199761Member country:TW 2024-06-30 0000922457 bragfi:C000199761Member country:US 2024-06-30 0000922457 bragfi:MSCIAllCountryWorldIndexMember 2024-06-30 iso4217:USDiso4217:USDxbrli:sharesxbrli:purexbrli:sharesutr:Dbragfi:Holding
UNITED STATES
SECURITIES AND EXCHANGE COMMISSION
Washington, D.C. 20549
FORM N-CSR
CERTIFIED SHAREHOLDER REPORT OF REGISTERED MANAGEMENT INVESTMENT COMPANIES
Investment Company Act file number:
Name of Fund:
BlackRock Advantage Global Fund, Inc.
Fund Address: 100 Bellevue Parkway, Wilmington, DE 19809
Name and address of agent for service: John M. Perlowski, Chief Executive Officer, BlackRock Advantage Global Fund, Inc., 50 Hudson Yards, New York, NY 10001
Registrant's telephone number, including area code:
Date of reporting period:
Item 1 — Report to Stockholders
(a) The Report to Shareholders is attached herewith
BlackRock Advantage Global Fund, Inc.
Institutional Shares | MAGCX
Annual Shareholder Report — June 30, 2024
This annual shareholder report contains important information about BlackRock Advantage Global Fund, Inc. (the “Fund”) for the period of July 1, 2023 to June 30, 2024. You can find additional information about the Fund at blackrock.com/fundreports. You can also request this information by contacting us at (800) 441‑7762.
What were the Fund costs for the last year?
(based on a hypothetical $10,000 investment)
| Class name |
Costs of a $10,000
investment |
Costs paid as a percentage of a
$10,000 investment |
| Institutional Shares |
$79 |
0.71% |
How did the Fund perform last year?
-
Global equities generally enjoyed strong performance over the period, as resilient macro and micro data combined with excitement around innovation in information technology and healthcare.
-
While U.S. market leadership trends exhibited persistence they also evolved and broadened over the period, helping alleviate concerns of a potential momentum reversal.
-
International markets kept pace with the United States while much broader market participation enabled value styles to keep pace with momentum.
What contributed to performance?
The Fund delivered strong gains as stock selection insights were able to identify and lean into the dominant market trends. These insights aligned with a soft-landing expectation and motivated positioning across the artificial intelligence (“AI”) and GLP-1 weight loss drug themes. Sentiment measures identifying trends across analyst and executive comments as well as smart money positioning were key performance drivers.
Fundamental quality and valuation measures provided a further source of returns as markets increasingly discerned AI winners versus losers. More broadly, valuation insights drove gains across the United States and Japan with measures evaluating cash flows, valuations and other financial statement metrics all contributing. Additionally, growth-oriented quality insights evaluating research expenditures helped the Fund benefit from AI optimism.
What detracted from performance?
Despite the strong gains, changing market leadership proved a headwind to trend-following industry insights over the period. In particular, industry measures picking up on price momentum and favoring defensive positioning performed poorly. In addition, select consumer intent-related measures were wrong-footed. In this vein, measures evaluating mobile app usage detracted by motivating exposure to the automobile industry.
The views expressed reflect the opinions of BlackRock as of the date of this report and are subject to change based on changes in market, economic or other conditions. These views are not intended to be a forecast of future events and are no guarantee of future results.
Fund performance
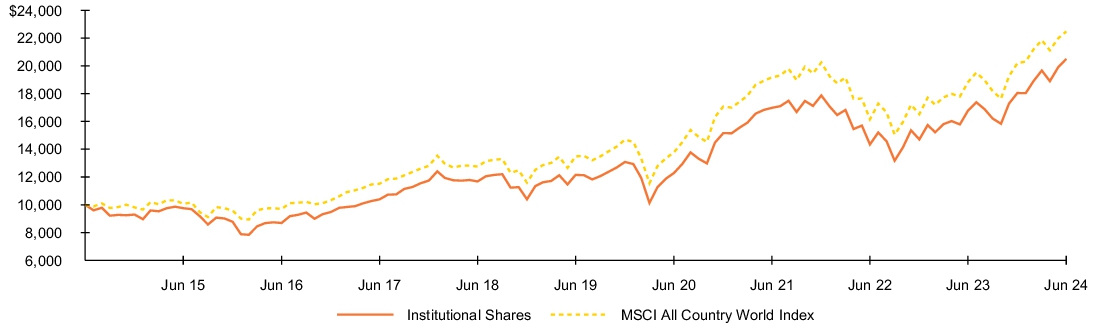
Cumulative performance: July 1, 2014 through June 30, 2024
Initial investment of $10,000
See “Average annual total returns” for additional information on fund performance.
| Average annual total returns |
|
|
|
|
1 Year |
5 Years |
10 Years |
| Institutional Shares |
22.20% |
11.02% |
7.44% |
| MSCI All Country World Index |
19.38% |
10.76% |
8.43% |
| Key Fund statistics |
|
| Net Assets |
$382,532,073% |
| Number of Portfolio Holdings |
$204% |
| Net Investment Advisory Fees |
$1,821,675% |
| Portfolio Turnover Rate |
$152% |
The Fund's returns shown prior to October 26, 2017, are the returns of the Fund when it followed a different investment objective and different investment strategies under the name BlackRock Global SmallCap Fund, Inc.
Past performance is not an indication of future results. Performance results may include adjustments made for financial reporting purposes in accordance with U.S. generally accepted accounting principles. Performance results do not reflect the deduction of taxes that a shareholder would pay on fund distributions or on the redemption or sale of fund shares. Visit blackrock.com for more recent performance information.
What did the Fund invest in?
(as of June 30, 2024)
| Geographic allocation |
| Country/Geographic Region |
Percent of
Net Assets |
| United States |
69.7% |
| Japan |
4.3% |
| China |
3.0% |
| Taiwan |
2.9% |
| Switzerland |
2.7% |
| Spain |
2.2% |
| Canada |
1.9% |
| Denmark |
1.6% |
| Germany |
1.4% |
| India |
1.3% |
| Other# |
8.8% |
| Other Assets Less Liabilities |
0.2% |
| Ten largest holdings |
| Security |
Percent of
Net Assets(a) |
| Microsoft Corp. |
4.9% |
| Apple, Inc. |
4.8% |
| NVIDIA Corp. |
4.5% |
| Amazon.com, Inc. |
4.0% |
| Johnson & Johnson |
1.9% |
| Alphabet, Inc., Class A |
1.9% |
| S&P Global, Inc. |
1.7% |
| Lam Research Corp. |
1.7% |
| Comcast Corp., Class A |
1.7% |
| QUALCOMM, Inc. |
1.7% |
| (a) |
Excludes short-term securities. |
| # |
Ten largest country/geographic regions are presented. Additional country/geographic regions are found in Other. |
Additional information
If you wish to view additional information about the Fund, including but not limited to financial statements, the Fund’s prospectus, and proxy voting policies and procedures, please visit blackrock.com/fundreports. For proxy voting records, visit blackrock.com/proxyrecords.
Householding
The Fund will mail only one copy of shareholder documents, including prospectuses, annual and semi-annual reports and proxy statements, to shareholders with multiple accounts at the same address. This practice is commonly called “householding” and is intended to reduce expenses and eliminate duplicate mailings of shareholder documents. Mailings of your shareholder documents may be householded indefinitely unless you instruct us otherwise. If you do not want the mailing of these documents to be combined with those for other members of your household, please call the Fund at (800) 441-7762.
The Fund is not sponsored, endorsed, issued, sold, or promoted by MSCI Inc. and its affiliates, nor does this company make any representation regarding the advisability of investing in the Fund. BlackRock is not affiliated with the company listed above.
©2024 BlackRock, Inc. or its affiliates. All rights reserved. BLACKROCK is a registered trademark of BlackRock, Inc. or its affiliates. All other trademarks are those of their respective owners.
BlackRock Advantage Global Fund, Inc.
Institutional Shares | MAGCX
Annual Shareholder Report — June 30, 2024
MAGCX-06/24-AR
BlackRock Advantage Global Fund, Inc.
Investor A Shares | MDGCX
Annual Shareholder Report — June 30, 2024
This annual shareholder report contains important information about BlackRock Advantage Global Fund, Inc. (the “Fund”) for the period of July 1, 2023 to June 30, 2024. You can find additional information about the Fund at blackrock.com/fundreports. You can also request this information by contacting us at (800) 441‑7762.
What were the Fund costs for the last year?
(based on a hypothetical $10,000 investment)
| Class name |
Costs of a $10,000
investment |
Costs paid as a percentage of a
$10,000 investment |
| Investor A Shares |
$107 |
0.96% |
How did the Fund perform last year?
-
Global equities generally enjoyed strong performance over the period, as resilient macro and micro data combined with excitement around innovation in information technology and healthcare.
-
While U.S. market leadership trends exhibited persistence they also evolved and broadened over the period, helping alleviate concerns of a potential momentum reversal.
-
International markets kept pace with the United States while much broader market participation enabled value styles to keep pace with momentum.
What contributed to performance?
The Fund delivered strong gains as stock selection insights were able to identify and lean into the dominant market trends. These insights aligned with a soft-landing expectation and motivated positioning across the artificial intelligence (“AI”) and GLP-1 weight loss drug themes. Sentiment measures identifying trends across analyst and executive comments as well as smart money positioning were key performance drivers.
Fundamental quality and valuation measures provided a further source of returns as markets increasingly discerned AI winners versus losers. More broadly, valuation insights drove gains across the United States and Japan with measures evaluating cash flows, valuations and other financial statement metrics all contributing. Additionally, growth-oriented quality insights evaluating research expenditures helped the Fund benefit from AI optimism.
What detracted from performance?
Despite the strong gains, changing market leadership proved a headwind to trend-following industry insights over the period. In particular, industry measures picking up on price momentum and favoring defensive positioning performed poorly. In addition, select consumer intent-related measures were wrong-footed. In this vein, measures evaluating mobile app usage detracted by motivating exposure to the automobile industry.
The views expressed reflect the opinions of BlackRock as of the date of this report and are subject to change based on changes in market, economic or other conditions. These views are not intended to be a forecast of future events and are no guarantee of future results.
Fund performance
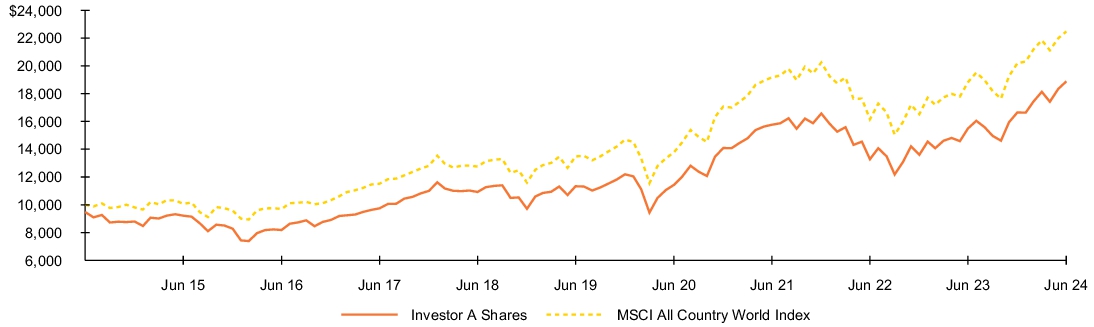
Cumulative performance: July 1, 2014 through June 30, 2024
Initial investment of $10,000
See “Average annual total returns” for additional information on fund performance.
| Average annual total returns |
|
|
|
|
1 Year |
5 Years |
10 Years |
| Investor A Shares |
21.87% |
10.75% |
7.14% |
| Investor A Shares (with sales charge) |
15.47% |
9.56% |
6.56% |
| MSCI All Country World Index |
19.38% |
10.76% |
8.43% |
| Key Fund statistics |
|
| Net Assets |
$382,532,073% |
| Number of Portfolio Holdings |
$204% |
| Net Investment Advisory Fees |
$1,821,675% |
| Portfolio Turnover Rate |
$152% |
The Fund's returns shown prior to October 26, 2017, are the returns of the Fund when it followed a different investment objective and different investment strategies under the name BlackRock Global SmallCap Fund, Inc.
Assuming maximum sales charges. Average annual total returns with and without sales charges reflect reductions for service fees.
Past performance is not an indication of future results. Performance results may include adjustments made for financial reporting purposes in accordance with U.S. generally accepted accounting principles. Performance results do not reflect the deduction of taxes that a shareholder would pay on fund distributions or on the redemption or sale of fund shares. Visit blackrock.com for more recent performance information.
What did the Fund invest in?
(as of June 30, 2024)
| Geographic allocation |
| Country/Geographic Region |
Percent of
Net Assets |
| United States |
69.7% |
| Japan |
4.3% |
| China |
3.0% |
| Taiwan |
2.9% |
| Switzerland |
2.7% |
| Spain |
2.2% |
| Canada |
1.9% |
| Denmark |
1.6% |
| Germany |
1.4% |
| India |
1.3% |
| Other# |
8.8% |
| Other Assets Less Liabilities |
0.2% |
| Ten largest holdings |
| Security |
Percent of
Net Assets(a) |
| Microsoft Corp. |
4.9% |
| Apple, Inc. |
4.8% |
| NVIDIA Corp. |
4.5% |
| Amazon.com, Inc. |
4.0% |
| Johnson & Johnson |
1.9% |
| Alphabet, Inc., Class A |
1.9% |
| S&P Global, Inc. |
1.7% |
| Lam Research Corp. |
1.7% |
| Comcast Corp., Class A |
1.7% |
| QUALCOMM, Inc. |
1.7% |
| (a) |
Excludes short-term securities. |
| # |
Ten largest country/geographic regions are presented. Additional country/geographic regions are found in Other. |
Additional information
If you wish to view additional information about the Fund, including but not limited to financial statements, the Fund’s prospectus, and proxy voting policies and procedures, please visit blackrock.com/fundreports. For proxy voting records, visit blackrock.com/proxyrecords.
Householding
The Fund will mail only one copy of shareholder documents, including prospectuses, annual and semi-annual reports and proxy statements, to shareholders with multiple accounts at the same address. This practice is commonly called “householding” and is intended to reduce expenses and eliminate duplicate mailings of shareholder documents. Mailings of your shareholder documents may be householded indefinitely unless you instruct us otherwise. If you do not want the mailing of these documents to be combined with those for other members of your household, please call the Fund at (800) 441-7762.
The Fund is not sponsored, endorsed, issued, sold, or promoted by MSCI Inc. and its affiliates, nor does this company make any representation regarding the advisability of investing in the Fund. BlackRock is not affiliated with the company listed above.
©2024 BlackRock, Inc. or its affiliates. All rights reserved. BLACKROCK is a registered trademark of BlackRock, Inc. or its affiliates. All other trademarks are those of their respective owners.
BlackRock Advantage Global Fund, Inc.
Investor A Shares | MDGCX
Annual Shareholder Report — June 30, 2024
MDGCX-06/24-AR
BlackRock Advantage Global Fund, Inc.
Investor C Shares | MCGCX
Annual Shareholder Report — June 30, 2024
This annual shareholder report contains important information about BlackRock Advantage Global Fund, Inc. (the “Fund”) for the period of July 1, 2023 to June 30, 2024. You can find additional information about the Fund at blackrock.com/fundreports. You can also request this information by contacting us at (800) 441‑7762.
What were the Fund costs for the last year?
(based on a hypothetical $10,000 investment)
| Class name |
Costs of a $10,000
investment |
Costs paid as a percentage of a
$10,000 investment |
| Investor C Shares |
$189 |
1.71% |
How did the Fund perform last year?
-
Global equities generally enjoyed strong performance over the period, as resilient macro and micro data combined with excitement around innovation in information technology and healthcare.
-
While U.S. market leadership trends exhibited persistence they also evolved and broadened over the period, helping alleviate concerns of a potential momentum reversal.
-
International markets kept pace with the United States while much broader market participation enabled value styles to keep pace with momentum.
What contributed to performance?
The Fund delivered strong gains as stock selection insights were able to identify and lean into the dominant market trends. These insights aligned with a soft-landing expectation and motivated positioning across the artificial intelligence (“AI”) and GLP-1 weight loss drug themes. Sentiment measures identifying trends across analyst and executive comments as well as smart money positioning were key performance drivers.
Fundamental quality and valuation measures provided a further source of returns as markets increasingly discerned AI winners versus losers. More broadly, valuation insights drove gains across the United States and Japan with measures evaluating cash flows, valuations and other financial statement metrics all contributing. Additionally, growth-oriented quality insights evaluating research expenditures helped the Fund benefit from AI optimism.
What detracted from performance?
Despite the strong gains, changing market leadership proved a headwind to trend-following industry insights over the period. In particular, industry measures picking up on price momentum and favoring defensive positioning performed poorly. In addition, select consumer intent-related measures were wrong-footed. In this vein, measures evaluating mobile app usage detracted by motivating exposure to the automobile industry.
The views expressed reflect the opinions of BlackRock as of the date of this report and are subject to change based on changes in market, economic or other conditions. These views are not intended to be a forecast of future events and are no guarantee of future results.
Fund performance
Cumulative performance: July 1, 2014 through June 30, 2024
Initial investment of $10,000
See “Average annual total returns” for additional information on fund performance.
| Average annual total returns |
|
|
|
|
1 Year |
5 Years |
10 Years |
| Investor C Shares |
20.91% |
9.92% |
6.48% |
| Investor C Shares (with sales charge) |
19.91% |
9.92% |
6.48% |
| MSCI All Country World Index |
19.38% |
10.76% |
8.43% |
| Key Fund statistics |
|
| Net Assets |
$382,532,073% |
| Number of Portfolio Holdings |
$204% |
| Net Investment Advisory Fees |
$1,821,675% |
| Portfolio Turnover Rate |
$152% |
The Fund's returns shown prior to October 26, 2017, are the returns of the Fund when it followed a different investment objective and different investment strategies under the name BlackRock Global SmallCap Fund, Inc.
Assuming maximum sales charges. Average annual total returns with and without sales charges reflect reductions for distribution and service fees.
Past performance is not an indication of future results. Performance results may include adjustments made for financial reporting purposes in accordance with U.S. generally accepted accounting principles. Performance results do not reflect the deduction of taxes that a shareholder would pay on fund distributions or on the redemption or sale of fund shares. Visit blackrock.com for more recent performance information.
What did the Fund invest in?
(as of June 30, 2024)
| Geographic allocation |
| Country/Geographic Region |
Percent of
Net Assets |
| United States |
69.7% |
| Japan |
4.3% |
| China |
3.0% |
| Taiwan |
2.9% |
| Switzerland |
2.7% |
| Spain |
2.2% |
| Canada |
1.9% |
| Denmark |
1.6% |
| Germany |
1.4% |
| India |
1.3% |
| Other# |
8.8% |
| Other Assets Less Liabilities |
0.2% |
| Ten largest holdings |
| Security |
Percent of
Net Assets(a) |
| Microsoft Corp. |
4.9% |
| Apple, Inc. |
4.8% |
| NVIDIA Corp. |
4.5% |
| Amazon.com, Inc. |
4.0% |
| Johnson & Johnson |
1.9% |
| Alphabet, Inc., Class A |
1.9% |
| S&P Global, Inc. |
1.7% |
| Lam Research Corp. |
1.7% |
| Comcast Corp., Class A |
1.7% |
| QUALCOMM, Inc. |
1.7% |
| (a) |
Excludes short-term securities. |
| # |
Ten largest country/geographic regions are presented. Additional country/geographic regions are found in Other. |
Additional information
If you wish to view additional information about the Fund, including but not limited to financial statements, the Fund’s prospectus, and proxy voting policies and procedures, please visit blackrock.com/fundreports. For proxy voting records, visit blackrock.com/proxyrecords.
Householding
The Fund will mail only one copy of shareholder documents, including prospectuses, annual and semi-annual reports and proxy statements, to shareholders with multiple accounts at the same address. This practice is commonly called “householding” and is intended to reduce expenses and eliminate duplicate mailings of shareholder documents. Mailings of your shareholder documents may be householded indefinitely unless you instruct us otherwise. If you do not want the mailing of these documents to be combined with those for other members of your household, please call the Fund at (800) 441-7762.
The Fund is not sponsored, endorsed, issued, sold, or promoted by MSCI Inc. and its affiliates, nor does this company make any representation regarding the advisability of investing in the Fund. BlackRock is not affiliated with the company listed above.
©2024 BlackRock, Inc. or its affiliates. All rights reserved. BLACKROCK is a registered trademark of BlackRock, Inc. or its affiliates. All other trademarks are those of their respective owners.
BlackRock Advantage Global Fund, Inc.
Investor C Shares | MCGCX
Annual Shareholder Report — June 30, 2024
MCGCX-06/24-AR
BlackRock Advantage Global Fund, Inc.
Class K Shares | MKGCX
Annual Shareholder Report — June 30, 2024
This annual shareholder report contains important information about BlackRock Advantage Global Fund, Inc. (the “Fund”) for the period of July 1, 2023 to June 30, 2024. You can find additional information about the Fund at blackrock.com/fundreports. You can also request this information by contacting us at (800) 441‑7762.
What were the Fund costs for the last year?
(based on a hypothetical $10,000 investment)
| Class name |
Costs of a $10,000
investment |
Costs paid as a percentage of a
$10,000 investment |
| Class K Shares |
$73 |
0.66% |
How did the Fund perform last year?
-
Global equities generally enjoyed strong performance over the period, as resilient macro and micro data combined with excitement around innovation in information technology and healthcare.
-
While U.S. market leadership trends exhibited persistence they also evolved and broadened over the period, helping alleviate concerns of a potential momentum reversal.
-
International markets kept pace with the United States while much broader market participation enabled value styles to keep pace with momentum.
What contributed to performance?
The Fund delivered strong gains as stock selection insights were able to identify and lean into the dominant market trends. These insights aligned with a soft-landing expectation and motivated positioning across the artificial intelligence (“AI”) and GLP-1 weight loss drug themes. Sentiment measures identifying trends across analyst and executive comments as well as smart money positioning were key performance drivers.
Fundamental quality and valuation measures provided a further source of returns as markets increasingly discerned AI winners versus losers. More broadly, valuation insights drove gains across the United States and Japan with measures evaluating cash flows, valuations and other financial statement metrics all contributing. Additionally, growth-oriented quality insights evaluating research expenditures helped the Fund benefit from AI optimism.
What detracted from performance?
Despite the strong gains, changing market leadership proved a headwind to trend-following industry insights over the period. In particular, industry measures picking up on price momentum and favoring defensive positioning performed poorly. In addition, select consumer intent-related measures were wrong-footed. In this vein, measures evaluating mobile app usage detracted by motivating exposure to the automobile industry.
The views expressed reflect the opinions of BlackRock as of the date of this report and are subject to change based on changes in market, economic or other conditions. These views are not intended to be a forecast of future events and are no guarantee of future results.
Fund performance
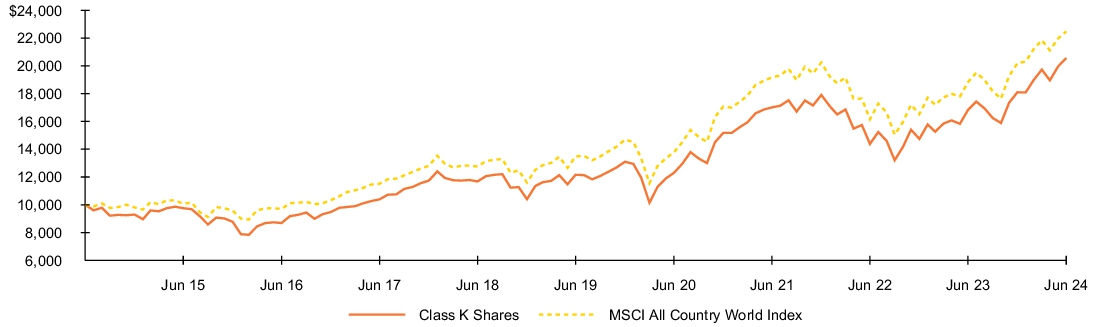
Cumulative performance: July 1, 2014 through June 30, 2024
Initial investment of $10,000
See “Average annual total returns” for additional information on fund performance.
| Average annual total returns |
|
|
|
|
1 Year |
5 Years |
10 Years |
| Class K Shares |
22.22% |
11.08% |
7.48% |
| MSCI All Country World Index |
19.38% |
10.76% |
8.43% |
| Key Fund statistics |
|
| Net Assets |
$382,532,073% |
| Number of Portfolio Holdings |
$204% |
| Net Investment Advisory Fees |
$1,821,675% |
| Portfolio Turnover Rate |
$152% |
The Fund's returns shown prior to October 26, 2017, are the returns of the Fund when it followed a different investment objective and different investment strategies under the name BlackRock Global SmallCap Fund, Inc.
Performance shown prior to the Class K Shares inception date of January 25, 2018 is that of Institutional Shares. The performance of Class K Shares would be substantially similar to Institutional Shares because Class K Shares and Institutional Shares invest in the same portfolio of securities and performance would only differ to the extent that Class K Shares and Institutional Shares have different expenses. The actual returns of Class K Shares would have been higher than those of the Institutional Shares because Class K Shares have lower expenses than the Institutional Shares.
Past performance is not an indication of future results. Performance results may include adjustments made for financial reporting purposes in accordance with U.S. generally accepted accounting principles. Performance results do not reflect the deduction of taxes that a shareholder would pay on fund distributions or on the redemption or sale of fund shares. Visit blackrock.com for more recent performance information.
What did the Fund invest in?
(as of June 30, 2024)
| Geographic allocation |
| Country/Geographic Region |
Percent of
Net Assets |
| United States |
69.7% |
| Japan |
4.3% |
| China |
3.0% |
| Taiwan |
2.9% |
| Switzerland |
2.7% |
| Spain |
2.2% |
| Canada |
1.9% |
| Denmark |
1.6% |
| Germany |
1.4% |
| India |
1.3% |
| Other# |
8.8% |
| Other Assets Less Liabilities |
0.2% |
| Ten largest holdings |
| Security |
Percent of
Net Assets(a) |
| Microsoft Corp. |
4.9% |
| Apple, Inc. |
4.8% |
| NVIDIA Corp. |
4.5% |
| Amazon.com, Inc. |
4.0% |
| Johnson & Johnson |
1.9% |
| Alphabet, Inc., Class A |
1.9% |
| S&P Global, Inc. |
1.7% |
| Lam Research Corp. |
1.7% |
| Comcast Corp., Class A |
1.7% |
| QUALCOMM, Inc. |
1.7% |
| (a) |
Excludes short-term securities. |
| # |
Ten largest country/geographic regions are presented. Additional country/geographic regions are found in Other. |
Additional information
If you wish to view additional information about the Fund, including but not limited to financial statements, the Fund’s prospectus, and proxy voting policies and procedures, please visit blackrock.com/fundreports. For proxy voting records, visit blackrock.com/proxyrecords.
Householding
The Fund will mail only one copy of shareholder documents, including prospectuses, annual and semi-annual reports and proxy statements, to shareholders with multiple accounts at the same address. This practice is commonly called “householding” and is intended to reduce expenses and eliminate duplicate mailings of shareholder documents. Mailings of your shareholder documents may be householded indefinitely unless you instruct us otherwise. If you do not want the mailing of these documents to be combined with those for other members of your household, please call the Fund at (800) 441-7762.
The Fund is not sponsored, endorsed, issued, sold, or promoted by MSCI Inc. and its affiliates, nor does this company make any representation regarding the advisability of investing in the Fund. BlackRock is not affiliated with the company listed above.
©2024 BlackRock, Inc. or its affiliates. All rights reserved. BLACKROCK is a registered trademark of BlackRock, Inc. or its affiliates. All other trademarks are those of their respective owners.
BlackRock Advantage Global Fund, Inc.
Class K Shares | MKGCX
Annual Shareholder Report — June 30, 2024
MKGCX-06/24-AR
BlackRock Advantage Global Fund, Inc.
Class R Shares | MRGSX
Annual Shareholder Report — June 30, 2024
This annual shareholder report contains important information about BlackRock Advantage Global Fund, Inc. (the “Fund”) for the period of July 1, 2023 to June 30, 2024. You can find additional information about the Fund at blackrock.com/fundreports. You can also request this information by contacting us at (800) 441‑7762.
What were the Fund costs for the last year?
(based on a hypothetical $10,000 investment)
| Class name |
Costs of a $10,000
investment |
Costs paid as a percentage of a
$10,000 investment |
| Class R Shares |
$134 |
1.21% |
How did the Fund perform last year?
-
Global equities generally enjoyed strong performance over the period, as resilient macro and micro data combined with excitement around innovation in information technology and healthcare.
-
While U.S. market leadership trends exhibited persistence they also evolved and broadened over the period, helping alleviate concerns of a potential momentum reversal.
-
International markets kept pace with the United States while much broader market participation enabled value styles to keep pace with momentum.
What contributed to performance?
The Fund delivered strong gains as stock selection insights were able to identify and lean into the dominant market trends. These insights aligned with a soft-landing expectation and motivated positioning across the artificial intelligence (“AI”) and GLP-1 weight loss drug themes. Sentiment measures identifying trends across analyst and executive comments as well as smart money positioning were key performance drivers.
Fundamental quality and valuation measures provided a further source of returns as markets increasingly discerned AI winners versus losers. More broadly, valuation insights drove gains across the United States and Japan with measures evaluating cash flows, valuations and other financial statement metrics all contributing. Additionally, growth-oriented quality insights evaluating research expenditures helped the Fund benefit from AI optimism.
What detracted from performance?
Despite the strong gains, changing market leadership proved a headwind to trend-following industry insights over the period. In particular, industry measures picking up on price momentum and favoring defensive positioning performed poorly. In addition, select consumer intent-related measures were wrong-footed. In this vein, measures evaluating mobile app usage detracted by motivating exposure to the automobile industry.
The views expressed reflect the opinions of BlackRock as of the date of this report and are subject to change based on changes in market, economic or other conditions. These views are not intended to be a forecast of future events and are no guarantee of future results.
Fund performance
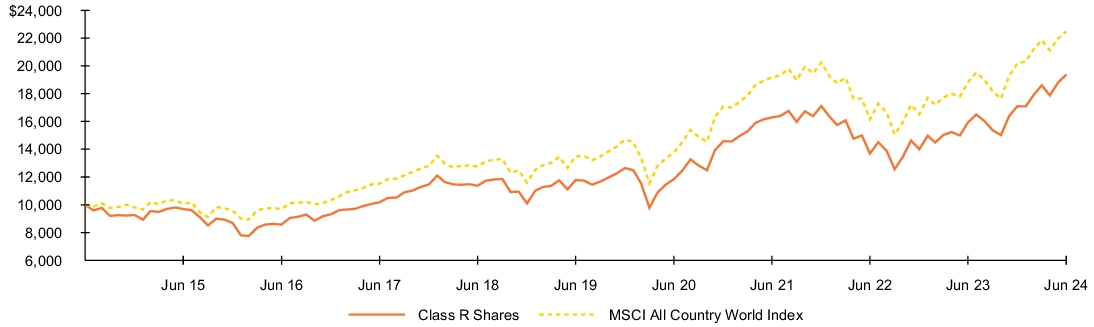
Cumulative performance: July 1, 2014 through June 30, 2024
Initial investment of $10,000
See “Average annual total returns” for additional information on fund performance.
| Average annual total returns |
|
|
|
|
1 Year |
5 Years |
10 Years |
| Class R Shares |
21.59% |
10.47% |
6.83% |
| MSCI All Country World Index |
19.38% |
10.76% |
8.43% |
| Key Fund statistics |
|
| Net Assets |
$382,532,073% |
| Number of Portfolio Holdings |
$204% |
| Net Investment Advisory Fees |
$1,821,675% |
| Portfolio Turnover Rate |
$152% |
The Fund's returns shown prior to October 26, 2017, are the returns of the Fund when it followed a different investment objective and different investment strategies under the name BlackRock Global SmallCap Fund, Inc.
Average annual total returns reflect reductions for distribution and service fees.
Past performance is not an indication of future results. Performance results may include adjustments made for financial reporting purposes in accordance with U.S. generally accepted accounting principles. Performance results do not reflect the deduction of taxes that a shareholder would pay on fund distributions or on the redemption or sale of fund shares. Visit blackrock.com for more recent performance information.
What did the Fund invest in?
(as of June 30, 2024)
| Geographic allocation |
| Country/Geographic Region |
Percent of
Net Assets |
| United States |
69.7% |
| Japan |
4.3% |
| China |
3.0% |
| Taiwan |
2.9% |
| Switzerland |
2.7% |
| Spain |
2.2% |
| Canada |
1.9% |
| Denmark |
1.6% |
| Germany |
1.4% |
| India |
1.3% |
| Other# |
8.8% |
| Other Assets Less Liabilities |
0.2% |
| Ten largest holdings |
| Security |
Percent of
Net Assets(a) |
| Microsoft Corp. |
4.9% |
| Apple, Inc. |
4.8% |
| NVIDIA Corp. |
4.5% |
| Amazon.com, Inc. |
4.0% |
| Johnson & Johnson |
1.9% |
| Alphabet, Inc., Class A |
1.9% |
| S&P Global, Inc. |
1.7% |
| Lam Research Corp. |
1.7% |
| Comcast Corp., Class A |
1.7% |
| QUALCOMM, Inc. |
1.7% |
| (a) |
Excludes short-term securities. |
| # |
Ten largest country/geographic regions are presented. Additional country/geographic regions are found in Other. |
Additional information
If you wish to view additional information about the Fund, including but not limited to financial statements, the Fund’s prospectus, and proxy voting policies and procedures, please visit blackrock.com/fundreports. For proxy voting records, visit blackrock.com/proxyrecords.
Householding
The Fund will mail only one copy of shareholder documents, including prospectuses, annual and semi-annual reports and proxy statements, to shareholders with multiple accounts at the same address. This practice is commonly called “householding” and is intended to reduce expenses and eliminate duplicate mailings of shareholder documents. Mailings of your shareholder documents may be householded indefinitely unless you instruct us otherwise. If you do not want the mailing of these documents to be combined with those for other members of your household, please call the Fund at (800) 441-7762.
The Fund is not sponsored, endorsed, issued, sold, or promoted by MSCI Inc. and its affiliates, nor does this company make any representation regarding the advisability of investing in the Fund. BlackRock is not affiliated with the company listed above.
©2024 BlackRock, Inc. or its affiliates. All rights reserved. BLACKROCK is a registered trademark of BlackRock, Inc. or its affiliates. All other trademarks are those of their respective owners.
BlackRock Advantage Global Fund, Inc.
Class R Shares | MRGSX
Annual Shareholder Report — June 30, 2024
MRGSX-06/24-AR
(b) Not Applicable
| Item 2 – |
Code of Ethics – The registrant (or the “Fund”) has adopted a code of ethics, as of the end of the period covered by this report, applicable to the registrant’s principal executive officer, principal financial officer, principal accounting officer or controller, or persons performing similar functions. During the period covered by this report, the code of ethics was amended to update certain information and to make other non-material changes. During the period covered by this report, there have been no waivers granted under the code of ethics. The registrant undertakes to provide a copy of the code of ethics to any person upon request, without charge, who calls 1-800-441-7762. |
| Item 3 – |
Audit Committee Financial Expert – The registrant’s board of directors (the “board of directors”), has determined that (i) the registrant has the following audit committee financial experts serving on its audit committee and (ii) each audit committee financial expert is independent: |
Neil A. Cotty
Henry R. Keizer
Kenneth L. Urish
Under applicable securities laws, a person determined to be an audit committee financial expert will not be deemed an “expert” for any purpose, including without limitation for the purposes of Section 11 of the Securities Act of 1933, as a result of being designated or identified as an audit committee financial expert. The designation or identification of a person as an audit committee financial expert does not impose on such person any duties, obligations, or liabilities greater than the duties, obligations, and liabilities imposed on such person as a member of the audit committee and board of directors in the absence of such designation or identification. The designation or identification of a person as an audit committee financial expert does not affect the duties, obligations, or liability of any other member of the audit committee or board of directors.
| Item 4 – |
Principal Accountant Fees and Services |
The following table presents fees billed by Deloitte & Touche LLP (“D&T”) in each of the last two fiscal years for the services rendered to the Fund:
|
|
|
|
|
|
|
|
|
|
|
|
|
|
|
|
|
| |
|
(a) Audit Fees |
|
(b) Audit-Related Fees1 |
|
(c) Tax Fees2 |
|
(d) All Other Fees |
| Entity Name |
|
Current Fiscal Year End |
|
Previous Fiscal Year End |
|
Current Fiscal Year End |
|
Previous Fiscal Year End |
|
Current Fiscal Year End |
|
Previous Fiscal Year End |
|
Current Fiscal Year End |
|
Previous Fiscal Year End |
| BlackRock Advantage Global Fund, Inc. |
|
$36,414 |
|
$36,414 |
|
$0 |
|
$44 |
|
$16,328 |
|
$18,700 |
|
$407 |
|
$0 |
The following table presents fees billed by D&T that were required to be approved by the registrant’s audit committee (the “Committee”) for services that relate directly to the operations or financial reporting of the Fund and that are rendered on behalf of BlackRock Advisors, LLC
(the “Investment Adviser” or “BlackRock”) and entities controlling, controlled by, or under common control with BlackRock (not including any sub-adviser whose role is primarily portfolio management and is subcontracted with or overseen by another investment adviser) that provide ongoing services to the Fund (“Affiliated Service Providers”):
|
|
|
|
|
| |
|
Current Fiscal Year End |
|
Previous Fiscal Year End |
| (b) Audit-Related Fees1 |
|
$0 |
|
$0 |
| (c) Tax Fees2 |
|
$0 |
|
$0 |
| (d) All Other Fees3 |
|
$2,149,000 |
|
$2,154,000 |
1 The nature of the services includes assurance and related services reasonably related to the performance of the audit or review of financial statements not included in Audit Fees, including accounting consultations, agreed-upon procedure reports, attestation reports, comfort letters, out-of-pocket expenses and internal control reviews not required by regulators.
2 The nature of the services includes tax compliance and/or tax preparation, including services relating to the filing or amendment of federal, state or local income tax returns, regulated investment company qualification reviews, taxable income and tax distribution calculations.
3 Non-audit fees of $2,149,000 and $2,154,000 for the current fiscal year and previous fiscal year, respectively, were paid to the Fund’s principal accountant in their entirety by BlackRock, in connection with services provided to the Affiliated Service Providers of the Fund and of certain other funds sponsored and advised by BlackRock or its affiliates for a service organization review and an accounting research tool subscription. These amounts represent aggregate fees paid by BlackRock and were not allocated on a per fund basis.
(e)(1) Audit Committee Pre-Approval Policies and Procedures:
The Committee has adopted policies and procedures with regard to the pre-approval of services. Audit, audit-related and tax compliance services provided to the registrant on an annual basis require specific pre-approval by the Committee. The Committee also must approve other non-audit services provided to the registrant and those non-audit services provided to the Investment Adviser and Affiliated Service Providers that relate directly to the operations and the financial reporting of the registrant. Certain of these non-audit services that the Committee believes are (a) consistent with the SEC’s auditor independence rules and (b) routine and recurring services that will not impair the independence of the independent accountants may be approved by the Committee without consideration on a specific case-by-case basis (“general pre-approval”). The term of any general pre-approval is 12 months from the date of the pre-approval, unless the Committee provides for a different period. Tax or other non-audit services provided to the registrant which have a direct impact on the operations or financial reporting of the registrant will only be deemed pre-approved provided that any individual project does not exceed $10,000 attributable to the registrant or $50,000 per project. For this purpose, multiple projects will be aggregated to determine if they exceed the previously mentioned cost levels.
Any proposed services exceeding the pre-approved cost levels will require specific pre-approval by the Committee, as will any other services not subject to general pre-approval (e.g., unanticipated but permissible services). The Committee is informed of each service approved subject to general pre-approval at the next regularly scheduled in-person board meeting. At this meeting, an analysis of such services is presented to the Committee for ratification. The Committee may delegate to the Committee Chairman the authority to approve the provision of and fees for any specific engagement of permitted non-audit services, including services exceeding pre-approved cost levels.
(e)(2) None of the services described in each of Items 4(b) through (d) were approved by the Committee pursuant to the de minimis exception in paragraph (c)(7)(i)(C) of Rule 2-01 of Regulation S-X.
(f) Not Applicable
(g) The aggregate non-audit fees, defined as the sum of the fees shown under “Audit-Related Fees,” “Tax Fees” and “All Other Fees,” paid to the accountant for services rendered by the accountant to the registrant, the Investment Adviser and the Affiliated Service Providers were:
|
|
|
|
|
| Entity Name |
|
Current Fiscal Year End |
|
Previous Fiscal Year End |
| BlackRock Advantage Global Fund, Inc. |
|
$16,735 |
|
$18,744 |
Additionally, the amounts billed by D&T in connection with services provided to the Affiliated Service Providers of the Fund and of other funds sponsored and advised by BlackRock or its affiliates during the current and previous fiscal years for a service organization review and an accounting research tool subscription were:
|
|
|
| Current Fiscal Year End |
|
Previous Fiscal Year End |
| $2,149,000 |
|
$2,154,000 |
These amounts represent aggregate fees paid by BlackRock and were not allocated on a per fund basis.
(h) The Committee has considered and determined that the provision of non-audit services that were rendered to the Investment Adviser and the Affiliated Service Providers that were not pre-approved pursuant to paragraph (c)(7)(ii) of Rule 2-01 of Regulation S-X is compatible with maintaining the principal accountant’s independence.
(i) Not Applicable
(j) Not Applicable
| Item 5 – |
Audit Committee of Listed Registrant – Not Applicable |
(a) The registrant’s Schedule of Investments is included as part of the Financial Statements and Financial Highlights for Open-End Management Investment Companies filed under Item 7 of this Form.
(b) Not Applicable due to no such divestments during the semi-annual period covered since the previous Form N-CSR filing.
| Item 7 – |
Financial Statements and Financial Highlights for Open-End Management Investment Companies |
(a) The registrant’s Financial Statements are attached herewith.
(b) The registrant’s Financial Highlights are attached herewith.
June 30, 2024
2024 Annual Financial Statements |
BlackRock Advantage Global Fund, Inc. |
| |
Not FDIC Insured • May Lose Value • No Bank Guarantee |
Derivative Financial Instruments
The Funds may invest in various derivative financial instruments. These instruments are used to obtain exposure to a security, commodity, index, market, and/or other assets without owning or taking physical custody of securities, commodities and/or other referenced assets or to manage market, equity, credit, interest rate, foreign currency exchange rate, commodity and/or other risks. Derivative financial instruments may give rise to a form of economic leverage and involve risks, including the imperfect correlation between the value of a derivative financial instrument and the underlying asset, possible default of the counterparty to the transaction or illiquidity of the instrument. Pursuant to Rule 18f-4 under the 1940 Act, among other things, the Funds must either use derivative financial instruments with embedded leverage in a limited manner or comply with an outer limit on fund leverage risk based on value-at-risk. The Funds’ successful use of a derivative financial instrument depends on the investment adviser’s ability to predict pertinent market movements accurately, which cannot be assured. The use of these instruments may result in losses greater than if they had not been used, may limit the amount of appreciation a Fund can realize on an investment and/or may result in lower distributions paid to shareholders. The Funds’ investments in these instruments, if any, are discussed in detail in the Notes to Financial Statements.
Derivative Financial Instruments
3
Schedule of Investments
June 30, 2024
BlackRock Advantage Global Fund, Inc.
(Percentages shown are based on Net Assets)
| |
|
|
|
| |
| |
|
| |
|
|
|
| |
|
| |
|
|
|
| |
|
| |
|
|
|
B3 SA - Brasil Bolsa Balcao |
|
|
|
| |
|
|
|
Marfrig Global Foods SA(a) |
|
|
|
NU Holdings Ltd./Cayman Islands, Class A(a) |
|
|
|
Pagseguro Digital Ltd., Class A(a) |
|
|
|
Ultrapar Participacoes SA |
|
|
|
| |
|
|
|
| |
|
Brookfield Corp., Class A |
|
|
|
| |
|
|
|
| |
|
|
|
| |
|
|
|
| |
|
|
|
| |
|
|
|
| |
|
BOE Technology Group Co. Ltd., Class A |
|
|
|
Oriental Pearl Group Co. Ltd., Class A |
|
|
|
SAIC Motor Corp. Ltd., Class A |
|
|
|
Shanghai Electric Group Co. Ltd., Class A(a) |
|
|
|
Shenwan Hongyuan Group Co. Ltd., Class A |
|
|
|
| |
|
|
|
| |
|
|
|
| |
|
| |
|
|
|
Novo Nordisk A/S, Class B |
|
|
|
| |
|
|
|
| |
|
| |
|
|
|
| |
|
|
|
| |
|
|
|
| |
|
|
|
| |
|
Bayer AG, Class N, Registered Shares |
|
|
|
Siemens AG, Class N, Registered Shares |
|
|
|
| |
|
|
|
| |
|
|
|
| |
|
| |
|
|
|
Jardine Matheson Holdings Ltd. |
|
|
|
| |
|
|
|
| |
|
| |
|
|
|
| |
|
|
|
Dixon Technologies India Ltd. |
|
|
|
| |
|
|
|
| |
|
|
|
| |
|
|
|
| |
|
|
|
| |
|
|
|
| |
|
|
|
| |
|
|
|
| |
|
SBI Life Insurance Co. Ltd.(b) |
|
|
|
| |
|
|
|
| |
|
|
|
| |
|
|
|
| |
|
Check Point Software Technologies Ltd. |
|
|
|
| |
|
|
|
| |
|
|
|
| |
|
| |
|
|
|
| |
|
| |
|
|
|
Central Japan Railway Co. |
|
|
|
GMO Payment Gateway, Inc. |
|
|
|
| |
|
|
|
Japan Post Holdings Co. Ltd. |
|
|
|
| |
|
|
|
| |
|
|
|
Mitsubishi UFJ Financial Group, Inc. |
|
|
|
| |
|
|
|
Mizuho Financial Group, Inc. |
|
|
|
Oriental Land Co. Ltd./Japan |
|
|
|
Pan Pacific International Holdings Corp. |
|
|
|
| |
|
|
|
Recruit Holdings Co. Ltd. |
|
|
|
| |
|
|
|
| |
|
|
|
Sumitomo Mitsui Financial Group, Inc. |
|
|
|
| |
|
|
|
| |
|
|
|
| |
|
| |
|
|
|
| |
|
| |
|
|
|
| |
|
| |
|
|
|
| |
|
| |
|
|
|
| |
|
| |
|
|
|
| |
|
|
|
| |
|
|
|
| |
|
|
|
| |
|
|
|
| |
|
|
|
| |
|
|
|
| |
|
|
|
| |
|
Rabigh Refining & Petrochemical Co.(a) |
|
|
|
| |
|
| |
|
|
|
| |
|
| |
|
|
|
| |
|
|
|
| |
|
|
|
4 2024 BlackRock Annual Financial Statements
Schedule of Investments (continued)
June 30, 2024
BlackRock Advantage Global Fund, Inc.
(Percentages shown are based on Net Assets)
| |
|
|
|
| |
|
| |
|
|
|
| |
|
|
|
| |
|
|
|
| |
|
|
|
| |
|
| |
|
|
|
| |
|
|
|
Industria de Diseno Textil SA |
|
|
|
| |
|
|
|
| |
|
|
|
| |
|
| |
|
|
|
| |
|
ABB Ltd., Class N, Registered Shares |
|
|
|
Chocoladefabriken Lindt & Spruengli AG |
|
|
|
Novartis AG, Class N, Registered Shares |
|
|
|
| |
|
|
|
| |
|
| |
|
|
|
Elan Microelectronics Corp. |
|
|
|
| |
|
|
|
| |
|
|
|
| |
|
|
|
Realtek Semiconductor Corp. |
|
|
|
Taiwan Semiconductor Manufacturing Co. Ltd. |
|
|
|
| |
|
|
|
| |
|
|
|
| |
|
Migros Ticaret A/S, Class A |
|
|
|
Turkcell Iletisim Hizmetleri A/S, Class A |
|
|
|
| |
|
|
|
| |
|
CK Hutchison Holdings Ltd. |
|
|
|
Direct Line Insurance Group PLC |
|
|
|
| |
|
|
|
| |
|
|
|
| |
|
|
|
| |
|
|
|
| |
|
|
|
| |
|
| |
|
|
|
| |
|
|
|
| |
|
|
|
Advanced Micro Devices, Inc.(a) |
|
|
|
| |
|
|
|
| |
|
|
|
| |
|
|
|
| |
|
|
|
| |
|
|
|
| |
|
|
|
| |
|
|
|
| |
|
|
|
Arch Capital Group Ltd.(a) |
|
|
|
Arrow Electronics, Inc.(a) |
|
|
|
Berkshire Hathaway, Inc., Class B(a) |
|
|
|
| |
|
|
|
| |
|
|
|
| |
|
|
|
| |
|
|
|
United States (continued) |
|
Builders FirstSource, Inc.(a) |
|
|
|
CACI International, Inc., Class A(a) |
|
|
|
Cadence Design Systems, Inc.(a) |
|
|
|
| |
|
|
|
| |
|
|
|
CBRE Group, Inc., Class A(a) |
|
|
|
| |
|
|
|
| |
|
|
|
| |
|
|
|
| |
|
|
|
| |
|
|
|
| |
|
|
|
| |
|
|
|
| |
|
|
|
| |
|
|
|
| |
|
|
|
| |
|
|
|
Expeditors International of Washington, Inc. |
|
|
|
| |
|
|
|
| |
|
|
|
| |
|
|
|
| |
|
|
|
| |
|
|
|
| |
|
|
|
| |
|
|
|
Honeywell International, Inc. |
|
|
|
| |
|
|
|
| |
|
|
|
Ionis Pharmaceuticals, Inc.(a) |
|
|
|
| |
|
|
|
| |
|
|
|
| |
|
|
|
| |
|
|
|
| |
|
|
|
Manhattan Associates, Inc.(a) |
|
|
|
Marsh & McLennan Cos., Inc. |
|
|
|
Mastercard, Inc., Class A |
|
|
|
| |
|
|
|
Meta Platforms, Inc., Class A |
|
|
|
| |
|
|
|
| |
|
|
|
| |
|
|
|
| |
|
|
|
| |
|
|
|
| |
|
|
|
| |
|
|
|
| |
|
|
|
| |
|
|
|
| |
|
|
|
Regeneron Pharmaceuticals, Inc.(a) |
|
|
|
Reinsurance Group of America, Inc. |
|
|
|
| |
|
|
|
| |
|
|
|
| |
|
|
|
| |
|
|
|
| |
|
|
|
| |
|
|
|
| |
|
|
|
| |
|
|
|
| |
|
|
|
| |
|
|
|
Thermo Fisher Scientific, Inc. |
|
|
|
Schedule of Investments
5
Schedule of Investments (continued)
June 30, 2024
BlackRock Advantage Global Fund, Inc.
(Percentages shown are based on Net Assets)
| |
|
|
|
United States (continued) |
|
| |
|
|
|
| |
|
|
|
Uber Technologies, Inc.(a) |
|
|
|
United Airlines Holdings, Inc.(a) |
|
|
|
| |
|
|
|
Vertex Pharmaceuticals, Inc.(a) |
|
|
|
| |
|
|
|
| |
|
|
|
| |
|
|
|
| |
|
|
|
Total Common Stocks — 97.7%
(Cost: $286,506,896) |
|
| |
| |
| |
|
| |
|
|
|
CTEEP-Cia de Transmissao de Energia Eletrica Paulista |
|
|
|
| |
|
|
|
Usinas Siderurgicas de Minas Gerais S/A Usiminas |
|
|
|
| |
|
|
|
Total Preferred Securities — 0.3%
(Cost: $1,325,957) |
|
Total Long-Term Investments — 98.0%
(Cost: $287,832,853) |
|
| |
|
|
|
| |
Money Market Funds — 1.8% |
|
BlackRock Liquidity Funds, T-Fund, Institutional Shares, 5.19%(d)(e) |
|
|
|
Total Short-Term Securities — 1.8%
(Cost: $6,831,991) |
|
Total Investments — 99.8%
(Cost: $294,664,844) |
|
Other Assets Less Liabilities — 0.2% |
|
| |
|
| |
Non-income producing security. |
| |
Security exempt from registration pursuant to Rule 144A under the Securities Act of 1933, as amended. These securities may be resold in transactions exempt from registration to qualified institutional investors. |
| |
Security is valued using significant unobservable inputs and is classified as Level 3 in the fair value hierarchy. |
| |
|
| |
Annualized 7-day yield as of period end. |
Investments in issuers considered to be affiliate(s) of the Fund during the year ended June 30, 2024 for purposes of Section 2(a)(3) of the Investment Company Act of 1940, as amended, were as follows:
| |
|
|
|
|
Change in
Unrealized
Appreciation
(Depreciation) |
|
|
|
Capital Gain
Distributions
from
Underlying
Funds |
BlackRock Cash Funds: Institutional, SL Agency Shares(a) |
|
|
|
|
|
|
|
|
|
BlackRock Liquidity Funds, T-Fund, Institutional Shares |
|
|
|
|
|
|
|
|
|
SL Liquidity Series, LLC, Money Market Series(a) |
|
|
|
|
|
|
|
|
|
| |
|
|
|
|
|
|
|
|
|
| |
As of period end, the entity is no longer held. |
| |
Represents net amount purchased (sold). |
| |
All or a portion represents securities lending income earned from the reinvestment of cash collateral from loaned securities, net of fees and collateral investment expenses, and other payments to and from borrowers of securities. |
Derivative Financial Instruments Outstanding as of Period End
| |
|
|
|
Value/
Unrealized
Appreciation
(Depreciation) |
| |
|
|
|
|
| |
|
|
|
|
6 2024 BlackRock Annual Financial Statements
Schedule of Investments (continued)
June 30, 2024
BlackRock Advantage Global Fund, Inc.
Futures Contracts (continued)
| |
|
|
|
Value/ Unrealized Appreciation (Depreciation) |
Long Contracts (continued) |
|
|
|
|
MSCI Emerging Markets Index |
|
|
|
|
| |
|
|
|
|
| |
|
|
|
|
Derivative Financial Instruments Categorized by Risk Exposure
As of period end, the fair values of derivative financial instruments located in the Statements of Assets and Liabilities were as follows:
| |
|
|
|
Foreign
Currency
Exchange
Contracts |
|
|
|
Assets — Derivative Financial Instruments |
|
|
|
|
|
|
|
Futures contracts
Unrealized appreciation on futures contracts(a) |
|
|
|
|
|
|
|
| |
Net cumulative unrealized appreciation (depreciation) on futures contracts and centrally cleared swaps, if any, are reported in the Schedule of Investments. In the Statements of Assets and Liabilities, only current day’s variation margin is reported in receivables or payables and the net cumulative unrealized appreciation (depreciation) is included in accumulated earnings (loss). |
For the period ended June 30, 2024, the effect of derivative financial instruments in the Statements of Operations was as follows:
| |
|
|
|
Foreign
Currency
Exchange
Contracts |
|
|
|
Net Realized Gain (Loss) from: |
|
|
|
|
|
|
|
| |
|
|
|
|
|
|
|
Net Change in Unrealized Appreciation (Depreciation) on: |
|
|
|
|
|
|
|
| |
|
|
|
|
|
|
|
Average Quarterly Balances of Outstanding Derivative Financial Instruments
| |
|
Average notional value of contracts — long |
|
Average notional value of contracts — short |
|
| |
Derivative financial instrument not held at any quarter-end. The risk exposure table serves as an indicator of activity during the period. |
For more information about the Fund’s investment risks regarding derivative financial instruments, refer to the Notes to Financial Statements.
Fair Value Hierarchy as of Period End
Various inputs are used in determining the fair value of financial instruments. For a description of the input levels and information about the Fund’s policy regarding valuation of financial instruments, refer to the Notes to Financial Statements.
The following table summarizes the Fund’s financial instruments categorized in the fair value hierarchy. The breakdown of the Fund’s financial instruments into major categories is disclosed in the Schedule of Investments above.
Schedule of Investments
7
Schedule of Investments (continued)
June 30, 2024
BlackRock Advantage Global Fund, Inc.
Fair Value Hierarchy as of Period End (continued)
| |
|
|
|
|
Common Stocks (continued) |
|
|
|
|
| |
|
|
|
|
| |
|
|
|
|
| |
|
|
|
|
| |
|
|
|
|
| |
|
|
|
|
| |
|
|
|
|
| |
|
|
|
|
| |
|
|
|
|
| |
|
|
|
|
| |
|
|
|
|
| |
|
|
|
|
| |
|
|
|
|
| |
|
|
|
|
| |
|
|
|
|
| |
|
|
|
|
| |
|
|
|
|
| |
|
|
|
|
| |
|
|
|
|
| |
|
|
|
|
| |
|
|
|
|
| |
|
|
|
|
| |
|
|
|
|
| |
|
|
|
|
| |
|
|
|
|
| |
|
|
|
|
| |
|
|
|
|
| |
|
|
|
|
| |
|
|
|
|
| |
|
|
|
|
| |
|
|
|
|
Derivative Financial Instruments(a) |
|
|
|
|
| |
|
|
|
|
| |
|
|
|
|
| |
Derivative financial instruments are futures contracts. Futures contracts are valued at the unrealized appreciation (depreciation) on the instrument. |
See notes to financial statements.
8 2024 BlackRock Annual Financial Statements
Schedule of Investments
June 30, 2024
BlackRock EuroFund
(Percentages shown are based on Net Assets)
| |
|
|
|
| |
| |
|
| |
|
|
|
| |
|
|
|
| |
|
|
|
| |
|
| |
|
|
|
| |
|
| |
|
|
|
| |
|
| |
|
|
|
| |
|
|
|
| |
|
|
|
| |
|
|
|
| |
|
|
|
| |
|
|
|
LVMH Moet Hennessy Louis Vuitton SE |
|
|
|
| |
|
|
|
| |
|
|
|
| |
|
|
|
| |
|
|
|
| |
|
|
|
| |
|
| |
|
|
|
| |
|
|
|
| |
|
|
|
CTS Eventim AG & Co. KGaA |
|
|
|
| |
|
|
|
MTU Aero Engines AG, Class N |
|
|
|
Muenchener Rueckversicherungs-Gesellschaft AG in Muenchen, Class N, Registered Shares |
|
|
|
| |
|
|
|
Siemens AG, Class N, Registered Shares |
|
|
|
| |
|
|
|
| |
|
| |
|
|
|
| |
|
| |
|
|
|
| |
|
|
|
| |
|
|
|
| |
|
|
|
| |
|
|
|
| |
|
| |
|
|
|
| |
|
|
|
BE Semiconductor Industries NV |
|
|
|
| |
|
|
|
| |
|
|
|
| |
|
| |
|
|
|
| |
|
Banco Bilbao Vizcaya Argentaria SA |
|
|
|
| |
|
|
|
| |
|
|
|
| |
|
| |
|
|
|
| |
|
| |
|
|
|
| |
|
|
|
| |
|
|
|
| |
|
| |
|
|
|
| |
|
|
|
| |
|
|
|
| |
|
|
|
Total Long-Term Investments — 100.3%
(Cost: $69,721,543) |
|
| |
Money Market Funds — 0.5% |
|
BlackRock Liquidity Funds, T-Fund, Institutional Shares, 5.19%(a)(b) |
|
|
|
Total Short-Term Securities — 0.5%
(Cost: $462,681) |
|
Total Investments — 100.8%
(Cost: $70,184,224) |
|
Liabilities in Excess of Other Assets — (0.8)% |
|
| |
|
| |
|
| |
Annualized 7-day yield as of period end. |
Investments in issuers considered to be affiliate(s) of the Fund during the year ended June 30, 2024 for purposes of Section 2(a)(3) of the Investment Company Act of 1940, as amended, were as follows:
| |
|
|
|
|
Change in
Unrealized
Appreciation
(Depreciation) |
|
|
|
Capital Gain
Distributions
from
Underlying
Funds |
BlackRock Cash Funds: Institutional, SL Agency Shares(a) |
|
|
|
|
|
|
|
|
|
BlackRock Liquidity Funds, T-Fund, Institutional Shares |
|
|
|
|
|
|
|
|
|
SL Liquidity Series, LLC, Money Market Series(a) |
|
|
|
|
|
|
|
|
|
| |
|
|
|
|
|
|
|
|
|
| |
As of period end, the entity is no longer held. |
Schedule of Investments
9
Schedule of Investments (continued)
June 30, 2024
| |
All or a portion represents securities lending income earned from the reinvestment of cash collateral from loaned securities, net of fees and collateral investment expenses, and other payments to and from borrowers of securities. |
| |
Represents net amount purchased (sold). |
Fair Value Hierarchy as of Period End
Various inputs are used in determining the fair value of financial instruments. For a description of the input levels and information about the Fund’s policy regarding valuation of financial instruments, refer to the Notes to Financial Statements.
The following table summarizes the Fund’s financial instruments categorized in the fair value hierarchy. The breakdown of the Fund’s financial instruments into major categories is disclosed in the Schedule of Investments above.
See notes to financial statements.
10 2024 BlackRock Annual Financial Statements
Statements of Assets and Liabilities
June 30, 2024
| |
BlackRock
Advantage Global
Fund, Inc. |
|
| |
|
|
Investments, at value — unaffiliated(a) |
|
|
Investments, at value — affiliated(b) |
|
|
Cash pledged for futures contracts |
|
|
Foreign currency, at value(c) |
|
|
| |
|
|
| |
|
|
| |
|
|
| |
|
|
| |
|
|
Variation margin on futures contracts |
|
|
| |
|
|
| |
|
|
| |
|
|
| |
|
|
| |
|
|
| |
|
|
| |
|
|
| |
|
|
| |
|
|
Deferred foreign capital gain tax |
|
|
| |
|
|
IRS compliance fee for foreign withholding tax claims |
|
|
Directors’ and Officer’s fees |
|
|
| |
|
|
| |
|
|
Service and distribution fees |
|
|
| |
|
|
Variation margin on futures contracts |
|
|
| |
|
|
Commitments and contingent liabilities |
|
|
| |
|
|
| |
|
|
| |
|
|
| |
|
|
| |
|
|
(a) Investments, at cost—unaffiliated |
|
|
(b) Investments, at cost—affiliated |
|
|
(c) Foreign currency, at cost |
|
|
Statements of Assets and Liabilities
11
Statements of Assets and Liabilities (continued)
June 30, 2024
| |
BlackRock
Advantage Global
Fund, Inc. |
|
| |
|
|
| |
|
|
| |
|
|
| |
|
|
| |
|
|
| |
|
|
| |
|
|
| |
|
|
| |
|
|
| |
|
|
| |
|
|
| |
|
|
| |
|
|
| |
|
|
| |
|
|
| |
|
|
| |
|
|
| |
|
|
| |
|
|
| |
|
|
| |
|
|
| |
|
|
| |
|
|
| |
|
|
| |
|
|
| |
|
|
| |
|
|
| |
|
|
| |
|
|
| |
|
|
| |
|
|
See notes to financial statements.
12 2024 BlackRock Annual Financial Statements
Statements of Operations
Year Ended June 30, 2024
| |
BlackRock
Advantage Global
Fund, Inc. |
|
| |
|
|
| |
|
|
| |
|
|
| |
|
|
Securities lending income — affiliated — net |
|
|
Other income — unaffiliated |
|
|
| |
|
|
Foreign withholding tax claims |
|
|
IRS compliance fee for foreign withholding tax claims |
|
|
| |
|
|
| |
|
|
| |
|
|
Service and distribution — class specific |
|
|
Transfer agent — class specific |
|
|
| |
|
|
| |
|
|
| |
|
|
| |
|
|
| |
|
|
| |
|
|
| |
|
|
Total expenses excluding interest expense |
|
|
Interest expense — unaffiliated |
|
|
| |
|
|
| |
|
|
Fees waived and/or reimbursed by the Manager |
|
|
Transfer agent fees waived and/or reimbursed by the Manager — class specific |
|
|
Total expenses after fees waived and/or reimbursed |
|
|
| |
|
|
REALIZED AND UNREALIZED GAIN (LOSS) |
|
|
Net realized gain (loss) from: |
|
|
Investments — unaffiliated(a) |
|
|
| |
|
|
Foreign currency transactions |
|
|
| |
|
|
| |
|
|
| |
|
|
Net change in unrealized appreciation (depreciation) on: |
|
|
Investments — unaffiliated(b) |
|
|
| |
|
|
Foreign currency translations |
|
|
| |
|
|
| |
|
|
Net realized and unrealized gain |
|
|
NET INCREASE IN NET ASSETS RESULTING FROM OPERATIONS |
|
|
(a) Net of foreign capital gain tax and capital gain tax refund, if applicable of |
|
|
(b) Net of increase in deferred foreign capital gain tax of |
|
|
See notes to financial statements.
Statements of Operations
13
Statements of Changes in Net Assets
| |
BlackRock Advantage Global Fund, Inc. |
|
| |
|
|
|
|
| |
INCREASE (DECREASE) IN NET ASSETS |
|
|
|
|
| |
|
|
|
|
| |
|
|
|
|
| |
|
|
|
|
Net change in unrealized appreciation (depreciation) |
|
|
|
|
Net increase in net assets resulting from operations |
|
|
|
|
DISTRIBUTIONS TO SHAREHOLDERS(a) |
|
|
|
|
| |
|
|
|
|
| |
|
|
|
|
| |
|
|
|
|
| |
|
|
|
|
| |
|
|
|
|
Decrease in net assets resulting from distributions to shareholders |
|
|
|
|
CAPITAL SHARE TRANSACTIONS |
|
|
|
|
Net decrease in net assets derived from capital share transactions |
|
|
|
|
| |
|
|
|
|
Total increase (decrease) in net assets |
|
|
|
|
| |
|
|
|
|
| |
|
|
|
|
| |
Distributions for annual periods determined in accordance with U.S. federal income tax regulations. |
See notes to financial statements.
14 2024 BlackRock Annual Financial Statements
Financial Highlights
(For a share outstanding throughout each period)
| |
BlackRock Advantage Global Fund, Inc. |
| |
|
| |
|
|
|
|
|
| |
Net asset value, beginning of year |
|
|
|
|
|
| |
|
|
|
|
|
Net realized and unrealized gain (loss) |
|
|
|
|
|
Net increase (decrease) from investment operations |
|
|
|
|
|
| |
|
|
|
|
|
From net investment income |
|
|
|
|
|
| |
|
|
|
|
|
| |
|
|
|
|
|
Net asset value, end of year |
|
|
|
|
|
| |
|
|
|
|
|
| |
|
|
|
|
|
Ratios to Average Net Assets(e) |
|
|
|
|
|
| |
|
|
|
|
|
Total expenses after fees waived and/or reimbursed |
|
|
|
|
|
| |
|
|
|
|
|
| |
|
|
|
|
|
Net assets, end of year (000) |
|
|
|
|
|
| |
|
|
|
|
|
| |
Based on average shares outstanding. |
| |
Distributions for annual periods determined in accordance with U.S. federal income tax regulations. |
| |
Where applicable, assumes the reinvestment of distributions. |
| |
Includes payment received from a settlement of litigation, which impacted the Fund’s total return. Excluding the payment from a settlement of litigation, the Fund’s total return is 22.12%. |
| |
Excludes fees and expenses incurred indirectly as a result of investments in underlying funds. |
See notes to financial statements.
Financial Highlights (continued)
(For a share outstanding throughout each period)
| |
BlackRock Advantage Global Fund, Inc. (continued) |
| |
|
| |
|
|
|
|
|
| |
Net asset value, beginning of year |
|
|
|
|
|
| |
|
|
|
|
|
Net realized and unrealized gain (loss) |
|
|
|
|
|
Net increase (decrease) from investment operations |
|
|
|
|
|
| |
|
|
|
|
|
From net investment income |
|
|
|
|
|
| |
|
|
|
|
|
| |
|
|
|
|
|
Net asset value, end of year |
|
|
|
|
|
| |
|
|
|
|
|
| |
|
|
|
|
|
Ratios to Average Net Assets(e) |
|
|
|
|
|
| |
|
|
|
|
|
Total expenses after fees waived and/or reimbursed |
|
|
|
|
|
| |
|
|
|
|
|
| |
|
|
|
|
|
Net assets, end of year (000) |
|
|
|
|
|
| |
|
|
|
|
|
| |
Based on average shares outstanding. |
| |
Distributions for annual periods determined in accordance with U.S. federal income tax regulations. |
| |
Where applicable, excludes the effects of any sales charges and assumes the reinvestment of distributions. |
| |
Includes payment received from a settlement of litigation, which impacted the Fund’s total return. Excluding the payment from a settlement of litigation, the Fund’s total return is 21.78%. |
| |
Excludes fees and expenses incurred indirectly as a result of investments in underlying funds. |
See notes to financial statements.
16 2024 BlackRock Annual Financial Statements
Financial Highlights (continued)
(For a share outstanding throughout each period)
| |
BlackRock Advantage Global Fund, Inc. (continued) |
| |
|
| |
|
|
|
|
|
| |
Net asset value, beginning of year |
|
|
|
|
|
Net investment income (loss)(a) |
|
|
|
|
|
Net realized and unrealized gain (loss) |
|
|
|
|
|
Net increase (decrease) from investment operations |
|
|
|
|
|
| |
|
|
|
|
|
From net investment income |
|
|
|
|
|
| |
|
|
|
|
|
| |
|
|
|
|
|
Net asset value, end of year |
|
|
|
|
|
| |
|
|
|
|
|
| |
|
|
|
|
|
Ratios to Average Net Assets(e) |
|
|
|
|
|
| |
|
|
|
|
|
Total expenses after fees waived and/or reimbursed |
|
|
|
|
|
Net investment income (loss) |
|
|
|
|
|
| |
|
|
|
|
|
Net assets, end of year (000) |
|
|
|
|
|
| |
|
|
|
|
|
| |
Based on average shares outstanding. |
| |
Distributions for annual periods determined in accordance with U.S. federal income tax regulations. |
| |
Where applicable, excludes the effects of any sales charges and assumes the reinvestment of distributions. |
| |
Includes payment received from a settlement of litigation, which impacted the Fund’s total return. Excluding the payment from a settlement of litigation, the Fund’s total return is 20.86%. |
| |
Excludes fees and expenses incurred indirectly as a result of investments in underlying funds. |
See notes to financial statements.
Financial Highlights (continued)
(For a share outstanding throughout each period)
| |
BlackRock Advantage Global Fund, Inc. (continued) |
| |
|
| |
|
|
|
|
|
| |
Net asset value, beginning of year |
|
|
|
|
|
| |
|
|
|
|
|
Net realized and unrealized gain (loss) |
|
|
|
|
|
Net increase (decrease) from investment operations |
|
|
|
|
|
| |
|
|
|
|
|
From net investment income |
|
|
|
|
|
| |
|
|
|
|
|
| |
|
|
|
|
|
Net asset value, end of year |
|
|
|
|
|
| |
|
|
|
|
|
| |
|
|
|
|
|
Ratios to Average Net Assets(e) |
|
|
|
|
|
| |
|
|
|
|
|
Total expenses after fees waived and/or reimbursed |
|
|
|
|
|
| |
|
|
|
|
|
| |
|
|
|
|
|
Net assets, end of year (000) |
|
|
|
|
|
| |
|
|
|
|
|
| |
Based on average shares outstanding. |
| |
Distributions for annual periods determined in accordance with U.S. federal income tax regulations. |
| |
Where applicable, assumes the reinvestment of distributions. |
| |
Includes payment received from a settlement of litigation, which impacted the Fund’s total return. Excluding the payment from a settlement of litigation, the Fund’s total return is 22.05%. |
| |
Excludes fees and expenses incurred indirectly as a result of investments in underlying funds. |
See notes to financial statements.
18 2024 BlackRock Annual Financial Statements
Financial Highlights (continued)
(For a share outstanding throughout each period)
| |
BlackRock Advantage Global Fund, Inc. (continued) |
| |
|
| |
|
|
|
|
|
| |
Net asset value, beginning of year |
|
|
|
|
|
| |
|
|
|
|
|
Net realized and unrealized gain (loss) |
|
|
|
|
|
Net increase (decrease) from investment operations |
|
|
|
|
|
| |
|
|
|
|
|
From net investment income |
|
|
|
|
|
| |
|
|
|
|
|
| |
|
|
|
|
|
Net asset value, end of year |
|
|
|
|
|
| |
|
|
|
|
|
| |
|
|
|
|
|
Ratios to Average Net Assets(e) |
|
|
|
|
|
| |
|
|
|
|
|
Total expenses after fees waived and/or reimbursed |
|
|
|
|
|
| |
|
|
|
|
|
| |
|
|
|
|
|
Net assets, end of year (000) |
|
|
|
|
|
| |
|
|
|
|
|
| |
Based on average shares outstanding. |
| |
Distributions for annual periods determined in accordance with U.S. federal income tax regulations. |
| |
Where applicable, assumes the reinvestment of distributions. |
| |
Includes payment received from a settlement of litigation, which impacted the Fund’s total return. Excluding the payment from a settlement of litigation, the Fund’s total return is 21.49%. |
| |
Excludes fees and expenses incurred indirectly as a result of investments in underlying funds. |
See notes to financial statements.
Financial Highlights (continued)
(For a share outstanding throughout each period)
| |
|
| |
|
| |
|
|
|
|
|
| |
Net asset value, beginning of year |
|
|
|
|
|
| |
|
|
|
|
|
Net realized and unrealized gain (loss) |
|
|
|
|
|
Net increase (decrease) from investment operations |
|
|
|
|
|
Distributions from net investment income(b) |
|
|
|
|
|
Net asset value, end of year |
|
|
|
|
|
| |
|
|
|
|
|
| |
|
|
|
|
|
Ratios to Average Net Assets(d) |
|
|
|
|
|
| |
|
|
|
|
|
Total expenses after fees waived and/or reimbursed |
|
|
|
|
|
Total expenses after fees waived and/or reimbursed and excluding professional fees for foreign withholding taxes |
|
|
|
|
|
| |
|
|
|
|
|
| |
|
|
|
|
|
Net assets, end of year (000) |
|
|
|
|
|
| |
|
|
|
|
|
| |
Based on average shares outstanding. |
| |
Distributions for annual periods determined in accordance with U.S. federal income tax regulations. |
| |
Where applicable, assumes the reinvestment of distributions. |
| |
Excludes fees and expenses incurred indirectly as a result of investments in underlying funds. |
See notes to financial statements.
20 2024 BlackRock Annual Financial Statements
Financial Highlights (continued)
(For a share outstanding throughout each period)
| |
BlackRock EuroFund (continued) |
| |
|
| |
|
|
|
|
|
| |
Net asset value, beginning of year |
|
|
|
|
|
Net investment income (loss)(a) |
|
|
|
|
|
Net realized and unrealized gain (loss) |
|
|
|
|
|
Net increase (decrease) from investment operations |
|
|
|
|
|
Distributions from net investment income(c) |
|
|
|
|
|
Net asset value, end of year |
|
|
|
|
|
| |
|
|
|
|
|
| |
|
|
|
|
|
Ratios to Average Net Assets(e) |
|
|
|
|
|
| |
|
|
|
|
|
Total expenses after fees waived and/or reimbursed |
|
|
|
|
|
Total expenses after fees waived and/or reimbursed and excluding professional fees for foreign withholding taxes |
|
|
|
|
|
Net investment income (loss) |
|
|
|
|
|
| |
|
|
|
|
|
Net assets, end of year (000) |
|
|
|
|
|
| |
|
|
|
|
|
| |
Based on average shares outstanding. |
| |
Amount is greater than $(0.005) per share. |
| |
Distributions for annual periods determined in accordance with U.S. federal income tax regulations. |
| |
Where applicable, excludes the effects of any sales charges and assumes the reinvestment of distributions. |
| |
Excludes fees and expenses incurred indirectly as a result of investments in underlying funds. |
See notes to financial statements.
Financial Highlights (continued)
(For a share outstanding throughout each period)
| |
BlackRock EuroFund (continued) |
| |
|
| |
|
|
|
|
|
| |
Net asset value, beginning of year |
|
|
|
|
|
Net investment income (loss)(a) |
|
|
|
|
|
Net realized and unrealized gain (loss) |
|
|
|
|
|
Net increase (decrease) from investment operations |
|
|
|
|
|
Distributions from net investment income(b) |
|
|
|
|
|
Net asset value, end of year |
|
|
|
|
|
| |
|
|
|
|
|
| |
|
|
|
|
|
Ratios to Average Net Assets(d) |
|
|
|
|
|
| |
|
|
|
|
|
Total expenses after fees waived and/or reimbursed |
|
|
|
|
|
Total expenses after fees waived and/or reimbursed and excluding professional fees for foreign withholding taxes |
|
|
|
|
|
Net investment income (loss) |
|
|
|
|
|
| |
|
|
|
|
|
Net assets, end of year (000) |
|
|
|
|
|
| |
|
|
|
|
|
| |
Based on average shares outstanding. |
| |
Distributions for annual periods determined in accordance with U.S. federal income tax regulations. |
| |
Where applicable, excludes the effects of any sales charges and assumes the reinvestment of distributions. |
| |
Excludes fees and expenses incurred indirectly as a result of investments in underlying funds. |
See notes to financial statements.
22 2024 BlackRock Annual Financial Statements
Financial Highlights (continued)
(For a share outstanding throughout each period)
| |
BlackRock EuroFund (continued) |
| |
|
| |
|
|
|
|
|
| |
Net asset value, beginning of year |
|
|
|
|
|
| |
|
|
|
|
|
Net realized and unrealized gain (loss) |
|
|
|
|
|
Net increase (decrease) from investment operations |
|
|
|
|
|
Distributions from net investment income(b) |
|
|
|
|
|
Net asset value, end of year |
|
|
|
|
|
| |
|
|
|
|
|
| |
|
|
|
|
|
Ratios to Average Net Assets(d) |
|
|
|
|
|
| |
|
|
|
|
|
Total expenses after fees waived and/or reimbursed |
|
|
|
|
|
Total expenses after fees waived and/or reimbursed and excluding professional fees for foreign withholding taxes |
|
|
|
|
|
| |
|
|
|
|
|
| |
|
|
|
|
|
Net assets, end of year (000) |
|
|
|
|
|
| |
|
|
|
|
|
| |
Based on average shares outstanding. |
| |
Distributions for annual periods determined in accordance with U.S. federal income tax regulations. |
| |
Where applicable, assumes the reinvestment of distributions. |
| |
Excludes fees and expenses incurred indirectly as a result of investments in underlying funds. |
See notes to financial statements.
Financial Highlights (continued)
(For a share outstanding throughout each period)
| |
BlackRock EuroFund (continued) |
| |
|
| |
|
|
|
|
|
| |
Net asset value, beginning of year |
|
|
|
|
|
Net investment income (loss)(a) |
|
|
|
|
|
Net realized and unrealized gain (loss) |
|
|
|
|
|
Net increase (decrease) from investment operations |
|
|
|
|
|
Distributions from net investment income(b) |
|
|
|
|
|
Net asset value, end of year |
|
|
|
|
|
| |
|
|
|
|
|
| |
|
|
|
|
|
Ratios to Average Net Assets(d) |
|
|
|
|
|
| |
|
|
|
|
|
Total expenses after fees waived and/or reimbursed |
|
|
|
|
|
Total expenses after fees waived and/or reimbursed and excluding professional fees for foreign withholding taxes |
|
|
|
|
|
Net investment income (loss) |
|
|
|
|
|
| |
|
|
|
|
|
Net assets, end of year (000) |
|
|
|
|
|
| |
|
|
|
|
|
| |
Based on average shares outstanding. |
| |
Distributions for annual periods determined in accordance with U.S. federal income tax regulations. |
| |
Where applicable, assumes the reinvestment of distributions. |
| |
Excludes fees and expenses incurred indirectly as a result of investments in underlying funds. |
See notes to financial statements.
24 2024 BlackRock Annual Financial Statements
Notes to Financial Statements
BlackRock Advantage Global Fund, Inc., (the “Corporation”) and BlackRock EuroFund (the “Trust”) are each registered under the Investment Company Act of 1940, as amended (the “1940 Act”), as open-end management investment companies. The Corporation is organized as a Maryland corporation. The Trust is organized as a Massachusetts business trust. The following are referred to herein collectively as the “Funds” or individually as a “Fund”:
| |
|
Diversification
Classification |
BlackRock Advantage Global Fund, Inc. |
|
|
| |
|
|
Each Fund offers multiple classes of shares. All classes of shares have identical voting, dividend, liquidation and other rights and are subject to the same terms and conditions, except that certain classes bear expenses related to the shareholder servicing and distribution of such shares. Institutional and Class K Shares are sold only to certain eligible investors. Investor A, Investor C and Class R Shares bear certain expenses related to shareholder servicing of such shares, and Investor C and Class R Shares also bear certain expenses related to the distribution of such shares. Investor A and Investor C Shares are generally available through financial intermediaries. Class R Shares are sold only to certain employer-sponsored retirement plans. Each class has exclusive voting rights with respect to matters relating to its shareholder servicing and distribution expenditures (except that Investor C shareholders may vote on material changes to the Investor A Shares distribution and service plan).
| |
|
|
|
Institutional, Class K and Class R Shares |
|
|
|
| |
|
|
|
| |
|
|
To Investor A Shares after approximately 8 years |
| |
Investor A Shares may be subject to a contingent deferred sales charge (“CDSC”) for certain redemptions where no initial sales charge was paid at the time of purchase. |
| |
A CDSC of 1.00% is assessed on certain redemptions of Investor C Shares made within one year after purchase. |
The Board of Trustees of the Trust and the Board of Directors of the Corporation are collectively referred to throughout this report as the “Board,” and the directors/trustees thereof are collectively referred to throughout this report as “Directors”.
The Funds, together with certain other registered investment companies advised by BlackRock Advisors, LLC (the “Manager”) or its affiliates, are included in a complex of funds referred to as the BlackRock Multi-Asset Complex.
2.
SIGNIFICANT ACCOUNTING POLICIES
The financial statements are prepared in conformity with accounting principles generally accepted in the United States of America (“U.S. GAAP”), which may require management to make estimates and assumptions that affect the reported amounts of assets and liabilities in the financial statements, disclosure of contingent assets and liabilities at the date of the financial statements and the reported amounts of increases and decreases in net assets from operations during the reporting period. Actual results could differ from those estimates. Each Fund is considered an investment company under U.S. GAAP and follows the accounting and reporting guidance applicable to investment companies. Below is a summary of significant accounting policies:
Investment Transactions and Income Recognition: For financial reporting purposes, investment transactions are recorded on the dates the transactions are executed. Realized gains and losses on investment transactions are determined using the specific identification method. Dividend income and capital gain distributions, if any, are recorded on the ex-dividend dates. Non-cash dividends, if any, are recorded on the ex-dividend dates at fair value. Dividends from foreign securities where the ex-dividend dates may have passed are subsequently recorded when the Funds are informed of the ex-dividend dates. Under the applicable foreign tax laws, a withholding tax at various rates may be imposed on capital gains, dividends and interest. Upon notification from issuers, a portion of the dividend income received from a real estate investment trust may be redesignated as a reduction of cost of the related investment and/or realized gain. Income, expenses and realized and unrealized gains and losses are allocated daily to each class based on its relative net assets.
Foreign Currency Translation: Each Fund’s books and records are maintained in U.S. dollars. Securities and other assets and liabilities denominated in foreign currencies are translated into U.S. dollars using exchange rates determined as of the close of trading on the New York Stock Exchange (“NYSE”). Purchases and sales of investments are recorded at the rates of exchange prevailing on the respective dates of such transactions. Generally, when the U.S. dollar rises in value against a foreign currency, the investments denominated in that currency will lose value; the opposite effect occurs if the U.S. dollar falls in relative value.
Each Fund does not isolate the effect of fluctuations in foreign exchange rates from the effect of fluctuations in the market prices of investments for financial reporting purposes. Accordingly, the effects of changes in exchange rates on investments are not segregated in the Statements of Operations from the effects of changes in market prices of those investments, but are included as a component of net realized and unrealized gain (loss) from investments. Each Fund reports realized currency gains (losses) on foreign currency related transactions as components of net realized gain (loss) for financial reporting purposes, whereas such components are generally treated as ordinary income for U.S. federal income tax purposes.
Foreign Taxes: The Funds may be subject to foreign taxes (a portion of which may be reclaimable) on income, stock dividends, capital gains on investments, or certain foreign currency transactions. All foreign taxes are recorded in accordance with the applicable foreign tax regulations and rates that exist in the foreign jurisdictions in which each Fund invests. These foreign taxes, if any, are paid by each Fund and are reflected in its Statements of Operations as follows: foreign taxes withheld at source are presented as a reduction of income, foreign taxes on securities lending income are presented as a reduction of securities lending income, foreign taxes on stock dividends are presented as “Foreign taxes withheld”, and foreign taxes on capital gains from sales of investments and foreign taxes on foreign currency transactions are included in their respective net realized gain (loss) categories. Foreign taxes payable or deferred as of June 30, 2024, if any, are disclosed in the Statements of Assets and Liabilities.
Notes to Financial Statements
25
Notes to Financial Statements (continued)
The Funds file withholding tax reclaims in certain jurisdictions to recover a portion of amounts previously withheld. The Funds may record a reclaim receivable based on collectability, which includes factors such as the jurisdiction’s applicable laws, payment history and market convention. The Statements of Operations include tax reclaims recorded as well as professional and other fees, if any, associated with recovery of foreign withholding taxes.
Bank Overdraft: The Funds had outstanding cash disbursements exceeding deposited cash amounts at the custodian during the reporting period. The Funds are obligated to repay the custodian for any overdraft, including any related costs or expenses, where applicable. For financial reporting purposes, overdraft fees, if any, are included in interest expense in the Statements of Operations.
Collateralization: If required by an exchange or counterparty agreement, the Funds may be required to deliver/deposit cash and/or securities to/with an exchange, or broker-dealer or custodian as collateral for certain investments.
Distributions: Distributions paid by the Funds are recorded on the ex-dividend dates. The character and timing of distributions are determined in accordance with U.S. federal income tax regulations, which may differ from U.S. GAAP.
Indemnifications: In the normal course of business, a Fund enters into contracts that contain a variety of representations that provide general indemnification. A Fund’s maximum exposure under these arrangements is unknown because it involves future potential claims against a Fund, which cannot be predicted with any certainty.
Other: Expenses directly related to a Fund or its classes are charged to that Fund or the applicable class. Expenses directly related to the Funds and other shared expenses prorated to the Funds are allocated daily to each class based on their relative net assets or other appropriate methods. Other operating expenses shared by several funds, including other funds managed by the Manager, are prorated among those funds on the basis of relative net assets or other appropriate methods.
The Funds have an arrangement with their custodian whereby credits are earned on uninvested cash balances. For financial reporting purposes, custodian credits, if any, are included in interest income in the Statements of Operations.
3.
INVESTMENT VALUATION AND FAIR VALUE MEASUREMENTS
Investment Valuation Policies: Each Fund’s investments are valued at fair value (also referred to as “market value” within the financial statements) each day that the Fund is open for business and, for financial reporting purposes, as of the report date. U.S. GAAP defines fair value as the price a fund would receive to sell an asset or pay to transfer a liability in an orderly transaction between market participants at the measurement date. The Board has approved the designation of each Fund’s Manager as the valuation designee for each Fund. Each Fund determines the fair values of its financial instruments using various independent dealers or pricing services under the Manager’s policies. If a security’s market price is not readily available or does not otherwise accurately represent the fair value of the security, the security will be valued in accordance with the Manager’s policies and procedures as reflecting fair value. The Manager has formed a committee (the “Valuation Committee”) to develop pricing policies and procedures and to oversee the pricing function for all financial instruments, with assistance from other BlackRock pricing committees.
Fair Value Inputs and Methodologies: The following methods and inputs are used to establish the fair value of each Fund’s assets and liabilities:
•Equity investments traded on a recognized securities exchange are valued at that day’s official closing price, as applicable, on the exchange where the stock is primarily traded. Equity investments traded on a recognized exchange for which there were no sales on that day may be valued at the last available bid (long positions) or ask (short positions) price.
•Investments in open-end U.S. mutual funds (including money market funds) are valued at that day’s published net asset value (“NAV”).
•Futures contracts are valued based on that day’s last reported settlement or trade price on the exchange where the contract is traded.
Generally, trading in foreign instruments is substantially completed each day at various times prior to the close of trading on the NYSE. Each business day, the Funds use current market factors supplied by independent pricing services to value certain foreign instruments (“Systematic Fair Value Price”). The Systematic Fair Value Price is designed to value such foreign securities at fair value as of the close of trading on the NYSE, which follows the close of the local markets.
If events (e.g., market volatility, company announcement or a natural disaster) occur that are expected to materially affect the value of such investment, or in the event that application of these methods of valuation results in a price for an investment that is deemed not to be representative of the market value of such investment, or if a price is not available, the investment will be valued by the Valuation Committee in accordance with the Manager’s policies and procedures as reflecting fair value (“Fair Valued Investments”). The fair valuation approaches that may be used by the Valuation Committee include market approach, income approach and cost approach. Valuation techniques such as discounted cash flow, use of market comparables and matrix pricing are types of valuation approaches and are typically used in determining fair value. When determining the price for Fair Valued Investments, the Valuation Committee seeks to determine the price that each Fund might reasonably expect to receive or pay from the current sale or purchase of that asset or liability in an arm’s-length transaction. Fair value determinations shall be based upon all available factors that the Valuation Committee deems relevant and consistent with the principles of fair value measurement.
For investments in equity or debt issued by privately held companies or funds (“Private Company” or collectively, the “Private Companies”) and other Fair Valued Investments, the fair valuation approaches that are used by the Valuation Committee and third-party pricing services utilized by the Valuation Committee include one or a combination of, but not limited to, the following inputs.
| |
Standard Inputs Generally Considered By The Valuation Committee And Third-Party Pricing Services |
| |
|
recent market transactions, including subsequent rounds of financing, in the underlying investment or comparable issuers; |
| |
|
recapitalizations and other transactions across the capital structure; and |
| |
|
market multiples of comparable issuers. |
26 2024 BlackRock Annual Financial Statements
Notes to Financial Statements (continued)
| |
Standard Inputs Generally Considered By The Valuation Committee And Third-Party Pricing Services |
| |
|
future cash flows discounted to present and adjusted as appropriate for liquidity, credit, and/or market risks; |
| |
|
quoted prices for similar investments or assets in active markets; and |
| |
|
other risk factors, such as interest rates, yield curves, volatilities, prepayment speeds, loss severities, credit risks, recovery rates, liquidation amounts and/or default rates. |
| |
|
audited or unaudited financial statements, investor communications and financial or operational metrics issued by the Private Company; |
| |
|
changes in the valuation of relevant indices or publicly traded companies comparable to the Private Company; |
| |
|
relevant news and other public sources; and |
| |
|
known secondary market transactions in the Private Company’s interests and merger or acquisition activity in companies comparable to the Private Company. |
Investments in series of preferred stock issued by Private Companies are typically valued utilizing market approach in determining the enterprise value of the company. Such investments often contain rights and preferences that differ from other series of preferred and common stock of the same issuer. Enterprise valuation techniques such as an option pricing model (“OPM”), a probability weighted expected return model (“PWERM”), current value method or a hybrid of those techniques are used as deemed appropriate under the circumstances. The use of these valuation techniques involves a determination of the exit scenarios of the investment in order to appropriately allocate the enterprise value of the company among the various parts of its capital structure.
The Private Companies are not subject to the public company disclosure, timing, and reporting standards applicable to other investments held by a Fund. Typically, the most recently available information by a Private Company is as of a date that is earlier than the date a Fund is calculating its NAV. This factor may result in a difference between the value of the investment and the price a Fund could receive upon the sale of the investment.
Fair Value Hierarchy: Various inputs are used in determining the fair value of financial instruments. These inputs to valuation techniques are categorized into a fair value hierarchy consisting of three broad levels for financial reporting purposes as follows:
•Level 1 – Unadjusted price quotations in active markets/exchanges for identical assets or liabilities that each Fund has the ability to access;
•Level 2 – Other observable inputs (including, but not limited to, quoted prices for similar assets or liabilities in markets that are active, quoted prices for identical or similar assets or liabilities in markets that are not active, inputs other than quoted prices that are observable for the assets or liabilities (such as interest rates, yield curves, volatilities, prepayment speeds, loss severities, credit risks and default rates) or other market–corroborated inputs); and
•Level 3 – Unobservable inputs based on the best information available in the circumstances, to the extent observable inputs are not available (including the Valuation Committee’s assumptions used in determining the fair value of financial instruments).
The hierarchy gives the highest priority to unadjusted quoted prices in active markets for identical assets or liabilities (Level 1 measurements) and the lowest priority to unobservable inputs (Level 3 measurements). Accordingly, the degree of judgment exercised in determining fair value is greatest for instruments categorized in Level 3. The inputs used to measure fair value may fall into different levels of the fair value hierarchy. In such cases, for disclosure purposes, the fair value hierarchy classification is determined based on the lowest level input that is significant to the fair value measurement in its entirety. Investments classified within Level 3 have significant unobservable inputs used by the Valuation Committee in determining the price for Fair Valued Investments. Level 3 investments include equity or debt issued by Private Companies that may not have a secondary market and/or may have a limited number of investors. The categorization of a value determined for financial instruments is based on the pricing transparency of the financial instruments and is not necessarily an indication of the risks associated with investing in those securities.
4.
SECURITIES AND OTHER INVESTMENTS
Preferred Stocks: Preferred stock has a preference over common stock in liquidation (and generally in receiving dividends as well), but is subordinated to the liabilities of the issuer in all respects. As a general rule, the market value of preferred stock with a fixed dividend rate and no conversion element varies inversely with interest rates and perceived credit risk, while the market price of convertible preferred stock generally also reflects some element of conversion value. Because preferred stock is junior to debt securities and other obligations of the issuer, deterioration in the credit quality of the issuer will cause greater changes in the value of a preferred stock than in a more senior debt security with similar stated yield characteristics. Unlike interest payments on debt securities, preferred stock dividends are payable only if declared by the issuer’s board of directors. Preferred stock also may be subject to optional or mandatory redemption provisions.
Securities Lending: The Funds may lend their securities to approved borrowers, such as brokers, dealers and other financial institutions. The borrower pledges and maintains with the Funds collateral consisting of cash, an irrevocable letter of credit issued by a bank, or securities issued or guaranteed by the U.S. Government. The initial collateral received by each Fund is required to have a value of at least 102% of the current value of the loaned securities for securities traded on U.S. exchanges and a value of at least 105% for all other securities. The collateral is maintained thereafter at a value equal to at least 100% of the current market value of the securities on loan. The market value of the loaned securities is determined at the close of each business day of the Fund and any additional required collateral is delivered to the Fund, or excess collateral returned by the Fund, on the next business day. During the term of the loan, the Funds are entitled to all distributions made on or in respect of the loaned securities, but do not receive interest income on securities received as collateral. Loans of securities are terminable at any time and the borrower, after notice, is required to return borrowed securities within the standard time period for settlement of securities transactions.
As of period end, any securities on loan were collateralized by cash and/or U.S. Government obligations. Cash collateral invested by the securities lending agent, BlackRock Investment Management, LLC (“BIM”), if any, is disclosed in the Schedules of Investments. Any non-cash collateral received cannot be sold, re-invested or pledged by the Fund, except in the event of borrower default. The securities on loan, if any, are disclosed in the Funds’ Schedules of Investments. The market value of any securities on loan
Notes to Financial Statements
27
Notes to Financial Statements (continued)
and the value of related collateral, if any, are shown separately in the Statements of Assets and Liabilities as a component of investments at value – unaffiliated and collateral on securities loaned, respectively.
Securities lending transactions are entered into by the Funds under Master Securities Lending Agreements (each, an “MSLA”), which provide the right, in the event of default (including bankruptcy or insolvency), for the non-defaulting party to liquidate the collateral and calculate a net exposure to the defaulting party or request additional collateral. In the event that a borrower defaults, the Funds, as lender, would offset the market value of the collateral received against the market value of the securities loaned. When the value of the collateral is greater than that of the market value of the securities loaned, the lender is left with a net amount payable to the defaulting party. However, bankruptcy or insolvency laws of a particular jurisdiction may impose restrictions on or prohibitions against such a right of offset in the event of an MSLA counterparty’s bankruptcy or insolvency. Under the MSLA, absent an event of default, the borrower can resell or re-pledge the loaned securities, and the Funds can reinvest cash collateral received in connection with loaned securities. Upon an event of default, the parties’ obligations to return the securities or collateral to the other party are extinguished, and the parties can resell or re-pledge the loaned securities or the collateral received in connection with the loaned securities in order to satisfy the defaulting party’s net payment obligation for all transactions under the MSLA. The defaulting party remains liable for any deficiency.
The risks of securities lending include the risk that the borrower may not provide additional collateral when required or may not return the securities when due. To mitigate these risks, the Funds benefit from a borrower default indemnity provided by BIM. BIM’s indemnity allows for full replacement of the securities loaned to the extent the collateral received does not cover the value on the securities loaned in the event of borrower default. Each Fund could incur a loss if the value of an investment purchased with cash collateral falls below the market value of loaned securities or if the value of an investment purchased with cash collateral falls below the value of the original cash collateral received. Such losses are borne entirely by the Funds.
5.
DERIVATIVE FINANCIAL INSTRUMENTS
The Funds engage in various portfolio investment strategies using derivative contracts both to increase the returns of the Funds and/or to manage their exposure to certain risks such as credit risk, equity risk, interest rate risk, foreign currency exchange rate risk, commodity price risk or other risks (e.g., inflation risk). Derivative financial instruments categorized by risk exposure are included in the Schedules of Investments. These contracts may be transacted on an exchange or over-the-counter (“OTC”).
Futures Contracts: Futures contracts are purchased or sold to gain exposure to, or manage exposure to, changes in interest rates (interest rate risk) and changes in the value of equity securities (equity risk) or foreign currencies (foreign currency exchange rate risk).
Futures contracts are exchange-traded agreements between the Funds and a counterparty to buy or sell a specific quantity of an underlying instrument at a specified price and on a specified date. Depending on the terms of a contract, it is settled either through physical delivery of the underlying instrument on the settlement date or by payment of a cash amount on the settlement date. Upon entering into a futures contract, the Funds are required to deposit initial margin with the broker in the form of cash or securities in an amount that varies depending on a contract’s size and risk profile. The initial margin deposit must then be maintained at an established level over the life of the contract. Amounts pledged, which are considered restricted, are included in cash pledged for futures contracts in the Statements of Assets and Liabilities.
Securities deposited as initial margin are designated in the Schedules of Investments and cash deposited, if any, are shown as cash pledged for futures contracts in the Statements of Assets and Liabilities. Pursuant to the contract, the Funds agree to receive from or pay to the broker an amount of cash equal to the daily fluctuation in market value of the contract (“variation margin”). Variation margin is recorded as unrealized appreciation (depreciation) and, if any, shown as variation margin receivable (or payable) on futures contracts in the Statements of Assets and Liabilities. When the contract is closed, a realized gain or loss is recorded in the Statements of Operations equal to the difference between the notional amount of the contract at the time it was opened and the notional amount at the time it was closed. The use of futures contracts involves the risk of an imperfect correlation in the movements in the price of futures contracts and interest rates, foreign currency exchange rates or underlying assets.
6.
INVESTMENT ADVISORY AGREEMENT AND OTHER TRANSACTIONS WITH AFFILIATES
Investment Advisory: Each Fund entered into an Investment Advisory Agreement with the Manager, the Funds’ investment adviser and an indirect, wholly-owned subsidiary of BlackRock, Inc. (“BlackRock”), to provide investment advisory and administrative services. The Manager is responsible for the management of each Fund’s portfolio and provides the personnel, facilities, equipment and certain other services necessary to the operations of each Fund.
For such services, each Fund pays the Manager a monthly fee at an annual rate equal to the following percentages of the average daily value of each Fund’s net assets:
With respect to EuroFund, the Manager entered into a sub-advisory agreement with BlackRock International Limited (“BIL”), an affiliate of the Manager. The Manager pays BIL for services it provides for that portion of the Fund for which BIL acts as sub-adviser, a monthly fee that is equal to a percentage of the investment advisory fees paid by EuroFund to the Manager.
28 2024 BlackRock Annual Financial Statements
Notes to Financial Statements (continued)
Service and Distribution Fees: The Funds entered into a Distribution Agreement and Distribution and Service Plans with BlackRock Investments, LLC (“BRIL”), an affiliate of the Manager. Pursuant to the Distribution and Service Plan and in accordance with Rule 12b-1 under the 1940 Act, each Fund pays BRIL ongoing service and distribution fees. The fees are accrued daily and paid monthly at annual rates based upon the average daily net assets of the relevant share class of each Fund as follows:
BRIL and broker-dealers, pursuant to sub-agreements with BRIL, provide shareholder servicing and distribution services to the Funds. The ongoing service and/or distribution fee compensates BRIL and each broker-dealer for providing shareholder servicing and/or distribution related services to shareholders.
For the year ended June 30, 2024, the following table shows the class specific service and distribution fees borne directly by each share class of each Fund:
Transfer Agent: Pursuant to written agreements, certain financial intermediaries, some of which may be affiliates, provide the Funds with sub-accounting, recordkeeping, sub-transfer agency and other administrative services with respect to servicing of underlying investor accounts. For these services, these entities receive an asset-based fee or an annual fee per shareholder account, which will vary depending on share class and/or net assets. For the year ended June 30, 2024, the Funds did not pay any amounts to affiliates in return for these services.
The Manager maintains a call center that is responsible for providing certain shareholder services to the Funds. Shareholder services include responding to inquiries and processing purchases and sales based upon instructions from shareholders. For the year ended June 30, 2024, each Fund reimbursed the Manager the following amounts for costs incurred in running the call center, which are included in transfer agent — class specific in the Statements of Operations:
For the year ended June 30, 2024, the following table shows the class specific transfer agent fees borne directly by each share class of each Fund:
Other Fees: For the year ended June 30, 2024, affiliates earned underwriting discounts, direct commissions and dealer concessions on sales of each Fund’s Investor A Shares as follows:
For the year ended June 30, 2024, affiliates received CDSCs as follows:
Expense Limitations, Waivers and Reimbursements: With respect to each Fund, the Manager contractually agreed to waive its investment advisory fees by the amount of investment advisory fees each Fund pays to the Manager indirectly through its investment in affiliated money market funds (the “affiliated money market fund waiver") through June 30, 2025. The contractual agreement may be terminated upon 90 days’ notice by a majority of the directors who are not “interested persons” of the Funds, as defined in the 1940 Act ("Independent Directors"), or by a vote of a majority of the outstanding voting securities of a Fund. The amount of waivers and/or reimbursements of fees and expenses made pursuant to the expense limitation described below will be reduced by the amount of the affiliated money market fund waiver. These amounts are included in fees waived and/or reimbursed by the Manager in the Statements of Operations. For the year ended June 30, 2024, the amounts waived were as follows:
| |
Fees Waived and/or Reimbursed
by the Manager |
| |
|
| |
|
The Manager has contractually agreed to waive its investment advisory fee with respect to any portion of each Fund’s assets invested in affiliated equity and fixed-income mutual funds and affiliated exchange-traded funds that have a contractual management fee through June 30, 2025. The contractual agreement may be terminated upon 90 days’ notice by a majority of the Independent Directors, or by a vote of a majority of the outstanding voting securities of a Fund. For the year ended June 30, 2024, there were no fees waived by the Manager pursuant to this arrangement.
Notes to Financial Statements
29
Notes to Financial Statements (continued)
With respect to each Fund, the Manager contractually agreed to waive and/or reimburse fees or expenses in order to limit expenses, excluding interest expense, dividend expense, acquired fund fees and expenses, and certain other fund expenses, which constitute extraordinary expenses not incurred in the ordinary course of each Fund’s business (“expense limitation”). The expense limitations as a percentage of average daily net assets are as follows:
With respect to Advantage Global, the Manager has agreed not to reduce or discontinue this contractual expense limitation through June 30, 2025, unless approved by the Board, including a majority of the Independent Directors or by a vote of a majority of the outstanding voting securities of a Fund. For the year ended June 30, 2024, the Manager waived and/or reimbursed investment advisory fees of $661,545, which is included in fees waived and/or reimbursed by the Manager in the Statements of Operations.
With respect to Euro Fund, effective June 1, 2024, the Manager voluntarily agreed to waive and/or reimburse fees or expenses in order to limit expenses, excluding dividend expense, interest expense, acquired fund fees and expenses, and certain other fund expenses, which constitute extraordinary expenses not incurred in the ordinary course of each Fund’s business (“expense limitation”). The expense limitations as a percentage of average daily net assets are as follows:
The voluntary expense limitation may be discontinued at any time without notice. For the year ended June 30, 2024, the Manager waived and/or reimbursed investment advisory fees of $99,735 which is included in fees waived and/or reimbursed by the Manager in the Statements of Operations.
In addition, these amounts waived and/or reimbursed by the Manager are included in transfer agent fees waived and/or reimbursed by the Manager — class specific in the Statements of Operations. For the year ended June 30, 2024, class specific expense waivers and/or reimbursements were as follows:
| |
Transfer Agent Fees Waived and/or
Reimbursed by the Manager - Class Specific |
| |
|
|
|
|
|
|
| |
|
|
|
|
|
|
| |
|
|
|
|
|
|
Securities Lending: The U.S. Securities and Exchange Commission (“SEC”) has issued an exemptive order which permits BIM, an affiliate of the Manager, to serve as securities lending agent for the Funds, subject to applicable conditions. As securities lending agent, BIM bears all operational costs directly related to securities lending. The Funds are responsible for fees in connection with the investment of cash collateral received for securities on loan (the “collateral investment fees”). The cash collateral is invested in a money market fund, BlackRock Cash Funds: Institutional, managed by the Manager or its affiliates. However, BIM has agreed to reduce the amount of securities lending income it receives in order to effectively limit the collateral investment fees the Funds bear to an annual rate of 0.04%. The SL Agency Shares of such money market fund will not be subject to a sales load, redemption fee, distribution fee or service fee. The money market fund in which the cash collateral has been reinvested may impose a discretionary liquidity fee of up to 2% of the value redeemed, if such fee, is determined to be in the best interests of such money market fund.
Securities lending income is generally equal to the total of income earned from the reinvestment of cash collateral (and excludes collateral investment fees), and any fees or other payments to and from borrowers of securities. Each Fund retains a portion of the securities lending income and remits the remaining portion to BIM as compensation for its services as securities lending agent.
Pursuant to the current securities lending agreement, each Fund retains 82% of securities lending income (which excludes collateral investment expenses), and this amount retained can never be less than 70% of the total of securities lending income plus the collateral investment expenses.
In addition, commencing the business day following the date that the aggregate securities lending income earned across the BlackRock Multi-Asset Complex in a calendar year exceeds a specified threshold, each Fund, pursuant to the securities lending agreement, will retain for the remainder of that calendar year securities lending income in an amount equal to 85% of securities lending income (which excludes collateral investment expenses), and this amount retained can never be less than 70% of the total of securities lending income plus the collateral investment expenses.
The share of securities lending income earned by each Fund is shown as securities lending income — affiliated — net in the Statements of Operations. For the year ended June 30, 2024, each Fund paid BIM the following amounts for securities lending agent services:
Interfund Lending: In accordance with an exemptive order (the “Order”) from the SEC, each Fund may participate in a joint lending and borrowing facility for temporary purposes (the “Interfund Lending Program”), subject to compliance with the terms and conditions of the Order, and to the extent permitted by each Fund’s investment policies and restrictions. EuroFund is currently permitted to borrow under the Interfund Lending Program. Advantage Global is currently permitted to borrow and lend under the Interfund Lending Program.
A lending BlackRock fund may lend in aggregate up to 15% of its net assets but may not lend more than 5% of its net assets to any one borrowing fund through the Interfund Lending Program. A borrowing BlackRock fund may not borrow through the Interfund Lending Program or from any other source more than 33 1/3% of its total assets (or any lower threshold provided for by the fund’s investment restrictions). If a borrowing BlackRock fund’s total outstanding borrowings exceed 10% of its total assets, each of its
30 2024 BlackRock Annual Financial Statements
Notes to Financial Statements (continued)
outstanding interfund loans will be subject to collateralization of at least 102% of the outstanding principal value of the loan. All interfund loans are for temporary or emergency purposes and the interest rate to be charged will be the average of the highest current overnight repurchase agreement rate available to a lending fund and the bank loan rate, as calculated according to a formula established by the Board.
During the year ended June 30, 2024, the Funds did not participate in the Interfund Lending Program.
Directors and Officers: Certain directors and/or officers of the Funds are directors and/or officers of BlackRock or its affiliates. The Funds reimburse the Manager for a portion of the compensation paid to the Funds’ Chief Compliance Officer, which is included in Directors and Officer in the Statements of Operations.
Other Transactions: With respect to Advantage Global, the Fund received proceeds from settlement of litigation where it was able to recover a portion of investment losses previously realized by the Fund. This amount is shown as litigation proceeds in the Statements of Operations.
The Funds may purchase securities from, or sell securities to, an affiliated fund provided the affiliation is due solely to having a common investment adviser, common officers, or common directors. For the year ended June 30, 2024, the purchase and sale transactions and any net realized gains (losses) with affiliated funds in compliance with Rule 17a-7 under the 1940 Act were as follows:
For the year ended June 30, 2024, purchases and sales of investments, excluding short-term securities, were as follows:
8.
INCOME TAX INFORMATION
It is each Fund’s policy to comply with the requirements of the Internal Revenue Code of 1986, as amended, applicable to regulated investment companies, and to distribute substantially all of its taxable income to its shareholders. Therefore, no U.S. federal income tax provision is required.
Each Fund files U.S. federal and various state and local tax returns. No income tax returns are currently under examination. The statute of limitations on each Fund’ s U.S. federal tax returns generally remains open for a period of three years after they are filed. The statutes of limitations on each Fund’s state and local tax returns may remain open for an additional year depending upon the jurisdiction.
Management has analyzed tax laws and regulations and their application to the Funds as of June 30, 2024, inclusive of the open tax return years, and does not believe that there are any uncertain tax positions that require recognition of a tax liability in the Funds’ financial statements.
The tax character of distributions paid was as follows:
As of June 30, 2024, the tax components of accumulated earnings (loss) were as follows:
| |
Undistributed
Ordinary Income |
Undistributed
Long-Term
Capital Gains |
Non-Expiring
Capital Loss
|
|
|
| |
|
|
|
|
|
| |
|
|
|
|
|
| |
Amounts available to offset future realized capital gains. |
| |
The difference between book-basis and tax-basis net unrealized gains (losses) was attributable primarily to the tax deferral of losses on wash sales, the realization for tax purposes of unrealized gains on investments in passive foreign investment companies and the realization for tax purposes of unrealized gains (losses) on certain futures and foreign currency contracts. |
Notes to Financial Statements
31
Notes to Financial Statements (continued)
During the year ended June 30, 2024, the Fund listed below utilized the following amount of its capital loss carryforward:
As of June 30, 2024, gross unrealized appreciation and depreciation based on cost of investments (including short positions and derivatives, if any) for U.S. federal income tax purposes were as follows:
| |
|
Gross Unrealized
Appreciation |
Gross Unrealized
Depreciation |
Net Unrealized
Appreciation
(Depreciation) |
| |
|
|
|
|
| |
|
|
|
|
The Funds, along with certain other funds managed by the Manager and its affiliates (“Participating Funds”), is party to a 364-day, $2.40 billion credit agreement with a group of lenders. Under this agreement, the Funds may borrow to fund shareholder redemptions. Excluding commitments designated for certain individual funds, the Participating Funds, including the Funds, can borrow up to an aggregate commitment amount of $1.75 billion at any time outstanding, subject to asset coverage and other limitations as specified in the agreement. The credit agreement has the following terms: a fee of 0.10% per annum on unused commitment amounts and interest at a rate equal to the higher of (a) Overnight Bank Funding Rate (“OBFR”) (but, in any event, not less than 0.00%) on the date the loan is made plus 0.80% per annum, (b) the Fed Funds rate (but, in any event, not less than 0.00%) in effect from time to time plus 0.80% per annum on amounts borrowed or (c) the sum of (x) Daily Simple Secured Overnight Financing Rate (“SOFR”) (but, in any event, not less than 0.00%) on the date the loan is made plus 0.10% and (y) 0.80% per annum. The agreement expires in April 2025 unless extended or renewed. Prior to April 11, 2024, the aggregate commitment amount was $2.50 billion. These fees were allocated among such funds based upon portions of the aggregate commitment available to them and relative net assets of Participating Funds. During the year ended June 30, 2024, the Funds did not borrow under the credit agreement.
In the normal course of business, the Funds invest in securities or other instruments and may enter into certain transactions, and such activities subject each Fund to various risks, including among others, fluctuations in the market (market risk) or failure of an issuer to meet all of its obligations. The value of securities or other instruments may also be affected by various factors, including, without limitation: (i) the general economy; (ii) the overall market as well as local, regional or global political and/or social instability; (iii) regulation, taxation or international tax treaties between various countries; or (iv) currency, interest rate and price fluctuations. Local, regional or global events such as war, acts of terrorism, the spread of infectious illness or other public health issues, recessions, or other events could have a significant impact on the Funds and their investments. Each Fund’s prospectus provides details of the risks to which each Fund is subject.
The Funds may be exposed to additional risks when reinvesting cash collateral in money market funds that do not seek to maintain a stable NAV per share of $1.00, which may be subject to discretionary liquidity fees under certain circumstances.
Valuation Risk: The market values of equities, such as common stocks and preferred securities or equity related investments, such as futures and options, may decline due to general market conditions which are not specifically related to a particular company. They may also decline due to factors which affect a particular industry or industries. A Fund may invest in illiquid investments. An illiquid investment is any investment that a Fund reasonably expects cannot be sold or disposed of in current market conditions in seven calendar days or less without the sale or disposition significantly changing the market value of the investment. A Fund may experience difficulty in selling illiquid investments in a timely manner at the price that it believes the investments are worth. Prices may fluctuate widely over short or extended periods in response to company, market or economic news. Markets also tend to move in cycles, with periods of rising and falling prices. This volatility may cause each Fund’s NAV to experience significant increases or decreases over short periods of time. If there is a general decline in the securities and other markets, the NAV of a Fund may lose value, regardless of the individual results of the securities and other instruments in which a Fund invests.
The price a Fund could receive upon the sale of any particular portfolio investment may differ from a Fund’s valuation of the investment, particularly for securities that trade in thin or volatile markets or that are valued using a fair valuation technique or a price provided by an independent pricing service. Changes to significant unobservable inputs and assumptions (i.e., publicly traded company multiples, growth rate, time to exit) due to the lack of observable inputs may significantly impact the resulting fair value and therefore a Fund’s results of operations. As a result, the price received upon the sale of an investment may be less than the value ascribed by a Fund, and a Fund could realize a greater than expected loss or lesser than expected gain upon the sale of the investment. A Fund’s ability to value its investments may also be impacted by technological issues and/or errors by pricing services or other third-party service providers.
Counterparty Credit Risk: The Funds may be exposed to counterparty credit risk, or the risk that an entity may fail to or be unable to perform on its commitments related to unsettled or open transactions, including making timely interest and/or principal payments or otherwise honoring its obligations. The Funds manage counterparty credit risk by entering into transactions only with counterparties that the Manager believes have the financial resources to honor their obligations and by monitoring the financial stability of those counterparties. Financial assets, which potentially expose the Funds to market, issuer and counterparty credit risks, consist principally of financial instruments and receivables due from counterparties. The extent of the Funds’ exposure to market, issuer and counterparty credit risks with respect to these financial assets is approximately their value recorded in the Statements of Assets and Liabilities, less any collateral held by the Funds.
A derivative contract may suffer a mark-to-market loss if the value of the contract decreases due to an unfavorable change in the market rates or values of the underlying instrument. Losses can also occur if the counterparty does not perform under the contract.
32 2024 BlackRock Annual Financial Statements
Notes to Financial Statements (continued)
With exchange-traded futures, there is less counterparty credit risk to the Funds since the exchange or clearinghouse, as counterparty to such instruments, guarantees against a possible default. The clearinghouse stands between the buyer and the seller of the contract; therefore, credit risk is limited to failure of the clearinghouse. While offset rights may exist under applicable law, a Fund does not have a contractual right of offset against a clearing broker or clearinghouse in the event of a default (including the bankruptcy or insolvency). Additionally, credit risk exists in exchange-traded futures with respect to initial and variation margin that is held in a clearing broker’s customer accounts. While clearing brokers are required to segregate customer margin from their own assets, in the event that a clearing broker becomes insolvent or goes into bankruptcy and at that time there is a shortfall in the aggregate amount of margin held by the clearing broker for all its clients, typically the shortfall would be allocated on a pro rata basis across all the clearing broker’s customers, potentially resulting in losses to the Funds.
Geographic/Asset Class Risk: A diversified portfolio, where this is appropriate and consistent with a fund’s objectives, minimizes the risk that a price change of a particular investment will have a material impact on the NAV of a fund. The investment concentrations within each Fund’s portfolio are disclosed in its Schedule of Investments.
The Funds invest a substantial amount of their assets in issuers located in a single country or a limited number of countries. When a fund concentrates its investments in this manner, it assumes the risk that economic, regulatory, political and social conditions in those countries may have a significant impact on their investment performance and could affect the income from, or the value or liquidity of, the Fund’s portfolio. Unanticipated or sudden political or social developments may cause uncertainty in the markets and as a result adversely affect the Fund’s investments. Foreign issuers may not be subject to the same uniform accounting, auditing and financial reporting standards and practices as used in the United States. Foreign securities markets may also be more volatile and less liquid than U.S. securities and may be less subject to governmental supervision not typically associated with investing in U.S. securities. Investment percentages in specific countries are presented in the Schedules of Investments.
Certain Funds invest a significant portion of their assets in securities of issuers located in the United States. A decrease in imports or exports, changes in trade regulations, inflation and/or an economic recession in the United States may have a material adverse effect on the U.S. economy and the securities listed on U.S. exchanges. Proposed and adopted policy and legislative changes in the United States may also have a significant effect on U.S. markets generally, as well as on the value of certain securities. Governmental agencies project that the United States will continue to maintain elevated public debt levels for the foreseeable future which may constrain future economic growth. Circumstances could arise that could prevent the timely payment of interest or principal on U.S. government debt, such as reaching the legislative “debt ceiling.” Such non-payment would result in substantial negative consequences for the U.S. economy and the global financial system. If U.S. relations with certain countries deteriorate, it could adversely affect issuers that rely on the United States for trade. The United States has also experienced increased internal unrest and discord. If these trends were to continue, they may have an adverse impact on the U.S. economy and the issuers in which the Funds invest.
Certain Funds invest a significant portion of their assets in securities of issuers located in Europe or with significant exposure to European issuers or countries. The European financial markets have recently experienced volatility and adverse trends due to concerns about economic downturns in, or rising government debt levels of, several European countries as well as acts of war in the region. These events may spread to other countries in Europe and may affect the value and liquidity of certain of the Funds’ investments.
Responses to the financial problems by European governments, central banks and others, including austerity measures and reforms, may not work, may result in social unrest and may limit future growth and economic recovery or have other unintended consequences. Further defaults or restructurings by governments and others of their debt could have additional adverse effects on economies, financial markets and asset valuations around the world. The United Kingdom has withdrawn from the European Union, and one or more other countries may withdraw from the European Union and/or abandon the Euro, the common currency of the European Union. These events and actions have adversely affected, and may in the future adversely affect, the value and exchange rate of the Euro and may continue to significantly affect the economies of every country in Europe, including countries that do not use the Euro and non-European Union member states. The impact of these actions, especially if they occur in a disorderly fashion, is not clear but could be significant and far reaching. In addition, Russia launched a large-scale invasion of Ukraine on February 24, 2022. The extent and duration of the military action, resulting sanctions and resulting future market disruptions in the region are impossible to predict, but have been, and may continue to be, significant and have a severe adverse effect on the region, including significant negative impacts on the economy and the markets for certain securities and commodities, such as oil and natural gas, as well as other sectors.
Significant Shareholder Redemption Risk: Certain shareholders may own or manage a substantial amount of fund shares and/or hold their fund investments for a limited period of time. Large redemptions of fund shares by these shareholders may force a fund to sell portfolio securities, which may negatively impact the fund’s NAV, increase the fund’s brokerage costs, and/or accelerate the realization of taxable income/gains and cause the fund to make additional taxable distributions to shareholders.
11.
CAPITAL SHARE TRANSACTIONS
Transactions in capital shares for each class were as follows:
| |
|
|
| |
|
|
|
|
| |
|
|
|
|
| |
|
|
|
|
| |
|
|
|
|
Shares issued in reinvestment of distributions |
|
|
|
|
| |
|
|
|
|
| |
|
|
|
|
Notes to Financial Statements
33
Notes to Financial Statements (continued)
| |
|
|
Fund Name / Share Class (continued) |
|
|
|
|
Advantage Global (continued) |
|
|
|
|
| |
|
|
|
|
Shares sold and automatic conversion of shares |
|
|
|
|
Shares issued in reinvestment of distributions |
|
|
|
|
| |
|
|
|
|
| |
|
|
|
|
| |
|
|
|
|
| |
|
|
|
|
Shares issued in reinvestment of distributions |
|
|
|
|
Shares redeemed and automatic conversion of shares |
|
|
|
|
| |
|
|
|
|
| |
|
|
|
|
| |
|
|
|
|
Shares issued in reinvestment of distributions |
|
|
|
|
| |
|
|
|
|
| |
|
|
|
|
| |
|
|
|
|
| |
|
|
|
|
Shares issued in reinvestment of distributions |
|
|
|
|
| |
|
|
|
|
| |
|
|
|
|
| |
|
|
|
|
| |
|
|
| |
|
|
|
|
| |
|
|
|
|
| |
|
|
|
|
| |
|
|
|
|
Shares issued in reinvestment of distributions |
|
|
|
|
| |
|
|
|
|
| |
|
|
|
|
| |
|
|
|
|
Shares sold and automatic conversion of shares |
|
|
|
|
Shares issued in reinvestment of distributions |
|
|
|
|
| |
|
|
|
|
| |
|
|
|
|
| |
|
|
|
|
| |
|
|
|
|
Shares issued in reinvestment of distributions |
|
|
|
|
Shares redeemed and automatic conversion of shares |
|
|
|
|
| |
|
|
|
|
| |
|
|
|
|
| |
|
|
|
|
Shares issued in reinvestment of distributions |
|
|
|
|
| |
|
|
|
|
| |
|
|
|
|
| |
|
|
|
|
| |
|
|
|
|
Shares issued in reinvestment of distributions |
|
|
|
|
| |
|
|
|
|
| |
|
|
|
|
| |
|
|
|
|
As of June 30, 2024, BlackRock Financial Management, Inc., an affiliate of the Fund, owned 12,070 Class K Shares of EuroFund.
34 2024 BlackRock Annual Financial Statements
Notes to Financial Statements (continued)
12.
FOREIGN WITHHOLDINGS TAX CLAIMS
EuroFund is seeking a closing agreement with the Internal Revenue Service ("IRS") to address any prior years’ U.S. income tax liabilities attributable to Fund shareholders resulting from the recovery of foreign taxes. The closing agreement would result in the Fund paying a compliance fee to the IRS, on behalf of its shareholders, representing the estimated tax savings generated from foreign tax credits claimed by Fund shareholders on their tax returns in prior years. The Fund has accrued a liability for the estimated IRS compliance fee related to foreign withholding tax claims, which is disclosed in the Statements of Assets and Liabilities. The actual IRS compliance fee may differ from the estimate and that difference may be material.
Management has evaluated the impact of all subsequent events on the Funds through the date the financial statements were issued and has determined that there were no subsequent events requiring adjustment or additional disclosure in the financial statements.
Notes to Financial Statements
35
Report of Independent Registered Public Accounting Firm
To the Shareholders and the Board of Directors/Trustees of BlackRock Advantage Global Fund, Inc. and BlackRock EuroFund:
Opinion on the Financial Statements and Financial Highlights
We have audited the accompanying statements of assets and liabilities of BlackRock Advantage Global Fund, Inc. and BlackRock EuroFund (the “Funds”), including the schedules of investments, as of June 30, 2024, the related statements of operations for the year then ended, the statements of changes in net assets for each of the two years in the period then ended, the financial highlights for each of the five years in the period then ended, and the related notes. In our opinion, the financial statements and financial highlights present fairly, in all material respects, the financial position of the Funds as of June 30, 2024, and the results of their operations for the year then ended, the changes in their net assets for each of the two years in the period then ended, and the financial highlights for each of the five years in the period then ended, in conformity with accounting principles generally accepted in the United States of America.
These financial statements and financial highlights are the responsibility of the Funds’ management. Our responsibility is to express an opinion on the Funds’ financial statements and financial highlights based on our audits. We are a public accounting firm registered with the Public Company Accounting Oversight Board (United States) (PCAOB) and are required to be independent with respect to the Funds in accordance with the U.S. federal securities laws and the applicable rules and regulations of the Securities and Exchange Commission and the PCAOB.
We conducted our audits in accordance with the standards of the PCAOB. Those standards require that we plan and perform the audit to obtain reasonable assurance about whether the financial statements and financial highlights are free of material misstatement, whether due to error or fraud. The Funds are not required to have, nor were we engaged to perform, an audit of their internal control over financial reporting. As part of our audits we are required to obtain an understanding of internal control over financial reporting but not for the purpose of expressing an opinion on the effectiveness of the Funds’ internal control over financial reporting. Accordingly, we express no such opinion.
Our audits included performing procedures to assess the risks of material misstatement of the financial statements and financial highlights, whether due to error or fraud, and performing procedures that respond to those risks. Such procedures included examining, on a test basis, evidence regarding the amounts and disclosures in the financial statements and financial highlights. Our audits also included evaluating the accounting principles used and significant estimates made by management, as well as evaluating the overall presentation of the financial statements and financial highlights. Our procedures included confirmation of securities owned as of June 30, 2024, by correspondence with custodians or counterparties; when replies were not received, we performed other auditing procedures. We believe that our audits provide a reasonable basis for our opinion.
Deloitte & Touche LLP
Boston, Massachusetts
August 22, 2024
We have served as the auditor of one or more BlackRock investment companies since 1992.
36 2024 BlackRock Annual Financial Statements
Important Tax Information (unaudited)
The following amounts, or maximum amounts allowable by law, are hereby designated as qualified dividend income for individuals for the fiscal year ended June 30, 2024:
| |
Qualified Dividend
Income |
| |
|
| |
|
The following amount, or maximum amount allowable by law, is hereby designated as qualified business income for individuals for the fiscal year ended June 30, 2024:
| |
Qualified Business
Income |
| |
|
The Funds intend to pass through to their shareholders the following amounts, or maximum amounts allowable by law, of foreign source income earned and foreign taxes paid for the fiscal year ended June 30, 2024:
| |
Foreign Source
Income Earned |
|
| |
|
|
The Funds hereby designate the following amounts, or maximum amounts allowable by law, of distributions from direct federal obligation interest for the fiscal year ended June 30, 2024:
| |
Federal Obligation
Interest |
| |
|
The law varies in each state as to whether and what percent of ordinary income dividends attributable to federal obligations is exempt from state income tax. Shareholders are advised to check with their tax advisers to determine if any portion of the dividends received is exempt from state income tax.
The following percentage, or maximum percentage allowable by law, of ordinary income distributions paid during the fiscal year ended June 30, 2024 qualified for the dividends-received deduction for corporate shareholders:
| |
Dividends-Received
Deduction |
| |
|
The Funds hereby designate the following amounts, or maximum amounts allowable by law, as interest income eligible to be treated as a Section 163(j) interest dividend for the fiscal year ended June 30, 2024:
The Funds hereby designate the following amounts, or maximum amounts allowable by law, as interest-related dividends eligible for exemption from U.S. withholding tax for nonresident aliens and foreign corporations for the fiscal year ended June 30, 2024:
| |
Interest-
Related
Dividends |
| |
|
| |
|
Important Tax Information
37
Changes in and Disagreements with Accountants
Remuneration Paid to Directors, Officers, and Others
Compensation to the independent directors/trustees of the Corporation and the Trust is paid by the Corporation and the Trust, on behalf of the Funds.
Quarterly performance, semi-annual and annual reports, current net asset value and other information regarding the Funds may be found on BlackRock’s website, which can be accessed at blackrock.com. Any reference to BlackRock’s website in this report is intended to allow investors public access to information regarding the Funds and does not, and is not intended to, incorporate BlackRock’s website in this report.
Shareholders can sign up for e-mail notifications of quarterly statements, annual and semi-annual shareholder reports and prospectuses by enrolling in the electronic delivery program.
To enroll in electronic delivery:
Shareholders Who Hold Accounts with Investment Advisors, Banks or Brokerages:
Please contact your financial advisor. Please note that not all investment advisors, banks or brokerages may offer this service.
Shareholders Who Hold Accounts Directly with BlackRock:
1. Access the BlackRock website at blackrock.com
2. Select “Access Your Account”
3. Next, select “eDelivery” in the “Related Resources” box and follow the sign-up instructions.
BlackRock’s Mutual Fund Family
BlackRock offers a diverse lineup of open-end mutual funds crossing all investment styles and managed by experts in equity, fixed-income and tax-exempt investing. Visit blackrock.com for more information.
Call us at (800) 441-7762 from 8:00 AM to 6:00 PM ET on any business day to get information about your account balances, recent transactions and share prices. You can also visit blackrock.com for more information.
Automatic Investment Plans
Investor class shareholders who want to invest regularly can arrange to have $50 or more automatically deducted from their checking or savings account and invested in any of the BlackRock funds.
Systematic Withdrawal Plans
Investor class shareholders can establish a systematic withdrawal plan and receive periodic payments of $50 or more from their BlackRock funds, as long as their account balance is at least $10,000.
Shareholders may make investments in conjunction with Traditional, Rollover, Roth, Coverdell, Simple IRAs, SEP IRAs and 403(b) Plans.
38 2024 BlackRock Annual Financial Statements
Additional Information (continued)
Fund and Service Providers
Investment Adviser
BlackRock Advisors, LLC
Wilmington, DE 19809
BlackRock International Limited
Edinburgh, EH3 8BL
United Kingdom
State Street Bank and Trust Company
Boston, MA 02114
Brown Brothers Harriman & Co.
Boston, MA 02109
BNY Mellon Investment Servicing (US) Inc.
Wilmington, DE 19809
(a) For BlackRock EuroFund.
Distributor
BlackRock Investments, LLC
New York, NY 10001
Independent Registered Public Accounting Firm
Deloitte & Touche LLP
Boston, MA 02116
Sidley Austin LLP
New York, NY 10019
100 Bellevue Parkway
Wilmington, DE 19809
Additional Information
39
Disclosure of Investment Advisory Agreements and Sub-Advisory Agreement
The Board of Trustees of BlackRock EuroFund (“EuroFund”) met on April 16, 2024 and May 16-17, 2024 to consider the approval to continue the investment advisory agreement (the “EuroFund Advisory Agreement”) between EuroFund and BlackRock Advisors, LLC (the “Manager”), its investment advisor. The Board of Trustees of EuroFund also considered the approval of the sub-advisory agreement (the “EuroFund Sub-Advisory Agreement”) between the Manager and BlackRock International Limited (the “Sub-Advisor”) with respect to EuroFund.
The Board of Directors of BlackRock Advantage Global Fund, Inc. (“Advantage Global Fund”) met on April 16, 2024 and May 16-17, 2024 to consider the approval to continue the investment advisory agreement (the “Advantage Global Fund Advisory Agreement”) between Advantage Global Fund and the Manager, its investment advisor.
EuroFund and Advantage Global Fund are referred to herein individually as a “Fund” or collectively as the “Funds.” The Manager and the Sub-Advisor are referred to herein as “BlackRock.” The EuroFund Advisory Agreement, the EuroFund Sub-Advisory Agreement and the Advantage Global Fund Advisory Agreement are referred to herein individually as an “Agreement” or collectively as the “Agreements.” For simplicity: (a) the Board of Trustees of EuroFund and the Board of Directors of Advantage Global Fund are referred to herein individually as the “Board” and collectively as the “Boards” and the members are referred to as “Board Members”; and (b) the meetings held on April 16, 2024 are referred to as the “April Meeting” and the meetings held on May 16-17, 2024 are referred to as the “May Meeting”.
Consistent with the requirements of the Investment Company Act of 1940 (the “1940 Act”), each Board considers the approval of the continuation of the pertinent Agreement for each Fund on an annual basis. The Board members who are not “interested persons” of the pertinent Fund, as defined in the 1940 Act, are considered independent Board members (the “Independent Board Members”). Each Board’s consideration entailed a year-long deliberative process during which the Board and its committees assessed BlackRock’s various services to each Fund, including through the review of written materials and oral presentations, and the review of additional information provided in response to requests from the Independent Board Members. Each Board had four quarterly meetings per year, each of which extended over a two-day period, as well as additional ad hoc meetings and executive sessions throughout the year, as needed. The committees of each Board similarly met throughout the year. Each Board also had an additional one-day meeting to consider specific information regarding the renewal of the Agreements. In considering the renewal of the Agreements, the Boards assessed, among other things, the nature, extent and quality of the services provided to the Fund by BlackRock, BlackRock’s personnel and affiliates, including (as applicable): investment management services; accounting oversight; administrative and shareholder services; oversight of the Fund’s service providers; risk management and oversight; and legal, regulatory and compliance services. Throughout the year, including during the contract renewal process, the Independent Board Members were advised by independent legal counsel, and met with independent legal counsel in various executive sessions outside of the presence of BlackRock’s management.
During the year, each Board, acting directly and through its committees, considered information that was relevant to its annual consideration of the renewal of the Agreements, including the services and support provided by BlackRock to the Fund and its shareholders. BlackRock also furnished additional information to each Board in response to specific questions from the Board. Among the matters each Board considered were: (a) investment performance for one-year, three-year, five-year, and/or since inception periods, as applicable, against peer funds, an applicable benchmark, and other performance metrics, as applicable, as well as BlackRock senior management’s and portfolio managers’ investment performance analyses, and the reasons for any outperformance or underperformance relative to its peers, benchmarks, and other performance metrics, as applicable; (b) fees, including advisory, administration, if applicable, and other amounts paid to BlackRock and its affiliates by the Fund for services; (c) Fund operating expenses and how BlackRock allocates expenses to the Fund; (d) the resources devoted to, risk oversight of, and compliance reports relating to, implementation of the Fund’s investment objective, policies and restrictions, and meeting regulatory requirements; (e) BlackRock’s and the Fund’s adherence to applicable compliance policies and procedures; (f) the nature, character and scope of non-investment management services provided by BlackRock and its affiliates and the estimated cost of such services, as available; (g) BlackRock’s and other service providers’ internal controls and risk and compliance oversight mechanisms; (h) BlackRock’s implementation of the proxy voting policies approved by the Board; (i) the use of brokerage commissions and execution quality of portfolio transactions; (j) BlackRock’s implementation of the Fund’s valuation and liquidity procedures; (k) an analysis of management fees paid to BlackRock for products with similar investment mandates across the open-end fund, exchange-traded fund (“ETF”), closed-end fund, sub-advised mutual fund, separately managed account, collective investment trust, and institutional separate account product channels, as applicable, and the similarities and differences between these products and the services provided as compared to the Fund; (l) BlackRock’s compensation methodology for its investment professionals and the incentives and accountability it creates, along with investment professionals’ investments in the fund(s) they manage; and (m) periodic updates on BlackRock’s business.
Prior to and in preparation for the April Meeting, each Board received and reviewed materials specifically relating to the renewal of the Agreements. The Independent Board Members continuously engaged in a process with their independent legal counsel and BlackRock to review the nature and scope of the information provided to the Boards to better assist its deliberations. The materials provided in connection with the April Meeting included, among other things: (a) information independently compiled and prepared by Broadridge Financial Solutions, Inc. (“Broadridge”), based on either a Lipper classification or Morningstar category, regarding each Fund’s fees and expenses as compared with a peer group of funds as determined by Broadridge (“Expense Peers”) and the investment performance of each Fund as compared with a peer group of funds (“Performance Peers”); (b) information on the composition of the Expense Peers and Performance Peers and a description of Broadridge’s methodology; (c) information on the estimated profits realized by BlackRock and its affiliates pursuant to the Agreements and a discussion of fall-out benefits to BlackRock and its affiliates; (d) a general analysis provided by BlackRock concerning investment management fees received in connection with other types of investment products, such as institutional accounts, sub-advised mutual funds, ETFs, closed-end funds, open-end funds, and separately managed accounts, under similar investment mandates, as well as the performance of such other products, as applicable; (e) a review of non-management fees; (f) the existence, impact and sharing of potential economies of scale, if any, with the Funds; (g) a summary of aggregate amounts paid by each Fund to BlackRock; (h) sales and redemption data regarding each Fund’s shares; and (i) various additional information requested by the Board as appropriate regarding BlackRock’s and the Funds’ operations.
At the April Meeting, each Board reviewed materials relating to its consideration of the Agreements and the Independent Board Members presented BlackRock with questions and requests for additional information. BlackRock responded to these questions and requests with additional written information in advance of the May Meeting, and such responses were reviewed by the Board Members.
At the May Meeting, each Board concluded its assessment of, among other things: (a) the nature, extent and quality of the services provided by BlackRock; (b) the investment performance of each Fund as compared to its Performance Peers and to other metrics, as applicable; (c) the advisory fee and the estimated cost of the services and estimated
40 2024 BlackRock Annual Financial Statements
Disclosure of Investment Advisory Agreements and Sub-Advisory Agreement (continued)
profits realized by BlackRock and its affiliates from their relationship with the Funds; (d) each Fund’s fees and expenses compared to its Expense Peers; (e) the existence and sharing of potential economies of scale; (f) any fall-out benefits to BlackRock and its affiliates as a result of BlackRock’s relationship with the Funds; and (g) other factors deemed relevant by the Board Members.
Each Board also considered other matters it deemed important to the approval process, such as other payments made to BlackRock or its affiliates relating to securities lending and cash management, and BlackRock’s services related to the valuation and pricing of the portfolio holdings of the pertinent Fund. Each Board noted the willingness of BlackRock’s personnel to engage in open, candid discussions with the Board. The Boards evaluated the information available to it on a fund-by-fund basis. The following paragraphs provide more information about some of the primary factors that were relevant to each Board’s decision. The Board Members did not identify any particular information, or any single factor as determinative, and each Board Member may have attributed different weights to the various items and factors considered.
A. Nature, Extent and Quality of the Services Provided by BlackRock
Each Board, including the Independent Board Members, reviewed the nature, extent and quality of services provided by BlackRock, including the investment advisory services, and the resulting performance of each Fund. Throughout the year, each Board compared each Fund’s performance to the performance of a comparable group of mutual funds, relevant benchmark, and performance metrics, as applicable. The Boards met with BlackRock’s senior management personnel responsible for investment activities, including the senior investment officers. Each Board also reviewed the materials provided by each Fund’s portfolio management team discussing the Fund’s performance, investment strategies and outlook.
Each Board considered, among other factors, with respect to BlackRock: the experience of each Fund’s portfolio management team; research capabilities; investments by portfolio managers in the funds they manage; portfolio trading capabilities; use of technology; commitment to compliance; credit analysis capabilities; risk analysis and oversight capabilities; and the approach to training and retaining portfolio managers and other research, advisory and management personnel. Each Board also considered BlackRock’s overall risk management program, including the continued efforts of BlackRock and its affiliates to address cybersecurity risks and the role of BlackRock’s Risk & Quantitative Analysis Group. Each Board engaged in a review of BlackRock’s compensation structure with respect to each Fund’s portfolio management team and BlackRock’s ability to attract and retain high-quality talent and create performance incentives.
In addition to investment advisory services, each Board considered the nature and quality of the administrative and other non-investment advisory services provided to each Fund. BlackRock and its affiliates provide the Funds with certain administrative, shareholder and other services (in addition to any such services provided to the Funds by third-parties) and officers and other personnel as are necessary for the operations of the Funds. In particular, BlackRock and its affiliates provide the Funds with administrative services including, among others: (i) responsibility for disclosure documents, such as the prospectus, the summary prospectus (as applicable), the statement of additional information and periodic shareholder reports; (ii) oversight of daily accounting and pricing; (iii) responsibility for periodic filings with regulators; (iv) overseeing and coordinating the activities of third-party service providers, including, among others, each Fund’s custodian, fund accountant, transfer agent, and auditor; (v) organizing Board meetings and preparing the materials for such Board meetings; (vi) providing legal and compliance support; (vii) furnishing analytical and other support to assist the Board in its consideration of strategic issues such as the merger, consolidation or repurposing of certain open-end funds; and (viii) performing or managing administrative functions necessary for the operation of the Funds, such as tax reporting, expense management, fulfilling regulatory filing requirements, overseeing each Fund’s distribution partners, and shareholder call center and other services. The Boards reviewed the structure and duties of BlackRock’s fund administration, shareholder services, and legal and compliance departments and considered BlackRock’s policies and procedures for assuring compliance with applicable laws and regulations. The Boards considered the operation of BlackRock’s business continuity plans.
The Board of EuroFund noted that the engagement of the Sub-Advisor with respect to EuroFund facilitates the provision of investment advice and trading by investment personnel out of non-U.S. jurisdictions. The Board considered that this arrangement provides additional flexibility to the portfolio management team, which may benefit EuroFund and its shareholders.
B. The Investment Performance of the Funds
Each Board, including the Independent Board Members, reviewed and considered the performance history of the Fund throughout the year and at the April Meeting. In preparation for the April Meeting, each Board was provided with reports independently prepared by Broadridge, which included an analysis of the Fund’s performance as of December 31, 2023, as compared to its Performance Peers. Broadridge ranks funds in quartiles, ranging from first to fourth, where first is the most desirable quartile position and fourth is the least desirable. In connection with its review, each Board received and reviewed information regarding the investment performance of the Fund as compared to its Performance Peers and the respective Morningstar Category (“Morningstar Category”). Each Board and its Performance Oversight Committee regularly review and meet with Fund management to discuss the performance of each Fund throughout the year.
In evaluating performance, the Boards focused particular attention on funds with less favorable performance records. Each Board also noted that while it found the data provided by Broadridge generally useful, it recognized the limitations of such data, including in particular, that notable differences may exist between a fund and its Performance Peers (for example, the investment objectives and strategies). Further, each Board recognized that the performance data reflects a snapshot of a period as of a particular date and that selecting a different performance period could produce significantly different results. Each Board also acknowledged that long-term performance could be impacted by even one period of significant outperformance or underperformance, and that a single investment theme could have the ability to disproportionately affect long-term performance.
The Board of Advantage Global Fund noted that for the one-, three- and five-year periods reported, Advantage Global Fund ranked in the first, second and second quartiles, respectively, against its Morningstar Category. The Board noted that BlackRock believes that the Morningstar Category is an appropriate performance metric for the Fund, and that BlackRock has explained its rationale for this belief to the Board.
Disclosure of Investment Advisory Agreements and Sub-Advisory Agreement
41
Disclosure of Investment Advisory Agreements and Sub-Advisory Agreement (continued)
The Board of EuroFund noted that for the one-, three- and five-year periods reported, EuroFund ranked in the second, third and first quartiles, respectively, against its Morningstar Category. The Board noted that BlackRock believes that the Morningstar Category is an appropriate performance metric for the Fund, and that BlackRock has explained its rationale for this belief to the Board. The Board and BlackRock reviewed the Fund’s underperformance relative to its Morningstar Category during the applicable period.
C. Consideration of the Advisory/Management Fees and the Estimated Cost of the Services and Estimated Profits Realized by BlackRock and its Affiliates from their Relationship with the Funds
Each Board, including the Independent Board Members, reviewed each Fund’s contractual management fee rate compared with those of its Expense Peers. The contractual management fee rate represents a combination of the advisory fee and any administrative fees, before taking into account any reimbursements or fee waivers. Each Board also compared each Fund’s total expense ratio, as well as its actual management fee rate, to those of its Expense Peers. The total expense ratio represents a fund’s total net operating expenses, including any 12b-1 or non-12b-1 service fees. The total expense ratio gives effect to any expense reimbursements or fee waivers, and the actual management fee rate gives effect to any management fee reimbursements or waivers. The Boards considered that the fee and expense information in the Broadridge report for the Fund reflected information for a specific period and that historical asset levels and expenses may differ from current levels, particularly in a period of market volatility. The Boards considered the services provided and the fees charged by BlackRock and its affiliates to other types of clients with similar investment mandates, as applicable, including institutional accounts and sub-advised mutual funds (including mutual funds sponsored by third parties).
Each Board received and reviewed statements relating to BlackRock’s financial condition. Each Board reviewed BlackRock’s profitability methodology and was also provided with an estimated profitability analysis that detailed the revenues earned and the expenses incurred by BlackRock for services provided to each Fund. Each Board reviewed BlackRock’s estimated profitability with respect to each Fund and other funds the Board currently oversees for the year ended December 31, 2023 compared to available aggregate estimated profitability data provided for the prior two years. Each Board reviewed BlackRock’s estimated profitability with respect to certain other U.S. fund complexes managed by the Manager and/or its affiliates. Each Board reviewed BlackRock’s assumptions and methodology of allocating expenses in the estimated profitability analysis, noting the inherent limitations in allocating costs among various advisory products. Each Board recognized that profitability may be affected by numerous factors including, among other things, fee waivers and expense reimbursements by the Manager, the types of funds managed, precision of expense allocations and business mix. Each Board thus recognized that calculating and comparing profitability at the individual fund level is difficult.
Each Board noted that, in general, individual fund or product line profitability of other advisors is not publicly available. Each Board reviewed BlackRock’s overall operating margin, in general, compared to that of certain other publicly traded asset management firms. Each Board considered the differences between BlackRock and these other firms, including the contribution of technology at BlackRock, BlackRock’s expense management, and the relative product mix.
Each Board considered whether BlackRock has the financial resources necessary to attract and retain high quality investment management personnel to perform its obligations under the Agreements and to continue to provide the high quality of services that is expected by the Board. The Boards further considered factors including but not limited to BlackRock’s commitment of time and resources, assumption of risk, and liability profile in servicing the Funds, including in contrast to what is required of BlackRock with respect to other products with similar investment mandates across the open-end fund, ETF, closed-end fund, sub-advised mutual fund, separately managed account, collective investment trust, and institutional separate account product channels, as applicable.
The Board of Advantage Global Fund noted that Advantage Global Fund’s contractual management fee rate ranked in the first quartile, and that the actual management fee rate and total expense ratio each ranked in the first quartile relative to the Fund’s Expense Peers.
The Board of EuroFund noted that EuroFund’s contractual management fee rate ranked in the second quartile, and that the actual management fee rate and total expense ratio ranked in the first and fourth quartiles, respectively, relative to the Fund’s Expense Peers. In addition, after discussions between the Board and BlackRock, the Board and BlackRock agreed to a voluntary expense cap to further limit the Fund’s total expenses as a percentage of the Fund’s average daily net assets on a class-by-class basis. This voluntary expense cap was implemented on June 1, 2024.
Each Board additionally noted that the applicable Fund has an advisory fee arrangement that includes breakpoints that adjust the fee rate downward as the size of the Fund increases above certain contractually specified levels. The Board additionally noted that the breakpoints can, conversely, adjust the advisory fee rate upward as the size of the Fund decreases below certain contractually specified levels.
Each Board further noted that BlackRock and the Board have contractually agreed to a cap on the applicable Fund’s total expenses as a percentage of the Fund’s average daily net assets on a class-by-class basis.
Each Board, including the Independent Board Members, considered the extent to which any economies of scale might benefit the pertinent Fund in a variety of ways as the assets of the Fund increase. Each Board considered multiple factors, including the advisory fee rate and breakpoints, unitary fee structure, fee waiver, and/or expense caps, as applicable. Each Board considered the pertinent Fund’s asset levels and whether the current fee schedule was appropriate.
E. Other Factors Deemed Relevant by the Board Members
Each Board, including the Independent Board Members, also took into account other ancillary or “fall-out” benefits that BlackRock or its affiliates may derive from BlackRock’s respective relationships with the Funds, both tangible and intangible, such as BlackRock’s ability to leverage its investment professionals who manage other portfolios and its risk management personnel, an increase in BlackRock’s profile in the investment advisory community, and the engagement of BlackRock’s affiliates as service providers to the Funds, including for administrative, distribution, securities lending and cash management services. With respect to securities lending, during the year the Boards also considered information provided by independent third-party consultants related to the performance of each BlackRock affiliate as securities lending agent. The Boards also
42 2024 BlackRock Annual Financial Statements
Disclosure of Investment Advisory Agreements and Sub-Advisory Agreement (continued)
considered BlackRock’s overall operations and its efforts to expand the scale of, and improve the quality of, its operations. The Boards also noted that, subject to applicable law, BlackRock may use and benefit from third-party research obtained by soft dollars generated by certain registered fund transactions to assist in managing all or a number of its other client accounts.
In connection with its consideration of the Agreements, the Boards also received information regarding BlackRock’s brokerage and soft dollar practices. The Boards received reports from BlackRock which included information on brokerage commissions and trade execution practices throughout the year.
The Boards noted the competitive nature of the open-end fund marketplace, and that shareholders are able to redeem their Fund shares if they believe that the pertinent Fund’s fees and expenses are too high or if they are dissatisfied with the performance of the Fund.
At the May Meeting, in a continuation of the discussions that occurred during the April Meeting, and as a culmination of the Board’s year-long deliberative process, the Board of EuroFund, including the Independent Board Members, unanimously approved the continuation of the EuroFund Advisory Agreement between the Manager and EuroFund for a one-year term ending June 30, 2025, and the EuroFund Sub-Advisory Agreement between the Manager and the Sub-Advisor with respect to EuroFund for a one-year term ending June 30, 2025.
The Board of Advantage Global Fund, including the Independent Board Members, unanimously approved the continuation of the Advantage Global Fund Advisory Agreement between the Manager and Advantage Global Fund for a one-year term ending June 30, 2025.
Based upon its evaluation of all of the aforementioned factors in their totality, as well as other information, the Boards, including the Independent Board Members, were satisfied that the terms of the Agreements were fair and reasonable and in the best interest of each Fund and its shareholders. In arriving at its decision to approve the Agreements, the Boards did not identify any single factor or group of factors as all-important or controlling, but considered all factors together, and different Board Members may have attributed different weights to the various factors considered. The Independent Board Members were advised by independent legal counsel throughout the deliberative process.
Disclosure of Investment Advisory Agreements and Sub-Advisory Agreement
43
Glossary of Terms Used in this Report
| |
| |
Morgan Stanley Capital International |
| |
Public Joint Stock Company |
| |
|
| |
Societe en Commandite par Actions |
44 2024 BlackRock Annual Financial Statements
THIS PAGE INTENTIONALLY LEFT BLANK.
THIS PAGE INTENTIONALLY LEFT BLANK.
THIS PAGE INTENTIONALLY LEFT BLANK.
Want to know more?
blackrock.com | 800-441-7762
This report is intended for current holders. It is not authorized for use as an offer of sale or a solicitation of an offer to buy shares of the Funds unless preceded or accompanied by the Funds’ current prospectus. Past performance results shown in this report should not be considered a representation of future performance. Investment returns and principal value of shares will fluctuate so that shares, when redeemed, may be worth more or less than their original cost. Statements and other information herein are as dated and are subject to change.
| Item 8 – |
Changes in and Disagreements with Accountants for Open-End Management Investment Companies – See Item 7 |
| Item 9 – |
Proxy Disclosures for Open-End Management Investment Companies – See Item 7 |
| Item 10 – |
Remuneration Paid to Directors, Officers, and Others of Open-End Management Investment Companies – See Item 7 |
| Item 11 – |
Statement Regarding Basis for Approval of Investment Advisory Contract – See Item 7 |
| Item 12 – |
Disclosure of Proxy Voting Policies and Procedures for Closed-End Management Investment Companies – Not Applicable |
| Item 13 – |
Portfolio Managers of Closed-End Management Investment Companies – Not Applicable |
| Item 14 – |
Purchases of Equity Securities by Closed-End Management Investment Company and Affiliated Purchasers – Not Applicable |
| Item 15 – |
Submission of Matters to a Vote of Security Holders – There have been no material changes to these procedures. |
| Item 16 – |
Controls and Procedures |
(a) The registrant’s principal executive and principal financial officers, or persons performing similar functions, have concluded that the registrant’s disclosure controls and procedures (as defined in Rule 30a-3(c) under the Investment Company Act of 1940, as amended (the “1940 Act”)) are effective as of a date within 90 days of the filing date of this report based on the evaluation of these controls and procedures required by Rule 30a-3(b) under the 1940 Act and Rule 13a-15(b) or 15d-15(b) under the Securities Exchange Act of 1934, as amended.
(b) There were no changes in the registrant’s internal control over financial reporting (as defined in Rule 30a-3(d) under the 1940 Act) that occurred during the period covered by this report that have materially affected, or are reasonably likely to materially affect, the registrant’s internal control over financial reporting.
| Item 17 – |
Disclosure of Securities Lending Activities for Closed-End Management Investment Companies – Not Applicable |
| Item 18 – |
Recovery of Erroneously Awarded Compensation – Not Applicable |
| Item 19 – |
Exhibits attached hereto |
(a)(1) Code of Ethics – See Item 2
(a)(2) Any policy required by the listing standards adopted pursuant to Rule 10D-1 under the Exchange Act (17 CFR 240.10D-1) by the registered national securities exchange or registered national securities association upon which the registrant’s securities are listed – Not Applicable
(a)(3) Section 302 Certifications are attached
(a)(4) Any written solicitation to purchase securities under Rule 23c-1 – Not Applicable
(a)(5) Change in Registrant’s independent public accountant – Not Applicable
Pursuant to the requirements of the Securities Exchange Act of 1934 and the Investment Company Act of 1940, the registrant has duly caused this report to be signed on its behalf by the undersigned, thereunto duly authorized.
BlackRock Advantage Global Fund, Inc.
|
|
|
| By: |
|
/s/ John M. Perlowski |
|
|
John M. Perlowski |
|
|
Chief Executive Officer (principal executive officer) of |
|
|
BlackRock Advantage Global Fund, Inc. |
Date: August 22, 2024
Pursuant to the requirements of the Securities Exchange Act of 1934 and the Investment Company Act of 1940, this report has been signed below by the following persons on behalf of the registrant and in the capacities and on the dates indicated.
|
|
|
| By: |
|
/s/ John M. Perlowski |
|
|
John M. Perlowski |
|
|
Chief Executive Officer (principal executive officer) of |
|
|
BlackRock Advantage Global Fund, Inc. |
Date: August 22, 2024
|
|
|
| By: |
|
/s/ Trent Walker |
|
|
Trent Walker |
|
|
Chief Financial Officer (principal financial officer) of |
|
|
BlackRock Advantage Global Fund, Inc. |
Date: August 22, 2024
EX-99. CERT
CERTIFICATION PURSUANT TO RULE 30a-2(a) UNDER THE 1940 ACT AND SECTION 302 OF THE SARBANES-OXLEY ACT OF
2002
I, John M. Perlowski, Chief Executive Officer (principal executive officer) of BlackRock Advantage Global Fund, Inc., certify that:
1. I have reviewed this report on Form N-CSR of BlackRock Advantage Global Fund, Inc.;
2. Based on my knowledge, this report does not contain any untrue statement of a material fact or omit to state a material fact necessary to
make the statements made, in light of the circumstances under which such statements were made, not misleading with respect to the period covered by this report;
3. Based on my knowledge, the financial statements, and other financial information included in this report, fairly present in all material
respects the financial condition, results of operations, changes in net assets, and cash flows (if the financial statements are required to include a statement of cash flows) of the registrant as of, and for, the periods presented in this report;
4. The registrant’s other certifying officer(s) and I are responsible for establishing and maintaining disclosure controls and
procedures (as defined in Rule 30a-3(c) under the Investment Company Act of 1940) and internal control over financial reporting (as defined in
Rule 30a-3(d) under the Investment Company Act of 1940) for the registrant and have:
a) designed such disclosure controls and procedures, or caused such disclosure controls and procedures to be designed under our
supervision, to ensure that material information relating to the registrant, including its consolidated subsidiaries, is made known to us by others within those entities, particularly during the period in which this report is being prepared;
b) designed such internal control over financial reporting, or caused such internal control over financial reporting to be
designed under our supervision, to provide reasonable assurance regarding the reliability of financial reporting and the preparation of financial statements for external purposes in accordance with generally accepted accounting principles;
c) evaluated the effectiveness of the registrant’s disclosure controls and procedures and presented in this report our
conclusions about the effectiveness of the disclosure controls and procedures, as of a date within 90 days prior to the filing date of this report based on such evaluation; and
d) disclosed in this report any change in the registrant’s internal control over financial reporting that occurred during
the period covered by this report that has materially affected, or is reasonably likely to materially affect, the registrant’s internal control over financial reporting; and
5. The registrant’s other certifying officer(s) and I have disclosed to the registrant’s auditors and the audit committee of the
registrant’s board of directors (or persons performing the equivalent functions):
a) all significant deficiencies and
material weaknesses in the design or operation of internal control over financial reporting which are reasonably likely to adversely affect the registrant’s ability to record, process, summarize, and report financial information; and
b) any fraud, whether or not material, that involves management or other employees who have a significant role in the
registrant’s internal control over financial reporting.
Date: August 22, 2024
/s/ John M. Perlowski
John M. Perlowski
Chief Executive Officer (principal executive officer) of
BlackRock Advantage Global Fund, Inc.
EX-99. CERT
CERTIFICATION PURSUANT TO RULE 30a-2(a) UNDER THE 1940 ACT AND SECTION 302 OF THE SARBANES-OXLEY ACT OF
2002
I, Trent Walker, Chief Financial Officer (principal financial officer) of BlackRock Advantage Global Fund, Inc., certify that:
1. I have reviewed this report on Form N-CSR of BlackRock Advantage Global Fund, Inc.;
2. Based on my knowledge, this report does not contain any untrue statement of a material fact or omit to state a material fact necessary to
make the statements made, in light of the circumstances under which such statements were made, not misleading with respect to the period covered by this report;
3. Based on my knowledge, the financial statements, and other financial information included in this report, fairly present in all material
respects the financial condition, results of operations, changes in net assets, and cash flows (if the financial statements are required to include a statement of cash flows) of the registrant as of, and for, the periods presented in this report;
4. The registrant’s other certifying officer(s) and I are responsible for establishing and maintaining disclosure controls and
procedures (as defined in Rule 30a-3(c) under the Investment Company Act of 1940) and internal control over financial reporting (as defined in
Rule 30a-3(d) under the Investment Company Act of 1940) for the registrant and have:
a) designed such disclosure controls and procedures, or caused such disclosure controls and procedures to be designed under our
supervision, to ensure that material information relating to the registrant, including its consolidated subsidiaries, is made known to us by others within those entities, particularly during the period in which this report is being prepared;
b) designed such internal control over financial reporting, or caused such internal control over financial reporting to be
designed under our supervision, to provide reasonable assurance regarding the reliability of financial reporting and the preparation of financial statements for external purposes in accordance with generally accepted accounting principles;
c) evaluated the effectiveness of the registrant’s disclosure controls and procedures and presented in this report our
conclusions about the effectiveness of the disclosure controls and procedures, as of a date within 90 days prior to the filing date of this report based on such evaluation; and
d) disclosed in this report any change in the registrant’s internal control over financial reporting that occurred during
the period covered by this report that has materially affected, or is reasonably likely to materially affect, the registrant’s internal control over financial reporting; and
5. The registrant’s other certifying officer(s) and I have disclosed to the registrant’s auditors and the audit committee of the
registrant’s board of directors (or persons performing the equivalent functions):
a) all significant deficiencies and
material weaknesses in the design or operation of internal control over financial reporting which are reasonably likely to adversely affect the registrant’s ability to record, process, summarize, and report financial information; and
b) any fraud, whether or not material, that involves management or other employees who have a significant role in the
registrant’s internal control over financial reporting.
Date: August 22, 2024
/s/ Trent Walker
Trent
Walker
Chief Financial Officer (principal financial officer) of
BlackRock Advantage Global Fund, Inc.
Exhibit 99.906CERT
Certification Pursuant to Rule 30a-2(b) under the 1940 Act and
Section 906 of the Sarbanes-Oxley Act of 2002
Pursuant to 18 U.S.C. § 1350, the undersigned officer of BlackRock Advantage Global Fund, Inc. (the “Registrant”), hereby certifies, to the
best of his knowledge, that the Registrant’s Report on Form N-CSR for the period ended June 30, 2024 (the “Report”) fully complies with the requirements of Section 13(a) or
15(d) of the Securities Exchange Act of 1934, as amended, and that the information contained in the Report fairly presents, in all material respects, the financial condition and results of operations of the Registrant.
Date: August 22, 2024
/s/ John M.
Perlowski
John M. Perlowski
Chief Executive Officer (principal executive officer) of
BlackRock Advantage Global Fund, Inc.
Pursuant to 18 U.S.C.
§ 1350, the undersigned officer of BlackRock Advantage Global Fund, Inc. (the “Registrant”), hereby certifies, to the best of his knowledge, that the Registrant’s Report on
Form N-CSR for the period ended June 30, 2024 (the “Report”) fully complies with the requirements of Section 13(a) or 15(d) of the Securities Exchange Act of 1934, as amended, and
that the information contained in the Report fairly presents, in all material respects, the financial condition and results of operations of the Registrant.
Date: August 22, 2024
/s/ Trent
Walker
Trent Walker
Chief
Financial Officer (principal financial officer) of
BlackRock Advantage Global Fund, Inc.
This certification is being furnished pursuant to Rule 30a-2(b) under the Investment Company Act of 1940, as
amended, and 18 U.S.C. § 1350 and is not being filed as part of the Form N-CSR with the Securities and Exchange Commission.
v3.24.2.u1
| X |
- DefinitionBoolean flag that is true when the XBRL content amends previously-filed or accepted submission.
| Name: |
dei_AmendmentFlag |
| Namespace Prefix: |
dei_ |
| Data Type: |
xbrli:booleanItemType |
| Balance Type: |
na |
| Period Type: |
duration |
|
| X |
- DefinitionFor the EDGAR submission types of Form 8-K: the date of the report, the date of the earliest event reported; for the EDGAR submission types of Form N-1A: the filing date; for all other submission types: the end of the reporting or transition period. The format of the date is YYYY-MM-DD.
| Name: |
dei_DocumentPeriodEndDate |
| Namespace Prefix: |
dei_ |
| Data Type: |
xbrli:dateItemType |
| Balance Type: |
na |
| Period Type: |
duration |
|
| X |
- DefinitionThe type of document being provided (such as 10-K, 10-Q, 485BPOS, etc). The document type is limited to the same value as the supporting SEC submission type, or the word 'Other'.
| Name: |
dei_DocumentType |
| Namespace Prefix: |
dei_ |
| Data Type: |
dei:submissionTypeItemType |
| Balance Type: |
na |
| Period Type: |
duration |
|
| X |
- DefinitionA unique 10-digit SEC-issued value to identify entities that have filed disclosures with the SEC. It is commonly abbreviated as CIK. Reference 1: http://www.xbrl.org/2003/role/presentationRef
-Publisher SEC
-Name Exchange Act
-Number 240
-Section 12
-Subsection b-2
| Name: |
dei_EntityCentralIndexKey |
| Namespace Prefix: |
dei_ |
| Data Type: |
dei:centralIndexKeyItemType |
| Balance Type: |
na |
| Period Type: |
duration |
|
| X |
- DefinitionThe exact name of the entity filing the report as specified in its charter, which is required by forms filed with the SEC. Reference 1: http://www.xbrl.org/2003/role/presentationRef
-Publisher SEC
-Name Exchange Act
-Number 240
-Section 12
-Subsection b-2
| Name: |
dei_EntityRegistrantName |
| Namespace Prefix: |
dei_ |
| Data Type: |
xbrli:normalizedStringItemType |
| Balance Type: |
na |
| Period Type: |
duration |
|
| X |
- ReferencesReference 1: http://www.xbrl.org/2003/role/presentationRef
-Publisher SEC
-Name Form N-1A
-Section 27A
-Subsection d
-Paragraph 2
-Subparagraph instruction
-Clause 7
| Name: |
oef_ShareholderReportLineItems |
| Namespace Prefix: |
oef_ |
| Data Type: |
xbrli:stringItemType |
| Balance Type: |
na |
| Period Type: |
duration |
|
v3.24.2.u1
Shareholder Report
|
12 Months Ended |
|
Jun. 30, 2024
USD ($)
Holding
|
|---|
| Shareholder Report [Line Items] |
|
| Document Type |
N-CSR
|
| Amendment Flag |
false
|
| Registrant Name |
BlackRock Advantage Global Fund, Inc.
|
| Entity Central Index Key |
0000922457
|
| Document Period End Date |
Jun. 30, 2024
|
| C000007432 [Member] |
|
| Shareholder Report [Line Items] |
|
| Fund Name |
BlackRock Advantage Global Fund, Inc.
|
| Class Name |
Institutional Shares
|
| Trading Symbol |
MAGCX
|
| Annual or Semi-Annual Statement [Text Block] |
This annual shareholder report contains important information about BlackRock Advantage Global Fund, Inc. (the “Fund”) for the period of July 1, 2023 to June 30, 2024.
|
| Shareholder Report Annual or Semi-Annual |
annual shareholder report
|
| Additional Information [Text Block] |
You can find additional information about the Fund at blackrock.com/fundreports. You can also request this information by contacting us at (800) 441‑7762.
|
| Additional Information Phone Number |
(800) 441‑7762
|
| Additional Information Website |
blackrock.com/fundreports
|
| Expenses [Text Block] |
What were the Fund costs for the last year? (based on a hypothetical $10,000 investment)
| Class name |
Costs of a $10,000
investment |
Costs paid as a percentage of a
$10,000 investment |
| Institutional Shares |
$79 |
0.71% |
|
| Expenses Paid, Amount |
$ 79
|
| Expense Ratio, Percent |
0.71%
|
| Factors Affecting Performance [Text Block] |
How did the Fund perform last year? -
Global equities generally enjoyed strong performance over the period, as resilient macro and micro data combined with excitement around innovation in information technology and healthcare. -
While U.S. market leadership trends exhibited persistence they also evolved and broadened over the period, helping alleviate concerns of a potential momentum reversal. -
International markets kept pace with the United States while much broader market participation enabled value styles to keep pace with momentum. What contributed to performance? The Fund delivered strong gains as stock selection insights were able to identify and lean into the dominant market trends. These insights aligned with a soft-landing expectation and motivated positioning across the artificial intelligence (“AI”) and GLP-1 weight loss drug themes. Sentiment measures identifying trends across analyst and executive comments as well as smart money positioning were key performance drivers. Fundamental quality and valuation measures provided a further source of returns as markets increasingly discerned AI winners versus losers. More broadly, valuation insights drove gains across the United States and Japan with measures evaluating cash flows, valuations and other financial statement metrics all contributing. Additionally, growth-oriented quality insights evaluating research expenditures helped the Fund benefit from AI optimism. What detracted from performance? Despite the strong gains, changing market leadership proved a headwind to trend-following industry insights over the period. In particular, industry measures picking up on price momentum and favoring defensive positioning performed poorly. In addition, select consumer intent-related measures were wrong-footed. In this vein, measures evaluating mobile app usage detracted by motivating exposure to the automobile industry. The views expressed reflect the opinions of BlackRock as of the date of this report and are subject to change based on changes in market, economic or other conditions. These views are not intended to be a forecast of future events and are no guarantee of future results.
|
| Performance Past Does Not Indicate Future [Text] |
Past performance is not an indication of future results.
|
| Line Graph [Table Text Block] |
Fund performance Cumulative performance: July 1, 2014 through June 30, 2024 Initial investment of $10,000 See “Average annual total returns” for additional information on fund performance.
|
| Average Annual Return [Table Text Block] |
| Average annual total returns |
|
|
|
|
1 Year |
5 Years |
10 Years |
| Institutional Shares |
22.20% |
11.02% |
7.44% |
| MSCI All Country World Index |
19.38% |
10.76% |
8.43% |
|
| No Deduction of Taxes [Text Block] |
Performance results do not reflect the deduction of taxes that a shareholder would pay on fund distributions or on the redemption or sale of fund shares.
|
| Updated Performance Information Location [Text Block] |
Visit blackrock.com for more recent performance information.
|
| Net Assets |
$ 382,532,073
|
| Holdings Count | Holding |
204
|
| Advisory Fees Paid, Amount |
$ 1,821,675
|
| Investment Company Portfolio Turnover |
152.00%
|
| Additional Fund Statistics [Text Block] |
| Key Fund statistics |
|
| Net Assets |
$382,532,073% |
| Number of Portfolio Holdings |
$204% |
| Net Investment Advisory Fees |
$1,821,675% |
| Portfolio Turnover Rate |
$152% |
|
| Holdings [Text Block] |
What did the Fund invest in? (as of June 30, 2024)
| Geographic allocation |
| Country/Geographic Region |
Percent of
Net Assets |
| United States |
69.7% |
| Japan |
4.3% |
| China |
3.0% |
| Taiwan |
2.9% |
| Switzerland |
2.7% |
| Spain |
2.2% |
| Canada |
1.9% |
| Denmark |
1.6% |
| Germany |
1.4% |
| India |
1.3% |
| Other# |
8.8% |
| Other Assets Less Liabilities |
0.2% |
| Ten largest holdings |
| Security |
Percent of
Net Assets(a) |
| Microsoft Corp. |
4.9% |
| Apple, Inc. |
4.8% |
| NVIDIA Corp. |
4.5% |
| Amazon.com, Inc. |
4.0% |
| Johnson & Johnson |
1.9% |
| Alphabet, Inc., Class A |
1.9% |
| S&P Global, Inc. |
1.7% |
| Lam Research Corp. |
1.7% |
| Comcast Corp., Class A |
1.7% |
| QUALCOMM, Inc. |
1.7% |
| (a) |
Excludes short-term securities. |
| # |
Ten largest country/geographic regions are presented. Additional country/geographic regions are found in Other. |
|
| Largest Holdings [Text Block] |
| Ten largest holdings |
| Security |
Percent of
Net Assets(a) |
| Microsoft Corp. |
4.9% |
| Apple, Inc. |
4.8% |
| NVIDIA Corp. |
4.5% |
| Amazon.com, Inc. |
4.0% |
| Johnson & Johnson |
1.9% |
| Alphabet, Inc., Class A |
1.9% |
| S&P Global, Inc. |
1.7% |
| Lam Research Corp. |
1.7% |
| Comcast Corp., Class A |
1.7% |
| QUALCOMM, Inc. |
1.7% | (a)Excludes short-term securities.
|
| C000007429 [Member] |
|
| Shareholder Report [Line Items] |
|
| Fund Name |
BlackRock Advantage Global Fund, Inc.
|
| Class Name |
Investor A Shares
|
| Trading Symbol |
MDGCX
|
| Annual or Semi-Annual Statement [Text Block] |
This annual shareholder report contains important information about BlackRock Advantage Global Fund, Inc. (the “Fund”) for the period of July 1, 2023 to June 30, 2024.
|
| Shareholder Report Annual or Semi-Annual |
annual shareholder report
|
| Additional Information [Text Block] |
You can find additional information about the Fund at blackrock.com/fundreports. You can also request this information by contacting us at (800) 441‑7762.
|
| Additional Information Phone Number |
(800) 441‑7762
|
| Additional Information Website |
blackrock.com/fundreports
|
| Expenses [Text Block] |
What were the Fund costs for the last year? (based on a hypothetical $10,000 investment)
| Class name |
Costs of a $10,000
investment |
Costs paid as a percentage of a
$10,000 investment |
| Investor A Shares |
$107 |
0.96% |
|
| Expenses Paid, Amount |
$ 107
|
| Expense Ratio, Percent |
0.96%
|
| Factors Affecting Performance [Text Block] |
How did the Fund perform last year? -
Global equities generally enjoyed strong performance over the period, as resilient macro and micro data combined with excitement around innovation in information technology and healthcare. -
While U.S. market leadership trends exhibited persistence they also evolved and broadened over the period, helping alleviate concerns of a potential momentum reversal. -
International markets kept pace with the United States while much broader market participation enabled value styles to keep pace with momentum. What contributed to performance? The Fund delivered strong gains as stock selection insights were able to identify and lean into the dominant market trends. These insights aligned with a soft-landing expectation and motivated positioning across the artificial intelligence (“AI”) and GLP-1 weight loss drug themes. Sentiment measures identifying trends across analyst and executive comments as well as smart money positioning were key performance drivers. Fundamental quality and valuation measures provided a further source of returns as markets increasingly discerned AI winners versus losers. More broadly, valuation insights drove gains across the United States and Japan with measures evaluating cash flows, valuations and other financial statement metrics all contributing. Additionally, growth-oriented quality insights evaluating research expenditures helped the Fund benefit from AI optimism. What detracted from performance? Despite the strong gains, changing market leadership proved a headwind to trend-following industry insights over the period. In particular, industry measures picking up on price momentum and favoring defensive positioning performed poorly. In addition, select consumer intent-related measures were wrong-footed. In this vein, measures evaluating mobile app usage detracted by motivating exposure to the automobile industry. The views expressed reflect the opinions of BlackRock as of the date of this report and are subject to change based on changes in market, economic or other conditions. These views are not intended to be a forecast of future events and are no guarantee of future results.
|
| Performance Past Does Not Indicate Future [Text] |
Past performance is not an indication of future results.
|
| Line Graph [Table Text Block] |
Fund performance Cumulative performance: July 1, 2014 through June 30, 2024 Initial investment of $10,000 See “Average annual total returns” for additional information on fund performance.
|
| Average Annual Return [Table Text Block] |
| Average annual total returns |
|
|
|
|
1 Year |
5 Years |
10 Years |
| Investor A Shares |
21.87% |
10.75% |
7.14% |
| Investor A Shares (with sales charge) |
15.47% |
9.56% |
6.56% |
| MSCI All Country World Index |
19.38% |
10.76% |
8.43% |
|
| No Deduction of Taxes [Text Block] |
Performance results do not reflect the deduction of taxes that a shareholder would pay on fund distributions or on the redemption or sale of fund shares.
|
| Updated Performance Information Location [Text Block] |
Visit blackrock.com for more recent performance information.
|
| Net Assets |
$ 382,532,073
|
| Holdings Count | Holding |
204
|
| Advisory Fees Paid, Amount |
$ 1,821,675
|
| Investment Company Portfolio Turnover |
152.00%
|
| Additional Fund Statistics [Text Block] |
| Key Fund statistics |
|
| Net Assets |
$382,532,073% |
| Number of Portfolio Holdings |
$204% |
| Net Investment Advisory Fees |
$1,821,675% |
| Portfolio Turnover Rate |
$152% |
|
| Holdings [Text Block] |
What did the Fund invest in? (as of June 30, 2024)
| Geographic allocation |
| Country/Geographic Region |
Percent of
Net Assets |
| United States |
69.7% |
| Japan |
4.3% |
| China |
3.0% |
| Taiwan |
2.9% |
| Switzerland |
2.7% |
| Spain |
2.2% |
| Canada |
1.9% |
| Denmark |
1.6% |
| Germany |
1.4% |
| India |
1.3% |
| Other# |
8.8% |
| Other Assets Less Liabilities |
0.2% |
| Ten largest holdings |
| Security |
Percent of
Net Assets(a) |
| Microsoft Corp. |
4.9% |
| Apple, Inc. |
4.8% |
| NVIDIA Corp. |
4.5% |
| Amazon.com, Inc. |
4.0% |
| Johnson & Johnson |
1.9% |
| Alphabet, Inc., Class A |
1.9% |
| S&P Global, Inc. |
1.7% |
| Lam Research Corp. |
1.7% |
| Comcast Corp., Class A |
1.7% |
| QUALCOMM, Inc. |
1.7% |
| (a) |
Excludes short-term securities. |
| # |
Ten largest country/geographic regions are presented. Additional country/geographic regions are found in Other. |
|
| Largest Holdings [Text Block] |
| Ten largest holdings |
| Security |
Percent of
Net Assets(a) |
| Microsoft Corp. |
4.9% |
| Apple, Inc. |
4.8% |
| NVIDIA Corp. |
4.5% |
| Amazon.com, Inc. |
4.0% |
| Johnson & Johnson |
1.9% |
| Alphabet, Inc., Class A |
1.9% |
| S&P Global, Inc. |
1.7% |
| Lam Research Corp. |
1.7% |
| Comcast Corp., Class A |
1.7% |
| QUALCOMM, Inc. |
1.7% | (a)Excludes short-term securities.
|
| C000007431 [Member] |
|
| Shareholder Report [Line Items] |
|
| Fund Name |
BlackRock Advantage Global Fund, Inc.
|
| Class Name |
Investor C Shares
|
| Trading Symbol |
MCGCX
|
| Annual or Semi-Annual Statement [Text Block] |
This annual shareholder report contains important information about BlackRock Advantage Global Fund, Inc. (the “Fund”) for the period of July 1, 2023 to June 30, 2024.
|
| Shareholder Report Annual or Semi-Annual |
annual shareholder report
|
| Additional Information [Text Block] |
You can find additional information about the Fund at blackrock.com/fundreports. You can also request this information by contacting us at (800) 441‑7762.
|
| Additional Information Phone Number |
(800) 441‑7762
|
| Additional Information Website |
blackrock.com/fundreports
|
| Expenses [Text Block] |
What were the Fund costs for the last year? (based on a hypothetical $10,000 investment)
| Class name |
Costs of a $10,000
investment |
Costs paid as a percentage of a
$10,000 investment |
| Investor C Shares |
$189 |
1.71% |
|
| Expenses Paid, Amount |
$ 189
|
| Expense Ratio, Percent |
1.71%
|
| Factors Affecting Performance [Text Block] |
How did the Fund perform last year? -
Global equities generally enjoyed strong performance over the period, as resilient macro and micro data combined with excitement around innovation in information technology and healthcare. -
While U.S. market leadership trends exhibited persistence they also evolved and broadened over the period, helping alleviate concerns of a potential momentum reversal. -
International markets kept pace with the United States while much broader market participation enabled value styles to keep pace with momentum. What contributed to performance? The Fund delivered strong gains as stock selection insights were able to identify and lean into the dominant market trends. These insights aligned with a soft-landing expectation and motivated positioning across the artificial intelligence (“AI”) and GLP-1 weight loss drug themes. Sentiment measures identifying trends across analyst and executive comments as well as smart money positioning were key performance drivers. Fundamental quality and valuation measures provided a further source of returns as markets increasingly discerned AI winners versus losers. More broadly, valuation insights drove gains across the United States and Japan with measures evaluating cash flows, valuations and other financial statement metrics all contributing. Additionally, growth-oriented quality insights evaluating research expenditures helped the Fund benefit from AI optimism. What detracted from performance? Despite the strong gains, changing market leadership proved a headwind to trend-following industry insights over the period. In particular, industry measures picking up on price momentum and favoring defensive positioning performed poorly. In addition, select consumer intent-related measures were wrong-footed. In this vein, measures evaluating mobile app usage detracted by motivating exposure to the automobile industry. The views expressed reflect the opinions of BlackRock as of the date of this report and are subject to change based on changes in market, economic or other conditions. These views are not intended to be a forecast of future events and are no guarantee of future results.
|
| Performance Past Does Not Indicate Future [Text] |
Past performance is not an indication of future results.
|
| Line Graph [Table Text Block] |
Fund performance Cumulative performance: July 1, 2014 through June 30, 2024 Initial investment of $10,000 See “Average annual total returns” for additional information on fund performance.
|
| Average Annual Return [Table Text Block] |
| Average annual total returns |
|
|
|
|
1 Year |
5 Years |
10 Years |
| Investor C Shares |
20.91% |
9.92% |
6.48% |
| Investor C Shares (with sales charge) |
19.91% |
9.92% |
6.48% |
| MSCI All Country World Index |
19.38% |
10.76% |
8.43% |
|
| No Deduction of Taxes [Text Block] |
Performance results do not reflect the deduction of taxes that a shareholder would pay on fund distributions or on the redemption or sale of fund shares.
|
| Updated Performance Information Location [Text Block] |
Visit blackrock.com for more recent performance information.
|
| Net Assets |
$ 382,532,073
|
| Holdings Count | Holding |
204
|
| Advisory Fees Paid, Amount |
$ 1,821,675
|
| Investment Company Portfolio Turnover |
152.00%
|
| Additional Fund Statistics [Text Block] |
| Key Fund statistics |
|
| Net Assets |
$382,532,073% |
| Number of Portfolio Holdings |
$204% |
| Net Investment Advisory Fees |
$1,821,675% |
| Portfolio Turnover Rate |
$152% |
|
| Holdings [Text Block] |
What did the Fund invest in? (as of June 30, 2024)
| Geographic allocation |
| Country/Geographic Region |
Percent of
Net Assets |
| United States |
69.7% |
| Japan |
4.3% |
| China |
3.0% |
| Taiwan |
2.9% |
| Switzerland |
2.7% |
| Spain |
2.2% |
| Canada |
1.9% |
| Denmark |
1.6% |
| Germany |
1.4% |
| India |
1.3% |
| Other# |
8.8% |
| Other Assets Less Liabilities |
0.2% |
| Ten largest holdings |
| Security |
Percent of
Net Assets(a) |
| Microsoft Corp. |
4.9% |
| Apple, Inc. |
4.8% |
| NVIDIA Corp. |
4.5% |
| Amazon.com, Inc. |
4.0% |
| Johnson & Johnson |
1.9% |
| Alphabet, Inc., Class A |
1.9% |
| S&P Global, Inc. |
1.7% |
| Lam Research Corp. |
1.7% |
| Comcast Corp., Class A |
1.7% |
| QUALCOMM, Inc. |
1.7% |
| (a) |
Excludes short-term securities. |
| # |
Ten largest country/geographic regions are presented. Additional country/geographic regions are found in Other. |
|
| Largest Holdings [Text Block] |
| Ten largest holdings |
| Security |
Percent of
Net Assets(a) |
| Microsoft Corp. |
4.9% |
| Apple, Inc. |
4.8% |
| NVIDIA Corp. |
4.5% |
| Amazon.com, Inc. |
4.0% |
| Johnson & Johnson |
1.9% |
| Alphabet, Inc., Class A |
1.9% |
| S&P Global, Inc. |
1.7% |
| Lam Research Corp. |
1.7% |
| Comcast Corp., Class A |
1.7% |
| QUALCOMM, Inc. |
1.7% | (a)Excludes short-term securities.
|
| C000199761 [Member] |
|
| Shareholder Report [Line Items] |
|
| Fund Name |
BlackRock Advantage Global Fund, Inc.
|
| Class Name |
Class K Shares
|
| Trading Symbol |
MKGCX
|
| Annual or Semi-Annual Statement [Text Block] |
This annual shareholder report contains important information about BlackRock Advantage Global Fund, Inc. (the “Fund”) for the period of July 1, 2023 to June 30, 2024.
|
| Shareholder Report Annual or Semi-Annual |
annual shareholder report
|
| Additional Information [Text Block] |
You can find additional information about the Fund at blackrock.com/fundreports. You can also request this information by contacting us at (800) 441‑7762.
|
| Additional Information Phone Number |
(800) 441‑7762
|
| Additional Information Website |
blackrock.com/fundreports
|
| Expenses [Text Block] |
What were the Fund costs for the last year? (based on a hypothetical $10,000 investment)
| Class name |
Costs of a $10,000
investment |
Costs paid as a percentage of a
$10,000 investment |
| Class K Shares |
$73 |
0.66% |
|
| Expenses Paid, Amount |
$ 73
|
| Expense Ratio, Percent |
0.66%
|
| Factors Affecting Performance [Text Block] |
How did the Fund perform last year? -
Global equities generally enjoyed strong performance over the period, as resilient macro and micro data combined with excitement around innovation in information technology and healthcare. -
While U.S. market leadership trends exhibited persistence they also evolved and broadened over the period, helping alleviate concerns of a potential momentum reversal. -
International markets kept pace with the United States while much broader market participation enabled value styles to keep pace with momentum. What contributed to performance? The Fund delivered strong gains as stock selection insights were able to identify and lean into the dominant market trends. These insights aligned with a soft-landing expectation and motivated positioning across the artificial intelligence (“AI”) and GLP-1 weight loss drug themes. Sentiment measures identifying trends across analyst and executive comments as well as smart money positioning were key performance drivers. Fundamental quality and valuation measures provided a further source of returns as markets increasingly discerned AI winners versus losers. More broadly, valuation insights drove gains across the United States and Japan with measures evaluating cash flows, valuations and other financial statement metrics all contributing. Additionally, growth-oriented quality insights evaluating research expenditures helped the Fund benefit from AI optimism. What detracted from performance? Despite the strong gains, changing market leadership proved a headwind to trend-following industry insights over the period. In particular, industry measures picking up on price momentum and favoring defensive positioning performed poorly. In addition, select consumer intent-related measures were wrong-footed. In this vein, measures evaluating mobile app usage detracted by motivating exposure to the automobile industry. The views expressed reflect the opinions of BlackRock as of the date of this report and are subject to change based on changes in market, economic or other conditions. These views are not intended to be a forecast of future events and are no guarantee of future results.
|
| Performance Past Does Not Indicate Future [Text] |
Past performance is not an indication of future results.
|
| Line Graph [Table Text Block] |
Fund performance Cumulative performance: July 1, 2014 through June 30, 2024 Initial investment of $10,000 See “Average annual total returns” for additional information on fund performance.
|
| Average Annual Return [Table Text Block] |
| Average annual total returns |
|
|
|
|
1 Year |
5 Years |
10 Years |
| Class K Shares |
22.22% |
11.08% |
7.48% |
| MSCI All Country World Index |
19.38% |
10.76% |
8.43% |
|
| No Deduction of Taxes [Text Block] |
Performance results do not reflect the deduction of taxes that a shareholder would pay on fund distributions or on the redemption or sale of fund shares.
|
| Updated Performance Information Location [Text Block] |
Visit blackrock.com for more recent performance information.
|
| Net Assets |
$ 382,532,073
|
| Holdings Count | Holding |
204
|
| Advisory Fees Paid, Amount |
$ 1,821,675
|
| Investment Company Portfolio Turnover |
152.00%
|
| Additional Fund Statistics [Text Block] |
| Key Fund statistics |
|
| Net Assets |
$382,532,073% |
| Number of Portfolio Holdings |
$204% |
| Net Investment Advisory Fees |
$1,821,675% |
| Portfolio Turnover Rate |
$152% |
|
| Holdings [Text Block] |
What did the Fund invest in? (as of June 30, 2024)
| Geographic allocation |
| Country/Geographic Region |
Percent of
Net Assets |
| United States |
69.7% |
| Japan |
4.3% |
| China |
3.0% |
| Taiwan |
2.9% |
| Switzerland |
2.7% |
| Spain |
2.2% |
| Canada |
1.9% |
| Denmark |
1.6% |
| Germany |
1.4% |
| India |
1.3% |
| Other# |
8.8% |
| Other Assets Less Liabilities |
0.2% |
| Ten largest holdings |
| Security |
Percent of
Net Assets(a) |
| Microsoft Corp. |
4.9% |
| Apple, Inc. |
4.8% |
| NVIDIA Corp. |
4.5% |
| Amazon.com, Inc. |
4.0% |
| Johnson & Johnson |
1.9% |
| Alphabet, Inc., Class A |
1.9% |
| S&P Global, Inc. |
1.7% |
| Lam Research Corp. |
1.7% |
| Comcast Corp., Class A |
1.7% |
| QUALCOMM, Inc. |
1.7% |
| (a) |
Excludes short-term securities. |
| # |
Ten largest country/geographic regions are presented. Additional country/geographic regions are found in Other. |
|
| Largest Holdings [Text Block] |
| Ten largest holdings |
| Security |
Percent of
Net Assets(a) |
| Microsoft Corp. |
4.9% |
| Apple, Inc. |
4.8% |
| NVIDIA Corp. |
4.5% |
| Amazon.com, Inc. |
4.0% |
| Johnson & Johnson |
1.9% |
| Alphabet, Inc., Class A |
1.9% |
| S&P Global, Inc. |
1.7% |
| Lam Research Corp. |
1.7% |
| Comcast Corp., Class A |
1.7% |
| QUALCOMM, Inc. |
1.7% | (a)Excludes short-term securities.
|
| C000007433 [Member] |
|
| Shareholder Report [Line Items] |
|
| Fund Name |
BlackRock Advantage Global Fund, Inc.
|
| Class Name |
Class R Shares
|
| Trading Symbol |
MRGSX
|
| Annual or Semi-Annual Statement [Text Block] |
This annual shareholder report contains important information about BlackRock Advantage Global Fund, Inc. (the “Fund”) for the period of July 1, 2023 to June 30, 2024.
|
| Shareholder Report Annual or Semi-Annual |
annual shareholder report
|
| Additional Information [Text Block] |
You can find additional information about the Fund at blackrock.com/fundreports. You can also request this information by contacting us at (800) 441‑7762.
|
| Additional Information Phone Number |
(800) 441‑7762
|
| Additional Information Website |
blackrock.com/fundreports
|
| Expenses [Text Block] |
What were the Fund costs for the last year? (based on a hypothetical $10,000 investment)
| Class name |
Costs of a $10,000
investment |
Costs paid as a percentage of a
$10,000 investment |
| Class R Shares |
$134 |
1.21% |
|
| Expenses Paid, Amount |
$ 134
|
| Expense Ratio, Percent |
1.21%
|
| Factors Affecting Performance [Text Block] |
How did the Fund perform last year? -
Global equities generally enjoyed strong performance over the period, as resilient macro and micro data combined with excitement around innovation in information technology and healthcare. -
While U.S. market leadership trends exhibited persistence they also evolved and broadened over the period, helping alleviate concerns of a potential momentum reversal. -
International markets kept pace with the United States while much broader market participation enabled value styles to keep pace with momentum. What contributed to performance? The Fund delivered strong gains as stock selection insights were able to identify and lean into the dominant market trends. These insights aligned with a soft-landing expectation and motivated positioning across the artificial intelligence (“AI”) and GLP-1 weight loss drug themes. Sentiment measures identifying trends across analyst and executive comments as well as smart money positioning were key performance drivers. Fundamental quality and valuation measures provided a further source of returns as markets increasingly discerned AI winners versus losers. More broadly, valuation insights drove gains across the United States and Japan with measures evaluating cash flows, valuations and other financial statement metrics all contributing. Additionally, growth-oriented quality insights evaluating research expenditures helped the Fund benefit from AI optimism. What detracted from performance? Despite the strong gains, changing market leadership proved a headwind to trend-following industry insights over the period. In particular, industry measures picking up on price momentum and favoring defensive positioning performed poorly. In addition, select consumer intent-related measures were wrong-footed. In this vein, measures evaluating mobile app usage detracted by motivating exposure to the automobile industry. The views expressed reflect the opinions of BlackRock as of the date of this report and are subject to change based on changes in market, economic or other conditions. These views are not intended to be a forecast of future events and are no guarantee of future results.
|
| Performance Past Does Not Indicate Future [Text] |
Past performance is not an indication of future results.
|
| Line Graph [Table Text Block] |
Fund performance Cumulative performance: July 1, 2014 through June 30, 2024 Initial investment of $10,000 See “Average annual total returns” for additional information on fund performance.
|
| Average Annual Return [Table Text Block] |
| Average annual total returns |
|
|
|
|
1 Year |
5 Years |
10 Years |
| Class R Shares |
21.59% |
10.47% |
6.83% |
| MSCI All Country World Index |
19.38% |
10.76% |
8.43% |
|
| No Deduction of Taxes [Text Block] |
Performance results do not reflect the deduction of taxes that a shareholder would pay on fund distributions or on the redemption or sale of fund shares.
|
| Updated Performance Information Location [Text Block] |
Visit blackrock.com for more recent performance information.
|
| Net Assets |
$ 382,532,073
|
| Holdings Count | Holding |
204
|
| Advisory Fees Paid, Amount |
$ 1,821,675
|
| Investment Company Portfolio Turnover |
152.00%
|
| Additional Fund Statistics [Text Block] |
| Key Fund statistics |
|
| Net Assets |
$382,532,073% |
| Number of Portfolio Holdings |
$204% |
| Net Investment Advisory Fees |
$1,821,675% |
| Portfolio Turnover Rate |
$152% |
|
| Holdings [Text Block] |
What did the Fund invest in? (as of June 30, 2024)
| Geographic allocation |
| Country/Geographic Region |
Percent of
Net Assets |
| United States |
69.7% |
| Japan |
4.3% |
| China |
3.0% |
| Taiwan |
2.9% |
| Switzerland |
2.7% |
| Spain |
2.2% |
| Canada |
1.9% |
| Denmark |
1.6% |
| Germany |
1.4% |
| India |
1.3% |
| Other# |
8.8% |
| Other Assets Less Liabilities |
0.2% |
| Ten largest holdings |
| Security |
Percent of
Net Assets(a) |
| Microsoft Corp. |
4.9% |
| Apple, Inc. |
4.8% |
| NVIDIA Corp. |
4.5% |
| Amazon.com, Inc. |
4.0% |
| Johnson & Johnson |
1.9% |
| Alphabet, Inc., Class A |
1.9% |
| S&P Global, Inc. |
1.7% |
| Lam Research Corp. |
1.7% |
| Comcast Corp., Class A |
1.7% |
| QUALCOMM, Inc. |
1.7% |
| (a) |
Excludes short-term securities. |
| # |
Ten largest country/geographic regions are presented. Additional country/geographic regions are found in Other. |
|
| Largest Holdings [Text Block] |
| Ten largest holdings |
| Security |
Percent of
Net Assets(a) |
| Microsoft Corp. |
4.9% |
| Apple, Inc. |
4.8% |
| NVIDIA Corp. |
4.5% |
| Amazon.com, Inc. |
4.0% |
| Johnson & Johnson |
1.9% |
| Alphabet, Inc., Class A |
1.9% |
| S&P Global, Inc. |
1.7% |
| Lam Research Corp. |
1.7% |
| Comcast Corp., Class A |
1.7% |
| QUALCOMM, Inc. |
1.7% | (a)Excludes short-term securities.
|
| X |
- DefinitionBoolean flag that is true when the XBRL content amends previously-filed or accepted submission.
| Name: |
dei_AmendmentFlag |
| Namespace Prefix: |
dei_ |
| Data Type: |
xbrli:booleanItemType |
| Balance Type: |
na |
| Period Type: |
duration |
|
| X |
- DefinitionFor the EDGAR submission types of Form 8-K: the date of the report, the date of the earliest event reported; for the EDGAR submission types of Form N-1A: the filing date; for all other submission types: the end of the reporting or transition period. The format of the date is YYYY-MM-DD.
| Name: |
dei_DocumentPeriodEndDate |
| Namespace Prefix: |
dei_ |
| Data Type: |
xbrli:dateItemType |
| Balance Type: |
na |
| Period Type: |
duration |
|
| X |
- DefinitionThe type of document being provided (such as 10-K, 10-Q, 485BPOS, etc). The document type is limited to the same value as the supporting SEC submission type, or the word 'Other'.
| Name: |
dei_DocumentType |
| Namespace Prefix: |
dei_ |
| Data Type: |
dei:submissionTypeItemType |
| Balance Type: |
na |
| Period Type: |
duration |
|
| X |
- DefinitionA unique 10-digit SEC-issued value to identify entities that have filed disclosures with the SEC. It is commonly abbreviated as CIK. Reference 1: http://www.xbrl.org/2003/role/presentationRef
-Publisher SEC
-Name Exchange Act
-Number 240
-Section 12
-Subsection b-2
| Name: |
dei_EntityCentralIndexKey |
| Namespace Prefix: |
dei_ |
| Data Type: |
dei:centralIndexKeyItemType |
| Balance Type: |
na |
| Period Type: |
duration |
|
| X |
- DefinitionThe exact name of the entity filing the report as specified in its charter, which is required by forms filed with the SEC. Reference 1: http://www.xbrl.org/2003/role/presentationRef
-Publisher SEC
-Name Exchange Act
-Number 240
-Section 12
-Subsection b-2
| Name: |
dei_EntityRegistrantName |
| Namespace Prefix: |
dei_ |
| Data Type: |
xbrli:normalizedStringItemType |
| Balance Type: |
na |
| Period Type: |
duration |
|
| X |
- DefinitionTrading symbol of an instrument as listed on an exchange.
| Name: |
dei_TradingSymbol |
| Namespace Prefix: |
dei_ |
| Data Type: |
dei:tradingSymbolItemType |
| Balance Type: |
na |
| Period Type: |
duration |
|
| X |
- ReferencesReference 1: http://www.xbrl.org/2003/role/presentationRef
-Publisher SEC
-Name Form N-1A
-Section 27A
-Subsection e
| Name: |
oef_AddlFundStatisticsTextBlock |
| Namespace Prefix: |
oef_ |
| Data Type: |
dtr-types:textBlockItemType |
| Balance Type: |
na |
| Period Type: |
duration |
|
| X |
- ReferencesReference 1: http://www.xbrl.org/2003/role/presentationRef
-Publisher SEC
-Name Form N-1A
-Section 27A
-Subsection b
-Paragraph instruction
-Subparagraph 2
| Name: |
oef_AddlInfoPhoneNumber |
| Namespace Prefix: |
oef_ |
| Data Type: |
xbrli:stringItemType |
| Balance Type: |
na |
| Period Type: |
duration |
|
| X |
- ReferencesReference 1: http://www.xbrl.org/2003/role/presentationRef
-Publisher SEC
-Name Form N-1A
-Section 27A
-Subsection b
-Paragraph 4
| Name: |
oef_AddlInfoTextBlock |
| Namespace Prefix: |
oef_ |
| Data Type: |
dtr-types:textBlockItemType |
| Balance Type: |
na |
| Period Type: |
duration |
|
| X |
- ReferencesReference 1: http://www.xbrl.org/2003/role/presentationRef
-Publisher SEC
-Name Form N-1A
-Section 27A
-Subsection b
-Paragraph instruction
-Subparagraph 2
| Name: |
oef_AddlInfoWebsite |
| Namespace Prefix: |
oef_ |
| Data Type: |
xbrli:stringItemType |
| Balance Type: |
na |
| Period Type: |
duration |
|
| X |
- ReferencesReference 1: http://www.xbrl.org/2003/role/presentationRef
-Publisher SEC
-Name Form N-1A
-Section 27A
-Subsection e
| Name: |
oef_AdvisoryFeesPaidAmt |
| Namespace Prefix: |
oef_ |
| Data Type: |
xbrli:monetaryItemType |
| Balance Type: |
na |
| Period Type: |
duration |
|
| X |
- ReferencesReference 1: http://www.xbrl.org/2003/role/presentationRef
-Publisher SEC
-Name Form N-1A
-Section 27A
-Subsection b
-Paragraph 3
| Name: |
oef_AnnlOrSemiAnnlStatementTextBlock |
| Namespace Prefix: |
oef_ |
| Data Type: |
dtr-types:textBlockItemType |
| Balance Type: |
na |
| Period Type: |
duration |
|
| X |
- ReferencesReference 1: http://www.xbrl.org/2003/role/presentationRef
-Publisher SEC
-Name Form N-1A
-Section 27A
-Subsection d
-Paragraph 2
-Subparagraph instruction
-Clause 7
| Name: |
oef_AvgAnnlRtrTableTextBlock |
| Namespace Prefix: |
oef_ |
| Data Type: |
dtr-types:textBlockItemType |
| Balance Type: |
na |
| Period Type: |
duration |
|
| X |
- ReferencesReference 1: http://www.xbrl.org/2003/role/presentationRef
-Publisher SEC
-Name Form N-1A
-Section 27A
-Subsection b
-Paragraph instruction
-Subparagraph 2
| Name: |
oef_ClassName |
| Namespace Prefix: |
oef_ |
| Data Type: |
dei:securityTitleItemType |
| Balance Type: |
na |
| Period Type: |
duration |
|
| X |
- ReferencesReference 1: http://www.xbrl.org/2003/role/presentationRef
-Publisher SEC
-Name Form N-1A
-Section 27A
-Subsection c
-Paragraph iii
| Name: |
oef_ExpenseRatioPct |
| Namespace Prefix: |
oef_ |
| Data Type: |
dtr-types:percentItemType |
| Balance Type: |
na |
| Period Type: |
duration |
|
| X |
- ReferencesReference 1: http://www.xbrl.org/2003/role/presentationRef
-Publisher SEC
-Name Form N-1A
-Section 27A
-Subsection c
-Paragraph ii
| Name: |
oef_ExpensesPaidAmt |
| Namespace Prefix: |
oef_ |
| Data Type: |
xbrli:monetaryItemType |
| Balance Type: |
na |
| Period Type: |
duration |
|
| X |
- ReferencesReference 1: http://www.xbrl.org/2003/role/presentationRef
-Publisher SEC
-Name Form N-1A
-Section 27A
-Subsection c
| Name: |
oef_ExpensesTextBlock |
| Namespace Prefix: |
oef_ |
| Data Type: |
dtr-types:textBlockItemType |
| Balance Type: |
na |
| Period Type: |
duration |
|
| X |
- ReferencesReference 1: http://www.xbrl.org/2003/role/presentationRef
-Publisher SEC
-Name Form N-1A
-Section 27A
-Subsection d
-Paragraph 1
| Name: |
oef_FactorsAffectingPerfTextBlock |
| Namespace Prefix: |
oef_ |
| Data Type: |
dtr-types:textBlockItemType |
| Balance Type: |
na |
| Period Type: |
duration |
|
| X |
- ReferencesReference 1: http://www.xbrl.org/2003/role/presentationRef
-Publisher SEC
-Name Form N-1A
-Section 27A
-Subsection b
-Paragraph 1
| Name: |
oef_FundName |
| Namespace Prefix: |
oef_ |
| Data Type: |
xbrli:normalizedStringItemType |
| Balance Type: |
na |
| Period Type: |
duration |
|
| X |
- ReferencesReference 1: http://www.xbrl.org/2003/role/presentationRef
-Publisher SEC
-Name Form N-1A
-Section 27A
-Subsection e
| Name: |
oef_HoldingsCount |
| Namespace Prefix: |
oef_ |
| Data Type: |
xbrli:integerItemType |
| Balance Type: |
na |
| Period Type: |
instant |
|
| X |
- ReferencesReference 1: http://www.xbrl.org/2003/role/presentationRef
-Publisher SEC
-Name Form N-1A
-Section 27A
-Subsection f
| Name: |
oef_HoldingsTableTextBlock |
| Namespace Prefix: |
oef_ |
| Data Type: |
dtr-types:textBlockItemType |
| Balance Type: |
na |
| Period Type: |
duration |
|
| X |
- ReferencesReference 1: http://www.xbrl.org/2003/role/presentationRef
-Publisher SEC
-Name Form N-1A
-Section 27A
-Subsection f
| Name: |
oef_LargestHoldingsTableTextBlock |
| Namespace Prefix: |
oef_ |
| Data Type: |
dtr-types:textBlockItemType |
| Balance Type: |
na |
| Period Type: |
duration |
|
| X |
- ReferencesReference 1: http://www.xbrl.org/2003/role/presentationRef
-Publisher SEC
-Name Form N-1A
-Section 27A
-Subsection d
-Paragraph 2
| Name: |
oef_LineGraphTableTextBlock |
| Namespace Prefix: |
oef_ |
| Data Type: |
dtr-types:textBlockItemType |
| Balance Type: |
na |
| Period Type: |
duration |
|
| X |
- ReferencesReference 1: http://www.xbrl.org/2003/role/presentationRef
-Publisher SEC
-Name Form N-1A
-Section 27A
-Subsection d
-Paragraph 2
-Subparagraph iii
-Clause B
| Name: |
oef_NoDeductionOfTaxesTextBlock |
| Namespace Prefix: |
oef_ |
| Data Type: |
dtr-types:textBlockItemType |
| Balance Type: |
na |
| Period Type: |
duration |
|
| X |
- ReferencesReference 1: http://www.xbrl.org/2003/role/presentationRef
-Publisher SEC
-Name Form N-1A
-Section 27A
-Subsection b
-Paragraph 3
| Name: |
oef_ShareholderReportAnnualOrSemiAnnual |
| Namespace Prefix: |
oef_ |
| Data Type: |
oef:shareholderReportTypeItemType |
| Balance Type: |
na |
| Period Type: |
duration |
|
| X |
- ReferencesReference 1: http://www.xbrl.org/2003/role/presentationRef
-Publisher SEC
-Name Form N-1A
-Section 27A
-Subsection d
-Paragraph 2
-Subparagraph instruction
-Clause 7
| Name: |
oef_ShareholderReportLineItems |
| Namespace Prefix: |
oef_ |
| Data Type: |
xbrli:stringItemType |
| Balance Type: |
na |
| Period Type: |
duration |
|
| X |
- ReferencesReference 1: http://www.xbrl.org/2003/role/presentationRef
-Publisher SEC
-Name Form N-1A
-Section 27A
-Subsection d
-Paragraph 2
-Subparagraph instruction
-Clause 15
| Name: |
oef_UpdPerfInfoLocationTextBlock |
| Namespace Prefix: |
oef_ |
| Data Type: |
dtr-types:textBlockItemType |
| Balance Type: |
na |
| Period Type: |
duration |
|
| X |
- DefinitionAmount of net assets (liabilities). Reference 1: http://fasb.org/us-gaap/role/ref/legacyRef
-Name Accounting Standards Codification
-Section 50
-Paragraph 1
-SubTopic 30
-Topic 205
-Publisher FASB
-URI https://asc.fasb.org//1943274/2147479910/205-30-50-1
| Name: |
us-gaap_AssetsNet |
| Namespace Prefix: |
us-gaap_ |
| Data Type: |
xbrli:monetaryItemType |
| Balance Type: |
debit |
| Period Type: |
instant |
|
| X |
- DefinitionPercentage of lesser of purchase or sale of portfolio securities to average value of portfolio securities owned. Reference 1: http://www.xbrl.org/2009/role/commonPracticeRef
-Topic 946
-SubTopic 205
-Name Accounting Standards Codification
-Section 50
-Paragraph 27
-Publisher FASB
-URI https://asc.fasb.org//1943274/2147480737/946-205-50-27
| Name: |
us-gaap_InvestmentCompanyPortfolioTurnover |
| Namespace Prefix: |
us-gaap_ |
| Data Type: |
dtr-types:percentItemType |
| Balance Type: |
na |
| Period Type: |
duration |
|
| X |
- Details
| Name: |
oef_ClassAxis=bragfi_C000007432Member |
| Namespace Prefix: |
|
| Data Type: |
na |
| Balance Type: |
|
| Period Type: |
|
|
| X |
- Details
| Name: |
oef_ClassAxis=bragfi_C000007429Member |
| Namespace Prefix: |
|
| Data Type: |
na |
| Balance Type: |
|
| Period Type: |
|
|
| X |
- Details
| Name: |
oef_ClassAxis=bragfi_C000007431Member |
| Namespace Prefix: |
|
| Data Type: |
na |
| Balance Type: |
|
| Period Type: |
|
|
| X |
- Details
| Name: |
oef_ClassAxis=bragfi_C000199761Member |
| Namespace Prefix: |
|
| Data Type: |
na |
| Balance Type: |
|
| Period Type: |
|
|
| X |
- Details
| Name: |
oef_ClassAxis=bragfi_C000007433Member |
| Namespace Prefix: |
|
| Data Type: |
na |
| Balance Type: |
|
| Period Type: |
|
|
v3.24.2.u1
Shareholder Report, Line Graph (Details) - USD ($)
|
12 Months Ended |
60 Months Ended |
120 Months Ended |
|
|
|
|
|
|
|
|
|
|
Jun. 30, 2024 |
Jun. 30, 2024 |
Jun. 30, 2024 |
Jun. 30, 2023 |
Jun. 30, 2022 |
Jun. 30, 2021 |
Jun. 30, 2020 |
Jun. 30, 2019 |
Jun. 30, 2018 |
Jun. 30, 2017 |
Jun. 30, 2016 |
Jun. 30, 2015 |
Jun. 30, 2014 |
| C000007432 [Member] |
|
|
|
|
|
|
|
|
|
|
|
|
|
| Account Value [Line Items] |
|
|
|
|
|
|
|
|
|
|
|
|
|
| Line Graph and Table Measure Name |
Institutional Shares
|
|
|
|
|
|
|
|
|
|
|
|
|
| Account Value |
$ 20,498
|
$ 20,498
|
$ 20,498
|
$ 16,774
|
$ 14,344
|
$ 16,979
|
$ 12,283
|
$ 12,152
|
$ 11,681
|
$ 10,390
|
$ 8,688
|
$ 9,755
|
$ 10,000
|
| Average Annual Return, Percent |
22.20%
|
11.02%
|
7.44%
|
|
|
|
|
|
|
|
|
|
|
| C000007429 [Member] |
|
|
|
|
|
|
|
|
|
|
|
|
|
| Account Value [Line Items] |
|
|
|
|
|
|
|
|
|
|
|
|
|
| Line Graph and Table Measure Name |
Investor A Shares (with sales charge)
|
|
|
|
|
|
|
|
|
|
|
|
|
| Average Annual Return, Percent |
15.47%
|
9.56%
|
6.56%
|
|
|
|
|
|
|
|
|
|
|
| C000007429 [Member] | Without Sales Load [Member] |
|
|
|
|
|
|
|
|
|
|
|
|
|
| Account Value [Line Items] |
|
|
|
|
|
|
|
|
|
|
|
|
|
| Line Graph and Table Measure Name |
Investor A Shares
|
|
|
|
|
|
|
|
|
|
|
|
|
| Account Value |
$ 18,882
|
$ 18,882
|
$ 18,882
|
15,494
|
13,282
|
15,763
|
11,430
|
11,335
|
10,923
|
9,744
|
8,182
|
9,215
|
9,475
|
| Average Annual Return, Percent |
21.87%
|
10.75%
|
7.14%
|
|
|
|
|
|
|
|
|
|
|
| C000007431 [Member] |
|
|
|
|
|
|
|
|
|
|
|
|
|
| Account Value [Line Items] |
|
|
|
|
|
|
|
|
|
|
|
|
|
| Line Graph and Table Measure Name |
Investor C Shares (with sales charge)
|
|
|
|
|
|
|
|
|
|
|
|
|
| Average Annual Return, Percent |
19.91%
|
9.92%
|
6.48%
|
|
|
|
|
|
|
|
|
|
|
| C000007431 [Member] | Without Sales Load [Member] |
|
|
|
|
|
|
|
|
|
|
|
|
|
| Account Value [Line Items] |
|
|
|
|
|
|
|
|
|
|
|
|
|
| Line Graph and Table Measure Name |
Investor C Shares
|
|
|
|
|
|
|
|
|
|
|
|
|
| Account Value |
$ 18,738
|
$ 18,738
|
$ 18,738
|
15,376
|
13,181
|
15,759
|
11,514
|
11,501
|
11,168
|
10,041
|
8,496
|
9,647
|
10,000
|
| Average Annual Return, Percent |
20.91%
|
9.92%
|
6.48%
|
|
|
|
|
|
|
|
|
|
|
| C000199761 [Member] |
|
|
|
|
|
|
|
|
|
|
|
|
|
| Account Value [Line Items] |
|
|
|
|
|
|
|
|
|
|
|
|
|
| Line Graph and Table Measure Name |
Class K Shares
|
|
|
|
|
|
|
|
|
|
|
|
|
| Account Value |
$ 20,564
|
$ 20,564
|
$ 20,564
|
16,825
|
14,381
|
17,012
|
12,297
|
12,159
|
11,681
|
10,390
|
8,688
|
9,755
|
10,000
|
| Average Annual Return, Percent |
22.22%
|
11.08%
|
7.48%
|
|
|
|
|
|
|
|
|
|
|
| C000007433 [Member] |
|
|
|
|
|
|
|
|
|
|
|
|
|
| Account Value [Line Items] |
|
|
|
|
|
|
|
|
|
|
|
|
|
| Line Graph and Table Measure Name |
Class R Shares
|
|
|
|
|
|
|
|
|
|
|
|
|
| Account Value |
$ 19,369
|
$ 19,369
|
$ 19,369
|
15,929
|
13,692
|
16,287
|
11,843
|
11,775
|
11,375
|
10,175
|
8,574
|
9,692
|
10,000
|
| Average Annual Return, Percent |
21.59%
|
10.47%
|
6.83%
|
|
|
|
|
|
|
|
|
|
|
| MSCI All Country World Index [Member] |
|
|
|
|
|
|
|
|
|
|
|
|
|
| Account Value [Line Items] |
|
|
|
|
|
|
|
|
|
|
|
|
|
| Line Graph and Table Measure Name |
MSCI All Country World Index
|
|
|
|
|
|
|
|
|
|
|
|
|
| Account Value |
$ 22,474
|
$ 22,474
|
$ 22,474
|
$ 18,826
|
$ 16,156
|
$ 19,176
|
$ 13,769
|
$ 13,485
|
$ 12,752
|
$ 11,517
|
$ 9,696
|
$ 10,071
|
$ 10,000
|
| Average Annual Return, Percent |
19.38%
|
10.76%
|
8.43%
|
|
|
|
|
|
|
|
|
|
|
| X |
- ReferencesReference 1: http://www.xbrl.org/2003/role/presentationRef
-Publisher SEC
-Name Form N-1A
-Section 27A
-Subsection d
-Paragraph 2
| Name: |
oef_AccountValueLineItems |
| Namespace Prefix: |
oef_ |
| Data Type: |
xbrli:stringItemType |
| Balance Type: |
na |
| Period Type: |
duration |
|
| X |
- ReferencesReference 1: http://www.xbrl.org/2003/role/presentationRef
-Publisher SEC
-Name Form N-1A
-Section 27A
-Subsection d
-Paragraph 2
-Subparagraph i
| Name: |
oef_AcctVal |
| Namespace Prefix: |
oef_ |
| Data Type: |
xbrli:monetaryItemType |
| Balance Type: |
na |
| Period Type: |
instant |
|
| X |
- ReferencesReference 1: http://www.xbrl.org/2003/role/presentationRef
-Publisher SEC
-Name Form N-1A
-Section 27A
-Subsection d
-Paragraph 2
-Subparagraph instruction
-Clause 7
| Name: |
oef_AvgAnnlRtrPct |
| Namespace Prefix: |
oef_ |
| Data Type: |
dtr-types:percentItemType |
| Balance Type: |
na |
| Period Type: |
duration |
|
| X |
- ReferencesReference 1: http://www.xbrl.org/2003/role/presentationRef
-Publisher SEC
-Name Form N-1A
-Section 27A
-Subsection d
-Paragraph 2
-Subparagraph i
| Name: |
oef_LineGraphAndTableMeasureName |
| Namespace Prefix: |
oef_ |
| Data Type: |
xbrli:stringItemType |
| Balance Type: |
na |
| Period Type: |
duration |
|
| X |
- Details
| Name: |
oef_ClassAxis=bragfi_C000007432Member |
| Namespace Prefix: |
|
| Data Type: |
na |
| Balance Type: |
|
| Period Type: |
|
|
| X |
- Details
| Name: |
oef_ClassAxis=bragfi_C000007429Member |
| Namespace Prefix: |
|
| Data Type: |
na |
| Balance Type: |
|
| Period Type: |
|
|
| X |
- Details
| Name: |
oef_SalesLoadAxis=oef_WithoutSalesLoadMember |
| Namespace Prefix: |
|
| Data Type: |
na |
| Balance Type: |
|
| Period Type: |
|
|
| X |
- Details
| Name: |
oef_ClassAxis=bragfi_C000007431Member |
| Namespace Prefix: |
|
| Data Type: |
na |
| Balance Type: |
|
| Period Type: |
|
|
| X |
- Details
| Name: |
oef_ClassAxis=bragfi_C000199761Member |
| Namespace Prefix: |
|
| Data Type: |
na |
| Balance Type: |
|
| Period Type: |
|
|
| X |
- Details
| Name: |
oef_ClassAxis=bragfi_C000007433Member |
| Namespace Prefix: |
|
| Data Type: |
na |
| Balance Type: |
|
| Period Type: |
|
|
| X |
- Details
| Name: |
oef_BroadBasedIndexAxis=bragfi_MSCIAllCountryWorldIndexMember |
| Namespace Prefix: |
|
| Data Type: |
na |
| Balance Type: |
|
| Period Type: |
|
|
v3.24.2.u1
| X |
- ReferencesReference 1: http://www.xbrl.org/2003/role/presentationRef
-Publisher SEC
-Name Form N-1A
-Section 27A
-Subsection f
| Name: |
oef_HoldingsLineItems |
| Namespace Prefix: |
oef_ |
| Data Type: |
xbrli:stringItemType |
| Balance Type: |
na |
| Period Type: |
duration |
|
| X |
- ReferencesReference 1: http://www.xbrl.org/2003/role/presentationRef
-Publisher SEC
-Name Form N-1A
-Section 27A
-Subsection f
| Name: |
oef_PctOfNav |
| Namespace Prefix: |
oef_ |
| Data Type: |
dtr-types:percentItemType |
| Balance Type: |
na |
| Period Type: |
instant |
|
| X |
- Details
| Name: |
oef_ClassAxis=bragfi_C000007432Member |
| Namespace Prefix: |
|
| Data Type: |
na |
| Balance Type: |
|
| Period Type: |
|
|
| X |
- Details
| Name: |
oef_LargestHoldingAxis=bragfi_MicrosoftCorpMember |
| Namespace Prefix: |
|
| Data Type: |
na |
| Balance Type: |
|
| Period Type: |
|
|
| X |
- Details
| Name: |
oef_LargestHoldingAxis=bragfi_AppleIncMember |
| Namespace Prefix: |
|
| Data Type: |
na |
| Balance Type: |
|
| Period Type: |
|
|
| X |
- Details
| Name: |
oef_LargestHoldingAxis=bragfi_NVIDIACorpMember |
| Namespace Prefix: |
|
| Data Type: |
na |
| Balance Type: |
|
| Period Type: |
|
|
| X |
- Details
| Name: |
oef_LargestHoldingAxis=bragfi_AmazonComIncMember |
| Namespace Prefix: |
|
| Data Type: |
na |
| Balance Type: |
|
| Period Type: |
|
|
| X |
- Details
| Name: |
oef_LargestHoldingAxis=bragfi_JohnsonAndJohnsonMember |
| Namespace Prefix: |
|
| Data Type: |
na |
| Balance Type: |
|
| Period Type: |
|
|
| X |
- Details
| Name: |
oef_LargestHoldingAxis=bragfi_AlphabetIncClassAMember |
| Namespace Prefix: |
|
| Data Type: |
na |
| Balance Type: |
|
| Period Type: |
|
|
| X |
- Details
| Name: |
oef_LargestHoldingAxis=bragfi_SAndPGlobalIncMember |
| Namespace Prefix: |
|
| Data Type: |
na |
| Balance Type: |
|
| Period Type: |
|
|
| X |
- Details
| Name: |
oef_LargestHoldingAxis=bragfi_LamResearchCorpMember |
| Namespace Prefix: |
|
| Data Type: |
na |
| Balance Type: |
|
| Period Type: |
|
|
| X |
- Details
| Name: |
oef_LargestHoldingAxis=bragfi_ComcastCorpClassAMember |
| Namespace Prefix: |
|
| Data Type: |
na |
| Balance Type: |
|
| Period Type: |
|
|
| X |
- Details
| Name: |
oef_LargestHoldingAxis=bragfi_QUALCOMMIncMember |
| Namespace Prefix: |
|
| Data Type: |
na |
| Balance Type: |
|
| Period Type: |
|
|
| X |
- Details
| Name: |
oef_OtherCategory1Axis=bragfi_OtherMember |
| Namespace Prefix: |
|
| Data Type: |
na |
| Balance Type: |
|
| Period Type: |
|
|
| X |
- Details
| Name: |
oef_GeographicRegionAxis=country_CA |
| Namespace Prefix: |
|
| Data Type: |
na |
| Balance Type: |
|
| Period Type: |
|
|
| X |
- Details
| Name: |
oef_GeographicRegionAxis=country_CH |
| Namespace Prefix: |
|
| Data Type: |
na |
| Balance Type: |
|
| Period Type: |
|
|
| X |
- Details
| Name: |
oef_GeographicRegionAxis=country_CN |
| Namespace Prefix: |
|
| Data Type: |
na |
| Balance Type: |
|
| Period Type: |
|
|
| X |
- Details
| Name: |
oef_GeographicRegionAxis=country_DE |
| Namespace Prefix: |
|
| Data Type: |
na |
| Balance Type: |
|
| Period Type: |
|
|
| X |
- Details
| Name: |
oef_GeographicRegionAxis=country_DK |
| Namespace Prefix: |
|
| Data Type: |
na |
| Balance Type: |
|
| Period Type: |
|
|
| X |
- Details
| Name: |
oef_GeographicRegionAxis=country_ES |
| Namespace Prefix: |
|
| Data Type: |
na |
| Balance Type: |
|
| Period Type: |
|
|
| X |
- Details
| Name: |
oef_GeographicRegionAxis=country_IN |
| Namespace Prefix: |
|
| Data Type: |
na |
| Balance Type: |
|
| Period Type: |
|
|
| X |
- Details
| Name: |
oef_GeographicRegionAxis=country_JP |
| Namespace Prefix: |
|
| Data Type: |
na |
| Balance Type: |
|
| Period Type: |
|
|
| X |
- Details
| Name: |
oef_GeographicRegionAxis=country_TW |
| Namespace Prefix: |
|
| Data Type: |
na |
| Balance Type: |
|
| Period Type: |
|
|
| X |
- Details
| Name: |
oef_GeographicRegionAxis=country_US |
| Namespace Prefix: |
|
| Data Type: |
na |
| Balance Type: |
|
| Period Type: |
|
|
| X |
- Details
| Name: |
us-gaap_InvestmentTypeAxis=bragfi_OtherAssetsLessLiabilitiesMember |
| Namespace Prefix: |
|
| Data Type: |
na |
| Balance Type: |
|
| Period Type: |
|
|
| X |
- Details
| Name: |
oef_ClassAxis=bragfi_C000007429Member |
| Namespace Prefix: |
|
| Data Type: |
na |
| Balance Type: |
|
| Period Type: |
|
|
| X |
- Details
| Name: |
oef_ClassAxis=bragfi_C000007431Member |
| Namespace Prefix: |
|
| Data Type: |
na |
| Balance Type: |
|
| Period Type: |
|
|
| X |
- Details
| Name: |
oef_ClassAxis=bragfi_C000199761Member |
| Namespace Prefix: |
|
| Data Type: |
na |
| Balance Type: |
|
| Period Type: |
|
|
| X |
- Details
| Name: |
oef_ClassAxis=bragfi_C000007433Member |
| Namespace Prefix: |
|
| Data Type: |
na |
| Balance Type: |
|
| Period Type: |
|
|
{
"version": "2.2",
"instance": {
"d679196dncsr.htm": {
"nsprefix": "bragfi",
"nsuri": "http://www.blackrock.com/20240823",
"dts": {
"schema": {
"local": [
"bragfi-20240823.xsd"
],
"remote": [
"http://www.xbrl.org/2003/xbrl-instance-2003-12-31.xsd",
"http://www.xbrl.org/2003/xbrl-linkbase-2003-12-31.xsd",
"http://www.xbrl.org/2003/xl-2003-12-31.xsd",
"http://www.xbrl.org/2003/xlink-2003-12-31.xsd",
"http://www.xbrl.org/2005/xbrldt-2005.xsd",
"http://www.xbrl.org/2006/ref-2006-02-27.xsd",
"http://www.xbrl.org/lrr/arcrole/deprecated-2009-12-16.xsd",
"http://www.xbrl.org/lrr/role/deprecated-2009-12-16.xsd",
"http://www.xbrl.org/lrr/role/negated-2009-12-16.xsd",
"http://www.xbrl.org/lrr/role/reference-2009-12-16.xsd",
"https://www.xbrl.org/2020/extensible-enumerations-2.0.xsd",
"https://www.xbrl.org/dtr/type/2020-01-21/types.xsd",
"https://www.xbrl.org/dtr/type/2022-03-31/types.xsd",
"https://xbrl.fasb.org/srt/2023/elts/srt-2023.xsd",
"https://xbrl.fasb.org/srt/2023/elts/srt-roles-2023.xsd",
"https://xbrl.fasb.org/srt/2023/elts/srt-types-2023.xsd",
"https://xbrl.fasb.org/us-gaap/2023/elts/us-gaap-2023.xsd",
"https://xbrl.fasb.org/us-gaap/2023/elts/us-roles-2023.xsd",
"https://xbrl.fasb.org/us-gaap/2023/elts/us-types-2023.xsd",
"https://xbrl.sec.gov/country/2023/country-2023.xsd",
"https://xbrl.sec.gov/country/2023/country-2023_def.xsd",
"https://xbrl.sec.gov/dei/2023/dei-2023.xsd",
"https://xbrl.sec.gov/oef/2023/oef-2023.xsd",
"https://xbrl.sec.gov/oef/2023/oef-2023_lab.xsd",
"https://xbrl.sec.gov/oef/2023/oef-sr-2023.xsd"
]
},
"inline": {
"local": [
"d679196dncsr.htm"
]
}
},
"keyStandard": 33,
"keyCustom": 0,
"axisStandard": 7,
"axisCustom": 0,
"memberStandard": 11,
"memberCustom": 18,
"hidden": {
"total": 68,
"http://xbrl.sec.gov/oef/2023": 66,
"http://xbrl.sec.gov/dei/2023": 2
},
"contextCount": 203,
"entityCount": 1,
"segmentCount": 29,
"elementCount": 150,
"unitCount": 6,
"baseTaxonomies": {
"http://xbrl.sec.gov/oef/2023": 313,
"http://fasb.org/us-gaap/2023": 10,
"http://xbrl.sec.gov/dei/2023": 10
},
"report": {
"R1": {
"role": "http://xbrl.sec.gov/oef/role/NcsrCover",
"longName": "030000 - Disclosure - Form N-CSR Cover",
"shortName": "Form N-CSR Cover",
"isDefault": "true",
"groupType": "disclosure",
"subGroupType": "",
"menuCat": "Cover",
"order": "1",
"firstAnchor": {
"contextRef": "DefaultContext",
"name": "dei:DocumentType",
"unitRef": null,
"xsiNil": "false",
"lang": "en-US",
"decimals": null,
"ancestors": [
"div",
"div",
"div",
"div",
"div",
"div",
"div",
"div",
"div",
"div",
"div",
"div",
"body",
"html"
],
"reportCount": 1,
"baseRef": "d679196dncsr.htm",
"first": true
},
"uniqueAnchor": null
},
"R2": {
"role": "http://xbrl.sec.gov/oef/role/ShareholderReport",
"longName": "030001 - Disclosure - Shareholder Report",
"shortName": "Shareholder Report",
"isDefault": "false",
"groupType": "disclosure",
"subGroupType": "",
"menuCat": "Notes",
"order": "2",
"firstAnchor": {
"contextRef": "DefaultContext",
"name": "dei:DocumentType",
"unitRef": null,
"xsiNil": "false",
"lang": "en-US",
"decimals": null,
"ancestors": [
"div",
"div",
"div",
"div",
"div",
"div",
"div",
"div",
"div",
"div",
"div",
"div",
"body",
"html"
],
"reportCount": 1,
"baseRef": "d679196dncsr.htm",
"first": true
},
"uniqueAnchor": {
"contextRef": "FY2024_C000007432Member",
"name": "oef:FundName",
"unitRef": null,
"xsiNil": "false",
"lang": "en-US",
"decimals": null,
"ancestors": [
"div",
"div",
"div",
"div",
"div",
"div",
"body",
"html"
],
"reportCount": 1,
"baseRef": "d679196dncsr.htm",
"unique": true
}
},
"R3": {
"role": "http://xbrl.sec.gov/oef/role/ShareholderReportLineGraphDetails",
"longName": "040010 - Disclosure - Shareholder Report, Line Graph (Details)",
"shortName": "Shareholder Report, Line Graph (Details)",
"isDefault": "false",
"groupType": "disclosure",
"subGroupType": "details",
"menuCat": "Details",
"order": "3",
"firstAnchor": {
"contextRef": "FY2024_C000007432Member",
"name": "oef:LineGraphAndTableMeasureName",
"unitRef": null,
"xsiNil": "false",
"lang": "en-US",
"decimals": null,
"ancestors": [
"td",
"tr",
"table",
"oef:AvgAnnlRtrTableTextBlock",
"div",
"div",
"div",
"div",
"div",
"div",
"div",
"div",
"div",
"div",
"body",
"html"
],
"reportCount": 1,
"baseRef": "d679196dncsr.htm",
"first": true,
"unique": true
},
"uniqueAnchor": {
"contextRef": "FY2024_C000007432Member",
"name": "oef:LineGraphAndTableMeasureName",
"unitRef": null,
"xsiNil": "false",
"lang": "en-US",
"decimals": null,
"ancestors": [
"td",
"tr",
"table",
"oef:AvgAnnlRtrTableTextBlock",
"div",
"div",
"div",
"div",
"div",
"div",
"div",
"div",
"div",
"div",
"body",
"html"
],
"reportCount": 1,
"baseRef": "d679196dncsr.htm",
"first": true,
"unique": true
}
},
"R4": {
"role": "http://xbrl.sec.gov/oef/role/ShareholderReportHoldingsDetails",
"longName": "040020 - Disclosure - Shareholder Report, Holdings (Details)",
"shortName": "Shareholder Report, Holdings (Details)",
"isDefault": "false",
"groupType": "disclosure",
"subGroupType": "details",
"menuCat": "Details",
"order": "4",
"firstAnchor": {
"contextRef": "TI20240630_C000007432Member_MicrosoftCorpMember",
"name": "oef:PctOfNav",
"unitRef": "pure",
"xsiNil": "false",
"lang": null,
"decimals": "4",
"ancestors": [
"td",
"tr",
"table",
"oef:LargestHoldingsTableTextBlock",
"ix:continuation",
"div",
"div",
"div",
"div",
"div",
"div",
"div",
"div",
"div",
"div",
"body",
"html"
],
"reportCount": 1,
"baseRef": "d679196dncsr.htm",
"first": true,
"unique": true
},
"uniqueAnchor": {
"contextRef": "TI20240630_C000007432Member_MicrosoftCorpMember",
"name": "oef:PctOfNav",
"unitRef": "pure",
"xsiNil": "false",
"lang": null,
"decimals": "4",
"ancestors": [
"td",
"tr",
"table",
"oef:LargestHoldingsTableTextBlock",
"ix:continuation",
"div",
"div",
"div",
"div",
"div",
"div",
"div",
"div",
"div",
"div",
"body",
"html"
],
"reportCount": 1,
"baseRef": "d679196dncsr.htm",
"first": true,
"unique": true
}
}
},
"tag": {
"oef_AccountValueLineItems": {
"xbrltype": "stringItemType",
"nsuri": "http://xbrl.sec.gov/oef/2023",
"localname": "AccountValueLineItems",
"presentation": [
"http://xbrl.sec.gov/oef/role/ShareholderReportLineGraphDetails"
],
"lang": {
"en-us": {
"role": {
"label": "Account Value [Line Items]"
}
}
},
"auth_ref": [
"r35"
]
},
"oef_AccountValueTable": {
"xbrltype": "stringItemType",
"nsuri": "http://xbrl.sec.gov/oef/2023",
"localname": "AccountValueTable",
"presentation": [
"http://xbrl.sec.gov/oef/role/ShareholderReportLineGraphDetails"
],
"lang": {
"en-us": {
"role": {
"label": "Account Value [Table]"
}
}
},
"auth_ref": [
"r35"
]
},
"oef_AccountValueTableAbstract": {
"xbrltype": "stringItemType",
"nsuri": "http://xbrl.sec.gov/oef/2023",
"localname": "AccountValueTableAbstract",
"lang": {
"en-us": {
"role": {
"label": "Account Value Table [Abstract]"
}
}
},
"auth_ref": [
"r35"
]
},
"oef_AccountantChngDate": {
"xbrltype": "dateItemType",
"nsuri": "http://xbrl.sec.gov/oef/2023",
"localname": "AccountantChngDate",
"presentation": [
"http://xbrl.sec.gov/oef/role/ShareholderReport"
],
"lang": {
"en-us": {
"role": {
"label": "Accountant Change Date"
}
}
},
"auth_ref": [
"r59"
]
},
"oef_AccountantChngDisagreementsTextBlock": {
"xbrltype": "textBlockItemType",
"nsuri": "http://xbrl.sec.gov/oef/2023",
"localname": "AccountantChngDisagreementsTextBlock",
"presentation": [
"http://xbrl.sec.gov/oef/role/ShareholderReport"
],
"lang": {
"en-us": {
"role": {
"label": "Accountant Change Disagreements [Text Block]"
}
}
},
"auth_ref": [
"r60"
]
},
"oef_AccountantChngStatementTextBlock": {
"xbrltype": "textBlockItemType",
"nsuri": "http://xbrl.sec.gov/oef/2023",
"localname": "AccountantChngStatementTextBlock",
"presentation": [
"http://xbrl.sec.gov/oef/role/ShareholderReport"
],
"lang": {
"en-us": {
"role": {
"label": "Accountant Change Statement [Text Block]"
}
}
},
"auth_ref": [
"r59"
]
},
"oef_AcctVal": {
"xbrltype": "monetaryItemType",
"nsuri": "http://xbrl.sec.gov/oef/2023",
"localname": "AcctVal",
"presentation": [
"http://xbrl.sec.gov/oef/role/ShareholderReportLineGraphDetails"
],
"lang": {
"en-us": {
"role": {
"label": "Account Value"
}
}
},
"auth_ref": [
"r36"
]
},
"oef_AdditionalIndexAxis": {
"xbrltype": "stringItemType",
"nsuri": "http://xbrl.sec.gov/oef/2023",
"localname": "AdditionalIndexAxis",
"presentation": [
"http://xbrl.sec.gov/oef/role/ShareholderReportLineGraphDetails"
],
"lang": {
"en-us": {
"role": {
"label": "Additional Index [Axis]"
}
}
},
"auth_ref": [
"r35"
]
},
"oef_AdditionalIndexDomain": {
"xbrltype": "domainItemType",
"nsuri": "http://xbrl.sec.gov/oef/2023",
"localname": "AdditionalIndexDomain",
"presentation": [
"http://xbrl.sec.gov/oef/role/ShareholderReportLineGraphDetails"
],
"lang": {
"en-us": {
"role": {
"label": "Additional Index [Domain]"
}
}
},
"auth_ref": [
"r35"
]
},
"oef_AddlFundStatisticsSignificanceOrLimitsTextBlock": {
"xbrltype": "textBlockItemType",
"nsuri": "http://xbrl.sec.gov/oef/2023",
"localname": "AddlFundStatisticsSignificanceOrLimitsTextBlock",
"presentation": [
"http://xbrl.sec.gov/oef/role/ShareholderReport"
],
"lang": {
"en-us": {
"role": {
"label": "Additional Fund Statistics Significance or Limits [Text Block]"
}
}
},
"auth_ref": [
"r49"
]
},
"oef_AddlFundStatisticsTextBlock": {
"xbrltype": "textBlockItemType",
"nsuri": "http://xbrl.sec.gov/oef/2023",
"localname": "AddlFundStatisticsTextBlock",
"presentation": [
"http://xbrl.sec.gov/oef/role/ShareholderReport"
],
"lang": {
"en-us": {
"role": {
"label": "Additional Fund Statistics [Text Block]"
}
}
},
"auth_ref": [
"r48"
]
},
"oef_AddlInfoEmail": {
"xbrltype": "stringItemType",
"nsuri": "http://xbrl.sec.gov/oef/2023",
"localname": "AddlInfoEmail",
"presentation": [
"http://xbrl.sec.gov/oef/role/ShareholderReport"
],
"lang": {
"en-us": {
"role": {
"label": "Additional Information Email"
}
}
},
"auth_ref": [
"r27"
]
},
"oef_AddlInfoPhoneNumber": {
"xbrltype": "stringItemType",
"nsuri": "http://xbrl.sec.gov/oef/2023",
"localname": "AddlInfoPhoneNumber",
"presentation": [
"http://xbrl.sec.gov/oef/role/ShareholderReport"
],
"lang": {
"en-us": {
"role": {
"label": "Additional Information Phone Number"
}
}
},
"auth_ref": [
"r27"
]
},
"oef_AddlInfoTextBlock": {
"xbrltype": "textBlockItemType",
"nsuri": "http://xbrl.sec.gov/oef/2023",
"localname": "AddlInfoTextBlock",
"presentation": [
"http://xbrl.sec.gov/oef/role/ShareholderReport"
],
"lang": {
"en-us": {
"role": {
"label": "Additional Information [Text Block]"
}
}
},
"auth_ref": [
"r25"
]
},
"oef_AddlInfoWebsite": {
"xbrltype": "stringItemType",
"nsuri": "http://xbrl.sec.gov/oef/2023",
"localname": "AddlInfoWebsite",
"presentation": [
"http://xbrl.sec.gov/oef/role/ShareholderReport"
],
"lang": {
"en-us": {
"role": {
"label": "Additional Information Website"
}
}
},
"auth_ref": [
"r27"
]
},
"oef_AdvisoryFeesPaidAmt": {
"xbrltype": "monetaryItemType",
"nsuri": "http://xbrl.sec.gov/oef/2023",
"localname": "AdvisoryFeesPaidAmt",
"presentation": [
"http://xbrl.sec.gov/oef/role/ShareholderReport"
],
"lang": {
"en-us": {
"role": {
"label": "Advisory Fees Paid, Amount"
}
}
},
"auth_ref": [
"r48"
]
},
"bragfi_AlphabetIncClassAMember": {
"xbrltype": "domainItemType",
"nsuri": "http://www.blackrock.com/20240823",
"localname": "AlphabetIncClassAMember",
"presentation": [
"http://xbrl.sec.gov/oef/role/ShareholderReportHoldingsDetails"
],
"lang": {
"en-us": {
"role": {
"label": "Alphabet Inc Class A [Member]"
}
}
},
"auth_ref": []
},
"bragfi_AmazonComIncMember": {
"xbrltype": "domainItemType",
"nsuri": "http://www.blackrock.com/20240823",
"localname": "AmazonComIncMember",
"presentation": [
"http://xbrl.sec.gov/oef/role/ShareholderReportHoldingsDetails"
],
"lang": {
"en-us": {
"role": {
"label": "Amazon com Inc [Member]"
}
}
},
"auth_ref": []
},
"dei_AmendmentDescription": {
"xbrltype": "stringItemType",
"nsuri": "http://xbrl.sec.gov/dei/2023",
"localname": "AmendmentDescription",
"presentation": [
"http://xbrl.sec.gov/oef/role/NcsrCover",
"http://xbrl.sec.gov/oef/role/ShareholderReport"
],
"lang": {
"en-us": {
"role": {
"label": "Amendment Description",
"documentation": "Description of changes contained within amended document."
}
}
},
"auth_ref": []
},
"dei_AmendmentFlag": {
"xbrltype": "booleanItemType",
"nsuri": "http://xbrl.sec.gov/dei/2023",
"localname": "AmendmentFlag",
"presentation": [
"http://xbrl.sec.gov/oef/role/NcsrCover",
"http://xbrl.sec.gov/oef/role/ShareholderReport"
],
"lang": {
"en-us": {
"role": {
"label": "Amendment Flag",
"documentation": "Boolean flag that is true when the XBRL content amends previously-filed or accepted submission."
}
}
},
"auth_ref": []
},
"oef_AnnlOrSemiAnnlStatementTextBlock": {
"xbrltype": "textBlockItemType",
"nsuri": "http://xbrl.sec.gov/oef/2023",
"localname": "AnnlOrSemiAnnlStatementTextBlock",
"presentation": [
"http://xbrl.sec.gov/oef/role/ShareholderReport"
],
"lang": {
"en-us": {
"role": {
"label": "Annual or Semi-Annual Statement [Text Block]"
}
}
},
"auth_ref": [
"r24"
]
},
"bragfi_AppleIncMember": {
"xbrltype": "domainItemType",
"nsuri": "http://www.blackrock.com/20240823",
"localname": "AppleIncMember",
"presentation": [
"http://xbrl.sec.gov/oef/role/ShareholderReportHoldingsDetails"
],
"lang": {
"en-us": {
"role": {
"label": "Apple Inc [Member]"
}
}
},
"auth_ref": []
},
"us-gaap_AssetsNet": {
"xbrltype": "monetaryItemType",
"nsuri": "http://fasb.org/us-gaap/2023",
"localname": "AssetsNet",
"crdr": "debit",
"presentation": [
"http://xbrl.sec.gov/oef/role/ShareholderReport"
],
"lang": {
"en-us": {
"role": {
"label": "Net Assets",
"documentation": "Amount of net assets (liabilities)."
}
}
},
"auth_ref": [
"r0"
]
},
"oef_AvgAnnlRtrPct": {
"xbrltype": "percentItemType",
"nsuri": "http://xbrl.sec.gov/oef/2023",
"localname": "AvgAnnlRtrPct",
"presentation": [
"http://xbrl.sec.gov/oef/role/ShareholderReportLineGraphDetails"
],
"lang": {
"en-us": {
"role": {
"label": "Average Annual Return, Percent"
}
}
},
"auth_ref": [
"r42"
]
},
"oef_AvgAnnlRtrTableTextBlock": {
"xbrltype": "textBlockItemType",
"nsuri": "http://xbrl.sec.gov/oef/2023",
"localname": "AvgAnnlRtrTableTextBlock",
"presentation": [
"http://xbrl.sec.gov/oef/role/ShareholderReport"
],
"lang": {
"en-us": {
"role": {
"label": "Average Annual Return [Table Text Block]"
}
}
},
"auth_ref": [
"r42"
]
},
"oef_BroadBasedIndexAxis": {
"xbrltype": "stringItemType",
"nsuri": "http://xbrl.sec.gov/oef/2023",
"localname": "BroadBasedIndexAxis",
"presentation": [
"http://xbrl.sec.gov/oef/role/ShareholderReportLineGraphDetails"
],
"lang": {
"en-us": {
"role": {
"label": "Broad Based Index [Axis]"
}
}
},
"auth_ref": [
"r35"
]
},
"oef_BroadBasedIndexDomain": {
"xbrltype": "domainItemType",
"nsuri": "http://xbrl.sec.gov/oef/2023",
"localname": "BroadBasedIndexDomain",
"presentation": [
"http://xbrl.sec.gov/oef/role/ShareholderReportLineGraphDetails"
],
"lang": {
"en-us": {
"role": {
"label": "Broad Based Index [Domain]"
}
}
},
"auth_ref": [
"r35"
]
},
"bragfi_C000007429Member": {
"xbrltype": "domainItemType",
"nsuri": "http://www.blackrock.com/20240823",
"localname": "C000007429Member",
"presentation": [
"http://xbrl.sec.gov/oef/role/ShareholderReport",
"http://xbrl.sec.gov/oef/role/ShareholderReportHoldingsDetails",
"http://xbrl.sec.gov/oef/role/ShareholderReportLineGraphDetails"
],
"lang": {
"en-us": {
"role": {
"label": "C000007429 [Member]",
"terseLabel": "Investor A"
}
}
},
"auth_ref": []
},
"bragfi_C000007431Member": {
"xbrltype": "domainItemType",
"nsuri": "http://www.blackrock.com/20240823",
"localname": "C000007431Member",
"presentation": [
"http://xbrl.sec.gov/oef/role/ShareholderReport",
"http://xbrl.sec.gov/oef/role/ShareholderReportHoldingsDetails",
"http://xbrl.sec.gov/oef/role/ShareholderReportLineGraphDetails"
],
"lang": {
"en-us": {
"role": {
"label": "C000007431 [Member]",
"terseLabel": "Investor C"
}
}
},
"auth_ref": []
},
"bragfi_C000007432Member": {
"xbrltype": "domainItemType",
"nsuri": "http://www.blackrock.com/20240823",
"localname": "C000007432Member",
"presentation": [
"http://xbrl.sec.gov/oef/role/ShareholderReport",
"http://xbrl.sec.gov/oef/role/ShareholderReportHoldingsDetails",
"http://xbrl.sec.gov/oef/role/ShareholderReportLineGraphDetails"
],
"lang": {
"en-us": {
"role": {
"label": "C000007432 [Member]",
"terseLabel": "Institutional"
}
}
},
"auth_ref": []
},
"bragfi_C000007433Member": {
"xbrltype": "domainItemType",
"nsuri": "http://www.blackrock.com/20240823",
"localname": "C000007433Member",
"presentation": [
"http://xbrl.sec.gov/oef/role/ShareholderReport",
"http://xbrl.sec.gov/oef/role/ShareholderReportHoldingsDetails",
"http://xbrl.sec.gov/oef/role/ShareholderReportLineGraphDetails"
],
"lang": {
"en-us": {
"role": {
"label": "C000007433 [Member]",
"terseLabel": "Class R"
}
}
},
"auth_ref": []
},
"bragfi_C000199761Member": {
"xbrltype": "domainItemType",
"nsuri": "http://www.blackrock.com/20240823",
"localname": "C000199761Member",
"presentation": [
"http://xbrl.sec.gov/oef/role/ShareholderReport",
"http://xbrl.sec.gov/oef/role/ShareholderReportHoldingsDetails",
"http://xbrl.sec.gov/oef/role/ShareholderReportLineGraphDetails"
],
"lang": {
"en-us": {
"role": {
"label": "C000199761 [Member]",
"terseLabel": "Class K"
}
}
},
"auth_ref": []
},
"country_CA": {
"xbrltype": "domainItemType",
"nsuri": "http://xbrl.sec.gov/country/2023",
"localname": "CA",
"presentation": [
"http://xbrl.sec.gov/oef/role/ShareholderReportHoldingsDetails"
],
"lang": {
"en-us": {
"role": {
"label": "CANADA"
}
}
},
"auth_ref": []
},
"country_CH": {
"xbrltype": "domainItemType",
"nsuri": "http://xbrl.sec.gov/country/2023",
"localname": "CH",
"presentation": [
"http://xbrl.sec.gov/oef/role/ShareholderReportHoldingsDetails"
],
"lang": {
"en-us": {
"role": {
"label": "SWITZERLAND"
}
}
},
"auth_ref": []
},
"country_CN": {
"xbrltype": "domainItemType",
"nsuri": "http://xbrl.sec.gov/country/2023",
"localname": "CN",
"presentation": [
"http://xbrl.sec.gov/oef/role/ShareholderReportHoldingsDetails"
],
"lang": {
"en-us": {
"role": {
"label": "CHINA"
}
}
},
"auth_ref": []
},
"oef_ClassAxis": {
"xbrltype": "stringItemType",
"nsuri": "http://xbrl.sec.gov/oef/2023",
"localname": "ClassAxis",
"presentation": [
"http://xbrl.sec.gov/oef/role/ShareholderReport",
"http://xbrl.sec.gov/oef/role/ShareholderReportHoldingsDetails",
"http://xbrl.sec.gov/oef/role/ShareholderReportLineGraphDetails"
],
"lang": {
"en-us": {
"role": {
"label": "Class [Axis]"
}
}
},
"auth_ref": [
"r22"
]
},
"oef_ClassName": {
"xbrltype": "securityTitleItemType",
"nsuri": "http://xbrl.sec.gov/oef/2023",
"localname": "ClassName",
"presentation": [
"http://xbrl.sec.gov/oef/role/ShareholderReport"
],
"lang": {
"en-us": {
"role": {
"label": "Class Name"
}
}
},
"auth_ref": [
"r27"
]
},
"bragfi_ComcastCorpClassAMember": {
"xbrltype": "domainItemType",
"nsuri": "http://www.blackrock.com/20240823",
"localname": "ComcastCorpClassAMember",
"presentation": [
"http://xbrl.sec.gov/oef/role/ShareholderReportHoldingsDetails"
],
"lang": {
"en-us": {
"role": {
"label": "Comcast Corp Class A [Member]"
}
}
},
"auth_ref": []
},
"dei_CoverAbstract": {
"xbrltype": "stringItemType",
"nsuri": "http://xbrl.sec.gov/dei/2023",
"localname": "CoverAbstract",
"lang": {
"en-us": {
"role": {
"documentation": "Cover page."
}
}
},
"auth_ref": []
},
"oef_CreditQualityAxis": {
"xbrltype": "stringItemType",
"nsuri": "http://xbrl.sec.gov/oef/2023",
"localname": "CreditQualityAxis",
"presentation": [
"http://xbrl.sec.gov/oef/role/ShareholderReportHoldingsDetails"
],
"lang": {
"en-us": {
"role": {
"label": "Credit Quality [Axis]"
}
}
},
"auth_ref": [
"r50"
]
},
"oef_CreditQualityDomain": {
"xbrltype": "domainItemType",
"nsuri": "http://xbrl.sec.gov/oef/2023",
"localname": "CreditQualityDomain",
"presentation": [
"http://xbrl.sec.gov/oef/role/ShareholderReportHoldingsDetails"
],
"lang": {
"en-us": {
"role": {
"label": "Credit Quality [Domain]"
}
}
},
"auth_ref": [
"r50"
]
},
"oef_CreditQualityExplanationTextBlock": {
"xbrltype": "textBlockItemType",
"nsuri": "http://xbrl.sec.gov/oef/2023",
"localname": "CreditQualityExplanationTextBlock",
"presentation": [
"http://xbrl.sec.gov/oef/role/ShareholderReport"
],
"lang": {
"en-us": {
"role": {
"label": "Credit Quality Explanation [Text Block]"
}
}
},
"auth_ref": [
"r50"
]
},
"srt_CreditRatingAMBestAxis": {
"xbrltype": "stringItemType",
"nsuri": "http://fasb.org/srt/2023",
"localname": "CreditRatingAMBestAxis",
"presentation": [
"http://xbrl.sec.gov/oef/role/ShareholderReportHoldingsDetails"
],
"auth_ref": [
"r18",
"r64",
"r65",
"r66"
]
},
"srt_CreditRatingAMBestDomain": {
"xbrltype": "domainItemType",
"nsuri": "http://fasb.org/srt/2023",
"localname": "CreditRatingAMBestDomain",
"presentation": [
"http://xbrl.sec.gov/oef/role/ShareholderReportHoldingsDetails"
],
"auth_ref": []
},
"srt_CreditRatingFitchAxis": {
"xbrltype": "stringItemType",
"nsuri": "http://fasb.org/srt/2023",
"localname": "CreditRatingFitchAxis",
"presentation": [
"http://xbrl.sec.gov/oef/role/ShareholderReportHoldingsDetails"
],
"auth_ref": [
"r18",
"r64",
"r66"
]
},
"srt_CreditRatingMoodysAxis": {
"xbrltype": "stringItemType",
"nsuri": "http://fasb.org/srt/2023",
"localname": "CreditRatingMoodysAxis",
"presentation": [
"http://xbrl.sec.gov/oef/role/ShareholderReportHoldingsDetails"
],
"auth_ref": [
"r18",
"r64",
"r65",
"r66"
]
},
"srt_CreditRatingStandardPoorsAxis": {
"xbrltype": "stringItemType",
"nsuri": "http://fasb.org/srt/2023",
"localname": "CreditRatingStandardPoorsAxis",
"presentation": [
"http://xbrl.sec.gov/oef/role/ShareholderReportHoldingsDetails"
],
"auth_ref": [
"r18",
"r64",
"r65",
"r66"
]
},
"oef_CreditRatingsSelectionTextBlock": {
"xbrltype": "textBlockItemType",
"nsuri": "http://xbrl.sec.gov/oef/2023",
"localname": "CreditRatingsSelectionTextBlock",
"presentation": [
"http://xbrl.sec.gov/oef/role/ShareholderReport"
],
"lang": {
"en-us": {
"role": {
"label": "Credit Ratings Selection [Text Block]"
}
}
},
"auth_ref": [
"r50"
]
},
"country_DE": {
"xbrltype": "domainItemType",
"nsuri": "http://xbrl.sec.gov/country/2023",
"localname": "DE",
"presentation": [
"http://xbrl.sec.gov/oef/role/ShareholderReportHoldingsDetails"
],
"lang": {
"en-us": {
"role": {
"label": "GERMANY"
}
}
},
"auth_ref": []
},
"country_DK": {
"xbrltype": "domainItemType",
"nsuri": "http://xbrl.sec.gov/country/2023",
"localname": "DK",
"presentation": [
"http://xbrl.sec.gov/oef/role/ShareholderReportHoldingsDetails"
],
"lang": {
"en-us": {
"role": {
"label": "DENMARK"
}
}
},
"auth_ref": []
},
"oef_DistOfCapitalTextBlock": {
"xbrltype": "textBlockItemType",
"nsuri": "http://xbrl.sec.gov/oef/2023",
"localname": "DistOfCapitalTextBlock",
"presentation": [
"http://xbrl.sec.gov/oef/role/ShareholderReport"
],
"lang": {
"en-us": {
"role": {
"label": "Distribution of Capital [Text Block]"
}
}
},
"auth_ref": [
"r44"
]
},
"dei_DocumentPeriodEndDate": {
"xbrltype": "dateItemType",
"nsuri": "http://xbrl.sec.gov/dei/2023",
"localname": "DocumentPeriodEndDate",
"presentation": [
"http://xbrl.sec.gov/oef/role/NcsrCover",
"http://xbrl.sec.gov/oef/role/ShareholderReport"
],
"lang": {
"en-us": {
"role": {
"label": "Document Period End Date",
"documentation": "For the EDGAR submission types of Form 8-K: the date of the report, the date of the earliest event reported; for the EDGAR submission types of Form N-1A: the filing date; for all other submission types: the end of the reporting or transition period. The format of the date is YYYY-MM-DD."
}
}
},
"auth_ref": []
},
"dei_DocumentType": {
"xbrltype": "submissionTypeItemType",
"nsuri": "http://xbrl.sec.gov/dei/2023",
"localname": "DocumentType",
"presentation": [
"http://xbrl.sec.gov/oef/role/NcsrCover",
"http://xbrl.sec.gov/oef/role/ShareholderReport"
],
"lang": {
"en-us": {
"role": {
"label": "Document Type",
"documentation": "The type of document being provided (such as 10-K, 10-Q, 485BPOS, etc). The document type is limited to the same value as the supporting SEC submission type, or the word 'Other'."
}
}
},
"auth_ref": []
},
"country_ES": {
"xbrltype": "domainItemType",
"nsuri": "http://xbrl.sec.gov/country/2023",
"localname": "ES",
"presentation": [
"http://xbrl.sec.gov/oef/role/ShareholderReportHoldingsDetails"
],
"lang": {
"en-us": {
"role": {
"label": "SPAIN"
}
}
},
"auth_ref": []
},
"dei_EntityCentralIndexKey": {
"xbrltype": "centralIndexKeyItemType",
"nsuri": "http://xbrl.sec.gov/dei/2023",
"localname": "EntityCentralIndexKey",
"presentation": [
"http://xbrl.sec.gov/oef/role/NcsrCover",
"http://xbrl.sec.gov/oef/role/ShareholderReport"
],
"lang": {
"en-us": {
"role": {
"label": "Entity Central Index Key",
"documentation": "A unique 10-digit SEC-issued value to identify entities that have filed disclosures with the SEC. It is commonly abbreviated as CIK."
}
}
},
"auth_ref": [
"r20"
]
},
"dei_EntityInvCompanyType": {
"xbrltype": "invCompanyType",
"nsuri": "http://xbrl.sec.gov/dei/2023",
"localname": "EntityInvCompanyType",
"presentation": [
"http://xbrl.sec.gov/oef/role/NcsrCover",
"http://xbrl.sec.gov/oef/role/ShareholderReport"
],
"lang": {
"en-us": {
"role": {
"label": "Entity Investment Company Type",
"documentation": "One of: N-1A (Mutual Fund), N-1 (Open-End Separate Account with No Variable Annuities), N-2 (Closed-End Investment Company), N-3 (Separate Account Registered as Open-End Management Investment Company), N-4 (Variable Annuity UIT Separate Account), N-5 (Small Business Investment Company), N-6 (Variable Life UIT Separate Account), S-1 or S-3 (Face Amount Certificate Company), S-6 (UIT, Non-Insurance Product)."
}
}
},
"auth_ref": [
"r63"
]
},
"dei_EntityRegistrantName": {
"xbrltype": "normalizedStringItemType",
"nsuri": "http://xbrl.sec.gov/dei/2023",
"localname": "EntityRegistrantName",
"presentation": [
"http://xbrl.sec.gov/oef/role/NcsrCover",
"http://xbrl.sec.gov/oef/role/ShareholderReport"
],
"lang": {
"en-us": {
"role": {
"label": "Registrant Name",
"documentation": "The exact name of the entity filing the report as specified in its charter, which is required by forms filed with the SEC."
}
}
},
"auth_ref": [
"r20"
]
},
"oef_EtfDiscountNumDays": {
"xbrltype": "integerItemType",
"nsuri": "http://xbrl.sec.gov/oef/2023",
"localname": "EtfDiscountNumDays",
"presentation": [
"http://xbrl.sec.gov/oef/role/ShareholderReport"
],
"lang": {
"en-us": {
"role": {
"label": "ETF Discount, Number of Days"
}
}
},
"auth_ref": [
"r45"
]
},
"oef_EtfPastPerfTextBlock": {
"xbrltype": "textBlockItemType",
"nsuri": "http://xbrl.sec.gov/oef/2023",
"localname": "EtfPastPerfTextBlock",
"presentation": [
"http://xbrl.sec.gov/oef/role/ShareholderReport"
],
"lang": {
"en-us": {
"role": {
"label": "ETF Past Performance [Text Block]"
}
}
},
"auth_ref": [
"r47"
]
},
"oef_EtfPremiumDiscountTextBlock": {
"xbrltype": "textBlockItemType",
"nsuri": "http://xbrl.sec.gov/oef/2023",
"localname": "EtfPremiumDiscountTextBlock",
"presentation": [
"http://xbrl.sec.gov/oef/role/ShareholderReport"
],
"lang": {
"en-us": {
"role": {
"label": "ETF Premium Discount [Text Block]"
}
}
},
"auth_ref": [
"r45"
]
},
"oef_EtfPremiumNumDays": {
"xbrltype": "integerItemType",
"nsuri": "http://xbrl.sec.gov/oef/2023",
"localname": "EtfPremiumNumDays",
"presentation": [
"http://xbrl.sec.gov/oef/role/ShareholderReport"
],
"lang": {
"en-us": {
"role": {
"label": "ETF Premium, Number of Days"
}
}
},
"auth_ref": [
"r45"
]
},
"oef_EtfPurchaseExplanationTextBlock": {
"xbrltype": "textBlockItemType",
"nsuri": "http://xbrl.sec.gov/oef/2023",
"localname": "EtfPurchaseExplanationTextBlock",
"presentation": [
"http://xbrl.sec.gov/oef/role/ShareholderReport"
],
"lang": {
"en-us": {
"role": {
"label": "ETF Purchase Explanation [Text Block]"
}
}
},
"auth_ref": [
"r46"
]
},
"oef_ExpenseRatioPct": {
"xbrltype": "percentItemType",
"nsuri": "http://xbrl.sec.gov/oef/2023",
"localname": "ExpenseRatioPct",
"presentation": [
"http://xbrl.sec.gov/oef/role/ShareholderReport"
],
"lang": {
"en-us": {
"role": {
"label": "Expense Ratio, Percent"
}
}
},
"auth_ref": [
"r30"
]
},
"oef_ExpensesExclExtraordinaryExpensesPct": {
"xbrltype": "percentItemType",
"nsuri": "http://xbrl.sec.gov/oef/2023",
"localname": "ExpensesExclExtraordinaryExpensesPct",
"presentation": [
"http://xbrl.sec.gov/oef/role/ShareholderReport"
],
"lang": {
"en-us": {
"role": {
"label": "Expenses Excluding Extraordinary Expenses, Percent"
}
}
},
"auth_ref": [
"r33"
]
},
"oef_ExpensesPaidAmt": {
"xbrltype": "monetaryItemType",
"nsuri": "http://xbrl.sec.gov/oef/2023",
"localname": "ExpensesPaidAmt",
"presentation": [
"http://xbrl.sec.gov/oef/role/ShareholderReport"
],
"lang": {
"en-us": {
"role": {
"label": "Expenses Paid, Amount"
}
}
},
"auth_ref": [
"r29"
]
},
"oef_ExpensesRepresentBothMasterAndFeeder": {
"xbrltype": "stringItemType",
"nsuri": "http://xbrl.sec.gov/oef/2023",
"localname": "ExpensesRepresentBothMasterAndFeeder",
"presentation": [
"http://xbrl.sec.gov/oef/role/ShareholderReport"
],
"lang": {
"en-us": {
"role": {
"label": "Expenses Represent Both Master and Feeder [Text]"
}
}
},
"auth_ref": [
"r31",
"r61"
]
},
"oef_ExpensesShortPeriodFnTextBlock": {
"xbrltype": "textBlockItemType",
"nsuri": "http://xbrl.sec.gov/oef/2023",
"localname": "ExpensesShortPeriodFnTextBlock",
"presentation": [
"http://xbrl.sec.gov/oef/role/ShareholderReport"
],
"lang": {
"en-us": {
"role": {
"label": "Expenses Short Period Footnote [Text Block]"
}
}
},
"auth_ref": [
"r32"
]
},
"oef_ExpensesTextBlock": {
"xbrltype": "textBlockItemType",
"nsuri": "http://xbrl.sec.gov/oef/2023",
"localname": "ExpensesTextBlock",
"presentation": [
"http://xbrl.sec.gov/oef/role/ShareholderReport"
],
"lang": {
"en-us": {
"role": {
"label": "Expenses [Text Block]"
}
}
},
"auth_ref": [
"r28"
]
},
"oef_ExposureBasisExplanationTextBlock": {
"xbrltype": "textBlockItemType",
"nsuri": "http://xbrl.sec.gov/oef/2023",
"localname": "ExposureBasisExplanationTextBlock",
"presentation": [
"http://xbrl.sec.gov/oef/role/ShareholderReport"
],
"lang": {
"en-us": {
"role": {
"label": "Exposure Basis Explanation [Text Block]"
}
}
},
"auth_ref": [
"r50"
]
},
"srt_ExternalCreditRatingFitchMember": {
"xbrltype": "domainItemType",
"nsuri": "http://fasb.org/srt/2023",
"localname": "ExternalCreditRatingFitchMember",
"presentation": [
"http://xbrl.sec.gov/oef/role/ShareholderReportHoldingsDetails"
],
"auth_ref": []
},
"srt_ExternalCreditRatingMoodysMember": {
"xbrltype": "domainItemType",
"nsuri": "http://fasb.org/srt/2023",
"localname": "ExternalCreditRatingMoodysMember",
"presentation": [
"http://xbrl.sec.gov/oef/role/ShareholderReportHoldingsDetails"
],
"auth_ref": []
},
"srt_ExternalCreditRatingStandardPoorsMember": {
"xbrltype": "domainItemType",
"nsuri": "http://fasb.org/srt/2023",
"localname": "ExternalCreditRatingStandardPoorsMember",
"presentation": [
"http://xbrl.sec.gov/oef/role/ShareholderReportHoldingsDetails"
],
"auth_ref": []
},
"oef_ExtraordinaryExpensesFnTextBlock": {
"xbrltype": "textBlockItemType",
"nsuri": "http://xbrl.sec.gov/oef/2023",
"localname": "ExtraordinaryExpensesFnTextBlock",
"presentation": [
"http://xbrl.sec.gov/oef/role/ShareholderReport"
],
"lang": {
"en-us": {
"role": {
"label": "Extraordinary Expenses Footnote [Text Block]"
}
}
},
"auth_ref": [
"r33"
]
},
"oef_FactorsAffectingPerfTextBlock": {
"xbrltype": "textBlockItemType",
"nsuri": "http://xbrl.sec.gov/oef/2023",
"localname": "FactorsAffectingPerfTextBlock",
"presentation": [
"http://xbrl.sec.gov/oef/role/ShareholderReport"
],
"lang": {
"en-us": {
"role": {
"label": "Factors Affecting Performance [Text Block]"
}
}
},
"auth_ref": [
"r34"
]
},
"oef_FundName": {
"xbrltype": "normalizedStringItemType",
"nsuri": "http://xbrl.sec.gov/oef/2023",
"localname": "FundName",
"presentation": [
"http://xbrl.sec.gov/oef/role/ShareholderReport"
],
"lang": {
"en-us": {
"role": {
"label": "Fund Name"
}
}
},
"auth_ref": [
"r23"
]
},
"oef_GeographicRegionAxis": {
"xbrltype": "stringItemType",
"nsuri": "http://xbrl.sec.gov/oef/2023",
"localname": "GeographicRegionAxis",
"presentation": [
"http://xbrl.sec.gov/oef/role/ShareholderReportHoldingsDetails"
],
"lang": {
"en-us": {
"role": {
"label": "Geographic Region [Axis]"
}
}
},
"auth_ref": [
"r50"
]
},
"oef_GeographicRegionDomain": {
"xbrltype": "domainItemType",
"nsuri": "http://xbrl.sec.gov/oef/2023",
"localname": "GeographicRegionDomain",
"presentation": [
"http://xbrl.sec.gov/oef/role/ShareholderReportHoldingsDetails"
],
"lang": {
"en-us": {
"role": {
"label": "Geographic Region [Domain]"
}
}
},
"auth_ref": [
"r50"
]
},
"oef_HoldingsAbstract": {
"xbrltype": "stringItemType",
"nsuri": "http://xbrl.sec.gov/oef/2023",
"localname": "HoldingsAbstract",
"lang": {
"en-us": {
"role": {
"label": "Holdings [Abstract]"
}
}
},
"auth_ref": [
"r50"
]
},
"oef_HoldingsCount": {
"xbrltype": "integerItemType",
"nsuri": "http://xbrl.sec.gov/oef/2023",
"localname": "HoldingsCount",
"presentation": [
"http://xbrl.sec.gov/oef/role/ShareholderReport"
],
"lang": {
"en-us": {
"role": {
"label": "Holdings Count"
}
}
},
"auth_ref": [
"r48"
]
},
"oef_HoldingsLineItems": {
"xbrltype": "stringItemType",
"nsuri": "http://xbrl.sec.gov/oef/2023",
"localname": "HoldingsLineItems",
"presentation": [
"http://xbrl.sec.gov/oef/role/ShareholderReportHoldingsDetails"
],
"lang": {
"en-us": {
"role": {
"label": "Holdings [Line Items]"
}
}
},
"auth_ref": [
"r50"
]
},
"oef_HoldingsTable": {
"xbrltype": "stringItemType",
"nsuri": "http://xbrl.sec.gov/oef/2023",
"localname": "HoldingsTable",
"presentation": [
"http://xbrl.sec.gov/oef/role/ShareholderReportHoldingsDetails"
],
"lang": {
"en-us": {
"role": {
"label": "Holdings [Table]"
}
}
},
"auth_ref": [
"r50"
]
},
"oef_HoldingsTableTextBlock": {
"xbrltype": "textBlockItemType",
"nsuri": "http://xbrl.sec.gov/oef/2023",
"localname": "HoldingsTableTextBlock",
"presentation": [
"http://xbrl.sec.gov/oef/role/ShareholderReport"
],
"lang": {
"en-us": {
"role": {
"label": "Holdings [Text Block]"
}
}
},
"auth_ref": [
"r50"
]
},
"country_IN": {
"xbrltype": "domainItemType",
"nsuri": "http://xbrl.sec.gov/country/2023",
"localname": "IN",
"presentation": [
"http://xbrl.sec.gov/oef/role/ShareholderReportHoldingsDetails"
],
"lang": {
"en-us": {
"role": {
"label": "INDIA"
}
}
},
"auth_ref": []
},
"oef_InabilityToMeetDistLevelTextBlock": {
"xbrltype": "textBlockItemType",
"nsuri": "http://xbrl.sec.gov/oef/2023",
"localname": "InabilityToMeetDistLevelTextBlock",
"presentation": [
"http://xbrl.sec.gov/oef/role/ShareholderReport"
],
"lang": {
"en-us": {
"role": {
"label": "Inability to Meet Distribution Level [Text Block]"
}
}
},
"auth_ref": [
"r44"
]
},
"oef_IndustrySectorAxis": {
"xbrltype": "stringItemType",
"nsuri": "http://xbrl.sec.gov/oef/2023",
"localname": "IndustrySectorAxis",
"presentation": [
"http://xbrl.sec.gov/oef/role/ShareholderReportHoldingsDetails"
],
"lang": {
"en-us": {
"role": {
"label": "Industry Sector [Axis]"
}
}
},
"auth_ref": [
"r50"
]
},
"oef_IndustrySectorDomain": {
"xbrltype": "domainItemType",
"nsuri": "http://xbrl.sec.gov/oef/2023",
"localname": "IndustrySectorDomain",
"presentation": [
"http://xbrl.sec.gov/oef/role/ShareholderReportHoldingsDetails"
],
"lang": {
"en-us": {
"role": {
"label": "Industry Sector [Domain]"
}
}
},
"auth_ref": [
"r50"
]
},
"us-gaap_InvestmentCompanyPortfolioTurnover": {
"xbrltype": "percentItemType",
"nsuri": "http://fasb.org/us-gaap/2023",
"localname": "InvestmentCompanyPortfolioTurnover",
"presentation": [
"http://xbrl.sec.gov/oef/role/ShareholderReport"
],
"lang": {
"en-us": {
"role": {
"label": "Investment Company Portfolio Turnover",
"documentation": "Percentage of lesser of purchase or sale of portfolio securities to average value of portfolio securities owned."
}
}
},
"auth_ref": [
"r67"
]
},
"us-gaap_InvestmentTypeAxis": {
"xbrltype": "stringItemType",
"nsuri": "http://fasb.org/us-gaap/2023",
"localname": "InvestmentTypeAxis",
"presentation": [
"http://xbrl.sec.gov/oef/role/ShareholderReportHoldingsDetails"
],
"lang": {
"en-us": {
"role": {
"label": "Investment Type [Axis]",
"documentation": "Information by type of investments."
}
}
},
"auth_ref": [
"r1",
"r2",
"r3",
"r4",
"r5",
"r6",
"r7",
"r8",
"r9",
"r10",
"r11",
"r12",
"r13",
"r14",
"r15",
"r16",
"r17",
"r19"
]
},
"us-gaap_InvestmentTypeCategorizationMember": {
"xbrltype": "domainItemType",
"nsuri": "http://fasb.org/us-gaap/2023",
"localname": "InvestmentTypeCategorizationMember",
"presentation": [
"http://xbrl.sec.gov/oef/role/ShareholderReportHoldingsDetails"
],
"lang": {
"en-us": {
"role": {
"documentation": "Asset obtained to generate income or appreciate in value."
}
}
},
"auth_ref": [
"r1",
"r2",
"r3",
"r4",
"r5",
"r6",
"r7",
"r8",
"r9",
"r10",
"r11",
"r12",
"r13",
"r14",
"r15",
"r16",
"r17",
"r19"
]
},
"country_JP": {
"xbrltype": "domainItemType",
"nsuri": "http://xbrl.sec.gov/country/2023",
"localname": "JP",
"presentation": [
"http://xbrl.sec.gov/oef/role/ShareholderReportHoldingsDetails"
],
"lang": {
"en-us": {
"role": {
"label": "JAPAN"
}
}
},
"auth_ref": []
},
"bragfi_JohnsonAndJohnsonMember": {
"xbrltype": "domainItemType",
"nsuri": "http://www.blackrock.com/20240823",
"localname": "JohnsonAndJohnsonMember",
"presentation": [
"http://xbrl.sec.gov/oef/role/ShareholderReportHoldingsDetails"
],
"lang": {
"en-us": {
"role": {
"label": "Johnson And Johnson [Member]"
}
}
},
"auth_ref": []
},
"bragfi_LamResearchCorpMember": {
"xbrltype": "domainItemType",
"nsuri": "http://www.blackrock.com/20240823",
"localname": "LamResearchCorpMember",
"presentation": [
"http://xbrl.sec.gov/oef/role/ShareholderReportHoldingsDetails"
],
"lang": {
"en-us": {
"role": {
"label": "Lam Research Corp [Member]"
}
}
},
"auth_ref": []
},
"oef_LargestHoldingAxis": {
"xbrltype": "stringItemType",
"nsuri": "http://xbrl.sec.gov/oef/2023",
"localname": "LargestHoldingAxis",
"presentation": [
"http://xbrl.sec.gov/oef/role/ShareholderReportHoldingsDetails"
],
"lang": {
"en-us": {
"role": {
"label": "Largest Holding [Axis]"
}
}
},
"auth_ref": [
"r50"
]
},
"oef_LargestHoldingsDomain": {
"xbrltype": "domainItemType",
"nsuri": "http://xbrl.sec.gov/oef/2023",
"localname": "LargestHoldingsDomain",
"presentation": [
"http://xbrl.sec.gov/oef/role/ShareholderReportHoldingsDetails"
],
"lang": {
"en-us": {
"role": {
"label": "Largest Holdings [Domain]"
}
}
},
"auth_ref": [
"r50"
]
},
"oef_LargestHoldingsTableTextBlock": {
"xbrltype": "textBlockItemType",
"nsuri": "http://xbrl.sec.gov/oef/2023",
"localname": "LargestHoldingsTableTextBlock",
"presentation": [
"http://xbrl.sec.gov/oef/role/ShareholderReport"
],
"lang": {
"en-us": {
"role": {
"label": "Largest Holdings [Text Block]"
}
}
},
"auth_ref": [
"r50"
]
},
"oef_LineGraphAndTableMeasureName": {
"xbrltype": "stringItemType",
"nsuri": "http://xbrl.sec.gov/oef/2023",
"localname": "LineGraphAndTableMeasureName",
"presentation": [
"http://xbrl.sec.gov/oef/role/ShareholderReportLineGraphDetails"
],
"lang": {
"en-us": {
"role": {
"label": "Line Graph and Table Measure Name"
}
}
},
"auth_ref": [
"r36"
]
},
"oef_LineGraphTableTextBlock": {
"xbrltype": "textBlockItemType",
"nsuri": "http://xbrl.sec.gov/oef/2023",
"localname": "LineGraphTableTextBlock",
"presentation": [
"http://xbrl.sec.gov/oef/role/ShareholderReport"
],
"lang": {
"en-us": {
"role": {
"label": "Line Graph [Table Text Block]"
}
}
},
"auth_ref": [
"r35"
]
},
"bragfi_MSCIAllCountryWorldIndexMember": {
"xbrltype": "domainItemType",
"nsuri": "http://www.blackrock.com/20240823",
"localname": "MSCIAllCountryWorldIndexMember",
"presentation": [
"http://xbrl.sec.gov/oef/role/ShareholderReportLineGraphDetails"
],
"lang": {
"en-us": {
"role": {
"label": "MSCI All Country World Index [Member]"
}
}
},
"auth_ref": []
},
"oef_MaterialChngDate": {
"xbrltype": "dateItemType",
"nsuri": "http://xbrl.sec.gov/oef/2023",
"localname": "MaterialChngDate",
"presentation": [
"http://xbrl.sec.gov/oef/role/ShareholderReport"
],
"lang": {
"en-us": {
"role": {
"label": "Material Change Date"
}
}
},
"auth_ref": [
"r40"
]
},
"oef_MaterialChngDescriptionTextBlock": {
"xbrltype": "textBlockItemType",
"nsuri": "http://xbrl.sec.gov/oef/2023",
"localname": "MaterialChngDescriptionTextBlock",
"presentation": [
"http://xbrl.sec.gov/oef/role/ShareholderReport"
],
"lang": {
"en-us": {
"role": {
"label": "Material Change Description [Text Block]"
}
}
},
"auth_ref": [
"r40"
]
},
"oef_MaterialFundChngAdviserTextBlock": {
"xbrltype": "textBlockItemType",
"nsuri": "http://xbrl.sec.gov/oef/2023",
"localname": "MaterialFundChngAdviserTextBlock",
"presentation": [
"http://xbrl.sec.gov/oef/role/ShareholderReport"
],
"lang": {
"en-us": {
"role": {
"label": "Material Fund Change Adviser [Text Block]"
}
}
},
"auth_ref": [
"r57"
]
},
"oef_MaterialFundChngExpensesTextBlock": {
"xbrltype": "textBlockItemType",
"nsuri": "http://xbrl.sec.gov/oef/2023",
"localname": "MaterialFundChngExpensesTextBlock",
"presentation": [
"http://xbrl.sec.gov/oef/role/ShareholderReport"
],
"lang": {
"en-us": {
"role": {
"label": "Material Fund Change Expenses [Text Block]"
}
}
},
"auth_ref": [
"r54"
]
},
"oef_MaterialFundChngNameTextBlock": {
"xbrltype": "textBlockItemType",
"nsuri": "http://xbrl.sec.gov/oef/2023",
"localname": "MaterialFundChngNameTextBlock",
"presentation": [
"http://xbrl.sec.gov/oef/role/ShareholderReport"
],
"lang": {
"en-us": {
"role": {
"label": "Material Fund Change Name [Text Block]"
}
}
},
"auth_ref": [
"r52"
]
},
"oef_MaterialFundChngNoticeTextBlock": {
"xbrltype": "textBlockItemType",
"nsuri": "http://xbrl.sec.gov/oef/2023",
"localname": "MaterialFundChngNoticeTextBlock",
"presentation": [
"http://xbrl.sec.gov/oef/role/ShareholderReport"
],
"lang": {
"en-us": {
"role": {
"label": "Material Fund Change Notice [Text Block]"
}
}
},
"auth_ref": [
"r26"
]
},
"oef_MaterialFundChngObjectivesTextBlock": {
"xbrltype": "textBlockItemType",
"nsuri": "http://xbrl.sec.gov/oef/2023",
"localname": "MaterialFundChngObjectivesTextBlock",
"presentation": [
"http://xbrl.sec.gov/oef/role/ShareholderReport"
],
"lang": {
"en-us": {
"role": {
"label": "Material Fund Change Objectives [Text Block]"
}
}
},
"auth_ref": [
"r53"
]
},
"oef_MaterialFundChngRisksChngTextBlock": {
"xbrltype": "textBlockItemType",
"nsuri": "http://xbrl.sec.gov/oef/2023",
"localname": "MaterialFundChngRisksChngTextBlock",
"presentation": [
"http://xbrl.sec.gov/oef/role/ShareholderReport"
],
"lang": {
"en-us": {
"role": {
"label": "Material Fund Change Risks Change [Text Block]"
}
}
},
"auth_ref": [
"r56"
]
},
"oef_MaterialFundChngStrategiesTextBlock": {
"xbrltype": "textBlockItemType",
"nsuri": "http://xbrl.sec.gov/oef/2023",
"localname": "MaterialFundChngStrategiesTextBlock",
"presentation": [
"http://xbrl.sec.gov/oef/role/ShareholderReport"
],
"lang": {
"en-us": {
"role": {
"label": "Material Fund Change Strategies [Text Block]"
}
}
},
"auth_ref": [
"r55"
]
},
"oef_MaterialFundChngTextBlock": {
"xbrltype": "textBlockItemType",
"nsuri": "http://xbrl.sec.gov/oef/2023",
"localname": "MaterialFundChngTextBlock",
"presentation": [
"http://xbrl.sec.gov/oef/role/ShareholderReport"
],
"lang": {
"en-us": {
"role": {
"label": "Material Fund Change [Text Block]"
}
}
},
"auth_ref": [
"r51"
]
},
"oef_MaturityAxis": {
"xbrltype": "stringItemType",
"nsuri": "http://xbrl.sec.gov/oef/2023",
"localname": "MaturityAxis",
"presentation": [
"http://xbrl.sec.gov/oef/role/ShareholderReportHoldingsDetails"
],
"lang": {
"en-us": {
"role": {
"label": "Maturity [Axis]"
}
}
},
"auth_ref": [
"r50"
]
},
"oef_MaturityDomain": {
"xbrltype": "domainItemType",
"nsuri": "http://xbrl.sec.gov/oef/2023",
"localname": "MaturityDomain",
"presentation": [
"http://xbrl.sec.gov/oef/role/ShareholderReportHoldingsDetails"
],
"lang": {
"en-us": {
"role": {
"label": "Maturity [Domain]"
}
}
},
"auth_ref": [
"r50"
]
},
"bragfi_MicrosoftCorpMember": {
"xbrltype": "domainItemType",
"nsuri": "http://www.blackrock.com/20240823",
"localname": "MicrosoftCorpMember",
"presentation": [
"http://xbrl.sec.gov/oef/role/ShareholderReportHoldingsDetails"
],
"lang": {
"en-us": {
"role": {
"label": "Microsoft Corp [Member]"
}
}
},
"auth_ref": []
},
"bragfi_NVIDIACorpMember": {
"xbrltype": "domainItemType",
"nsuri": "http://www.blackrock.com/20240823",
"localname": "NVIDIACorpMember",
"presentation": [
"http://xbrl.sec.gov/oef/role/ShareholderReportHoldingsDetails"
],
"lang": {
"en-us": {
"role": {
"label": "NVIDIA Corp [Member]"
}
}
},
"auth_ref": []
},
"oef_NoDeductionOfTaxesTextBlock": {
"xbrltype": "textBlockItemType",
"nsuri": "http://xbrl.sec.gov/oef/2023",
"localname": "NoDeductionOfTaxesTextBlock",
"presentation": [
"http://xbrl.sec.gov/oef/role/ShareholderReport"
],
"lang": {
"en-us": {
"role": {
"label": "No Deduction of Taxes [Text Block]"
}
}
},
"auth_ref": [
"r37"
]
},
"dei_NoTradingSymbolFlag": {
"xbrltype": "trueItemType",
"nsuri": "http://xbrl.sec.gov/dei/2023",
"localname": "NoTradingSymbolFlag",
"presentation": [
"http://xbrl.sec.gov/oef/role/ShareholderReport"
],
"lang": {
"en-us": {
"role": {
"label": "No Trading Symbol Flag",
"documentation": "Boolean flag that is true only for a security having no trading symbol."
}
}
},
"auth_ref": []
},
"bragfi_OtherAssetsLessLiabilitiesMember": {
"xbrltype": "domainItemType",
"nsuri": "http://www.blackrock.com/20240823",
"localname": "OtherAssetsLessLiabilitiesMember",
"presentation": [
"http://xbrl.sec.gov/oef/role/ShareholderReportHoldingsDetails"
],
"lang": {
"en-us": {
"role": {
"label": "Other Assets Less Liabilities [Member]"
}
}
},
"auth_ref": []
},
"oef_OtherCategory1Axis": {
"xbrltype": "stringItemType",
"nsuri": "http://xbrl.sec.gov/oef/2023",
"localname": "OtherCategory1Axis",
"presentation": [
"http://xbrl.sec.gov/oef/role/ShareholderReportHoldingsDetails"
],
"lang": {
"en-us": {
"role": {
"label": "Other Category 1 [Axis]"
}
}
},
"auth_ref": [
"r50"
]
},
"oef_OtherCategory1Domain": {
"xbrltype": "domainItemType",
"nsuri": "http://xbrl.sec.gov/oef/2023",
"localname": "OtherCategory1Domain",
"presentation": [
"http://xbrl.sec.gov/oef/role/ShareholderReportHoldingsDetails"
],
"lang": {
"en-us": {
"role": {
"label": "Other Category 1 [Domain]"
}
}
},
"auth_ref": [
"r50"
]
},
"oef_OtherCategory2Axis": {
"xbrltype": "stringItemType",
"nsuri": "http://xbrl.sec.gov/oef/2023",
"localname": "OtherCategory2Axis",
"presentation": [
"http://xbrl.sec.gov/oef/role/ShareholderReportHoldingsDetails"
],
"lang": {
"en-us": {
"role": {
"label": "Other Category 2 [Axis]"
}
}
},
"auth_ref": [
"r50"
]
},
"oef_OtherCategory2Domain": {
"xbrltype": "domainItemType",
"nsuri": "http://xbrl.sec.gov/oef/2023",
"localname": "OtherCategory2Domain",
"presentation": [
"http://xbrl.sec.gov/oef/role/ShareholderReportHoldingsDetails"
],
"lang": {
"en-us": {
"role": {
"label": "Other Category 2 [Domain]"
}
}
},
"auth_ref": [
"r50"
]
},
"bragfi_OtherMember": {
"xbrltype": "domainItemType",
"nsuri": "http://www.blackrock.com/20240823",
"localname": "OtherMember",
"presentation": [
"http://xbrl.sec.gov/oef/role/ShareholderReportHoldingsDetails"
],
"lang": {
"en-us": {
"role": {
"label": "Other [Member]"
}
}
},
"auth_ref": []
},
"oef_PctOfNav": {
"xbrltype": "percentItemType",
"nsuri": "http://xbrl.sec.gov/oef/2023",
"localname": "PctOfNav",
"presentation": [
"http://xbrl.sec.gov/oef/role/ShareholderReportHoldingsDetails"
],
"lang": {
"en-us": {
"role": {
"label": "Percent of Net Asset Value"
}
}
},
"auth_ref": [
"r50"
]
},
"oef_PctOfNetLongExposure": {
"xbrltype": "percentItemType",
"nsuri": "http://xbrl.sec.gov/oef/2023",
"localname": "PctOfNetLongExposure",
"presentation": [
"http://xbrl.sec.gov/oef/role/ShareholderReportHoldingsDetails"
],
"lang": {
"en-us": {
"role": {
"label": "Percent of Net Long Exposure"
}
}
},
"auth_ref": [
"r50"
]
},
"oef_PctOfNetShortExposure": {
"xbrltype": "percentItemType",
"nsuri": "http://xbrl.sec.gov/oef/2023",
"localname": "PctOfNetShortExposure",
"presentation": [
"http://xbrl.sec.gov/oef/role/ShareholderReportHoldingsDetails"
],
"lang": {
"en-us": {
"role": {
"label": "Percent of Net Short Exposure"
}
}
},
"auth_ref": [
"r50"
]
},
"oef_PctOfTotalInv": {
"xbrltype": "percentItemType",
"nsuri": "http://xbrl.sec.gov/oef/2023",
"localname": "PctOfTotalInv",
"presentation": [
"http://xbrl.sec.gov/oef/role/ShareholderReportHoldingsDetails"
],
"lang": {
"en-us": {
"role": {
"label": "Percent of Total Investments"
}
}
},
"auth_ref": [
"r50"
]
},
"oef_PctOfTotalLongExposure": {
"xbrltype": "percentItemType",
"nsuri": "http://xbrl.sec.gov/oef/2023",
"localname": "PctOfTotalLongExposure",
"presentation": [
"http://xbrl.sec.gov/oef/role/ShareholderReportHoldingsDetails"
],
"lang": {
"en-us": {
"role": {
"label": "Percent of Total Long Exposure"
}
}
},
"auth_ref": [
"r50"
]
},
"oef_PctOfTotalShortExposure": {
"xbrltype": "percentItemType",
"nsuri": "http://xbrl.sec.gov/oef/2023",
"localname": "PctOfTotalShortExposure",
"presentation": [
"http://xbrl.sec.gov/oef/role/ShareholderReportHoldingsDetails"
],
"lang": {
"en-us": {
"role": {
"label": "Percent of Total Short Exposure"
}
}
},
"auth_ref": [
"r50"
]
},
"oef_PerfInceptionDate": {
"xbrltype": "dateItemType",
"nsuri": "http://xbrl.sec.gov/oef/2023",
"localname": "PerfInceptionDate",
"presentation": [
"http://xbrl.sec.gov/oef/role/ShareholderReport"
],
"lang": {
"en-us": {
"role": {
"label": "Performance Inception Date"
}
}
},
"auth_ref": [
"r36"
]
},
"oef_PerfTableMarketIndexChngdTextBlock": {
"xbrltype": "textBlockItemType",
"nsuri": "http://xbrl.sec.gov/oef/2023",
"localname": "PerfTableMarketIndexChngdTextBlock",
"presentation": [
"http://xbrl.sec.gov/oef/role/ShareholderReport"
],
"lang": {
"en-us": {
"role": {
"label": "Performance Table Market Index Changed [Text Block]"
}
}
},
"auth_ref": [
"r43"
]
},
"oef_PerformancePastDoesNotIndicateFuture": {
"xbrltype": "stringItemType",
"nsuri": "http://xbrl.sec.gov/oef/2023",
"localname": "PerformancePastDoesNotIndicateFuture",
"presentation": [
"http://xbrl.sec.gov/oef/role/ShareholderReport"
],
"lang": {
"en-us": {
"role": {
"label": "Performance Past Does Not Indicate Future [Text]"
}
}
},
"auth_ref": [
"r38",
"r62"
]
},
"oef_PreviousInvestmentAdviserTextBlock": {
"xbrltype": "textBlockItemType",
"nsuri": "http://xbrl.sec.gov/oef/2023",
"localname": "PreviousInvestmentAdviserTextBlock",
"presentation": [
"http://xbrl.sec.gov/oef/role/ShareholderReport"
],
"lang": {
"en-us": {
"role": {
"label": "Previous Investment Adviser [Text Block]"
}
}
},
"auth_ref": [
"r39"
]
},
"oef_PriorMarketIndexComparisonTextBlock": {
"xbrltype": "textBlockItemType",
"nsuri": "http://xbrl.sec.gov/oef/2023",
"localname": "PriorMarketIndexComparisonTextBlock",
"presentation": [
"http://xbrl.sec.gov/oef/role/ShareholderReport"
],
"lang": {
"en-us": {
"role": {
"label": "Prior Market Index Comparison [Text Block]"
}
}
},
"auth_ref": [
"r43"
]
},
"bragfi_QUALCOMMIncMember": {
"xbrltype": "domainItemType",
"nsuri": "http://www.blackrock.com/20240823",
"localname": "QUALCOMMIncMember",
"presentation": [
"http://xbrl.sec.gov/oef/role/ShareholderReportHoldingsDetails"
],
"lang": {
"en-us": {
"role": {
"label": "QUALCOMM Inc [Member]"
}
}
},
"auth_ref": []
},
"bragfi_SAndPGlobalIncMember": {
"xbrltype": "domainItemType",
"nsuri": "http://www.blackrock.com/20240823",
"localname": "SAndPGlobalIncMember",
"presentation": [
"http://xbrl.sec.gov/oef/role/ShareholderReportHoldingsDetails"
],
"lang": {
"en-us": {
"role": {
"label": "S And P Global Inc [Member]"
}
}
},
"auth_ref": []
},
"oef_SalesLoadAxis": {
"xbrltype": "stringItemType",
"nsuri": "http://xbrl.sec.gov/oef/2023",
"localname": "SalesLoadAxis",
"presentation": [
"http://xbrl.sec.gov/oef/role/ShareholderReportLineGraphDetails"
],
"lang": {
"en-us": {
"role": {
"label": "Sales Load [Axis]"
}
}
},
"auth_ref": [
"r42"
]
},
"dei_SecurityExchangeName": {
"xbrltype": "edgarExchangeCodeItemType",
"nsuri": "http://xbrl.sec.gov/dei/2023",
"localname": "SecurityExchangeName",
"presentation": [
"http://xbrl.sec.gov/oef/role/ShareholderReport"
],
"lang": {
"en-us": {
"role": {
"label": "Security Exchange Name",
"terseLabel": "Exchange",
"documentation": "Name of the Exchange on which a security is registered."
}
}
},
"auth_ref": [
"r21"
]
},
"oef_ShareClassDomain": {
"xbrltype": "domainItemType",
"nsuri": "http://xbrl.sec.gov/oef/2023",
"localname": "ShareClassDomain",
"presentation": [
"http://xbrl.sec.gov/oef/role/ShareholderReport",
"http://xbrl.sec.gov/oef/role/ShareholderReportHoldingsDetails",
"http://xbrl.sec.gov/oef/role/ShareholderReportLineGraphDetails"
],
"lang": {
"en-us": {
"role": {
"label": "Share Classes"
}
}
},
"auth_ref": [
"r22"
]
},
"oef_ShareholderReportAbstract": {
"xbrltype": "stringItemType",
"nsuri": "http://xbrl.sec.gov/oef/2023",
"localname": "ShareholderReportAbstract",
"lang": {
"en-us": {
"role": {
"label": "Shareholder Report [Abstract]"
}
}
},
"auth_ref": [
"r42"
]
},
"oef_ShareholderReportAnnualOrSemiAnnual": {
"xbrltype": "shareholderReportTypeItemType",
"nsuri": "http://xbrl.sec.gov/oef/2023",
"localname": "ShareholderReportAnnualOrSemiAnnual",
"presentation": [
"http://xbrl.sec.gov/oef/role/ShareholderReport"
],
"lang": {
"en-us": {
"role": {
"label": "Shareholder Report Annual or Semi-Annual"
}
}
},
"auth_ref": [
"r24"
]
},
"oef_ShareholderReportLineItems": {
"xbrltype": "stringItemType",
"nsuri": "http://xbrl.sec.gov/oef/2023",
"localname": "ShareholderReportLineItems",
"presentation": [
"http://xbrl.sec.gov/oef/role/NcsrCover",
"http://xbrl.sec.gov/oef/role/ShareholderReport"
],
"lang": {
"en-us": {
"role": {
"label": "Shareholder Report [Line Items]"
}
}
},
"auth_ref": [
"r42"
]
},
"oef_ShareholderReportTable": {
"xbrltype": "stringItemType",
"nsuri": "http://xbrl.sec.gov/oef/2023",
"localname": "ShareholderReportTable",
"presentation": [
"http://xbrl.sec.gov/oef/role/NcsrCover",
"http://xbrl.sec.gov/oef/role/ShareholderReport"
],
"lang": {
"en-us": {
"role": {
"label": "Shareholder Report [Table]"
}
}
},
"auth_ref": [
"r42"
]
},
"oef_SummaryOfChngLegendTextBlock": {
"xbrltype": "textBlockItemType",
"nsuri": "http://xbrl.sec.gov/oef/2023",
"localname": "SummaryOfChngLegendTextBlock",
"presentation": [
"http://xbrl.sec.gov/oef/role/ShareholderReport"
],
"lang": {
"en-us": {
"role": {
"label": "Summary of Change Legend [Text Block]"
}
}
},
"auth_ref": [
"r58"
]
},
"country_TW": {
"xbrltype": "domainItemType",
"nsuri": "http://xbrl.sec.gov/country/2023",
"localname": "TW",
"presentation": [
"http://xbrl.sec.gov/oef/role/ShareholderReportHoldingsDetails"
],
"lang": {
"en-us": {
"role": {
"label": "TAIWAN"
}
}
},
"auth_ref": []
},
"dei_TradingSymbol": {
"xbrltype": "tradingSymbolItemType",
"nsuri": "http://xbrl.sec.gov/dei/2023",
"localname": "TradingSymbol",
"presentation": [
"http://xbrl.sec.gov/oef/role/ShareholderReport"
],
"lang": {
"en-us": {
"role": {
"label": "Trading Symbol",
"terseLabel": "Ticker",
"documentation": "Trading symbol of an instrument as listed on an exchange."
}
}
},
"auth_ref": []
},
"country_US": {
"xbrltype": "domainItemType",
"nsuri": "http://xbrl.sec.gov/country/2023",
"localname": "US",
"presentation": [
"http://xbrl.sec.gov/oef/role/ShareholderReportHoldingsDetails"
],
"lang": {
"en-us": {
"role": {
"label": "UNITED STATES"
}
}
},
"auth_ref": []
},
"oef_UpdPerfInfoLocationTextBlock": {
"xbrltype": "textBlockItemType",
"nsuri": "http://xbrl.sec.gov/oef/2023",
"localname": "UpdPerfInfoLocationTextBlock",
"presentation": [
"http://xbrl.sec.gov/oef/role/ShareholderReport"
],
"lang": {
"en-us": {
"role": {
"label": "Updated Performance Information Location [Text Block]"
}
}
},
"auth_ref": [
"r41"
]
},
"oef_UpdProspectusEmailAddress": {
"xbrltype": "stringItemType",
"nsuri": "http://xbrl.sec.gov/oef/2023",
"localname": "UpdProspectusEmailAddress",
"presentation": [
"http://xbrl.sec.gov/oef/role/ShareholderReport"
],
"lang": {
"en-us": {
"role": {
"label": "Updated Prospectus Email Address"
}
}
},
"auth_ref": [
"r58"
]
},
"oef_UpdProspectusPhoneNumber": {
"xbrltype": "stringItemType",
"nsuri": "http://xbrl.sec.gov/oef/2023",
"localname": "UpdProspectusPhoneNumber",
"presentation": [
"http://xbrl.sec.gov/oef/role/ShareholderReport"
],
"lang": {
"en-us": {
"role": {
"label": "Updated Prospectus Phone Number"
}
}
},
"auth_ref": [
"r58"
]
},
"oef_UpdProspectusWebAddress": {
"xbrltype": "stringItemType",
"nsuri": "http://xbrl.sec.gov/oef/2023",
"localname": "UpdProspectusWebAddress",
"presentation": [
"http://xbrl.sec.gov/oef/role/ShareholderReport"
],
"lang": {
"en-us": {
"role": {
"label": "Updated Prospectus Web Address"
}
}
},
"auth_ref": [
"r58"
]
},
"oef_WithSalesLdMember": {
"xbrltype": "domainItemType",
"nsuri": "http://xbrl.sec.gov/oef/2023",
"localname": "WithSalesLoadMember",
"presentation": [
"http://xbrl.sec.gov/oef/role/ShareholderReportLineGraphDetails"
],
"lang": {
"en-us": {
"role": {
"label": "With Sales Load [Member]"
}
}
},
"auth_ref": [
"r42"
]
},
"oef_WithoutSalesLoadMember": {
"xbrltype": "domainItemType",
"nsuri": "http://xbrl.sec.gov/oef/2023",
"localname": "WithoutSalesLoadMember",
"presentation": [
"http://xbrl.sec.gov/oef/role/ShareholderReportLineGraphDetails"
],
"lang": {
"en-us": {
"role": {
"label": "Without Sales Load [Member]"
}
}
},
"auth_ref": [
"r42"
]
}
}
}
},
"std_ref": {
"r0": {
"role": "http://fasb.org/us-gaap/role/ref/legacyRef",
"Name": "Accounting Standards Codification",
"Section": "50",
"Paragraph": "1",
"SubTopic": "30",
"Topic": "205",
"Publisher": "FASB",
"URI": "https://asc.fasb.org//1943274/2147479910/205-30-50-1"
},
"r1": {
"role": "http://www.xbrl.org/2003/role/disclosureRef",
"Topic": "946",
"SubTopic": "210",
"Name": "Accounting Standards Codification",
"Section": "50",
"Paragraph": "1",
"Subparagraph": "(b)(1)",
"Publisher": "FASB",
"URI": "https://asc.fasb.org//1943274/2147480524/946-210-50-1"
},
"r2": {
"role": "http://www.xbrl.org/2003/role/disclosureRef",
"Topic": "946",
"SubTopic": "210",
"Name": "Accounting Standards Codification",
"Section": "50",
"Paragraph": "1",
"Subparagraph": "(c)(1)",
"Publisher": "FASB",
"URI": "https://asc.fasb.org//1943274/2147480524/946-210-50-1"
},
"r3": {
"role": "http://www.xbrl.org/2003/role/disclosureRef",
"Topic": "946",
"SubTopic": "210",
"Name": "Accounting Standards Codification",
"Section": "50",
"Paragraph": "1",
"Subparagraph": "(c)(2)",
"Publisher": "FASB",
"URI": "https://asc.fasb.org//1943274/2147480524/946-210-50-1"
},
"r4": {
"role": "http://www.xbrl.org/2003/role/disclosureRef",
"Topic": "946",
"SubTopic": "210",
"Name": "Accounting Standards Codification",
"Section": "50",
"Paragraph": "6",
"Subparagraph": "(a)(1)",
"Publisher": "FASB",
"URI": "https://asc.fasb.org//1943274/2147480524/946-210-50-6"
},
"r5": {
"role": "http://www.xbrl.org/2003/role/disclosureRef",
"Topic": "946",
"SubTopic": "210",
"Name": "Accounting Standards Codification",
"Section": "50",
"Paragraph": "6",
"Subparagraph": "(c)",
"Publisher": "FASB",
"URI": "https://asc.fasb.org//1943274/2147480524/946-210-50-6"
},
"r6": {
"role": "http://www.xbrl.org/2003/role/disclosureRef",
"Topic": "946",
"SubTopic": "320",
"Name": "Accounting Standards Codification",
"Section": "S99",
"Paragraph": "1",
"Subparagraph": "(SX 210.12-12(Column A)(Footnote 1))",
"Publisher": "FASB",
"URI": "https://asc.fasb.org//1943274/2147480032/946-320-S99-1"
},
"r7": {
"role": "http://www.xbrl.org/2003/role/disclosureRef",
"Topic": "946",
"SubTopic": "320",
"Name": "Accounting Standards Codification",
"Section": "S99",
"Paragraph": "1",
"Subparagraph": "(SX 210.12-12(Column C)(Footnote 5))",
"Publisher": "FASB",
"URI": "https://asc.fasb.org//1943274/2147480032/946-320-S99-1"
},
"r8": {
"role": "http://www.xbrl.org/2003/role/disclosureRef",
"Topic": "946",
"SubTopic": "320",
"Name": "Accounting Standards Codification",
"Section": "S99",
"Paragraph": "2",
"Subparagraph": "(SX 210.12-12A(Column C)(Footnote 4))",
"Publisher": "FASB",
"URI": "https://asc.fasb.org//1943274/2147480032/946-320-S99-2"
},
"r9": {
"role": "http://www.xbrl.org/2003/role/disclosureRef",
"Topic": "946",
"SubTopic": "320",
"Name": "Accounting Standards Codification",
"Section": "S99",
"Paragraph": "3",
"Subparagraph": "(SX 210.12-12B(Column A)(Footnote 7))",
"Publisher": "FASB",
"URI": "https://asc.fasb.org//1943274/2147480032/946-320-S99-3"
},
"r10": {
"role": "http://www.xbrl.org/2003/role/disclosureRef",
"Topic": "946",
"SubTopic": "320",
"Name": "Accounting Standards Codification",
"Section": "S99",
"Paragraph": "3",
"Subparagraph": "(SX 210.12-12B(Column C)(Footnote 2))",
"Publisher": "FASB",
"URI": "https://asc.fasb.org//1943274/2147480032/946-320-S99-3"
},
"r11": {
"role": "http://www.xbrl.org/2003/role/disclosureRef",
"Topic": "946",
"SubTopic": "320",
"Name": "Accounting Standards Codification",
"Section": "S99",
"Paragraph": "5D",
"Subparagraph": "(SX 210.12-13D(Column B)(Footnote 2))",
"Publisher": "FASB",
"URI": "https://asc.fasb.org//1943274/2147480032/946-320-S99-5D"
},
"r12": {
"role": "http://www.xbrl.org/2003/role/disclosureRef",
"Topic": "946",
"SubTopic": "320",
"Name": "Accounting Standards Codification",
"Section": "S99",
"Paragraph": "5D",
"Subparagraph": "(SX 210.12-13D(Column C)(Footnote 2))",
"Publisher": "FASB",
"URI": "https://asc.fasb.org//1943274/2147480032/946-320-S99-5D"
},
"r13": {
"role": "http://www.xbrl.org/2003/role/disclosureRef",
"Topic": "946",
"SubTopic": "320",
"Name": "Accounting Standards Codification",
"Section": "S99",
"Paragraph": "6",
"Subparagraph": "(SX 210.12-14(Column F)(Footnote 7))",
"Publisher": "FASB",
"URI": "https://asc.fasb.org//1943274/2147480032/946-320-S99-6"
},
"r14": {
"role": "http://www.xbrl.org/2003/role/disclosureRef",
"Topic": "946",
"SubTopic": "320",
"Name": "Accounting Standards Codification",
"Section": "S99",
"Paragraph": "7",
"Subparagraph": "(SX 210.12-15(Column A))",
"Publisher": "FASB",
"URI": "https://asc.fasb.org//1943274/2147480032/946-320-S99-7"
},
"r15": {
"role": "http://www.xbrl.org/2003/role/disclosureRef",
"Topic": "946",
"SubTopic": "320",
"Name": "Accounting Standards Codification",
"Section": "S99",
"Paragraph": "7",
"Subparagraph": "(SX 210.12-15(Column B))",
"Publisher": "FASB",
"URI": "https://asc.fasb.org//1943274/2147480032/946-320-S99-7"
},
"r16": {
"role": "http://www.xbrl.org/2003/role/disclosureRef",
"Topic": "946",
"SubTopic": "320",
"Name": "Accounting Standards Codification",
"Section": "S99",
"Paragraph": "7",
"Subparagraph": "(SX 210.12-15(Column C))",
"Publisher": "FASB",
"URI": "https://asc.fasb.org//1943274/2147480032/946-320-S99-7"
},
"r17": {
"role": "http://www.xbrl.org/2003/role/disclosureRef",
"Topic": "946",
"SubTopic": "320",
"Name": "Accounting Standards Codification",
"Section": "S99",
"Paragraph": "7",
"Subparagraph": "(SX 210.12-15(Column D))",
"Publisher": "FASB",
"URI": "https://asc.fasb.org//1943274/2147480032/946-320-S99-7"
},
"r18": {
"role": "http://www.xbrl.org/2003/role/exampleRef",
"Topic": "326",
"SubTopic": "20",
"Name": "Accounting Standards Codification",
"Section": "55",
"Paragraph": "15",
"Subparagraph": "(b)",
"Publisher": "FASB",
"URI": "https://asc.fasb.org//1943274/2147479294/326-20-55-15"
},
"r19": {
"role": "http://www.xbrl.org/2003/role/exampleRef",
"Topic": "946",
"SubTopic": "210",
"Name": "Accounting Standards Codification",
"Section": "55",
"Paragraph": "1",
"Publisher": "FASB",
"URI": "https://asc.fasb.org//1943274/2147480493/946-210-55-1"
},
"r20": {
"role": "http://www.xbrl.org/2003/role/presentationRef",
"Publisher": "SEC",
"Name": "Exchange Act",
"Number": "240",
"Section": "12",
"Subsection": "b-2"
},
"r21": {
"role": "http://www.xbrl.org/2003/role/presentationRef",
"Publisher": "SEC",
"Name": "Exchange Act",
"Number": "240",
"Section": "12",
"Subsection": "d1-1"
},
"r22": {
"role": "http://www.xbrl.org/2003/role/presentationRef",
"Publisher": "SEC",
"Name": "Form N-1A",
"Section": "1",
"Subsection": "a",
"Paragraph": "1"
},
"r23": {
"role": "http://www.xbrl.org/2003/role/presentationRef",
"Publisher": "SEC",
"Name": "Form N-1A",
"Section": "27A",
"Subsection": "b",
"Paragraph": "1"
},
"r24": {
"role": "http://www.xbrl.org/2003/role/presentationRef",
"Publisher": "SEC",
"Name": "Form N-1A",
"Section": "27A",
"Subsection": "b",
"Paragraph": "3"
},
"r25": {
"role": "http://www.xbrl.org/2003/role/presentationRef",
"Publisher": "SEC",
"Name": "Form N-1A",
"Section": "27A",
"Subsection": "b",
"Paragraph": "4"
},
"r26": {
"role": "http://www.xbrl.org/2003/role/presentationRef",
"Publisher": "SEC",
"Name": "Form N-1A",
"Section": "27A",
"Subsection": "b",
"Paragraph": "5"
},
"r27": {
"role": "http://www.xbrl.org/2003/role/presentationRef",
"Publisher": "SEC",
"Name": "Form N-1A",
"Section": "27A",
"Subsection": "b",
"Paragraph": "instruction",
"Subparagraph": "2"
},
"r28": {
"role": "http://www.xbrl.org/2003/role/presentationRef",
"Publisher": "SEC",
"Name": "Form N-1A",
"Section": "27A",
"Subsection": "c"
},
"r29": {
"role": "http://www.xbrl.org/2003/role/presentationRef",
"Publisher": "SEC",
"Name": "Form N-1A",
"Section": "27A",
"Subsection": "c",
"Paragraph": "ii"
},
"r30": {
"role": "http://www.xbrl.org/2003/role/presentationRef",
"Publisher": "SEC",
"Name": "Form N-1A",
"Section": "27A",
"Subsection": "c",
"Paragraph": "iii"
},
"r31": {
"role": "http://www.xbrl.org/2003/role/presentationRef",
"Publisher": "SEC",
"Name": "Form N-1A",
"Section": "27A",
"Subsection": "c",
"Paragraph": "instruction",
"Sentence": "1",
"Clause": "b"
},
"r32": {
"role": "http://www.xbrl.org/2003/role/presentationRef",
"Publisher": "SEC",
"Name": "Form N-1A",
"Section": "27A",
"Subsection": "c",
"Paragraph": "instruction",
"Subparagraph": "1",
"Clause": "c"
},
"r33": {
"role": "http://www.xbrl.org/2003/role/presentationRef",
"Publisher": "SEC",
"Name": "Form N-1A",
"Section": "27A",
"Subsection": "c",
"Paragraph": "instruction",
"Subparagraph": "1",
"Clause": "d"
},
"r34": {
"role": "http://www.xbrl.org/2003/role/presentationRef",
"Publisher": "SEC",
"Name": "Form N-1A",
"Section": "27A",
"Subsection": "d",
"Paragraph": "1"
},
"r35": {
"role": "http://www.xbrl.org/2003/role/presentationRef",
"Publisher": "SEC",
"Name": "Form N-1A",
"Section": "27A",
"Subsection": "d",
"Paragraph": "2"
},
"r36": {
"role": "http://www.xbrl.org/2003/role/presentationRef",
"Publisher": "SEC",
"Name": "Form N-1A",
"Section": "27A",
"Subsection": "d",
"Paragraph": "2",
"Subparagraph": "i"
},
"r37": {
"role": "http://www.xbrl.org/2003/role/presentationRef",
"Publisher": "SEC",
"Name": "Form N-1A",
"Section": "27A",
"Subsection": "d",
"Paragraph": "2",
"Subparagraph": "iii",
"Clause": "B"
},
"r38": {
"role": "http://www.xbrl.org/2003/role/presentationRef",
"Publisher": "SEC",
"Name": "Form N-1A",
"Section": "27A",
"Subsection": "d",
"Paragraph": "2",
"Subparagraph": "iiii",
"Clause": "A"
},
"r39": {
"role": "http://www.xbrl.org/2003/role/presentationRef",
"Publisher": "SEC",
"Name": "Form N-1A",
"Section": "27A",
"Subsection": "d",
"Paragraph": "2",
"Subparagraph": "instruction",
"Clause": "12"
},
"r40": {
"role": "http://www.xbrl.org/2003/role/presentationRef",
"Publisher": "SEC",
"Name": "Form N-1A",
"Section": "27A",
"Subsection": "d",
"Paragraph": "2",
"Subparagraph": "instruction",
"Clause": "14"
},
"r41": {
"role": "http://www.xbrl.org/2003/role/presentationRef",
"Publisher": "SEC",
"Name": "Form N-1A",
"Section": "27A",
"Subsection": "d",
"Paragraph": "2",
"Subparagraph": "instruction",
"Clause": "15"
},
"r42": {
"role": "http://www.xbrl.org/2003/role/presentationRef",
"Publisher": "SEC",
"Name": "Form N-1A",
"Section": "27A",
"Subsection": "d",
"Paragraph": "2",
"Subparagraph": "instruction",
"Clause": "7"
},
"r43": {
"role": "http://www.xbrl.org/2003/role/presentationRef",
"Publisher": "SEC",
"Name": "Form N-1A",
"Section": "27A",
"Subsection": "d",
"Paragraph": "2",
"Subparagraph": "instruction",
"Clause": "8"
},
"r44": {
"role": "http://www.xbrl.org/2003/role/presentationRef",
"Publisher": "SEC",
"Name": "Form N-1A",
"Section": "27A",
"Subsection": "d",
"Paragraph": "3"
},
"r45": {
"role": "http://www.xbrl.org/2003/role/presentationRef",
"Publisher": "SEC",
"Name": "Form N-1A",
"Section": "27A",
"Subsection": "d",
"Paragraph": "4"
},
"r46": {
"role": "http://www.xbrl.org/2003/role/presentationRef",
"Publisher": "SEC",
"Name": "Form N-1A",
"Section": "27A",
"Subsection": "d",
"Paragraph": "4",
"Subparagraph": "instruction",
"Clause": "3"
},
"r47": {
"role": "http://www.xbrl.org/2003/role/presentationRef",
"Publisher": "SEC",
"Name": "Form N-1A",
"Section": "27A",
"Subsection": "d",
"Paragraph": "4",
"Subparagraph": "instruction",
"Clause": "4"
},
"r48": {
"role": "http://www.xbrl.org/2003/role/presentationRef",
"Publisher": "SEC",
"Name": "Form N-1A",
"Section": "27A",
"Subsection": "e"
},
"r49": {
"role": "http://www.xbrl.org/2003/role/presentationRef",
"Publisher": "SEC",
"Name": "Form N-1A",
"Section": "27A",
"Subsection": "e",
"Paragraph": "instruction",
"Subparagraph": "6"
},
"r50": {
"role": "http://www.xbrl.org/2003/role/presentationRef",
"Publisher": "SEC",
"Name": "Form N-1A",
"Section": "27A",
"Subsection": "f"
},
"r51": {
"role": "http://www.xbrl.org/2003/role/presentationRef",
"Publisher": "SEC",
"Name": "Form N-1A",
"Section": "27A",
"Subsection": "g"
},
"r52": {
"role": "http://www.xbrl.org/2003/role/presentationRef",
"Publisher": "SEC",
"Name": "Form N-1A",
"Section": "27A",
"Subsection": "g",
"Paragraph": "1"
},
"r53": {
"role": "http://www.xbrl.org/2003/role/presentationRef",
"Publisher": "SEC",
"Name": "Form N-1A",
"Section": "27A",
"Subsection": "g",
"Paragraph": "2"
},
"r54": {
"role": "http://www.xbrl.org/2003/role/presentationRef",
"Publisher": "SEC",
"Name": "Form N-1A",
"Section": "27A",
"Subsection": "g",
"Paragraph": "3"
},
"r55": {
"role": "http://www.xbrl.org/2003/role/presentationRef",
"Publisher": "SEC",
"Name": "Form N-1A",
"Section": "27A",
"Subsection": "g",
"Paragraph": "4"
},
"r56": {
"role": "http://www.xbrl.org/2003/role/presentationRef",
"Publisher": "SEC",
"Name": "Form N-1A",
"Section": "27A",
"Subsection": "g",
"Paragraph": "5"
},
"r57": {
"role": "http://www.xbrl.org/2003/role/presentationRef",
"Publisher": "SEC",
"Name": "Form N-1A",
"Section": "27A",
"Subsection": "g",
"Paragraph": "6"
},
"r58": {
"role": "http://www.xbrl.org/2003/role/presentationRef",
"Publisher": "SEC",
"Name": "Form N-1A",
"Section": "27A",
"Subsection": "g",
"Paragraph": "instruction",
"Subparagraph": "2"
},
"r59": {
"role": "http://www.xbrl.org/2003/role/presentationRef",
"Publisher": "SEC",
"Name": "Form N-1A",
"Section": "27A",
"Subsection": "h",
"Paragraph": "1"
},
"r60": {
"role": "http://www.xbrl.org/2003/role/presentationRef",
"Publisher": "SEC",
"Name": "Form N-1A",
"Section": "27A",
"Subsection": "h",
"Paragraph": "2"
},
"r61": {
"role": "http://www.xbrl.org/2003/role/presentationRef",
"Publisher": "SEC",
"Name": "Form N-1A",
"Section": "3",
"Subsection": "instruction",
"Paragraph": "1",
"Subparagraph": "d",
"Sentence": "i"
},
"r62": {
"role": "http://www.xbrl.org/2003/role/presentationRef",
"Publisher": "SEC",
"Name": "Form N-1A",
"Section": "4",
"Subsection": "b",
"Paragraph": "2",
"Subparagraph": "i"
},
"r63": {
"role": "http://www.xbrl.org/2003/role/presentationRef",
"Publisher": "SEC",
"Name": "Regulation S-T",
"Number": "232",
"Section": "313"
},
"r64": {
"role": "http://www.xbrl.org/2009/role/commonPracticeRef",
"Topic": "310",
"SubTopic": "10",
"Name": "Accounting Standards Codification",
"Section": "50",
"Paragraph": "29",
"Publisher": "FASB",
"URI": "https://asc.fasb.org//1943274/2147481962/310-10-50-29"
},
"r65": {
"role": "http://www.xbrl.org/2009/role/commonPracticeRef",
"Topic": "326",
"SubTopic": "20",
"Name": "Accounting Standards Codification",
"Section": "50",
"Paragraph": "5",
"Publisher": "FASB",
"URI": "https://asc.fasb.org//1943274/2147479319/326-20-50-5"
},
"r66": {
"role": "http://www.xbrl.org/2009/role/commonPracticeRef",
"Topic": "815",
"SubTopic": "10",
"Name": "Accounting Standards Codification",
"Section": "50",
"Paragraph": "4K",
"Subparagraph": "(a)(4)",
"Publisher": "FASB",
"URI": "https://asc.fasb.org//1943274/2147480434/815-10-50-4K"
},
"r67": {
"role": "http://www.xbrl.org/2009/role/commonPracticeRef",
"Topic": "946",
"SubTopic": "205",
"Name": "Accounting Standards Codification",
"Section": "50",
"Paragraph": "27",
"Publisher": "FASB",
"URI": "https://asc.fasb.org//1943274/2147480737/946-205-50-27"
}
}
}